aphid responses to drought - eTheses Repository - University of
260
APHID RESPONSES TO DROUGHT: A COMBINED PHYSIOLOGICAL AND TRANSCRIPTOMIC APPROACH By LAURA VICKERS A thesis submitted to The University of Birmingham for the degree of DOCTOR OF PHILOSOPHY Supervisors: Dr Jeremy Pritchard and Professor Jeff Bale School of Biosciences University of Birmingham September 2011
Transcript of aphid responses to drought - eTheses Repository - University of

APHID RESPONSES TO DROUGHT: A COMBINED PHYSIOLOGICAL AND
TRANSCRIPTOMIC APPROACH
By
LAURA VICKERS
A thesis submitted to
The University of Birmingham
for the degree of
DOCTOR OF PHILOSOPHY
Supervisors: Dr Jeremy Pritchard and Professor Jeff Bale
School of Biosciences
University of Birmingham
September 2011

University of Birmingham Research Archive
e-theses repository This unpublished thesis/dissertation is copyright of the author and/or third parties. The intellectual property rights of the author or third parties in respect of this work are as defined by The Copyright Designs and Patents Act 1988 or as modified by any successor legislation. Any use made of information contained in this thesis/dissertation must be in accordance with that legislation and must be properly acknowledged. Further distribution or reproduction in any format is prohibited without the permission of the copyright holder.

Abstract
Drought is arguably one the greatest future challenges for agriculture. The response
of phloem feeders, such as aphids, to increased drought expected under climate
change is still relatively undefined. The effect on aphid feeding of drought stress in
plants can be viewed as potentially positive and negative. It is currently accepted
that under drought conditions, host plant sieve elements will become more
concentrated; hence increases in available amino acid concentrations will potentially
benefit aphids. However, the increased need for aphid osmoregulation under
drought, to deal with the osmotically challenging diet, may be detrimental to aphid
performance.
Using the electrical penetration graph technique (EPG), the probing behaviour of two
clones of Myzus persicae (O Clone and B Clone), Brevicoryne brassicae,
Rhopalosiphum padi and Sitobion avenae on the host plants Brassica nigra and
Lolium perenne (respectively), were analysed under a defined drought regime.
Drought treatment had a significant effect on the behaviours of all aphid species and
clones, except S. avenae. In B. brassicae and B clones of M. persicae, xylem feeding
was significantly increased on droughted host plants. Furthermore, both clones of M.
persicae and R. padi spent significantly less time ingesting sieve element sap, and
more time not probing or in plant pathway activities whilst on droughted host
plants. These results suggest that drought stress may cause a reduced palatability of
host plants.
In addition, fecundity measurements showed that drought resulted in a reduction in
aphid reproductive performance in M. persciae (O and B clone), B. brassicae, R. padi

and S. avenae. However, fecundity was only significantly reduced in the M. persicae
(O clone only), B. brassicae and R. padi.
To understand the aphid response to droughted B. nigra at the genetic level, the
gene expression of M. persicae exposed to different drought regimes was analysed
using microarrays. Gene expression analysis showed up regulation of the
osmoregulation associated enzyme, sucrase, as well as the up regulation of other
enzymes such as amylases, cytochrome P450s, Heat Shock Proteins, and an
aquaporin when exposed to droughted hosts. Furthermore, it was found that the
level of drought had a noticeable effect on gene expression in M. persicae, showing
aphids have a very adaptable response to drought stress.
The combined physiological and transcriptomic approach of this study gives a
complementary whole organism assessment of aphid responses to drought. This
study has helped to confirm xylem feeding and sugar polymerisation as important
mechanisms of aphid osmoregulation, as well as providing support for the
hypothesis of water cycling within the body of the aphid. This study has highlighted
that aphids respond heterogeneously to water stress, and although it has been
possible to identify some general trends, this study has emphasised that the
adaptability of aphids to stress is species and even ecotype specific.

Acknowledgments
I would first like to thank my supervisors Dr Jeremy Pritchard and Professor Jeff Bale
for all their support, advice and guidance over the last four years. In particular I
would like to thank Dr Jeremy Pritchard for imparting wisdom to me in sayings such
as ‘you can’t argue with the data’, as well as his unwavering belief in my ability and
for his support in activities outside of my main research. Other academic staff I
would like to thank is Professor Brian Ford-Lloyd, Professor John Newbury and Dr
Scott Hayward, all of whom have given me good advice and feedback over the years.
Huge thanks to Dr George Jander at the Boyce Thompson Institute for Plant Research
in New York for the opportunity to conduct the microarray experiments in his lab
and to Dr John Ramsey for helping me with the extraction to visualisation process.
Thanks also to NERC for providing the studentship and Dr Brian Fenton and Phil
Northing for supplying me with aphid clones.
I would dearly like to thank my family too, in particular my mom and dad, who have
emotionally supported me through my seven year university education. Thank you
both for listening to my moaning and rants on things you never understood, as well
as for giving me lifts in and out of the labs when I was working unsociable hours. I
would also like to give a big thank you to all the other Doctoral Researchers who
made working at the University of Birmingham such a great experience, and to my
friends outside of the university who have kept me sane with regular jaunts to the
Birmingham social scene. Finally thank you to Dave, who has given me the time off
my part-time job to get this thesis finally written up, Dave you are a lifesaver!

Contents
List of Figures….………………………………………………………………………………………………………...i
List of Tables……………………………………………………………………………………………………………..ii
Glossary of Terms……..…………………………………………………………………..………………………...iii
Chapter One: Literature Review
1.0 Climate Change and drought stress……………….………………………………...…………….…18
1.1 The Aphid………………………..……………………………………………………………………….…….…19
1.1.1 Importance of Aphids as Agricultural Pests………………..……...………………21
1.1.2 Feeding Mechanism………………………..………………………………………………….24
1.1.3 Host Detection…………………………………………………………………………….……..25
1.1.4 Sieve Element Location and Feeding………………………………….…...............28
1.2 Aphid Interactions: Plant defence and disarmament …………………………..……….....28
1.2.1 Plant Strategies…………………………………………….……………………………..……..29
1.2.2 Defence against aphids: Antibiosis and antixenosis………………..…………..31
1.2.3 Defence against aphids: Recruitment………………………............................32
1.2.4 Plant Signalling Pathways and Aphids………………………………………………...35
1.2.5 Gene-to-gene recognition systems: R genes induced aphid resistance……………………………………………………………………………………………………36
1.2.6 Plant Defence: multi-strategies, pathway crosstalk and timing……......38
1.2.7 Aphids Overcoming Plant Defences…………………………………………………….39
1.2.8 Summary…………………………………………………………………………………………….41
1.3 Aphid Interactions: Aphid responses to conspecifics…………………………………………42
1.4 Aphid Osmoregulation: Diet? A struggle even for aphids……………………………..……44
1.4.1 Phloem sap assimilation…………………………………………………………….…..…..44
1.4.2 Osmoregulation Mechanisms………………………………………………………….....45
1.5 Aphid Interactions: Response to Drought Stress……………………………………………….49
1.5.1 Current Debate & Summary.……………………………………………………..…….…52

Chapter Two: Development of a reproducible drought regime and its effects on plant performance
2.0 Abstract………………………………………..……………………………………………….………………….55
2.1 Introduction…………………………………………….………………………………………….…………….56
2.1.1 Early Adaptations – from the seas to the land………………………………......57
2.1.2 Plant strategies to deal with drought stress……………………..………..………58
2.1.3 Physiological Adaptations to Drought stress…………………………..………....59
2.2 Materials and Methods……………………………………………..………………………………………64
2.2.1 Plant Species……………………………..……………………………………………………….64
2.2.2 Plant culturing…………………………………………………………………………………….66
2.2.3 Drought regime……………………………………………………………………………..……66
2.2.4 Plant growth scoring & determining age of plants for experiments…………………………………………………………………………………………..……67
2.2.5 Chardakov technique and calculating leaf water potential (MPa)…………………………………………………………………………………………………………..69
2.2.6 Pot Size………………………………………..…………………………………………………….69
2.2.7 Calculating Fresh weight: Dry weight Ratios…………………………….………..70
2.2.8 Collection of sap from whole tissue……………………………………………………71
2.2.9 Sugar Quantification and the Somogyi-Nelson Method………………...…..71
2.2.10 Using the HPLC for analysing cation concentrations………………….……..72
2.2.11 Amino Acid Analysis…………………………………………………………………………73
2.2.12 Statistical Analysis……………………………………..…………………………………….74
2.3 Results………………………………..………………………………………………………………….…………75
2.3.1 Drought induced water potential (MPa) changes……………..………….…….75
2.3.2 Fresh: Dry weight ratio (fw:dw) changes under drought …………………….76
2.3.3 Amino acids………………………………………….…………………………………………….77
2.3.4 Sugars……………………………………….……….…………………………………….…………79
2.3.5 Cations……………………………………………………………………………………………….80
2.4 Discussion…………………………………………………………………………………………………………85
2.4.1 Conclusion & The Experimental System…………………………………………..…90

Chapter Three: The feeding and settling behaviours of Myzus persicae, Brevicoryne brassicae, Rhopalosiphum padi and Sitobion avenae on water stressed hosts Brassica nigra and Lolium perenne
3.0 Abstract………………………………………………………………………………………………….………...93
3.1 Introduction……………………………………………………………………………………………..……….93
3.1.1 Aphid Behaviour – Locating and Accepting suitable Plant-Hosts………..94
3.1.2 Olfactory influence on plant-host selection………………………………….…….95
3.1.3 Influence of Initial Plant Contact in Host Acceptance………………….………97
3.1.4 Chemoreceptors or Mechanoreceptors or both?..................................98
3.1.5 Probing Host-Plants and Feeding………………………………………………….…….99
3.1.6 Phloem Location…………………………………………………………………………….…100
3.1.7 Phloem Acceptance………………………………………………………….………………101
3.1.8 Assessing aphid probing behaviour using the Electrical Penetration Graph Technique………………………………………………………………………………………103
3.1.9 Influences of drought and environmental stressors on aphid behaviour………………………………………………………………………………………………….107 3.1.10 Chapter Aims………………………………………………………..………………………..108
3.2 Methods and Materials……………………………………………………………..……………………109
3.2.1 Plant Species………………………………………………………………………………….…109
3.2.2 Aphid Species……………………………………………………………..…………………...109
3.2.3 Plant Culturing………………………………………………………………………………….109
3.2.4 Aphid Culturing…………………………………………………………………………………109 3.2.5 Electrical Pentration Graph (EPG) Technique……………………..…………….110
3.2.6 Electrical Penetration Graph Statistical Analysis………………….…………..111
3.2.7 Behavioural Scoring………………………………………………………………………….111
3.2.8 Observational Scoring Statistical Analysis…………………………..…………….113
3.3 Results…………………………………………………………………………………………………………….114
3.3.1 Effect of time on feeding behaviour…………………………………………………114
3.3.2 Effect of drought on feeding behaviour…………………………..………….……115
3.3.3 Proportional changes in EPG behaviour over the 6 hours……………….…116

3.3.4 Analysis of aphid locomotion and antennae movements upon initial host-plant contact………………………………………………………………………………...….129
3.4 Discussion……………………………………………………………………………………………………….132
3.4.1 Effect of Drought on Feeding Behaviour……………………………..…………...134
3.4.2 Conclusion……………………………………………………………………………………..…138
Chapter Four: Reproductive performance of Myzus persicae, Brevicoryne brassicae, Rhopalosiphum padi and Sitobion avenae on water stressed hosts Brassica nigra and Lolium perenne
4.0 Abstract…………………………………………………………………………………………………………..140
4.1 Introduction…………………………………………………………………………………………………….141
4.1.1 Aphid life cycles………………………………………………………………………………142
4.1.2 Myzus persicae……………………………………………………..…………………………143
4.1.3 Brevicoryne brassicae……………………………………………………………………….144
4.1.4 Sitobion avenae………………………………………………….....………………………...145
4.1.5 Rholpalosiphum padi………………………………………………………………………..145
4.1.6 Measuring Insect Performance………………………………………………………...146
4.1.7 Measuring Honeydew……………………………………………………………………….147
4.1.8 Effect of drought on plants…………………………………..…………………………..148
4.1.9 Effect of diet on aphids…………………………………………………………………...149
4.1.10 Plant-stress hypothesis……………………………………………..…………………...150
4.2 Materials and Methods…………………………………………………………………………………..153
4.2.1 Plant Species……………………………………………………………………………………153
4.2.2 Aphids……………………………………………………………………………………………...153
4.2.3 Plant Culturing……………………………………………………..…………………………..153
4.2.4 Aphid Culturing…………………………………………………………………………………153
4.2.5 Fecundity…………………………………………………..…………………………………..…154
4.2.6 Honeydew……………………………………………………………………………..…………155
4.2.6 Statistical Analysis……………………………………………………………………………156

4.3 Results……………………………………………………………………………………………………………157
4.4 Discussion………………………………………………………………………………………..…………….162
4.4.1 Conclusion…………………………………………………………………………..……………167
Chapter Five: Analysis of gene expression by microarray of Myzus persicae feeding on Brassica nigra subjected to differing water regimes
5.0 Abstract…………………………………………………………………………………………………………..170
5.1 Introduction……………………………………………………………………………………….……………171
5.1.1 Aphid Osmoregulation………………………………………………………………………173
5.1.2 Microarray Technology…………………………………………………..………………..175
5.1.3 Quality Control in Microarray Design………………………………………………..180
5.1.4 Chapter Aims………………………………………………………………………….…………182
5.2 Methods and Materials……………………………………………………………………………………182
5.2.1 Aphids…………………………………………………………………………………….………..182
5.2.2 Plants……………………………………………………………………………………………….183
5.2.3 Aphid Treatments………………………………………………………………………….….183
5.2.4 RNA extraction………………………………………………………………..……….………185
5.2.5 cDNA conversion and aRNA synthesis…………………………….…………………185
5.2.6 Quantification check and Labelling……………………………………………….…..185
5.2.7 Fragmentation and Hybridisation to Array………………..……………………..187
5.2.8 Data Analysis and Quality Control……………………………………….……...……187

5.3 Results…………………………………………………………………………………………………….………190
5.3.1 Mild drought………………………………………………………….………………………...190
5.3.1.1 Quality Control………………………………………………………….……….190
5.3.1.2 Significant Genes…………………………………………………………………………………………….191
5.3.2 Extreme drought……………………………………………………………………….……..195
5.3.2.1 Quality Control………………………………………………………….……….195
5.3.2.2 Significant Genes…………………………………………………….………….196
5.3.3 Comparison of treatments………………………………………………………………..200
5.3.4 Candidate Genes………………………………………………………………………………202
5.3.4.1 Identification………………………………………………………………………202
5.3.4.2 Candidate Genes relationships……………………….………………….206
5.4 Discussion……………………………………………………………………………………………………….209
Chapter Six: General Discussion
6.0 Discussion……………………………………………………………………………………………………….217
Chapter Seven: References
7.0 References………………………………………………………………………………………………………224

List of Figures
Figure 1.1: Basic internal and external anatomy of an aphid….……………………………….22
Figure 1.2: Schematic representation of the stylets bundle anatomy of M.
persicae…………………………………………………………………………………………………………………23
Figure 2.1: The growth of B. nigra over a period of a month in growth room
conditions………………………………………..………………………………………………………….………….68
Figure 2.2: The growth of L. perenne over a period of a month in growth room
conditions……………………………………………………………………………………………………….……...69
Figure 2.3: The water potential (MPa) of 20 day old B. nigra in four pot sizes over a
period of progressive drought…………………………………………………………………………..….…71
Figure 2.4: Typical standard curve used for sugars analysis………………………….…………73
Figure 2.5: Typical standard curve used for amino acid analysis…………………………..74
Figure 2.6: The water potential (MPa) of B. nigra and L. perenne subjected to a
progressive drought regime….……………………………………………………………………….………76
Figure 2.7: Changes in the FW: DW ratio of B. nigra and L. perenne subjected to a
progressive drought regime…………………………………………………………………………….…….77
Figure 2.8: Changes in amino acid concentrations in sap of B. nigra subjected to a
progressive drought………………………………………………………………………..……………………..79
Figure 2.9: Changes in amino acid concentrations in sap of L. perenne subjected to a
progressive drought………………………..……………………………………………………………………..79
Figure 2.10: Changes in concentrations of non-reducing sugars in L. perenne and B.
nigra cell sap…………………….…………………………………………………………………………………..81
Figure 2.11: Changes in K+ cation concentrations in sap of B. nigra subjected to a
progressive drought……………………………………………………………………..……..…………………82
Figure 2.12: Changes in Mg+ and Ca2+ cation concentrations in sap of B. nigra
subjected to a progressive drought……………………………………………………………………….82

Figure 2.13: Changes in Na+ and NH4+ concentrations in sap of B. nigra subjected to a
progressive drought……………………..………..………………………………………………………………83
Figure 2.14: Changes in K+ cation concentrations in sap of L. perenne subjected to a
progressive drought………………………..……………………………………………………………………...83
Figure 2.15: Changes in NH4+ cation concentrations in sap of L. perenne subjected to
a progressive drought…………..…………………………………………………………………..…………84
Figure 2.16: Changes in Mg+, Na+ and Ca2+ cation concentrations in sap of L. perenne
subjected to a progressive drought…..………………………………………………………………..…85
Figure 3.0: EPG waveforms as defined in the Probe 3.4 Manual……………………........106
Figure 3.1: Amount of time spent not probing by four aphid species when subjected
to droughted and well watered plants hosts………………………………………………….….….118
Figure 3.2: Amount of time spent probing by four aphid species when subjected to
droughted and well watered plant hosts…………………………………………………………..….119
Figure 3.3: Amount of time spent salivating into the sieve element by four aphid
species when subjected to droughted and well watered plant hosts ……………………120
Figure 3.4: Amount of time spent ingesting sieve element sap by four aphid species
when subjected to droughted and well watered plant hosts ………………………….…….121
Figure 3.5: Amount of time spent ingesting xylem sap by four aphid species when
subjected to droughted and well watered plant hosts …………………………………….……122
Figure 3.6: Proportion of time spent per hour for a variety of feeding behaviours in
M. persicae and B. brassicae when subjected to droughted and well watered B.
nigra……………………………………………………………………………………………………………………..127
Figure 3.7: Proportion of time spent per hour for a variety of feeding behaviours in S.
avenae and R. padi when subjected to droughted and well watered L.
perenne..…………….…………………………………………………………………………………………………128

Figure 3.8: Frequency for locomotive and antennae behaviours in four aphid species
when subjected to droughted and well watered plant hosts…………………………...…..130
Figure 4.1: Fecundity of adult M. persicae (green O clone) over a 72 hour period
whilst feeding on droughted and well watered B. nigra………………………………………..157
Figure 4.2: Fecundity of adult M. persicae (red type B clone) over a 72 hour period
whilst feeding on droughted and well watered B. nigra…………………………………..……158
Figure 4.3: Fecundity of adult B. brassciae over a 72 hour period whilst feed on
droughted and well watered B. nigra…………………………………………………………………159
Figure 4.4: Fecundity of adult R. padi over a 72 hour period whilst feed on droughted
and well watered L. perenne……………………………………………………………………………….160
Figure 4.5: Fecundity of adult S. avenae over a 72 hour period whilst feed on
droughted and well watered L. perenne..…………………………………………..………………160
Figure 4.6: Honeydew droplet frequency of adult green (O) clone M. persicae on
droughted and well watered B. nigra..………………………………………………………...………161
Figure 4.7: Honeydew droplet frequency of adult red (B) clone M. persicae on
droughted and well watered B. nigra..…………………………………………………..……………162
Figure 5.1: Example of a one and two colour array workflow………………………..………179
Figure 5.2: Profile plot of genes in mild drought treatment post filtering………………190
Figure 5.3: Volcano plot of significant genes for mild drought treatment……………..192
Figure 5.4: Pie chart of significant gene function for mild drought treatment……….195
Figure 5.5: Profile plot of genes in extreme drought treatment post filtering……….196
Figure 5.6: Volcano plot of significant genes for extreme drought treatment……….197
Figure 5.7: Pie chart of significant gene function for extreme drought
treatment……………………………………………………………………………………………………………..199
Figure 5.8: Phylogram of M. persicae sucrase ESTs……………………………………………….205
Figure 5.9: Phylogram of amylase and sucrase homologs……………………………..………208

List of Tables
Table 3.1: Values assigned to aphid behaviours for observational scoring
experiments…………………….……….……………………………………………………………………….....113
Table 3.2: Statistical analysis results for Electrical Penetration Graph experiments on
four aphid species and two clones…………..........................................................123-126
Table 3.3: Statistical analysis results for Behavioural Observational Scoring
experiments on four aphid species and two clones…………………………………....………..131
Table 4.1: Average honeydew volume results for M. persicae O and B clones when
fed on well watered and drought stressed B. nigra…………………………………………..…162

Glossary of terms
Abaxial: Facing away from the stem of the plant, i.e. lower surface of leaves
Alate: A winged aphid
Apterous: An aphid without wings
Buccal Cavity: the cavity between the jaws and the cheeks
Cauda: a small projection at the tip of the abdomen
Cibral Pump: Food can be sucked into the buccal cavity and into the pharynx by contractile action of cibarial muscles (located between the head capsule and the anterior wall of the pharynx) which create suction by enlarging the volume of the pharynx, this "suction pump" mechanism is called the cibarial pump.
Epipharynx: A structure that overlaps the mouth of certain insects
EST: Expressed Sequence Tag
Fundatrix: (aka stem-mother) the aphid which emerges from the winter egg and gives rise to the first generation in spring
Gametogenesis: the production of cells specialised in sexual reproduction
Gynoparae: Parthenogenetic females which produce sexual females
Heteroecious: Requiring more than one host species to complete a life cycle
Hypopharynx: The bottom part of the pharynx
Labium: (aka rostrum) Lower lips that surround the probiscus containing the stylet. During piercing, the labium encasing the stylet remains outside the plant tissue
Labrum: Upper lips that surround the probiscus containing the stylet.
Monoecious: Completes whole life cycle on one host
Oviposition: The process of laying eggs by oviparous animals
Parthenogenetic: A form of asexual reproduction found in females, where growth and development of embryos occurs without fertilisation by a male
Proboscis: In aphids the mandibles and maxillae are modified into a proboscis, which in turn is sheathed within a modified labium
Siphunculi: (aka cornicles) Paired protruding organs near the end of the abdomen of aphids, through which a sugary secretion is extruded
Stylectomy: A technique to obtain sieve tube sap by severing the stylets of feeding aphids

Stylet: Paired mandibles and maxillae together form the aphid stylet, which is used to pierce the plant tissue
Type I error: false positive, when the statistical test rejects a true null hypothesis
Type II error: false negative, when the test fails to reject a false null hypothesis
Virginoparae: female aphids giving birth to young by parthenogenesis
Viviparous: method of reproduction in which the embryo develops inside the body of the female from which it gains nourishment (opposite of oviposition)
List of Abbreviations
RIN – RNA Integrity Number
EST – Expressed Sequence Tag
cDNA – Complementary DNA
mRNA – Messenger RNA
aRNA – amplified RNA
UTP - uridine 5'-triphosphate.
DMSO - Dimethyl sulfoxide
NCBI – National Center for Biotechnology Information
GO Analysis – Gene Ontology Analysis
Nt – Single stranded unit of DNA/RNA

Chapter 1: Literature Review

1.0 Climate Change and drought stress
The “warming of the climate system is unequivocal, as is now evident from
observations of increases in global average air and ocean temperatures, widespread
melting of snow and ice and rising global average sea level” IPCC (2007).
Anthropogenic increases in greenhouse gases are predicted to cause changes in
global precipitation profiles. In the UK a warming in atmospheric temperature is
expected of ≈2-3.5oC, in addition to a predicted fall in summer precipitation levels by
up to 50% by 2080 (Hulme et al, 2002). Extremely warm seasons and years are
predicted to increase in frequency by 30% by 2050, with a 90% chance of two warm
dry years occurring consecutively (CCIRG 1996). In the southeast of the UK,
prolonged periods of drought are likely, even in years where average rainfall has
occurred (CCIRG 1996).
Under the current climate change scenario, it is anticipated that the UK agricultural
industry could suffer from increased insect outbreaks related to the global rising
temperatures, and crop losses from increased incidences of drought and flooding
events. The effect of frequent droughts on one of agriculture’s most significant
insect pests, the aphid, is not well understood. It can be certain that the interaction
between aphids and their host plants will alter under drought conditions, as drought
affects the host-plant and consequently phloem composition. However, whether we
can predict these changes for the whole feeding guild is questionable. In a recent
review on this subject, it was suggested that the species specific adaptability among

the Aphididae, might make any predictions only valid if made on an individual
species level (Pritchard et al, 2007).
This study aims to examine the effect of drought on the physiology of two common
British plant species, the herbaceous Brassica nigra and the grass species Lolium
perenne, with the aim of creating a repeatable drought regime. This thesis will then
explore the effect of this drought regime on the behaviour and fecundity of the
aphid species, Brevicoryne brassicae, Rhopalosiphum padi, Sitobion avenae and two
clones of Myzus persicae. In chapter five this thesis will also investigate whether the
aphid species M. persicae alters gene expression in response to varying levels of
drought stress.
It is hoped that this work will determine whether the response of aphids to drought
stress is predictable across the feeding guild, as well as highlight aphid mechanisms
of osmoregulation. Therefore, the following sections in this chapter will introduce a
background to aphid evolution, biology, diet, osmoregulation and their relationships
with plants and conspecifics in attempt to understand the complexity of the aphid-
plant relationship, as well as providing an introduction on the current work on aphid
responses to drought.
1.1 The Aphid
Over 400 million years ago the three phyla of vascular plants diverged from early
land plants (Campbell and Reece, 2002), these early vascular plants revolutionised
the colonisation of plants to terrestrial habitats. Their vascular systems enabled the
transport of solutes as well as control of cell water content vital for the turgor
pressure that drives cell expansion and maintains structure. The two types of

vascular tissue in vascular plants are xylem and phloem tissue. The xylem carries
minerals and water from the roots to the shoots in a unidirectional manner, whilst
phloem tissue transports nutrients such as sugars and amino acids bi-directionally.
The emergence of this vascular tissue opened up a niche for specialist vascular
feeding insects, and 220 million years ago in the Carboniferous period the first
aphids, phloem feeders, are thought to have appeared (Evans, 1956). Currently, the
oldest known aphid fossil is from the Triassic period, is a species called Triassoaphis
cubitus (Evans, 1956). These early ancestors of aphids were relatively unspecialised
lacking a proboscis and wing venation structures until the appearance of
angiosperms 160 million years ago, which provided the evolutionary drive for aphid
speciation.
Parthenogenesis, the ability to reproduce asexually without fertilisation of eggs has
been estimated to have evolved in aphids around 200 million years ago (Heie, 1967).
Other special adaptations such as viviparae, the reproduction of live offspring, as
well as wing venation and proboscis structures are believed to have appeared
around 146 million years ago. Structures such as the cauda and siphunculi appeared
later in the Cretaceous around 65 million years ago (Shaposhnikov, 1977).
Today there are 10 different families of aphid; Adelgidae, Anoeciidae, Aphididae,
Drepanosiphidae, Greenideidae, Hormaphididae, Mindaridae, Pemphigidae,
Phloeomyzidae, Phylloxeridae, Thelaxidae and Lachnidae consisting of around 4,000
described species (Dixon, 1998), of which approximately 250 species are classified as
pests (Blackman and Eastop, 2000). In the UK there are more than 500 species and

although the distribution of aphids is global, the majority of species are found in
temperate environments.
1.1.1 Importance of Aphids as Agricultural Pests
Aphids are among the most important agricultural pests in temperate agriculture
systems, attacking all types of plants, woody trees, shrubs, herbs and grasses (Hill,
1997). The damage they cause can be direct via extraction of phloem sap which can
cause a reduction in photoassimilates and crop yield, or indirect in the transmission
of plant viruses (Dedryver et al, 2010). In a study by Nault et al, (1997), it was found
that a staggering 50% of insect borne plant viruses were transmitted by aphids.
Additionally, aphids can cause damage to crops via their sucrose rich excreta, termed
honeydew, which can attract other pests species (Gratwick, 1992) as well as being
ideal for the growth of sooty moulds that cover host-plant foliage and hinder the
photosynthetic capacity of the plant (Jones and Jones, 1974).
The success of the aphid can be attributed to its lifecycle. The aphid’s lifecycle can
vary between species and they have adapted unique ways to coping with seasonal
and climatic variation. Some species are monophagous, and feed only on one species
of plant, whereas others are polyphagous. Aphids are also capable of two different
types of reproduction: oviposition (eggs) or viviparae (live young). Depending on the
cues the aphid receives the young can be born gamogenetically (sexual
reproduction) or agamogenetically (asexual reproduction), and become apterous
(wingless) or alate (winged) aphids as adults. Aphids also display the phenomena
known as the ‘telescoping of generations’, whereby the female aphid will have a
daughter within her body that despite not being born yet, is already

parthenogenetically producing her own daughter (fig 1.1). This ‘telescoping of
generations’ not only allows aphids to pass on important environmental information
through generations, but also increases their intrinsic rate of population increase
(rm). For example, in the summer a single viviparous reproducing adult female of the
pea aphid species, Acyrthosiphon pisum, can reproduce 50+ progeny in less than a
month, which in turn can complete maturation and commence reproducing in as
little as ten days (Baumann et al, 1997).
1.1.2 Feeding Mechanism
Aphids are largely phloem feeders and the nature of the diet of aphids requires
specialist equipment to feed. The stylet bundle (fig 1.2) consists of a pair of outer
mandibular stylets and inner maxillary stylets. The maxillary stylets meet at the
hypopharynx and form two canals, an anterior food canal and posterior salivary
canal. The stylets are typically driven into the plant and moved around the mesophyll
layer in the plant in an attempt to locate the phloem sieve element.
Figure 1.1 Image taken from The University of Arizona, Centre for Insect Science Education Outreach (http://insected.arizona.edu/gg/resource/internal.html). The image shows the basic external a) and internal b) anatomy of an aphid. Diagram b) shows the ovaries with developing embryos, demonstrating viviparity and the adaptive physiology that allow aphids to increase their rm.
a) b)

The size of the stylet bundle can vary in width and length in different species. In
Myzus persciae the average diameter of the stylet bundle is 3μm, the food canal
being a diameter of 0.5μm near the head and 0.35μm near the stylet tips, whereas in
Tuberolachus saligans the diameter of the food canal is 3.6μm near the aphids head,
and 1.2μm near the tips.
The overall length of the stylet in M. persicae is 300μm, whereas in Adelges piceae
the length can be up to 1.5 mm (Auclair, 1963). The variation in stylet width and
length between aphid species is one of the features that make aphids specially
adapted to host plants. Small stylets would restrict penetration depth within plant
tissue, whilst long, thick stylets would require a large labium (lower ‘lips’ that
Figure 1.2 Schematic representation of the stylets bundle anatomy of M. persicae a) image taken from Biology Teaching Resources, Insect Life-Cycles Educational Material by © D.G. Mackean (http://www.biology-resources.com/insects-01.html) b) Image reproduced from Taylor and Robertson (1974). Image a) and b) show the mandibular stylets (md) located on the outside of the bundle, protecting the maxillary stylets (mx). The inner architecture of maxillary stylets is a large food canal (FC) and a narrow salivary canal (SC). Image b) also shows along several hundred micrometers of the stylet's length the narrowing of the inner architecture to form a fusion between the FC and SC into single common duct (CD)

surround the probiscus) to hold them during periods when the aphid is not feeding.
In addition, the size of the stylet bundle can vary between instars and in some cases
morphs (Balch, 1952; Amman, 1970). Young nymphs of Aphis gossypii do not have
stylet bundles long enough to reach the phloem from the upper surface of cotton
leafs (Pollard, 1958), and so are found in larger concentrations in the abaxial regions
of leaves. These compromises demonstrate how aphid size and physiologically are
evolutionarily intertwined with the physiology of their host plants.
In selecting plant hosts aphids are thought to have an array of different mechanisms
that are initiated on plant contact. Due to their specificity of feeding it is vital for
survival that aphids are able to recognise suitable host plants, to ensure successful
reproduction and colonisation.
1.1.3 Host Detection
Alate (winged) aphids (during flight) use visual cues to locate plants, with most
species displaying a preference to land on yellow surfaces (Prokopy and Owens,
1983; Roberts, 1987), whilst the polyphagous species R. padi and A. fabae, have
been found to be more responsive to green wavelengths (Hardies, 1989; Nottingham
et al, 1991). In addition to visual cues, aphids can also use chemical cues in the form
of olfaction detection. Aphids can detect plant volatiles such as nitriles, green leaf
volatiles, henzaldehydes, isothiocyanates and monoterpenes (Visser and Piron,
1997). The exact role of plant volatiles in host selection has been subject to debate in
the literature and although it is not well understood in alate morphs, walking
apterae have been shown to respond to host-plant odours and even avoid non-host
odours when in olfactometers (Pettersson, 1970; 1973; Petterson et al, 1994;

Nottingham et al, 1991b; Hori, 1999). Thus aphids can utilise both visual and
chemical cues when locating a suitable host plant.
It has been suggested that aphids also use mechanical information about a plant,
such as leaf waxiness, hairiness, glandular trichrome absence or presence, and
epidermal thickness before deciding whether to attempt probing. At the distal end of
an aphid’s probiscus there is a ring of hairs, which could be a sensory mechanism to
determine plant texture and to find a suitable place for stylet insertion. In addition,
an organ located over the epipharynx has been suggested to play a role in host
acceptance. The organ consists of specialised hypodermal cells with epipharynx
nerve endings, and this is thought to be a ‘tasting organ’ that enables aphids to taste
plant sap as it enters the pharynx (Auclair, 1963). The ability to taste plant sap can
provide vital information to the aphid such as host palatability and host condition.
1.1.4 Sieve Element Location and Feeding
Once aphids insert their stylets into plant tissue they perform a series of cell
punctures. It is thought that during these cell punctures aphids sample cell sap to
acquire information about their host plant (Martin et al, 1997). Although the exact
mechanisms in sieve element location are not well understood, it has been
suggested that gustatory monitoring of ingested sap samples allows aphids to follow
potential apoplastic gradients in pH and sugar leading to the phloem.
Upon sieve element location aphids always start with a brief cell puncture; it is
thought that this event is crucial in the aphid deciding whether or not to commit to
phloem feeding. Phloem sap is typically made up of water, carbohydrates often as
sucrose, amino acids, inorganic ions, proteins, hormones, mRNA, lipids and

secondary compounds (Van Bel, 2003). Once aphids decide to commit to phloem
feeding they commence salivating into the sieve element for a short duration
(known as E1 waveforms) and then move onto the second phase of phloem activity,
sap ingestion (known as E2 waveforms, these waveforms and the feeding behaviours
of aphids will be discussed in more detail in chapter three).
During ingestion the hydrostatic pressure of the phloem forces sap up into maxillary
food canal of the aphid. In addition to the hydrostatic driving force of sap, aphids
also have the cibarial pump which is located between the head capsule and anterior
wall of the pharynx. The cibarial pump is a mass of muscles, which act on the
pharynx enlarging the volume of the pharynx. This action causes a pump action
drawing sap from the buccal cavity into the pharynx. It is believed that this ‘sucking
action’ is how aphids assimilate additional sap, than what is driven hydrostatically.
Phloem feeding aphids have also been shown to pierce the xylem of the plant and
acquire water and ions. Xylem feeding is rare and the majority of studies have shown
xylem feeding displayed in aphids experiencing dehydration (Spiller et al, 1990;
Ramirez et al, 2000; Daniels et al, 2009), under these conditions to acquire xylem sap
in watered stressed plants aphids would require the cibarial pumping action.
The discovery of the importance of plant turgor pressure in the feeding of aphids
was enabled by the development of the technique called stylectomy (Kennedy and
Mittler, 1953). This technique involved the cutting of feeding aphid stylets in situ,
and measuring the rate of sap exudation from the remaining severed stylet. Sap
exudation from severed stylets can continue sometimes for several days in the
absence of the aphid. The importance of hydrostatic pressure in the feeding of

aphids is undisputed. However, techniques developed to measure sap ingestion have
shown that aphids can assimilate more sap than the amount exuded out of the plant.
By measuring the frequency and volume of honeydew droplets, calculations of
honeydew excretion can be obtained. It has been found in some studies that the
amount of honeydew excreted by aphids has exceeded the amount exuded from
severed stylets (Mittler, 1957). When we consider the loss of water and nutrients
from ingested sap for processes involving growth, development, respiration and
reproduction, it can be concluded that sap exudation rates are lower than the actual
rate of intake of sap by the aphid, especially on plants with lower hydrostatic
pressures such as herbaceous species. In support of this, work involving the feeding
of aphids on artificial diets where there is very little hydrostatic pressure has shown
that aphids have a physiological adaptation to ingest sap in the absence of these
forces. This adaptation takes the form of the cibarial pump. Interestingly a study into
the plant resistance in two lucerne (Medicago sativa) genotypes suggested that
resistance was linked to sap viscosity. Genotypes where aphid performance was
reduced did not vary in sugars, amino acids or GABA concentrations but in exudation
rates when compared to susceptible genotypes. Resistant genotypes had exudation
rates that were 2.8 and 2.3 times lower than susceptible genotypes (Girousse and
Bournoville, 1994). This suggests that there is a cost in aphids overcoming the
difficulty in phloem acquisition. This may be a result of resource allocation to
mechanisms such as a cibarial pump.

1.2 Aphid Interactions: Plant defence and disarmament
To understand the complexity of the aphid-plant relationship, this section will
explore the ways in which plants have adapted defensive strategies against
herbivory and then will specifically consider aphid examples.
1.2.1 Plant Strategies
Natural selection by herbivores on plants has resulted in a broad array of plant
defences, ranging from constitutively expressed to induced defences. Plant defences
can be structural, such as cell wall modifications, or chemical. The induction of plant
defences can be a universal response to herbivory damage via the initiation of a
signalling pathway, or species (even ecotype specific) with R gene induction.
Plants have also adapted different defensive strategies, with some species adapting
to escape herbivores in space and time by growing in an inaccessible location, or
adapting growing seasons to avoid herbivores. For plant hosts unable to avoid their
herbivore in space and time, tolerance is another defensive strategy that can be
adopted; this sometimes involves diverting resources to damaged areas to assist in
recovery after herbivory. Strategies of avoidance and tolerance are strategies that
act on the plant as opposed to the herbivore; however, antibiosis and antixenosis are
defence strategies that affect herbivores in the interaction.
If a plant has antibiosis resistance it means that it affects the biology of the
herbivore, and therefore herbivore abundance by reducing longevity, fecundity or
increasing mortality. Antixenosis resistance is where the plant affects the behaviour
of the herbivore, usually this manifests as a deterrent towards colonisation on the

host plant, and thus the herbivore typically demonstrates a preference for non-
resistant plants. Antixenosis or antibiosis strategies may take the form of chemical
defence molecules like secondary metabolites, which are produced by plants to
influence the behaviour, growth, or survival of a herbivore. These defences can be
repellents or toxins and can affect the herbivore directly or reduce the palatability of
the plant.
1.2.2 Defence against aphids: Antibiosis and antixenosis
Antibiosis and antixenosis are widespread defence mechanisms utilised against
aphid herbivores. Some of these are constitutively expressed whereas others may be
induced. Inducible antibiosis defence was demonstrated in Arabidopsis thaliana in
response to feeding by the aphid M. persicae. Plants converted one indole
glucosinolate, a secondary metabolite (indol-3-ylmethylglucosinolate), into another
(4-methoxyindol-3-ylmethylglucosinolate) to provide a more effective toxic defence.
This induced defence was localised and not systemic (Kim and Jander, 2006). In
soybean resistant genotypes, soybean aphids, Aphis glycines matsumur, showed a
reduction in feeding and longer maturation periods. The resistance mechanism is
thought to be due to the production of potentially toxic compounds yet to be fully
investigated in the resistant genotypes (Li et al, 2004). Other plant secondary
metabolites involved in defence include saponins, which act as feeding deterrants to
pea aphid, Acyrthosiphon pisum, reducing the aphid’s ability to ingest phloem or
xylem sap (Golawska, 2007). Saponins in A. pisum have also been found to reduce
growth and reproductive rates (Sylwia et al, 2006). In the plant alfalfa, saponin

defence is constitutive, with some varieties containing higher concentrations than
their more susceptible counterparts.
Plants can adopt a constitutive defence by simply absorbing chemicals from the
environment. Selenium (Se) is an essential trace element; however, in high
concentrations the element is toxic to biological functions. The aphid M. persicae
showed no preference in choice tests towards the Indian mustard plant, Brassica
juncea, when grown in a medium containing selenium. Aphid population growth was
also inversely correlated with Se leaf concentration. This study is intriguing as it
opens up the possible function of plant defence in hyperaccumulation varieties.
Although studies so far show how the accumulation of toxic chemicals within leaves
can affect aphids, other studies into aphid-plant systems have shown resistance can
also be localised to the phloem. In lupin, resistance against the cowpea aphid, Aphis
craccivora, was in the form of a feeding deterrence, with aphids exhibiting more
time in pathway activities (i.e. in mesophyll tissue layers) on narrow leafed lupin
(Lupinus angustifolius). This deterrence mechanism was thought to be from
fluctuating phloem alkaloid concentrations (Zehnder et al, 2001) however, further
investigation is required to prove this.
Phloem based resistance is not limited to Lupins, but is demonstrated to be a
strategy employed across the plant kingdom. As aphids are phloem feeders, they
cause little mechanical tissue damage when inserting their stylets, and pose
detection problems for the host plants. Detection of aphid presence by the host
plant therefore, may only be once the aphid has reached the phloem. Phloem based
defence would mean that the defence could be specialised to the phloem feeding

guild and induced only on attack by the aphid. This strategy could save resource
allocation costs as the plant is only initiating a defence upon aphid infestation, but it
would not be effective against potential virus transmission by the aphid.
A study on the resistant breeding line of melon, Cucumis melo, AR5, concluded
resistance against the cotton-melon aphid, Aphis gossypii, was located within the
phloem sieve elements. Resistance resulted in a slower population growth and acted
throughout aphid development. The behaviour of aphids on the resistant line
showed longer salivation periods, reduced phloem ingestion and consequently
secretion (Klinger et al, 1998). Increased salivation by aphids is usually associated
with reduced palatability of the phloem sap, or changes in its composition. It is
possible that these results are the consequence of an induced phloem defence
response on resistant lines of melon.
1.2.3 Defence against aphids: Recruitment
The last type of defence plants have in their chemical warfare is recruitment. Plants
can recruit the colonisation of herbivore natural enemies by releasing chemical
attractant signals. Plants from the Brassicaceae family are renowned for their
accumulations of secondary metatoblites, especially glucosinolates, following aphid
herbivory. Glucosinolates are toxic to aphid herbivores and can be hydrolysed into
isothiocyanates compounds, which are involved in indirect defence through
recruitment of parasitoids of herbivores. The braconid wasp, Diaeretiella rapae, is an
endoparasitoid that attacks aphids on Brassica hosts including species of aphids that
are Brassica specialists. Infested turnip plants have been shown to release higher
levels of isothiocyanates than uninfested plants, promoting recruitment of D. rapae

(Blande, 2004). Furthermore, D. rapae individuals appear to have an innate evolved
recognition of certain plant volatiles, and additionally D. rapae can also be
conditioned by (plant emitted) chemical cues whilst developing and emerging out of
the aphid mummy. It is using combinations of these chemical signals that plants are
able to recruit aphid natural enemies (Pope et al, 2008).
1.2.4 Plant Signalling Pathways and Aphids
An adaptation of plants to deal with the multitudes of abiotic and biotic stresses is to
utilise similar messaging pathways to activate responses to stimuli. Hormones such
as jasmonic acid (JA), salicylic acid (SA), ethylene, absisic acid (ABA), gibberellic acid
(GA), nitric oxide (NO) and auxin (IAA), can activate and induce responses to
generalist/specialist herbivory, or even to drought and temperature stress. This
universal response in plants provides a mechanism whereby an attack below ground
would influence responses aboveground, and vice versa. Using these systemic
signalling pathways plants can mount a multiple layered defence throughout the
plant, involving production of secondary metabolites, modification of leaf or phloem
composition, cell wall modification, metabolism changes, recruitment of natural
enemies and signalling to neighbouring plants. Systemic defence also enables
defence enhancement, resulting from prior attack by other organisms against future
herbivores (Mauch-Mani and Métraux, 1998).
Microarrays of A. thaliana have shown how systemic defence can enhance defence
over a period of time. After a 2h infestation period by M. persciae, it was shown two
genes had altered expression. After an infestation period of 36h, A. thaliana had
significantly altered expression of twenty two genes. Twenty of the genes were up

regulated whilst two were down regulated. These genes were involved in cell wall
modification, carbon metabolism, signalling, oxidative stress and defence
(Couldridge et al, 2007). In species of Triticum, Sorghum and Nicotiana, genes
associated with the disruption of cell wall tissues are shown to be expressed during
aphid feeding (Smith & Boyko, 2007). Whilst in celery, Apium graveolens, feeding by
M. persicae resulted in an increase in RNA transcripts for 126 genes in the phloem.
These genes belonged to cell wall modification, vitamin biosynthesis, carbon
assimilation, carbon mobilisation, nitrogen modification, water transport and
photosynthesis. The response was found to vary from that driven by a pathogen
infection, suggesting a degree of specificity and a role for the phloem in signalling
and recruiting metabolic pathways at the site of aphid feeding (Divol et al, 2005).
In some plant species the release of signalling molecules involved in signal pathways
has been favoured for defence against aphids. The lettuce aphid, Nasonovia
ribisnigri, when sensing JA will avoid the host, this is in part due to the attractive
nature JA has on aphid antagonists such as parasitoids. The plant stress signal,
methyl salicylate (MeSA), has also been suggested as a deterrent in aphid host
selection (Chamberlain et al, 2001). Interestingly, neighbouring plants took up JA
released from infested plants. These non-infested plants then became more
attractive to parasitoids. The release of plant volatiles as a defence against aphids
has been researched in other species and seems to be another defence mechanism
evolved against these specialist feeders (Verheggen et al, 2008).
Systemic signalling of herbivorous attack in plants is largely mediated by the JA
pathway and its derivatives. JA signalling is highly conserved and shown to be

involved in not only defence against herbivores but also against microbial pathogens
and stress responses to abiotic stressors such as UV radiation and ozone (Howe and
Jander, 2008). JA defences are widespread throughout the plant kingdom, which
may reflect that induced defences have lower costs associated with them than
constitutive defence mechanisms. Although mechanical damage is often viewed as
the trigger for JA-herbivore related defences, mechanical damage is not always
sufficient to trigger JA production and induced responses. As aphids cause little
mechanical tissue damage when feeding, detection and activation of JA related
defences are therefore limited.
Some studies have shown that aphids are able to avoid activation of the JA
pathways. In a study on the greenbug aphid, Schizaphis graminum, it was found that
feeding caused exclusive activation of gene transcipts on the plant host sorghum,
Sorghum bicolor, that were independent of SA or JA pathways. Aphid feeding was
found to activate SA signalling and a weak induction of methyl jasmonic acid (MeJA)
regulated defences. It was hypothesised that aphids avoid activation of the effective
plant machinery characteristic of a JA activation defence, by inducement of SA and
MeJA pathways that act antagonistically with JA-mediated responses (Zhu-Salzman
et al, 2004). This antagonistic approach is also shown in other phloem insects such as
the silver whitefly, which adopts repression of JA defences associated with basal
defence (Zarate et al, 2007). It is also suggested that the absence of JA mediated
defences is due to the way in which plant hosts perceive aphids, i.e. comparable to
that of fungal hyphae growth or viruses, causing elicitation of different defence
responses than chewing herbivores or mechanical damage (Fidantsef et al, 1999).

1.2.5 Gene-to-gene recognition systems: R gene induced aphid resistance
Increasing evidence is gathering over aphid resistance in host plants being
attributable to gene-to-gene recognition systems, like those in pathogen defence. In
these systems plants acquire resistance by specific resistance genes (R genes), that
recognise elicitors from aphid-related compounds and initiate defence responses.
Plant identification of aphid salivary components is thought to be the main
mechanism of recognition to identify attack (Howe and Jander, 2008). Studies into
this area have shown that after exposure to aphid feeding plants alter gene
expression levels, in particular in aphid species specific genes. In some plant species
aphid R genes have been identified.
In the aphid-plant system, A. thaliana and M. persicae, genetic profiling showed
after infestation for 72 and 96h that plant responses to aphid feeding included genes
involved in oxidative stress, calcium dependent signalling, pathogenesis related
responses (PR), and signalling (Moran et al, 2002). Using Arabidopsis mutants,
defence against aphid feeding induced premature chlorosis and cell death, caused by
an increased expression of SENESCENCE ASSOCIATED GENES (SAGs).
Hypersenescence in A. thaliana, was also correlated with enhanced resistance
against M. persicae feeding. Further investigation revealed that the gene PAD4
modulates activation of senescence in aphid infested leaves, and it is this R gene
mechanism that contributes to basal resistance not its association with SA signalling
(Venkatramana et al, 2005).
Identification of other R genes in other host- aphid systems include the tomato gene
Mi-1.2 against the potato aphid Macrosiphum euphorbiae (Rossi et al, 1998), the Sd1

dominant gene conferring resistance to biotypes of the rosy leaf curling aphid
Dysaphis devecta (Roche et al, 1997), and wheat Pto and Pti1-like kinase genes
against the Russian wheat aphid, Diuraphis noxia (Boyko et al, 2006). Finally in melon
the Vat gene not only confers resistance against the cotton aphid, A. gossypii, but
also against plant viruses transmitted by the species (Garzo et al, 2001). Hopefully
further work in these systems will soon elucidate aphid specific elicitors, and
potential aphid avirulence genes mimicking gene-to-gene systems in plant-pathogen
interactions.
1.2.6 Plant Defence: multi-strategies, pathway crosstalk and timing
In certain circumstances conflicting elicitors from different species may reduce
defence. In Brassica nigra, the glucosinolate sinigrin is positively correlated to
damage caused by specialist aphids, whilst being negatively correlated to generalist
aphid damage. This suggests that specialist and generalist herbivores exert opposing
selection pressures on chemical defences (Lankau, 2007). It was also found in B.
nigra that selection for chemical defence was favoured when under the influence of
herbivores experiencing interspecific competition and not intraspecific competition
(Lankau & Strauss, 2008). Selection for chemical defences it seems is dependent
upon the prevalence or rarity of certain species.
In some plants resistance involves both an antixenosis and antibiosis response, with
parts being constitutively expressed and induced. In the resistant variety kondoi of
Medicago truncatula, migratory aphids showed a significant deterrence in their
settling behaviour, showing a preference to settle on susceptible plants. When
aphids were given no choice of host, antibiosis resistance in M. truncatula was found

to be enhanced by prior infestation, located in the sieve element and in need of an
intact plant. Resistance was also shown to be inherited by a single dominant gene,
AKR (Acrythosiphon kondoi resistance). This work highlights a combined defence
system, with initial defence being antixenosis with aphid deterrence, followed upon
colonisation to antibiosis if the host has the appropriate R gene AKR (Klinger at al,
2005). Defences multifaceted like these are most likely the standard across the plant
kingdom.
Although multifaceted defence strategies seem an effective but costly defence
strategy by plants, effective timing and organisation of these defences is paramount.
Natural selection has resulted in a step wise defence initiation. Studies into the
timing of defence initiation in A. thaliana infested with Brevicoryne brassicae,
showed early defence mechanisms involved reactive oxygen species (chemically
reactive molecules containing oxygen involved in signalling) and calcium signalling.
Regulation of initial defences was controlled by the SA and JA pathways. Later
defence included callose deposits at feeding sites and the production of secondary
metabolites, which accumulated after 48h infestation (Kus’Nierczyk et al, 2008).
Similarities in plant defence mechanisms against aphids can be found across
different major plant taxa; however, due to the specificity and diversity of aphids
there are also examples of unique aphid-plant interactions. When three ecotypes of
A. thaliana are exposed to specialist aphid feeding by B. brassicae, and generalist
feeding by M. persicae, each ecotype showed different defence glucosinolate
profiles. Furthermore, infestation by each aphid species resulted in differential
regulation of 60 genes in some of the ecotypes; these genes encoded proteins

involved in JA and tryptophan synthesis pathways as well as PR proteins. Aphid
fitness of the specialist B. brassicae, also varied on each ecotype, but not for the
generalist feeder M. persicae. This research reveals insect specific induction of the
indole glucosinolate synthesis pathway in different ecotypes of Arabidopsis
(Kus’nierczyk et al, 2007).
Confirmation of aphid-plant defences being interaction specific was also obtained in
studies using the bird-cherry oat aphid, Rhopalosiphum padi. Microarray analysis of
resistant and susceptible lines of barley, Hordeum vulgare, gave raise to potential
resistance gene candidates that reduce aphid growth. Gene induction between the
susceptible and resistance lines had substantial variation in induced responses even
in closely related genotypes. These variations were related to defence, primary
metabolism and signalling. Two of the plant lines tested also revealed differences in
constitutive defence gene expression (Delp et al, 2008). Constitutive levels of
peroxidase and polyphenol oxidase activity, proteinase inhibitors and soluble
phenolics also differed among five varieties of Lupin (Lupinus) when exposed to
feeding by M. persicae (Cardoza et al, 2005).
1.2.7 Aphids Overcoming Plant Defences
Aphids have a complex array of mechanisms to overcome plant defences, some co-
evolved against a specialist host defence. The relationship between host and
herbivore is an evolutionary arms race. Aphids have detection methods to identify
potential hosts, which they are adapted to feeding on as choosing a different host
for most aphid species could risk survival.

Detection of a host involves a wide array of host features. Host surface texture and
‘taste’ may be external mechanisms of identification, whilst internal cell elicitors and
secondary metabolites contribute to internal recognition. Once the host is
recognised the aphid begins to assimilate the plant resources by tapping into the
sieve element of the plant with stylets. Once in the phloem the aphids must
overcome the phloem defences of the plant. The phloem wound response involves
the release of coagulating proteins in the phloem sieve element of the plant.
Coagulating proteins may also pose a problem directly to aphids by blocking the
aphid’s food canal (Tjallingii, 2006). To address this aphids have two main forms of
saliva, gelling saliva to produce the salivary sheaths that protect the stylets and keep
sieve elements open following puncture by stylets (Walling, 2008), and watery saliva
which is injected into sieve elements prior to sap ingestion (Prado and Tjallingii,
1994). To overcome coagulating proteins blocking the aphid’s food canal the
ejection of watery saliva plays a pivotal role. Behavioural analysis using the electrical
penetration graph has shown aphids perform E2 salivation, which is a combination of
the behaviours E1 salivation (involving watery saliva) and E2 sap ingestion. This
behaviour of continuous ingestion and salivation is thought to be a mechanism to
prevent blockage of the aphid’s food canal (Tjallingii, 2006).
In other studies into aphid feeding it has been noticed that before sap ingestion
aphids always salivate into the phloem sap and that this salivation rate increases
when aphids experience changes in phloem sap composition. In response to water
stressed barley seedlings the aphid R. padi was shown to increase sieve element
salivation (Ponder et al, 2000), and this behaviour has also been exhibited where

aphids are exposed to reduced amino acid concentrations (Hunt et al, 2009). This
behaviour is believed to be the aphid using salivary compounds to condition phloem
sap and the sieve element so it is more favourable.
In response to injury the phloem has a natural occlusion mechanism, which is
calcium triggered. This defence mechanism involves forisomes that undergo calcium
regulated conformational changes, thus blocking the phloem. It has been shown that
aphid saliva in vitro reverts forisomes in the phloem into a non-plugging contracted
state. Initiation of sieve tube occlusion causes aphid behaviour to change from
ingestion to watery salivation. It has further been shown that M. persicae aphid
saliva has calcium binding proteins that competitively bind calcium in the sieve
element, preventing plugging by calcium bound forisomes (Will et al, 2007). This is
considered a crucial adaptation in providing aphids with continuous phloem sap.
Evolutionary success of the aphid thus depends on the calcium binding abilities of
aphid saliva proteins, when compared with plant forisomes.
Aphid saliva is made up of many proteins. A proteomic study into the salivary
proteins of M. persicae showed the presence of glucose oxidase, glucose
dehydrogenase, NADH dehydrogenase, α-glucosidase, α–amylase and many
unknown proteins (Harmel et al, 2008). Further studies into the functions of salivary
proteins are uncovering the extent of importance salivary proteins bear on aphid
growth and survival. Using novel RNA interference (RNAi) methods, knockouts of the
abundant saliva encoded transcript C002, function unknown, caused premature
mortality and a change in feeding behaviour in the pea aphid, A pisum (Mutti et al

2006; Mutti et al, 2008). These studies may lead to the uncovering of aphid saliva
proteins that are important for overcoming plant defences.
Earlier it was mentioned that plants have an indirect defence in the form of
recruitment of natural enemies of aphids, using signals in the form of plant volatiles.
In response to attack by recruited natural enemies, aphids can release an alarm
pheromone that causes conspecifics in the population to cease feeding and disperse;
this is also supplemented by avoidance and aggressive behaviour (Verheggen et al,
2008).
Finally, the release of secondary compounds such as glucosinolates by hosts has
been cleverly utilised by aphids to compliment their own defence against predators.
The aphid B. brassicae has been shown to accumulate the secondary metabolite
glucosinolate, sinigrin as a defense against Coccinellid species. For example, Adalia
bipunctata, is unable to survive first instar stages when fed on aphids that have been
reared on B. nigra, a sinigrin producer (Pratt et al, 2008 & Kanzana et al, 2007).
1.2.8 Summary
In summary, although plant hosts elicit defences specific to aphid species, and even
aphid ecotypes, activation of general stress related defences still has an important
role. Hosts have evolved to display a wide range of defence strategies; tolerance,
avoidance, antixenosis and antibiosis. In many systems defence is multifaceted
encompassing a multilayer of defences that are timed, systematic and enhanced
during periods of continued attack.

Despite these defences aphids are still major agricultural pests, causing devastating
economic losses from virus transmission and plant damage. Observed aphid
population growth year on year can only lead to the conclusion that aphids are
highly adaptable insects with their own developed defence system. The adaptability
of aphids to overcome plant defences may be of benefit in overcoming
environmental stresses such as drought. However, the aphid-plant interaction is very
complex and any predictions with regards to performance to drought would be
extremely difficult.
1.3 Aphid Interactions: Aphid responses to conspecifics
Certain herbivores also have the ability to overcome defences of plants, making
hosts more susceptible to attack from other organisms. Some aphids will colonise a
plant more easily if it has already been colonised by conspecifics. The aphid Sipha
flava induces red spots on infested leaves of the host plant Sorghum halepense. This
attack was shown to induce plant susceptibility that benefited additional S. flava
colonisers with enhanced feeding and growth (Gonz’ales et al, 2002). The aphid M.
euphorbiae also appears to benefit pre-infestation as it demonstrated to prefer
preinfested potato plants, Solanum tuberosum (Ameline et al, 2007). This suggests
that the preinfestation by conspecifics may aid the aphids in overcoming the plant’s
natural defences, hence the preference of aphids for pre-infested plants. The
discovery of differentiation between aphid probing behaviour on plants previously
damaged abiotically or by heterospecifics, than preinfested plants by conspecifics,
has lead to the increasing support for the idea that in some aphid species saliva has a
pivotal role in combating host defences, and even altering phloem composition. This

hypothesis would underpin the selective advantage for the majority of aphid species
to fulfil a monophagous lifestyle.
The presence of other herbivores can also have the opposite effect, resulting in a
decrease in population fitness. Variation was observed in the ability of two clones of
pea aphid, Acyrthosiphon pisum, to outcompete the vetch aphid, Megoura viciae.
One clone was able to outcompete M. viciae whilst the other was overcome. The
differences were contributed to the differential population growth rates between
the clones, and potential intra and inter-specific behavioural responses to predators
(Hazel et al, 2006). In a comparative study it was found that specificity occurs in
plant response to preinfestation by two aphid species. The cereal aphid
Rhopalosiphum padi, which usually shows no behavioural response to prior
colonisation (Prado and Tjallingii, 1997; Messina et al, 2002), resulted in reduced
plant quality making it less nutritious to future conspecific colonisation. Whereas
Diuraphis noxia enhanced plant quality for conspecifics, and Aphis fabae resulted in
conspecifics displaying reduced salivation and continuous sap ingestion.
The change in aphid feeding behaviour suggests that prior colonisation by some
species of aphid, can result in saliva induced changes in sieve element composition.
The ability of aphids to induce changes in sieve element composition to benefit
conspecifics suggests the possibility that aphids could also manipulative sieve
elements in water stressed plants to negate any detrimental drought induced
effects. The effect of drought, therefore, may not be detrimental to aphid
performance. However, these studies into the effects of prior colonisation have also

yielded the observation that not all aphid species respond homogenously. This
diversity of responses may also be observed in the aphid’s response to drought.
1.4 Aphid Osmoregulation: Diet? A struggle even for aphids
Aphids are highly specialised insects adapted to their nutritionally poor and
osmotically challenging diet of phloem sap. Phloem sap has a high C: N ratio with a
low concentration of essential amino acids, vital for aphid growth, reproduction and
development. Aphids are thought to combat this by exploiting a highly evolved
symbiotic relationship with bacteria (Sasaki & Ishikawa, 1995).
1.4.1 Phloem sap assimilation
The bacteria Buchnera ia a vertically transmitted obligate symbiotes that lives within
aphids in specialised cells called bacteriocytes. It has been found that they provide
aphids with essential amino acids, which are unavailable to aphids from their natural
diet. Buchnera are therefore responsible for the capacity of aphids to utilise phloem
sap. In A. pisum, Buchnera are responsible for producing 90% of the essential amino
acids required for aphid nutrition and physiology (Douglas, 2006). The effect of
amino acids on aphid performance is therefore, largely determined by the
relationship between the aphid and its bacterial symbiont, Buchnera (Douglas,
2003). Due to this being a highly specialised relationship, the Buchnera are
ineffective on non-host plants adding complexity to the plant-aphid interaction
(Wilkinson et al, 2001; Douglas, 2003), and provides a possible insight into why some
species of aphid remain monophagous.

Phloem sap contains large quantities of sugar in the form of sucrose. Although
sucrose concentration in sap changes with seasons, time of day, plant tissue and
species, sucrose is still dominant in sap composition. Its large quantities make it an
ideal candidate for respiration and aphids have been shown to preferentially oxidise
sucrose than amino acids for respiration (Rhodes et al, 1996).
Phloem sap also has a sucrose attributed high osmotic potential (-0.6 to -3.0MPa)
which can vary between and within plants (Downing, 1978; Wilkinson et al, 1997;
Fisher, 2000). The osmotic potential of phloem sap from a host plant can be three
fold that of the aphid haemolymph, moreover, the aphid haemolymph and excreted
honeydew are iso-osmotic (Wilkinson et al, 1997). The aphid’s ability to maintain
water potentials less than the food they ingest can be attributed to various
osmoregulation mechanisms.
1.4.2 Osmoregulation Mechanisms
To deal with the osmotic challenge of ingesting phloem sap aphids have
demonstrated an array of potentially important osmoregulation mechanisms.
Increasing respiration rates of sucrose was suggested as a possible mechanism, but
shown not to be, as altering sucrose concentrations in artificial diets did not result in
altered respiration rates (Rhodes et al, 1996). However, acquisition of water from
the xylem of host plants and producing metabolic water from processes such as
flight has been suggested as other potential mechanisms of osmoregulation. The
production of metabolic water was first suggested after aphids showed that post a
six hour flight the body water content in the aphid had increased by 7%, whilst the
dry weight had decreased by 15%, indicating the elevated respiration rates had

resulted in a release of metabolic water (Cobain, 1961). However, a proteomics
study of M. euphorbiae fed on droughted plants showed an overall decrease in the
abundance of energy metabolism enzymes, and this was suggested as a function to
conserve energy and prioritise survival (Nguyen et al, 2007).
The mechanism of metabolic water as an osmoregulatory mechanism is not likely
when we consider apterous parthenogenetic morphs. More likely is that apterous
aphids may instead place a dependence on other osmoregulatory mechanisms, such
as sugar polymerisation or xylem water acquisition. Studies have shown that aphids
starved for 24h spent 26% of their time xylem feeding when placed back onto a host
plant, whereas those starved for only 1h displayed no xylem feeding (Spiller et al,
1990). Another study showed that starved Sitobion fragariae increased xylem
feeding on wheat and oats (Ramirez et al, 2000). These observations are consistent
with the process of removing aphids from plants resulting in water loss, these
studies show that dehydrated aphids increase xylem feeding, and thus the act of
water acquisition from the xylem is the aphid’s means of rehydration.
Starvation is not the only scenario in which an aphid may find itself dehydrated, alate
black bean aphids, A. fabae, were shown to frequently ingest from the xylem of
broad bean plants, Vicia faba. The study showed that aphids are predisposed to
xylem feeding as a result of fasting during the teneral period (Powell and Hardie,
2002). It was also suggested that alate aphids may reduce their weight before take
off, giving aerodynamic benefits, but resulting in dehydration which makes xylem
feeding a priority following plant contact. These results may also explain the
observed increase in body water content of aphids following flights, as they break

down fat stores to release energy and produce metabolic water to cope with
physiological challenges of flight (Cobain, 1961).
If xylem feeding is important for osmoregulation, then if feeding becames
unfavourable aphids will be denied an essential rehydration source and perform
worse. TMX, a xylem borne insecticide, was used at sub lethal doses to make the
xylem unpalatable to aphids starved for 5h. The results showed that there was a
reduction in the proportion of time spent xylem feeding, from 25% in control plants
to 0.6% in TMX treated plants. The aphids on TMX plants also showed a reduced
growth, performance and water content (Daniels et al, 2009), indicating that xylem
feeding is an important part of an aphids diet.
Alternatively, work into the importance of sugar metabolism has provided a strong
case for sugar polymerisation being one of the major methods of aphid
osmoregulation. Modification of phloem sap to reduce the osmotic pressure is
postulated via sucrase mediated hydrolysis of phloem sucrose into glucose and
fructose; the glucose can then be polymerised by transglucosidase into
oligosaccharides of low osmotic pressure per hexose unit. In support of this studies
into honeydew analysis showed that under high dietary sucrose concentrations,
aphids excreted higher concentrations of oligosaccharides (Wilkinson et al, 1997),
whilst A. pisum fed on artificial diets with 14-C labelled sucrose showed showed that
glucose polymerisation resulted in a 34% reduction in sugar molarity of the
honeydew (Rhodes et al, 1997).
Research into the area of aphid osmoregulation is unearthing enzymes involved in
this sugar hydrolysis and transglucosidase activity. In A.pisum, sucrase activity has

been localised to the gut distal to the stomach (Ashford et al, 2000; Cristofoletti et
al, 2003). One identified sucrase APS1 was found in aphid guts and shown to have α-
glucosidase activity to form the hexose units for oligosaccharide synthesis (Price, et
al. 2007). Application of α-glucosidase inhibitor acarbose to inhibit sucrase activity in
aphids gut resulted in aphids being unable to osmotically control haemolymph water
potential when exposed to a hyperosmotic diet. It was concluded that the aphid gut
sucrase activity is essential for osmoregulation of aphids when ingesting diet
hyperosmotic to their haemolymph (Karley et al, 2005).
Other suggested mechanisms of osmoregulation is water cycling from the distal to
proximal regions of the gut. This water flux would require membrane associated
aquaporins to mediate water movement. A putative aquaporin, ApAQP1, was
identified in A. pisum; when expressed in Xenopus oocytes ApAQP1 increased
osmotic water permeability was demonstrated. ApAQP1 was also localised in aphids
to the stomach and distal intestine, and an RNAi-mediated knockout for AqAQP1
expression resulted in an increase in haemolymph osmotic pressure (Shakesby et al,
2009). These advances in the literature aid to uncover aphid osmoregulation
mechanisms, and provide evidence supporting the important role for aquaporins,
sucrases and polymerising enzymes in osmoregulation.
Despite phloem sap being costly to aphids, with resource allocation to the array of
osmoregulation mechanisms, the presence of sucrose gradients from sieve elements
may play a role in host acceptance in some aphid species. Aphid species M. persicae
and Aulacorthum solani performed equally or superior when reared on potato plants
with a two fold reduction in sucrose, due to treatment with antisense for a sucrose-

H+ transporter (StSUT1), than when fed on wild types. This indicates the
osmoregulation cost to aphid performance from high sucrose concentrations.
Interestingly, the opposite was observed in the aphid M. euphorbiae, which
struggled to locate sieve elements and withdrew stylets prematurely from sieve
elements reduced in sucrose concentration. These results demonstrate the
importance of sucrose concentration gradients, and sieve element composition, in
sieve element location and acceptance in some species of aphids (Pescod et al,
2007).
1.5 Aphid Interactions: Response to Drought Stress
Studies into the effects of watering regimes on the cowpea aphid, Aphis craccivora,
showed significant negative linear correlations between water stress on host plant
and aphid population, shoot biomass and seed yield (Agele et al, 2006). We can
conclude from this study that drought has a detrimental effect upon both plant and
herbivore. Although other studies have indicated that we can expect this not to be
true of the whole feeding guild. The performance of R. padi and S. avenae aphid
clones sourced from England and Spain on drought stressed wheat, demonstrated
no initial difference between clone performance on drought stressed plants. No
effect of water stress was observed in aphid development time, nymphal mortality
and embryo number in first generation teneral adults at the onset of reproduction.
However, in subsequent reproduction, there was a significant reduction, indicating
sustained water stress was needed to cause detrimental affects on aphid
performance. There was also an observed clonal difference in R. padi clones, with
clones from Spain performing better than English clones. This was not observed in S.

avenae clones, although English S. avenae clones did produce significantly more
alates on water stressed plants (Pons and Tatchell, 1995).
Ultimately under drought stress, hosts plant water potentials become more negative
and aphids would place an increased dependence on osmoregulation mechanisms to
cope with the extreme osmotic challenge posed by concentrated phloem sap. Water
stress has been associated with net increases in sieve element solutes (Smith and
Milburn, 1980) to maintain positive phloem turgor pressure. Although solutes other
than sucrose, i.e. ions, can play important roles in phloem osmotic pressure, such as
potassium ions found to have important role in transport of photo-assimilates
(Gould et al, 2004), it is thought that phloem sap carbohydrate concentrations are
mainly responsible for adjustments in phloem osmotic pressure. Phloem
carbohydrates in water stressed Eucalyptus trees, Eucalyptus globulus, can increase
in concentration by over 50% from 550mM to 850mM (Cernusak et al, 1980).
Similarly, in more recent literature using tomato plants, Solanum lycopersicum cv.
Marmara, carbohydrate concentrations were shown to increase by 20-40% (Najla et
al, 2010). Although these values are dependant on the level of water stress, location
in the plant, plant developmental stage and growth conditions, it is indicative that
carbohydrates play a dominant role in the adjustment of phloem osmotic pressure
under water stress.
Alterations in organic ions composition, such as amino acids, in sieve element sap of
water stressed plants have been have been suggested as potentially beneficial to
aphids. Although the symbiont Buchnera provide aphids with a mechanism to
overcome low essential amino acids content, increasing available amino acids in

drought stressed plants may increase aphid performance and may even promote
colonisation of non-hosts. In droughted B. napus there is an observed increase in
essential amino acids (Good and Zaplachinski, 1994). Drought was also shown to
increase the quality of phloem sap in four grass species with an observed increase in
osmotic pressure and essential amino acids (Hale et al, 2003). The aphid R. padi on
drought stressed hosts reduced sap ingestion rates and where amino acid
concentrations were higher, the performance of the aphid correlated with the
accessibility of essential amino acids, although this correlation seems species
dependant.
In the Arabidopsis mutant AAP6 where amino acid levels were reduced in leaves,
aphids hardly showed any differences in feeding. These results suggest that amino
acid levels may not have been reduced sufficiently below threshold limits to have an
effect. This also highlights the importance of endosymbionts in altering the quality of
phloem sap to benefit the aphid (Hunt et al, 2009).
A lot of current research has shown aphid responses to droughted hosts under
laboratory conditions. Aphid population performance in fields may then vary
considerably, with aphids simply moving to more drought tolerant or physiologically
favourable hosts to avoid water stress. A field study into the effects of drought on
populations of pea aphids, A. pisum, on pea pants, reported that after three weeks
of moderate drought, significantly fewer aphids were found on droughted plants to
controls. There were also an observed higher proportion of alate aphids on the
droughted plants, than controls, by week four. Post week four, the study did not
observe any proportional difference in the number of alatoid nymphs, suggesting

that the process of plant senescence rather than drought stress was important in
determining nymph physiology (McVean and Dixon, 2001). The primary observation
that populations were significantly smaller on drought stressed to well watered
hosts illustrates the sensitivity of aphids to water stress in the natural environment.
However, the differences observed in all these discussed studies may reflect more
the level and duration of water stress imposed. Alternatively they may demonstrate
how drought performance in aphids can vary between species and genotypes, with
some species more equipped to adjust to the heterogeneity of plant quality.
1.5.1 Current Debate & Summary
There are currently two main hypothesises that attempt to explain how aphids will
respond to drought stress. The first hypothesis is that the osmotic stress from
feeding on severely droughted hosts would be detrimental to aphid performance, as
aphids have to reallocate their energy resources from growth and reproduction into
osmoregulation mechanisms. Alternatively, the plant stress hypothesis (White, 1984)
proposes that under water stress host plants may become more susceptible to
herbivores, with aphids benefiting from the change in plant physiology, such as
increases in amino acid concentrations in host plant species (Good and Zaplachinski,
1994; Hale et al, 2003; also see Chapter two results). Plant defences may also
become reduced in water stressed plants (Rhoades, 1985) making plants more
susceptible to insect attack. So far there have been a number of studies (discussed
in more depth in chapter four) that support the plant-stress hypothesis (Wearing,
1967; Wearing and van Emden, 1967; Wearing, 1972; Miles et al, 1982; Oswald and
Brewer, 1997), and conversely, a number of studies that support the notion that

resource allocation to osmoregulation mechanisms, as a result of feeding on drought
stressed hosts, would be detrimental to aphid performance (Larsson, 1989; Pons and
Tatchell, 1995; Bethke et al, 1998; Honěk et al, 1998; Kennedy et al, 1958; Kennedy
and Booth, 1959).
In conclusion, this chapter has highlighted that the aphid-plant interaction is very
complex and multifaceted. Differences observed in the discussed studies may reflect
the differences in the level and duration of water stress imposed, or they may
represent the variation between species and genotypes. Alternatively, these studies
indicate that the response of aphids to water stress may be too complex to
summarise within one simple hypothesis. It is possible that the variation in results in
the literature may be due to the differential plant responses to water-stress, and
subsequent differential insect responses to plant stress.
Thus, this study will set out to establish a repeatable drought regime using water
withdrawal in two plant species Brassica nigra and Lolium perenne. Once a drought
regime has been defined this study will try to find out if there is variation in aphid
behavioural and reproductive responses to drought, and by imposing a similar level
of drought for all the species, attempt to establish if the response is predictable
across the feeding guild. To establish the latter four aphid species and two clones
will be used. Furthermore this study will later go on to try and elucidate whether
aphids respond to drought stress by altering their gene expression, particularly in
genes related to osmoregulation functions like sucrase and aquaporins. It is
hypothesised that aphid responses may vary between species and even clones. It is
also hypothesised that aphids under drought stress may place an increased

dependence on osmoregulation functions such as xylem feeding and sugar
polymerisation.

Chapter 2: Development of a reproducible
drought regime and its effects on plant
performance

2.0 Abstract
Plants may avoid drought stress by trying to maintain tissue water potentials, or
alternatively, plants may simply tolerate the water stress by decreasing their
vulnerability to it. In this chapter the physiological changes in Brassica nigra and
Lolium perenne were quantified under a progressive drought regime.
Results showed that B. nigra was able to maintain water potential for the first 9 days
of water withdrawal, whereas, in L. perenne it progressively dropped throughout the
drought regime. Interestingly, both species displayed similar water potential and
water content levels at the beginning and end of the drought treatment.
Measurements of water content demonstrated that water content fell faster in L.
perenne than B. nigra. Tissue sap from both L. perenne and B. nigra had increased
levels of reducing sugars and amino acids over the course of the drought treatment,
except by day seven in B. nigra, where amino acids concentrations started to fall.
Furthermore, cations K+, Mg+ and Ca2+ were significantly altered in B. nigra, and
NH4+, Na+, K+, Mg+ and Ca2+, significantly altered in L. perenne over the drought
treatment.
This chapter suggests that the water stress strategy of both plants is slightly
different. B. nigra is predicted to use osmotic adjustment and leaf shedding to
minimise water loss, whilst, osmotic adjustment is also thought to play a role in L.
perenne. Furthermore, controlled water withdrawal is concluded as suitable for a
repeatable drought regime in both of these plant species.

2.1 Introduction
Drought is a serious problem for agriculture worldwide. Improving drought tolerance
in plant cultivars has become an important aim of scientific research. Fortunately,
many drought resistance traits are heritable and work has been carried out on
breeding drought tolerant varieties. Ultimately how tolerant a plant is to drought
could have knock-on effects to the herbivores that feed on it. Changes in cell or
phloem composition to compensate against water stress could affect phloem
feeding insects like aphids.
This chapter will seek to briefly review plant adaptations to drought stress and their
potential effect on phloem feeding insects. The work in this chapter will then
develop a repeatable drought regime in Brassica nigra and Lolium perenne, that can
then be used in subsequent chapters to determine the effect of drought on aphids.
During the establishment of a repeatable drought regime, physiological data will be
collected in an attempt to assess the plants’ physiological status during water stress.
This physiological data is important in gauging the type of diet the aphids are
ingesting, which can later inform chapters involving aphid responses to water
stressed host-plants (Chapter three-five). In quantifying the drought regime and its
effect on B. nigra and L. perenne, this chapter is not only just setting up a drought
experimental system, but also defining the level of drought and subsequent changes
experienced by plant hosts.

2.1.1 Early Adaptations – from the seas to the land
Early ancestors of plants made a transition from aquatic to terrestrial environments
over 500 million years ago. In the absence of an aquatic environment, plants were
exposed to the problem of transporting and controlling water loss. Adaptations such
as a cuticle coated epidermal layers helped prevent excessive water loss from above
ground plant tissue (Campbell and Reece, 2002). Special organs called stomata
provided a mechanism for gas exchange in and out of the plant tissue to supply
photosynthesis, with the flexibility to close and prevent water loss in arid conditions.
Over 400 million years ago the three phyla of vascular plants diverged from early
land plants. These were: pteridophytes, gymnosperms and angiosperms (Campbell
and Reece, 2002). The vascular systems in these phyla revolutionised the
colonisation of plants to terrestrial habitats. The vascular system enabled the
transport and division of solutes as well as control of cell water content vital for
turgor pressure, which drives cell expansion and maintains structure. The two types
of vascular tissue in vascular plants are xylem and phloem tissue. The xylem consists
of dead conducting cells that carry minerals and water from the roots to the shoots.
The xylem transport system operates in a unidirectional manner unlike the living
phloem tissue that can transport nutrients such as sugars and amino acids bi-
directionally. The emergence of this vascular tissue also opened up a niche for
specialist vascular feeding insects, and 220 million years ago in the Carboniferous
period the first aphids are thought to have appeared (Evans, 1956). Aphids feed
directly from the phloem tissue with their specialist stylet mouthparts and utilise
cues, such as the sugar species and concentration, to locate the phloem and

commence feeding (Hewer et al, 2010). Changes in phloem composition or gradients
within the tissue of the plant could affect the ability of the aphid to locate the
phloem and feed successfully from the plant.
2.1.2 Plant strategies to deal with drought stress
Under drought stress land plants demonstrate a variety of physiological changes
ranging from the physical, metabolomic and chemical. Although some mechanisms
appear conserved throughout the plant kingdom, certain combinations of
mechanisms involved in drought avoidance and tolerance are species specific,
depending upon the strategy of the plant.
Drought resistance strategies are classically divided into three categories: escape,
avoidance and tolerance (Levitt, 1972). These strategies are not mutually exclusive
and can occur in a range of combinations (Chaves et al, 2003). An example of a
drought escape strategy would be desert ephemerals (short lived plants), which are
able to escape drought conditions by germinating and completing their life cycle
whilst water is available. Drought avoidance is where plants avoid tissue dehydration
by maintaining tissue water potential, maximising water uptake and minimising
water loss. Stomatal closure, lowering cuticular conductance and leaf shedding are
all mechanisms that plants can use to minimise water loss, whilst utilising water
storage and investment in roots (Jackson et al, 2000) are ways to maximise water
uptake. Drought tolerance is defined as decreasing vulnerability to water stress by
continuing water transport by osmotic adjustment, increasing the ability of meristem
cells to survive at low water potentials and attempting to reduce occurrence of
xylem cavitation (Tyree et al, 2002). It is the strategy of drought tolerance and

drought avoidance that could potentially affect aphids the most. Leaf shedding could
prove beneficial to some species of aphids as they preferentially feed on dying plant
tissue. However, continuing water transport by lowering water potentials could have
a detrimental effect on aphids, which would be ingesting a more osmotically
challenging diet of altered phloem sap. Additionally, synthesis of osmoprotectants
could prove beneficial to phloem feeders, if those osmoprotectants were essential
amino acids required by the aphids for growth.
2.1.3 Physiological Adaptations to Drought stress
Under progressive drought plants can demonstrate a variety of physiological
alternations. For example, in response to drought, leaf physiology can change with
younger developing leaves maintaining water uptake remaining turgid whilst older
leaves wilt (Bray et al, 2000). Water stress can also result in a number of
physiological phenomena in different plant species. Root alterations have been
observed in members of the Cruciferae family in response to progressive drought.
Under drought conditions short, hairless, tuberized roots emerge, which survive
under extreme soil desiccation. Upon rehydration these tuberized roots rapidly
develop hairs and elongate (Vartanian et al, 1987).
However, the main and arguably most important physiological response to drought
stress is osmotic adjustment. The ability of plants to increase or maintain water
uptake from the soil, by lowering their internal root water potential, is fundamental
and a process that is likely to have the greatest impact on aphids. Osmotic
adjustment is usually achieved by the translocation and alteration of internal solute
concentrations.

Water stress has been associated with net increases in sieve element solutes (Smith
and Milburn, 1980), to maintain positive phloem turgor pressure. Although there are
other solutes, i.e. ions, which can play important roles in phloem osmotic pressure, it
is thought that phloem sap carbohydrate concentrations are mainly responsible for
adjustments in phloem osmotic pressure.
Phloem carbohydrates in water stressed Eucalyptus trees, Eucalyptus globulus, can
increase by over 50% from 550mM to 850mM (Cernusak et al, 2003). Similarly in
tomato plants, Solanum lycopersicum, carbohydrate concentrations were shown to
increase by 20-40% (Najla et al, 2010). Although these values are dependant on the
level of water stress, location in the plant, plant developmental stage and growth
conditions, it is indicative that carbohydrates play a dominant role in the adjustment
of phloem osmotic pressure under water stress. Aphids already feed on a diet with a
high in C:N ratio and an increase in carbohydrates via osmotic adjustment may prove
to be detrimental to growth of the aphid, which will subsequently have to allocate
more resources to osmoregulation.
Water stress in plants is also shown to have an effect on altering levels of other
organic ions; in droughted Brassica napus there has been observed increases in
essential amino acids (Good and Zaplachinski, 1994). Drought was also shown to
change the quality of phloem sap in four grass species with an observed increase in
osmotic pressure and essential amino acids (Hale et al, 2003). Meanwhile, potassium
ions have been shown to play an important role in phloem osmotic pressure
adjustment and transport of photo-assimilates (Gould et aI, 2004). It is not just
amino acids, carbohydrates and ions that are altered in response to water stress, in

oilseed rape leaves, Brassica rapa, drought induced decreases in galactolipid and
phospholipid concentration and increased neutral lipids (Dakhma et al, 1995). Unlike
increases in carbohydrates, increases in amino acids may be beneficial to aphids,
which are limited by the available essential amino acids in phloem sap. The bird
cherry-oat aphid, Rhopalosiphum padi, on drought stressed hosts with higher amino
acid concentrations demonstrated greater performance, showing that aphid
performance is correlated with the accessibility of essential amino acids (Hale et al,
2003).
Additionally, alterations in certain solutes used in osmotic adjustment can influence
the susceptibility of plants to aphid infestation. Some osmotic adjustment solutes
are referred to as ‘compatible solutes’ and have a dual role as osmoprotectants,
protecting cell membranes from dehydration. Usually these osmoprotection
mechanisms are only functional when severe dehydration occurs, indicating that
they are critical to survival (Chaves et al, 2003). Proline is one such compatible
solute, with high proline concentration in cells being associated with prevention of
protein denaturation, preservation of enzyme structure and activity, and protection
from drought induced damage by reactive oxygen species (Rajendrakumar et al,
1994; Samuel et al, 2000; Saradhi et al, 1995).
Proline is synthesised by two successive reduction reactions catalysed by the enzyme
P5C synthetase (P5CS) and P5C reductase (PC5R). In plants, genes encoding P5CS and
P5CR have been found to be up-regulated by water stress, whilst the catabolism of
proline by the enzyme P5C dehydrogenase (P5CDH) is repressed under water stress
(Deuschle et al, 2001). Up regulation of genes encoding P5CS and P5CR have been

found to be initiated by both the ABA-independent (abscisic acid) and ABA-
dependant pathways (Hare et al, 1999). Water deficit exposure generally results in
the initiation of one or both of these signalling pathways in plants (Kizis et al 2001).
Alterations in proline content have been shown to influence the performance of
aphids beyond altering the quality of diet. Susceptible cultivars of pea have show
increased amounts of all free amino acids except proline, which was reduced,
suggesting that aphid infestation is related with the proline content of plant hosts
(Auclair et al, 1957). CCC-induced resistance to aphids has also been shown to be
accompanied by increased proline concentrations (Van Emden, 1964), whilst
reduced transmission of cabbage black ringspot virus was associated with free
proline concentration alterations (Selman and Kandiah, 1971).
The degree at which osmotic adjustment can allow a plant species to tolerate
drought is variable between species and genotypes. Interestingly, a study of the
desiccation-tolerant Licania platypus showed individuals did not die until leaf water
potentials fell to _7.5 MPa and relative water content fell to 0.14 under progressive
drought. In addition it was also found that whilst whole stem hydraulic conductance
declined by 85% in dead L. platypus, whole-root hydraulic conductance declined by
only 50% in plants with dead shoots (Tyree et al, 2002), displaying an active
preference to maintaining hydraulic conductance in root tissue than shoot tissue.
This drought-induced prioritisation in some plants to maintain hydraulic
conductance in roots could be hypothesised to be more beneficial to root feeding
aphid species than shoot feeding species.

Drought studies in plants have so far used leaf water potential as a reliable
parameter for quantifying the plant water stress response. However, in separate
observations water potential can differ among genotypes under drought stress
(Singh et al, 1990) and so it is suggested that leaf relative water content (RWC)
would be a better indicator of water status (Sinclair and Ludlow, 1985). To reliably
determine the drought response of B. nigra and L. perenne in this chapter, both leaf
water potential and water content assessments in the form of fresh weight to dry
ratios will be used.
It is important to quantify the extent at which each plant species adapts to drought,
as there is inter- and intra-species plasticity for each drought response. Interestingly,
studies into the genotypic plasticity of water stressed silver birch, Betula pendula,
showed that although there was no clonal differences in leaf water potential, there
were marked differences in other physiological parameters such as stomatal
conductance, net photosynthesis and leaf carbon isotope composition (δ13C).
Reduction of stomatal conductance was found to be the first and most plastic
response to drought in all genotypes before osmotic adjustment (Aspelmeier and
Leuschner, 2003). In addition, work on three tropical plant species Eperua falcate,
Diplotropis purpurea and Virola michelii, found species had a differential stomatal
sensitivity to atmospheric drought (Bonal and Guehl, 2001).
What these studies demonstrate is that plant species and genotypes can differ in
their plasticity of response and value in certain drought adaptations and responses.
Other physiological responses to drought besides osmotic adjustment such as
altering stomatal conductance, hydraulic conductance and photosynthesis rates may

be more heavily weighted upon in some species, suggesting that in fact any
mechanism that influences the process of water cycling in the plant may be enrolled
in some form as part of the plant’s physiological response to water stress.
This chapter will attempt to quantify the variation of individual responses to drought
stress, and the extent to which each drought tolerance mechanism is weighted in L.
perenne and B. nigra. Through biological replication the aim of this chapter is to have
a defined repeatable drought regime for use in later chapters. Although it is beyond
the scope of this study to examine the detailed molecular responses of these two
plants to water stress, by utilising basic physiological protocols to examine total
amino acid, cation and reducing sugar concentrations, it is hoped that an insight will
be gained into the types of solutes in which these two plants species use in osmotic
adjustment. In comparing water potentials and fresh weight : dry weight ratios we
hope to be able to monitor the level of water stress both species experience, and
gain an understanding of the level of drought resistance each species has. In
addition, this information will enable us to gain an insight into the changes of diet
that aphids will experience when exposed to drought stressed hosts in later
chapters.
2.2 Materials and Methods
2.2.1 Plant Species
The two plant species that were chosen for this investigation were B. nigra and L.
perenne. B. nigra is a weedy annual plant cultivated for its seeds commonly referred
to as black mustard. The plant is a dicot and can be found growing naturally

throughout England. B. nigra belongs to the Brassica genus, in the family Cruciferae
(also known as the Brassicaceae). One characteristic of the Cruciferae family is their
ability to produce glucosinolates, these are sulphur containing compounds that play
an important role in plant defence. Although toxic to non-brassica feeding insects,
the presence of the glucosinolates appears to be no problem for the aphid species
Brevicoryne brassicae and Myzus persicae, which can be found naturally feeding on
B. nigra from March or April respectively, until November (Kirk, 1992). It is thought
that the specialist feeding mechanism of aphids allows them to avoid the toxic effect
of glucosinolates.
B. nigra was chosen as the dicotyledon host plant for the following studies due to its
membership in a commercially important crop family, its palatability to both
generalist and specialist aphids M. persicae and B. brassicae, the recent expansion in
available species specific genomic resources, and the ease and quantity of which UK
wild native seeds could be sourced. Seeds used in experiments were obtained from
John Chambers Wildflower Seeds Co. and were from a wild seed stock in
Northamptonshire, UK.
L. perenne, is from the family Poaceae and is widely cultivated as a pasture and
forage plant. It is commonly referred to as perennial ryegrass and has been
cultivated in the UK for over 300 years. A monocot plant species, L. perenne can be
found in old pastures, meadows, road sides and waste land throughout the UK, and
typically flowers from May to August. L. perenne easily hybridises with other species
of Lolium, as well as Festuca, and can be very variable in spike structure (Hubbard,
1984). Although L. perenne can serve as a grass host for the aphid species Sitobion

avenae and Rhopalosiphum padi, it is a relatively unsuitable winter host in
comparison to other grass species (Leather and Dixon, 1982) or indeed to wheat
species. However, L. perenne was chosen as the monocotyledon host plant for the
following studies as it is often the commonest grass species on farmland and around
the UK (Hubbard, 1984). In addition, due to its commonness it is very easy to get a
supply of wild UK native seeds. Thus, seeds used in experiments were also obtained
from John Chambers Wildflower Seeds Co. and were from a wild seed stock in
Northamptonshire, UK.
2.2.2 Plant culturing
Plants were grown in the insect free plant growth rooms with a 16:8 light cycle at a
temperature of 22oC. Growth room PAR was between 80-120mol m-2 s-1 with a
relative air humidity 70-80%. Plants were grown in John Innes peat based compost
with mixed in Silvaperl in 100-150ml plastic pots (for L. perenne and B. nigra
respectively).
2.2.3 Drought regime
Plants pots were stood in a tray and drought stress was produced by withholding water from the tray
for a prolonged period of between 1 to 13 days. Subsequent experiments described below
determined plant age and pot size used in the drought regime for each species. Plants were
randomised within the growth room. To gather data on the plants physiological status during water
withdrawal, a total of two large experiments were conducted involving 100 plants. At each time point
individual plants randomly selected were destructively sampled to assess solute concentrations and
water status.

2.2.4 Plant growth scoring & determining age of plants for experiments
To decide the age at which plants should experience water withdrawal so that they
would survive long enough under water stress in subsequent aphid fecundity
experiments (Chapter 4), plant growth data was scored. Plants were measured using
a 15cm ruler at regular intervals. Data was recorded on leaf width, leaf length and
number of leaves (fig 2.1 & 2.2).
Growth of B. nigra quantified as maximum leaf length, maximum leaf width and
number of leaves increased significantly with time post sowing (one-way ANOVA
P<0.001 F69, F46.92, F116.20 respectively) under growth room conditions (22oC 16:8 LD).
Growth of L. perenne, quantified as maximum leaf length and number of leaves also
increased significantly with time post sowing (one-way ANOVA P<0.001 F57.40, F81.82
0
1
2
3
4
5
6
7
5 10 15 20 25 30
Days post sowing
Max. leaf length (cm) Max. leaf width (cm) No. of leaves
(28) (21)
(23)
(57)
(16)
(41)
Fig 2.1 - The mean (±SE) growth B. nigra over 30 days in growth room conditions (22oC 16:8 LD). Growth was assessed using maximum leaf length and width and total number of leaves, all measurements increased significantly over time (one way ANOVA P<0.001 F69,
F46.92, F116.20 respectively), N is shown in brackets on graph.

respectively). For the drought regime to have a visible effect on both species the
optimum time for drought treatment to commence should be whilst the plant is still
growing. If drought treatment was imposed just before or during flowering then
observed alterations could be related to the developmental stage of the plant and
not the drought treatment. Using simple visual observations it was found that both
species did not reach flowering within the first 28-30 days of growth under growth
room conditions. The growth data (fig 2.1 & 2.2) shows a continued steady growth
during the first 28-30 days post sowing. Therefore it was decided that plants would
be grown in well watered growth room conditions for 20 days post sowing, before
imposing a drought treatment of water withdrawal. This length of time is sufficient
for plants to reach a reasonable size for experimental handling, whilst ensuring
plants are still in the growth stage of development.
0
5
10
15
20
25
30
5 10 15 20 25 30 35
Days post sowing
Max. leaf length (cm) No. of leaves
n (18) (23)
(17) (22)
(30)
Fig 2.2 – The mean (±SE) growth L. lolium over a period of a month in growth room conditions (22oC 16:8 LD). Growth was assessed using maximum leaf length and total number of leaves, both measurements increased significantly over time (one way ANOVA P<0.001 F57.40 , F81.82 respectively), N is shown in brackets on graph.

2.2.5 Chardakov technique and calculating leaf water potential (MPa)
The Chardakov technique was used to verify drought stress via leaf water potential
measurements. Test tube stock solutions of sucrose were made up with distilled
water to 0, 0.5, 0.1, 0.15, 0.2, 0.25, 0.3, 0.35, 0.4, 0.45, 0.5 M concentrations. 0.5ml
of each solution was placed in 1.5ml microfuge tubes with added methylene blue
dye (approximately 0.001g) using a small paintbrush. Leaf tissue from the mid-top
leaves of the plant were cut using a scalpel into 10 small pieces (ea piece ~ 2mm2)
and placed into microfuge tubes with methylene dyed solutions. Tissue was
incubated in solution for approximately 10 minutes. Using a glass pipette a drop of
the solution bathing the leaf tissue was withdrawn and released in test tubes.
Records were made of whether the droplets sank, rose or remained suspended in
the solution. Suspension means the tissue sample is isosmotic with the test tube
solutions. If the droplet sank, the tissue had a lower water potential than the
solution, and if it rose it had a higher water potential. Water potential was calculated
using the standard that 500M sucrose is the equivalent to –1.25MPa and therefore a
250M sucrose solution is the equivalent to –0.625MPa water potential.
2.2.6 Pot Size
Plants were grown in plastic pots, although pot size has previously been found to
have no significant effect on the transpiration response to drought (Ray and Sinclair,
1998), B. nigra was potted in 4 different pot sizes (‘pot 1’= 100ml, ‘pot 2’= 150ml,
‘pot 3’= 250ml, and ‘pot 4’= 400ml) at 20 days old and exposed to progressive
drought until desiccated. At intervals of 1-2 days plants were assessed to determine
tissue water potential (fig 2.3) using the Chardakov method described above.

There was a significant effect of time on the water potential. However, pot size was
shown to have had no significant effect on the rate of water loss on the plants
(Kruskall Wallis P value 0.215). Thus pot size chosen for consecutive experiments
with B. nigra was ‘pot 2’ (150ml), with ‘pot 1’ (100ml) used for L. perenne, these pots
were chosen because they were the smallest pot sizes that provided adequate room
for plant growth, without limiting space in the growth room for other experiments.
2.2.7 Calculating Fresh weight: Dry weight Ratios
To estimate water loss in plants over the progressive drought regime fresh: dry
weight ratios were calculated. Empty 1.5ml microfuge tubes were weighed and then
weighed again once plant tissue (a mixture of stem and leaves from all over the
-1.4
-1.2
-1
-0.8
-0.6
-0.4
-0.2
0 0 2 4 6 8 10 12 14 16
Wat
er P
oten
tial o
f lea
f tis
sue
(MPa
) Pot 1 Pot 2 Pot 3 Pot 4
(≥6) (≥5) (6)
(6)
(6)
(≥5)
(≥4)
(≥3)
Fig 2.3 – The mean (±SE) leaf water potential (MPa) of 20 day old B. nigra potted in four different pot sizes (‘pot 1’= 100ml, ‘pot 2’= 150ml, ‘pot 3’= 250ml, and ‘pot 4’= 400ml) during a progressive drought regime of water withdrawal in growth room conditions (22oC 16:8LD). MPa did not vary significantly between pot sizes (Kruskal Wallis P>0.0.5), N is shown in brackets on graph.
.
Time (d)

plant) was inserted to calculate fresh weight. The microfuge tubes were then placed
for 24h in an oven set at approximately 50oC with their lids open. The microfuge
tubes were weighed again and dry weight was calculated.
2.2.8 Collection of sap from whole tissue
Sugar, cation and amino acid analysis was analysed from sap extracted from whole
tissue. To extract sap, leaves from the top and middle of B. nigra and L. perenne
were placed in a 0.5ml microfuge tubes. Tubes were sealed and placed in a freezer;
once tissue was frozen it was macerated with a small plunger. A small hole was
placed in the bottom of the microfuge tube, and then it was placed in a 1.5ml
microfuge tube. The tissue was then centrifuged at 13,000rpm for 10 minutes. The
leaf sap collected in the lower tube and was frozen for later analysis.
2.2.9 Sugar Quantification and the Somogyi-Nelson Method
Reducing sugars (glucose, fructose, glyceraldehyde and galactose) were quantified
using the Somogyi-Nelson method (Wager, 1954). Sugar standards were made up
using 1mg/ml glucose in distilled water. Glucose standards were transferred in
aliquots of 5 to 75 µl into test tubes whereas aliquots of 20 µl of samples were used.
To each test tube 1ml of distilled water and 1ml of low alkalinity copper reagent
(made up according to the protocol in Wager, 1954) was added to the test tubes.
Samples were placed into a boiling water bath for 10 minutes and then transferred
to a fume cupboard where 1ml of arsenomolybdate reagent (Wager, 1954) was
added. Samples and standards were then transferred to curvettes and read on
spectrophotometer set at absorbance A500. Samples were diluted when absorbance

Standard
y = 0.102x - 0.042R2 = 0.9534
0
0.1
0.2
0.3
0.4
0.5
0.6
0 1 2 3 4 5 6
Glucose concentration μg/ml
Abs
orba
nce
at 5
00nm
w
avel
engt
h
was over 1.0 OD. Standards were plotted in Excel and the linear equation (y=mx+b)
was used to calculate the concentrations of reducing sugar in each of the samples.
2.2.10 Using the HPLC for analysing cation concentrations
Total cell sap was collected, via the bulk sap collection method described earlier,
from both L. perenne and B. nigra plants. Extracted total cell sap was then diluted in
de-ionised water 1:200. This was usually done by adding 497.5μl of eluent to 2.5μl of
sample (eluent was made by adding 0.7ml of 1M H2SO4 to 1l of de-ionised water).
Standards were diluted 1:40 by adding 12.5μl standard solution to 487.5μl eluent.
The standard solution was a 1M solution of each cation in salt form (i.e. 1mM of
MgCl2, NaCl, KCl, CaCl2, NH4Cl). Once diluted 500μl of standards and samples was
pipetted into the Dionex polyvial tube (1.5ml) and covered with a Dionex polyvial
filtercap (0.5ml). These samples were placed into the autosampling cartridges and
placed in the autosampler (Dionex AS40 Automated Sampler). The HPLC (Dionex DX-
120 Ion Chromatograph) was switched on and primed to ensure the column had not
dried up. The HPLC was set at flow rate 1.0, pressure <2000MPa but >1500MPa and
Fig 2.4 – A typical standard curve for sugar analysis. Glucose standards were plotted against absorbance. MS Excel generated linear equations was used to work out sugar concentrations of unknown total sap samples. N=1 per standard, five standard concentrations were used to create curve. Standard curves were repeated each time analysis took place

total conductivity <5. The programming schedule detailing the order of samples was
programmed into the computer using PeakNet software. The program was run using
the schedule, which had every six samples followed by a sample of solely eluent, to
ensure no cations got stuck to the column during the sampling process. In addition,
after every six samples a standard was re-analysed to cater for any detection
changes in the process. The area under each cation peak was interpreted within the
context of the standard results.
2.2.11 Amino Acid Analysis
Sample sap was diluted 1:20 with distilled water in a microfuge tube. In a fluorimeter
glass curvette (with light path 10mm, 12.5 mm width and length, 45mm height and
four polished sides), 100μl of sample was added to 1.5ml of 0.5M Sodium borate
buffer (boric acid and sodium tetra-borate, pH 8.5), 1ml distilled water and 0.5ml
Fluorescamine solution (25mg Fluram dissolved in 100ml acetone). Fluorescence was
read on the fluorimeter (Perkin Elmer LS-5 Luminescence Spectrometer) at 390
excitation and 490 emission. Leucine at 0, 0.2, 0.4, 0.6, 0.8 and 1.0mM
concentrations was used to create a standard curve calibration. In the assay 100μl of
standard was used instead of sample sap to create the standard calibration.
Standards were plotted in Excel (fig 2.5) and a linear equation (y=mx+b) used to
calculate the concentrations of amino acids in the samples.

2.2.12 Statistical Analysis
Data was entered into MINITAB and analysed using the Anderson-Darling Normality
Test. If the P value was ≤0.05 then the data was not normally distributed. In cases
where data is normally distributed parametric tests utilising the means, such as the
t-test (to compare two datasets with one variable) and ANOVA (to compare multiple
datasets with one or more variable) were used. Where data was not normally
distributed, non-parametric statistical tests that use the median like the Mann-
Whitney and Kruskal Wallis test were used respectively.
2.3 Results
2.3.1 Drought induced water potential (MPa) changes
Leaf water potential decreased significantly over the drought period (fig 2.6) in both
B. nigra and L. perenne (Kruskal Wallis P<0.001, P<0.001 respectively). Interestingly,
in B. nigra the leaf water potential was maintained during the first nine days of
water withdrawal, not dropping significantly until after day 9 of the drought
treatment, in contrast to L. perenne. After 9 days from withholding water, leaf water
Fig 2.5 – A typical standard curve for amino acid analysis. Leucine standards (0, 0.2, 0.4, 0.6, 0.8 and 1.0) were plotted against absorbance. N=1 per standard, five standard concentrations were used to create curve. Standard curves were repeated each time analysis took place
Amino Acid Standard
y = 664.43x + 85.352
0 200 400
600 800
0 0.2 0.4 0.6 0.8 1 1.2 Leucine standard concentration (mM)
Absorbance

potential (MPa) had dropped by only 66% (-0.062 ± 0.0 SE n=7 to -0.104 ± 0.01 SE
n=4 MPa) in B. nigra, but by approximately 740% in L. perenne (-0.062 ± 0.0 SE n=8
to -0.527 ± 0.01 SE n=4 MPa). The maintenance of water potential in B. nigra
suggests a well established osmotic adjustment mechanism or control of water loss.
However, by end of the drought treatment both species displayed similar leaf water
potentials, with -0.588 (± 0.1 SE, n = 4) MPa in B. nigra and -0.625 (± 0.0 SE n= 4)
MPa in L. perenne, by day 13 and day 12 of drought treatment respectively. Visual
observations of both species at ten days water withdrawal confirmed both species
were severely wilted, as they both had a substantial amount of ‘crispy’ dead older
leaf tissue with a similar surface area.
-0.8
-0.7
-0.6
-0.5
-0.4
-0.3
-0.2
-0.1
0
Days droughted
Leaf
Wat
er P
oten
tial (
MPa
) B. nigra L. perenne
(6) (6) (6) (6)
(5)
(4)
n (7)
(8) (8)
(8)
(8) (4)
(8)
(7)
(4)
(4)
Fig 2.6 – The mean (±SE) leaf water potential (MPa) of 20 day old B. nigra and L. perenne during a progressive drought regime of water withdrawal in growth room conditions (22oC 16:8LD). MPa dropped significantly (Kruskal Wallis P<0.001 and P<0.001) in both B. nigra and L. perenne (respectively), N is shown in brackets on graph.
.
0 2 4 6 8 10 12

0
2
4
6
8
10
12
14
16
0 2 4 6 8 10 12 14
Days droughted
fw/d
w ra
tio
B. nigra L. perenne
(6) (17)
(8)
(15)
(9)
(11) (14) (8)
n (4)
(8) (8) (8) (8)
(8)
(8)
(4)
(4)
(4)
2.3.2 Fresh: Dry weight ratio (fw:dw) changes under drought
The fresh weight to dry weight ratio (fw/dw) decreased significantly over the course
of the drought treatment (fig 2.7) in both plant species (Kruskal Wallis P<0.001,
P<0.001 respectively). Despite both plants having a similar fw/dw ratio when under
well watered conditions (B. nigra 10.1 ± 0.19 SE n=4 and L. perenne 10.8 ± 4.16 SE
n=8), L. perenne fw/dw ratios dropped within the first day of the drought treatment
(fw/dw 9.6 ± 0.18 SE n=8), whereas in B. nigra it initially rose (fw/dw 12.4± 1.37 SE
n=8) and did not drop until day 6 of the drought treatment (fw/dw 9.5 ± 1.44 SE
n=9).
Fig 2.7 – The mean (±SE) fresh: dry weight (fw:dw) ratio of 20 day old B. nigra and L. perenne during a progressive drought regime of water withdrawal in growth room conditions (22oC 16:8LD), fw:dw ratio dropped significantly (Kruskal Wallis P<0.001 and P<0.001) for B. nigra and L. perenne (respectively), N is shown in brackets on graph

Interestingly, B. nigra displays a slightly higher fw:dw ratios than L. lolium; with a
ratio of 1.23 (± 0.02 SE n=6) in L. lolium, and 2.03 (± 0.12 SE n=4) in B. nigra by day 12
and 11 of drought treatment respectively. However, these results demonstrate that
overall the drought regime has a detrimental effect on the relative water content of
both plant species.
2.3.3 Amino acids
B. nigra and L. perenne total average leaf sap amino acid concentrations significantly
(one way ANOVA P<0.005 F3.65, Kruskal Wallis P<0.001 respectively) altered during
the droughting regime. B. nigra individuals showed average higher concentrations
(fig 2.8) when subjected to between 3 and 8 days water withdrawal. The maximum
increase was at 5 days water withdrawal (+27%) and the minimum increase was at 7
days water withdrawal (+7.7%). At nine days water withdrawal B. nigra had reduced
concentrations (-29%) compared to well watered controls. In contrast amino acid
concentrations showed an increase throughout the drought regime in L. perenne (fig
2.9), with the max increase on day 9 of drought treatment (+233%). Overall total cell
sap amino acid concentrations were found to be higher in L. perenne, with well
watered individuals containing 58.95 mM (± 7.7 SE n=12) in comparison to well
watered B. nigra individuals which had average amino acid concentrations of much
lower at 17.6mM (± 0.84 SE n=15). Leaf sap was only analysed post nine days after
the commencement of the drought treatment as after this leaves were to dry too
extract cell sap adequately.

5
10
15
20
25
30
0 2 4 6 8 10
Days droughted
Am
ino
acid
con
cent
ratio
n m
M
n (15) (7)
(11) (8)
(6) (13)
(5)
(5)
Fig 2.9 – The effect of drought on the mean amino acid concentration (mM) of L. perenne cell sap (±SE); drought treatment consisted of water withdrawal at age 20d from plants for up to 9 days in growth room conditions (22oC 16:8LD). Amino acid concentrations increased significantly (Kruskal Wallis P< 0.001), N is shown in brackets on graph.
0
50
100
150
200
250
0 2 4 6 8 10
Days droughted
Am
ino
acid
con
cent
ratio
n (m
M)
n (12)
(12) (11)
(12) (12)
(12) (12)
(12) (12)
(11)
Fig 2.8 – The effect of drought on the mean amino acid concentration (mM) of B. nigra cell sap (±SE); drought treatment consisted of water withdrawal at age 20d from plants for up to 9 days in growth room conditions (22oC 16:8LD). Amino acid concentrations increased significantly (one way ANOVA P< 0.005F3.65) with drought until day 9 when amino acids dropped below levels in well watered controls, N is shown in brackets on graph.

2.3.4 Sugars
Cell sap absorbance measurements showed that B. nigra and L. perenne average
reducing sugar concentrations (glucose, fructose, glyceraldehyde and galactose etc)
significantly (Kruskal Wallis P<0.001, P<0.001 respectively) increased during the
droughting regime. L. perenne individuals showed average higher concentrations (fig
2.10) of reducing sugars throughout the drought regime particularly when subjected
to between 7 and 9 days water withdrawal. The max increase was at 9 days water
withdrawal (+783%) and the min increase was at 4 days water withdrawal (+90%). B.
nigra (fig 2.10), also showed a max increase on day 9 of drought treatment when
compared to well watered (+409%). Despite L. perenne over the course of the
drought regime displaying higher increases in concentrations of reducing sugars in
leaf tissue, both well watered L. perenne and B. nigra leaves display similar
concentrations of reducing sugars (1.54μg/ml ± 0.08 SE n=5 and 1.53 μg/ml ± 0.08 SE
n=5 respectively).

Average concentration of reducing sugars in droughted L.
perenne and B. nigra
0
1
2
3
4
5
6
7
0 2 4 6 8 10
Days droughted
Red
ucin
g su
gar c
once
ntra
tion
(mic
rogr
am/m
l)
B. nigra
L. perenne
2.3.5 Cations
The concentration of the cations magnesium (Mg+), potassium (K+), calcium (Ca2+),
ammonium (NH4+) and sodium (Na+) were quantified in total cell sap of droughted B.
nigra plants. Only K+, Mg+ and Ca2+ were significantly increased (fig 2.11 & 2.12) over
the droughting period (one way ANOVA P<0.001 F6.73, P<0.05 F2.26 and P<0.05 F2.60
respectively). NH4+ and Na+ levels (fig 2.13) did not vary significantly in B. nigra
leaves (one way ANOVA P>0.05 F1.84 and P>0.05 F1.30 respectively) over the
droughting period indicating that only K+, Mg+ and Ca2+ ions accumulated in
droughted leaves. However, the accumulation of K+, Mg+ and Ca2+ ions did not start
until around day 9 of the drought regime.
Fig 2.10 – The mean (±SE) absorbance of reducing sugars in leaves of 20 day old B. nigra and L.
perenne during a progressive drought regime of water withdrawal in growth room conditions (22oC 16:8LD), sugar concentrations rose significantly (Kruskal Wallis P<0.001 and P<0.001) for B. nigra and L. perenne (respectively), N is 5 for each point on graph.

0
100
200
300
400
500
600
0 2 4 6 8 10 12
Days droughted
Con
cent
ratio
n (m
M)
0
20
40
60
80
100
120
140
0 2 4 6 8 10 12
Days droughted
Con
cent
ratio
ns (m
M)
Mg
Ca
Figure 2.11: Changes in mean K+ cation concentrations (mM) in cell sap of B. nigra subjected to a progressive drought (±SE) under growth room conditions (22oC 16:8LD). Drought treatment consisted of water withdrawal at age 20d for up to 11 days. Ion concentrations increased significantly over the drought regime (one way ANOVA P<0.001 F6.73), N is shown in brackets on graph.
Figure 2.12: Changes in mean Mg+ and Ca2+ cation concentrations (mM) in cell sap of B. nigra subjected to a progressive drought (±SE) under growth room conditions (22oC 16:8LD). Drought treatment consisted of water withdrawal at age 20d for up to 11 days. Ion concentrations increased significantly over the drought regime (one way ANOVA P<0.05 F2.26 and P<0.05 F2.60 respectively), N is shown in brackets on graph.
(8)
n (29) (12)
(19)
(13) (21)
(5)
(10)
(5)
(21) (13) (10) (12)
(19) (8)
n (29)

Figure 2.14: Changes in mean K+ cation concentrations (mM) in cell sap of L. perenne subjected to a progressive drought (±SE) under growth room conditions (22oC 16:8LD). Drought treatment consisted of water withdrawal at age 20d for up to 9 days. Ion concentrations altered significantly over the drought regime (one way ANOVA P<0.001 F11.42), N is shown in brackets on graph.
0
100
200
300
400
0 2 4 6 8 10
Days droughted
Con
cent
ratio
n m
M
(10) (10)
(10)
(10) (9) (10) (10)
(10)
n (9) (10)
Whilst in the grass species L. perenne, all the cation concentrations (Mg+, K+, Ca2+,
NH4+ and Na+) were significantly altered (one way ANOVA P<0.001, F12.77, F11.42, F10.76,
F5.79 and F15.86 respectively). Levels of K+ cations (fig 2.14) dropped at day four of the
drought regime (-5%) and droughted leaves maintained a lower average K+
concentration then well watered L. perenne for the rest of the drought regime.
0
2
4
6
8
10
12
14
0 2 4 6 8 10 12
Days Droughted
Con
cent
ratio
ns (m
M)
NH4
Na (13)
(12)
(19)
(8)
n (29)
(21)
(10)
(5)
Figure 2.13: Changes in mean NH4+ and Na+ cation concentrations (mM) in cell sap of B. nigra
subjected to a progressive drought (±SE) under growth room conditions (22oC 16:8LD). Drought treatment consisted of water withdrawal at age 20d for up to 11 days. Ion concentrations did not change significantly over the drought regime (one way ANOVA P>0.05 F1.84 and P>0.05 F1.30 respectively), N is shown in brackets on graph.

A similar pattern was seen in levels of NH4+ cations (fig 2.15) which maintained a
drop in droughted leaves at day six (-38%) until day eight (-30%) of the drought
regime, however by day nine droughted leaves had a higher average NH4+
concentration than well watered leaves (+30%, 3.8mM ± 0.6 SE n=10). In addition
unlike K+, the NH4+ cations initially rose in droughted leaves at the start of the
drought regime with a peak average of 5.5mM (± 0.59 SE n=10), an 86% higher
concentration than in well watered L. perenne leaves (2.9mM ± 0.34 SE n=9).
In contrast, the average concentrations of cations Mg+, Ca2+ and Na+ initially stayed
the same until day seven of the drought regime when they significantly rose by
111%, 74% and 55%, respectively (fig 2.16). The highest average concentration of
each cation in L. perenne was in leaves subjected to nine days drought; whereby
concentrations of Mg+, Ca2+ and Na+ increased by 294%, 222% and 258%,
respectively, when compared to well watered leaves.
0
2
4
6
8
0 2 4 6 8 10
Days droughted Con
cent
ratio
n m
M
Figure 2.15: Changes in mean NH4+ cation concentrations (mM) in cell sap of L. perenne
subjected to a progressive drought (±SE) under growth room conditions (22oC 16:8LD). Drought treatment consisted of water withdrawal at age 20d for up to 9 days. Ion concentrations altered significantly over the drought regime (one way ANOVA P<0.001 F5.79), N is shown in brackets on graph.
(10) (10)
(10)
(10) (10)
(10)
(10)
(10)
(9)
n (9)

These results demonstrate that drought has a significant effect on cation
concentrations in cell sap of droughted leaves of L. perenne and B. nigra. In
particular extreme drought stress results in an increase of Mg+ and Ca2+ cations,
which increased significantly in both B. nigra and L. perenne, with K+ cations also
being increased in B. nigra and Na+ only being increased in L. perenne.
2.4 Discussion
Simply withholding water from plants as a drought methodology has the issue that
the level of drought stress is hard to quantify. Although pot size seemed to have no
effect on water loss through transpiration in some studies (Ray and Sinclair, 1998),
keeping pots at constant weights for the treatment is required to keep drought
stress treatment reproducible (Socias et al, 1997; Sanguineti et al, 1999). The results
of this chapter have demonstrated that in utilising an optimum pot size and plant
growth rates, a reproducible drought regime can be established. The drought regime
showed significant differences between treatments via a variety of physiological
parameters.
0
10
20
30
40
50
0 2 4 6 8 10
Days droughted
Con
cent
ratio
n m
M
Ca
Mg
Na
Figure 2.16: Mean Mg+, Ca2+ and Na+ concentrations (±SE) significantly increased in cell sap of L. perenne (one way ANOVA P<0.001, F12.77, F10.76 and F15.86 respectively) subjected to a progressive drought under growth room conditions (22oC 16:8LD). Drought treatment consisted of water withdrawal at age 20d for up to 9 days. Ion concentrations increased after day 6 of the drought regime, N is shown in brackets on graph.
(10)
(10) (10) (10) (10)
(10)
(10)
(10)
(9) (9)

Measurements of leaf water potentials show that both plant species B. nigra and L.
perenne display significantly lower water potentials as the drought treatment
progressed. However, B. nigra appears not to undergo significant osmotic
adjustment for the first nine days of the drought regime as leaf water potential
values are maintained. This is in contrast to L. perenne, which lowers its leaf water
potential within a day of water withdrawal. The maintenance of leaf water potential
in B. nigra may be due to the plant maintaining water loss through stomatal closure,
leaf shedding or other mechanisms that increase water acquisition, such as root
investment. Although not recorded, leaf shedding of older leaves was observed
during drought regimes in B. nigra. It could be hypothesised that maintaining water
potential during drought could benefit aphids which would otherwise be osmotically
challenged if leaf water potential dropped. Despite these differences both plant
species show a similar water potential level in leaf tissue around 12-13 days of water
withdrawal, indicating that at this point of the drought regime neither plant species
can remedy the effect of the water stress on leaf water potential.
Drought stress has typically been associated with a reduction in plant growth
(Ashenden et al, 1974; Thomas, 1986; Thomas, 1991; Khalil and Grace, 1992; Volaire
et al, 1998; Clarke et al, 1999), as reductions in plant turgor detrimentally affect
plant cell growth (Wu and Cosgrove, 1999). Measurements of percentage water
content proceeding drought in a variety of grass species (Hale et al, 2003) showed
that drought stress also induces lower fresh weight to dry weight ratios (fw:dw) than
in well watered plants. The results in our study confirm this, with the fw:dw ratio
lowering in both the grass species L. perenne, as well as in the dicotyledon, B. nigra.

Interestingly, despite both plant species having similar fw:dw ratios at the beginning
and end of the drought regime, B. nigra displayed slightly higher fw:dw ratios than L.
perenne during the drought treatment, with L. perenne fw:dw ratios dropping more
rapidly over the course of the regime. Unlike the measurements in leaf water
potential, fw: dw ratio calculations show a dynamic change in the water status of
both plant species over the drought time course. The drop in fw:dw ratio in B. nigra
individuals is interesting as it occurs before the drop in leaf water potential. From
this information it could be hypothesised that leaf water potential is maintained in
the younger leaves via leaf shedding, as measurements of the fw:dw ratio involved a
mixture of plant tissue from all over the plant, whereas leaf water potential
measurements were taken from the younger mid to top leaves on the plants. With
regards to aphid performance a leaf shedding drought strategy from the host plant
B. nigra, could be predicted to be less detrimental than the strategy of osmotic
adjustment that L. perenne appears to favour, that is unless the changes as a result
of osmotic adjustment were advantageous to aphids.
Leaf sap had a significant increase in amino acid concentration compared with well
watered controls in L. perenne and B. nigra. In L. perenne amino acid concentrations
increased throughout the drought regime confirming other studies which have
observed increases in the osmotic pressure and concentration of essential and total
amino acids in four grass species (Hale et al, 2003). This increase in amino acids in L.
perenne may be part of the plants osmotic adjustment mechanism, or a by product
of water loss from transpiration, given that it occurs at the same time as the leaf

water potential becomes more negative it could also be a result of loss of membrane
integrity.
Interestingly, despite other studies showing observed increases in essential amino
acids in droughted B. napus (Good and Zaplachinski, 1994), in B. nigra our results
showed the initial increase in amino acids was relatively small compared to L.
perenne. Furthermore, at nine days water withdrawal there was a reduction in
amino acid concentrations, which was followed closely by lowering of leaf water
potential. Observations of B. nigra during the drought regime suggest that at this
stage individuals are fatally affected by the drought stress. Therefore, it can be
hypothesised that as this initial increase in amino acid concentrations is small it may
not be due to osmotic adjustment in B. nigra, but part of a drought resistance
mechanism that protects cell membranes, or a result of leaf shedding as part of the
strategy to reduce water loss. The delayed reduction in MPa and slower decline in
fw:dw in B. nigra compared to L. perenne suggest that B. nigra individuals are able to
reduce water loss. Whereas, in L. perenne the increase of amino acids in cell sap at
day four of the drought regime also coincides with the reduction in leaf water
potential, leading to the hypothesis that amino acids play a role osmotic adjustment
in L. perenne.
However, usually it is phloem sap carbohydrate concentrations that are mainly
responsible for adjustments in phloem osmotic pressure, with increases in sieve
element solutes such as sugars (Smith and Milburn, 1980) used to maintain positive
phloem turgor pressure. The amount at which carbohydrate concentrations increase
is dependant on the level of water stress, location in the plant, plant developmental

stage, growth conditions and how dominant the role of carbohydrate is in
adjustment of phloem osmotic pressure. In water stressed Eucalyptus globulus,
carbohydrates increased by over 50% (Cernusak et al, 2003), whilst in Solanum
lycopersicum, carbohydrate concentrations increased by 20-40% (Najla et al, 2010).
Our results have shown that B. nigra and L. perenne are able to greatly exceed this
value, with maximum increases in reducing sugar concentrations in cell sap of
around 410% and 780%, respectively. However, these increases were observed by
day nine of the drought regime, which due to the wilting and frequently fatal level of
water stress to the plants will be classified as severe drought. Although it could be
argued that these changes could be an artefact of simple water loss the data has
shown changes in solute concentrations that would make this unlikely unless there
has been active transport of solutes out of the shoots.
Overall, analysis of the reducing sugar concentrations (glucose, fructose,
glyceraldehyde and galactose etc) in the cell sap of L. perenne and B. nigra shows us
that both species increase the concentration of reducing sugars throughout the
drought regime. Interestingly, L. perenne undergoes a greater increase in reducing
sugar concentrations during water stress than in B. nigra, despite well watered
individuals of both species displaying similar concentrations of reducing sugars.
These results further suggest that the strategy between the two species is different
with regards to water stress.
Aside from amino acids and carbohydrates there are many other solutes that can
play an important role in osmotic adjustment and drought tolerance. Ions can play
roles in phloem osmotic pressure, with potassium ions found to have an important

role in transport of photo-assimilates in B. napus (Gould et al 2004). Interestingly,
studies into water stress perception have also shown that signal transduction
cascades involve changes in cytoplasmic Ca2+ (Luan 1998; Lee et al, 1999), whilst in
Eucalyptus camaldulensis a high affinity K+ transporter was identified that shows the
properties of being an osmosensor (Liu et al, 2001), suggesting that ion levels
within/outside cells is important in sensing and communicating water stress.
Our results have confirmed that ion levels alter during water stress, suggesting they
may have an important role. HPLC analysis showed significant increases in the ions
magnesium, potassium and calcium in B. nigra, and significant changes in the levels
of potassium, ammonium, magnesium, calcium and sodium in L. perenne. These
results demonstrate that water stress significantly alters the levels of cations in B.
nigra and L. perenne, and that magnesium and unsurprisingly calcium accumulation
is an effect of drought on both species.
2.4.1 Conclusion & The Experimental System
It is clear from the data that both L. perenne and B. nigra undergo a series of
physiological changes in response to water stress. So far the data has enabled many
hypotheses to be made about the type of mechanisms and strategies each species
uses to address water stress, but it is not in depth enough to make any clear
statement about how each species divides resources between drought mechanisms.
For example both species show an increase in amino acids, however, the exact role
of this increase is debatable with only small increases observed in B. nigra compared
with L. perenne. Detailed analysis via HPLC would enable us to pinpoint which amino
acids are increased in concentration preferentially during water stress. Previous

studies have already shown that certain amino acids such as proline are associated
with prevention and protection of damage to protein structure and activity, and
protection from drought induced damage by reactive oxygen species
(Rajendrakumar et al, 1994; Samuel et al, 2000; Saradhi et al, 1995). Interestingly,
increased levels of proline have also been associated with resistance to aphid
infestation (Auclair et al, 1957; Van Emden, 1964; Selman and Kandiah, 1971). HPLC
analysis of the amino acid composition changes in B. nigra and L. perenne would
enable an assessment to ascertain which amino acids increase. This additional work
would provide information to make more informed hypotheses as to the effect of
drought on aphids, as increases in plant sourced essential amino acids could be
beneficial to aphids, whereas increases in amino acids associated with resistance
would be detrimental.
Overall, B. nigra and L. perenne have demonstrated that water withdrawal at 20 days
of age results in a decrease of fresh mass relative to dry mass and a drop in leaf
water potential. Both species undergo an increase in sap sugar concentrations,
altering the sugar: amino acid ratios, as well as alterations in cation concentrations.
It can be hypothesised that this alteration in sap composition could be unpalatable
to specialist aphid species that rely on specific plant cues to establish phloem feeding
(Wensler and Filshie, 1969, Martin et al, 1997), as well as resulting in aphids
displaying poor reproductive performance as energy is reallocated to
osmoregulation mechanisms, such as sugar polymerisation to deal with the
increased sugar concentrations ingested.

To conclude the data from this chapter has shown that simple water withdrawal can
be a repeatable drought treatment. Using a progressive drought regime also gives
access to different levels of drought stress. For the rest of the thesis two levels of
drought will be defined, mild drought and extreme drought, where plants are
droughted for 3-6 and 6-9 days at 20 days post sowing respectively. Mild drought is
defined by both species showing alterations in levels of amino acids and sugars
without the plants showing substantial water loss or osmotic adjustment. Extreme
drought is defined as both plant species showing increases in sugar levels, alterations
in amino acid and cation levels with substantial water loss quantified in the form of
fw: dw ratios. The extreme drought treatment also results in a substantial drop in
the leaf water potential of L. perenne and is just before a substantial drop in leaf
water potential in B. nigra, indicating that it is just before the water potential
maintenance mechanisms no longer function in B. nigra.

Chapter 3: The feeding and settling behaviours
of Myzus persicae, Brevicoryne brassicae,
Rhopalosiphum padi and Sitobion avenae, on
water stressed hosts Brassica nigra and Lolium
perenne

3.0 Abstract
Aphid behaviour can be affected intrinsically by genes and biochemical processes
and externally by environmental and social cues. Many variables can affect the
quality of host plants and in turn affect the feeding behaviour of aphids. Using the
electrical penetration graph technique the feeding behaviours of four aphid species
and two clones was quantified in response to water stress.
Results showed that there was no significant effect of water stress on the aphid
Sitobion avenae when fed on Lolium perenne. However, Brevicoryne brassicae and B
clones of Myzus persicae, did show a significant increase in xylem feeding when fed
on droughted Brassica nigra plants. Furthermore, both O and B clones of M. persicae
and Rhopalosiphum padi (fed on B. nigra and L. perenne, respectively), showed
significantly less time ingesting sieve element sap on droughted host plants.
The results are consistent with the view that xylem drinking is an important
osmoregulation mechanism in B. brassicae and B clones of M. persicae. This chapter
has hypothesised that the reduction in sieve element sap ingestion by M. persicae
and R. padi may be an artefact of the drought induced increases in amino acids in
plant sap, or conversely a reduced palatability of water stressed hosts.
3.1 Introduction
Behaviour is a very complex aspect of an organism’s response, being influenced
intrinsically via genes and biochemical processes and externally via environmental
and social driving forces. Behaviour has arguably had a large influence on evolution,
especially in sexual selection. It is therefore vital to study the behavioural responses

of organisms in addition to their molecular and physiological responses. This chapter
will set out to examine how aphids locate, and then subsequently accept suitable
hosts. It will then set out to address the behavioural responses of aphids to water
stress, using two techniques. Firstly, observational scoring and secondly, the
electrical penetration graph (EPG) technique. By understanding the behavioural
adaptations of aphids to water stress, it is hoped that the function of genetic
responses examined later will be better understood.
3.1.1 Aphid Behaviour – Locating and Accepting suitable Plant-Hosts
Aphids live in colonies; colonial existence may benefit aphids by resulting in a less
viable plant stress response, or a change in phloem composition that improves host
quality (Telang et al, 1999). Colonial existence can however cause other issues such
as attracting natural enemies, increasing the risk of infection from contagious
pathogens, and in some cases eventual exhaustion of plant host. Therefore, in such
instances aphid survival depends on the dispersal of colony members to infest
alternative suitable hosts.
The aphid colonial dispersal mechanism is the result of host and social cues. In R.
padi increased mobility of aphids has been attributed to an increase, over threshold
levels, of aphid originated volatile semiochemicals (Quiroz et al, 1997). Conversely
Drepanosiphum platanoidis increased mobility after an increase in tactile
disturbance from other members of the colony (Dixon, 1998). This type of social cue
can also promote production of winged individuals, called alata(e). Additionally
feeding interruption and decreased food quality are all stimuli associated with alate
production (Harrewijn, 1972; Dixon, 1998; Muller et al, 2001). Development of alate

individuals is a crucial mechanism in the aphid dispersal strategy to find suitable
hosts.
Alate aphids are able to cover considerable distances as well as remain airborne for
many hours being transported by air currents (Wiktelius, 1984). Despite some flight
weaknesses, alatae aphids are able to control to some degree where they land. Most
species of aphids show a preference to land on yellow surfaces (Prokopy and Owens,
1983; Roberts, 1987) although the more polyphagous species such as A. fabae and R.
padi have been found to be more responsive to wavelengths in the green region of
the spectrum (Hardie, 1989; Nottingham et al, 1991). With 95% of aphid species
being monophagous (Blackman and Estop, 1984), aphids must have effective
mechanisms that enable them to detect host suitability
3.1.2 Olfactory influence on plant-host selection
The development of the electroantennogram (EAG) technique has resulted in a
range of studies that show aphids can detect plant volatiles, indicating that olfactory
cues are important in host plant selection. Aphid’s olfactory organs are mainly
situated on the antennae; EAG has shown that main olfactory organ present in all
morphs and life stages is the primary rhinaria, which is located on the last antennal
segment (Bromley et al, 1980). Electrophysiological recordings have shown that the
rhinaria in adult aphids contain receptors for common leaf volatiles (van Giessen et
al, 1994; Park and Hardie et al, 2002; 2004). Although aphids can detect plant
volatiles such as nitriles, green leaf volatiles, henzaldehydes, isothiocyanates and
monoterpenes (Visser and Piron, 1997), the exact role of plant volatiles as a cue for
host selection in alate morphs is not well understood. Previous studies have shown

that alate aphids from the species Myzus persicae, Brevicoryne brassicae and Aphis
fabae showed no distinction between host and non host plants when landing. These
findings are unsurprising considering the polyphagous nature of M. persicae, but are
when considering the specialist species B. brassicae. This indicates that at a distance
these aphids do not show discrimination between host plants using olfactory cues
(Kennedy et al, 1963 a & b). However, several studies in walking apterae have shown
aphids respond to host plant odours when in olfactometers (Pettersson, 1970; 1973;
Petterson et al, 1994) with some experiments showing that apterous aphids even
avoid non host odours (Nottingham et al, 1991b; Hori 1999). Olfactory sensory cells
in aphids may be more involved in host plant selection once grounded and the
initiation of probing behaviours may be dependant on host recognition by these
sensory cells on the antennae.
If olfactory cues play a role in the location of host plants, then responses to certain
plant volatiles may differ between species with different host plants. It can be
hypothesised that different morphs of the same species may alter in their sensitivity
to certain plant odours as the season dictates they switch plant host.
Comparisons between the specialist aphid B. brassciae and the generalist aphid M.
persicae, showed differences in response to 35 out of 80 (58%) plant volatiles when
reared on the same host plant (Visser and Piron, 1997). In M. persicae, summer
morphs of apterous and alate aphids differed by 16% in their responses to tested
plant volatiles. When compared to M. persicae reared on artificial diet, alate morphs
reared on host plants differed in response to 20% of the tested plant volatiles, whilst
apterae differed by 12% suggesting that sensitivity to plant volatiles varies with

species, morph and previous experience. In the aphid R. padi, significant differences
were observed in EAG responses between winged virginoparae and gynoparae (Park
et al, 2000), with gynoparae being sensitive to benzaldehyde, a prominent volatile
from the aphids winter host, bird cherry (Prunus padus). Aphid morphal differences
in plant volatile sensitivity may contribute to successful host plant location for aphid
species that seasonally alternate host plants. However, morphal differences are not
universal across species, with A. fabae showing no difference between apterae and
alatae in response to 35 plant volatiles (Hardie et al, 1994). Moreover R. padi host
acceptance and growth, was affected by plant volatiles in resistant varieties of
Hordeum vulgare (Ninkovic and Åhman, 2009), suggesting that certain plant volatiles
which are also connected with aphid resistance add to the need for early detection
when aphids are selecting suitable hosts.
It can be concluded that plant volatiles play a role in host plant location, providing a
rapid host plant screening mechanism in the field (Pettersson et al, 2007). The
importance of plant volatile cues may vary between species with some aphids relying
on volatiles as a mechanism to locate winter hosts.
3.1.3 Influence of Initial Plant Contact in Host Acceptance
When attempting to locate host plants aphids can utilise visual cues in the form of
light wavelengths, and olfactory cues in form of detection of plant volatiles. These
stimuli although useful in locating host plants, may not suffice in giving the aphid
sufficient information as to the feeding quality of the host plant. The gathering of
other information is therefore required before complete host acceptance.

Aphids can utilise both chemical and mechanical information about the plant before
deciding whether to attempt probing. Host plant waxiness, hairiness, glandular
trichrome absence or presence, and epidermal thickness are all important
morphological features that could affect aphid colonisation. Hairiness has the
potential to limit aphid movement, whilst glandular trichomes have the potential to
physically entrap aphids. Host plants with a genotype for waxy cuticles can pose grip
problems for aphid’s tarsal claws and result in aphids falling off plants more
frequently, whilst genotypes with thicker epidermal cell walls could pose additional
probing resistance. In a study the aphid Lipaphis pseudobrassicae (mustard aphid)
was placed on genotypes of Brassica with different waxy cuticles, it was found that
on waxy genotypes the tarsal claws of the aphid L. pseudobrassicae were too short
to sufficiently grip the leaf cuticle wax and so the aphids fell off the leaves (Åhman,
1990). It has also been found that when cultivars that produce glandular trichromes
were washed, aphids were able to probe them as easily as cultivars that lacked them
altogether (Alvarez et al, 2006). This demonstrates that glandular trichrome
presence has a repellent effect on aphid feeding, which can be attributed to the
trichrome production of volatile repellents and sticky membranes.
3.1.4 Chemoreceptors or Mechanoreceptors or both?
When arriving on a potential host plant, chemoreception is thought to be important
in determining host suitability. However, aphids have a reduced number of external
chemoreceptors when compared to other phytophagous insects. The aphid labial tip
and other labia sensilla were found to contain only mechanoreceptors (Wensler,
1977; Tjallingii, 1978), suggesting that mechanoreceptors play the dominant role in

host acceptance upon initial plant contact. However, additional sensory organs
located on the antennae are thought to be involved in olfaction detection of plant
volatiles. Ultra-structural imaging evidence has been used to suggest that it is
chemoreceptors present on the apical antennal hairs that play a role in surface
chemoreception (Bromley et al, 1980; Powell et al, 1995). This coincides with
observations that when walking on a host plant aphids wave their antennae, and the
tips of the antennae touch the plant surface (Powell et al, 1995). This behaviour
could be to maximise the detection on non-volatile cuticle chemical cues. Aphids can
also detect non-volatile epicuticular lipids (Powell et al, 1999), but what
chemoreceptors are attributable for lipid detection is unknown. What is clear is that
aphids have mechanisms for external chemoreception.
Thus, although we know that mechanoreceptors and chemoreceptors play a role in
external assessment of host suitability, the exact relationship needs further
investigation. Ultimately, the less time aphids use to decide if a host is suitable, the
more time an aphid can spend feeding and reproducing on suitable hosts.
3.1.5 Probing Host-Plants and Feeding
Upon landing and satisfaction with the exterior qualities of a plant host an aphid will
start penetrating behaviour. This begins with a series of ‘test probes’, these are short
stylet penetrations into the epidermal and mesophyll cells of the host. It is believed
that during these initial probes the aphid ‘samples’ the internal plant chemical
composition allowing for assessment of the internal quality of a host. This
mechanism of gustatory monitoring may involve the pharyngeal gustatory organ,
which contains 60 taste cells (Wensler and Filshie, 1969). After satisfactory ‘test

probes’ aphids begin a sustained period of penetration in an attempt to locate the
phloem.
In addition, during probing aphids may produce a gelling saliva to produce the
salivary sheaths that protect the stylets in the plant tissue and keep sieve elements
open following puncture by stylets (Walling, 2008). This gelling saliva is excreted by
the accessory glands and forms a protective sheath that assists in stabilising the
stylet within plant tissue (Pollard, 1973; Douglas, 2003). Aphids also produce watery
saliva, which is injected into sieve elements prior to sap ingestion (Prado and
Tjallingii, 1994) and will be discussed in more depth later on.
3.1.6 Phloem Location
Although aphid stylets penetrate exclusively intercellularly (Tjallingi and Hogen Esch,
1993) they are also found to puncture nearly every cell intracellularly through plant
cell walls on route to the phloem sieve elements, although this will depend upon the
host plant and its physiological state. There can typically be 50-100 cell punctures
before reaching the phloem, each penetration lasting 5-10s (Tjallingii, 1985). Aphids
are thought to sample small amounts of sap during puncture events (Martin et al,
1997). These small samples are thought to provide the aphid with information about
their host.
The mechanism(s) of sieve element location are not well understood but it has been
suggested that location is a result of the gustatory monitoring of ingested sap
samples (Wensler and Filshie, 1969). The intracellular puncturing of plant cells along
the stylet pathway provides aphids with the ability to follow potential apoplastic

gradients, in pH and sugar leading to the phloem, these gradients are a result of the
combined effects of symplastic loading and leakage into the apoplast. It is also
possible that tasting the allelochemicals contained in vacuoles aids plant host
selection
3.1.7 Phloem Acceptance
Once reaching the sieve element, initial acceptance is determined by brief cell
punctures of the sieve tubes and companion cells. Typically phloem activities always
start with a brief cell puncture; it is thought that this event is crucial in the aphid
deciding whether or not to commit to phloem feeding. In support of this hypothesis
electron microscopy has shown punctures into sieve elements where no subsequent
phloem phase activities where detected using the Electrical Penetration Graph
Technique (EPG) (Tjallingii and Hogen Esch, 1993). Upon initial phloem acceptance
aphids without exception commence salivating into the sieve element; this
behaviour is defined as E1 in EPG. However, it is not the only saliva produced by
aphids during plant penetration, the first saliva is a lipoproteinous gelling saliva
mentioned earlier, which is secreted during the phloem locating phase of plant
penetration (aka pathway phase). The saliva secreted during E1 behaviour into the
sieve element is known as watery saliva (Miles, 1999; Tjallingii, 2006) and is secreted
by the principle gland of the aphid.
On host plants the secretion of watery saliva lasts for roughly one minute before the
aphids move onto the second phase of phloem activity, termed E2, which is phloem
sap ingestion coupled with watery salivation. Unsuitable hosts may result in aphids
not proceeding onto E2 behaviour and withdrawing their stylets from the sieve

element entirely. The exact stimuli that results in successive E2 after E1 behaviour is
currently unknown. E1 salivation is thought to be associated with suppressing
potential phloem wound responses, and phloem resistance mechanisms that can
hinder feeding. Aphis gossypii showed extended periods of E1 when fed on resistant
melon cultivars (Garzo et al, 2002), whilst aphids involved in phloem ingestion (E2)
resorted back to phloem salivation (E1) when forisomes (proteins involved in the
phloem wound response) were activated (Will and van Bel, 2006). Thus, continued
salivation during the sap ingestion (E2) is thought to be associated with preventing
stylet canal blockage (Tjallingii and Hogen Esh, 1993).
Complete phloem acceptance can then be defined as when aphids display
‘committed phloem ingestion’, instead of merely displaying an absence or presence
of each behaviour. Committed phloem ingestion is generally accepted as when E2
behaviour occurs continuously for longer than fifteen minutes (Montllor et al, 1983;
Tjallingii, 1990), and if the host plant is suitable aphids can then sustain E2 for many
hours.
To summarise aphids have an array of mechanisms that assist them in finding
suitable hosts, from visual cues when in flight, to chemical cues detected within the
tissues of plants. The dependence on each of these host selection mechanisms may
alter depending on the aphid-plant species combination. Central in the elucidation of
these mechanisms has been the study of aphid behaviour, and one technique which
changed the way aphids were studied was the electrical penetration graph
technique.

3.1.8 Assessing aphid probing behaviour using the Electrical Penetration Graph
Technique
EPG is a method used to qualitatively and quantitatively assess aphid’s feeding
behaviour through the visualisation and recording of waveforms that correlate with
specific feeding behaviour. The EPG technique makes an aphid and plant part of an
electrical circuit; this is done by inserting a wire into the soil of the plant and
attaching a thin wire to the dorsum of the aphid. As the aphid pierces the plant
tissue with its stylet mouthparts the circuit is completed, and a fluctuating voltage
sent through the system, called the ‘EPG signal’, is amplified and recorded to form
distinct patterns known as ‘waveforms’. Analysis of these waveforms allows the
differentiation between different feeding behaviours.
Waveform patterns are produced by a variety of different components. The
fluctuating voltage is affected by the changes in electrical resistance in the stylet of
the aphid; this is known as the resistance component (R). In addition, the fluctuating
voltage is also affected by voltages generated in the aphid-plant interaction called
emf components. These are a consequence of plant cell punctures by the aphid’s
stylet resulting in changes in membrane potentials, causing a drop in measured
voltage as well as streaming potentials in the stylet canal of the aphid.
The EPG system was originally designed by McLean and Kinsey (1964), but the early
AC system lost emf components in the signal generation. As a result, the DC system
was developed by Freddy Tjallingii from Wageningen University (Tjallingii, 1988),
which could record both R and emf components. It is this system that is used in this
study.

EPG has provided a lot of information on aphid feeding behaviour especially in
regards to plant resistance (van Helden and Tjallingii, 1993; Klinger et al, 1998;
Kaloshian et al, 2000). For example, EPG allows the experimenter to assess whether
plant resistance is phloem based, with the ability to assess the amount of time
aphids spend feeding from the phloem, xylem or in pathway (defined in this thesis as
probing in non-vascular plant tissues). Short durations of phloem feeding detected
by EPG followed by rejection of plant host (often defined as non-penetration) may
suggest a plant has unsuitable phloem quality and or phloem based resistance.
Phloem resistance may make the phloem more difficult to locate or result in phloem
feeding being unsustained (Garzo et al, 2002; Marchetti et al, 2009).
Criticism of the EPG technique is that the process of wiring may have adverse affects
on aphid behaviour (Annan et al, 1997). However, as it is mainly used in comparative
studies it has been counter argued that the effects of EPG tethering are constant,
and therefore, do not negate the reliability of the results (Tjallingii, 1978). In a study
to test the effects of EPG tethering (Annan et al, 1997), it was found that tethered
and un-tethered aphids displayed no significant differences in survivorship,
reproductive period, rm (intrinsic rate of increase) and fecundity. Therefore, it is
maintained that EPG is an effective method for study, as any detrimental impacts of
EPG are the same for both experimental and control trials.
In order to disseminate the information produced by the EPG system it is important
that feeding behaviours are clearly correlated with the waveforms produced by EPG.
Over the last few decades there have been many studies using a variety of
techniques to correlate waveforms to behaviours. Video observations coupled to
EPG systems have been used to observe when food uptake and salivatory release

takes place (Hardie et al, 1992; Hardie and Powell, 2000; Lösel et al, 1992), whilst
stylectomy and honeydew production have been used to correlate EPG patterns to
feeding. However, histological sectioning has probably been the most important tool
in assigning waveforms to behaviours. Sections taken during particular waveforms
have allowed experimenters to view where aphids were feeding at that point in time
(Tjallingii, 1978; Tjallingii and Hogen Esh, 1993; Tjallingii and Gabrys, 1999). As a
result at least six feeding waveforms have now been distinguished using the EPG
system (Tjallingii, 1978; 1985; 1990) (fig 3.0). In this thesis EPG data acquired shall be
defined in less subcategories as the software allows. For simplicity data will be
categorised as non-penetration, pathway defined as aphid feeding/probing in non-
vascular tissue layers, cell penetrations, xylem feeding and phloem feeding defined
in two catagories, salivation (defined as E1) and ingestion (defined as E2).

Figure 3.0: Diagram showing the EPG waveforms and correlations to aphid feeding behaviours, as defined in the ‘Probe 3.4 Manual: Software manual for EPG acquisition and analysis in Windows’, by Tjallingii, W. F. (2007), distributed by EPG systems, Wageningen the Netherlands. Definitions of waveforms in this guide were used to interpret waveforms obtained in EPG traces for this chapter.

3.1.9 Influences of drought and environmental stressors on aphid behaviour
Aphids when on non hosts usually display reduced phloem feeding (Gabrys and
Pawluk, 1999; McLean and Kinsey, 1968) and more non-penetration waveforms.
Furthermore, they may tend to probe more frequently and for shorter amounts of
time (McLean and Kinsey, 1968). On resistant plant varieties aphids have been found
to alter their feeding displaying longer salivation (E1) periods (Ramirez and
Niemeyer, 1999; Caillaud et al, 1995), lower total plant penetration times (van
Helden and Tjallingii, 1993; Paul et al, 1996) reduced phloem ingestion and
consequently secretion (Klinger et al, 1998). Increased salivation by aphids is usually
associated with reduced palatability of the phloem sap or changes in its composition.
Additionally, studies have shown aphids alter their feeding behaviour in response
environmental stressors. In response to water stressed barley seedlings, the aphid R.
padi, was shown to increase sieve element salivation (Ponder et al, 2000), this
behaviour has also been exhibited where aphids are exposed to reduced amino acid
concentrations (Hunt et al, 2009). Dehyrated and water stressed aphids have also
been known to exhibit more xylem feeding. Studies have shown that aphids starved
for 24h spent 26% of their time xylem feeding when placed back onto a host plant,
whereas those starved for only 1h displayed no xylem feeding (Spiller et al, 1990). In
another study starved Sitobion fragariae increased xylem feeding on wheat and oats
(Ramirez et al, 2000). Recently TMX, a xylem borne insecticide, was used to
determine the importance of xylem feeding in aphids. TMX was used at sub lethal
doses to make the xylem unpalatable to aphids starved for 5h. The study showed
that there was a reduction in xylem feeding from 25% in control plants to 0.6% in

TMX treated plants. However, aphids on TMX plants showed a reduced growth,
performance and water content (Daniels et al, 2009), indicating that xylem feeding is
an important aspect of an aphids diet, in particular in response to dehydration and
water stress.
3.1.10 Chapter Aims
It can be concluded that, many variables that affect the quality of host plants, can
also affect the feeding behaviour of aphids. This study aims to quantify aphid feeding
behaviour in response to drought stress. This chapter will analyse the settling and
probing behaviour of Myzus persicae, Brevicoryne brassicae, Rhopalosphium padi
and Sitobion avenae on droughted and well watered plant hosts Brassica nigra and
Lolium perenne, to observe if drought stress is detected upon initial plant contact or
upon aphid probing.
The two techniques that will be used to meet this aim will also provide two levels of
behavioural analysis in response to droughted and well watered host plants. The first
approach is observational scoring (OS), which provides an overview of aphid
behaviour in the initial ten minutes of host plant contact, for example, whether the
aphid is walking or not. In contrast the EPG technique will provide more specific data
on aphid feeding at the level of the stylet and cell for the first six hours of plant
contact.
EPG is able to record in detail what the aphid is doing with its stylet mouthparts once
it is in the plant tissue, but EPG does not give an account of behaviour prior to
penetration. Behavioural scoring is an effective tool to study the initial behaviour of

aphids before host plant probing. Using behavioural observations data can be
obtained on aphid behaviour during periods where no penetration is taking place.
3.2 Methods and Materials
3.2.1 Plant Species
B. nigra and L. perenne were obtained from John Chambers Wildflower Seeds Co.
and from wild seed stocks in Northamptonshire, UK.
3.2.2 Aphid Species
Myzus persicae clones used in the experiment were the red type B clones obtained
from Brian Fenton’s cultures in SCRI and a green clone obtained from the University
of Birmingham, School of Biosciences. Brevicoryne brassicae, Rhopalosiphum padi
and Sitobion avenae were obtained from Phil Northing culture stocks at FERA.
3.2.3 Plant Culturing
Plants were grown in the insect free plant growth rooms with a 16:8 light cycle at a
temperature of 22oC. Growth room PAR was between 80-120mol m-2 s-1 with a
relative air humidity 70-80%. Plants were grown in John Innes peat based compost
with mixed in Silvaperl in 100-150ml plastic pots (for B. nigra and L. perenne
respectively).
3.2.4 Aphid Culturing
‘Tents’ (Megaview Bugdorm 3120) were used to isolate the cultures from other
insects and to prevent the escape of insects from the culture. Plants were grown in
the insect free plant growth rooms before being placed into tents to be fed on by the

insects. The constant removal of old dying plants and replacement with young new
plants into the cultures ensured that the culture was healthy with an abundant
supply of insects. The insect rooms was held at a constant temperature of 18oC
under a 16:8 light: dark cycle.
3.2.5 Electrical Pentration Graph (EPG) Technique
A gold wire (0.25mm diameter, 2-3cm long) was attached to the dorsum of an adult
apterous aphid using silver conductive paint (RS Components). Aphids were
previously cultured on either B. nigra or L. perenne, depending on species. This wire
was then connected via a pin to the EPG probe. An output probe was inserted into
the soil of the potted plant. When the aphid’s stylets penetrated the plant, the
circuit was completed, and a fluctuating voltage was amplified using the Giga-8 DC
amplifier and recorded by Probe on a Windows platform (Wageningen Agricultural
University, The Netherlands). The voltage fluctuations appear in a number of distinct
patters, referred to as 'waveforms'. These waveforms correlate with the feeding
activity of the aphid, i.e. whether it is xylem or phloem feeding etc. All plants and
insects were contained in a Faraday cage surrounded by reflective foil to minimise
electronic noise disturbance. All experiments were conducted at ambient room
temperature of 18oC.
EPG traces were acquired and analysed using Windows XP OS system and Probe
software developed by Freddy Tjallingii, (Wageningen Agricultural University, The
Netherlands). The acquisition of traces was using software ACQ-8, and analysis was
conducted on ANA-34. Data was imported from ANA-34 to MS Excel, where
cumulative time for each behaviour per hour was calculated.
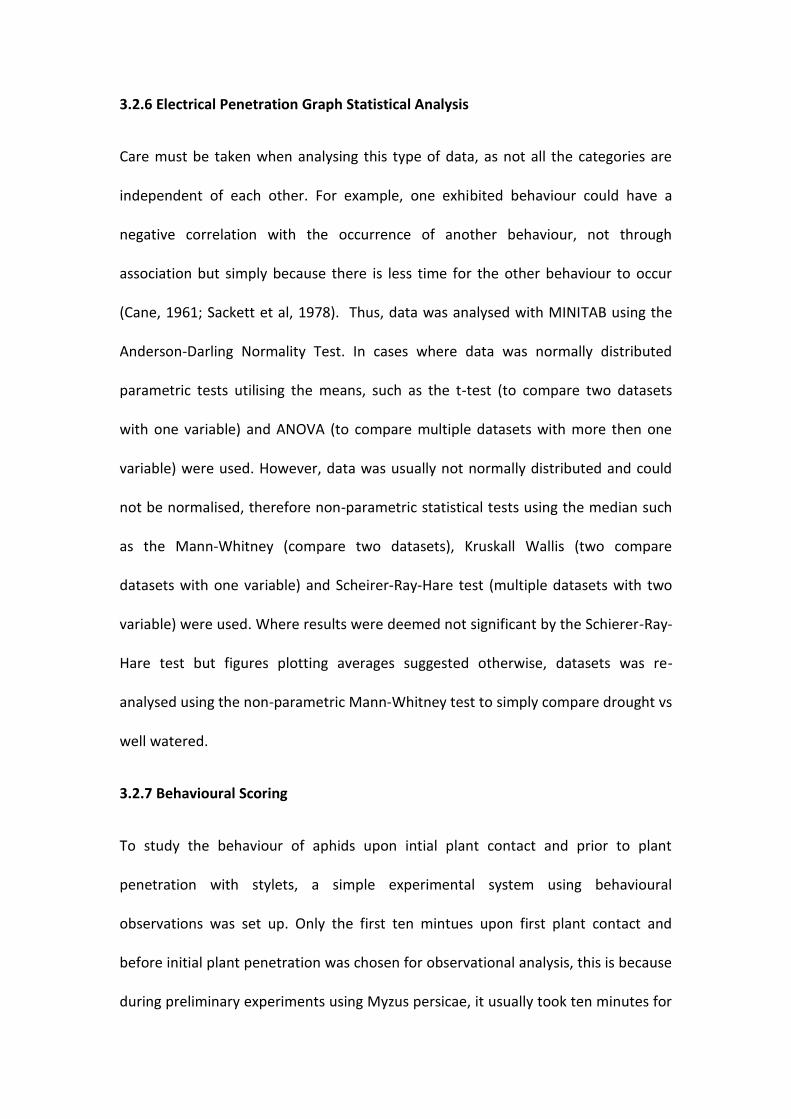
3.2.6 Electrical Penetration Graph Statistical Analysis
Care must be taken when analysing this type of data, as not all the categories are
independent of each other. For example, one exhibited behaviour could have a
negative correlation with the occurrence of another behaviour, not through
association but simply because there is less time for the other behaviour to occur
(Cane, 1961; Sackett et al, 1978). Thus, data was analysed with MINITAB using the
Anderson-Darling Normality Test. In cases where data was normally distributed
parametric tests utilising the means, such as the t-test (to compare two datasets
with one variable) and ANOVA (to compare multiple datasets with more then one
variable) were used. However, data was usually not normally distributed and could
not be normalised, therefore non-parametric statistical tests using the median such
as the Mann-Whitney (compare two datasets), Kruskall Wallis (two compare
datasets with one variable) and Scheirer-Ray-Hare test (multiple datasets with two
variable) were used. Where results were deemed not significant by the Schierer-Ray-
Hare test but figures plotting averages suggested otherwise, datasets was re-
analysed using the non-parametric Mann-Whitney test to simply compare drought vs
well watered.
3.2.7 Behavioural Scoring
To study the behaviour of aphids upon intial plant contact and prior to plant
penetration with stylets, a simple experimental system using behavioural
observations was set up. Only the first ten mintues upon first plant contact and
before initial plant penetration was chosen for observational analysis, this is because
during preliminary experiments using Myzus persicae, it usually took ten minutes for

an aphid on a suitable host to commence probing when wired up to the EPG system.
To avoid effects of starvation, aphids were transferred directly from the culture plant
to the host plant in the experiment.
Each individual aphid was observed for a standard duration, and the frequency of
categories of behaviour recorded (focal sampling). The sampling duration for this
study was ten minutes. Behaviours were categorised and the frequency of
occurrence measured at set ‘instances’ of time (instantaneous sampling). Adult
aphids were removed from the culture and immediately transferred onto
experimental plants in the laboratory. Aphid behaviour was scored at the point of
contact with the host plant and successively every 30 seconds from then on, for a
total of ten minutes. Behaviours scored were; aphid movement, defined as walking
or still, and the position of the antennae, back, straight up or forward (see table 3.1).
In total behavioural data was collected for 21 time points over the ten minute
period. Each experimental plant had a maximum of three aphids present to avoid
aphid crowding and displays of conspecific induced behaviour. Plant host species
were L. perenne and B. nigra, that had been subjected to one of two different types
of pre-treatments, namely control or extremely drought stressed (as defined in
chapter two). All plants were approximately 29 days old, with drought stressed
plants experiencing total water withdrawal for 9 days prior to the experiment.
With regards to the above experimental design, the categories of antennae
orientation and locomotion can occur simultaneously, thus both categories are truly
independent of each other. However, within each category the observed behaviours

are not independent, as the aphids can either do one or the other and so they must
be treated with caution during analysis using appropriate statistics.
Behaviour
Category 1: Walking 1
Still 2
Category 2: Antennae
facing forwards
1
Antennae facing upright 3
Antennae facing
backwards
2
Table 3.1: List of the numerical values assigned to behaviours recorded in Observational Scoring experiments, involving the aphid species M. persicae (red type B clone and green clone), B. brassicae, S. avenae and R. padi. Aphids were scored for every 0.5 minutes during the first ten minutes contact with droughted (extreme drought defined in Chapter 2) and well watered host plants B. nigra and L. perenne respectively.
3.2.8 Observational Scoring Statistical Analysis
Data was analysed with MINITAB using the Anderson-Darling Normality Test. In cases
where data is normally distributed parametric tests utilising the means, such as the t-
test (to compare two datasets with one variable) and ANOVA (to compare multiple
datasets with more than one variable) were used. However, where data was not
normally distributed and could not be normalised, non-parametric statistical tests
that use the median such as the Mann-Whitney (compare two datasets), Kruskall
Wallis (two compare datasets with one variable).

3.3 Results
3.3.1 Effect of time on feeding behaviour
Analysis of the EPG results showed that time had a major effect on most feeding
behaviours in the four aphid species and two clones studied. As a general rule the
longer the aphid was on a host plant the more time it would spend per hour
ingesting sieve element sap (E2) (fig 3.4). Conversely the longer the aphids were
exposed to plant hosts the less time they would spend per hour not probing at all
and probing non vascular tissue (referred to as pathway from now on) (fig 3.1 and
3.2).
In R. padi, S. avenae, B. brassicae and M. persicae (red type B and green clone) the
amount of time spent per hour not probing and ingesting sieve element sap was
significantly affected by the length of time the aphid had spent on the plant (see
table 3.2 for significance values). Aphids spent less time not probing as time went on
(fig 3.1), then as they settled, they displayed more sieve element ingestion (fig 3.4).
The length of time aphids were on host plants also significantly affected the amount
of time spent per hour in pathway (fig 3.2) in S. avenae, B. brassicae, R. padi and one
clone of M. persicae (red type B clone only). Overall there was a decrease in none
probing behaviour over time (fig 3.1), as aphids became more settled on host plants
and increased the time spent ingesting sap from the sieve element (E2). In red (type
B) clones of M. persicae the length of time spent on host plants also had a significant
effect on the duration spent each hour salivating into the sieve element, with a
decrease over time in red clones of M. persicae (fig 3.3). Interestingly, in green
clones of M. persicae, time had neither an effect on the duration each aphid spent

per hour in E1 or pathway. These results indicate that there are significant clonal
differences in the feeding behaviour of aphids.
3.3.2 Effect of drought on feeding behaviour
EPG analysis showed there was no significant effect of drought treatment on feeding
behavious of S. avenae individuals over the six hour period (fig 3.1-3.5). However, S.
avenae proved a difficult species to obtain traces from, and consequently the
replication for this species was only eight and four traces for well watered and
droughted treatments respectively. However, drought did have a significant effect
on behaviours in all the other species of aphids tested. Red clones of M. persicae
and B. brassicae fed significantly longer from the xylem on droughted hosts than on
well watered host plants (fig 3.5). Green M. persicae showed no significant effect of
treatment of time spent xylem feeding. Nevertheless, both red and green clones of
M. persicae and R. padi showed significant differences in the amount of time spent
not-probing (fig 3.1), in pathway (fig 3.2) and ingesting from the sieve element, when
on droughted than well watered hosts (fig 3.4). Overall, aphids on droughted hosts
spent less time ingesting sieve element sap, and more time over the six hours not
probing or in pathway (fig 3.1 & fig 3.2). Interestingly, both M. persicae clones spent
a greater time per hour salivating (E1) into the sieve element of droughted hosts (fig
3.3), however these findings were not significant when tested using an non
parametric version of ANOVA the Schierer-Ray-Hare test (red clone P>0.05, green
clone P>0.05). However, when the data for both M. persicae clones was analysed
using (a non parametric t-test equivalent) the Mann-Whitney test, there was a
significant effect of drought (Mann-Whitney P<0.05) on time spent salivating in only

red clone of M. persicae. Furthermore, there was a significant effect of drought
(P<0.05) on the time spent ingesting sieve element sap in B. brassicae when using
the Mann-Whitney non-parametric test directly to compare data from aphids
feeding on well watered and droughted hosts, but not with the Schierer-Ray-Hare
test (P>0.05).
3.3.3 Proportional changes in EPG behaviour over the 6 hours
Data collected over the six hour period was collated to examine the average change
in the proportion of time aphids spent engaged in each of the feeding behaviours on
droughted hosts (fig 3.6 & 3.7). Drought increased the time aphids spent not probing
in all species and clones (M. persicae red clone +76%, green clone +50%, B. brassicae
+82% and R. padi +162%) except in S. avenae, which showed hardly any difference (-
3%). This was partially confirmed by statistical analyses (table 3.2), which found
significant increases in the time not probing in both M. persicae clones and R. padi.
Time spent probing in pathway, was increased in both M. persicae clones (+42% in
the red clone, +32% in the green clone) and R. padi (+33%) when on feeding on
droughted host plants, whereas no substantial difference was observed for B.
brassicae (-4%) and S. avenae (+5%).
Sieve element salivation (E1) was increased in both M. persicae clones (+147% in red
type B clone, +78% in green clone), but reduced in R. padi and B. brassicae (-50% and
-27% respectively) feeding on droughted plants. S. avenae showed little difference
between treatments (-6%). Interestingly, previous statistical analysis indicated the
changes in E1 under drought in the green M. persicae were not significant whereas,
it was significant for R. padi.

Overall average E2 ingestion was reduced in all species and clones over the six hour
period when feeding on droughted host plants. The largest reduction was observed
in the green M. persicae clone (-65%, P<0.001), followed by R. padi (-58% P<0.001),
M. persicae red clone (-34% P<0.005), B. brassicae (-29% P>0.05) and S. avenae (-8%
P>0.05) respectively.
The proportion of time spent xylem feeding was increased in most aphid species on
droughted hosts. The largest increases in xylem feeding behaviours were in B.
brassicae (+208904%, P<0.05) and the red clone of M. persicae (+1203%, P<0.05)
where the behaviour of xylem feeding was rare when fed on well watered hosts.
Increases in xylem feeding were also displayed by the green clone of M. persicae
(+123%, P>0.05) and S. avenae (+25%, P>0.05). Surprisingly, xylem feeding over the
whole period was reduced in R. padi (-43%, P>0.05). Collectively this analysis
suggests that xylem feeding is significantly increased in B. brassicae and red clones of
M. persicae in response to host plant water stress.

Out - (no probing) M. persicae Red type B Clone
0 200 400 600 800
1000 1200 1400 1600
0 2 4 6 8 Hour
Tim
e sp
ent (
s)
Well watered Drought
Out - (no probing) M. persicae Green Clone
0
500
1000
1500
2000
2500
0 2 4 6 8 hour
time
spen
t (s)
Well watered Droughted
Out - (no probing) B. brassicae
0
500
1000
1500
2000
2500
0 2 4 6 8 Hour
Tim
e sp
ent (
s)
Well watered Droughted
Out - (no probing) R. padi
0 500
1000 1500 2000 2500 3000
0 2 4 6 8 Hour
Tim
e sp
ent (
s)
Well watered Droughted
Out - (no probing) S. avenae
0 500
1000 1500 2000 2500 3000 3500
0 2 4 6 8 Hour
Tim
e sp
ent (
s)
Well watered Droughted
Figure 3.1: Average amount of time (s) recorded via the Electrical Penetration Graph (EPG) technique that aphids spent not probing the plant-host (±SE) on well watered and drought host-plants. Aphids species tested were Myzus persicae (green O clone (A) and red type B clone (B)), Brevicoryne brassicae (C), Rhopalosphium padi (D) and Sitobion avenae (E) over a six hour period. Pink lines denote aphids fed on droughted treatments whilst blue lines denote well watered treatments. Plants were between 27-29 days old, with droughted plants having experienced prior to experimentation 7-9 days water withdrawal in growth room conditions (22oC 16:8LD). Aphids were removed from culture and wired straight up to the EPG system. Statistical analysis of this data can be found in table 3.2. N = 15 per treatment for M. persicae red type B clone and B.
brassicae; 10 per treatment for M. persicae green clone; 15 and 10 for well watered and drought treatment of R. padi; 8 and 4 for well watered and drought treatment of S. avenae respectively.
A B C
D E

Pathway - M. persicae Green Clone
0
500
1000
1500
2000
2500
0 2 4 6 8
hour
time
(s)
Well w atered
Droughted
Pathway - B. brassicae
0 500
1000 1500 2000 2500 3000
0 2 4 6 8 hour
time
spen
t (s)
Well watered Droughted
C Pathway M. persicae Red type B Clone
0
500
1000
1500
2000
2500
0 2 4 6 8 Hour
Tim
e sp
ent (
s)
Well watered
Drought
Pathway - S. avenae
0
500
1000
1500
2000
2500
0 2 4 6 8 hour
time
spen
t (s)
Well watered Droughted
Pathway - R. padi
0
500
1000
1500
2000
2500
0 2 4 6 8 hour
time
spen
t (s)
Well watered Droughted
E
Figure 3.2: Average amount of time (s) recorded via the Electrical Penetration Graph (EPG) technique that aphids spent probing the plant-host but not in xylem or phloem tissue (±SE) on well watered and drought host-plants. Aphids species tested were Myzus persicae (green O clone (A) and red type B clone (B)), Brevicoryne brassicae (C), Rhopalosphium padi (D) and Sitobion avenae (E) over a six hour period. Pink lines denote aphids fed on droughted treatments whilst blue lines denote well watered treatments. Plants were between 27-29 days old, with droughted plants having experienced prior to experimentation 7-9 days water withdrawal in growth room conditions (22oC 16:8LD). Aphids were removed from culture and wired straight up to the EPG system. Statistical analysis of this data can be found in table 3.2. N = 15 per treatment for M. persicae red type B clone and B. brassicae; 10 per treatment for M. persicae green clone; 15 and 10 for well watered and drought treatment of R. padi; 8 and 4 for well watered and drought treatment of S. avenae respectively.
B
A B C
D E

E1 - (SE Salivation) S. avenae
0
100
200
300
400
500
600
700
800
0 2 4 6 8
Hour
Tim
e sp
ent (
s)w ell w atered
droughted
E1 - (SE Salivation) M. persicae Green Clone
0 20 40 60 80
100 120 140
0 2 4 6 8 hour
time
spen
t (s)
Well watered Droughted
E1 - (SE Salivation) R. padi
0
50
100
150
200
250
300
0 2 4 6 8 Hour
Tim
e sp
ent (
s)
Well watered Droughted
E1 - (SE Salivation) B. brassciae
-20 0
20 40
60 80
100 120
0 2 4 6 8
Hour
Tim
e sp
ent (
s)
well watered Droughted
E1 - (SE Salivation) M. persicae Red B Clone
0 10 20 30 40 50 60 70 80 90
0 2 4 6 8 Hour
Tim
e sp
ent (
s)
Well watered Drought
Figure 3.3: Average amount of time (s) recorded via the Electrical Penetration Graph (EPG) technique that aphids spent salivating in the sieve element (±SE) on well watered and drought host-plants. Aphids species tested were Myzus persicae (green O clone (A) and red type B clone (B)), Brevicoryne brassicae (C), Rhopalosphium padi (D) and Sitobion avenae (E) over a six hour period. Pink lines denote aphids fed on droughted treatments whilst blue lines denote well watered treatments. Plants were between 27-29 days old, with droughted plants having experienced prior to experimentation 7-9 days water withdrawal in growth room conditions (22oC 16:8LD). Aphids were removed from culture and wired straight up to the EPG system. Statistical analysis of this data can be found in table 3.2. N = 15 per treatment for M. persicae red type B clone and B. brassicae; 10 per treatment for M. persicae green clone; 15 and 10 for well watered and drought treatment of R. padi; 8 and 4 for well watered and drought treatment of S. avenae respectively.
D E
C B A

E2 - (SE Ingestion) M. persicae Green Clone
0 500
1000 1500 2000 2500 3000
0 2 4 6 8 hour
time
spen
t (s)
Well watered Droughted
E2 - (SE Ingestion) R. padi
0 500
1000 1500 2000 2500 3000 3500
0 2 4 6 8 Hour
Tim
e sp
ent (
s)
Well watered Droughted
E2 - (SE Ingestion) B. brassicae
0 500
1000 1500 2000 2500 3000
0 2 4 6 8 Hour
Tim
e sp
ent (
s)
Well watered Droughted
E2 - (SE Ingestion) S. avenae
0 500
1000 1500 2000 2500 3000 3500 4000
0 2 4 6 8 Hour
Tim
e sp
ent (
s)
Well watered Droughted
E2 - (SE Ingestion) M. persciae Red B clone
0 500
1000 1500 2000 2500 3000 3500 4000
0 2 4 6 8 Hour
Tim
e sp
ent (
s)
Well watered Droughted
Figure 3.4: Average amount of time (s) recorded via the Electrical Penetration Graph (EPG) technique that aphids spent ingesting sieve element sap (±SE) on well watered and drought host-plants. Aphids species tested were Myzus persicae (green O clone (A) and red type B clone (B)), Brevicoryne brassicae (C), Rhopalosphium padi (D) and Sitobion avenae (E) over a six hour period. Pink lines denote aphids fed on droughted treatments whilst blue lines denote well watered treatments. Plants were between 27-29 days old, with droughted plants having experienced prior to experimentation 7-9 days water withdrawal in growth room conditions (22oC 16:8LD). Aphids were removed from culture and wired straight up to the EPG system. Statistical analysis of this data can be found in table 3.2. N = 15 per treatment for M. persicae red type B clone and B.
brassicae; 10 per treatment for M. persicae green clone; 15 and 10 for well watered and drought treatment of R. padi; 8 and 4 for well watered and drought treatment of S. avenae respectively.
D E
C B A

Xylem - M. persicae Green Clone
0 200 400 600 800
1000
0 2 4 6 8 hour
time
(s)
Well watered Droughted
Xylem - R. padi
0 100 200 300 400 500 600 700 800
0 2 4 6 8 Hour
Tim
e sp
ent (
s)
Well watered Droughted
Xylem - B. brassicae
0 100 200 300 400 500 600
0 2 4 6 8 Hour
Tim
e sp
ent (
s)
Well watered Droughted
Xylem - S. avenae
0 200 400 600 800
1000 1200 1400 1600 1800 2000
0 2 4 6 8 Hour
Tim
e sp
ent (
s)
Well watered Droughted
Xylem - M. persicae Red B Clone
-100 0
100 200 300 400 500 600 700
0 2 4 6 8 Hour
Tim
e sp
ent (
s)
Well watered Drought
Figure 3.5: Average amount of time (s) recorded via the Electrical Penetration Graph (EPG) technique that aphids spent xylem feeding (±SE) on well watered and drought host-plants. Aphids species tested were Myzus persicae (red type B clone and green O clone), Brevicoryne brassicae, Rhopalosphium padi and Sitobion avenae over a six hour period. Pink lines denote aphids fed on droughted treatments whilst blue lines denote well watered treatments. Plants were between 27-29 days old, with droughted plants having experienced prior to experimentation 7-9 days water withdrawal in growth room conditions (22oC 16:8LD). Aphids were removed from culture and wired straight up to the EPG system. Statistical analysis of this data can be found in table 3.2. N = 15 per treatment for M. persicae red type B clone and B. brassicae; 10 per treatment for M.
persicae green clone; 15 and 10 for well watered and drought treatment of R. padi; 8 and 4 for well watered and drought treatment of S. avenae respectively.
D E
C B A

Table 3.2 Statistical test: Scheirer-Ray-Hare Test (balanced design)
Behaviour Species Total SS Total DF Total MS Factor SS SS/Total MS Chi P
Non-probing time B. brassicae 444900 179 2485.47
Treatment 3809 1.5325 0.784 0.216
Hour 100171 40.3026 1 0.000
interaction 9786 3.9373 0.441 0.558
Non-probing time
M. persicae
red type B 362531 179 2025.31
Treatment 12087 5.968 0.985 0.015
Hour 85580 42.2552 1 0.000
interaction 4978 2.4579 0.217 0.783
Non-probing time
M. persicae
green 140995 119 1184.83
treatment 9883 8.3413 0.996 0.004
hour 18306 15.4503 0.991 0.009
interaction 4561 3.8495 0.428 0.571
Non-probing time R. padi General Linear Model
treatment 21281583 21281583 23.37 0.000
hour 26443659 5288732 5.81 0.000
interaction 1738149 347630 0.38 0.861
Non-probing time S.avenae General Linear Model
treatment 26062 26062 0.03 0.873
hour 18515527 3703105 3.65 0.006
interaction 5137643 1027529 1.01 0.419
Probing time B. brassciae 476179 179 2660.22
Treatment 1176 0.4421 0.493 0.506
Hour 45735 17.1922 0.995 0.004
interaction 8596 3.2313 0.335 0.664
Probing time
M. persicae
red type B 436599 179 2439.1
Treatment 12650 5.1863 0.977 0.023
Hour 128677 52.7559 1 0.000

interaction 8297 3.4017 0.361 0.631
Probing time
M. persicae
green 142838 119 1200.32
treatment 8927 7.43719 0.993 0.006
hour 1820 1.51626 0.088 0.911
interaction 1275 1.06222 0.042 0.957
Probing time R. padi General Linear Model
treatment 4447617 4447617 3.95 0.049
hour 22571887 4514377 4.01 0.002
interaction 11722438 2344488 2.08 0.071
Probing time S. avenae General Linear Model
treatment 41436 41436 0.05 0.83
hour 931885 1863771 2.09 0.079
interaction 2154463 430893 0.48 0.788
E1 - Salivation in
sieve element B. brassciae 327107 179 1827.41
Treatment 6055 3.31343 0.931 0.069
Hour 7935 4.3422 0.498 0.501
interaction 14699 8.04361 0.846 0.154
E1 - Salivation in
sieve element
M. persicae
red type B
clone 315295 179 1761.42
Treatment 2509 1.4244 0.767 0.233
Hour 22747 12.914 0.975 0.024
interaction 17281 9.8108 0.919 0.081
E1 - Salivation in
sieve element
M. persicae
green 98048 119 823.933
treatment 935 1.1348 0.713 0.287
hour 1056 1.28166 0.063 0.937
interaction 4325 5.24921 0.613 0.386
E1 - Salivation in
sieve element R. padi General Linear Model
treatment 17628 17628 0.59 0.443
hour 76192 15238 0.51 0.767
interaction 64674 12935 0.43 0.824
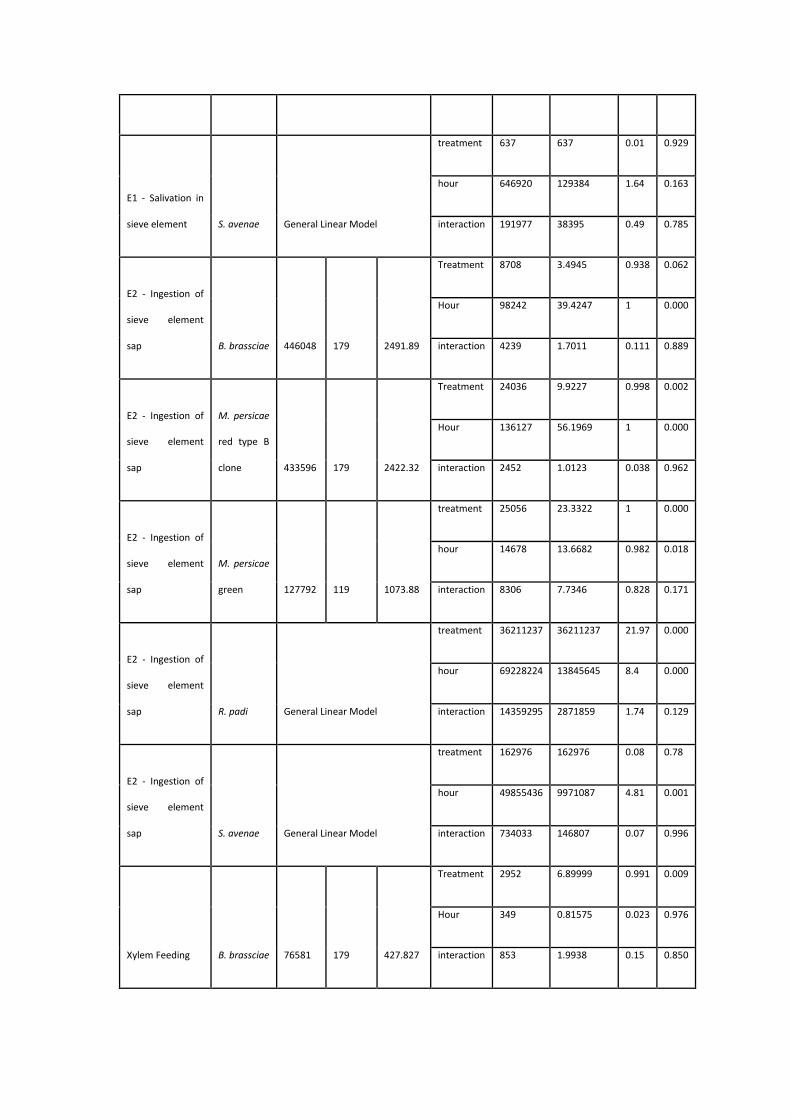
E1 - Salivation in
sieve element S. avenae General Linear Model
treatment 637 637 0.01 0.929
hour 646920 129384 1.64 0.163
interaction 191977 38395 0.49 0.785
E2 - Ingestion of
sieve element
sap B. brassciae 446048 179 2491.89
Treatment 8708 3.4945 0.938 0.062
Hour 98242 39.4247 1 0.000
interaction 4239 1.7011 0.111 0.889
E2 - Ingestion of
sieve element
sap
M. persicae
red type B
clone 433596 179 2422.32
Treatment 24036 9.9227 0.998 0.002
Hour 136127 56.1969 1 0.000
interaction 2452 1.0123 0.038 0.962
E2 - Ingestion of
sieve element
sap
M. persicae
green 127792 119 1073.88
treatment 25056 23.3322 1 0.000
hour 14678 13.6682 0.982 0.018
interaction 8306 7.7346 0.828 0.171
E2 - Ingestion of
sieve element
sap R. padi General Linear Model
treatment 36211237 36211237 21.97 0.000
hour 69228224 13845645 8.4 0.000
interaction 14359295 2871859 1.74 0.129
E2 - Ingestion of
sieve element
sap S. avenae General Linear Model
treatment 162976 162976 0.08 0.78
hour 49855436 9971087 4.81 0.001
interaction 734033 146807 0.07 0.996
Xylem Feeding B. brassciae 76581 179 427.827
Treatment 2952 6.89999 0.991 0.009
Hour 349 0.81575 0.023 0.976
interaction 853 1.9938 0.15 0.850

Xylem Feeding
M. persicae
red type B 131703 179 735.771
Treatment 3320 4.51227 0.966 0.034
Hour 494 0.6714 0.015 0.985
interaction 4389 5.96517 0.690 0.310
Xylem Feeding
M. persicae
green 52938 119
444.857
treatment 875 1.96692 0.839 0.161
hour 3153 7.08767 0.785 0.214
interaction 1611 3.62139 0.394 0.605
Xylem Feeding R. padi General Linear Model
treatment 425702 425702 0.91 0.342
hour 1369300 273860 0.58 0.712
interaction 1194252 238850 0.51 0.769
Xylem Feeding S. avenae General Linear Model
treatment 30574 30574 0.08 0.774
hour 2070984 414197 1.13 0.357
interaction 2035799 407160 1.11 0.367
Table 3.2: Statistical analysis of the amount of time (recorded via the Electrical Penetration Graph (EPG) technique), that aphids spent not-probing, probing non-vascular tissue, xylem feeding, ingesting and salivating into plant sieve elements on well watered and drought host-plants. Aphid species tested were Myzus persicae (red type B clone and green O clone), Brevicoryne brassicae, Rhopalosphium padi and Sitobion avenae over a six hour period. N = 15 per treatment for M.
persicae red type B clone and B. brassicae; 10 per treatment for M. persicae green clone; 15 and 10 for well watered and drought treatment of R. padi; 8 and 4 for well watered and drought treatment of S. avenae respectively. The Scheirer Ray Hare non-parametric test was used to compare the effects of time and water treatment on each of the behaviours for both M. persicae clones and B. brassicae. However, due to the unbalanced number of replicates per treatment, a General Linear Model was used to analysis of the behaviour of R. padi and S. avenae.

Watered Green M. persicae Clone O
Out
Pathw ay
E1
E2
Xylem
Droughted Green M. persicae Clone O
Out
Pathw ay
E1
E2
Xylem
Watered B. brassicae
Out
Pathw ay
E1
E2
Droughted B. brassicae
Out
Pathw ay
E1
E2
Xylem
Droughted Red M. persicae clone B
Out Pathway E1 E2 Xylem
Watered Red M. persicae clone B
Out Pathway E1 E2 Xylem
Figure 3.6: Average proportion of time (s) each hour (recorded via the Electrical Penetration Graph (EPG) technique) that aphids spent not-probing (defined as ‘out’), probing non host vascular tissue (defined as ‘pathway’) and in vascular tissue (defined as ‘xylem’ feeding, salivating into the sieve element ‘E1’ and ingesting sieve element sap ‘E2’) when on well watered and drought host-plants. Aphids species tested were Myzus persicae (red type B clone and green O clone) and Brevicoryne brassicae, over a six hour period. Plants were between 27-29 days old, with droughted Brassica
nigra plants having experienced prior to experimentation 7-9 days water withdrawal in growth room conditions (22oC 16:8LD). Aphids were removed from culture and wired straight up to the EPG system. N = 15 per treatment for M. persicae red type B clone and B. brassicae; 10 per treatment for M. persicae green clone.
A
B
C

Watered R. padi
Out
Pathw ay
E1
E2
Xylem
Droughted R. padi
Out
Pathw ay
E1
E2
Xylem
Watered S. avenae
Out
Pathw ay
E1
E2
Xylem
Droughted S. avenae
Out
Pathw ay
E1
E2
Xylem
Figure 3.7: Average proportion of time (s) each hour (recorded via the Electrical Penetration Graph (EPG) technique) that aphids spent not-probing (defined as ‘out’), probing non host vascular tissue (defined as ‘pathway’) and in vascular tissue (defined as ‘xylem’ feeding, salivating into the sieve element ‘E1’ and ingesting sieve element sap ‘E2’) when on well watered and drought host-plants. Aphids species tested were Rhopalosiphum padi and Sitobion avenae, over a six hour period. Plants were between 27-29 days old, with droughted L. perenne plants having experienced prior to experimentation 7-9 days water withdrawal in growth room conditions (22oC 16:8LD). Aphids were removed from culture and wired straight up to the EPG system. N = 15 and 10 for well watered and drought treatment of R. padi; 8 and 4 for well watered and drought treatment of S. avenae respectively.
D
E

3.3.4 Analysis of aphid locomotion and antennae movements upon initial host
plant contact
Aphid locomotion was defined as ‘walking’ or ‘still’. Analysis showed that there was
no significant effect of treatments on aphid locomotion and no significant difference
in locomotion activity between aphid species for the first ten minutes of contact with
host plants. Similarly there was no significant difference in antennae movements
between treatments. Antennae movements were categorised as forward facing (in
front of aphid body), upright (vertical to aphid body) and backward facing (over
aphid body). There was a significant difference in antennae movements between
species. Frequencies of a forward facing antenna (P<0.05) as well as a backward
facing antenna (P<0.05) differed between aphid species. R. padi and M. persicae
(green and red clones) tended to have backward facing antennae, whereas S.
avenae, showed no distinction (fig 3.8). B. brassicae showed exlusively backward
facing antennae on droughted hosts; however effect of treatment on antennae
positions was found not to be significant (P>0.05).

0.0
0.2
0.4
0.6
0.8
1.0
1.2
1.4
1.6
1.8
R. padi M. persicae
red
B.brassicae M. persicae
green
W D W D W D W D W D
Walking Still Antennae: Forward Antennae: Upright Antennae: Backward
S. avenae
Figure 3.8: Observational behaviour scoring of aphid species Myzus persicae (red type B clone and green O clone), Brevicoryne brassicae, Rhopalosphium padi and Sitobion
avenae. Behaviour responses were recorded every 0.5 minutes for a 10 minute duration on initial contact with host plant. Recorded behaviours were locomotion defined as walking and still, and antennae movements, defined as forward, upright or backward facing. Adult aphids were removed from the culture and placed onto the host plants. Plants were 29 days old, with droughted plants having experienced prior to experimentation 9 days water withdrawal in growth room conditions (22oC 16:8LD). N = 15 per treatment. Statistical analysis of this data can be found in table 3.3. X axis denotes species, clone and treatment; W=well watered and D=droughted host plants
Freq of
behav in 10
min period

Behaviour Total SS
Total
DF Total MS Factor SS
SS/
TotalMS Chi P
Walking
279857
149
1878.23
treatment 600 0.31945 0.428061 0.571939
species 15168 8.07567 0.911155 0.088845
interaction 8891 4.7337 0.684271 0.315729
Still
279804
149
1877.88
treatment 812 0.4324 0.489188 0.510812
species 16442 8.75562 0.932493 0.067507
interaction 8635 4.59827 0.668947 0.331053
Antennae:
Forward
279695
149
1877.15
treatment 0 0 0 1
species 21679 11.5489 0.978959 0.02104
interaction 8548 4.5537 0.663775 0.33623
Antennae:
Upward
271914
149
1824.93
treatment 5210 2.85491 0.908905 0.091095
species 9659 5.29282 0.74145 0.25855
interaction 3072 1.68336 0.206261 0.793739
Antennae:
Backward 280172 149 1880.35
treatment 11 0.0058 0.060967 0.939033
species 22489 11.96 0.982349 0.01765
interaction 6945 3.6935 0.550923 0.44908
Table 3.3: Statistical analysis of locomotive and antennae behaviour frequencies recorded in the aphid species Myzus persicae (red type B clone and green O clone), Brevicoryne
brassicae, Rhopalosphium padi and Sitobion avenae when placed on well watered and droughted host plants for 10 minutes. N = 15 per treatment. The Scheirer Ray Hare non-parametric test was used to assess if behaviour frequency was affected by species or water treatment.

3.4 Discussion
The EPG results in this chapter have shown that over the six hours all of aphid
species altered the proportion of time spent exhibiting certain behaviours. The
longer aphids were exposed to plant hosts the less time they spent not probing and
probing non vascular tissue. This is consistent with the view that aphids begin
feeding on a new host plant with a series of ‘test probes’, which penetrate into the
epidermal and mesophyll cells of the host. During these initial probes the aphid can
sample the plant chemical composition and assess the internal quality of a host.
After satisfactory test probes aphids begin a sustained period of penetration in an
attempt to locate the phloem (Tjallingii, 1985). In this study S. avenae, B. brassicae
and one clone of M. persicae (red type B clone only), aphids showed a significant
decrease in time spent per hour probing non-vascular tissue (aka pathway) as they
became more settled on host plants. Additionally in R. padi, S. avenae, B. brassicae
and M. persicae (red type B and green clone), the longer aphids were on host plants
then more time was invested in E2 activities. This confirms findings in the literature
that upon initial phloem acceptance aphids usually commence salivation into the
sieve element (E1) before the aphids move onto the second phase of phloem
activity; phloem sap ingestion (E2) coupled with watery salivation. This second phase
of E2 behaviour on suitable hosts can be sustained for many hours (Montllor et al,
1983; Tjallingii, 1990).
Interestingly red (type B) clones of M. persicae, showed a significant effect of time
on the duration spent each hour salivating into the sieve element (E1). Overall as
time progressed, decreases in E1 activities were observed in red clones of M.

persicae. Typically E1 waveforms represent watery saliva which is injected into sieve
elements prior to sap ingestion (Prado and Tjallingii, 1994). These observed changes
in E1 salivation may be associated with the phloem’s natural occlusion mechanism
found in legumes, which is a calcium triggered response to injury. This occlusion
mechanism involves proteins called forisomes that undergo calcium regulated
conformational changes blocking the sieve tube upon injury. It has been shown that
aphid saliva in vitro can revert forisomes into a non-plugging contracted state.
Initiation of sieve tube occlusion also causes aphid behaviour to change from
ingestion (E2) to watery salivation (E1) (Will et al, 2007). Furthermore, studies into
the effects of conspecifics and heterospecifcs on feeding behaviour have given
support for the idea that aphid saliva may have a pivotal role in combating host
defences and altering phloem composition to be more palatable (Ameline et al,
2007). For example M. persicae host acceptance, was enhanced on leaves pre-
infested by heterospecifics Macrosiphum euphorbiae (Dugravot et al, 2007), whilst
Diuraphis noxia enhanced plant quality for conspecifics (Messina et al, 2002), and
Aphis fabae resulted in conspecifics displaying reduced salivation and continuous sap
ingestion (Prado and Tjallingii, 1997).
Thus, the alterations in E1 behaviour seen in M. persicae red clones in this study may
be a product of aphid phloem conditioning. If E1 salivation is the aphid’s mechanism
to condition the phloem then these results suggest that the M. persicae red clones
are more efficient at phloem conditioning, reducing their salivation rates with time.
Furthermore this trend was not observed for M. persicae green clones, indicating
that there are clonal differences in behaviour within this species. Interestingly, the

red type B clone was first detected in 1996 and associated with insecticide control
failure reported by Rothamsted. It was consequently one of the first MACE clones
discovered in the UK (unpublished correspondence Fenton, 2010). The differential
feeding behaviour of B clones to green clones may indicate that there could be
indirect trade-offs between MACE insecticide resistance and other aphid fitness
parameters (like feeding).
3.4.1 Effect of Drought on Feeding Behaviour
Drought treatment had a significant effect on behaviours in all aphid species and
clones except S. avenae. In B. brassicae and red clones of M. persicae, xylem feeding
was significantly increased on droughted host plants. These results confirm other
studies, which have shown xylem feeding to be an important behavioural response
to dehydration (Spiller et al, 1990; Ramirez et al, 2000). Studies involving TMX, a
xylem borne insecticide, have highlighted that xylem feeding is an important part of
an aphid’s diet especially when dehydrated (Daniels et al, 2009), with aphids
deprived of xylem feeding experiencing higher mortality rates. Additionally, in
contrast to phloem feeding there is little nutrition value to be gained from xylem
feeding for an aphid (Pettersson et al, 2007). The xylem elements, unlike sieve
elements, are under negative hydrostatic pressures during stomatal opening in the
day, this means that to aquire xylem sap aphids have to actively suck. This
technicality has resulted in the literature referring to ‘xylem drinking’ as opposed to
‘xylem feeding’ (Pettersson et al, 2007).
The results in this chapter are consistent with the view that xylem drinking is an
important osmoregulation mechanism in B. brassicae, and red clones of M. persicae.

However, xylem drinking was not found to be significant in all the species tested in
this chapter, for example, it was not found in R. padi, S. avenae or green clones of M.
persicae. The dependence on xylem drinking as an osmoregulation mechanism
appears to vary depending on the level of water stress experienced, aphid species,
clone and even morph. For example on host plants Aphis fabae winged morphs
displayed a high percentage of xylem drinking, whilst apterous A. fabae displayed no
xylem drinking behaviour (Powell and Hardie, 2002). In contrast, xylem drinking in R.
padi apterous morphs was found to be common (Prado and Tjallingii, 1997), as well
as in apterous morphs of B. brassicae and A. pisum (Gabrys et al, 1997; Tjallingii,
1986). As this study in this chapter has used only apterous morphs and similar levels
of drought stress across species (defined in chapter two as higher reducing sugar
levels, altered ionic and amino acid levels, and severe water loss defined as a fw: dw
ratio <6), differential preference for xylem drinking behaviour can be attributed to
aphid species and clonal variation, which affects the dependence aphid may place on
xylem drinking as an osmoregulation mechanism. However, as stylectomy was not
used to directly assess the phloem osmotic pressure, we cannot rule out the
possibility of variation in plant phloem osmotic pressures also attributing to this
observation.
Other significant effects of drought in this study are changes in the amount of time
spent not probing, in pathway and ingesting from the sieve element. Overall, both
(red and green) clones of M. persicae and R. padi spent less time ingesting sieve
element sap, and more time over the six hours not probing or in pathway on
droughted host plants. Drought has previously been shown to reduce sap ingestion

rates in R. padi, when feeding on drought stressed grasses (Hale et al, 2003). This
reduction in sap ingestion may have been due to the observed increase in phloem
osmotic pressure and other phloem factors. However, the strength of this
association seems species dependent, for example, this effect was not observed in
all the species in this study. It has been hypothesised that drought induced increases
in available amino acids in the sieve element could result in a reduction of sap
ingestion in aphids as aphids would require less sap to obtain the required amount
of amino acids for growth and development. However, in the Arabidopsis thaliana
loss of function mutant AAP6 (amino acid permease) lowered sieve element amino
acid levels but had no effect on the feeding behaviour of M. persicae (Hunt et al,
2009).
Typically aphids display reduced phloem feeding (Gabrys and Pawluk, 1999; McLean
and Kinsey, 1968) and more non-penetration waveforms when fed on non host
plants. Additionally, they tend to probe more frequently and for shorter amounts of
time (McLean and Kinsey, 1968). The increase in non-penetration and pathway
activities observed in both (red and green) clones of M. persicae and R. padi may be
a result of the reduced palatability of droughted host plants. Alternatively, changes
within the plant such as, the reduction in water content coupled with increases in
solutes (such as sugar species, amino acids and certain cations concentrations) may
have altered the gradients and chemical cues relied upon by aphids to locate the
phloem. However, a reduction in the time spent in sieve element ingestion may not
result in less sap uptake by the aphid.

Although this study has demonstrated an effect of time on E1 salivation in red clones
of M. persicae, there was no significant effect of drought treatment on E1 behaviour
in any of the aphid species tested. Increased salivation is usually associated with
instances where sieve element sap is unpalatable to the aphid such as on resistant
plant varieties (Ramirez and Niemeyer, 1999; Caillaud et al, 1995), in response to
water stress (Ponder et al, 2000) or reduced amino acids concentrations (Hunt et al,
2009). However, the absence of significant alterations in E1 behaviours in any of the
species in this study, indicate that perhaps the complexity of the plant-aphid
interaction defies attempts for behavioural generalisation and that a species by
species approach is required (Pritchard et al, 2007).
Finally, the observation scoring experiments in this study revealed that quantitative
behavioural responses to drought stress occur once aphids have commenced plant
penetration. Within the first ten minutes of contact with the plant host none of the
aphid species tested had displayed any responses specific to drought stressed hosts.
Locomotion and antennae movements were unchanged in response to host
condition; however, there were species dependant behavioural preferences with
regards to antennae positions with R. padi and both M. persicae clones showing a
preference for facing their antennae backwards over the body. Interestingly, settled
aphids typically face their antennae backwards, and whilst moving aphids face their
antennae forwards and vertically. Furthermore, aphids have been observed to ‘wave’
their antennae in front of them allowing them to touch the leaf surface (Powell et al,
1995). This behaviour has been suggested to maximise detection of non-volatile
chemical cuticle cues of the plant. Aphid antennae contain sensory organs, which are

thought to be involved in olfaction detection of plant volatiles. The lack of any
observed significant changes in behaviour during initial plant contact, and the
preferred backwards facing antennae positions recorded in R. padi and M. persicae
in this study, suggests that these aphid species did not detect any surface differences
between well watered and droughted host plants to warrant further investigation.
3.4.2 Conclusion
The data in this chapter demonstrate that drought stress is detectable by aphids
following host plant penetration. Alterations in the chemical composition of plants as
a result of drought can result in behavioural changes in aphid feeding. Aphids
feeding on droughted plant hosts typically ingest less sieve element sap and spend
more time not penetrating at all or in pathway activities. Xylem drinking appears to
be an established osmoregulation mechanism in some species of aphids. However,
drought stress does not affect aphid species or clones homogeneously. The complex
relationship between plants and aphids make general predictions above the
behavioural responses to drought even at a clonal level.

Chapter 4: Reproductive performance of Myzus
persicae, Brevicoryne brassicae, Rhopalosiphum
padi and Sitobian avenae on water stressed
hosts Brassica nigra and Lolium perenne

4.0 Abstract
Water stress in plants is associated with net increases in sieve element solutes, as
plants try to maintain positive turgor pressure. The subsequent affect on aphid
performance may be negative, as aphids have to reallocate resources from growth
and reproduction to osmoregulation mechanisms. Alternatively it may be positive, as
water stress makes plants more susceptible to herbivores and changes phloem
composition to the benefit of phloem feeders.
The results in this chapter show that Brevicoryne brassicae and O clones of Myzus
persicae have significantly reduced fecundity when fed on droughted Brassica nigra.
In addition, Rhopalosiphum padi fed on droughted Lolium perenne also had
significantly lowered fecundity. Interestingly, although B clones of M. persicae and
Sitobion avenae showed reduced fecundity when fed on droughted B. nigra and L.
perenne (respectively), it was found to be not significant. Furthermore, honeydew
analysis of both M. persicae clones found aphids significantly reduced their rate of
honeydew production when on droughted host plants.
The conclusion of this chapter is that the level of drought used in this study is
detrimental to aphid reproduction. It is also suggested that the level of drought
influences aphid performance and that there is heterogeneity in the adaptability of
aphids to water stress.

4.1 Introduction
The ultimate goal of all organisms is reproduction, which accounts for a large
proportion of resource allocation. An organism’s reproductive fitness is determined
by the amount of progeny that the organism produces and so the number of genes
reaching the next generation.
Reproductive success depends on many factors such as an organism’s body size, its’
physiological state as well as the environmental conditions. Stress, whether abiotic
and biotic can be detrimental to an organism’s reproductive success and strategies
used to cope with a stressor can use up resources and energy that would ordinarily
be utilised in maximising reproductive output. Generally energy investment in
reproduction follows two different patterns; organisms may be r-selected or K-
selected. In K-selected organisms offspring are relatively large and require high
resource input by the parents, resulting overall in fewer offspring.
Invertebrates such as aphids, often have an r-selected reproductive strategy. Smaller
offspring require a smaller amount of energy from parents, which can then produce
large numbers of progeny. In the aphid species considered in this thesis, each
individual is capable of producing hundreds of progeny in a lifetime. This
reproductive strategy does come with the trade-off that there is less energy in
parental care. In the case of aphids there is yet no record of any type of parental
care, with progeny able to commence feeding from the plant host immediately.

4.1.1 Aphid life cycles
Aphids have evolved a highly adaptable lifecycle that consists of both
parthenogenetic and sexual reproduction. Embryogenesis can be initiated in the
grandparent; this is known as the telescoping of generations. Some species of aphids
can have a development time from first instar nymph to adulthood that lasts as little
as nine days (Ozgökqe and Athhan 2005). Once into adulthood within a week of the
onset of reproduction an aphid can produce 50 progeny. This reproductive capacity
is a classic example of an r-selected organism, as well as being a major reason why
aphids have become such prominent agricultural pests globally.
The evolutionary advantage of a rapid generation time is that the organism can
rapidly increase population numbers under favourable environmental conditions. In
the case of aphids, the annual sexual phase is usually initiated in response to a
number of environmental and genetic factors. Photoperiod was the first
environmental cue to be discovered that acted as a stimulus in initiating sexual
morphs, and it was later found that specifically the length of night as opposed to the
length of day was the stimulus for sexual morph production (Lees, 1961; 1963;
1964). Temperature was also later identified as being an important factor in sexual
morph production (Dixon and Glen, 1971). Changes in host plant growth, such as a
halt in plant growth have also been found to be important cues in root feeding
aphids, as they cannot be influenced directly by night or day length (Hille Ris
Lambers, 1960; Forrest, 1970).
In addition to environmental factors it was also found that aphids had an intrinsic
clock that could delay the production of sexual morphs. Offspring of Megoura viciae

fundatrices (stem mothers that hatch from the egg after winter), do not produce
sexual morphs before 80-90 days has elapsed, despite being reared in conditions
optimal for sexual morph production (Lee, 1960). All of these mechanisms are
important in ensuring that the holocyclic oviparae (sexual female) is produced in
time to mature to adulthood with egg laying capabilities, just before the autumn
induces leaf senescence in temperate environments. However, not all aphids have
sexual morphs which are produced under the correct environmental cues
(holocycly), some aphids genotypes are purely asexual (anholocycly). Furthermore,
aphid species can differ in host specificity with some species alternating hosts
throughout the year, whereas others are monophagous, feeding on one host all year
round. In order to understand the adaptability and plasticity of the aphid species
studied in this chapter, it is important to have an understanding of each aphid
species lifecycle.
4.1.2 Myzus persicae
Myzus persicae (the peach-potato aphid) is a cosmopolitan, holocyclic, polyphagous
aphid, which has gained pest status due to its ability to spread plant viruses and its
rapid development time. The aphid overwinters as an egg stage on Prunus spp. In the
spring the eggs hatch and the emerging nymphs feed on the young plant foliage,
after several generations (winged) alates are produced (late April-early June), which
disperse from Prunus to summer hosts. M. persicae has many summer hosts spread
over 40 dicotyledon plant families and include many economically important plants
(Blackman, and Eastop, 1984). In temperate climates M. persicae returns to Prunus in
the autumn (late September-early October), where mating occurs and eggs are

deposited. All generations except the egg producing autumn generation are
parthenogenetic (asexual). Although M. persicae overwinters as eggs on peach,
overwintering in mild winter climes can also occur as parthenogenetic clones on
herbaceous plants, weeds and brassicas. M. persicae unlike other species do not
form dense colonies, instead when aphid density increases M. persicae disperses to
other host plants and therefore spreads disease making it an effective virus vector.
Generally in the UK M. persicae numbers peak around July, its dispersal mechanisms
contribute to it being an efficient virus transmitter (van Emden et al. 1969).
4.1.3 Brevicoryne brassicae
The mealy cabbage aphid, Brevicoryne brassicae, is a specialist aphid species that
does not reproduce as rapidly as M. persicae. B. brassicae also requires the cue of
sinigrin, a glucosinolate in Brassica plants, to initiate a feeding response, so as a
result its entire life cycle is restricted to the Brassicaceae (Cruciferae) family (Gabryś
et al, 1997). B. brassicae is holocyclic, and can overwinter on cruciferous crops as
eggs which hatch between February to April. Summer migration occurs in May-July
as (winged) alate forms are produced, populations usually peak around July to
August and autumn migrations follow (September-October) which result in egg
laying. If mild winters are experienced, like M. persicae, B. brassicae can also spend
the winter as parthenogenetic mobile forms resulting in earlier colonisation of
cruciferous crops the following spring.

4.1.4 Sitobion avenae
The majority of Sitobion avenae (grain aphid) species no longer have host
alternation. It has evolved to spend its entire life cycle on cereals and grasses. S.
avenae can also produce sexual morphs, and a small proportion of the population
will lay overwintering eggs, which will hatch in March on species of Poaceae in
Europe. However, where winters are mild, the majority of the population will
continue through the winter parthenogenetically, similarly to B. brassicae and M.
persicae (Blackman and Eastop, 2007).
4.1.5 Rhopalosiphum padi
A major pest of cereal crops, Rholpalosiphum padi, the bird cherry-oat aphid feeds
on all grasses and cereals, as well as some Poaceae species. It can colonise many
monocotyledonous plant species and even some dicotyledons. R. padi also has a
broader range than S. avenae, and lays eggs overwinter on Prunus padus, which
hatch from April onwards. Alate forms are produced in May-June and migrate to
species of Gramineae. Upon infestation R. padi settle on lower leaves and stems,
moving higher up the host as the population size increases. Summer migrations of
the parthenogenetic clones usually result in the movement away from cereals to
wild grasses, until the autumn migration of R. padi to the winter host P. padus. Like
the other aphid species discussed, mild winters mean R. padi can overwinter as eggs
on P. padus and parthenogenetic forms on grasses (Blackman and Eastop, 2007).

4.1.6 Measuring Insect Performance
There are a variety of methods to measure insect performance, most of which will
depend upon the experimental system being used. Fecundity is probably one of the
most frequently used parameters to assess insect performance (Wearing, 1972; Li et
al, 2004), whilst counting the number of unborn aphid nymphs can even give a
measure of potential fecundity (Pons and Tatchell, 1995). Relative growth rates
(RGR) and developmental weight increases are also parameters used to assess aphid
performance (Castle and Berger, 1993; Mesfin et al, 1995). Low RGRs can be
correlated with unsuitable hosts (Van Emden and Bashford, 1971), whilst measuring
insect size, weight, longevity, survival and developmental rates can also be useful in
assessing insect performance (Llewellyn and Brown, 1985; Kennedy and Kishaba,
1977; Miles et al, 1982; Grüber and Dixon, 1988). The duration of the pre-
reproductive, reproductive and post-reproductive lives can also be measured
(Williams, 1995; Kift et al, 1996; Bethke et al, 1998).
The intrinsic rate of natural increase (rm) is another method to measure performance
but unlike the others it has the advantage of factoring the survival and fecundity of
an insect during each day of its reproductive life (Birch, 1948; Wyatt and White,
1977). The rm provides a single statistical value that summarises fecundity, survival
and development; this provides a useful performance index to compare the
performance of insects exposed to different treatments. The disadvantage with this
method is that it can be time consuming.
Special care must be taken to avoid any sources of variability when measuring insect
performance. For example, variation in the host plants such as leaf age or exposure

to prior aphid feeding can influence future aphid performance as well as the type of
aphid clone, morph, birth weight or age (Dixon, 1987; Sandström, 1994a).
Interestingly, marked differences in performance have been found between and
within aphid clones (Sandström, 1994a; Sandström 1994b; Sandström and
Pettersson, 1994). However, whether the M. pesicae clones used in this chapter will
vary in performance to drought stress is yet to be established.
4.1.7 Measuring Honeydew
Although EPG used in chapter three can define if an aphid is spending on average
more time in phloem ingestion feeding activities, it cannot be used to determine if
aphid ingestion rates are greater. However, by studying the frequency and quantity
of honeydew production (honeydew being the liquid excretion of the remaining
phloem sap ingested by aphids), we can determine the rate of secretion. Honeydew
rate of production is defined as the volume of honeydew produced over a given
period of time, and the frequency of production is the number of droplets produced
in any unit of time (Mittler, 1958).
The volume, dry mass and composition of honeydew is likely to be affected by the
solute potential and composition of ingested phloem sap, as well as the gut
metabolic activity within the aphid. This makes honeydew analysis an important
aspect of understanding how the quality of assimilated nutrients can affect aphid
performance.
There are a variety of techniques that can be used to determine volume and
frequency of honeydew droplets. Honeydew frequency can be recorded using

collection in oil (Mittler and Meikle, 1991), circles or paper (Auclair, 1958), or
honeydew clocks (Smith, 1937; Broadbent, 1951; Ajayi and Dewer, 1982). Honeydew
clocks consist of a motor that rotates at a constant velocity to which a disc is placed
on top to collect honeydew droplets. The advantage of honeydew clocks is that
excreted droplets land on clean sections over the duration of the experiment so each
droplet is discrete from other droplets. To determine volume, collection in oil is the
easiest method, as both frequency and volume can be calculated by measuring
droplet diameter and occurrence.
4.1.8 Effect of drought on plants
Water stress in plants is associated with net increases in sieve element solutes
(Smith and Milburn, 1980), to maintain positive phloem turgor pressure.
Carbohydrate concentrations can increase by 20-40% (Najla et al, 2010), and cause
increases in amino acids and osmotic pressure (Good and Zaplachinski, 1994;
Thomas, 1991; Hale et al, 2003; Volaire et al, 1998). Specifically water deficit can
cause increase in levels of serine and GABA, valine, isoleucine, leucine, threonine,
glutamate, aspartate and proline (Tully and Hanson, 1979; Girousse et al, 1996).
However, it is not just amino acids and carbohydrates that can alter in response to
water stress, ions can also increase as they play a role in phloem osmotic pressure
adjustment and the transport of photo-assimilates (Gould et al, 2004).
In chapter two, it was shown that water withdrawal in B. nigra and L. perenne at 20
days of age resulted in a drop in fresh weight. Furthermore, total water withdrawal
for 6-9 days resulted in increases in reducing sugar levels, alterations in amino acid

and cation levels, and a substantial water loss quantified in the form of fw: dw ratios
in both species.
4.1.9 Effect of diet on aphids
As the composition of sieve element sap varies in host plants in response to drought,
so may the performance of aphids feeding on the hosts. Studies have shown that
the concentrations of essential amino acids, arginine, threonine, aspartate,
glutamate, glycine, tyrosine, proline and valine are positively correlated with aphid
performance (Sandström and Pettersson, 1994; van Emden and Bashfod, 1971;
Holopainen et al, 1997; Srivastava et al, 1983), whilst methionine, histidine and
phenylalanine are essential for normal aphid growth (Leckstein and Llewellyn, 1973).
Interestingly, enhanced levels of glutamate can also be correlated with inhibition of
aphid feeding (Sandström and Pettersson, 1994). This is also the case with proline,
which has been shown to be in higher concentrations in plant resistant varieties (van
Emden, 1964).
Aphids also respond to the levels of carbohydrates in their diet. Low concentrations
of sucrose have been shown to cause a reduction in feeding rates (Srivastava and
Auclair, 1971); this is thought to be due to a lack of phagostimulation. Additionally, if
the level of sucrose is too high, then this can also lead to a reduction in aphid feeding
rate (Mittler and Meikle, 1991). Aphids ordinarily reduce the osmotic pressure of
phloem sap by assimilating and transforming sugars (Mittler and Meikle, 1991;
Wilkinson et al, 1997). Hsowever where levels of sucrose are higher than normal, the
increased osmotic stress may reduce aphid performance, as body water is lost to the
gut (Hendrix et al, 1992).

4.1.10 Plant Stress Hypothesis
One hypothesis is that aphids feeding on droughted B. nigra and L. perenne, would
have to reallocate their energy resources from growth and reproduction into
osmoregulation mechanisms to cope with the osmotic stress from feeding on
droughted host plants. This resource allocation is predicted to be observed via an
overall reduction in fecundity in aphids fed on droughted host plants, when
compared with aphids on well watered host plants. In addition the reduction in
performance between species may vary, with species that are more specialised with
slower reproductive rates like B. brassicae, displaying a greater reduction in
performance than species that are cosmopolitan, highly polyphagous, with higher
reproductive rates, like M. persicae.
Alternatively, the plant stress hypothesis (White 1984) proposes that under water
stress host plants may become more susceptible to herbivores, with aphids
benefiting from the change in plant physiology, such as the increase in amino acid
concentrations in both host plant species (see Chapter 2 results). Amino acids are
essential to insect development and growth (Brodbeck and Strong, 1987), and an
increase in free amino acids, sugars and minerals may result in host plants being
more attractive to insect herbivores. Additionally plant defences may be reduced in
water stressed plants (Rhoades, 1985), making plants more susceptible to insect
attack. So far a number of studies have supported this idea, with higher fecundity,
faster development, and longer adult reproductive lives being observed under
drought stress for the aphid species; Myzus persciae (Wearing, 1967; Wearing and
van Emden, 1967; Wearing, 1972), Brevicoryne brassicae (Wearing, 1972; Miles et al,

1982) and Diuraphis noxia (Oswald and Brewer, 1997). Additionally the grasshopper,
Melanoplus differentialis, was shown to prefer wilted to turgid plants (Lewis, 1982);
further studies found that grasshoppers fed more on plants enriched with proline
and valine (Haglund, 1980). Thus, increases in free amino acids, especially essential
amino acids in drought stressed plants could lead to proliferation of herbivores on
water stressed plants, as herbivores benefit from the increased availability of amino
acids.
In contrast there have been many studies that contradict the plant-stress hypothesis,
and instead support the notion described earlier, that resource allocation to
osmoregulation mechanisms as a result of feeding on drought stressed host, should
lead to a detrimental effect on aphid performance. More recently the plant-stress
hypothesis has come under direct attack (Larsson, 1989), with many studies showing
evidence that there is no effect of drought stress on development time, adult
weight, nymphal mortality or number of embryos in the aphid species S. avenae and
R. padi when fed on drought stressed wheat, Triticum aestivum (Pons and Tatchell,
1995). No effect on fecundity, longevity and rm was also observed in Aphis gossypii
(Bethke et al, 1998) when fed on drought stressed chrysanthemums, Dendranthema
grandiflora. In addition, residence time of R. padi, S. avenae and Macrosiphum
euphorbiae (Honěk et al, 1998) and feeding, survival and oviposition of Aphis fabae
(Kennedy et al, 1958; Kennedy and Booth 1959) were all negatively affected by
drought stress.
These studies suggest that the response of aphids to water stress may be too
complex to summarise within one simple hypothesis. It is possible that the variation

in results in the literature may be due to the differential plant responses to water
stress, and subsequent differential insect responses to plant stress. Additionally, in
previous studies the level of drought has not always been defined in a way that can
be compared to other studies. It may be that aphid species benefit from low level
water stress situations and consequential rises in certain amino acid concentrations,
but under extreme water stress scenarios, the cost of aphid osmoregulation and
overcoming drought induced responses such as, leaf waxiness, prove detrimental to
aphid performance.
In this chapter the aim is to assess aphid performance in response to a defined
extreme level of water stress (defined in chapter 2) in the form of fecundity
measurements. In addition, measurements of honeydew frequency and volume will
allow an assessment on the rate of phloem sap ingestion in aphids subjected to a
drought regime. Honeydew analysis will be interpreted within the context of the
earlier EPG analysis (chapter three) and fecundity results.
To ascertain an overview of the fecundity response of aphids to drought four aphid
species (Myzus persicae, Brevicoryne brassicae, Sitobian avenae and Rhopalosiphum
padi) and two genotypes (M. persicae green ‘O’ clone and red ‘B’ clone) were
analysed. Aphid species range from strictly monocotyledonous non-host alternating
species like S. avenae to dicotyledonous host-alternating species like M. persicae. For
honeydew measurements in response to drought only the two M. persicae clones (O
and B) shall be measured.

4.2 Materials and Methods
4.2.1 Plant Species
B. nigra and L. perenne used in experiments were seeds obtained from John
Chambers Wildflower Seeds Co. from wild seed stocks in Northamptonshire, UK
4.2.2 Aphids
Myzus persicae clones used in the experiment were the red type B clone and the
green O clone, which were obtained from Brian Fenton’s cultures in SCRI.
Brevicoryne brassicae, Rhopalosiphum padi and Sitobion avenae were obtained from
Phil Northing culture stocks at FERA.
4.2.3 Plant Culturing
Plants were grown in the insect free plant growth rooms with a 16:8 light cycle at a
temperature of 22oC. Growth room PAR was between 80-120mol m-2 s-1 with a
relative air humidity 70-80%. Plants were grown in John Innes peat based compost
with mixed in Silvaperl in 100-150ml plastic pots (L. perenne and B. nigra
respectively).
4.2.4 Aphid Culturing
Special tents are used to isolate the cultures from any infestation from other insects
as well as to prevent the escape of insects from the culture. Plants are reared up in
the insect free plant growth rooms before being placed into tents (Megaview
Bugdorm 3120) to be fed on by the insects. The constant removal of old dying plants
and replacement with young new plants into the cultures ensures that the culture is

kept healthy with an abundant supply of insects. Growth rooms are run at a constant
temperature of 18oC under a 16:8 light cycle.
4.2.5 Fecundity
Adult aphids were removed from the culture and immediately transferred onto
experimental plants in the insect room with a constant temperature of around 18oC
and 16:8 light cycle. Plant hosts species were B. nigra and L. perenne for M. persicae
(green O clone and red type B clone) / Brevicoryne Brassicae and Rholashipon padi /
Sitobion avenae respectively. The host plants had been subjected to one of two
different types of treatments, control or extremely drought stressed (as defined in
the discussion of chapter two). All plant hosts were 26 days old, with drought
stressed plants experiencing total water withdrawal for 6 days prior to the
experiment. Aphids were left on the plants for 72 hours, thus droughted plants
experienced an additional 72 hours of water withdrawal (totalling 9 days of water
withdrawal at the end of the experiment), whilst well watered plants had access to
water. Droughted plants of both species had increased levels of sugars, calcium and
magnesium, reduced water content and changes in amino acid concentrations to
well watered controls (see results in chapter 2). Aphids during this period were
contained on the plant host using an inverted clear plastic cup with mesh for
ventilation; this prevented aphid dispersal to other plants. After 72 hours the aphids
were removed and the total number of progeny produced for each aphid was
recorded.

4.2.6 Honeydew
The frequency and volume of honeydew drops excreted by adults feeding on well
watered and droughted plants was determined using a honeydew clock (Wilkinson
and Douglas, 1995). Adult reproducing aphids were taken from culture and
immediately placed (using a small paint brush) onto plant leaves, for drop frequency
measurements one aphid per plant was used, whereas for drop volume
measurements aphids were placed onto the plants in groups of 5. Aphids were left
for an hour to settle before the plant was positioned over the honeydew clock to
collect droplets. Only aphids that had fully settled were used for honeydew
collection, this reduced the risk of using aphids that subsequently dispersed half way
through the experiment. To measure honeydew rate, each plant leaf was placed
horizontally above a plastic petri dish (14 cm diameter) and connected to the hour-
hand spigot of a kitchen clock. This ensured a rotation of 360o in a 12 h period. In the
petri dish a circle of filter paper was placed (125 mm diameter; Fischer Scientific, UK)
pre-treated with 0.1% bromophenol blue (Sigma-Aldrich Company Ltd., UK) and 0.01
M HCl (Sigma-Aldrich Company Ltd.). As the aphids excreted the honeydew it was
visualised by a colour change on the dyed filter paper from yellow to blue, after 12
hours the droplets could be counted for each hour from the filter paper to work out
honeydew production rate. Only results where aphids were still in the same position
post and prior to the experiment were used. In addition a silanized dish (which
prevents the adsorption of the honeydew droplets to the glass surface) is filled with
oil and placed under the aphids. The honeydew drops collected in the dish can be

later quantified for volume by measuring the diameter of the sphere which would
not stick to the glass and alter shape.
4.2.7 Statistical Analysis
Data was entered into MINITAB and analysed using the Anderson-Darling Normality
Test. If the P value was ≤0.05 then the data was not normally distributed. In cases
where data is normally distributed parametric tests utilising the means, such as the t-
test were used. In examples where data was not normally distributed, non-
parametric statistical tests that use the median like the Mann-Whitney test were
used.

4.3 Results
Adult green (O) clones of M. persicae showed a significant reduction (t-test P< 0.01)
of approximately 19% in fecundity over the 72 hour period, when fed on droughted
B. nigra plants as opposed to well watered controls (fig 4.1). The average nymph
production fell from 14.9 per adult (± 0.64 SE N=10) in green M. persicae clones on
well watered B. nigra to 12.0 (± 1.77 SE N=11) when fed on droughted B. nigra in the
72 hour period.
0
2
4
6
8
10
12
14
16
18
Well watered Drought
Treatment
Ave
rage
no.
of n
ymph
s pr
oduc
ed
by a
dults
A drop in fecundity was also observed in the adult red (B) clones of M. persicae.
However, the fall in fecundity was not as large with an average drop of
approximately 9% in fecundity (fig 4.2) over the 72 hour period, from 4.6 (± 0.36 SE
N=11) to 4.2 (± 0.42 SE N=13), on well watered to droughted B. nigra respectively.
This reduction was not significant.
Figure 4.1: Average fecundity (±SE) over a 72 hour period in adult green O clones of M. persicae fed on well watered and droughted B. nigra. Plants were grown in growth room conditions (22oC 16:8LD) until 20 days old prior to experiment, drought treatment consisted of water withdrawal for 6 days before experimentation, and 3 days during the experiment. Fecundity experiments were conducted at 16oC and under a 16:8 LD cycle. Fecundity significantly fell in aphids fed on droughted B. nigra (t-test value 0.003), N is shown in brackets on chart.
N
(10)(1
0) (11)
(10)

These results demonstrate that an extreme level of drought has a negative effect on
the fecundity of M. persicae. It also demonstrates clonal differences within the
species, M. persicae, with the green O clone and red B clone displaying different
fecundity rates on B. nigra and a differential degree of response to the water-
stressed hosts.
0
1
2
3
4
5
6
Well w atered Drought
Treatment
Ave
rage
no.
of n
ymph
s pr
oduc
ed b
y ad
ults
aph
ids
In Brevicoryne brassicae there was a significant (t-test P<0.001) marked decrease in
fecundity of 37% over the 72 hours (fig 4.3). Adult apterous B. brassicae fed on well
watered B. nigra produced an average of 9.3 (±0.56 SE N=15) nymphs over the 72
hour period, whilst only 5.9 (±0.42 SE N=19) nymphs were produced on droughted B.
nigra hosts. This data also suggests that water stress affects the reproductive
performance of the specialist B. brassicae greater than the polyphagous aphid M.
Figure 4.2: Average fecundity (±SE) over a 72 hour period in adult red B clones of M. persicae fed on well watered and droughted B. nigra. Plants were grown in growth room conditions (22oC 16:8LD) until 20 days old prior to experiment, drought treatment consisted of water withdrawal for 6 days before experimentation, and 3 days during the experiment. Fecundity experiments were conducted at 18oC and under a 16:8 LD cycle. Fecundity did not significantly alter in aphids fed on droughted B. nigra when compared to well watered B. nigra (t-test value 0.49), N is shown in brackets on chart.
N (11) (13)

persicae, as reductions of 37% were observed in the fecundity of B. brassicae,
compared to only 19% in (green O clone) M. persicae.
0
2
4
6
8
10
12
Well watered Drought
Treatment
Aver
gae
no. o
f nym
phal
pro
duce
d by
adu
lts
The trend of reduced fecundity in aphids feeding on water stressed plants was also
seen in Rhopalosiphum padi and Sitobion avenae. R. padi adult fecundity was
reduced by an average of 35% in aphids fed on drought stressed Lolium perenne.
Average fecundity over the 72 hour period in adult R. padi aphids was 4.0 (±0.49 SE
N=10) nymphs when fed on well watered L. perenne plants. However, on drought
stressed L. perenne, nymphal production dropped to an average of 2.6 (±0.16 SE
N=10) nymphs over the 72 hour period. This observed reduction in reproductive
performance in R. padi was also statistically significant (t-test P<0.05). In contrast, S.
avenae showed no statistically significant differences in reproductive output, despite
a visible overall reduction of 48% in nymphal production on drought stressed L.
perenne. This could be attributed to the low number of biological replicates for this
Figure 4.3: Average fecundity (±SE) over a 72 hour period in B. brassicae fed on well watered and droughted B. nigra. Plants were grown in growth room conditions (22oC 16:8LD) until 20 days old prior to experiment, drought treatment consisted of water withdrawal for 6 days before experimentation, and 3 days during the experiment. Fecundity experiments were conducted at 18oC and under a 16:8 LD cycle. Fecundity significantly decreased in aphids fed on droughted B. nigra when compared to well watered B. nigra (t-test value P<0.001), N is shown in brackets on chart.
N (15)
(19)

species, as only 5 individuals per treatment were successfully recorded on L.
perenne. The low biological replication was due to difficulties encountered in
culturing S. avenae on L. perenne prior to experimentation. Despite this average
nymphal production of S. avenae on well watered L. perenne was 5 (±0.89 SE N=5)
nymphs over the 72 hour period, whereas on droughted L. perenne it was 2.6 (±0.81
SE N=5).
00.5
11.5
22.5
33.5
44.5
5
Well watered Drought
Treatment
Aver
age
no. o
f nym
phs
prod
uced
by
adu
lts a
phid
s
0
1
2
3
4
5
6
7
Well watered Drought
Treatment
Aver
age
no. o
f nym
phs
prod
uced
by
adu
lts a
phid
s
Figure 4.4: Average fecundity (±SE) over a 72 hour period in R. padi fed on well watered and droughted L. perenne. Plants were grown in growth room conditions (22oC 16:8LD) until 20 days old prior to experiment, drought treatment consisted of water withdrawal for 6 days before experimentation, and 3 days during the experiment. Fecundity experiments were conducted at 18oC and under a 16:8 LD cycle. Fecundity significantly decreased in aphids fed on droughted L. perenne when compared to well watered controls (t-test value 0.015), N is shown in brackets on chart.
N (10)
(10)
Figure 4.5: Average fecundity (±SE) over a 72 hour period in S. avenae fed on well watered and droughted L. perenne. Plants were grown in growth room conditions (22oC 16:8LD) until 20 days old prior to experiment, drought treatment consisted of water withdrawal for 6 days before experimentation, and 3 days during the experiment. Fecundity experiments were conducted at 18oC and under a 16:8 LD cycle. Fecundity did not significantly alter in aphids fed on droughted L. perenne when compared to well watered controls (t-test value 0.08), N is shown in brackets on chart.
N (5)
(5)

Honeydew frequency was significantly affected by drought treatment in both M.
persicae clones (O and B types). Honeydew frequency (Mann-Whitney P<0.05) and
droplet volume (P<0.001) was reduced in green M. persicae (O) clones (fig 4.6), when
subjected to extreme drought, by 54% and 17% (respectively). However, whilst red
M. persicae (B) clones (fig 4.7) displayed a reduction in honeydew frequency by
140% in response to drought (P<0.001), honeydew droplet volume was significantly
increased (P<0.001) by 4%.
0
0.5
1
1.5
2
2.5
3
well watered Drought
Treatment
Drop
lets
per
Hou
r
Figure 4.6: Average honeydew frequency (±SE) over a 12 hour period in green O clones of M. persicae fed on well watered and droughted B. nigra. Plants were grown in growth room conditions (22oC 16:8LD) until 20 days old prior to experiment, drought treatment consisted of water withdrawal for 8 days prior to experimentation. Honeydew experiments were conducted at approximately 18oC. Honeydew frequency significantly reduced in aphids fed on droughted hosts (Mann-Whitney value 0.032, N 15 per treatment). Additionally droplet volume also significantly reduced in response to drought (P<0.001, N=64 and 53 for well watered and drought treatment, respectively).

0
0.2
0.4
0.6
0.8
1
1.2
1.4
1.6
well watered Drought
Treatment
Drop
lets
per
hou
r
Control M.
persicae green O
clone
Drought stressed M.
persicae green O clone
Control M.
persicae Red B clone
Drought stressed M.
persicae Red B clone
Honeydew Droplet Average Volume mm
0.93 0.64 0.73 0.79
N 64 53 100 94
Table 4.1: Average honeydew droplet volume of M. persicae green O and red B clones when fed on well-watered and drought stressed B. nigra over a 12 hour period at 16oC and under a 16:8 LD cycle. Plants were grown in growth room conditions (22oC 16:8LD) until 20 days old prior to experiment; drought treatment consisted of water withdrawal for 6-8 days before experimentation.
4.4 Discussion
Fecundity was reduced in all species of aphid; however it was only significantly
reduced in the green O clone of M. persicae, B. brassicae and R. padi. In S. avenae
although fecundity was reduced by the drought treatment, it was not a statistically
Figure 4.7: Average honeydew frequency (±SE) over a 24 hour period in red B clones of M. persicae fed on well watered and droughted B. nigra. Plants were grown in growth room conditions (22oC 16:8LD) until 20 days old prior to experiment, drought treatment consisted of water withdrawal for 8 days prior to experimentation. Honeydew experiments were conducted at approximately 18oC. Honeydew frequency was significantly reduced in aphids fed on droughted hosts (Mann-Whitney value 0.000, N is 10 for drought treatment and 15 for well watered treatment), whilst droplet volume significantly increased (P<0.001, N 100 per treatment) in response to drought, however the increase in droplet size was marginal at 4%
significant reduction. Interestingly, the two clones of M. persicae responded
differently to the drought stressed host, with no significant effect of drought
treatment on red Myzus clone ‘B’, but a significant effect of drought on the green
Myzus clone ‘O’. As many laboratory lineages are derived from a single
parthenogenetic female aphid, the observed differences between M. persicae clones
could be due to clonal variation. Additionally studies into M. persicae and aphid
species Aphis craccivora, Sitobion miscanthis and Acyrthosiphon pisum, have shown
genetic attributed variation in growth and development rates even when reared on
host plants of similar quality (Edwards, 2001; Sandström, 1994; Sunnucks et al,
1998). Field studies into clonal composition using molecular markers have also
revealed that aphid clones proliferate differentially during the summertime (Tomiuk
and Woehrmann, 1981; Haack et al. 2000). Individual reproductive rates may also
differ over the lifetime of the aphid, with aphids not producing nymphs at the same
constant rate throughout adulthood. Studies into the dynamics of nymphal
production showed that A. pisum produced more nymphs during the daytime (Zeng
et al, 1993) than during the night. The observed difference between fecundity of
both M. persicae clones in this study, is further evidence that genetic variation
between clones can affect clonal performance responses sto certain host plants and
environmental conditions. This makes it difficult to predict precisely the response of
other clones of aphids. However, the data does show that under extreme drought
none of the clones or species showed an increase in fecundity, thus demonstrating
that although precise responses cannot be predicted it may be possible to infer an
overall expected response based on this information.

Aphids can alter their reproductive rate due to changes in plant quality (Leather,
1987) or environmental conditions (Leather et al, 1983; Grüber and Dixon, 1988).
Additionally, environmental changes may affect reproductive rates but not growth
rates, and vica versa. In S. avenae, doubling atmospheric CO2 affected fecundity but
not development rates (Awmack et al, 1996). Whilst in the greenhouse potato aphid,
Aulacorthum solani, aphids demonstrated decreased development time and
increased rm values when reared on Tanacetum vulgare under elevated CO2, but not
on Vicia faba, instead increased fecundity was the only effect of increased CO2 on
aphids fed on V. faba (Awmack et al, 1997). These studies highlight the importance
of not inferring other aspects of aphid performance based on fecundity or growth
results, as the relationship between aphid size, fecundity and rm can become
uncoupled. If aphids are exposed to starvation, they may resorb embryos to release
energy and essential nutrients (Ward and Dixon, 1982), altering their future
reproductive capacity.
The results from this chapter do not support the plant stress hypothesis (White,
1984). The plant stress hypothesis proposes that water stressed host plants may
benefit aphids in their stress induced change in physiology. The most obvious change
in the host plants in this chapter would be the increase in amino acid concentrations
described in chapter 2. Amino acids are essential to insect development and growth
(Brodbeck and Strong, 1987), and increases in concentrations of free amino acids
could promote accelerated growth in aphids. However, the results in this chapter
suggest that an extreme level of water stress is detrimental to the aphids species
almost universally, with no aphids displaying a benefit in reproductive performance.

Whilst we can conclude aphid reproduction is affected by this level of drought, it
must be noted that this chapter has not explored aphid growth. There is the
possibility that the effect of drought stress on reproduction may not be concurrent
with any affects this level of stress would have on growth. Studies have shown that
MRGR is more correlated with rm than fecundity in R. padi, despite MRGR increases
usually correlating with fecundity increases (Leather and Dixon, 1984). Conversely,
more recently another study has shown correlations between MRGR, rm and
fecundity as not significant in Aphis fabae on different cultivars of Vicia faba
(Wojciechowicz-Zytko and Emden, 2009). Ultimately, it is more likely that growth
would be detrimentally affected by an extreme level of drought, as nutrient
resources in the host plant become scarce due to leaf shedding and tissue
dehydration. In a study into the effects of drought in four grass species on the aphid
R. padi, it was found that drought detrimentally affected the rm of R. padi for all but
one species of grass. On the species of grass where R. padi did not display a reduced
rm value, there was also no record of any increase in rm either (Hale et al, 2003).
The results in this chapter so far support many other studies showing evidence that
drought has either no effect or a negative effect on aphid performance (Agele et al,
2006; Bethke et al, 1998; Hale et al, 2003; Honěk et al, 1998; Kennedy et al, 1958;
Kennedy and Booth, 1959). In contrast other studies indicate that this may not be
true of the whole feeding guild (Wearing, 1967; Wearing and van Emden, 1967;
Wearing, 1972; Miles et al, 1982; Oswald and Brewer, 1997). It is possible that the
variation in the literature may be due to the level of drought used in the other
studies, and are not representative of intra- and interspecies plasticity and

adaptability. It can therefore be concluded from this study that an extreme level of
drought has a detrimental effect upon aphid herbivores.
Interestingly, the fecundity reduction when exposed to droughted host was greater
in B. brassicae than in both green and red M. persicae clones. Overall, fecundity on
well watered B. nigra was also higher in the green clone of M. persicae than in B.
brassicae. These results suggest that the polyphagous life cycle of M. persicae may
influence the aphids’ ability to tolerate plant hosts of differential quality, whereas
the specialist life cycle of B. brassicae restricts plasticity in environmental adaptation.
If this hypothesis is correct then it would be expected that R. padi would also out
perform S. avenae on drought stressed L. perenne. However, despite S. avenae
displaying a greater reduction in fecundity than R. padi on L. perenne, this reduction
was not significant.
A consideration to be taken into account, when interpreting this data, is that any
conclusion drawn from laboratory based studies into aphid performance may not
reflect the performance of a wild population of aphids. Wild aphid populations will
interact with many other abiotic and biotic factors in addition to drought, natural
populations are rarely uniform possessing a greater genetic variability than a
laboratory culture derived from a few parthenogenetic females (Edwards, 2001;
Loxdale, 1998; Sandström, 1994, Wilson et al, 2003). Although aphid growth and
development has been successfully recorded in field conditions (Cannon, 1984), it
was beyond the scope of this study. Another consideration is that with the exception
of M. persicae O clones and B. brassicae, aphid fecundity was found to be quite low
in both treatments, however this is consistent with observations of the aphid

culturess. Furthermore, the results of R. padi and S. avenae in this study suggest that
L. perenne was not a preferred host of these aphid species.
Finally, honeydew results showed that droplet frequency was significantly reduced in
response to drought in both M. persicae clones. This reduction in honeydew
frequency was also accompanied by a reduction in droplet volume in the green (O)
clones of M. persicae. In contrast, droplet volume in red (B) clones of M. persicae
increased under drought stress, however, the observed increase was only marginal
(+4%) when compared to the reduction in droplet frequency (-140%). These findings
support behavioural analysis in chapter three, which showed both clones reduce
sieve element ingestion times whilst on droughted host plants. We can therefore
conclude that M. persicae reduces both the time spent in the sieve element and the
volume of sap ingested from sieve elements when on fed droughted host plants.
4.4.1 Conclusion
Extreme drought (defined in chapter two as higher reducing sugar levels, altered
amino acid profiles, altered cation profiles and severely decreased water content;
fw: dw ratio <6), has a detrimental effect on the fecundity in most of the aphid
species and clones in this study. Where a significant reduction in fecundity was not
observed, aphid species/clones did not display any evidence to contradict these
findings. Based on this data, we can reject the idea that aphids will reproductively
perform better under drought due to increases in free amino acids in the host plant.
However, we can only reject this hypothesis when aphids are subjected to extreme
levels of drought. Furthermore as aspects of aphid performance such as growth,
developmental rates, rm and fecundity can be uncoupled in certain circumstances it

is not possible to infer that all aspects of aphid performance would be detrimentally
affected by extreme drought in the same way as fecundity. To conclude although it is
easier to assess aphid performance by a simple fecundity count over 72 hours,
perhaps the most reliable way to investigate drought effects on aphids would be to
use populations in field conditions. This way the effects of genetic variation,
crowding, competition, predation, disease and sink induction would also be
incorporated into any results.

Chapter 5: Analysis of gene expression by
microarray of Myzus persicae feeding on Brassica
nigra subjected to differing water regimes

5.0 Abstract
The osmotic potential of phloem sap is thought to be three fold that of the aphid
haemolymph. The ability of aphids to maintain water potential hypo-osmotic to their
diet, is thought to be due to an array of osmoregulation mechanisms. Xylem
drinking, water cycling, metabolic water production and sugar polymerisation are all
suggested mechanisms of aphid osmoregulation. It is thought that under drought
stress aphids will have to place an increased dependence on these mechanisms.
This chapter has investigated the gene expression, using microarray technology, of
Myzus persicae under two different drought levels on Brassica nigra. Results
revealed that under extreme drought, aphids increased their regulation of a putative
aquaporin AqAQP1 and sucrases, supporting the hypothesis that sugar
polymerisation and water cycling play an important role in osmoregulation. It was
also found that the salivatory enzyme alpha-amylase was increased in response to
extreme drought. Aphids also heterogeneously expressed stress-related genes
depending on the level of drought experienced, with cytochrome P450s being
expressed preferentially when exposed to a mild drought treatment, and heat shock
proteins when exposed to an extreme drought treatment.
To summarise this chapter has helped to confirm and elucidate genes induced under
drought stress, enabling us to start to understand a complex response with many
functions still unknown.

5.1 Introduction
The results of chapter 3 (in this thesis) have showed that extreme drought in the
host plant (as defined in chapter 2), has a significant effect on the feeding behaviours
of Rhopalosiphum padi, Brevicoryne brassciae and two clones of M. persicae. In B.
brassicae and red clones of M. persicae, xylem feeding was significantly increased on
droughted host plants, confirming other studies which have shown xylem feeding to
be an important behavioural response to dehydration and water stress (Spiller et al,
1990; Ramirez et al, 2000). Additionally on droughted hosts, both clones of M.
persicae and R. padi demonstrated reduced sieve element ingestion time, and an
increase in time spent not probing or probing non-vascular tissue. Reductions in sap
ingestion and increases in non-penetration waveforms can be associated with non-
host plants (Gabrys and Pawluk, 1999; McLean and Kinsey, 1968), increases in sap
osmotic pressure, increases in sap essential amino acids concentrations (Hale et al,
2003), reduced phloem palatability or difficulty in phloem location.
Increased salivation is a behaviour associated with instances where sieve element
sap is unpalatable, such as on resistant plant varieties (Ramirez and Niemeyer, 1999;
Caillaud et al, 1995), in response to water stress (Ponder et al, 2000) or in response
to reduced amino acids concentrations in sieve elements (Hunt et al, 2009).
Aphid saliva is comprised of amino acids, haemolymph and salivary gland secreted
proteins (Miles, 1999). Proteins found in aphid saliva are amylases, cellulases,
glucosidases, oxidases, dehydrogenases and pectinesterase (Cherqui and Tjallingii,
2000; Miles, 1999; Urbanska and Leszczynski, 1997; Hamel et al, 2008). Cellulases,
pectinesterases and glucosidases are all enzymes that can be involved with breaking

down plant cell wall components such as cellulose, pectin and glycoproteins, and this
may be their function in aphid saliva. Oxidases and dehydrogenases are common
catalytic enzymes associated with many functions including respiration; interestingly
amylases are only involved in the breakdown of starch, which in plants is only found
in the plastids not in the cell wall or cytoplasm.
In the vetch aphid, Megoura viciae, watery aphid saliva was also found to contain
calcium binding proteins that caused contraction of the injury induced forisomes,
found in sieve elements (Will et al, 2007). This suggests that aphid saliva plays a role
in altering the phloem composition to prevent the plant’s injury induced natural
occlusion mechanism blocking the sieve element. Despite these recent advances
there are still many proteins in aphid saliva with unknown functions. In some recent
work, RNAi was used to knock out the expression of an unknown aphid saliva
protein, which was found in large abundance in aphid saliva, called C002. The result
was increased aphid mortality (Mutti et al, 2006). Further experimentation showed
that loss of function in C002 resulted in a change in foraging and feeding behaviour
in aphids associated with increased mortality (Mutti et al, 2008). This uncovering of a
molecular relationship between saliva and feeding behaviour is particularly
interesting, when considering that increased salivation is a behaviour that has
previously been characterised as a response to unsuitable hosts. These studies
suggest that the process of salivation and its composition is important for successful
feeding.
Studies so far have elucidated the importance of saliva and found that aphids may
increase salivation on unsuitable hosts; however, none of these studies have

investigated if aphids change the composition of saliva in response to drought. The
behavioural work in chapter 3 and other studies (Hale et al, 2003; Ponder et al, 2000)
have shown that M. persicae, B. brassicae and R. padi all alter their feeding
behaviours on water stressed host plants. Although none of these species in this
study have been found to significantly alter the amount of time they spend
salivating, it could be hypothesised that aphids may instead alter the composition of
saliva to drought stress. In the literature aphid saliva has already been found to be
important in phloem conditioning for conspecifics (Prado and Tjallingii, 1997), and as
a defence against the phloem’s natural injury occlusion mechanism (Will et al, 2007).
More recently, it has been found that salivatory proteins are important for
survivorship (Mutti et al, 2006; 2008) and that salivation is a behaviour associated
with instances where sieve element sap is unpalatable (Ramirez and Niemeyer, 1999;
Caillaud et al, 1995; Ponder et al, 2000; Hunt et al, 2009). It can therefore, be
hypothesised that saliva may play a role against drought stress as observed in
Ponder et al (2000), and that under droughted conditions aphids may either increase
the time spent salivating or potentially alter the composition of saliva.
5.1.1 Aphid Osmoregulation
Aphids are highly specialised insects adapted to their osmotically challenging diet of
phloem sap. Phloem sap has a high osmotic potential (-0.6 to -3.0MPa) which can
vary between and within plants (Downing, 1978; Wilkinson et al, 1997; Fisher, 2000).
The osmotic potential of phloem sap from a host plant can be three fold that of the
aphid haemolymph, moreover, the aphid haemolymph and excreted honeydew are

iso-osmotic. The ability of aphids to maintain a water potential hypo-osmotic to
their diet can be attributed to various osmoregulation mechanisms.
Phloem sap modification to reduce osmotic pressure is thought to occur in aphids
through sucrase mediated hydrolysis of phloem sucrose into glucose and fructose.
This glucose can then be polymerised into oligosaccharides of low osmotic pressure
per hexose unit (Rhodes et al, 1997). Honeydew analysis has also shown that under
high dietary sucrose concentrations the excreted oligosaccharide levels significantly
increased (Wilkinson et al, 1997).
In the pea aphid, Acyrthosiphon pisum, sucrase activity has been localised to the gut,
distal to the stomach (Ashford et al, 2000; Cristofoletti et al, 2003). More recently,
an identified sucrase APS1 was found in aphids gut and shown to have an α-
glucosidase activity to form the hexose units for oligosaccharide synthesis (Price et
al, 2007). Furthermore, the application of α-glucosidase inhibitor acarbose to inhibit
sucrase activity in aphids gut resulted in aphids being unable to osmotically control
haemolymph water potential when exposed to a hyperosmotic diet. Aphid gut
sucrase activity is therefore essential for osmoregulation of aphids when ingesting
diet hyperosmotic to their haemolymph (Karley et al, 2005).
Other mechanisms of osmoregulation are water cycling from the distal to proximal
regions of the gut. This water flux would require membrane aquaporins to mediate
water movement. A putative aquaporin, ApAQP1, was identified in A. pisum, which
when expressed in Xenopus oocytes increased osmotic water permeability. ApAQP1
has been localised in aphids to the stomach and distal intestine, and using an RNAi-

mediated knockout for AqAQP1, demonstrated that it is important in maintaining
the osmotic pressure of the haemolymph (Shakesby et al, 2009).
Currently, advances in the literature are helping to elucidate aphid osmoregulation
mechanisms and provide evidence to support the important role for aquaporins,
sucrases and polymerising enzymes in osmoregulation. Under drought stress, host
plant water potentials would increase and aphids would place an increased
dependence on these various mechanisms to cope with the extreme osmotic
challenge posed by concentrated phloem sap. It can be hypothesised, that under
these conditions resultant increases in the expression of sucrases, aquaporins and
other sugar glucosidases would occur.
Furthermore previous studies have suggested that aphid saliva is important in
phloem conditioning (Ramirez and Niemeyer, 1999; Caillaud et al, 1995; Ponder et al,
2000; Hunt et al, 2009; Prado and Tjallingii, 1997; Will et al, 2007) and survivorship
(Mutti et al, 2006; 2008). It could therefore be hypothesised that saliva may play a
role in drought stress, and that under droughted conditions aphids may alter the
composition of saliva resulting in altered expression of salivary enzymes, such as
amylases, cellulases, pectinesterases, oxidases and dehyrogenases.
5.1.2 Microarray Technology
Microarrays consist of thousands of microscopic spots containing short
olignucleotides called ‘features’ that represent sections of genes, these are used as
probes to hybridise to target cDNA or cRNA samples under controlled conditions.
The samples are usually pre-labeled with fluorescence to allow for detection of

relative abundance of target within a sample. Microarray technology evolved from
Southern Blotting, and is used commonly today to detect and measure changes in
gene expression level or to detect single nucloetide polymorphisms (SNPs) in
genotyping. As microarrays contain thousands of probes, it means one single
experiment can achieve many genetic tests in parallel (Voelckel et al, 2004; Voelckel
and Baldwin, 2004). This has meant that special software and statistics have had to
be developed to deal with the sheer amount of data generated by microarrays.
Microarray technology allows thousands of probes to be tested simultaneously,
these probes could originate from an EST or cDNA library. Arrays can be designed so
that each feature represents a single gene. The technology means that the
experimenter can test for changes in thousands of genes between treatments. This
chapter will attempt to elucidate whether (and which) gene expression changes
underlie aphid responses to osmotic stress. This information will help to inform
determine whether aphids place an increased dependence on genetically controlled
osmoregulation mechanisms when fed on extremely droughted host plants. To
achieve this would require the screening of many genes, thus microarray technology
shall be used to analyse whole aphid body tissue, with ‘features’ representing an EST
library developed for M. persicae by Ramsey et al (2007).
Microarrays can be fabricated using a variety of technologies; the main two different
technologies are spotted arrays and oligonucleotide arrays. In spotted arrays the
probes can be oligonucleotides, cDNA or small PCR fragments, and can be
synthesised prior to being spotted onto the glass array surface. The advantage of this
technology is that it can be done ‘in house’ in a lot of labs, and is a relatively low-cost

way of studying gene expression without having other genes on the microarray of
no-interest to the researcher. The disadvantage of spotted arrays is that they may
experience printing inefficiencies and misalignment that can result in a lack of
specificity.
In oligonucleotide arrays, the oligonucleotides are synthesised directly onto the
array surface, instead of being deposited intact as in spotted arrays. With this
technology the sequences can be longer up to 60 mer with companies such as
Agilent. In this chapter Agilent oligonucleotide arrays were used, with the probes
synthesised from an EST library (Ramsey et al, 2007) as the genome of the aphid M.
persicae is yet to be sequenced.
Another variation in the technology is whether to use a one-dye/colour (one-
channel) or two dye/colour (two channel) experimental design. With both these
designs the sample cDNA is typically hybridised to a fluorescent label. The most
common fluorescent dyes are Cy 3 and Cy 5, containing cyanine. Cy 3 has an
emission of 570nm (corresponding to the green part of the spectrum) whereas Cy 5
has an emission wavelength of 670nm (corresponding to the red part of the
spectrum). In this project the dyes 555 and 647 were used, as the name suggests dye
555 had an emission wavelength of 555nm and corresponded to the green part of
the spectrum whereas, 647 had an emission of 647nm and corresponded the red
part of the spectrum. In two colour arrays the two fluorescently labeled cDNA
samples (control and treatment) are mixed together and hybridised to one single
microarray, which is then scanned in a microarray scanner to visualise the intensity
of fluorescence. Each sample in a two colour array will be labelled with a different

fluorescent dye. Therefore using Cy3 (green) and Cy5 (red) dyes as an example if
equal amounts of gene expression were found in the control and treatment samples,
then there would be equal amounts of hybridisation of fluorescently labelled cDNA
to the array, this would generate a yellow colour. If the spot on the array appeared
more red in colour then more cDNA labelled with Cy5 had bound to the spot,
showing a higher expression of gene product in that sample. Therefore the relative
intensities of each different fluorophore are used to determine ratios, which then
inform whether each gene was up-regulated or down-regulated from a comparison
between the intensities of control and treatment fluorescence. In one colour arrays
the design is more focused on giving an absolute level of gene expression, as
opposed to a measure of difference as in the two colour arrays. This is due to a single
dye being used per sample per array. The strength in one-colour arrays is that one
aberrant sample cannot affect the raw data from another sample. Another benefit is
that the data is generally more comparable to other experiments, even those
conducted years apart. A drawback is that twice as many arrays are needed for each
experiment.

Figure 5.1: Example of a two-colour/channel microarray experimental workflow taken from the NCBI website and an Affymetrix (single-channel) microarray experimental workflow also taken from the NCBI website

5.1.3 Quality Control in Microarray Design
The three most important factors to consider in array experiments are biological
replication, technical replication and spot replication. The custom designed arrays
that are being used in this experiment, contain duplicate probes of certain EST
sequences addressing spot replication, whilst cost limitations mean it will not be
possible to conduct technical replication in this chapter.
In two-colour experiments there are a number of different experimental designs to
consider (Stekel, 2003). These are:
1. Direct comparison: the results of two samples being directly compared via
hybridization to the same array
2. Reference Design: Each sample is compared to a standard reference that is
common to all arrays
3. Loop Design: comparisons which link together to form a loop allowing
indirect comparison between at least two other conditions i.e. A-B, B-C, C-A
Reference design is the most cost effective whilst loop designs and direct
comparisons are the most effective (Stekel, 2003). As this project involves two
different drought treatments and their relative controls the most effective design for
this experiment would be direct comparison.
Whilst there are some problems, which are unsolvable in the design process such as
the reliance on a genomic EST library to fully represent and be associated with every
gene there are other problems that can be avoided or catered for in the
experimental design. By adding in control probes on the array design it is possible to

check the degree of hybridization to assist in normalization of the other target
probes. This is achieved by mixing in RNA ‘Spike-ins’ with the samples to hybridise
with the control probes on the Agilent oligonucleotide arrays used in the project.
Another possible area of error is the binding affinity and resulting intensity of each of
the dyes. By alternating which dye hybridises with the control and treatment
samples this can be overcome, this is called dye swapping and a regular practice in
microarray design.
Dye incorporation rates, even with dye swapping techniques, can be an issue in
microarray design. A technique to overcome this is the conversion of complementary
DNA (cDNA) into amplified RNA (aRNA). Fluorescent dyes are easily incorporated
into aRNA with greater efficiency than into cDNA and mRNA, overcoming this
problem. Therefore in this study aRNA was used at the stage of dye incorporation.
Other control tools are the implementation of special statistical tests during
microarray analysis. When a significant gene list has been populated, the sheer
amount of genes being analysed can sometimes result in the probability of genes
being generated out of chance increasing. This is called the ‘false discovery rate’.
Statistical methods have been tailored to adjust for this such as the Bonferonni
correction, first used in a paper by Paulson (1952). The Bonferroni adjustment works
by lowering the alpha value (experiment error rate), as the number of comparisons
made increases. For an observation to be significant, the P value would be corrected
to be lower than 0.05 in respect to the increasing number of comparisons. This
makes it harder to claim a significant result and in so doing decreases the chance of
making a Type I error (false positive) to acceptable levels. However in doing this it

can make it too hard to claim a significant result, and the strictness of the test can
have the possibility of identifying genes as false positive, when in fact they are false
negatives (Type II error).
5.1.4 Chapter aims
This chapter aims to test if under drought stress aphids place an increased
dependence the sucrases, aquaporins and other sugar glucosidases as part of their
osmoregulation mechanisms, and if aphids alter saliva composition by changing the
abundance in expression of known salivatory associated proteins such as amylases,
pectinases etc.
At the end of this study we will have:
1. Examined gene expression of whole body tissue of Myzus persicae when fed
on well watered, mild and extremely droughted plant host Brassica nigra.
2. Studied changes in expression of predicted aquaporin, sucrase, amylase,
cellulase, glucosidase, oxidase, dehydrogenases and pectinesterase
sequences.
3. Used two different levels of drought stress to ascertain the threshold of
water stress needed to induce expression changes.
5.2 Methods and Materials
5.2.1 Aphids
M. persicae was from the Lab culture at The University of Birmingham. Culture is
kept at a constant temperature of 18oC under a 16:8h light cycle.

5.2.2 Plants
Brassica nigra seeds used in the experiments were seeds obtained from John
Chambers Wildflower Seeds Co. from wild seed stocks in Northamptonshire, UK. B.
nigra plants were potted up and grown in a plant quarantine room at the University
of Birmingham with a 16:8h light cycle at a temperature of 22oC. Growth room PAR
was between 80-120mol m-2 s-1 with a relative air humidity of 70-80%. Plants were
grown in John Innes peat based compost with mixed in Silvaperl in 150ml plastic
pots.
5.2.3 Aphid Treatments
Ten individual reproducing adult M. persicae were placed on B. nigra individuals
subjected to one of four treatment types (see below). Aphids had previously been
cultured on B. nigra for at least three generations in growth rooms. Aphids prior to
experimentation had been kept in relatively un-crowded colonies in bug dorms
under a 16:8h light cycles at 16-18oC. Aphids were left for 72 hours and then
removed and immediately frozen in microfuge tubes in liquid nitrogen for later total
RNA extraction.
The treatments were as follows:
Well watered (1) – Individual well watered B. nigra plants aged 23 days old
were exposed to approximately 5-10 adult M. persicae individuals each. After
72 hours these aphid individuals were removed for genetic analysis. B. nigra
plants had water available to them throughout the 72 hours of aphid
exposure.

Mild Drought – Individual B. nigra plants were grown for 20 days with
unlimited water supply. At 20 days plants experienced total water withdrawal
for 6 days. After the first initial 72 hours of drought plants were also exposed
to approximately 5-10 adult M. persicae individuals each that remained on
the plant for the final 72 hours of drought, after which the aphids were
removed for genetic analysis.
Well watered (2) – Individual well watered B. nigra plants aged 26 days old
were exposed to approximately 5-10 adult M. persicae individuals each. After
3 days these individuals were removed. B. nigra plants had water available to
them throughout the 3 days of aphid exposure.
Extreme Drought – Individual B. nigra plants were grown for 20 days with
unlimited water supply. At 20 days plants experienced total water withdrawal
for 9 days. After the first 6 days of drought plants were also exposed to
approximately 5-10 adult M. persicae individuals to each plant that remained
on the plant for the 3 days of drought, after which the aphids were removed
for genetic analysis.
During each treatment aphids did reproduce, however, only the original adult aphids
were removed from plants for extraction. For each treatment there were four
biological replicates used for array analysis, each replicate had the surviving aphids
grouped together from 2-3 B. nigra plants, totalling twelve plants used for each
treatment. In each replicate there were approximately 10-20 aggregated frozen
aphids.

5.2.4 RNA extraction
The frozen aphids were processed to remove the RNA using a TRIzol based total RNA
extraction (Ambion RiboPure™ Kit). The quality of the total RNA was evaluated using
A260/A280 ratios determined via a Nanodrop. Only RNA with a ratio value of 1.9 was
used. The RNA was also quantified by electrophoresis on the Agilent Bioanalyser.
RNA extractions used had to have 11 μl of RNA at a concentration ranging from 100-
1000ng and a RIN (RNA Integrity Number) number no lower than 5 to proceed, this
was to ensure the quality of the RNA was suitable to use for subsequent
amplification/conversion without sequence degradation.
5.2.5 cDNA conversion and aRNA synthesis
The isolated RNA was then converted into cDNA and then transcribed into aRNA
using the Ambion Amino Allyl MessageAmp™ II aRNA Amplification Kit. The kit
reverse transcribes the total poly(A) RNA into cDNA using a oligo(dT) primer
containing a T7 RNA polymerase promoter sequence. During second strand cDNA
synthesis the enzyme RNase H is added to cleave mRNA template into small
fragments which act as primers to produce the double-stranded cDNA. This cDNA is
purified to remove rRNA, mRNA and primers. The purified cDNA is then transcribes
into aRNA in vitro by Ambions MEGAscript® technology, with the additional
incorporation of amino allyl UTP’s. The above was all conducted following the
protocols set out in each of the kits.
5.2.6 Quantification check and Labelling
The resulting aRNA is quantified again using the NanoDrop to ensure aRNA presence.
The aRNA is then coupled to the dye using the protocol set out in Alexafuor 555 and

647 Reactive Dye Decapack. 5 μg of aRNA is then coupled to the NHS ester label dyes
555 (cy) and 647 (cy). This is done via aliquoting 5 μg into a new tube and placing in a
speed vac on low heat until dry. The chosen fluorescent dyes (555 and 647) were re-
suspended in 11µ l of DMSO, vortexed and kept in the dark at room temperature for
up to 1 hour. 9µl coupling buffer was used to re-suspend the dry RNA samples and
then the 11µl of re-suspended dye was added and left for 30 minutes in the dark at
room temperature. The coupling reaction is quenched with 4.5µl of 4M
hydroxylamine and incubated for 15 minutes in the dark at room temperature. To
this 5.5µl of pre-heated nuclease free water is added and the labelled aRNA is
purified, using the method and columns in the aRNA Amplification Kit. This labelled
aRNA once purified by the columns is then quantified again along with determining
A260/A280 ratios via a NanoDrop technology to ensure quality control. The
absorbance values read off the Nanodrop at 260nm and either 555nm or 647nm was
used to work out the dye incorporation rate for each sample. The dye incorporation
rate was calculated using the equation and information below. The dye
incorporation rate should be around 30-60 dye molecules/1000nt. If the samples did
not equate to the range of these values then the samples were not used in the next
step.
#dye molecules/1000nt = [(555nm OR 647nm absorbance value depending on dye
used)/Absorbance at 260nm] x [9010/dye extinction coefficient] x 1000
Dye 555 extinction co-efficient: 150000
Dye 647 extinction co-efficient: 239000

5.2.7 Fragmentation and Hybridisation to Array
The dye labelled aRNA is re-quantified to ensure there is at least 300ng in 9 μ l of dye
labelled aRNA for use in hybridisation, again using A260/A280 ratios quality control
was also enforced at this point using the NanoDrop.
The aRNA is ready for fragmentation and hybridisation to the Agilent custom chips.
The fragmentation involved 9.5µl of 300ng of 555 labelled control sample and 9.5µl
of 300ng 647 labelled treatment sample being mixed together along with 5µl 10X
blocking agent, 1µl 25x fragmentation buffer. This was incubated in a pre-heated
water bath at 60oC for 30 minutes. To stop the fragmentation reaction 25µl 2xGEx
Hybridisation Buffer HI-PRM was added. The samples were then placed on ice and
transferred for hybridisation to the Agilent service at Cornell University (NY, USA),
and this was followed by the proceeding scanning of the arrays. The chips used were
eight arrays chips, each array containing approximately 15,000 oligonucleotides
formed from a M. persicae EST library (Ramsey et al, 2007), and both treatment and
corresponding control were hybridised together in the two-dye experiment.
5.2.8 Data Analysis and Quality Control
As part of quality control the microarray chip used had 15744 features, of which
14555 features relate to M. persicae EST sequences from an EST database created by
Ramsey et al, 2007. There was a total of 1189 control features on each chip,
randomly distributed around the array that correspond to sequences in other
organisms. In addition, there were approximately 4000 repeated M. persicae
sequences on each array. Thus out of the 14555 EST features for M. persicae, there
were only 4000 features that were duplicated on the array and only 6555 features
that were not, totalling 10555 M. persicae EST sequences represented on each array.

The results from the microarray were imported into GeneSpring software and
background corrections were performed. All samples were normalised using the
method ‘loess’ before further analysis and subjected to basic quality control
parameters. To test if any samples were outside the mean of the other replicates of
the same treatment box plots were formed; it was found that one sample meet this
criteria and so one replicate for extreme drought was disregarded. Quality control
parameters on the remaining samples were; intensity values must be no lower than
100 and probes outside the range of 20-100% intensity, meaning that probes had to
give between 20-100% intensity to be used. In addition unless probes in 3/7 samples
were consistent then they were disregarded. This means that probes had to be
consistent in three out of three of my biological replicates for the extreme drought
treatment and at least three out of the four replicates for the mild drought
treatment. In addition a stdev< 1 filter was also applied. Statistical analysis was
conducted using the unequal t-test and probe lists were blasted on the NCBI
database for information on function. Where function was assigned, sequence
homology had to be 90% or more identical to the homologous sequence from the
NCBI database.
Due to the repetition of M. persicae EST sequences on each array, the Bonferroni
statistical correction was not used in the analysis. Although computing multiple t-
tests has risk of type I errors, the Bonferroni for this array comes with a high risk of
type II errors as it will be unable to take into account the duplicity of some of the EST
sequences on the array.

Phylogenetic analysis of significant genes was done using PhylomeDB (Huerta-Cepas
et al, 2008; http://phylomedb.org), a database that contains pregenerated
phylogenetic trees for each A. pisum aphid gene. The phylogenetic trees contain
paralog gene information obtained by sequencing data (International Aphid
Genomics Consortium, 2010) and information on homologous genes in other
arthropods with sequenced genomes (Huerta-Cepas et al, 2010; 2011). Investigation
into similarity and relatedness between EST sequences was done using ClustalW2
online software (http://www.ebi.ac.uk/Tools/clustalw2/) by EMBL-EBI, Wellcome
Trust Genome Campus, Cambridgeshire.

5.3 Results
5.3.1 Mild drought
5.3.1.1 Quality Control
Arrays for mild drought treatment were filtered using GeneSpring software selecting
only features that had intensities of 20-100% and a minimum fluorescence of 100.
Filtering removed 3862 features, which did not meet this criterion leaving 11882 for
further statistical analysis (fig 5.2). Box plots of means were also used to check that
none of the arrays for mild drought treatment were outside the means for the group
of samples. As a result all four arrays were used giving a biological replication of four
for the mild drought treatment.
Figure 5.2 Profile plot using GeneSpring software of adult M. persicae fed on B. nigra individuals subjected to the mild drought treatment defined in Chapter 2, data has been filtered to contain intensities 20-100% and a minimum fluorescence of 100. Each line represents a difference feature (EST probe) in a total of 11882, the colour scale indicates the degree of up regulation (red) or down regulation (blue)

5.3.1.2 Significant Genes
When the Bonferroni adjustment was applied in GeneSpring to array data, none of
the EST sequences were found to be significantly up or down regulated in M.
persicae in response to a mild drought treatment. The Bonferroni correction can also
be calculated manually online via the SISA Bonferroni correction tool
(www.quantitativeskills.com/sisa/calculations/bonfer.htm). An alpha value of 0.05
was used with N being the filtered number of probes (11882). The manual
calculation indicated that the Bonferroni correction would require the alpha value
for any one feature on the array to be lowered to 4.2E-6 in order to rule out a type I
error (aka false positive, when the statistical test rejects a true null hypothesis).
Consequently by using the Bonferroni correction in GeneSpring, only features that
have a significance value of 4.2E-6 would be considered as significantly altered
genes, of which none fitted this criterion.
However, if we were to calculate instead the potential number of false positive
genes that could occur by chance from a 0.05 alpha level in our 11882 filtered probes
(by simple multiplication), then we can estimate that there would be 594 features
that would appear significant but were actually the consequence of a type I error.
Statistical analysis without a Bonferroni correction in GeneSpring highlighted that
there were 736 feature spots (fig 5.3) that had significantly different intensities
between treatments according to an alpha level of 0.05. This indicates that in
applying the Bonferroni correction a type II error would occur (aka false negative,
when the test fails to reject a false null hypothesis), with potentially 141 genes being

classified as false positives by the correction when they are actually biologically
significant.
Furthermore, the 736 probe features highlighted as significant to an alpha level of
0.05 by GeneSpring (fig 5.3), contained 94 EST sequences that had duplicated spots
whereby both spots were found significant in the treatment. These duplicated spots
are therefore accountable for a total of 188 features out of the 736 highlighted by
GeneSpring.
Figure 5.3 Volcano plot using GeneSpring software of the expression of adult M. persicae fed on B. nigra individuals subjected to the mild drought treatment defined in Chapter 2, data has been filtered to contain intensities 20-100% and a minimum fluorescence of 100. Each square represents a different feature (EST probe), the red squares (736) represent each EST which was significantly (P=0.05) differentially expressed in individuals fed on droughted plant hosts than the controls whilst the green squares (11) are those significant to a P value of <0.001
As the Bonferroni cannot take into account the duplicity within the array, the data
has been analysed without the application of a Bonferroni correction, therefore,
where any probes are presented as being significant without their duplicate probes,

they are considered as false positives. Therefore any significant probes found to also
have high fold changes and be highly significant (<0.005) will be considered as
biologically significant regardless of the Bonferroni correction.
The 736 EST sequences highlighted as significant to an alpha level of 0.05 by
GeneSpring were blasted in NCBI and categorised according to predicted gene
functions. Genes were manually classified into the following categories (as the
genome of M. persicae is still unsequenced, and no GO Annotation has been made
for the EST sequences used in this microarray):
unknown function
aquaporins
amino acid processing/transport
sugar hydrolysis/transport
metabolism
sensory, nervous and hormonal messaging/control, oxygen transport, haemostasis and immunity
solute carriers/exchangers/transport, transmembrane proteins/receptors
DNA replication/transcription/translation and chromosome (dis)assembly, DNA-RNA interactions, chromosome interaction and regulation
Development and Growth
Aphid communication, defence and behaviour
Cell-cell communication, membrane formation and membrane trafficking
Analysis found (fig 5.4) that most of the EST sequences identified as significant were
of an unknown function (391 EST sequences). Furthermore, 94 EST sequences were
present with their duplicated features accounting for 188 out of the 736 EST
sequences found significantly altered in the mild drought treatment.

Conversely 135 EST sequences out of the 736 were found without their duplicate
probes, indicating type I errors within the analysis. Interestingly, no EST sequences
relating to aquaporins were found significantly altered in regulation between control
and mild drought treated aphids. Unsurprisingly, the category of
DNA/RNA/chromosome regulation and control represented the second largest group
of EST sequences found altered in response to mild drought stress, with 110 EST
sequences out of the 736 EST sequences found significantly altered. Amino acid and
sugar related EST sequences accounted for 46 significantly altered features, whilst
metabolism (including amino acid and sugar metabolism) accounted for 115
sequences out of the 736 found significantly altered.
Furthermore, only 11 EST sequences were directly related to stress, and these were
mostly cytochrome proteins (8 ESTs). Sensory, nervous and hormonal messaging
accounted for 20 EST sequences, whilst there were only 3 EST sequences directly
related to communication, behaviour and defence. However, it is worth being
cautious when interpreting these groups as some EST sequences may be related to
these categories but due to being dehyrogenases or DNA regulation proteins they
have been categorised into other categories above. This highlights one of the issues
with interpreting data without an automated GO analysis that can cross reference
every sequence.
Sequences related to solute movement, membrane proteins/receptors, cell
communication and membrane trafficking/formation accounted for 52 EST
sequences whilst EST sequences related to development, growth and movement
accounted for 34 out of the 736 significantly altered ESTs.

4% 2%9%
3%4%
15%
5%1%
54%
3%
0.4%amino acid processing, amino acid movement
sugar hydrolysis and metabolism
metabolism related: phosphorylation, hydrogenases, dehydrogenases, kinases, carboxylases etc
sensory, nervous system, hormonal messaging/control, oxygen acquisition/haemostasis/immunity
solute carriers/exchangers/transport of molecules/transmembrane proteins/membrane receptors
DNA replication/transcription/translation/chromosome (dis-)assembly/DNA-RNA interactions/chromosome interactions/regulation
development/growth/movement
stress
communication/defense/behaviour
unknown function
cell communication/membrane formation/membrane trafficking/signalling
Figure 5.4 Piechart showing portions of EST sequences found significantly altered in an expression microarray of adult M. persicae fed on B. nigra individuals subjected to the mild drought treatment defined in Chapter 2. The EST sequences found significantly (t-test, alpha value=0.05) up/down regulated between aphids on control and treatment host plants were blasted in NCBI and manually categorised according to function. The piechart shows the percentage each group occupied out of the 736 EST sequences.
5.3.2 Extreme drought
5.3.2.1 Quality Control
Arrays for extreme drought treatment were filtered using GeneSpring software in
the same way as the mild drought treatment. Filtering was set so that only features
which had intensities of 20-100% and a minimum fluorescence of 100 were left.
Filtering removed 3778 features that did not meet this criterion, leaving 11966
features for statistical analysis (fig 5.5). Box plots of means were also used to check
that none of the arrays for extreme drought treatment were outside the means for
the group of samples. As a result to prevent anomalous results later in analysis, one

array was removed from the group, as it was not within the group’s means, this gave
three biological replicates for the extreme drought treatment.
Figure 5.5 Profile plot using GeneSpring software of adult M. persicae fed on B. nigra individuals subjected to the extreme drought treatment defined in Chapter 2, data has been filtered to contain intensities 20-100% and a minimum fluorescence of 100. Each line represents a difference feature (EST probe) total of 11966, indicates the degree of up regulation (red) or down regulation (blue)
5.3.2.2 Significant Genes
When the Bonferroni adjustment was applied in GeneSpring to the extreme drought
array data, like the mild treatment, none of the EST sequences were found to be
significantly up or down regulated in M. persicae in response to the drought stress.
Using the online SISA Bonferroni correction tool
(www.quantitativeskills.com/sisa/calculations/bonfer.htm), the alpha value for any
one feature on the array would have to be lowered to 4.2E-6 in order to rule out a

type I error, this is based on N being the number of filtered probes (11966) after
quality control (fig 5.5). In addition, it was also estimated that in the 11966 filtered
array features there would be 598 that would appear significant but would be down
to chance and a consequence of a type I error.
Fig 5.6 Volcano plot using GeneSpring software of the expression of adult M. persicae fed on B. nigra individuals subjected to the extreme drought treatment defined in Chapter 2, data has been filtered to contain intensities 20-100% and a minimum fluorescence of 100. Each square represents a different feature (EST probe), the red squares (690) represent each EST which were significantly (P=0.05) differentially expressed in individuals fed on droughted plant hosts than the controls, whilst the green squares (15) are those significant to a P value of <0.001
However, statistical analysis in GeneSpring highlighted that there were 690 feature
spots (fig 5.6) that had significantly different intensities between treatments
according to an alpha level of 0.05. This indicates that in applying the Bonferroni
correction a type II error would occur, with potentially 91 genes being classified as
false positives by the correction when they are biologically significant.

Furthermore, out of the 690 probe features highlighted as significant to an alpha
level of 0.05 by GeneSpring, 52 EST sequences were present with their duplicate
spots. These duplicated spots are therefore accountable for a total of 104 features
out of the 690 highlighted by GeneSpring. As the Bonferroni correction cannot take
into account the duplicity within the array, as in the mild drought data, this data has
been analysed without a Bonferroni correction. In addition (as in mild drought data)
where any probes are presented as being significant without their duplicate probes,
they are considered as false positives. Additionally where significant probes have
high fold changes and are highly significant (<0.005)s then they will be considered as
biologically significant regardless of the Bonferroni correction.
The 690 EST sequences highlighted as significant to an alpha level of 0.05 by
Genespring were blasted in NCBI and categorised according to predicted gene
functions. EST sequences were manually classified into the same categories used in
analysis of the mild drought microarray data (see section 5.3.1.2).
Compared to the mild drought treatment (736) there were less EST sequences
significantly altered in expression level in the extreme drought treatment (690).
However, analysis found (fig 5.7) that like in the mild drought treatment most of the
EST sequences identified as significant were of an unknown function (341 EST
sequences). Additionally, 52 EST sequences were present with their duplicated
features accounting for 104 out of the 690 EST sequences found significantly altered
in the mild drought treatment.

4.9% 2.0%12.5%
3.0%2.6%
14.1%
5.4%
49.5%
3.5% 0.3%
1.6%0.6%aquaporinsamino acid processing, amino acid movementsugar hydrolysis and metabolismmetabolism related: phosphorylation, hydrogenases, dehydrogenases, kinases, carboxylases etcsensory, nervous system, hormonal messaging/control, oxygen acquisition/haemostasis/immunitysolute carriers/exchangers/transport of molecules/transmembrane proteins/membrane receptorsDNA replication/transcription/translation/chromosome (dis-)assembly/DNA-RNA interactions/chromosome interactions/regulationdevelopment/growthstresscommunication/defense/behaviourunknown functioncell communication/membrane formation/membrane trafficking
Figure 5.7 Piechart showing portions of EST sequences found significantly altered in an expression microarray of adult M. persicae fed on B. nigra individuals subjected to the extreme drought treatment defined in Chapter 2. The EST sequences found significantly (t-test, alpha value=0.05) up/down regulated between aphids on control and treatment host plants were blasted in NCBI and manually categorised according to function. The piechart shows the percentage each group occupied out of the 690 EST sequences.
Conversely, 96 EST sequences out of the 690 were found without their duplicate
probes, indicating like in analysis of the mild data that type I errors had occurred
within the analysis. Interestingly fewer ESTs without their duplicate probes were
found in the extreme drought treatment (96) than the mild drought treatment (135),
however, this may correlate with there being overall less EST sequences significantly
altered in expression levels in the extreme (690) than mild drought treatment (736).
Again the category of DNA/RNA/chromosome regulation and control represented
the second largest group of EST sequences found altered in response to mild drought

stress, with 97 EST sequences out of the 690 EST sequences found significantly
altered. Amino acid and sugar related EST sequences accounted for 48 significantly
altered features, whilst metabolism (including amino acid and sugar metabolism)
accounted for 134 sequences out of the 690 found significantly altered. Extreme
drought treatment therefore has a higher proportion of metabolism ESTs (19.4%)
significantly altered, than the mild drought treatment (15.6%).
Interestingly, exactly like the mild drought treatment only 11 EST sequences were
directly related to stress, although unlike the mild drought treatment only 2 were
cytochrome proteins, whilst 6 were heat shock proteins associated proteins.
Sensory, nervous and hormonal messaging accounted for 21 EST sequences, whilst
there were 4 EST sequence directly related to communication, behaviour and
defence. Sequences related to solute movement, membrane proteins/receptors, cell
communication and membrane trafficking/formation accounted for 42 EST
sequences, and EST sequences related to development, growth and movement
accounted for 37 out of the 690 significantly altered ESTs.
Interestingly, only in the extreme drought treatment were aquaporin related ESTs
significantly altered. Two features (duplicated probes) representing an EST sequence
for AQP1 Aquaporin were found significantly up regulated (probe: M_persicae2387a
P=0.045 and M_persicae2387b P=0.033, t-test) in the extreme treatment.
5.3.3 Comparison of treatments
Overall, the amount of significant ESTs in the extreme drought treatment was lower
then the mild treatment. However, the extreme drought treatment displayed more
(134) EST sequences involved in metabolism, and specifically in amino acid

processing (28 ESTs in mild treatment and 34 ESTs in extreme treatment), than the
mild drought treatment (115), although ESTs specifically involved in sugar
metabolism were reduced (18 ESTs in mild treatment and 14 ESTs in extreme
treatment) in the extreme drought treatment.
Significant EST sequences involved in DNA/RNA/chromosome regulation and control
were also more abundant in the mild treatment (110) than extreme drought
treatment (97). This may be related to the increase in metabolism related ESTs in the
drought treatment, indicating that a period under mild drought conditions may
trigger gene regulation pathways. These pathways may be involved in increasing
expression of metabolic related proteins, explaining the increase in abundance of
metabolism ESTs in the extreme drought treatment.
The difference in expression between treatments indicates that there is an effect of
the level of drought on gene expression in M. persicae. This is highlighted by absence
of any significantly altered aquaporin ESTs in the mild drought treatment, and
presence of an AQP1 EST aquaporin sequence in the extreme drought treatment.
Finally despite both mild and drought treated aphids expressing 11 stress associated
ESTs, the composition of ESTs in these categories varies between treatments, with
mild droughted aphids significantly expressing more cytochrome related ESTs and
drought stressed aphid expressing heat shock related ESTs (not found in significantly
altered in the mild drought treatment).

5.3.4 Candidate Genes
5.3.4.1 Identification
So far the analysis has indicated that aphids change gene expression in response to
the level of drought. The purpose of this study was to also evaluate if aphids change
the expression levels of genes potentially involved in osmoregulation, specifically
genes such as glucosidases, sucrases and aquaporins (Shakeby, et al 2009; Ashford et
al, 2000; Cristofoletti et al, 2003; Price, et al. 2007; Karley, et al 2005). In addition,
this study was to investigate if expression levels altered in salivatory related genes,
such as cellulases, glucosidases, oxidases, dehydrogenases and pectinesterase
(Cherqui and Tjallingii, 2000; Miles, 1999; Urbanska and Leszczynski, 1997; Hamel et
al, 2008).
To achieve this ESTs relating to these functions were searched for in the lists of
significant ESTs for both array datasets (mild and extreme drought treatment).
Interestingly, ESTs (M_persicae3682a/b, M_persicae3987; M_persicae8280;
M_persicae3812, M_persicae2868a/b) relating to three putative amylase genes
ACYPI007122, ACYPI007753, ACYPI009042 (respectively) were identified as
significantly increased (ACYPI007122 P<0.05FC:3.363/3.856 0.03FC:3.415; ACYPI007753
P=0.034FC:1.165; ACYPI009042 P<0.05FC:4.022 0.035FC: 8.215, t-test) in the extreme drought
treatment, but did not show changes in expression in the mild drought treatment.
Furthermore, a duplicated EST sequence (M_persicae2387a/b) relating to the
aquaporin AQP1 (ACYPI006387) was significantly up regulated only in the extreme
drought treatment (P<0.05FC:1.8-1.95, t-test).

Further analysis of the mild drought treatment found significant up regulation of aN
ortholog to the A. pisum gene ACYPI001296, encoding for a peroxisomal n1-acetyl-
spermine/spermidine oxidase (P<0.05FC:1.132, t-test), whilst a significant down
regulation (P<0.05~FC:1.25, t-test) was observed in ten EST probes (M_persicae15aP1-
10) for a NAD-dependent methanol dehydrogenase (similar to ACYPI009841).
These observations were not consistent in aphids subjected to an extreme drought
regime. Aphids under an extreme drought regime displayed no changes in
expression of oxidases, however, they did display a significant up regulation
(P<0.05FC:1.317, t-test) in an EST encoding an alcohol dehyrogenase similar to the A.
pisum gene ACYPI003387.
Whilst no alterations in expression levels of glucosidases were detected in either
treatment, one EST sequence related to the A. pisum sucrase gene ACYPI000002 was
significantly up regulated in the extreme drought treatment (P<0.05FC:1.5, t-test) and
down regulated in the mild drought treatment (P<0.05FC:1.6, t-test). However, in each
array there were a total of four EST sequence probes that showed orthology to the
A. pisum sucrase gene ACYPI000002 (M_persicae4022a/b, M_persicae7717,
M_persicae7867, M_persicae8379). Only one of these EST sequences wass
significantly (M_persicae8379) altered in this analysis may signify that M. persicae
has a family of paralogous sucrases which share homology to ACYPI000002,
conversely it could also indicate that this EST sequence is an artefact of a type I error
in the analysis.
Additionally, an EST sequence relating to the sucrase gene ACYPI001436 was also
found up regulated in aphids from the extreme drought treatment (P<0.05FC:1.785, t-
a/b: denoted duplicated probe
FC: Fold change on array

test) and down regulated in aphids from mild drought treatment (P<0.05FC:1.241, t-
test). As with ACYPI000002, ACYPI001436 was represented by two EST sequences
M_persicae10020 and M_persicae933, however only the EST M_persicae10020 was
found significantly altered in expression in the extreme drought analysis, whilst EST
M_persicae933 was found significantly altered in the mild drought analysis.
Although, these results support the data for ACYPI000002, that sucrase activity is
down regulated in aphids during the mild drought treatment and up regulated
during extreme drought treatment, these results also further raise the question of
whether these EST sequences are representative of one gene or multiple gene
paralogs.
To investigate the overlap between sucrase EST sequences, ClustalW2 (multiple
sequence alignment) online software was used; this software enables analysis
between EST sequences to determine the extent of EST sequence homology. If the
sucrase EST sequences used in this array overlap or share similarities with each other
then this will show up in the ClustalW2 analysis and EST sequences will score a high
alignment scoring. However, where alignment scores are low between the ESTs (eg
M_persicae10020 and M_persicae933, predicted to encode the sucrase gene
ACYPI001436 in A. pisum), then this would suggest that in M. persicae there is gene
redundancy and multiple paralogs of that gene. Alternatively, it may suggest that
the ESTs for ACYPI001436 encode different regions of the gene.
A phylogram tree created through ClustalW2 analysis showed that EST
M_persicae10020 predicted to encode ACYPI001436 and M_persicae7717 encoding
ACYPI000002 were closely related, unsurprisingly EST sequences M_persicae8279
a/b: denoted duplicated probe
FC: Fold change on array

and M_persicae7867 both predicted to encode ACYPI000002 were also closely
related (fig 5.8). In contrast the other EST predicted to encode ACYPI001436,
M_persicae933, was not closely related to M_persicae10020. Therefore, it can be
concluded that these EST sequences may encode different areas of a homologous
gene to ACYPI001436, or alternatively, may indicate that these ESTs represent two
sucrase gene orthologs of ACYPI001436. The latter is supported by observed
differential expression of each ESTs in the array, with M_persicae10020 was only
found significantly up regulated in the extreme drought analysis, whilst EST
M_persicae933 was only found significantly down regulated in the mild drought
analysis.
Figure 5.8 Phylogram tree of M. persicae ESTs created using online multiple sequence alignment software, ClustalW2 (http://www.ebi.ac.uk/Tools/clustalw2/). Tree shows the sequence homology between ESTs M_persicae10020 (sequence 1), M_persicae7717 (sequence 2), M_persicae8379 (sequence 3), M_persicae7867 (sequence 4), M_persicae933 (sequence 5) and M_persicae4022 (sequence 6). All EST sequences have predicted sucrase functions. M_persicae10020 and M_persicae933 share homology with the A. pisum gene ACYPI001436, whilst the other ESTs share sequence homology with A. pisum gene ACYPI000002. Alignment scores from ClustalW2 are as follows: Sequence 1:2=65, 1:3=56, 1:4=61, 1:5=69,1:6=45, 2:3=58, 2:4=56, 2:5=57, 2:6=69, 3:4=74, 3:5=74, 3:6=54, 4:5=58, 4:6=61, 5:6=64.
Finally, in the array there were differences in expression of amino acid metabolism
related genes between treatments. ESTs predicted to encode for ACYPI009247 a
homocysteine S-methyltransferase (M_persicae562a/b P<0.05FC:1.345, t-test),
ACYPI006227 an alanine-glyoxylate aminotransferase (M_persicae2724a/b
a/b: denoted duplicated probe
FC: Fold change on array
P<0.05FC:1.453, t-test), ACYPI004184 an amino acid transporter (M_persicae3389a/b
P<0.05FC:1.553, t-test), ACYPI000561 an alpha-aminoadipate aminotransferase
(M_persicae3127a/b P<0.05FC:2.676, t-test) and ACYPI007549 an trypsin-like serine
protease (M_persicae4618a P<0.05FC:1.33, t-test) were significantly up regulated in
the extreme drought treatment but absent from the mild drought treatment. Most
of these EST sequences featured duplicated spots on the array and were observed to
have both spots significantly up regulated.
5.3.4.2 Candidate Genes relationships (model A. pisum genome)
So far blasting the EST sequences from M. persicae in NCBI has enabled predicted
functions for around half the EST sequences contained on the array. However, using
PhylomeDB tree explorer means predicted M. persicae sucrase and amylase
sequences can be compared against other gene orthologs within the A. pisum
genome and in other arthropods species (Huerta-Cepas et al, 2008; 2010; 2011;
International Aphid Genomics Consortium, 2010).
Phylogenetic analysis using PhylomeDB can provide an insight into the size and
diversity of the amylase and sucrase family in A. pisum. This information will be
important for predicting the diversity and similarity of these genes within M.
persicae.
Analysis of a pre-generated phylogenetic tree containing the A. pisum alpha amylase
gene ACRYPI007122 (homologous to EST sequences significantly up regulated in
extreme drought treated M. persicae), showed that the amylase gene family (in A.
pisum) was very closely related to the sucrase gene family (fig 5.9). Analysis showed
a/b: denoted duplicated probe
FC: Fold change on array

A. pisum has nine paralogous alpha amylase genes (ACYPI005645, ACYPI006558,
ACYPI003132, ACYPI007122, ACYPI002724, ACYPI009754, ACYPI001772,
ACYPI009042 and ACYPI007753). Four of these genes were detected with sequence
homology in the M. persicae EST database, ACYPI007122, ACYPI002724,
ACYPI009042 and ACYPI007753. Additonally, three of these genes (ACRYPI007122,
ACYPI009042 and ACYPI007753) were found to alter in response to extreme drought
stress in M. persicae.
Furthermore, phylogenetic analysis revealed A. pisum has seven sucrase paralogs
(ACYPI001436, ACYPI007467, ACYPI000002, ACYPI009924, ACYPI002020,
ACYPI003310 and ACYPI002659), of which two of these were detected with
sequence homology to sequences in the M. persicae EST database (ACYPI001436,
and ACYPI000002), both of which were found to significantly alter in both mild and
extreme drought treatment.
The presence of multiple paralogous amylase and sucrase genes within the A. pisum
genome leads to the suggestion that M. persicae may also have further paralogs that
are yet to be uncovered. Alternatively, A. pisum may be unique in the Aphididae
family with the extent of gene redundancy in amylases. Interestingly, this analysis
has shown that alpha amylase and sucrase genes in A. pisum are closely related
phylogenetically, and this information may help to explain the unexpected increase
in alpha amylase expression in drought stressed in M. persicae.

Figure 5.9 Phylogenetic tree generated using PhylomeDB (http://phylomedb.org) showing amylase and sucrase genes in A. pisum and orthologs in other organisms. Genes with sequence homology to M. persicae ESTs are circled blue; genes with sequence homology to M. persicae ESTs and found with altered expression in response to drought stress in M. persicae are circled red. Names for genes were pre-generated by PhylomeDB, thus a translation to gene names in NCBI with a summary of gene function is given for the following: Phy000YR5Z=ACYPI054809 Glean peptide; Phy0010I28=ACYPI001436 sucrase; Phy0010de8=ACYPI007467 sucrase; Phy000XQ9A=ACYPI000002 sucrase; Phy0010BH8= ACYPI009924 sucrase; Phy0010HM6=ACYPI002020 sucrase; Phy0010ET4=ACYPI005645 alpha-amylase; Phy0010E3R=ACYPI006558 alpha-amylase; Phy0010GR7=ACYPI003132 alpha-amylase; Phy0010DNU=ACYPI007122 alpha-amylase; Phy0010H2M=ACYPI002724 alpha-amylase; Phy0010BM0=ACYPI009754 alpha-amylase; Phy0010C8B=ACYPI008964 CG14935; Phy0010HSY=ACYPI001772 alpha amylase; Phy0010G0A= ACYPI004099 alpha-glucosidase isozyme; Phy000XPOV=ACYPI000732 CG14935; Phy0010GM9=ACYPI003310 sucrase; Phy0010C62=ACYPI009042 alpha-amylase; Phy0010D61=ACYPI007753 alpha-amylase; Phy0008AA8=Human basic amino acid transport protein; Phy000XPNN= ACYPI000768 GA13362 and Phy0010H4E=ACYPI002659 sucrase

5.4 Discussion
Unfortunately, the genome for M. persicae is not yet fully sequenced and the use of
an EST library (Ramsey et al, 2007) in this study means that there is the possibility
that not all the genes in M. persicae genome have been represented in the array. It is
also a possibility that there may be redundancy in the EST sequences on the array,
with multiple EST sequences representing one gene.
Despite this, analysis of array data has shown that M. persicae alters gene expression
in response to the level of water stress. For example, an M. persicae EST encoding
the putative aquaporin, ApAQP1, was significantly up regulated in aphids undergoing
the extreme drought treatment, but absent from those undergoing a mild drought
treatment. Interestingly, ApAQP1 was originally identified in A. pisum, and was
localised to the stomach and distal intestine area, where it was suggested to function
in maintaining haemolymph osmotic pressure (Shakesby et al, 2009). The data in this
chapter has indicated that ApAQP1 plays an important role in the aphid response to
drought stress. In this study ApAQP1 expression was increased in response to
extreme drought stress in M. persicae. Therefore, this study supports the hypothesis
that water cycling may be an important osmoregulation mechanism in aphids. An
RNAi knockout of ApAQP1 in drought stressed M. persicae followed by a
measurement of aphid performance would enable an assessment of the importance
of water cycling, and ApAQP1 in osmoregulation, which currently the data in this
chapter can only speculate on.
Additionally, aphids also heterogeneously expressed stress related genes depending
on the level of drought experienced. Heat shock transcripts were only up regulated

in M. persicae experiencing extreme drought through their plant host. Heat shock
proteins are a class of proteins that are involved in the unfolding and folding of
proteins, their expression is usually increased in the heat shock response or in
response to other stresses. In two resistant cotton varieties, heat shock protein
(HSPs) homologs were increased in expression in response to water deficit. One of
the presumed functions of HSPs is that they prevent protein denaturation during
cellular dehydration (Nepomuceno et al, 2002). Furthermore, HSPs have been found
to be increased in expression in other organisms, with water stress inducing the
production of heat-shock genes in parasitic protozoa and arthropods (Petersen and
Mitchell, 1985; Van der Ploeg et al, 1985). The increased expression of HSPs in
extremely droughted M. persicae suggests that under severe drought aphids may
utilise HSPs to prevent protein denaturation. However, this would have to be further
investigated.
Interestingly, heterogeneous expression was also observed between treatments for
cytochrome proteins. Eight cytochrome proteins were up regulated in aphids on
mildly droughted hosts, whilst only two were up regulated in aphids on extremely
droughted hosts. This emphasises that aphids are able to distinguish levels of
drought and adjust expression accordingly. This may partly explain the adaptability
of aphids to drought stress, and why aphid fecundity was only reduced by a
maximum of 37% (in B. brassicae) on extremely droughted hosts (in chapter four).
Cytochromes are membrane-bound hemoproteins that carry out electron transport
and contain heme groups. The cytochromes that were up regulated in M. persicae
during this study were mainly cytochrome P450 oxidase proteins, which function as

oxidising catalysts (monooxygenases) and are the largest and most functionally
diverse class of insect detoxification enzymes (Scott, 1999; Li et al, 2007). Studies
have shown that cytochrome P450 (P450), in M. persicae resistant clones, mediate
detoxification of neonicotinoid insecticides (Puinean et al, 2010). Moreover, it has
been estimated that the P450 gene family in M. persicae is around 40% larger than
that of the sequenced A. pisum (Ramsey et al, 2010). This expansion of P450s is
believed to reflect the host range of M. persicae, which feeds on 40 different plant
families, and requires a greater variety of detoxification enzymes compared to A.
pisum, which only feeds on the plant family Fabaceae. Thus, as P450s are typically
associated with toxicity stress, it is interesting that P450s were found increased more
under mild drought stress than under extreme drought. It may be that under mild
drought the host plant B. nigra responds to drought stress by activating stress
pathways that influence leaf toxicity, resulting in an increase in P450s in M. persicae.
Under extreme drought B. nigra may divert more resource allocation specifically to
osmoregulation mechanisms resulting in less P450s being up regulated in aphids
feeding on extremely droughted B. nigra plants. However, to confirm any of this
speculation further investigation into B. nigra leaf toxicity under water stress would
be required.
Increased salivation in the literature is associated with overcoming plant defences
and reduced palatability in host plants (Ramirez and Niemeyer, 1999; Caillaud et al,
1995; Ponder et al, 2000; Hunt et al, 2009; Hale et al, 2003; Prado and Tjallingii,
1997; Will et al, 2007). Recently there have been many studies attempting to
elucidate the composition of aphid saliva. In Sitobion avenae, oxidoreductases

(polyphenol oxidase and peroxidase) have been found in the gelling saliva forming
the aphid’s stylet sheath, whilst polyphenol oxidase has been located in watery saliva
(Urbanska et al, 1998). Oxidoreductases have been suggested to function in
mediating oxidative detoxification of plant allelochemicals or promoting the gelling
of the sheath protein (Carolan et al, 2009). Additionally, phosphatases have been
putatively identified in the saliva of the Russian wheat aphid, Diuraphis noxia, using
gel electrophoresis and mass spectrophotometry. In D. noxia, other peptides were
also identified as putative dehydrogenases and RNA helicases from their similarities
to ESTs identified from other aphids (Cooper et al, 2010). In A. pisum, a homolog of
an angiotensin-converting enzyme (an M2 metalloprotease), an M1 zinc-dependant
metalloprotease, a glucose-methanol-choline-oxidoreductase and a homolog to
regucalcin (a putative calcium-binding protein) have been identified in saliva.
Furthermore, metalloproteases and regucalcin have been predicted as functioning
by inactivating plant protein defences and inhibiting the calcium-mediated occlusion
mechanism in phloem sieve elements (respectively) (Carolan et al, 2009).
Earlier in this chapter it was hypothesised that aphids may potentially alter saliva
composition in response to drought. If aphid salivation composition alters as a
response to drought then it could be expected that differential expression levels in
M. persciae salivatory associated genes such as amylases, cellulases, glucosidases,
oxidases, dehydrogenases and pectinesterase (Cherqui and Tjallingii, 2000; Miles,
1999; Urbanska and Leszczynski, 1997; Hamel et al, 2008) would be observed.
However, the microarray data gathered in this chapter showed no significant
changes in the expression of pectinesterases, cellulases or glucosidases.

In contrast, there were some oxidases and dehydrogenases that were up regulated
heterogeneously between the two drought treatments. A peroxisomal n1-acetyl-
spermine/spermidine oxidase was significantly up regulated in the mild drought
treatment whilst ten EST probes (M_persicae15aP1-10) for a NAD-dependent
methanol dehydrogenase (similar to ACYPI009841) were significantly down
regulated. Interestingly, none of these genes were altered in expression levels in the
extreme drought treatment, furthermore, aphids under an extreme drought regime
displayed no changes in expression of any oxidases. However, an EST encoding an
alcohol dehyrogenase similar to the A. pisum gene, ACYPI003387, was up regulated
in aphids under the extreme drought treatment.
Peroxisomal n1-acetyl-spermine/spermidine oxidase is a polyamine oxidase, which
oxidises spermine involved in cellular metabolism, whilst methanol dehydrogenase
catalyses methanol into formaldehyde and participates in methane metabolism.
Interestingly, in plant cells of sycamore, Acer pseudoplatanus, methanol has been
shown to be metabolised to serine, methionine, and phosphatidylcholine (Gout et al,
2000). Methanol dehydrogenase may play a similar role in aphids.
Although the differential expression of these genes highlights that aphids must
perceive the level of drought, and adapt expression levels accordingly, the protein
products from these genes may not be exclusively expressed in saliva. Without tissue
localisation experiments, it is impossible to conclude if the saliva composition has
altered under drought. It is possible that the alterations in expression levels of these
dehydrogenases and oxidases, are in fact an artefact of other changes in metabolism
relating to osmoregulation.

Interestingly, analysis of amylase expression provides the most support for the
hypothesis of aphids having an alternative salivation composition in response to
drought stress. The enzyme α-amylase catalyses the hydrolysis of 1, 4-alpha-D-
glucosidic linkages in oligosaccharides and polysaccharides (Hamel et al, 2009). In
honeybees, amylase is thought to be needed to convert plant starch (found in
nectar) into glucose, which can then be converted in gluconic acid (Ohashi et al,
1999). Alpha-amylase has also been found with glucosidase in mosquito salivary
glands (Effio et al, 2003) and in the saliva of M. persicae (Harmel et al, 2008).
Unlike dehydrogenases and oxidases, there are fewer putative amylases found in the
EST library of M. persicae, this may be because amylase is involved in fewer
pathways. This study has shown that M. persicae under an extreme drought
treatment significantly increased the expression of three putative amylase genes.
Furthermore, phylogenetic analysis shows that amylase genes in A. pisum are closely
related to sucrase genes.
In the pea aphid, Acyrthosiphon pisum, sucrase activity has been localised to the gut,
distal to the stomach (Ashford et al, 2000; Cristofoletti et al, 2003). Gut sucrase APS1
in A. pisum was shown to have an α-glucosidase activity to form the hexose units for
oligosaccharide synthesis (Price, et al. 2007). Phylogenetic analysis has shown A.
pisum has seven sucrase genes, of which, two orthologs were detected up regulated
in M. persicae fed on extremely droughted plants. This indicates that sucrase and
amylases play important roles in M. persicae osmoregulation, in their role in
breaking down sugars into hexose units for polymerisation into polysaccharides.

Finally, around half of the genes found in both treatments to be significantly
up/down regulated were of an unknown function. Although it is beyond the scope of
this study to elucidate the function of these genes, they should not be disregarded.
Recently, C002 a salivatory protein of unknown function, has been identified as
having a significant effect on aphid survivorship (Mutti et al, 2006; 2008). This
demonstrates that there is still a lack in the body of knowledge surrounding gene
functions in aphids. However, despite this it is hoped the data in this study will aid in
any further investigation into the function of some of these genes. Additionally as
the focus of this chapter has been to study the changes in gene expression in relation
to osmoregulation and salivary processes, the results found here would require
further validation by RT-PCR, particularly for the sequences relating to predicted
sucrases and aquaporins.
In summary, this chapter has helped us to identify and confirm genes that are
induced under drought stress, enabling us to start to understand a response that is
very complex, with many functions still unknown. The increased expression of
sucrases and the ApAQP1 aquaporin, under drought stress, supports the current
hypothesis of sugar polymerisation and water cycling as important aphid
osmoregulation mechanisms. In addition, this chapter has highlighted that the level
of drought plays an important role in observed expression changes. Therefore, it is
suggested that for future comparative studies it is important for the same level of
drought to be adopted.

Chapter 6: General Discussion

6.0 Discussion
The complexity of the plant-aphid interaction was highlighted at the beginning of
this thesis. Ultimately, how it responds to stressors will depend on the species in the
interaction and the influences of past experience, environmental and social cues.
This study set out to establish if the response of the plant-aphid interaction was
predictable, or whether there was variation in aphid behavioural, reproductive and
transcriptomic responses to drought.
Currently, there are conflicting hypothesises on how aphids might respond to
drought and the predictability of this relationship. The plant-stress hypothesis states
that plant defences may become reduced in water stressed plants and that drought
induced composition changes may make them more palatable or susceptible to
herbivory. In support of this hypothesis are a number of studies (Wearing, 1967;
Wearing and van Emden, 1967; Miles et al, 1982; Oswald and Brewer, 1997)
recorded in the literature, however, there are a number of studies that support an
alternative notion.
This notion is that the osmotic stress resulting from drought will result in resource
re-allocation from growth and reproduction into osmoregulation mechanisms.
Therefore, aphid performance would be reduced. In addition, drought induced
changes in the plant host may make the host less palatable to aphid herbivores, for
instance changes in sugar/pH gradients may result in aphids facing difficulty in
locating the phloem. In support of this hypothesis there has also been a number of
studies (Larsson, 1989; Pons and Tatchell, 1995; Bethke et al, 1998; Honěk et al,
1998; Kennedy et al, 1958; Kennedy and Booth, 1959) recorded in the literature.

So far the differences observed in these studies may be attributable to the
differences in the level and duration of water stress imposed, or to the variation
between species and genotypes. In order to establish if these differences are
attributed to the level and duration of water stress, this thesis set out to establish a
droughting regime that was repeatable in two plant species, Brassica nigra and
Lolium perenne and to test the responses of four aphids species. Chapter two
defined a mild and extreme drought regime, in extreme drought both B. nigra and L.
perenne showed altered levels of ions and amino acids, increased reducing sugar
concentrations and fresh weight: dry weight ratios of <6. Interestingly,
transcriptomic analysis showed that the level of drought affected gene expression of
Myzus persicae feeding on drought treated Brassica nigra. Under mild drought
treatment, cytochromes associated with detoxification (Scott, 1999; Puinean et al,
2010) were abundantly upregulated, and this observation was absent in extreme
drought. However, under extreme drought Heat Shock Proteins (HSPs) were
abundantly upregulated, and again this observation was not observed in the mild
drought treatment. HSPs have the predicted function of preventing protein
denaturation during cellular dehydration, and so this seems to be a response to
osmotic stress, whilst the upregulation of cytochrome may be a response to drought
triggered plant defences.
It was predicted that to cope with the extreme level of drought established in
chapter two, aphid species would have to utilise their well evolved array of
osmoregulation mechanisms. These mechanisms under normal conditions allow
aphids to cope with diets that have three-fold greater osmotic pressures than their

haemolymph. These mechanisms have been identified as sugar polymerisation,
xylem feeding, water cycling and production of metabolic water.
Subsequent analysis of these mechanisms in this thesis showed they were not
utilised homogenously under water stressed conditions. Upon plant contact and
initial probing, Brevicoryne brassicae and Myzus persicae (B clone) placed a greater
bearing upon behavioural osmoregulatory mechanisms such as water acquisition
from the xylem.
In the field aphids may behaviourally attempt to avoid water stressed hosts spatially,
by migration. Whilst it was beyond the scope of this thesis to assess the extent
aphids simply avoid drought stress spatially. If it was shown that in Rhopalosiphum
padi, Brevicoryne brassicae and two clones of Myzus persicae (O and B clone),
drought resulted in reduced sieve element sap ingestion and significantly more time
spent not-probing plant tissue. These results suggest that aphids are unsettled on
droughted hosts, and if subsequent field studies were conducted, we may find these
species behaviourally avoided droughted hosts by migration.
When aphids are faced with no host alternative, adaption to water stress may be an
upregulation of enzymes associated with sugar polymerisation, arguably the most
important osmoregulation mechanism in aphids. If aphids have the ability to
upregulate sugar polymerisation enzymes then, despite aphids feeding on an
osmotically extreme diet, they may still have an adaptive capability to withstand
further osmotic stress.

It is thought that sugar polymerisation of sieve element sap in aphids is mediated by
sucrase enzymes that hydrolyse sucrose into glucose and fructose units (Wilkinson et
al, 1997; Ashford et al, 2000; Cristofoletti et al, 2003). These units can then be
polymerised into oligosaccharides of low osmotic pressure per hexose unit (Rhodes
et al, 1997), inhibition of sucrase activity has been shown to result in aphids being
unable to control haemolymph water potential (Karley et al, 2005). The results of
this thesis showed that sucrases in M. persicae are upregulated in response to
extreme drought stress, indicating that aphids have the potential physiological
plasticity to cope with drought stress.
Furthermore, the upregulation of a putative aquaporin ApAQP1 in extreme drought
treated M. persicae highlighted that water cycling is also important in the aphid’s
response to drought stress. ApAQP1 has been demonstrated to increased osmotic
water permeability and play an important role in maintaining the osmotic pressure
of the haemolymph (Shakesby et al, 2009). The upregulation of ApAQP1 in M.
persicae indicates that like with sucrases, there is regulation of these mechanisms
and that the genes controlling them are not expressed at stress threshold levels
under normal conditions.
However, aphid adaptability appears to vary between species, with some species
exhibiting more plasticity then others. Aphid performance in response to water
stress has also been shown to vary depending on the clone of aphid. The results of
this thesis showed that fecundity was reduced in both M. persicae clones but only
significantly in green (O) clones, which displayed a reduction of 19% whilst red (B)
clones of M. persicae displayed a reduction of 9%. Studies into development rates of

aphid species have shown that variation in growth and development rate can occur
within the species M. persicae, Sitobion avenae, Aphis craccivora and Acyrthosiphon
pisum (Edwards, 2001; Sandström, 1994; Sunnucks et al, 1998). Additionally field
studies have also shown that aphid clones can proliferate differentially during the
summertime (Tomiuk and Woehrman, 1981; Haack et al, 2000). Whilst other studies
regarding clonal temperature tolerance have shown clonal variation in response to
stress is not unusual (Alford et al, 2011; Powell and Bale, 2005).
In conclusion aphids are highly adaptable to their mode of feeding. Water stress is
without a doubt generally detrimental to aphid hosts, but its’ affect on aphids
depends heavily on the level of water stress experienced as much as the aphid
species and clone. In fecundity experiments in this chapter, fecundity was reduced in
all species; M. persicae, S. avenae, R. padi and B. brassicae. However, fecundity was
only significantly reduced in R. padi, B. brassicae and the M. persicae green (O) clone.
Furthermore, the percentage reduction in fecundity varied between species, with
the specialist B. brassicae showing a reduction of 37% compared to 19% and 9% in
the two M. persicae clones (O and B clone respectively), this is despite both species
being exposed to a similar drought level on the same host plant.
So far our study has shown that the plasticity in adaption to water stress in different
aphid species, is dependant on the ability to upregulate sugar polymerisation,
increase aquaporin expression to increase water cycling, or even the ability of an
aphid to locate the xylem. Furthermore, this study has shown that the response of
the plant-aphid interaction is predictable only in the sense that an extreme level of
drought is detrimental to aphid performance. However, under varying levels of

drought, and with different aphid-plant combinations, this thesis suggests that the
response of the aphid-plant interaction is not predictable. This is due to the different
responses of plant hosts to drought stress, and the differential adaptability and
preference for certain osmoregulation mechanisms in aphid clones and species.
Finally, although this study has found some convincing behavioural and genetic
evidence in support of some of the aphid osmoregulation mechanisms, there were
still many genes in M. persicae that were found significantly upregulated in response
to drought stress, but of an unknown function. These genes demonstrate that there
is a lack in the body of knowledge, with an unknown gene recently being identified
as vital for survivorship (Mutti et al, 2006; 2008). If the work in this thesis was
continued then an obvious route would be gene cloning and use of RNAi to knockout
function, in the hope to reveal the importance and function of some of these
unknown genes.

Chapter 7: References

7.0 References
Agele, S. O., Ofuya, T. I. and James, P. O. (2006) Effects of watering regimes on aphid
infestation and performance of selected varieties of cowpea (Vigna unguiculata L.
Walp) in a humid rainforest zone of Nigeria. Crop Protection 25, 73-78
Åhman, I. (1990) Plant surface characteristics and movements of two Brassica-
feeding aphids, Lipaphis erysimi and Brevicoryne brassicae. In: Symposia Biologica
Hungaria No. 39. Publishing House of Hungarian Academy of Sciences, Budapest,
119-125
Ajayi, O. and Dewer, A. M. (1982) The effect of barley yellow dwarf virus on
honeydew production by the cereal aphids, Sitobion avenae and Metopolophium
dirhodum. Annals of Applied Biology 100, 203-212
Alford, L., Blackburn, T. M. and Bale, J. S. (2011) Effects of acclimation and latitude
on the activity thresholds of the aphid Myzus persicae in Europe. Journal of Applied
Entomology
Alvarez, A. E., Tjallingii, W. F., Garzo, E., Vleeshouwers, V., Dicke, M and Vosman, B.
(2006) Location of resistance factors in the leaves of potato and wild tuber-bearing
Solanum species to the aphid Myzus persicae. Entomologia Experimentalis et
Applicata 122, 145-157
Amman, G.D. (1970) Phenomena of Adelges piceae populations (Homoptera:
Phylloxeridae) in North Carolina. Annals of the Entomological Society of America 63
(6), 1727-1734
Annan, B. I., Schaefers, G. A., Tingey, W. M. and Tjallingii, F. W. (1997) Effects of
treatments for electrical penetration graph recordings on behaviour and biology of
Aphis craccivora (Aphididae). Physiological Entomology 22, 95-101

Aranda, I., Castro, L., Pardos, M., Gil, L. and Pardos, J. A. (2005) Effects of the
interaction between drought and shade on water relations, gas exchange and
morphological traits in cork oak (Quercus suber L.) seedlings. Forest Ecology and
Management 210, 117–129
Ashenden, T. W., Stewart, W. S. and Williams, W. (1974) Growth responses of sand
dune populations of Dactylis glomerata L. to different levels of water stress. Journal
of Ecology 63, 97-107
Ashford, D. A., Smith, W. A. and Douglas, A. E. (2000) Living on a high sugar
diet: the fate of sucrose ingested by a phloem-feeding insect, the pea aphid
Acyrthosiphon pisum. Journal of Insect Physiology 46, 335-342
Aspelmeier, S. and Leuschner, C. (2003) Genotypic variation in drought response of
silver birch (Betula pendula): leaf water status and carbon gain. Tree Physiology 24
(5), 517-528
Auclair, J. L. (1958) Honeydew excretion in the pea aphid, Acyrthosiphon pisum
(Harr.) (Homoptera: Aphididae). Journal of Insect Physiology 2, 330-337
Auclair, J. L. (1963) Aphid feeding and Nutrition. Annual Review of Entomology 8,
439-490
Auclair, J. L., Maltais, J. B. and Cartier, J. J. (1957) Factors in resistance to the pea
aphid Acyrthosiphon pisum. Canadian Entomology 89, 457-464
Awmack, J. L., Harrington, R., Leather, S. R. and Lawton, J. H. (1996) The impacts of
elevated CO2 on the aphid-plant interactions. In: Froud Williams, R. J., Harrington, R.,
Hocking, T. J., Smith, H. G. and Thomas, J. H. (eds) Implications of ‘Global
Environmental Change’ for Crops in Europe. Aspects of Applied Biology 47, 317-322

Awmack, C. S., Harrington, R. and Leather, S. R. (1997) Host plant effects on the
performance of the aphid Aulacorthum solani (Homoptera: Aphididae) at ambient
and elevated CO2. Global Change Biology 3, 545-549
Balch, R. E. (1952) Studies of the balsam woolly aphid, Adelges piceae (Ratz.)
(Homoptera: Phylloxeridae) and its effects on balsam fir, Abies balsamea (L.) Mill.—
Canadian Department of Agriculture Publication ( 867), 1-76
Baron, R. L., Guthrie, F. E. (1960) A quantitative and qualitative study of sugars found
in tobacco as affected by the green peach aphid, Myzus persicae, and its honeydew.
Annals of the Entomological Society of America 53, 220-228
Baumann, P., Moran, N. A. and Baumann, L. (1997) The evolution and genetics of
aphid endiosymbionts. BioScience 47 (1), 12-21
Bethke, J. A., Redak, R. A. and Schuch, U. K. (1998) Melon aphid performance on
chrysanthemum as mediated by cultivar, and differential levels of fertilisation and
irrigation. Entomologia Experimentalis et Applicata 88, 41-47
Birch, L. C. (1948) The intrinsic rate of increase of an insect population. Journal of
Animal Ecology 17, 15-26
Blackman, R. L. and Eastop, V. F. (1984) Aphids on the World’s Crops: An
Identification and Information Guide. Wiley, Chicester, 466
Blackman, R. L. and Eastop, V. F. (2007) Taxomomic Issues. In: Aphids as Crops Pests,
Eds. van Emden and Harrington. CAB International, 1-30
Broadbent, L. (1951) Aphid excretion. Proceedings of the Entomological Society of
London 26, 97-103
Brodbeck, B. and Strong, D. (1987) Amino acid nutrition of herbivorous insects and
stress to host plants. Insect Outbreaks, Academic Press, San Diego, California, 347-
364

Bonal, D. and Guehl, J. M (2001) Contrasting patterns of leaf water potential and gas
exchange responses to drought in seedlings of tropical rainforest species. Functional
Ecology 15, 490-496
Boyke, E. V., Smith, C. M., Thara, V. K., Bruno, J. M., Deng, Y., Starkey, S. R. and
Klaahsen, D. L. (2006) Molecular Basis of Plant Gene Expression During Aphid
Invasion: Wheat Pto- and Pti-Like Sequences Are Involved in Interactions Between
Wheat and Russian Wheat Aphid (Homoptera: Aphididae). Journal of Economic
Entomology 99 (4), 1430–1445
Brady Hanson, B., Lindblom, S. D., Loeffler, M. L. and Pilon-Smits, E. L. H. 2004.
Selenium protects plants from phloem-feeding aphids due to both deterrence and
toxicity. New Phytologist 162: 655-662
Bray, E. A., Bailey-Serres, J. and Weretilnyk, E. (2000) Responses to Abiotic Stress.
Biochemistry & Molecular Biology of Plants, Chapter 22, 1159-1160
Bromley, A. K., Dunn, J. A. and Anderson, M. (1980) Ultrastructure of the antennal
sensilla of aphids II. Trichoid, chordotonal and campaniform sensilla. Cellular and
Tissue Research 205, 493-511
Campbell, N. A. and Reece, J. B. (2002) Plant Diversity I: How Plants Colonised Land.
Biology (Sixth Edition), Chapter 29, 575-596
Cardoza, Y. J., Reidy-Crofts, J. and Edwards, O. R. (2005). Differential inter- and intra-
specific defense induction in Lupinus by Myzus persicae feeding. Entomologia
Experimentalis et Applicata 117, 155–163
Caillaud, C.M., Di Pietro, J. P., Chaubet, B. and Pierre, J. S. (1995). Application of
discriminant analysis to electrical penetration graphs of the aphid Sitobion avenae
feeding on resistant and susceptible wheat. Journal of Applied Entomology 119, 103–
106
Cane, V. (1961) Some ways of describing behaviour. In: Current Problems in Animal
Behaviour (eds) Thorpe, W. H. and Zangwill, O. L., Cambridge University Press, 361-
388

Cannon, R. J. C. (1984) The development rate of Metopolophium dirhodum (Walker)
(Hemiptera: Aphididae) on winter wheat. Bulletin of Entomological Research 74, 33-
46
Carolan, J. C., Fitzroy, C. I. J., Ashton, P. D., Douglas, A. E. and Wilkinson, T. L. (2009)
The secreted salivary proteome of the pea aphid Acyrthosiphon pisum characterised
by mass spectrometry. Proteomics 9, 2457-2467
Castle, S.J. and Berger, P. H. (1993) Rates of growth and increase of Myzus persicae
on virus-infected potatoes according to type of virus-vector relationship.
Entomologia Experimentalis et Applicata 69, 51-60
Cernusak, L. A., Arthur, D.J., Pate, J.S. and Farquhar, G.D. (2003). Water relations link
carbon and oxygen isotope discrimination to phloem sap sugar concentration in
Eucalyptus globules. Plant Physiology 131, 1544–1554
Chamberlain, K., Guerrieri, E., Pennacchio, F., Pettersson, J., Pickett, J. A., Poppy, G.
M., Powell, W., Wadhams, L. J. and Woodcock, C. M. (2001) Can aphid-induced plant
signals be transmitted aerially and through the rhizosphere? Biochemical Systemics
and Ecology 29, 1063-1074
Chaves, M. M., Maroco, J. P. and Pereira, J. S. (2003) Understanding plant responses
to drought – from genes to the whole plant. Functional Plant Biology 30, 239-264
CCIRG: Climate Change Impacts Review Group (1991) The Potential Effects of Climate
Change in the United Kingdom. HMSO Publications, London.
Clarke, H. Newton, P. C. D. and Baker, D. J. (1999) Physiological and morphological
responses to elevated CO2 and a soil moisture deficit of temperate pasture species
growing in an established plant community. Journal of Experimental Botany 50, 233-
242
Cobain, A. J. (1961) Water relations of Aphis fabae Scop. during tethered flight.
Journal of Experiemental Biology 38, 175-180

Cooper, W. R., Dillwith, J. W. and Puterka, G. J. (2010) Salivary Proteins of Russian
Wheat Aphid (Hemiptera: Aphididae). Environmental Entomology 39 (1), 223-231
Couldridge, C., Newbury, J. H., Ford-Lloyd, B., Bale, J. and Pritchard, J. (2007)
Exploring plant responses to aphid feeding using a full Arabidopsis microarray reveals
a small number of genes with significantly altered expression. Bull Entomological
Research 97 (5), 523-32
Cristofoletti, P. T., Ribeiro, A. F., Deraison, C, Rhabe, Y., Terra, W. R. (2003) Midgut
adaptation and digestive enzyme distribution in a phloem feeding insect, the pea
aphid Acyrthosiphon pisum. Journal of Insect Physiology 49, 11-24
Dakhma W.S., Zarrouk M., and Cherif A. (1995) Effects of drought-stress on lipids in
rape leaves. Phytochemistry 40 (5), 1383-1386
Daniels, M., Bale, J. S., Newbury, H. J., Lind, R. J., Pritchard, J (2009) A sublethal dose
of thiamethoxam causes a reduction in xylem feeding by the bird cherry-oat aphid
(Rhopalosiphum padi), which is associated with dehydration and reduced
performance. Journal of Insect Physiology 55, 758–765
Dedryver, C. A., Le Ralec, A. and Fabre, F. (2010) The conflicting relationships
between aphids and men: a review of aphid damage and control strategies. Comptes
Rendus Biologies 333 (6-7), 539-553
Delp, G., Gradin, T., Ahman, I. and Jonsson, L. M. V. (2008) Microarray analysis of the
interaction between the aphid Rhopalosiphum padi and host plants reveals both
differences and similarities between susceptible and partially resistant barley lines.
Mol Genet Genomics
Deuschle, K., Funck, D., Hellmann, H., Daschner, K., Binder, S. and Frommer, W
(2001) A nuclear gene encoding mitochondrial δ-pyrroline-5-carboxylate
dehydrogenase and its role in protection from proline toxicity. The Plant Journal 27,
345-356

Diaz-Montano, J., Reese, J. C., Louis, J., Campbell, L. R. and Schapaugh, W. T. (2007)
Feeding behavior by the soybean aphid (Hemiptera: Aphididae) on resistant and
susceptible soybean genotypes. Journal of Economic Entomology 100 (3), 984-9
Divol, F., Vilaine, F., Thibivilliers, S., Amselem, J., Palauqui, J. C., Kusiak, C. and Dinant,
S. (2005) Systemic response to aphid infestation by Myzus persicae in the phloem of
Apium graveolens. Plant Molecular Biology 57:517–540
Dixon, A. F. G. (1987) Parthenogenetic reproduction and the rate of increase in
aphids. Aphids, their Biology, Natural Enemies and Control. Volume A, Elsevier,
Amsterdam, 197-207
Dixon, A. F. G. (1998) Aphid Ecology. Chapman and Hall, London, 300
Dixon, A. F. G. and Glen, D. M. (1971) Laboratory studies on aggregation, size and
fecundity in the black bean aphid, Aphis fabae Scop. Bulletin of Entomological
Research 61, 97-111
Douglas, A. E. (2003). The nutritional physiology of aphids. Advances in Insect
Physiology 31, 72-140
Douglas, A.E., Price D. R. G., Minto, L. B., Jones E., Pescod, K. V., Francois,
C. L. M. J., Pritchard, J. and Boonham, N. (2006) Sweet problems: insect
traits defining the limits to dietary sugar utilisation by the pea aphid,
Acyrthosiphon pisum. Journal of Experimental Biology 209, 1395-1403
Douglas, A. E. (2006) Phloem sap feeding by animals: problems and
solutions. Journal of Experimental Botany 56, 747-754
Downing, N. (1978) Measurements of the osmotic concentrations of stylet sap,
haemolymph and honeydew from an aphid under osmotic stress. Journal of
Experimental Biology 77, 247-250

Dugravot, S., Brunissen, L., Létocart, E., Tjallingii, W. F., Vincent, C., Giordanengo, P.
and Cherqui, A. (2007) Local and systemic responses induced by aphids in Solanum
tuberosum plants. Entomologia Experimentalis et Applicata 123, 271-277
Edwards, O. R. (2001) Interspecific and intraspecific variation in the performances of
three pest aphid species on five grain legume hosts. Entomologia Experimentalis et
Applicata 100, 21-30
Effio, P. C., Folgueras-Flatschart, A. V., Montor, W. R., Pernasetti, F. M., Pueyo, M. T.
and Sogayar, M. C. (2003) Expression of functional Anopheles merus α-amylase in the
baculovirus/Spodoptera frugiperda system. Insect Molecular Biology 12, 415–425
Fenton, B. (2010) Origin of Myzus persicae red clones obtained from SCRI. Email
correspondence with Vickers, L. H.
Ferrari, F., Müller, C. B., Kraaijeveld, A. R., Godfray, C. J. H. (2001) Clonal variation
and covariation in aphid resistance to parasitoids and a pathogen. Evolutions 55 (9),
1805-1814
Fidantsef, A. L., Stout, M. J., Thaler, J. S., Duffey, S. S., Bostock, R. M. (1999) Signal
interactions in pathogen and insect attack: expression of lipoxygenase, proteinase
inhibitor II, and pathogenesis-related protein P4 in the tomato, Lycopersicon
esculentum. Physiological and Molecular Plant Pathology 54: 97-114
Fisher, D. B., Wright, J. P., Mittler, T. E. (1984) Osmoregulation by the aphid Myzus
persicae: a physiological role for honeydew oligosaccharides. Journal of Insect
Physiology 30, 387-393
Forrest, W. A. (1970) The effects of maternal and larval experience on morph
determination in Dysaphis devecta. Journal of Insect Physiology 15, 2179-2201

Gabryś, B. J., Gadomski, H. J., Klukowski, Z., Pickett, J. A., Sobota, G. T., Wadhams, L.
J. and Woodcock, C. M. (1997) Sex pheromone of cabbage aphid, Brevicoryne
brassicae: Identification and field trapping of male aphids and parasitoids. Journal of
Chemical Ecology 23 (7), 1881-1890
Gabryś, B. J. and Pawluk, M. (1999) Acceptibility of different species of Brassicaceae
as hosts for the cabbage aphid. Entomologia Experimentalis et Applicata 91, 105-109
Garzo, E., Palacios, I., Martin, B. and Fereres, A. (2001). The virus aphid transmission
resistance (Vat) gene in melon (Cucumis melo) germplasm: Properties and proposed
mode of action. Recent research developments in Plant Biology 1, 71-81
Garzo, E., Soria, C., Gomez-Guillamon, M. L. and Fereres, A. (2002) Feeding behavior
of Aphis gossypii on resistant accessions of different melon genotypes (Cucumis
melo). Phytoparasitica 30, 129-140
Girousse, C. and Bournoville, R. (1994) Role of phloem sap quality and exudation
characteristics on performance of pea aphid grown on lucerne genotypes.
Entomologia et Applicata 70, 227-235
Girousse, C., Bournoville, R. and Bonnemain, J. L. (1996) Water deficit-induced
changes in concentrations of proline and some other amino acids in the phloem sap
of alfalfa. Plant Physiology 111, 109-113
Golawska, S. (2007) Deterrence and Toxicity of Plant Saponins for the Pea Aphid
Acyrthosiphon Pisum Harris. Journal of Chemical Ecology 33:1598–1606
Gonz´ales, W. L., Ram´ırez, C. C., Olea, N. and Niemeyer, H. M. (2002). Host plant
changes produced by the aphid Sipha flava: consequences for aphid feeding
behaviour and growth. Entomologia Experimentalis et Applicata 103: 107–113

Good, A. G. and Zaplachinski, S. T. (1994) The effects of drought stress on free amino
acid accumulation and protein synthesis in Brassica napus. Physiologia Plantarum 90
(1), 9–14
Gould, N., Thorpe, M. R., Minchin, P. E. H., Pritchard, J. and White, P. J. (2004) Solute
is imported to elongating root cells of barley as a pressure driven-flow of solution.
Functional Plant Biology 31, 391–397
Gout, E., Aubert, S., Bligny, R., Rébeillé, F., Nonomura, A. R., Benson, A. A. and
Douce, R. (2000) Metabolism of Methanol in Plant Cells. Carbon-13 Nuclear Magnetic
Resonance Studies. Plant Physiology 123, 287-296
Gratwick, M. (1992) Crop Pests in the UK – Collected Edition of MAFF Leaflets.
Chapman and Hall, London.
Grüber, K. and Dixon, A. F. G. (1988) The effect of nutrient stress on development
and reproduction in an aphid. Entomologia Expermentalis et Applicata 47, 23-30
Haack, L., Simon, J. C., Gauthier, J. P., Plantegenest, M. and Dedryver, C. A. (2000)
Evidence for predominant clones in a cyclically parthenogenetic organism provided
by combined demographic and genetic analyses. Molecular Ecology 9, 2055-2066
Haglund, B. M. (1980) Proline and valine - cues which stimulate grasshopper
herbivory during drought stress? Nature 288, 697-698
Hardie, J. (1989) Spectral specificity for targeted flight in the black bean aphid, Aphis
fabae. Journal of Insect Physiology 35, 619-626
Hardie, J., Holyoak, M., Taylor, N. J. and Griffiths, D. C. (1992) The combination of
electronic monitoring and video-assisted onservations of plant penetration by aphids
and behavioural effects of polygodial. Entomologia Experimentalis et Applicata 62,
233-239
Hardie, J. and Powell, G. (2000) Close-up video combined with electronic monitoring
of plant penetration and behavioural effects of an aphid (Hemiptera: Aphididae)

antifeedant. In: G. P. Walker, E. A. Backus (eds) Principles and Applications of
Electronic Monitoring and Other Techniques in the Study of Homopteran Feeding
Behaviour. Thomas Say Publications in Entomology: Proceedings of the Symposium
at the XIX International Congress of Entomology, Beijing, China. 201-211
Hardie, J., Visser, J. H. and Piron, P. G. M. (1994) Perception of volatiles associated
with sex and food by different forms of black bean aphid, Aphis Fabae. Physiological
Entomology 19, 278-284
Hare, P., Cress, W. and van Staden, J. (1999) Proline synthesis and degradation: a
model system for elucidating stress-related signal transducation. Journal of
Experimental Botany 50, 413-434
Harmel, N., Létocart, E., Cherqui, A., Giordanengo, P., Mazzucchelli, G., Guillonneau,
F., De Pauw, E., Haubruge, E. and Francis, F. (2008). Identification of aphid salivary
proteins: a proteomic investigation of Myzus persicae. Insect Molecular Biology 17,
165-174
Harrewijn, P. (1972) Wing production by the aphid Myzus persicae related to
nutritional factors in potato plants and artificial diets. In: Rogriguez, J. (eds) Insect
and Mite Nutrition. North-Holland, Amsterdam, 575-588
Hazell, S. P., McClintock, I. A. D. and Fellowes, M. D. E. (2006) Intraspecific heritable
variation in life-history traits can alter the outcome of interspecific competition
among insect herbivores. Basic and Applied Ecology 7, 215-223
Hale, B. K., Bale, J. S., Pritchard, J., Masters, G. J. and Brown, V. K. (2003). Effects of
host plant drought stress on the performance of the bird cherry-oat aphids,
Rholalosiphum padi (L.): a mechanistic analysis. Ecological Entomology 28, 666-677
Hendrix, D. L., Wei, Y. A. and Leggett, J. e. (1992) Homopteran honeydew sugar
composition is determined by both the insect and plant species. Comparative
Biochemistry and Physiology 101b, 23-27
Hewer, A., Will, T. and van Bel, A. J. E. (2010) Plant cues for aphid navigation in
vascular tissues. Journal of Experimental Biology 213, 4030-4042

Hill, D. S. (1997) The Economic Importance of Insects. Chapman and Hall, London.
Hille Ris Lambers, D. (1960) Some notes on morph determination in aphids.
Entomologie Berlin 20, 110-113
Holopainen, J. K., Kainulainen, P. and Oksanen, J. (1997) Growth and reproduction of
aphids and levels of free amino acids in Scots pine and Norway spruce in an open-air
fumigation with ozone. Global Change Biology 3, 139-147
Honěk, A. (1991) Environment stress, plant quality and abundance or cereal aphids
(Hom., Aphididae) on winter wheat. Journal of Applied Entomology 112, 65-70
Hori, M. (1999) Role of host-plant odours in the host-finding behaviours of aphids.
Applied Entomology and Zoology 34, 293-298
Howe, G. and Jander, G. (2008). Plant immunity to insect herbivores. Annual Review
Plant Biology 59: 41-66
Hubbard, C. E. (1984) Grasses: A guide to their structure, identification, uses and
distribution in the British Isles. Third Edition, Penguin Books, 149
Huerta-Cepas, J., Bueno, A., Dopazo, J. and Gabaldón, T. (2008) PhylomeDB: a
database for genome-wide collections of gene phylogenies. Nucleic Acids Research
36, 491-6
Huerta-Cepas, J., Marcet-Houben, M., Pignatelli, M., Moya, A. and Gabaldón, T.
(2010) The pea aphid phylome: a complete catalogue of evolutionary histories and
arthropod orthology and paralogy relationships for Acyrthosiphon pisum genes.
Insect Molecular Biology 19 (2), 13-21
Huerta-Cepas, J., Capella-Gutierrez, S., Pryszcz, L. P., Denisov, I., Kormes, D.,
Marcet-Houben, M. and Gabaldón, T. (2011) PhylomeDB v3.0: an expanding

repository of genome-wide collections of trees, alignments and phylogeny-based
orthology and paralogy predictions. Nucleic Acids Research 39, 556-60
Hulme, M., Turnpenny, J. R. and Jenkins, G. J. (2002) Climate change scenarios for
the United Kingdom: the UKCIP02 briefing report. Tyndall Centre for Climate Change
Research, Norwich, UK, 15.
Hunt, E., Gattolin, S., Newbury, J., Bale, J. S., Tseng, H-M., Barrett, D. A. and
Pritchard, J. (2009). A mutation in amino acid permease AAP6 reduces the amino
acid content of the Arabidopsis sieve elements but leaves aphid herbivores
unaffected. Journal of Experimental Botany 61, 55-64
International Aphid Genomics Consortium (2010) Genome sequence of the pea
aphid Acyrthosiphon pisum. PLoS Biology 8 (2)
IPCC (2007) IPCC Fourth Assessment Report. Climate Change 2007: Synthesis Report.
Geneva, Switzerland.
Jackson, R. B., Sperry, J. S. and Dawson, T. E. (2000) Root water uptake and
transport: using physiological processes in global predictions. Trends in Plant Science
5, 482-488
Jones, F. G. W. and Jones, M. G. (1974) Pests of Field Crops, 2nd Edition. London:
Edward Arnold, 448
Kaloshian, I., Kinsey, M. G., Williamson, V. M. and Ullman, D. E. (2000) Mi-mediated
resistance against the potato aphid Macrosiphum euphorbiae (Hemiptera:
Aphididae) limits sieve element ingestion. Environmental Entomology 29, 690–695
Karley, A. J., Ashford, D. A., Minto, L. B., Pritchard, J. and Douglas, A. E.
(2005). The significance of gut sucrase activity for osmoregulation in the pea
aphid, Acyrthosiphon pisum. Journal of Insect Physiology 51: 1313-1319

Kazana, E., Pope, T. W., Tibbles, L., Bridges, M., Pickett, G. A., Bones, A. M., Powell, G.
and Rossiter, J. T. (2007) The cabbage aphid: a walking mustard oil bomb.
Proceedings of the Royal Society of Biology 274, 2271-2277
Kennedy, J. S. and Booth, O. (1959) Response of Aphis fabae Scop. to water shortage
in host plants in the field. Entomologia Experimentalis et Applicata 2, 1-11
Kennedy, J. S., Booth, O. and Kershaw (1963a) Host finding by aphids in the field I.
Gynoparae of Myzus persicae (Sulzer). Annals of Applied Biology 47, 410-423
Kennedy, J. S., Booth, O. and Kershaw (1963b) Host finding by aphids in the field II.
Aphis fabae Scop. gynoparae and Brevicoryne brassicae L,; with a re-apprasial of the
role of host0finidng behaviour in virus spread. Annals of Applied Biology 47, 424-444
Kennedy, G. G. and Kishaba, A. N. (1977) Response of alatae melon aphids to
resistant and susceptible muskmelon lines. Journal of Economic Entomology 70, 407-
410
Kennedy, J. S., Lamb, K. P. and Booth, C. O. (1958) Responses of Aphis fabae Scop. to
water shortage in host plants in pots. Entomologia Experimentalis et Applicata 1,
274-291
Kennedy, J. S. and Mittler, T. E. (1953) A method of obtaining phloem sap via the
mouthparts of aphids. Nature 171, 528
Khalil, A. and Grace, J. (1992) Acclimation to drought in Acer pseudoplatanus L.
(sycamore) seedlings. Journal of Experimental Botany 43, 1592-1602
Kift, N. B., Dewar, A. M., Werker, A. R. and Dixon, A. F. G. (1996) The effect of plant
age and infection with virus yellows on the survival of Myzus persicae on sugar beet.
Annuals of Applied Biologyt 129, 371-378
Kim, J. H. and Jander, G. (2006) Myzus persicae (green peach aphid) feeding on
Arabidopsis induces the formation of a deterrent indole glucosinolate. The Plant
Journal 49, 1008–1019

Kirk, W. G. J. (1992) Insects on cabbages and oilseed rape. Naturalists Handbook 18,
Richmond Publishing Co. Ltd, 1-6
Kizis, D., Lumbreras, V. and Pagés, M. (2001) Role of AP2/EREBP transcription factors
in gene regulation during abiotic stress. FEBS Letters 498, 187-189
Klingler, J., Powell, G., Thompson, G. A. and Isaacs, R. 1998. Phloem specific aphid
resistance in Cucumis melo line AR5: effects on feeding behaviour and performance
of Aphis gossypi. Entomologia Experimentalis et Applicata 86: 79–88
Klingler, J., Creasy, R., Gao, L., Nair, R. M., Calix, A. S., Jacob, H. S., Edwards, O. R. and
Singh, K. B 2005. Aphid Resistance in Medicago truncatula Involves Antixenosis and
Phloem-Specific, Inducible Antibiosis, and Maps to a Single Locus Flanked by NBS-LRR
Resistance Gene Analogs. Plant Physiology 137, pp. 1445–1455
Kus´nierczyk, A., Winge, P., Midelfart, H., Armbruster, S. W., Rossiter, W. T. and
Bones, A. M. 2007. Transcriptional responses of Arabidopsis thaliana ecotypes with
different glucosinolate profiles after attack by polyphagous Myzus persicae and
oligophagous Brevicoryne brassicae. Journal of Experimental Botany 58(10):2537-
2552
Kus’Nierczyk, A., Winge, P., JØrstad, T. S., Troczyn’ Ska, J., Rossiter, J. T. and Bones, A.
M. (2008) Towards global understanding of plant defence against aphids – timing
and dynamics of early Arabidopsis defence responses to cabbage aphid (Brevicoryne
brassicae) attack. Plant, Cell and Environment 31, 1097-1115
Lankau, R. A. (2007) Specialist and generalist herbivores exert opposing selection on
a chemical defense. New Phytologist 175, 176-184
Lankau, R. A. and Strauss, S. Y. (2008) Community complexity drives patterns of
natural selection on a chemical defense of Brassic nigra. America Nature 171 (2),
150-61
Larsson, S. (1989) Stressful times for the plant stress-insect performance hypothesis.
Oikos 56, 277-283

Leather, S. R. (1987) Generation specific trends in aphid life history parameters.
Journal of Applied Entomology 104, 278-284
Leather, S. R. and Dixon, A. F. G. (1982) Secondary host preferences and reproductive
activity of the bird cherry-oat aphid, Rhopalosiphum padi. Annuals of Applied Biology
101, 219-228
Leather, S. R., Ward, S. A. and Dixon, A. F. G (1983) The effect of nutrient stress on
life history parameters of the black bean aphid Aphis fabae Scop. Oecologia 57, 156-
157
Leather, S. R. and Dixon, A. F. G. (1984) Aphid growth and reproductive rates.
Entomologia Experimentalis et Applicata 35, 137–140
Leckstein, P. M. and Llewellyn, M. (1973) Effect of dietary amino acids on the size
and alary polymorphism of Aphis fabae. Journal of Insect Physiology 20, 877-885
Lees, A. D. (1960) The role of photoperiod and temperature in the determination of
parthenogenetic and sexual forms in the aphid Megoura viciae Buckton – II. The
operation of the ‘interval timer’ in young clones. Journal of Insect Physiology 4, 154-
175
Lees, A. D. (1961) Aphid Clocks. New Scientist 355, 148-150
Lees, A. D. (1963) The role of photoperiod and temperature in the determination of
parthenogenetic and sexual forms in the aphid Megoura viciae Buckton – III. Further
properties of the maternal switching mechanism in apterous aphids. Journal if Insect
Physiology 9, 153-164
Lees, A. D. (1964) The location of the photoperiodic receptors in the aphid Megoura
viciae Buckton. Journal of Experimental Biology 41, 119-133

Lee, J. H., Van Montagu, M. and Verbruggen, N. (1999) A highly conserved kinase is
an essential component for stress tolerance in yeast and plant cells. Proceedings of
the National Academy of Sciences USA 96, 5873-5877
Levitt, J (1972) Responses of plants to Environmental Stresses. Academic Press New
York, Physiological Ecology series, 569-665
Lewis, A. C. (1982) Leaf wilting alters a plant species ranking by the grasshopped
Melanoplus differentialis. Ecological Entomology 7, 391-395
Li, Y., Hill, C. B. and Hartman, G. L. (2004) Effect of three resistant soybean genotypes
on the fecundity, mortality, and maturation of soybean aphid (Homoptera:
Aphididae). Journal of Economic Entomology 97 (3), 1106-11
Li, X., Schuler, M. A. and Berenbaum, M. R. (2007) Molecular mechanisms of
metabolic resistance to synthetic and natural xenobiotics. Annual Review of
Entomology 52, 231-53
Liu, W., Fairbairn, D. J., Reid, R. J., Schachtman, D. P. (2001) Characterisation of two
HKT1 homologues from Eucalyptus camaldulensis that display intrinsic osmosensing
capability. Plant physiology 127, 283-294
Lösel, P. M., Guerin, P. M. and Diehl, P. A. (1992) Feeding electrogram studies on the
African cattle brown ear tick Rhipicephalus appendiculatus: evidence for an
antifeeding effect of tick resistant serum. Physiological Entomology 17, 342-350
Loxdale, H. D., Brookes, C. P. and Wynne, I. R. (1998) Genetic variability within and
between English populations of the damson-hop aphid, Phorodon humuli
(Hemiptera: Aphididae), with special reference to esterases associated with
insecticide resistance. Bulletin of Entomological Research 88, 513-526

Luan, S. (1998) Protein phosphatase and signalling cascade in plants. Trends in Plant
Science 3, 271-275
Marchetti, E., Civolani, S., Leis, M., Chicca, M., Tjallingii, W. F., Pasqualini, E. and
Baroni, P. (2009) Tissue location of resistance in apple to the rosy apple aphid
established by electrical penetration graphs. Bulletin of Insectology 62, 203-208
Mauch-Mani, B. and Métraux, J. P. (1998) Salicyclic Acid and Systemic Acquired
Resistance to Pathogen Attack. Annals of Botany 82, 535-540
McLean, D. L. and Kinsey, M. G. (1968) Probing behaviours of the pea aphid
Acrythosiphon pisum II: comparison of salivation and ingestion in host and non-host
plant leaves. Annals of the Entomological Society of America 61, 730-739
McVean, R. I. K. and Dixon, F. G. (2001). The effect of plant drought-stress on
populations of the pea aphid Acrythosiphon pisum. Ecological Entomology 26, 440-
443
Mesfin, T., Den Hollander, J. and Markham, P. G. (1995) Feeding activities of
Cicadulina mbila (Hemiptera: Cicadellidae) on different host-plants. Bulletin of
Entomological Research 85, 387-396
Messina, F. J., Taylor, R., and Karren, M. E. 2002. Divergent responses of two cereal
aphids to previous infestation of their host plant. Entomologia Experimentalis et
Applicata 16, 43–50
Miles, P. W., Aspinall, D. and Rosenberg, L. (1982) Performance of the Cabbage
Aphid, Brevicoryne brassicae (L.), on water stressed rape plants, in relation to their
changes in chemical composition. Australian Journal of Zoology 30, 337-345
Miles, P. W. (1999) Aphid Saliva. Biological Reviews of the Cambridge Philosphical
Society 74, 41-85

Mittler, T. E. (1957) Studies on the feeding and nutrition of Tuberolachnus saligans
(Gmelin). I. The uptake of phloem sap. Journal of Experimental Biology 34, 334-341
Mittler, T. E. (1958) The excretion of honeydew by Tuberolachnus salignus (Gemlin)
(Homoptera: Aphididae) II: the nitrogen and sugar composiotn of ingested phloem
sap and excreted honeydew. Journal of Experimental Biology 35, 74-84
Mittler, T. E. and Meikle, T. (1991) Effects of dietary sucrose concentration on aphid
honeydew carbohydrate levels and rates of excretion. Entomologia Experimentalis et
Applicata 59, 1-7
Monchois, V., Willemot, R. M. and Monsan, P. (1999) Glucansucrases: mechanism of
action and structure-function relationships. FEMS Microbiology Rev. 23, 131-151
Montllor, C. B., Campbell, B. C. Mittler, T. E. (1983) Natural and induced differences
in probing behaviour of two biotypes of the green bug, Schizaphis graminum, in
relation to resistance in sorghum. Entomologia Experimentalis et Applicata 34, 99-
106
Moran, P. J., Cheng, Y., Cassell, J. L. and Thompson, G. A. (2002). Gene Expression
Profiling of Arabidopsis thaliana in Compatible Plant-Aphid Interactions. Archives of
Insect Biochemistry and Physiology 51:182–203
Müller, C., Williams, I. and Hardie, J. (2001) The role of nutrition, crowding and
interspecific interactions in wing development in aphids. Ecological Entomology 26,
330-340
Muriel P, Downing T, Hulme M, Harrington R, Lawlor D, Wurr D, Atkinson C J,
Cockshull K E, Taylor D R, Richards A J, Parsons D J, Hillerton J E, Parry M L, Jarvis S C,
Weatherhead K, Jenkins G. (2000) Climate Change and Agriculture in the United
Kingdom. UK Ministry of Agriculture, Fisheries and Food, DEFRA
Mutti, N. S., Park, Y., Reese, J. C. and Reeck, G. R. (2006). RNAi knockdown of a
salivary transcript leading to lethality in the pea aphid, Acyrthosiphon pisum. Journal
of Insect Science, 6 (38), 1-7

Mutti, N. S., Louis, J., Pappan, L. K., Pappan, K., Begum, K., Chen, M. S., Park, Y.,
Dittmer, N., Marshall, J., Reese, J. C. and Reeck, G. R. (2008) A protein from the
salivary glands of the pea aphid, Acyrthosiphon pisum, is essential in feeding on a
host plant. Proceedings of the National Academy of Science USA 105 (29), 9965-9969
Najla, S., Vercambre, G. and Genard, M. (2010). Improvement of the enhanced
phloem exudation technique to estimate phloem concentration and turgor pressure
in tomato. Plant Science 179 (4), 316-324
Nault, L. R. (1997) Arthropod transmission of plant viruses: A new synthesis. Annals
of the Entomological Society of America 90, 521-541
Nepomuceno, A. L., Oosterhuis, D., Stewart, J. M., Turley, R., Neumaier, N. and
Farias, J. R. B. (2002) Expression of heat shock protein and trehalose-6-phosphate
synthase homologues induced during water deficit in cotton. Brazilian Journal of
Plant Physiology 14 (1), 11-20
Ninkovic, V. and Ǻhman, I. (2009) Aphid acceptance of Hordeum genotypes is
affected by plant volatile exposure and is corrlated with aphid growth. Euphytica
169, 177–185
Nguyen, T. T. A., Boudreault, S., Michaud, D. and Cloutier, C. (2008) Proteomes of the
aphid Macrosiphum euphorbiae in its resistance and susceptibility responses to
differently compatible parasitoids. Insect Biochemistry and Molecular Biology 38,
730– 739
Nottingham, S. F., Hardie, J. and Tatchell, G. M. (1991a) Flight behaviour of the bird
cherry aphid, Rhopalosiphum padi. Physiological Entomology 16, 223-229
Nottingham, S. F., Hardies, J., Dawson, G. W., Hick, A. J., Pickett, J. A., Wadhams, L. J.
and Woodcock, C. M. (1991b) Behavioural and electrophysiological responses of
aphids to host- and non-host plant volatiles. Journal of Chemical Ecology 17, 1231-
1242

Ohashi, K., Natori, S. and Kubo, T. (1999) Expression of amylase and glucose oxidase
in the hypopharyngeal gland with an agedependent role change of the worker
honeybee (Apis mellifera L.). European Journal of Biochemistry 265, 127–133.
Oswald, H. C. J. and Brewer, M. J. (1997) Aphid-barley interactions mediated by
water stress and barley resistance to Russian wheat aphid (Homoptera: Aphididae).
Environmental Entomology 26, 591-602
Ozgȍkqe, M. S. and Athhan, R. (2005) Biological Parameters and Life Table
Parameters of the Mealy Plum Aphid Hyalopterus pruni on Different Apricot
Cultivars. Phytoparasitica 33 (1), 7-14
Park, K. C., Elias, D., Donato, B. and Hardie, J. (2000) Electroantennogram and
behavioural responses of different forms of the bird cherry-oat aphid,
Rhopalosiphum padi, to sex pheromone and a plant volatile. Journal of Insect
Physiology 46, 597-604
Park, K. C. and Hardie, J. (2002) Functional specialisation and polyphenism in aphid
olfactory sensilla. Journal of Experimental Biology 48, 527-535
Park, K. C. and Hardie, J. (2004) Electrophysiological characterisation of olfactory
sensilla in the black bean aphid, Aphis fabae. Journal of Experimental Physiology 50,
647-655
Paul, T. A., Darby, P., Green, C. J. and Rossiter, J. T. (1996) Electrical penetration
graphs of the damson-hop aphid Phorodon humuli on resistant and susceptible hops
(Humulus lupulus). Entomologia Experimentalis et Applicata 80, 335-342
Paulson, E (1952) On the comparison of several experimental categories with a
control. Annals of Mathematical Statistics 23, 239–246

Petersen, N. S. and Mitchell. H. K. (1985) Heat shock proteins. In: Comprehensive
Insect Physiology, Biochemistry and Pharmacology (vol 10). Eds. Kerkut, G. A. and
Gilbert, L. I. Pergamon Press, Oxford, UK, 347-365
Pettersson, J. (1970) Studies on Rhopalosiphum padi (L.):Laboratory studies on
olfactometric responses to the winter host Prunus padus L. Lantbrukshȍgskolans
Annaler 36, 381-399
Pettersson, J. (1973) Olfactory reactions of Brevicoryne brassicae (L.) (Hom.:Aph.).
Swedish Journal of Agricultural Research 3, 95-103
Pettersson, J., Pickett, J. A., Pye, B. J., Quiroz, A., Smart, L. E., Wadhams, L. J. and
Woodcock, C. M. (1994) Winter host component reduces colonization of summer
hosts by the bird-cherry-oat aphid, Rhopalosiphum padi (L.) and other aphids in
cereal fields. Journal of Chemical Ecology 20, 2565-2574
Pettersson, J., Tjallingii, W. F. and Hardie, J. (2007) Host-plant selection and feeding.
In: van Emden, H., Harrington, R. (eds) Aphids as crop pest, Volume 4. CAB
International, Wallingford, 87–113
Pescod, K. V., Quick, W. P. and Douglas, A. E. (2007). Aphid responses to plants with
genetically manipulated phloem nutrient levels. Physiological Entomology 32, 253-
258
van der Ploeg, L. H. T., Giannini, S. H. and Cantor, C. R. (1985) Heat shock genes:
Regulatory role for differentiation in parasitic protozoa. Science 228, 1443-1446
Pollard, D. G. (1958) Feeding of the cotton aphid (Aphis gossypii Glover). Empire
Cotton Growing Review 35, 244-253.

Pollard, D. G. (1973) Plant penetration by feeding aphids (Hemiptera, Aphidoidea): a
review. Bulletin of Entomological Research 62, 631-714
Ponder, K. L., Pritchard, J., Harrington, R. and Bale, J. S. (2000) Feeding behaviour of
the aphid Rhopalosiphum padi (Hemiptera: Aphididae) on nitrogen and water-
stressed barley (Hordeum vulgare) seedlings. Bulletin of Entomological Research 91,
125-130
Pons, X. and Tatchell, G. M. (1995) Drought stress and cereal aphid performance.
Annals of applied biology 126 (1), 19-31
Pope, T. W., Kissen, R., Grant, M., Pickett, J. A., Rossiter, J. T. and Powell, G.
2008.Comparative Innate Responses of the Aphid Parasitoid Diaeretiella rapae to
Alkenyl Glucosinolate Derived Isothiocyanates, Nitriles, and Epithionitriles. Journal of
Chemical Ecology
Powell, S. J. and Bale, J. S. (2005) Low temperature acclimated populations of the
grain aphid Sitobion avenae retain ability to rapid cold harden with advanced fitness.
The Journal of Experimental Biology 208, 2615- 2620
Powell, G., Pirone, T. and Hardie, J. (1995) Aphid stylet activity during potyvirus
acquisition from plants and an in vitro system that correlates with subsequent
transmission. European Journal of Plant Pathology 101, 411-420
Powell, G., Maniar, S. P., Pickett, J. A. and Hardie, J. (1999) Aphid responses to non-
host epticuticular lipids. Entomologia Experimentalis et Applicata 91, 115-123
Powell, G. and Hardie, J. (2002). Xylem ingestion by winged aphids. Entomologia
Experimentalis et Applicata. 104, 103-108
Prado, E. and Tjallingii, W. F. (1994) Aphid activities during sieve element punctures.
Entomologia Experimentalis et Applicata 72, 157–165
Prado, E. & Tjallingii, F. W. 1997. Effects of previous plant infestation on sieve
element acceptance by two aphids. Entomologia Experimentalis et Applicata 82:
189–200

Prado, E. and Tjallingii, W. F. (1999) Effects of experimental stress factors on probing
behaviour by aphids. Entomologia Experimentalis et Applicata 90 (3), 289-300
Pratt, C., Pope, T. W., Powell, G. and Rossiter, J. T. (2008) Accumulation of
Glucosinolates by the Cabbage Aphid Brevicoryne brassicae as a Defense Against Two
Coccinellid Species. Journal of Chemical Ecology 34, 323-329
Price, D. R. G., Karley, A. J. , Ashford, D. A., Isaacs, H. V., Pownall, M. E.,
Wilkinson, H. S., Gatehouse, J. A. and Douglas, A. E. (2007) Molecular
characterisation of a candidate gut sucrase in the pea aphid Acyrthosiphon
pisum. Insect Biochemistry & Molecular Biology 37, 307-317
Pritchard, J., Griffith, B. and Hunt, E. J. (2007) Can the plant-mediated impacts on
aphids of elevated CO2 and drought be predicted? Global Change Biology 13 (1),
1616–1629
Prokopy, R. J. and Owens, E. D. (1983) Visual detection of plants by herbivorous
insects. Annual Review of Entomology 28, 337-364
Puinean, A. M., Foster, S. P., Oliphant, L., Denholm, I., Field, L. M., Millar, N. S.,
Williamson, M. S. and Bass. C. (2010) Amplification of a Cytochrome P450 Gene Is
Associated with Resistance to Neonicotinoid Insecticides in the Aphid Myzus
persicae. PLoS Genetics 6 (6), 1-11
Quiroz, A., Pettersson, J., Pickett, J. A., Wadhams, L. and Niemeyer, H. M. (1997) Key
compounds in a spacing pheromone in the bird cherry-oat aphid, Rhopalosiphum
padi (L.) (Hemiptera, Aphididae). Journal of Chemical Ecology 23, 2599-2607
Rajendrakumar, C. S. V., Reddy, B. V. D. and Reddy, A. R. (1994) Proline-protein
interactions: protection of structural and functional integrity of M4 lactate
dehydrogenase. Biochemical and Biophysical Research Communications 201, 957-
963

Ramirez, C. C. and Niemeyer, H. M. (1999) Salivation into sieve elements in relation
to plant chemistry: the case of the aphid Sitobion fragariae and the wheat Triticum
aestivum. Entomologia Experimentalis et Applicata 91, 111-114
Ramirez, C. C. and Niemeyer, H. M. (2000) The influence of previous experience and
starvation on aphid feeding behavior Journal of Insect Behavior 13 (5), 699-709
Ramsey, J. S., Wilson, A. CC., De Vos, M., Sun, Q., Tamborindeguy, C., Winfield, A.,
Malloch, G., Smith, D. M., Fenton, B., Gray, S. T. and Jander, G. (2007) genomic
resources for Myzus persicae: EST sequencing, SNP idenification and microarray
design. BMC Genomics 8, 423
Ramsey, J. S., Rider, D. S., Walsh, T. K., De Vos, M., Gordon, K. H. J., Ponnala, L.,
Macmil, S. L., Roe, B. A. and Jander, G. (2010) Comparative analysis of detoxification
enzymes in Acrythosiphon pisum and Myzus persicae. Insect Molecular Biology S2,
155-164
Ray, J. D. and Sinclair, T. R. (1998) The effect of pot size on growth and transpiration
of maize and soybean during water deficit stress. Journal of Experimental Biology 49,
1381-1386
Rhoades, D. F. (1985) Offensive-defensive interactions between herbivores and
plants: their relevance in herbivore population dynamics and ecological theory.
American Naturalist 125, 205-238
Rhodes, J. D., Croghan, P. C., and Dixon, A. F. G. (1996) Uptake, excretion and
respiration of sucrose and amino acids by the pea aphid Acrythosiphon pisum. The
Journal of Experimental Biology 199, 1269-1276.
Rhodes, J. D., Croghan, P. C., and Dixon, A. F. G. (1997) Dietary sucrose and
oligosaccharide synthesis in relation to osmoregulation in the pea aphid,
Acyrthosiphon pisum. Physiological Entomology 22 (4), 373-379

Roberts, Y. (1987) Dispersion and migration. In: Minks, A. K. and Harrewwijn, P. (eds)
Aphids. Their Biology, Natural Enemies and Control, Volume 2A. Elsevier,
Amsterdam, 299-313
Roche, P., Alston, F. H., Maliepaard, C., Evans, K. M., Vrielink, R., Dunemann, F.,
Markussen, T., Tartarini, S., Brown, L. M., Ryder, C. and King, C. J. 1997. RFLP and
RAPD markers linked to the rosy leaf curling aphid resistance gene (Sd1) in apple .
Theoretical Applied Genetics, (94), 528-533
Rossi, M., Goggin, F. L., Milligan, S.B., Kaloshian, I., Ullman, D. E., and Williamson, V.
M. (1998) The nematode resistance gene Mi of tomato confers resistance against the
potato aphid. Proceedings Natural Academic Science 95 (17), 9750-9754
Sackett, G. P., Ruppenthal, G. C. and Gluck, J. (1978) Introduction: an overview of
methodological and statistical problems with observational research. In: Observing
Behaviour, Volume II, Data Collection and Analysis Methods (ed.) Sackett, G. P.,
Baltimore, University Park Press, 1-14
Samuel, D., Kumar. T. K., Ganesh, G., Jayaraman, G., Yang, P. W., Chang, M. M.,
Trivedi, V. D., Wang, S. L., Huang, K. C., Chang, D. K. and Yu, C (2000) Proline inhibits
aggregation during protein refolding. Protein Science 9, 344-352
Sandström, J. (1994a) High variation in host adaptation among clones of the pea
aphid, Acyrthosiphon pisum on peas, Pisum sativum. Emotologia Experimentalis et
Applicata 71, 245-256
Sandström, J. (1994b) Performance of pea aphid, Acyrthosiphon pisum clones on
host plants and synthetic diets mimicking the same plants phloem amino acid
composition. Journal of Insect Physiology 40, 1051-1057
Sandström, J. P. and Pettersson, J. (1994) Amino acid composition in phloem sap and
relation to intraspecific variation in pea aphid (Acyrthosiphon pisum) performance.
Journal of Insect Physiology 40, 947-955
Sanguineti, M. C., Tuberosa, R., Landi, P., Salvi, S., Maccaferri, M., Casarini, E. and
Conti, S. (1999) QTL analysis of drought-related traits and grain yield in relation to

genetic variation of leaf abscisic acid concentration in field-grown maize. Journal of
Experimental Biology 50, 1289-1297
Saradhi, P. P., Arora, S and Prasad, K. V. S. K. (1995) Proline accumulates in plants
exposed to UV radiation and protects them against induced peroxidation
Biochemical and Biophysical Research Communications 290, 1-5
Sasaki T, Ishikawa H. (1995) Production of essential amino acids from glutamate by
mycetocyte symbionts of pea aphid, Acyrthosiphon pisum. Journal of Insect
Physiology 36, 35-60
Scott, J. G. (1999) Cytochromes P450 and insecticide resistance. Insect Biochemical
Molecular Biology 29, 757-77
Selman, I. W. and Kandiah, U. (1971) Influence of gibberellic acid and nitrogen sprays
on transmission of cabbage black ringspot virus by Myzus persicae (Sulz.) Bulletin of
Entomological Research. 60, 359365
Shakesby, A. J., Wallace, I. S., Isaacs, H. V., Pritchard, J., Roberts, D. M. and A.E.
Douglas. A. E. (2009) A water specific aquaporin involved in aphid osmoregulation.
Insect Biochemistry and Molecular Biology 39 (1), 1-10
Sinclair, T.R. and M.M. Ludlow. 1985. Who taught plants thermodynamics? The
unfulfilled potential of plant water potential. Aust. J. Plant Physiol. 33, 213-217
Singh, M., J.P. Srivastava, and A. Kumar. 1990. Effect of water on water potential
components in wheat genotypes. Indian J. Plant Physiol. 33, 312-317
Smith, L. M. (1937) Growth, reproduction, feeding and wing development of the
mealy plum aphid in relation to climatic factors. Journal of Agricultural Research 54,
345-364
Smith, C. M. and Boyko, V. E. (2007) The molecular bases of plant resistance and defense
responses to aphid feeding: current status. Entomologia Experimentalis et Applicata 122 (1),
1–16

Smith, J. A. C. and Milburn, J. A. (1980). Phloem turgor and the regulation of sucrose
loading in Ricinus communis L. Planta 148 (1), 42-48
Socias, F. X., Aguilo, P. F. and Medrano, H. (1997) Effects of rapidly and gradually
induced water stress on plant response in subterranean clover leaves. Journal of
Plant Physiology 150, 212-219
Spiller, N. J., Koenders, L. and Tjallingii, W. F. (1990) Xylem ingestion by aphids: a
strategy for maintaining water balance. Entomologia Experimentalis et Applicata 55,
101–104
Sunnucks, P., Chisholm, D., Turak, E. and Hales, D. (1998) Evolution of an ecological
trait in parthenogenetic Sitobion aphids. Heredity 81, 638-647
Sylwia, G., Bogumila, L. and Wieslaw, O (2006). Effect of low and high-saponin lines
of alfalfa on pea aphid. Journal of Insect Physiology 52, 737–743
Taylor C. E. and Robertson, W. M. (1974) Journal of Phytopathology 80, 257-266
Telang, A., Sandstrȍm, J., Dyreson, E. and Moran, N. A. (1999) Feeding damage by
Diuraphis noxia results in a nutritionally enhanced phloem diet. Entomologia
Experimentalis et Applicata 91, 403-412
Thomas, H. (1986) Water use characteristics of Dactylis glomerata L., Lolium perenne
L. and L. mulitflorum Lam. Plants. Annals of Botany 57, 211-223
Thomas, H. (1991) Accumulation and consumption of solutes in swards of Lolium
perenne during drought and after rewatering. New Physiologist 118, 35-48
Tjallingii, W. F. (1978) Mechanoreceptors of the aphid labium. Entomologia
Experimentalis et Applicata 24, 531-537

Tjallingii, W. F. (1985) Membrane potentials as an indication for plant cell
penetration by aphid stylets. Entomologia Experimentalis et Applicata 38, 187-193
Tjallingii, W. F. (1986) Wire effects on aphids during electrical recording of stylet
penetration. Entomologia Experimentalis et Applicata 40, 89-98
Tjallingii, W. F. (1988) Electrical recording of stylet penetration activities. In: Minks,
A. K. and Harrewijn, P. (eds) Aphids, Their Biology, Natural Enemies and Control,
Volume 2B, Elsevier, Amsterdam, 95-108
Tjallingii, W. F. (1990) Continuous recording of stylet penetration activities. In: Minks,
A. K. and Harrewijn, P. (eds) Aphids their Biology, Natural Enemies and Control,
Volume 2B Elsevier, Amsterdam, 95-108
Tjallingii, W. F. (2006) Salivary secretions by aphids interacting with proteins of
phloem wound responses. Journal of Experimental Botany 57 (4), 739-45
Tjallingii, W. F. and Gabrys, B. (1999) Anomalous stylet punctures of phloem sieve
elements in aphids. Entomologia Experimentalis et Applicata 91, 97-103
Tjallingii, W. F. and Hogen Esch, Th. (1993) Fine structure of the stylet en route in
plant tissues by some aphids. Physiological Entomology 18, 317-328
Tomiuk, J. and Woehrmann, K. (1981) Changes of the genotype frequencies at the
MDH-locus in populations of Macrosiphum rosae (L.) (Hemiptera, Aphididae).
Biologisches Zentralblatt 100, 631-640
Tully, R. E. and Hanson, A. D. (1979) Amino acids translocated from turgid and water-
stressed barley leaves I. Phloem exudation studies. Plant Physiology 64, 460-466
Tyree, M. T., Vargas, G., Engelbrecht, B. M. J. and Kursar, T. A. (2002) Drought until
death do us part: a case study of the desiccation-tolerance of a tropical moist forest
seedling-tree, Licania platypus (Hemsl.) Fritsch. Journal of Experimental Botany, 53,
2239-2247
Tyree, M (2003) Ascent of Water. Nature, 423, 923

Urao, T., Yakubova, B., Satoha, R., Yamaguchi-Shinozaki, K., Sekib, M., Hirayamab, T.
and Shinozakib, K. (1999) A transmembrane hybrid-type histidine kinase in
Arabidopsis functions as an osmosensor. The Plant Cell 11, 1743-1754
Urbanska, A. and Leszczynski, B. (1997) Enzymatic adaptations of cereal aphids to
plant glycosides. Communication of Plants with the Environment. Phytochemical
Society of North American and Phytochemical society of Europe. Norrdwijkerhout,
The Netherlands, 23-25
Urbanska, A., Tjallingii, F. W., Dixon, A. F. G. and Leszczynski, B. (1998) Phenol
oxidising enzymes in the grain aphid’s saliva. Entomologica Experimentalis et
Applicata 86, 197-203
Van Bel, A. J. E. (2003) The phloem, a miracle of ingenuity. Plant, Cell and
Environment 26, 125-149
Van Emden, H. F. (1964) CCC-induced resistance of plants against aphids.—CCC.
Research Symposium (Geneva) 1964
Van Emden, H. F. and Bashford, M. A (1971) The performance of Brevicoryne brassica
and Myzus persicae in relation to plant age and leaf amino acids. Entomologia
Experimentalis et Applicata 14, 349-360
Van Emden, H. F., Eastop, V. F., Hughes, V. F. and Way, M. J. (1969) The ecology of
Myzus Persicae. Annual Reviews of Entomology 14, 197-270
Van Giessen, W. A., Fescemyer, H. W., Burrows, P. M., Peterson, J. K. and Barnett, O.
W. (1994) Quantification of electroantennogram responses of the primary rhinaria of

Acyrthosiphonpisum (Harris) to C4-C6 primary alcohols and aldehydes. Journal of
Chemical Ecology 20, 909-927
Van Helden, M. and Tjallingii, W. F. (1993) Tissue localisation of lettuce resistance to
the aphid Nasonovia ribisnigri using electrical penetration graphs. Entomologia
Experimentalis et Applicata 68, 269-278
Vartanian, N., Damerval, C., and de Vienne, D. (1987) Drought-Induced Changes in
Protein Patterns of Brassica napus var. oleifera Roots. Plant Physiology 84, 989-992
Venkatramana, P., Knepper, C., Reese, J. and Shah, J. (2005) Premature Leaf
Senescence Modulated by the Arabidopsis PHYTOALEXIN DEFICIENT4 Gene Is
Associated with Defense against the Phloem-Feeding Green Peach Aphid. Plant
Physiology 139, 1927–1934
Verheggen, F. J., Arnaud, L., Bartram, S., Gohy, M. and Haubruge, E. (2008) Aphid and
Plant Volatiles Induce Oviposition in an Aphidophagous Hoverfly. Journal of Chemical
Ecology 34, 301-307
Verheggen, F. J., Mescher, M.C., Haubruge, E., De Moraes, C. M., and Schwartzberg,
E. G. (2008) Emission of Alarm Pheromone in Aphids: a Non-Contagious
Phenomenon. Journal of Chemical Ecology, 34:1146–1148
Visser, J. H. and Piron, P. G. M. (1997) Odour response profiles in aphids
differentiating for species, clone, form and food. Proceedings of the Section
Experimental and Applied Entonomology of the Netherlands Entomological Society
8, 115-118

Voelckel, C. and Baldwin, I. T. (2004) Herbivore-induced plant vaccination. Part II.
Array-studies reveal the transience of herbivore-specific transcriptional imprints and
a distinct imprint from stress combinations. Plant Journal 38, 650–663
Voelckel, C., Weisser, W. W., and Baldwin, I. T. (2004) An analysis of plant-aphid
interactions by different microarray hybridization strategies. Molecualr Ecology 13,
3187–3195
Volaire, F. Thomas, H. and Lelievre, F. (1998) Survival and recovery of perennial
forage grasses under prolonger Mediterrenean drought. I. Growth, death, water
relations and solute content in herbage and stubble. New Phytologist 140, 439-449
Walling, L. L. (2008). Avoiding Effective Defenses: Strategies Employed by Phloem-
Feeding Insects. Plant Physiology 146, 859-866
Wager, H.G. (1954) An improved copper reduction method for the micro-
determination of reducing sugars. Analyst 79, 34-41
Ward, S. A. and Dixon, A. F. G. (1982) Selective resorption of aphid embryos and
habitat changes relative to lifespan. Jounral of Animal Ecology 51, 859-864
Watt, A. D., Whittaker, J. B., Docherty, M., Brooks, G., Lindsay, E. and Salt, D. T.
(1993) The Impact of Elevated Atmospheric CO2 on Insect Herbivores. 17th
Symposium of the Royal Entomological Society of London, Academic Press, 198-215
Wearing, C. H. (1967) Studies on the relations of insect and host plant: II. Effects of
water stress on host plant on the fecundity of Myzus persicae (Sulz.) and Brevicoryne
brassicae (L.). Nature 203, 1052-1053

Wearing, C. H. (1972) Response of Myzus persicae and Brevicoryne brassicae to leaf
age and water stress in Brussels sprouts grown in pot. Entomologia Experimentalis et
Applicata 15, 61-80
Wearing, C. H. and van Emden, H. F. (1967) Studies on the relations of insect and
host plant: I. Effects of water stress in host plants on infestation by Myzus perseicae
(Sulz.) and Brevicoryne brassicae (L.). Nature 203, 1051-1052
Wensler, R. D. J. (1977) The fine structure of distal receptors on the labium of the
aphid Brevicoryne brassicae L. (Homoptera). Cell and Tissue Research 181, 409-421
Wensler, R. D. J. and Filshie, B. K. (1969) Gustatory sense organs in the food canal of
aphids. Journal of Morphology 129, 473-492
White, T. C. R. (1984) The abundance of invertebrate herbivores in relation to the
availability of nitrogen in stressed food plants. Oecologia (Berlin) 63, 90-105
Wiktelius, S. (1984) Long-range migration of aphids into Sweden. International
Journal of Biometerology 28, 185-200
Wilkinson, T., Ashford, D., Pritchard, J. and Douglas, A. (1997) Honeydew sugars and
osmoregulation in the pea aphid Acyrthosiphon pisum. Journal of Experimental
Biology 200 (15), 2137-43
Will, T. and van Bel, A. J. E. (2006) Physical and chemical interactions between aphids
and plants. Journal of Experimental Botany, 57, 729-737
Will, T., Tjallingii, W. F., Thönnessen, A. and Bel, A. J. (2007) Molecular sabotage of
plant defense by aphid saliva. Proceedings of Natural Academic Science USA 104
(25), 10536-41

Williams, C. T. (1995) Effects of plant age, leaf age and virus yellows on the
population dynamics of Myzus persicae (Homoptera: Aphididae) on sugarbeet in field
plots. Bulletin of Entomological Research 85, 557-567
Wilson, A. C. C., Sunnucks, P. and Hales, D. F. (2003) Heritable genetic variation and
potential for adaptive evolution in asexual aphids (Aphidoidea). Biological Journal of
the Linnean Society 79, 115-135
Wojciechowicz-Zytko, E. and van Emden, H. F. (2009) Are aphid mean relative growth
rate and intrinsic rate of increase likely to show a correlation in plant resistance
studies? Journal of Applied Entomology 119 (1-5), 405-409
Wu, Y. and Cosgrove, D. J. (2000) Adaptation to low water potentials by changes in
cell wall extensibility and cell wall proteins. Journal of Experimental Botany 51, 1543-
1553
Wyatt, I. J. and White, P. F. (1977) Simple Estimation of Intrinsic Increase Rates for
Aphids and Tetranychid Mites. The Journal of Applied Ecology 14 (3), 757-766
Zarate, S. I., Kempema, L. A., and Walling, L. L. 2007. Silverleaf Whitefly Induces
Salicylic Acid Defenses and Suppresses Effectual Jasmonic Acid Defenses. Plant
Physiology 143, 866–875
Zeng, F., Pederson, G., Ellsbury, M. and Davies, F. (1993) Demographic statistics for
the pea aphid (Homoptera: Aphidadae) on resistant and susceptible red clovers.
Jounral of Economic Entomology 86, 1852-1856
Zehnder, G. W., Nichols, A. J., Edwards, O. R. & Ridsdill-Smith, T. J. 2001.
Electronically monitored cowpea aphid feeding behaviour on resistance and
susceptible lupins. Entomologia Experimentalis et Applicata 98, 259-269

Zhu-Salzman, K., Salzman, R. A., Ahn, J. E., and Koiwa, H. 2004. Transcriptional
Regulation of Sorghum Defense Determinants against a Phloem-Feeding Aphid. Plant
Physiology (134) 420–431