APEX–SZ: The Atacama Pathfinder EXperiment Sunyaev–Zel ... · Sunyaev–Zel’dovich Effect...
6
7 The Messenger 147 – March 2012 Daniel Schwan 1 Rüdiger Kneissl 2, 3 Peter Ade 4 Kaustuv Basu 5 Amy Bender 6 Frank Bertoldi 5 Hans Böhringer 7 Hsaio-Mei Cho 8 Gayoung Chon 7 John Clarke 1, 9 Matt Dobbs 10 Daniel Ferrusca 1 Daniel Flanigan 1 Nils Halverson 6,11 William Holzapfel 1 Cathy Horellou 12 Daniel Johansson 12 Bradley Johnson 1,13 James Kennedy 10 Zigmund Kermish 1 Matthias Klein 5 Trevor Lanting 10 Adrian Lee 1,14 Martin Lueker 1 Jared Mehl 1 Karl Menten 15 Dirk Muders 15 Florian Pacaud 5 Thomas Plagge 1 Christian Reichardt 1 Paul Richards 1 Reinhold Schaaf 5 Peter Schilke 16 Martin Sommer 5,15 Helmuth Spieler 14 Carole Tucker 4 Axel Weiss 15 Benjamin Westbrook 1 Oliver Zahn 1 1 Department of Physics, University of California, Berkeley, USA 2 ESO 3 Joint ALMA Observatory, Vitacura, Santiago, Chile 4 School of Physics and Astronomy, Cardiff University, Wales, United Kingdom 5 Argelander Institute for Astronomy, Bonn University, Germany 6 Center for Astrophysics and Space Astronomy, Department of Astophysical and Planetary Sciences, University of Colorado, Boulder, USA 7 Max-Planck-Institut für extraterres- trische Physik, Garching, Germany 8 National Institute of Standards and Technology, Boulder, USA 9 Materials Sciences Division, Lawrence Berkeley National Labo- ratory, Berkeley, USA 10 Department of Physics, McGill University, Montreal, Canada 11 Department of Physics, University of Colorado, Boulder, USA 12 Department of Earth and Space Sciences, Onsala Space Observatory, Chalmers University of Technology, Sweden 13 Department of Physics, Columbia University, New York, USA 14 Physics Division, Lawrence Berkeley National Laboratory, Berkeley, USA 15 Max-Planck-Institut für Radioastro- nomie, Bonn, Germany 16 I. Physikalisches Institut, Universität zu Köln, Germany The APEX–SZ instrument was a milli- metre-wave (150 GHz) cryogenic re- ceiver for the APEX telescope designed to observe galaxy clusters via the Sunyaev–Zel’dovich Effect (SZE). The receiver contained a focal plane of 280 superconducting transition-edge sensor bolometers equipped with a frequency-domain-multiplexed readout system, and it played a key role in the introduction of these new, robust, and scalable technologies. With 1-arcminute resolution, the instrument had a higher instantaneous sensitivity and covered a larger field of view (22 arcminutes) than earlier generations of SZE instruments. During its period of operation from 2007 to 2010, APEX–SZ was used to image over 40 clusters and map fields overlap- ping with external datasets. This paper briefly describes the instrument and data reduction procedure and presents a cluster image gallery, as well as results for the Bullet cluster, Abell 2204, Abell 2163, and a power spectrum analysis in the XMM-LSS field. Galaxy clusters Galaxy clusters comprise dark matter and constituent galaxies with hot, low density ionised gas filling the space between the galaxies. This gas, known as the intracluster medium (ICM), domi- nates the baryonic mass in clusters. Thus, galaxy clusters are important labo- ratories for studying various astrophysical phenomena in great detail, for example, cluster formation and dynamics, cluster mergers and their associated shock waves (which are sites of cosmic ray acceleration), the cosmic ratio of dark matter to baryonic matter density, active galactic nuclei feedback, the evolution of galaxies in the ICM, heat transport pro- cesses, and plasma instabilities (Sarazin, 1988). In addition, galaxy clusters offer a unique probe into the composition and evolu- tion of the Universe. They are the most massive gravitationally-collapsed objects and directly map large-scale structure over a large range of redshifts. Conse- quently, measuring the evolution of the cluster number density places powerful constraints on the parameters that govern the growth of structure. These parameters are, notably, the mass energy density and dark energy density of the Universe, the dark energy equation of state, and the matter power spectrum normalisation (Carlstrom et al., 2002). The hot ICM is observable at millimetre- wavelengths via the SZE (Sunyaev & Zel’dovich, 1970). In the SZE, about 1% of cosmic microwave background (CMB) photons incident on the cluster are scattered by free intracluster electrons. The resulting signal distorts the CMB blackbody spectrum and is visible as a temperature decrement (increment) at frequencies below (above) 217 GHz. The SZE surface brightness is proportional to the integrated gas pressure along the line of sight through the cluster. Since the SZE is a scattering effect seen rela- tive to the CMB, and the scattered and unscattered photons are redshifted together, the SZE signal is independent of the redshift of the scattering cluster. In contrast, X-ray and optical surface brightness dim with increasing redshift. The redshift independence makes the SZE a uniquely sensitive method for dis- covering and observing distant clusters. Instrument overview APEX–SZ observations were performed at 150 GHz (2 mm) from the 12-metre APEX telescope (Güsten et al., 2006). Technical details of the receiver can be found in Schwan et al. (2011). The telescope was Telescopes and Instrumentation APEX–SZ: The Atacama Pathfinder EXperiment Sunyaev–Zel’dovich Instrument
Transcript of APEX–SZ: The Atacama Pathfinder EXperiment Sunyaev–Zel ... · Sunyaev–Zel’dovich Effect...

7The Messenger 147 – March 2012
Daniel Schwan1 Rüdiger Kneissl2, 3 Peter Ade4 Kaustuv Basu5 Amy Bender6 Frank Bertoldi5 Hans Böhringer7 Hsaio-Mei Cho8 Gayoung Chon7 John Clarke1, 9 Matt Dobbs10 Daniel Ferrusca1 Daniel Flanigan1 Nils Halverson6,11 William Holzapfel1 Cathy Horellou12 Daniel Johansson12 Bradley Johnson1,13 James Kennedy10
Zigmund Kermish1 Matthias Klein5 Trevor Lanting10 Adrian Lee1,14 Martin Lueker1 Jared Mehl1 Karl Menten15 Dirk Muders15 Florian Pacaud5 Thomas Plagge1 Christian Reichardt1 Paul Richards1 Reinhold Schaaf5 Peter Schilke16 Martin Sommer 5,15 Helmuth Spieler14 Carole Tucker 4 Axel Weiss15 Benjamin Westbrook1 Oliver Zahn1
1 Department of Physics, University of California, Berkeley, USA
2 ESO3 Joint ALMA Observatory, Vitacura,
Santiago, Chile4 School of Physics and Astronomy,
Cardiff University, Wales, United Kingdom
5 Argelander Institute for Astronomy, Bonn University, Germany
6 Center for Astrophysics and Space Astronomy, Department of Astophysical and Planetary Sciences, University of Colorado, Boulder, USA
7 Max-Planck-Institut für extraterres-trische Physik, Garching, Germany
8 National Institute of Standards and Technology, Boulder, USA
9 Materials Sciences Division, Lawrence Berkeley National Labo-ratory, Berkeley, USA
10 Department of Physics, McGill University, Montreal, Canada
11 Department of Physics, University of Colorado, Boulder, USA
12 Department of Earth and Space Sciences, Onsala Space Observatory, Chalmers University of Technology, Sweden
13 Department of Physics, Columbia University, New York, USA
14 Physics Division, Lawrence Berkeley National Laboratory, Berkeley, USA
15 Max-Planck-Institut für Radioastro-nomie, Bonn, Germany
16 I. Physikalisches Institut, Universität zu Köln, Germany
The APEX–SZ instrument was a milli-metre-wave (150 GHz) cryogenic re -ceiver for the APEX telescope designed to observe galaxy clusters via the Sunyaev–Zel’dovich Effect (SZE). The receiver contained a focal plane of 280 superconducting transition-edge sensor bolometers equipped with a frequency-domain-multiplexed readout system, and it played a key role in the introduction of these new, robust, and scalable technologies. With 1-arcminute resolution, the instrument had a higher instantaneous sensitivity and covered a larger field of view (22 arcminutes) than earlier generations of SZE instruments. During its period of operation from 2007 to 2010, APEX–SZ was used to image over 40 clusters and map fields overlap-ping with external datasets. This paper briefly describes the instrument and data reduction procedure and presents a cluster image gallery, as well as results for the Bullet cluster, Abell 2204, Abell 2163, and a power spectrum analysis in the XMM-LSS field.
Galaxy clusters
Galaxy clusters comprise dark matter and constituent galaxies with hot, low density ionised gas filling the space between the galaxies. This gas, known as the intracluster medium (ICM), domi-nates the baryonic mass in clusters. Thus, galaxy clusters are important labo-ratories for studying various astrophysical
phenomena in great detail, for example, cluster formation and dynamics, cluster mergers and their associated shock waves (which are sites of cosmic ray acceleration), the cosmic ratio of dark matter to baryonic matter density, active galactic nuclei feedback, the evolution of galaxies in the ICM, heat transport pro-cesses, and plasma instabilities (Sarazin, 1988).
In addition, galaxy clusters offer a unique probe into the composition and evolu- tion of the Universe. They are the most massive gravitationally-collapsed objects and directly map large-scale structure over a large range of redshifts. Conse-quently, measuring the evolution of the cluster number density places powerful constraints on the parameters that govern the growth of structure. These parameters are, notably, the mass energy density and dark energy density of the Universe, the dark energy equation of state, and the matter power spectrum normalisation (Carlstrom et al., 2002).
The hot ICM is observable at millimetre-wavelengths via the SZE (Sunyaev & Zel’dovich, 1970). In the SZE, about 1% of cosmic microwave background (CMB) photons incident on the cluster are scattered by free intracluster electrons. The resulting signal distorts the CMB blackbody spectrum and is visible as a temperature decrement (increment) at frequencies below (above) 217 GHz. The SZE surface brightness is proportional to the integrated gas pressure along the line of sight through the cluster. Since the SZE is a scattering effect seen rela-tive to the CMB, and the scattered and unscattered photons are redshifted together, the SZE signal is independent of the redshift of the scattering cluster. In contrast, X-ray and optical surface brightness dim with increasing redshift. The redshift independence makes the SZE a uniquely sensitive method for dis-covering and observing distant clusters.
Instrument overview
APEX–SZ observations were performed at 150 GHz (2 mm) from the 12-metre APEX telescope (Güsten et al., 2006). Technical details of the receiver can be found in Schwan et al. (2011). The telescope was
Telescopes and Instrumentation
APEX–SZ: The Atacama Pathfinder EXperiment Sunyaev–Zel’dovich Instrument

8 The Messenger 147 – March 2012
dent on the absorber are measured by the TES mounted at its centre. The TES is a thin superconducting film with a transition temperature higher than the reser-voir temperature. A constant bias voltage is applied across the TES so that the total applied power (the electrical power dissipated in the TES plus optical power incident on the absorber) raises the temperature of the sensor to pre- cisely the transition temperature. An increase (decrease) in the incident optical power produces a cancelling decrease (increase) in electrical power. Since the voltage bias is held constant, the change in electrical power is measured as a change in current through the sensor.
The bolometers are fabricated using standard photolithographic techniques. The absorber, the TES and the leads to bias the TES are deposited onto a 1 μm thick, low-stress silicon nitride (LSN) spiderweb membrane. The LSN spider-web is suspended by eight LSN legs above a ~ 20 μm vacuum gap etched in the silicon. The gap thermally isolates the absorber from the silicon substrate. The thermal conductance of the bo- lom eter is set by a gold thermal link that runs from the TES to the thermal reser-voir, parallel to the bias leads. The APEX–SZ detector array is assembled from six identical 55-element, triangular subarrays (Figure 1).
The APEX–SZ TES bolometers are read out with a SQUID (Superconducting Quantum Interference Device) amplifier fMUX, which allows several detectors to be read out by a single 4 K SQUID ampli-fier connected through a single pair of wires (Lanting et al., 2004). Readout mul-ti plexing enables the use of large detector arrays by greatly reducing the thermal load on the low temperature stage, the complexity of cold wiring and the system cost. The APEX–SZ system uses seven detectors read out by one SQUID ampli-fier in each multiplexer module.
In the fMUX system, the bolometers are biased with alternating voltages at carrier frequencies (0.3–1 MHz) that are much higher than the bolometer thermal band-width, so the bias deposits a constant power on the sensor. Each bolometer in the module is biased at a different fre-quency. As described above, changes in
commissioned by the Max-Planck-Institut für Radioastronomie, ESO and the Swedish Onsala Space Observatory for use with bolometric and heterodyne receivers. It is located near the ALMA site at an altitude of 5107 metres on Llano de Chajnantor in the Atacama desert in Chile, which has exceptionally low water vapour conditions. In addition, the low latitude of the site (23 degrees south) allows targeted observation of clusters with rich multi-frequency datasets. Over-lapping observations at different wave-lengths enable a more complete study and characterisation of clusters.
The telescope beam was coupled to the APEX receiver by a series of reimaging optics inside the Cassegrain cabin. The full optical system had 58-arcsecond FWHM (Full Width at Half Maximum) beams, diffraction-limited performance, over a 22arcminute field of view (FoV). This large FoV enabled APEX–SZ to map the large angular size of low redshift clusters, where the SZE signal can extend beyond a 10-arcminute radius.
Within the receiver, the APEX–SZ focal plane was 133 mm across and consisted of 330 feedhorn-coupled TES (transition-edge sensor) bolometers. Of these, 280 detectors were read out. The detec-tors and readout system are described in the next section. The horn array was
machined from a single aluminium block and mounted above the planar focal surface. Each bolometer was centred behind a cylindrical waveguide in the horn array. There was a small gap between the horn array and the bolometers to pro-vide thermal isolation. Radiation not absorbed by a detector could leak radi-ally to neighbouring detectors or be reflected back through the horns. This leakage resulted in a small, ~ 1%, optical cross-talk between adjacent bolometers.
The TES bolometers and frequency-domain multiplexed (fMUX) readout sys-tem used in the APEX–SZ focal plane have low noise, but require a cryogenic system for their operation. The receiver interior was cooled by a closed cycle pulsetube cooler with cold stages at 60 K and 4 K. The mechanical cooler elimi-nated the need for open reservoirs of liq-uid cryogens, greatly simplifying the design and construction of the cryostat while reducing the cost and difficulty of remote observations. The bolometers were further cooled to 280 mK by a three-stage helium sorption fridge.
Detectors and readout
Each APEX–SZ bolometer consists of an optical absorber coupled to a TES that is connected to a thermal reservoir by a weak thermal link. The absorbing ele-ment is a 3 mm diameter gold spiderweb (Figure 1). The spiderweb shape absorbs millimetre-wave radiation, provides a small cross-section to cosmic rays and minimises the heat capacity of the absorber. Changes in optical power inci-
Telescopes and Instrumentation
1 mm
25 mm
Figure 1. The TES bolometer array, with inset show-ing three spiderweb bolometers. Six identical trian-gular sub-arrays are assembled into a single planar array, 133 mm in diameter, containing 330 bolome-ters. Each bolometer has two leads which run from the spiderweb to bonding pads at the edge of its tri-angle, visible as light traces between the bolometers.
Schwan D. et al., APEX–SZ: The APEX Sunyaev–Zel’dovich Instrument
9The Messenger 147 – March 2012
incident radiation modulate the current through the bolometer. This amplitude modulation translates the absorbed sig-nal spectrum to sidebands centred around the carrier bias frequency. Since the currents from the different bolometers are separated in frequency, they can be combined and transmitted to the SQUID amplifier with a single wire. Furthermore, the bolometers are connected through series inductor–capacitor circuits, each of which is tuned to the appropriate bias frequency, so all bias carriers can also be fed through a single line. As a result, each multiplexer module requires only a single pair of wires from the low temperature stage to the 4 K stage to read out all the bolometers in the module.
Imaging techniques
With bolometer receivers operating near the performance limit set by statistical photon noise, the main challenge in long-integration, millimetre-wave observa- tions of spatially extended signals is the contamination from atmospheric noise. The emission from the turbulent atmos-phere carrying water vapour typically exhibits a Kolmogorov power spectrum (Tatarskii, 1961), with power increasing steeply with increasing angular scale. It also varies with time relative to the celes-tial signal. The APEX–SZ observation pattern and data reduction techniques exploit these characteristics to mitigate atmospheric noise.
APEX–SZ used a circular drift scan pat-tern to observe clusters. In the circular drift scan, the telescope performs circu-lar scans which are stationary in azimuth and elevation. After the source drifts across the array FoV, the telescope slews to the new source position. This circular drift scan pattern combines constant low amplitude acceleration for efficiency with modulation of celestial signals at timescales faster than typical atmos-pheric variations.
The data reduction algorithms remove the low frequency, large-scale atmos-pheric noise using highpass filters in the time and spatial domains. A low-order polynomial is fitted and subtracted from the data timestream for each channel. Additionally, a low-order two-dimensional
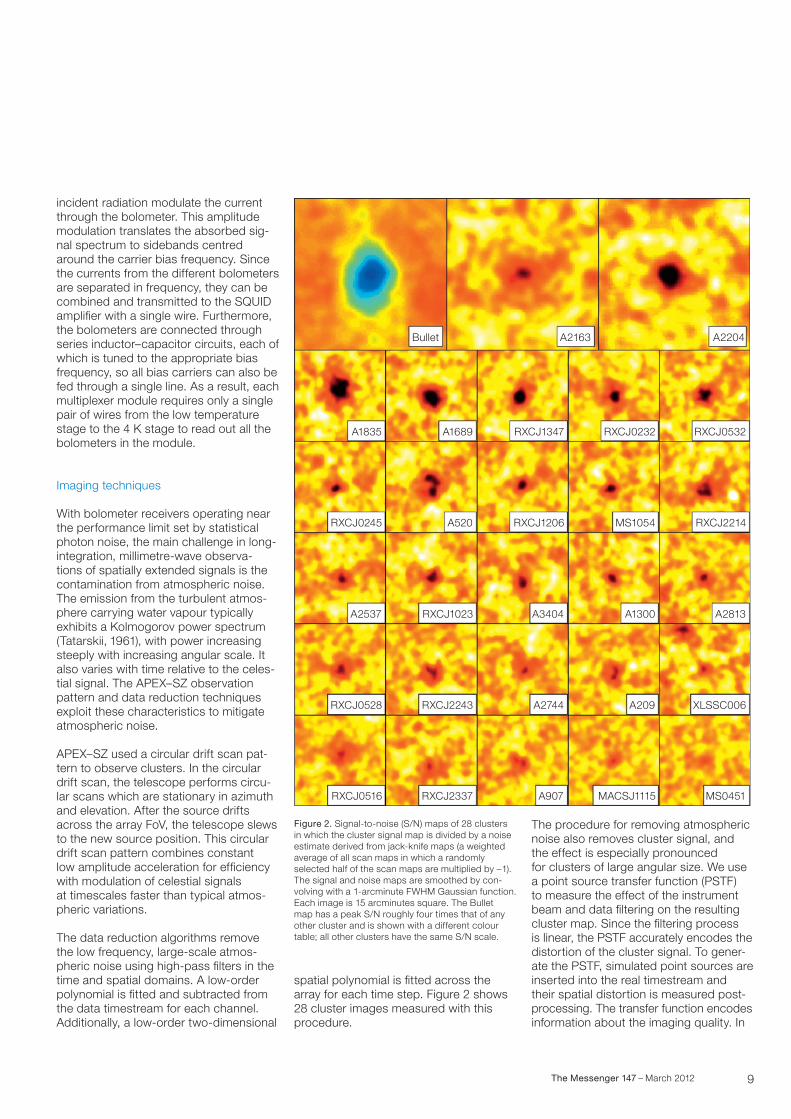
spatial polynomial is fitted across the array for each time step. Figure 2 shows 28 cluster images measured with this procedure.
The procedure for removing atmospheric noise also removes cluster signal, and the effect is especially pronounced for clusters of large angular size. We use a point source transfer function (PSTF) to measure the effect of the instrument beam and data filtering on the resulting cluster map. Since the filtering process is linear, the PSTF accurately encodes the distortion of the cluster signal. To gener-ate the PSTF, simulated point sources are inserted into the real timestream and their spatial distortion is measured post-processing. The transfer function encodes information about the imaging quality. In
Bullet
RXCJ1347 RXCJ0232 RXCJ0532A1689
A2163 A2204
A1835
RXCJ1206 MS1054 RXCJ2214A520RXCJ0245
A3404 A1300 A2813RXCJ1023A2537
A2744 A209 XLSSC006RXCJ2243RXCJ0528
A907 MACSJ1115 MS0451RXCJ2337RXCJ0516
Figure 2. Signal-to-noise (S/N) maps of 28 clusters in which the cluster signal map is divided by a noise estimate derived from jack-knife maps (a weighted average of all scan maps in which a randomly selected half of the scan maps are multiplied by –1). The signal and noise maps are smoothed by con-volving with a 1-arcminute FWHM Gaussian function. Each image is 15 arcminutes square. The Bullet map has a peak S/N roughly four times that of any other cluster and is shown with a different colour table; all other clusters have the same S/N scale.

10 The Messenger 147 – March 2012
particular, negative sidelobes indicate missing spatial information on larger angular scales. This is very similar to an interferometric synthesised beam, where the inner portion of the Fourier plane, corresponding to very short baselines, is often not sampled. In both cases, the observation process is designed so that the most relevant information is most densely sampled.
Figure 3 shows maps of the Bullet cluster and Abell 2163 made using two different schemes to mitigate the effect of noise
filtering on the sky signal. The Bullet clus-ter is a system of two merging clusters (mass ratio ~ 1:10), which shows an offset between the gas and dark matter (Clowe et al., 2006; also Figure 5). The map of Figure 3 is produced by masking a cir-cular region centred on the cluster source prior to fitting for the loworder polyno-mial filters, then applying the filters to the entire dataset. The masking procedure limits attenuation of the cluster extended emission at the expense of increased map noise. The observations and data processing are detailed by Halverson et
al. (2009). The cluster map of Abell 2163 is produced by applying a procedure similar to the CLEAN algorithm used in radio interferometry to deconvolve the signal image and PSTF. The procedure, detailed by Nord et al. (2009), allowed the first direct reconstruction of the den-sity and temperature profiles in a cluster without a parametric model.
Cluster gas constraints from the SZE and X-ray
Joint SZE and X-ray observations allow strong constraints to be placed on the cluster gas. The surface brightness of the SZE signal is proportional to the electron density and the temperature of the intra-cluster gas. X-ray emission from the gas is dominated by thermal bremsstrahlung, which is roughly proportional to the square of the density and the X-ray cool-ing function, itself a weak function of temperature. Multi-frequency data enable detailed measurements of the cluster gas, including determination of the gas temperature and mass, as well as their distributions.
Halverson et al. (2009) fit the intracluster gas of the Bullet cluster to an elliptical isothermal βprofile (Cavaliere & FuscoFemiano, 1978) convolved with the PSTF. A Markov-chain Monte Carlo approach is used to find the maximum likelihood in parameter space with an X-ray-derived prior on β. The analysis yields a core radius rc = 142 +/– 18 arcseconds, an axial ratio 0.889 +/– 0.072, and a central temperature decrement –771 +/– 71 μKCMB (in units of temperature referred to a source at the CMB temperature), in cluding a +/– 5.5 % flux calibration uncertainty. With a map of projected electron density from Chandra data, the SZE-derived gas (electron) temperature is Te = 10.8 +/– 0.9 keV. This temperature is lower than some previously reported X-ray temperatures, which could be biased towards hot, com-pact regions. On the other hand, the gas mass fraction derived from the SZE map (under the approximation of hydro-static equilibrium), is in good agreement with estimates from X-rays.
Nord et al. (2009) and Basu et al. (2010) further explore cluster physics with SZE data combined with X-rays. Nord et al.
Telescopes and Instrumentation Schwan D. et al., APEX–SZ: The APEX Sunyaev–Zel’dovich Instrument
�
�
�
�
� Figure 3. APEX–SZ maps of two clusters. Top: Map of the Bullet cluster (from Halverson et al., 2009). The circle in the lower left corner represents the 85-arc-second FWHM map res-olution, which is the result of the instrument beam, data reduction filter, and 1arcminute FWHM Gaussian smoothing applied to the map. The contour intervals are 100 μKCMB. The + marker indicates the centroid position of the bestfit elliptical β-model. The * marker indicates the position of a bright, dust-obscured, lensed galaxy, which is detected at higher frequencies (e.g., at 350 GHz by LABOCA; Johansson et al., 2010), but does not signifi-cantly contaminate the measurement at 150 GHz. Bottom: Map of Abell 2163 (from Nord et al., 2009). The APEX–SZ map, deconvolved from the effects of the trans-fer function, is overlaid with XMM-Newton X-ray contours in units of 10–13 erg s–1 cm–2 arcmin–2.

11The Messenger 147 – March 2012
(2009) derive gas density and tempera-ture profiles for Abell 2163 via the Abel integral in Silk & White (1978). The derived temperature profile shown in Figure 4, representative of the bulk of the gas, is in excellent agreement with the high gas-temperature estimates from X-ray data. The profiles have been converted to yield
non-parametric estimates for the total mass and the gas mass, giving a gas mass fraction profile, which again is con-sistent with X-ray analyses. Nord et al. (2009) also combine the APEX–SZ SZE measurements of Abell 2163 at 150 GHz with 345 GHz measurements from the LABOCA camera on APEX and published measurements at other frequencies to place constraints on the peculiar velocity of the cluster. Basu et al. (2010) present an analysis of the relaxed cluster Abell 2204, where the assumption of spherical symmetry should be especially valid. A comparison of the derived entropy pro-files (entropy is Te n
–2/3, where Te and n
Figure 4. Derived radial profiles of cluster gas proper-ties. Left: De-projected temperature for Abell 2163 with 1σ uncertainties (from Nord et al., 2009). The vertical arrow labelled “r200” marks the aproproximate virial radius (i.e., outer boundary) of the cluster. Right: Entropy derived from APEX–SZ and X-ray data for the relaxed cluster Abell 2204 (red circles) and the merging cluster Abell 2163 (blue squares).
are the electron temperature and density, respectively) for Abell 2204 and Abell 2163 shows that the entropy in the centre of a relaxed cluster is much lower than in a violently disturbed merging cluster and follows a power law (Figure 4). This result
–55°52�
54�
56�
Dec
linat
ion
(J20
00)
58�
00�
06h59m00s 58m30s
Right Ascension (J2000)58m00s
1� = 253 kpc
Figure 5. Left: Multi-wavelength overlay (from Halverson et al., 2009) on the Bullet cluster X-ray (XMM-Newton) colour image with SZE contours in white (100 μKCMB level intervals) and the weak-lensing surface mass density reconstruction con-tours in green. Right: B, V, R colour image of the central region of RXCJ0232.2-4420 (z = 0.28) with SZE contours in cyan (–90, –110, –130, –150, –170 μKCMB) and smoothed weak-lensing conver-gence contours in red (0.10, 0.11, 0.12, 0.13, 0.14).

12 The Messenger 147 – March 2012
A major aspect of the recent and future work is a multi-wavelength analysis of clusters imaged with APEX–SZ (Figure 5). For this reason, an optical follow-up programme has been conducted using the Wide Field Imager (WFI) at the 2.2-metre MPG/ESO telescope. Deep B-, V- and R-band images obtained during 42 nights, together with archival data from WFI and Subaru Suprime-Cam, pro-vide excellent weak-lensing data for 35 galaxy clusters at redshift 0.15–1 for the study of SZE and weak-lensing scal-ing relations. Our multi-frequency cluster data provide a unique sample to study cluster mass scaling laws and baryon physics in unprecedented detail.
References
Arnold, K. et al. 2010, SPIE, 77411EBasu, K. et al. 2010, A&A, 519, A29Bender, A. et al. 2012, in preparationCarlstrom, J. E., Holder, G. & Reese, E. D. 2002, Ann Rev Astron. Astrophys., 40, 643Cavaliere, A. & Fusco-Femiano, R. 1978, A&A, 70, 677Clowe, D. et al. 2006, ApJL, 648, L109Güsten, R. et al. 2006, A&A, 454, L13Halverson, N. W. et al. 2009, ApJ, 701, 42Johansson, D. et al. 2010, A&A, 514, A77Lanting, T. M. et al. 2004, Nuclear Instruments and Methods in Physics Research A, 520, 548Nord, M. et al. 2009, A&A, 506, 623Reichardt, C. L. et al. 2009, ApJ, 694, 1200Sarazin, C. L. 1988, X-ray emission from clusters of galaxies (Cambridge: Cambridge University Press)Schwan, D. et al. 2011, Review of Scientific Instruments, 82, 091301Silk, J. & White, S. D. M. 1978, ApJL, 226, L103Sunyaev, R. A. & Zel’dovich, Y. B. 1970, Comments on Astrophysics and Space Physics, 2, 66Tatarskii, V. I., ed. 1961, Wave Propagation in a Turbulent Medium (New York: Dover)
agrees with previous X-ray studies, but is derived independently without X-ray spectroscopy.
Power spectrum analysis
Reichardt et al. (2009) use an SZE image taken with APEX–SZ within the XMMLSS field (0.8 square degrees, centred on the medium mass cluster XLSSUJ022145.2034614, with 12 μKCMB root mean square noise at the centre) for statistical analysis of the temperature fluctuations from undetected clusters and other sources. This type of fluctua-tion analysis applied to large datasets places strong constraints on σ8, the nor-malisation of the matter density power spectrum on the scale of roughly 10 Mpc. The power spectrum of the integrated SZE from all clusters along the line of sight scales as σ8
7. The APEX–SZ image was the most sensitive fluctuation meas-urement at 150 GHz at the time, with the resulting constraint on the matter fluctuation amplitude being σ8 < 1.18 at 95 % confidence. Determination of the constraint requires consideration of con-tamination of the SZE signal by other populations, such as radio sources or dusty submillimetre (sub-mm) galaxies, which can be correlated with clusters as members or via gravitational lensing. The Reichardt et al. (2009) analysis esti-mates the contribution of sub-mm galax-ies to the power spectrum at 150 GHz to be Cl = 1.1+
–00
.9
.8 × 10–5 μK2 (the ampli-tude of the angular power spectrum for spherical harmonic multipole index l in the range 3000–10 000 assuming flat
band powers) or 1.7+–
11.4.3 Jy2 sr–1. Assuming
that the same sources are responsible for the power fluctuations measured by BLAST at 600 GHz, the spectral index of the source population is 2.6+
–00
.4
.2. The Atacama Large Millimeter/submillimeter Array (ALMA) will resolve remaining ques-tions about contaminating sources by providing the missing statistical informa-tion on population counts over all rele- vant wavelengths and by providing the ability to directly correct SZE images for their point source contamination.
Future directions
APEX–SZ was a pioneering instrument for arcminute resolution SZE cluster observa-tions, advancing bolometer and readout technology and applying multi-wavelength data analysis to constrain cluster gas physics. The TES bolometer array with fMUX readout has been adopted for dedi-cated instruments with larger arrays, notably the South Pole Telescope, with 960 detectors, and POLARBEAR (Arnold et al., 2010), a Berkeley CMB polarisation experiment, with over 1200 detectors.
APEX–SZ took over 800 hours of scien-tific data during its four years of opera-tions, targeting over 40 X-ray selected clusters in a wide range of mass and red-shift. Over 30 of these clusters were detected with high significance. The analy sis of the full dataset is still ongoing (Bender et al., 2012). These observations are being used to study the scaling of the SZE signal with cluster mass (hydro-dynamical and weak lensing).
Telescopes and Instrumentation Schwan D. et al., APEX–SZ: The APEX Sunyaev–Zel’dovich Instrument
Composite image of the complex galaxy cluster merger Abell 2744 (redshift 0.308) formed by com-bining visible light images from NASA/ESA Hubble Space Telescope and VLT with an image of the hot intracluster gas (pink) from NASA Chandra X-ray Observatory data. A reconstruction of the dark mat-ter in the cluster is overlaid (blue). See Science Release eso1120 for full details.N
AS
A, E
SA
, ES
O, C
XC &
D. C
oe
(STS
cI)/J
. Mer
ten
(Hei
del
ber
g/B
olo
gna)