Apartment Regulatory Impact Statement - energymining.sa.gov.au
113
FINAL REPORT OCTOBER 2017 Regulatory Impact Statement for a South Australian variation to the National Construction Code to increase the energy efficiency requirements for Class 2 residential buildings Report prepared for Department of Premier and Cabinet, South Australia
Transcript of Apartment Regulatory Impact Statement - energymining.sa.gov.au
FINAL REPORT OCTOBER 2017
Regulatory Impact Statement for a South Australian variation to the National Construction Code to increase the energy efficiency requirements for Class 2 residential buildings
Report prepared for Department of Premier and Cabinet, South Australia

Marsden Jacob Associates Financial & Economic Consultants Melbourne, Perth, Sydney, Brisbane ABN 66 663 324 657 ACN 072 233 204 Internet: http://www.marsdenjacob.com.au E-mail: [email protected] Author(s): Elizabeth O’Brien, Marsden Jacob Associates Alex Marsden, Marsden Jacob Associates Philip Harrington, Strategy.Policy.Research Phil McLeod, Strategy.Policy.Research Rod Carr, Marsden Jacob Associates
This report has been prepared in accordance with the scope of services described in the contract or agreement between Marsden Jacob Associates Pty Ltd ACN 072 233 204 and the Client. Any findings, conclusions or recommendations only apply to the aforementioned circumstances and no greater reliance should be assumed or drawn by the Client. Furthermore, the report has been prepared solely for use by the Client and Marsden Jacob Associates accepts no responsibility for its use by other parties.
Copyright © Marsden Jacob Associates Pty Ltd 2017

MARSDEN JACOB ASSOCIATES
TABLE OF CONTENTS
Page
Executive summary ................................................................................................................ i
1. Introduction .................................................................................................................. 1
1.1 Background ................................................................................................................................. 1
1.2 Scope .......................................................................................................................................... 2
1.3 Structure of this report ................................................................................................................ 4
2. Description of the problem ............................................................................................. 5
2.1 Description of market failure ....................................................................................................... 5
2.2 Rationale for government intervention ........................................................................................ 5
3. Objectives of government action .................................................................................. 10
4. Statement of Options .................................................................................................. 12
4.1 How to address the issue? .......................................................................................................... 12
4.2 Reform options for assessment .................................................................................................. 12
4.3 Thermal modelling assumptions ................................................................................................. 13
4.4 Base case: 6 star average rating, minimum 5 star individual rating .............................................. 17
4.5 Option 1: 7 star average, 6 star minimum individual rating ......................................................... 19
4.6 Option 2: No average rating, 6 star minimum individual rating ................................................... 20
4.7 Option 3: Separate cooling and heating caps (equivalent to average 6 star rating) ...................... 22
5. Cost benefit analysis results ......................................................................................... 27
5.1 Summary of results..................................................................................................................... 27
5.2 Key assumptions ....................................................................................................................... 28
5.3 Base case: 6 star average rating, 5 star minimum individual rating ............................................. 41
5.4 Option 1: 7 star average, 6 star minimum individual rating ......................................................... 42
5.5 Option 2: No average rating, 6 star minimum individual rating ................................................... 45
5.6 Option 3: Separate heating & cooling caps ................................................................................. 49
5.7 Sensitivity Analyses ................................................................................................................... 52
5.8 Limitations of analysis ............................................................................................................... 56
5.9 Equity and distributional considerations .................................................................................... 56
6. Consultation................................................................................................................ 63
7. Conclusion and recommended option ........................................................................... 65
7.1 Assessment ............................................................................................................................... 65
7.2 Ranking of options ......................................................................................................................67
8. Implementation, monitoring and review ....................................................................... 68
8.1 Implementation ......................................................................................................................... 68
8.2 Monitoring and review ............................................................................................................... 69
Appendix 1: Incremental costs to achieve performance outcomes .......................................... 70
Appendix 2: Quantity Surveyor Report ................................................................................. 72
Appendix 3: Selected thermal modelling certificates ............................................................. 73

MARSDEN JACOB ASSOCIATES
LIST OF TABLES Page
Table 1: Building fabric details ............................................................................................................................... vi Table 2: Summary of benefit cost analysis indicators ($2017, real)......................................................................... vii Table 3: Distribution of costs and benefits (net present value, $2017) ...................................................................... x Table 4: Building fabric, base case ........................................................................................................................ 17 Table 5: Building performance summary, base case .............................................................................................. 18 Table 6: Building fabric, option 1........................................................................................................................... 19 Table 7: Option 1 - Building performance summary ............................................................................................... 20 Table 8: Building fabric, option 2 .......................................................................................................................... 21 Table 9: Building performance summary, option 2 ................................................................................................ 22 Table 10: Class 2 heating and cooling load caps .................................................................................................... 23 Table 11: Area adjusted heating and cooling loads, base case ............................................................................... 24 Table 12: Building fabric, option 3 ......................................................................................................................... 25 Table 13: Area adjusted heating and cooling loads, option 3 .................................................................................. 25 Table 14: Summary of benefit cost analysis indicators ($2017, real) ....................................................................... 28 Table 15: General assumptions ............................................................................................................................. 29 Table 16: Number of apartments broken down by number of bedrooms in SA Climate Zones, 2013 ...................... 30 Table 17: Mapping of ABS Statistical Divisions to NatHERS Climate Zones ........................................................... 30 Table 18: Average incremental costs of compliance, option 1 ................................................................................ 43 Table 19: Summary of benefit cost analysis indicators by region, option 1 ($2017, real) ......................................... 44 Table 20: Option 2 - Average incremental costs of compliance.............................................................................. 47 Table 21: Summary of benefit cost analysis Indicators by region, option 2 ($2017, real) ......................................... 48 Table 22: Summary of benefit cost analysis indicators by region, option 3 ($2017, real) ......................................... 51 Table 23: Sensitivity analysis results – Real discount rate ...................................................................................... 52 Table 24: Sensitivity analysis results –Electricity prices ......................................................................................... 53 Table 25: Sensitivity analysis results – Electricity imports ...................................................................................... 54 Table 26: Sensitivity analysis results – Shadow carbon prices ................................................................................ 54 Table 27: Sensitivity analysis results – Incremental construction costs ................................................................... 55 Table 28: Sensitivity analysis results – Learning rates............................................................................................ 55 Table 29: Sensitivity analysis results – Stress test.................................................................................................. 56 Table 30: Summary of impacts by stakeholder groups .......................................................................................... 58 Table 31: Distribution of costs and benefits (net present value, $2017) .................................................................. 61 Table 32: Impact of changes in apartment purchase price ..................................................................................... 62 Table 33: Summary of benefit cost analysis indicators ($2017, real) ....................................................................... 66
MARSDEN JACOB ASSOCIATES
LIST OF FIGURES Page
Figure 1: Base case and reform options for analysis ................................................................................................ iii Figure 2: Floorplan of modelled apartment building................................................................................................ v Figure 3: Total costs of compliance for reform options relative to the base case ................................................... viii Figure 4: Movements in the average annual electricity Standard and Market Offer bills for residential customers ($ nominal)................................................................................................................................................................. 6 Figure 5: Proportion of new flats or apartments is rising .......................................................................................... 7 Figure 6: South Australian residential energy efficiency index (EEI) ....................................................................... 10 Figure 7: Revised drafting for options.................................................................................................................... 13 Figure 8: Floorplan of modelled apartment building.............................................................................................. 15 Figure 9: NaTHERS Climate Zones ....................................................................................................................... 31 Figure 10: Statistical Divisions, South Australia ..................................................................................................... 31 Figure 11: Population Distribution by Region, South Australia, 2017 (no. of persons) ............................................. 32 Figure 12: Housing Stock Shares by Type, South Australia, 2015 (‘000 sqm) .......................................................... 32 Figure 13: Annual Rate of Growth in Households by Household Composition, South Australia .............................. 33 Figure 14: Annual floor area built to code (Class 2 dwellings), South Australia ....................................................... 34 Figure 15: Trends in South Australia supply chain components ............................................................................. 35 Figure 16: Energy Price Projections, Retail Residential, South Australia ($/MWh, $/GJ, 2016 real prices) ................ 36 Figure 17: Shadow Carbon Price Assumptions (2011-12) ........................................................................................ 39 Figure 18: Learning effects leading to zero incremental costs ............................................................................... 40 Figure 19: Energy consumption and greenhouse gas emissions, base case (regulated cohort) ............................... 41 Figure 20: Energy consumption and greenhouse gas emissions, option 1 and base case ........................................ 42 Figure 21: Value of benefits by type, option 1 ........................................................................................................ 43 Figure 22: Total incremental costs of compliance (compared to the base case), option 1 ....................................... 44 Figure 23: Annualised net economic benefit, option 1 ........................................................................................... 45 Figure 24: Energy consumption and greenhouse gas emissions, option 2 and base case ........................................ 46 Figure 25: Value of benefits by type, option 2 ....................................................................................................... 46 Figure 26: Total incremental cost of compliance (compared to the base case), option 2 ........................................ 47 Figure 27: Annualised net economic benefit, option 2 ........................................................................................... 48 Figure 28: Energy consumption and greenhouse gas emissions, option 3 and base case ........................................ 49 Figure 29: Value of Benefits by class, option 3 ....................................................................................................... 50 Figure 30: Total incremental costs of compliance (compared to the base case), option 3 ....................................... 50 Figure 31: Net economic benefits, option 3 ........................................................................................................... 51 Figure 32: South Australian building regulatory framework ................................................................................... 68

SA variation to the NCC to increase energy efficient requirement for Class 2 buildings Regulatory Impact Statement
ES.i
MARSDEN JACOB ASSOCIATES
Executive summary
This report is a Regulatory Impact Statement (RIS) that assesses proposed amendments to
energy efficiency requirements in the Building Code of Australia (the Building Code) for
residential apartment buildings (Class 2 buildings in the Building Code) in South Australia.
Background
Regulation setting out minimum energy efficiency standards for residential dwellings has been
a feature of the Building Code of Australia1 for well over a decade. The standards set out the
performance requirements that must be achieved for new building. Minimum energy efficiency
ratings are a way to meet the requirements.
The inclusion of the standards recognises a persistent market failure in the housing market.
Without the standards, stakeholders involved in design, material selection and construction of
buildings may not fully consider the impact of their decisions on the thermal performance of the
buildings, including the impacts associated with the use of energy to compensate for poor
thermal performance. This can have long term impacts on the comfort and energy costs incurred
by inhabitants of the buildings, and on greenhouse gas emissions over the life of the building.
Since the initial introduction of minimum energy efficiency standards, the measures have been
progressively reviewed and increased by the Australian Building Codes Board (ABCB) and State
Governments. Updates have been made where it was considered prudent to do so in terms of
the relative costs and benefits.
Scope
There are a range of regulatory and other policy levers2 available to Government in addressing
the market failure problems in relation to energy efficiency, however the most practical starting
point in considering Government stipulated remedies is to look to the effectiveness of existing
regulations and how these, if enhanced, might deliver additional desired benefits.
The scope of this RIS is confined to consideration of options within the Building Code to address
energy efficiency performance and the specific variations being considered are limited to
amendments to Section J0.2(a) – which sets out energy efficiency requirements for Class 2
buildings.
Additional restrictions to the scope of the RIS and the analysis undertaken for this report are as
follows:
Analysis is limited to Class 2 buildings (i.e. analysis on parts of Class 4 building that may be
impacted by the reform are not quantified in the analysis);
1 Volume’s One and Two of National Construction Code (NCC) comprise the Building Code of Australia, with
Volume One primarily applying to Class 2 to 9 (multi-residential, commercial, industrial and public) buildings and structures and Volume Two primary applying to Class 1 (residential) and Class 10 (non-habitable) buildings and structures. The Building Code of Australia together with Plumbing Code of Australia (Volume Three of the NCC) together form the NCC.
2 Regulatory levers include traditional market interventions such as laws and regulation, enforcement, taxation and subsidies, as well as alternative and complementary interventions including education, incentive schemes, structured choice and facilitating feedback loops.

SA variation to the NCC to increase energy efficient requirement for Class 2 buildings Regulatory Impact Statement
ES.ii
MARSDEN JACOB ASSOCIATES
No changes to common areas of Class 2 buildings considered; and
Only the energy rating ‘Deemed-to-Satisfy’ Solution has been considered in this RIS.
Approaches to compliance that are Performance Solutions (previously referred to as
Alternative Solutions) are beyond the current scope.
Each of these scope limitations is explained in greater detail in Section 1.2.
Objectives of government action
The policy objective of the SA Government is to improve the efficiency of Class 2 dwellings when
considering the construction costs and the operational costs for heating and cooling. This
outcome would ensure apartments are more comfortable for inhabitants and help residents
living in apartments save on energy bills.
The reforms also align with the State’s energy efficiency targets aimed at addressing climate
change by reducing greenhouse gas emissions. Target 60 in South Australia’s Strategic Plan is:
To improve the energy efficiency of dwellings by 15% by 2020 (baseline: 2003-04)
Milestone of 10% by 2014. 3
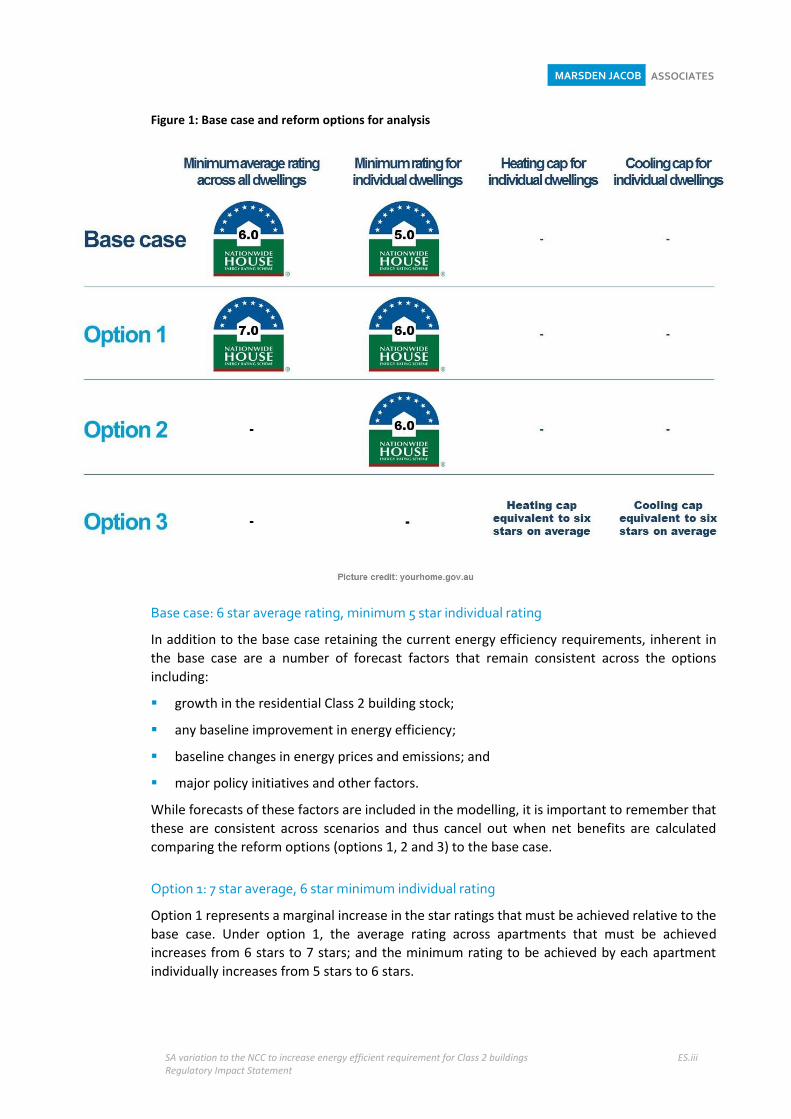
Base case and reform options
The base case or business as usual retains the current requirements of an average rating of 6
stars and a minimum heating and cooling requirement for individual apartments of 5 stars. It is
against this option that the impacts (costs and benefits) for each for the reform options have
been considered.
Three reform options are considered with each reform being able to be implemented via a State-
based variation to section J0.2(a) of the Building Code. Each of the base case and reforms options
are summarised diagrammatically in Figure 1 and are briefly outlined below.
3 SA Government, South Australia’s Strategic Plan, 2011, p. 47. For more information refer to:
http://www.statedevelopment.sa.gov.au/resources/energy-efficiency/south-australias-energy-efficiency-targets
SA variation to the NCC to increase energy efficient requirement for Class 2 buildings Regulatory Impact Statement
ES.iii
MARSDEN JACOB ASSOCIATES
Figure 1: Base case and reform options for analysis
Base case: 6 star average rating, minimum 5 star individual rating
In addition to the base case retaining the current energy efficiency requirements, inherent in
the base case are a number of forecast factors that remain consistent across the options
including:
growth in the residential Class 2 building stock;
any baseline improvement in energy efficiency;
baseline changes in energy prices and emissions; and
major policy initiatives and other factors.
While forecasts of these factors are included in the modelling, it is important to remember that
these are consistent across scenarios and thus cancel out when net benefits are calculated
comparing the reform options (options 1, 2 and 3) to the base case.
Option 1: 7 star average, 6 star minimum individual rating
Option 1 represents a marginal increase in the star ratings that must be achieved relative to the
base case. Under option 1, the average rating across apartments that must be achieved
increases from 6 stars to 7 stars; and the minimum rating to be achieved by each apartment
individually increases from 5 stars to 6 stars.

SA variation to the NCC to increase energy efficient requirement for Class 2 buildings Regulatory Impact Statement
ES.iv
MARSDEN JACOB ASSOCIATES
Option 2: No average rating, 6 star minimum individual rating
Option 2 removes the average rating requirement, thus removing the ability to trade off less
than 6 star performance in some apartments for above 6 star performance in others. Instead
every apartment would be required to achieve minimum 6 star rating.
The removal of the average rating acts to increase the onus on each individual apartment to be
designed and constructed to meet the 6 star rating requirements, which may involve higher
costs (but also lower energy costs) for those apartments that currently perform at less than 6
stars.
Option 3: Separate cooling and heating caps
Option 3 removes the requirement for dwellings to meet a specified star rating and instead
requires dwellings to comply with heating and cooling caps that are an on average equivalent to
a 6 star rating. It means that not all apartments continue to meet the 6 star minimum rating
(since it is not specifically required).
These caps are set at levels that do not change the overall 6 star (annual) requirement. However,
additional cost may be incurred to ensure that all apartments meet the separate summer and
winter caps. Where such costs do arise, occupants will also experience the benefits of lower
energy costs over time relative to the base case.
The separation of heating and cooling loads is, in principle, more stringent than an annual
‘heating and cooling’ requirement, because it limits the ability of the designer to trade-off
improved winter performance for worse summer performance, or vice versa.
Effectively, the requirement would ensure Class 2 building apartments are designed to remain
both warm in the winter (thus reducing the heating needed by occupants) and cool in the
summer (reducing the cooling needs of occupants). This approach, of separate heating and
cooling caps, is being considered for roll-out Australia-wide in the National Construction Code
for 2019.4
Key assumptions
The thermal modelling and cost benefit analysis are necessarily underpinned by a number of
assumptions. These are outlined in the main body of the report in Chapter 4 (thermal modelling
assumptions) and Chapter 5 (cost benefit analysis assumptions).
The thermal modelling has been developed based on apartments in four stories of a building
that contained six apartments per story, with the layout of apartments consistent across the
stories.
Thermal modelling results are presented for four of the six unit (units 204, 205, 207, and 208)
for each of four floors (the top, upper middle, lower middle and ground floors).
4 As per the Australian Building Codes Board work program. Refer to:
http://www.abcb.gov.au/Connect/Articles/2017/03/09/Section-J-Overhaul-big-changes-are-coming-your-way

SA variation to the NCC to increase energy efficient requirement for Class 2 buildings Regulatory Impact Statement
ES.v
MARSDEN JACOB ASSOCIATES
Figure 2: Floorplan of modelled apartment building
Source: Strategy.Policy.Research, 2017
The building is a concrete framed building with masonry external walls and the building fabric
modelled under the base case (which are subsequently varied under the reform scenarios is
summarised in Table 1.

SA variation to the NCC to increase energy efficient requirement for Class 2 buildings Regulatory Impact Statement
ES.vi
MARSDEN JACOB ASSOCIATES
Table 1: Building fabric details
Element Base case Option 1 Option 2 Option 3
External walls
Brick veneer, internal plasterboard lining
Add R1.5 wall insulation Add R1.5 wall insulation
Add R1.5 wall insulation) to:
Unit 208, Mt Gambier & Ceduna (top floor)
Unit 204, Mt Gambier (upper mid floor)
External balcony wall
Fibre-cement sheet, internal plasterboard lining
Add R1.5 wall insulation Add R1.5 wall insulation -
Internal walls Plasterboard and solid blockwork
- - -
Floors between units
200 mm concrete slab - - -
Top floor ceiling 200 mm concrete slab, R3.0 insulation, plasterboard lining
- - -
Windows Aluminium single-glazed High Solar Gain Low-E: U = 5.40: SHGC = 0.58
- - Change to double-gazing:
Unit 208, Ceduna (top floor)
External shading
Balconies shaded by balcony above. Top floor balconies shaded by roof overhang. No other external shading.
Unit 204, Mt Gambier (top floor) - remove a west window in the living room
Unit 207, Adelaide (top floor) - reduced glazing area of north window in living room
Unit 208, Ceduna and Mt Gambier (top floor) - reduce glazing in east wall of living room
- -
Average incremental cost of compliance
Adelaide $8.09 per sqm $7.68 per sqm -
Ceduna $4.22 per sqm $3.81 per sqm $0.61 per sqm
Mt Gambier $7.42 per sqm $7.01 per sqm $1.93 per sqm
Source: Strategy.Policy.Research, Donald Cant Watts Corke, 2017

SA variation to the NCC to increase energy efficient requirement for Class 2 buildings Regulatory Impact Statement
ES.vii
MARSDEN JACOB ASSOCIATES
We assume that any new requirement would apply from 1 May 2019, aligned with the
commencement date for changes to the National Construction Code, and would apply for two
regulatory cycles of three years each; that is, for six years in total.
Additionally, it is assumed that:
compliance costs are fully passed onto the user of the asset (the owner-occupier)
all new building work requiring approval from the relevant regulatory authority is assumed
to comply with the amended BCA.
Expected net impacts for the economy
The net public benefit delivered by each of the reform options as assessed incrementally to the
base case are summarised in Table 2 with further detail in Chapter 5.
The key findings from the cost benefit analysis are:
Option 1 would deliver the highest net present value benefits, with option 2 delivering a
similar, but slightly lower, level of benefits.
The benefit cost ratio is most favourable under option 3 (3.9), indicating the benefits are
highest as a ratio of costs for this option. However both options 1 and 2 have favourable
benefit cost ratios of 2.8 and 2.5 respectively.
The social return on investment is also highest under option 3 (at 29%), however the return
is also above 20% for both option 1 (24%) and option 2 (22%).
Cumulative energy savings and greenhouse gas emissions are highest under option 1, with
option 2 also delivering significantly more savings compared to option 3.
Table 2: Summary of benefit cost analysis indicators ($2017, real)
Indicator Option 1 (7 star average, 6
star minimum individual rating)
Option 2 (No average rating,
6 star minimum individual rating)
Option 3 (Separate cooling and heating caps)
Net Present Value $3,063,376 $2,447,784 $97,829
Benefit Cost Ratio 2.8 2.5 3.9
Social Return on Investment 24% 22% 29%
Cumulative energy savings, 2020 to 2050 (TJ)
68 59 2
Cumulative GHG emissions, 2020 to 2050 (t CO2-e)
6,834 5,838 187
Source: Strategy.Policy.Research, 2017
Costs
Two key types of cost were identified:
Costs of compliance with the National Construction Code are estimated as an incremental
costs based on changes in the building materials required to meet the higher energy
efficiency standards. The costs of compliance with the Code is assumed to be higher in the

SA variation to the NCC to increase energy efficient requirement for Class 2 buildings Regulatory Impact Statement
ES.viii
MARSDEN JACOB ASSOCIATES
initial years following implementation of the higher standards and reduced in line with an
assumed ‘learning rate’ of 2% per annum before levelling out.
Training and redesign costs of up to $50,000 per year have also been included for the first
three years following implementation of the reform. While ongoing training and updating
of knowledge base is ongoing in the industry, this marginal amount allows for current efforts
to be “ramped” up. Note that the training and redesign costs are assumed to be lower under
option 3 as there is no changes required to meet revised standards in the Adelaide region.
Figure 3 (below) summarised the combined costs of compliance and training incurred under the
reform options relative to the base case.
Figure 3: Total costs of compliance for reform options relative to the base case
Source: Strategy.Policy.Research, 2017
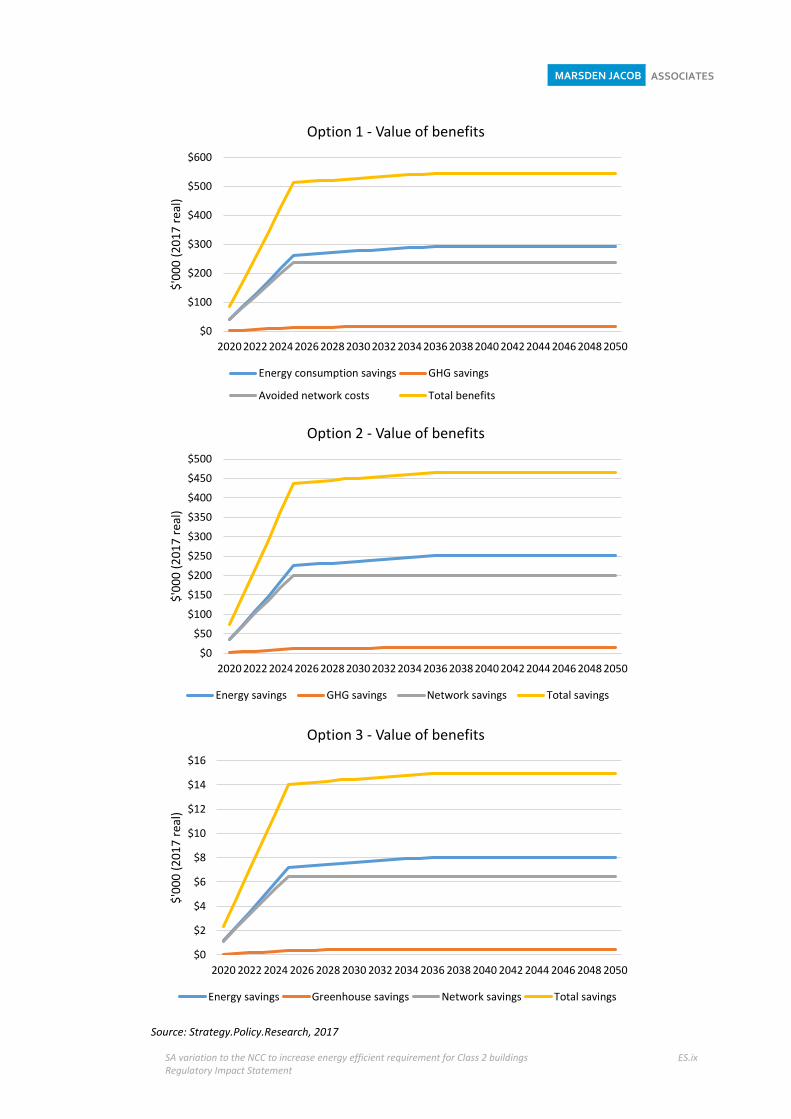
Benefits
Three types of benefits were quantified as part of the cost benefit analysis:
Energy cost savings are expected to accrue to the home occupier (either owner or tenant)
over the life of the building;
Avoided network costs resulting reduced peak electricity demand are expected to benefit
all energy users over the life of the building; and
Greenhouse gas emission savings have been quantified using conservative shadow carbon
prices and are expected to benefit the whole community in the form of environmental
benefits (if there is no formal price on carbon) or the home occupiers (if there is a price on
carbon).
The relative magnitude of the benefits under each of the reform options relative to the base
case are summarised graphically below.
$0
$50
$100
$150
$200
$250
$300
$350
$400
$450
$500
2018 2019 2020 2021 2022 2023 2024 2025
$'0
00
(2
01
7 r
eal)
Option 1 Option 2 Option 3
SA variation to the NCC to increase energy efficient requirement for Class 2 buildings Regulatory Impact Statement
ES.ix
MARSDEN JACOB ASSOCIATES
Source: Strategy.Policy.Research, 2017
$0
$100
$200
$300
$400
$500
$600
2020 2022 2024 2026 2028 2030 2032 2034 2036 2038 2040 2042 2044 2046 2048 2050
$'0
00
(2
01
7 r
eal)
Option 1 - Value of benefits
Energy consumption savings GHG savings
Avoided network costs Total benefits
$0
$50
$100
$150
$200
$250
$300
$350
$400
$450
$500
2020 2022 2024 2026 2028 2030 2032 2034 2036 2038 2040 2042 2044 2046 2048 2050
$'0
00
(2
01
7 r
eal)
Option 2 - Value of benefits
Energy savings GHG savings Network savings Total savings
$0
$2
$4
$6
$8
$10
$12
$14
$16
2020 2022 2024 2026 2028 2030 2032 2034 2036 2038 2040 2042 2044 2046 2048 2050
$'0
00
(2
01
7 r
eal)
Option 3 - Value of benefits
Energy savings Greenhouse savings Network savings Total savings

SA variation to the NCC to increase energy efficient requirement for Class 2 buildings Regulatory Impact Statement
ES.x
MARSDEN JACOB ASSOCIATES
Distributional impacts
The stakeholders identified as likely to be impacted by changes to energy efficiency
requirements for Class 2 building have been considered by stakeholder class as follows:
Commonwealth, State and local Government – no significant impacts quantified.
Industry
Building industry (builders and property developers) – increased training and awareness
costs as well as increased cost of compliance with Code (which may be passed directly
onto property owners).
Energy industry – no significant impacts quantified.
Heating and cooling appliance industry – no significant impacts quantified.
Community
Property owners – increased construction costs to be passed on from building industry.
Residents and tenants living in Class 2 buildings – reduced electricity costs, potentially
for increased construction costs to be passed on from building industry (via higher
purchases prices for owner occupiers or increased rent for tenants).
All community – avoided network expenditure costs from reduced electricity demand.
Environment – reduced greenhouse gas emissions from lower electricity consumption.
The full range of impacts identified (including those which have not been quantified on the basis
that they are unlikely to be significant) are outlined in section 5.9.
Table 3 summarised the net present value of costs and benefits and the stakeholders to whom
they are expected to accrue.
Home occupiers (owner-occupiers and tenants) and the environment are the main beneficiaries
of changes under all reform options. Home occupiers will receive the greatest benefit in the
form of reduced electricity costs as heating and cooling requirements are reduced.
Costs are expected to fall to industry in the form of increased training and reside costs as well
as increased building construction costs (or compliance with Code costs). It is noted that the
later cost – increased compliance with Code costs) – are likely to be passed directly onto
property owners in the form of higher purchase prices for apartments. As highlighted in the
subsequent section, this is expected to be a maximum of around $1,000 per apartment.
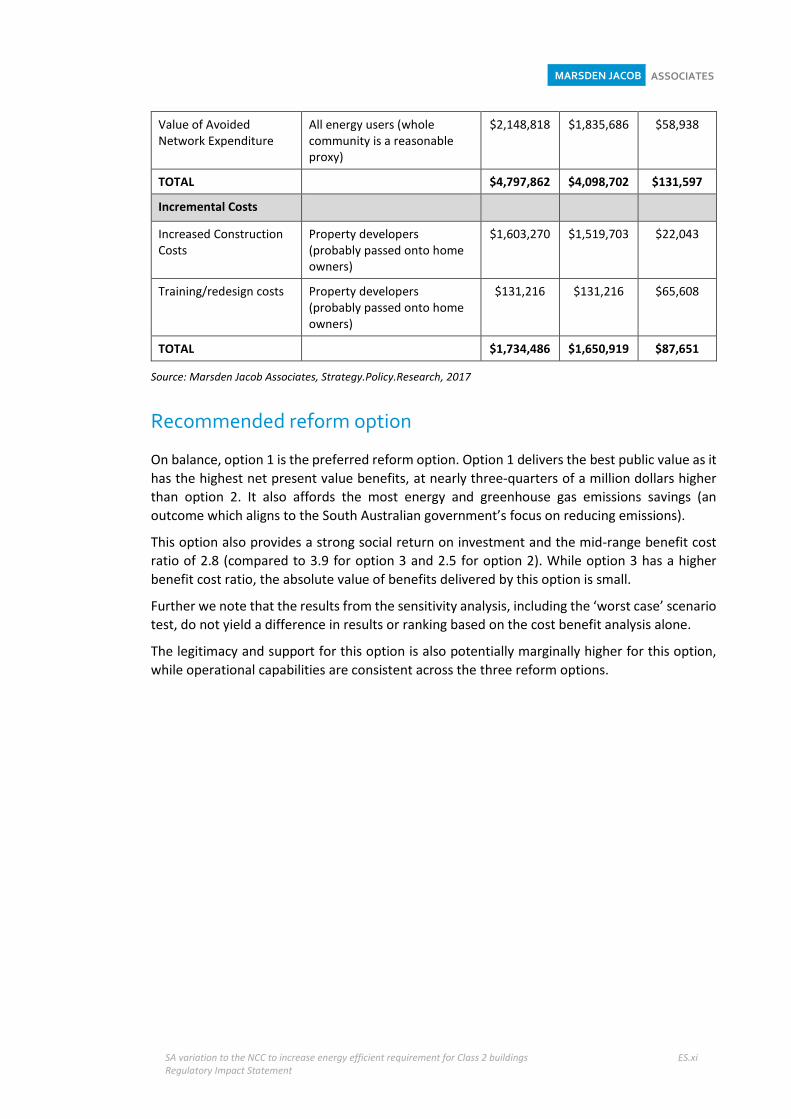
Table 3: Distribution of costs and benefits (net present value, $2017)
Benefit/Cost will be distributed to
Option 1 Option 2 Option 3
Incremental benefits
Value of Energy Consumption Savings
Home occupier (either owner or tenant)
$2,514,913 $2,148,432 $68,980
Value of greenhouse gas savings
Depends: - Whole community (if no price on carbon) - Home occupier (if there is a price on carbon)
$134,130 $114,585 $3,679
SA variation to the NCC to increase energy efficient requirement for Class 2 buildings Regulatory Impact Statement
ES.xi
MARSDEN JACOB ASSOCIATES
Value of Avoided Network Expenditure
All energy users (whole community is a reasonable proxy)
$2,148,818 $1,835,686 $58,938
TOTAL $4,797,862 $4,098,702 $131,597
Incremental Costs
Increased Construction Costs
Property developers (probably passed onto home owners)
$1,603,270 $1,519,703 $22,043
Training/redesign costs Property developers (probably passed onto home owners)
$131,216 $131,216 $65,608
TOTAL $1,734,486 $1,650,919 $87,651
Source: Marsden Jacob Associates, Strategy.Policy.Research, 2017
Recommended reform option
On balance, option 1 is the preferred reform option. Option 1 delivers the best public value as it
has the highest net present value benefits, at nearly three-quarters of a million dollars higher
than option 2. It also affords the most energy and greenhouse gas emissions savings (an
outcome which aligns to the South Australian government’s focus on reducing emissions).
This option also provides a strong social return on investment and the mid-range benefit cost
ratio of 2.8 (compared to 3.9 for option 3 and 2.5 for option 2). While option 3 has a higher
benefit cost ratio, the absolute value of benefits delivered by this option is small.
Further we note that the results from the sensitivity analysis, including the ‘worst case’ scenario
test, do not yield a difference in results or ranking based on the cost benefit analysis alone.
The legitimacy and support for this option is also potentially marginally higher for this option,
while operational capabilities are consistent across the three reform options.

SA variation to the NCC to increase energy efficient requirement for Class 2 buildings Regulatory Impact Statement
1.
1. Introduction
This Regulatory Impact Statement (RIS) assesses the costs and benefits of proposed
amendments to energy efficiency requirements in the Building Code of Australia (the Building
Code) for residential apartment buildings (Class 2 building in the Building Code).
The RIS and underlying analysis has been prepared by Marsden Jacob Associates (Marsden
Jacob) and Strategy.Policy.Research (S.P.R) on behalf of the Department of Premier and Cabinet
in South Australia.
1.1 Background
Regulation setting out minimum energy efficiency standards for residential dwellings has been
a feature of the Building Code of Australia5 for well over a decade. Standards were first
introduced for Class 1 buildings on 1 January 2003.6 In early 2005, the standards were expanded
to apply to Classes 2, 3 and since 2006, non-residential buildings have also been required to
meet energy efficiency standards.
The inclusion of the standards recognises a persistent market failure. Without the standards,
stakeholders involved design, material selection and construction of buildings may not fully
consider the impact of their decisions on the thermal performance of the buildings, including
the impacts associated with the use of energy to compensate for poor thermal performance.
This can have long term impacts on the comfort and energy costs incurred by inhabitants of the
buildings, and on greenhouse gas emissions over the life of the building.
The standards set out the performance requirements that must be achieved for new building.
Minimum energy efficiency ratings are a way to meet the requirements.
Since the initial introduction of the standards and the minimum energy efficiency rating system,
the measures have been progressively reviewed and increased by the Australian Building Codes
Board (ABCB) and State Governments. Updates have been made where it was considered
prudent to do so in terms of the relative costs and benefits.
The most recent update of the energy efficiency requirements in Section J that apply to Class 2
buildings in South Australia was undertaken in 2010. Since then, energy prices have risen and
there has been increased pressure to undertake energy efficiency measures to increase energy
productivity and reduce greenhouse gas emissions. Additionally, the number of Class 2 buildings
(described in Box 1) has increased and the proportion of new residential dwellings being
approved that are classified as Class 2 compared to alternative Class 1 dwelling structures is
increasing.
5 Volume’s One and Two of National Construction Code (NCC) comprise the Building Code of Australia, with
Volume One primarily applying to Class 2 to 9 (multi-residential, commercial, industrial and public) buildings and structures and Volume Two primary applying to Class 1 (residential) and Class 10 (non-habitable) buildings and structures. The Building Code of Australia together with Plumbing Code of Australia (Volume Three of the NCC) together form the NCC.
6 Australian Uniform Building Regulations Co-ordinating Council (1990) Building Code of Australia 1990 Housing Extract, refer to ACT F6.2 and VIC F6.2.

SA variation to the NCC to increase energy efficient requirement for Class 2 buildings Regulatory Impact Statement
2.
Box 1: What are Class 2 buildings?
Class 2 buildings are buildings which containing two or more sole-occupancy units each being a separate dwelling. Class 2 buildings are predominately multi-story residential developments, often referred to as multi-unit dwellings or MUDs.
The classification of multi-residential developments does not depend on the number of units proposed but the design. The simple way of determining the classification of residential buildings is by checking whether a wall or a floor separates each dwelling.7
1.2 Scope
There are a range of regulatory and other policy levers8 available to Government in addressing
the market failure problems defined in Section 2 of this report. However, the most practical
starting point in considering Government stipulated remedies is to look to the effectiveness of
existing regulations and how these, if enhanced, might deliver additional desired benefits.
The scope of this RIS is confined to consideration of options within the Building Code to address
energy efficiency performance and the specific variations being considered are limited to
amendments to Section J0.2(a) – which sets out energy efficiency requirements for Class 2
buildings.
Additional restrictions to the scope of the RIS and the analysis undertaken for this report are as
follows:
Analysis is limited to Class 2 dwellings;
No changes to common areas of Class 2 buildings considered; and
Only the Deemed-to-Satisfied Solutions have been considered in this RIS. Approaches to
compliance that are Performance Solutions (previously referred to as Alternative Solutions)
are beyond the current scope.
Each of these scope limitations is explained in turn.
1.2.1 Exclusion of Class 4 buildings parts
Although the reform options being considered in this RIS contemplates changes to drafting that
currently also covers Class 4 parts of buildings, these impacts on these parts of buildings have
not been quantified.
A Class 4 part of a building is a dwelling or residence within a building of a non-residential nature.
The dwelling must be the only dwelling in the building and can only be located in a Class 5 to 9
building. Class 4 parts of buildings are typically on-site caretaker’s residences.
The reason for excluding these parts of Class 4 building are as follows:
The number of parts of Class 4 buildings is likely to be very low such that the impact
compared to Class 2 stock will be minimal.
7 Master Builders, ‘BCA: Class 1A vs Class 2’, accessed April 2017, Refer to: http://www.mbawa.com/blog/bca-
class-1a-vs-class-2/
8 Regulatory levers include traditional market interventions such as laws and regulation, enforcement, taxation and subsidies, as well as alternative and complementary interventions including education, incentive schemes, structured choice and facilitating feedback loops.
SA variation to the NCC to increase energy efficient requirement for Class 2 buildings Regulatory Impact Statement
3.
The range of designs and forms of parts of Class 4 building is considerable. Inclusion of a
suitable range of designs would have increased the cost of analysis being undertaken where
the benefit of quantifying the impacts from changes to this type of building on various
stakeholders would be marginal.
1.2.2 Exclusion of common areas in Class 2 buildings
Changes to regulations impacting the thermal efficiency of common areas within Class 2
buildings are not considered for the following reasons:
The SA Government energy efficiency goals set out in Chapter 3 specifically target dwellings.
Common area requirements in the Building Code only indirectly impact the energy costs
faced by residents living within the buildings where energy costs are paid by building owners
(e.g. via strata) fees and may not be passed on in their entirety. Hence, the market failures
(discussed in section 2) may be less prevalent (but not non-existing) where common areas
are concerned compared to for individual dwellings within Class 2 buildings.
It is noted that the Australian Building Codes Board is has recently announced that it is
considering changes targeting the common areas of Class 2 buildings – as well as buildings in
Class 3 and Classes 5 to 9.9
1.2.3 Alternative ‘Performance Solutions’ not considered
The Performance Requirements of the NCC can be met by either using a Performance Solution
(previously referred to as an Alternative Solution), a Deemed-to-Satisfy Solution (i.e. complying
with detailed provisions in the NCC), or a combination of both.
For the purposes of this study, alternative solutions that achieve the relevant Performance
Requirements have not been considered and all modelled quantitative analysis assumes
compliance is met via only Deemed-to-Satisfy Solutions (DTS). We note that, in principle,
alternative solutions should generate results that are equivalent to the DTS in terms of energy
performance.
1.2.4 Economic costs and benefits accrued in South Australia
The RIS considers economic costs and benefits from a South Australian perspective. This has two
simplifying but important consequences for the analysis:
South Australia is a net importer of electricity. Reductions in electricity consumption
resulting from higher energy efficiency in building design are assumed to result in a
reduction in the quantity of electricity imported. This assumption allows for any reduction
in electricity use to be considered a direct benefit to South Australia, rather than being a
transfer between generators and retailers / customers as may be the case elsewhere in the
National Electricity Market. This assumption is stress tested in a sensitivity analysis.
The majority of building materials which need to be varied to achieve increased efficiency
ratings are assumed to be imported to South Australia. Hence, costs associated with these
products represent an economic cost rather than a transfer (as would be the case if South
Australia was a primary manufacturer of these products).
9 Refer to: http://www.abcb.gov.au/Connect/Articles/2017/03/09/Section-J-Overhaul-big-changes-are-coming-
your-way

SA variation to the NCC to increase energy efficient requirement for Class 2 buildings Regulatory Impact Statement
4.
1.3 Structure of this report
The remainder of this report is structured to align with the seven RIS elements outlined in the
SA Government’s Better Regulation Handbook10 as follows:
Chapter 2: Description of the problem (Element 1)
Chapter 3: Objectives of Government action (Element 2)
Chapter 4: Statement of options (Element 3)
Chapter 5: Analysis of costs and benefits (Element 4)
Chapter 6: Consultation (Element 5)
Chapter 7: Conclusion and recommended option (Element 6)
Chapter 9: Implementation, monitory and review (Element 7)
The report is supported by one Appendix that provides details on the incremental costs of
achieving the performance outcomes described in Chapter 4 independently quantified by
quantity surveyors, Daniel Cant Watts Corke.
10 SA Government (2011) Better Regulation Handbook: How to design and review regulation and prepare a
Regulatory Impact Statement, January. Available at: http://www.treasury.sa.gov.au/__data/assets/pdf_file/0020/14951/SA_Better-Regulation-Handbook_2011.pdf

SA variation to the NCC to increase energy efficient requirement for Class 2 buildings Regulatory Impact Statement
5.
2. Description of the problem
Element 1: Describing the problem requires that the RIS clearly identify the problem, an
assessment on the significance of the problem, and that a case for government action is
established based.
The case for government intervention requires identification of the cause of the program or
the type of program to be clearly identified.
Reasons may include that market forces are failing to generate an efficient outcome or
maximise benefits (i.e. market failure exists), existing regulation is failing to achieve its
objective or creating unwanted consequence (regulator failure), an unacceptable hazard or
risk is posed, social goals or equity issues need to be addressed or issue of public order or
protection need to be addressed. 11
In this section, the market failures to be addressed are clearly set out. The range and types of
stakeholders involved and impacts on each stakeholder type are detailed. Finally, recent
developments which have altered the range and magnitude of impacts and the relative costs
and benefits from regulation of energy efficiency measure for Class 2 building are summarised.
2.1 Description of market failure
The primary market failure that minimum energy efficiency requirements seek to remedy is
referred to by economists as split incentives. Split incentives occur when those responsible for
paying energy bills (i.e. tenants or future occupants) are not the same entity as those making
the capital investment decision (the landlord or original building owner).
Split incentives are a barrier to the increased use of energy efficient measures in buildings as the
building developer is not incentivised to upgrade building materials or alter design features. This
is because the benefits associated with the resulting energy savings accrue to subsequent
owners and tenants. Some benefits may also flow to the broader community – dependent on
how carbon emissions and climate change considerations are priced included).12
2.2 Rationale for government intervention
As there are existing regulations stating minimum energy efficiency standards for Class 2
buildings the question to be considered is whether increasing the existing standards delivers a
net public benefit.
Recent developments that impact the economic value delivered from energy efficiency
standards for Class 2 buildings include:
changes in energy prices;
11 SA Government (2011) Better Regulation Handbook: How to design and review regulation and prepare a
Regulatory Impact Statement, January, p. 13-14
12 Department of the Environment and Energy, HVAC HESS Factsheet: Overcoming Split Incentives, September 2013. Available at: https://www.environment.gov.au/system/files/energy/files/hvac-factsheet-split-incentives.pdf

SA variation to the NCC to increase energy efficient requirement for Class 2 buildings Regulatory Impact Statement
6.
changes in the composition of housing stock;
changing public priorities– such as the increased importance of climate change impacts; and
changes in the costs incurred to achieve benefits– where it may not have been prudent to
adopt more stringent requirements earlier, evidence elsewhere suggests this is no longer
the case.
Each change is considered in turn.
2.2.1 Changes in energy prices
Cost of energy to residential consumers remains a key concern for governments. In South
Australia, both standard and market offers to residential customers in electricity have decreased
in recent years (Figure 4).
Figure 4: Movements in the average annual electricity Standard and Market Offer bills for residential customers ($ nominal)
Note: (a) Annual consumption of electricity for residential customers is assumed to be 5,000 kWh
Source: Essential Services Commission of South Australia, Energy Retail Offers Comparison Report 2015-16, report to the Minister for Mineral Resources and Energy, August 2016.13
2.2.2 Changing composition of housing stock
Since the previous revision of the energy efficiency requirements for Class 2 buildings in 2010,
the composition of housing stock for residential dwellings has altered.
Based on the number of building approvals, the number of multi-residential developments is
increasing faster than other types of residential dwelling developments. Figure 5 provides a snap
13 Available at: http://www.escosa.sa.gov.au/industry/electricity/reporting-compliance/energy-retail-offer-prices

SA variation to the NCC to increase energy efficient requirement for Class 2 buildings Regulatory Impact Statement
7.
shot of the proportion building approvals for dwelling units that are houses; semi-detached row
or terrace houses, townhouses; or flats, units or apartments in 2006 and 2016 in South Australia.
The proportion of building approvals that represent flats, units or apartments has increased
from 8 per cent in 2006 to 16 per cent in 2016.
As changes in housing demand result in higher number of apartments, the number of
households impacted by higher energy costs due to design inefficiencies increases.
Figure 5: Proportion of new flats or apartments is rising
Source: ABS, 8731.0 Building Approvals, Australia, TABLE 25. Dwelling Units Approved in New Residential Buildings, Number and Value, Original - South Australia, May 2017
2.2.3 Changing public priorities
A number of local and state government initiatives reflect the public prioritisation of climate
sensitive programs. South Australia was the first Australian state to legislate a specific target to
reduce greenhouse gas emissions in the Climate Change and Greenhouse Emissions Reduction
Act 2007. In November 2015, the Premier and Minister for Climate Change released a new
climate change strategy for South Australia - South Australia’ Climate Change Strategy 2015-
2050: Towards a low carbon economy, at the centre of which is a ‘bold and ambitious’ target for
the state to achieve net zero emissions by 2050.14
The development of the strategy was underpinned by an extensive consultation process during
which more than 300 people attended workshops, 46 people contributed to the online
discussion forum and more than 200 written submission were received. 15
In Adelaide, where the significant majority of Class 2 dwellings are currently located and where
the majority of new Class 2 dwellings are expected to be built in the future, initiatives include:
Carbon Neutral Adelaide is the community’s shared ambition to make the City of Adelaide
the world’s first carbon neutral city and one of the six pillars underpinning South Australia’s
target to achieve net zero emission by 2050.16 The Carbon Neutral Strategy 2015-2025 for
South Australia highlights the City’s achievements to date of reducing carbon emission by
14 Department of Environment, Water and Natural Resources, ‘SA Climate Change Strategy’, last updated 29
November 2015. Refer to: http://www.environment.sa.gov.au/Science/Science_research/climate-change/climate-change-initiatives-in-south-australia/sa-climate-change-strategy
15 SA Government, South Australia’s Climate Change Strategy 2015- 2050: Towards a low carbon economy, November 2015, p. 12
16 Department of Environment, Water and Natural Resources, ‘Carbon Neutral Adelaide’, last updated 19 June 2017. Refer to: https://www.environment.sa.gov.au/Science/Science_research/climate-change/climate-change-initiatives-in-south-australia/sa-climate-change-strategy/carbon-neutral-adelaide

SA variation to the NCC to increase energy efficient requirement for Class 2 buildings Regulatory Impact Statement
8.
20% between 2007 and 2013. The Strategy also in the shared aspiration for Adelaide to
achieve carbon neutrality by 2025. 17
The Building Upgrade Finance mechanism is design to help stimulate jobs in South Australia
while also helping Adelaide to become the world’s first carbon neutral city. The mechanism,
which was launched on 20 August 2016, helps building owners to access loans to improve
the energy, water and environmental efficiency of existing commercial buildings. 18
In March 2017, the South Australian State government unveiled the South Australian Power for
South Australians energy plan.19 The plan looks to ensure more to the State’s power is sourced,
generated and controlled in South Australia with the aim of ensuring an energy future that
delivers reliable, affordable and clean power for South Australia.20
Initiatives outlined in the plan relevant to cleaner and more efficient use of energy sources
include:
Building Australia’s largest battery to store energy from the wind and sun, part of a new
Renewable Technology Fund that supports clean, dispatchable and affordable power; and
Building a government owned gas-fired electricity generator, capable of providing up to 250
megawatts of generation, which can be switched on in times of emergency.
2.2.4 Changing economics of energy efficiency
The economics of increasingly energy efficiency requirements is improving. The Pathway to 2020
for Increased Stringency in New Building Energy Efficiency Standards: Benefit Cost Analysis: 2016
Update for Residential Building, shows there is cost-effective potential to lift the efficiency
performance requirements for Class 2 buildings inter alia.
The report, prepared by pitt&sherry, provided updated cost benefit analysis findings from the
original Pathway to 2020 report published in 2012. While the methodology and design for
houses assessed were the same as those from the 2012, updated energy price projects, learning
rates and cost projections were incorporated.21
Also relevant is a recently study prepared by pitt&sherry’s Carbon & Energy Team (now SPR) for
the NSW Office of Environment and Heritage NABERS program, that provides a quantitative
17 Adelaide City Council, Carbon Neutral Strategy 2015-2025, Adelaide, South Australia, [undated], p. 6 and 7
18 Department of Environment, Water and Natural Resources, ‘Building Upgrade Finance’, last updated 20 April 2017. Refer to: http://www.environment.sa.gov.au/Science/Science_research/climate-change/climate-change-initiatives-in-south-australia/reducing-greenhouse-emissions-to-mitigate-climate-change/building-upgrade-finance
19 Refer to ourenergyplan.sa.gov.au for more information on the plan
20 Weatherill, Jay MP (14 Marhc 2017) South Australia is taking charge of its energy future, media release, viewed 11 August 2017. Refer to: https://www.premier.sa.gov.au/index.php/jay-weatherill-news-releases/7198-south-australia-is-taking-charge-of-its-energy-future
21 Pitt & Sherry (2016) Pathway to 2020 for Increased Stringency in new Building Energy Efficiency Standards: Benefit Cost Analysis: 2016 Update for Residential Buildings, report prepared for the Department of Industry, Innovation and Science, 13 May 2016, p. 1

SA variation to the NCC to increase energy efficient requirement for Class 2 buildings Regulatory Impact Statement
9.
analysis of Class 2 common area energy and water consumption by State, based on extensive
bottom-up data capture.22
Pitt&sherry’s recent report Accelerating Net-Zero High-Rise Residential Buildings in Australia23,
prepared with ark resources for the international Carbon Neutral Cities Alliance, provides the
most thorough analysis of abatement potentials in Class 2 buildings ever undertaken in Australia.
This provides further evidence of the changing economics of energy efficient improvements in
Class 2 buildings.
22 Unpublished, but see:
https://nabers.gov.au/public/webpages/ContentStandard.aspx?module=10&template=3&include=mediarelease.htm&side=latest-news-tertiary.htm#New funding to tackle apartment energy efficiency
23 Available at: http://www.cityofsydney.nsw.gov.au/vision/towards-2030/sustainability/carbon-reduction/net-zero-apartment-buildings

SA variation to the NCC to increase energy efficient requirement for Class 2 buildings Regulatory Impact Statement
10.
3. Objectives of government action
Element 2: Objectives of Government action provides for clear outcomes and objectives for
the government action to be stated. The objective should be stated in specific terms, where
progress will be measurable. It should be achievable in the prevailing economic conditions,
specified time frames and with the resources available. It must be within the realm of
government influence.24
The policy objective of the SA Government is to improve the efficiency of class 2 dwellings when
considering the construction costs and the operational costs for heating and cooling. This
outcome would ensure apartments are more comfortable for inhabitants and help residents
living in apartments save on energy bills.
The reforms also align with the State’s energy efficiency targets aimed at addressing climate
change by reducing greenhouse gas emissions. Target 60 in South Australia’s Strategic Plan is:
To improve the energy efficiency of dwellings by 15% by 2020 (baseline: 2003-04)
Milestone of 10% by 2014. 25
In 2014-15, tracking based on the Energy Efficiency Index26 indicated South Australian
households had achieved energy efficiency improvements in excess of the 2014 target and were
on track towards achievement of the 2020 (Figure 6).
Figure 6: South Australian residential energy efficiency index (EEI) 27
24 SA Government (2011) Better Regulation Handbook: How to design and review regulation and prepare a
Regulatory Impact Statement, January, p. 16.
25 SA Government, South Australia’s Strategic Plan, 2011, p. 47. For more information refer to: http://www.statedevelopment.sa.gov.au/resources/energy-efficiency/south-australias-energy-efficiency-targets
26 The Energy Efficiency Index (EEI) is defined as the number of average residential dwellings that can have their annual energy needs met by a given quantity of energy – in this case 1 terajoule (TJ) of energy.
27 Department of State Development, SA Strategic Plan website: ‘Target: 60. Energy efficiency – dwellings: Improve the energy efficiency of dwellings by 15% by 2020’. Refer to http://saplan.org.au/targets/60-energy-efficiency-dwellings

SA variation to the NCC to increase energy efficient requirement for Class 2 buildings Regulatory Impact Statement
11.
The SA Government recognise the current trend as being influenced by energy efficiency policies
(such as Minimum Energy Performance Standards, buildings standards, the Retailer Energy
Efficiency Scheme and SA's low emission water heater installation requirements), policies
promoting the residential use of photovoltaic systems, and consumer responses to rising energy
costs.
In order to ensure achievement of the 2020 energy efficiency target efforts to increase building
standards on energy efficiency need to continue where these improvements deliver public
value.
It was agreed with the Department that the Public Value Scorecard would be used to assess the
outcomes of the reform options ahead of undertaking the cost benefit analysis.
Public Value Scorecard
Developed by Harvard Professor Mark Moore, the public value scorecard provides a framework
for establishing what constitutes public value, and to whom, within a particular context. Under
this approach, the creation of public value and the success of public sector programs is achieved
through the alignment of three elements:
Public value delivered – as defined by the outcomes that the proposal aims to achieve and
for whom;
Legitimacy and support – recognising that building a coalition of stakeholders whose
support is necessary to sustain active and ensuring formal authorising requirements are
met; and
Operational capabilities – ensuring capacity and mobilising operational resources to
implement proposals and achieve desired public value outcomes.
Consideration and articulation of each of the above elements helps public policy make decisions
on proposals. The articulation of the elements helps by clarifying the degree to which proposals
are valuable, plausible, authorisable, and doable.
In making an assessment of the proposed reform (refer to Chapter 7) consideration is given both
the overall government objectives as well as the outcomes of a Public Value Scorecard based
assessment.

SA variation to the NCC to increase energy efficient requirement for Class 2 buildings Regulatory Impact Statement
12.
4. Statement of Options
Element 3: Statement of Options ensure that a RIS clearly demonstrates a range of alternative
ways of solving the problem.
One of the options must include maintaining the status quo and options may consist of
various types of regulatory interventions but may also include variations of the same form of
regulation (such is the case for this project).
The main criteria for the options are that they are feasible and described in sufficient detail
too allow assessment of the costs and benefits of the option. Consideration of how options
would be implemented and enforced are covered as part of this element.28
4.1 How to address the issue?
The existing energy efficiency regulations being considered as part of this reform are outlined in
the Background section of this report. This RIS is confined to consideration of options within the
Building Code to address energy efficiency performance.
Section J0.2 addresses energy efficiency outcomes for Class 2 building by requiring stated star
energy ratings to be achieved for heating and cooling loads where achievement is determined
by modelling design aspects using house energy rating software.
Under the current drafting of clause J0.2 contemplates collective achievement of energy ratings
by the apartments within a complex and the achievement of energy ratings by the individual
apartments on a stand-alone basis.
4.2 Reform options for assessment
The Department has identified a number of alternative reform options to achieve the reform
objective. The reform options vary key components of the energy efficiency requirements set
out in J0.2(a), including:
changes to the star rating(s) to be achieved;
removal of the collective rating, such that only an individual rating remains; and
separation of requirement for heating and cooling loads.
Figure 7 (below) summarises the proposed drafting of each of the reform options (option 1 to
3) as well as the base case with no changes to the current drafting. The naming of each of the
options (left hand column of Figure 7) are based on the core change characterising the option.
Each of the options are described qualitatively below and further detail underpinning the cost
benefit analysis is provided in Chapter 5.
28 SA Government (2011) Better Regulation Handbook: How to design and review regulation and prepare a
Regulatory Impact Statement, January, p. 16.

SA variation to the NCC to increase energy efficient requirement for Class 2 buildings Regulatory Impact Statement
13.
Figure 7: Revised drafting for options
Option Proposed drafting
Base Case: 6 star average rating, minimum 5 star individual rating
No change to NCC J0.2(a).
The sole-occupancy units of a Class 2 building or a Class 4 part of a building must—
(a) for reducing the heating and cooling load –
i. collectively achieve an average energy rating of not less than 6 stars; and
ii. individually achieve an energy rating of not less than 5 stars,
using house energy rating software.
Option 1: 7 star average rating, 6 star minimum individual rating
Amend NCC J0.2(a) to:
The sole-occupancy units of a Class 2 building or a Class 4 part of a building must—
(a) for reducing the heating and cooling load –
i. collectively achieve an average energy rating of not less than 7 stars; and
ii. individually achieve an energy rating of not less than 6 stars
using house energy rating software
Option 2: No average rating, 6 star minimum individual rating
Amend NCC J0.2(a) to:
The sole-occupancy units of a Class 2 building or a Class 4 part of a building must—
(a) for reducing the heating and cooling load –
i. individually achieve an energy rating of not less than 6 stars
using house energy rating software
Option 3: Separate cooling and heating caps
Amend NCC J0.2(a) to:
The sole-occupancy units of a Class 2 building or a Class 4 part of a building must—
(a) for reducing the heating and cooling load –
i. individually achieve maximum annual cooling load of not less than equivalent to 6 stars; and
ii. individually achieve maximum annual heating load of not less than equivalent to 6 stars
using house energy rating software.
4.3 Thermal modelling assumptions
Thermal modelling outputs underpin the analysis of each of the reform options. The approach
to thermal modelling is described in the first section below and the approach to the cost benefit
analysis is subsequently outlined.
Thermal modelling and the determination of changes in materials required to meet more
stringent energy efficient rating requirements consisted of a three-step process:
Step 1 involved the identification of a typical Class 2 building likely to be built in South
Australia. The building design selected consisted of four stories, with the layout for each
story remaining the same and each story consisting of 6 apartments. We investigated
whether a second, curtain wall construction method with a highly glazed façade – typical of
new apartment buildings in Sydney or Melbourne – should be modelled, but were advised

SA variation to the NCC to increase energy efficient requirement for Class 2 buildings Regulatory Impact Statement
14.
by the City of Adelaide that such a building would be unlikely to be compliant with Adelaide’s
planning scheme (and would be even less likely to be built in the Ceduna or Mt Gambier
climate zones) – although it was stressed that a range of building solutions might be judged
compliant with performance-based requirements, and a curtain-wall building could not be
ruled out. This issue is discussed further below.
Step 2 required the specification of a base set of building materials that would be varied to
achieve energy efficiency ratings in an iterative processes along-side thermal modelling.
Step 3 consisted of the thermal modelling of the base case and alternative reform options
with the materials being varied to ensure achievement of required ratings whilst minimising
the incremental cost.
Each step is briefly discussed below.
Indicative building design
The approach to assessing these options involved, first, identifying a typical Class 2 building of
the kind likely to be built in South Australia. To do this we consulted with the Department and
also with the Planning Department of Adelaide City Council (ACC). ACC referred us to the
Adelaide (City) Development Plan Consolidated – 24 September 2015, which provides guidance,
inter alia, on the principles underpinning acceptable building solutions. These include design
considerations (for Class 2 buildings) such as access to natural daylight and ventilation; solar
access requirements; window positioning and aspect; balconies; disposition of living areas;
cross-ventilation and other factors. This document provides indicative floor plans that reflect
appropriate solutions, and we have incorporated these within our modelled building (see
below).
Also, we reviewed a number of actual Class 2 buildings undergoing review by South Australia’s
Development Assessment Commission (Capital City Development Assessment Committee),
which applies to developments over $10 million in value. The documentation for developments
includes floorplans, and so a number of these were reviewed as indication of current and
acceptable building solutions.
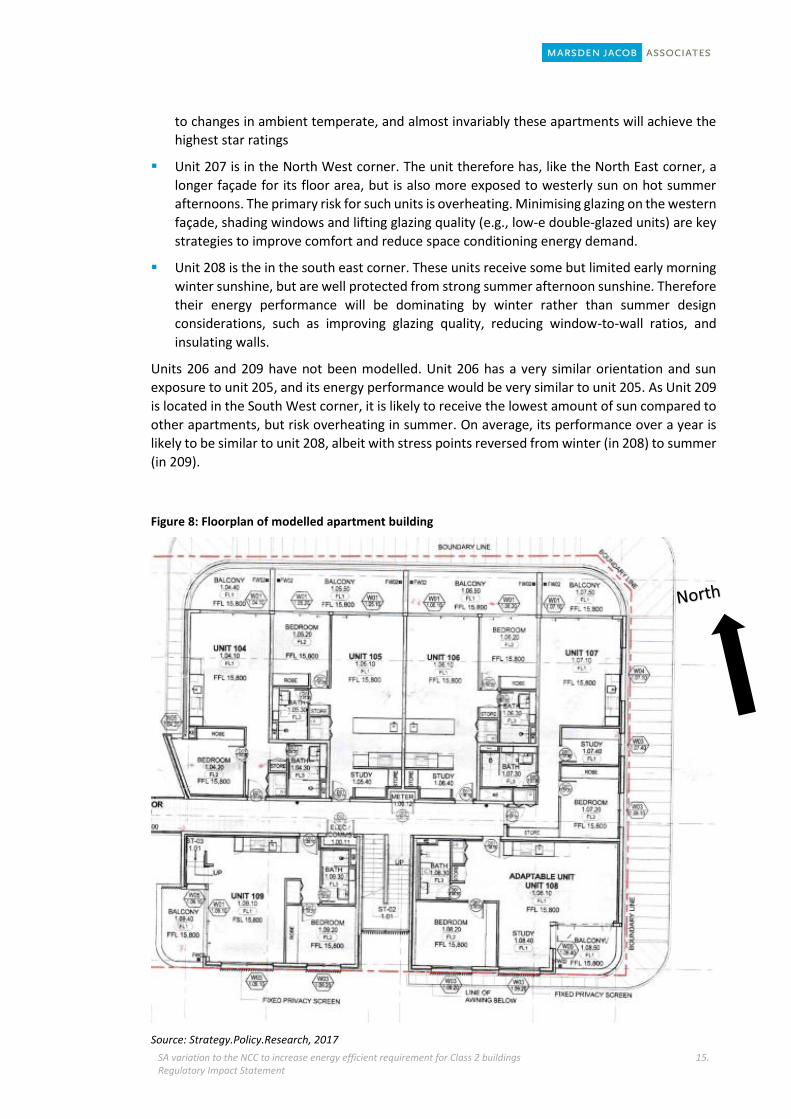
Based on these considerations, we then developed a model building for thermal modelling
purposes. The floor plan of the Class 2 building used for the modelling is shown in Figure 8 below.
The building is four storeys tall and the floor plan is the same for each storey. Each unit, except
those on the ground floor has a balcony, which is an Adelaide City Council planning requirement.
The orientation of the apartment as shown in Figure 8 means individual units that have been
used in the thermal modelling have the following orientation and sun exposure:
Unit 204 in located in the North West corner. Corner units have a longer façade-to-floor-are
ratio than middle units, which means that they are more exposed and sensitive to the
external environment. A North West unit is, however, advantageous from a solar passive
perspective, receiving low sun angles on winter mornings (helping to warm the unit), and
potentially shaded from the North East sun on summer afternoons/evenings. Good solar
design would see appropriate shading structures used to limit overheating, in particular,
during periods (all year round) with low sun angles.
Unit 205 is the middle apartment on the North facing side of the building. Such units have
the natural advantage of receiving useful sunshine in winter, when sun angles are lower,
and – provided suitable shading devices are used – should be shaded from direct sunstrike
on windows in summer. Their reduced façade-to-floor-area ratio makes them less sensitive
SA variation to the NCC to increase energy efficient requirement for Class 2 buildings Regulatory Impact Statement
15.
to changes in ambient temperate, and almost invariably these apartments will achieve the
highest star ratings
Unit 207 is in the North West corner. The unit therefore has, like the North East corner, a
longer façade for its floor area, but is also more exposed to westerly sun on hot summer
afternoons. The primary risk for such units is overheating. Minimising glazing on the western
façade, shading windows and lifting glazing quality (e.g., low-e double-glazed units) are key
strategies to improve comfort and reduce space conditioning energy demand.
Unit 208 is the in the south east corner. These units receive some but limited early morning
winter sunshine, but are well protected from strong summer afternoon sunshine. Therefore
their energy performance will be dominating by winter rather than summer design
considerations, such as improving glazing quality, reducing window-to-wall ratios, and
insulating walls.
Units 206 and 209 have not been modelled. Unit 206 has a very similar orientation and sun
exposure to unit 205, and its energy performance would be very similar to unit 205. As Unit 209
is located in the South West corner, it is likely to receive the lowest amount of sun compared to
other apartments, but risk overheating in summer. On average, its performance over a year is
likely to be similar to unit 208, albeit with stress points reversed from winter (in 208) to summer
(in 209).
Figure 8: Floorplan of modelled apartment building
Source: Strategy.Policy.Research, 2017

SA variation to the NCC to increase energy efficient requirement for Class 2 buildings Regulatory Impact Statement
16.
Building fabric
The building is a concrete framed building with masonry external walls. The building fabric of
the building modelled under the base case is shown in the description of the base case in section
4.4 below.
A masonry veneer was selected because this wall type is used current plans that are most
representative of South Australian units. Alternative finishes, such as tilt-up panels, were also
considered however the selection does not make a significant different to the thermal modelling
where the tilt-up panels are insulated.29 Both masonry veneer and tilt-up panels have a cavity
built on the inside allowing for additional insulation to be added to reach higher star rating.
We note that curtain walls were not considered a viable option. We understand these types of
finishes are unlikely to be compliant with Adelaide’s planning scheme – the location where most
Class 2 buildings are expected in our modelling. These types of configurations can also cost more
than alternative veneers as more structural reinforcement is required in order to unload the
other walls that are typically fully glass or at least highly glazed. This type of veneer is more
frequently used for office buildings and is being applied to taller Class 2 building in CBD markets
around Australia – just not yet as common for smaller Class 2 buildings in South Australia.
Changed building elements under reform options were determined via iterative processes
alongside the thermal modelling (described below). The resulting building fabric details for
options 1, 2 and 3 have been summarised in Table 1 (in the Executive Summary) and have been
provided in the sections below for each reform option.
Details on the incremental costs of achieving the performance outcomes as independently
quantified by quantity surveyors, Daniel Cant Watts Corke are outlined in Appendix 1. It has
been assumed that builders would choose the lowest cost option to meet the requirements.
AccuRate thermal modelling
Having selected an appropriate and typical Class 2 building design, and the base case fabric
element thermal modelling of the building was undertaken. Modelling was conducted using
AccuRate thermal modelling software.
AccuRate is the reference standard rating tool, against which other ratings software packages
(like FirstRate 5 and BERS Pro) must be accredited under the National House Energy Rating
Scheme (NatHERS), which is administered by the Australian Government. The thermal
modelling ‘engine’ powering AccuRate was originally developed by CSIRO, and CSIRO remains
the primary developer of new versions and upgrades.
An iterative process was used to determine the required specification for the thermal
performance of the building under the current, or NCC2016, energy performance requirements.
Note that most elements, for most options, remain the same, regardless of the option – thus
the table below notes only where changes were made.
Attached this this report are certificates that reflect the modelling of units as described below.
Two units both on the upper mid-level have been selected – unit 204 and unit 208. In the
appendix the following is provided for each:
Base case certificates: These shows a rating of 4.9 for unit 204 and a rating of 5.3 for unit
208.
29 Often panels are not insulated and a timber stud wall (with or without) insulation is built on the internal side of
the panel to run services and then lined with plasterboard.

SA variation to the NCC to increase energy efficient requirement for Class 2 buildings Regulatory Impact Statement
17.
Option 1 certificates: These show a rating of 6.9 for unit 204 and a rating of 7.2 for unit 208.
Design details.
4.4 Base case: 6 star average rating, minimum 5 star individual rating
The base case or business as usual retains the current requirements of an average rating of 6
stars and a minimum heating and cooling requirement for individual apartments of 5 stars.
It is against this option that the impacts (costs and benefits) for each for the reform options have
been considered.
The base case used in the cost benefit analysis also provides forward forecast of factors that
remain the same across all options. It accounts for:
growth in the residential Class 2 building stock;
any baseline improvement in energy efficiency;
baseline changes in energy prices and emissions; and
major policy initiatives and other factors.
While forecasts of these factors are included in the modelling, it is important to remember that
these are consistent across scenarios and thus cancel out when net benefits are calculated
comparing the reform options (options 1, 2 and 3) to the base case.
The thermal modelling results used for the purposes of the cost benefit analysis are summarised
below.
Thermal modelling results (base case)
Under the base case, each unit must achieve a minimum 5 star rating and the average of all units
achieved must be a minimum of 6 stars.
The building is a concrete framed building with masonry external walls under all scenarios. The
fabric of the building under the base case is shown in Table 4 below.
Table 4: Building fabric, base case
Element Composition
External walls Brick veneer, internal plasterboard lining
External balcony wall Fibre-cement sheet, internal plasterboard lining
Internal walls Plasterboard and solid blockwork
Floors between units 200 mm concrete slab
Top floor ceiling 200 mm concrete slab, R3.0 insulation, plasterboard lining
Windows Aluminium single-glazed High Solar Gain Low-E: U = 5.40: SHGC = 0.58
Window size changes Balconies shaded by balcony above. Top floor balconies shaded by roof overhang. No other external shading.
External shading Brick veneer, internal plasterboard lining
Source: Strategy.Policy.Research
Table 5 below shows the star rating of each unit under the business as usual (or base case)
scenario. The actual calculated heating and cooling requirement that corresponds to each star

SA variation to the NCC to increase energy efficient requirement for Class 2 buildings Regulatory Impact Statement
18.
rating is also shown. It is clear from the table that star rating of individual units within the
building varies very widely depending on a unit’s location. Star ratings vary from 4.9 to 8.6. Unit
205 has the best thermal performance on the mid and ground floors in all climate zones. The
reason for this is because it is a central unit bounded on either side by another unit, leaving it
with only one external wall. On the top floor, however, this unit doesn’t perform as well,
requiring a greater heating load. This reflects the greater exposure to the external environment
that top floor apartments experience, relative to those on lower floors.
On the top floor, the west facing Unit 204 performs best in Adelaide and Ceduna, whereas the
east facing Unit 207 performs the best in Mt Gambier. Unit 208 is south facing and, in most
cases on each floor and in each climate zone it has lower star rating than the other units because
of its orientation.
Overall, the building in this specification achieves the current regulatory requirement of a 6 star
average and 5 star minimum, noting that Unit 204 shows 4.9 star on two floors. We consider
that this is within a normal margin of error.
Table 5: Building performance summary, base case
ADELAIDE CEDUNA MT GAMBIER
Star Rating
Heating load
(MJ/m2)
Cooling load
(MJ/m2)
Star Rating
Heating load
(MJ/m2)
Cooling load
(MJ/m2)
Star Rating
Heating load
(MJ/m2)
Cooling load
(MJ/m2)
Top Floor
Unit 204* 7.3 18.2 52 7.8 16.2 31.7 5.6 151.1 30.9
Unit 205 6.3 43.9 55.2 6.4 40.2 38.1 6.4 132.2 10.2
Unit 207 5.3 29.5 85 6.2 24.6 59.4 6.7 109 20.9
Unit 208* 6.1 23.6 80.4 7.4 44.3 69.3 5.1 185.2 28.8
Upper Mid Floor
Unit 204 4.9 51.1 85.1 5.4 42.8 52.5 5.4 161.7 15.4
Unit 205 7.8 21.6 30 8.1 16.1 20.1 7.4 89.6 4.5
Unit 207 5.4 33.6 81.8 7 19.7 40.7 6.4 121 11.7
Unit 208 5.3 40 84.1 6.2 29.8 50.3 6.1 137 12.8
Lower Mid Floor
Unit 204 5.7 55.3 65.4 5.9 48.1 41.9 5.1 200.1 8.4
Unit 205 8.6 20.5 14.6 8.6 16.4 12.1 7 115.6 1.7
Unit 207 6.4 37.2 59.8 7.4 22.1 31.5 6 154.9 7.2
Unit 208 6.2 43.2 63.8 6.8 33.6 39.5 5.7 172.6 7.1
Ground Floor
Unit 204 4.9 51.1 85.1 5.4 42.8 52.5 5.4 161.7 15.4
Unit 205 7.8 21.6 30 8.1 16.1 20.1 7.4 89.6 4.5
Unit 207 5.4 33.6 81.8 7 19.7 40.7 6.4 121 11.7
Unit 208 5.3 40 84.1 6.2 29.8 50.3 6.1 137 12.8
AVG 6.2 35.3 64.9 6.9 28.9 40.7 6.1 140.0 12.8
*In Adelaide and Ceduna Units 204 and 208 on the top floor need R1.5 wall insulation to meet the minimum 5 star rating under the base case.
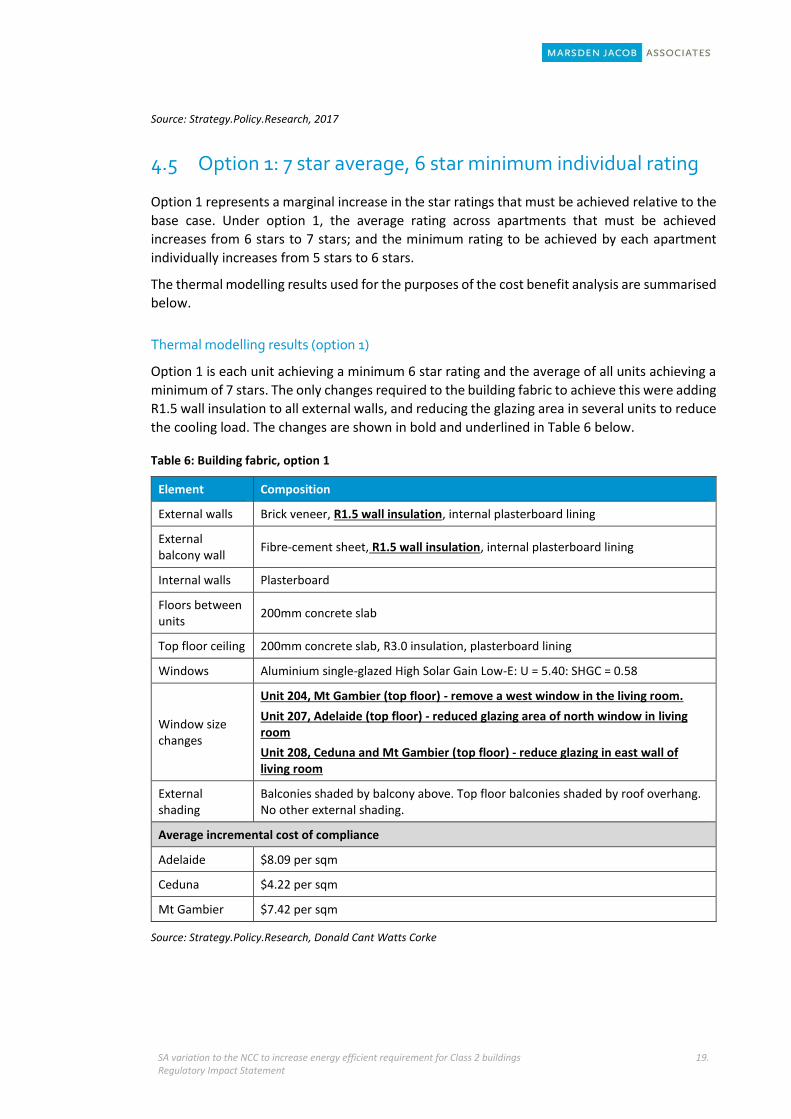
SA variation to the NCC to increase energy efficient requirement for Class 2 buildings Regulatory Impact Statement
19.
Source: Strategy.Policy.Research, 2017
4.5 Option 1: 7 star average, 6 star minimum individual rating
Option 1 represents a marginal increase in the star ratings that must be achieved relative to the
base case. Under option 1, the average rating across apartments that must be achieved
increases from 6 stars to 7 stars; and the minimum rating to be achieved by each apartment
individually increases from 5 stars to 6 stars.
The thermal modelling results used for the purposes of the cost benefit analysis are summarised
below.
Thermal modelling results (option 1)
Option 1 is each unit achieving a minimum 6 star rating and the average of all units achieving a
minimum of 7 stars. The only changes required to the building fabric to achieve this were adding
R1.5 wall insulation to all external walls, and reducing the glazing area in several units to reduce
the cooling load. The changes are shown in bold and underlined in Table 6 below.
Table 6: Building fabric, option 1
Element Composition
External walls Brick veneer, R1.5 wall insulation, internal plasterboard lining
External balcony wall
Fibre-cement sheet, R1.5 wall insulation, internal plasterboard lining
Internal walls Plasterboard
Floors between units
200mm concrete slab
Top floor ceiling 200mm concrete slab, R3.0 insulation, plasterboard lining
Windows Aluminium single-glazed High Solar Gain Low-E: U = 5.40: SHGC = 0.58
Window size changes
Unit 204, Mt Gambier (top floor) - remove a west window in the living room.
Unit 207, Adelaide (top floor) - reduced glazing area of north window in living room
Unit 208, Ceduna and Mt Gambier (top floor) - reduce glazing in east wall of living room
External shading
Balconies shaded by balcony above. Top floor balconies shaded by roof overhang. No other external shading.
Average incremental cost of compliance
Adelaide $8.09 per sqm
Ceduna $4.22 per sqm
Mt Gambier $7.42 per sqm
Source: Strategy.Policy.Research, Donald Cant Watts Corke

SA variation to the NCC to increase energy efficient requirement for Class 2 buildings Regulatory Impact Statement
20.
Star rating and heating/cooling load results for this option are shown in Table 7 below.
Table 7: Option 1 - Building performance summary
ADELAIDE CEDUNA MT GAMBIER
Star Rating
Heating load
(MJ/m2)
Cooling load
(MJ/m2)
Star Rating
Heating load
(MJ/m2)
Cooling load
(MJ/m2)
Star Rating
Heating load
(MJ/m2)
Cooling load
(MJ/m2)
Top Floor
Unit 204* 7.3 18.2 52 7.8 16.2 31.7 6.8 100.2 30.3
Unit 205 6.3 43.9 55.2 6.4 40.2 38.1 6.4 132.2 10.2
Unit 207 6.6 16 74.3 6.2 24.6 59.4 6.7 109 20.9
Unit 208 6.1 23.6 80.4 7.4 44.3 69.3 7 92.9 26.6
Upper Mid-Floor
Unit 204 6.9 12 65 7.4 10.2 41.1 7.9 62.7 13
Unit 205 8.7 4.3 24.3 8.8 4.1 16.9 8.7 39.1 3.8
Unit 207 7.2 7.6 62.4 7 19.7 40.7 6.4 121 11.7
Unit 208 7.2 9 60.8 6.2 29.8 50.3 6.1 137 12.8
Lower Mid Floor
Unit 204 6.9 12 65 7.4 10.2 41.1 7.9 62.7 13
Unit 205 7.8 21.6 30 8.1 4.1 16.9 7.4 89.6 4.5
Unit 207 7.2 7.6 62.4 7 4 30 6.4 121 11.7
Unit 208 7.2 9 60.8 6.2 6.2 35.2 6.1 137 12.8
Ground Floor
Unit 204 7.7 15.9 46.5 5.9 48.1 41.9 7.4 95.4 6.8
Unit 205 8.6 20.5 14.6 8.6 16.4 12.1 7 115.6 1.7
Unit 207 6.4 37.2 59.8 7.4 22.1 31.5 6 154.9 7.2
Unit 208 6.2 43.2 63.8 6.8 33.6 39.5 7.9 78.4 4.3
AVG 7.1 18.9 54.8 7.2 20.9 37.2 7.0 103.0 12.0
*No west window
Source: Strategy.Policy.Research, 2017
4.6 Option 2: No average rating, 6 star minimum individual rating
Option 2 removes the average rating requirement, thus removing the ability to trade off less
than 6 star performance in some apartments for above 6 star performance in others. Instead
every apartment would be required to achieve minimum 6 star rating.
The removal of the average rating acts to increase the onus on each individual apartment to be
designed and constructed to meet the 6 star rating requirements, which may involve higher
costs (but also lower energy costs) for those apartments that currently perform at less than 6
stars.
The thermal modelling results used for the purposes of the cost benefit analysis are summarised
below.

SA variation to the NCC to increase energy efficient requirement for Class 2 buildings Regulatory Impact Statement
21.
Thermal modelling results (option 2)
Noting that between 8 and 11 of the 16 units already achieve 6 star ratings in the base case
(depending upon the climate zone), relatively few changes were required to bring all units up to
a 6 star minimum here was no change in the building fabric from either the base case or option 1
reform scenario except for those units highlighted by shading.
In the case of the highlighted units in Table 9 (overleaf), the level of wall insulation remains at
R1.5 as per option 1, however the quality of glazing can be reduced from what was used in the
base case and option 1, while still complying with the minimum 6 star requirement. This slightly
reduces the cost of compliance with this option, along with the average energy performance.
See Table 8 below.
Table 8: Building fabric, option 2
Element Composition
External walls Brick veneer, R1.5 wall insulation, internal plasterboard lining
External balcony wall
Fibre-cement sheet, R1.5 wall insulation, internal plasterboard lining
Internal walls Plasterboard
Floors between units
200 mm concrete slab
Top floor ceiling 200 mm concrete slab, R3.0 insulation, plasterboard lining
Windows Aluminium single-glazed High Solar Gain Low-E: U = 5.40: SHGC = 0.58
Window size changes
Balconies shaded by balcony above. Top floor balconies shaded by roof overhang. No other external shading.
External shading
Brick veneer, internal plasterboard lining
Average incremental cost of compliance
Adelaide $7.68 per sqm
Ceduna $3.81 per sqm
Mt Gambier $7.01 per sqm
Source: Strategy.Policy.Research, Donald Cant Watts Corke
Note that, because the Ceduna and Mt Gambier climate zones are more severe than Adelaide,
the star ratings for the highlighting apartments increase more than strictly required in these two
climate zones, leading to a slightly higher average star rating for these climate zones in option 2
when compared to option 1.
As discussed further in Chapter 5, because most of the new construction work is assumed to
take place in the Adelaide climate zone, this result does not have a material impact. In reality,
specifications for these climates could be ‘detuned’ slightly and still remain compliant.

SA variation to the NCC to increase energy efficient requirement for Class 2 buildings Regulatory Impact Statement
22.
Table 9: Building performance summary, option 2
ADELAIDE CEDUNA MT GAMBIER
Stars Heating
load (MJ/m2)
Cooling load
(MJ/m2) Stars
Heating load
(MJ/m2)
Cooling load
(MJ/m2) Stars
Heating load
(MJ/m2)
Cooling load
(MJ/m2)
Top Floor
Unit 204* 7.3 18.2 52 7.8 16.2 31.7 6.8 100.2 30.3
Unit 205 6.3 43.9 55.2 6.4 40.2 38.1 6.4 132.2 10.2
Unit 207 6.6 16 74.3 7.4 12.5 42.1 7.8 69.7 13.8
Unit 208 6.1 23.6 80.4 7.4 44.3 69.3 7 92.9 26.6
Upper Mid Floor
Unit 204 6.9 12 65 7.4 10.2 41.1 7.9 62.7 13
Unit 205 7.8 21.6 30 8.1 16.1 20.1 7.4 89.6 4.5
Unit 207 6.8 14.4 65.2 7.9 8.3 32.5 7.8 69.2 9.5
Unit 208 6.8 15.6 64.9 7.5 11.4 38.4 7.8 71 10.1
Lower Mid Floor
Unit 204 6.9 12 65 7.4 10.2 41.1 7.9 62.7 13
Unit 205 7.8 21.6 30 8.1 4.1 16.9 7.4 89.6 4.5
Unit 207 6.8 14.4 65.2 7 4 30 6.4 121 11.7
Unit 208 6.8 15.6 64.9 6.2 6.2 35.2 6.1 137 12.8
Ground Floor
Unit 204 7.2 25.5 50.8 7.4 23.2 23.6 6.7 125.2 7.3
Unit 205 8.6 20.5 14.6 8.6 16.4 12.1 7 115.6 1.7
Unit 207 6.4 37.2 59.8 7.4 22.1 31.5 6 154.9 7.2
Unit 208 6.2 43.2 63.8 6.8 33.6 39.5 7.9 78.4 4.3
AVG 7.0 22.2 56.3 7.4 17.4 34.0 7.1 98.2 11.3
*no west window
Source: Strategy.Policy.Research, 2017
4.7 Option 3: Separate cooling and heating caps (equivalent to average 6 star rating)
Option 3 removes the requirement for dwellings to meet a specified star rating and instead
requires dwellings to comply with heating and cooling caps. The heating and cooling caps
selected for option 3 are on average equivalent to a 6 star rating, but do not necessarily mean
all apartments continue to meet the 6 star minimum rating (since it is not specifically required).
The separation of heating and cooling loads is, in principle, more stringent than an annual
‘heating and cooling’ requirement, because it limits the ability of the designer to trade-off
improved winter performance for worse summer performance, or vice versa.
Effectively, the requirement would ensure Class 2 building apartments are designed to remain
both warm in the winter (thus reducing the heating needed by occupants) and cool in the
summer (reducing the cooling needs of occupants). This approach, of separate heating and

SA variation to the NCC to increase energy efficient requirement for Class 2 buildings Regulatory Impact Statement
23.
cooling caps, is being considered for roll-out Australia-wide in the National Construction Code
for 2019.30
For clarity it is noted that since caps used in modelling only equate to a six star rating on average,
the costs (and benefits) may be limited for particular regions or designs where extremes are less
prominent.
The thermal modelling results used for the purposes of the cost benefit analysis are summarised
below.
Thermal modelling results (option 3)
Option 3 was to model the units so as not to exceed maximum area adjusted heating and cooling
load caps. Options 1 and 2 were calculated using the actual rather than adjusted loads. The area
adjustment accounts for the difference in total building surface area to floor area ratio in small
versus larger dwellings. Smaller dwellings have a greater total building surface area to floor area
than larger dwellings. Since heat transfer through the building fabric is proportionate to total
building surface area, an area adjustment is required to ensure that smaller dwellings (with less
building surface area but larger surface area to floor area ratio) are compared with larger
dwellings fairly and therefore rated based on adjusted energy loads (NatHERS Protocols).
The caps specified to be used in this analysis are shown below. These values were sourced from
the Australian Building Codes Board and derive from analysis (by third parties) which is still in
draft form. Therefore, these values should not be treated as finals, and are not endorsed or
recommended by the Board.
Table 10: Class 2 heating and cooling load caps
Max Heating (MJ/m2)
Max Cooling (MJ/m2)
Adelaide 96 93
Ceduna 80 62
Mt Gambier 172 35
Source: Strategy.Policy.Research, 2017
Table 11 below shows the area adjusted heating and cooling loads of the base case (note that
they are lower than the actual loads used for the analysis of option 1).
The units highlighted by shading are the only ones where either the maximum heating or
maximum cooling load caps specified were exceeded. The table shows that:
None of the caps were exceeded under the base case for units in the Adelaide climate zone.
Only one unit in Ceduna and two in Mt Gambier required any treatments to meet the
requirements.
We note that Unit 208 on the ground floor is marginal in Mt Gambier – but within a normal
margin of error.
30 As per the Australian Building Codes Board work program. Refer to:
http://www.abcb.gov.au/Connect/Articles/2017/03/09/Section-J-Overhaul-big-changes-are-coming-your-way

SA variation to the NCC to increase energy efficient requirement for Class 2 buildings Regulatory Impact Statement
24.
Table 11: Area adjusted heating and cooling loads, base case
ADELAIDE CEDUNA MT GAMBIER
Stars Heating
load (MJ/m2)
Cooling load
(MJ/m2) Stars
Heating load
(MJ/m2)
Cooling load
(MJ/m2) Stars
Heating load
(MJ/m2)
Cooling load
(MJ/m2)
Top Floor
Unit 204* 7.3 18.2 52 7.8 16.2 31.7 5.6 151.1 30.9
Unit 205 6.3 43.9 55.2 6.4 40.2 38.1 6.4 132.2 10.2
Unit 207 5.3 29.5 85 6.2 24.6 59.4 6.7 109 20.9
Unit 208 6.1 23.6 80.4 7.4 44.3 69.3 5.1 185.2 28.2
Upper Mid Floor
Unit 204 4.9 51.1 85.1 5.4 42.8 52.5 5.4 161.7 15.4
Unit 205 7.8 21.6 30 8.1 16.1 20.1 7.4 89.6 4.5
Unit 207 5.4 33.6 81.8 7 19.7 40.7 6.4 121 11.7
Unit 208 5.3 40 84.1 6.2 29.8 50.3 6.1 137 12.8
Lower Mid Floor
Unit 204 5.7 55.3 65.4 5.9 48.1 41.9 5.1 200.1 8.4
Unit 205 8.6 20.5 14.6 8.6 16.4 12.1 7 115.6 1.7
Unit 207 6.4 37.2 59.8 7.4 22.1 31.5 6 154.9 7.2
Unit 208 6.2 43.2 63.8 6.8 33.6 39.5 5.7 172.6 7.1
Ground Floor
Unit 204 4.9 51.1 85.1 5.4 42.8 52.5 5.4 161.7 15.4
Unit 205 7.8 21.6 30 8.1 16.1 20.1 7.4 89.6 4.5
Unit 207 5.4 33.6 81.8 7 19.7 40.7 6.4 121 11.7
Unit 208 5.3 40 84.1 6.2 29.8 50.3 6.1 137 12.8
AVG 6.2 35.3 64.9 6.9 26.8 38.6 6.4 127.6 12.5
*No west window
Source: Strategy.Policy.Research, 2017
For Unit 208 (top floor) in Ceduna under the base case the maximum heating cap was met,
however the maximum cooling cap was exceeded. The treatment applied to ensure that both
heating and cooling loads did not exceed the caps was the same as option 2 - R1.5 wall insulation
and double-glazed windows.
For the two units highlighted in Mt Gambier, the heating cap was exceeded under base case,
while the maximum cooling cap was easily met. The treatment applied in ensure that both
heating and cooling loads did not exceed the caps was the same as option 1 - R1.5 wall insulation.

SA variation to the NCC to increase energy efficient requirement for Class 2 buildings Regulatory Impact Statement
25.
Table 12: Building fabric, option 3
Element Composition
External walls Brick veneer, internal plasterboard lining (Unit 208 top – Mt Gambier & Ceduna, Unit 204 mid – Mt Gambier, R1.5 wall insulation)
External balcony wall
Fibre-cement sheet, internal plasterboard lining
Internal walls Plasterboard and solid blockwork
Floors between units
200 mm concrete slab
Top floor ceiling 200 mm concrete slab, R3.0 insulation, plasterboard lining
Windows Aluminium single-glazed High Solar Gain Low-E: U = 5.40: SHGC = 0.58 (Unit 208 top – Ceduna, double-glazed)
Window size changes
Balconies shaded by balcony above. Top floor balconies shaded by roof overhang. No other external shading.
External shading
Brick veneer, internal plasterboard lining
Average incremental cost of compliance
Adelaide -
Ceduna $0.61 per sqm
Mt Gambier $1.93 per sqm
Source: Strategy.Policy.Research, Donald Cant Watts Corke
Star rating and heating/cooling load results for this option after changes to building material are
shown in Table 13 below.
Table 13: Area adjusted heating and cooling loads, option 3
ADELAIDE CEDUNA MT GAMBIER
Stars Heating
load (MJ/m2)
Cooling load
(MJ/m2) Stars
Heating load
(MJ/m2)
Cooling load
(MJ/m2) Stars
Heating load
(MJ/m2)
Cooling load
(MJ/m2)
Top Floor
Unit 204 7.3 18.2 52 7.8 16.2 31.7 5.6 151.1 30.9
Unit 205 6.3 43.9 55.2 6.4 40.2 38.1 6.4 132.2 10.2
Unit 207 5.3 29.5 85 6.2 24.6 59.4 6.7 109 20.9
Unit 208 6.1 23.6 80.4 7.9 10.8 35.6 7 92.9 26.6
Upper Mid Floor
Unit 204 4.9 51.1 85.1 5.4 42.8 52.5 5.4 161.7 15.4
Unit 205 7.8 21.6 30 8.1 16.1 20.1 7.4 89.6 4.5
Unit 207 5.4 33.6 81.8 7 19.7 40.7 6.4 121 11.7
Unit 208 5.3 40 84.1 6.2 29.8 50.3 6.1 137 12.8
Lower Mid Floor
Unit 204 4.9 51.1 85.1 5.4 42.8 52.5 5.4 161.7 15.4
Unit 205 7.8 21.6 30 8.1 16.1 20.1 7.4 89.6 4.5

SA variation to the NCC to increase energy efficient requirement for Class 2 buildings Regulatory Impact Statement
26.
ADELAIDE CEDUNA MT GAMBIER
Stars Heating
load (MJ/m2)
Cooling load
(MJ/m2) Stars
Heating load
(MJ/m2)
Cooling load
(MJ/m2) Stars
Heating load
(MJ/m2)
Cooling load
(MJ/m2)
Unit 207 5.4 33.6 81.8 7 19.7 40.7 6.4 121 11.7
Unit 208 5.3 40 84.1 6.2 29.8 50.3 6.1 137 12.8
Ground Floor
Unit 204 5.7 55.3 65.4 5.9 48.1 41.9 7.4 95.4 6.8
Unit 205 8.6 20.5 14.6 8.6 16.4 12.1 7 115.6 1.7
Unit 207 6.4 37.2 59.8 7.4 22.1 31.5 6 154.9 7.2
Unit 208 6.2 43.2 63.8 6.8 33.6 39.5 5.7 172.6 7.1
AVG 6.2 35.3 64.9 6.9 26.8 38.6 6.4 127.6 12.5
Source: Strategy.Policy.Research, 2017

SA variation to the NCC to increase energy efficient requirement for Class 2 buildings Regulatory Impact Statement
27.
5. Cost benefit analysis results
Element 4: Analysis of costs and benefits. Every South Australian RIS must include a cost
benefit analysis, with the resources devoted to undertaking the CBA proportional to the
significance of the proposal and the size of the likely economic and social implications.
For each regulatory option proposed, the CBA should identify the impacts on all sectors of the
community within the State – business, consumers, the wider community and the
environment 31
5.1 Summary of results
The purpose of the cost-benefit analysis (CBA) is to assess the economic costs and benefits of
each of the options incrementally to the business-as-usual case. Economic impacts (costs and
benefits) are assessed in the model by aggregating the relevant subset of financial
(distributional) impacts and externality impacts. Financial transfers between stakeholder groups
have been excluded from the analysis because they do not result in a net economic cost or
benefit.
The results of the CBA and compares the performance of options using three key metrics:
Net Present Value (NPV), which is the Present Value (PV) of economic benefits delivered by
the option less the PV of economic costs incurred; and
Benefit Cost Ratio (BCR), which is the ratio of the PV of economic benefits to PV of economic
costs.
Social return on investment, which expresses the net social benefits over time as an effective
interest rate (%) on the investment induced by each option
The NPV measures the expected benefit (or cost) to society of implementing the policy
expressed in monetary terms, whereas the BCR identifies the option that provides the highest
benefit per unit of cost.
The analysis in this report is necessarily based on a series of assumptions, which means that
there is a degree of uncertainty around the results. The assumptions outlined in the next section
reflected current information at the time the assessment was completed.
Key findings of the analysis are as follows:
Key finding 1: All the options studied (options 1 – 3) would deliver net economic benefits relative to the base case
The analysis below indicates that all options have a positive net present value, which means that
the value of benefits they create is larger than the costs they incur – see Table 14 below. This is
a prima facie indication that any of three options could be implemented by the South Australian
Government.
31 SA Government (2011) Better Regulation Handbook: How to design and review regulation and prepare a
Regulatory Impact Statement, January, p. 17-21
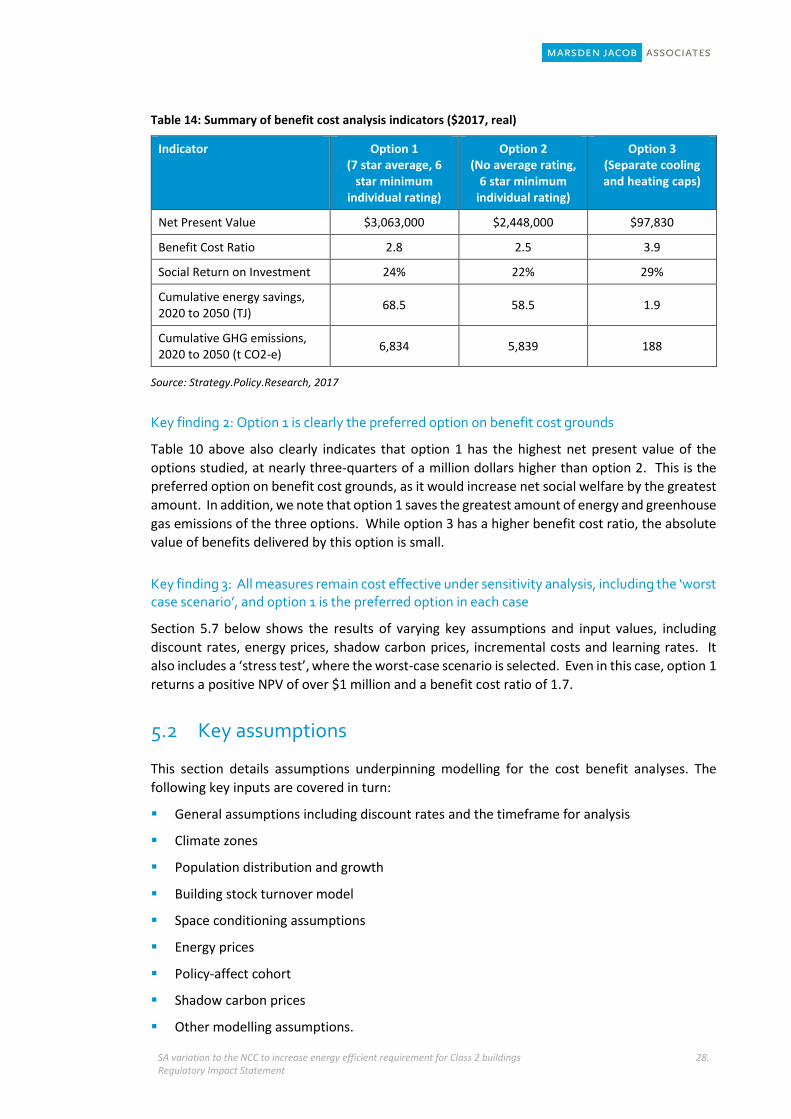
SA variation to the NCC to increase energy efficient requirement for Class 2 buildings Regulatory Impact Statement
28.
Table 14: Summary of benefit cost analysis indicators ($2017, real)
Indicator Option 1 (7 star average, 6
star minimum individual rating)
Option 2 (No average rating,
6 star minimum individual rating)
Option 3 (Separate cooling and heating caps)
Net Present Value $3,063,000 $2,448,000 $97,830
Benefit Cost Ratio 2.8 2.5 3.9
Social Return on Investment 24% 22% 29%
Cumulative energy savings, 2020 to 2050 (TJ)
68.5 58.5 1.9
Cumulative GHG emissions, 2020 to 2050 (t CO2-e)
6,834 5,839 188
Source: Strategy.Policy.Research, 2017
Key finding 2: Option 1 is clearly the preferred option on benefit cost grounds
Table 10 above also clearly indicates that option 1 has the highest net present value of the
options studied, at nearly three-quarters of a million dollars higher than option 2. This is the
preferred option on benefit cost grounds, as it would increase net social welfare by the greatest
amount. In addition, we note that option 1 saves the greatest amount of energy and greenhouse
gas emissions of the three options. While option 3 has a higher benefit cost ratio, the absolute
value of benefits delivered by this option is small.
Key finding 3: All measures remain cost effective under sensitivity analysis, including the ‘worst case scenario’, and option 1 is the preferred option in each case
Section 5.7 below shows the results of varying key assumptions and input values, including
discount rates, energy prices, shadow carbon prices, incremental costs and learning rates. It
also includes a ‘stress test’, where the worst-case scenario is selected. Even in this case, option 1
returns a positive NPV of over $1 million and a benefit cost ratio of 1.7.
5.2 Key assumptions
This section details assumptions underpinning modelling for the cost benefit analyses. The
following key inputs are covered in turn:
General assumptions including discount rates and the timeframe for analysis
Climate zones
Population distribution and growth
Building stock turnover model
Space conditioning assumptions
Energy prices
Policy-affect cohort
Shadow carbon prices
Other modelling assumptions.

SA variation to the NCC to increase energy efficient requirement for Class 2 buildings Regulatory Impact Statement
29.
5.2.1 General assumptions
Several general assumptions have been used in the cost benefit analysis. These include the
analysis base year, the base year for valuation (of costs and benefits), the discount rate applied
to costs and benefits over time and sensitivity discount rates.
The general assumptions are outlined in Table 15 below. Discount rates and the time frame for
analysis are discussed in greater detail below.
Table 15: General assumptions
Variable Assumption
Base Year FY 2016
Prices $2017, real
Evaluation Period FY 2017-2050
Discount Rate 7% (real)
Discount Rate Sensitivity 3% and 10% (real)
Period of regulation impact 2020 to 2030
Period over which benefit accrue 2020 to 2050
Discount rates
Results are presented in present value (PV) terms using the standard discount rate of 7 per cent
per annum (real), with sensitivity testing applied at 3 per cent and 10 per cent levels.
The range of discount rates are consistent with the most recent national RIS on energy efficiency
requirements for residential building completed in 2010 32, as well as recent recommendations
from Houston Kemp in their recent review of the Residential Building Regulatory Impact
Statement Methodology33.
In particular, the 3 per cent level sensitivity has been included based on the Houston Kemp
recommendation that:
Greater weight should be applied to lower discount rates, to take into account
community values about the desirability of lowering greenhouse gases both now
and into the future. (Houston Kemp, p. ii)
The SA Better Regulation Handbook from 2011 recommends the use of a real discount rate of
6 per cent per annum34 - the middle of the two reporting values selected for this study.
Timeframe for analysis
Modelling assumes the revised standards are adopted from 2020 and the new standards are
assumed to impact new Class 2 dwellings built in the 10-year period following this (to 2030). The
32 The Centre for International Economics (CIE) (2009) Final Regulation Impact Statement for Residential Buildings
(Class 1, 2, 4 and 10 Buildings), prepared for the Australian Building Codes Board, December 2009, p. 17
33 Houston Kemp (2017) Review of the Residential Building Regulatory Impact Statement Methodology, 6 April 2017.
34 SA Government (2011) Better Regulation Handbook: How to design and review regulation and prepare a Regulatory Impact Statement, January. p. 57.

SA variation to the NCC to increase energy efficient requirement for Class 2 buildings Regulatory Impact Statement
30.
costs and benefits arising from the changed building standards during this 10-year period are
then assessed over the life of the dwellings – 30-years to 2050.
These timeframes have been selected with consideration to:
The expected length of time over which the proposed changes are expected to have a
meaningful impact.
The duration over which costs and benefits continue to flow from the changed behaviour
during meaningful impact phase.
5.2.2 Climate zones
NatHERS divides Australia into 69 climate zones (Figure 9), this study focused on the impact in
three of these regions where Class 2 buildings are currently located (Table 16) and are most
likely to be built going forwards:
Adelaide (NatHERS climate zone 16)
Ceduna (NatHERS climate zone 53)
Mt Gambier (NatHERS climate zone 61).
Table 16: Number of apartments broken down by number of bedrooms in SA Climate Zones, 2013
Number of bedrooms
NatHERS Climate Zones
Adelaide Ceduna Mt Gambier Other Zones South
Australia
None (includes bedsitters)
168 - - 6 174
1 bedroom 1,741 10 7 62 1,820
2 bedrooms 5,184 13 37 155 5,389
3 bedrooms 989 - 4 3 996
4 bedrooms 96 - - - 96
5+ bedrooms 12 - - - 12
Not stated 1,336 4 3 26 1,369
Total 8,190 23 48 226 8,487
Source: SA Government Data Directory, Dwelling Type, created 27 May 2013, last updated 30 October 2014, online.
These three climate zones were mapped onto the Statistical Divisions used by the Australian
Bureau of Statistics, which are shown in Table 17 below. The Northern Statistical Division is the
only one excluded, on the grounds that very few Class 2 buildings are likely to be built in this
zone.
Table 17: Mapping of ABS Statistical Divisions to NatHERS Climate Zones
Statistical Division (name) NatHERS Climate Zone
Adelaide Adelaide (16)
Outer Adelaide Adelaide (16)
Yorke and Lower North Ceduna (53)
Murray Lands Adelaide (16)
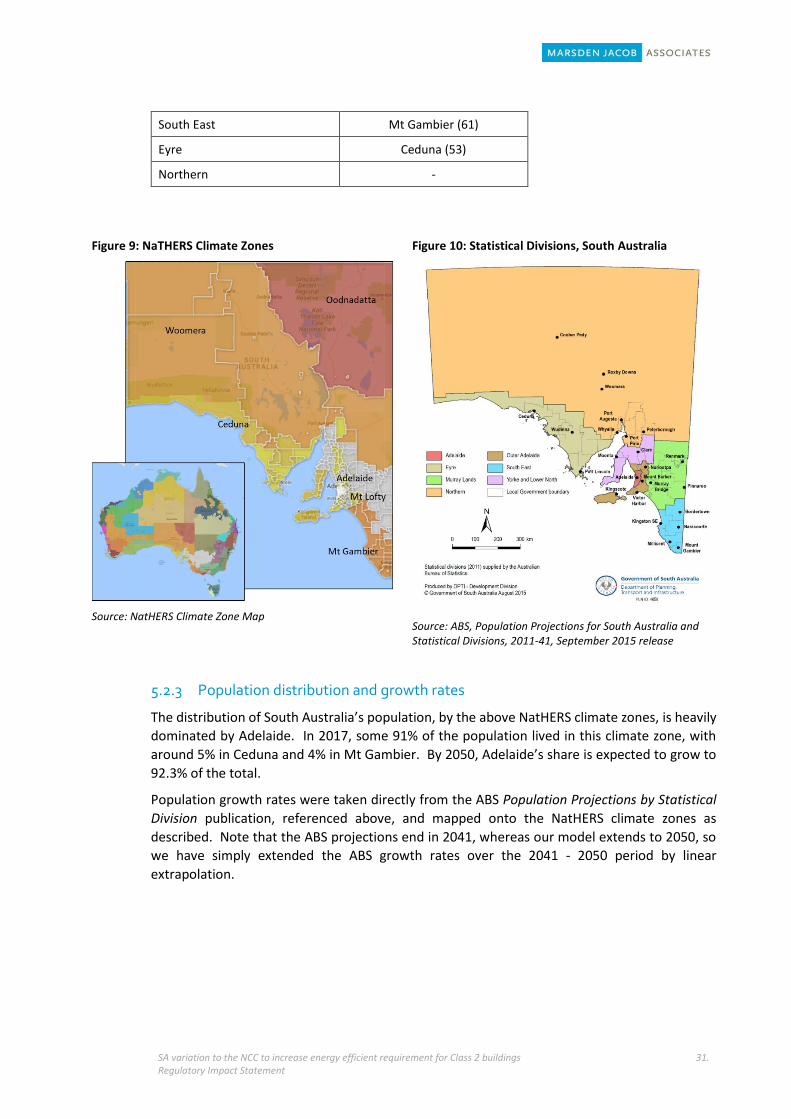
SA variation to the NCC to increase energy efficient requirement for Class 2 buildings Regulatory Impact Statement
31.
South East Mt Gambier (61)
Eyre Ceduna (53)
Northern -
Figure 9: NaTHERS Climate Zones
Source: NatHERS Climate Zone Map
Figure 10: Statistical Divisions, South Australia
Source: ABS, Population Projections for South Australia and Statistical Divisions, 2011-41, September 2015 release
5.2.3 Population distribution and growth rates
The distribution of South Australia’s population, by the above NatHERS climate zones, is heavily
dominated by Adelaide. In 2017, some 91% of the population lived in this climate zone, with
around 5% in Ceduna and 4% in Mt Gambier. By 2050, Adelaide’s share is expected to grow to
92.3% of the total.
Population growth rates were taken directly from the ABS Population Projections by Statistical
Division publication, referenced above, and mapped onto the NatHERS climate zones as
described. Note that the ABS projections end in 2041, whereas our model extends to 2050, so
we have simply extended the ABS growth rates over the 2041 - 2050 period by linear
extrapolation.

SA variation to the NCC to increase energy efficient requirement for Class 2 buildings Regulatory Impact Statement
32.
Figure 11: Population Distribution by Region, South Australia, 2017 (no. of persons)
Source: ABS, Population Projections for South Australia and Statistical Divisions, 2011-41, September 2015 release
5.2.4 Building stock turnover model
The next step was to convert population projections to housing projections. For this, we begin
with an observation of total 2015 apartment floor area from GeoSciences Australia’s NEXIS
database. This source indicates that in that year, some 2,155,200 sqm of Class 2s existed in
South Australia in that year (and, for simplicity, we assume none of these are in the Northern
Statistical Division). We note that this is the smallest share of the three housing types, with Class
1a)i) detached housing dominating the overall housing stock.
Figure 12: Housing Stock Shares by Type, South Australia, 2015 (‘000 sqm)
Source: GeoSciences Australia, NEXIS database
We note that in South Australia, as across most of the rest of Australia, there is a rising share of
Class 2s in the new building stock. The trend towards Class 2 housing reflects changing consumer
1,500,530
83,60465,524 80,852
Adelaide Ceduna Mt Gambier Other
159,047
10,458 2,155
Class 1a)i) - detached Class 1a)Ii) - semi-detached Class 2s

SA variation to the NCC to increase energy efficient requirement for Class 2 buildings Regulatory Impact Statement
33.
preferences for inner city/urban living, and also changes in household composition, with an
increase in single person households in particular. To represent these trends in the expected
future growth of Class 2 dwellings, we drew on another Australian Bureau of Statistics
document, Household and Family Projections, Australia, 2011 to 2036.35 This reference projects
population by ‘living arrangement’, which includes a range of different ‘family households’,
‘group households’ and ‘lone person households’ by state and region. We then applied the ABS
projections about household composition, by weighting 100% of the sole person households
and 20% of other households to Class 2s, for the Adelaide region. The sole person households
are assumed by the ABS to grow faster than other household types, and this translates into a
faster relative growth in Class 2 housing.
Specifically, in 2017, the growth rate for Class 2 floor area is assumed to be 1.37%, compared to
1.06% for Class 1s and 1.18% for the total households. We note that the ABS data shows an
overall slowdown in the rate of household growth over the period to 2036, and therefore this
assumption is also built into our projections, along with the relatively faster growth in Class 2
dwellings. See Figure 13 below.
Figure 13: Annual Rate of Growth in Households by Household Composition, South Australia
Source: From ABS, 32360DO001_20112036 Household and Family Projections, Australia, 2011 to 2036
Since this study examines options for the National Construction Code, and noting that Code
provisions apply to ‘new building work’ (which includes major refurbishments, extensions and
additions, demolitions and rebuilds, in addition to the net growth in floor area every year), then
the stock model must also take into account the expected rate of major refurbishment (this term
is used as a summary for all of those above).
Unfortunately there is no authoritative data source on this rate. Industry sources assume that
around 1% of the stock undergoes major refurbishment annually, sufficient to trigger Code
35 ABS, 32360DO001_20112036 Household and Family Projections, Australia, 2011 to 2036; and assumed constant
thereafter.
0.00%
0.20%
0.40%
0.60%
0.80%
1.00%
1.20%
1.40%
1.60%
20
12
20
13
20
14
20
15
20
16
20
17
20
18
20
19
20
20
20
21
20
22
20
23
20
24
20
25
20
26
20
27
20
28
20
29
20
30
20
31
20
32
20
33
20
34
20
35
20
36
Class 1 growth rate Class 2 growth rate Total households

SA variation to the NCC to increase energy efficient requirement for Class 2 buildings Regulatory Impact Statement
34.
application, and we therefore apply this assumption. This results in a total of around 52,000
sqm of Class 2s being built to Code in South Australia per year at present, but growing to some
60,000 sqm per year by 2050, as indicated in Figure 14 below. Note that we have discussed this
result with the Adelaide City Council and it appears that this is a realistic figure.
Figure 14: Annual floor area built to code (Class 2 dwellings), South Australia
Source: Strategy.Policy.Research, 2017
5.2.5 Space conditioning assumptions
The AccuRate modelling described in Section 4.3 above produces, as its key output metric,
heating and cooling loads in mega joule per metre squared per annum (MJ/m2.a). These can be
thought of as the amounts of thermal energy required to maintain comfortable internal
temperatures over a year – given assumptions about average climate conditions in each climate
zone, and given the building design, orientation and specification modelled. However, since
these are thermal or heat loads, some assumption has to be made about the nature of the space
conditioning equipment use to generate the thermal energy.
Our baseline assumptions are, first, that 100% of the heating and cooling in the new stock is
performed by heat pumps. As South Australia (and Adelaide in particular) is a cooling dominated
climate, and given falling prices for air conditioning capacity, and rising gas prices, we believe
this is a reasonable assumption.
Second, we assume that the average co-efficient of performance (COP) of space conditioning
equipment installed is 3.0 in 2016, and rising at 3% per year (reaching 6.0 in 2050). Arguably
these are conservative assumptions, as it is possible to source heat pumps today with COPs of 4
or 5, but where builders are involved in selecting the equipment, a least-first-cost approach is
likely to apply, so we assume less efficient devices are installed on average. On the other hand,
where gas is used for space heating, we would assume a COP of no more than 0.85. To the
extent that this occurs, this would drag down the average space conditioning COP in new
dwellings in South Australia.
We also assume that 90% of the floor area of apartment dwellings is conditioned.
0
10
20
30
40
50
60
'00
0 s
qm
Adelaide Ceduna Mt Gambier

SA variation to the NCC to increase energy efficient requirement for Class 2 buildings Regulatory Impact Statement
35.
5.2.6 Energy savings and prices
Energy savings
Electricity costs as faced by residential consumers are built up from costs incurred throughout
the electricity supply chain. Figure 15 presents data published by the Australian Energy Market
Commission (AEMC) that provides a recent snapshot of the proportion of each cost component
that makes up residential bills in South Australia.
Reductions in energy costs considered sensitive to change in energy efficiency standards for
Class 2 buildings include wholesale or generation costs (presented within the ‘Competitive
market’ segment in Figure 15 – a value which also includes retail costs) and avoided network
costs (regulated networks) where there are reductions in peak demand and therefore alleviation
or deferment of constraints on the network. The assumptions underpinning our estimation of
these two forms of energy savings are discussed in turn.
Note that energy savings in this report refers only to electricity savings as dwellings in Class 2
building in South Australia are not expected to incorporate gas for heating going forwards.
Figure 15: Trends in South Australia supply chain components
Source: AEMC, 2016 Residential Electricity Price Trends data (EPR0049)36
Electricity prices
Our energy price assumptions are based on the forecast reports produced by the Australian
Energy Market Operator (AEMO) for both electricity and gas. There is enormous uncertainty
about future energy prices in Australia at present. Electricity prices have already risen strongly
over the past decade, and future trends are clouded by considerable uncertainty about NEM
36 Data available from: http://www.aemc.gov.au/Markets-Reviews-Advice/2016-Residential-Electricity-Price-
Trends#

SA variation to the NCC to increase energy efficient requirement for Class 2 buildings Regulatory Impact Statement
36.
policies in particular – with the Finkel Review (Independent Review into the Future Security of
the National Energy Market) having been released in June 2016. At the time of writing no formal
government responses have been made to its large number of recommendations. In addition
to that, key market based trends include a continuing steep reduction in the costs of new
renewable energy technologies – notably solar and wind – but offset at the system level to some
degree by the need for ‘firming’ investments either in storage, demand management, fast-start
or flexible fossil fuel generation (usually gas), or some combination of these.
Our approach is to look through the short term noise and uncertainty, and adopt AEMO’s price
outlooks – not because we believe they are likely to prove more accurate than anyone else’s,
but rather because they provide an ongoing annual reference point which – if adopted in benefit
cost analyses more generally – helps to limit random variation in results, and instead assist in
the comparability of results realised in related studies. We note that the Australian Government
advocates this approach, and for the same reason of consistency and comparability in results.
Note that varying energy prices are tested in scenario analysis, as reported in Section 5.7 below.
Electricity prices used for modelling are from the ‘residential retail’ outlook scenario from
AEMO’s National Electricity Forecasting Report, 2016. Note that this report projects prices to
2037 only, and we assume constant real prices thereafter.
Figure 16: Energy Price Projections, Retail Residential, South Australia ($/MWh, $/GJ, 2016 real prices)
Source: AEMO, National Electricity Forecasting Report, 2016
Avoided network costs
The overall methodology used to value network savings draws from analysis conducted by the
Institute for Sustainable Future and Energetics in a report prepared for the Department of
Climate Change and Energy Efficiency, and is known as the Conservation Load Factor (CLF)
method.37
37 Institute for Sustainable Future and Energetics, Building our savings: Reduced infrastructure costs from
improving building energy efficiency, report prepared for the Department of Climate Change and Energy Efficiency, July 2010. Available at: https://industry.gov.au/Energy/EnergyEfficiency/Documents/04_2013/building_our_savings.pdf
0
50
100
150
200
250
300
350
400
450
500
Elec
tric
ity
$/M
Wh
Electricity

SA variation to the NCC to increase energy efficient requirement for Class 2 buildings Regulatory Impact Statement
37.
Input values including the CLF were informed by two additional references by Oakley
Greenwood/Marchment Hill and SKM MMA.38,39
The reduction in energy that is attributable to avoided network costs is calculated based on the
following formula:
Rearranging the above formula, the Conversion Load Factor (CLF) for a specific energy saving
technology is defined as “…its average reduction in load divided by its peak reduction in load
(annual energy savings in MWh divided by number of hours per year divided by system co-
incident peak reduction (in MW))”.40
The calculation of avoided network and electricity system infrastructure as a consequence of an
improvement in energy efficiency is a complex calculation, potentially affected by many factors.
It is not within the scope of this project to re-estimate appropriate values for South Australia.
SKM note:
Due to…complexities discussed [in its Report], there is no definitive approach to produce
a value per kW of peak demand reduction. Depending on the timing and location in the
network, the value can vary from zero up to several times the average capacity cost, with
large project deferral values tending to lie within this range. (p. 33)
The Conversion Load Factor (CLF) used here is 0.10. This is based on the value appropriate for
space conditioning end uses, as indicated in Oakley Greenwood et al (pp. 71-71). This is selected
since the primary effect of a change in star rating is to change the demand for space
conditioning. Space conditioning is a ‘peaky’ load, in that it is strongly correlated with
temperature variability.
The avoided networks cost savings are then calculated as a multiple of the peak demand
reduction and the average value of electricity infrastructure savings:
Avoided network expenditure = Peak demand reduction x average value of electricity
infrastructure savings
Here we have used a value of $310,000/MW.a for the average value of electricity infrastructure
savings, although we note that higher values are found in the literature cited above. Indeed,
SKM cites a value of $2.44 million/MW for South Australia (p. 34), but notes that this value was
derived using 5-year proposed system augmentation capital expenditure estimates and, as such,
could be biased upwards. The more conservative value used here reflects past feedback from
network businesses, who note that overall network expenditure has slowed markedly in recent
years. On this basis, the value of avoided network costs is modelled to reach around $235,000
per year.
38 Oakley Greenwood/Marchment Hill, Stocktake and Assessment of Energy Efficiency Policies and Programs tht
Impact or Seek to Integrate with the NEM: Stage 2 Report, August 2012.
39 SKM/MMA, Energy Market Modelling of National Energy Savings Initiative Scheme – Assumptions Report, December 2011.
40 Oakley Greenwood et al, p. 70

SA variation to the NCC to increase energy efficient requirement for Class 2 buildings Regulatory Impact Statement
38.
The exact relationship between the mooted Code changes and avoided network investment
would require separate – and potentially quite elaborate – analysis. Some relevant
considerations would include:
Modelling of ‘thermal lag’, or how long the benefits of more efficient envelopes last in
heatwave conditions. This depends on many factors (housing size and form, thermal mass,
degree of sealing and insulation, etc) and each heatwave event is also unique in terms of its
severity, duration and diurnal range.
More efficient dwellings will tend to heat up more slowly in heatwave conditions, as they
tend to be better sealed, better insulated and may have better use of internal thermal mass.
There is the risk that if a heatwave event goes on long enough, these factors could be
swamped, but the counter-view is that day/night temperature variations still occur during a
long heatwave, and the more efficient dwellings can cool down sufficiently (with heat
pumps) to be able to regain enough thermal inertia to manage the next day.
Occupant behaviours – such as ‘pre-cooling’ overnight, and opening and closing of windows
– may become critical in heatwave conditions.
Whether or not demand management schemes are in operation, for example to limit the
power demand of air conditioning compressors during peak demand conditions.
5.2.7 Policy-affected cohort
This study examines scenarios for changed Code energy performance requirements. To quantify
the benefits and costs associated with such changes, we need to assume:
When the new measure would begin?
When the measure would end?
What is the economic life of the buildings built to the new standard?
We assume that the measure would take effect from 1 July 2019, the beginning of FY2020. In
reality, Code changes in Australia tend to take effect from 1 May in the relevant year, but there
is also a delay associated with the take-up of the new standard, as developments that already
have building approval at that date are allowed to be completed at the old standard, while the
new standard applies to buildings that receive development approval from 1 May.
In terms of an end date, the notional practice of the Australian Building Codes Board is to review
and potentially revise standards every three years, and we assume SA will do the same. That
said, there is no evidence that standards were reviewed in either 2013 or 2016. We therefore
assume that two regulatory periods (of three years each) are likely to pass for standards are
again changed. This means that the mooted new standards would apply to the ‘cohort’ of Class
2 buildings built from 1 July 2019 to 30 June 2025. Note that the size of the cohort will affect
the total energy and greenhouse gas savings that accumulate over time, but will not materially
affect the benefit cost analysis, as lengthening the cohort period adds both costs and benefits
in a proportionate manner.
Finally, the economic life of a house is conventionally assumed to be 40 years, however it is not
as clear whether the current Class 2 buildings will prove as durable. An assumption of 30 years
average economic life would be more conservative, but the effect of discounting means that the
difference between these two, on the present value of energy costs for example, is virtually
indistinguishable. As noted below, since we only model building stock turnover to 2050, our
calculations assume a conservative maximum economic life of 30 years.

SA variation to the NCC to increase energy efficient requirement for Class 2 buildings Regulatory Impact Statement
39.
5.2.8 Shadow carbon price
We assume a shadow price for carbon; that is, that avoided emissions of greenhouse gases have
value (see Figure 17). For this, we apply the ‘Central Policy Scenario’ projected by ACIL Allen in
the context of the Climate Change Authority’s 2013 Targets and Progress Review.41 While these
values date from 2013, it is notable that the Australian Government has not updated these
values since, and indeed they remain the consultant’s assumptions, rather than officially-
endorsed values. These values are applied to the quantities of greenhouse gas emissions savings
noted above. Other values are tested in sensitivity analysis. On this shadow carbon price
assumption, the value of avoided emissions is less than $17,000 per year.
Figure 17: Shadow Carbon Price Assumptions (2011-12)
Source: ACIL Allen, 2013
5.2.9 Industry training and design costs
Training and re-design costs are assumed to occur only in the first three years following
commencement of the reforms (2018, 2019, and 2020). As the changes required to comply with
the options are very modest, these costs are assumed to be minimal, and likely to be
accommodated within existing continuous professional development programs.
Nevertheless, the modelling assumes costs of $50,000 per year on training and awareness for
the first three years spread across the industry.
5.2.10 Learning rates
The learning rate is the rate at which extra costs that occur delivering new or innovative products
decrease over time as firms adapt, adopt new technology and revise their designs and/ or
production processes.
41 ACIL Allen Consulting (2013) Electricity Sector Emissions: Modelling of the Australian Electricity Generation
Sector, 4 September. Available from: http://climatechangeauthority.gov.au/files/files/Target-Progress-Review/Electricity-Sector-Emission-to-2050/Electricty%20sector%20emissions.pdf
$0
$50
$100
$150
$200
$250
$300
$ p
er t
CO
2-e
Central Policy scenario High Carbon Price scenario
Low Carbon Price scenario
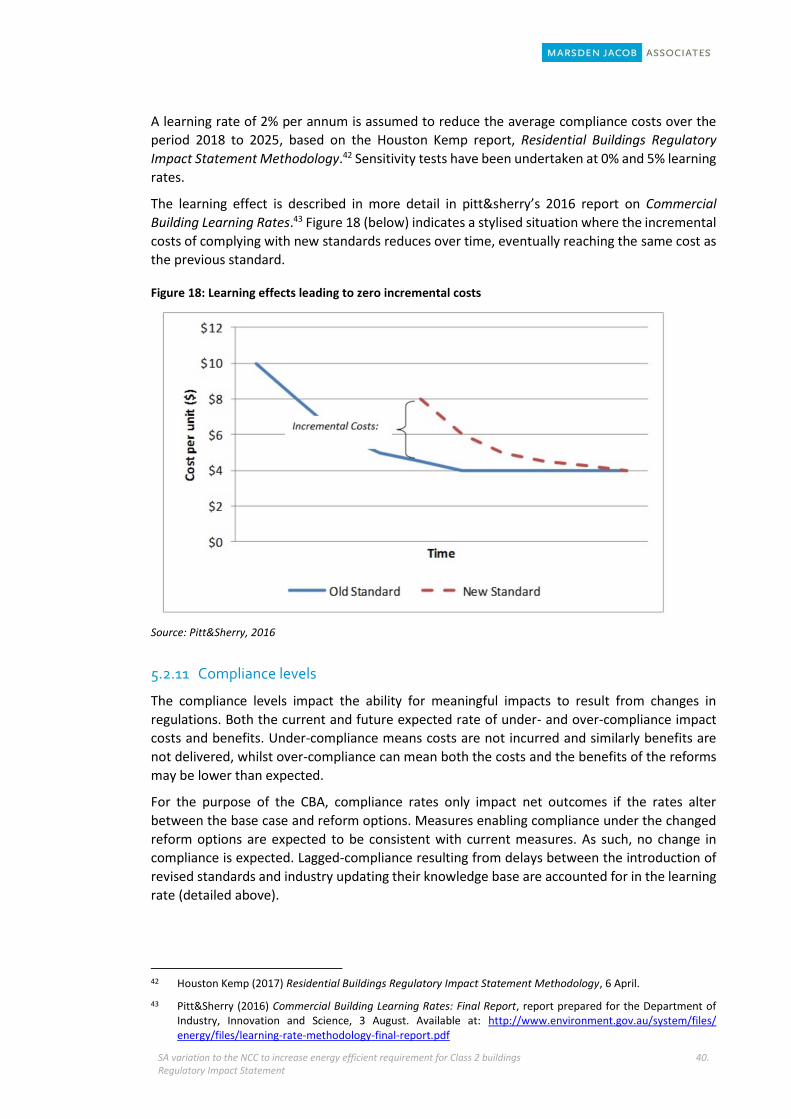
SA variation to the NCC to increase energy efficient requirement for Class 2 buildings Regulatory Impact Statement
40.
A learning rate of 2% per annum is assumed to reduce the average compliance costs over the
period 2018 to 2025, based on the Houston Kemp report, Residential Buildings Regulatory
Impact Statement Methodology.42 Sensitivity tests have been undertaken at 0% and 5% learning
rates.
The learning effect is described in more detail in pitt&sherry’s 2016 report on Commercial
Building Learning Rates.43 Figure 18 (below) indicates a stylised situation where the incremental
costs of complying with new standards reduces over time, eventually reaching the same cost as
the previous standard.
Figure 18: Learning effects leading to zero incremental costs
Source: Pitt&Sherry, 2016
5.2.11 Compliance levels
The compliance levels impact the ability for meaningful impacts to result from changes in
regulations. Both the current and future expected rate of under- and over-compliance impact
costs and benefits. Under-compliance means costs are not incurred and similarly benefits are
not delivered, whilst over-compliance can mean both the costs and the benefits of the reforms
may be lower than expected.
For the purpose of the CBA, compliance rates only impact net outcomes if the rates alter
between the base case and reform options. Measures enabling compliance under the changed
reform options are expected to be consistent with current measures. As such, no change in
compliance is expected. Lagged-compliance resulting from delays between the introduction of
revised standards and industry updating their knowledge base are accounted for in the learning
rate (detailed above).
42 Houston Kemp (2017) Residential Buildings Regulatory Impact Statement Methodology, 6 April.
43 Pitt&Sherry (2016) Commercial Building Learning Rates: Final Report, report prepared for the Department of Industry, Innovation and Science, 3 August. Available at: http://www.environment.gov.au/system/files/ energy/files/learning-rate-methodology-final-report.pdf

SA variation to the NCC to increase energy efficient requirement for Class 2 buildings Regulatory Impact Statement
41.
5.3 Base case: 6 star average rating, 5 star minimum individual rating
As noted in Chapter 4, the base case describes a ‘business as usual’ world in which, in particular,
the current NCC requirements continue to apply to Class 2 dwellings throughout the regulatory
period (i.e. to end FY2025). That is, Class 2 buildings must achieve an average star rating of 6
star, and a minimum star rating of 5 star.
We project the energy consumption by fuel, and the greenhouse gas emissions that would result
from these performance requirements applying to the stock turnover described above based on
the AccuRate simulations described in Chapter 4.
5.3.1 Energy consumption
Figure 19 below shows the space conditioning energy use of the cohort of buildings, constructed
between 1 July 2019 and 30 June 2025, over the period to 2050. Note that this implies an
average building economic life of 30 years, for the buildings built in FY2020, and just 25 years
for those built in 2025, as we only model these buildings to 2050.
Figure 19: Energy consumption and greenhouse gas emissions, base case (regulated cohort)
Source: Strategy.Policy.Research, 2017
In Figure 19, energy consumption rises over the 6 year regulatory period, as new buildings are
added each year. From 2026 onwards, we assume no new buildings are added (at the prevailing
standard), effectively shutting off the regulated cohort at that date. This cohort then continues
to use the same amount of energy annually (on average) for space conditioning purposes out to
(at least) 2050. The greenhouse gas emissions associated with this energy consumption,
however, fall over time, as we assume a declining greenhouse gas intensity of electricity
consumption over time (see section 5.2.6), along with 100% electricity consumption for space
conditioning purposes, in our reference scenario.
This scenario – of the energy consumption and greenhouse gas emissions associated with a six-
year cohort of buildings built to the current NCC standard over the period to 2019 – 2025, and
remaining in place until 2050 – defines our reference case against which the three policy
scenarios below are compared.
0
200
400
600
800
1,000
1,200
1,400
0
2,000
4,000
6,000
8,000
10,000
t C
O2
-e
GJ
Base case energy consumption (RH axis) Base case GHG Emissions (LH axis)

SA variation to the NCC to increase energy efficient requirement for Class 2 buildings Regulatory Impact Statement
42.
5.4 Option 1: 7 star average, 6 star minimum individual rating
As discussed in Chapter 4, this option differs from the base case in that it assumes that the
FY2020 – FY2025 cohort of Class 2 dwellings is built to a 7 star average, 6 star minimum
requirement. The resulting star ratings and maximum heating and cooling loads for each
apartment and climate zone were shown in Chapter 4.
5.4.1 Quantity of savings
Applying these values to our stock turnover model results in the following energy and
greenhouse gas emissions savings, as shown in Figure 20 below.
Figure 20: Energy consumption and greenhouse gas emissions, option 1 and base case
Source: Strategy.Policy.Research, 2017
Figure 20 indicates that option 1 would deliver significant energy and greenhouse gas emissions
savings. The cohort would save around 68 TJ of energy, and up to 6,834 t CO2-e, per year.
Compiling the three benefit streams noted above results in the following values for option 1 –
see Figure 21 below.
0
200
400
600
800
1,000
1,200
1,400
0
1,000
2,000
3,000
4,000
5,000
6,000
7,000
8,000
9,000
10,000
t C
O2
-e
GJ
Base case energy consumption Option 1 energy consumption
Base case GHG Emissions Option 1 GHG Emissions

SA variation to the NCC to increase energy efficient requirement for Class 2 buildings Regulatory Impact Statement
43.
Figure 21: Value of benefits by type, option 1
Source: Strategy.Policy.Research, 2017
5.4.2 Value of Costs
The incremental costs of achieving the performance outcomes described in Chapter 4 were
independently quantified by quantity surveyors, Daniel Cant Watts Corke. Details of these
costings are provided in Appendix 1.
For option 1, the average incremental costs of compliance relative to the base case are as shown
in Table 18 below. These are the costs associated with the changes (relative to the base case)
specified in Chapter 4.
Table 18: Average incremental costs of compliance, option 1
Climate Zone Cost ($/sqm)
Adelaide $8.09
Ceduna $4.22
Mt Gambier $7.42
Source: Strategy.Policy.Research, 2017
These costs relate to the current period, and we apply a 2% per year learning rate, or reduction
in the incremental cost of compliance, in line with the recommendations of the Houston Kemp
report, Residential Buildings Regulatory Impact Statement Methodology.44 On this basis, the
total annual costs of compliance around to a little under $400,000 in FY2020, falling to $370,000
by FY2025. To this we assume that some $50,000 per year is expended by the State Government
to assist in alerting the SA industry to the change and in providing or assisting with the provision
of training courses, in the two years leading up to the change and in the first year of
implementation. Total costs therefore appear as shown in Figure 22 below.
44 Houston Kemp, Residential Buildings Regulatory Impact Statement Methodology, 6 April 2017.
$0
$100
$200
$300
$400
$500
$600
2020 2022 2024 2026 2028 2030 2032 2034 2036 2038 2040 2042 2044 2046 2048 2050
$'0
00
(2
01
7 r
eal)
Energy consumption savings GHG savings
Avoided network costs Total benefits

SA variation to the NCC to increase energy efficient requirement for Class 2 buildings Regulatory Impact Statement
44.
Figure 22: Total incremental costs of compliance (compared to the base case), option 1
Source: Strategy.Policy.Research, 2017
5.4.3 Net benefits and summary indicators
Figure 23 below shows that option 1 would initially generate net social costs, during the period
when training and awareness costs, and then incremental construction costs, are being incurred.
The value of savings climbs steadily each year, and by FY 2024 net benefits are being achieved.
The net benefits then climb to over $500,000 per year for at least the period until 2050 (recalling
our conservative economic life assumption for housing).
In terms of key indicators, option 1 is shown to be highly cost effective and – as will be
demonstrated – the most valuable of the three policy options studied. The net present value of
option 1 is just over $3 million, with a benefit cost ratio (averaged across the three climate zones)
of 2.8. This option generates a social return on investment (equivalent to an interest rate on a
public investment) of 24% per annum. See Table 19 below.
Table 19: Summary of benefit cost analysis indicators by region, option 1 ($2017, real)
Indicator Adelaide Ceduna Mt Gambier Total
Present value of benefits $4,412,958 $107,720 $277,183 $4,797,862
Present value of costs $1,618,473 $50,399 $65,614 $1,734,486
Net Present Value $3,063,376
Benefit Cost Ratios 2.7 2.1 4.2 2.8
Social Return on Investment 24% 18% 40% 24%
Cumulative Energy Savings 2020 – 2050 (TJ) 68
Cumulative GHG Emissions Savings 2020 – 2050 (t Co2-e) 6,834
Source: Strategy.Policy.Research, 2017
$0
$50
$100
$150
$200
$250
$300
$350
$400
$450
$500
2018 2019 2020 2021 2022 2023 2024 2025
$'0
00
(2
01
7 r
eal)

SA variation to the NCC to increase energy efficient requirement for Class 2 buildings Regulatory Impact Statement
45.
Figure 23: Annualised net economic benefit, option 1
Source: Strategy.Policy.Research, 2017
5.5 Option 2: No average rating, 6 star minimum individual rating
This option has many similarities with option 1, as discussed in Chapter 4. The primary
difference is that the average star rating that applies across apartments in a building is not
specified. This enabled some apartments to be ‘detuned’ somewhat, reducing their costs (and
benefits), while still delivering on the requirement for every apartment to be at least 6 star.
We note that, as modelled, some apartments over-comply with the requirement, particularly in
the Mt Gambier and Ceduna climate zones. In principle, it would be possible to vary designs
and/or specifications more, from unit to unit, and further reduce the costs of compliance.
However, this would also introduce more variation in specification from one unit to the next,
which is not consistent with conventional industry practice. As noted in the reference scenario
above, there is very wide variation in the star rating performance of apartments within a typical
Class 2 building already, and no evidence that builders detune individual apartments to just
meet compliance requirements – although it would be perfectly legal to do so. We note,
therefore, that it is possible that the incremental costs of compliance reported below are on the
high side, making the overall analysis more conservative.
Noting the similarities with option 1, option 2 key results are reported in a more summary
manner.
5.5.1 Quantity of Savings
Figure 24 below shows the space conditioning energy consumption and greenhouse gas
emissions savings generated by option 2. The savings are somewhat less than for option 1, with
energy savings peaking at just over 59 TJ per year (compared to 68 TJ for option 1), and
greenhouse gas emissions savings of 5,838 t CO2-e (compared to 6,834 t CO2-e for option 1).
-$500
-$400
-$300
-$200
-$100
$0
$100
$200
$300
$400
$500
$600
$'0
00
(2
01
7 r
eal)
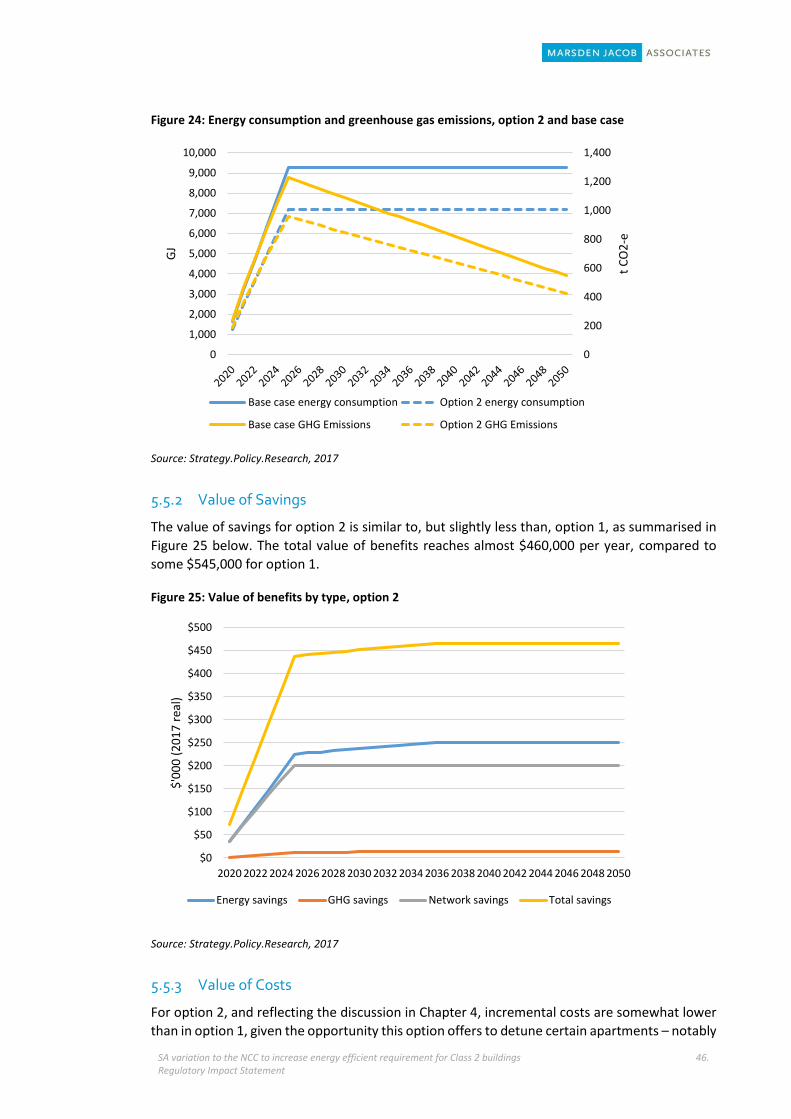
SA variation to the NCC to increase energy efficient requirement for Class 2 buildings Regulatory Impact Statement
46.
Figure 24: Energy consumption and greenhouse gas emissions, option 2 and base case
Source: Strategy.Policy.Research, 2017
5.5.2 Value of Savings
The value of savings for option 2 is similar to, but slightly less than, option 1, as summarised in
Figure 25 below. The total value of benefits reaches almost $460,000 per year, compared to
some $545,000 for option 1.
Figure 25: Value of benefits by type, option 2
Source: Strategy.Policy.Research, 2017
5.5.3 Value of Costs
For option 2, and reflecting the discussion in Chapter 4, incremental costs are somewhat lower
than in option 1, given the opportunity this option offers to detune certain apartments – notably
0
200
400
600
800
1,000
1,200
1,400
0
1,000
2,000
3,000
4,000
5,000
6,000
7,000
8,000
9,000
10,000
t C
O2
-e
GJ
Base case energy consumption Option 2 energy consumption
Base case GHG Emissions Option 2 GHG Emissions
$0
$50
$100
$150
$200
$250
$300
$350
$400
$450
$500
2020 2022 2024 2026 2028 2030 2032 2034 2036 2038 2040 2042 2044 2046 2048 2050
$'0
00
(2
01
7 r
eal)
Energy savings GHG savings Network savings Total savings

SA variation to the NCC to increase energy efficient requirement for Class 2 buildings Regulatory Impact Statement
47.
in Ceduna and Mt Gambier, relative to the Adelaide specification – and thereby avoiding some
costs. The average incremental costs of compliance relative to the base case for option 2 are
summarised in Table 20 (below).
Table 20: Option 2 - Average incremental costs of compliance
Climate Zones Cost ($/sqm, 2017 real)
Adelaide $7.68
Ceduna $3.81
Mt Gambier $7.01
Source: Strategy.Policy.Research, 2017
Again applying a 2% annual learning rate to these costs, and also allowing $50,000 per year for
three years for training and redesign costs, the annualised costs would appear as shown in Figure
26.
Figure 26: Total incremental cost of compliance (compared to the base case), option 2
Source: Strategy.Policy.Research, 2017
5.5.4 Net benefits and summary indicators
Consistent with the above trends, the overall shape of the net economic benefit trace over time
for option 2 is similar to option 1, but shifted downward towards slightly lower net benefit levels.
The net economic benefit levels out at around $465,000 per annum for option 2, compared with
$545,000 for option 1.
$0
$50
$100
$150
$200
$250
$300
$350
$400
$450
2018 2019 2020 2021 2022 2023 2024 2025
$'0
00
(2
01
7 r
eal)
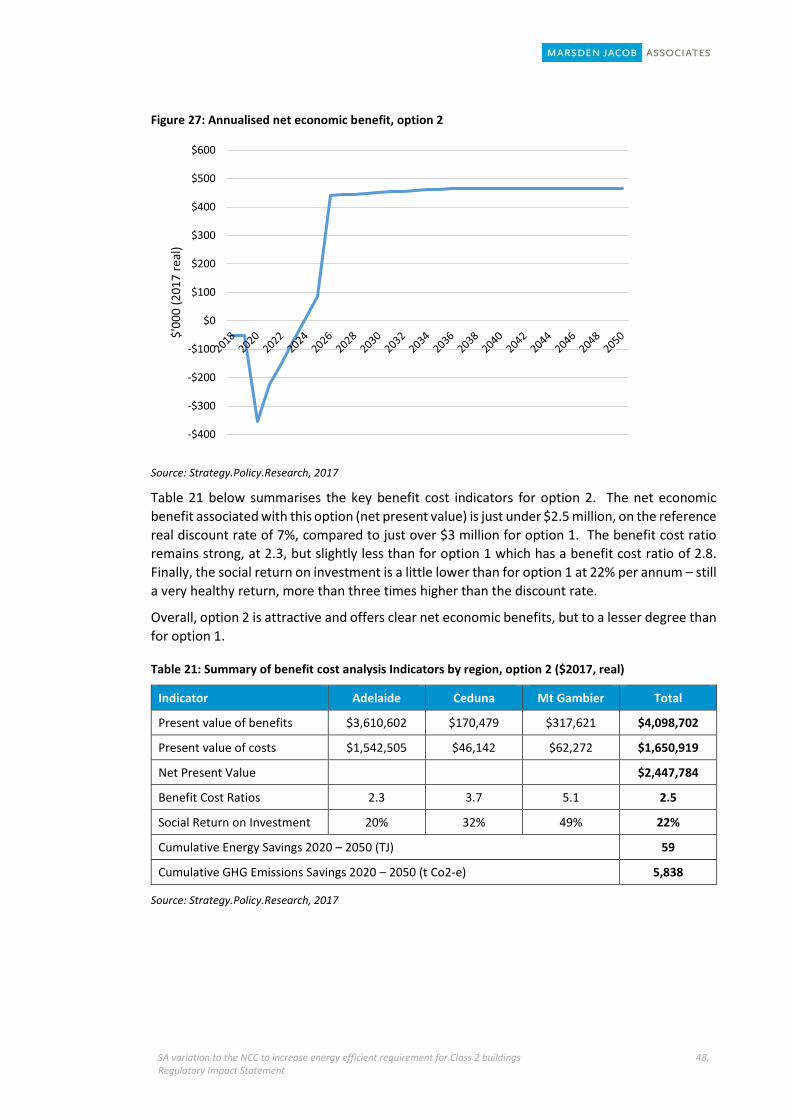
SA variation to the NCC to increase energy efficient requirement for Class 2 buildings Regulatory Impact Statement
48.
Figure 27: Annualised net economic benefit, option 2
Source: Strategy.Policy.Research, 2017
Table 21 below summarises the key benefit cost indicators for option 2. The net economic
benefit associated with this option (net present value) is just under $2.5 million, on the reference
real discount rate of 7%, compared to just over $3 million for option 1. The benefit cost ratio
remains strong, at 2.3, but slightly less than for option 1 which has a benefit cost ratio of 2.8.
Finally, the social return on investment is a little lower than for option 1 at 22% per annum – still
a very healthy return, more than three times higher than the discount rate.
Overall, option 2 is attractive and offers clear net economic benefits, but to a lesser degree than
for option 1.
Table 21: Summary of benefit cost analysis Indicators by region, option 2 ($2017, real)
Indicator Adelaide Ceduna Mt Gambier Total
Present value of benefits $3,610,602 $170,479 $317,621 $4,098,702
Present value of costs $1,542,505 $46,142 $62,272 $1,650,919
Net Present Value $2,447,784
Benefit Cost Ratios 2.3 3.7 5.1 2.5
Social Return on Investment 20% 32% 49% 22%
Cumulative Energy Savings 2020 – 2050 (TJ) 59
Cumulative GHG Emissions Savings 2020 – 2050 (t Co2-e) 5,838
Source: Strategy.Policy.Research, 2017
-$400
-$300
-$200
-$100
$0
$100
$200
$300
$400
$500
$600
$'0
00
(2
01
7 r
eal)

SA variation to the NCC to increase energy efficient requirement for Class 2 buildings Regulatory Impact Statement
49.
5.6 Option 3: Separate heating & cooling caps
This option involves relatively few changes from the reference scenario, as described in
Chapter 4. As a result, there are relatively few costs incurred, but also relatively small benefits
created. The results for this option are presented in a summary manner.
5.6.1 Quantity of savings
Figure 28 below shows the space conditioning energy consumption and greenhouse gas
emissions savings generated by option 3 compared to the base case
The energy and emissions savings for option 3 compared to the base case are hard to discern on
this chart, as they amount to only around 2 GJ of energy and less than 187 t CO2-e.
Figure 28: Energy consumption and greenhouse gas emissions, option 3 and base case
Source: Strategy.Policy.Research, 2017
5.6.2 Value of Savings
The value of savings for option 3 is also low, peaking at around $15,000 per year in total – see
Figure 29 below.
0
200
400
600
800
1,000
1,200
1,400
0
1,000
2,000
3,000
4,000
5,000
6,000
7,000
8,000
9,000
10,000
t C
O2
-e
GJ
Base case energy consumption Option 3 energy consumption
Base case GHG Emissions Option 3 GHG Emissions

SA variation to the NCC to increase energy efficient requirement for Class 2 buildings Regulatory Impact Statement
50.
Figure 29: Value of Benefits by class, option 3
Source: Strategy.Policy.Research, 2017
5.6.3 Value of costs
Given the minor nature of changes involved in this option, we have revised downwards our
allowance for government training and communication costs to $25,000 per year for 3 years
(potentially still more than needed). This revision reflects that no changes are required for
apartments built in the Adelaide region so effectively compliance costs would only be incurred
in Ceduna and Mt Gambier. This results in the total costs of compliance shown in Figure 30
below.
Figure 30: Total incremental costs of compliance (compared to the base case), option 3
Source: Strategy.Policy.Research, 2017
$0
$2
$4
$6
$8
$10
$12
$14
$16
2020 2022 2024 2026 2028 2030 2032 2034 2036 2038 2040 2042 2044 2046 2048 2050
$'0
00
(2
01
7 r
eal)
Energy savings Greenhouse savings Network savings Total savings
$0
$5
$10
$15
$20
$25
$30
$35
2018 2019 2020 2021 2022 2023 2024 2025
$'0
00
(2
01
7 r
eal)

SA variation to the NCC to increase energy efficient requirement for Class 2 buildings Regulatory Impact Statement
51.
5.6.4 Net benefits and summary indicators
While the shape of Figure 31 is similar to those for options 1 and 2 – costs upfront overtaken by
benefits over time – the absolute values are much smaller, with the net economic benefit
levelling out at some $15,000 per year.
Figure 31: Net economic benefits, option 3
Source: Strategy.Policy.Research, 2017
Despite this, option 3 has a positive net present value, delivering a small net present value of
$97,829. The benefit cost ratio for option 3 is the highest of all the options studied, at 3.9, while
the social return on investment is also the highest at 29% (Table 22).
Table 22: Summary of benefit cost analysis indicators by region, option 3 ($2017, real)
Indicator Adelaide Ceduna Mt Gambier Total
Present value of benefits $0 $39,693 $91,904 $131,597
Present value of costs $0 $12,897 $20,871 $33,768
Net Present Value $97,829
Benefit Cost Ratios n/a 3.1 4.4 3.9
Social Return on Investment n/a 22% 35% 29%
Cumulative Energy Savings 2020 – 2050 (TJ) 2
Cumulative GHG Emissions Savings 2020 – 2050 (t Co2-e) 187
Source: Strategy.Policy.Research, 2017
These results provide a useful illustration of the relative significance of different benefit cost
analysis indictors.
The most important indicator for comparing policy options is the net present value (NPV) of the
measures. This metric indicates the net economic benefit (that is, the present value of total
benefits minus the present value of total costs) associated with the option. The higher this value,
the higher the net economic benefit created. On this basis, option 1 is the preferred option
-$10
-$5
$0
$5
$10
$15
$20
$'0
00
(2
01
7 r
eal)

SA variation to the NCC to increase energy efficient requirement for Class 2 buildings Regulatory Impact Statement
52.
(with just over $3 million of present value net benefits), and option 3 the least preferred (with
only around $98,000 of present value net benefits).
Benefit cost ratio (BCR), on the other hand, only provides an indication of the relative sizes of
benefits and costs, and is therefore a poor predictor of the solution that will generate the most
value for society. Similarly, the social rate of return indicator tells us the annual percentage
return on the social investment undertaken, but it ignores the size of that investment, and
therefore the size of the benefit created.
5.7 Sensitivity Analyses
This section presents summary results of varying key inputs to the analysis. We test the
following variables:
Discount rate
Energy prices
Shadow carbon prices
Incremental costs
Learning rates.
The objective of sensitivity analysis is to determine if one or more assumptions or variables in
the analysis are critical to the reported results and, more broadly, to test the extent to which
the options remain cost effective – and retain the same order of priority – in the face of
reasonable variation in these input values.
5.7.1 Discount rates
In line with Houston Kemp’s Review of the Residential Building Regulatory Impact Statement
Methodology45 our default value for the real discount rate was 7%, while values of 10% and 3%
are tested in sensitivity analysis. The higher the real discount rate, the greater is the weighting,
in present value results, of values in the near-term, such as in the first 10 years, while values
further out have little impact on the analysis. If a real discount rate of 0% were selected, values
from all periods would have equal weighting.
Table 23 below indicates that while the real discount rate assumption changes the absolute
values of the net present value (NPV) and benefit cost ratio (BCR) indicators, NPVs remain
positive in all cases, and BCRs remain comfortably above 1 in all cases. Further, the ‘order of
merit’ of the three options remains the same, regardless of the real discount rate selected.
Table 23: Sensitivity analysis results – Real discount rate
Real discount rate of 3% Real discount rate of 7%
(central case) Real discount rate of 10%
NPV BCR NPV BCR NPV BCR
Option 1 $6.8m 4.2 $3.06m 2.8 $1.7m 2.1
Option 2 $5.6m 3.8 $2.45m 2.5 $1.3m 1.9
Option 3 $0.2m 6.1 $0.10m 3.9 $0.06m 2.9
45 Houston Kemp (2017) Review of the Residential Building Regulatory Impact Statement Methodology, 6 April.

SA variation to the NCC to increase energy efficient requirement for Class 2 buildings Regulatory Impact Statement
53.
Source: Strategy.Policy.Research, 2017
5.7.2 Electricity prices
To test the sensitivity of the results to possible changes in electricity prices, we have assumed
that price of residential retail electricity varies, from the reference case, by +/- 30%. The results
are shown in Table 24 below.
Table 24: Sensitivity analysis results –Electricity prices
-30% electricity prices Electricity prices (central
case) +30% electricity prices
NPV BCR NPV BCR NPV BCR
Option 1 $2.3m 2.3 $3.06m 2.8 $3.8m 3.2
Option 2 $1.8m 2.1 $2.45m 2.5 $3.1m 2.9
Option 3 $0.1m 3.3 $0.10m 3.9 $0.1m 4.5
Source: Strategy.Policy.Research, 2017
Results from the sensitivity testing indicate that net social benefit of all of the measures is higher
when energy prices are higher than expected and lower when energy prices are lower.
However, even in the low price scenario, all measures retain their positive NPVs and BCRs
greater than 1, while the merit order of the three options remains the same as in the reference
case. Overall, we can conclude that the options remain robust in the face of reasonable energy
price variations.
5.7.3 Electricity imports
Under the central case, we assume that reduction in electricity consumption from enhanced
building design benefit South Australia on the basis that this marginal electricity is imported into
the state.
This treatment is consistent with South Australia’s position in the National Electricity Market as
a net importer of electricity. In 2014, 2015, and 2016 there was 1,797 GWh, 2,210 GWh and
2,637 GWh of electricity imported into South Australia from Victoria respectively46.
On a half-hour interval basis, South Australia is also largely a net importer of electricity. In 2016,
electricity was imported into South Australia across the Victorian to South Australia
interconnectors in 86 per cent of half hour intervals for the year47.
To test the sensitivity of the results to possible changes in the quantity of imports into South
Australia and therefore the benefits that may accrue to the state, we have assumed that only
50 per cent and 85 per cent of the electricity saved can be counted as an economic benefit. The
remaining amounts are treated as a transfer between customers (and retailers) to generators
that are located within the State. The results are shown in Table 25 below.
46 Data from NEO based on aggregate flows over the VIC-SA (Heywood) interconnector for each calendar year.
47 Marsden Jacob analysis based on Victorian to South Australia flows for half hour trading intervals on the VIC-SA (Heywood) interconnector in 2016.
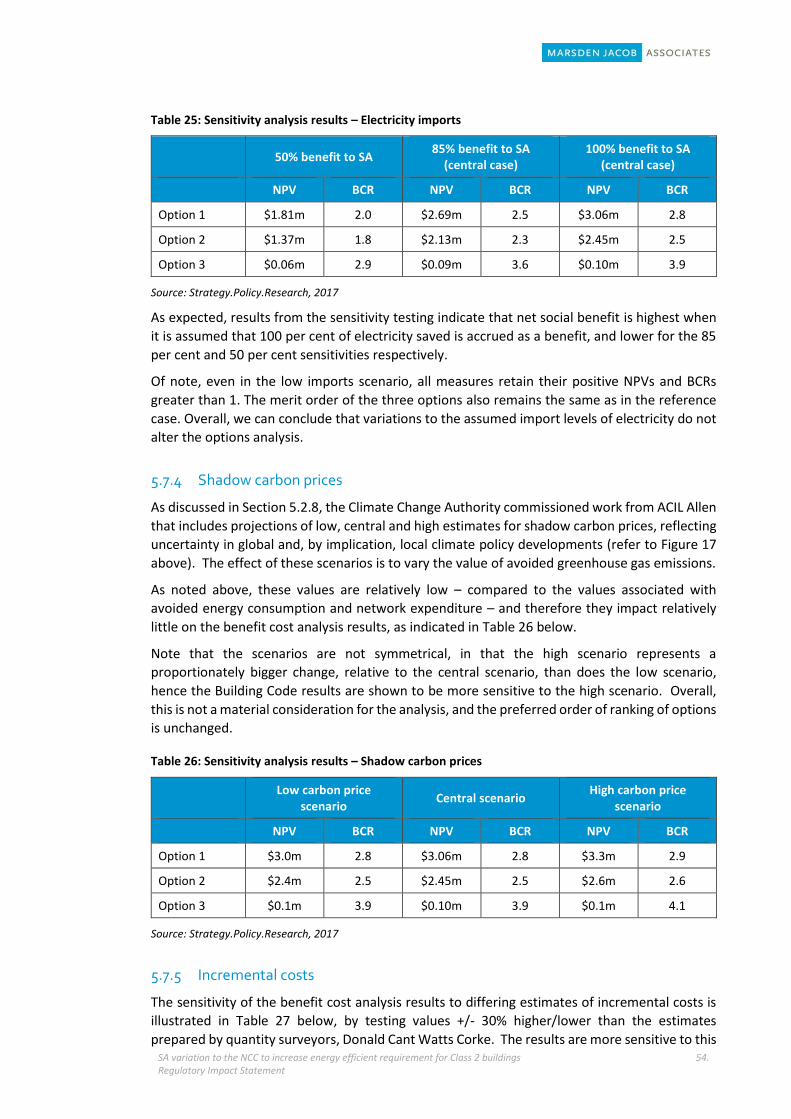
SA variation to the NCC to increase energy efficient requirement for Class 2 buildings Regulatory Impact Statement
54.
Table 25: Sensitivity analysis results – Electricity imports
50% benefit to SA 85% benefit to SA
(central case) 100% benefit to SA
(central case)
NPV BCR NPV BCR NPV BCR
Option 1 $1.81m 2.0 $2.69m 2.5 $3.06m 2.8
Option 2 $1.37m 1.8 $2.13m 2.3 $2.45m 2.5
Option 3 $0.06m 2.9 $0.09m 3.6 $0.10m 3.9
Source: Strategy.Policy.Research, 2017
As expected, results from the sensitivity testing indicate that net social benefit is highest when
it is assumed that 100 per cent of electricity saved is accrued as a benefit, and lower for the 85
per cent and 50 per cent sensitivities respectively.
Of note, even in the low imports scenario, all measures retain their positive NPVs and BCRs
greater than 1. The merit order of the three options also remains the same as in the reference
case. Overall, we can conclude that variations to the assumed import levels of electricity do not
alter the options analysis.
5.7.4 Shadow carbon prices
As discussed in Section 5.2.8, the Climate Change Authority commissioned work from ACIL Allen
that includes projections of low, central and high estimates for shadow carbon prices, reflecting
uncertainty in global and, by implication, local climate policy developments (refer to Figure 17
above). The effect of these scenarios is to vary the value of avoided greenhouse gas emissions.
As noted above, these values are relatively low – compared to the values associated with
avoided energy consumption and network expenditure – and therefore they impact relatively
little on the benefit cost analysis results, as indicated in Table 26 below.
Note that the scenarios are not symmetrical, in that the high scenario represents a
proportionately bigger change, relative to the central scenario, than does the low scenario,
hence the Building Code results are shown to be more sensitive to the high scenario. Overall,
this is not a material consideration for the analysis, and the preferred order of ranking of options
is unchanged.
Table 26: Sensitivity analysis results – Shadow carbon prices
Low carbon price
scenario Central scenario
High carbon price scenario
NPV BCR NPV BCR NPV BCR
Option 1 $3.0m 2.8 $3.06m 2.8 $3.3m 2.9
Option 2 $2.4m 2.5 $2.45m 2.5 $2.6m 2.6
Option 3 $0.1m 3.9 $0.10m 3.9 $0.1m 4.1
Source: Strategy.Policy.Research, 2017
5.7.5 Incremental costs
The sensitivity of the benefit cost analysis results to differing estimates of incremental costs is
illustrated in Table 27 below, by testing values +/- 30% higher/lower than the estimates
prepared by quantity surveyors, Donald Cant Watts Corke. The results are more sensitive to this

SA variation to the NCC to increase energy efficient requirement for Class 2 buildings Regulatory Impact Statement
55.
assumption than to other variables noted above, but overall the effect of these changed
assumptions is modest, adding or subtracting about $0.5 million at the most. All options remain
cost effective, even with 30% higher costs, and the order of ranking of the measures does not
change.
Table 27: Sensitivity analysis results – Incremental construction costs
+30% costs Reference costs -30% costs
NPV BCR NPV BCR NPV BCR
Option 1 $3.3m 2.5 $3.06m 2.8 $4.2m 4.4
Option 2 $2.6m 2.2 $2.45m 2.5 $3.5m 3.9
Option 3 $0.1m 3.7 $0.10m 3.9 $0.12m 5.5
Source: Strategy.Policy.Research, 2017
5.7.6 Learning rates
To test the sensitivity of results to learning rates – or the rate of change in incremental costs
over time – we vary our reference assumption of 2% per annum to 0% (indicating that the costs
of compliance do not change over time) and to 5% per annum (indicating the costs of compliance
reduce more quickly than expected based on the reference scenario).
Results are as indicated in Table 28 below. Overall, the results are modestly sensitive to these
assumptions, but again not sufficiently to make any option sub-economic or to change the order
of ranking of the measures.
Table 28: Sensitivity analysis results – Learning rates
Learning rate of 0% Learning rate of 2%
(central case) Learning rate of 5%
NPV BCR NPV BCR NPV BCR
Option 1 $2.9m 2.6 $3.06m 2.8 $3.3m 3.1
Option 2 $2.3m 2.3 $2.45m 2.5 $2.6m 2.8
Option 3 $0.1m 3.7 $0.10m 3.9 $0.1m 4.2
Source: Strategy.Policy.Research, 2017
5.7.7 Stress test
Our final sensitivity analysis is a stress test. A stress test assumes that the ‘worst’ happens with
all sensitivity variables – energy prices are low, shadow carbon prices are low, a 10% real
discount rate is applied, costs are 30% higher than expected, and there is no learning. The
results are shown in Table 29 below.
Not surprisingly, this worst case scenario damages the economic performance of each of the
options. However, all options remain cost effective, with the lowest BCR falling only to 1.4, and
the preferred option 1 still returning a net social benefit (NPV) of over $1 million. Also, the order
of merit of the three options is unchanged. This result should give the South Australian
government the comfort of knowing that, even if highly adverse circumstances, these policy
measures – and particularly the preferred option 1 – would create net economic welfare, in
additional to saving energy consumption and greenhouse gas emissions.

SA variation to the NCC to increase energy efficient requirement for Class 2 buildings Regulatory Impact Statement
56.
Table 29: Sensitivity analysis results – Stress test
Worst case scenario Central scenario
NPV BCR NPV BCR
Option 1 $1.09m 1.7 $3.06m 2.8
Option 2 $0.77m 1.5 $2.45m 2.5
Option 3 $0.04m 2.3 $0.10m 3.9
Source: Strategy.Policy.Research, 2017
5.8 Limitations of analysis
Builder decision on material
The analysis assumes builders would always choose the lowest cost option to meet the
requirements. While this is likely to be the case under most circumstances, there may be
perceived trade-offs between different types of materials that have not been considered fully in
this analysis and which would alter the outcomes in reality.
Minimal residual value
The model allows for establishment costs in 2018 and 2019 with the policy commencing in 2020.
The model looks at buildings constructed during 2020 – 2025 (inclusive) and looks at the impact
on construction cost and on heating/cooling costs over the period from 2020 to 2050 (a 30 year
period).
The model effectively assumes no residual value at the end of the period (2050) and no impact
on maintenance costs for the life of the building.
Avoided network cost uncertainty
It is also worth noting that AEMO and other regulators are now less convinced with ever
expanding demand than they were in 2010 when the previous RIS analysis was undertaken. This
is important as the benefit only arises if the network is being expanded due to increased
demand.
Similarly (but somewhat conversely) the benefit will also only arise if investment in upgrading
the network is actually delayed. This would require the regulator to be confident that peak
energy use had actually changed. If there was any risk that after several hot days the peak
demand would still be at historical per capita highs, then the investment will still occur and there
won’t be any benefit.
5.9 Equity and distributional considerations
The following stakeholders have been identified as likely to be impacted by changes to energy
efficiency requirements for Class 2 buildings:
Commonwealth, State and local Government
Industry
Building industry – builders and property developers

SA variation to the NCC to increase energy efficient requirement for Class 2 buildings Regulatory Impact Statement
57.
Energy industry
Heating and cooling appliance industry
Community
Property owners
Residents and tenants living in Class 2 buildings
Environment
A summary of the expected impacts by stakeholder group is provided in Table 30 (below).

SA variation to the NCC to increase energy efficient requirement for Class 2 buildings Regulatory Impact Statement
58.
Table 30: Summary of impacts by stakeholder groups
Stakeholder group Description of impacts Modelled impact
Government Commonwealth and other state and territory governments
The Australian and other state and territory governments will marginally benefit from additional good and services tax (GST) collected as expenditure shifts to more expensive types of building material and to reflect a more costly design stage.
Note that this impact is very marginal (around $100 per apartment of additional GST based on the highest increase in building material costs) and as such the impact has not been quantified.
No significant impact
SA Government The development and implementation of a South Australian variation to the NCC will be undertaken by the SA Government.
Activities to be undertaken include:
development of the changes to regulations
development of industry guidance and information on the new standards
ongoing administration, monitoring and enforcement.
Discussions with the Department indicate that each of the above activities will be undertaken as part of existing activities. As such, no additional costs are assumed to be incurred if reform options are implemented.
Similar to the impact of expenditure on more costly design and building material on the Commonwealth Government revenue, the SA Government will marginally benefit from an increase in GST. T
There is also potential for some additional revenue to the SA Government in the form of increased stamp duty receipts. However, similar to the quantification of GST benefits the impact is likely to be exceedingly marginal.
No significant impact
Industry Building industry – builders and property developers, designers
The building industry will incur costs associated with the transition and implementation of the higher energy efficiency standards. Additional costs include:
training awareness and re-design costs.
higher material costs where materials required to achieve standards are more expensive – if these costs are not able to be passed on to property buyers (noting we assume costs are passed on in the analysis) and that these costs reduce over time subject to the ‘learning rate’ (discussed in section 5.2.10).
Cost - Training/redesign costs (absorbed)
Cost - Increased buildings construction costs (passed on to apartment owners)

SA variation to the NCC to increase energy efficient requirement for Class 2 buildings Regulatory Impact Statement
59.
Stakeholder group Description of impacts Modelled impact
Energy industry Impacts on the energy industry are expected to be mainly limited to the electricity industry. While gas connections feature in some new apartment developments, gas use is mostly limited to cooking, with most apartments relying on reverse-cycle air-conditioning units for both heating and cooling.
Reductions in expected electricity consumption from more stringent energy efficiency standards will flow throughout the electricity supply chain. The impact will initial be felt by energy retailers in the form of lower revenue.
Subsequent impacts are possible where there is a reduction in peak demand that alters planned network expenditure. Changes in the overall electricity consumption will also flow through to generators as retailers purchase reduced volumes of electricity through the wholesale market.
Note: The treatment of energy industry impacts – from a South Australian perspective compared to other areas of the National Electricity Market (NEM) - was assumed in the scope of the project (refer to section 1.2.4).
No significant impact
Heating and cooling appliance industry
At the very high of energy efficient building design the requirement for heating and cooling appliance becomes obsolete if the outside temperature provides a desirable inside temperature for inhabitants. The changes being considered in this reform however are not expected to reach this point with most new apartments likely have appliances installed in one or two rooms.
As such, the impact on the heating and cooling appliance industry is likely to be minimal regarding number of installations. Changes in maintenance and average life of products may be impacted through reduced use of installed appliances, however, due to warranty requirements, changes in behaviour are likely to be minimal and therefore the impact on industry from this will also be minimal.
No significant impact
Community and Environment
Property owners Property owners will initially bear most of the higher costs of design and construction from increased energy efficiency requirements. Costs will be borne directly by owner-builders (via higher material and design costs) or otherwise passed through to property owners/ investors via developers/ construction companies.
The ability for these higher initial costs to be passed on to tenants is subject to competitive pressures across the rental market. Further, recovery of costs (where possible) will only occur over an extended period of time. The net impact on property owners of Class 2 buildings developments is likely to be slightly negative for this reason.
Cost - Increased buildings construction costs (passed on to apartment owners from building industry)

SA variation to the NCC to increase energy efficient requirement for Class 2 buildings Regulatory Impact Statement
60.
Stakeholder group Description of impacts Modelled impact
Residents and tenants
Residents (or owner-occupiers) and tenants are both likely to benefit from reduced electricity costs as heating and cooling requirements are able to be meet more frequently without external appliances.
For owner-occupiers, this benefit is offset by the higher property development or purchase costs that incorporate additional material and design costs.
For tenants, the benefits are expected to be greater. Some of the higher property development or purchase costs will be passed on but this relationship is less direct than for owner-occupiers.
Benefit Value of energy consumption savings
Environment Reduced electricity consumption will deliver environmental benefits in the form of reduced greenhouse gas emissions.
Note: Distribution depends on whether or not there is a carbon price:
- Whole community (if no price on carbon)
- Home occupier (if there is a price on carbon)
Benefit - Value of GHG Savings
Community Value of Avoided Network Expenditure (benefit accrues to all electricity users) Benefit Value of Avoided Network Expenditure
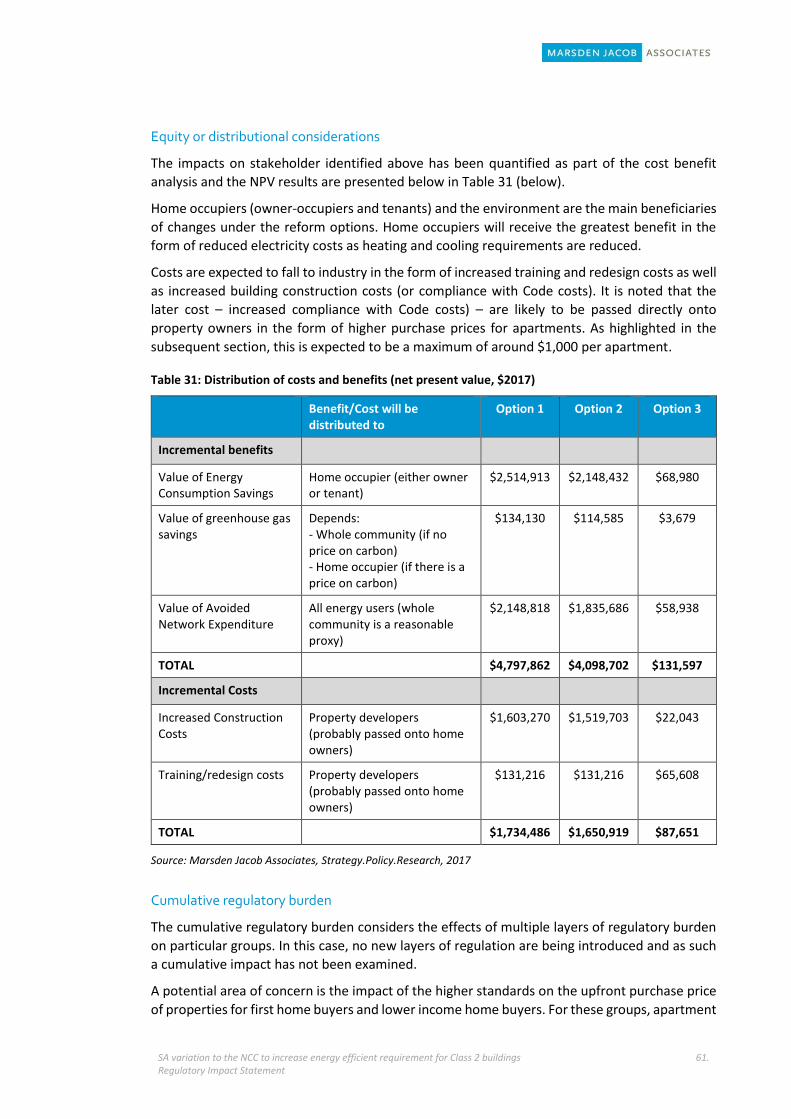
SA variation to the NCC to increase energy efficient requirement for Class 2 buildings Regulatory Impact Statement
61.
Equity or distributional considerations
The impacts on stakeholder identified above has been quantified as part of the cost benefit
analysis and the NPV results are presented below in Table 31 (below).
Home occupiers (owner-occupiers and tenants) and the environment are the main beneficiaries
of changes under the reform options. Home occupiers will receive the greatest benefit in the
form of reduced electricity costs as heating and cooling requirements are reduced.
Costs are expected to fall to industry in the form of increased training and redesign costs as well
as increased building construction costs (or compliance with Code costs). It is noted that the
later cost – increased compliance with Code costs) – are likely to be passed directly onto
property owners in the form of higher purchase prices for apartments. As highlighted in the
subsequent section, this is expected to be a maximum of around $1,000 per apartment.
Table 31: Distribution of costs and benefits (net present value, $2017)
Benefit/Cost will be distributed to
Option 1 Option 2 Option 3
Incremental benefits
Value of Energy Consumption Savings
Home occupier (either owner or tenant)
$2,514,913 $2,148,432 $68,980
Value of greenhouse gas savings
Depends: - Whole community (if no price on carbon) - Home occupier (if there is a price on carbon)
$134,130 $114,585 $3,679
Value of Avoided Network Expenditure
All energy users (whole community is a reasonable proxy)
$2,148,818 $1,835,686 $58,938
TOTAL $4,797,862 $4,098,702 $131,597
Incremental Costs
Increased Construction Costs
Property developers (probably passed onto home owners)
$1,603,270 $1,519,703 $22,043
Training/redesign costs Property developers (probably passed onto home owners)
$131,216 $131,216 $65,608
TOTAL $1,734,486 $1,650,919 $87,651
Source: Marsden Jacob Associates, Strategy.Policy.Research, 2017
Cumulative regulatory burden
The cumulative regulatory burden considers the effects of multiple layers of regulatory burden
on particular groups. In this case, no new layers of regulation are being introduced and as such
a cumulative impact has not been examined.
A potential area of concern is the impact of the higher standards on the upfront purchase price
of properties for first home buyers and lower income home buyers. For these groups, apartment

SA variation to the NCC to increase energy efficient requirement for Class 2 buildings Regulatory Impact Statement
62.
purchases are likely to be higher than other forms of housing (due to the relatively lower cost of
apartments). The potential impact is examined below.
The average apartment size in South Australia has fallen from a peak of more than 160 sqm in
2010 to around 131 sqm according to an ABS study commissioned by CommSec late last year.48
The following table (Table 32) presents the average compliance cost in year 1 (prior to learning
rate assumptions taking effect) and the likely average compliance cost per unit based on the 131
sqm average size of apartment from the ABS study.
If the compliance cost was passed on in full to purchasers the incremental cost is estimated to
range up to just over $1,000 (total) with the cost of compliance per unit likely to be slightly
higher in Adelaide compare to Ceduna and Mt Gambier.
This is relatively small considering the value of apartments can fluctuated much more
significantly with market movements. Hence, the impact on potential home owners is not
considered to be unduly disproportionate such as to hinder participation in the market by first
home buyers or lower income buyers.
The analysis is done as a ‘point in time’ analysis as prices for apartments tend to fluctuate
significantly over time, however the change will remain fairly constant.
Table 32: Impact of changes in apartment purchase price
Adelaide Ceduna Mt Gambier
Option 1
Average compliance cost (year 1) $8.09 per sqm $4.22 per sqm $7.42 per sqm
Average compliance cost per unit $1,060 $553 $972
Option 2
Average compliance cost (year 1) $7.68 per sqm $3.81 per sqm $7.01 per sqm
Average compliance cost per unit $1,006 $499 $918
Option 3
Average compliance cost (year 1) N/A $0.61 per sqm $1.93 per sqm
Average compliance cost per unit - $80 $253
Source: Marsden Jacob Associates, Strategy.Policy.Research, 2017
48 The Advertiser, ‘Average SA home floor space shrinking’, 30 October 2016, Refer to:
http://www.adelaidenow.com.au/realestate/news/adelaide-sa/average-sa-home-floor-space-shrinking/news-story/4f9d1035c1c79b53382164cddb0612dd

SA variation to the NCC to increase energy efficient requirement for Class 2 buildings Regulatory Impact Statement
63.
6. Consultation
Element 5: Consultation is required where there are likely to be significant impacts on
business, families, society, the community or the environment, and/or where the views of
parties/stakeholders who are affected by the proposal will be an important consideration for
decision makers or the agency considering the various alternatives.49
As highlighted in section 2.2.3, public priorities in South Australia show a strong preference for
carbon neutral and climate sensitive strategies.
During the development of the South Australia’s Climate Change Strategy 2015- 2050: Towards
a low carbon economy, released in November 2015, an extensive public consultation process
was undertaken during which more than 300 people attended workshops, 46 people
contributed to the online discussion forum and more than 200 written submissions were
received.50
As highlighted in section 3 (Objectives of Government Action), Target 60 in the Plan targets an
improvement in energy efficiency of dwellings by 15% by 2020 (baseline: 2003-04) Milestone of
10% by 2014. 51
The implementation of six star energy efficiency requirements for new (Class 1) homes has
already been implemented as a means to achieving this target (most of Australia since 2011)
and extensive consultation has been undertaken to further progress this and Class 2 measures
in line with the broader National Energy Efficient Building Project52.
Consultation conducted as part of Phase 1 of the National Energy Efficient Building Project in
2014 has been the most extensive, reaching many of the same industry stakeholders likely to be
impacted by changes outlined in this RIS. The consultation with building industry, stakeholders,
regulators and policy makers across Australia on issues with the current efficiency standards and
options to improve the standards included the engagement of over 1,000 stakeholders from
across industry and Australia. Stakeholders participated in the review at the time by:53
providing submissions to the Issues Paper (41 received)
participating in one of seventeen workshops held in all capital cities and a range of regional
centres (covering NCC climate zones 1 – 7, with over 271 participants);
49 SA Government (2011) Better Regulation Handbook: How to design and review regulation and prepare a
Regulatory Impact Statement, January, p. 22
50 SA Government, South Australia’s Climate Change Strategy 2015- 2050: Towards a low carbon economy, November 2015, p. 12. Reports, workshop papers, submission and online forum discussions are available on the SA Government’s YourSAy website here: https://yoursay.sa.gov.au/decisions/yoursay-engagements-climate-change-strategy-for-south-australia/about
51 SA Government, South Australia’s Strategic Plan, 2011, p. 47. For more information refer to: http://www.statedevelopment.sa.gov.au/resources/energy-efficiency/south-australias-energy-efficiency-targets
52 National Energy Efficient Building Project is led by the Government of South Australia’s Department of State Development and is co-funded by all Australian states and territories through the Council of Australian Government (COAG) Energy Council. The program commenced in 2012 and Phases 1, 2, and 3 have now been completed.
53 Sustainable Thinking and pitt&sherry, National Energy Efficiency Building Project, report prepared for the Department of State Development SA, November 2014, p. vii.

SA variation to the NCC to increase energy efficient requirement for Class 2 buildings Regulatory Impact Statement
64.
meeting with members of the project team; and/or
responding to an online survey (with 571 responses)
Based on the number and range of consultation undertaken on related changes the key
stakeholders who would need to respond to the higher energy efficient standard proposed in
this RIS, namely building, designers and construction industry, are likely to be well aware of the
potential for developments.
These stakeholders are also likely to subscribe to updates provided by the SA government such
as the e-newsletter ‘The Building Standard’ produced and distributed by the Planning and
Development Directorate of the Department of Planning, Transport and Infrastructure.
We understand the South Australian Government is currently considering the need for further
consultation and input on this RIS.

SA variation to the NCC to increase energy efficient requirement for Class 2 buildings Regulatory Impact Statement
65.
7. Conclusion and recommended option
Element 6: Conclusion and recommended option describes the preferred regulatory option,
how it will achieve the objective and the size and nature of the net benefits.
The groups affected by the preferred option and how they will be impacted should also be
identified. Importantly, the RIS should demonstrated that the benefits of the preferred option
to the community out weighty the costs and they the selected option delivers the greatest
net benefit to the community.
Reasons that other proposed options were rejected should be stated and the interaction with
existing State regulation and any required amendments outlined.54
7.1 Assessment
As outlined in Chapter 3, the assessment of the options for this RIS is against each of the three
elements that together comprise the public value score card. This section considers the options
in terms of:
Public value delivered
Legitimacy and support
Operational capabilities
We consider each element in turn.
7.1.1 Public value delivered
The public value delivered from each of the reform options relative to the base case is evident
from the outcomes of the cost benefit analysis. Table 33 (below) repeats the key cost benefit
analysis indicators presented in Chapter 5.
The results indicate:
Option 1 would deliver the highest net present value benefits, with option 2 delivering a
similar, but slightly lower, level of benefits.
The benefit cost ratio is most favourable under option 3, indicating the benefits are highest
as a ratio of costs for this option. However both options 1 and 2 have favourable benefit
cost ratios of 3.2 and 2.8 respectively.
The social return on investment is also highest under option 3 (at 29%), however the return
is also above 20% for both option 1 (24%) and option 2 (22%).
Cumulative energy savings and greenhouse gas emissions are highest under option 1, with
option 2 also delivering significantly more savings compared to option 3.
54 SA Government (2011) Better Regulation Handbook: How to design and review regulation and prepare a
Regulatory Impact Statement, January, p. 22

SA variation to the NCC to increase energy efficient requirement for Class 2 buildings Regulatory Impact Statement
66.
Table 33: Summary of benefit cost analysis indicators ($2017, real)
Indicator Option 1 (7 star average, 6
star minimum individual rating)
Option 2 (No average rating,
6 star minimum individual rating)
Option 3 (Separate cooling and heating caps)
Net Present Value $3,063,376 $2,447,784 $97,829
Benefit Cost Ratios 2.8 2.5 3.9
Social Return on Investment 24% 22% 29%
Cumulative energy savings, 2020 to 2050 (TJ)
68 59 2
Cumulative GHG emissions, 2020 to 2050 (t CO2-e)
6,834 5,838 187
Source: Strategy.Policy.Research, 2017
On balance, option 1 appears to deliver the most public value as it has the highest net present
value benefits, at nearly three-quarters of a million dollars higher than option 2. It also affords
the most energy and greenhouse gas emissions savings (an outcome which aligns to the SA
government focus on reducing emissions).
This option also provides a strong social return on investment and the mid-range benefit cost
ratio of 3.2 (compared to 4.5 for option 3 and 2.8 for option 2). While option 3 has a higher
benefit cost ratio, the absolute value of benefits delivered by this option is small.
Further we note that the results from the sensitivity analysis, including the ‘worst case’ scenario
test, do not yield a difference in results or ranking based on the cost benefit analysis alone.
7.1.2 Legitimacy and support
Legitimacy and support is evident where there is strong stakeholder feedback or evidence that
the reform is likely to be understood, adopted and the change is sustainable.
The energy efficiency star rating process is a well-established regulator mechanism in South
Australia. The reforms being proposed to not intend to dramatically alter the functioning of the
requirement or the means by which compliance may be achieved.
Option 3 represents the reform with the greatest change as separation of cooling and heating
caps while understood by thermal modelling practitioners, has less common application in
practice.
There is current support for the concept of reducing energy consumption and emissions through
regulatory requirements. Evidence exists in the numerous South Australian government
programs that target emissions reductions, including the Carbon Neutral Adelaide initiative
(outlined in section 2.2.3).
7.1.3 Operational capabilities
The operational capabilities element of the Public Value Scorecard focuses on the capacity and
mobilising of operational resources required and available to implement proposals and achieved
desired outcomes.
The iterative thermal modelling and building materials modification approach indicated that
relatively few changes to building materials would be required to achieve each of the reform
SA variation to the NCC to increase energy efficient requirement for Class 2 buildings Regulatory Impact Statement
67.
options. The materials required are readily available in the current market and the additional
compliance costs expected to be incurred by any individual dwelling buyer (upfront) are around
$1,000 per apartment in the first year following implementation.
7.2 Ranking of options
On balance, option 1 is the preferred reform option. As highlighted above, it will deliver the
highest public value. The legitimacy and support is potentially marginally higher for this option,
while operational capabilities are consistent across the options.
The second best option is option 2. Similar to option 1, this option performs well it he public
value delivered and has legitimacy and support.
Option 3 is the least preferred option on the basis that is delivers the lowest absolute value of
benefits. This option potentially also has slightly less legitimacy and support in the current
market on the basis that it represents the largest change in methodology used to demonstrate
compliance from the current requirements compared to alternate options.

SA variation to the NCC to increase energy efficient requirement for Class 2 buildings Regulatory Impact Statement
68.
8. Implementation, monitoring and review
Element 7: Implementation monitoring and review. The final element of a RIS details how
the preferred option will be implemented and monitored once implemented.55
8.1 Implementation
The NCC sets out the energy efficiency standards applying to all Class 2 buildings in South
Australia. In South Australia, the NCC is given legal effect through56 the Development Act 1993
and associated Development Regulations 2008 (Figure 32).
The South Australian variation to the NCC would be implemented via relevant South Australian
regulations under the Development Act 1993.
Figure 32: South Australian building regulatory framework
Notional time frames for the implementation would see the revised standards coming into effect
in 2020. This timing allows for the necessary amendments to be made to the standards and
allows a period of time for training and awareness activities to commence before the first higher
standard building is constructed.
55 SA Government (2011) Better Regulation Handbook: How to design and review regulation and prepare a
Regulatory Impact Statement, January, p. 22-23
56 SA Government, ‘About building rules for construction work’, last updated 2 November 2015, Refer to: https://www.sa.gov.au/topics/property-and-land/land-and-property-development/building-rules-regulations-and-information/technical-building-rules-for-construction-work

SA variation to the NCC to increase energy efficient requirement for Class 2 buildings Regulatory Impact Statement
69.
8.2 Monitoring and review
Due to the similarities in the drafting of the regulations and policy setting framework, no new
monitoring or compliance activities (beyond those already undertaken) are required by the
South Australia Government.
Awareness and advertisement of the changes would be communicated via the existing means,
including through information on relevant government webpages and notifications from the
‘The Building Standard’ e-newsletter produced by the Planning and Development Directorate of
the Department of Planning, Transport and Infrastructure.
To align with existing SA building processes for evaluation and review, we recommend the
standards be reviewed following a five year period. Consistent with this assessment, the future
review should consider whether there are additional benefits that can or should be made
accessible to apartment occupants due to changes in technology or future increased energy
costs.

SA variation to the NCC to increase energy efficient requirement for Class 2 buildings Regulatory Impact Statement
70.
Appendix 1: Incremental costs to achieve performance outcomes
This Appendix provides details on the incremental costs of achieving the performance outcomes
described in Chapter 4 independently quantified by quantity surveyors, Daniel Cant Watts Corke,
and collated by Strategy.Policy.Research.
The methodology report and itemised cost of materials is available in Appendix 2.
Option 1: Incremental costs by apartment and climate zone
ADELAIDE CEDUNA MT GAMBIER
$ total $/sqm $ total $/sqm $ total $/sqm
Top floor Unit 204 $31.6 $0.74 $31.6 $0.74 $643.2 $15.06 Unit 205 - - - - - - Unit 207 $74.9 $1.48 $697.0 $13.77 $697.0 $13.77 Unit 208 $540.0 $9.73 $540.0 $9.73 $878.0 $15.82
Upper mid-floor
Unit 204 $643.2 $15.06 $643.2 $15.06 $643.2 $15.06
Unit 205 $320.0 $6.56 $320.0 $6.56 $320.0 $6.56 Unit 207 $697.6 $13.79 - - - - Unit 208 $878.0 $15.82 - - - -
Lower mid-floor
Unit 204 $643.2 $15.06 $643.2 $15.06 $643.2 $15.06
Unit 205 $320.0 $6.56 $320.0 $6.56 $320.0 $6.56 Unit 207 $697.6 $13.79 - - - - Unit 208 $878.0 $15.82 - - - -
Ground-floor
Unit 204 $643.2 $15.06 - - $643.2 $15.06
Unit 205 - - - - - - Unit 207 - - - - - - Unit 208 - - - - $878.0 $15.82
Average (all units) $397.96 $8.09 $199.69 $4.22 $354.11 $7.42
Average (excluding zeros)
$530.61 $10.79 $456.43 $9.64 $629.53 $13.20
Option 2: Incremental costs by apartment and climate zone
ADELAIDE CEDUNA MT GAMBIER
$ total $/sqm $ total $/sqm $ total $/sqm
Top floor Unit 204 $31.6 $0.74 $31.6 $0.74 $643.2 $15.06 Unit 205 - - - - - - Unit 207 $74.9 $1.48 $697.0 $13.77 $697.0 $13.77 Unit 208 $540.0 $9.73 $540.0 $9.73 $878.0 $15.82
Upper mid-floor
Unit 204 $643.2 $15.06 $643.2 $15.06 $643.2 $15.06

SA variation to the NCC to increase energy efficient requirement for Class 2 buildings Regulatory Impact Statement
71.
Unit 205 - - - - - - Unit 207 $697.6 $13.79 - - - - Unit 208 $878.0 $15.82 - - - -
Lower mid-floor
Unit 204 $643.2 $15.06 $643.2 $15.06 $643.2 $15.06
Unit 205 $320.0 $6.56 $320.0 $6.56 $320.0 $6.56 Unit 207 $697.6 $13.79 - - - - Unit 208 $878.0 $15.82 - - - -
Ground-floor
Unit 204 $643.2 $15.06 - - $643.2 $15.06
Unit 205 - - - - - - Unit 207 - - - - - - Unit 208 - - - - $878.0 $15.82
Average (all units) $377.96 $7.68 $179.69 $3.81 $334.11 $7.01
Average (excluding zeros)
$549.75 $11.17 $479.17 $10.15 $668.23 $14.03
Option 3: Incremental costs by apartment and climate zone
ADELAIDE CEDUNA MT GAMBIER
$ total $/sqm $ total $/sqm $ total $/sqm
Top floor Unit 204 - - - - - - Unit 205 - - - - - - Unit 207 - - - - - - Unit 208 - - $540.0 $9.73 $878.0 $15.82
Upper mid-floor
Unit 204 - - - - - -
Unit 205 - - - - - - Unit 207 - - - - - - Unit 208 - - - - - -
Lower mid-floor
Unit 204 - - - - - -
Unit 205 - - - - - - Unit 207 - - - - - - Unit 208 - - - - - -
Ground-floor
Unit 204 - - - - $643.2 $15.06
Unit 205 - - - - - - Unit 207 - - - - - - Unit 208 - - - - - -
Average (all units) - - $33.75 $0.61 $95.08 $1.93
Average (excluding zeros)
- - $540.00 $9.73 $760.60 $15.44

SA variation to the NCC to increase energy efficient requirement for Class 2 buildings Regulatory Impact Statement
72.
Appendix 2: Quantity Surveyor Report
Please refer to the attached report from Donald Cant Watts Corke (ACT) Pty Ltd tilted South
Australia Class 2 Project, dated 24 July 2017.

South Australia Class 2 Project Strategy. Policy. Research.

South Australia Class 2 Project Strategy. Policy. Research.
24 July 2017
Stephen Bisseker Director Donald Cant Watts Corke (ACT) Pty Ltd ABN 91 062 723 755 Level 4, City Walk Centre 2 Mort Street Canberra City ACT 2601 P: +61 2 6257 3400 [email protected] www.dcwc.com.au
© Donald Cant Watts Corke Pty Ltd, 2017 Donald Cant Watts Corke Pty Ltd has prepared this proposal in accordance with the instructions of their client for their sole and specific use. Any other persons who use any information contained herein do so at their own risk. This proposal has been prepared in accordance with generally accepted consulting practices and no other warranty, expressed or implied, is made as to the professional advice included in this proposal. The appreciation and methodology contained within this proposal are based on information provided by others and the assumption is that all relevant information has been supplied by these individuals and bodies from whom it has been requested. Information obtained from third parties as not been independently verified.
Document Status
Rev No.
Author Reviewer Approved for Issue
Name Signature Date
1.0 Shiva Nuvula S.Bisseker Stephen Bisseker
24 July 2017
File Ref. C17047 Class 2 Analysis 24.07.2017

Contents
1 EXECUTIVE SUMMARY 1
1.1 Methodology 2
2 BASIS OF REPORT 2
2.1 Methodology 2
2.2 Documentation 2
2.3 Abbreviations 2
2.4 Clarifications 3
2.5 Exclusions 3
APPENDIX 1 – SA CLASS 2 BREAKUP 4

C17047 SA Class 2 Report | 24 July 2017 P. 1
1 EXECUTIVE SUMMARY Donald Cant Watts Corke (DCWC) at the request of the Strategy. Policy. Research (S.P.R) has compiled
actual cost observations in the review and analysis for upgrading Class 2 energy performance standards in
South Australia. The aim is to provide costs in relation to building fabric changes such as insulation and
window to wall ratios such as changing the existing glazed façade to a more efficient energy performance
material.
The analysis encompasses 4 design options as detailed below with a number of sub-options, based on high
and medium material specifications to the existing properties to analysis the costs based on the selected
material specification
• Design Option 204 – Top specification
o External Walls (2 types)
o Windows (6 types)
o Roof (1 type)
• Design Option 205 Mid specification
o External Walls (1 type)
o Windows (6 types)
• Design Option 207 – Top specification
o External Walls (2 types)
o Windows (6 types)
o Roof (1 type)
• Design Option 208 – Top specification
o External Walls (2 types)
o Windows (6 types)
o Roof (1 type)

C17047 SA Class 2 Report | 24 July 2017 P. 2
1.1 Methodology The Costs are presented in a summary table for each design option. The table details the elemental costs
based on current market rates for South Australia. There are two different sources used in obtaining the
information as listed below:
1. Database costs from Material Suppliers in South Australia;
2. Rawlinsons Australian Construction Handbook (Edition 22, 2004 to Edition 34, 2016); and
2 BASIS OF REPORT
2.1 Methodology The aim of this study is to determine the cost implications in Class 2 energy performance standards in South
Australia based on changing building fabric changes.
The brief was to cost the proposed design options based on the specification i.e. top or medium specification
and develop costs relating to the different option designs. The main elements that were under review were
external walls, windows and roof. These elements are significant in calculating energy performance.
The specified materials were split into sub-elements to enable cost comparison of the specified materials. For
example 4mm thick clear glass cost $155/m2 compared to 6mm high solar gain with aluminium frame cost
$420/m2
We provide a summary of the costs across all the design options:
1. Compile the costs of the design options broken down into various items to provide an
example of the costs per m2 for materials. This is done based on the information furnished
by the material suppliers, historical costing records from industry accepted construction cost
publications:
• Rawlinsons Australian Construction Handbook (Edition 22 to 34);
2.2 Documentation
The costs study has been undertaken on the basis of the following documentation:
1. Learning rates email dated 1 May 2017 confirming the specification of the design options
204/205/207/208
2.3 Abbreviations
C17047 SA Class 2 Report | 24 July 2017 P. 3
S.P.R Strategy. Policy. Research.
DCWC Donald Cant Watts Corke (ACT) Pty Ltd
2.4 Clarifications In relation to the actual costs provided the following clarifications are noted:
1. The historical costs obtained from Material suppliers are average supply only and exclude
overheads, profits, freight and Good & Services Tax.
2. The rates obtained from Rawlinsons Australian Construction Handbook include supply,
installation, allowance for Builder’s overheads and profit, allowance for respective trade minor
preliminaries items (small tools, hand plants and supervision) and exclude Builder’s
Preliminaries (site establishment, supervision, large plant, scaffolding, temporary services,
notices and fees, insurances, etc.;), transportation systems, Base material prices and Good &
Services Tax.
3. Viridian rates are average supply rates for supply of the glazing and associated powder
coating framing and excluding OHP, Margin & GST.
4. The rates for fibre batt insulation are considered to be Bradford Glass fibre batt insulation and
exclude overheads, profits, freight and Good & Services Tax
5. The 66mm and 132mm thick Glass fibre batt: R1.5 are a custom thickness overheads, and
exclude profits, freight and Good & Services Tax
2.5 Exclusions All actual costs contained in this report exclude:
• Overheads;
• Profits;
• Freight; and
• Goods and Services Tax (GST);

SA variation to the NCC to increase energy efficient requirement for Class 2 buildings Regulatory Impact Statement
73.
Appendix 3: Selected thermal modelling certificates
Please refer to attached certificates that reflect thermal modelling under taken for two of the
units. The two units selected as examples are both on the upper mid-level have been selected –
unit 204 and unit 208. The attachment provides the following certificates for each:
Base case certificates: These shows a rating of 4.9 for unit 204 and a rating of 5.3 for unit
208.
Option 1 certificates: These show a rating of 6.9 for unit 204 and a rating of 7.2 for unit 208.
Design details.

P R E V I E W
Interim Simulation Result
***NOT FOR RATING
Run: Base
***NOT FOR RATING PROJECT DETAILS NOT FOR RATING***Project Name: Class 2 analysis File Name: SA job.PROP o s t c o d e : 5000 Climate Zone: 16Design Option: 204 mid, no wall insD e s c r i p t i o n :
***NOT FOR RATING Client Details NOT FOR RATING***Client Name: P h o n e : F a x : E m a i l : Postal Address: Site Address: 205 87-89 Glenayr Avenue, Adelaide 5000, SA E x p o s u r e : SuburbanCouncil submitted to (if known by assessor):
***NOT FOR RATING Assessor Details NOT FOR RATING***Assessor Name: Assessor No. P h o n e : F a x : E m a i l : Project Code: Assessment Date: 07/09/2017 T i m e : 16:32:25Assessor Signature:
CALCULATED ENERGY REQUIREMENTS*Heating Cooling (sensible) Cooling (latent) Total Energy Units
56.4 73.7 4.3 134.4 MJ/m².annum* These energy requirements have been calculated using a standard set of occupant behaviours and so do not necessarily represent the usage pattern or lifestyleof the intended occupants. They should be used solely for the purposes of rating the building. They should not be used to infer actual energy consumption orrunning costs. The settings used for the simulation are shown in the building data report.
AREA-ADJUSTED ENERGY REQUIREMENTSHeating Cooling (sensible) Cooling (latent) Total Energy Units
53.0 69.2 4.1 126.3 MJ/m².annumFloor area conditioned: 42.7 m² unconditioned: 4.4 m² garage: 0.0 m²
BAND RESULT4.9
Area-adjusted band score thresholdsBand 1 Band 2 Band 3 Band 4 Band 5 Band 6 Band 7 Band 8 Band 9 Band 10
480 325 227 165 125 96 70 46 22 3
Printed: 07/09/2017 04:32 pm Page 1 of 1

P R E V I E W
Interim Simulation Result
***NOT FOR RATING
Run: Base
***NOT FOR RATING PROJECT DETAILS NOT FOR RATING***Project Name: Class 2 analysis File Name: SA job.PROP o s t c o d e : 5000 Climate Zone: 16Design Option: 204, midD e s c r i p t i o n :
***NOT FOR RATING Client Details NOT FOR RATING***Client Name: P h o n e : F a x : E m a i l : Postal Address: Site Address: 205 87-89 Glenayr Avenue, Adelaide 5000, SA E x p o s u r e : SuburbanCouncil submitted to (if known by assessor):
***NOT FOR RATING Assessor Details NOT FOR RATING***Assessor Name: Assessor No. P h o n e : F a x : E m a i l : Project Code: Assessment Date: 24/09/2017 T i m e : 17:11:33Assessor Signature:
CALCULATED ENERGY REQUIREMENTS*Heating Cooling (sensible) Cooling (latent) Total Energy Units
12.0 61.0 4.0 77.1 MJ/m².annum* These energy requirements have been calculated using a standard set of occupant behaviours and so do not necessarily represent the usage pattern or lifestyleof the intended occupants. They should be used solely for the purposes of rating the building. They should not be used to infer actual energy consumption orrunning costs. The settings used for the simulation are shown in the building data report.
AREA-ADJUSTED ENERGY REQUIREMENTSHeating Cooling (sensible) Cooling (latent) Total Energy Units
11.3 57.3 3.8 72.4 MJ/m².annumFloor area conditioned: 42.7 m² unconditioned: 4.4 m² garage: 0.0 m²
BAND RESULT6.9
Area-adjusted band score thresholdsBand 1 Band 2 Band 3 Band 4 Band 5 Band 6 Band 7 Band 8 Band 9 Band 10
480 325 227 165 125 96 70 46 22 3
Printed: 24/09/2017 05:11 pm Page 1 of 1
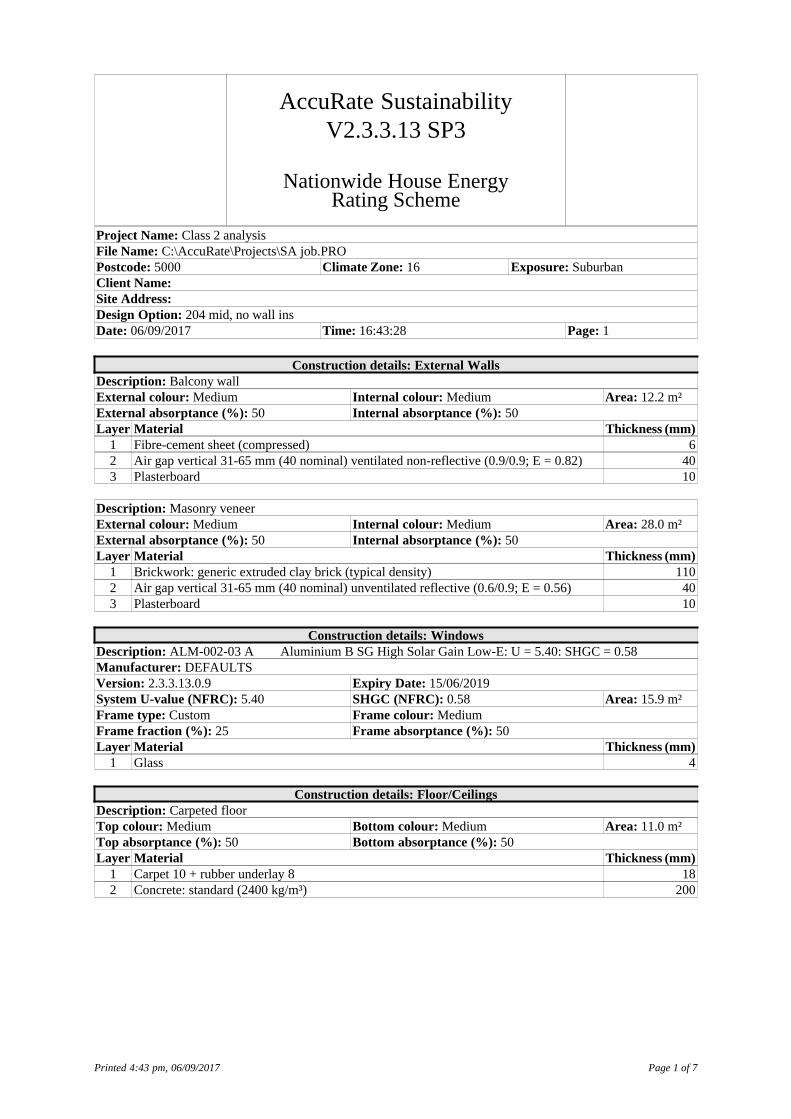
AccuRate SustainabilityV2.3.3.13 SP3
Nationwide House EnergyRating Scheme
Project Name: Class 2 analysisFile Name: C:\AccuRate\Projects\SA job.PROP o s t c o d e : 5000 Climate Zone: 16 E x p o s u r e : SuburbanClient Name: Site Address: Design Option: 204 mid, no wall insD a t e : 06/09/2017 T i m e : 16:43:28 P a g e : 1
Construction details: External WallsD e s c r i p t i o n : Balcony wallExternal colour: Medium Internal colour: Medium A r e a : 12.2 m²External absorptance (%): 50 Internal absorptance (%): 50Layer Material Thickness (mm)
1 Fibre-cement sheet (compressed) 62 Air gap vertical 31-65 mm (40 nominal) ventilated non-reflective (0.9/0.9; E = 0.82) 403 Plasterboard 10
D e s c r i p t i o n : Masonry veneerExternal colour: Medium Internal colour: Medium A r e a : 28.0 m²External absorptance (%): 50 Internal absorptance (%): 50Layer Material Thickness (mm)
1 Brickwork: generic extruded clay brick (typical density) 1102 Air gap vertical 31-65 mm (40 nominal) unventilated reflective (0.6/0.9; E = 0.56) 403 Plasterboard 10
Construction details: WindowsD e s c r i p t i o n : ALM-002-03 A Aluminium B SG High Solar Gain Low-E: U = 5.40: SHGC = 0.58M a n u f a c t u r e r : DEFAULTSV e r s i o n : 2.3.3.13.0.9 Expiry Date: 15/06/2019System U-value (NFRC): 5.40 SHGC (NFRC): 0.58 A r e a : 15.9 m²Frame type: Custom Frame colour: MediumFrame fraction (%): 25 Frame absorptance (%): 50Layer Material Thickness (mm)
1 Glass 4
Construction details: Floor/CeilingsD e s c r i p t i o n : Carpeted floorTop colour: Medium Bottom colour: Medium A r e a : 11.0 m²Top absorptance (%): 50 Bottom absorptance (%): 50Layer Material Thickness (mm)
1 Carpet 10 + rubber underlay 8 182 Concrete: standard (2400 kg/m³) 200
Page 1 of 7Printed 4:43 pm, 06/09/2017

AccuRate SustainabilityV2.3.3.13 SP3
Nationwide House EnergyRating Scheme
Project Name: Class 2 analysisFile Name: C:\AccuRate\Projects\SA job.PROP o s t c o d e : 5000 Climate Zone: 16 E x p o s u r e : SuburbanClient Name: Site Address: Design Option: 204 mid, no wall insD a t e : 06/09/2017 T i m e : 16:43:28 P a g e : 2
D e s c r i p t i o n : tiled floorTop colour: Medium Bottom colour: Medium A r e a : 4.4 m²Top absorptance (%): 50 Bottom absorptance (%): 50Layer Material Thickness (mm)
1 Ceramic tile 82 Concrete: standard (2400 kg/m³) 200
D e s c r i p t i o n : floating timberTop colour: Medium Bottom colour: Medium A r e a : 31.7 m²Top absorptance (%): 50 Bottom absorptance (%): 50Layer Material Thickness (mm)
1 Timber (softwood) 82 Concrete: standard (2400 kg/m³) 200
D e s c r i p t i o n : ceilingTop colour: Medium Bottom colour: Medium A r e a : 47.1 m²Top absorptance (%): 50 Bottom absorptance (%): 50Layer Material Thickness (mm)
1 Concrete: standard (2400 kg/m³) 200
Construction details: Internal WallsD e s c r i p t i o n : Plasterboard on studsFirst colour: Medium Last colour: Medium A r e a : 26.3 m²First absorptance (%): 50 Last absorptance (%): 50Layer Material Thickness (mm)
1 Plasterboard 102 Air gap vertical >66 mm (90 nominal) unventilated non-reflective (0.9/0.9; E = 0.82) 903 Plasterboard 10
D e s c r i p t i o n : common wallFirst colour: Medium Last colour: Medium A r e a : 54.3 m²First absorptance (%): 50 Last absorptance (%): 50Layer Material Thickness (mm)
1 Plasterboard 102 Concrete block 190 denseweight (core-filled at 1800 centres) 1903 Plasterboard 10
Page 2 of 7Printed 4:43 pm, 06/09/2017
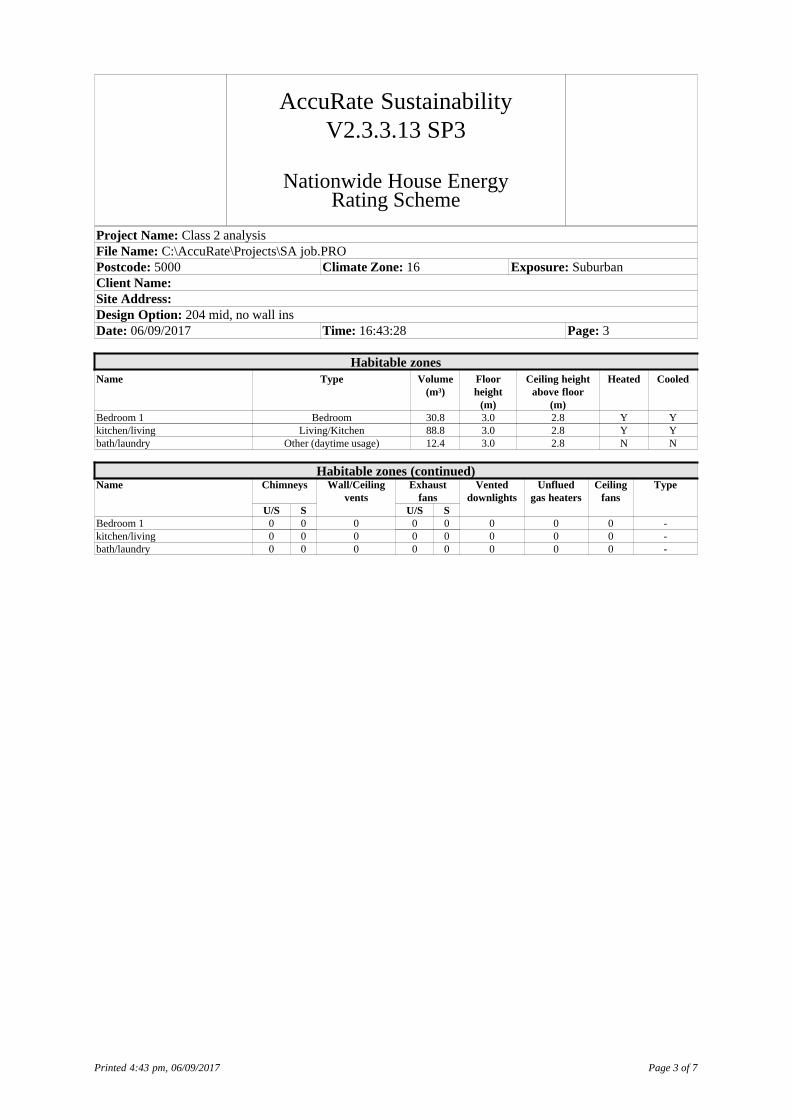
AccuRate SustainabilityV2.3.3.13 SP3
Nationwide House EnergyRating Scheme
Project Name: Class 2 analysisFile Name: C:\AccuRate\Projects\SA job.PROP o s t c o d e : 5000 Climate Zone: 16 E x p o s u r e : SuburbanClient Name: Site Address: Design Option: 204 mid, no wall insD a t e : 06/09/2017 T i m e : 16:43:28 P a g e : 3
Habitable zonesName Type Volume Floor Ceiling height Heated Cooled
(m³) height above floor(m) (m)
Bedroom 1 Bedroom 30.8 3.0 2.8 Y Ykitchen/living Living/Kitchen 88.8 3.0 2.8 Y Ybath/laundry Other (daytime usage) 12.4 3.0 2.8 N N
Habitable zones (continued)Name Chimneys Wall/Ceiling Exhaust Vented Unflued Ceiling Type
vents fans downlights gas heaters fansU/S S U/S S
Bedroom 1 0 0 0 0 0 0 0 0 -kitchen/living 0 0 0 0 0 0 0 0 -bath/laundry 0 0 0 0 0 0 0 0 -
Page 3 of 7Printed 4:43 pm, 06/09/2017

AccuRate SustainabilityV2.3.3.13 SP3
Nationwide House EnergyRating Scheme
Project Name: Class 2 analysisFile Name: C:\AccuRate\Projects\SA job.PROP o s t c o d e : 5000 Climate Zone: 16 E x p o s u r e : SuburbanClient Name: Site Address: Design Option: 204 mid, no wall insD a t e : 06/09/2017 T i m e : 16:43:28 P a g e : 4
Bedroom 1: External walls main dataWall Construction Azi L H Area Area Fixed shade Opening Opening
(deg.) (m) (m) (gross) (net) (m²) Type(m²) (m²)
1 Masonry veneer 220 3.00 2.80 8.40 5.71 None 0.00 Controlled2 Masonry veneer 0 1.00 2.80 2.80 1.90 None 0.00 Controlled3 Masonry veneer 270 0.60 2.80 1.68 1.68 None 0.00 Controlled
Bedroom 1: External walls wing wall dataLeft Wing Wall Right Wing Wall
Horizontal Vertical Horizontal VerticalWall Projection Offset Offset Projection Offset Offset Part of courtyard?
(m) (m) (m) (m) (m) (m)2 - - - 6.50 0.00 0.00 N3 1.00 0.00 0.00 - - - N
Bedroom 1: Windows in wallsWall Window Name Type Construction Azi. H W Area
(deg.) (m) (m) (m²)1 w4 Awning ALM-002-03 A Aluminium B SG High Solar Gain Low-E: U = 5.40: SHGC = 0.58 220 1.60 1.68 2.692 w1 Double or Single HungALM-002-03 A Aluminium B SG High Solar Gain Low-E: U = 5.40: SHGC = 0.58 0 1.54 0.58 0.90
Bedroom 1: Windows in walls (continued)Wall Window Name Indoor covering Outdoor covering Fixed shade HH HO Opening Weather Gap
(m) (m) (%) stripped size1 w4 Holland blinds None 2.50 0.65 30.00 Y2 w1 Holland blinds None 2.10 0.20 45.00 Y
Bedroom 1: Internal wallsWall Construction L H Area Area Adjacent Zone Opening Opening
(m) (m) (gross) (net) (m²) Type(m²) (m²)
1 common wall 3.20 2.80 8.96 9.0 Neighbour 0.00 Controlled2 Plasterboard on studs 6.60 2.80 18.48 16.8 kitchen/living 1.72 Controlled
Bedroom 1: FloorsFloor Construction Area Area Under the floor Edge Opening Opening
(gross) (net) Ins. (m²) Type(m²) (m²)
1 Carpeted floor 11.0 11.0 Neighbour 0.00 Controlled
Bedroom 1: CeilingsCeiling Construction Area Area Above the ceiling Opening Opening
(gross) (net) (m²) Type(m²) (m²)
1 ceiling 11.0 11.0 Neighbour 0.00 Controlled
Page 4 of 7Printed 4:43 pm, 06/09/2017

AccuRate SustainabilityV2.3.3.13 SP3
Nationwide House EnergyRating Scheme
Project Name: Class 2 analysisFile Name: C:\AccuRate\Projects\SA job.PROP o s t c o d e : 5000 Climate Zone: 16 E x p o s u r e : SuburbanClient Name: Site Address: Design Option: 204 mid, no wall insD a t e : 06/09/2017 T i m e : 16:43:28 P a g e : 5
kitchen/living: External walls main dataWall Construction Azi L H Area Area Fixed shade Opening Opening
(deg.) (m) (m) (gross) (net) (m²) Type(m²) (m²)
1 Masonry veneer 270 5.40 2.80 15.12 10.72 None 0.00 Controlled2 Balcony wall 0 4.35 2.80 12.18 4.22 roof over balcony 0.00 Controlled
kitchen/living: External walls wing wall dataLeft Wing Wall Right Wing Wall
Horizontal Vertical Horizontal VerticalWall Projection Offset Offset Projection Offset Offset Part of courtyard?
(m) (m) (m) (m) (m) (m)1 1.00 0.60 0.00 - - - N2 - - - 2.40 0.00 0.00 N
kitchen/living: External walls horizontal shading dataEaves Other fixed shading
Vertical Horizontal Vertical HorizontalWall Name Projection Offset Offset Length Projection Offset Offset Length Monthly blocking factors
(m) (m) (m) (m) (m) (m) (m) (m) (%)2 roof over balcony 2.40 0.00 0.00 4.40 0.00 0.00 0.00 0.00 100,100,100,100,100,100,100,100,100,100,100,100
kitchen/living: Windows in wallsWall Window Name Type Construction Azi. H W Area
(deg.) (m) (m) (m²)1 w2 Sliding ALM-002-03 A Aluminium B SG High Solar Gain Low-E: U = 5.40: SHGC = 0.58 270 1.60 2.75 4.402 w2 Sliding ALM-002-03 A Aluminium B SG High Solar Gain Low-E: U = 5.40: SHGC = 0.58 0 2.20 3.62 7.96
kitchen/living: Windows in walls (continued)Wall Window Name Indoor covering Outdoor covering Fixed shade HH HO Opening Weather Gap
(m) (m) (%) stripped size1 w2 Holland blinds None 2.50 1.20 30.00 Y2 w2 Holland blinds None 2.20 0.35 50.00 Y
kitchen/living: Internal wallsWall Construction L H Area Area Adjacent Zone Opening Opening
(m) (m) (gross) (net) (m²) Type(m²) (m²)
1 common wall 8.40 2.80 23.52 23.5 Neighbour 0.00 Controlled2 Plasterboard on studs 6.60 2.80 18.48 16.8 Bedroom 1 1.72 Controlled3 Plasterboard on studs 2.80 2.80 7.84 6.1 bath/laundry 1.72 Controlled
kitchen/living: FloorsFloor Construction Area Area Under the floor Edge Opening Opening
(gross) (net) Ins. (m²) Type(m²) (m²)
1 floating timber 31.7 31.7 Neighbour 0.00 Controlled
kitchen/living: CeilingsCeiling Construction Area Area Above the ceiling Opening Opening
(gross) (net) (m²) Type(m²) (m²)
1 ceiling 31.7 31.7 Neighbour 0.00 Controlled
Page 5 of 7Printed 4:43 pm, 06/09/2017

AccuRate SustainabilityV2.3.3.13 SP3
Nationwide House EnergyRating Scheme
Project Name: Class 2 analysisFile Name: C:\AccuRate\Projects\SA job.PROP o s t c o d e : 5000 Climate Zone: 16 E x p o s u r e : SuburbanClient Name: Site Address: Design Option: 204 mid, no wall insD a t e : 06/09/2017 T i m e : 16:43:28 P a g e : 6
bath/laundry: Internal wallsWall Construction L H Area Area Adjacent Zone Opening Opening
(m) (m) (gross) (net) (m²) Type(m²) (m²)
1 common wall 7.80 2.80 21.84 21.8 Neighbour 0.00 Controlled2 Plasterboard on studs 2.80 2.80 7.84 6.1 kitchen/living 1.72 Controlled
bath/laundry: FloorsFloor Construction Area Area Under the floor Edge Opening Opening
(gross) (net) Ins. (m²) Type(m²) (m²)
1 tiled floor 4.4 4.4 Neighbour 0.00 Controlled
bath/laundry: CeilingsCeiling Construction Area Area Above the ceiling Opening Opening
(gross) (net) (m²) Type(m²) (m²)
1 ceiling 4.4 4.4 Neighbour 0.00 Controlled
Page 6 of 7Printed 4:43 pm, 06/09/2017

AccuRate SustainabilityV2.3.3.13 SP3
Nationwide House EnergyRating Scheme
Project Name: Class 2 analysisFile Name: C:\AccuRate\Projects\SA job.PROP o s t c o d e : 5000 Climate Zone: 16 E x p o s u r e : SuburbanClient Name: Site Address: Design Option: 204 mid, no wall insD a t e : 06/09/2017 T i m e : 16:43:28 P a g e : 7
Shading SchemesEaves Other fixed shading
Vert Horiz Vert HorizName Projection Offset Offset Length Projection Offset Offset Length Monthly blocking factors
(m) (m) (m) (m) (m) (m) (m) (m) (%)roof over balcony 2.40 0.00 0.00 4.40 0.00 0.00 0.00 0.00 100,100,100,100,100,100,100,100,100,100,100,100
VentilationFootprint: vertical dimension Footprint: horizontal dimension Azimuth of highlighted facade Insect screens
(m) (m) (degrees)10.0 4.5 0 N
Page 7 of 7Printed 4:43 pm, 06/09/2017

P R E V I E W
Interim Simulation Result
***NOT FOR RATING
Run: Base
***NOT FOR RATING PROJECT DETAILS NOT FOR RATING***Project Name: Class 2 analysis File Name: SA job.PROP o s t c o d e : 5000 Climate Zone: 16Design Option: 208 mid, no wall insD e s c r i p t i o n :
***NOT FOR RATING Client Details NOT FOR RATING***Client Name: P h o n e : F a x : E m a i l : Postal Address: Site Address: 205 87-89 Glenayr Avenue, Adelaide 5000, SA E x p o s u r e : SuburbanCouncil submitted to (if known by assessor):
***NOT FOR RATING Assessor Details NOT FOR RATING***Assessor Name: Assessor No. P h o n e : F a x : E m a i l : Project Code: Assessment Date: 07/09/2017 T i m e : 16:38:13Assessor Signature:
CALCULATED ENERGY REQUIREMENTS*Heating Cooling (sensible) Cooling (latent) Total Energy Units
39.4 82.0 3.5 125.0 MJ/m².annum* These energy requirements have been calculated using a standard set of occupant behaviours and so do not necessarily represent the usage pattern or lifestyleof the intended occupants. They should be used solely for the purposes of rating the building. They should not be used to infer actual energy consumption orrunning costs. The settings used for the simulation are shown in the building data report.
AREA-ADJUSTED ENERGY REQUIREMENTSHeating Cooling (sensible) Cooling (latent) Total Energy Units
36.8 76.5 3.3 116.7 MJ/m².annumFloor area conditioned: 55.6 m² unconditioned: 6.7 m² garage: 0.0 m²
BAND RESULT5.3
Area-adjusted band score thresholdsBand 1 Band 2 Band 3 Band 4 Band 5 Band 6 Band 7 Band 8 Band 9 Band 10
480 325 227 165 125 96 70 46 22 3
Printed: 07/09/2017 04:38 pm Page 1 of 1

P R E V I E W
Interim Simulation Result
***NOT FOR RATING
Run: Base
***NOT FOR RATING PROJECT DETAILS NOT FOR RATING***Project Name: Class 2 analysis File Name: SA job.PROP o s t c o d e : 5000 Climate Zone: 16Design Option: Unit 208, midD e s c r i p t i o n :
***NOT FOR RATING Client Details NOT FOR RATING***Client Name: P h o n e : F a x : E m a i l : Postal Address: Site Address: 205 87-89 Glenayr Avenue, Adelaide 5000, SA E x p o s u r e : SuburbanCouncil submitted to (if known by assessor):
***NOT FOR RATING Assessor Details NOT FOR RATING***Assessor Name: Assessor No. P h o n e : F a x : E m a i l : Project Code: Assessment Date: 24/09/2017 T i m e : 17:14:23Assessor Signature:
CALCULATED ENERGY REQUIREMENTS*Heating Cooling (sensible) Cooling (latent) Total Energy Units
9.0 57.7 3.1 69.7 MJ/m².annum* These energy requirements have been calculated using a standard set of occupant behaviours and so do not necessarily represent the usage pattern or lifestyleof the intended occupants. They should be used solely for the purposes of rating the building. They should not be used to infer actual energy consumption orrunning costs. The settings used for the simulation are shown in the building data report.
AREA-ADJUSTED ENERGY REQUIREMENTSHeating Cooling (sensible) Cooling (latent) Total Energy Units
8.4 53.8 2.9 65.1 MJ/m².annumFloor area conditioned: 55.6 m² unconditioned: 6.7 m² garage: 0.0 m²
BAND RESULT7.2
Area-adjusted band score thresholdsBand 1 Band 2 Band 3 Band 4 Band 5 Band 6 Band 7 Band 8 Band 9 Band 10
480 325 227 165 125 96 70 46 22 3
Printed: 24/09/2017 05:14 pm Page 1 of 1

AccuRate SustainabilityV2.3.3.13 SP3
Nationwide House EnergyRating Scheme
Project Name: Class 2 analysisFile Name: C:\AccuRate\Projects\SA job.PROP o s t c o d e : 5000 Climate Zone: 16 E x p o s u r e : SuburbanClient Name: Site Address: Design Option: 208 mid, no wall insD a t e : 06/09/2017 T i m e : 16:46:30 P a g e : 1
Construction details: External WallsD e s c r i p t i o n : Balcony wallExternal colour: Medium Internal colour: Medium A r e a : 9.0 m²External absorptance (%): 50 Internal absorptance (%): 50Layer Material Thickness (mm)
1 Fibre-cement sheet (compressed) 62 Air gap vertical 31-65 mm (40 nominal) unventilated non-reflective (0.9/0.9; E = 0.82) 403 Plasterboard 10
D e s c r i p t i o n : external wallExternal colour: Medium Internal colour: Medium A r e a : 45.9 m²External absorptance (%): 50 Internal absorptance (%): 50Layer Material Thickness (mm)
1 Brickwork: generic extruded clay brick (typical density) 1102 Air gap vertical 31-65 mm (40 nominal) unventilated non-reflective (0.9/0.9; E = 0.82) 403 Plasterboard 10
Construction details: WindowsD e s c r i p t i o n : ALM-002-03 A Aluminium B SG High Solar Gain Low-E: U = 5.40: SHGC = 0.58M a n u f a c t u r e r : DEFAULTSV e r s i o n : 2.3.3.13.0.9 Expiry Date: 15/06/2019System U-value (NFRC): 5.40 SHGC (NFRC): 0.58 A r e a : 20.2 m²Frame type: Custom Frame colour: MediumFrame fraction (%): 25 Frame absorptance (%): 50Layer Material Thickness (mm)
1 Glass 4
Construction details: Floor/CeilingsD e s c r i p t i o n : Carpeted floorTop colour: Medium Bottom colour: Medium A r e a : 13.1 m²Top absorptance (%): 50 Bottom absorptance (%): 50Layer Material Thickness (mm)
1 Carpet 10 + rubber underlay 8 182 Concrete: standard (2400 kg/m³) 200
Page 1 of 7Printed 4:46 pm, 06/09/2017

AccuRate SustainabilityV2.3.3.13 SP3
Nationwide House EnergyRating Scheme
Project Name: Class 2 analysisFile Name: C:\AccuRate\Projects\SA job.PROP o s t c o d e : 5000 Climate Zone: 16 E x p o s u r e : SuburbanClient Name: Site Address: Design Option: 208 mid, no wall insD a t e : 06/09/2017 T i m e : 16:46:30 P a g e : 2
D e s c r i p t i o n : tiled floorTop colour: Medium Bottom colour: Medium A r e a : 6.7 m²Top absorptance (%): 50 Bottom absorptance (%): 50Layer Material Thickness (mm)
1 Ceramic tile 82 Concrete: standard (2400 kg/m³) 200
D e s c r i p t i o n : floating timberTop colour: Medium Bottom colour: Medium A r e a : 42.5 m²Top absorptance (%): 50 Bottom absorptance (%): 50Layer Material Thickness (mm)
1 Timber (softwood) 82 Concrete: standard (2400 kg/m³) 200
D e s c r i p t i o n : ceilingTop colour: Medium Bottom colour: Medium A r e a : 62.3 m²Top absorptance (%): 50 Bottom absorptance (%): 50Layer Material Thickness (mm)
1 Concrete: standard (2400 kg/m³) 200
Construction details: Internal WallsD e s c r i p t i o n : Plasterboard on studsFirst colour: Medium Last colour: Medium A r e a : 32.5 m²First absorptance (%): 50 Last absorptance (%): 50Layer Material Thickness (mm)
1 Plasterboard 102 Air gap vertical >66 mm (90 nominal) unventilated non-reflective (0.9/0.9; E = 0.82) 903 Plasterboard 10
D e s c r i p t i o n : common wallFirst colour: Medium Last colour: Medium A r e a : 48.7 m²First absorptance (%): 50 Last absorptance (%): 50Layer Material Thickness (mm)
1 Plasterboard 102 Concrete block 190 denseweight (core-filled at 1800 centres) 1903 Plasterboard 10
Page 2 of 7Printed 4:46 pm, 06/09/2017

AccuRate SustainabilityV2.3.3.13 SP3
Nationwide House EnergyRating Scheme
Project Name: Class 2 analysisFile Name: C:\AccuRate\Projects\SA job.PROP o s t c o d e : 5000 Climate Zone: 16 E x p o s u r e : SuburbanClient Name: Site Address: Design Option: 208 mid, no wall insD a t e : 06/09/2017 T i m e : 16:46:30 P a g e : 3
Habitable zonesName Type Volume Floor Ceiling height Heated Cooled
(m³) height above floor(m) (m)
Bedroom 1 Bedroom 36.7 3.0 2.8 Y Ykitchen/living Living/Kitchen 119.0 3.0 2.8 Y Ybath/laundry Other (daytime usage) 18.8 3.0 2.8 N N
Habitable zones (continued)Name Chimneys Wall/Ceiling Exhaust Vented Unflued Ceiling Type
vents fans downlights gas heaters fansU/S S U/S S
Bedroom 1 0 0 0 0 0 0 0 0 -kitchen/living 0 0 0 0 0 0 0 0 -bath/laundry 0 0 0 0 0 0 0 0 -
Page 3 of 7Printed 4:46 pm, 06/09/2017
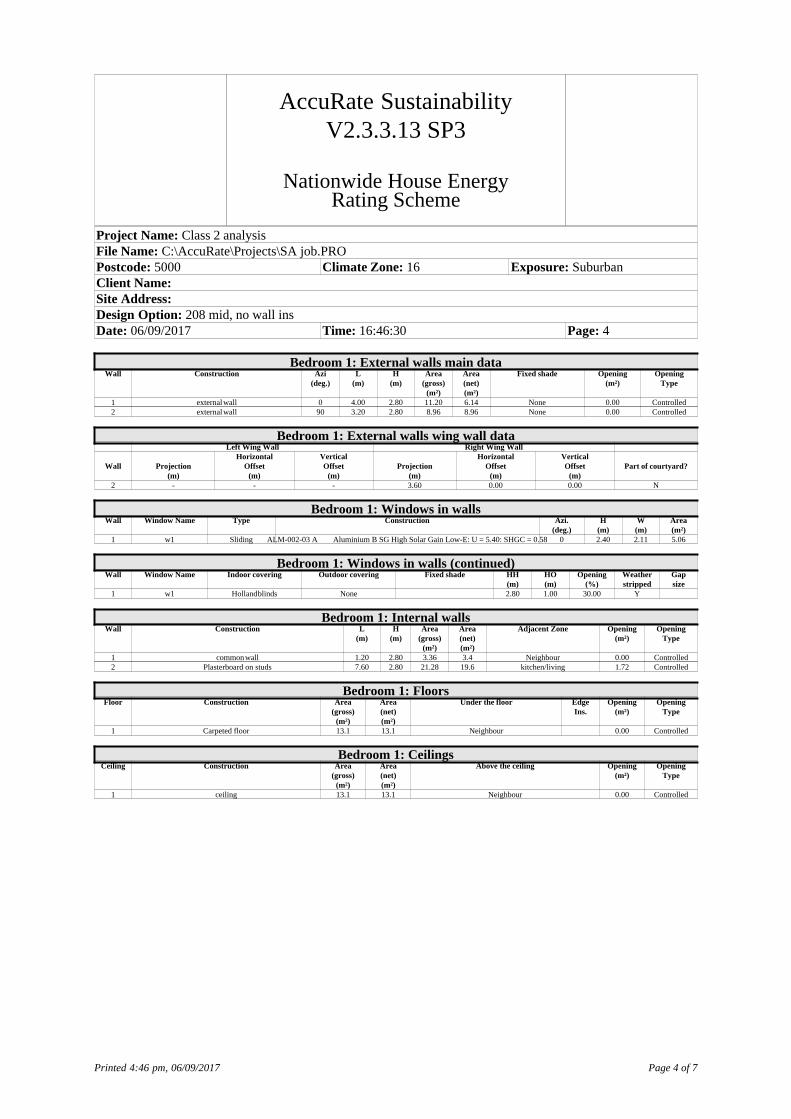
AccuRate SustainabilityV2.3.3.13 SP3
Nationwide House EnergyRating Scheme
Project Name: Class 2 analysisFile Name: C:\AccuRate\Projects\SA job.PROP o s t c o d e : 5000 Climate Zone: 16 E x p o s u r e : SuburbanClient Name: Site Address: Design Option: 208 mid, no wall insD a t e : 06/09/2017 T i m e : 16:46:30 P a g e : 4
Bedroom 1: External walls main dataWall Construction Azi L H Area Area Fixed shade Opening Opening
(deg.) (m) (m) (gross) (net) (m²) Type(m²) (m²)
1 external wall 0 4.00 2.80 11.20 6.14 None 0.00 Controlled2 external wall 90 3.20 2.80 8.96 8.96 None 0.00 Controlled
Bedroom 1: External walls wing wall dataLeft Wing Wall Right Wing Wall
Horizontal Vertical Horizontal VerticalWall Projection Offset Offset Projection Offset Offset Part of courtyard?
(m) (m) (m) (m) (m) (m)2 - - - 3.60 0.00 0.00 N
Bedroom 1: Windows in wallsWall Window Name Type Construction Azi. H W Area
(deg.) (m) (m) (m²)1 w1 Sliding ALM-002-03 A Aluminium B SG High Solar Gain Low-E: U = 5.40: SHGC = 0.58 0 2.40 2.11 5.06
Bedroom 1: Windows in walls (continued)Wall Window Name Indoor covering Outdoor covering Fixed shade HH HO Opening Weather Gap
(m) (m) (%) stripped size1 w1 Holland blinds None 2.80 1.00 30.00 Y
Bedroom 1: Internal wallsWall Construction L H Area Area Adjacent Zone Opening Opening
(m) (m) (gross) (net) (m²) Type(m²) (m²)
1 common wall 1.20 2.80 3.36 3.4 Neighbour 0.00 Controlled2 Plasterboard on studs 7.60 2.80 21.28 19.6 kitchen/living 1.72 Controlled
Bedroom 1: FloorsFloor Construction Area Area Under the floor Edge Opening Opening
(gross) (net) Ins. (m²) Type(m²) (m²)
1 Carpeted floor 13.1 13.1 Neighbour 0.00 Controlled
Bedroom 1: CeilingsCeiling Construction Area Area Above the ceiling Opening Opening
(gross) (net) (m²) Type(m²) (m²)
1 ceiling 13.1 13.1 Neighbour 0.00 Controlled
Page 4 of 7Printed 4:46 pm, 06/09/2017

AccuRate SustainabilityV2.3.3.13 SP3
Nationwide House EnergyRating Scheme
Project Name: Class 2 analysisFile Name: C:\AccuRate\Projects\SA job.PROP o s t c o d e : 5000 Climate Zone: 16 E x p o s u r e : SuburbanClient Name: Site Address: Design Option: 208 mid, no wall insD a t e : 06/09/2017 T i m e : 16:46:30 P a g e : 5
kitchen/living: External walls main dataWall Construction Azi L H Area Area Fixed shade Opening Opening
(deg.) (m) (m) (gross) (net) (m²) Type(m²) (m²)
1 external wall 0 3.20 2.80 8.96 3.84 None 0.00 Controlled2 external wall 270 2.40 2.80 6.72 4.28 roof baclont to east 0.00 Controlled3 Balcony wall 0 3.20 2.80 8.96 4.28 roof over balcony to south 0.00 Controlled4 external wall 270 3.60 2.80 10.08 7.15 None 0.00 Controlled
kitchen/living: External walls wing wall dataLeft Wing Wall Right Wing Wall
Horizontal Vertical Horizontal VerticalWall Projection Offset Offset Projection Offset Offset Part of courtyard?
(m) (m) (m) (m) (m) (m)2 3.20 0.00 0.00 - - - N3 - - - 3.20 0.00 0.00 N
kitchen/living: External walls horizontal shading dataEaves Other fixed shading
Vertical Horizontal Vertical HorizontalWall Name Projection Offset Offset Length Projection Offset Offset Length Monthly blocking factors
(m) (m) (m) (m) (m) (m) (m) (m) (%)2 roof baclont to east 2.40 0.00 0.00 3.60 0.00 0.00 0.00 0.00 100,100,100,100,100,100,100,100,100,100,100,1003roof over balcony to south3.60 0.00 0.00 2.40 0.00 0.00 0.00 0.00 100,100,100,100,100,100,100,100,100,100,100,100
kitchen/living: Windows in wallsWall Window Name Type Construction Azi. H W Area
(deg.) (m) (m) (m²)1 w2 Sliding ALM-002-03 A Aluminium B SG High Solar Gain Low-E: U = 5.40: SHGC = 0.58 0 2.40 2.13 5.122 w3 Awning ALM-002-03 A Aluminium B SG High Solar Gain Low-E: U = 5.40: SHGC = 0.58 270 2.10 1.16 2.443 w4 Sliding ALM-002-03 A Aluminium B SG High Solar Gain Low-E: U = 5.40: SHGC = 0.58 0 2.20 2.13 4.684 w5 Sliding ALM-002-03 A Aluminium B SG High Solar Gain Low-E: U = 5.40: SHGC = 0.58 270 1.60 1.83 2.93
kitchen/living: Windows in walls (continued)Wall Window Name Indoor covering Outdoor covering Fixed shade HH HO Opening Weather Gap
(m) (m) (%) stripped size1 w2 Holland blinds None 2.80 0.50 30.00 Y2 w3 Holland blinds None 2.40 1.00 60.00 Y3 w4 Holland blinds None 2.20 0.20 30.00 Y4 w5 Holland blinds None 2.20 1.00 30.00 Y
kitchen/living: Internal wallsWall Construction L H Area Area Adjacent Zone Opening Opening
(m) (m) (gross) (net) (m²) Type(m²) (m²)
1 common wall 9.60 2.80 26.88 26.9 Neighbour 0.00 Controlled2 Plasterboard on studs 4.00 2.80 11.20 9.5 bath/laundry 1.72 Controlled3 Plasterboard on studs 7.60 2.80 21.28 19.6 Bedroom 1 1.72 Controlled
kitchen/living: FloorsFloor Construction Area Area Under the floor Edge Opening Opening
(gross) (net) Ins. (m²) Type(m²) (m²)
1 floating timber 42.5 42.5 Neighbour 0.00 Controlled
kitchen/living: CeilingsCeiling Construction Area Area Above the ceiling Opening Opening
(gross) (net) (m²) Type(m²) (m²)
1 ceiling 42.5 42.5 Neighbour 0.00 Controlled
Page 5 of 7Printed 4:46 pm, 06/09/2017

AccuRate SustainabilityV2.3.3.13 SP3
Nationwide House EnergyRating Scheme
Project Name: Class 2 analysisFile Name: C:\AccuRate\Projects\SA job.PROP o s t c o d e : 5000 Climate Zone: 16 E x p o s u r e : SuburbanClient Name: Site Address: Design Option: 208 mid, no wall insD a t e : 06/09/2017 T i m e : 16:46:30 P a g e : 6
bath/laundry: Internal wallsWall Construction L H Area Area Adjacent Zone Opening Opening
(m) (m) (gross) (net) (m²) Type(m²) (m²)
1 common wall 6.60 2.80 18.48 18.5 Neighbour 0.00 Controlled2 Plasterboard on studs 4.00 2.80 11.20 9.5 kitchen/living 1.72 Controlled
bath/laundry: FloorsFloor Construction Area Area Under the floor Edge Opening Opening
(gross) (net) Ins. (m²) Type(m²) (m²)
1 tiled floor 6.7 6.7 Neighbour 0.00 Controlled
bath/laundry: CeilingsCeiling Construction Area Area Above the ceiling Opening Opening
(gross) (net) (m²) Type(m²) (m²)
1 ceiling 6.7 6.7 Neighbour 0.00 Controlled
Page 6 of 7Printed 4:46 pm, 06/09/2017

AccuRate SustainabilityV2.3.3.13 SP3
Nationwide House EnergyRating Scheme
Project Name: Class 2 analysisFile Name: C:\AccuRate\Projects\SA job.PROP o s t c o d e : 5000 Climate Zone: 16 E x p o s u r e : SuburbanClient Name: Site Address: Design Option: 208 mid, no wall insD a t e : 06/09/2017 T i m e : 16:46:30 P a g e : 7
Shading SchemesEaves Other fixed shading
Vert Horiz Vert HorizName Projection Offset Offset Length Projection Offset Offset Length Monthly blocking factors
(m) (m) (m) (m) (m) (m) (m) (m) (%)roof over balcony to south 3.60 0.00 0.00 2.40 0.00 0.00 0.00 0.00 100,100,100,100,100,100,100,100,100,100,100,100
roof baclont to east 2.40 0.00 0.00 3.60 0.00 0.00 0.00 0.00 100,100,100,100,100,100,100,100,100,100,100,100
VentilationFootprint: vertical dimension Footprint: horizontal dimension Azimuth of highlighted facade Insect screens
(m) (m) (degrees)6.5 12.0 180 N
Page 7 of 7Printed 4:46 pm, 06/09/2017