AP42 Section: 11.1 Reference Number: 386 … · Compliance Tests On The Mathy/Northwoods Paving...
127
AP42 Section: 11.1 Reference Number: 386 Title: Results Of The August 11 & 28, 1999 Air,Emission Compliance Tests On The Mathy/Northwoods Paving Plant No. 25 Near Superior, Wisconsin, Interpoll Laboratories, Circle Pines, MN, September 24, 1999.
-
Upload
truongcong -
Category
Documents
-
view
217 -
download
0
Transcript of AP42 Section: 11.1 Reference Number: 386 … · Compliance Tests On The Mathy/Northwoods Paving...
AP42 Section: 11.1
Reference Number: 386
Title: Results Of The August 11 & 28, 1999 Air,Emission Compliance Tests On The Mathy/Northwoods Paving Plant No. 25 Near Superior, Wisconsin,
Interpoll Laboratories, Circle Pines, MN,
September 24, 1999.
EPA
Text Box
Note: This is a reference cited in AP 42, Compilation of Air Pollutant Emission Factors, Volume I Stationary Point and Area Sources. AP42 is located on the EPA web site at www.epa.gov/ttn/chief/ap42/ The file name refers to the reference number, the AP42 chapter and section. The file name "ref02_c01s02.pdf" would mean the reference is from AP42 chapter 1 section 2. The reference may be from a previous version of the section and no longer cited. The primary source should always be checked.
Interpoll Laboratories, Inc. 4500 Ball Road N.E.
Circle Pines, Minnesota 55014-1819
TEL: (612) 786-6020 FAX: (612) 786-7854
RESULTS OF THE AUGUST 11 & 28,1999 AIR EMISSION COMPLIANCE TESTS
ON THE MATHYlNORTHWOODS PAVING PLANT NO. 25
NEAR SUPERIOR, WISCONSIN
Submitted to:
Mathy Construction Company 920 10th Ave. N.
Onalaska, Wisconsin 54650
Attention:
Tara Wetzel
Report Number 9-13373 September 24, 1999 KWkce
Approved by:
Department Coordinator Field Services Department
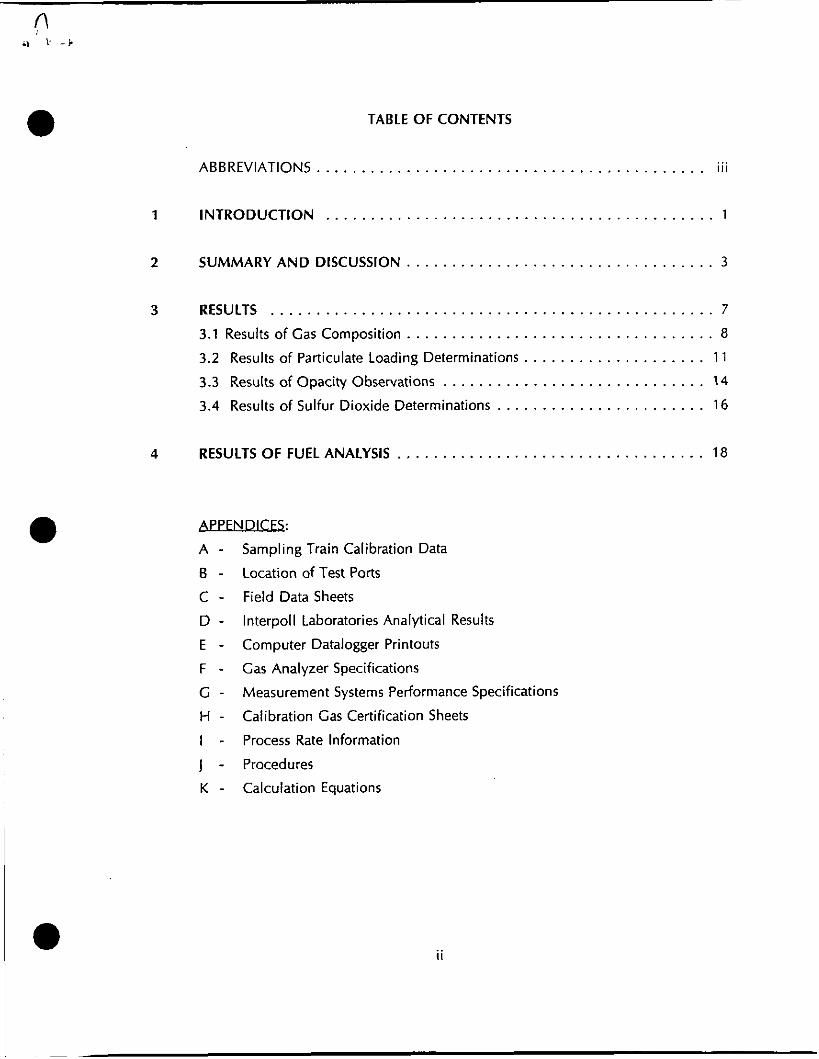
TABLE OF CONTENTS
ABBREVIATIONS . . . . . . . . . . . . . . . . . . . . . . . . . . . . . . . . . . . . . . . . . . . iii
1 INTRODUCTION . . . . . . . . . . . . . . . . . . . . . . . . . . . . . . . . . . . . . . . . . . . 1
2 SUMMARY AND DISCUSSION . . . . . . . . . . . . . . . . . . . . . . . . . . . . . . . . . . 3
3 RESULTS . . . . . . . . . . . . . . . . . . . . . . . . . . . . . . . . . . . . . . . . . . . . . . . . . 7
3.1 Results of Gas Composition . . . . . . . . . . . . . . . . . . . . . . . . . . . . . . . . . . 8
3.2 Results of Particulate Loading Determinations . . . . . . . . . . . . . . . . . . . . 1 1
3.3
3.4 Results of Sulfur Dioxide Determinations . . . . . . . . . . . . . . . . . . . . . . . 16
Results of Opacity Observations . . . . . . . . . . . . . . . . . . . . . . . . . . . . . 14
4 RESULTS OF FUEL ANALYSIS . . . . . . . . . . . . . . . . . . . . . . . . . . . . . . . . . . 18
AlY&ua5 A - 6 - Location of Test Ports
C - Field Data Sheets
D - E - Computer Datalogger Printouts
F - Gas Analyzer Specifications
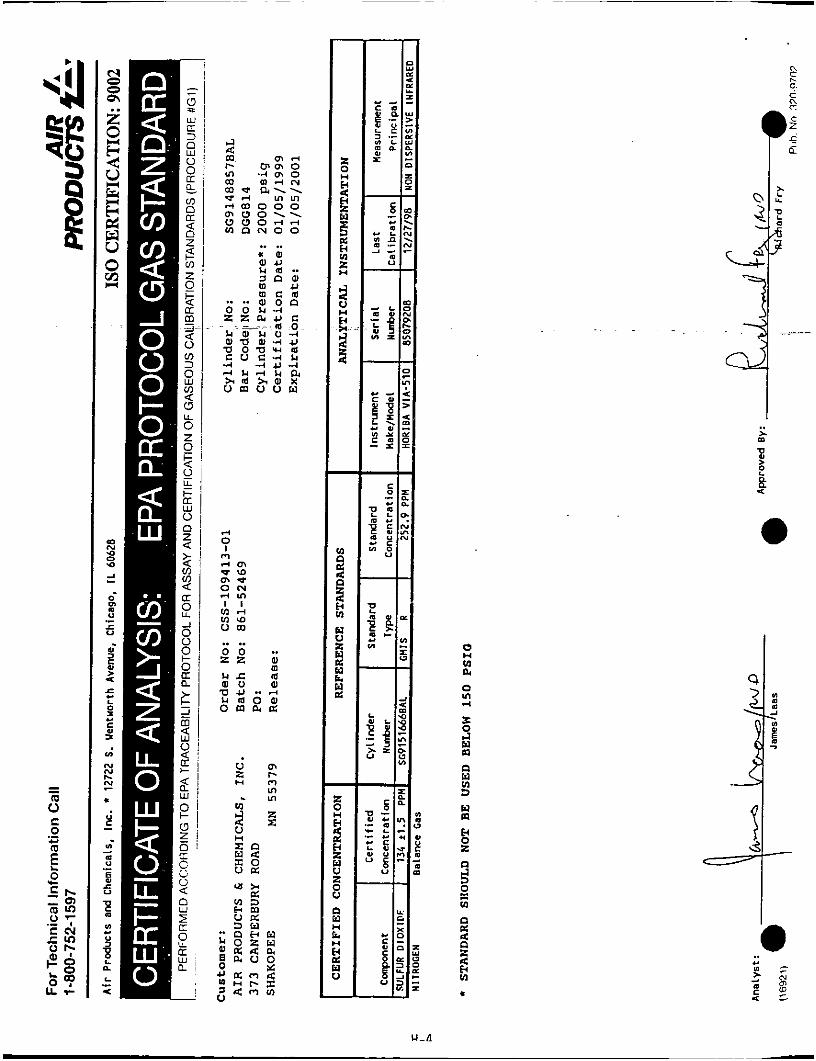
G - H - Calibration Gas Certification Sheets
I - Process Rate Information
1 - Procedures
K - Calculation Equations
Sampling Train Calibration Data
Interpoll Laboratories Analytical Results
Measurement Systems Performance Specifications
.. I 1
.. i)
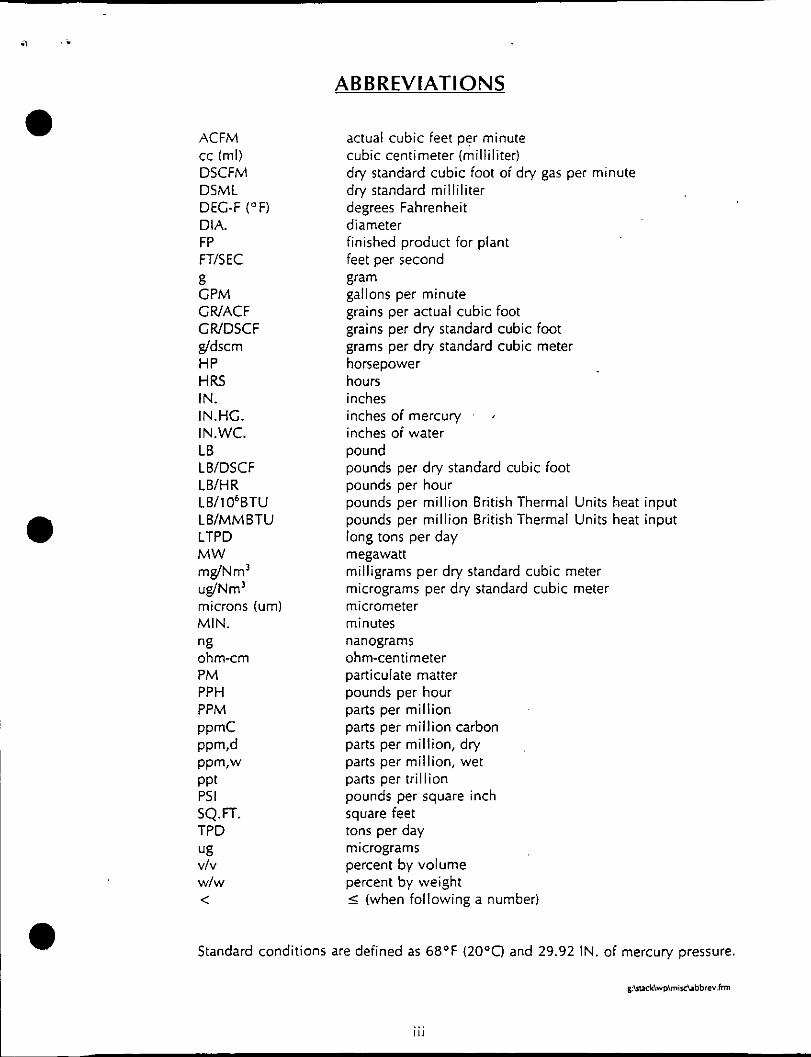
AB B REVIATI ONS
ACFM cc (ml) DSCFM DSML DEC-F ( O F )
DIA. FP FTISEC g CPM CWACF CWDSCF g/dscm HP HRS IN. IN.HC. IN.WC. LB LBIDSCF LBIHR
LBIMMBTU LTPD MW mg/Nm' ugiNm' microns (urn) MIN. "g ohmcm PM PPH PPM
LBIIO~BTU
PPmC PPmd PPmw PPt PSI SQ.FT. TPD ug vlv WIW
<
actual cubic feet per minute cubic centimeter (milliliter) dry standard cubic foot of dry gas per minute dry standard milliliter degrees Fahrenheit diameter finished product for plant feet per second gram gallons per minute grains per actual cubic foot grains per dry standard cubic foot grams per dry standard cubic meter horsepower hours inches inches of mercury . ' inches of water pound pounds per dry standard cubic foot pounds per hour pounds per million British Thermal Units heat input pounds per million British Thermal Units heat input long tons per day megawatt milligrams per dry standard cubic meter micrograms per dry standard cubic meter micrometer minutes nanograms ohm-centimeter particulate matter pounds per hour parts per million parts per million carbon parts per million, dry parts per million, wet parts per trillion pounds per square inch square feet tons per day micrograms percent by volume percent by weight 5 (when following a number)
Standard conditions are defined as 68'F (2OoO and 29.92 IN. of mercury pressure.
g : b N w p \ m i d a b b r e v . h
... 111
.I
INTRODUCTION
On August 11 and 27, 1999 Interpoll Laboratories personnel conducted air emission
compliance tests on the Mathy-Northwoods Paving Plant No. 25 located near Superior,
Wisconsin. The plant was tested while fired with waste oil. On-site testing was performed
on August 11 by Scott Fjelsta, Doug Peterson, and Jim Thoma. Testing on August 27 was
performed by Troy Thome, Scott Fjelsta and Joe Tuma. Coordination between testing
activities and plant operation was provided by Tara Wetzel of Mathy Construction. The tests
were not witnessed by a representative of the Wisconsin Department of Natural Resources.
Testing on the No. 25 Asphalt Plant Stack was conducted from five test ports evenly
spaced across the face of the stack. The ports are located 3.0 diameter equivalents
downstream of the nearest flow disturbance and 0.50 diameter equivalents upstream of the
stack exit. A 25-point traverse was used to collect representative particulate samples. Each
traverse point was sampled 2.5 minutes to give a total sampling time of 62.5 minutes per run.
Particulate determinations were performed in accordance with EPA Methods 1 - 5,
CFR Title 40, Part 60, Appendix A (revised July 1, 1999). A preliminary determination of the gas linear velocity profile was made before the first particulate determination to select the
appropriate nozzle diameter for isokinetic sample withdrawal. An Interpoll Labs sampling
train which meet or exceed specifications in the above-cited reference was used to extract
particulate samples by means of heated glass-lined probes. A onehour visible emission
determination was performed on August 11 by Doug Peterson, a certified observer.
The 0,, CO,, SO, determinations were performed in accordance with CFR Title 40,
Part 60 Appendix B (revised July 1, 1998). Evaluations were performed in accordance with
EPA Methods 3A and 6C . For oxygen analysis, a slip stream of sample gas was withdrawn
from the exhaust gas stream using test ports (provided by the plant) on the stack using a heat-
traced probe and filter assembly. After passing through the filter, the gas passed through two
condenser-type moisture removal systems operating in series. The particulatefree dry gas was
then transported to the oxygen analyzer with the excess exhausted to the atmosphere through
a calibrated orifice which was used to ensure that the flow from the stack exceeds the
requirements of the analyzer. For SO, and CO, analysis, a dilution probe based system was
used. In this system, a slip stream of exhaust gas i s drawn from the exhaust gas stream using

an EPM dilution probe. The sample stream is filtered and diluted (dilution during this test
was 1OO: l ) before delivery to the SO, and CO, analyzers. The analog response of the
analyzers in both systems was recorded using a computer data logger and backed up with
a strip chart recorder.
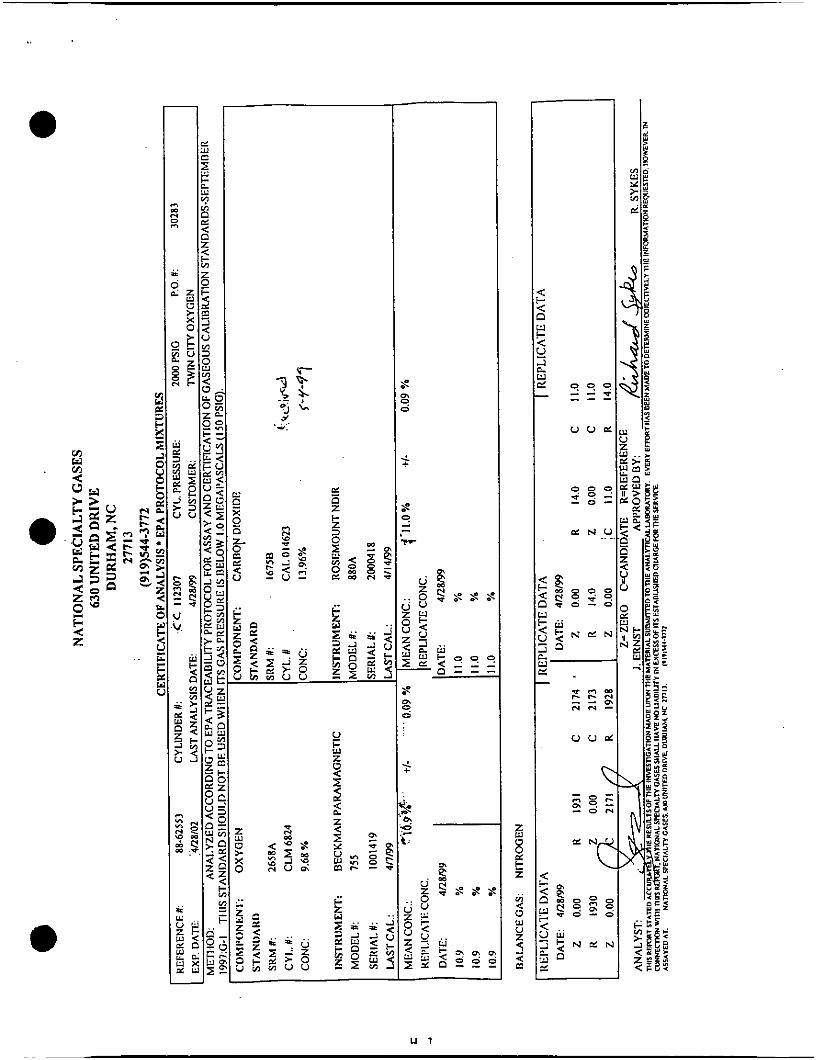
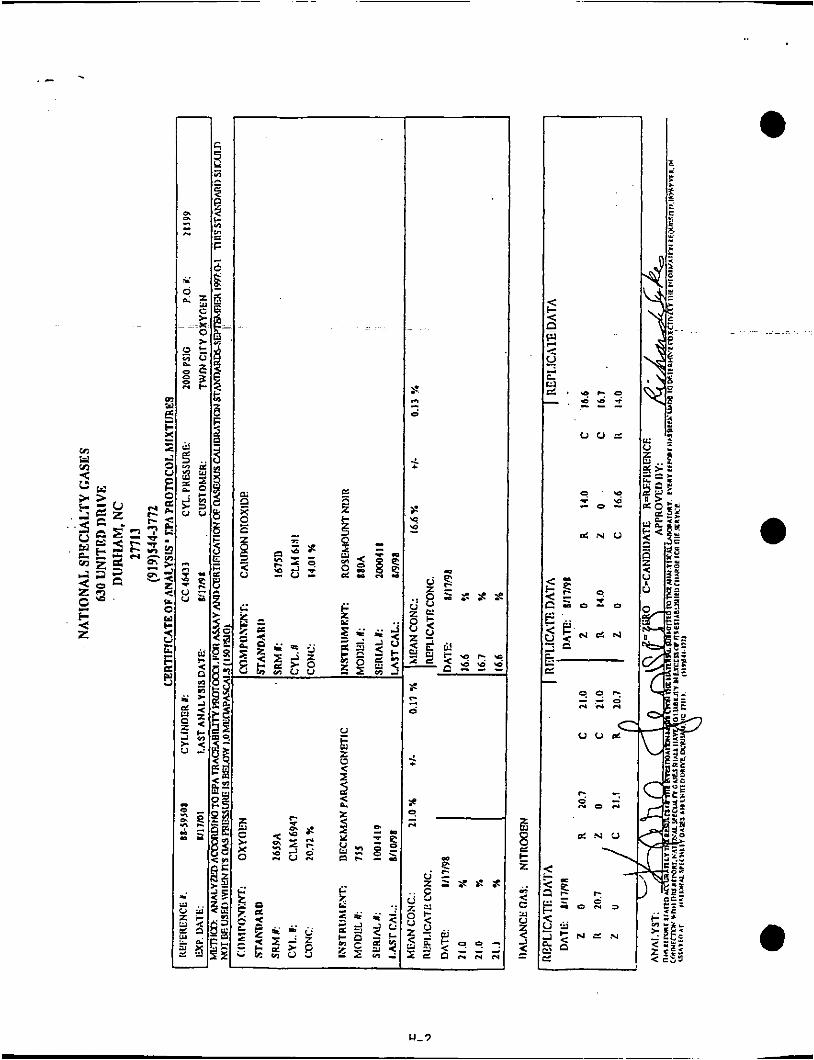
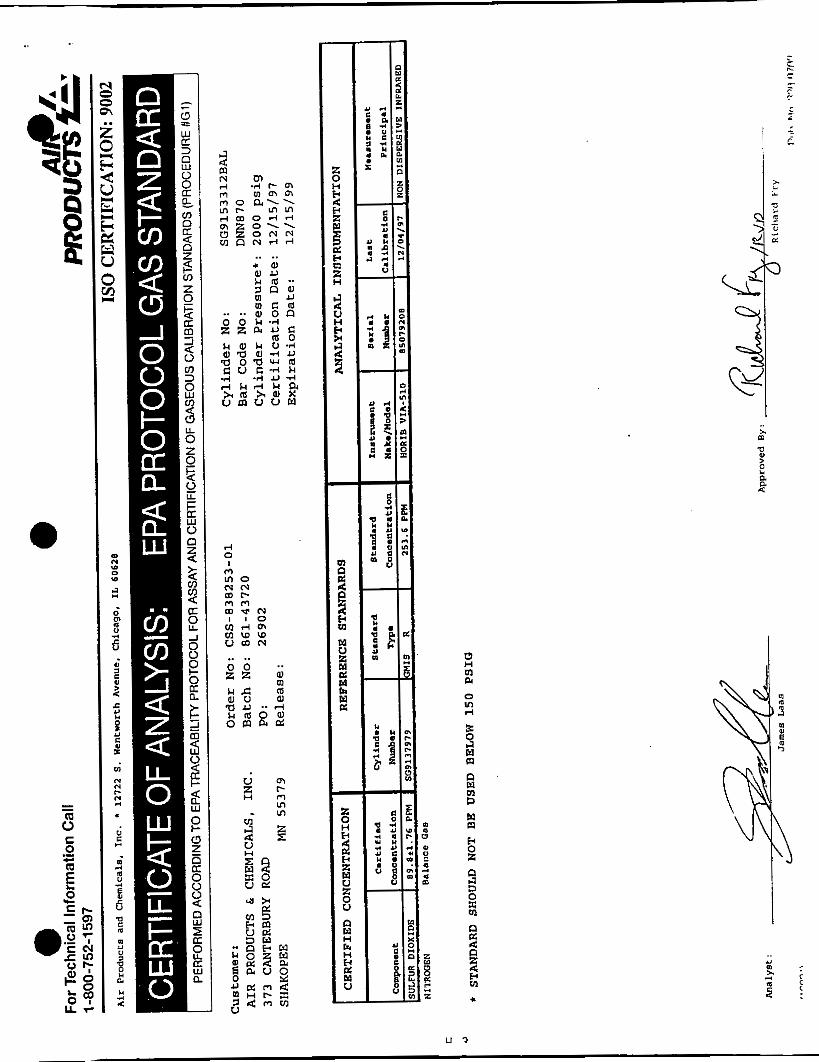
The 0,, SO,, and CO, analyzers were calibrated with National Specialty Gases and
Air Products and Chemicals standard gases. The instruments were calibrated before and after
each run as per EPA Method 3Aand 6C. The sample probe was moved through a three-point
traverse ( l h , 3/6, 5/6 of the stack diameter) to measure total hydrocarbon and carbon
monoxide concentrations.
The important results of the test are summarized in Section 2. Detailed results are
presented in Section 3. Field data and all other supporting information are presented in the
appendices.
2
.
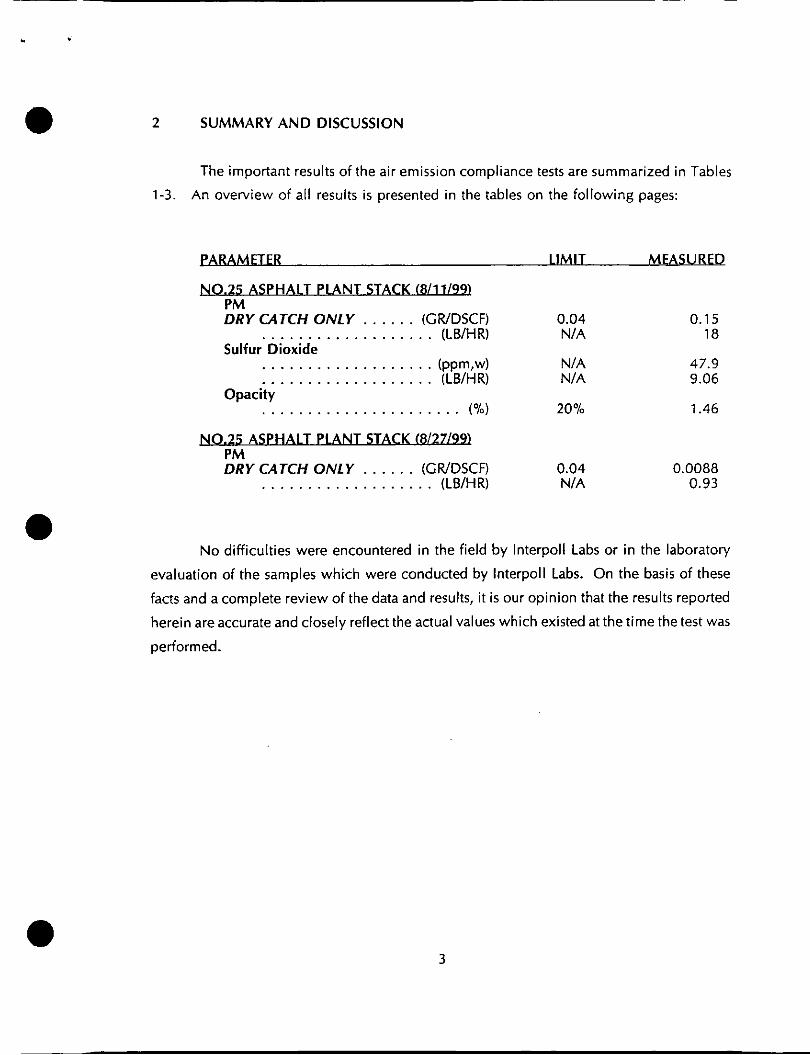
2 SUMMARY AND DISCUSSION
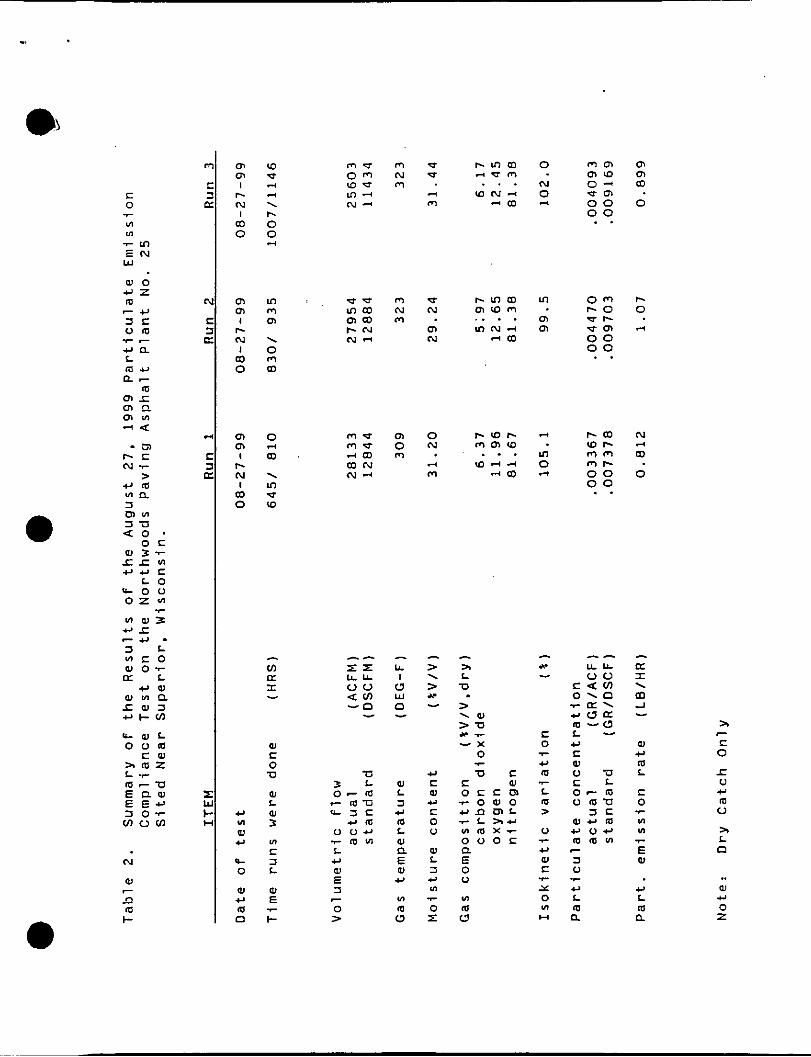
The important results of the air emission compliance tests are summarized in Tables
1-3. An overview of all results is presented in the tables on the following pages:
N0.25 ASPHALT PLANT STACK (8/11/991 P M DRY CATCH ONLY . . . . . . (GWDSCF) 0.04
. . . . . . . . . . . . . . . . . . . (LBIHR) NIA Sulfur Dioxide
. . . . . . . . . . . . . . . . . . . (ppm,w) NIA
. . . . . . . . . . . . . . . . . . . (LBIHR) N/A
. . . . . . . . . . . . . . . . . . . . . . (010) 20% Opacity
N- PLANT STACK (8~2ZL9-9 PM DRY CATCH ONLY . . . . . . (CWDSCF) 0.04
. . . . . . . . . . . . . . . . . . . (LBIHR) NIA
0.15 18
47.9 9.06
1.46
0.0088 0.93
No difficulties were encountered in the field by Interpoll Labs or in the laboratory
evaluation of the samples which were conducted by Interpoll Labs. On the basis of these
facts and a complete review of the data and results, it is our opinion that the results reported
herein are accurate and closely reflect the actual values which existed at the time the test was
performed.
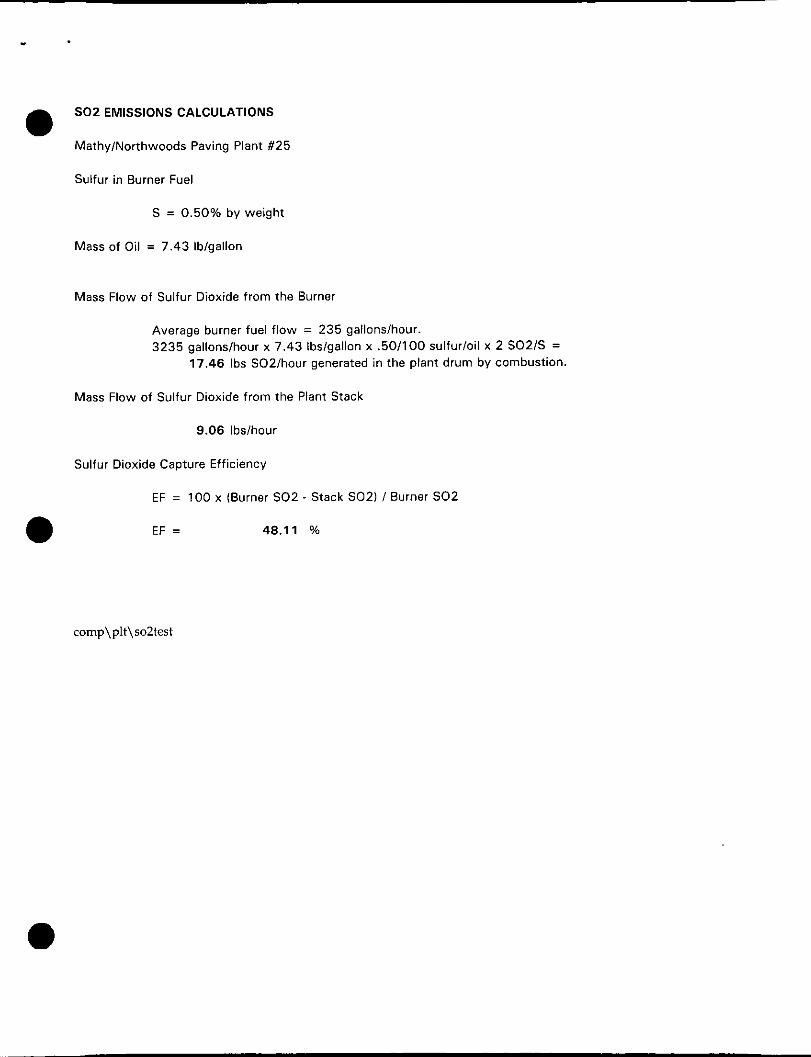
SO2 EMISSIONS CALCULATIONS 0 Mathy/Northwoods Paving Plant #25
Sulfur in Burner Fuel
S = 0.50% by weight
Mass of Oil = 7.43 Ib/gallon
Mass Flow of Sulfur Dioxide from the Burner
Average burner fuel flow = 235 gallonsihour. 3235 gallonslhour x 7.43 Ibs/gallon x .50/100 sulfur/oil x 2 SO2/S =
17.46 Ibs S02/hour generated in the plant drum by combustion.
Mass Flow of Sulfur Dioxide from the Plant Stack
9.06 Ibs/hour
Sulfur Dioxide Capture Efficiency
EF = 100 x (Burner SO2 - Stack SO21 / Burner So2
EF = 48.11 %
comp\ plt\ so2tes t
U
w m U - c m a
7
c v l
3 a 0 .r m 4 J N L
m a m n m “ V I
a r c
U E W c nu
O U L v m o v c o
- 0 1 L - r
E v l S
3 E - E - m
m w n
4
W 7
n - m k
m m I “ 4 I
0 m
m m I .-I 4 I
0 m
m m I ” 4 I
0 m
U VI W U
P 0
W U
O m
m N N ” . 0 N “ 4
W 0 ” 4 . 0 0 0 - m o m . 0 U m
1 5 - ( 0 u “ 3 4 0-3 0 . . . m F - .
a m m r l m 0 . r- .o ”
N O m m
m o N . m N m . ~m m u
m o N r l N - m
o m m “ m m m m m u N N W m . . . u m - . 150 m m
o m 0 . m m u
m m u . O N N . N 4 N - m .o
N A P - m w w p1
. . . m 15- . m m m 4 0, 0 . - .o - u u m y1 0 - 0 N m N . m o m 0
m m N “ N - m d w N .
W C 0 U U
3 L W 0- m L - m u W e z c 3 u m
O O U VI ; * m c L - 3 U L W
E W 3
0 E r - I- >
- LL I c) w n -
W L 3 +r
L W Q E W U
VI
m
m 0
- > > . a. -
U S W U C 0 0
W L 3 U VI - 0 x
- a L U . > . W > U a?.? - x 0
u c (I W o s c m r o w 0 G O mr- c L 2.l- vl m x r 0 0 0 s P E 0 0
c
VI
- * - S 0
U r
m
m c L
> 0
U W S
Y 0 VI H
r
c
-- u u v u
s a m 0.0 -m. 4 J a m m -c) L - 4J C W 0 u C L
0 m u z c
U 0 U m m v l
o - m
W U ~
c 3 0
U L
%-
m n
a
m I \
2 - W U
L
C 0
m
7
VI VI c E W
U L m n
5,
S 0
-c V U
0
> L
c
m
n
.. W U 0 z
m u o m w u m - N -
m N m
0 U
3 m
r - m m - o m
0
N 0 .-I
m m m u ) 0' u m 0 0 0 0 . .
o m r -0 G-r- u m 0 0 0 0 . .
r - m m r - m m mr- 0 0 0 0 . .
-I
U L L 0 0
0.0 .-E. d 0 K m - 0 L - Y C W V U C L o r m v m u s s
u o m Y V C m m m
s a m
7
3 V
Y L
?
m n
m m m 0
r- O
m m
10 U 4 4 S
0 r- N I m 0
I O N * - m L .
r- 0 0 4
VI m -v) E N w
r - m m m u ) m
m m m I r- N
m m m
u u m m m m P.N N 4
m N m
0 N
m m
. . . . ION4 m
N . 0 m m
m 0
m ." m z m n m m
m m
0
m 4
0 N
r- N
I
0 m
3 m .
m U u)
0 5
m w
a o . S U 0 o s
- a I . -I m -
a
a L U
> . W > U - 7 -
v u -0 a m
C 0 7-
W S Y 0
0 S 0 U
- x 0
u s S al o s s m - o w 0 ~ n m ~ 7- L aO
m x - 0 0 0 s a E 0 V
-
w m u
Y m
m
- L
>
V
Y 01 S
Y 0 VI Y
.-
m L z
0 a Y - .
m - - o E a W E E O 3 0 - m o m
W L s + L W c E W d
m
m
m 0
S al W
L W 3
- S Y - 0 0 m 4-8
S 0 V
0 m W Y
e 0
W Y
O m
m m 5, .- L E 0 W
42 W
m S 3 L
W L 3 c) m
L Y m E s 0 > 7
N
W - W E - 2
m 7
0 T
L O m 0 n z I- t- e
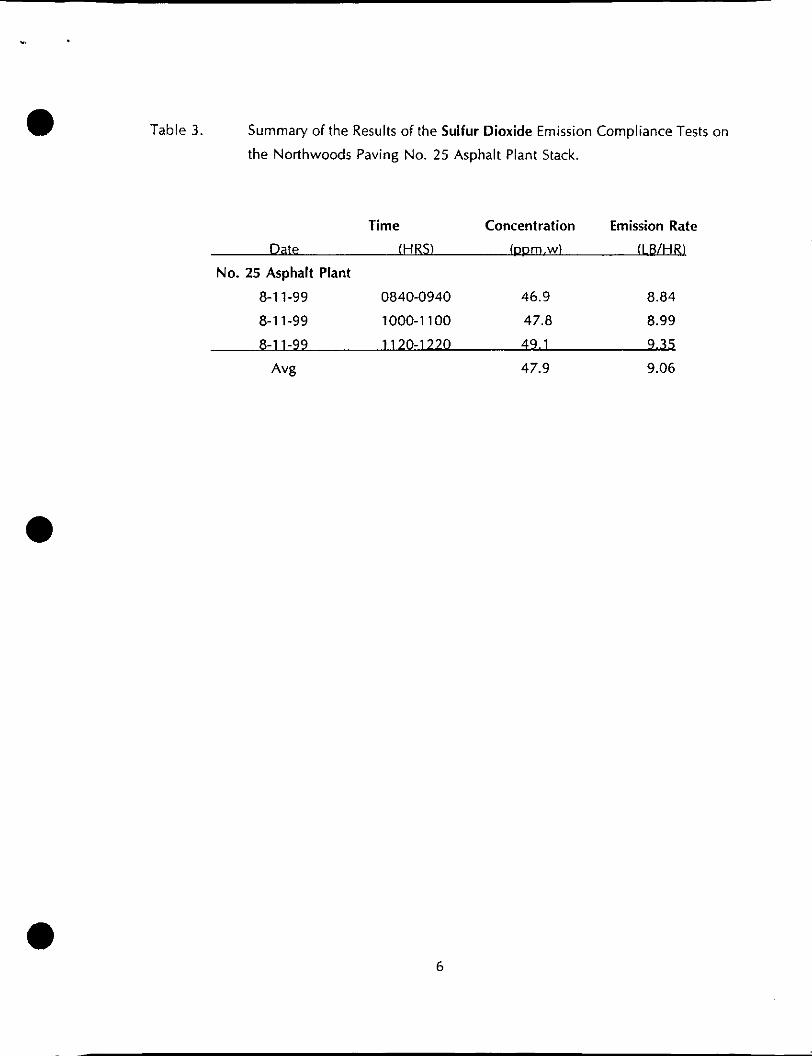
Table 3. Summary of the Results of the Sulfur Dioxide Emission Compliance Tests on
the Northwoods Paving No. 25 Asphalt Plant Stack.
Time Concentration Emission Rate
Date (HRS) (ppm.w) (LBIHRL
No. 25 Asphalt Plant
8-1 1-99 0840-0940 46.9 8.84
8-1 1-99 1000-1 100 47.8 8.99
- - 1 120-1 330 49.1 9.35
A% 47.9 9.06
6

3 RESULTS
The results of all field and laboratoryevaluations are presented in this section. Orsat
(gas composition) and moisture is presented first followed by the computer printout of the
particulate, sulfur dioxide and opacity results. Preliminary measurements including test port
locations are given in the appendices.
The results have been calculated on a personal computer using programs written in
Extended BASIC specifically for source testing calculations. EPA-published equations have
been used as the basis of the calculation techniques in these programs. The emission rates
have been calculated using the product of the concentration times flow method.
7
e
e
e
. . 3.1
I n t e r p o l 1 L a b s R e p o r t N o . 9-13290 M a t h y - N o r t h w o o d s P a v i n g
S u p e r i o r , W i s c o n s i n
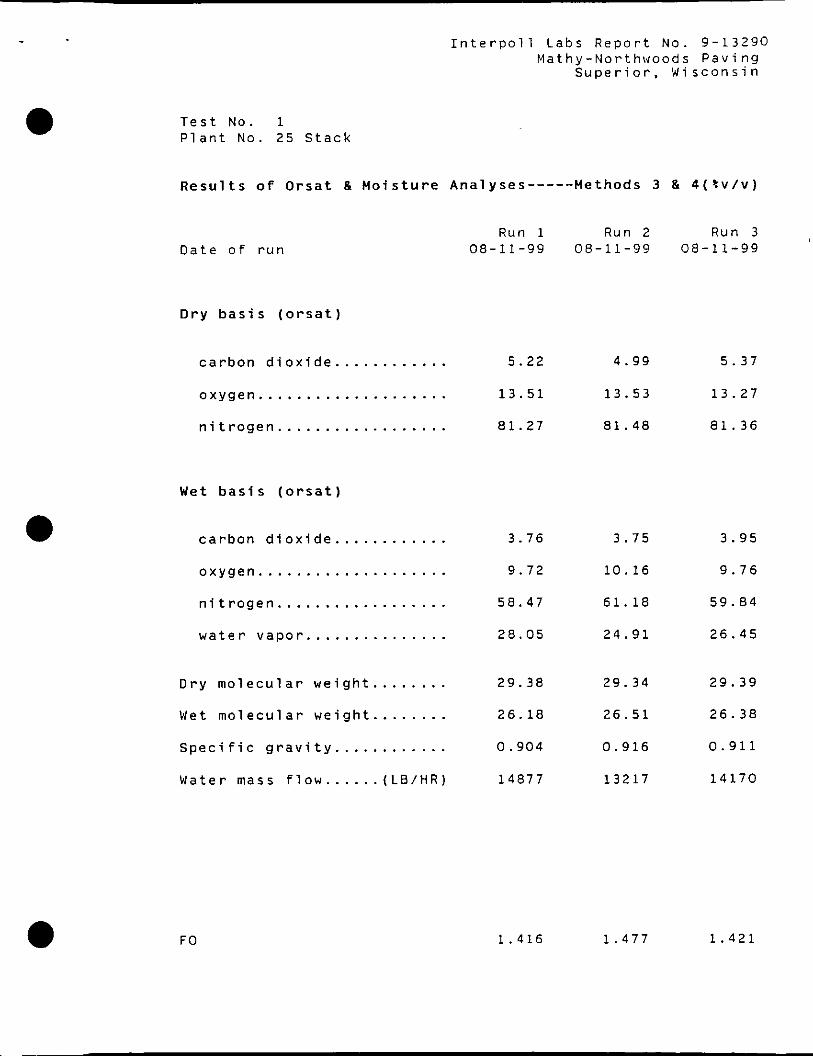
T e s t N o . 1 P l a n t N o . 25 S t a c k
R e s u l t s o f O r s a t B M o i s t u r e A n a l y s e s - - - - - M e t h o d s 3 & 4 ( 0 v / v )
D a t e o f r u n
D r y b a s i s ( o r s a t )
Run 1 Run 2 Run 3 08-11-99 08-11-99 08-11-99
c a r b o n d i o x i d e ............ 5.22
o x y g e n .................... 13.51
n i t r o g e n . . . . . . . . . . . . . . . . . . 81.27
Wet b a s i s ( o r s a t )
c a r b o n d i o x i d e . . . . . . . . . . . . 3.76
o x y g e n .................... 9.72
n i t r o g e n . . . . . . . . . . . . . . . . . . 58.47
w a t e r v a p o r . . . . . . . . . . . . . . . 28.05
D r y m o l e c u l a r w e i g h t . . . . . . . . 29.38
Wet m o l e c u l a r w e i g h t . . . . . . . . 26.18
S p e c i f i c g r a v i t y . . . . . . . . . . . . 0.904
W a t e r mass f l o w . . . . . . ( L B / H R ) 14877
FO 1.416
4.99 5.37
13.53 13.27
81.48 81.36
3.75 3.95
10.16 9.76
61.18 59.84
24.91 26.45
29.34 29.39
26.51 26.38
0.916 0.911
13217 14170
1.477 1.421
APPENDIX E
COMPUTER DATALOGGER PRINTOUTS
a
0
0
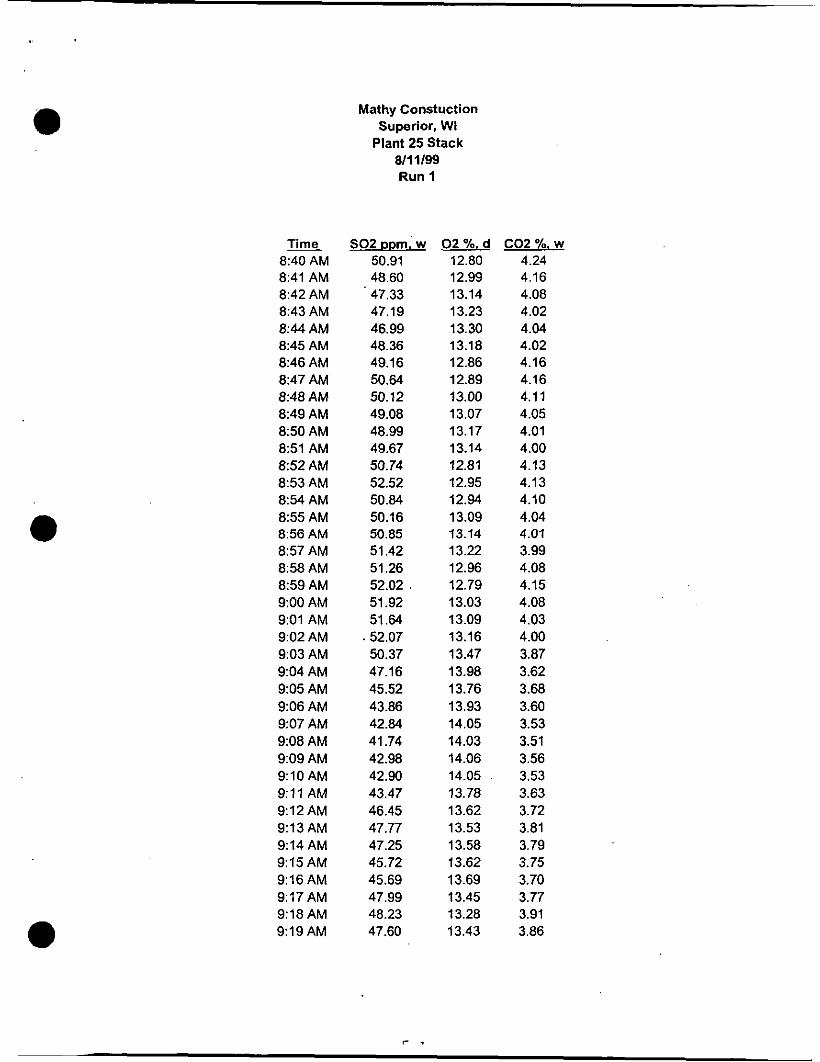
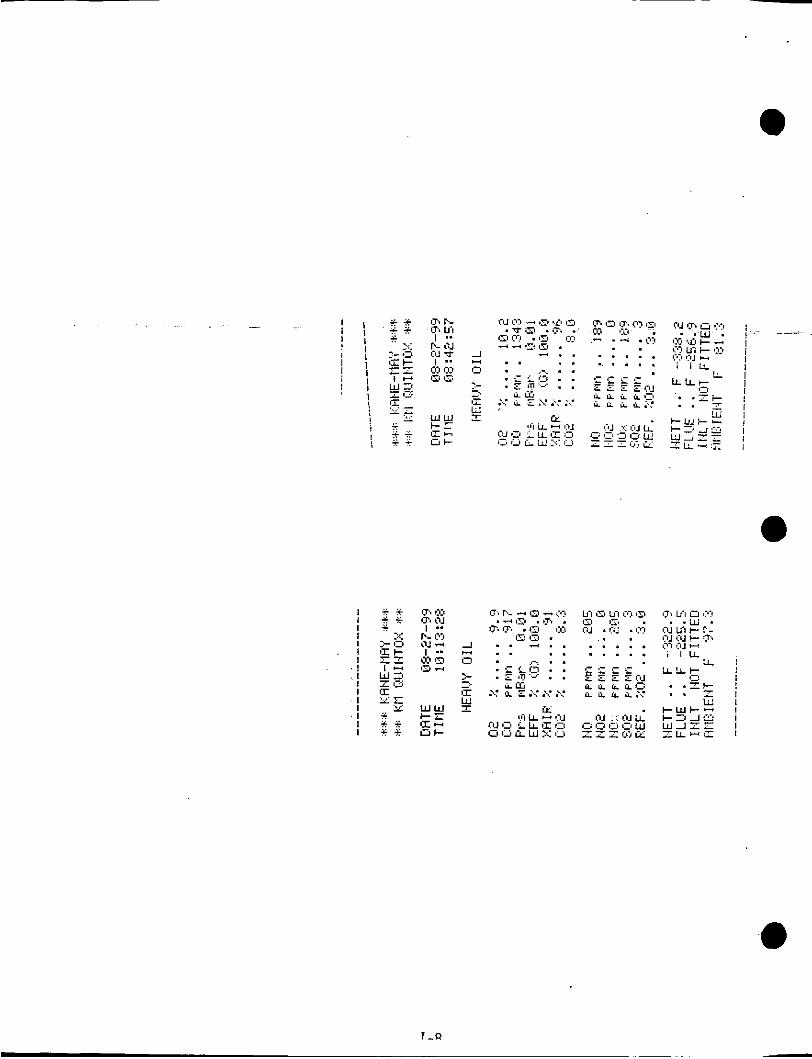
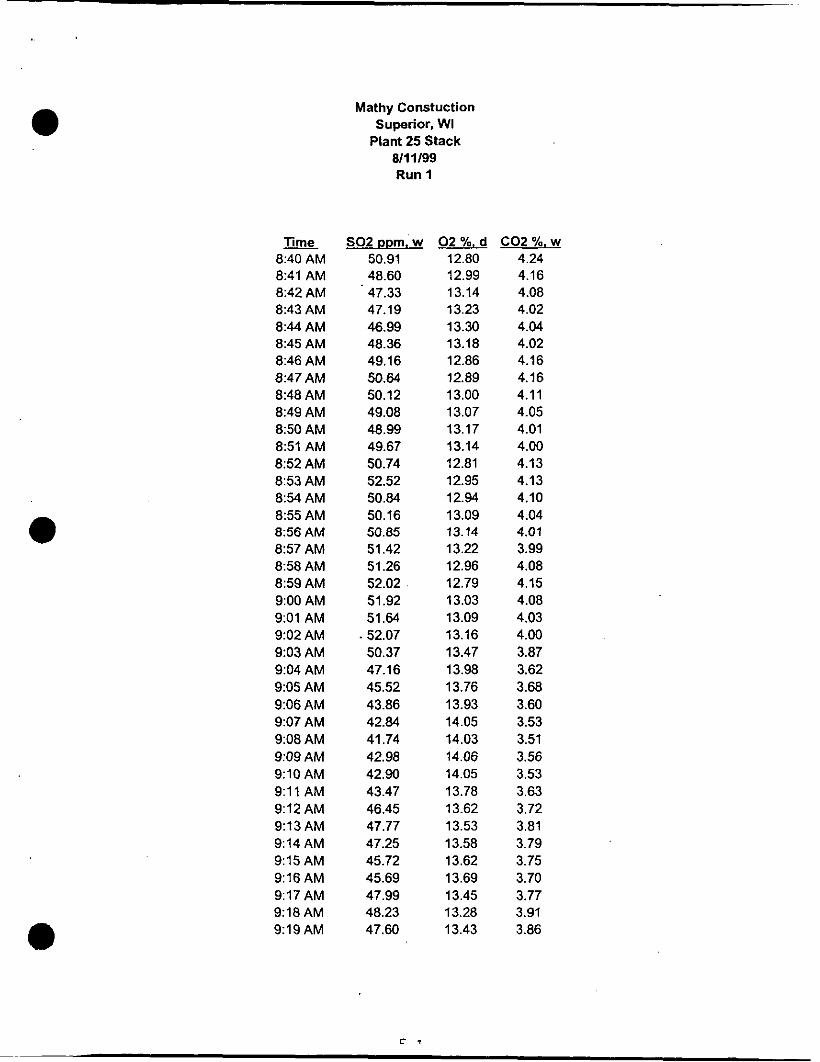
Time 8:40 AM 8:41 AM 8:42AM 8:43 AM 8:44 AM 8:45 AM 8:46 AM 8:47 AM 8:48AM 8:49 AM 850 AM 851 AM 8:52AM 853 AM 8:54 AM 855 AM 856 AM 857 AM 858 AM 859 AM 9:00 AM 9:Ol AM 9:02 AM 9:03 AM 9:04 AM 9:05 AM 9:06 AM 9:07 AM 9:08 AM 9:09 AM 9:lO AM 9:11 AM 9:12AM 9:13 AM 9:14 AM 9:15 AM 9:16 AM 9:17AM 9:18 AM 9:19 AM
Mathy Constuction Superior, WI
Plant 25 Stack ami99 Run 1
so2 DDm. W
50.91 48.60 47.33 47.19 46.99 48.36 49.16 50.64 50.12 49.08 48.99 49.67 50.74 52.52 50.84 50.16 50.85 51.42 51.26 52.02 51.92 51.64
. 52.07 50.37 47.16 45.52 43.86 42.84 41.74 42.98 42.90 43.47 46.45 47.77 47.25 45.72 45.69 47.99 48.23 47.60
7 .
0 2 %. d C02 %, w 12.80 4.24 12.99 13.14 13.23 13.30 13.18 12.86 12.89 13.00 13.07 13.17 13.14 12.81 12.95 12.94 13.09 13.14 13.22 12.96 12.79 13.03 13.09 13.16 13.47 13.98 13.76 13.93 14.05 14.03 14.06 14.05 13.78 13.62 13.53 13.58 13.62 13.69 13.45 13.28 13.43
4.16 4.08 4.02 4.04 4.02 4.16 4.16 4.11 4.05 4.01 4.00 4.13 4.13 4.10 4.04 4.01 3.99 4.08 4.15 4.08 4.03 4.00 3.87 3.62 3.68 3.60 3.53 3.51 3.56 3.53 3.63 3.72 3.81 3.79 3.75 3.70 3.77 3.91 3.86
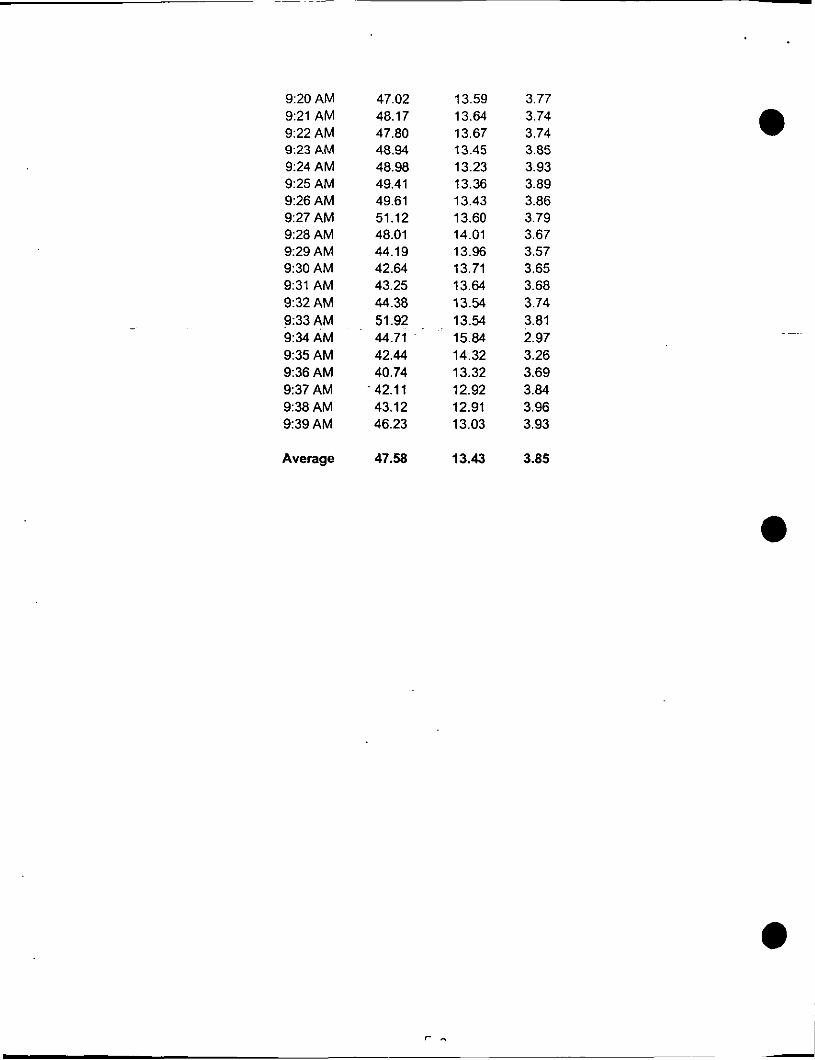
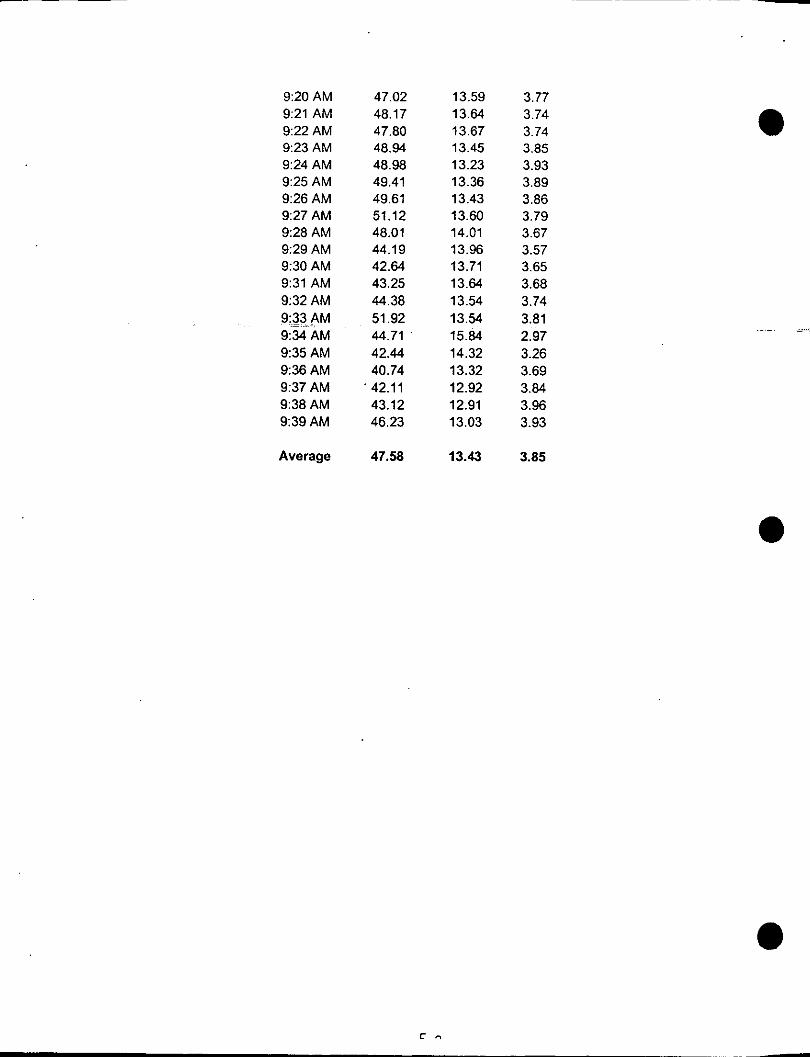
9:20 AM 9:21 AM 9:22 AM 9:23 AM 9:24 AM 9:25 AM 9:26AM 9:27 AM 9:28 AM 9:29AM 9:30 AM 9:31 AM 9:32AM 9:33AM 9:34 AM 9:35 AM 9:36AM 9:37 AM 9:38AM 9:39AM
Average
47.02 13.59 3.77 48.17 13.64 3.74 47.80 13.67 3.74 48.94 13.45 3.85 48.98 13.23 3.93 49.41 13.36 3.89 49.61 13.43 3.86 51.12 13.60 3.79 48.01 14.01 3.67 44.19 13.96 3.57 42.64 13.71 3.65 43.25 13.64 3.68 44.38 13.54 3.74 51.92 13.54 3.81 44.71 15.84 2.97 42.44 14.32 3.26 40.74 13.32 3.69
. 42.1 1 12.92 3.84 43.12 12.91 3.96 46.23 13.03 3.93
47.58 13.43 3.85

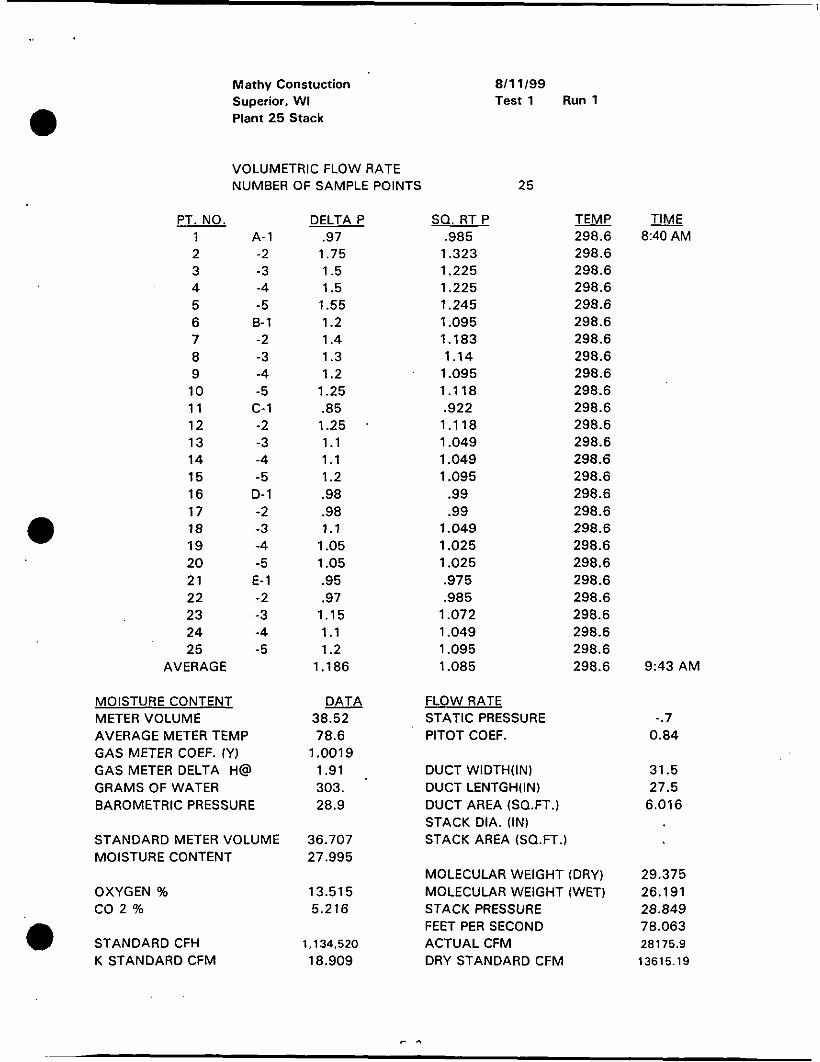
Mathy Constuction Superior, WI Plant 25 Stack
VOLUMETRIC FLOW RATE NUMBER OF SAMPLE POINTS
1 2 3 4 5 6 7 8 9 10 11 12 13 14 15 16 17 18 19 20 21 22 23 24 25
AVERAGE
MOISTURE CONTENT METER VOLUME
A- 1 -2 -3 -4 -5 B- 1 -2 -3 -4 -5 c-1 -2 -3 -4 -5 D-1 -2 -3 -4 -5
E- 1 -2 -3 -4 -5
AVERAGE METER TEMP GAS UETER COEF. (Y) GAS METER DELTA H@ GRAMS OF WATER BAROMETRIC PRESSURE
STANDARD METER VOLUME MOISTURE CONTENT
OXYGEN % co 2 %
STANDARD CFH K STANDARD CFM
DELTA P .97 1.75 1.5 1.5
1.55 1.2 1.4 1.3 1.2
1.25 .85 1.25 1.1 1.1 1.2 .98 .98 1.1
1.05 1.05 .95 .97 1.15 1.1 1.2
1.186
DATA 38.52 78.6
1.001 9 1.91 303. 28.9
36.707 27.995
13.515 5.216
1.1 34,520 18.909
SQ. RT P .985 1.323 1.225 1.225 1.245 1.095 1.183 1.14
1.095 1.118 ,922 1.118 1.049 1.049 1.095 .99 .99
1.049 1.025 1.025 3 7 5 .985 1.072 1.049 1.095 1.085
8/11/99 Test 1 Run 1
25
- TEMP 298.6 298.6 298.6 298.6 298.6 298.6 298.6 298.6 298.6 298.6 298.6 298.6 298.6 298.6 298.6 298.6 298.6 298.6 298.6 298.6 298.6 298.6 298.6 298.6 298.6 298.6
FLOW RATE STATIC PRESSURE PITOT COEF.
DUCT WIDTHfIN) DUCT LENTGH(1N) DUCT AREA (SQ.FT.) STACK DIA. (IN) STACK AREA (SQ.FT.)
MOLECULAR WEIGHT (DRY) MOLECULAR WEIGHT (WET) STACK PRESSURE FEET PER SECOND ACTUAL CFM DRY STANDARD CFM
- TIME 8:40 AM
9:43 A M
-.7 0.84
31.5 27.5
6.016
29.375 26.191 28.849 78.063 28175.9 1361 5.19

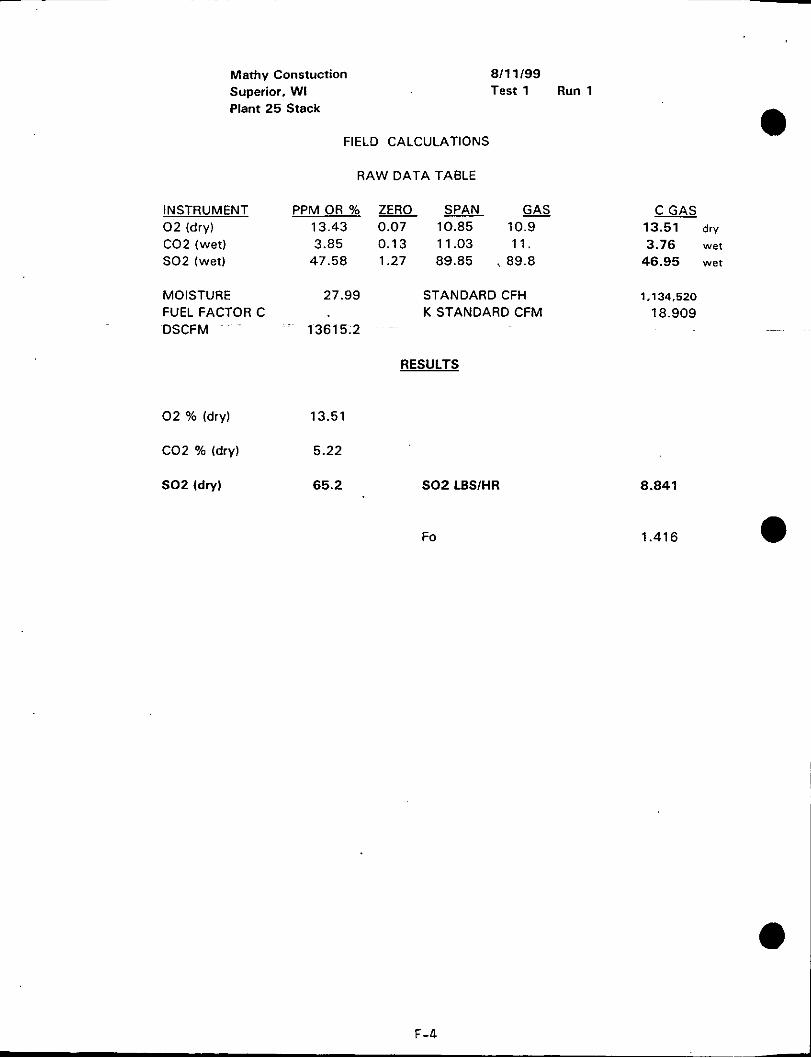
Mathy Constuction Superior, WI Plant 25 Stack
811 1/99 Test 1 Run 1
INSTRUMENT 0 2 (dry) C02 (wet) SO2 (wet)
MOISTURE FUEL FACTOR C DSCFM
0 2 % (dry)
CO2 % (dry)
SO2 (dry)
FIELD CALCULATIONS
RAW DATA TABLE
PPMOR% SPAN - GAS 13.43 0.07 10.85 10.9 3.85 0.13 11.03 11.
47.58 1.27 89.85 89.8
27.99 STANDARD CFH K STANDARD CFM
13615.2
RESULTS
13.51
5.22
65.2 SO2 LBSlHR
Fo
13.51 dry
3.76 wet
46.95 wet
1.1 34.520 18.909
8.841
1.416
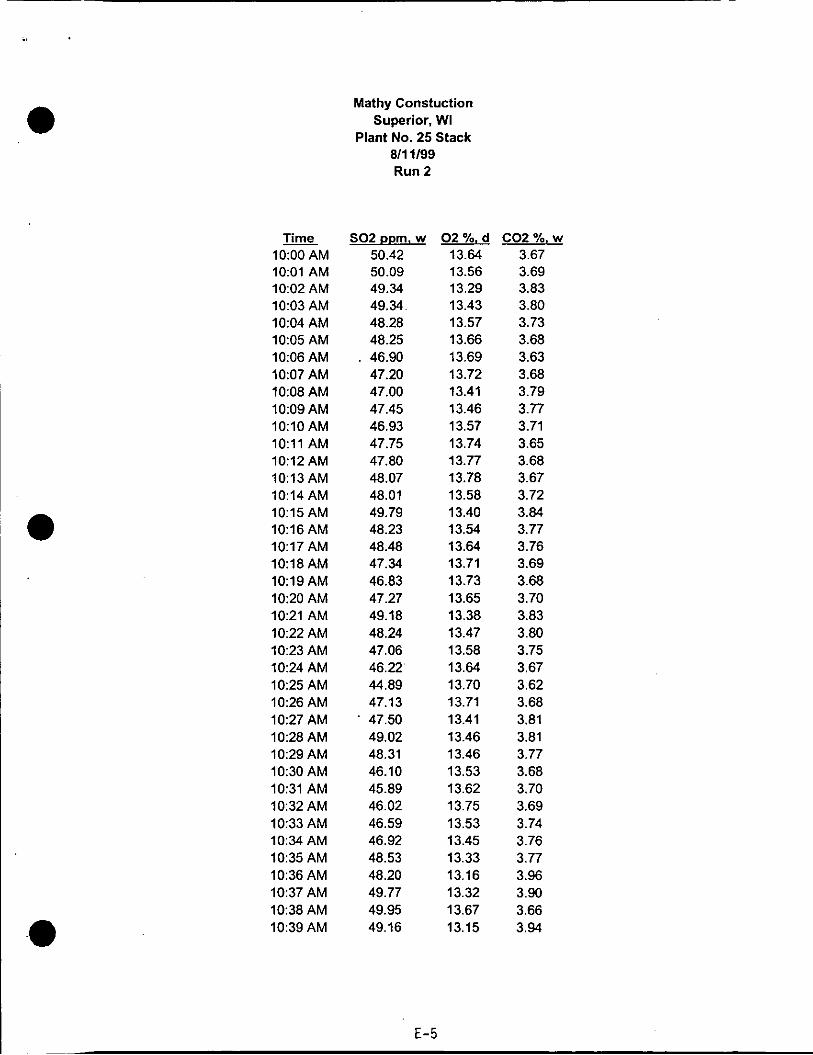
Time 1O:OO AM 1O:Ol AM 10:02 AM 10:03 AM 10:04 AM 10:05 AM 10:06 AM 10:07 AM 10:08 AM 10:09 AM 1O:lO AM 1O:ll AM 10:12 AM 10:13AM 10:14 AM 10:15 AM 10:16 AM 10:17 AM 10:18 AM 10:19 AM 10:20 AM 10:21 AM 10:22 AM 1023 AM 1024 AM 10% AM 1056 AM 1027 AM 10:28 AM 1029 AM 10:30 AM 10:31 AM 10:32 AM 10:33 AM 1024 AM 10:35 AM 10:36 AM 10:37 AM 10:38 AM 10:39 AM
Mathy Constuction Superior. WI
Plant No. 25 Stack
Run 2 ai1 1/99
SO2 pDm. w 50.42 50.09 49.34 49.34. 48.28 48.25
. 46.90 47.20 47.00 47.45 46.93 47.75 47.80 48.07 48.01 49.79 48.23 48.48 47.34 46.83 47.27 49.18 48.24 47.06 46.22' 44.89 47.13
' 47.50 49.02 48.31 46.10 45.89 46.02 46.59 46.92 48.53 48.20 49.77 49.95 49.16
E-5
0 2 %. d C02 %, w 13.64 3.67 13.56 13.29 13.43 13.57 13.66 13.69 13.72 13.41 13.46 13.57 13.74 13.77 13.78 13.58 13.40 13.54 13.64 13.71 13.73 13.65 13.38 13.47 13.58 13.64 13.70 13.71 13.41 13.46 13.46 13.53 13.62 13.75 13.53 13.45 13.33 13.16 13.32 13.67 13.15
3.69 3.83 3.80 3.73 3.68 3.63 3.68 3.79 3.77 3.71 3.65 3.68 3.67 3.72 3.84 3.77 3.76 3.69 3.68 3.70 3.83 3.80 3.75 3.67 3.62 3.68 3.81 3.81 3.77 3.68 3.70 3.69 3.74 3.76 3.77 3.96 3.90 3.66 3.94
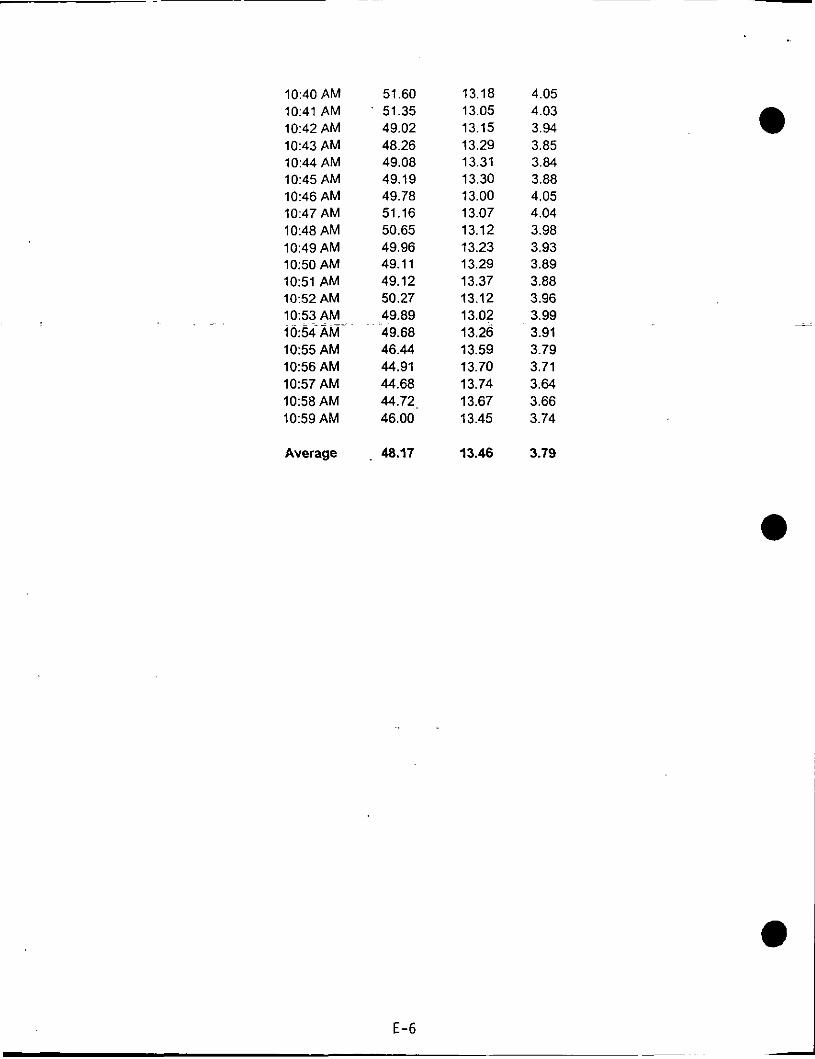
10:40 AM 51.60 10:41 AM ' 51.35 10:42 AM 49.02 10:43 AM 48.26 10:44 AM 49.08 10:45 AM 49.19 10:46 AM 49.78 10:47 AM 51.16 10:48 AM 50.65 10:49 AM 49.96 10:50 AM 49.11 10:51 AM 49.12 1052 AM 50.27
49.68 10:55 AM 46.44 1056 AM 44.91 10:57 AM 44.68 10:58 AM 44.72, 10:59 AM 46.00
10:53 ro:54.AM-. AM ~ ~ ~ 49.89
Average . 48.17
13.18 4.05 13.05 4.03 13.15 3.94 13.29 3.85 13.31 3.84 13.30 3.88 13.00 4.05 13.07 4.04 13.12 3.98 13.23 3.93 13.29 3.89 13.37 3.88 13.12 3.96 13.02 3.99 13.26 3.91 13.59 3.79 13.70 3.71 13.74 3.64 13.67 3.66 13.45 3.74
13.46 3.79
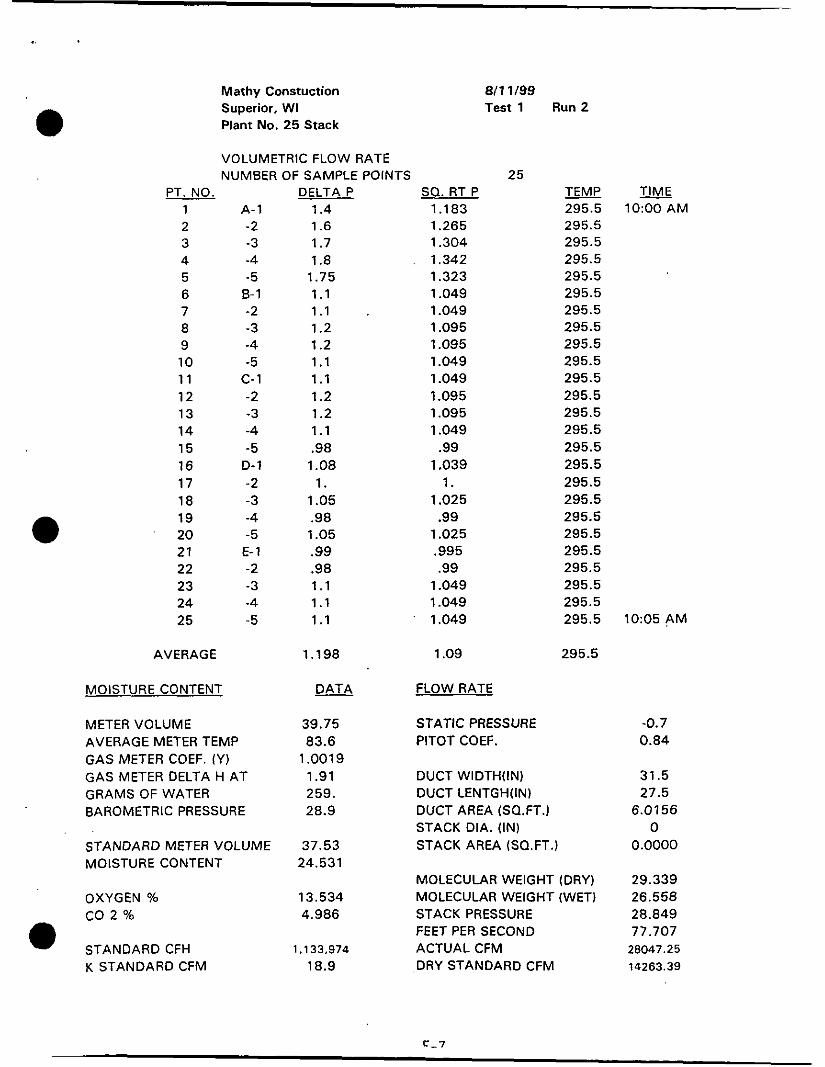
Mathy Constuction Superior, WI Plant No. 25 Stack
811 1/99 Test 1 Run 2
a
VOLUMETRIC FLOW RATE NUMBER OF SAMPLE POINTS
PT. NO. 1 2 3 4 5 6 7 8 9 10 1 1 12 13 14 15 16 17 18 19 20 21 22 23 24 25
AVERAGE
MOISTURE CONTENT
A- 1 -2 -3 -4 -5 B- 1 -2 -3 -4 -5 c-1 -2 -3 -4 -5
D- 1 -2 -3 -4 -5
E- 1 -2 -3 -4 -5
METER VOLUME AVERAGE METER TEMP GAS METER COEF. IY) GAS METER DELTA H AT GRAMS OF WATER BAROMETRIC PRESSURE
STANDARD METER VOLUME MOISTURE CONTENT
OXYGEN % co 2 % ' STANDARD CFH K STANDARD CFM
DELTA P 1.4 1.6 1.7 1.8 1.75 1.1 1.1 1.2 1.2 1.1 1.1 1.2 1.2 1.1 .98 1.08 1. 1.05 .98 1.05 .99 .98 1.1 1.1 1.1
1.198
DATA
39.75 83.6 1.0019 1.91 259. 28.9
37.53 24.531
13.534 4.986
1,133,974 18.9
25 SQ. RT P 1.183 1.265 1.304 1.342 1.323 1.049 1.049 1.095 1.095 1.049 1.049 1.095 1.095 1.049 .99 1.039
1. 1.025 .99 1.025 ,995 .99 1.049 1.049 1.049
1.09
FLOW RATE
STATIC PRESSURE PITOT COEF.
TEMP - TIME 295.5 1O:OO AM 295.5 295.5 295.5 295.5 295.5 295.5 295.5 295.5 295.5 295.5 295.5 295.5 295.5 295.5 295.5 295.5 295.5 295.5 295.5 295.5 295.5 295.5 295.5 295.5 10:05 AM
295.5
DUCT WIDTHIIN) DUCT LENTGHUN) DUCT AREA (SQ.FT.1 STACK DIA. (IN) STACK AREA (SO.FT.1
MOLECULAR WEIGHT (DRY) MOLECULAR WEIGHT (WET) STACK PRESSURE FEET PER SECOND ACTUAL CFM DRY STANDARD CFM
-0.7 0.84
31.5 27.5 6.0156 0
0.0000
29.339 26.558 28.849 77.707 28047.25 14263.39

Mathy Constuction Superior, WI Plant No. 25 Stack
FIELD CALCULATIONS
RAW DATA TABLE
8/11/99 Test 1 Run 2
INSTRUMENT PPM OR % ZERO SPAN - GAS 0 2 (dry) 13.46 0.05 10.85 10.9 C 0 2 (wet) 3.79 0.13 10.83 11 SO2 (wet) 48.17 1.65 89.13 89.8
MOISTURE 24.53 STANDARD CFH FUEL FACTOR C 0 K STANDARD CFM DSCFM 14263.4
RESULTS
0 2 Oh (dry1 13.53
CO2 % (dry) 4.99
SO2 ppm (dry1 63.28 SO2 LBSlHR
Fo
13.53 dry
3.76 wet
47.76 wet
. -~ 1,133,974 - 18.9
8.989
1.477
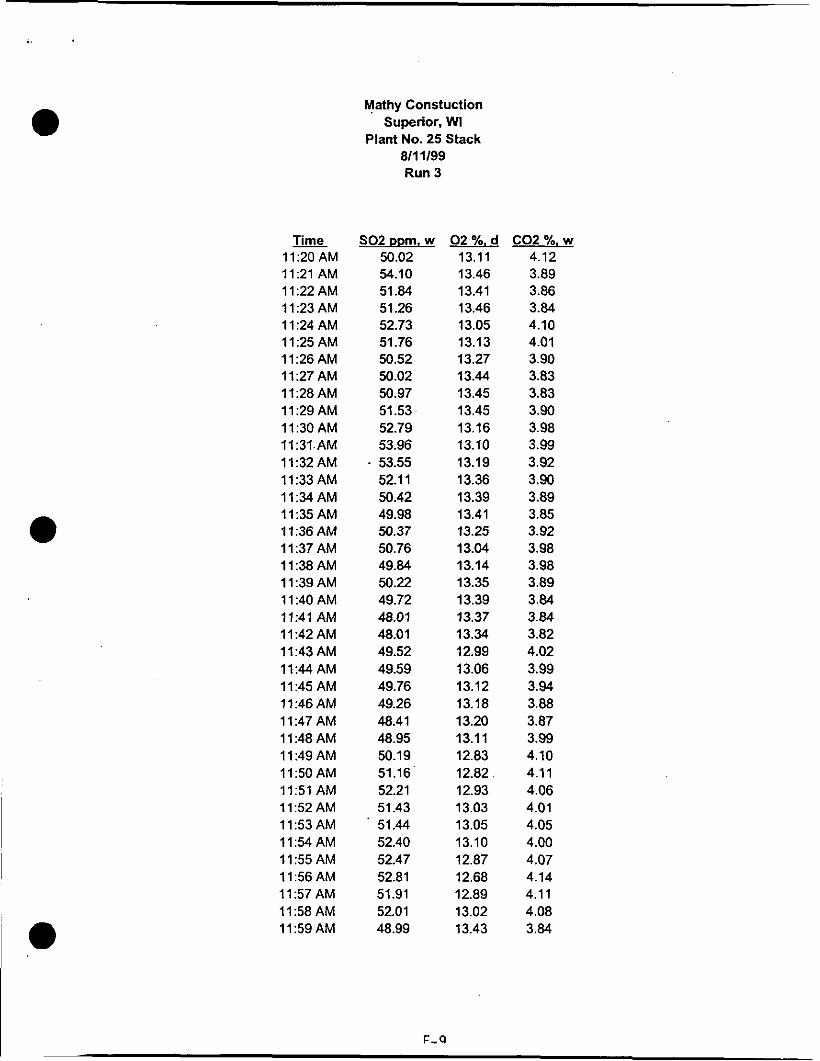
Time 11:20AM 11:21 AM 11:22 AM 11:23 AM 11:24AM 11:25AM 11:26 AM 11:27 AM 11:28AM 11:29AM 11:30AM ll:31.AM 11:32AM 11:33 AM 11:34AM 11:35AM 11:36 AM 11:37AM 11:38AM 11:39 AM 11:40 AM 11:41 AM 11:42AM 11:43AM 11:44AM 11:45AM 11:46 AM 11:47 AM 11:48 AM 11:49AM 11:50AM 1151 AM 1152 AM 11 :53 AM 11:54AM 11:55AM 11:56AM 11:57AM 11:58AM 11:59AM
Mathy Constuction Superior, WI
Plant No. 25 Stack 811 1/99 Run 3
50.02 54.10 51.84 51.26 52.73 51.76 50.52 50.02 50.97 51.53 52.79 53.96
. 53.55 52.1 1 50.42 49.98 50.37 50.76 49.84 50.22 49.72 48.01 48.01 49.52 49.59 49.76 49.26 48.41 48.95 50.19 51.16. 52.21 51.43 51.44 52.40 52.47 52.81 51.91 52.01 48.99
13.11 13.46 13.41 13.46 13.05 13.13 13.27 13.44 13.45 13.45 13.16 13.10 13.19 13.36 13.39 13.41 13.25 13.04 13.14 13.35 13.39 13.37 13.34 12.99 13.06 13.12 13.18 13.20 13.11 12.83 12.82 12.93 13.03 13.05 13.10 12.87 12.68 12.89 13.02 13.43
4.12 3.89 3.86 3.84 4.10 4.01 3.90 3.83 3.83 3.90 3.98 3.99 3.92 3.90 3.89 3.85 3.92 3.98 3.98 3.89 3.84 3.84 3.82 4.02 3.99 3.94 3.88
3.99 4.10 4.11 4.06 4.01 4.05 4.00 4.07 4.14 4.11 4.08 3.84
3.87
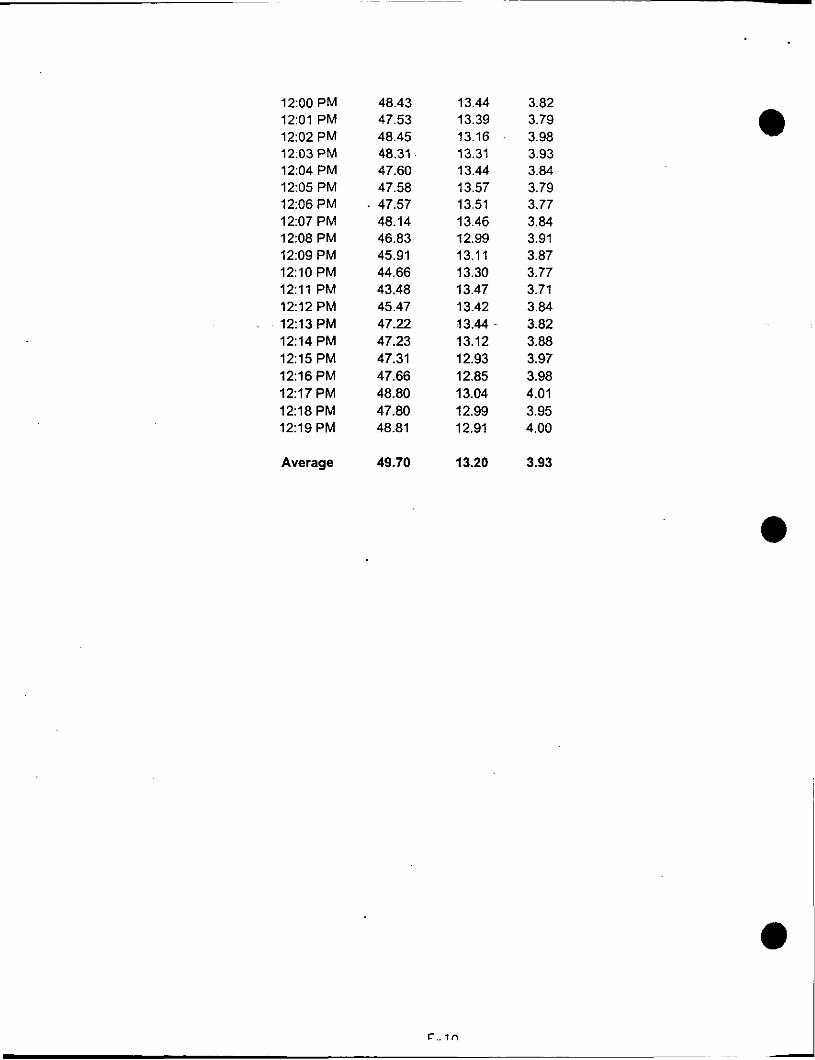
12:OO PM 12:Ol PM 12:02 PM 12.03 PM 12:04 PM 1205 PM 12:06 PM 12:07 PM 12:08 PM 12:09 PM 12:lO PM 12:ll PM 12:12 PM 12:13 PM 12:14 PM 12:15 PM 1216 PM 1237 PM 12:18 PM 12:19 PM
Average
48.43 13.44 47.53 13.39 48.45 13.16 48.31 13.31 47.60 13.44 47.58 13.57
. 47.57 13.51 48.14 13.46 46.83 12.99 45.91 13.11 44.66 13.30 43.48 13.47 45.47 13.42
47.23 13.12 47.31 12.93 47.66 12.85 48.80 13.04 47.80 12.99 48.81 12.91
47.22 13.44 -
49.70 13.20
3.82 3.79 3.98 3.93 3.84 3.79 3.77 3.84 3.91 3.87 3.77 3.71 3.84 3.82 3.88 3.97 3.98 4.01 3.95 4.00
3.93
L l n

Mathy Constuction Superior, WI Plant No. 25 Stack
8/11/99 Test 1 Run 3
VOLUMETRIC FLOW RATE NUMBER OF SAMPLE POINTS
1 2 3 4 5 6 7 8 9 10 1 1 12 13 14 15 16 17 18 19 20 21 22 23 24 25
AVERAGE
MOISTURE CONTENT
METER VOLUME AVERAGE METER TEMP GAS METER COEF. (Y) GAS METER DELTA H AT GRAMS OF WATER BAROMETRIC PRESSURE
A- 1 -2 -3 -4 -5
6- 1 -2 -3 -4 -5 c- 1 -2 -3 -4 -5 D- 1 -2 -3 -4 -5 E- 1 -2 -3 -4 -5
STANDARD METER VOLUME MOISTURE CONTENT
OXYGEN % co 2 %
STANDARD CFH K STANDARD CFM
DELTA P SQ. RT P .96 .98 1.2 1.095 1.1 1.049 1.1 1.3 1.05 1.2 1. .95 1. .98 1.15 1.15 1.15 1.1 1.15 1.3 1.3 .98 1.1 1.3 1.7 1.6 1.7 1.85
1.215
DATA
40.36 85.8 1.0013 1.91 289. 28.9
37.53 26.616
13.268 5.368
1,146,555 19.109
1.049 1.14 1.025 1.095
1. ,975 1. .99 1.072 1.072 1.072 1.049 1.072 1.14 1.14 .99 1.049 1.14 1.304 1.265 1.304 1.36
1.097
25
FLOW RATE
STATIC PRESSURE PITOT COEF.
DUCT WIDTH(IN) DUCT LENTGH(IN) DUCT AREA (SQ.FT.1 STACK DIA. (IN1 STACK AREA (SO.FT.)
TIME TEMP - 294.8 1 1 :20 AM 294.8 294.8 294.8 294.8 294.8 294.8 294.8 294.8 294.8 294.8 294.8 294.8 294.8 294.8 294.8 294.8 294.8 294.8 294.8 294.8 294.8 294.8 294.8 294.8 12:25 PM
294.8
MOLECULAR WEIGHT (DRY) MOLECULAR WEIGHT (WET) STACK PRESSURE FEET PER SECOND ACTUAL CFM DRY STANDARD CFM
-0.7 0.84
31.5 27.5
6.01 5625 0 0
29.39 26.358 28.849 78.496
28332.15 14023.19
F-11

Mathy Constuction Superior, WI Plant No. 25 Stack
INSTRUMENT 0 2 (dry) C02 (wet) SO2 (wet)
MOISTURE FUEL FACTOR C DSCFM
0 2 36 (dry)
CO2 % (dry)
SO2 ppm (dry)
FIELD CALCULATIONS
RAW DATA TABLE
8/11/99 Test 1 Run 3
PPMOR % ZERO SPAN GAS 13.2 0.04 10.85 10.9 13.27 dry 3.93 0.10 10.80 11 3.94 wet 49.7 1.84 89.37 89.8 49.11 wet
26.62 ' STANDARD CFH 1,146,555
0 K STANDARD CFM 19.109 14023.2
RESULTS
13.27
5.37
66.92 SO2 LBSlHR
Fo
9.345
1.422
c . 1 1
e APPENDIX F
GAS ANALYZER SPECIFICATIONS
e
e
Semomex 0
. .. .. ..
1420 Oxygen Analyser
Instruction Manual Ref: 01420/001~0
- Order as part No. 01420001A . . ~. . .
" was (7982-2342) .. . . . . . .
~.
. . . . . . . ..:. . .
. . . . . . . . . .
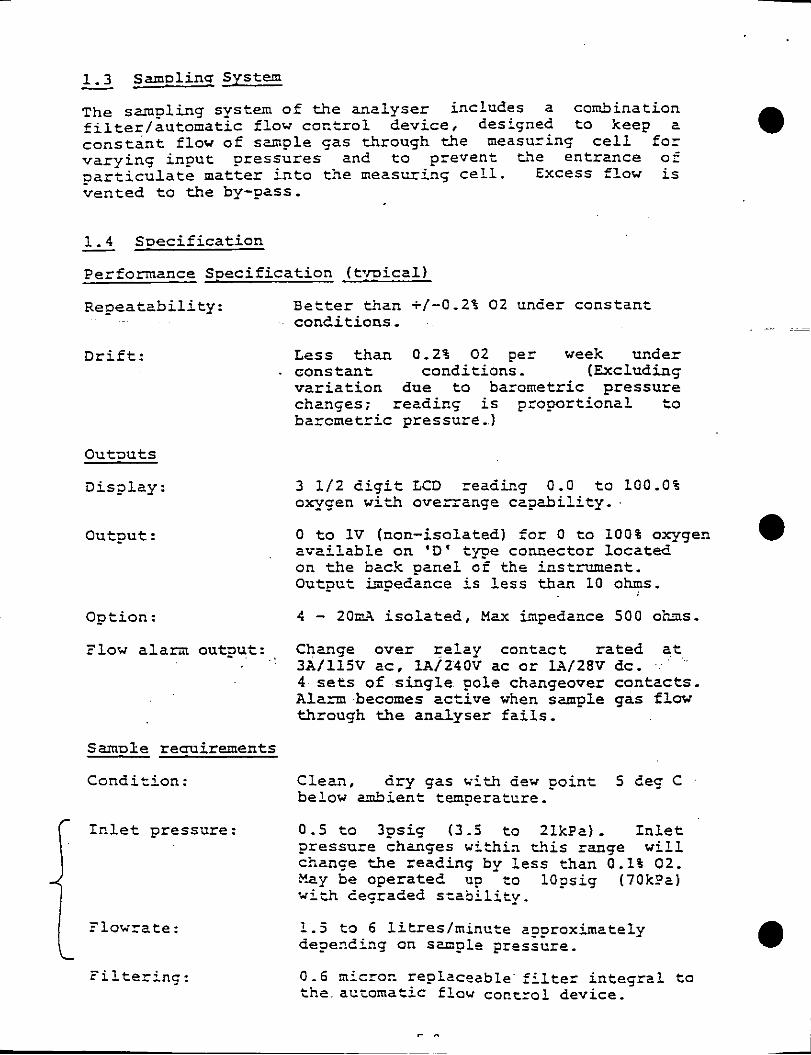
1.3 Samulinu Sys t ca - The sampling system o f t h e ana lyse r includes a combination f i l t e r / a u t o m a t i c flow c o x t r o l device , designed t o keep 2 c o n s t a n t flow o f s a p l e qas through the measurinq c e l l f o r v a r y i n g i n p u t p r e s s u r e s and t o prevent tbe en t rance of p a r t i c u l a t e m a t t e r i n t o t h e mezsuring c e l l . Excess flow is ven ted t o t h e by-pass.
- 1.4 S p e c i f i c a t i o n
Performance S p e c i f i c a t i o n ( t n i c a l )
R e p e a t a b i l i t y :
D r i f t :
O U t D U t S
ais? lay :
O u t p l t :
Opt ion:
Flow a l a m out3ut :
SamDle recruirements
Cond i t ion :
1r.let pressure : r Flowra t e : I
L i i l t e r i n g :
B e t t e r than i/-O.24 0 2 under cons t an t conciit ions.
L e s s than 0.25 02 p e r week under cons tan', condi t ions . (Excluding v a r i a t i o n due t o barometric pressure changes; re2dir.q is propor t iona l t o barometr ic pressure . )
3 1/2 d i g i t LCD reacing 0.0 t o 100.05 oxvGen wi*A overrange capab i l i t y .
0 t o 1V (non-isolated] for 0 t o 100% oxygen a v a i l a b l e on ' D ' type connector l o c a t e on t h e back panel of t he i o s t m e n t . Output inpedance is l e s s than 10 ohms.
4 - ton\ i s o l a t e d , Max impedance 500 ohi~s .
Chmge ove r r e l a y contac t r a t e d at 3M115V a c , lA /240V ac o r lA/28V dc. 4 sets of s i n g l e pole changeover con tac t s . A1z-m becomes active when srmple gas flow through the analyser f a i l s .
Cleaii, d r y gas ui'ch d e w po in t 5 Seq C below a b i e n t temperatcre.
0.5 t o 3ps ig (3.5 t o 2lkPa). I n l e t p ressuze changes u i t h i n this range w i l l chance 'he reading by l e s s than 0.1% 02. Y a y be opera ted up to lOpsig ( 7 0 k - D ~ ) w i t h eecrased s z a b i l i t y .
1.5 t? 6 l i t r e s / m i n u t e approximately d e ? e d i n g on s2nple pressure .
0 - 6 rnicror. replaceable . f i l t e : i n t e g r a l t o t h e . acEomatic f l o u coctzo!. device.
r n
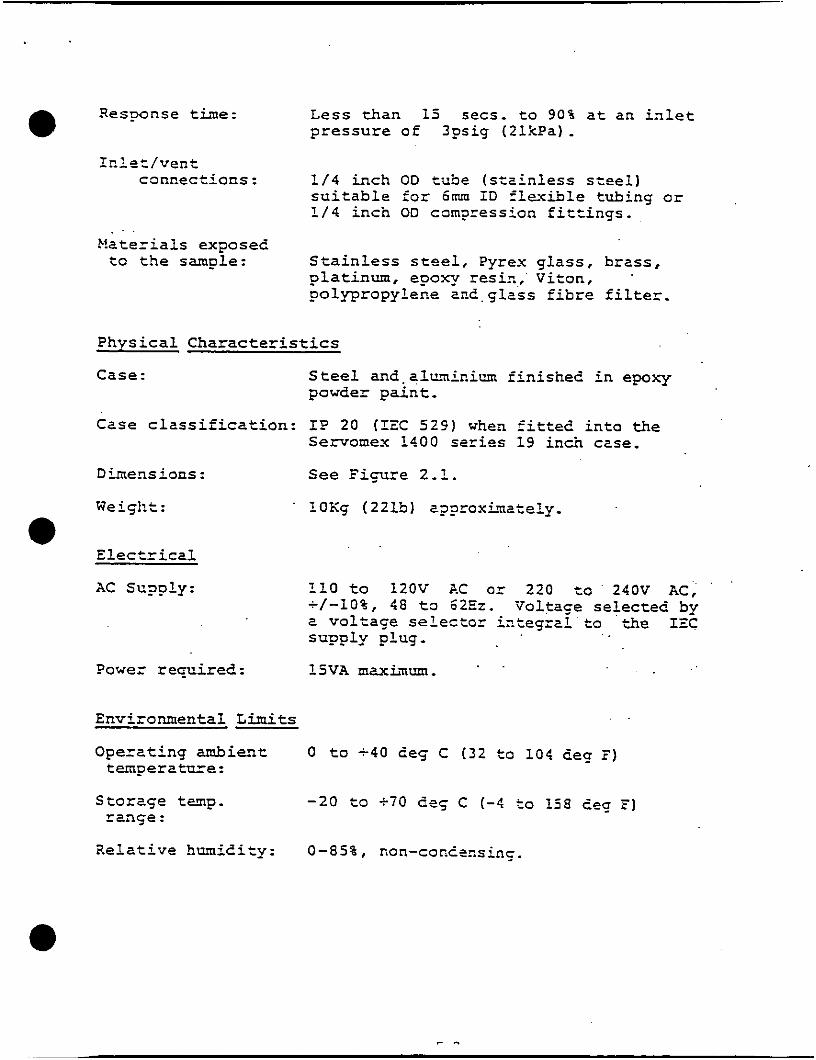
Response t ime: L e s s t h a n 15 secs. t o 9 0 3 a t an i n l e t p r e s s u r e of 3ps ig (2 lkPa) .
Inle:/vent connec t ions : 1 / 4 i n c h OD t ube ( s t a i n l e s s s teel)
s u i t a b l e f o r 6mm I D f l e x i b l e tub ing o r l / 4 i n c h 00 corn?ression f i t t i n g s .
. . >!ate=ials expose2
t o t h e sample: S t a i n l e s s s teel , Pyrex g l a s s , b ra s s , p l a t inum, epoxy resir,, Viton, po lypropylene az2. glass f i b r e f i l t e r .
P h y s i c a l Charac te r i s t ics
C a s e : S tee1 and. qlL.minium f i n i s h e 2 i n epoxy powder p a i n t .
C a s e c l a s s i f i c a t i o n : I? 20 ( I Z C 5 2 9 ) when f i t t e 2 i n t o the Servomex 1400 series 1 9 inch case.
Dimensions : S e e F i F r e 2.1.
W e igii t :
Elec t r i ca l
xc su?ply: 110 t o l 2 O V AC o r 220 zo 240V AC, -/-lo%, 4 8 t o 62Ez. Voltase selected by a v o l t a s e s e l ec to r iztegral t o *he I Z C s u p p l y plug.
. . ?owe= re-ired: l 5 V A m z x i n u m .
EnvironmentaL L i m i t s
O p e r a t i n g s m b i e T t 0 t o -40 E e g C (32 t o 1 0 4 de9 F) tempera tL-e :
Storage t a p . -20 t o +70 deg C ( - 4 to 158 1eq F) ranse :
R e l a t i v e h u m i l i t y : 0-85%, non-conetnsinq.

SPECIFICATIONS FOR ACS MODEL 3300 q- NDIR
Measuring principle NDIR single beam method
Measurable gas components 0 - 20% and measuring range
Reproducibility
Stability
Noise
Amb i en t temperatu re
Ambient humidity
Response time (90% of final reading)
Indicator
Output signal
Linearity
Power supply
?0.5% of full scale
Zero drift; 2% of full scale/24H Span drift; 2% of full scale/24H
0.5% of full scale
-5 to 45Jc
Less than 90% RH
Electrical system; 2 sec, 3 sec, 5 sec (selectable with connector) Response of actual gas; Within 15
sec (depending on cell length)
100 linear division
OUTPUT 1; DC 0 - 1 V OUTPUT 2; DC 0 - 10 mV or DC 0 - 100 mV
or DC 0 - 1 V or DC 4 - 20 mA
(Allowable load resistance 500Q max. )
Better than 22% of full scale (when linearizer is used)
AC 115 V +- l ox , 60 Hz
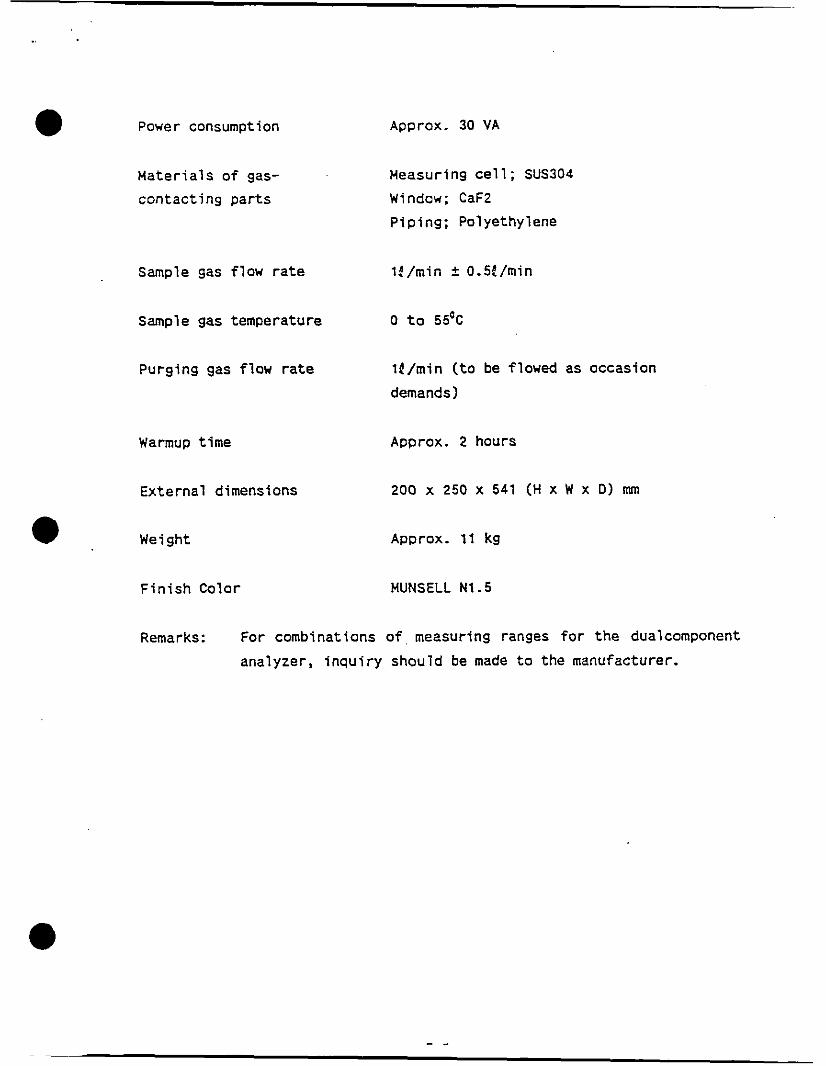
Power consumption
M a t e r i a l s o f gas-
contac t ing pa r t s
Approx. 30 VA
Heasuring C e l l ; SUS304
Window; CaF2
P ip ing ; Polyethylene
Sample gas f low r a t e 1 ? / m i n ? O.S!/min
Sample gas temperature 0 t o 55%
Purging gas f l ow r a t e I ( / m i n ( t o be f lowed as occasion
demands)
Warmup t ime Approx. 2 hours
External dimensions 200 x 250 x 541 (H x W x D) mm
Weight Approx. 11 kg
F i n i s h Color MUNSELL N1.5
Remarks: For combinations o f , measuring ranges for t h e dualcomponent
analyzer. i n q u i r y should be made t o the manufacturer.
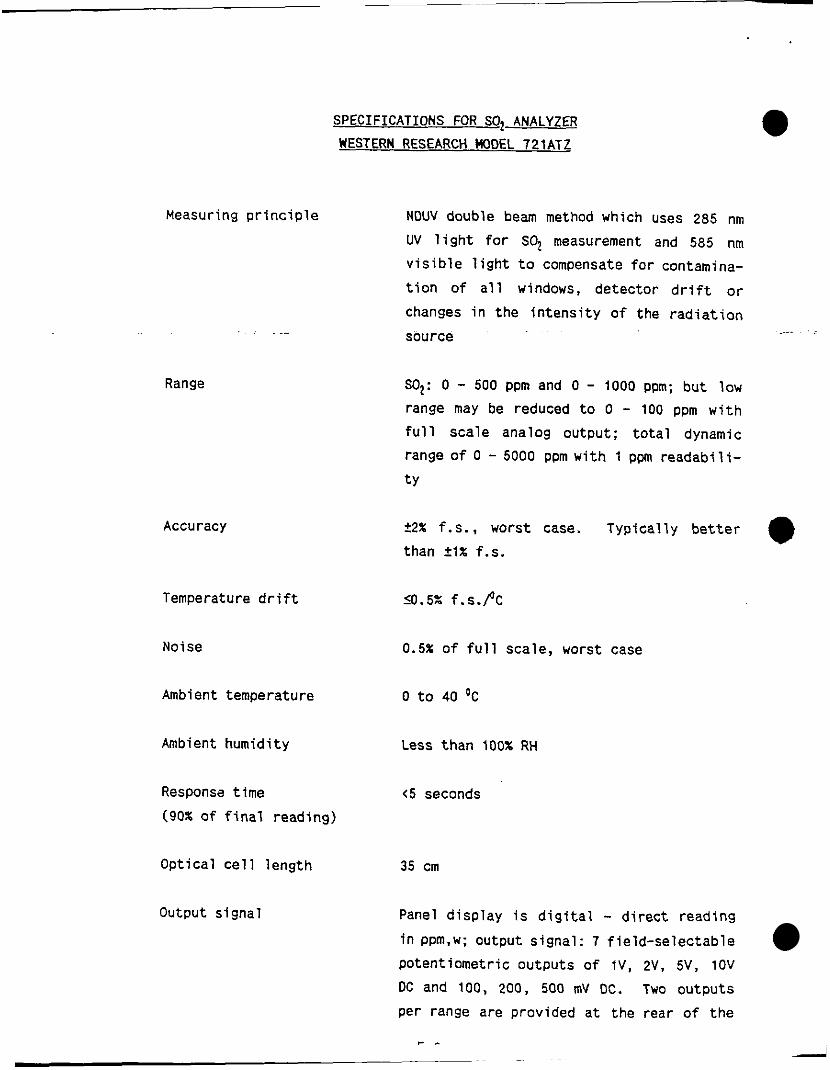
Measuring p r i n c i p l e
Range
Accuracy
SPECIFICATIONS FOR SO2 ANALYZER
WESTERN RESEARCH HODEL 721ATZ
N O W double beam method which uses 285 nm
UV l i g h t f o r SO2 measurement and 585 nm
v i s i b l e l i g h t t o compensate for contamina-
t i o n o f a l l windows, detector d r i f t o r
changes i n the i n t e n s i t y o f the r a d i a t i o n
source ~
SOz: 0 - 500 ppm and 0 - 1000 ppm; hu t low range may be reduced t o 0 - 100 ppm w i t h
f u l l scale analog output; t o t a l dynamic
range o f 0 - 5000 ppm with 1 ppm readah i l i -
t y
0 t 2 % f . s . , worst case. Typica l ly b e t t e r
than 21% f.s.
Temperature d r i f t g . 5 x f .S.PC
Noise 0.5% o f f u l l scale, worst case
Ambient temperature 0 t o 40 'C
Ambient humidi ty Less than lOOX RH
Response t ime t5 seconds
(9OX o f f i n a l reading)
Opt ical c e l l length 35 cm
Output s ignal Panel d isp lay i s d i g i t a l - d i r e c t reading
i n ppm,w; output s ignal : 7 f ie ld -se lec tab le
potent iometr ic outputs o f i v , 2V, 5V, 1OV
DC and 100, 200, 500 mV OC. Two outputs
per range are provided a t the rear o f t he
r -
~

Interferences
Linearity
Power supply
Power consumption
Electronic span value
Sample gas f low
Sample gas temperature
Warmup time
External dimensions
Weight
instrument, standard. Unit equipped also with 4 - 20 mA
No known interferences from O,, COz, CO or hydrocarbons; internally compensated for NO interference
t 1 . 5 X o f full scale
AC 115 V k lo%, 60 HZ
Less than 575 watts
Nominal 766 Q 77 OF and 29.92 in Hg
1.0 - 5.0 LPM to give desired response time
0 to 40 ‘C
Approximately 30 minutes
7 x 19 x 22 (H x W x D) inch
40 LB
APPENDIX G
MEASUREMENT SYSTEMS PERFORMANCE SPECIFICATIONS

Calibration Error
-- Cylynder Analyzer
Value Response Difference (ppm) ‘(ppm) (ppm)
Mid Level 89.90 90.35 0.45 Zero 0.00 1.05 1.05
High Level 134.00 130.96 3.04
e
Span % Value of (ppm) Span 200.00 0.53 200.00 0.22 200.00 1.52
Mathy ConstuCtiOn Superior, WI
Plant No. 25 Stack 8/11/99 Test 1
Cylynder Analyzer Value Response Difference (ppm) (ppm) (ppm)
Zero 0.00 0.10 0.10 11.13 0.13 16.55 0.05
Mid Level 11 .OO High Level 16.60
SO2 TEI Model 438)
- Span %
(wm) Span of Value
20.00 0.50 20.00 0.65 20.00 0.25
Cylynder Analyzer Value Response Difference
Span % Value of
0 2 (Servomex Series 1400)
Zero Mid Level . High Level
(ppm) (ppm) (ppm) (ppm) Span 0.00 0.07 0.07 25.00 0.28
10.89 0.01 25.00 0.04 10.90 20.95 0.05 25.00 0.20 21 .OO
e
e
6-2 -
APPENDIX H
CALIBRATION GAS CERTIFICATION SHEETS
sc h
0 9
I L
C N
u 1
7
c
i
e
.. .
cl a m m r ( P m m o ul . d m o m m r l w m~ o 4 m u l r l m o o o m u o 11 u w o r ( r l L O P N O O .. ..
e m alu u m .. g o a l
** .. al 0 0 0 0 L1.4 z z o l u c
m o a l m QJ-Iu
c v c 4 L 1 4 4 u 4 -4LlrlLla % m bal x
m u m c m
-!4 r & u 4 u o m w m
v m v v w
. . 0 I o o w O N r ( m I I
L O 4 1 0 - o m
r l m m e
.. .. 0 0 .. z z m u c m m u m m u . . . +
m
u m o a l o m a a
v m z l - u o Ln
- u l 10
" Z r: U
$ 2 s o v a
h
c. E c c\ t" d
APPENDIX I
PROCESS RATE INFORMATION
I ,
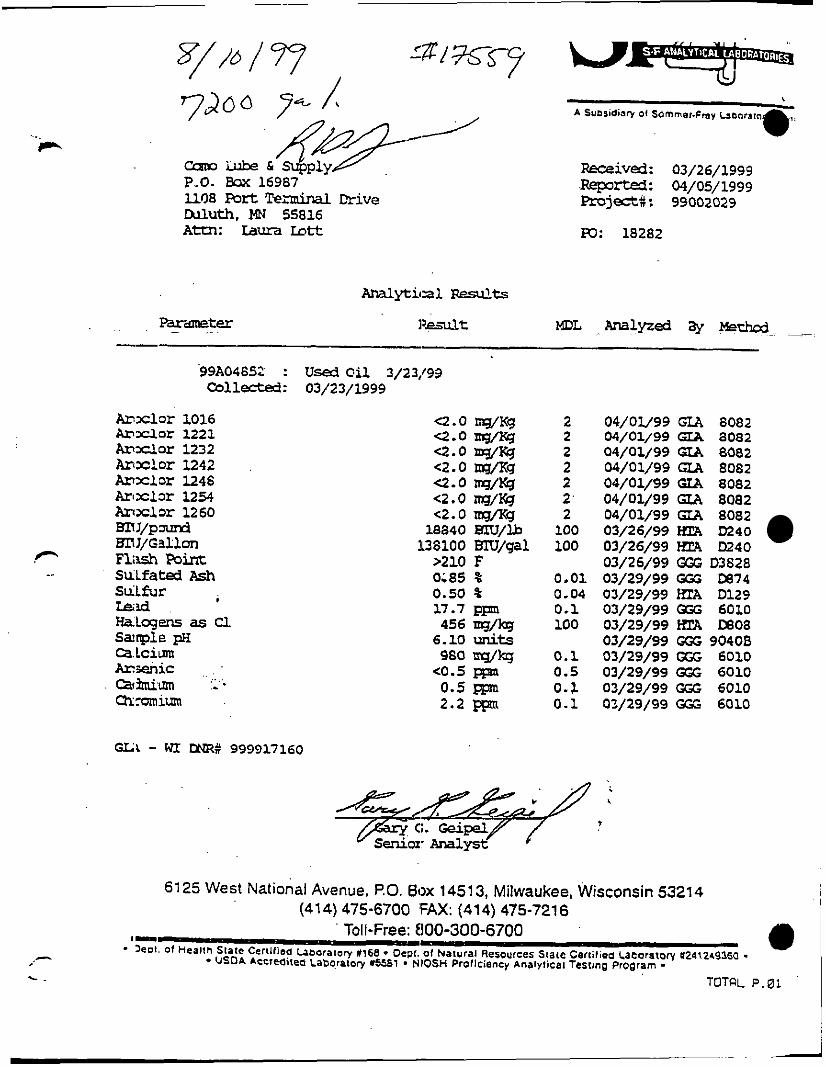
99A04652 : Used O i l 3/23,/93 Collected: 03/23/1999
h x l o r 1016 b x l o r 1221 h a o r 1232 A r r l o r 1242 A r m l o r 1246 Arccbr 1254 A r i x l D r 1260 ~ J / P - g n J / G a l l o n
__ Sulfated Ash SuLfur Ls3d HaLCgem as a. Sanple pH Q LClUm Arsenic QlillliUm ChrDm1Ul
m Fli3sh P o h t
I
Q - 0 my& -2.0 w m -2.0 WICg c2.0 IUyKg e . 0 w w e.0 w w c2.0 Uq/q
138100 BN/gal >210 F 0;85 Oe 0.50 % 17.7 ppm
18840 BIW/lb
456 mykg
980 W% c0.s p 0.5 ppn 2.2 pFan
6.10 &IS
2 2 2 2 2 2 ’ 2 100 100
0.01 0.04 0.1 100
0.1 0.5 0.1 0.1
04/01/99 GIA 6082 04/01/99 GIA a082 0 4 / 0 w 9 GLA a082
04/01/99 CIA a082 04/0y99 GVL a082
04/01/99 GL?i 8082
04/01/99 GIA 8082 03/26/99 D240 03/26/99 KllA 13240 03/26/99 GQ; D3628 03/29/99 WG m14 03/29/99 IITA D129 03/29/99 a;G 6010
03/29/99 GCG 90408 03/29/99 CCG 6010 03/29/99 aX 6010 03/29/99 GGG 6010 03/29/99 GGG 6010
os/29/99 moa
GLl - WI ONRnY 999917160
6125 West National Avenue, P.O. Box 14513, Milwaukee, Wisconsin 53214 (414) 475-6700 ‘FAX: (414) 475-7216
e Toll-Free: 800-300-6700 1- - 3erJl. of Heallh Slate Cerilflea haoratory d16a - Ocpr. of Natural Resources Siaic Certified Ueora ioq ~2412~9360 - .- USDA AcCiMited Labo!aIoTy 6 5 8 1 - NlOSH PrOllciancy AnalyliCa1 Testing Program -
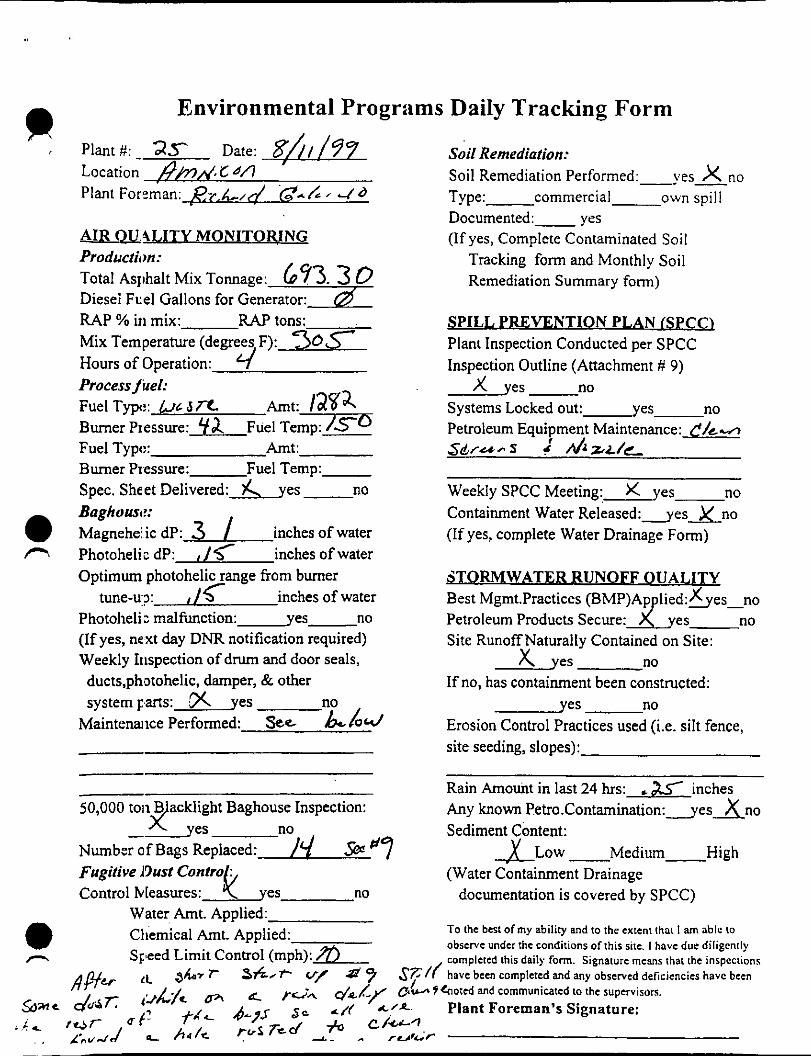
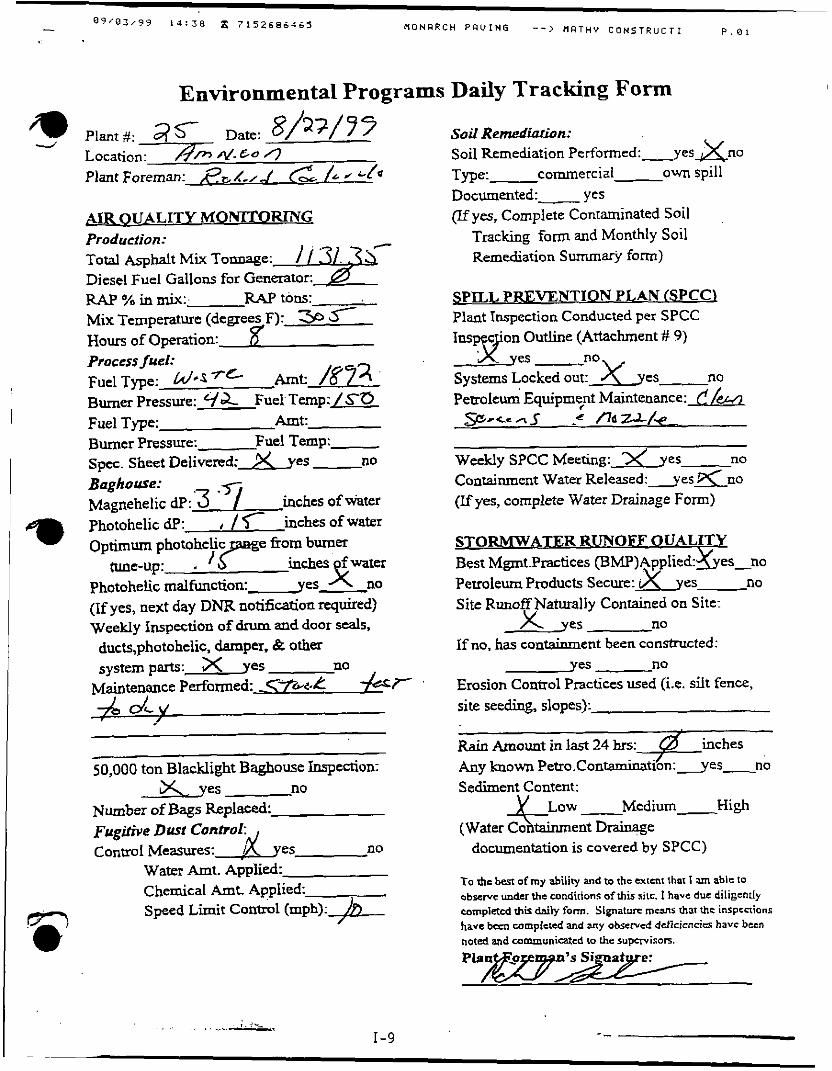
Environmental Programs Daily Tracking Form
Plant#:- 227 Date: ?A//90/ Soil Remediation: Location M f i ~ , C U I Soil Remediation Performed: -I v e s x n o Plant Foreman: gr,L,d '@&A I J d Type: commercial own spill
AIR OU.4LITY MONITOW NG Production: Total Asphalt Mix Tonnage: 643. 3 0 Diesei Fuel Gallons for Gene- RAP % iii mix: Mix Temperature (degrees F): 30s Hours of Operation: 4 Inspection Outline (Attachment # 9)
Documented:- yes (If yes, Complete Contaminated Soil
Tracking form and Monthly Soil Remediation Summary form)
RAP tons: SPILL PREVENT ION PJ.AN LSPCC) Plant Inspection Conducted per SPCC
Process juel:
Burner Piessure: 42 Fuel Temp: /so Burner Piessure: Fuel Temp: Spec. Sheet Delivered: %. yes no
Fuel Typc:: UL 5 TC ht:
Fuel Typc:: Amt:
Baghousc: Magnehelic dP: 3 / inches of water Photoheli;. dP: ,/< inches ofwater Optimum photohelic range from burner
tune-!?: '6 inches of water Photoheli: malfunction: yes no (If yes, next day DNR notification required) Weekly Illspection of drum and door seals, ducts,photohelic, damper, & other systemparts: LX yes no
Maintenance Performed: See bc. /od
50,000 toil . yacklight Baghouse Inspection: -&Yes no
Numbcr of Bags Replaced: 1.I @ "9 Fugitive Dust Contro : Control Measures: k yes no
A yes no Systems Locked out: yes no Petroleum Equipment Maintenance: P/! .A S d . / u - S r dJB.L /L
Weekly SPCC Meeting: x yes no Containment Water R e 1 e a s e d : y e s X n o (If yes, complete Water Drainage Form)
dTORM WATER R UNOFF OUALITY Best Mgmt.Practices (BMP)Applied:&esgo Petroleum Products Secure:)(es no Site Runoff Naturally Contained on Site:
X yes no If no, has containment been constructed:
d e s no Erosion Control Practices used (i.e. silt fence, site seeding, slopes):
Rain Amount in last 24 hrs: .a, inches Any known Petro.Contaminat ion:yesAno Sediment Content:
(Water Containment Drainage &ow - Medium- High
documentation is covered by SPCC) Water Amt. Applied: Chemical Amt. Applied: Speed Limit Control (mph): /r,
To the best of my ability and to the extent thsi I am ablc to obscrvc under the conditions ofthis site. I havc due diligently , completed this daily form. Sinnaturc means that the insocctions
0 n
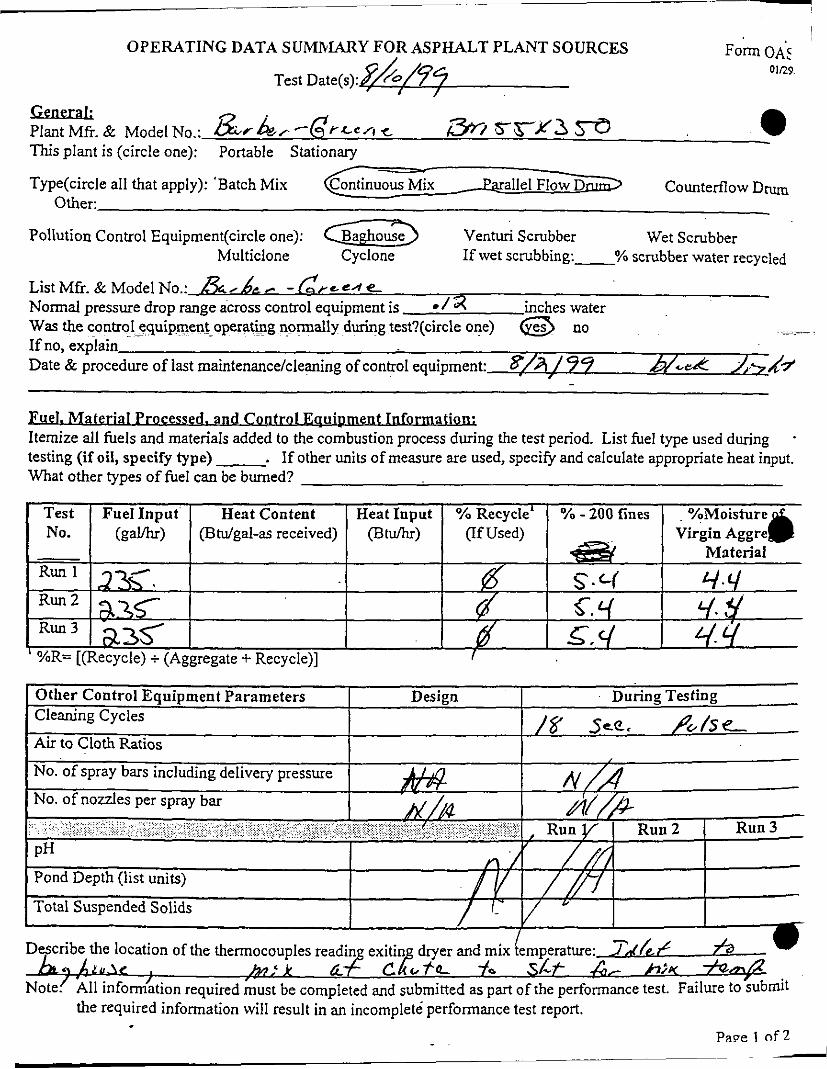
OPERATING DATA SUMMARY FOR ASPHALT PLANT SOURCES
e General: Plant M f r . & Model No.: &fi&, c 6 f l c c 4 C 6sIY3 ss, This plant is (circle one): Portable Stationary
Type(circle all that apply): ‘Batch Mix llel FI~W- Counterflow D m
Pollution Control Equipment(circ1e one): a Venturi Scrubber Wet Scrubber
Other:
Multiclone Cyclone If wet scntbbing:-Ya scrubber water recycled
List Mfr. & Model No.: & / d ,%e - Normal pressure drop range across control equipment is
If no, explain
c c n e * I 3 inches water
~ Was the control _ - equipment-operating normally during test?(circle one) @ no -
Date & procedure of last maintenance/cleaning of control equipment: :/a/ 99 b/c& J-7 A !
Fuel. Material Proc essed. and Control Ea -u-ormatiorl; Itemize all hels and materials added to the combustion process during the test period. List fuel type used during testing (if oil, specify type) What other types of fuel can be burned?
. . If other units of measure are used, specify and calculate appropriate heat input.
’ %R= [(Recycle) + (Aggregate + Recycle)] I
I
Total Suspended Solids / ’-” v Describe the location of the thermocouples readin exitin dryer and mix (ernperatwe: 7 A h - f fa
J C , &,L k G- 2 C L f L 0 S L t r h2.Y *mn nformkon required Lust be completed and submitted as part ofthe performance test. Failure to;ubrnit
- . P a x 1 of2
the required information will result in an incomplete performance test report. .
I
I;
I I '
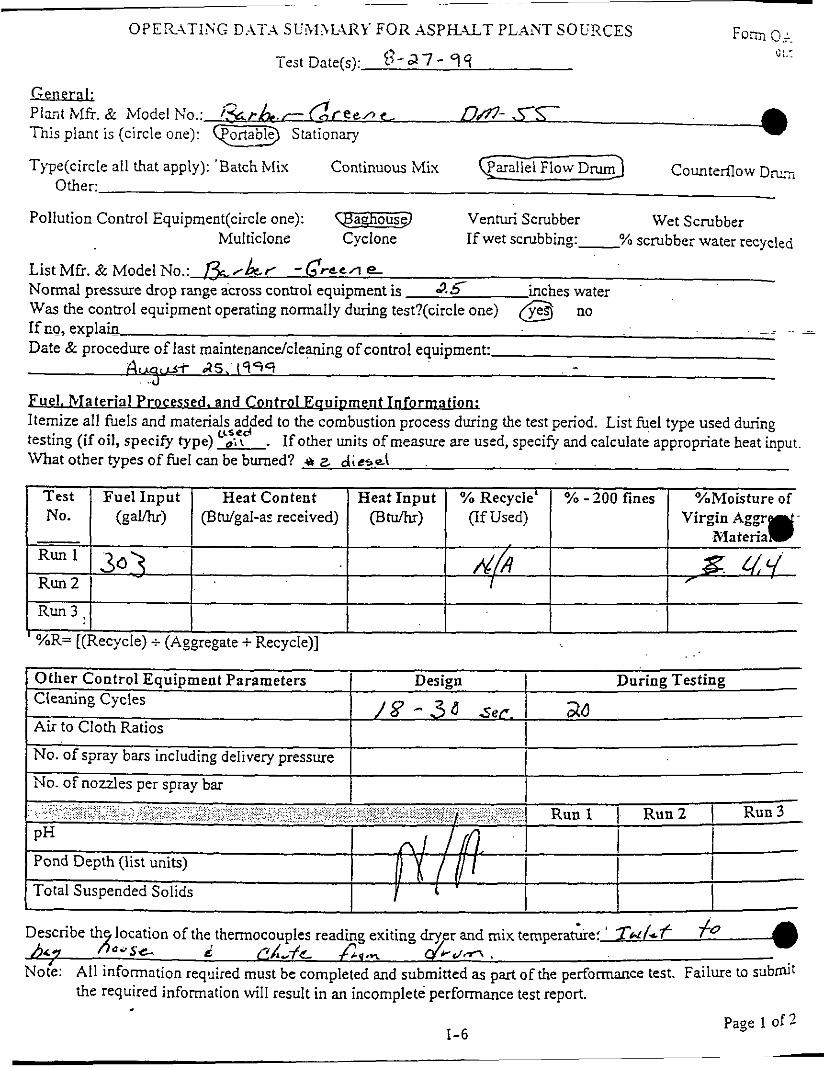
Type(circle all that apply): 'Batch Mix Continuous Mix countsmow D~~ Other:
Test No. - Run 1
Run 2
Run3 ,
Fuel Input Heat Content Heat Input YO Recycle' YO - 200 fines %Moisture of
YY ay
( g a b ) (Btdgal-a: received) (Btdhr) (If Used) Virgin Aggr Materia
30'3 4 4 r
- Other Control Equipmeut Parameters Design I During Testing Cleaning Cycles
Air to Cloth Ratios / 8 - 3 8 SeC. I aa
I I I
No. of spray bars including delivery pressure 1 I
A / fl, I Pond Depth (list units)
Total Suspended Solids Y I
I I No. of nozzles per spray bar
I I
1-6 Page 1 o f ?

I :
e
Plant Foreman: - , / 4 a
Am0 UALITY MONITO IUNG Production: TotalAsphaltMixTo~mage: 1 ' . . Diesel Fuel Gallons for Generator: +- RAP YO in mix: Mix Temperatwe (degre Hours of Operation:
RAP tons:
Process fuel: FuelType: Amt: /@' Burner Pressure: 42 Fuel Temp:/- Fuel Type: Amt: Burner Pressure: Fuel Temp:- Spec. Sheet Delivered: 3( yes no Baghouse: Magnehelic dP: 3 .q inches of water photohelic dP: , / inches of water Optimum photohelic e *om burner
inches fuam -k no photohelic malfunction: yes (If yes, next day DNR notification required) Weekly Inspection of drum and door seals,
tune-up: a
ducts,photohelic, damper, & other systernparts: X yes no
Maintenance Performed -<?%e,k k r A d L V
50,000 ton Blacklight Baghouse Inspeaion:
Number of Bags R e p l e d : Fugitive Dus! Control: ControlMemes: d yes no
A L Y e s no
Water Amt. Applied: Chemical Amt Applied: Speed Limit Conhul (mph): ,I!
Soil Remediarion: Soil &mediation Perfomed:-yesxno Type: Documented:- yes (If yes, Complete Contaminated Soil
Tracking form and Monthly Soil Remediation Summary form)
commercial- own spill
SPILL PREVENTION PLAN [SPCCl Plant Inspection Conducted per SPCC
Systems Locked es --n%es out: Peaole& Equipmeft Maintenance: e/&
'on Outline (Attachment # 9)
no l T Y
S - c e 4 S Le n62J-k
W&.kly SPCC Meeting:')(es no Containment Water R e 1 e a s e d : y e s K n o (Lf yes, complete Water Drainage Form)
STORMWATE. R RUN OFF 0 UALITY Best Mgmt.Practices (BMP)Applied&es-no Petroleum Products Secure:$<ves no Site Runoff Naturally Contained on Site:
X yes no If no, has containment been constructed:
y e s no Erosion Control Practices used (i.e. silt fence, site seeding, slopes):
Rain Amount in last 24 hrs: b y known Petro.Contaminat&:yes-no Sediment Content:
(Water Co tainment Drainage
inches
p- Medium- High
documentation is covered by SPCC)
To rhs best of my ability and to rhc cxtcnt that I am able lo obwrvc under the wndidons of h i s silc. I have due diligently completed thu daily fom. Signalm m a s rhst ihc inspcnions hare tan w m p l s l d and any obscrvcd deticicncic- h a w been noled and wmmuniaZcd to lhc supcwisorr.

APPENDIX J
PROCEDURES

Particulate Loading and Emission Rates
The particulate emission rates were determined per EPA Methods 1 - 5, CFR Title 40,
Part 60, Appendix A (revised July 1, 1992). In this procedure a preliminary velocity profile
of the gases in the flue is obtained by means of a temperature and velocity traverse. On the
basis of these values, sampling nozzles of appropriate diameter are selected to allow
isokinetic sampling, a necessary prerequisite for obtaining a representative sample.
The sampling train consists of a heated glass-lined sampling probe equipped with a
Type S pitot and a thermocouple. The probe is attached to a sampling module which houses
the all-glass in line filter holder in a temperature controlled oven. The sampling module also
houses the impinger case and a Drierite filled cohnn. The sampling module is connected
by means of an umbilical cord to the control module. The control module houses the dry
test gas meter, the calibrated orifice, a leakless pump, two inclined manometers, and all
controls required for operating the sampling train. .
Particulate samples are collected as follows: The sample gas is drawn through the
sampling probe isokinetically and passed through a 4-inch diameter Celman Type A/€ glass
fiber filter where particulates are removed. The sample gas is then passed through an ice- cooled impinger train and a desiccant-packed column which absorbs remaining moisture.
The sample gas then passes through a vacuum pump followed by a dry test gas meter. The
gas meter integrates the sample gas flow throughout the course of the test. A calibrated
orifice attached to the outlet of the gasmeter provides real time flow rate data.
A representative particulate sample was acquired by sampling for equal periods of time at the centroid of a number of equal area regions in the duct. The sampling rate is
adjusted at each test point maintaining isokinetic sampling conditions. Nomographs are used
for rapid determination of the sampling rate.
1 0 3 1 O ? ~ : ' ~ A C ( \ W W R O C E D U R ~ a Pl(1-5)
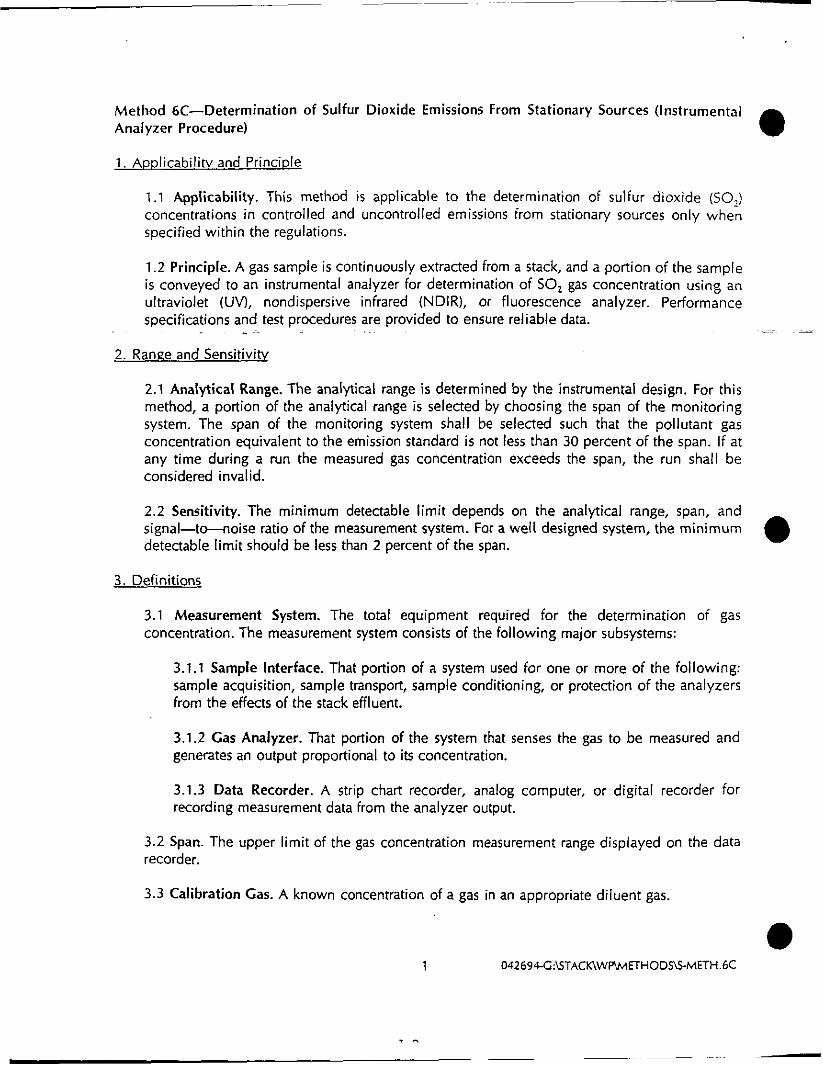
0 Method 6C-Determination of Sulfur Dioxide Emissions From Stationary Sources (Instrumental Analyzer Procedure)
1. Applicabilitv and Princide
1.1 Applicability. This method is applicable to the determination of sulfur dioxide (SO,) concentrations in controlled and uncontrolled emissions from stationary sources only when specified within the regulations.
1.2 Principle. A gas sample is continuously extracted from a stack, and a portion of the sample is conveyed to an instrumental analyzer for determination of SO, gas concentration using an ultraviolet (UV, nondispersive infrared (NDIR), or fluorescence analyzer. Performance specifications and test procedures are provided to ensure reliable data.
~ ~. - ~~ ._ ~~
2. Range and Sensitivity
2.1 AnaIytical Range. The analytical range is determined by the instrumental design. For this method, a portion of the analytical range i s selected by choosing the span of the monitoring system. The span of the monitoring system shall be selected such that the pollutant gas concentration equivalent to the emission standard is not less than 30 percent of the span. If at any time during a run the measured gas concentration exceeds the span, the run shall be considered invalid.
2.2 Sensitivity. The minimum detectable limit depends on the analytical range, span, and signal-t-noise ratio of the measurement system. For a well designed system, the minimum detectable limit should be less than 2 percent of the span. 0
3. Definitions
3.1 Measurement System. The total equipment required for the determination of gas concentration. The measurement system consists of the following major subsystems:
3.1.1 Sample Interface. That portion of a system used for one or more of the following: sample acquisition, sample transport, sample conditioning, or protection of the analyzers from the effects of the stack effluent.
3.1.2 Cas Analyzer. That portion of the system that senses the gas to be measured and generates an output proportional to its concentration.
3.1.3 Data Recorder. A strip chart recorder, analog computer, or digital recorder for recording measurement data from the analyzer output.
3.2 Span. The upper limit of the gas concentration measurement range displayed on the data recorder.
3.3 Calibration Cas. A known concentration of a gas in an appropriate diluent gas.
1 042694C:KTACK\WPMETHOD9S-METH.6C
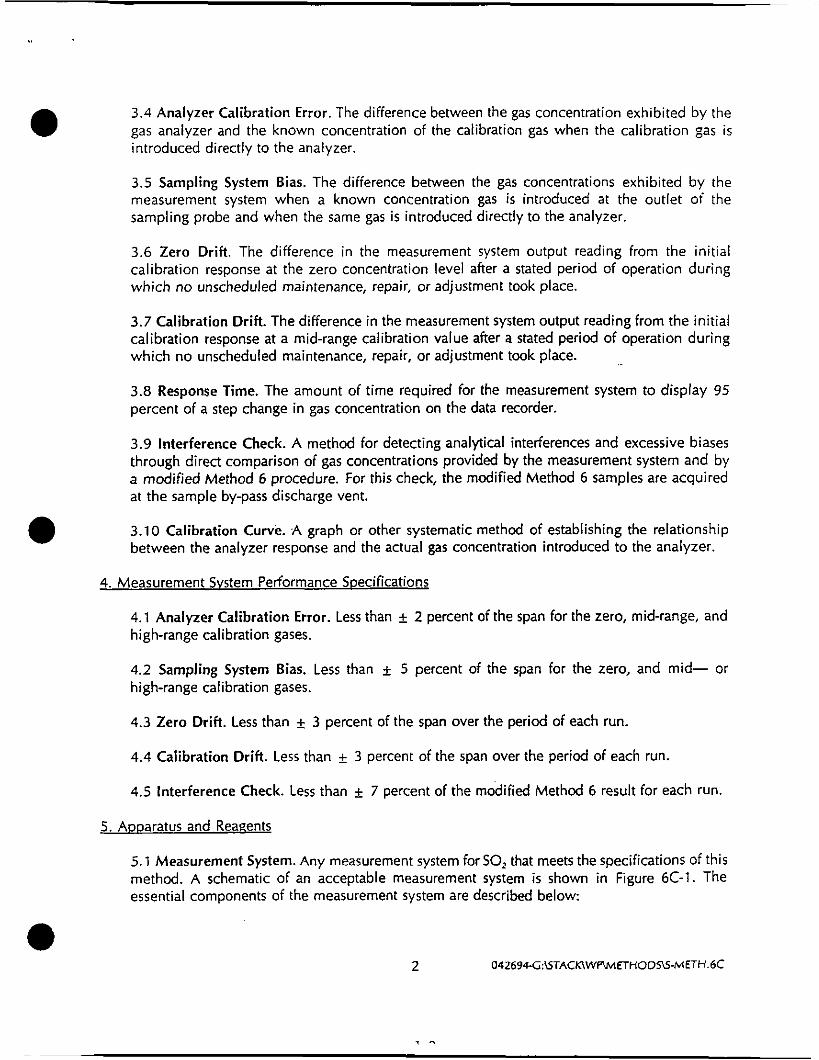
3.4 Analyzer Calibration Error. The difference between the gas concentration exhibited by the gas analyzer and the known concentration of the calibration gas when the calibration gas i s introduced directly to the analyzer.
3.5 Sampling System Bias. The difference between the gas concentrations exhibited by the measurement system when a known concentration gas is introduced at the outlet of the sampling probe and when the same gas is introduced directly to the analyzer.
3.6 Zero Drift. The difference in the measurement system output reading from the initial calibration response at the zero concentration level after a stated period of operation during which no unscheduled maintenance, repair, or adjustment took place.
3.7 Calibration Drift. The difference in the measurement system output reading from the initial calibration response at a mid-range calibration value after a stated period of operation during which no unscheduled maintenance, repair, or adjustment took place.
3.8 Response Time. The amount of time required for the measurement system to display 95 percent of a step change in gas concentration on the data recorder.
3.9 Interference Check. A method for detecting analytical interferences and excessive biases through direct comparison of gas concentrations provided by the measurement system and by a modified Method 6 procedure. For this check, the modified Method 6 samples are acquired at the sample by-pass discharge vent.
3.10 Calibration Curve. A graph or other systematic method of establishing the relationship between the analyzer response and the actual gas concentration introduced to the analyzer.
e
0 4. Measurement Svstem Performance Soecifications
4.1 Analyzer Calibration Error. Less than & 2 percent of the span for the zero, mid-range, and high-range calibration gases.
4.2 Sampling System Bias. Less than f 5 percent of the span for the zero, and mid- or high-range calibration gases.
4.3 Zero Drift. Less than c 3 percent of the span over the period of each run.
4.4 Calibration Drift. Less than c 3 percent of the span over the period of each run.
4.5 Interference Check. Less than 7 percent of the modified Method 6 result for each run.
5. Apparatus and Reanents
5.1 Measurement System. Any measurement system for SO, that meets the specifications of this method. A schematic of an acceptable measurement system i s shown in Figure 6C-1. The essential components of the measurement system are described below:
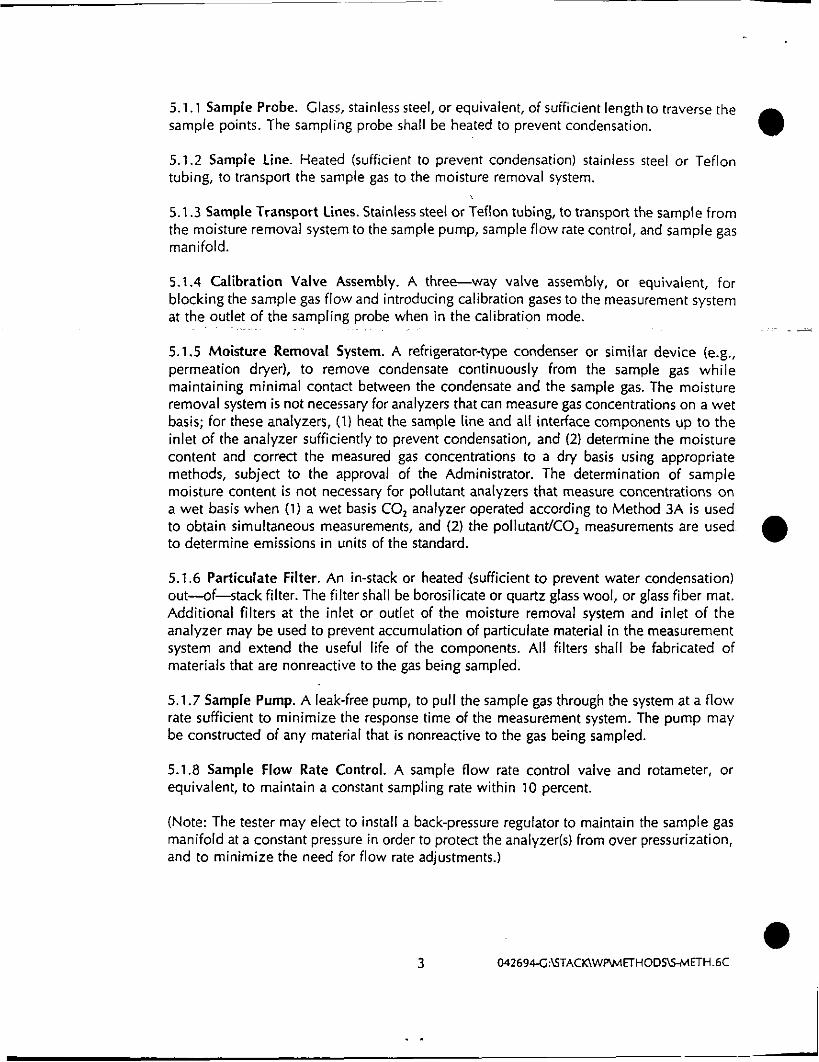
0 5.1.1 Sample Probe. Glass, stainless steel, or equivalent, of sufficient length to traverse the sample points. The sampling probe shall be heated to prevent condensation.
5.1.2 Sample Line. Heated (sufficient to prevent condensation) stainless steel or Teflon tubing, to transport the sample gas to the moisture removal system.
5.1.3 Sample Transport Lines. Stainless steel or Teflon tubing, to transport the sample from the moisture removal system to the sample pump, sample flow rate control, and sample gas manifold.
5.1.4 Calibration Valve Assembly. A three-way valve assembly, or equivalent, for blocking the sample gas flow and introducing calibration gases to the measurement system at the outlet of the sampling probe when in the calibration mode.
5.1.5 Moisture Removal System. A refrigerator-type condenser or similar device (e.g., permeation dryer), to remove condensate continuously from the sample gas while maintaining minimal contact between the condensate and the sample gas. The moisture removal system i s not necessary for analyzers that can measure gas concentrations on a wet basis; for these analyzers, (1) heat the sample line and all interface components up to the inlet of the analyzer sufficiently to prevent condensation, and (2) determine the moisture content and correct the measured gas concentrations to a dry basis using appropriate methods, subject to the approval of the Administrator. The determination of sample moisture content is not necessary for pollutant analyzers that measure concentrations on a wet basis when (1) a wet basis CO, analyzer operated according to Method 3A is used to obtain simultaneous measurements, and (2) the pollutantKO, measurements are used to determine emissions in units of the standard.
5.1.6 Particulate Filter. An in-stack or heated {sufficient to prevent water condensation) out-of-stack filter. The filter shall be borosilicate or quartz glass wool, or glass fiber mat. Additional filters at the inlet or outlet of the moisture removal system and inlet of the analyzer may be used to prevent accumulation of particulate material in the measurement system and extend the useful life of the components. All filters shall be fabricated of materials that are nonreactive to the gas being sampled.
5.1.7 Sample Pump. A leak-free pump, to pull the sample gas through the system at a flow rate sufficient to minimize the response time of the measurement system. The pump may be constructed of any material that is nonreactive to the gas being sampled.
5.1.8 Sample Flow Rate Control. A sample flow rate control valve and rotameter, or equivalent, to maintain a constant sampling rate within 10 percent.
(Note: The tester may elect to install a back-pressure regulator to maintain the sample gas manifold at a constant pressure in order to protect the analyzer(s) from over pressurization, and to minimize the need for flow rate adjustments.)
3 0 4 2 6 9 4 C : ~ T A C ~ W P \ M E H O D ~ ~ H . 6 C
. . I

5.1.9 Sample Cas Manifold. A sample gas manifold, to divert a portion of the sample gas stream to the analyzer, and the remainder to the by-pass discharge vent. The sample gas manifold should also include provisions for introducing calibration gases directly to the analyzer. The manifold may be constructed of any material that is nonreactive to the gas being sampled.
5.1.10 Gas Analyzer. A UV or NDlR absorption or fluorescence analyzer, to determine continuously the SO, concentration in the sample gas stream. The analyzer shall meet the applicable performance specifications of Section 4. A means of controlling the analyzer flow rate and a device for determining proper sample flow rate (e.g., precision rotameter, pressure gauge downstream of all flow controls, etc.) shall be provided at the analyzer.
(Note: Housing the analyzer(s) in a clean, thermally-stable, vibration-free environment will minimize drift in the analyzer calibration.)
5.1.11 Data Recorder. A strip chart recorder, analog computer, or digital recorder, for recording measurement data. The data recorder resolution (i.e., readability) shall be 0.5 percent of span. Alternatively, a digital or analog meter having a resolution of 0.5 percent of span may be used to obtain the analyzer responses and the readings may be recorded manually. If this alternative i s used, the readings shall be obtained at equally spaced intervals over the duration of the sampling run. For sampling run durations of less than 1 hour, measurements at 1-minute intervals or a minimum of 30 measurements, whichever is less restrictive, shall be obtained. For sampling run durations greater than 1 hour, measurements at 2-minute intervals or a minimum of 96 measurements, whichever i s less restrictive, shall be obtained.
5.2 Method 6 Apparatus and Reagents. The apparatus and reagents described in Method 6, and shown by the schematic of the sampling train in Figure 6C-2, to conduct the interference check.
5.3 SO2 Calibration Gases. The calibration gases for the gas analyzer shall be SO, in N, or SO, in air. Alternatively, SOJCO,, SOJO,, or SOJCOJO, gas mixtures in N, may be used. For fluorescencebased analyzers, the 0, and CO, concentrations of the calibration gases as introduced to the analyzer shall be within 1 percent (absolute) 0, and 1 percent (absolute) CO, of the 0, and Co, concentrations of the effluent samples as introduced to the analyzer. Alternatively, for fluorescence-based analyzers, use calibration blends of SO, in air and the nomographs provided by the vendor to determine the quenching correction factor (the effluent 0, and CO, concentrations must be known). Use three calibration gases as specified below:
5.3.1 High-Range Gas. Concentration equivalent to 80 to 100 percent of the span.
5.3.2 Mid-Range Gas. Concentration equivalent to 40 to 60 percent of the span.
5.3.3 Zero Gas. Concentration of less than 0.25 percent of the span. Purified ambient air may be used for the zero gas by passing air through a charcoal filter, or through one or more impingers containing a solution of 3 percent H,O,.
4 042694C.UTACK\WPLMETHODN-METH.6C
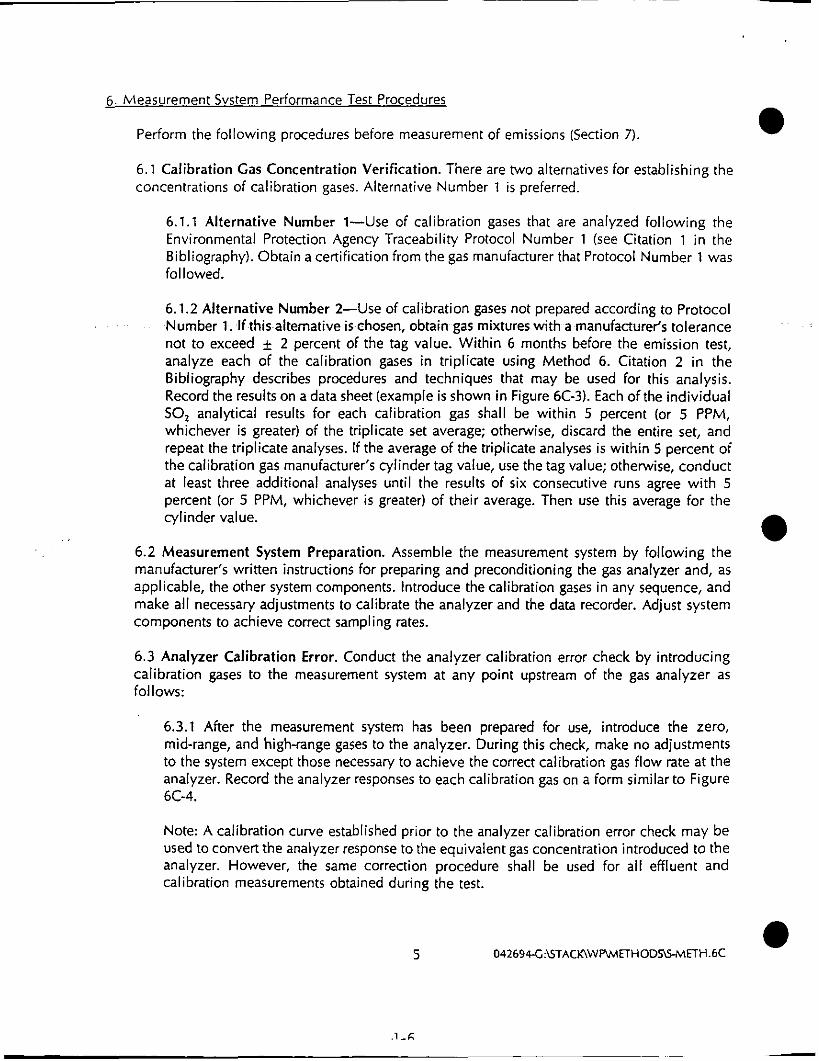
6. Measurement Svstem Performance Test Procedures
Perform the following procedures before measurement of emissions (Section 7).
6.1 Calibration Gas Concentration Verification. There are two alternatives for establishing the concentrations of calibration gases. Alternative Number 1 is preferred.
6.1.1 Alternative Number 1-Use of calibration gases that are analyzed following the Environmental Protection Agency Traceability Protocol Number 1 (see Citation 1 in the Bibliography). Obtain a certification from the gas manufacturer that Protocol Number 1 was followed.
6.1.2 Alternative Number 2-uSe of calibration gases not prepared according to Protocol Number 1 . If this alternative is chosen, obtain gas mixtures with a manufacturefs tolerance not to exceed 2 percent of the tag value. Within 6 months before the emission test, analyze each of the calibration gases in triplicate using Method 6. Citation 2 in the Bibliography describes procedures and techniques that may be used for this analysis. Record the results on a data sheet (example is shown in Figure 6C-3). Each of the individual SO, analytical results for each calibration gas shall be within 5 percent (or 5 PPM, whichever is greater) of the triplicate set average; otherwise, discard the entire set, and repeat the triplicate analyses. If the average of the triplicate analyses is within 5 percent of the calibration gas manufacturer’s cylinder tag value, use the tag value; otherwise, conduct at least three additional analyses until the results of six consecutive runs agree with 5 percent (or 5 PPM, whichever i s greater) of their average. Then use this average for the cylinder value.
6.2 Measurement System Preparation. Assemble the measurement system by following the manufacturer’s written instructions for preparing and preconditioning the gas analyzer and, as applicable, the other system components. Introduce the calibration gases in any sequence, and make all necessary adjustments to calibrate the analyzer and the data recorder. Adjust system components to achieve correct sampling rates.
6.3 Analyzer Calibration Error. Conduct the analyzer calibration error check by introducing calibration gases to the measurement system at any point upstream of the gas analyzer as follows:
6.3.1 After the measurement system has been prepared for use, introduce the zero, mid-range, and high-range gases to the analyzer. During this check, make no adjustments to the system except those necessary to achieve the correct calibration gas flow rate at the analyzer. Record the analyzer responses to each calibration gas on a form similar to Figure 6C-4.
Note: A calibration curve established prior to the analyzer calibration error check may be used to convert the analyzer response to the equivalent gas concentration introduced to the analyzer. However, the same correction procedure shall be used for a l l effluent and calibration measurements obtained during the test.
5 042694C:\STACK\WPMETHODSSMETH.6C

0
0
6.3.2 The analyzer calibration error check shall be considered invalid if the gas concentration displayed by the analyzer exceeds i: 2 percent of the span for any of the calibration gases. If an invalid calibration is exhibited, take corrective action, and repeat the analyzer calibration error check until acceptable performance is achieved.
6.4 Sampling System Bias Check. Perform the sampling system bias check by introducing calibration gases at the calibration valve installed at the outlet of the sampling probe. A zero gas and either the mid-range or high-range gas, whichever most closely approximates the effluent concentrations, shall be used for this check as follows:
6.4.1 Introduce the upscale calibration gas, and record the gas concentration displayed by the analyzer on a form similar to Figure 6C-5. Then introduce zero gas, and record the gas concentration displayed by the analyzer. During the sampling system bias check, operate the system at the normal sampling rate, and make no adjustments to the measurement system other than those necessary to achieve proper calibration gas flow rates at the analyzer. Alternately introduce the zero and upscale gases until a stable response is achieved. The tester shall determine the measurement system response time by observing the times required to achieve a stable response for both the zero and upscale gases. Note the longer of the two times as the response time.
6.4.2 The sampling system bias check shall be considered invalid if the difference between the gas concentrations displayed by the measurement system for the analyzer calibration error check and for the sampling system bias check exceeds f 5 percent of the span for either the zero or upscale calibration gas. If an invalid calibration i s exhibited, take corrective action, and repeat-the sampling system bias check until acceptable performance is achieved. If adjustment to the analyzer i s required, first repeat the analyzer calibration error check, then repeat the sampling system bias check.
7. Emission Test Procedure
7.1 Selection of Sampling Site and Sampling Points. Select a measurement site and sampling points using the same criteria that are applicable to Method 6.
7.2 Interference Check Preparation. For each individual analyzer, conduct an interference check for at least three runs during the initial field test on a particular source category. Retain the results, and report them with each test performed on that source category. If an interference check is being performed, assemble the modified Method 6 train (flow control valve, two midget impingers containing 3 percent H,O,, and dry gas meter) as shown in Figure 6C-2. Install the sampling train to obtain a sample at the measurement system sample by-pass discharge vent. Record the initial dry gas meter reading.
,
6 042694-C:\STACK\WP&lFTHODS\SMETH.6C
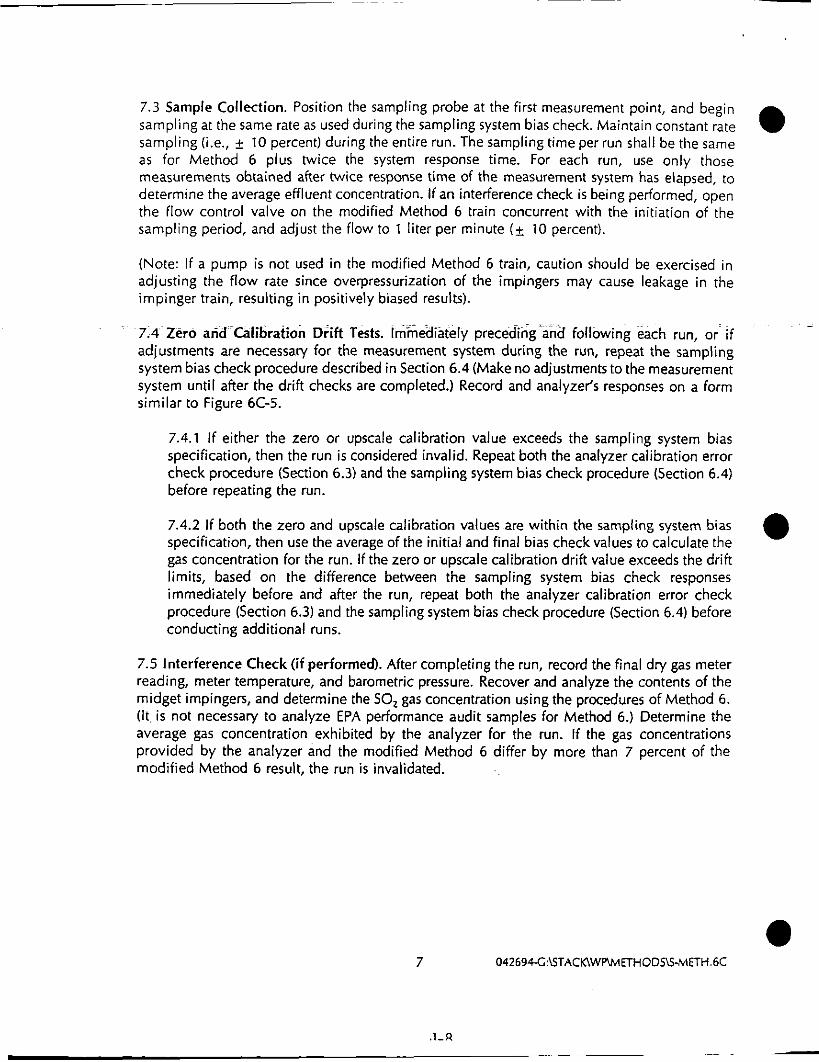
7.3 Sample Collection. Position the sampling probe at the first measurement point, and begin sampling at the same rate as used during the sampling system bias check. Maintain constant rate sampling (i.e., 10 percent) during the entire run. The sampling time per run shall be the same as for Method 6 plus twice the system response time. For each run, use only those measurements obtained after twice response time of the measurement system has elapsed, to determine the average effluent concentration. If an interference check is being performed, open the flow control valve on the modified Method 6 train concurrent with the initiation of the sampling period, and adjust the flow to 1 liter per minute ( 5 10 percent).
(Note: If a pump is not used in the modified Method 6 train, caution should be exercised in adjusting the flow rate since overpressurization of the impingers may cause leakage in the impinger train, resulting in positively biased results).
714. Zero and'~Ca1ibration Drift Tests. Immediately precedingana following each run, or^ if adjustments are necessary for the measurement system during the run, repeat the sampling system bias check procedure described in Section 6.4 (Make no adjustments to the measurement system until after the drift checks are completed.) Record and analyzer's responses on a form similar to Figure 6C-5.
- .~~. . ~.
7.4.1 If either the zero or upscale calibration value exceeds the sampling system bias specification, then the run is considered invalid. Repeat both the analyzer calibration error check procedure (Section 6.3) and the sampling system bias check procedure (Section 6.4) before repeating the run.
7.4.2 If both the zero and upscale calibration values are within the sampling system bias specification, then use the average of the initial and final bias check values to calculate the gas concentration for the run. If the zero or upscale calibration drift value exceeds the drift limits, based on the difference between the sampling system bias check responses immediately before and after the run, repeat both the analyzer calibration error check procedure (Section 6.3) and the sampling system bias check procedure (Section 6.4) before conducting additional runs.
e
7.5 Interference Check (if performed). After completing the run, record the final dry gas meter reading, meter temperature, and barometric pressure. Recover and analyze the contents of the midget impingen, and determine the SO, gas concentration using the procedures of Method 6. (It, i s not necessary to analyze €PA performance audit samples for Method 6.) Determine the average gas concentration exhibited by the analyzer for the run. If the gas concentrations provided by the analyzer and the modified Method 6 differ by more than 7 percent of the modified Method 6 result, the run i s invalidated.
7 042694C:L5TACKlWP\METHODS~-METH.6C
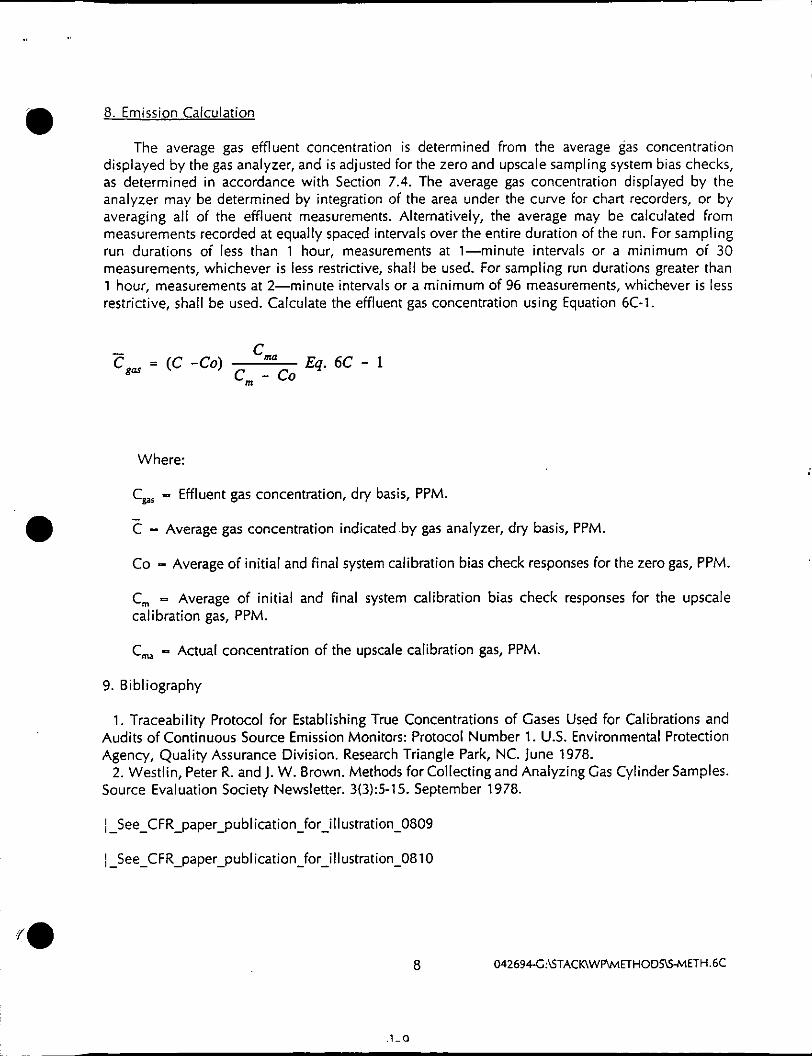
8. Emission Calculation 0 The average gas effluent concentration is determined from the average gas concentration
displayed by the gas analyzer, and is adjusted for the zero and upscale sampling system bias checks, as determined in accordance with Section 7.4. The average gas concentration displayed by the analyzer may be determined by integration of the area under the curve for chart recorders, or by averaging all of the effluent measurements. Alternatively, the average may be calculated from measurements recorded at equally spaced intervals over the entire duration of the run. For sampling run durations of less than 1 hour, measurements at 1-minute intervals or a minimum of 30 measurements, whichever is less restrictive, shall be used. For sampling run durations greater than 1 hour, measurements at 2-minute intervals or a minimum of 96 measurements, whichever is less restrictive, shall be used. Calculate the effluent gas concentration using Equation 6C-1.
Eq. 6C - 1 - c, = (C -CO) c, - co
Where:
C,, = Effluent gas concentration, dry basis, PPM.
C - Average gas concentration indicated .by gas analyzer, dry basis, PPM.
Co - Average of initial and final system calibration bias check responses for the zero gas, PPM.
C, - Average of initial and final system calibration bias check responses for the upscale calibration gas, PPM.
C, - Actual Concentration of the upscale calibration gas, PPM.
- 0
9. Bibliography
1. Traceability Protocol for Establishing True Concentrations of Gases Used for Calibrations and Audits of Continuous Source Emission Monitors: Protocol Number 1. US. Environmental Protection Agency, Quality Assurance Division. Research Triangle Park, NC. June 1978.
2. Westlin, Peter R. and j. W. Brown. Methods for Collecting and Analyzing Gas Cylinder Samples. Source Evaluation Society Newsletter. 3(3):5-15. September 1978.
1 -5ee-CFR-paper-pubI ication~for~illustration~0809
1 I- See - CFR - paper - publication~for~illustration~0810
8 042694-C:\STACK\WP\METHODS\SMETH.6C
APPENDIX K
CALCULATION EQUATIONS
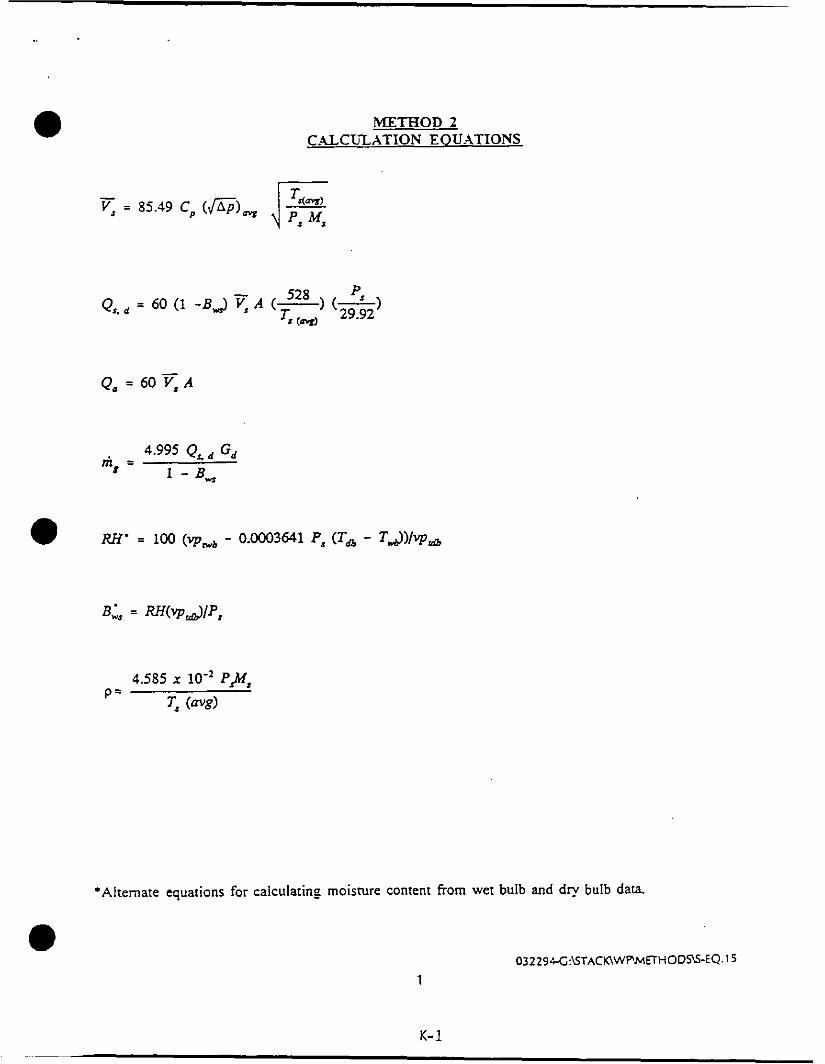
METHOD 2 CPLLCbTLZATION EOUATIONS
Q. = 60 A
*Alternate equations for calculating moisture content from wet bulb and d y bulb data
032294-C:\STACK\WPMETHODN-EQ. 15
1
K- 1
A
W f
EA
Y
G*
I
Md
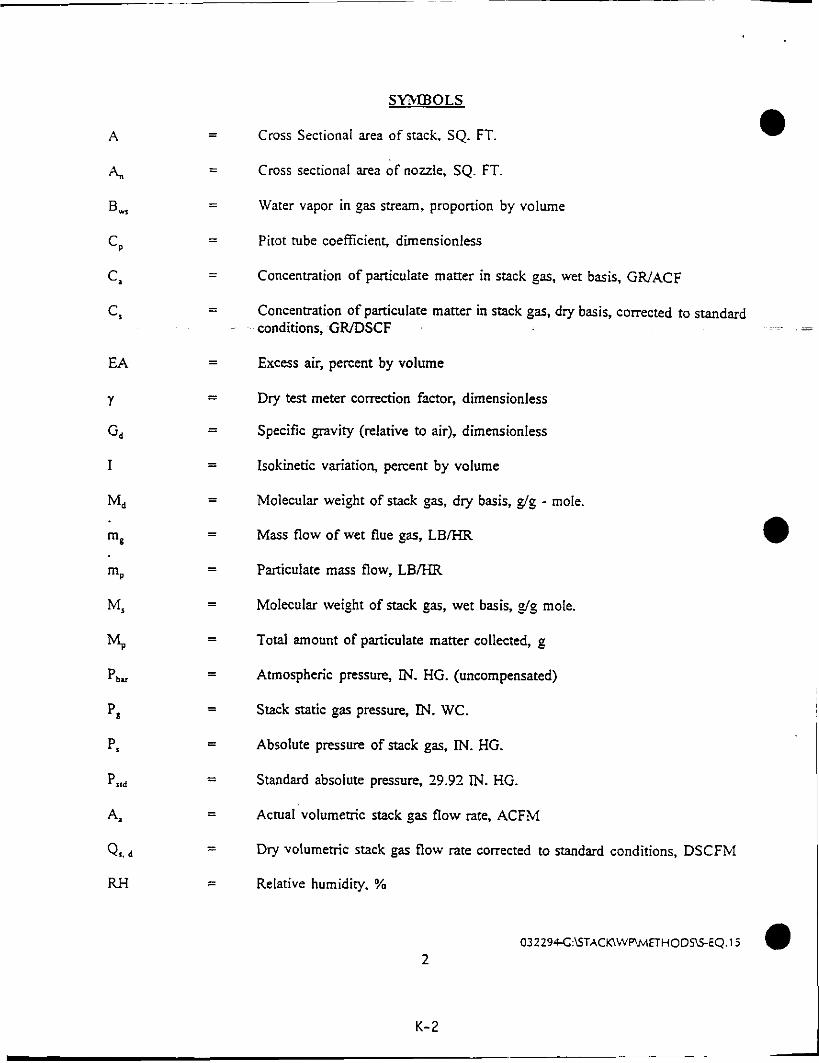
SYXBOLS
Cross Sectional area of stack, SQ. FT.
Cross sectional area of nozzle, SQ. FT.
Water vapor in gas stream, proportion by volume
Pitot tube coeficienc dimensionless
Concentration of particulate matter in stack %as, wet basis, GWACF
Concentration of particulate matter in stack gas, dry basis, corrected to standard conditions, GIUDSCF
Excess air, percent by volume
Dry test meter correction factor, dimensionless
Specific gravity (relative to air), dimensionless
Isokinetic vm-ation, percent by volume
Molecular weight of stack gas, dry basis, g/g - mole.
Mass flow of wet flue gas, LB/HR
Particulate mass flow, LB/HR
Molecular weight of stack gas, wet basis, g/g mole.
Total amount of particulate matter collected, g
Atmospheric pressure, IN. HG. (uncompensated)
Stack static gas pressure, IN. WC.
Absolute pressure of stack gas, IN. HG.
Standard absolute pressure, 29.92 M. HG.
Actual volumetric stack gas flow rate, ACFM
Dly volumetric stack gas flow rate corrected to standard conditions, DSCFM
Relative humidity, %
~ ~ ~ ~ ~ ~ - G : ~ T A C K I ' V V ~ E T H O O ~ - E Q . 15
2
K-2
- AH
AP
Y
P
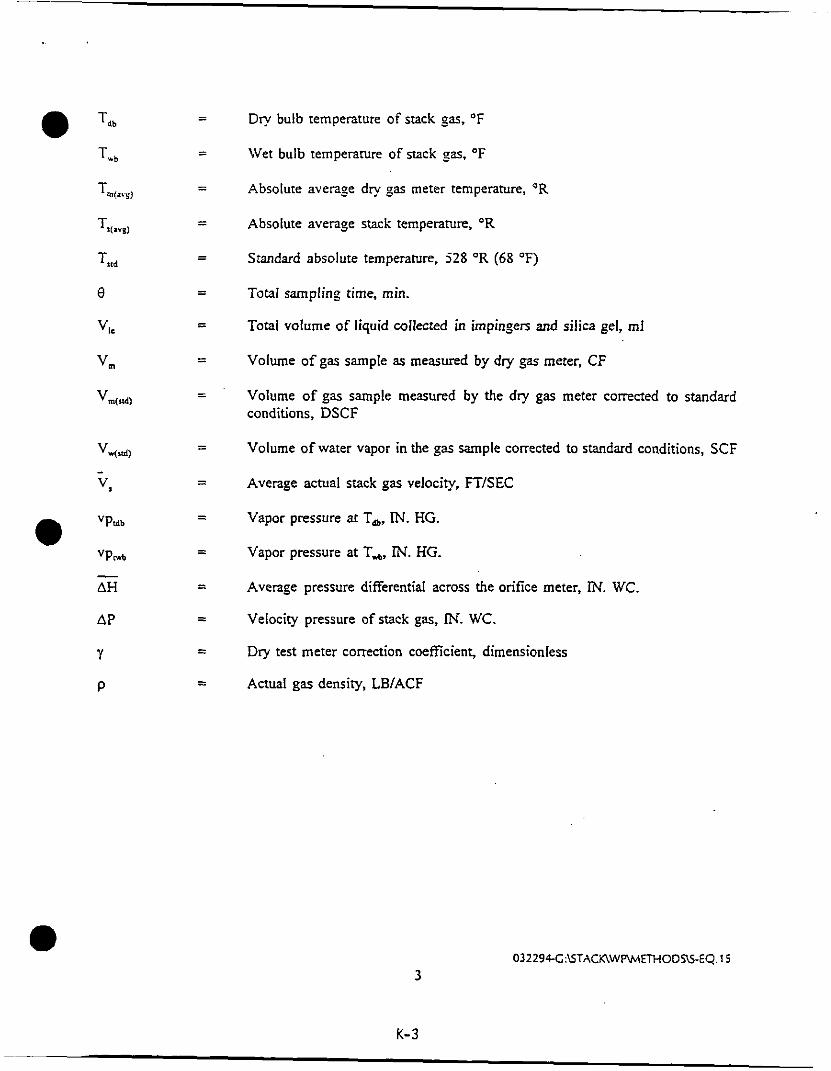
Dry bulb temperature of stack sas, O F
Wet bulb temperature of stack gas, O F
Absolute average dry gas meter temperature, O R
Absolute average stack temperature, O R
Standard absolute temperature. 528 "R (68 O F )
Total sampling time, min.
Total volume of liquid collected in impingen and silica gel, rnl
Volume of gas sample as measured by dry gas meter, CF
Volume of gas sample measured by the dry gas meter corrected to standard conditions, DSCF
Volume of water vapor in the gas sample corrected to standard conditions, SCF
Average actual stack gas velocity, FT/SEC
Vapor pressure at Ta, IN. HG.
Vapor pressure at T.+, IN. HG.
Average pressure differential across the orifice meter, M. WC.
Velocity pressure of stack gas, IN. WC.
Dry test meter correction coefficient, dimensionless
Actual gas density, LB/ACF
032294C:\STACK\WP\M€THODS\S-€Q. 15
3
K- 3 -
%EA
Md =
M, =
100(%0. - 0.5%
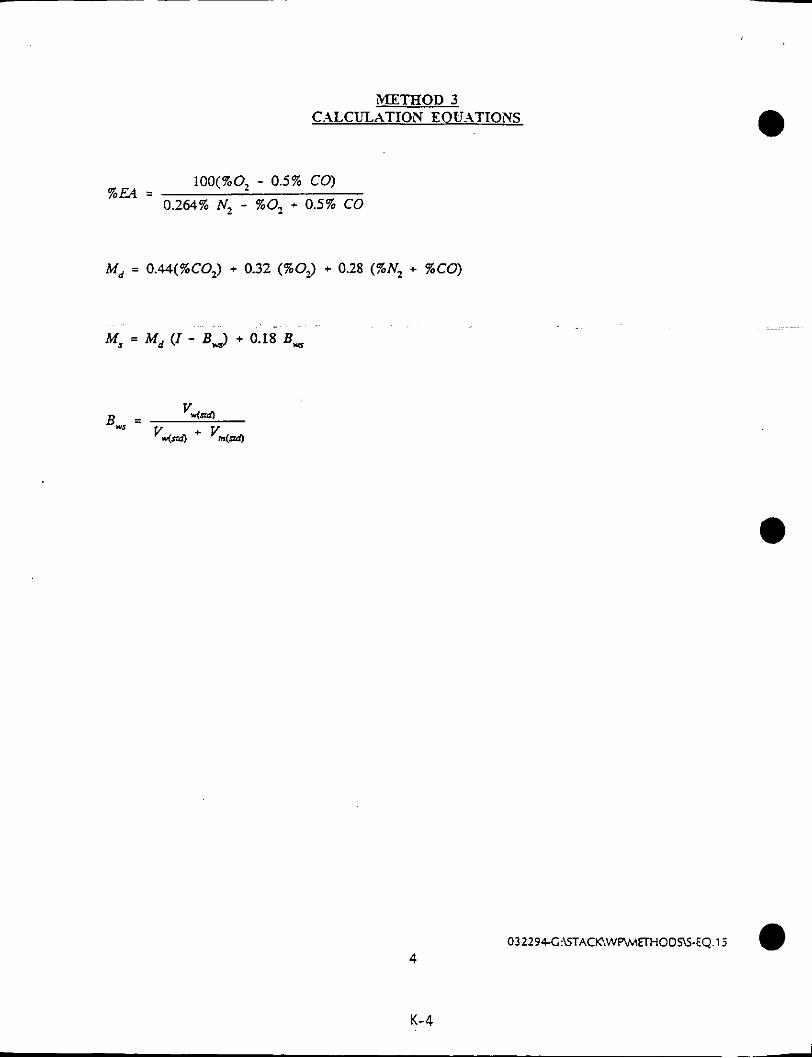
;METHOD 3 C.ALCLZ.ATION EOU.AT1OYS
CO) - i - -
0.264% N2 - %O, + 0.5% CO
0.44(%CO2) + 032 (%OJ + 0.28 (%Nz
.
0.18 B ,
96 CO)
e
4 032294-C:KTACK?WP\MEHODSE-EQ.15
K-4
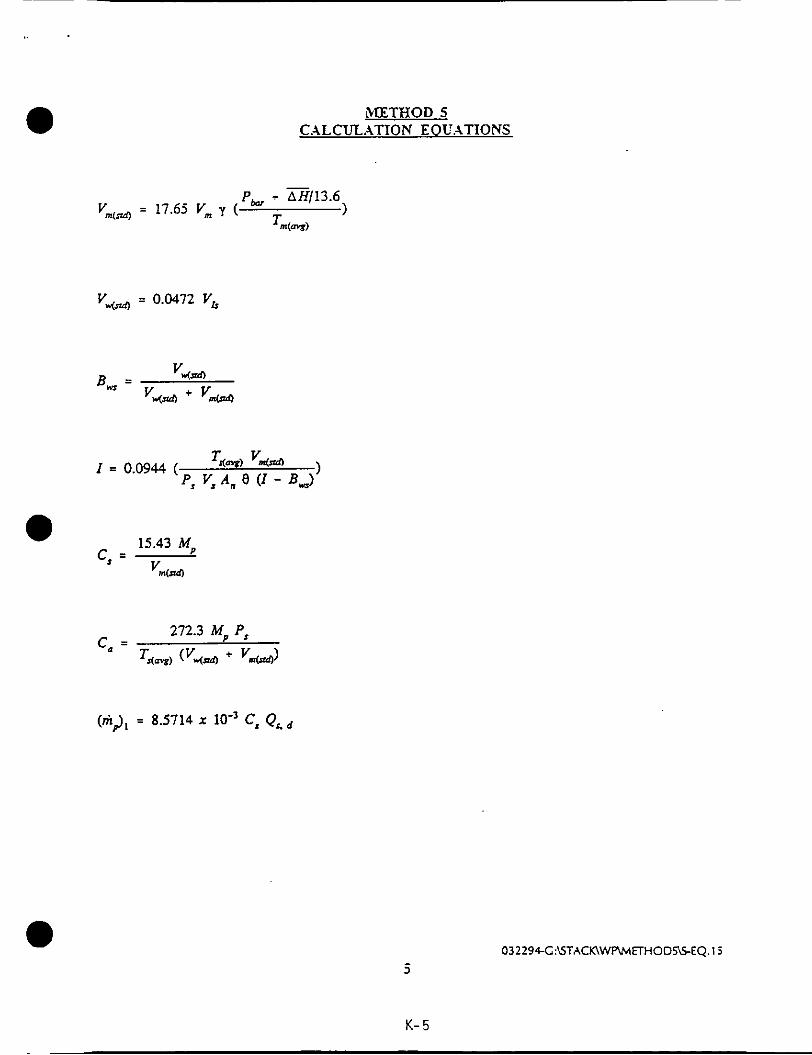
a METHOD 5 CALCULATION EOU.4TIONS
Pb + z113.6 Vm(- = 17.65 V,,, y ( 1
V4& = 0.0472 V,
15.43 M,
V m m c, =
a
(mJ, = 8.5714 x lo-' C, QLd
a - 3
K- 5
032294-G:ETACK\WPUIETHODSE-S-Eq. 13
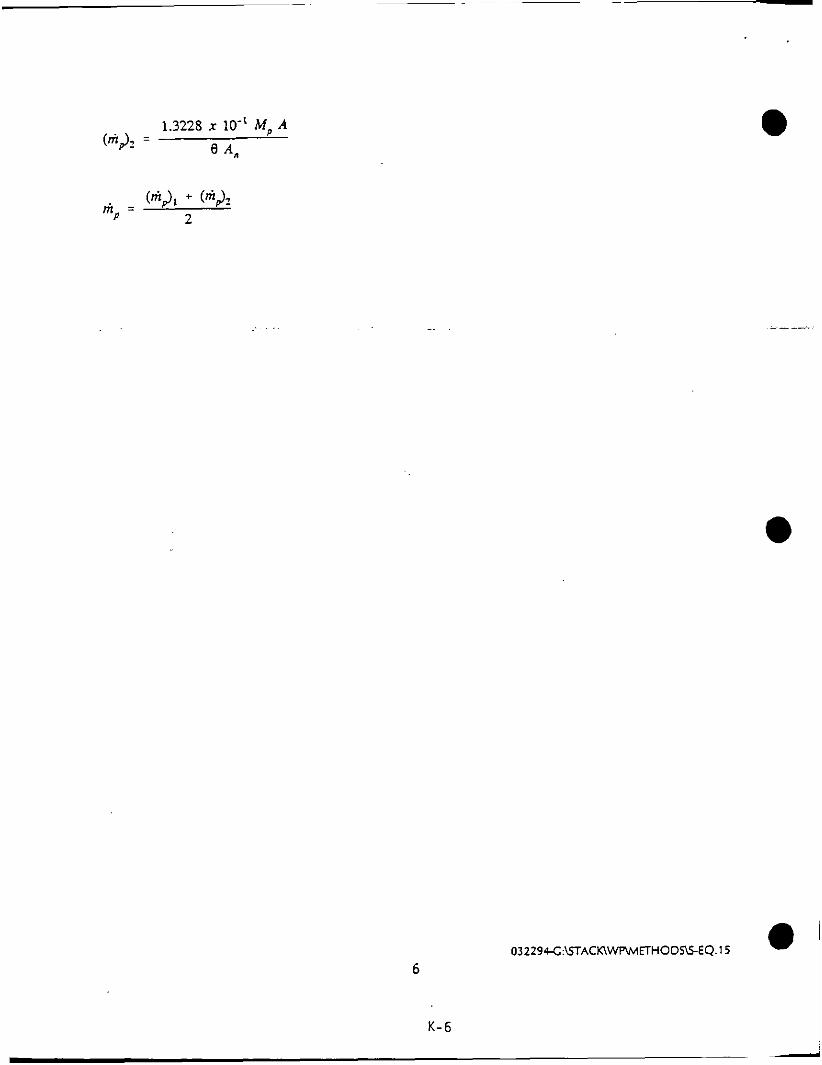
1.3228 x lo-' M, A =
e 4
032294-G:WACK\WPMETHODN-EQ.15 a 6
K- 6 -
0
e
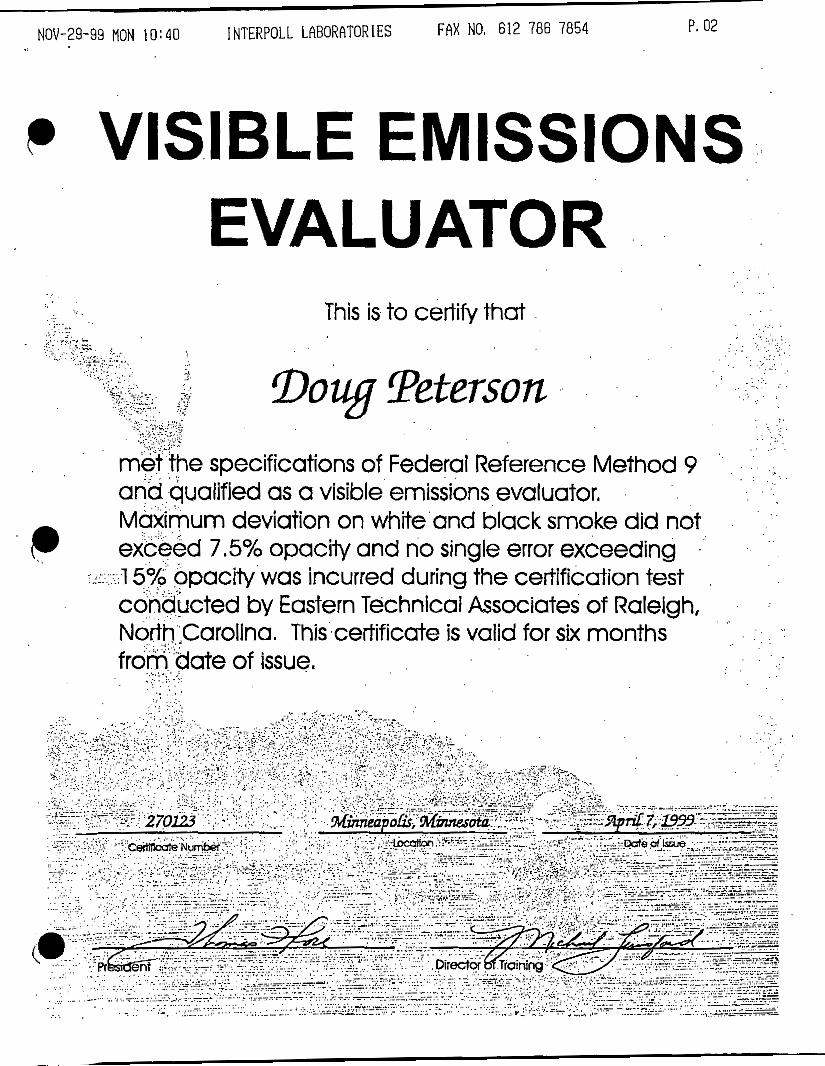
NOV-29-99 MON 10:40 INTERPOLL LABORATORIES FAX NO. 612 786 7854 P. 02
P VISIBLE EMISSIONS EVALUATOR
. . 'i . . . ..... ..
.̂ This is to certify that
:*
. I Doug Teterson ..
, .
. . . . ...
. . . e specifications of Federal Reference Method 9 " . . ' . .., .. . . . . .
. . . .
and.qualified as a visible' emissions evaluator. urn deviation on white'and black smoke did not
7.5% opacity and no single error exceeding .''
acity'was incurred during the certification test ted by Eastern Technical Associates of Raleigh, ,
rolina. This'.certificate is valid for six months :
... . . . .
. . . .
. . of issue.
8:40 AM 8:41 AM 8:42 AM 8:43 AM 8:44 AM 8:45 AM 8:46 AM 8:47AM 8:48AM 8:49 AM 8:50 AM 851 AM 8:52AM 8:53AM 8 : s AM 8:55AM 8:56 AM 8:57 AM 8:58 AM 859 AM 9:00 AM 9:Ol AM 9:02 AM 9:03 AM 9:04 AM 9:05 AM 9:06 AM 9:07 AM 9:08 AM 9:09 AM 9:lO AM 9:11 AM 9:12 AM 9:13AM 9:14 AM 9:15 AM 9:16 AM 9:17AM 9:18 AM 9:19 AM
Mathy Constuction Superior, WI
Plant 25 Stack 8/11/99 Run 1
so2 DDm. W
50.91 48.60 47.33 47.19 46.99 48.36 49.16 50.64 50.12 49.08 48.99 49.67 50.74 52.52 50.84 50.16 50.85 51.42 51.26 52.02 51.92 51.64
. 52.07 50.37 47.16 45.52 43.86 42.84 41.74 42.98 42.90 43.47 46.45 47.77 47.25 45.72 45.69 47.99 48.23 47.60
0 2 %, d C02 %, W
12.80 4.24 12.99 13.14 13.23 13.30 13.18 12.86 12.89 13.00 13.07 13.17 13.14 12.81 12.95 12.94 13.09 13.14 13.22 12.96 12.79 13.03 13.09 13.16 13.47 13.98 13.76 13.93 14.05 14.03 14.06 14.05 13.78 13.62 13.53 13.58 13.62 13.69 13.45 13.28 13.43
4.16 4.08 4.02 4.04 4.02 4.16 4.16 4.11 4.05 4.01 4.00 4.13 4.13 4.10 4.04 4.01 3.99 4.08 4.15 4.08 4.03 4.00 3.87 3.62 3.68 3.60 3.53 3.51 3.56 3.53 3.63 3.72 3.81 3.79 3.75 3.70 3.77 3.91 3.86
9:20 AM 9:21 AM 9:22 AM 9:23 AM 9:24 AM 9:25 AM 9:26AM 9:27 AM 9:28 AM 9:29 AM 9:30 AM 9:31 AM 9:32 AM 9:~33. AM
9:35 AM 9:36 AM 9:37 AM 9:38 AM 9:39 AM
Average
g;G~AM
47.02 13.59 3.77 48.17 13.64 3.74 47.80 13.67 3.74 48.94 13.45 3.85 48.98 13.23 3.93 49.41 13.36 3.89 49.61 13.43 3.86 51.12 13.60 3.79 48.01 14.01 3.67 44.19 13.96 3.57 42.64 13.71 3.65 43.25 13.64 3.68 44.38 13.54 3.74 51.92 13.54 3.81 44.71 15.84 2.97 42.44 14.32 3.26 40.74 13.32 3.69
' 42.11 12.92 3.84 43.12 12.91 3.96 46.23 13.03 3.93
47.58 13.43 3.85
Mathy Constuction Superior, WI Plant 25 Stack
VOLUMETRIC FLOW RATE NUMBER OF SAMPLE POINTS
PT. NO. 1 2 3 4 5 6 7 8 9 10 11 12 13 14 15 16 17 18 19 20 21 22 23 24 25
AVERAGE
A- 1 -2 -3 -4 -5
B- 1 -2 -3 -4 -5 c-1 -2 -3 -4 -5
D- 1 -2 -3 -4 -5 E- 1 -2 -3 -4 -5
MOISTURE CONTENT METER VOLUME AVERAGE METER TEMP GAS METER COEF. (Y) GAS METER DELTA H@ GRAMS OF WATER BAROMETRIC PRESSURE
STANDARD METER VOLUME MOISTURE CONTENT
OXYGEN % co 2 %
- K STANDARD CFM
DELTA P .97 1.75 1.5 1.5
1.55 1.2 1.4 1.3 1.2
1.25 .85 1.25 1.1 1 . l 1.2 .98 .98 1.1
1.05 1.05 .95 .97
1.15 1.1 1.2
1.186
DATA 38.52 78.6
1.001 9 1.91 303. 28.9
36.707 27.995
13.515 5.216
1,134.520
18.909
811 1199 Test 1 Run 1
25
SO. RT P .985 1.323 1.225 1.225 1.245 1.095 1.183 1.14 1.095 1.118 ,922 1.118 1.049 1.049 1.095
.99
.99 1.049 1.025 1.025 ,975 ,985
1.072 1.049 1.095 1.085
FLOW RATE STATIC PRESSURE PITOT COEF.
DUCT WIDTH(IN) DUCT LENTGH(IN) DUCT AREA (SQ.FT.) STACK DIA. (IN) STACK AREA (SQ.FT.)
TEMP 298.6 298.6 298.6 298.6 298.6 298.6 298.6 298.6 298.6 298.6 298.6 298.6 298.6 298.6 298.6 298.6 298.6 298.6 298.6 298.6 298.6 298.6 298.6 298.6 298.6 298.6
MOLECULAR WEIGHT (DRY) MOLECULAR WEIGHT (WET) STACK PRESSURE FEET PER SECOND ACTUAL CFM DRY STANDARD CFM
- TIME 8:40 AM
9:43 A M
-.7 0.84
31.5 27.5
6.016
29.375 26.191 28.849 78.063 28175.9 13615.19
Mathy Constuction Superior, WI Plant 25 Stack
8/11 /99 Test 1 Run 1
FIELD CALCULATIONS
RAW DATA TABLE
INSTRUMENT PPMOR % ZERO SPAN GAS 02 (dry) 13.43 0.07 10.85 10.9 C02 (wet) 3.85 0.13 11.03 1 1 . SO2 (wet) 47.58 1.27 89.85 , 89.8
MOISTURE 27.99 STANDARD CFH FUEL FACTOR C KSTANDARDCFM DSCFM 13615.2
RESULTS
0 2 % (dry) 13.51
C02 % (dry) 5.22
SO2 (dry) 65.2 SO2 LBSlHR
Fo
13.51 dry
3.76 wet
46.95 wet
1.1 34,520
18.909
8.841
1.41 6
F-4

Time 1O:OO AM 1O:Ol AM 10:02 AM 10:03 AM 1004 AM 10:05 AM 10:06 AM 10:07 AM 10:08 AM 10:09 AM 1O:lO AM 1O:ll AM 10:12 AM 10:13AM 10:14 AM 10:15 AM 10:16 AM 10:17 AM 10:18AM 10:19AM 10:20 AM 10% AM 1022 AM 1023 AM 1024 AM 1025 AM 1026 AM 1027 AM 1028 AM 1029 AM 10:30 AM 10:31 AM 10:32 AM 10:33 AM 10% AM 10:35 AM 10:36 AM 10:37 AM 10:38 AM 10:39 AM
Mathy Constuction Superior, WI
Plant No. 25 Stack
Run 2 ai1 1/99
SO2 porn. w 50.42 50.09 49.34 49.34 48.28 48.25
. 46.90 47.20 47.00 47.45 46.93 47.75 47.80 48.07 48.01 49.79 48.23 48.48 47.34 46.83 47.27 49.18 48.24 47.06 46.22' 44.89 47.13
. 47.50 49.02 48.31 46.10 45.89 46.02 46.59 46.92 48.53 48.20 49.77 49.95 49.16
02 Yo, d COZ %. w 13.64 3.67 13.56 13.29 13.43 13.57 13.66 13.69 13.72 13.41 13.46 13.57 13.74 13.77 13.78 13.58 13.40 13.54 13.64 13.71 13.73 13.65 13.38 13.47 13.58 13.64 13.70 13.71 13.41 13.46 13.46 13.53 13.62 13.75 13.53 13.45 13.33 13.16 13.32 13.67 13.15
3.69 3.83 3.80 3.73 3.68 3.63 3.68 3.79 3.77 3.71 3.65 3.68 3.67 3.72 3.84 3.77 3.76 3.69 3.68 3.70 3.83 3.80 3.75 3.67 3.62 3.68 3.81 3.81 3.77 3.68 3.70 3.69 3.74 3.76 3.77 3.96 3.90 3.66 3.94
E-5

10:40 AM 10:41 AM 10:42 AM 10:43 AM 10:44 AM 10:45 AM 10:46 AM 10:47 AM 10:48 AM 10:49 AM 10:50 AM 10:51 AM 1052 AM 10:53 AM 10:54-AM 1055 AM 1056 AM 1057 AM 10:58 AM 1059 AM
Average
51.60 13.18 4.05 ' 51.35 13.05 4.03
49.02 13.15 3.94 48.26 13.29 3.85 49.08 13.31 3.84 49.19 13.30 3.88 49.78 13.00 4.05 51.16 13.07 4.04 50.65 13.12 3.98 49.96 13.23 3.93 49.1 1 13.29 3.89 49.12 13.37 3.88 50.27 13.12 3.96 49.89 13.02 3.99 49768 13.26 3.91 46.44 13.59 3.79 44.91 13.70 3.71 44.68 13.74 3.64 44.72 13.67 3.66 46.00 13.45 3.74
. 48.11 13.46 3.79
e
E-6

0
PT. NO. 1 2 3 4 5 6 7 8 9 10 11 12 13 14 15 16 17 18 19 20 21 22 23 24 25
AVERAGE
Mathy Constuction Superior. WI Plant No. 25 Stack
VOLUMETRIC FLOW RATE NUMBER OF SAMPLE POINTS
A-1 -2 -3 -4 -5
B- 1 -2 -3 -4 -5 c-1 -2 -3 -4 -5
D-1 -2 -3 -4 -5 E- 1 -2 -3 -4 -5
MOISTURE CONTENT
METER VOLUME AVERAGE METER TEMP GAS METER COEF. (Y) GAS METER DELTA H A T GRAMS OF WATER BAROMETRIC PRESSURE
STANDARD METER VOLUME MOISTURE CONTENT
OXYGEN % co 2 %
STANDARD CFH K STANDARD CFM
DELTA P 1.4 1.6 1.7 1 .8
1.75 1.1 1.1 1.2 1.2 1.1 1.1 1.2 1.2 1.1 .98 1.08 1.
1.05 .98
1.05 .99 .98 1.1 1.1 1.1
1.198
DATA
39.75 83.6
1.001 9 1.91 259. 28.9
37.53 24.531
13.534 4.986
1.1 33.974 18.9
811 1/99 Test 1 Run 2
sa. RT P 1.183 1.265 1.304 1.342 1.323 1.049 1.049 1.095 1.095 1.049 1.049 1.095 1.095 1.049 .99
1.039 1.
1.025 .99
1.025 ,995 .99
1.049 1.049 1.049
1.09
FLOW RATE
25 TEMP 295.5 295.5 295.5 295.5 295.5 295.5 295.5 295.5 295.5 295.5 295.5 295.5 295.5 295.5 295.5 295.5 295.5 295.5 295.5 295.5 295.5 295.5 295.5 295.5 295.5
STATIC PRESSURE PITOT COEF.
295.5
DUCT WIDTH(IN) DUCT LENTGH(IN) DUCT AREA (S0.FT.j STACK DIA. (IN) STACK AREA (S0.FT.j
MOLECULAR WEIGHT (DRY) MOLECULAR WEIGHT (WET) STACK PRESSURE FEET PER SECOND ACTUAL CFM DRY STANDARD CFM
TIME 1O:OO A M -
10:05 A M
-0.7 0.84
31.5 27.5
6.0156 0
0.0000
29.339 26.558 28.849 77.707
28047.25 14263.39

Mathy Constuction Superior, WI Plant No. 25 Stack
FIELD CALCULATIONS
811 1199 Test 1 Run 2
RAW DATA TABLE
INSTRUMENT PPM OR % ZERO SPAN - GAS 0 2 (dry) 13 46 0.05 10.85 10.9 C 0 2 (wet) 3.79 0.13 10.83 11 SO2 (wet) 48.17 7.65 89.13 89.8
MOISTURE 24.53 STANDARD CFH FUEL FACTOR c 0 K STANDARD CFM DSCFM 14263.4
RESULTS
0 2 % (dry) 13.53
CO2 % (dry) 4.99
SO2 ppm (dry) 63.28 SO2 L8SlHR
Fo
13.53 dry 3.76 wet
41.16 wet
1,133,974 18.9
8.989
1.477

Time 11:20 AM 11 :21 AM 11:22AM 11.23 AM 11:24AM 11:25 AM 11:26AM 11:27 AM 11:28 AM
1:29 AM 1:30 AM 1:31-AM 1:32 AM 1:33 AM 1:34 AM
11:35 AM 11:36AM 11:37AM 11:38AM 11:39 AM 11 :40 AM 11:41 AM 11 :42 AM 11:43AM 11:44AM 11:45 AM 11:46 AM 11:47AM 11:48 AM 11.49 AM 11:50AM 1151 AM 11:52AM 11:53AM 11:54 AM 11:55 AM 11:56AM 1157 AM 11:58AM 11:59AM
Mathy Constuction Superior, WI
Plant No. 25 Stack 811 1199 Run 3
so2 DDfll. W
50.02 54.10 51 .84 51.26 52.73 51.76 50.52 50.02 50.97 51 5 3 52.79 53.96
. 53.55 52.11 50.42 49.98 50.37 50.76 49.84 50.22 49.72 48.01 48.01 49.52 49.59 49.76 49.26 48.41 48.95 50.19 51.16 52.21 51.43 51.44 52.40 52.47 52.81 51.91 52.01 48.99
0 2 %. d C02 %. w 13.11 13.46 13.41 13.46 13.05 13.13 13.27 13.44 13.45 13.45 13.16 13.10 13.19 13.36 13.39 13.41 13.25 13.04 13.14 13.35 13.39 13.37 13.34 12.99 13.06 13.12 13.18 13.20 13.11 12.83 12.82 12.93 13.03 13.05 13.10 12.87 12.68 12.89 13.02 13.43
4.12 3.89 3.86 3.84 4.10 4.01 3.90 3.83 3.83 3.90 3.98 3.99 3.92 3.90 3.89 3.85 3.92 3.98 3.98 3.89 3.84 3.84 3.82 4.02 3.99 3.94 3.88 3.87 3.99 4.10 4.1 1 4.06 4.01 4.05 4.00 4.07 4.14 4.11 4.08 3.84
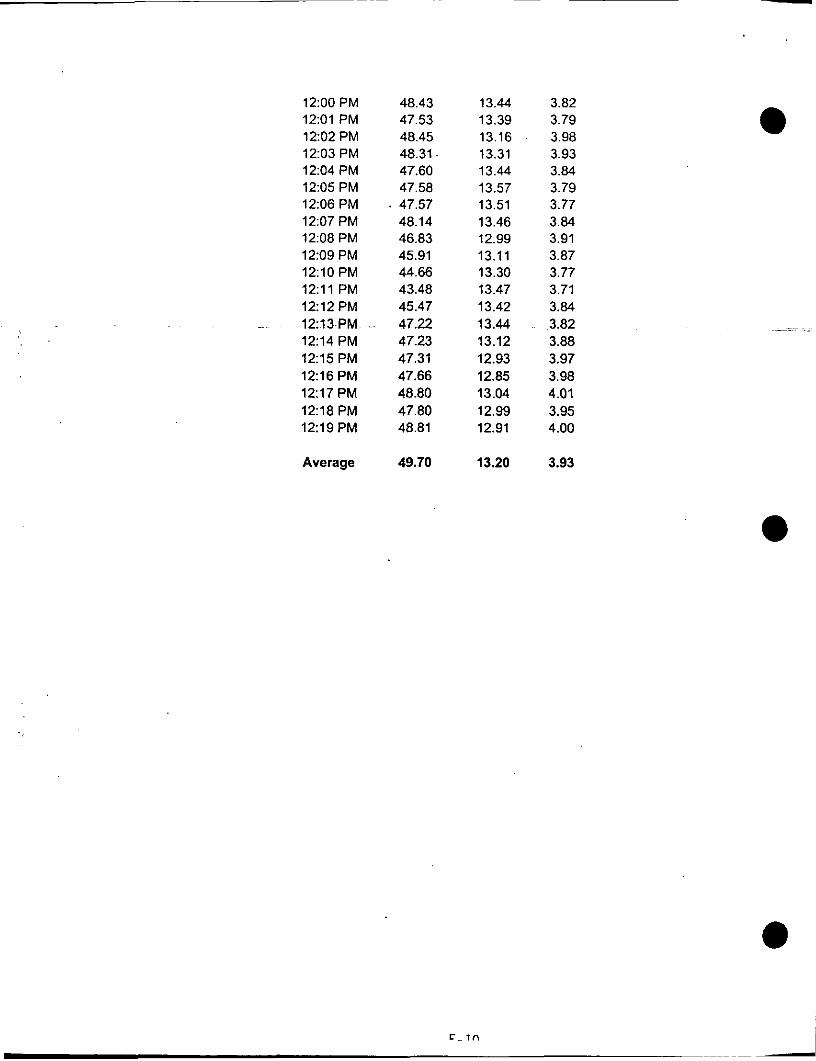
12:OO PM 12:Ol PM 12:02 PM 12:03 PM 12:04 PM 12:05 PM 12:06 PM 12:07 PM 12:08 PM 12:09 PM 12:lO PM 12:ll PM 12:12 PM 12:13 PM 12:14 PM 12:15 PM 12:16 PM 12:17 PM 12:18 PM 12:19 PM
Average
48.43 13.44 3.82 47.53 13.39 3.79 48.45 13.16 3.98 48.31 13.31 3.93 47.60 13.44 3.84 47.58 13.57 3.79
. 47.57 13.51 3.77 48.14 13.46 3.84 46.83 12.99 3.91 45.91 13.11 3.87 44.66 13.30 3.77 43.48 13.47 3.71 45.47 13.42 3.84 47.22 13.44 3.82 47.23 13.12 3.88 47.31 12.93 3.97 47.66 12.85 3.98 48.80 13.04 4.01 47.80 12.99 3.95 48.81 12.91 4.00
49.70 13.20 3.93
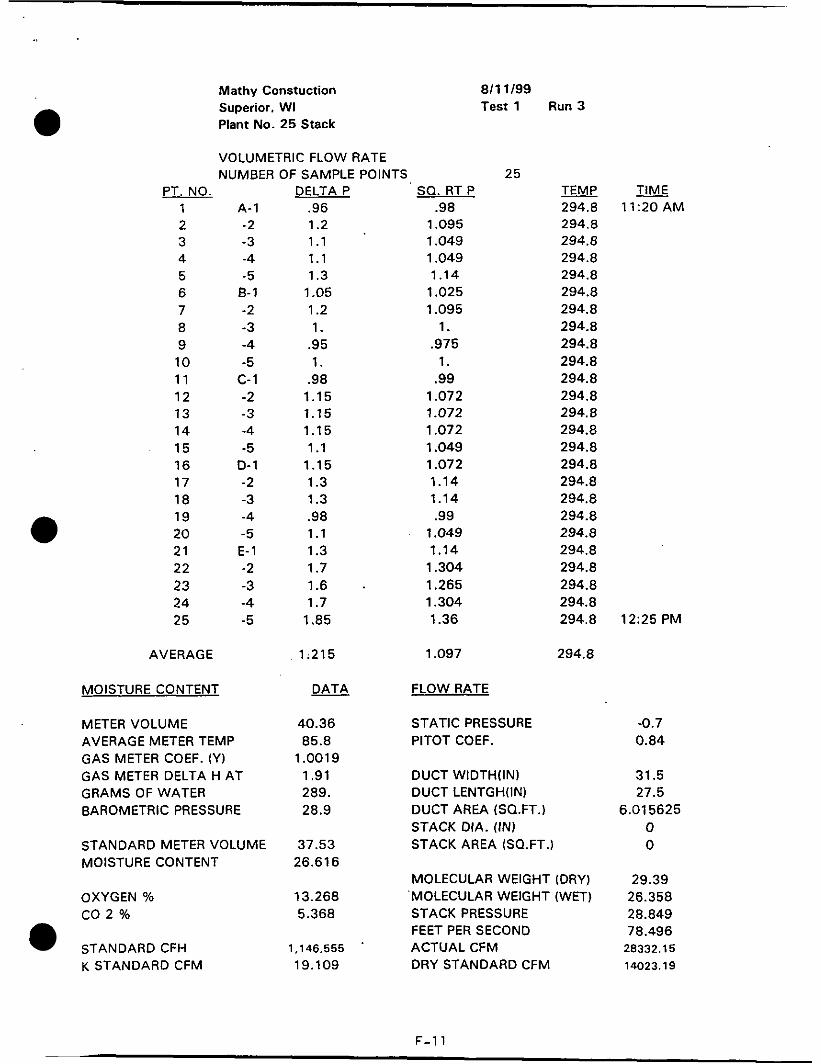
Mathy Constuction 811 1/99 Superior. WI Test 1 Run 3 Plant No. 25 Stack
VOLUMETRIC FLOW RATE NUMBER OF SAMPLE POINTS 25
PT. NO. 1 A-1 2 -2 3 -3 4 -4 5 -5 6 6- 1 7 -2 8 -3 9 -4 10 -5 11 c- 1 12 -2 13 -3 14 -4 15 -5 16 0-1 17 -2 18 -3 19 -4 20 -5 21 E- 1 22 -2 23 -3 24 -4 25 -5
AVERAGE
MOISTURE CONTENT
METER VOLUME AVERAGE METER TEMP GAS METER COEF. (Y) GAS METER DELTA H AT GRAMS OF WATER BAROMETRIC PRESSURE
STANDARD METER VOLUME MOISTURE CONTENT
OXYGEN % co 2 %
STANDARD CFH K STANDARD CFM
DELTA P .96 1.2 1.1 1.1 1.3
1.05 1.2 1.
,953 1.
.98 1.15 1.15 1.15 1.1
1.15 1.3 1.3 .98 1.1 1.3 1.7 1.6 1.7
1.85
1;215
DATA
40.36 85.8
1.001 9 1.91 289. 28.9
37.53 26.616
13.268 5.368
1,146,555 19.109
sa. RT P .98
1.095 1.049 1.049 1.14 1.025 1.095
1. .975
1. .99
1.072 1.072 1.072 1.049 1.072 1.14 1.14 .99
1.049 1.14 1.304 1.265 1.304 1.36
1.097
FLOW RATE
STATIC PRESSURE PITOT COEF.
DUCT WIDTH(IN1 DUCT LENTGHUN) DUCT AREA (SO.FT.) STACK DIA. (IN) STACK AREA (SQ.FT.)
TIME TEMP - 294.8 11:20 A M 294.8 294.8 294.8 294.8 294.8 294.8 294.8 294.8 294.8 294.8 294.8 294.8 294.8 294.8 294.8 294.8 294.8 294.8 294.8 294.8 294.8 294.8 294.8 294.8 12:25 PM
294.8
MOLECULAR WEIGHT (DRY) MOLECULAR WEIGHT (WET) STACK PRESSURE FEET PER SECOND ACTUAL CFM DRY STANDARD CFM
-0.7 0.84
31.5 27.5
6.01 5625 0 0
29.39 26.358 28.849 78.496
28332.15 14023.19
F-11
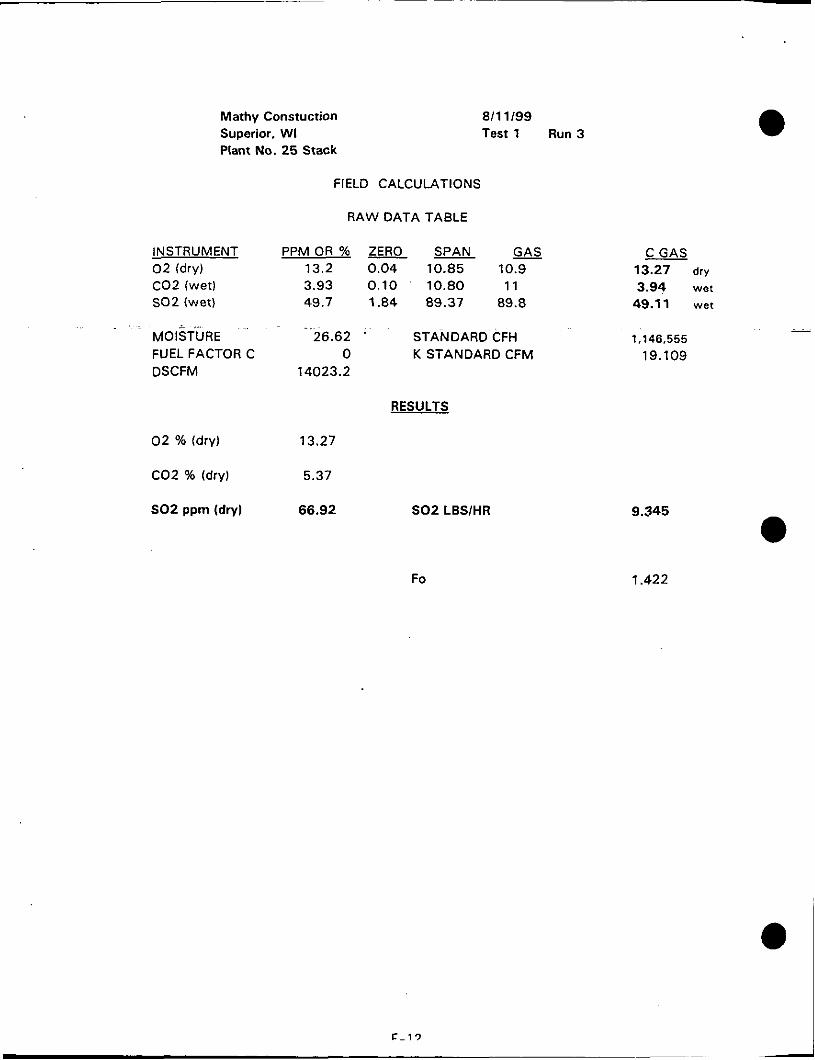
Mathy Constuction Superior, WI Plant No. 25 Stack
INSTRUMENT 0 2 (dry) C02 (wet1 SO2 (wet)
MOISTURE FUEL FACTOR C DSCFM
FIELD CALCULATIONS
RAW DATA TABLE
8/11/99 Test 1 Run 3
PPMOR% ZERO SPAN GAS 13.2 0.04 10.85 10.9 3.93 0.10 10.80 11 49.7 1.84 89.37 89.8
26.62 . STANDARD CFH 0 K STANDARD CFM
14023.2
RESULTS
13.27
5.37
66.92 SO2 LBSlHR
Fo
13.27 dry 3.94 wet
49.11 wet
1,146,555
19.109
9.345
1.422
APPENDIX F
GAS ANALYZER SPECIFICATIONS
Servomex e
. . . . . . .
. . . ..
. . :.. ..
I420 Oxygen Analyser
Instruction Manual Ref: 01420/001~0
'. i: Order as Dart No. 01420001A . . . . -~ . . ,. . .
. .. : . ,.. was 17982-28421
. - i
. . . . ~. . . ,. .. . .. .
. .. . . .. . .. . . ;;
. . . . ~
. .
. .
. . . . . . . . . . . .~ . . . . . . .

1 3 Samplinu System
The s a 9 l i n g system of the a n a l y s e r includes a combination f i l t e r / a u t o m a t i c flow c o n t r o l dev ice , designed t o keep a c o n s t a n t flow o f s m p l e gas through the mezsurins c e l l f o r varying i n p u t p r e s s u r e s and t o prevent t..e en t r ance of p a r t i c u l a t e matter i n t o the measuring c e l l . Excess flow is v e n t e d t o t h e by-pass.
-
- 1.4 S p e c i f i c a t i o n
Performance S p e c i f i c a t i o n ( t-mical)
R e p e a t a b i l i t y :
D r i f t : . ..
O U t D U t S
i)is?lay:
Output :
Opt ion :
? l o w a l a m o u t p t :
SamDle reauirements
Cond i t ion :
I c l e t p re s su re : r I 7 lowra t e : I L
i i l t e r i n g :
B e t t e r t h a n i / - 0 - 2 4 0 2 under c o n s t a n t conclit ions . L e s s than 0.2% 0 2 p e r week under c o n s t a n t condi t ions . (Excluding v a r i a t i o n due t o barometric pressure changes; r e a d i q is p ropor t iona l t o ba rcme t r i c p re s su re . )
3 1 / 2 5 i g i t LCD reading 0.0 t o 100.0% oxycen wi'h overrange c a p a b i l i t y .
0 to 1V (non-isolated1 f o r 0 t o 1 0 0 % oxygen a v a i l a b l e on ' D ' type connector l o c a t d on the back pane l o f the i o s t m e n t . Output impedance is less than 1 0 ohms.
4 - 201~4 i s o l a t e d , Max impedance 500 o b s .
Chznge over r e l z y con tac t rated a t 3A/115V ac, IA/240V ac o r l N 2 8 V dc. 4 sets of single pole changeover c o n t a c t s . Ala&- becomes a c t i v e when sample gas flow through the ana lyse r fa i l s .
C l e L i , dry gas viLA 6 e w p o i n t 5 deg C below ambient temperature.
0.5 to 3 p s i g (3.5 t o 2lk?z). I n l e t p r e s s u r e changes u i t h i n t h i s range w r l l chance +&e reading by Less than 0.1% 02. k y be ope ra t ed u? t o 1Opsig (70kSa) u i t h t e c r a z e d s z + b i l i t y .
L.5 t o 6 l i t r e s / m i n u t e approximately deFez2ing on s m p l a presstlre.
0 . 6 micro- replaceable ' f i l t e r i n t e g r a l t o t h e . automatic flow coctzo l device.
e
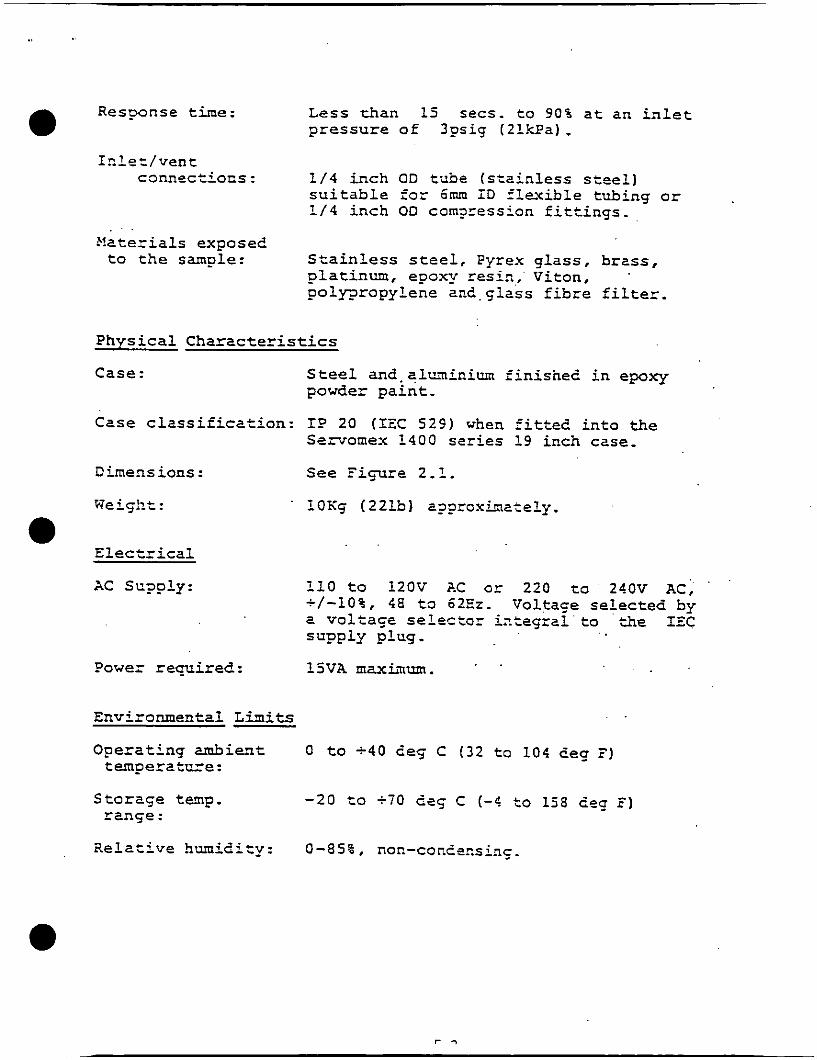
Response time: L e s s t han 15 secs . t o 9 0 % a t an i n l e t 0 p r e s s u r e of 3psig (2lkPal .
I r . le=/ven t connec t ions : 1/4 i nch OD tube ( s t z i n l e s s s t e e l ]
s u i t a b l e f o r 6mm ID f l e x i b l e tub ing o r 114 i n c h OD comsression f i t t i n g s .
Ma tez i a l s expose l t o t h e sample: S t a i n l e s s s t e e l , Pyrex glass, brzss,
p la t inum, epoxy resir,, Viton, po lypropylene an<. 5 1 2 ~ ~ f i b r e f i l t e r .
P h y s i c a l C h a r a c t e r i s t i c s
Case: S teel and. q l ~ m i c i u m f i n i s h e 2 i n epoxy powder p a i n t -
Case c l a s s i f i c a t i o n : I? 20 (IEC 529) when f i t t e d i n t o t h e Servomex 1 4 0 0 s e r i e s 1 9 inch case.
D h e n s ions : See F i p r e 2.1.
Weight :
- Electrical
xc su?ply: 110 t o 120V AC o r 220 t o 24OV AC, '/-lo%, 4 8 t o 6 2 2 . Voltage selected by e v o l t a g e s e l e c t o r i z t e g r z l t o *he I E C supp ly plug.
. . ?owe= re-ired: LfVA mzxinum.
Environmental L i m i t s
Opera t ing A i e T t 0 t o - 4 0 le5 C ( 3 2 t o 1 0 4 deg 7 ) tempera tu=e :
S tora5e t a p . -20 t o ti0 des C ( - 4 t o 158 l e q Fl r an5e :
i l e l a t i v e h u m i l i t y : 0-85%, non-conCcnsing.
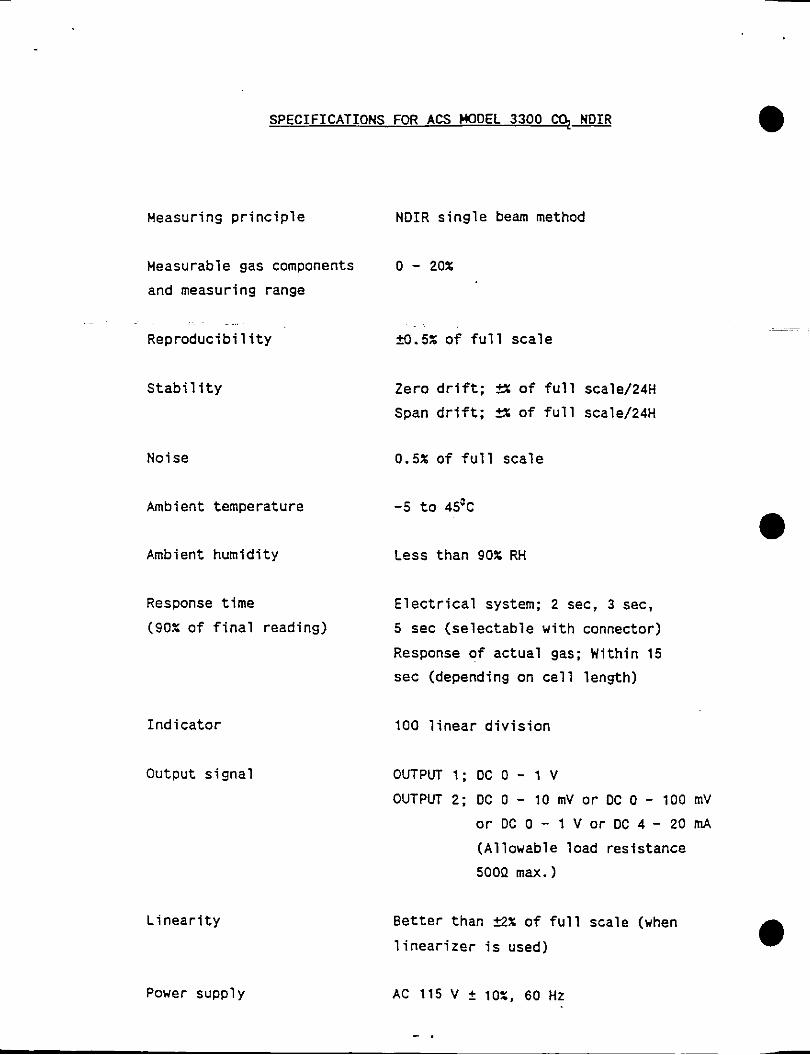
SPECIFICATIONS FOR ACS WODEL 3300 Cq- NDIR
Measuring principle
Measurable gas components and measuring range
Reproducibi 1 ity
Stability
Noise
Ambient temoerature
Ambient humidity
Response time (90% of final reading)
Indicator
Output signal
Linearity
Power supply
NDIR single beam method
0 - 20%
S . 5 % of full scale
Zero drift; 5 of full scale/24H Span drift; 5% of full scale/24H
0.5% of full scale
-5 to 45k
Less than 90% RH
Electrical system; 2 sec, 3 sec, 5 sec (selectable with connector) Response of actual gas; Within 15
sec (depending on cell length)
100 linear division
OUTPUT 1; DC 0 - 1 V OUTPUT 2; DC 0 - 10 mV or DC 0 - 100 mV
or DC 0 - 1 V or DC 4 - 20 mA
(Allowable load resistance 50012 max.)
Better than t 2% of full scale (when linearizer is used)
AC 115 V +_ 10%. 60 Hz
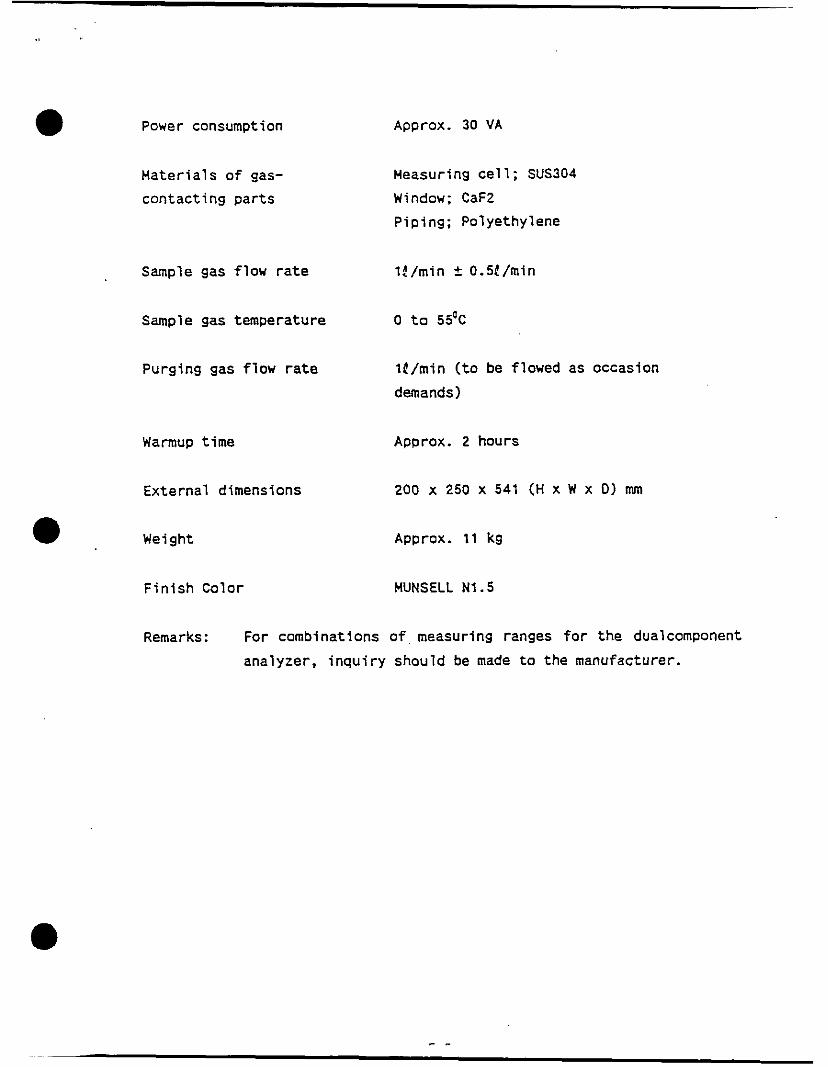
e
Power consumption Approx. 30 VA
Materials o f gas-
c o n t a c t i n g p a r t s
Measuring cell ; SUS304 Window; CaFZ P i p i n g ; Polye thylene
Sample g a s flow rate 1 ? / m i n 2 O.S!/min
Sample gas t e m p e r a t u r e 0 t o 55%
Purging g a s flow rate 1E/min ( t o be flowed as occas ion demands)
Warmup time Approx. 2 hours
External dimensions
Weight Approx. 11 kg
F i n i s h Color MUNSELL N1.5
Remarks: For combina t ions of measuring ranges for t h e dualcomponent
a n a l y z e r , i n q u i r y shou ld be made t o the manufacturer .
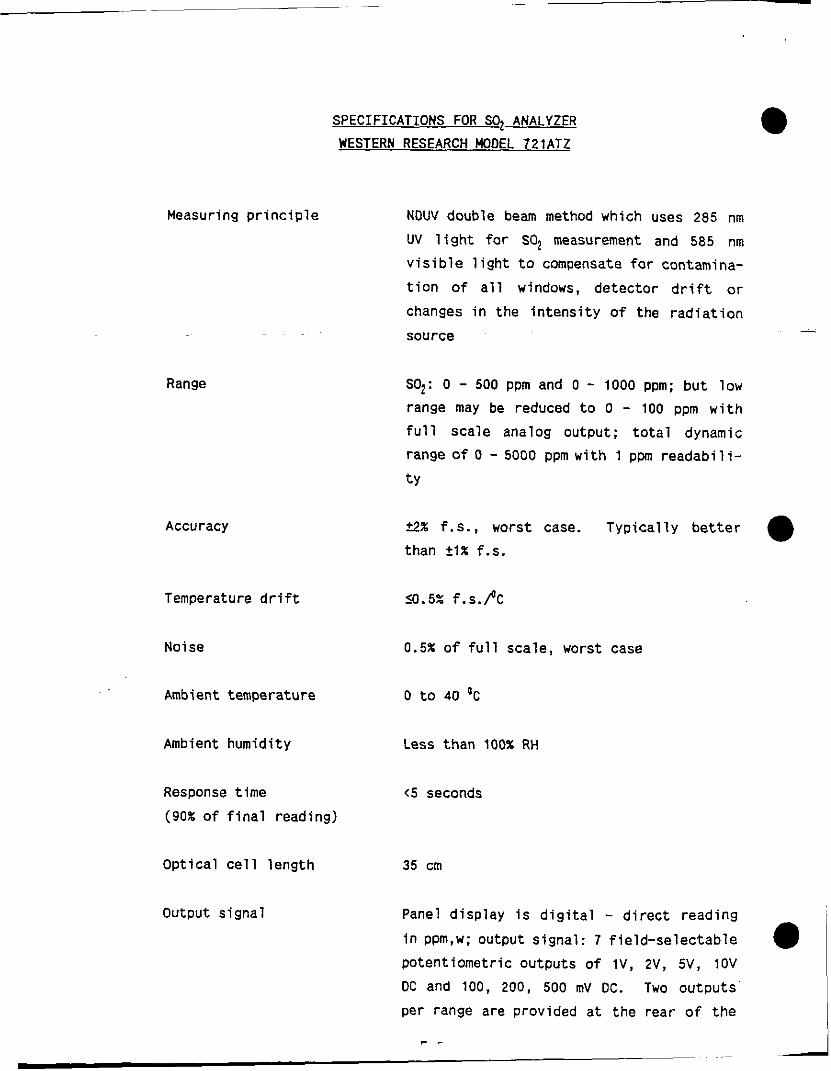
Measuring p r i n c i p l e
Range
Accuracy
SPECIFICATIONS FOR SO2 ANALYZER
WESTERN RESEARCH HODEL 721ATZ
NDUV double beam method which uses 285 nm
UV l i g h t f o r SO2 measurement and 585 nm
v i s i b l e l i g h t t o compensate for contamina-
t i o n o f a l l windows, detector d r i f t or
changes i n the i n tens i t y o f the r a d i a t i o n
source
SO2: 0 - 500 ppm and 0 - 1000 ppm; bu t low range may be reduced t o 0 - 100 ppm w i t h
f u l l scale analog output; t o t a l dynamic
range o f 0 - 5000 ppm with 1 ppm readab i l i -
t y
0 t2% f.s., worst case. Typ ica l l y b e t t e r
than 21% f . s .
Temperature d r i f t so.5% f .S .PC
Noise 0.5% o f f u l l scale, worst case
Ambient temperature 0 t o 40 'C
Ambient humidity Less than 100% RH
Response t ime t 5 seconds
(90% o f f i n a l reading)
Opt ical c e l l length 35 cm
Output s ignal Panel d isplay i s d i g i t a l - d i r e c t reading
i n pPm,w; output signal: 7 f ie ld -se lec tab le
potentiometric outputs o f i v , 2v, 5v, 1OV
DC and 100, 200, 500 mV Dc. Two outputs
per range are provided a t the rear o f the
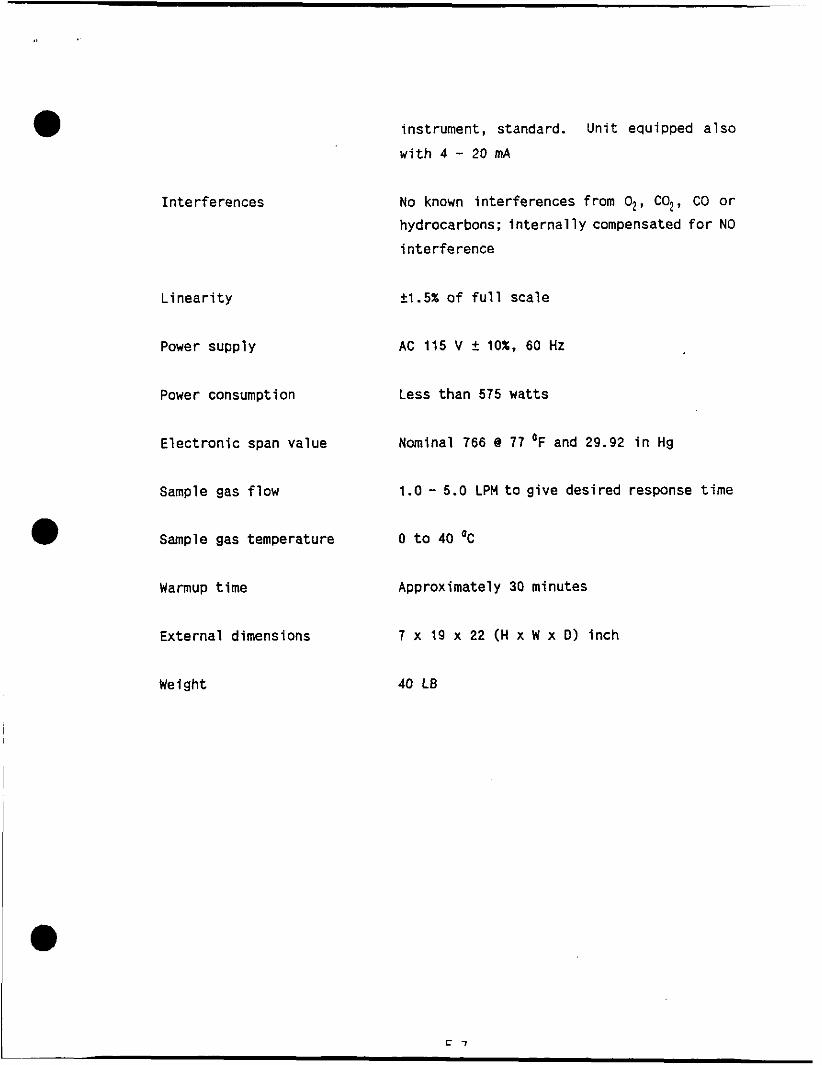
Interferences
L inea r i t y
Power supply
Power consumption
Elect ron ic span value
Sample gas f low
Sample gas temperature
Warmup t ime
External dimensions
Weight
instrument, standard. Uni t equipped a lso
with 4 - 20 mA
No known interferences from 02, C 0 2 , CO o r
hydrocarbons; i n t e r n a l l y compensated f o r NO
in ter ference
21.5% o f f u l l scale
AC 115 V t 10%. 60 Hi!
Less than 575 watts
Nominal 766 Q 77 OF and 29.92 i n Hg
1.0 - 5.0 LPH t o give desired response t ime
0 to 40 *C
Approximately 30 minutes
7 x 19 x 22 (H x W x D) inch
40 LB
e APPENDIX G
MEASUREMENT SYSTEMS PER FORMAN C E SPEC I FI CAT1 0 N S
e
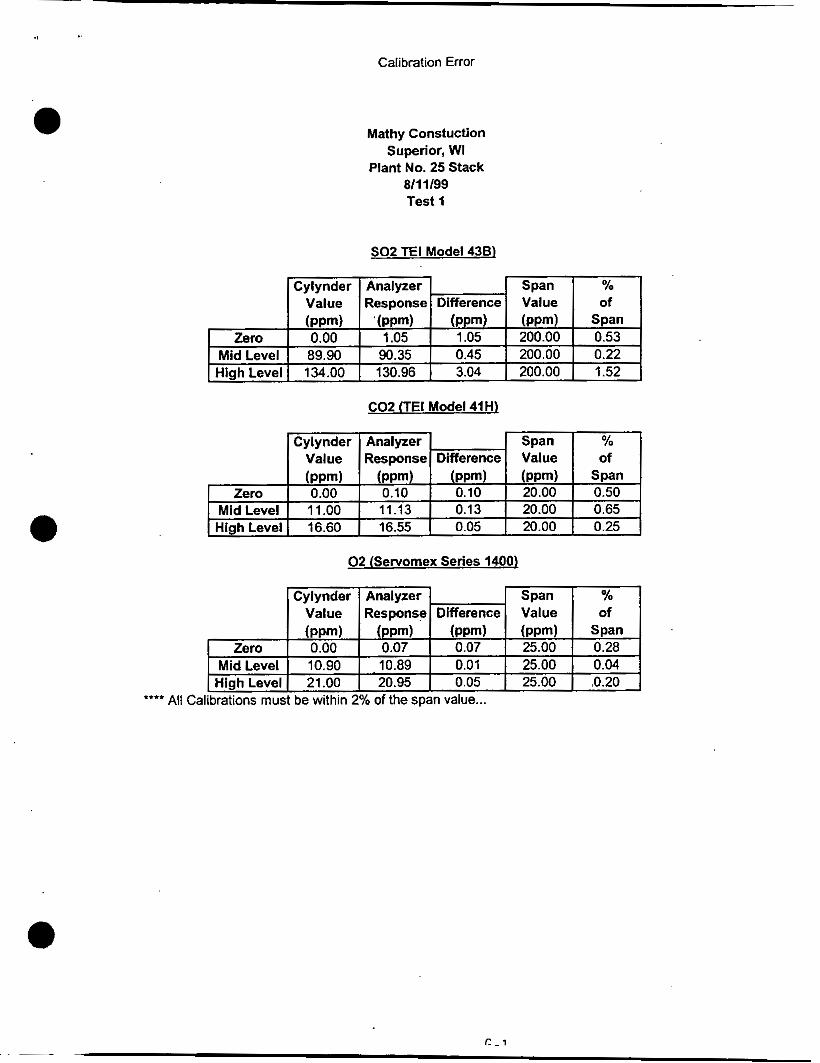
Calibration Error
Cylynder Analyzer Span Value ResDonse Difference Value
Mathy ConstUCtiOn Superior, WI
Plant No. 25 Stack 8l11199 Test 1
% of
SO2 TEI Model 438)
Zero Mid Level High Level
-~
(pprn) .(pim) (ppm) (pprn) Span
89.90 90.35 0.45 200.00 0.22 0.00 1.05 1.05 200.00 0.53
134.00 130.96 3.04 200.00 1.52
Cylynder Analyzer Value Response Difference
Span % Value of
Zero Mid Level High Level
0 2 (Servornex Series 1400)
(ppm) (ppm) (ppm) (ppm) span 0.00 0.10 0.10 20.00 0.50 1 1 .OO 11.13 0.13 20.00 0.65 16.60 16.55 0.05 20.00 0.25
Span % Difference Value of

6-2
0
APPENDIX H
CALIBRATION GAS CERTIFICATION SHEETS
0

i
x 0 z
I +
L
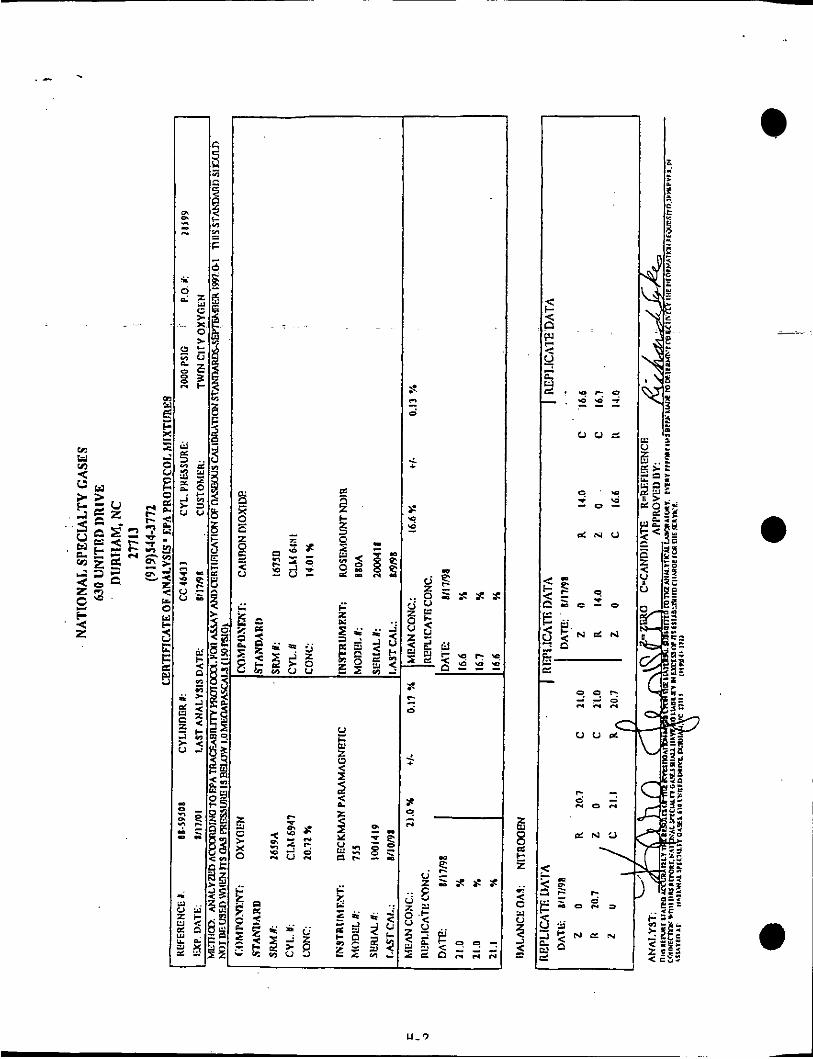
1 1
b N '3
\
e
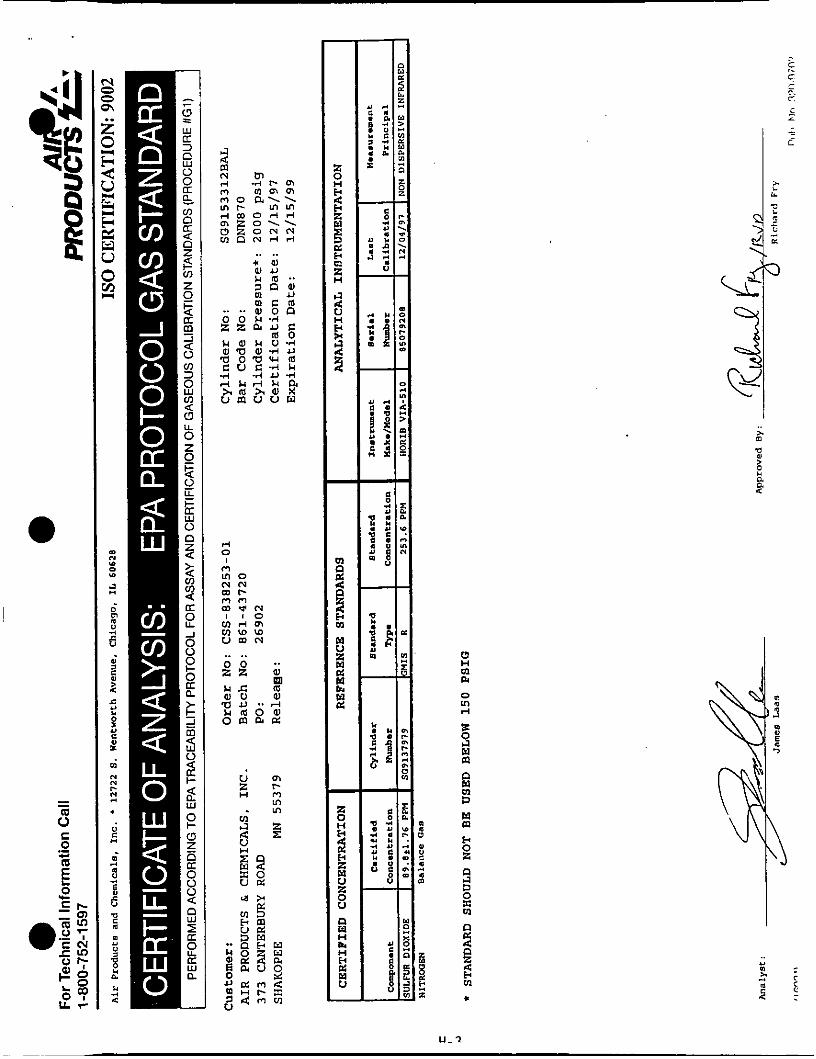
.. ..
.. .. .. 2 g m U L : Ld m u 0) aJu . . A u a o m o m a a
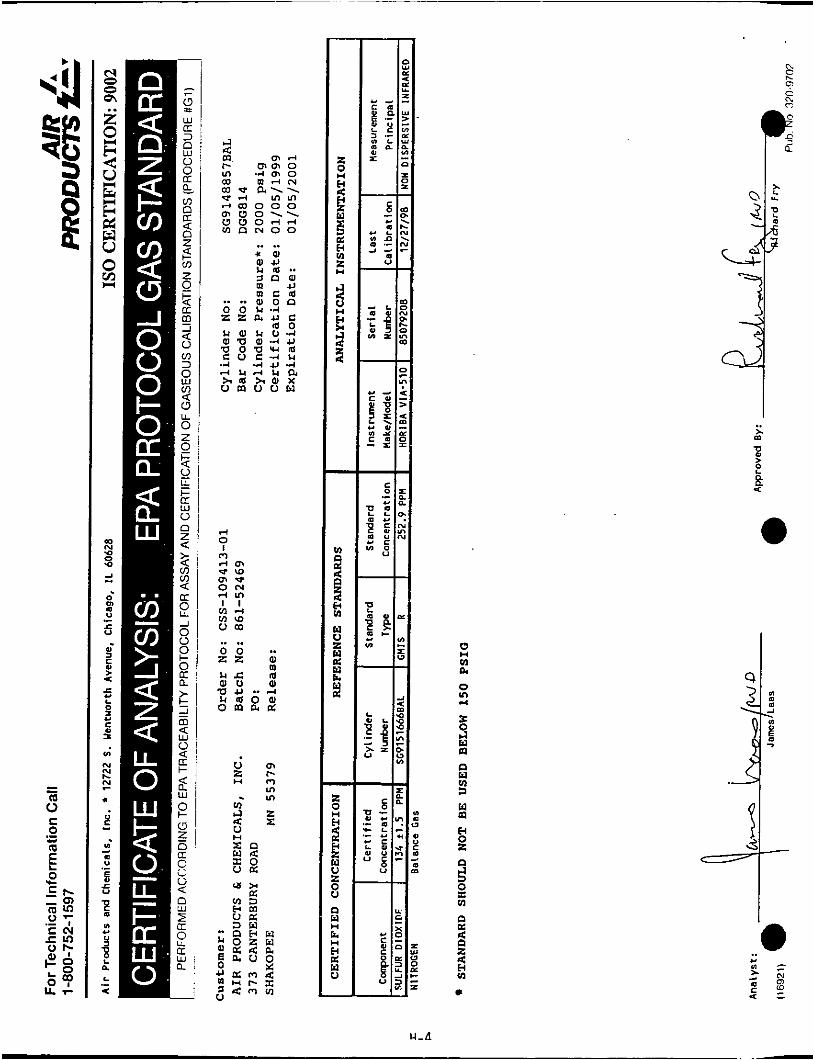
rl 0 I
F1
b W
O N rl ln I 1 V l r l Low o m
r l m m b
.. ..
u ' m E % 2 2 8 "
ln . l n
U I : o x o u a w a
U-A
Fl a 01
0 n 4
a w Y w m
s z
I
APPENDIX I
PROCESS RATE INFORMATION
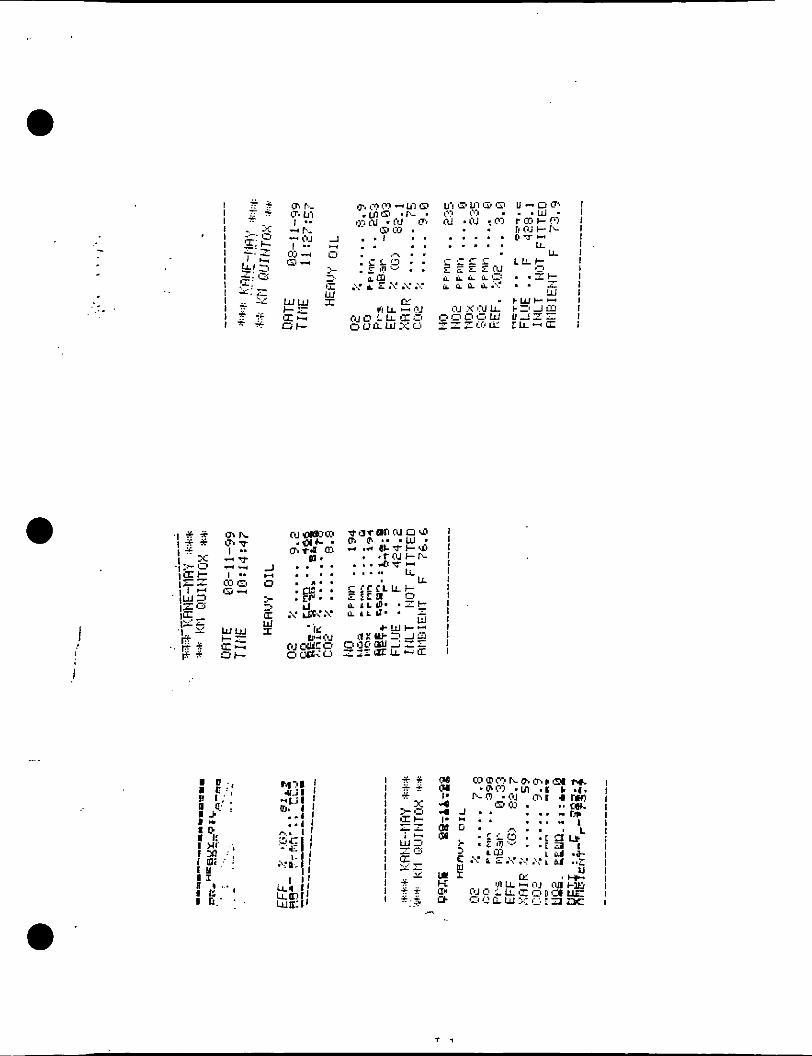
-
. . ...
I
- * * + i
- i s J _I . - 1 . . . . . . . I.. w . . . . . . . . .

rr /
P.O. Bour 16987
. .. parmneter
' ."' .I: ;. , ,Q
Received: 03/26/1999
project$: 99002029
K): 16282
ml3XXl: 04/05/1999
MDL Analyzed ay Method
99A04652 : Used O i l 3123.193 Col leCtd : 03/23/1999
2 2 2 2 2 2- 2
100
0.01 0.04 0.1 100
0.1 0.5 0.r 0.1
ao
04/01/99 GIA 6082
04/01/99 GLA 8082 04/01/99 G U 8062 04/01/99 GLA 8082 04/01/99 GIA 8082 04/01/99 GIA 8082 03/26/99 HllA D240 03/26/99 H l 2 E 4 0 03/26/99 GQ; D3628 03/29/99 ttG DB74 03/29/99 IITA D129 03/29/99 (3% 6010
03/29/99 GGG 90408 03/29/99 GGG 6010 03/29/99 0;G 6010 03/29/99 GGG 6010 03/29/99 Gu; 6010
04/01/99 GIA a082
03/29/99 m moa
GI21 - WI DNRny 999917160
t
6125 West National Avenue, P.O. Box 14513, Milwaukee, Wisconsin 53214 (414) 475-6700 'FAX: (414) 475-7216
a Toll-Free: 2100-300-6700 a-
* )eo!. of Health State Cerulied UaoratoT e168 * ocpi. 0 1 Natural flesources Slate Cnrt iha Lanorstory P241249360 - - USDA Accrwiied Laboratory 6581 - NlOSH Ptollcinncy AnalvIlCal TeSllng PrOQrarn - .-
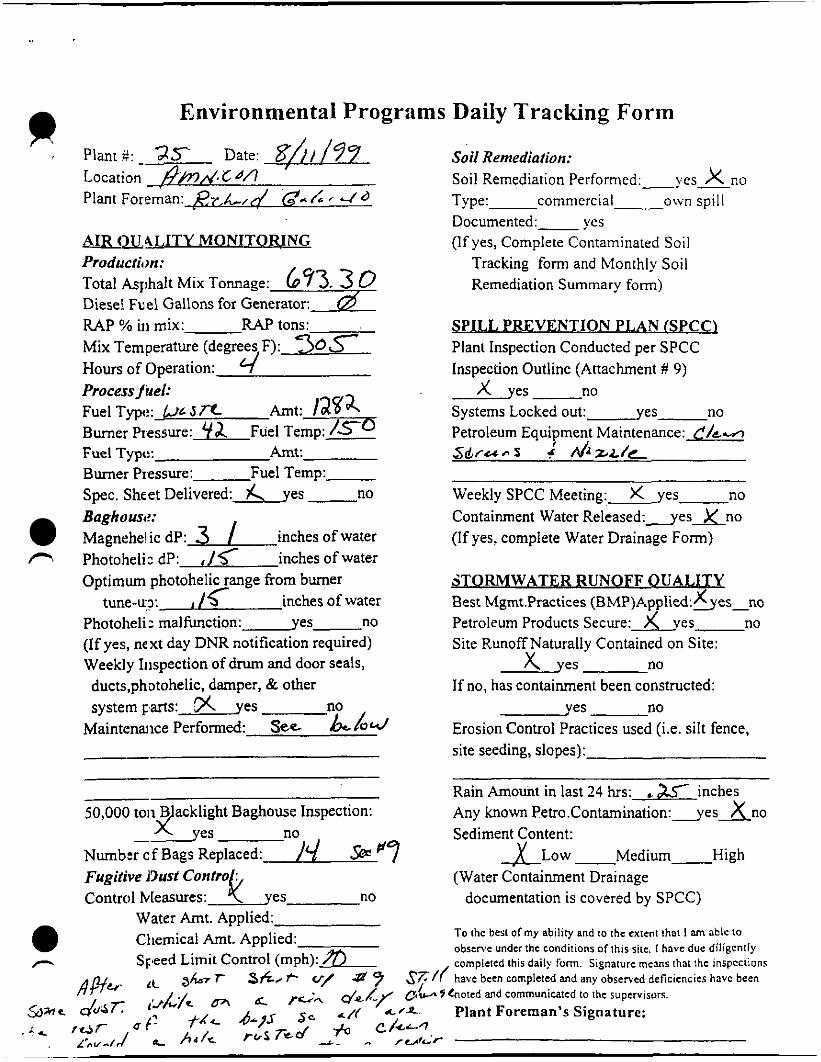
Environmental Progr:ims Daily Tracking Form
I re ant#:- a s Date: s / , / 9 9 Soil Remediation: d c m Location /?,WJA
Plant Foreman: g~,L.,d 'Q../.. J d Type: commercial own spill
AIR OU.4LITY MONI TOFUNG Production: Total Asphalt Mix Tonnage: 643. 3 0 Diesei Fuel Gallons for Gene- RAP % iii mix: Mix Temperature (degrees F): 30s
Process fuel: Fuel Typ:: k6 J Amt: lay& Systems Locked out: Yes no Burner Piessure: 4& Fuel Temp: I s o
Burner Pxessure: Fuel Temp:- Spec. Shcet Delivered: & yes no Weekly SPCC Meeting: x yes no Baghoul!: Containment Water R e 1 e a s e d : y e s X n o
Photohelic dP: ,/< inches ofwater Optimum photohelic range from burner
Photoheli : m a 1 f h c t i o n : y e s no Petroleum Products Secure:)<es no (If yes, next day DNR notification required) Weekly Inspection of drum and door seals, X yes no ducts,photohelic, damper, & other systemparts: 5 yes no d e s no
Soil Remediation Performed:-yes - x no
Documented:- yes (If yes, Complete Contaminated Soil
Tracking form and Monthly Soil Remediation Summary form)
R
RAP tons: SPILL PRE VENTION PLAN tSPCC) Plant Inspection Conducted per SPCC Inspeclion Outline (Attachment # 9)
X yes no Hours of Operation: 4
Petroleum Equipment Maintenance: C/L.W-J t Fuel Typt:: Amt: Sdr-ccaS J d&Z.L/C
Magnehelic dP: 3 / inches of water (If yes, complete Water Drainage Form)
aTORM WATER R UNOFF QUALITY tune-q: ,I< inches of water Best Mgmt Practices (BMP)Applied:>es-no x
Site RunoffNaturally Contained on Site:
If no, has containment been constructed:
Maintenance Performed: See h- Erosion Control Practices used (Le. silt fence, site seeding, slopes):
Rain Amount in last 24 hrs: inches Any known Petro.Contamination: y e s x n o 50,000 ton B acklight Baghouse Inspection:
Numb:r cf Bags Replaced: 1.I % '9 Fugitive Dust Contro : Control Measures: k yes no documentation is covered by SPCC)
no Sediment Content: .&ow - Medium- High
- y e s 2 (Water Containment Drainage
Water Amt. Applied: Chemical Amt. Applied: Speed Limit Control (mph):
To the best of my ability and to thc cxient that I am able 10
0bscn.e under the conditions of this site. I have due diligently completed this daily form. Slgnaturc means that the inspections
Ic g h 7 7 sfi, f- V/ 7 sT/f have been completed and any observed deficiencies havc been
,&& ~
,.&,, d f3un5Cootcd and cornmunicatcd to thc supervisurs. f.4, 4-75 sc df ( a l / P . Plant Foreman's Signature:
0 f' ~ ha/< res~ed A- - c ' ~ ~ ~ r u r i r

OPERATING DATA SUMMARY FOR ASPHALT PLANT SOURCES
Other Control Equipment Parameters Cleaning Cycles
Air to Cloth Ratios
0 General:
?his plant is (circle one): Portable Stationary Plant Mfr. & Model No.: &r&/..-G r L c n c m1 ;STY3 s-s,
Design During Testing
/r see. A /S e
- tinu0usMi.u 2 allel F- Counterflow D m Type(circ1e all that apply): 'Batch Mix
Other:
Pollution Control Equipment(ckc1e one): Venturi Scrubber Wet Scrubber Multiclone Cyclone If wet scrubbing: - Yo scrubber water recycled
List Me. & Model No.: ,& , LC - Q P c e 4 c
Normal pressure drop range across control equipment is Was the control equipment operating normally during test?(circle one) If no, explain
* / 3 inches water a no
Date & procedure of last maintenance/cleaning of control equipment: ?/ai / 99 d/& A-7 dv
Fuel. Material Processed. and Control Eau- Itemize all fuels and materials added to the combustion process during the test period. List he1 type used during testing (if oil, specify type) What other types of fuel can be burned?
. . If other units of measure are used, specify and calculate appropriate heat input.
Describe the location of the thermocouples readin exitin dryer and mix temperature: I x(& fa W I< , @> k ri B c t u f - c fo S L t 4, l e c *&A nforrnkon required Lust be completed and submitted as part of the performance test. Failure to;ubmit
the required information will result in an incomplete performance test report. . - . Paoe 1 o f ?

I E n d , a - ; E G O I .
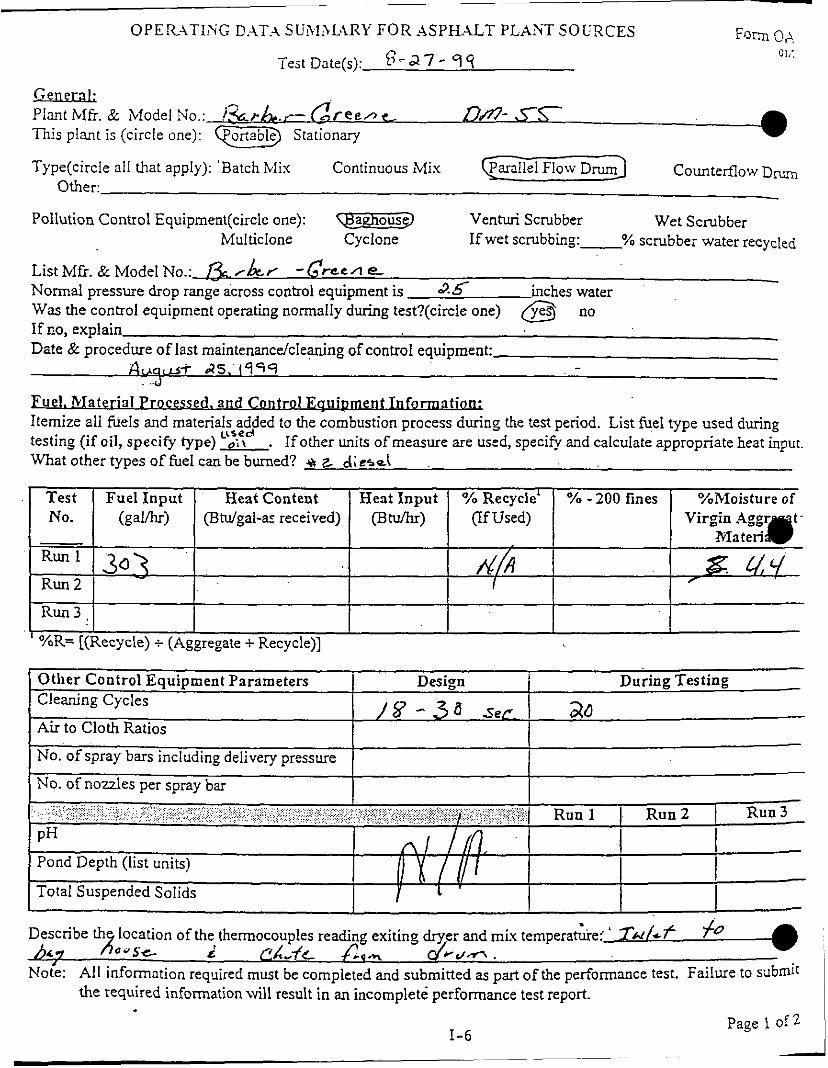
- Plant Mfr. & Model No.: &P&,,-- Gr e e A C, S- TII~S plant is (circle one): Stationary
Test Fuel Input Heat Content Heat Input YO Recycle’ YO - 200 fines %Moisture of NO. (gaVhr) (Bhdgal-a: received) (Btu/hr) (if Used) Virgin A g g r a t - Rlateri
Run 1 Run 2
Run3 ,
- 303 dh &: ay r
Type(circ1e all that apply): ‘Batch Mix Continuous iMix -el FIOW D-] Counterflow D- Other:
Other Control Equipment Parameters Cleaning Cycles
Air to Cloth Ratios
Design During Testing
/ 8 - 3 8 set. 20 I
No. of spray bars including delivery pressure
No. of n o d e s per spray bar
Note: All information required must be completed and submitted as part ofthe performance test. Failure to d m i t the required information \vi11 result in an incomplete performance test report.
1-6 Page 1 o f 2 I

!---
I :
I
L
t
1-7
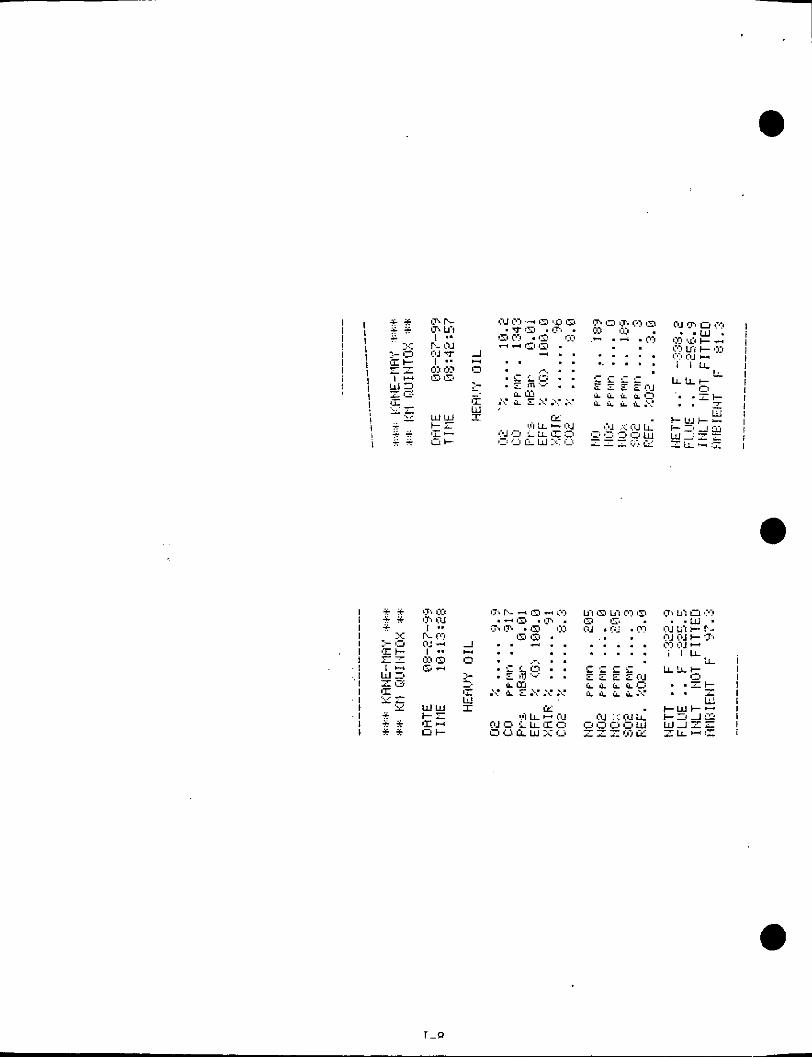
. . . . . . . . . . . . .
e
e
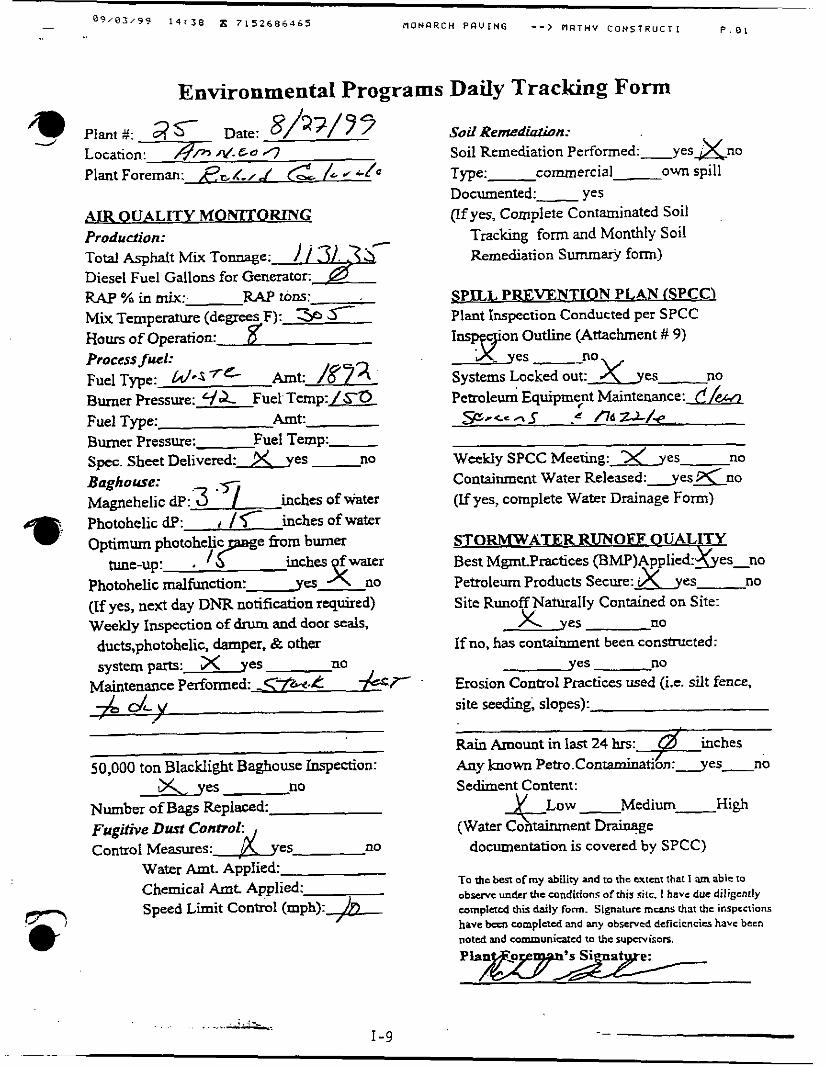
A I R 0 UALITY M O W 0 RrNG Production: Total Asphalt Mix To-e:-F Diesel Fuel Gallons for Generator: @ RAP % in mix:. RAP tom: Mix Temperature (de Hours of Operation: Process fuel:
Burner Pressure: q& Fuel Temp:= Fuel Type: #*S7-= Amt: /m Fuel Type: Amt: Burner Pressure: Fuel Temp: Spec. Sheet Delivered 3( yes no Baghouse: Magnehelic dP: mches of mkiter Photohelic dP: I /r inches of water Optimum photohelic e fiom burner
I? inches fwaier -k no tune-up: , Photohelic malfunction: yes (If yes, next day DNR notification required) Weekly Inspection of drum and door seals, ducts,photohelic, damper, & other systemparts: X yes n0
Maintenance Performed Cv&ck *7-
50,000 ton Blacklight Baghouse Inspeaion:
Number of Bags Replaced: FugiriVe Dust Conhol: ConaoIMeasures: .d yes no
X e s no
Water Amt. Applied: Chemical Amt Applied: Speed Limit Control (rnph):*
Soil Remedia&n: Soil Remediation P e r f o r m e d : v e s x n o Type:- commercial own spill Documented:- yes (rf yes, Complete Contaminated Soil
Tracking form and Monthly Soil Remediation Summarjr form)
SPILL PREVENTION PLAN CSPCC) Plant Inspection Conducted per SPCC
'my - yes-- no Systems Locked out: x y e s Pe t ro led Equipm5nt Maintenance: e/-
on Outline (Attachment # 9)
no
s - < = o 5 .& A 6 2 J - k
Weekly SPCC Meering: % y e s no Containment Water R e 1 e a s e d : y e s K n o (Eyes, complete Water Drainage Form)
S T O W Al%R RUN OFF 0 UALITY Best MgmtPrastices (BMP)Applied:&'es_no Petroleum Products Secure:$<vrs no Site Runoff Naturally Contained on Site:
X yes no If no, has containment been consfncted:
d e s no Erosion Control Practices used (Le. silt fence, site seeding, slopes):
Rain Amount in last 24 hrs: ~ n y known Petro.Contaminati/on:yes-no Sediment Content:
(Water Co tainment Draina;ge
inches
+Low- Medium- Hlgh
documentation is covered by SPCC)
To rhc besl of my abilify and to rho W I ~ I that I yn able lo observs vndcr the cnndidons of rhis s i t r I have due diligcnlly wmplncd rhb daily form. Signaturc m a s : rhm rhc inspccrions have bcsn wmplstcd and any observed deficicnciss havc been noted and Eommunicatcd to lhe supemisom.
APPENDIX J
PROCEDURES
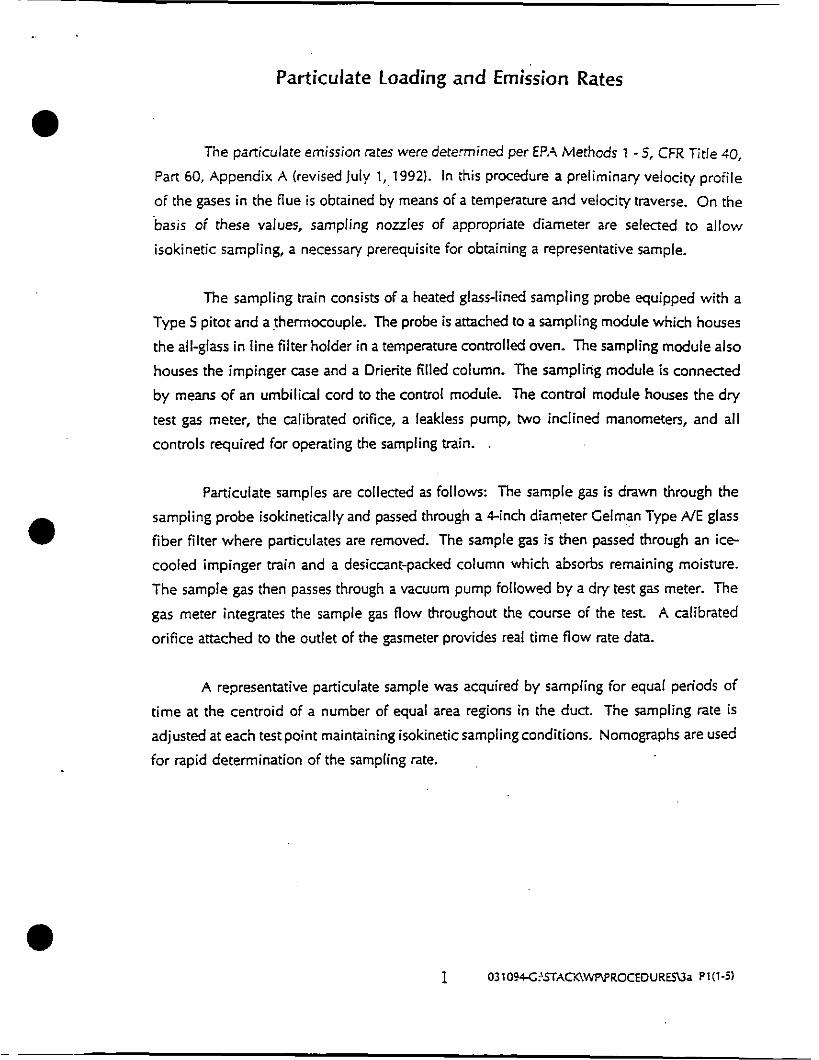
Particulate Loading and Emission Rates
The particulate emission rates were determined per EPA Methods 1 - 5, CFR Title 40,
Part 60, Appendix A (revised July 1, 1992). In this procedure a preliminary velocity profile
of the gases in the flue i s obtained by means of a temperature and velocity traverse. On the
basis of these values, sampling nozzles of appropriate diameter are selected to allow
isokinetic sampling, a necessary prerequisite for obtaining a representative sample.
The sampling train consists of a heated glass-lined sampling probe equipped with a
Type 5 pitot and a thermocouple. The probe is attached to a sampling module which houses
the all-glass in line filter holder in a temperature controlled oven. The sampling module also
houses the impinger case and a Drierite filled column. The sampling module is connected
by means of an umbilical cord to the control module. The control module houses the dry test gas meter, the calibrated orifice, a leakless pump, two inclined manometers, and all
controls required for operating the sampling train. .
Particulate samples are collected as follows: The sample gas is drawn through the
sampling probe isokinetically and passed through a &inch diameter Celman Type NE glass
fiber filter where particulates are removed. The sample gas is then passed through an ice-
cooled impinger train and a desiccant-packed column which absorbs remaining moisture.
The sample gas then passes through a vacuum pump followed by a dry test gas meter. The
gas meter integrates the sample gas flow throughout the course of the test. A calibrated
orifice attached to the outlet of the gasmeter provides real time flow rate data.
A representative particulate sample was acquired by sampling for equal periods of
time at the centroid of a number of equal area regions in the duct. The sampling rate is
adjusted at each test point maintaining isokinetic sampling conditions. Nomographs are used
for rapid determination of the sampling rate.
I 031094C:'STAC~WPVROCEDUREWa Pl(1-5)
Method 6C-Determination of Sulfur Dioxide Emissions From Stationary Sources (Instrumental Analyzer Procedure)
1. Applicabilitv and Principle
1.1 Applicability. This method is applicable to the determination of sulfur dioxide (SO,) concentrations in controlled and uncontrolled emissions from stationary sources only when specified within the regulations.
1.2 Principle. A gas sample is continuously extracted from a stack, and a portion of the sample i s conveyed to an instrumental analyzer for determination of 5 0 , gas concentration using an ultraviolet (UV), nondispersive infrared (NDIR), or fluorescence analyzer. Performance specifications and test procedures are provided to ensure reliable data.
2. Range and Sensitivity
'2.1 Analytical Range. The analytical range is determined by the instrumental design. For this method, a portion of the analytical range is selected by choosing the span of the monitoring system. The span of the monitoring system shall be selected such that the pollutant gas concentration equivalent to the emission standard i s not less than 30 percent of the span. If at any time during a run the measured gas concentration exceeds the span, the run shall be
. considered invalid.
2.2 Sensitivity. The minimum detectable limit depends on the analytical range, span, and signal-to-noise ratio of the measurement system. For a well designed system, the minimum dereaable limit should be less than 2 percent of the span. a
3. Definitions
3.1 Measurement System. The total equipment required for the determination of gas concentration. The measurement system consists of the following major subsystems:
3.1.1 Sample Interface. That portion of a system used for one or more of the following: sample acquisition, sample transport, sample conditioning, or protection of the analyzers from the effects of the stack effluent.
3.1.2 Cas Analyzer. That portion of the system that senses the gas to be measured and generates an output proportional to its concentration.
3.1.3 Data Recorder. A strip chart recorder, analog computer, or digital recorder for recording measurement data from the analyzer output.
.,. .. ...
3.2 Span. The upper limit of the gas concentration measurement range displayed on the data recorder.
3.3 Calibration Gas. A known concentration of a gas in an appropriate diluent gas.
1 042694-G\STACK\WP&lEHODN-METn.6C
3.4 Analyzer Calibration Error. The difference between the gas concentration exhibited by the gas analyzer and the known concentration of the calibration gas when the calibration gas i s introduced directly to the analyzer.
3.5 Sampling System Bias. The difference between the gas concentrations exhibited by the measurement system when a known concentration gas i s introduced at the outlet of the sampling probe and when the same gas is introduced directly to the analyzer.
3.6 Zero Drift. The difference in the measurement system output reading from the initial calibration response at the zero concentration level after a stated period of operation during which no unscheduled maintenance, repair, or adjustment took place.
3.7 Calibration Drift. The difference in the measurement system output reading from the initial calibration response at a mid-range calibration value after a stated period of operation during which no unscheduled maintenance, repair, or adjustment took place.
3.8 Response Time. The amount of time required for the measurement system to display 95 percent of a step change in gas concentration on the data recorder.
3.9 Interference Check. A method for detecting analytical interferences and excessive biases through direct comparison of gas concentrations provided by the measurement system and by a modified Method 6 procedure. For this check, the modified Method 6 samples are acquired at the sample by-pass discharge vent.
3.10 Calibration Curve. A graph or other systematic method of establishing the relationship between the analyzer response and the actual gas concentration introduced to the analyzer.
0
0 4. Measurement Svstem Performance Soecifications
4.1 Analyzer Calibration Error. Less than high-range calibration gases.
4.2 Sampling System Bias. Less than * 5 percent of the span for the zero, and mid- or high-range calibration gases.
4.3 Zero Drift. Less than * 3 percent of the span over the period of each run.
4.4 Calibration Drift. Less than * 3 percent of the span over the period of each run.
4.5 Interference Check. Less than -t 7 percent of the modified Method 6 result for each run.
2 percent of the span for the zero, mid-range, and
5. Amaratus and Reagents
5.1 Measurement System. Any measurement system for SO, that meets the specifications of this method. A schematic of an acceptable measurement system is shown in Figure 6C-1. The essential components of the measurement system are described below:
2 042694-C:~TACK\WP\METHOD".6C
5.1.1 Sample Probe. Glass, stainless steel, or equivalent, of sufficient length to traverse the sample points. The sampling probe shall be heated to prevent condensation.
5.1.2 Sample Line. Heated (sufficient to prevent condensation) stainless steel or Teflon tubing, to transport the sample gas to the moisture removal system.
5.1.3 Sample Transport Lines. Stainless steel or Teflon tubing, to transport the sample from the moisture removal system to the sample pump, sample flow rate control, and sample gas manifold.
5.1.4 Calibration Valve Assembly. A three-way valve assembly, or equivalent, for blocking the sample gas flow and introducing calibration gases to the measurement system at the outlet of the sampling probe when in the calibration mode.
5.1 .5 Moisture Removal System. A refrigerator-type condenser or similar device (e.g., permeation dryer), to remove condensate continuously from the sample gas while maintaining minimal contact between the condensate and the sample gas. The moisture removal system i s not necessary for analyzers that can measure gas concentrations on a wet basis; for these analyzers, (1) heat the sample line and all interface components up to the inlet of the analyzer sufficiently to prevent condensation, and (2) determine the moisture content and correct the measured gas concentrations to a dry basis using appropriate methods, subject to the approval of the Administrator. The determination of sample moisture content is not necessary for pollutant analyzers that measure concentrations on a wet basis when (1) a wet basis CO, analyzer operated according to Method 3A is used to obtain simultaneous measurements, and (21 the pollutantKO, measurements are used to determine emissions in units of the standard.
5.1.6 Particulate Filter. An in-stack or heated {sufficient to prevent water condensation) out-of-stack filter. The filter shall be borosilicate or quartz glass wool, or glass fiber mat. Additional filters at the inlet or outlet of the moisture removal system and inlet of the analyzer may be used to prevent accumulation of particulate material in the measurement system and extend the useful life of the components. All filters shall be fabricated of
'materials that are nonreactive to the gas being sampled.
,
-- 5.1.7 Sample Pump. A leak-free pump, to pull the sample gas through the system at a flow rate sufficient to minimize the response time of the measurement system. The pump may be constructed of any material that is nonreactive to the gas being sampled.
5.1.8 Sample Flow Rate Control. A sample flow rate control valve and rotameter, or equivalent, to maintain a constant sampling rate within 10 percent.
(Note: The tester may elect to install a back-pressure regulator to maintain the sample gas manifold at a constant pressure in order to protect the analyzer(s) from over pressurization, and to minimize the need for flow rate adjustments.)
3 042694-(;:KTACK\WPM.1FIHODNMETH.6C
. .
5.1.9 Sample Gas Manifold. A sample gas manifold, to divert a portion of the sample gas stream to the analyzer, and the remainder to the by-pass discharge vent. The sample gas manifold should also include provisions for introducing calibration gases directly to the analyzer. The manifold may be constructed of any material that is nonreactive to the gas being sampled.
5.1.10 Gas Analyzer. A UV or NDlR absorption or fluorescence analyzer, to determine continuously the SO, concentration in the sample gas stream. The analyzer shall meet the applicable performance specifications of Section 4. A means of controlling the analyzer flow rate and a device for determining proper sample flow rate (e.g., precision rotameter, pressure gauge downstream of all flow controls, etc.) shall be provided at the analyzer.
(Note: Housing the analyzer(s) in a clean, thermally-stable, vibration-free environment will minimize drift in the analyzer calibration.)
5.1.1 1 Data Recorder. A strip chart recorder, analog computer, or digital recorder, for recording measurement data. The data recorder resolution (i.e., readability) shall be 0.5 percent of span. Alternatively, a digital or analog meter having a resolution of 0.5 percent of span may be used to obtain the analyzer responses and the readings may be recorded manually. If this alternative i s used, the readings shall be obtained at equally spaced intervals over the duration of the sampling run. For sampling run durations of less than 1 hour, measurements at 1-minute intervals or a minimum of 30 measurements, whichever is less restrictive, shall be obtained. For sampling run durations greater than 1 hour, measurements at 2-minute intervals or a minimum of 96 measurements, whichever i s less restrictive, shall be obtained.
5.2 Method 6 Apparatus and Reagents. The apparatus and reagents described in Method 6, and shown by the schematic of the sampling train in Figure 6C-2, to conduct the interference check.
5.3 SO2 Calibration Gases. The calibration gases for the gas analyzer shall be SO, in N, or SO, in air. Alternatively, SOJCO,, SOJO,, or SOJCOJO, gas mixtures in N, may be used. For fluorescence-based analyzers, the 0, and CO, concentrations of the calibration gases as introduced to the analyzer shall be within 1 percent (absolute) 0, and 1 percent (absolute) CO, of the 0, and Co, concentrations of the effluent samples as introduced to the analyzer. Alternatively, for fluorescence-based analyzers, use calibration blends of SO, in air and the nomographs provided by the vendor to determine the quenching correction factor (the effluent 0, and CO, concentrations must be known). Use three calibration gases as specified below:
5.3.1 High-Range Gas. Concentration equivalent to 80 to 100 percent of the span.
5.3.2 Mid-Range Gas. Concentration equivalent to 40 to 60 percent of the span.
5.3.3 Zero Gas. Concentration of less than 0.25 percent of the span. Purified ambient air may be used for the zero gas by passing air through a charcoal filter, or through one or more impingers containing a solution of 3 percent H,O,.
4 042694C:6TACKlWFWET HODSlS-METH.6C
6. Measurement Svstem Performance Test Procedures
Perform the following procedures before measurement of emissions (Section 7)
6.1 Calibration Gas Concentration Verification. There are two alternatives for establishing the concentrations of calibration gases. Alternative Number 1 is preferred.
6.1.1 Alternative Number 1-Use of calibration gases that are analyzed following the Environmental Protection Agency Traceability Protocol Number 1 (see Citation 1 in the Bibliography). Obtain a certification from the gas manufacturer that Protocol Number 1 was followed.
6.1.2 Alternative Number 2-Use of calibration gases not prepared according to Protocol Number 1. If this alternative is chosen, obtain gas mixtures with a manufacturer’s tolerance not to exceed f 2 percent of the tag value. Within 6 months before the emission test, analyze each of the calibration gases in triplicate using Method 6. Citation 2 in the Bibliography describes procedures and techniques that may be used for this analysis. Record the results on adata sheet (example is shown in Figure 6C-3). Each of the individual SO, analytical results for each calibration gas shall be within 5 percent (or 5 PPM, whichever is greater) of the triplicate set average; otherwise, discard the entire set, and repeat the triplicate analyses. If the average of the triplicate analyses is within 5 percent of the calibration gas manufacturer’s cylinder tag value, use the tag value; otherwise, conduct at least three additional analyses until the results of six consecutive runs agree with 5 percent (or 5 PPM, whichever is greater) of their average. Then use this average for the cylinder value. -
6.2 Measurement System Preparation. Assemble the measurement system by following the manufacturer’s written instructions for preparing and preconditioning the gas analyzer and, as applicable, the other system components. Introduce the calibration gases in any sequence, and make all necessary adjustments to calibrate the analyzer and the data recorder. Adjust system components to achieve correct sampling rates.
6.3 Analyzer Calibration Error. Conduct the analyzer calibration error check by introducing calibration gases to the measurement system at any point upstream of the gas analyzer as f.01 lows:
. . ”
6.3.1 AFter the measurement system has been prepared for use, introduce the zero, mid-range, and high-range gases to the analyzer. During this check, make no adjustments to the system except those necessary to achieve the correct calibration gas flow rate at the analyzer. Record the analyzer responses to each calibration gas on a form similar to Figure 6C-4.
Note: A calibration cuwe established prior to the analyzer calibration error check may be used to convert the analyzer response to the equivalent gas concentration introduced to the analyzer. However, the same correction procedure shall be used for al l effluent and calibration measurements obtained during the test.
5 042694C:UTACKIWFWETHODNMETH.bC
6.3.2 The analyzer calibration error check shall be considered invalid if the gas concentration displayed by the analyzer exceeds 2 percent of the span for any of the calibration gases. If an invalid calibration is exhibited, take corrective action, and repeat the analyzer calibration error check until acceptable performance is achieved.
6.4 Sampling System Bias Check. Perform the sampling system bias check by introducing calibration gases at the calibration valve installed at the outlet of the sampling probe. A zero gas and either the mid-range or high-range gas, whichever most closely approximates the effluent concentrations, shall be used for this check as follows:
6.4.1 Introduce the upscale calibration gas, and record the gas concentration displayed by the analyzer on a form similar to Figure 6C-5. Then introduce zero gas, and record the gas concentration displayed by the analyzer. During the sampling system bias check, operate the system at the normal sampling rate, and make no adjustments to the measurement system other than those necessary to achieve proper calibration gas flow rates at the analyzer. Alternately introduce the zero and upscale gases until a stable response is achieved. The tester shall determine the measurement system response time by observing the times required to achieve a stable response for both the zero and upscale gases. Note the longer of the two times as the response time.
6.4.2 The sampling system bias check shall be considered invalid if the difference between the gas concentrations displayed by the measurement system for the analyzer calibration error check and for the sampling system bias check exceeds 5 percent of the span for either the zero or upscale calibration gas. If an invalid calibration is exhibited, take corrective action;and repeat the sampling system bias check until-acceptable performance i s achieved. If adjustment to the analyzer is required, first repeat the analyzer calibration error check, then repeat the sampling system bias check.
7. Emission Test Procedure
7.1 Selection of Sampling Site and Sampling Points. Select a measurement site and sampling points using the same criteria that are applicable to Method 6.
7.2 Interference Check Preparation. For each individual analyzer, conduct an interference check for at least three runs during the initial field test on a particular source category. Retain the results, and report them with each test performed on that source category. If an interference check is being performed, assemble the modified Method 6 train (flow control valve, two midget impingers containing 3 percent H,O,, and dry gas meter) as shown in Figure 6C-2. Install the sampling train to obtain a sample at the measurement system sample by-pass discharge vent. Record the initial dry gas meter reading.
6 042694-C:~TACMW~ETHODN-METH.6C
7.3 Sample Collection. Position the sampling probe at the first measurement point, and begin sampling at the same rate as used during the sampling system bias check. Maintain constant rate sampling (i.e., r 10 percent) during the entire run. The sampling time per run shall be the same as for Method 6 plus twice the system response time. For each run, use only those measurements obtained after twice response time of the measurement system has elapsed, to determine the average effluent concentration. If an interference check is being performed, open the flow control valve on the modified Method 6 train concurrent with the initiation of the sampling period, and adjust the flow to 1 liter per minute (5 10 percent).
(Note: If a pump is not used in the modified Method 6 train, caution should be exercised in adjusting the flow rate since overpressurization of the impingers may cause leakage in the impinger train, resulting in positively biased results).
7x4 Zero and Calibration Drift Tests. Immediately preceding and following each run, or if adjustments are necessary for the measurement system during the run, repeat the sampling system bias check procedure described in Section 6.4 (Make no adjustments to the measurement system until after the drift checks are completed.) Record and analyzer's responses on a form similar to Figure 6C-5.
7.4.1 If either the zero or upscale calibration value exceeds the sampling system bias specification, then the run i s considered invalid. Repeat both the analyzer calibration error check procedure (Section 6.3) and the sampling system bias check procedure (Section 6.4) before repeating the run.
- r 7.4.2 If both the zero and upscale calibration-values are within the sampling system bias specification, then use the average of the initial and final bias check values to calculate the
..gas concentration for the run. If the zero or upscale calibration drift value exceeds the drift limits, based on the difference between the sampling system bias check responses immediately before and after the run, repeat both the analyzer calibration error check procedure (Section 6.3) and the sampling system bias check procedure (Section 6.4) before conducting additional runs.
7.5 Interference Check (if performed). After completing the run, record the final dry gas meter reading, meter temperature, and barometric pressure. Recover and analyze the contents of the midget impingen, and determine the SO, gas concentration using the procedures of Method 6. (It:.is not necessary to analyze EPA performance audit samples for Method 6.) Determine the average gas concentration exhibited by the analyzer for the run. If the gas concentrations provided by the analyzer and the modified Method 6 differ by more than 7 percent of the modified Method 6 result, the run i s invalidated.
7 0 4 2 6 9 4 C : C i T A C ~ ~ E H O D S ~ ~ E T H . 6 C

8. Emission Calculation
The average gas effluent concentration is determined from the average ias concentration 0
- - displayed by the gas analyzer, and is adjusted for the zero and upscale sampling system bias checks, as determined in accordance with Section 7.4. The average gas concentration displayed by the analyzer may be determined by integration of the area under the curve for chart recorders, or by averaging all of the effluent measurements. Alternatively, the average may be calculated from measurements recorded at equally spaced intervals over the entire duration of the run. For sampling run durations of less than 1 hour, measurements at 1-minute intervals or a minimum of 30 measurements, whichever i s less restrictive, shall be used. For sampling run durations greater than 1 hour, measurements at 2-minute intervals or a minimum of 96 measurements, whichever is less restrictive, shall be used. Calculate the effluent gas concentration using Equation 6C-1.
Eq. 6C - 1 - cm c, = (C -Co) c, - co
Where:
C,, = Effluent gas concentration, dry basis, PPM.
C - Average gas concentration indicated by gas analyzer, dry basis, PPM.
Co - Average of initial and final system calibration bias check responses for the zero gas, PPM.
C, - Average of initial and final system calibration bias check responses for the upscale calibration gas, PPM.
C, - Actual concentration of the upscale calibration gas, PPM.
-
0
9. Bibliography
1. Traceability Protocol for Establishing True Concentrations of Gases Used for Calibrations and Audits of Continuous Source Emission Monitors: Protocol Number 1. U.S. Environmental Protection Agency, Quality Assurance Division. Research Triangle Park, NC. June 1978.
2. Westlin, Peter R. and J. W. Brown. Methods for Collecting and Analyzing Gas Cylinder Samples. Source Evaluation Society Newsletter. 3(3):5-15. September 1978.
I -See - CFRgapergubl ication-for-i I I usfrat ion-0809
I -See-CFR-paper-publication-for-ilIustration-OBlO
8 04269PC:~TACK\WP\MEHOD”.6C
APPENDIX K
CA LC U LATl ON EQUATIONS

METHOD 2 CALCLIATION EOU.ATIONS
p, ) (-1 528
29.92 Qlad = 60 (1 -B,J A (- Ts (a?)
Qa = 60 A
4.995 Q G d G, n i =
I 1 - B,
4.585 x lo-' PM.
'Alternate equations for calculating moisture content from wet bulb and dry bulb data
032294C:\STACKlWPM~HOD%-EQ. 15
1
K- 1
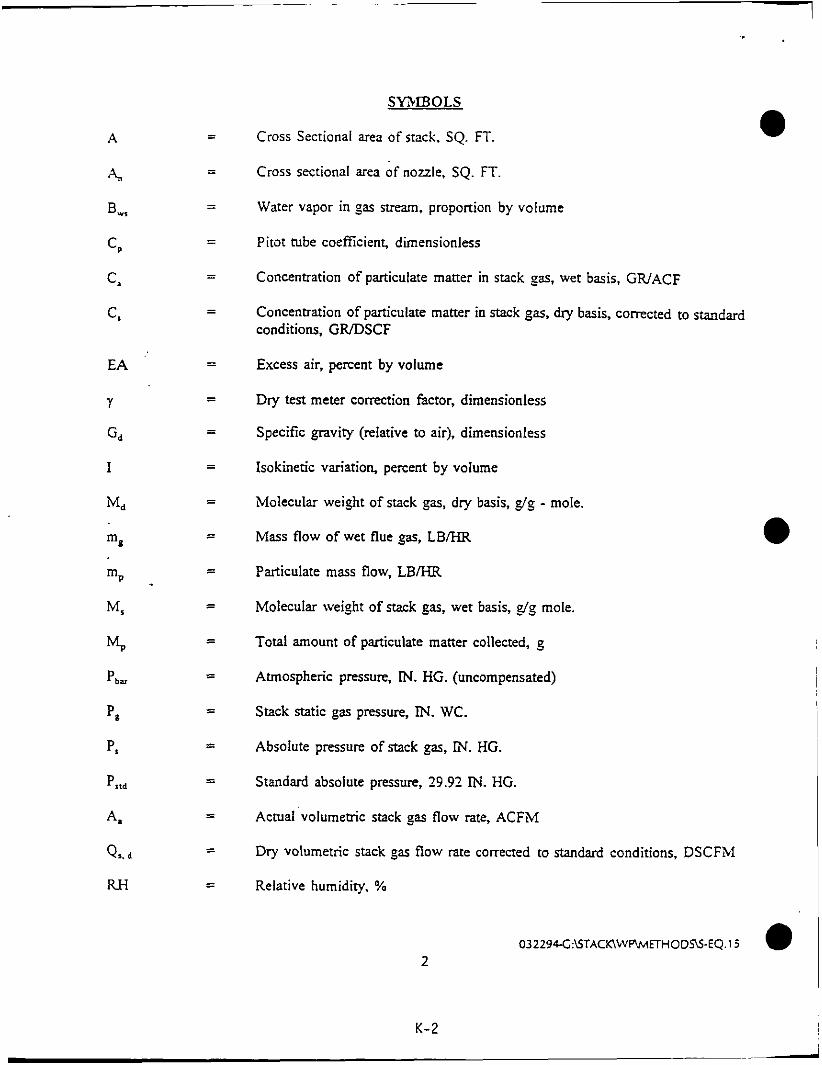
1
EA
Y
Gd
I
Md
SYMBOLS
Cross Sectional area of stack, SQ. FT.
Cross sectional area of nozzle, SQ. FT.
Water vapor in gas stream, proponion by volume
Pitot tube coeEcienL dimensionless
Concentration of particulate matter in stack gas, wet basis, GWACF
Concentration of particulate matter in stack gas, dry basis, corrected to standard conditions, GRDSCF
Excess air, percent by volume
Dry test meter correction factor, dimensionless
Specific gravity (relative to air), dimensionless
Isokinetic vm'ation, percent by volume
Molecular weight of stack gas, dry basis, 8/g - mole.
Mass flow of wet flue gas, LBA-IR
Particulate mass flow, LBA-IR
Molecular weight of stack gas, wet basis, g/g mole.
Total amount of particulate matter collected, g
Atmospheric pressure, M. HG. (uncompensated)
Stack static gas pressure, IN. WC.
Absolute pressure of stack gas, M. HG.
Standard absolute pressure, 29.92 M. HG.
Actual.volumemc stack gas flow rate, ACFM
Dry volumemc stack gas flow rate corrected to standard conditions, DSCFM
Relative humidity, %
2
K- 2 ~-

T=b
'Ptdb 0 VPtwb
AH
AP
-
Y
P
Dry bulb temperature of srack gas, "F
Wet bulb temperature of srack gas, OF
Absolute averaze dry gas meter temperature, "R
Absolute average stack temperature, "R
Standard absolute temperature, 528 "R (68 OF)
Total sampling time, min.
Total volume of liquid collected in impingers and silica gel, mi
Volume of gas sample as measured by dry gas meter, CF
Volume of gas sample measured by the dry gas meter corrected to standard conditions, DSCF
Volume of water vapor in the gas sample corrected to standard conditions, SCF
Average actual stack gas velocity, FTISEC
Vapor pressure at Tdb, M. HG.
Vapor pressure at T*, M. HG.
Average pressure differential across the orifice meter, IN. WC.
Velocity pressure of stack gas, M. WC.
Dry test meter correction coefficienL dimensionless
Actual gas density, LB/ACF
032294C:\STACK\WP\MEOO~~EQ. 15
3
K-3
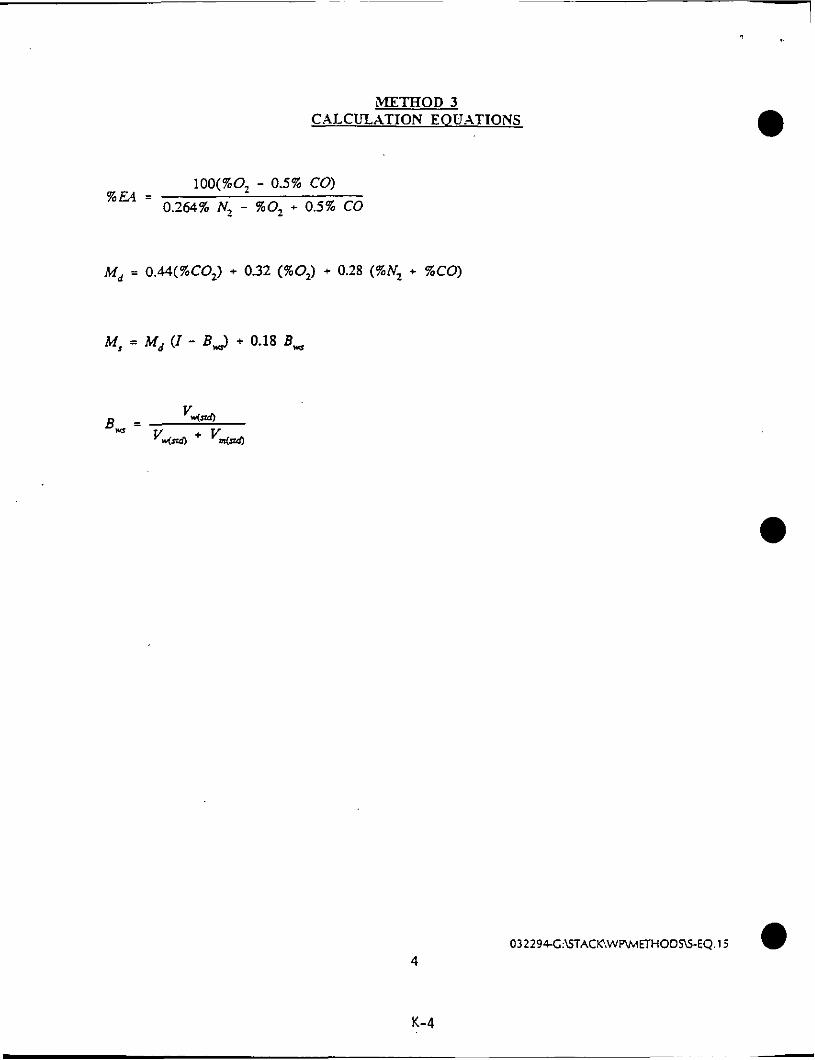
%EA
Md =
M, =
METFIOD 3 C.ALCLZATION EOLJATIONS
100(%0, - 0.5% CU)
0.264% N, - %O, + 0.5% CO - -
0.44(%COz) + 032 (%Oz) + 0.28 (%Nz + % CO)
e
E,J + 0.18 B ,
e
4 032294C:\STACIC.WP\METHOD"EQ.lj a
K-4
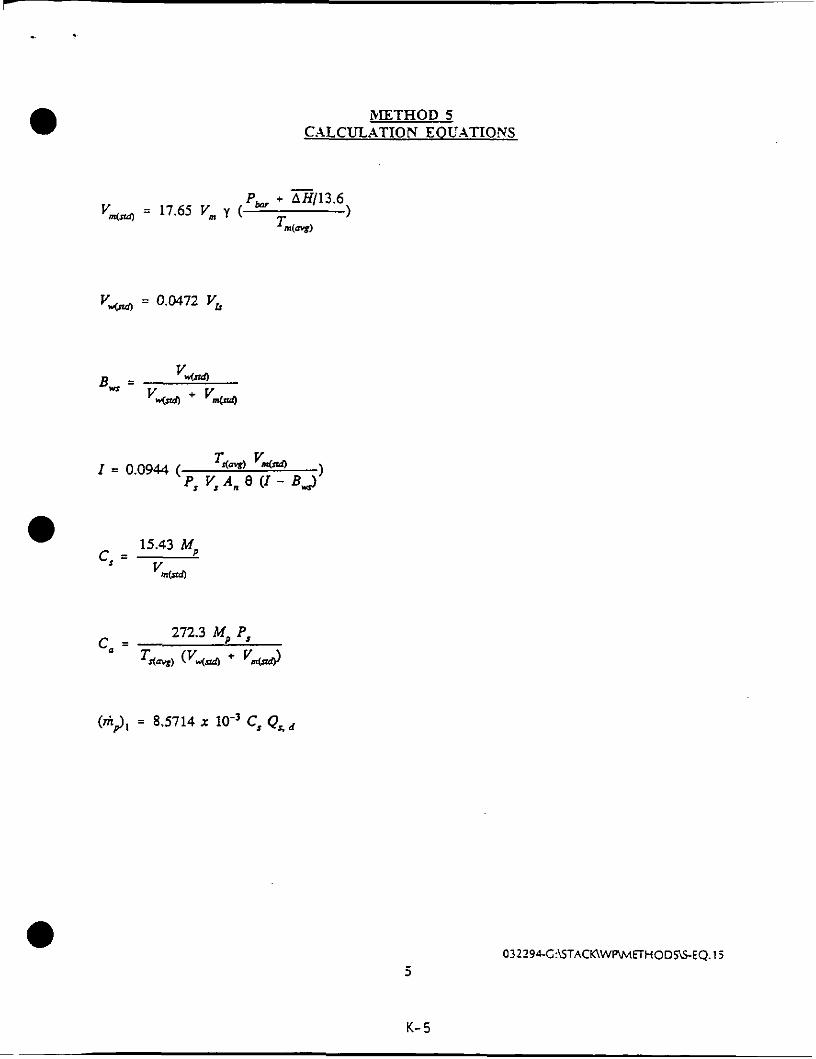
METHOD 5 C.4LCULATION EOCATIONS
v- = 0.0472 v,
15.43 M, cs = .,
( f i J , = 8.5714 x C, QSd
032294C:~TACK\WPMEHODSEQ. 15 - 3
K- 5
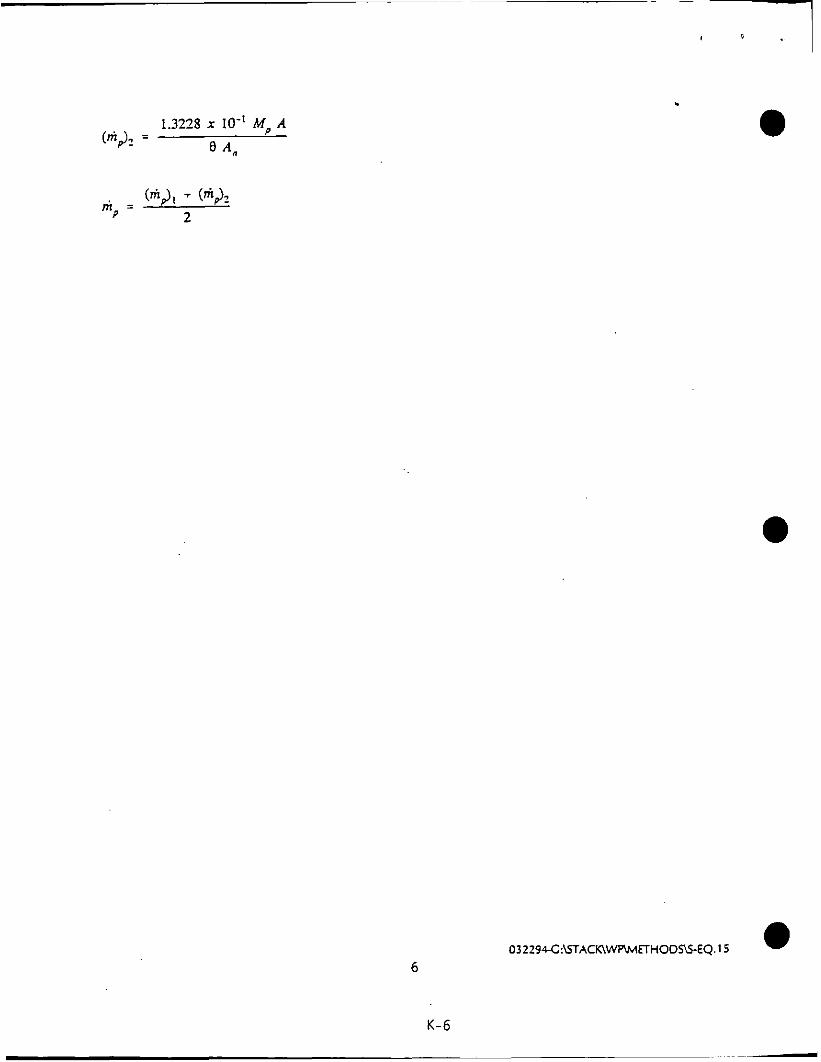
6
.
032294-G:\STACK\WPMETHOD~-EQ. 1 5 0
K-6
-/
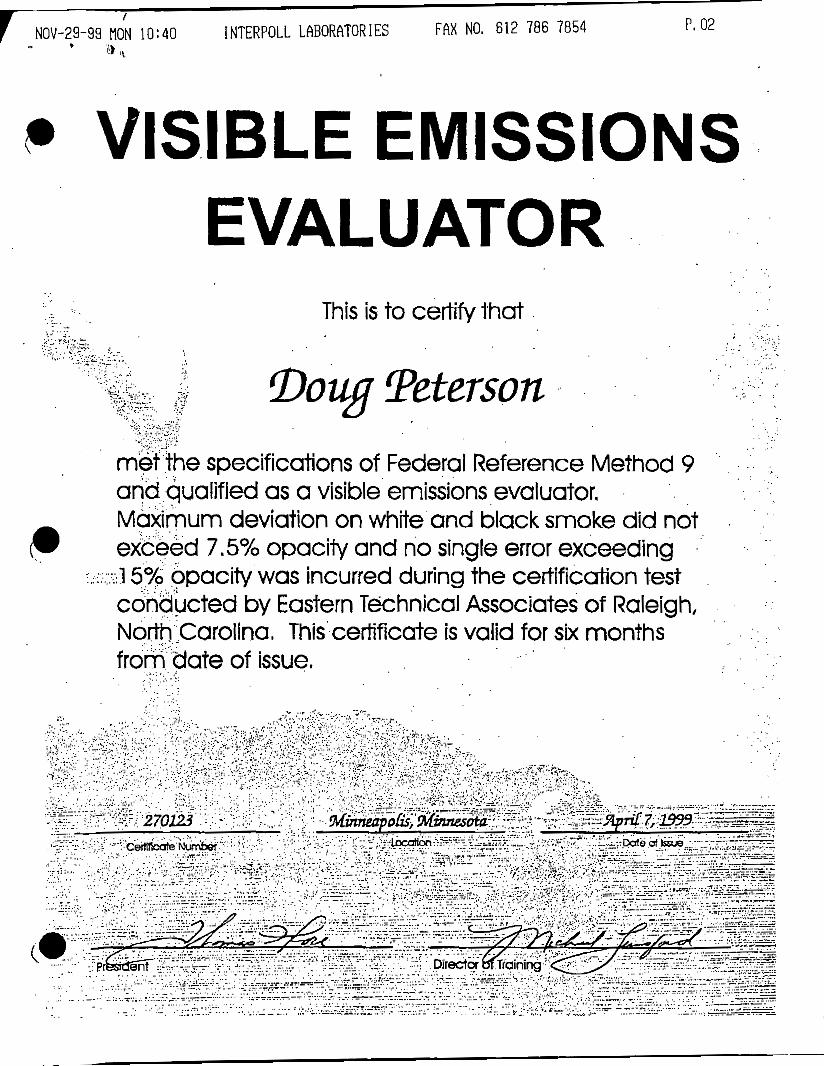
I
NOV-29-99 flON 10:40 INTERPOLL LABORATORIES FAX NO. 612 786 7854 P. 02 ' l ' ) , ,
P VISIBLE EMISSIONS EVALUATOR
. ,. . .
. .:. This is to certify that
Doug Teterson . .
he specifications of Federal Reference Method 9
urn deviation on white and black smoke did not 7.5% opacity and no single error exceeding
pacity was incurred during the certification test cted by Eastern Technical Associates of Raleigh,
and qualified as a visible emissions evaluator.
(.
North Carolina. This certificate is valid for six months fr ate of issue.