AP42 Section: 11.1 C. Hot Mix Loadout Asphalt … · In this report "loadout operations" refers to...
46
AP42 Section: 11.1 Reference Number: 358 Title: Pretest Survey And Screening Report-Plant C. Hot Mix Loadout Asphalt Cement. October 15, 1997
Transcript of AP42 Section: 11.1 C. Hot Mix Loadout Asphalt … · In this report "loadout operations" refers to...
AP42 Section: 11.1
Reference Number: 358
Title: Pretest Survey And Screening Report-Plant C. Hot Mix Loadout Asphalt Cement.
October 15, 1997
EPA
Text Box
Note: This is a reference cited in AP 42, Compilation of Air Pollutant Emission Factors, Volume I Stationary Point and Area Sources. AP42 is located on the EPA web site at www.epa.gov/ttn/chief/ap42/ The file name refers to the reference number, the AP42 chapter and section. The file name "ref02_c01s02.pdf" would mean the reference is from AP42 chapter 1 section 2. The reference may be from a previous version of the section and no longer cited. The primary source should always be checked.
'I - . , ' 'I
--- fl PACIFIC ENVIRONMENTAL SERVICES. INC.
Central Park West so01 South Miami Boulevard. Suite 300
PO. Box 12077 Research Triangle Park, NC 27709-2077
(919) 941-0333 FAX (919) 941-0224
October 15. 1997
Mr. Michael L. Toney (MD-19) Work Assignment Manager SCGB, EMC. EMAD. OAQPS U.S. Environmental Protection Agency Research Triangle Park, NC 2771 1
Subject: Pretest Survey and Screening Report: Contract No. 68-D7-0002. Work Assignment No. 0/005.001. Hot Mix Loadout Asphalt Cement
Dear Mr. Toney:
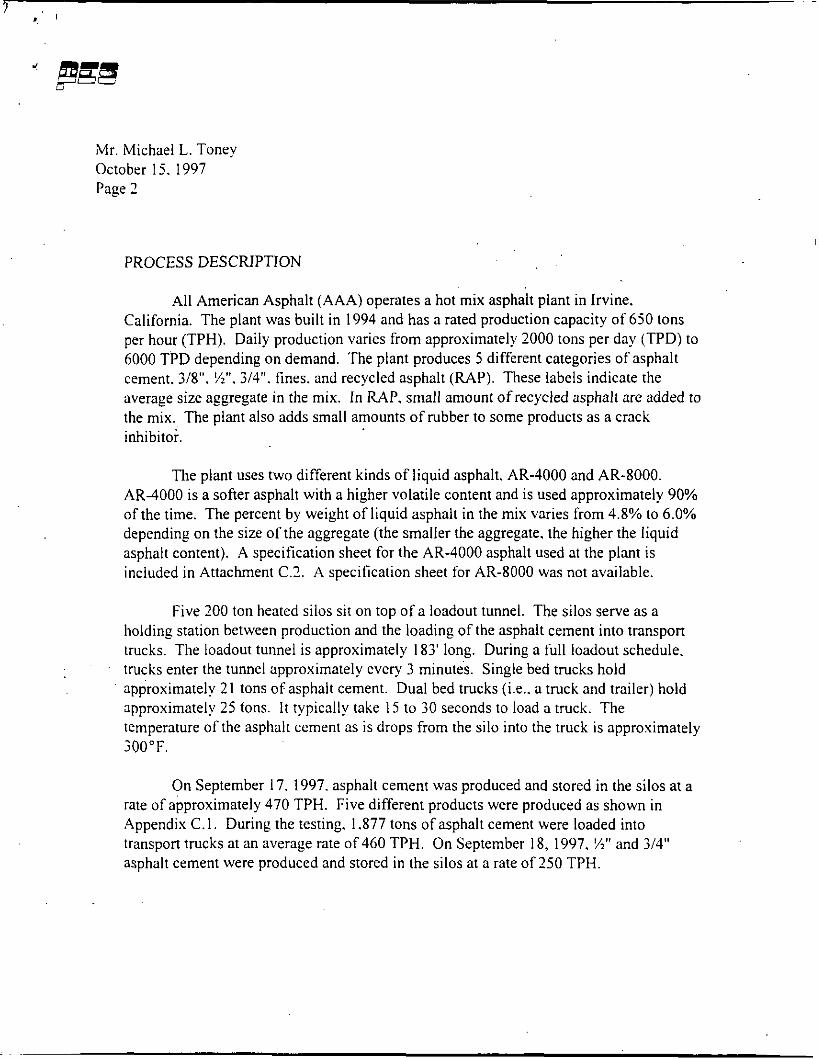
This is a letter report summarizing the results of the preliminary testing performed at the All American Asphalt plant in Irvine. California. The purpose of the preliminary testing was to approximate emissions of particulates and 50 volatile organics from loadout operations at the plant. In this report "loadout operations" refers to the transferring of asphalt cement from heated storage silos to transport trucks.
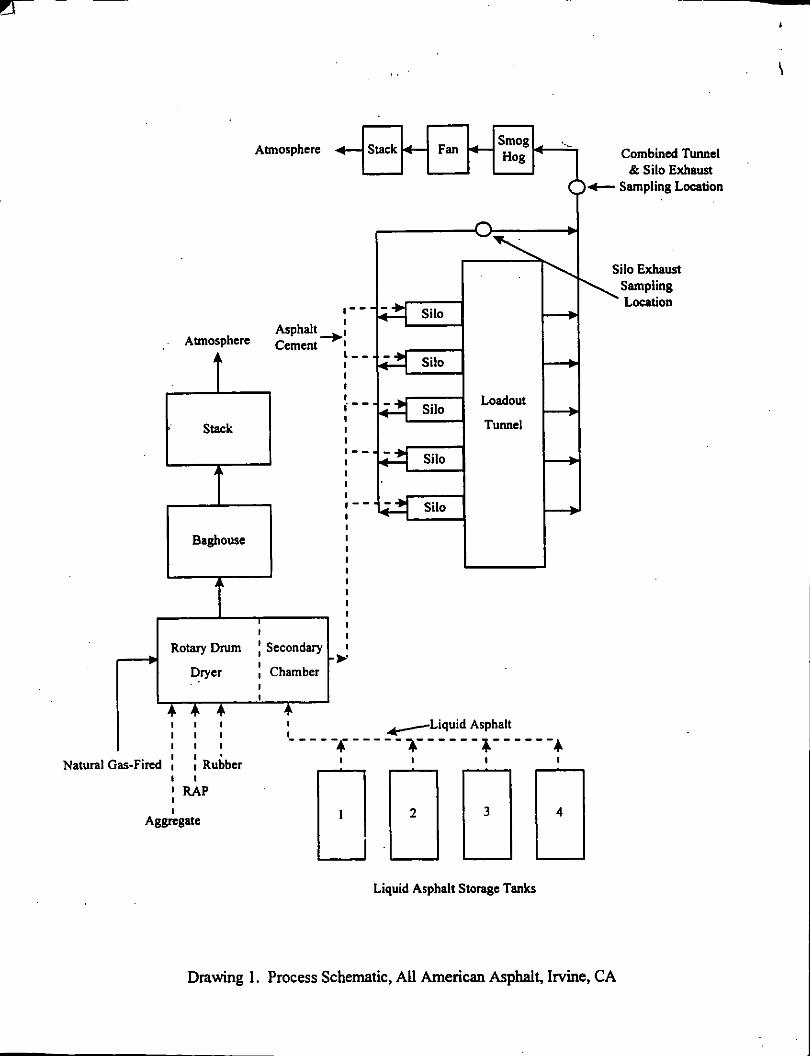
Testing was performed at two locations. Testing was first performed i n the 36" main header that leads from the loadout tunnel to the Smog Hog40 electrostatic precipitator. Testing was also performed in the 12" line that leads trotn the top ofthe silos to the main header. This 12" line. referred to as the Silo Exhaust. is a common line exhausting all five silos. I t is important to note that the main header sampling location is downstream of where the Silo Exhaust enters the main header. The emissions measured in the main header are therefore a combination of the emissions from the loadout tunnel and the silo exhaust. The 36" main header sampling location has been referred to as the Combined Tunnel and Silo Exhaust. A process air flow schematic is presented in Attachment C.3.
At the Combined Tunnel and Silo Exhaust location, two particulate runs and four VOST runs were performed on September 17. 1997. In the Silo Exhaust. two particulate runs and two VOST runs were performed on September 18. 1997. To follow is a brief process description. a discussion of the sampling and analytical procedures used. and a discussion of the test results. Detailed test results appear in Attachments A and B. Process data appears in Attachment C.
WASHINOTON. D.C.. RESEARCH TRIANOLE PARK. NC , LOSAN(IE1ES. CA ,CINCINNATI. OM
@
Mi-. Michael L. Toney October 15. 1997 Page 2
PROCESS DESCRIPTION
All American Asphalt (AAA) operates a hot mix asphalt plant in Irvine. California. The plant was built in 1994 and has a rated production capacity of650 tons per hour (TPH). Daily production varies from approximately 2000 tons per day (TPD) to 6000 TPD depending on demand. The plant produces 5 different categories of asphalt cement. 318". %". 3/4". tines. and recycled asphalt (RAP). These labels indicate the average size aggregate in the mix. In RAP, small amount of recycled asphalt are added to the mix. The plant also adds small amounts of rubber to some products as a crack inhibitoi.
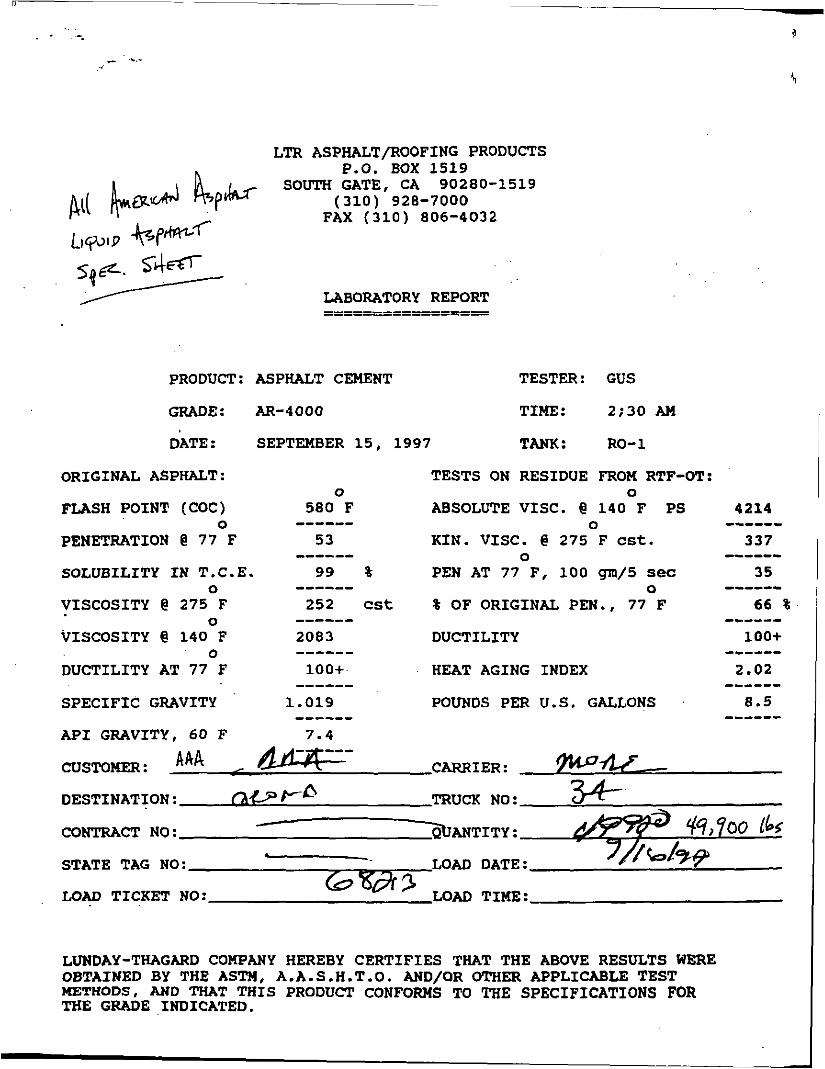
The plant uses two different kinds of liquid asphalt. AR-4000 and AR-8000. AR-4000 is a softer asphalt with a higher volatile content and is used approximately 90% of the time. The percent by weight of liquid asphalt in the mix varies from 4.8% to 6.0% depending on the size of the aggregate (the smaller the aggregate. the higher the liquid asphalt content). A specification sheet for the AR-4000 asphalt used at the plant is included in Attachment (2.2. A specification sheet for AR-8000 was not available.
Five 200 ton heated silos sit on top of a loadout tunnel. The silos serve as a holding station between production and the loading of the asphalt cement into transport trucks. The loadout tunnel is approximately 183' long. During a full loadout schedule. trucks enter the tunnel approximately every 3 minutes. Single bed trucks hold approximately 21 tons of asphalt cement. Dual bed trucks (Le.. a truck and trailer) hold approximately 25 tons. I t typically take 15 to 30 seconds to load a truck. The temperature of the asphalt cement as is drops from the silo into the truck is approximately 300°F.
On September 17. 1997. asphalt cement was produced and stored in the silos at a rate of approximately 470 TI". Five different products were produced as shown in Appendix C.1. During the testing. 1.877 tons of asphalt cement were loaded into transport trucks at an average rate of 460 TI". On September 18, 1997. %" and Y4" asphalt cement were produced and stored in the silos at a rate of 250 TPH.
Mr. Michael L. Toney October 15. 1997 Page 3
SAMPLING AND ANALYTICAL PROCEDURES
In general. the procedures of EPA Method 5 and SW846 Method 0010 were used to measure particulate and volatile organic emissions respectively. EPA Methods 2 and 4 were used to measure the flue gas flow rate and moisture content respectively. At both locations a single horizontal traverse axis was used (only one port was available). For EPA Method 5. front and back half analyses were performed using methylene chloride as the extraction solvent. For SW846 MOOIO the Volatile Organic Sampling Train (VOST) with TenaxO and Tenax/charcoal tubes was used. For each VOST run the Tenax and Tenaxldharcoal tubes were analyzed in tandem using Method 8240A. No field blanks were collected.
DISCUSSION OF RESULTS
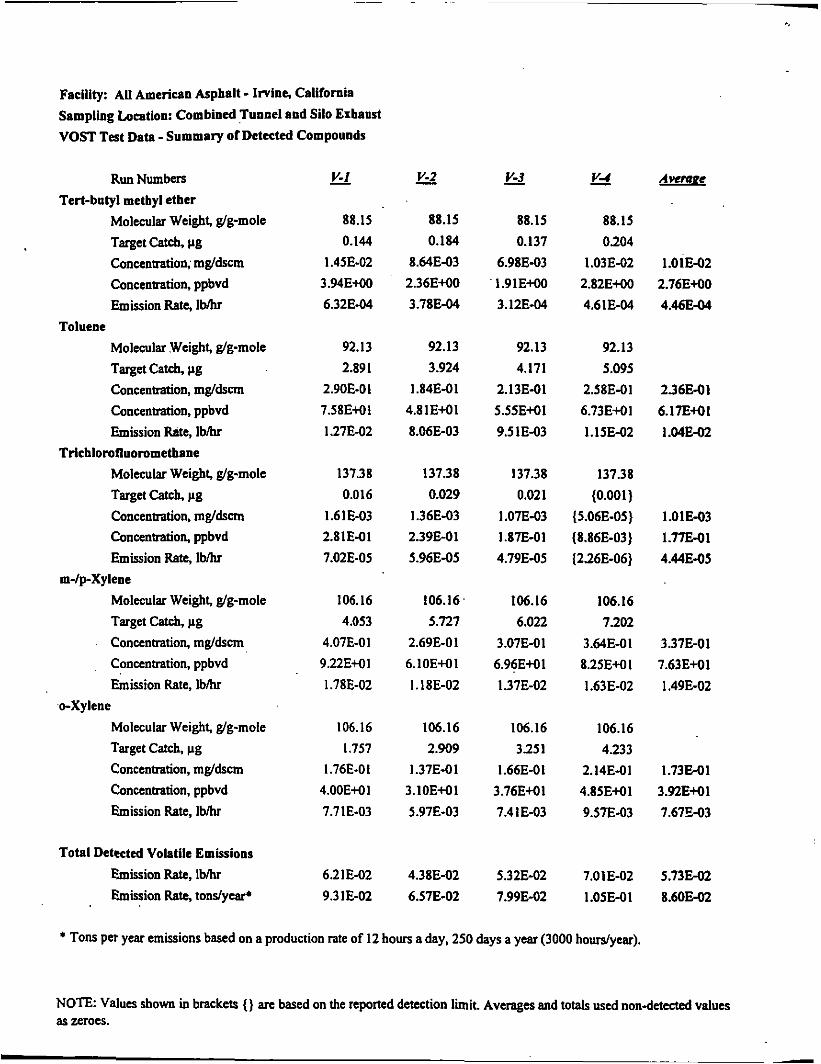
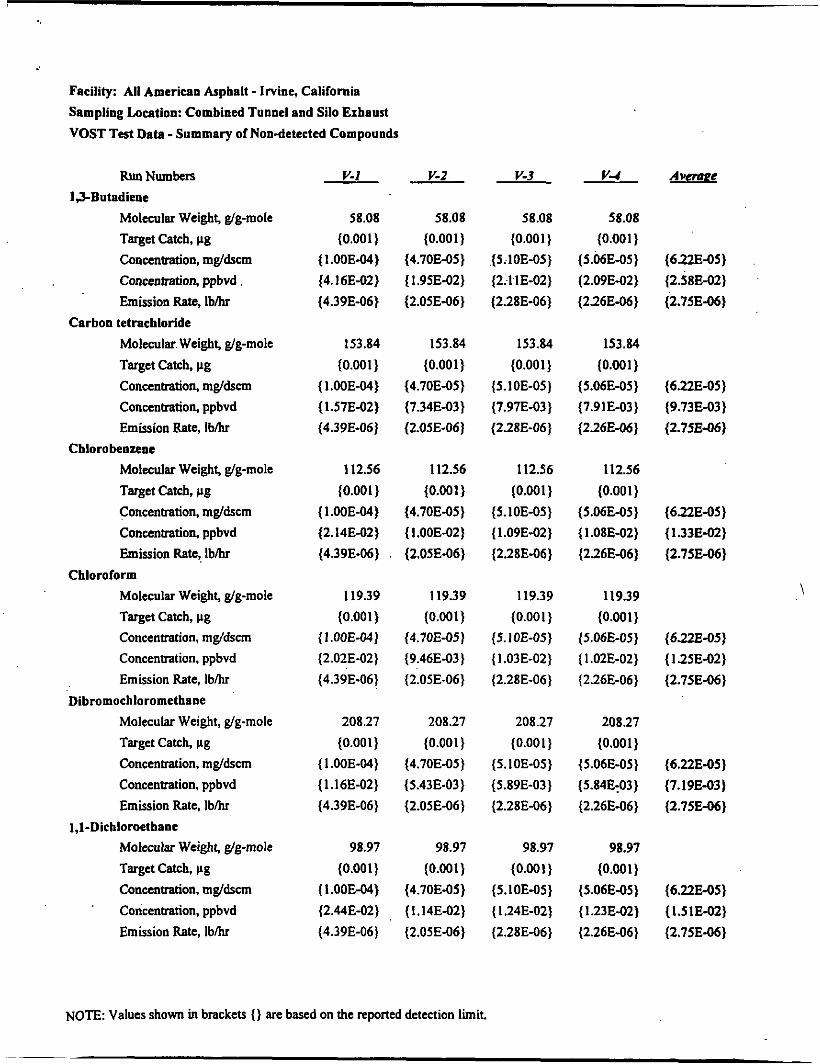
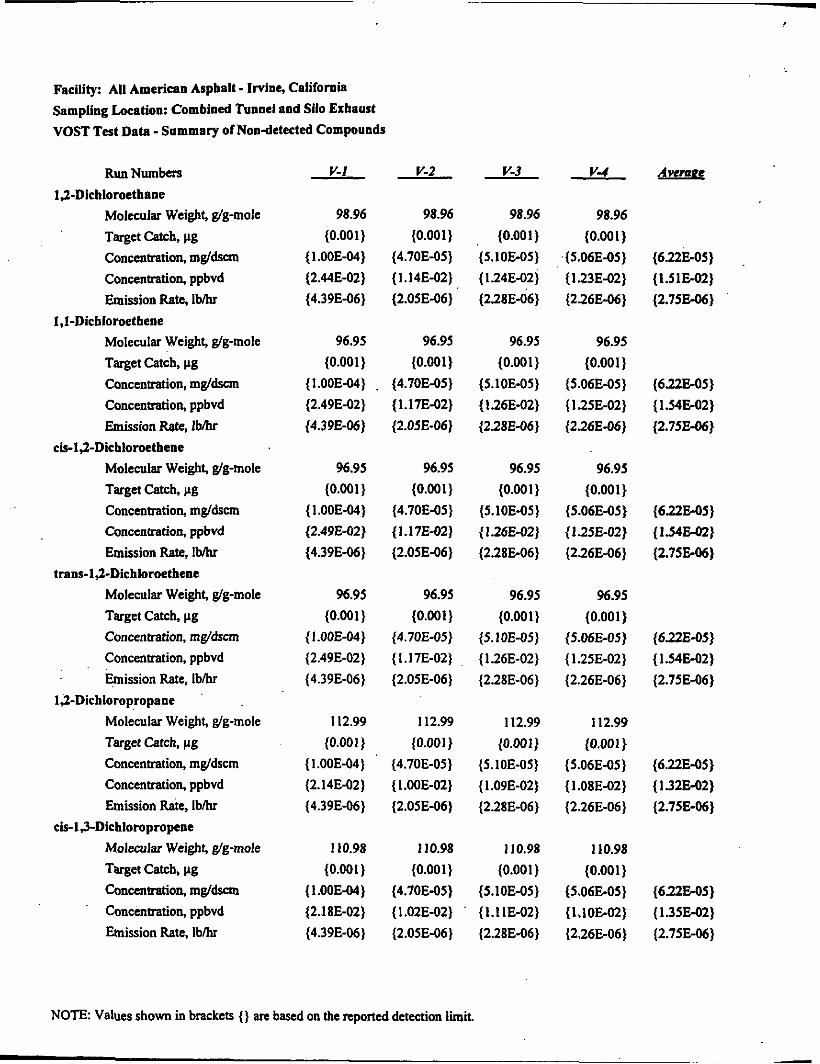
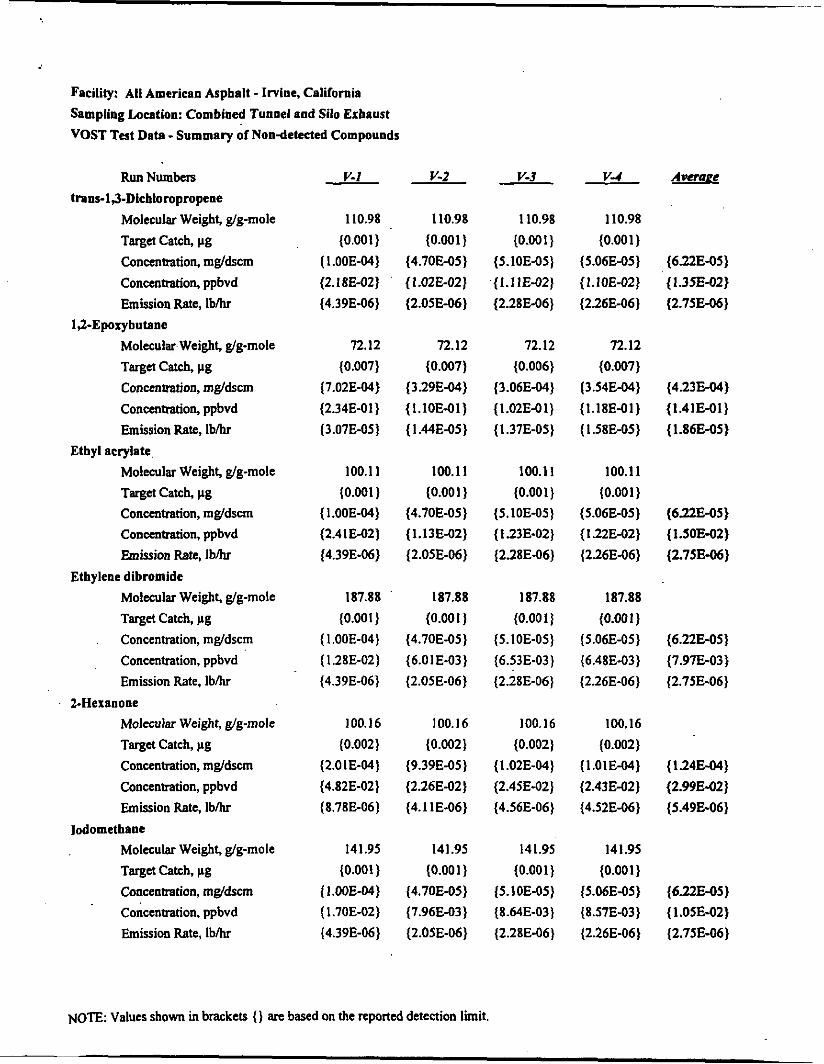
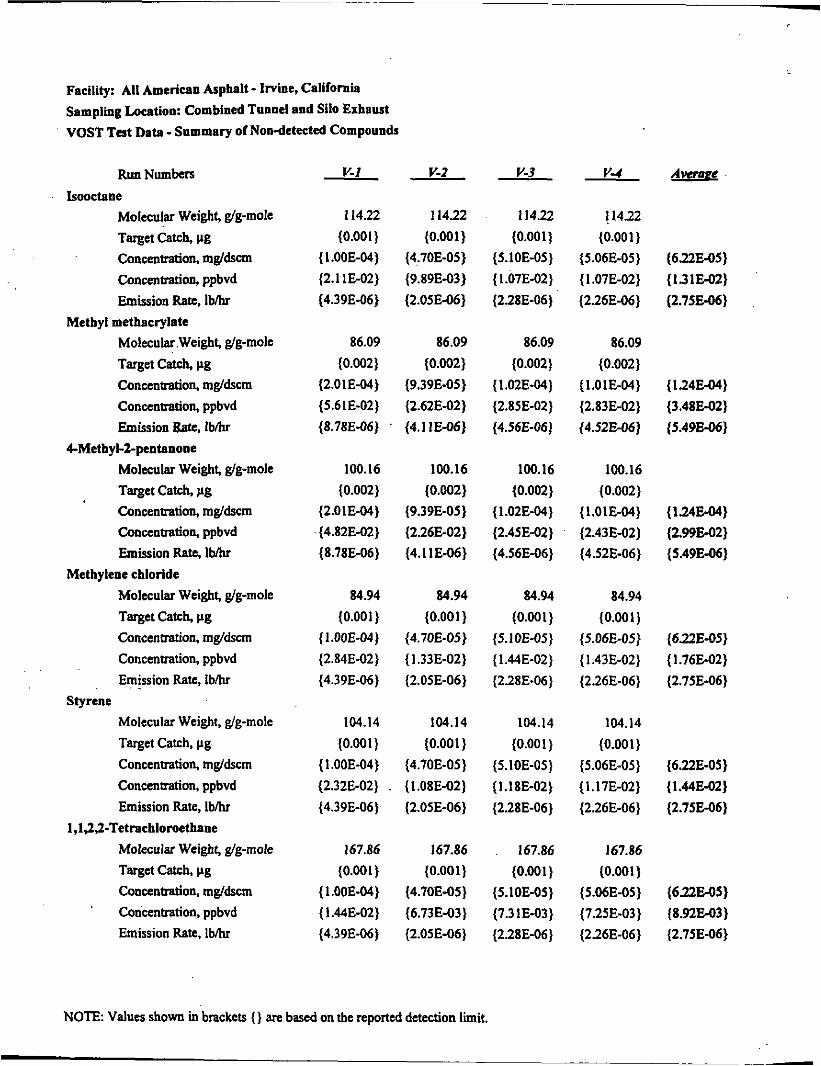
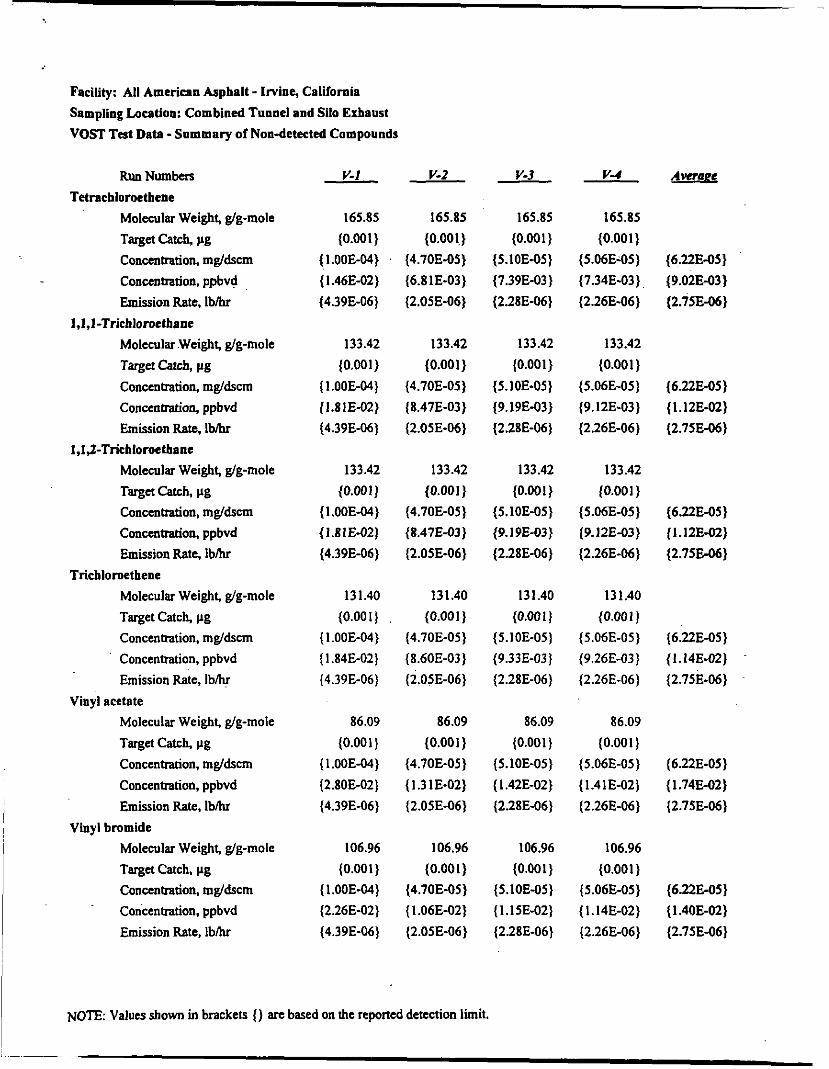
Detailed results of the particulate and VOST tests are presented in Attachments A and B. In Attachment A the results ofthe testing performed in the Combined Tunnel and Silo Exhaust location are presented. The particulate test results are presented in Attachment A.1. The average particulate emission rate was 0.253 pounds per hour (PPH). In Attachments A.2 and A.3 the results ofthe VOST testing are presented. Analysis was performed for 50 target analytes. Fifteen of the target analytes were detected. These results are presented in Attachment A.2. Two compounds. toluene and in-/p-Xylene were found at sufficient levels in all four samples to saturate the mass spectrometer. For these compounds the results presented should be considered underestimated (the underestimated averages for toluene and m-/p-Xylene were 0.0 10 and 0.015 PPH respectively). The total volatile organic emission rate (sum ofthe 15 detected compounds) was 0.086 PPH. Thirty five of the target analytes were reported as non- detected. These results are presented in Attachment A.3. The ten largest non-target peaks were also estimated. The majority of these compounds. referred to as tentatively identified compounds or TICs. were alkanes and cyclic alkanes. All of the TICs were saturated. These results are not presented with this report.
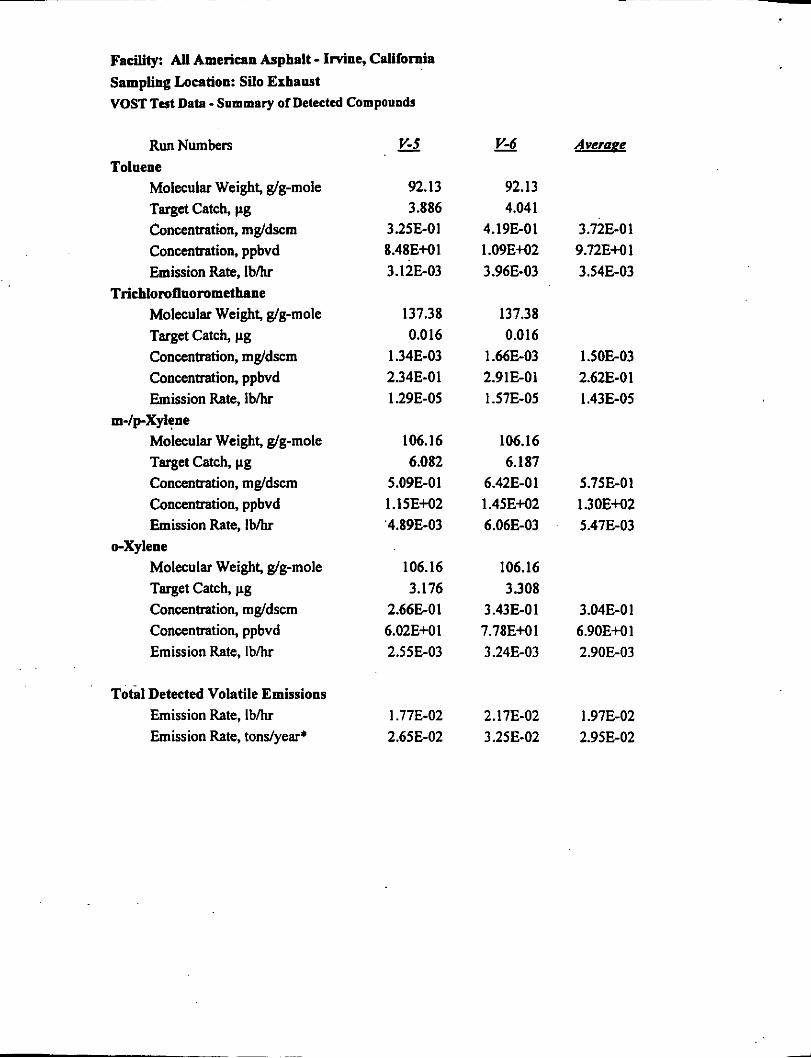
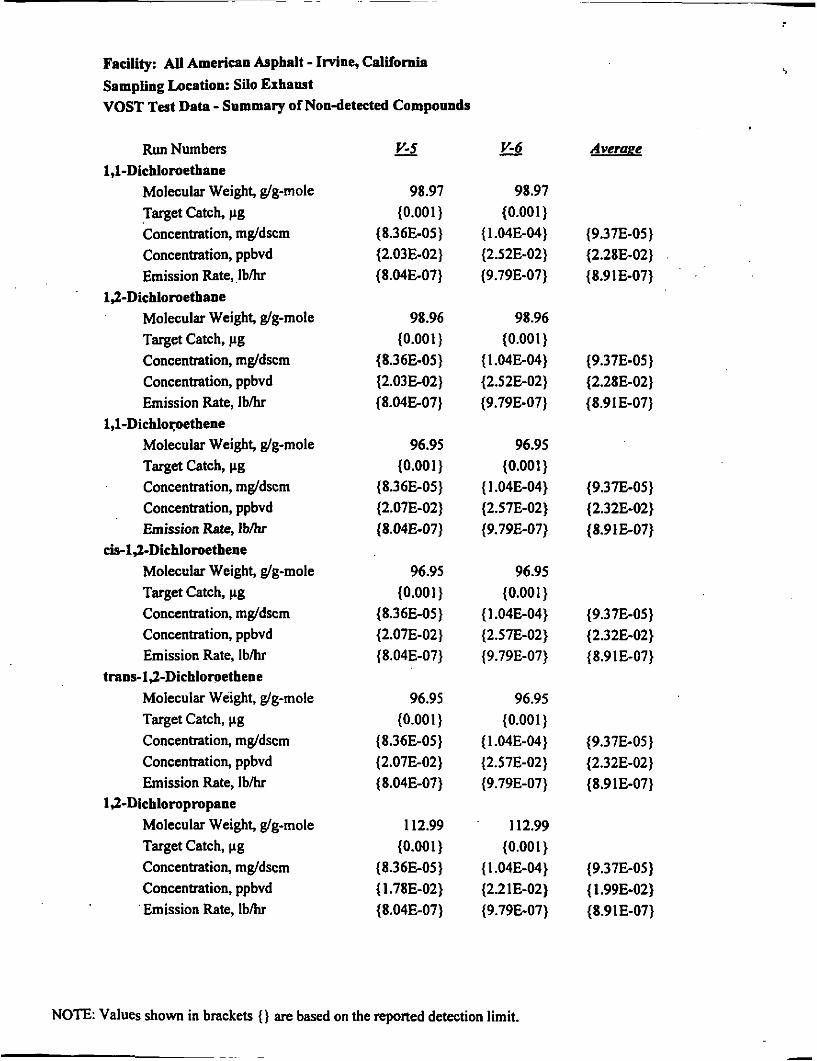
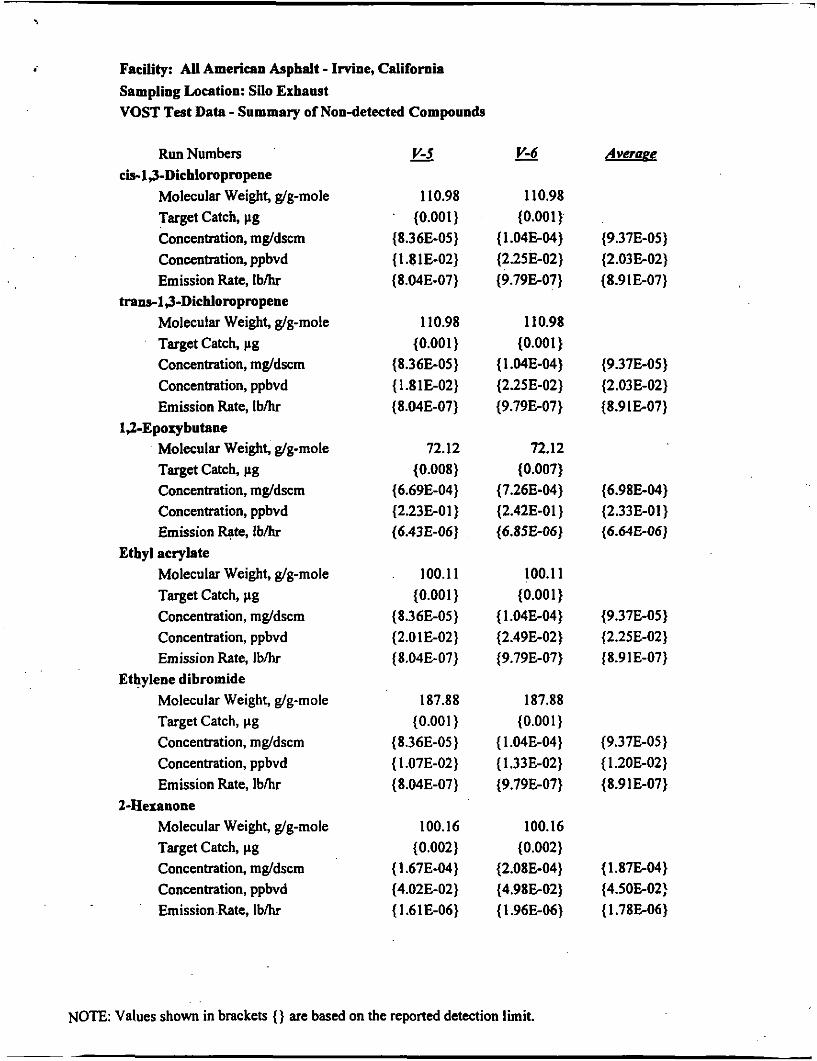
In Attachment B the results ofthe testing performed in the Silo Exhaust location ate presented. The particulate test results are presented in Attachment 9.1, The average particulate emission rate was 0.555 PPH. In Attachments 8.2 and B.3 the results of the VOST testing are presented. Analysis was performed for 50 target analytes. Fourteen of
.
Mr. Michael L. Toney October 15, 1997 Page 4
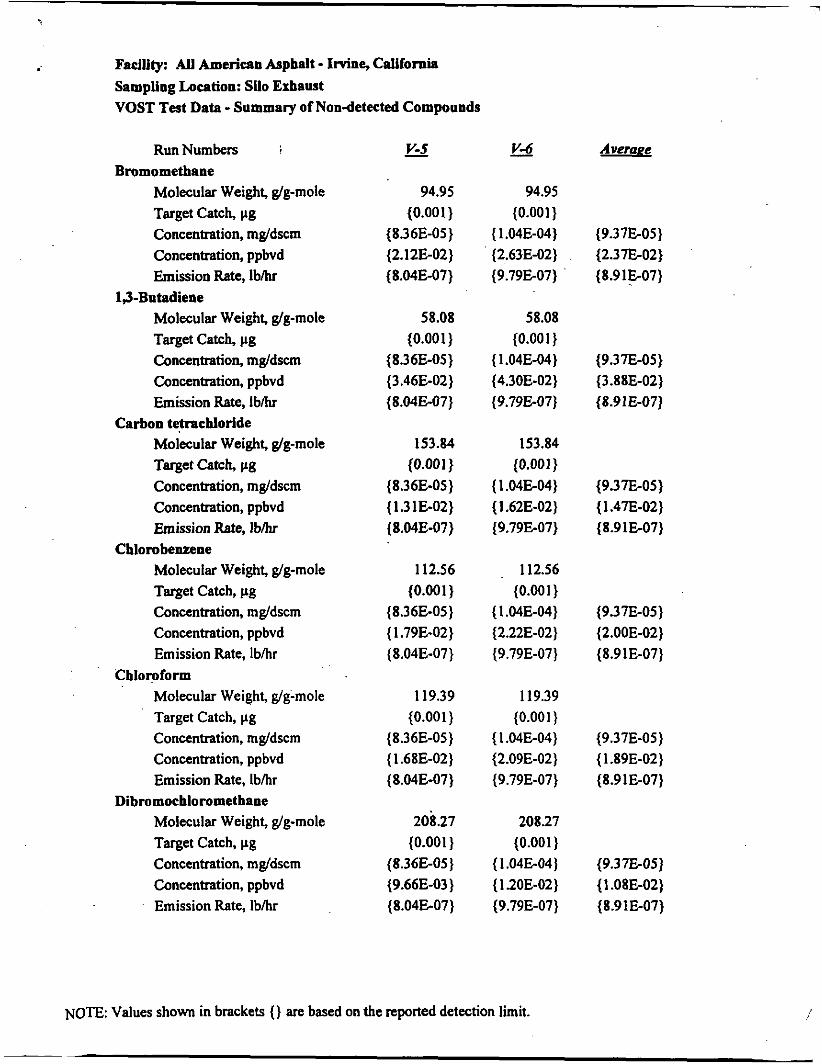
the 15 compound detected at the Combined Tunnel and Silo Exhaust were detected in the Silo Exhaust. These results are presented in Attachment B.2. Two compounds. toluene and m-/p-Xylene. were found at sufficient levels in both samples to saturate the mass spectrometer. For these compounds the results presented should be considered underestimated (the underestimated averages for toluene and m-/p-Xylene were 0.00354 and 0.00547 PPH respectively). The total volatile organic emission rate (sum ofthe 14 detected compounds) was 0.0295 PPH. Thirty six of the target analytes were reported as non-detected. Bromomethane. detected at the Combined Tunnel and Silo Exhaust location. was reported as non-detected. These results are presented in Attachment B.3. The ten'largest non-target peaks were also estimated. The majority of these compounds, referred to as tentatively identified compounds or TICS, were alkanes and cyclic alkanes. All of the TICS were saturated. These results are not presented with this report.
I have not included copies of the raw field data or copies ofthe analytical reports. If you would like to see this information or the TIC results please let me know.
Sincerely,
PACIFIC ENVIRONMENTAL SERVICES. INC.
' I . - Frank J. Phoenix. PE
W ' Frank J. Phoenix. PE I Project Manager
p:\rOOS.OO I\prelimin\prrlim.np Iwp6)
Attachments
cc: John Chehaske. PES Frank Meadows. PES Quality Assurance Coordinator Brenda Massengill. EPA Project Officer (MD) Sandra V . Savage. EPA Contracting Officer - Cincinnati PES Correspondence File PES Project File
Y
AlTACHMENT A
Test Results - Combined Tunnel and Silo Exhaust
ATTACHMENT A. 1
Test Results - Combined Tunnel and Silo Exhaust
Particulate Test Results: Runs M5-1 and M5-2
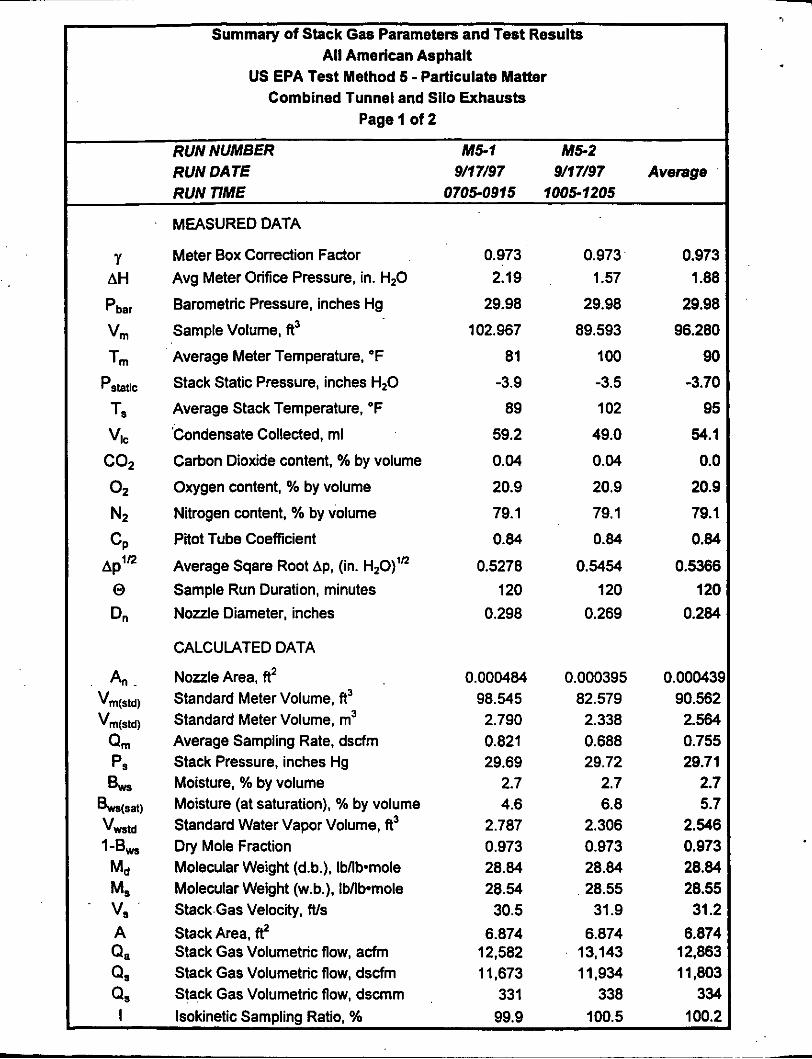
Summary of Stack Gas Parameters and Test Results All American Asphalt
US EPA Test Method 5 - Particulate Matter Combined Tunnel and Silo Exhausts
Page 1 of 2
RUN NUMBER M5-1 M5-2 RUN DATE 9/17/97 9/17/97 Average RUN TIME 0705-0915 1005-1205
MEASURED DATA
Meter Box Correction Factor Avg Meter Orifice Pressure, in. H,O
Barometric Pressure, inches Hg
Sample Volume, ft3
Average Meter Temperature, "F
Stack Static Pressure, inches H20
Average Stack Temperature, 'F
'Condensate Collected, rnl
Carbon Dioxide content, % by volume
Oxygen content, % by volume
Nitrogen content, % by volume
Pitot Tube Coefficient
Average Sqare Root Ap, (in. H20)ln Sample Run Duration, minutes Nozzle Diameter, inches
CALCULATED DATA
Nozzle Area, ft2 Standard Meter Volume, f13 Standard Meter Volume, m3 Average Sampling Rate, dsdm Stack Pressure, inches Hg Moisture, % by volume Moisture (at saturation), % by volume Standard Water Vapor Volume, ft3 Dry Mole Fraction Molecular Weight (d.b.), Ibflb-mole Molecular Weight (w.b.), Ibflbvnole Stack Gas Velocity, ftls Stack Area, f? Stack Gas Volumetric flow, acfm Stack Gas Volumetric flow, dsdm Stack Gas Volumetric flow, dscmm
0.973 2.19
29.98
102.967
81
-3.9
89
59.2
0.04
20.9
79.1
0.84
0.5278 120
0.298
0.000484 98.545 2.790 0.821 29.69
2.7 4.6
2.787 0.973 28.84 28.54 30.5
6.874 12,582 11,673
331
0.973 1.57
29.98
89.593
100
-3.5
102
49.0
0.04
20.9
79.1
0.84
0.5454 120
0.269
0.000395 82.579 2.338 0.688 29.72
2.7 6.8
2.306 0.973 28.84 28.55 31.9
6.874 13,143 11,934
338
0.973 1 .88
29.98
96.280
90
-3.70
95
54.1
0.0
20.9
79.1
0.84 0.5366
120 0.284
0.00043! 90.562 2.564 0.755 29.71
2.7 5.7
2.546 0.973 28.84 28.55 31.2
6.874 12,863 11,803
334 lsokinetic Sampling Ratio, % 99.9 100.5 100.2
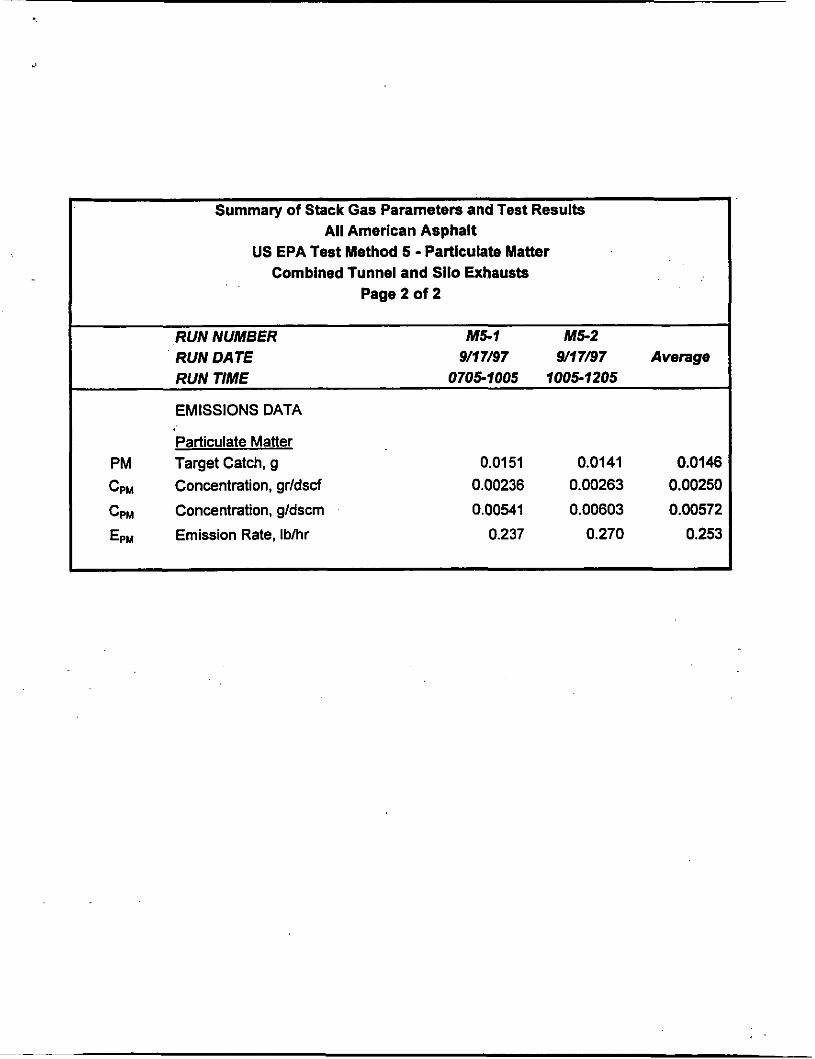
Summary of Stack Gas Parameters and Test Results All American Asphalt
US EPA Test Method 5 - Particulate Matter Combined Tunnel and Silo Exhausts
Page 2 of 2
RUN NUMBER M5-1 M5-2 RUN DATE 911 7/97 9/17/97 Average RUN TIME 0705-1005 1005-1205
EMISSIONS DATA
Particulate Matter PM Target Catch, g 0.01 51 0.0141 0.0146
CPM Concentration, gr/dsd 0.00236 0.00263 0.0025C
CPM Concentration, g/dscm 0.00541 0.00603 0.00572
EPM Emission Rate, Ibhr 0.237 0.270 0.25:
ATTACHMENT A.2
Test Results - Combined Tunnel and Silo Exhaust
VOST Test Results: Runs V-1, V-2, V-3, and V 4 , Detected Compounds
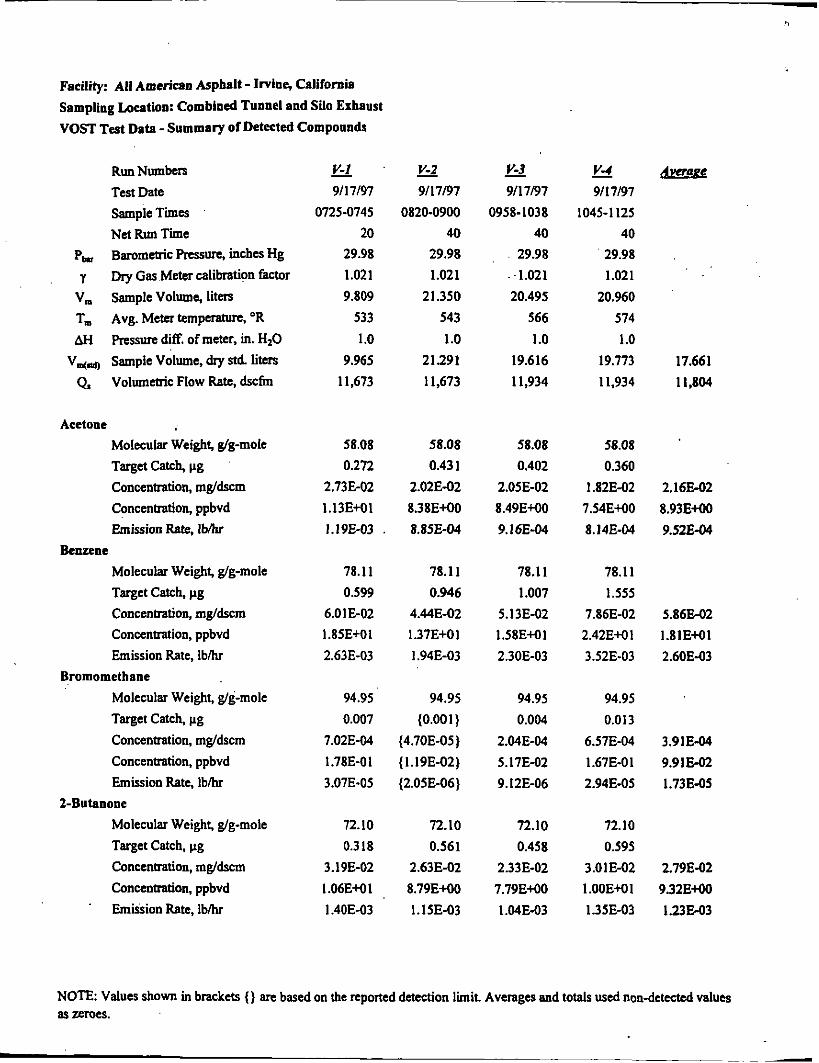
Facility: All American Aspbslt - Irvine, California Sampling Loeation: Combined Tunnel and Silo Exhaust VOST TeJt Data -Summary of Detected Compounds
Run Numbtrs Test Date
Net Run Time Barometric Rcssurc, inches Hg Dry Gas Meter calibration factor sample Volume, liters Avg. Meter temperature, O R Ressurc diff. of meter, in. H20 Sample Volume, dry std. litcrs VolumCtric Flow Ratc, dscfm
Sample Tima
Acetone Molecular Weight, glg-mole
Concentration, mgldscm Concentration, ppbvd Emission Rate, lbhr
Molecular Weight, glg-mole
Concenmtion, mgldscm Concentration, ppbvd Emission Rate, I b h
Molecular Weight, glg-mole Target Catch, pg Concentration, mgldscm Concentration, ppbvd Emission Rate, I b h
Molecular Weight, glg-mole Target Catch, pg Concentration, mgldscm Concenkation, ppbvd
Target Catch, pg
Benzene
Tsrget Catch, pg
Bromomethane
2-Butanone
. EmissionRate,Ib/hr
- v-1 9/17/97
0725-0745 20
29.98 1.021 9.809
533 1.0
9.965 1 1,613
58.08 0.272
2.73E-02 1.13EM I I. 19E-03
78.11 0.599
6.01E-02 1.85EM1 2.63E-03
94.95 0.007
7.02E-04 1.78E-0 I 3.07E-05
72.10 0.318
3. I9E-02 1.06EMl 1.40E-03
v-2 9/17/97 -
0820-0900 40
29.98 1.02 1
21.350 543 1 .o
21.291 11,673
58.08 0.43 1
2.02E-02 8.38EM0 8.85E-04
78.11 0.946
4.448-02 1.37EM 1 1.94E-03
94.95 (0.001)
(4.70E-05) (1.19E-02) (2.05E-06)
72.10 0.561
2.638-02 8.79EMO l.lSE-03
- v-3 9/17/97
0958-1038 40
29.98 --1.021 20.495
566 1 .o
19.616 11,934
58.08 0.402
2.05E-02 8.49EM0 9.16E-04
78.1 I 1.007
5.13E-02 1.58E+O1 2.3OE-03
94.95 0.004
2.04E-04 5.17E-02 9. I2E-06
72.10 0.458
2.33E-02 7.79E+OO 1.04E-03
V-4 9/17/97 -
1045-1 125 40
29.98 1.02 1
20.960 574 1 .o
19.773 17.661 11,934 11.804
58.08
0.360 1.82E-02 2.16E-02
7.54EM0 8.93EMO 8.14E-04 9.52E-04
78.11 1.555
7.86E-02 5.86E-02 2.42E+O1 1.81EM1 3.52E-03 2.60E-03
94.95 0.013
6.57E-04 3.91E-04 1.67E-01 9.91E-02 2.94E-OS 1.73E-05
72.10 0.595
3.01E-02 2.798-02 I.OOE+Ol 9.32EtOO 1.35E-03 I.23E-03
NOTE: Values shown in brackets () arc based on the reponed detection limit. Averages and totals used non-detcctcd values as zeroes.
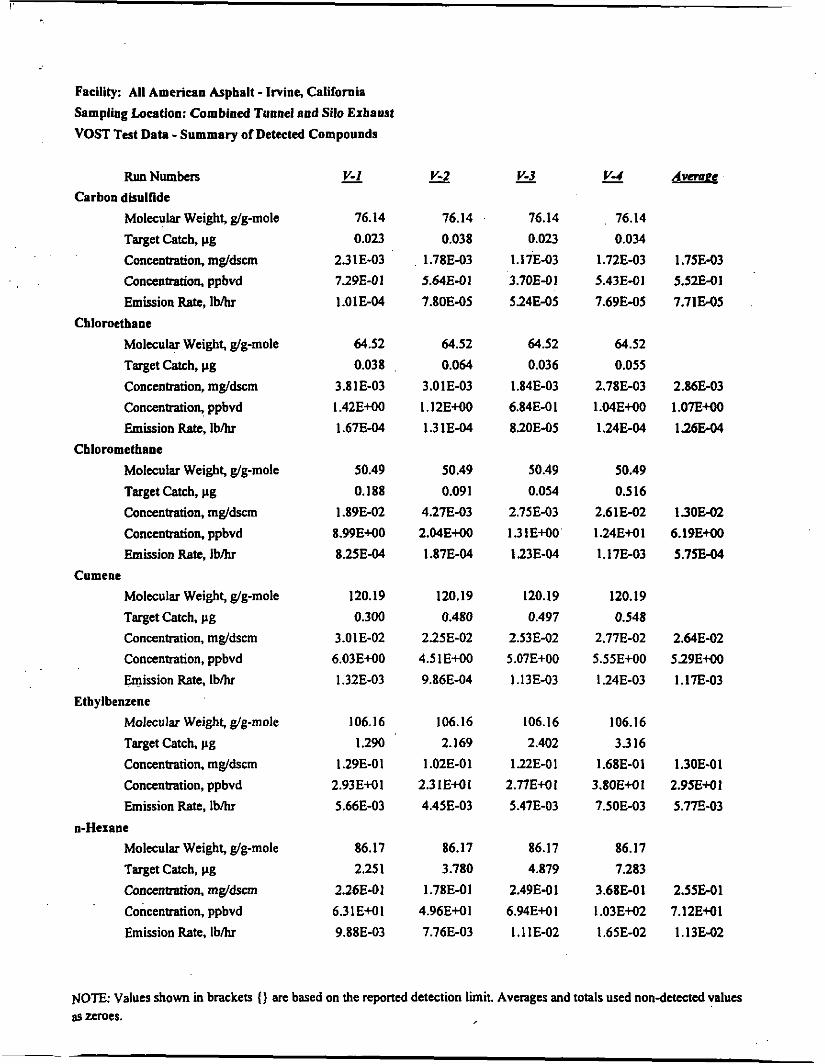
Facility: All American Asphalt - Imine, Califnrnin Sampling Location: Combined Tunnel and Silo Exhaust VOST Test Data - Summary of Detected Compounds
Run Numben
Molecular Weight, &-mole
Concentration. mg/&cm Concentration, ppbvd Emission Rate, lwbr
Molecular Weight, &-mole
Concentration, mg/dscm Concentration, ppbvd Emission Rate, I b h
Molecular Weight, g/g-mole
Concentration, mg/dscm Concentdon, ppbvd Emission Rate, iblhr
Molecular Weight, g/g-mole Target Catch, pg Concentration, mg/dscm Concentration, ppbvd Emission Rate, I b h
Molecular Weight, &-mole Target Catch, pg Concentration, mgldscm Concentration, ppbvd Emission Rate, i b h
Molecular Weight, g/g-mole
Concenbation, mg/dsrm Concenmtion, ppbvd Emission Rate, I b h
Carbon disulfide
Target Catch, Pg
Chlomethane
Target Catch, Pg
Chloromethane
Target Catch, cg
Cumene
Ethylbenzene
n-Hexane
Target Catch, Pg
v-I - 76.14 0.023
2.31E-03 729E-01 1 .01E-04
64.52 0.038
3.81E-03 I .42EMO 1.67E-04
50.49 0.188
1.89E-02 8.99EHO 8.25E-04
120.19 0.300
3.01 E-02 6.03EM0 1.32E-03
106.16 1.290
I .29E-0 I 2.93EMI 5.66E-03
86.17 2.251
2.26E-01 6.3 1 EM1 9.88E-03
- v-2
76.14 0.038
1.78E-03 5.64E-01 7.80E-05
64.52 0.064
3.0 IE-03 I. 12EM0 1.31E-04
50.49 0.091
4.278-03 2.04E+OO 1.87E-04
120.19 0.480
2.25E-02 4.51EMO 9.86E-04
106.16 2.169
1.02E-01 2.31EMI 4.45E-03
86.17 3.780
1.78E-01 4.96EMl 7.76E-03
v-3 - 76.14 0.023
1.17E-03 3.70E-01 524E-05
64.52 0.036
1.84E-03 6.84E-01 820E-05
50.49 0.054
2.75E-03 1.3 1EMO 123E-04
120.19 0.497
2.53E-02 5.07E+00 1.13E-03
106.16 2.402
132E-0 1 2.77EMI 5.47E-03
86.17 4.879
2.49E-0 I 6.94EMl 1.11E-02
- V-4
76.14 0.034
1.72E-03 5.43E-01 7.69E-05
64.52 0.055
2.78E-03 1.04E+00 1.24E-04
50.49 0.516
2.61E-02 1.24EM 1
1 J7E-03
120.19 0.548
2.77E-02 5.55E+00 I .24E-03
106.16 3.316
1.68E-01 3.80EM1 7.5OE-03
86.17 7283
3.68E-01 1.03EM2 1.65E-02
1.75E-03 5.52E-01 7.71E-05
2.86E-03 I.O7E+OO 126E-04
13om 6.19E+OO 5.7sE-04
2.64E-02 529EM0 1. LE-03
1.30E-01 2.95EMI 5.7E-03
2.55E-01 7.12EtO1 1.13E-02
NOTE: Values shown in brackets () an based on the reported detection h i t . Averages and totals used nondetected values as zcfoes.
Facility: AU American Asphalt - Imine. California Sampling Location: Combined Tunnel and Silo Exhausl VOST Test Data - Summary of Detected Compounds
Run Numbers
Molecular Weight, glg-mole Target catch, pg Concentration, mgldscm Concentration, ppbvd Emission Rate, l b h
Molecular Weight, g/g-mole
Concentration, mg/dscm Concentration. ppbvd Emission Rate, I b h
Molccular Weight, g/g-mole Target Catch, pg Concentration, mgldscm Concentration, ppbvd Emission Rate, I b h
Molecular Weight, glg-mole Target Catch, pg
Concentration, mg/dscm Concentration, ppbvd Emission Rate, l b h
Molecular Weight, glg-mole Target Catch, pg
Concenoation, mgldscm Concentration, ppbvd Emission Rate, I b h
Tert-butyl metbyl ether
Toluene
Target Catch pg
Tricblorofluorometbane
mJp-Xylene
o-Xylene
Total Dettcted Volatile Emissions Emission Rate, I b h Emission Rate, tondyear.
v-I - 88.15 0.144
1.45E-02 3.94EMO 6.32E-04
92.13 2.891
2.90E-01 7.58EtO1 1.27E-02
137.38 0.016
1.61E-03 2.81E-01 7.02E-05
106.16 4.053
4.07E-01 9.22EtOl 1.78E-02
106.16 1.757
1.76E-01 4.00EM1 7.7 1E-03
6.2 1 E-02 9.3 IE-02
v-2 - 88.15 0.184
8.64E-03 2.36Ei-00 3.78E-04
92.13 3.924
1.84E-01 4.81EMl 8.06E-03
137.38 0.029
1.36E-03 2.39E-01 5.96E-05
106.16 5.727
2.69E-01 6.10EM1 I. 18E-02
106.16 2.909
1.37E-01 3.10EMI 5.97E-03
4.38E-02 6.57E-02
- v-3
88.15 0.137
6.98E-03 I .91E+OO 3.12E-04
92.13 4.171
2.13E-01 5.55EM1 9.51843
137.38 0.021
1.07E-03 1.87E-01 4.79E-05
106.16 6.022
3.07E-01 6.96EMI 1.37E-02
106.16 3251
l.66E-01 3.76EtO1 7.41E-03
5.32E-02 7.99E-02
V-4 - 88.15 0204
1.03E-02 2.82EMO 4.61E-04
92.13 5.095
2.58E-01 6.73EM1 1.ISE-02
137.38 (0.001)
(5.06E-OS) (8.86E-03) (226E-06)
106.16 7.202
3.64E-01 8.25EMl I .63E-02
106.16 4.233
2.14E-01 4.85EMl 9.57E-03
7.01E-02 1.OSEOl
* Tons per year emissions based on a production rate of 12 hours a day, 250 days a year (3000 hourslyear).
NOTE: Values shown in brackets (} am based on the reported detection limit. Averages and totals used non-detcatd values as zeroes.
A m
1.OIM2 2.76EMO 4.46E-04
2 3 6 M 1 6.17E+01 1.04E-02
1.01M3 1.77E-01 4.44E-05
3.37E-01 7.63EM1 1.49E-02
1.73E-01 3.92EMl 7.67503
5.73E-02 8.60E-02
ATTACHMENT A.3
Test Results - Combined Tunnel and Silo Exhaust
VOST Test Results: Runs V-1, V-2, V-3, and V-4, Non-detected Compounds
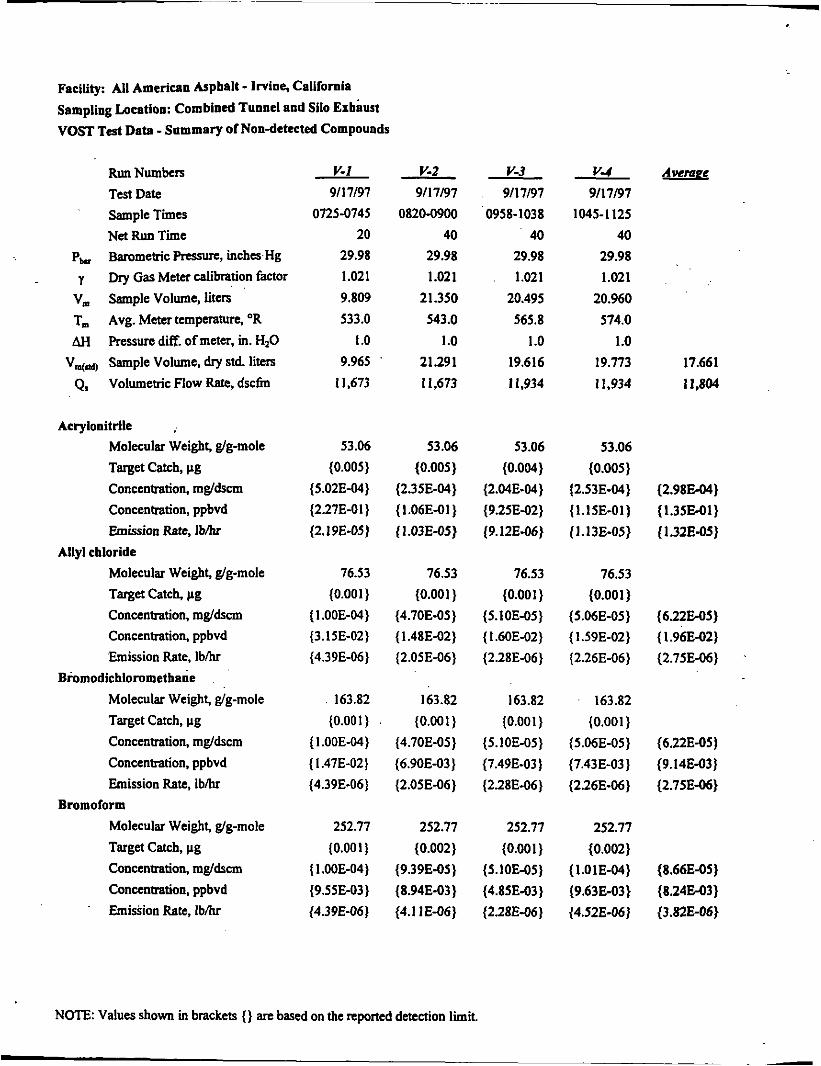
Facility: All American Asphalt - Imine, California Sampling Location: Combined Tunnel and Silo Exhaust VOST Tat Data - Summary of Non-detected Compounds
Run Numbers Test Date Sample T i e s Net Run Time
Dry Gas Meter calibration factor Pa, Barometric Pressure, inches Hg
y V, Sample Volume, liters T, Avg. Meter temperature, O R
AH Pressure diff. of meter, in. H20 VNdb Sample Volume, dry std. liters
Q, Volumetric Flow Rate, dsciin
Acrylonitrile Molecular Weight, &-mole Target Catch, pg Concentration, mg/dscm Concentration, ppbvd Emission Rate, I b h
Molecular Weight, &-mole Target Catch, pg Concentration. mgldscm Concentration. ppbvd .Emission Rate, I b h
Molecular Weight, &-mole Target Catch, pg Concentration, mg/dscm Concentration, ppbvd Emission Rate, I b h
Molecular Weight, g/g-mole Target Catch, pg Concentration, mgldscm Concentration, ppbvd
Allyl chloride
Biomodichloromethane
Bromoform
. Emisiion Rate, I b h r
v-1 9/17/97
0725-0745 20
29.98 1.021 9.809 533.0
I .o 9.965
1 1,673
53.06 (0.005)
(5.02E-04)
(2.19E-05)
76.53
(2.27E-0 I )
(0.001)
(1.00E-04) (3.15E-02) (4.39E-06)
163.82 (0.001)
(1 .00E-04) ( I .47E-02) (4.39E-06)
252.77 (0.001)
( 1.00E-04) (9.55E-03) (4.39E-06)
v-2 9/17/97
0820-0900 40
29.98 1.02 1
21.350 543.0
I .o 21.291 11,673
53.06 (0.005)
(2JSE-04) (1.06E-01) (1.03E-05)
76.53 (0.001)
(4.70E-OS) (1.48E-02) (LOSE-06)
163.82 (0.001)
(4.70E-05) (6.90E-03) (2.05E-06)
252.77 (0.002)
(9.398-05) (8.94E-03) (4.1 IE-06)
NOTE: Values shown in brackets () arc based on the reported detection limit.
v-3 9/17/97
0958-1038 40
29.98 1.021
20.495 565.8
I .o 19.616 11,934
53.06 (0.004)
(9.25E-02) (9.12E-06)
(2.04E-04)
76.53 (0.001)
(5.lOE-05) ( I .60E-02) (2.28E-06)
163.82 (0.001)
(5.10E-05) (7.49E-03) (228E-06)
252.77 (0.00 1 )
(5.10E-05) (4.858-03) (2.28E-06)
V-4 9/17/97
1045-1125 40
29.98 1.021
20.960 574.0
I .o 19.773 11,934
53.06 (0.005)
(2.53E-04) (1. I SE-Ol ) (1.13E05)
76.53 (0.00 1 )
(5.06E-OS) { 1.59E-02) ( 2.26E-06)
163.82 (0.001)
(5.06E-05) (7.43 E-03 ) (226E-06)
252.77 (0.002)
( 1.0 IE-04) (9.63E-03) (4.52E-06)
17.661 11,804
( 2 . 9 8 W ) (1.35M1) ( 1.32E-05)
(6.22E-05) ( 1.96E-02) (2.75M6)
(6.ZE-05) (9.14M3) (2.75E-06)
(8.66E-05) (8.24E-03) {3.gzE-06)
Facility: All American Asphalt - Irvine, California Sampling Location: Combined Tunnel and Silo Exhaust VOST Test Data - Summary of Nondetected Compounds
Run Numbers
Molecular Weight, g/g-mole Target Catch, pg Concentration, mg/dscm Concentration, ppbvd Emission Rate, lwhr
Molecular Weight, g/g-mole Target Catch, pg Concentration, mgldscm Concentration, ppbvd Emission Rate, I b h
Molecular Weight, g/g-mole Target Catch. pg Concentration, mg/dscm Concentration, ppbvd Emission Rate, l b h
Molecular Weight, g/g-mole Target Catch, pg
Concentration, mg/dscm Concentration. ppbvd Emission Rate, I b h
Molecular Weight, glg-mole Target Catch, pg
Concentration, mgldscm Concentration, ppbvd Emission Rate, I b h
Molecular Weight, glg-mole Target Catch. pg Concentration. mgldscm Concentration, ppbvd Emission Rate, I b h
15-Butadiene
Carbon tetrachloride
Chlorobenzene
Chloroform
Dibromochloromethane
1,l-Dichloroethane
v-1
58.08 (0.001)
(1.00E-04) (4.1 6E-02) (4.39E-06)
153.84 (0.001)
( 1.00E-04) (1.57E-02) (4.39E-06)
112.56 (0.001)
( 1.00E-04) (2.14E-02) (4.39E-06)
119.39 (0.001)
{ I .00E-04) (2.02E-02) (4.39E-06)
208.27 (0.001)
( 1.00E-04) (1.16E-02) (4.39E-06)
98.97 (0.001)
( I .00E-04) (2.44E-02) (4.39E-06)
v-2
58.08 (0.001)
(4.70E-05) (1.95E-02) (2.OSE-06)
153.84 (0.001)
(4.70E-05) (7.34E-03) (2.05E-06)
112.56 (0.001)
(4.70E-05) (1.OOE-02) (2.05E-06)
119.39 (0.001)
(4.70E-05) (9.46E-03) (2.05E-06)
208.27 (0.001)
(4.70E-05) (5.43E-03) (2.05E-06)
98.97 (0.001)
(4.70E-05) ( 1.14E-02) (2.05E-06)
v-3
58.08
(0.001) (S.10E-05) (2.11E-02) (2.28E-06)
153.84 (0.001)
(5.lOE-OS) (7.97E-03) (228E-06)
112.56 (0.001)
(S.1OE-OS) (1.09E-02) (2.28E-06)
119.39 (0.001 }
(5. IOE-05) (1.03E-02) (2.28E-06)
208.27 (0.001)
(5.10E-05) (5.89E-03) (2.28E-06)
98.97 (0.001)
(5.10E-05) ( 1.24E-02) (2.28E-06)
V 4
58.08
(0.00 1 ) (5.06E-05) (2.09E-02) (226E-06)
153.84 (0.001)
(5.06E-05) (7.91E-03) (226E-06)
112.56 (0.001)
(5.06E-05) (1.08E-02) (226E-06)
119.39 (0.001)
(5.06E-05) ( 1.02E-02) (2.26E-06)
208.27 (0.001)
(5.06E-OS) (5.84E:03) (2.26E-06)
98.97 (0.001)
(5.06E-05) (1.23E-02) (2.26E-06)
(622E-05) (2.58E-02) (2.75E-06)
(6.22E-05)
(2.75E-06) (9.73E-03)
(632E-05) ( 1.33E-02) (2.75E-06)
\
(6.22E-05) ( 125E-02) (2.75E-06)
(6.22E-05) (7. I9E-03) (2.75E-06)
(6.22E-05) (1.51E-02) (2.75E-06)
NOTE: Values shown in brackets (} are based on the reported detection limit.
Facility: All American Asphalt - twine, California Sampling Location: Combined Tunnel and Silo Exhaust VOST Test Data - Summary of Nondetected Compounds
RunNumbeR
Molecular Weight, g/g-mole
Target Catch, pg Concentration, mg/dscm Concentration, ppbvd Emission Rate, lwhr
Molecular Weight, g/g-mole Target Catch, pg Concentration, mg/dsun Concentration, ppbvd Emission Rate, Ib/hr
Molecular Weight, gig-mole Target Catch, pg
Concentration, mg/dscm Concentration, ppbvd Emission Rate, lwhr
trans-1.2-Dichloroethene Molecular Weight, g/g-mole Target Catch, pg Concentdon, mgldscm Concentration, ppbvd Emission Rate, I b h
Molecular Weight, g/g-mole Target Catch, pg Concentration, mg/dscm Concentration, ppbvd Emission Rate, I b h
cis-l$-Dichloropropene Molecular Weight, g/g-mole Target Catch, pg
Concentration, mg/dscm Concentration, ppbvd Emission Rate, l b h
1.2-Dichloroethane
I ,I-Dichloroetbene
cis-I.2-Dichloroethene
1.2-Dichloropropane
v-1
98.96 (0.00 1 )
{ 1.00E-04) {2.44E-02) (4.39E-06)
96.95 (0.001)
{ 1.00E-04) (2.49E-02) {4.39E-06)
96.95 (0.00 1 )
{ 1.00E-04) (2.49E-02) (4.39E-06)
96.95 (0.00 1 )
{I .OOE-04) { 2.49E-02) (4.39E-06)
112.99 (0.001}
(2.14E-02) (4.39E-06)
110.98
{ I.OOE-04)
(0.001) (l.OOE-04) (2.1 8E-02) (4.39E-06)
v-2
98.96 (0.001)
(4.70E-05) { 1.14E-02) (2.OSE-06)
96.95 (0.001)
{4.70E-05) { 1.17E-02) {2.05E-06)
96.95 (0.00 1 )
(4.70E-05) { 1.17E-02) (2.05E-06)
96.95 (0.001)
(4.70E-05) ( I. 17E-02) (2.05E-06)
112.99 (0.001)
(4.70E-05) { 1.00E-02) (2.05E-06)
110.98 (0.00 1 )
(4.70E-05) { 1.02E-02) (2.05E-06)
v-3
98.96 (0.00 1 )
(5.10E-05) { 124E-02) (228E-k)
96.95 (0.001)
(5.1 OE-05) { 126E-02) (2.28E-06)
96.95 (0.001)
(5.10E-05) {I .26E-02) (2.28E-06)
96.95 (0.00 1 )
(5. IOE-05) (1.26E-02) (2.28E-06)
112.99 (0.001)
(5.10E-OS) (1.09E-02) (2.28E-06)
110.98 (0.001)
(5.10MS)
(2.28E-06) { 1. I 1E-02)
V-4
98.96 (0.001)
(5.06E-05) ( 1.23E-02) (2.26E-06)
96.95 (0.00 1 )
(5.06E-05) { 1.25E-02) (2268-06)
96.95 (0.00 1 }
(5.06E-05) (125E-02) (2.26E-06)
96.95 (0.001)
(5.06E-OS) (1.25E-02) (2.26E-06)
112.99 (0.001}
{ 5.06E-05) { I.OBE-02) (2.26E-06)
110.98 {O.OO 1 )
(5.06E-05) ( 1,10E-02) (2.26E-06)
A m
(6.22E-05)
(2.75E-06) (1.51E-02)
(6.22E-05) { 1.54E-02) (2.75E-06)
(622E-05)
(2.75E-06) (1-54E-021
(6.22E-05) { 1.54E-02) (2.75E-06)
(6.22E-05)
(2.75E-06) { 1.32E-02)
(622E-05) (1.35E-02) (2.75E-06)
NO= Values shown in bracketr {) arc based on the reported detection limit.
Facility: All American Asphalt - Imine, California Sampling Loeation: Combined Tunnel and Silo Exhaust VOST Test Data - Summamy of Nondetected Compounds
Run Numbers
Molecular Weight, g/g-mole Target Catch pg Concentration, mgldscm Concentration, ppbvd Emission We, I b h
Molecular Weight, glg-mole
Concentration, mg/dscm Concentration, ppbvd Emiiion Rate, I b h
Molecular Weight, &-mole Target Catch, pg Concentration, mgldscm Concentration, ppbvd Emission Rate, l b h
Molecular Weight, g/g-mole Target Catch, pg Concentration, mg/dscm Concentration, ppbvd Emission Rate, I b h
Molecular Weight, g/g-mole Target Catch, pg Concenhation, mgldscm Coneenbation, ppbvd Emission Rate, Ib/hr
Molecular Weight, g/g-mole Target Catch, pg Concenmtion, mgldscm Concentration, ppbvd Emissioo Rate, I b h
traaP-l$-Dlchloropropene
13-Epoxybutane
Target Catch Pg
Ethyl acrylate
Ethylene dibromide
2-Hexanone
lodomethane
v-1 v-2
110.98 110.98 (0.001) (0.00 1 )
(1.OOE-04) (4.70E-05) (2.18E-02) ' (I.02E-02) (4.39E-06) (2.05E-06)
72.12 72.12 (0.007) (0.007)
(7.02E-04) (329E-04) (2.34E-01) (l.lOE-O1) (3.07E-05) (1.44E-05)
100.11 100.11 (0.001) (0.001)
(1.00E-04) (4.70E-05) (2.41E-02) (1.13E-02) (4.39E-06) (2.05E-06)
187.88 ' 187.88 (0.00 1 ) (0.001)
(1.00E-04) (4.7OE-05) (1.28E-02) (6.OlE-03) (4.39E-06) (2.05E-06)
100.16 100.16
(0.002) (0.002) (2.01E-04) (9.39E-05) (4.82E-02) (2.26E-02) (8.78806) (4.11E-06)
141.95 141.95 (0.001) (0.001)
(I.OOE-04) (4.70E-05) (1.70E-02) (7.96E-03) (4.39E-06) (2.05E-06)
NOTE. Values shown in brackets () are based on the reported detection h i t .
v-3
110.98 (0.001)
(5.10E-05) (I . I 1E-02) (2.28E-06)
72.12 (0.006)
(3.06E-04)
(1.37E-05)
100.11 (0.00 1 )
(1.02E-01)
(5.10E-05) ( 1.23E-02) (2.28E-06)
187.88 (O.OOl]
(5.10E-OS) (6.53E-03) (2.28E-06)
100.16 (0.002)
( 1.02E-04) (2.45E-02) (4.56E-06)
141.95 (0.001)
(5.1 OE-05)
(2.28E-06) (8.64E-03)
~~
V-4
110.98 (0.001)
(5.06E-05) {I. IOE-02) (226E-06)
72.12 (0.007)
(3.54E-04) (1.18E-0 1) (1.58E-05)
100.11 (0.001)
(5.068-05) ( I22E-02) (226E-06)
187.88 (0.001)
(5.06E-05) (6.48E-03) (2.26E-06)
100.16 (0.002)
(1.01 E-04) (2.43E-02) (4.52E-06)
141.95 (0.00 1 )
(5.06E-05) (8.57E-03) (2.26E-06)
A-
(6.22E-05) { 1.35E-02) (2.75E-06)
(4.23E-04) ( 1.41E-01) (1.86E-05)
(6.22E-05) (1.50E-02) (2.75E-06)
(6.22E-05) (7.97E-03) (2.75E-06)
(124E-04)
(5.49E06) {2.99M2)
(6.22E-05) (1.05E-02) (2.75E-06)
Facility: All American Asphalt - Imine, California Samplig Location: Combined Tunnel and Silo Exhaust VOST Test Data - Summary of Non-detected Compounds
RunNumbers
Molecular Weight, g/g-mole Target Catch, )Ig Concentration, mgldscm Concentration, ppbvd Emission Rate, Iwhr
Molecular Weight, g/g-mole Target catfh, pg Concentration, mg/dscm Concentration, ppbvd Emission $ate. lwhr
Molecular Weight, g/g-mole Target Catch, pg Concenmtion, mgldscm Concentration, ppbvd Emission Rate, Iwhr
Molecular Weight, g/g-mole Target Catch, pg Concentration, mg/dscm Concentration, ppbvd Emission Rate, I b h
Molecular Weight, g/g-mole Target Catch, pg Concentration, mgldscm Concentration, ppbvd Emission Rate, lwhr
Molecular Weight, g/g-mole Target Catch. pg
Concentration, mgldscm Concentration, ppbvd Emission Rate, lwhr
Isooctane
Methyl methacrylate
4-Methyl-2-pentanonc
Methylene chloride
Styrene
1,1~J-Tetrachlomethane
v-1
114.22 (0.00 I )
( I .OOE-04) (2.1IE-02) (4.39E-06)
86.09 (0.002)
(2.01E-04) {5.6 I E-02) (8.78E-06)
100.16 (0.002)
(2.01E-04) (4.82E-02) (8.78E-06)
84.94 (0.001)
f 1.00E-04) (2.84E-02) (4.39E-06)
104.14 (0.001)
( 1.00E-04) (2.32E-02) (4.39E-06)
167.86 (0.001)
( 1.00E-04) ( I ME-02) (4.39E-06)
v-2
114.22 (0.001)
(4.7OE-05) (9.89E-03) (2.05E-06)
86.09 (0.002)
(9.39E-05) (2.62E-02) {4.11E-06)
100.16 (0.002)
(9.39E-05) (2.26E-02) (4.11E-06)
84.94 (0.001)
(4.708-05) (1.33E-02) (2.05E-06)
104.14 (0.001)
(4.70E-05) { 1.08E-02) (2.05E-06)
167.86 (0.001)
(4.70E-05) (6.73E-03) (2.05E-06)
NOTE. Values shown in brackets () arc based on the reported detection limit.
v-3
114.22 (0.00 1 )
(5.1OE-OS) (1.07E-02) (2.28E-06)
86.09 (0.002)
( 1 .O2E-04) (2.85E-02) (4.56E-06)
100.16 {0.002)
{ 1.02E-04) (2.45E-02) (4.56E-06)
84.94 (0.001)
(5.1OE-OS} { 1.44E-02) (228E-06)
104.14 (0.001)
(5.lOE-OS) (1.18E-02) (2.28E-06)
167.86 (0.00 1 )
(5.10E-05) (7.31E-03) (228E-06)
V-4
114.22 (0.001)
(1.07E-02) (226E-06)
86.09
(5.06E-05)
(0.002) { 1.0 1E-04) (2.83E-02) {4.52E-06)
100.16 (0.002)
{I .01E-04) I2.43E-02) (4.52E-06)
84.94 (0.001)
(5.06E-05) (1.43E-02) (226E-06)
104.14 (0.001)
(5.06E-OS) ( 1.17E-02) (2.26E-06)
167.86 (0.001)
(5.06E-05) (7.25E-03) { 2.26E-06)
( 6 m 5 ) { 13lE-02) (2.75E-06)
(124E-04) (3.48E-02) (5.49E-06)
(124E-04) (2.99E-02) (5.49E-06)
(6.22E-05) ( 1.76E-02) (2.75E-06)
(622E-05) { 1.44E-02) (2.75E-06)
(622E-05) (8.92E-03) (2.75E-06)
Facility: All American Asphalt - Imine, California Sampling Loeation: Combined Tunnel and Silo Exhaust VOST Tat Data - Summary of Non-deteeted Compounds
Run Numbers
Molefular Weight, glg-mole
Concmtration, rng/dscm Concentration, ppbvd Emission Rate. lwhr
Molecular Weight, glg-mole
Concentration, mgldscm Concentration, ppbvd Emission Rate. Iwhr
Molecular Weight, glg-mole Target Catch, pg Concentration, mgldscm Concentmion, ppbvd Emission Rate, I b h
Molecular Weight, glg-mole Target Catch, pg
Concenfntion, mgldscm Concentration, ppbvd Emission Rate, lwhr
Molecular Weight, glg-mole
Target Catch, pg Concentration, mgldscm Concentration, ppbvd Emission Rate, I b h
Molecular Weight, glg-mole
Target Catch, pg Concentration, mgldscm Concentration, ppbvd Emission Rate, l b h
Tetracbloroetbene
Target Catch, pg
1,1,1-Tricbloroethane
Targ* catch, Pg
1,lJ-Trichloroetbanc
Tricbloroetbene
Vinyl acetate
Vinyl bromide
v-1
165.85 (0.001)
(1.00E-04) ( I .46E-02) (4.39E-06)
133.42 (0.001)
(1.00E-04) ( I .8 1E-02) (4.39E-06)
133.42 (0.001)
(1 .OOE-O4) ( I .81E-02) (4.39E-06)
131.40 (0.OOl)
(1.00E-04) ( I .84E-02) (4.39E-06)
86.09 (0.001)
(1.00E-04) (2.80E-02) (4.39E-06)
106.96 (0.001)
(1.00E-04) (2.26E-02) (4.39E-06)
v-2
165.85 (0.001)
(4.70E-05) (6.81E-03) (2.05E-06)
133.42 (0.001)
(4.70E-05) (8.47E-03) (2.05E-06)
133.42 (0.00 I }
(4.70E-OS) (8.47E-03) (2.05E-06)
131.40 (0.001)
(4.7OE-05) (8.60E-03) (2.05E-06)
86.09 (0.001)
(4.70E-05) (1.3 1E-02) (2.05E-06)
106.96 (0.001)
(4.70E-OS) (1.06E-02) (2.05E-06)
NOTE: Values shown in brackets () are based on the reported detection limit.
v-3
165.85 (0.00 I )
{5.10E-05) (7.39E-03) (2.28E-06)
133.42 (0.001)
(5.lOE-05) (9.19E-03) (228E-06)
133.42 (0.00 I )
(5.10E-OS) (9.198-03} (2.28E-06)
131.40 (0.001)
(5.10E-05) (9.33E-03) (2.28E-06)
86.09 (0.001)
(5.lOE-05) ( I .42E-02) (2.28E-06)
106.96 (0.001)
( I. 15E-02) (5.10E-05)
(2.28E-06)
V-4
165.85 (0.001)
(5.06E-05) (7.34E-03) (2.26E-06)
133.42 (0.001)
(5.06E-05) (9.12E-03) (2.26E-06)
133.42 (0.001)
(5.06E-05) (9. IZE-03) (2.26E-06)
131.40 (0.001)
(5.06E-05) (9.26E-03) (2.26E-06)
86.09 (0.001)
(5.06E-05) ( 1.4 1E-02) (2.26E-06)
106.96 (0.001)
(5.06E-05) (1.14E-02) (2.26E-06)
A m
(6.22E-05) (9.02E-03) (2.7SE-06)
(6.22E-05) (1.12E-02) (2.75E-06)
(6ZE-05)
(2.75E-06) ( 1. 1ZE-02)
(6.22E-05) (1.14E-02) (2.75E-06)
(6.ZE-05) ( 1.74E-02) (2.75E-06)
(622E-05) ( 1.40E02) (2.75E-06)
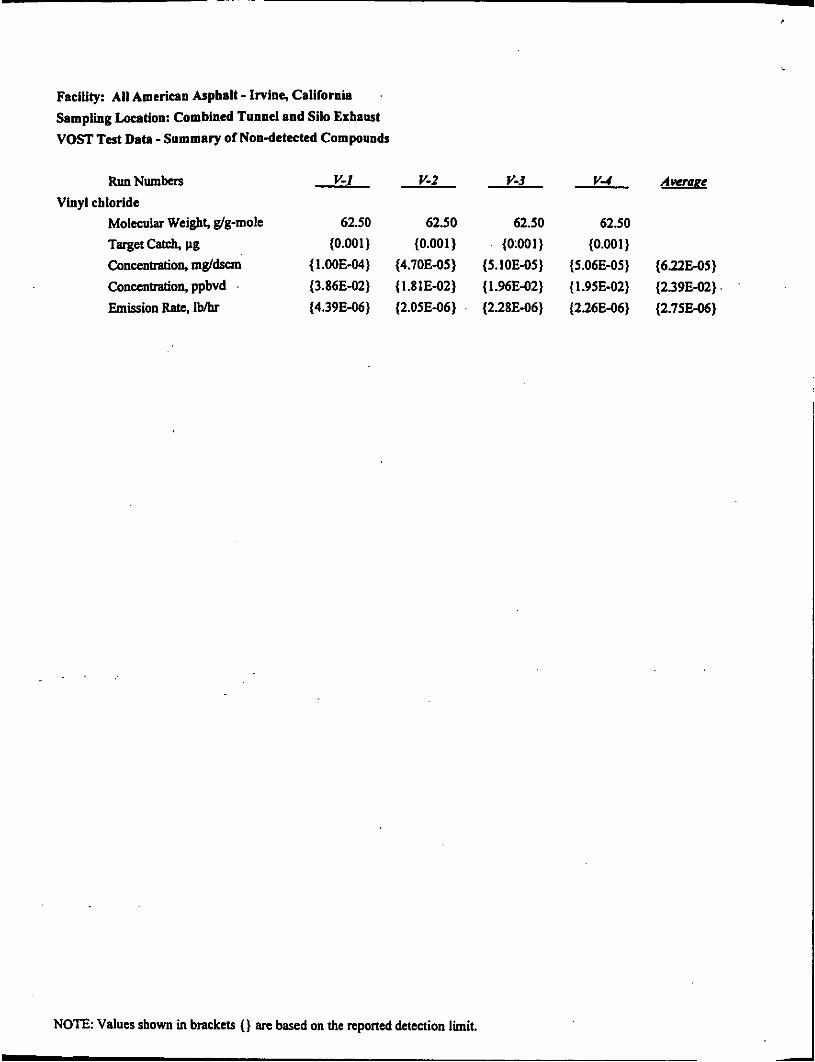
Facility: All Americnn Asphalt - Irvine, California .
Sampling Location: Combined Tunnel and Silo Exhaust VOST Test Datn - Summary of Nondetected Compounds
Run Numbers v-1 v-2 v-3 V-4 A m Vinyl chloride
Molecular Weigh& g/g-mok 62.50 62.50 62.50 62.50
Concenmtion, rngJdsan (1.00E-04) (4.70E-05) (S.IOE-05) (5.06E-05) (6.22E-05)
Emiiion Ratc, I b h (4.39E-06) (2.05E-06) (2.28E-06) (226E-06) (2.75E-06)
Target Catch, Pg (0.001) (0.001) (0.00 1 ) (0.001)
Concentdon, ppbvd (3.86E-02) (1.81E-02) (1.96E-02) (1.95E-02) (2.39E-02)
NOTE: Values shown in brackets () arc based on the reported detection limit.
ATTACHMENT B
Test Results - Silo Exhaust
ATTACHMENT B. 1
Test Results - Silo Exhaust
Particulate Test Results: Runs M5-3 and M5-4
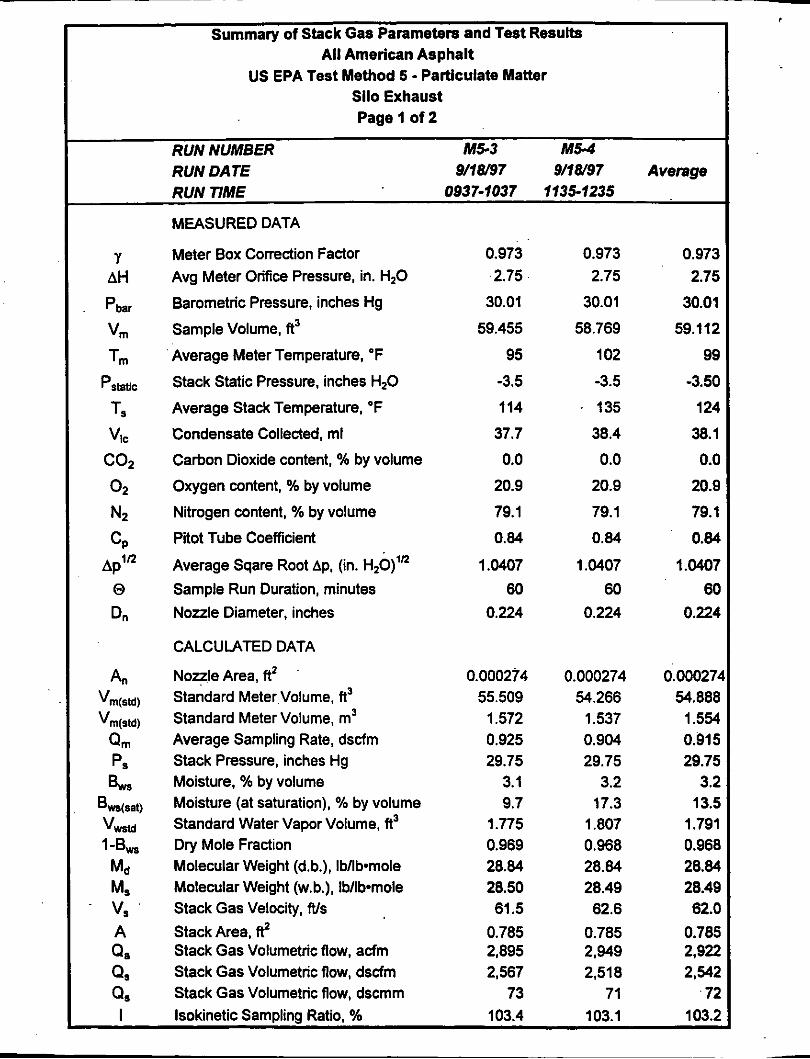
Summary of Stack Gas Parameters and Test Results All American Asphalt
US EPA Test Method 5 - Particulate Matter Silo Exhaust Page 1 of 2
RUN NUMBER M13 M5-4 RUN DATE RUN TIME
!w18/97 9/18/97 Average 0937-1037 11311235
MEASURED DATA
Meter Box Correction Factor Avg Meter Orifice Pressure, in. HzO
Barometric Pressure, inches Hg
SampleVolume,ft3
Average Meter Temperature, "F
Stack Static Pressure, inches HzO
Average Stack Temperature, "F Condensate Collected, ml
Carbon Dioxide content, % by volume
Oxygen content, % by volume
Nitrogen content, % by volume
Pitot Tube Coefficient
Average Sqare Root Ap, (in. HZO)" Sample Run Duration, minutes Nozzle Diameter, inches
CALCULATED DATA
Nozzle Area, ft2 Standard Meter Volume, f13 Standard Meter Volume, m3 Average Sampling Rate, dscfm Stack Pressure, inches Hg Moisture, % by volume Moisture (at saturation), % by volume Standard Water Vapor Volume, R3 Dry Mole Fraction Molecular Weight (d.b.), Ibllbmole Molecular Weight (w.b.), Ib/lb*mole Stack Gas Velocity, Ws Stack Area, f? Stack Gas Volumetric flow, acfm Stack Gas Volumetric flow, dscfm Stack Gas Volumetric Row, dscmm lsokinetic Samplina Ratio. %
0.973 2.75
30.01
59.455
95
-3.5
114
37.7
0.0
20.9
79.1
0.84
1.0407 ao
0.224
0.000274 55.509
1.572 0.925 29.75
3.1 9.7
1.775
28.84 28.50
0.785 2,895
73 103.4
0.989
61.5
2,587
0.973 2.75
30.01
58.769
102
-3.5
. 135
38.4
0.0
20.9
79.1
0.04
1.0407 60
0.224
0.000274 54.266
1.537 0.904 29.75
3.2 17.3
1.807 0.968 28.84 28.49 62.6
0.785 2.949 2,518
71 103.1
0.973 2.75
30.01
59.112
99
-3.50
124
38.1
0.0
20.9
79.1
0.84
1 .W07 60
0.224
0.000271
1.554 0.915 29.75
3.2 13.5
1.791 0.968
28.49 62.0
0.785 2,922 2,542
72 103.2
54.888
28.84
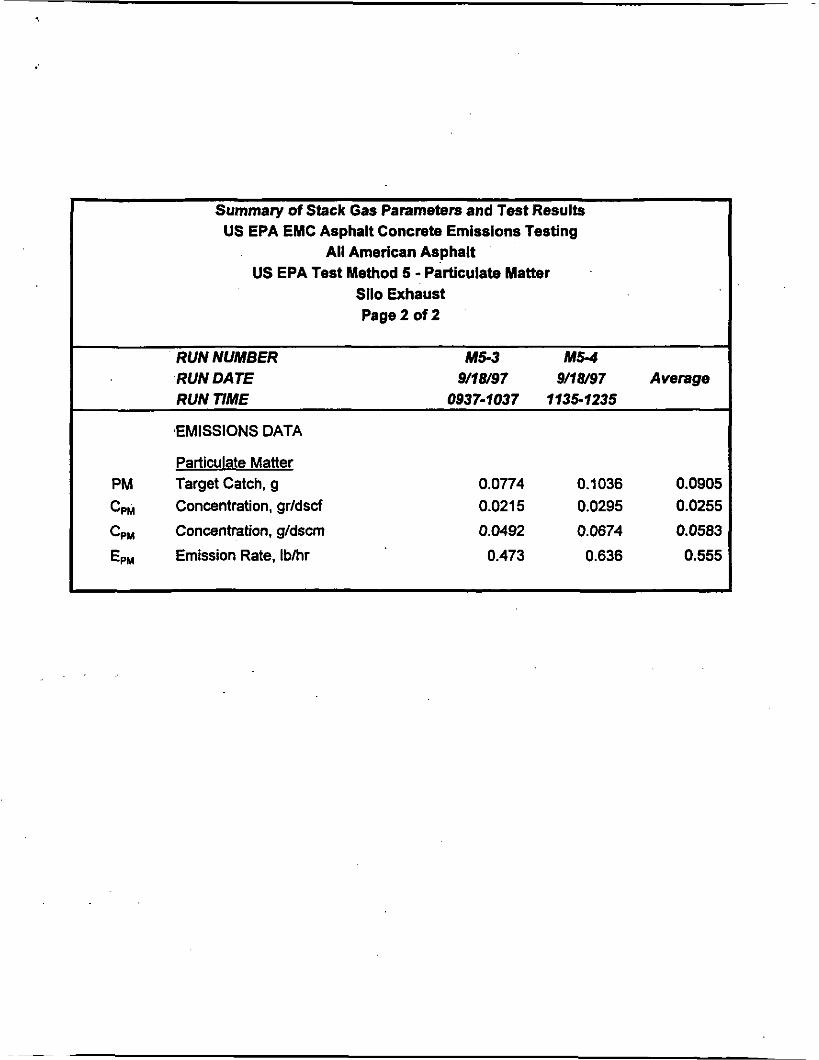
Summary of Stack Gas Parameters and Test Results US EPA EMC Asphalt Concrete Emissions Testing
All American Asphalt US EPA Test Method 5 - Particulate Matter
Silo Exhaust Page 2 of 2
RUN NUMBER M5-3 M5-4 RUN DATE 9/18/97 9/18/97 Average RUN TIME 0937-1037 1135-1235
.EMISSIONS DATA
PM Target Catch, g 0.0774 0.1036 0.0905 cPM Concentration, gr/dscf 0.021 5 0.0295 0.0255
cPM Concentration. g/dscm 0.0492 0.0674 0.0583
EPM Emission Rate, ibhr 0.473 0.636 0.555
ATTACHMENT B.2
Test Results - Silo Exhaust
VOST Test Results: Runs V-5 and V-6, Detected Compounds
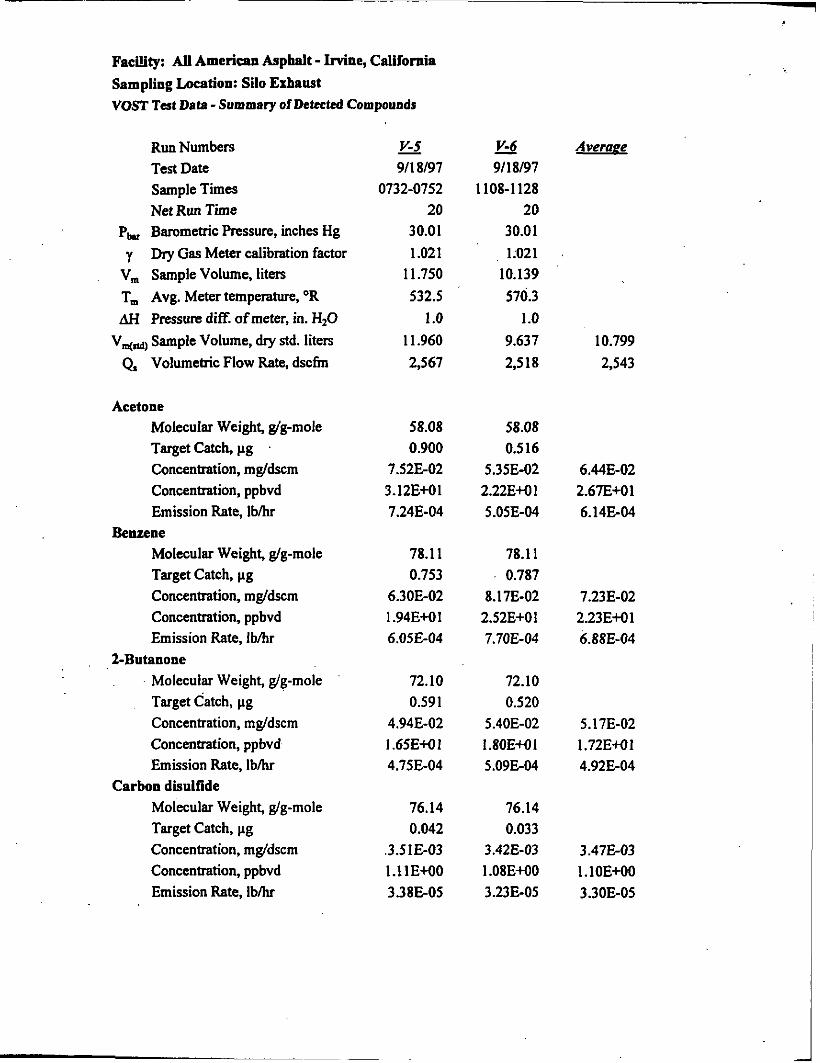
Facility: AU American Asphalt - Irvine, California Sampling Location: Silo Exhaust VOST Test Data - Summary of Detected Compounds
Run Numbers Test Date Sample Times Net Run Time
Dry Gas Meter calibration factor P,,,, Barometric Pressure, inches Hg y
V, Sample Volume, liters T, Avg. Meter temperature, O R
AH Pressure diff. of meter, in. H20 Vmcd1 Sample Volume, dry std. liters Q, Volumetric Flow Rate, dscfrn
Acetone Molecular Weight, glg-mole Target Catch, pg Concentration, mgldscm Concentration, ppbvd Emission Rate, Ibhr
Molecular Weight, glg-mole Target Catch, pg Concentration, mgldscm Concentration, ppbvd Emission Rate, Ibhr
Molecular Weight, g/g-mole Target Catch, pg Concentration, mgldscm Concentration, ppbvd Emission Rate, I b h
Molecular Weight, g/g-mole Target Catch, pg Concentration, mgldscm Concentration, ppbvd Emission Rate, I b h
Benzene
2-Butanone
Carbon disulfide
- V-5 911 8/97
0732-0752 20
30.01 1.021
11.750 532.5
1 .o 11.960 2,567
58.08 0.900
7.52E-02 3.12EM1 7.24E-04
78.1 1 0.753
6.30E-02 1.94E-I-01 6.05E-04
72.10 0.591
4.94E-02 I .65E+o I 4.75E-04
76.14 0.042
1.1 1 EM0 3.38E-05
.3.5 IE-03
- V-6 9/18/97
1108-1128 20
30.01 1:021
10.139 570.3
1 .o 9.637 2,518
58.08 0.516
2.22EM1 5.35E-02
5.05E-04
78.11 0.787
8.17E-02 2.52E+01 7.70E-04
72.10 0.520
5.4OE-02 1.80EM1 5.09E-04
76.14 0.033
1.08EMO 3.23E-05
3.42E-03
Averape
10.799 2,543
6.44E-02 2.67EM1 6.14E-04
7.23E-02 2.23EM1 6.88E-04
5.17E-02 1.72EM1 4.92E-04
3.47E-03 l.lOE+OO 3.3OE-05
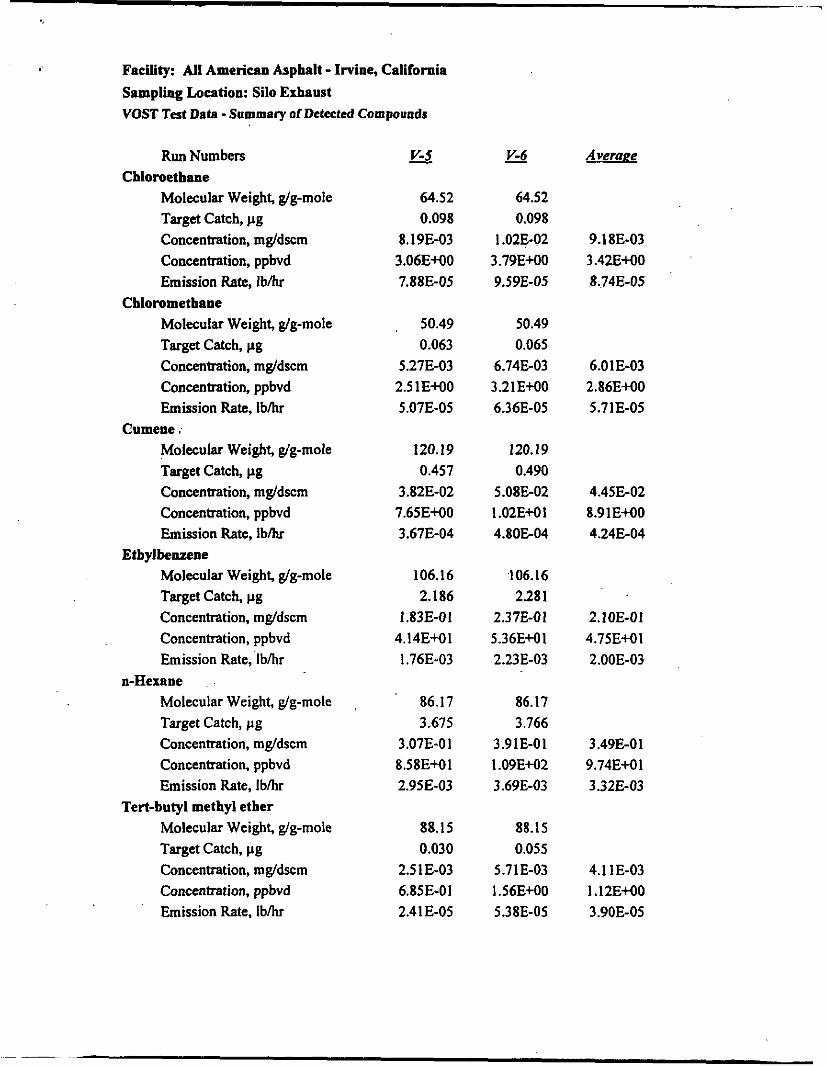
Facility: All American Asphalt - Imine, California Sampling Location: Silo Exhaust VOST Test Data -Summary of Detected Compounds
Run Numbers
Molecular Weight, g/g-mole Target Catch, pg Concentration, mg/dscm Concentration, ppbvd Emission Rate, I b h
Molecular Weight, g/g-mole Target Catch, pg Concentration, mg/dscm Concentration, ppbvd Emission Rate, lwhr
Molecular Weight, g/g-mole Target Catch, pg Concentration, mg/dscm Concentration, ppbvd Emission Rate, I b h
Molecular Weight, g/g-mole Target Catch, pg Concentration, mg/dscm Concentration, ppbvd Emission Rate, Ibihr
Molecular Weight, g/g-mole Target Catch, pg Concentration, mg/dscm Concentration, ppbvd Emission Rate, Ibihr
Molecular Weight, g/g-mole Target Catch, pg Concentration, mgldscm Concentration, ppbvd Emission Rate, Ibihr
Chloroethane
Chloromethane
Cumene ,
Ethyl benzene
n-Hexane
Tert-butyl methyl ether
- v-5
64.52 0.098
8.19E-03 3.06E+OO 7.88E-05
, 50.49 0.063
2.51E+OO 5.27E-03
5.07E-05
120.19 0.457
7.65EWO 3.82E-02
3.67E-04
106.16 2.186
1.83E-01 4.14E+O 1 1.76E-03
86.17 3.675
3.07E-01 8.58E+01 2.95E-03
88.15 0.030
2.5 1E-03 6.85E-01 2.41E-OS
- V-6
64.52 0.098
1 .02E-02 3.79E+OO 9.59E-05
50.49 0.065
6.74E-03 3.21 EM0 6.36E-05
120.19 0.490
5.08E-02 1.02EM1 4.80E-04
,106.16 2.281
5.36E+O 1 2.37E-0 1
2.23E-03
86.17 3.766
1.09E+O2 3.91E-01
3.69E-03
88.15 0.055
5.7 1 E-03 1.56E+OO 5.3 8E-OS
Averape
9.18E-03 3.42Ei-00 8.74E-05
6.01E-03 2.86EMO 5.71E-05
4.45E-02 8.9 1 E+OO 4.24E-04
2.1OE-01 4.75Ei-01 2.00E-03
3.49E-01 9.74EiOI 3.32E-03
4.11E-03 l.lZE+OO 3.90E-05
Facility: All American Asphalt - Irvine, California Sampling Location: Silo Exhaust VOST Tat Data - Summary of Detected Compound9
Run Numbers
Molecular Weight, g/g-mole Target Catch, pg Concentration, mgldscm Concentration, ppbvd Emission Rate, Ibhr
Molecular Weight, g/g-mole Target Catch, pg Concentration, mgldscm Concentration, ppbvd Emission Rate, lwhr
Molecular Weight, g/g-mole Target Catch, pg Concentration, mgldscm Concentration, ppbvd Emission Rate, lbhr
Molecular Weight, g/g-mole Target Catch, pg Concentration, mg/dscm Concentration, ppbvd Emission Rate, Ibhr
Toluene
Trichlorofluoromethane
m-/p-Xylene
o-Xylene
Total Detected Volatile Emissions Emission Rate, Ibihr Emission Rate, tons/year*
- V-5
92.1 3.886
3.25501 8.48Ei-01 3.12E-03
137.38 0.016
1.34E-03 2.34E-01 1.29E-05
106.16 6.082
5.09501 1.15Ei-02 '4.89E-03
106.16 3.176
2.66E-01 6.02Ei-01 2.55E-03
1.77E-02 2.65E-02
- Vd
92.1 4.041
4.19E-01 1.09Ei-02 3.96E-03
137.38 0.016
1.66503 2.91E-01 1.57E-05
106.16 6.187
1.45Ei-02 6.42E-01
6.06E-03
106.16 3.308
3.43E-01 7.78Ei-01 3.24E-03
2.17E-02 3.258-02
Average
3.72E-01 9.72Ei-0 1 3.54E-03
1.5OE-03
1.43E-05 2.62E-01
5.75E-01 1.30Ei-02 5.47E03
3.04E-01 6.90Ei-01 2.90E-03
1.97E-02 2.95E-02
,
ATTACHMENT B.3
Test Results - Silo Exhaust
VOST Test Results: Runs V-5 and V-6, Non-detected Compounds
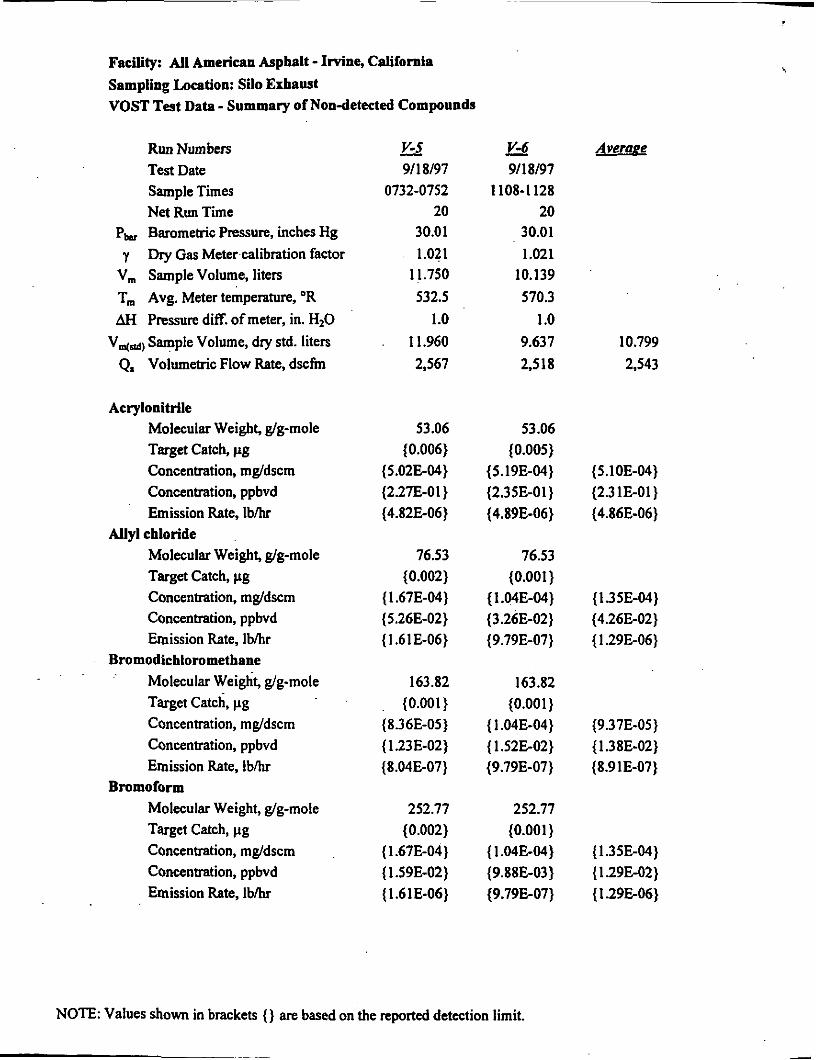
Facility: All American Asphalt - Irvine, California Sampling Location: Silo Exhaust VOST Test Data - Summary of Nondetected Compounds
Run Numbers Test Date Sample Times Net Run Time
Dry Gas Meter calibration factor Pb, Barometric Pressure, inches Hg
y V, Sample Volume, liters T, Avg. Meter temperature, O R
AH Pressure diff. of meter, in. H20 VNd) Sample Volume, dry std. liters Q. Volumetric Flow Rate, d s c h
Acrylonitrile Molecular Weight, glg-mole Target Catch, pg Concentration, mgldscm Concentration, ppbvd Emission Rate, I b h
Molecular Weight, glg-mole Target Catch, pg Concenkation, mgldscm Concentration, ppbvd Emission Rate, Ibhr
Molecular Weight, glg-mole Target Catch, pg Concentration, mgldscm Concentration, ppbvd Emission Rate, I b h
Molecular Weight, glg-mole Target Catch, pg Concentration, mgldscm Concentration, ppbvd Emission Rate, Ibhr
Allyl chloride
Bromodichloromethane
Bromoform
- v-5 9/18/97
0732-0752 20
30.01 1.02 1
11.750 532.5
1 .o . 11.960
2,567
53.06 {0.006)
{ 5.02E-04) {2.27E-01} {4.82506)
76.53 {O.OOZ)
{ 1.67E-04) { 5.26E-02) (1.61E-06)
163.82 {0.001)
(8.36E-05) { I .23E-02) {8.04507)
252.77 {0.002)
{ 1.67E-04) { 1.59E-02) { 1.61E-06)
- V-6 9/18/97
1108-1 128 20
30.01 1.021
10.139 570.3
1 .o 9.637 2.5 18
53.06 { 0.005)
{ 5.19504) {2.35E-01) { 4.89E-06)
76.53 {0.001)
{ 1.04E-04) { 3.26E-02) {9.79E-07)
163.82 {0.001)
{ 1.04E-04) { 1.52E-02) (9.79E-07)
252.77
{ 1.04E-04) {9.88E-03) {9.79E-07)
{0.001)
Average
10.799 2,543
{ 5.10E-04) {2.31E-01} (4.86E-06)
{ 1.3 5E-04) (4.26502) { 1.29E-06)
{9.37E-05) { 1.38E-02) {8.9 IE-07)
{ 1.35E-04) { 1.29E-02) { 1.29E-06)
NOTE: Values shown in brackets { } are based on the reported detection limit.
Facility: AU American Asphalt - Irvine, c d f o r n h Sampling Loeation: Silo Exhanst VOST Test Data - Summary of Non-detected Compounds
Run Numbers
Molecular Weight, g/g-mole Target Catch, pg Concentration, mg/dscm Concentration, ppbvd Emission Rate, lwhr
Molecular Weight, g/g-mole Target Catch, pg Concentration, mgldscm Concentration, ppbvd Emission Rate, I b h
Carbon tetrachloride Moiecular Weight, g/g-mole Target Catch, pg Concentration, mg/dscm Concentration, ppbvd Emission Rate, l b h
Molecular Weight, g/g-mole Target Catch, pg Concentration, mg/dscm Concentration, ppbvd Emission Rate, I b h
Molecular Weight, g/g-mole Target Catch, pg Concentration, mg/dscm Concentration, ppbvd Emission Rate, I b h
Molecular Weight, g/g-mole Target Catch, pg Concentration, mg/dscm Concentration, ppbvd Emission Rate, I b h
Bromomethane
1.3-Butadiene
Chlorobenzene
Chloroform
Dibromoehloromethane
- v-5
94.95 {0.001)
{8.36E-05) {2.12E-02) ( 8.04E-07)
58.08
{ 8.36E-05)
{ 8.04E-07)
153.84
{0.001)
(3.46E-02)
(0.001) (8.36E-05) { 1.3 1E-02) { 8.O4E-07)
112.56 (0.001 }
(8.36E-05) { 1.79L02) { 8.04E-07)
119.39 (0.00 I }
{8.36E-05) { 1.68E-02) { 8.O4E-07)
208.27
{8.36E-OS)
{ 8.04E-07)
(0.001)
(9.66E-03 }
V-6 - 94.9s
{ 1.04E-04) ( 2.63E-02)
{0.001)
( 9.79E-07)
58.08 (0.00 1 }
( 1.04E-04)
{ 9.79L07)
153.84
{ 1.04E-04)
(9.79E-07)
112.56
(4.3OE-02)
(0.001)
{ 1.62E-02)
IO.00 1 } { 1.04E-04) { 2.22E-02) (9.79E-07)
119.39
{ 1.04E-04) (0.00 1 )
(2.09E-02) { 9.79E-07)
208.27
( 1.04E-04) (0.001)
{ 12OE-02) {9.79E-07)
Averaee
{9.37&05) {2.37&02) { 8.91E-07)
(9.37E-05) { 3.88E-02) { 8.9 1 E-07)
(9.37E-05) { 1.47E-02) (8.91E-07)
{ 9.3 7E-05) { 2.00E-02) ( 8.9 1 E-07)
{9.37E-05) { 1.89E-02) { 8.91 E-07)
{9.3 7E-OS) { 1.08E-02) { 8.91E-07)
NOTE: Values shown in brackets {} are based on the reported detection limit. ,’
Facility: AU American Asphalt - Irvine, California Sampling Location: Silo Exhaust VOST Test Data - Summary of Nondetected Compounds
Run Numbers 1.1-Dichloroethane
Molecular Weight, g/g-rnole Target Catch, pg Concentration, mg/dscm Concentration, ppbvd Emission Rate, I b h
Molecular Weight, g/g-mole Target Catch, pg Concentration, mgldscm Concentration, ppbvd Emission Rate, I b h
Molecular Weight, g/g-mole Target Catch, pg Concentration, mg/dscm Concentration, ppbvd Emission Rate, lwhr
cis-l.2-Dichloroethene Molecular Weight, g/g-mole Target Catch, pg Concentration, mg/dscm Concentration, ppbvd Emission Rate, Ibhr
trans-1.2-Dichloroetheoe Molecular Weight, &-mole Target Catch, pg Concentration, mg/dscm Concentration, ppbvd Emission Rate, I b h
Molecular Weight, g/g-mole Target Catch, pg Concentration, mg/dscm Concentration, ppbvd Emission Rate, I b h
1.2-Dichloroethane
1,l-Dichlorpethene
1.2-Dichloropropane
- v-5
98.97 {0.001)
{ 8.36E-05) (2.03E-02) (8.04E-07)
98.96 {0.001)
(8.36E-05) { 2.03502) { 8.04507)
96.95
(8.36E-05)
{8.04&07)
96.95
{ 8.36E-05)
{O.OOl)
{2.07E3-02}
(0.00 1)
{2.07E-02) { 8.04E-07)
96.95
(8.36E-05) (2.07E-02) (8.04E-07)
112.99
(8.36505)
{ 8.04507)
{0.001)
{0.001)
{ 3.78E-02)
- V-6
98.97 {0.001}
{ 1.04E-04) (2.52E-02) (9.79E-07)
98.96
{ 1.04E-04)
(9.79507)
96.95
( 1.04E-04)
(0.00 1 }
(2.52E-02)
(0.001)
(2.57E-02) { 9.79E-07)
96.95 {O.OOl )
{ 1.04E-04) (2.57E-02) {9.79E-07}
96.95 (0.001)
{ 1.04E-04) (257E-02) (9.79E-07)
112.99
( 1.04E-04)
{ 9.79E-07)
{0.001)
{2.21E-02)
Averaee
(9.37E-05) {2.28502) (8.91E-07)
{9.37E-05) { 2.28E-02) {8.91E-07)
(9.37E-05)
(8.9 1 E-07) (2.32E-02)
{9.37E-05) {2.32E-02) { 8.9 IE-07)
(9.37E-05) (2.32E-02) {8.9 IE-07)
{9.37EOS} { 1.99E-02) (8.91E-07)
NOTE. Values shown in brackets () are based on the reported detection limit.
.' Facility: AU American Asphalt - Irvine, California Sampling Location: Silo Exhanst VOST Test Data - Summary of Non-detected Compounds
Run Numbcrs cis-1,3-Dichloropropene
Molecular Weight, g/g-mole Target Catch, pg Concentration, mg/dscm Concentration, ppbvd Emission Rate, I b h
traael.3-Diehloropmpeae Molecular Weight, g/g-mole Target Catch, pg Concentration, mg/dscm Concentration, ppbvd Emission Rate, Ibhr
Molecular Weight, g/g-mole Target Catch, pg Concentration, mg/dscm Concentration, ppbvd Emission Rate, lbhr
Molecular Weight, g/g-mole Target Catch, pg Concentration, mg/dscm Concentration, ppbvd Emission Rate, Ibhr
Molecular Weight, &-mole
Target Catch, pg Concentration, mg/dscm Concentration, ppbvd Emission Rate, Ibhr
Molecular Weight, g/g-mole Target Catch, pg Concentration, mg/dscm Concentration, ppbvd Emission Rate, I b h
If-Epoxybutane
Ethyl acrylate
Ethylene dibromide
2-Heranone
- v-5
110.98
(8.36E-05)
(8.04E-07)
110.98
{ 8.36E-05)
' (0.001)
(1.81E-02)
{O.OOl }
( 1.8 1E-02) (8.04E-07)
72.12 (0.008)
{ 6.69E-04) (2.23E-01) (6.43E-06)
. 100.11
{ 8.36E-05) (2.0 1 E-02) { 8.04E-07)
(0.001)
187.88 (0.001)
{ 8.36E-05) ( 1.07E-02) { 8.04E-07)
100.16 {0.002)
( 1.67E-04) (4.02E-02) { 1.6 1 E-06)
- V-6
110.98 {0.001)
(1.04E-04) {225E-02) {9.79E-07)
11 0.98 (0.001)
( I B4E-04) {2.25E-02) {9.79E-07)
72.12 (0.007)
(7.26E-04) {2.42E-01) {6.85E-06)
100.11
{ 1 B4E-04) { 2.49E-02) { 9.79E-07)
{0.001 }
187.88 (0.001)
{ 1 ME-04) { 1.33E-02) (9.79E-07)
100.16 {0.002)
{ 2.08E-04) (4.98E-02) ( 1.96E-06)
Averoee
(9.37E-05) {2.03E-02) { 8.9 1 E-07)
(9.37E-05)
(8.9 IE-07) {2.03E-02)
{6.98E-04) {2.33E-01) i6.64506)
(9.37E-05) (2.25E-02) (8.91E-07)
(9.37E-05) (1.2OE-02) {8.91E-07)
{ 1.87E-04) {4.50E-02! (1.78E-06)
NOTE: Values shown in brackets (} are based on the reported detection limit.
~-
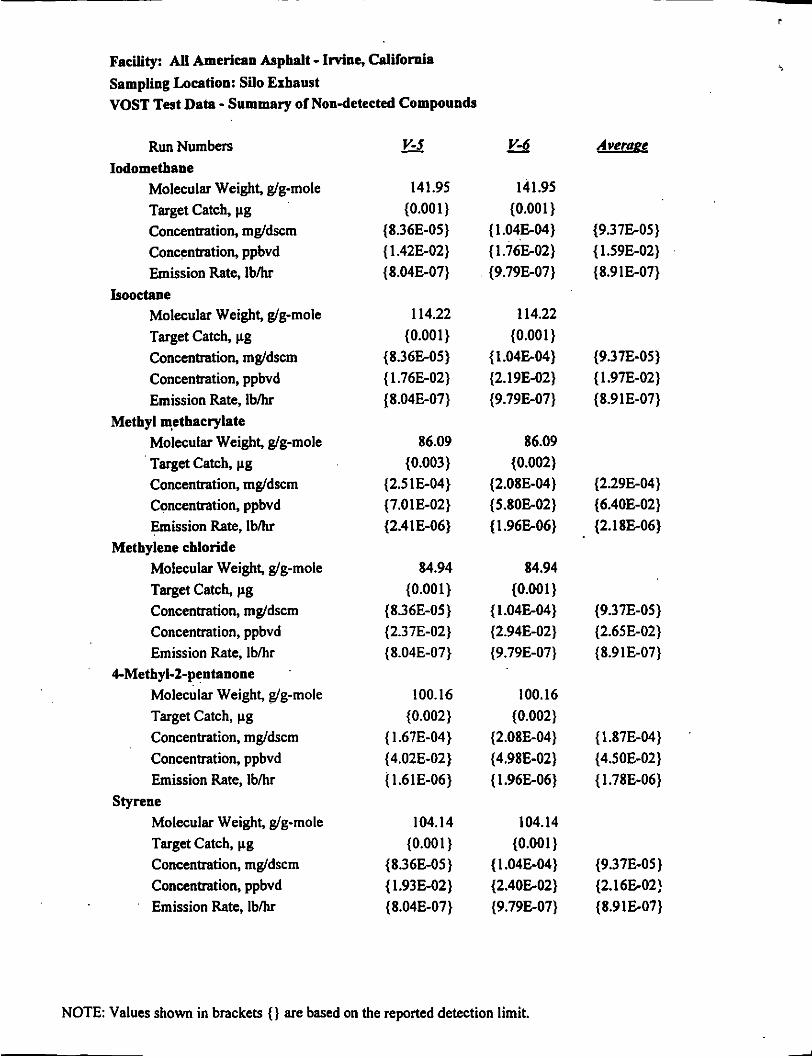
Facility: AU American Asphalt - Irvine, California Sampling Location: Silo Exhaust VOST Test Data - Summary of Nondetected Compounds
Run Numbers
Molecular Weight, g/g-mole Target Catch, pg Concentration, mg/dscm Concentration, ppbvd Emission Rate, I b h
Molecular Weight, g/g-mole Target Catch, pg Concentration, mg/dscm Concentration, ppbvd Emission Rate, I b h
Molecular Weight, g/g-mole Target Catch, pg Concentration, mg/dscm Concentration, ppbvd Emission Rate, I b h
Molecular Weight, g/g-mole Target Catch, pg Concentration, mg/dscm Concentration, ppbvd Emission Rate, Ibhr
4-Methyl-2-pentanone Molecular Weight, g/g-mole Target Catch, pg Concentration, mg/dscm Concentration, ppbvd Emission Rate, I b h
Molecular Weight, g/g-mole Target Catch, pg Concentration, mg/dscm Concentration, ppbvd Emission Rate, I b h
Iodomethane
Isooctane
Methyl methacrylate
Methylene chloride
Styrene
- v-5
141.95 (0.001 )
{ 8.36E-05) ( 1.42E-02) { 8.04E-07)
114.22 {0.001)
{8.36E-05) (1.76E-02) L8.04E-07)
86.09 I0.003)
(2.51E-04) { 7.0 1 E-02) { 2.4 1 E-06)
84.94 {0.001)
(8.36E-05) { 2.37E-02) (8.04E-07)
100.16 {0.002)
{ 1.67E-04) { 4.02E-02) ( 1.61E-06)
104.14
{ 8.36E-05) { 1.93E-02)
{0.001)
(8.04E-07)
- V-6
141.95 {0.001)
{ 1.04E-04) { 1 ~6E-02) {9.79E-07)
114.22
{ 1 .04E-04)
{9.79E-07)
86.09 {0.002)
(2.08E-04) {5.80E-02) ( 1.96E-06)
84.94
{ 1.04E-04)
{0.001)
{2.19E-02)
IO.00 1 }
(2.94E-02) (9.79E-07)
100.16 {0.002)
{2.08E-04) (4.98E-02) { I .96E-06)
104.14
{ 1.04E-04) {2.40E-02) {9.79E-07)
{0.001)
i
Averaee
{9.37E-05) { 1.59E-02) {8.91E-07)
{9.3 7E-05) { 1.97E-02) { 8.9 1E-07)
(2.29E-04) (6.4OE-02) {2.18E-06)
{9.37E-05) {2.65E-02) { 8.9 IE-07)
(1.87E-04) {4.5OE-O2) { 1.78E-06)
{9.37E-05) {2.16%02! { 8.91 E-07)
NOTE Values shown in brackets {) are based on the reported detection limit.
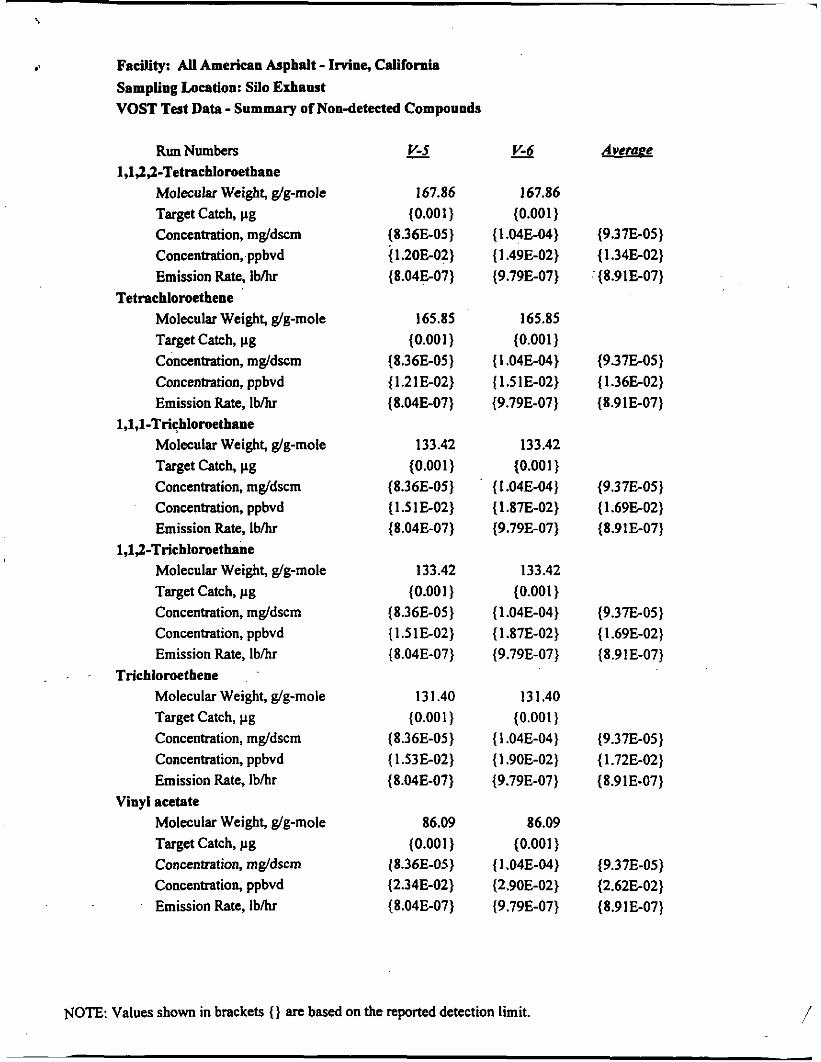
FaciJity: AU American Asphalt - IMne, California Sampling Location: Silo Exhaust VOST Test Data - Summary of Non-detected Compounds
Run Numbers 1,1,2,2-Tetrachloroethane
Molecular Weight, g/g-mole Target Catch, pg Concentration, mg/dscm Concentration, ppbvd Emission Rate, l b h
Molecular Weight, g/g-mole Target Catch, pg Concentration, mgldscm Concentration, ppbvd Emission Rate, l b h
1,l.l-Tri+lomthane Molecular Weight, g/g-mole Target Catch, pg Concentration, mg/dscm Concentdon, ppbvd Emission Rate, I b h
1,lf-Trichloroethane Molecular Weight, g/g-mole Target Catch, pg Concentration, mg/dscm Concentration, ppbvd Emission Rate, Ibhr
Molecular Weight, g/g-mole Target Catch, pg Concentration, mg/dscm Concentration, ppbvd Emission Rate, Ibhr
Molecular Weight, g/g-mole Target Catch, pg Concentration, mg/dscm Concentration, ppbvd Emission Rate, I b h
Tetrachloroethene
Trichloroethene
Vinyl acetate
v-5
167.86 (0.001)
{ 1.2oE-02) ( 8 . 0 4 ~ 0 7 )
{8.36E-05)
165.85 (0.00 1)
{ 1.21E-02) {8.36E-05)
{ 8.04E-07)
133.42 {0.001)
(8.36E-05) { 1 .S 1E-02) { 8.04E-07)
133.42
{ 8.36E-05) {1.51E-02)
(0.001)
{ 8.04E-07)
131.40 {0.001)
{ 8.36E-05) { 1.53E-02) { 8.04E-07)
86.09
(8.36E-05) (2.34E-02)
{0.001)
{ 8.04E-07)
- V-6
167.86 {0.001)
{ 1.04E-04) { 1.49E-02) {9.79E-07)
165.85 (0.001)
( 1.04E-04) { 1.5 1 E-02) (9.79E-07)
133.42
{ 1.04E-04) {0.001)
{ 1.m-02) (9.79E-07)
133.42 {0.001)
{ 1.04E-04) { 1.87E-02) (9.79E-07)
131.40 {0.001)
{ I .04E-04) { 1.90E-02) {9.79E-07)
86.09 {0.001)
( 1.04E-04) { 2.90E-02) {9.79E-07)
Averam
(9.37E-05) { 1.34502) { 8.9 1507)
{9.37E-05) ( 1.36E-02) { 8.9 1 E-07)
{9.37E-05) { 1.69E-02) { 8.91E-07)
(9.37E-05) { 1.69E-02) { 8.9 1 E-07)
(9.37E-05) { 1.72E-02) { 8.9 1 E-07)
(9.37E-05) {2.62E-02) { 8.91 E-07)
NOTE. Values shown in brackets { } are based on the reported detection limit. /
Facility: AN American Asphalt - Irvine, California Sampling Location: Silo Exhaust VOST Test Data - Summary of Non-detected Compounds
Run Numbers
Molecular Weight, g/g-mole Target Catch, pg Concentration, mgldscm Concentration, ppbvd Emission Rate, I b h
Molecular WeighS g/g-mole Target Catch, pg Concentration, mgldscm Concentration, ppbvd Emission Rate, I b h
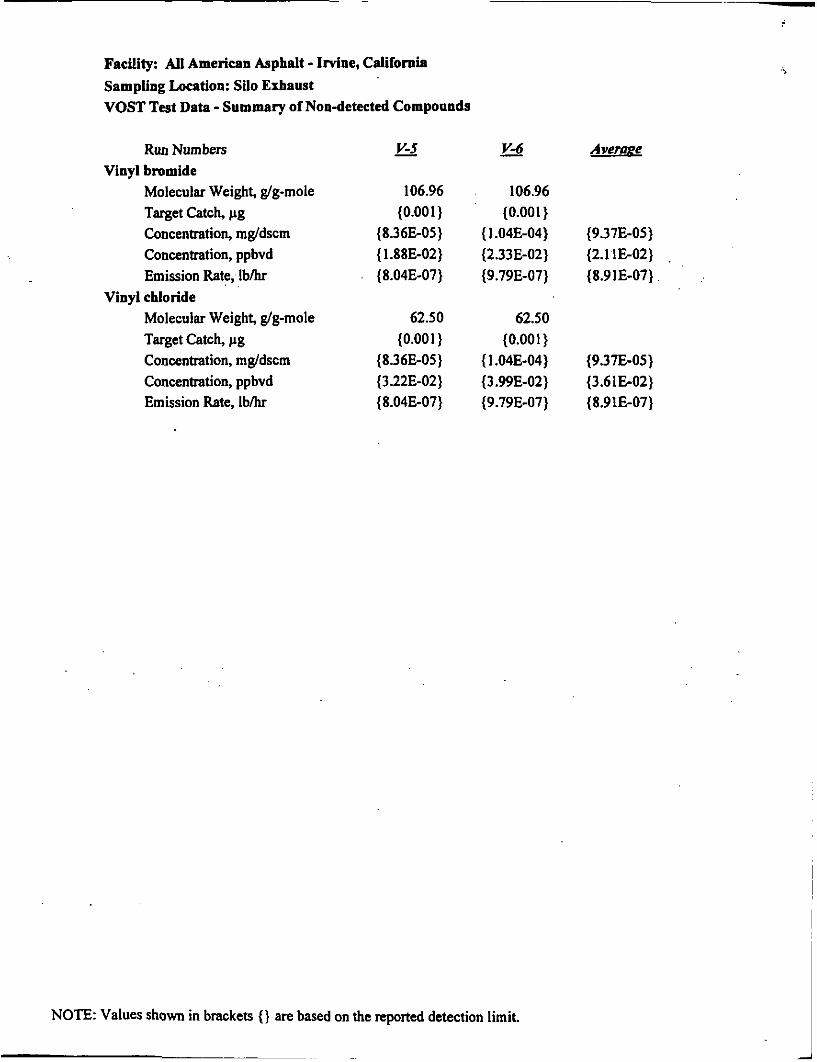
Vinyl bromide
Vinyl chloride
- V-5
106.96
(8.36E-05) ( 1.88E-02)
(0.001)
( 8.04E-07)
62.50
(8.36E-05) (0.001 }
(3.22E-02) ( 8.04E-07)
- V-6
106.96 (0.001)
{ 1.04E-04) (2.33E-02) (9.79E-07)
62.50 (0.001)
( 1.04E-04) ( 3.99E-02) ( 9.79E-07)
AveraRe
(9.37E-05) (2.11E-02) ,
( 8.9 1E-07)
(9.37E-05) ( 3.6 1 E-02) (8.91E-07)
NOTE: Values shown in brackets (} are based on the reported detection limit.
,I
ATTACHMENT C
Process Data
A ? T A C ” T C.l
Process Data
Loadout Data for September 17,1997
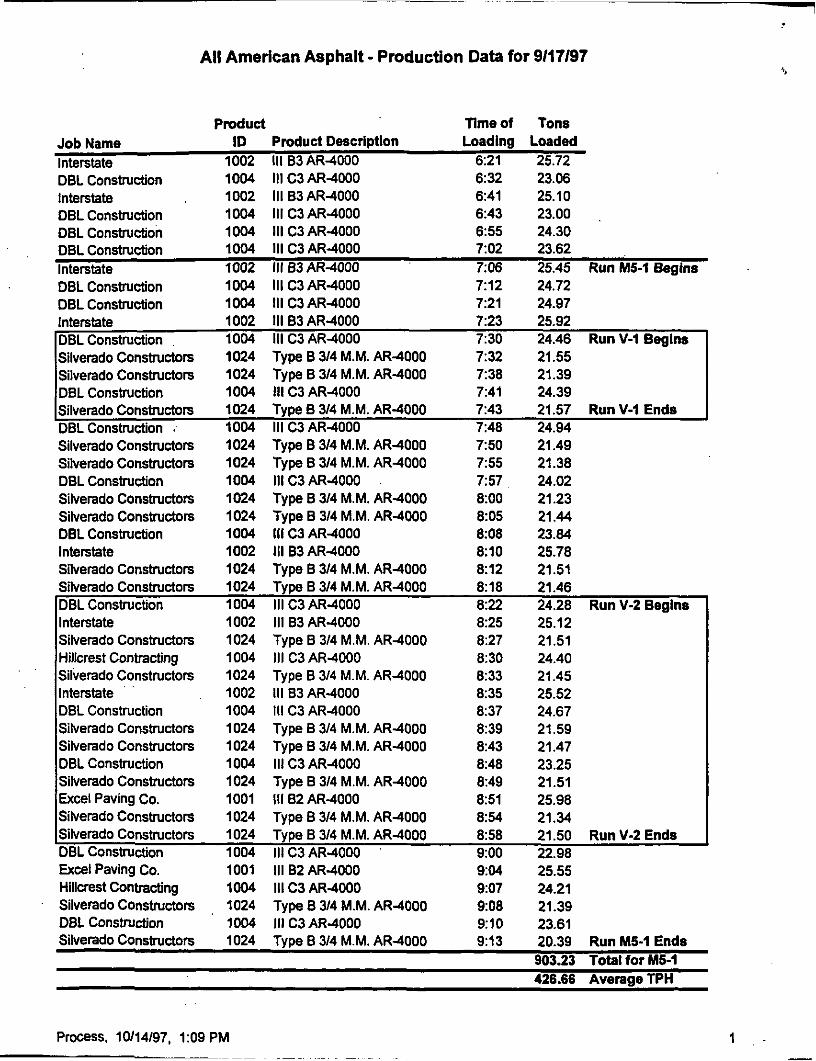
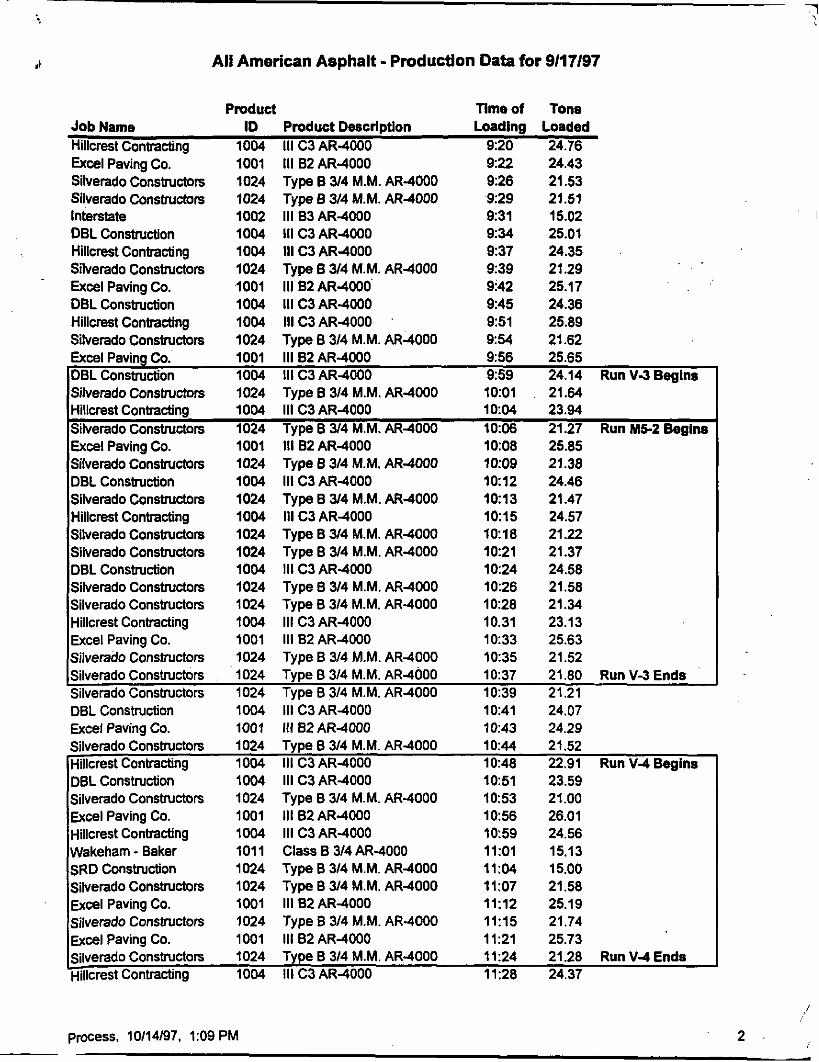
All American Asphalt - Production Data for 9/17/97
Product Tlme of Tons Job Name ID Product Description Loading Loaded Interstate 1002 111 83 AR-4000 6:21 25.72 DBL Construction 1004 111 c 3 AR-4000 6:32 23.06 Interstate 1002 111 B3AR-4000 6:41 25.10 DBL Construction 1004 111 c3 AR-4000 6:43 23.00 . DBL Construction 1004 111 C3 AR-4000 655 24.30 DBL Construction 1004 111 C3 AR-4000 7:02 23.62 Interstate 1002 111 83 AR-4000 7:06 25.45 Run M5-1 Begins DBL Construction 1004 111 c3 AR-4000 7:12 24.72 DBL Construction 1004 111 C3 AR-4000 7:21 24.97 Interstate 1002 111 83 AR-4000 7:23 25.92
IOBL construction 1004 111 C3 AR-4000 7:30 24.46 Run V-I Bealns " _ _ _ _ _ __~._.
Silverado Constructors 1024 Type B 314 M.M. AR-4000 7:32 21.55 Siiverado Constructors 1024 Type B 3/4 M.M. AR-4000 7:38 21.39 DBL Construction 1004 111 C3 AR-4000 7:41 24.39 ~~
ISilverado Constructors 1024 Type B 3/4 M.M. AR-4000 7:43 21.57 Run V-I Ends DBL Construction . 1004 111 C3 AR-4000 7:48 24.94 Silverado Constructors Siiverado Constructors DBL Construction Silverado Constructors Silverado Constructors DBL Construction Interstate Silverado Constructors
I 024 1024 1004 1024 1024 1004 1002 1024
Type B 314 M.M. AR-4000 Type B 314 M.M. AR-4000 111c3AR-4000 . Type B 3/4 M.M. AR-4000 Type B 314 M.M. AR-4000 111 C3 AR-4000 111 83 AR-4000 Type B 3/4 M.M. AR-4000
750 21.49 755 21.38 757 24.02 8:OO 21.23 8:05 21.44 8:08 23.84 8:lO 25.78 8:12 21.51
Silverado Constructors 1024 Type B 314 M.M. AR-4000 8:18 21.46 IDBL Construction 1004 111 c 3 AR-4000 8:22 24.28 Run V-2 Beglns Interstate Silverado Constructors Hillcrest Contracting Silverado Constructors Interstate DBL Construction Silverado Constructors Silverado Constructors DBL Construction Silverado Constructors Excel Paving Co. Silverado Constructors
1002 1024 1004 1024 1002 1004 1024 1024 1004 1024 I001 1024
111 83 AR-4000 Type B 314 M.M. AR-4000 111 c3 AR-4000 Type B 314 M.M. AR-4000 111 83 AR-4000 111 C3 AR-4000 Type B 3/4 M.M. AR-4000 Type B 314 M.M. AR-4000 111 C3 AR-4000 Type B 314 M.M. AR-4000 111 82 AR-4000 T v ~ e B 3/4 M.M. AR-4000
8:25 25.12 8:27 21.51 8:30 24.40 8:33 21.45 8:35 25.52 8:37 24.67 8:39 21.59 8:43 21.47 8:48 23.25 8:49 21.51 851 25.98 854 21.34
ISilverado Constructors 1024 Type B 314 M.M. AR-4000 8:58 21.50 Run V-2 Ends DBL Construction 1004 111 C3 AR-4000 9:oo 22.98 Excel Paving Co. 1001 111 82 AR-4000 9:04 25.55 Hillcrest Contracting 1004 111 C3 AR-4000 9:07 24.21 Silverado Constructors 1024 Type B 3/4 M.M. AR-4000 9:08 21.39 DBL Construction 1004 111 C3 AR-4000 9:lO 23.61 Silverado Constructors 1024 Type B 314 M.M. AR-4000 9:13 20.39 Run MS-1 Ends
903.23 Total for MCl
Process, 10114/97, 1:09 PM ~
1 *. :
All American Asphalt - Production Data for 9117197
Pmduct Time of Tons Job Name ID Product Descrlptlon Loading Loaded Hillcrest Contractina 1004 111 C3 AR-4000 9:20 24.76 - Excel Paving Co. 1001 111 82 AR-4000 9:22 24.43 Silverado Constructors 1024 Type B 3 4 M.M. AR-4000 9:26 21.53 Silverado Constructors 1024 Type B 3/4 M.M. AR-4000 9:29 21.51 Interstate 1002 111 83 AR-4000 931 15.02 DBL Construction 1004 111 C3 AR-4000 9: 34 25.01 Hillcrest Contracting I004 111 C3 AR-4000 927 24.35
Excel Paving Co. i o a i 111 82 ~ ~ - 4 0 0 0 . 9:42 25.17 DBL Construction 1004 111 C3 AR-4000 9:45 24.36 Hillcrest Contracting 1004 111 C3 AR-4000 951 25.89 Silverado Constructors 1024 Type B 314 M.M. AR-4000 9:54 21.62 Excel Paving Co. I001 111 82 AR-4000 9% 25.65 DBL Construction 1004 111 C3AR-4000 959 24.14 Run V-3 Beeins
Hillcrest Contracting 1004 111 C3 AR-4000 10:04 23.94 Silverado Constructors 1024 Type B 3/4 M.M. AR-4000 1036 21.27 Run MS-2 Begins Excel Paving Co. 1001 111 82 AR-4000 10:08 25.85 Silverado Constructors 1024 Type B 3/4 M.M. AR-4000 10:09 21.38 DBL Construction 1004 111 C3 AR-4000 10:12 24.46 Silverado Constructors 1024 Type B 3 4 M.M. AR-4000 10:13 21.47 Hillcrest Contracting 1004 111 C3 AR-4000 10:15 24.57 Silverado Constructors 1024 Type B 3/4 M.M. AR-4000 10:18 21.22 Silverado Constructors 1024 Type B 3/4 M.M. AR-4000 10:21 21.37 DBL Construction I004 111 C3AR-4000 10:24 24.58 Silverado Constructors 1024 Type B 3/4 M.M. AR-4000 10:26 21.58
Hillcrest Contracting 1004 Ill C3 AR-4000 10.31 23.13 Excel Paving Co. 1001 111 82 AR-4000 1033 25.63 Silverado Constructors 1024 Type B 314 M.M. AR-4000 1035 21.52 Silverado Constructors . 1024 Type B 3/4 M.M. AR-4000 10:37 21.80 Run V-3 Ends Silverado Constructors 1024 Type B 3/4 M.M. AR-4000 10:39 21.21
. . Silverado Constructors 1024 Type B 3 4 M.M. AR4000 9:39 21.29
Siberado Constructors 1024 Type B 314 M.M. AR-4000 10:01 . 21.64
Silverado Constructors 1024 Type B 314 M.M. AR-4000 10:28 21.34
DBL Construction 1004 111 C3 AR-4000 Excel Pavina Co. 1001 111 82 AR-4000
10:41 24.07 10:43 24.29
Silverado Constructors 1024 Type B 3/4 M.M. AR-4000 10:44 21.52 \Hillcrest Contractina 1004 111 C3 AR-4000 10:48 22.91 Run V-4 Bealns - DBL Construction Silverado Constructors Excel Paving Co. Hillcrest Contracting Wakeham - Baker SRD Construction Silverado Constructors mcel Paving Co. Silverado Constructors ~ x c e l Pavina Co.
1004 1024 1001 1004 1011 1 024 1024 1001 1024 1001
111 C3 AR-4000 Type B 314 M.M. AR-4000 111 82 AR-4000 111 C3 AR-4000 Class B 314 AR-4000 Type B 314 M.M. AR-4000 Type B 314 M.M. AR-4000 111 82 AR-4000 Type B 3/4 M.M. AR-4000 111 82 AR-4000
- 1031 23.59 1053 21.00 1056 26.01 1059 24.56 1l:Ol 15.13 11:04 15.00 11:07 21.58 11:12 25.19 11:15 21.74 11:21 25.73 - -
Silverado Constructors 1024 Type B 314 M.M. AR-4000 11:24 21.28 Run V-4 Ends Hillcrest Contracting 1004 111 C3 AR-4000 11:28 24.37
process. 10114197, 1:09 PM
/
2
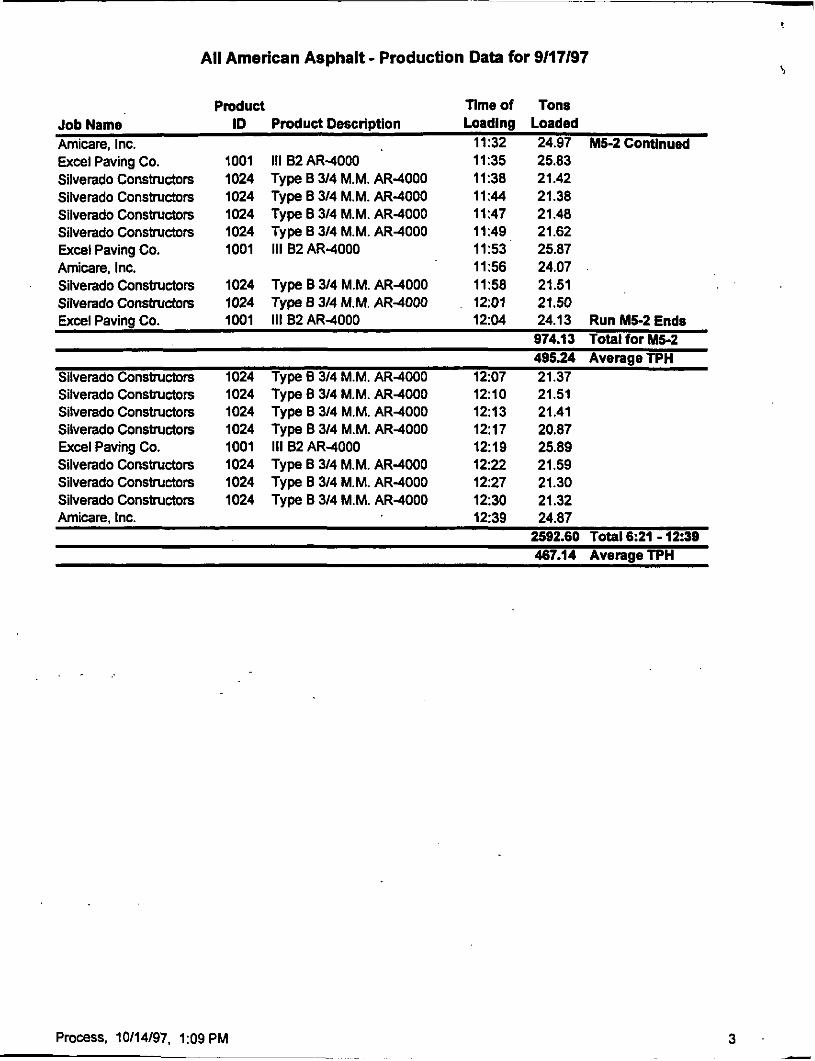
', All American Asphalt - Production Data for 9/17/97
Product Tlme of Tons Job Name ID Product Description Loadlng Loaded Arnicare. Inc. 11:32 24.97 M5-2 Contlnued -. ~
Excel Paving Co. Silverado Constructors Silverado Constructors Silverado Constructors Silverado Constructors Excel Paving Co. Arnicare, Inc. Silverado Constructors Silverado Consttutors
1001 1024 1024 1024 1024 I001
1024 1024
111 82 AR-4000 Type B 3/4 M.M. AR-4000 Type B 314 M.M. AR-4000 Type B 314 M.M. AR-4000 Type B 314 M.M. AR-4000 111 82 AR-4000
Type B 3 4 M.M. AR-4000 Type B 314 M.M. AR-4000
11135 25.03 11:38 21.42 11:44 21.30 11:47 21.40 11:49 21.62 11353' 25.07 1156 24.07 11150 21.51 12:Ol 21.50
Excel Paving Co. 1001 Ill 82 AR-4000 1294 24.13 Run M5-2 Ends 874.13 Total for M5-2 485.24 Average TPH
Silveraao Constructors 1024 Type B 314 M.M. AR-4000 12107 21.37 Silverado Constructors 1024 Type B 3 4 M.M. AR-4000 12:lO 21.51 Silverado Constructors 1024 Type B 314 M.M. AR-4000 12:13 21.41 Silverado Constructors 1024 Type B 314 M.M. AR-4000 12117 20.07 Excel Paving Co. 1001 111 82 AR-4000 1219 25.09 Silverado Constructors 1024 Type B 314 M.M. AR-4000 1222 21.59 Silverado Constructors 1024 Type B 314 M.M. AR-4000 1227 21.30 Silverado Constructors 1024 Type B 3/4 M.M. AR-4000 1230 21.32 Arnicare, Inc. 1239 24.07
2582.60 Total 6 2 1 - 1238 467.14 Average TPH
Process, 10114197, 1:09 PM 3
A'ITACHMENT (2.2
Process Data
Specification Sheet for AR-4000 Liquid Asphalt
. - - ...-
d
ORIGINAL ASPHALT:
FLASH POINT (COC) 580 F
PENETRATION @ 77 F 53
SOLUBILITY IN T.C.E. 99 %
0
------ 0
------ 0 VISCOSITY @ 275 F 252 CE
VISCOSITY @ 140 F 2083
DUCTILITY AT 77 F loo+
SPECIFIC GRAVITY 1.019
API GRAVITY, 60 F 7.4
------ 0
0
------ ------
LTR ASPHALT/ROOFING PRODUCTS P.O. BOX 1519
SOUTH GATE, CA 90280-1519 (310) 928-7000
FAX (310) 806-4032
LABORATORY REPORT
PRODUCT: ASPHALT CEHENT TESTER: GUS
GRADE: AR-4000 TIME: 2;30 AH
DATE : SEPTEMBER 15, 1997 TANK: RO-1
TESTS ON RESIDUE FROM RTF-OT:
ABSOLUTE VISC. @ 140 F PS 4214
KIN. VISC. I? 275 F cst. 337
PEN AT 77 F, 100 gm/5 sec 35
0
------ 0
------ 0
------ 0 % OF ORIGINAL PEN., 77 F 66 %
DUCTILITY loo+
HEAT AGING INDEX 2.02
POUNDS PER U.S. GALLONS 8.5
------ ------ ------ ------
CUSTOMER: AM - CARRIER: - DESTINATION: n P r@ TRUCK NO: 3+- - ~ A N T I T Y : q L ; ; 7 a o lb5 CONTRACT NO:
LOAD DATE: -. STATE TAG NO: Ka 3 LOAD TIME: LOAD TICKET NO:
LUNDAY-THAGARD COMPANY HEREBY CERTIFIES THAT THE ABOVE RESULTS WERE _. ~
OBTAINED BY THE ASTM, A.A.S.B.T.O. AND/OR OTHER APPLICAELE TEST KETHODS, AND THAT THIS PRODUCT CONFORMS TO THE SPECIFICATIONS FOR THE GRADE INDICATED.
ATTACHMENT (2.3
Process Data
Process Air Flow Schematic, Drawing 1
n ~
,
Combined Tunnel & Silo Exhaust
t Sampling Location
Atmosphere
Natural I 1
I 1 r Gas-Fired I I Rukber
- - -Liquid
' - - 3- - - - - Asphalt
-$.--- -4 I I I
Liquid Asphalt Storage Tanks
Drawing 1 . Process Schematic, All American Asphalt, Irvine, CA