AP42 Section: 1 - United States Environmental … gallons per minute gr- per rctual cublc foot...
267
AP42 Section: Reference: 1 .I 63 Results of the November 5, 1991 Air Toxic Emission Study on the No. 1, 3 & 4 Boilers at the NSP Black Dog Plant. Interpoll Laboratories, Inc., Circle Pines, Minnesota. January 3,1992.
Transcript of AP42 Section: 1 - United States Environmental … gallons per minute gr- per rctual cublc foot...

AP42 Section:
Reference:
1 .I
63
Results of the November 5, 1991 Air Toxic Emission Study on the No. 1, 3 & 4 Boilers at the NSP Black Dog Plant. Interpoll Laboratories, Inc., Circle Pines, Minnesota.
January 3,1992.
aingram
Text Box
Note: This is a reference cited in AP 42, Compilation of Air Pollutant Emission Factors, Volume I Stationary Point and Area Sources. AP42 is located on the EPA web site at www.epa.gov/ttn/chief/ap42/ The file name refers to the reference number, the AP42 chapter and section. The file name "ref02_c01s02.pdf" would mean the reference is from AP42 chapter 1 section 2. The reference maybe from a previous version of the section and no longer cited. The primary source should always be checked.

RESULTS OF THE NOVDBER 5. 1991 A I R TOXIC MISSION STUDY ON THE
NO. 1. 3 6 4 BOILERS AT THE NsPBLAcKMx;pLAIcT
.
03 interpoll

Interpol1 Laboratories, Inc. 4500 Bal l Road N.E.
Ci rc le Pines, Minnesota 55014-1819
TEL: (612) 786-6020 FAX: (612) 786-7854
RESULTS OF THE NOVEMBER 5. 1991 A I R TOXIC EMISSION STUDY ON THE
NSP BLACK WC PLANT NO. 1. 3 a 4 mILErcs AT THE
Submitted to:
NORTFERN STATES M E R COMPANY 414 N i c o l l e t Ual l
Minneapolis, Minnesota 55401
Attention:
P a t r i c i a Boyce
Reviewed by: - Report Number 1-3451 January 3. 1992 PL/kce F i e l d Testing Department

TABLE OF CONTENTS
i t i, 1 c i
i i I 51
ABBREVIATIONS . . . . . . . . . . . . . . . . . . . . . . . . i i
1 INTRODUCTION . . . . . . . . . . . . . . . . . . . . . . . . . 1
2 SUHHARY AND DISCUSSION . . . . . . . . . . . . . . . . . . . . 5
2.1 Tota l P a r t i c u l a t e Ma te r ia l . . . . . . . . . . . . . . . 5
2.2 Elemental Analys is . . . . . . . . . . . . . . . . . . . 10
2.3 PM-10.. . . . . . . . . . . . . . . . . . . . . . . . . 15
2.4 Conclusions . . . . . . . . . . . . . . . . . . . . . . . 16
3 RESULTS.. . . . . . . . . . . . . . . . . . . . . . . . . . . 17
3.1 Resul ts o f Orsat and Mois ture Analyses . . . . . . . . . 18
3.2 Resul ts o f P a r t i c u l a t e Determinations . . . . . . . . . . . 25
3.3 Sampling Data f o r t he Metals Tests . . . . . . . . . . . 30
3.4 Resul ts o f t he PM-10 Determinations . . . . . . . . . . . 35
4 RESULTS OF FUEL AN4LYSES . . . . . . . . . . . . . . . . . . . 39
APPENDICES:
A - Volumetr ic F low Rate Determinatlons
B - Locat ion o f Test Po r t s
C - F i e l d Data Sheets
D - I n t e r p o l 1 Labs A n a l y t i c a l Data
E - B o i l e r Operational Data
F - Procedures
G - C a l c u l a t i o n Equations
H - Sampling T r a i n C a l i b r a t i o n Data
I - Mass Rate Conversion Fac tor For G/Sec
J - Resul ts o f Flyash Composition Ca lcu la t lons
K - S u l f u r Diox ide D ispos i t i on
il

ACFM cc ( m l ) DSCFM DSML DEG-F (OF) D I A . FP FT/SEC 9 GPH GR/ACF GR/DSCF
HP HRS I N . IY.HG. IN.WC. LB LB/DSCF LB/HR6 LW10 BTU LB/WWBTU LTPD ubi mg/DSCn microns (un) MIN . ng ohm-cm PH PPH PPH PPmC p w , d PPm,W
' PDt PSI s0.F-r. u9 V/V u/w
g/dscm
<
ABBRNIATIWS
actual cubic feet per mlnute cubic centiaeter ( m i l l i l i t e r ) standard cubic foot of dry gas pcr DlnUte dry standard m l l l l l l t e r degrees Fahrenheit d I ame t e r finished product f o r plant f e e t per second gram gallons per minute gr- per rctual cublc foot grains per dry standard cubic fWt grms per dry standard cublc meter horsepwer hours Inches inches o f mercury Inches o f water pound pounds per dry standard cublc fwt pounds per hour pounds per m l l l i on Brlt lsh Thermal Unlts heat wunds wr mi l l l on Br l t lsh T h e m 1 Units heat ion9 tons per day megawatt milligrams per dry standard cubic meter n i c r w t e r minutes nanograms ohn-centimeter part iculate matter pounds per hour parts per a l l l l o n pa r t s per mi l l ton arbon parts per ml l l ion, dry parts per a l l l l on , vet parts per t r i l l i o n pounds per square inch square feet micrograms percent by v o l w percent by weight - < (when f o l l w i n g a nmber)
1 nput input
. .
Standard condltlons are defined as 68 OF (20 pressure.
and 29.92 IN . of mrcury
lii

Jeff Cole, R T I , says this is a dry bottom boiler, according to I the UDI/EEI database. Jeff has been working with the N S P data I
Jj
for five years and, therefore, I am taking his word on this.

On November 11. 1991 I n t e r p o l 1 Laborator ies personnel conducted an
a i r t o x i c s emission study on the No. 1. 3 B 4 B o i l e r s a t t h e Northern
States Power Company (NSP) Black Dog Plant loca ted i n B u m s v i I l e .
Minnesota. On-site t e s t i n g was performed by D. Van Hoever. M. Kaehler. E.
Trowbridge. D. Brennan. G. Hove. P. O 'Ne i l l . J . Bergstrom and C. Mosser.
Coordinat ion between t e s t i n g a c t i v i t i e s and p lan t operat ion was provided
by J i m P a r i s o f NSP.
The No. 1. 3 B 4 B o i l e r s are water tube b o i l e r s equipped t o fire
pu lver ized coal and gas. The steaming capaci ty o f these b o i l e r s i s 720.-
OOO. 775.000 and 1.250.000 LB/HR o f superheated steam, respect ive ly .
P a r t i c u l a t e emissions f r o m each b o i l e r are c o n t r o l l e d by a primary
(Research-Cottrel l 12-section) and secondary (Selco/GE 12-section)
e l e c t r o s t a t i c p r e c i p i t a t o r . Cleaned f l u e gas f r o m a l l three b o i l e r s i s
exhaus ted to the atmosphere by means o f a comnon 600-foot r a d i a l concrete
stack w i t h a s tee l l i n e r which has an i n t e r n a l diameter o f 22'-6' a t t h e
e l e v a t i o n o f the t e s t por ts . Dur ing the t e s t the b o i l e r s were f i r e d w i t h
subbituminous coal f r o m the Antelope and North Antelope mines.
An EPA Mult i -Metal Mod i f i ed Method 5 (4H5) sampling t r a i n was used
t o i s o k i n e t i c a l l y c o l l e c t s o l i d and vapor phase t r a c e metals a t the Stack
t e s t s i t e . The samples were c o l l e c t e d and analyzed as per the EPA D r a f t
Method .Methodology f o r the Determinat ion o f Metals Emissions i n Exhaust
Gases f r o m Stat ionary Source Combustion Processes'. The aerosol or s o l i d
phase t r a c e metal samples w e r e c o l l e c t e d on P a l l f l e x R Type 2500 QAT u l t r a
pure f i l t e r s . The vapor phase t r a c e metals were c o l l e c t e d i n an a l l g lass
impinger t r a i n . The f i r s t and second impingers each contained 100 cc o f
a mix ture o f 5% HNOl and 10% HZOz. The third and f o u r t h impingers contained
100 cc o f a mix ture o f 4% KMnO, and 10% HzSO,. These impingers c o l l e c t any
elemental mercury which might penetrate the f i r s t two impingers.
1

The recovered four-part samples were returned t o the laboratory
where the probe r inse , f i l t e r and nitr ic acid impinger catch were
combincd. dlssolved I n acid (Including the quartz f l l t e r ) and analyzed by
Inductlvely Coupled Argon Plasma Emission Spectrometry ( I C P ) . I n some
cases. samples were reanalyzed by graphl te furnace atomic absorption
spectrometry fo r g rea t e r s e n s l t i v i t y . The permanganate mercury catch and
an a l iquot of the f ront half ca tch were each analyzed by cold vapor atomlc
absorption spectrometry (CV/AA). Two field-biased blanks were co l lec ted
and recovered a t each t e s t s l t e and analyzed f o r t race metals w i t h t h e
f i e l d samples. The probe rinse and f i l t e r catch were conditioned and
analyzed gravimetrically p r io r t o processlng so t h a t the t o t a l pa r t i cu la t e
welght could be determlned.
The combined pa r t i cu la t e and t r a c e metal samplings performed a t t h e
ESP I n l e t t e s t s l t e s were performed using a modlfied EPA Method 17
sampling t r a i n designed t o sample s i t e s wlth high par t icu la te loadlngs.
The samples were co l lec ted using an out-stack s t a ln l e s s s tee l f l l t e r holder equipped w i t h a speclal high e f f ic iency s t a i n l e s s s t ee l f i l t e r
thimble. The sample gas passes through a pig t a i l s t a i n l e s s s tee l nozzle
d i r e c t l y i n t o the f i l t e r . After sampling i s completed and the end-of-the
r u n leak check performed, the sample t r a i n i s turned on again a t 0.75 cfm and t h e nozzle and f l l t e r holder tapped while sampling ambient a i r . This
s t ep c a r r l e s any flyash deposited inside the nozzle in to the f i l t e r
holder. The f l l t e r thimble i s then removed; returned t o the laboratory;
conditloned t o remove f r ee mois ture and weighed which completes the
gravlmetric analysls . Samples f o r elemental analysls are obtained by
bouncing the f l l t e r thimble on a hard surface which releases the e n t i r e
f i l t e r cake f r p m the mirror-l lke SS f i l t e r thimble walls. Allquots of
known weight ape then taken f o r chemical analysis . No attempt I s made t o
recover the t h i n l ayer of f lyash remalning on the surface of the f i l t e r .
since a more than adequate mass of f lyash i s recovered fo r chemical
ana lys i s and s ince t h i s layer of f lyash i s I n c lose contact w i t h t h e
s t a i n l e s s s tee l f l l t e r and might be contaminated t o one degree or another
2

1: i i i 1 i 1 i i ii it i 'i I J 1 I I 1
w i t h chromium or n icke l stemning f r o m decomposition o f the s ta in less s tee l
f i 1 t r a t i o n substrate.
The I n l e t sampling t r a i n s a l s o included an ice-bath cooled impinger
t r a i n which contained four impingers (100 cc o f a c i d i f i e d permanganate i n
each o f the f i r s t two; t h e th i rd impinger serves as a t r a p and t h e f o u r t h
contains des iccant) . This impinger t r a i n c o l l e c t s the elemental mercury
vapor which passes through the f i l t e r .
PM-10 determinat ions were performed a t the Stack t e s t s i t e using an
EPA I45 sampling t r a i n equipped w i t h an elght-stage cascade impactor
at tached t o t h e ins tack end o f the probe. The gold-plated p la tes were
coated w i t h Apiezon H t o minimize p a r t i c l e bounce o f f . Three
determinat ions and one con t ro l were performed i n accordance w i th PM-10 S IP
Development Guidel ine USEPA - 450/2-86-001: Appendix C. Four separate
impactor sets were used t o c o l l e c t the samples. The samples were returned
t o the laboratory , condi t ioned and weighed. The r e s u l t s were ca lcu la ted
i n accordance w i t h the impactor manufacturers recomnendations using the
provided 50% cu t p o i n t c a l i b r a t i o n data.
In tegra ted f l u e gas samples were ext racted slrmltaneously w i t h each
o f the above-referenced sample t r a i n s f r o m the sampling t r a i n exhaust
po r t s us ing a s p e c i a l l y designed gas sampling system as p a r t o f the
o v e r a l l p r o j e c t q u a l i t y assurance . In tegra ted f l u e gas samples were
c o l l e c t e d I n 4 4 - l i t e r Tedlar bags housed i n a p r o t e c t i v e aluminum housing.
A f t e r sampling was complete, the bags were sealed and returned t o the
labora tory f o r Orsat analys is . P r i o r t o sampling, the Tedlar bags are
leak checked a t 15 IN.HG. vacuum w i t h an i n - l i n e rotameter. Bags w i th any
detectable inleakage are discarded.
The combined p a r t i c u l a t e and t r a c e metal t e s t i n g a t the ESP I n l e t s
was conducted f r o m 10 o r 12 t e s t p o r t s on each o f the respect ive ESP I n l e t
Ducts. Each t e s t run was 120 minutes i n durat ion. Test ing on the Stack
was conducted f r o m four t e s t p o r t s o r ien ted a t 90 degrees. These t e s t
3

por ts are located approximately 9.8 stack dlameters downstream of the
breechlng I n l e t and 7.2 dlameters upstream of the stack ex l t . A 12-polnt
t r ave r se was used t o extract representa t lve trace metals samples. Each
traverse p o l n t was sampled t e n minutes for t h e comblned pa r t l cu la t e and
t r a c e metals puns t o glve a total sampling time of 120 minutes per run.A four-point t raverse was used for PH-10 (cascade Impactor) t e s t ing . Run times varled from 48 mlnutes f o r Run 1 t o 96 minutes f o r Run 3.
The Important resu l t s of t h e t e s t a r e sumarlzed In Sectlon 2.
Detalled results are presented I n Sectlon 3. Field da t a and a l l o the r
supportlng Informatlon are presented In t h e appendlces.
4

2 SUMMARY AND DISCUSSION
2 .1 To ta l P a r t i c u l a t e Ma te r ia l
The r e s u l t s o f t he t o t a l p a r t i c u l a t e ma te r ia l mass r a t e
determinations performed a t the No. 1. 3 and 4 B o i l e r s ESP I n l e t s and
Common Stack are presented i n Tables l a - Id . The average mass ra tes and
removal e f f i c i e n c i e s were as fo l l ows :
Mass Rate (LB/HRL Removal
Run No. ( I n l e t s ) (Stack) E f f i c i e n c v ( 5 1 1 9431 67.9 99.28
2 9986 64.9 99.35
3 8638 60.5 99.07
Avg . 9352 71 .1 99.23
I n rev iewing the p a r t i c u l a t e mass r a t e determinations, i t should be
noted t h a t the sum o f t he d ry standard vo lumetr ic f l ow r a t e s measured a t
the ESP I n l e t t e s t s i t e s was 5 - 11.42 h ighe r than those a t the Common
Stack t e s t s i t e . T h i s i s no t unexpected. The Stack t e s t s i t e i s
aerodynamically i d e a l f o r gas v e l o c i t y measurements inasmuch as the gas
stream f l ow i s undis turbed f o r more than e i g h t stack diameters upstream
ensuring t h a t t h e f l ow l i n e s are p a r a l l e l t o the stack wa l ls . I n the case
o f the I n l e t measurements, the t e s t s i t e s are genera l l y l e s s than one
diameter downstream o f a f l ow d is turbance and thus nonpara l l e l f low i s t o
be expected. The S-Type p i t o t tube used i n t h i s work, always over
est imates the v e l o c i t y pressure when the p i t o t tube i s no t fac ing d i r e c t l y
i n t o the flow (angle o f a t tack <> 0 ) .
1 5

0 N
\ 0 d l- d
a d
m 0 lo d \ 0 La m d
0 t N d \ 0 t 0 d
0
0 0 m
0
t m t
0
0
t a
O N m a mru lom o m t N
t m do m N m d O N
o m
N m rum mI- 0 - m n t N
0 m 0
W l- 0
I- r- m
0 d
N - t I-
d d
I- 0
a
0 0 0 W C l -
M I - 0 . . .
~m
d a
I m 0
I d d
d
I m 0
I d M
m
d a
I m 0 I d 4
- 0 0 0 . . d N
d '4 0 0 I n - .- 0
I-d m a o m 0 0 . .
d 0 0 t
10 t m d
d 0 m d
m 0
0
m m N
0 d
N
m m a
c U a m o u A U
m Q C urn m - c 3 L . o u m r r u U C 0 L L m s o u
c d u r 01.. 4 .
. m e m e
C r L U >
-
a z c
a r z
u a
0 0 0 dNI-
d(D0 . . .
. - s m M
d 0
W
0 0 4
0 0 0 a m - o m 0 ~ ( m . . .
- u - m n c c E U L u a > ~ m 0 0 2.- c u o u u
d U L . a 0 0 0
2 0 m - J u u -r* 3 u c U C I -
7.-
r m o
m m
a o a I * - -- e -
3 I-
X X \
m
m a
u u U I u
W 0
@ m a r c o c o o
r x L U v 0106
C8-
L E m L L E U U E U 1
s- m
a u o m o a
c 0
2 c c 0
- W C 0 0
U U
L m
- x 0 c
U m r L 4 >
0 3 L o r 4 r m u L 3 E
C . 0 0 C r e e l L U
U c r
L V 0 U C 4 0 0 m
0 L
U 6 L 0 P E Y C
a 0 L
3
C 0
0 m
r n m 1
0 V c
a U
m a x . - O V O S n E 0 0
111 4 u
i a el c L a
c E U
L c 0 a
a L 3 U
ru r.
Q c n m I-
~
c c
U
c X 0 m U
a r
L 0
a 0 c
a E
0 > c
E
U a
.- C L
c, L m a
a C 4 0
a E
c- - m
0 x c
m U m m c)
r U E 0 W z
m a
6

r z I I I I I I I I I I F I I I I> I, I
0 c .- urn m a ~a o u
U VIA U .c r L
0s . r Y U U L O
3 0 .
L O - mz a n c
m
.c rlrr m u s d U .
a m I n U F
a - L r > a r m nu E E L a L 3 > a m O r Z r E
0.- a m r u o m a
U L .I 0 0 0
z o
r s u 3 u c
. -
m d o m
m a a c- a o a a m -
. C E O u 0 0
.I-x L U O
c- o m m ar m L E m L L ~ a a E U 3 a a o w a n
n ,-I
0 - n m I-
I
! C
e
! d
c
C a
a LI c
d m I In 0 I rl rl
rl
I In 0 I d d
a
d m I In 0 I d d
U m 0 U
L 0
a m U
0
c N d \ 0
c
m
d
d
0 d In rl \ 0 In 0 d
O 0 m d \ 0 * 0 d
w I a - E 0 U
a L 0 3 U c a L
a E
I- r
o ID In n
0
0 ID m
0
0 ID In
I
a
m I \
-I x -
3 0
L c
e a 0
U w
N m m
.-I m m
c N m
- Y I 0 Y 0 - a L a 4a a L 0 n E a U .. I U
c N
0 rl
Y)
0
m
rl
t 0
0 d
- w \ w e - U c U c 0 0
a
a L a U m
0 L
c
0 0 0 N t O
N e 0 . . .
d m
0 0 0 m m t . . . W e 0 r l m
0 0 0 v ) O t . . . d m o - m
a L U I
5
> U e- - x
0
\a
c u c
O E E D - 0 0 0 .- L au c a
U P D L
m m x - O O O C n E 0 0
U . U
m m
0 0 r(
m 01
1 * - c 0
U r
m
a r L
> 0
U
E
X 0 m I4
r
a r
m m crl I D - .d
0
o m "
rlN . .
N m 0 - . . rld
-- IAL 0 0
E < @ 0 \o -a\ u u a a -u
a
L - U C
0 u C L O r . 0 m u 3 c
u 0 u ..U
a u a - a 0
U L (0
?
a
m rl t N
v)
In t
d
0 v) v) 0
I
a
m f \
-I - a U m L
c 0
m n
E a
c
c
U L m a
ID In N
m c 0
m 0
O
- a m
m
c L L \
-I - L 0 o 0
L
c 0
m m
E
m
c
.- W
a - c 0
S 0 U
0
L 0
a
a
- V U 0 z

-
I I 1 I i
I I 'I I I I i 1 B I I I I I. I
m C
urn
o u U
urn U
r L > a l e
c u u U L O L O U
c
m w - r m
m c
o r m
m z w a c
m u = m
m w
w c d S -
d U - . - m u r
w - L - > w c m
E L W L s
0 - z r c
0 -
s o U P w
U
0 0 0 z o
U - 1 u w - x u > U T
w s -
n u c
> o m
w m
e a m
u l m
a o n U U W s c o u o w
. rY e u o
c - o m m a- rn L E m L L E w w E U 3 3 w o m o a
U 4
0 - n m I-
d m I 10 0 I d d
d
I m 0 I
m
rl d
d m I
m 0 I H d
U In W U
c 0
W U
0 m
N N
rl m \ 0 rl I- d
N 0 W
\ 0 m m d
d
m m N
\ 0 0 0
rl
d
- rn I a - W c 0 W
W L W 3 U c s L
0) E I- c
0
m N d rl
0
m N d d
N I- d d
a
m I \
-I Y -
3 0
L r
E
W U rn
m
YIN
N o
m m I-o
o m o m
o m m m m d m m a m I-o
O m m w w o m m I-*
m w
-- I = u u 00 urn - 0 -
W 3 L 0 - m
- m u c s c
u m 0 0 u L U
E 3
0 > r
I- m
0 d
N W
0 d
m m 0 d
> \ > z -
w c w U C 0 0
W L s U VI
0 I
-
0 0 0 m w w . . . m l n o . - a m
0 0 0 w m w . . . m - 0 d m
0 0 0 w o w m w o . . .
d m
% L U
> \ W 5 0
. z - - x
0
u c C 0 o c c w c o w 0 c L au O V O C
E 0 0
c
U P m L UI a x r n
U m U
I-
01 m
m 01 m
m
0 0 rl
z - c 0
U c
m
m c L
> 0
U 0) C
x 0 U U
c
c
m 0 o m m m 0 0 . .
m m w w m m
0 0 . .
m N m .
0
m o . r l
I-
U U 00
c a u l 0 x 0 -a\ u u a m -u L - U E W 0 0 C L 0 - m 0 m u a c
w u m a m - u 0 0 - s 0
U L
c
m a
m d N N
U N W m
0 I-
m m
- a
m r \
-1 - W U
L
C 0
m
7 U U c E W
U L m a
m d
4
I- m d
0 0
N
3 c I I \
-1
m
m - L 0 U 0
e c 0
U U
m
c
c E W
%
c 0
r: 0 U
0
a L 0
r
m
.. w U 0 2
c

C L .
S C W Y 0 C L U
- 2 c 3 c 0 w - r s x C Y L .
w m
m o w
m u u a m -
m v > m m m d C c
u ) L - a m m m
L L a c u-.- n- E O U c m u O P a
m o
- d Y . -
> @
2 0
u 2 s m C .C
d C
0 . - U Z O D - u o 3 s u U Y X 0 0
0 -
S C C U L
u u e t 3 0 0 c a
S O L r U m w w E U S E - m 3 E C w w u )
e m o n
a c m
u m
0 d
u 7
n m I-
d m I
m 0 I d d
d m I
m 0 I .-I 4
4
I m 0 I d 4
m
Y Ul W C
L 0
W Y
0 m
ul 4
4 \ 0 d I- 4
m
N
10
\ 0 ul m d
d
d
0 m N
\ 0 s 0 4
d
u)
I a - al C 0 U
W L W 3 U C
L
W E
l-
a
c
0
I- m 4 N
0
10 I-
N - 0
N N N N
a
m I \
-1 Y -
3 0 - L
E m 0) u u)
10 4 m
m r(
m
0 r(
m
- U I U W 0 -
0) L 3 C
L 0) (1 E 0) Y
U
m
m U
m m
0 d
.-I 0
0 d
4 m 0 .-I
- > \ > a. -
C C V C C 0 0
u L 3 C U c 0 I
0 0 0 0 1 0 0 _ . . - . . m 1 0 0 r ( m
0 0 0
N - 0
m m s
~m . . .
0 0 0 0 - m N - 0 . . .
d m
- a L U
> \ W W D 4 - 7 - x
.
a
C u O C C D - 0 0 0 U P W L .- L au n m x r o v o c P E 0 - 0
U m U
10
0 0 4
d
0 0 d
m
d
,-I 0
- U - E 0
Y - m
m .- L
> 0
C 0 C
X 0 111 U
r
.-
m s 1 0 4 10- 0 0 0 .
m m ~m y l m 0 0 0 0 . .
10- m u 0 0 0 0
y l m
. .
-- ULL v u
c a v ) 0 \o .-u\ C V U
L - C C 0) v u E L 0 - m
a - u
v m u a c
w u m m m u a
Y O U - 0
C L
0
c
m
0 m 0 m
I- OD
Q
m m h co
- U I \
-1 m - u C
L
C 0
M U
m
.-
.- E W
C. L m n
m N 0
0
m d 0
0
0 N 0
0
1
3 I-
s L 0 0 S C m 0 V m e S
L C 0 0
I I I

I I
I 1 I I I I I I I I I I I I I I
i 2 . 2 Elemental Analvs is
The r e s u l t s o f t h e elemental analyses p e r f o m d on t h e f l y a s h
samples c o l l e c t e d a t the ESP I n l e t s and the Stack have been used together
w i th the f l u e gas sample volumes t o ca l cu la te exhaust gas concentrat ions
of each o f the 24 elements o f i n t e r e s t (See Table 2a). The elemental
concentrat ions are presented f o r each o f t he th ree two-hour t e s t r u n s a t
bo th the ESP I n l e t s and O u t l e t . Table 2b presents the same r e s u l t s except
1 n LBIIO~BTU.
Elemental mass f l ow r a t e s en te r ing and leav ing the ESP have been
ca l cu la ted from the I n d i v i d u a l element exhaust gas concentrat ions and the
vo lumetr ic exhaust gas f l ow ra tes . These r e s u l t s are g iven i n Table 3 .
Mass f low ra tes o f elements e n t e r i n g the ESP were ca l cu la ted us ing the
vo lumetr ic f low ra tes measured a t t he Stack t e s t s i t e a f t e r c o r r e c t i o n f o r
the oxygen content ( i . e . d i l u t i o n ) . This was done t o circumvent the
de le te r i ous e f f e c t o f l a r g e sca le turbulence (known t o e x i s t a t these
s i t e s ) or! the accuracy o f f l ow measurements. Removal e f f i c i e n c i e s f o r
each e l e n m t were a l s o c a l c u l a t e d where poss ib le us ing the average mass
ra tes a t the ESP I n l e t s and O u t l e t . The r e s u l t s o f these c a l c u l a t i o n s are
a l so presented i n Table 3 . Elemental removal e f f i c i e n c i e s are i n good
agreement w i t h t h e t o t a l p a r t i c u l a t e removal e f f i c i e n c i e s . Elements t h a t
are very v o l a t i l e and/or not c o l l e c t e d e f f i c i e n t l y by the e l e c t r o s t a t i c
p r e c i p i t a t o r s e x h i b i t lower removal e f f i c i e n c i e s .
The r e s u l t s o f t he elemental analyses performed on the f l y a s h
samples were a l so used t o c a l c u l a t e f l y a s h composition (See Table 4 ) . I n
the case o f major and minor elements, the r e s u l t s are repor ted as the
corresponding minera l form expected t o e x i s t In the f l yash as i s custom i n
mineral ash analyses. T h i s da ta shows t h a t the analyses performed
accounted f o r almost 100% o f the t o t a l composition o f the samples i n the
case of the I n l e t samples and 69 - 88% i n the case o f t he o f the Stack
samples. S i l i c o n , a major component o f f l yash was no t analyzed f o r i n the
case o f the Stack samples n o r was s u l f u r o r carbon.

-~
I I
r I il
I I
? I I
I I I I u I I I I I I I I I
Table 2a. Results of the November 5. 1991 Trace Metal Determinations Performed a t the
ESP I n l e t s t o the No. 1. 3 8 4 B o i l e r s and Conmon Stack a t t he NSP Black Dog Plant i n Burnsv i l l e . Minnesota.
Concentrat ion (uq/Nml)
Run 1 Run 2 Run 3 Element I n l e t Stack I n l e t Stack I n l e t Stack
Aluminum Ant i mony Arsenic Barium Bery l l i um Boron Cadmi um Calcium Chromium Copper I r o n Potassium Magnesium Manganese Molybdenum Sodl um N icke l Lead Selenium St r o n t i um Vanadium Zinc Mercury S i l v e r S u l f u r Si 1 i con
SO2
note:
322000 c6.0 42.9
17800 6.86 1330 13.2
458000 214 573
123000 12200 97200
314 39.1
53200 194 213
49.6 6470
549 465
6.91 2.74
19000 454000
2810 368000 ~ 6 . 0 c6.0
.7 47.4 214 20200 .1 7.46
34.5 1400 .5 52.4
4010 517000 2.3 245
11.9 589 990 139000 167 ' 12200 850 1 loo00 5.9 344
C2.0 41.8 491 56800 3.7 202 5.3 521 1.3 45.8
73.3 7280 7.3 559
18.8 490 5.3 6.58 1.2 ~ 3 . 0 6
22000 521000
477000
3080 339000 <6.0 ~ 6 . 0
.7 40.0 163 18900 .1 5.51
31.3 1220 4.2 63.4
4830 447000 4.0 174
45.1 533 1200 127000 295 10600
1030 96700 6.7 274 C2.0 28.6
794 50800 16.5 157 60.9 583
1.3 43.2 14.3 6410 8.0 485 145 388 2.7 1.71 1.0 C2.82
19400 459000
516000
3530 c6 .0
.7 71.7
.2 38.3
.5 4280
2.9 11.0 1320 211
1170 7.1
C2.0 617 3.0 2.7 1.4
60.6 8.4 126 7.2 2.5
473000
S u l f u r c o u l d n o t be analyzed in t h e ISP O u t l e t f l y a s h r a a p l c s s i n c e t h e f i r s t t u o i i p i n g e r s i n t h e bil5 s a i p l i n g t r a i n c o n t a i n 101 H,O, v h i c h r e t a i n s SO,. Thus t h e s u l f u r r e s u l t s r e p o r t e d f o r t h e Stack t e s t s i t e r e f l e c t s t h e IUD o f t h e s u l f u r i n t h e f l y a s h as well as t h c s u l f u r i n t h e SO1 e n i s s i o n s .
S i l i c o n vas n o t analyzed i n t h e tSP O u t l e t f l y a s h samples s i n c e t h e [PA ~e thOdOlOQy r e q u i r e s d i s r o ~ u t i o n o f t h e f i l t e r v h i c h i s pure SiO,.

Table 2b. Results o f the November 5. 1991 Trace Wetal Determlnations Performed a t the ESP I n l e t s to the No. 1. 3 B 4 Boi le rs and Common Stack a t the NSP Black Dog P l a n t i n B u r n s v l l l e . Minnesota.
Emission Factor (LB/lO'BTU) Run 1 Run 2 Run 3
Element I n l e t Stack I n l e t Stack I n l e t Stack
A1 uml num Antimony Arsenic Barlum Bery l l ium Boron Calcium Cadmium Chromium Copper I r o n Potasslum Magnesium Manganese Molybdenum Sodium Nickel Lead Selenium Stront i um Vanadium Zinc Mercury S i l v e r Su l fur S l l i c o n
1.97XlO-1 1.72X10-' ~ 3 . 7 0 X 1 0 - ~ <3. 70X10-6
2.62X10-' 4.27X10-' 1.09X10⁻² 1.31X10-' 4.19X10e6 6.11XlO"
2.80X 10-l 2.45X 10.' 8.03X10⁻⁶ 3.05X10-' 1.31X lo-' 1. 40X10-6 3.50X10-' 7. 27X10-6 7.53X10" 6.05X10-' 7.45X10-' 1.02XlO-' 5.94X10⁻² 5.19XlO-' 1.92X10-' 3.60X10⁻⁶ 2.39X10-' <1.22XlO-' 3. 25X10'2 3 .OOX10-' l . l8XlO- ' 2. 26X10-6 1.30X10-' 3. 24X1OS6 3.03X10-' 7.94X10-' 3.95XlO.' 4.48X10-' 3.35X10-' 4. 46X10-6 2.84X1OS4 1.15XlO-' 4.22X10⁻⁶ 3. 24X10-6 3. 06XlO-' 7.33X lo-' 1. 16X10-2 2. 77x10-1
B. l lX lo - ' 2.11x10-'
4.4 1 X 10-l
3. 32x10-1 c3. 70X10-6
1.82X10⁻² 6. 74X10-6 1.27XlO-' 4.67XlO-1 4.74XlO-'
5.33X10-' 1.26X10⁻¹
9.92X10⁻² 3.11XlO" 3.78XlO.' 5. 13X10-2
4.7 1 XlO-' 4.14X10-' 6.58X10" 5.05X10-' 4.43X10.' 5. 95X10-6
<2.77X10⁻⁶
4.28X10⁴
2.22x10-'
1.1ox10-2
1.82x10-~
1.99x10⁻² 4. 71x10-1
1.88Xlo-' <3.70X10⁻⁶
4.27X10-' 9.95X10-' 6.11X lo-' 1.91X10-'
2.56X lo-' 2. 44X10-6 2.75XlO-' 7.34X10-'
6. 28X10-' 4 .09X10-6
2.95x10-'
1. Boxlo-'
< 1.22x 10'6 4.85X lo-' 1.01x10-' 3.72X10-' 7.94X10-' 4.54XlO-' 4.88x10⁻⁶ 8.85X10" 1. 65X1OS6 6. l l X I O - l
4.67XlO-1
2.07X10'1
2.49X 10.'
3. 36X10-6 7.46XlO-' 2.7 3X 1O-I 3.87X10-' 1.06X 10'' 3.26XlO.' 7.75XlO.' 6.48XlO-' 5.91X10⁻² 1.67XlO.' 1.75X10-'
9.58X IO-' 3.56X10-' 2.64X10-' 3.91X lo-' 2.96X1OS' 2.37X10-' 1.04X10⁻⁶
<3.70X
1.15x10-2
3. lox 10-2
< 1.72X 1.18X10.2 2.80X10⁴
2. 16X10-' <3, 70X10-6
4.27X10-' 4.38X10-'
2.34XlO-' 2.61X10-' 3.05X lo-' 1.77X10⁻⁶ 6.72X10+
1.29X10*' 7.13X10-'
1.22x10⁻¹
8.08x10-'
4.34x:.3-6 <1.22x 13-6
3.77XlO-' 1.83X10⁻⁶ 1. 65X10-6 8.55XiO*' 3.70X10-' 5. 13X10-6 7.69XlO-' 4. 40X10-6 1.53X10⁻⁶
4.22X10⁻¹
note: S u l f u r c o u l d not be a n d y Z e d i n t h e KP O u t l e t f l y a s h samples s i n c e t h e f i r s t t u o i i p i n g e r s i n t h e 1115 sampl ing t r a i n c o n t a i n 101 H,Ol v h i c h r e t a i n s SO1. Thus t h e s u l f u r r e s u l t s r e p o r t e d f o r t h e Stack test s i t e r e f l e c t s t h e sun o f t h e s u l f u r i n the f l y a s h as u e l l as t h e s u l f u r i n t h e SO1 e a i s s i o n s .
S i l i c o n uas not analyzed i n the t S P O u t l e t f l y a s h samples s i n c e t h e tPL methodology r e q u i r e s d i s s o l u t i o n o f the f i l t e r u h i c h i s pure SiO,.

I I I I I I I I I I I I U I I ‘I I
Table 3. Results o f the November 5 . 1991 Trace Metal Determlnations performed a t the ESP I n l e t s t o
the NO. 1. 3 8 4 8 o l l e r s and C o m n Stack a t the NSP Black Dog Plant i n Burnsv l l le .
MI nnesota . Mass Flow (LB/HR)
Run 1 Run 2 Run 3 Avg. Removal Stack E f f . ( % u / w l Element I n l e t Stack I n l e t Stack I n l e t
A1 urni num A n t I mony Arsenic Barium Beryl l lurn Bomn Cadmi urn Calclurn Chromlurn Copper I r o n Pot as s i urn Magneslus Manganese
Sodlum Nickel Lead Selenlurn Stmnt ium Vanadlurn z inc uercury SI 1 ver Sulfur S i 1 icon
Molybdenum
=I
note:
1010 c.019
.13 56
.021 4 .2
.041 1435
.67 1 .8 386
38 305 .98 .12 167 . 6 1 .66 .16 20
1.7 1.5
.022
. w 9 60
1420
-
8.8 c.019 . w 2 1
.67 .WO36
.ll . W 1 7 12.6
.0071 .037 3 . 1 .52 2.7
.019 c.0063
1.5 .012 .017
.W42 .23
.023
.059 .017
. W 3 8 - -
1490
1162 9.7 c.019 c.019
.15 . m 2 1 64 . 5 1
-024 . m 4 7 4.4 .099 .17 .013
1635 15.2 .78 .013 1.9 .14 440 3 . 8
39 .93 347 3 .2 1.1 .021 .13 c. 0063 179 2 .5 .64 .052 1.6 .19 .15 . W 4 2 23 .23
1.8 .025 1.5 .46
.021 . m e 7 c.010 .0032
7 0 - 1650 -
- 1630
1050 c.019
.13 58
.017 3.8 .20
1383 .54 1.7 393
33 300 .85
.OB9 157 .49 1.8 .14 20
1.5 1.2
.w53 c . w e 7
60 1420
-
10.9 c.019 .0021
.22 .ooo55
.12 .017 13.2
. w 9 0 .034 4 . 1 .65 3 . 6
.022 c.0063
1.9 . W 9 2 .0084 . W 4 2
.19 .026 .091 .022
. W 7 8 - -
1460
h l f u r could not be (ntlyzed i n the 1SP Outlet f l yash suplei since the f i r s t tu0 i i v i n q e r s i n the MS s u p l i n g t r a i n c o a t i i n 101 8,0, whlch re ta ins $3,. Thus the sulfur rtsults reported for the S t i c k test s i t e reflects the SUI of the sulfur i n the f lyash IS rill i s the sulfur i n the SQ, e l i ss ions .
S i l i c o n mas not In t lyzed i n the 1SP Outlet flyash si8vles since the tPA lCthOdOlOsy r t q u i r t S d i sso lu t i on o f the f i l t e r which i s pure SiO,.
99.085
98.45 99.209 97.70 97.32 93.23 99.079 98.54 96.19 99.101 98.09 99.00 97,85
w94.27 98.83 96 .01 95.03 97.19 98.97 98.51 85.94
(77.9) 4 2 . 9 4
!‘I I

I I I I I I 1 I I 1 B 1 3
I I 'I 'I I
s
2.3 PM-10
The r e s u l t s o f t h e PM-10 Constan t Sampling Rate (CSP) de te rm ina t ions
are sumnarized i n Table 4. The t o t a l p a r t i c u l a t e emiss ion r a t e averaged
89.9 LB/HR using the CSR PM-10 sampl lng t r a i n . The s i z e d i s t r i b u t i o n
r e s u l t s o b t a i n e d P r o m t h e i n s i t u aerodynamic s i z e c l a s s i f i c a t i o n s (See
S e c t i o n 3.4) i n d i c a t e t h a t about 86.25 by we igh t o f t h e f l y a s h p a r t i c l e s
have d iamete rs l e s s than 10 microns. The PM-10 emiss ion r a t e averaged
77.7 LB/HR.
Table 4. Sumnary o f t h e FW-IO Measurements Performed on t h e No. 1, 3 B 4 B o i l e r s a t t h e NSP B lack Dog P l a n t i n B u r n s v i l l e . Minnesota.
Run 1 Run 2 Run 3 Avs . T o t a l mass r a t e (LB/HR) 93.4 91.3 85.1 89.9
t s 10 um 88.8 90.9 78.8 86.2
PM-13 mass r a t e (LB/HR) 82.9 83.0 67.1 77.7

I I I I I I I I I I 'I I I I I I I I I
2.4 Conclusions
No d t f f i c u l t i e s i ncu r red i n the f i e l d or i n the l abo ra to ry
ana lys i s o f the f l u e gas samples which could no t be solved. Based on
these f a c t s p l u s a complete review o f a l l o f t h e data, i t i s our op in ion
t h a t t he r e s u l t s repor ted he re in are accurate and c l o s e l y r e f l e c t the
ac tua l values which ex i s ted a t t h e t i m e the t e s t was performed.

3 RESULTS
I [
I I
I i
I 1
I I
r, c I I I I I I I I
The r e s u l t s o f a l l f i e l d and labo ra to ry evaluat ions are presented i n
t h i s section. Gas composit ion (Orsat and mois ture) are presented F i r s t
Followed by the computer p r i n t o u t o f t he p a r t i c u l a t e and PM-10 r e s u l t s and
the t race metals sampling data. Pre l im inary measurements i nc lud ing t e s t
p o r t l oca t i ons are g iven i n the appendices.
The r e s u l t s have been c a l c u l a t e d on a personal computer us ing
programs w r i t t e n i n Extended BASIC s p e c i f i c a l l y f o r source t e s t i n g c a l -
cu la t i ons . EPA-published equations have been used as the bas is OF the
c a l c u l a t i o n techniques i n these programs. Emission ra tes have been
ca l cu la ted us ing the product o f t h e concent ra t ion times Flow method.
1 7

I I I I I I I 1 B I I I I I 1 P I I I
3 . 1 Results o f Orsat and Moisture Analvses
18

I! I1 1: I I I I I 1 I i i I I I I I I I
I n t e r p o l 1 Labs R e p o r t No. 1 -3451 N o r t h e r n S t a t e s Power - B l a c k Dog
B u r n s v i l l e . M i n n e s o t a
T e s t No. 1 No. 1 B o i l e r I n l e t
R e s u l t s o f O r s a t 6 M o i s t u r e A n a l y s e s - - - - - M e t h o d s 3 6 4 ( t v / v )
D a t e o f r u n
D r y b a s i s ( o r s a t )
Run 1 Run 2 Run 3 11 -05 -91 1 1 - 0 5 - 9 1 11 -05 -91
c a r b o n d i o x i d e . ........... 10.90
o x y g e n .................... 8 .50
c a r b o n m o n o x i d e ........... 0.00
n i t r o g e n . . . . . . . . . . . . . . . . . . 8 0 . 6 0
11.10 11 .60
8.20 7 .70
0.00 0.00
80.70 8 0 . 7 0
Wet b a s i s ( o r s a t )
c a r b o n d i o x i d e ............ 9.88 9.80 10.20
.................... o x y g e n 7 .70 7 . 2 4 6 . 7 1
c a r b o n m o n o x i d e . . . . . . . . . . . 0.00 0.00 0.00
n i t r o g e n . ................. 73.04 71.23 7 0 . 9 4
w a t e r v a p o r 9 .37 11.74 12 .10 . . . . . . . . . . . . . . .
........ Dry m o l e c u l a r w e i g h t 30 .08 30.10 30.16
Wet m o l e c u l a r w e i g h t 28 .95 28.68 28 .69 ........ ............ S p e c i f i c g r a v i t y 1.000 0 . 9 9 1 0 . 9 9 1
. . . . . . W a t e r mass f l o w 68400 79180 90050 (LB/HR)
F O
19
1 . 1 3 8 1 . 1 4 4 1.138

I n t e r p o l 1 Labs R e p o r t No. 1 -3451 N o r t h e r n S t a t e s Power - B l a c k Dog
B u r n s v i 1 l e , M i n n e s o t a
T e s t No. 1 No. 3 B o i l e r I n l e t
R e s u l t s O f O r s a t 6 M o i s t u r e Ana lyses - - - - -Me thods 3 6 4 ( * v / v )
D a t e o f r u n
D r y b a s i s ( o r s a t )
Run 1 Run 2 Run 3 11-05 -91 11 -05 -91 11-05-91
c a r b o n d i o x i d e . ........... 11.60
o x y g e n . . . . . . . . . . . . . . . . . . . . 8 .00
c a r b o n m o n o x i d e . . . . . . . . . . . 0.00
n i t r o g e n . . . . . . . . . . . . . . . . . . 80.40
Wet b a s i s ( o r s a t )
c a r b o n d i o x i d e . . . . . . . . . . .. 10.44
o x y g e n . . . . . . . . . . . . . . . . . . . . 7 . 2 0
c a r b o n m o n o x i d e . . . . . . . . . . . 0.00
n i t r o g e n . . . . . . . . . . . . . . . . . . 72.33
w a t e r v a p o r ............... 10.04
D r y m o l e c u l a r w e i g h t . . ...... 30.18
Wet m o l e c u l a r w e i g h t . . ...... 28.95
S p e c i f i c g r a v i t y . . .......... 1.000
W a t e r mass f l o w . . . . . . (LB/HR) 75127
12 .30 12.20
7 . 3 0 7.40
0.00 0.00
8 0 . 4 0 80.40
10.95 1 0 . 9 5
6 .50 6.64
0.00 0.00
71 .59 72 .14
1 0 . 9 6 10.27
30.26 30.25
2 8 . 9 2 28.99
0 . 9 9 9 1.001
81562 76675
F O 1 . 1 1 2 1.106 1 .107
20

I 1 I I I I) I I I I II I c 1 'I :I :1 'i I
I n t e r p o l 1 L a b s R e p o r t N o . 1 -3451 N o r t h e r n S t a t e s Power - B l a c k Dog
B u r n s v l l l e . M i n n e s o t a
T e s t No. 1 No. 4 B o i l e r I n l e t
R e s u l t s o f O r s a t 6 M o i s t u r e A n a l y s e s - - - - - M e t h o d s 3 6 4(tv/v)
D a t e o f r u n
D r y b a s l s ( o r s a t )
Run 1 Run 2 Run 3 11 -05 -91 11-05-91 11 -05 -91
c a r b o n d i o x i d e ............ 13.40
o x y g e n .................... 6.00
c a r b o n m o n o x i d e . . . ........ 0.00
n i t r o g e n . ................. 80.60
13 .60 13 .80
5 . 8 0 5 .60
0.00 0.00
80.60 80 .60
Wet b a s i s ( o r s a t )
c a r b o n d i o x i d e . . . . . . . . . . . . 11.95 12 .16 12.34
o x y g e n .................... 5 . 3 5 5 . 1 8 5 . 0 1
c a r b o n m o n o x l d e . . . . . . . . . . . 0.00 0.00 0.00
n i t r o g e n . . . . . . . . . . . . . . . . . . 71.87 72.04 72 .08
w a t e r v a p o r ............... 10.83 10.62 10 .51
D r y m o l e c u l a r w e i g h t . . . . . . . . 30.38 30 .41 30.43
Wet m o l e c u l a r w e i g h t . 29 .04 29 .09 29 .12
S p e c i f i c g r a v i t y 1 .003 1 .005 1.006
. . . . . . . . . . . . . . . . . . .
W a t e r mass f l o w . . . . . . ( L B / H R ) 154997 145447 146005
F O 1 . 1 1 2
21
1.110 1 .109

I n t e r p o l 1 Labs R e p o r t No. 1 - 3 4 5 1 N o r t h e - n S t a t e s Power - B l a c k Dog
B u r n s v i l l e . M i n n e s o t a
T e s t No. 1 U n i t 1 - 3 - 4 S t a c k
R e s u l t s o f O r s a t 6 M o l s t u r e A n a l y s e s - - - - - M e t h o d s 3 6 4 ( t v / v )
D a t e o f run
D r y b a s i s ( o r s a t )
Run 1 Run 2 Run 3 1 1 - 0 5 - 9 1 1 1 - 0 5 - 9 1 1 1 - 0 5 - 9 1
c a r b o n d i o x i d e . . . . . . . . . . . . 1 2 . 4 0
o x y g e n . . . . . . . . . . . . . . . . . . . . 7 . 1 0
c a r b o n m o n o x i d e . . . . . . . . . . . 0.00
n i t r o g e n . . . . . . . . . . . . . . . . . . 80.50
Wet b a s i s ( o r s a t )
c a r b o n d i o x i d e . . . . . . . . . . . . 11 * 10
o x y g e n .................... 6 . 3 5
c a r b o n m o n o x i d e . . . . . . . . . . . 0.00
n i t r o g e n . . . . . . . . . . . . . . . . . . 72.04
w a t e r v a p o r . . . . . . . . . . . . . . . 1 0 . 5 1
D r y m o l e c u l a r w e i g h t . . .. . . . . 3 0 . 2 7
Wet m o l e c u l a r w e i g h t . . . . . . . . 20.98
S p e c i f i c g r a v i t y . . . . . . . . . . . . 1.001
W a t e r mass f l o w . . . . . . ( L B / H R ) 275574
F O
12. 80 1 3 . 0 0
6 . 8 0 6 . 6 0
0 .00 0.00
8 0 . 4 0 8 0 . 4 0
11.47 1 1 . 6 6
6 . 0 9 5 . 9 2
0.00 0.00
1 2 . 0 3 1 2 . 0 8
1 0 . 4 1 1 0 . 3 5
30 .32 3 0 . 3 4
2 9 . 0 4 2 9 . 0 7
1 . 0 0 3 1 . 0 0 4
2 7 4 6 9 7 2 6 6 9 3 5
1 . 1 1 3 1 . 1 0 2 1.100
22

I n t e r p o l 1 Labs R e p o r t No. 1-3451 N o r t h e r n S t a t e s Power - B l a c k Dog
B u r n s v i 1 1 e , H i nne SOta
T e s t N O . 2 (Cascade Impactor) U n i t s 1 - 3 - 4 S t a c k
R e s u l t s o f O r s a t & M o l s t u r e A n a l y s e s - - - - - M e t h o d s 3 6 4 ( 8 v / v )
D a t e o f r u n
D r y b a s i s ( o r s a t )
c a r b o n d i o x i d e . . . . . . . . . . . . o x y g e n . . . ................. c a r b o n monox i de . . . . . . . . . . . n i t r o g e n . . . . . . . . . . . . . . . . . .
Wet b a s i s ( o r s a t )
c a r b o n d i o x i d e . ........... o x y g e n .................... c a r b o n m o n o x i d e . . . . . . . . . . . n i t r o g e n . . . . . . . . . . . . . . . . . . w a t e r v a p o r . . . . . . . . . . . . . . .
Dry m o l e c u l a r w e i g h t . . ...... Wet m o l e c u l a r w e i g h t . . . . . . . . S p e c i f i c g r a v i t y . . .......... W a t e r mass f l o w . ..... ( L B / H R )
F O
23
Control 11-05-91
12 .30
7 .30
0.00
8 0 . 4 0
11 .22
6 . 6 6
0.00
73 .33
8 . 8 0
30 .26
2 9 . 1 8
1 .008
0.00
1.106
Run 1 11-05-91
12 .40
7 . 1 0
0 .00
8 0 . 5 0
11.19
6 . 4 1
0 . 0 0
72.64
9 . 7 7
30 .27
29 .07
1.004
263478
1 .113
Run 2 11-05-91
11 .50
8 . 2 0
0 . 0 0
8 0 . 3 0
10 .14
7 .23
0.00
70 .84
1 1 . 7 8
30 .17
2 8 . 7 3
0 .993
8322396.
1 .104

I n t e r p o l 1 Labs R e p o r t No. 1 - 3 4 5 1 N o r t h e r n S t a t e s P o w e r - B l i ack Dog
B u r n s v i l l e . M i n n e s o t a
T e s t No. 2 (Cascade Impactor) U n i t s 1 - 3 - 4 S t a c k
R e s u l t s o f O r s a t L M o l s t u r e A n a l y s e s - - - - - M e t h o d s 3 L 4 ( t V / V )
D a t e o f run
D r y b a s l s ( o r s a t )
c a r b o n d i o x i d e . . . ......... o x y g e n .................... c a r b o n m o n o x i d e . .......... n i t r o g e n . . . . . . . . . . . . . . . . . .
Wet b a s i s ( o r s a t )
c a r b o n d i o x i d e . . .......... o x y g e n . . . . . . . . . . . . . . . . . . . . c a r b o n m o n o x i d e . . . . ....... n i t r o g e n . ................. w a t e r v a p o r . . .............
D r y m o l e c u l a r w e i g h t . . ...... Wet m o l e c u l a r w e i g h t . . . . . . . . S p e c i f i c g r a v i t y . . . . . . . . . . . . W a t e r mass f l o w . . . . . . (LB /HR)
F O
74
Run 3 1 1 - 0 5 - 9 1
1 0 . 5 0
9 . 4 0
0.00
80.10
9 . 4 4
0 . 4 5
0.00
7 1 . 9 9
1 0 . 1 2
30.06
2 8 . 8 4
0 .996
255657
1 . 0 9 5

3 . 2 Results o f Part iculate Determinat'nx

1 I 1 I 1 I 1 I I I I I I 1 I I I I 1
T e s t No.
Re su
D a t e
I n t e r p o l 1 Labs R e p o r t No. 1-3451 B l a c k Dog M i n n e s o t a
No : ’ t he rn S t a t e s 8u r n s v Pow I 7 r e
No. 1 B o i 1 e r I n 1 e t
t s o f P a r t i c u l a t e L o a d i n g D e t e r m i n a t i o n s - - - - - - - M e t h o d 5
o f r u n
T i m e run s t a r t / e n d . . ... (HRS)
S t a t i c p r e s s u r e . . . . . . ( 1 N . W C ) C r o s s s e c t i o n a l a r e a ( S Q . F T ) P i t o t t u b e c o e f f i c i e n t . . . . . .
W a t e r i n s a m p l e g a s c o n d e n s e r . ............ ( M L )
d e s i c c a n t . . . . . . . . . . (GRAMS) t o t a l . . . . . . . . . . . . . . (GRAMS)
T o t a l p a r t i c u l a t e m a t e r i a l : . .......... c o l l e c t e d ( g r a m s )
i m p i n g e r s . . . . . . . . . . ( G R A M S )
Gas m e t e r c o e f f i c i e n t . . ..... B a r o m e t r i c p r e s s u r e . . ( I N . H G ) Avg . o r i f . p r e s . d r o p . . ( I N . W C ) Avg . gas m e t e r t e m p . . ( D E F - F )
Vo lume t h r o u g h g a s m e t e r . . . . a t m e t e r c o n d i t i o n s . . . ( C F ) s t a n d a r d c o n d i t i o n s . ( D S C F )
T o t a l s a m p l i n g t i m e . . . . ( M I N ) N o z z l e d i a m e t e r . . . . . . . . . ( I N ) A v g . s t a c k g a s t e m p . . (DEG-F)
V o l u m e t r i c f l o w r a t e . . . . . . . . a c t u a l . . . . . . . . . . . . . .( ACFM) d r y s t a n d a r d . . . . . . . (DSCFM)
I s o k i n e t i c v a r i a t i o n . . . . . ( % )
P a r t i c u l a t e c o n c e n t r a t i o n . . . a c t u a l . . .......... ( G R / A C F ) d r y s t a n d a r d . . . . . (GR/DSCF)
P a r t i c l e mass r a t e . . . (LB/HR)
F - f a c t o r . . . . . . . ( DSCF/MMBTU) E m i s s i o n f a c t o r ... (LB/MMBTU)
Run 1 11-05-91
1040/1240
-7.00 233.33
.840
0.0 123.0 19.0
142.0
3.7387
1.0056 29.13 1.12
110.2
71.23 64.73
120.00 .312 377
430922 235753
100.6
0.48738 0.89121
1800.893
9780 2.099
Run 2 11-05-91
350/1605
-7.00 233.33
.840
0.0 145.0 21.0
166.0
3.8698
1.0056 29.13 0.90 113.5
65.19 58.87
120.00 .312 376
398014 212303
101.6
0.54085 1.01436
1845.854
9780 2.332
Run 3 11-05-91
1710/1920
-7.00 233.33
.840
0.0 158.0 27.0
185.0
8.2187
1.0056 29.13 1.07
114.7
70.31 63.39
120.00 .312 390
446950 233292
99.6
1.04383 2.00062
4000.516
9780 4.426

1 I I I 1 I I I 1 I I I 1 1 I 1 I a
I n t e r p o l 1 L a b s R e p o r t Yo. 1 -3451 N o r t h e r n S t a t e s Power - B l a c k Dog
B u r n s v i l l e . M i n n e s o t a
T e s t No. 1 No. 3 B o i l e r I n l e t
R e s u l t s o f P a r t i c u l a t e Loading D e t e r m i n a t i o n s - - - - - - - M e t h o d 5
D a t e o f r u n Run 1
11-05-91
T i m e r u n s t a r t / e n d . . . . . ( H R S ) 1040 /1304
S t a t i c p r e s s u r e . ..... ( 1 N . W C ) C r o s s s e c t i o n a l a r e a ( S Q . F T ) P i t o t t u b e c o e f f i c i e n t . . . . . . W a t e r i n s a m p l e g a s
c o n d e n s e r . . ........... ( M L ) i m p i n g e r s . . . . . . . . . . (GRAMS) d e s i c c a n t . . . . . . . . . . (GRAMS) t o t a l . . . . . . . . . . . . . . (GRAMS)
T o t a l p a r t i c u l a t e m a t e r i a l . . . . ........ c o l l e c t e d ( g r a m s )
Gas m e t e r c o e f f i c i e n t . B a r o m e t r i c p r e s s u r e . . Avg . o r i f . p r e s . d r o p . . Avg . g a s m e t e r t e m p . .
Vo lume t h r o u g h g a s me a t m e t e r c o n d i t i o n s . s t a n d a r d c o n d i t i ons .
T o t a l s a m p l i n g t i m e . . . N o z z l e d i a m e t e r . . . . . . .
. . . . . . I N . H G ) IN.WC) DEF-F)
e r . . .. . . ( C F ) ( D S C F )
. ( M I N )
. . ( I N ) A v g . s t a c k g a s t e m p . . ( D E G - F )
V o l u m e t r i c f l o w r a t e . a c t u a l . . . . . . . . . . . . . d r y s t a n d a r d . . . . . . .
I s o k i n e t i c v a r i a t i o n .
P a r t i c u l a t e c o n c e n t r a a c t u a l . . . . . . . . . . . . (
. . . . . . (ACFM) DSCFM)
. . . ( % )
i o n . . . R/ACF 1
d r y s t a n d a r d . . . . . ( G R / D S C F )
P a r t i c l e mass r a t e . . . (LB /HR)
F - f a c t o r . . . . . . . (DSCF/MMBTU) E m i s s i o n f a c t o r . . . (LB/MMBTU)
-8 .16 222.63
. 8 4 0
0.0 111.0
2 1 .o 144 .0
7.0157
0 .9992 2 9 . 0 1
1.04 88.5
64 .98 60 .86
120.00 . 2 9 4
3 2 1
418119 240019
99 .8
1 .02014 1 . 1 7 8 6 8
3660.117
9180 4 .026
Run 2 11 -05 -91
1350 /1510
-8.16 222.63
.840
0.0 138 .0
2 0 . 0 158 .0
8 .1489
0 . 9 9 9 2 2 9 . 0 1
1.01 87.4
64 .41 60 .50
120.00 .294 3 3 1
411156 236139
100.9
1 .26011 2 .23132
4516.295
9180
Run 3 11-05 -91
1 7 1 0 / 1 9 2 1
-8.16 222.63
.B40
0.0 1 2 2 . 0
2 3 . 0 145.0
4 .5139
0 .9992 29.07
0.99 9 2 . 1
64 .11 59.10
120.00 .294
332
419319 238106
9 8 . 5
0 .61261 1 .18211
2418.636
9180 4 . 1 9 1 2 . 5 5 1
27

I n t e r p o l 1 Labs R e p o r t No. 1 -3451 N o r t h e r n S t a t e s Power - B l a c k Dog
B u r n s v i 1 l e , M i n n e s o t a
T e s t No. 1 No. 4 B o i l e r I n l e t
R e s u l t s o f P a r t i c u l a t e L o a d i n g D e t e r m i n a t i o n s - - - - - - - M e t h o d 5
D a t e o f r u n Run 1
11-05-91
T i m e run s t a r t / e n d . . . . . ( HRS) 1040 /1255
S t a t i c p r e s s u r e . . . . . . ( 1 N . W C ) C r o s s s e c t i o n a l a r e a ( S Q . F T ) P i t o t t u b e c o e f f i c i e n t . . . . . . W a t e r i n samp le g a s
c o n d e n s e r . . . . . . . . . . . . . ( M L ) i m p i n g e r s . . . . . . . . . . (GRAMS) d e s i c c a n t . . . . . . . . . . ( GRAMS) t o t a l . . . . . . . . . . . . . . (GRAMS)
T o t a l p a r t i c u l a t e m a t e r i a l . . . . . . . . . . . . c o l l e c t e d ( g r a m s )
Gas m e t e r c o i f f i c i e n t . . . . . . . B a r o r ; i e t r i c p r ' e s s u r e . . ( I N . H G ) A v g . o r i f . p r e s . d r o p . . ( I N . W C ) A v g . gas m e t e r t e m p . . ( D E F - F )
Vo lume t h r o u g h g a s m e t e r . . . . a t m e t e r c o n d i t i o n s . . . ( C F ) s t a n d a r d c o n d i t i o n s . ( D S C F )
T o t a l s a m p l i n g t i m e . . . . ( M I N ) N o z z l e d i a m e t e r . . . . . . . . . ( I N ) A v g . s t a c k g a s t e m p . . ( D E G - F )
V o l u m e t r i c f 1 ow r a t e . . . . . . . . a c t u a l . . . . . . . . . . . . . . ( A C F M ) d r y s t a n d a r d . . . . . . . (DSCFM)
I s o k i n e t i c v a r i a t i o n . . . . . ( % )
P a r t i c u l a t e c o n c e n t r a t i o n . . . a c t u a l . . . . . . . . . . . . ( G R / A C F ) d r y s t a n d a r d . . . . . (GR/DSCF)
P a r t i c l e mass r a t e . . . (LB/HR)
F - f a c t o r . . . . . . . (DSCF/MMBTU) E m i s s i o n f a c t o r . . . (LB/MMBTU)
-9 .10 3 5 1 .OO
. 8 4 0
0.0 119.0
2 8 . 0 2 0 1 .o
5.3014
0 .9939 29.17
1 . 6 1 82.6
84.90 80 .35
120 .00 . 3 1 0 316
786850 454883
100.3
0 .58834 1 . 0 1 8 1 0
3969.568
9180 1 . 9 9 5
Run 2 11-05-91
13 5 0 / 1602
-9 .10 357.00
. 8 4 0
0.0 1 1 2 . 0
2 1 . 0 1 9 3 . 0
4 .7899
0 .9939 29.17
1 .48 8 6 . 1
81 .50 1 6 . 6 1
120.00 .3 10
308
140354 438199
99 .3
0 . 5 6 4 6 8 0 . 9 6 4 1 4
3 6 2 3 . 5 6 1
9180 1 .866
Run 3 1 1 - 0 5 - 9 1
1710/1922
-9 .10 3 5 1 .OO
. 8 4 0
0.0 110.0
2 3 . 0 193 .0
2 .9425
0 .9939 29 .17
1 .49 85 .0
01.10 1 6 . 9 5
1 2 0 . 0 0 . 3 1 0 3 1 4
154245 438492
99.7
0 . 3 4 2 8 1 0 .59000
2211.504
9180 1 . 1 2 6

I I 1
I I
I I
1 1
I I
I I I 1
c I d
I c I I I I I I
T e s t U n i t
Resu
D a t e
T i me
I n t e r p o l 1 L a b s R e p o r t N O . 1 - 3 4 5 1 N o r t h e r n S t a t e s Power - B l a c k Dog
B u r n s v i l l e . M i n n e s o t a
No. 1 1-3-4 S t a c k
t s o f P a r t i c u l a t e L o a d i n g O e t e r m i n a t
o f r u n
run s t a r t / e n d . . . S t a t i c p r e s s u r e . . . . .. C r o s s s e c t i o n a l a r e a P i t o t t u b e c o e f f i c i e n
W a t e r i n samp le g a s c o n d e n s e r . . . . . . . . . . i mpi n g e r s . . . . . . . . . . d e s i c c a n t . . . . . . . . . . t o t a l . . . . . . . . . . . . . .
T o t a l p a r t i c u l a t e m a t . . ........ c o l l e c t e d
Gas m e t e r c o e f f i c i e n t B a r o m e t r i c p r e s s u r e . . A v g . o r i f . p r e s . d r o p . . A v g . g a s m e t e r t e m p . .
Vo lume t h r o u g h gas me a t m e t e r c o n d i t i o n s s t a n d a r d c o n d i t i o n s
T o t a l s a m D l i n a t i m e . . .
Run 1 1 1 - 0 5 - 9 1
. (HRS) 1040 /1254
IN.WC) SQ.FT) . .....
. . ( M L ) GRAMS) G R A M S ) GRAMS)
r i a1 . . g r a m s )
. . .... 1N.HG) IN.WC) DEF-F)
e r . . . . . . ( C F ) (DSCF)
. f M I N ) - N o z z l e d i a m e t e r . . . . . . . . . ( I N ) A v g . s t a c k g a s t e m p . . ( D E C - F )
V o l u m e t r i c f l o w r a t e ........ a c t u a l . . ............ ( A C F M ) d r y s t a n d a r d . ...... ( D S C F M )
I s o k i n e t i c v a r i a t i o n . . . . . ( 8 )
P a r t i c u l a t e c o n c e n t r a t i o n . . . a c t u a l . . . . . . . . . . . . ( G R / A C F ) d r y s t a n d a r d . .... (GR/DSCF)
P a r t i c l e mass r a t e . . . (LB /HR)
F - f a c t o r . . ..... (OSCF/MMBTU) E m i s s i o n f a c t c r ... (LB/MMBTU)
-1.85 3 9 7 . 6 1
. 8 4 0
0.0 1 1 6 . 0
16 .0 1 3 2 . 0
0 .0325
1. OOO? 28.94
0 .64 48 .2
52 .64 5 2 . 9 8
120.00 . 1 9 5 314
1423339 036298
101.3
0 .00556 0 . 0 0 9 4 7
6 7 . 8 5 0
9780 0 . 0 2 0
Run 2 11 -05 -91
1350/ 1 6 1 2
-1.85 397 .61
.840
0.0 120 .0
10.0 130 .0
0.0307
1 .0003 28.94
0 . 6 4 5 2 . 0
5 2 . 8 1 52 .76
120 .00 .195
313
1431439 8 4 2 8 9 1
100.1
0.00529 0 .00898
6 4 . 8 7 1
9780 0 .019
Run 3 1 1 - 0 5 - 9 1
1710 /1915
- 1 . 8 5 397 .61
0
. 8 4 0
0 .0 16.0 11.0 27 .O
0 3 8 3
1 .0003 28.94
0 . 6 2 5 5 . 9
52.34 51.89
120.00 . 1 9 5 3 1 6
1405036 824638
100.6
0 .00668 0 . 0 1 1 3 9
8 0 . 5 0 1
9780 0 .023

3 . 3 SarnDlinq Data f o r the Metals Tests
g I I I I I I I I I I I I I I 1 I I I
I n t e r p o l 1 L a b s R e p o r t N o . 1-3451 N o r t h e r n S t a t e s Power - B l a c k Dog
B u r n s v i 11 e , M i n n e s o t a
T e s t No. 1 No. 1 B o i l e r I n l e t
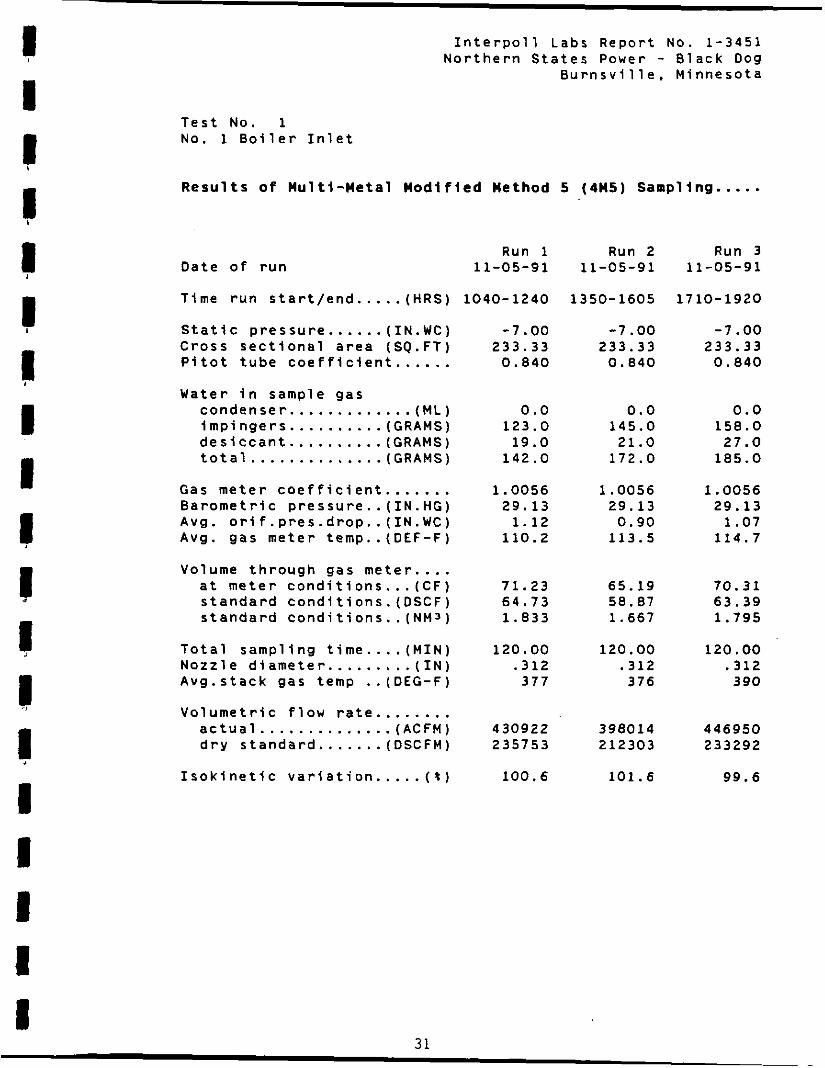
R e s u l t s o f M u l t i - M e t a l M o d l f i e d Method 5 (4M5) S a a p l l n g .....
D a t e o f r u n Run 1
11-05-91
T i m e r u n s t a r t / e n d . . ... (HRS) 1040-1240 S t a t i c p r e s s u r e ...... (1N.WC) -7.00 C r o s s s e c t i o n a l a r e a ( S Q . F T ) 233.33 P i t o t t u b e c o e f f i c i e n t . . . ... 0.840
W a t e r i n s a m p l e g a s c o n d e n s e r . . ........... ( M L ) 0.0 i m p i n g e r s . . . . . . . . . . (GRAMS) d e s i c c a n t . . . . . . . . . . (GRAMS) 19.0 t o t a l . . . . . . . . . . . . . . (GRAMS) 142.0
123.0
Gas m e t e r c o e f f i c i e n t . ...... I. 0056 B a r o m e t r i c p r e s s u r e . . (1N.HG) 29.13 Avg. o r i f . p r e s . d r o p . . ( I N . W C ) 1.12 Avg . g a s m e t e r t e m p . . ( D E F - F ) 110.2
Vo lume t h r o u g h g a s m e t e r . . . . a t m e t e r c o n d i t i o n s . . . ( C F ) 71.23 s t a n d a r d c o n d i t i o n s . ( D S C F ) 64.73 s t a n d a r d c o n d i t i o n s . . ( N M 3 ) I. 833
T o t a l s a m p l i n g t i m e . . . . ( M I N ) 120.00 N o z z l e d i a m e t e r . . . . . . . . . ( I N ) .312 A v g . s t a c k g a s temp . . ( D E G - F ) 377
V o l u m e t r i c f l o w r a t e . ....... a c t u a l . . . . . . . . . . . . . . (ACFM) 430922
I s o k i n e t l c v a r i a t i o n . . . . . ( t ) 100.6
d r y s t a n d a r d . . . . . . . ( DSCFM) 235753
Run 2 11-05-91
1350- 1605
-7.00 233.33 0.840
0.0 145.0 21.0
172.0
1.0056 29.13 0.90
113.5
65.19 58.07 1.667
120.00 .312 376
398014 212303
101.6
Run 3 11-05-91
1710-1920
-7.00 233.33 0.840
0.0 158.0 27.0
185.0
I . 0056 29.13 1.07
114.7
70.31 63.39 1.795
120.00 .312 390
446950 233292
99.6
31

It I: I
11 ' I I I I I I I I 1 1 I I I '1
I n t e r p o l 1 L a b s R e p o r t N O . 1-3451 N o r t h e r n S t a t e s Power - B l a c k Dog
B u r n s v i 1 1 e , M i n n e s o t a
T e s t No. 1 No. 3 B o i l e r I n l e t
R e s u l t s o f M u l t i - M e t a l M o d l f l e d Method 5 (4M53 S a m p l i n g .....
D a t e of run
T i m e run s t a r t / e n d . . . . . ( H R S )
S t a t i c p r e s s u r e . ..... (1N.WC) Cross s e c t i o n a l a r e a ( S Q . F T ) P i t o t t u b e c o e f f i c i e n t . . .... W a t e r i n s a m p l e g a s
c o n d e n s e r . . . . . . . . . . . . . ( M L ) i m p i n g e r s . . . . . . . . . . (GRAMS) d e s i c c a n t .......... (GRAMS) t o t a l . . . . . . . . . . . . . . (GRAMS)
Gas m e t e r c o e f f i c i e n t . . . . . . . B a r o m e t r i c p r e s s u r e . . ( I N . H G ) Avg. o r i f . p r e s . d r o p . . ( I N . W C ) Avg. ga; m e t e r t e m p . . ( D E F - F )
Vo lume t h r o u g h g a s m e t e r . . . . a t m e t e r c o n d i t i o n s ... ( C F ) s t a n d a r d c o n d i t i o n s . (DSCF) s t a n d a r d c o n d i t i o n s . . ( N M 3 )
T o t a l s a m p l i n g t i m e . . . . ( M I N ) N o z z l e d i a m e t e r . . ....... ( I N ) A v g . s t a c k g a s t e m p . . (DEG-F)
V o l u m e t r i c f l o w r a t e ........ a c t u a l .............. (ACFM) d r y s t a n d a r d . . . . . . . (DSCFM)
I s o k i n e t i c v a r i a t i o n . . . . . ( % )
Run 1 Run 2 Run 3 11-05-91 11-05-91 11-05-91
1040-1304 1350-1510 1710-1927
-8 .16 -8.16 -8.16 222 .63 222 .63 222 .63
0 . 8 4 0 0 .840 0.840
0 . 0 0.0 0.0 1 1 7 . 0 1 3 8 . 0 1 2 2 . 0
27 .0 2 0 . 0 2 3 . 0 1 4 4 . 0 1 6 1 . 0 145.0
0 . 9 9 9 2 0 . 9 9 9 2 0 .9992 29 .07 29 .07 29 .07
1 . 0 4 1.01 0.99 8 8 . 5 8 7 . 4 9 2 . 1
6 4 . 9 8 6 4 . 4 7 64 .17 6 0 . 8 6 60.50 59 .70 1 . 7 2 3 1 . 7 1 3 1 . 6 9 1
1 2 0 . 0 0 1 2 0 . 0 0 1 2 0 . 0 0 .294 .294 .294 327 331 332
418179 417756 419319 240079 236139 238706
9 9 . 8 100.9 9 8 . 5
I 32

I n t e r p o l 1 L a b s R e p o r t No. 1 -3451 N o r t h e r n S t a t e s Power - B l a c k Dog
B u r n s v i l l e . M i n n e s o t a
T e s t No. 1 No. 4 0 o i l e r I n l e t
R e s u l t s o f M u l t i - M e t a l M o d i f i e d Method 5 (41153 S a m p l i n g .....
D a t e o f r u n Run 1
1 1 - 0 5 - 9 1
T i m e r u n s t a r t / e n d . . . . . (HRS) 1040-1255
S t a t i c p r e s s u r e . ..... (1N.WC) C r o s s s e c t i o n a l a r e a (SQ.FT) P i t o t t u b e c o e f f i c i e n t . . .... W a t e r i n s a m p l e g a s
c o n d e n s e r . . ........... (ML) 1 m p l n g e r s . . . . . . . . . . d e s i c c a n t . . . . . . . . . . t o t a l . . . . . . . . . . . . . .
Gas m e t e r c o e f f i c i e n t B a r o m e t r i c p r e s s u r e . . Avg . o r l f . p r e s . d r o p . . A v g . g a s m e t e r t e m p . .
GRAMS) GRAMS) GRAMS)
. ..... 1 N . H G ) IN.WC) DEF-F)
Vo lume t h r o u g h gas m e t e r . . . . a t m e t e r c o n d i t i o n s . . . ( C F ) s t a n d a r d c o n d i t i o n s . ( D S C F ) s t a n d a r d c o n d i t i o n s . . ( N M 3 )
T o t a l s a m p l i n g t i m e . . . . ( M I N ) N o z z l e d i a m e t e r . . . . . . . . . ( I N ) A v g . s t a c k g a s temp . . ( D E G - F )
V o l u m e t r i c f l o w r a t e . a c t u a l . . . . . . . . . . ... d r y s t a n d a r d . . . . . . .
I s o k l n e t l c v a r i a t i o n .
. . . . . . (ACFM) DSCFM)
. . . ( % )
-9 .10 357 .00
0 .040
0.0 179 .0
20 .0 2 0 7 . 0
0 . 9 9 3 9 29.17
1 . 6 1 02.6
04 .90 80 .35 2 . 2 7 5
120.00 . 3 1 0
3 1 6
706050 454003
100 .3
Run 2 11 -05 -91
1350-1602
-9.10 357.00
0 .040
0.0 1 7 2 . 0
21.0 195 .0
0 .9939 29 .17
1.40 0 6 . 1
01 .50 76 .61 2.169
120.00 . 3 1 0
308
740354 438199
99.3
Run 3 11-05-91
1710-1922
-9 .10 357 .oo
0 . 0 4 0
0.0 170 .0
23 .0 1 9 3 . 0
0 . 9 9 3 9 29.17
1 .49 05 .0
81 .70 76.95 2 .179
120.00 . 3 1 0
3 1 4
754245 430492
99.7
33

1 11 U
I- I
1 I I I I
I n t e r p o l 1 Labs R e p o r t No. 1-3451 N o r t h e r n S t a e s
P o Y T ~ ~ ; a i n n e s o t 2 a c k Do B u r n s v i
T e s t No . 1 U n i t 1-3-4 S t a c k
Results o f Multi-Metal Hodlfled Method 5 ( 4 M 5 ) Sampling .....
D a t e o f r u n Run 1 Run 2 Run 3
11-05-91 11-05-91 11-05-91
T i m e r u n s t a r t / e n d . . . . . ( H R S ) 1040-1254 1350-1612 1710-1915
S t a t i c p r e s s u r e . . . . . . (1N.WC) -1 .05 -1 .85 -1.05 C r o s s s e c t i o n a l a r e a ( S Q . F T ) 397.61 397.61 397.61 P i t o t t u b e c o e f f i c i e n t . . . . . . 0.040 0.040 0.040
W a t e r i n s a m p l e g a s c o n d e n s e r . . . . . . . . . . . . . ( M L ) 0.0 0.0 0.0 i m p i n g e r s . . . . . . . . . . (GRAMS) 116.0 120.0 116.0 d e s i c c a n t . . . . . . . . . . ( G R A M S ) 16.0 10.0 11.0 t o t a l . . . . . . . . . . . . . . (GRAMS) 132.0 131.0 127.0
Gas m e t e r c o e f f i c i e n t . . . . . . . 1.0003 1.0003 1.0003 B a r o m e t r i c p r e s s u r e . . ( I N . H G ) 20.94 20.94 20.94 Avg. o r i f . p r e s . d r o p . . ( I N . W C ) 0.64 0.64 0.62 Avg . g a s m e t e r t e m p . . ( D E F - F ) 40.2 52.0 5 5 . .I
Volume t h r o u g h g a s m e t e r . ... a t m e t e r c o n d i t i o n s . . . ( C F ) 52.64 52.01 52.34 s t a n d a r d c o n d i t i o n s . ( D S C F ) 52.90 52.76 51. 09 s t a n d a r d c o n d i t i o n s . . ( N M 3 ) 1.500 1.494 1.469
T o t a l s a m p l i n g t i m e . . . . ( M I N ) 120.00 120.00 120.00 N o z z l e d i a m e t e r . . . . . . . . . ( I N ) .195 .195 .195 A v g . s t a c k g a s t e m p . . ( D E G - F ) 314 313 316
V o l u m e t r i c f l o w r a t e . . . . . . . . . . . . . . . . . . . . . . 1431439 1405036
042091 024630
I s o k i n e t i c v a r i a t i o n . . . . . ( % ) 101.3 100.1 100.6
a c t u a l ( A C F M ) 1423339 . . . . . . . d r y s t a n d a r d (DSCFM) 836298
I

I I i I i I I i I i I I I I I I I I I
3 . 4 Results o f PM-10 Determinations
35

1; I I I 1 I I Il 1
I I I I I I I I
i
I n t e r p o l 1 Labs Report No. 1-3451 Northern States Power - Black Dog
Burnsv i l l e , Minnesota
Resul ts o f t he P a r t i c l e S ize D i s t r i b u t i o n Determination
Sample I d e n t i f i c a t i o n : No. 1. 3 8 4 B o i l e r s Stack - November 5 . 1991 Cascade Impactor Sampling
Assigned Density: 1.00 g/cc
Run 1 Run 2 Run 3
Stage um * , um % 2 um % 2
Pre i mpactor
1
2
3
4
5
6
7
.;\
10.2 11.23
6 .4 18.85
4 .2 21.84
2 .5 39.84
1 . 5 5 1 . 4 1
1.0 66.37
0.64 79.12
0 .36 80 .70
10.2 9 .08
6.4 14.45
4 .2 17.71
2.5 33.81
1 .5 47.43
1.0 64.50
0.64 76.19
0 .36 81.42
10.2 21.17
6 .4 26.99
4.2 29.85
2.5 43.83
1 . 5 56.14
1.0 71.09
0.64 84.37
0.36 89.99
Aerodynamic equiva lent diameter i n microns R e l a t i v e cumulative frequency - percent by mass o f aerosol w i t h diameters g rea ter than s ta ted s i z e
I 36

~I I I I I I I' i I c I D I 1 I C I ,I I
I n t e r p o l 1 Labs R e p o r t No. 1-3451 N o r t h e r n S t a t e s Power - B l a c k Dog
B u r n s v i 11 e , M i n n e s o t a
T e s t No. 2 (Cascade Impactor) U n i t s 1-3-4 S t a c k
R e s u l t s o f P a r t i c u l a t e L o a d i n g D e t e r m i n a t i o n s - - - - - - - M e t h o d 5
D a t e o f r un Control
11-05-91
T i m e run s t a r t / e n d . . .. . ( H R S ) 1018/1123
S t a t i c p r e s s u r e . . ... .(IN.WC) C r o s s s e c t i o n a l a r e a (SQ.FT) P i t o t t u b e c o e f f i c i e n t . . .... W a t e r i n samp le gas
c o n d e n s e r . ............ ( M L ) i m p i n g e r s . . . . ..... .(GRAMS) d e s l c c a n t .......... (CRAMS) t o t a l . . . . . . . . . . . . . . (GRAMS)
T o t a l p a r t i c u l a t e m a t e r i a l . . . . . . . . . . . . c o l l e c t e d ( g r a m s )
Gas m e t e r c o e f f i c i e n t . ...... B a r o m e t r i c p r e s s u r e . . (1N.HG) A v g . o r 1 f . p r e s . d r o p . . ( IN .WC) A v g . gas m e t e r te rnp . . (DEF-F)
Vo lume t h r o u g h gas m e t e r . . . . a t m e t e r c o n d l t i o n s ... ( C F ) s t a n d a r d c o n d i t i o n s . ( O S C F )
T o t a l s a m p l i n g t i m e . . . . ( M I N ) N o z z l e d i a m e t e r . . ....... ( I N ) A v g . s t a c k g a s temp . . ( O E G - F )
V o l u m e t r i c f l o w r a t e . ....... a c t u a l . . . . . . . . . . . . . . ( A C F M ) d r y s t a n d a r d . . . . ... (DSCFM)
I s o k i n e t i c v a r i a t i o n ..... ( % )
P a r t i c u l a t e c o n c e n t r a t i o n . . . a c t u a l . . ........... ( G R / A C F ) d r y s t a n d a r d . . . . . (GR/DSCF)
P a r t i c l e mass r a t e . . . ( L B / H R )
37
- 1 . 8 5 391 .61
.840
48 .0 0.0 9 . 0
5 1 . 0
0.0000
1 . O O l O 2 0 . 9 4
0 . 1 5 4 9 . 8
21 .54 2 1 . 0 2
6 0 . 0 0 .195
313
1460239 875747
101.6
0.00000 0.00000
0 .00
Run 1 11-05-91
1206/1300
- 1 . 8 5 3 9 7 . 6 1
. 0 4 0
3 1 . 0 0 . 0
1 9 . 0 5 0 . 0
0 .0117
1 .0070 2 8 . 9 4
0 . 7 1 4 8 . 9
2 1 . 5 0 2 1 . 7 6
48 .00 .195
315
1465050 066907
100.3
0 .00143 0 . 0 1 2 5 7
9 3 . 3 8
Run 2 11-05-91
1428/1530
- 1 . 8 5 391 .61
.040
5 1 . 0 0 .0
2 0 . 0 11.0
0 .0218
1.0010 28.94 0.11 5 5 . 8
21 .19 21 .15
60 .00 .195
312
1480 124 859446
101 .o
0.00119 0.01239
9 1 . 2 8

1
1 d
I 1
I J
! 1 1 ! I I i
I I I I
I 4
I n t e r p o l 1 Labs R e p o r t No. 1 - 3 4 5 1 N o r t h e r n S t a t e s Power - B l a c k Dog
B u r n s v i l l e . M i n n e s o t a
T e s t No. 2 (Cascade Impactor) U n i t s 1 - 3 - 4 S t a c k
R e s u l t s o f P a r t l c u l a t e Loading D e t e r m l n a t i o n s - - - - - - - M e t h o d 5
D a t e o f r u n
T i m e r u n s t a r t / e n d . . . . S t a t i c p r e s s u r e . . .... C r o s s s e c t i o n a l a r e a P i t o t t u b e c o e f f i c i e n
W a t e r i n s a m p l e g a s c o n d e n s e r . . . . . . .... i mpi n g e r s .......... d e s i c c a n t . . . . . . . . . . t o t a l . . . . . . . . . . . . . .
T o t a l p a r t i c u l a t e m a t . ......... c o l l e c t e d
Gas m e t e r c o e f f i c i e n t B a r o m e t r i c p r e s s u r e . . Avg. o r i f . p r e s . d r o p . . Avg. g a s m e t e r t e m p . .
Volume t h r o u g h g a s me a t m e t e r c o n d i t i o n s
Run 3 1 1 - 0 5 - 9 1
. (HRS) 1 6 3 6 / 1 8 1 6
IN.WC) SQ.FT) . . . . . .
. . (ML) GRAMS) GRAMS) GRAMS)
r i a l . . g r a m s )
. . . . . . I N . H G ) IN.WC) DEF-F)
e r . . . . . . ( C F )
s t a n d a r d c o n d i t i o n s . ( D S C F )
T o t a l s a m p l i n g t l m e . . . . ( M I N ) N o z z l e d i a m e t e r . . . ...... ( I N ) A v g . s t a c k g a s t e m p . . (DEC-F)
V o l u m e t r i c f l o w r a t e . . . . . . . . a c t u a l . . . . . . . . . . . . . . (ACFM) d r y s t a n d a r d . . . . . . . (DSCFM)
I s o k i n e t i c v a r i a t i o n . . . . . ( % )
P a r t i c u l a t e c o n c e n t r a t i o n . . . a c t u a l . . . . . . . . . . . . (GR/ACF) d r y s t a n d a r d . .... (GR/DSCF)
P a r t i c l e mass r a t e ... (LB /HR)
F - f a c t o r . . . . . . . (DSCF/MMBTU) E m i s s i o n f a c t o r . . . (LB/MMBTU)
-1 .85 3 9 7 . 6 1
. 8 4 0
7 4 . 0 0.0
28 .0 102 .0
0 . 0 3 4 0
1 .0070 28 .94
0 . 6 8 5 3 . 9
42 .55 42 .64
96 .00 . 1 9 5 314
1369583 808046
105 .4
0 . 0 0 7 2 5 0 . 0 1 2 2 9
8 5 . 1 4
0 0.000

I I
I i
I 1
I 1
I I I 1
I I
4 RESULTS OF FUEL ANALYSES
I

I I I
INTERPOLL LABORATORIES I N C . Fuel Laboratory (612) 786-6020
11-26-1991
Cl ients NSP/BLACK M)(;
Laboratory Log Number: 4677-101-0681
Sample I d e n t l f i c a t i o n : COAL COMPOSITE UNITS 1-3-4 11/5/91
Ult imate Analvsis WT t
Moisture B Moi sture As Parameter Ash Free Free Recel ved
Moisture. Total
Ash
Carbon 74.40
Hydrogen 5.32
N i t mgen 0.09
Oxygen (calculated) 19.84
Sulfur 0.35
Heating Value, BTU/LB. 12819
Re
6.68
69.44
4.96
0.09
18.52
0.32
11963
27.22
4.86
50.54
3.61
0.06
13.47
0.24
8707
f u l l y submitt
<Jeannie F. O'Nei l . Manager Inorganic Chemistry Group
9695

I 1 1 I
I
I
I
I 'I 1
'I i h I E i I
I I I i I I I I I
d
I
I
4
INTERPOLL LABORATORIES, I N C . ( 6 1 2 ) 7 8 6 - 6 0 2 0
NSP/Black Dog Laboratory Log No. 4677
Source: Un l t s 1. 3 B 4 Sample Type: Coal
Trace Metal Method 11/5/91
(Log No.) S l l v e r A1 urn1 num Arsenic Bomn Bar1 urn Bery l 1 lum Caldum Cadrnl um Chroml um copper Iron Mercury Potassium Magnesium Manganese Molybdenum Sod1 urn Nlckel Lead Antlmony Selenium S t m n t i urn Vanadl urn Zinc
SW-846. 6010 SW-846. 6010 SW-846. 7060 SW-846. 6010 SW-846. 6010 SW-846. 6010 SW-846. 6020 SW-846. 6010 SW-846. 6010 SW-846. 6010 SW-846. 6010 SW-846. 7470 SW-846. 6010 SW-846, 6010 SW-846. 6010 SW-846. 6010 53-846. 6010 SW-846. 6010 SW-846. 6010 SW-846. 7041 SW-846. 7740 Std. Heth. 326A SW-846. 6010 SW-846. 6010
(4677-101) 0.06 3730 0.4 23.3
1.98 0.1
6480 0.1 2.3
18.8 1670
0.006 188
1380 5;2 0.8 534 2.5 5.7 0.4 0.3 566 8.9 9.6
'Reiul ts are repor ted on an as m c e l v e d basls. w l th a molsture content o f 27.2% and an ash conten t o f 4.86%.

.
APPENDIX A
V O L U M E T R I C FLOW R A T E D E T E R M I N A T I O N S

I I n t e r p o l 1 Labs R e p o r t NO . 1-3451 N o r t h e r n S t a t e s Power . B l a c k Dog
B u r n s v i 1 l e . M i n n e s o t a
T e s t No . 1 No . 1 B o i l e r I n l e t
R e s u l t s o f V o l u m e t r l c F l o w R a t e Determination....... Method 2
D a t e o f D e t e r m i n a t i o n ............ T i m e o f D e t e r m i n a t i o n ....... (HRS)
B a r o m e t r i c p r e s s u r e ....... ( IN .HG)
P i t o t t u b e c o e f f i c i e n t ...........
Number o f s a m p l i n g p o r t s ......... T o t a l number o f p o i n t s . . ......... Shape o f d u c t .................... Duct w i d t h ................... ( I N )
D u c t l e n g t h .................. ( I N )
D u c t a r e a . . . . . . . . . . . . . . . . . (SQ.FT)
D i r e c t i o n o f f l o w . ...............
S t a t i c p r e s s u r e ........... (1N.WC)
Avg . g a s temp ............. (DEG-F)
M o i s t u r e c o n t e n t . . . . . . . . . . ( % V / V )
Avg . l i n e a r v e l o c i t y . . ... (FT/SEC)
Gas d e n s i t y .............. (LB/ACF)
M o l e c u l a r w e i g h t . . .... (LB/LBMOLE)
Mass f l o w o f g a s . ......... (LB/HR)
V o l u m e t r i c f l o w r a t e . . . . . . . . . . . . . a c t u a l . . . . . . . . . . . . . . . . . . . (ACFM) d r y s t a n d a r d . . . . . . . . . . . . (DSCFM)
11-05-91
910
2 9 . 1 3
. 84
10
4 0
R e c t a n g u l a r
6 0
5 6 0
233 .33
UP
-7
375
9 . 3 1
3 2 . 2
. 0 4 5 4 6
30 .08
1229480
450758 247004

I n t e r p o l 1 L a b s R e p o r t No. 1 -3451 N o r t h e r n S t a t e s Power - B l a c k Dog
B u r n s v l l l e . M i n n e s o t a
T e s t No. 1 No. 4 B o i l e r I n l e t
R e s u l t s o f Vo lumet r i c F l o w R a t e D e t e r m i n a t i o n - - - - - - - Method 2
D a t e o f D e t e r m i n a t i o n . . . . . . . . . . . . T i m e o f D e t e r m i n a t i o n ....... (HRS)
B a r o m e t r i c p r e s s u r e . . . . . . . ( I N . H G )
P i t o t t u b e c o e f f i c i e n t . . . . . . .....
Number o f s a m p l i n g p o r t s . . . . . .... T o t a l number o f p o i n t s . . . . . . . . . . . Shape o f d u c t . . . . ................ D u c t w i d t h ................... ( I N )
D u c t l e n g t h .................. ( I N )
D u c t a r e a . ................ (SQ.FT) D i r e c t i o n o f f l o w . . . . . . . . . . . . . . . .
S t a t
Avg . M o i s
Avg .
c p r e s s u r e ........... (1N.WC)
g a s temp, . . ........... ( D E G - F )
u r e c o n t e n t .......... ( t V / V )
l i n e a r v e l o c i t y . . . . . (FT/SEC)
Gas d e n s i t y .............. (LB/ACF)
M o l e c u l a r w e i g h t . . . . . . (LB/LBMOLE)
Mass f l o w o f g a s . ......... (LB/HR)
V o l u m e t r i c f l o w r a t e . . . . . . . . . . . . . a c t u a l . . ................. (ACFM) d r y s t a n d a r d . . . . . . . . . . . . (DSCFM)
11 -05 -91
8 4 0
29 .17
.84
6
48
R e c t angu 1 a r
76.5
672
357.00
UP
-9 .100001
312
1 0 . 8 3
36.2
.04916
3 0 . 3 8
2285381
774850 450320

APPENDIX B
LOCATION OF TEST PORTS

1
a
I I
I a 1
B- 1
kA Y \

APPENDIX C F I E L D DATA SHEETS
TABLE OF CONTENTS
No. 1 Boiler Inlet . . . . . . . . . . . . . . . . . . . 1 No. 3 Boiler Inlet . . . . . . . . . . . . . . . . . . . 12 No. 4 Boiler Inlet . . . . . . . . . . . . . . . . . . . 22 No. 1. 3 & 4 Boilers Stack . . . . . . . . . . . . . . . 33

I INTEFPOLL LABORATORIES EPA METHOD 2 F I E L D DGTA SHEET Jot r/.CP. &a& 26b =7/Gd
S o u r c e ~ H L F T - &/LWhcJ
T e s t L R u w m D a t e I ~ / s ~ q l S t a c l . d i m e n . 60 d- T 6 o ” f % > IN.
Dry b u l b OF Wet bulb- OF
Manometer: 0 Reg. 0 E::p. 0 E l e c .
B a r o m e t r i c pressure 74.l3 i n Hg
S t a t i c p r e s s u r e -30 i n WC
O p e r a t or 5 x. &Le -,.l)JJJ A L. - P i t o t No. 24-6 Cp .kq
,,. ..... * *
R or n ~ t h i n g = r e g . manometer: S = expanded: E = e l e c t r o n i c S -392 .1
L- 1

I N T E R P O L L L A B O R A T O R I E S E P A n E T H O D 2 F I E L D D A T a SHEET
T e s t Hun - D a t e
S t a c k d i m e n . I N .
D r y b u l b "F W e t bulb- OF
Manometer : 0 Reg. 0 E x p . 0 E l e c .
B a r o m e t r i c p r e s s u r e i n Hg
S t a t i c p r e s s u r e i n WC
O p e r a t o r s S c h e m a t i c o f
P i t o t No. CP IL--- C r o s s S e c t i o n
Parr &
1 € I' I
fi o r G o t h i n g = r e g . manometer ; S= e x p a n d e d ; E = e l e c t r o n i c s-392.1
c- 2

Sample T r a i n L e a k Check:
P r e t e s t : ( 0.02 cfm a t 15 i n . Hg. ( v a c ) Fastest: .ou c f m a t /L i n . Hg. ( v a c )
P a r t i c u l a t e C a t c h Data: 5s .7M&
N G . 5 Of CCLb s used : . .
NO. of probe w a s h ba t t l e s : 1 Sample r e c o v e r e d b y : nn
C o n d e n s a t e D a t a :
D i f f e r e n c e
I m p i n g e r No. 2
C o n d e n s e r
I n t e g r a t e d Gas S a m p l i n g Data:
Bag pump N o . &a BG;: NO. i Hag NO. 1
Hag material: 5 - l a y e r A lumin ized T e d l a r S i z e : 4 s
F ' r E t E S t leab: C h E C k : . D O c c / a i n a t 4 in. ~ g .
T i m e s t a r t : /O\lL) (HRS) T i m e end: (HRS)
ampl ling r a t e : D D c c / m i n O p e r a t o r : b.@.
S / N cd O= PlnAlyzer used t o m o n i t o r t r a i n o u t l e t : * I - I
CF-t:iZ:
S-0046RR c- 3

c-4
I I I I I I I l l I P

c - 5

I I N T E R F O L L LAHORATORIES € P A METHOD 5/17 SAMPLE L O G SHEET -
Sample T r a i n Leak Check:
Pre tes t : ( 0.02 cfm a t 15 in. Hg. ( v a c ) -# Fostes t : - - -00 c f m a t A in. ~ g . (vac) 8
P a r t i c u l a t e Catch Data: r&#m&.’I-
1 4 0 . 5 of f-s used: Recovery so lvent ( 5 )
P7€ u,
I
55 T U I H A s t a - f i r v u f tu& 0 o t h e r t s )
No. of probe wash b o t t l e s : Sample recovered by: 3-4‘
Condensate Data:
Weight (g) I tem
Fina l Tare D i f f erencc
Impinger No. 1 L Z S rife t4S.o Impinger No. 2
lmpinger No. 3
Condenser
Desiccant 1355 i3 34 2 i . O
.................................. ......... ... ... .. ............. ......... - ......... - ................ __----__-.---.- --_- ---”-----_._ ...... . I 1LL.O - -. - _ _ . . . T o t a l
I n t e g r a t e d Gas Sampling Data:
Hag Fump No. @-& Bo:: No. 1 Hag No. A Bag Mate r ia l : 5- layer Aluminized Tedlar Size:
P re tes t leak check: . od cc/min a t 6’ in . ~ g .
Time s t a r t : t35c (HRS) Time end: fLo5 (HRS)
sampling r a t e : 200 cc/min Operator: 0 1 3 ~ s/r4 O= Analyzer used t o monitor t r a i n o u t l e t : //
C F - I : ~ ~ ?
i* I: I ’ I : I ’. I . I I ’ I 1 I I I II I II
C - 6 S-0046RR I

1 I I II 1 I
I I=
A - a =- a = = -, Y; 3
c - 7

C-8

1 I 1 I 1 I 1 1 1 1 I 1 I 1 I I I 1 I
INTERFOLL LAHOHATOHIES ETA METHOD 5/17 SAMPLE LOG SHEET -
J trb /id 5. P. &&+ beL Source & l ~ % y \ ~ i t c t r Eethod y n r 5 s F i l t e r ho lder : rwW2
H* Sample T r a i n Lea): Check:
Pre tes t : ( 0.02 cfm a t 15 Fostest : - .cD cfm a t 111
7 D i t s / / /r/41 T E S t 1 R u n > tdo. o f t ravo rse p o i n t s F i l t e r type: gs fd!&
n. Hg. (vac) n. Ha. (vac) 4
P a r t i c u l a t e Catch Data:
N0.s of f i l t e r s used: Recovery so lvent ( 5 )
No. of probe wash b o t t l e s : <I) Sample recovered by: I .
Condensate Data:
I Weight ( g ) I tem 1
F ina l Tare D i f f e rence
6 do Impinger No. 1
Impinger No. 2 I
Desiccant
. . . . . . .. . . . . . . . . . . . -. -. . . . . . . . . . -. . . . . . -. . . . - - . . . . . . . . ... ._ . . . . . . . . . . -. . -. . . . -- .- . . . . - .. . . . . .- .. . . . . . . -----I---.-. . . +,e _-- _.__.-_* _______. Tota l I
I n t e g r a t e d Gas Sampling Data:
B i g Fump NO. g-2 fioi: NO. 1 Bag NO. 3 Bag Mater ia l : %layer Aluminized Tedlar Size:
P r e t ~ s t leal: check: *Oo cc/min a t tL in. Hg.
~ i m e s t a r t : 13rO (HRS) T~CTE end: I ~ J D (HRS)
Sampling r a t e : 20 cc/min Operator: b.R. S I N 04 0, Analyzer used t o monitor t r a i n o u t l e t : 11 -
CF- t:iZ:
S-0046RR c-9


a
Ii 1 I 1
1 -'
I 1 i
=-
c-11

~~~~ ~
I N T E R F O L L LABORFTCRIES EPG METHOD 2 FIELD D&T& SHEET
I 1: I I : I'
- !
i 'I 1
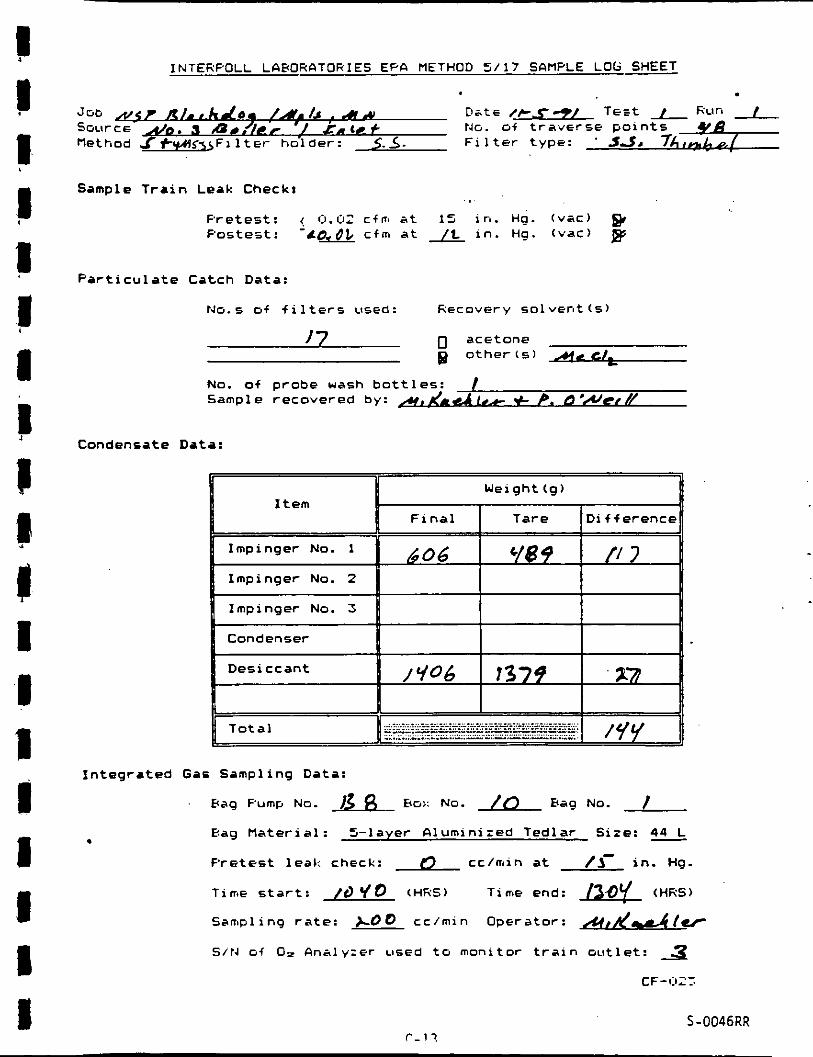
- INTERF'OLL LABORATORIES EPO METHOD 5 / 1 7 saMxE LOG SHEET .
Sample T r a i n Leak Check:
F re tes t : ( 0.02 c f a a t 15 i n . Hg. (vac) h), Fostes t : -do& cfm a t /L in. Hg. (vat) p
P a r t i c u l a t e Catch Data:
~ 0 . 5 of f i l t e r s used: Recovery so lvent ( 5 )
17 0 acetone
& B o t h e r ( s )
No. of probe uash b o t t l e s : Sample recovered by: + p. b'/Vet//
Condensate Data:
erence
mp i nger No.
I rc/y , , ., . . . .. . . .. . .__ . . . . . . . . . . . . . . .. . . .. . . . . . . . . .. .. . . . . . . . . . . . ---_.------.---.--I ~..,..,, ̂ ..._.-..-..-^-.I.--- ._..___ T o t a l
I n teg ra ted Gas Sampling Data:
. ~ a g Pump NO. j3 R no;: NO. / n nag NO.
Rag Mater ia l : 5- layer Aluminized Tedlar Size: 4 s
Fretest leak check: 0 cc/min a t 11- in. Hq.
Time s t a r t : / d q o (HRS) Time end: (HRS)
.
Simpl ing r a t e : k O O cc/min Operator: ~ , k & f e r
5/14 G< 0:. analyzer used t o monitor t r a i n o u t l e t : 2 CF-OZZ
5 -0046RR r -17

C-14

Y P

INTERFOLL LGBOHGTOHIES ETA RETHOD 5 /17 SAMPLE L O G SHEET _-
Sample T r a i n Leak Check:
Fre tes t : ( 0.02 c f m a t 15 in. Hg. (vat) Fostest : *4oL(L1 c f m a t in. ~ g . (vac)
I . '
I~ P a r t i c u l a t e Catch. Data:
NO. 5 of f i l t e r s used: f?€COVEry Solvent (5)
0 acetone 9 o t h e r ( s ) - 31
IC c I I' I Ir 11 I
I . I I I
NO. of probe wash b o t t l e s : 1 Sample recovered by: t P. 0 wet //
Condensate Data:
I n teg ra ted G a s Sampling Data:
Hag Pump NO. BO;: NO. / O ~ a g NO. z gag Mate r ia l : 5-layer Aluminized Tedlar Size: 4 s
F r e t e s t leal: check: 0 cc/min a t 1 3 ~ in . Hg.
Time s t a r t : (HHS) Time end: /!C/O * (HRS)
Sampling r a t e : -0 cc/min Operator: ~ , / ( d t u S / t 4 o4 O= Anslyzer used t o monitof t r a i n o u t l e t : 11
C-16 S-0046RR I

I
i
i
J
1
I
! r l
C-17

C-18

- INTERFOLL LABORATORIES EPA METHOD 5/17 SElMPLE LOG SHEET
- Weight(g)
Item Final I Tare Difference
Sample T r a i n Leak Check:
I Y n Desiccant
ia Pretest: ( 0.02 cfm at 15 in. Hg. (vat) Fostest : -
Cfrn at - in. Ha. (vac) 0
/4/3 1 23. I
Particulate Catch Data:
NO. 5 of f i Iter5 LISEd: Recovery solvent ( 5 )
w7 0 acetone p othercs) &e L I .
No. of probe Wash bottles: f . Sample recovered by: fl,i& + p #we # //
Condensate Data:
L f 3 I Y4/ t lmpinger No. 1
Impinger No. 2
Impinger No. 3
Condenser
/qr . . ... . . . .. -. . ._ . .. . . . . . . . .. ._ ._ .. . . .. -. . . . . _ _ . . . . _ _ . . . --.-- ---. - ---. .. ... . . . . . . Total
Integrated Gas Sampling Data:
Hag Pump NO. a BO;: NO. / n Bag NG. 3 Eag Material: 5-layer Aluminized Tedlar Size:
Protest leal: Check: 0 cc/min at / A - in. ~ g .
Time start: I l l0 (HRS) Time end: !vL) (HRS)
Sampling rate: -0 cc/min Operator: /f,/ < o I d r u s/rd of O= anslyzer used to monltor train outlet: 3
CF-~:BIT
c-19 S-0046RR

c-20 .\
3

1
I 1 I
I- a 0
W
c-21

1


_- INTERFOLL LOHOHOTOHIES €PO METHOD 5/17SAPlPLE LOG SHEET
Sample T r a i n Leak Check:
E- Pre tes t : , 0.C12 c f m at 15 in. Hq. (vat)
Fos tes t : - D cfm a t a i n . ~ q . (vat)
P a r t i c u l a t e Catch Data:
N G . 5 O f f i l t E r S LISEd: Fiecovery solvent ( 5 )
0 acetone p- o t h e r ( s ) M C 5s # 9
No. o f probe wash bo t t l es : . / Sample recovered by: e r
Condensate Data:
Weight ( g )
F i n a l Tare D i f f e rence
I //ad \ I 1 Impinger NO. 1 I
I n t e g r a t e d Gas Sampling Data:
Hag Fump N o . J / a Eo;: No. 5 Eraq No. / Rag Mate r ia l : 5- layer Aluminized Tedlar Size:
P r e t e s t leal. check: d cc/min a t /5- in. ~ g .
Time s t a r t : / / q / (HRS) T ~ I W end: / 2 5 + (FIRS)
ampl ling r a t e : Z?BD cc/min Operator: &7-
s/rJ oi O= Analyzer used t o monitor t r a i n o u t l e t : A CF-02:
C- 24 S-0046RR
I

C-25

i
C-26
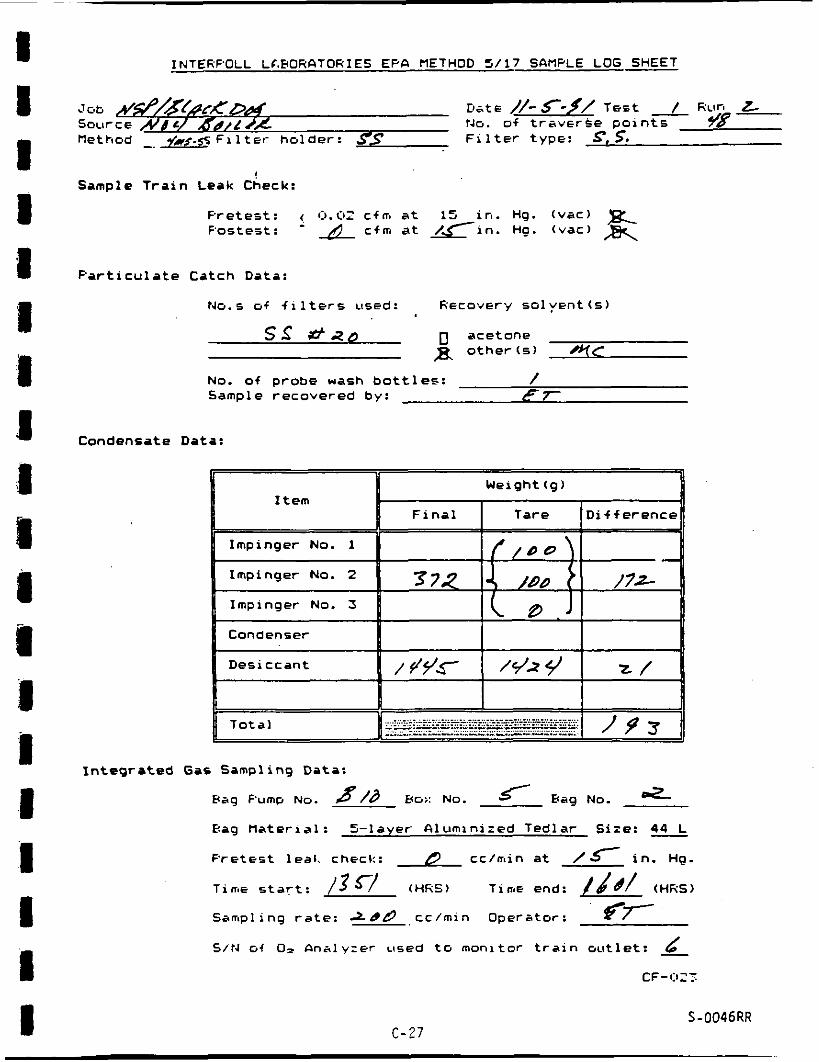
I I 1 1 1 s 1 1 i 1 $I 1 I
i I 1 I I I
INTEKFOLL LC.HOHATOHIES EPA METHOD 5/17 SOMPLE LOG SHEET
D i t € /!/-<-y/ Test Fun L tJo. of t rave rse p o i n t s f8 - Job /+@ /JfkKDd4
SoLtrcr N d & L 2 Method v L f . z l t f holder : 3s F i l t e r type: 9,s.
! Sample T r a i n Leak Check:
Pre tes t : 0.02 cfm a t 15 i n . Hg. (vac) Fostest : - & c f m a t K i n . Hg. (vat)
Cond i t e D
F a r t i c u l a t e Catch Data:
No.5 of f i l t e r s used: Hrcorery so lyent ( 5 )
s s & t r & 0 acetone o t h e r t s ) #fC
No. of probe wash b o t t l e s : / Sample recovered by: 67-
til:
Weight (g) l t em
F i n a l Tare D i f f e rence
/ O O lmpinger No. 1
Impinger No. 2 372 /72- Impinger No. 3
condenser
Des i cc an t /ws / . /czs/ z /
I n t e g r a t e d Gas Sampling Data:
Hag Fump NO. %/b BO;: NO. f l Hag No. 2
Hag Mater ia l : 5- layer Aluminized Tedlar S i z e : 4 s
p r e t e s t leal. chrc):: B cc/min a t /< in. ~ g .
Time s t a r t : /3s/ (HHS) T i m e end: (HRS)
Sampling r a t e : 280 cc/min Operator: f7 S / N 0 4 Orz Annlyzer used t o monitor t r a i n o u t l e t : &
CF-I:I~:
c -27 S-0046RR

IU. I. a=- Y - "
. . _.
C-28 I

C-29

-- I I N T E R F O L L LABORATORIES EPA METHOD 5/17 SAMPLE L O G SHEET
Sample T r a i n Leak Check: C
b e t e s t : < 15.CI2 C f m a t i n . H g . (vac) F'ostest : cfm a t 2 i n . H g . (vac)
P a r t i c u l a t e Catch Data:
rJo..s of f i l t e r s used: Recovery so lvent ( s )
0 acetone ;e: o t h e r t s ) rir
s s + 3 /
No. of probe wash b o t t l e s : / Sample recovered by: c /
Condensate Data:
. . .. . .. .~__ ~ ___ _. i:_ .._ ~
. .- . . -.-. . . . . . . . . . . . __. .. . ._ . . . . . . .. .. .. ._ . . . . . .. _-._--. --.-. . .. . . ---.-- . -*- To ta l
I n t e g r a t e d Gas Sampling Data:
3 B i g pump No. $-/d Bo;: NO.
Hag Mater ia l : 5- layer e lumin ized Tedlar Size: 4 s
p r e t e s t leal: check: 8 cc/min a t / K i n . ~ a .
Bag No.
Saapl i n g r a t e : JSD cc/min Operator
Sit4 of O= AnalyZEr used t o monitor t r a
I :I I I; I. I :I I I: I I' I I 1 I ' 0 I I I
C-30 S-0046RR I


C-32

~
I I 1 I I I I I 1 I I I I I I I 1 I I
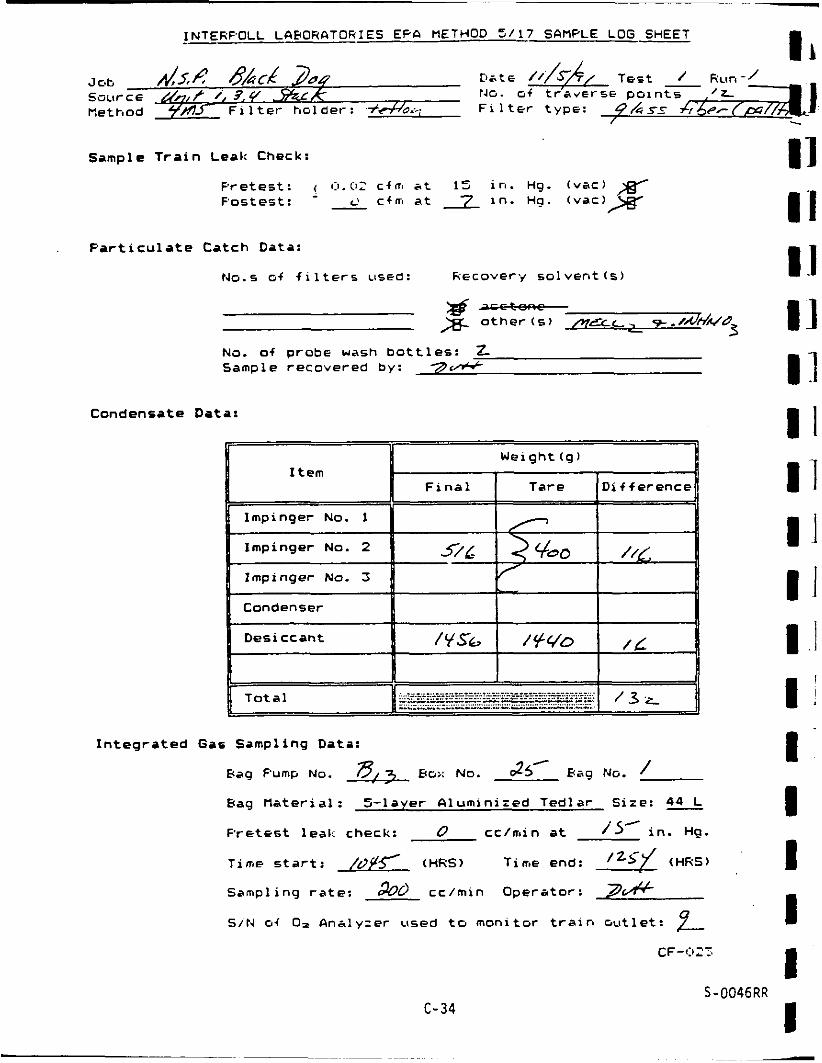
INTERFOLL LCiBOHATOHIES EFA METHOD 5 /17 SPMPLE LOG SHEET --
lmpinger No. 1
lmpinger No. 2
lmpinger No. 3 /
- 5 / L ///,
Sample T r a i n Lea): Check:
Condenser
Desiccant /YSG / W O / L
I 1
Pretes t : i:i.C12 cfm at 1 5 i n . Hg. ( v a c ) F'ostest: - L' c f m a t 2 i n . Hg. ( v a c ' x
P a r t i c u l a t e Catch Data:
NG.S of f i l t e r s usEd: Recovery so lvent ( 5 )
NJ. Of probe w a s h b o t t l e s : 2 Sample recovered by: 3 '+
Condensate Data:
I I F i n a l I Tare D i f fe rence
Weight ( g ) I tem
............. .................... .............. ......... -. ..... .................. ............... . . . . . . . . . . L.;.___L:_.---I.-. ~ --._--._-. Tota l
I n t e g r a t e d Gas Sampling Data:
Bag Pump No. "3,3 BO;. No. 25- Bag NG. /
Hag n a t e r i a l : 5- layer a lumin ized Tedlar Size: 4 s
F r e t r s t leal. check: 0 c c / s i n a t 15- i n . HQ.
T i m e s t a r t : /d#< (HRS) Time end: /*s/ (HRS)
Sampling r a t e : cc/min Operator:
s/rd o i O~ Analyzer used t u monitor t r a i n o u t l e t : E CF-t:iZ,
S-0046RR c-34
I I I1 11 1 : I I I I I I

c-35

I .! - INTERFOLL LAPOHnTOHIES EPa METHOD 5 /17 SAMPLE LOG SHEET
I Weightcg) Item
Final Tare Difference
lmpinger No. 1 r
Sample Train Leak Check:
- . - Pretest: (, 1 5 . ~ 1 , c f m at 15 in. Hq. (vat)
Postest : - 0 c f m at in. Hg. (vac)
Particulate Catch Data:
No.5 of filters used: Recovery scjlvrnt ( 5 )
0 acetone other ( 5 ) ~ I ~ L G
NO. of probe uash bottles: Sample recovered by:
Condensate Data:
~~
Impinger No. 2 5-2 3 / t D - Impinger No. 3
Integrated Gas Sampling Data:
Bag pump NO. 333 Bo;: No. z5- Bag No. 3
Bag tlaterial:
Pretest leal: check: LJ cc/min at in. Hg.
T i m e start: /350 (HRS) Time end: (HRS)
Sannplinq rate: &V cc/min Operator:
S/td cjf oz analyzer used t o monitor traln outlet: -3 CF-t:iZI
I) 13 I :I I 1 I: I -; 1 -1
1- I I I I I I I I
C-36 S-0046RR I

r c I c I
c 111 h ! I I I I I I I c -37

~~ ~~
INTEKFOLL LAPORATORIES EPA METHOD 5/17 SAMPLE LOG SHEET
S a m p l e T r a i n L e a k Check:
P r e t e s t : ( 0.02 cfm a t 15 i n . Hg. ( v a c ) p Fostest : - d cfm a t 2 i n . Hg. ( v a c )
P a r t i c u l a t e C a t c h Data:
NO. 5 Of f 1 1 t E r S UsEd: f i E C 0 V E r ' f e G l V E n t ( 5 )
a c e t o n e ik- o t h e r ( § ) r r e c L r .f /v W03
No. of p r o b e wash b o t t l e s : 2 Sample r e c o v e r e d by: n w
C o n d e n s a t e Data:
I I w 1 C o n d e n s e r
I l i D e s i c c a n t
P 1
........................................ ... ........ .. ........ .- - - _. I 27
............ ........................ -. - ---.------- --.-..- ........................... --.i-i. T o t a l I
I n t e g r a t e d Gas S a m p l i n g Data:
Hag Pump No. 8-13 Bo;: NO. ~5 Bag No. 3 Bag Material: % l a y e r A l u m i n i z e d T e d l a r S i ze :
P r e t e s t l e a l : c h e c k : 0 c c / m i n a t / F i n . Hg.
T i m e s t a r t : (HRS 1 T i m e end: ( HFS )
Ssmpl i ng ra te : c c / m i n O p e r a t o r : $Ub' s/t.r oi O= Ann1y:er u s e d t o m o n i t o r t r a i n o u t l e t : 4
cF-l:12;
S-0046RR C-38
11 I1 13
I1 I :I I1 11 II I1 I 1 I I ll II
I1
I I

a a- il== -, Y> 3 I
c-39

1
17 I- 1- I' I I. I. I

~
! I u
r I 8
I I J
t U I 1 1 s b r I I I I 1 I
I n t e r p o l 1 L a b o r a t o r i e s (612) 786-6020
PEI-10 T R A V E R S E POINT SELECTION D A T A S H E E T
Job N 5,p, 4/&k <ad F i t o t T u b e NO. & 3 - r Source &, *< */. 3 4 s4 d - 4 Ear omet r i c pres . .2f.+q 1rI.ng. ?Est .~ +,a . R u n c D u c t s h ~ p e : M o u n d Rectana.
1 1-0 . D a t e D u e t d i mens1 o n 3 O p e r a t o t - 9 /& & der
f/ Length of p o r t
F M - l i r G u i d e l i n e s r e q u i r e t h a t t h e v e l o c i t y a t each of t h e four
v e l o c i t y pres.3ui-e o f t h e t r a v e r s e p o i n t s and p e r f o r m t h e i n d i c a t e d c a l c u l a t i o n s . The v a l u e s i n t h e l a 5 t column m u s t f a l l w i t h i n range o f 80 - 1Xi.
s e l e c t e d t r a v e r s e p o i n t s be w i t h i n +/- --. &UL, REC0t-d t h e
T;. dver'sje - g o i n t s on rour id duc ts : D is t snce f rcm t h e d u c t wall: i n . L: i=tsr#ce trom t t .e End ut g o r t : - : n .
g a n d .85 D

~~
- INTERFOLL LAROHATOHIES EPA METHOD 5/17 SAMPLE LOG SHEET
Sample T r a i n Leak Check:
P re tes t : < 1:1.02 c fm a t 15 in . Hg. ( v a c ) & Fastes t : - - o cfm at 7 in. HQ. ( v a c ) W
P a r t i c u l a t e Catch Data:
N0.5 o f f i l t e r s used: Recovery so lvent ( 5 )
No. O f probe wash b o t t l e s : Sample recovered by:
Condensate Data:
Impinger No. 2
I n t e g r a t e d Gas Sampling Data: / haq F'ump No. @7 hor: No. hag No.
hag Mater ia l : !%layer a lumin ized Tedlar Size:
F re tes t lea): check: c cc/min a t / / i n . Hg.
Time s t a r t : t O z r . 3 (HRS) Time end: i/*,3 (HRS)
9'0 4-6 Sampl i n q r a t e : ce/min Operator:
S i N of Ot Analyzer used t o m o n i t o r t r a i n o u t l e t : - -
C-42 S-0046RR

i L

I n t e r p o l 1 L a b o r a t o r i e s (612; 786-6020
I L IJ II Ppl-10 TRAVERSE POINT SELEGTlON DATA SHEET
Job f??Y / i3I F i t o t Tube No. v z 3 - s in.Hg. 11 A M l 3 - v
Haromet r i c p res . ' Z ~ . q 4 source w,+% I , 5.1, 5 T a d Te5t 3 R u n Duct shape: @'Kound 0 Rectarig.
D u c t d imensions 2 ?O 1 n . L.- ir , .
Date - 11 .53 I u p s r a t o r -3. (2 r k T f i , Lenq th of p o r t
FPI-1U G u i d e l i n e s r e q u i r e t h a t t h e v e l o c i t y a t each o f t h e four s e l e c t e d t r a v e r s e p o i n t s be w i t h i n +/- XJ%. Record t h e v e l o c i t y p r e s s u r e of t h e t r a v e r s e p o i n t s and per fo rm t h e i n d i c a t e d c a l c u l a t i o n s . T h e v a l u e s i n t h e l a s t column m u s t f s l l w i t h i n range of 80 - 120.
The aLerage v e l o c i t y p r e s s u r e t o be used t o r t h e 51:lna r u n ( T G ~ now b~ c a l c u l a t e d f r o m t h e f o l l o w i n p e: :pressiun:

U I I I I -I I I I I I I
IV&F Desiccant
I I I I I 1 I
lY6q 14 I
~ INTERFOLL LAPORATORIES EPA NETHOD 5/17 SANPLE LOG SHEET
Jub 4wp/ /3/6& -9 Dete / / -5+f Test R u n I fiethod Z U I F i l t e r ho lder : / r / P F i l t e r type: Source l-=tGdh 1 , 3, v/ 5. F'CLK tJo. o f t ravo rse p o i n t s /
/
Sample T r a i n Leak Check:
F r e t e s t : ( 0.02 cfm a t 15 in. Hg. (vac) F'ostest: - _e cfm a t g' in. ~ g . (vac)
P a r t i c u l a t e Catch Data:
No.5 o f f i l t e r s used: Recovery so lvent ( 5 )
0 acetone D other (s)
No. of probe wash b o t t l e s : Sample recovered by:
Condensate Data:
D i f f e rence
Impinger No. 2
1 I I 1 31 I Condenser
In teg ra ted Gas Sampling Data:
Hag F'ump N o . 17 7 Bo;: No. zk Hag No. z
Hag Mate r ia l : 5- layer Aluminized Tedlar Size: 4%
F'retESt leak: check: 0 cc/min a t /Sc in. Hg.
Time s t a r t : IT'D (HRS) Time end: 1 3 0 0 (HFS)
Sampling r a t e : $%O cc/min Operator: 23. 5/14 of Ot Analyzer used t o monitor t r a i n o u t l e t : -
CF-i:123
S-0046RR c-45

'.- -. C-46
~ ~~
I
4

~
I I I I I I
( I I r r s (I r (I I I I I1 I
I n t e r p o l 1 L a b o r a t o r i e s (6123 786-6020
PH-10 TRAVERSE POINT SELECTION DATA SHEET
P M - 1 0 G u i d e l i n e s r e q u i r e t h a t t h e v e l o c i t y a t each of t h e f o u r s e l e c t e d t r a v e r s e p o i n t s be w i t h i n + / - 20%. Record t h e v e l o c i t y p r e s s u r e of t h e t r G v e r s e p o i n t s and pe r fu rm t h e i n d i c a t e d c a l c u l a t i o n s . The v a l u e s i n t h e l a s t CUlLlmn must f a l l w i t h i n range of 81:) - 121:).
The average v e l o c i t y p r e s s u r e t o be used f o r t h e s i z i n g r u n may now be c a l c u l a t e d f rom t h e f o l l c ~ w i n g express ion:
Traverse p a i n t s on round ducts : . I 5 D and .85 G
Lli- ; i .cncE irorn t h e e n d o+ p o r t : i n . in .
___-. D is tance from t h e d u c t w a l l : *.c ~-
i F- t:l 1 .b
c -47

~~~ ~ ~~ ~~
I INTERFOLL LAFOHATORIES €PA PlETHOD 5/17 SAMPLE LOG SHEET --
Sample T r a i n Leak Check:
P re tes t : (, CI.02 c fm i t i n . Hg. ( v a c ) Postes t : i n . Hg. (vac)
P a r t i c u l a t e Catch Data:
1 4 0 . 5 O f f l l t E r S LlSEd: Kecovery so lvent ( 5 )
acetone 3, o the r ( 5 ) m e u , ~ - No. of probe wash b o t t l e s : Sample recovered by:
Condensate Data:
D i f f e rence
/ Integ ra ted Gas Sampling Data:
& Hag No. 3
P r e t e s t leak check: 0 cc/min a t in. Hg.
Sampling r a t e : 90 cc/min Operator: 7 A
Bo;: No. = Hag F u m p No.
Rag t l a t e r i a l : 5-layer Aluminized Tedlar Size:
Time s t a r t : I q g (HRS) Time end: ‘08 (HRS)
S i r 4 o i O= Anslyzer used t o monitor t r a i n o u t l e t : - CF-i:127
S-0046RR c-4a
I :r
11 I- I: I: 1- I. I I I. I I I I I I I

I I P I E 1 I I] F I
I P I I I I
I

I n t e r p o l 1 L a b o r a t o r i e s (612; 786-6020
P M - f 0 TRAVERSE P O I N T S E L E C T I O N RATA SHEET
I
ds.P, B k . 4 ZLL F l t o t Tube No. Jz-3 -r Jot 1 n . Hg .
Round 0 Rectang. Y i n .
Source I , 3 . 4 9 trc& B a r o m e t r i c p r
Date //[S-/G- Duct dimensions 270 Up e r at or w e d ? , - I_ e r: /yl Leng th o f p o r t 6 i n .
..?.e. 9 Y 2- R L I ~ 3 Duet shape: 1 E s t
PM-10 G u i d e l i n e s r e q u i r e t h a t t h e v e l o c i t y a t each of t h e f o u r s e l e c t e d t r a v e r s e p o i n t s be w i t h i n + / - 20%. Record t h e v e l o c i t y p r e s s u r e o f t h e t r a v e r s e p o i n t s and p e r f o r m t h e i n d i c a t e d c a l c u l a t i o n s . Ths v a l u e s i n t h e l a s t column m u s t f a l l w i t h i n range o f 80 - 120.
The average v z l o c i t y p r e s s u r e t o b e used f o r t h e s i z i n a run r r ~ q now be c e l c n l a t e d f rom t h e f o l l o w i n g e::preaslon:
T rava rse p o i n t s on round d u c t s : . I ; D and .S5 0 Dis tance from t h e d u c t & a l l : %.r i n . : l istorice iron; t k 3 s end ot p o r t : c i n . __ 1 ,
,=-#.:I 1 .2
C- 50

INTERFOLL LaBoRaToRiEs E m METHOD 5/17 SCIPIPLE LOG SHEET -
Sample T r a i n Leak Check:
Pre tes t : ( 0 . 0 2 cfm a t 15 i n . Hg. Fostest : - A cfm a t in. ~ g .
P a r t i c u l a t e Catch Data:
N0.5 of f i l t e r s used: Recovery so l ven t (5 )
0 acetone .& o t h e r ( s ) ,@F-L,
L
Nu. of probe wash b o t t l e s : / Sample recovered by: '2,<- - "
Condensate Data:
I Weight ( g ) I tem
F i n a l Tare Di f ference
Impinger No. 1
Impinger NO. 2 1 1 I Impinger No. 3
Condenser 7Y 0
Des i ccan t /r36 /5U8 u m I I
. . . ..._... .. . ._.__ . . . . .. . - .. . . .. . . . . . . .. . . . . .. - . . .. . .. . . . . - . . . .. . .. ---.-.- --_^--_______ f0 t . . . . . .. . . Tota l -.--...-.------_---._.-.
In teg ra ted Gas Sampling Data:
BO>: NO. = 3 ( n a g NO. 7 -+- Bag Fump NO.
Bag Mate r ia l : 5- layer Aluminized Tedlar S i re : 4%
F r e t e s t leak check: d cc/min a t /r in. ~ g .
Time s ta ' r t : 'c3b (HRS) Time end: /f(6 (ms) Sampling r a t e : %O cc/min Operator: P& S I N o( 0- Anslyzer u s e d t o monitor t r a i n o u t l e t : -
C F - I : I ~ T
r-Ki S-0046RR

C-52

APPENDIX D
INTERPOLL LABS ANALYTICAL DATA
TABLE OF CONTENTS
O r s a t . . . . . . . . . . . . . . . . . . . . . . . . . . 1
Par t icu la te . . . . . . . . . . . . . . . . . . . . . . . 6
P M - 1 0 . . . . . . . . . . . . . . . . . . . . . . . . . . 16
Trace Metals . . . . . . . . . . . . . . . . . . . . . . 20
Sample Deposition Sheets . . . . . . . . . . . . . . . . 27

1 Interpol 1 Laboratorles (512) 786-5023
EPA Method 3 Data Reporting Sheet Or pat Anal ysi E
Source bOILCI7 + I > 0- Test Site J R
ib 1 4 . S . f Blcic 'cJ,y tam Leader ,te Submi tked I D a t e of Test I I *<-a< 'St No. rdo. o f Runs Campi Ite of Analysis /lC6*' Techn i c 1 an
Buret Readings (ml.)
I I I I I I I I 1 n
I I I I 2 I I 1 I
1 I l l I I I I I I I I I I I I I I I
I-- 2 I , I I I= I 0 B 0 F (Avg!
I I I I
1 0 Ambient A i r QA Check EPA Method 3 Guidelines 0 Orsat Analyzer System Leak Check Fuel Type F0 Range
Within EPA M-3 Guidelines Coal : Onthracite/Lignite 1.016-1.130 Bituminous 1.003-1.2;m
Distillate 1.240-1.41z Residual 1.210-1.570
Natura 1 1.600-1.9;5 Prop an e 1.324-1.586
1 0 F-
1 a
f o r fuel type.
Where F - "-0 9-0 Oil:
Gas:
-coI
F=Flask (250 Cc a l l glass) Butane 1.305-1.55.z b=Tedl ar bag (5-1 dyer ) Wood/Wood B a r k 1.000-1.1z0
0- 1 L s C - w - g Q

Interpol 1 Leboratorles ( 6 12 ) 706-6020
EPA Method 3 Data Reporting Sheet Orsat analysis
I I I -9 I I I I I L I I I I
0 B 0 F avg! I I 1 . 1 I I 1
I
I I I i I I
E -- * I I I
I-
Coal : fo r fuel type. Anthracite/Lignite 1.016-1.130
co, Disti 1 late 1.260-1.412 Residual 1.210-1.Z70
Natura 1 1.600-1.8Z6 Prop an e 1.JZ4- 1.596
Eli tuminous 1.09;-1.2;0 Where F,= 20.9-0, Oil:
I Gas:
F=Flask (250 cc a l l glass) Butane 1.405-1.55.; &=Ted1 ar Bag (5-1 ayer ) Wood/Wood Bark 1.z0Cl-1.1:0
D-2 LSC-04-BR

Interpol 1 Laboratories (612) 786-602U
EPA Method 3 Data Reporting Sheet Orsat Anrlysi E
ted a Source I V O 4 6 0 1 s ~ Date Submitted // e - $ y/ Test No. Date of analysis / f -6-7 / Techni c i an
Sample
and Type 1;;: Log Number of
, - q /
Buret Readings ( m l )
I I I I I 1 I
I l I I I 1 1 I i
1 1 I I I-- 3
I I l I I I 1 I I
Ambient air QA Check EPCI Method 3 Guidelines Orsat Analyzer System Leak Check Fuel Type F0 Range Fs Within EPA M-3 Guidelines Coal : for fuel type. Anthracite/Liqnite 1.016-1.130 -
Bituminous I. aaz-i.3~0 Where L= 20.9-0, Oil:
Gas: COZ Di st i 1 1 ate 1.260-1.41;
Hesi dual 1.210-1.Z70
Propane 1.374-1.596 Natural i.mo-i.az5
(250 cc all g1az.z) Butane 1.405- 1.55s Hag (5-1 dyer ) Wood/Wood Bark 1.s00-1.130
D- 3 1 SS-fl4-Ro

EPA Method 3 D a t a R e p o r t i n g Sheet O r s a t A n a l y r l s 1
I 0 B 0 F Ovg. I I 1 I I I I I
m b i e n t A i r QA Check EPA Method 3 G u i d e l i n e s r s a t A n a l y z e r System Leak Check Fuel Type - Within €Pa M-3 G u i d e l i n e s Coal :
Where Fa= 20.9-0, O i l :
Gas:
f o r fuel t y p e . Anthrac i t e / L i g n i t e 1.015-1.1Z0 Bituminous 1 .083-1 .230
coz D i s t i 11 a t e 1 260-1.41; Res idua l 1 .210-1 .Z70
1 .600-1 .936 N a t u r a l 1.4.Z4- 1 .596 Propane
I E '
F = F l a s k ( 2 5 0 cc a l l g l a s s ) Butane 1. 405- 1.55; H=Tedl a r Bag (5-1 ayer ) Wood/Wood Bark 1. 900- 1-1-70
D-4 LSC-04-BR fi

I Intwpoll Laboratories (6 12) 786-6020
EPA method 3 Data Reporting Sheet Orsat Analysis
v n Dva Job N.SP fila&
Team Leader Date Submitted - 11 Y - q I Test No. I Date of Analysis I / - - b q/
\I
Buret Readings (ml)
I-- 2
I 0 B 0 F IAvg' I I l l I I I I '"! I l I I I 1 I I
,Ambient A i r QA Check EPCI Method 3 Guidelines O r s a t Anal yser S y s t e m Leak Check Fuel Type F0 Range F, Within EPA M-3 Guidelines Coal : for fue l type. AnthraciteILignite 1.016-1.130
Where L= 20 9-0 Oil: bituminous 1.00.3-1.230
Distillate I . 260-1.4 1 Z Residual 1.210-1.370 Nat urd 1 1.600-1.S;S
-3€e Gas:

Q
1
2
3
4
5
V O ~ . o f S o l v e n t x m l D i s h T a r e W t . W7- t c I / B Log N u m b e r - 0 6 Dish+Samp le W t . 14s .M%S Comment 5 Sample W t . / . n u / g \
I n t o r p o l 1 L s k ~ ~ - < : o r 12s ($12) ?%-tcl20
EPA Method 5 D a t a R e p o r t i n g Shee t P r o b e / C y c l o n e Wash
T e s t - H u n k F i e l d Y?anl: Log ?Jumber '201. of S o l v e n t - m l *Sol v e n t R e s i d u e - ug/ml
G i s h tlo. D i s h T a r e W t . 9 C i sh+Sampl e W t . 9 Sample W t . 9
T e s t R u n 1 D i s h No. 27 V o l . o f S o l v e n t U J m l D i s h T a r e W t . 51. W5? 0 Log Numte r w6 7 m z D i sh+Sample W t . 53-45'fY 9 Coinmen t s. Sample W t . / . 0 0 9 2 9
T e s t R u n 3 D i s h tlo. G K V O ~ . of S o l v e n t io0 m l D i s h T a r e W t . Y 6.6377 9
Commants Sample W t . 2 . 6 Q V 9 Y
L'ol. of S o l v e n t - m l C i s h T a r e W t . 9 Log Numbar D i sh+Sjamp 1 e W t . 9 Comments Sample W t . 9
T e s t Run- D i s h NO. '.'ol. o f S o l v e n t - m l D i s h T a r e W t . 9 Log N u m b e r DI ShcSampl e U t . F1 Csmnents Sample W t . 9
Log Number -Ir, Dish+Samp le W t . q d . 7 3 2 g
T e s t - Run- c l 5 h b10.
+Sc , lvan t Rosidue-ug/ml=C (Sample W t . - 9) ( lo- ) l / C o l . of Sol .- ,r, 1 EVA-PIS A c e t o n e R e s i d u e B l a n k Spec. ( 7 . 3 c;y/ml Results: F i e l d B l k . Run 1 R u n 2 R u n 5 Run 4 Run 5
-
SC-O1YR I / . O O 6 8 I /.00/5 D-I 2 . 6 4 y r

c 1 3 I B
I n t e r p o l 1 L a b o r a t o r i e s (512) 7S$-bP),7P)
EPA Method S Data R e p o r t i n g Sheet F i 1 t e r G r avi m e t r i cs
Source R n ; l e r NO. / Test S i t e ZV~ l e f
Job hrP 0 l a r k Team Leader Of3 Date Submit ted /l-6-’7/ Vate o f Tes t 11:1-9/ Test No. No. of Runs C o l e t e d 3 Date of A n a l y s i s 1 1 - 7 - 7 1 Techn ic ian d,&
T e s t - Run p) F i 1 t e r No. F i e l d Blank F i 1 t e r Type Log Number Fi 1 t e r Tare W t . 9 Comments Fi 1 ter+Sampl e W t . 9
Sample W t . 9
T e s t -Run 1 F i l t e r No. r7 Log Number 146 7 7 - 63 F i 1 t e r Type I: Jjec/ Comments F i l t e r Tare W t . qd.8267 9
F i 1 ter+Sample W t . 9 .3 5%g 9 Sample W t . z . ’ l t q q 9
T e r : & R u n k F i l t e r No. z? Log Number -0’7 F i 1 t e r Type r. J-kd Comments F i l t e r Tare W t . c/o. g r b6 9
F i l t e r + S a m p l e W t . S . b y 4 9 g Sample W t . z.g.5E3 9
Tes t 1 Run- F i l t e r No. 73- Log Number - I ‘ F i 1 t e r Type s. J-t!ecl Comments F i l t e r Tare W t . Y3. 3 7 75 9
Sample W t . 7. .sz 542 9 F i 1 ter+Sampl e W t -257.8987 9
Tes t - Run - F i 1 t e r No. Log Number F i l t e r Type Comments Fi 1 t e r Tare W t . 9
F i 1 ter+Sampl e W t . 9 Sample W t . - 9
T e s t - R u n - F i 1 t e r No. Log Number F i l t e r Type Comments F i l t e r Tare W t . 9
Fi 1 t e r +Sampl e W t . 9 Sample W t . 9
Rerul t r : F i e l d E l k . R u n 1 R u n 2 R u n 3 R u n 4 R u n 5
F i e l d E l k . R u n 1 Run 2 Run 3 Run 4 Run 5
I I I - I - I I 1 - 1

I n t e r p o l 1 L a t o r ; c c r ~ i s (512) 70+,-6Ll20
€PA Method 5 Data R e p o r t i n g Sheet Probe/Cyclone Wash
I 7 S 3 b b 1 3 3 3 2 3 f . 2 6 7
dab P J C Y /B)/<Ck D O f - Team Loader P k Date Sabmit ted 1 ’ - Test r.10. I Cat3 o f f n a l y s i s I I Transpar t Leakage None ml
5oL;rcs jdo.3 6”O‘le- Test S i t e h 1 2 ‘ Date of Test 11-5-71 NO. of Huns Completed Techn ic ian A .* So lven t /--=*TI- C h l O r ~ V L
T e s t - R u n k ~
F i e l d Ylanl: Log Number 96 7 1 4 L’ol. o f S o l v e n t E m l
Gish tlo. Z L Dish T x e W t . Yb. 18 ’ 0 9 CishtSample W t . Y s . 3 f 7 d 9 Sample W t . 0 9
*So lvent H e s i d u P Y . 6 u g / m l
Tes t 1 R u n L C i s h No. L13
Log Numter - /L Dish+Sample W t . q 4 . 1 3 1 1 9 Comments Sample W t . 2.5372 ‘3
Tes t / Run& C ish No. 57p ‘ ~ 0 1 . o f S o l v e n t / L o m l D i s h Tare W t . Y7.9 1 4 2 - 9 Log Number - w Dish+Sample dt. 51.7.q rf J Comments Sample W t . 3 . 3 3 2 7 9
Tes t R u n 3 D i s h rlo. 60 Val . o f S o l v e n t / 7 0 m l D ish Tare W t . +9.6‘-&L) 9 Log tlumber -2 v Dish+Sample W t . $ 1 . y S 5 6 0 Comments Sample W t . /, k 776 U
‘3 Vol. of S o l v e n t L m l D i s h Tare W t . ’46 597-0
~ ~
Test __ Run - D i s h Plo. L’ol. of Solvent- ml Cish Tare W t . 9 Log Number Dish+Sample W t . 9 Commen t s San.ple W t . Y
Test R u n - D i s h rio. Val . of Solvent- m l D i sh Tare W t . Y Log Number Dish+Sample W t . F1 Canments Sample W t . 3
*Solvent Residue-ug/ml=C (Sample wt . -g ) (lo6) 1iC01. of s o l .%m! EF‘A-MS Acetcne Residue Blank Spec. Rerul ts: F i e l d B lk . R u n 1 R u n 2 Run 3 R u n 4 R u n S
- (7.3 u q i m l

El
1
2
3
4
c -I
~~
I . r . Y T 7 1
I n t e r p o l 1 L a b o r a t o r i e s (512) 73J-6L320
€PA Method 5 D a t a R e p o r t i n g S h e e t F i 1 t e r G r a v i m e t r i c5
5 9 i & 3 3 r 7 1 J
Job 0 0 S o u r c e AO. 3 f l 7 o ; f p f i 4 T e s t S i t e 2- k f - Team L e a d e r
D a t e S u b m i t t e d If-6-?/ D a t e of T e s t If- J-- 9/ T e s t No. ! NO. o f Runs C D a t e a i A n a l y s i s ( f - - l - ? / T e c h n i c i an /t
T e s t - R u n 0 F i l t e r No. F i e l d 6 l a n l : F i 1 t e r Type L o g Number F i 1 t e r T a r e W t . 9 C o m m e n t 6 F i 1 t e r + S a m p l e W t . 9
S a m p l e W t . 9
F i l t e r No. 17 T e s t -Run 1 L o g Number %? 7 - I - ) F l l t e r Type XI& e/ Comments F i l t e r T a r e W t . 4 0 . y 3 Y 8 9
F i l t e r + S a m p l e W t . m ? 9 Samp le W t . Y Y 7 7 / 9
T e s t I R u n A F i l t e r No. 3s Log Number - L I F i l t e r Type s-S%zf C o m m e n t 5 F i l t e r T a r e W t . Y Z . 6 7 8 ;
F i l t e r + S a m p l e W t . q 7 2?q Samp le W t . 5; Y l 6 6 9
T e s t R u n - F i 1 t e r No. YO
Commen t s F i l t e r T a r e W t . Y3 , /203 9 L o g Number - 2Y F i 1 t e r Type 5. SfceI
F i 1 t e r +Samp 1 e W t . 'fS. %b 7s 9 9 Samp le U t . 2 . 7 V 7 2
T e s t - Run- F i l t e r No. L o g Number F i l t e r Type Comments F i l t e r T a r e W t . 9
F i l t e r + S a m p l e W t . 4 Samp le W t . 4
Fi 1 t e r No. T e s t - R u n - L o g Number F i 1 t e r T;pe Comments F i 1 t e r T a r e W t . c
F i l t e r + S a m p l e W t . c Samp le W t . c
Rerul tr: F i e l d E l k . R u n 1 R u n 2 R u n 3 R u n 4 R u n 5

I n t e r p o l l L a k ~ r i c c r ~ r - s ($12) 785,-tJ20
EPCI Method 5 Data R e p o r t i n g Sheet Probe/Cyclone Wash
~1
1
2
3
4
J o b /c/_lp /l!3/&k rooy T p a m Leader lz7 - Cate Submit ted / I - d-W/ Test r.10. / Cata of A n a l y s i s / I Transpor t Leakage a None 0 m l
I R u n L I j l s h r.10. 3 /+ Test ___ F i e l d Blank D ish Tare U t . 57. go rir 9 Log Number 9 6 7 7 - 2 s Dish+Sample W t . 57- gU4l- 9 V O I . of s o l v e n t x m l Sample W t . 0. d& 5. 9
T e s t i R u n 1 Dish No. 6 f v o l . o f So lven t I O 0 m l Dish Tare W t . rid. sL?W '3 Log Numter - 3@ C i sh+Sample W t . 95- d V f s 9 Coinmen t s Sample W t . 8. Y5&1 9
Test I R u n D ish NO. L t 4;ol. o f S o l v e n t L m l Dish Tare U t . 59/0 9 Log Number - 3 Y Dish+Sample ? J t . 5 I . * L L J Commen t s Sample W t . 0.39 5 L 9
Test I R u n c D ish NO. i J / VOI. of S o l v e n t z m l D ish Tare W t . UU. 7 q d y 9 Log Number - 3 8 Cish+Sample W t . 7 c)
Commen t s Sample W t . /1. 357* 9
Vol . of Solvent- m l Cish Tare W t . 9 Log Number D i sh+Sample U t . 9 Commen t s Sample W t . 9
*So lvent R e s i d u e Y . c ) u g / m l
Test- R u n - Dish No.
lJJ. r/ & 8 1e-H
Test S i t e x. le+ Cate o f Test I / -5 -Y /
Techn ic ian F7.4L6.G
Source
No. of Huns C o m p l e t e d 3
So lven t m c f A .r/c,,L ch/' ,>jY=
~~~~
R u n - C ish No. of Sol.Jent- m l Dish Tare W t . Y
C s m m s n t s Sample W t . 3 Log Xumbar Dish+Sample W t .
-~~ *Solva.nt FiesidueY13ug/ml=C(Sample ~ t . = q ) ( I W ) I / P ~ ~ . o f s o l . W m :
EPA-MS Acetone Residue Blank Spec. Results: F i e l d B lk . Run 1 R u n 2 Run 3 R u n 4 R u n 5
- (7.3 u y / m l

i b i i i b b i i b 4 f Q i I i
0
1
2
7 ._.
4
c 4
i
I n t e r p o l 1 L a b o r a t o r i e s (512) 736-65ZO
EPA Method 5 Data Repor t i ng Sheet F i 1 t e r Gr a v i metr i cs
Source 40. Y 8 0 I ~ c r Test S i t e ?a//pf
No. o i Runs
Job /u$P elqCic Jo2 Team Leader z7 Date Submit ted / I - L - ? / Date o f Test //-S-?/ Test No. f Date of & n a l y s i s I f - ? - ? p / Techni ci an P.
F i l t e r No. Test - R u n L F i e l d Blank F i 1 t e r Type Log Number F i l t e r Tare W t . 9 Comments F i l t e r+Samp le W t . 9
Sample W t . 9
T e s t A R u n / F i l t e r No. 9 Log Number m- 3 I F i l t e r Type r . X A - 1 Comments F i l t e r Tare W t . 39.7f76 9
Sample W t . v, k 437 9 F i l t e r+Samp le Wt.Y‘/64/3 a
F i l t e r No. Z O T e s t I R u n x Log Number -3F F i 1 t e r Type r. Comments F i 1 t e r Tare W t . +;;!9w*, ;
Fi l te r+Samp le W t . Sample W t . y. 35950 J
-~ ~ ~
Test L R u n L F i l t e r No. 3 1 Log Number - 79 Fi I t e r Type +e/ Comments Fi 1 t e r Tare%. ‘4/# 170 9 9
F i l t e r+Samp le W t . yq, 357% a Sample W t . 2.5 6k’i 9
~
F i l t e r No. Test __ Run - Log Number F i 1 t e r Type Comments Fi 1 t e r Tare W t . 9
F i l t e r+Samp le W t . 9 Sample W t . 9
~
Test - Run- Fi 1 t e r No. Log Number F i 1 t e r Type Comments F i l t e r Tare W t . 9
F i 1 ter+Sample W t . 9 Sample W t . 9
Results: F i e l d E l k . R u n 1 R u n 2 Run 3 R u n 4 Run 5
F i e l d E l k . R u n 1 R u n 2 Run 3 R u n 4 Run 5

-
1 a II I
1 I I I I J 1. I I 1
I I I
a
a
0
1
2
- 3
4
5
I n t z r p o l l L a t o r d c c r i f 5
($12) 78kJ-tJ20
€PA M e t h o d 5 D a t a R e p o r t i n g Sheet P r o b o / C y c l o n e Wash
Job N J P ll3l&LL s u i S o u r c e uh.'+ Il 2,3 SJU 'C rc T e a m Leader p. * T 2 s t 51 te
D a t e S u b m i t t e d J J - 5-41 C a t e o f T e s t I / - Y-91 T e s t No. I No. o f H u n s C o m p l e t e & C a t e of C n a l y s i s 11-15-91 T e c h n i c i a n 4. ' ranspor t Leakape @None 0 m l S o l v e n t M.&kglt-* ch,o.,;/c
~ ~
T e s t 4 R u n - F i e l d filanl: Log PJumber '4677- L / t V o l . of S o l v e n t x m l *Solvent R e s i d u e - u g / m l
G i s h Mo. 19 D:sh T a r e U t . 50.3360 9 C i s h + S a m p l e W t . 50. '3 $9 S a m p l e U t . o . u u 3 4 9
9
T e s t R u n 1 V o l . o f S o l v e n t m m l Log N u m b e r - 5z
D i s h No. 11 D i s h T a r e W t . so. 5710 9 C i s h + S a m p l e W t . 5G. 37 3y 9
Coinmen t s S a m p l e U t . p . o , t . I 9
T e s t I R u n L D i s h No. L3 ~ o l . of S o l v e n t A m l D i s h T a r e W t . 9 . Y Y Y 5 Log N u m b e r - n D i s h + S a m p l e W t . 96 ' f - 5 3 C o m m e n t P S a m p l e W t . 0 u4qu '3
T e s t I R u n L D i s h rlo. 25 vol. of S o l v e n t x m l D i s h T a r e W t . 9 . b q O u 9 Log IJunber -6 L D ; s h + S a m p l e W t . sc (0457 CJ C o m m e n t s S a m p l e W t . d.ud63 9
V o l . o f S o l v e n t - m l C i s h T a r e W t . 9 Log N u m b a r D i s h + S a m p l e W t . 9 C o m m e n t s S a m p l e W t . 9
'Jol. o f S o l v e n t - m l D i s h T a r e W t . 9 Log N u m b a r D i s h + S a m p l e W t . D
-
T e s t - Run - D i s h No.
T e s t Run- D i s h No.
C=l.amen t s S a m p l e W t . - + S o l v r n t R e s i d u e - u g / m l = C ( S a m p l e W t . - g ) ( 1 0 ~ ) 3 / 9 0 1 . of S o l . - IT, :
€PA-MS A c e t o n e R e s i d u e filanl: Spec. ( '?.a ~ ; g 3 / m l Results: F i e l d E l k . R u n 1 R u n 2 R u n 3 R u n 4 R u n 5
-
1

Interpol1 Laboratories ($12) 795-6020
EPA Method 5 Data Reporting Sheet Filter Gravimetric5
Job h5? / 3lLs)I Dc, Source L L : ~ # I , T , Y Team Leader 3u I t Test Site f s c L Date Submitted I I - 5 - 9 1 Date of Test i l -4 -5 ' - Test No. I No. of Runs Completed 5 Date of Analysis I I - / b -41 Technician A. ,%4/
T e s t l R u n 0 - 1 Field Blank Log Number 'fb 7 e q V
Filter No. b0S-I Filter Type W S 3.7-2 I '
Fi 1 ter Tare Wt. . Y U 7 6 - 9 Comments Filter+Sample Wt. . q Y 7 0 9
Sample Wt. 3.4Udt.J 9
T e s t I R u n - Filter NO. Log Number - 5-Y Filter Type 6lMT 3 . 5 3 ' ' Comments Filter Tare Wt. ,4/ cob 9
Filter+Sample Wt. . q 3 3 7 9 Sample Wt. d.df6 I 9
T e s t l R u n 2 Fi 1 ter No. cpo r4
Comments Filter Tare Wt. , qaLi i 9 Filter+Sample Wt. .rrl4 9 Sample Wt. o u t / 7 4
Log Number - 59 Filter Type 3 5-2 ''
T e s t i R u n L Filter No. bGTsc Log Number --L v Filter Type 3 . 5 2 Comments Filter Tare Wt. . q f z a 9
Filter+Sample Wt.d * y Z a ; Sample Wt. . d 4 d
Test Run Filter No. Log Number Fi 1 ter Type Comments Filter Tare Wt. 9
Filter+Sample Wt. 9 Sample Wt. 9
Test R u n - Fi 1 ter No. Log Number Fi 1 ter Type Comments Fi 1 ter Tare Wt. 9
Fi 1 ter +Sampl e Wt . 9 Sample Wt. 9
Rerul tr: Field Elk. Run 1 Run 2 Hun 3 Run 4 Run 5
Field Blk. Run 1 Run 2 Run 3 Run 4 Run 5

2 ob s p J 6 00 7 5ourcs u1? J'L / , 5 3 Tsam Loader 0 u 14- Test S i t e 5h.c. Date Submit ted 1,- 5 - d Date of Test I J -Y -91
I No. o f Huns Completed 3 L 5 . r
Tes t NO. Data o f C n a l y s i s "1- J ~ - Q I Techn ic ian Transpor t Leakase None 0 n l So lven t /vreY Jenc C~LI.'IJC
Test I Run=% f l s h MO. Z L
'"'01. of S o l v e n t L m l S i m p l e W t . 9
F i e l d B l a n k D i s h Tare Log P l u m b a - y'L77-'
*So lven t iieSlduR- ug/ml
Tes t Run- D i s h No. V o l . of Solvent- m l D i s h Tare W t . '3 Log P l u m t e r Dish+Sample W t . 9 Coinmen t o Sample U t . 9
Cish No. Tare U t . . ; 1 Tes t R u n -
'.'ol. of Solvent- m l Log Number DishtSample W t . .Cornmen.k Sample Ut.-,
T e s t R u n - Vol. of Solvent- m l D i s h Tare W t .
- D i s h rlo.
Log Number Dish+Sample W t . (3 Comments Sample U t . 9
Tes t Run- D i s h rio. Vol. o f Solvent- m l D i s h Tare W t . Y Log N u m b a r Di =h+Sampl e U t . (3 C-,- cldnsn t s Sample W t .
~~ ~ ~
Tes t R u n - D i s h No. Vol. of Solvent- m l C i s h Tare U t . 9 Log Number Dish+Sample W t . 9 Comments Sample W t . Ll
I .- D 14 LSC-01YI
+Sulvar \ t Residue-ug/ml=C (Sample Wt.- 0 ) (ID') I i V o l . of Sol .- en 1 €PA-MS Acetcne Residue Elanl: Spec. (7.3 u g ; ' m l R e s u l ts: F i e l d E l k . Run 1 Run 2 R u n 3 R u n 4 R u n 5
-

..
Testing Laboratory Internal Correspondence
DATE March 20,1992
FROM TMLevercna
m RogaClarke Patricia Boyce
LOCATION ac-2
LOCATION -2 Go-2
s u ~ m c r ANALYSIS OF COAL ASH
1.0 Purpose of Testing
The Testing Lab anal@ samples of wid ash from variouS plants to provide currcnt i n f o d o n on coal ash gcncratcd from NSFS sttam plants.
2.0 Test Methods
The samples were leached according to EPA's Methods 1311 and 1312 For Total Composition analyses, thc samples wacdigcstcd with a mixme of acids in a dosed rniaowavevessclthat~~inaneariyw~~dissolationofthcsamplc
3.0 Test Results
Lab's analyses of Rivasidcash. AIl Total Compositionrcsults art rcparted on adry weight basis. A floppy diskcontaining the Lab'sresllla will also be sent to Roger Qaacc.
.+
me results ofthe Lab's analyses ale attached Also attachedare the results oflnmpoll
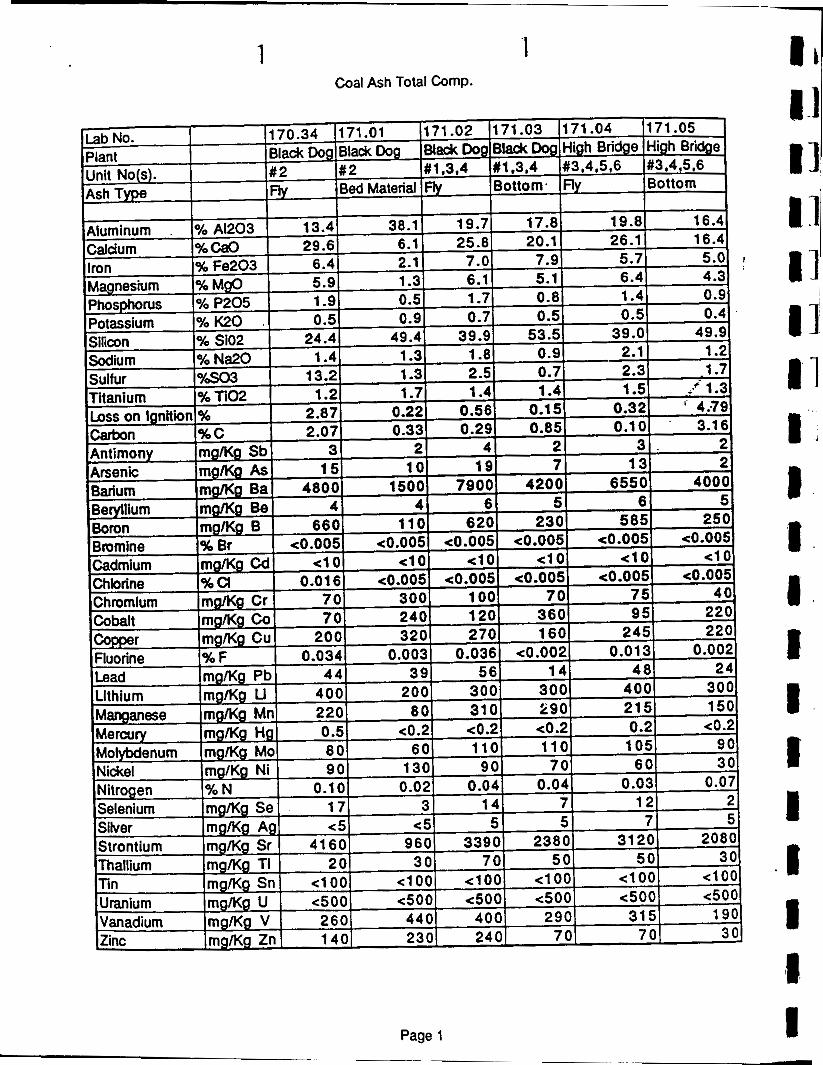
1 Coal Ash Total C o w .
Page 1

1 Coal Ash 1312 Leach

I !
Coal Ash TCLF' Leach
Page 1
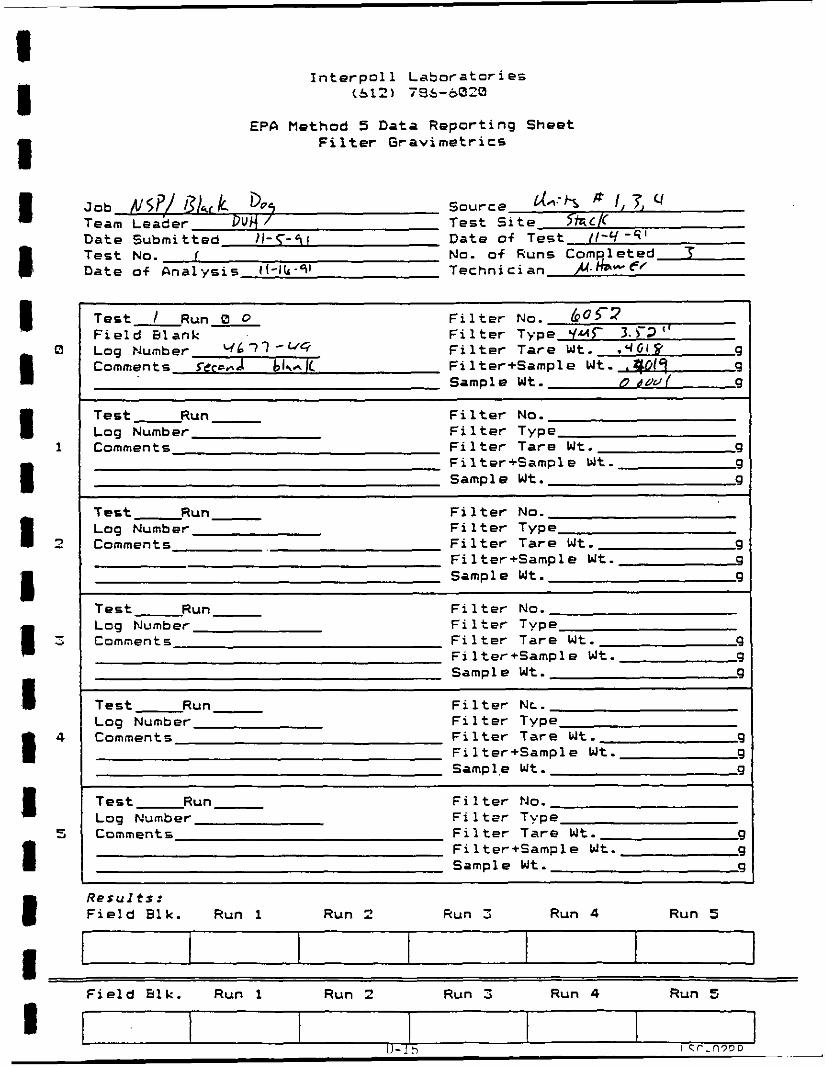
1 I 1 I I I I I I 1 1 1 I I I 1 1
I n t e r p o l l L a b o r a t o r i e s (512) 756-6020
€PA Method 5 Data R e p o r t i n g Sheet Fi 1 t e r G r a v i m e t r i c s
Da te Submi t ted ) I -
T e s t l R u n 0 0 F i l t e r No. b o g 2 F i e l d 6 lank F i l t e r Type V M r 3.>-2 ‘ I
Log Number Y6 7 7 e uq F i l t e r Tare W t , . *Glp 9 Comments 5 e c o A b L IC F i l t e r + S a m p l e W t . .a0 19 9
Sample W t . u 4Udf 9 ~ ~ ~ ~ ~ ~
T e s t - Run F i l t e r No. Log Number F i l t e r Type Comments F i 1 t e r Tare W t . 9
F i 1 ter+Sample W t . 9 Sample W t . 9
T e s t - R u n F i l t e r No. Log Number F i l t e r Type Comments F i 1 t e r Tare W t . 9
Sample W t . 9 F i 1 ter+Sampl e W t - 9
Test- Run F i 1 t e r No. Log Number F i l t e r Type Comment 5 F i l t e r Tare W t . 9
F i 1 ter+Sampl e Ut . 9 Sample W t . 9
Tes t Run F i 1 t e r NL. Log Number F i 1 t e r Type Comments F i l t e r Tare W t . 9
F i l t e r + S a m p l e W t . 9 Sample W t . 9
Test- R u n F i 1 t e r No. Log Number F i 1 t s r Type Comments F i 1 t e r Tare W t . 9
F i 1 ter+Sampl e W t . 9 Sample W t . 9
R e s u l t s : F i e l d B l k . Run 1 R u n 2 Hun 3 R u n 4 Run 5
F i e l d b l k . Run 1 R u n 2 Run 2 Run 4 R u n 5
u - 1 3 I C T - f l 3 D D
I

Cascade Impactor L a b o r a t o r y Data Sheet
Ill
I== F'r-eimpact.
T a r e
Ye. %551G
Sampling r a t e d a t a : 4 0
= a( 1. f ; DSCF
t, = 3 3 -F
R e v . 1 CF-028
D-16
I I

l r t t e r i ~ e l 1 L a t o r a t G r l c s (SI2 ;55-6t.12~1
Cascade Impactor L a b o r a t o r y Data Sheet -
Sampl ing r a t e d a t a :
min. - - 4i e
Cc1m. Weiaht
(0)
..:.. . . . .. .:= . . . . .. - %.::::..\ . . . . .. . ,I. ... ... .. ...... . ..... _." I .-. *..,.._...--- .. .
R E V . 1 CF-028

Sampling r a t e d a t a :
t.. = 3 / 2 -F
c J . &7
F‘e.
F‘,
MC
f R It, + ;It
in. Hg I I i n . WC
7. v i v
D-18

I I 1 I I I I I I I 1 1 1 I P 1 r m i
l n t e r p o l 1 L & t a o r a t c . r i e s ( & I 2 1 7&e-602'~J
C a s c a d e Impactor L a b o r a t o r y Data S h e e t
S tag€ No.
- ' r e i m p a c t .
.. . 4
7
F i l t e r
Sampling r a t e d a t a :
9 = ?f. m i n .
R e v . 1 CF-028

I I I I I I I I I I

1 I d
! I d
? I I
1 ii
I .I
c 1 1
I 1
INTERPOLL LABORATORIES. I N C . ( 6 1 2 ) 7 8 6 - 6 0 2 0
NSP/Black Dog Laboratory Log No. 4677
Resul ts o f Trace Metal Analyses
Test: 1 Source : Un i t s 1. 3 & 4 I n l e t Sample Type: To ta l T ra in Catch
T o t a l Mass o f Trace Metal i n SamDle (uq)
Trace Metal Method Run 1 Run 2 Run 3
(Log No.) (4677-94) S i l v e r SW-846. 6010 16 A1 umi num SW-846, 6010 188oooO Arsenic SW-846. 7060 2 50 Boron SW-846. 6010 7740 Barium SW-846. 6010 104000 Bery l l i um SW-846. 6010 40.0 Calcium SW-846, 6010 267oooO Cadmium SW-846, 6010 76.7 C h r o m i u m SW-846. 6010 1250 Copper SW-846. 6010 3340 I r o n SW-846. 6010 . 719000 Potassium SW-846. 6010 71100 Magnesium SW-846. 6010 567000 Manganese SW-846. 6010 1830
Sodi um SW-846. 6010 31oooO Nicke l SW-846. 6010 1130 Lead SW-846. 6010 1240 Antimony SW-846. 7041 32 Selenium SW-846. 7740 289 Stront lum Std. Meth. 326A 31700 Vanadium SW-846. 6010 3200 z inc SW-846. 6010 2 1 10
Molybdenum SW-846. 6010 228
(4677-95) c 17 2040000
263 7780
112000 41.4
287oooO 291
1360 3270
773000 67700
609000 1910 232
315000 1120 2890 15.7 254
40400 3 1 0 0 2720
(4677-96) c 16 192oooO
231 6920
107000 31.2
253oooO 359 988
3020 719000
60100 548000
1550 162
288000 889
3 300 c 7.9
245 36300
2750 2200

INTERPOLL LABORATORIES. I N C . ( 6 1 2 ) 7 8 6 - 6 0 2 0
NSP/Black Dog 11 Laboratory Log No. 4677
Resul ts o f Trace Metal Ana lys is
Test: 1
Source: U n i t s 1. 3 & 4 I n l e t
Tot 1 Ma - o f Trace Metal i n SamDle (us) '1 F i e l d
Trace Metal Method 81 an k Run 1 Run 2 Run 3
(Front H a l f + HN03/HZ02 Impinger Catch)
(Log No.) (4677-94) (4677-95) (4677-96)
Mercury SW-846. 7470 18.3 10 .9 9.06 1 I
6.39 I I
(Permanganate Impinger Catch)
(Log No.) (4677-97) (4677-98) (4677-99) (4677-1oO)
Mercury SW-846, 7470 5.77 9.47 31.4
Tota l 5.77 21.77 42.3 15.45
Blank co r rec ted 22.0 36.53
I I I I
D-22

INTERPOLL LABORATORIES, INC ( 6 1 2 ) 7 8 6 - 6 0 2 0
I I 1
NSP/Bl ack Dog Laboratory Log No. 4677
Results o f Trace Metal Analyses
Test: 1 Source: U n i t s 1. 3 & 4 Stack Sample Type: To ta l T ra in Catch
To ta l Mass o f Trace Metal i n Sample (uq)
F i e l d F i e l d Trace Metal Method Blank 1 Blank 2 Run 1 Run 2 Run 3
(Log No.) (4677-67 ) S i l v e r SW-846. 6010 < 1 Alum4 num SW-846, 6010 177 Arsenic SW-846, 7060 0.897 Boron SW-846. 6010 4.1 Barium SW-846. 6010 5.4 Be ry l l i um SW-C+5, 7091 < 0.005 Calcium SW-8r6. 6010 230 Cadmium SW-846. 6010 < 0.5 Chromi um SW-846, 6010 2.9 Copper SW-846. 6010 4.2 I ran SW-846. 6010 70 Potassium SW-846. 6010 < 40 Magnesium SW-846. 6010 40 Manganese SW-846. 6010 1.9 Molybdenum SW-846, 6010 15.0 Sodium SW-846. 6010 680 Nickel SW-846. 6010 2.0 Lead SW-846. 6010 6.0 Antimony SW-846, 7041 0.2 Selenium SW-846. 1740 0.05 Stront ium Std. Meth. 326A 5 Vanadium SW-846. 6010 1 24 nc SW-846. 6010 13.5
(4677-68) < 1
130 0.08
6.9 4.4
< 0.005 190
< 0.5 1.4 5.9
45 < 40
3 1 1.5
12.3 668 2.0 3.0 0.4
< 0.05 < 5 < 1
11.7
(4677-69) 1.8
4370 1.0
57.6 326
0.17 6200 0.8 4.8
23 1530 250
1300 10.4 14.7 1410 7.6 11
< 0.5 2.0 110 11
37.3
(4677-70) (4677-71) 1.5 3.7
4750 5340 1.0 1.0
52.6 62.1 248 110
0.22 0.26 7390 6470
6.2 0.8 7.4 5.7
72.4 21.2 1840 1990 440 310
1560 1740 11.5 12 14.7 13.9 1860 1580 26.7 6.4
94 7 7.81 < 0.5
2.0 2.0 111 89
12 12.4 225 52.5

INTERPOLL LABORATORIES, I N C . ( 6 1 2 ) 7 8 6 - 6 0 2 0
NSP/Black Dog Laboratory Log No. 4677
Results o f Trace k t a l Analysis'
Test: 1
source: Units 1. 3 & 4 Stack
Tota l Mass o f Trace Metal i n SamDle (Uql
F i e l d F l e l d Trace Metal Method Blank 1 Blank 2 Run 1 Run 2 Run 3
(Front H a l f + H N O ~ / H ~ O ~ Impinger Catch) (Log No.) (4677-67) (4677-68) (4677-69) (4677-70) (4677-71)
0.06 4.09 3.55 6.66 Mercury SW-846, 7470 0.08
(permanganate Irnpinger Catch)
(Log No.) (4677-46) (4677-51) (4677-56) (4677-61) (4677-e6)
0 .12 3.07 0 .54 3.92 Mercury SW-846. 7470 0 .30
D-24
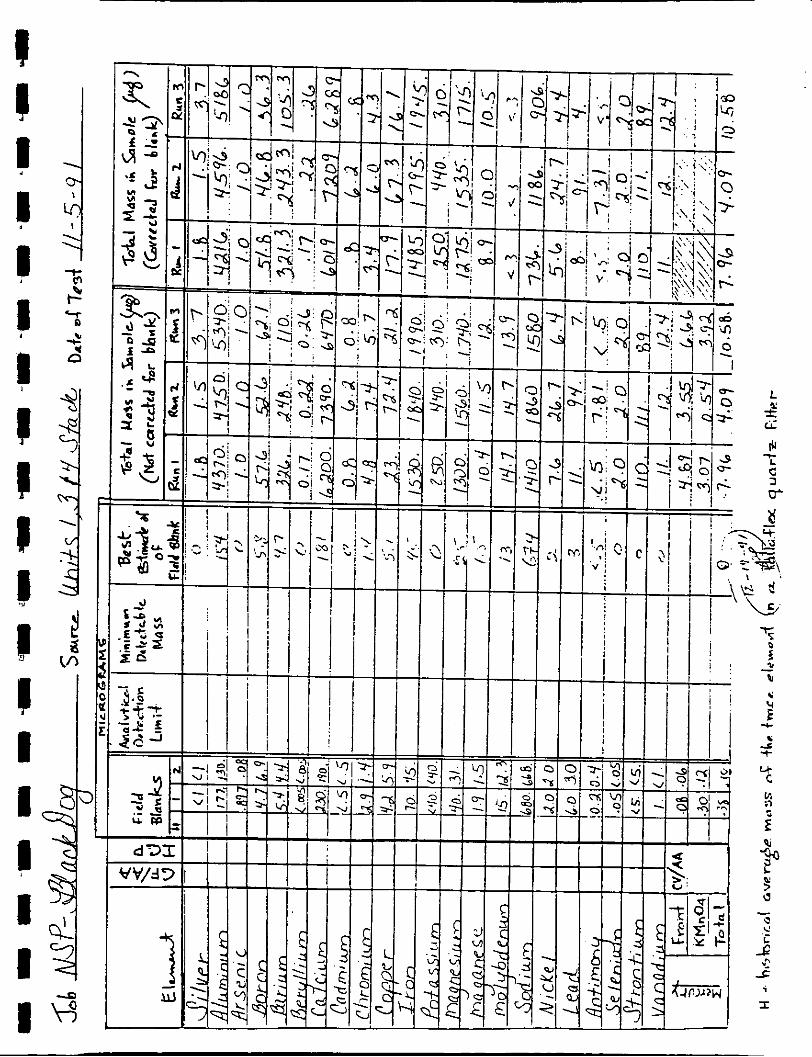
I 1 I I

I , I '
I ! / i i
1 ! i I - i i - -
T-
1 I -
I ! ! -
I I i I i
I c__
Y
I D- 26

~
I I I 1 I I I 1 I I I I I I I 1 I i I
IAudit Samples
~ OOther
gSu1 f ur Di 0): i de gOxides of Nit.
Interpol 1 Laboratories (512) 796-6020
Chain o f Custody Sample Deposition Sheet
Job Ncf ~ L L L ( L ~ C bdp , (rorlOJ Source E,,~sR 1 I Team Leader h i 4 Test Site Z l 2 L f f Date Submitted I l l L / q' Date of Test 11/S/@l Test No. I No. of Run5 Completed 3
I n
Type of Sample Analysis Required No. of ;amp1 es
Probe Wash: gAcetone gD.1. Water
Fi 1 ter: p" G. F. 1S.S. Thimble 02.5'' G.F. 047 mm G.F.
p s per EPA M-5 p s per E P A t4-17 gother
Impinger Catch: p.1. Water 04M5 Hg Only' m 4 M 5 Metals 01.0 N NaOH gother
0 3 H=OZ gMN Protocol p J 1 Protocol gEPA M - 6 or 8 p c i d Gases OFormal dehyde p e t a l s gother
Integrated Gas samDle
@ A s per EPA M-Z LlAs per EPA M-10 nother
@IS per EPA M-7A OOther
Oxides of Nitrogen (NO,)
g Fuel Sample g Aggregate
Particle Size
gAttached fuel Form #S-0163HHH
UX-Ray Sedigraph gHahco Method gother
gAs per €PA M-5 gA= per €PA M-?A OOther
S o u r c e I n f o r mat ion
1) Type of Source: a 6oiler g Asphalt Plant 0 Incinerator g Dryer 2) Fuel: Coal 0 Wood 0 Gas 0 Oil 0 HDF 0 Other 5 ) Is sample combustible? No 0 Yes 4) Does sample need special handling? Q No g Y e s I f yes, explain
IJ Other
- -- S - Z x w F i n

I n t e r p o l 1 Laboratories (517) 796-6020
Chain of Custody Sample Deposi t i on Sheet
J o b N S ” , l k L h . l c - fA# Source&. 7 l u Team Leader At,&l/&/&- Test S l t e z a i & Date Subml t ted I t Tes t No. I No. of Runs Completed 3
- c - I Date of Test / I - r - q f
No. o f ;amp 1 e6
3 + I
Type of Sample
Probe Wash: OAcetone
F i 1 t e r : 04” G.F. @.S. Thimble 02.5‘’ G. F. 047 mm G.F.
3 e/
3
Impinger Catch: OD.’. Water 0Z.X H=OI F M 5 Hg Only 04M5 meta l s 01.0 N NaOH OOther
I n t e g r a t e d Gas sample
Oxides o f N i t r o g e n (NO,)
P a r t i c l e S i z e
- A u d i t Samples nSu1 f ur D i ox i de DOxides o f N i t . p t h e r
Source I n 7 o r a e t ion
A n a l y s i s Requi red Comments
@s p e r € P A M-5 OOther
F s per EPA M-5 ofis per €PA 11-17 pt h e r d e n Y P>
g l N P r o t o c o l
OEPA M-6 o r 8 p c i d Gases OFormal dehyde OMetal s n o t h e r
Ijwl P r o t o c o l
I gas per EPA M-3 p s per EPA M-10 n o t h e r
p s per €PA M-7A Date OOther Time(HHS)
OAttached f u e l Form #S-C116;HHH
OX-Ray Sed igraph OHahco Method OOther
nAs per EPA M-6 gas per EPA M-?A OOther
1) Type o f Source: @!,:oiler 0 A s p h a l t P l a n t 0 Incinerator 0 Drye r
2) Fue l : B C o a l 0 Wood 0 Gas 0 011 0 RDF 0 Other Z ) 4 ) Does sample need s p e c i a l h a n d l i n g - No 0 Yes I f yes, e: :p la ln
Other
Is sample c o m b u s t i b l e 3 M No D Yes
S-279KKRR D-28
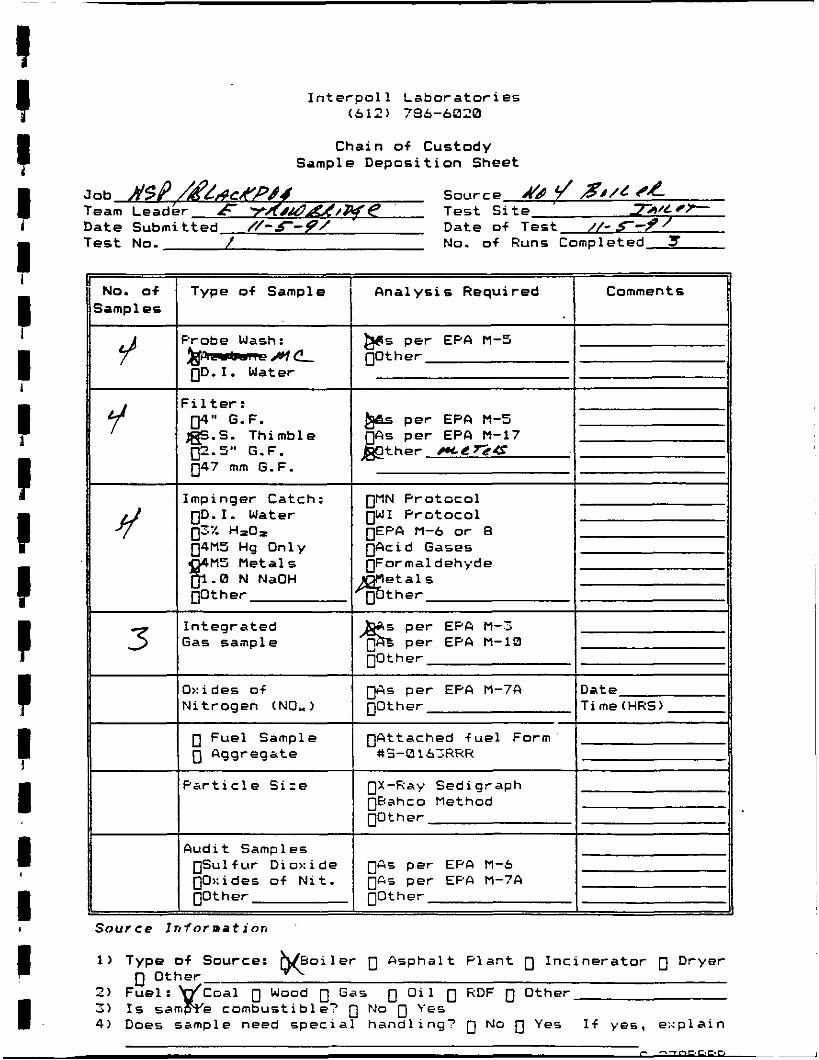
.
I n t e r p o l 1 L a b o r a t o r i e s (5 12 ) 736-6020
Chain of Custody Sample D e p o s i t i o n Sheet
Source k// ,c/ p L T A / L e*
ctP494 Team Lead& c 7. . &&&/ye Test S i t e Date Submit ted //-5-9/ Date of Test - - Test No. 1 No. of Runs Completed 3
A n a l y s i s Requi red No. of Samples
Type of Sample
il @s p e r EPA M - 5 g o t h e r
Probe Wash: &-p1c gD.1. Water n
F i l t e r :
@.S. Thimble 04'' G . F.
02.5'' G . F . n47 mm G.F.
&s pe r EPA M - 5 s p e r EPFI M-17 t h e r m e e&
Impinger Catch: gD.1. Water 03" H z O = g4M5 Hg Only
M 5 M e t a l s % .m N N ~ O H [IOther
gMN P r o t o c o l O W 1 P r o t o c o l g w a M - 6 or 8 OAcid Gases UFormal dehyde
e ta15 t h e r
l 3 I n t e g r a t e d Gas sample
s p e r EPA M - 3 % per EPA M - 1 0 OOther
D 7 j TimetHRS) Oxides o f N i t r o g e n (NO,)
0"s per EPA M-7A OOther
~~
g Fue l Sample 0 Aggregate
gAt tached f u e l Form #S-1316;HHH
P a r t i c l e S i z e nX-Ray Sedigraph OBahco Method OOther
bud i t Samp 1 es nSul f ur D i o x i d e OOxides o f N i t . no the r
Sour ce I n f o r II a t i on
OAs per E P A M-5 0"s per EPA M-7A n o t h e r
1 ) Type of Source: k o i l e r 0 Aspha l t P l a n t g I n c i n e r a t o r Dryer
7 ) Fue l : Coal 0 Wood 0 Gas n O i l 0 RDF 0 Other Z ) I s S a m % e combust ib le - 0 No 0 Y e s 4) Does sample need s p e c i a l h a n d l i n g - 0 No 0 Y e s I f y e s , e x p l a i n
Other- M.

I n t e r p o l l L a b o r a t o r i e s (512) 795-6020
Chain of Custody Sample D e p o s i t i o n Sheet
Source iL.rdr 9 Test S i t e Date o f Test No. o f Runs Completed %
Job / / 5 6 /L3/6&2 Team Leader' D . d H D a t e Submi t ted ///>:/sf
Tes t No. 1
Type of Sample
r o b e Wash: 8mELcLt
ater . /M#UO 3 * 8 .
. I . - ' i l t e r : 04" G. F. 0S.S. Thimble 02.5" G . F . 047 mm G.F. - I d
mpinger Catch: p . 1 . Water
<.-. -
M 5 M e t a l s .B N NaOH
no the r
[ n t egr a t ed jas sample
3x ides of \ l i t r o g e n (NO, )
F u e l Sample 0 Aggregate
P a r t i c l e S i z e
A u d i t Samples gSu1 f ur D i o x i d e OOxides of N i t . p t h e r
A n a l y s i s Requ i red
p s per EPA N-5 pt h e r h F ~ ~ P L T
g s per EPA M - 5 -jAs per EPA N-17 p t h e r -&,N m L-7
]MN P r o t o c o l IWI P r o t o c o l 3EPA M-6 or 8 p c i d Gases [Formaldehyde [Meta ls [Other ~
@s per EPA N-3 gas per EPA M-10 n o t h e r
@s per EPA M-7A OOther
DAt tached f u e l F o r m #S-016;HHH
OX-Ftay Sedigraph nbahco Method no the r
0"s per EPA M-6 06s per EPA M-?A OOther
Comments ___A
Sour c e I n f o r me t i or,
1) Type o f Source: ,@oiler 0 A s p h a l t P l a n t 0 I n c i n e r a t o r 0 Dryer
1 0 Wood 0 Z ) Is sample combust ib le7 4 ) Does sample need spec1 If yes, e;:plaln
S - 2 7 S K K R H D-30
I ' 1- I- I 1. I I I I I I

APPENDIX E
BOILER OPERATIONAL DATA

-
I I I I I 1 # 3 1 II 1 3 1 1 I 'I il :I I
!
I .. ..
...
I 1
.I I
1 i I I
!
!
! I
I I
I
I
I ! I I I !
I i
I !


1 I I c I I I I I I I I 1 I I I I I I
BLACKDOG STEAM PLANT GENERATED LOAD RECORD
UNIT #1 ON LINE @ 0000
OFF LINE @ 20 47 N1V 0 5 1991 DATE

c. 'i, ti
r
-,.._..
n r: w I-
EI w t- ''r
-1
z U
(5 >
a
a M
a - U
(5 W u 4
L!l K, c.
z E: 3
a E W t- 3 lL
I- w J 5 iL E W I- I- <
(I, > a ..a
IL
0 Id ia .n LI-I I?) ,.I
I- t- < 3

I I I I I I I I I 1 I I I I I I I' I I
- i
t! -.
J
t:, rJ .J ... -
w
c, (', w ic a
i li w ic u.
3 I :, LI
t-
I 3
.4 K L W t-
7
I' 5 lil
3 (LO J b. 5 ._
W l- C:
LII c- u- 3 CI W W LL
l - .I K
l- 13 ci W W 1L
0 > 'I
CJ i a
t- z -
4 ...

:, i;' .. _,
1- ._(
z 3
35 1.- I- &ul
D . 5: LI! k-
:3 L L
1- id . I -.. 1- -
.. ,., ..... - . . ..

I I I c I I I I I I I I I I I
< 0..
i. . :
..
. / . ..-
L. . ,- . - . .. i:i iNi 1 . ; .
li L', !L
3 t -
1 I I. s
CI _ I LI
G : 1,: t 1. -. D w LI1 U
1.'. !'! L
!L IU t-
- :3 ij I l l !U li
_ I r i i * - 8
IL
k L!! I.
t; ... G
I' i c . # ._I . . I I , 1. ,:. :;. ,: , . j

., , -_ - . . .. 2 .. .. c : c. , : a i I _ . _ I - . .I r I/ 1, I- I c .
L
.+ , I -. ,.
r . r . i I I . c:, n. . I 0: I .. . . . . .
f ,
E-8
. , . . a . I . 8
: . . . . ,,: t . : 8 . I , . . . .I ./. :. a 4 . . , . I
I .
. . .. . .
.. .

..........
I. I I,
- ..... - . - , .. - ...... ..... -. ... - -.
. . . .
. . . . f - !: ... -. L L , i ..I - r .
F . i i. i , (.: c e. . . . . i I . . <. ( I
I' 1..
I :.
I !' . .
... ,: ... i e.. G I
. .
.. .... 1. !
, i: , . 1 1 8
I . ,

r'. ., L I i.
.... ..4 i ,-. .. - - .. n
II II 1'1 I:! IL1 I 1 I1 I' I I I I I I I I 'I I I

4' (. . L'
L
r. -4
I" c . 5
1. t- a, Y
.. c:, . 4
I I I I i
L:. 1 ,. ... . ..- 1.1 1.1 1 . ) . I,.
I
111 I -
z LII ,:, .
. I
\ - 2 .A IL
u. 5. w k-
z w I- <"
a 1.: 1.8 1 - ti' :S ii l?I L:I l a .
.J
.I t- 33 I-
+ LII z
! c.1
'. .I 13
'I . ' t i
. I . . # . , . , ..I .. .: .I

I ' I I I I I T . i o . i L u . l ; t- I- I- t- I - N C.! ,?. -, .- c,:, c.; .(, c.:, 1;3
('0
. . . . .
v 6 .J
.4
u E: W t.-
t- L_.
-* - 3
t W I- ('I
a
IL
......
.... - . 1. .- E-12

i
i
i i i I I c
I 'I
I ' I
. . . t : t: t t: &'. L L L , I r 4 rl ,..
I i I i I I i I I
.. . ..
- 1 G 2 .I
li. IL
0 > ci
l i . 0 . >
> a - cn a .. - . .
I,.
L I I : . , I i'l .. i:. ,..I , ' I I I
. . (., L i ,., .
.. . I
l i - ..

1
I I :I . .

BOILER ROOM L O G
NORTHERN STATES POWER COMPANY - DLACK DOG STATION
UNIT NO. 3 D A T E
-. , . . . . . . MULTI-POINTER GAUGE READINGS
I

E-16
J l I I
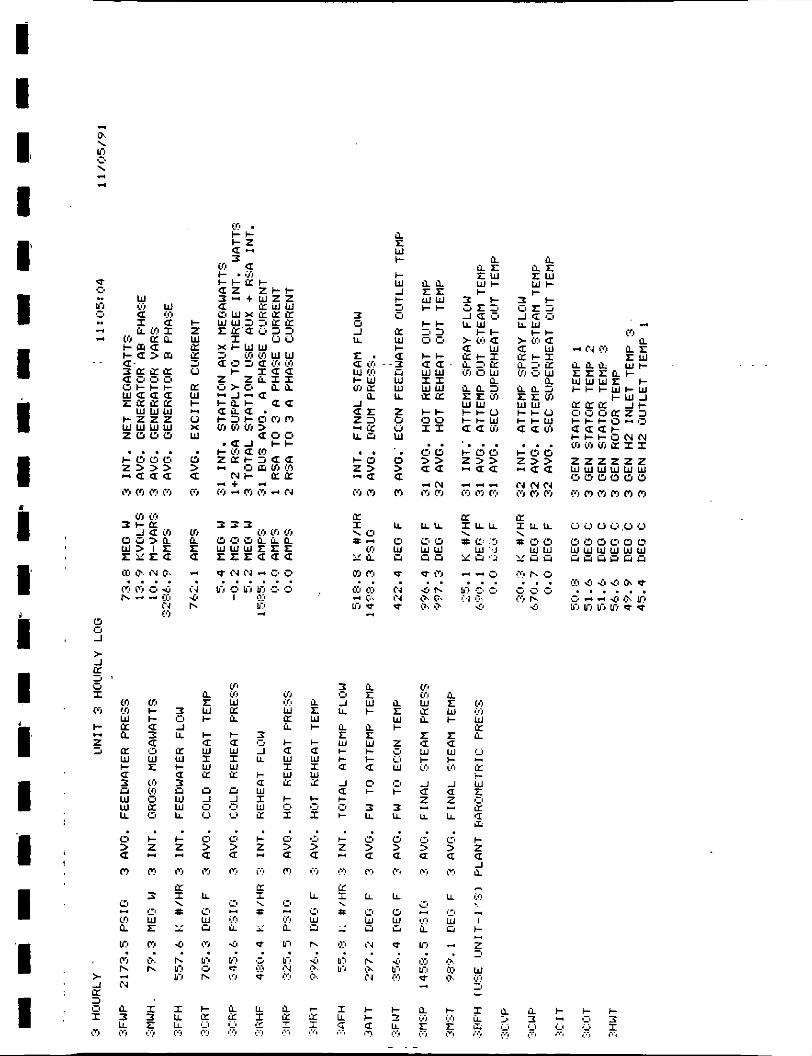
a r W I-
I- W _I
t- J Y
I- z w iY K 3 u
n W I- a - z u W W U
K P
z
W u v
I-I- 00 X I E
W . . 0 0 > > a a
0 > a
d a >
. . C o 5 2
z z z z z z w w w w w w 0 0 li 0 0 0
- N m r, m m m m i', ,') m i.i m r, m m r,
m

. . ax P u LT, - r. z
E-18

~
I I I I I 1 I I I 1 I I I I I I I I I
m m I,) m
I- z W a: n 2 a W
0 X W
t,
u > a m
. . . . . . . . 0 C I- c? 0 + 0 0 > z z > > z > > a - - a a - a a
. . . . . . der; +r ,o > > z > > z > > a a ~ a a - a a

Q " .. 2 .. P .. I- z
W E a ., a W e L) X W
;:a >
fr,
- a
ir, . e + + z 3 a -
il IT W + L
> _I a
ti a z w I T W us k s

I I I 1 I I I I 1 I I
I- z W y: rT 3 u y: W I-
u W
- x
0 > a
. . I - 0 52
z! u W
0 > a i',
a a T : s w w +I-
I-+ 35 U 0
P L E E W W C
>
I 'I I

I
. - !
i I in . 11
I1 I I I 'I I1 I1 I 1 I1 I1 I' I ' 1 I I I I

3 I I I 4 I I - -
I I I 1 I I I I I I I I
.\. . .
I . .
., ,. j
.. ..% . . > I
. . .
. .
. .
..I .r:. .- I : . ...
ir i',
G
a 'J -I LL
a r W I- + U
-1
I- n I-
C z ri
a
- $ \ 0
i' r. KO P
I U u
a > ti
..
m m (9 o m m
r. r e P ,:.. 0. P
.> - .. l i t a bi Li, b-, M b i P P
. . . . . .

- I\ It II II It I J I 1 II t i I1 I I li I I I I I I I -

I
a S W
I
I .. 0. -
I
m m m F, ,
I- z W K K 5 - u K W I- - :: W
d a >
- 1 - 3 I'
0 J K U W e
W io Y I - w w v, K w
a l L -1 a r z 23 u - K u L L U - . w
IC . a -a rr, - -?
;s, c: -a a Z > ' >
C) m m - N m r,

j
I
!
I
I I
I 1 !
I I
I
I
1
i !
i !
!
1 I
I
I ! I
!
.i
I I I !
I
.i
I i i
I I I I I I I 'I l l I: 1- I I I I I I I I I I I I

I I
-1
.
MRIN GENERATOR
'UEGAWATTS 11 U ECAVhRS I
BLACKDOG STEiU4 GENERATED LOAD
' 0 : 1951 UNIT # 4 I DATE 1-1 i
... .
P W J T RECORD
ON LINE @
OFF LINE @ . : . .. . .

BOILER ROO!A LOG
NORTHERN ST.4TES POWER CClMPANY - BLACK 0 0 G STATION
E-28 .. .
I

I I I
I I

Ir, t a a 3 0 W . XI- z ...
Li, G
Li, - cia w
.. = w .. 6 a VI
s a t - ac0s z
ef f ia + a > f f i a a 5 x a n a c) acsoo oI-I-+ Y w a a a w r a a a t; I - z z z ti w w w w x z o o 0 w
m a a E
w w w
. . . . . t-000 o z > > > > - a a a a P P P U P
0 0 -I
>

~
I I I I I I I I I I I I I I I I I I I
I- z W u: a: I) u U W I-
u W
0 >
P
- x
a
eo I- I-
3 a
g - W . i c z .- L 3
0 -1 U
> J z 3 0 I W
K L 3 w us I - W mu: a -1
z =I -a: U U
I-0
a ir,
a x
. . 5 2 U P
a E W I-
I- W -1 I- s a
a W I- 3 0 W W U z 0 u W
a >
P
a
a a i L w w I-+
+I- 33 ca 0 I-I-
w w II w w U K I-I- 0 a SI
0 c, > >
a a
. . a a - rd U P
ti tir i W W I - I-
I- s T: =, J a u > iil a a w a:+=
U W +I-
a 3 a: UI 0 w a L a 3 f r lr, w w I-I-c) I - I - W a a cr, . . . E, ,I, 0 > > > a a a 4 - d P P P
P u P P P ' P P P P P P P P z

I- z W a a 3 ti ic W e ti
W
0 >
P
- x
a
P P P P P P P P
L a it w w +I-
t t & & l-+
w w II w w ica I-l- 00 X I
c, i2 > >
a a
. . a a - rr P-r
L a r UI- r w
E-32

~
I I I I I I I I I I I 1 I 1 I I I 'I I
! i I
I !
I !
1
I
I
K, t
Lo 0 .. LT, 0 .. P ..
P P P P
I- z w a a 5 u a: W I- ,-., W
0 '> c 9
- X
a r
P P P P P P

W . I T + z
li, G
K W I- - 2 W
P P P P
(3 > a P
E-34
II II I 1 It II II II I I II II l l
I I I , I
I I I I

I I I I I I I I I I I I I I I I I I I
I
c z W a a 3 L)
0: W
ti
W
0 >
P
L x
a
. . . . . . . W . 0 0 0 0 o em en 0 ,:m > > > > > > > > > a a a a a a a a

<<j I-
s 2.
g W . T:+ z .-
(IS 0
b i 0
..
.. 2 + z
W E a 3 ti
a W I- - :: W
u > a P
t J
P
c - 5
2- J
P I -0
U
>
U P
a E W I-
C
w -1 I- 2 a W I-
3 U W W LL
a
z W 5
c? > a P
I-+ O O X I
c? 13 > > . .
a a - a P P
- I! II I I I I I I I1 I -1 II II I ' I I I I I I I I I /

~~
I I I I I I
3 0 J LL
a L Z Z W L a W e
E X I- w w 3 I- + + O E 3
c e L L W 3 3 I-c
I-t- a c x w w i n o w I I- a
J a o
o u > 1.6 a a w
a a a = ~ a
w w a a s a a r r w
11 aav)
w w I-+ CI- i ) 00 I - c w
>
I I I I I I I I I I 'I I
. . . cr; cr; 0 0 ,3 > > > > > a a a a a
. . c (3 E 2 I
I I
I ,
1 I I I
i i I
I
i i I I
j I I
i I
I I I I I
!
N r 4 N P P P a
* D O
Y Y Y
ZLLL
w w
0
LL u: * -
ti, x a
:I3
a,. CI r. c9 Q 0 0 LT, 0 r, 0) m 0 0 . . . . . . .
I titi 0 C l
0 N I\ r, c. P P -
tir.9 r. - 0% I\ 0%
. . .
a E: W I-
a E:
3 w u t - J L I - c L r w W I I - w 3 l i u W J w o LL 0
a u :
a E: W I-
I-
W I W u: c D I
,:, >
P
LL
0
a
a
: ti
0~ 0.. 0.
t- K I P
a 3 Z O W - I C L L c
a E u
a
!!!I-
- C' c 3 LL . .
c D Z i - a
. . I - e z > - a
. . I - 0 z > - a
ifl > a
0 9 ti C l P O - m
. . .i P P
I C L L K u u P P
L L a x u : K S v P
x e L L t -
P P a a

E, L.
P U P * P U P
> _I u:
I\ I1 I1 It I I I1 I1 I 1 I I II Ii I ' I I ' I I I I I --

m I- C
3 0 W
a a
s < z .- uil 0
bil c
tl
..
.. - . . -
. . . . ;000 0
- a a a a z > > > >
P P P P P
0 0 -1
cr, cr, W u: a
W I-
3 u W W U
a
a
x C8 -1 U
u: W c a 2 W W U
L I W c C
W I W ic u -1
a 3 0 -1 U I-
W I W ic
a
a s W e c W 8 W ic
a
5 I . . . . . . . .
0 I- I- I3 0 I- 0 0 > z z > > z > > a - - a a - a a P P P P P P P P
3 0 -1 L > -1 K 3 & I W
K t 3 w eo I - W 0) u: a J
z 3 -ic UCI
I-0
a cr,
a =
. . 52 P P
a s W I-
c W -1 I- 3 u K W I-
3 Y W. W LL z u ti W
0 >
P
a
a
L a T I w w I-c I-+ 3 3 00 c c w w SI w w K K
+I- u 0 I X
00 > > - r4 U P
a a
. . a a
-1 ~ P P P U L

I I I I I I I 1 I I I I I I I I 'I I I
APPENDIX F
PROCEDURES

~
I# I I I I I I I I I I I I I I I ;I !I I
A -#%?FOR THE DETERMINATION OF
I N EXHAUST GASES FROM STATIONAAY SOUFXE
HETALS EMISSIONS
COMBUSTION PROCESSES
1. App l i cab i l i t y and P r i n c i p l e
1.1 App l i cab i l i t y . Th i s method is appl icable f o r t h e determination of
t o t a l chromium ( C r ) . cadmium (Cd). a r s e n i c ( A s ) . n icke l (Ni l . manganese (Mn). beryl l ium (Be). copper (Cu). z inc ( Z n ) . l ead (Pb). selenium (Se) . phosphorus
(P), tha l l ium (Tl). silver ( A g ) . antimony (Sb) . barium (Ba) . and mercury ( H g )
emissions from municipal w a s t e i n c i n e r a t o r s . sewage sludge i n c i n e r a t o r s , and
hazardous waste i n c i n e r a t o r s . This method may also be used f o r t h e
determinat ion o f p a r t i c u l a t e emissions following t h e a d d i t i o n a l procedures
descr ibed . Modif icat ions t o the sample recovery and a n a l y s i s procedures
descr ibed i n this p ro toco l f o r t he purpose of determining p a r t i c u l a t e emissions
may p o t e n t i a l l y impact t h e f r o n t h a l f mercury determination:
1.2 P r i n c i p l e . P a r t i c u l a t e and gaseous metal emissions are withdrawn
i s o k i n e t i c a l l y from the source and co l l ec t ed on a heated filt?r. and in a
series of c h i l l e d impingers con ta in ing a so lu t ion of' d i l u t e n - t r i c ac id i n hydrogen peroxide i n two impingers. and ac id i c potassium permanganate s o l u t i o n
i n two (or one) impingers. Sampling t r a i n components are recovered and
d iges ted i n sepa ra t e f r o n t a n d back h a l f f r ac t ions . Mater ia l s co l lec ted i n t h e
sampling t r a i n are d iges t ed with a c i d so lu t ions t o d i s so lve inorganics and t o
remove organic c o n s t i t u e n t s t h a t may c r e a t e ana ly t i ca l i n t e r f e rences . Acid
d i g e s t i o n i s performed u s i n g conventional Par$ Bomb or microwave d iges t ion
techniques. The n i t r i c a c i d and hydrogen peroxide impinger so lu t ion . the a c i d i c potassium permanganate impinger so lu t ion . and t h e probe r i n s e and
d iges ted f i l t e r s o l u t i o n s are analyzed for mercury by cold vapor atomic absorp t ion spectroscopy ( C V A S ) . Except for t he pemanganate so lu t ion . the
*Field tests t o d a t e have shohn t h a t of the t o t a l amount of mercury measured by the method, pnly 0 t o <2Z w a s measured i n the f ron t h a l f . Therefore. i t is t e n t a t i v e l y concluded, based on t h e above da ta . t h a t p a r t i c u l a t e emissions may be measured by t h i s t r a i n , without s i g n i f i c a n t l y a l t e r i n g t h e mercury r e s u l t s .

remainder of t he sampling t r a i n ca tches are analyzed f o r Cr. Cd. N i . Mn. Be.
CU. Zn. Pb. Se. P. Tl, Ag. Sb. Ba. and A s by induct ive ly coupled argon plasma
emission spectroscopy (ICAP) or atomic absorp t ion spectroscopy (AAS). Graphi te
furnace atomic absorp t ion spectroscopy (GFAllr) i s used f o r ana lys i s of antimony, a r sen ic . cadmium, lead . selenium. and thal l ium, i f t hese elements
r e q u i r e greater a n a l y t i c a l s e n s i t i v i t y than can be obtained by ICAP.
Add i t iona l ly , i f d e s i r e d , t h e tester may use AAS f o r analyses o f all metals i f
t h e d e t e c t i o n l i m i t s meet the goal of the t e s t i n g program. For convenience.
a l i q u o t s o f each d iges t ed sample f r a c t i o n can be combined p ropor t iona l ly f o r a
s i n g l e analytical determinat ion. The e f f i c i e n c y of the a n a l y t i c a l procedure is q u a n t i f i e d by t h e a n a l y s i s of spiked q u a l i t y con t ro l samples conta in ing each of
t h e target metals inc lud ing a c t u a l sample matrix e f f e c t s checks.
2. Range, S e n s i t i v i t y , P rec i s ion , and In t e r f e rences
2.1 Range. For the analyses desc r ibed i n t h i s methodology and for s i m i l a r
ana lyses . t h e ICAP response is l i n e a r ove r s eve ra l orders of magnitude.
p l e s con ta in ing metal concent ra t ions i n the nanograms pe r mi l l i l i t e r (ng/ml) t o
micrograms per mil l i l i ter (ug/ml) range i n the ana ly t i ca l f i n i s h s o l u t i o n can
be analyzed using this technique. Samples containing greater than
approximately 50 ug/ml of chromium, l e a d . or a r sen ic should be d i l u t e d b e f o r e
a n a l y s i s . Samples con ta in ing greater than approximately 20 u g / d of cadmium should be d i l u t e d before a n a l y s i s .
Sam-
2.2 Analy t i ca l S e n s i t i v i t y . ICAP de tec t ion limits i n the a n a l y t i c a l
s o l u t i o n (based on SU-846. Method 6010) are approximately as follows: Sb (32 ng/ml) . As (53 ng/ml) . Ba (2 ng/ml). Be (0.3 ng/ml). Cd (4 ng/ml). C r (7 ng/ml). Cu (6 nJm1). Pb (42 ng/ml). Pln (2 ng/mU. N i (15 ng/d). P (75 ng/ml). Se (75 ng/ml). Ag (7 ng/ml). T i (40 ng/ml). and Zn (2 ng/ml). The a c t u a l
method d e t e c t i o n limits are sample dependent and may vary as the sample mat r ix
may a f f e c t the limits. The de tec t ion l i m i t s f o r ana lys i s by d i r e c t a s p i r a t i o n
AAS (based cn SW-846. Method 7000) are approximately es follows: Sb (200
ng/ml) . As (2 ng/ml) . Ba (100 ng/ml). Be ( 5 ng/ml). Cd (5 ng/ml). C r (50 ng/ml) . Cu (20 ng/ml) , Pb (100 ng/ml) . Mn (10 ng/ml). N i (40 ng/ml), Se ( 2
ng/ml) . Ag (10 ng/ml) , Tl (100 ng/ml) , and Zn (5 ng/ml). The d e t e c t i o n l i m i t
for mercury by CVMS is approximately 0.2 ng/ml.
added s e n s i t i v i t y compared t o the use of d i r e c t a sp i r a t ion AA3 for the
fol lowing metals: Sb (3 .ng /ml ) . As (1 ng/ml). Be (0.2 ng/ml). Cd (0.1 ng/ml).
2
The use of CFAAS can give
WD -ant 5 L'.-mnm:nav e-t,
=?d -Id not 8t thk stage 1W-t mfW POIICY.
not bssn bma!r~ I W ~ ~ C J b, tpo CON^^^,;
tt IS k i r j cl'cui~tcd hr cornpent on rn t ~ ~ h , , : ~ wmc7 and p4cy Irnpl1c;lticas
F-2

~
I I I I I I I I I I I I I I I I I 'I I
Cr (1 ng/ml). Pb (1 ng/ml). Se ( 2 ng/ml). and T1 (1 ng/ml). To ensure the p o s s i b i l i t y of optimum ease i n ob ta in ing accurate measurements. t h e
concent ra t ion of target metals i n samples should be a t least ten times t h e
d e t e c t i o n l i m i t .
a n a l y t i c a l procedure, this concent ra t ion can be as low as approximately three times t h e d e t e c t i o n l i m i t . However. t h e scatter of such d a t a may render them
unacceptable or may r e q u i r e many ana lyses before t h e d e s i r e d r e l i a b i l i t y of a n a l y t i c a l da t a i s obtained.
Under c e r t a i n condi t ions . and with g r e a t e r care i n t h e
Us ing the procedures descr ibed i n this method. t h e t h e o r e t i c a l a n a l y t i c a l
d e t e c t i o n l i m i t s shown above. a volume of 300 m l f o r t h e f r o n t h a l f and 150 m l
f o r t h e back h a l f samples. and a s t a c k gas sample volume of 1.25 m 3 , t h e
corresponding in-s tack d e t e c t i o n l i m i t s are presented i n Table A - 1 and
c a l c u l a t e d as shown: Thb &ru7 lh ! In I .prrUmlnary dnR W has not been formally released bjl EPA and Should not at mb S b g O tK mn&NC: p remerr-: Aqene policy. I t i. ? e a
- A X B S D C
Ur..s;:,.' to, ,:JmmC,"t cr. :.:. .i --- .i@ .. .--. ., I,,. ... I . . . . . .
where: A = a n a l y t i c a l d e t e c t i o n l i m i t . ug/ml. B = volume o f sample p r i o r t o a l iquo t for a n a l y s i s , ml. C = s t a c k sample volume, dscm. m3. D = in -s tack d e t e c t i o n l i m i t . ugIm3. t
Values i n Table A-1 are c a l c u l a t e d for the f r o n t and back h a l f and/or t h e to ta l t r a i n .
Actual method in - s t ack d e t e c t i o n l i m i t s are based on a c t u a l test values .
If requi red . t h i s method's i n - s t ack de tec t ion l i m i t s l i s t e d can be improved f o r
a s p e c i f i c test by us ing one or more of the following opt ions :
o A normal 1-hour sampling m c o l l e c t s a s t a c k gas sampling volume of
about 1.25 m3. I f the sampling time i s increased and 5 m3 is c o l l e c t e d , t he in-stack method de tec t ion l i m i t s would be one fou r th of t h e va lues shown above ( t h i s means t h a t with this change, the method i s four times more s e n s i t i v e than-normal).
The in-s tack d e t e c t i o n l i m i t s assume t h a t a l l of t h e sample is d iges t ed
(with except ion of the a l i q u o t f o r mercury) and t h e f i n a l l i q u i d volume
f o r a n a l y s i s is 300 m l f o r the f r o n t ha l f and 150 m l for +e back h a l f
sample. .If the f r o n t h a l f volume i s reduced from 300 m l t o 30 m l . the
f r o n t h a l f i n - s t ack d e t e c t i o n limits would be one t e n t h of the values shorn above ( t e n times more s e n s i t i v e ) . If t h e back ha l f volume is
reduced from 150 m l t o 25 ml t h e in-stack de tec t ion limits would be one
s i x t h of t h e above values.
o
Matrix erfects checks are necessary on
3 9 not h e n torma~y csteaswt bf EPI m h dDcwTlanf li b ~ . - ~ H m t n q am?.
m d Should no1 8t c b 8tage Dt mtstruc: -D represent Agenq pollcy. It Is tcitp dfculated for conpan1 on Its wct.iic.: w..-r-.-w nnn y-tlcy tmollatlonr

1 I1 It It I t I I I 'I I I I I
TABLE A-I. IN-STACK MFIHOD DETECTION LWTS (ug/m3) FOR 'IRAIN FRACTIONS U S I N G ICAP AND AAS
Front Half Back Half1 Back Half2 Fraction 1 Fraction 2 Fraction 3 Total Train
Metal Probe and F i l t e r Impingers 1-3 Impingers 4-5
Antimony Arsenic Barium B e r y l 1 ium Cadmium Chromium Copper Lead Manganese Mercury Nicke l Phosphorus Selenium S i l v e r Thallium Zinc
-
7.7 (0.7)' 12.7 (0.3)' 0.5 0.07 (0.05)' 1.0 (0.02)' 1.7 (0.2)' 1 . 4
10.1 (0.2)' 0.5 (0.2)' 0.05'' 3.6 18
3.8 (0.4)' 6.4 (0.1)' 0.3 0.04 (0.03)' 0.5 (0.01)- 0.8 (0.1)' 0.7 5.0 (0.1). 0.2 (0.1)' 0.03'- 1.8 9
18 (0.5)' 9 (0.3)' 1.7 0.9 9.6 (0.2)' 4.8 (0.1)' 0.5 0 . 3
11.5 (1.1)' 19.1 (0.4)" 0.8 0.11 (0.08)' 1.5 (0.3)' 2.5 (0.3)' 2.1
15.1 (0.3)' 0.7 (0.3)'
0.03" 0.11'. 5.4
27 27 (0.8)' 2.6
14.4 (0.3)' 0.8
( 1' Detection l i m i t when analyzed by GFAAS. Detection l i m i t when analyzed by CVAAS. *'
Actual method in-stack detection limits are based on actual t e s t values.
analyses of samples and typ ica l ly are of greater significance for samples tha t have been concentrated below the normal sample volume.
volume less than 25 ml may not allow resolubilization of the r e s i d u e
and may increase interference by other compounds.
When both of the above two improvements are used on one sample a t the
same time, the resu l tan t improvements are multiplicative. For example
A
o
11 I I I I I I I I I I I
where s tack gas volume is increased by a factor of f ive and the t o t a l
l iqu id sample digested volume of both the f ront and back halves is
reduced by factor of s i x , the in-stack method detection l i m i t i s
reduced by a fac tor of t h i r t y rthe method i s t h i r t y times more
s e n s i t i v e ) .
o Conversely, reducing stack gas sample volume and increasing sample l i qu id volume w i l l increase l i m i t s . The f ront half and back half1
samples'(Fractions 1 and 2 ) can be combined pr ior t o analysis.
r e su l t an t l iquid volume (excluding Fraction 3 which must be analyzed
separa te ly) is recorded. Combining the sample as described does not
allow determination (whether f ron t or back h a l f l ) of where i n the t r a in
The
4
I I F-4

I' I I I I I I 1 I I I I I
I I I I
I I I
the sample w a s captured.
becomes a s ing le value f o r all metals. except mercury for which the
contr ibut ion of Fraction 3 must be considered.
The in-stack method detection l i m i t then
o The above discussion assumes no blank correction. Blank correct ions are discussed l a t e r i n t h i s method.
2.3 Precision. The precis ions ( r e l a t i v e standard deviation) f o r each metal detected i n a method development test at a sewage sludge inc inera tor . a r e
as follows: Sb (13.9%). As (13.5%). Ba (13.1%). Cd (11.5%). Cr (12.5%). Cu
(11.9%). Pb (11.6%). N i (7.7%). P (13.5%). Se (15.3%). T1 (12.3%). and Zn (11.8%). Beryllium, manganese and s i l v e r were not detected in the t e s t s :
however, based on the ana ly t i ca l s e n s i t i v i t y of the ICAP f o r these metals. i t
i s assumed tha t their precis ions should be similiar t o those for the other
metals.
2 .4 Interferences. I ron can be a spec t ra l interference during the
ana lys i s of arsenic . chromium. and cadmium by ICAP. Aluminum can be a s p e c t r a l
in te r fe rence during the analysis of a rsen ic and lead by ICAP. Generally, these
in te r fe rences can be reduced by d i l u t i n g the sample, but t h i s increases the
method detect ion l i m i t .
po t en t i a l in te r fe rences f o r this method. For all GFAAS analyses, matrix modifiers should be used t o l i m i t i n te r fe rences . and standards should be matrix
matched.
Refer t o EPA Method 6010 (w) for d e t a i l s on
3. Apparatus
3.1 Sampling T r a i n . A schematic of the sampling t r a i n i s shown i n Figure
A - 1 . I t is s imi l a r t o the Method 5 t r a i n . The sampling t r a i n cons is t s of the
following components.
3.1.1 Probe Nozzle (Probe Tip) and Borosil icate or Quartz G l a s s Probe
Liner. Same as Method 5. Sections 2.1.1 and 2.1.2. Glass nozzles are required unless an a l t e r n a t e probe t i p p r e v e n t s the poss ib i l i ty of contamination or in te r fe rence of the sample w i t h its mater ia ls of construction. I f a probe t i p
o ther than glass is used. no correct ion of the stack sample t e s t results can be
made because of the e f f e c t on the r e s u l t s by the probe t i p .
-
3.1.2 Pi to t ' Tube and Di f f e ren t i a l Pressure Gauge. Same EIS Method 2 .
Sections 2.1 and 2 . 2 . respect ively.
3.1.3 F i l t e r Holder. Glass, same as Method 5 . Section 2.1.5. except t h a t
a Teflon f i l t e r support may be used. i f desired, to replace the g lass frit.
5 mb *.M*nt b F.~~UIIIIM~~ 6n+, * ha* mf been lolmsiiy F S I ~ S ~ ~ b, 01 *m should not at thb &go m -,trues 0 r e v e * m ( k e n o r miiy. )t IS beinp v m h t e * tor corrynent on )tt IethqlEy -"*CY Y - I ~ impilcat!onr

e a
f X - W C 0 - - n
t o_
F Y
F-6
I 'I I 1 I I II I1 li I ' I I I 1 1 I 1

I! I I I I I I I I I I I I I I I I Io I
o the r impingers remain the same. If mercury analysis is not needed, the
potassium permanganate impingers are removed.
3.1 .6 Metering System, Barometer, and Gas Density Determination
Equipment. Same as Method 5, Sections 2 .1 .8 through 2.1.10. respectively.
3 . 2 Sample Recovery.
3 .2 .1 Nonmetallic Probe Liner and Probe Nozzle Brushes. Wash Bottles,
Sample Storage Containers. P e t r i Dishes. Graduated Cylinders, P las t ic Storage
Containers, Funnel and Rubber Policeman, and Glass Funnel. Same as Method 5 . Sect ions 2 . 2 . 1 through 2 . 2 . 8 , respect ively.
The following items are needed for sample recovery:
3 . 2 . 2 Labels. For i den t i f i ca t ion of samples.
collected i n the f ront half of the sampling t r a i n .
3 . 1 . 4 F i l t e r Heating Systea. Same as Method 5 . Section 2 .1 .6 .
3 . 1 . 5 Condenser. The following system s h a l l be used for the condensation
and co l lec t ion of gaseous metals and for determining the moisture content of
the s t a c k gas.
connected i n series w i t h leak-free ground glass f i t t i n g s or other leak-free,
The condensing system should consist of four t o s i x impingers
non-contaminating f i t t i n g s . The f i r s t impinger i s optional and is recommended
as a water knockout t r ap f o r use during test conditions which require such a
t r a p . t he f i r s t impinger is used as a water knockout, i t s h a l l have a short stem.
The second impinger ( o r the first HNO3/H2O2 impinger) s h a l l be as described for
the f i r s t impinger i n Method 5. Paragraph 2.1 .7 . The th i rd impinger (or t h e
The impingers t o be used i n the metals t r a i n are now described. When
impinger used as the second HNO3/Ii,O2 impinger i n any case) i s the same as t h e
Greenburg Smith impinger with the standard t i p described as the second impinger
i n Method 5 . Paragraph 2.1.7. A l l o the r impingers used i n the metals t r a in are the same as the second impinger previously described. The f i r s t impinger
should be empty. the second and t h i r d s h a l l contain known quant i t ies of a
n i t r i c acid/hydrogen peroxide so lu t ion (Section 4 . 2 . 1 ) . the fourth (and f i f t h .
i f required) s h a l l contain a h o r n quant i ty of acidic potassium permanganate
so lu t ion (Section 4 . 2 . 2 ) . and the l a s t impinger s h a l l contain a known quantity
of s i l i c a g e l or equival:nt desiccant.
within l0C ( 2 O F ) s h a l l be placed a t the o u t l e t of the last impinger. When t h e
A thermometer capable of measuring t o
water knockout impinger is not needed, it is removed from the train and the
3 . 2 . 3 Polypropylene Tweezers and/or P l a s t i c Gloves. For recovery of the
f i l t e r from the sampling t r a i n f i l t e r holder.
3 . 2 . 4 Nonmetallic Bristle Brush. For quant i ta t ive recovery of materials

3.3 Sample Preparation and Analysis. For the analysis. the following
equipment is needed:
3.3.1 Volumetric F la sks . 100 m l . 250 m l . and 1000 m l . For preparation of
standards and sample d i lu t ion . 3.3.2 Graduated Cylinders. For preparation of reagents.
3.3.3 par$ Bombs o r Hicrovave Pressure Relief Vessels w i t h Capping
Sta t ion . ( E N Corporation model o r equivalent) . 3.3.4 Beakers and Watchglasses. 250 m l beakers for sample digestion w i t h
watchglasses t o cover the tops. 3.3.5 Ring Stands and Clamps. For securing equipment such 85 f i l t r a t i o n
apparatus. 3.3.6 F i l t e r Funnels. For holding f i l t e r paper.
3.3.7 Whatman 541 F i l t e r Paper (o r equivalent).For f i l t r a t i o n of
digested samples.
3.3.8 3.3.9 Volumetric Pipers.
3.3.10 Analytical Balance. Accurate t o within 0.1 mg. 3.3.11 Microwave o r Conventional Oven. For heating samples a t fixed
Disposable Pasteur Pipets and Bulbs.
power leve ls o r temperatures. 3.3.12 Hot P la tes .
3.3.13 Atomic Absorption Spectrometer (AAS). Equipped w i t h a badground cor rec tor .
3.3.13.1 Graphite Furnace Attachment. W i t h antimony, arsenic. cadmium,
lead, selenium, thalium. and hollow cathode lamps ( H C L s ) o r electrodeless
discharge lamps (EDLs). 7131 (cadmium). 7421 ( l ead ) . 7740 (selenium), and 7841 (thallium).
Same as EPA Methods 7041 (antimony), 7060 (arsenic) .
3.3.13.2 Cold Vapor Mercury Attachment. W i t h a mercury HCL or EDL. The equipment needed f o r t h e cold vapor mertury attachment includes an air rec i rcu la t ion pump, a quartz c e l l , an aerator apparatus, and a heat lamp or
desiccator tube.
temperature a t t he quartz c e l l by 10°C such tha t no condensation fa- on the w a l l of the quarcz cell. Same as EPA U e t h o d 7470.
3.3.14 Inductively Coupled Argon Plasma Spectrometer. W i t h e i t he r a
The heat lamp should be capable of r a i s ing the ambient
d i r e c t o r sequential reader and an alumina torch. Same 85 EPA Method 6010.
I I s I
F-8

~-
I' I I I I I I I I I I I I 1 I I I I I
4. Reagents
Unless otherwise indicated, i t i s intended that all reagents conform t o t h e spec i f ica t ions established by the Committee on Analytical Reagents of the
America? Chemical Society. where such specifications are available: othervise ,
use t h e bes t avai lable grade.
4.1 Sampling. The reagents used i n sampling are as follows:
4.1.1 F i l t e r s . The f i l t e r s s h a l l contain less than 1-25 ug of each of the
metals t o be measured. Analytical r e s u l t s provided by f i l ter manufacturers a re
acceptable. However, i f no such r e s u l t s are available. f i l ter blanks must be
analyzed f o r each ta rge t metal p r io r t o emission testing.
g lass f i b e r f i l t e r s without organic binders s h a l l be used.
exhib i t a t least 99.95 percent e f f ic iency (<0.05 percent penetration) on 0.3 micron d ioc ty l phthalate smoke p a r t i c l e s . The f i l t e r efficiency test s h a l l be
conducted i n accordance with ASM Standard Method D2986-71 (incorporated by
reference) . For par t icu la te determination. the f i l ter should have a surface
a l k a l i n i t y less than 7.5 pH. Again, ana ly t ica l results provided by f i l t e r
manufacturers are acceptable. Pa l l f lexR type 2500 QAT-Up Ultra Pure F i l t e r s
have been found t o meet these l i m i t s .
Quartz f i b e r or The filters should
4.1.2 Water. To conform t o ASTM Specification Dll! 3.77. Ty& I1
(incorporated by reference).
f i e l d use. A l l t a rge t metals should be less than 1 ng/ml.
Analyze the water for all target metals p r io r t o
4.1.3 N i t r i c Acid. Concentrated. Baker Instra-analyzed or equivalent.
4.1.4 Hydrochloric Acid. Concentrated. Baker Instra-analyzed or equivalent.
4.1.5 Hydrogen Peroxide. 30 Percent (V/V) . 4.1.6 Potassium Permanganate.
4.1.7 Sulfur ic Acid. Concentrated.
4.1.8 S i l i c a G e l and Crushed Ice.'Same 85 Method 5. Sections 3.1.2 and
3.1.3. respectively.
4.2 4.2.1 Ni t r i c Acid/Hydrogen Peroxide Absorbing Solution. Add 50 m 1 of
concentrated n i t r i c acid and 333 m l of 30 percent hydrogen peroxide t o a 1000
m l volumetric f l a sk or graduated cyl inder containing approximately 500 m l of
water. D i l u t e to volume w i t h water. The reagent s h a l l contain less than
2 ng/ml of each ta rge t metal.
Pretest Preparation for Sampling Reagents.
9
.

4.2.2 Acidic Potassium Permanganate Solution. F i l l a 1 l i t e r volumetric f l a s k o r graduated cylinder w i t h approximately 800 m l of water.
40.0 g of potassium permanganate and dissolve i t i n the water. Add 100 m l of
concentrated s u l f u r i c acid and mix well. Let the solution cool and d i lu t e t o
vdlume w i t h water.
metal. Precaution: so lu t ion . f i l t e r t h e solut ion through Whatman 541 f i l t e r paper. react ion of the potassium permanganate w i t h t h e acid, there may be pressure
buildup i n t h e sample s torage bot t le .
and should be vented both t o relieve excess pressure end t o prevent explosion
due t o pressure bui ldup . Venting is highly recommended. but should not allow
contamination of the sample; a No. 70-72 hole d r i l l ed i n the container cap and
Teflon l i n e r has been used.
Weigh out
The reagent sha l l contain less than 2 ng/ml of each ta rge t
To prevent autocatalyt ic decomposition of the permanganate
Also due t o
These bo t t l e s should not be f i l l e d f u l l
4.2.3 Ni t r ic Acid. 0.1 N . Add 6.3 m l of concentrated n i t r i c acid (70
percent) t o a graduated cylinder containing approximately 900 m l of water. Di lu te t o 1000 m l w i t h water. M i x w e l l . The reagent s h a l l contain less than 2
ng/ml of each ta rge t metal. 4.2.4 Hydrochloric Acid, 8 N. Add 690 ml of concentrated hydrochloric
a c i d t o a graduated cylinder containing 250 ml of water. water.
t a r g e t metals.
Dilute t o 100 m l w i t h
Mix well. The reagent s h a l l contain less than 2 ng/ml of each the
4.3 Glassware Cleaning Reagents.
4.3.1 Ni t r ic Acid. Concentrated. Fisher ACS grade or equivalent.
4.3.2 Water. To conform t o ASTM Specifications D1193-77. Type 11. 4.3.3 Ni t r ic Acid, 10 Percent ( V / V ) . Add 500 m l of concentrated n i t r i c
ac id t o a graduated cylinder containing approximately 4000 m l of water. Di lu te t o 5000 m l w i t h water. -
4 .4 4 . 4 . 1 Hydrochloric Acid. Concentrated.
4.4.2 Hydrofluoric Acid. Concentrated.
4 - 4 . 3 Nitric Acid. Concentrated. Baker Instra-analyzed or equivalent.
4 .4 .4 Ni t r ic Acid, 10 Percent ( V / V ) . Add 100 ml of concentrated n i t r i c
Sample Digestion and Analysis Reagents.
acid t o 800 ml of water. D i l u t e t o 1000 m l with water. Mix w e l l . Reagent
s h a l l contain less than 2 ng/ml of each target metal.
* e :s jccurnent b 5 .-MIIrnrri)ri~ry 6nr- * has no: besn hrmally mlcised b~ W.
a::! s k c m nor at thlr Itage be c o r s w t d T rejrescnt A g e n q pollcy. R 1% being C ~ ~ C A ~ I P : tor convnmnt on Its recn+u' DZCU:~C~ ana y-lity tmpliattc-.-
rhb &mlWtnlli mlldnuj W- 9 IUS mf bcen -fly mbead by EPA ?:d Should nor at thh rtsge be construed '0 re2rucnt Agena) policy. R is Wing scda;eC Icr corn-rneq 03 ifs :-?--IC** =.L'r>cy .nu y . I,,-\ . *I,, ....' '
10
F-10

~
I I I I I I I I I 1 I I C I I I I 'I I
4.4.23 AAS Grade Cu Standard, 1000 ug/ml.
4.4.24 AAS Grade Mn Standard, 1000 ug/ml. - 4.4.25 AAS Grade N i Standard, lo00 ug/ml.
4.4.26 AAS Grade P Standard. 1000 ug/ml.
4.4.27 AAS Grade Se Standard. 1000 u g f d .
4.4.28 AAS Grade Ag Standard. 1000 ug/ml.
4.4.29 AAS Grade T1 Standard. lOOQ ug/ml.
4.4.30 AAS Grade Zn Standard. 1000 ug/ml.
4.4.31 AAS Grade A 1 Standard. 1000 ugfml.
4.4.32 AAS Grade Fe Standard, 1000 ug/ml:
4.4.33
. - .L. - - _.-- -uu
The metals standards may also be made from so l id chemicals 85
described i n EPA Method 200.7. Analysis of Water and Wastewater. 15th Edition. Method 303F should be referred
to for addi t ional information on mercury standards.
E P A Method 7470 or Standard Methods for the
11
4.4.5 Nit r ic Acid, 5 Percent (V/V). Add 50 ml of concentrated n i t r i c acid
to 800 m l of water. D i lu t e t o 1000 m l w i t h water. Reagent s h a l l contain less
than 2 ngfml of each target metal. 4.4.6 Water. To conform to AS'IU Specifications D1193-77. Tvpe XI. 4.4.7 Hydroxylamine Hydrochloride and Sodium Chloride Solution. See E P A
4.4.8 St&ous Chloride.
4.4.9 4.4.10 Sulfur ic Acid, Concentrated.
4.4.11 N i t r i c Acid, 50 Percent (V/V). 4.4.12 Potassium Persulfate. 5 Percent (W/V) - 4.4.13 Nickel Nitrate. Ni(N03)2'6H20. 4.4.14 Lanthanum Oxide, La2O3.
4.4.15 AAS Grade Hg Standard. 1000 ugfml.
4.4.16 AAS Grade Pb Standard. 1000 ug/ml.
4.4.17 AAS Grade A s Standard. 1000 ug/ml. .- - - *
4.4.18 AAS Grade Cd Standard, lo00 ug/ml.
Method 7470 for preparation.
Potassium Permanganate. 5 Percent (W/V) .
--..e.- DYi* ., .. .. . - . -

4.4.34 Mercury Standards and Qual i ty Control Samples. Prepare a 10 ug/ml
mercury standard by adding 5 m 1 of loo0 ug/ml mercury standard t o a 500 m l
volumetric flask. then water.
standard t o a 250 m l volumetric flask and d i l u t e t o 250 m l with 5 m l of 4% KMnO4. 5 m l 15 percent n i t r i c acid, and then water. prepared by d i lu t ion of the 200 ng/ml mercury standard.
standards should be used t o prepare the standard curve.
0 . 2 5 , 0.50. 1.00, and 2.00 t o t a l ng are suggested. Quality control samples
should be prepared by making a separate 10 n g / m l standard and di lut ing u n t i l i t
i s i n t he range of the samples.
Dilute t o 500 m l with 20 m 1 of 15 percent n i t r i c acid and
Prepare a 200 ng/ml standard by adding 5 m l of the 10 ugfml
Other standards should be
A t least four Standards containing
4.4.35 ICAP Standards and Quality Control Samples. Calibration standards
f o r ICAP analysis can be combined i n t o four different mixed standard solutions
as shown below.
M I X E D STANDARD SOLVTIONS FOR ICAP ANALYSIS
Solution Elements I As. Be. Cd. Mn, Pb. Se. Zn I1
111 I V
Ea, Cu. Fe Al. C r . N i Ag, P. Sb. ll
Prepare these standards by combining and d i lu t ing the appropriate volumes of
t he 1000 ug/ml solut ions with 5 percent n i t r i c acid. A minimum of one stan- dard and a blank can be used t o form each cal ibrat ion curve. However. a sep-
a r a t e q u a l i t y control sample spiked with known amounts of the target metals i n quan t i t i e s expected t o be i n the midrange of the cal ibrat ion curve should be
Prepared. Suggested standard levels are 50 ug/ml for Al. 25 ug/ml for C r and
Pb. 15 ug/ml for Fe, and 10 ug/ml for the remaining elements. Standards con-
t a in ing less than 1 ug/ml of metal should be prepared daily. Standards con-
t a in ing g rea t e r than 1 ug/ml of metal zbould be s table for a minimum of 1 to 2
weeks.
4.4.36 Graphite Furnace AAS Standards for Antimony, Arsenic, Cadmium.
Lead, Selenium. and Thallium. Prepare a 10 ug/ml standard by adding 1 ml of 1000 ug/ml standard t o a 100 m l volumetric flask. percent n i t r i c acid. For graphite furnace AAS. the standards must be matrix
matched: e . 6 . . i f the samples contain 6 percent n i t r i c acid and 4 percent hydrofluoric acid. t h e standards should a l s o be made up with 6 percent n i t r i c
D i l u t e t o 100 m l with 10
-3 dw?Jmant b a prcllminafy dm: bas nol been h a l l y rsltased bf iyi
xi should net at mlr sap ~e COMN.~ -n represent Agmnq pollcy. It Is be:% ~rcda led for cornplant on IS te:hd-' u c u ~ c y and p l k y tmollatlc;.r
12
F-12 ~
1 I

I I I I
I I I I I
acid and 4 percent hydrofluoric acid.
1 m l of the 10 ug/ml standard t o a 100 m l volumetric flask and d i l u t e t o 100 ml with the appropriate matrix solut ion.
d i lu t ion of the 100 ng/ml standards.
make up t h e standard curve.
Quality control samples should be prepared by making a separate 10 ug/ml
standard and d i lu t ing until i t is i n the range of the samples.
containing less than 1 ug/ml of metal should be prepared dai ly .
containing greater than 1 ug/ml of metal should be stable for a minimum of 1 to
2 weeks.
Prepare a 100 ng/ml standard by adding
Other standards should be prepared by
A t least four standards should be used t O
Suggested levels are 10. 50. 75. and 100 ng/ml.
Standards
Standards
4.4.37 Matrix Modifiers.
4.4.37.1 Nickel Nitrate, 1 Percent (V/V). Dissolve 4.956 g of
Ni(N03)2.6HZO i n approximately 50 m l of water i n a 100 m l volumetric f l a s k .
Di lute t o 100 m l w i t h water.
4.4.37.2 Nickel Nitrate , One-tenth Percent (V/V). Dilute 10 m 1 of 1 per-
cent nickel n i t r a t e solution t o 100 m l with water. In jec t an equal amount of sample and t h i s modifier i n t o the graphi te furnace during AAS analysis for A s .
4.4.37.3 Lanthanum. Dissolve 0.5864 g of La203 i n 10 m l of concentrated
HNO3 and d i l u t e t o 100 ml with water.
t h i s modifier i n t o the graphite furnace during AAS analysis for Pb.
In jec t an e q u a l mount of sample and
5. Procedure
5 . 1 Sampling. The complexity of t h i s method i s such tha t . i n order t o
obtain re l iab le resu l t s . t e s t e r s should be trained and experienced w i t h the
test procedures.
5.1.1 Pre tes t Preparation. Follow the same general procedure given i n Method 5. Section 4.1.1. except t ha t . unless particulate emissions are to be determined. the f i l t e r need not be desiccated or weighed.
glassware should f i r s t be rinsed w i t h hat tap water and then washed i n hot
soapy water. Next. glassware should be rinsed three times w i t h tap water,
followed by three additional r inses with water.
soaked i n a 10 percent (V/V) n i t r i c ac id solution for a minimum of 4 hours, r insed three times w i t h water. r insed a f ina l time with acetone. and allowed
t o a i r dry.
covered u n t i l the sampling t r a i n i s assembled. pr ior to sampling.
A l l sampling t r a in
All glassware should then be
All glassware openings where contamination can occur should be

5.1.2 Prel iminary Determinations. Same as Uethod 5. Sect ion 4.1.2. 5.1.3 prepa ra t ion of Sampling Tra in . Follow t h e same general procedures
g iven i n Method 5. S e c t i o n 4.1.3. except place 100 ml of the n i t r i c acid/hydrogen peroxide s o l u t i o n (Sec t ion 4 -2.1) i n the two HNO3/H202 impingers (normally t h e second and t h i r d impingers) . p l ace 100 m l of the ac id i c potassium
permanganate s o l u t i o n (Sec t ion 4.2.2) i n t h e f o u r t h and f i f t h impinger. and
transfer approximately 200 t o 300 g of preweighed s i l i ca gel from its con ta ine r
t o t h e last impinger. A l t e rna t ive ly , t h e s i l i c a gel may be weighed d i r e c t l y i n
t h e impinger j u s t p r i o r t o t r a i n assembly.
Seve ra l op t ions are a v a i l a b l e t o t h e tester based on the sampling
cond i t ions .
mois ture t o be c o l l e c t e d i n the impingers is ca lcu la t ed or determined to be
less than 150 m l . The tester s h a l l i n c l u d e two impingers containing the a c i d i c potassium permanganate s o l u t i o n f o r t he first test run. unless p a s t
t e s t i n g exper ience a t t h e same or s i m i l a r sources has shorn t h a t only one is
necessa ry .
permanganate impingers have re ta ined t h e i r o r i g i n a l deep purple permanganate
color. t h r e e permanganate impingers) may be used. i f necessary, to m a i n t a i n t h e
d e s i r e d c o l o r i n t h e last permanganate impinger.
The use of an empty f irst impinger can be eliminated i f t he
The last permanganate impinger may be discarded i f both
A m a x i m u m of 200 ml i n each permanganate impinger (or a maximum of
Reta in f o r reagent blanks. 100 m l of the n i t r i c acid/hydrogen peroxide
s o l u t i o n and 100 m l of t h e ac id i c potassium permanganate so lu t ion . These s o l u t i o n s should be l abe led and t r e a t e d 85 descr ibed i n Sect ion 7. sampling t r a i n as shown i n Figure A - 1 .
Set up t h e
Precaut ion: Extreme care should be taken t o prevent contamination wi th in
t h e t r a i n . Prevent the mercury c o l l e c t i o n reagent ( a c i d i c potassium
permanganate) from con tac t ing any glassware of the train which is washed and
analyzed for Mn. Prevent hydrogen peroxide from mixing w i t h t he ac id i c potassium permanganate. -
5.1.4 Leak-Check Procedures. Follow t h e leak-check procedures given i n
Method 5. S e c t i o n 4.1.4.1 ( P r e t e s t Leak-Check), Sec t ion 4.1.4.2 (Leak-Checks
During t h e Sample Run). and Sect ion 4.1.4.3 (Post-Test Leak-Checks).
5.1.5 Sampling Tra in Operation. Follow the procedures given in Method 5. S e c t i o n 4.1.5. For each run. record t h e d a t a requi red on a da ta sheet such as t h e one shown i n Figure 5-2 of Method 5.
r.:r e v : 5 e - . b p+*it?tnr.,y oz... ' b s not t r f ~ ~ ~ ! l ; . q;esh. tl c; .,
14 should r - a i rnir stage DL cz,-.t.vz5 ''> fePre:wj: %*-ria) policy. f i is b,jzT arcI.:aled tor conpent on ) ~ r Icchrli;i. ~ U R C Y *no p-Uq ~ m p u ~ t & ~

~
I I J
I 1
I d
I I I I I
r s I I
r I I I I I I
5.1.6 Calculation of Percent Isokinet ic . Same as Method 5. Section 4.1.6.
5.2 Sample Recovery.
removed from the s tack a t the end of a sampling period.
Begin cleanup procedures as soon as the probe is
The probe should be allowed to cool pr ior t o sample recovery. When i t C a n
be sa fe ly handled. w i p e off a l l ex terna l par t iculate matter near t h e t i p of
the probe nozzle and place a r insed , non-contaminating cap over the probe
nozzle t o prevent losing or gaining par t icu la te matter.
t i p t i g h t l y while t h e sampling t r a i n is cooling.
t o form i n the f i l t e r holder. thus causing the undesired r e s u l t of drawing
l i q u i d from the impinges i n t o the f i l ter .
Do not cap the probe
This normally causes a vacuum
Before moving the sampling t r a i n t o the cleanup s i te . remove the probe from
t h e sampling t r a i n and cap the open o u t l e t .
condensate tha t might be present .
fastened. Remove the umbilical cord from the last impinger and cap the
impinger.
contaminating caps. whether ground-glass stoppers. p l a s t i c caps, or serum caps,
t o c lose these openings.
Be careful not t o lose any
Cap the f i l t e r inlet where the probe w a s
Cap off the f i l t e r holder o u t l e t and impinger i n l e t . Use non-
Transfer the probe and f i l ter- impinger assembly t o a cleanup area tha t is clean and protected from the wind and other potential causes of contamination
or loss 0:: sample. . Inspect the t r a i n before and during disassembly and note
any abnormal conditions. The sample i s recovered and t rea ted as follows (see
schematic i n Figure A-2). sample do not contaminate it.
Assure t h a t all items necessary fo r recovery of t h e
5.2.1 Container No. 1 ( F i l t e r ) . Carefully remove the f i l t e r from the
f i l t e r holder and place i t i n its iden t i f i ed pe t r i dish container. Acid-
washed polypropylene or Teflon coated tweezers or clean, disposable surgical
gloves rinsed w i t h water should be used t o handle the f i l t e r s . I f it is necessary t o fold the f i l t e r , make c e r t a i n the part iculate cake is inside the
f o l d . Carefully transfer the f i l t e r and any par t iculate matter or filter
f i b e r s t ha t adhere t o t h e f i l t e r holder gasket to the p e t r i dish by using a dry
(acid-cleaned) nylon b r i s t l e brush. Do not use any metal-containing materials when recovering t h i s train. Seal the labeled petri dish.
5.2.2 Conteiner No. 2 (Probe). Note: Container No. 2 can be omitted i f
the t e s t i n g does not include the determination of par t icu la te concentration.
Taking care t o see t h a t dus t on t h e outs ide of the probe or other exter ior
sur faces does not get i n t o the sample. q u a n t i t a t i v e l y recover par t icu la te 'P.b dccmtient b h .pronmina~ &UT. ' has not t e e n tormally released tf ZP:. - 'd Should not 01 thlC rtaze D I cz*.:%< .. repmsmt Ageno) policy. ll i% L...;:: Jrculaled tor comyncnt on I b Ieztm'ii ucu:acy ann y-licy I rp l la t loas
15

- ..
- K N 4 r -
.
16
F-16
I i
I 1 I 1 I 1 I I III I I I 'I I I I I I ' I I I 1 I

__
I I I I I I I I I 1 I ,I 1 I I I I :I I
matter or any condensate from the probe nozzle, probe f i t t i n g , probe l i n e r . and f ron t half of the f i l t e r holder by washing these components w i t h acetone
and placing t h e wash i n a g las s container.
of acetone when approved by the Administrator and s h a l l be used when specif ied
by the Administrator; i n these cases. save a water blenk and follow the
Administrator's direct ions on analysis.
Carefully remove the probe nozzle and clean the inside surface by r insing with
acetone from a wash b o t t l e and brushing with a metal-free Nylon b r i s t l e brush.
Brush u n t i l the acetone r in se shows no v i s i b l e par t ic les . a f t e r which make a f i n a l r i n se of the i n s i d e surface with acetone.
D i s t i l l e d water may be used instead
Perform the acetone rinses as follows:
Brush and r inse the in s ide pa r t s of the Swagelok f i t t i n g w i t h acetone i n a similar way u n t i l no v i s i b l e p a r t i c l e s remain.
Rinse t h e probe l i n e r w i t h acetone by t i l t i n g and rotat ing the probe while
squ i r t i ng acetone in to its upper end so t h a t all inside surfaces w i l l be we t t ed
w i t h acetone. L e t the acetone drain from the lover end in to the sample
container. A funnel (g lass o r polyethylene) may be used t o a i d on t ransferr ing
l i qu id washings t o the container.
probe brush.
upper end as the probe brush i s being pushed with a twisting action through the
probe; hold a sample container underneath the lowtr end of the probe, and catch
any acetone and par t icu la te matter which i s brushed through the probe three
times or more u n t i l no v i s i b l e pa r t i cu la t e matter is carried out with the
acetone or u n t i l none remains i n the probe l i n e r on visual inspection. Rinse
the brush with acetone, and quant i ta t ive ly co l lec t these washings i n the sample
container.
described above.
Follow the acetone rinse w i t h a metal-free
Hold the probe i n an incl ined posit ion, squ i r t acetone i n t o the
After the brushing, make a f i n a l acetone r inse of the probe as
It i s recommended t h a t two people be used t o clean the probe t o minimize
Between sampling runs, keep brushes clean and protected from sample losses.
contaminations.
After ensuring tha t all j o i n t s have been wiped clean of s i l icone grease.
clean the i n s i d e of t h e f ron t half of the f i l t e r holder by rubbing the surfaces
with a metal-free nylon b r i s t l e brush and r insing with acetone.
surface three times o r more i f needed to remove v i s ib l e par t iculate . Wake a f i n a l r i n se of the brush and f i l t e r holder.
pa r t i cu la t e matter have been col lected i n the sample container, t ighten the l i d
Rinse each
After all acetone washings and
on , tone
17 t o

the laboratory. ' Mark the height of the f lu id level to determine whether or not
leakage occurred during t ransport . Label the container c lear ly t o ident i fy i t s
contents . 5.2.3 Container No. 3 (Probe Rinse). Rinse the probe liner. probe nozzle,
and f ront half of the f i l t e r holder by r insing these components thoroughly w i t h
0.1 N n i t r i c acid and placing the wash i n t o a sample storage container. Perform the r inses as described i n Method 12. Section 5.2.2. record the volume of the combined r inses , and place the sample i n t o a storage
container . and use t h i s mark t o determine i f leakage occurs during transport . Seal the
container and c lear ly labe l the contents.
Measure and
Mark the height of the f l u i d leve l on the outside of the container
5.2.4 Container No. 4 (Impingers 1 through 3. Contents and Rinses). Due t o the la rge quant i ty of l iqu id involved, the tester m a y place the impinger
so lu t ions i n more than one container. Measure the l iqu id i n the first three impingers volumetrically .to within 0.5 m l using a graduated cylinder.
the volume of l iqu id present. This information is required t o calculate the
moisture content of the sampled f lue gas. impingers and connecting glassware by thoroughly r insing with 0.1 N n i t r i c acid as described i n Method 12. Section 5.2.4. so lu t ions . measure and record t h e volume. Mark the height of the f lu id l e v e l on the outside of the container t o determine if leakage occurs during t ranspor t . Seal the container and c l ea r ly labe l the contents.
Record
Clean each of the f i r s t three
Combine the rinses and impinger
5.2.5 Container No. 5 (Acidified Potassium Permanganate Solution and
Rinses, Inpingers No. 4 h 5) . impingers ( four th and f i f t h , i f two permanganate impingers are used) in to a
graduated cylinder and measure the volume t o w i t h i n 0.5 m l . This information is required t o calculate the moisture content of the sampled flue gas. Rinse t h e permanganate impinger(s) and connecting glass pieces a minimum of three
times w i t h ac id i f ied potassium permangwate solution. Combine the rinses w i t h
t h e permmganate impinger solut ion i n a graduated cylinder and measure the
t o t a l volune within 0.5 m l . Place the combined rinses and impinger contents i n a labeled container.
container t o determine i f leakage occurs during transport.
note and the Precaution i n Paragraph 4.2.2 and properly seal the container and
Clearly label t h e contents.
Pour all the l i q u i d from the permanganate
Mark the height of the f luid level on the outside of the See the following
"fi *.U*P.)?I li s..-mnmtr.,v *mf; 'iz: r e teen toormally Rleaszc b, ::-
.. I\oL'!: nr.t at ~ I S rtage be tzT..-.. . 18 .. W r e s w . : Agene) policy. n i , be,,.;
::The: tor conpent on =-CY ana v4cy Lnpllwti0.l;.

~~
I I I I I I I I I I I I I I I I I 1 I
w: Due t o the poten t ia l react ion of the potassium permanganate wi th the
acid. there may be pressure buildup i n the sample storage bot t les .
bo t t l e s should not be f i l l e d f u l l and should be vented t o relieve excess pressure.
container cap and Teflon l i n e r has been found t o allow adequate venting without
loss of sample.
lhese
Venting is highly recommended. A No. 70-72 hole d r i l l ed in the
5.2.6 Container No. 6 (S i l i ca G e l ) . Note the color of the indicating s i l i c a gel t o determine whether i t has been completely spent and make a
notation of its condition. or iginal container and seal. ge l and a rubber policeman t o remove the s i l i c a gel from the impinger.
small amount of p a r t i c l e s that may adhere t o the impinger wall need not be removed. weight gained i n the s b l i c a gel impinger i s used for moisture calculations. Alternatively. i f a balance i s avai lable i n the f i e l d , record the weight of
the spent s i l i c a gel (or s i l i c a gel plus impinger) t o the nearest 0.5 g.
Transfer the s i l i c a gel from i t s impinger t o its The tester may use a funnel t o pour the s i l i c a
The
Do not use water or other l iqu ids to transfer the s i l i c a gel since
5.2.7 Container No. 7 (Acetone Blank). Once during each f i e l d test, place
100 m l of t he acetone used i n the sample recovery process i n t o a labeled container f o r use as a recovery solvent blank. Seal the container.
5.2.8 Container No. 8 (0.1 N N i t r i c Acid Blank). Once during each f i e l d
test. place 100 m l of t he 0.1 N n i t r i c acid solution used in the sample recovery process i n t o a labeled container for use as a recovery solvent blank.
Seal the container. 5.2.9 Container No. 9 (5% Ni t r i c Acid/lO% Hydrogen Peroxide Blank). Once
during each f i e l d test, place 100 m l of the 5% n i t r i c acid/lO% hydrogen
peroxide solut ion used as t he n i t r i c acid impinger reagent i n t o a labeled container f o r use as a blank. Seal the container.
5.2.10 Container No. 10 (Acidified Potassium Permanganate B l a n k ) . Once
during each f i e l d t e s t , p lace 100 m l of-the acidified potassium permanganate
solution used as t h e impinger solut ion and i n the sample recovery process in to
a labeled container f o r use as a blank. Seal the container.
- Note: This container should be vented, as described i n Section 5.2.4. t o
re l ieve excess pressure. 5.2.11 Container No. 11 ( F i l t e r B l a n k ) . Once during each f i e l d test.
place an unused f i l t e r from t h e same l o t as the sampling f i l t e r s in a labeled
petri dish. Seal the petri dish. m cbmnant ir m a r n t n a v dn(t fiol k e n t o r m a ~ y nlea:i< b, L ~ :
' ' ' 5 rhould not at MIS stage De c31.:t.f..
-J :ePre:Mt Agene) ~ O I I C ~ .
19 it i.. tr+,y
;I?CuUIled tor C D ~ ~ L I : I- ,& ,z~.,,::;~ U=U=CI .no p-!il, G. , , . ; C:,r

5.3 Sample Preparation. Note the leve l of the l iquid i n each of the
containers and determine i f any sample w a s l o s t during shipment. not iceable mount of leakage has occurred. e i ther void the sample or use
methods. subject t o the approval O f the Administrator, t o correct the f i n a l
r e s u l t s . each of t h e sample t r a i n components i s shown i n Figure A-3.
If a
A diagram i l l u s t r a t i n g sample preparation and analysis procedures for
5.3.1 Container No. 1 ( F i l t e r ) . The f i l t e r with i t s f i l t e r catch should
be divided i n t o portions containing approximately 0.5 g each and placed i n t o the ana lys t ' s choice of either individual microwave pressure r e l i e f vessels or
Par$ Bombs. hydrofluoric acid should be added t o each vessel.
microwave the sample vessels for approximately 12-15 minutes in in te rva ls of 1
t o 2 minutes a t 600 Watts.
14OoC (285OF) for 6 hours. Then cool t h e samples t o room temperature and
combine with the acid digested probe rinse as required i n Section 5.3.3. below.
Six m l of concentrated n i t r i c acid and 4 m l of concentrated
For microwave heating.
For conventional heating. heat the Parr Bombs a t
- Notes: 1. Suggested microwave heat ing times are approximate and are dependent
upon the number of samples being digested. Twelve t o 15 minute heating times have been found t o be acceptable f o r simultaneous digestion of up t o 12 individual samples. evidenced by sorbent re f lux within the vessel.
Suf f ic ien t heating 1s
2. I f the sampling t r a i n uses an optional cyclone. the cyclone catch
shouid be prepared and digested using the same procedures described
for the f i l ters and combined w i t h the digested f i l t e r samples.
5.3.2 Container No. 2 (Probe). Note the level of l iqu id in the container
and confirm on the analysis sheet whether or not leakage occurred during
t ranspor t . If a noticeable amount of leakage has occurred, e i t h e r void the
sample o r use methods, subjec t t o the approval of the Administrator, t o correct the f i n a l r e su l t s . Measure t h e l i q u i d i n t h i s container e i t h e r volumetrically
t o - *1 m l or gravimetrically t o ~ 0 . 5 g.
tared Z5O-ml beaker and evaporate to dryness at ambient temperature and Pressure.
the procedures described i n Section 4.3 of Method 5. neares t 0.1 mg. Resolubilire the residue w i t h concentrated n i t r i c acid and
combine t h e resu l tan t sample including all l i q u i d and any pa r t i cu la t e matter
with Container No. 3 p r i o r t o beginning the following s t ep 5.3.3.
Transfer the contents t o an acid-cleaned
Desiccate for 24 hours and weigh t o a constant weight according t o Report the results to the
r)lb dPr.tn?hnt b b pnllmmary enf.. * tms nol been (onnrlly d e a a e d b, Eph.
rhoula not .t ?his sbge be crnstrr't*
20
0 I*DrCSM01 &.no) poky. h i- a'Eublea 101 conynent on iG -.. --.-::in'
u u . a c y .no p-llcy lmoliLa:*:. .
F-20

I
-
O L . Y 0
- L -
c 0 L
b O L . O
- m m . >I. a * C m
..I
4

5.3.3 Container No. 3 (Probe Rinse). The PH of t h i s sample sha l l be 2 or
lower. n i t r i c acid t o pH 2.
t he beaker should be covered with a ribbed WatchglESS.
be reduced t o approximately 50 m l by heating on a hot p l a t e a t a temperature
j u s t below boiling. depending on the results of the inspection. perform one of the following.
p a r t i c u l a t e matter i s observed, combine the sample d i rec t ly with the acid
digested portions of the f i l t e r prepared Previously i n Section 5.3.1. I f
p a r t i c u l a t e matter is observed. d iges t the sample i n microwave vessels o r Par9
Bombs following the procedures described i n Section 5.3.1; then combine the
r e s u l t a n t sample d i r e c t l y w i t h t h e a c i d digested portions of the f i l t e r prepared
previously i n Section 5.3.1. Fraction 1. r i n s e samples using Whatman 541 f i l t e r paper. Dilute t o 300 m l (or the
appropriate volume for the expected metals concentration) with water.
and record the combined volume of the Fraction 1 solution t o within 0.1 m l .
Quanti ta t ively remove a 50 m l a l iquot and label as Fraction 1B. remaining 250 m l portion as Fraction 1 A .
ana lys i s .
If the pH is higher. the sample should be acidif ied w i t h concentrated The sample should be r insed in to a beaker w i t h water and
The sample volume should
Inspect the sample for v i s ib l e par t icu la te matter. and
I f no
The resu l tan t combined sample is referred to as F i l t e r the combined solut ion of the acid digested f i l t e r and probe
Measure
Label the Fraction 1 A is used for ICAP or AAS
Fraction 1B is used f o r t he determination of f ront half mercury. 5.3.4 Container No. 4 (Impingers 1-31. Measure and record the to t a l vol-
ume of t h i s sample to within 0.5 m l .
sis and l abe l as Fraction 2B. analyzed as described i n Section 5.4.3. The remaining portion of Container No. 3 should be labeled Fraction 2A and s h a l l be pH 2 or lower. I f necessary, use concentrated n i t r i c acid to lower this f rac t ion t o pH 2. The sample should be
r insed i n t o a beaker with water and the beaker should be covered with a ribbed
watchglass. heat ing on a hot p l a t e a t a t empera ture jus t below boiling.
of the digescion procedures described i n Sections 5.3.4.1 and 5.3.4.2. below.
Remove a 50 m 1 a l iquot for mercury analy-
The Fraction 2B aliquot should be prepared and
The sample volume should be reduced t o approximately 20 m l by
Then follow e i ther
5.3.4.1 Conventional Digestion Procedure. Add 30 m 1 of 50 percent n i t r i c ac id and heat f o r 30 minutes on a hot p l a t e t o just below boiling.' Add 10 m l of
3 percent hydrogen peroxide and heat for 10 more minutes.
water and heat the sample f o r an addi t ional 20 minutes. Cool. f i l t e r the
sample. and d i l u t e to 150 m l ( o r the appropriate volume for t h e expected metals
Add 50 m l of hot
concentrat ions) w i t h water.
F-22
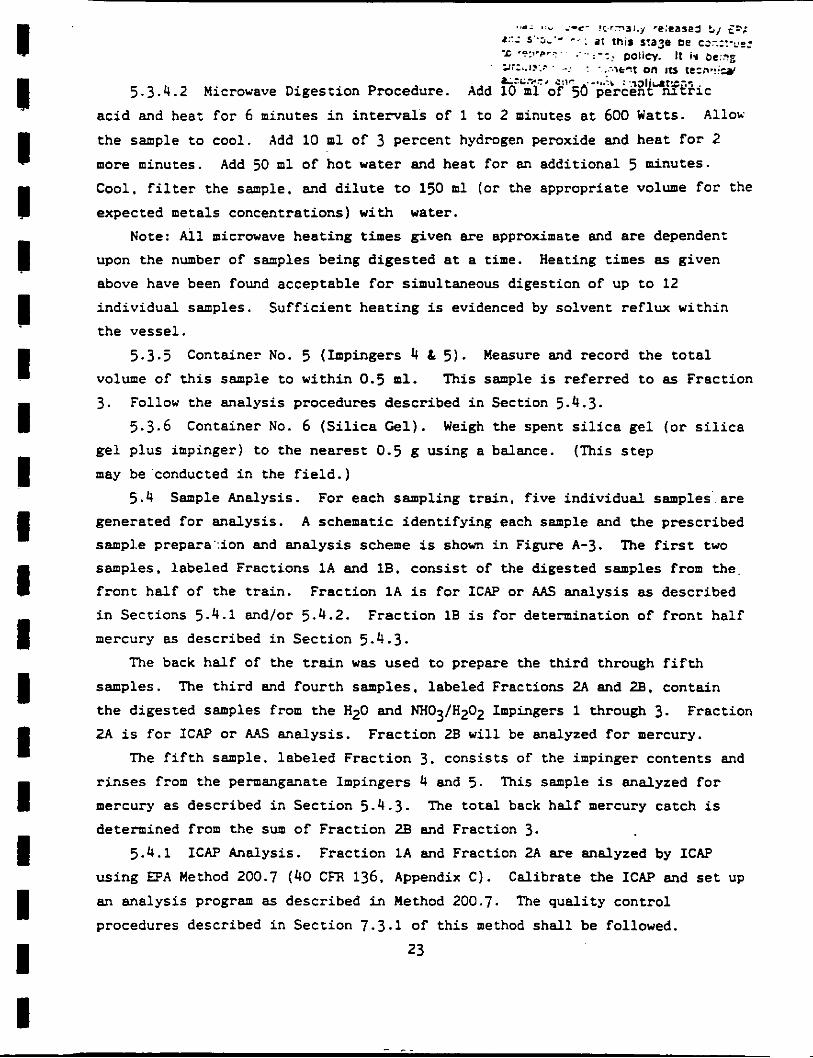
~
I I I 1 I I I I I I I I I I I I I I I
.IO; I:" -.-e- . c . r 3 3 j , y 'e:ca)aJ 5, <"; a::.: s'.>.,- .. . -= .*:,.>-.; .. ;..
. a: this stazs oe c::::-~:: . .: Dolicy. It i% b c - 5
>;:..n'.? . .-: : . .<.,t'.f 0" ,= cezn.!;ry LX-,:, 2 : v . _ a , . :, : .,JI'Llf.L.:l .
5.3.4.2 Microwave Digestion Procedure. Add 10 m l of 56 percent n r t r l c
ac id and heat f o r 6 minutes i n i n t e r v a l s of 1 to 2 minutes a t 600 Watts. Allow t he sample t o cool.
more minutes.
Cool, f i l t e r the sample, and d i l u t e t o 150 m l (or the appropriate volume for the
expected metals concentrations) with water.
Add 10 m l of 3 percent hydrogen peroxide and heat f o r 2 Add 50 m l of hot water and heat f o r an additional 5 minutes.
Note: All microwave heat ing times given are approximate and a re dependent upon the number of samples being digested at a time. Heating times as given
above have been found acceptable f o r simultaneous digestion of up t o 12
individual samples. Suf f i c i en t hea t ing is evidenced by solvent re f lux w i t h i n
the vessel .
5.3.5 Container No. 5 (Impingers 4 & 5 ) . Measure and record the t o t a l volume of this sample t o within 0.5 m l . This sample i s referred t o as Fraction
3. Follow the analysis procedures described i n Section 5.4.3. 5.3.6 Container No. 6 ( S i l i c a G e l ) . Weigh the spent s i l i c a gel (or s i l i c a
gel plus impinger) t o the nearest 0.5 g using a balance. (This step
may be 'conducted i n the f i e l d . ) 5.4 Sample Analysis. For each sampling t r a i n , f i ve individual samples'.are
A schematic ident i fy ing each sample and the prescribed generated f o r analysis. sample prepara':ion and analysis scheme is shown i n Figure A-3. samples. labeled Fractions 1 A and 1B. cons is t of the digested samples from t h e .
f ron t ha l f of the t r a i n . Fraction 1 A i s f o r I C A P or AAS analysis as described
i n Sections 5.4.1 and/or 5.4.2. mercury as described i n Sect ion 5.4.3.
The first two
Fract ion 1B i s for determination of f ron t half
The back half of the t r a i n w a s used t o prepare the t h i r d through f i f t h
samples. The t h i r d and four th samples, labeled Fractions 2A and 2B. contain
t h e digested samples from the H20 and NH03/H202 Impingers 1 through 3. 2A i s f o r ICAP or A4S analys is .
Fraction Fract ion 2E w i l l be analyzed f o r mercury.
The f i f t h sample, labeled Fract ion 3. consis ts of the impinger contents and
r i n s e s from the permanganate Impingers 4 and 5. This sample is analyzed f o r
mercury as described i n Sect ion 5.4.3. The t o t a l back half mercury catch is determined from the sum of Fraction 28 and Fraction 3.
5.4.1 ICAP Analysis. Fraction 1 A and Fraction 2A are analyzed by ICAP
using EPA Method 200.7 (40 CFR 136. Appendix C). Calibrate the ICAP and set up
an analysis program as described in Method 200.7. The q u a l i t y control
procedures described i n Section 7.3.1 of t h i s method s h a l l be followed.
23

s p e c t r a l in te r fe rence .
I n i t i a l l y . analyze a l l samples'for the t a rge t metals plus i r o n and II aluminum. If i ron and aluminum are present i n the sample. the sample may have t o be d i lu t ed so t h a t each of these elements is at a concentration of less than
50 ppm t o reduce t h e i r spec t r a l i n t e r f e rences on arsenic and lead.
I1 11 I I
- Note: When analyzing samples i n a hydrofluoric acid matrix, an alumina torch should be u s e l : s ince all f r o n t h a l f samples w i l l contain hydrofluoric
ac id . use an alumina torch. 5 .4 .2 AAS by Direct Aspiration and/or Graphite Furnace. If analysis of
metals i n Fraction 1 A and Fraction 24 using graphi te furnace or d i r e c t a sp i r a t ion AAS is desired. Table A-2 should be used t o determine which
techniques and methods should be appl ied f o r each ta rge t metal. should a l s o be consulted t o determine poss ib le interferences and techniques t o
be followed f o r their minimization. Cal ibra te t h e instrument according t o
Table A-2
Sect ion 6 . 3 and follow the qua l i t y cont ro l procedures specif ied i n Section
7.3.2. . 5 . 4 . 3 Cold Vapor AAS Mercury Analysis. Fraction 1B. Fraction 3. and
Fract ion 2B should be analyzed for mercury using cold vapor atomic absorption
spectroscopy following the method out l ined i n EPA Method 7470 or i n Standard
24
F-24

~
1 J I a I I ! I z c c b 1 z I I I I I I
.- .. e
51 0 c . u c o r 5
3
a m W x
- E .- a e L
V C 6 n
m C 0 Y " 0
- 2
m Y u 01 L L al 0, N rl C i
-3 e E 0 Y
L al m
Y
!i Id
a n
2 e
n
" " Y
0
L DI
.. i L 2
0 W L m " E - G m z m
a .,4 51
al 0 Y alu u Y
m a l cal
L
u 0 1 c a
V C a a l E E > a v
0" a .x 8 0 u 6 a l
m 4 4 3
m
C o m a2 - n~
0 m L
n a
z
" n c u
m e m
e
- - C -I 0
-3
W
C E o 1 9 L
c a - t L
al Y Y c i m -
a
m a Y
m m m
nal C L a a m u u c m O L - a Y C
N e E L ) 0 3 + a -IC 0 0 x u
z -L
m a "
m
E 0
W i 0) Y u u Y Y U Y U Y u a m 0 a 6 6 a a a
L L E L C I. . c - i L - I. " L
s C 0
- - - a l " .+ 0 - W a l
5 .- L c z
t $ n n a c 2 n -
- r ; L m m k m rl. m Lr. n In U 4 4 4 4

1
Q N 0
v) v) I- I- N N
m r.7
N e
26
F-26
I\ II II I I II I1 I1 II 1'1 I I l l

I I 1 I I I I I I I I I I I I I ,I I
Methods f o r Water and Wastewater Analysis. 1 5 t h Edition, Method 303F. Set up
t h e ca l ibra t ion curve as described i n Section 7.3 of Method 303F.
approximately j m l of each sample t o BOD bot t les .
added. The amount used is dependent upon the expected leve ls of mercury.
Dilute t o approximately 120 m l with mercury-free water. Add approximately 15 m l of 5 percent potassium permanganate solut ion t o t h e Fraction 2B and Fractior.
3 samples. Add 5 percent potassium permanganate solution t o the Fraction 1B sample as needed t o produce a purple so lu t ion las t ing a t least 15 minutes. A
minimum of 25 m l i s suggested.
concentrated s u l f u r i c acid. and 9 ml of 5 percent potassium pe r su l f a t e t o each
sample and each standard.
(205OF) i n ' a convection oven or water bath for 2 hoursL. Cool.
hydroxylamine hydrochloride so lu t ion and mix t h e sample.
Add
Record the amount of sample
Add 5 ml of 50 percent n i t r i c ac id , j m l of
Digest t he so lu t ion i n the capped BOD b o t t l e a t 9j°C Add 5 ml of .. . . -.- . .. . -._ -
T h e n 3 mi' Of""-. stannous chlor ide t o each sample and analyze immediately.,,!.
6 . Cal ibrat ion
C<r.;-.nt 6-.-jn '' F > t .." mtna.-y UZ,Y"
1 , :: i - , .
*en f m a t i y re!:;s2z tn I' at this sta,oe EL , ~ ~ ~ ~ . . .
- ,... d $2, ,:;'.":.-.$"* cn it; ;;. -.:-a-
.: r:.- ...( . .:>.sp. - .e%=c, pat:;y. . ., I..._
'
. . -.. Maintain a laboratory log of all ca l ibra t ions . - ..-. ani. .>-:::.?. - . I . . . 6.1 Sampling Train Cal ibrat ion. C a l i b r a t e t h e sampling t r a i n components ... ._ _.\. ~-
according t o the indicated sec t ions of Method 5: Probe Nozzle (Section 5.1): P i t o t Tube (Section 5.2); Metering System (Section 5.3): Pmbe Heater (Set :ion
5 .4) : Temperature Gauges (Section 5.5) ; Leak-Check of the Metering System
(Section 5 .6) ; and Barometer (Section 5.7). 6.2 Inductively Coupled Argon Plasma Spectrometer Calibration. Prepare
standards as outlined i n Section 4.6.4. Prof i le and ca l ib ra t e the instrument
according t o the instrument manufacturer's recommended procedures using the
above standards.
I f the instrument does no t reproduce the concentrations of the standard w i t h i n
10 percent , the complete ca l ib ra t ion procedures should be performed.
The instrument ca l ib ra t ion should be checked once per hour.
6.3 Atomic Absorption Spectrometer - Direct Aspiration, Graphite Furnace
and Cold Vapor Mercury Analyses. Prepare the standards as outl ined i n Section
4.6.5. Cal ibra te the spectrometer us ing these prepared standards. Calibration
procedures are a l s o out l ined i n t he EPA methods referred t o i n Table A-2 and i n Standard Methodsfor Water and Wastewater. 15th Edition. Method 303F ( f o r
mercury).
used t o ca l cu la t e the ca l ib ra t ion l i n e . The instrument should be recal ibrated
approximately once every 10 t o 12 samples.
Each standard curve should be run i n duplicate and t h e mean values
27
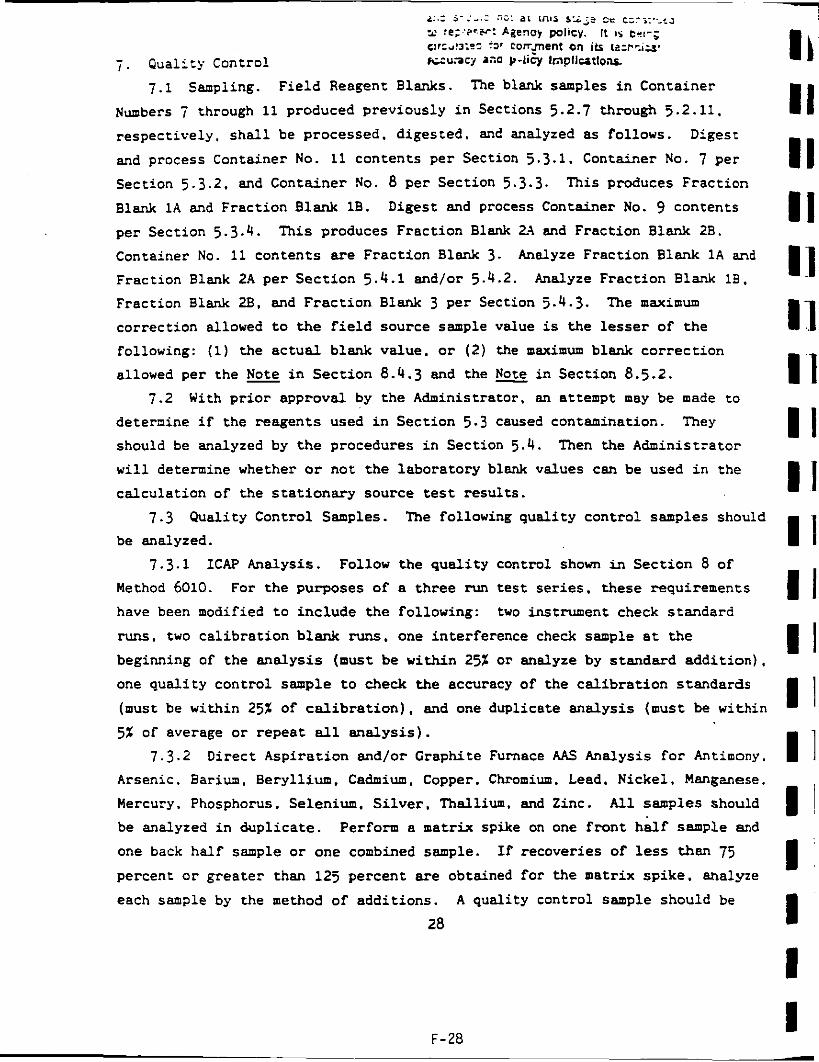
2 : , = 5 - : - . : 5s: *I Inas S;;J” DE: C:Ti:..-’.J
.r‘ :e;..r-v: Aaenoy policy. It 8s E?!-; ctr:.,!3:?? $3‘ corrpent on its t x i - T i z 8
7 . Qual i ty Control r ~ u a c y m a y-licy lmolicztlo,as
7 . 1 Sampling. Field Reagent Blanks. The blank samples i n Container
Numbers 7 through 11 produced previously i n Sections 5.2.7 through 5.2.11.
respectively, s h a l l be processed. digested. and analyzed as follows. Digest
and process Container No. 11 contents per Section 5.3.1. Container No. 7 per
Section 5.3.2. and Container No. 8 per Section 5.3.3. Blank 1 A and Fraction Blank 1B. Digest and process Container No. 9 contents
per Section 5.3.4. Container No. 11 contents are Fraction Blank 3. Analyze Fraction Blank 1 A a n d Fraction Blank 2.4 per Sect ion 5.4.1 and/or 5.4.2.
Fraction Blank 2B. and Frac t ion Blank 3 per Section 5.4.3. correction allowed t o t h e f ie ld source sample value is the lesser of the
following: (1) the ac tua l blank value. o r (2 ) the maximum blank correc t ion allowed per the Note i n Sec t ion 8.4.3 and the Nore i n Section 8.5.2.
This produces Fraction
This produces Fraction Blank 2 4 and Fraction Blank 2B.
Analyze Fraction Blank la. The m a x i m u m
7 . 2 With p r i o r approval by the Administrator, an attempt may be made to
determine i f the reagents used i n Section 5.3 caused contamination. should be analyzed by t h e procedures i n Section 5.4. Then the Administrator
w i l l determine whether or not t he laboratory blank values can be used i n the
calculat ion of the s t a t i o n a r y source test resu l t s .
They
7.3 Qual i ty Control Samples. The following qual i ty control samples should
be analyzed. 7.3.1 ICAP Analysis. Follow the qua l i t y control shown i n Sect ion 8 of
Method 6010.
have been modified t o include the following: two instrument check s t a n d a r d
runs. two ca l ibra t ion blank runs. one interference check sample a t the
beginning of the ana lys i s (must be w i t h i n 25% or analyze by standard add i t ion ) .
one qua l i ty control sample t o check the accuracy of the ca l ib ra t ion standards
(must be within 25% of c a l i b r a t i o n ) , and one duplicate ana lys i s (must be w i t h i n
5% of average o r repeat all ana lys i s ) .
For the purposes of a three run t e s t s e r i e s . these requirements
7.3.2 Direct Aspirat ion and/or Graphite Furnace AAS Analysis f o r Antimony,
Arsenic, Barium. Beryl l ium. Cadmium. Copper. Chromium. Lead. Nickel. Mangznese.
Mercury, Phosphorus, Selenium, S i l v e r , Thallium. and Zinc. All samples should be analyzed i n dupl icate . Perform a matrix spike on one f ron t ha l f sample and
one back h a l f sample or one combined sample.
percent or grea ter than 125 percent are obtained for the matrix spike. analyze
each sample by the method of addi t ions.
If recoveries of less than 75
A quali ty control sample should be
28
F-28

anal .yzed t o check standards . The r e s u l t s nus:
be within 10% or t h e ca l ibra t ion repeated.
7.3.3 Cold Vapor AAS Analysis for Mercury. All samples should be analyzed
i n dupl icate .
of the ca l ib ra t ion standards (within 10: or repeat ca l ib ra t ion ) .
matrix sp ike on one sample from the n i t r i c impinger portion (must be within 25:
or samples must be analyzed by t h e method of standard addi t ions) .
information on qua l i ty control can be obtained from EPA Method 7470 or i n
Standard Methods for Water and Wastewater. 1 5 t h Edition, Method 303F.
A qual i ty control sample should be analyzed t o check the acccracv
Perform a
Additional
8 . Calculations
8.1 Dry Gas Volume. Using the d a t a from t h i s test. ca lcu la te V,(,td). t h e
dry gas sample volume a t standard conditions as outlined in Section 6.3 of
Method 5. 8.2 Volume of Water Vapor and Moisture Content. Using the data obtained
from t h i s test, calculate the volume of water vapor Vu(std) and the moisture
content BUS of the s tack gas. Use Equations 5-2 and 5-3 of Method 5. 8.3 Stack Gas Velocity. Using the data f r o m t h i s test and Equation 2-9 of
Method 2 . ca lcu la te the average s t ack gas velocity.
8 . 4 Metals (Except Mercury) i n Source Sample.
8.4.1 Fraction 1 A . Front H a l f . Metals (except Hg). Calculate the amount
of each m e t a l col lected i n Fraction 1 of the sampling t r a i n using the following
equation:
where: M f i = Ca Fdm Vsoln Eq. 1
M f i = t o t a l m a s s of each metal (except H g ) col lected in the f ron t ha l f of t he sampling train (Fraction 1). ug.
standard curve (ug/ml) . i n Vconc. produce the reading which is Ca. Vconc is e i t h e r a pure o r a d i lu t ed solut ion of Fraction 1 A . When Vconc has been d i lu t ed t o br ing i t i n t o the ana ly t ica l range based on the ca l ibra t ion of the instrument, VcPnc w i l l have the following two portions:.Vco,cTd. which i s the drrluent so lu t ion . and VconC- Fractibn 1 A solut ion. i s from 2 t o 10 m l . the f r ac t iona l portion Vconc-p ( 2 m l ) i n Vconc (10 m l ) is 1/.5. and Fdm = 5).
Ca = concentration of metal i n sample Fraction 1 A as read from the
Fdm = d i lu t ion f ac to r ( F b = t he inverse of the f r ac t iona l portion Vconc-p Vconc i s the so lu t ion actual ly used in the instrument t o
which is the orig?.nal For example, when Le di lu t ion of Fraction 1 A
VSoln = t o t a l volume of digested sample solut ion (Fraction 1). ml.
29

orcula:eo tor comment on iLr t C i n + u '
8.4.2 Fraction 2.4. aack Ha??ave!&!%&v!%?? Calculate the amount of
each metal co l lec ted i n Fraction 2 of the sampling train using the following
equation.
Mbh = ca Fa va where:
Eq. 2
Mbh = t o t a l mass of metal (except Hg) col lec ted i n the back ha l f of t he sampling t r a i n (Fract ion 2 ) . ug.
standard curve (ug/ml).
Fraction 2A.
Ca = concentration of metal i n sample Fraction 2A. as read from the
Fa = a l iquo t f ac to r . volume of Fraction 2 divided by volume of a l iquot
Va = volume of sample a l iquot analyzed (concentrated Fraction Z A ) . m l .
8.4.3 Total Train. Metals (except Hg). Calculate the t o t a l amount of each
of the quant i f ied metals col lected i n the sampling t r a i n as follows:
M t ( M f i - M a ) * (Mbh - Mbb) Eq. 3
where:
M t
Mfb
Mbb
= t o t a l mass of each metal ( separa te ly s t a t ed for each metal) col lected
= blank correct ion value of mass of metal detected i n f ront h a l f of
= blank cor rec t ion value of m a S s of metal detected in back half of
i n the sampling t r a i n . ug.
f i e ld reagent blank. ug.
f i e l d reagent blank, ug.
- Note: f o r t h e f ron t ha l f and 1 ug for the back h a l f , or 3 ug f o r an analysis of the
so lu t ion r e s u l t i n g from combining Fraction 1 A and Fraction 2A;. or 5: of t h e
average m a s s f o r the correponding f r ac t ion of the sampling train. whichever i s g rea t e r .
The m a x i m u m value of f i e l d reagent blank that may be subtracted is 2 ug
8.5 Mercury i n Source Sample.
8.5.1 Fraction 1B. Front Half, Hg. Calculate the amount of mercury col lected i n t he f ron t h a l f . Fraction 1. of t he sampling t r a i n using the
following equation:
Eq. 4 .
*In combining Fract ions 1 A and 2A. proportional a l iquots must be used. Appropriate changes must be made i n Equations 1-3 t o r e f l e c t t h i s approach.
30
F-30
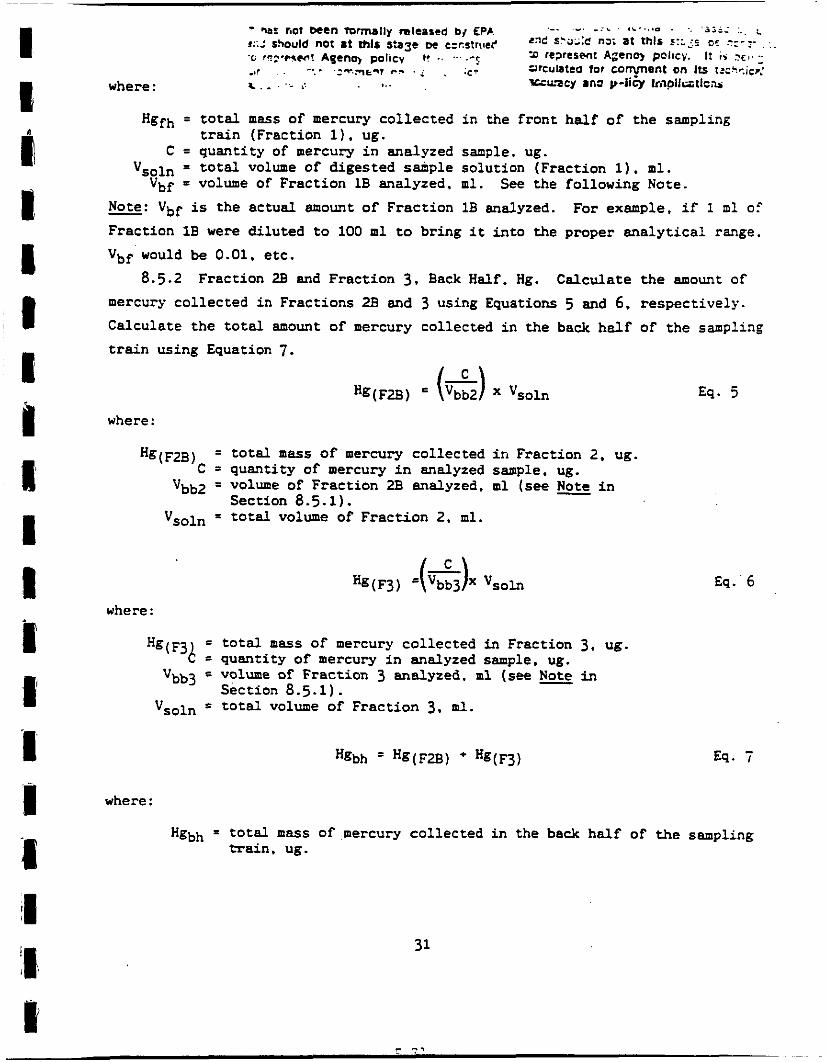
.". . , L . . . * O . .. .j;=; :,. - ha1 nor wen mrnuiiy mieased b{ LPB. ::.: not mir s:aze De c=c,tr,,cf '(I ???*c%cn? Aqenq policy I? .. '.. .-c: P revesent Ageno) pclicv. It i s .?E,. ; -6, -.: .:.Tfqe., e_. . , ;c' Prculatca tor conynent on I t s t ~ c + i ~ ~ :
e x a*;r-:c na; at fhls I:;;: DE .::-;- . .,
where: z: . I . . W u - c y ana y-licy Irapllwtls.u
Hgfh = t o t a l mass of mercury co l lec ted i n the f ront ha l f o f the sampling t r a i n (Fraction 1). ug.
C = quant i ty of mercury i n analyzed sample, ug. Vsoln = t o t a l volume of digested s a i p l e solution (Fraction 1). m l .
Vbf = volume of Fraction 1B analyzed. m l . See the following Note. - Note: Vbf is the actual amount of Fraction 1B analyzed. For example. i f 1 m l of
Fraction 1B were di luted to 100 ml to bring i t i n t o the proper ana ly t i ca l range.
Vbf would be 0.01. e t C .
8.5.2 Fraction 2B and Fraction 3. Back H a l f . Hg. Calculate the amount of
mercury col lected i n Fractions 2B and 3 using Equations 5 and 6. respect ively.
Calculate the t o t a l amount of mercury collected i n the back h a l f of the sampling t r a i n using Equation 7.
where:
H g ( ~ 2 ~ ) = t o t a l mass of mercury col lected i n Fraction 2. ug. C = quant i ty of mercury i n analyzed sample, ug.
Vbb2 = volume of Fract ion ZB analyzed, m l (see NOte i n Section 8 .5 .1 ) .
Vsoln = t o t a l volume of Fract ion 2. m l .
where:
t o t a l m a s s of mercury col lected in Fraction 3. ug.
vbb3 5 volume of Fraction 3 analyzed. m l (see Note in
Hg( F3J = quant i ty of mercury i n analyzed sample, ug.
Section 8.5.1). = t o t a l volume of Fract ion 3. m l . Vsoln
Eq. 6
where:
Hgbh = t o t a l m a s s of mercury col lected i n the back half of the sampling t r a i n . ug.

8.5.3 Total Train Mercury Catch. Calculate t h e t o t a l amount of mercury u: .- . . . ; . ..*-E:.. I- .... . . . . . I . p
col lec ted i n the sampling t r a i n using Equation 8.
where:
M t = t o t a l mass of mercury col lected i n the sampling t r a in . ug. Hgfi = blank correct ion value of mass of mercury detected in the f ron t half
Hgbb = blank co i rec t ion value of mass of mercury detected i n the back of the f i e l d reagent blank, ug.
ha l f of the f i e l d reagent blank, ug.
- Note: f o r t h e f ron t ha l f and 2 ug fo r the back h a l f , or 3 ug fo r a combined f ron t half/back h a l f analysis : or 51 of the average m a s s of mercury f o r the
correponding f r ac t ion of the sampling t r a i n ; whichever is greater .
The m a x i m u m value of f i e l d reagent b l a h t h a t may be subtracted is 1 ug
8.6 Metal Concentration of Stack Gas. Calculate t h e cadmium. t o t a l
chromium, arsenic . nickel . manganese. beryllium. copper. lead, phosphorus,
thallium. s i l v e r , barium. zinc, selenium. antimony. and mercury concentrations
i n the s tack gas (dry bas is . adjusted t o standard conditions) as follows:
where:
C, = concentration K4 = 10-3 mgjug. M t = t o t a l mass of
Vm(std) = VOlUe Of gas
of each metal i n t h e stack gas. mgjdscm.
each metal co l lec ted i n the sampling train. ug. sample as measured by the dry gas meter. corrected
t o dry standard conditions, dscm.
8.7 I sok ine t i c Variation and Acceptable Results. Same 85 Method 5. Sections 6.11 and 6.12. respectively. To ca lcu la te the average s tack gas
ve loc i ty , use Equation 2-9 of Method 2 and the data f r o m t h i s f i e l d test.
9 . Bibliography
9.1 Ward. T.E., S.C. Steinsberger. W.G. DeWees. R.R. Segall. W.S. smith. K . M . Luk. and P.M. Grohse. "Laboratory and Field Evaluation of Methodology fo r Measuring Emissions of Trace Metals f o r Stat ionary Sources." Draft repor t prepared f o r U.S. Environmental Protect ion Agency, Environmental Monitoring
32
F-32

-Size Testinq
The PH-10 concentration and the size d is t r ibu t ion w i l l be deter- mined i n accordance wi th EPA's in ter im 'Guidelines f o r Source Test ing f o r Size Speci f ic Part iculate Emissions.' ( I ) using an I n e r t i a l cascade impactor cur ren t ly manufactured by Anderson 2000 Inc., the exact model of which i s known as 'Flow Sensor.'
The Flow Sensor impactor i s a high flow r a t e (10-30 LPH) e igh t -
preimpactor t o c o l l e c t pa r t i c l es approximately 10 microns and la rge r (50% cu t po in t a t 0.6 ACFM). This preimpactor has an i n l e t uh ich Is m t 90 degrees t o the ex i t .
stage cascade impactor which I S l!QUfpped with a Lpetlal high CaDACitY
Slnce the complete slze I i r t r l b u t i o n I s required as well as t h e PM-10 concentration, t h e e n t l n cascade Impactor with the prelmpactor I s used I n conjunctlon with an EPA Hethod 5 Sampling t r a i n except t h a t t h e f l n a l f i l t e r and i t s support are removed from the Impactor.
The preimpactor and cascade Impactor I s attached t o the In-stack end o f t h e probe. The c l a s s l f i e r Is eQUlpped with the appropr la te 'atralght ' type nozzle and nozzle plug and inserted i n t o the stack gas t o preheat f o r a 20-ninute prlod t o prevent condensatlon p r i o r t o In- i t i a t i n g sarnpllng. The exact nozzle diameter 1s selected based on a pre tes t veloc 1 t y traverse .
A simple four point sampling g r i d i s usec. If the ve loc i t ies a t the four traverse points are 2 20% o f one another, one samler i s used t o sample each o f the four g r i d points. otherwise a separate sample i s rCQUIrCd f o r each t raverse p o i n t which does not f a l l I n the 2 201 ve loc i t y range. Experience has shown that t h i s requirement Is not as s t r ingent as i t appears and one samoler can usually be used f o r a l l f ou r points.
(1) FW-IO SIP Developnent Guideline USEPA EPA-450/2-86-0dl, June 1987: Appendix C. -

i
The ve loc i t y pressure, stack gas temperature, moisture content and s t a t i c pressure fo r each t raverse po in t from a prel iminary t e s t is used t o g e t h e r w i t h t h e impactor 50% c u t p o i n t curves t o s e l e c t t h e AP- p r o p r i a t e nozzle required t o g ive i sok ine t i c sampling w i t h t h e des i red 50% c u t points. I f the s i t e meets t h e 2 20% ve loc i t y requirements, sam- p l i n g is i n i t i a t e d a f t e r a 20 minute warm up per iod by uncapping t h e nozz le and pos i t ion ing t h e i n - s i t u impactor nozzle a t the f i r s t t raverse p o i n t . The pump i s act ivated and t h e f low i s rap id l y adjusted us ing t h e c a l i b r a t e d o r i f i c e t o t h e d e s i r e d r a t e . The data r e c o r d i n g by t h e operator during the t e s t i s i d e n t i c a l t c tha t f o r Method 5 sampling ek- cept t h a t the f low ra te i s he ld constant. Sampling i s continued U n t i l a l l f o u r po ints are sampled.
A f t e r sampling i s complete. t h e coarse valve i s closed, t h e DUmp t u r n e d o f f and t h e probe w i thdrawn from t h e s tack. The p re impac to r sample i s recovered i n the f i e ! d and t h e impactor catch i s re turned i n t a c t t o the laboretory f o r grav imetr ic analysis. The Method 5 Sampling t r a i n i s also processed up and through t h e glass f i b e r f i l t e r s lnce t h e in-s tack f i l t e r i n t h e impactor i s not being used. Tne EPA Uethod 5 probe r i n s e and f i l t e r catch are then subst i tu ted f o r t h e impactor fil- t e r catch i n the calculat ions.
The Impactor may be operated w i t h bare c o l l e c t i o n p l a t e s or w i t h a coat ing. The PM-10 Guidel lnes recomnends tha t a coat lng be used. A v e r y l i g h t f i l m of h igh temperature s i l i cone grease 4s appl led t o each s tage before condi t lon lng and weighing. Chemical reactions can occur w i t h t h i s coat ing which could a l t e r t h e apparent weight c o l l e c t e d by each stage. A con t ro l 'sampling o f the same durat ion Is run w i t h an i n - s tack f i l t e r assembly In Dlace of the prellapsctor. The instack f i l t e r is discarded a t t h e end of the run. The contro l sample .is c o l l e c t e d and processed i n an i d e n t i c a l manner as the other Impactor samplings. The change i n weight I n the stages I n the contro l run I s then used t o cor- r e c t t h e subseguent determinations.
Impactors a r e not designed i n a manner such t h a t they ri l l meet a Uethod 5 leak check. nor need they be. The maximum pressure droD across t h e housing i s on ly a few hundredths 1N.W. since t h e f low has f ree ac- cess t o the ins ide o f the impactor through the open nozzle. For t h i s reason, the pre- and post t c r t leak checks are conducted'pr ior t o and a f t e r removing the impactor assembly from the end o f t h e probe. The standard €PA Method 5 leak speci f icat icms are then used f o r t h i s p a r t i o n of t h e sampling t r a i n .
F-34
__

FIGURE 1. R E C M N D E D W P L l N G WIHlf FOR ClRCIMR AnD SQUARE OR UCTANGULAR WCTS. -
..

WPINGLR TRAIN OPTIONAL: H A Y BE REPLACED BY AN tOUIVALEN1 CONDLNSER 'm I
F- 36
FIWnE 2. RI 10 ?ARTICUATE SAWLING TRAIN FOR COHDENSIBLE AND WNCONDENSlBLE lART1CUUTE (WDIFICD EPA METHOD 5 TWIn).
I '

8 5

8 r
I
F-38
I I

I I I Y I I I I 1 I e
E 1 I I I 1 I
c
APPENDIX G
CALCULATION EQUATIONS

I. I 1 I I I I 1 I 1 1 i I I I I I 3 I
CALCULATION EQUATIONS
METHOD 2
Qa = 60 vs A
RH' P 100 (vptwb 0.0003641 Ps (Tdb - TWb))/vptdb
* A l t e r n a t e e q u a t i o n s f o r c a l c u l a t i n g m o i s t u r e c o n t e n t from wet b u l b and d r y b u l d d a t a .

1
S M O L S
Cross sectional area o f stack, SQ. FT.
Cross sectional area o f nozzle, SQ. FT.
Water vapor in gas stream, proportion by volune
Pitot tube coefficient, dimensionless
Concentration of particulate matter in stack gas, wet basis, 6R/ACF
Concentration of particulate matter in stack gas, dry basis, corrected to standard conditions, GR/DSCF
Excess air, percent by volume
Dry test meter correction factor. dimensionless
Specific gravity (relative t o air), dimensionless
Isokinetic variation, percent by volume
Molecular weight o f stack gas, dry basis, g/g - mole. Mass flow of wet flue gas, L B D R
Particulate mass f l ow , LB/HR
Molecular weight of stack gas, wet basis, g/g, mole.
Total amount of particulate matter collected, g
Atmospheric pressure, IN. HG. (uncompensated)
Stack static gas pressure, IN. WC.
6-2

PS = Absolute p r e s s u r e o f s t a c k g a s , IN.HG.
P s t d = Standard ' a b s o l u t e p r e s s u r e , 29.92 IN. HG.
Aa = Actual v o l u m e t r i c s t a c k g a s f l o w rate, ACM
Qs ,d = Dry v o l u m e t r i c stack g a s f low r a t e c o r r e c t e d t o s t a n d a r d c o n d i t i o n s , DSCFH
RH = R e l a t i v e humid i ty . I
Tdb = Dry b u l b t e m p e r a t u r e o f stack g a s , OF
Twb = Yet bu lb t e m p e r a t u r e of stack g a s , OF
Tm(avg) = Absolute a v e r a g e d r y g a s meter temperature , OR
T S ( a v g ) = Absolute a v e r a g e s t a c k t e m p e r a t u r e , OF
T s t d = Standa rd a b s o l u t e t e m p e r a t u r e , 528 O F (68 O F )
e = Tota l s ampl ing time, min .
v1 c = Tota l volume of l i q u i d c o l l e c t e d i n impingers and s i l i c a g e l , m l
Vm = Volume o f g a s s a m p l e a s measured by d r y gas meter, CF
V,(,-td) = Volume of g a s sample measured by the d r y gas meter c o r r e c t e d t o s t a n d a r d c o n d i t i o n s , DSCF
V w ( s t d ) = volume o f w a t e r v a p o r i n t h e gas sample c o r r e c t e d ' t o s t a n d a r d c o n d i t i o n s , SCF
- VS = Average a c t u a l s t a c k g a s v e l o c i t y . FT/SEC
VPtdb = Vapor p r e s s u r e a t Tdb. IN. HG.

V P t w b = Vapor pressure a t Twb. 1N:HG
= Average pressure differential across .the or i f ice meter, 1N. Ut.
AP - Velocity pressure of stack gas , I N . WC.
Y = Dry t e s t meter correction coeff ic ient . dimensionless
P - Actual gas density, LB/ACF
. . .. -

I i i CALCULATION EQUATIONS
METHOD 3
l0O(%O2 - ) . 5 X t o ) %EA =
= Md ( I - Bws) + 0.18 Bws MS

CALCULATION EQUATIONS
METHOD 5
Pbar + fi/13.6 1 'm(std1 = 17.65 Vm y (
Tm(avg)
'w(std) = 0.0472 VIS
15.43 M
% "m(std) - -
= 8.5714 x C, Qs,d
1 I
1.3228 x 10⁻¹ Mp A
O An - (hP)2 -

~-
I I 1 I b I I I I C i D I 1 I
s 1 I
i
A
An
Bws
CP
Ca
CS
EA
Y
Gd
I
Md
ms
mp
MS
MP
Pbar
pg
SYMBOLS
= Cross sectional area of stack, SQ. FT.
= Cross sectional area of nozzle, SQ. FT.
= Water vapor in gas stream, proportion by volume
= Pitot tube coefficient, dimensionless
= Concentration of particulate matter in stack gas, wet basis, GR/ACF
Concentration of particulate matter in stack gas, dry basis, corrected to standard conditions, GR/DSCF
=
= Excess air. percent by volume
= Dry test meter correction factor, dimensionless
Specific gravity (relative to air), dimensionless =
= Isokinetic variation, percent by volume
= Molecular weight of stack gas, dry basis, g/g - mole. = Mass flow o f wet flue gas, LB/HR
= Particulate mass flow, LB/HR
= Molecular weight of stack gas, wet basis, g/g, mole.
= Total amount o f particulate matter collected, g
= Atmospheric pressure, IN. HG. (uncompensated)
= Stack itatic gas pressure, IN. WC.

Absolute pressure o f s t ack g a s , I I I . H t .
S t a n d a r d absolute pressure, 29.92 IN. HG.
Actual volumetric s t a c k gas flow ra t e , ACFM
Dry volumetric s t ack gas f l o w r a t e corrected to s t a n d a r d conditions, DSCFX
Relative humidity, 2
Dry b u l b temperature o f stack gas. O F
Wet b u l b temperature o f stack gas. OF
Absolute average dry gas meter temperature. 02
Absolute average s t a c k temperature. OF
S t a n d a r d absolute temperature, 528 OF (68 O F )
Total sampling t ime, m i n .
Total volume o f l i q u i d col lec ted i n impingers and s i l i c a gel. m l
Volume o f gas sample as measured by dry gas meter, CF
Volume o f gas sample measured by the dry gas meter corrected t o s tandard condi t ions, DSCF
\‘olume o f water vapor i n the gas sample corrected t o s t a n d a r d condi t ions, SCF
Average actual s tack gas veloci ty . fT/SEC
Vapor pressure a t Tdb. IN. H;.
G-8

"Ptwb = Vapor pressure a t Twb. I N . H G
in = Average pressure differential across the orif ice meter, I N . UC.
AP = Velocity pressure o f stack gas. IN. WC.
Y = Dry te s t meter correction coefficient, dimensionless
P = Actual gas density, LS/ACF

1. CONCENTRATION (ug/Nm3)
ug/Nm3 = m 3 m3 Vm (DSCF 1
where Vm = Exhaust gas volume through meter (DSCF)
2. EMISSION RATE Qb/hr) 1 (Ib/hr)= ug-x L x a x-x m x 60mrnx1(,028 3Nm3 1
Nm3 4549 IOOOmg loooUg min hr DSCF
(Ib/hr) = (3.74 x 10⁻⁹ 1 x DSCFM x -ug Urn3 . .. .
where DSCFM = Volumetric flow rate in the source
'II 1 I I s I I 0
G- 10

I I P 4 I I 1 I I e i II I 1 I
I I I
i
C a l c u l a t i o n o f Elemental
Emission Factors
Ei = 1.2762~10-~ Ci
20.9 - O2
where E = emission f a c t o r o f element i i n LB/106BTU
1 Ci = concentrat ' ioc o f element i i n ug/Nm
O2 = oxygen content i n f l u e gas a t po in t of
sample c o l l e c t i o n i n %v/v.d

Y
i
I I i
I
I I I I I
APPENDIX H
S A M P L I N G T R A I N C A L I B R A T I O N DATA

~~
r I 4 I I 1 I I I I 1 I II r II t I I I I I
T i m e (mi n )
EFPl Method 5 G a s M e t e r i n g Svstem Q u a l i t y C o n t r o l C h e c k Data S h e e t
Meter Temp. (OF)
I n l e t O u t l e t Vu1 L i m e (CF)
I n 6 t r u c t i o n e : O p e r a t e t h e c o n t r o l m o d u l e a t a f l o w r a t e e q u a l t o ."H@ fo r 1 0 m i n u t e s before a t t a c h i n g t h e um- b i l i c a l . R e c o r d t h e f o l l o w i n g d a t a :
C a l c u l a t e Y,, a5 f o l l o w s :
I f 'fcm is n o t w i t h i n t he r a n g e of 0.99;' t u 1.iSS. " t h e volume m e t e r i n g s y s t e m s h o u l d b e i n v e s t i g a t e d b e f o r e b e g i n n i n g . "
CFR T i t l e 4 0 , P a r t 5 0 , A p p e n d i x A . k t h o d 5, S e c t i o n 4.4.1
5-432R H- 1 Page 11

EFA Method 5 G a s M e t e r i n g System D u a l i t y C o n t r o l C h e c k Data S h e e t
I n s t r u c t i o n s : O p e r a t e t h e c o n t r o l m o d u l e a t a f l o w r a t e e q u a l t o .'.'.HG f o r 1 0 m i n u t e s before a t t a c h i n g t h e um- b i l i c z l . Record t h e f o l l o w i n g d a t a :
B a r p r e s s 29.70 i n . ~ g . = /.&70 .'-H@&?( i n . W . C .
- Meter Temp. (OF)
T i m e Vol L i m e
!min) ( C F ) I n l e t Out 1 et
C a l c u l a t e Y,, a 5 f o l l o w s :
.I.CO = 1.05
I f Y e , i s n o t w i t h i n the r a n g e of i5.9;' t o 1.03, " t h e v o l u m e m e t e r i n g s y s t e m s h o u l d b e i n v e s t i g a t e d b e f o r e b e g i n n i n g . "
CFF;: T i t l e 49 , F ' a r t $ 0 . Gppendi:.: A , Method 5, S e c t i o n 4 . 4 . 1
5-432R H-2 Page 11

EFP Method 5 Gas M e t e r i n g Sys t em O u a l i t y C o n t r o l C h e c k Data S h e e t
T i m e !min)
3 Op er a t or n. &WJJk) Module No.
Meter Temp. ( O F )
( C F ) I n l e t Out 1 et Vol u m e
I n s t r u c t i o n s : O p e r a t e t h e c o n t r o l m o d u l e a t a f l o w ra te e q u a l t o "'HE! fo r 10 m i n u t e s b e f o r e a t t a c h i n g t h e u m - b i l i c a l . Record the f o l l o w i n g data:
C a l c u l a t e Y,, as fol lows:
I + 'f=- is not w i t h i n the r a n g e of 0.97 t o 1.153, " t h e volume m e t e r i n g system shi ju ld b e i n v E 5 t i g a t c d b e f o r e b e g i n n i n g . Io
CFR T i t l e 40, P a r t 6 0 , fippendi:; &, Method 5 , S e c t i o n 4 . 4 . 1
S-422R H-3 Paae 11

EFA M e t h o d 5 G a s M e t e r i n 0 S y s t e m 6 u a l i t y C o n t r o l C h e c k Data Sheet
I n s t r u c t i o n s : O p e r a t e t h e C G n t r o l f l ~ 2 d ~ : l ~ a t a flow r a t e e q u a l t u -.'.H3 f o r 10 m i n u t e s a s i s r e a t t a c h i n g t h e um- S i l i c a l . E z c u r d the f s l i G w i n y d a t a :
Ear P T E J 6 Jq.Yg i n . HS. 'T - - n.999, ..'. H -3 1-81 i n . M.C.
Meter Temp. (OF) T i m e Vo 1 u m e !min ) (CF) I n l z t Ou t 1 et
C a l c u l a t e Y,, as follows:
L --I
jl 1 I
1. I I I : I 1 ' I I . I - I I I I I

- .. ::,:zr-G.=.; i L;z.:;-s:.::- .:=. . ; -, - ) -.:.A. . , _ * _ . _ ._ _ _ - . .
EF'A Method 5 Gas M e t e r i n a Svstem O u a l i t y C o n t r o l Check Data Sheet
I
I
I
I I I I
I n s t r u c t i o n s : Operate r h e cor . t ro1 module a t a f l o w r a t e equal t o He + o r 1,:) o n i n c i t e s b a f v r e a t t a c h i n g t h e um- b i l i c a l . F .ecord the fa1lcjw:ng d s t a :
C a l c u l a t e Y,, a5 follows:
L -1

1 : I ' I'
8
. . - m
0
I I I I I 1 I I 1 I I
~-
U 3 U
U v)
m d m m rl 0
C U
W OI
U 3 m
I
I- L Jz V
-a- 0 z
. . 0 r
c 0
U 6 L
?
n " C L 0
V a a
4 - I D c - 0 n
L V Y
B r m U
L 0 X
0 m al U m 0
L W Y
B V 0 c >,
L P
N
" d d m m 2 2
x 0 m L V U V x
I I I H-6

I I I I I I I I I r I
I I t I I I I
n 0 - 9 - \+I
3 - - 3 0 0 w -
P '
L a u o S I C I - U r m
m a l
LL
e a - L a U
s!E - r u - a l
C U
a m + a c
0 z U L 0
al a a
2 3 L 0
El + O m
0 E U
i - I D
0 0. L a U C Y
c -
. I-
o z
" U L
al
L 0 a U
0
8 a
m
u)
"
0 z
H- 7
r m 0
L
c

r(
01 m - .-I . E: I- * ID
I-
L U
al > 0
8- - 3 c .- z m
i .. u L 0 L n U 0 U
0 U
e L P
U m z Y) al
0 % L 0
H-8

I 4
I 4
I 4
1 1
1 I
I J
I I
I I 1 I I
(II
c c v1
u D m 3 U t m S 0 U m L
a
YI
r
n c - m 0
2 L 0) c u z
H m 2 . r- L
d 4 i
0)
.. c
U
e 0
W w m
a
n
1
rl m Y) 0 v) m
0 z m - c
5 L u U
B
f c YI
L n r - P x 0 0 a - r-
.. 0 z X 0
L u c
m
s
H-9
I - m r - 0 - . . (oN N O r l m
r - r l c m . . ( o m N - l r l N
- Id m m m m r l r l
C 0 U m L
r
n c r 4 0
0 0 C bl r
c

- r u 3 x 0 0 a
m
.. 0 2
ii L al U
2
8 I. lo 4
8 w
I (0 C 0 ..-
8
4
4 al 2 m-
I : I I I. I ' I I I I I

~
I 1
I 1
I i
I 1
I I
1 1
I I I 1
I J
I J
I I
I 1
1
i
I 1 I i I I I I
H-11

In terpol l Laboratories, Inc.
(612) 786-6020 I
Nozzle Callbratlon
Data Sheet
Date of Callbratlon: 11-5-91
Technlci an: Duane Van Hoever
Nozzle: Glass
The nozzle I s rotated i n 60 degree Increments and the dlameter a t each
point i s measured t o the nearest 0.001 Inch. The observed readings and
average are shown below. 11 posltlon Dlameter
I Inches 1
1 .195
2 .195
3 .194
Average : .195
H-12
- ~-
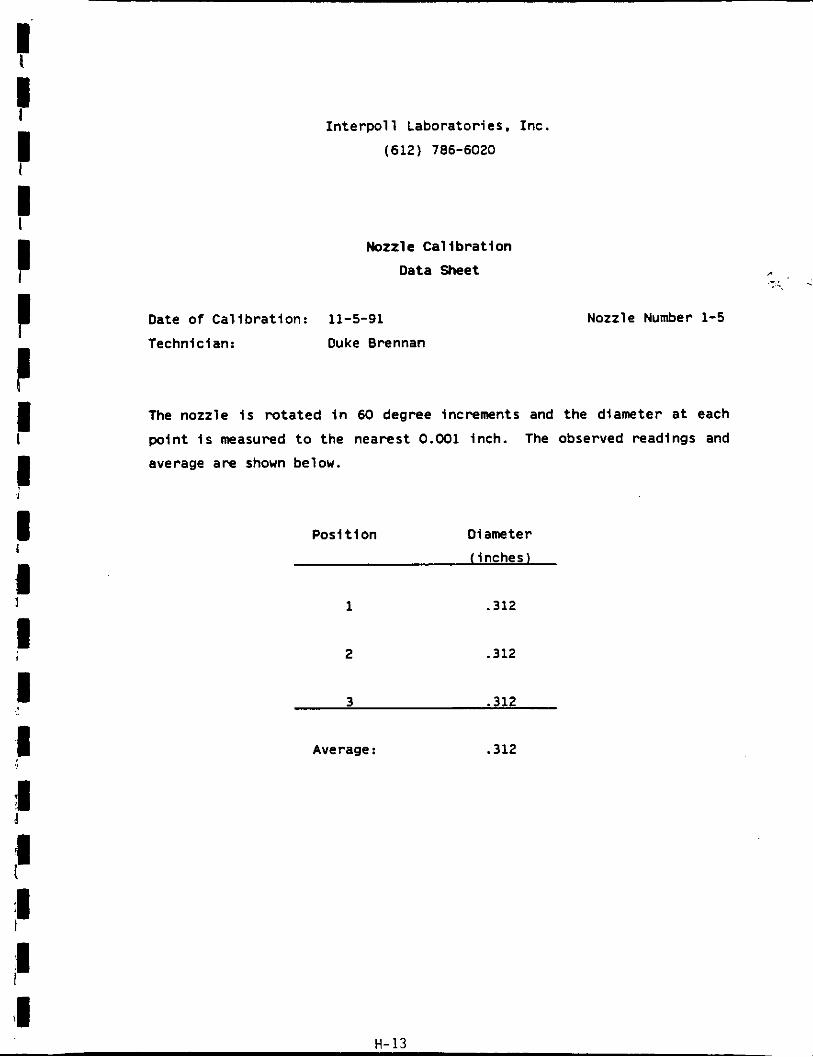
I I
I I
c I I
I 1
c c I I I i
1 I 1 1 I 'I ,
:I
Interpo l1 Laboratories, Inc .
(612) 786-6020
Nozzle Cal ibrat ion
Data Sheet
Date o f Cal ibrat ion: 11-5-91
Technlci an: Duke Brennan
Nozzle Number 1-5
The nozzle i s rotated i n 60 degree increments and the diameter a t each
point i s measured t o the nearest 0.001 inch. The observed readings and
average are shown below.
Posit ion Diameter
(inches)
1 .312
2 .312
3 .312
Average : .312
' . . .- I . ., .
H- 13

-1
I n t e r p o l l Laboratories. Inc.
(612) 766-6020
tbzz le Ca l lb ra t lon
Data Sheet
Date of Cal ibrat ion: 11-5-91
Technician: Hark Kaehler
I I] Nozzle Number 2-5
I The nozzle i s ro tated i n 60 degree increments and the dlameter a t each
point i s measured t o the nearest 0.001 inch. The observed readlngs and average are shown below.
' I Posi t l o n Diameter
( i nches 1
1 .294
2 .296
3 .293
Average : .294
H- 14

I I I I I I I I I I I I I I I I I I
Interpol1 Laboratories, Inc .
(612) 786-6020
Nozzle Ca l lbra t lon
Data Sheet
Date o f Cal lbrat ion: 11-5-91
Technlclan: Ed Trowbridge
Nozzle Number 8-5
The nozzle Is rotated I n 60 degree Increments and the dlameter a t each
polnt Is measured t o the nearest 0.001 Inch. The observed readings and
average are shown below.
Posl t i on Diameter
(Inches)
1 .311
2 .309
3 .310
Average : . 3 10
I H-15

~ ~~~~~~ ~
I n te rpa l l Laboratories, Inc.
Tenoerature Measurement Device ca l ib ra t ion S k e t
u n l t under test: vendor / +k in J
Mode 1 ‘z96C6 - X Serial Wunber 2 Range 0 - 200c OF Therrwouplr Type K
Date o f Calibrat ion 8 - b - q l Tt2ChnlClan /urr.~ kaCh/ e /
jj II
Method o f Calibration: 13 Campirison c q i i n r t ASTM mercury i n 9 le rs thermometer using I thermst i t red end insulated e!uiinum b lock designee
t o n rov id t uniform t tm~er i t u re . It11 temperature 18 idlusted bi t d p s t i a g the v o l t l ~ l on the block h i i t e r , I .ti c i r t r i d y .
Omrqa meti CL-100 ~ r n r I Therwcouolc s i t u l i t o r which provides 21 l rmc ie r temnereture tou ivml tn t . i i l l i r o l t a ‘ c i ~ n i l s . The CL-100 i s cold p a c t i o n coiDensIttd. Cel ibret ion u c u r l c y i s 0.11 of SDIn 1 2 1 0 0 ~ 1 I f o r n i g i t i v e tetoeretures add t z degretr .
1 degr i r The EL-100 siwlatts exectll the t i l l i r o l r c q e of I line I 1-1 thermocounlt I t t h t indlccted t m e r l t o r L
Desi red T ~ D (OF) Wanlnal
0 100 200 300 400 500 600 too 800 900
1000 1100 1200 1300 1400 1500 1600 1700 1800 1900 2000 2100
Tmwraturs of . - Standardor -
Simulated Temp (9)
Response of I Devi a t ion
OF = o f f scale reswnse by u n i t under t e s t (OF1 X dev = 100 At / (460 + t)
B u n i t i n tolerance 0 Uni t was not i n tolerance; recal ibrated - See new cal ibrat ion sheet.
5-433
H-16

I
thirwcollple it t h i itdicitid titpiratire. . .
0 100 200 300 100 UK) 600 700 wx) u)o
100 1100 1200 1300 1100 1500 1600 1700 1600 low 2OW 2100 I
OF = off scale response by u n i t under test X &V = 100 At / (450 + t)
Unit I n to1emnc.m Unit vas not I n tolerance: recalibrated - Sea MV callbration sheet.
..
_ _
5-433 H-17
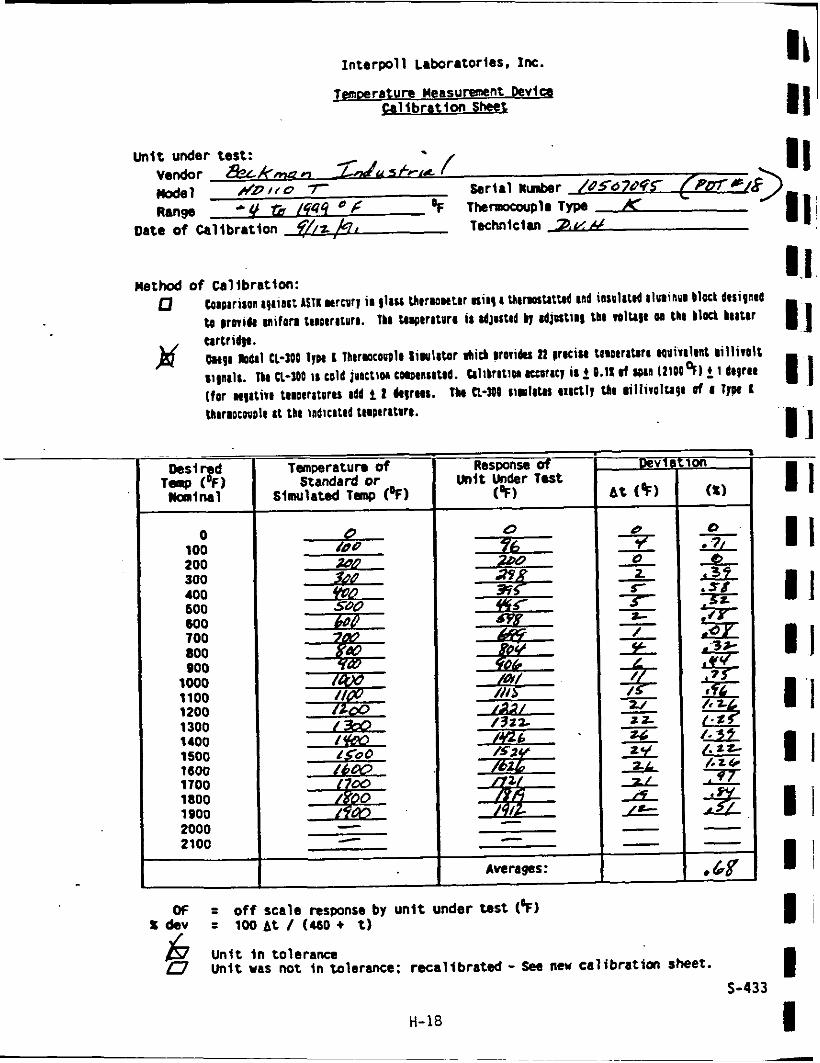
Interpol1 Laboratories, Inc.
thiraocouoh i t t b i rndlcited teaptretora.
~~ - Ossi Td
TeUP ( f ) W i M 1
0 100 200 300 400 500 600 100 800 900 lo00 1100 1200 1300 1400 1500 1600 1100
1900 2000 2100
iaoo
Tanperaturn of Standard or
simulated ~ a a p ( O F )
Reswnse of
hwrages:
OF = o f f scale response by u n l t under tnst (%I .4 d e V = 1WAt / (460+ t) .
pev la t lm I
16 u n i t i n t o l e r a m a Unlt was not I n tolerance; reca1lbrated - Sea new calibration sheet. 5-433
H-18
I 1 II
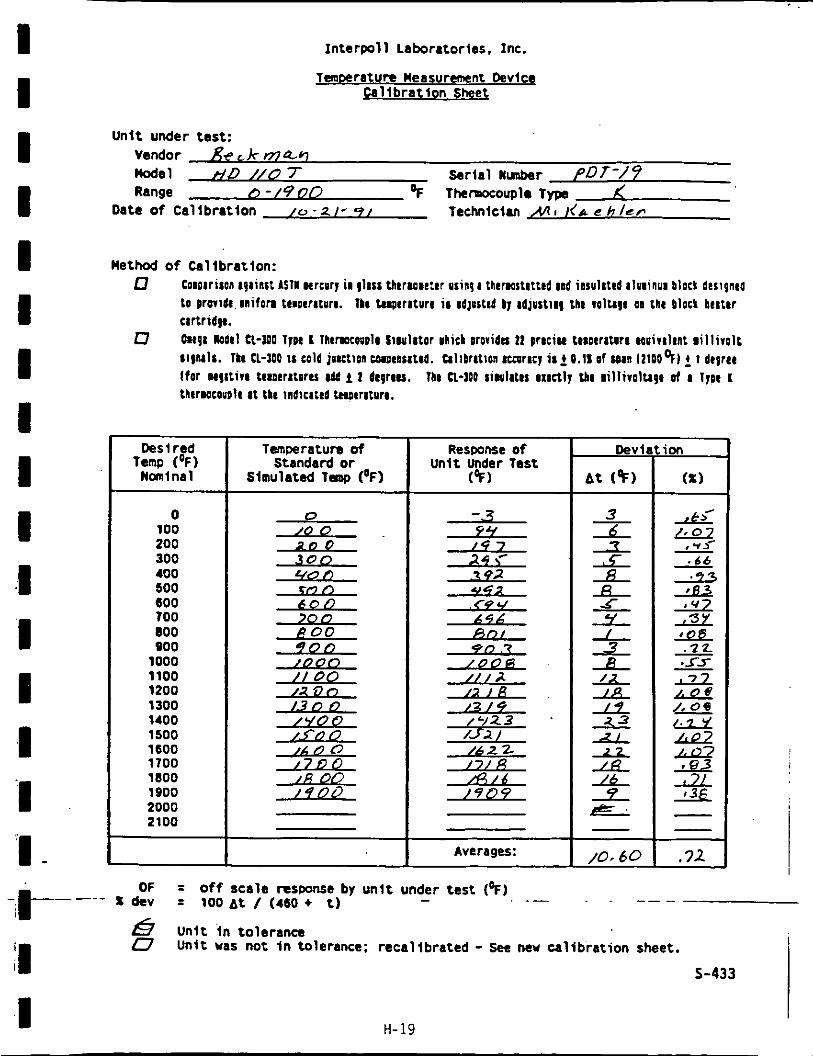
~
I I I I I I I 1 I I .I I I I 'I
- .
Interpol l Laboratories, Inc.
Taaperature Measuremnt Devlce - l i b r a t i o n $ k e y
U n i t under test: Vendor Kt- ck may Mode 1 H D //O 7- Serial Nunbar pDT-/9 Range &-/90/;, OF ThemJCOupl. Type x
Technician -AA 1 I ( O e ~ I L F Date of Cal ibrat ion /o - Z I * 9 /
Method o f Calibration: L3 Comparison 191iast ASTM w r c u r l i n glass therao ie ter usin9 I theraostctted tad insulated a l w i n u a block designea
t o nror ide . i n i f o n teioerctur8. 1ka t u p r a t u r c i a adjusted b) adjust ing t h e iolt~gc OB t h e block beater c t r t r i d ~ . Ole91 kdtl CL-IOO vyoe I ~ h t r n c o w h simulator did o r o r i d o zz DrBciae teaoera t i re eau i ia lcnt m i l l i v o l t a l g n t l r . ILe CL-100 18 cold juaction coloensated. Ca l ibr i t ion m r a c l i c r 0.11 of (Dan I2lOO4t 1 degree ( f o r *(atin t e i o e r a t n r u W f t degrees. lbt n-100 a i w l i t e r exaetlj tbc iillivolu9c of 8 1yDe I therBocouole a t t k e indicated ttaoeraturc.
D
Tenperaturn of Response of Standard or I Simulated iaap (OF)
Desi red Temp (OF)
N a l n a l
0 100 200 300 400 500 600 700 800 900
1000 1100 1200 1300 1400 1500 1600 1700 1800 1900 2000 2100 I I
1
1 I I I /0,60 Averages:
5-433
_ _ . . OF = o f f scale response by u n l t under tes t (%I - X d e V = 100 At / (460 4 t)
B u n i t i n tolerance D Unit was not in tolerance: recal ibrated - Sec new cal ibrat ion sheet.
I H-19

Interpol1 Laboratories
5-Type Pi tot Tube Inspection Sheet
Pitobe No. %- MF!s
(612)786-6020
Pi to t tube dimensions:
1. External tubing diameter (Dt) ,3& IN. 2. 3. * v&> IN.
Base t o Side A opening plane (PA) . &- IN. Base t o Side B opening plane (P,)
A1 i gnment :
4. a1 e100 D 5. a2 < l o 0 7
I I
Distance from P i to t t o Probe Components:
10. Pi to t t o 0.500 IN. nozzle 8 7& IN.
11. Pi to t t o probe sheath T. or4 IN.
12. P i t o t t o thermocouple (para l le l to probe) r8d IN.
13. Pi to t to thennocouple (perpendicular t o probe) . 76 U .
Date of Inspection:
H-20
Inspected by:

(612)786-6020 I z r . r ’ 3 c r 3 3 I e I I I I - I I I I
P i t o t tube dimensions: ..
1. External tubing diameter (Dt) : , T / 3 IN. 2. Base to Side A opcning plane (PA) 3. Base to Side B opening plant (PB)
m. . , u5-7 111. ,
A1 i w n t :
4. al<lOO r 5. 6*‘1OO K
.. 6. B <‘So / 1 7. B2 < So L
8. Z <.125. . /d 9. Y <.0625’ , L; : -
- 5
- Distance from P i t o t t o Probe Components:
H-21
10. Pitot to 0.500 IN. nozzle , 76@ IN.
11. P i t o t to probe sheath IN.
12. P i t o t to thermocouple (paral le l to probe) ‘z.C-kl IN.
13. P i t o t to thermocouple (perpendicular to probe) , 7 d ;z IN.
@
a Meets all EPA deslgn crlterla thus Cp 0.84
Does not meet €PA deslgn criteria - thus calibrate In wind tunnel
’
C) =
Date’ of Inspection: Inspected by:
cFR T i t l e 40 Part 60 Appendlx A Method 2

'I Interpol1 Inc.
5-Type Pi to t Tube Inspection Sheet
(612) 786-6020
Pitobe No. A/-6
Pi to t tube dimensions:
1. External tubing diameter ( O t ) , 3'16 IN. 2. 3. I P!!r IN.
Base t o Side A opening plane ( P A ) I YA9 IN. Base t o Side B opening plane (P,)
A1 i gnment :
4. al <loo c9 5. a2 <loo B
I I:
8. z c.125" , & /
9. W c.0625' I D /
Distance from Pi tot t o Probe Components:
10. P i t o t t o 0.500 IN. nozzle , d 7 d IN. 11. Pi to t t o probe sheath 3, 0 IN. 12. Pi to t t o thermocouple (pa ra l l e l t o probe) IN.
13. P i t o t t o thermocouple (perpendicular t o probe) IN.
Date of Inspection :
A- 26-92
I ' I . I ' I . I I
I
Inspected by:
erd I
H-22

I I I I I I I I I I I I I ' I I I. I I
.-
Interpol1 Laboratories (612)786-6020
S-Type P i to t Tube Inspection Sheet
Pitobe NO. -641
PItot tube dimensions:
1. External t u b i n g diameter (Dt) . 316 IN. 2. Base t o Side A opening plane (PA) . IN. 3. Base t o Side B opening plane (PB) *#- IN.
Distance from Pi tot t o Probe Components:
10. Pi to t t o 0.500 IN. nozzle 7/* IN.
11. Pi to t t o probe shea th 3.49 IN.
12. Pi to t t o thermocouple (para l le l t o probe) 7- IN.
13. P i to t t o thermocouple (perpendicular to probe) 0 7'ZIN.
Date of Inspection: Inspected by:
H-23

.
I I:' 1 :,
1. 2. 3.
4. 5.
6. 7.
(612)786-6020
S-Type'Pitot Tube Inspection Sheet
. . P i t a b e Ilo. 2.3 -6
P i t o t tube dimensions: ._
External tub lng diameter (Dt) . I '? - a /3 IN. Base to Slde A openlag plane (PA) ' e/// In. Base to Slde B open ing plane (P,) In. L ''L < -
..
I 1 I
I .I I
- Dis tance from P l t o t t o Probe Components:
10. P i t o t to 0.500 IN. nozzle , 73T IN.
11. P i t o t to probe s h e a t h -j- L .67 In.
12. P i t o t to thermocouple ( p a r a l l e l to probe) d . dd IN.
13. P i t o t to thermocouple ( p e r p e n d i c u l a r to probe) , 7'49 IN.
Meets a l l €PA deslgn c r i t e r i a t h u s Cp = 0.84
0 Does n o t meet €PA d e s l g n cr i ter ia - t h u s c a l i b r a t e i n wlnd tunne l c, =
Date' of InSpeCtfOn: Inspected by:
CFR t i t l r 40 P a r t 60 Appendlx A Method 2
I I
H-24

I s
I 8
I Y
I 1
I i
I I
I I I I I I I I I I I ' I I
\ I I
Temperature Actual Mercury Ambient Correction Adjsted Mercury Initial Aneriod Barometer Read Temp. Factor Barometer Read Barometer Read
' 23,U 96 4 l S D 2-3.4s 24 & - Pl? - a001 ' ts-qz t 9 . o r
INTERPOLL LABORATORIES (612) 786-6020
Stack Sampling Department - PA Aneroid Barometer Calibration Sheet
Difference (Pba-Ph)
0.10
0. IO
Date # 13-71 Technician s r z r z d s b u c 1 0
Mercury Column Barometer No. Aneroid Barometer No. V N T7-D W?
LJoLJ*-- I
Has this barometer shown any consistent problems with calibratioti" yes, explain. rn
Yes/No. I f
,
~~ ~
Has problem been alleviated? Yes/No. How? #&l
*Note
Aneroid barometers will be calibrated periodically against a mercury COhnnn barometer. The aneroid barometer to be calibrated should be placed i n close proximity to the mercury barometer and left to equilibrate for 20-30 minutes before calibrating. Aneriod barmeter will be calibrated to the adjusted mercury barometer readings. 5-312
H-25

- -
rl -
I , I
Temperature Ac tua l Mercury Ambient C o r r e c t i o n A d j s t e d Mercury I n i t i a l Aner iod D i f f e rence Barometer Read Temp. Fac to r Barometer Read Barometer Read (Pba-Pbm)
L d9.27 7L . I / 29. /G- 2.5. I 7 . & /
~-
INTERPOLL LABORATORIES (612)786-6020
Stack Sampl ing Department - QA Anero id Barometer C a l i b r a t i o n Sheet
Has t h i s barometer shown any c o n s i s t e n t problems w i th c a l i b r a t i o n ? Yes/No.
yes, exp la in . z r I I ' Has problem been a l l e v i a t e d ? Yes/No. How?
I .
*Note I I
5-312 I
Anero id barometers w i l l be c a l i b r a t e d p e r i o d i c a l l y aga ins t a mercury column barometer. The anero id barometer t o be c a l i b r a t e d should be p laced i n c l o s e p r o x i m i t y t o the mercury barometer and l e f t t o e q u i l i b r a t e f o r 20-30 minutes before c a l i b r a t i n g . Aner iod barometer w i l l be c a l i b r a t e d t o the ad jus ted mercury barometer readings.
H-26

I I
1 t
1 I I I
I I I I I I
Actual Mercury Ambient
INTERPOLL LABORATORIES (612)786-6020
Stack Sampling Department - QA Aneroid Barometer Calibration Sheet
Temperature Correction Adjsted Mercury Initial Aneriod Difference
.I
Barometer Read I Temp. Factor Barometer Read
I
Barometer Read (Pba-Pbm)
I I -1 I .I
Date 7- z 2-9/
Mercury Column Barometer No. & L L J / A L 7t.L &,&L /a Technician G 7 A p .
Aneroid Barometer No. &r/ - &//la 2 L9&
Has this barometer shown any consistent problems with calibration? Yes/No. yes, explain. 7A
If
Has problem been alleviated? Yes/No. How?
*Note
Aneroid barometers will be calibrated periodically against a mercury column barometer. The aneroid barometer to be calibrated should be placed in close proximity to the mercury barometer and left to equilibrate for 20-30 minutes before calibrating. Aneriod barometer will be calibrated to the adjusted mercury barometer readings. 5-312
H-27

1
~
Actual Mercury Barometer Read
A @ , 6 0
INTERPOLL LABORATORIES (612)786-6020
Stack Sampling Department - QA Aneroid Barometer Calibration Sheet
Temperature Ambient Correction Adjsted Mercury Initial Aneriod Difference Temp. Factor Barometer Read Barometer Read (Pba-Pb)
70 , io7 ;I@. v97 -IC?. 3 cn ,190
Date 9-29-91 Technician & /<4&- Mercury Column Barometd No. / -Lax Aneroid Barometer No. C 6 7 4 2 3 - r
1 I I I I I
I I
I 1 It
I I I I
Has this barometer shown any consistent problems with calibration? Ye@ yes, explain.
If
I1 Has problem been alleviated? Yes/No. How?
*Note
Aneroid barometers wi,, be calibrated periodically against a mercury column barometer. The aneroid barometer to be calibrated should be placed in close proximity to the mercury barometer and left to equilibrate for 20-30 minutes before calibrating. Aneriod barometer will be calibrated to the adjusted
I I mercury barometer readings. 5-312
H-28

I
I
I I
1 :I
APPENDIX I MASS RATE C O N V E R S I O N FACTOR FOR G/SEC

I I 1 I I I I S :I .I -1 :I I I I I :I 1 I
Mass Rate Converston
Factor fo r a/sec
LB g/sec = - x [ ts - x HR 3600SeC
g/s = 0.126 (LB/HR)
1-1

APPENDIX 3
R E S U L T S O F F L Y A S H C O M P O S I T I O N C A L C U L A T I O N

I I I I I I I I I I I I I I I I
1 I I I
T o t a l s
INTERPOLL LABORATORIES. INC. (612)786-6020
9225177.70 99.76913
Meta ls Resul ts for NSP/Black Dog: B o i l e r s 11. 3 and 4 ESP I n l e t Composite Samples
I l T e s t 1 Run 1 (4677-94)
% o f T o t a l Weight as the Oxide
Ag A 1 As 8 8a Be C Ca Cd C r cu Fe Hg K Mg Mn Mo Na N i Pb S Sb se si S r V Zn
II 1880000.00 O-O0 I
1 1 76.70 I 1250.00 3340.00
719000.00 22.00
7 1100 .OO 567000.00 1830.00 228.00
31oooO.00 1130.00 1240.00
112000.00 32.00 289.00
267oooO. 00 37700.00 3200.00 2710.00
0.00000 22.12503 0.00206 0.15523 0.72316 0.00069 0.37993 23.26803 0.00055 0.01138 0.02604 6.40209 0.00015 0.53346 5.85666 0.01582 0.00213 2.60263 0.00896 0. 00832 1.74196 0.00024 0.00253 35.56784 0.27768 0.03558 0.02101
.est 1 Run 2 (4677-95)
TOTAL UC
0.00 2040000 .OO
263.00 7780.00
112000.00 41.40
52200.00 287OOOO. 00
291 .OO 1360.00 3270.00
773000.00 36.50
67700.00 609000.00 1910.00 232.00
315000.00 1120.00 2890.00
122000.00 15.70
254.00 289oooO.00 40400.00 3100.00 2720.00
9916583.60
J-1
S of Tota l Welght as the Oxide
0.00000 22.14238 0.00199 0.14391 0.71826 0.00066 0.29985 23.06738 0.00191 0.01142 0.0235 1 6.34805 0.00023 0.46848 5.80166 0.01523 0.00200 2.43910 0.00819 0.01788 1.75004 0.00011 0.00205 35.50685 0.27445 0.03179 0.01945
~ ~~
99.09683
rest 1 Run 3 (4677-96)l
TOTAL UG
0.00 192oooO. 00
231.00 6920.00
107000.00 31.20
55100.00 253oooO. 00
359.00 988.00 3020.00
719000.00 9.68
60100.00 548000.00 1550.00 162.00
288000.00 889.00 3300.00
11oooO.00 0.00
245.00 2600000.00 36300.00 2750.00 2200.00
8996154.88
S o f T o t a l Weight as t h e Oxide
0.00000 23.05630 0.00194 0.14162 0.75918 0.00055 0.35017 22.49735 0. 00261 I 0. 00!3 18 0.02402 6.53257 0.00007 0.46012 5.77577 0.01367 0.00154 2.46721 0.00719 0.02259 1.74572
0.00219 35.34126 0.27282 0.03120 0.017 40
99.53424

- ELEHENl
Ag A1 As B 8a Be C Ca Cd C r cu Fe Hg K Mg Hn Ho Na N i Pb S Sb Se S i Sr V Zn
T o t a l !
~-
1.50 4600.00
1.00 46.80 243.00 0.22
INTERPOLL LABORATORIES, INC. (612)786-6020
~
0.00525 28.31244 0.00430 0.49089 0.-
Metals Results for NSPIBlack Dog: Boilers #I. 3 and 4 ESP O u t l e t Samples 11
403630.82
'est 1 Run 1 (4677-69)
t of Total Weight as
TOTAL UC the Oxide
0.00595 4220.00 24.53505
1 .OO 0.00406 57.60 0.5707 1 326.00 I 1.11986
0.00145
88.43321
0.17 0.00
6020.00 0.80 3.40 17.90
1480.00 7.96
250.00 1280.00
8.90 0.00
736.00 5.60 8.00
358000.00 0.00 2.00
110.00 11.00 28.20
0.00000 25.91752 0.00281 0.01529 0.06894 6.51033 0.02645 0.92666 6.53169 0.03802 0.00000 3.05265 0.02193 0.02652 0.00000 0.00000 0.00865
0.40027 0.06042 0.10800
I
372576.33 69.95323
e s t 1 Run 2 (4677-70)
t of Total Weight as -I- TOTAL UC the Oxide
0.00 7210.00
6.20 6.00 67.30
1800.00 4.09
440.00 1540.00 10.00 0.00
1190.00 24.90 91.00
386000.00 7.81 2 .OO
111.00 12.00
216.00
~~~
0.00199 0.00000 32.8607 3 0.02307 0.02857 0.27441 8.38221 0.01439 1.72654 8.31919 0.04522 0.00000 5.22506 0.10321 0.31931 0.00000 0.03045 0.00915
0.42759 0.06978 0.87 577
TOTAL UG
t of Total Weight as the Oxide
3.70 5190.00
1.00 56.30 103. w 0.26 0.00
6290.00 0.80 4.30 16.10
1940.00 10.58 310.00 1720.00 10.50 0.00
906.00 4.40 4.00
348000.00 0.00 2.00
43.40
22.97905 0.00239 0.01641 0.05262 7.24148 0.02983 0.97505 7,44781 0.03806 0.00000 3.18869 0.01462 0.01125 0.00000 0.00000 0.00734
0.2748~ 0.05593 0.14105
68.87662 4
5-2

I
I
I
APPENDIX K
SULFUR D I O X I D E D I S P O S I T I O N
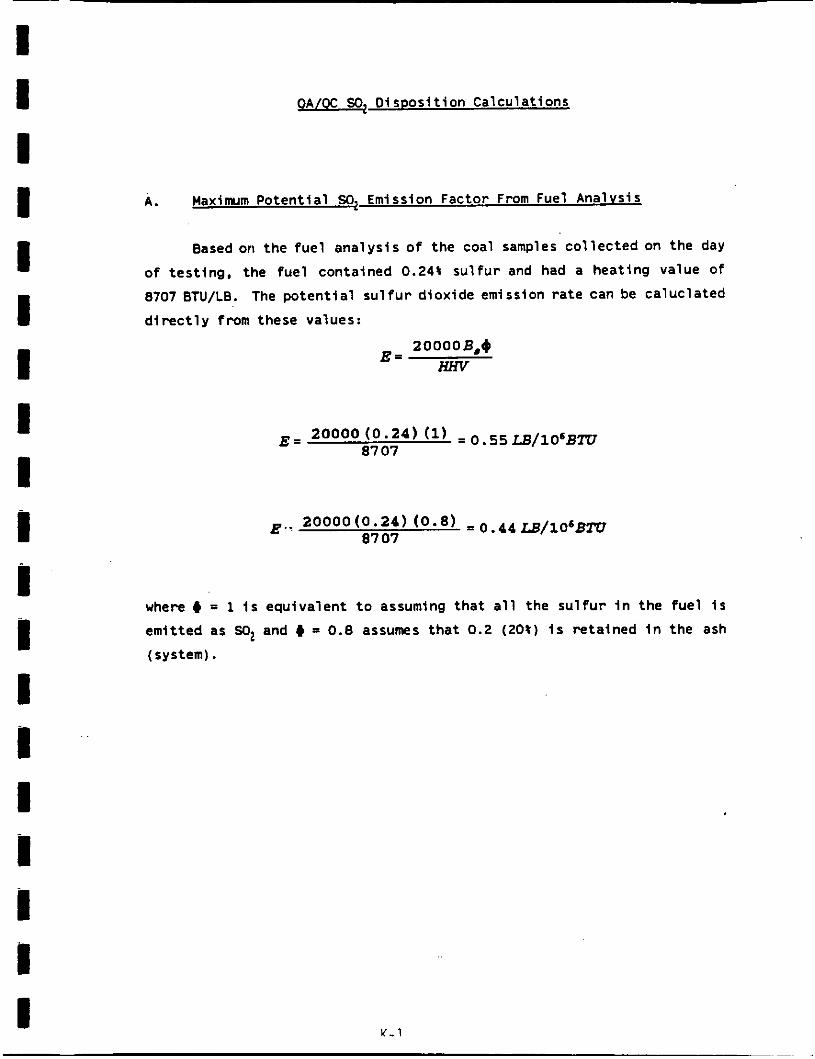
I I I I I I I I I I i i
i
i i i
I
I
I
QA/QC SO2 Disposi t ion Calculat ions
A. Maximum Potent ia l SO. Emission Factor From Fuel Analvsis
Based on the fue l analysis o f the coal samples co l lec ted on the day
o f test ing, the fue l contained 0.24% su l fu r and had a heating value o f
8707 BTU/LB. The poten t ia l s u l f u r d ioxide emission ra te can be caluclated
d i r e c t l y f r o m these values:
2 0000 B,o "v
E =
where + = 1 i s equivalent t o assuming that a l l the sul fur i n the fue l i s
emitted as SO2 and 6 = 0.8 assumes tha t 0.2 (20%) i s retained i n the ash
(system).

8 . From Emission T e s t i n q
Slnce t h e t r a c e metal t r a i n impingers con ta in peroxide. the So2
emiss ion f a c t o r can a l s o be c a l c u l a t e d f r o m the emlsslon da ta us ing the
Pol l ow ing expression:
2 9 . 2 C , E - ao.9-c+
Mass (UCJ) "Itd C 01 E
Run S so, INm') Iua/Nm') f *v /v ) I L B / ~ O ~ BTU)
1 358000 715263 1.500 477000 7.10 0 . 4 4
2 386000 771205 1.494 516000 6.80 0.47
3 695269 695269 1.469 473000 6.60 0 . 4 2
C. ComDarlson o f Emission Fac tors
The r e s u l t s of t h e exhaust gas sampling are seen t o be i n r e l a t i v e l y
good agreement with t h e r e s u l t s o f t h e f u e l sampling and ana lys is .
I- I I
K- 2
I I