AP Report to the Nation Michigan - College...
15
Michigan THE 10TH ANNUAL AP ® Report to the Nation STATE SUPPLEMENT FEBRUARY 11, 2014
Transcript of AP Report to the Nation Michigan - College...

Mic
hig
an
THE 10TH ANNUAL
AP® Report to the NationSTATE SUPPLEMENT FEBRUARY 11, 2014

2
T H E 1 0 T H A N N U A L A P R E P O R T T O T H E N A T I O N · M I C H I G A N S U P P L E M E N T
About This Report
This report provides educators and policymakers with information
they can use to celebrate their successes, understand their unique
challenges, and set meaningful goals to increase opportunity for all
students. It’s important to note that while AP® Exams are valid
measures of students’ content mastery of college-level studies in
specific academic disciplines, AP results should never be used as
the sole measure for gauging educational excellence and equity.
Because reliable demographic data for nonpublic schools are not
available for all states, this report represents public school students
only. Additionally, this report looks at students’ entire experience
with AP — tracking exams taken by graduates throughout their high
school careers — as opposed to reporting exam results from a
particular calendar year.
Additional data are available at apreport.collegeboard.org.
Table of Contents
3 State Strategies
7 Fostering AP® Participation and Success
9 A Closer Look at Equity Gaps in AP Participation and Success
Note: Throughout this report, public high school graduates represent projections supplied in Knocking at the College Door (Western Interstate Commission for Higher Education, 2012).
The redesigned courses, Biology, Latin, and Spanish Literature and Culture, began in fall 2012, and the first AP Exam based on those redesigned courses was administered in May 2013. As a result, the data in this report reflect a blend of the old and redesigned exam results.

3
T H E 1 0 T H A N N U A L A P R E P O R T T O T H E N A T I O N · M I C H I G A N S U P P L E M E N T
STATE STRATEG IESSTATE STRATEG IES
Michigan has made progress in recent years in improving student access and supporting student performance in AP®. Just as we do in the national report, we wanted to take an opportunity to applaud your efforts and offer additional strategies for your consideration.
Current Picture
Congratulations. You are already using these strategies to build a robust AP Program. You:
Have 31 districts that have earned a spot on the AP Honor Roll through their hard work and dedication to increasing participation and success in AP, particularly for underrepresented students. See page 5 for more details.
Encourage your educators to participate in the development of the AP Program, such as by becoming AP Exam Readers or participating in course and exam development committees. See page 5 for more details.

4
T H E 1 0 T H A N N U A L A P R E P O R T T O T H E N A T I O N · M I C H I G A N S U P P L E M E N T
STATE STRATEG IESSTATE STRATEG IES
The following strategies have been proven effective. To build an even stronger AP program, you could:
¨ Include AP in the state accountability system. • Establish AP participation and performance indicators. • Set clear, measurable statewide goals toward improvement.
¨ Ensure that public colleges and universities develop AP Exam credit and placement policies based on institutional goals, alignment with corresponding courses, and objective outcomes research.
¨ Provide targeted assistance and resources to schools serving traditionally underserved populations. For example, funding for materials, supplies, outreach efforts, professional development, and tutoring programs.
¨ Provide resources to schools and districts to support research-based programs that build content knowledge and skills — particularly in literacy and math — to prepare students for success in AP course work, and in college and careers.
¨ Participate in the Expedited AP data program, which provides states with their AP student data on an earlier time frame than ever before, free of charge, by using a standardized data agreement and file format.
Opportunities
5
T H E 1 0 T H A N N U A L A P R E P O R T T O T H E N A T I O N · M I C H I G A N S U P P L E M E N T
STATE STRATEG IESSTATE STRATEG IES
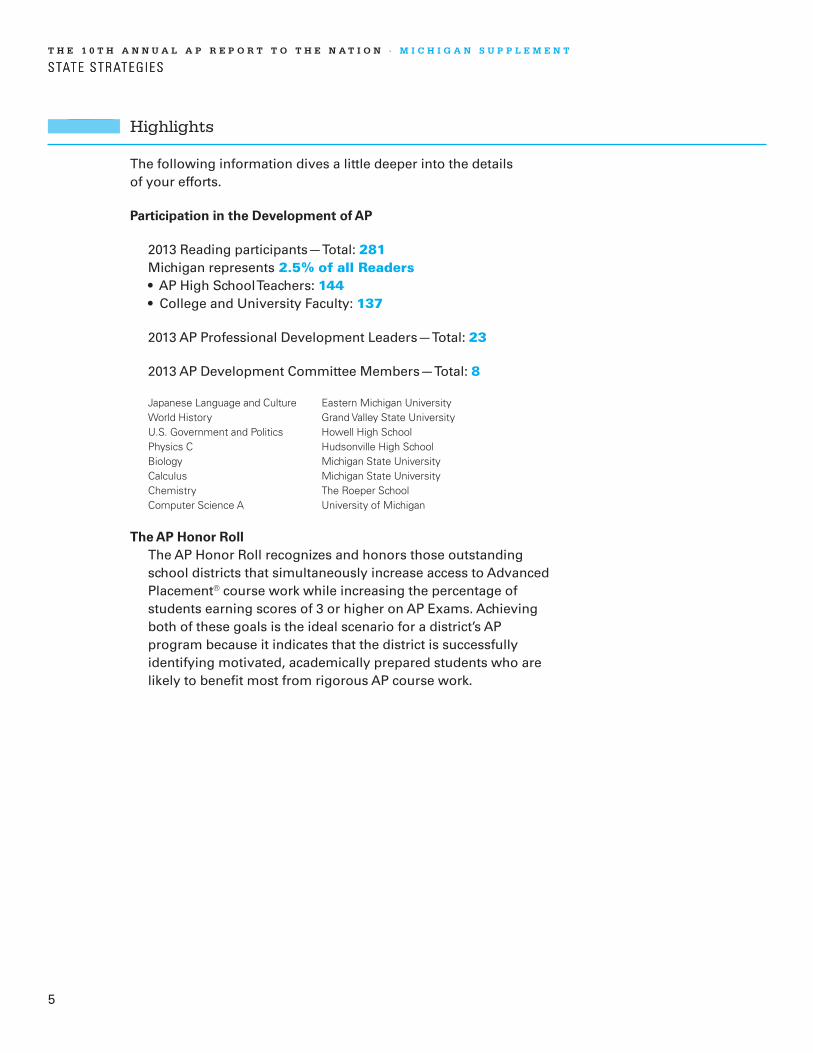
The following information dives a little deeper into the details of your efforts.
Participation in the Development of AP
2013 Reading participants — Total: 281 Michigan represents 2.5% of all Readers • AP High School Teachers: 144 • College and University Faculty: 137
2013 AP Professional Development Leaders — Total: 23
2013 AP Development Committee Members — Total: 8
Japanese Language and Culture Eastern Michigan UniversityWorld History Grand Valley State University U.S. Government and Politics Howell High SchoolPhysics C Hudsonville High SchoolBiology Michigan State University Calculus Michigan State University Chemistry The Roeper School Computer Science A University of Michigan
The AP Honor RollThe AP Honor Roll recognizes and honors those outstanding school districts that simultaneously increase access to Advanced Placement® course work while increasing the percentage of students earning scores of 3 or higher on AP Exams. Achieving both of these goals is the ideal scenario for a district’s AP program because it indicates that the district is successfully identifying motivated, academically prepared students who are likely to benefit most from rigorous AP course work.
Highlights

6
T H E 1 0 T H A N N U A L A P R E P O R T T O T H E N A T I O N · M I C H I G A N S U P P L E M E N T
STATE STRATEG IESSTATE STRATEG IES
Highlights (continued)
4th Annual Honor Roll Districts in Michigan: 31
Allendale Public SchoolsAnn Arbor Public SchoolsBirmingham Public Schools*Brighton Area Schools*Cedar Springs Public SchoolsCoopersville Area Public Schools*Dewitt Public SchoolsDiocese of Kalamazoo East Grand Rapids Public School District*Farmington Public Schools*Grand Ledge Public Schools*Gull Lake Community Schools*Houghton-Portage Township SchoolsHowell Public School District*Lakeview School District*L’Anse Creuse Public Schools*Ludington Area School DistrictMason Public Schools*Northville Public Schools*Paw Paw Public Schools*Public Schools of Petoskey*Portage Public Schools*Rochester Community Schools*Saint Joseph Public School DistrictSouth Lyon Community SchoolsStandish-Sterling Community School DistrictThornapple Kellogg SchoolsTraverse City Area Public Schools*Troy School District*Waterford School DistrictZeeland Public Schools
*District has achieved the honor for multiple years.

7
T H E 1 0 T H A N N U A L A P R E P O R T T O T H E N A T I O N · M I C H I G A N S U P P L E M E N T
FOSTER ING AP PART IC IPAT ION AND SUCCESS
More graduatesare succeeding on AP Exams today than took them in 2003
History and Social Scienceshad the greatest number of students achieving a score of 3 or higher
F I G U R E 1 Growth in AP® Participation and Success
F I G U R E 2 Participation in and Success on AP Exams in the Class of 2013
Number of graduates leaving high school having taken an AP Exam Number of graduates scoring 3+ on an AP Exam during high school
2003 2008 2012 2013
22,49516,183 26,822 27,843
14,46110,50717,262 18,231
60%30%0%
Percentage of Michigan Graduating Class
Arts
English
WorldLanguages
Mathematics andComputer Science
Sciences
History andSocial Sciences
AnyDiscipline
Total Number of Graduates: 105,971
0.6
12.5
16.5
10.6
9.8
1.4
26.3
0.5
7.8
11.0
6.8
6.0
1.0
17.2
60%30%0%
Percentage of graduates leaving high school having taken an AP Exam Percentage of graduates scoring 3+ on an AP Exam during high school
* AP Italian Language and Culture was discontinued after the 2008-09 school year, and was reinstated in 2011-12.
Art History, Music Theory, Studio Art: Drawing, Studio Art: 2-D Design, and Studio Art: 3-D Design
English Language and Composition, and English Literature and Composition
Comparative Government and Politics, European History, Human Geography, Macroeconomics, Microeconomics, Psychology, United States Government and Politics, United States History, and World History
Calculus AB, Calculus BC, Computer Science A, and Statistics
Biology, Chemistry, Environmental Science, Physics B, Physics C: Electricity and Magnetism, and Physics C: Mechanics
Chinese Language and Culture, French Language and Culture, German Language and Culture, Italian Language and Culture*, Japanese Language and Culture, Latin, Spanish Language, and Spanish Literature and Culture

8
T H E 1 0 T H A N N U A L A P R E P O R T T O T H E N A T I O N · M I C H I G A N S U P P L E M E N T
FOSTER ING AP PART IC IPAT ION AND SUCCESS
+ Due to rounding, percentages do not always add up to 100.0.* AP Italian Language and Culture was discontinued after the 2008-09 school year, and was reinstated in 2011-12.
Subjects with fewer than five AP Exam takers were omitted from this figure.
F I G U R E 3 Score Distributions of AP Exams Taken by the Class of 2013 During High School
Rank
100% 80% 60% 40% 20% 0% 20% 40% 60% 80% 100%
Subject No. of Exams % of Exam Scores+
Italian Language and Culture* 6
Chinese Language and Culture 90
Calculus BC 2,238
Studio Art: Drawing 152
German Language and Culture 194
Physics C: Mechanics 1,226
Studio Art: 2-D Design 321
Studio Art: 3-D Design 38
Computer Science A 447
Japanese Language and Culture 17
Microeconomics 1,628
5 Psychology 6,545
French Language and Culture 215
Macroeconomics 1,822
9 Statistics 3,797
Physics C: Electricity and Magnetism 411
European History 1,132
Latin 15
1 English Language and Composition 8,348
7 Biology 5,451
Physics B 1,038
Spanish Literature and Culture 20
10 World History 3,146
6 United States Government and Politics 6,447
4 United States History 6,859
Music Theory 92
Human Geography 295
Spanish Language 1,006
Comparative Government and Politics 303
3 Calculus AB 7,059
Environmental Science 1,568
8 Chemistry 4,112
2 English Literature and Composition 8,224
Art History 65
6.7
8.8
2.0
2.1
6.1
2.2
2.6
14.1
23.5
7.4
13.0
1.9
11.7
13.6
8.8
21.5
6.1
14.0
17.4
9.4
12.5
10.2
10.9
20.7
19.2
13.9
27.9
15.9
23.9
6.3
20.0
12.2
20.1
51.3
38.7
22.8
33.3
50.0
15.2
25.1
20.1
40.0
22.1
27.9
16.3
40.4
53.3
32.5
29.5
30.8
35.0
35.1
29.0
26.4
26.1
21.7
22.6
25.1
19.3
18.4
23.1
35.1
26.2
13.3
18.4
22.4
22.7
28.7
39.9
23.7
31.5
5.9
33.1
29.0
22.3
29.0
26.3
26.5
18.2
6.7
22.6
23.0
21.5
30.0
20.5
18.0
24.6
14.1
19.7
21.1
22.8
18.4
30.3
21.0
17.8
26.2
5.6
5.7
13.2
13.9
13.2
18.1
18.4
6.9
16.6
11.3
23.3
17.1
16.3
21.2
10.8
33.3
27.7
20.6
17.2
35.0
25.7
25.1
27.6
27.2
18.3
19.9
25.4
12.5
24.6
17.1
34.8
21.5
100.0
62.2
47.0
11.2
22.7
29.2
6.5
5.3
32.2
70.6
17.8
26.6
12.6
20.1
15.9
27.3
9.2
6.7
11.1
12.9
13.0
9.2
15.3
11.2
21.7
19.7
17.3
12.9
21.9
10.8
14.9
6.0
6.2
9
T H E 1 0 T H A N N U A L A P R E P O R T T O T H E N A T I O N · M I C H I G A N S U P P L E M E N T
A CLOSER LOOK AT EQUITY GAPS IN AP PART IC IPAT ION AND SUCCESS
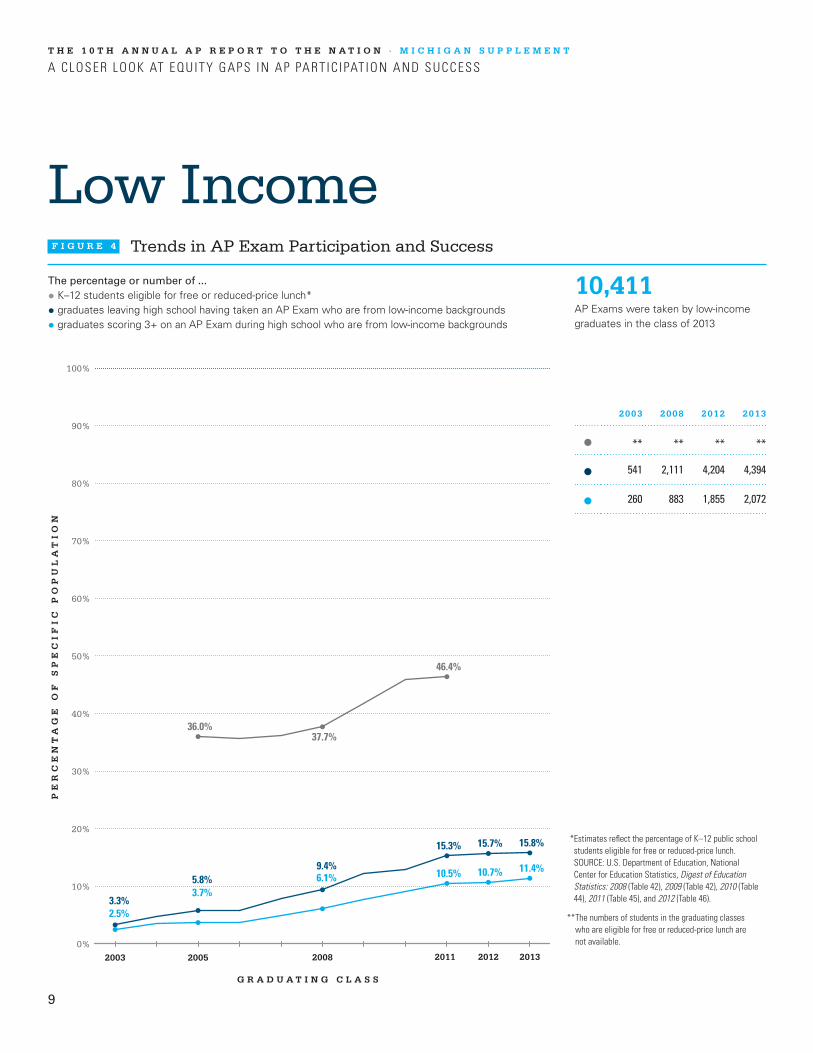
Low IncomeF I G U R E 4 Trends in AP Exam Participation and Success
10,411AP Exams were taken by low-income graduates in the class of 2013
The percentage or number of ...
• K–12 students eligible for free or reduced-price lunch*
• graduates leaving high school having taken an AP Exam who are from low-income backgrounds
• graduates scoring 3+ on an AP Exam during high school who are from low-income backgrounds
2003 2008 2012 2013
** ** ** **
541 2,111 4,204 4,394
260 883 1,855 2,072
2003 2008 20122011 2013
PE
RC
EN
TA
GE
OF
SP
EC
IF
IC
PO
PU
LA
TI
ON
G R A D U A T I N G C L A S S
10%
20%
0%
30%
40%
50%
60%
70%
80%
90%
100%
9.4%
15.3% 15.7%
6.1% 10.5% 10.7%
46.4%
37.7%36.0%
5.8%3.7%
3.3%2.5%
11.4%
15.8%
2005
* Estimates reflect the percentage of K–12 public school students eligible for free or reduced-price lunch. SOURCE: U.S. Department of Education, National Center for Education Statistics, Digest of Education Statistics: 2008 (Table 42), 2009 (Table 42), 2010 (Table 44), 2011 (Table 45), and 2012 (Table 46).
** The numbers of students in the graduating classes who are eligible for free or reduced-price lunch are not available.
10
T H E 1 0 T H A N N U A L A P R E P O R T T O T H E N A T I O N · M I C H I G A N S U P P L E M E N T
A CLOSER LOOK AT EQUITY GAPS IN AP PART IC IPAT ION AND SUCCESS
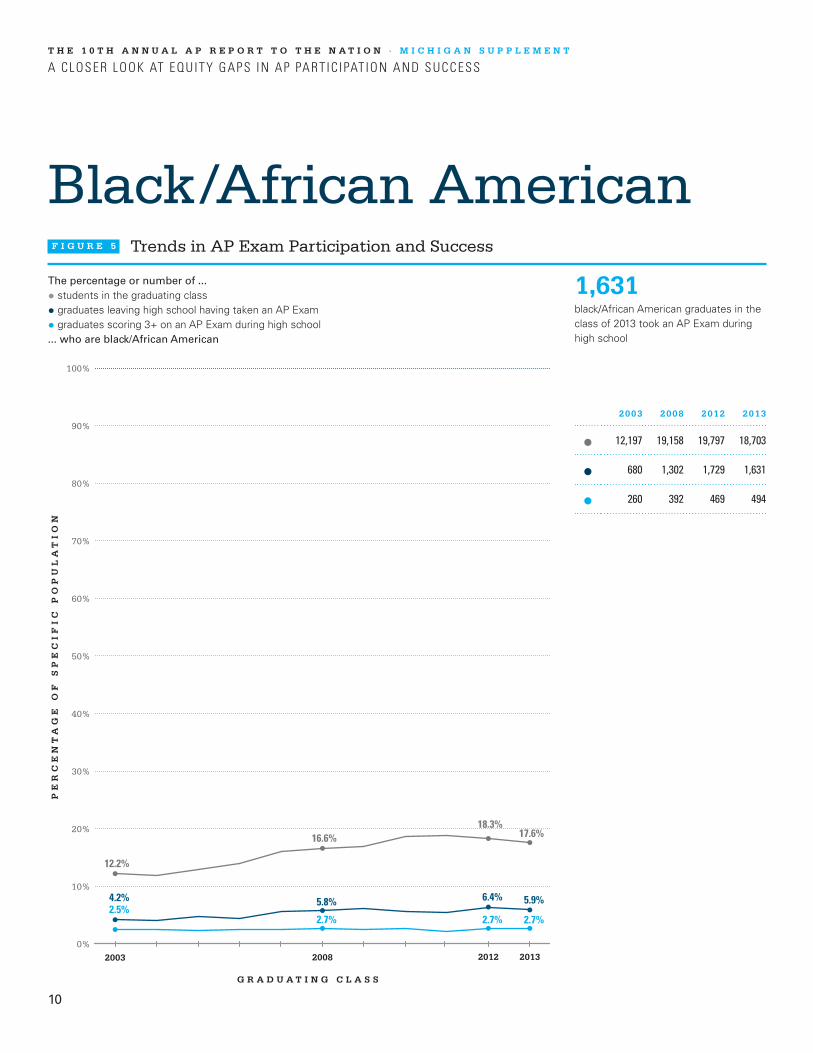
Black/African AmericanF I G U R E 5 Trends in AP Exam Participation and Success
1,631black/African American graduates in the class of 2013 took an AP Exam during high school
The percentage or number of ...
• students in the graduating class
• graduates leaving high school having taken an AP Exam
• graduates scoring 3+ on an AP Exam during high school... who are black/African American
2003 2008 2012 2013
12,197 19,158 19,797 18,703
680 1,302 1,729 1,631
260 392 469 494
2003 2008 2012 2013
PE
RC
EN
TA
GE
OF
SP
EC
IF
IC
PO
PU
LA
TI
ON
G R A D U A T I N G C L A S S
10%
20%
0%
30%
40%
50%
60%
70%
80%
90%
100%
12.2%
16.6%18.3%
17.6%
4.2% 5.8% 6.4% 5.9%2.5%
2.7% 2.7% 2.7%

11
T H E 1 0 T H A N N U A L A P R E P O R T T O T H E N A T I O N · M I C H I G A N S U P P L E M E N T
A CLOSER LOOK AT EQUITY GAPS IN AP PART IC IPAT ION AND SUCCESS
Hispanic/LatinoF I G U R E 6 Trends in AP Exam Participation and Success
945Hispanic/Latino graduates in the class of 2013 took an AP Exam during high school
The percentage or number of ...
• students in the graduating class
• graduates leaving high school having taken an AP Exam
• graduates scoring 3+ on an AP Exam during high school... who are Hispanic/Latino
2003 2008 2012 2013
2,246 3,500 4,250 4,471
288 526 858 945
170 330 478 567
2003 2008 2012 2013
PE
RC
EN
TA
GE
OF
SP
EC
IF
IC
PO
PU
LA
TI
ON
G R A D U A T I N G C L A S S
10%
20%
0%
30%
40%
50%
60%
70%
80%
90%
100%
2.2% 3.0% 3.9% 4.2%
1.8% 2.3% 3.2% 3.4%
1.6% 2.3% 2.8% 3.1%

12
T H E 1 0 T H A N N U A L A P R E P O R T T O T H E N A T I O N · M I C H I G A N S U P P L E M E N T
A CLOSER LOOK AT EQUITY GAPS IN AP PART IC IPAT ION AND SUCCESS
American Indian/ Alaska NativeF I G U R E 7 Trends in AP Exam Participation and Success
127American Indian/Alaska Native graduates in the class of 2013 took an AP Exam during high school
The percentage or number of ...
• students in the graduating class
• graduates leaving high school having taken an AP Exam
• graduates scoring 3+ on an AP Exam during high school... who are American Indian/Alaska Native
2003 2008 2012 2013
881 967 837 810
68 106 109 127
41 60 64 65
2003 2008 2012 2013
PE
RC
EN
TA
GE
OF
SP
EC
IF
IC
PO
PU
LA
TI
ON
G R A D U A T I N G C L A S S
10%
20%
0%
30%
40%
50%
60%
70%
80%
90%
100%
0.9% 0.8% 0.8% 0.8%0.4% 0.5% 0.4% 0.5%0.4% 0.4% 0.4% 0.4%

13
T H E 1 0 T H A N N U A L A P R E P O R T T O T H E N A T I O N · M I C H I G A N S U P P L E M E N T
A CLOSER LOOK AT EQUITY GAPS IN AP PART IC IPAT ION AND SUCCESS
Asian/Asian American/ Pacific IslanderF I G U R E 8 Trends in AP Exam Participation and Success
1,845Asian/Asian American/Pacific Islander graduates in the class of 2013 took an AP Exam during high school
The percentage or number of ...
• students in the graduating class
• graduates leaving high school having taken an AP Exam
• graduates scoring 3+ on an AP Exam during high school... who are Asian/Asian American/Pacific Islander
2003 2008 2012 2013
2,233 2,807 2,813 3,037
943 1,309 1,647 1,845
728 995 1,288 1,431
2003 2008 2012 2013
PE
RC
EN
TA
GE
OF
SP
EC
IF
IC
PO
PU
LA
TI
ON
G R A D U A T I N G C L A S S
10%
20%
0%
30%
40%
50%
60%
70%
80%
90%
100%
2.2% 2.4% 2.6% 2.9%
5.8% 5.8% 6.1% 6.6%6.9% 6.9% 7.5% 7.8%

14
T H E 1 0 T H A N N U A L A P R E P O R T T O T H E N A T I O N · M I C H I G A N S U P P L E M E N T
A CLOSER LOOK AT EQUITY GAPS IN AP PART IC IPAT ION AND SUCCESS
WhiteF I G U R E 9 Trends in AP Exam Participation and Success
21,959white graduates in the class of 2013 took an AP Exam during high school
The percentage or number of ...
• students in the graduating class
• graduates leaving high school having taken an AP Exam
• graduates scoring 3+ on an AP Exam during high school... who are white
2003 2008 2012 2013
82,744 88,225 80,230 79,216
13,446 18,155 20,985 21,959
8,830 11,998 14,132 14,901
2003 2008 2012 2013
PE
RC
EN
TA
GE
OF
SP
EC
IF
IC
PO
PU
LA
TI
ON
G R A D U A T I N G C L A S S
10%
20%
0%
30%
40%
50%
60%
70%
80%
90%
100%
82.5%
76.6%74.3% 74.8%
83.1%
80.7% 78.2% 78.9%
84.0%
83.0% 81.9% 81.7%

15
ABOUT THE COLLEGE BOARD
The College Board is a mission-driven not-for-profit
organization that connects students to college success
and opportunity. Founded in 1900, the College Board
was created to expand access to higher education.
Today, the membership association is made up of over
6,000 of the world’s leading educational institutions
and is dedicated to promoting excellence and equity in
education. Each year, the College Board helps more
than seven million students prepare for a successful
transition to college through programs and services in
college readiness and college success — including
the SAT®, and the Advanced Placement Program®. The
organization also serves the education community through
research and advocacy on behalf of students, educators,
and schools.
For further information, visit www.collegeboard.org.
© 2014 The College Board. College Board, Advanced Placement, Advanced Placement Program, AP, SAT and the acorn logo are registered trademarks of the College Board. All other products and services may be trademarks of their respective owners. Visit the College Board on the Web: www.collegeboard.org.
apreport.collegeboard.org