AP Lecture 6-What is Risk
21
ASSET PRICING Lecture 6 What is Risk? Bristol Business School, UWE Dr. Jesus G. Garza-Garcia
Transcript of AP Lecture 6-What is Risk

8/8/2019 AP Lecture 6-What is Risk
http://slidepdf.com/reader/full/ap-lecture-6-what-is-risk 1/21
ASSET PRICING
Lecture 6
What is Risk?
Bristol Business School, UWE
Dr. Jesus G. Garza-Garcia

8/8/2019 AP Lecture 6-What is Risk
http://slidepdf.com/reader/full/ap-lecture-6-what-is-risk 2/21
1. WHAT IS (FINANCIAL) RISK?
´ Some preliminary questions
´ Assume that you want to invest $100,000.
What do you want from this investment?
´ What dangers to your investment could you
see?

8/8/2019 AP Lecture 6-What is Risk
http://slidepdf.com/reader/full/ap-lecture-6-what-is-risk 3/21
1. WHAT IS (FINANCIAL) RISK?
´ Definition of risk:
´ Actual outcome (return) is different from theexpected outcome (return). This means a gain or
a loss. So, the definition of risk is symmetric.
´ However, people·s attitude towards risk isasymmetric. People are more concerned about a
possible loss than a possible gain. People are riskaverse.
´ The same amount added to wealth is valued lessthan the same amount lost.

8/8/2019 AP Lecture 6-What is Risk
http://slidepdf.com/reader/full/ap-lecture-6-what-is-risk 4/21
1. WHAT IS (FINANCIAL) RISK?
´ It follows: If people are risk averse, they will be less
willing to hold a risky asset than they will be to hold anasset with little or no risk. Thus, agents only hold riskyassets if they receive a higher reward.

8/8/2019 AP Lecture 6-What is Risk
http://slidepdf.com/reader/full/ap-lecture-6-what-is-risk 5/21
1. WHAT IS (FINANCIAL) RISK?
´ What is the reward? (Recall!)
´ Reward = return
´ Eg. A share: the current return is: (Recall: HPR!)
´ Again, risk is the deviation of the actual returnfrom the average return.
1 1 0
0
( ) D P P return
P
!
sumof returnaveragereturn
T
!§

8/8/2019 AP Lecture 6-What is Risk
http://slidepdf.com/reader/full/ap-lecture-6-what-is-risk 6/21
1. WHAT IS (FINANCIAL) RISK?
´ Exercise 1:
´ An investor has the choice between assets with
the following return-risk combinations:A
(8,15);B(6,12); C(11,15); D(16,21).
´ Which asset will the risk averse investor reject?

8/8/2019 AP Lecture 6-What is Risk
http://slidepdf.com/reader/full/ap-lecture-6-what-is-risk 7/21
1. WHAT IS (FINANCIAL) RISK?
´ Daily returns of McDonald·s stock price 2nd Jan 1990 to31st Jan 1990
´
Looking at the graph, is it risky to invest in
McDonald·s?

8/8/2019 AP Lecture 6-What is Risk
http://slidepdf.com/reader/full/ap-lecture-6-what-is-risk 8/21
1. WHAT IS (FINANCIAL) RISK?
´ Daily data from 29th Dec 1989 until 31st Dec1999 (2531 returns): Graph:
´ What do you see?
McDonald's--Daily Returns, 29 Dec 89 - 31 Dec 99
-11.0%
-10.0%
-9.0%
-8.0%
-7.0%
-6.0%
-5.0%
-4.0%
-3.0%
-2.0%
-1.0%
0.0%
1.0%
2.0%
3.0%
4.0%
5.0%
6.0%
7.0%
8.0%
9.0%
10.0%
11.0%
02- J an
- 9 0
0 9- S e p- 9 0
17-M a
y- 91
22- J an
- 92
2 8- S e p- 92
0 5- J un
- 9 3
1 0-F e b- 94
1 8- O c t - 94
2 5- J un
- 9 5
01-M a
r - 9 6
0 6-N ov- 9 6
14- J ul - 97
21-M a
r - 9 8
2 6-N ov- 9 8
0 3-A u g- 9 9
8 September 1998
31 August 1998

8/8/2019 AP Lecture 6-What is Risk
http://slidepdf.com/reader/full/ap-lecture-6-what-is-risk 9/21
1. WHAT IS (FINANCIAL) RISK?
´ Y ou get a bit more when you look at a frequency distribution:
´ Highest daily return = 10.86%´ Lowest daily return= -10.07%
´ What do you see now?

8/8/2019 AP Lecture 6-What is Risk
http://slidepdf.com/reader/full/ap-lecture-6-what-is-risk 10/21
WHAT DOES AN INVESTOR WANT FROM
THE INVESTMENT?
´ High average rate of return and low risk
´ How do we measure both?
´ For ease of calculation (and daily averagereturn is close to zero), we use annual data
now.

8/8/2019 AP Lecture 6-What is Risk
http://slidepdf.com/reader/full/ap-lecture-6-what-is-risk 11/21
WHAT DOES AN INVESTOR WANT FROM
THE INVESTMENT?
Date
McDonald's
return
Return minus
average,
squared
31-Dec-90 -15.65% 11.908%31-Dec-91 30.54% 1.365%
31-Dec-92 28.31% 0.893%
31-Dec-93 16.90% 0.038%
30-Dec-94 2.64% 2.633%
29-Dec-95 54.27% 12.536%
31-Dec-96 0.54% 3.357%
31-Dec-97 5.23% 1.857%
31-Dec-98 60.88% 17.659%
31-Dec-99 4.94% 1.938%

8/8/2019 AP Lecture 6-What is Risk
http://slidepdf.com/reader/full/ap-lecture-6-what-is-risk 12/21
WHAT DOES AN INVESTOR WANT FROM
THE INVESTMENT?
´ Calculate expected return:
´ On average, an investor in McDonald·s stocksreceives about 19% p.a.
´ Calculating the variance:
´ (Since risk is defined as the difference of actualreturns from expected returns, variance andstandard deviations seem to be good measures.)
1
1 1( ) 15.65 30.54 ... 4.94 18.86%
10
T
t
t
E r r T !
! ! !§

8/8/2019 AP Lecture 6-What is Risk
http://slidepdf.com/reader/full/ap-lecture-6-what-is-risk 13/21
WHAT DOES AN INVESTOR WANT FROM
THE INVESTMENT?
´ The average variation around the expected
return of 18.86% is 24.56%.
´ Anything striking?
8/8/2019 AP Lecture 6-What is Risk
http://slidepdf.com/reader/full/ap-lecture-6-what-is-risk 14/21
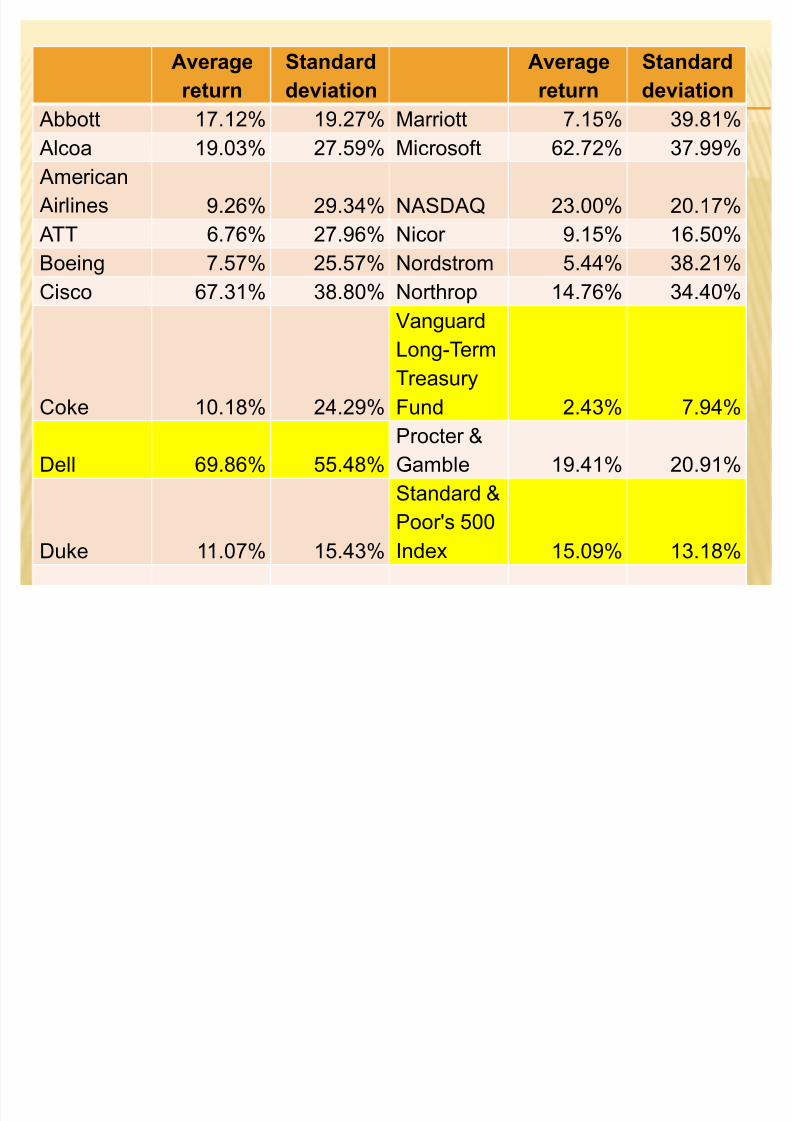
AVERAGE RETURN VERSUS STANDARD
DEVIATION OF RETURNS
Average
return
Standard
deviation
Average
return
Standard
deviation
Abbott 17.12% 19.27% Marriott 7.15% 39.81%
Alcoa 19.03% 27.59% Micr osoft 62.72% 37.99%
American
Air lines 9.26% 29.34% NASDAQ 23.00% 20.17%
ATT 6.76% 27.96% Nicor 9.15% 16.50%
Boeing 7.57% 25.57% Nordstr om 5.44% 38.21%
Cisco 67.31% 38.80% Nor thr op 14.76% 34.40%
Coke 10.18% 24.29%
Vanguard
Long-Ter m
Tr easury
Fund 2.43% 7.94%
Dell 69.86% 55.48%
Pr octer &
Gamble 19.41% 20.91%
Duke 11.07% 15.43%
Standard &
Poor's 500
Index 15.09% 13.18%

8/8/2019 AP Lecture 6-What is Risk
http://slidepdf.com/reader/full/ap-lecture-6-what-is-risk 15/21
WHAT DOES AN INVESTOR WANT FROM
THE INVESTMENT?
´ What do you see on the graph (relate to table)?
´ What does the straight line indicate to you?

8/8/2019 AP Lecture 6-What is Risk
http://slidepdf.com/reader/full/ap-lecture-6-what-is-risk 16/21
VALUE AT RISK (VAR)
´ What is VaR?
´ VaR estimates the capital loss on a portfolio over agiven period (e.g.1 day) that will be exceeded with
a given percentage (e.g. 1%).
´ Capital loss can be in £ or, as we will define ithere, it can be a percentage of our portfolio.
´ VaR is calculated on the basis of the probabilitydistribution of returns.

8/8/2019 AP Lecture 6-What is Risk
http://slidepdf.com/reader/full/ap-lecture-6-what-is-risk 17/21
VALUE AT RISK (VAR)
´ Figure 1: Histogram of daily returns of FTSE All
Shares between 3rd May 2004 and 2nd May 2008.
0
50
100
150
200
250
F
r
e
u
e
n
c
y
Return %
p=1%
(1-p)=99%

8/8/2019 AP Lecture 6-What is Risk
http://slidepdf.com/reader/full/ap-lecture-6-what-is-risk 18/21
VALUE AT RISK (VAR)
´ Here: the daily VaR (99% confidence level) = -
2.61%. This means that if the portfolio value
were £100 million, the VaR would simply be:
´ VaR = £100 million x 2.61% = £2.61 million
´ The VaR value of £2.61 million tells us that
there is a 1% chance that next day we will lose
£2.61 million or more.
8/8/2019 AP Lecture 6-What is Risk
http://slidepdf.com/reader/full/ap-lecture-6-what-is-risk 19/21
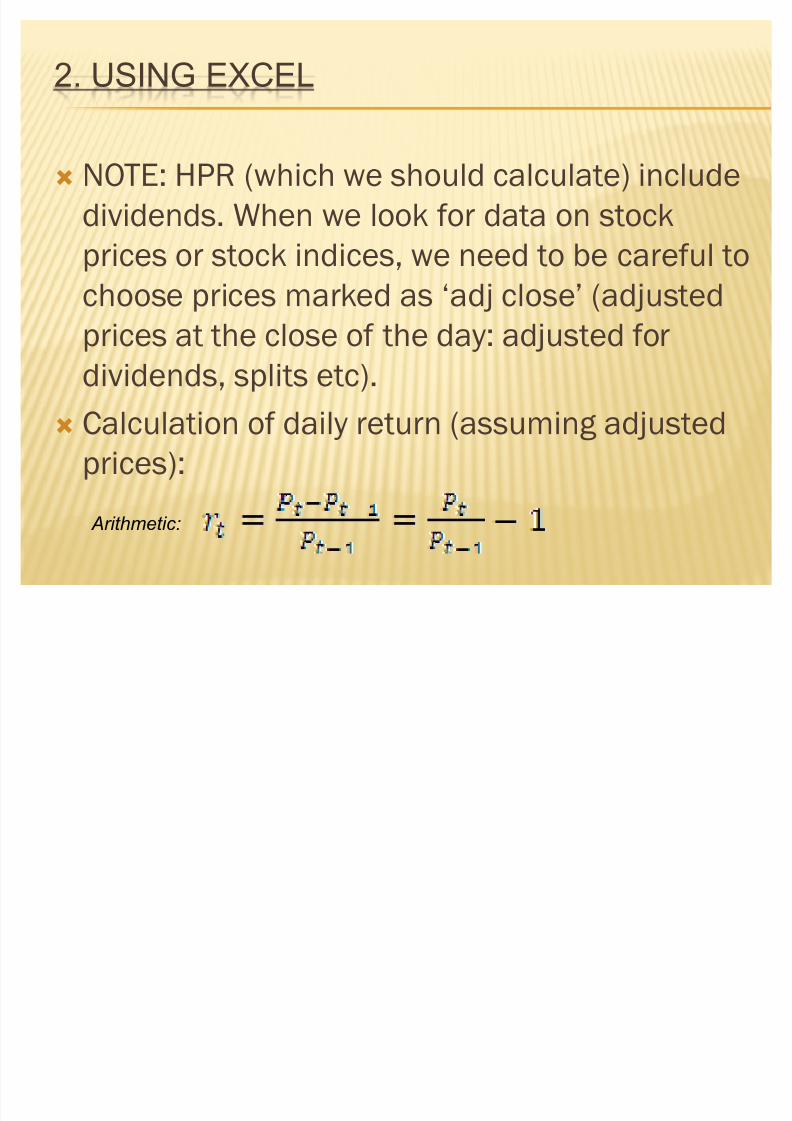
2. USING EXCEL
´ NOTE: HPR (which we should calculate) include
dividends. When we look for data on stock
prices or stock indices, we need to be careful to
choose prices marked as ¶adj close· (adjusted
prices at the close of the day: adjusted for
dividends, splits etc).
´ Calculation of daily return (assuming adjustedprices):
Arithmetic:

8/8/2019 AP Lecture 6-What is Risk
http://slidepdf.com/reader/full/ap-lecture-6-what-is-risk 20/21
2. USING EXCEL
´ To calculate frequency distribution:
´ Use frequency function in EXCEL:
´ Construct classes (called BINS)´ Use frequency command

8/8/2019 AP Lecture 6-What is Risk
http://slidepdf.com/reader/full/ap-lecture-6-what-is-risk 21/21
2. USING EXCEL
A B C D E F
1 Date Price Return Frequency
Distribution
EXEL
Instruction
2 29-Jan-90 8.50 -10% =frequency
(c3:c102,
e3:e12)
3 30-Jan-90 8.59 1.05% -8%
4 31-Jan-90 8.50 -1.053% -6%
5 1-Feb-90 8.34 -1.900% -4%
6 2-Feb-90 8.19 -1.815% -2%
7 « « «. 0%
.. « « «. «
102