AP Biology Lab 9: Transpiration. AP Biology Lab 9: Transpiration Description test the effects of...
10
AP Biology Lab 9: Transpiration
-
Upload
marcus-cook -
Category
Documents
-
view
227 -
download
2
Transcript of AP Biology Lab 9: Transpiration. AP Biology Lab 9: Transpiration Description test the effects of...

AP Biology
Lab 9: Transpiration
AP Biology
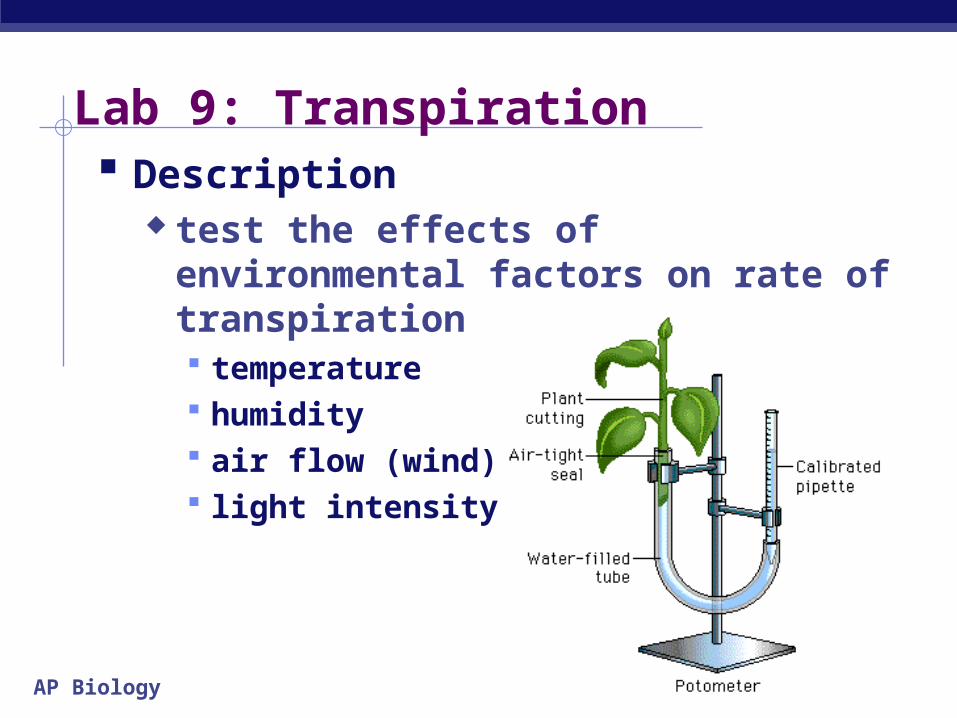
Lab 9: Transpiration Description
test the effects of environmental factors on rate of transpiration temperature humidity air flow (wind) light intensity
AP Biology
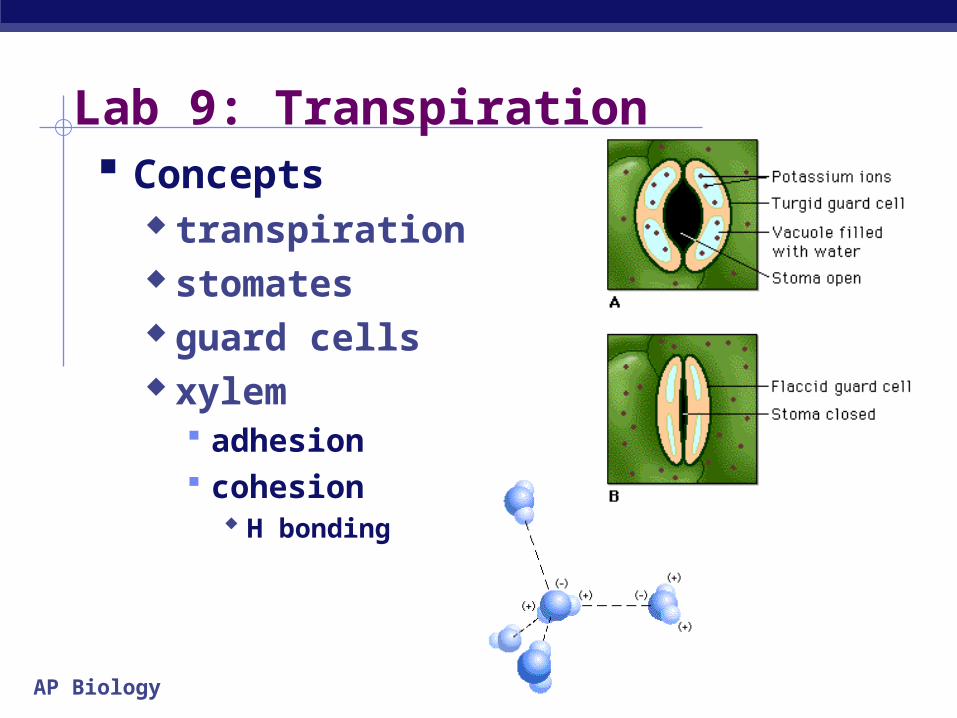
Lab 9: Transpiration Concepts
transpiration stomates guard cells xylem
adhesion cohesion
H bonding
AP Biology
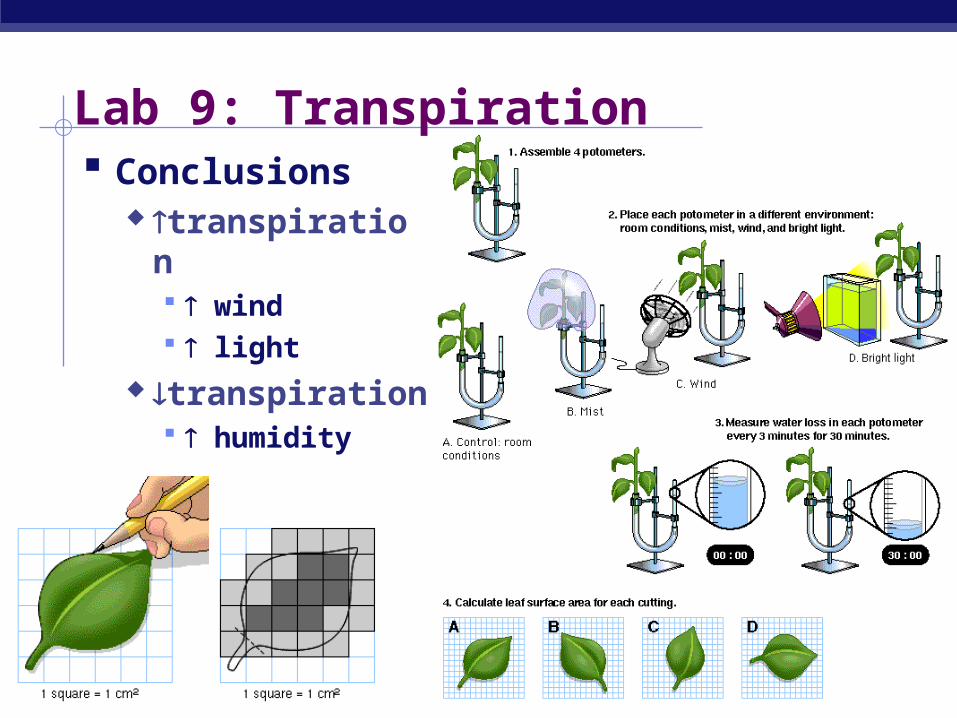
Lab 9: Transpiration Conclusions
transpiration wind light
transpiration humidity
AP Biology
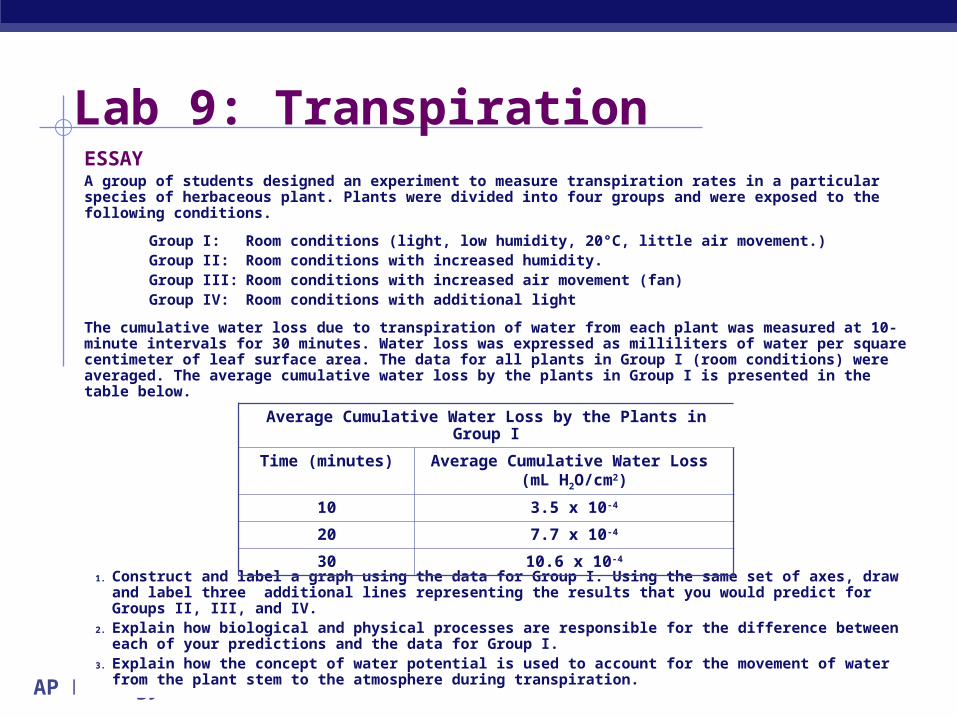
Lab 9: TranspirationESSAYA group of students designed an experiment to measure transpiration rates in a particular species of herbaceous plant. Plants were divided into four groups and were exposed to the following conditions.
Group I: Room conditions (light, low humidity, 20°C, little air movement.) Group II: Room conditions with increased humidity. Group III: Room conditions with increased air movement (fan) Group IV: Room conditions with additional light
The cumulative water loss due to transpiration of water from each plant was measured at 10-minute intervals for 30 minutes. Water loss was expressed as milliliters of water per square centimeter of leaf surface area. The data for all plants in Group I (room conditions) were averaged. The average cumulative water loss by the plants in Group I is presented in the table below.
1. Construct and label a graph using the data for Group I. Using the same set of axes, draw and label three additional lines representing the results that you would predict for Groups II, III, and IV.
2. Explain how biological and physical processes are responsible for the difference between each of your predictions and the data for Group I.
3. Explain how the concept of water potential is used to account for the movement of water from the plant stem to the atmosphere during transpiration.
Average Cumulative Water Loss by the Plants in Group I
Time (minutes) Average Cumulative Water Loss (mL H2O/cm2)
10 3.5 x 10⁻⁴
20 7.7 x 10⁻⁴
30 10.6 x 10⁻⁴
AP Biology
Lab 10: Circulatory Physiology
AP Biology
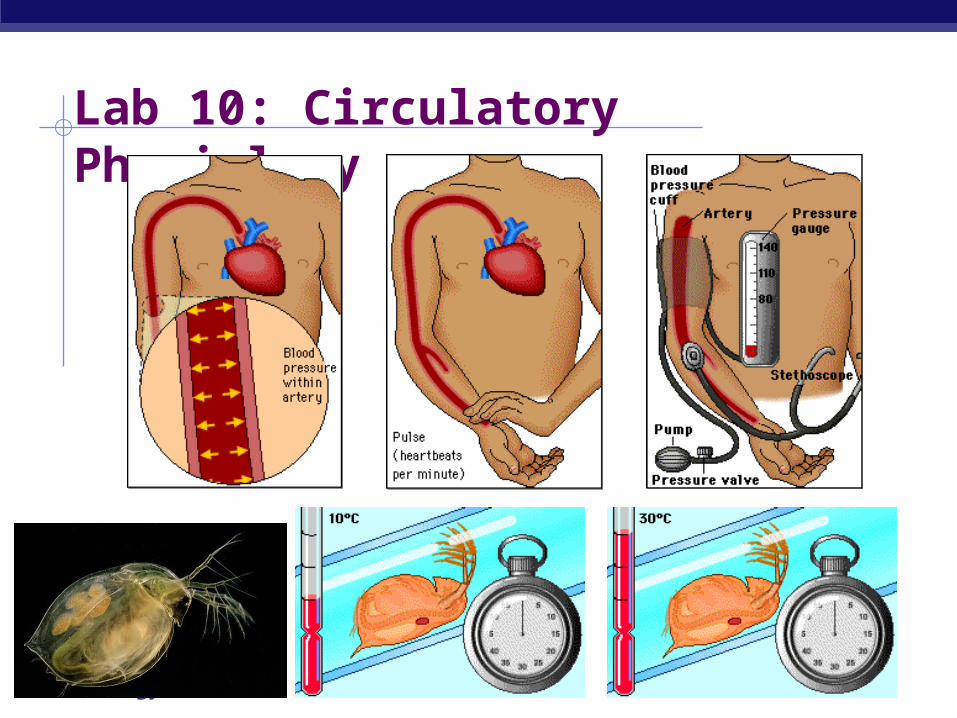
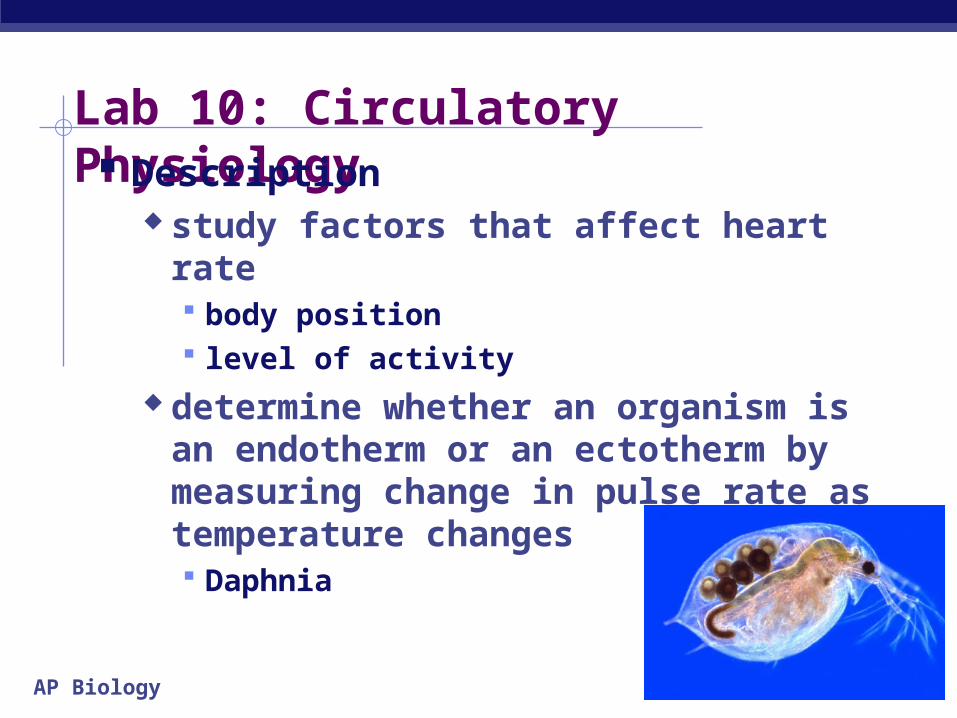
Lab 10: Circulatory Physiology Description
study factors that affect heart rate body position level of activity
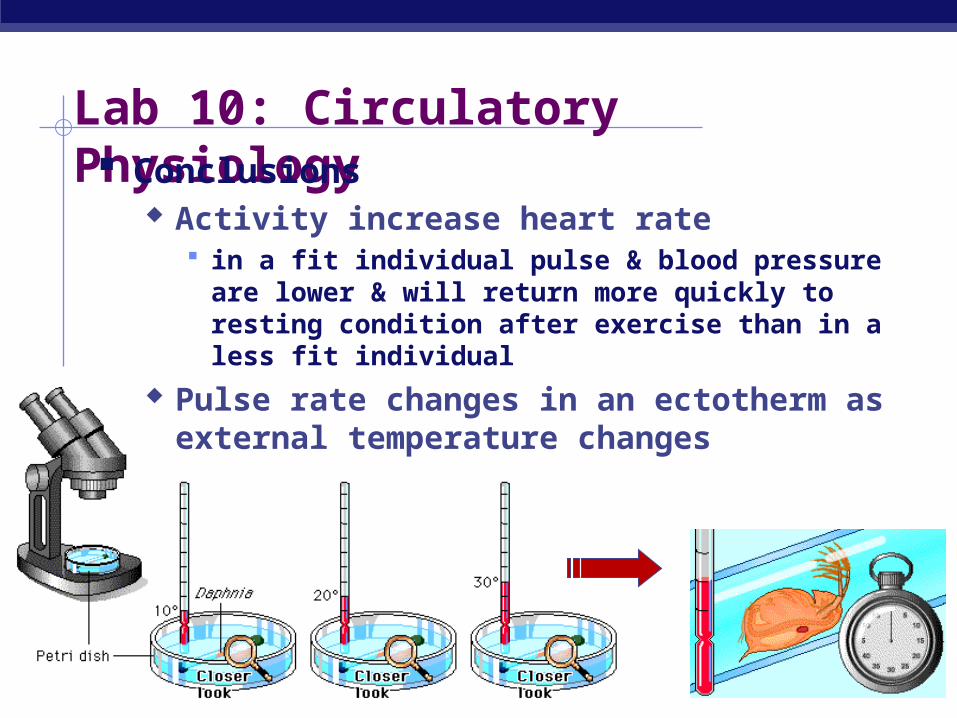
determine whether an organism is an endotherm or an ectotherm by measuring change in pulse rate as temperature changes Daphnia
AP Biology
Lab 10: Circulatory Physiology Concepts
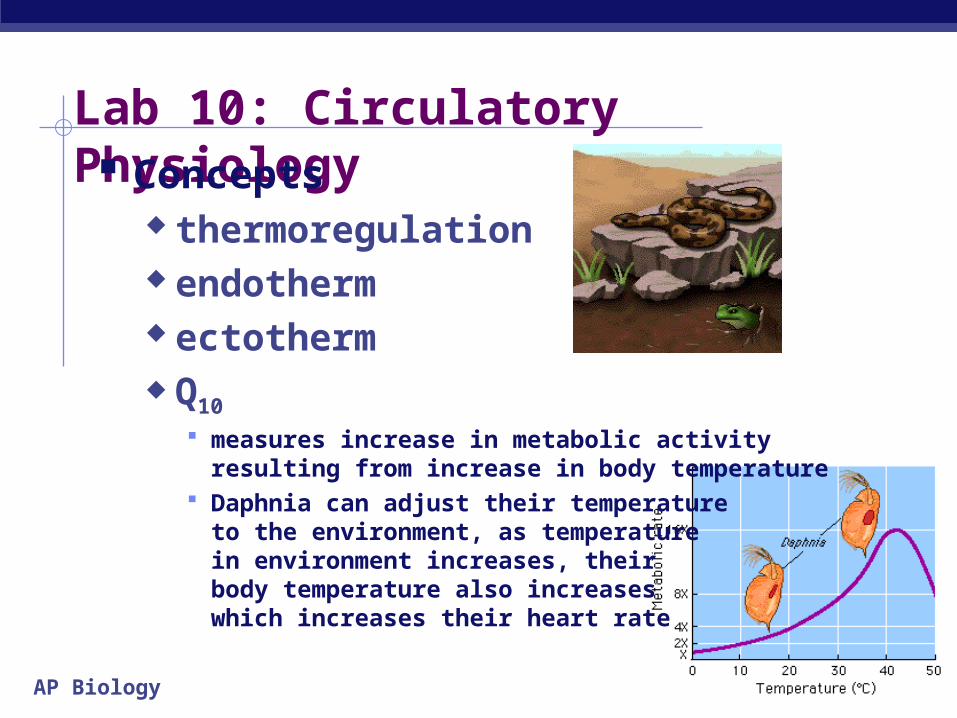
thermoregulation endotherm ectotherm Q10
measures increase in metabolic activity resulting from increase in body temperature
Daphnia can adjust their temperature to the environment, as temperature in environment increases, their body temperature also increases which increases their heart rate
AP Biology
Lab 10: Circulatory Physiology Conclusions
Activity increase heart rate in a fit individual pulse & blood pressure are lower &
will return more quickly to resting condition after exercise than in a less fit individual
Pulse rate changes in an ectotherm as external temperature changes
AP Biology
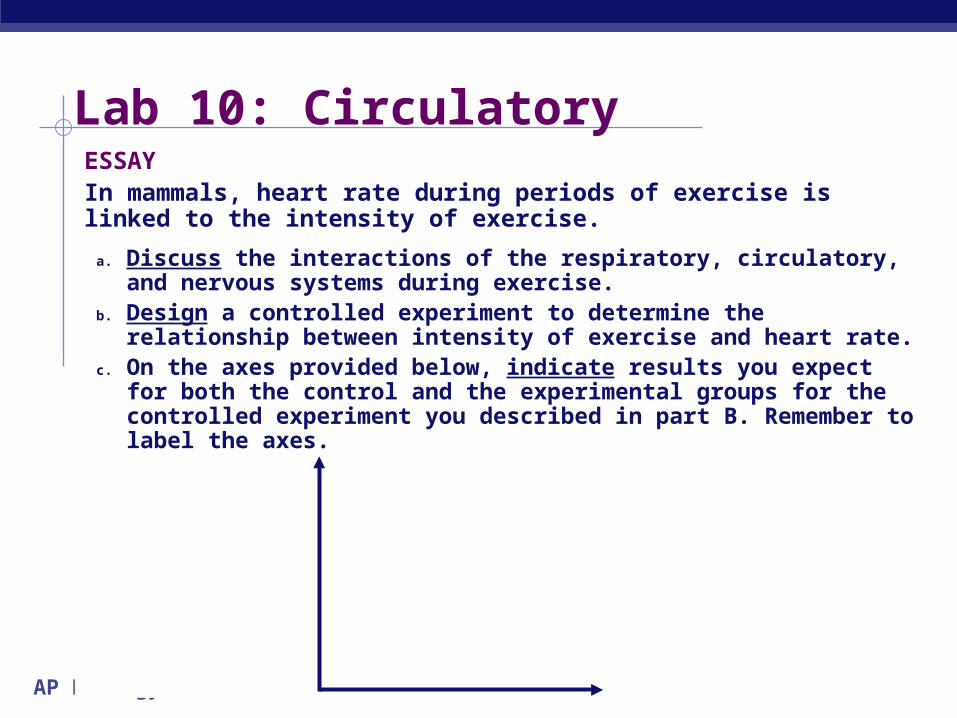
Lab 10: Circulatory PhysiologyESSAYIn mammals, heart rate during periods of exercise is linked to the intensity of exercise.
a. Discuss the interactions of the respiratory, circulatory, and nervous systems during exercise.
b. Design a controlled experiment to determine the relationship between intensity of exercise and heart rate.
c. On the axes provided below, indicate results you expect for both the control and the experimental groups for the controlled experiment you described in part B. Remember to label the axes.