AOSIS Presentation Nationally Mitigation of common...
20
AOSIS Presentation Nationally‐Appropriate Mitigation Actions: the importance of common accounting rules AWG‐LCA In‐session workshop May 18, 2012 Bonn, Germany
Transcript of AOSIS Presentation Nationally Mitigation of common...

AOSIS PresentationNationally‐Appropriate Mitigation Actions: the importance of common
accounting rules
AWG‐LCA In‐session workshopMay 18, 2012Bonn, Germany
Convention agreed in 1992, but CO2 concentrations still rising
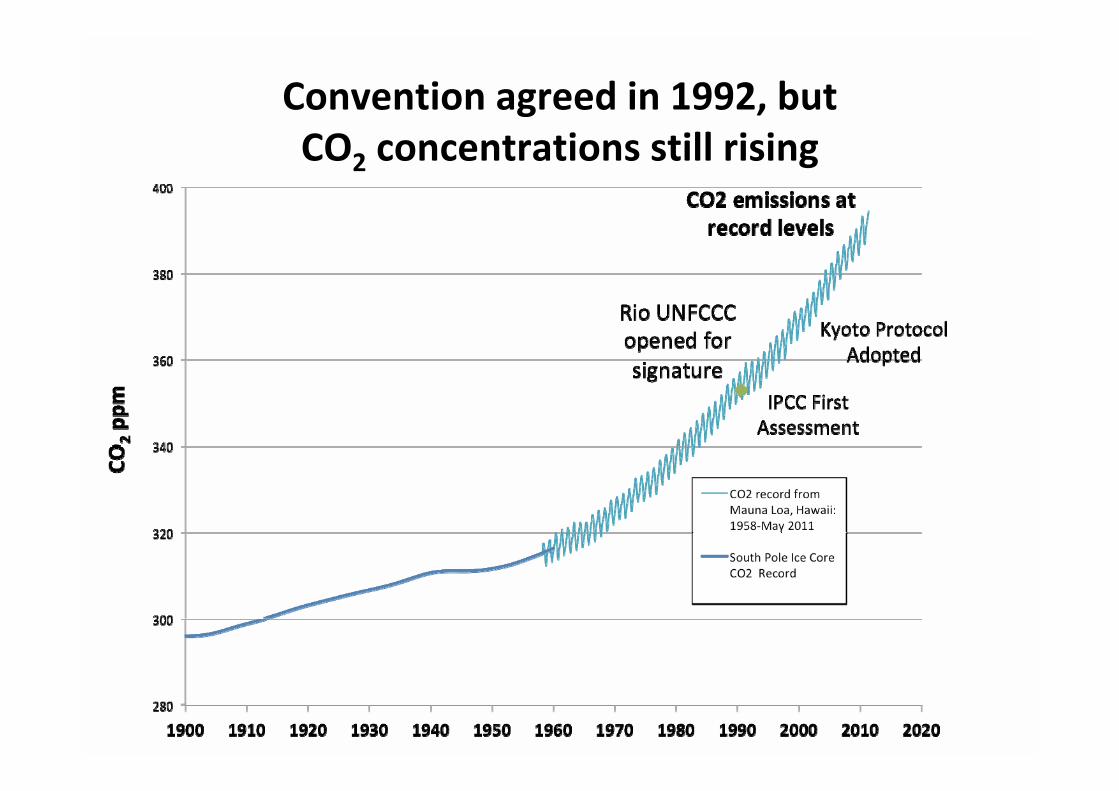
Non‐Annex I Emissions Gap?
Data source: www.climateactiontracker.org

Climate change impacts are accelerating
� Hotter temperatures
� Sea level rise and permanent land loss
� Coastal erosion
� Food security challenges
� Ocean acidification and coral bleaching
� Loss of biodiversity
� More intense extreme weather events
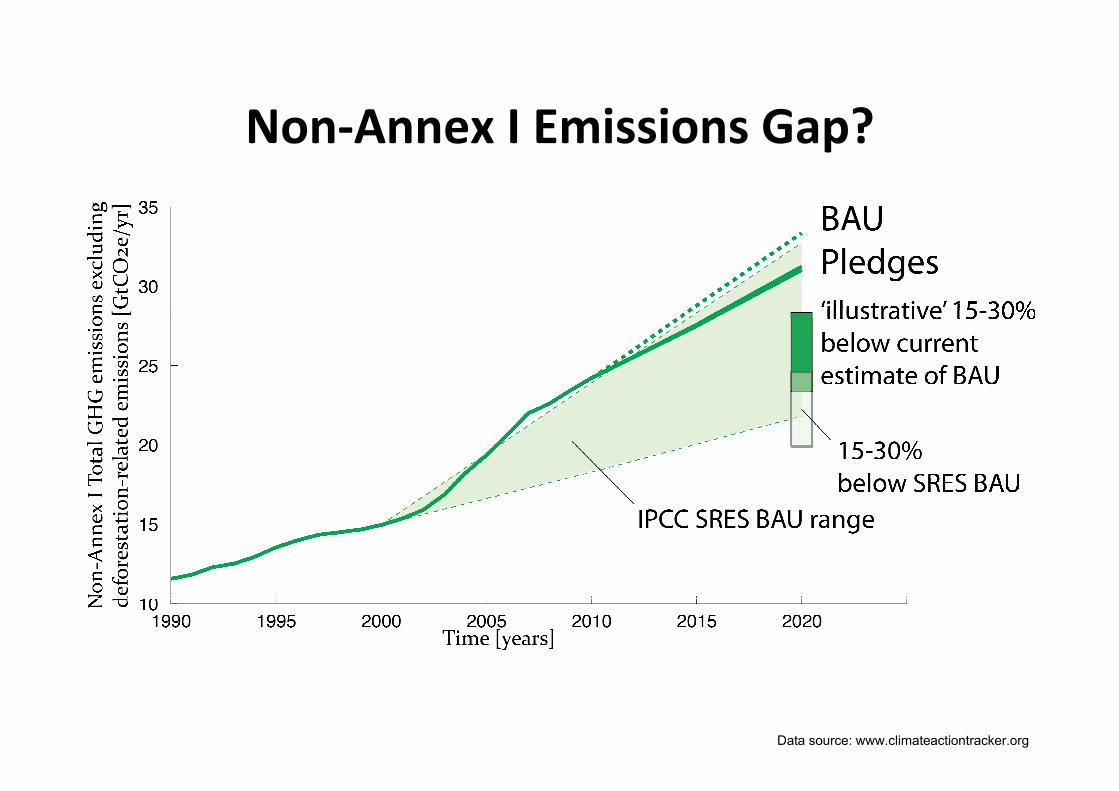
UNEP Gap Report 2011 �The gap is not closing
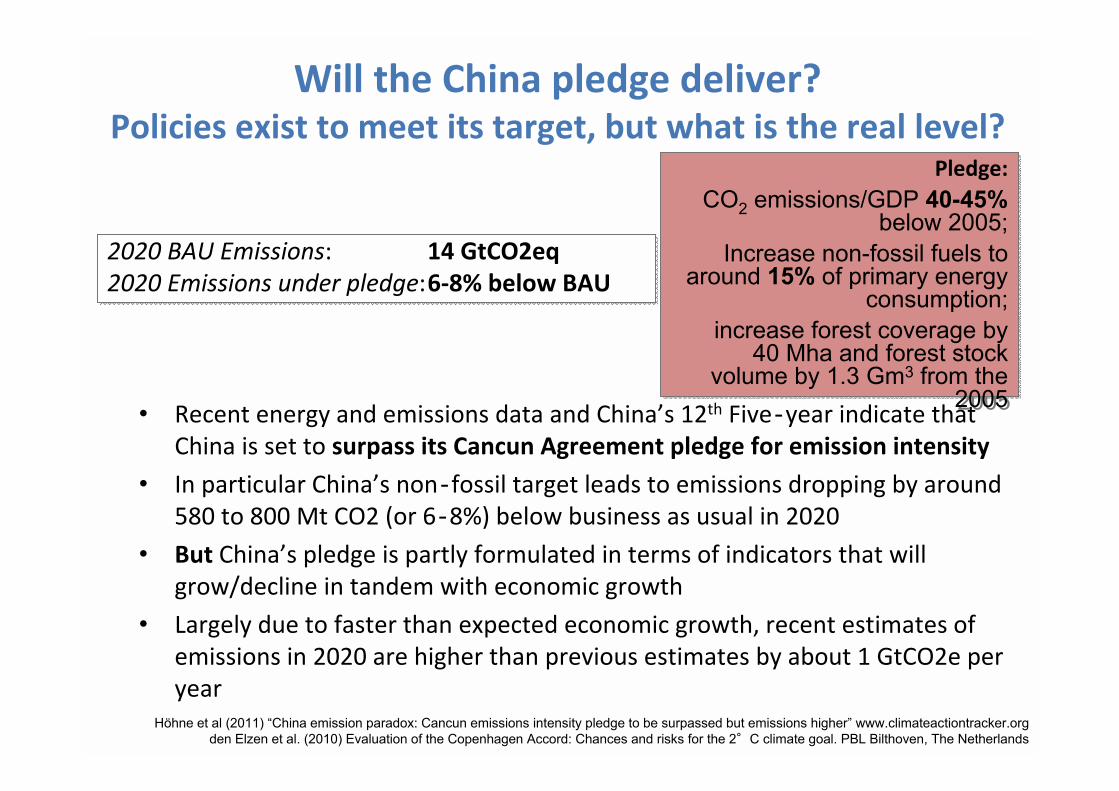
Will the China pledge deliver?Policies exist to meet its target, but what is the real level?
2020 BAU Emissions: 14 GtCO2eq2020 Emissions under pledge:6‐8% below BAU2020 BAU Emissions: 14 GtCO2eq2020 Emissions under pledge:6‐8% below BAU
� Recent energy and emissions data and China�s 12th Five‐year indicate that China is set to surpass its Cancun Agreement pledge for emission intensity
� In particular China�s non‐fossil target leads to emissions dropping by around 580 to 800 Mt CO2 (or 6‐8%) below business as usual in 2020
� But China�s pledge is partly formulated in terms of indicators that will grow/decline in tandem with economic growth
� Largely due to faster than expected economic growth, recent estimates of emissions in 2020 are higher than previous estimates by about 1 GtCO2e per year
Höhne et al (2011) �China emission paradox: Cancun emissions intensity pledge to be surpassed but emissions higher� www.climateactiontracker.orgden Elzen et al. (2010) Evaluation of the Copenhagen Accord: Chances and risks for the 2°C climate goal. PBL Bilthoven, The Netherlands
Pledge: CO2 emissions/GDP 40-45%
below 2005;Increase non-fossil fuels to
around 15% of primary energy consumption;
increase forest coverage by40 Mha and forest stock
volume by 1.3 Gm3 from the 2005
Pledge: CO2 emissions/GDP 40-45%
below 2005;Increase non-fossil fuels to
around 15% of primary energy consumption;
increase forest coverage by40 Mha and forest stock
volume by 1.3 Gm3 from the 2005

Will the Brazil pledge deliver?Policies exist to meet its target
� Brazilian commitment taken during COP15 became part of Brazilian legislation.
� 2011 government data from Brazil shows emissions will grow more rapidly than previously expected (current BAU 18% higher, partly due to larger projected emissions from deforestation and other sources)
Details on Brazilian emissions reductions goals in the ANNEX of DECRETO Nº 7.390, DE 9 DE DEZEMBRO DE 2010.Höhne et al (2011) �China emission paradox: Cancun emissions intensity pledge to be surpassed but emissions higher� www.climateactiontracker.org
2020 BAU Emissions: 3.2 GtCO2eq2020 Emissions under pledge: 36.1‐38.9% below BAU
2020 BAU Emissions: 3.2 GtCO2eq2020 Emissions under pledge: 36.1‐38.9% below BAU
Pledge: 36.1‐38.9% below BAU
Pledge: 36.1‐38.9% below BAU
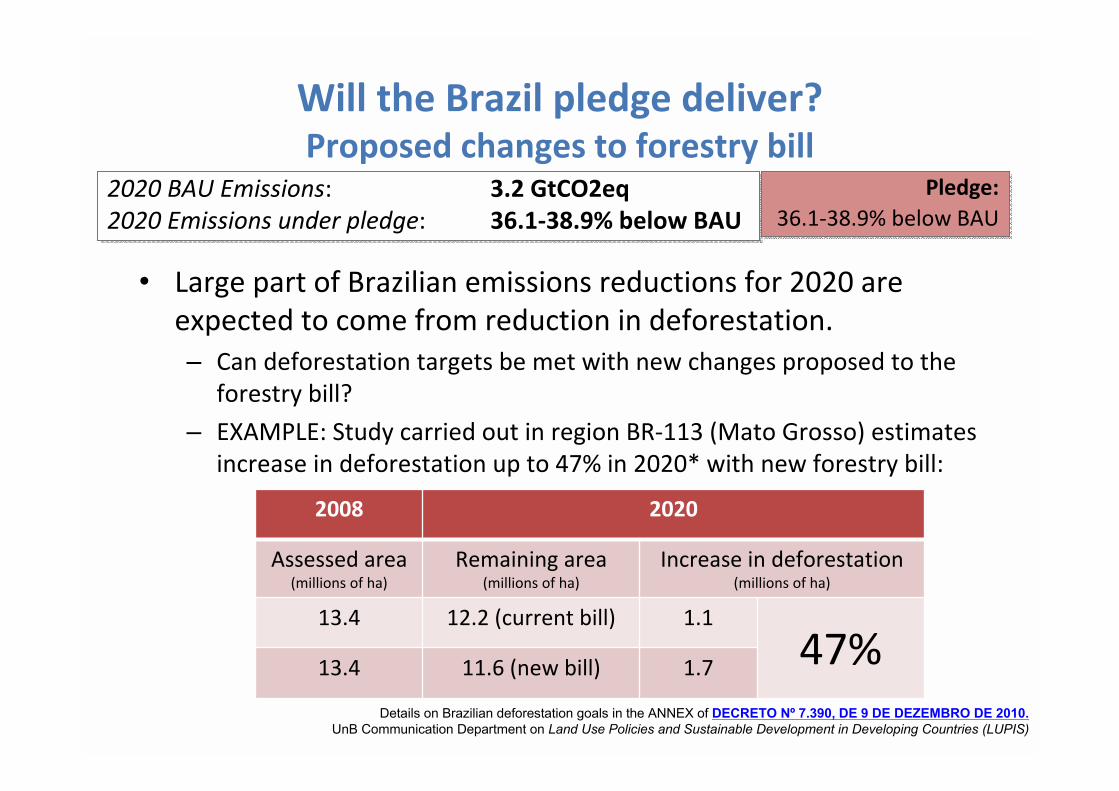
Will the Brazil pledge deliver?Proposed changes to forestry bill
� Large part of Brazilian emissions reductions for 2020 are expected to come from reduction in deforestation.� Can deforestation targets be met with new changes proposed to the
forestry bill?
� EXAMPLE: Study carried out in region BR‐113 (Mato Grosso) estimates increase in deforestation up to 47% in 2020* with new forestry bill:
Details on Brazilian deforestation goals in the ANNEX of DECRETO Nº 7.390, DE 9 DE DEZEMBRO DE 2010.UnB Communication Department on Land Use Policies and Sustainable Development in Developing Countries (LUPIS)
2020 BAU Emissions: 3.2 GtCO2eq2020 Emissions under pledge: 36.1‐38.9% below BAU2020 BAU Emissions: 3.2 GtCO2eq2020 Emissions under pledge: 36.1‐38.9% below BAU
Pledge: 36.1‐38.9% below BAU
Pledge: 36.1‐38.9% below BAU
2008 2020
Assessed area(millions of ha)
Remaining area(millions of ha)
Increase in deforestation(millions of ha)
13.4 12.2 (current bill) 1.1
47%13.4 11.6 (new bill) 1.7

Will the India pledge deliver?Emission intensity pledge is comparable to business‐as‐usual development from various sources. But which Gt emissions level is consistent with India�s policies?
� Figure shows emission intensity trend from IEA WEO2011 & IMF
� Following this trend emission intensity by 2020 would be more than 25% below 2005, although emissions (WEO2011) would still double over this time frame
� This brings India�s emissions at or near business‐as‐usual, which is in agreement with the literature on �burden sharing� / equity
� Is this trend data consistent with India�s pledge and policies?
� Why is agriculture excluded (1/4th of total emissions in 2005)?
Data source: emissions IEA WEO 2009/2011, EDGAR4.2; GDP IMF 2011; www.climateactiontracker.org
2020 BAU Emissions: 3‐4.5 GtCO2eq2020 Emissions under pledge: 0% below BAU?2020 BAU Emissions: 3‐4.5 GtCO2eq2020 Emissions under pledge: 0% below BAU?
Pledge: emission intensity of GDP
20-25% below 2005excluding agricultural sector
Pledge: emission intensity of GDP
20-25% below 2005excluding agricultural sector
Emissions intensity 20-25% below 2005
Emission
s intensity
(MtCO2/Bil. USD
GDPP
PP)
To understand impact of these and other developing country NAMAs on reaching the
1.5°C global goal, need:
� Transparent assumptions� related to BAU�data sources�GDP, emissions intensity, share of non‐fossil fuel, etc.
� Transparent methodologies� for calculation of BAU� calculation of tonnes reduced

SIDS are finding ways to innovate and develop sustainably
� Replacement of diesel by locally‐produced and consumed biofuels
� OTEC being tested in the Pacific
� Geothermal ‐ supply multiple islands in Caribbean
� Pacific SIDS introducing adaptation measures to safeguard installed RE against climate impacts
� Innovative, collaborative, sustainable development of SIDS
Categories of NAMAs already formally submitted by SIDS
� Carbon neutrality� E.g., Maldives, PNG
� Reductions below base year� E.g., Antigua and Barbuda, Marshall Islands, PNG
� Reductions below BAU� E.g., Singapore
� Renewable energy targets� E.g., Mauritius
� Energy efficiency targets

The Barbados Declaration on Achieving Sustainable Energy for All in Small Island Developing States (SIDS)
Barbados, Bridgetown, 7‐8 May 2012
� SIDS have inscribed voluntary commitments in an Annex to the Declaration, which aim to promote transformational activities in the areas of renewable energy, energy efficiency, energy access, and low carbon development � Annex is open for addition of further countries and donors to
provide support until 25 May 2012
� Countries have brought forward voluntary commitments since the meeting
� Renewable energy is �not an option, but the only way� to ensure green economy and sustainable development in SIDS ‐ Henry Puna, Prime Minister, Cook Islands

Sustainable Development Goals in SIDS ‐ examplesBarbados Declaration on Sustainable Energy, Barbados 7‐8 May 2012
Country Economy‐wide goals Timing
Cape Verde 35% reduction in GHGs 2020
Grenada 20% reduction in GHGs below BAU 2020
Marshall Is. 40% reduction in GHGs below 2009 2020
Country Renewable Energy goals Timing
Barbados 29% of energy consumption from RE (indicative) 2029
Cook islands 50% of energy from RE (inhabited islands) 2015
Cook islands 100% of energy from RE (inhabited islands) 2020
Dominica Increase RE (hydro) generation from 30% to 100%
Guyana 90% of electricity from RE (hydro)
Marshall Is. 20% of energy from RE 2020
Mauritius 35% share of RE 2025
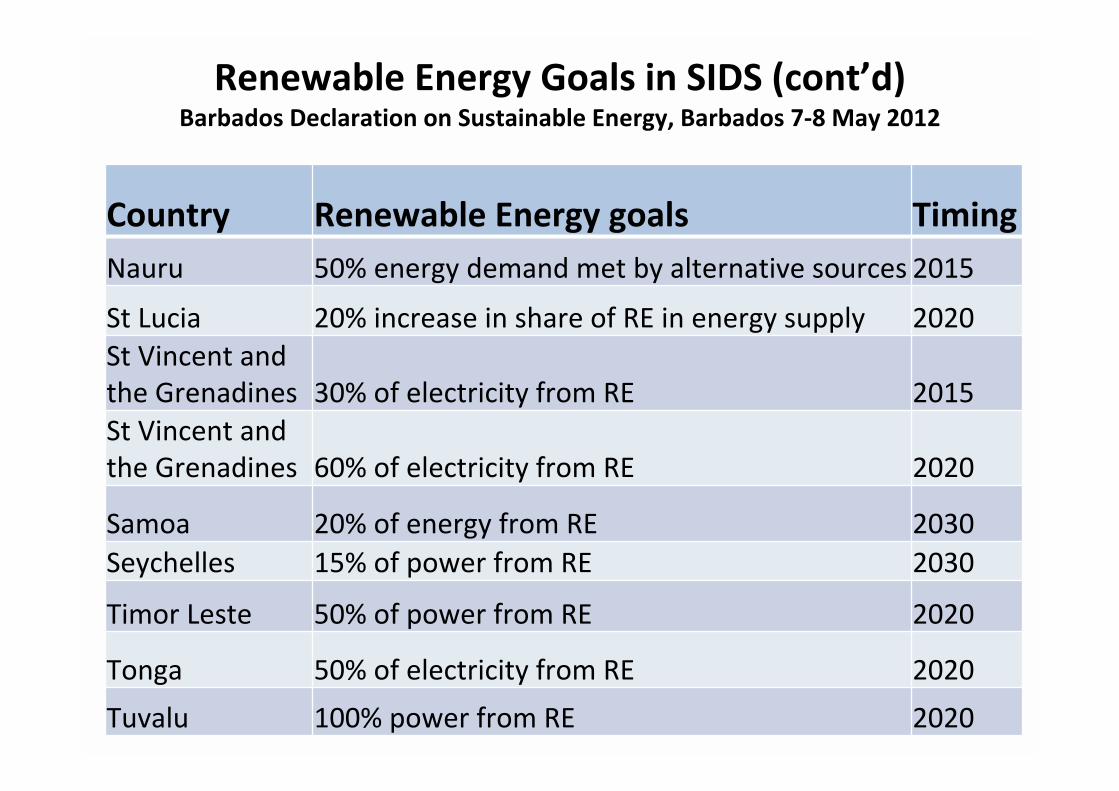
Renewable Energy Goals in SIDS (cont�d)Barbados Declaration on Sustainable Energy, Barbados 7‐8 May 2012
Country Renewable Energy goals TimingNauru 50% energy demand met by alternative sources 2015
St Lucia 20% increase in share of RE in energy supply 2020St Vincent and the Grenadines 30% of electricity from RE 2015St Vincent and the Grenadines 60% of electricity from RE 2020
Samoa 20% of energy from RE 2030Seychelles 15% of power from RE 2030
Timor Leste 50% of power from RE 2020
Tonga 50% of electricity from RE 2020
Tuvalu 100% power from RE 2020
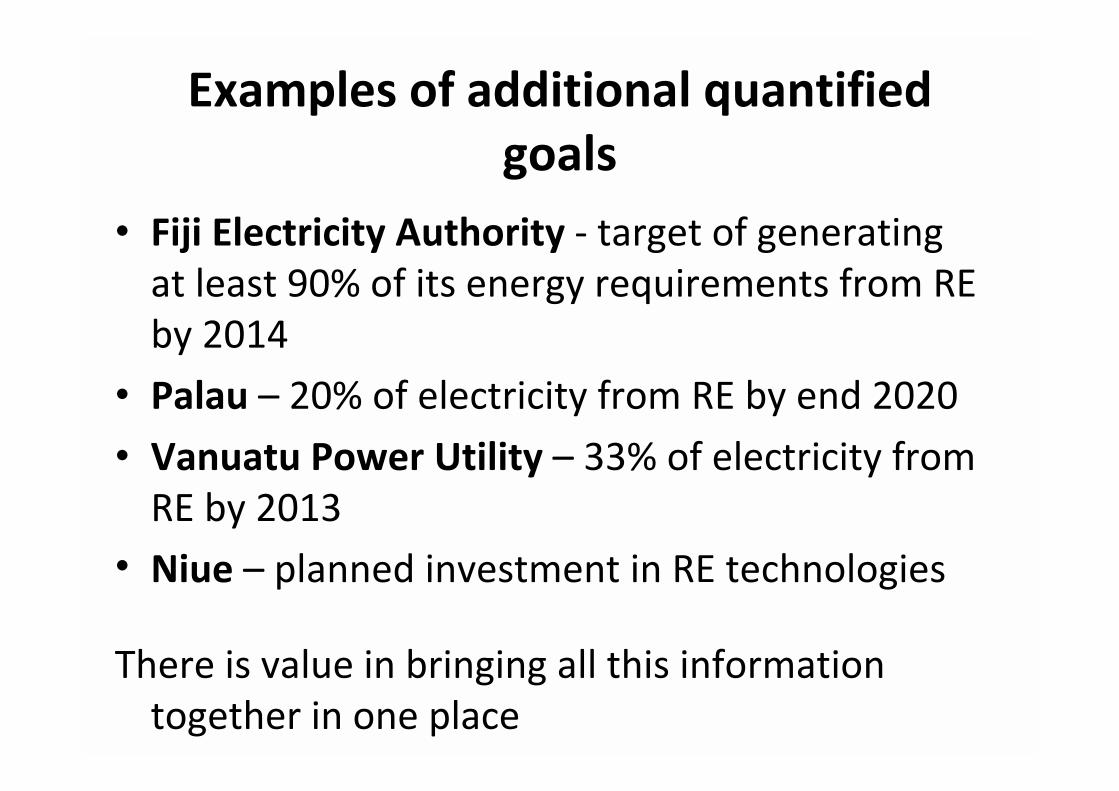
Examples of additional quantified goals
� Fiji Electricity Authority ‐ target of generating at least 90% of its energy requirements from RE by 2014
� Palau � 20% of electricity from RE by end 2020
� Vanuatu Power Utility � 33% of electricity from RE by 2013
� Niue � planned investment in RE technologies
There is value in bringing all this information together in one place
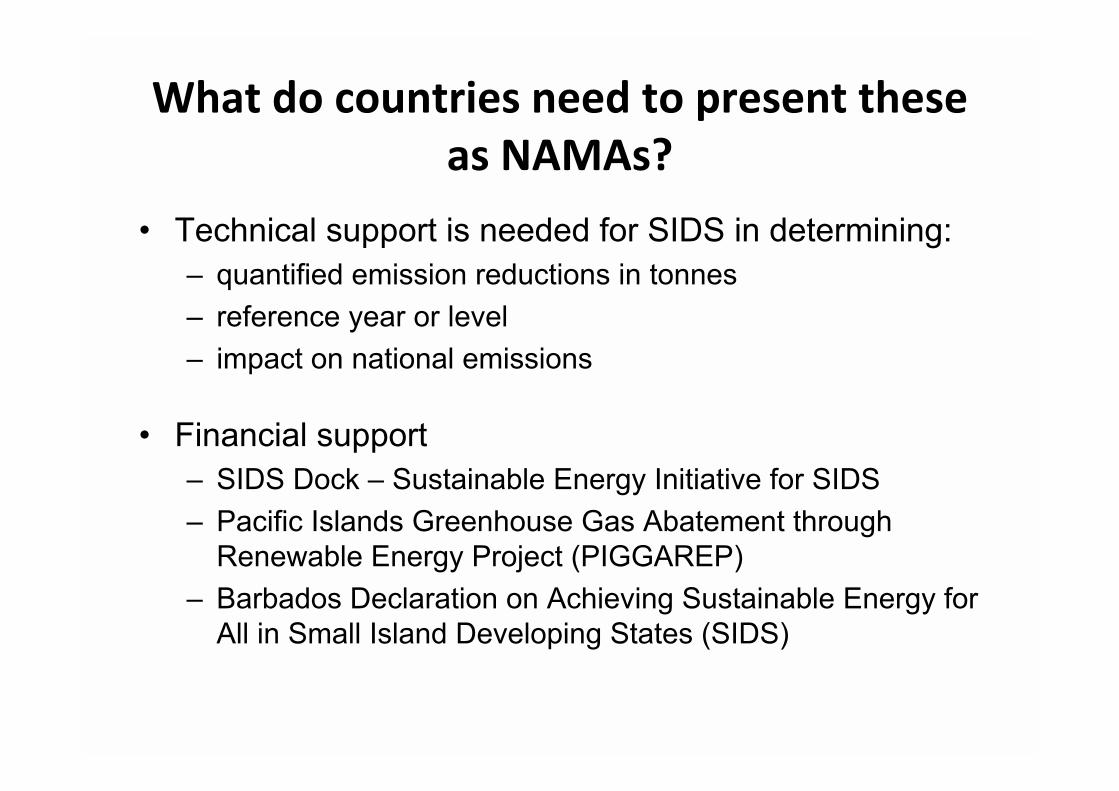
What do countries need to present these as NAMAs?
� Technical support is needed for SIDS in determining:� quantified emission reductions in tonnes� reference year or level � impact on national emissions
� Financial support� SIDS Dock � Sustainable Energy Initiative for SIDS � Pacific Islands Greenhouse Gas Abatement through
Renewable Energy Project (PIGGAREP)� Barbados Declaration on Achieving Sustainable Energy for
All in Small Island Developing States (SIDS)
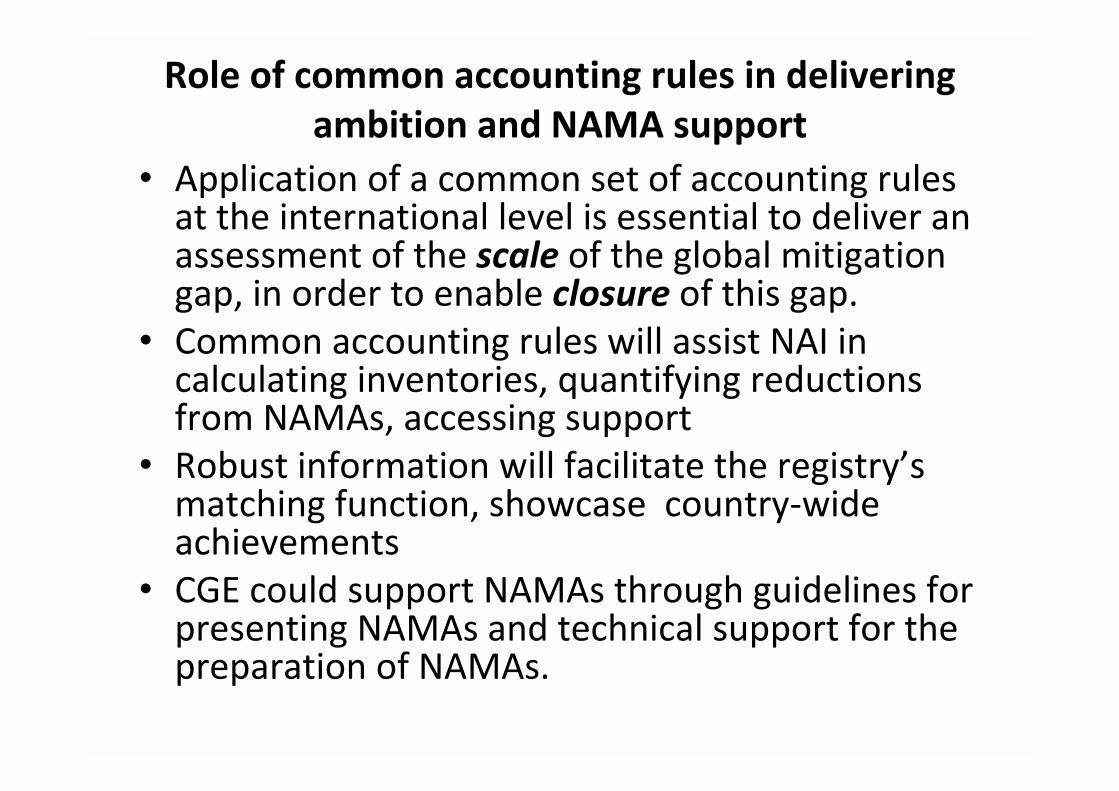
Role of common accounting rules in delivering ambition and NAMA support
� Application of a common set of accounting rules at the international level is essential to deliver an assessment of the scale of the global mitigation gap, in order to enable closure of this gap.
� Common accounting rules will assist NAI in calculating inventories, quantifying reductions from NAMAs, accessing support
� Robust information will facilitate the registry�s matching function, showcase country‐wide achievements
� CGE could support NAMAs through guidelines for presenting NAMAs and technical support for the preparation of NAMAs.

Common accounting rules will facilitate market participation
Environmental integrity requires:
�Reliable time‐series of sectoral or economy‐wide emissions
�Consistent methodologies according to IPCC guidelines
�Technical review of baselines, targets, inscribed amounts at international level by experts.
�Regular reporting on sectoral and national emissions
�Maintain inscribed amounts and/or units in dedicated registry
�Avoid double counting of emission reductions

Next steps
� Bangkok session � Assess scale of mitigation ambition gap � Identify support needed for implementation � Technical paper prepared by the Secretariat on understanding diversity of NAMAs and support needs, for consideration
� Decision in Doha: � Increase pre‐2020 ambition in line with science and gap assessment
� Mandate to CGE extended to provide support for preparation of NAMAs development of guidelines and guidance for the presentation of NAMAs


![SUPREME COURT OF CANADA CITATION R. v. DATE 20120518 … · Maybin, 2012 SCC 24, [2012] 2 S.C.R. 30 DATE: 20120518 DOCKET: 34011 BETWEEN: Matthew Leslie Maybin and Timothy Andrew](https://static.fdocuments.in/doc/165x107/6001e39346694a2ed33f35e0/supreme-court-of-canada-citation-r-v-date-20120518-maybin-2012-scc-24-2012.jpg)