Aortic Valve Stenosis with low EF : TAVR versus Replacement
36
ACC San Diego 2015 Joseph E. Bavaria M.D. Roberts Professor and Vice Chief, Division of CV Surgery Hospital of the University of Pennsylvania
-
Upload
drucsamal -
Category
Healthcare
-
view
626 -
download
0
Transcript of Aortic Valve Stenosis with low EF : TAVR versus Replacement
ACC San Diego 2015
Joseph E. Bavaria M.D. Roberts Professor and Vice Chief, Division of CV Surgery Hospital of the University of Pennsylvania
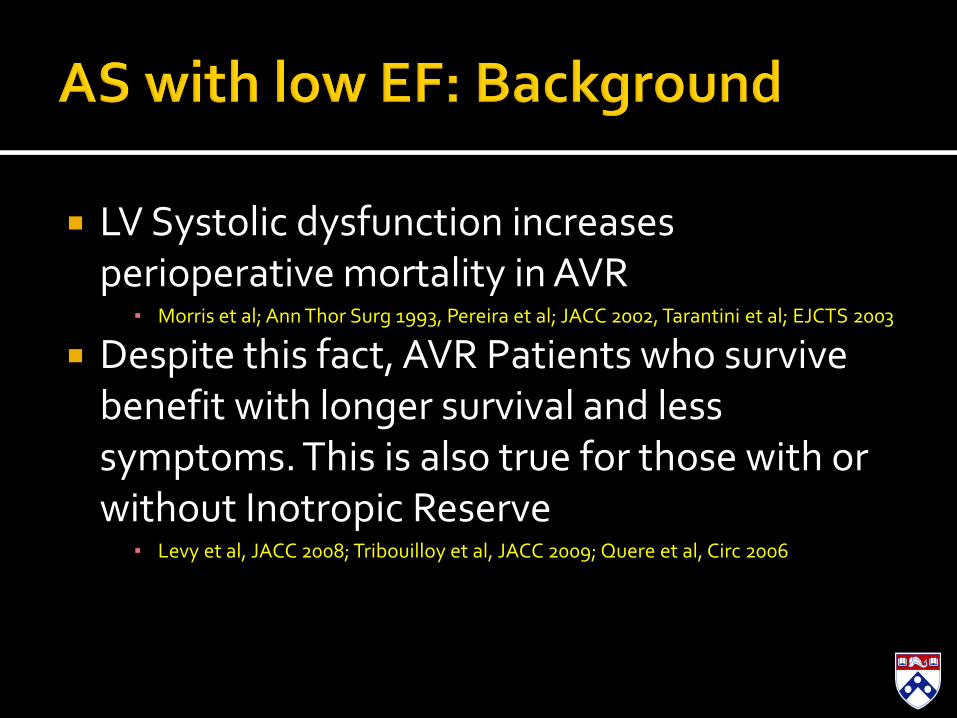
LV Systolic dysfunction increases perioperative mortality in AVR
▪ Morris et al; Ann Thor Surg 1993, Pereira et al; JACC 2002, Tarantini et al; EJCTS 2003
Despite this fact, AVR Patients who survive benefit with longer survival and less symptoms. This is also true for those with or without Inotropic Reserve
▪ Levy et al, JACC 2008; Tribouilloy et al, JACC 2009; Quere et al, Circ 2006
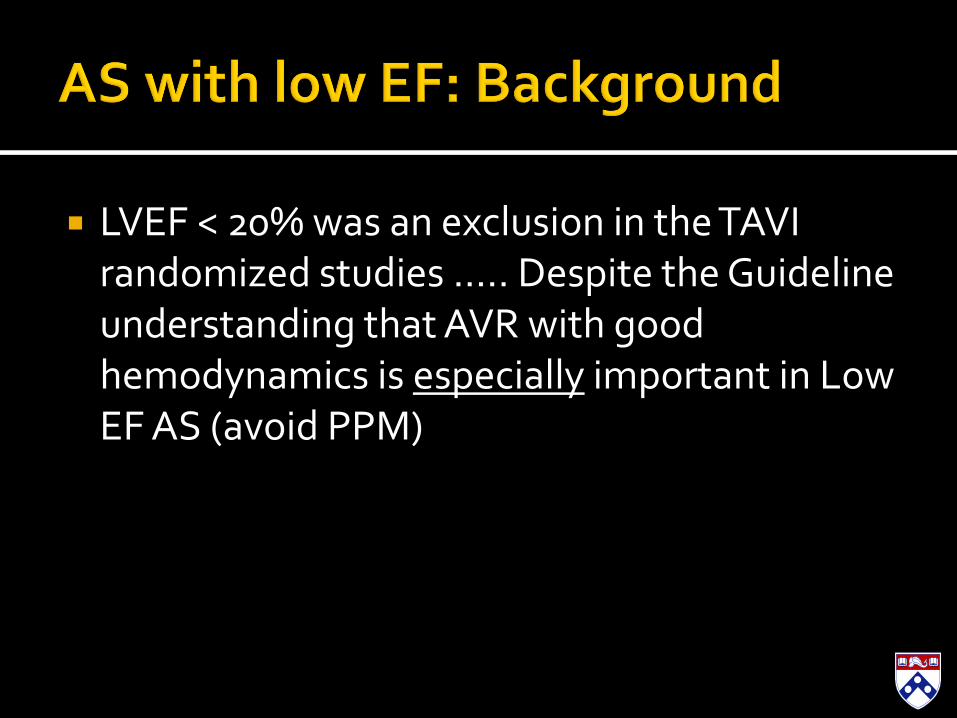
LVEF < 20% was an exclusion in the TAVI randomized studies ….. Despite the Guideline understanding that AVR with good hemodynamics is especially important in Low EF AS (avoid PPM)
Are There any
Differences between
AVR and TAVI in
patients with AS and
Low EF?
What is the Result of Low EF in TAVR?
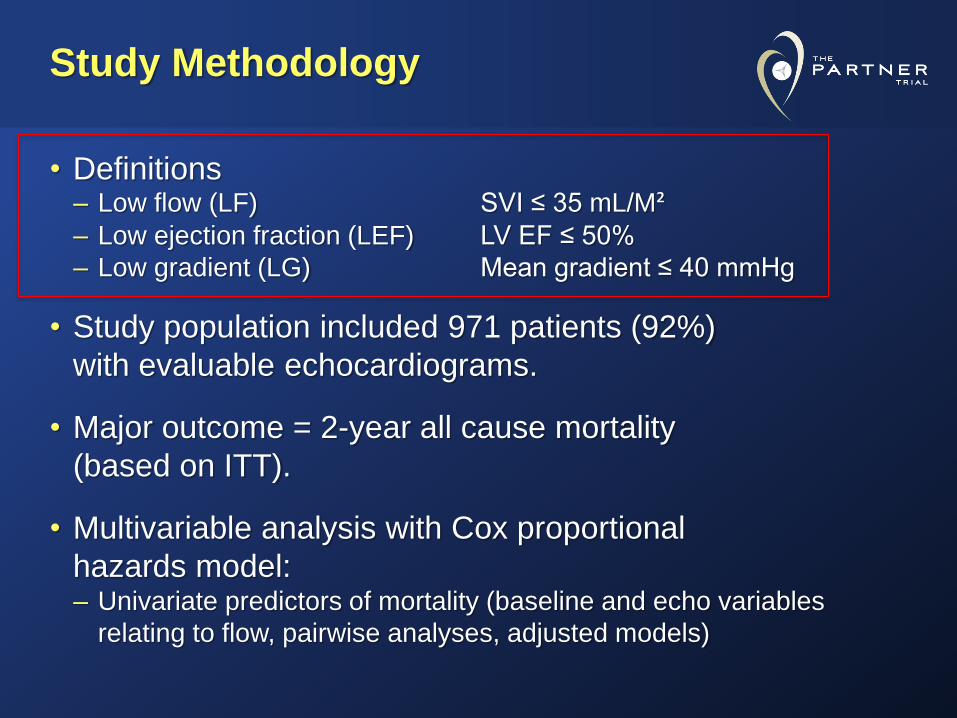
Study Methodology
• Definitions – Low flow (LF) SVI ≤ 35 mL/M² – Low ejection fraction (LEF) LV EF ≤ 50%
– Low gradient (LG) Mean gradient ≤ 40 mmHg
• Study population included 971 patients (92%)
with evaluable echocardiograms.
• Major outcome = 2-year all cause mortality
(based on ITT).
• Multivariable analysis with Cox proportional
hazards model: – Univariate predictors of mortality (baseline and echo variables
relating to flow, pairwise analyses, adjusted models)
Impact of Left Ventricular Function on Outcomes of Transcatheter Aortic Valve Replacement and Medical Therapy in Inoperable Patients with Aortic Stenosis: Insights from The PARTNER Trial (Cohort B)
Sammy Elmariah, MD, MPH, FACC on Behalf of The PARTNER Trial Investigators
and The PARTNER Publications Office
TCT 2013 | San Francisco | October 29, 2013
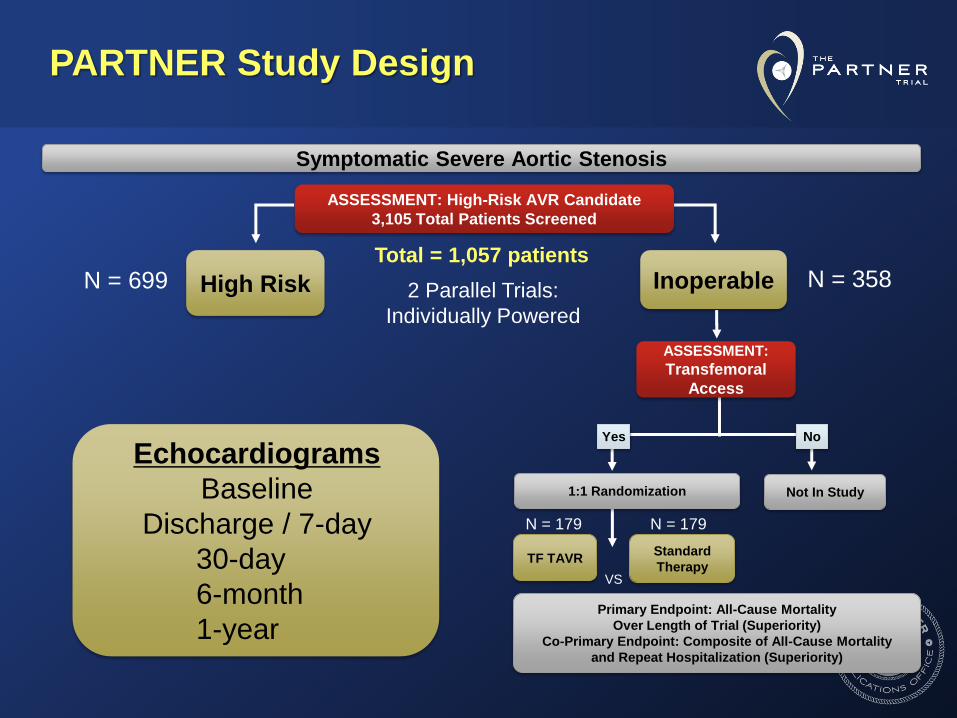
PARTNER Study Design
N = 179
N = 358 Inoperable
Standard
Therapy
ASSESSMENT:
Transfemoral
Access
Not In Study
TF TAVR
Primary Endpoint: All-Cause Mortality
Over Length of Trial (Superiority)
Co-Primary Endpoint: Composite of All-Cause Mortality
and Repeat Hospitalization (Superiority)
1:1 Randomization
VS
Yes No
N = 179
Symptomatic Severe Aortic Stenosis
ASSESSMENT: High-Risk AVR Candidate
3,105 Total Patients Screened
Total = 1,057 patients
2 Parallel Trials:
Individually Powered
N = 699 High Risk
Echocardiograms
Baseline
Discharge / 7-day
30-day
6-month
1-year
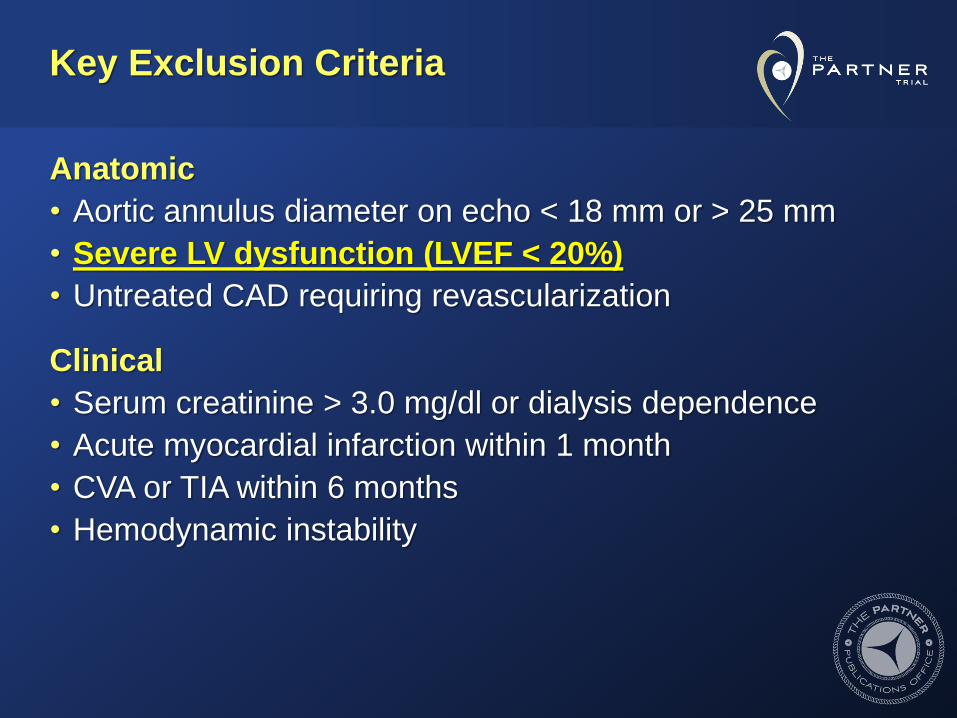
Key Exclusion Criteria
Anatomic
• Aortic annulus diameter on echo < 18 mm or > 25 mm
• Severe LV dysfunction (LVEF < 20%)
• Untreated CAD requiring revascularization
Clinical
• Serum creatinine > 3.0 mg/dl or dialysis dependence
• Acute myocardial infarction within 1 month
• CVA or TIA within 6 months
• Hemodynamic instability

Baseline Patient Characteristics (1) Demographics (AT)
Characteristic
TAVR ST
LVEF
<50%
(n=46)
LVEF
≥50%
(n=123)
p-value
LVEF
<50%
(n=59)
LVEF
≥50%
(n=114)
p-value
Age - yr 85 ± 8 83 ± 9 0.15 85 ± 7 82 ± 9 0.051
Male sex (%) 52.2 41.5 0.21 50.8 45.6 0.51
STS score 13.2 ± 6.4 10.5 ± 5.5 0.006 13.3 ± 5.3 11.1 ± 4.5 0.006
NYHA 0.61 0.31
II (%) 4.3 8.1 3.4 8.8
III or IV (%) 95.7 91.9 96.6 91.2
CAD (%) 73.9 65.9 0.32 78.0 71.9 0.39
Prior MI (%) 26.7 17.2 0.17 40.7 20.2 0.004
Prior PCI (%) 30.4 26.0 0.57 27.1 19.3 0.24
Prior CABG (%) 45.7 28.5 0.03 45.8 39.5 0.43
Prior BAV (%) 19.6 12.2 0.22 22.0 19.3 0.67

0
10
20
30
40
50
60
70
1/1/00 2/1/00 3/1/00 4/1/00 5/1/00 6/1/00 7/1/00 8/1/00 9/1/00 10/1/00 11/1/00 12/1/00 1/1/01
TAVR Low LVEF
TAVR High LVEF
ST Low LVEF
ST High LVEF
Change in LVEF over Time All subjects: Low EF cases improve EF well
Left
Ventr
icula
r E
jection F
raction (
%)
Ba
se
line
1 m
on
th
6 m
on
ths
1 y
ea
r
11-14% point
improvement
in LVEF
*** ***
*** ***
Paired comparisons vs baseline:
* P < 0.05
** P < 0.005
*** P < 0.0005
*
** ***
*
‡ ‡
†
Between group comparisons :
† P < 0.05
‡ P < 0.005
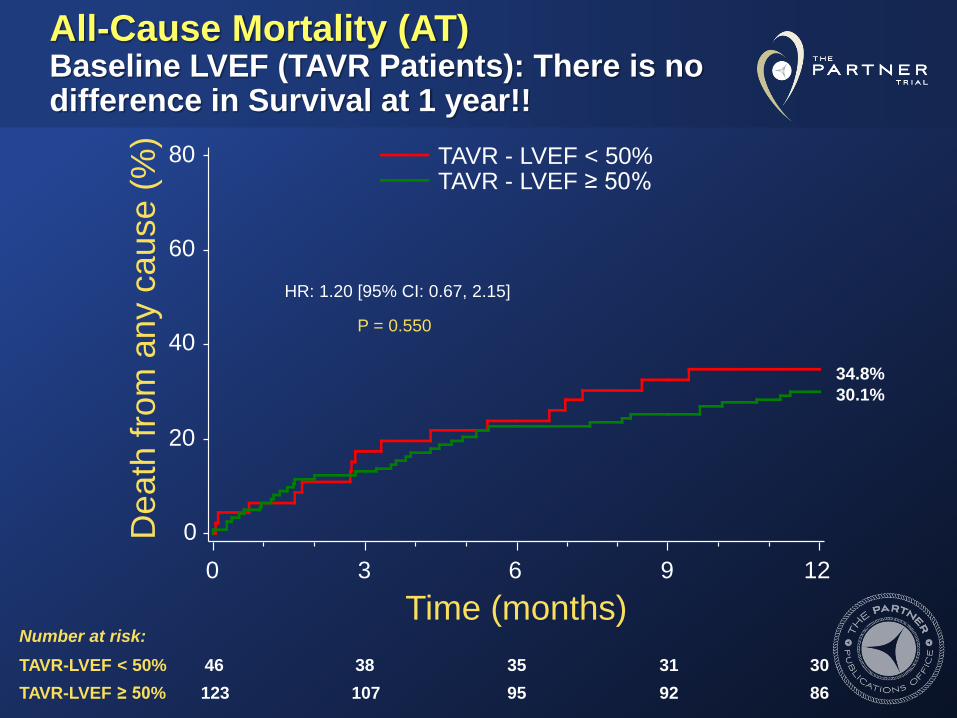
All-Cause Mortality (AT) Baseline LVEF (TAVR Patients): There is no difference in Survival at 1 year!!
De
ath
fro
m a
ny c
au
se
(%
)
0
20
40
60
80
Time (months)
0 3 6 9 12
46 38 35 31 30
123 107 95 92 86
Number at risk:
TAVR-LVEF < 50%
TAVR-LVEF ≥ 50%
P = 0.550
HR: 1.20 [95% CI: 0.67, 2.15]
34.8%
30.1%
TAVR - LVEF < 50% TAVR - LVEF ≥ 50%
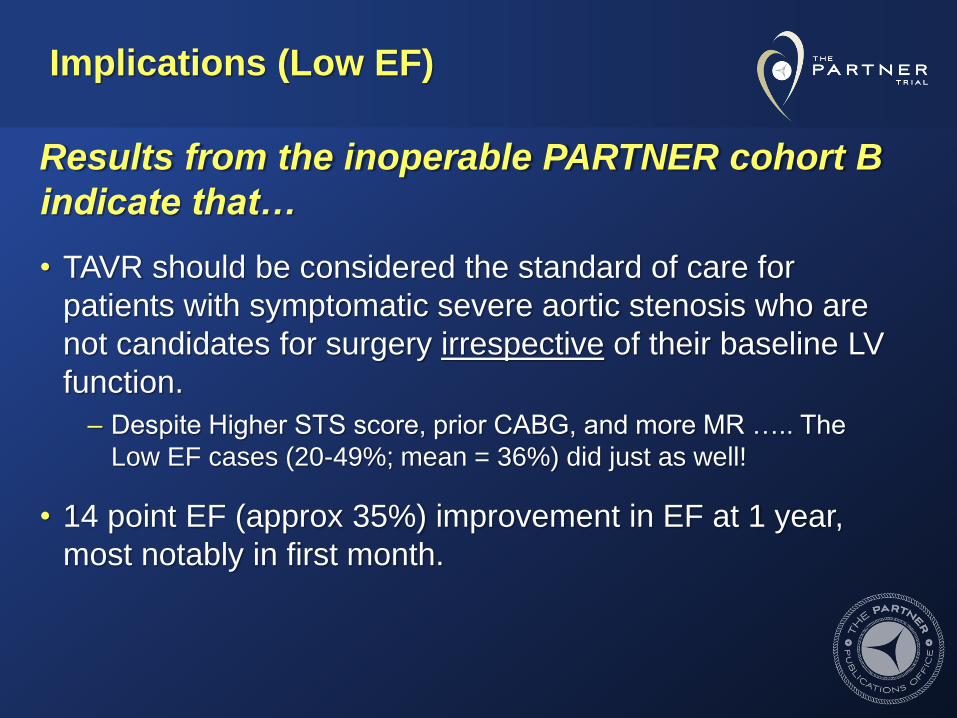
Implications (Low EF)
Results from the inoperable PARTNER cohort B
indicate that…
• TAVR should be considered the standard of care for
patients with symptomatic severe aortic stenosis who are
not candidates for surgery irrespective of their baseline LV
function.
– Despite Higher STS score, prior CABG, and more MR ….. The
Low EF cases (20-49%; mean = 36%) did just as well!
• 14 point EF (approx 35%) improvement in EF at 1 year,
most notably in first month.
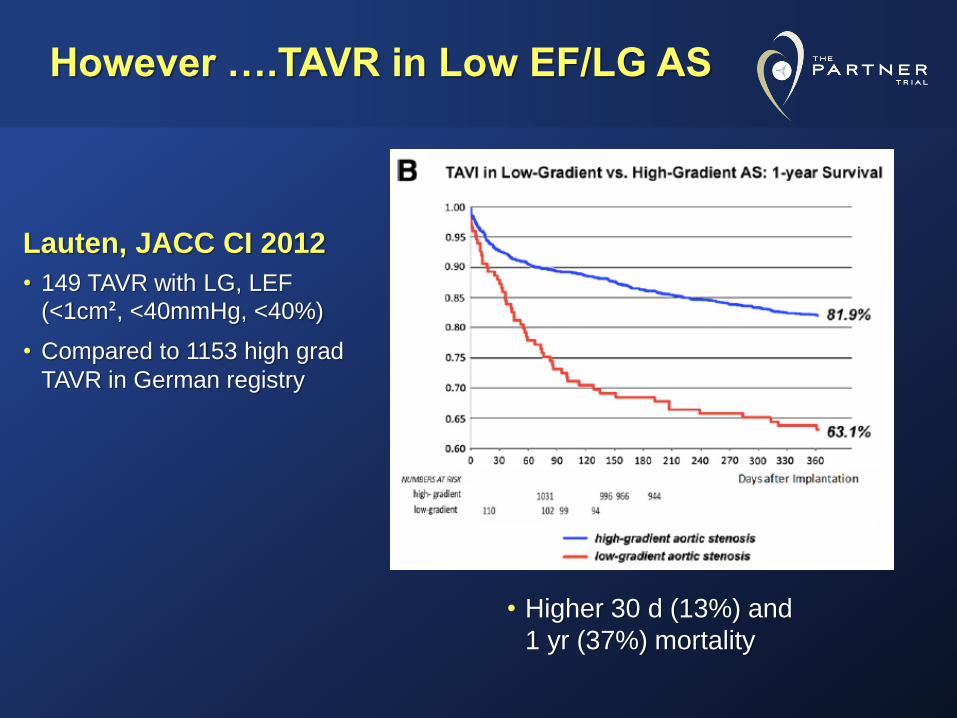
Lauten, JACC CI 2012
• 149 TAVR with LG, LEF
(<1cm², <40mmHg, <40%)
• Compared to 1153 high grad
TAVR in German registry
However ….TAVR in Low EF/LG AS
• Higher 30 d (13%) and
1 yr (37%) mortality

What about Very Low EF
and TAVI?
One-year Outcomes Following TAVI for Severe Aortic Stenosis in Elderly Patients
with Low LV Ejection Fraction
Gerhard Schymik, MD
Klinikum Karlsruhe, Germany
on behalf of the SOURCE XT Investigators
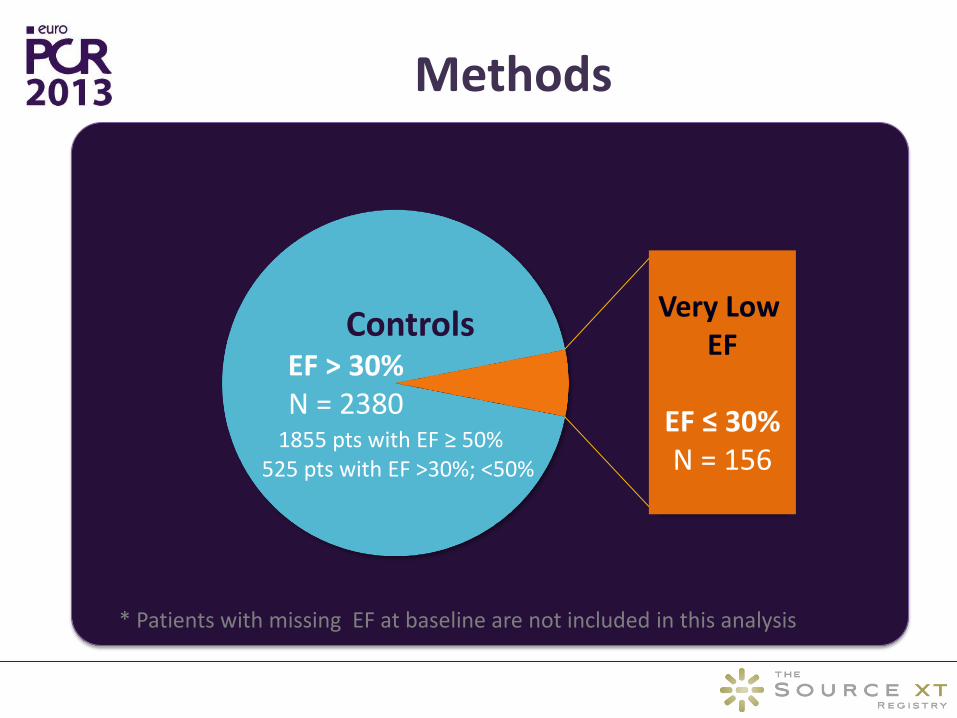
Methods
Controls EF > 30% N = 2380
1855 pts with EF ≥ 50% 525 pts with EF >30%; <50%
Very Low EF
EF ≤ 30% N = 156
* Patients with missing EF at baseline are not included in this analysis
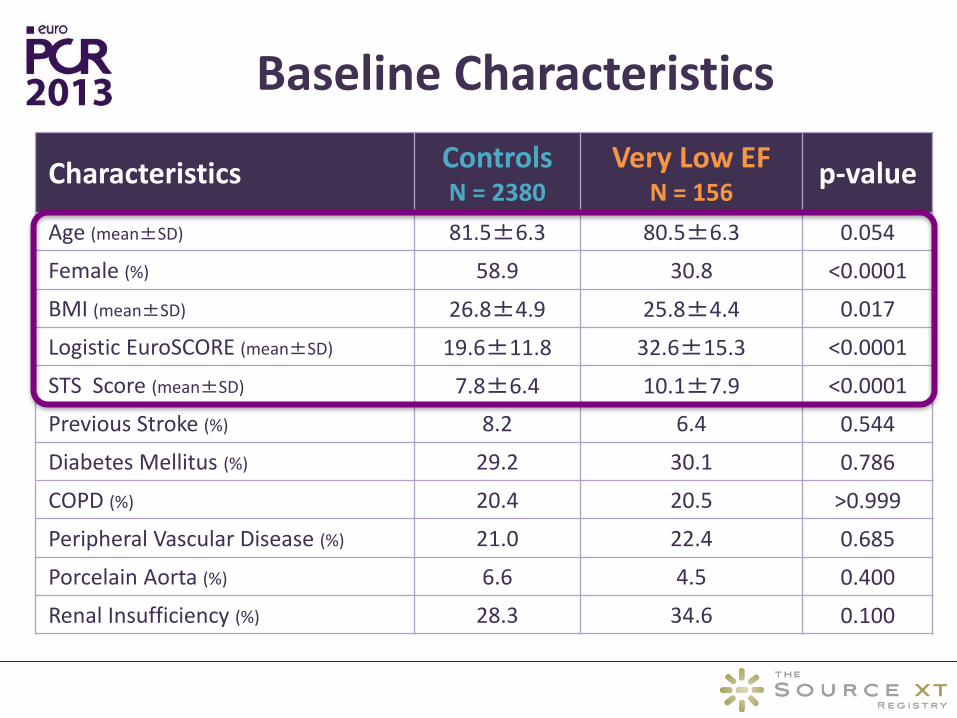
Baseline Characteristics
Characteristics Controls N = 2380
Very Low EF N = 156
p-value
Age (mean±SD) 81.5±6.3 80.5±6.3 0.054
Female (%) 58.9 30.8 <0.0001
BMI (mean±SD) 26.8±4.9 25.8±4.4 0.017
Logistic EuroSCORE (mean±SD) 19.6±11.8 32.6±15.3 <0.0001
STS Score (mean±SD) 7.8±6.4 10.1±7.9 <0.0001
Previous Stroke (%) 8.2 6.4 0.544
Diabetes Mellitus (%) 29.2 30.1 0.786
COPD (%) 20.4 20.5 >0.999
Peripheral Vascular Disease (%) 21.0 22.4 0.685
Porcelain Aorta (%) 6.6 4.5 0.400
Renal Insufficiency (%) 28.3 34.6 0.100
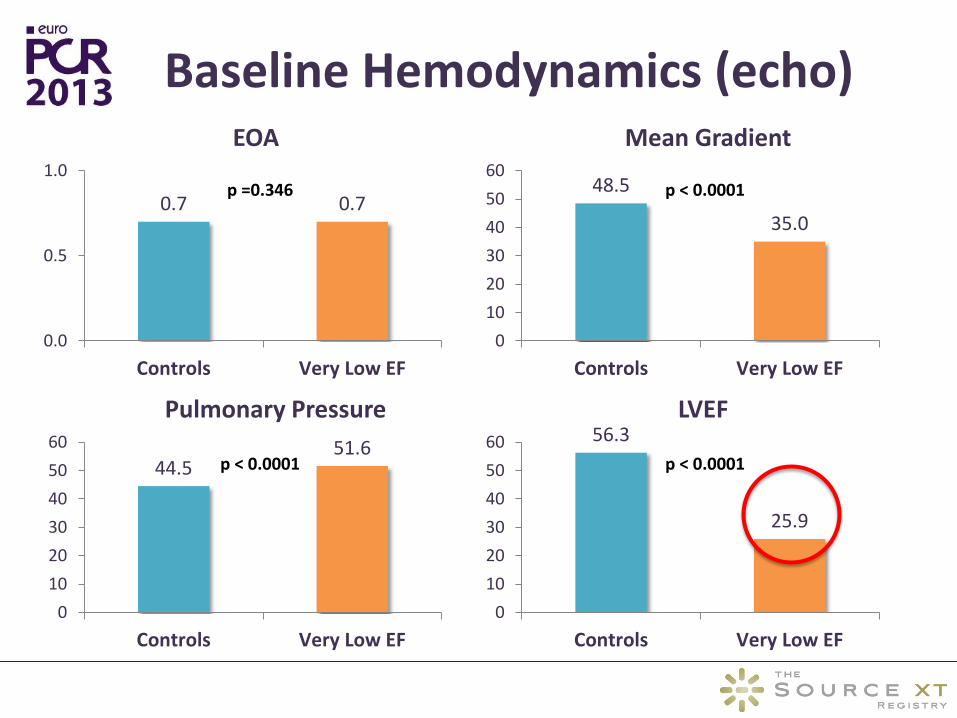
Baseline Hemodynamics (echo)
44.5 51.6
0
10
20
30
40
50
60
Controls Very Low EF
Pulmonary Pressure
0.7 0.7
0.0
0.5
1.0
Controls Very Low EF
EOA
56.3
25.9
0
10
20
30
40
50
60
Controls Very Low EF
LVEF
48.5
35.0
0
10
20
30
40
50
60
Controls Very Low EF
Mean Gradient
p =0.346 p < 0.0001
p < 0.0001 p < 0.0001
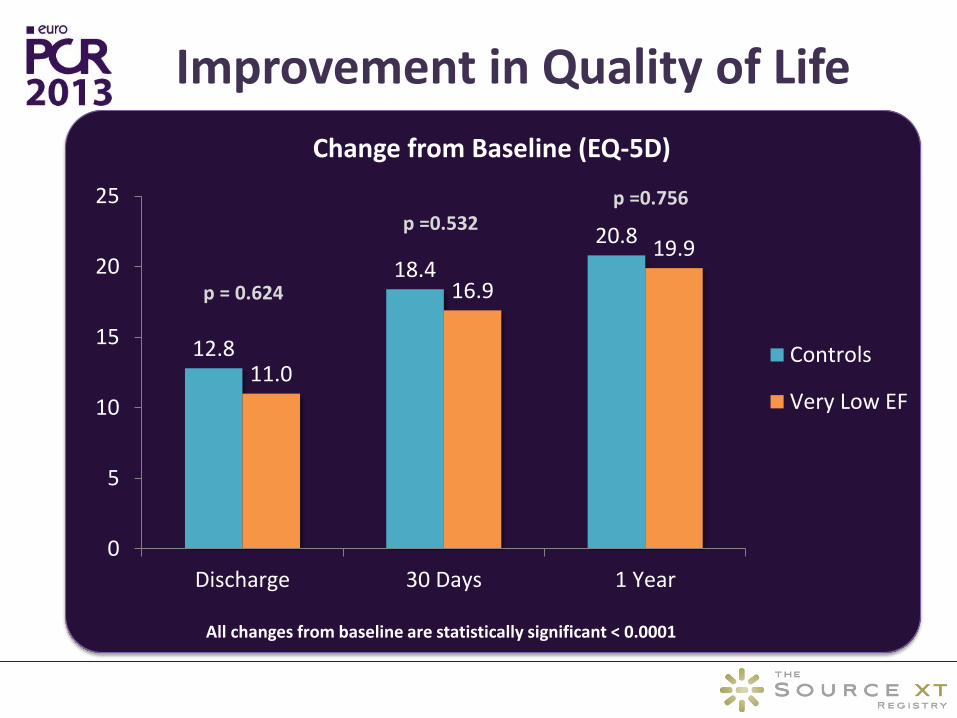
Improvement in Quality of Life
12.8
18.4
20.8
11.0
16.9
19.9
0
5
10
15
20
25
Discharge 30 Days 1 Year
Change from Baseline (EQ-5D)
Controls
Very Low EF
All changes from baseline are statistically significant < 0.0001
p =0.756 p =0.532
p = 0.624

1 Year Mortality
All-Cause Mortality Cardiac Mortality
40%
60%
80%
100%
0 2 4 6 8 10 12Su
rviv
al
Months
Very Low EF Controls
40%
60%
80%
100%
0 2 4 6 8 10 12
Surv
ival
Months
Very Low EF Controls
Log-rank p =0.012
70.1%
81.5%
80.6%
89.9%
Log-rank p =0.0004
0-2 Months: Log-rank p = 0.0003
0-4 Months: Log-rank p = 0.6053
88.9%
95.6%
78.2%
88.9%
80%
85%
90%
95%
100%
0 5 10 15 20 25 30
Surv
ival
Days
Very Low EF Controls
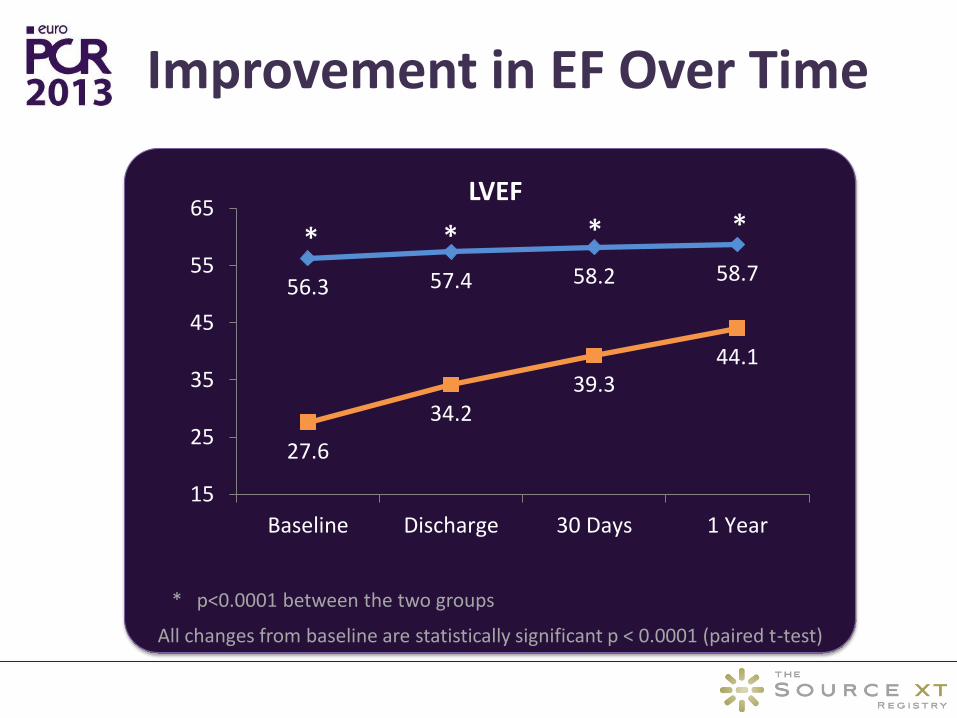
Improvement in EF Over Time
56.3 57.4 58.2 58.7
27.6
34.2 39.3
44.1
15
25
35
45
55
65
Baseline Discharge 30 Days 1 Year
LVEF
* p<0.0001 between the two groups
All changes from baseline are statistically significant p < 0.0001 (paired t-test)
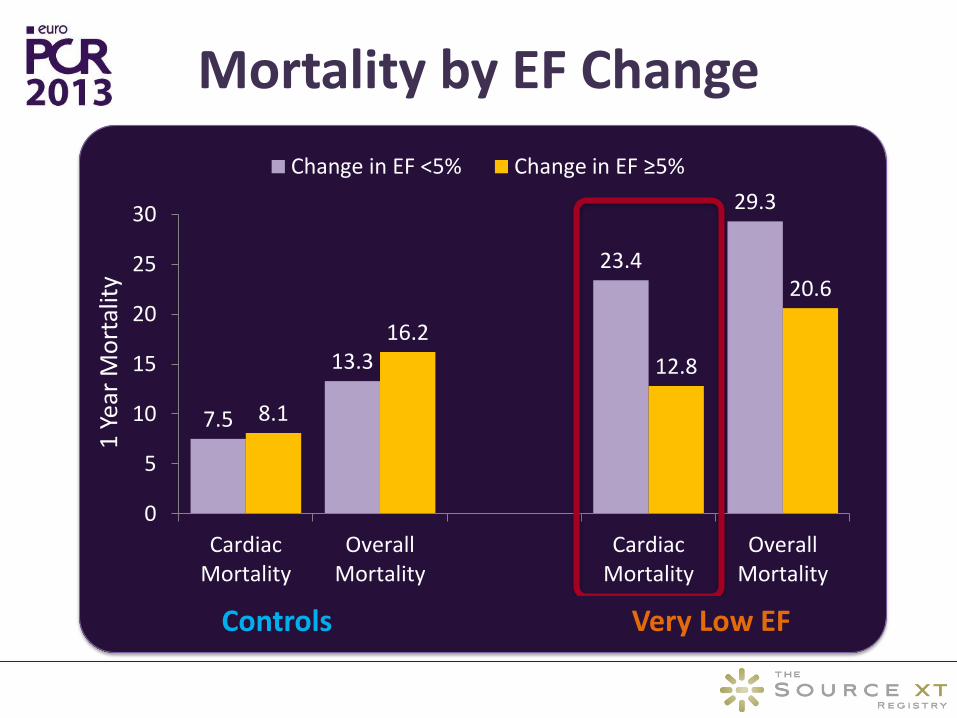
7.5
13.3
23.4
29.3
8.1
16.2
12.8
20.6
0
5
10
15
20
25
30
CardiacMortality
OverallMortality
CardiacMortality
OverallMortality
1 Y
ear
Mo
rtal
ity
Change in EF <5% Change in EF ≥5%
Controls Very Low EF
Mortality by EF Change

Conclusions
Patients with very low EF undergoing TAVI are with significantly higher risk and cardiovascular morbidity as compared to patients with EF > 30%.
Following TAVI procedure, there is a substantial improvement in functional class and the quality of life regardless of the baseline EF.
Although, very low EF improves steadily and significantly over the first year after the intervention, it is associated with significantly higher mortality at 1 year. (?? Early effect)
Failure of severe LV dysfunction to improve early after TAVI portends an increased risk of late cardiac mortality with rates twice higher compared to those who demonstrate early improvement in LV function.
What about Comparing
AVR and TAVI in Low EF?
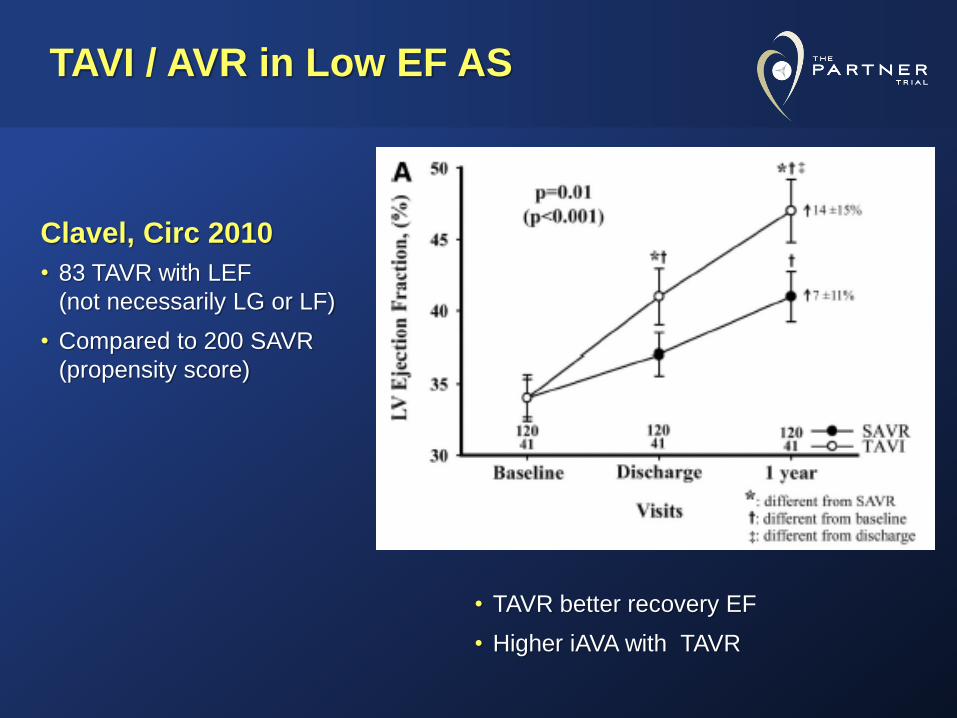
TAVI / AVR in Low EF AS
Clavel, Circ 2010
• 83 TAVR with LEF
(not necessarily LG or LF)
• Compared to 200 SAVR
(propensity score)
• TAVR better recovery EF
• Higher iAVA with TAVR
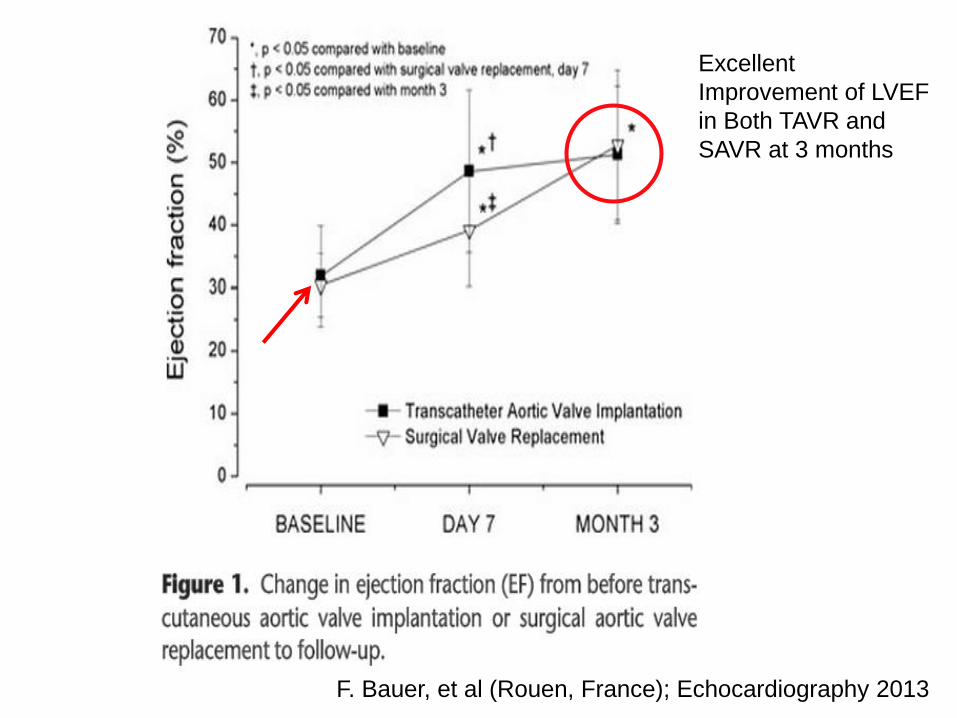
F. Bauer, et al (Rouen, France); Echocardiography 2013
Excellent
Improvement of LVEF
in Both TAVR and
SAVR at 3 months
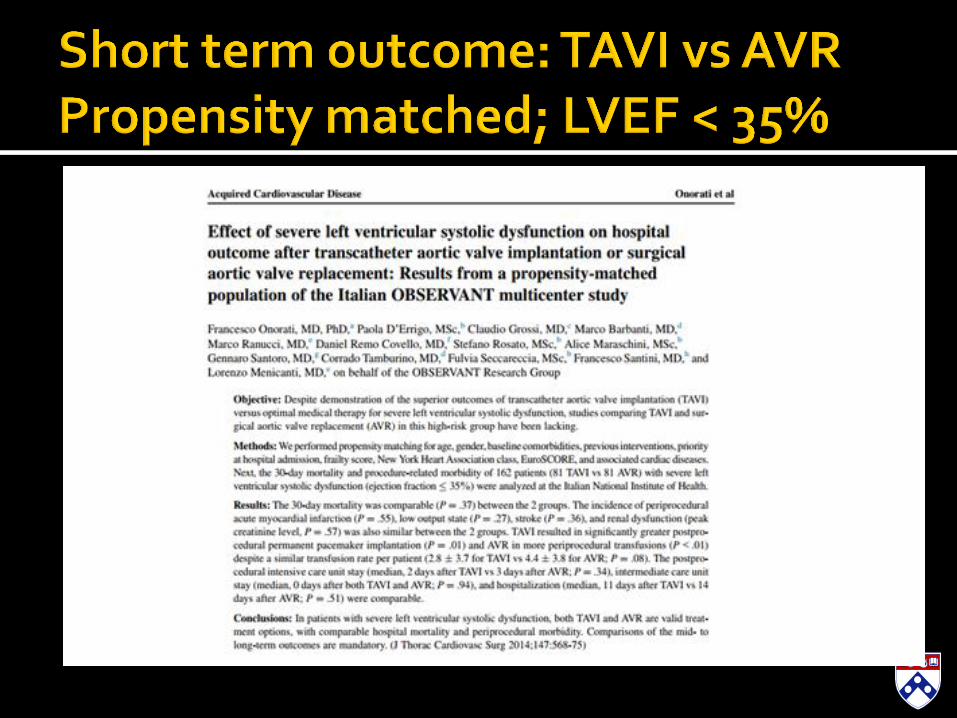
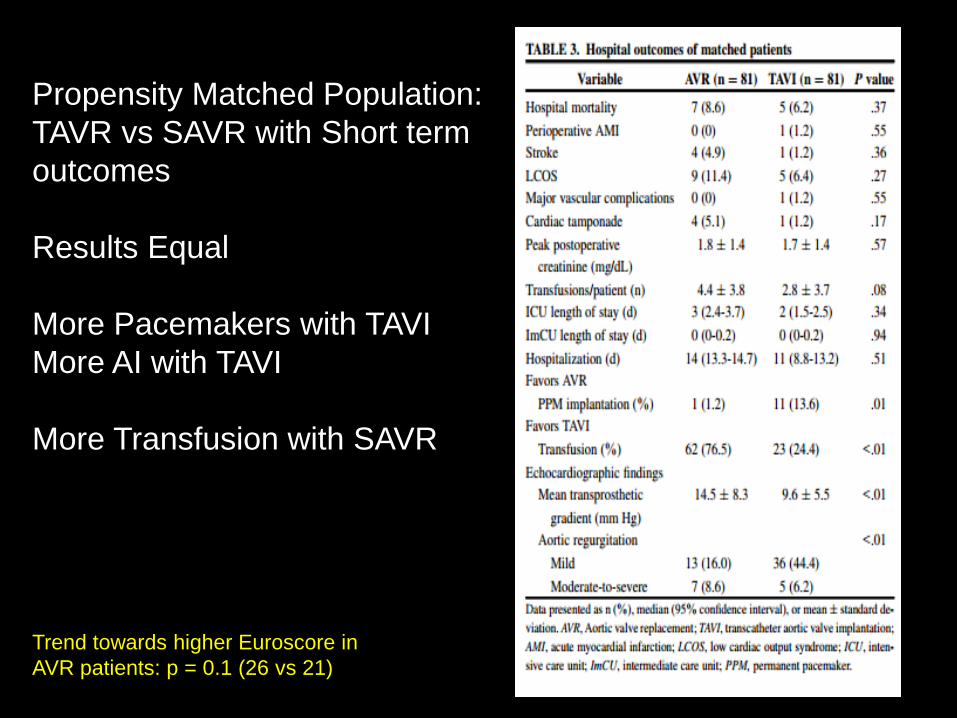
Propensity Matched Population:
TAVR vs SAVR with Short term
outcomes
Results Equal
More Pacemakers with TAVI
More AI with TAVI
More Transfusion with SAVR
Trend towards higher Euroscore in
AVR patients: p = 0.1 (26 vs 21)

Randomized PARTNER Trial
Predictors of Mortality and Outcomes of Therapy in Low Flow Severe Aortic Stenosis
Howard C. Herrmann, MD University of Pennsylvania, Philadelphia, PA
And the PARTNER A and B Investigators
TCT 2012 | Miami, FL | October 24, 2012: Circulation 2013
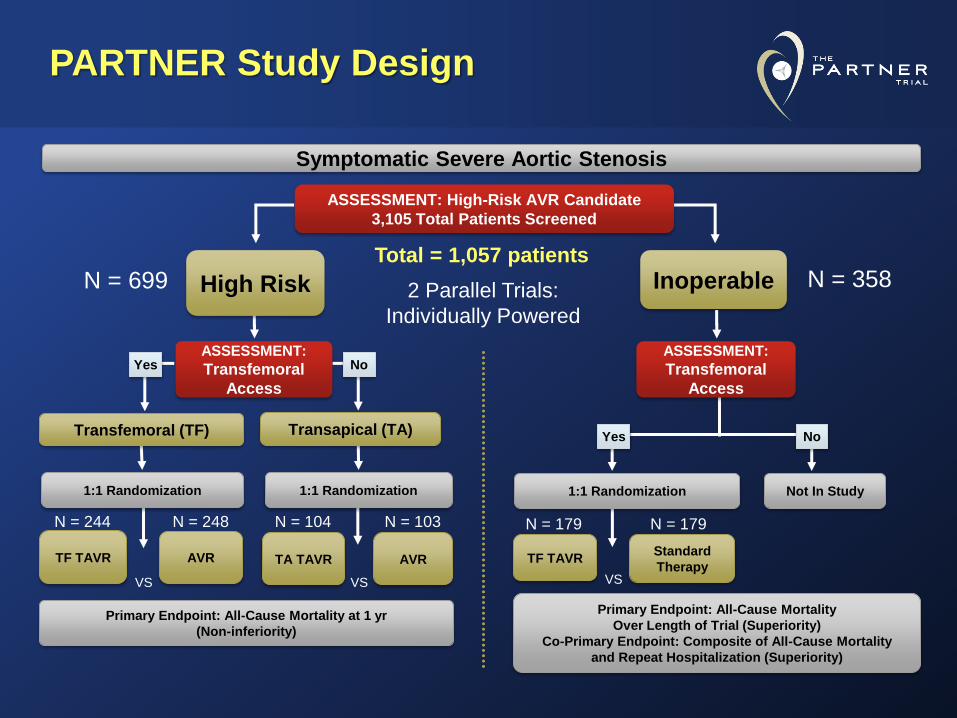
PARTNER Study Design
N = 179
N = 358 Inoperable
Standard
Therapy
ASSESSMENT:
Transfemoral
Access
Not In Study
TF TAVR
Primary Endpoint: All-Cause Mortality
Over Length of Trial (Superiority)
Co-Primary Endpoint: Composite of All-Cause Mortality
and Repeat Hospitalization (Superiority)
1:1 Randomization
VS
Yes No
N = 179
TF TAVR AVR
Primary Endpoint: All-Cause Mortality at 1 yr
(Non-inferiority)
TA TAVR AVR VS
VS
N = 248 N = 104 N = 103 N = 244
Symptomatic Severe Aortic Stenosis
ASSESSMENT: High-Risk AVR Candidate
3,105 Total Patients Screened
Total = 1,057 patients
2 Parallel Trials:
Individually Powered
N = 699 High Risk
ASSESSMENT:
Transfemoral
Access
Transapical (TA) Transfemoral (TF)
1:1 Randomization 1:1 Randomization
Yes No
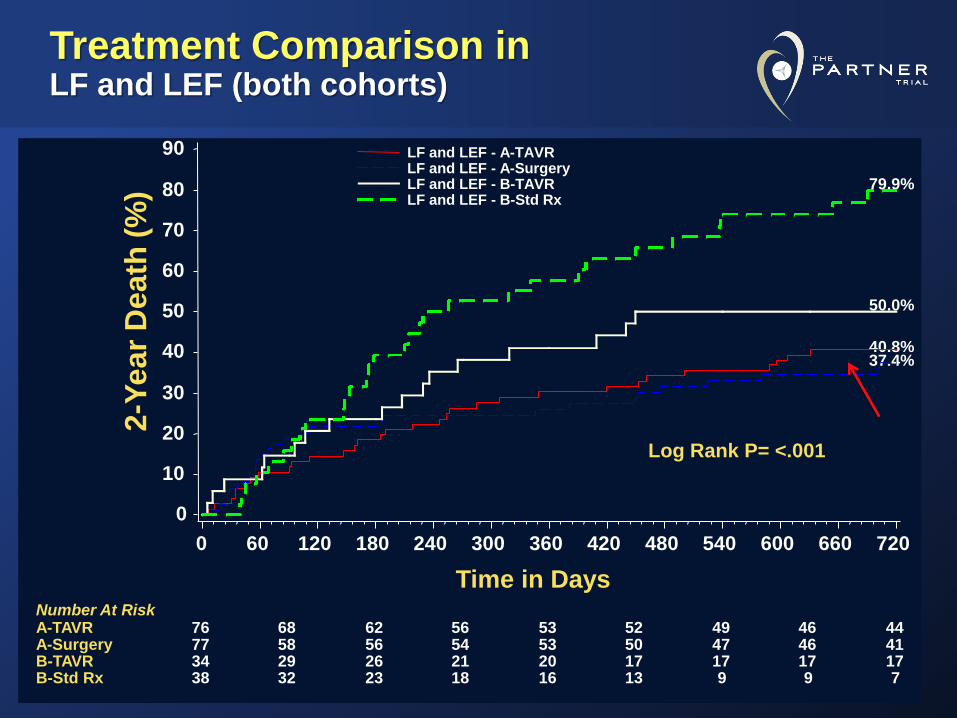
Treatment Comparison in LF and LEF (both cohorts)
2-Y
ea
r D
ea
th (
%)
0
10
20
30
40
50
60
70
80
90
Time in Days
0 60 120 180 240 300 360 420 480 540 600 660 720
76 68 62 56 53 52 49 46 44 77 58 56 54 53 50 47 46 41 34 29 26 21 20 17 17 17 17 38 32 23 18 16 13 9 9 7
Number At Risk A-TAVR A-Surgery B-TAVR B-Std Rx
Log Rank P= <.001
40.8% 37.4%
50.0%
79.9%
LF and LEF - A-TAVR LF and LEF - A-Surgery LF and LEF - B-TAVR LF and LEF - B-Std Rx
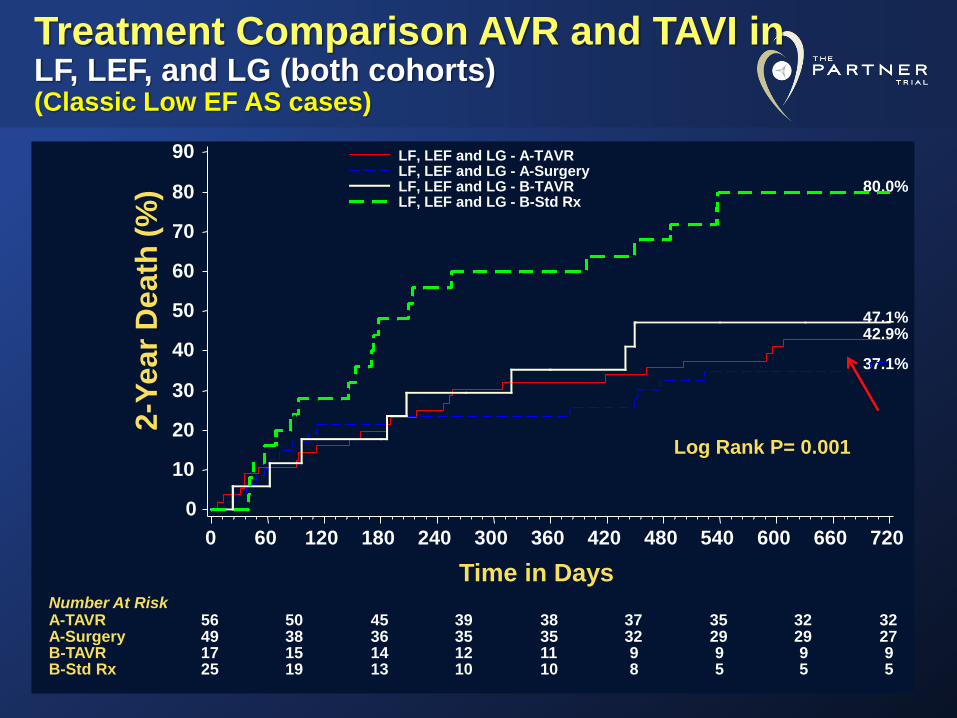
Treatment Comparison AVR and TAVI in LF, LEF, and LG (both cohorts) (Classic Low EF AS cases)
2-Y
ea
r D
ea
th (
%)
0
10
20
30
40
50
60
70
80
90
Time in Days
0 60 120 180 240 300 360 420 480 540 600 660 720
56 50 45 39 38 37 35 32 32 49 38 36 35 35 32 29 29 27 17 15 14 12 11 9 9 9 9 25 19 13 10 10 8 5 5 5
Number At Risk A-TAVR A-Surgery B-TAVR B-Std Rx
Log Rank P= 0.001
42.9%
37.1%
47.1%
80.0%
LF, LEF and LG - A-TAVR LF, LEF and LG - A-Surgery LF, LEF and LG - B-TAVR LF, LEF and LG - B-Std Rx
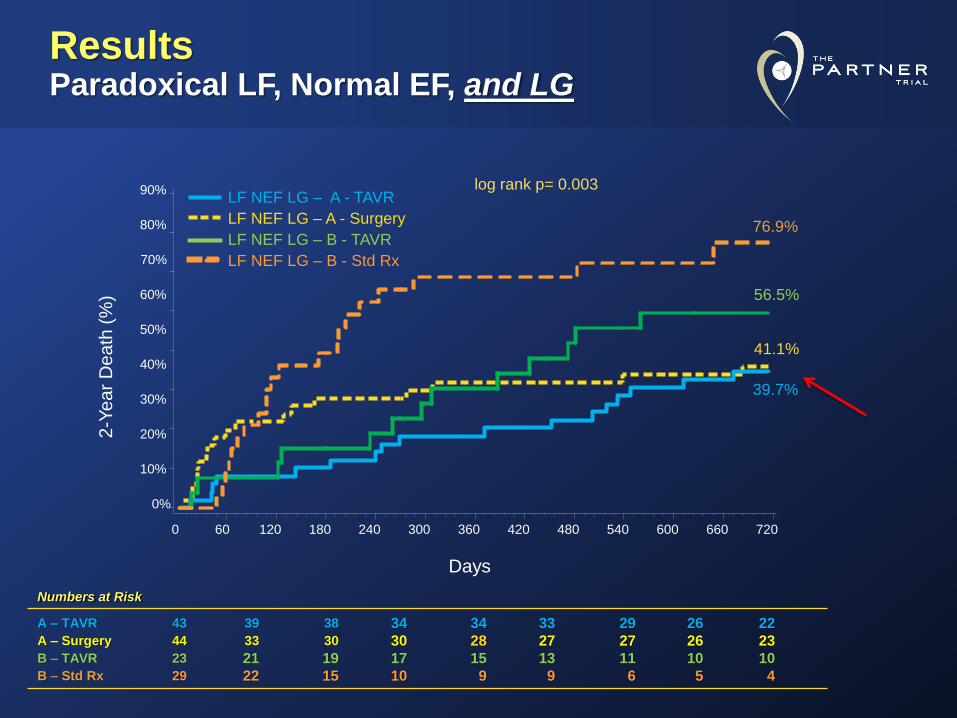
Results Paradoxical LF, Normal EF, and LG
0%
10%
20%
30%
40%
50%
60%
80%
90%
60 120 180 240 300 360 420 480 540 600 660 720
70%
2-Y
ea
r D
ea
th (
%)
39.7%
41.1%
56.5%
76.9%
0
log rank p= 0.003
Numbers at Risk
A – TAVR 43 39 38 34 34 33 29 26 22 A – Surgery 44 33 30 30 28 27 27 26 23 B – TAVR 23 21 19 17 15 13 11 10 10 B – Std Rx 29 22 15 10 9 9 6 5 4
LF NEF LG – A - TAVR
LF NEF LG – A - Surgery
LF NEF LG – B - TAVR
LF NEF LG – B - Std Rx
Days
AVR or TAVI should be performed in patients with Low EF (Low Flow) and severe AS
Inoperable and High Risk Low EF patients should usually receive a TAVI (STS > 8 or EuroScore > 25)
▪ Make sure there is no AI and need Big Valve (PPM)
Low Flow, Low gradient, NORMAL EF patients (Paradoxical) may be better served with TAVI