‘A‘ohe pau ka ‘ike i ka hālau ho‘okahi · Basic Skills Course Enrollment milestone...
25
Enrollment Management Committee: Evaluation of FREGAS Implementation & Outcomes ‘A‘ohe pau ka ‘ike i ka hālau ho‘okahi One learns from many sources
Transcript of ‘A‘ohe pau ka ‘ike i ka hālau ho‘okahi · Basic Skills Course Enrollment milestone...

Enrollment Management Committee:Evaluation of FREGAS Implementation & Outcomes
‘A‘ohe pau ka ‘ike i ka hālau ho‘okahi
One learns from many sources

Reminders about FREGAS Implementation General Findings:Associates with strengthened Fall 2011 admissions yield among resident and non resident freshmen.
Associates with increasing share of freshmen registering for ENG or MATH course in 1st academic year.
Associates with stronger academic progress and academic standing among participants.
Associates with restored positive 1st semester retention trend.Basic Skills Course Enrollment milestone attainment associates with increased graduation probability.
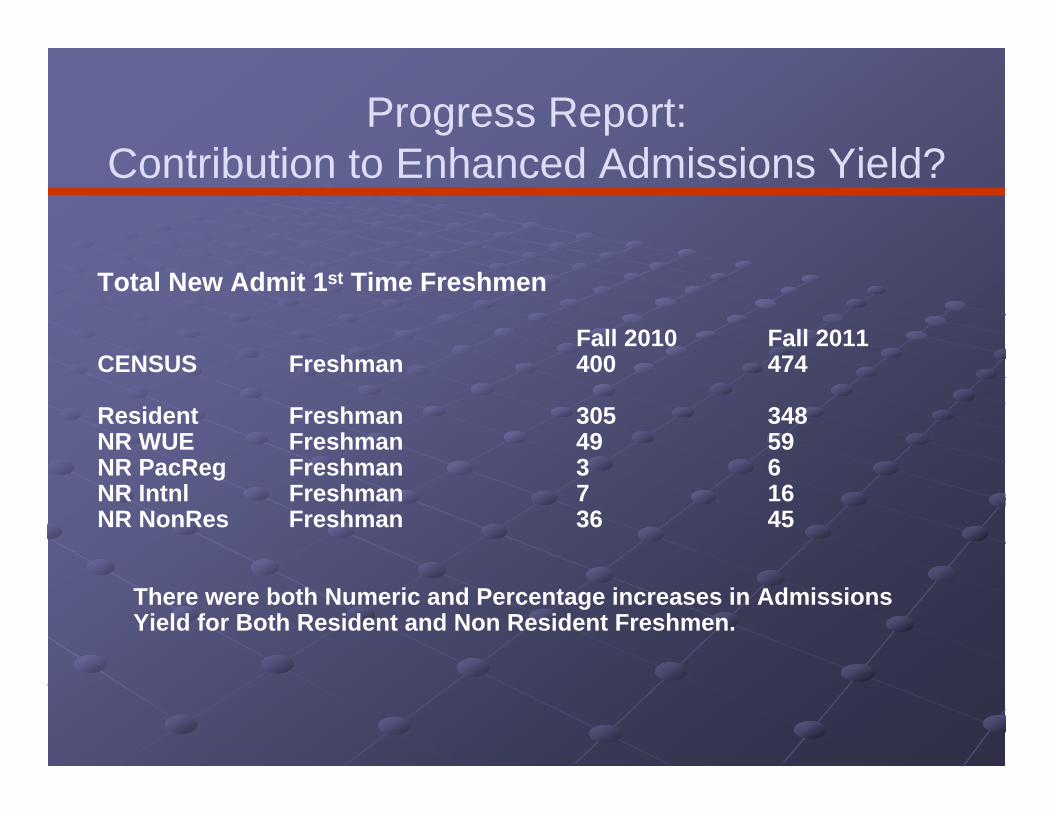
Progress Report:Contribution to Enhanced Admissions Yield?
Total New Admit 1st Time Freshmen
Fall 2010 Fall 2011CENSUS Freshman 400 474
Resident Freshman 305 348NR WUE Freshman 49 59NR PacReg Freshman 3 6NR Intnl Freshman 7 16NR NonRes Freshman 36 45
There were both Numeric and Percentage increases in Admissions Yield for Both Resident and Non Resident Freshmen.
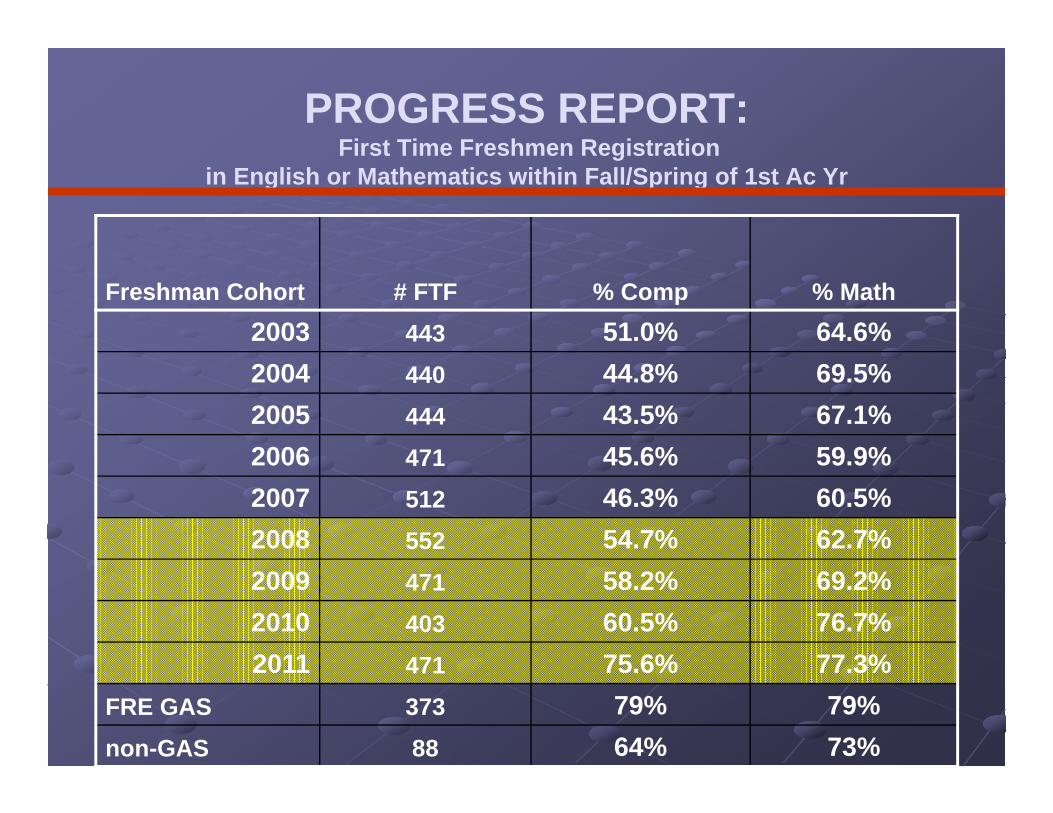
PROGRESS REPORT:First Time Freshmen Registration
in English or Mathematics within Fall/Spring of 1st Ac Yr
Freshman Cohort # FTF % Comp % Math2003 443 51.0% 64.6%2004 440 44.8% 69.5%2005 444 43.5% 67.1%2006 471 45.6% 59.9%2007 512 46.3% 60.5%2008 552 54.7% 62.7%2009 471 58.2% 69.2%2010 403 60.5% 76.7%2011 471 75.6% 77.3%
FRE GAS 373 79% 79%non-GAS 88 64% 73%
PROGRESS REPORT:
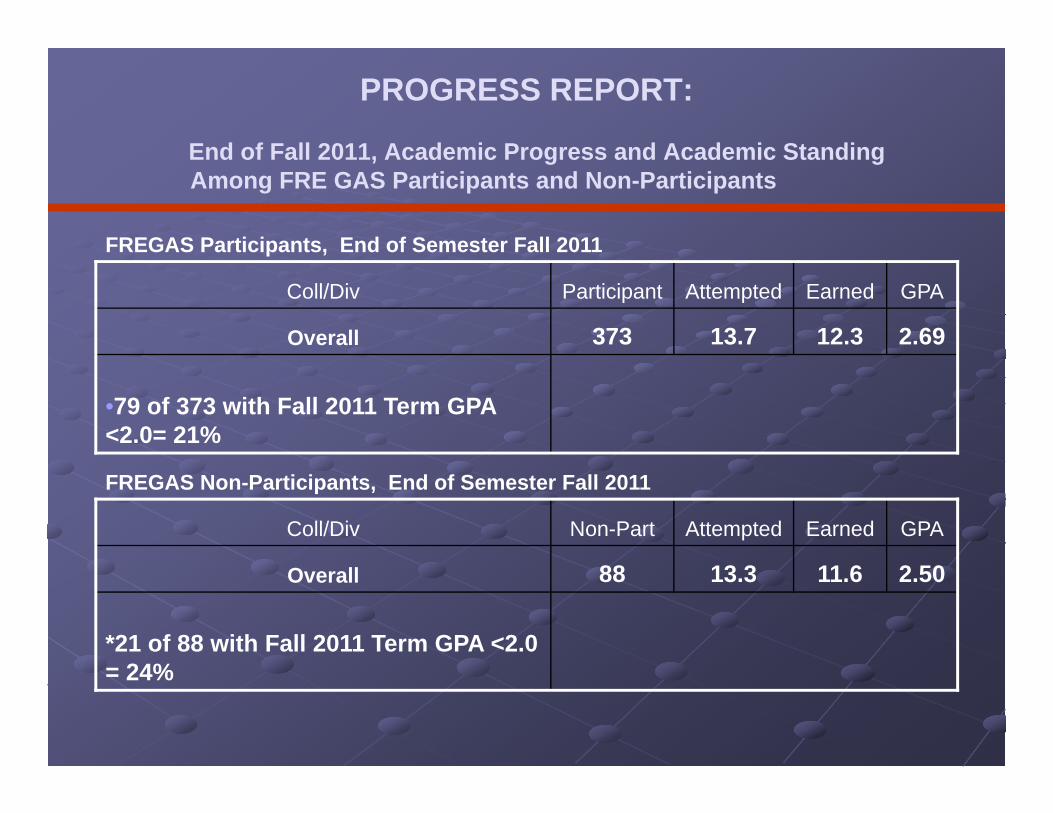
End of Fall 2011, Academic Progress and Academic Standing Among FRE GAS Participants and Non-Participants
FREGAS Participants, End of Semester Fall 2011
Coll/Div Participant Attempted Earned GPA
Overall 373 13.7 12.3 2.69
•79 of 373 with Fall 2011 Term GPA <2.0= 21%
FREGAS Non-Participants, End of Semester Fall 2011
Coll/Div Non-Part Attempted Earned GPA
Overall 88 13.3 11.6 2.50
*21 of 88 with Fall 2011 Term GPA <2.0 = 24%
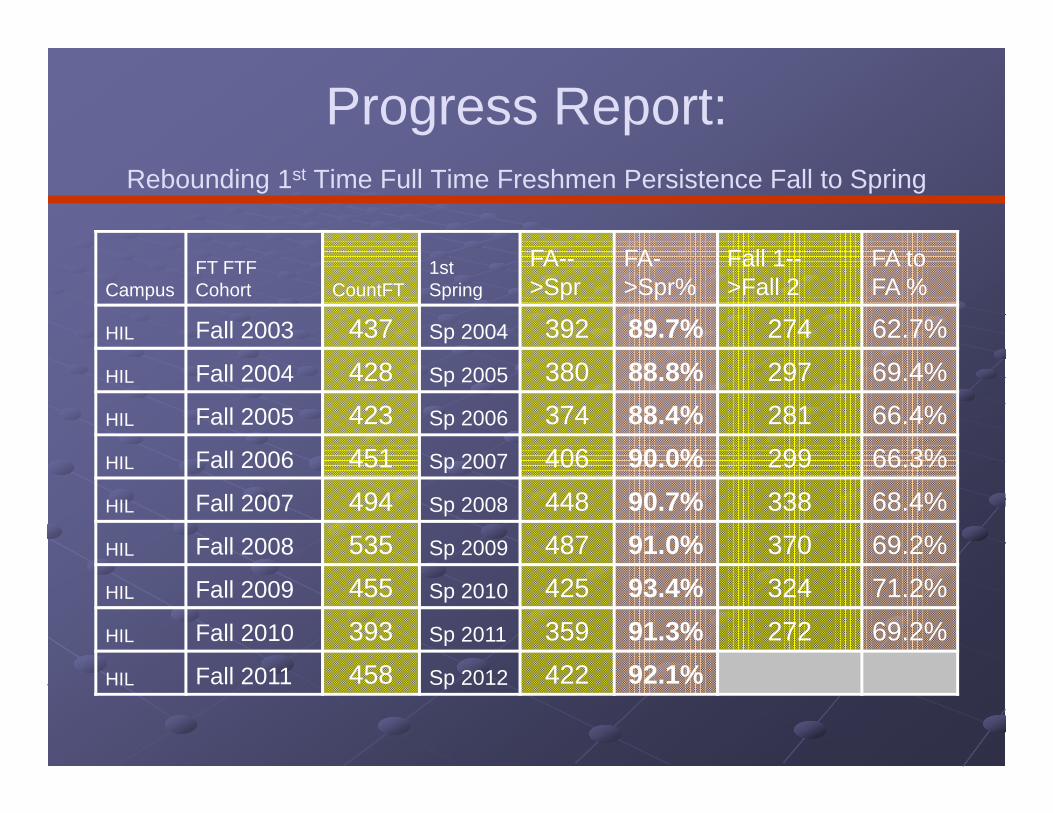
Progress Report: Rebounding 1st Time Full Time Freshmen Persistence Fall to Spring
CampusFT FTF Cohort CountFT
1st Spring
FA-->Spr
FA->Spr%
Fall 1-->Fall 2
FA to FA %
HIL Fall 2003 437 Sp 2004 392 89.7% 274 62.7%
HIL Fall 2004 428 Sp 2005 380 88.8% 297 69.4%
HIL Fall 2005 423 Sp 2006 374 88.4% 281 66.4%
HIL Fall 2006 451 Sp 2007 406 90.0% 299 66.3%
HIL Fall 2007 494 Sp 2008 448 90.7% 338 68.4%
HIL Fall 2008 535 Sp 2009 487 91.0% 370 69.2%
HIL Fall 2009 455 Sp 2010 425 93.4% 324 71.2%
HIL Fall 2010 393 Sp 2011 359 91.3% 272 69.2%
HIL Fall 2011 458 Sp 2012 422 92.1%
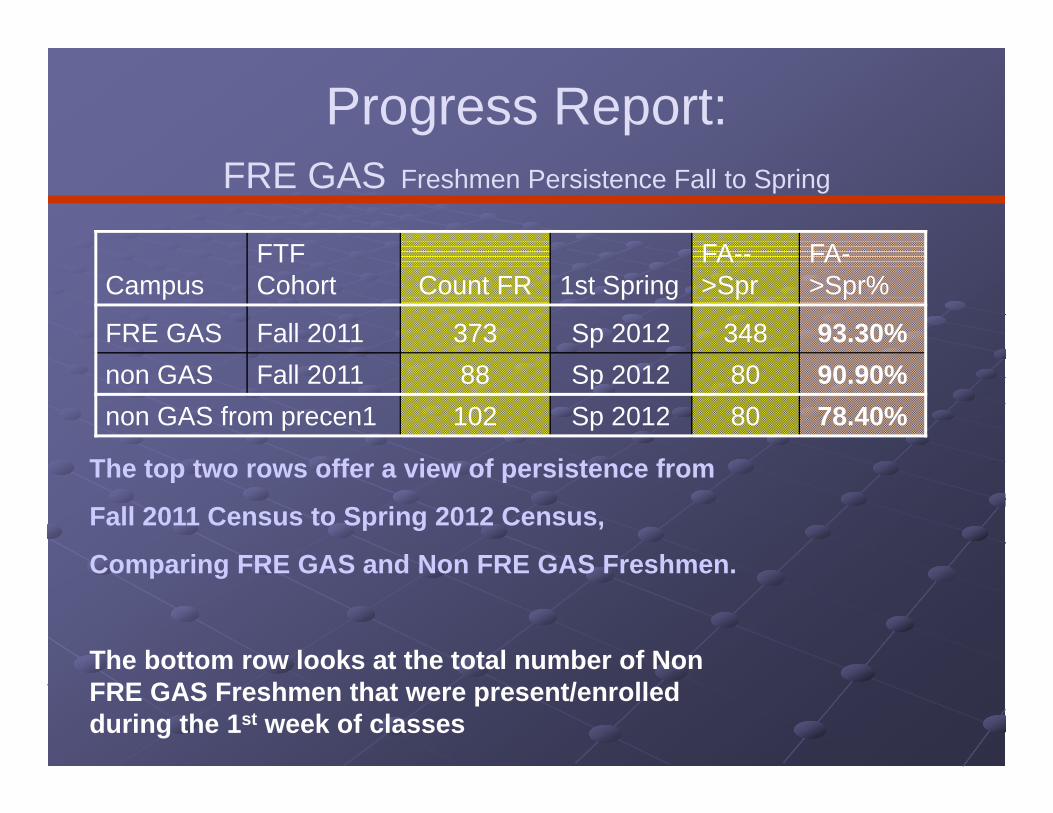
Progress Report: FRE GAS Freshmen Persistence Fall to Spring
CampusFTF Cohort Count FR 1st Spring
FA-->Spr
FA->Spr%
FRE GAS Fall 2011 373 Sp 2012 348 93.30%non GAS Fall 2011 88 Sp 2012 80 90.90%non GAS from precen1 102 Sp 2012 80 78.40%
The top two rows offer a view of persistence from
Fall 2011 Census to Spring 2012 Census,
Comparing FRE GAS and Non FRE GAS Freshmen.
The bottom row looks at the total number of Non FRE GAS Freshmen that were present/enrolled during the 1st week of classes
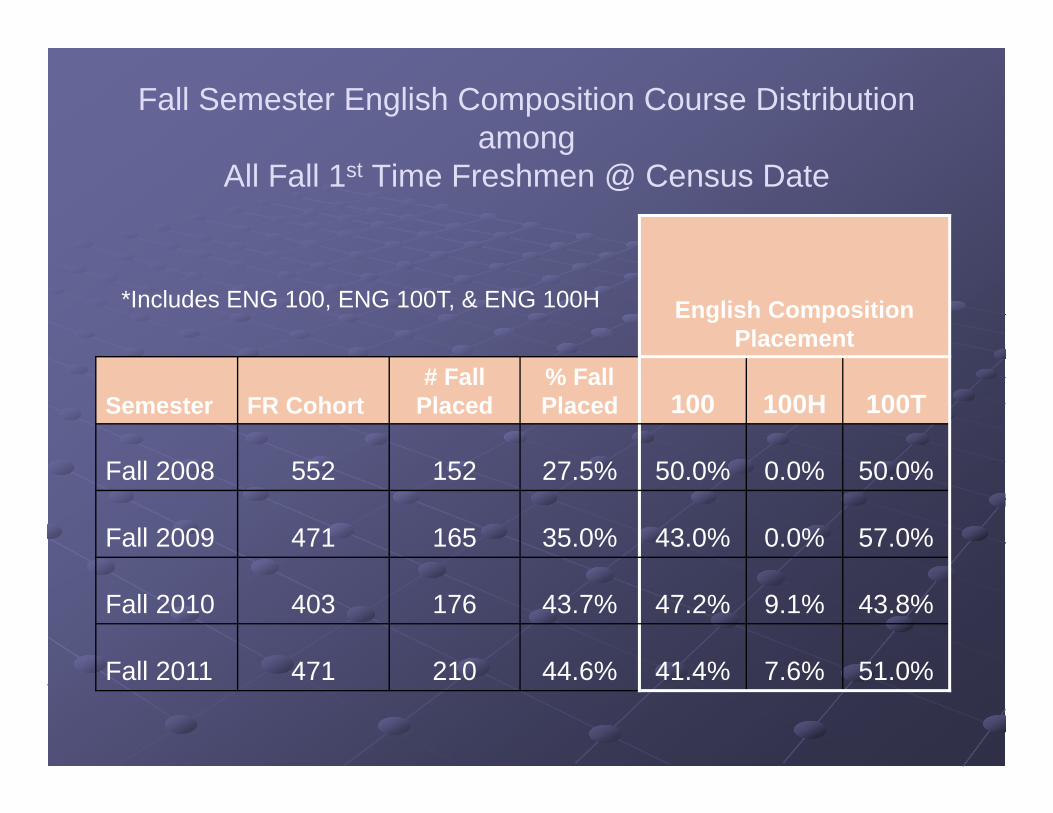
Fall Semester English Composition Course Distribution among
All Fall 1st Time Freshmen @ Census Date
English Composition Placement
Semester FR Cohort# Fall
Placed% Fall Placed 100 100H 100T
Fall 2008 552 152 27.5% 50.0% 0.0% 50.0%
Fall 2009 471 165 35.0% 43.0% 0.0% 57.0%
Fall 2010 403 176 43.7% 47.2% 9.1% 43.8%
Fall 2011 471 210 44.6% 41.4% 7.6% 51.0%
*Includes ENG 100, ENG 100T, & ENG 100H
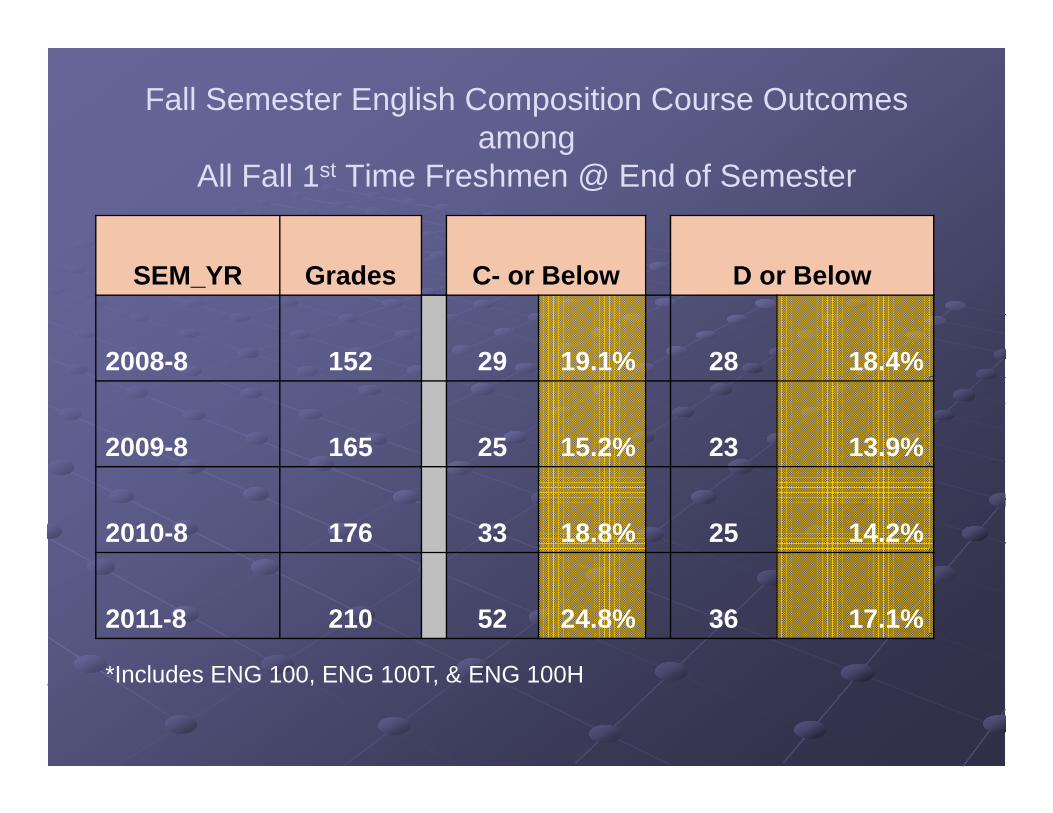
Fall Semester English Composition Course Outcomes among
All Fall 1st Time Freshmen @ End of Semester
SEM_YR Grades C- or Below D or Below
2008-8 152 29 19.1% 28 18.4%
2009-8 165 25 15.2% 23 13.9%
2010-8 176 33 18.8% 25 14.2%
2011-8 210 52 24.8% 36 17.1%
*Includes ENG 100, ENG 100T, & ENG 100H
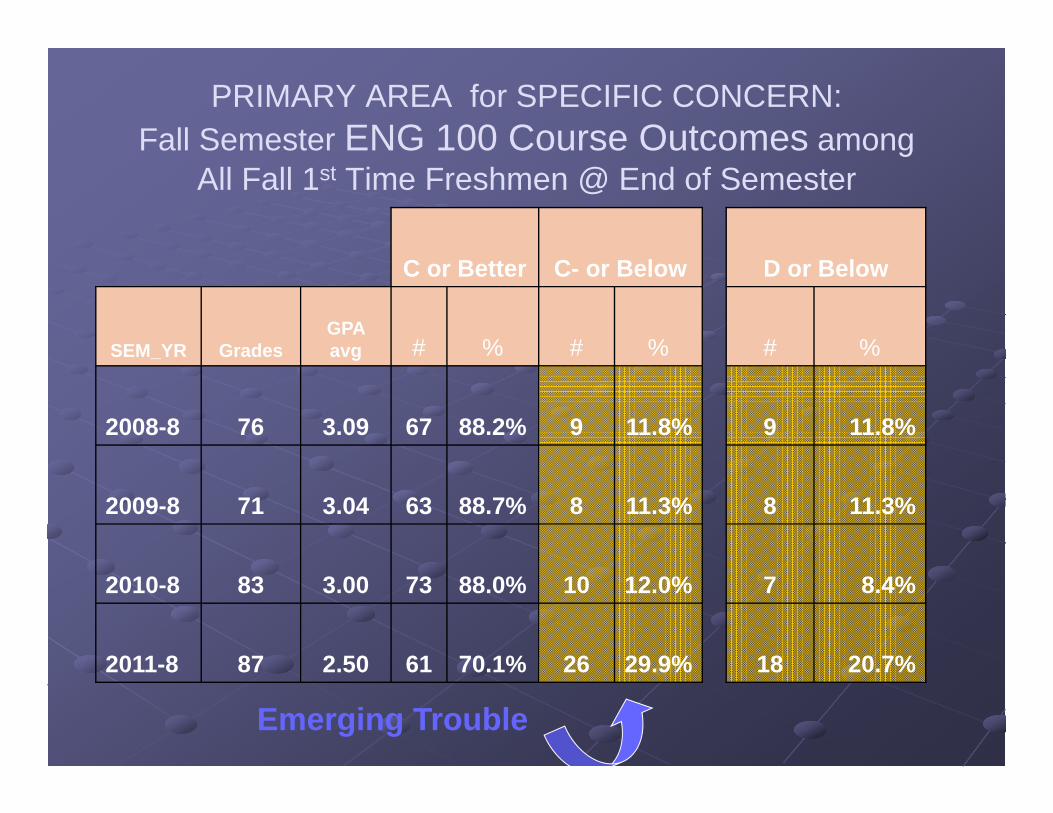
PRIMARY AREA for SPECIFIC CONCERN:Fall Semester ENG 100 Course Outcomes among
All Fall 1st Time Freshmen @ End of Semester
C or Better C- or Below D or Below
SEM_YR GradesGPA avg # % # % # %
2008-8 76 3.09 67 88.2% 9 11.8% 9 11.8%
2009-8 71 3.04 63 88.7% 8 11.3% 8 11.3%
2010-8 83 3.00 73 88.0% 10 12.0% 7 8.4%
2011-8 87 2.50 61 70.1% 26 29.9% 18 20.7%
Emerging Trouble

Lesser AREA for SPECIFIC CONCERN:Fall Semester ENG 100T Course Outcomes among
All Fall 1st Time Freshmen @ End of Semester
C or Better C- or Below D or Below
SEM_YR Grades GPA avg # % # % # %
2008-8 76 2.49 56 73.7% 20 26.3% 19 25.0%
2009-8 94 2.67 77 81.9% 17 18.1% 15 16.0%
2010-8 77 2.19 56 72.7% 21 27.3% 16 20.8%
2011-8 107 2.54 82 76.6% 25 23.4% 17 15.9%
Remember, these Percentages below “C” contribute heavily to Future Seat Demand.
Long Standing Trouble
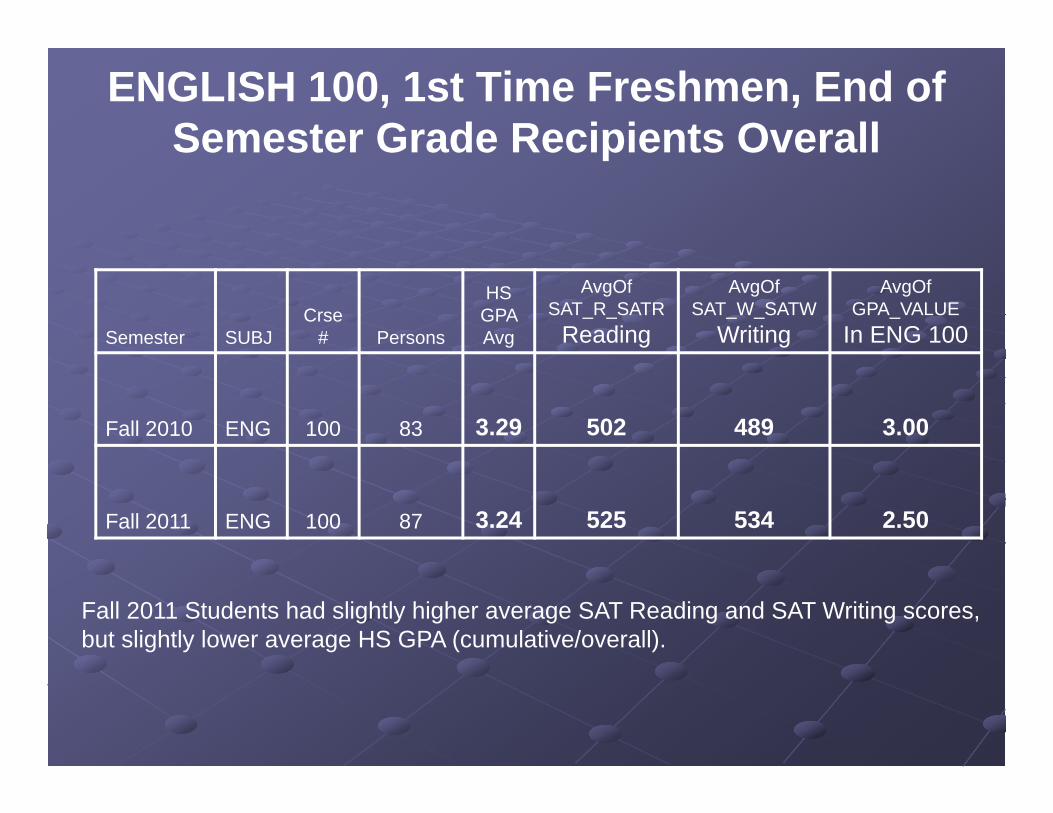
ENGLISH 100, 1st Time Freshmen, End of Semester Grade Recipients Overall
Semester SUBJCrse
# Persons
HS GPA Avg
AvgOfSAT_R_SATR
Reading
AvgOfSAT_W_SATW
Writing
AvgOfGPA_VALUE
In ENG 100
Fall 2010 ENG 100 83 3.29 502 489 3.00
Fall 2011 ENG 100 87 3.24 525 534 2.50
Fall 2011 Students had slightly higher average SAT Reading and SAT Writing scores, but slightly lower average HS GPA (cumulative/overall).

ENGLISH 100, 1st Time Freshmen, Overall End of Semester Recipients of Grades Below “C”
Semester SUBJCrse
# Persons
HS GPA Avg
AvgOfSAT_R_SATR
Reading
AvgOfSAT_W_SATW
Writing
AvgOfGPA_VALUE
In ENG 100
Fall 2010 ENG 100 10 2.94 480 464 0.68
Fall 2011 ENG 100 26 2.96 516 527 0.89
Fall 2011 1st time freshmen Recipients of Grades below “C” had higher HS GPA and significantly higher average SAT Reading and SAT Writing scores—
compared to those Fall 2010 1st time Freshmen receiving grades below “C”

Fall 2011 ENGLISH 100, 1st Time Freshmen, Overall by FRE GAS Participant Indicator
Semester FREGAS SUBJ
Crse # Persons
HS GPA Avg
AvgOfSAT_R_SATR
Reading
AvgOfSAT_W_SATW
Writing
AvgOfGPA_VALUE
In ENG 100
FREGAS Yes ENG 100 69 3.22 526 534 2.52
FREGAS NO ENG 100 18 3.34 522 536 2.42
Fall 2011 FREGAS Participants Who Received Grades in ENG 100 were quite comparable in SAT_W and SAT_R scores to the non FREGAS 1st time Freshmen.
Their HS GPA were .12 lower on average, but avg ENG 100 GPA was .10 higher.

Fall 2011 ENGLISH 100, 1st Time Freshmen, Overall by FRE GAS Participant Indicator
Further comparing Fall 2011 FREGAS Participant 1st time Freshmen to the non FREGAS Participant 1st time Freshmen Who Received Grades in ENG 100.
FREGAS?
MIN HS GPA
MAX HS GPA
MIN SAT_R_
MAX SAT_R_
MIN SAT_W
MAX SAT_W_
Yes = 69 2.207 4 360 800 480 740
No = 18 2.33 4 370 680 480 650
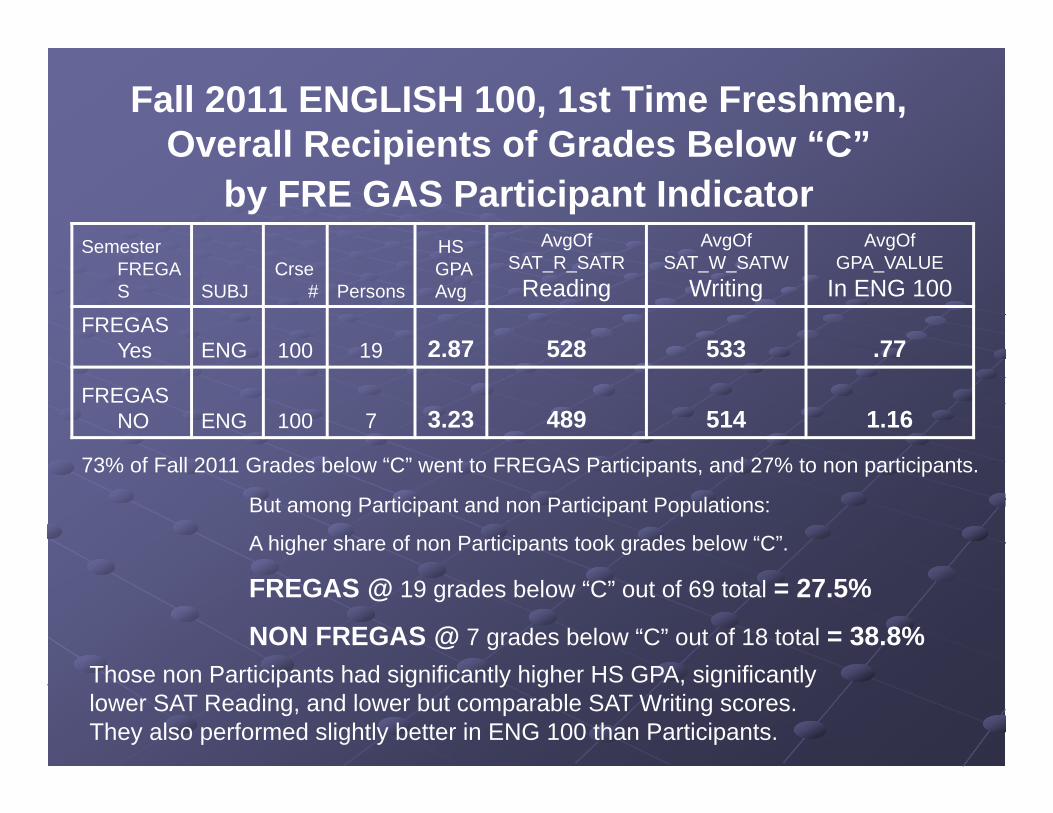
Fall 2011 ENGLISH 100, 1st Time Freshmen, Overall Recipients of Grades Below “C”
by FRE GAS Participant IndicatorSemester
FREGAS SUBJ
Crse # Persons
HSGPA Avg
AvgOfSAT_R_SATR
Reading
AvgOfSAT_W_SATW
Writing
AvgOfGPA_VALUE
In ENG 100FREGAS
Yes ENG 100 19 2.87 528 533 .77
FREGAS NO ENG 100 7 3.23 489 514 1.16
But among Participant and non Participant Populations:
A higher share of non Participants took grades below “C”.
FREGAS @ 19 grades below “C” out of 69 total = 27.5%
NON FREGAS @ 7 grades below “C” out of 18 total = 38.8%
73% of Fall 2011 Grades below “C” went to FREGAS Participants, and 27% to non participants.
Those non Participants had significantly higher HS GPA, significantly lower SAT Reading, and lower but comparable SAT Writing scores. They also performed slightly better in ENG 100 than Participants.
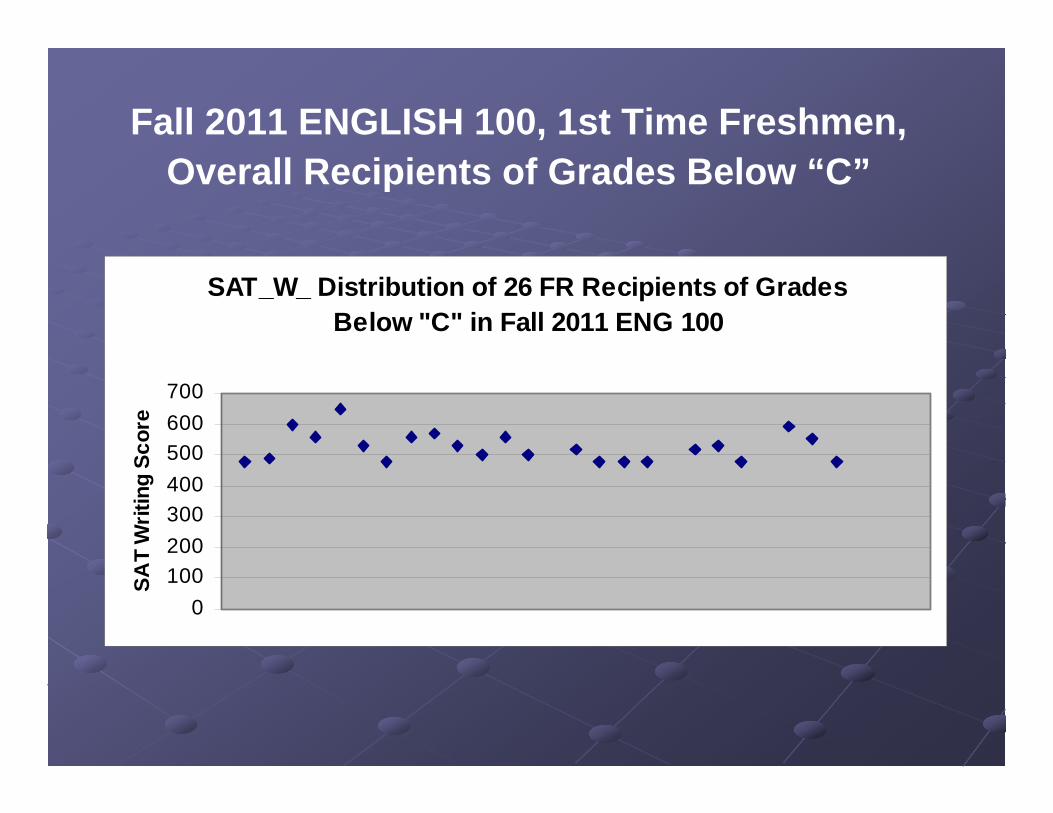
Fall 2011 ENGLISH 100, 1st Time Freshmen, Overall Recipients of Grades Below “C”
SAT_W_ Distribution of 26 FR Recipients of Grades Below "C" in Fall 2011 ENG 100
0100200300400500600700
SAT
Writ
ing
Scor
e

1st Time Freshmen SAT_WRITING and Fall 2011 ENG 100 Course GPA
All Freshmen Fall 2011 ENG 100 GPA Relative to SAT WRITING
012345
0 100 200 300 400 500 600 700 800
SAT_W
GPA
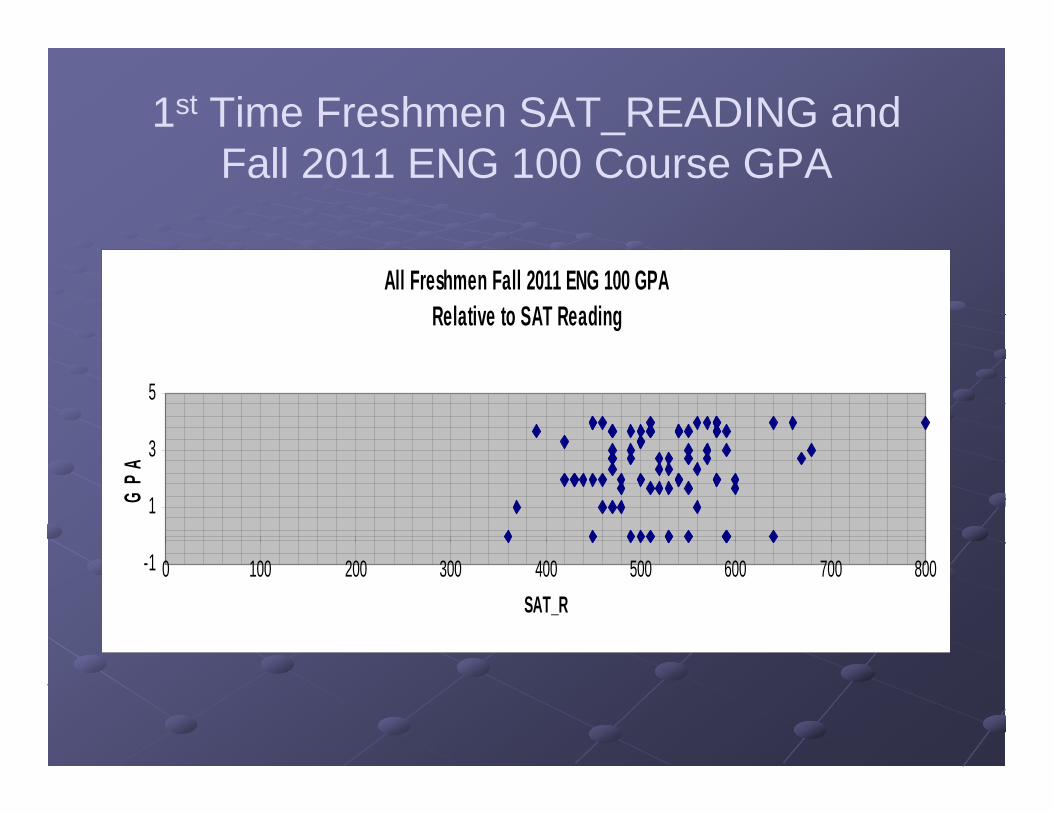
1st Time Freshmen SAT_READING and Fall 2011 ENG 100 Course GPA
All Freshmen Fall 2011 ENG 100 GPA Relative to SAT Reading
-1
1
3
5
0 100 200 300 400 500 600 700 800SAT_R
GPA

1st Time Freshmen HS_GPA and Fall 2011 ENG 100 Course GPA
All Freshmen Fall 2011 ENG 100 GPA Relative to High School GPA
-1
1
3
5
0 0.5 1 1.5 2 2.5 3 3.5 4 4.5HS GPA
ENG
100
GPA
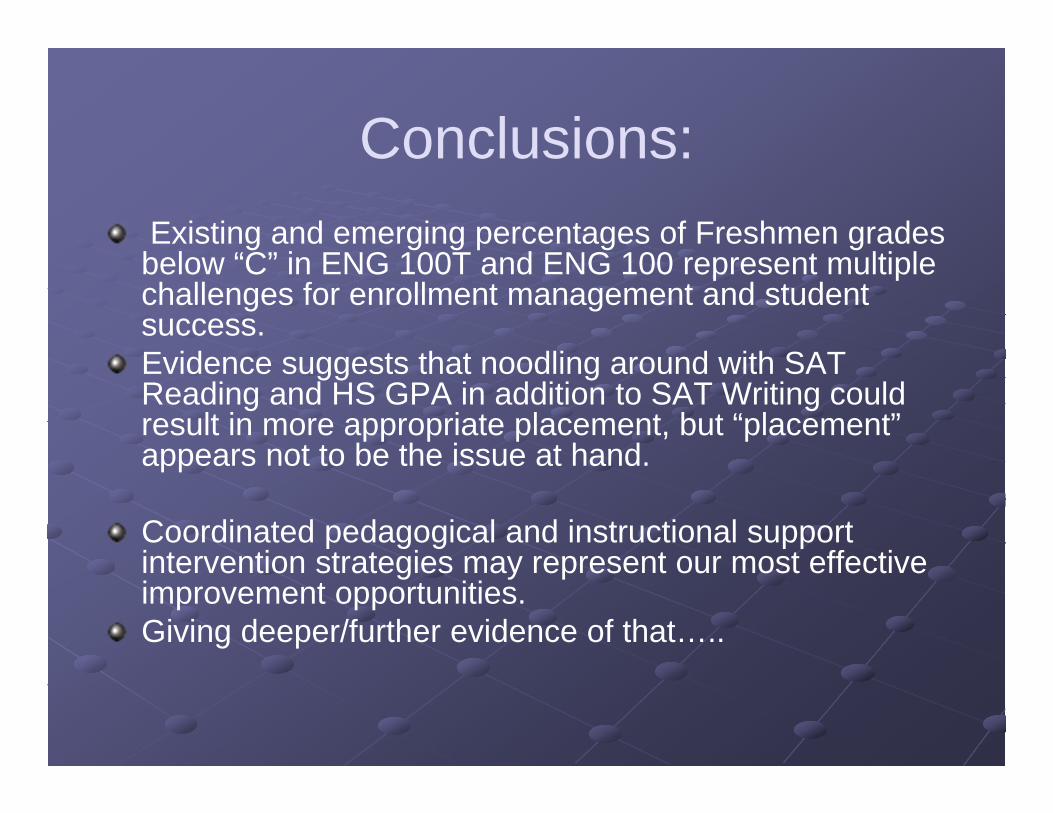
Conclusions:Existing and emerging percentages of Freshmen grades below “C” in ENG 100T and ENG 100 represent multiple challenges for enrollment management and student success.Evidence suggests that noodling around with SAT Reading and HS GPA in addition to SAT Writing could result in more appropriate placement, but “placement” appears not to be the issue at hand.
Coordinated pedagogical and instructional support intervention strategies may represent our most effective improvement opportunities.Giving deeper/further evidence of that…..
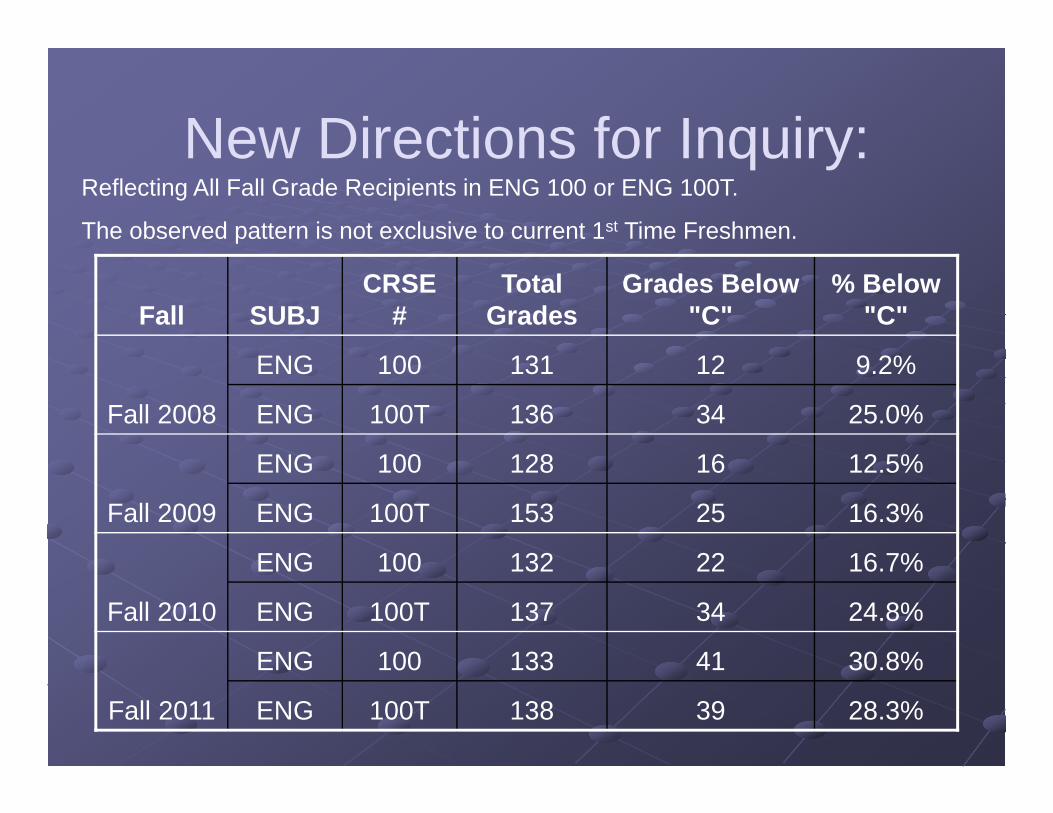
New Directions for Inquiry:
Fall SUBJCRSE
#Total
GradesGrades Below
"C"% Below
"C"
Fall 2008
ENG 100 131 12 9.2%
ENG 100T 136 34 25.0%
Fall 2009
ENG 100 128 16 12.5%
ENG 100T 153 25 16.3%
Fall 2010
ENG 100 132 22 16.7%
ENG 100T 137 34 24.8%
Fall 2011
ENG 100 133 41 30.8%
ENG 100T 138 39 28.3%
Reflecting All Fall Grade Recipients in ENG 100 or ENG 100T.
The observed pattern is not exclusive to current 1st Time Freshmen.
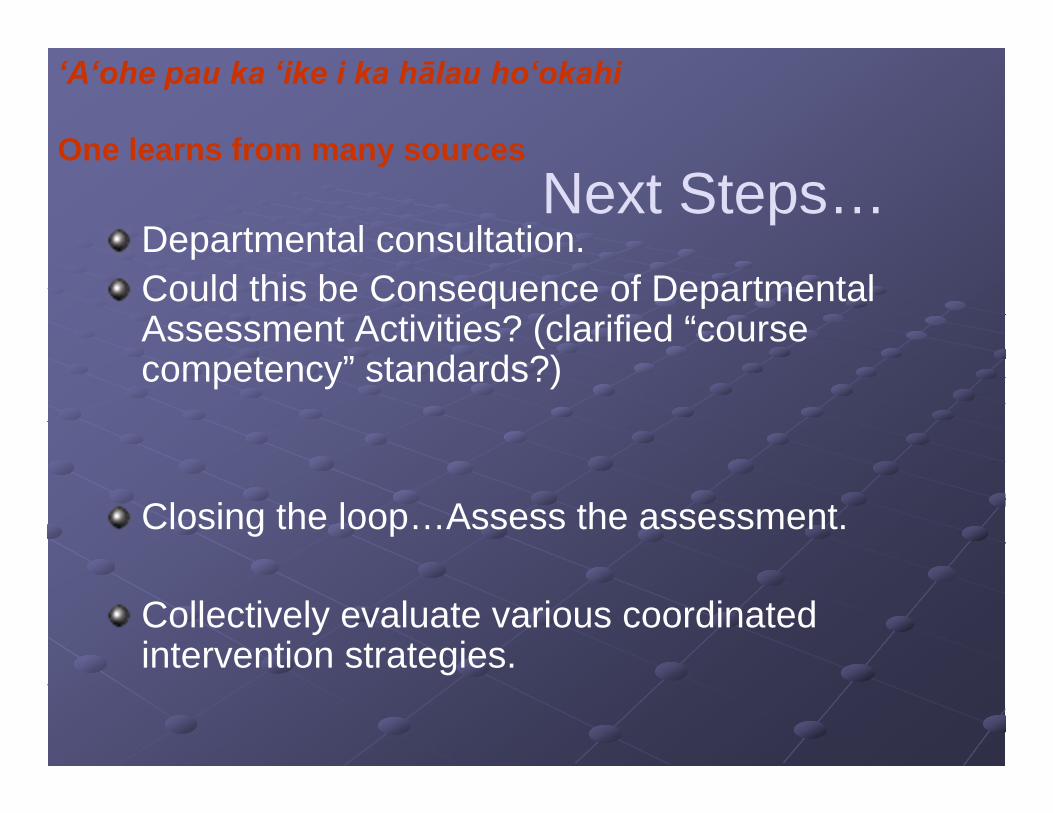
Next Steps…Departmental consultation.Could this be Consequence of Departmental Assessment Activities? (clarified “course competency” standards?)
Closing the loop…Assess the assessment.
Collectively evaluate various coordinated intervention strategies.
‘A‘ohe pau ka ‘ike i ka hālau ho‘okahi
One learns from many sources
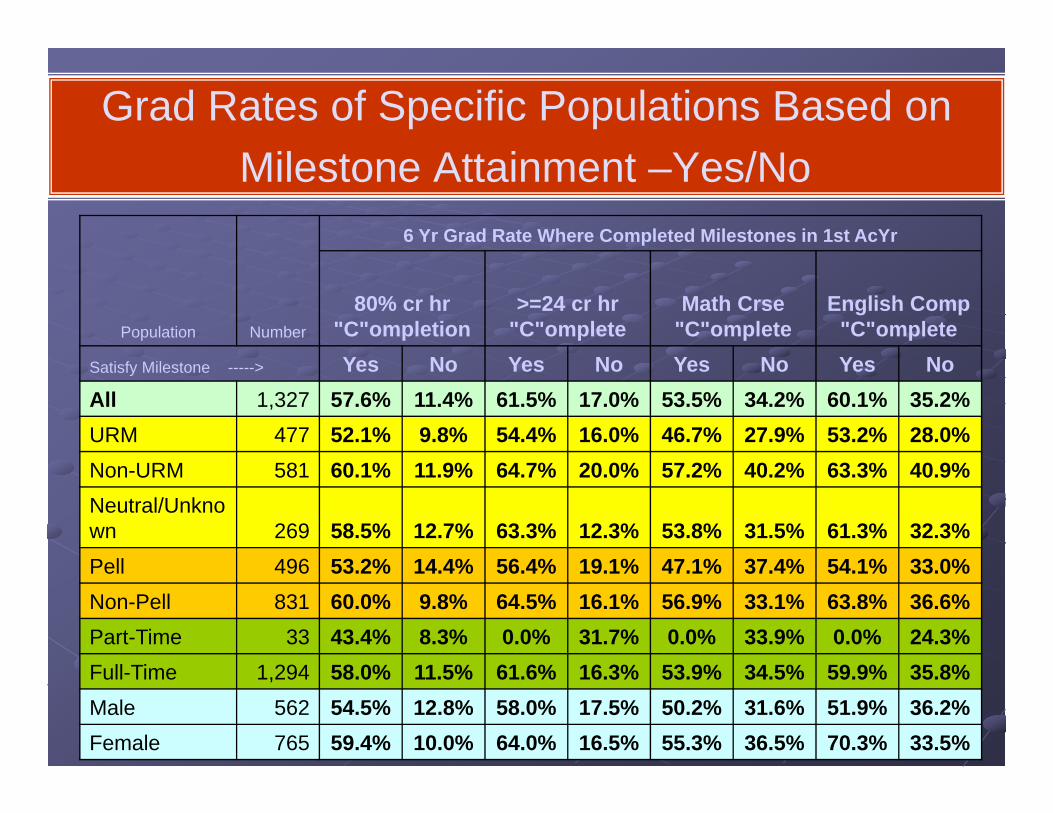
Grad Rates of Specific Populations Based on Milestone Attainment –Yes/No
Population Number
6 Yr Grad Rate Where Completed Milestones in 1st AcYr
80% cr hr "C"ompletion
>=24 cr hr "C"omplete
Math Crse "C"omplete
English Comp "C"omplete
Satisfy Milestone -----> Yes No Yes No Yes No Yes NoAll 1,327 57.6% 11.4% 61.5% 17.0% 53.5% 34.2% 60.1% 35.2%URM 477 52.1% 9.8% 54.4% 16.0% 46.7% 27.9% 53.2% 28.0%Non-URM 581 60.1% 11.9% 64.7% 20.0% 57.2% 40.2% 63.3% 40.9%Neutral/Unknown 269 58.5% 12.7% 63.3% 12.3% 53.8% 31.5% 61.3% 32.3%Pell 496 53.2% 14.4% 56.4% 19.1% 47.1% 37.4% 54.1% 33.0%Non-Pell 831 60.0% 9.8% 64.5% 16.1% 56.9% 33.1% 63.8% 36.6%Part-Time 33 43.4% 8.3% 0.0% 31.7% 0.0% 33.9% 0.0% 24.3%Full-Time 1,294 58.0% 11.5% 61.6% 16.3% 53.9% 34.5% 59.9% 35.8%Male 562 54.5% 12.8% 58.0% 17.5% 50.2% 31.6% 51.9% 36.2%Female 765 59.4% 10.0% 64.0% 16.5% 55.3% 36.5% 70.3% 33.5%
Population Number
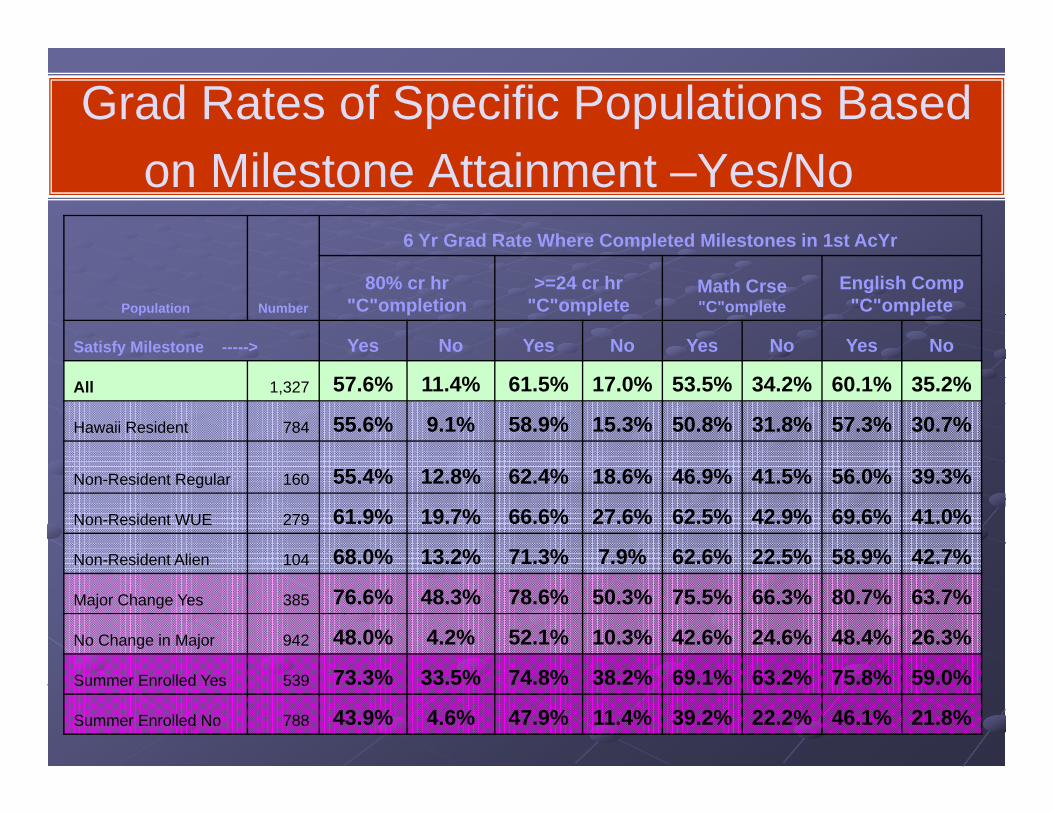
6 Yr Grad Rate Where Completed Milestones in 1st AcYr
80% cr hr "C"ompletion
>=24 cr hr "C"omplete
Math Crse"C"omplete
English Comp "C"omplete
Satisfy Milestone -----> Yes No Yes No Yes No Yes No
All 1,327 57.6% 11.4% 61.5% 17.0% 53.5% 34.2% 60.1% 35.2%
Hawaii Resident 784 55.6% 9.1% 58.9% 15.3% 50.8% 31.8% 57.3% 30.7%
Non-Resident Regular 160 55.4% 12.8% 62.4% 18.6% 46.9% 41.5% 56.0% 39.3%
Non-Resident WUE 279 61.9% 19.7% 66.6% 27.6% 62.5% 42.9% 69.6% 41.0%
Non-Resident Alien 104 68.0% 13.2% 71.3% 7.9% 62.6% 22.5% 58.9% 42.7%
Major Change Yes 385 76.6% 48.3% 78.6% 50.3% 75.5% 66.3% 80.7% 63.7%
No Change in Major 942 48.0% 4.2% 52.1% 10.3% 42.6% 24.6% 48.4% 26.3%
Summer Enrolled Yes 539 73.3% 33.5% 74.8% 38.2% 69.1% 63.2% 75.8% 59.0%
Summer Enrolled No 788 43.9% 4.6% 47.9% 11.4% 39.2% 22.2% 46.1% 21.8%
Grad Rates of Specific Populations Based on Milestone Attainment –Yes/No