“THE ESTIMATION OF THE INTERREGIONAL TRADE IN THE … · of the interregional input-output model....
27
“THE ESTIMATION OF THE INTERREGIONAL TRADE IN THE CONTEXT OF AN INTERREGIONAL INPUT-OUTPUT MODEL FOR THE SPANISH ECONOMY” Carlos Llano Verduras INSTITUTO LAWRENCE R. KLEIN Departamento de Economía Aplicada Facultad Ciencias Económicas y Empresariales Universidad Autónoma de Madrid [email protected] In this paper we introduce the first version of INTERTIO, a Multiregional- Multisectoral model for the Spanish Economy. The model combines the spatial and sectoral dimensions assuming the theoretical and empirical possibilities and limitations of the interregional input-output model. The research tries to use most of the regional information available at that time, using non-survey techniques for the estimation of incomplete data. The model is based on the following two pillars: • A complete set of 17 th regional input-output tables built (or updated) for 1995 (one for each of the 17 th Spanish regions-NUT2). All of them coherent with the National input-output Table. • A set of interregional trade matrices, estimated indirectly for each kind of product and developed from the interregional transport flows, and valued using export prices. Apart from a brief description of the main underpinnings of INTERTIO, we will focus on the strategy used for the estimation of this set of interregional trade matrices, using transport flows and value/weight relations indirectly deduced from detailed international trade statistics. As a consequence, we obtain a full estimation of a total Balance of Goods for the 17 Spanish regions with considerable sectoral detail.
Transcript of “THE ESTIMATION OF THE INTERREGIONAL TRADE IN THE … · of the interregional input-output model....

“THE ESTIMATION OF THE INTERREGIONAL
TRADE IN THE CONTEXT OF AN
INTERREGIONAL INPUT-OUTPUT MODEL
FOR THE SPANISH ECONOMY”
Carlos Llano Verduras
INSTITUTO LAWRENCE R. KLEIN
Departamento de Economía Aplicada
Facultad Ciencias Económicas y Empresariales
Universidad Autónoma de [email protected]
In this paper we introduce the first version of INTERTIO, a Multiregional-Multisectoral model for the Spanish Economy. The model combines the spatial andsectoral dimensions assuming the theoretical and empirical possibilities and limitationsof the interregional input-output model. The research tries to use most of the regionalinformation available at that time, using non-survey techniques for the estimation ofincomplete data. The model is based on the following two pillars:• A complete set of 17th regional input-output tables built (or updated) for 1995 (one
for each of the 17th Spanish regions-NUT2). All of them coherent with the Nationalinput-output Table.
• A set of interregional trade matrices, estimated indirectly for each kind of productand developed from the interregional transport flows, and valued using exportprices.
Apart from a brief description of the main underpinnings of INTERTIO, we willfocus on the strategy used for the estimation of this set of interregional trade matrices,using transport flows and value/weight relations indirectly deduced from detailedinternational trade statistics. As a consequence, we obtain a full estimation of a totalBalance of Goods for the 17 Spanish regions with considerable sectoral detail.

2
1. INTRODUCTION
Although there are several evidences on an increase in the intensity of
international economic relations within Europe, it is commonly accepted that regional
economies are more closely integrated with each other than their national counterparts.
Apart from peculiar small and truly open economies (such us Belgium, Luxemburg or
The Netherlands; see Oosterhaven et al., 1995; Dietzenbacher et al. 1997; Llano C.
1998), most of inter-sectoral and final trade relations takes place among national agents.
As a consequence, although regional dependence on international trade is increasing in
most of the Spanish regions, a large part of regional growth should be explained by
national causes.
Some recent work has illustrated the existence of deep inter-country relations
between clusters of sectors (Dietzenbacher 1997), where the international dependence
could be even stronger than their corresponding inter-sectoral relations within the
national economy (Kollmann, 1995; Costello, 1993). As a consequence, sectoral
specialisation of regions could induce deeper backward or forward relations with
foreign economies than with their natural partners, imposing stronger synchronicity of
the regional economy with the foreign cycle than with the national one.
With the progressive fulfilment of the EMU stages and the introduction of the
EURO as a single currency, the international transactions between European countries
will take place in almost the same way as they do between different regions within one
country. As a consequence, it is expected that some of the Spanish regions will open
their economies even more, re-orienting their sales and purchases to foreign markets,
breaking the frontiers of spatial proximity and contiguity. The effects of such openness
and trade diversion will depend mostly on sectoral specialisation.
With this new and more integrated market structure, the capability of detecting
and valuing the spatial and sectoral effects of regional, national and supra-national
shocks seems to be an important part of any strategic information system. Additionally,
the evidence of “spatial clubs” and “sectoral clusters” interacting in most of current
debates on integration, growth and convergence have also influenced the interest in the
spatial and sectoral dimensions of these questions in Europe. As a consequence, we find
new efforts by economic model designers to develop new and more realistic tools for
economic analysis, one that would be able to simulate inter-sectoral relations, within

3
inter-regional (Benvenuti et al., 1996; Hewings et al, 1993) and inter-national
(Oosterhaven et al, 1995) systems.
Apart from the European integration process, Spain is facing a parallel evolution
towards a more decentralised kind of government, where regions absorb increasing
quotas of power. As a consequence, the role of central planners is moving towards an
intermediate position between supranational policies and local expenses, with an
increasing need to anticipate and justify sectoral and spatial effects of any policy using
powerful analytical tools.
In this paper we introduce the first version of a multiregional-multisectoral
model that combines the spatial and sectoral dimensions assuming the theoretical and
empirical possibilities and limitations of the interregional input-output model (Isard,
1951), using most of the regional information available at that time.
The paper begins with a brief description of the input-output model and its main
spatial extensions. Then, we introduce the main underpinnings of our model, starting
with a brief description of the principal steps followed in the process of its construction.
Most of our attention will focus on the estimation of the interregional trade matrices,
that have been deduced indirectly using interregional transport flows, and valued
through export prices. As a consequence, we obtain a full estimation of a total and
bilateral balance of goods for the 17 Spanish regions with a considerable sectoral detail.
2. SOME SPATIAL EXTENSIONS OF THE INPUT OUTPUT MODEL.
The interregional input-output model was originally developed by Isard, who in
1951 suggested a new version of the Leontief model where the USA inter-sectoral
relations were split in three big areas : EAST, SOUTH and WEST (Isard, 1951). After
this first theoretical work, where the main underpinnings of the model were established,
some multi-regional input-output projects have navigated towards this “ideal” where the
spatial and sectoral origin and destination of the inter-industry flows where perfectly
and directly known. Probably, the best known derivation from this ideal is the so called
multiregional or Chenery-Moses model, where instead of splitting the sectoral and
spatial origin and destination of each flow, it propose a combination of single-region
tables and commodity trade matrices (Miller&Blair, 1989).

4
2.1. The estimation of interregional trade: methods and examples
One of the critical elements that determine the kind of model to be estimated is
the availability of information related to the interregional flows. Usually, neither
national statistical systems nor regional ones could satisfy the sectoral and spatial detail
for inter-sectoral and final flows that is required for the pure interregional input-output
model. As a consequence of this important gap, a large number of researchers have look
for less-expensive approaches, watering down some theoretical assumptions (Chenery-
Moses approach, Leontief Pool-approach...), or developing non-survey techniques for
the estimation of regional and interregional technical and trade coefficients (see Batten
1983; Oosterhaven, 1984, for a deep description). Next we offer a brief classification of
the some approaches used in the specification of those interregional flows:
Table Error! Unknown switch argument.: Possible approaches for the estimation of
interregional flows within the context of Multirregional input-output models
TECHNIQUE USED FOR THEESTIMATION SOME MODELS
INDIRECT ESTIMATIONUse of Gravitational model TIM, (Funck et al. 1975)Use of Entropy Maximising Paradigm Batten (1983)Pool-Approach of Leontief Leontief (1977)
INTERREG (Martellato et al, 1996)DIRECT ESTIMATION BASE ON REAL DATA
Use of International trade flows EU-IRIO (Oosterhaven et al., 1995)Use of Transport flows MRIO-HERP (Polenske 1980);
Hewings, 1993; Kazumi H., 2000.INTERTIO, (Llano, 2000)
A PO
STER
IORI
! !!! A
PRI
ORI
Use of surveys designed ad-hoc forproducers and consumers.
JAPAN IRIO TABLES (1960-70)
Note: Classification proposed by the author based on previous work (Batten 1983)
In our case, the combination of direct regional input-output tables with non
survey ones and the use of indirect estimation for the interregional flows takes our
model into a mixed position between pure-survey vs pure-non-survey approaches, “as
an hybrid between the so-called “multi-regional-columns-only input-output table” and
its “inter-regional-columns-only” equivalent (Oosterhaven, 1984).

5
3. A BRIEF DESCRIPTION OF THE MODEL
Our purpose of reproducing a complete multi-regional input-output model force
us to use a complete set of 17 input-output tables, one for each of the Spanish regions.
Although some of the them have a large tradition in the generation of survey and non-
survey regional input-output tables, others have no antecedents at all. As a consequence,
the process of construction of a complete interregional framework has had to combine
all the regional information available with the use of non-survey techniques for the
estimation of the non existing statistics. In essence, the model is based on the following
two pillars:
• A complete set of 17 regional IO tables built (or updated) for 1995 (one for each of
the 17 Spanish regions-NUT2). All of them coherent with the 1995 national input-
output table (INE) and the Regional Spanish Accounts.
• A set of Interregional trade matrices, estimated indirectly for each kind of product
and developed from the interregional transport flows, and valued through export
prices.
Since the process of construction of the model has been already described in
previous work (Perez J., 2000) we will summarise it by means of a short set of schemes
and graphs that will make easier going trough the more detailed description of the
methodology used for the estimation of the interregional trade.
Table Error! Unknown switch argument.: Principal steps on the process of
construction of INTERTIO
STEP ACTIVITY1. Estimation of the complete data set that is going to be used as constraints for
sectoral and regional figures2. Homogenisation of the “official” regional input-output Tables available for
19953. Actualisation and homogenisation of the “official” regional input-output tables
available for other years: 1987, 1990, 1992, 1996.4. Estimation of the non-available tables (total figures) by RAS technique using
the structure of similar-regions with input-output tables and the control figuresestimated in the first step.
5. Estimation of the corresponding Domestic, Rest of Spain and Rest of theWorld matrices, using different approaches depending on the existence ofofficial, up-dated or pure-non-survey Table for each region.
6. Estimation of the 26th interregional flows matrices for different products and
6
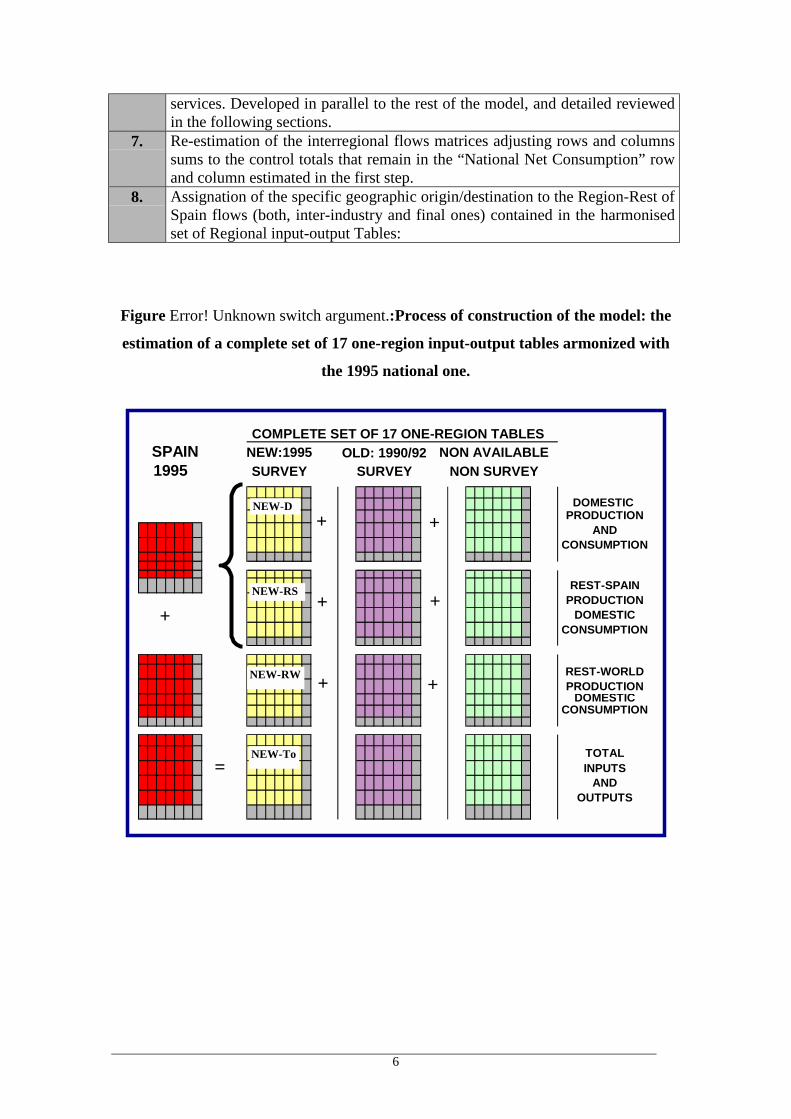
services. Developed in parallel to the rest of the model, and detailed reviewedin the following sections.
7. Re-estimation of the interregional flows matrices adjusting rows and columnssums to the control totals that remain in the “National Net Consumption” rowand column estimated in the first step.
8. Assignation of the specific geographic origin/destination to the Region-Rest ofSpain flows (both, inter-industry and final ones) contained in the harmonisedset of Regional input-output Tables:
Figure Error! Unknown switch argument.:Process of construction of the model: the
estimation of a complete set of 17 one-region input-output tables armonized with
the 1995 national one.
SPAIN NEW:1995 NON AVAILABLESURVEY SURVEY NON SURVEY
DOMESTIC PRODUCTION
ANDCONSUMPTION
REST-SPAINPRODUCTION
DOMESTICCONSUMPTION
REST-WORLDPRODUCTION
DOMESTICCONSUMPTION
TOTAL
ANDOUTPUTS
OLD: 1990/921995
INPUTS
COMPLETE SET OF 17 ONE-REGION TABLES
+ +
=
NEW-D
NEW-RS
+ +NEW-RW
NEW-To
+ ++

1995 ANDALUCIA´s INPUT-OUTPUT TABLE INTERREGIONAL INPUT-OUTPUT TABLE. 1995INDUSTRY FINAL DEM. INTERINDUSTRY D. FINAL DEMAND
EXPORT OUTPUT Andal ... Rioja Andal ... RiojaTOTAL
Z ... Z Y ... Y
TOTAL INPUTS AND OUTPUTS... ... ... ... ... ...
I.C.Z ... Z Y ... Y
ADJ ... ADJ ... ADJP.I.
IMP ... IMPIMPORTS
V ... V1. PRODUCTS WITH DOMESTIC ORIGIN
TOT. RESOURCES x ... x y ... yI.C.
INTERREGIONAL TRADE MATRICES
P.I.Andalucia Rioja
Andalucia
I.C.
I.C.
2. INTERMEDIATE IMPORTS FROM R. OF SPAIN
3. INTERMEDIATE IMPORTS FROM R. OF WORLD
ESPAÑA
...
ADJUSTMENTSSEC95
IMPORTS
P.I.
ADJ
Andalucia
EXP
Rioja
TOTAL
Rioja
TOTAL
...ORIGIN
DESTINATIONIMPORT
COEFFICIENTS PEREACH TRADABLEPRODUCTS AND
SERVICESOBTAINED FROM
THE INTERREGIONALTRADE MATRICES

4. THE ESTIMATION OF INTERREGIONAL TRADE.
4.1. Possible approaches based on the information available.
In Table Error! Unknown switch argument. we sum up the principal accounts
that offer some information related to interregional flows and the corresponding
statistical sources in which they are usually based on. Apart from the partial information
(Region-Rest of Spain) published on our incomplete set of survey regional input-output
tables, there are some other accounts systems and statistical sources that could
contribute to the estimation of the required data.
Table Error! Unknown switch argument.: Statistics containing data related to the
Spanish Interegional trade
ACCOUNTING SISTEM STATISTICAL SOURCES
Macro-economic balance(Alcaide-BBV)
Interregional trade is deduced as “a rest” bycomparing different variables from both sides ofthe Economy, Inputs and Outputs
TO
P-D
OW
N A
PPR
OA
CH
Input-output TablesRegional Accounts.
(Most of the Spanish regionalinput-output tables)
Information base on direct Survey to producers,and/or consumers:
• The use of “available official” statistics,such as National Industry, Agricultural orMining Surveys...(INE)
• Conduct other surveys designed “ad-hoc”for the input-output table.
Regional Balance ofPayments
(Parellada, 1982;
Oliver, 1997).
The use of interregional transport flows data,with detailed information about the geographicorigin and destination of the flows:
• The use of regional and national transportstatistics in terms of volume.
• Estimation of domestic prices using extrainformation to value transport flows.
DO
WN
-TO
P A
PPR
OA
CH
E
NOT AVAILABLEBECAUSE OF
STATISTICAL SECRET(Santiso, 2000)
The use of fiscal information contained in someadministrative documents of the SpanishTaxation over Economic Activity:
• Declarations of economic transactions donewith other economic agents specifying itsregional code.
With the exception of using ad-hoc surveys or a-priori estimations based on
different techniques (see Table 1), the only way to estimate the specific origin and
9
destination of interregional flows from real information lies on the use of transport and,
probably, fiscal data. We say “probably” because, as a consequence of the “statistical
secret”, there is no previous experience in the use of such information for the
quantification of the Spanish domestic trade. Obviously, it is an interesting line to be
explore in the future. Next we resume the main steps followed in the process of
estimation of the interregional trade of products and services.
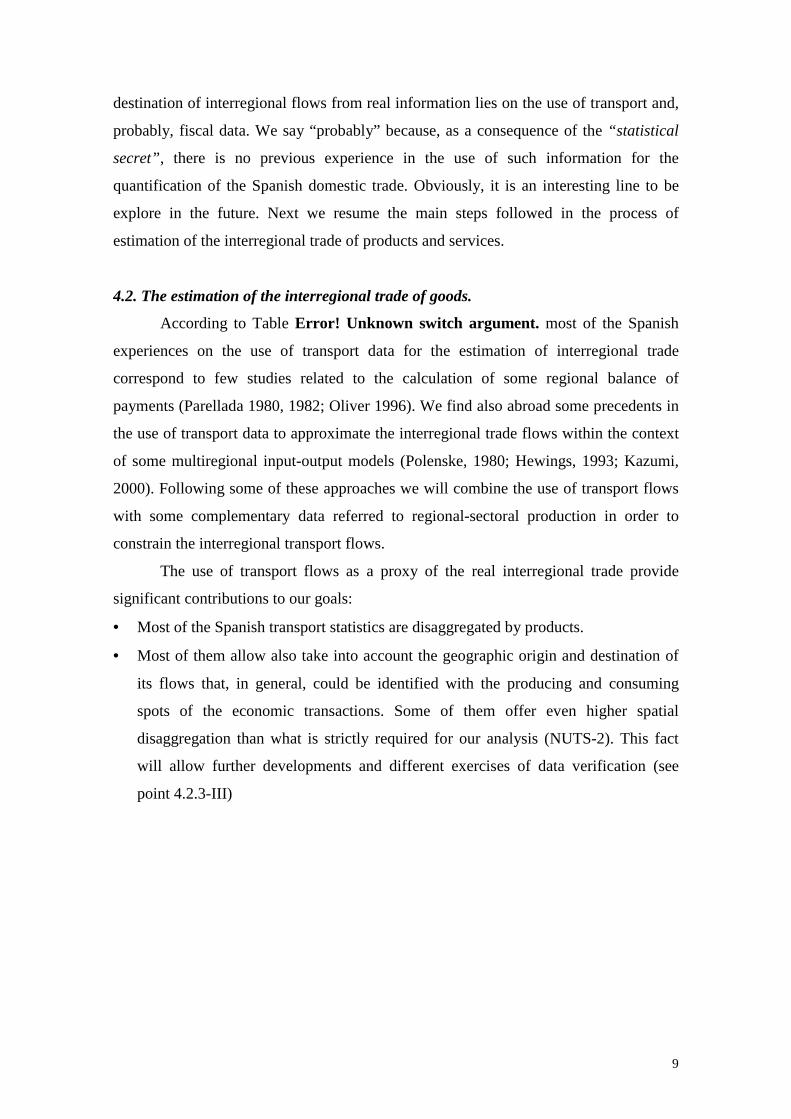
4.2. The estimation of the interregional trade of goods.
According to Table Error! Unknown switch argument. most of the Spanish
experiences on the use of transport data for the estimation of interregional trade
correspond to few studies related to the calculation of some regional balance of
payments (Parellada 1980, 1982; Oliver 1996). We find also abroad some precedents in
the use of transport data to approximate the interregional trade flows within the context
of some multiregional input-output models (Polenske, 1980; Hewings, 1993; Kazumi,
2000). Following some of these approaches we will combine the use of transport flows
with some complementary data referred to regional-sectoral production in order to
constrain the interregional transport flows.
The use of transport flows as a proxy of the real interregional trade provide
significant contributions to our goals:
• Most of the Spanish transport statistics are disaggregated by products.
• Most of them allow also take into account the geographic origin and destination of
its flows that, in general, could be identified with the producing and consuming
spots of the economic transactions. Some of them offer even higher spatial
disaggregation than what is strictly required for our analysis (NUTS-2). This fact
will allow further developments and different exercises of data verification (see
point 4.2.3-III)
10
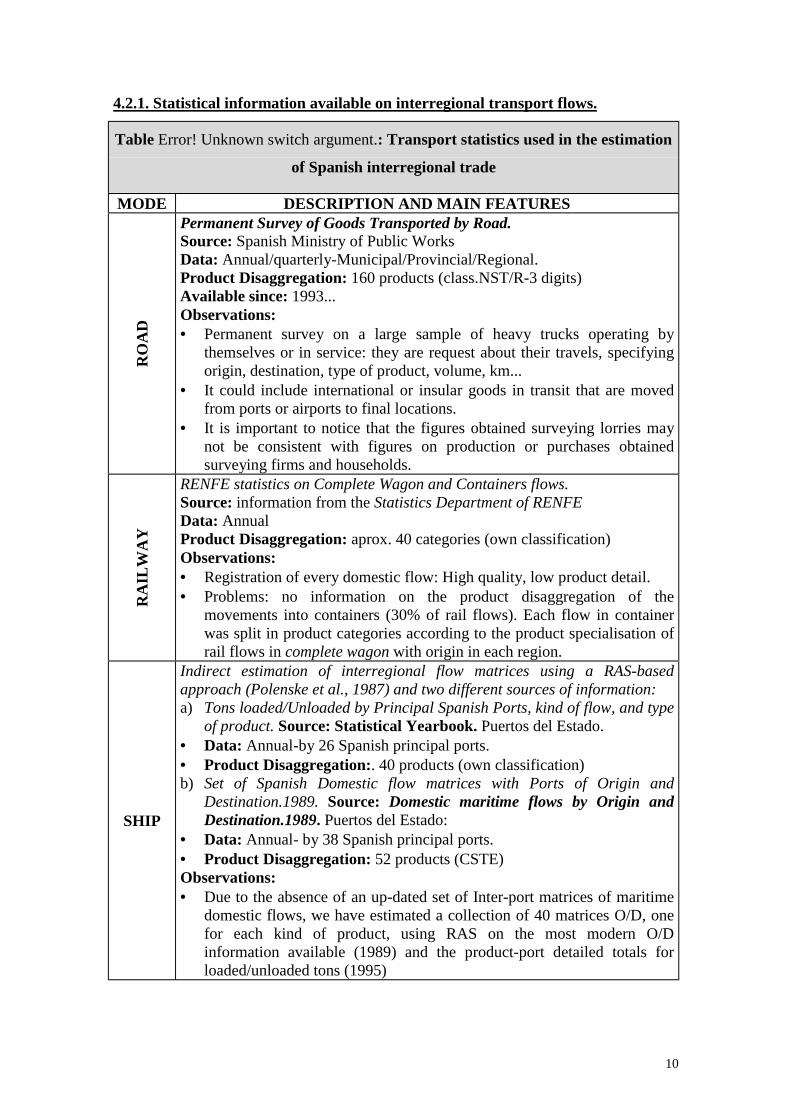
4.2.1. Statistical information available on interregional transport flows.
Table Error! Unknown switch argument.: Transport statistics used in the estimation
of Spanish interregional trade
MODE DESCRIPTION AND MAIN FEATURES
RO
AD
Permanent Survey of Goods Transported by Road.Source: Spanish Ministry of Public WorksData: Annual/quarterly-Municipal/Provincial/Regional.Product Disaggregation: 160 products (class.NST/R-3 digits)Available since: 1993...Observations:• Permanent survey on a large sample of heavy trucks operating by
themselves or in service: they are request about their travels, specifyingorigin, destination, type of product, volume, km...
• It could include international or insular goods in transit that are movedfrom ports or airports to final locations.
• It is important to notice that the figures obtained surveying lorries maynot be consistent with figures on production or purchases obtainedsurveying firms and households.
RA
ILW
AY
RENFE statistics on Complete Wagon and Containers flows.Source: information from the Statistics Department of RENFE Data: AnnualProduct Disaggregation: aprox. 40 categories (own classification)Observations:• Registration of every domestic flow: High quality, low product detail.• Problems: no information on the product disaggregation of the
movements into containers (30% of rail flows). Each flow in containerwas split in product categories according to the product specialisation ofrail flows in complete wagon with origin in each region.
SHIP
Indirect estimation of interregional flow matrices using a RAS-basedapproach (Polenske et al., 1987) and two different sources of information:a) Tons loaded/Unloaded by Principal Spanish Ports, kind of flow, and type
of product. Source: Statistical Yearbook. Puertos del Estado.• Data: Annual-by 26 Spanish principal ports.• Product Disaggregation:. 40 products (own classification)b) Set of Spanish Domestic flow matrices with Ports of Origin and
Destination.1989. Source: Domestic maritime flows by Origin andDestination.1989. Puertos del Estado:
• Data: Annual- by 38 Spanish principal ports.• Product Disaggregation: 52 products (CSTE)Observations:• Due to the absence of an up-dated set of Inter-port matrices of maritime
domestic flows, we have estimated a collection of 40 matrices O/D, onefor each kind of product, using RAS on the most modern O/Dinformation available (1989) and the product-port detailed totals forloaded/unloaded tons (1995)

11
AIR
CR
AFT
O/D Matrices of Domestic flows of goods by airport of Origin andDestination 1995. AENA.Source: AENA&Spanish Ministry of Public Works.Data: Annual-Principal Airports.Product Disaggregation: NoneObservations:• Product disagreggation of the unique matrix available of total domestic
flows is deduced using the product specialisation of international flights(available) per airport of origin in 1995.
PIPE
O/D matrix of oil flows using pipe 1995Font: CLH (main oil distributor in the Spanish market). 1993.Data: Not available for 1995Product Disaggregation: NoneObservations:• Non available data on O/D flows after sector liberalisation.• Indirect estimation using O/D matrix obtained by Department of Public
Works&TEMA-Consulting Group from CLH. Data from 1993 are re-scaled to 1995 figures.
• Due to the special characteristics of oil distribution where pipe is oftenused as an approach to consumer locations, the pipe information shouldbe used just for the re-allocation of road (capillary distribution) flows ofenergetic products apparently loaded in regions without refinery, thathave been fed by other regions (with refinery) using pipe.
4.2.2. Limits of transport information
Spanish transport statistics are usually designed not with economic purposes but
with the goal of covering different needs of engineers and transport planners. As a
consequence, they do not satisfy all the information desired for our analysis:
a) As transport flows are expressed in physical units (Tn, Km.*Tn...) rather than in
monetary ones, they should be valued using some kind of “value/volume” relations.
b) Information for each mode of transport (truck, rail,...) is collected by different
institutions, with different strategies, specific product classifications, and
incompatible methodologies. This fact introduce additional difficulties to the
conciliation and harmonisation of different sources, both between them and as
regards to the economic information (input-output Tables, National and Regional
Accounts, International trade data...).
c) Additionally, the lack of co-ordination in collecting data for each mode of transport
introduces serious problems in the capability to follow multi-modal flows. Due to
the current proliferation of multi-modal combinations in logistics, the inattentive use
of transport statistics could introduce the wrong assignment of the origin/destination
and accumulate problems of double-counting.

12
d) Other limitations come from the complex strategies currently displayed on product
distribution. For instance, the existence of “central purchase centres” and “transport
platforms” could over-estimate imports and exports of some big markets, inducing
infra-estimation of peripheral ones: after the reception and consolidation of different
transport flows (with different origins), a large part of the stock will be re-exported
to the final spot of consumption.
e) Another important limitation on transport information comes from the special
characteristics of the available statistics for road, that almost represents the 90% of
total transport flows in Spain: although the survey is reliable in general terms,
interpretation needs to be made with care when it is used at lower levels of
aggregation in space and products. In fact, we have checked the existence of
important conflicts between some flows of product x with origin in one region and
the economic information on the available resources (production+imports) of such
products in the region. This fact forced us to introduce a new data screening system
that is briefly described in point 4.2.3.-VIII
4.2.3. Methodology used for the estimation of interregional trade flows of goods
I. Harmonisation of physical transport flows obtained from different sources.
II. Estimation of non-available data: Bringing up to date the available maritime
domestic flows; disaggregating the total domestic air and rail flows moved using
containers according to the most probable product categories.
III. First screening procedure for transport flows in tons:
• Identification of international trade in transition along the Spanish peninsula using
road statistics: the EPTMC survey allows the identification of detailed road flows
(split by 160 types of products) between the 17 regions and the municipalities where
the main maritime ports are located. Then we confront such flows with the detailed
information on international goods (40 categories measured in tons)
loaded/unloaded into/from ships in those ports, with production data of the region
and also with different information on known inertial practices on the logistic
management of some international exports and imports (Ministerio de Fomento,
1995, 1996). Following this exhaustive approach, we detect some unbelievable
interregional flows that are then eliminated.
• Re-allocation of multi-modal flows: with a similar approach we identify and re-
allocate possible interregional flows that use ships and trucks complementarily.

13
V. Estimation of value/weight relations from International trade statistics.
Due to the total absence of a perfect statistical source that contains domestic prices
for every kind of product, we have to deduce them from alternative information.
Following previous works on the estimation of regional balance of payments (Oliver,
1997), we use value/weight relations deduced from very detailed statistics on
International Trade (exports) split by value and weight, region of origin, and about 1300
types of products (NC-4 digits). In contrast to other previous works we have estimated
18 different vectors of export prices (one for each possible region of origin) instead of
only two (one for imports one for exports) with the purpose of capturing price
differences derived from the sectoral specialisation of each region. As the inter-regional
comparison of deduced prices shows high volatility, we decide to introduce previous
debug in the rough regional export data:
• First we estimate a unique debugged-price-vector containing the statistical median
for the 18 different original prices and each of the 1300 items available. In that way
we eliminate extreme values.
• Then we deduce a set of 18 definitive-price-vectors (one for each mode of transport
an its classification) as weighted means of the “debugged-price-vector” (the weigh
comes from the amount of tons exported for each product and region):
Re
1 1
_ _* Pr .... * Pr
_ _
R Rgion Debbuged Debbugedi n
I i ni n i nR Ri i
i i
Exports Tns Exports TnsPRICE ice iceExports Tns Exports Tns
= =
= =
= + + ∑ ∑
The PRICE for the flow of the
products contained in the "I"
category of a particular transport
mode (i.e.: within the Road NST/R
class.) with origin in region "R".
I= ranges from i=1 to n (NC class)
R= range from 1 to 18 regions
=
• Weighted mean of the “single-
debugged prices” for each “i”
category included en “I”, weighted by
the ratio between Tons exported of "i"
product over the whole amount of Tons
of category “I” exported by the same
region "R" of origin
VI. Translation of O/D debugged matrices measured in Tons into Monetary
Units using the whole set of vector prices deduced in the previous step.

14
VII. Aggregation of the different sets of O/D-product-matrices valued in current
ESP. into the common INTERTIO´s classification, where 16 out of the 26
activities produce primary or manufactures goods of any kind.
VIII. Final screen of the 16 O/D matrices of Goods expressed in ESP.:
Although we have observed significant correspondence between our total exports
and imports and those published in regional input-output tables for some regions, we
have also detected some remarkable divergences:
• In general, interregional trade deduced exclusively from transport flows (without
any constraint from regional/sectoral production) appear overvalued.
• Coincidence between different sources increase, both from export and import sides,
when we introduce additional restrictions for each regional/sectoral export based on
the capability of the region to produce (and export) each kind of product.
At this stage we have applied two different options:
1. According to the needs of INTERTIO our matrices are submitted to marginal totals
deduced “as a difference” from known information deduced in the first stage of the
process of construction (see stage 1 and 7 in Table 2).
2. With the purpose of analysing interregional trade databank outside the restrictions
imposed by INTERTIO we adopt an additional option:
" The 15 O/D trade matrices corresponding to industrial activities are harmonised
by “sums along rows” (exports only) with the detailed information on the “Sales
to the Rest of Spain” that is generated from the Industrial Survey (INE) for all
of our regions and industrial activities. As a consequence, any activity of any
region will not be able to export to other regions more than what this survey
establishes as “Production sold to the Rest of Spain” for this region/activity.
The lack of information on the imports side encourages us to leave the “sums
along columns” without restriction.
" Since there is not a equivalent information for primary products, the constraint
for the flows of the first activity (Agriculture, Fishing and Forestry) is based on
the information available on regional production and exports for a range number
of products, so that any region could move (intra+inter) more tons of than its
production not exported to foreign countries.
15
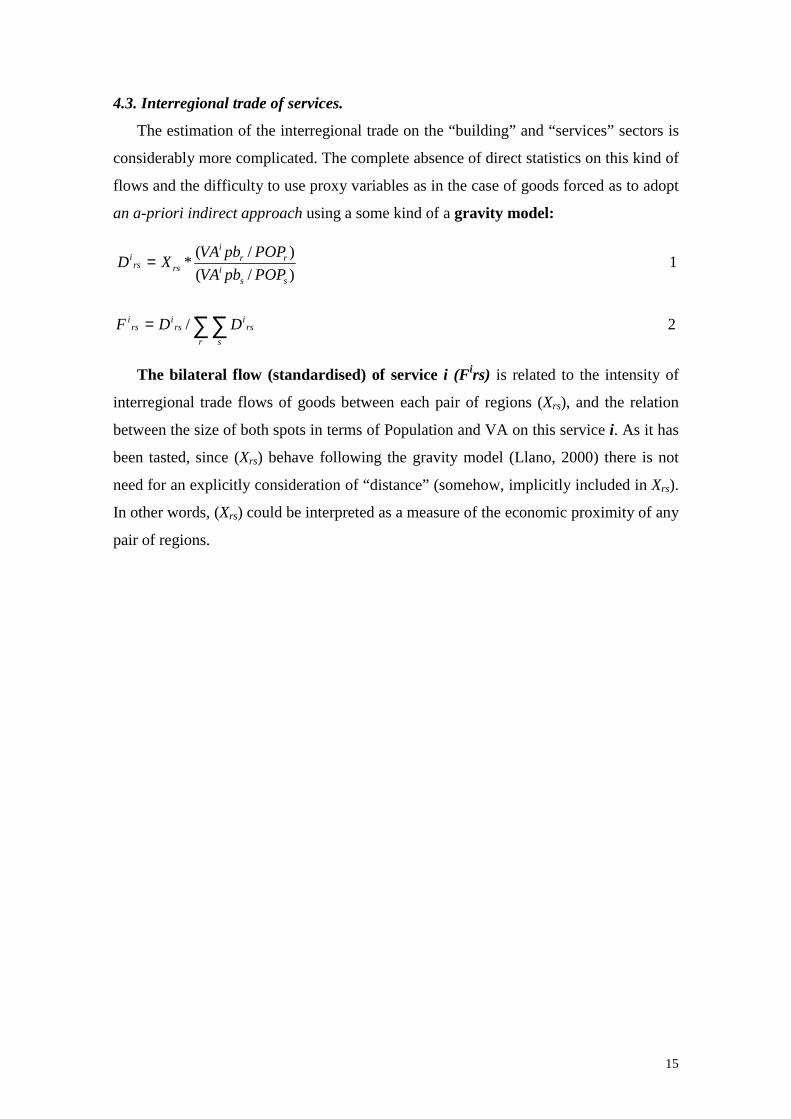
4.3. Interregional trade of services.
The estimation of the interregional trade on the “building” and “services” sectors is
considerably more complicated. The complete absence of direct statistics on this kind of
flows and the difficulty to use proxy variables as in the case of goods forced as to adopt
an a-priori indirect approach using a some kind of a gravity model:
)/()/(*
ssi
rri
rsrsi
POPpbVAPOPpbVAXD = 1
∑∑=r s
rsi
rsi
rsi DDF / 2
The bilateral flow (standardised) of service i (Firs) is related to the intensity of
interregional trade flows of goods between each pair of regions (Xrs), and the relation
between the size of both spots in terms of Population and VA on this service i. As it has
been tasted, since (Xrs) behave following the gravity model (Llano, 2000) there is not
need for an explicitly consideration of “distance” (somehow, implicitly included in Xrs).
In other words, (Xrs) could be interpreted as a measure of the economic proximity of any
pair of regions.

16
5. DATA ANALYSIS
In the following section we analyse some of the most remarkable phenomena
observed in a first exploration of the interregional trade matrices. We start by
identifying the main ratios deduced from the total interregional trade matrix analysed
outside the model so that the corresponding margins are harmonised with the available
figures on interregional sales by each sector and region of origin (see point 2-VIII on
section 4) and not with the margins deduced form the input-output system.
Table Error! Unknown switch argument.: Intra, intereg and international
Spanish trade flows of goods.
INTRA OPENESSREGION* SPAIN WORLD SPAIN WORLD SPAIN WORLD RATIO***
(2+3+4+5)/(1+2+3)
ANDALUCIA 1.895 2.320 985 2.527 1.025 -208 -41 132%ARAGON 612 1.270 699 1.796 563 -526 136 168%ASTURIAS 675 689 166 743 170 -53 -4 116%BALEARES 248 96 110 499 134 -403 -24 185%CANARIAS 493 318 109 541 383 -224 -274 147%CANTABRIA 227 448 133 622 169 -174 -36 170%C-LEON 1.380 1.938 685 2.298 708 -360 -24 141%C-MANCHA 768 1.622 149 1.513 245 109 -96 139%CATALUÑA 4.965 5.363 2.925 3.035 4.263 2.328 -1.338 118%C.VALENCIA 2.207 2.674 1.626 3.045 1.164 -371 463 131%EXTREMADURA 236 384 61 528 33 -144 27 148%GALICIA 1.289 1.546 563 1.034 646 511 -82 111%MADRID 1.691 2.644 1.141 3.112 2.966 -468 -1.824 180%MURCIA 357 713 284 950 217 -237 66 160%NAVARRA 302 995 469 851 286 144 183 147%PAIS VASCO 972 2.161 1.039 1.919 960 242 79 146%LA RIOJA 95 460 74 435 58 25 16 163%CEU/MEL 0 10 5 201 60 -191 -56 1894%
TOTAL 18.413 25.650 11.222 25.650 14.052 0 -2.829Source: Own calculation based on our Interregional Trade Matrices. 1995*Interregional Exports and Imports are deduced from own calculations.** Flows with the Rest of the World are obtained from Custom data.1995*** Since data does not include "services", Openess ratio is different than the usual (X+M)/PIB.
IMPORTS BALANCE
1995(6)=(2-4) (7)=(3-5)(5)**(2)*(1) (3)** (4)*
MAIN RATIOS FROM THE INTERREGIONAL TRADE MATRICES.GOODS (ITEMS 1-16 FROM INTERTIO CLASSIFICATION.). BILLIONS OF ESP.
EXPORTS

17
Table 7: The strongest interregional flows of goods within the Spanish economy.
ORIGIN=DESTINATION % ORIGIN DESTINATION %1 CATALUÑA 11,3% CATALUÑA C.VALENCIA 4,1%2 C.VALENCIA 5,0% CATALUÑA ARAGON 3,1%3 ANDALUCIA 4,3% CATALUÑA MADRID 3,0%4 MADRID 3,8% C.VALENCIA CATALUÑA 2,6%5 C-LEON 3,1% CATALUÑA ANDALUCIA 2,1%6 GALICIA 2,9% MADRID C-MANCHA 1,8%7 PAIS VASCO 2,2% ARAGON CATALUÑA 1,8%8 C-MANCHA 1,7% CATALUÑA PAIS VASCO 1,7%9 ASTURIAS 1,5% PAIS VASCO C-LEON 1,7%
10 ARAGON 1,4% MADRID ANDALUCIA 1,7%44.063 25.650
Source: Own calculations based on our interregional trade matrices
RANKING OF THE MAIN INTRA-INTER REGIONAL FLOWS ALL GOODS (INDUSTRIES 1-16). % and billions of Esp.
1995 INTRA INTERREGIONALAs % of Total Trade As % of Total Interregional Trade
INTRA+INTER TOTAL INTERREGIONAL TOTAL
• With the exception of Aragón, the highest openness ratio appear in the economies
with smaller surface: Madrid, La Rioja, Baleares, Navarra, Cantabria.
• According to our figures we confirm the expected fact that most part of the regional
trade relations, both from the import and the exports sides, takes place among other
regional markets within Spain rather than with foreign countries. The rankings of
regions in terms of international and interregional trade remains stable. Just Galicia
and Castilla-León seems to be more focus on foreign markets.
• Just six regions register positive balances in terms of interregional trade while seven
does in the international one. The highest surplus appears in Cataluña trade relations
with the rest of Spain, followed by the positive balance of Galicia and País Vasco.
• It is interesting to notice some changes in the sign of some balances when we move
from the interregional trade to the international one: while some regions -Cataluña,
Galicia and Castilla-La Mancha- show positive balances in the national market and
deficits in the international one, others as –Aragón, Valencia, Extremadura and
Murcia- register just the opposite relation among their two balances.
By means of the relative share that each bilateral flow represents overall the
interregional Spanish flows we could identify some of the strongest economic
transactions that have taken place in 1995 (see Table 7):

18
• The highest intra-regional flows occurs within the regions that combine a large
territorial size (Andalucía, Castilla-León), with high population ratios (Cataluña,
Andalucía, Madrid, C. Valenciana) and high shares of the economic activity
(Cataluña, Madrid, Andalucía).
• Then if we rank the strongest interregional flows of goods we realise that the first 10
positions of the ranking include at least one of the most industrialised economies,
namely Cataluña, Madrid, C.Valenciana, Aragón or País Vasco.
Figure Error! Unknown switch argument.
CATALUÑA
NAVARRACANTABRIA
RIOJA
MADRIDCASTILLA-LEÓN
ARAGON
P.VASCO
BALEARES
MURCIA
EXTREMADURA
ASTURIASGALICIA
CASTILLA-LA MANCHA
ANDALUCIA
COM. VALENCIANA
SPAIN199,51,9
POPULATION %
TOTAL INTERREG TRADE OF GOODS(1)-THE STRONGEST INTERREGIONAL FLOWS. 1995
3.1%
1.8%
2.6%
3.0%
4.1%
2.1%
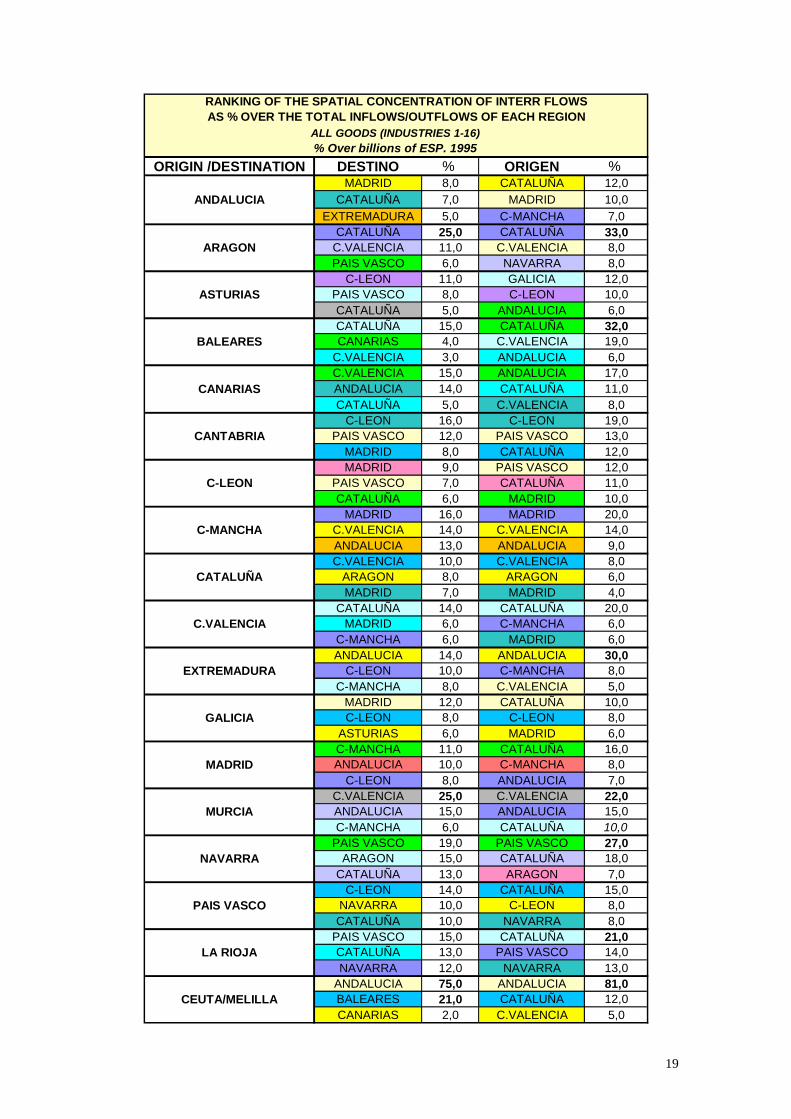
Once that the main intra and interregional trade flows have been detected it
would be interesting to have a look on these other flows that, despite of their relative
importance in terms of their intensity, involve the highest levels of concentration in the
inflows or outflows of a specific region.
19
ORIGIN /DESTINATION DESTINO % ORIGEN % MADRID 8,0 CATALUÑA 12,0
ANDALUCIA CATALUÑA 7,0 MADRID 10,0EXTREMADURA 5,0 C-MANCHA 7,0
CATALUÑA 25,0 CATALUÑA 33,0ARAGON C.VALENCIA 11,0 C.VALENCIA 8,0
PAIS VASCO 6,0 NAVARRA 8,0C-LEON 11,0 GALICIA 12,0
ASTURIAS PAIS VASCO 8,0 C-LEON 10,0CATALUÑA 5,0 ANDALUCIA 6,0CATALUÑA 15,0 CATALUÑA 32,0
BALEARES CANARIAS 4,0 C.VALENCIA 19,0C.VALENCIA 3,0 ANDALUCIA 6,0C.VALENCIA 15,0 ANDALUCIA 17,0
CANARIAS ANDALUCIA 14,0 CATALUÑA 11,0CATALUÑA 5,0 C.VALENCIA 8,0
C-LEON 16,0 C-LEON 19,0CANTABRIA PAIS VASCO 12,0 PAIS VASCO 13,0
MADRID 8,0 CATALUÑA 12,0MADRID 9,0 PAIS VASCO 12,0
C-LEON PAIS VASCO 7,0 CATALUÑA 11,0CATALUÑA 6,0 MADRID 10,0
MADRID 16,0 MADRID 20,0C-MANCHA C.VALENCIA 14,0 C.VALENCIA 14,0
ANDALUCIA 13,0 ANDALUCIA 9,0C.VALENCIA 10,0 C.VALENCIA 8,0
CATALUÑA ARAGON 8,0 ARAGON 6,0MADRID 7,0 MADRID 4,0
CATALUÑA 14,0 CATALUÑA 20,0C.VALENCIA MADRID 6,0 C-MANCHA 6,0
C-MANCHA 6,0 MADRID 6,0ANDALUCIA 14,0 ANDALUCIA 30,0
EXTREMADURA C-LEON 10,0 C-MANCHA 8,0C-MANCHA 8,0 C.VALENCIA 5,0
MADRID 12,0 CATALUÑA 10,0GALICIA C-LEON 8,0 C-LEON 8,0
ASTURIAS 6,0 MADRID 6,0C-MANCHA 11,0 CATALUÑA 16,0
MADRID ANDALUCIA 10,0 C-MANCHA 8,0C-LEON 8,0 ANDALUCIA 7,0
C.VALENCIA 25,0 C.VALENCIA 22,0MURCIA ANDALUCIA 15,0 ANDALUCIA 15,0
C-MANCHA 6,0 CATALUÑA 10,0PAIS VASCO 19,0 PAIS VASCO 27,0
NAVARRA ARAGON 15,0 CATALUÑA 18,0CATALUÑA 13,0 ARAGON 7,0
C-LEON 14,0 CATALUÑA 15,0PAIS VASCO NAVARRA 10,0 C-LEON 8,0
CATALUÑA 10,0 NAVARRA 8,0PAIS VASCO 15,0 CATALUÑA 21,0
LA RIOJA CATALUÑA 13,0 PAIS VASCO 14,0NAVARRA 12,0 NAVARRA 13,0
ANDALUCIA 75,0 ANDALUCIA 81,0CEUTA/MELILLA BALEARES 21,0 CATALUÑA 12,0
CANARIAS 2,0 C.VALENCIA 5,0
RANKING OF THE SPATIAL CONCENTRATION OF INTERR FLOWSAS % OVER THE TOTAL INFLOWS/OUTFLOWS OF EACH REGION
ALL GOODS (INDUSTRIES 1-16)% Over billions of ESP. 1995

20
Although it has been observed that most of the regions keep trade relations with
the others, the table below shows the existence of high levels of concentration in the
spatial origin and destination of the interregional imports and exports 1:
• First of all, it is important to realise that most part of the highest export and import
shares are registered between contiguous regions.
• Since this concentration on the spatial distribution of trade could be interpreted as an
evidence of the existence of important interregional intersectoral linkages we will be
identifying some important channels for the interregional spillover of domestic
impulses in terms of growth, prices, and per capita income...
The spatial distribution of the main interregional flows (see Error! Unknown
switch argument.) and the observed tendency to find the highest exports shares around
the contiguous regions (see Table 8), remain us once again the importance of the first
law of geography in which “everything is related with everything else, but near things
are more related than distant things” (Tobler´s 1979, quoted in Anselin 1986). Besides
the graphical and intuitive approach, the use of a gravity-based model2 help us to
understand the relation between the intensity of the interregional Spanish trade taking
into account the socio-economic power (approached by means of Population and Value
Added) of the two areas interconnected (regions r and s ) as well as the distance (dist)
between them:
0 1 2 3ln( ) ln( ) ln( ) ( )p p p prs sr r s r s rsx x a b VA VA b POP POP b dist u+ = + + + + + + 4
Dependent Variable: L(Xij+Xji)Method: Least SquaresSample: 1 105Included observations: 105
Variable Coefficient Std. Error t-Statistic Prob.C -3.573249 2.371691 -1.506625 0.1350
L(Value Added) 1.290173 0.282891 4.560670 0.0000L(Population) 0.558684 0.275641 2.026856 0.0453L(Distance) -1.304770 0.115770 -11.27036 0.0000
R-squared 0.784140 Mean dependent var 11.89013Adjusted R-squared 0.777728 S.D. dependent var 1.414740S.E. of regression 0.666990 Akaike info criterion 2.065266Sum squared resid 44.93239 Schwarz criterion 2.166369Log likelihood -104.4265 F-statistic 122.2984
1 Since the % are calculated over the total inflows/outflows, that is including intrarregional fows, theidentification of exports and import shares around 20% in some of the regions should be consideredconsiderable high.2 The formulation of the gravity model is based on (Goicolea, et al. 1998)

21
Durbin-Watson stat 2.081379 Prob(F-statistic) 0.000000Although the results obtained in the estimation of equation 4 by OLS seems to
validate the gravity model for a general explanation of most part of the interregional
flows of goods, it is important to remark the possible existence of different behaviours
depending on the type of commodity being traded. For this reason it would be
interesting to reproduce a similar analysis for each of the 16 sectoral matrices of goods.
Due to the obvious limitations of time and space, we analyse the main features of the
interregional trade observed for the products generated by two activities clearly
interrelated: Agriculture and Food&Beverages industries.
Table Error! Unknown switch argument.
INTRAREGION SPAIN WORLD SPAIN WORLD SPAIN WORLD
ANDALUCIA 745 378 226 431 120 -54 107ARAGON 230 270 10 248 24 23 -14
ASTURIAS 384 76 0 71 7 5 -7BALEARES 95 9 1 108 4 -100 -3CANARIAS 134 89 50 88 37 1 13
CANTABRIA 48 43 2 88 19 -45 -17C-LEON 735 393 10 310 32 84 -22
C-MANCHA 297 559 6 254 12 306 -5CATALUÑA 810 408 59 378 285 30 -225
C.VALENCIA 207 287 298 350 96 -63 202EXTREMADURA 140 215 12 62 2 153 10
GALICIA 463 85 17 151 54 -66 -37MADRID 22 78 7 237 73 -159 -66MURCIA 159 137 129 197 29 -60 100
NAVARRA 71 131 4 95 16 36 -12PAIS VASCO 37 60 3 163 77 -104 -73
LA RIOJA 32 111 3 82 11 29 -8CEU/MEL 0 1 0 18 2 -17 -2
TOTAL 4.609 3.331 839 3.331 899 0 -60
RATIOS FROM THE INTERREGIONAL TRADE MATRICESR1. AGRICULTURE, FORESTRY, FISHING. BILLIONS OF ESP.
1995 EXPORTS IMPORTS BALANCE

22
Table Error! Unknown switch argument.
ORIGIN=DESTINATION % ORIGIN DESTINATION %1 CATALUÑA 10,2% C-MANCHA ANDALUCIA 5,4%2 ANDALUCIA 9,4% ARAGON CATALUÑA 4,1%3 C-LEON 9,3% C-MANCHA C.VALENCIA 4,0%4 GALICIA 5,8% CATALUÑA ARAGON 3,1%5 ASTURIAS 4,8% C.VALENCIA C-MANCHA 2,2%6 C-MANCHA 3,7% CATALUÑA BALEARES 2,1%7 C.VALENCIA 2,6% C-MANCHA MADRID 2,1%8 MURCIA 2,0% C-LEON CANTABRIA 1,9%9 EXTREMADURA 1,8% CATALUÑA C.VALENCIA 1,9%
10 CANARIAS 1,7% ANDALUCIA MURCIA 1,6%7.940 3.331
Source: Own calculations based on our interregional trade matrices
RANKING OF THE MAIN INTRA-INTER REGIONAL FLOWS R1-AGRICULTURE, FORESTRY AND FISHING. % and billions of Esp.
1995 INTRA INTERREGIONALAs % of Total Trade As % of Total Interregional Trade
INTRA+INTER TOTAL INTERREGIONAL TOTAL
Figure Error! Unknown switch argument.3
ANDALUCIA
12,4GALICIA
3,61
8,13
27,15
8,72CASTILLA-LA MANCHA
COM. VALENCIANA
CASTILLA-LEON7,24
7,87ARAGON
CATALUÑA
AGRICULTURE, FORESTRY, FISHING...(1)-THE STRONGEST INTERREGIONAL FLOWS. 1995
3.1%
5.4%
4.1%
4.0%
2.2%
2.1%
2.1%
3 The intensity of the colour express the spatial concentration of population while the numbers are thepercentage shares of regions in the Agriculture VA of the Spanish economy. Regional Accounts (INE).

23
According to the results contained in Table 6 and Table 7, most of the Spanish regions
keep having more intense trade of agricultural products with other national agents than
with foreign ones. Just the Comuidad Valenciana region seems to be more specialised in
the exports to non-national economies.
• The number of regions with positive balance in their interregional trade has increase
compare to the previous analysis based on all goods, although just Extremadura
seems to keep positive balance also in the international market. Andalucia, C.
Valenciana and Murcia share the same trend in their balances: a considerable
positive balance in their trade with foreign countries and a slight deficit in the
national market.
• In average, the share of intrarregional trade of agriculture products appears to be
higher than in the case of total goods. The strongest intra flows are located in the
regions that capture the highest shares of the Spanish production in the sector.
• Now, the most intense interregional flows take place among regions with hard
specialisation in the production of agricultural products (as origins) and regions with
strong levels of final or intermediate consumption as a consequence of their level of
population or/and an important presence of transforming industries (as destination).
• Notice that, in this particular case all of the strongest interregional flows take place
between neighbour economies. Probably, this fact could be partially explained by
the location-process of the transforming industries as well as the presence of
centralised markets of agricultural products in the main cities of each region (the
“MERCA”-net).

24
Table Error! Unknown switch argument.
INTRAREGION SPAIN WORLD SPAIN WORLD SPAIN WORLD
ANDALUCIA 613 813 192 675 116 138 76ARAGON 74 198 28 307 13 -109 16
ASTURIAS 55 165 10 174 7 -9 3BALEARES 57 33 4 127 9 -93 -4CANARIAS 154 59 14 131 106 -72 -92
CANTABRIA 24 130 15 87 10 42 5C-LEON 219 512 50 390 40 122 10
C-MANCHA 123 338 34 318 26 19 8CATALUÑA 846 997 235 493 383 504 -148
C.VALENCIA 258 446 80 484 104 -38 -24EXTREMADURA 47 85 27 176 8 -91 19
GALICIA 229 304 98 197 124 108 -26MADRID 267 302 50 782 174 -480 -124MURCIA 58 182 82 198 28 -16 55
NAVARRA 67 136 20 74 26 61 -6PAIS VASCO 105 184 36 261 57 -76 -21
LA RIOJA 13 157 26 94 8 63 18CEU/MEL 0 1 2 73 8 -72 -5
TOTAL 3.211 5.042 1.005 5.042 1.246 0 -241
RATIOS FROM THE INTERREGIONAL TRADE MATRICESR3-FOOD&BEVERAGES. BILLIONS OF ESP.
1995 EXPORTS IMPORTS BALANCE
Table Error! Unknown switch argument.
ORIGIN=DESTINATION % ORIGIN DESTINATION %1 CATALUÑA 10,3% CATALUÑA MADRID 3,8%2 ANDALUCIA 7,4% CATALUÑA C.VALENCIA 3,6%3 MADRID 3,2% ANDALUCIA MADRID 3,4%4 C.VALENCIA 3,1% CATALUÑA ARAGON 3,4%5 GALICIA 2,8% CATALUÑA ANDALUCIA 2,9%6 C-LEON 2,7% ANDALUCIA EXTREMADURA 2,0%7 CANARIAS 1,9% C.VALENCIA ANDALUCIA 2,0%8 C-MANCHA 1,5% ANDALUCIA CANARIAS 1,9%9 PAIS VASCO 1,3% C.VALENCIA C-MANCHA 1,7%
10 ARAGON 0,9% C-LEON MADRID 1,7%8.253 5.042
Source: Own calculations based on our interregional trade matrices
RANKING OF THE MAIN INTRA-INTER REGIONAL FLOWS R3-FOOD&BEVERAGES. % and billions of Esp.
1995 INTRA INTERREGIONALAs % of Total Trade As % of Total Interregional Trade
INTRA+INTER TOTAL INTERREGIONAL TOTAL

25
Figure Error! Unknown switch argument.4
5,1
6,7
10
8,3
16,3
22,5
CASTILLA-LA MANCHA
ANDALUCIA
ARAGONMADRID
COM. VALENCIANA
CATALUÑA
3.6%
3.8%
3.4%
3.4%
FOOD AND BEVERAGES(1)-THE STRONGEST INTERREGIONAL FLOWS. 1995
2.0%2.0%
2.9%
• Now the amount of regions with positive figures in both sides of the balance
increases up to five. It is also remarkable the clear contrast observed between the
high positive balance of Cataluña in the national market and the negative balance
account in the international one.
• Taking into account the economic nature of this products, it is normal that the
strongest intrarregional flows appears in the regions with the largest shares of final
consumption induced by their high levels of population: Cataluña, Madrid,
Andalucia and Comunidad Valenciana.
• Cataluña, with about the 22% of the Spanish food industry total output, appears as
the main origin of interregional exports toward their neighbour regions and even
further. It is interesting to observe that in this case the strongest interregional flows
tends to interrelate some of the economically most power regions rather than the
closest ones.
4 The numbers and the intensity of the colour in the map express the spatial concentration of theFood&Beverages industry output calculated according to the National Industry Survey (INE, 1995).

26
6. CONCLUSIONS
In this paper we have described the main steps followed on the process of
construction of the first version a Multiregional-Multisectoral model for the Spanish
Economy. Apart from the interest of our methodological approach, the process of
construction implies the estimation of important pieces of information that are worthy in
and of themselves.
We have specially focused on the strategy followed for the estimation of a
complete set of interregional trade matrices, using transport flows and value/weight
relations indirectly deduced from detailed international trade statistics. Finally, we have
analysed some key-figures that have been helpful for the identification of some of the
highest interregional trade flows. As a consequence we offer a general vision about the
quality and credibility of the interregional data that interconnect each of the 17 one-
region input-output tables within the interregional framework, as well as we introduce a
new, interesting and exclusive overview about the interregional trade relations within
the Spanish economy.
AKNOWLEDGEMENTSThe first part of this paper briefly describes the work developed by the whole team
involved in the Project of INTERTIO (Catalina Cantero, Milagros Dones, Julián Pérez, AnaSerrano). The estimation and analysis of the interregional trade is derived from my own thesis.An special mention corresponds to Antonio Pulido, who has support all my work since the verybeginning. To Emilio Fontela and Geoffrey Hewings for their comments on an earlier draft. Theproject and my own thesis have been financed respectively by the Spanish Ministry ofEconomy using FEDER funds, and by a FPI fellowship from the Regional Government ofMadrid. I would also like to thank all the people and Institutions that have supplied the requiredstatistics.
REFERENCES
• Alcaide J. (1996): "Contabilidad Regional de las autonomías españolas: un modelosimplificado". Papeles de Economía Española. FUNCAS. Nº 67, 1996.
• Anselin (1986): “Spatial Econometrics: Methods and Models”. Studies in OperationalRegional Science. Kluwer Academic Publisher.
• Batten, D.F. (1983):"Spatial Analysis of Interacting Economics” , Kluwer-NijhoffPublishing, The Netherlands.
• Benvenuti S., Martellato D., Raffaelli C. (1995): “INTEREG: A twenty-region Input-OutputModel for Italy”, Economic System Research , Vol.7 Nº2.
• Beaumont, P.M.(1990): “Supply and demand Interaction in Integrated Econometric andinput-output Models”, International Regional Science Review, Vol 13, Nº 1&2, .
• Costello, D.M. (1993): "A cross-country, cross-industry comparison of productivity growth",CEPR Discussion Paper, 384 and NBER-6422.
• Dietzenbacher, E., van der Linden (1997): “Linkages in EC productions structure”, Journalof Regional Science, vol, 37, Nº2.

27
• Dietzenbacher, E., van der Linden, J. A. & Steenge, A. E. (1993) : “The regional extractionmethod : applications to the European Community”, Economic System Research, 5.
• Goicolea A., Herce J.A., De Lucio J. (1998) "Regional integration and growth: The Spanishcase". Documento de trabajo 98-14. FEDEA.
• Hewings,G. Hulu e.(1993): “The development and use of interregional input.output modelsfor Indonesia under conditions of limited information” Review of Urban and RegionalDevelopment Studies 5: 135-153 (1993).
• Isard, W.(1951): “Interregional and regional input-output analysis : a model of spaceeconomy, Review of Economics and Statistics”, 33, pp.318-328.
• Kazumi Hitomi (2000): “Development of an Interrregional input-output table for Japaneseelectricity supplier regions”. Denryolcu Keizai Kenkyu. Nº.43. 2000.3.
• Kollman, P. (1995): "The correlation of productivity growth across regions and industries inthe United States", Economic Letters, 47, 229-250.
• Leontief, W., Carter A., Petri P.A. (1977): “The Future of the World Economy .” NewYork : Oxford University Press.
• Llano, C (1998): "Un Modelo Input-Output Interregional para Europa: una visiónintersectorial de las relaciones de dependencia comercial Intra-UE". Tesina. Octubre 1998.
• Llano, C (2000): "Una estimación del comercio interregional en el contexto de un modeloMultirregional para la economía española". Tesis. En elaboración.
• Miller, R., Blair, P. (1985): “Input-output Analysis : foundation and extensions”, Prentice-Hall, Inc., Englewood Cliffs, New Jersey.
• Ministerio de Fomento (1995): “ Actualización de las pautas de la movilidad del transportepor carretera y previsión de la misma a largo plazo”. D. G. de Planificación Territorial.
• Oliver, J. (1997), en "La Balança de Pagaments de Catalunya: Una aproximació als fluxoseconomòmics amb la resta dÉspanya i l`estranger (1993-1994)". Institu dÉstudisAutonòmics. Generalitat de Catalunya
• Oosterhaven, J. : “European Community Intercountry input-output Relations: ConstructionMethod and Main Results for 1965-85” , Economic System Research, vol. 7, Nº3 de 1995.
• Oosterhaven, J (1994): “On the Plausibility of Demand-Pull versus Cost-Push input-outputPrice Models”, SOM Research Report 94543.
• Oosterhaven, J. (1984) : “A Family of Square and Rectangular interregional input-OutputTables and Models”, Regional Science & Urban Economics, Nº 4, Vol. 14, Nov.
• Parellada,M (1982): "El comerç exterior de Catalunya. Els fluxos comercials entre Catalunyai la resta d´Espanya (1975) i entre Catalunya i l´estranger (1975-78), Edicions 62, Barcelona.
• Polenske,K (1980): "The U.S. Multiregional Input-Output Accounts and Model". LexingtonBooks.
• Perez J. (2000): “Proceso de estimación de una tabla input-output interregional paraEspaña.1995”. Mimeo. Instituto L.R.Klein.
• Pulido A., López A., Llano C. (2000): "La Balanza Comercial de Madrid en sus relacionescon el Resto de España (1995-1998)" en "La Balanza de Pagos de la Comunidad de Madrid(1995-1998)". Pendiente de publicación.
• Santiso, (2000): "La Balanza de Pagos de Galicia" ponencia presentada en el Seminario "LaArticulación Territorial de la Economía Española". Santiago de Compostela, 1999. Proximapublicación.