“En el campo hubo de todo: sequía, caracol, fiebre...
24
“En el campo hubo de todo: sequía, caracol, fiebre aftosa.” Isabel Allende in La casa de los espíritus
Transcript of “En el campo hubo de todo: sequía, caracol, fiebre...

“En el campo hubo de todo: sequía, caracol, fiebre aftosa.” Isabel Allende
in La casa de los espíritus


0. Introduction


Surface plasmon resonance biosensors

SPR as a tool in the functional analysis of an immunodominant site in FMDV
6

Surface plasmon resonance biosensors
7
0.1 Surface Plasmon Resonance
0.1.1 The physical phenomenon1-6
When a beam of light propagating through a first medium of higher refractive index, n1 (e.g. a glass
or quartz prism) meets an interface with a second medium of lower refractive index, n2 (e.g. an
aqueous solution), then it will be totally internally reflected for all incident angles greater than a
critical angle θc:
θc=sin-1(n2/n1) (0.1)
where θ is the angle between the incident
beam and the axis normal to the plane of
the interface. This phenomenon is known
as total internal reflection (TIR)4. Despite
being totally reflected, the incident beam
establishes an electromagnetic field that
penetrates a small distance into the
second medium, where it propagates
parallel to the plane of the interface (Fig.
0.1). This electromagnetic field is called the evanescent wave. The intensity of the evanescent
electric field, I(z), decays exponentially with perpendicular distance z from the interface:
I(z)=Ioe-z/d (0.2)
where d is the penetration depth for angles of incidence θ<θc and light of wavelength λo:
d=(λo/4π)(n12sin2θ-n2
2) (0.3)
d is independent of incident light polarisation but depends on its wavelength. The evanescent
electric field intensity at z=0, Io, depends both on θ and the incident beam polarisation. When the
beam is polarised parallel to the plane of the interface, Io is given by Io//:
Io//=I//[4cos2θ(2sin2θ-n2)]/(n4cosθ+sin2θ-n2) (0.4)
When the beam is polarised perpendicular to the plane of the interface, the field intensity at z=0 is
equal to:
Figure 0. 1 Schematic view of the total internal reflection (TIR) phenomenon3.

SPR as a tool in the functional analysis of an immunodominant site in FMDV
8
Io⊥=I⊥(4cos2θ)/(1-n2) (0.5)
I// and I⊥ are the intensities of the incident light beam polarised parallel or perpendicular to the
interface, respectively, and n=(n2/n1)<1. Therefore, two major characteristics of the evanescent
wave are worth to notice:
i) the depth of the evanescent wave is typically less than a wavelength, thus extending a few
hundred nm into the dielectric (liquid phase of refractive index n2);
ii) the evanescent field intensity, Io, for angles a few degrees above the critical angle θc is
several times the incident intensity, I.
When a thin metal film is inserted at the prism/dielectric interface, a new phenomenon called surface
plasmon resonance (SPR) can occur5. Surface plasmons are waves of oscillating surface charge
density (conducting electrons) propagating along the metal surface, at a metal (e.g. silver or
gold)/dielectric (e.g. aqueous solution) interface. The field amplitude of the surface plasmon is
maximal at the interface and decays evanescently, i.e., perpendicularly to it, with a penetration into
the dielectric of about 100-200 nm. Due to high loss in the metal, the surface plasmon wave
propagates with high attenuation in the visible and the near-infrared spectral regions. The
distribution of the electromagnetic field of a surface plasmon wave is highly asymmetric and the
majority of the field is concentrated in the dielectric (Table 0.1).
Table 0.1 Major characteristics of surface plasmon waves (SPW) at the metal-water interface6.
Metal layer supporting SPW Silver Gold Wavelength (nm) 630 850 630 850 Propagation length(µm) 19 57 3 24 Penetration depth into metal (nm) 24 23 29 25 Penetration depth into dielectric (nm) 219 443 162 400 Concentration of field in dielectric (%) 90 95 85 94
Surface plasmons cannot be directly excited
(resonate) by light, since the frequency and
wave vector requirements cannot be
simultaneously matched. Nevertheless, indirect
excitation can be achieved by an evanescent
wave created by the internal reflection of a p-
polarised incident beam at the metal-coated
surface of the prism.
This excitation, or resonance, occurs only at a well-defined angle of incidence, θsp, given by:
θsp =sin-1(ksp/ngko) (0.6)
Figure 0. 2 Schematic view of the surface plasmon resonance (SPR) phenomenon3.
Surface plasmon resonance biosensors
9
where ng is the refractive index of the prism, λ is the wavelength of the incident light in the vacuum,
ksp is the wave vector of the surface plasmon and ko is the wave vector of the light in the vacuum
ko=2π/λ. When the resonance condition is fulfilled, energy from the incident light is transferred to
the non-radiative surface plasmon and converted to heat. This energy loss is recognised by a sharp
minimum (≤1o at half-width) in the angle-dependent reflectance (Fig. 0.2).
0.1.2 SPR optical sensors and their applications1-31
The phase matching, i.e., the resonance angle θsp, is very sensitive to changes in wavelength, metal
thickness and refractive indices of the prism (n1) and of the dielectric (n2). However, if the first three
factors are all kept constant, θsp will depend only on the refractive index (i.e., on the dielectric
constant) of the dielectric (n2). A change in the dielectric refractive index very close to the metal
surface will originate a change in the resonance angle θsp, which is the principle of SPR sensing.
Considering the unique characteristics of SPR detection, it is possible to design SPR sensors that,
under the proper geometries, allow the sensing of physical, chemical or biochemical phenomena
which give rise to changes in the optical properties of the solution (dielectric) very close to the metal
surface.
Generally, an SPR optical sensor is composed of an optical system, a transducing medium inter-
relating the optical and the reagent domains, and an electronic system controlling the optoelectronic
devices and allowing data processing. The transducing unit transforms changes in the refractive
index, determined by continuously monitoring the SPR angle, into changes in the quantity of
interest. Measurement of the angular dependence of reflectance from an SPR sensor surface requires
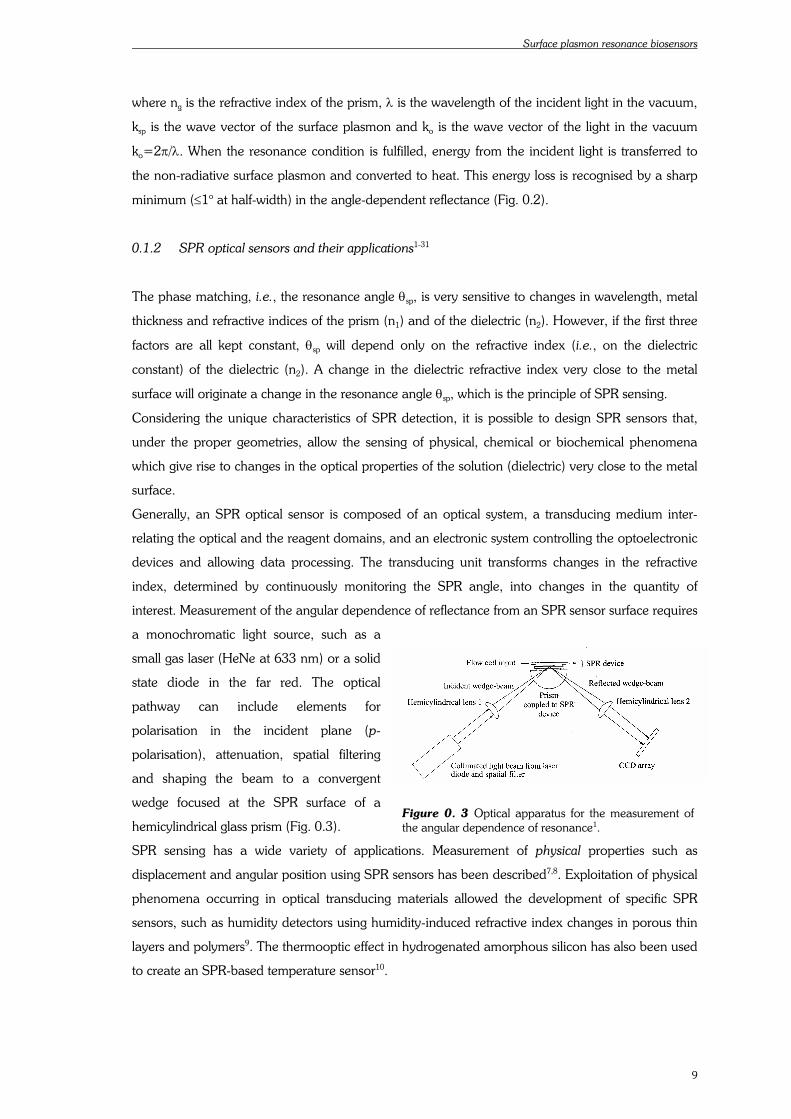
a monochromatic light source, such as a
small gas laser (HeNe at 633 nm) or a solid
state diode in the far red. The optical
pathway can include elements for
polarisation in the incident plane (p-
polarisation), attenuation, spatial filtering
and shaping the beam to a convergent
wedge focused at the SPR surface of a
hemicylindrical glass prism (Fig. 0.3).
SPR sensing has a wide variety of applications. Measurement of physical properties such as
displacement and angular position using SPR sensors has been described7,8. Exploitation of physical
phenomena occurring in optical transducing materials allowed the development of specific SPR
sensors, such as humidity detectors using humidity-induced refractive index changes in porous thin
layers and polymers9. The thermooptic effect in hydrogenated amorphous silicon has also been used
to create an SPR-based temperature sensor10.
Figure 0. 3 Optical apparatus for the measurement of the angular dependence of resonance1.
SPR as a tool in the functional analysis of an immunodominant site in FMDV
10
Chemical SPR sensors are based on the measurement of SPR variations due to adsorption or
chemical reaction of an analyte within a transducing medium which causes changes in its optical
properties. Examples of chemical applications of SPR due to analyte adsorption include: monitoring
of hydrocarbons, aldehydes and alcohols adsorbing on polyethyleneglycol films11; monitoring of
chlorinated hydrocarbons adsorbing on polyfluoroalkylsiloxane12; detection of aromatic
hydrocarbons adsorbing on Teflon film13. SPR devices using palladium are effective in the detection
of molecular hydrogen14; also, chemisorption of NO2 on gold has been used for NO2 detection15.
Copper and nickel phtalocyanine films have been used for SPR detection of toluene16, while bromo-
cresol purple films have been employed for the detection of NH3 vapours17. SPR detection of Cu
and Pb ions was also made possible by combination with anodic stripping voltammetry18.
Affinity SPR biosensors are the most
widely employed, where SPR, as a
surface-oriented method, allows real-time
analysis of biospecific interactions
without the use of labelled biomolecules.
The SPR biosensor technology has been
commercialised and has become a
central tool for characterising and
quantifying biomolecular interactions.
Since the first demonstration, in 1983, of the viability of SPR biosensing19, SPR detection of
biospecific interactions was developed until the appearance, in 1994, of the first analysis methods
for surveying biomolecular interactions in real-time3. These methods have been improved for the
study of kinetic and thermodynamic constants of those interactions. Generally, SPR biosensing relies
on the immobilisation of the biological receptor at the chemically modified gold surface, which is in
contact with a buffer solution20. Upon addition of a specific ligand to the solution, binding occurs
close to the gold surface, allowing for SPR detection due to mass increase, and consequent change
in the refractive index in this region (Fig. 0.4)21. The shift in the resonance angle acts as a mass
detector and the continuous angular interrogation in the SPR-sensing device allows for the real-time
monitoring of binding, providing kinetic data on the biospecific interaction. Prism-based SPR
biosensors using angular interrogation have been employed in studies of antigen-antibody23-26,
protein-protein27,28, protein-DNA interactions29and epitope mapping30,31. Many other biomolecular
studies are presently among the applications of SPR biosensing, which has become a part of modern
analytical methods.
Figure 0. 4 SPR detection caused by biospecific binding of ligand in solution to an immobilised receptor22.

Surface plasmon resonance biosensors
11
0.2 Real-Time Biospecific Interaction Analysis
The use of optical biosensors for interaction analysis has made it possible to obtain affinity and
kinetic data for a large number of protein-protein, protein-peptide and protein-DNA systems.
Biosensor AB (Uppsala, Sweden) is undoubtedly the biosensor market leader, since it launched, in
late 1990, the first commercial SPR-based instrument, BIAcore32-36.
0.2.1 The BIAcore technology3,20-22,37,38
BIAcore uses SPR to investigate biospecific
interactions at the surface of a sensor chip. One
of the components in the interaction is
immobilised on the sensor chip surface and the
other flows over the surface free in solution. As
the interaction proceeds, the concentration
(mass) of analyte in the surface layer changes,
giving an SPR response which can be followed
in real-time in the form of a sensorgram (Fig.
0.5). The instrument consists of a processing
unit, reagents for ligand immobilisation,
exchangeable sensor chips and a personal
computer for control and evaluation. The
processing unit contains the SPR detector and
an integrated microfluidic cartridge that,
together with an autosampler, controls the
delivery of sample plugs into a transport buffer
which flows continuously over the sensor chip
surface (Fig. 0.6). All the injection and
detection systems are thermostatically
controlled so that BIAcore measurements are carried out at constant temperature. The light source
in BIAcore is a near-infrared light-emitting diode (LED) and light is focused on the gold film as a
wedge-shaped beam giving a fixed range of incident angles. The SPR response is monitored by a
fixed array of light-sensitive diodes covering the whole wedge of reflected light. Reagents, buffers
and samples are delivered to the sensor chip surface through a liquid handling system composed by
three main parts: the pumps, the sample injector and the integrated fluidic cartridge (IFC). One of
the pumps is used to maintain the continuous flow over the surface, while the other is used for
injection of samples and reagents via the autosampler (sample injector). This autosampler is
programmed to take defined volumes of liquid from specified sample positions to either other
sample positions or to the IFC injection port.
Figure 0. 5 Sensorgram: monitoring the SPR response in terms of binding to receptor22.
Figure 0. 6 Scheme of the BIAcore instrument21.
SPR as a tool in the functional analysis of an immunodominant site in FMDV
12
0.2.2 Ligand immobilisation3,20-22,37,39,40
Sensor chip architecture
The sensor chip is a glass slide onto which a 50-nm thick gold
film has been deposited. Immobilisation by physical adsorption
on gold has disadvantages, namely ligand denaturation, non-
specific binding and steric hindrance. Therefore, the gold surface
has been chemically modified to allow ligand covalent
immobilisation39 in order to obtain a stable ligand surface, with
the possibility of repeated analyses and maximum exposure of
the ligand to the solution containing the biospecific partner (Fig.
0.7).
Immobilisation chemistry
Proteins are, by far, the most widely employed ligands in biospecific interaction analysis. Therefore,
the development of chemistries for ligand immobilisation was based on protein chemistry, namely
on the reaction between protein primary amino groups and the carboxyl groups from the
carboxymethyldextran matrix to form amide bonds. Immobilisation starts by activation of the matrix
COOH groups as N-hydroxysuccinimide active esters, upon reaction with N-hydroxysuccinimide
(NHS) in the presence of N-ethyl-N’-(dimethylaminopropyl)carbodiimide (EDC), in water. Next, a
protein solution at low ionic strength and pH below the isoelectric point is passed over the surface
and protein-matrix amide bonds are formed (Fig. 0.8). The efficiency of the immobilisation step
relies simultaneously on two factors:
i) Electrostatic pre-concentration of positively charged protein in the negatively charged
carboxymethyldextran matrix, and
ii) Reaction between the protein primary amines and the matrix active esters.
1 2 34
Figure 0. 7 Sensor chip CM521,22.
Figure 0. 8 Steps in the standard ligand immobilisation on CM5 sensor chips: 1. COOH activation with EDC/NHS; 2. Ligand coupling; 3. Blocking of remaining reactive NHS-ester groups with ethanolamine; 4. Final ligand surface20.

Surface plasmon resonance biosensors
13
Remaining active esters after protein immobilisation are
converted into inactive amides via reaction with
ethanolamine. The SPR detector continuously monitors
the immobilisation steps (Fig. 0.8) and the amount of
immobilised protein can be controlled either by protein
concentration, reaction time or other factors such as ionic
strength or pH20. NHS-esters are also reactive with other
nucleophilic groups from the ligand, such as thiol or
aldehyde groups (Fig. 0.9). Other chemical modifications
based on NHS-active esters were proposed40:
i) Formation of an amine derivative by reaction of the NHS-esters with ethylenediamine;
ii) Similar preparation of a hydrazide derivative upon reaction of hydrazine with the NHS-
active esters;
iii) Obtention of a maleimide derivative adding sulfo-m-maleimidobenzoyl-N-
hydroxysuccinimide ester (sulfo-MBS) to the amine surface prepared according to i).
Tailor-made sensor chips
The high versatility of the carboxymethyldextran matrix in sensor chip CM5 is accompanied by a
very high binding capacity and low non-specific binding suitable for the majority of biospecific
analyses, particularly those involving kinetic studies on low-molecular weight analytes or
concentration analysis. However, the size and charge density of the matrix can be detrimental for
specific studies, such as those involving high-molecular weight molecules or complex culture media.
Presently, a set of sensor chips in which the dextran matrix has been tailored to suit various
experimental studies is available, ranging from chips with absent (C1) or shortened (F1) dextran
polymers to chips with reduced charge density (B1) in the dextran matrix. Other specific sensor
chips are also available, such as a plain gold surface (J1) suitable to create new surface chemistries,
a streptavidin (SA) surface to capture biotinylated ligands, a nitrilotriacetic acid (NTA) surface with
capture via nickel chelation and a flat hydrophobic (HPA) surface for membrane biochemistry.
0.2.3 General methodology3,21-31,37,41-54
Binding strategies
Methods for real-time biospecific interaction analysis include single- or multi-step binding to the
sensor chip surface and direct or indirect measurement of analyte. In single-step methods binding of
one component to the immobilised ligand is measured, while in multi-step methods sequential
binding of two or more components is monitored. When the interaction of the analyte itself with the
modified sensor surface is monitored, the method is direct and in such case the response increases
with increasing amount of analyte. Indirect methods rely upon measurement of a component which
either:
Figure 0. 9 Ligand immobilisation based on NHS-ester activation22.

SPR as a tool in the functional analysis of an immunodominant site in FMDV
14
i) interacts with analyte in solution and the remaining free concentration in solution is
measured (solution affinity), or
ii) competes with the analyte of interest for the same ligand binding site (surface competition).
In indirect methods, the response is inversely related to the amount of analyte.
Direct single-step methods (Fig. 0.10) are the simplest
way to study biospecific interactions and are commonly
used for kinetic studies and for concentration
measurement of macromolecules at relatively high
quantities (medium to large analytes above ca. 1
µg/ml)23,27,28,41-45.
Direct multi-step methods are assays in which each
stage in the series of binding steps is recorded in the
sensorgram. A common use of these methods consists
in the immobilisation of a capturing molecule (e.g.
streptavidin, anti-immunoglobulin) that specifically
binds the ligand (biotinylated molecule,
immunoglobulin), which is the receptor of the target
analyte (Fig. 0.11)29,46-48. This affinity capture allows
the use of non-pure samples of ligand (e.g. from cell culture media) and also the oriented non-
covalent immobilisation of ligand. These methods are often employed in binding site analysis such
as epitope mapping30,31,49. Another application of multi-step methods is the use of a secondary
molecule to enhance analyte response in sandwich assays where an analyte binds an immobilised
ligand and a second macromolecule is then injected to bind the bound analyte.
Indirect methods are most widely employed for small
analytes (molecular weight<1000 Da) in solution. Direct
detection of such analytes is often difficult and these
usually lack multiple independent binding sites necessary
for response enhancement with sandwich techniques. In
solution affinity experiments the analyte and a specific
receptor interact in solution and, once equilibrium is
reached, the remaining free receptor is determined by
SPR using a sensor chip where another ligand (e.g. the
analyte itself) is immobilised (Fig. 0.12)24,25,50,51. Thus,
the solution affinity between analyte and receptor can be
determined.
Figure 0. 10 Direct single-step detection of analyte on the sensor surface22.
Figure 0. 11 Direct multi-step detection of analyte on the sensor surface22.
Figure 0. 12 Solution affinity studies – the target analyte is pre-equilibrated with its biospecific receptor in solution and remaining free receptor is measured on the surface.
Sensor surface
Target analyte
Analyte receptor(measured molecule)

Surface plasmon resonance biosensors
15
In surface competition assays a high molecular
weight analyte is usually employed to compete with
the low molecular weight target analyte for the
same ligand binding site. Since response due to
small analyte binding is unappreciable, only the
response from the large analyte is monitored.
Therefore, the effects on the kinetics of
macromolecule binding due to additions of small
competing analyte can be measured and the
kinetics of small analyte binding can be indirectly
determined (Fig. 0.13)52.
Surface regeneration
Regeneration of the ligand surface allows for the re-utilisation of the same biospecific surface for
series of measurements, obviating the need to replicate identical surfaces. The most general
regeneration methods rely on pH reduction below 2.5 using strong inorganic acids such as 10-100
mM HCl or H3PO4 or weaker acids such as glycine buffers. Nevertheless, ligand tolerance to acids is
variable and, on the other hand, many ligand-analyte complexes may not be disrupted under acidic
conditions. Therefore, regeneration procedures must be optimised and many regenerating agents
other than acids (bases such as 10 mM NaOH, high ionic strength solutions such as 1M NaCl, etc.)
may be found to be more effective. A systematic regeneration optimisation protocol has been
recently described and successfully applied to antibody surfaces53,54. Stock solutions are mixtures of
similar components (e.g. all acids, all bases, all salts, all detergents, etc.) and regeneration cocktails
are different combinations of such stock solutions. Fine-tuning of regeneration cocktails may provide
the answer to problems not overcome with standard regeneration methods and allow for the use of
molecules that, otherwise, would not be suitable as easy-to-regenerate ligands.
0.3 Measuring kinetics of biospecific interactions
Characterisation of the affinities and rates of biospecific interactions is fundamental in many areas of
biochemical research. Methods that measure changes in optical parameters, such as fluorescence or
absorbance, can be employed for direct kinetic analysis. However, these methods require that one
of the reactants is often labelled with a radioactive or fluorescent probe and thus no longer in native
form. SPR detection is more general than these methods, since it is sensitive to changes in mass and
no labelling is required. When analyte is injected across a ligand surface, the resulting sensorgram
displays three essential phases, namely, association of analyte with ligand during sample injection,
equilibrium (if reached) during sample injection, where the rate of analyte binding is balanced with
complex dissociation, and dissociation of analyte-ligand complex due to buffer flow immediately
Figure 0. 13 Surface competition between the small target analyte and the SPR-detected macromolecule.
Sensor surface
Target analyte(small competitor)
Large analyte(measured molecule)
SPR as a tool in the functional analysis of an immunodominant site in FMDV
16
after the end of analyte injection. With suitable analysis of binding data, reliable affinity and kinetic
data can be obtained from SPR experiments. However, for the majority of experimental purposes,
semi-quantitative ranking of rates and/or affinities is sufficient.
0.3.1 Basic theory3,31,37,55,56
A 1:1 interaction between the analyte (A) continuously flowing in solution over the ligand (B)
surface may be described by:
Considering that, in the association phase, the sensor surface is continuously replenished with free
analyte solution and the amount of bound analyte is negligible with respect to the total analyte
concentration (C), pseudo-first order kinetics can be assumed. Thus, the rate of complex formation
is given by the equation:
d[AB]/dt=ka[A][B]-kd[AB] (0.7)
which, in terms of SPR response, can be expressed as:
dR/dt=kaC(Rmax-R)-kdR= kaCRmax-(kaC+kd)R (0.8)
where:
R is the SPR response (in resonance units, RU) at time t;
Rmax is the maximum analyte binding capacity (in RU), which reflects the number of ligand
binding sites, i.e., total ligand concentration;
ka is the association rate constant;
kd is the dissociation rate constant.
Therefore, a plot of dR/dt against R will be a straight line of slope -(kaC+kd) or -ks, where ks is the
apparent binding rate, and a plot of ks against analyte concentration will give a straight line with
slope ka and intercept on the ordinate kd.
When equilibrium is reached, the total binding rate (dR/dt) is zero and, from equation 0.8:
kaC(Rmax-Req)=kdReq (0.9)
Where Req is the total response at equilibrium. Considering that the affinity association constant (KA)
is given by ka/kd, binding affinity can be determined from equilibrium measurements, as it can be
inferred from substituting and rearranging equation 0.9:
A+B ka
kd AB

Surface plasmon resonance biosensors
17
Req/C=KARmax-KAReq (0.10)
Thus, by plotting Req/C against Req, a straight line is obtained and KA and Rmax can be calculated
from the slope and the intercept on the ordinate, respectively.
During the dissociation phase, analyte solution is replaced by a continuous flow of running buffer
solution and analyte concentration drops to zero. For the pseudo-first order kinetics model, complex
dissociation can be described by:
dR/dt=-kdR (0.11)
which, in the logarithmic form, can be given by:
ln(R0/Rt)=kd(t-t0) (0.12)
where R0 is the response at an arbitrary start dissociation time t0. Consequently, a plot of ln(Rt/R0)
will give a straight line with slope -kd.
This basic theoretical model only applies when the interaction is homogeneous and when the
pseudo-first order kinetics is actually observed.
0.3.2 Fitting and evaluating biosensor data55-58
Curve fitting methods
In early kinetic studies based on SPR biospecific interaction analysis, data evaluation relied upon
linearisation of the binding data, according to the equations described in the previous section.
Nevertheless, linear transformations also transform the parameter-associated errors, which decreases
the quality of primary data.
On the other hand, it requires data from many analyte
concentrations. Therefore, non-linear least squares analysis
has been introduced for fitting and evaluating biosensor
data57. Non-linear least squares methods optimise
parameter values by minimising the sum of the squared
residuals (S), being the latter the difference between the
fitted (rf) and the experimental (rx) curves at each point
(residuals are squared in order to equal the weight of
deviations above and below the experimental curve, Fig.
0.14, Eq. 0.13).
( )2
1∑ −=
n
xf rrS (0.13)
Figure 0. 14 Schematic representation of non-linear least squares fitting by minimising squared residuals55.

SPR as a tool in the functional analysis of an immunodominant site in FMDV
18
Non-linear least squares analysis has been applied to curve fitting based on the integrated rate
equations (Table 0.2, page 21). This analytical integration is the simplest tool for systems with rate
equations that can be readily integrated. However, many interactions studied on biosensors do not
fit simple kinetic models, which can be seen by curved plots when linearisation is applied or by poor
fits when using the integrated rate equations. The software currently employed for biosensor data
evaluation includes several kinetic fitting models (Table 0.2, page 21). Those models corresponding
to binding that can be described by well-known rate equations use analytical integration while more
complex models, such as interactions with mass transfer limitations or conformational changes, rely
upon curve fitting with numerical integration58. Numerical integration is more computationally-
intensive but allows evaluation when the rate equations cannot be integrated analytically. In
numerical integration methods, each species is assigned an initial concentration and the reaction is
stepped through in discrete time intervals. At the end of each interval the concentration of each
species is calculated considering its rate of formation or disappearance according to the rate
equations. Numerical integration can be used to model any kinetic mechanism and also to analyse
biosensor data by curve fitting as is done with analytical integration. However, with numerical
methods data is usually analysed globally by fitting both the association and dissociation phases for
several concentrations simultaneously. Global curve fitting is advantageous, because it minimises the
possibility of having a good fit with a wrong kinetic model and it lowers the variance in the estimates
of the rate constants.
Evaluating fitted data
The fitting algorithms are purely mathematical tools without any biochemical “knowledge”.
Therefore, it is always important to examine the results of fitted data to check for “reasonableness”
of the parameters found. This must be kept in mind at the time of choosing the “best fit”. This best
fit depends on the ability of the fitting algorithm to converge for the true minimum in the sum of
squared residuals and on the number of parameters that can be varied in the model, i.e., the
complexity of the model. Increasing model complexity also increases the probability to fall in local
minima and obtain misleading fits. Wrong fits are usually evident from markedly poor curve fits or
unreasonable results and are often due to bad data quality or inadequate choice of the fitting model.
Increasing the complexity of a model will also increase the ability of fitting the experimental curves
to the equation, since there is a wider range for varying parameters in order to obtain a closer fit.
Therefore, it is important to accept the simplest model that fits the sensorgrams when evaluating
kinetic data and judge whether a slightly better fit with a more complex model is experimentally
significant. The quality of the fit is described by the chi squared statistical parameter, defined as:
χ2=S/(n-p) (0.14)
where n is the number of data points, p is the number of fitted parameters and S is the sum of the
residuals (Eq. 0.13). Since n>>p, χ2 reflects the average squared residual per data point and, when

Surface plasmon resonance biosensors
19
the model fully fits the experimental data, χ2 represents the mean square of the signal noise. In
practice it is useful to check for the shape of the residual plot, since non-random distribution of
residuals is often a symptom of an incorrect fit.
0.3.3 Deviations from the langmuirian behaviour2,3,37,51,55,58-72
a) Mass-transport limitations2,3,51,55,59-66
Transport of mobile analyte to the sensor surface (Fig.
0.15) may be a serious problem when the interaction is
fast. Insufficient transport rate will not allow to obtain
meaningful kinetics (the rate-limiting step will be the
diffusion into the dextran matrix and not the interaction
itself) and the assumption that analyte bulk
concentration is constant and equal to the injected
concentration is no longer valid. Consequently, the rate
equations corresponding to pseudo-first-order kinetics
are not applicable to systems under diffusion-controlled kinetics. Diffusion effects can be minimised
using high flow rates (> 30 µl/min), low density ligand surfaces and high analyte concentrations.
Nevertheless, systems with very high interaction rates will be always diffusion-controlled, which
implies an upper limit to the range of association rate constants amenable to study by SPR. Another
effect related to mass-transport limitations is analyte rebinding during the dissociation phase. If
analyte depletion from the surface is not fast enough, analyte molecules will rebind to the ligand and
response no longer follows a single exponential decay.
b) Ligand heterogeneity2,3,55,58-61,67,68
Random immobilisation chemistries and high surface density
lead to heterogeinety of ligand sites, which therefore are no
longer equivalent neither independent (Fig. 0.16). This effect
is more pronounced with high analyte concentrations, i.e.,
with decreasing number of free “readily accessible⇔higher
affinity” ligand sites. Oriented attachment of ligand to the
dextran layer, low analyte concentrations and low
immobilisation levels are the best measures to avoid
heterogeneity effects.
c) Analyte heterogeneity3,55,59
Although biospecific analysis allows for the utilisation of non-purified samples (concentration
measurements of bioactive molecules in biological samples, ligand fishing, etc.), it must be ensured
that samples for kinetic analysis do not contain molecules, other than the analyte, that can interact
with the ligand. Otherwise, the SPR response will reflect the sum of different binding events and
cannot be described by simple kinetics.
Figure 0. 15 Scheme of the different factors influencing transport of mobile analyte to the sensor surface with immobilised ligand2.
Figure 0. 16 Illustration of heterogeneous binding of analyte to ligand molecules immobilised in exposed and buried sites59.

SPR as a tool in the functional analysis of an immunodominant site in FMDV
20
d) Steric hindrance2,59,60
The formation of a complex between a large analyte and
immobilised ligand can mask additional binding sites. Although it
could be argued that such steric hindrance would not affect
binding kinetics (it would only decrease Rmax), this is not strictly
true, since the flexibility/fluidity of the dextran matrix allows
temporarily masked sites to become accessible during analyte
injection, adding complexity to the kinetics of the interaction.
This problem, also named the parking problem, assumes greater
proportions for large macromolecular analytes, higher analyte
concentrations and high density ligand surfaces (Fig. 0.17).
e) Analyte multivalency and ligand co-operativity51,55,59,69
Poor fits with pseudo-first-order kinetics should be expected whenever analyte is multivalent (e.g.
antibody bivalency), since 1:1 stoichiometry is no longer observed. Also, it is difficult to ensure that
both analyte binding sites (in the case of bivalency) are equivalent and independent, as well as to
know to which extent has the interaction 1:1 or 1:2 stoichiometry. Another situation where binding
sites may not be independent occurs when there is ligand co-operativity. Although equivalent, the
ligand binding sites may not interact independently from each other and negative or positive co-
operative interactions will prevent the system from following simple pseudo-first-order kinetics.
f) Conformational changes58-60
It has been suggested that non-conformity of sensorgrams with the langmuirian model could be due
to additional steps involving isomerisation of the AB complex. Such two-state-reactions, where there
is conformational change upon binding, are not well described by pseudo-first-order kinetics and
other models must be employed to fit the data.
0.3.4 Experimental design in kinetic SPR analysis2,3,37,51,55,61,68-72
Deviations to pseudo-first-order kinetics predicted for 1:1 interactions could be interpreted as due to
more complex interaction mechanisms describing the interactions. However, they are often
produced by artefacts which can be minimised by careful experimental design. Low ligand
immobilisation levels are advisable to avoid mass-transport limitations, ligand heterogeneity or steric
hindrance. Analyte concentration must be high enough to avoid diffusion-controlled kinetics and low
enough not to saturate the surface (between 0.1KD and 10 KD). Buffer flow must be kept at high rate
to minimise diffusion-controlled binding and, whenever possible, soluble ligand must be added to
buffer in the dissociation phase to avoid rebinding effects. Oriented immobilisation chemistries
should be used when random amine coupling is seen to be a significative source of surface
heterogeneities. Instrumental drifts or non-specific binding to the carboxymethyldextran matrix are
often eliminated by subtraction of a blank run, using either an inactive analyte or a suitable
reference cell with inactive ligand. If problems with non-specific binding are persistent, the choice of
another kind of surface (other model of sensor chip) may be the solution.
Figure 0. 17 Illustration of the parking problem: masking of ligand binding sites by attachment of large analyte molecules59.
Surface plasmon resonance biosensors
21
Table 0.2 Rate equations used in the pre-defined fitting models included in the BIAevaluation 3.0 software55.
Simultaneous ka/kd fit
Differential equations
Total response
Reaction scheme
(a) 1:1 langmuirian
binding
d[B]/dt=-(ka[A][B]-kd[AB])
d[AB]/dt=ka[A][B]-kd[AB]
[AB]+RI
A+B⇔AB
[A]=C, [B]0=Rmax,
[AB]0=0
(b) 1:1 binding with
drifting baseline
the same as in (a)
[AB]+drift(t-
ton)+RI
the same as in (a)
(c) 1:1 binding with
mass transfer
the same as in (a) plus
d[A]/dt=kt(C-[A])- (ka[A][B]-kd[AB])
[AB]+RI
Abulk⇔A+B⇔AB
[A] bulk=C, [B]0=Rmax,
[AB]0=0
(d) Heterogeneous
ligand (2 different
binding sites)
d[B1]/dt=-(ka1[A][B1]-kd1[AB1])
d[AB1]/dt=ka1[A][B1]-kd1[AB1]
d[B2]/dt=-(ka2[A][B2]-kd2[AB2])
d[AB2]/dt=ka2[A][B2]-kd2[AB2]
[AB1]+[AB2]+RI
A+B1⇔AB1
A+B2⇔AB2
[A]=C, [B1]0=Rmax1,
[B2]0=Rmax2
[AB1]0=[AB2]0=0
(e) Heterogeneous
analyte (competition
between two different
analytes)
d[B]/dt=-(ka1[A1]mw1[B]-
kd1[A1B])/mw1n1-(ka2[A2]mw2[B]-
kd2[A2B])/mw2n2
d[A1B]/dt=ka1[A1]mw1[B]-kd1[A1B]
d[A2B]/dt=ka2[A2]mw2[B]-kd2[A2B]
[A1B]+[A2B]+RI
A1+B⇔A1B
A2+B⇔A2B
[A1]=C1, [A2]=C2,
[B]0=Rmax/mw1,
[A1B]0=[A2B]0=0
(f) Bivalent analyte
d[B]/dt=-(ka1[A][B]-kd1[AB])-
(ka2[AB][B]-kd2[AB2])
d[AB]/dt=(ka1[A][B]-kd1[AB])-
(ka2[AB][B]-kd2[AB2])]
d[AB2]/dt=ka2[AB][B]-kd2[AB2]
[AB]+[AB2]+RI
A+B⇔AB
AB+B⇔AB2 [A]=C, [B]0=Rmax,
[AB]0=[AB2]0=0
(g) Conformational
change (two-state
reaction)
d[B]/dt=-(ka1[A][B]-kd1[AB])
d[AB]/dt=(ka1[A][B]-kd1[AB])-
(ka2[AB]-kd2[AB*])
d[AB*]/dt=ka2[AB]-kd2[AB*]
[AB]+[AB*]+RI
A+B⇔AB⇔AB*
[A]=C, [B]0=Rmax,
[AB]0=[AB*]0=0
Separate ka/kd fit
Integrated rate equations
(h) 1:1 langmuirian binding
( )( )[ ]RI
kCkeRCk
Rda
tkCkmaxa
da
++
−=
+−1
R = R0e-kdt + offset
[AB]+RI
[AB]+offset
the same as in (a)

SPR as a tool in the functional analysis of an immunodominant site in FMDV
22
References
1 Garland, P. B. (1996) Optical evanescent wave methods for the study of biomolecular interactions, Quart. Rev. Biophys. 2, 91-117.
2 Schuck, P. (1997) Use of surface plasmon resonance to probe the equilibrium and dynamic aspects of interactions between biological macromolecules, Annu. Rev. Biophys. Biomol. Struct. 26, 541-566.
3 “BIAcore Instrument Handbook”, (Pharmacia Biosensor AB, 1994) Uppsala, Sweden. 4 Hirshcfield, T. (1967), Physics of Thin Films 9, 145. 5 Kretschmann, E. and Raether, H. (1968) Radiative decay of non-radiative surface plasmons excited
by light, Z. Natuforsch. 23A, 2135-2136. 6 Homola, J., Yee, S. S. and Gauglitz, G. (1999) Surface plasmon resonance sensors: review, Sens. &
Actuat. B 54, 3-15. 7 Margheri, G., Mannoni, A. and Quercioli F. (1996) A new high-resolution displacement sensor based
on surface plasmon resonance, Proc. SPIE 2783, 211-220. 8 Schaller, J. K., Czepluch, R. and Stojanoff, C. G. (1997) Plasmon spectroscopy for high resolution
angular measurements, Proc. SPIE 3098, 476-486. 9 Weiss, M. N., Srivastava, R. and Groger, H. (1996) Experimental investigation of a surface plasmon-
based integrated-optic humidity sensor, Electron. Lett. 32, 842-843. 10 Chadwick, B. and Gal, M. (1993) An optical temperature sensor using surface plasmons, Japn. J.
Appl. Phys. 32, 2716-2717. 11 Miwa, S. and Arakawa, T. (1996) Selective gas detection by means of surface plasmon resonance
sensors, Thin Solid Films 281-282, 466-468. 12 Abdelghani, A., Chovelon, J. M., Jaffrezic-Renault, N., Ronot-Trioli C., Veillas, C. and Gagnaire, H.
(1997) Surface plasmon resonance fiber-optic sensor for gas detection, Sens. & Actuat. B 38-39, 407-410.
13 Podgorsek, R. P., Sterdenburgh, T. Wolters, J. Ehrenreich, T., Nischwitz, S. and Franke, H. (1997) Optical gas sensing by evaluating ATR leaky mode spectra, Sens. & Actuat. B 39, 349-352.
14 Chadwick, B. and Gal, M. (1994) A hydrogen sensor based on the optical generation of surface plasmons in a palladium alloy, Sens. & Actuat. B 17, 215-220.
15 Ashwell, G. J. and Roberts, M. P. S. (1996) Highly selective surface plasmon resonance sensor for NO2, Electron. Lett. 32, 2089-2091.
16 Granito, C., Wilde, J. N., Petty, M. C., Houston, S. and Iradale, P.J. (1996) Toluene vapor sensing using copper and nickel phthalocyanine Langmuir-Blodgett films, Thin Solid Films 284-285, 98-101.
17 Van Gent, J., Lambeck, P. V., Bakker, R. J., Popma, T. J., Sudholter, E.J.R. and Reinhoudt, D.N. (1991) Design and realization of a surface plasmon resonance-based chemo-optical sensor, Sens. & Actuat. A 26, 449-452.
18 Chinowsky, T. M., Saban, S. B. and Yee, S. S. (1996) Experimental data from a trace metal sensor combining surface plasmon resonance with anodic stripping voltammetry, Sens. & Actuat. B 35, 37-43.
19 Liedberg, B., Nylander, C. and Lundström, K. (1983) Surface plasmons resonance for gas detection and biosensing, Sens. & Actuat. 4, 299-304.
20 Johnsson, B., Löfås, S. and Lindquist, G. (1991) Immobilization of proteins to a carboxymethyldextran-modified gold surface for biospecific interaction analysis in surface plasmon resonance sensors, Anal. Biochem. 198, 268-277.
21 Fägerstam, L. G., Frostel-Karlsson, Å., Karlsson, R., Persson, B. and Rönnberg, I. (1992) Biospecific interaction analysis using surface plasmon resonance detection applied to kinetic, binding site and concentration analysis, J. Chrom. 597, 397-410.
22 http://www.biacore.com/ 23 Altschuh, D., Dubs, M. C., Weiss, E., Zeder-Lutz, G. and Van Regenmortel, M. H. V. (1992)
Determination of kinetic constants for the interaction between monoclonal antibody and peptides using surface plasmon resonance, Biochemistry 31, 6298-6304.
24 Lasonder, E., Bloemhoff, W. and Welling, G. W. (1994) Interaction of lysozyme with synthetic anti-lysozyme D1.3 antibody fragments studied by affinity chromatography and surface plasmon resonance, J. Chrom. A 676, 91-98.
25 Lasonder, E., Schellekens, G. A., Koedijk, D. G. A. M., Damhof, R. A., Welling-Wester S., Feijlbrrief, M., Scheffer, A. J. and Welling, G. W. (1996) Kinetic analysis of synthetic analogues of linear-epitope peptides of glycoprotein D of herpes simplex virus type I by surface plasmon resonance, Eur. J. Biochem. 240, 209-214.
26 Houshmand, H., Fröman, G. and Magnusson, G. (1999) Use of bacteriophage T7 displayed peptides for determination of monoclonal antibody specificity and biosensor analysis of the binding reaction, Anal. Biochem. 268, 363-370.
27 Wu, Z., Johnson, K., Choi, Y. and Ciardelli, T. L. (1995) Ligand binding analysis of soluble interleukin 2-receptor complexes by surface plasmon resonance, J. Biol. Chem. 270, 16045-16051.

Surface plasmon resonance biosensors
23
28 Lessard, I. A. D., Fuller, C. and Perham, R. N. (1996) Competitive interaction of component enzymes with the peripheral subunit-binding domain of the pyruvate-dehydrogenase multienzyme complex of Baccilus stearothermophilus: kinetic analysis using surface plasmon resonance detection, Biochemistry 35, 16863-16870.
29 Cheskis, B. and Freedman, L. P. (1996) Modulation of nuclear receptor interactions by ligands: kinetic analysis using surface plasmon resonance, Biochemistry 35, 3309-3318.
30 Dubs, M. C., Altschuh, D. and Van Regenmortel, M. H. V. (1992) Mapping of viral epitopes with conformationally specific monoclonal antibodies using biosensor technology, J. Chrom. 597, 391-396.
31 Saunal, H. and Van Regenmortel, M. H. V. (1995) Mapping of viral conformational epitopes using biosensor measurements, J. Immunol. Meth. 183, 33-41.
32 Hodgson, J. (1994) Light, Angles, Action: Instruments for label-free, real-time monitoring of intermolecular interactions, Biotechnology 12, 31-35.
33 Malmqvist, M. and Karlsson, R. (1997) Biomolecular interaction analysis: affinity biosensor technologies for functional analysis of proteins, Curr. Op. Chem. Biol. 1, 378-383.
34 Pathak, S. and Savelkoul, H. F. J. (1997) Biosensors in immunology: the story so far, Immunol. Today 18, 464-467.
35 Fivash, M., Towler, E. M. and Fisher, R. J. (1998) BIAcore for macromolecular interaction, Curr. Op. Biotechnol. 9, 97-101.
36 Lakey, J. H. and Raggett, E. M. (1998) Measuring protein-protein interactions, Curr. Op. Struct. Biol. 8, 119-123.
37 “BIAapplications Handbook”, (Pharmacia Biosensor AB, 1994) Uppsala, Sweden. 38 Sjölander, S. and Urbaniczky, C. (1991) Integrated fluid handling system for biomolecular interaction
analysis, Anal. Chem. 63, 2338-2345. 39 Löfås, S. and Johnsson, B. (1990) A novel hydrogel matrix on gold surfaces in surface plasmon
resonance sensors for fast and efficient covalent immobilization of ligands, J. Chem. Soc., Chem. Commun., 1526-1528.
40 O’Shannessy, D. J., Brigham-Burke, M. and Peck, K. (1992) Immobilization chemistries suitable for use in the BIAcore surface plasmon resonance detector, Anal. Biochem. 205, 132-136.
41 Brigham-Burke, M., Edwards, J. R. and O’Shannessy, D. J. (1992) Detection of receptor-ligand interactions using surface plasmon resonance: model studies employing the HIV-1 gp120/CD4 interaction, Anal. Biochem. 205, 125-131.
42 Lemmon. M. A., Ladbury, J. E., Mandiyan, V., Zhou, M. and Schlessinger, J. (1994) Independent binding of peptide ligands to the SH2 and SH3 domains of Grb2, J. Biol. Chem. 269, 31653-31658.
43 Tamamura, H., Otaka, A., Murakami, T., Ishihara, T., Ibuka, T., Waki, M., Matsumoto, A., Yamamoto, N. and Fujii, N. (1996) Interaction of an anti-HIV peptide, T22, with gp120 and CD4, Biochem. Biophys. Res. Comm. 219, 555-559.
44 Chao, H. Houston, M. E., Grothe, S., Kay, C. M., O’Connor-McCourt, M., Irvin, R. T. and Hodges, R. S. (1996) Kinetic study on the formation of a de novo designed heterodimeric coiled-coil: use of surface plasmon resonance to monitor the association and dissociation of polypeptide chains, Biochemistry 35, 12175-12185.
45 England, P., Brégére, F. and Bedouelle, H. (1997) Energetic and kinetic contributions of contact residues of antibody D1.3 in the interaction with lysozyme, Biochemistry 36, 164-172.
46 Huyer, G., Li, Z. M., Adam, M., Huckle, W. R. and Ramachandran, C. (1995) Direct determination of the sequence recognition requirements of the SH2 domains of SH-PTP2, Biochemistry 34, 1040-1049.
47 Shen, B. J., Hage, T. and Sebald, W. (1996) Global and local determinants for the kinetics of interleukin-4/interleukin 4 receptor α chain interaction: a biosensor study employing recombinant interleukin-4 binding protein, Eur. J. Biochem. 240, 252-261.
48 Lookene, A., Chevreuil, O., Østergaard, P. and Olivecrona, G. (1996) Interaction of lipoprotein lipase with heparin fragments and with heparan sulfate: stoichiometry, stabilization and kinetics, Biochemistry 35, 12155-12163.
49 Van Regenmortel, M. H. V., Altschuh, D., Pellequer, J. L., Richalet-Sécordel, P., Saunal, H., Wiley, J. A. and Zeder-Lutz, G. (1994) Analysis of viral antigens using biosensor technology, Methods: A Comp. Meth. Enzymol. 6, 177-197.
50 Zeder-Lutz, G., Rauffer, N., Altschuh, D. and Van Regenmortel, M. H. V. (1995) Analysis of cyclosporin interactions with antibodies and cyclophilin using BIAcore, J. Immunol. Meth. 183, 131-140.
51 Nieba, L., Krebber, A. and Plükthun, A. (1996) Competition BIAcore for measuring true affinities: large differences from values determined from binding kinetics, Anal. Biochem. 234, 155-165.
52 Karlsson, R. (1994) Real-time competitive kinetic analysis of interactions between low-molecular-weight ligands in solution and surface-immobilized receptors, Anal. Biochem. 221, 142-151.
53 Andersson, K., Hamalainen, M. and Malmqvist, M. (1999) Identification and optimization of regeneration conditions for affinity-based biosensor assays. A multivariate cocktail approach, Anal. Chem. 71, 2475-2481.
SPR as a tool in the functional analysis of an immunodominant site in FMDV
24
54 Andersson, K., Areskoug, D. and Hardenborg, E. (1999) Exploring buffer space for molecular interactions, J. Molec. Recogn. 12,
55 “BIAevaluation Software Handbook: version 3.0”, (Biosensor AB, 1997) Uppsala, Sweden. 56 Atkins P. W., “Physical Chemistry, 5th ed., Oxford University Press, Oxford, U. K. 1994. 57 O’Shannessy, D. J., Brigham-Burke, M., Soneson, K. K., Hensley, P. and Brooks, I. (1993)
Determination of rate and equilibrium binding constants for macromolecular interactions using surface plasmon resonance: use of nonlinear least squares analysis methods, Anal. Biochem. 212, 457-468.
58 Morton, T. A., Myszka, D. and Chaiken, I. (1995) Interpreting complex binding kinetics from optical biosensors: a comparison of analysis by linearization, the integrated rate equation and numerical integration, Anal. Biochem. 227, 176-185.
59 O’Shannessy, D. J. and Winzor, D. J. (1996) Interpretation of deviations from pseudo-first-order kinetic behavior in the characterization of ligand binding by biosensor technology, Anal. Biochem. 236, 275-283.
60 Bowles, M. R., Hall, D. R., Pond, S. M. and Winzor, D. J. (1997) Studies of protein interactions by biosensor technology: an alternative approach to the analysis of sensorgrams deviating from pseudo-first-order kinetic behavior, Anal. Biochem. 244, 133-143.
61 Schuck, P. (1997) Reliable determination of binding affinity and kinetics using surface plasmon resonance biosensors, Curr. Op. Biotech. 8, 498-502.
62 Glaser, R. W. (1993) Antigen-antibody binding and mass transport by convection and diffusion to a surface: a two-dimensional computer model of binding and dissociation kinetics, Anal. Biochem. 213, 152-161.
63 Myszka, D., Arulanatham, P. R., Sana, T., Wu, Z., Morton, T. A. and Ciardelli, T. L. (1996) Kinetic analysis of ligand binding to interleukin-2 receptor complexes created on an optical biosensor surface, Prot. Sci. 5, 2468-2478.
64 Hall, D. R., Cann, J. R. and Winzor, D. J. (1996) Demonstration of an upper limit to the range of association rate constants amenable to study by biosensor technology based on surface plasmon resonance, Anal. Biochem. 235, 175-184.
65 Myszka, D., Morton, T. A., Doyle, M. L. and Chaiken, I. M. (1997) Kinetic analysis of a protein antigen-antibody interaction limited by mass transport on an optical biosensor, Biophys. Chem. 64, 127-137.
66 Witz, J. (1999) Kinetic analysis of analyte binding by optical biosensors: hydrodynamic penetration of the analyte flow into the polymer matrix reduces the influence of mass transport, Anal. Biochem. 270, 201-206.
67 Oddie, G. W., Gruen, L. C., Odgers, G. A., King, L. G. and Kortt, A. A. (1997) Identification and minimization of nonideal binding effects in BIAcore analysis: ferritin/anti-ferritin Fab’ interaction as a model system, Anal. Biochem. 244, 301-311.
68 Kortt, A. A., Oddie, G. W., Iliades, P., Gruen, L. C. and Hudson, P. J. (1997) Nonspecific amine immobilization of ligand can be a potential source of error in BIAcore binding experiments and may reduce binding affinities, Anal. Biochem. 253, 103-111.
69 Kalinin, N. L., Ward, L. D. and Winzor, D. J. (1995) Effects of solute multivalence on the evaluation of binding constants by biosensor technology: studies with concanavalin A and interleukin-6 as partitioning proteins, Anal. Biochem. 228, 238-244.
70 Catimel, B., Nerrie, M., Lee, F.T., Scott, A. M., Ritter, G., Welt, S., Old, L. J., Burgess, A. W. and Nice, E. C. (1997) Kinetic analysis of the interaction between the monoclonal antibody A33 and its colonic epithelial antigen by the use of an optical biosensor: a comparison of immobilisation strategies, J. Chrom. A 776, 15-30.
71 Karlsson, R. and Fält, A. (1997) Experimental design for kinetic analysis of protein-protein interactions with surface plasmon resonance biosensors, J. Immunol. Meth. 200, 121-133.
72 Ober, R. J. and Ward, E. S. (1999) The choice of the reference cell in the analysis of kinetic data using BIAcore, Anal. Biochem. 271, 70-80.