Anwar Nasution - Regional integration · Anwar Nasution Anwar Nasution is Senior Deputy Governor of...
28
Recent Issues in the Management of Macroeconomic Policies in the Philippines Anwar Nasution Anwar Nasution is Senior Deputy Governor of Bank Indonesia; Dean, Faculty of Economics; and Professor of Economics, University of Indonesia.
Transcript of Anwar Nasution - Regional integration · Anwar Nasution Anwar Nasution is Senior Deputy Governor of...
Recent Issues in theManagement of Macroeconomic
Policies in the Philippines
Anwar Nasution
Anwar Nasution is Senior Deputy Governor of Bank Indonesia; Dean, Facultyof Economics; and Professor of Economics, University of Indonesia.
2 A STUDY OF FINANCIAL MARKETS
○
○
○
○
○
○
○
○
○
○
○
○
○
○
○
○
○
○
○
○
○
○
○
○
○
○
○
○
○
○
○
○
○
○
○
○
○
○
○
○
○
○
○
○
○
○
○
○
○
○
○
○
○
○
○
○
○
○
○
○
○
○
○
○
○
○
○
○
○
○
○
○
○
○
○
○
○
○
○
○
○
○
○
○
Introduction
The Philippines has managed to avoid the severe
fallout from the regional financial crisis partly be-
cause it has barely recovered from the past spend-
ing and investment binge and banking crisis of the
1970s and 1980s. The short-term stabilization pro-
gram and long-term economy-wide reform initiated
by the Aquino administration (1986–1991) have be-
gun to bear fruit. Trade, investment, and financial
sector policy reform and the privatization program
(more vigorously implemented during the adminis-
tration of President Fidel V. Ramos who came to
office in May 1992) have revived private sector in-
vestment because the reforms have significantly cut
the costs of doing business and raised productivity
and efficiency. The new public and private sector
investment helped ease the infrastructure constraints
in the economy, including the power crisis during
1992–1993. This and the restoration of peace and
order and political stability have improved the invest-
ment climate.1 The significant reduction of resources
required for security purposes raised their availabil-
ity for economic development. As a result, the
economy has been growing back to a respectable
level in terms of gross domestic product (GDP), av-
eraging at 4.2 percent per annum between 1992 and
1996. Inflation rates were suppressed from the
double-digit levels of 1981–1991 to single-digit levels
from 1992 to 1997. After having been in deficit con-
tinuously for two decades, the cash position of the
national Government has been in surplus since 1994.
In nominal dollar values, exports grew by 21 percent
annually between 1992 and 1997.
The completion of the full liberalization of foreign
exchange in 1992, combined with those encouraging
developments, has increased capital inflows to the
country to finance its wide current account deficit.
The current account deficit, as a percentage of GDP,
rose sharply from 1.6 percent in 1992 to 5.5 percent
in 1993 and stabilized at around 4.5 percent per an-
num from 1994 to 1997. Prior to the economy-wide
liberalization, the access of the private sector to in-
ternational capital markets was relatively limited. The
access became greater as the country was gradu-
ated from the International Monetary Fund (IMF)
Standby Arrangement in March 1993 and with the
conclusion of the Paris Club rescheduling negotia-
tions in 1994. To boost public confidence, including
that of international investors, the Philippines, how-
ever, chose to voluntarily sign up on 11 March 1998
for a two-year IMF Extended Fund Facility that will
give access to $1.37 billion in case of emergencies.
At the same time, the compulsory regular consulta-
tions with the IMF and other multilateral financial
institutions help shape the policies and improve coor-
dination among Government bureaucracy who draw
and implement the policies. The favorable market
response to the issue of Samurai bonds in July 1996
and the Brady Exchange Program in September later
that year signified significant improvements in the
international creditworthiness of the Philippines.
Having recovered from a serious banking crisis in
the 1980s, the banking system in the Philippines is in a
better shape compared with, say, those in Indonesia
and Thailand. To enhance the credibility of the mon-
etary authority and improve the effectiveness of the
monetary policy, the Philippines undertook a reform
of the financial system between 1986 and 1993. The
authorities toughened up prudential rules and regula-
tions, which include capital adequacy and provisions
for loan loss or doubtful accounts, compliance with
the minimum risk-asset ratio, legal lending limits, and
interlocking directorship (Lamberte and Llanto 1995,
Paderanga Jr. 1996, and Intal and Llanto 1998).
The reform includes major restructuring and re-
habilitation of the central bank, a number of State-
owned financial institutions, and the deposit insur-
ance corporation. To replace the old bankrupt Cen-
tral Bank of the Philippines (CBP), a better orga-
nized and well-funded brand new central bank,
Bangko Sentral ng Pilipinas (BSP), was estab-
lished in 1993 (Republic Act No. 7653). Restructur-
ing included transfer of the foreign liabilities of CBP

3ISSUES IN THE MANAGEMENT OF MACROECONOMIC POLICIES IN THE PHILIPPINES
○
○
○
○
○
○
○
○
○
○
○
○
○
○
○
○
○
○
○
○
○
○
○
○
○
○
○
○
○
○
○
○
○
○
○
○
○
○
○
○
○
○
○
○
○
○
○
○
○
○
○
○
○
○
○
○
○
○
○
○
○
○
○
○
○
○
○
○
○
○
○
○
○
○
○
○
○
○
○
○
○
○
○
to the National Government and capital increase.
Between 1986 and 1990, the CBP suffered from
heavy losses as a result of successive currency de-
valuation, swap, forward cover and open market
operations, and granting of emergency loans to dis-
tressed financial institutions. The collapsed State-
owned banks, namely, Philippine National Bank
(PNB) and Development Bank of the Philippines
(DBP), were fully rehabilitated in 1986 by transfer-
ring their nonperforming assets to the National Gov-
ernment.2 Established in 1916, PNB is the principal
depository of Government funds. The reduction of
political intrusion in the financial system significantly
decreases the chronic moral hazard behavior and
principal-agent problems in this system.
Economic Growth,Structural Changes,Employment, and InflationAfter a decade of economy-wide structural reforms,
resolution of the power crisis during 1992–1993, and
improvements in political life and security, the
economy of the Philippines began to recover in 1994.
Since then, it has been growing at a rapid pace. Real
gross national product (GNP) rose by an annual av-
erage of 5.9 percent and real GDP by 5.2 percent
from 1994 to 1997 (Table 1). Because of the positive
net factor income from abroad, mainly workers’ re-
mittances, both the level and rate of growth of the
GNP of the Philippines are higher than that of the
GDP.3 These rates of growth of national income are
well above the average annual rate of population
growth of 2.3 percent per annum, thus allowing an
average annual increase in per capita income of
around 2.7 percent.
Aggregate Demand andSectoral Growth RatesUnlike in the past two decades, growth in the 1990s
has been driven by increased levels of private sector
investment, high export growth, and decreased role
of the public sector in the economy. Over one fifth
of the annual GNP of the Philippines is now plowed
back into physical investment. However, the buoy-
ant accumulation of capital goods during the first half
Table 1: Share and Rate of Growth—Real Gross National Product by Industrial Origin (percent)
Sharea Rate of Growth
Item 1985 1995 1990 1991 1992 1993 1994 1995 1996 1997
Gross National Product (GNP) 100.0 100.0 4.8 0.5 1.6 2.1 5.3 5.0 6.9 5.8
Gross Domestic Product (GDP) 103.8 97.3 3.0 (0.6) 0.3 2.1 4.4 4.8 5.7 5.1
Agriculture, Forestry, and Fishery 25.5 20.9 0.5 1.4 0.4 2.1 2.6 0.8 3.1 2.8
Industry Sector 36.5 34.5 2.6 (2.7) (0.5) 1.6 5.8 7.0 6.3 5.7
Mining and Quarrying 2.2 1.3 (2.6) (2.9) 6.7 0.7 (7.0) (0.8) (1.5) (3.2)
Manufacturing 26.1 24.6 2.7 (0.4) (1.7) 0.7 5.0 6.8 5.6 4.0
Construction 5.3 5.4 4.9 (15.7) 2.8 5.7 8.9 6.5 10.9 16.3
Electricity, Gas and Water Supply 2.9 3.2 (0.7) 4.7 0.7 2.9 13.9 13.0 7.5 4.1
Services Sector 41.8 41.9 4.9 0.2 1.0 2.5 4.2 5.0 6.5 5.6
Transportation, Communication, and Storage 5.7 5.7 2.3 0.4 1.4 2.6 4.2 5.8 7.4 7.9
Trade 15.0 15.0 4.6 0.5 1.6 2.5 4.0 5.6 5.5 4.2
Finance and Housing 8.9 9.4 5.8 (1.1) 0.6 2.0 4.0 4.9 8.3 7.7
Services 12.2 11.8 5.9 0.5 0.4 2.8 4.8 4.1 5.7 4.6
Net Factor Income (3.7) 2.7 75.3 198.1 237.1 2.5 54.9 12.8 52.2 23.0
Traded Sectorb 51.8 48.2 1.5 0.3 (0.5) 1.4 3.5 3.8 4.3 3.3
Nontraded Sectorc 48.1 51.8 4.6 (1.4) 1.2 2.8 5.2 5.6 7.0 6.7
a As percentage of GNP, except for traded and nontraded sectors, which are computed as percentage of GDP.b Comprising agriculture, forestry and fishery; mining; and quarrying; and manufacturing.c Comprising construction; electricity, gas and water supply; and services.Sources: Bangko Sentral ng Pilipinas (BSP), 1996 Annual Report; Statistical Bulletin. BSP, 1998. Selected Philippine Economic Indicators. February.
4 A STUDY OF FINANCIAL MARKETS
○
○
○
○
○
○
○
○
○
○
○
○
○
○
○
○
○
○
○
○
○
○
○
○
○
○
○
○
○
○
○
○
○
○
○
○
○
○
○
○
○
○
○
○
○
○
○
○
○
○
○
○
○
○
○
○
○
○
○
○
○
○
○
○
○
○
○
○
○
○
○
○
○
○
○
○
○
○
○
○
○
○
○
○
of the 1990s was mainly concentrated in the
nontraded sector of the economy. This included the
much needed investment in durable equipment in
energy, transportation, and telecommunication to solve
the supply-side constraints. Major power projects of
the National Power Corporation (NPC) were com-
pleted in 1994 and modernization of water and air
transport peaked in 1993–1994. Deregulation of the
telecommunications industry has attracted substan-
tial private sector investment and introduced market
competition. These increased the number of tele-
phone connections, which more than tripled between
1990 and 1995, and reduced rates. The pace of in-
vestment in construction and real estate slowed down
with the BSP ruling on 5 June 1997 to cap the growth
of bank credit to the real estate sector to no more
than 20 percent of a bank’s total loan portfolio. In-
vestment in durable equipment grew strongly with
the surge in private sector investment, particularly in
the manufacturing industry.
The share of the agriculture sector (comprising
crops, poultry and livestock, fishery, and forestry) in
GNP slightly dropped from 25.5 percent in 1985 to
20.9 percent in 1995. During the same period, the
contribution of the industry sector was relatively stag-
nant at around 35 percent. Similarly, the share of
services in GNP was also stable at 42 percent. Manu-
facturing was the most important segment of the in-
dustry sector, contributing about 25 percent to the
annual GNP in 1985 and 1995. The construction in-
dustry produced 5.4 percent while other industries
(mining and quarrying and public utilities) generated
4.5 percent of GNP in 1995. The contribution of min-
ing and quarrying to annual GNP sharply dropped
from 2.2 percent in 1985 to 1.3 percent in 1995. In
the service sector, trade was the biggest generator
of GNP in 1995 (with 15 percent share), followed by
services (11.8 percent); finance and housing (9.4
percent); and transportation, communication and stor-
age (5.7 percent). As in other developing economies,
services include mainly labor-intensive and low-tech-
nology activities that produce low value added.
After increasing by an average of 4.6 percent per
annum during the height of the green revolution in
1965–1980, the growth rate of agricultural output
decelerated to an average of 1.0 percent per annum
in the 1980s and early 1990s. During the period 1980–
1993, rice, the nation’s staple food, grew by 2.9 per-
cent per annum compared with average annual growth
rates of the whole agriculture sector at 1.6 percent
and of all crops (comprising rice, corn, coconut, sug-
arcane, banana, and other crops) at 0.8 percent.
Other crops include fruits and vegetables, especially
nontraditional export crops such as coffee and pine-
apple. During the same period, poultry and livestock
grew by 7.7 percent per annum, and fishery by 1.6
percent. However, the forestry sector recorded a
negative growth rate of 30 percent per annum. Dur-
ing this period, sugarcane and banana also registered
negative annual growth rates of 3.1 and 0.5 percent,
respectively. In 1992, all crops accounted for over
59 percent of agriculture value added, poultry and
livestock for 24 percent, fishery for 16 percent, and
forestry for 0.8 percent. Rice was the most impor-
tant commodity in the group of crops as it consti-
tuted 16 percent of agriculture value added in 1992.
A number of factors contributed to the stagnation
of the agriculture sector until the mid-1980s
(Balisacan 1995). The insecurity and political insta-
bility slowed down the cultivation of new lands, while
the uncertainty concerning the implementation of the
Government’s Comprehensive Agrarian Reform Pro-
gram of June 1988 discouraged the flow of private
investments into agriculture and encouraged conver-
sion of agricultural lands into nonagricultural uses.
The fall of public investment in the agriculture sector
(especially on rural roads, irrigation, and research
and development and extension services) severely
affected production and productivity as well as pro-
cessing and marketing. Meanwhile, the rise in Gov-
ernment interventions (including price and quantita-
tive controls of agricultural inputs and products that
affected domestic production, processing, distribu-
tion, and international trade) has acted as explicit and
5ISSUES IN THE MANAGEMENT OF MACROECONOMIC POLICIES IN THE PHILIPPINES
○
○
○
○
○
○
○
○
○
○
○
○
○
○
○
○
○
○
○
○
○
○
○
○
○
○
○
○
○
○
○
○
○
○
○
○
○
○
○
○
○
○
○
○
○
○
○
○
○
○
○
○
○
○
○
○
○
○
○
○
○
○
○
○
○
○
○
○
○
○
○
○
○
○
○
○
○
○
○
○
○
○
○
implicit onerous taxation on agriculture. Moreover,
the exhaustion of forest resources because of rapid
deforestation in the 1960s and 1970s has deceler-
ated the growth rate of the forestry sector.
Most of the distorted Government interventions in
the agriculture sector were phased out starting re-
cently. Moreover, a combination of the restoration of
peace and order and political stability allowed the
cultivation of new lands while the increase in public
investment improved production, processing, and pro-
ductivity of this sector. However, mainly because of
a long drought, agricultural output stagnated in 1995
and grew by only 3.1 percent in 1996. The continu-
ing El Niño reduced the rate of growth of the agri-
culture sector further down to 2.8 percent in 1997.
The growth rate of the industry sector peaked at
7 percent in 1995, but declined to 6.3 percent in the
following year and to 5.7 percent in 1997. The ser-
vice sector grew by over 6 percent per annum from
1995 to 1997. In the industry sector, construction had
the highest growth rate from 1992 to 1997. Partly
because of the new investment in public utilities and
land-based industries, construction activities rose
from 2.8 percent in 1992 to 8.9 percent in 1994 to
further 10.9 percent in 1996 and 16.3 percent in
1997. Again, because of the new investment, the
rate of growth of the electricity, gas, and water sup-
ply subsector peaked in 1994 and 1995 at 13.9 and
13.0 percent, respectively. In the service sector, the
transportation, communication, and storage
subsector, and the finance and housing subsector
grew rapidly at an annual average rate of about 8
percent from 1995 to 1997.
Sectoral EmploymentFrom 1980 to 1994, the working age population, those
who are between 15 and 64 years old, grew by about
3 percent per annum. During this period, the labor
force increased by 3.4 percent annually, which meant
about 650,000 new entrants to the labor force every
year. Owing mainly to the increasing rate of female
labor force participation, the total labor force partici-
pation rate has been rising through time, from about
60 percent in the 1970s to roughly 63 percent in the
1980s and to around 66 percent in the 1990s. The
progrowth policies have raised employment rate dur-
ing the period 1980–1994 to sufficiently absorb new
entrants to the labor force. The accumulated labor
surplus was partly reduced by the increasing num-
ber of overseas contract workers (Esguerra 1995).
Nevertheless, the unemployment rate in the Philip-
pines is still relatively high at around 9 percent from
1993 to 1997. The underemployment rate is estimated
at 20–23 percent.
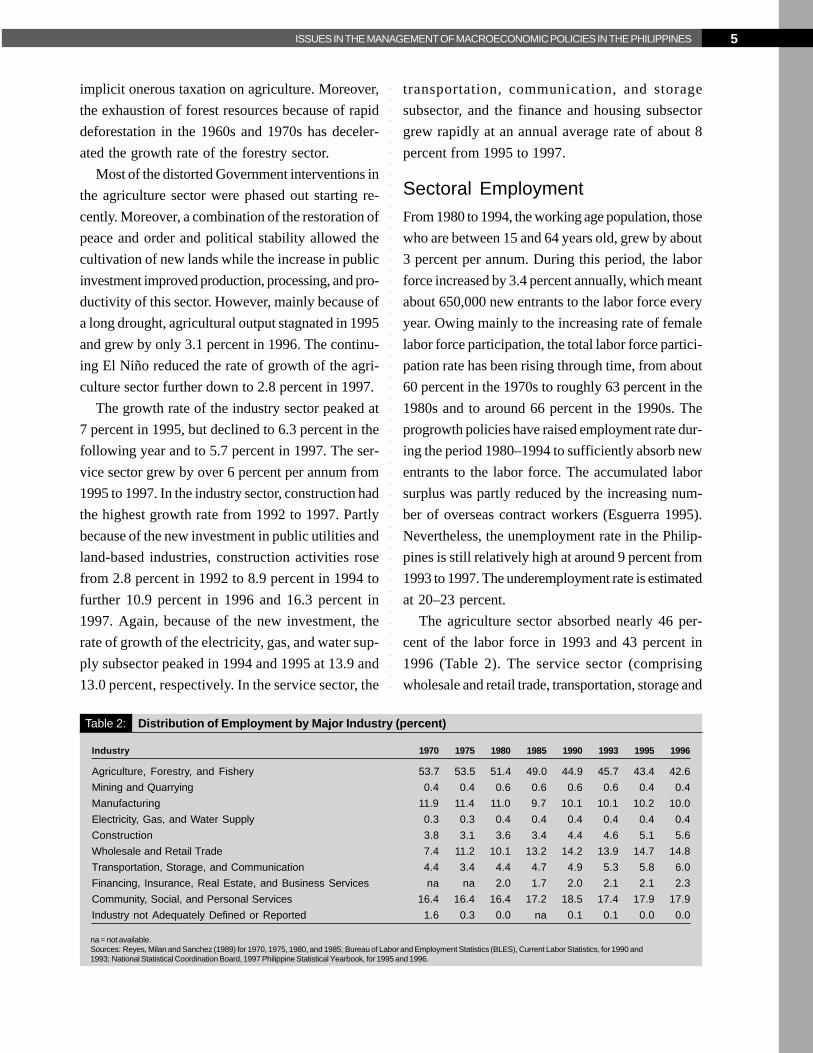
The agriculture sector absorbed nearly 46 per-
cent of the labor force in 1993 and 43 percent in
1996 (Table 2). The service sector (comprising
wholesale and retail trade, transportation, storage and
Table 2: Distribution of Employment by Major Industry (percent)
Industry 1970 1975 1980 1985 1990 1993 1995 1996
Agriculture, Forestry, and Fishery 53.7 53.5 51.4 49.0 44.9 45.7 43.4 42.6
Mining and Quarrying 0.4 0.4 0.6 0.6 0.6 0.6 0.4 0.4
Manufacturing 11.9 11.4 11.0 9.7 10.1 10.1 10.2 10.0
Electricity, Gas, and Water Supply 0.3 0.3 0.4 0.4 0.4 0.4 0.4 0.4
Construction 3.8 3.1 3.6 3.4 4.4 4.6 5.1 5.6
Wholesale and Retail Trade 7.4 11.2 10.1 13.2 14.2 13.9 14.7 14.8
Transportation, Storage, and Communication 4.4 3.4 4.4 4.7 4.9 5.3 5.8 6.0
Financing, Insurance, Real Estate, and Business Services na na 2.0 1.7 2.0 2.1 2.1 2.3
Community, Social, and Personal Services 16.4 16.4 16.4 17.2 18.5 17.4 17.9 17.9
Industry not Adequately Defined or Reported 1.6 0.3 0.0 na 0.1 0.1 0.0 0.0
na = not available.Sources: Reyes, Milan and Sanchez (1989) for 1970, 1975, 1980, and 1985; Bureau of Labor and Employment Statistics (BLES), Current Labor Statistics, for 1990 and1993; National Statistical Coordination Board, 1997 Philippine Statistical Yearbook, for 1995 and 1996.
6 A STUDY OF FINANCIAL MARKETS
○
○
○
○
○
○
○
○
○
○
○
○
○
○
○
○
○
○
○
○
○
○
○
○
○
○
○
○
○
○
○
○
○
○
○
○
○
○
○
○
○
○
○
○
○
○
○
○
○
○
○
○
○
○
○
○
○
○
○
○
○
○
○
○
○
○
○
○
○
○
○
○
○
○
○
○
○
○
○
○
○
○
○
○
communication, financial sector, community, social
and personal services, and business services), which
employed 38.7 percent of the labor force in 1993
and 41.0 percent in 1996, has been the main recipi-
ent of the labor force moving out of agriculture. The
rapid growth of employment in this sector indicates
the fast growth of low-productivity and low-paying
jobs in the informal sector of the economy, which
mainly produces nontraded goods and services.
The economic reform has been designed to de-
velop an efficient industry sector, increase external
competitiveness, and promote employment. Measures
to achieve these objectives include creation of a
sound macroeconomic environment, modifications in
the tariff structure, dismantling of nontariff barri-
ers, removal of the capital bias in the system of
investment incentives, and promotion of cottage,
small, and medium industries. These policies have
changed the structure of the industry sector. But
the percentage share of employment absorbed by
industry has been hovering between 14 and 16.5
percent since the 1970s. The manufacturing sector
provided between 10 and 12 percent of total em-
ployment, but its share in more recent years has
been lower than in the 1970s.
Owing to their relatively large shares in employ-
ment, the agriculture and service sectors exert con-
siderable influence on the overall performance and
on the aggregate profile of poverty and income dis-
tribution.
Inflation RatesPrice inflation is generated by interactions between
domestic and international markets for goods and
services, labor markets, and financial (including for-
eign exchange) market. A combination of stabiliza-
tion policy to suppress aggregate demand, economy-
wide reforms in all three markets, and real peso ap-
preciation has helped control inflation rate. The re-
forms in the market for goods and services included
the phasing out of price and quantitative controls,
adoption of measures to improve domestic market
competition, and policies to reduce levels and vari-
ance of levies and taxes on domestic trade and ex-
ports. The trade policy reforms also liberalized im-
ports and cut the levels and variance of import tar-
iffs. Greater market competition decreased prices
further and improved productivity. Prices of imported
goods in the local market were reduced by trade lib-
eralization, tariff cuts, and real peso appreciation.
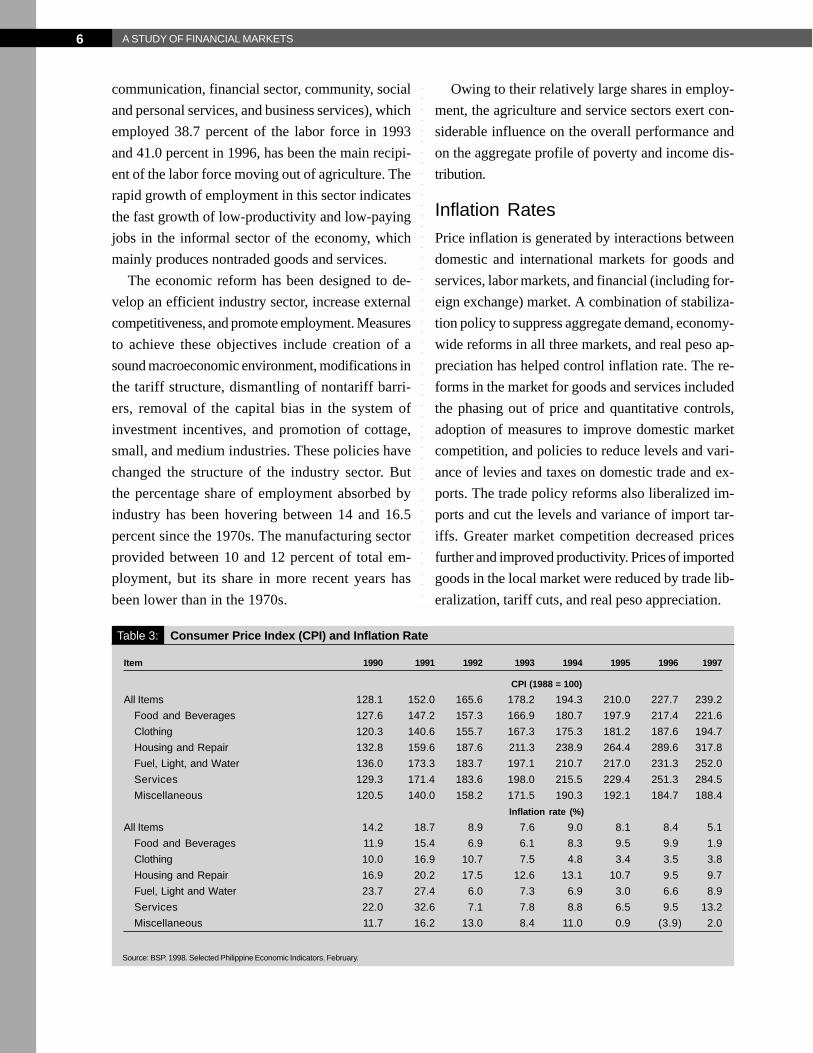
Table 3: Consumer Price Index (CPI) and Inflation Rate
Item 1990 1991 1992 1993 1994 1995 1996 1997
CPI (1988 = 100)
All Items 128.1 152.0 165.6 178.2 194.3 210.0 227.7 239.2
Food and Beverages 127.6 147.2 157.3 166.9 180.7 197.9 217.4 221.6
Clothing 120.3 140.6 155.7 167.3 175.3 181.2 187.6 194.7
Housing and Repair 132.8 159.6 187.6 211.3 238.9 264.4 289.6 317.8
Fuel, Light, and Water 136.0 173.3 183.7 197.1 210.7 217.0 231.3 252.0
Services 129.3 171.4 183.6 198.0 215.5 229.4 251.3 284.5
Miscellaneous 120.5 140.0 158.2 171.5 190.3 192.1 184.7 188.4
Inflation rate (%)
All Items 14.2 18.7 8.9 7.6 9.0 8.1 8.4 5.1
Food and Beverages 11.9 15.4 6.9 6.1 8.3 9.5 9.9 1.9
Clothing 10.0 16.9 10.7 7.5 4.8 3.4 3.5 3.8
Housing and Repair 16.9 20.2 17.5 12.6 13.1 10.7 9.5 9.7
Fuel, Light and Water 23.7 27.4 6.0 7.3 6.9 3.0 6.6 8.9
Services 22.0 32.6 7.1 7.8 8.8 6.5 9.5 13.2
Miscellaneous 11.7 16.2 13.0 8.4 11.0 0.9 (3.9) 2.0
Source: BSP. 1998. Selected Philippine Economic Indicators. February.
7ISSUES IN THE MANAGEMENT OF MACROECONOMIC POLICIES IN THE PHILIPPINES
○
○
○
○
○
○
○
○
○
○
○
○
○
○
○
○
○
○
○
○
○
○
○
○
○
○
○
○
○
○
○
○
○
○
○
○
○
○
○
○
○
○
○
○
○
○
○
○
○
○
○
○
○
○
○
○
○
○
○
○
○
○
○
○
○
○
○
○
○
○
○
○
○
○
○
○
○
○
○
○
○
○
○
The inflation rate has been suppressed from nearly
19 percent in 1991 to around 9 percent in 1992 and it
has remained at a single digit thereafter (Table 3).
The decline in the inflation rate of food and bever-
ages and clothing has been due mainly to import lib-
eralization. In the housing and repair sector, new con-
struction of housing and commercial buildings relaxed
the supply constraint and slowed the increase in rents.
Moreover, new investment in public utilities also miti-
gated price increases in this sector.
Domestic Savings andthe Financial SectorVolatile economic conditions, political instability, and
security problems have dampened public confidence,
and restrained savings and investment and growth
of the financial industry in the Philippines.
Domestic SavingsThe aggregate savings ratio in this country, ranging
between 16 and 20 percent of annual GDP during
1990–1996, was not only low by Asian (Associa-
tion of Southeast Asian Nations [ASEAN] and East
Asian) standard, but each sector of the economy—
households, corporations, and the Government—
saved considerably less than its counterpart in this
region.4 Considering that the gross national invest-
ment was between 20 and 24 percent of annual
GDP, the resource gap in the Philippines hovered
between 1 to 4 percent of annual GDP during 1990–
1996. To narrow the gap, the Philippines, in recent
years, has started to catch up with its neighbors by
maintaining sound and stable macroeconomic man-
agement and introducing a number of policies to
increase domestic savings. These included mea-
sures to control the inflation rate, raise positive real
interest rate, and policies to promote a fast growth
rate of household incomes as well as to affect the
age and employment structures of the population
by reducing the dependency ratio through a family
planning program.
Government employees in the Philippines are re-
quired to participate in the Government Service In-
surance System (GSIS) while private employees are
encouraged to become members of the Social Secu-
rity System (SSS). Both agencies are modeled after
the Employment Provident Fund (EPF) in Singapore
and Malaysia.
The corporate sector has been a net borrower in
the Philippines. The relatively high savings rates of
this sector are partly explained by the past repres-
sive financial policies and industrialization strategies.
The authorities in the Philippines, like their counter-
parts in other Asian countries, accepted the view
that highly diversified private conglomerates and
State-owned enterprises are to be the main instru-
ments for the rapid industrialization process. Thus,
the Government strengthened State-owned compa-
nies and supported private business by directing en-
try and exit of firms, and providing subsidized credit
and other funds from State-owned institutions. In-
dustrialization strategies included high rates of pro-
tection from imports, and special access to locally
produced inputs and to Government procurements.
A close relationship grew between the Government
and these enterprises. The result is a long history
and extensive record of State interventions, inward-
looking trade and investment regimes, financial re-
pression, patrimonialism, and cronyism.
For the first time after two decades of continued
deficit, the cash position of the central Government
recorded a surplus of nearly 1 percent of GDP in
1994. The consolidated public sector financial posi-
tion improved significantly in the 1990s, from a defi-
cit of close to 5 percent of GDP to a small surplus in
1996. The improvements, however, have been due
partly to large receipts from the privatization of State-
owned enterprises, particularly in 1994 and 1995. To
generate a Government budget surplus in 1997,
State-owned enterprises were required to remit a
$210 million dividend due in 1998. Selling public
sector assets is of course not a sustainable source
of Government revenues, and the advance payments
8 A STUDY OF FINANCIAL MARKETS
○
○
○
○
○
○
○
○
○
○
○
○
○
○
○
○
○
○
○
○
○
○
○
○
○
○
○
○
○
○
○
○
○
○
○
○
○
○
○
○
○
○
○
○
○
○
○
○
○
○
○
○
○
○
○
○
○
○
○
○
○
○
○
○
○
○
○
○
○
○
○
○
○
○
○
○
○
○
○
○
○
○
○
○
distorted the fiscal picture. To raise sustainable rev-
enues from internal taxes, the Government imple-
mented the expanded value-added tax (VAT) in Janu-
ary 1996 and passed the Comprehensive Tax Re-
form Program in December 1997. Tax efforts and
revenue collections are expected to increase with
the program to strengthen tax administration. On the
expenditure side, the Government reduces nondebt
and nonpersonnel expenditures by, among others,
decreasing the demand for public investment through
privatization of State-owned enterprises. To make up
for the reduction of public sector investment in public
utilities, the Government attracts private sector invest-
ment through the build-operate-transfer (BOT)
scheme. The surplus in the public budget helps control
domestic aggregate demand, stabilizes public debt lev-
els, and controls and reduces real interest rates.
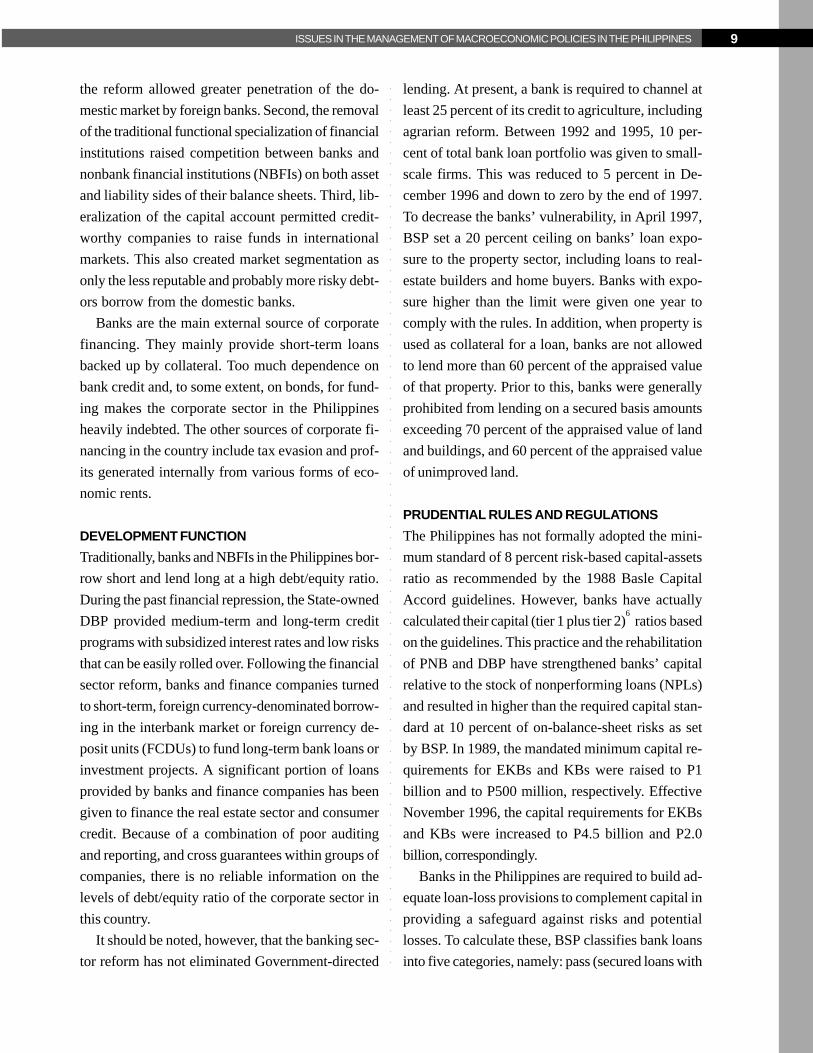
Financial Sector DevelopmentsSTRUCTURE OF THE FINANCIAL SYSTEM
As in many other developing countries, in terms of
total assets and number of offices, the banking sys-
tem is the core of the financial system in the Philip-
pines (Table 4). As of March 1998, there were 51
banks in the Philippines: 18 domestic expanded com-
mercial banks (EKBs), 15 domestic commercial
banks (KBs), 17 branch offices of foreign banks,
and 1 land bank.5 The list excludes DBP and also
the Al-Amanah Islamic Investment Bank of the Phil-
ippines, which operates based on risk-sharing accord-
ing to Shariah or Islamic laws. Both the EKBs and
KBs are allowed to deal in foreign exchange trans-
actions, but only the EKBs are licensed to exercise
the authority of an investment house. Operating li-
censes for 10 of these banks were issued between
October 1994 and December 1997.
The gradual financial sector reform, which started
in 1980, has enhanced competition in the banking
system through many avenues: first, the relaxation
of barriers to new entrants to the banking industry
rapidly increased the number of banks and their
branches. Some of these were foreign institutions as Tabl
e 4:
Str
uct
ure
of
the
Fin
anci
al S
yste
m a
nd
Sh
are
in A
sset
s, 1
990–
1997
Nu
mb
er o
f O
ffic
esS
har
e in
Ass
ets
(%)
Ass
et G
row
th (%
)
Fin
anci
al I
nst
itu
tio
n19
9019
9119
9219
9319
9419
9519
9619
97a
1992
1993
1994
1995
1996
1993
1994
1995
1996
1997
a
Cen
tral
Ban
k1
11
11
11
135
.027
.622
.619
.619
.0(1
1.6)
(7.4
)4.
623
.3na
Com
mer
cial
Ban
ksb
1,86
31,
989
2,36
12,
604
2,92
43,
221
3,64
73,
890
41.3
46.0
49.8
52.7
57.6
25.1
22.5
27.3
39.2
24.1
Thr
ift B
anks
653
663
718
780
821
925
1,17
11,
386
3.6
4.0
5.0
5.6
5.7
23.9
43.0
34.3
29.2
19.2
Sav
ings
Ban
ks27
028
531
633
434
736
742
650
02.
22.
43.
33.
53.
022
.154
.727
.611
.914
.3
Priv
ate
Dev
. B
anks
211
202
218
250
265
310
432
547
1.0
1.2
1.3
1.7
2.1
30.6
28.4
48.8
58.5
29.0
SS
LA
c17
217
618
419
620
924
831
333
90.
40.
40.
40.
50.
616
.917
.140
.452
.010
.0
Spe
cial
ized
Ban
ksd
7676
7777
7777
nana
2.5
3.1
2.8
2.7
0.0
36.7
4.9
13.3
na
Rur
al B
anks
1,04
51,
063
1,14
011
,195
1,27
41,
346
1,51
41,
650
1.1
1.2
1.3
1.4
1.5
22.0
24.2
29.8
31.1
12.1
Non
Ban
ks3,
849
4,06
94,
613
5,28
25,
977
6,87
19,
161
9,91
316
.518
.118
.417
.916
.323
.515
.116
.716
.14.
7
To
tal
7,48
77,
861
8,91
019
,939
11,0
7412
,441
15,4
9416
,840
100.
010
0.0
100.
010
0.0
100.
025
.021
.124
.728
.6n
a
na =
not
ava
ilabl
e.a
Pre
limin
ary
data
as
of S
epte
mbe
r 199
7.b
Incl
udes
Lan
d B
ank
of th
e P
hilip
pine
s, D
evel
opm
ent B
ank
of th
e P
hilip
pine
s st
artin
g F
ebru
ary
1996
, and
Al-A
man
ah Is
lam
ic In
vest
men
t Ban
k of
the
Phi
lippi
nes
star
ting
June
199
6.c
SS
LA =
Sto
ck S
avin
gs a
nd L
oans
Ass
ocia
tions
.d
Con
solid
ated
with
com
mer
cial
ban
ks in
199
6.S
ourc
e: B
SP.
199
8. S
elec
ted
Phi
lippi
ne E
cono
mic
Indi
cato
rs, F
ebru
ary.
9ISSUES IN THE MANAGEMENT OF MACROECONOMIC POLICIES IN THE PHILIPPINES
○
○
○
○
○
○
○
○
○
○
○
○
○
○
○
○
○
○
○
○
○
○
○
○
○
○
○
○
○
○
○
○
○
○
○
○
○
○
○
○
○
○
○
○
○
○
○
○
○
○
○
○
○
○
○
○
○
○
○
○
○
○
○
○
○
○
○
○
○
○
○
○
○
○
○
○
○
○
○
○
○
○
○
the reform allowed greater penetration of the do-
mestic market by foreign banks. Second, the removal
of the traditional functional specialization of financial
institutions raised competition between banks and
nonbank financial institutions (NBFIs) on both asset
and liability sides of their balance sheets. Third, lib-
eralization of the capital account permitted credit-
worthy companies to raise funds in international
markets. This also created market segmentation as
only the less reputable and probably more risky debt-
ors borrow from the domestic banks.
Banks are the main external source of corporate
financing. They mainly provide short-term loans
backed up by collateral. Too much dependence on
bank credit and, to some extent, on bonds, for fund-
ing makes the corporate sector in the Philippines
heavily indebted. The other sources of corporate fi-
nancing in the country include tax evasion and prof-
its generated internally from various forms of eco-
nomic rents.
DEVELOPMENT FUNCTION
Traditionally, banks and NBFIs in the Philippines bor-
row short and lend long at a high debt/equity ratio.
During the past financial repression, the State-owned
DBP provided medium-term and long-term credit
programs with subsidized interest rates and low risks
that can be easily rolled over. Following the financial
sector reform, banks and finance companies turned
to short-term, foreign currency-denominated borrow-
ing in the interbank market or foreign currency de-
posit units (FCDUs) to fund long-term bank loans or
investment projects. A significant portion of loans
provided by banks and finance companies has been
given to finance the real estate sector and consumer
credit. Because of a combination of poor auditing
and reporting, and cross guarantees within groups of
companies, there is no reliable information on the
levels of debt/equity ratio of the corporate sector in
this country.
It should be noted, however, that the banking sec-
tor reform has not eliminated Government-directed
lending. At present, a bank is required to channel at
least 25 percent of its credit to agriculture, including
agrarian reform. Between 1992 and 1995, 10 per-
cent of total bank loan portfolio was given to small-
scale firms. This was reduced to 5 percent in De-
cember 1996 and down to zero by the end of 1997.
To decrease the banks’ vulnerability, in April 1997,
BSP set a 20 percent ceiling on banks’ loan expo-
sure to the property sector, including loans to real-
estate builders and home buyers. Banks with expo-
sure higher than the limit were given one year to
comply with the rules. In addition, when property is
used as collateral for a loan, banks are not allowed
to lend more than 60 percent of the appraised value
of that property. Prior to this, banks were generally
prohibited from lending on a secured basis amounts
exceeding 70 percent of the appraised value of land
and buildings, and 60 percent of the appraised value
of unimproved land.
PRUDENTIAL RULES AND REGULATIONS
The Philippines has not formally adopted the mini-
mum standard of 8 percent risk-based capital-assets
ratio as recommended by the 1988 Basle Capital
Accord guidelines. However, banks have actually
calculated their capital (tier 1 plus tier 2)6 ratios based
on the guidelines. This practice and the rehabilitation
of PNB and DBP have strengthened banks’ capital
relative to the stock of nonperforming loans (NPLs)
and resulted in higher than the required capital stan-
dard at 10 percent of on-balance-sheet risks as set
by BSP. In 1989, the mandated minimum capital re-
quirements for EKBs and KBs were raised to P1
billion and to P500 million, respectively. Effective
November 1996, the capital requirements for EKBs
and KBs were increased to P4.5 billion and P2.0
billion, correspondingly.
Banks in the Philippines are required to build ad-
equate loan-loss provisions to complement capital in
providing a safeguard against risks and potential
losses. To calculate these, BSP classifies bank loans
into five categories, namely: pass (secured loans with
10 A STUDY OF FINANCIAL MARKETS
○
○
○
○
○
○
○
○
○
○
○
○
○
○
○
○
○
○
○
○
○
○
○
○
○
○
○
○
○
○
○
○
○
○
○
○
○
○
○
○
○
○
○
○
○
○
○
○
○
○
○
○
○
○
○
○
○
○
○
○
○
○
○
○
○
○
○
○
○
○
○
○
○
○
○
○
○
○
○
○
○
○
○
○
no interest arrears and no reduction in principal);
special mention (secured loans with interest arrears
that do not exceed three months, without reduction
in capital); substandard; doubtful; and loss. For sub-
standard loans (secured loans with interest arrears
that do not exceed six months without reduction in
principal) banks are required to build provisions
amounting to 25 percent of the unsecured portion.
Doubtful loans (secured substandard for 12 months
without at least a 20 percent repayment) need an
extra minimum reserve requirement of 50 percent of
the amount of the loan. For loss loans (secured loans
classified as doubtful for 12 months) banks are re-
quired to build additional reserve amounting to 100
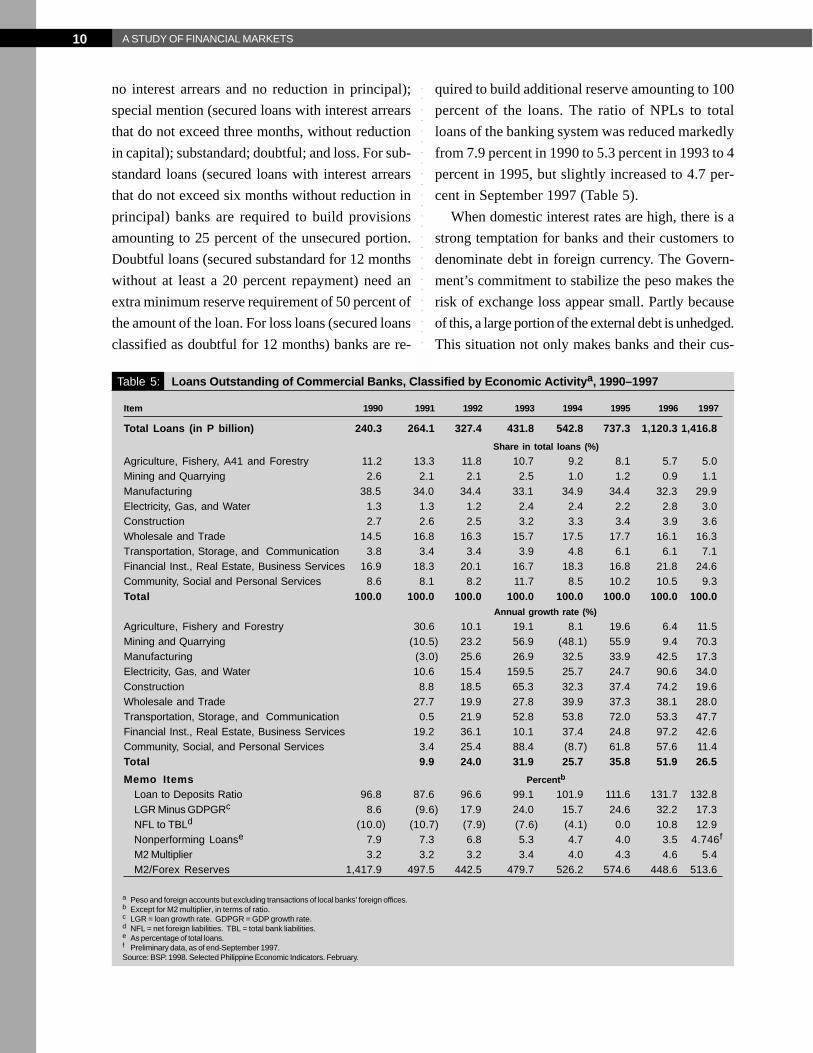
percent of the loans. The ratio of NPLs to total
loans of the banking system was reduced markedly
from 7.9 percent in 1990 to 5.3 percent in 1993 to 4
percent in 1995, but slightly increased to 4.7 per-
cent in September 1997 (Table 5).
When domestic interest rates are high, there is a
strong temptation for banks and their customers to
denominate debt in foreign currency. The Govern-
ment’s commitment to stabilize the peso makes the
risk of exchange loss appear small. Partly because
of this, a large portion of the external debt is unhedged.
This situation not only makes banks and their cus-
Table 5: Loans Outstanding of Commercial Banks, Classified by Economic Activitya, 1990–1997
Item 1990 1991 1992 1993 1994 1995 1996 1997
Total Loans (in P billion) 240.3 264.1 327.4 431.8 542.8 737.3 1,120.3 1,416.8
Share in total loans (%)
Agriculture, Fishery, A41 and Forestry 11.2 13.3 11.8 10.7 9.2 8.1 5.7 5.0Mining and Quarrying 2.6 2.1 2.1 2.5 1.0 1.2 0.9 1.1Manufacturing 38.5 34.0 34.4 33.1 34.9 34.4 32.3 29.9Electricity, Gas, and Water 1.3 1.3 1.2 2.4 2.4 2.2 2.8 3.0Construction 2.7 2.6 2.5 3.2 3.3 3.4 3.9 3.6Wholesale and Trade 14.5 16.8 16.3 15.7 17.5 17.7 16.1 16.3Transportation, Storage, and Communication 3.8 3.4 3.4 3.9 4.8 6.1 6.1 7.1Financial Inst., Real Estate, Business Services 16.9 18.3 20.1 16.7 18.3 16.8 21.8 24.6Community, Social and Personal Services 8.6 8.1 8.2 11.7 8.5 10.2 10.5 9.3Total 100.0 100.0 100.0 100.0 100.0 100.0 100.0 100.0
Annual growth rate (%)
Agriculture, Fishery and Forestry 30.6 10.1 19.1 8.1 19.6 6.4 11.5Mining and Quarrying (10.5) 23.2 56.9 (48.1) 55.9 9.4 70.3Manufacturing (3.0) 25.6 26.9 32.5 33.9 42.5 17.3Electricity, Gas, and Water 10.6 15.4 159.5 25.7 24.7 90.6 34.0Construction 8.8 18.5 65.3 32.3 37.4 74.2 19.6Wholesale and Trade 27.7 19.9 27.8 39.9 37.3 38.1 28.0Transportation, Storage, and Communication 0.5 21.9 52.8 53.8 72.0 53.3 47.7Financial Inst., Real Estate, Business Services 19.2 36.1 10.1 37.4 24.8 97.2 42.6Community, Social, and Personal Services 3.4 25.4 88.4 (8.7) 61.8 57.6 11.4Total 9.9 24.0 31.9 25.7 35.8 51.9 26.5
Memo Items Percentb
Loan to Deposits Ratio 96.8 87.6 96.6 99.1 101.9 111.6 131.7 132.8LGR Minus GDPGRc 8.6 (9.6) 17.9 24.0 15.7 24.6 32.2 17.3NFL to TBLd (10.0) (10.7) (7.9) (7.6) (4.1) 0.0 10.8 12.9Nonperforming Loanse 7.9 7.3 6.8 5.3 4.7 4.0 3.5 4.746f
M2 Multiplier 3.2 3.2 3.2 3.4 4.0 4.3 4.6 5.4M2/Forex Reserves 1,417.9 497.5 442.5 479.7 526.2 574.6 448.6 513.6
a Peso and foreign accounts but excluding transactions of local banks’ foreign offices.b Except for M2 multiplier, in terms of ratio.c LGR = loan growth rate. GDPGR = GDP growth rate.d NFL = net foreign liabilities. TBL = total bank liabilities.e As percentage of total loans.f Preliminary data, as of end-September 1997.Source: BSP. 1998. Selected Philippine Economic Indicators. February.
11ISSUES IN THE MANAGEMENT OF MACROECONOMIC POLICIES IN THE PHILIPPINES
○
○
○
○
○
○
○
○
○
○
○
○
○
○
○
○
○
○
○
○
○
○
○
○
○
○
○
○
○
○
○
○
○
○
○
○
○
○
○
○
○
○
○
○
○
○
○
○
○
○
○
○
○
○
○
○
○
○
○
○
○
○
○
○
○
○
○
○
○
○
○
○
○
○
○
○
○
○
○
○
○
○
○
tal markets, they sell only a portion of the total equity
and retain control of the majority shares of the com-
panies. Business conglomerates in the Philippines,
as in many other Asian countries, are family owned
and controlled. These companies are run by the
founding families who take up the top management
positions rather than give them to professional man-
agers. The availability of low-cost and risk-free loans
during the past financial repression had reduced the
incentive for firms to go public. On the demand side,
market participants are confined to a limited number
of institutional investors made up of large banks, in-
surance companies, and State-controlled pension
funds. Through subsidiaries, the commercial banks
in the Philippines are allowed to engage in capital
market operations. BSP imposes a single limit of 25
percent of the unimpaired capital. In practice, how-
ever, such regulation of the legal lending limit is not
well implemented. The latest example of this is the
recent collapse of Orient Bank because of overlend-
ing to its sister company in the real estate business.
The swift transition to a market-based financial
system and open capital account has not been fol-
lowed by rapid progress in the implementation of pru-
dential rules and regulations. This is partly due to the
structural weaknesses in the legal and accounting
systems (Intal and Llanto 1998). Moreover, after a
long period of financial repression, bank supervisors
and managers often lack the experience and skills
required to supervise and examine the fast-growing
number of banks and rapidly expanding powers of
these institutions. The State-owned financial institu-
tions (e.g., PNB, Land Bank of the Philippines, and
DBP) suffered from erratic Government policies,
such as the shifting of public deposits from these
banks to BSP. After a long era of political intrusion
under the Marcos regime, there is a principal-agent
problem as regulators and supervisors may not be
operating in the public interest. Meanwhile, private
banks belong to business conglomerates and do not
act tough on affiliated companies since they can
expect financial assistance from BSP.
tomers more vulnerable; it also makes it harder for
them to deal with the banking crisis, rise in interest
rates, and sharp devaluation of the peso. The latter
results in deterioration of banks’ and firms’ balance
sheets because much of their debt is denominated in
foreign currencies. The substantial fall of the exter-
nal value of the peso in relation to foreign currencies
rapidly increases the cost of renewing or rolling over
the short-term floating rate of foreign borrowings in
real terms. The indebtedness of domestic banks and
firms rises and their net worth falls. This would be
the case, for example, if domestic banks extend for-
eign currency-denominated loans to local borrowers
for financing activities in the nontraded sector. The
surge in interest rates causes interest payment to
increase, resulting in the deterioration of the balance
sheets of the banks and their customers.
The risks of maturity mismatches are higher for
the unlisted banks, which cannot mobilize long-term
sources of funding (by selling bonds, shares, and other
types of securities) in stock markets. Selling equity
in stock markets can be a way to spread or share the
risks. Those who can issue local currency-denomi-
nated securities (such as stocks) can transfer the
foreign exchange risk to foreign investors. The risks
of maturity mismatches are higher as, again, most
companies in the Philippines rely excessively on bank
loans for financing, with land as the main collateral
for credit. The high loans-to-value ratio of banks to
companies such as property developers has exposed
Philippine banks to sharp declines in real estate prices.
This and the plunge in equity prices depress the mar-
ket value of the collateral and assets of the banks.
The liquidity problem becomes serious because there
is no securitization of mortgages nor a well-developed
secondary market for Government bonds.
The markets for equity and long-term debt instru-
ments are relatively narrow and shallow. On the sup-
ply side, the growth of the capital market is partly
hindered because of the reluctance of family-owned
firms to raise capital by floating equities or debts to
finance their expansion. If they are listed in the capi-
12 A STUDY OF FINANCIAL MARKETS
○
○
○
○
○
○
○
○
○
○
○
○
○
○
○
○
○
○
○
○
○
○
○
○
○
○
○
○
○
○
○
○
○
○
○
○
○
○
○
○
○
○
○
○
○
○
○
○
○
○
○
○
○
○
○
○
○
○
○
○
○
○
○
○
○
○
○
○
○
○
○
○
○
○
○
○
○
○
○
○
○
○
○
○
At present, there is tax discrimination between
income from financial assets and that from real prop-
erty. A 20 percent final withholding tax on interest
income from bank deposits, treasury bills, and other
securities is imposed. In contrast, capital gains on
property accruing to individuals are subject to a tax
of 5 percent of the grossly outdated selling price of
the real property in the assessor’s schedule. For ad-
ministrative efficiency, the authorities in 1981 shifted
to a secular individual income taxation because of
the difficulty of taxing interest income on bank de-
posits and dividend income on a global basis.
Monetary PolicyMonetary policy has been utilized as the main tool to
pursue a short-run stabilization objective in the Phil-
ippines. The policy heavily relies on the use of two
principal instruments, namely: (i) sterilization inter-
vention in the foreign exchange market, and (ii)
change in the mandatory reserve requirement ratio.
Other policy tools include transfer of public sector
deposits between commercial banks and BSP. In
addition, BSP imposes ceilings on both the rate of
credit expansion and sectoral allocation of banks’
credit. This mix of tight monetary policy, despite
greater openness of the financial market and stable
nominal exchange rate, has raised domestic interest
rates higher than those in international markets. The
pressure for higher domestic interest rates has in-
creased further with the shift in Government policy
for financing of public sector deficit from foreign
sources to issuance of Government securities (trea-
sury bills or T-bills), which overcrowded the domes-
tic financial markets.
External Reserves andSterilization OperationsAside from financing a chronic current account defi-
cit, capital inflows to the Philippines have also been
used for accumulating foreign exchange reserves.
Using the balance of payment identity, this can be
written as:
K = CA + R (1)
where: stands for changes, K is capital
inflows, CA is current account deficit, and
R is foreign exchange reserves.
The Government’s commitment to stabilize the
peso exchange rate requires the piling up of foreign
reserves. In 1997, the country held foreign exchange
reserves to cover 2.3 months’ imports or 1.2 times
of its short-term debt. According to some economic
literature (Grilli and Roubini 1992), the need for ex-
ternal reserves increases in line with the rising levels
of national income, import and foreign debt, and with
closer integration of the national economy with the
rest of the world. The latter exposes the economy to
external shocks such as terms of trade changes, re-
alignment of major vehicle currencies in international
trade, contagious effects of currency crises in other
countries, and fluctuations in trade and capital ac-
counts that would cause variability in the balance of
payments. Realignment of major currencies since the
mid-1980s has encouraged the authorities in the Phil-
ippines to diversify the currency composition of its
holding of foreign exchange reserves so as to ease
the burden of rising imports and external debt repay-
ments. To strengthen or raise external liquidity, BSP
has also increased the stock of its standby commer-
cial loans and entered bilateral repurchase agree-
ments with other central banks in the Asia and Pa-
cific region.7
In their study on the Indonesian economy, Woo
and Nasution (1989) argued that the total stock of
the short-term external debt should be counted as
part of debt-service due each year. In their view,
this more inclusive definition provides a better indi-
cator of the short-term external liquidity of the
economy. In a normal case, however, it is unlikely
that the creditor would call in all short-term debt at
once. Calvo (1994) stresses the need to build ex-
ternal reserve to face financial vulnerability because
of financial deepening, particularly the rapid rise in
vulnerable dollar-denominated deposits at local com-
13ISSUES IN THE MANAGEMENT OF MACROECONOMIC POLICIES IN THE PHILIPPINES
○
○
○
○
○
○
○
○
○
○
○
○
○
○
○
○
○
○
○
○
○
○
○
○
○
○
○
○
○
○
○
○
○
○
○
○
○
○
○
○
○
○
○
○
○
○
○
○
○
○
○
○
○
○
○
○
○
○
○
○
○
○
○
○
○
○
○
○
○
○
○
○
○
○
○
○
○
○
○
○
○
○
○
In the early 1980s, CBP issued its own securities,
the central bank certificate of indebtedness (CBCI),
to reduce the excess liquidity created by the CBP
itself as it rescued a number of financially distressed
banks and NBFIs. Their problems originated from a
combination of events. In 1983 the peso was deval-
ued nearly 30 percent as the country’s international
reserves went down to an alarmingly low level. In
October of that year, the Government declared a
moratorium on debt repayment. The problems were
compounded by the flight in 1984 of Dewey Dee, a
Chinese businessman who was heavily indebted to
these financial institutions. All of these, together with
the political uncertainty and the coup attempts, caused
severe bank runs and capital flight. To accommo-
date the surge of withdrawal of deposits and capital
flight, CBP provided special credit facilities (in peso
and foreign exchange) to banks and NBFIs that faced
serious liquidity problems.
The CBCI was a flexible instrument for man-
agement of short-term liquidity as the central bank
itself determines the issuance, auction system,
counterparties, maturities, and settlement rules
(Chandravarkar 1996). The dual issue of the cen-
tral bank and Government securities posed prob-
lems of coordination, segmentation, and compres-
sion in the markets of these two competing finan-
cial assets. The heavy use of CBCI to reduce ex-
cess liquidity represents the expensive interest costs
of the instruments that contributed to CBP losses
in the 1980s. The financial losses not only eroded
the credibility of CBP but also undermined the ef-
fectiveness of monetary policy because of the dan-
ger of monetization of the losses.
The increasing use of Government securities as
an instrument for management of short-term liquid-
ity began in 1986. The restructuring of the central
bank and establishment of Bangko Sentral ng Pilipinas
in 1993 completely changed the use of financial in-
struments for sterilization operations. T-bills are now
the principal instrument for sterilization as BSP
stopped issuing CBCI and mainly used the T-bills it
mercial banks as shown by the rising ratio of M2/
GDP. In a world of fractional reserve banking sys-
tem and implicit deposit insurance, bank deposits
are contingent liabilities of the central bank and the
Government.
Nonsterilized capital inflows allow both nominal
and real peso appreciation to help reduce domestic
interest rates and inflation rates. On the other hand,
when capital inflows fell in July 1997, BSP resorted
to contractionary monetary policy and sold foreign
exchange of about $4 billion to finance the current
account deficit and defend the peso. Subsequently,
the running down of foreign exchange reserves re-
duced the monetary base and hence the money sup-
ply, and raised domestic interest rates and their dif-
ferentials with foreign rates. Formally, the identity of
the monetary base is
B = D + R (2)
where: stands for changes, B is monetary
base (currency plus commercial bank re-
serves at the central bank), D is domestic
credit of the central bank (to Government,
commercial banks, and business sector), and
R, again, is foreign exchange reserves.
Accumulation of external reserves is paid by
money created by the central bank. To keep the
monetary base constant, the monetary authorities can
reduce domestic credit or deposit money banks loans
by an equivalent amount. Such operation is called
sterilization as the central bank does not allow the
accumulation of the external reserves to be carried
over to the monetary base and money supply. The
operation changes only the balance between the do-
mestic credit component and reserve component of
the monetary base, keeping the supply of monetary
base or money supply constant. Thus, using identity
(2), if a ceiling on B is imposed, then an increase in
R is sterilized by decreasing D. D can be re-
duced if the public sector and commercial banks re-
duce their borrowings from the central bank or in-
crease their savings deposits in it.
14 A STUDY OF FINANCIAL MARKETS
○
○
○
○
○
○
○
○
○
○
○
○
○
○
○
○
○
○
○
○
○
○
○
○
○
○
○
○
○
○
○
○
○
○
○
○
○
○
○
○
○
○
○
○
○
○
○
○
○
○
○
○
○
○
○
○
○
○
○
○
○
○
○
○
○
○
○
○
○
○
○
○
○
○
○
○
○
○
○
○
○
○
○
○
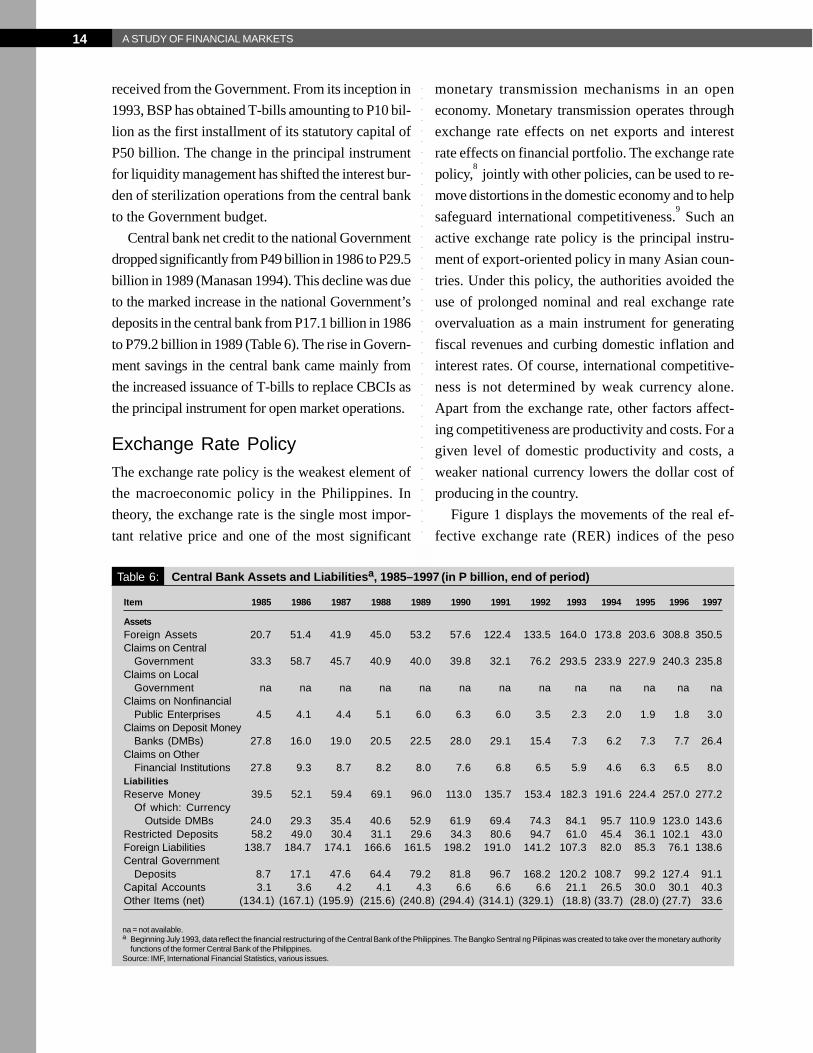
received from the Government. From its inception in
1993, BSP has obtained T-bills amounting to P10 bil-
lion as the first installment of its statutory capital of
P50 billion. The change in the principal instrument
for liquidity management has shifted the interest bur-
den of sterilization operations from the central bank
to the Government budget.
Central bank net credit to the national Government
dropped significantly from P49 billion in 1986 to P29.5
billion in 1989 (Manasan 1994). This decline was due
to the marked increase in the national Government’s
deposits in the central bank from P17.1 billion in 1986
to P79.2 billion in 1989 (Table 6). The rise in Govern-
ment savings in the central bank came mainly from
the increased issuance of T-bills to replace CBCIs as
the principal instrument for open market operations.
Exchange Rate PolicyThe exchange rate policy is the weakest element of
the macroeconomic policy in the Philippines. In
theory, the exchange rate is the single most impor-
tant relative price and one of the most significant
monetary transmission mechanisms in an open
economy. Monetary transmission operates through
exchange rate effects on net exports and interest
rate effects on financial portfolio. The exchange rate
policy,8 jointly with other policies, can be used to re-
move distortions in the domestic economy and to help
safeguard international competitiveness.9 Such an
active exchange rate policy is the principal instru-
ment of export-oriented policy in many Asian coun-
tries. Under this policy, the authorities avoided the
use of prolonged nominal and real exchange rate
overvaluation as a main instrument for generating
fiscal revenues and curbing domestic inflation and
interest rates. Of course, international competitive-
ness is not determined by weak currency alone.
Apart from the exchange rate, other factors affect-
ing competitiveness are productivity and costs. For a
given level of domestic productivity and costs, a
weaker national currency lowers the dollar cost of
producing in the country.
Figure 1 displays the movements of the real ef-
fective exchange rate (RER) indices of the peso
Table 6: Central Bank Assets and Liabilitiesa, 1985–1997 (in P billion, end of period)
Item 1985 1986 1987 1988 1989 1990 1991 1992 1993 1994 1995 1996 1997
AssetsForeign Assets 20.7 51.4 41.9 45.0 53.2 57.6 122.4 133.5 164.0 173.8 203.6 308.8 350.5Claims on Central
Government 33.3 58.7 45.7 40.9 40.0 39.8 32.1 76.2 293.5 233.9 227.9 240.3 235.8Claims on Local
Government na na na na na na na na na na na na naClaims on Nonfinancial
Public Enterprises 4.5 4.1 4.4 5.1 6.0 6.3 6.0 3.5 2.3 2.0 1.9 1.8 3.0Claims on Deposit Money
Banks (DMBs) 27.8 16.0 19.0 20.5 22.5 28.0 29.1 15.4 7.3 6.2 7.3 7.7 26.4Claims on Other
Financial Institutions 27.8 9.3 8.7 8.2 8.0 7.6 6.8 6.5 5.9 4.6 6.3 6.5 8.0LiabilitiesReserve Money 39.5 52.1 59.4 69.1 96.0 113.0 135.7 153.4 182.3 191.6 224.4 257.0 277.2
Of which: CurrencyOutside DMBs 24.0 29.3 35.4 40.6 52.9 61.9 69.4 74.3 84.1 95.7 110.9 123.0 143.6
Restricted Deposits 58.2 49.0 30.4 31.1 29.6 34.3 80.6 94.7 61.0 45.4 36.1 102.1 43.0Foreign Liabilities 138.7 184.7 174.1 166.6 161.5 198.2 191.0 141.2 107.3 82.0 85.3 76.1 138.6Central Government
Deposits 8.7 17.1 47.6 64.4 79.2 81.8 96.7 168.2 120.2 108.7 99.2 127.4 91.1Capital Accounts 3.1 3.6 4.2 4.1 4.3 6.6 6.6 6.6 21.1 26.5 30.0 30.1 40.3Other Items (net) (134.1) (167.1) (195.9) (215.6) (240.8) (294.4) (314.1) (329.1) (18.8) (33.7) (28.0) (27.7) 33.6
na = not available.a Beginning July 1993, data reflect the financial restructuring of the Central Bank of the Philippines. The Bangko Sentral ng Pilipinas was created to take over the monetary authority
functions of the former Central Bank of the Philippines.Source: IMF, International Financial Statistics, various issues.
15ISSUES IN THE MANAGEMENT OF MACROECONOMIC POLICIES IN THE PHILIPPINES
○
○
○
○
○
○
○
○
○
○
○
○
○
○
○
○
○
○
○
○
○
○
○
○
○
○
○
○
○
○
○
○
○
○
○
○
○
○
○
○
○
○
○
○
○
○
○
○
○
○
○
○
○
○
○
○
○
○
○
○
○
○
○
○
○
○
○
○
○
○
○
○
○
○
○
○
○
○
○
○
○
○
○
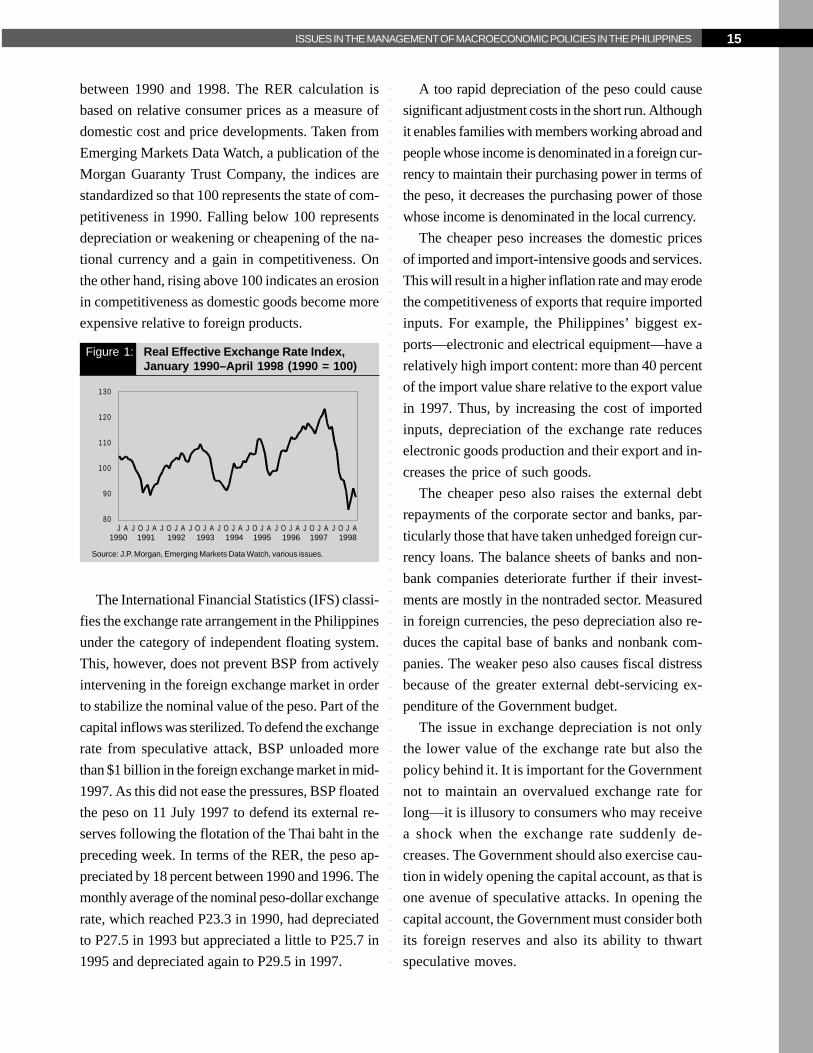
between 1990 and 1998. The RER calculation is
based on relative consumer prices as a measure of
domestic cost and price developments. Taken from
Emerging Markets Data Watch, a publication of the
Morgan Guaranty Trust Company, the indices are
standardized so that 100 represents the state of com-
petitiveness in 1990. Falling below 100 represents
depreciation or weakening or cheapening of the na-
tional currency and a gain in competitiveness. On
the other hand, rising above 100 indicates an erosion
in competitiveness as domestic goods become more
expensive relative to foreign products.
The International Financial Statistics (IFS) classi-
fies the exchange rate arrangement in the Philippines
under the category of independent floating system.
This, however, does not prevent BSP from actively
intervening in the foreign exchange market in order
to stabilize the nominal value of the peso. Part of the
capital inflows was sterilized. To defend the exchange
rate from speculative attack, BSP unloaded more
than $1 billion in the foreign exchange market in mid-
1997. As this did not ease the pressures, BSP floated
the peso on 11 July 1997 to defend its external re-
serves following the flotation of the Thai baht in the
preceding week. In terms of the RER, the peso ap-
preciated by 18 percent between 1990 and 1996. The
monthly average of the nominal peso-dollar exchange
rate, which reached P23.3 in 1990, had depreciated
to P27.5 in 1993 but appreciated a little to P25.7 in
1995 and depreciated again to P29.5 in 1997.
A too rapid depreciation of the peso could cause
significant adjustment costs in the short run. Although
it enables families with members working abroad and
people whose income is denominated in a foreign cur-
rency to maintain their purchasing power in terms of
the peso, it decreases the purchasing power of those
whose income is denominated in the local currency.
The cheaper peso increases the domestic prices
of imported and import-intensive goods and services.
This will result in a higher inflation rate and may erode
the competitiveness of exports that require imported
inputs. For example, the Philippines’ biggest ex-
ports—electronic and electrical equipment—have a
relatively high import content: more than 40 percent
of the import value share relative to the export value
in 1997. Thus, by increasing the cost of imported
inputs, depreciation of the exchange rate reduces
electronic goods production and their export and in-
creases the price of such goods.
The cheaper peso also raises the external debt
repayments of the corporate sector and banks, par-
ticularly those that have taken unhedged foreign cur-
rency loans. The balance sheets of banks and non-
bank companies deteriorate further if their invest-
ments are mostly in the nontraded sector. Measured
in foreign currencies, the peso depreciation also re-
duces the capital base of banks and nonbank com-
panies. The weaker peso also causes fiscal distress
because of the greater external debt-servicing ex-
penditure of the Government budget.
The issue in exchange depreciation is not only
the lower value of the exchange rate but also the
policy behind it. It is important for the Government
not to maintain an overvalued exchange rate for
long—it is illusory to consumers who may receive
a shock when the exchange rate suddenly de-
creases. The Government should also exercise cau-
tion in widely opening the capital account, as that is
one avenue of speculative attacks. In opening the
capital account, the Government must consider both
its foreign reserves and also its ability to thwart
speculative moves.
Figure 1: Real Effective Exchange Rate Index,January 1990–April 1998 (1990 = 100)
Source: J.P. Morgan, Emerging Markets Data Watch, various issues.
J A J O J A J O J A J O J A J O J A J O J A J O J A J O J A J O J A80
90
100
110
120
130
1990 1991 1992 1993 1994 1995 1996 1997 1998
16 A STUDY OF FINANCIAL MARKETS
○
○
○
○
○
○
○
○
○
○
○
○
○
○
○
○
○
○
○
○
○
○
○
○
○
○
○
○
○
○
○
○
○
○
○
○
○
○
○
○
○
○
○
○
○
○
○
○
○
○
○
○
○
○
○
○
○
○
○
○
○
○
○
○
○
○
○
○
○
○
○
○
○
○
○
○
○
○
○
○
○
○
○
○
Policy to Reduce Interest RatesThe high interest rate policy was implemented dur-
ing the stabilization period in 1991–1992. The stabili-
zation program included sterilization of capital inflows.
This operation, however, entails high domestic inter-
est rates, thus driving a large wedge between do-
mestic and international interest rates, and subse-
quently creating an additional incentive for banks and
the corporate sector to borrow overseas. The float-
ing of the peso since July 1997 has also contributed
to the high domestic interest rates. To reduce the
interest rate differentials, in July 1997 BSP applied a
30 percent reserve requirement against the foreign
currency deposits of banks.
To bring down the intermediation cost of banks
and, ultimately, interest rates, BSP reduced the re-
serve requirement ratio seven times during 1993–
1997. The mandatory ratio for peso deposit liabilities
and deposit substitutes was lowered from 24 per-
cent in 1993 to 15 percent by May 1995, further down
to 14 percent effective from January 1997 and to 13
percent effective from 4 July 1997. On top of the
mandatory reserve ratio, the banks are also required
to maintain an additional 2 percent reserve in the
form of short-term market yielding Government se-
curities (STMY-GS). Effective 15 June 1995, the
common trust funds are subject to a 10 percent re-
serve ratio, excluding the required reserves that may
be maintained in the form of STMY-GS: 4 percent
effective 3 January 1997 and 3 percent beginning 4
July 1997. A minimum of 25 percent of the reserve
ratios for both peso deposit liabilities and common
trust funds has to be deposited with BSP, earning no
interest; the balance is held in vaults and as Govern-
ment securities.
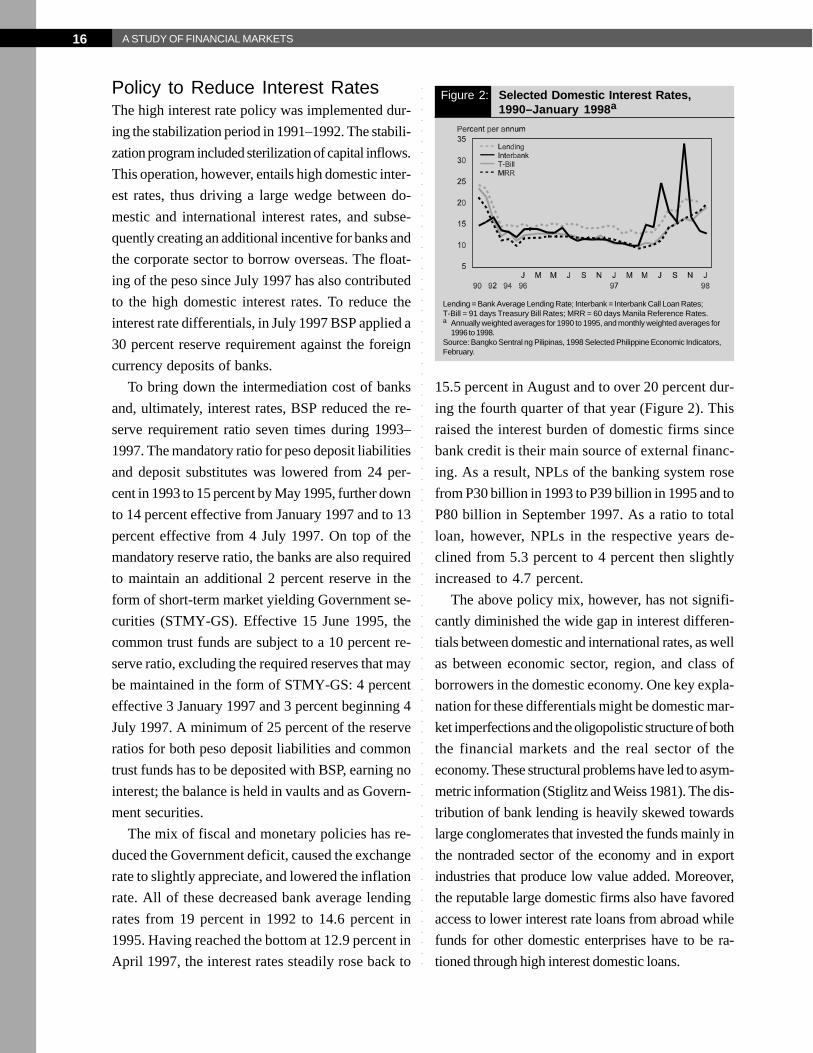
The mix of fiscal and monetary policies has re-
duced the Government deficit, caused the exchange
rate to slightly appreciate, and lowered the inflation
rate. All of these decreased bank average lending
rates from 19 percent in 1992 to 14.6 percent in
1995. Having reached the bottom at 12.9 percent in
April 1997, the interest rates steadily rose back to
15.5 percent in August and to over 20 percent dur-
ing the fourth quarter of that year (Figure 2). This
raised the interest burden of domestic firms since
bank credit is their main source of external financ-
ing. As a result, NPLs of the banking system rose
from P30 billion in 1993 to P39 billion in 1995 and to
P80 billion in September 1997. As a ratio to total
loan, however, NPLs in the respective years de-
clined from 5.3 percent to 4 percent then slightly
increased to 4.7 percent.
The above policy mix, however, has not signifi-
cantly diminished the wide gap in interest differen-
tials between domestic and international rates, as well
as between economic sector, region, and class of
borrowers in the domestic economy. One key expla-
nation for these differentials might be domestic mar-
ket imperfections and the oligopolistic structure of both
the financial markets and the real sector of the
economy. These structural problems have led to asym-
metric information (Stiglitz and Weiss 1981). The dis-
tribution of bank lending is heavily skewed towards
large conglomerates that invested the funds mainly in
the nontraded sector of the economy and in export
industries that produce low value added. Moreover,
the reputable large domestic firms also have favored
access to lower interest rate loans from abroad while
funds for other domestic enterprises have to be ra-
tioned through high interest domestic loans.
Figure 2: Selected Domestic Interest Rates,1990–January 1998a
Lending = Bank Average Lending Rate; Interbank = Interbank Call Loan Rates;T-Bill = 91 days Treasury Bill Rates; MRR = 60 days Manila Reference Rates.a Annually weighted averages for 1990 to 1995, and monthly weighted averages for
1996 to 1998.Source: Bangko Sentral ng Pilipinas, 1998 Selected Philippine Economic Indicators,February.
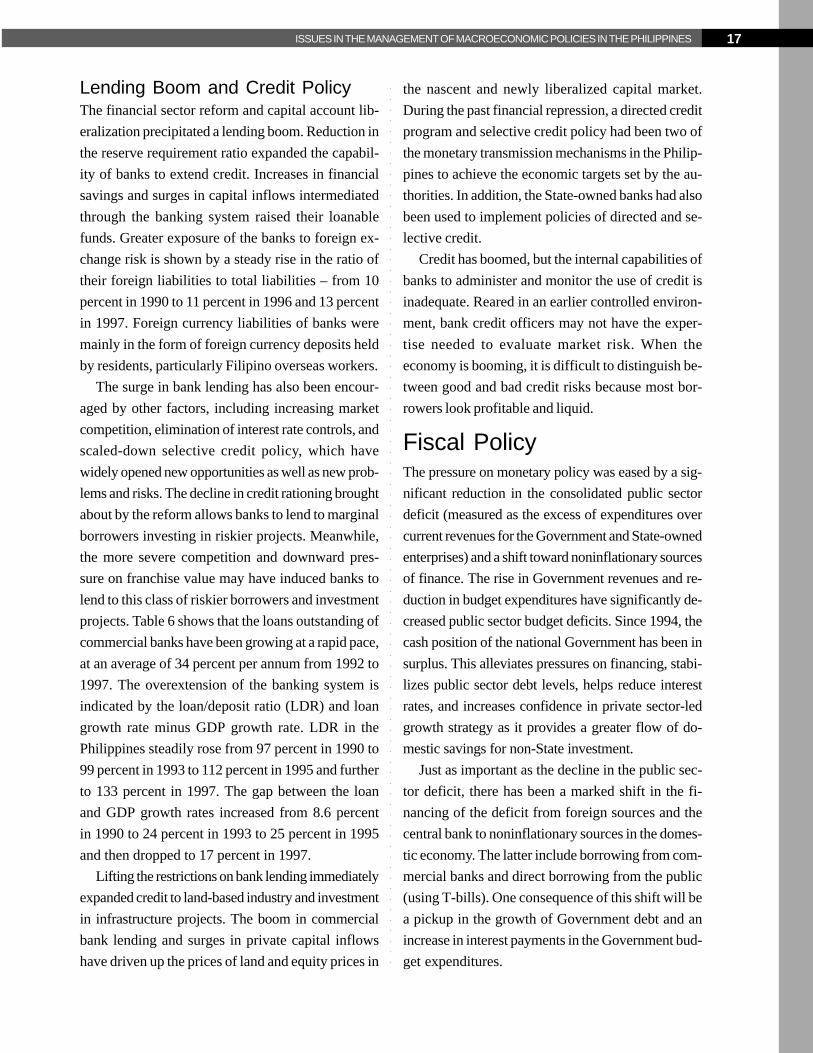
17ISSUES IN THE MANAGEMENT OF MACROECONOMIC POLICIES IN THE PHILIPPINES
○
○
○
○
○
○
○
○
○
○
○
○
○
○
○
○
○
○
○
○
○
○
○
○
○
○
○
○
○
○
○
○
○
○
○
○
○
○
○
○
○
○
○
○
○
○
○
○
○
○
○
○
○
○
○
○
○
○
○
○
○
○
○
○
○
○
○
○
○
○
○
○
○
○
○
○
○
○
○
○
○
○
○
Lending Boom and Credit PolicyThe financial sector reform and capital account lib-
eralization precipitated a lending boom. Reduction in
the reserve requirement ratio expanded the capabil-
ity of banks to extend credit. Increases in financial
savings and surges in capital inflows intermediated
through the banking system raised their loanable
funds. Greater exposure of the banks to foreign ex-
change risk is shown by a steady rise in the ratio of
their foreign liabilities to total liabilities – from 10
percent in 1990 to 11 percent in 1996 and 13 percent
in 1997. Foreign currency liabilities of banks were
mainly in the form of foreign currency deposits held
by residents, particularly Filipino overseas workers.
The surge in bank lending has also been encour-
aged by other factors, including increasing market
competition, elimination of interest rate controls, and
scaled-down selective credit policy, which have
widely opened new opportunities as well as new prob-
lems and risks. The decline in credit rationing brought
about by the reform allows banks to lend to marginal
borrowers investing in riskier projects. Meanwhile,
the more severe competition and downward pres-
sure on franchise value may have induced banks to
lend to this class of riskier borrowers and investment
projects. Table 6 shows that the loans outstanding of
commercial banks have been growing at a rapid pace,
at an average of 34 percent per annum from 1992 to
1997. The overextension of the banking system is
indicated by the loan/deposit ratio (LDR) and loan
growth rate minus GDP growth rate. LDR in the
Philippines steadily rose from 97 percent in 1990 to
99 percent in 1993 to 112 percent in 1995 and further
to 133 percent in 1997. The gap between the loan
and GDP growth rates increased from 8.6 percent
in 1990 to 24 percent in 1993 to 25 percent in 1995
and then dropped to 17 percent in 1997.
Lifting the restrictions on bank lending immediately
expanded credit to land-based industry and investment
in infrastructure projects. The boom in commercial
bank lending and surges in private capital inflows
have driven up the prices of land and equity prices in
the nascent and newly liberalized capital market.
During the past financial repression, a directed credit
program and selective credit policy had been two of
the monetary transmission mechanisms in the Philip-
pines to achieve the economic targets set by the au-
thorities. In addition, the State-owned banks had also
been used to implement policies of directed and se-
lective credit.
Credit has boomed, but the internal capabilities of
banks to administer and monitor the use of credit is
inadequate. Reared in an earlier controlled environ-
ment, bank credit officers may not have the exper-
tise needed to evaluate market risk. When the
economy is booming, it is difficult to distinguish be-
tween good and bad credit risks because most bor-
rowers look profitable and liquid.
Fiscal PolicyThe pressure on monetary policy was eased by a sig-
nificant reduction in the consolidated public sector
deficit (measured as the excess of expenditures over
current revenues for the Government and State-owned
enterprises) and a shift toward noninflationary sources
of finance. The rise in Government revenues and re-
duction in budget expenditures have significantly de-
creased public sector budget deficits. Since 1994, the
cash position of the national Government has been in
surplus. This alleviates pressures on financing, stabi-
lizes public sector debt levels, helps reduce interest
rates, and increases confidence in private sector-led
growth strategy as it provides a greater flow of do-
mestic savings for non-State investment.
Just as important as the decline in the public sec-
tor deficit, there has been a marked shift in the fi-
nancing of the deficit from foreign sources and the
central bank to noninflationary sources in the domes-
tic economy. The latter include borrowing from com-
mercial banks and direct borrowing from the public
(using T-bills). One consequence of this shift will be
a pickup in the growth of Government debt and an
increase in interest payments in the Government bud-
get expenditures.
18 A STUDY OF FINANCIAL MARKETS
○
○
○
○
○
○
○
○
○
○
○
○
○
○
○
○
○
○
○
○
○
○
○
○
○
○
○
○
○
○
○
○
○
○
○
○
○
○
○
○
○
○
○
○
○
○
○
○
○
○
○
○
○
○
○
○
○
○
○
○
○
○
○
○
○
○
○
○
○
○
○
○
○
○
○
○
○
○
○
○
○
○
○
○
Government RevenuesThe rise in Government revenues as a share of GDP
comes from four sources. First, the more rapid eco-
nomic growth has expanded the tax base. Second,
proceeds have come from the privatization of State-
owned enterprises. Third, the comprehensive tax
policy reform, first introduced in 1986, has broad-
ened the tax base further. Fourth, better tax adminis-
tration has led to improvement in compliance. The
tax reform concurrently helps eliminate distortions,
raises economic efficiency, and improves sectoral
allocation of economic resources.
The corporate and individual income taxes have
been the workhorse of the tax reform in the Philip-
pines, generating over 32 percent of revenue since
the early 1990s. Introduced in 1988, the VAT has
contributed to over 13 percent of total tax revenues
since 1991. The VAT rebates are increasing in line
with the export performance of the Philippines, par-
ticularly the processing trade, which is exempted from
the VAT. Concerned about the rising level of rebates,
the authorities have undertaken more thorough veri-
fication because of suspicion of widespread fraud.
To improve tax revenue collections, the recent tax
reform bills are widening the tax base by closing cer-
tain loopholes and improving compliance by strength-
ening tax administration and the credibility of Gov-
ernment to prosecute tax delinquents. Legislated in
1996 and 1997, the comprehensive tax reform cov-
ers domestic taxes, such as excise duties and corpo-
rate and individual income taxes. The increased rev-
enues generated from domestic taxes are expected
to replace the losses in custom revenues due to the
tariff reform program, which provides for a low uni-
form tariff rate of 5 percent by the year 2004. The
investment law of the Philippines, however, still of-
fers a variety of tax incentives for new investors,
such as import duty exemptions and tax holidays.
ExpendituresThe desire to reduce or eliminate the budget deficit,
amid the decline in revenue as a share of GDP, has
meant strong pressure to keep budgetary expendi-
tures under control. Subsidies to State-owned enter-
prises and demand for public investment have been
significantly reduced with the privatization of these
enterprises and the adoption of policies to attract pri-
vate investment in education, health, and public utili-
ties. However, mainly because of the existence of
externalities, the involvement of the private sector in
certain activities and sectors may be neither possible
nor desirable. Most rural infrastructure, including
roads, sanitation, basic education and extension ser-
vices, irrigation, and water supply fall under this cat-
egory. The Government will have to remain a key
investor in this sector to promote rural development
and channel the benefits of development to the poor.
Mainly because of the sharp increase in interest
payments, national Government expenditures, mea-
sured as a percentage of GNP, rose from 13.4 per-
cent in 1986 to 16.3 percent in 1987 and since then
stabilized at about 17 to 19 percent from 1990 to
1997 (Table 7). At present, interest rates, personnel,
and allotments to local government units account for
about two thirds of the budgetary expenditures of
the national Government. Personnel expenditures
have been stable at about 6 percent of GNP. In 1994,
these expenditures accounted for 35 percent of the
current expenditures and 29 percent of the total ex-
penditures of the central Government. The authori-
ties have drawn up a plan for a civil service reform
that will help contain the growth of personnel expen-
ditures in the Government budget.
A number of present Government programs will
potentially put pressure on its future expenditures.
Pressure will come from (i) the possibly large stock
and flow losses associated with housing loans under
various public programs of the Unified Home Lend-
ing Program (UHLP); (ii) implicit pension debt of
social security unless the authorities take corrective
measures to address the causes of decline in funding
levels to face the coming demographic transition;
(iii) the unfunded compulsory health care insurance
program, which covers a large segment of society;
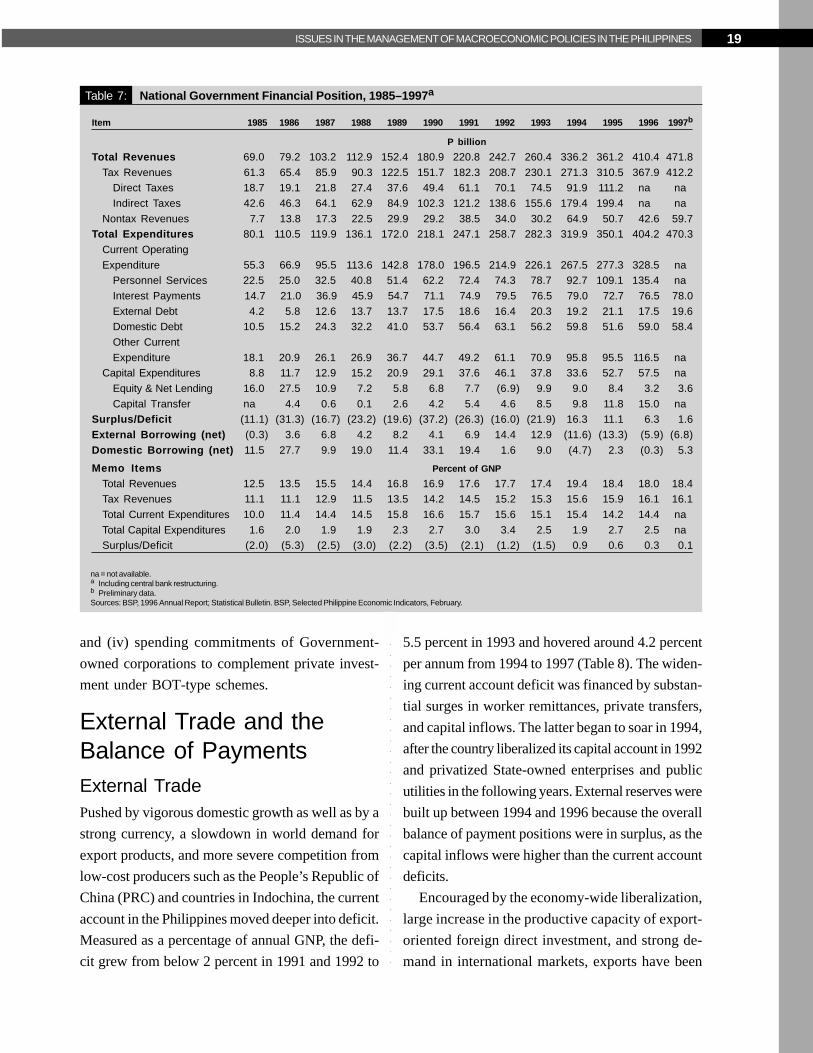
19ISSUES IN THE MANAGEMENT OF MACROECONOMIC POLICIES IN THE PHILIPPINES
○
○
○
○
○
○
○
○
○
○
○
○
○
○
○
○
○
○
○
○
○
○
○
○
○
○
○
○
○
○
○
○
○
○
○
○
○
○
○
○
○
○
○
○
○
○
○
○
○
○
○
○
○
○
○
○
○
○
○
○
○
○
○
○
○
○
○
○
○
○
○
○
○
○
○
○
○
○
○
○
○
○
○
and (iv) spending commitments of Government-
owned corporations to complement private invest-
ment under BOT-type schemes.
External Trade and theBalance of PaymentsExternal TradePushed by vigorous domestic growth as well as by a
strong currency, a slowdown in world demand for
export products, and more severe competition from
low-cost producers such as the People’s Republic of
China (PRC) and countries in Indochina, the current
account in the Philippines moved deeper into deficit.
Measured as a percentage of annual GNP, the defi-
cit grew from below 2 percent in 1991 and 1992 to
5.5 percent in 1993 and hovered around 4.2 percent
per annum from 1994 to 1997 (Table 8). The widen-
ing current account deficit was financed by substan-
tial surges in worker remittances, private transfers,
and capital inflows. The latter began to soar in 1994,
after the country liberalized its capital account in 1992
and privatized State-owned enterprises and public
utilities in the following years. External reserves were
built up between 1994 and 1996 because the overall
balance of payment positions were in surplus, as the
capital inflows were higher than the current account
deficits.
Encouraged by the economy-wide liberalization,
large increase in the productive capacity of export-
oriented foreign direct investment, and strong de-
mand in international markets, exports have been
Table 7: National Government Financial Position, 1985–1997a
Item 1985 1986 1987 1988 1989 1990 1991 1992 1993 1994 1995 1996 1997b
P billion
Total Revenues 69.0 79.2 103.2 112.9 152.4 180.9 220.8 242.7 260.4 336.2 361.2 410.4 471.8
Tax Revenues 61.3 65.4 85.9 90.3 122.5 151.7 182.3 208.7 230.1 271.3 310.5 367.9 412.2Direct Taxes 18.7 19.1 21.8 27.4 37.6 49.4 61.1 70.1 74.5 91.9 111.2 na na
Indirect Taxes 42.6 46.3 64.1 62.9 84.9 102.3 121.2 138.6 155.6 179.4 199.4 na na
Nontax Revenues 7.7 13.8 17.3 22.5 29.9 29.2 38.5 34.0 30.2 64.9 50.7 42.6 59.7Total Expenditures 80.1 110.5 119.9 136.1 172.0 218.1 247.1 258.7 282.3 319.9 350.1 404.2 470.3
Current Operating
Expenditure 55.3 66.9 95.5 113.6 142.8 178.0 196.5 214.9 226.1 267.5 277.3 328.5 naPersonnel Services 22.5 25.0 32.5 40.8 51.4 62.2 72.4 74.3 78.7 92.7 109.1 135.4 na
Interest Payments 14.7 21.0 36.9 45.9 54.7 71.1 74.9 79.5 76.5 79.0 72.7 76.5 78.0
External Debt 4.2 5.8 12.6 13.7 13.7 17.5 18.6 16.4 20.3 19.2 21.1 17.5 19.6Domestic Debt 10.5 15.2 24.3 32.2 41.0 53.7 56.4 63.1 56.2 59.8 51.6 59.0 58.4
Other Current
Expenditure 18.1 20.9 26.1 26.9 36.7 44.7 49.2 61.1 70.9 95.8 95.5 116.5 naCapital Expenditures 8.8 11.7 12.9 15.2 20.9 29.1 37.6 46.1 37.8 33.6 52.7 57.5 na
Equity & Net Lending 16.0 27.5 10.9 7.2 5.8 6.8 7.7 (6.9) 9.9 9.0 8.4 3.2 3.6
Capital Transfer na 4.4 0.6 0.1 2.6 4.2 5.4 4.6 8.5 9.8 11.8 15.0 naSurplus/Deficit (11.1) (31.3) (16.7) (23.2) (19.6) (37.2) (26.3) (16.0) (21.9) 16.3 11.1 6.3 1.6
External Borrowing (net) (0.3) 3.6 6.8 4.2 8.2 4.1 6.9 14.4 12.9 (11.6) (13.3) (5.9) (6.8)
Domestic Borrowing (net) 11.5 27.7 9.9 19.0 11.4 33.1 19.4 1.6 9.0 (4.7) 2.3 (0.3) 5.3
Memo Items Percent of GNP
Total Revenues 12.5 13.5 15.5 14.4 16.8 16.9 17.6 17.7 17.4 19.4 18.4 18.0 18.4Tax Revenues 11.1 11.1 12.9 11.5 13.5 14.2 14.5 15.2 15.3 15.6 15.9 16.1 16.1
Total Current Expenditures 10.0 11.4 14.4 14.5 15.8 16.6 15.7 15.6 15.1 15.4 14.2 14.4 na
Total Capital Expenditures 1.6 2.0 1.9 1.9 2.3 2.7 3.0 3.4 2.5 1.9 2.7 2.5 naSurplus/Deficit (2.0) (5.3) (2.5) (3.0) (2.2) (3.5) (2.1) (1.2) (1.5) 0.9 0.6 0.3 0.1
na = not available.a Including central bank restructuring.b Preliminary data.Sources: BSP, 1996 Annual Report; Statistical Bulletin. BSP, Selected Philippine Economic Indicators, February.
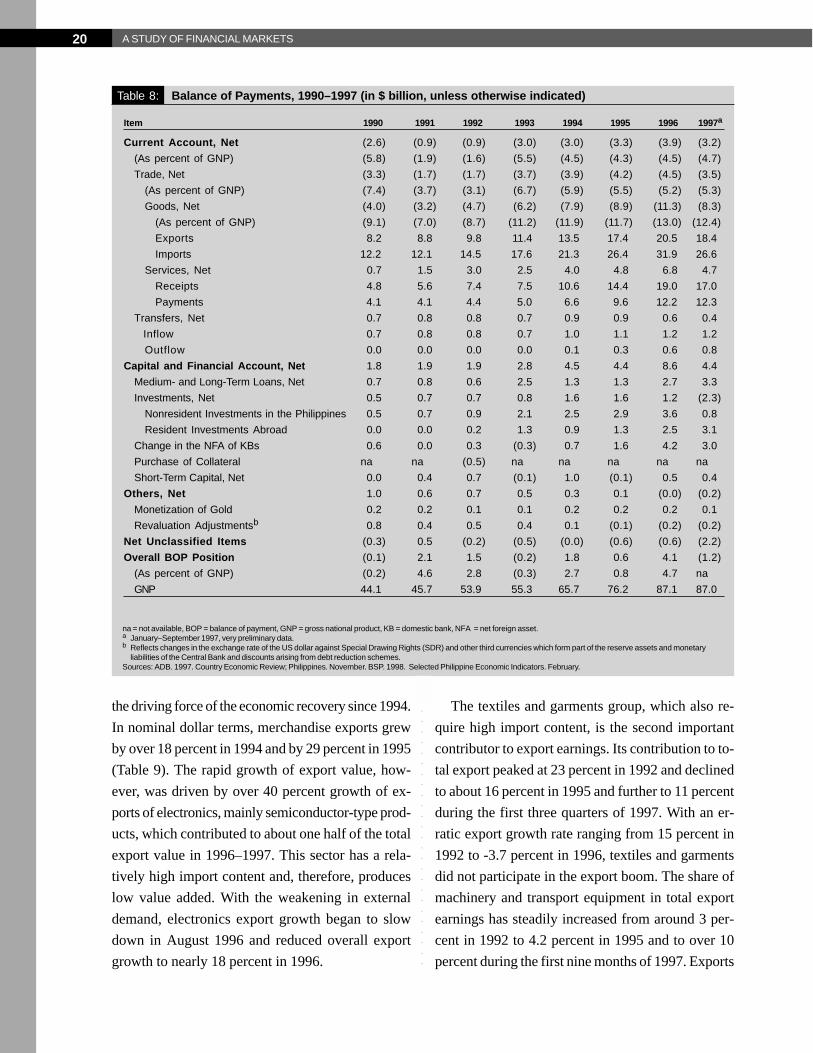
20 A STUDY OF FINANCIAL MARKETS
○
○
○
○
○
○
○
○
○
○
○
○
○
○
○
○
○
○
○
○
○
○
○
○
○
○
○
○
○
○
○
○
○
○
○
○
○
○
○
○
○
○
○
○
○
○
○
○
○
○
○
○
○
○
○
○
○
○
○
○
○
○
○
○
○
○
○
○
○
○
○
○
○
○
○
○
○
○
○
○
○
○
○
○
Table 8: Balance of Payments, 1990–1997 (in $ billion, unless otherwise indicated)
Item 1990 1991 1992 1993 1994 1995 1996 1997a
Current Account, Net (2.6) (0.9) (0.9) (3.0) (3.0) (3.3) (3.9) (3.2)
(As percent of GNP) (5.8) (1.9) (1.6) (5.5) (4.5) (4.3) (4.5) (4.7)
Trade, Net (3.3) (1.7) (1.7) (3.7) (3.9) (4.2) (4.5) (3.5)
(As percent of GNP) (7.4) (3.7) (3.1) (6.7) (5.9) (5.5) (5.2) (5.3)
Goods, Net (4.0) (3.2) (4.7) (6.2) (7.9) (8.9) (11.3) (8.3)
(As percent of GNP) (9.1) (7.0) (8.7) (11.2) (11.9) (11.7) (13.0) (12.4)
Exports 8.2 8.8 9.8 11.4 13.5 17.4 20.5 18.4
Imports 12.2 12.1 14.5 17.6 21.3 26.4 31.9 26.6
Services, Net 0.7 1.5 3.0 2.5 4.0 4.8 6.8 4.7
Receipts 4.8 5.6 7.4 7.5 10.6 14.4 19.0 17.0
Payments 4.1 4.1 4.4 5.0 6.6 9.6 12.2 12.3
Transfers, Net 0.7 0.8 0.8 0.7 0.9 0.9 0.6 0.4
Inflow 0.7 0.8 0.8 0.7 1.0 1.1 1.2 1.2
Outflow 0.0 0.0 0.0 0.0 0.1 0.3 0.6 0.8
Capital and Financial Account, Net 1.8 1.9 1.9 2.8 4.5 4.4 8.6 4.4
Medium- and Long-Term Loans, Net 0.7 0.8 0.6 2.5 1.3 1.3 2.7 3.3
Investments, Net 0.5 0.7 0.7 0.8 1.6 1.6 1.2 (2.3)
Nonresident Investments in the Philippines 0.5 0.7 0.9 2.1 2.5 2.9 3.6 0.8
Resident Investments Abroad 0.0 0.0 0.2 1.3 0.9 1.3 2.5 3.1
Change in the NFA of KBs 0.6 0.0 0.3 (0.3) 0.7 1.6 4.2 3.0
Purchase of Collateral na na (0.5) na na na na na
Short-Term Capital, Net 0.0 0.4 0.7 (0.1) 1.0 (0.1) 0.5 0.4
Others, Net 1.0 0.6 0.7 0.5 0.3 0.1 (0.0) (0.2)
Monetization of Gold 0.2 0.2 0.1 0.1 0.2 0.2 0.2 0.1
Revaluation Adjustmentsb 0.8 0.4 0.5 0.4 0.1 (0.1) (0.2) (0.2)
Net Unclassified Items (0.3) 0.5 (0.2) (0.5) (0.0) (0.6) (0.6) (2.2)
Overall BOP Position (0.1) 2.1 1.5 (0.2) 1.8 0.6 4.1 (1.2)
(As percent of GNP) (0.2) 4.6 2.8 (0.3) 2.7 0.8 4.7 na
GNP 44.1 45.7 53.9 55.3 65.7 76.2 87.1 87.0
na = not available, BOP = balance of payment, GNP = gross national product, KB = domestic bank, NFA = net foreign asset.a January–September 1997, very preliminary data.b Reflects changes in the exchange rate of the US dollar against Special Drawing Rights (SDR) and other third currencies which form part of the reserve assets and monetary
liabilities of the Central Bank and discounts arising from debt reduction schemes.Sources: ADB. 1997. Country Economic Review; Philippines. November. BSP. 1998. Selected Philippine Economic Indicators. February.
the driving force of the economic recovery since 1994.
In nominal dollar terms, merchandise exports grew
by over 18 percent in 1994 and by 29 percent in 1995
(Table 9). The rapid growth of export value, how-
ever, was driven by over 40 percent growth of ex-
ports of electronics, mainly semiconductor-type prod-
ucts, which contributed to about one half of the total
export value in 1996–1997. This sector has a rela-
tively high import content and, therefore, produces
low value added. With the weakening in external
demand, electronics export growth began to slow
down in August 1996 and reduced overall export
growth to nearly 18 percent in 1996.
The textiles and garments group, which also re-
quire high import content, is the second important
contributor to export earnings. Its contribution to to-
tal export peaked at 23 percent in 1992 and declined
to about 16 percent in 1995 and further to 11 percent
during the first three quarters of 1997. With an er-
ratic export growth rate ranging from 15 percent in
1992 to -3.7 percent in 1996, textiles and garments
did not participate in the export boom. The share of
machinery and transport equipment in total export
earnings has steadily increased from around 3 per-
cent in 1992 to 4.2 percent in 1995 and to over 10
percent during the first nine months of 1997. Exports
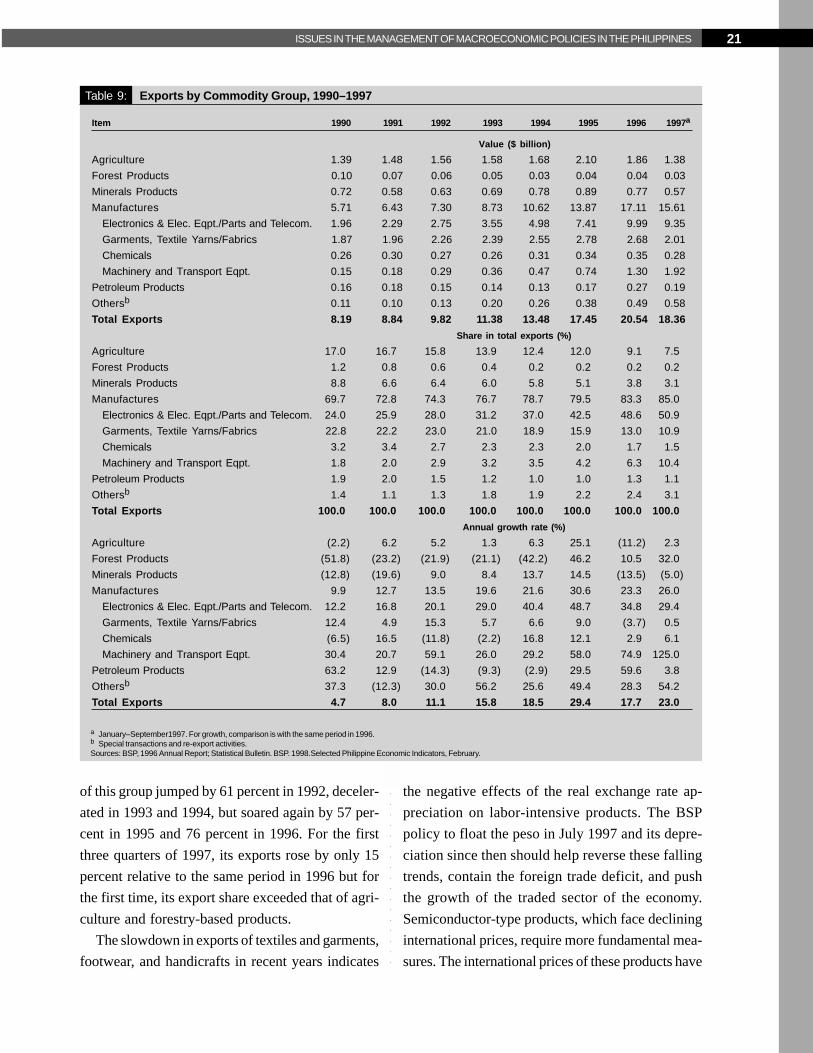
21ISSUES IN THE MANAGEMENT OF MACROECONOMIC POLICIES IN THE PHILIPPINES
○
○
○
○
○
○
○
○
○
○
○
○
○
○
○
○
○
○
○
○
○
○
○
○
○
○
○
○
○
○
○
○
○
○
○
○
○
○
○
○
○
○
○
○
○
○
○
○
○
○
○
○
○
○
○
○
○
○
○
○
○
○
○
○
○
○
○
○
○
○
○
○
○
○
○
○
○
○
○
○
○
○
○
of this group jumped by 61 percent in 1992, deceler-
ated in 1993 and 1994, but soared again by 57 per-
cent in 1995 and 76 percent in 1996. For the first
three quarters of 1997, its exports rose by only 15
percent relative to the same period in 1996 but for
the first time, its export share exceeded that of agri-
culture and forestry-based products.
The slowdown in exports of textiles and garments,
footwear, and handicrafts in recent years indicates
the negative effects of the real exchange rate ap-
preciation on labor-intensive products. The BSP
policy to float the peso in July 1997 and its depre-
ciation since then should help reverse these falling
trends, contain the foreign trade deficit, and push
the growth of the traded sector of the economy.
Semiconductor-type products, which face declining
international prices, require more fundamental mea-
sures. The international prices of these products have
Table 9: Exports by Commodity Group, 1990–1997
Item 1990 1991 1992 1993 1994 1995 1996 1997a
Value ($ billion)
Agriculture 1.39 1.48 1.56 1.58 1.68 2.10 1.86 1.38
Forest Products 0.10 0.07 0.06 0.05 0.03 0.04 0.04 0.03
Minerals Products 0.72 0.58 0.63 0.69 0.78 0.89 0.77 0.57
Manufactures 5.71 6.43 7.30 8.73 10.62 13.87 17.11 15.61
Electronics & Elec. Eqpt./Parts and Telecom. 1.96 2.29 2.75 3.55 4.98 7.41 9.99 9.35
Garments, Textile Yarns/Fabrics 1.87 1.96 2.26 2.39 2.55 2.78 2.68 2.01
Chemicals 0.26 0.30 0.27 0.26 0.31 0.34 0.35 0.28
Machinery and Transport Eqpt. 0.15 0.18 0.29 0.36 0.47 0.74 1.30 1.92
Petroleum Products 0.16 0.18 0.15 0.14 0.13 0.17 0.27 0.19
Othersb 0.11 0.10 0.13 0.20 0.26 0.38 0.49 0.58
Total Exports 8.19 8.84 9.82 11.38 13.48 17.45 20.54 18.36
Share in total exports (%)
Agriculture 17.0 16.7 15.8 13.9 12.4 12.0 9.1 7.5
Forest Products 1.2 0.8 0.6 0.4 0.2 0.2 0.2 0.2
Minerals Products 8.8 6.6 6.4 6.0 5.8 5.1 3.8 3.1
Manufactures 69.7 72.8 74.3 76.7 78.7 79.5 83.3 85.0
Electronics & Elec. Eqpt./Parts and Telecom. 24.0 25.9 28.0 31.2 37.0 42.5 48.6 50.9
Garments, Textile Yarns/Fabrics 22.8 22.2 23.0 21.0 18.9 15.9 13.0 10.9
Chemicals 3.2 3.4 2.7 2.3 2.3 2.0 1.7 1.5
Machinery and Transport Eqpt. 1.8 2.0 2.9 3.2 3.5 4.2 6.3 10.4
Petroleum Products 1.9 2.0 1.5 1.2 1.0 1.0 1.3 1.1
Othersb 1.4 1.1 1.3 1.8 1.9 2.2 2.4 3.1
Total Exports 100.0 100.0 100.0 100.0 100.0 100.0 100.0 100.0
Annual growth rate (%)
Agriculture (2.2) 6.2 5.2 1.3 6.3 25.1 (11.2) 2.3
Forest Products (51.8) (23.2) (21.9) (21.1) (42.2) 46.2 10.5 32.0
Minerals Products (12.8) (19.6) 9.0 8.4 13.7 14.5 (13.5) (5.0)
Manufactures 9.9 12.7 13.5 19.6 21.6 30.6 23.3 26.0
Electronics & Elec. Eqpt./Parts and Telecom. 12.2 16.8 20.1 29.0 40.4 48.7 34.8 29.4
Garments, Textile Yarns/Fabrics 12.4 4.9 15.3 5.7 6.6 9.0 (3.7) 0.5
Chemicals (6.5) 16.5 (11.8) (2.2) 16.8 12.1 2.9 6.1
Machinery and Transport Eqpt. 30.4 20.7 59.1 26.0 29.2 58.0 74.9 125.0
Petroleum Products 63.2 12.9 (14.3) (9.3) (2.9) 29.5 59.6 3.8
Othersb 37.3 (12.3) 30.0 56.2 25.6 49.4 28.3 54.2
Total Exports 4.7 8.0 11.1 15.8 18.5 29.4 17.7 23.0
a January–September1997. For growth, comparison is with the same period in 1996.b Special transactions and re-export activities.Sources: BSP, 1996 Annual Report; Statistical Bulletin. BSP. 1998.Selected Philippine Economic Indicators, February.
22 A STUDY OF FINANCIAL MARKETS
○
○
○
○
○
○
○
○
○
○
○
○
○
○
○
○
○
○
○
○
○
○
○
○
○
○
○
○
○
○
○
○
○
○
○
○
○
○
○
○
○
○
○
○
○
○
○
○
○
○
○
○
○
○
○
○
○
○
○
○
○
○
○
○
○
○
○
○
○
○
○
○
○
○
○
○
○
○
○
○
○
○
○
○
been decreasing because of weak demand and
aggressive investment in many Asian countries
(particularly in the PRC; Hong Kong, China; Rep-
ublic of Korea; Malaysia; Philippines; Singapore;
Taipei,China; and Thailand) during 1995 and 1996.
International competitiveness can be improved by
adopting measures that reduce labor costs and raise
productivity.
Philippine total imports more than doubled during
1990–1996, with an annual average growth rate of
18 percent. Capital products and raw materials and
intermediate goods formed the bulk of imports, re-
flecting the robust growth of investment and produc-
tion in the domestic economy. On the other hand, the
share of consumer good imports has grown steadily
from around 8 percent in 1990–1992 to about 10 per-
cent since 1994 (Table 10). The slight appreciation
of the RER may have contributed to the rapid growth
of imports, particularly that of consumer goods, which
rose by an annual average of 22 percent in 1990–
1996.
Worker RemittancesReceipts from services and inflows of transfers rose
rapidly beginning in 1992 and 1994, respectively. The
surges may be due to increasing inflows of worker
remittances and a portfolio shift among nonresidents.
Significant improvements in the banking system also
restored confidence that resulted in greater use of
banks in intermediating remittances (World Bank,
1988).
Capital FlowsNet private capital inflows more than doubled during
1990–1994 and continued their rapid growth in 1995
and 1996 (Table 11). The sharp decrease in long-
term loans indicates the reduction in public sector
borrowing as a result of the privatization of State-
owned enterprises and public utilities. Privatization
and greater investor confidence in the Philippine
economy increased the inflows of foreign direct in-
vestment. Portfolio inflows started only quite recently
with a relatively small amount. Improvement in the
international creditworthiness of the Philippines is also
reflected by the first issue of Samurai bonds in 15
years in July 1996 and a Brady Exchange Program
in September of the same year. The dual issue of
five-and-a-half and seven-year yen bonds in Tokyo
allowed the Philippines to retire more expensive debts
and replace them with cheaper ones, and develop
benchmarks for future borrowings of economic
agents from the Philippines in Japanese financial
markets. Under the Brady program, the Philippines
was permitted to retire 39 percent of its outstanding
$1.6 billion of Brady bonds for uncollateralized 20-
year fixed rate bonds at 225 basis points over the 30-
year US Treasury bond rate. The collateral released
in the retirement of par bonds in such transaction
will make available $183 million in cash to the Philip-
pines. Meanwhile, the bond exchange component
reduced the debt stock by $84 million. In addition,
the transaction developed a benchmark for future
borrowings of the country’s economic units in inter-
national capital markets.
The Philippines has developed an FCDU market
as an offshore financial market in Manila by provid-
ing it with regulatory and tax advantages over the
domestic market. For example, foreign exchange
deposits in this market are not subject to the 5 per-
cent gross receipts tax and the 20 percent withhold-
ing tax on interest earnings of residents. Moreover,
prior to June 1997, the FCDUs were not subject to
reserve requirements. The FCDU market was origi-
nally intended as a regional financial center, to en-
able local financial institutions to provide clients in
nearby countries with financial services (“out-out
transactions”). In reality, however, it functions as a
vehicle to encourage worker remittances and for-
eign exchange deposits by Filipinos, and to service
creditworthy domestic firms (“out-in transactions”).
The recent foreign exchange liberalization permits
exporters to retain their earnings in foreign currency.
This and the rapid growth in worker remittances and
trade and investment flows have raised the ratio of
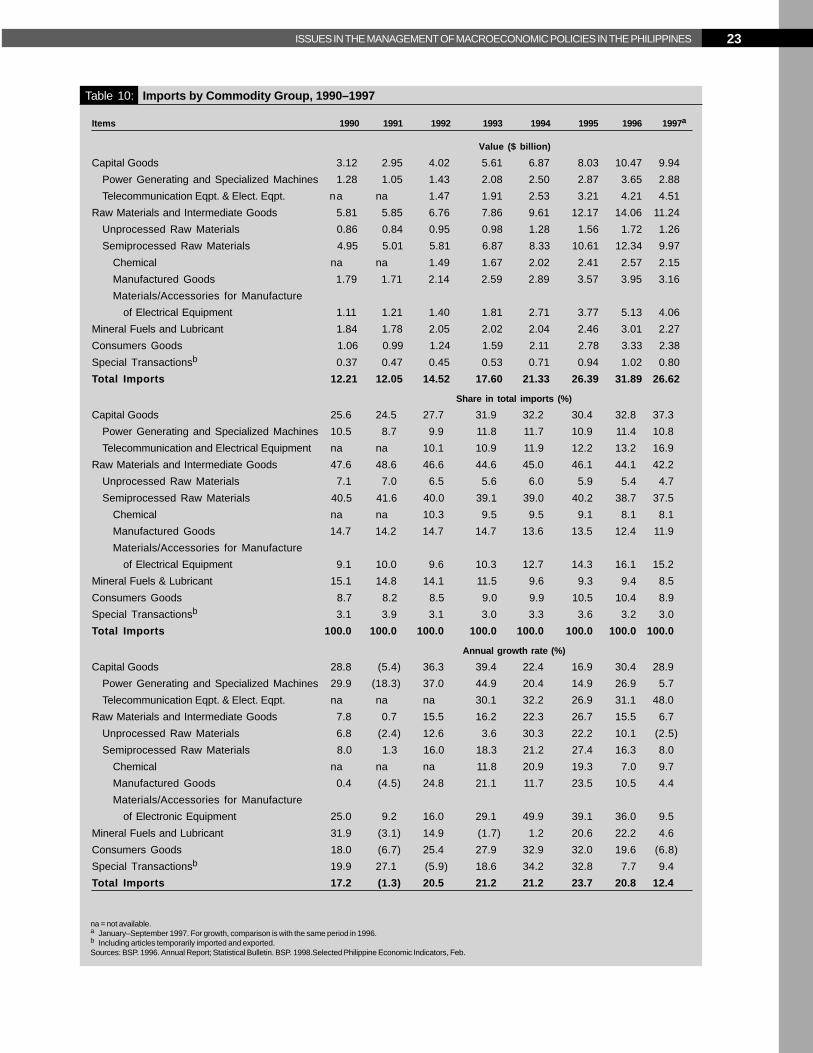
23ISSUES IN THE MANAGEMENT OF MACROECONOMIC POLICIES IN THE PHILIPPINES
○
○
○
○
○
○
○
○
○
○
○
○
○
○
○
○
○
○
○
○
○
○
○
○
○
○
○
○
○
○
○
○
○
○
○
○
○
○
○
○
○
○
○
○
○
○
○
○
○
○
○
○
○
○
○
○
○
○
○
○
○
○
○
○
○
○
○
○
○
○
○
○
○
○
○
○
○
○
○
○
○
○
○
Table 10: Imports by Commodity Group, 1990–1997
Items 1990 1991 1992 1993 1994 1995 1996 1997a
Value ($ billion)
Capital Goods 3.12 2.95 4.02 5.61 6.87 8.03 10.47 9.94
Power Generating and Specialized Machines 1.28 1.05 1.43 2.08 2.50 2.87 3.65 2.88
Telecommunication Eqpt. & Elect. Eqpt. na na 1.47 1.91 2.53 3.21 4.21 4.51
Raw Materials and Intermediate Goods 5.81 5.85 6.76 7.86 9.61 12.17 14.06 11.24
Unprocessed Raw Materials 0.86 0.84 0.95 0.98 1.28 1.56 1.72 1.26
Semiprocessed Raw Materials 4.95 5.01 5.81 6.87 8.33 10.61 12.34 9.97
Chemical na na 1.49 1.67 2.02 2.41 2.57 2.15
Manufactured Goods 1.79 1.71 2.14 2.59 2.89 3.57 3.95 3.16
Materials/Accessories for Manufacture
of Electrical Equipment 1.11 1.21 1.40 1.81 2.71 3.77 5.13 4.06
Mineral Fuels and Lubricant 1.84 1.78 2.05 2.02 2.04 2.46 3.01 2.27
Consumers Goods 1.06 0.99 1.24 1.59 2.11 2.78 3.33 2.38
Special Transactionsb 0.37 0.47 0.45 0.53 0.71 0.94 1.02 0.80
Total Imports 12.21 12.05 14.52 17.60 21.33 26.39 31.89 26.62
Share in total imports (%)
Capital Goods 25.6 24.5 27.7 31.9 32.2 30.4 32.8 37.3
Power Generating and Specialized Machines 10.5 8.7 9.9 11.8 11.7 10.9 11.4 10.8
Telecommunication and Electrical Equipment na na 10.1 10.9 11.9 12.2 13.2 16.9
Raw Materials and Intermediate Goods 47.6 48.6 46.6 44.6 45.0 46.1 44.1 42.2
Unprocessed Raw Materials 7.1 7.0 6.5 5.6 6.0 5.9 5.4 4.7
Semiprocessed Raw Materials 40.5 41.6 40.0 39.1 39.0 40.2 38.7 37.5
Chemical na na 10.3 9.5 9.5 9.1 8.1 8.1
Manufactured Goods 14.7 14.2 14.7 14.7 13.6 13.5 12.4 11.9
Materials/Accessories for Manufacture
of Electrical Equipment 9.1 10.0 9.6 10.3 12.7 14.3 16.1 15.2
Mineral Fuels & Lubricant 15.1 14.8 14.1 11.5 9.6 9.3 9.4 8.5
Consumers Goods 8.7 8.2 8.5 9.0 9.9 10.5 10.4 8.9
Special Transactionsb 3.1 3.9 3.1 3.0 3.3 3.6 3.2 3.0
Total Imports 100.0 100.0 100.0 100.0 100.0 100.0 100.0 100.0
Annual growth rate (%)
Capital Goods 28.8 (5.4) 36.3 39.4 22.4 16.9 30.4 28.9
Power Generating and Specialized Machines 29.9 (18.3) 37.0 44.9 20.4 14.9 26.9 5.7
Telecommunication Eqpt. & Elect. Eqpt. na na na 30.1 32.2 26.9 31.1 48.0
Raw Materials and Intermediate Goods 7.8 0.7 15.5 16.2 22.3 26.7 15.5 6.7
Unprocessed Raw Materials 6.8 (2.4) 12.6 3.6 30.3 22.2 10.1 (2.5)
Semiprocessed Raw Materials 8.0 1.3 16.0 18.3 21.2 27.4 16.3 8.0
Chemical na na na 11.8 20.9 19.3 7.0 9.7
Manufactured Goods 0.4 (4.5) 24.8 21.1 11.7 23.5 10.5 4.4
Materials/Accessories for Manufacture
of Electronic Equipment 25.0 9.2 16.0 29.1 49.9 39.1 36.0 9.5
Mineral Fuels and Lubricant 31.9 (3.1) 14.9 (1.7) 1.2 20.6 22.2 4.6
Consumers Goods 18.0 (6.7) 25.4 27.9 32.9 32.0 19.6 (6.8)
Special Transactionsb 19.9 27.1 (5.9) 18.6 34.2 32.8 7.7 9.4
Total Imports 17.2 (1.3) 20.5 21.2 21.2 23.7 20.8 12.4
na = not available.a January–September 1997. For growth, comparison is with the same period in 1996.b Including articles temporarily imported and exported.Sources: BSP. 1996. Annual Report; Statistical Bulletin. BSP. 1998.Selected Philippine Economic Indicators, Feb.
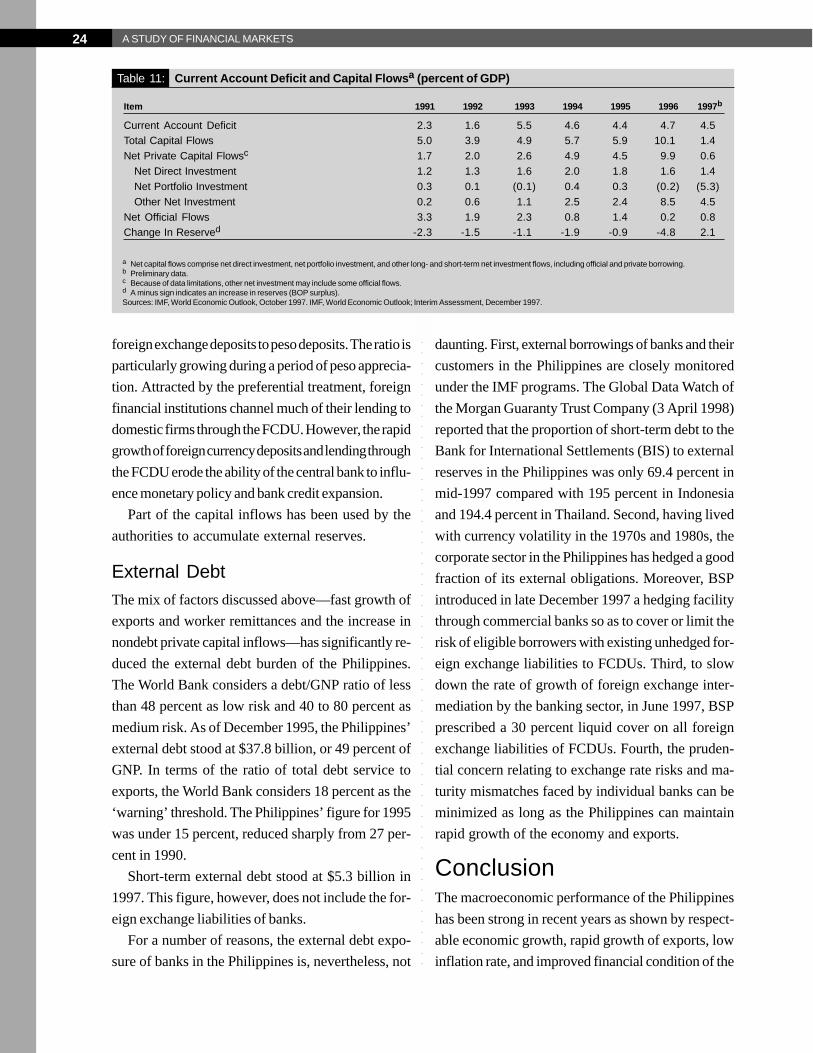
24 A STUDY OF FINANCIAL MARKETS
○
○
○
○
○
○
○
○
○
○
○
○
○
○
○
○
○
○
○
○
○
○
○
○
○
○
○
○
○
○
○
○
○
○
○
○
○
○
○
○
○
○
○
○
○
○
○
○
○
○
○
○
○
○
○
○
○
○
○
○
○
○
○
○
○
○
○
○
○
○
○
○
○
○
○
○
○
○
○
○
○
○
○
○
foreign exchange deposits to peso deposits. The ratio is
particularly growing during a period of peso apprecia-
tion. Attracted by the preferential treatment, foreign
financial institutions channel much of their lending to
domestic firms through the FCDU. However, the rapid
growth of foreign currency deposits and lending through
the FCDU erode the ability of the central bank to influ-
ence monetary policy and bank credit expansion.
Part of the capital inflows has been used by the
authorities to accumulate external reserves.
External DebtThe mix of factors discussed above—fast growth of
exports and worker remittances and the increase in
nondebt private capital inflows—has significantly re-
duced the external debt burden of the Philippines.
The World Bank considers a debt/GNP ratio of less
than 48 percent as low risk and 40 to 80 percent as
medium risk. As of December 1995, the Philippines’
external debt stood at $37.8 billion, or 49 percent of
GNP. In terms of the ratio of total debt service to
exports, the World Bank considers 18 percent as the
‘warning’ threshold. The Philippines’ figure for 1995
was under 15 percent, reduced sharply from 27 per-
cent in 1990.
Short-term external debt stood at $5.3 billion in
1997. This figure, however, does not include the for-
eign exchange liabilities of banks.
For a number of reasons, the external debt expo-
sure of banks in the Philippines is, nevertheless, not
daunting. First, external borrowings of banks and their
customers in the Philippines are closely monitored
under the IMF programs. The Global Data Watch of
the Morgan Guaranty Trust Company (3 April 1998)
reported that the proportion of short-term debt to the
Bank for International Settlements (BIS) to external
reserves in the Philippines was only 69.4 percent in
mid-1997 compared with 195 percent in Indonesia
and 194.4 percent in Thailand. Second, having lived
with currency volatility in the 1970s and 1980s, the
corporate sector in the Philippines has hedged a good
fraction of its external obligations. Moreover, BSP
introduced in late December 1997 a hedging facility
through commercial banks so as to cover or limit the
risk of eligible borrowers with existing unhedged for-
eign exchange liabilities to FCDUs. Third, to slow
down the rate of growth of foreign exchange inter-
mediation by the banking sector, in June 1997, BSP
prescribed a 30 percent liquid cover on all foreign
exchange liabilities of FCDUs. Fourth, the pruden-
tial concern relating to exchange rate risks and ma-
turity mismatches faced by individual banks can be
minimized as long as the Philippines can maintain
rapid growth of the economy and exports.
ConclusionThe macroeconomic performance of the Philippines
has been strong in recent years as shown by respect-
able economic growth, rapid growth of exports, low
inflation rate, and improved financial condition of the
Table 11: Current Account Deficit and Capital Flowsa (percent of GDP)
Item 1991 1992 1993 1994 1995 1996 1997b
Current Account Deficit 2.3 1.6 5.5 4.6 4.4 4.7 4.5Total Capital Flows 5.0 3.9 4.9 5.7 5.9 10.1 1.4Net Private Capital Flowsc 1.7 2.0 2.6 4.9 4.5 9.9 0.6
Net Direct Investment 1.2 1.3 1.6 2.0 1.8 1.6 1.4Net Portfolio Investment 0.3 0.1 (0.1) 0.4 0.3 (0.2) (5.3)Other Net Investment 0.2 0.6 1.1 2.5 2.4 8.5 4.5
Net Official Flows 3.3 1.9 2.3 0.8 1.4 0.2 0.8Change In Reserved -2.3 -1.5 -1.1 -1.9 -0.9 -4.8 2.1
a Net capital flows comprise net direct investment, net portfolio investment, and other long- and short-term net investment flows, including official and private borrowing.b Preliminary data.c Because of data limitations, other net investment may include some official flows.d A minus sign indicates an increase in reserves (BOP surplus).Sources: IMF, World Economic Outlook, October 1997. IMF, World Economic Outlook; Interim Assessment, December 1997.
25ISSUES IN THE MANAGEMENT OF MACROECONOMIC POLICIES IN THE PHILIPPINES
○
○
○
○
○
○
○
○
○
○
○
○
○
○
○
○
○
○
○
○
○
○
○
○
○
○
○
○
○
○
○
○
○
○
○
○
○
○
○
○
○
○
○
○
○
○
○
○
○
○
○
○
○
○
○
○
○
○
○
○
○
○
○
○
○
○
○
○
○
○
○
○
○
○
○
○
○
○
○
○
○
○
○
banking system. These have enabled the country to
exit from the IMF program and to regain access to
the international financial markets. Its encouraging
economic performance, however, has also been ac-
companied by a number of disquieting developments.
The degree of overextension in the banking system
and exposure to foreign exchange risk are rising.
Probably because of market imperfections and the
oligopolistic structure of the financial markets, inter-
est rates are still persistently high. The fast-growing
bank loans are largely invested in the nontraded sec-
tor of the economy and in the traded sector compo-
nent that requires high imported inputs and produces
low value added. All of these indicate the need to
improve monitoring and supervision of the banking
system. Better implementation of the rules and regu-
lations governing the banking industry acts as a brake
to prevent banks from making excessive risky loans.
The ongoing economic crisis in the Asian region
has also affected external trade, labor remittances,
and capital inflow to the Philippines. The crisis re-
duced its exports to neighboring countries. Devalua-
tion of the currencies of its competitors and appre-
ciation of the peso decreased its competitiveness in
international markets. Economic difficulties dimin-
ished the capacity of neighboring countries to ab-
sorb workers from the Philippines. Moreover, the
drying up of private sector capital inflows from
Hong Kong, China; Japan; and the Republic of Korea
cannot be replaced by rising inflows from Singapore;
Taipei,China; and elsewhere. Aside from currency
devaluation, international competitiveness can also
be enhanced by increasing labor productivity, remov-
ing economic distortions, and eliminating antiexport
policies.
To improve economic management and restore
public confidence, the authorities have adopted a
short-run stabilization program. The program includes
measures to tighten fiscal and monetary policies, raise
interest rates, control inflation rate, and allow the peso
to float more freely. The experiences of other Asian
countries indicate that these policies should be done
carefully to allow the banking system and corporate
sector to adjust smoothly to the new environment,
particularly as they are highly leveraged and increas-
ingly dependent on foreign borrowings.
The short-run stabilization program has also been
supplemented with structural reform to remove dis-
tortions in the economy and to eradicate poverty. This
reform covers policies on trade and investment, taxes,
and the financial sector. The structure of Govern-
ment expenditures (such as for education and basic
health and rural infrastructure) also plays an impor-
tant role in eradicating poverty. In the long run, the
reform will extend further to legal and accounting
frameworks to improve the market infrastructure.
To further boost public confidence, including that of
international investors, these efforts have been sup-
ported by the voluntary standby arrangements with
the IMF.
26 A STUDY OF FINANCIAL MARKETS
○
○
○
○
○
○
○
○
○
○
○
○
○
○
○
○
○
○
○
○
○
○
○
○
○
○
○
○
○
○
○
○
○
○
○
○
○
○
○
○
○
○
○
○
○
○
○
○
○
○
○
○
○
○
○
○
○
○
○
○
○
○
○
○
○
○
○
○
○
○
○
○
○
○
○
○
○
○
○
○
○
○
○
○
Notes
1The administration of President Corazon Aquino wasbesieged by coup attempts at least once a year between1987 and 1989. The most dangerous one occurred in De-cember 1989, led by a group of disappointed soldiers whoplayed an active role in toppling President FerdinandMarcos in 1986 .
2Between 1981 and 1987, 161 small financial institutions,holding 3.5 percent of total financial system assets, closed.Five private banks were nationalized in varying stages ofcentral bank supervision, and later privatized.
3As in any other developing country, it is difficult to esti-mate the national accounts in the Philippines partly be-cause of the relative difficulty of measuring the signifi-cant informal and nonmarketable economic activity andthe rapid growth of net factor income from abroad, mainlyworkers’ remittances (World Bank 1996).
4The main problem of most studies on savings in lessdeveloped countries, including the Philippines, is the un-reliable nature of the savings data. As pointed out earlier,this is partly due to the difficulty of measuring the na-tional accounts. Moreover, savings tends to be calcu-lated as a residual. As a result, it inherits all the statisticalproblems of other components of national income, par-ticularly investment.
5The 18 domestic EKBs are Allied Banking Corporation,Asian Bank Corporation, Banco de Oro, Bank of the Phil-ippine Islands, China Banking Corporation, EquitableBanking Corporation, Far East Bank and Trust Company,Metropolitan Bank and Trust Company, Philippine Bankof Communications, Philippine Commercial and IndustrialBank, PNB, Prudential Bank, Rizal Commercial BankingCorporation, Security Bank Corporation, Solid Bank Cor-poration, United Coconut Planters Bank, Union Bank ofthe Philippines, and Urban Bank. The 15 domestic com-mercial banks are Bank of Commerce, Bank of South EastAsia, East West Banking Corporation, Export and Indus-try Bank, Global Bank (joint venture with Tokai Bank ofJapan), International Exchange Bank, MayBank (formerlyPhilippine National Republic Bank; MayBank is classifiedas a domestic bank since it was incorporated in the Philip-pines but the major stockholder is Malaysian), Orient Bank,Philippine Banking Corporation, Philippine Trust Company,
Philippine Veterans Bank, Pilipinas Bank, Traders RoyalBank, TA Bank of the Philippines, Inc., and WestmontBank Philippines. The 16 foreign banks are Australia andNew Zealand Banking Group, Bank of America NT&SA,Bangkok Bank Public Company Limited (Bangkok), TheBank of Tokyo-Mitsubishi Limited, The Chase Manhat-tan Bank, China Trust Philippine Commercial Bank Corpo-ration, Citibank, NA, Dao Heng Bank, Development Bankof Singapore, Deutsche Bank AG, The Fuji Limited Bank,International Commercial Bank of China, ING Bank, KoreaExchange Bank, Banco Santander Philippines Incorpo-rated, and Standard Chartered Bank. The land bank is theState-owned Land Bank of the Philippines. PNB and UnionBank have Government shares.
6Tier 1 capital or “core” capital includes stock issues aswell as disclosed reserves without any limit. Tier 2 capitalor “supplementary” capital consists of perpetual securi-ties, “undisclosed reserves,” subordinated debt with ma-turity exceeding five years, and share redeemable at theoption of the issuers.
7The central banks include those of Australia; Hong Kong,China; Malaysia; Singapore; and Thailand under theExecutive Meeting of East Asia and Pacific (EMEAP).EMEAP was established in February 1991. Other mem-bers of the organization are People’s Republic of China,Republic of Korea, Japan, New Zealand, and the Philip-pines. In addition to cooperation in central bank facili-ties, the EMEAP has two other objectives, namely: fi-nancial market development and banking prudential su-pervision to improve the flow of information. The quickresponses from other central banks in extending finan-cial support to the Central Bank of Thailand for defend-ing the baht during the crisis in mid-May 1997 was thefirst test of the EMEAP. The financial resources, how-ever, were inadequate to solve the structural problems ofthe Thai economy: large current account deficit, low qual-ity of investment, fragile banking system, and rigid ex-change rate regime.
8The exchange rate policy includes devaluation, speed-ing up depreciation of the national currency, widening theintervention band in the band system, and raising trans-action costs in the foreign exchange markets.
9It should be pointed out, however, that it is relativelyeasy to define competitiveness at the level of firms, butextremely difficult at the level of countries or economies.
27ISSUES IN THE MANAGEMENT OF MACROECONOMIC POLICIES IN THE PHILIPPINES
○
○
○
○
○
○
○
○
○
○
○
○
○
○
○
○
○
○
○
○
○
○
○
○
○
○
○
○
○
○
○
○
○
○
○
○
○
○
○
○
○
○
○
○
○
○
○
○
○
○
○
○
○
○
○
○
○
○
○
○
○
○
○
○
○
○
○
○
○
○
○
○
○
○
○
○
○
○
○
○
○
○
○
References
Asian Development Bank. 1997. Country Economic Re-view: Philippines: November. Manila.
Balisacan, Arsenio M. 1995. Agriculture in Transition: Ar-resting Poverty in the Rural Sector. In Towards Sus-tained Growth, Chapter VI, edited by Raul V. Fabellaand Hideyoshi Sakai. Tokyo: Institute of DevelopingEconomies.
Bangko Sentral ng Pilipinas. 1996. Annual Report. Manila.
__________. 1996. Statistical Bulletin. Manila.
__________. 1998. The Philippines: Staying on Course.February.
__________. 1998. Selected Philippine Economic Indi-cators. February.
Bureau of Labor and Employment Statistics. 1990 and 1993.Current Labor Statistics. Manila.
Calvo, Guillermo A. 1994. Comment on Dornbusch andWerner. In Brooking Papers on Economic Activity, No. 1.
Chandravarkar, Anand. 1996. Central Banking in Devel-oping Countries. New York: Macmillan Press, Ltd.
Cororaton, Caesar B. 1997. Exchange Rate Movements inthe Philippines. In Pacific Economic Outlook, PEO/Structure, Exchange Rate Fluctuations and Macro-economic Management. Background Papers, Septem-ber. Osaka: Japan Committee for Pacific Economic Out-look.
De Dios, Emmanuel S. 1995. On Recent Financial Flows:Causes and Consequences. In Towards SustainedGrowth, Chapter 5, edited by Raul V. Fabella andHideyoshi Sakai. Tokyo: Institute of DevelopingEconomies.
Esguerra, Emmanuel F. 1995. Employment, Competitivenessand Growth: 1980–1994. In Towards Sustained Growth,Chapter VII, edited by Raul V. Fabella and HideyoshiSakai. Tokyo: Institute of Developing Economies.
Grilli, Vittorio, and Nouriel Roubini. 1992. Liquidity andExchange Rates. Journal of International Economics32: 339–352.
Intal, Ponciano S. and Gilberto M. Llanto. 1998. FinancialReform and Development in the Philippines, 1980–1997:Imperatives, Performance and Challenges. DiscussionPaper Series No. 98–02. Makati: Philippine Institute forDevelopment Studies.
International Monetary Fund. 1997. World Economic Out-look: Interim Assessment. December. Washington, D.C.:IMF.
_______1998. Memorandum of Economic and FinancialPolicies of the Philippine Government. Washington,D.C.: the IMF website. March 11.
______. Various issues. International Financial Statis-tics. Washington D. C.: IMF.
Lamberte, Mario and Gilberto M. Llanto. 1995. A Study ofFinancial Sector Policies: The Philippine Case. In Fi-nancial Sector Development in Asia. Manila: AsianDevelopment Bank.
Manasan, Rosario M. 1994. Breaking Away From the Fis-cal Bind: Reforming the Fiscal System. Makati: Philip-pine Institute for Development Studies.
Morgan, J. P. 1998. The Global Data Watch. 3 April. NewYork: JP Morgan and Co., Inc.
__________. 1998. Emerging Market Data Watch. NewYork: JP Morgan and Co., Inc.
National Statistical Coordination Board. 1997. PhilippineStatistical Yearbook. Manila.
Paderanga, Jr., Cayetano. 1996. Philippine Financial Devel-opments: 1980–95. In Financial Sector Issues in thePhilippines, Chapter I, edited by Raul V. Fabella andKazuhisa Ito. Tokyo: Institute of Developing Economies.
__________. 1995. Debt Management in the Philippines.In Towards Sustained Growth, Chapter III, edited byRaul V. Fabella and Hideyoshi Sakai. Tokyo: Institute ofDeveloping Economies.
Quintyn, M. 1994. Government Versus Central Bank Secu-rities in Developing Open Market Operations. In Frame-works for Monetary Stability, edited by T.J.T. Balinoand C. Cottarelli. Washington, D.C.: IMF.
Reyes E., E. Milan, and M. T. Sanchez. 1989. Employ-ment, Productivity and Wages in the Philippine Labor
28 A STUDY OF FINANCIAL MARKETS
○
○
○
○
○
○
○
○
○
○
○
○
○
○
○
○
○
○
○
○
○
○
○
○
○
○
○
○
○
○
○
○
○
○
○
○
○
○
○
○
○
○
○
○
○
○
○
○
○
○
○
○
○
○
○
○
○
○
○
○
○
○
○
○
○
○
○
○
○
○
○
○
○
○
○
○
○
○
○
○
○
○
○
○
Market: An Analysis of Trends and Policies. PIDSWorking Paper Series No. 89–03. Makati: PIDS.
Stiglitz, Joseph and Andrew Weiss. 1981. Credit Ration-ing in Markets with Imperfect Information. AmericanEconomic Review 71 (June): 393–410.
University of British Columbia Data Base, Canada.
Woo, Wing Thye and Anwar Nasution. 1989. IndonesianEconomic Policies and Their Relations to External Debt
Management. In Developing Country Debt and Eco-nomic Performance. Vol. 3, edited by J. Sachs and S.Collins. Chicago: University of Chicago Press.
World Bank. 1996. Philippines Strengthening EconomicResiliency. Report No. 15985-PH.
World Bank. 1998. East Asia: The Road to Recovery.Washington, D.C. September.