AnUnderlying Asymmetrywithin Particle-size Segregation
5
arXiv:1501.06879v2 [cond-mat.soft] 8 May 2015 An Underlying Asymmetry within Particle-size Segregation K. van der Vaart, 1, * P. Gajjar, 2 G. Epely-Chauvin, 1 N. Andreini, 1 J.M.N.T. Gray, 2 and C. Ancey 1 1 Environmental Hydraulics Laboratory, ´ Ecole Polytechnique F´ ed´ erale de Lausanne, ´ Ecublens, Lausanne, Switzerland 2 School of Mathematics and Manchester Centre for Nonlinear Dynamics, University of Manchester, Manchester, UK (Dated: July 31, 2018) We experimentally study particle scale dynamics during segregation of a bidisperse mixture under oscillatory shear. Large and small particles show an underlying asymmetry that is dependent on the local particle concentration, with small particles segregating faster in regions of many large particles and large particles segregating slower in regions of many small particles. We quantify the asymmetry on bulk and particle scales, and capture it theoretically. This gives new physical insight into segregation and reveals a similarity with sedimentation, traffic flow and particle diffusion. PACS numbers: 45.70.Mg, 05.45.-a, 47.57.Gc The natural tendency of granular media to self- organize when agitated or sheared produces a rich diver- sity of complex and beautiful patterns [1–3]. Although it is counter-intuitive that the components of a heteroge- neous mixture will readily separate, this property has se- rious technical implications as the cause of product non- uniformity in many industrial processes [4–6] and also plays a pivotal role in the enhanced run-out of large scale geophysical granular flows, such as debris-flows, pyroclas- tic flows and snow avalanches [7–10]. A firm knowledge of the segregation process is thus of universal importance. Although there has been considerable recent progress in developing continuum based segregation models for sheared granular flows [11–16], the individual particle dynamics are still poorly understood. Discrete Particle Method (DPM) simulations [17–20] produce a wealth of micro-scale information, but are models in themselves. It is vital to directly measure particle segregation dynam- ics in real experiments, but such an analysis is difficult with conventional techniques such as binning and side- wall observation [21–24]. Non-intrusive imaging tech- niques, such as X-ray tomography [25] and refractive index-matched scanning (RIMS) [26, 27] allow examina- tion of the interior of a granular medium, with RIMS recently developing into a powerful tool for examining monodisperse and bidisperse flows [29–31]. In particu- lar, the work of Harrington et al. [31] on the emergence of granular segregation demonstrates how particle scale analysis can give new physical insights. In this Letter, we analyze particle scale dynamics dur- ing segregation of a bidisperse mixture under oscillatory shear. We find that the behavior of small and large par- ticles exhibits an asymmetry related to the local particle concentration, with small grains moving faster through regions of many large particles and large particles ris- ing slower through regions of many small particles. This asymmetry is quantified on both particle and bulk length scales, and it is shown how to incorporate the behavior within the theoretical framework. Methods.—A shearbox 51 mm deep and 37 mm wide is filled to a height h = 87 ± 3 mm with a bidisperse mixture of borosilicate glass spheres (ρ p = 2.23 g/cm 3 ) with diameters d l = 8 mm and d s = 4 mm. The larger particles are placed at the bottom, the surface flattened and the smaller particles placed on top. The sidewalls oscillate whilst remaining parallel, applying a periodic shear γ (t)= γ 0 sin(ωt) [32] as shown in Figure 1. The corresponding shear rate ˙ γ (t)= γ 0 ω cos(ωt), frequency ω =2π/T rad s -1 , period T = 13 s and strain ampli- tude γ 0 = tan θ max . The sidewalls displace to a maxi- mum angle θ max = ±30°, giving a maximum shear rate of ˙ γ 0 = γ 0 ω and a maximum grain displacement ampli- tude A = hγ 0 . The angle is decreased to θ max = ±10° for the particle trajectory data in order to slow down the segregation and increase the temporal resolution. Non- dimensional time ˆ t = t/T corresponds to the number of elapsed cycles. We follow a sample using RIMS, with the index-matched liquid a mixture of benzylalcohol and ethanol (viscosity μ = 3 mPa s) containing a fluorescent dye (rhodamine). The low viscosity of the interstitial liq- uid means that fluid drag forces are small compared to both gravitational forces and the applied shear (Stokes number > 1 [33]). The mixture is lit with a 532 nm laser sheet perpendicular to the oscillating walls, giving a stack of vertical cross sections. A scan is performed after each full oscillation with the shearbox in the upright position. The images were processed using convolution [34] to give FIG. 1: (color online). Left: The experimental setup. A raw data image is shown and a cross-section of a reconstructed sample with 3 mm and 6 mm beads. Right: cross-sections at different times during an experiment.
Transcript of AnUnderlying Asymmetrywithin Particle-size Segregation

arX
iv:1
501.
0687
9v2
[co
nd-m
at.s
oft]
8 M
ay 2
015
An Underlying Asymmetry within Particle-size Segregation
K. van der Vaart,1, ∗ P. Gajjar,2 G. Epely-Chauvin,1 N. Andreini,1 J.M.N.T. Gray,2 and C. Ancey1
1Environmental Hydraulics Laboratory, Ecole Polytechnique Federale de Lausanne, Ecublens, Lausanne, Switzerland2School of Mathematics and Manchester Centre for Nonlinear Dynamics, University of Manchester, Manchester, UK
(Dated: July 31, 2018)
We experimentally study particle scale dynamics during segregation of a bidisperse mixture underoscillatory shear. Large and small particles show an underlying asymmetry that is dependent onthe local particle concentration, with small particles segregating faster in regions of many largeparticles and large particles segregating slower in regions of many small particles. We quantify theasymmetry on bulk and particle scales, and capture it theoretically. This gives new physical insightinto segregation and reveals a similarity with sedimentation, traffic flow and particle diffusion.
PACS numbers: 45.70.Mg, 05.45.-a, 47.57.Gc
The natural tendency of granular media to self-organize when agitated or sheared produces a rich diver-sity of complex and beautiful patterns [1–3]. Althoughit is counter-intuitive that the components of a heteroge-neous mixture will readily separate, this property has se-rious technical implications as the cause of product non-uniformity in many industrial processes [4–6] and alsoplays a pivotal role in the enhanced run-out of large scalegeophysical granular flows, such as debris-flows, pyroclas-tic flows and snow avalanches [7–10]. A firm knowledge ofthe segregation process is thus of universal importance.
Although there has been considerable recent progressin developing continuum based segregation models forsheared granular flows [11–16], the individual particledynamics are still poorly understood. Discrete ParticleMethod (DPM) simulations [17–20] produce a wealth ofmicro-scale information, but are models in themselves. Itis vital to directly measure particle segregation dynam-ics in real experiments, but such an analysis is difficultwith conventional techniques such as binning and side-wall observation [21–24]. Non-intrusive imaging tech-niques, such as X-ray tomography [25] and refractiveindex-matched scanning (RIMS) [26, 27] allow examina-tion of the interior of a granular medium, with RIMSrecently developing into a powerful tool for examiningmonodisperse and bidisperse flows [29–31]. In particu-lar, the work of Harrington et al. [31] on the emergenceof granular segregation demonstrates how particle scaleanalysis can give new physical insights.
In this Letter, we analyze particle scale dynamics dur-ing segregation of a bidisperse mixture under oscillatoryshear. We find that the behavior of small and large par-ticles exhibits an asymmetry related to the local particleconcentration, with small grains moving faster throughregions of many large particles and large particles ris-ing slower through regions of many small particles. Thisasymmetry is quantified on both particle and bulk lengthscales, and it is shown how to incorporate the behaviorwithin the theoretical framework.
Methods.—A shearbox 51 mm deep and 37 mm wideis filled to a height h = 87 ± 3 mm with a bidisperse
mixture of borosilicate glass spheres (ρp = 2.23 g/cm3)with diameters dl = 8 mm and ds = 4 mm. The largerparticles are placed at the bottom, the surface flattenedand the smaller particles placed on top. The sidewallsoscillate whilst remaining parallel, applying a periodicshear γ(t) = γ0 sin(ωt) [32] as shown in Figure 1. Thecorresponding shear rate γ(t) = γ0ω cos(ωt), frequencyω = 2π/T rad s−1, period T = 13 s and strain ampli-tude γ0 = tan θmax. The sidewalls displace to a maxi-mum angle θmax = ±30°, giving a maximum shear rateof γ0 = γ0ω and a maximum grain displacement ampli-tude A = hγ0. The angle is decreased to θmax = ±10°for the particle trajectory data in order to slow down thesegregation and increase the temporal resolution. Non-dimensional time t = t/T corresponds to the number ofelapsed cycles. We follow a sample using RIMS, withthe index-matched liquid a mixture of benzylalcohol andethanol (viscosity µ = 3 mPa s) containing a fluorescentdye (rhodamine). The low viscosity of the interstitial liq-uid means that fluid drag forces are small compared toboth gravitational forces and the applied shear (Stokesnumber> 1 [33]). The mixture is lit with a 532 nm lasersheet perpendicular to the oscillating walls, giving a stackof vertical cross sections. A scan is performed after eachfull oscillation with the shearbox in the upright position.The images were processed using convolution [34] to give
FIG. 1: (color online). Left: The experimental setup. A rawdata image is shown and a cross-section of a reconstructedsample with 3 mm and 6 mm beads. Right: cross-sections atdifferent times during an experiment.
2
three dimensional particle positions, which are coarse-grained in order to determine a continuous volume frac-tion [35]. Some sidewall effects exist, with small particlespreferentially located near the stationary vertical walls,but this does not affect the overall segregation. The hor-izontal particle motion is diffusive, hence the concentra-tion is spatially averaged to give a uniform concentrationin the x-y plane. We observe no convection rolls [36], al-though for |φmax| > 45° geometrical squeezing was seento cause convection.
Results.—The typical behavior is shown in Fig. 1: Theinitial state with large particles on the bottom evolves toa final state with large particles on top, because smallparticles sink and large particles rise. Interestingly, somelarge particles remain below when all the others havereached the top. These particles are not stuck but riseat a slower rate than the ones that have reached the topbefore them. Although this has been inferred before, ithas not yet been explained [24].
We define a segregation time ts as the time needed forthe vertical centers of mass of the two species to reach asteady state, as shown in Fig. 2(a). We record ts for mix-tures with varying global volume fraction of small parti-cles Φ(%) = Vs/(Vl+Vs), while keeping the total mixturevolume constant. Figure 2(b) shows that ts scales linearlywith Φ, i.e. with more small particles in the mixture thesegregation is slower [20]. Similar trends were observedover the entire range of angles that can be accessed inour setup. This behavior is usually given a two-part ex-planation: At low Φ, small particles move slower whenthere are more small particles [37]. At high Φ, it takes alonger time for large particles to travel to the top whenthe layer of small particles above them is thicker [20, 24].In both explanations the behavior of the other speciesis ignored. So how do these explanations combine at anintermediate Φ? A clue is given by [24] which reportedthat for a Φ = 50% mixture the transition from the statewith small particles on top to a mixed state was faster
0 50 100 1500
2
4
6
8
10
t
zdl
0 50 1000
50
100
150
200
250
Φ(%)
ts
(a) (b)
smalllarge
exper imentasymmetr icsymmetr ic
FIG. 2: (a) Time evolution of the vertical center of mass po-sition ( 1
n
∑n
i=1zi) for large and small particles in Φ = 25%
(black), 50% (dark gray) and 75% (light gray) mixtures.θmax = ±30°. (b) Segregation time ts as a function of Φ; solidline is a fit for the symmetric model with Sr = 0.016, whilethe dashed line is a fit for asymmetric model with Sr = 0.030and κ = 0.89.
than the subsequent transition from the mixed state tothe final segregated state. This points to two separateprocesses that are likely to be related to the distinct be-havior of small and large particles.Particle dynamics.—We are thus motivated to study
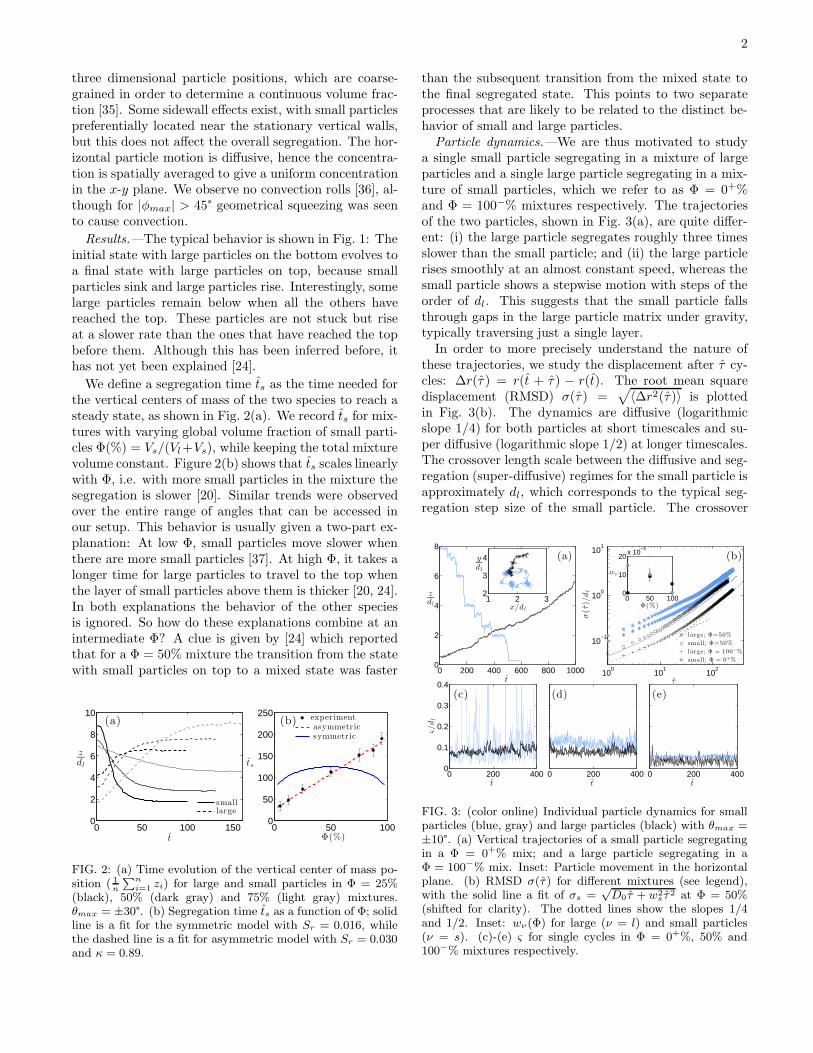
a single small particle segregating in a mixture of largeparticles and a single large particle segregating in a mix-ture of small particles, which we refer to as Φ = 0+%and Φ = 100−% mixtures respectively. The trajectoriesof the two particles, shown in Fig. 3(a), are quite differ-ent: (i) the large particle segregates roughly three timesslower than the small particle; and (ii) the large particlerises smoothly at an almost constant speed, whereas thesmall particle shows a stepwise motion with steps of theorder of dl. This suggests that the small particle fallsthrough gaps in the large particle matrix under gravity,typically traversing just a single layer.In order to more precisely understand the nature of
these trajectories, we study the displacement after τ cy-cles: ∆r(τ ) = r(t + τ ) − r(t). The root mean squaredisplacement (RMSD) σ(τ ) =
√
〈∆r2(τ )〉 is plottedin Fig. 3(b). The dynamics are diffusive (logarithmicslope 1/4) for both particles at short timescales and su-per diffusive (logarithmic slope 1/2) at longer timescales.The crossover length scale between the diffusive and seg-regation (super-diffusive) regimes for the small particle isapproximately dl, which corresponds to the typical seg-regation step size of the small particle. The crossover
0 200 400 600 800 10000
2
4
6
8
t
zdl
1 2 32
3
4
x/d l
ydl
100
101
102
10−1
100
101
τ
σ(τ
)/dl
0 50 1000
10
20x 10
−3
Φ(%)
wν
0 200 4000
0.1
0.2
0.3
0.4
t
ς/dl
0 200 400t
0 200 400
(a) (b)
(c) (d) (e)
t
large; Φ=50%
small; Φ=50%
large; Φ = 100−%
small; Φ = 0+%
FIG. 3: (color online) Individual particle dynamics for smallparticles (blue, gray) and large particles (black) with θmax =±10°. (a) Vertical trajectories of a small particle segregatingin a Φ = 0+% mix; and a large particle segregating in aΦ = 100−% mix. Inset: Particle movement in the horizontalplane. (b) RMSD σ(τ) for different mixtures (see legend),with the solid line a fit of σs =
√D0τ + w2
s τ 2 at Φ = 50%(shifted for clarity). The dotted lines show the slopes 1/4and 1/2. Inset: wν(Φ) for large (ν = l) and small particles(ν = s). (c)-(e) ς for single cycles in Φ = 0+%, 50% and100−% mixtures respectively.

3
length scale for the large particle is lower, roughly 0.2dl(0.4ds), and is likely to be related to the scale of the re-arrangements of the surrounding small particles. To con-firm this, we measure the RMSD per cycle ς =
√
〈∆r2〉,as shown in Figs. 3(c) and 3(e). The typical value of ς forthe single large particle lies just below ς for the surround-ing small particles [Fig. 3(e)]. Although the displace-ments ς for the single small particle experiences largevariations, as a result of falling through layers, the meanvalue is of the same order as that of the surrounding largeparticles [Fig. 3(c)].
The plot of σ(τ ) for a Φ = 50% mixture in Fig. 3(b)shows that the curves lie between those for Φ = 0+%and Φ = 100−%, but with a comparable amount ofsegregation. Fitting each of the curves with σν(τ ) =√
D0τ + w2ν τ
2 with diffusion coefficient D0 allows us toexamine the segregation velocities wν for large (ν = l)and small (ν = s) particles at different Φ. The inset ofFig. 3(b) shows that ws(Φ) decreases with increasing Φ,whereas wl(Φ) increases to a maximum at Φ = 50% andthen decreases, although not to zero, at Φ = 100−%. Tounderstand the peak in wl(Φ), we plot ς for Φ = 50%in Fig. 3(d). The values of ς for both small and largeparticles increase with respect to the Φ = 100−% mix,however, the large particle movement is still less com-pared to the small particles.
At this point we can hypothesize an explanation forthe trend in Fig. 2(b): the individual dynamics of small
(a)
P (∆z l|φ)
∆zl/dl
0 0.5 1
−0.1
−0.05
0
0.05
0.1
0.15(b)
P (∆zs|φ)
∆zs/dl
0 0.5 1
−0.1
−0.05
0
0.05
0.1
0.15
0 0.5 10
0.01
0.02
0.03(c)
φ
|〈∆zl〉|/A
0 0.5 10
0.01
0.02
0.03(d)
φ
|〈∆zs〉|/A
FIG. 4: (color online). (a)-(b) Conditional probabilitiesP (∆zl|φ) and P (∆zs|φ). White curves are 〈∆zl〉 and 〈∆zs〉.(c)-(d) |〈∆zl〉|/A and |〈∆zs〉|/A as a function of φ, with error-bars indicating the standard error of the mean. Dashed andsolid lines are plots of Eq. (5) for quadratic and cubic fluxfunctions F (φ) with Sr = 0.008 and Sr = 0.015 respectively.The values of Sr were scaled to account for the lower shearrate γ0ω at θmax = ±10°.
and large grains have a different significance on the over-all segregation dynamics at different Φ. At high Φ, thesignificant dynamics are of the ‘slow’ large particle, whichare governed by the scale of rearrangements of the sur-rounding small particles. At low Φ, it is the ‘fast’ smallparticle which is significant as it can make big segregationsteps between large particle layers. At an intermediate Φboth processes combine; small particles slow down, be-cause layering disappears, while large particles speed up,because the scale of rearrangements increases.Displacement statistics.—To study this behavior at the
particle scale for each species (ν = l, s), we measurethe conditional probabilities P (∆zν |φ) of the vertical dis-placement ∆zν given that the local small particle volumefraction is φ. Note that shear-gradients [38] do not playa role, because of the linear shear profile that is applied.Here, φ = 0 corresponds to regions of only large parti-cles and φ = 1 to only small particles. The results inFigs. 4(a) and 4(b) demonstrate that large particles areless likely to segregate at high φ compared to small par-ticles segregating at low φ. In the following, we will referto this as “asymmetry”. Similar to the data for wl(Φ) inthe inset of Fig. 3(b), we observe that the large particleshave their greatest displacement at an intermediate φ.The effect of asymmetry at a mesoscale can be seen in
the temporal development of φ(z, t) for a Φ = 50% mix-ture in Fig. 5(a). Two important features exist: (i) smallparticles reach the bottom of the flow faster compared tolarge particles reaching the top; (ii) large particles appearto rise predominantly together (indicated by the band oflow φ). The first feature is easily explained by asymme-try: small particles beginning the experiment near theinterface between the two species quickly travel to thebottom through the large particle matrix, in accordancewith P (∆zs|φ). The second feature is possibly linked tothe large particles having a maximum segregation speedat an intermediate concentration.Theoretical comparison.—Current approaches to mod-
eling size segregation use an advection-diffusion equationfor φ [40]:
∂φ
∂t+ div(φu) −
∂
∂z
(
qF (φ))
=∂
∂z
(
D∂φ
∂z
)
, (1)
where u is the bulk velocity field, q = q(ωγ0, g) is themean segregation speed, g is gravity, D is the diffusivityand F (φ) is the flux function, which determines the de-pendence of the segregation flux on φ. The simplest fluxfunction has a quadratic form
F (φ) = φ(1 − φ). (2)
This is employed in a number of models [12–14] and issymmetric about φ = 0.5, dictating that small and largeparticles behave identically, but in opposite directions.Recently, asymmetric flux functions were introduced by[41] with the simplest being a cubic form
F (φ) = Aκφ(1 − φ)(1 − κφ), (3)

4
zh
0
0.5
1
z
0
0.5
1
(c)
(b)
(a)
t
z
0 20 40 60 80 100 1200
0.5
1
0 0.5 1.0
FIG. 5: (color online). (a) Temporal development of φ(z, t)versus normalized flow height z/h for a Φ = 50% mixture withθmax = ±30°. (b)-(c) Theoretical predictions from Eq. (4).(b) Prediction using the symmetric flux function (2), withSr = 0.016 and Sr/Dr = 20.9 [39]. (c) Prediction using theasymmetric flux function (3), with Sr = 0.030, Sr/Dr = 29.6and κ = 0.89.
where asymmetry parameter 0 6 κ < 1, and normaliza-tion constant Aκ gives the same amplitude as the sym-metric flux function. The applied shear gives a velocityprofile u = (u(z, t), 0, 0). In combination with the lateralspatial uniformity of φ, this means that the transportterm in Eq. (1) is zero. Equation (1) reduces to:
∂φ
∂t−
∂
∂z
(
SrF (φ))
=∂
∂z
(
Dr
∂φ
∂z
)
, (4)
where z = z/A, and Sr = qT/A, Dr = DT/A2 arenon-dimensional segregation and diffusive-remixing co-efficients respectively. The symmetric and asymmetricmodels were least squares fitted to the data in Fig. 2(b) toobtain Sr = 0.016 for the symmetric model and κ = 0.89,Sr = 0.030 for the asymmetric model. Integrating Eq. (4)gives the φ evolution in Figs. 5(b) and 5(c). Qualitatively,Fig. 5(c) reproduces the experimental result on some crit-ical points: (i) the difference in time between the arrivalof small particles at the bottom and large particles at thetop of the flow; (ii) the collective rising of large particles;and (iii) a lower φ in the bottom half of the flow near theend of the experiment, indicating that some large parti-cles are still inside the small particle matrix, segregatingvery slowly. These features are not found in the symmet-ric result in Fig. 5(b). The theoretical displacements percycle are given by
∣
∣∆zl∣
∣ = Sr
F (φ)
1− φ,
∣
∣∆zs∣
∣ = Sr
F (φ)
φ, (5)
and are shown alongside the experimental data inFigs. 4(c) and 4(d). The trend is clearly better pre-dicted by the asymmetric flux, which is able to reproduceboth the peak in |〈∆zl〉| around φ = 0.5 and the nonlin-ear decrease of |〈∆zs〉|. We attribute the discrepancy of
|〈∆zs〉| at low φ to tracking errors, when small particlesmove more than their radius and their displacement isnot recorded, thereby lowering the measured value.
Discussion.—We analyze particle motion in a segre-gating bidisperse mixture under oscillatory shear and dis-cover an underlying asymmetry in the behavior of largeand small particles. The small particle motion is step-like, falling down through the large particle matrix typ-ically one layer at a time. On the other hand, the largeparticle motion is smoother but slower, and linked to thescale of rearrangements of the surrounding small parti-cles. The asymmetric motion of the large and small par-ticles combine to give a characteristic dependence of theparticle segregation speeds on the local volume fraction.Large particles segregate slower in the presence of manysmall particles, while small particles segregate faster inthe presence of many large particles. We also observethat large particles move quickest when close to otherlarge particles at intermediate concentrations, a processreminiscent of a collective motion [42]. The underlyingasymmetry also manifests at meso and bulk scales. Inthe development of φ(z, t), small particles reach the bot-tom of the flow faster than large particles reach the top.The segregation time increases linearly when a mixturecontains a larger fraction of small particles. Althoughthere is no direct evidence that the observed asymmetrypersists for continuous shear, Staron and Phillips [20] re-port that the segregation time under steady shear alsoincreases linearly with the total concentration of smallparticles. These insights give a new understanding ofsegregation in sheared systems, with the dynamic behav-ior of two species being inherently different.Models for segregation have typically considered the
motion of the large and small grains to be identical.However, an experimentally determined cubic flux [41]brings asymmetric behavior for the two species and givesgood agreement on both particle and bulk scales. Thisdraws parallels with the use of asymmetric flux func-tions to model asymmetry in sedimentation [43], trafficflows [44, 45] and diffusion across membranes [46]. Forexample, in the sedimentation of suspensions, particlessettle faster when traveling together, but the settling ve-locity goes to zero more rapidly than a linear decrease athigh concentrations [43]. Similarly, the velocity of carsin traffic approaches zero non-linearly at high car den-sities [45]. The commonality between these processes istheir discrete nature, but interestingly, size segregationis the only process that consists of two discrete species.Further work is needed to analyze particle scale mo-
tion for continuously sheared flows, e.g. down chutesand within rotating drums, to determine whether asym-metry persists and what form the segregation flux takes.The distinct segregation dynamics of the two species alsoleads to questions as to a possible relation with other dy-namic processes such as dynamic heterogeneity [48].
Acknowledgements.—The authors would like to ac-

5
knowledge enlightening discussions with Marco Ra-maioli, Karen Daniels, Anthony Thornton and MatthiasSchroter, as well as technical and analytical assis-tance from Justine Caillet. Financial support forthis work came from the Swiss SNF grant 200021-149441 and NERC grants NER/A/S/2003/00439 andNE/E003206/1, as well as EPSRC grants EP/I019189/1and EP/K00428X/1.
∗ Electronic address: [email protected][1] I. S. Aranson and L. S. Tsimring, Granular Patterns (Ox-
ford University Press, 2008).[2] J. M. Ottino and D. V. Khakhar, Annu. Rev. Fluid Mech.
32, 55 (2000).[3] D. Pihler-Puzovic and T. Mullin, Proc. Roy. Soc. A 469,
20130203 (2013).[4] S. C. Williams, Powder Technol. 2, 13 (1968).[5] J. Johanson, Chem. Eng. May, 183 (1978).[6] T. Shinbrot and F. J. Muzzio, Phys. Today 53, 25 (2000).[7] R. M. Iverson, Rev. Geophys 35, 245 (11007).[8] C. G. Johnson, B. P. Kokelaar, R. M. Iverson, M. Logan,
R. G. LaHusen, and J. M. N. T. Gray, J. Geophys. Res.117, 013301 (2012).
[9] D. M. Palladino and G. A. Valentine, J. Volcanol.Geotherm. Res. 69, 343 (11005), ISSN 0377-0273.
[10] J. McElwaine and K. Nishimura, in IUTAM Sympo-
sium on Segregation in Granular Flows, edited by A. D.Rosato and D. L. Blackmore (Springer Netherlands,2000), vol. 81 of Solid Mechanics and Its Applications,pp. 81–88.
[11] J. Bridgwater, W. Foo, and D. Stephens, Powder Tech-nol. 41, 147 (1985).
[12] J. M. N. T. Gray and A. R. Thornton, P. R. Soc. A 461,1447 (2005).
[13] L. B. H. May, L. A. Golick, K. C. Phillips, M. Shearer,and K. E. Daniels, Phys. Rev. E 81, 051301 (2010).
[14] Y. Fan, C. P. Schlick, P. B. Umbanhowar, J. M. Ottino,and R. M. Lueptow, J. Fluid Mech. 741, 252 (2014).
[15] B. Marks, P. Rognon, and I. Einav, J. Fluid Mech. 690,4100 (2012).
[16] K. M. Hill and S. D. Tan, J. Fluid Mech. 756, 54 (2014).[17] J. Bridgwater, Particuology 8, 563 (2010).[18] A. Thornton, T. Weinhart, S. Luding, and O. Bokhove,
Int. J. Mod. Phys. C 23, 1240014 (2012).[19] Y. Fan, P. B. Umbanhowar, J. M. Ottino, and R. M.
Lueptow, Proc. Roy. Soc. A 469, 20130235 (2013).[20] L. Staron and J. Phillips, Phys. Fluids 26, 033302 (2014).[21] S. B. Savage and C. K. K. Lun, J. Fluid Mech. 189, 311
(1988).[22] J. Vallance and S. Savage, in IUTAM symposium on seg-
regation in granular materials, edited by A. D. Rosatoand D. L. Blackmore (Dordrecht: Kluwer, 2000), pp. 31–51.
[23] S. Wiederseiner, N. Andreini, G. Epely-Chauvin,
G. Moser, M. Monnereau, J. M. N. T. Gray, and C. An-cey, Phys. Fluids A 23, 013301 (2011).
[24] L. A. Golick and K. E. Daniels, Phys. Rev. E 80, 042301(2009).
[25] S. McDonald, D. Harris, and P. Withers, Int. J. Material
Res. 103, 162 (2012).[26] J. A. Dijksman, F. Rietz, K. A. Lorincz, M. van Hecke,
and W. Losert, Rev. Sci. Instrum. 83, 011301 (2012).[27] S. Wiederseiner, N. Andreini, G. Epely-Chauvin, and
C. Ancey, Exp. Fluids 50, 1183 (2011), ISSN 0723-4864.[28] M. Iskander, Modelling with Transparent Soils, Springer
Series in Geomechanics and Geoengineering (Springer,2010).
[29] M. Herrera, S. McCarthy, S. Slotterback, E. Cephas,W. Losert, and M. Girvan, Phys. Rev. E 83, 061303(2011).
[30] S. Slotterback, M. Mailman, K. Ronaszegi, M. van Hecke,M. Girvan, and W. Losert, Phys. Rev. E 85, 021309(2012).
[31] M. Harrington, J. H. Weijs, and W. Losert, Phys. Rev.Lett. 111, 078001 (2013).
[32] A. M. Scott and J. Bridgwater, Ind. Eng. Chem. Fund.14, 22 (1975).
[33] C. Cassar, M. Nicolas and O. Pouliquen, Phys. Fluids17, 103301 (2005).
[34] M. D. Shattuck, R. A. Ingale, and P. M. Reis, AIP Conf.Proc. 1145, 43 (2009).
[35] T. Weinhart, R. Hartkamp, A. R. Thornton, and S. Lud-ing, Phys. Fluids 25, 070605 (2013).
[36] J. R. Royer and P. M. Chaikin, P. Natl. Acad. Sci. USA112, 49 (2015).
[37] A. Jha, J. Gill, and V. Puri, Particul. Sci. Technol. 26,482 (2008).
[38] Y. Fan and K. M. Hill, New J. Phys. 13, 095009 (2011).[39] The ratio Sr/Dr is found by least squares matching the
steady end state.[40] J. Gray, P. Gajjar, and B. P. Kokelaar, Comptes Rendus
Physique 16, 73 (2015).[41] P. Gajjar and J. M. N. T. Gray, J. Fluid Mech. 757, 297
(2014).[42] T. Vicsek and A. Zafeiris, Phys. Rep. 517, 71 (2012).[43] G. Batchelor, J. Fluid Mech. 52, 245 (1972).[44] M. J. Lighthill and G. B. Whitham, Proc. Roy. Soc. Lond.
A229, 317 (1955).[45] 75 Years of the Fundamental Diagram for Traffic Flow
Theory: Greenshields Symposium, no. E-C149 in Trans-portation Research Circular (Transportation ResearchBoard of the National Academies, Washington, DC,USA, 2011).
[46] N. Packard and R. Shaw, Working Paper, Santa FeInstitution, Santa Fe Institute, 13100 Hyde ParkRoad, Santa Fe, New Mexico 87501, USA (2004), URLhttp://www.santafe.edu/media/workingpapers/04-12-040.pdf.
[47] T. S. Majmudar and R. P. Behringer, Nature 435, 1079(2005).
[48] R. Candelier, O. Dauchot, and G. Biroli, Phys. Rev.Lett. 102, 088001 (2009).