Anuj Mundra Moderator – Dr. Abhishek Raut. What is “burden of disease” Need for measuring...
45
Measuring global burden of diseases Anuj Mundra Moderator – Dr. Abhishek Raut
-
Upload
madeline-robinson -
Category
Documents
-
view
219 -
download
2
Transcript of Anuj Mundra Moderator – Dr. Abhishek Raut. What is “burden of disease” Need for measuring...

Measuring global burden of diseasesAnuj MundraModerator – Dr. Abhishek Raut

FrameworkWhat is “burden of disease”Need for measuring burden of disease?Measures of population healthLife expectancyHealthy life expectancyDisability adjusted and disability free life expectancyQuality Adjusted Life years Incidence, prevalence, mortalityDALYGlobal Burden of Disease study
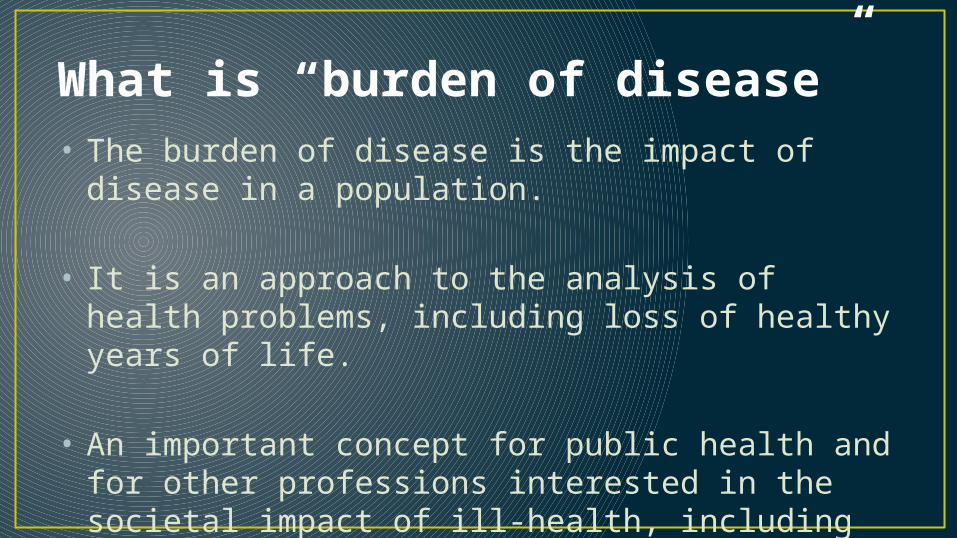
What is “burden of disease”• The burden of disease is the impact of disease in
a population.
• It is an approach to the analysis of health problems, including loss of healthy years of life.
• An important concept for public health and for other professions interested in the societal impact of ill-health, including injuries and disabilities.

Need for measuring burden of diseaseFor public health interventions to be effective and
appropriate for improving population health, understanding of the key challenges and their dynamics is necessary both regionally as well as globally.
The global health landscape is undergoing rapid transformation and the trends differ globally.
Recently the role of disability in estimating disease burden & health status is increasingly being projected than mortality only.

Need for measuring burden of diseaseCommercial and professional interests often lead to implausible
claims of the number of deaths or cases due to a particular disease.
To respond to these challenges, high-quality comparable and combined data on the size and trends in mortality and morbidity are essential.
For this we need to make a comprehensive assessment of the health of each population by ensuring that all deaths by cause add up to the total number of deaths and similar criteria be applied to classifying cases of disease &/or the morbidity due to it.
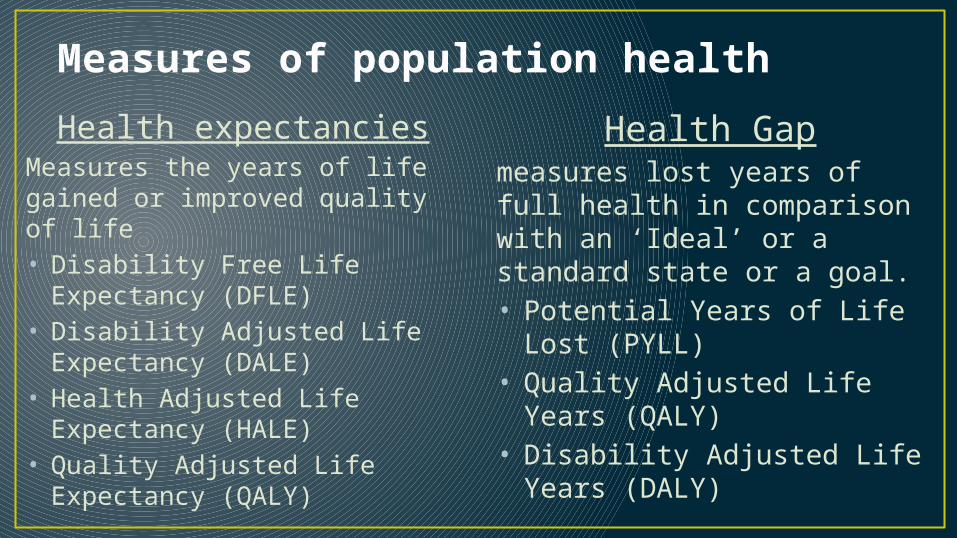
Measures of population health
Health expectanciesMeasures the years of life gained or improved quality of life• Disability Free Life Expectancy
(DFLE)• Disability Adjusted Life
Expectancy (DALE)• Health Adjusted Life
Expectancy (HALE)• Quality Adjusted Life
Expectancy (QALY)
Health Gapmeasures lost years of full health in comparison with an ‘Ideal’ or a standard state or a goal.• Potential Years of Life Lost
(PYLL)• Quality Adjusted Life Years
(QALY)• Disability Adjusted Life
Years (DALY)
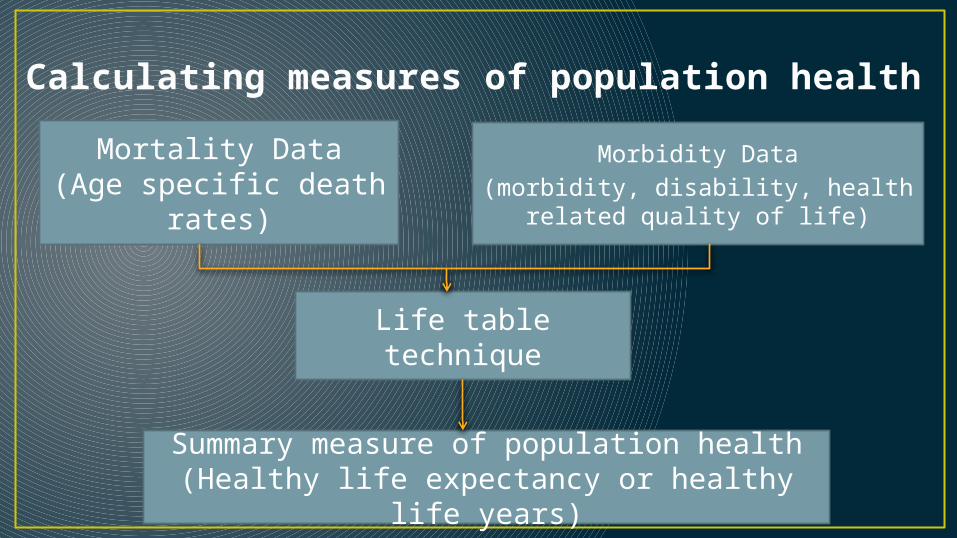
Calculating measures of population health
Mortality Data(Age specific death
rates)
Morbidity Data(morbidity, disability, health
related quality of life)
Life table technique
Summary measure of population health(Healthy life expectancy or healthy life
years)

Life expectancy Indicates the number of years a person would live if prevailing
patterns of mortality at that age were to stay the same throughout its life.
Composite measure of age specific mortality rates.
Indicates overall health status & mortality patterns across age groups in a region.
Mortality rates change with time and hence life expectancy with age (mostly higher than estimated figures due to falling death rates).
Does not give an estimate of impact of a particular disease.

Life expectancy at birth - 2013
Globally – 71 yrsLow income countries -62 yrsHigh income countries – 79yrsLowest: Sierra-Leone (46 yrs)Highest: Iceland & Japan–83yrs India – 67.3 yrs (M), 69.6 yrs (F)
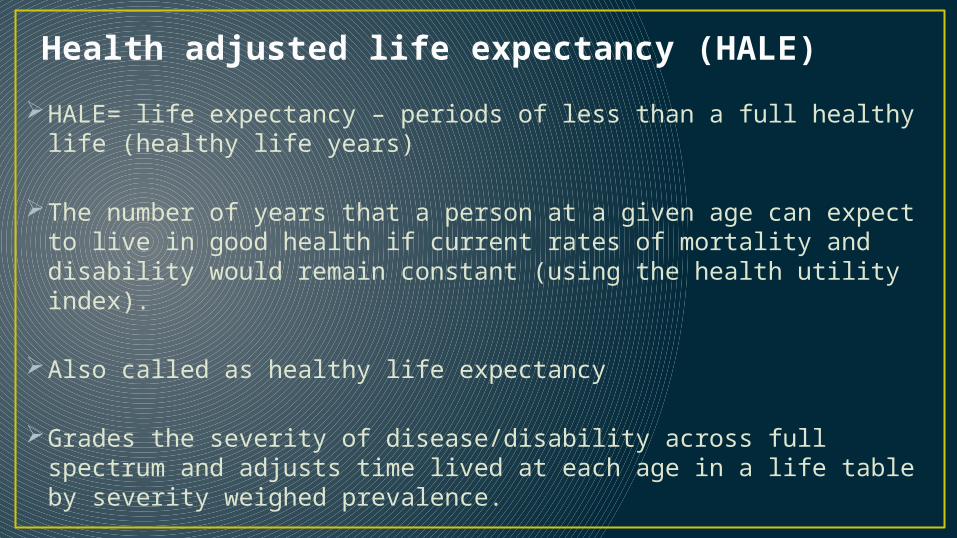
Health adjusted life expectancy (HALE)
HALE= life expectancy – periods of less than a full healthy life (healthy life years)
The number of years that a person at a given age can expect to live in good health if current rates of mortality and disability would remain constant (using the health utility index).
Also called as healthy life expectancy
Grades the severity of disease/disability across full spectrum and adjusts time lived at each age in a life table by severity weighed prevalence.

Health Adjusted Life Expectancy
Data Source
Data
Healthy life
expectancy
Life table
technique
Mortality data
Mid year population estimates
Health data
Age specific death rates
Self assessed
health


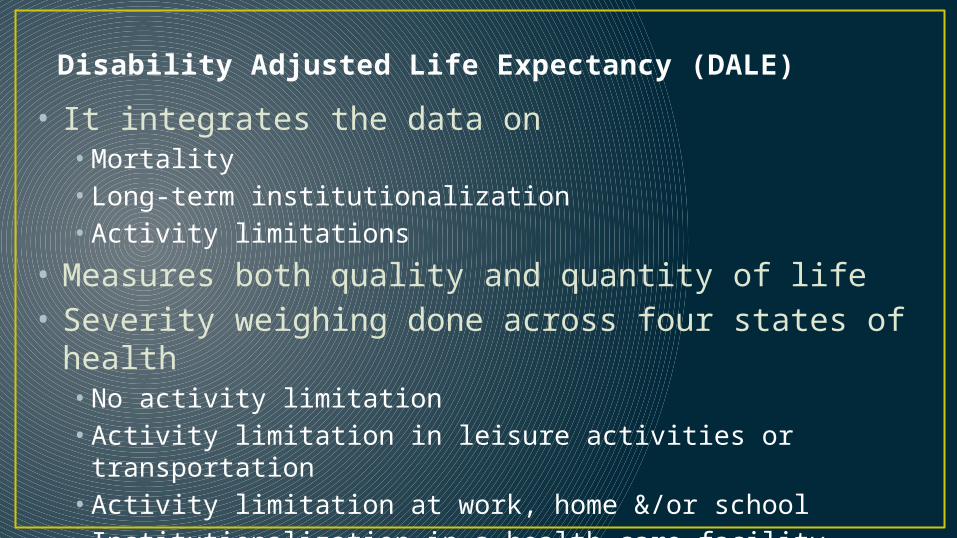
Disability Adjusted Life Expectancy (DALE)
• It integrates the data on• Mortality • Long-term institutionalization• Activity limitations
• Measures both quality and quantity of life• Severity weighing done across four states of health• No activity limitation• Activity limitation in leisure activities or transportation• Activity limitation at work, home &/or school• Institutionalization in a health care facility.

Disability Free Life Expectancy (DFLE)
Classifies disability in a dichotomous way: those above threshold contribute no time whereas those below threshold contribute a full year to a healthy (disability free) life.
DFLE is the coarsest measure of health expectancy.
Does not give weightage to the severity of disability once it has crossed the threshold.


• Advantages of health expectancy measures• Health expectancies are an adaptation of life expectancy
taking into account that not all years of remaining life expectancy are lived in good health.• They capture the health status of a population in a single
number which provides an easy and intuitive way to interpret the results.
• Limitations of health expectancy measures• Not easy to attribute a populations health status (both
good or bad) to any particular disease, injury, risks or other conditions

Quality Adjusted Life Years (QALY) A composite measure of gain in life expectancy and health
related quality of life. Combines length of life and quality of life. It is quality adjustment to years of life gained or length of time
for which the quality of life improved or both due to an intervention.
Quality of life is calculated by obtaining a measure of health state of patients using a generic measure like EQ-5D and comparing with a standard population

Quality Adjusted Life Years (QALY)Advantages of QALY• Can be applied to any intervention whether it increases life expectancy without improving quality of life or vice versa, improves both or improves one at the cost of other.• Useful for cost-effective analysis.
Disadvantage-• It is argued that longevity and quality should not be compared in the same metric.

Measures of disease burden• Incidence• Prevalence• Mortality rates-• Age-specific mortality rates• Cause specific mortality rates• Case fatality rates
• Disability Adjusted Life Years (DALY)

Measures of disease burden• Incidence – no. of new cases of a disease.• Incidence rates – no of new cases of a disease per
year
• Prevalence – proportion of people in a population living with a disease (new + old) at any given point of time or over a period of time.

Mortality rates• No of deaths per year due to a disease or a health
condition.• Can be calculated for different age/age groups (thus
indicates the burden of any disease at different stages of life).
• Case fatality rates indicate about the severity of the disease.
• Incidence, prevalence and mortality do not give a complete picture regarding the impact/burden of a disease particularly about quality of life.
• May be difficult to compare across regions due to lack of uniformity and consistency in data.
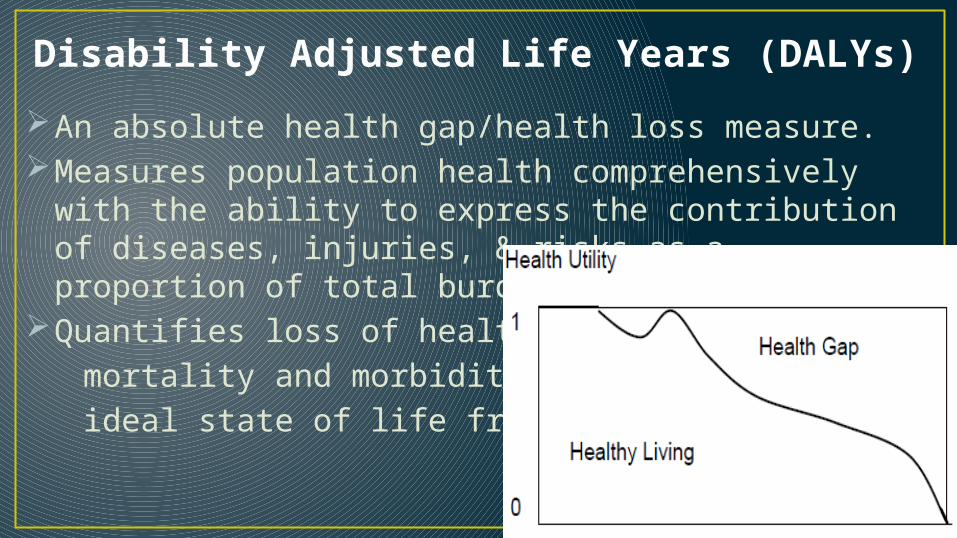
Disability Adjusted Life Years (DALYs)
An absolute health gap/health loss measure.Measures population health comprehensively with the
ability to express the contribution of diseases, injuries, & risks as a proportion of total burden of disease.
Quantifies loss of health from mortality and morbidity against an ideal state of life free of disease.

DALY• Ranges from 0 (no disability) to 1 (death). 1DALY = 1 year of
healthy life lost• Converse of the QALY (quality adjusted life year)• Uses life table to compare with maximum life expectancy
(i.e.lowest age specific mortality)

Years of Life Lost (YLL)• Years of life lost due to premature death from a
disease or risk factor.• YLL = N * L N= no of deaths
L= standard life expectancy at age of death
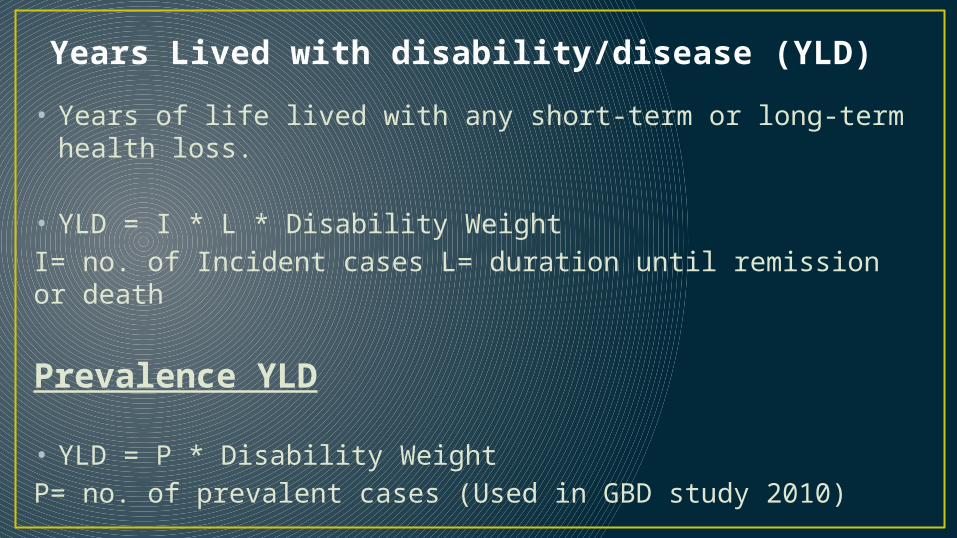
Years Lived with disability/disease (YLD)
• Years of life lived with any short-term or long-term health loss.
• YLD = I * L * Disability WeightI= no. of Incident cases L= duration until remission or death
Prevalence YLD
• YLD = P * Disability WeightP= no. of prevalent cases (Used in GBD study 2010)

Disability weights• A disability weight is a weight/severity factor that reflects
the severity of the disease on a scale from 0 (equivalent to perfect health) to 1 (equivalent to death).
• Translates morbidity into healthy life years lost, thus enabling comparison of morbidity and mortality.
• Years Lost due to Disability (YLD) are calculated by multiplying the incident cases by duration and disability weight for the condition.

Disability weight scaleDisability
classSeverity weights Conditions
1 0.00 – 0.02 Vitiligo on face, malnutrition
2 0.02 – 0.12 Watery diarrhoea, sore throat, anemia
3 0.12 – 0.24Radius # in cast, infertility, erectile dysfunction, RA, Angina
4 0.24 – 0.36 Below knee amputation, deafness
5 0.36 – 0.50 Rectovaginal fistula, Mild mental retardation, Down syndrome
6 0.50 – 0.70Unipolar major depression, blindness, paraplegia
7 0.70 – 1.00Active psychosis, dementia, Quadriplegia
Source: The Global Burden of Disease report summary 1990
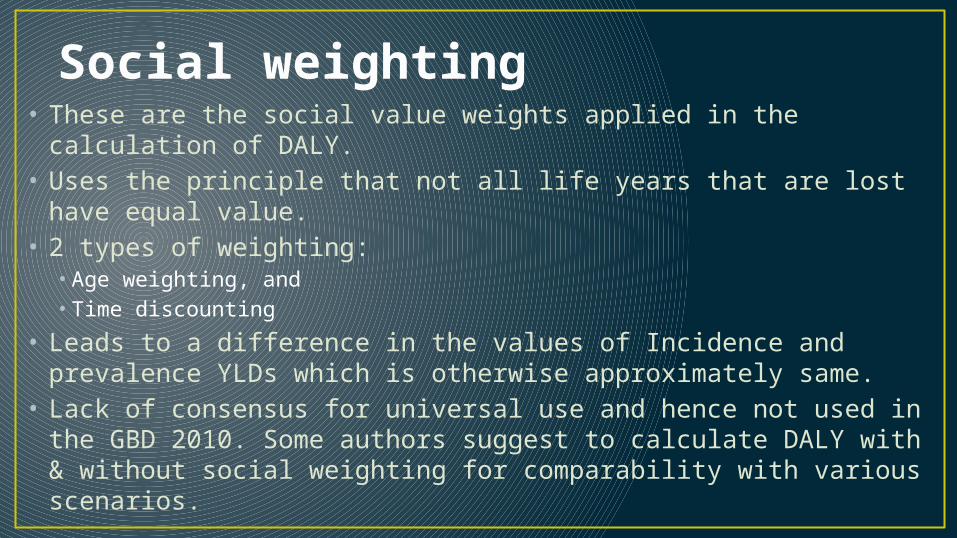
Social weighting• These are the social value weights applied in the calculation of
DALY.• Uses the principle that not all life years that are lost have equal
value.• 2 types of weighting:• Age weighting, and• Time discounting
• Leads to a difference in the values of Incidence and prevalence YLDs which is otherwise approximately same.
• Lack of consensus for universal use and hence not used in the GBD 2010. Some authors suggest to calculate DALY with & without social weighting for comparability with various scenarios.

Age weighting• A higher weight is given to the healthy life years
lived in the so assumed socially more important age group.
• Age weighting formula is given by - Cxe-βx
C- constant (0.1658), β- constant (0.04), x- concerned age

Time discounting• Time discounting discounts years of healthy life lived
in the future to prevent giving excessive weight to deaths at a younger age.
• Usually the discount rate is taken as 3%.• It is a more common practice in economic
assessments and motivates policy makers to invest in currently available intervention measures, though they may be less effective than from saving resources for future programs.
• It can be calculated by the following formula - e-r(x-a)
r- discount rate, x- concerned age,a- age to which burden will be assigned
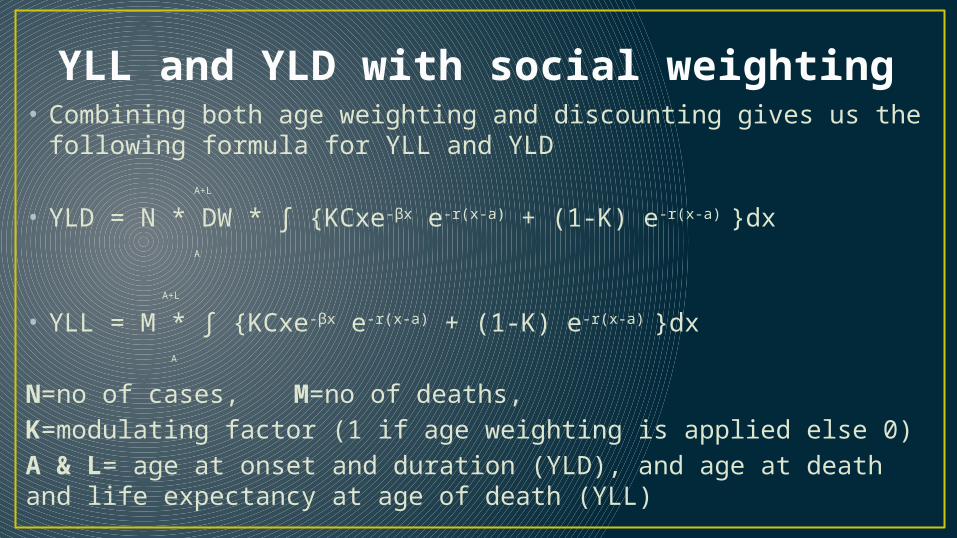
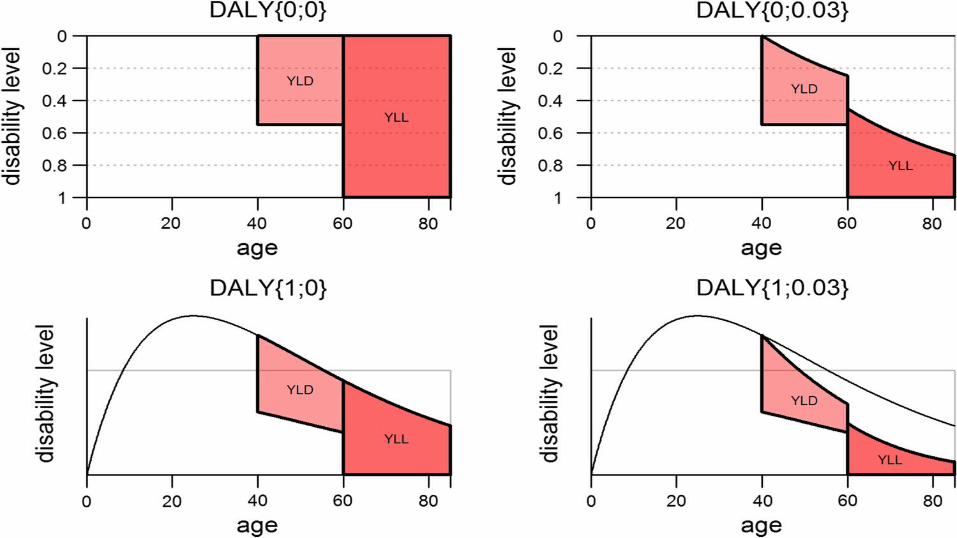
YLL and YLD with social weighting• Combining both age weighting and discounting gives us the
following formula for YLL and YLD A+L
• YLD = N * DW * ʃ {KCxe-βx e-r(x-a) + (1-K) e-r(x-a) }dx A
A+L
• YLL = M * ʃ {KCxe-βx e-r(x-a) + (1-K) e-r(x-a) }dx A
N=no of cases, M=no of deaths,K=modulating factor (1 if age weighting is applied else 0)A & L= age at onset and duration (YLD), and age at death and life expectancy at age of death (YLL)
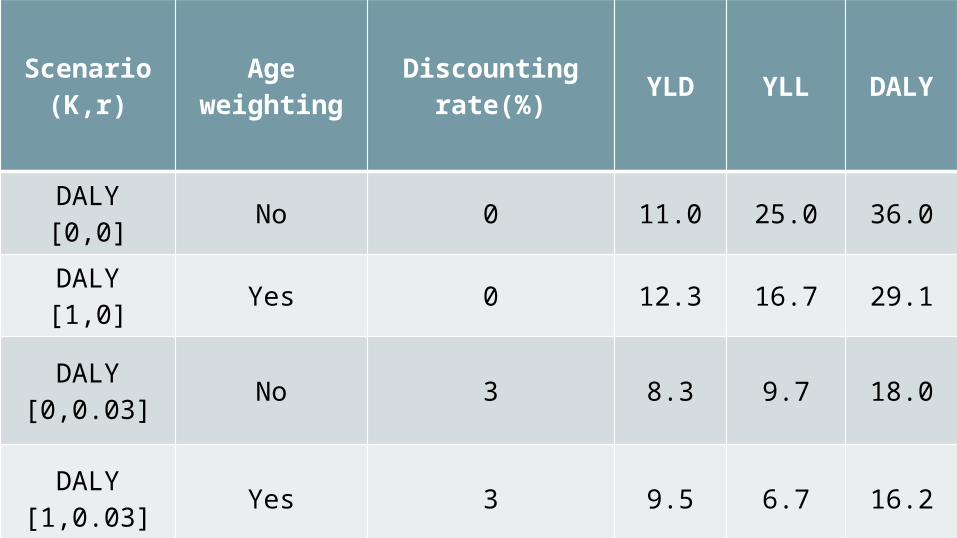
Scenario (K,r)
Age weighting
Discounting rate(%)
YLD YLL DALY
DALY [0,0] No 0 11.0 25.0 36.0
DALY [1,0] Yes 0 12.3 16.7 29.1
DALY [0,0.03] No 3 8.3 9.7 18.0
DALY [1,0.03] Yes 3 9.5 6.7 16.2
DALY Limitations
• Doesn’t help determine the right interventions.• The true “burden” of disease will depend on the
economic, family and social circumstances.
• Does not assess qualitative difference in outcomes• Discriminates against young and the old

A- Global
B-High Income Countries
C- low Income Countries

The global burden of disease study


Global YLL trends 1990-2013

Global YLD trends
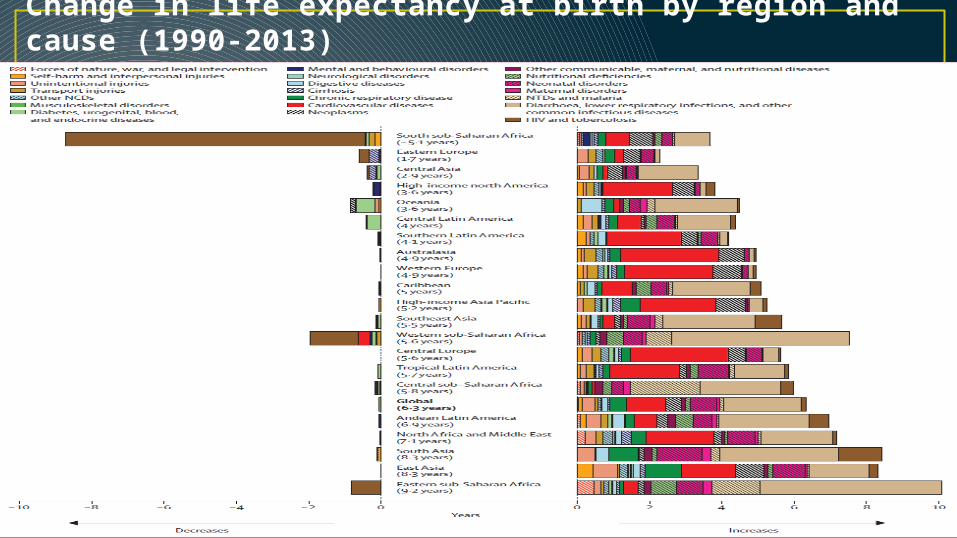
Change in life expectancy at birth by region and cause (1990-2013)

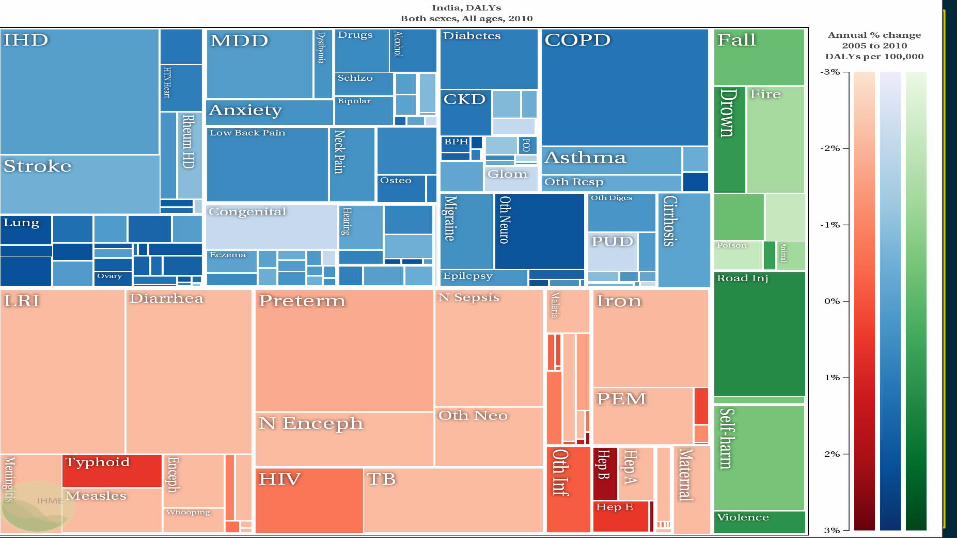
India – trends in burden of diseaseRanking of causes
YLD 2013 YLL 2013
1 Major Depressive disorder
IHD
2 Back Pain LRI
3 Iron Deficiency TB
4 Migraine Neonatal encephalitis
5 COPD Preterm birth Complications
6 Hearing disorder Diarrhoea
7 Neck pain Stroke
8 Diabetes COPD
9 Anxiety Self Harm
10 Refraction error Road Injuries
Referrences1. Institute for Health Metrics and Evaluation. The Global Burden of Disease:
Generating Evidence, Guiding Policy. Seattle, WA: IHME, 2013.
2. Molla MT, Madans JH, wagener DK, Crimmins EM, Summary measures of population health : report of findings on methodologic and data issues. National Center for Health Statistics. Hyattsville, Maryland. 2003.
3. Murray CJL, Vos T, Lozano R, Naghavi M, Flaxman AD, Michaud C, et al. Disability-adjusted life years (DALYs) for 291 diseases and injuries in 21 regions, 1990?2010: a systematic analysis for the Global Burden of Disease Study 2010. The Lancet. 2012;380(9859):2197-223.
4. The World Bank Group. Life expectancy at birth, total (years) [Internet]. 2015. Available from: http://data.worldbank.org/indicator/SP.DYN.LE00.IN
5. Devleesschauwer B, Havelaar AH, Maertens De Noordhout C, Haagsma J a., Praet N, Dorny P, et al. Calculating disability-adjusted life years to quantify burden of disease. Int J Public Health. 2014;59(3):565–9.

Referreces 6. Sassi F. Calculating QALYs, comparing QALY and DALY calculations. Health Policy Plan. 2006;21(5):402–8. 7. Murray CJL, Lopez AD. Measuring the Global Burden of Disease. N Engl J Med. 2013;369(5):448–57. 8. Meyrowitsch DW, Bygbjerg IC. Global burden of disease--a race against time. Dan Med Bull. 2007;54(1):32–4. 9. Murray CJL, Lopez AD. The global burden of decease: Summary. World Health Organization. 1996. 10. Global, regional, and national incidence, prevalence, and years lived with disability for 301 acute and chronic diseases and injuries in 188 countries, 1990–2013: a systematic analysis for the Global Burden of Disease Study 2013. Lancet. Elsevier; 2015 Jun 10; 11. Global, regional, and national age–sex specific all-cause and cause-specific mortality for 240 causes of death, 1990–2013: a systematic analysis for the Global Burden of Disease Study 2013. Lancet. Elsevier; 2015 Jun 10;385(9963):117–71.