Antisolvent micronization of BSA using supercritical mixtures carbon dioxide+organic solvent
9
J. of Supercritical Fluids 94 (2014) 189–197 Contents lists available at ScienceDirect The Journal of Supercritical Fluids j our na l ho me page: www.elsevier.com/locate/supflu Antisolvent micronization of BSA using supercritical mixtures carbon dioxide + organic solvent Valentina Prosapio, Ernesto Reverchon, Iolanda De Marco ∗ Department of Industrial Engineering, University of Salerno, Via Giovanni Paolo II, 132, 84084 Fisciano, SA, Italy a r t i c l e i n f o Article history: Received 20 May 2014 Received in revised form 17 July 2014 Accepted 17 July 2014 Available online 27 July 2014 Keywords: Expanded liquid antisolvent process Hydrosoluble proteins Bovine serum albumin Supercritical fluids a b s t r a c t In this work, expanded liquid antisolvent (ELAS) process has been used to micronize bovine serum albu- min (BSA) solubilized in water. Carbon dioxide mixtures with ethanol, acetone or isopropyl alcohol, at expanded liquid conditions, have been used as the antisolvent. The effect of process parameters, such as the kind of co-antisolvent and the organic co-antisolvent/water/carbon dioxide mole fraction on the morphology and dimensions of the precipitates, was studied. Changing co-antisolvent and operating con- ditions, we obtained nanoparticles (with a mean diameter of about 60 nm ± 10 nm), sub-microparticles (with a mean diameter of 470 nm ± 130 nm), microparticles (with a mean diameter of 0.93 m ± 0.37 m) and expanded microparticles with an empty core (with a mean diameter of about 9 m ± 5 m). Fourier transform infrared analysis on BSA powders revealed that, using acetone as co-antisolvent, no modifica- tions of the protein secondary structure were induced by ELAS processing. © 2014 Elsevier B.V. All rights reserved. 1. Introduction Micronization of high-added value products, such as pharma- ceuticals, nutraceuticals, proteins and enzymes, has been fre- quently attempted using supercritical carbon dioxide (SC-CO 2 ) based techniques [1–4]. Among them, supercritical antisolvent (SAS) has been successfully used to obtain microparticles and nanoparticles of various materials, changing the organic solvent and the operating conditions [1,5]. Studies on precipitation mech- anisms and attempts at the modeling of SAS process were also performed [6–10]. SAS is based on two pre-requisites: (a) organic solvent and SC-CO 2 have to be perfectly miscible at the process conditions; (b) the solute to be micronized has to be soluble in the organic solvent and has to possess a near zero solubility in the mixture formed by SC-CO 2 and the organic solvent. It has been demonstrated that, for standard SAS processing, thermodynamic conditions of complete miscibility represent the necessary condition for successful micronization; whereas, fluid dynamics and mass transfer concur in determining the morphology of particles produced [7,8]. The condition of miscibility, between solvent and antisolvent, limits the applicability of the SAS process to hydrophobic com- pounds that are generally soluble in SC-CO 2 . Water solubility in ∗ Corresponding author. Tel.: +39 089 964066; fax: +39 89 964057. E-mail address: [email protected] (I. De Marco). carbon dioxide is, instead, very limited at the usual SAS condi- tions (40–60 ◦ C and 100–250 bar) [11]. Since several categories of pharmaceutical products, as, for example, proteins and enzymes, are water-soluble, a modification of the SAS process is required to extend its applicability to water soluble compounds. An interesting opportunity could be to add to the supercritical antisolvent an organic solvent, completely miscible with SC-CO 2 at process conditions, to form a supercritical mixture in which water solubility is largely enhanced or complete. Practically speaking, the mixture CO 2 plus organic solvent can act as a hydrophilic antisol- vent in the modified SAS process. Some papers can be found in the literature, in which CO 2 + organic solvent were used in the attempt of processing hydrophilic compounds by supercritical antisolvent precipitation [12–15]. Some proteins, like, for example, lysozyme, albumin, insulin, recombinant human deoxyribonuclease (rhD- Nase), lysozyme-lactose and rhDNase-lactose were processed by Bustami et al. [12,13] using a 0.2 mole fraction of ethanol or of ethanol and triethylamine in SC-CO 2 as the antisolvent. Irregular and aggregated micrometric particles (3–18 m) were obtained. Bouchard et al. [14,15], processed lysozyme, -glycine and phenylalanine anhydrate, obtaining microparticles in the range 1–50 m using methanol, ethanol, 2-propanol or acetone as co- antisolvent. However, these authors [14,15] processed very small quantities of water solutions (around 0.06 water mole fraction), producing, as a result, extremely small quantities of precipitates. Recently, De Marco and Reverchon [16] proposed the supercrit- ical antisolvent processing of bovine serum albumin (BSA) using http://dx.doi.org/10.1016/j.supflu.2014.07.012 0896-8446/© 2014 Elsevier B.V. All rights reserved.
Transcript of Antisolvent micronization of BSA using supercritical mixtures carbon dioxide+organic solvent
Ad
VD
a
ARRAA
KEHBS
1
cqb(naapsctm
tndo
lp
h0
J. of Supercritical Fluids 94 (2014) 189–197
Contents lists available at ScienceDirect
The Journal of Supercritical Fluids
j our na l ho me page: www.elsev ier .com/ locate /supf lu
ntisolvent micronization of BSA using supercritical mixtures carbonioxide + organic solvent
alentina Prosapio, Ernesto Reverchon, Iolanda De Marco ∗
epartment of Industrial Engineering, University of Salerno, Via Giovanni Paolo II, 132, 84084 Fisciano, SA, Italy
r t i c l e i n f o
rticle history:eceived 20 May 2014eceived in revised form 17 July 2014ccepted 17 July 2014vailable online 27 July 2014
a b s t r a c t
In this work, expanded liquid antisolvent (ELAS) process has been used to micronize bovine serum albu-min (BSA) solubilized in water. Carbon dioxide mixtures with ethanol, acetone or isopropyl alcohol, atexpanded liquid conditions, have been used as the antisolvent. The effect of process parameters, suchas the kind of co-antisolvent and the organic co-antisolvent/water/carbon dioxide mole fraction on themorphology and dimensions of the precipitates, was studied. Changing co-antisolvent and operating con-
eywords:xpanded liquid antisolvent processydrosoluble proteinsovine serum albuminupercritical fluids
ditions, we obtained nanoparticles (with a mean diameter of about 60 nm ± 10 nm), sub-microparticles(with a mean diameter of 470 nm ± 130 nm), microparticles (with a mean diameter of 0.93 �m ± 0.37 �m)and expanded microparticles with an empty core (with a mean diameter of about 9 �m ± 5 �m). Fouriertransform infrared analysis on BSA powders revealed that, using acetone as co-antisolvent, no modifica-tions of the protein secondary structure were induced by ELAS processing.
© 2014 Elsevier B.V. All rights reserved.
. Introduction
Micronization of high-added value products, such as pharma-euticals, nutraceuticals, proteins and enzymes, has been fre-uently attempted using supercritical carbon dioxide (SC-CO2)ased techniques [1–4]. Among them, supercritical antisolventSAS) has been successfully used to obtain microparticles andanoparticles of various materials, changing the organic solventnd the operating conditions [1,5]. Studies on precipitation mech-nisms and attempts at the modeling of SAS process were alsoerformed [6–10]. SAS is based on two pre-requisites: (a) organicolvent and SC-CO2 have to be perfectly miscible at the processonditions; (b) the solute to be micronized has to be soluble inhe organic solvent and has to possess a near zero solubility in the
ixture formed by SC-CO2 and the organic solvent.It has been demonstrated that, for standard SAS processing,
hermodynamic conditions of complete miscibility represent theecessary condition for successful micronization; whereas, fluidynamics and mass transfer concur in determining the morphologyf particles produced [7,8].
The condition of miscibility, between solvent and antisolvent,imits the applicability of the SAS process to hydrophobic com-ounds that are generally soluble in SC-CO2. Water solubility in
∗ Corresponding author. Tel.: +39 089 964066; fax: +39 89 964057.E-mail address: [email protected] (I. De Marco).
ttp://dx.doi.org/10.1016/j.supflu.2014.07.012896-8446/© 2014 Elsevier B.V. All rights reserved.
carbon dioxide is, instead, very limited at the usual SAS condi-tions (40–60 ◦C and 100–250 bar) [11]. Since several categories ofpharmaceutical products, as, for example, proteins and enzymes,are water-soluble, a modification of the SAS process is required toextend its applicability to water soluble compounds.
An interesting opportunity could be to add to the supercriticalantisolvent an organic solvent, completely miscible with SC-CO2 atprocess conditions, to form a supercritical mixture in which watersolubility is largely enhanced or complete. Practically speaking, themixture CO2 plus organic solvent can act as a hydrophilic antisol-vent in the modified SAS process. Some papers can be found in theliterature, in which CO2 + organic solvent were used in the attemptof processing hydrophilic compounds by supercritical antisolventprecipitation [12–15]. Some proteins, like, for example, lysozyme,albumin, insulin, recombinant human deoxyribonuclease (rhD-Nase), lysozyme-lactose and rhDNase-lactose were processed byBustami et al. [12,13] using a 0.2 mole fraction of ethanol or ofethanol and triethylamine in SC-CO2 as the antisolvent. Irregularand aggregated micrometric particles (3–18 �m) were obtained.
Bouchard et al. [14,15], processed lysozyme, �-glycine andphenylalanine anhydrate, obtaining microparticles in the range1–50 �m using methanol, ethanol, 2-propanol or acetone as co-antisolvent. However, these authors [14,15] processed very small
quantities of water solutions (around 0.06 water mole fraction),producing, as a result, extremely small quantities of precipitates.Recently, De Marco and Reverchon [16] proposed the supercrit-ical antisolvent processing of bovine serum albumin (BSA) using
1 critica
Ccaser0i
titampEw
2
2
ptwc
2
iaFm(tshspcocw31baoomw1atce
acawflt
90 V. Prosapio et al. / J. of Super
O2 + ethanol mixtures; but, the operating range of antisolventomposition was extended to expanded liquid conditions and,ccordingly, they named this process ELAS (expanded liquid anti-olvent) precipitation, since it works in the region in which anxpanded liquid mixture is formed. BSA microparticles with nar-ow particle size distributions and mean diameters in the range.5–2 �m were obtained. To the best of our knowledge, other stud-
es using the ELAS technique have not yet been performed.In this work, ELAS technique is proposed for the microniza-
ion of BSA as a model compound, but, the co-antisolvent useds not only ethanol, but, also acetone and isopropyl alcohol wereested in an attempt to understand if the different co-antisolventsllow BSA processing and how they can influence particle size andorphology of precipitates and the unfolding of the processed
rotein. These results can give a contribution to the extension ofLAS applicability to other compounds of interest soluble in theater–SC-CO2–ethanol mixture.
. Materials, apparatus and methods
.1. Materials
Bovine serum albumin (BSA, fraction V, 66 kDa, � globulin free,urity 99%), distilled water (H2O), ethanol (EtOH, purity 99.5%), ace-one (AC, purity 99.5%) and isopropyl alcohol (iPrOH, purity 99.5%)ere supplied by Sigma–Aldrich (Italy). CO2 (purity 99%) was pur-
hased from SON (Italy). All materials were used as received.
.2. ELAS apparatus and procedures
A schematic representation of the apparatus used in this studys reported in Fig. 1. The ELAS laboratory apparatus consists of
diaphragm high-pressure pump (Milton Roy, model Milroyal B,rance) used to deliver carbon dioxide, an HPLC pump (Gilson,odel 805, Middleton, WI) used to deliver the co-antisolvent
EtOH, AC or iPrOH), and a diaphragm high-pressure pump (Mil-on Roy, mod. Milroyal D, France), used to deliver the aqueousolution. The pump that delivers CO2 is equipped with a coolingead to avoid cavitation. The pre-mixer is a high-pressure ves-el with an internal volume of 35 cm3, loaded with stainless steelerforated saddles, which ensures a large contact surface betweeno-antisolvent and CO2. A cylindrical vessel with an internal volumef 500 cm3 was used as the precipitation chamber, that was electri-ally heated using thin band heaters. The pressure in the chamberas measured by a test gauge manometer (Salmoiraghi, model SC-
200, Italy) and regulated by a micrometering valve (Hoke, model315G4Y, Spartanburg, SC) located at the exit (bottom) of the cham-er. The aqueous solution was delivered to the precipitator through
thin wall stainless steel nozzle with a diameter of 100 �m. A sec-nd collection chamber located downstream of the precipitator,perating at a lower pressure (18–20 bar) was used to recover theixture of water and co-antisolvent. The pressure in this chamberas controlled by a back-pressure regulator (Tescom, model 26-
723-44, Italy). At the exit of the second vessel a rotameter and dry test meter were used to measure the CO2 flow rate and theotal quantity of CO2 delivered, respectively. At the end of the pro-ess, the co-antisolvent was recovered from water using a vacuumvaporator.
An ELAS experiment usually begins delivering supercritical CO2t a constant flow rate to the pre-mixer and to the precipitationhamber, until the desired pressure is reached. Then, the co-
ntisolvent is pumped to the pre-mixer, where it is put in contactith CO2 forming an expanded liquid solution. Once reached stableow rates, temperature and pressure conditions in the precipita-ion chamber, water is sent through the nozzle in the precipitatorl Fluids 94 (2014) 189–197
to obtain steady state composition conditions of the fluid phaseduring the solute precipitation. Then, the flow of water is stoppedand the aqueous solution is delivered through the nozzle at thegiven flow rate, producing the precipitation of the solute. At theend of the aqueous solution delivery, two washing steps were per-formed: in the first one, the mixture co-antisolvent + CO2 continuedto flow to eliminate water residues for a time t1 and, in the sec-ond one, CO2 alone continued to flow to eliminate co-antisolventresidues for a time t2. At the end of this second washing step, CO2flow was stopped and the precipitator was depressurized down toatmospheric pressure.
The operating conditions chosen to ELAS processing BSA were:a pressure of 150 bar, a temperature of 40 ◦C, a BSA concentrationin water of 20 mg/mL, a CO2 flow rate of 10,000 mL/min measuredat room pressure and temperature. The two washing times werefixed at 45 min for the washing step with CO2 ± co-antisolvent andat 90 min for the washing step with CO2.
2.3. Analytical methods
Samples of the precipitated material were observed by a FieldEmission Scanning Electron Microscope (FESEM, mod. LEO 1525,Carl Zeiss SMT AG, Oberkochen, Germany). Powders were dispersedon a carbon tab previously stuck to an aluminum stub (Agar Scien-tific, United Kingdom); then, were coated with gold (layer thickness250 A) using a sputter coater (mod. 108 A, Agar Scientific, Stansted,United Kingdom).
Particle size distribution (PSD) of the powders was mea-sured from FESEM photomicrographs using the Sigma Scan Proimage analysis software (release 5.0, Aspire Software Interna-tional Ashburn, VA). Approximately 1000 particles, taken at highenlargements and in various locations inside the precipitator, wereanalyzed in the elaboration of each particle size distribution. His-tograms representing the particle size distributions were fittedusing Microcal Origin Software (release 8.0, Microcal Software, Inc.,Northampton, MA).
X-ray diffractograms were recorded using an X-ray powderdiffractometer (model D8 Discover; Bruker, USA) with a Cu sealedtube source. The measuring conditions were: Ni-filtered CuK� radi-ation, � = 1.54 A, 2� angle ranging from 5◦ to 50◦ with a scan rate of0.3 s/step and a step size of 0.028◦.
Fourier transform infrared (FT-IR) spectra were obtained viaM2000 FTIR (MIDAC Co, Costa Mesa, CA), at a resolution of 0.5 cm−1.The scan wavenumber range was 4000–400 cm−1, and 16 scan sig-nals were averaged to reduce the noise. The powder samples wereground and mixed thoroughly with potassium bromide (KBr) asinfrared transparent matrix. KBr discs were prepared by compress-ing the powders in a hydraulic press. Composition bands of theamide I band were determined using the inverted second deriva-tive and all spectra were smoothed using a 13-point Savitzky–Golaysmoothing function to remove white noise.
The influence of ELAS processing on BSA degradation was alsomeasured using HPLC (model 1200 series; Agilent TechnologiesInc., Santa Clara, CA) analyses. The elution was obtained usinga TSK-Gel G3000SWXL column (Tosoh Biosciences, LLC, Mont-gomeryville, PA). The column was equilibrated at a flow rate of0.5 mL/min with a mobile phase consisting of phosphate bufferedsaline (PBS) at pH 7.2. The protein was dissolved in water, filteredwith a 0.2 �m membrane syringe and detected at 214 nm with aretention time of 25 min. All chromatographic analyses were car-ried out at room temperature.
Ethanol, acetone, and isopropyl alcohol residues in the precip-
itates were measured using a headspace sampler (model 7694E,Agilent Technologies Inc., Santa Clara, CA) coupled to a gas chro-matograph equipped with a flame ionization detector (GC-FID,model 6890 GC-SYSTEM, Hewlett Packard, Agilent Technologies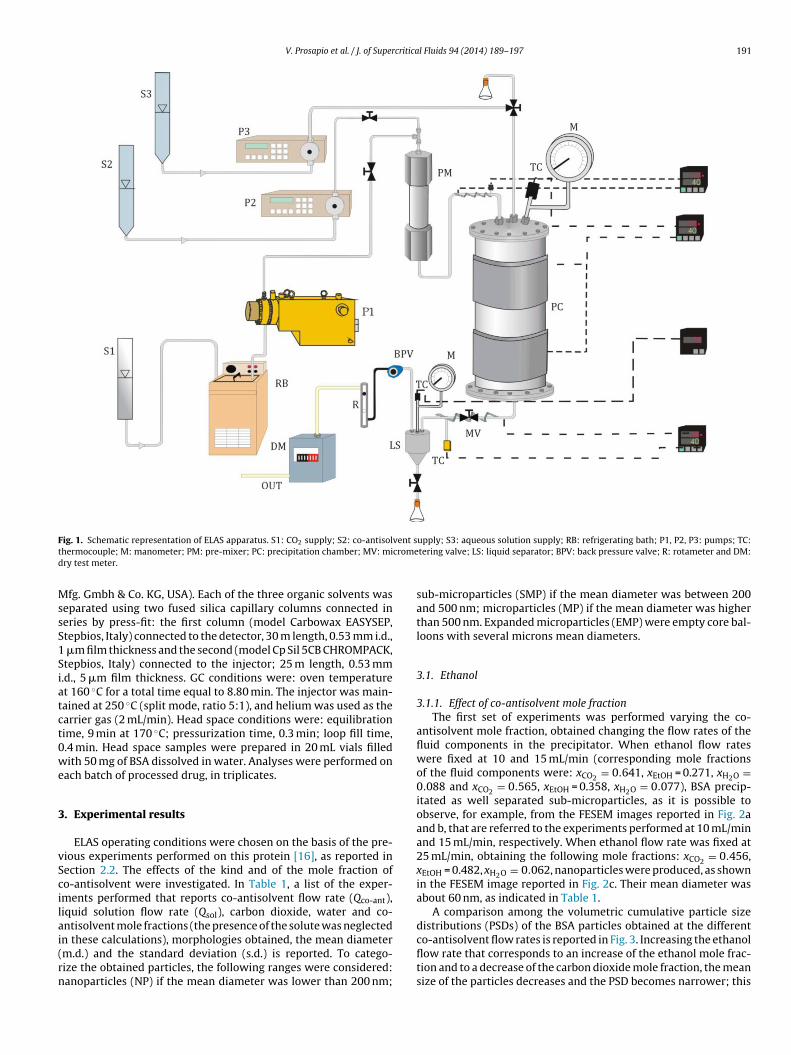
V. Prosapio et al. / J. of Supercritical Fluids 94 (2014) 189–197 191
F vent st cromed
MssS1Siatct0we
3
vScilai(rn
ig. 1. Schematic representation of ELAS apparatus. S1: CO2 supply; S2: co-antisolhermocouple; M: manometer; PM: pre-mixer; PC: precipitation chamber; MV: miry test meter.
fg. Gmbh & Co. KG, USA). Each of the three organic solvents waseparated using two fused silica capillary columns connected ineries by press-fit: the first column (model Carbowax EASYSEP,tepbios, Italy) connected to the detector, 30 m length, 0.53 mm i.d.,
�m film thickness and the second (model Cp Sil 5CB CHROMPACK,tepbios, Italy) connected to the injector; 25 m length, 0.53 mm.d., 5 �m film thickness. GC conditions were: oven temperaturet 160 ◦C for a total time equal to 8.80 min. The injector was main-ained at 250 ◦C (split mode, ratio 5:1), and helium was used as thearrier gas (2 mL/min). Head space conditions were: equilibrationime, 9 min at 170 ◦C; pressurization time, 0.3 min; loop fill time,.4 min. Head space samples were prepared in 20 mL vials filledith 50 mg of BSA dissolved in water. Analyses were performed on
ach batch of processed drug, in triplicates.
. Experimental results
ELAS operating conditions were chosen on the basis of the pre-ious experiments performed on this protein [16], as reported inection 2.2. The effects of the kind and of the mole fraction ofo-antisolvent were investigated. In Table 1, a list of the exper-ments performed that reports co-antisolvent flow rate (Qco-ant),iquid solution flow rate (Qsol), carbon dioxide, water and co-ntisolvent mole fractions (the presence of the solute was neglected
n these calculations), morphologies obtained, the mean diameterm.d.) and the standard deviation (s.d.) is reported. To catego-ize the obtained particles, the following ranges were considered:anoparticles (NP) if the mean diameter was lower than 200 nm;upply; S3: aqueous solution supply; RB: refrigerating bath; P1, P2, P3: pumps; TC:tering valve; LS: liquid separator; BPV: back pressure valve; R: rotameter and DM:
sub-microparticles (SMP) if the mean diameter was between 200and 500 nm; microparticles (MP) if the mean diameter was higherthan 500 nm. Expanded microparticles (EMP) were empty core bal-loons with several microns mean diameters.
3.1. Ethanol
3.1.1. Effect of co-antisolvent mole fractionThe first set of experiments was performed varying the co-
antisolvent mole fraction, obtained changing the flow rates of thefluid components in the precipitator. When ethanol flow rateswere fixed at 10 and 15 mL/min (corresponding mole fractionsof the fluid components were: xCO2 = 0.641, xEtOH = 0.271, xH2O =0.088 and xCO2 = 0.565, xEtOH = 0.358, xH2O = 0.077), BSA precip-itated as well separated sub-microparticles, as it is possible toobserve, for example, from the FESEM images reported in Fig. 2aand b, that are referred to the experiments performed at 10 mL/minand 15 mL/min, respectively. When ethanol flow rate was fixed at25 mL/min, obtaining the following mole fractions: xCO2 = 0.456,xEtOH = 0.482, xH2O = 0.062, nanoparticles were produced, as shownin the FESEM image reported in Fig. 2c. Their mean diameter wasabout 60 nm, as indicated in Table 1.
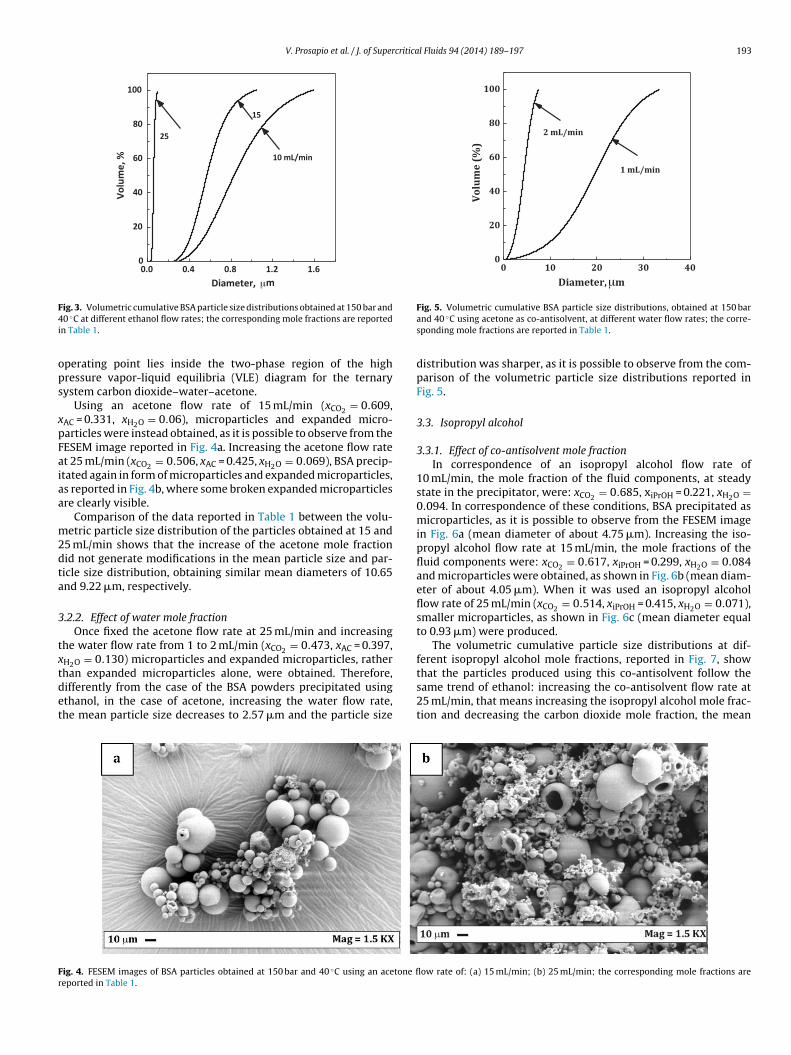
A comparison among the volumetric cumulative particle sizedistributions (PSDs) of the BSA particles obtained at the different
co-antisolvent flow rates is reported in Fig. 3. Increasing the ethanolflow rate that corresponds to an increase of the ethanol mole frac-tion and to a decrease of the carbon dioxide mole fraction, the meansize of the particles decreases and the PSD becomes narrower; this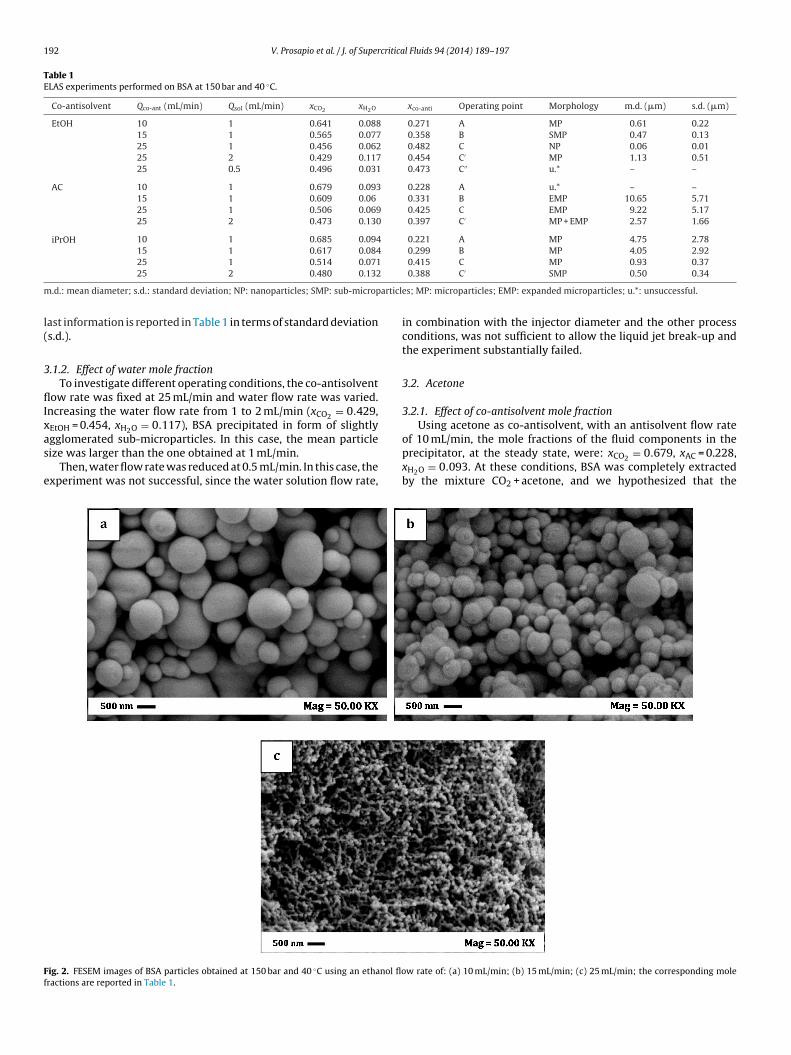
192 V. Prosapio et al. / J. of Supercritical Fluids 94 (2014) 189–197
Table 1ELAS experiments performed on BSA at 150 bar and 40 ◦C.
Co-antisolvent Qco-ant (mL/min) Qsol (mL/min) xCO2 xH2O xco-anti Operating point Morphology m.d. (�m) s.d. (�m)
EtOH 10 1 0.641 0.088 0.271 A MP 0.61 0.2215 1 0.565 0.077 0.358 B SMP 0.47 0.1325 1 0.456 0.062 0.482 C NP 0.06 0.0125 2 0.429 0.117 0.454 C′ MP 1.13 0.5125 0.5 0.496 0.031 0.473 C′′ u.* – –
AC 10 1 0.679 0.093 0.228 A u.* – –15 1 0.609 0.06 0.331 B EMP 10.65 5.7125 1 0.506 0.069 0.425 C EMP 9.22 5.1725 2 0.473 0.130 0.397 C′ MP + EMP 2.57 1.66
iPrOH 10 1 0.685 0.094 0.221 A MP 4.75 2.7815 1 0.617 0.084 0.299 B MP 4.05 2.9225 1 0.514 0.071 0.415 C MP 0.93 0.37
m articl
l(
3
flIxas
e
Ff
25 2 0.480 0.132
.d.: mean diameter; s.d.: standard deviation; NP: nanoparticles; SMP: sub-microp
ast information is reported in Table 1 in terms of standard deviations.d.).
.1.2. Effect of water mole fractionTo investigate different operating conditions, the co-antisolvent
ow rate was fixed at 25 mL/min and water flow rate was varied.ncreasing the water flow rate from 1 to 2 mL/min (xCO2 = 0.429,EtOH = 0.454, xH2O = 0.117), BSA precipitated in form of slightly
gglomerated sub-microparticles. In this case, the mean particleize was larger than the one obtained at 1 mL/min.Then, water flow rate was reduced at 0.5 mL/min. In this case, thexperiment was not successful, since the water solution flow rate,
ig. 2. FESEM images of BSA particles obtained at 150 bar and 40 ◦C using an ethanol floractions are reported in Table 1.
0.388 C′ SMP 0.50 0.34
es; MP: microparticles; EMP: expanded microparticles; u.*: unsuccessful.
in combination with the injector diameter and the other processconditions, was not sufficient to allow the liquid jet break-up andthe experiment substantially failed.
3.2. Acetone
3.2.1. Effect of co-antisolvent mole fractionUsing acetone as co-antisolvent, with an antisolvent flow rate
of 10 mL/min, the mole fractions of the fluid components in theprecipitator, at the steady state, were: xCO2 = 0.679, xAC = 0.228,xH2O = 0.093. At these conditions, BSA was completely extractedby the mixture CO2 + acetone, and we hypothesized that the
w rate of: (a) 10 mL/min; (b) 15 mL/min; (c) 25 mL/min; the corresponding mole
V. Prosapio et al. / J. of Supercritical Fluids 94 (2014) 189–197 193
0.0 0.4 0.8 1.2 1.60
20
40
60
80
100
10 mL/min
15
25
Volu
me,
%
Diame ter, μm
F4i
ops
xpFaiaa
m2dta
3
txtdet
0 10 20 30 400
20
40
60
80
100
2 mL/min
1 mL/min
Volu
me
(%)
Diameter, mμ
Fr
ig. 3. Volumetric cumulative BSA particle size distributions obtained at 150 bar and0 ◦C at different ethanol flow rates; the corresponding mole fractions are reported
n Table 1.
perating point lies inside the two-phase region of the highressure vapor-liquid equilibria (VLE) diagram for the ternaryystem carbon dioxide–water–acetone.
Using an acetone flow rate of 15 mL/min (xCO2 = 0.609,AC = 0.331, xH2O = 0.06), microparticles and expanded micro-articles were instead obtained, as it is possible to observe from theESEM image reported in Fig. 4a. Increasing the acetone flow ratet 25 mL/min (xCO2 = 0.506, xAC = 0.425, xH2O = 0.069), BSA precip-tated again in form of microparticles and expanded microparticles,s reported in Fig. 4b, where some broken expanded microparticlesre clearly visible.
Comparison of the data reported in Table 1 between the volu-etric particle size distribution of the particles obtained at 15 and
5 mL/min shows that the increase of the acetone mole fractionid not generate modifications in the mean particle size and par-icle size distribution, obtaining similar mean diameters of 10.65nd 9.22 �m, respectively.
.2.2. Effect of water mole fractionOnce fixed the acetone flow rate at 25 mL/min and increasing
he water flow rate from 1 to 2 mL/min (xCO2 = 0.473, xAC = 0.397,H2O = 0.130) microparticles and expanded microparticles, rather
han expanded microparticles alone, were obtained. Therefore,ifferently from the case of the BSA powders precipitated usingthanol, in the case of acetone, increasing the water flow rate,he mean particle size decreases to 2.57 �m and the particle sizeig. 4. FESEM images of BSA particles obtained at 150 bar and 40 ◦C using an acetone fleported in Table 1.
Fig. 5. Volumetric cumulative BSA particle size distributions, obtained at 150 barand 40 ◦C using acetone as co-antisolvent, at different water flow rates; the corre-sponding mole fractions are reported in Table 1.
distribution was sharper, as it is possible to observe from the com-parison of the volumetric particle size distributions reported inFig. 5.
3.3. Isopropyl alcohol
3.3.1. Effect of co-antisolvent mole fractionIn correspondence of an isopropyl alcohol flow rate of
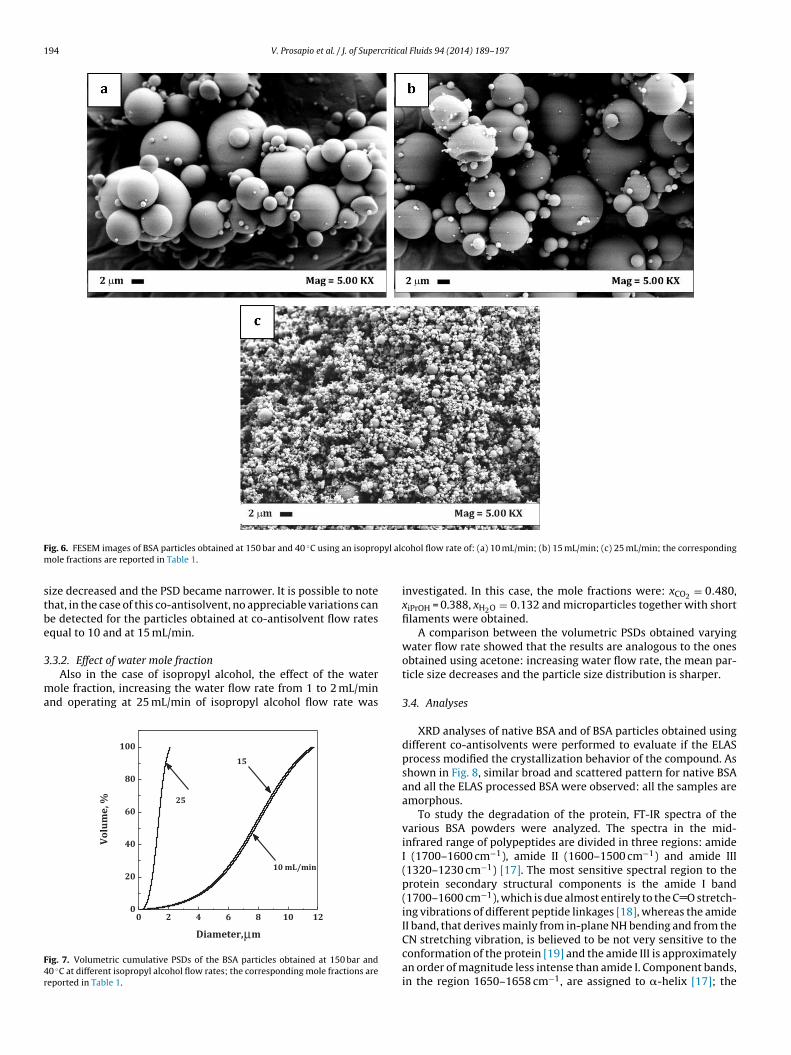
10 mL/min, the mole fraction of the fluid components, at steadystate in the precipitator, were: xCO2 = 0.685, xiPrOH = 0.221, xH2O =0.094. In correspondence of these conditions, BSA precipitated asmicroparticles, as it is possible to observe from the FESEM imagein Fig. 6a (mean diameter of about 4.75 �m). Increasing the iso-propyl alcohol flow rate at 15 mL/min, the mole fractions of thefluid components were: xCO2 = 0.617, xiPrOH = 0.299, xH2O = 0.084and microparticles were obtained, as shown in Fig. 6b (mean diam-eter of about 4.05 �m). When it was used an isopropyl alcoholflow rate of 25 mL/min (xCO2 = 0.514, xiPrOH = 0.415, xH2O = 0.071),smaller microparticles, as shown in Fig. 6c (mean diameter equalto 0.93 �m) were produced.
The volumetric cumulative particle size distributions at dif-ferent isopropyl alcohol mole fractions, reported in Fig. 7, show
that the particles produced using this co-antisolvent follow thesame trend of ethanol: increasing the co-antisolvent flow rate at25 mL/min, that means increasing the isopropyl alcohol mole frac-tion and decreasing the carbon dioxide mole fraction, the meanow rate of: (a) 15 mL/min; (b) 25 mL/min; the corresponding mole fractions are
194 V. Prosapio et al. / J. of Supercritical Fluids 94 (2014) 189–197
F pyl alcm
stbe
3
ma
F4r
ig. 6. FESEM images of BSA particles obtained at 150 bar and 40 ◦C using an isoproole fractions are reported in Table 1.
ize decreased and the PSD became narrower. It is possible to notehat, in the case of this co-antisolvent, no appreciable variations cane detected for the particles obtained at co-antisolvent flow ratesqual to 10 and at 15 mL/min.
.3.2. Effect of water mole fractionAlso in the case of isopropyl alcohol, the effect of the water
ole fraction, increasing the water flow rate from 1 to 2 mL/minnd operating at 25 mL/min of isopropyl alcohol flow rate was
0 2 4 6 8 10 120
20
40
60
80
10015
10 mL/min
25
Volu
me,
%
Diameter, mμ
ig. 7. Volumetric cumulative PSDs of the BSA particles obtained at 150 bar and0 ◦C at different isopropyl alcohol flow rates; the corresponding mole fractions areeported in Table 1.
ohol flow rate of: (a) 10 mL/min; (b) 15 mL/min; (c) 25 mL/min; the corresponding
investigated. In this case, the mole fractions were: xCO2 = 0.480,xiPrOH = 0.388, xH2O = 0.132 and microparticles together with shortfilaments were obtained.
A comparison between the volumetric PSDs obtained varyingwater flow rate showed that the results are analogous to the onesobtained using acetone: increasing water flow rate, the mean par-ticle size decreases and the particle size distribution is sharper.
3.4. Analyses
XRD analyses of native BSA and of BSA particles obtained usingdifferent co-antisolvents were performed to evaluate if the ELASprocess modified the crystallization behavior of the compound. Asshown in Fig. 8, similar broad and scattered pattern for native BSAand all the ELAS processed BSA were observed: all the samples areamorphous.
To study the degradation of the protein, FT-IR spectra of thevarious BSA powders were analyzed. The spectra in the mid-infrared range of polypeptides are divided in three regions: amideI (1700–1600 cm−1), amide II (1600–1500 cm−1) and amide III(1320–1230 cm−1) [17]. The most sensitive spectral region to theprotein secondary structural components is the amide I band(1700–1600 cm−1), which is due almost entirely to the C O stretch-ing vibrations of different peptide linkages [18], whereas the amideII band, that derives mainly from in-plane NH bending and from the
CN stretching vibration, is believed to be not very sensitive to theconformation of the protein [19] and the amide III is approximatelyan order of magnitude less intense than amide I. Component bands,in the region 1650–1658 cm−1, are assigned to �-helix [17]; the
V. Prosapio et al. / J. of Supercritical Fluids 94 (2014) 189–197 195
10 20 30 40 50
iPrOH
AC
unprocess ed
EtOH
elacsyrartibra,ytisnetnI
2θFd
i([
uF
esio�da1tuevEac
ieB
Fd
0 10 20 30 40
EtOH
iPrOH
unpro cess ed
abso
rban
ce, a
rbit
rary
sca
le
tim e, min
ig. 8. XRD analysis of unprocessed and ELAS processed BSA particles obtained usingifferent co-antisolvents.
nfrared spectra related to �-sheet exhibit a low intensity region1620–1640 cm−1) and a high intensity region (1670–1695 cm−1)17]. Other possible structures are unordered and �-turns.
The overall FT-IR traces of the native and ELAS processed BSAsing the different co-antisolvents are very similar, as reported inig. 9. No differences could be discerned from these diagrams.
Therefore, the second order derivative amide I spectra tonhance the resolution of overlapping IR bands and to identify theecondary structures of the protein were compared [20]. Consider-ng that �-helix and unordered structures can each be assigned tone band, whereas multiple bands are associated with �-sheets and-turns [21], the relative intensity of the �-helix peaks using alsoata from the literature were compared [22]. The analysis revealedn �-helix content, referred to the percentage area of the peak at657 cm−1, of about 55% for the BSA particles obtained using ace-one as the co-antisolvent, of about 45% for the particles obtainedsing iso-propanol and of about 40% for the particles obtained usingthanol. Native BSA showed an �-helix content equal to 55%; thisalue is in agreement with the literature data [22]. Therefore, theLAS process has induced minor modifications in the case of ethanolnd isopropyl alcohol. Using acetone as co-antisolvent, no modifi-ations of the BSA secondary structure were found.
HPLC analysis was performed on BSA powders processed using
sopropyl alcohol and ethanol as co-antisolvents, to study thextent of the protein degradation. HPLC traces of native BSA,SA microparticles obtained using isopropyl alcohol and BSA4000 3500 3000 2500 2000 1500 1000 500
iPrOH
AC
EtOH
unprocessed
1657
Abso
rban
ce
Wave number, cm-1
ig. 9. FT-IR traces for unprocessed and ELAS processed BSA particles obtained usingifferent co-antisolvents.
Fig. 10. HPLC traces for unprocessed and ELAS processed BSA, using isopropyl alco-hol and ethanol as co-antisolvents.
nanoparticles obtained using ethanol showed similar peaks, asshown in Fig. 10, (the peak was detected at 214 nm in cor-respondence of 24 min of retention time), but the intensity ofthe processed BSA peaks with respect to the one detected forthe untreated BSA was equal to 90% in the case of BSA micro-particles obtained from isopropyl alcohol and 82% in the case ofBSA nanoparticles obtained from ethanol, indicating a degradationof the protein, that, in every case, is smaller than the degrada-tion obtained in the case of the traditional processing with organicsolvents at low temperature [23].
The three co-antisolvents belong to class 3 products and, there-fore, their FDA limit is 5000 ppm in the final product. A headspacesampler coupled to a gas chromatograph was used to verify the co-antisolvent residue content, in BSA produced particles. The analysisrevealed that the solvent residue was around 1000 ppm in the caseof acetone, 3000 ppm in the case of ethanol and 1000 in the case ofisopropyl alcohol; i.e., in all cases, it is lower that the FDA limits.
4. Discussion
An attempt at the explanation of the observed morphologiesduring ELAS could start from the consolidated knowledge of theSAS precipitation. We know that thermodynamics, fluid dynamicsand mass transfer are involved in the SAS precipitation mechanisms[6–9]. In a first approximation, thermodynamic aspects are relatedto the distance between SAS operating point and the mixture criti-cal point (MCP) of the binary system organic solvent–supercriticalcarbon dioxide. When SAS operates at a pressure lower thatthe mixture critical pressure, expanded microparticles can beobserved; at an operating pressure near the MCP, microparticlescan be obtained and at a pressure relatively larger than MCP pres-sure, nanoparticles can be observed. The different morphologiesdepend also on the competition between jet break-up time andtime of vanishing of the interfacial tension [7,10].
Trying to extend to ELAS the interpretation of SAS mecha-nisms and their interaction with VLEs previously discussed, itshould be possible to use similar considerations to try to explainELAS BSA results. Binary CO2–solvent diagrams used in SAS willbe substituted by ternary diagrams CO2–co-antisolvent–solvent inELAS analysis. Data used in the diagrams reported in Figs. 11a–c
were obtained from the scientific literature available. Theyrepresent high pressure phase equilibria for the ternary sys-tems CO2–ethanol–water, CO2–acetone–water and CO2–isopropylalcohol–water [24–26]. Ternary diagrams are referred to the same
196 V. Prosapio et al. / J. of Supercritical Fluids 94 (2014) 189–197
0.0 0.2 0.4 0.6 0.8 1.0
0.0
0.2
0.4
0.6
0.8
1.0 0.0
0.2
0.4
0.6
0.8
1.0100 bar200 bar
II
I
C'C
B
A
C''
EtOH, mole fraction
CO2, mole fraction
H 2O, m
ole f
ract
ion
MCP
0.0 0.2 0.4 0.6 0.8 1.0
0.0
0.2
0.4
0.6
0.8
1.0 0.0
0.2
0.4
0.6
0.8
1.0
II
I
C'C
B
A
AC, mole fraction
CO2, mol e fra ction
H 2O, m
ole f
ract
ion
100 bar
0.0 0.2 0.4 0.6 0.8 1.0
0.0
0.2
0.4
0.6
0.8
1.0 0.0
0.2
0.4
0.6
0.8
1.0
II
I
100 bar
C'C
B
A
iPrOH, mole fraction
CO2, mol e fra ction
H 2O, m
ole f
ract
ion
F id/wai
tpdatvtbuaopcot
repsig
ig. 11. High pressure phase equilibria for the system carbon dioxide/organic liqusopropyl alcohol. A, B, C, C′ and C′′ indicate process conditions used in this work.
emperature we used in ELAS processing (40 ◦C), but at differentressures with respect to our experiments: in the case of ethanol,ata is available at 100 and 200 bar; whereas, in the case of acetonend isopropyl alcohol only data at 100 bar is available. However,he equilibrium curves related to ethanol at 100 and 200 bar areery close one to the other, especially in the region we performedhe experiments. The corresponding curve at 150 bar should lieetween those available. This hypothesis was positively verifiedsing Aspen Plus® software. In the case of acetone and isopropyllcohol, data is available only at one pressure; but, by extensionf the previous considerations and, in a first approximation, it isossible to assume that for these systems the VLE curve at 100 barould be very similar to the one at 150 bar, that should evidencenly a slightly smaller miscibility hole. Therefore, we can try to usehese curves for our discussion.
The three diagrams reported in Fig. 11 are characterized by aegion I in which the system is homogeneous and behaves as anxpanded liquid or a supercritical mixture, depending on its com-
osition with respect to the MCP and a region II in which theystem splits in two phases. In Fig. 11a, the position of the MCPs evidenced; it was estimated from the experimental data, using araphical method [27]. Successful ELAS processing can be obtainedter, at 40 ◦C, 100 bar, adapted from literature [24–26]: (a) ethanol; (b) acetone; (c)
operating in region I. In analogy with the previous SAS interpre-tation, the distance of the operating point from the VLE curve canbe considered as an indicator of the expected particles morphol-ogy. Looking at the sequence of points A, B, C, C′ in Fig. 11a, a trendfrom microparticles to nanoparticles formation can be observed,that can be correlated to the distance of the operating point withrespect to the VLE curve for the system CO2–EtOH–H2O: ELASoperation at point A produces microparticles; point B produces sub-microparticles and points C and C′ produce nanoparticles. Point C′′
is related to unsuccessful processing due to causes not related tothermodynamics: we observed that no jet break-up was obtained.
It is known that nanoparticles formation during SAS cannot beexplained considering only a thermodynamic interpretation. Theseparticles formation is explained considering gas mixing and parti-cles nucleation and growth [28]. Also in the case of ELAS process,these characteristic times could be applied, whose competition canexplain the attainment of given morphologies: if the time of jetbreak-up (�1) is higher than the time of the surface tension vanish-
ing (�2), gas mixing prevails and nanoparticles are obtained from agas-to-particles process.Looking at the ELAS experiments performed using acetone,excluding the operating point A that falls in the biphasic region,
critica
aiph
dilww
5
ama
tpilp
rota
ttp
R
[
[
[
[
[
[
[
[
[
[
[
[
[[
[
[
[
V. Prosapio et al. / J. of Super
ll the experiments fall in the expanded liquid region and accord-ng to the binary system explanation, expanded microparticles arerevalently observed, except for the experiment performed at theighest water mole fraction (point C′ in Fig. 11b).
A similar trend can be observed using isopropyl alcohol/carbonioxide as the antisolvent mixture. In that case, the miscibility hole
s narrower, therefore, the operating points are far from the equi-ibrium curve. Microparticles rather than expanded microparticles
ere obtained, except for the experiment performed at higherater mole fraction, in which sub-microparticles were produced.
. Conclusions and perspectives
ELAS process demonstrated to be very efficient in producing BSAmorphous particles. Nanoparticles, microparticles and expandedicroparticles were obtained, varying the kind of co-antisolvent
nd its mole fractions.Particularly, the use of ethanol/carbon dioxide antisolvent mix-
ures led to the production of micro and nanoparticles with narrowarticle size distributions; the use of acetone/carbon dioxide and
sopropyl alcohol/carbon dioxide as antisolvent mixtures, instead,ed mainly to the production of microparticles and expanded micro-articles.
We hypothesized that the distance of the operating point withespect to the ternary high pressure VLE can condition the morphol-gy of the precipitates: increasing the co-antisolvent mole fraction,his distance increases and the mean size of the particles decreasesnd the particle size distribution become narrower.
However, further experimentations are required to gain addi-ional information about different materials that can be processedo better understand also the mechanisms involved in particlesrecipitation.
eferences
[1] A. Shariati, C.J. Peters, Recent developments in particle design using super-critical fluids, Current Opinion in Solid State and Materials Science 7 (2003)371–383.
[2] Y. Hakuta, H. Hayashi, K. Arai, Fine particle formation using supercritical fluids,Current Opinion in Solid State & Materials Science 7 (4−5) (2003) 341–351.
[3] E. Reverchon, R. Adami, G. Caputo, I. De Marco, Spherical microparticles pro-duction by supercritical antisolvent precipitation: interpretation of result, J.Supercritical Fluids 47 (1) (2008) 70–84.
[4] S. Liparoti, R. Adami, E. Reverchon, PEG micronization by supercritical assistedatomization, operated under reduced pressure, J. Supercritical Fluids 72 (2012)46–51.
[5] E. Torino, I. De Marco, E. Reverchon, Organic nanoparticles recovery in super-critical antisolvent precipitation, J. Supercritical Fluids 55 (1) (2010) 300–306.
[6] E. Reverchon, E. Torino, S. Dowy, A. Braeuer, A. Leipertz, Interactions of phaseequilibria, jet fluid dynamics and mass transfer during supercritical antisolventmicronization, Chemical Engineering Journal 156 (2010) 446–458.
[[
l Fluids 94 (2014) 189–197 197
[7] E. Reverchon, I. De Marco, Mechanisms controlling supercritical antisol-vent precipitate morphology, Chemical Engineering Journal 169 (2011)358–370.
[8] I. De Marco, E. Reverchon, Influence of pressure, temperature and concentra-tion on the mechanisms of particle precipitation in supercritical antisolventmicronization, J. Supercritical Fluids 58 (2011) 295–302.
[9] I. De Marco, O. Knauer, F. Cice, A. Braeuer, E. Reverchon, Interactions of phaseequilibria, jet fluid dynamics and mass transfer during supercritical antisol-vent micronization: the influence of solvents, Chemical Engineering Journal203 (2012) 71–80.
10] F. Marra, I. De Marco, E. Reverchon, Numerical analysis of the characteristictimes controlling supercritical antisolvent micronization, Chemical Engineer-ing Science 71 (2012) 39–45.
11] A.N. Sabirzyanov, A.P. Il’in, A.R. Akhunov, F.M. Gumerov, Solubility of water insupercritical carbon dioxide, High Temperature 40 (2002) 203–206.
12] R.T. Bustami, H.-K. Chan, F. Dehghani, N.R. Foster, Generation of micro-particlesof proteins for aerosol delivery using high pressure modified carbon dioxide,Pharmaceutical Research 17 (11) (2000) 1360–1366.
13] R.T. Bustami, H.-K. Chan, T. Sweeney, F. Dehghani, N.R. Foster, Genera-tion of fine powders of recombinant human deoxyribonuclease using theaerosol solvent extraction system, Pharmaceutical Research 20 (12) (2003)2028–2035.
14] A. Bouchard, N. Jovanovic, W. Jiskoot, E. Mendes, G.-J. Witkamp, D.J.A. Crom-melin, G.W. Hofland, Lysozyme particle formation during supercritical fluiddrying: Particle morphology and molecular integrity, J. Supercritical Fluids 40(2007) 293–307.
15] A. Bouchard, N. Jovanovic, A. Martín, G.W. Hofland, D.J.A. Crommelin, W. Jiskoot,G.-J. Witkamp, Effect of the modifier on the particle formation and crystal-lization behaviour during precipitation from aqueous solutions, J. SupercriticalFluids 44 (2008) 409–421.
16] I. De Marco, E. Reverchon, Supercritical carbon dioxide + ethanol mixtures forthe antisolvent micronization of hydrosoluble materials, Chemical EngineeringJournal 187 (2012) 401–409.
17] P.M. Bummer, An FTIR study of structure of human serum albumin adsorbedto polysulfone, International Journal of Pharmaceutics 132 (1996) 143–151.
18] J. Kong, S. Yu, Fourier transform infrared spectroscopic analysis of protein sec-ondary structures, Acta Biochimica et Biophysica Sinica 39 (8) (2007) 549–559.
19] F.S. Parker, Application of Infrared Spectroscopy in Biochemistry, Plenum Press,New York, 1983.
20] H. Susi, D.M. Byler, Protein structure by Fourier transform infrared spec-troscopy: second derivative spectra, Biochemical and Biophysical ResearchCommunications 115 (1983) 391–397.
21] A. Dong, P. Huang, W.S. Caughey, Protein secondary structures in waterfrom second-derivative amide I infrared spectra, Biochemistry 29 (1990)3303–3308.
22] T. Peters Jr., Serum albumin, Advanced Protein Chemistry 37 (1985) 161–245.23] H. Yoshikawa, A. Hirano, T. Arakawa, K. Shiraki, Effects of alcohol on the sol-
ubility and structure of native and disulfide-modified bovine serum albumin,International Journal of Biological Macromolecules 50 (2012) 1286–1291.
24] N.E. Durling, O.J. Catchpole, S.J. Tallon, J.B. Grey, Measurement and modelling ofthe ternary phase equilibria for high pressure carbon dioxide–ethanol–watermixtures, Fluid Phase Equilibria 252 (2007) 103–113.
25] P. Traub, K. Stephan, High-pressure phase equilibria of the systemCO2–water–acetone measured with a new apparatus, Chemical EngineeringScience 45 (3) (1990) 751–758.
26] B.-S. Chun, G.T. Wilkinson, Ternary phase equilibria of the iso-propanol + water + carbon dioxide system at high pressure, Korean J.
Chemical Engineering 16 (2) (1999) 189–192.27] R.E. Treybal, Liquid Extraction, McGraw-Hill, New York, 1983.28] E. Reverchon, I. De Marco, E. Torino, Nanoparticles production by supercriti-
cal antisolvent precipitation: a general interpretation, J. Supercritical Fluids 43(2007) 126–138.


![Control of the Fine Cholesterol Particles Using Supercritical … · 2015-12-18 · solvent, toluene, with the antisolvent, carbon dioxide, has already been studied [8]. The literature](https://static.fdocuments.in/doc/165x107/5f0c560b7e708231d434e524/control-of-the-fine-cholesterol-particles-using-supercritical-2015-12-18-solvent.jpg)