Antique Pharma
17
A N T I Q UE S T O C K B R O K IN G L IM I TED 11 December 2013 | 4 FROM THE RESEARCH DESK Aditya Khemka +91 22 4031 3429 [email protected] Mitesh Shah +91 22 4031 3426 [email protected] Indian Pharmaceuticals Investors Prescription Indian healthcare to outperform FMCG in near- to medium-term At current lev els , FMC G’s pre mium to the hea lt hca re is sec tor ove rdo ne. The for mer has his to ric al ly traded at a 20% premium to healthcare compared to 46% now. FMCG FY15e consolidated PA T (consensus) h as been flattish since May-12 whereas healthcare FY15e consolidated PA T has been revised upward by 25% over the same time period. Growth for FMCG is likely to taper off as premiumisation and rural expansion have been factored in by the market. For healthcare, the growth momentum is likely to continue driven by niche and interesting launches in US, revival of gro wth in India post DPCO-2013 turbulenc e and gain in market share in unde r penetrated emerging markets. We recommend being overweight in healthcare and do not see any material risk to the valuations currently commanded by frontline players. Ranking of stoc ks under our coverage on a risk-adjusted KPA basis We rank stoc ks under our cover age with regards to three key perfor mance areas and one risk parameter. We present the rankings below: Rankings of our coverage companies on management of investment risk Rank Sun Pharma Dr Reddy's Cipla Lupin Ranbaxy Cadila Glenmark IPCA Management focus on execution 1 6 7 1 8 5 4 1 Management of investment risk 5 1 7 5 7 1 4 3 Scaling up the value chain 3 1 7 1 8 5 3 6 Operational / Quality risk 1 2 7 2 7 4 4 6 Overall Rank 2 2 7 1 8 4 4 6 Source: Antique Lupin is at pole position among Indian pharmaceutical companies in our assessment. The company is ahead of peers in terms of execution and long-term strategy . We are excited about the US generics pipeline which would unfold over the next two-to -three years. It plans to launch ~100 products in three-years compared to ~60 products that it currently markets in the US. Sun Pharmaceutical Industries and Dr R eddy’s Laboratories are close runners-up to Lupin. Sun Pharma continues to surprise on the upside in terms of earnings. Tar o/URL Pharma acquisitions have been largely responsible for the positive surprises. Going forward , we expect Sun Pharma to remain acquisitive. Dr Reddy’s is likely to continue its growth trajectory driven by niche opportunities in the US, acceleration of growth in India, and continued traction in Russia. Among midcaps, Glenmark Pharmaceuticals and Cadila Healthcare are well poised for growth with limited risk. Ipca Laboratories seems to be a re -rating candidate given its excellent execution and management focus. We recommend a b uy o n L upin (our top pick), Dr .Reddy’s , Sun Pharma, Cadila Healthcare , Glenmark and Ipca. We believe these companies are well poised to register PAT growth of 17-30% over FY13-16e. We recommend a Hold on Ranbaxy and Cipla. Recommendatio n summary Reco CMP 12M Target Upside Target 1yr Current 1yr Valuation (INR) Price (INR) (%) Fwd P/E (x) Fwd P/E (x) Lupin BUY 857 1,050 22.5 20 20 PE Dr Reddy BUY 2,455 2,830 15.3 18 18 PE Sun Pharma BUY 584 689 18.0 24 23 SOTP Glenmark BUY 525 650 23.8 16 16 SOTP IP CA BUY 67 4 847 25.7 17 15 PE Cadila BUY 734 961 31.0 18 18 PE Ranbaxy HOLD 435 433 (0.5) 20 29 SOTP Cipla HOLD 386 436 12.9 17 17 PE Source: Antique; Note: CMP as of 5 December 2013
-
Upload
jigarsavla -
Category
Documents
-
view
249 -
download
0
Transcript of Antique Pharma

7/21/2019 Antique Pharma
http://slidepdf.com/reader/full/antique-pharma 1/27
TIQUE STOCK BROKING LIMITED 11 December 201FROM THE RESEARCH DESK
Aditya Khemka+91 22 4031 [email protected]
Mitesh Shah+91 22 4031 [email protected]
Indian PharmaceuticalsInvestors Prescription
Indian healthcare to outperform FMCG in near- to medium-term At current levels, FMCG’s premium to the healthcare is sector overdone. The former has historitraded at a 20% premium to healthcare compared to 46% now. FMCG FY15e consolidatedPAT (consensus) has been flattish since May-12 whereas healthcare FY15e consolidated Phas been revised upward by 25% over the same time period. Growth for FMCG is likely taper off as premiumisation and rural expansion have been factored in by the market. Fohealthcare, the growth momentum is likely to continue driven by niche and interesting launcin US, revival of growth in India post DPCO-2013 turbulence and gain in market share in undpenetrated emerging markets. We recommend being overweight in healthcare and do not seeany material risk to the valuations currently commanded by frontline players.Ranking of stocks under our coverage on a risk-adjusted KPA basis
We rank stocks under our coverage with regards to three key performance areas and one riskparameter. We present the rankings below:
Rankings of our coverage companies on management of investment riskRank Sun Pharma Dr Reddy's Cipla Lupin Ranbaxy Cadila Glenmark IPCAManagement focus on execution 1 6 7 1 8 5 4 1Management of investment risk 5 1 7 5 7 1 4 3Scaling up the value chain 3 1 7 1 8 5 3 6Operational / Quality risk 1 2 7 2 7 4 4 6Overall Rank 2 2 7 1 8 4 4 6Source: Antique
Lupin is at pole position among Indian pharmaceutical companies in our assessment. Tcompany is ahead of peers in terms of execution and long-term strategy. We are excited abouthe US generics pipeline which would unfold over the next two-to-three years. It plans to lau~100 products in three-years compared to ~60 products that it currently markets in the US.Sun Pharmaceutical Industries and Dr Reddy’s Laboratories are close runners-up to Lupin.Pharma continues to surprise on the upside in terms of earnings. Taro/URL Pharma acquisitihave been largely responsible for the positive surprises. Going forward, we expect Sun Pharmto remain acquisitive. Dr Reddy’s is likely to continue its growth trajectory driven by nopportunities in the US, acceleration of growth in India, and continued traction in Russia.
Among midcaps, Glenmark Pharmaceuticals and Cadila Healthcare are well poised fogrowth with limited risk. Ipca Laboratories seems to be a re-rating candidate given its excellexecution and management focus.
We recommend a buy on Lupin (our top pick), Dr.Reddy’s, Sun Pharma, Cadila Healthca
Glenmark and Ipca. We believe these companies are well poised to register PAT growth o17-30% over FY13-16e. We recommend a Hold on Ranbaxy and Cipla.Recommendation summary
Reco CMP 12M Target Upside Target 1yr Current 1yr Valuation(INR) Price (INR) (%) Fwd P/E (x) Fwd P/E (x)
Lupin BUY 857 1,050 22.5 20 20 PEDr Reddy BUY 2,455 2,830 15.3 18 18 PESun Pharma BUY 584 689 18.0 24 23 SOTPGlenmark BUY 525 650 23.8 16 16 SOTPIPCA BUY 674 847 25.7 17 15 PECadila BUY 734 961 31.0 18 18 PERanbaxy HOLD 435 433 (0.5) 20 29 SOTP
Cipla HOLD 386 436 12.9 17 17 PESource: Antique; Note: CMP as of 5 December 2013

7/21/2019 Antique Pharma
http://slidepdf.com/reader/full/antique-pharma 2/27
TIQUE STOCK BROKING LIMITED 11 December 201FROM THE RESEARCH DESK
Healthcare to outperform FMCG in near- to medium-teThe healthcare index (BSE Healthcare) has outperformed the broader market (BSE Senconsistently over the past four years. The outperformance has largely come as a result stronger earnings and a re-rating of the sector.
Healthcare index vs Sensex
Source: Bloomberg, AntiqueNote: 2013 data is YTD. Pricing date as of 6 December 2013
The healthcare premium to the broader market is close to its 2006 peak. At current levels, thhealthcare index is trading at ~18.5x one-year forward blended EPS (as per Bloomberdata), which represents a 41% premium to the BSE Sensex. Over the last seven years, taverage premium for the sector over the broader market has been ~22%.
Healthcare premium to Sensex since 2006. Also plot the average at 22%.
Source: Bloomberg, Antique
Pharmaceutical sector cheap viz-a-viz FMCGThe healthcare index continues to underperform the FMCG index by a wide margin. Historicathe FMCG index has traded at a 20%premium to healthcare (in terms of one-year forward Pmultiple). However, since 2010, the premium has expanded. The FMCG sector now tradat a 46% premium to healthcare. The re-rating of the FMCG sector from 2010 to 2013 walargely driven by earnings momentum. Most consumer companies had made investmentstap the rural market prior to 2010. These investments started to pay-off in 2010 and thsector thus re-rated. At current levels, the FMCG and BSE Healthcare indices trade at a 105and 41% premium to BSE Sensex.
-18%
13%
42% 47% 47%
-52%
81%
17%
-25%
26%10%
96%
34% 39%
4%
73%
-10%
23%
2%17%
69%
17%
-13%
-33%
22%
3%
-60%
-40%
-20%
0%
20%
40%
60%
80%
100%
120%
2001 2002 2003 2004 2005 2006 2007 2008 2009 2010 2011 2012 2013YTD
Sensex BSE HC
-30%
-15%
0%
15%
30%
45%
60%
A p r - 0 6
O c t - 0 6
A p r - 0 7
O c t - 0 7
A p r - 0 8
O c t - 0 8
A p r - 0 9
O c t - 0 9
A p r - 1 0
O c t - 1 0
A p r - 1 1
O c t - 1 1
A p r - 1 2
O c t - 1 2
A p r - 1 3
O c t - 1 3
7/21/2019 Antique Pharma
http://slidepdf.com/reader/full/antique-pharma 3/27
TIQUE STOCK BROKING LIMITED 11 December 201FROM THE RESEARCH DESK
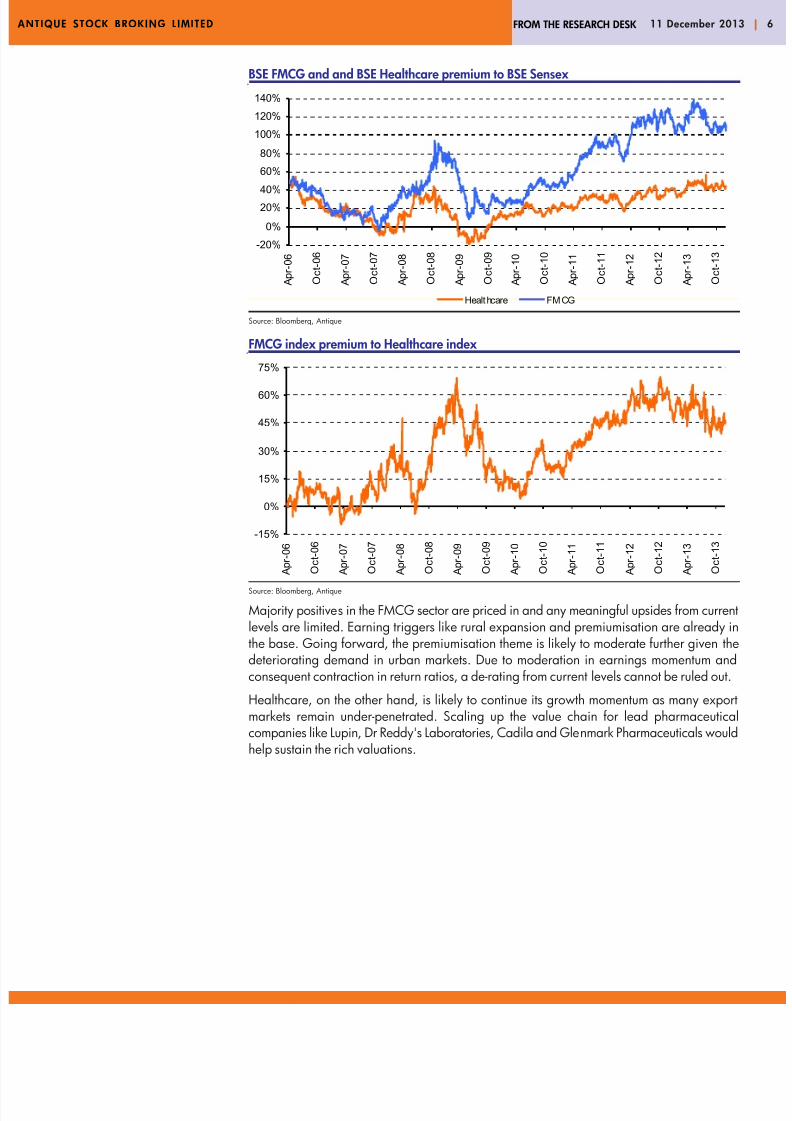
BSE FMCG and and BSE Healthcare premium to BSE Sensex
Source: Bloomberg, Antique
FMCG index premium to Healthcare index
Source: Bloomberg, Antique
Majority positives in the FMCG sector are priced in and any meaningful upsides from currlevels are limited. Earning triggers like rural expansion and premiumisation are alreadythe base. Going forward, the premiumisation theme is likely to moderate further given deteriorating demand in urban markets. Due to moderation in earnings momentum anconsequent contraction in return ratios, a de-rating from current levels cannot be ruled ou
Healthcare, on the other hand, is likely to continue its growth momentum as many expmarkets remain under-penetrated. Scaling up the value chain for lead pharmaceuticcompanies like Lupin, Dr Reddy's Laboratories, Cadila and Glenmark Pharmaceuticals wohelp sustain the rich valuations.
-20%
0%
20%40%
60%
80%
100%
120%
140%
A p r - 0 6
O c t - 0 6
A p r - 0 7
O c t - 0 7
A p r - 0 8
O c t - 0 8
A p r - 0 9
O c t - 0 9
A p r - 1 0
O c t - 1 0
A p r - 1 1
O c t - 1 1
A p r - 1 2
O c t - 1 2
A p r - 1 3
O c t - 1 3
Healt hcare FM CG
-15%
0%
15%
30%
45%
60%
75%
A p r - 0 6
O c t - 0 6
A p r - 0 7
O c t - 0 7
A p r - 0 8
O c t - 0 8
A p r - 0 9
O c t - 0 9
A p r - 1 0
O c t - 1 0
A p r - 1 1
O c t - 1 1
A p r - 1 2
O c t - 1 2
A p r - 1 3
O c t - 1 3

7/21/2019 Antique Pharma
http://slidepdf.com/reader/full/antique-pharma 4/27
TIQUE STOCK BROKING LIMITED 11 December 201FROM THE RESEARCH DESK
FMCG FY15e earnings momentum vs Pharmaceuticals (aggregate of our coverage univer
Source: Bloomberg, Antique
We list factors which would aid the healthcare sector in sustaining higher earnings growth FMCG in near- to medium-term:
FMCG entails additional macro-economic risk vs pharmaceuticals: FMCGcompanies derive their revenues primarily from India. This geographical concentratexposes revenues and profits to macro-economic fluctuations. Pharmaceutical companin India are much more diversified, with India accounting for only a fraction of consolidarevenues. Geographical diversification reduces macro-economic risk in the near- to mediuterm. Further, the pharmaceuticals sector tends to be relatively less discretionary.
Affordability: Indian pharmaceutical companies stand to benefit from macro-economdownturns in their respective markets as they offer a more affordable alternativebranded/innovator medicines. The Indian consumer sector is prone to reduction consumption (both in value and volume terms) and minimising wastage in times of maeconomic turbulence.
Barriers to entry: Indian pharmaceutical companies are scaling up the value chainThe primary barriers to entry in their focus segments are technology and intellectproperty. These barriers prevent smaller, unorganised players from competing wiincumbents. FMCG companies do not offer such entry barriers.
INR depreciation a tailwind for pharmaceuticals and headwind for FMCG:FMCG companies import 20-30% of their raw material needs as compared tpharmaceutical companies which are net exporters. The recent INR depreciation is likto aid pharmaceutical margins while the same would be a headwind to FMCG profit
Expect healthcare to outperform FMCG index in near- to medium-term.
Based on the above analysis, we confer that the healthcare index is likely tooutperform FMCG in the near- to medium-term. Compared to FMCGcompanies, healthcare companies offer higher valuation comfort and higherearnings growth.
90%
95%
100%
105%
110%
115%
120%
125%
130%
May-12 Jul-12 Sep-12 Nov-12 Jan-13 Mar-13 May-13 Jul-13 Sep-13 Nov-13
Consolidated FY15e PAT FMCG Consolidated FY15e PAT Pharma

7/21/2019 Antique Pharma
http://slidepdf.com/reader/full/antique-pharma 5/27
TIQUE STOCK BROKING LIMITED 11 December 201FROM THE RESEARCH DESK
Pharmaceuticals: A bitter or sweet pill?Companies under our coverage unlikely to see P/E contraction
We wish to highlight below that for stocks under our coverage, price performance over the samperiod has been largely driven by earnings rather than P/E expansion. On an average, for ourcoverage universe, 67% of stock performance has been accounted for by earnings growth.
Stock performance, P/E expansion, Growth in earnings (since Jan-06)Price performance PE expansion Earnings expansionSun Pharma 7.36x 2.46x 2.99xDr. Reddy's 3.47x 1.81x 1.91xLupin 8.21x 1.32x 6.24xCipla 1.42x 0.52x 2.73xGlenmark 3.29x 0.85x 3.88xCadila 4.85x 2.06x 2.36xIPCA 9.19x 2.10x 4.38xSource: Bloomberg, Antique
The P/E multiples for companies under our coverage universe is likely to sustain given nterm earnings visibility, earnings growth momentum, currency tailwind to margins, and higRoEs when compared to international peers.
Identifying key performance areas for success of Indian pharmaceuticalplayersManagement engagement and focus on execution is a key criterion for selecting future winnewhich is relevant across markets and business segments. Hence, we evaluate all companiunder our coverage on the basis of this criterion below:Management’s focus on executionManagement structure and its focus on execution are the most important KPAs pharmaceutical companies. Due to the profitability that pharmaceutical markets offer, mosthem are highly fragmented with stiff competition from local players. Indian pharmaceutcompanies where promoters play an active role in management have been observed to bmore successful when compared to other companies. For example, in the past, companiewhich have recorded higher than broader market growth in India have been SunPharmaceutical, Lupin, Ipca Laboratories, Glenmark Pharmaceuticals, and Cadila HealthcaThe top management in all of these companies are led by the promoter family. Furtheagency costs in these companies are low as promoters hold a significant economic stake the company. Promoter-led management and low agency costs have culminated in highfocus on execution in these companies as can be seen from their track records in India. Wrank companies under our coverage universe below based on this parameter:
Ranks of companies on management focus on executionRank Sun Pharma Dr Reddy's Cipla Lupin Ranbaxy Cadila Glenmark IPCA
Management focus on execution 1 6 7 1 8 5 4 1Source: Antique
Promoters’ stakesCompany (%)Lupin 46.78Dr Reddy 25.52Sun Pharma 63.65Glenmark 48.31IPCA 45.89Cadila 74.79Ranbaxy 63.51Cipla 36.8Source: Company, Antique

7/21/2019 Antique Pharma
http://slidepdf.com/reader/full/antique-pharma 6/27
TIQUE STOCK BROKING LIMITED 11 December 201FROM THE RESEARCH DESK
We believe Lupin, Sun Pharma and Ipca score the highest on management focus on executiomarginally ahead of Glenmark and Cadila. The Gupta family spear heads the strategy andexecution at Lupin while Mr. Dilip Sanghvi leads the same for Sun Pharma. The Godfamily at Ipca is also at a similar position. All three promoters hold more than 45% staketheir respective companies and hence agency costs are minimal. Execution slippages in thpast for Cadila (US and Indian consumer business) and Glenmark (debt, intangibles anworking capital) undermine their score on this front.
By and large, all companies under our coverage operate in three broad business segmentsbranded generics, generic generics, and differentiated products.
Branded genericsThe markets which fall under this category include India, Russia, Central and Eastern EuroBrazil, and most other Asian emerging markets. These markets are highly profitable and ofsustainable earnings for established players. But for new players, these markets are difficto win over and takes time and investments to build critical mass. We analyze the brandegeneric markets using Michael Porter's Five Forces model:
Threat of new entrants: Branded generic markets have relatively higher barriers entry when compared to generic generic markets. These markets offer branding of gener
drugs and no / little substitution at the pharmacy level.Thus, building brand image/perception takes upfront investment and involves a high gestation periodto establish consumer recall. High barrier to entry also implies higher profitability established players.
Bargaining power of buyers: Since doctors are an educated target consumer, thebargaining power of buyers is high. This makes it difficult to be an instant market succunless there is incremental innovation (patient benefit) involved. High buyer bargainpower also implies that cost to the buyer for switching from one player's product to tother is low. Thus, the cost of promotion like hiring of sales force, advertising spends are higher in these markets.
Bargaining power of suppliers: The bargaining power of suppliers (intermediarychemical manufacturers) is low in these markets as their product is mostly commoditiThis implies low input costs and high gross margins for incumbents.
Threat of substitutes: Threat of substitutes like Ayurveda/homeopathy is low in mpharmaceutical markets as of now. Branded generic markets are mostly emerging markewith low levels of access to medication. Government/patient groups are not yet focuseon the risks of allopathic medication.
Competitive rivalry within an industry: Higher profitability in these markets attraa lot of competition. However, the branded nature of the market lends an early movadvantage to incumbents and organic/inorganic consolidation has widely been observed.
The KPA for success in branded generic markets are management of investment risk:
Management of investment riskThough branded generic markets offer great opportunity, there are inherent risks. Tinvestments required in sales force and other infrastructure is high. Moreover, the gestatiperiod for such investments is low as profitability comes only after achieving mass. Thusmanagement of investment risks in these markets is a key differentiator in our opinion. presence of Indian companies in branded generic markets other than India varies fromowning a front-ended franchise to partnering with incumbents and other established playeOwning a front-ended franchise is a long-term strategy with a relatively longer gestatiperiod. In the near-term, this strategy offers high upfront investments and losses which becoa drag on the company's profitability and return ratios. Ranbaxy Laboratories and GlenmarPharmaceuticals are companies under our coverage with extensive ground presence in certa

7/21/2019 Antique Pharma
http://slidepdf.com/reader/full/antique-pharma 7/27
TIQUE STOCK BROKING LIMITED 11 December 2013FROM THE RESEARCH DESK
branded generic markets. Companies that have relied more on partnering /alliances/jointventures are Dr Reddy's, Cadila Healthcare, Ipca and Cipla. However, Cipla is now in atransition phase where it is converting the partnership model in to a front-end owned modfor some of its focus markets.
We wish to highlight below that companies like Glenmark and Ranbaxy areyet to become profitable in many foreign subsidiaries. The losses incurredin these subsidiaries are shown below as a percentage of consolidated PBT.
Losses incurred by our coverage companies in branded generic marketsCompany FY13 LBT FY13 PBT LBT as %
(INRm)* (INRm)* of PBTGlenmark (2,809) 7,337 38%Ranbaxy (2,365) 2,774 85%Source: Company, AntiqueNote: Subsidiaries exclude India and US for b oth companies. Also excludes Swiss subsidiary for Glenmark
Rankings of our coverage companies on management of investment riskRank Sun Pharma Dr Reddy's Cipla Lupin Ranbaxy Cadila Glenmark IPCAManagement of investment risk 5 1 7 5 7 1 4 3Source: Antique
Dr. Reddy's and Cadila score the highest on management of investment risk. Both the companhave engaged in multiple JVs / alliances / partnerships to manage their investments iexpanding geographical footprint and / or product lines. Cadila's JVs recorded an RoE o69% in FY13. This exhibits the high returns that these alliances and partnerships offer. DReddy's partnership with Merck for biosimilars in developed markets also diversifies R&Dwhile expanding geographical footprint for the product line. Ipca and Glenmark are closrunners up on this parameter. Ipca has taken the partnership route in most of its expomarkets and is recording significant growth. Glenmark had made upfront investments inNBE and NCE pipeline. However, by partnering these projects at an early stage odevelopment, the company has been able to recoup its investments despite clinicdisappointments.
Generic genericsMarkets which fall under this category mostly include developed markets like Western Eur(UK), US and Japan. We believe these markets are fragmented but key differentiator for tplayers in the market is technology. Critical mass is lesser important in these markets infrastructure required is not capital intensive. Gestation periods could also be low for tsame reason. We analyze the branded generic markets using Michael Porter's five forcemodel:
Threat of new entrants: Generic generics markets have relatively low entry barriewhen compared to branded generic markets. These markets do not offer branding ogeneric drugs and substitution at the pharmacy level is permitted.Thus, low cost ofproduction and technological edge tend to provide leverage in thesemarkets. Low entry barrier also imply varied profitability for high tech play(differentiated/difficult to make products) and lower-end manufacturers. Inorgaconsolidation to acquire technologies and customer relationships is common across themarkets.
Bargaining power of buyers: Most developed markets offer high insurancpenetration for patients. Hence, target consumers for these companies are insuranccompanies, pharmacy benefit manufacturers, and health management organisations. Ithe US, we have seen significant consolidation on the buying side as well. As per dareleased by the Pharmacy Benefit Management Institute, Top IV PBM players con~52% of the US pharmaceutical market in terms of number of patients (2QCY11). Hencthe bargaining power of buyers is high. The success of a player in the commodity/'m

7/21/2019 Antique Pharma
http://slidepdf.com/reader/full/antique-pharma 8/27
TIQUE STOCK BROKING LIMITED 11 December 2013FROM THE RESEARCH DESK
too' medication space largely depends on their customer relationships, supply-chaexcellence, and cost management. High bargaining power on the buying side impliepricing pressure as competition increases and hence gross margins tend to be lowHowever, for high tech/differentiated/limited competition opportunities, pricing poweretained by the generic player.
Bargaining power of suppliers: The bargaining power of suppliers (intermediarychemical manufacturers) is low in these markets.This implies low input costs. Butdue to low pricing as discussed above, gross margins tend to be lowerthan branded generic markets.
Threat of substitutes: Threat of substitutes like Ayurveda/homeopathy is relativehigher. Developed markets have reasonably high access to medication. The US governmehas set-up National Center for Complementary and Alternative Medicine and there aother voluntary organizations like National Ayurvedic Medical Association which promuse of ayurvedic medications. Although, we do not perceive alternate medication asnear- to medium-term threat for substitution of allopathic medication, acceptabilityalternative medication in developed markets is growing.
Competitive rivalry within an industry: Low-entry barriers in these markets attraa lot of competition. However, the generic nature of the market lends an early movadvantage to incumbents with established customer relationships.
The key performance area for success in the generic generics markets is investment in technol(scaling up the value chain).Scaling up the value chainInvestments in R&D and technology is a key differentiator in an otherwise competitive gengenerics market. Various products like oral contraceptives, dermatological, ophthalmic productransdermal products, pre-filled syringes etc have various regulatory and manufacturing hurdwhich may be expensive/difficult to overcome. Companies which have been able to overcomthese barriers get to operate in a limited competitive environment despite an overall competitmarket. This limited competition yields high margins and more sustainable revenues. Compan
that are currently investing heavily in to these product segments are Dr Reddy's, Cadila, Luand Glenmark.
Rankings of our coverage companies on scaling up the value chainRank Sun Pharma Dr Reddy's Cipla Lupin Ranbaxy Cadila Glenmark IPCAScaling up the value chain 3 1 7 1 8 5 3 6Source: Antique
R&D cost as a % of sales (FY13)
Source: Company, Antique
5.9%
7.4%6.6%
7.3%
3.6%
8.2%
4.0%
7.5%
0.0%
1.0%
2.0%
3.0%
4.0%
5.0%6.0%
7.0%
8.0%
9.0%
SunPharma
Lupin Dr.Reddy's
Cadila Ranbaxy Glenmark Cipla Ipca

7/21/2019 Antique Pharma
http://slidepdf.com/reader/full/antique-pharma 9/27

7/21/2019 Antique Pharma
http://slidepdf.com/reader/full/antique-pharma 10/27
TIQUE STOCK BROKING LIMITED 11 December 2013FROM THE RESEARCH DESK
Consolidating the rankings given above, we summarize the overall rank ofIndian pharma companies under our coverage below:
Rankings of our coverage companies on management of investment riskRank Sun Pharma Dr Reddy's Cipla Lupin Ranbaxy Cadila Glenmark IPCAManagement focus on execution 1 6 7 1 8 5 4 1Management of investment risk 5 1 7 5 7 1 4 3Scaling up the value chain 3 1 7 1 8 5 3 6Operational / Quality risk 1 2 7 2 7 4 4 6Overall Rank 2 2 7 1 8 4 4 6Source: Antique
Lupin is at pole position among the Indian pharma companies, in ourassessment. The company is ahead of peers in terms of execution and longterm strategy. Sun Pharma and Dr. Reddy's are close runners up. Amongstthe midcaps, Glenmark and Cadila are well poised for growth with limitedrisk. Ipca seems to be a relatively higher risk proposition.
Recommendation summaryReco CMP 12M Target Upside Target 1yr Current 1yr Valuation
(INR) Price (INR) (%) Fwd PE (x) Fwd PE (x)Lupin BUY 857 1,050 22.5 20 20 PEDr Reddy BUY 2,455 2,830 15.3 18 18 PESun Pharma BUY 584 689 18.0 24 23 SOTPGlenmark BUY 525 650 23.8 16 16 SOTPIPCA BUY 674 847 25.7 17 15 PECadila BUY 734 961 31.0 18 18 PERanbaxy HOLD 435 433 (0.5) 20 29 SOTPCipla HOLD 386 436 12.9 17 17 PESource: Antique
Multiples summaryEV/Sales (x) EV/EBITDA (x) P/E (x) ROE (%)
FY12 FY13 FY14e FY15e FY16e FY12 FY13 FY14e FY15e FY16e FY12 FY13 FY14e FY15e FY16e FY13
Lupin 5.6 4.1 3.5 2.9 2.5 27.5 17.3 14.7 11.7 9.8 44.4 29.3 23.1 18.5 15.7 28.5
Dr Reddy 4.6 3.9 3.3 2.8 2.4 18.1 16.4 14.1 11.5 9.5 27.7 24.1 21.5 17.7 15.0 25.7
Sun Pharma 14.7 10.4 7.2 6.1 5.0 36.2 23.8 15.6 13.7 11.0 45.5 40.5 40.0 20.3 16.2 21.9
Glenmark 4.0 3.3 2.7 2.3 1.9 16.3 15.4 13.1 10.7 9.0 30.9 23.1 21.8 16.5 13.5 23.8
IPCA 3.9 3.2 2.7 2.3 1.9 17.7 14.5 11.0 9.5 8.0 30.7 26.3 18.3 14.3 12.1 23.0
Cadila 3.2 2.7 2.5 2.2 1.8 15.3 15.4 17.0 12.2 10.1 23.0 23.0 22.4 16.3 13.1 23.7
Ranbaxy 2.0 1.5 2.1 1.4 1.4 11.8 9.8 24.7 4.1 12.9 (6.4) 20.2 (24.7) 4.7 23.1 26.5
Cipla 4.4 3.9 3.2 2.6 2.2 40.3 30.6 25.4 22.8 20.0 27.2 20.5 18.3 16.7 14.6 18.1
Source: Company, Antique

7/21/2019 Antique Pharma
http://slidepdf.com/reader/full/antique-pharma 11/27
TIQUE STOCK BROKING LIMITED 11 December 2013FROM THE RESEARCH DESK
COMPANIES SECTION

7/21/2019 Antique Pharma
http://slidepdf.com/reader/full/antique-pharma 12/27
TIQUE STOCK BROKING LIMITED 11 December 2013FROM THE RESEARCH DESK
COMPANY UPDATE
Lupin LimitedQuality at a price - BuyLupin has been the best performing stock in the largecap universe over thelast five years. The company has seen strong earnings growth led byexcellent execution in the US and Indian business. The company's foray in to
Japan and novel research are long-term growth drivers. A focusedmanagement, well entrenched promoters, no management transition in sightfor the next decade, niche product strategy and high visibility in the US productpipeline, strong balance sheet, intent to be acquisitive in the US specialtyspace, high RoE, and high R&D investments makes Lupin our top pick in thelargecap pharmaceutical space.
Business highlights:Generics: Outlook for the US generics business is positive as pipeline visibility is high. upcoming opportunities include Zymaxid (already launched), Niaspan, and Trilipix, whiare expected to be limited competition opportunities in the near-term. The OC filings wo
also come to the fore over the next 12-24 months. Despite near-term regulatory headwindhigh regulatory and quality standards in Japan present an entry barrier for new entrants anlend a competitive advantage to early movers like Lupin.Specialty: The branded business contributed only 10% to US sales in 2QFY14 compared the 28% peak in FY12. The induction of low dose Antara, Locoid lotion, and Alinia in brandfranchise is likely to aid in ramp-up of the business. As per management, low dose Antacould recoup lost sales due to genericisation of Antara. We remain conservative in our outlooand estimate 11% of US revenues to come from branded compared to company's two yeaguidance of 25-30%.Branded generics: The company's presence in chronic segments like anti-diabet(including Eli Lilly's insulin portfolio), neurology, respiratory and cardiology augurs welmaintaining growth above the broader market. In-licensing opportunities to add to growth
and when they materialise.Differentiated products: The company has a basket of 10 biosimilars and NCE projecteach. We do not expect any near-term fruits from these initiatives but the focus on theprograms may offer sustainability to profits and growth in the longer-term.Margins: We are building in a 141bps margin expansion over FY13-16e led by betterproduct mix and gradual ramp-up in branded business.
Valuations and risksLupin currently trades at 20x one-year forward EPS. We project earnings CAGR of 20% fFY13-16e. We value Lupin at 20x (current trading multiple) one-year forward EPS (blendFY15e and FY16e EPS) of INR52.5. This gives us a 12-month price target of INR1,050 pshare, an 23% upside from current levels. Key risks to our Buy call are Suprax gene
competition, failure to ramp-up the US branded portfolio, and regulatory risks.
Aditya Khemka+91 22 4031 [email protected]
Mitesh Shah+91 22 4031 [email protected]
Current Reco : BUYPrevious Reco : BUYCMP : INR857Target Price : INR1,050Potential Return : 23%
Market dataSector : PharmaMarket Cap (INRbn) : 390.3Market Cap (USDbn) : 6.4O/S Shares (m) : 448.2Free Float (m) : 28452-wk HI/LO (INR) : 946/568
Avg Daily Vol ('000) : 490Bloomberg : LPC IN
Source: Bloomberg
Returns (%)1m 3m 6m 12m
Absolute (1) 4 14 44Relative (4) (2) 5 32
Source: Bloomberg
Price performance vs Nifty
Source: Bloomberg
Shareholding patternPromoters : 47%FII : 31%DII : 12%Others : 10%
Source: Bloomberg
Key financials Year ended 31 Mar FY12 FY13 FY14e FY15e FY16eRevenue (INRm) 70,829 96,413 109,765 129,386 147,549EBITDA (INRm) 14,447 22,699 26,246 32,330 37,310EBITDA Margin (%) 20.4 23.5 23.9 25.0 25.3PAT (INRm) 8,677 13,141 16,692 20,764 24,478EPS (INR) 19.3 29.3 37.2 46.2 54.5P/E (x) 44.2 29.2 23.0 18.5 15.7FCF Yield (%) (0.1) 1.8 1.7 3.1 3.8RoE (%) 23.8 28.5 28.3 27.8 26.1Source: Company, Antique
80
100
120
140
160
Dec-12 Apr-13 Aug-13 Dec-13
Lupin NIFTY

7/21/2019 Antique Pharma
http://slidepdf.com/reader/full/antique-pharma 13/27
TIQUE STOCK BROKING LIMITED 11 December 2013FROM THE RESEARCH DESK
FinancialsProfit and loss account (INRm)
Year ended 31 Mar 2012 2013 2014e 2015e 2016eNet Sales 70,829 96,413 109,765 129,386 147,549Material costs 26,039 35,480 39,761 46,019 52,320Employee cost 8,127 10,359 12,359 14,687 16,803
R&D costs 5,228 7,098 8,802 10,386 11,632Other expenditure 16,988 20,777 22,598 25,965 29,483Operating expenses 56,382 73,713 83,519 97,056 110,238EBITDA 14,447 22,699 26,246 32,330 37,310Depreciation 2,275 3,322 2,582 2,916 3,293EBIT 12,172 19,378 23,664 29,414 34,018Other income 144 279 2,000 450 850Interest 355 410 270 214 411PBT 11,961 19,246 25,394 29,650 34,457Tax 3,086 5,842 8,451 8,599 9,648PAT 8,875 13,404 16,942 21,052 24,809Minority interest & prior period items 199 263 250 288 331Net profits 8,677 13,141 16,692 20,764 24,478
EPS 19.3 29.3 37.2 46.2 54.5
Balance sheet (INRm) Year ended 31 Mar 2012 2013 2014e 2015e 2016eShare capital 893 895 895 895 895Reserves & surplus 39,236 51,147 65,177 82,632 103,208Net Worth 40,129 52,042 66,073 83,527 104,103Minorities 723 595 595 595 595Total Debt 16,400 11,645 7,645 7,645 7,645Capital employed 57,252 64,281 74,312 91,766 112,342Net assets 26,894 28,036 30,953 34,038 37,745Investments 28 21 21 21 21Other non-current assets 5,040 5,073 5,073 5,073 5,073
Current Assets Loan & AdvancesInventory 17,327 19,489 23,767 28,088 32,494Debtors 17,318 21,870 25,144 29,717 33,954Cash & Bank 4,025 4,349 5,868 14,485 25,633Loan & advances and others 8,241 9,597 9,797 10,537 11,228Current Liabilities & ProvisionsCreditors 13,978 15,431 17,934 20,754 23,367Others Liabilities and Provisions 6,200 7,090 6,726 7,769 8,750Net Current Assets 26,733 32,784 39,915 54,304 71,193Deferred tax assets/(liabilities) (1,442) (1,632) (1,651) (1,669) (1,690)
Application of Funds 57,252 64,281 74,312 91,766 112,342
Per share data Year ended 31 Mar 2012 2013 2014e 2015e 2016eNo.of Shares (Mn) 449 449 449 449 449BVPS (INR) 89 116 147 186 232CEPS (INR) 24 37 43 53 62DPS (INR) 3 4 5 6 7
Margins (%) Year ended 31 Mar 2012 2013 2014e 2015e 2016eEBITDA 20.4 23.5 23.9 25.0 25.3EBIT 17.2 20.1 21.6 22.7 23.1PAT 12.2 13.6 15.2 16.0 16.6
Source: Company, Antique
Revenue Mix (INRm) Year ended 31 Mar 2012 2013 2014e 2015e 2016eFormulations 60,028 84,392 97,720 116,902 134,612India (Gross) 19,374 23,840 26,263 30,060 34,370US generics 17,105 29,051 39,745 50,151 58,901
US brand 6,804 7,722 5,820 6,875 7,438 Japan 8,607 13,040 12,833 14,373 16,098Europe 1,975 2,356 3,533 4,148 4,586RoW 6,163 8,383 9,525 11,295 13,220
API 8,596 9,921 10,715 11,251 11,813Total 68,624 94,313 108,435 128,153 146,426
Cash flow statement (INRm) Year ended 31 Mar 2012 2013 2014e 2015e 2016ePBT 11,961 19,246 25,394 29,650 34,457Depreciation 2,275 3,322 2,582 2,916 3,293Tax paid (3,139) (5,439) (8,433) (8,580) (9,627)Chg in working capital (4,399) (4,470) (6,216) (6,074) (6,030)
Others (1,107) (149) 308 (132) 108CF from operations (a) 5,592 12,510 13,634 17,780 22,200Capital expenditure (7,341) (5,515) (5,500) (6,000) (7,000)Chg in investments and others 311 296 0 0 0CF from investing (b) (7,030) (5,219) (5,500) (6,000) (7,000)Free CF (a+b) (1,438) 7,292 8,134 11,780 15,200Equity raised/(repaid) 52 128 0 0 0Debt raised/(repaid) 3,076 (4,645) (4,000) 0 0Dividend (incl. tax) (1,652) (1,689) (2,095) (2,661) (3,310Others (213) (761) (520) (502) (742CF from financing (c) 1,262 (6,967) (6,615) (3,163) (4,052)Net chg in cash (a+b+c) (176) 324 1,519 8,617 11,148
Growth indicators (%) Year ended 31 Mar 2012 2013 2014e 2015e 2016eRevenue 21.7 36.1 13.8 17.9 14.0EBITDA 21.3 57.1 15.6 23.2 15.4PAT 0.6 51.5 27.0 24.4 17.9EPS 0.6 51.5 27.0 24.4 17.9
Valuation (x) Year ended 31 Mar 2012 2013 2014e 2015e 2016ePE (X) 44.2 29.2 23.0 18.5 15.7P/BV (X) 9.6 7.4 5.8 4.6 3.7EV/EBITDA (X) 27.4 17.2 14.7 11.7 9.EV/Sales (X) 5.6 4.1 3.5 2.9 2.5
Dividend Yield (%) 0.4 0.5 0.6 0.7 0.9
Financial ratios Year ended 31 Mar 2012 2013 2014e 2015e 2016eRoE 23.8 28.5 28.3 27.8 26.1RoCE 15.8 22.2 22.8 25.1 24.0Debt/Equity (x) 0.4 0.2 0.1 0.1 0.1EBIT/Interest (x) 0.0 0.0 0.0 0.0 0.0
Source: Company Antique

7/21/2019 Antique Pharma
http://slidepdf.com/reader/full/antique-pharma 14/27
TIQUE STOCK BROKING LIMITED 11 December 2013FROM THE RESEARCH DESK
COMPANY UPDATE
Dr Reddy's Laboratories LimitedPossible re-rating to be driven by India and Russia - BuDr Reddy's Laboratories is a play on the US generics and complex APIopportunity, secular India growth story, 'pharmerging' markets, andbiosimilars. A focused management, well entrenched promoters, niche andcomplex product focus, early entry in to the biosimilars space, and high R&Dinvestments makes DRL a preferred pick in the large cap pharma space.
Business highlightsGenerics: The US generics business outlook remains positive. Recent launches like Dacoand Vidaza are likely to remain low competition opportunities that provide earnings suppoin the near-term. Supply issues at Wockhardt may aid market share gains in limited competitiproducts like Depakote ER, Prevacid, Toprol XL and Lamictal XR.Branded generics: With the impact of domestic formulation sales force restructuring behus, we expect the company to grow in line with the broader market going forward. Wbelieve that consistent growth in the business segment is likely to drive re-rating of the stocthe medium-term. We expect the Russia business to continue on its growth path. Dr. Reddhas established a platform in the market and should be able to grow consistently in thmarket here on.
Alliances: DRL has inked partnerships with Merck for biosimilars in developed markFujifilm for generic drugs in Japan, and Glaxo for emerging markets, which illustrate effective investment risk management and provide long-term growth drivers. We also loforward to the introduction of additional biosimilar products in emerging markets, particulaRussia and India.Specialty: We believe the company's presence in the dermatology specialty space througPromius Pharma is exciting. We believe dermatology as a space holds long term potentiwith reasonable barriers to entry.
API: Despite a proven track record, the PSAI segment offers low future growth potenvisibility. We expect segment contribution to overall sales and profits to decrease over timMargins muted due to hedges: DRL is yet to benefit from the INR depreciation as cflow hedge losses continue to be ~3% of gross profits (2QFY14). We pencil in a margiexpansion of 136bps over FY13-16e.
Valuation and risksThe company currently trades at ~18x one-year forward EPS, i.e. at a 10-25% discount other frontline generic companies like Sun Pharmaceutical and Lupin. We project earninCAGR of 17% for FY13-16e. We value DRL at 18x one-year forward EPS (blended FYand FY16e EPS) of INR157.4. This gives us a 12-month price target of INR2,830 per sharan upside of 15% from current levels. The key risks to our buy call are: 1) Delay in key prodapprovals in the US; and 2) Substantial increase in spending for high risk R&D projects.
Aditya Khemka+91 22 4031 [email protected]
Mitesh Shah+91 22 4031 [email protected]
Current Reco : BUYPrevious Reco : BUYCMP : INR2,455Target Price : INR2,830Potential Return : 15%
Market dataSector : PharmaMarket Cap (INRbn) : 416.6Market Cap (USDbn) : 6.8O/S Shares (m) : 170.0Free Float (m) : 12052-wk HI/LO (INR) : 2545/1720
Avg Daily Vol ('000) : 281Bloomberg : DRRD IN
Source: Bloomberg
Returns (%)1m 3m 6m 12m
Absolute 2 8 12 30Relative (1) 2 3 19
Source: Bloomberg
Price performance vs Nifty
Source: Bloomberg
Shareholding patternPromoters : 25%FII : 33%DII : 9%Others : 33%
Source: Bloomberg
Key financials Year ended 31 Mar FY12 FY13 FY14e FY15e FY16eRevenue (INRm) 96,737 116,266 133,660 153,653 171,805EBITDA (INRm) 24,505 27,351 31,342 37,319 42,760EBITDA Margin (%) 25.3 23.5 23.4 24.3 24.9PAT (INRm) 14,261 16,779 19,476 23,637 27,873EPS (INR) 89 102 114 139 164P/E (x) 27.8 24.2 21.6 17.8 15.1FCF Yield (%) 0.7 0.2 2.8 3.7 5.3RoE (%) 27.6 25.7 23.9 23.7 22.9Source: Company, Antique
80
100
120
140
Dec-12 Apr-13 Aug-13 Dec-13
Dr Reddy NIFTY

7/21/2019 Antique Pharma
http://slidepdf.com/reader/full/antique-pharma 15/27
TIQUE STOCK BROKING LIMITED 11 December 2013FROM THE RESEARCH DESK
FinancialsProfit and loss account (INRm)
Year ended 31 Mar FY12 FY13 FY14e FY15e FY16eNet Sales 96,737 116,266 133,660 153,653 171,805Operating expenses 78,486 95,152 109,579 124,383 137,709Cost of sales 43,432 55,687 59,669 67,355 73,942
SG&A costs 27,281 31,893 37,954 42,943 48,057R&D costs 5,911 7,673 12,156 14,285 15,910
Amortization 1,586 1,691 2,200 2,200 2,200 Write-downs 1,040 688 - - -Other operating expenses (764) (2,479) (2,400) (2,400) (2,400)Operating income 18,251 21,114 24,081 29,271 34,097Finance costs and other income 529 (95) (290) (1,125) (1,765)Forex loss / (gain) (689) (365) 131 - -Equity in loss of affiliates 54 104 104 104 104PBT 18,465 21,678 24,345 30,500 35,965Tax 4,204 4,900 4,869 6,862 8,092Minority Interest - (1) - - -PAT 14,261 16,779 19,476 23,637 27,873
Adj. EPS 89 102 114 139 164EBITDA 24,505 27,351 31,342 37,319 42,760
Balance sheet (INRm) Year ended 31 Mar FY12 FY13 FY14e FY15e FY16eShare capital 848 849 849 849 849Reserves & surplus 56,596 72,236 88,748 108,945 132,642Net Worth 57,444 73,085 89,597 109,794 133,491Minorities - 20 - - -Total Debt 32,210 36,678 30,300 18,300 18,300Capital employed 89,654 109,783 119,897 128,094 151,791Net assets 46,775 51,835 53,375 51,827 49,664Investments 368 681 681 681 681
Other non-current assets 417 487 487 487 487Current Assets Loan & AdvancesInventory 19,352 21,600 25,971 30,985 35,168Debtors 25,339 31,972 36,359 43,380 48,588Cash & Bank 7,379 5,136 7,792 9,051 28,659Loan & advances and others 17,882 27,006 27,439 27,936 28,387Current Liabilities & ProvisionsCreditors 9,502 11,862 13,078 14,763 16,206Others Liabilities and Provisions 18,083 17,731 19,787 22,150 24,295Net Current Assets 42,367 56,121 64,695 74,440 100,300Other non-current Liabilities (1,106) (1,010) (1,010) (1,010) (1,010)Deferred tax assets/(liabilities) 833 1,669 1,669 1,669 1,669
Application of Funds 89,654 109,783 119,897 128,094 151,791
Per share data Year ended 31 Mar FY12 FY13 FY14e FY15e FY16eNo.of Shares (Mn) 170 170 170 170 170BVPS (INR) 337 429 526 645 784CEPS (INR) 120 135 157 186 215DPS (INR) 16 17 20 25 29
Margins (%) Year ended 31 Mar FY12 FY13 FY14e FY15e FY16eEBITDA 25.3 23.5 23.4 24.3 24.9EBIT 18.9 18.2 18.0 19.0 19.8PAT 14.7 14.4 14.6 15.4 16.2
Source: Company, Antique
Sales Mix (INR mn) Year ended 31 Mar FY12 FY13 FY14e FY15e FY16eGlobal GenericsNorth America 31,889 37,846 51,185 59,475 66,690One off revenues 6,919 6,356 7,270 2,858 2,904
Europe 8,259 7,716 7,049 7,521 7,665India 12,931 14,560 15,857 17,877 20,201Russia & Other CIS 13,260 16,908 20,937 24,577 28,263Others (incl. GSK alliance) 3,904 5,533 6,713 9,369 12,073PSAI 23,812 30,650 28,320 30,700 32,339Others 2,682 3,001 3,001 3,509 3,947Total 96,737 116,266 133,660 153,653 171,805
Cash flow statement (INRm) Year ended 31 Mar FY12 FY13 FY14e FY15e FY16ePre-tax profit 18,465 21,678 24,345 30,500 35,965Depreciation 5,181 5,549 7,260 8,048 8,663Tax paid (4,554) (5,537) (4,869) (6,862) (8,092)
Chg in working capital (8,469) (13,146) (5,919) (8,485) (6,254)Others 5,503 4,775 (290) (1,125) (1,765)CF from operations (a) 16,126 13,319 20,527 22,076 28,518Capital expenditure (b) (8,788) (8,764) (8,800) (6,500) (6,500)Chg in others (10,101) (5,180) 2,000 2,100 2,500CF from investing (18,889) (13,944) (6,800) (4,400) (4,000)Free cash flow (a+b) 7338 4555 11727 15576 22018Equity raised/(repaid) and change in MI 6 1 (20) - Debt raised/(repaid) 7,212 2,182 (6,378) (12,000) -Dividend (incl. tax) (2,216) (2,714) (2,964) (3,440) (4,176Other financing activities (1,111) (1,261) (1,710) (975) (735CF from financing (c) 3,891 (1,792) (11,072) (16,416) (4,911)Net chg in cash (a+b+c) 1,129 (2,417) 2,656 1,260 19,607
Growth indicators (%) Year ended 31 Mar FY12 FY13 FY14e FY15e FY16eRevenue 29.5 20.2 15.0 15.0 11.8EBITDA 46.1 11.6 14.6 19.1 14.6PAT 129.2 117.7 116.1 121.4 117.9EPS 135.7 114.8 112.4 121.4 117.9
Valuation (x) Year ended 31 Mar FY12 FY13 FY14e FY15e FY16ePE (X) 27.8 24.2 21.6 17.8 15.1P/BV (X) 7.3 5.7 4.7 3.8 3.1EV/EBITDA (X) 18.2 16.5 14.1 11.5 9.
EV/Sales (X) 4.6 3.9 3.3 2.8 2.4Dividend Yield (%) 0.6 0.7 0.8 1.0 1.2
Financial ratios Year ended 31 Mar FY12 FY13 FY14e FY15e FY16eRoE 27.6 25.7 23.9 23.7 22.9RoCE 51.8 42.4 41.9 47.2 48.7Debt/Equity (x) 0.6 0.5 0.3 0.2 0.1EBIT/Interest (x) 17.1 20.7 14.1 30.0 46.4
Source: Company Antique
7/21/2019 Antique Pharma
http://slidepdf.com/reader/full/antique-pharma 16/27
TIQUE STOCK BROKING LIMITED 11 December 2013FROM THE RESEARCH DESK
COMPANY UPDATE
Sun Pharmaceutical Industries LimiteStrong balance sheet and high cash flow generation tosustain premium valuations - BuySun Pharma's outperformance has been primarily led by: 1) Opportunisticprice hikes taken by Taro and URL Pharma; 2) Value accretive acquisitionslike URL; 3) Doxil opportunity; and 4) Consistent growth in base portfolio inthe US and India. The stock currently trades at 24x one-year forward EPS(adjusting for Doxil). We concede that valuations are comparatively rich butargue that the same is supported by excellence in execution (track record),well entrenched promoter, high cash flow generation, strong balance sheet,high RoE, and scaling up the value chain. With enough levers to drive growthin the near- to medium-term, we recommend a Buy on the stock.Business highlightsUS business: Sun Pharma's growth in the US has been led by a ramp-up in base salesthrough launch of new differentiated products, FTF opportunities like Prandin, and
acquisitions like Taro, URL and DUSA Pharmaceuticals. Our estimates assume launch of products per year in the US from Sun Pharma, excluding Taro and URL.Taro acquisition: Further price hikes in limited competition products in Taro's portfocannot be ruled out. It is interesting to note that Sun Pharma acquired its 66% stake in Taro a total cost of ~USD300m and the latter currently reports an EBITDA run rate of USD50
We have pencil in some price erosion in Taro's products in our estimates.URL acquisition: We do not rule out further, meaningful and significant price hikes in URportfolio. From a longer-term perspective, URL may add further value through re-introduof niche and/or limited competition products.DUSA acquisition: Going forward, we see slow and steady ramp-up in DUSA as thcompany bolsters its geographical reach and expands indications of the Levulan produc
We do not assign any value to Dusa’s pipeline.
India business - Refuses to slowdown despite a large base: We see Sun Pharmaoutperforming the broader market in the foreseeable future. However, a large base doepose a credible risk to our forecasts.RoW business - Small base to fuel growth; Inorganic strategy to unfold: Growthof a small base is likely to come through new product registrations and inorganic expansioMargins: Our estimates assume a 84bps decline in consolidated EBITDA margins primarily by incremental competition expected in Doxil from Johnson & Johnson and other generic play
Valuation and Risks We value Sun Pharma at 24x FY15e/16e blended base earnings (excluding Doxil andImatinib) of INR27.9 per share. We add another INR18 per share for product specific upsideof Doxil and Imatinib. This gives us a 12-month target price of INR689 per share, an upsi
of 18% from current levels. Key risks to our recommendations are: 1) Regulatory risks; anHigher-than-anticipated pricing pressure in Taro/URL..
Aditya Khemka+91 22 4031 [email protected]
Mitesh Shah+91 22 4031 [email protected]
Current Reco : BUYPrevious Reco : BUYCMP : INR584Target Price : INR689Potential Return : 18%
Market dataSector : PharmaMarket Cap (INRbn) : 1,213.9Market Cap (USDbn) : 19.9O/S Shares (m) : 2,071.1Free Float (m) : 1,13752-wk HI/LO (INR) : 652/347
Avg Daily Vol ('000) : 2,072Bloomberg : SUNP IN
Source: Bloomberg
Returns (%)1m 3m 6m 12m
Absolute (3) 7 17 66Relative (5) 0 7 52
Source: Bloomberg
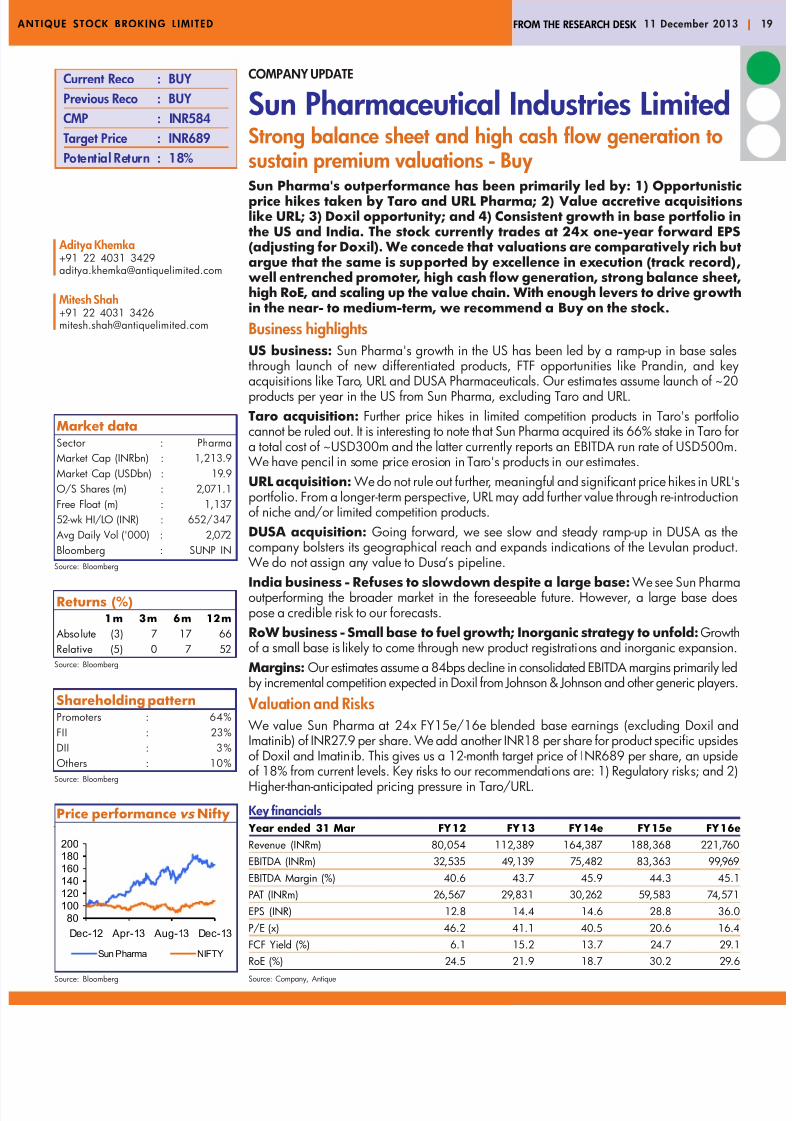
Price performance vs Nifty
Source: Bloomberg
Shareholding patternPromoters : 64%FII : 23%DII : 3%Others : 10%
Source: Bloomberg
Key financials Year ended 31 Mar FY12 FY13 FY14e FY15e FY16eRevenue (INRm) 80,054 112,389 164,387 188,368 221,760EBITDA (INRm) 32,535 49,139 75,482 83,363 99,969EBITDA Margin (%) 40.6 43.7 45.9 44.3 45.1PAT (INRm) 26,567 29,831 30,262 59,583 74,571EPS (INR) 12.8 14.4 14.6 28.8 36.0P/E (x) 46.2 41.1 40.5 20.6 16.4FCF Yield (%) 6.1 15.2 13.7 24.7 29.1RoE (%) 24.5 21.9 18.7 30.2 29.6Source: Company, Antique
80100120140160180200
Dec-12 Apr-13 Aug-13 Dec-13
Sun Pharma NIFTY

7/21/2019 Antique Pharma
http://slidepdf.com/reader/full/antique-pharma 17/27
TIQUE STOCK BROKING LIMITED 11 December 2013FROM THE RESEARCH DESK
FinancialsProfit and loss account (INRm)
Year ended 31 Mar 2012 2013 2014e 2015e 2016eNet Sales 80,054 112,389 164,387 188,368 221,760 Material costs 16,399 20,733 27,891 33,669 39,636 Other expenses 17,118 23,216 34,003 40,296 47,006
R&D expenses 3,892 6,249 8,717 10,317 12,124 Personnel costs 10,110 13,051 18,294 20,723 23,026Operating expenses 47,519 63,250 88,906 105,005 121,792EBITDA 32,535 49,139 75,482 83,363 99,969Depreciation 2,912 3,362 4,302 4,564 4,749EBIT 29,624 45,777 71,180 78,799 95,220Other income 4,212 (2,197) (21,974) 4,400 6,100Interest expense 282 432 386 386 386PBT 33,554 43,149 48,819 82,812 100,933Tax 3,132 8,456 11,099 14,492 17,663Profit after tax 30,422 34,693 37,720 68,320 83,270Minority interest 3,855 4,863 7,458 8,737 8,699Net profit 26,567 29,831 30,262 59,583 74,571
EPS 12.8 14.4 14.6 28.8 36.0
Balance sheet (INRm) Year ended 31 Mar 2012 2013 2014e 2015e 2016eShare capital 1,036 1,036 1,036 1,036 1,036Reserves & surplus 121,322 148,862 172,751 219,786 282,241Net Worth 122,358 149,897 173,786 220,822 283,277Minorities 11,615 16,351 16,351 16,351 16,351Total Debt 3,207 2,597 2,597 2,597 2,597Capital employed 137,180 168,845 192,734 239,770 302,225Net assets 42,960 62,101 65,799 67,235 68,486Investments 22,129 24,116 24,116 24,116 24,116Current Assets Loan & Advances
Inventory 20,870 25,778 37,704 43,204 50,863Debtors 20,787 27,108 38,551 44,181 52,007Cash & Bank 33,672 40,587 31,841 70,808 114,411Loan & advances and others 17,487 19,947 26,296 30,868 36,794Current Liabilities & ProvisionsCreditors 9,927 13,565 19,546 22,398 26,368Others Liabilities and Provisions 16,081 24,348 19,149 25,367 25,206Net Current Assets 66,808 75,506 95,697 141,297 202,501Deferred tax assets/(liabilities) 5,283 7,122 7,122 7,122 7,122
Application of Funds 137,180 168,845 192,734 239,770 302,225
Per share data Year ended 31 Mar 2012 2013 2014e 2015e 2016eNo.of Shares (Mn) 2,071 2,071 2,071 2,071 2,071BVPS (INR) 59 72 84 107 137CEPS (INR) 11 13 13 27 34DPS (INR) 2 2 3 3 5
Margins (%) Year ended 31 Mar 2012 2013 2014e 2015e 2016eEBITDA 40.6 43.7 45.9 44.3 45.1EBIT 37.0 40.7 43.3 41.8 42.9PAT 33.2 26.5 18.4 31.6 33.6
Source: Company, Antique
Sales break up (INRm) Year ended 31 Mar 2012 2013 2014e 2015e 2016eDomestic formuation 29,154 29,657 36,129 42,221 48,925US ex Taro 12,934 23,607 38,235 44,958 64,676Other Mkts ex Taro 6,875 10,759 14,784 19,093 23,866
Taro 25,993 36,476 48,068 55,075 55,705Dusa + URL - 2,746 19,846 18,697 19,517
API 6,147 7,549 8,469 9,625 10,588Others 31 73 14 50 50Total 81,134 110,866 165,544 189,719 223,326
Cash flow statement (INRm) Year ended 31 Mar 2012 2013 2014e 2015e 2016ePBT 33,554 43,149 48,819 82,812 100,933Depreciation 2,912 3,362 4,302 4,564 4,749Tax paid (2,268) (10,735) (11,537) (14,799) (17,878)Chg in working capital (10,053) (448) (23,006) (12,501) (16,954)Other operating activities (1,800) (1,699) (8,122) (3,514) (5,214)
CF from operations (a) 22,345 33,629 10,456 56,563 65,636Capital expenditure (7,021) (8,318) (8,000) (6,000) (6,000)Chg in investments (570) (3,695) - - Other investing activities (1,036) (14,009) 2,700 3,900 5,600CF from investing (b) (8,627) (26,022) (5,300) (2,100) (400)Free CF (a+b) 13,718 7,606 5,156 54,463 65,236Equity raised/(repaid) - 357 - - Debt raised/(repaid) (1,049) (749) - - Dividend (incl. tax) (4,096) (5,115) (6,058) (6,373) (12,548)Other financing activities (300) (1,206) (7,845) (9,123) (9,086)CF from financing (c) (5,444) (6,713) (13,902) (15,496) (21,633)Net chg in cash (a+b+c) 8,274 894 (8,746) 38,967 43,603
Growth indicators (%) Year ended 31 Mar 2012 2013 2014e 2015e 2016eRevenue 39.9 40.4 46.3 14.6 17.7EBITDA 65.2 51.0 53.6 10.4 19.9PAT 46.3 12.3 1.4 96.9 25.2EPS 46.3 12.3 1.4 96.9 25.2
Valuation (x) Year ended 31 Mar 2012 2013 2014e 2015e 2016ePE (X) 46.2 41.1 40.5 20.6 16.4P/BV (X) 10.0 8.2 7.1 5.6 4.3EV/EBITDA (X) 36.8 24.2 15.9 13.9 11.EV/Sales (X) 14.9 10.6 7.3 6.1 5.0
Dividend Yield (%) 0.3 0.4 0.4 0.4 0.9
Financial ratios Year ended 31 Mar 2012 2013 2014e 2015e 2016eRoE 24.5 21.9 18.7 30.2 29.6RoCE 21.9 24.1 30.4 30.1 29.0Debt/Equity (x) 0.0 0.0 0.0 0.0 0.0EBIT/Interest (x) 105.0 106.1 184.3 204.0 246.5
Source: Company Antique

7/21/2019 Antique Pharma
http://slidepdf.com/reader/full/antique-pharma 18/27
TIQUE STOCK BROKING LIMITED 11 December 2013FROM THE RESEARCH DESK
COMPANY UPDATE
Glenmark Pharmaceuticals LimitedTransitioning into a largecap; Novel research a potentiaboom - BuyOver the past 12 months, the Glenmark Pharmaceuticals' stock has tradedat a valuation between 16x and 20x one-year forward earnings as comparedto a range of 14-18x for the 24 months prior to that period. The re-rating hasbeen justified given the consistent growth reported across all businesssegments and improvement in the balance sheet. The company has alsoshown excellent management of its novel research pipeline. Amongcompanies under our coverage, Glenmark arguably has the highestcredibility attached to its novel research pipeline. A focused management,well entrenched promoters, strategy based on moving up the pharmaceuticalvalue chain, and effective management of novel R&D investments makes itour top pick in the midcap pharmaceutical space.Business Highlights
Branded generics: We are excited about the product strategy that Glenmark has exhibitedin the domestic formulations space. Its lead in Telmisartan in India is an example of proactplanning and flawless execution. Moreover, the launch of Sitagliptin has brought a nedimension to its business strategy. In the foreseeable future, we expect the company to maintaits domestic growth rate higher than the broader market. Notwithstanding the receunderperformance in the RoW branded business, growth is likely to pick-up from 2HFYonwards as approval timelines and new product launches pick-up speed.Generics: Apart from benefiting from new launches like Campral, the US business algained from price hikes in certain products in 2QFY14. In our assessment, there remains tpossibility of approval/launch of impact products (annual revenue potential of USD10-20with limited competition. We expect the company to launch 10-15 products annually in tUS from here on and earn incremental sales of USD60-70m annually for FY14-16e. In Eurothe company has in-licensed products which are expected to fuel growth.Differentiated products: Six out of eight products in Glenmark's novel research targpain as a therapy area. We believe the company has taken multiple shots at the paingoalpost. Pain is an USD20bn therapy area worldwide. We value the initiative at 6x expectedlicensing income: 40% of expected R&D spends.
Valuation and risksGlenmark currently trades at ~16x one-year forward EPS. We value the company at 16one-year forward EPS (blended FY15e and FY16e EPS) of INR37, which gives us a valuINR592 per share. We have added INR47 per share for novel research (discounting theexpected out-licensing income set at 40% of consolidated R&D spends in FY14e for perpetat 15%) and INR12 per share for Zetia opportunity in Dec-16 and subtracted potential Tarkliability of USD20m. This gives us a 12-month price target of INR650 per share, an upside
24% from current levels. The key risks to our Buy call are delay in approvals in the US aother emerging markets and regulatory risks.
Aditya Khemka+91 22 4031 [email protected]
Mitesh Shah+91 22 4031 [email protected]
Current Reco : BUYPrevious Reco : BUYCMP : INR525Target Price : INR650Potential Return : 24%
Market dataSector : PharmaMarket Cap (INRbn) : 146.0Market Cap (USDbn) : 2.4O/S Shares (m) : 271.1Free Float (m) : 12852-wk HI/LO (INR) : 613/440
Avg Daily Vol ('000) : 767Bloomberg : GNP IN
Source: Bloomberg
Returns (%)1m 3m 6m 12m
Absolute 3 3 (3) 19Relative (0) (3) (11) 9
Source: Bloomberg
Price performance vs Nifty
Source: Bloomberg
Shareholding patternPromoters : 48%FII : 34%DII : 7%
Others : 11%Source: Bloomberg
Key financials Year ended 31 Mar FY12 FY13 FY14e FY15e FY16eRevenue (INRm) 40,216 50,123 60,717 71,264 82,004EBITDA (INRm) 9,911 10,600 12,670 15,219 17,628EBITDA Margin (%) 24.6 21.1 20.9 21.4 21.5PAT (INRm) 4,603 6,147 6,529 8,640 10,494EPS (INR) 17.0 22.7 24.1 31.9 38.7P/E (x) 30.9 23.1 21.8 16.5 13.6FCF Yield (%) 23.2 7.2 1.4 15.2 22.7
RoE (%) 20.7 23.8 21.4 23.0 22.6Source: Company, Antique
80
100
120
140
Dec-12 Apr-13 Aug-13 Dec-13
Glenmark NIFTY

7/21/2019 Antique Pharma
http://slidepdf.com/reader/full/antique-pharma 19/27
TIQUE STOCK BROKING LIMITED 11 December 2013FROM THE RESEARCH DESK
FinancialsProfit and loss account (INRm)
Year ended 31 Mar 2012 2013 2014e 2015e 2016eSales 40,216 50,123 60,717 71,264 82,004Material Cost 13,454 16,536 19,169 22,366 25,744Employee cost 6,289 7,882 9,568 11,044 12,590
R&D expenses 2,916 4,116 5,433 6,247 7,185Other expenses 7,647 10,990 13,878 16,387 18,857Operating expenses 30,306 39,524 48,047 56,045 64,377EBITDA 9,911 10,600 12,670 15,219 17,628Depreciation 979 1,270 2,231 2,634 2,943EBIT 8,932 9,330 10,439 12,585 14,685Other income 82 65 120 120 120Exchange gain / (loss) (1,440) (500) (120) - 0Interest 1,377 1,557 1,960 1,750 1,500Extra-ordinary expense 1,317 0 0 0 0Pre-tax profit 4,880 7,337 8,479 10,955 13,305Tax (current + deferred) 238 1,107 1,855 2,191 2,661Profit after tax 4,643 6,230 6,624 8,764 10,644
Minority interests 39.6 82.6 95.4 123.3 149.7Net profit 4,603 6,147 6,529 8,640 10,494EPS 17.0 22.7 24.1 31.9 38.7
Balance sheet (INRm) Year ended 31 Mar 2012 2013 2014e 2015e 2016eShare capital 271 271 271 271 271Reserves & surplus 23,746 27,359 33,256 41,264 51,125Net Worth 24,016 27,630 33,526 41,534 51,396Minorities 250 244 244 244 244Total Debt 22,445 27,649 27,649 27,649 27,649Capital employed 46,711 55,523 61,419 69,427 79,288Net assets 24,856 28,286 30,355 32,220 33,777
Investments 298 323 323 323 323Current Assets Loan & AdvancesInventory 7,877 8,435 11,572 13,664 15,724Debtors 12,436 16,400 20,663 24,400 28,078Cash & Bank 3,253 6,110 4,241 6,289 10,564Loan & advances and others 5,940 6,584 7,137 7,700 8,255Current Liabilities & ProvisionsCreditors 7,888 10,456 12,711 15,010 17,272Others Liabilities and Provisions 2,734 3,964 3,964 3,964 3,964Net Current Assets 18,883 23,111 26,938 33,080 41,385Deferred tax assets/(liabilities) 2,674 3,803 3,803 3,803 3,803
Application of Funds 46,711 55,523 61,419 69,427 79,288
Per share data Year ended 31 Mar 2012 2013 2014e 2015e 2016eNo.of Shares (Mn) 270.5 270.9 270.9 270.9 270.9BVPS (INR) 88.8 102.0 123.8 153.3 189.8CEPS (INR) 20.6 27.4 32.3 41.6 49.6DPS (INR) 2.0 2.0 2.0 2.0 2.0
Margins (%) Year ended 31 Mar 2012 2013 2014e 2015e 2016eEBITDA 24.6 21.1 20.9 21.4 21.5EBIT 22.2 18.6 17.2 17.7 17.9PAT 11.4 12.3 10.8 12.1 12.8
Source: Company, Antique
Sales Mix (INRm) Year ended 31 Mar 2012 2013 2014e 2015e 2016eGlenmark GenericsUS 12,138 16,887 22,364 26,920 31,225Europe 1,031 1,707 2,357 2,857 3,357
Argentina 142 189 189 189 189 API 3,094 3,976 4,776 5,526 6,276SpecialtyLatin America 2,869 3,279 3,509 4,035 4,641Europe 1,976 2,017 2,425 2,802 3,082India 10,021 13,096 15,596 18,296 21,096RoW 5,926 8,122 9,122 10,622 12,122Out-licensing & Others 3,009 850 364 - Total 40,206 50,123 60,701 71,248 81,988
Cash flow statement (INRm) Year ended 31 Mar 2012 2013 2014e 2015e 2016ePre-tax profit 4,880 7,337 8,479 10,955 13,305
Depreciation 978 1,270 2,231 2,634 2,943Tax paid -1,330 -1,650 -1,855 -2,191 -2,661Chg in working capital -348 -2,530 -5,697 -4,094 -4,030Other operating activities 3,862 2,069 1,960 1,750 1,500CF from operations (a) 8,043 6,496 5,118 9,054 11,057Capital expenditure -2,854 -4,710 -4,300 -4,500 -4,500Chg in investments 0 0 0 0Other investing activities -236 -405 -95 -123 -15CF from investing (b) -3,090 -5,115 -4,395 -4,623 -4,650Free cash flow (a+b) 4,954 1,381 723 4,431 6,407Equity raised/(repaid) 36 65 0 0 0Debt raised/(repaid) -1,565 4,475 0 0 0Dividend (incl. tax) -126 -643 -632 -632 -63
Other financing activities -2,032 -2,422 -1,960 -1,750 -1,500CF from financing (c) -3,687 1,476 -2,592 -2,382 -2,132Net chg in cash (a+b+c) 1,267 2,857 -1,869 2,048 4,275
Growth indicators (%) Year ended 31 Mar 2012 2013 2014e 2015e 2016eRevenue 36.4 24.6 21.1 17.4 15.1EBITDA 66.0 7.0 19.5 20.1 15.8PAT 1.6 33.6 6.2 32.3 21.5EPS 1.5 33.4 6.2 32.3 21.5
Valuation (x) Year ended 31 Mar 2012 2013 2014e 2015e 2016e
PE (X) 30.9 23.1 21.8 16.5 13.6P/BV (X) 5.9 5.1 4.2 3.4 2.8EV/EBITDA (X) 16.3 15.4 13.1 10.7 9.EV/Sales (X) 4.0 3.3 2.7 2.3 1.9Dividend Yield (%) 0.0 0.0 0.0 0.0 0.0
Financial ratios Year ended 31 Mar 2012 2013 2014e 2015e 2016eRoE 20.7 23.8 21.4 23.0 22.6RoCE 38.6 31.1 28.0 30.9 31.7Debt/Equity (x) 0.9 1.0 0.8 0.7 0.5EBIT/Interest (x) 6.5 6.0 5.3 7.2 9.8
Source: Company Antique

7/21/2019 Antique Pharma
http://slidepdf.com/reader/full/antique-pharma 20/27
TIQUE STOCK BROKING LIMITED 11 December 2013FROM THE RESEARCH DESK
COMPANY UPDATE
IPCA Laboratories LimitedEnough levers for growth and profitability - BuyOver the past 12-18 months, IPCA has been re-rated to a 15-18x one-yearforward earnings valuation range from 10-12x. The re-rating, thus far, hasbeen justified by earnings performance and incremental visibility lent by themanagement, in our assessment. The company has seen strong earningsgrowth led by excellent execution in India, and institutional and branded genericbusinesses. A focused management, well entrenched promoters, conventionalcost-based strategy, strong balance sheet, and highly focused R&D investmentsmakes it our preferred pick in the midcap pharmaceutical space.
Business HighlightsBranded generics: We expect the business to continue to outperform the broader markdespite the legacy anti-malaria business being volatile and largely unpredictable. Ouexpectations are based on the company's excellent execution. We remain excited about thecompany's niche strategy in India as exhibited in arthritis, rheumatology, and cardiology. Th
company's branded formulation exports comprise sales to countries like Russia/CIS, Asia a West Asia, Africa and Latin America. We expect over 20% revenue CAGR over our expliforecast period for this business.Institutional business: We expect the near-term business to grow in low double digitnotwithstanding any increase in competition and pricing pressure as these headwinds woulikely be absorbed by an increase in market size in case of better funding.Generics: Ipca has a very low sales base in the US and capacity debottlenecking is likelto drive growth. The company has filed 36 ANDAs so far, of which approvals for 20 arpending. At present, less than 10 products have been commercialised in the US. We expecUS sales to grow at a CAGR of 40% over our explicit forecast period.Differentiated products: IPCA has three 505(b)(2) projects under development. We dnot build in any expectations from these projects and any upside from the same would be aupside to our estimates.Margins: We expect EBITDA margins to be flattish. Better-than-expected performanthe US generics business may present an upside risk to our margin ests.
Valuation and risksIpca currently trades at ~16x one-year forward EPS. Its valuations are at a discount to frontligeneric companies but the same may narrow given its strong earnings growth during thexplicit forecast period. We project earnings CAGR of 24% for FY13-16e and value thcompany at 17x one-year forward EPS (blended FY15e and FY16e EPS) of INR54. Tgives us a 12-month price target of INR910 per share: an upside of 26% from current levelThe key risk to our Buy call is slower than anticipated growth in the US market. The comphas 'me too' filings in the US (other than 505(b)(2) filings and relies on cost competitiven
to ramp-up/gain market share once the capacity constraints are eased.
Aditya Khemka+91 22 4031 [email protected]
Mitesh Shah+91 22 4031 [email protected]
Current Reco : BUYPrevious Reco : BUYCMP : INR674Target Price : INR847Potential Return : 26%
Market dataSector : PharmaMarket Cap (INRbn) : 81.9Market Cap (USDbn) : 1.3O/S Shares (m) : 126.2Free Float (m) : 9252-wk HI/LO (INR) : 744/440
Avg Daily Vol ('000) : 61Bloomberg : IPCA IN
Source: Bloomberg
Returns (%)1m 3m 6m 12m
Absolute (7) (5) 7 42Relative (9) (10) (2) 30
Source: Bloomberg
Price performance vs Nifty
Source: Bloomberg
Shareholding patternPromoters : 46%FII : 25%DII : 12%Others : 17%
Source: Bloomberg
Key financials Year ended 31 Mar FY12 FY13 FY14e FY15e FY16eRevenue (INRm) 23,587 28,131 33,628 39,014 45,673EBITDA (INRm) 5,135 6,232 8,266 9,328 10,900EBITDA Margin (%) 21.8 22.2 24.6 23.9 23.9PAT (INRm) 2,771 3,236 4,658 5,963 7,012EPS (INR) 22 26 37 47 56P/E (x) 30.7 26.3 18.3 14.3 12.1FCF Yield (%) (0.2) 0.3 2.0 3.2 3.5
RoE (%) 24.0 23.0 26.7 27.4 26.0Source: Company, Antique
80
100
120
140
160
Dec-12 Apr-13 Aug-13 Dec-13
IPCA NIFTY

7/21/2019 Antique Pharma
http://slidepdf.com/reader/full/antique-pharma 21/27
TIQUE STOCK BROKING LIMITED 11 December 2013FROM THE RESEARCH DESK
FinancialsProfit and loss account (INRm)
Year ended 31 Mar 2012 2013 2014e 2015e 2016eNet sales 23,587 28,131 33,628 39,014 45,673Material Cost 9,131 10,966 12,277 14,622 17,152Employee cost 3,355 3,918 4,741 5,689 6,542
R&D Expenses 780 1,007 1,406 1,539 1,806Other Expenses 5,187 6,008 6,937 7,836 9,273Operating expenses 18,452 21,899 25,362 29,685 34,773EBITDA 5,135 6,232 8,266 9,328 10,900Depreciation 671 867 1,046 1,243 1,439EBIT 4,464 5,365 7,220 8,086 9,460Other income 120 143 200 200 200Forex Loss (Gain) 527 631 879 - -Interest 413 334 247 228 184EBT 3,643 4,543 6,295 8,058 9,476Tax 881 1,299 1,637 2,095 2,464PAT 2,762 3,243 4,658 5,963 7,012Other items 9 (8) - - -
Net profit 2,771 3,236 4,658 5,963 7,012EPS 22 26 37 47 56
Balance sheet (INRm) Year ended 31 Mar 2012 2013 2014e 2015e 2016eShare capital 252 252 252 252 252Reserves & surplus 12,288 15,285 19,071 23,918 29,618Net Worth 12,540 15,538 19,324 24,170 29,870Total Debt 6,011 6,170 6,170 5,208 4,008Capital employed 18,551 21,708 25,494 29,379 33,878Net assets 10,386 12,334 14,788 16,545 18,605Investments 341 90 90 90 90Current Assets Loan & Advances
Inventory 6,699 7,410 8,906 10,355 12,147Debtors 3,491 4,178 5,021 5,838 6,849Cash & Bank 122 582 695 1,325 1,807Loan & advances and others 2,235 2,374 2,374 2,374 2,374Current Liabilities & ProvisionsCreditors 2,369 2,684 3,225 3,750 4,399Others Liabilities and Provisions 1,422 1,274 1,850 2,095 2,291Net Current Assets 8,755 10,588 11,920 14,048 16,486Deferred tax assets/(liabilities) (932) (1,304) (1,304) (1,304) (1,304)
Application of Funds 18,551 21,708 25,494 29,379 33,878
Per share data Year ended 31 Mar 2012 2013 2014e 2015e 2016eNo.of Shares (Mn) 126.2 126.2 126.2 126.2 126.2BVPS (INR) 99 123 153 192 237CEPS (INR) 27 33 45 57 67DPS (INR) 3 4 6 8 9
Margins (%) Year ended 31 Mar 2012 2013 2014e 2015e 2016eEBITDA 21.8 22.2 24.6 23.9 23.9EBIT 18.9 19.1 21.5 20.7 20.7PAT 11.7 11.5 13.9 15.3 15.4
Source: Company, Antique
Revenue Mix (INRm) Year ended 31 Mar 2012 2013 2014e 2015e 2016eDomestic formulations 7,534 8,781 9,659 11,108 12,552Domestic API 1,439 1,446 1,591 1,750 1,925Export formulations 9,961 11,942 15,230 18,324 22,608
Branded 2,200 2,882 3,602 4,503 5,404Generics 4,765 5,144 7,128 8,646 11,253Institutional 2,996 3,916 4,500 5,175 5,951Export API 4,058 5,219 6,158 6,774 7,452Subsidiary sales 340 395 454 522 601Total gross sales 23,332 27,783 33,093 38,479 45,138
Cash flow statement (INRm) Year ended 31 Mar 2012 2013 2014e 2015e 2016ePre-tax profit 3643 4543 6295 8058 9476Depreciation 671 867 1046 1243 1439Foreign exchange gain 524 149 879 0 0Interest expense 413 334 247 228 184
Tax paid (801) (916) (1637) (2095) (2464)Chg in working capital (1609) (1444) (1220) (1497) (1957)Other operating activities (59) (89) (85) (85) (8CF from operations (a) 2783 3445 5524 5851 6594Capital expenditure (2605) (2993) (3500) (3000) (3500)Chg in investments 0 250 0 0 0Chg in associates 0 (11) 0 0 0Other investing activities (254) 130 85 85 85CF from investing (b) (2859) (2624) (3415) (2915) (3415)Free cash flow (a+b) (76) 821 2110 2936 3179Debt raised/(repaid) 549 576 0 (962) (1200)Interest paid (386) (339) (247) (228) (184Dividend (incl. tax) (467) (468) (872) (1116) (1313
Other financing activities 341 (130) (879) 0 0CF from financing (c) 37 (361) (1997) (2306) (2697)Net change in cash (a+b+c) (39) 460 112 630 482
Growth indicators (%) Year ended 31 Mar 2012 2013 2014e 2015e 2016eRevenue 24.2 19.3 19.5 16.0 17.1EBITDA 36.5 21.4 32.6 12.8 16.8PAT 5.5 16.8 44.0 28.0 17.6EPS 5.1 16.7 44.0 28.0 17.6
Valuation (x) Year ended 31 Mar 2012 2013 2014e 2015e 2016e
PE (X) 30.7 26.3 18.3 14.3 12.1P/BV (X) 6.8 5.5 4.4 3.5 2.8EV/EBITDA (X) 17.7 14.5 11.0 9.5 8.EV/Sales (X) 3.9 3.2 2.7 2.3 1.9Dividend Yield (%) 0.5 0.6 0.9 1.1 1.3
Financial ratios Year ended 31 Mar 2012 2013 2014e 2015e 2016eRoE 24.0 23.0 26.7 27.4 26.0RoCE 39.4 38.1 45.3 43.6 44.3Debt/Equity (x) 0.5 0.4 0.3 0.2 0.1EBIT/Interest (x) 10.8 16.1 29.3 35.5 51.3
Source: Company Antique

7/21/2019 Antique Pharma
http://slidepdf.com/reader/full/antique-pharma 22/27
TIQUE STOCK BROKING LIMITED 11 December 2013FROM THE RESEARCH DESK
COMPANY UPDATE
Cadila Healthcare LimitedUnfolding of the US pipeline to drive re-rating of thestock - BuyOver the past two years, the Cadila Healthcare stock has materially de-rated to16x one-year forward earnings from 26x. There have been three primaryreasons for this de-rating: 1) Lack of material US launches and delay inapprovals due to the warning letter to the Moraiya facility, which depressedgrowth in the US; 2) Stiff competition in the domestic consumer space isdepressing growth and returns (by way of higher advertising spends); and 3)The domestic formulations business has failed to maintain higher than broadermarket growth. The Biochem Pharmaceutical acquisition has not led to anymaterial expansion in margins. At an xx% discount to frontliners, the correctionis perhaps overdone. Our Buy call is compelled by reasonable valuations;expectation of the US pipeline materialising over the next two years; wellentrenched promoters; excellent management of investments through joint-ventures and alliances; and growth potential of the Indian consumer business.
Business Highlights:Branded formulations: In India, the company has limited presence in the faster growinareas of anti-diabetes and neurology. We expect the business to maintain growth in lowteens, which is below the industry average. Biochem has shown improvement in margiHowever, we do not expect much improvement ahead given the acute heavy portfolio.Generics: Cadila's US business, excluding Nesher Pharmaceuticals, has been facing pricinpressures. We expect the US business to scale up on approvals of niche opportunities andlaunch of controlled substance products from the Nesher stable. Key opportunities over next 12-24 months are Toprol XL, transdermals, nasal sprays.Consumer business: We expect the business to grow in mid-teens for the explicit forecperiod. We see upside risk to these estimates, if the recent launch of ActiLife and re-launchEverYuth brands were to perform better-than-expectations.
JVs: The JV business generated RoCE of 69% for Cadila in FY13. We expect the businessgrow in high single-digits and see upside risk to our estimates in case any significant anniche opportunities were to materialise.Margins: Out of the 21 foreign subsidiaries listed in the FY13 annual report, Cadila reportea loss before tax in 16 subsidiaries. The company has some operating leverage and marginscould expand if these markets were to become profitable. We are pencilling in EBITDmargin expansion of 326bps over FY14e-16e.
Valuation and rIsksCadila currently trades at ~15x one-year forward EPS. We value Cadila at 17x one-yeaforward EPS (blended FY15e and FY16e EPS) of INR53, which gives a 12-month price taof INR907 per share, an upside of 31% from current levels. Key risks to our Buy call are delin approvals in the US and other emerging markets and regulatory risks.
Aditya Khemka+91 22 4031 [email protected]
Mitesh Shah+91 22 4031 [email protected]
Current Reco : BUYPrevious Reco : BUYCMP : INR734Target Price : INR961Potential Return : 31%
Market dataSector : PharmaMarket Cap (INRbn) : 149.7Market Cap (USDbn) : 2.4O/S Shares (m) : 204.7Free Float (m) : 4452-wk HI/LO (INR) : 925/629
Avg Daily Vol ('000) : 82Bloomberg : CDH IN
Source: Bloomberg
Returns (%)1m 3m 6m 12m
Absolute 2 11 (4) (13)Relative (1) 5 (13) (21)
Source: Bloomberg
Price performance vs Nifty
Source: Bloomberg
Shareholding patternPromoters : 75%FII : 6%DII : 9%
Others : 10%Source: Bloomberg
Key financials Year ended 31 Mar FY12 FY13 FY14e FY15e FY16eRevenue (INRm) 52,633 63,577 69,712 82,460 96,620EBITDA (INRm) 10,987 11,251 10,334 14,488 17,462EBITDA Margin (%) 20.9 17.7 14.8 17.6 18.1PAT (INRm) 6,526 6,535 6,698 9,201 11,504EPS (INR) 31.9 31.9 32.7 44.9 56.2P/E (x) 23.0 23.0 22.4 16.3 13.1FCF Yield (%) (4.7) 0.4 0.1 1.1 2.7
RoE (%) 27.5 23.7 21.1 24.5 25.1Source: Company, Antique
70
80
90
100
110
Dec-12 Apr-13 Aug-13 Dec-13
Cadila NIFTY

7/21/2019 Antique Pharma
http://slidepdf.com/reader/full/antique-pharma 23/27
TIQUE STOCK BROKING LIMITED 11 December 2013FROM THE RESEARCH DESK
FinancialsProfit and loss account (INRm)
Year ended 31 Mar 2012 2013 2014e 2015e 2016eNet Sales 52,633 63,577 69,712 82,460 96,620Material Cost 16,793 23,202 26,038 29,507 34,655Employee cost 6,511 7,799 9,359 10,763 12,377
R&D Expenses 3,628 4,669 4,902 5,540 6,260Other Expenses 14,714 16,656 19,078 22,163 25,867Operating expenses 41,646 52,326 59,377 67,972 79,158EBITDA 10,987 11,251 10,334 14,488 17,462Depreciation 1,579 1,847 2,026 2,291 2,556EBIT 9,408 9,404 8,308 12,196 14,905Other income 531 370 470 470 470Net interest expense 1,849 1,687 1,408 1,453 1,453Extra-ordinary expense 148 - (661) - -Pre-tax profit 7,942 8,088 8,031 11,213 13,922Tax (current + deferred) 1,130 1,188 1,004 1,682 2,088Profit after tax 6,812 6,900 7,028 9,531 11,834Minority interests 286 364 330 330 330
Net profit 6,526 6,535 6,698 9,201 11,504EPS 31.9 31.9 32.7 44.9 56.2
Balance sheet (INRm) Year ended 31 Mar 2012 2013 2014e 2015e 2016eShare capital 1,024 1,024 1,024 1,024 1,024Reserves & surplus 24,712 28,459 33,051 40,147 49,546Net Worth 25,736 29,483 34,075 41,171 50,570Minorities 904 1,193 1,193 1,193 1,193Total Debt 22,893 29,178 31,178 31,178 31,178Capital employed 49,533 59,854 66,446 73,542 82,941Net assets 33,318 37,612 42,086 46,295 50,239Investments 242 1,145 1,145 1,145 1,145
Current Assets Loan & AdvancesInventory 10,905 12,136 13,512 15,986 18,741Debtors 8,863 9,551 10,634 12,582 14,750Cash & Bank 4,666 5,838 5,587 3,999 4,791Loan & advances and others 5,767 7,478 8,494 9,662 11,005Current Liabilities & ProvisionsCreditors 5,455 6,568 7,371 8,353 9,810Others Liabilities and Provisions 7,588 6,333 6,635 6,768 6,915Net Current Assets 17,158 22,102 24,220 27,108 32,563Deferred tax assets/(liabilities) (1,185) (1,005) (1,005) (1,005) (1,005)
Application of Funds 49,533 59,854 66,446 73,543 82,942
Per share data Year ended 31 Mar 2012 2013 2014e 2015e 2016eNo.of Shares (Mn) 204.7 204.7 204.7 204.7 204.7BVPS (INR) 126 144 166 201 247CEPS (INR) 40 41 43 56 69DPS (INR) 8 8 8 8 8
Margins (%) Year ended 31 Mar 2012 2013 2014e 2015e 2016eEBITDA 20.9 17.7 14.8 17.6 18.1EBIT 17.9 14.8 11.9 14.8 15.4PAT 12.4 10.3 9.6 11.2 11.9
Source: Company, Antique
Revenue Mix (INRm) Year ended 31 Mar 2012 2013 2014e 2015e 2016eDomestic Formulations 18,955 23,232 24,495 27,057 30,488
API (Domestic and Exports) 2,855 3,098 3,426 3,748 4,079Consumer 3,446 4,100 4,674 5,375 6,181
Animal Health 2,024 2,462 2,679 2,990 3,337Export Formulations 19,982 24,886 29,724 38,270 47,206 North America (US) 12,431 15,068 18,844 25,722 32,758 Ex North America 7,551 9,818 10,880 12,548 14,448
JV Revenues 4,230 5,070 4,974 5,349 5,766Total Gross Sales 51,807 62,848 69,973 82,789 97,058
Cash flow statement (INRm) Year ended 31 Mar 2012 2013 2014e 2015e 2016ePre-tax profit 7,942 8,087 8,031 11,213 13,922Depreciation 1,579 1,847 2,026 2,291 2,556Tax paid (1,435) (2,720) (1,004) (1,682) (2,088)Chg in working capital (4,217) (1,996) (2,600) (4,476) (4,663)
Other operating activities (446) (1,028) (330) (330) (330CF from operations (a) 3,423 4,190 6,123 7,016 9,398Capital expenditure (12,444) (7,243) (6,500) (6,500) (6,500)Chg in investments (1,665) (880) 0 0Other investing activities 2,206 528 0 0 0CF from investing (b) (11,903) (7,595) (6,500) (6,500) (6,500)Free cash flow (a+b) (8,480) (3,405) (377) 516 2,898Debt raised/(repaid) 11,978 6,285 2,000 0 0Dividend (incl. tax) (1,753) (1,790) (1,874) (2,105) (2,105CF from financing (c) 10,225 4,495 126 (2,105) (2,105)Net chg in cash (a+b+c) 1,745 1,090 (251) (1,589) 793
Growth indicators (%) Year ended 31 Mar 2012 2013 2014e 2015e 2016eRevenue 17.9 20.8 9.6 18.3 17.2EBITDA 7.1 2.4 (8.1) 40.2 20.5PAT (8.2) 0.1 2.5 37.4 25.0EPS (8.2) 0.1 2.5 37.4 25.0
Valuation (x) Year ended 31 Mar 2012 2013 2014e 2015e 2016ePE (X) 22.9 22.9 22.3 16.3 13.0P/BV (X) 5.8 5.1 4.4 3.6 3.0EV/EBITDA (X) 15.3 15.4 17.0 12.2 10.EV/Sales (X) 3.2 2.7 2.5 2.1 1.8Dividend Yield (%) 0.0 0.0 0.0 0.0 0.0
Financial ratios Year ended 31 Mar 2012 2013 2014e 2015e 2016eRoE 27.5 23.7 21.1 24.5 25.1RoCE 19.5 14.7 11.5 14.8 16.2Debt/Equity (x) 0.9 1.0 0.9 0.8 0.6EBIT/Interest (x) 5.1 5.6 5.9 8.4 10.3
Source: Company Antique

7/21/2019 Antique Pharma
http://slidepdf.com/reader/full/antique-pharma 24/27
TIQUE STOCK BROKING LIMITED 11 December 2013FROM THE RESEARCH DESK
COMPANY UPDATE
Ranbaxy Laboratories LimitedStruggling with compliance; Expect value to emergeover the longer-term - HoldOver the past 12 months, Ranbaxy Laboratories has been the worstperforming stock among pharmaceutical largecap names. Theunderperformance has been largely led by delay in monetisation of key FTFopportunities like Diovan and Valycte. The import alert at Mohali may furtherpush timelines for monetisation of these opportunities. The Mohali importalert could also delay launch of base business products that the companyhas been filing from the unit. Escalation in compliance costs has led to marginpressures in 2QFY14 and there is limited visibility on how the costs are goingto shape up over the next 12-15 months before they start tapering down. Wealso have limited visibility on when the Paonta Sahib, Dewas, and Mohaliconsent decree is going to be resolved. However, Absorica has been a biggersuccess than anticipated and expectations from Desvenlafaxine remain lowas there has been no ramp-up in market share. Even though the near-term
financial prospects remain uncertain, value may emerge over the longer-term. We would wait on sidelines for now and wait for a visibilityimprovement on issues highlighted above.Business highlightsUS business: We are cautious on the near-term ramp-up in the base business. We projecbase business revenue CAGR of 10% over CY13-15e in USD terms. Absorica is a silver linand has outperformed our expectations. Expectations around Desvenlafaxine are low anthere may be a positive surprise in case of a ramp-up. We pencil in monetisation of ValcytDiovan and Nexium in CY14e.India business: We are conservative on the outlook for the prescription business anpencil in growth of 10% YoY for CY14e and CY15e. We expect the OTC business segmentclock 15% revenue CAGR over CY12-16e due to strong presence of lead brands like Reviand Volini.Other markets: The company has been working with Daiichi Sankyo on a hybrid businemodel, which may provide the much required growth in these markets, by leveraging tparent's competencies. Based on the performance so far, we are optimistic on the company
African, Russian, Latin American, and Asia-Pacific businesses. We have a cautious stanceits European and Romanian businesses.Margins: We estimate a 425bps EBITDA margin expansion in the base business s ovCY12-15e.
Valuations and Risks We value Ranbaxy at 20x CY15e core EPS of INR18.8 per share to arrive at a base businessvalue of INR377 per share. We value the large exclusivities of Diovan, Valcyte and Nexiu
at INR71 per share and derivative losses at -INR15 per share. This gives us a 12-month targprice of INR433 per share, a downside of 1% from current levels. Key risks to our call are: Better-than-expected performance of US business; and 2) Regulatory risks.
Aditya Khemka+91 22 4031 [email protected]
Mitesh Shah+91 22 4031 [email protected]
Current Reco : HOLDPrevious Reco : SELLCMP : INR435Target Price : INR433Potential Return : -1%
Market dataSector : PharmaMarket Cap (INRbn) : 179.0Market Cap (USDbn) : 2.9O/S Shares (m) : 423.1Free Float (m) : 12952-wk HI/LO (INR) : 525/254
Avg Daily Vol ('000) : 2,379Bloomberg : RBXY IN
Source: Bloomberg
Returns (%)1m 3m 6m 12m
Absolute 0 (6) 12 (17)Relative (2) (12) 3 (24)
Source: Bloomberg
Price performance vs Nifty
Source: Bloomberg
Shareholding patternPromoters : 64%FII : 10%DII : 9%
Others : 17%Source: Bloomberg
Key financials Year ended 31 Dec CY11 CY12E CY13e CY14e CY15eRevenue (INRm) 102,295 124,597 107,003 167,850 135,162EBITDA (INRm) 17,002 19,379 9,071 55,470 15,052EBITDA Margin (%) 16.6 15.6 8.5 33.0 11.1PAT (INRm) (28,997) 9,228 (7,546) 40,048 8,081EPS (INR) (67.6) 21.5 (17.6) 93.4 18.8P/E (x) (6.6) 20.9 (25.5) 4.8 23.9FCF Yield (%) 17.9 9.6 (8.4) 0.4 20.3
RoE (%) (68.4) 26.5 (21.4) 83.3 11.8Source: Company, Antique
5060708090
100110
Dec-12 Apr-13 Aug-13 Dec-13
Ranbaxy NIFTY

7/21/2019 Antique Pharma
http://slidepdf.com/reader/full/antique-pharma 25/27
TIQUE STOCK BROKING LIMITED 11 December 2013FROM THE RESEARCH DESK
FinancialsProfit and loss account (INRm)
Year ended 31 Dec 2011 2012 2013e 2014e 2015eNet sales 102,295 124,597 107,003 167,850 135,162Material costs 31,825 39,323 37,271 44,373 46,043Employee cost 14,973 17,576 20,617 23,151 25,466
R&D costs 4,496 4,509 4,959 5,703 6,559SG&A costs 34,000 43,811 35,085 39,152 42,042Operating expenses 85,293 105,218 97,932 112,380 120,110EBITDA 17,002 19,379 9,071 55,470 15,052Depreciation 2,654 2,648 2,476 2,717 2,959EBIT 14,348 16,731 6,595 52,753 12,093Other income (9,421) 994 (5,435) 500 1,200Exchange gain / (loss) (3,231) (1,065) (1,887) 0 0Interest 795 1,796 2,144 2,144 2,144
Amortization 502 555 749 749 749Extra-ordinary income / (exp) (27,264) (1,860) (1,887) 0 0PBT (26,865) 12,449 (5,506) 50,360 10,401Tax 1,969 2,939 1,800 10,072 2,080
PAT (28,834) 9,510 (7,306) 40,288 8,320MI & other adjustments 163 282 240 240 240PAT (28,997) 9,228 (7,546) 40,048 8,081EPS (67.6) 21.5 (17.6) 93.4 18.8
Balance sheet (INRm) Year ended 31 Dec 2011 2012 2013e 2014e 2015eShare capital 2,110 2,115 2,115 2,115 2,115Reserves & surplus 26,584 38,729 27,672 64,210 68,781Net Worth 28,694 40,843 29,786 66,325 70,895Minorities 810 890 1,129 1,369 1,609Total Debt 44,907 49,013 49,013 49,013 49,013Capital employed 74,411 90,746 79,929 116,707 121,518
Net assets 50,573 52,156 54,003 55,536 56,828Investments 982 790 790 790 790Current Assets Loan & AdvancesInventory 26,107 27,314 30,056 34,395 38,390Debtors 30,053 20,368 18,785 56,516 23,765Cash & Bank 30,637 46,004 11,527 7,592 41,184Loan & advances and others 18,398 17,531 17,400 17,858 17,612Current Liabilities & ProvisionsCreditors 14,231 16,214 15,367 18,296 18,984Others Liabilities and Provisions 68,483 57,560 37,621 38,041 38,424Net Current Assets 22,481 37,443 24,779 60,024 63,542Deferred tax assets/(liabilities) 375 357 357 357 357
Application of Funds 74,411 90,746 79,929 116,707 121,518
Per share data Year ended 31 Dec 2011 2012 2013e 2014e 2015eNo.of Shares (Mn) 429 429 429 429 429BVPS (INR) 67 95 69 155 165CEPS (INR) (74) 15 (23) 87 12DPS (INR) 0 0 7 7 7
Margins (%) Year ended 31 Dec 2011 2012 2013e 2014e 2015eEBITDA 16.6 15.6 8.5 33.0 11.1EBIT 14.0 13.4 6.2 31.4 8.9PAT (28.3) 7.4 (7.1) 23.9 6.0
Source: Company, Antique
Revenue Mix (USDm) Year ended 31 Dec 2011 2012 2013e 2014e 2015eIndia 350 338 300 304 335GCHC 66 70 72 79 91Europe 297 345 307 351 398
North America 767 993 550 1,335 652One - Offs 396 553 17 742 -Russia + CIS 108 83 86 98 112
Africa 189 177 183 204 235Latin America 61 41 42 44 48
Asia Pac 108 107 96 106 117 API & Others 154 158 122 134 148Total 2,100 2,313 1,758 2,655 2,135
Cash flow statement (INRm) Year ended 31 Dec 2011 2012 2013e 2014e 2015ePre-tax profit (26,865) 12,449 (5,506) 50,360 10,401Depreciation 3,940 3,202 3,225 3,466 3,708
Tax paid (2,197) (3,130) (1,800) (10,072) (2,080)Chg in working capital 19,450 7,029 (21,814) (39,179) 30,073Other operating activities 12,060 (3,730) 3,147 1,644 944CF from operations (a) 6,388 15,821 (22,748) 6,219 43,045Capital expenditure (4,245) (4,649) (5,000) (5,000) (5,000)Chg in investments 3,905 (21) - - Other investing activities 17,027 (13,533) 1,500 500 1,200CF from investing (b) 16,687 (18,203) (3,500) (4,500) (3,800)Free cash flow (a+b) 23,075 (2,382) (26,248) 1,719 39,245Equity raised/(repaid) 148 159 - - Debt raised/(repaid) (10,643) 3,603 (2,504) - -Dividend (incl. tax) (979) - (3,510) (3,510) (3,510Other financing activities (703) (1,393) (2,144) (2,144) (2,144)
CF from financing (c) (12,177) 2,369 (8,157) (5,654) (5,654)Net chg in cash (a+b+c) 10,899 (13) (34,405) (3,934) 33,592
Growth indicators (%) Year ended 31 Dec 2011 2012 2013e 2014e 2015eRevenue 9.2 21.8 (14.1) 56.9 (19.5)EBITDA (25.3) 14.0 (53.2) 511.5 (72.9PAT (293.7) (131.8) (181.8) (630.7) (79.8)EPS (290.9) (131.8) (181.8) (630.7) (79.8)
Valuation (x) Year ended 31 Dec 2011 2012 2013e 2014e 2015ePE (X) (6.6) 20.9 (25.5) 4.8 23.9
P/BV (X) 6.7 4.7 6.5 2.9 2.7EV/EBITDA (X) 12.2 10.1 25.4 4.2 13.EV/Sales (X) 2.0 1.6 2.2 1.4 1.5Dividend Yield (%) 0.0 0.0 1.6 1.6 1.6
Financial ratios Year ended 31 Dec 2011 2012 2013e 2014e 2015eRoE (68.4) 26.5 (21.4) 83.3 11.8RoCE (23.5) (15.5) (10.3) (42.9) (8.1Debt/Equity (x) 1.6 1.2 1.6 0.7 0.7EBIT/Interest (x) 18.1 9.3 3.1 24.6 5.6
Source: Company Antique

7/21/2019 Antique Pharma
http://slidepdf.com/reader/full/antique-pharma 26/27
TIQUE STOCK BROKING LIMITED 11 December 2013FROM THE RESEARCH DESK
COMPANY UPDATE
Cipla LimitedBusiness transition to pressurise near-term margins;Cautious on the combination inhaler opportunity in
developed markets - HoldCipla is in transition mode at present. It is transitioning its exports businessfrom a joint venture/alliance/partnership model to an owned, front-endmodel in certain key markets. This strategy is positive in the longer-term.However, the company is a bit late in executing the strategy and may be at acomparative disadvantage when compared to incumbents who haveundertaken the transition much earlier. The business transition has alreadystarted with the company acquiring its distribution partners Medpro andQuality Chemicals in Africa. With the addition of ground presence in keymarkets, near-term margins are likely to decline till integration is completed.The company till now has benefitted from the USD appreciation against theINR as it used to invoice in USD in most export markets. With the establishmentof a front-end, the currency tailwind is likely to erode. The most excitingopportunity for the company is inhalers in developed markets of EU and US.Competitor Mylan has indicated that it will be able to launch combinationinhalers in EU by 2HCY15. Although Cipla has maintained a similar timeline,we have taken a cautious view on this front given execution slippages in thepast. We will wait on sidelines before entering the stock.Business highlightsIndia business: The company's large product base and wide therapy area coveragemakes it difficult to maintain a stream of new launches. We pencil in an adverse impact INR800m in FY15e sales due to the Drug Prices Control Order 2013. We expect the companydomestic formulations business to grow in mid-teens.
Africa business: Cipla's acquisition of Medpro, Celeris and Quality Chemicals is part o
its business transformation. Excluding Medpro's tender business, we expect Cipla's Africbusiness to grow in high single-digits.Other exports: In markets other than India and Africa, we expect Cipla to maintain growrate in low double-digits, led by new product registrations and growth off a low base.Margins: Upfront investments in assets and staff would lead to rise in overheads but revenramp-up would come in due time. Excluding tech income, we pencil in a 10-20bps declineEBITDA margins for FY15e and FY16e. There may be downside to our margin estimates iproduct mix turns unfavourable due to higher tender business (ARVs) in Africa.
Valuation and risks We value Cipla at 17x (current trading multiple) FY15e and FY16e blended EPS of INR25.per share to arrive at our 12-month target price of INR436 per share. We retain our Holdrecommendation. The key risks to our Hold call are materialisation of the combination inhalopportunity in EU during our explicit forecast period.
Aditya Khemka+91 22 4031 [email protected]
Mitesh Shah+91 22 4031 [email protected]
Current Reco : HOLDPrevious Reco : HOLDCMP : INR386Target Price : INR436Potential Return : 13%
Market dataSector : PharmaMarket Cap (INRbn) : 311.3Market Cap (USDbn) : 5.1O/S Shares (m) : 802.9Free Float (m) : 48652-wk HI/LO (INR) : 450/354
Avg Daily Vol ('000) : 980Bloomberg : CIPLA IN
Source: Bloomberg
Returns (%)1m 3m 6m 12m
Absolute (8) (12) 4 (7)Relative (11) (17) (5) (15)
Source: Bloomberg
Price performance vs Nifty
Source: Bloomberg
Shareholding patternPromoters : 37%FII : 24%DII : 11%
Others : 28%Source: Bloomberg
Key financials Year ended 31 Mar FY12 FY13 FY14e FY15e FY16eRevenue (INRm) 69,598 82,163 99,618 115,317 129,653EBITDA (INRm) 15,980 21,348 25,547 28,029 31,242EBITDA Margin (%) 23.0 26.0 25.6 24.3 24.1PAT (INRm) 11,413 15,111 16,912 18,555 21,289EPS (INR) 14.2 18.8 21.1 23.1 26.5P/E (x) 27.2 20.5 18.3 16.7 14.6FCF Yield (%) 1.6 0.6 1.4 1.6 2.3
RoE (%) 14.9 18.1 17.3 16.3 16.2Source: Company, Antique
80
90
100
110
Dec-12 Apr-13 Aug-13 Dec-13
CIPLA NIFTY

7/21/2019 Antique Pharma
http://slidepdf.com/reader/full/antique-pharma 27/27
TIQUE STOCK BROKING LIMITED 11 December 2013FROM THE RESEARCH DESK
FinancialsProfit and loss account (INRm)
Year ended 31 Mar 2012 2013 2014e 2015e 2016eNet Sales 69,598 82,163 99,618 115,317 129,653Material costs 26,953 29,306 33,350 38,828 43,568Employee cost 6,891 9,197 12,416 14,279 16,421
R&D costs 2,854 3,286 4,107 4,723 5,432Other expenditure 16,920 19,026 24,197 29,458 32,991Total expense 53,619 60,815 74,071 87,288 98,411EBITDA 15,980 21,348 25,547 28,029 31,242Depreciation 3,122 3,305 3,716 4,027 4,231EBIT 12,858 18,043 21,832 24,002 27,011Other Income 2,004 2,852 2,112 1,917 2,553Interest 383 339 1,395 1,179 1,179PBT 14,478 20,556 22,549 24,741 28,385Tax 3,065 5,445 5,637 6,185 7,096PAT 11,413 15,111 16,912 18,555 21,289Net profit 11,413 15,111 16,912 18,555 21,289EPS 14.2 18.8 21.1 23.1 26.5
Balance sheet (INRm) Year ended 31 Mar 2012 2013 2014e 2015e 2016eShare capital 1,606 1,606 1,606 1,606 1,606Reserves & surplus 74,784 88,581 103,571 120,247 139,657Net Worth 76,389 90,187 105,176 121,853 141,263Total Debt 135 9,671 11,787 11,787 11,787Capital employed 76,524 99,858 116,963 133,640 153,050Net assets 35,870 39,878 67,459 66,932 66,201Investments 12,688 25,324 0 0 0Current Assets Loan & AdvancesInventory 18,501 23,871 28,155 33,717 37,863Debtors 15,536 16,688 20,795 24,555 27,712
Cash & Bank 905 1,430 7,835 17,127 31,149Loan & advances and others 10,004 9,387 9,643 9,643 9,643Current Liabilities & ProvisionsCreditors 6,017 8,284 8,017 9,427 10,611Others Liabilities and Provisions 8,629 5,631 6,102 6,102 6,102Net Current Assets 30,299 37,461 52,309 69,513 89,653Deferred tax assets/(liabilities) (2,332) (2,805) (2,805) (2,805) (2,805)
Application of Funds 76,524 99,858 116,963 133,640 153,050
Per share data (INR) Year ended 31 Mar 2012 2013 2014e 2015e 2016eNo.of Shares (Mn) 803 803 803 803 803BVPS (INR) 95.1 112.3 131.0 151.8 175.9
CEPS (INR) 18.1 22.9 25.7 28.1 31.8DPS (INR) 2.0 2.0 2.0 2.0 2.0
Margins (%) Year ended 31 Mar 2012 2013 2014e 2015e 2016eEBITDA 23.0 26.0 25.6 24.3 24.1EBIT 18.5 22.0 21.9 20.8 20.8PAT 16.4 18.4 17.0 16.1 16.4
Source: Company, Antique
Revenue Mix (INRm) Year ended 31 Mar 2012 2013 2014e 2015e 2016eIndia 32,129 36,814 41,199 46,623 53,151
Africa 14,972 14,897 24,794 30,652 33,427 Australasia 4,866 5,868 6,052 6,657 7,323
Europe 6,363 6,320 7,628 9,144 10,059Middle East 2,620 2,708 3,166 3,719 4,090
Americas 8,609 15,348 14,701 17,903 21,053Exports 37,429 45,141 56,342 68,075 75,952Gross Product Sales 69,558 81,955 97,541 114,699 129,103
Cash flow statement (INRm) Year ended 31 Mar 2012 2013 2014e 2015e 2016ePre-tax profit 14,478 20,954 22,549 24,741 28,385Depreciation 3,122 3,305 3,716 4,027 4,231Tax paid (3,315) (4,617) (5,637) (6,185) (7,096)Chg in working capital 2,454 (5,198) (6,638) (7,912) (6,119)Other operating activities 389 (466) 1,172 551 (84)
CF from operations (a) 17,128 13,977 15,162 15,222 19,316Capital expenditure (5,611) (7,567) (4,500) (3,500) (3,500)Chg in investments (4,040) (13,062) (1,523) 628 1,263CF from investing (b) (9,651) (20,629) (6,023) (2,872) (2,237)Free cash flow (a+b) 7,477 (6,652) 9,138 12,349 17,079Debt raised/(repaid) (5,665) 9,044 (811) (1,179) (1,179)Dividend (incl. tax) (1,866) (1,866) (1,879) (1,879) (1,879CF from financing (c) (7,532) 7,178 (2,689) (3,057) (3,057)Net chg in cash (a+b+c) (55) 525 6,449 9,292 14,022
Growth indicators (%) Year ended 31 Mar 2012 2013 2014e 2015e 2016eRevenue 10.2 18.1 21.2 15.8 12.4
EBITDA 19.2 33.6 19.7 9.7 11.5PAT 18.0 32.4 11.9 9.7 14.7EPS 18.0 32.4 11.9 9.7 14.7
Valuation (x) Year ended 31 Mar 2012 2013 2014e 2015e 2016ePE (X) 27.5 20.8 18.6 16.9 14.8P/BV (X) 4.1 3.5 3.0 2.6 2.2EV/EBITDA (X) 40.3 30.6 25.4 22.8 20.EV/Sales (X) 4.5 3.9 3.2 2.7 2.3Dividend Yield (%) 0.5 0.5 0.5 0.5 0.5
Financial ratios
Year ended 31 Mar 2012 2013 2014e 2015e 2016eRoE (%) 14.9 18.1 17.3 16.3 16.2RoCE (%) 13.2 15.0 15.1 14.4 14.1Debt/Equity (x) 0.0 0.1 0.1 0.1 0.1EBIT/Interest (x) 33.5 53.2 15.7 20.4 22.9
Source: Company Antique