Antinuclear antibodies - Les Jeudis de Fleurus of the American College of Rheumatology (ACR)...
95
Antinuclear antibodies Xavier Bossuyt UZ Leuven
Transcript of Antinuclear antibodies - Les Jeudis de Fleurus of the American College of Rheumatology (ACR)...

Antinuclear antibodies
Xavier Bossuyt
UZ Leuven
Evidence-based guidelines for the use of immunologic tests Antinuclear antibody testing Daniel H Solomon Arthur J Kavanaugh Peter H Schur
Arthritis Care amp Research 2002 47434ndash444
ANA very useful for diagnosis
Systemic lupus erythematosus
Systemic sclerosis
ANA somewhat useful for diagnosis
Sjoumlgrens syndrome
Polymyositis-dermatomyositis
ANA very useful for monitoring or prognosis
Juvenile chronic arthritis
Raynauds phenomenon
ANA is a critical part of the diagnostic criteria
Drug-associated lupus
Mixed connective tissue disease
Autoimmune hepatitis
ANA not useful or has no proven value for diagnosis monitoring or prognosis
Rheumatoid arthritis
Multiple sclerosis
Thyroid disease
Infectious disease
Idiopathic thrombocytopenic purpura
Fibromyalgia
bull Immunofluorescence on HEp-2 cells to screen for ANA ndash Titer
ndash Pattern
bull More specific second line tests to identify the target antigen ndash Anti-dsDNA
ndash Anti-ENA
Homogeneous pattern Speckled pattern
ANA titer Anti-dsDNA ANA titer Anti-ENA
180 (n=512) 15 180 (n=116) 1
1160 (n=414) 27 1160 (n=72) 12
1320 (n=277) 35 1320 (n=34) 18
1640 (n=192) 38 1640 (n=27) 33
11280 (n=103) 53 11280 (n=15) 60
1gt1280 (n=64) 68 1gt1280 (n=15) 89
Bossuyt X et al Arthritis Rheum 200553987-8
1567 consecutive samples
ANA pattern Antibody to Disease
Homogeneous DNA Histones Scl-70
SLE DIL SSc
Speckled U1-RNP Sm SSA SSB RNA-Pol III
SLE SLE and SS SSc
Centromeric Centromeres
Limited SSc
Nucleolar PMScl U3RNP others
SSc SLE SS
Speckled cytoplasmic Jo-1 Mitochondria
PMDM PBC
Diffuse cytoplasmic Ribosomes
SLE
Ann Rheum Dis 2010691420-2
ANA screening an old test with new recommendations
Meroni PL Schur PH
N Engl J Med 2009360711-20
Case records of the Massachusetts General Hospital Case 5-2009 A 47-year-old woman with a rash and numbness and pain in the legs
Kroshinsky D Stone JH Bloch DB Sepehr A
Ann Rheum Dis 2014 Jan73(1)17-23 doi 101136annrheumdis-2013-203863 Epub 2013 Oct 14 International recommendations for the assessment of autoantibodies to cellular antigens referred to as anti-nuclear antibodies Agmon-Levin N1 Damoiseaux J Kallenberg C Sack U Witte T Herold M Bossuyt X Musset L Cervera R Plaza-Lopez A Dias C Sousa MJ Radice A Eriksson C Hultgren O Viander M Khamashta M Regenass S Andrade LE Wiik A Tincani A Roumlnnelid J Bloch DB Fritzler MJ Chan EK Garcia-De La Torre I Konstantinov KN Lahita R Wilson M Vainio O Fabien N Sinico RA Meroni P Shoenfeld Y
Recommendations of the American College of Rheumatology (ACR) Antinuclear Antibody (ANA) Task Force Immunofluorescence ANA test should remain the gold standard for ANA testing Hospital and commercial laboratories using bead-based multiplex platforms or other solid phase assays for detecting ANA must provide data to ordering physicians on request that their assay has the same or improved sensitivity and specificity as the immunofluorescence ANA In-house assays for detecting ANA as well as anti-DNA anti-Sm anti-RNP anti-RoSS-A anti-LaSS-B etc should be standardized according to national (eg CDC) andor international (eg WHO IUIS) standards Laboratories should specify the methods used for detecting ANA when reporting their results
Members of the ACR ANA Task Force Peter Schur (Chair) Donald Bloch Joe Craft John A Goldman Pier L Meroni Eileen Moynihan
Morris Reichlin Westley Reeves Eng Tan Dan Wallace and Mark Wener
ANA screening an old test with new recommendations Pierre Luigi Meroni Peter H Schur
Ann Rheum Dis 2010691420-2
Antibodies to extractable nuclear antigens in antinuclear antibody-negative samples Bossuyt X Luyckx A
Clin Chem 2005512426-7
2405 consecutive samples
ndash 565 ANA pos anti-ENA in 102 (18) ndash 1840 ANA neg anti-ENA in 21 (11)
ndash sensitivity of ANA for anti-ENA 83 (75-89)
Hofman et al [Clin Chem 2002] sensitivity 72
Conclusion ndash Although ANA has high sensitivity it may miss reactivities ndash When there is a high clinical suspicion focused testing for specific antibodies
should be performed
Patient no Dot-blot analysis EliA (EliA unitsmL) Clinical findings 1 SSA SSA (136) Rheumatoid arthritis
2 SSA SSA (297) Systemic lupus erythematosus
3 SSA SSA (372) No data available
4 SSA SSA (207) Sjoumlgren syndrome cutaneous lupus cryogobulinemia
5 Jo-1 Jo-1 (119) Polymyositis
6 SmRNP + Sm U1RNP (51) + RNP 70 (19) + Sm (6) Drug-induced lupus2
7 Scl-70 Negative Reactive arthritis
8 Negative SSA (112) B-CLL3 (bone marrow transplantation)
9 Negative SSA (387) Neonatal lupus erythematosus (skin rash)
10 Negative SSA (184) Psoriatic spondylarthropathy (HLA-B27+)
11 Negative SSA (235) Chronic urticaria
12 Negative SSA (203) Pregnancy and thrombocytopenia
13 Negative SSA (271) Subacute cutaneous lupus
14 Negative SSA (195)4 Rheumatoid arthritis
15 Negative Sm (125) Subacute sclerosing panencephalitis
16 Negative U1RNP (567) Cervical tension
A 67-year-old woman with a systemic inflammatory syndrome and sicca Bossuyt X Marieumln G Vanderschueren S
Clin Chem 2010561508-9
Magnetic resonance image showing cystic enlargement of the left parotid gland (arrow)
140 11280
EVALUATION OF ANA BY IIF AND SOLID PHASE ASSAY
Detection of antinuclear antibodies by indirect immunofluorescence and by solid phase assay Op De Beeck K Vermeersch P Verschueren P Westhovens R Marieumln G Blockmans D Bossuyt X Autoimmun Rev 201110801-8
ANA HEp-2000 Immunoconcepts Anti-ENA anti-dsDNA EliA Phadia
n MF Mean age (range)
SLE 80 1070 36 (15-72)
SCL 10 37 49 (32-85)
SSc 69 2544 53 (18-79)
MCTD 13 112 31 (16-66)
SS 36 531 50 (21-75)
PMDM 28 1117 54 (26-77)
Blood donors 149 7574 44 (19-65)
CFS 139 125114 41 (18-75)
Dis controls 134 34100 46 (17-81)
bull SSA-transfected HEp-2000trade cells (Immunoconcepts)
bull EliA ndash CTD screen ndash Recombinant antigens (SSARo52 SSARo60 SSB RNP-70 RNP-A RNP-C
Sm Centromere B Jo-1 Scl-70 Rib-P fibrillarin RNA pol III PM-Scl PCNA Mi-2)
ndash dsDNA purified
EVALUATION OF ANA BY IIF
SLE
0
005
01
015
02
025
negative SSA pattern 140 180 1160 1320 1640 11280 1gt1280
Like
liho
od
cytoplasmic
centromere
nucleolar
speckled
homogeneous
distinct SSA pattern
negative
Systemic sclerosis
0
005
01
015
02
025
negative SSA pattern 140 180 1160 1320 1640 11280 1gt1280
Like
liho
od
cytoplasmic
centromere
nucleolar
speckled
homogeneous
distinct SSA pattern
negative
MCTD
0
005
01
015
02
025
03
035
04
045
05
negative SSA pattern 140 180 1160 1320 1640 11280 1gt1280
Like
liho
od
cytoplasmic
centromere
nucleolar
speckled
homogeneous
distinct SSA pattern
negative
Sjoumlgrenrsquos syndrome
0
005
01
015
02
025
03
negative SSA pattern 140 180 1160 1320 1640 11280 1gt1280
Like
liho
od
cytoplasmic
centromere
nucleolar
speckled
homogeneous
distinct SSA pattern
negative
Inflammatory myopathy
0
005
01
015
02
025
03
035
04
negative SSA pattern 140 180 1160 1320 1640 11280 1gt1280
Like
liho
od
cytoplasmic
centromere
nucleolar
speckled
homogeneous
distinct SSA pattern
negative
Blood donors
0
01
02
03
04
05
06
07
08
09
1
negative SSA pattern 140 180 1160 1320 1640 11280 1gt1280
Like
liho
od
cytoplasmic
centromere
nucleolar
speckled
homogeneous
distinct SSA pattern
negative
Chronic fatique syndrome
0
01
02
03
04
05
06
07
08
09
negative SSA pattern 140 180 1160 1320 1640 11280 1gt1280
Like
liho
od
cytoplasmic
centromere
nucleolar
speckled
homogeneous
distinct SSA pattern
negative
Diseased controls
0
01
02
03
04
05
06
07
negative SSA pattern 140 180 1160 1320 1640 11280 1gt1280
Like
liho
od
cytoplasmic
centromere
nucleolar
speckled
homogeneous
distinct SSA pattern
negative
EVALUATION OF ANA BY SOLID PHASE ASSAY - ELIA
0
5
10
15
20
25
30
35
BD CFS DisControls
SLE SCL SSc MCTD SS PM DM
Rati
o
Groups
CTD Screen EliA
CTD
scr
ee
n
AN
A 1
40
o
r SS
A p
acirctte
rn
AN
A 1
80
o
r SS
A p
atte
rn
A
NA
11
60
o
r SS
A p
atte
rn
A
NA
13
20
o
r SS
A p
atte
rn
A
NA
16
40
o
r SS
A p
atte
rn
A
NA
11
28
0
or
SSA
pat
tern
SLE 74 963 925 900 688 538 313
SSc 72 986 971 928 812 623 391
MCTD 100 1000 1000 1000 1000 923 692
SS 89 917 833 556 444 417 361
PMDM 39 643 464 357 286 143 71
Blood donors 27 121 87 60 27 13 07
CFS 29 144 79 36 29 29 29
Diseased controls 37 358 254 171 112 60 30
0
005
01
015
02
025
negative SSA pattern 140 180 1160 1320 1640 11280 1gt1280
Like
liho
od
SLE
no ENAdsDNA
dsDNA
SSA
U1-RNP
mixed
0
005
01
015
02
025
negative SSA pattern 140 180 1160 1320 1640 11280 1gt1280
Like
liho
od
Systemic Sclerosis
no ENAdsDNA
PM-Scl
RNA-pol
Scl-70
CENP
SSA
0
005
01
015
02
025
03
negative SSA pattern 140 180 1160 1320 1640 11280 1gt1280
Like
liho
od
Sjoumlgrens syndrome
no ENAdsDNA
SSA
SSA+SSB
dsDNA+SSA
0
005
01
015
02
025
03
035
04
negative SSA pattern 140 180 1160 1320 1640 11280 1gt1280
Like
liho
od
Inflammatory myopathy
no ENAdsDNA
PM-Scl
Mi-2
Jo-1
Jo-1+SSA52
0
005
01
015
02
025
03
035
04
045
05
negative SSA pattern 140 180 1160 1320 1640 11280 1gt1280
Like
liho
od
MCTD
U1-RNP
U1-RNP+RNP70
dsD
NA
SSA
-60
SSA
-52
SSB
U1
-RN
P
RN
P-7
0
Sm
Rib
-P
CEN
P
Scl-
70
Po
l-II
I
PM
-Scl
Jo-1
Mi-
2
CTD
scr
ee
n
SLE 45 48 38 19 16 63 63 88 74
SCL 60 30 10 60
SSc 14 72 29 14 35 28 72 29 72
MCTD 77 100 92 77 100
SS 28 86 81 58 89
PMDM 18 36 36 71 29 36 39
Blood donors 07 07 27
CFS 07 14 07 07 29
Diseased controls 07 22 07 07 37
ge1 ge2 ge3 ge4 ge5 ge6 ge7
SLE 725 488 325 175 75 63 13
SCL 600 300 100
SSc 739 101 14
MCTD 1000 923 154
SS 889 861 528
PMDM 393 179 71
Blood donors 13
CFS 29 07
Diseased controls 45
Antinuclear antibody detection indirect immunofluorescene
versus solid phase assay
Xavier Bossuyt
Annals Rheum Dis 2010691420-22
Aim
To evaluate the diagnostic performance of
IIF solid phase assay amp the combination of both for
Systemic lupus erythematosus (SLE)
Systemic slcerosis (SSc)
pSjogrenrsquos syndrome (SS)
1
2
3
BioPlex 2200 chromatin Sm ribosomal protein SSA-60 SSB RNP-A and RNP-68 SSA-52 Scl-70 Jo-1 centromere B dsDNA
IIF HEp-2000 (Immunoconcepts) EliA CTD screen (Thermo Fisher) SSARo 52 SSARo 60 SSBLa U1-RNP (RNP-70 A C) Sm centromere B Jo-1 Scl-70 Rib-P fibrillarin RNA Pol III PM-Scl PCNA and Mi-2 dsDNA
IIF 180 IIF 1160 EliA CTD screen BioPlex 2200
Sensitivity
Systemic lupus erythematosus Reference 1 2 (n=80) 925 (84-97) 90 (81-95) 74 (63-82) 79 (69-86) Reference 3 (n=41) 97 (87-99) 95 (83-99) Systemic sclerosis Reference 1 2 (n=69) 97 (90-99) 93 (84-97) 725 (61-82) 72 (61-82) Reference 3 (n=37) 95 (82-98) 865 (72-94) Sjoumlgrenrsquos syndrome Reference 1 2 (n=36) 83 (68-92) 56 (40-70) 89 (75-96) 89 (75-96) Reference 3 (n=40) 76 (62-88) 74 (57-83)
Specificity
Healthy controls (n=125) (Ref 3) 87 (80-92) 95 (90-98) Blood donors (n=149) (Ref1 2) 91 (85-95) 94 (89-97) 97 (93-99) 95 (90-97) Chronic fatigue syndrome (n=139) (Ref1 2)
92 (86-96) 96 (92-98) 97 (92-99) 93 (87-96)
Diseased controls (n=134) (Ref1 2) 75 (67-81) 82 (75-88) 96 (91-98) 89 (82-93)
All controls (n=422) (Ref1 2) 86 (83-89) 91 (88-93) 97 (95-98) 92 (89-94)
0
005
01
015
02
025
Like
liho
od
SLE
0
005
01
015
02
025
Like
liho
od
Systemic sclerosis
0
005
01
015
02
025
03
Like
liho
od
Sjoumlgrens syndrome
LR Systemic lupus erythematosus
Systemic sclerosis Sjoumlgrenrsquos syndrome
IIF(+) (Ref 1 2) 67 (53-86) 71 (55-90) 61 (46-80) IIF(+) (Ref 3) 71 (46-112) 64 (40-101)0 57 (35-59) IIF(-) (Ref 1 2) 008 (004-019) 003 (001-013) 019 (009-040) IIF(-) (Ref 3) 003 (0004-020) 016 (003-035) 026 (015-046) EliA CTD screen (+) 239 (138-415) 235 (135-409) 288 (167-499) EliA CTD screen (-) 027 (019-039) 028 (019-042) 011 (005-029) IIF (+) EliA CTD screen (+) 414 (196-877) 436 (207-468) 468 (220-998) IIF (+) EliA CTD screen (-) 20 (12-31) 20 (13-33) 045 (012-18) IIF (-) EliA CTD screen (+) 35 (10-122) 78 (23-264) IIF (-) EliA CTD screen (-) 003 (0007-012) 003 (0009-013) 006 (002-025)
Prevalence
Systemic lupus erythematosus
Systemic sclerosis
Sjoumlgrenrsquos syndrome
Controls
IIF (+) EliA CTD screen (+) 69 72 78 16 IIF (+) EliA CTD screen (-) 24 25 55 12 IIF (-) EliA CTD screen (+) 5 11 14 IIF (-) EliA CTD screen (-) 2 3 55 85
0
02
04
06
08
1
0 02 04 06 08 1
Po
st-t
est
pro
bab
ility
Pre-test probability
FEIA+ IIF+
FEIA+
IIF+
FEIA+ IIF-
FEIA- IIF+
FEIA-
IIF-
FEIA- IIF-
SLE
Comparative analysis of different strategies
1 IIF and FEIA on all samples
2 IIF
If IIF positive FEIA
If IIF negative stop
3 FEIA
4 IIF
Conclusion
Integrated interpretation
of IIF and solid phase assay results adds value
Optimal strategy
depends on the pathology
Bossuyt X Fieuws S Ann Rheum Dis 2014 Mar73(3)
Antinuclear antibodies by automated
indirect immunofluorescence Opportunities for value added
reporting
Xavier Bossuyt Leuven Belgium
Instrument NOVA View AKLIDES EUROPattern Image
Navigator
Helios ZENIT G Sight
Manufacturer INOVA Medipan EUROPattern Immuno Concepts Aesku Menarini
LIMS connection (software) Yes (QUANTA
Link)
Yes Yes
(EUROLabOffice)
Yes (direct) Yes (direct) Yes (ZenIT)
Slide identification via
barcode
Yes by handheld
scanner
Yes by handheld
scanner
Yes by integrated
scanner
Yes Yes by integrated
scanner
Yes by integrated
scanner
Loading capacity 5 slides (up to 60
wells)
5 slides (up to 60
wells)
50 slides (up to 500
wells)
4 slides (up to 84
wells)
20 slides (up to 240
wells)
5 slides (up to 70
wells)
Image acquisition speed ~45swell for 3
images
~40swell lt20swell ~25swell for 4
images
10spicture
Customizable from 1
to 10 images
gt60swell
pictures 5 (small
scan) 50 (medium
scan) 220 (full scan)
100 QC for substrate and
process integrity
counterstaining
Yes DAPI Yes DAPI Yes Propidium
iodide
None None None None None None
Automatic posneg
discrimination incl
presorting of images
Yes Yes Yes Yes Yes Yes
Batchwise verification of
negative samples
Yes Yes Yes Yes Yes Yes
Automatic pattern
recognition
Yes Yes Yes No No Yes
Pattern Analysis method Pattern recognition by
mathematical algorithm
Pattern recognition by
mathematical algorithm
Pattern recognition by
mathematical algorithm
No pattern matching
capabilities
No pattern matching
capabilities
Pattern recognition by
mathematical algorithm
No of recognizable ANA
staining pattern list out
6
Homogeneous
Speckled
Centromere
Nucleolar
Nuclear dot
Cytoplasm
Negative
Positive unrecognized
10
Homogeneous
Speckled
Centromere
Nucleolar
Nuclear dot
Cytoplasm
Negative
Positive unrecognized
8
Homogeneous
Speckled
Centromere
Nucleolar
Nuclear dot
Cytoplasm
Nuclear rim
Mitotic negative
None None 5
Homogeneous
Speckled
Centromere
Nucleolar
Cytoplasm
Negative
Instrument calibration to
minimize variability
Yes Yes Yes Yes Yes No
Integration with slide
processing in 1 instrument
No No No No Yes No
Mahler et al J Immunol Research in press
Automated fluorescence microscopy is increasingly used for image acquisition quantitative analysis and pattern recognition of anti-nuclear antibody
testing
Positivenegative discrimination
bull Exposure time is inversely proportional to intensity of fluorescence
bull Probability value is given to samples
Pattern recognition ANA
bull five patterns ndash Homogeneous
ndash Speckled
ndash Centromere
ndash Nucleolar
ndash Mitochondrial
bull Based on statistical morphological and geometric features
IMAGE ACQUISITION
RNP
PM-Scl
Golgi
Membrane
Review of digital images
harr
manual approach (posneg)
ndash 90 identical interpretation (n=332) (Bonroy et al CCLM 2013)
ndash 88 identical interpretation (n=268) (Bossuyt et al CCA 2013)
Bonroy et al CCLM 2013
FLUORESENCE INTENSITY VERSUS ANTIBODY TITER
HEp-2
-10
10
30
50
70
90
neg 80 160 320 640 1280
Ind
ex
Titer
Outlier Boxplot
Outliers gt 15 and lt 3 IQR
Outliers gt 3 IQR
Midbody centriole few nuclear dots Golgi
Bossuyt et al CCA 2013
G-Sight HEp-2000
0
20
40
60
80
100
neg 180 1160 1320 1640 1gt=1280
Pro
ba
bil
ity i
nd
ex
Antibody titer
Bonroy et al 2013
NOVA View
0
500
1000
1500
2000
2500
3000
3500
Neg 80 160 320 640 gt=1280
Nova
Vie
w F
luo
resce
nce
In
de
x
Titer
Schouwers et al Clin Chem Lab Med 201452547-51
Pattern recognition
Visual inspection Correct assignment by G-Sight HEp-2
Correct assignment by G-sight HEp-2000
Homogeneous (n=42) 68 92
Speckled (n=34) 71 56
Centromere (n=6) 83 42
Pattern recognition (Bonroy et al 2013) Pattern assignment was incorrect in 29 of 132 pos samples No pattern assigned in 45 of samples Global accuracy of pattern assignment 26
FLUORESCENCE INTENSITY IN WELL-DEFINED PATIENT COHORTS
Study Population
n M()F() Median age (range)
Blood donors
108 5149 45 (19-65)
Chronic Fatigue Syndrome
150 1981 41 (16-75)
Diseased Controls 134 2575 45 (17-81)
392
Systemic Lupus Erythematosus
85 1288 355 (15-72)
Sjoumlgrenrsquos Syndrome
36 1486 56 (21-75)
Systemic Sclerosis
76 3466 53 (18-80)
Polymyositis Dermatomyositis
32 4456 50 (24-77)
Mixed Connective Tissue Disease
16 694 315 (16-66)
245
HEp2
-10
10
30
50
70
90
Blooddonor
CFS Discontrols
SLE SCL SS SSc MCTD PM DM
Gro
up
s
Groups
Outlier Boxplot
Outliers gt 15 and lt 3 IQR
Outliers gt 3 IQR
Bossuyt et al CCA 2013
G-Sight HEp-2000
-10
10
30
50
70
90
BloodDonors
CFS Dis Contr SLE SCL SS SSc MCTD PM DM
Pro
ba
bil
ity i
nd
ex
G-Sight HEp-2
Probability index
Blood donor CFS Diseased controls SLE SS SSc MCTD PMDM
le10 11-le30 31-le50 51-le85 gt85
075 024 001 000 000
084 013 001 001 000
050 038 003 007 003
004 009 012 032 043
009 009 009 043 031
001 020 014 042 022
000 000 000 000 100
015 041 011 026 007
Probability index SLE SS SSc MCTD PMDM
le10 11 le30 31 le50 51 le85 gt85
006 (002-02)
04 (02-08)
68 (26-178)
121 (62-236)
439 (160-1204)
01 (004-04)
03 (01-10)
50 (14-186)
160 (79-322)
322 (108-959)
002 (0003-01)
08 (05-13)
85 (33-215)
157 (82-299)
223 (76-651)
1025 (387-2718)
02 (009-05)
16 (10-27)
65 (18-238)
97 (40-229)
76 (14-396)
Bonroy et al CCLM 2013
0
500
1000
1500
2000
2500
3000
3500
HC CVS DC SLE SS SSc PMDM MCTD
L
I
U
Outlier Boxplot
Percentiles (95 of Distribution)
Outliers gt 15 and lt 3 IQR
Outliers gt 3 IQR
NOVA View
NOVA View LR LIU Controls SLE SS SSc PMDM MCTD SARD
Prevalence
lt49 056 006 003 003 013 005
49-120 026 005 006 005 019 007
121-600 013 011 003 009 034 011
601-2000 004 046 061 034 025 006 039
gt2000 001 033 028 049 009 094 038
LR
lt49 011 005 005 023 009
49-120 018 021 020 073 025
121-600 079 021 069 257 085
601-2000 112 150 84 61 15 96
gt2000 291 245 429 83 827 335
NOVA View
009 025 085
10
33
0
10
20
30
40
0
01
02
03
04
05
06
lt49 49-120 121-600 601-2000 gt2000
Like
liho
od
rat
io
Pre
vale
nce
Nuclear Index
controls
SRD
LR
LR 1 no clinical value gt10 lt01 clinically important difference 5 ndash 10 01 ndash 02 modest but substantial difference 2 ndash 5 02 ndash 05 small difference that may be relevant
Post-test odds
=
Pre-test odds x LR
probability rarr odds
02 rarr 02 (1 ndash 02)
025
odds rarr probability
4 rarr 4 (1 + 4)
08
0
02
04
06
08
1
000 020 040 060 080 100
Po
st-t
est
pro
bab
ility
Pre-test probability
lt20
20-50
51-200
gt200
gt2000
Pre-test probability Post-test probability
lt49 120-600 600-2000 gt2000
1 a young women with hair loss and polyarthralgia 007 05 5 25
0
02
04
06
08
1
000 020 040 060 080 100
Po
st-t
est
pro
bab
ility
Pre-test probability
lt20
20-50
51-200
gt200
gt2000
Pre-test probability Post-test probability
lt49 120-600 600-2000 gt2000
10 a young women with photosensitivity and mild leucopenia (3000-3500mm3)
07 55 36 79
0
02
04
06
08
1
000 020 040 060 080 100
Po
st-t
est
pro
bab
ility
Pre-test probability
lt20
20-50
51-200
gt200
gt2000
Pre-test probability Post-test probability
lt49 120-600 600-2000 gt2000
50 a young women with photosensitivity malar rash and symmetrical polyarthritis
65 35 83 97
G-Sight HEp-2
Probability index
Blood donor CFS Diseased controls SLE SS SSc MCTD PMDM
le10 11-le30 31-le50 51-le85 gt85
075 024 001 000 000
084 013 001 001 000
050 038 003 007 003
004 009 012 032 043
009 009 009 043 031
001 020 014 042 022
000 000 000 000 100
015 041 011 026 007
Probability index SLE SS SSc MCTD PMDM
le10 11 le30 31 le50 51 le85 gt85
006 (002-02)
04 (02-08)
68 (26-178)
121 (62-236)
439 (160-1204)
01 (004-04)
03 (01-10)
50 (14-186)
160 (79-322)
322 (108-959)
002 (0003-01)
08 (05-13)
85 (33-215)
157 (82-299)
223 (76-651)
1025 (387-2718)
02 (009-05)
16 (10-27)
65 (18-238)
97 (40-229)
76 (14-396)
Maenhout et al 2014
Maenhout et al 2014
Conclusions
bull High quality image acquisition
bull Significant correlation between intensity and antibody titer
bull Fluorescence intensity provides clinically useful information
bull Enables implementation of a quantitative internal quality
control system
bull Accuracy of pattern recognition is limited
a microdot array based immunoassay developed to allow simultaneous detection of multiple
autoantibodies on a single patient
Cambridge Life Sciences Ltd
ZENITbullAMiDot
bull One patient sample per well ndash 9 x 9 microarray (81 dots)
Cambridge Life Sciences Ltd
ZENITbullAMiDot
bull Each 9 x 9 microarray contains
bull Multiple autoimmune antigen dots
bull Calibration dots
bull Control dots
bull Registration dots
Cambridge Life Sciences Ltd
ZENITbullAMiDot
0
25000
50000
75000
100000
125000
150000
175000
200000
0 10 20 30 40 50 60 70 80 90 100
Raw
Sig
nal
Calibrator Conc (UmL)
Calibration
bullEach 9 x 9 microarray is
bullPrinted on to an activated glass surface
bullEach dot is ~20microm in diameter
bullEach autoimmune antigen calibrator and control is printed in duplicate or triplicate
bullAutomated analysis
bullImage taken by Reader (G-Sight or AMiDot reader)
Cambridge Life Sciences Ltd
ZENITbullAMiDot
Software receives the image analyses the image and produces a patient report
Antigen RecombinantNative Antigen RecombinantNative
Ro60SS-A recombinant PL7PL12 recombinant
Ro52SS-A recombinant MPO native
LaSS-B recombinant PR3 native
Sm native GBM native
U1-snRNP (68kDAC) recombinant Cathepsin native
Jo-1 recombinant SRP-54 recombinant
Scl70 native BPI native
PMScl100 recombinant ASCA native
dsDNA plasmid tTG recombinant
Histones Native deaminated Gliadin recombinant
Mi-2 recombinant TPO recombinant
Centromere B recombinant Intrinsic Factor recombinant
Ku recombinant Gastric Parietal Cell native
PCNA recombinant M2 recombinant
Ribosomal P0 recombinant LKM-1 recombinant
Elastase native LC1 recombinant
ZENITbullAMiDot
Cambridge Life Sciences Ltd
Conclusion AMiDot
bull Allows multiplex detection of autoantibodies
bull Overall a good concordance with results obtained by EliA
bull Multiplex ANA testing is an efficient way to simultaneously test for specific antibodies
bull Small sample volumes can be used
bull Further studies are warranted to prove the reliability of this technique
Acknowledgements
bull Dept of Laboratory Medicine - Immunology
ndash Dr Vermeersch ndash Dr Marieumln Mrs Godefridis ndash S Cooreman ndash S Schouwers
bull Experimental Laboratory
Immunology ndash K Op de Beeacuteck ndash D Dillaerts
bull Dept of Rheumatology Internal
Medicine ndash Dr Verschueren ndash Dr Westhovens ndash Dr Blockmans
bull Menarini ndash Heidi Debaere
bull Instrumentation Laboratory ndash Nathalie Vandeputte
bull KUL - statistics ndash S Fieuws

Ann Rheum Dis 2010691420-2
ANA screening an old test with new recommendations
Meroni PL Schur PH
N Engl J Med 2009360711-20
Case records of the Massachusetts General Hospital Case 5-2009 A 47-year-old woman with a rash and numbness and pain in the legs
Kroshinsky D Stone JH Bloch DB Sepehr A
Ann Rheum Dis 2014 Jan73(1)17-23 doi 101136annrheumdis-2013-203863 Epub 2013 Oct 14 International recommendations for the assessment of autoantibodies to cellular antigens referred to as anti-nuclear antibodies Agmon-Levin N1 Damoiseaux J Kallenberg C Sack U Witte T Herold M Bossuyt X Musset L Cervera R Plaza-Lopez A Dias C Sousa MJ Radice A Eriksson C Hultgren O Viander M Khamashta M Regenass S Andrade LE Wiik A Tincani A Roumlnnelid J Bloch DB Fritzler MJ Chan EK Garcia-De La Torre I Konstantinov KN Lahita R Wilson M Vainio O Fabien N Sinico RA Meroni P Shoenfeld Y
Recommendations of the American College of Rheumatology (ACR) Antinuclear Antibody (ANA) Task Force Immunofluorescence ANA test should remain the gold standard for ANA testing Hospital and commercial laboratories using bead-based multiplex platforms or other solid phase assays for detecting ANA must provide data to ordering physicians on request that their assay has the same or improved sensitivity and specificity as the immunofluorescence ANA In-house assays for detecting ANA as well as anti-DNA anti-Sm anti-RNP anti-RoSS-A anti-LaSS-B etc should be standardized according to national (eg CDC) andor international (eg WHO IUIS) standards Laboratories should specify the methods used for detecting ANA when reporting their results
Members of the ACR ANA Task Force Peter Schur (Chair) Donald Bloch Joe Craft John A Goldman Pier L Meroni Eileen Moynihan
Morris Reichlin Westley Reeves Eng Tan Dan Wallace and Mark Wener
ANA screening an old test with new recommendations Pierre Luigi Meroni Peter H Schur
Ann Rheum Dis 2010691420-2
Antibodies to extractable nuclear antigens in antinuclear antibody-negative samples Bossuyt X Luyckx A
Clin Chem 2005512426-7
2405 consecutive samples
ndash 565 ANA pos anti-ENA in 102 (18) ndash 1840 ANA neg anti-ENA in 21 (11)
ndash sensitivity of ANA for anti-ENA 83 (75-89)
Hofman et al [Clin Chem 2002] sensitivity 72
Conclusion ndash Although ANA has high sensitivity it may miss reactivities ndash When there is a high clinical suspicion focused testing for specific antibodies
should be performed
Patient no Dot-blot analysis EliA (EliA unitsmL) Clinical findings 1 SSA SSA (136) Rheumatoid arthritis
2 SSA SSA (297) Systemic lupus erythematosus
3 SSA SSA (372) No data available
4 SSA SSA (207) Sjoumlgren syndrome cutaneous lupus cryogobulinemia
5 Jo-1 Jo-1 (119) Polymyositis
6 SmRNP + Sm U1RNP (51) + RNP 70 (19) + Sm (6) Drug-induced lupus2
7 Scl-70 Negative Reactive arthritis
8 Negative SSA (112) B-CLL3 (bone marrow transplantation)
9 Negative SSA (387) Neonatal lupus erythematosus (skin rash)
10 Negative SSA (184) Psoriatic spondylarthropathy (HLA-B27+)
11 Negative SSA (235) Chronic urticaria
12 Negative SSA (203) Pregnancy and thrombocytopenia
13 Negative SSA (271) Subacute cutaneous lupus
14 Negative SSA (195)4 Rheumatoid arthritis
15 Negative Sm (125) Subacute sclerosing panencephalitis
16 Negative U1RNP (567) Cervical tension
A 67-year-old woman with a systemic inflammatory syndrome and sicca Bossuyt X Marieumln G Vanderschueren S
Clin Chem 2010561508-9
Magnetic resonance image showing cystic enlargement of the left parotid gland (arrow)
140 11280
EVALUATION OF ANA BY IIF AND SOLID PHASE ASSAY
Detection of antinuclear antibodies by indirect immunofluorescence and by solid phase assay Op De Beeck K Vermeersch P Verschueren P Westhovens R Marieumln G Blockmans D Bossuyt X Autoimmun Rev 201110801-8
ANA HEp-2000 Immunoconcepts Anti-ENA anti-dsDNA EliA Phadia
n MF Mean age (range)
SLE 80 1070 36 (15-72)
SCL 10 37 49 (32-85)
SSc 69 2544 53 (18-79)
MCTD 13 112 31 (16-66)
SS 36 531 50 (21-75)
PMDM 28 1117 54 (26-77)
Blood donors 149 7574 44 (19-65)
CFS 139 125114 41 (18-75)
Dis controls 134 34100 46 (17-81)
bull SSA-transfected HEp-2000trade cells (Immunoconcepts)
bull EliA ndash CTD screen ndash Recombinant antigens (SSARo52 SSARo60 SSB RNP-70 RNP-A RNP-C
Sm Centromere B Jo-1 Scl-70 Rib-P fibrillarin RNA pol III PM-Scl PCNA Mi-2)
ndash dsDNA purified
EVALUATION OF ANA BY IIF
SLE
0
005
01
015
02
025
negative SSA pattern 140 180 1160 1320 1640 11280 1gt1280
Like
liho
od
cytoplasmic
centromere
nucleolar
speckled
homogeneous
distinct SSA pattern
negative
Systemic sclerosis
0
005
01
015
02
025
negative SSA pattern 140 180 1160 1320 1640 11280 1gt1280
Like
liho
od
cytoplasmic
centromere
nucleolar
speckled
homogeneous
distinct SSA pattern
negative
MCTD
0
005
01
015
02
025
03
035
04
045
05
negative SSA pattern 140 180 1160 1320 1640 11280 1gt1280
Like
liho
od
cytoplasmic
centromere
nucleolar
speckled
homogeneous
distinct SSA pattern
negative
Sjoumlgrenrsquos syndrome
0
005
01
015
02
025
03
negative SSA pattern 140 180 1160 1320 1640 11280 1gt1280
Like
liho
od
cytoplasmic
centromere
nucleolar
speckled
homogeneous
distinct SSA pattern
negative
Inflammatory myopathy
0
005
01
015
02
025
03
035
04
negative SSA pattern 140 180 1160 1320 1640 11280 1gt1280
Like
liho
od
cytoplasmic
centromere
nucleolar
speckled
homogeneous
distinct SSA pattern
negative
Blood donors
0
01
02
03
04
05
06
07
08
09
1
negative SSA pattern 140 180 1160 1320 1640 11280 1gt1280
Like
liho
od
cytoplasmic
centromere
nucleolar
speckled
homogeneous
distinct SSA pattern
negative
Chronic fatique syndrome
0
01
02
03
04
05
06
07
08
09
negative SSA pattern 140 180 1160 1320 1640 11280 1gt1280
Like
liho
od
cytoplasmic
centromere
nucleolar
speckled
homogeneous
distinct SSA pattern
negative
Diseased controls
0
01
02
03
04
05
06
07
negative SSA pattern 140 180 1160 1320 1640 11280 1gt1280
Like
liho
od
cytoplasmic
centromere
nucleolar
speckled
homogeneous
distinct SSA pattern
negative
EVALUATION OF ANA BY SOLID PHASE ASSAY - ELIA
0
5
10
15
20
25
30
35
BD CFS DisControls
SLE SCL SSc MCTD SS PM DM
Rati
o
Groups
CTD Screen EliA
CTD
scr
ee
n
AN
A 1
40
o
r SS
A p
acirctte
rn
AN
A 1
80
o
r SS
A p
atte
rn
A
NA
11
60
o
r SS
A p
atte
rn
A
NA
13
20
o
r SS
A p
atte
rn
A
NA
16
40
o
r SS
A p
atte
rn
A
NA
11
28
0
or
SSA
pat
tern
SLE 74 963 925 900 688 538 313
SSc 72 986 971 928 812 623 391
MCTD 100 1000 1000 1000 1000 923 692
SS 89 917 833 556 444 417 361
PMDM 39 643 464 357 286 143 71
Blood donors 27 121 87 60 27 13 07
CFS 29 144 79 36 29 29 29
Diseased controls 37 358 254 171 112 60 30
0
005
01
015
02
025
negative SSA pattern 140 180 1160 1320 1640 11280 1gt1280
Like
liho
od
SLE
no ENAdsDNA
dsDNA
SSA
U1-RNP
mixed
0
005
01
015
02
025
negative SSA pattern 140 180 1160 1320 1640 11280 1gt1280
Like
liho
od
Systemic Sclerosis
no ENAdsDNA
PM-Scl
RNA-pol
Scl-70
CENP
SSA
0
005
01
015
02
025
03
negative SSA pattern 140 180 1160 1320 1640 11280 1gt1280
Like
liho
od
Sjoumlgrens syndrome
no ENAdsDNA
SSA
SSA+SSB
dsDNA+SSA
0
005
01
015
02
025
03
035
04
negative SSA pattern 140 180 1160 1320 1640 11280 1gt1280
Like
liho
od
Inflammatory myopathy
no ENAdsDNA
PM-Scl
Mi-2
Jo-1
Jo-1+SSA52
0
005
01
015
02
025
03
035
04
045
05
negative SSA pattern 140 180 1160 1320 1640 11280 1gt1280
Like
liho
od
MCTD
U1-RNP
U1-RNP+RNP70
dsD
NA
SSA
-60
SSA
-52
SSB
U1
-RN
P
RN
P-7
0
Sm
Rib
-P
CEN
P
Scl-
70
Po
l-II
I
PM
-Scl
Jo-1
Mi-
2
CTD
scr
ee
n
SLE 45 48 38 19 16 63 63 88 74
SCL 60 30 10 60
SSc 14 72 29 14 35 28 72 29 72
MCTD 77 100 92 77 100
SS 28 86 81 58 89
PMDM 18 36 36 71 29 36 39
Blood donors 07 07 27
CFS 07 14 07 07 29
Diseased controls 07 22 07 07 37
ge1 ge2 ge3 ge4 ge5 ge6 ge7
SLE 725 488 325 175 75 63 13
SCL 600 300 100
SSc 739 101 14
MCTD 1000 923 154
SS 889 861 528
PMDM 393 179 71
Blood donors 13
CFS 29 07
Diseased controls 45
Antinuclear antibody detection indirect immunofluorescene
versus solid phase assay
Xavier Bossuyt
Annals Rheum Dis 2010691420-22
Aim
To evaluate the diagnostic performance of
IIF solid phase assay amp the combination of both for
Systemic lupus erythematosus (SLE)
Systemic slcerosis (SSc)
pSjogrenrsquos syndrome (SS)
1
2
3
BioPlex 2200 chromatin Sm ribosomal protein SSA-60 SSB RNP-A and RNP-68 SSA-52 Scl-70 Jo-1 centromere B dsDNA
IIF HEp-2000 (Immunoconcepts) EliA CTD screen (Thermo Fisher) SSARo 52 SSARo 60 SSBLa U1-RNP (RNP-70 A C) Sm centromere B Jo-1 Scl-70 Rib-P fibrillarin RNA Pol III PM-Scl PCNA and Mi-2 dsDNA
IIF 180 IIF 1160 EliA CTD screen BioPlex 2200
Sensitivity
Systemic lupus erythematosus Reference 1 2 (n=80) 925 (84-97) 90 (81-95) 74 (63-82) 79 (69-86) Reference 3 (n=41) 97 (87-99) 95 (83-99) Systemic sclerosis Reference 1 2 (n=69) 97 (90-99) 93 (84-97) 725 (61-82) 72 (61-82) Reference 3 (n=37) 95 (82-98) 865 (72-94) Sjoumlgrenrsquos syndrome Reference 1 2 (n=36) 83 (68-92) 56 (40-70) 89 (75-96) 89 (75-96) Reference 3 (n=40) 76 (62-88) 74 (57-83)
Specificity
Healthy controls (n=125) (Ref 3) 87 (80-92) 95 (90-98) Blood donors (n=149) (Ref1 2) 91 (85-95) 94 (89-97) 97 (93-99) 95 (90-97) Chronic fatigue syndrome (n=139) (Ref1 2)
92 (86-96) 96 (92-98) 97 (92-99) 93 (87-96)
Diseased controls (n=134) (Ref1 2) 75 (67-81) 82 (75-88) 96 (91-98) 89 (82-93)
All controls (n=422) (Ref1 2) 86 (83-89) 91 (88-93) 97 (95-98) 92 (89-94)
0
005
01
015
02
025
Like
liho
od
SLE
0
005
01
015
02
025
Like
liho
od
Systemic sclerosis
0
005
01
015
02
025
03
Like
liho
od
Sjoumlgrens syndrome
LR Systemic lupus erythematosus
Systemic sclerosis Sjoumlgrenrsquos syndrome
IIF(+) (Ref 1 2) 67 (53-86) 71 (55-90) 61 (46-80) IIF(+) (Ref 3) 71 (46-112) 64 (40-101)0 57 (35-59) IIF(-) (Ref 1 2) 008 (004-019) 003 (001-013) 019 (009-040) IIF(-) (Ref 3) 003 (0004-020) 016 (003-035) 026 (015-046) EliA CTD screen (+) 239 (138-415) 235 (135-409) 288 (167-499) EliA CTD screen (-) 027 (019-039) 028 (019-042) 011 (005-029) IIF (+) EliA CTD screen (+) 414 (196-877) 436 (207-468) 468 (220-998) IIF (+) EliA CTD screen (-) 20 (12-31) 20 (13-33) 045 (012-18) IIF (-) EliA CTD screen (+) 35 (10-122) 78 (23-264) IIF (-) EliA CTD screen (-) 003 (0007-012) 003 (0009-013) 006 (002-025)
LR Systemic lupus erythematosus
Systemic sclerosis Sjoumlgrenrsquos syndrome
IIF(+) (Ref 1 2) 67 (53-86) 71 (55-90) 61 (46-80) IIF(+) (Ref 3) 71 (46-112) 64 (40-101)0 57 (35-59) IIF(-) (Ref 1 2) 008 (004-019) 003 (001-013) 019 (009-040) IIF(-) (Ref 3) 003 (0004-020) 016 (003-035) 026 (015-046) EliA CTD screen (+) 239 (138-415) 235 (135-409) 288 (167-499) EliA CTD screen (-) 027 (019-039) 028 (019-042) 011 (005-029) IIF (+) EliA CTD screen (+) 414 (196-877) 436 (207-468) 468 (220-998) IIF (+) EliA CTD screen (-) 20 (12-31) 20 (13-33) 045 (012-18) IIF (-) EliA CTD screen (+) 35 (10-122) 78 (23-264) IIF (-) EliA CTD screen (-) 003 (0007-012) 003 (0009-013) 006 (002-025)
Prevalence
Systemic lupus erythematosus
Systemic sclerosis
Sjoumlgrenrsquos syndrome
Controls
IIF (+) EliA CTD screen (+) 69 72 78 16 IIF (+) EliA CTD screen (-) 24 25 55 12 IIF (-) EliA CTD screen (+) 5 11 14 IIF (-) EliA CTD screen (-) 2 3 55 85
0
02
04
06
08
1
0 02 04 06 08 1
Po
st-t
est
pro
bab
ility
Pre-test probability
FEIA+ IIF+
FEIA+
IIF+
FEIA+ IIF-
FEIA- IIF+
FEIA-
IIF-
FEIA- IIF-
SLE
Comparative analysis of different strategies
1 IIF and FEIA on all samples
2 IIF
If IIF positive FEIA
If IIF negative stop
3 FEIA
4 IIF
Conclusion
Integrated interpretation
of IIF and solid phase assay results adds value
Optimal strategy
depends on the pathology
Bossuyt X Fieuws S Ann Rheum Dis 2014 Mar73(3)
Antinuclear antibodies by automated
indirect immunofluorescence Opportunities for value added
reporting
Xavier Bossuyt Leuven Belgium
Instrument NOVA View AKLIDES EUROPattern Image
Navigator
Helios ZENIT G Sight
Manufacturer INOVA Medipan EUROPattern Immuno Concepts Aesku Menarini
LIMS connection (software) Yes (QUANTA
Link)
Yes Yes
(EUROLabOffice)
Yes (direct) Yes (direct) Yes (ZenIT)
Slide identification via
barcode
Yes by handheld
scanner
Yes by handheld
scanner
Yes by integrated
scanner
Yes Yes by integrated
scanner
Yes by integrated
scanner
Loading capacity 5 slides (up to 60
wells)
5 slides (up to 60
wells)
50 slides (up to 500
wells)
4 slides (up to 84
wells)
20 slides (up to 240
wells)
5 slides (up to 70
wells)
Image acquisition speed ~45swell for 3
images
~40swell lt20swell ~25swell for 4
images
10spicture
Customizable from 1
to 10 images
gt60swell
pictures 5 (small
scan) 50 (medium
scan) 220 (full scan)
100 QC for substrate and
process integrity
counterstaining
Yes DAPI Yes DAPI Yes Propidium
iodide
None None None None None None
Automatic posneg
discrimination incl
presorting of images
Yes Yes Yes Yes Yes Yes
Batchwise verification of
negative samples
Yes Yes Yes Yes Yes Yes
Automatic pattern
recognition
Yes Yes Yes No No Yes
Pattern Analysis method Pattern recognition by
mathematical algorithm
Pattern recognition by
mathematical algorithm
Pattern recognition by
mathematical algorithm
No pattern matching
capabilities
No pattern matching
capabilities
Pattern recognition by
mathematical algorithm
No of recognizable ANA
staining pattern list out
6
Homogeneous
Speckled
Centromere
Nucleolar
Nuclear dot
Cytoplasm
Negative
Positive unrecognized
10
Homogeneous
Speckled
Centromere
Nucleolar
Nuclear dot
Cytoplasm
Negative
Positive unrecognized
8
Homogeneous
Speckled
Centromere
Nucleolar
Nuclear dot
Cytoplasm
Nuclear rim
Mitotic negative
None None 5
Homogeneous
Speckled
Centromere
Nucleolar
Cytoplasm
Negative
Instrument calibration to
minimize variability
Yes Yes Yes Yes Yes No
Integration with slide
processing in 1 instrument
No No No No Yes No
Mahler et al J Immunol Research in press
Automated fluorescence microscopy is increasingly used for image acquisition quantitative analysis and pattern recognition of anti-nuclear antibody
testing
Positivenegative discrimination
bull Exposure time is inversely proportional to intensity of fluorescence
bull Probability value is given to samples
Pattern recognition ANA
bull five patterns ndash Homogeneous
ndash Speckled
ndash Centromere
ndash Nucleolar
ndash Mitochondrial
bull Based on statistical morphological and geometric features
IMAGE ACQUISITION
RNP
PM-Scl
Golgi
Membrane
Review of digital images
harr
manual approach (posneg)
ndash 90 identical interpretation (n=332) (Bonroy et al CCLM 2013)
ndash 88 identical interpretation (n=268) (Bossuyt et al CCA 2013)
Bonroy et al CCLM 2013
FLUORESENCE INTENSITY VERSUS ANTIBODY TITER
HEp-2
-10
10
30
50
70
90
neg 80 160 320 640 1280
Ind
ex
Titer
Outlier Boxplot
Outliers gt 15 and lt 3 IQR
Outliers gt 3 IQR
Midbody centriole few nuclear dots Golgi
Bossuyt et al CCA 2013
G-Sight HEp-2000
0
20
40
60
80
100
neg 180 1160 1320 1640 1gt=1280
Pro
ba
bil
ity i
nd
ex
Antibody titer
Bonroy et al 2013
NOVA View
0
500
1000
1500
2000
2500
3000
3500
Neg 80 160 320 640 gt=1280
Nova
Vie
w F
luo
resce
nce
In
de
x
Titer
Schouwers et al Clin Chem Lab Med 201452547-51
Pattern recognition
Visual inspection Correct assignment by G-Sight HEp-2
Correct assignment by G-sight HEp-2000
Homogeneous (n=42) 68 92
Speckled (n=34) 71 56
Centromere (n=6) 83 42
Pattern recognition (Bonroy et al 2013) Pattern assignment was incorrect in 29 of 132 pos samples No pattern assigned in 45 of samples Global accuracy of pattern assignment 26
FLUORESCENCE INTENSITY IN WELL-DEFINED PATIENT COHORTS
Study Population
n M()F() Median age (range)
Blood donors
108 5149 45 (19-65)
Chronic Fatigue Syndrome
150 1981 41 (16-75)
Diseased Controls 134 2575 45 (17-81)
392
Systemic Lupus Erythematosus
85 1288 355 (15-72)
Sjoumlgrenrsquos Syndrome
36 1486 56 (21-75)
Systemic Sclerosis
76 3466 53 (18-80)
Polymyositis Dermatomyositis
32 4456 50 (24-77)
Mixed Connective Tissue Disease
16 694 315 (16-66)
245
HEp2
-10
10
30
50
70
90
Blooddonor
CFS Discontrols
SLE SCL SS SSc MCTD PM DM
Gro
up
s
Groups
Outlier Boxplot
Outliers gt 15 and lt 3 IQR
Outliers gt 3 IQR
Bossuyt et al CCA 2013
G-Sight HEp-2000
-10
10
30
50
70
90
BloodDonors
CFS Dis Contr SLE SCL SS SSc MCTD PM DM
Pro
ba
bil
ity i
nd
ex
G-Sight HEp-2
Probability index
Blood donor CFS Diseased controls SLE SS SSc MCTD PMDM
le10 11-le30 31-le50 51-le85 gt85
075 024 001 000 000
084 013 001 001 000
050 038 003 007 003
004 009 012 032 043
009 009 009 043 031
001 020 014 042 022
000 000 000 000 100
015 041 011 026 007
Probability index SLE SS SSc MCTD PMDM
le10 11 le30 31 le50 51 le85 gt85
006 (002-02)
04 (02-08)
68 (26-178)
121 (62-236)
439 (160-1204)
01 (004-04)
03 (01-10)
50 (14-186)
160 (79-322)
322 (108-959)
002 (0003-01)
08 (05-13)
85 (33-215)
157 (82-299)
223 (76-651)
1025 (387-2718)
02 (009-05)
16 (10-27)
65 (18-238)
97 (40-229)
76 (14-396)
Bonroy et al CCLM 2013
0
500
1000
1500
2000
2500
3000
3500
HC CVS DC SLE SS SSc PMDM MCTD
L
I
U
Outlier Boxplot
Percentiles (95 of Distribution)
Outliers gt 15 and lt 3 IQR
Outliers gt 3 IQR
NOVA View
NOVA View LR LIU Controls SLE SS SSc PMDM MCTD SARD
Prevalence
lt49 056 006 003 003 013 005
49-120 026 005 006 005 019 007
121-600 013 011 003 009 034 011
601-2000 004 046 061 034 025 006 039
gt2000 001 033 028 049 009 094 038
LR
lt49 011 005 005 023 009
49-120 018 021 020 073 025
121-600 079 021 069 257 085
601-2000 112 150 84 61 15 96
gt2000 291 245 429 83 827 335
NOVA View
009 025 085
10
33
0
10
20
30
40
0
01
02
03
04
05
06
lt49 49-120 121-600 601-2000 gt2000
Like
liho
od
rat
io
Pre
vale
nce
Nuclear Index
controls
SRD
LR
LR 1 no clinical value gt10 lt01 clinically important difference 5 ndash 10 01 ndash 02 modest but substantial difference 2 ndash 5 02 ndash 05 small difference that may be relevant
Post-test odds
=
Pre-test odds x LR
probability rarr odds
02 rarr 02 (1 ndash 02)
025
odds rarr probability
4 rarr 4 (1 + 4)
08
0
02
04
06
08
1
000 020 040 060 080 100
Po
st-t
est
pro
bab
ility
Pre-test probability
lt20
20-50
51-200
gt200
gt2000
Pre-test probability Post-test probability
lt49 120-600 600-2000 gt2000
1 a young women with hair loss and polyarthralgia 007 05 5 25
0
02
04
06
08
1
000 020 040 060 080 100
Po
st-t
est
pro
bab
ility
Pre-test probability
lt20
20-50
51-200
gt200
gt2000
Pre-test probability Post-test probability
lt49 120-600 600-2000 gt2000
10 a young women with photosensitivity and mild leucopenia (3000-3500mm3)
07 55 36 79
0
02
04
06
08
1
000 020 040 060 080 100
Po
st-t
est
pro
bab
ility
Pre-test probability
lt20
20-50
51-200
gt200
gt2000
Pre-test probability Post-test probability
lt49 120-600 600-2000 gt2000
50 a young women with photosensitivity malar rash and symmetrical polyarthritis
65 35 83 97
G-Sight HEp-2
Probability index
Blood donor CFS Diseased controls SLE SS SSc MCTD PMDM
le10 11-le30 31-le50 51-le85 gt85
075 024 001 000 000
084 013 001 001 000
050 038 003 007 003
004 009 012 032 043
009 009 009 043 031
001 020 014 042 022
000 000 000 000 100
015 041 011 026 007
Probability index SLE SS SSc MCTD PMDM
le10 11 le30 31 le50 51 le85 gt85
006 (002-02)
04 (02-08)
68 (26-178)
121 (62-236)
439 (160-1204)
01 (004-04)
03 (01-10)
50 (14-186)
160 (79-322)
322 (108-959)
002 (0003-01)
08 (05-13)
85 (33-215)
157 (82-299)
223 (76-651)
1025 (387-2718)
02 (009-05)
16 (10-27)
65 (18-238)
97 (40-229)
76 (14-396)
Maenhout et al 2014
Maenhout et al 2014
Conclusions
bull High quality image acquisition
bull Significant correlation between intensity and antibody titer
bull Fluorescence intensity provides clinically useful information
bull Enables implementation of a quantitative internal quality
control system
bull Accuracy of pattern recognition is limited
a microdot array based immunoassay developed to allow simultaneous detection of multiple
autoantibodies on a single patient
Cambridge Life Sciences Ltd
ZENITbullAMiDot
bull One patient sample per well ndash 9 x 9 microarray (81 dots)
Cambridge Life Sciences Ltd
ZENITbullAMiDot
bull Each 9 x 9 microarray contains
bull Multiple autoimmune antigen dots
bull Calibration dots
bull Control dots
bull Registration dots
Cambridge Life Sciences Ltd
ZENITbullAMiDot
0
25000
50000
75000
100000
125000
150000
175000
200000
0 10 20 30 40 50 60 70 80 90 100
Raw
Sig
nal
Calibrator Conc (UmL)
Calibration
bullEach 9 x 9 microarray is
bullPrinted on to an activated glass surface
bullEach dot is ~20microm in diameter
bullEach autoimmune antigen calibrator and control is printed in duplicate or triplicate
bullAutomated analysis
bullImage taken by Reader (G-Sight or AMiDot reader)
Cambridge Life Sciences Ltd
ZENITbullAMiDot
Software receives the image analyses the image and produces a patient report
Antigen RecombinantNative Antigen RecombinantNative
Ro60SS-A recombinant PL7PL12 recombinant
Ro52SS-A recombinant MPO native
LaSS-B recombinant PR3 native
Sm native GBM native
U1-snRNP (68kDAC) recombinant Cathepsin native
Jo-1 recombinant SRP-54 recombinant
Scl70 native BPI native
PMScl100 recombinant ASCA native
dsDNA plasmid tTG recombinant
Histones Native deaminated Gliadin recombinant
Mi-2 recombinant TPO recombinant
Centromere B recombinant Intrinsic Factor recombinant
Ku recombinant Gastric Parietal Cell native
PCNA recombinant M2 recombinant
Ribosomal P0 recombinant LKM-1 recombinant
Elastase native LC1 recombinant
ZENITbullAMiDot
Cambridge Life Sciences Ltd
Conclusion AMiDot
bull Allows multiplex detection of autoantibodies
bull Overall a good concordance with results obtained by EliA
bull Multiplex ANA testing is an efficient way to simultaneously test for specific antibodies
bull Small sample volumes can be used
bull Further studies are warranted to prove the reliability of this technique
Acknowledgements
bull Dept of Laboratory Medicine - Immunology
ndash Dr Vermeersch ndash Dr Marieumln Mrs Godefridis ndash S Cooreman ndash S Schouwers
bull Experimental Laboratory
Immunology ndash K Op de Beeacuteck ndash D Dillaerts
bull Dept of Rheumatology Internal
Medicine ndash Dr Verschueren ndash Dr Westhovens ndash Dr Blockmans
bull Menarini ndash Heidi Debaere
bull Instrumentation Laboratory ndash Nathalie Vandeputte
bull KUL - statistics ndash S Fieuws

SLE
0
005
01
015
02
025
negative SSA pattern 140 180 1160 1320 1640 11280 1gt1280
Like
liho
od
cytoplasmic
centromere
nucleolar
speckled
homogeneous
distinct SSA pattern
negative
Systemic sclerosis
0
005
01
015
02
025
negative SSA pattern 140 180 1160 1320 1640 11280 1gt1280
Like
liho
od
cytoplasmic
centromere
nucleolar
speckled
homogeneous
distinct SSA pattern
negative
MCTD
0
005
01
015
02
025
03
035
04
045
05
negative SSA pattern 140 180 1160 1320 1640 11280 1gt1280
Like
liho
od
cytoplasmic
centromere
nucleolar
speckled
homogeneous
distinct SSA pattern
negative
Sjoumlgrenrsquos syndrome
0
005
01
015
02
025
03
negative SSA pattern 140 180 1160 1320 1640 11280 1gt1280
Like
liho
od
cytoplasmic
centromere
nucleolar
speckled
homogeneous
distinct SSA pattern
negative
Inflammatory myopathy
0
005
01
015
02
025
03
035
04
negative SSA pattern 140 180 1160 1320 1640 11280 1gt1280
Like
liho
od
cytoplasmic
centromere
nucleolar
speckled
homogeneous
distinct SSA pattern
negative
Blood donors
0
01
02
03
04
05
06
07
08
09
1
negative SSA pattern 140 180 1160 1320 1640 11280 1gt1280
Like
liho
od
cytoplasmic
centromere
nucleolar
speckled
homogeneous
distinct SSA pattern
negative
Chronic fatique syndrome
0
01
02
03
04
05
06
07
08
09
negative SSA pattern 140 180 1160 1320 1640 11280 1gt1280
Like
liho
od
cytoplasmic
centromere
nucleolar
speckled
homogeneous
distinct SSA pattern
negative
Diseased controls
0
01
02
03
04
05
06
07
negative SSA pattern 140 180 1160 1320 1640 11280 1gt1280
Like
liho
od
cytoplasmic
centromere
nucleolar
speckled
homogeneous
distinct SSA pattern
negative
EVALUATION OF ANA BY SOLID PHASE ASSAY - ELIA
0
5
10
15
20
25
30
35
BD CFS DisControls
SLE SCL SSc MCTD SS PM DM
Rati
o
Groups
CTD Screen EliA
CTD
scr
ee
n
AN
A 1
40
o
r SS
A p
acirctte
rn
AN
A 1
80
o
r SS
A p
atte
rn
A
NA
11
60
o
r SS
A p
atte
rn
A
NA
13
20
o
r SS
A p
atte
rn
A
NA
16
40
o
r SS
A p
atte
rn
A
NA
11
28
0
or
SSA
pat
tern
SLE 74 963 925 900 688 538 313
SSc 72 986 971 928 812 623 391
MCTD 100 1000 1000 1000 1000 923 692
SS 89 917 833 556 444 417 361
PMDM 39 643 464 357 286 143 71
Blood donors 27 121 87 60 27 13 07
CFS 29 144 79 36 29 29 29
Diseased controls 37 358 254 171 112 60 30
0
005
01
015
02
025
negative SSA pattern 140 180 1160 1320 1640 11280 1gt1280
Like
liho
od
SLE
no ENAdsDNA
dsDNA
SSA
U1-RNP
mixed
0
005
01
015
02
025
negative SSA pattern 140 180 1160 1320 1640 11280 1gt1280
Like
liho
od
Systemic Sclerosis
no ENAdsDNA
PM-Scl
RNA-pol
Scl-70
CENP
SSA
0
005
01
015
02
025
03
negative SSA pattern 140 180 1160 1320 1640 11280 1gt1280
Like
liho
od
Sjoumlgrens syndrome
no ENAdsDNA
SSA
SSA+SSB
dsDNA+SSA
0
005
01
015
02
025
03
035
04
negative SSA pattern 140 180 1160 1320 1640 11280 1gt1280
Like
liho
od
Inflammatory myopathy
no ENAdsDNA
PM-Scl
Mi-2
Jo-1
Jo-1+SSA52
0
005
01
015
02
025
03
035
04
045
05
negative SSA pattern 140 180 1160 1320 1640 11280 1gt1280
Like
liho
od
MCTD
U1-RNP
U1-RNP+RNP70
dsD
NA
SSA
-60
SSA
-52
SSB
U1
-RN
P
RN
P-7
0
Sm
Rib
-P
CEN
P
Scl-
70
Po
l-II
I
PM
-Scl
Jo-1
Mi-
2
CTD
scr
ee
n
SLE 45 48 38 19 16 63 63 88 74
SCL 60 30 10 60
SSc 14 72 29 14 35 28 72 29 72
MCTD 77 100 92 77 100
SS 28 86 81 58 89
PMDM 18 36 36 71 29 36 39
Blood donors 07 07 27
CFS 07 14 07 07 29
Diseased controls 07 22 07 07 37
ge1 ge2 ge3 ge4 ge5 ge6 ge7
SLE 725 488 325 175 75 63 13
SCL 600 300 100
SSc 739 101 14
MCTD 1000 923 154
SS 889 861 528
PMDM 393 179 71
Blood donors 13
CFS 29 07
Diseased controls 45
Antinuclear antibody detection indirect immunofluorescene
versus solid phase assay
Xavier Bossuyt
Annals Rheum Dis 2010691420-22
Aim
To evaluate the diagnostic performance of
IIF solid phase assay amp the combination of both for
Systemic lupus erythematosus (SLE)
Systemic slcerosis (SSc)
pSjogrenrsquos syndrome (SS)
1
2
3
BioPlex 2200 chromatin Sm ribosomal protein SSA-60 SSB RNP-A and RNP-68 SSA-52 Scl-70 Jo-1 centromere B dsDNA
IIF HEp-2000 (Immunoconcepts) EliA CTD screen (Thermo Fisher) SSARo 52 SSARo 60 SSBLa U1-RNP (RNP-70 A C) Sm centromere B Jo-1 Scl-70 Rib-P fibrillarin RNA Pol III PM-Scl PCNA and Mi-2 dsDNA
IIF 180 IIF 1160 EliA CTD screen BioPlex 2200
Sensitivity
Systemic lupus erythematosus Reference 1 2 (n=80) 925 (84-97) 90 (81-95) 74 (63-82) 79 (69-86) Reference 3 (n=41) 97 (87-99) 95 (83-99) Systemic sclerosis Reference 1 2 (n=69) 97 (90-99) 93 (84-97) 725 (61-82) 72 (61-82) Reference 3 (n=37) 95 (82-98) 865 (72-94) Sjoumlgrenrsquos syndrome Reference 1 2 (n=36) 83 (68-92) 56 (40-70) 89 (75-96) 89 (75-96) Reference 3 (n=40) 76 (62-88) 74 (57-83)
Specificity
Healthy controls (n=125) (Ref 3) 87 (80-92) 95 (90-98) Blood donors (n=149) (Ref1 2) 91 (85-95) 94 (89-97) 97 (93-99) 95 (90-97) Chronic fatigue syndrome (n=139) (Ref1 2)
92 (86-96) 96 (92-98) 97 (92-99) 93 (87-96)
Diseased controls (n=134) (Ref1 2) 75 (67-81) 82 (75-88) 96 (91-98) 89 (82-93)
All controls (n=422) (Ref1 2) 86 (83-89) 91 (88-93) 97 (95-98) 92 (89-94)
0
005
01
015
02
025
Like
liho
od
SLE
0
005
01
015
02
025
Like
liho
od
Systemic sclerosis
0
005
01
015
02
025
03
Like
liho
od
Sjoumlgrens syndrome
LR Systemic lupus erythematosus
Systemic sclerosis Sjoumlgrenrsquos syndrome
IIF(+) (Ref 1 2) 67 (53-86) 71 (55-90) 61 (46-80) IIF(+) (Ref 3) 71 (46-112) 64 (40-101)0 57 (35-59) IIF(-) (Ref 1 2) 008 (004-019) 003 (001-013) 019 (009-040) IIF(-) (Ref 3) 003 (0004-020) 016 (003-035) 026 (015-046) EliA CTD screen (+) 239 (138-415) 235 (135-409) 288 (167-499) EliA CTD screen (-) 027 (019-039) 028 (019-042) 011 (005-029) IIF (+) EliA CTD screen (+) 414 (196-877) 436 (207-468) 468 (220-998) IIF (+) EliA CTD screen (-) 20 (12-31) 20 (13-33) 045 (012-18) IIF (-) EliA CTD screen (+) 35 (10-122) 78 (23-264) IIF (-) EliA CTD screen (-) 003 (0007-012) 003 (0009-013) 006 (002-025)
LR Systemic lupus erythematosus
Systemic sclerosis Sjoumlgrenrsquos syndrome
IIF(+) (Ref 1 2) 67 (53-86) 71 (55-90) 61 (46-80) IIF(+) (Ref 3) 71 (46-112) 64 (40-101)0 57 (35-59) IIF(-) (Ref 1 2) 008 (004-019) 003 (001-013) 019 (009-040) IIF(-) (Ref 3) 003 (0004-020) 016 (003-035) 026 (015-046) EliA CTD screen (+) 239 (138-415) 235 (135-409) 288 (167-499) EliA CTD screen (-) 027 (019-039) 028 (019-042) 011 (005-029) IIF (+) EliA CTD screen (+) 414 (196-877) 436 (207-468) 468 (220-998) IIF (+) EliA CTD screen (-) 20 (12-31) 20 (13-33) 045 (012-18) IIF (-) EliA CTD screen (+) 35 (10-122) 78 (23-264) IIF (-) EliA CTD screen (-) 003 (0007-012) 003 (0009-013) 006 (002-025)
Prevalence
Systemic lupus erythematosus
Systemic sclerosis
Sjoumlgrenrsquos syndrome
Controls
IIF (+) EliA CTD screen (+) 69 72 78 16 IIF (+) EliA CTD screen (-) 24 25 55 12 IIF (-) EliA CTD screen (+) 5 11 14 IIF (-) EliA CTD screen (-) 2 3 55 85
0
02
04
06
08
1
0 02 04 06 08 1
Po
st-t
est
pro
bab
ility
Pre-test probability
FEIA+ IIF+
FEIA+
IIF+
FEIA+ IIF-
FEIA- IIF+
FEIA-
IIF-
FEIA- IIF-
SLE
Comparative analysis of different strategies
1 IIF and FEIA on all samples
2 IIF
If IIF positive FEIA
If IIF negative stop
3 FEIA
4 IIF
Conclusion
Integrated interpretation
of IIF and solid phase assay results adds value
Optimal strategy
depends on the pathology
Bossuyt X Fieuws S Ann Rheum Dis 2014 Mar73(3)
Antinuclear antibodies by automated
indirect immunofluorescence Opportunities for value added
reporting
Xavier Bossuyt Leuven Belgium
Instrument NOVA View AKLIDES EUROPattern Image
Navigator
Helios ZENIT G Sight
Manufacturer INOVA Medipan EUROPattern Immuno Concepts Aesku Menarini
LIMS connection (software) Yes (QUANTA
Link)
Yes Yes
(EUROLabOffice)
Yes (direct) Yes (direct) Yes (ZenIT)
Slide identification via
barcode
Yes by handheld
scanner
Yes by handheld
scanner
Yes by integrated
scanner
Yes Yes by integrated
scanner
Yes by integrated
scanner
Loading capacity 5 slides (up to 60
wells)
5 slides (up to 60
wells)
50 slides (up to 500
wells)
4 slides (up to 84
wells)
20 slides (up to 240
wells)
5 slides (up to 70
wells)
Image acquisition speed ~45swell for 3
images
~40swell lt20swell ~25swell for 4
images
10spicture
Customizable from 1
to 10 images
gt60swell
pictures 5 (small
scan) 50 (medium
scan) 220 (full scan)
100 QC for substrate and
process integrity
counterstaining
Yes DAPI Yes DAPI Yes Propidium
iodide
None None None None None None
Automatic posneg
discrimination incl
presorting of images
Yes Yes Yes Yes Yes Yes
Batchwise verification of
negative samples
Yes Yes Yes Yes Yes Yes
Automatic pattern
recognition
Yes Yes Yes No No Yes
Pattern Analysis method Pattern recognition by
mathematical algorithm
Pattern recognition by
mathematical algorithm
Pattern recognition by
mathematical algorithm
No pattern matching
capabilities
No pattern matching
capabilities
Pattern recognition by
mathematical algorithm
No of recognizable ANA
staining pattern list out
6
Homogeneous
Speckled
Centromere
Nucleolar
Nuclear dot
Cytoplasm
Negative
Positive unrecognized
10
Homogeneous
Speckled
Centromere
Nucleolar
Nuclear dot
Cytoplasm
Negative
Positive unrecognized
8
Homogeneous
Speckled
Centromere
Nucleolar
Nuclear dot
Cytoplasm
Nuclear rim
Mitotic negative
None None 5
Homogeneous
Speckled
Centromere
Nucleolar
Cytoplasm
Negative
Instrument calibration to
minimize variability
Yes Yes Yes Yes Yes No
Integration with slide
processing in 1 instrument
No No No No Yes No
Mahler et al J Immunol Research in press
Automated fluorescence microscopy is increasingly used for image acquisition quantitative analysis and pattern recognition of anti-nuclear antibody
testing
Positivenegative discrimination
bull Exposure time is inversely proportional to intensity of fluorescence
bull Probability value is given to samples
Pattern recognition ANA
bull five patterns ndash Homogeneous
ndash Speckled
ndash Centromere
ndash Nucleolar
ndash Mitochondrial
bull Based on statistical morphological and geometric features
IMAGE ACQUISITION
RNP
PM-Scl
Golgi
Membrane
Review of digital images
harr
manual approach (posneg)
ndash 90 identical interpretation (n=332) (Bonroy et al CCLM 2013)
ndash 88 identical interpretation (n=268) (Bossuyt et al CCA 2013)
Bonroy et al CCLM 2013
FLUORESENCE INTENSITY VERSUS ANTIBODY TITER
HEp-2
-10
10
30
50
70
90
neg 80 160 320 640 1280
Ind
ex
Titer
Outlier Boxplot
Outliers gt 15 and lt 3 IQR
Outliers gt 3 IQR
Midbody centriole few nuclear dots Golgi
Bossuyt et al CCA 2013
G-Sight HEp-2000
0
20
40
60
80
100
neg 180 1160 1320 1640 1gt=1280
Pro
ba
bil
ity i
nd
ex
Antibody titer
Bonroy et al 2013
NOVA View
0
500
1000
1500
2000
2500
3000
3500
Neg 80 160 320 640 gt=1280
Nova
Vie
w F
luo
resce
nce
In
de
x
Titer
Schouwers et al Clin Chem Lab Med 201452547-51
Pattern recognition
Visual inspection Correct assignment by G-Sight HEp-2
Correct assignment by G-sight HEp-2000
Homogeneous (n=42) 68 92
Speckled (n=34) 71 56
Centromere (n=6) 83 42
Pattern recognition (Bonroy et al 2013) Pattern assignment was incorrect in 29 of 132 pos samples No pattern assigned in 45 of samples Global accuracy of pattern assignment 26
FLUORESCENCE INTENSITY IN WELL-DEFINED PATIENT COHORTS
Study Population
n M()F() Median age (range)
Blood donors
108 5149 45 (19-65)
Chronic Fatigue Syndrome
150 1981 41 (16-75)
Diseased Controls 134 2575 45 (17-81)
392
Systemic Lupus Erythematosus
85 1288 355 (15-72)
Sjoumlgrenrsquos Syndrome
36 1486 56 (21-75)
Systemic Sclerosis
76 3466 53 (18-80)
Polymyositis Dermatomyositis
32 4456 50 (24-77)
Mixed Connective Tissue Disease
16 694 315 (16-66)
245
HEp2
-10
10
30
50
70
90
Blooddonor
CFS Discontrols
SLE SCL SS SSc MCTD PM DM
Gro
up
s
Groups
Outlier Boxplot
Outliers gt 15 and lt 3 IQR
Outliers gt 3 IQR
Bossuyt et al CCA 2013
G-Sight HEp-2000
-10
10
30
50
70
90
BloodDonors
CFS Dis Contr SLE SCL SS SSc MCTD PM DM
Pro
ba
bil
ity i
nd
ex
G-Sight HEp-2
Probability index
Blood donor CFS Diseased controls SLE SS SSc MCTD PMDM
le10 11-le30 31-le50 51-le85 gt85
075 024 001 000 000
084 013 001 001 000
050 038 003 007 003
004 009 012 032 043
009 009 009 043 031
001 020 014 042 022
000 000 000 000 100
015 041 011 026 007
Probability index SLE SS SSc MCTD PMDM
le10 11 le30 31 le50 51 le85 gt85
006 (002-02)
04 (02-08)
68 (26-178)
121 (62-236)
439 (160-1204)
01 (004-04)
03 (01-10)
50 (14-186)
160 (79-322)
322 (108-959)
002 (0003-01)
08 (05-13)
85 (33-215)
157 (82-299)
223 (76-651)
1025 (387-2718)
02 (009-05)
16 (10-27)
65 (18-238)
97 (40-229)
76 (14-396)
Bonroy et al CCLM 2013
0
500
1000
1500
2000
2500
3000
3500
HC CVS DC SLE SS SSc PMDM MCTD
L
I
U
Outlier Boxplot
Percentiles (95 of Distribution)
Outliers gt 15 and lt 3 IQR
Outliers gt 3 IQR
NOVA View
NOVA View LR LIU Controls SLE SS SSc PMDM MCTD SARD
Prevalence
lt49 056 006 003 003 013 005
49-120 026 005 006 005 019 007
121-600 013 011 003 009 034 011
601-2000 004 046 061 034 025 006 039
gt2000 001 033 028 049 009 094 038
LR
lt49 011 005 005 023 009
49-120 018 021 020 073 025
121-600 079 021 069 257 085
601-2000 112 150 84 61 15 96
gt2000 291 245 429 83 827 335
NOVA View
009 025 085
10
33
0
10
20
30
40
0
01
02
03
04
05
06
lt49 49-120 121-600 601-2000 gt2000
Like
liho
od
rat
io
Pre
vale
nce
Nuclear Index
controls
SRD
LR
LR 1 no clinical value gt10 lt01 clinically important difference 5 ndash 10 01 ndash 02 modest but substantial difference 2 ndash 5 02 ndash 05 small difference that may be relevant
Post-test odds
=
Pre-test odds x LR
probability rarr odds
02 rarr 02 (1 ndash 02)
025
odds rarr probability
4 rarr 4 (1 + 4)
08
0
02
04
06
08
1
000 020 040 060 080 100
Po
st-t
est
pro
bab
ility
Pre-test probability
lt20
20-50
51-200
gt200
gt2000
Pre-test probability Post-test probability
lt49 120-600 600-2000 gt2000
1 a young women with hair loss and polyarthralgia 007 05 5 25
0
02
04
06
08
1
000 020 040 060 080 100
Po
st-t
est
pro
bab
ility
Pre-test probability
lt20
20-50
51-200
gt200
gt2000
Pre-test probability Post-test probability
lt49 120-600 600-2000 gt2000
10 a young women with photosensitivity and mild leucopenia (3000-3500mm3)
07 55 36 79
0
02
04
06
08
1
000 020 040 060 080 100
Po
st-t
est
pro
bab
ility
Pre-test probability
lt20
20-50
51-200
gt200
gt2000
Pre-test probability Post-test probability
lt49 120-600 600-2000 gt2000
50 a young women with photosensitivity malar rash and symmetrical polyarthritis
65 35 83 97
G-Sight HEp-2
Probability index
Blood donor CFS Diseased controls SLE SS SSc MCTD PMDM
le10 11-le30 31-le50 51-le85 gt85
075 024 001 000 000
084 013 001 001 000
050 038 003 007 003
004 009 012 032 043
009 009 009 043 031
001 020 014 042 022
000 000 000 000 100
015 041 011 026 007
Probability index SLE SS SSc MCTD PMDM
le10 11 le30 31 le50 51 le85 gt85
006 (002-02)
04 (02-08)
68 (26-178)
121 (62-236)
439 (160-1204)
01 (004-04)
03 (01-10)
50 (14-186)
160 (79-322)
322 (108-959)
002 (0003-01)
08 (05-13)
85 (33-215)
157 (82-299)
223 (76-651)
1025 (387-2718)
02 (009-05)
16 (10-27)
65 (18-238)
97 (40-229)
76 (14-396)
Maenhout et al 2014
Maenhout et al 2014
Conclusions
bull High quality image acquisition
bull Significant correlation between intensity and antibody titer
bull Fluorescence intensity provides clinically useful information
bull Enables implementation of a quantitative internal quality
control system
bull Accuracy of pattern recognition is limited
a microdot array based immunoassay developed to allow simultaneous detection of multiple
autoantibodies on a single patient
Cambridge Life Sciences Ltd
ZENITbullAMiDot
bull One patient sample per well ndash 9 x 9 microarray (81 dots)
Cambridge Life Sciences Ltd
ZENITbullAMiDot
bull Each 9 x 9 microarray contains
bull Multiple autoimmune antigen dots
bull Calibration dots
bull Control dots
bull Registration dots
Cambridge Life Sciences Ltd
ZENITbullAMiDot
0
25000
50000
75000
100000
125000
150000
175000
200000
0 10 20 30 40 50 60 70 80 90 100
Raw
Sig
nal
Calibrator Conc (UmL)
Calibration
bullEach 9 x 9 microarray is
bullPrinted on to an activated glass surface
bullEach dot is ~20microm in diameter
bullEach autoimmune antigen calibrator and control is printed in duplicate or triplicate
bullAutomated analysis
bullImage taken by Reader (G-Sight or AMiDot reader)
Cambridge Life Sciences Ltd
ZENITbullAMiDot
Software receives the image analyses the image and produces a patient report
Antigen RecombinantNative Antigen RecombinantNative
Ro60SS-A recombinant PL7PL12 recombinant
Ro52SS-A recombinant MPO native
LaSS-B recombinant PR3 native
Sm native GBM native
U1-snRNP (68kDAC) recombinant Cathepsin native
Jo-1 recombinant SRP-54 recombinant
Scl70 native BPI native
PMScl100 recombinant ASCA native
dsDNA plasmid tTG recombinant
Histones Native deaminated Gliadin recombinant
Mi-2 recombinant TPO recombinant
Centromere B recombinant Intrinsic Factor recombinant
Ku recombinant Gastric Parietal Cell native
PCNA recombinant M2 recombinant
Ribosomal P0 recombinant LKM-1 recombinant
Elastase native LC1 recombinant
ZENITbullAMiDot
Cambridge Life Sciences Ltd
Conclusion AMiDot
bull Allows multiplex detection of autoantibodies
bull Overall a good concordance with results obtained by EliA
bull Multiplex ANA testing is an efficient way to simultaneously test for specific antibodies
bull Small sample volumes can be used
bull Further studies are warranted to prove the reliability of this technique
Acknowledgements
bull Dept of Laboratory Medicine - Immunology
ndash Dr Vermeersch ndash Dr Marieumln Mrs Godefridis ndash S Cooreman ndash S Schouwers
bull Experimental Laboratory
Immunology ndash K Op de Beeacuteck ndash D Dillaerts
bull Dept of Rheumatology Internal
Medicine ndash Dr Verschueren ndash Dr Westhovens ndash Dr Blockmans
bull Menarini ndash Heidi Debaere
bull Instrumentation Laboratory ndash Nathalie Vandeputte
bull KUL - statistics ndash S Fieuws

Systemic sclerosis
0
005
01
015
02
025
negative SSA pattern 140 180 1160 1320 1640 11280 1gt1280
Like
liho
od
cytoplasmic
centromere
nucleolar
speckled
homogeneous
distinct SSA pattern
negative
MCTD
0
005
01
015
02
025
03
035
04
045
05
negative SSA pattern 140 180 1160 1320 1640 11280 1gt1280
Like
liho
od
cytoplasmic
centromere
nucleolar
speckled
homogeneous
distinct SSA pattern
negative
Sjoumlgrenrsquos syndrome
0
005
01
015
02
025
03
negative SSA pattern 140 180 1160 1320 1640 11280 1gt1280
Like
liho
od
cytoplasmic
centromere
nucleolar
speckled
homogeneous
distinct SSA pattern
negative
Inflammatory myopathy
0
005
01
015
02
025
03
035
04
negative SSA pattern 140 180 1160 1320 1640 11280 1gt1280
Like
liho
od
cytoplasmic
centromere
nucleolar
speckled
homogeneous
distinct SSA pattern
negative
Blood donors
0
01
02
03
04
05
06
07
08
09
1
negative SSA pattern 140 180 1160 1320 1640 11280 1gt1280
Like
liho
od
cytoplasmic
centromere
nucleolar
speckled
homogeneous
distinct SSA pattern
negative
Chronic fatique syndrome
0
01
02
03
04
05
06
07
08
09
negative SSA pattern 140 180 1160 1320 1640 11280 1gt1280
Like
liho
od
cytoplasmic
centromere
nucleolar
speckled
homogeneous
distinct SSA pattern
negative
Diseased controls
0
01
02
03
04
05
06
07
negative SSA pattern 140 180 1160 1320 1640 11280 1gt1280
Like
liho
od
cytoplasmic
centromere
nucleolar
speckled
homogeneous
distinct SSA pattern
negative
EVALUATION OF ANA BY SOLID PHASE ASSAY - ELIA
0
5
10
15
20
25
30
35
BD CFS DisControls
SLE SCL SSc MCTD SS PM DM
Rati
o
Groups
CTD Screen EliA
CTD
scr
ee
n
AN
A 1
40
o
r SS
A p
acirctte
rn
AN
A 1
80
o
r SS
A p
atte
rn
A
NA
11
60
o
r SS
A p
atte
rn
A
NA
13
20
o
r SS
A p
atte
rn
A
NA
16
40
o
r SS
A p
atte
rn
A
NA
11
28
0
or
SSA
pat
tern
SLE 74 963 925 900 688 538 313
SSc 72 986 971 928 812 623 391
MCTD 100 1000 1000 1000 1000 923 692
SS 89 917 833 556 444 417 361
PMDM 39 643 464 357 286 143 71
Blood donors 27 121 87 60 27 13 07
CFS 29 144 79 36 29 29 29
Diseased controls 37 358 254 171 112 60 30
0
005
01
015
02
025
negative SSA pattern 140 180 1160 1320 1640 11280 1gt1280
Like
liho
od
SLE
no ENAdsDNA
dsDNA
SSA
U1-RNP
mixed
0
005
01
015
02
025
negative SSA pattern 140 180 1160 1320 1640 11280 1gt1280
Like
liho
od
Systemic Sclerosis
no ENAdsDNA
PM-Scl
RNA-pol
Scl-70
CENP
SSA
0
005
01
015
02
025
03
negative SSA pattern 140 180 1160 1320 1640 11280 1gt1280
Like
liho
od
Sjoumlgrens syndrome
no ENAdsDNA
SSA
SSA+SSB
dsDNA+SSA
0
005
01
015
02
025
03
035
04
negative SSA pattern 140 180 1160 1320 1640 11280 1gt1280
Like
liho
od
Inflammatory myopathy
no ENAdsDNA
PM-Scl
Mi-2
Jo-1
Jo-1+SSA52
0
005
01
015
02
025
03
035
04
045
05
negative SSA pattern 140 180 1160 1320 1640 11280 1gt1280
Like
liho
od
MCTD
U1-RNP
U1-RNP+RNP70
dsD
NA
SSA
-60
SSA
-52
SSB
U1
-RN
P
RN
P-7
0
Sm
Rib
-P
CEN
P
Scl-
70
Po
l-II
I
PM
-Scl
Jo-1
Mi-
2
CTD
scr
ee
n
SLE 45 48 38 19 16 63 63 88 74
SCL 60 30 10 60
SSc 14 72 29 14 35 28 72 29 72
MCTD 77 100 92 77 100
SS 28 86 81 58 89
PMDM 18 36 36 71 29 36 39
Blood donors 07 07 27
CFS 07 14 07 07 29
Diseased controls 07 22 07 07 37
ge1 ge2 ge3 ge4 ge5 ge6 ge7
SLE 725 488 325 175 75 63 13
SCL 600 300 100
SSc 739 101 14
MCTD 1000 923 154
SS 889 861 528
PMDM 393 179 71
Blood donors 13
CFS 29 07
Diseased controls 45
Antinuclear antibody detection indirect immunofluorescene
versus solid phase assay
Xavier Bossuyt
Annals Rheum Dis 2010691420-22
Aim
To evaluate the diagnostic performance of
IIF solid phase assay amp the combination of both for
Systemic lupus erythematosus (SLE)
Systemic slcerosis (SSc)
pSjogrenrsquos syndrome (SS)
1
2
3
BioPlex 2200 chromatin Sm ribosomal protein SSA-60 SSB RNP-A and RNP-68 SSA-52 Scl-70 Jo-1 centromere B dsDNA
IIF HEp-2000 (Immunoconcepts) EliA CTD screen (Thermo Fisher) SSARo 52 SSARo 60 SSBLa U1-RNP (RNP-70 A C) Sm centromere B Jo-1 Scl-70 Rib-P fibrillarin RNA Pol III PM-Scl PCNA and Mi-2 dsDNA
IIF 180 IIF 1160 EliA CTD screen BioPlex 2200
Sensitivity
Systemic lupus erythematosus Reference 1 2 (n=80) 925 (84-97) 90 (81-95) 74 (63-82) 79 (69-86) Reference 3 (n=41) 97 (87-99) 95 (83-99) Systemic sclerosis Reference 1 2 (n=69) 97 (90-99) 93 (84-97) 725 (61-82) 72 (61-82) Reference 3 (n=37) 95 (82-98) 865 (72-94) Sjoumlgrenrsquos syndrome Reference 1 2 (n=36) 83 (68-92) 56 (40-70) 89 (75-96) 89 (75-96) Reference 3 (n=40) 76 (62-88) 74 (57-83)
Specificity
Healthy controls (n=125) (Ref 3) 87 (80-92) 95 (90-98) Blood donors (n=149) (Ref1 2) 91 (85-95) 94 (89-97) 97 (93-99) 95 (90-97) Chronic fatigue syndrome (n=139) (Ref1 2)
92 (86-96) 96 (92-98) 97 (92-99) 93 (87-96)
Diseased controls (n=134) (Ref1 2) 75 (67-81) 82 (75-88) 96 (91-98) 89 (82-93)
All controls (n=422) (Ref1 2) 86 (83-89) 91 (88-93) 97 (95-98) 92 (89-94)
0
005
01
015
02
025
Like
liho
od
SLE
0
005
01
015
02
025
Like
liho
od
Systemic sclerosis
0
005
01
015
02
025
03
Like
liho
od
Sjoumlgrens syndrome
LR Systemic lupus erythematosus
Systemic sclerosis Sjoumlgrenrsquos syndrome
IIF(+) (Ref 1 2) 67 (53-86) 71 (55-90) 61 (46-80) IIF(+) (Ref 3) 71 (46-112) 64 (40-101)0 57 (35-59) IIF(-) (Ref 1 2) 008 (004-019) 003 (001-013) 019 (009-040) IIF(-) (Ref 3) 003 (0004-020) 016 (003-035) 026 (015-046) EliA CTD screen (+) 239 (138-415) 235 (135-409) 288 (167-499) EliA CTD screen (-) 027 (019-039) 028 (019-042) 011 (005-029) IIF (+) EliA CTD screen (+) 414 (196-877) 436 (207-468) 468 (220-998) IIF (+) EliA CTD screen (-) 20 (12-31) 20 (13-33) 045 (012-18) IIF (-) EliA CTD screen (+) 35 (10-122) 78 (23-264) IIF (-) EliA CTD screen (-) 003 (0007-012) 003 (0009-013) 006 (002-025)
LR Systemic lupus erythematosus
Systemic sclerosis Sjoumlgrenrsquos syndrome
IIF(+) (Ref 1 2) 67 (53-86) 71 (55-90) 61 (46-80) IIF(+) (Ref 3) 71 (46-112) 64 (40-101)0 57 (35-59) IIF(-) (Ref 1 2) 008 (004-019) 003 (001-013) 019 (009-040) IIF(-) (Ref 3) 003 (0004-020) 016 (003-035) 026 (015-046) EliA CTD screen (+) 239 (138-415) 235 (135-409) 288 (167-499) EliA CTD screen (-) 027 (019-039) 028 (019-042) 011 (005-029) IIF (+) EliA CTD screen (+) 414 (196-877) 436 (207-468) 468 (220-998) IIF (+) EliA CTD screen (-) 20 (12-31) 20 (13-33) 045 (012-18) IIF (-) EliA CTD screen (+) 35 (10-122) 78 (23-264) IIF (-) EliA CTD screen (-) 003 (0007-012) 003 (0009-013) 006 (002-025)
Prevalence
Systemic lupus erythematosus
Systemic sclerosis
Sjoumlgrenrsquos syndrome
Controls
IIF (+) EliA CTD screen (+) 69 72 78 16 IIF (+) EliA CTD screen (-) 24 25 55 12 IIF (-) EliA CTD screen (+) 5 11 14 IIF (-) EliA CTD screen (-) 2 3 55 85
0
02
04
06
08
1
0 02 04 06 08 1
Po
st-t
est
pro
bab
ility
Pre-test probability
FEIA+ IIF+
FEIA+
IIF+
FEIA+ IIF-
FEIA- IIF+
FEIA-
IIF-
FEIA- IIF-
SLE
Comparative analysis of different strategies
1 IIF and FEIA on all samples
2 IIF
If IIF positive FEIA
If IIF negative stop
3 FEIA
4 IIF
Conclusion
Integrated interpretation
of IIF and solid phase assay results adds value
Optimal strategy
depends on the pathology
Bossuyt X Fieuws S Ann Rheum Dis 2014 Mar73(3)
Antinuclear antibodies by automated
indirect immunofluorescence Opportunities for value added
reporting
Xavier Bossuyt Leuven Belgium
Instrument NOVA View AKLIDES EUROPattern Image
Navigator
Helios ZENIT G Sight
Manufacturer INOVA Medipan EUROPattern Immuno Concepts Aesku Menarini
LIMS connection (software) Yes (QUANTA
Link)
Yes Yes
(EUROLabOffice)
Yes (direct) Yes (direct) Yes (ZenIT)
Slide identification via
barcode
Yes by handheld
scanner
Yes by handheld
scanner
Yes by integrated
scanner
Yes Yes by integrated
scanner
Yes by integrated
scanner
Loading capacity 5 slides (up to 60
wells)
5 slides (up to 60
wells)
50 slides (up to 500
wells)
4 slides (up to 84
wells)
20 slides (up to 240
wells)
5 slides (up to 70
wells)
Image acquisition speed ~45swell for 3
images
~40swell lt20swell ~25swell for 4
images
10spicture
Customizable from 1
to 10 images
gt60swell
pictures 5 (small
scan) 50 (medium
scan) 220 (full scan)
100 QC for substrate and
process integrity
counterstaining
Yes DAPI Yes DAPI Yes Propidium
iodide
None None None None None None
Automatic posneg
discrimination incl
presorting of images
Yes Yes Yes Yes Yes Yes
Batchwise verification of
negative samples
Yes Yes Yes Yes Yes Yes
Automatic pattern
recognition
Yes Yes Yes No No Yes
Pattern Analysis method Pattern recognition by
mathematical algorithm
Pattern recognition by
mathematical algorithm
Pattern recognition by
mathematical algorithm
No pattern matching
capabilities
No pattern matching
capabilities
Pattern recognition by
mathematical algorithm
No of recognizable ANA
staining pattern list out
6
Homogeneous
Speckled
Centromere
Nucleolar
Nuclear dot
Cytoplasm
Negative
Positive unrecognized
10
Homogeneous
Speckled
Centromere
Nucleolar
Nuclear dot
Cytoplasm
Negative
Positive unrecognized
8
Homogeneous
Speckled
Centromere
Nucleolar
Nuclear dot
Cytoplasm
Nuclear rim
Mitotic negative
None None 5
Homogeneous
Speckled
Centromere
Nucleolar
Cytoplasm
Negative
Instrument calibration to
minimize variability
Yes Yes Yes Yes Yes No
Integration with slide
processing in 1 instrument
No No No No Yes No
Mahler et al J Immunol Research in press
Automated fluorescence microscopy is increasingly used for image acquisition quantitative analysis and pattern recognition of anti-nuclear antibody
testing
Positivenegative discrimination
bull Exposure time is inversely proportional to intensity of fluorescence
bull Probability value is given to samples
Pattern recognition ANA
bull five patterns ndash Homogeneous
ndash Speckled
ndash Centromere
ndash Nucleolar
ndash Mitochondrial
bull Based on statistical morphological and geometric features
IMAGE ACQUISITION
RNP
PM-Scl
Golgi
Membrane
Review of digital images
harr
manual approach (posneg)
ndash 90 identical interpretation (n=332) (Bonroy et al CCLM 2013)
ndash 88 identical interpretation (n=268) (Bossuyt et al CCA 2013)
Bonroy et al CCLM 2013
FLUORESENCE INTENSITY VERSUS ANTIBODY TITER
HEp-2
-10
10
30
50
70
90
neg 80 160 320 640 1280
Ind
ex
Titer
Outlier Boxplot
Outliers gt 15 and lt 3 IQR
Outliers gt 3 IQR
Midbody centriole few nuclear dots Golgi
Bossuyt et al CCA 2013
G-Sight HEp-2000
0
20
40
60
80
100
neg 180 1160 1320 1640 1gt=1280
Pro
ba
bil
ity i
nd
ex
Antibody titer
Bonroy et al 2013
NOVA View
0
500
1000
1500
2000
2500
3000
3500
Neg 80 160 320 640 gt=1280
Nova
Vie
w F
luo
resce
nce
In
de
x
Titer
Schouwers et al Clin Chem Lab Med 201452547-51
Pattern recognition
Visual inspection Correct assignment by G-Sight HEp-2
Correct assignment by G-sight HEp-2000
Homogeneous (n=42) 68 92
Speckled (n=34) 71 56
Centromere (n=6) 83 42
Pattern recognition (Bonroy et al 2013) Pattern assignment was incorrect in 29 of 132 pos samples No pattern assigned in 45 of samples Global accuracy of pattern assignment 26
FLUORESCENCE INTENSITY IN WELL-DEFINED PATIENT COHORTS
Study Population
n M()F() Median age (range)
Blood donors
108 5149 45 (19-65)
Chronic Fatigue Syndrome
150 1981 41 (16-75)
Diseased Controls 134 2575 45 (17-81)
392
Systemic Lupus Erythematosus
85 1288 355 (15-72)
Sjoumlgrenrsquos Syndrome
36 1486 56 (21-75)
Systemic Sclerosis
76 3466 53 (18-80)
Polymyositis Dermatomyositis
32 4456 50 (24-77)
Mixed Connective Tissue Disease
16 694 315 (16-66)
245
HEp2
-10
10
30
50
70
90
Blooddonor
CFS Discontrols
SLE SCL SS SSc MCTD PM DM
Gro
up
s
Groups
Outlier Boxplot
Outliers gt 15 and lt 3 IQR
Outliers gt 3 IQR
Bossuyt et al CCA 2013
G-Sight HEp-2000
-10
10
30
50
70
90
BloodDonors
CFS Dis Contr SLE SCL SS SSc MCTD PM DM
Pro
ba
bil
ity i
nd
ex
G-Sight HEp-2
Probability index
Blood donor CFS Diseased controls SLE SS SSc MCTD PMDM
le10 11-le30 31-le50 51-le85 gt85
075 024 001 000 000
084 013 001 001 000
050 038 003 007 003
004 009 012 032 043
009 009 009 043 031
001 020 014 042 022
000 000 000 000 100
015 041 011 026 007
Probability index SLE SS SSc MCTD PMDM
le10 11 le30 31 le50 51 le85 gt85
006 (002-02)
04 (02-08)
68 (26-178)
121 (62-236)
439 (160-1204)
01 (004-04)
03 (01-10)
50 (14-186)
160 (79-322)
322 (108-959)
002 (0003-01)
08 (05-13)
85 (33-215)
157 (82-299)
223 (76-651)
1025 (387-2718)
02 (009-05)
16 (10-27)
65 (18-238)
97 (40-229)
76 (14-396)
Bonroy et al CCLM 2013
0
500
1000
1500
2000
2500
3000
3500
HC CVS DC SLE SS SSc PMDM MCTD
L
I
U
Outlier Boxplot
Percentiles (95 of Distribution)
Outliers gt 15 and lt 3 IQR
Outliers gt 3 IQR
NOVA View
NOVA View LR LIU Controls SLE SS SSc PMDM MCTD SARD
Prevalence
lt49 056 006 003 003 013 005
49-120 026 005 006 005 019 007
121-600 013 011 003 009 034 011
601-2000 004 046 061 034 025 006 039
gt2000 001 033 028 049 009 094 038
LR
lt49 011 005 005 023 009
49-120 018 021 020 073 025
121-600 079 021 069 257 085
601-2000 112 150 84 61 15 96
gt2000 291 245 429 83 827 335
NOVA View
009 025 085
10
33
0
10
20
30
40
0
01
02
03
04
05
06
lt49 49-120 121-600 601-2000 gt2000
Like
liho
od
rat
io
Pre
vale
nce
Nuclear Index
controls
SRD
LR
LR 1 no clinical value gt10 lt01 clinically important difference 5 ndash 10 01 ndash 02 modest but substantial difference 2 ndash 5 02 ndash 05 small difference that may be relevant
Post-test odds
=
Pre-test odds x LR
probability rarr odds
02 rarr 02 (1 ndash 02)
025
odds rarr probability
4 rarr 4 (1 + 4)
08
0
02
04
06
08
1
000 020 040 060 080 100
Po
st-t
est
pro
bab
ility
Pre-test probability
lt20
20-50
51-200
gt200
gt2000
Pre-test probability Post-test probability
lt49 120-600 600-2000 gt2000
1 a young women with hair loss and polyarthralgia 007 05 5 25
0
02
04
06
08
1
000 020 040 060 080 100
Po
st-t
est
pro
bab
ility
Pre-test probability
lt20
20-50
51-200
gt200
gt2000
Pre-test probability Post-test probability
lt49 120-600 600-2000 gt2000
10 a young women with photosensitivity and mild leucopenia (3000-3500mm3)
07 55 36 79
0
02
04
06
08
1
000 020 040 060 080 100
Po
st-t
est
pro
bab
ility
Pre-test probability
lt20
20-50
51-200
gt200
gt2000
Pre-test probability Post-test probability
lt49 120-600 600-2000 gt2000
50 a young women with photosensitivity malar rash and symmetrical polyarthritis
65 35 83 97
G-Sight HEp-2
Probability index
Blood donor CFS Diseased controls SLE SS SSc MCTD PMDM
le10 11-le30 31-le50 51-le85 gt85
075 024 001 000 000
084 013 001 001 000
050 038 003 007 003
004 009 012 032 043
009 009 009 043 031
001 020 014 042 022
000 000 000 000 100
015 041 011 026 007
Probability index SLE SS SSc MCTD PMDM
le10 11 le30 31 le50 51 le85 gt85
006 (002-02)
04 (02-08)
68 (26-178)
121 (62-236)
439 (160-1204)
01 (004-04)
03 (01-10)
50 (14-186)
160 (79-322)
322 (108-959)
002 (0003-01)
08 (05-13)
85 (33-215)
157 (82-299)
223 (76-651)
1025 (387-2718)
02 (009-05)
16 (10-27)
65 (18-238)
97 (40-229)
76 (14-396)
Maenhout et al 2014
Maenhout et al 2014
Conclusions
bull High quality image acquisition
bull Significant correlation between intensity and antibody titer
bull Fluorescence intensity provides clinically useful information
bull Enables implementation of a quantitative internal quality
control system
bull Accuracy of pattern recognition is limited
a microdot array based immunoassay developed to allow simultaneous detection of multiple
autoantibodies on a single patient
Cambridge Life Sciences Ltd
ZENITbullAMiDot
bull One patient sample per well ndash 9 x 9 microarray (81 dots)
Cambridge Life Sciences Ltd
ZENITbullAMiDot
bull Each 9 x 9 microarray contains
bull Multiple autoimmune antigen dots
bull Calibration dots
bull Control dots
bull Registration dots
Cambridge Life Sciences Ltd
ZENITbullAMiDot
0
25000
50000
75000
100000
125000
150000
175000
200000
0 10 20 30 40 50 60 70 80 90 100
Raw
Sig
nal
Calibrator Conc (UmL)
Calibration
bullEach 9 x 9 microarray is
bullPrinted on to an activated glass surface
bullEach dot is ~20microm in diameter
bullEach autoimmune antigen calibrator and control is printed in duplicate or triplicate
bullAutomated analysis
bullImage taken by Reader (G-Sight or AMiDot reader)
Cambridge Life Sciences Ltd
ZENITbullAMiDot
Software receives the image analyses the image and produces a patient report
Antigen RecombinantNative Antigen RecombinantNative
Ro60SS-A recombinant PL7PL12 recombinant
Ro52SS-A recombinant MPO native
LaSS-B recombinant PR3 native
Sm native GBM native
U1-snRNP (68kDAC) recombinant Cathepsin native
Jo-1 recombinant SRP-54 recombinant
Scl70 native BPI native
PMScl100 recombinant ASCA native
dsDNA plasmid tTG recombinant
Histones Native deaminated Gliadin recombinant
Mi-2 recombinant TPO recombinant
Centromere B recombinant Intrinsic Factor recombinant
Ku recombinant Gastric Parietal Cell native
PCNA recombinant M2 recombinant
Ribosomal P0 recombinant LKM-1 recombinant
Elastase native LC1 recombinant
ZENITbullAMiDot
Cambridge Life Sciences Ltd
Conclusion AMiDot
bull Allows multiplex detection of autoantibodies
bull Overall a good concordance with results obtained by EliA
bull Multiplex ANA testing is an efficient way to simultaneously test for specific antibodies
bull Small sample volumes can be used
bull Further studies are warranted to prove the reliability of this technique
Acknowledgements
bull Dept of Laboratory Medicine - Immunology
ndash Dr Vermeersch ndash Dr Marieumln Mrs Godefridis ndash S Cooreman ndash S Schouwers
bull Experimental Laboratory
Immunology ndash K Op de Beeacuteck ndash D Dillaerts
bull Dept of Rheumatology Internal
Medicine ndash Dr Verschueren ndash Dr Westhovens ndash Dr Blockmans
bull Menarini ndash Heidi Debaere
bull Instrumentation Laboratory ndash Nathalie Vandeputte
bull KUL - statistics ndash S Fieuws

MCTD
0
005
01
015
02
025
03
035
04
045
05
negative SSA pattern 140 180 1160 1320 1640 11280 1gt1280
Like
liho
od
cytoplasmic
centromere
nucleolar
speckled
homogeneous
distinct SSA pattern
negative
Sjoumlgrenrsquos syndrome
0
005
01
015
02
025
03
negative SSA pattern 140 180 1160 1320 1640 11280 1gt1280
Like
liho
od
cytoplasmic
centromere
nucleolar
speckled
homogeneous
distinct SSA pattern
negative
Inflammatory myopathy
0
005
01
015
02
025
03
035
04
negative SSA pattern 140 180 1160 1320 1640 11280 1gt1280
Like
liho
od
cytoplasmic
centromere
nucleolar
speckled
homogeneous
distinct SSA pattern
negative
Blood donors
0
01
02
03
04
05
06
07
08
09
1
negative SSA pattern 140 180 1160 1320 1640 11280 1gt1280
Like
liho
od
cytoplasmic
centromere
nucleolar
speckled
homogeneous
distinct SSA pattern
negative
Chronic fatique syndrome
0
01
02
03
04
05
06
07
08
09
negative SSA pattern 140 180 1160 1320 1640 11280 1gt1280
Like
liho
od
cytoplasmic
centromere
nucleolar
speckled
homogeneous
distinct SSA pattern
negative
Diseased controls
0
01
02
03
04
05
06
07
negative SSA pattern 140 180 1160 1320 1640 11280 1gt1280
Like
liho
od
cytoplasmic
centromere
nucleolar
speckled
homogeneous
distinct SSA pattern
negative
EVALUATION OF ANA BY SOLID PHASE ASSAY - ELIA
0
5
10
15
20
25
30
35
BD CFS DisControls
SLE SCL SSc MCTD SS PM DM
Rati
o
Groups
CTD Screen EliA
CTD
scr
ee
n
AN
A 1
40
o
r SS
A p
acirctte
rn
AN
A 1
80
o
r SS
A p
atte
rn
A
NA
11
60
o
r SS
A p
atte
rn
A
NA
13
20
o
r SS
A p
atte
rn
A
NA
16
40
o
r SS
A p
atte
rn
A
NA
11
28
0
or
SSA
pat
tern
SLE 74 963 925 900 688 538 313
SSc 72 986 971 928 812 623 391
MCTD 100 1000 1000 1000 1000 923 692
SS 89 917 833 556 444 417 361
PMDM 39 643 464 357 286 143 71
Blood donors 27 121 87 60 27 13 07
CFS 29 144 79 36 29 29 29
Diseased controls 37 358 254 171 112 60 30
0
005
01
015
02
025
negative SSA pattern 140 180 1160 1320 1640 11280 1gt1280
Like
liho
od
SLE
no ENAdsDNA
dsDNA
SSA
U1-RNP
mixed
0
005
01
015
02
025
negative SSA pattern 140 180 1160 1320 1640 11280 1gt1280
Like
liho
od
Systemic Sclerosis
no ENAdsDNA
PM-Scl
RNA-pol
Scl-70
CENP
SSA
0
005
01
015
02
025
03
negative SSA pattern 140 180 1160 1320 1640 11280 1gt1280
Like
liho
od
Sjoumlgrens syndrome
no ENAdsDNA
SSA
SSA+SSB
dsDNA+SSA
0
005
01
015
02
025
03
035
04
negative SSA pattern 140 180 1160 1320 1640 11280 1gt1280
Like
liho
od
Inflammatory myopathy
no ENAdsDNA
PM-Scl
Mi-2
Jo-1
Jo-1+SSA52
0
005
01
015
02
025
03
035
04
045
05
negative SSA pattern 140 180 1160 1320 1640 11280 1gt1280
Like
liho
od
MCTD
U1-RNP
U1-RNP+RNP70
dsD
NA
SSA
-60
SSA
-52
SSB
U1
-RN
P
RN
P-7
0
Sm
Rib
-P
CEN
P
Scl-
70
Po
l-II
I
PM
-Scl
Jo-1
Mi-
2
CTD
scr
ee
n
SLE 45 48 38 19 16 63 63 88 74
SCL 60 30 10 60
SSc 14 72 29 14 35 28 72 29 72
MCTD 77 100 92 77 100
SS 28 86 81 58 89
PMDM 18 36 36 71 29 36 39
Blood donors 07 07 27
CFS 07 14 07 07 29
Diseased controls 07 22 07 07 37
ge1 ge2 ge3 ge4 ge5 ge6 ge7
SLE 725 488 325 175 75 63 13
SCL 600 300 100
SSc 739 101 14
MCTD 1000 923 154
SS 889 861 528
PMDM 393 179 71
Blood donors 13
CFS 29 07
Diseased controls 45
Antinuclear antibody detection indirect immunofluorescene
versus solid phase assay
Xavier Bossuyt
Annals Rheum Dis 2010691420-22
Aim
To evaluate the diagnostic performance of
IIF solid phase assay amp the combination of both for
Systemic lupus erythematosus (SLE)
Systemic slcerosis (SSc)
pSjogrenrsquos syndrome (SS)
1
2
3
BioPlex 2200 chromatin Sm ribosomal protein SSA-60 SSB RNP-A and RNP-68 SSA-52 Scl-70 Jo-1 centromere B dsDNA
IIF HEp-2000 (Immunoconcepts) EliA CTD screen (Thermo Fisher) SSARo 52 SSARo 60 SSBLa U1-RNP (RNP-70 A C) Sm centromere B Jo-1 Scl-70 Rib-P fibrillarin RNA Pol III PM-Scl PCNA and Mi-2 dsDNA
IIF 180 IIF 1160 EliA CTD screen BioPlex 2200
Sensitivity
Systemic lupus erythematosus Reference 1 2 (n=80) 925 (84-97) 90 (81-95) 74 (63-82) 79 (69-86) Reference 3 (n=41) 97 (87-99) 95 (83-99) Systemic sclerosis Reference 1 2 (n=69) 97 (90-99) 93 (84-97) 725 (61-82) 72 (61-82) Reference 3 (n=37) 95 (82-98) 865 (72-94) Sjoumlgrenrsquos syndrome Reference 1 2 (n=36) 83 (68-92) 56 (40-70) 89 (75-96) 89 (75-96) Reference 3 (n=40) 76 (62-88) 74 (57-83)
Specificity
Healthy controls (n=125) (Ref 3) 87 (80-92) 95 (90-98) Blood donors (n=149) (Ref1 2) 91 (85-95) 94 (89-97) 97 (93-99) 95 (90-97) Chronic fatigue syndrome (n=139) (Ref1 2)
92 (86-96) 96 (92-98) 97 (92-99) 93 (87-96)
Diseased controls (n=134) (Ref1 2) 75 (67-81) 82 (75-88) 96 (91-98) 89 (82-93)
All controls (n=422) (Ref1 2) 86 (83-89) 91 (88-93) 97 (95-98) 92 (89-94)
0
005
01
015
02
025
Like
liho
od
SLE
0
005
01
015
02
025
Like
liho
od
Systemic sclerosis
0
005
01
015
02
025
03
Like
liho
od
Sjoumlgrens syndrome
LR Systemic lupus erythematosus
Systemic sclerosis Sjoumlgrenrsquos syndrome
IIF(+) (Ref 1 2) 67 (53-86) 71 (55-90) 61 (46-80) IIF(+) (Ref 3) 71 (46-112) 64 (40-101)0 57 (35-59) IIF(-) (Ref 1 2) 008 (004-019) 003 (001-013) 019 (009-040) IIF(-) (Ref 3) 003 (0004-020) 016 (003-035) 026 (015-046) EliA CTD screen (+) 239 (138-415) 235 (135-409) 288 (167-499) EliA CTD screen (-) 027 (019-039) 028 (019-042) 011 (005-029) IIF (+) EliA CTD screen (+) 414 (196-877) 436 (207-468) 468 (220-998) IIF (+) EliA CTD screen (-) 20 (12-31) 20 (13-33) 045 (012-18) IIF (-) EliA CTD screen (+) 35 (10-122) 78 (23-264) IIF (-) EliA CTD screen (-) 003 (0007-012) 003 (0009-013) 006 (002-025)
LR Systemic lupus erythematosus
Systemic sclerosis Sjoumlgrenrsquos syndrome
IIF(+) (Ref 1 2) 67 (53-86) 71 (55-90) 61 (46-80) IIF(+) (Ref 3) 71 (46-112) 64 (40-101)0 57 (35-59) IIF(-) (Ref 1 2) 008 (004-019) 003 (001-013) 019 (009-040) IIF(-) (Ref 3) 003 (0004-020) 016 (003-035) 026 (015-046) EliA CTD screen (+) 239 (138-415) 235 (135-409) 288 (167-499) EliA CTD screen (-) 027 (019-039) 028 (019-042) 011 (005-029) IIF (+) EliA CTD screen (+) 414 (196-877) 436 (207-468) 468 (220-998) IIF (+) EliA CTD screen (-) 20 (12-31) 20 (13-33) 045 (012-18) IIF (-) EliA CTD screen (+) 35 (10-122) 78 (23-264) IIF (-) EliA CTD screen (-) 003 (0007-012) 003 (0009-013) 006 (002-025)
Prevalence
Systemic lupus erythematosus
Systemic sclerosis
Sjoumlgrenrsquos syndrome
Controls
IIF (+) EliA CTD screen (+) 69 72 78 16 IIF (+) EliA CTD screen (-) 24 25 55 12 IIF (-) EliA CTD screen (+) 5 11 14 IIF (-) EliA CTD screen (-) 2 3 55 85
0
02
04
06
08
1
0 02 04 06 08 1
Po
st-t
est
pro
bab
ility
Pre-test probability
FEIA+ IIF+
FEIA+
IIF+
FEIA+ IIF-
FEIA- IIF+
FEIA-
IIF-
FEIA- IIF-
SLE
Comparative analysis of different strategies
1 IIF and FEIA on all samples
2 IIF
If IIF positive FEIA
If IIF negative stop
3 FEIA
4 IIF
Conclusion
Integrated interpretation
of IIF and solid phase assay results adds value
Optimal strategy
depends on the pathology
Bossuyt X Fieuws S Ann Rheum Dis 2014 Mar73(3)
Antinuclear antibodies by automated
indirect immunofluorescence Opportunities for value added
reporting
Xavier Bossuyt Leuven Belgium
Instrument NOVA View AKLIDES EUROPattern Image
Navigator
Helios ZENIT G Sight
Manufacturer INOVA Medipan EUROPattern Immuno Concepts Aesku Menarini
LIMS connection (software) Yes (QUANTA
Link)
Yes Yes
(EUROLabOffice)
Yes (direct) Yes (direct) Yes (ZenIT)
Slide identification via
barcode
Yes by handheld
scanner
Yes by handheld
scanner
Yes by integrated
scanner
Yes Yes by integrated
scanner
Yes by integrated
scanner
Loading capacity 5 slides (up to 60
wells)
5 slides (up to 60
wells)
50 slides (up to 500
wells)
4 slides (up to 84
wells)
20 slides (up to 240
wells)
5 slides (up to 70
wells)
Image acquisition speed ~45swell for 3
images
~40swell lt20swell ~25swell for 4
images
10spicture
Customizable from 1
to 10 images
gt60swell
pictures 5 (small
scan) 50 (medium
scan) 220 (full scan)
100 QC for substrate and
process integrity
counterstaining
Yes DAPI Yes DAPI Yes Propidium
iodide
None None None None None None
Automatic posneg
discrimination incl
presorting of images
Yes Yes Yes Yes Yes Yes
Batchwise verification of
negative samples
Yes Yes Yes Yes Yes Yes
Automatic pattern
recognition
Yes Yes Yes No No Yes
Pattern Analysis method Pattern recognition by
mathematical algorithm
Pattern recognition by
mathematical algorithm
Pattern recognition by
mathematical algorithm
No pattern matching
capabilities
No pattern matching
capabilities
Pattern recognition by
mathematical algorithm
No of recognizable ANA
staining pattern list out
6
Homogeneous
Speckled
Centromere
Nucleolar
Nuclear dot
Cytoplasm
Negative
Positive unrecognized
10
Homogeneous
Speckled
Centromere
Nucleolar
Nuclear dot
Cytoplasm
Negative
Positive unrecognized
8
Homogeneous
Speckled
Centromere
Nucleolar
Nuclear dot
Cytoplasm
Nuclear rim
Mitotic negative
None None 5
Homogeneous
Speckled
Centromere
Nucleolar
Cytoplasm
Negative
Instrument calibration to
minimize variability
Yes Yes Yes Yes Yes No
Integration with slide
processing in 1 instrument
No No No No Yes No
Mahler et al J Immunol Research in press
Automated fluorescence microscopy is increasingly used for image acquisition quantitative analysis and pattern recognition of anti-nuclear antibody
testing
Positivenegative discrimination
bull Exposure time is inversely proportional to intensity of fluorescence
bull Probability value is given to samples
Pattern recognition ANA
bull five patterns ndash Homogeneous
ndash Speckled
ndash Centromere
ndash Nucleolar
ndash Mitochondrial
bull Based on statistical morphological and geometric features
IMAGE ACQUISITION
RNP
PM-Scl
Golgi
Membrane
Review of digital images
harr
manual approach (posneg)
ndash 90 identical interpretation (n=332) (Bonroy et al CCLM 2013)
ndash 88 identical interpretation (n=268) (Bossuyt et al CCA 2013)
Bonroy et al CCLM 2013
FLUORESENCE INTENSITY VERSUS ANTIBODY TITER
HEp-2
-10
10
30
50
70
90
neg 80 160 320 640 1280
Ind
ex
Titer
Outlier Boxplot
Outliers gt 15 and lt 3 IQR
Outliers gt 3 IQR
Midbody centriole few nuclear dots Golgi
Bossuyt et al CCA 2013
G-Sight HEp-2000
0
20
40
60
80
100
neg 180 1160 1320 1640 1gt=1280
Pro
ba
bil
ity i
nd
ex
Antibody titer
Bonroy et al 2013
NOVA View
0
500
1000
1500
2000
2500
3000
3500
Neg 80 160 320 640 gt=1280
Nova
Vie
w F
luo
resce
nce
In
de
x
Titer
Schouwers et al Clin Chem Lab Med 201452547-51
Pattern recognition
Visual inspection Correct assignment by G-Sight HEp-2
Correct assignment by G-sight HEp-2000
Homogeneous (n=42) 68 92
Speckled (n=34) 71 56
Centromere (n=6) 83 42
Pattern recognition (Bonroy et al 2013) Pattern assignment was incorrect in 29 of 132 pos samples No pattern assigned in 45 of samples Global accuracy of pattern assignment 26
FLUORESCENCE INTENSITY IN WELL-DEFINED PATIENT COHORTS
Study Population
n M()F() Median age (range)
Blood donors
108 5149 45 (19-65)
Chronic Fatigue Syndrome
150 1981 41 (16-75)
Diseased Controls 134 2575 45 (17-81)
392
Systemic Lupus Erythematosus
85 1288 355 (15-72)
Sjoumlgrenrsquos Syndrome
36 1486 56 (21-75)
Systemic Sclerosis
76 3466 53 (18-80)
Polymyositis Dermatomyositis
32 4456 50 (24-77)
Mixed Connective Tissue Disease
16 694 315 (16-66)
245
HEp2
-10
10
30
50
70
90
Blooddonor
CFS Discontrols
SLE SCL SS SSc MCTD PM DM
Gro
up
s
Groups
Outlier Boxplot
Outliers gt 15 and lt 3 IQR
Outliers gt 3 IQR
Bossuyt et al CCA 2013
G-Sight HEp-2000
-10
10
30
50
70
90
BloodDonors
CFS Dis Contr SLE SCL SS SSc MCTD PM DM
Pro
ba
bil
ity i
nd
ex
G-Sight HEp-2
Probability index
Blood donor CFS Diseased controls SLE SS SSc MCTD PMDM
le10 11-le30 31-le50 51-le85 gt85
075 024 001 000 000
084 013 001 001 000
050 038 003 007 003
004 009 012 032 043
009 009 009 043 031
001 020 014 042 022
000 000 000 000 100
015 041 011 026 007
Probability index SLE SS SSc MCTD PMDM
le10 11 le30 31 le50 51 le85 gt85
006 (002-02)
04 (02-08)
68 (26-178)
121 (62-236)
439 (160-1204)
01 (004-04)
03 (01-10)
50 (14-186)
160 (79-322)
322 (108-959)
002 (0003-01)
08 (05-13)
85 (33-215)
157 (82-299)
223 (76-651)
1025 (387-2718)
02 (009-05)
16 (10-27)
65 (18-238)
97 (40-229)
76 (14-396)
Bonroy et al CCLM 2013
0
500
1000
1500
2000
2500
3000
3500
HC CVS DC SLE SS SSc PMDM MCTD
L
I
U
Outlier Boxplot
Percentiles (95 of Distribution)
Outliers gt 15 and lt 3 IQR
Outliers gt 3 IQR
NOVA View
NOVA View LR LIU Controls SLE SS SSc PMDM MCTD SARD
Prevalence
lt49 056 006 003 003 013 005
49-120 026 005 006 005 019 007
121-600 013 011 003 009 034 011
601-2000 004 046 061 034 025 006 039
gt2000 001 033 028 049 009 094 038
LR
lt49 011 005 005 023 009
49-120 018 021 020 073 025
121-600 079 021 069 257 085
601-2000 112 150 84 61 15 96
gt2000 291 245 429 83 827 335
NOVA View
009 025 085
10
33
0
10
20
30
40
0
01
02
03
04
05
06
lt49 49-120 121-600 601-2000 gt2000
Like
liho
od
rat
io
Pre
vale
nce
Nuclear Index
controls
SRD
LR
LR 1 no clinical value gt10 lt01 clinically important difference 5 ndash 10 01 ndash 02 modest but substantial difference 2 ndash 5 02 ndash 05 small difference that may be relevant
Post-test odds
=
Pre-test odds x LR
probability rarr odds
02 rarr 02 (1 ndash 02)
025
odds rarr probability
4 rarr 4 (1 + 4)
08
0
02
04
06
08
1
000 020 040 060 080 100
Po
st-t
est
pro
bab
ility
Pre-test probability
lt20
20-50
51-200
gt200
gt2000
Pre-test probability Post-test probability
lt49 120-600 600-2000 gt2000
1 a young women with hair loss and polyarthralgia 007 05 5 25
0
02
04
06
08
1
000 020 040 060 080 100
Po
st-t
est
pro
bab
ility
Pre-test probability
lt20
20-50
51-200
gt200
gt2000
Pre-test probability Post-test probability
lt49 120-600 600-2000 gt2000
10 a young women with photosensitivity and mild leucopenia (3000-3500mm3)
07 55 36 79
0
02
04
06
08
1
000 020 040 060 080 100
Po
st-t
est
pro
bab
ility
Pre-test probability
lt20
20-50
51-200
gt200
gt2000
Pre-test probability Post-test probability
lt49 120-600 600-2000 gt2000
50 a young women with photosensitivity malar rash and symmetrical polyarthritis
65 35 83 97
G-Sight HEp-2
Probability index
Blood donor CFS Diseased controls SLE SS SSc MCTD PMDM
le10 11-le30 31-le50 51-le85 gt85
075 024 001 000 000
084 013 001 001 000
050 038 003 007 003
004 009 012 032 043
009 009 009 043 031
001 020 014 042 022
000 000 000 000 100
015 041 011 026 007
Probability index SLE SS SSc MCTD PMDM
le10 11 le30 31 le50 51 le85 gt85
006 (002-02)
04 (02-08)
68 (26-178)
121 (62-236)
439 (160-1204)
01 (004-04)
03 (01-10)
50 (14-186)
160 (79-322)
322 (108-959)
002 (0003-01)
08 (05-13)
85 (33-215)
157 (82-299)
223 (76-651)
1025 (387-2718)
02 (009-05)
16 (10-27)
65 (18-238)
97 (40-229)
76 (14-396)
Maenhout et al 2014
Maenhout et al 2014
Conclusions
bull High quality image acquisition
bull Significant correlation between intensity and antibody titer
bull Fluorescence intensity provides clinically useful information
bull Enables implementation of a quantitative internal quality
control system
bull Accuracy of pattern recognition is limited
a microdot array based immunoassay developed to allow simultaneous detection of multiple
autoantibodies on a single patient
Cambridge Life Sciences Ltd
ZENITbullAMiDot
bull One patient sample per well ndash 9 x 9 microarray (81 dots)
Cambridge Life Sciences Ltd
ZENITbullAMiDot
bull Each 9 x 9 microarray contains
bull Multiple autoimmune antigen dots
bull Calibration dots
bull Control dots
bull Registration dots
Cambridge Life Sciences Ltd
ZENITbullAMiDot
0
25000
50000
75000
100000
125000
150000
175000
200000
0 10 20 30 40 50 60 70 80 90 100
Raw
Sig
nal
Calibrator Conc (UmL)
Calibration
bullEach 9 x 9 microarray is
bullPrinted on to an activated glass surface
bullEach dot is ~20microm in diameter
bullEach autoimmune antigen calibrator and control is printed in duplicate or triplicate
bullAutomated analysis
bullImage taken by Reader (G-Sight or AMiDot reader)
Cambridge Life Sciences Ltd
ZENITbullAMiDot
Software receives the image analyses the image and produces a patient report
Antigen RecombinantNative Antigen RecombinantNative
Ro60SS-A recombinant PL7PL12 recombinant
Ro52SS-A recombinant MPO native
LaSS-B recombinant PR3 native
Sm native GBM native
U1-snRNP (68kDAC) recombinant Cathepsin native
Jo-1 recombinant SRP-54 recombinant
Scl70 native BPI native
PMScl100 recombinant ASCA native
dsDNA plasmid tTG recombinant
Histones Native deaminated Gliadin recombinant
Mi-2 recombinant TPO recombinant
Centromere B recombinant Intrinsic Factor recombinant
Ku recombinant Gastric Parietal Cell native
PCNA recombinant M2 recombinant
Ribosomal P0 recombinant LKM-1 recombinant
Elastase native LC1 recombinant
ZENITbullAMiDot
Cambridge Life Sciences Ltd
Conclusion AMiDot
bull Allows multiplex detection of autoantibodies
bull Overall a good concordance with results obtained by EliA
bull Multiplex ANA testing is an efficient way to simultaneously test for specific antibodies
bull Small sample volumes can be used
bull Further studies are warranted to prove the reliability of this technique
Acknowledgements
bull Dept of Laboratory Medicine - Immunology
ndash Dr Vermeersch ndash Dr Marieumln Mrs Godefridis ndash S Cooreman ndash S Schouwers
bull Experimental Laboratory
Immunology ndash K Op de Beeacuteck ndash D Dillaerts
bull Dept of Rheumatology Internal
Medicine ndash Dr Verschueren ndash Dr Westhovens ndash Dr Blockmans
bull Menarini ndash Heidi Debaere
bull Instrumentation Laboratory ndash Nathalie Vandeputte
bull KUL - statistics ndash S Fieuws
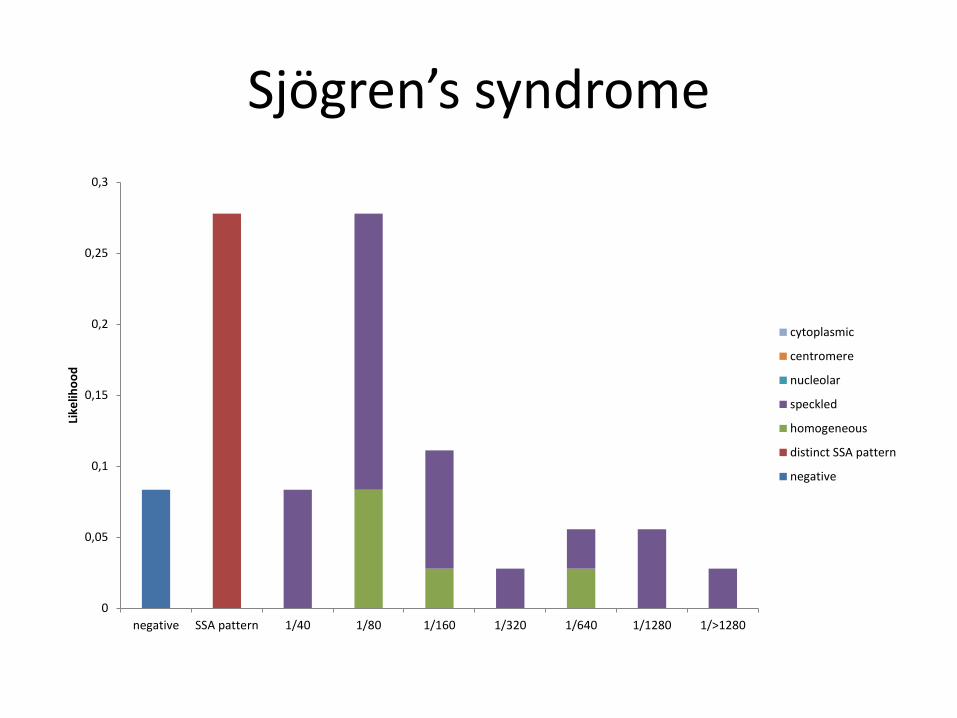
Sjoumlgrenrsquos syndrome
0
005
01
015
02
025
03
negative SSA pattern 140 180 1160 1320 1640 11280 1gt1280
Like
liho
od
cytoplasmic
centromere
nucleolar
speckled
homogeneous
distinct SSA pattern
negative
Inflammatory myopathy
0
005
01
015
02
025
03
035
04
negative SSA pattern 140 180 1160 1320 1640 11280 1gt1280
Like
liho
od
cytoplasmic
centromere
nucleolar
speckled
homogeneous
distinct SSA pattern
negative
Blood donors
0
01
02
03
04
05
06
07
08
09
1
negative SSA pattern 140 180 1160 1320 1640 11280 1gt1280
Like
liho
od
cytoplasmic
centromere
nucleolar
speckled
homogeneous
distinct SSA pattern
negative
Chronic fatique syndrome
0
01
02
03
04
05
06
07
08
09
negative SSA pattern 140 180 1160 1320 1640 11280 1gt1280
Like
liho
od
cytoplasmic
centromere
nucleolar
speckled
homogeneous
distinct SSA pattern
negative
Diseased controls
0
01
02
03
04
05
06
07
negative SSA pattern 140 180 1160 1320 1640 11280 1gt1280
Like
liho
od
cytoplasmic
centromere
nucleolar
speckled
homogeneous
distinct SSA pattern
negative
EVALUATION OF ANA BY SOLID PHASE ASSAY - ELIA
0
5
10
15
20
25
30
35
BD CFS DisControls
SLE SCL SSc MCTD SS PM DM
Rati
o
Groups
CTD Screen EliA
CTD
scr
ee
n
AN
A 1
40
o
r SS
A p
acirctte
rn
AN
A 1
80
o
r SS
A p
atte
rn
A
NA
11
60
o
r SS
A p
atte
rn
A
NA
13
20
o
r SS
A p
atte
rn
A
NA
16
40
o
r SS
A p
atte
rn
A
NA
11
28
0
or
SSA
pat
tern
SLE 74 963 925 900 688 538 313
SSc 72 986 971 928 812 623 391
MCTD 100 1000 1000 1000 1000 923 692
SS 89 917 833 556 444 417 361
PMDM 39 643 464 357 286 143 71
Blood donors 27 121 87 60 27 13 07
CFS 29 144 79 36 29 29 29
Diseased controls 37 358 254 171 112 60 30
0
005
01
015
02
025
negative SSA pattern 140 180 1160 1320 1640 11280 1gt1280
Like
liho
od
SLE
no ENAdsDNA
dsDNA
SSA
U1-RNP
mixed
0
005
01
015
02
025
negative SSA pattern 140 180 1160 1320 1640 11280 1gt1280
Like
liho
od
Systemic Sclerosis
no ENAdsDNA
PM-Scl
RNA-pol
Scl-70
CENP
SSA
0
005
01
015
02
025
03
negative SSA pattern 140 180 1160 1320 1640 11280 1gt1280
Like
liho
od
Sjoumlgrens syndrome
no ENAdsDNA
SSA
SSA+SSB
dsDNA+SSA
0
005
01
015
02
025
03
035
04
negative SSA pattern 140 180 1160 1320 1640 11280 1gt1280
Like
liho
od
Inflammatory myopathy
no ENAdsDNA
PM-Scl
Mi-2
Jo-1
Jo-1+SSA52
0
005
01
015
02
025
03
035
04
045
05
negative SSA pattern 140 180 1160 1320 1640 11280 1gt1280
Like
liho
od
MCTD
U1-RNP
U1-RNP+RNP70
dsD
NA
SSA
-60
SSA
-52
SSB
U1
-RN
P
RN
P-7
0
Sm
Rib
-P
CEN
P
Scl-
70
Po
l-II
I
PM
-Scl
Jo-1
Mi-
2
CTD
scr
ee
n
SLE 45 48 38 19 16 63 63 88 74
SCL 60 30 10 60
SSc 14 72 29 14 35 28 72 29 72
MCTD 77 100 92 77 100
SS 28 86 81 58 89
PMDM 18 36 36 71 29 36 39
Blood donors 07 07 27
CFS 07 14 07 07 29
Diseased controls 07 22 07 07 37
ge1 ge2 ge3 ge4 ge5 ge6 ge7
SLE 725 488 325 175 75 63 13
SCL 600 300 100
SSc 739 101 14
MCTD 1000 923 154
SS 889 861 528
PMDM 393 179 71
Blood donors 13
CFS 29 07
Diseased controls 45
Antinuclear antibody detection indirect immunofluorescene
versus solid phase assay
Xavier Bossuyt
Annals Rheum Dis 2010691420-22
Aim
To evaluate the diagnostic performance of
IIF solid phase assay amp the combination of both for
Systemic lupus erythematosus (SLE)
Systemic slcerosis (SSc)
pSjogrenrsquos syndrome (SS)
1
2
3
BioPlex 2200 chromatin Sm ribosomal protein SSA-60 SSB RNP-A and RNP-68 SSA-52 Scl-70 Jo-1 centromere B dsDNA
IIF HEp-2000 (Immunoconcepts) EliA CTD screen (Thermo Fisher) SSARo 52 SSARo 60 SSBLa U1-RNP (RNP-70 A C) Sm centromere B Jo-1 Scl-70 Rib-P fibrillarin RNA Pol III PM-Scl PCNA and Mi-2 dsDNA
IIF 180 IIF 1160 EliA CTD screen BioPlex 2200
Sensitivity
Systemic lupus erythematosus Reference 1 2 (n=80) 925 (84-97) 90 (81-95) 74 (63-82) 79 (69-86) Reference 3 (n=41) 97 (87-99) 95 (83-99) Systemic sclerosis Reference 1 2 (n=69) 97 (90-99) 93 (84-97) 725 (61-82) 72 (61-82) Reference 3 (n=37) 95 (82-98) 865 (72-94) Sjoumlgrenrsquos syndrome Reference 1 2 (n=36) 83 (68-92) 56 (40-70) 89 (75-96) 89 (75-96) Reference 3 (n=40) 76 (62-88) 74 (57-83)
Specificity
Healthy controls (n=125) (Ref 3) 87 (80-92) 95 (90-98) Blood donors (n=149) (Ref1 2) 91 (85-95) 94 (89-97) 97 (93-99) 95 (90-97) Chronic fatigue syndrome (n=139) (Ref1 2)
92 (86-96) 96 (92-98) 97 (92-99) 93 (87-96)
Diseased controls (n=134) (Ref1 2) 75 (67-81) 82 (75-88) 96 (91-98) 89 (82-93)
All controls (n=422) (Ref1 2) 86 (83-89) 91 (88-93) 97 (95-98) 92 (89-94)
0
005
01
015
02
025
Like
liho
od
SLE
0
005
01
015
02
025
Like
liho
od
Systemic sclerosis
0
005
01
015
02
025
03
Like
liho
od
Sjoumlgrens syndrome
LR Systemic lupus erythematosus
Systemic sclerosis Sjoumlgrenrsquos syndrome
IIF(+) (Ref 1 2) 67 (53-86) 71 (55-90) 61 (46-80) IIF(+) (Ref 3) 71 (46-112) 64 (40-101)0 57 (35-59) IIF(-) (Ref 1 2) 008 (004-019) 003 (001-013) 019 (009-040) IIF(-) (Ref 3) 003 (0004-020) 016 (003-035) 026 (015-046) EliA CTD screen (+) 239 (138-415) 235 (135-409) 288 (167-499) EliA CTD screen (-) 027 (019-039) 028 (019-042) 011 (005-029) IIF (+) EliA CTD screen (+) 414 (196-877) 436 (207-468) 468 (220-998) IIF (+) EliA CTD screen (-) 20 (12-31) 20 (13-33) 045 (012-18) IIF (-) EliA CTD screen (+) 35 (10-122) 78 (23-264) IIF (-) EliA CTD screen (-) 003 (0007-012) 003 (0009-013) 006 (002-025)
LR Systemic lupus erythematosus
Systemic sclerosis Sjoumlgrenrsquos syndrome
IIF(+) (Ref 1 2) 67 (53-86) 71 (55-90) 61 (46-80) IIF(+) (Ref 3) 71 (46-112) 64 (40-101)0 57 (35-59) IIF(-) (Ref 1 2) 008 (004-019) 003 (001-013) 019 (009-040) IIF(-) (Ref 3) 003 (0004-020) 016 (003-035) 026 (015-046) EliA CTD screen (+) 239 (138-415) 235 (135-409) 288 (167-499) EliA CTD screen (-) 027 (019-039) 028 (019-042) 011 (005-029) IIF (+) EliA CTD screen (+) 414 (196-877) 436 (207-468) 468 (220-998) IIF (+) EliA CTD screen (-) 20 (12-31) 20 (13-33) 045 (012-18) IIF (-) EliA CTD screen (+) 35 (10-122) 78 (23-264) IIF (-) EliA CTD screen (-) 003 (0007-012) 003 (0009-013) 006 (002-025)
Prevalence
Systemic lupus erythematosus
Systemic sclerosis
Sjoumlgrenrsquos syndrome
Controls
IIF (+) EliA CTD screen (+) 69 72 78 16 IIF (+) EliA CTD screen (-) 24 25 55 12 IIF (-) EliA CTD screen (+) 5 11 14 IIF (-) EliA CTD screen (-) 2 3 55 85
0
02
04
06
08
1
0 02 04 06 08 1
Po
st-t
est
pro
bab
ility
Pre-test probability
FEIA+ IIF+
FEIA+
IIF+
FEIA+ IIF-
FEIA- IIF+
FEIA-
IIF-
FEIA- IIF-
SLE
Comparative analysis of different strategies
1 IIF and FEIA on all samples
2 IIF
If IIF positive FEIA
If IIF negative stop
3 FEIA
4 IIF
Conclusion
Integrated interpretation
of IIF and solid phase assay results adds value
Optimal strategy
depends on the pathology
Bossuyt X Fieuws S Ann Rheum Dis 2014 Mar73(3)
Antinuclear antibodies by automated
indirect immunofluorescence Opportunities for value added
reporting
Xavier Bossuyt Leuven Belgium
Instrument NOVA View AKLIDES EUROPattern Image
Navigator
Helios ZENIT G Sight
Manufacturer INOVA Medipan EUROPattern Immuno Concepts Aesku Menarini
LIMS connection (software) Yes (QUANTA
Link)
Yes Yes
(EUROLabOffice)
Yes (direct) Yes (direct) Yes (ZenIT)
Slide identification via
barcode
Yes by handheld
scanner
Yes by handheld
scanner
Yes by integrated
scanner
Yes Yes by integrated
scanner
Yes by integrated
scanner
Loading capacity 5 slides (up to 60
wells)
5 slides (up to 60
wells)
50 slides (up to 500
wells)
4 slides (up to 84
wells)
20 slides (up to 240
wells)
5 slides (up to 70
wells)
Image acquisition speed ~45swell for 3
images
~40swell lt20swell ~25swell for 4
images
10spicture
Customizable from 1
to 10 images
gt60swell
pictures 5 (small
scan) 50 (medium
scan) 220 (full scan)
100 QC for substrate and
process integrity
counterstaining
Yes DAPI Yes DAPI Yes Propidium
iodide
None None None None None None
Automatic posneg
discrimination incl
presorting of images
Yes Yes Yes Yes Yes Yes
Batchwise verification of
negative samples
Yes Yes Yes Yes Yes Yes
Automatic pattern
recognition
Yes Yes Yes No No Yes
Pattern Analysis method Pattern recognition by
mathematical algorithm
Pattern recognition by
mathematical algorithm
Pattern recognition by
mathematical algorithm
No pattern matching
capabilities
No pattern matching
capabilities
Pattern recognition by
mathematical algorithm
No of recognizable ANA
staining pattern list out
6
Homogeneous
Speckled
Centromere
Nucleolar
Nuclear dot
Cytoplasm
Negative
Positive unrecognized
10
Homogeneous
Speckled
Centromere
Nucleolar
Nuclear dot
Cytoplasm
Negative
Positive unrecognized
8
Homogeneous
Speckled
Centromere
Nucleolar
Nuclear dot
Cytoplasm
Nuclear rim
Mitotic negative
None None 5
Homogeneous
Speckled
Centromere
Nucleolar
Cytoplasm
Negative
Instrument calibration to
minimize variability
Yes Yes Yes Yes Yes No
Integration with slide
processing in 1 instrument
No No No No Yes No
Mahler et al J Immunol Research in press
Automated fluorescence microscopy is increasingly used for image acquisition quantitative analysis and pattern recognition of anti-nuclear antibody
testing
Positivenegative discrimination
bull Exposure time is inversely proportional to intensity of fluorescence
bull Probability value is given to samples
Pattern recognition ANA
bull five patterns ndash Homogeneous
ndash Speckled
ndash Centromere
ndash Nucleolar
ndash Mitochondrial
bull Based on statistical morphological and geometric features
IMAGE ACQUISITION
RNP
PM-Scl
Golgi
Membrane
Review of digital images
harr
manual approach (posneg)
ndash 90 identical interpretation (n=332) (Bonroy et al CCLM 2013)
ndash 88 identical interpretation (n=268) (Bossuyt et al CCA 2013)
Bonroy et al CCLM 2013
FLUORESENCE INTENSITY VERSUS ANTIBODY TITER
HEp-2
-10
10
30
50
70
90
neg 80 160 320 640 1280
Ind
ex
Titer
Outlier Boxplot
Outliers gt 15 and lt 3 IQR
Outliers gt 3 IQR
Midbody centriole few nuclear dots Golgi
Bossuyt et al CCA 2013
G-Sight HEp-2000
0
20
40
60
80
100
neg 180 1160 1320 1640 1gt=1280
Pro
ba
bil
ity i
nd
ex
Antibody titer
Bonroy et al 2013
NOVA View
0
500
1000
1500
2000
2500
3000
3500
Neg 80 160 320 640 gt=1280
Nova
Vie
w F
luo
resce
nce
In
de
x
Titer
Schouwers et al Clin Chem Lab Med 201452547-51
Pattern recognition
Visual inspection Correct assignment by G-Sight HEp-2
Correct assignment by G-sight HEp-2000
Homogeneous (n=42) 68 92
Speckled (n=34) 71 56
Centromere (n=6) 83 42
Pattern recognition (Bonroy et al 2013) Pattern assignment was incorrect in 29 of 132 pos samples No pattern assigned in 45 of samples Global accuracy of pattern assignment 26
FLUORESCENCE INTENSITY IN WELL-DEFINED PATIENT COHORTS
Study Population
n M()F() Median age (range)
Blood donors
108 5149 45 (19-65)
Chronic Fatigue Syndrome
150 1981 41 (16-75)
Diseased Controls 134 2575 45 (17-81)
392
Systemic Lupus Erythematosus
85 1288 355 (15-72)
Sjoumlgrenrsquos Syndrome
36 1486 56 (21-75)
Systemic Sclerosis
76 3466 53 (18-80)
Polymyositis Dermatomyositis
32 4456 50 (24-77)
Mixed Connective Tissue Disease
16 694 315 (16-66)
245
HEp2
-10
10
30
50
70
90
Blooddonor
CFS Discontrols
SLE SCL SS SSc MCTD PM DM
Gro
up
s
Groups
Outlier Boxplot
Outliers gt 15 and lt 3 IQR
Outliers gt 3 IQR
Bossuyt et al CCA 2013
G-Sight HEp-2000
-10
10
30
50
70
90
BloodDonors
CFS Dis Contr SLE SCL SS SSc MCTD PM DM
Pro
ba
bil
ity i
nd
ex
G-Sight HEp-2
Probability index
Blood donor CFS Diseased controls SLE SS SSc MCTD PMDM
le10 11-le30 31-le50 51-le85 gt85
075 024 001 000 000
084 013 001 001 000
050 038 003 007 003
004 009 012 032 043
009 009 009 043 031
001 020 014 042 022
000 000 000 000 100
015 041 011 026 007
Probability index SLE SS SSc MCTD PMDM
le10 11 le30 31 le50 51 le85 gt85
006 (002-02)
04 (02-08)
68 (26-178)
121 (62-236)
439 (160-1204)
01 (004-04)
03 (01-10)
50 (14-186)
160 (79-322)
322 (108-959)
002 (0003-01)
08 (05-13)
85 (33-215)
157 (82-299)
223 (76-651)
1025 (387-2718)
02 (009-05)
16 (10-27)
65 (18-238)
97 (40-229)
76 (14-396)
Bonroy et al CCLM 2013
0
500
1000
1500
2000
2500
3000
3500
HC CVS DC SLE SS SSc PMDM MCTD
L
I
U
Outlier Boxplot
Percentiles (95 of Distribution)
Outliers gt 15 and lt 3 IQR
Outliers gt 3 IQR
NOVA View
NOVA View LR LIU Controls SLE SS SSc PMDM MCTD SARD
Prevalence
lt49 056 006 003 003 013 005
49-120 026 005 006 005 019 007
121-600 013 011 003 009 034 011
601-2000 004 046 061 034 025 006 039
gt2000 001 033 028 049 009 094 038
LR
lt49 011 005 005 023 009
49-120 018 021 020 073 025
121-600 079 021 069 257 085
601-2000 112 150 84 61 15 96
gt2000 291 245 429 83 827 335
NOVA View
009 025 085
10
33
0
10
20
30
40
0
01
02
03
04
05
06
lt49 49-120 121-600 601-2000 gt2000
Like
liho
od
rat
io
Pre
vale
nce
Nuclear Index
controls
SRD
LR
LR 1 no clinical value gt10 lt01 clinically important difference 5 ndash 10 01 ndash 02 modest but substantial difference 2 ndash 5 02 ndash 05 small difference that may be relevant
Post-test odds
=
Pre-test odds x LR
probability rarr odds
02 rarr 02 (1 ndash 02)
025
odds rarr probability
4 rarr 4 (1 + 4)
08
0
02
04
06
08
1
000 020 040 060 080 100
Po
st-t
est
pro
bab
ility
Pre-test probability
lt20
20-50
51-200
gt200
gt2000
Pre-test probability Post-test probability
lt49 120-600 600-2000 gt2000
1 a young women with hair loss and polyarthralgia 007 05 5 25
0
02
04
06
08
1
000 020 040 060 080 100
Po
st-t
est
pro
bab
ility
Pre-test probability
lt20
20-50
51-200
gt200
gt2000
Pre-test probability Post-test probability
lt49 120-600 600-2000 gt2000
10 a young women with photosensitivity and mild leucopenia (3000-3500mm3)
07 55 36 79
0
02
04
06
08
1
000 020 040 060 080 100
Po
st-t
est
pro
bab
ility
Pre-test probability
lt20
20-50
51-200
gt200
gt2000
Pre-test probability Post-test probability
lt49 120-600 600-2000 gt2000
50 a young women with photosensitivity malar rash and symmetrical polyarthritis
65 35 83 97
G-Sight HEp-2
Probability index
Blood donor CFS Diseased controls SLE SS SSc MCTD PMDM
le10 11-le30 31-le50 51-le85 gt85
075 024 001 000 000
084 013 001 001 000
050 038 003 007 003
004 009 012 032 043
009 009 009 043 031
001 020 014 042 022
000 000 000 000 100
015 041 011 026 007
Probability index SLE SS SSc MCTD PMDM
le10 11 le30 31 le50 51 le85 gt85
006 (002-02)
04 (02-08)
68 (26-178)
121 (62-236)
439 (160-1204)
01 (004-04)
03 (01-10)
50 (14-186)
160 (79-322)
322 (108-959)
002 (0003-01)
08 (05-13)
85 (33-215)
157 (82-299)
223 (76-651)
1025 (387-2718)
02 (009-05)
16 (10-27)
65 (18-238)
97 (40-229)
76 (14-396)
Maenhout et al 2014
Maenhout et al 2014
Conclusions
bull High quality image acquisition
bull Significant correlation between intensity and antibody titer
bull Fluorescence intensity provides clinically useful information
bull Enables implementation of a quantitative internal quality
control system
bull Accuracy of pattern recognition is limited
a microdot array based immunoassay developed to allow simultaneous detection of multiple
autoantibodies on a single patient
Cambridge Life Sciences Ltd
ZENITbullAMiDot
bull One patient sample per well ndash 9 x 9 microarray (81 dots)
Cambridge Life Sciences Ltd
ZENITbullAMiDot
bull Each 9 x 9 microarray contains
bull Multiple autoimmune antigen dots
bull Calibration dots
bull Control dots
bull Registration dots
Cambridge Life Sciences Ltd
ZENITbullAMiDot
0
25000
50000
75000
100000
125000
150000
175000
200000
0 10 20 30 40 50 60 70 80 90 100
Raw
Sig
nal
Calibrator Conc (UmL)
Calibration
bullEach 9 x 9 microarray is
bullPrinted on to an activated glass surface
bullEach dot is ~20microm in diameter
bullEach autoimmune antigen calibrator and control is printed in duplicate or triplicate
bullAutomated analysis
bullImage taken by Reader (G-Sight or AMiDot reader)
Cambridge Life Sciences Ltd
ZENITbullAMiDot
Software receives the image analyses the image and produces a patient report
Antigen RecombinantNative Antigen RecombinantNative
Ro60SS-A recombinant PL7PL12 recombinant
Ro52SS-A recombinant MPO native
LaSS-B recombinant PR3 native
Sm native GBM native
U1-snRNP (68kDAC) recombinant Cathepsin native
Jo-1 recombinant SRP-54 recombinant
Scl70 native BPI native
PMScl100 recombinant ASCA native
dsDNA plasmid tTG recombinant
Histones Native deaminated Gliadin recombinant
Mi-2 recombinant TPO recombinant
Centromere B recombinant Intrinsic Factor recombinant
Ku recombinant Gastric Parietal Cell native
PCNA recombinant M2 recombinant
Ribosomal P0 recombinant LKM-1 recombinant
Elastase native LC1 recombinant
ZENITbullAMiDot
Cambridge Life Sciences Ltd
Conclusion AMiDot
bull Allows multiplex detection of autoantibodies
bull Overall a good concordance with results obtained by EliA
bull Multiplex ANA testing is an efficient way to simultaneously test for specific antibodies
bull Small sample volumes can be used
bull Further studies are warranted to prove the reliability of this technique
Acknowledgements
bull Dept of Laboratory Medicine - Immunology
ndash Dr Vermeersch ndash Dr Marieumln Mrs Godefridis ndash S Cooreman ndash S Schouwers
bull Experimental Laboratory
Immunology ndash K Op de Beeacuteck ndash D Dillaerts
bull Dept of Rheumatology Internal
Medicine ndash Dr Verschueren ndash Dr Westhovens ndash Dr Blockmans
bull Menarini ndash Heidi Debaere
bull Instrumentation Laboratory ndash Nathalie Vandeputte
bull KUL - statistics ndash S Fieuws

Inflammatory myopathy
0
005
01
015
02
025
03
035
04
negative SSA pattern 140 180 1160 1320 1640 11280 1gt1280
Like
liho
od
cytoplasmic
centromere
nucleolar
speckled
homogeneous
distinct SSA pattern
negative
Blood donors
0
01
02
03
04
05
06
07
08
09
1
negative SSA pattern 140 180 1160 1320 1640 11280 1gt1280
Like
liho
od
cytoplasmic
centromere
nucleolar
speckled
homogeneous
distinct SSA pattern
negative
Chronic fatique syndrome
0
01
02
03
04
05
06
07
08
09
negative SSA pattern 140 180 1160 1320 1640 11280 1gt1280
Like
liho
od
cytoplasmic
centromere
nucleolar
speckled
homogeneous
distinct SSA pattern
negative
Diseased controls
0
01
02
03
04
05
06
07
negative SSA pattern 140 180 1160 1320 1640 11280 1gt1280
Like
liho
od
cytoplasmic
centromere
nucleolar
speckled
homogeneous
distinct SSA pattern
negative
EVALUATION OF ANA BY SOLID PHASE ASSAY - ELIA
0
5
10
15
20
25
30
35
BD CFS DisControls
SLE SCL SSc MCTD SS PM DM
Rati
o
Groups
CTD Screen EliA
CTD
scr
ee
n
AN
A 1
40
o
r SS
A p
acirctte
rn
AN
A 1
80
o
r SS
A p
atte
rn
A
NA
11
60
o
r SS
A p
atte
rn
A
NA
13
20
o
r SS
A p
atte
rn
A
NA
16
40
o
r SS
A p
atte
rn
A
NA
11
28
0
or
SSA
pat
tern
SLE 74 963 925 900 688 538 313
SSc 72 986 971 928 812 623 391
MCTD 100 1000 1000 1000 1000 923 692
SS 89 917 833 556 444 417 361
PMDM 39 643 464 357 286 143 71
Blood donors 27 121 87 60 27 13 07
CFS 29 144 79 36 29 29 29
Diseased controls 37 358 254 171 112 60 30
0
005
01
015
02
025
negative SSA pattern 140 180 1160 1320 1640 11280 1gt1280
Like
liho
od
SLE
no ENAdsDNA
dsDNA
SSA
U1-RNP
mixed
0
005
01
015
02
025
negative SSA pattern 140 180 1160 1320 1640 11280 1gt1280
Like
liho
od
Systemic Sclerosis
no ENAdsDNA
PM-Scl
RNA-pol
Scl-70
CENP
SSA
0
005
01
015
02
025
03
negative SSA pattern 140 180 1160 1320 1640 11280 1gt1280
Like
liho
od
Sjoumlgrens syndrome
no ENAdsDNA
SSA
SSA+SSB
dsDNA+SSA
0
005
01
015
02
025
03
035
04
negative SSA pattern 140 180 1160 1320 1640 11280 1gt1280
Like
liho
od
Inflammatory myopathy
no ENAdsDNA
PM-Scl
Mi-2
Jo-1
Jo-1+SSA52
0
005
01
015
02
025
03
035
04
045
05
negative SSA pattern 140 180 1160 1320 1640 11280 1gt1280
Like
liho
od
MCTD
U1-RNP
U1-RNP+RNP70
dsD
NA
SSA
-60
SSA
-52
SSB
U1
-RN
P
RN
P-7
0
Sm
Rib
-P
CEN
P
Scl-
70
Po
l-II
I
PM
-Scl
Jo-1
Mi-
2
CTD
scr
ee
n
SLE 45 48 38 19 16 63 63 88 74
SCL 60 30 10 60
SSc 14 72 29 14 35 28 72 29 72
MCTD 77 100 92 77 100
SS 28 86 81 58 89
PMDM 18 36 36 71 29 36 39
Blood donors 07 07 27
CFS 07 14 07 07 29
Diseased controls 07 22 07 07 37
ge1 ge2 ge3 ge4 ge5 ge6 ge7
SLE 725 488 325 175 75 63 13
SCL 600 300 100
SSc 739 101 14
MCTD 1000 923 154
SS 889 861 528
PMDM 393 179 71
Blood donors 13
CFS 29 07
Diseased controls 45
Antinuclear antibody detection indirect immunofluorescene
versus solid phase assay
Xavier Bossuyt
Annals Rheum Dis 2010691420-22
Aim
To evaluate the diagnostic performance of
IIF solid phase assay amp the combination of both for
Systemic lupus erythematosus (SLE)
Systemic slcerosis (SSc)
pSjogrenrsquos syndrome (SS)
1
2
3
BioPlex 2200 chromatin Sm ribosomal protein SSA-60 SSB RNP-A and RNP-68 SSA-52 Scl-70 Jo-1 centromere B dsDNA
IIF HEp-2000 (Immunoconcepts) EliA CTD screen (Thermo Fisher) SSARo 52 SSARo 60 SSBLa U1-RNP (RNP-70 A C) Sm centromere B Jo-1 Scl-70 Rib-P fibrillarin RNA Pol III PM-Scl PCNA and Mi-2 dsDNA
IIF 180 IIF 1160 EliA CTD screen BioPlex 2200
Sensitivity
Systemic lupus erythematosus Reference 1 2 (n=80) 925 (84-97) 90 (81-95) 74 (63-82) 79 (69-86) Reference 3 (n=41) 97 (87-99) 95 (83-99) Systemic sclerosis Reference 1 2 (n=69) 97 (90-99) 93 (84-97) 725 (61-82) 72 (61-82) Reference 3 (n=37) 95 (82-98) 865 (72-94) Sjoumlgrenrsquos syndrome Reference 1 2 (n=36) 83 (68-92) 56 (40-70) 89 (75-96) 89 (75-96) Reference 3 (n=40) 76 (62-88) 74 (57-83)
Specificity
Healthy controls (n=125) (Ref 3) 87 (80-92) 95 (90-98) Blood donors (n=149) (Ref1 2) 91 (85-95) 94 (89-97) 97 (93-99) 95 (90-97) Chronic fatigue syndrome (n=139) (Ref1 2)
92 (86-96) 96 (92-98) 97 (92-99) 93 (87-96)
Diseased controls (n=134) (Ref1 2) 75 (67-81) 82 (75-88) 96 (91-98) 89 (82-93)
All controls (n=422) (Ref1 2) 86 (83-89) 91 (88-93) 97 (95-98) 92 (89-94)
0
005
01
015
02
025
Like
liho
od
SLE
0
005
01
015
02
025
Like
liho
od
Systemic sclerosis
0
005
01
015
02
025
03
Like
liho
od
Sjoumlgrens syndrome
LR Systemic lupus erythematosus
Systemic sclerosis Sjoumlgrenrsquos syndrome
IIF(+) (Ref 1 2) 67 (53-86) 71 (55-90) 61 (46-80) IIF(+) (Ref 3) 71 (46-112) 64 (40-101)0 57 (35-59) IIF(-) (Ref 1 2) 008 (004-019) 003 (001-013) 019 (009-040) IIF(-) (Ref 3) 003 (0004-020) 016 (003-035) 026 (015-046) EliA CTD screen (+) 239 (138-415) 235 (135-409) 288 (167-499) EliA CTD screen (-) 027 (019-039) 028 (019-042) 011 (005-029) IIF (+) EliA CTD screen (+) 414 (196-877) 436 (207-468) 468 (220-998) IIF (+) EliA CTD screen (-) 20 (12-31) 20 (13-33) 045 (012-18) IIF (-) EliA CTD screen (+) 35 (10-122) 78 (23-264) IIF (-) EliA CTD screen (-) 003 (0007-012) 003 (0009-013) 006 (002-025)
LR Systemic lupus erythematosus
Systemic sclerosis Sjoumlgrenrsquos syndrome
IIF(+) (Ref 1 2) 67 (53-86) 71 (55-90) 61 (46-80) IIF(+) (Ref 3) 71 (46-112) 64 (40-101)0 57 (35-59) IIF(-) (Ref 1 2) 008 (004-019) 003 (001-013) 019 (009-040) IIF(-) (Ref 3) 003 (0004-020) 016 (003-035) 026 (015-046) EliA CTD screen (+) 239 (138-415) 235 (135-409) 288 (167-499) EliA CTD screen (-) 027 (019-039) 028 (019-042) 011 (005-029) IIF (+) EliA CTD screen (+) 414 (196-877) 436 (207-468) 468 (220-998) IIF (+) EliA CTD screen (-) 20 (12-31) 20 (13-33) 045 (012-18) IIF (-) EliA CTD screen (+) 35 (10-122) 78 (23-264) IIF (-) EliA CTD screen (-) 003 (0007-012) 003 (0009-013) 006 (002-025)
Prevalence
Systemic lupus erythematosus
Systemic sclerosis
Sjoumlgrenrsquos syndrome
Controls
IIF (+) EliA CTD screen (+) 69 72 78 16 IIF (+) EliA CTD screen (-) 24 25 55 12 IIF (-) EliA CTD screen (+) 5 11 14 IIF (-) EliA CTD screen (-) 2 3 55 85
0
02
04
06
08
1
0 02 04 06 08 1
Po
st-t
est
pro
bab
ility
Pre-test probability
FEIA+ IIF+
FEIA+
IIF+
FEIA+ IIF-
FEIA- IIF+
FEIA-
IIF-
FEIA- IIF-
SLE
Comparative analysis of different strategies
1 IIF and FEIA on all samples
2 IIF
If IIF positive FEIA
If IIF negative stop
3 FEIA
4 IIF
Conclusion
Integrated interpretation
of IIF and solid phase assay results adds value
Optimal strategy
depends on the pathology
Bossuyt X Fieuws S Ann Rheum Dis 2014 Mar73(3)
Antinuclear antibodies by automated
indirect immunofluorescence Opportunities for value added
reporting
Xavier Bossuyt Leuven Belgium
Instrument NOVA View AKLIDES EUROPattern Image
Navigator
Helios ZENIT G Sight
Manufacturer INOVA Medipan EUROPattern Immuno Concepts Aesku Menarini
LIMS connection (software) Yes (QUANTA
Link)
Yes Yes
(EUROLabOffice)
Yes (direct) Yes (direct) Yes (ZenIT)
Slide identification via
barcode
Yes by handheld
scanner
Yes by handheld
scanner
Yes by integrated
scanner
Yes Yes by integrated
scanner
Yes by integrated
scanner
Loading capacity 5 slides (up to 60
wells)
5 slides (up to 60
wells)
50 slides (up to 500
wells)
4 slides (up to 84
wells)
20 slides (up to 240
wells)
5 slides (up to 70
wells)
Image acquisition speed ~45swell for 3
images
~40swell lt20swell ~25swell for 4
images
10spicture
Customizable from 1
to 10 images
gt60swell
pictures 5 (small
scan) 50 (medium
scan) 220 (full scan)
100 QC for substrate and
process integrity
counterstaining
Yes DAPI Yes DAPI Yes Propidium
iodide
None None None None None None
Automatic posneg
discrimination incl
presorting of images
Yes Yes Yes Yes Yes Yes
Batchwise verification of
negative samples
Yes Yes Yes Yes Yes Yes
Automatic pattern
recognition
Yes Yes Yes No No Yes
Pattern Analysis method Pattern recognition by
mathematical algorithm
Pattern recognition by
mathematical algorithm
Pattern recognition by
mathematical algorithm
No pattern matching
capabilities
No pattern matching
capabilities
Pattern recognition by
mathematical algorithm
No of recognizable ANA
staining pattern list out
6
Homogeneous
Speckled
Centromere
Nucleolar
Nuclear dot
Cytoplasm
Negative
Positive unrecognized
10
Homogeneous
Speckled
Centromere
Nucleolar
Nuclear dot
Cytoplasm
Negative
Positive unrecognized
8
Homogeneous
Speckled
Centromere
Nucleolar
Nuclear dot
Cytoplasm
Nuclear rim
Mitotic negative
None None 5
Homogeneous
Speckled
Centromere
Nucleolar
Cytoplasm
Negative
Instrument calibration to
minimize variability
Yes Yes Yes Yes Yes No
Integration with slide
processing in 1 instrument
No No No No Yes No
Mahler et al J Immunol Research in press
Automated fluorescence microscopy is increasingly used for image acquisition quantitative analysis and pattern recognition of anti-nuclear antibody
testing
Positivenegative discrimination
bull Exposure time is inversely proportional to intensity of fluorescence
bull Probability value is given to samples
Pattern recognition ANA
bull five patterns ndash Homogeneous
ndash Speckled
ndash Centromere
ndash Nucleolar
ndash Mitochondrial
bull Based on statistical morphological and geometric features
IMAGE ACQUISITION
RNP
PM-Scl
Golgi
Membrane
Review of digital images
harr
manual approach (posneg)
ndash 90 identical interpretation (n=332) (Bonroy et al CCLM 2013)
ndash 88 identical interpretation (n=268) (Bossuyt et al CCA 2013)
Bonroy et al CCLM 2013
FLUORESENCE INTENSITY VERSUS ANTIBODY TITER
HEp-2
-10
10
30
50
70
90
neg 80 160 320 640 1280
Ind
ex
Titer
Outlier Boxplot
Outliers gt 15 and lt 3 IQR
Outliers gt 3 IQR
Midbody centriole few nuclear dots Golgi
Bossuyt et al CCA 2013
G-Sight HEp-2000
0
20
40
60
80
100
neg 180 1160 1320 1640 1gt=1280
Pro
ba
bil
ity i
nd
ex
Antibody titer
Bonroy et al 2013
NOVA View
0
500
1000
1500
2000
2500
3000
3500
Neg 80 160 320 640 gt=1280
Nova
Vie
w F
luo
resce
nce
In
de
x
Titer
Schouwers et al Clin Chem Lab Med 201452547-51
Pattern recognition
Visual inspection Correct assignment by G-Sight HEp-2
Correct assignment by G-sight HEp-2000
Homogeneous (n=42) 68 92
Speckled (n=34) 71 56
Centromere (n=6) 83 42
Pattern recognition (Bonroy et al 2013) Pattern assignment was incorrect in 29 of 132 pos samples No pattern assigned in 45 of samples Global accuracy of pattern assignment 26
FLUORESCENCE INTENSITY IN WELL-DEFINED PATIENT COHORTS
Study Population
n M()F() Median age (range)
Blood donors
108 5149 45 (19-65)
Chronic Fatigue Syndrome
150 1981 41 (16-75)
Diseased Controls 134 2575 45 (17-81)
392
Systemic Lupus Erythematosus
85 1288 355 (15-72)
Sjoumlgrenrsquos Syndrome
36 1486 56 (21-75)
Systemic Sclerosis
76 3466 53 (18-80)
Polymyositis Dermatomyositis
32 4456 50 (24-77)
Mixed Connective Tissue Disease
16 694 315 (16-66)
245
HEp2
-10
10
30
50
70
90
Blooddonor
CFS Discontrols
SLE SCL SS SSc MCTD PM DM
Gro
up
s
Groups
Outlier Boxplot
Outliers gt 15 and lt 3 IQR
Outliers gt 3 IQR
Bossuyt et al CCA 2013
G-Sight HEp-2000
-10
10
30
50
70
90
BloodDonors
CFS Dis Contr SLE SCL SS SSc MCTD PM DM
Pro
ba
bil
ity i
nd
ex
G-Sight HEp-2
Probability index
Blood donor CFS Diseased controls SLE SS SSc MCTD PMDM
le10 11-le30 31-le50 51-le85 gt85
075 024 001 000 000
084 013 001 001 000
050 038 003 007 003
004 009 012 032 043
009 009 009 043 031
001 020 014 042 022
000 000 000 000 100
015 041 011 026 007
Probability index SLE SS SSc MCTD PMDM
le10 11 le30 31 le50 51 le85 gt85
006 (002-02)
04 (02-08)
68 (26-178)
121 (62-236)
439 (160-1204)
01 (004-04)
03 (01-10)
50 (14-186)
160 (79-322)
322 (108-959)
002 (0003-01)
08 (05-13)
85 (33-215)
157 (82-299)
223 (76-651)
1025 (387-2718)
02 (009-05)
16 (10-27)
65 (18-238)
97 (40-229)
76 (14-396)
Bonroy et al CCLM 2013
0
500
1000
1500
2000
2500
3000
3500
HC CVS DC SLE SS SSc PMDM MCTD
L
I
U
Outlier Boxplot
Percentiles (95 of Distribution)
Outliers gt 15 and lt 3 IQR
Outliers gt 3 IQR
NOVA View
NOVA View LR LIU Controls SLE SS SSc PMDM MCTD SARD
Prevalence
lt49 056 006 003 003 013 005
49-120 026 005 006 005 019 007
121-600 013 011 003 009 034 011
601-2000 004 046 061 034 025 006 039
gt2000 001 033 028 049 009 094 038
LR
lt49 011 005 005 023 009
49-120 018 021 020 073 025
121-600 079 021 069 257 085
601-2000 112 150 84 61 15 96
gt2000 291 245 429 83 827 335
NOVA View
009 025 085
10
33
0
10
20
30
40
0
01
02
03
04
05
06
lt49 49-120 121-600 601-2000 gt2000
Like
liho
od
rat
io
Pre
vale
nce
Nuclear Index
controls
SRD
LR
LR 1 no clinical value gt10 lt01 clinically important difference 5 ndash 10 01 ndash 02 modest but substantial difference 2 ndash 5 02 ndash 05 small difference that may be relevant
Post-test odds
=
Pre-test odds x LR
probability rarr odds
02 rarr 02 (1 ndash 02)
025
odds rarr probability
4 rarr 4 (1 + 4)
08
0
02
04
06
08
1
000 020 040 060 080 100
Po
st-t
est
pro
bab
ility
Pre-test probability
lt20
20-50
51-200
gt200
gt2000
Pre-test probability Post-test probability
lt49 120-600 600-2000 gt2000
1 a young women with hair loss and polyarthralgia 007 05 5 25
0
02
04
06
08
1
000 020 040 060 080 100
Po
st-t
est
pro
bab
ility
Pre-test probability
lt20
20-50
51-200
gt200
gt2000
Pre-test probability Post-test probability
lt49 120-600 600-2000 gt2000
10 a young women with photosensitivity and mild leucopenia (3000-3500mm3)
07 55 36 79
0
02
04
06
08
1
000 020 040 060 080 100
Po
st-t
est
pro
bab
ility
Pre-test probability
lt20
20-50
51-200
gt200
gt2000
Pre-test probability Post-test probability
lt49 120-600 600-2000 gt2000
50 a young women with photosensitivity malar rash and symmetrical polyarthritis
65 35 83 97
G-Sight HEp-2
Probability index
Blood donor CFS Diseased controls SLE SS SSc MCTD PMDM
le10 11-le30 31-le50 51-le85 gt85
075 024 001 000 000
084 013 001 001 000
050 038 003 007 003
004 009 012 032 043
009 009 009 043 031
001 020 014 042 022
000 000 000 000 100
015 041 011 026 007
Probability index SLE SS SSc MCTD PMDM
le10 11 le30 31 le50 51 le85 gt85
006 (002-02)
04 (02-08)
68 (26-178)
121 (62-236)
439 (160-1204)
01 (004-04)
03 (01-10)
50 (14-186)
160 (79-322)
322 (108-959)
002 (0003-01)
08 (05-13)
85 (33-215)
157 (82-299)
223 (76-651)
1025 (387-2718)
02 (009-05)
16 (10-27)
65 (18-238)
97 (40-229)
76 (14-396)
Maenhout et al 2014
Maenhout et al 2014
Conclusions
bull High quality image acquisition
bull Significant correlation between intensity and antibody titer
bull Fluorescence intensity provides clinically useful information
bull Enables implementation of a quantitative internal quality
control system
bull Accuracy of pattern recognition is limited
a microdot array based immunoassay developed to allow simultaneous detection of multiple
autoantibodies on a single patient
Cambridge Life Sciences Ltd
ZENITbullAMiDot
bull One patient sample per well ndash 9 x 9 microarray (81 dots)
Cambridge Life Sciences Ltd
ZENITbullAMiDot
bull Each 9 x 9 microarray contains
bull Multiple autoimmune antigen dots
bull Calibration dots
bull Control dots
bull Registration dots
Cambridge Life Sciences Ltd
ZENITbullAMiDot
0
25000
50000
75000
100000
125000
150000
175000
200000
0 10 20 30 40 50 60 70 80 90 100
Raw
Sig
nal
Calibrator Conc (UmL)
Calibration
bullEach 9 x 9 microarray is
bullPrinted on to an activated glass surface
bullEach dot is ~20microm in diameter
bullEach autoimmune antigen calibrator and control is printed in duplicate or triplicate
bullAutomated analysis
bullImage taken by Reader (G-Sight or AMiDot reader)
Cambridge Life Sciences Ltd
ZENITbullAMiDot
Software receives the image analyses the image and produces a patient report
Antigen RecombinantNative Antigen RecombinantNative
Ro60SS-A recombinant PL7PL12 recombinant
Ro52SS-A recombinant MPO native
LaSS-B recombinant PR3 native
Sm native GBM native
U1-snRNP (68kDAC) recombinant Cathepsin native
Jo-1 recombinant SRP-54 recombinant
Scl70 native BPI native
PMScl100 recombinant ASCA native
dsDNA plasmid tTG recombinant
Histones Native deaminated Gliadin recombinant
Mi-2 recombinant TPO recombinant
Centromere B recombinant Intrinsic Factor recombinant
Ku recombinant Gastric Parietal Cell native
PCNA recombinant M2 recombinant
Ribosomal P0 recombinant LKM-1 recombinant
Elastase native LC1 recombinant
ZENITbullAMiDot
Cambridge Life Sciences Ltd
Conclusion AMiDot
bull Allows multiplex detection of autoantibodies
bull Overall a good concordance with results obtained by EliA
bull Multiplex ANA testing is an efficient way to simultaneously test for specific antibodies
bull Small sample volumes can be used
bull Further studies are warranted to prove the reliability of this technique
Acknowledgements
bull Dept of Laboratory Medicine - Immunology
ndash Dr Vermeersch ndash Dr Marieumln Mrs Godefridis ndash S Cooreman ndash S Schouwers
bull Experimental Laboratory
Immunology ndash K Op de Beeacuteck ndash D Dillaerts
bull Dept of Rheumatology Internal
Medicine ndash Dr Verschueren ndash Dr Westhovens ndash Dr Blockmans
bull Menarini ndash Heidi Debaere
bull Instrumentation Laboratory ndash Nathalie Vandeputte
bull KUL - statistics ndash S Fieuws

Blood donors
0
01
02
03
04
05
06
07
08
09
1
negative SSA pattern 140 180 1160 1320 1640 11280 1gt1280
Like
liho
od
cytoplasmic
centromere
nucleolar
speckled
homogeneous
distinct SSA pattern
negative
Chronic fatique syndrome
0
01
02
03
04
05
06
07
08
09
negative SSA pattern 140 180 1160 1320 1640 11280 1gt1280
Like
liho
od
cytoplasmic
centromere
nucleolar
speckled
homogeneous
distinct SSA pattern
negative
Diseased controls
0
01
02
03
04
05
06
07
negative SSA pattern 140 180 1160 1320 1640 11280 1gt1280
Like
liho
od
cytoplasmic
centromere
nucleolar
speckled
homogeneous
distinct SSA pattern
negative
EVALUATION OF ANA BY SOLID PHASE ASSAY - ELIA
0
5
10
15
20
25
30
35
BD CFS DisControls
SLE SCL SSc MCTD SS PM DM
Rati
o
Groups
CTD Screen EliA
CTD
scr
ee
n
AN
A 1
40
o
r SS
A p
acirctte
rn
AN
A 1
80
o
r SS
A p
atte
rn
A
NA
11
60
o
r SS
A p
atte
rn
A
NA
13
20
o
r SS
A p
atte
rn
A
NA
16
40
o
r SS
A p
atte
rn
A
NA
11
28
0
or
SSA
pat
tern
SLE 74 963 925 900 688 538 313
SSc 72 986 971 928 812 623 391
MCTD 100 1000 1000 1000 1000 923 692
SS 89 917 833 556 444 417 361
PMDM 39 643 464 357 286 143 71
Blood donors 27 121 87 60 27 13 07
CFS 29 144 79 36 29 29 29
Diseased controls 37 358 254 171 112 60 30
0
005
01
015
02
025
negative SSA pattern 140 180 1160 1320 1640 11280 1gt1280
Like
liho
od
SLE
no ENAdsDNA
dsDNA
SSA
U1-RNP
mixed
0
005
01
015
02
025
negative SSA pattern 140 180 1160 1320 1640 11280 1gt1280
Like
liho
od
Systemic Sclerosis
no ENAdsDNA
PM-Scl
RNA-pol
Scl-70
CENP
SSA
0
005
01
015
02
025
03
negative SSA pattern 140 180 1160 1320 1640 11280 1gt1280
Like
liho
od
Sjoumlgrens syndrome
no ENAdsDNA
SSA
SSA+SSB
dsDNA+SSA
0
005
01
015
02
025
03
035
04
negative SSA pattern 140 180 1160 1320 1640 11280 1gt1280
Like
liho
od
Inflammatory myopathy
no ENAdsDNA
PM-Scl
Mi-2
Jo-1
Jo-1+SSA52
0
005
01
015
02
025
03
035
04
045
05
negative SSA pattern 140 180 1160 1320 1640 11280 1gt1280
Like
liho
od
MCTD
U1-RNP
U1-RNP+RNP70
dsD
NA
SSA
-60
SSA
-52
SSB
U1
-RN
P
RN
P-7
0
Sm
Rib
-P
CEN
P
Scl-
70
Po
l-II
I
PM
-Scl
Jo-1
Mi-
2
CTD
scr
ee
n
SLE 45 48 38 19 16 63 63 88 74
SCL 60 30 10 60
SSc 14 72 29 14 35 28 72 29 72
MCTD 77 100 92 77 100
SS 28 86 81 58 89
PMDM 18 36 36 71 29 36 39
Blood donors 07 07 27
CFS 07 14 07 07 29
Diseased controls 07 22 07 07 37
ge1 ge2 ge3 ge4 ge5 ge6 ge7
SLE 725 488 325 175 75 63 13
SCL 600 300 100
SSc 739 101 14
MCTD 1000 923 154
SS 889 861 528
PMDM 393 179 71
Blood donors 13
CFS 29 07
Diseased controls 45
Antinuclear antibody detection indirect immunofluorescene
versus solid phase assay
Xavier Bossuyt
Annals Rheum Dis 2010691420-22
Aim
To evaluate the diagnostic performance of
IIF solid phase assay amp the combination of both for
Systemic lupus erythematosus (SLE)
Systemic slcerosis (SSc)
pSjogrenrsquos syndrome (SS)
1
2
3
BioPlex 2200 chromatin Sm ribosomal protein SSA-60 SSB RNP-A and RNP-68 SSA-52 Scl-70 Jo-1 centromere B dsDNA
IIF HEp-2000 (Immunoconcepts) EliA CTD screen (Thermo Fisher) SSARo 52 SSARo 60 SSBLa U1-RNP (RNP-70 A C) Sm centromere B Jo-1 Scl-70 Rib-P fibrillarin RNA Pol III PM-Scl PCNA and Mi-2 dsDNA
IIF 180 IIF 1160 EliA CTD screen BioPlex 2200
Sensitivity
Systemic lupus erythematosus Reference 1 2 (n=80) 925 (84-97) 90 (81-95) 74 (63-82) 79 (69-86) Reference 3 (n=41) 97 (87-99) 95 (83-99) Systemic sclerosis Reference 1 2 (n=69) 97 (90-99) 93 (84-97) 725 (61-82) 72 (61-82) Reference 3 (n=37) 95 (82-98) 865 (72-94) Sjoumlgrenrsquos syndrome Reference 1 2 (n=36) 83 (68-92) 56 (40-70) 89 (75-96) 89 (75-96) Reference 3 (n=40) 76 (62-88) 74 (57-83)
Specificity
Healthy controls (n=125) (Ref 3) 87 (80-92) 95 (90-98) Blood donors (n=149) (Ref1 2) 91 (85-95) 94 (89-97) 97 (93-99) 95 (90-97) Chronic fatigue syndrome (n=139) (Ref1 2)
92 (86-96) 96 (92-98) 97 (92-99) 93 (87-96)
Diseased controls (n=134) (Ref1 2) 75 (67-81) 82 (75-88) 96 (91-98) 89 (82-93)
All controls (n=422) (Ref1 2) 86 (83-89) 91 (88-93) 97 (95-98) 92 (89-94)
0
005
01
015
02
025
Like
liho
od
SLE
0
005
01
015
02
025
Like
liho
od
Systemic sclerosis
0
005
01
015
02
025
03
Like
liho
od
Sjoumlgrens syndrome
LR Systemic lupus erythematosus
Systemic sclerosis Sjoumlgrenrsquos syndrome
IIF(+) (Ref 1 2) 67 (53-86) 71 (55-90) 61 (46-80) IIF(+) (Ref 3) 71 (46-112) 64 (40-101)0 57 (35-59) IIF(-) (Ref 1 2) 008 (004-019) 003 (001-013) 019 (009-040) IIF(-) (Ref 3) 003 (0004-020) 016 (003-035) 026 (015-046) EliA CTD screen (+) 239 (138-415) 235 (135-409) 288 (167-499) EliA CTD screen (-) 027 (019-039) 028 (019-042) 011 (005-029) IIF (+) EliA CTD screen (+) 414 (196-877) 436 (207-468) 468 (220-998) IIF (+) EliA CTD screen (-) 20 (12-31) 20 (13-33) 045 (012-18) IIF (-) EliA CTD screen (+) 35 (10-122) 78 (23-264) IIF (-) EliA CTD screen (-) 003 (0007-012) 003 (0009-013) 006 (002-025)
LR Systemic lupus erythematosus
Systemic sclerosis Sjoumlgrenrsquos syndrome
IIF(+) (Ref 1 2) 67 (53-86) 71 (55-90) 61 (46-80) IIF(+) (Ref 3) 71 (46-112) 64 (40-101)0 57 (35-59) IIF(-) (Ref 1 2) 008 (004-019) 003 (001-013) 019 (009-040) IIF(-) (Ref 3) 003 (0004-020) 016 (003-035) 026 (015-046) EliA CTD screen (+) 239 (138-415) 235 (135-409) 288 (167-499) EliA CTD screen (-) 027 (019-039) 028 (019-042) 011 (005-029) IIF (+) EliA CTD screen (+) 414 (196-877) 436 (207-468) 468 (220-998) IIF (+) EliA CTD screen (-) 20 (12-31) 20 (13-33) 045 (012-18) IIF (-) EliA CTD screen (+) 35 (10-122) 78 (23-264) IIF (-) EliA CTD screen (-) 003 (0007-012) 003 (0009-013) 006 (002-025)
Prevalence
Systemic lupus erythematosus
Systemic sclerosis
Sjoumlgrenrsquos syndrome
Controls
IIF (+) EliA CTD screen (+) 69 72 78 16 IIF (+) EliA CTD screen (-) 24 25 55 12 IIF (-) EliA CTD screen (+) 5 11 14 IIF (-) EliA CTD screen (-) 2 3 55 85
0
02
04
06
08
1
0 02 04 06 08 1
Po
st-t
est
pro
bab
ility
Pre-test probability
FEIA+ IIF+
FEIA+
IIF+
FEIA+ IIF-
FEIA- IIF+
FEIA-
IIF-
FEIA- IIF-
SLE
Comparative analysis of different strategies
1 IIF and FEIA on all samples
2 IIF
If IIF positive FEIA
If IIF negative stop
3 FEIA
4 IIF
Conclusion
Integrated interpretation
of IIF and solid phase assay results adds value
Optimal strategy
depends on the pathology
Bossuyt X Fieuws S Ann Rheum Dis 2014 Mar73(3)
Antinuclear antibodies by automated
indirect immunofluorescence Opportunities for value added
reporting
Xavier Bossuyt Leuven Belgium
Instrument NOVA View AKLIDES EUROPattern Image
Navigator
Helios ZENIT G Sight
Manufacturer INOVA Medipan EUROPattern Immuno Concepts Aesku Menarini
LIMS connection (software) Yes (QUANTA
Link)
Yes Yes
(EUROLabOffice)
Yes (direct) Yes (direct) Yes (ZenIT)
Slide identification via
barcode
Yes by handheld
scanner
Yes by handheld
scanner
Yes by integrated
scanner
Yes Yes by integrated
scanner
Yes by integrated
scanner
Loading capacity 5 slides (up to 60
wells)
5 slides (up to 60
wells)
50 slides (up to 500
wells)
4 slides (up to 84
wells)
20 slides (up to 240
wells)
5 slides (up to 70
wells)
Image acquisition speed ~45swell for 3
images
~40swell lt20swell ~25swell for 4
images
10spicture
Customizable from 1
to 10 images
gt60swell
pictures 5 (small
scan) 50 (medium
scan) 220 (full scan)
100 QC for substrate and
process integrity
counterstaining
Yes DAPI Yes DAPI Yes Propidium
iodide
None None None None None None
Automatic posneg
discrimination incl
presorting of images
Yes Yes Yes Yes Yes Yes
Batchwise verification of
negative samples
Yes Yes Yes Yes Yes Yes
Automatic pattern
recognition
Yes Yes Yes No No Yes
Pattern Analysis method Pattern recognition by
mathematical algorithm
Pattern recognition by
mathematical algorithm
Pattern recognition by
mathematical algorithm
No pattern matching
capabilities
No pattern matching
capabilities
Pattern recognition by
mathematical algorithm
No of recognizable ANA
staining pattern list out
6
Homogeneous
Speckled
Centromere
Nucleolar
Nuclear dot
Cytoplasm
Negative
Positive unrecognized
10
Homogeneous
Speckled
Centromere
Nucleolar
Nuclear dot
Cytoplasm
Negative
Positive unrecognized
8
Homogeneous
Speckled
Centromere
Nucleolar
Nuclear dot
Cytoplasm
Nuclear rim
Mitotic negative
None None 5
Homogeneous
Speckled
Centromere
Nucleolar
Cytoplasm
Negative
Instrument calibration to
minimize variability
Yes Yes Yes Yes Yes No
Integration with slide
processing in 1 instrument
No No No No Yes No
Mahler et al J Immunol Research in press
Automated fluorescence microscopy is increasingly used for image acquisition quantitative analysis and pattern recognition of anti-nuclear antibody
testing
Positivenegative discrimination
bull Exposure time is inversely proportional to intensity of fluorescence
bull Probability value is given to samples
Pattern recognition ANA
bull five patterns ndash Homogeneous
ndash Speckled
ndash Centromere
ndash Nucleolar
ndash Mitochondrial
bull Based on statistical morphological and geometric features
IMAGE ACQUISITION
RNP
PM-Scl
Golgi
Membrane
Review of digital images
harr
manual approach (posneg)
ndash 90 identical interpretation (n=332) (Bonroy et al CCLM 2013)
ndash 88 identical interpretation (n=268) (Bossuyt et al CCA 2013)
Bonroy et al CCLM 2013
FLUORESENCE INTENSITY VERSUS ANTIBODY TITER
HEp-2
-10
10
30
50
70
90
neg 80 160 320 640 1280
Ind
ex
Titer
Outlier Boxplot
Outliers gt 15 and lt 3 IQR
Outliers gt 3 IQR
Midbody centriole few nuclear dots Golgi
Bossuyt et al CCA 2013
G-Sight HEp-2000
0
20
40
60
80
100
neg 180 1160 1320 1640 1gt=1280
Pro
ba
bil
ity i
nd
ex
Antibody titer
Bonroy et al 2013
NOVA View
0
500
1000
1500
2000
2500
3000
3500
Neg 80 160 320 640 gt=1280
Nova
Vie
w F
luo
resce
nce
In
de
x
Titer
Schouwers et al Clin Chem Lab Med 201452547-51
Pattern recognition
Visual inspection Correct assignment by G-Sight HEp-2
Correct assignment by G-sight HEp-2000
Homogeneous (n=42) 68 92
Speckled (n=34) 71 56
Centromere (n=6) 83 42
Pattern recognition (Bonroy et al 2013) Pattern assignment was incorrect in 29 of 132 pos samples No pattern assigned in 45 of samples Global accuracy of pattern assignment 26
FLUORESCENCE INTENSITY IN WELL-DEFINED PATIENT COHORTS
Study Population
n M()F() Median age (range)
Blood donors
108 5149 45 (19-65)
Chronic Fatigue Syndrome
150 1981 41 (16-75)
Diseased Controls 134 2575 45 (17-81)
392
Systemic Lupus Erythematosus
85 1288 355 (15-72)
Sjoumlgrenrsquos Syndrome
36 1486 56 (21-75)
Systemic Sclerosis
76 3466 53 (18-80)
Polymyositis Dermatomyositis
32 4456 50 (24-77)
Mixed Connective Tissue Disease
16 694 315 (16-66)
245
HEp2
-10
10
30
50
70
90
Blooddonor
CFS Discontrols
SLE SCL SS SSc MCTD PM DM
Gro
up
s
Groups
Outlier Boxplot
Outliers gt 15 and lt 3 IQR
Outliers gt 3 IQR
Bossuyt et al CCA 2013
G-Sight HEp-2000
-10
10
30
50
70
90
BloodDonors
CFS Dis Contr SLE SCL SS SSc MCTD PM DM
Pro
ba
bil
ity i
nd
ex
G-Sight HEp-2
Probability index
Blood donor CFS Diseased controls SLE SS SSc MCTD PMDM
le10 11-le30 31-le50 51-le85 gt85
075 024 001 000 000
084 013 001 001 000
050 038 003 007 003
004 009 012 032 043
009 009 009 043 031
001 020 014 042 022
000 000 000 000 100
015 041 011 026 007
Probability index SLE SS SSc MCTD PMDM
le10 11 le30 31 le50 51 le85 gt85
006 (002-02)
04 (02-08)
68 (26-178)
121 (62-236)
439 (160-1204)
01 (004-04)
03 (01-10)
50 (14-186)
160 (79-322)
322 (108-959)
002 (0003-01)
08 (05-13)
85 (33-215)
157 (82-299)
223 (76-651)
1025 (387-2718)
02 (009-05)
16 (10-27)
65 (18-238)
97 (40-229)
76 (14-396)
Bonroy et al CCLM 2013
0
500
1000
1500
2000
2500
3000
3500
HC CVS DC SLE SS SSc PMDM MCTD
L
I
U
Outlier Boxplot
Percentiles (95 of Distribution)
Outliers gt 15 and lt 3 IQR
Outliers gt 3 IQR
NOVA View
NOVA View LR LIU Controls SLE SS SSc PMDM MCTD SARD
Prevalence
lt49 056 006 003 003 013 005
49-120 026 005 006 005 019 007
121-600 013 011 003 009 034 011
601-2000 004 046 061 034 025 006 039
gt2000 001 033 028 049 009 094 038
LR
lt49 011 005 005 023 009
49-120 018 021 020 073 025
121-600 079 021 069 257 085
601-2000 112 150 84 61 15 96
gt2000 291 245 429 83 827 335
NOVA View
009 025 085
10
33
0
10
20
30
40
0
01
02
03
04
05
06
lt49 49-120 121-600 601-2000 gt2000
Like
liho
od
rat
io
Pre
vale
nce
Nuclear Index
controls
SRD
LR
LR 1 no clinical value gt10 lt01 clinically important difference 5 ndash 10 01 ndash 02 modest but substantial difference 2 ndash 5 02 ndash 05 small difference that may be relevant
Post-test odds
=
Pre-test odds x LR
probability rarr odds
02 rarr 02 (1 ndash 02)
025
odds rarr probability
4 rarr 4 (1 + 4)
08
0
02
04
06
08
1
000 020 040 060 080 100
Po
st-t
est
pro
bab
ility
Pre-test probability
lt20
20-50
51-200
gt200
gt2000
Pre-test probability Post-test probability
lt49 120-600 600-2000 gt2000
1 a young women with hair loss and polyarthralgia 007 05 5 25
0
02
04
06
08
1
000 020 040 060 080 100
Po
st-t
est
pro
bab
ility
Pre-test probability
lt20
20-50
51-200
gt200
gt2000
Pre-test probability Post-test probability
lt49 120-600 600-2000 gt2000
10 a young women with photosensitivity and mild leucopenia (3000-3500mm3)
07 55 36 79
0
02
04
06
08
1
000 020 040 060 080 100
Po
st-t
est
pro
bab
ility
Pre-test probability
lt20
20-50
51-200
gt200
gt2000
Pre-test probability Post-test probability
lt49 120-600 600-2000 gt2000
50 a young women with photosensitivity malar rash and symmetrical polyarthritis
65 35 83 97
G-Sight HEp-2
Probability index
Blood donor CFS Diseased controls SLE SS SSc MCTD PMDM
le10 11-le30 31-le50 51-le85 gt85
075 024 001 000 000
084 013 001 001 000
050 038 003 007 003
004 009 012 032 043
009 009 009 043 031
001 020 014 042 022
000 000 000 000 100
015 041 011 026 007
Probability index SLE SS SSc MCTD PMDM
le10 11 le30 31 le50 51 le85 gt85
006 (002-02)
04 (02-08)
68 (26-178)
121 (62-236)
439 (160-1204)
01 (004-04)
03 (01-10)
50 (14-186)
160 (79-322)
322 (108-959)
002 (0003-01)
08 (05-13)
85 (33-215)
157 (82-299)
223 (76-651)
1025 (387-2718)
02 (009-05)
16 (10-27)
65 (18-238)
97 (40-229)
76 (14-396)
Maenhout et al 2014
Maenhout et al 2014
Conclusions
bull High quality image acquisition
bull Significant correlation between intensity and antibody titer
bull Fluorescence intensity provides clinically useful information
bull Enables implementation of a quantitative internal quality
control system
bull Accuracy of pattern recognition is limited
a microdot array based immunoassay developed to allow simultaneous detection of multiple
autoantibodies on a single patient
Cambridge Life Sciences Ltd
ZENITbullAMiDot
bull One patient sample per well ndash 9 x 9 microarray (81 dots)
Cambridge Life Sciences Ltd
ZENITbullAMiDot
bull Each 9 x 9 microarray contains
bull Multiple autoimmune antigen dots
bull Calibration dots
bull Control dots
bull Registration dots
Cambridge Life Sciences Ltd
ZENITbullAMiDot
0
25000
50000
75000
100000
125000
150000
175000
200000
0 10 20 30 40 50 60 70 80 90 100
Raw
Sig
nal
Calibrator Conc (UmL)
Calibration
bullEach 9 x 9 microarray is
bullPrinted on to an activated glass surface
bullEach dot is ~20microm in diameter
bullEach autoimmune antigen calibrator and control is printed in duplicate or triplicate
bullAutomated analysis
bullImage taken by Reader (G-Sight or AMiDot reader)
Cambridge Life Sciences Ltd
ZENITbullAMiDot
Software receives the image analyses the image and produces a patient report
Antigen RecombinantNative Antigen RecombinantNative
Ro60SS-A recombinant PL7PL12 recombinant
Ro52SS-A recombinant MPO native
LaSS-B recombinant PR3 native
Sm native GBM native
U1-snRNP (68kDAC) recombinant Cathepsin native
Jo-1 recombinant SRP-54 recombinant
Scl70 native BPI native
PMScl100 recombinant ASCA native
dsDNA plasmid tTG recombinant
Histones Native deaminated Gliadin recombinant
Mi-2 recombinant TPO recombinant
Centromere B recombinant Intrinsic Factor recombinant
Ku recombinant Gastric Parietal Cell native
PCNA recombinant M2 recombinant
Ribosomal P0 recombinant LKM-1 recombinant
Elastase native LC1 recombinant
ZENITbullAMiDot
Cambridge Life Sciences Ltd
Conclusion AMiDot
bull Allows multiplex detection of autoantibodies
bull Overall a good concordance with results obtained by EliA
bull Multiplex ANA testing is an efficient way to simultaneously test for specific antibodies
bull Small sample volumes can be used
bull Further studies are warranted to prove the reliability of this technique
Acknowledgements
bull Dept of Laboratory Medicine - Immunology
ndash Dr Vermeersch ndash Dr Marieumln Mrs Godefridis ndash S Cooreman ndash S Schouwers
bull Experimental Laboratory
Immunology ndash K Op de Beeacuteck ndash D Dillaerts
bull Dept of Rheumatology Internal
Medicine ndash Dr Verschueren ndash Dr Westhovens ndash Dr Blockmans
bull Menarini ndash Heidi Debaere
bull Instrumentation Laboratory ndash Nathalie Vandeputte
bull KUL - statistics ndash S Fieuws
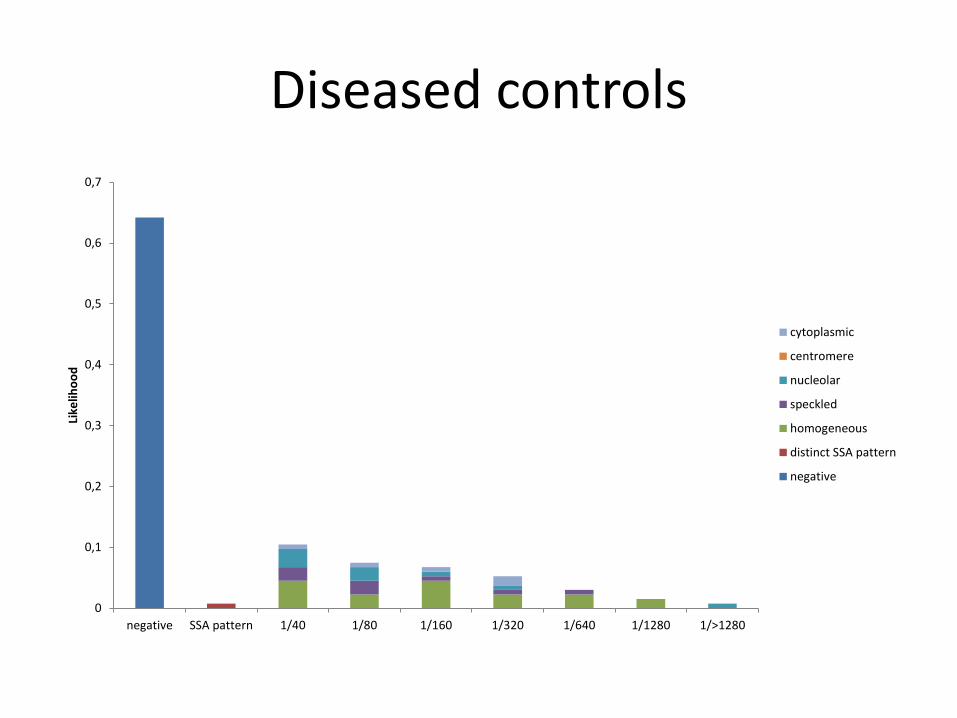

0
5
10
15
20
25
30
35
BD CFS DisControls
SLE SCL SSc MCTD SS PM DM
Rati
o
Groups
CTD Screen EliA
CTD
scr
ee
n
AN
A 1
40
o
r SS
A p
acirctte
rn
AN
A 1
80
o
r SS
A p
atte
rn
A
NA
11
60
o
r SS
A p
atte
rn
A
NA
13
20
o
r SS
A p
atte
rn
A
NA
16
40
o
r SS
A p
atte
rn
A
NA
11
28
0
or
SSA
pat
tern
SLE 74 963 925 900 688 538 313
SSc 72 986 971 928 812 623 391
MCTD 100 1000 1000 1000 1000 923 692
SS 89 917 833 556 444 417 361
PMDM 39 643 464 357 286 143 71
Blood donors 27 121 87 60 27 13 07
CFS 29 144 79 36 29 29 29
Diseased controls 37 358 254 171 112 60 30
0
005
01
015
02
025
negative SSA pattern 140 180 1160 1320 1640 11280 1gt1280
Like
liho
od
SLE
no ENAdsDNA
dsDNA
SSA
U1-RNP
mixed
0
005
01
015
02
025
negative SSA pattern 140 180 1160 1320 1640 11280 1gt1280
Like
liho
od
Systemic Sclerosis
no ENAdsDNA
PM-Scl
RNA-pol
Scl-70
CENP
SSA
0
005
01
015
02
025
03
negative SSA pattern 140 180 1160 1320 1640 11280 1gt1280
Like
liho
od
Sjoumlgrens syndrome
no ENAdsDNA
SSA
SSA+SSB
dsDNA+SSA
0
005
01
015
02
025
03
035
04
negative SSA pattern 140 180 1160 1320 1640 11280 1gt1280
Like
liho
od
Inflammatory myopathy
no ENAdsDNA
PM-Scl
Mi-2
Jo-1
Jo-1+SSA52
0
005
01
015
02
025
03
035
04
045
05
negative SSA pattern 140 180 1160 1320 1640 11280 1gt1280
Like
liho
od
MCTD
U1-RNP
U1-RNP+RNP70
dsD
NA
SSA
-60
SSA
-52
SSB
U1
-RN
P
RN
P-7
0
Sm
Rib
-P
CEN
P
Scl-
70
Po
l-II
I
PM
-Scl
Jo-1
Mi-
2
CTD
scr
ee
n
SLE 45 48 38 19 16 63 63 88 74
SCL 60 30 10 60
SSc 14 72 29 14 35 28 72 29 72
MCTD 77 100 92 77 100
SS 28 86 81 58 89
PMDM 18 36 36 71 29 36 39
Blood donors 07 07 27
CFS 07 14 07 07 29
Diseased controls 07 22 07 07 37
ge1 ge2 ge3 ge4 ge5 ge6 ge7
SLE 725 488 325 175 75 63 13
SCL 600 300 100
SSc 739 101 14
MCTD 1000 923 154
SS 889 861 528
PMDM 393 179 71
Blood donors 13
CFS 29 07
Diseased controls 45
Antinuclear antibody detection indirect immunofluorescene
versus solid phase assay
Xavier Bossuyt
Annals Rheum Dis 2010691420-22
Aim
To evaluate the diagnostic performance of
IIF solid phase assay amp the combination of both for
Systemic lupus erythematosus (SLE)
Systemic slcerosis (SSc)
pSjogrenrsquos syndrome (SS)
1
2
3
BioPlex 2200 chromatin Sm ribosomal protein SSA-60 SSB RNP-A and RNP-68 SSA-52 Scl-70 Jo-1 centromere B dsDNA
IIF HEp-2000 (Immunoconcepts) EliA CTD screen (Thermo Fisher) SSARo 52 SSARo 60 SSBLa U1-RNP (RNP-70 A C) Sm centromere B Jo-1 Scl-70 Rib-P fibrillarin RNA Pol III PM-Scl PCNA and Mi-2 dsDNA
IIF 180 IIF 1160 EliA CTD screen BioPlex 2200
Sensitivity
Systemic lupus erythematosus Reference 1 2 (n=80) 925 (84-97) 90 (81-95) 74 (63-82) 79 (69-86) Reference 3 (n=41) 97 (87-99) 95 (83-99) Systemic sclerosis Reference 1 2 (n=69) 97 (90-99) 93 (84-97) 725 (61-82) 72 (61-82) Reference 3 (n=37) 95 (82-98) 865 (72-94) Sjoumlgrenrsquos syndrome Reference 1 2 (n=36) 83 (68-92) 56 (40-70) 89 (75-96) 89 (75-96) Reference 3 (n=40) 76 (62-88) 74 (57-83)
Specificity
Healthy controls (n=125) (Ref 3) 87 (80-92) 95 (90-98) Blood donors (n=149) (Ref1 2) 91 (85-95) 94 (89-97) 97 (93-99) 95 (90-97) Chronic fatigue syndrome (n=139) (Ref1 2)
92 (86-96) 96 (92-98) 97 (92-99) 93 (87-96)
Diseased controls (n=134) (Ref1 2) 75 (67-81) 82 (75-88) 96 (91-98) 89 (82-93)
All controls (n=422) (Ref1 2) 86 (83-89) 91 (88-93) 97 (95-98) 92 (89-94)
0
005
01
015
02
025
Like
liho
od
SLE
0
005
01
015
02
025
Like
liho
od
Systemic sclerosis
0
005
01
015
02
025
03
Like
liho
od
Sjoumlgrens syndrome
LR Systemic lupus erythematosus
Systemic sclerosis Sjoumlgrenrsquos syndrome
IIF(+) (Ref 1 2) 67 (53-86) 71 (55-90) 61 (46-80) IIF(+) (Ref 3) 71 (46-112) 64 (40-101)0 57 (35-59) IIF(-) (Ref 1 2) 008 (004-019) 003 (001-013) 019 (009-040) IIF(-) (Ref 3) 003 (0004-020) 016 (003-035) 026 (015-046) EliA CTD screen (+) 239 (138-415) 235 (135-409) 288 (167-499) EliA CTD screen (-) 027 (019-039) 028 (019-042) 011 (005-029) IIF (+) EliA CTD screen (+) 414 (196-877) 436 (207-468) 468 (220-998) IIF (+) EliA CTD screen (-) 20 (12-31) 20 (13-33) 045 (012-18) IIF (-) EliA CTD screen (+) 35 (10-122) 78 (23-264) IIF (-) EliA CTD screen (-) 003 (0007-012) 003 (0009-013) 006 (002-025)
LR Systemic lupus erythematosus
Systemic sclerosis Sjoumlgrenrsquos syndrome
IIF(+) (Ref 1 2) 67 (53-86) 71 (55-90) 61 (46-80) IIF(+) (Ref 3) 71 (46-112) 64 (40-101)0 57 (35-59) IIF(-) (Ref 1 2) 008 (004-019) 003 (001-013) 019 (009-040) IIF(-) (Ref 3) 003 (0004-020) 016 (003-035) 026 (015-046) EliA CTD screen (+) 239 (138-415) 235 (135-409) 288 (167-499) EliA CTD screen (-) 027 (019-039) 028 (019-042) 011 (005-029) IIF (+) EliA CTD screen (+) 414 (196-877) 436 (207-468) 468 (220-998) IIF (+) EliA CTD screen (-) 20 (12-31) 20 (13-33) 045 (012-18) IIF (-) EliA CTD screen (+) 35 (10-122) 78 (23-264) IIF (-) EliA CTD screen (-) 003 (0007-012) 003 (0009-013) 006 (002-025)
Prevalence
Systemic lupus erythematosus
Systemic sclerosis
Sjoumlgrenrsquos syndrome
Controls
IIF (+) EliA CTD screen (+) 69 72 78 16 IIF (+) EliA CTD screen (-) 24 25 55 12 IIF (-) EliA CTD screen (+) 5 11 14 IIF (-) EliA CTD screen (-) 2 3 55 85
0
02
04
06
08
1
0 02 04 06 08 1
Po
st-t
est
pro
bab
ility
Pre-test probability
FEIA+ IIF+
FEIA+
IIF+
FEIA+ IIF-
FEIA- IIF+
FEIA-
IIF-
FEIA- IIF-
SLE
Comparative analysis of different strategies
1 IIF and FEIA on all samples
2 IIF
If IIF positive FEIA
If IIF negative stop
3 FEIA
4 IIF
Conclusion
Integrated interpretation
of IIF and solid phase assay results adds value
Optimal strategy
depends on the pathology
Bossuyt X Fieuws S Ann Rheum Dis 2014 Mar73(3)
Antinuclear antibodies by automated
indirect immunofluorescence Opportunities for value added
reporting
Xavier Bossuyt Leuven Belgium
Instrument NOVA View AKLIDES EUROPattern Image
Navigator
Helios ZENIT G Sight
Manufacturer INOVA Medipan EUROPattern Immuno Concepts Aesku Menarini
LIMS connection (software) Yes (QUANTA
Link)
Yes Yes
(EUROLabOffice)
Yes (direct) Yes (direct) Yes (ZenIT)
Slide identification via
barcode
Yes by handheld
scanner
Yes by handheld
scanner
Yes by integrated
scanner
Yes Yes by integrated
scanner
Yes by integrated
scanner
Loading capacity 5 slides (up to 60
wells)
5 slides (up to 60
wells)
50 slides (up to 500
wells)
4 slides (up to 84
wells)
20 slides (up to 240
wells)
5 slides (up to 70
wells)
Image acquisition speed ~45swell for 3
images
~40swell lt20swell ~25swell for 4
images
10spicture
Customizable from 1
to 10 images
gt60swell
pictures 5 (small
scan) 50 (medium
scan) 220 (full scan)
100 QC for substrate and
process integrity
counterstaining
Yes DAPI Yes DAPI Yes Propidium
iodide
None None None None None None
Automatic posneg
discrimination incl
presorting of images
Yes Yes Yes Yes Yes Yes
Batchwise verification of
negative samples
Yes Yes Yes Yes Yes Yes
Automatic pattern
recognition
Yes Yes Yes No No Yes
Pattern Analysis method Pattern recognition by
mathematical algorithm
Pattern recognition by
mathematical algorithm
Pattern recognition by
mathematical algorithm
No pattern matching
capabilities
No pattern matching
capabilities
Pattern recognition by
mathematical algorithm
No of recognizable ANA
staining pattern list out
6
Homogeneous
Speckled
Centromere
Nucleolar
Nuclear dot
Cytoplasm
Negative
Positive unrecognized
10
Homogeneous
Speckled
Centromere
Nucleolar
Nuclear dot
Cytoplasm
Negative
Positive unrecognized
8
Homogeneous
Speckled
Centromere
Nucleolar
Nuclear dot
Cytoplasm
Nuclear rim
Mitotic negative
None None 5
Homogeneous
Speckled
Centromere
Nucleolar
Cytoplasm
Negative
Instrument calibration to
minimize variability
Yes Yes Yes Yes Yes No
Integration with slide
processing in 1 instrument
No No No No Yes No
Mahler et al J Immunol Research in press
Automated fluorescence microscopy is increasingly used for image acquisition quantitative analysis and pattern recognition of anti-nuclear antibody
testing
Positivenegative discrimination
bull Exposure time is inversely proportional to intensity of fluorescence
bull Probability value is given to samples
Pattern recognition ANA
bull five patterns ndash Homogeneous
ndash Speckled
ndash Centromere
ndash Nucleolar
ndash Mitochondrial
bull Based on statistical morphological and geometric features
IMAGE ACQUISITION
RNP
PM-Scl
Golgi
Membrane
Review of digital images
harr
manual approach (posneg)
ndash 90 identical interpretation (n=332) (Bonroy et al CCLM 2013)
ndash 88 identical interpretation (n=268) (Bossuyt et al CCA 2013)
Bonroy et al CCLM 2013
FLUORESENCE INTENSITY VERSUS ANTIBODY TITER
HEp-2
-10
10
30
50
70
90
neg 80 160 320 640 1280
Ind
ex
Titer
Outlier Boxplot
Outliers gt 15 and lt 3 IQR
Outliers gt 3 IQR
Midbody centriole few nuclear dots Golgi
Bossuyt et al CCA 2013
G-Sight HEp-2000
0
20
40
60
80
100
neg 180 1160 1320 1640 1gt=1280
Pro
ba
bil
ity i
nd
ex
Antibody titer
Bonroy et al 2013
NOVA View
0
500
1000
1500
2000
2500
3000
3500
Neg 80 160 320 640 gt=1280
Nova
Vie
w F
luo
resce
nce
In
de
x
Titer
Schouwers et al Clin Chem Lab Med 201452547-51
Pattern recognition
Visual inspection Correct assignment by G-Sight HEp-2
Correct assignment by G-sight HEp-2000
Homogeneous (n=42) 68 92
Speckled (n=34) 71 56
Centromere (n=6) 83 42
Pattern recognition (Bonroy et al 2013) Pattern assignment was incorrect in 29 of 132 pos samples No pattern assigned in 45 of samples Global accuracy of pattern assignment 26
FLUORESCENCE INTENSITY IN WELL-DEFINED PATIENT COHORTS
Study Population
n M()F() Median age (range)
Blood donors
108 5149 45 (19-65)
Chronic Fatigue Syndrome
150 1981 41 (16-75)
Diseased Controls 134 2575 45 (17-81)
392
Systemic Lupus Erythematosus
85 1288 355 (15-72)
Sjoumlgrenrsquos Syndrome
36 1486 56 (21-75)
Systemic Sclerosis
76 3466 53 (18-80)
Polymyositis Dermatomyositis
32 4456 50 (24-77)
Mixed Connective Tissue Disease
16 694 315 (16-66)
245
HEp2
-10
10
30
50
70
90
Blooddonor
CFS Discontrols
SLE SCL SS SSc MCTD PM DM
Gro
up
s
Groups
Outlier Boxplot
Outliers gt 15 and lt 3 IQR
Outliers gt 3 IQR
Bossuyt et al CCA 2013
G-Sight HEp-2000
-10
10
30
50
70
90
BloodDonors
CFS Dis Contr SLE SCL SS SSc MCTD PM DM
Pro
ba
bil
ity i
nd
ex
G-Sight HEp-2
Probability index
Blood donor CFS Diseased controls SLE SS SSc MCTD PMDM
le10 11-le30 31-le50 51-le85 gt85
075 024 001 000 000
084 013 001 001 000
050 038 003 007 003
004 009 012 032 043
009 009 009 043 031
001 020 014 042 022
000 000 000 000 100
015 041 011 026 007
Probability index SLE SS SSc MCTD PMDM
le10 11 le30 31 le50 51 le85 gt85
006 (002-02)
04 (02-08)
68 (26-178)
121 (62-236)
439 (160-1204)
01 (004-04)
03 (01-10)
50 (14-186)
160 (79-322)
322 (108-959)
002 (0003-01)
08 (05-13)
85 (33-215)
157 (82-299)
223 (76-651)
1025 (387-2718)
02 (009-05)
16 (10-27)
65 (18-238)
97 (40-229)
76 (14-396)
Bonroy et al CCLM 2013
0
500
1000
1500
2000
2500
3000
3500
HC CVS DC SLE SS SSc PMDM MCTD
L
I
U
Outlier Boxplot
Percentiles (95 of Distribution)
Outliers gt 15 and lt 3 IQR
Outliers gt 3 IQR
NOVA View
NOVA View LR LIU Controls SLE SS SSc PMDM MCTD SARD
Prevalence
lt49 056 006 003 003 013 005
49-120 026 005 006 005 019 007
121-600 013 011 003 009 034 011
601-2000 004 046 061 034 025 006 039
gt2000 001 033 028 049 009 094 038
LR
lt49 011 005 005 023 009
49-120 018 021 020 073 025
121-600 079 021 069 257 085
601-2000 112 150 84 61 15 96
gt2000 291 245 429 83 827 335
NOVA View
009 025 085
10
33
0
10
20
30
40
0
01
02
03
04
05
06
lt49 49-120 121-600 601-2000 gt2000
Like
liho
od
rat
io
Pre
vale
nce
Nuclear Index
controls
SRD
LR
LR 1 no clinical value gt10 lt01 clinically important difference 5 ndash 10 01 ndash 02 modest but substantial difference 2 ndash 5 02 ndash 05 small difference that may be relevant
Post-test odds
=
Pre-test odds x LR
probability rarr odds
02 rarr 02 (1 ndash 02)
025
odds rarr probability
4 rarr 4 (1 + 4)
08
0
02
04
06
08
1
000 020 040 060 080 100
Po
st-t
est
pro
bab
ility
Pre-test probability
lt20
20-50
51-200
gt200
gt2000
Pre-test probability Post-test probability
lt49 120-600 600-2000 gt2000
1 a young women with hair loss and polyarthralgia 007 05 5 25
0
02
04
06
08
1
000 020 040 060 080 100
Po
st-t
est
pro
bab
ility
Pre-test probability
lt20
20-50
51-200
gt200
gt2000
Pre-test probability Post-test probability
lt49 120-600 600-2000 gt2000
10 a young women with photosensitivity and mild leucopenia (3000-3500mm3)
07 55 36 79
0
02
04
06
08
1
000 020 040 060 080 100
Po
st-t
est
pro
bab
ility
Pre-test probability
lt20
20-50
51-200
gt200
gt2000
Pre-test probability Post-test probability
lt49 120-600 600-2000 gt2000
50 a young women with photosensitivity malar rash and symmetrical polyarthritis
65 35 83 97
G-Sight HEp-2
Probability index
Blood donor CFS Diseased controls SLE SS SSc MCTD PMDM
le10 11-le30 31-le50 51-le85 gt85
075 024 001 000 000
084 013 001 001 000
050 038 003 007 003
004 009 012 032 043
009 009 009 043 031
001 020 014 042 022
000 000 000 000 100
015 041 011 026 007
Probability index SLE SS SSc MCTD PMDM
le10 11 le30 31 le50 51 le85 gt85
006 (002-02)
04 (02-08)
68 (26-178)
121 (62-236)
439 (160-1204)
01 (004-04)
03 (01-10)
50 (14-186)
160 (79-322)
322 (108-959)
002 (0003-01)
08 (05-13)
85 (33-215)
157 (82-299)
223 (76-651)
1025 (387-2718)
02 (009-05)
16 (10-27)
65 (18-238)
97 (40-229)
76 (14-396)
Maenhout et al 2014
Maenhout et al 2014
Conclusions
bull High quality image acquisition
bull Significant correlation between intensity and antibody titer
bull Fluorescence intensity provides clinically useful information
bull Enables implementation of a quantitative internal quality
control system
bull Accuracy of pattern recognition is limited
a microdot array based immunoassay developed to allow simultaneous detection of multiple
autoantibodies on a single patient
Cambridge Life Sciences Ltd
ZENITbullAMiDot
bull One patient sample per well ndash 9 x 9 microarray (81 dots)
Cambridge Life Sciences Ltd
ZENITbullAMiDot
bull Each 9 x 9 microarray contains
bull Multiple autoimmune antigen dots
bull Calibration dots
bull Control dots
bull Registration dots
Cambridge Life Sciences Ltd
ZENITbullAMiDot
0
25000
50000
75000
100000
125000
150000
175000
200000
0 10 20 30 40 50 60 70 80 90 100
Raw
Sig
nal
Calibrator Conc (UmL)
Calibration
bullEach 9 x 9 microarray is
bullPrinted on to an activated glass surface
bullEach dot is ~20microm in diameter
bullEach autoimmune antigen calibrator and control is printed in duplicate or triplicate
bullAutomated analysis
bullImage taken by Reader (G-Sight or AMiDot reader)
Cambridge Life Sciences Ltd
ZENITbullAMiDot
Software receives the image analyses the image and produces a patient report
Antigen RecombinantNative Antigen RecombinantNative
Ro60SS-A recombinant PL7PL12 recombinant
Ro52SS-A recombinant MPO native
LaSS-B recombinant PR3 native
Sm native GBM native
U1-snRNP (68kDAC) recombinant Cathepsin native
Jo-1 recombinant SRP-54 recombinant
Scl70 native BPI native
PMScl100 recombinant ASCA native
dsDNA plasmid tTG recombinant
Histones Native deaminated Gliadin recombinant
Mi-2 recombinant TPO recombinant
Centromere B recombinant Intrinsic Factor recombinant
Ku recombinant Gastric Parietal Cell native
PCNA recombinant M2 recombinant
Ribosomal P0 recombinant LKM-1 recombinant
Elastase native LC1 recombinant
ZENITbullAMiDot
Cambridge Life Sciences Ltd
Conclusion AMiDot
bull Allows multiplex detection of autoantibodies
bull Overall a good concordance with results obtained by EliA
bull Multiplex ANA testing is an efficient way to simultaneously test for specific antibodies
bull Small sample volumes can be used
bull Further studies are warranted to prove the reliability of this technique
Acknowledgements
bull Dept of Laboratory Medicine - Immunology
ndash Dr Vermeersch ndash Dr Marieumln Mrs Godefridis ndash S Cooreman ndash S Schouwers
bull Experimental Laboratory
Immunology ndash K Op de Beeacuteck ndash D Dillaerts
bull Dept of Rheumatology Internal
Medicine ndash Dr Verschueren ndash Dr Westhovens ndash Dr Blockmans
bull Menarini ndash Heidi Debaere
bull Instrumentation Laboratory ndash Nathalie Vandeputte
bull KUL - statistics ndash S Fieuws

CTD
scr
ee
n
AN
A 1
40
o
r SS
A p
acirctte
rn
AN
A 1
80
o
r SS
A p
atte
rn
A
NA
11
60
o
r SS
A p
atte
rn
A
NA
13
20
o
r SS
A p
atte
rn
A
NA
16
40
o
r SS
A p
atte
rn
A
NA
11
28
0
or
SSA
pat
tern
SLE 74 963 925 900 688 538 313
SSc 72 986 971 928 812 623 391
MCTD 100 1000 1000 1000 1000 923 692
SS 89 917 833 556 444 417 361
PMDM 39 643 464 357 286 143 71
Blood donors 27 121 87 60 27 13 07
CFS 29 144 79 36 29 29 29
Diseased controls 37 358 254 171 112 60 30
0
005
01
015
02
025
negative SSA pattern 140 180 1160 1320 1640 11280 1gt1280
Like
liho
od
SLE
no ENAdsDNA
dsDNA
SSA
U1-RNP
mixed
0
005
01
015
02
025
negative SSA pattern 140 180 1160 1320 1640 11280 1gt1280
Like
liho
od
Systemic Sclerosis
no ENAdsDNA
PM-Scl
RNA-pol
Scl-70
CENP
SSA
0
005
01
015
02
025
03
negative SSA pattern 140 180 1160 1320 1640 11280 1gt1280
Like
liho
od
Sjoumlgrens syndrome
no ENAdsDNA
SSA
SSA+SSB
dsDNA+SSA
0
005
01
015
02
025
03
035
04
negative SSA pattern 140 180 1160 1320 1640 11280 1gt1280
Like
liho
od
Inflammatory myopathy
no ENAdsDNA
PM-Scl
Mi-2
Jo-1
Jo-1+SSA52
0
005
01
015
02
025
03
035
04
045
05
negative SSA pattern 140 180 1160 1320 1640 11280 1gt1280
Like
liho
od
MCTD
U1-RNP
U1-RNP+RNP70
dsD
NA
SSA
-60
SSA
-52
SSB
U1
-RN
P
RN
P-7
0
Sm
Rib
-P
CEN
P
Scl-
70
Po
l-II
I
PM
-Scl
Jo-1
Mi-
2
CTD
scr
ee
n
SLE 45 48 38 19 16 63 63 88 74
SCL 60 30 10 60
SSc 14 72 29 14 35 28 72 29 72
MCTD 77 100 92 77 100
SS 28 86 81 58 89
PMDM 18 36 36 71 29 36 39
Blood donors 07 07 27
CFS 07 14 07 07 29
Diseased controls 07 22 07 07 37
ge1 ge2 ge3 ge4 ge5 ge6 ge7
SLE 725 488 325 175 75 63 13
SCL 600 300 100
SSc 739 101 14
MCTD 1000 923 154
SS 889 861 528
PMDM 393 179 71
Blood donors 13
CFS 29 07
Diseased controls 45
Antinuclear antibody detection indirect immunofluorescene
versus solid phase assay
Xavier Bossuyt
Annals Rheum Dis 2010691420-22
Aim
To evaluate the diagnostic performance of
IIF solid phase assay amp the combination of both for
Systemic lupus erythematosus (SLE)
Systemic slcerosis (SSc)
pSjogrenrsquos syndrome (SS)
1
2
3
BioPlex 2200 chromatin Sm ribosomal protein SSA-60 SSB RNP-A and RNP-68 SSA-52 Scl-70 Jo-1 centromere B dsDNA
IIF HEp-2000 (Immunoconcepts) EliA CTD screen (Thermo Fisher) SSARo 52 SSARo 60 SSBLa U1-RNP (RNP-70 A C) Sm centromere B Jo-1 Scl-70 Rib-P fibrillarin RNA Pol III PM-Scl PCNA and Mi-2 dsDNA
IIF 180 IIF 1160 EliA CTD screen BioPlex 2200
Sensitivity
Systemic lupus erythematosus Reference 1 2 (n=80) 925 (84-97) 90 (81-95) 74 (63-82) 79 (69-86) Reference 3 (n=41) 97 (87-99) 95 (83-99) Systemic sclerosis Reference 1 2 (n=69) 97 (90-99) 93 (84-97) 725 (61-82) 72 (61-82) Reference 3 (n=37) 95 (82-98) 865 (72-94) Sjoumlgrenrsquos syndrome Reference 1 2 (n=36) 83 (68-92) 56 (40-70) 89 (75-96) 89 (75-96) Reference 3 (n=40) 76 (62-88) 74 (57-83)
Specificity
Healthy controls (n=125) (Ref 3) 87 (80-92) 95 (90-98) Blood donors (n=149) (Ref1 2) 91 (85-95) 94 (89-97) 97 (93-99) 95 (90-97) Chronic fatigue syndrome (n=139) (Ref1 2)
92 (86-96) 96 (92-98) 97 (92-99) 93 (87-96)
Diseased controls (n=134) (Ref1 2) 75 (67-81) 82 (75-88) 96 (91-98) 89 (82-93)
All controls (n=422) (Ref1 2) 86 (83-89) 91 (88-93) 97 (95-98) 92 (89-94)
0
005
01
015
02
025
Like
liho
od
SLE
0
005
01
015
02
025
Like
liho
od
Systemic sclerosis
0
005
01
015
02
025
03
Like
liho
od
Sjoumlgrens syndrome
LR Systemic lupus erythematosus
Systemic sclerosis Sjoumlgrenrsquos syndrome
IIF(+) (Ref 1 2) 67 (53-86) 71 (55-90) 61 (46-80) IIF(+) (Ref 3) 71 (46-112) 64 (40-101)0 57 (35-59) IIF(-) (Ref 1 2) 008 (004-019) 003 (001-013) 019 (009-040) IIF(-) (Ref 3) 003 (0004-020) 016 (003-035) 026 (015-046) EliA CTD screen (+) 239 (138-415) 235 (135-409) 288 (167-499) EliA CTD screen (-) 027 (019-039) 028 (019-042) 011 (005-029) IIF (+) EliA CTD screen (+) 414 (196-877) 436 (207-468) 468 (220-998) IIF (+) EliA CTD screen (-) 20 (12-31) 20 (13-33) 045 (012-18) IIF (-) EliA CTD screen (+) 35 (10-122) 78 (23-264) IIF (-) EliA CTD screen (-) 003 (0007-012) 003 (0009-013) 006 (002-025)
LR Systemic lupus erythematosus
Systemic sclerosis Sjoumlgrenrsquos syndrome
IIF(+) (Ref 1 2) 67 (53-86) 71 (55-90) 61 (46-80) IIF(+) (Ref 3) 71 (46-112) 64 (40-101)0 57 (35-59) IIF(-) (Ref 1 2) 008 (004-019) 003 (001-013) 019 (009-040) IIF(-) (Ref 3) 003 (0004-020) 016 (003-035) 026 (015-046) EliA CTD screen (+) 239 (138-415) 235 (135-409) 288 (167-499) EliA CTD screen (-) 027 (019-039) 028 (019-042) 011 (005-029) IIF (+) EliA CTD screen (+) 414 (196-877) 436 (207-468) 468 (220-998) IIF (+) EliA CTD screen (-) 20 (12-31) 20 (13-33) 045 (012-18) IIF (-) EliA CTD screen (+) 35 (10-122) 78 (23-264) IIF (-) EliA CTD screen (-) 003 (0007-012) 003 (0009-013) 006 (002-025)
Prevalence
Systemic lupus erythematosus
Systemic sclerosis
Sjoumlgrenrsquos syndrome
Controls
IIF (+) EliA CTD screen (+) 69 72 78 16 IIF (+) EliA CTD screen (-) 24 25 55 12 IIF (-) EliA CTD screen (+) 5 11 14 IIF (-) EliA CTD screen (-) 2 3 55 85
0
02
04
06
08
1
0 02 04 06 08 1
Po
st-t
est
pro
bab
ility
Pre-test probability
FEIA+ IIF+
FEIA+
IIF+
FEIA+ IIF-
FEIA- IIF+
FEIA-
IIF-
FEIA- IIF-
SLE
Comparative analysis of different strategies
1 IIF and FEIA on all samples
2 IIF
If IIF positive FEIA
If IIF negative stop
3 FEIA
4 IIF
Conclusion
Integrated interpretation
of IIF and solid phase assay results adds value
Optimal strategy
depends on the pathology
Bossuyt X Fieuws S Ann Rheum Dis 2014 Mar73(3)
Antinuclear antibodies by automated
indirect immunofluorescence Opportunities for value added
reporting
Xavier Bossuyt Leuven Belgium
Instrument NOVA View AKLIDES EUROPattern Image
Navigator
Helios ZENIT G Sight
Manufacturer INOVA Medipan EUROPattern Immuno Concepts Aesku Menarini
LIMS connection (software) Yes (QUANTA
Link)
Yes Yes
(EUROLabOffice)
Yes (direct) Yes (direct) Yes (ZenIT)
Slide identification via
barcode
Yes by handheld
scanner
Yes by handheld
scanner
Yes by integrated
scanner
Yes Yes by integrated
scanner
Yes by integrated
scanner
Loading capacity 5 slides (up to 60
wells)
5 slides (up to 60
wells)
50 slides (up to 500
wells)
4 slides (up to 84
wells)
20 slides (up to 240
wells)
5 slides (up to 70
wells)
Image acquisition speed ~45swell for 3
images
~40swell lt20swell ~25swell for 4
images
10spicture
Customizable from 1
to 10 images
gt60swell
pictures 5 (small
scan) 50 (medium
scan) 220 (full scan)
100 QC for substrate and
process integrity
counterstaining
Yes DAPI Yes DAPI Yes Propidium
iodide
None None None None None None
Automatic posneg
discrimination incl
presorting of images
Yes Yes Yes Yes Yes Yes
Batchwise verification of
negative samples
Yes Yes Yes Yes Yes Yes
Automatic pattern
recognition
Yes Yes Yes No No Yes
Pattern Analysis method Pattern recognition by
mathematical algorithm
Pattern recognition by
mathematical algorithm
Pattern recognition by
mathematical algorithm
No pattern matching
capabilities
No pattern matching
capabilities
Pattern recognition by
mathematical algorithm
No of recognizable ANA
staining pattern list out
6
Homogeneous
Speckled
Centromere
Nucleolar
Nuclear dot
Cytoplasm
Negative
Positive unrecognized
10
Homogeneous
Speckled
Centromere
Nucleolar
Nuclear dot
Cytoplasm
Negative
Positive unrecognized
8
Homogeneous
Speckled
Centromere
Nucleolar
Nuclear dot
Cytoplasm
Nuclear rim
Mitotic negative
None None 5
Homogeneous
Speckled
Centromere
Nucleolar
Cytoplasm
Negative
Instrument calibration to
minimize variability
Yes Yes Yes Yes Yes No
Integration with slide
processing in 1 instrument
No No No No Yes No
Mahler et al J Immunol Research in press
Automated fluorescence microscopy is increasingly used for image acquisition quantitative analysis and pattern recognition of anti-nuclear antibody
testing
Positivenegative discrimination
bull Exposure time is inversely proportional to intensity of fluorescence
bull Probability value is given to samples
Pattern recognition ANA
bull five patterns ndash Homogeneous
ndash Speckled
ndash Centromere
ndash Nucleolar
ndash Mitochondrial
bull Based on statistical morphological and geometric features
IMAGE ACQUISITION
RNP
PM-Scl
Golgi
Membrane
Review of digital images
harr
manual approach (posneg)
ndash 90 identical interpretation (n=332) (Bonroy et al CCLM 2013)
ndash 88 identical interpretation (n=268) (Bossuyt et al CCA 2013)
Bonroy et al CCLM 2013
FLUORESENCE INTENSITY VERSUS ANTIBODY TITER
HEp-2
-10
10
30
50
70
90
neg 80 160 320 640 1280
Ind
ex
Titer
Outlier Boxplot
Outliers gt 15 and lt 3 IQR
Outliers gt 3 IQR
Midbody centriole few nuclear dots Golgi
Bossuyt et al CCA 2013
G-Sight HEp-2000
0
20
40
60
80
100
neg 180 1160 1320 1640 1gt=1280
Pro
ba
bil
ity i
nd
ex
Antibody titer
Bonroy et al 2013
NOVA View
0
500
1000
1500
2000
2500
3000
3500
Neg 80 160 320 640 gt=1280
Nova
Vie
w F
luo
resce
nce
In
de
x
Titer
Schouwers et al Clin Chem Lab Med 201452547-51
Pattern recognition
Visual inspection Correct assignment by G-Sight HEp-2
Correct assignment by G-sight HEp-2000
Homogeneous (n=42) 68 92
Speckled (n=34) 71 56
Centromere (n=6) 83 42
Pattern recognition (Bonroy et al 2013) Pattern assignment was incorrect in 29 of 132 pos samples No pattern assigned in 45 of samples Global accuracy of pattern assignment 26
FLUORESCENCE INTENSITY IN WELL-DEFINED PATIENT COHORTS
Study Population
n M()F() Median age (range)
Blood donors
108 5149 45 (19-65)
Chronic Fatigue Syndrome
150 1981 41 (16-75)
Diseased Controls 134 2575 45 (17-81)
392
Systemic Lupus Erythematosus
85 1288 355 (15-72)
Sjoumlgrenrsquos Syndrome
36 1486 56 (21-75)
Systemic Sclerosis
76 3466 53 (18-80)
Polymyositis Dermatomyositis
32 4456 50 (24-77)
Mixed Connective Tissue Disease
16 694 315 (16-66)
245
HEp2
-10
10
30
50
70
90
Blooddonor
CFS Discontrols
SLE SCL SS SSc MCTD PM DM
Gro
up
s
Groups
Outlier Boxplot
Outliers gt 15 and lt 3 IQR
Outliers gt 3 IQR
Bossuyt et al CCA 2013
G-Sight HEp-2000
-10
10
30
50
70
90
BloodDonors
CFS Dis Contr SLE SCL SS SSc MCTD PM DM
Pro
ba
bil
ity i
nd
ex
G-Sight HEp-2
Probability index
Blood donor CFS Diseased controls SLE SS SSc MCTD PMDM
le10 11-le30 31-le50 51-le85 gt85
075 024 001 000 000
084 013 001 001 000
050 038 003 007 003
004 009 012 032 043
009 009 009 043 031
001 020 014 042 022
000 000 000 000 100
015 041 011 026 007
Probability index SLE SS SSc MCTD PMDM
le10 11 le30 31 le50 51 le85 gt85
006 (002-02)
04 (02-08)
68 (26-178)
121 (62-236)
439 (160-1204)
01 (004-04)
03 (01-10)
50 (14-186)
160 (79-322)
322 (108-959)
002 (0003-01)
08 (05-13)
85 (33-215)
157 (82-299)
223 (76-651)
1025 (387-2718)
02 (009-05)
16 (10-27)
65 (18-238)
97 (40-229)
76 (14-396)
Bonroy et al CCLM 2013
0
500
1000
1500
2000
2500
3000
3500
HC CVS DC SLE SS SSc PMDM MCTD
L
I
U
Outlier Boxplot
Percentiles (95 of Distribution)
Outliers gt 15 and lt 3 IQR
Outliers gt 3 IQR
NOVA View
NOVA View LR LIU Controls SLE SS SSc PMDM MCTD SARD
Prevalence
lt49 056 006 003 003 013 005
49-120 026 005 006 005 019 007
121-600 013 011 003 009 034 011
601-2000 004 046 061 034 025 006 039
gt2000 001 033 028 049 009 094 038
LR
lt49 011 005 005 023 009
49-120 018 021 020 073 025
121-600 079 021 069 257 085
601-2000 112 150 84 61 15 96
gt2000 291 245 429 83 827 335
NOVA View
009 025 085
10
33
0
10
20
30
40
0
01
02
03
04
05
06
lt49 49-120 121-600 601-2000 gt2000
Like
liho
od
rat
io
Pre
vale
nce
Nuclear Index
controls
SRD
LR
LR 1 no clinical value gt10 lt01 clinically important difference 5 ndash 10 01 ndash 02 modest but substantial difference 2 ndash 5 02 ndash 05 small difference that may be relevant
Post-test odds
=
Pre-test odds x LR
probability rarr odds
02 rarr 02 (1 ndash 02)
025
odds rarr probability
4 rarr 4 (1 + 4)
08
0
02
04
06
08
1
000 020 040 060 080 100
Po
st-t
est
pro
bab
ility
Pre-test probability
lt20
20-50
51-200
gt200
gt2000
Pre-test probability Post-test probability
lt49 120-600 600-2000 gt2000
1 a young women with hair loss and polyarthralgia 007 05 5 25
0
02
04
06
08
1
000 020 040 060 080 100
Po
st-t
est
pro
bab
ility
Pre-test probability
lt20
20-50
51-200
gt200
gt2000
Pre-test probability Post-test probability
lt49 120-600 600-2000 gt2000
10 a young women with photosensitivity and mild leucopenia (3000-3500mm3)
07 55 36 79
0
02
04
06
08
1
000 020 040 060 080 100
Po
st-t
est
pro
bab
ility
Pre-test probability
lt20
20-50
51-200
gt200
gt2000
Pre-test probability Post-test probability
lt49 120-600 600-2000 gt2000
50 a young women with photosensitivity malar rash and symmetrical polyarthritis
65 35 83 97
G-Sight HEp-2
Probability index
Blood donor CFS Diseased controls SLE SS SSc MCTD PMDM
le10 11-le30 31-le50 51-le85 gt85
075 024 001 000 000
084 013 001 001 000
050 038 003 007 003
004 009 012 032 043
009 009 009 043 031
001 020 014 042 022
000 000 000 000 100
015 041 011 026 007
Probability index SLE SS SSc MCTD PMDM
le10 11 le30 31 le50 51 le85 gt85
006 (002-02)
04 (02-08)
68 (26-178)
121 (62-236)
439 (160-1204)
01 (004-04)
03 (01-10)
50 (14-186)
160 (79-322)
322 (108-959)
002 (0003-01)
08 (05-13)
85 (33-215)
157 (82-299)
223 (76-651)
1025 (387-2718)
02 (009-05)
16 (10-27)
65 (18-238)
97 (40-229)
76 (14-396)
Maenhout et al 2014
Maenhout et al 2014
Conclusions
bull High quality image acquisition
bull Significant correlation between intensity and antibody titer
bull Fluorescence intensity provides clinically useful information
bull Enables implementation of a quantitative internal quality
control system
bull Accuracy of pattern recognition is limited
a microdot array based immunoassay developed to allow simultaneous detection of multiple
autoantibodies on a single patient
Cambridge Life Sciences Ltd
ZENITbullAMiDot
bull One patient sample per well ndash 9 x 9 microarray (81 dots)
Cambridge Life Sciences Ltd
ZENITbullAMiDot
bull Each 9 x 9 microarray contains
bull Multiple autoimmune antigen dots
bull Calibration dots
bull Control dots
bull Registration dots
Cambridge Life Sciences Ltd
ZENITbullAMiDot
0
25000
50000
75000
100000
125000
150000
175000
200000
0 10 20 30 40 50 60 70 80 90 100
Raw
Sig
nal
Calibrator Conc (UmL)
Calibration
bullEach 9 x 9 microarray is
bullPrinted on to an activated glass surface
bullEach dot is ~20microm in diameter
bullEach autoimmune antigen calibrator and control is printed in duplicate or triplicate
bullAutomated analysis
bullImage taken by Reader (G-Sight or AMiDot reader)
Cambridge Life Sciences Ltd
ZENITbullAMiDot
Software receives the image analyses the image and produces a patient report
Antigen RecombinantNative Antigen RecombinantNative
Ro60SS-A recombinant PL7PL12 recombinant
Ro52SS-A recombinant MPO native
LaSS-B recombinant PR3 native
Sm native GBM native
U1-snRNP (68kDAC) recombinant Cathepsin native
Jo-1 recombinant SRP-54 recombinant
Scl70 native BPI native
PMScl100 recombinant ASCA native
dsDNA plasmid tTG recombinant
Histones Native deaminated Gliadin recombinant
Mi-2 recombinant TPO recombinant
Centromere B recombinant Intrinsic Factor recombinant
Ku recombinant Gastric Parietal Cell native
PCNA recombinant M2 recombinant
Ribosomal P0 recombinant LKM-1 recombinant
Elastase native LC1 recombinant
ZENITbullAMiDot
Cambridge Life Sciences Ltd
Conclusion AMiDot
bull Allows multiplex detection of autoantibodies
bull Overall a good concordance with results obtained by EliA
bull Multiplex ANA testing is an efficient way to simultaneously test for specific antibodies
bull Small sample volumes can be used
bull Further studies are warranted to prove the reliability of this technique
Acknowledgements
bull Dept of Laboratory Medicine - Immunology
ndash Dr Vermeersch ndash Dr Marieumln Mrs Godefridis ndash S Cooreman ndash S Schouwers
bull Experimental Laboratory
Immunology ndash K Op de Beeacuteck ndash D Dillaerts
bull Dept of Rheumatology Internal
Medicine ndash Dr Verschueren ndash Dr Westhovens ndash Dr Blockmans
bull Menarini ndash Heidi Debaere
bull Instrumentation Laboratory ndash Nathalie Vandeputte
bull KUL - statistics ndash S Fieuws

0
005
01
015
02
025
negative SSA pattern 140 180 1160 1320 1640 11280 1gt1280
Like
liho
od
SLE
no ENAdsDNA
dsDNA
SSA
U1-RNP
mixed
0
005
01
015
02
025
negative SSA pattern 140 180 1160 1320 1640 11280 1gt1280
Like
liho
od
Systemic Sclerosis
no ENAdsDNA
PM-Scl
RNA-pol
Scl-70
CENP
SSA
0
005
01
015
02
025
03
negative SSA pattern 140 180 1160 1320 1640 11280 1gt1280
Like
liho
od
Sjoumlgrens syndrome
no ENAdsDNA
SSA
SSA+SSB
dsDNA+SSA
0
005
01
015
02
025
03
035
04
negative SSA pattern 140 180 1160 1320 1640 11280 1gt1280
Like
liho
od
Inflammatory myopathy
no ENAdsDNA
PM-Scl
Mi-2
Jo-1
Jo-1+SSA52
0
005
01
015
02
025
03
035
04
045
05
negative SSA pattern 140 180 1160 1320 1640 11280 1gt1280
Like
liho
od
MCTD
U1-RNP
U1-RNP+RNP70
dsD
NA
SSA
-60
SSA
-52
SSB
U1
-RN
P
RN
P-7
0
Sm
Rib
-P
CEN
P
Scl-
70
Po
l-II
I
PM
-Scl
Jo-1
Mi-
2
CTD
scr
ee
n
SLE 45 48 38 19 16 63 63 88 74
SCL 60 30 10 60
SSc 14 72 29 14 35 28 72 29 72
MCTD 77 100 92 77 100
SS 28 86 81 58 89
PMDM 18 36 36 71 29 36 39
Blood donors 07 07 27
CFS 07 14 07 07 29
Diseased controls 07 22 07 07 37
ge1 ge2 ge3 ge4 ge5 ge6 ge7
SLE 725 488 325 175 75 63 13
SCL 600 300 100
SSc 739 101 14
MCTD 1000 923 154
SS 889 861 528
PMDM 393 179 71
Blood donors 13
CFS 29 07
Diseased controls 45
Antinuclear antibody detection indirect immunofluorescene
versus solid phase assay
Xavier Bossuyt
Annals Rheum Dis 2010691420-22
Aim
To evaluate the diagnostic performance of
IIF solid phase assay amp the combination of both for
Systemic lupus erythematosus (SLE)
Systemic slcerosis (SSc)
pSjogrenrsquos syndrome (SS)
1
2
3
BioPlex 2200 chromatin Sm ribosomal protein SSA-60 SSB RNP-A and RNP-68 SSA-52 Scl-70 Jo-1 centromere B dsDNA
IIF HEp-2000 (Immunoconcepts) EliA CTD screen (Thermo Fisher) SSARo 52 SSARo 60 SSBLa U1-RNP (RNP-70 A C) Sm centromere B Jo-1 Scl-70 Rib-P fibrillarin RNA Pol III PM-Scl PCNA and Mi-2 dsDNA
IIF 180 IIF 1160 EliA CTD screen BioPlex 2200
Sensitivity
Systemic lupus erythematosus Reference 1 2 (n=80) 925 (84-97) 90 (81-95) 74 (63-82) 79 (69-86) Reference 3 (n=41) 97 (87-99) 95 (83-99) Systemic sclerosis Reference 1 2 (n=69) 97 (90-99) 93 (84-97) 725 (61-82) 72 (61-82) Reference 3 (n=37) 95 (82-98) 865 (72-94) Sjoumlgrenrsquos syndrome Reference 1 2 (n=36) 83 (68-92) 56 (40-70) 89 (75-96) 89 (75-96) Reference 3 (n=40) 76 (62-88) 74 (57-83)
Specificity
Healthy controls (n=125) (Ref 3) 87 (80-92) 95 (90-98) Blood donors (n=149) (Ref1 2) 91 (85-95) 94 (89-97) 97 (93-99) 95 (90-97) Chronic fatigue syndrome (n=139) (Ref1 2)
92 (86-96) 96 (92-98) 97 (92-99) 93 (87-96)
Diseased controls (n=134) (Ref1 2) 75 (67-81) 82 (75-88) 96 (91-98) 89 (82-93)
All controls (n=422) (Ref1 2) 86 (83-89) 91 (88-93) 97 (95-98) 92 (89-94)
0
005
01
015
02
025
Like
liho
od
SLE
0
005
01
015
02
025
Like
liho
od
Systemic sclerosis
0
005
01
015
02
025
03
Like
liho
od
Sjoumlgrens syndrome
LR Systemic lupus erythematosus
Systemic sclerosis Sjoumlgrenrsquos syndrome
IIF(+) (Ref 1 2) 67 (53-86) 71 (55-90) 61 (46-80) IIF(+) (Ref 3) 71 (46-112) 64 (40-101)0 57 (35-59) IIF(-) (Ref 1 2) 008 (004-019) 003 (001-013) 019 (009-040) IIF(-) (Ref 3) 003 (0004-020) 016 (003-035) 026 (015-046) EliA CTD screen (+) 239 (138-415) 235 (135-409) 288 (167-499) EliA CTD screen (-) 027 (019-039) 028 (019-042) 011 (005-029) IIF (+) EliA CTD screen (+) 414 (196-877) 436 (207-468) 468 (220-998) IIF (+) EliA CTD screen (-) 20 (12-31) 20 (13-33) 045 (012-18) IIF (-) EliA CTD screen (+) 35 (10-122) 78 (23-264) IIF (-) EliA CTD screen (-) 003 (0007-012) 003 (0009-013) 006 (002-025)
LR Systemic lupus erythematosus
Systemic sclerosis Sjoumlgrenrsquos syndrome
IIF(+) (Ref 1 2) 67 (53-86) 71 (55-90) 61 (46-80) IIF(+) (Ref 3) 71 (46-112) 64 (40-101)0 57 (35-59) IIF(-) (Ref 1 2) 008 (004-019) 003 (001-013) 019 (009-040) IIF(-) (Ref 3) 003 (0004-020) 016 (003-035) 026 (015-046) EliA CTD screen (+) 239 (138-415) 235 (135-409) 288 (167-499) EliA CTD screen (-) 027 (019-039) 028 (019-042) 011 (005-029) IIF (+) EliA CTD screen (+) 414 (196-877) 436 (207-468) 468 (220-998) IIF (+) EliA CTD screen (-) 20 (12-31) 20 (13-33) 045 (012-18) IIF (-) EliA CTD screen (+) 35 (10-122) 78 (23-264) IIF (-) EliA CTD screen (-) 003 (0007-012) 003 (0009-013) 006 (002-025)
Prevalence
Systemic lupus erythematosus
Systemic sclerosis
Sjoumlgrenrsquos syndrome
Controls
IIF (+) EliA CTD screen (+) 69 72 78 16 IIF (+) EliA CTD screen (-) 24 25 55 12 IIF (-) EliA CTD screen (+) 5 11 14 IIF (-) EliA CTD screen (-) 2 3 55 85
0
02
04
06
08
1
0 02 04 06 08 1
Po
st-t
est
pro
bab
ility
Pre-test probability
FEIA+ IIF+
FEIA+
IIF+
FEIA+ IIF-
FEIA- IIF+
FEIA-
IIF-
FEIA- IIF-
SLE
Comparative analysis of different strategies
1 IIF and FEIA on all samples
2 IIF
If IIF positive FEIA
If IIF negative stop
3 FEIA
4 IIF
Conclusion
Integrated interpretation
of IIF and solid phase assay results adds value
Optimal strategy
depends on the pathology
Bossuyt X Fieuws S Ann Rheum Dis 2014 Mar73(3)
Antinuclear antibodies by automated
indirect immunofluorescence Opportunities for value added
reporting
Xavier Bossuyt Leuven Belgium
Instrument NOVA View AKLIDES EUROPattern Image
Navigator
Helios ZENIT G Sight
Manufacturer INOVA Medipan EUROPattern Immuno Concepts Aesku Menarini
LIMS connection (software) Yes (QUANTA
Link)
Yes Yes
(EUROLabOffice)
Yes (direct) Yes (direct) Yes (ZenIT)
Slide identification via
barcode
Yes by handheld
scanner
Yes by handheld
scanner
Yes by integrated
scanner
Yes Yes by integrated
scanner
Yes by integrated
scanner
Loading capacity 5 slides (up to 60
wells)
5 slides (up to 60
wells)
50 slides (up to 500
wells)
4 slides (up to 84
wells)
20 slides (up to 240
wells)
5 slides (up to 70
wells)
Image acquisition speed ~45swell for 3
images
~40swell lt20swell ~25swell for 4
images
10spicture
Customizable from 1
to 10 images
gt60swell
pictures 5 (small
scan) 50 (medium
scan) 220 (full scan)
100 QC for substrate and
process integrity
counterstaining
Yes DAPI Yes DAPI Yes Propidium
iodide
None None None None None None
Automatic posneg
discrimination incl
presorting of images
Yes Yes Yes Yes Yes Yes
Batchwise verification of
negative samples
Yes Yes Yes Yes Yes Yes
Automatic pattern
recognition
Yes Yes Yes No No Yes
Pattern Analysis method Pattern recognition by
mathematical algorithm
Pattern recognition by
mathematical algorithm
Pattern recognition by
mathematical algorithm
No pattern matching
capabilities
No pattern matching
capabilities
Pattern recognition by
mathematical algorithm
No of recognizable ANA
staining pattern list out
6
Homogeneous
Speckled
Centromere
Nucleolar
Nuclear dot
Cytoplasm
Negative
Positive unrecognized
10
Homogeneous
Speckled
Centromere
Nucleolar
Nuclear dot
Cytoplasm
Negative
Positive unrecognized
8
Homogeneous
Speckled
Centromere
Nucleolar
Nuclear dot
Cytoplasm
Nuclear rim
Mitotic negative
None None 5
Homogeneous
Speckled
Centromere
Nucleolar
Cytoplasm
Negative
Instrument calibration to
minimize variability
Yes Yes Yes Yes Yes No
Integration with slide
processing in 1 instrument
No No No No Yes No
Mahler et al J Immunol Research in press
Automated fluorescence microscopy is increasingly used for image acquisition quantitative analysis and pattern recognition of anti-nuclear antibody
testing
Positivenegative discrimination
bull Exposure time is inversely proportional to intensity of fluorescence
bull Probability value is given to samples
Pattern recognition ANA
bull five patterns ndash Homogeneous
ndash Speckled
ndash Centromere
ndash Nucleolar
ndash Mitochondrial
bull Based on statistical morphological and geometric features
IMAGE ACQUISITION
RNP
PM-Scl
Golgi
Membrane
Review of digital images
harr
manual approach (posneg)
ndash 90 identical interpretation (n=332) (Bonroy et al CCLM 2013)
ndash 88 identical interpretation (n=268) (Bossuyt et al CCA 2013)
Bonroy et al CCLM 2013
FLUORESENCE INTENSITY VERSUS ANTIBODY TITER
HEp-2
-10
10
30
50
70
90
neg 80 160 320 640 1280
Ind
ex
Titer
Outlier Boxplot
Outliers gt 15 and lt 3 IQR
Outliers gt 3 IQR
Midbody centriole few nuclear dots Golgi
Bossuyt et al CCA 2013
G-Sight HEp-2000
0
20
40
60
80
100
neg 180 1160 1320 1640 1gt=1280
Pro
ba
bil
ity i
nd
ex
Antibody titer
Bonroy et al 2013
NOVA View
0
500
1000
1500
2000
2500
3000
3500
Neg 80 160 320 640 gt=1280
Nova
Vie
w F
luo
resce
nce
In
de
x
Titer
Schouwers et al Clin Chem Lab Med 201452547-51
Pattern recognition
Visual inspection Correct assignment by G-Sight HEp-2
Correct assignment by G-sight HEp-2000
Homogeneous (n=42) 68 92
Speckled (n=34) 71 56
Centromere (n=6) 83 42
Pattern recognition (Bonroy et al 2013) Pattern assignment was incorrect in 29 of 132 pos samples No pattern assigned in 45 of samples Global accuracy of pattern assignment 26
FLUORESCENCE INTENSITY IN WELL-DEFINED PATIENT COHORTS
Study Population
n M()F() Median age (range)
Blood donors
108 5149 45 (19-65)
Chronic Fatigue Syndrome
150 1981 41 (16-75)
Diseased Controls 134 2575 45 (17-81)
392
Systemic Lupus Erythematosus
85 1288 355 (15-72)
Sjoumlgrenrsquos Syndrome
36 1486 56 (21-75)
Systemic Sclerosis
76 3466 53 (18-80)
Polymyositis Dermatomyositis
32 4456 50 (24-77)
Mixed Connective Tissue Disease
16 694 315 (16-66)
245
HEp2
-10
10
30
50
70
90
Blooddonor
CFS Discontrols
SLE SCL SS SSc MCTD PM DM
Gro
up
s
Groups
Outlier Boxplot
Outliers gt 15 and lt 3 IQR
Outliers gt 3 IQR
Bossuyt et al CCA 2013
G-Sight HEp-2000
-10
10
30
50
70
90
BloodDonors
CFS Dis Contr SLE SCL SS SSc MCTD PM DM
Pro
ba
bil
ity i
nd
ex
G-Sight HEp-2
Probability index
Blood donor CFS Diseased controls SLE SS SSc MCTD PMDM
le10 11-le30 31-le50 51-le85 gt85
075 024 001 000 000
084 013 001 001 000
050 038 003 007 003
004 009 012 032 043
009 009 009 043 031
001 020 014 042 022
000 000 000 000 100
015 041 011 026 007
Probability index SLE SS SSc MCTD PMDM
le10 11 le30 31 le50 51 le85 gt85
006 (002-02)
04 (02-08)
68 (26-178)
121 (62-236)
439 (160-1204)
01 (004-04)
03 (01-10)
50 (14-186)
160 (79-322)
322 (108-959)
002 (0003-01)
08 (05-13)
85 (33-215)
157 (82-299)
223 (76-651)
1025 (387-2718)
02 (009-05)
16 (10-27)
65 (18-238)
97 (40-229)
76 (14-396)
Bonroy et al CCLM 2013
0
500
1000
1500
2000
2500
3000
3500
HC CVS DC SLE SS SSc PMDM MCTD
L
I
U
Outlier Boxplot
Percentiles (95 of Distribution)
Outliers gt 15 and lt 3 IQR
Outliers gt 3 IQR
NOVA View
NOVA View LR LIU Controls SLE SS SSc PMDM MCTD SARD
Prevalence
lt49 056 006 003 003 013 005
49-120 026 005 006 005 019 007
121-600 013 011 003 009 034 011
601-2000 004 046 061 034 025 006 039
gt2000 001 033 028 049 009 094 038
LR
lt49 011 005 005 023 009
49-120 018 021 020 073 025
121-600 079 021 069 257 085
601-2000 112 150 84 61 15 96
gt2000 291 245 429 83 827 335
NOVA View
009 025 085
10
33
0
10
20
30
40
0
01
02
03
04
05
06
lt49 49-120 121-600 601-2000 gt2000
Like
liho
od
rat
io
Pre
vale
nce
Nuclear Index
controls
SRD
LR
LR 1 no clinical value gt10 lt01 clinically important difference 5 ndash 10 01 ndash 02 modest but substantial difference 2 ndash 5 02 ndash 05 small difference that may be relevant
Post-test odds
=
Pre-test odds x LR
probability rarr odds
02 rarr 02 (1 ndash 02)
025
odds rarr probability
4 rarr 4 (1 + 4)
08
0
02
04
06
08
1
000 020 040 060 080 100
Po
st-t
est
pro
bab
ility
Pre-test probability
lt20
20-50
51-200
gt200
gt2000
Pre-test probability Post-test probability
lt49 120-600 600-2000 gt2000
1 a young women with hair loss and polyarthralgia 007 05 5 25
0
02
04
06
08
1
000 020 040 060 080 100
Po
st-t
est
pro
bab
ility
Pre-test probability
lt20
20-50
51-200
gt200
gt2000
Pre-test probability Post-test probability
lt49 120-600 600-2000 gt2000
10 a young women with photosensitivity and mild leucopenia (3000-3500mm3)
07 55 36 79
0
02
04
06
08
1
000 020 040 060 080 100
Po
st-t
est
pro
bab
ility
Pre-test probability
lt20
20-50
51-200
gt200
gt2000
Pre-test probability Post-test probability
lt49 120-600 600-2000 gt2000
50 a young women with photosensitivity malar rash and symmetrical polyarthritis
65 35 83 97
G-Sight HEp-2
Probability index
Blood donor CFS Diseased controls SLE SS SSc MCTD PMDM
le10 11-le30 31-le50 51-le85 gt85
075 024 001 000 000
084 013 001 001 000
050 038 003 007 003
004 009 012 032 043
009 009 009 043 031
001 020 014 042 022
000 000 000 000 100
015 041 011 026 007
Probability index SLE SS SSc MCTD PMDM
le10 11 le30 31 le50 51 le85 gt85
006 (002-02)
04 (02-08)
68 (26-178)
121 (62-236)
439 (160-1204)
01 (004-04)
03 (01-10)
50 (14-186)
160 (79-322)
322 (108-959)
002 (0003-01)
08 (05-13)
85 (33-215)
157 (82-299)
223 (76-651)
1025 (387-2718)
02 (009-05)
16 (10-27)
65 (18-238)
97 (40-229)
76 (14-396)
Maenhout et al 2014
Maenhout et al 2014
Conclusions
bull High quality image acquisition
bull Significant correlation between intensity and antibody titer
bull Fluorescence intensity provides clinically useful information
bull Enables implementation of a quantitative internal quality
control system
bull Accuracy of pattern recognition is limited
a microdot array based immunoassay developed to allow simultaneous detection of multiple
autoantibodies on a single patient
Cambridge Life Sciences Ltd
ZENITbullAMiDot
bull One patient sample per well ndash 9 x 9 microarray (81 dots)
Cambridge Life Sciences Ltd
ZENITbullAMiDot
bull Each 9 x 9 microarray contains
bull Multiple autoimmune antigen dots
bull Calibration dots
bull Control dots
bull Registration dots
Cambridge Life Sciences Ltd
ZENITbullAMiDot
0
25000
50000
75000
100000
125000
150000
175000
200000
0 10 20 30 40 50 60 70 80 90 100
Raw
Sig
nal
Calibrator Conc (UmL)
Calibration
bullEach 9 x 9 microarray is
bullPrinted on to an activated glass surface
bullEach dot is ~20microm in diameter
bullEach autoimmune antigen calibrator and control is printed in duplicate or triplicate
bullAutomated analysis
bullImage taken by Reader (G-Sight or AMiDot reader)
Cambridge Life Sciences Ltd
ZENITbullAMiDot
Software receives the image analyses the image and produces a patient report
Antigen RecombinantNative Antigen RecombinantNative
Ro60SS-A recombinant PL7PL12 recombinant
Ro52SS-A recombinant MPO native
LaSS-B recombinant PR3 native
Sm native GBM native
U1-snRNP (68kDAC) recombinant Cathepsin native
Jo-1 recombinant SRP-54 recombinant
Scl70 native BPI native
PMScl100 recombinant ASCA native
dsDNA plasmid tTG recombinant
Histones Native deaminated Gliadin recombinant
Mi-2 recombinant TPO recombinant
Centromere B recombinant Intrinsic Factor recombinant
Ku recombinant Gastric Parietal Cell native
PCNA recombinant M2 recombinant
Ribosomal P0 recombinant LKM-1 recombinant
Elastase native LC1 recombinant
ZENITbullAMiDot
Cambridge Life Sciences Ltd
Conclusion AMiDot
bull Allows multiplex detection of autoantibodies
bull Overall a good concordance with results obtained by EliA
bull Multiplex ANA testing is an efficient way to simultaneously test for specific antibodies
bull Small sample volumes can be used
bull Further studies are warranted to prove the reliability of this technique
Acknowledgements
bull Dept of Laboratory Medicine - Immunology
ndash Dr Vermeersch ndash Dr Marieumln Mrs Godefridis ndash S Cooreman ndash S Schouwers
bull Experimental Laboratory
Immunology ndash K Op de Beeacuteck ndash D Dillaerts
bull Dept of Rheumatology Internal
Medicine ndash Dr Verschueren ndash Dr Westhovens ndash Dr Blockmans
bull Menarini ndash Heidi Debaere
bull Instrumentation Laboratory ndash Nathalie Vandeputte
bull KUL - statistics ndash S Fieuws

0
005
01
015
02
025
negative SSA pattern 140 180 1160 1320 1640 11280 1gt1280
Like
liho
od
Systemic Sclerosis
no ENAdsDNA
PM-Scl
RNA-pol
Scl-70
CENP
SSA
0
005
01
015
02
025
03
negative SSA pattern 140 180 1160 1320 1640 11280 1gt1280
Like
liho
od
Sjoumlgrens syndrome
no ENAdsDNA
SSA
SSA+SSB
dsDNA+SSA
0
005
01
015
02
025
03
035
04
negative SSA pattern 140 180 1160 1320 1640 11280 1gt1280
Like
liho
od
Inflammatory myopathy
no ENAdsDNA
PM-Scl
Mi-2
Jo-1
Jo-1+SSA52
0
005
01
015
02
025
03
035
04
045
05
negative SSA pattern 140 180 1160 1320 1640 11280 1gt1280
Like
liho
od
MCTD
U1-RNP
U1-RNP+RNP70
dsD
NA
SSA
-60
SSA
-52
SSB
U1
-RN
P
RN
P-7
0
Sm
Rib
-P
CEN
P
Scl-
70
Po
l-II
I
PM
-Scl
Jo-1
Mi-
2
CTD
scr
ee
n
SLE 45 48 38 19 16 63 63 88 74
SCL 60 30 10 60
SSc 14 72 29 14 35 28 72 29 72
MCTD 77 100 92 77 100
SS 28 86 81 58 89
PMDM 18 36 36 71 29 36 39
Blood donors 07 07 27
CFS 07 14 07 07 29
Diseased controls 07 22 07 07 37
ge1 ge2 ge3 ge4 ge5 ge6 ge7
SLE 725 488 325 175 75 63 13
SCL 600 300 100
SSc 739 101 14
MCTD 1000 923 154
SS 889 861 528
PMDM 393 179 71
Blood donors 13
CFS 29 07
Diseased controls 45
Antinuclear antibody detection indirect immunofluorescene
versus solid phase assay
Xavier Bossuyt
Annals Rheum Dis 2010691420-22
Aim
To evaluate the diagnostic performance of
IIF solid phase assay amp the combination of both for
Systemic lupus erythematosus (SLE)
Systemic slcerosis (SSc)
pSjogrenrsquos syndrome (SS)
1
2
3
BioPlex 2200 chromatin Sm ribosomal protein SSA-60 SSB RNP-A and RNP-68 SSA-52 Scl-70 Jo-1 centromere B dsDNA
IIF HEp-2000 (Immunoconcepts) EliA CTD screen (Thermo Fisher) SSARo 52 SSARo 60 SSBLa U1-RNP (RNP-70 A C) Sm centromere B Jo-1 Scl-70 Rib-P fibrillarin RNA Pol III PM-Scl PCNA and Mi-2 dsDNA
IIF 180 IIF 1160 EliA CTD screen BioPlex 2200
Sensitivity
Systemic lupus erythematosus Reference 1 2 (n=80) 925 (84-97) 90 (81-95) 74 (63-82) 79 (69-86) Reference 3 (n=41) 97 (87-99) 95 (83-99) Systemic sclerosis Reference 1 2 (n=69) 97 (90-99) 93 (84-97) 725 (61-82) 72 (61-82) Reference 3 (n=37) 95 (82-98) 865 (72-94) Sjoumlgrenrsquos syndrome Reference 1 2 (n=36) 83 (68-92) 56 (40-70) 89 (75-96) 89 (75-96) Reference 3 (n=40) 76 (62-88) 74 (57-83)
Specificity
Healthy controls (n=125) (Ref 3) 87 (80-92) 95 (90-98) Blood donors (n=149) (Ref1 2) 91 (85-95) 94 (89-97) 97 (93-99) 95 (90-97) Chronic fatigue syndrome (n=139) (Ref1 2)
92 (86-96) 96 (92-98) 97 (92-99) 93 (87-96)
Diseased controls (n=134) (Ref1 2) 75 (67-81) 82 (75-88) 96 (91-98) 89 (82-93)
All controls (n=422) (Ref1 2) 86 (83-89) 91 (88-93) 97 (95-98) 92 (89-94)
0
005
01
015
02
025
Like
liho
od
SLE
0
005
01
015
02
025
Like
liho
od
Systemic sclerosis
0
005
01
015
02
025
03
Like
liho
od
Sjoumlgrens syndrome
LR Systemic lupus erythematosus
Systemic sclerosis Sjoumlgrenrsquos syndrome
IIF(+) (Ref 1 2) 67 (53-86) 71 (55-90) 61 (46-80) IIF(+) (Ref 3) 71 (46-112) 64 (40-101)0 57 (35-59) IIF(-) (Ref 1 2) 008 (004-019) 003 (001-013) 019 (009-040) IIF(-) (Ref 3) 003 (0004-020) 016 (003-035) 026 (015-046) EliA CTD screen (+) 239 (138-415) 235 (135-409) 288 (167-499) EliA CTD screen (-) 027 (019-039) 028 (019-042) 011 (005-029) IIF (+) EliA CTD screen (+) 414 (196-877) 436 (207-468) 468 (220-998) IIF (+) EliA CTD screen (-) 20 (12-31) 20 (13-33) 045 (012-18) IIF (-) EliA CTD screen (+) 35 (10-122) 78 (23-264) IIF (-) EliA CTD screen (-) 003 (0007-012) 003 (0009-013) 006 (002-025)
LR Systemic lupus erythematosus
Systemic sclerosis Sjoumlgrenrsquos syndrome
IIF(+) (Ref 1 2) 67 (53-86) 71 (55-90) 61 (46-80) IIF(+) (Ref 3) 71 (46-112) 64 (40-101)0 57 (35-59) IIF(-) (Ref 1 2) 008 (004-019) 003 (001-013) 019 (009-040) IIF(-) (Ref 3) 003 (0004-020) 016 (003-035) 026 (015-046) EliA CTD screen (+) 239 (138-415) 235 (135-409) 288 (167-499) EliA CTD screen (-) 027 (019-039) 028 (019-042) 011 (005-029) IIF (+) EliA CTD screen (+) 414 (196-877) 436 (207-468) 468 (220-998) IIF (+) EliA CTD screen (-) 20 (12-31) 20 (13-33) 045 (012-18) IIF (-) EliA CTD screen (+) 35 (10-122) 78 (23-264) IIF (-) EliA CTD screen (-) 003 (0007-012) 003 (0009-013) 006 (002-025)
Prevalence
Systemic lupus erythematosus
Systemic sclerosis
Sjoumlgrenrsquos syndrome
Controls
IIF (+) EliA CTD screen (+) 69 72 78 16 IIF (+) EliA CTD screen (-) 24 25 55 12 IIF (-) EliA CTD screen (+) 5 11 14 IIF (-) EliA CTD screen (-) 2 3 55 85
0
02
04
06
08
1
0 02 04 06 08 1
Po
st-t
est
pro
bab
ility
Pre-test probability
FEIA+ IIF+
FEIA+
IIF+
FEIA+ IIF-
FEIA- IIF+
FEIA-
IIF-
FEIA- IIF-
SLE
Comparative analysis of different strategies
1 IIF and FEIA on all samples
2 IIF
If IIF positive FEIA
If IIF negative stop
3 FEIA
4 IIF
Conclusion
Integrated interpretation
of IIF and solid phase assay results adds value
Optimal strategy
depends on the pathology
Bossuyt X Fieuws S Ann Rheum Dis 2014 Mar73(3)
Antinuclear antibodies by automated
indirect immunofluorescence Opportunities for value added
reporting
Xavier Bossuyt Leuven Belgium
Instrument NOVA View AKLIDES EUROPattern Image
Navigator
Helios ZENIT G Sight
Manufacturer INOVA Medipan EUROPattern Immuno Concepts Aesku Menarini
LIMS connection (software) Yes (QUANTA
Link)
Yes Yes
(EUROLabOffice)
Yes (direct) Yes (direct) Yes (ZenIT)
Slide identification via
barcode
Yes by handheld
scanner
Yes by handheld
scanner
Yes by integrated
scanner
Yes Yes by integrated
scanner
Yes by integrated
scanner
Loading capacity 5 slides (up to 60
wells)
5 slides (up to 60
wells)
50 slides (up to 500
wells)
4 slides (up to 84
wells)
20 slides (up to 240
wells)
5 slides (up to 70
wells)
Image acquisition speed ~45swell for 3
images
~40swell lt20swell ~25swell for 4
images
10spicture
Customizable from 1
to 10 images
gt60swell
pictures 5 (small
scan) 50 (medium
scan) 220 (full scan)
100 QC for substrate and
process integrity
counterstaining
Yes DAPI Yes DAPI Yes Propidium
iodide
None None None None None None
Automatic posneg
discrimination incl
presorting of images
Yes Yes Yes Yes Yes Yes
Batchwise verification of
negative samples
Yes Yes Yes Yes Yes Yes
Automatic pattern
recognition
Yes Yes Yes No No Yes
Pattern Analysis method Pattern recognition by
mathematical algorithm
Pattern recognition by
mathematical algorithm
Pattern recognition by
mathematical algorithm
No pattern matching
capabilities
No pattern matching
capabilities
Pattern recognition by
mathematical algorithm
No of recognizable ANA
staining pattern list out
6
Homogeneous
Speckled
Centromere
Nucleolar
Nuclear dot
Cytoplasm
Negative
Positive unrecognized
10
Homogeneous
Speckled
Centromere
Nucleolar
Nuclear dot
Cytoplasm
Negative
Positive unrecognized
8
Homogeneous
Speckled
Centromere
Nucleolar
Nuclear dot
Cytoplasm
Nuclear rim
Mitotic negative
None None 5
Homogeneous
Speckled
Centromere
Nucleolar
Cytoplasm
Negative
Instrument calibration to
minimize variability
Yes Yes Yes Yes Yes No
Integration with slide
processing in 1 instrument
No No No No Yes No
Mahler et al J Immunol Research in press
Automated fluorescence microscopy is increasingly used for image acquisition quantitative analysis and pattern recognition of anti-nuclear antibody
testing
Positivenegative discrimination
bull Exposure time is inversely proportional to intensity of fluorescence
bull Probability value is given to samples
Pattern recognition ANA
bull five patterns ndash Homogeneous
ndash Speckled
ndash Centromere
ndash Nucleolar
ndash Mitochondrial
bull Based on statistical morphological and geometric features
IMAGE ACQUISITION
RNP
PM-Scl
Golgi
Membrane
Review of digital images
harr
manual approach (posneg)
ndash 90 identical interpretation (n=332) (Bonroy et al CCLM 2013)
ndash 88 identical interpretation (n=268) (Bossuyt et al CCA 2013)
Bonroy et al CCLM 2013
FLUORESENCE INTENSITY VERSUS ANTIBODY TITER
HEp-2
-10
10
30
50
70
90
neg 80 160 320 640 1280
Ind
ex
Titer
Outlier Boxplot
Outliers gt 15 and lt 3 IQR
Outliers gt 3 IQR
Midbody centriole few nuclear dots Golgi
Bossuyt et al CCA 2013
G-Sight HEp-2000
0
20
40
60
80
100
neg 180 1160 1320 1640 1gt=1280
Pro
ba
bil
ity i
nd
ex
Antibody titer
Bonroy et al 2013
NOVA View
0
500
1000
1500
2000
2500
3000
3500
Neg 80 160 320 640 gt=1280
Nova
Vie
w F
luo
resce
nce
In
de
x
Titer
Schouwers et al Clin Chem Lab Med 201452547-51
Pattern recognition
Visual inspection Correct assignment by G-Sight HEp-2
Correct assignment by G-sight HEp-2000
Homogeneous (n=42) 68 92
Speckled (n=34) 71 56
Centromere (n=6) 83 42
Pattern recognition (Bonroy et al 2013) Pattern assignment was incorrect in 29 of 132 pos samples No pattern assigned in 45 of samples Global accuracy of pattern assignment 26
FLUORESCENCE INTENSITY IN WELL-DEFINED PATIENT COHORTS
Study Population
n M()F() Median age (range)
Blood donors
108 5149 45 (19-65)
Chronic Fatigue Syndrome
150 1981 41 (16-75)
Diseased Controls 134 2575 45 (17-81)
392
Systemic Lupus Erythematosus
85 1288 355 (15-72)
Sjoumlgrenrsquos Syndrome
36 1486 56 (21-75)
Systemic Sclerosis
76 3466 53 (18-80)
Polymyositis Dermatomyositis
32 4456 50 (24-77)
Mixed Connective Tissue Disease
16 694 315 (16-66)
245
HEp2
-10
10
30
50
70
90
Blooddonor
CFS Discontrols
SLE SCL SS SSc MCTD PM DM
Gro
up
s
Groups
Outlier Boxplot
Outliers gt 15 and lt 3 IQR
Outliers gt 3 IQR
Bossuyt et al CCA 2013
G-Sight HEp-2000
-10
10
30
50
70
90
BloodDonors
CFS Dis Contr SLE SCL SS SSc MCTD PM DM
Pro
ba
bil
ity i
nd
ex
G-Sight HEp-2
Probability index
Blood donor CFS Diseased controls SLE SS SSc MCTD PMDM
le10 11-le30 31-le50 51-le85 gt85
075 024 001 000 000
084 013 001 001 000
050 038 003 007 003
004 009 012 032 043
009 009 009 043 031
001 020 014 042 022
000 000 000 000 100
015 041 011 026 007
Probability index SLE SS SSc MCTD PMDM
le10 11 le30 31 le50 51 le85 gt85
006 (002-02)
04 (02-08)
68 (26-178)
121 (62-236)
439 (160-1204)
01 (004-04)
03 (01-10)
50 (14-186)
160 (79-322)
322 (108-959)
002 (0003-01)
08 (05-13)
85 (33-215)
157 (82-299)
223 (76-651)
1025 (387-2718)
02 (009-05)
16 (10-27)
65 (18-238)
97 (40-229)
76 (14-396)
Bonroy et al CCLM 2013
0
500
1000
1500
2000
2500
3000
3500
HC CVS DC SLE SS SSc PMDM MCTD
L
I
U
Outlier Boxplot
Percentiles (95 of Distribution)
Outliers gt 15 and lt 3 IQR
Outliers gt 3 IQR
NOVA View
NOVA View LR LIU Controls SLE SS SSc PMDM MCTD SARD
Prevalence
lt49 056 006 003 003 013 005
49-120 026 005 006 005 019 007
121-600 013 011 003 009 034 011
601-2000 004 046 061 034 025 006 039
gt2000 001 033 028 049 009 094 038
LR
lt49 011 005 005 023 009
49-120 018 021 020 073 025
121-600 079 021 069 257 085
601-2000 112 150 84 61 15 96
gt2000 291 245 429 83 827 335
NOVA View
009 025 085
10
33
0
10
20
30
40
0
01
02
03
04
05
06
lt49 49-120 121-600 601-2000 gt2000
Like
liho
od
rat
io
Pre
vale
nce
Nuclear Index
controls
SRD
LR
LR 1 no clinical value gt10 lt01 clinically important difference 5 ndash 10 01 ndash 02 modest but substantial difference 2 ndash 5 02 ndash 05 small difference that may be relevant
Post-test odds
=
Pre-test odds x LR
probability rarr odds
02 rarr 02 (1 ndash 02)
025
odds rarr probability
4 rarr 4 (1 + 4)
08
0
02
04
06
08
1
000 020 040 060 080 100
Po
st-t
est
pro
bab
ility
Pre-test probability
lt20
20-50
51-200
gt200
gt2000
Pre-test probability Post-test probability
lt49 120-600 600-2000 gt2000
1 a young women with hair loss and polyarthralgia 007 05 5 25
0
02
04
06
08
1
000 020 040 060 080 100
Po
st-t
est
pro
bab
ility
Pre-test probability
lt20
20-50
51-200
gt200
gt2000
Pre-test probability Post-test probability
lt49 120-600 600-2000 gt2000
10 a young women with photosensitivity and mild leucopenia (3000-3500mm3)
07 55 36 79
0
02
04
06
08
1
000 020 040 060 080 100
Po
st-t
est
pro
bab
ility
Pre-test probability
lt20
20-50
51-200
gt200
gt2000
Pre-test probability Post-test probability
lt49 120-600 600-2000 gt2000
50 a young women with photosensitivity malar rash and symmetrical polyarthritis
65 35 83 97
G-Sight HEp-2
Probability index
Blood donor CFS Diseased controls SLE SS SSc MCTD PMDM
le10 11-le30 31-le50 51-le85 gt85
075 024 001 000 000
084 013 001 001 000
050 038 003 007 003
004 009 012 032 043
009 009 009 043 031
001 020 014 042 022
000 000 000 000 100
015 041 011 026 007
Probability index SLE SS SSc MCTD PMDM
le10 11 le30 31 le50 51 le85 gt85
006 (002-02)
04 (02-08)
68 (26-178)
121 (62-236)
439 (160-1204)
01 (004-04)
03 (01-10)
50 (14-186)
160 (79-322)
322 (108-959)
002 (0003-01)
08 (05-13)
85 (33-215)
157 (82-299)
223 (76-651)
1025 (387-2718)
02 (009-05)
16 (10-27)
65 (18-238)
97 (40-229)
76 (14-396)
Maenhout et al 2014
Maenhout et al 2014
Conclusions
bull High quality image acquisition
bull Significant correlation between intensity and antibody titer
bull Fluorescence intensity provides clinically useful information
bull Enables implementation of a quantitative internal quality
control system
bull Accuracy of pattern recognition is limited
a microdot array based immunoassay developed to allow simultaneous detection of multiple
autoantibodies on a single patient
Cambridge Life Sciences Ltd
ZENITbullAMiDot
bull One patient sample per well ndash 9 x 9 microarray (81 dots)
Cambridge Life Sciences Ltd
ZENITbullAMiDot
bull Each 9 x 9 microarray contains
bull Multiple autoimmune antigen dots
bull Calibration dots
bull Control dots
bull Registration dots
Cambridge Life Sciences Ltd
ZENITbullAMiDot
0
25000
50000
75000
100000
125000
150000
175000
200000
0 10 20 30 40 50 60 70 80 90 100
Raw
Sig
nal
Calibrator Conc (UmL)
Calibration
bullEach 9 x 9 microarray is
bullPrinted on to an activated glass surface
bullEach dot is ~20microm in diameter
bullEach autoimmune antigen calibrator and control is printed in duplicate or triplicate
bullAutomated analysis
bullImage taken by Reader (G-Sight or AMiDot reader)
Cambridge Life Sciences Ltd
ZENITbullAMiDot
Software receives the image analyses the image and produces a patient report
Antigen RecombinantNative Antigen RecombinantNative
Ro60SS-A recombinant PL7PL12 recombinant
Ro52SS-A recombinant MPO native
LaSS-B recombinant PR3 native
Sm native GBM native
U1-snRNP (68kDAC) recombinant Cathepsin native
Jo-1 recombinant SRP-54 recombinant
Scl70 native BPI native
PMScl100 recombinant ASCA native
dsDNA plasmid tTG recombinant
Histones Native deaminated Gliadin recombinant
Mi-2 recombinant TPO recombinant
Centromere B recombinant Intrinsic Factor recombinant
Ku recombinant Gastric Parietal Cell native
PCNA recombinant M2 recombinant
Ribosomal P0 recombinant LKM-1 recombinant
Elastase native LC1 recombinant
ZENITbullAMiDot
Cambridge Life Sciences Ltd
Conclusion AMiDot
bull Allows multiplex detection of autoantibodies
bull Overall a good concordance with results obtained by EliA
bull Multiplex ANA testing is an efficient way to simultaneously test for specific antibodies
bull Small sample volumes can be used
bull Further studies are warranted to prove the reliability of this technique
Acknowledgements
bull Dept of Laboratory Medicine - Immunology
ndash Dr Vermeersch ndash Dr Marieumln Mrs Godefridis ndash S Cooreman ndash S Schouwers
bull Experimental Laboratory
Immunology ndash K Op de Beeacuteck ndash D Dillaerts
bull Dept of Rheumatology Internal
Medicine ndash Dr Verschueren ndash Dr Westhovens ndash Dr Blockmans
bull Menarini ndash Heidi Debaere
bull Instrumentation Laboratory ndash Nathalie Vandeputte
bull KUL - statistics ndash S Fieuws

0
005
01
015
02
025
03
negative SSA pattern 140 180 1160 1320 1640 11280 1gt1280
Like
liho
od
Sjoumlgrens syndrome
no ENAdsDNA
SSA
SSA+SSB
dsDNA+SSA
0
005
01
015
02
025
03
035
04
negative SSA pattern 140 180 1160 1320 1640 11280 1gt1280
Like
liho
od
Inflammatory myopathy
no ENAdsDNA
PM-Scl
Mi-2
Jo-1
Jo-1+SSA52
0
005
01
015
02
025
03
035
04
045
05
negative SSA pattern 140 180 1160 1320 1640 11280 1gt1280
Like
liho
od
MCTD
U1-RNP
U1-RNP+RNP70
dsD
NA
SSA
-60
SSA
-52
SSB
U1
-RN
P
RN
P-7
0
Sm
Rib
-P
CEN
P
Scl-
70
Po
l-II
I
PM
-Scl
Jo-1
Mi-
2
CTD
scr
ee
n
SLE 45 48 38 19 16 63 63 88 74
SCL 60 30 10 60
SSc 14 72 29 14 35 28 72 29 72
MCTD 77 100 92 77 100
SS 28 86 81 58 89
PMDM 18 36 36 71 29 36 39
Blood donors 07 07 27
CFS 07 14 07 07 29
Diseased controls 07 22 07 07 37
ge1 ge2 ge3 ge4 ge5 ge6 ge7
SLE 725 488 325 175 75 63 13
SCL 600 300 100
SSc 739 101 14
MCTD 1000 923 154
SS 889 861 528
PMDM 393 179 71
Blood donors 13
CFS 29 07
Diseased controls 45
Antinuclear antibody detection indirect immunofluorescene
versus solid phase assay
Xavier Bossuyt
Annals Rheum Dis 2010691420-22
Aim
To evaluate the diagnostic performance of
IIF solid phase assay amp the combination of both for
Systemic lupus erythematosus (SLE)
Systemic slcerosis (SSc)
pSjogrenrsquos syndrome (SS)
1
2
3
BioPlex 2200 chromatin Sm ribosomal protein SSA-60 SSB RNP-A and RNP-68 SSA-52 Scl-70 Jo-1 centromere B dsDNA
IIF HEp-2000 (Immunoconcepts) EliA CTD screen (Thermo Fisher) SSARo 52 SSARo 60 SSBLa U1-RNP (RNP-70 A C) Sm centromere B Jo-1 Scl-70 Rib-P fibrillarin RNA Pol III PM-Scl PCNA and Mi-2 dsDNA
IIF 180 IIF 1160 EliA CTD screen BioPlex 2200
Sensitivity
Systemic lupus erythematosus Reference 1 2 (n=80) 925 (84-97) 90 (81-95) 74 (63-82) 79 (69-86) Reference 3 (n=41) 97 (87-99) 95 (83-99) Systemic sclerosis Reference 1 2 (n=69) 97 (90-99) 93 (84-97) 725 (61-82) 72 (61-82) Reference 3 (n=37) 95 (82-98) 865 (72-94) Sjoumlgrenrsquos syndrome Reference 1 2 (n=36) 83 (68-92) 56 (40-70) 89 (75-96) 89 (75-96) Reference 3 (n=40) 76 (62-88) 74 (57-83)
Specificity
Healthy controls (n=125) (Ref 3) 87 (80-92) 95 (90-98) Blood donors (n=149) (Ref1 2) 91 (85-95) 94 (89-97) 97 (93-99) 95 (90-97) Chronic fatigue syndrome (n=139) (Ref1 2)
92 (86-96) 96 (92-98) 97 (92-99) 93 (87-96)
Diseased controls (n=134) (Ref1 2) 75 (67-81) 82 (75-88) 96 (91-98) 89 (82-93)
All controls (n=422) (Ref1 2) 86 (83-89) 91 (88-93) 97 (95-98) 92 (89-94)
0
005
01
015
02
025
Like
liho
od
SLE
0
005
01
015
02
025
Like
liho
od
Systemic sclerosis
0
005
01
015
02
025
03
Like
liho
od
Sjoumlgrens syndrome
LR Systemic lupus erythematosus
Systemic sclerosis Sjoumlgrenrsquos syndrome
IIF(+) (Ref 1 2) 67 (53-86) 71 (55-90) 61 (46-80) IIF(+) (Ref 3) 71 (46-112) 64 (40-101)0 57 (35-59) IIF(-) (Ref 1 2) 008 (004-019) 003 (001-013) 019 (009-040) IIF(-) (Ref 3) 003 (0004-020) 016 (003-035) 026 (015-046) EliA CTD screen (+) 239 (138-415) 235 (135-409) 288 (167-499) EliA CTD screen (-) 027 (019-039) 028 (019-042) 011 (005-029) IIF (+) EliA CTD screen (+) 414 (196-877) 436 (207-468) 468 (220-998) IIF (+) EliA CTD screen (-) 20 (12-31) 20 (13-33) 045 (012-18) IIF (-) EliA CTD screen (+) 35 (10-122) 78 (23-264) IIF (-) EliA CTD screen (-) 003 (0007-012) 003 (0009-013) 006 (002-025)
LR Systemic lupus erythematosus
Systemic sclerosis Sjoumlgrenrsquos syndrome
IIF(+) (Ref 1 2) 67 (53-86) 71 (55-90) 61 (46-80) IIF(+) (Ref 3) 71 (46-112) 64 (40-101)0 57 (35-59) IIF(-) (Ref 1 2) 008 (004-019) 003 (001-013) 019 (009-040) IIF(-) (Ref 3) 003 (0004-020) 016 (003-035) 026 (015-046) EliA CTD screen (+) 239 (138-415) 235 (135-409) 288 (167-499) EliA CTD screen (-) 027 (019-039) 028 (019-042) 011 (005-029) IIF (+) EliA CTD screen (+) 414 (196-877) 436 (207-468) 468 (220-998) IIF (+) EliA CTD screen (-) 20 (12-31) 20 (13-33) 045 (012-18) IIF (-) EliA CTD screen (+) 35 (10-122) 78 (23-264) IIF (-) EliA CTD screen (-) 003 (0007-012) 003 (0009-013) 006 (002-025)
Prevalence
Systemic lupus erythematosus
Systemic sclerosis
Sjoumlgrenrsquos syndrome
Controls
IIF (+) EliA CTD screen (+) 69 72 78 16 IIF (+) EliA CTD screen (-) 24 25 55 12 IIF (-) EliA CTD screen (+) 5 11 14 IIF (-) EliA CTD screen (-) 2 3 55 85
0
02
04
06
08
1
0 02 04 06 08 1
Po
st-t
est
pro
bab
ility
Pre-test probability
FEIA+ IIF+
FEIA+
IIF+
FEIA+ IIF-
FEIA- IIF+
FEIA-
IIF-
FEIA- IIF-
SLE
Comparative analysis of different strategies
1 IIF and FEIA on all samples
2 IIF
If IIF positive FEIA
If IIF negative stop
3 FEIA
4 IIF
Conclusion
Integrated interpretation
of IIF and solid phase assay results adds value
Optimal strategy
depends on the pathology
Bossuyt X Fieuws S Ann Rheum Dis 2014 Mar73(3)
Antinuclear antibodies by automated
indirect immunofluorescence Opportunities for value added
reporting
Xavier Bossuyt Leuven Belgium
Instrument NOVA View AKLIDES EUROPattern Image
Navigator
Helios ZENIT G Sight
Manufacturer INOVA Medipan EUROPattern Immuno Concepts Aesku Menarini
LIMS connection (software) Yes (QUANTA
Link)
Yes Yes
(EUROLabOffice)
Yes (direct) Yes (direct) Yes (ZenIT)
Slide identification via
barcode
Yes by handheld
scanner
Yes by handheld
scanner
Yes by integrated
scanner
Yes Yes by integrated
scanner
Yes by integrated
scanner
Loading capacity 5 slides (up to 60
wells)
5 slides (up to 60
wells)
50 slides (up to 500
wells)
4 slides (up to 84
wells)
20 slides (up to 240
wells)
5 slides (up to 70
wells)
Image acquisition speed ~45swell for 3
images
~40swell lt20swell ~25swell for 4
images
10spicture
Customizable from 1
to 10 images
gt60swell
pictures 5 (small
scan) 50 (medium
scan) 220 (full scan)
100 QC for substrate and
process integrity
counterstaining
Yes DAPI Yes DAPI Yes Propidium
iodide
None None None None None None
Automatic posneg
discrimination incl
presorting of images
Yes Yes Yes Yes Yes Yes
Batchwise verification of
negative samples
Yes Yes Yes Yes Yes Yes
Automatic pattern
recognition
Yes Yes Yes No No Yes
Pattern Analysis method Pattern recognition by
mathematical algorithm
Pattern recognition by
mathematical algorithm
Pattern recognition by
mathematical algorithm
No pattern matching
capabilities
No pattern matching
capabilities
Pattern recognition by
mathematical algorithm
No of recognizable ANA
staining pattern list out
6
Homogeneous
Speckled
Centromere
Nucleolar
Nuclear dot
Cytoplasm
Negative
Positive unrecognized
10
Homogeneous
Speckled
Centromere
Nucleolar
Nuclear dot
Cytoplasm
Negative
Positive unrecognized
8
Homogeneous
Speckled
Centromere
Nucleolar
Nuclear dot
Cytoplasm
Nuclear rim
Mitotic negative
None None 5
Homogeneous
Speckled
Centromere
Nucleolar
Cytoplasm
Negative
Instrument calibration to
minimize variability
Yes Yes Yes Yes Yes No
Integration with slide
processing in 1 instrument
No No No No Yes No
Mahler et al J Immunol Research in press
Automated fluorescence microscopy is increasingly used for image acquisition quantitative analysis and pattern recognition of anti-nuclear antibody
testing
Positivenegative discrimination
bull Exposure time is inversely proportional to intensity of fluorescence
bull Probability value is given to samples
Pattern recognition ANA
bull five patterns ndash Homogeneous
ndash Speckled
ndash Centromere
ndash Nucleolar
ndash Mitochondrial
bull Based on statistical morphological and geometric features
IMAGE ACQUISITION
RNP
PM-Scl
Golgi
Membrane
Review of digital images
harr
manual approach (posneg)
ndash 90 identical interpretation (n=332) (Bonroy et al CCLM 2013)
ndash 88 identical interpretation (n=268) (Bossuyt et al CCA 2013)
Bonroy et al CCLM 2013
FLUORESENCE INTENSITY VERSUS ANTIBODY TITER
HEp-2
-10
10
30
50
70
90
neg 80 160 320 640 1280
Ind
ex
Titer
Outlier Boxplot
Outliers gt 15 and lt 3 IQR
Outliers gt 3 IQR
Midbody centriole few nuclear dots Golgi
Bossuyt et al CCA 2013
G-Sight HEp-2000
0
20
40
60
80
100
neg 180 1160 1320 1640 1gt=1280
Pro
ba
bil
ity i
nd
ex
Antibody titer
Bonroy et al 2013
NOVA View
0
500
1000
1500
2000
2500
3000
3500
Neg 80 160 320 640 gt=1280
Nova
Vie
w F
luo
resce
nce
In
de
x
Titer
Schouwers et al Clin Chem Lab Med 201452547-51
Pattern recognition
Visual inspection Correct assignment by G-Sight HEp-2
Correct assignment by G-sight HEp-2000
Homogeneous (n=42) 68 92
Speckled (n=34) 71 56
Centromere (n=6) 83 42
Pattern recognition (Bonroy et al 2013) Pattern assignment was incorrect in 29 of 132 pos samples No pattern assigned in 45 of samples Global accuracy of pattern assignment 26
FLUORESCENCE INTENSITY IN WELL-DEFINED PATIENT COHORTS
Study Population
n M()F() Median age (range)
Blood donors
108 5149 45 (19-65)
Chronic Fatigue Syndrome
150 1981 41 (16-75)
Diseased Controls 134 2575 45 (17-81)
392
Systemic Lupus Erythematosus
85 1288 355 (15-72)
Sjoumlgrenrsquos Syndrome
36 1486 56 (21-75)
Systemic Sclerosis
76 3466 53 (18-80)
Polymyositis Dermatomyositis
32 4456 50 (24-77)
Mixed Connective Tissue Disease
16 694 315 (16-66)
245
HEp2
-10
10
30
50
70
90
Blooddonor
CFS Discontrols
SLE SCL SS SSc MCTD PM DM
Gro
up
s
Groups
Outlier Boxplot
Outliers gt 15 and lt 3 IQR
Outliers gt 3 IQR
Bossuyt et al CCA 2013
G-Sight HEp-2000
-10
10
30
50
70
90
BloodDonors
CFS Dis Contr SLE SCL SS SSc MCTD PM DM
Pro
ba
bil
ity i
nd
ex
G-Sight HEp-2
Probability index
Blood donor CFS Diseased controls SLE SS SSc MCTD PMDM
le10 11-le30 31-le50 51-le85 gt85
075 024 001 000 000
084 013 001 001 000
050 038 003 007 003
004 009 012 032 043
009 009 009 043 031
001 020 014 042 022
000 000 000 000 100
015 041 011 026 007
Probability index SLE SS SSc MCTD PMDM
le10 11 le30 31 le50 51 le85 gt85
006 (002-02)
04 (02-08)
68 (26-178)
121 (62-236)
439 (160-1204)
01 (004-04)
03 (01-10)
50 (14-186)
160 (79-322)
322 (108-959)
002 (0003-01)
08 (05-13)
85 (33-215)
157 (82-299)
223 (76-651)
1025 (387-2718)
02 (009-05)
16 (10-27)
65 (18-238)
97 (40-229)
76 (14-396)
Bonroy et al CCLM 2013
0
500
1000
1500
2000
2500
3000
3500
HC CVS DC SLE SS SSc PMDM MCTD
L
I
U
Outlier Boxplot
Percentiles (95 of Distribution)
Outliers gt 15 and lt 3 IQR
Outliers gt 3 IQR
NOVA View
NOVA View LR LIU Controls SLE SS SSc PMDM MCTD SARD
Prevalence
lt49 056 006 003 003 013 005
49-120 026 005 006 005 019 007
121-600 013 011 003 009 034 011
601-2000 004 046 061 034 025 006 039
gt2000 001 033 028 049 009 094 038
LR
lt49 011 005 005 023 009
49-120 018 021 020 073 025
121-600 079 021 069 257 085
601-2000 112 150 84 61 15 96
gt2000 291 245 429 83 827 335
NOVA View
009 025 085
10
33
0
10
20
30
40
0
01
02
03
04
05
06
lt49 49-120 121-600 601-2000 gt2000
Like
liho
od
rat
io
Pre
vale
nce
Nuclear Index
controls
SRD
LR
LR 1 no clinical value gt10 lt01 clinically important difference 5 ndash 10 01 ndash 02 modest but substantial difference 2 ndash 5 02 ndash 05 small difference that may be relevant
Post-test odds
=
Pre-test odds x LR
probability rarr odds
02 rarr 02 (1 ndash 02)
025
odds rarr probability
4 rarr 4 (1 + 4)
08
0
02
04
06
08
1
000 020 040 060 080 100
Po
st-t
est
pro
bab
ility
Pre-test probability
lt20
20-50
51-200
gt200
gt2000
Pre-test probability Post-test probability
lt49 120-600 600-2000 gt2000
1 a young women with hair loss and polyarthralgia 007 05 5 25
0
02
04
06
08
1
000 020 040 060 080 100
Po
st-t
est
pro
bab
ility
Pre-test probability
lt20
20-50
51-200
gt200
gt2000
Pre-test probability Post-test probability
lt49 120-600 600-2000 gt2000
10 a young women with photosensitivity and mild leucopenia (3000-3500mm3)
07 55 36 79
0
02
04
06
08
1
000 020 040 060 080 100
Po
st-t
est
pro
bab
ility
Pre-test probability
lt20
20-50
51-200
gt200
gt2000
Pre-test probability Post-test probability
lt49 120-600 600-2000 gt2000
50 a young women with photosensitivity malar rash and symmetrical polyarthritis
65 35 83 97
G-Sight HEp-2
Probability index
Blood donor CFS Diseased controls SLE SS SSc MCTD PMDM
le10 11-le30 31-le50 51-le85 gt85
075 024 001 000 000
084 013 001 001 000
050 038 003 007 003
004 009 012 032 043
009 009 009 043 031
001 020 014 042 022
000 000 000 000 100
015 041 011 026 007
Probability index SLE SS SSc MCTD PMDM
le10 11 le30 31 le50 51 le85 gt85
006 (002-02)
04 (02-08)
68 (26-178)
121 (62-236)
439 (160-1204)
01 (004-04)
03 (01-10)
50 (14-186)
160 (79-322)
322 (108-959)
002 (0003-01)
08 (05-13)
85 (33-215)
157 (82-299)
223 (76-651)
1025 (387-2718)
02 (009-05)
16 (10-27)
65 (18-238)
97 (40-229)
76 (14-396)
Maenhout et al 2014
Maenhout et al 2014
Conclusions
bull High quality image acquisition
bull Significant correlation between intensity and antibody titer
bull Fluorescence intensity provides clinically useful information
bull Enables implementation of a quantitative internal quality
control system
bull Accuracy of pattern recognition is limited
a microdot array based immunoassay developed to allow simultaneous detection of multiple
autoantibodies on a single patient
Cambridge Life Sciences Ltd
ZENITbullAMiDot
bull One patient sample per well ndash 9 x 9 microarray (81 dots)
Cambridge Life Sciences Ltd
ZENITbullAMiDot
bull Each 9 x 9 microarray contains
bull Multiple autoimmune antigen dots
bull Calibration dots
bull Control dots
bull Registration dots
Cambridge Life Sciences Ltd
ZENITbullAMiDot
0
25000
50000
75000
100000
125000
150000
175000
200000
0 10 20 30 40 50 60 70 80 90 100
Raw
Sig
nal
Calibrator Conc (UmL)
Calibration
bullEach 9 x 9 microarray is
bullPrinted on to an activated glass surface
bullEach dot is ~20microm in diameter
bullEach autoimmune antigen calibrator and control is printed in duplicate or triplicate
bullAutomated analysis
bullImage taken by Reader (G-Sight or AMiDot reader)
Cambridge Life Sciences Ltd
ZENITbullAMiDot
Software receives the image analyses the image and produces a patient report
Antigen RecombinantNative Antigen RecombinantNative
Ro60SS-A recombinant PL7PL12 recombinant
Ro52SS-A recombinant MPO native
LaSS-B recombinant PR3 native
Sm native GBM native
U1-snRNP (68kDAC) recombinant Cathepsin native
Jo-1 recombinant SRP-54 recombinant
Scl70 native BPI native
PMScl100 recombinant ASCA native
dsDNA plasmid tTG recombinant
Histones Native deaminated Gliadin recombinant
Mi-2 recombinant TPO recombinant
Centromere B recombinant Intrinsic Factor recombinant
Ku recombinant Gastric Parietal Cell native
PCNA recombinant M2 recombinant
Ribosomal P0 recombinant LKM-1 recombinant
Elastase native LC1 recombinant
ZENITbullAMiDot
Cambridge Life Sciences Ltd
Conclusion AMiDot
bull Allows multiplex detection of autoantibodies
bull Overall a good concordance with results obtained by EliA
bull Multiplex ANA testing is an efficient way to simultaneously test for specific antibodies
bull Small sample volumes can be used
bull Further studies are warranted to prove the reliability of this technique
Acknowledgements
bull Dept of Laboratory Medicine - Immunology
ndash Dr Vermeersch ndash Dr Marieumln Mrs Godefridis ndash S Cooreman ndash S Schouwers
bull Experimental Laboratory
Immunology ndash K Op de Beeacuteck ndash D Dillaerts
bull Dept of Rheumatology Internal
Medicine ndash Dr Verschueren ndash Dr Westhovens ndash Dr Blockmans
bull Menarini ndash Heidi Debaere
bull Instrumentation Laboratory ndash Nathalie Vandeputte
bull KUL - statistics ndash S Fieuws

0
005
01
015
02
025
03
035
04
negative SSA pattern 140 180 1160 1320 1640 11280 1gt1280
Like
liho
od
Inflammatory myopathy
no ENAdsDNA
PM-Scl
Mi-2
Jo-1
Jo-1+SSA52
0
005
01
015
02
025
03
035
04
045
05
negative SSA pattern 140 180 1160 1320 1640 11280 1gt1280
Like
liho
od
MCTD
U1-RNP
U1-RNP+RNP70
dsD
NA
SSA
-60
SSA
-52
SSB
U1
-RN
P
RN
P-7
0
Sm
Rib
-P
CEN
P
Scl-
70
Po
l-II
I
PM
-Scl
Jo-1
Mi-
2
CTD
scr
ee
n
SLE 45 48 38 19 16 63 63 88 74
SCL 60 30 10 60
SSc 14 72 29 14 35 28 72 29 72
MCTD 77 100 92 77 100
SS 28 86 81 58 89
PMDM 18 36 36 71 29 36 39
Blood donors 07 07 27
CFS 07 14 07 07 29
Diseased controls 07 22 07 07 37
ge1 ge2 ge3 ge4 ge5 ge6 ge7
SLE 725 488 325 175 75 63 13
SCL 600 300 100
SSc 739 101 14
MCTD 1000 923 154
SS 889 861 528
PMDM 393 179 71
Blood donors 13
CFS 29 07
Diseased controls 45
Antinuclear antibody detection indirect immunofluorescene
versus solid phase assay
Xavier Bossuyt
Annals Rheum Dis 2010691420-22
Aim
To evaluate the diagnostic performance of
IIF solid phase assay amp the combination of both for
Systemic lupus erythematosus (SLE)
Systemic slcerosis (SSc)
pSjogrenrsquos syndrome (SS)
1
2
3
BioPlex 2200 chromatin Sm ribosomal protein SSA-60 SSB RNP-A and RNP-68 SSA-52 Scl-70 Jo-1 centromere B dsDNA
IIF HEp-2000 (Immunoconcepts) EliA CTD screen (Thermo Fisher) SSARo 52 SSARo 60 SSBLa U1-RNP (RNP-70 A C) Sm centromere B Jo-1 Scl-70 Rib-P fibrillarin RNA Pol III PM-Scl PCNA and Mi-2 dsDNA
IIF 180 IIF 1160 EliA CTD screen BioPlex 2200
Sensitivity
Systemic lupus erythematosus Reference 1 2 (n=80) 925 (84-97) 90 (81-95) 74 (63-82) 79 (69-86) Reference 3 (n=41) 97 (87-99) 95 (83-99) Systemic sclerosis Reference 1 2 (n=69) 97 (90-99) 93 (84-97) 725 (61-82) 72 (61-82) Reference 3 (n=37) 95 (82-98) 865 (72-94) Sjoumlgrenrsquos syndrome Reference 1 2 (n=36) 83 (68-92) 56 (40-70) 89 (75-96) 89 (75-96) Reference 3 (n=40) 76 (62-88) 74 (57-83)
Specificity
Healthy controls (n=125) (Ref 3) 87 (80-92) 95 (90-98) Blood donors (n=149) (Ref1 2) 91 (85-95) 94 (89-97) 97 (93-99) 95 (90-97) Chronic fatigue syndrome (n=139) (Ref1 2)
92 (86-96) 96 (92-98) 97 (92-99) 93 (87-96)
Diseased controls (n=134) (Ref1 2) 75 (67-81) 82 (75-88) 96 (91-98) 89 (82-93)
All controls (n=422) (Ref1 2) 86 (83-89) 91 (88-93) 97 (95-98) 92 (89-94)
0
005
01
015
02
025
Like
liho
od
SLE
0
005
01
015
02
025
Like
liho
od
Systemic sclerosis
0
005
01
015
02
025
03
Like
liho
od
Sjoumlgrens syndrome
LR Systemic lupus erythematosus
Systemic sclerosis Sjoumlgrenrsquos syndrome
IIF(+) (Ref 1 2) 67 (53-86) 71 (55-90) 61 (46-80) IIF(+) (Ref 3) 71 (46-112) 64 (40-101)0 57 (35-59) IIF(-) (Ref 1 2) 008 (004-019) 003 (001-013) 019 (009-040) IIF(-) (Ref 3) 003 (0004-020) 016 (003-035) 026 (015-046) EliA CTD screen (+) 239 (138-415) 235 (135-409) 288 (167-499) EliA CTD screen (-) 027 (019-039) 028 (019-042) 011 (005-029) IIF (+) EliA CTD screen (+) 414 (196-877) 436 (207-468) 468 (220-998) IIF (+) EliA CTD screen (-) 20 (12-31) 20 (13-33) 045 (012-18) IIF (-) EliA CTD screen (+) 35 (10-122) 78 (23-264) IIF (-) EliA CTD screen (-) 003 (0007-012) 003 (0009-013) 006 (002-025)
LR Systemic lupus erythematosus
Systemic sclerosis Sjoumlgrenrsquos syndrome
IIF(+) (Ref 1 2) 67 (53-86) 71 (55-90) 61 (46-80) IIF(+) (Ref 3) 71 (46-112) 64 (40-101)0 57 (35-59) IIF(-) (Ref 1 2) 008 (004-019) 003 (001-013) 019 (009-040) IIF(-) (Ref 3) 003 (0004-020) 016 (003-035) 026 (015-046) EliA CTD screen (+) 239 (138-415) 235 (135-409) 288 (167-499) EliA CTD screen (-) 027 (019-039) 028 (019-042) 011 (005-029) IIF (+) EliA CTD screen (+) 414 (196-877) 436 (207-468) 468 (220-998) IIF (+) EliA CTD screen (-) 20 (12-31) 20 (13-33) 045 (012-18) IIF (-) EliA CTD screen (+) 35 (10-122) 78 (23-264) IIF (-) EliA CTD screen (-) 003 (0007-012) 003 (0009-013) 006 (002-025)
Prevalence
Systemic lupus erythematosus
Systemic sclerosis
Sjoumlgrenrsquos syndrome
Controls
IIF (+) EliA CTD screen (+) 69 72 78 16 IIF (+) EliA CTD screen (-) 24 25 55 12 IIF (-) EliA CTD screen (+) 5 11 14 IIF (-) EliA CTD screen (-) 2 3 55 85
0
02
04
06
08
1
0 02 04 06 08 1
Po
st-t
est
pro
bab
ility
Pre-test probability
FEIA+ IIF+
FEIA+
IIF+
FEIA+ IIF-
FEIA- IIF+
FEIA-
IIF-
FEIA- IIF-
SLE
Comparative analysis of different strategies
1 IIF and FEIA on all samples
2 IIF
If IIF positive FEIA
If IIF negative stop
3 FEIA
4 IIF
Conclusion
Integrated interpretation
of IIF and solid phase assay results adds value
Optimal strategy
depends on the pathology
Bossuyt X Fieuws S Ann Rheum Dis 2014 Mar73(3)
Antinuclear antibodies by automated
indirect immunofluorescence Opportunities for value added
reporting
Xavier Bossuyt Leuven Belgium
Instrument NOVA View AKLIDES EUROPattern Image
Navigator
Helios ZENIT G Sight
Manufacturer INOVA Medipan EUROPattern Immuno Concepts Aesku Menarini
LIMS connection (software) Yes (QUANTA
Link)
Yes Yes
(EUROLabOffice)
Yes (direct) Yes (direct) Yes (ZenIT)
Slide identification via
barcode
Yes by handheld
scanner
Yes by handheld
scanner
Yes by integrated
scanner
Yes Yes by integrated
scanner
Yes by integrated
scanner
Loading capacity 5 slides (up to 60
wells)
5 slides (up to 60
wells)
50 slides (up to 500
wells)
4 slides (up to 84
wells)
20 slides (up to 240
wells)
5 slides (up to 70
wells)
Image acquisition speed ~45swell for 3
images
~40swell lt20swell ~25swell for 4
images
10spicture
Customizable from 1
to 10 images
gt60swell
pictures 5 (small
scan) 50 (medium
scan) 220 (full scan)
100 QC for substrate and
process integrity
counterstaining
Yes DAPI Yes DAPI Yes Propidium
iodide
None None None None None None
Automatic posneg
discrimination incl
presorting of images
Yes Yes Yes Yes Yes Yes
Batchwise verification of
negative samples
Yes Yes Yes Yes Yes Yes
Automatic pattern
recognition
Yes Yes Yes No No Yes
Pattern Analysis method Pattern recognition by
mathematical algorithm
Pattern recognition by
mathematical algorithm
Pattern recognition by
mathematical algorithm
No pattern matching
capabilities
No pattern matching
capabilities
Pattern recognition by
mathematical algorithm
No of recognizable ANA
staining pattern list out
6
Homogeneous
Speckled
Centromere
Nucleolar
Nuclear dot
Cytoplasm
Negative
Positive unrecognized
10
Homogeneous
Speckled
Centromere
Nucleolar
Nuclear dot
Cytoplasm
Negative
Positive unrecognized
8
Homogeneous
Speckled
Centromere
Nucleolar
Nuclear dot
Cytoplasm
Nuclear rim
Mitotic negative
None None 5
Homogeneous
Speckled
Centromere
Nucleolar
Cytoplasm
Negative
Instrument calibration to
minimize variability
Yes Yes Yes Yes Yes No
Integration with slide
processing in 1 instrument
No No No No Yes No
Mahler et al J Immunol Research in press
Automated fluorescence microscopy is increasingly used for image acquisition quantitative analysis and pattern recognition of anti-nuclear antibody
testing
Positivenegative discrimination
bull Exposure time is inversely proportional to intensity of fluorescence
bull Probability value is given to samples
Pattern recognition ANA
bull five patterns ndash Homogeneous
ndash Speckled
ndash Centromere
ndash Nucleolar
ndash Mitochondrial
bull Based on statistical morphological and geometric features
IMAGE ACQUISITION
RNP
PM-Scl
Golgi
Membrane
Review of digital images
harr
manual approach (posneg)
ndash 90 identical interpretation (n=332) (Bonroy et al CCLM 2013)
ndash 88 identical interpretation (n=268) (Bossuyt et al CCA 2013)
Bonroy et al CCLM 2013
FLUORESENCE INTENSITY VERSUS ANTIBODY TITER
HEp-2
-10
10
30
50
70
90
neg 80 160 320 640 1280
Ind
ex
Titer
Outlier Boxplot
Outliers gt 15 and lt 3 IQR
Outliers gt 3 IQR
Midbody centriole few nuclear dots Golgi
Bossuyt et al CCA 2013
G-Sight HEp-2000
0
20
40
60
80
100
neg 180 1160 1320 1640 1gt=1280
Pro
ba
bil
ity i
nd
ex
Antibody titer
Bonroy et al 2013
NOVA View
0
500
1000
1500
2000
2500
3000
3500
Neg 80 160 320 640 gt=1280
Nova
Vie
w F
luo
resce
nce
In
de
x
Titer
Schouwers et al Clin Chem Lab Med 201452547-51
Pattern recognition
Visual inspection Correct assignment by G-Sight HEp-2
Correct assignment by G-sight HEp-2000
Homogeneous (n=42) 68 92
Speckled (n=34) 71 56
Centromere (n=6) 83 42
Pattern recognition (Bonroy et al 2013) Pattern assignment was incorrect in 29 of 132 pos samples No pattern assigned in 45 of samples Global accuracy of pattern assignment 26
FLUORESCENCE INTENSITY IN WELL-DEFINED PATIENT COHORTS
Study Population
n M()F() Median age (range)
Blood donors
108 5149 45 (19-65)
Chronic Fatigue Syndrome
150 1981 41 (16-75)
Diseased Controls 134 2575 45 (17-81)
392
Systemic Lupus Erythematosus
85 1288 355 (15-72)
Sjoumlgrenrsquos Syndrome
36 1486 56 (21-75)
Systemic Sclerosis
76 3466 53 (18-80)
Polymyositis Dermatomyositis
32 4456 50 (24-77)
Mixed Connective Tissue Disease
16 694 315 (16-66)
245
HEp2
-10
10
30
50
70
90
Blooddonor
CFS Discontrols
SLE SCL SS SSc MCTD PM DM
Gro
up
s
Groups
Outlier Boxplot
Outliers gt 15 and lt 3 IQR
Outliers gt 3 IQR
Bossuyt et al CCA 2013
G-Sight HEp-2000
-10
10
30
50
70
90
BloodDonors
CFS Dis Contr SLE SCL SS SSc MCTD PM DM
Pro
ba
bil
ity i
nd
ex
G-Sight HEp-2
Probability index
Blood donor CFS Diseased controls SLE SS SSc MCTD PMDM
le10 11-le30 31-le50 51-le85 gt85
075 024 001 000 000
084 013 001 001 000
050 038 003 007 003
004 009 012 032 043
009 009 009 043 031
001 020 014 042 022
000 000 000 000 100
015 041 011 026 007
Probability index SLE SS SSc MCTD PMDM
le10 11 le30 31 le50 51 le85 gt85
006 (002-02)
04 (02-08)
68 (26-178)
121 (62-236)
439 (160-1204)
01 (004-04)
03 (01-10)
50 (14-186)
160 (79-322)
322 (108-959)
002 (0003-01)
08 (05-13)
85 (33-215)
157 (82-299)
223 (76-651)
1025 (387-2718)
02 (009-05)
16 (10-27)
65 (18-238)
97 (40-229)
76 (14-396)
Bonroy et al CCLM 2013
0
500
1000
1500
2000
2500
3000
3500
HC CVS DC SLE SS SSc PMDM MCTD
L
I
U
Outlier Boxplot
Percentiles (95 of Distribution)
Outliers gt 15 and lt 3 IQR
Outliers gt 3 IQR
NOVA View
NOVA View LR LIU Controls SLE SS SSc PMDM MCTD SARD
Prevalence
lt49 056 006 003 003 013 005
49-120 026 005 006 005 019 007
121-600 013 011 003 009 034 011
601-2000 004 046 061 034 025 006 039
gt2000 001 033 028 049 009 094 038
LR
lt49 011 005 005 023 009
49-120 018 021 020 073 025
121-600 079 021 069 257 085
601-2000 112 150 84 61 15 96
gt2000 291 245 429 83 827 335
NOVA View
009 025 085
10
33
0
10
20
30
40
0
01
02
03
04
05
06
lt49 49-120 121-600 601-2000 gt2000
Like
liho
od
rat
io
Pre
vale
nce
Nuclear Index
controls
SRD
LR
LR 1 no clinical value gt10 lt01 clinically important difference 5 ndash 10 01 ndash 02 modest but substantial difference 2 ndash 5 02 ndash 05 small difference that may be relevant
Post-test odds
=
Pre-test odds x LR
probability rarr odds
02 rarr 02 (1 ndash 02)
025
odds rarr probability
4 rarr 4 (1 + 4)
08
0
02
04
06
08
1
000 020 040 060 080 100
Po
st-t
est
pro
bab
ility
Pre-test probability
lt20
20-50
51-200
gt200
gt2000
Pre-test probability Post-test probability
lt49 120-600 600-2000 gt2000
1 a young women with hair loss and polyarthralgia 007 05 5 25
0
02
04
06
08
1
000 020 040 060 080 100
Po
st-t
est
pro
bab
ility
Pre-test probability
lt20
20-50
51-200
gt200
gt2000
Pre-test probability Post-test probability
lt49 120-600 600-2000 gt2000
10 a young women with photosensitivity and mild leucopenia (3000-3500mm3)
07 55 36 79
0
02
04
06
08
1
000 020 040 060 080 100
Po
st-t
est
pro
bab
ility
Pre-test probability
lt20
20-50
51-200
gt200
gt2000
Pre-test probability Post-test probability
lt49 120-600 600-2000 gt2000
50 a young women with photosensitivity malar rash and symmetrical polyarthritis
65 35 83 97
G-Sight HEp-2
Probability index
Blood donor CFS Diseased controls SLE SS SSc MCTD PMDM
le10 11-le30 31-le50 51-le85 gt85
075 024 001 000 000
084 013 001 001 000
050 038 003 007 003
004 009 012 032 043
009 009 009 043 031
001 020 014 042 022
000 000 000 000 100
015 041 011 026 007
Probability index SLE SS SSc MCTD PMDM
le10 11 le30 31 le50 51 le85 gt85
006 (002-02)
04 (02-08)
68 (26-178)
121 (62-236)
439 (160-1204)
01 (004-04)
03 (01-10)
50 (14-186)
160 (79-322)
322 (108-959)
002 (0003-01)
08 (05-13)
85 (33-215)
157 (82-299)
223 (76-651)
1025 (387-2718)
02 (009-05)
16 (10-27)
65 (18-238)
97 (40-229)
76 (14-396)
Maenhout et al 2014
Maenhout et al 2014
Conclusions
bull High quality image acquisition
bull Significant correlation between intensity and antibody titer
bull Fluorescence intensity provides clinically useful information
bull Enables implementation of a quantitative internal quality
control system
bull Accuracy of pattern recognition is limited
a microdot array based immunoassay developed to allow simultaneous detection of multiple
autoantibodies on a single patient
Cambridge Life Sciences Ltd
ZENITbullAMiDot
bull One patient sample per well ndash 9 x 9 microarray (81 dots)
Cambridge Life Sciences Ltd
ZENITbullAMiDot
bull Each 9 x 9 microarray contains
bull Multiple autoimmune antigen dots
bull Calibration dots
bull Control dots
bull Registration dots
Cambridge Life Sciences Ltd
ZENITbullAMiDot
0
25000
50000
75000
100000
125000
150000
175000
200000
0 10 20 30 40 50 60 70 80 90 100
Raw
Sig
nal
Calibrator Conc (UmL)
Calibration
bullEach 9 x 9 microarray is
bullPrinted on to an activated glass surface
bullEach dot is ~20microm in diameter
bullEach autoimmune antigen calibrator and control is printed in duplicate or triplicate
bullAutomated analysis
bullImage taken by Reader (G-Sight or AMiDot reader)
Cambridge Life Sciences Ltd
ZENITbullAMiDot
Software receives the image analyses the image and produces a patient report
Antigen RecombinantNative Antigen RecombinantNative
Ro60SS-A recombinant PL7PL12 recombinant
Ro52SS-A recombinant MPO native
LaSS-B recombinant PR3 native
Sm native GBM native
U1-snRNP (68kDAC) recombinant Cathepsin native
Jo-1 recombinant SRP-54 recombinant
Scl70 native BPI native
PMScl100 recombinant ASCA native
dsDNA plasmid tTG recombinant
Histones Native deaminated Gliadin recombinant
Mi-2 recombinant TPO recombinant
Centromere B recombinant Intrinsic Factor recombinant
Ku recombinant Gastric Parietal Cell native
PCNA recombinant M2 recombinant
Ribosomal P0 recombinant LKM-1 recombinant
Elastase native LC1 recombinant
ZENITbullAMiDot
Cambridge Life Sciences Ltd
Conclusion AMiDot
bull Allows multiplex detection of autoantibodies
bull Overall a good concordance with results obtained by EliA
bull Multiplex ANA testing is an efficient way to simultaneously test for specific antibodies
bull Small sample volumes can be used
bull Further studies are warranted to prove the reliability of this technique
Acknowledgements
bull Dept of Laboratory Medicine - Immunology
ndash Dr Vermeersch ndash Dr Marieumln Mrs Godefridis ndash S Cooreman ndash S Schouwers
bull Experimental Laboratory
Immunology ndash K Op de Beeacuteck ndash D Dillaerts
bull Dept of Rheumatology Internal
Medicine ndash Dr Verschueren ndash Dr Westhovens ndash Dr Blockmans
bull Menarini ndash Heidi Debaere
bull Instrumentation Laboratory ndash Nathalie Vandeputte
bull KUL - statistics ndash S Fieuws

0
005
01
015
02
025
03
035
04
045
05
negative SSA pattern 140 180 1160 1320 1640 11280 1gt1280
Like
liho
od
MCTD
U1-RNP
U1-RNP+RNP70
dsD
NA
SSA
-60
SSA
-52
SSB
U1
-RN
P
RN
P-7
0
Sm
Rib
-P
CEN
P
Scl-
70
Po
l-II
I
PM
-Scl
Jo-1
Mi-
2
CTD
scr
ee
n
SLE 45 48 38 19 16 63 63 88 74
SCL 60 30 10 60
SSc 14 72 29 14 35 28 72 29 72
MCTD 77 100 92 77 100
SS 28 86 81 58 89
PMDM 18 36 36 71 29 36 39
Blood donors 07 07 27
CFS 07 14 07 07 29
Diseased controls 07 22 07 07 37
ge1 ge2 ge3 ge4 ge5 ge6 ge7
SLE 725 488 325 175 75 63 13
SCL 600 300 100
SSc 739 101 14
MCTD 1000 923 154
SS 889 861 528
PMDM 393 179 71
Blood donors 13
CFS 29 07
Diseased controls 45
Antinuclear antibody detection indirect immunofluorescene
versus solid phase assay
Xavier Bossuyt
Annals Rheum Dis 2010691420-22
Aim
To evaluate the diagnostic performance of
IIF solid phase assay amp the combination of both for
Systemic lupus erythematosus (SLE)
Systemic slcerosis (SSc)
pSjogrenrsquos syndrome (SS)
1
2
3
BioPlex 2200 chromatin Sm ribosomal protein SSA-60 SSB RNP-A and RNP-68 SSA-52 Scl-70 Jo-1 centromere B dsDNA
IIF HEp-2000 (Immunoconcepts) EliA CTD screen (Thermo Fisher) SSARo 52 SSARo 60 SSBLa U1-RNP (RNP-70 A C) Sm centromere B Jo-1 Scl-70 Rib-P fibrillarin RNA Pol III PM-Scl PCNA and Mi-2 dsDNA
IIF 180 IIF 1160 EliA CTD screen BioPlex 2200
Sensitivity
Systemic lupus erythematosus Reference 1 2 (n=80) 925 (84-97) 90 (81-95) 74 (63-82) 79 (69-86) Reference 3 (n=41) 97 (87-99) 95 (83-99) Systemic sclerosis Reference 1 2 (n=69) 97 (90-99) 93 (84-97) 725 (61-82) 72 (61-82) Reference 3 (n=37) 95 (82-98) 865 (72-94) Sjoumlgrenrsquos syndrome Reference 1 2 (n=36) 83 (68-92) 56 (40-70) 89 (75-96) 89 (75-96) Reference 3 (n=40) 76 (62-88) 74 (57-83)
Specificity
Healthy controls (n=125) (Ref 3) 87 (80-92) 95 (90-98) Blood donors (n=149) (Ref1 2) 91 (85-95) 94 (89-97) 97 (93-99) 95 (90-97) Chronic fatigue syndrome (n=139) (Ref1 2)
92 (86-96) 96 (92-98) 97 (92-99) 93 (87-96)
Diseased controls (n=134) (Ref1 2) 75 (67-81) 82 (75-88) 96 (91-98) 89 (82-93)
All controls (n=422) (Ref1 2) 86 (83-89) 91 (88-93) 97 (95-98) 92 (89-94)
0
005
01
015
02
025
Like
liho
od
SLE
0
005
01
015
02
025
Like
liho
od
Systemic sclerosis
0
005
01
015
02
025
03
Like
liho
od
Sjoumlgrens syndrome
LR Systemic lupus erythematosus
Systemic sclerosis Sjoumlgrenrsquos syndrome
IIF(+) (Ref 1 2) 67 (53-86) 71 (55-90) 61 (46-80) IIF(+) (Ref 3) 71 (46-112) 64 (40-101)0 57 (35-59) IIF(-) (Ref 1 2) 008 (004-019) 003 (001-013) 019 (009-040) IIF(-) (Ref 3) 003 (0004-020) 016 (003-035) 026 (015-046) EliA CTD screen (+) 239 (138-415) 235 (135-409) 288 (167-499) EliA CTD screen (-) 027 (019-039) 028 (019-042) 011 (005-029) IIF (+) EliA CTD screen (+) 414 (196-877) 436 (207-468) 468 (220-998) IIF (+) EliA CTD screen (-) 20 (12-31) 20 (13-33) 045 (012-18) IIF (-) EliA CTD screen (+) 35 (10-122) 78 (23-264) IIF (-) EliA CTD screen (-) 003 (0007-012) 003 (0009-013) 006 (002-025)
LR Systemic lupus erythematosus
Systemic sclerosis Sjoumlgrenrsquos syndrome
IIF(+) (Ref 1 2) 67 (53-86) 71 (55-90) 61 (46-80) IIF(+) (Ref 3) 71 (46-112) 64 (40-101)0 57 (35-59) IIF(-) (Ref 1 2) 008 (004-019) 003 (001-013) 019 (009-040) IIF(-) (Ref 3) 003 (0004-020) 016 (003-035) 026 (015-046) EliA CTD screen (+) 239 (138-415) 235 (135-409) 288 (167-499) EliA CTD screen (-) 027 (019-039) 028 (019-042) 011 (005-029) IIF (+) EliA CTD screen (+) 414 (196-877) 436 (207-468) 468 (220-998) IIF (+) EliA CTD screen (-) 20 (12-31) 20 (13-33) 045 (012-18) IIF (-) EliA CTD screen (+) 35 (10-122) 78 (23-264) IIF (-) EliA CTD screen (-) 003 (0007-012) 003 (0009-013) 006 (002-025)
Prevalence
Systemic lupus erythematosus
Systemic sclerosis
Sjoumlgrenrsquos syndrome
Controls
IIF (+) EliA CTD screen (+) 69 72 78 16 IIF (+) EliA CTD screen (-) 24 25 55 12 IIF (-) EliA CTD screen (+) 5 11 14 IIF (-) EliA CTD screen (-) 2 3 55 85
0
02
04
06
08
1
0 02 04 06 08 1
Po
st-t
est
pro
bab
ility
Pre-test probability
FEIA+ IIF+
FEIA+
IIF+
FEIA+ IIF-
FEIA- IIF+
FEIA-
IIF-
FEIA- IIF-
SLE
Comparative analysis of different strategies
1 IIF and FEIA on all samples
2 IIF
If IIF positive FEIA
If IIF negative stop
3 FEIA
4 IIF
Conclusion
Integrated interpretation
of IIF and solid phase assay results adds value
Optimal strategy
depends on the pathology
Bossuyt X Fieuws S Ann Rheum Dis 2014 Mar73(3)
Antinuclear antibodies by automated
indirect immunofluorescence Opportunities for value added
reporting
Xavier Bossuyt Leuven Belgium
Instrument NOVA View AKLIDES EUROPattern Image
Navigator
Helios ZENIT G Sight
Manufacturer INOVA Medipan EUROPattern Immuno Concepts Aesku Menarini
LIMS connection (software) Yes (QUANTA
Link)
Yes Yes
(EUROLabOffice)
Yes (direct) Yes (direct) Yes (ZenIT)
Slide identification via
barcode
Yes by handheld
scanner
Yes by handheld
scanner
Yes by integrated
scanner
Yes Yes by integrated
scanner
Yes by integrated
scanner
Loading capacity 5 slides (up to 60
wells)
5 slides (up to 60
wells)
50 slides (up to 500
wells)
4 slides (up to 84
wells)
20 slides (up to 240
wells)
5 slides (up to 70
wells)
Image acquisition speed ~45swell for 3
images
~40swell lt20swell ~25swell for 4
images
10spicture
Customizable from 1
to 10 images
gt60swell
pictures 5 (small
scan) 50 (medium
scan) 220 (full scan)
100 QC for substrate and
process integrity
counterstaining
Yes DAPI Yes DAPI Yes Propidium
iodide
None None None None None None
Automatic posneg
discrimination incl
presorting of images
Yes Yes Yes Yes Yes Yes
Batchwise verification of
negative samples
Yes Yes Yes Yes Yes Yes
Automatic pattern
recognition
Yes Yes Yes No No Yes
Pattern Analysis method Pattern recognition by
mathematical algorithm
Pattern recognition by
mathematical algorithm
Pattern recognition by
mathematical algorithm
No pattern matching
capabilities
No pattern matching
capabilities
Pattern recognition by
mathematical algorithm
No of recognizable ANA
staining pattern list out
6
Homogeneous
Speckled
Centromere
Nucleolar
Nuclear dot
Cytoplasm
Negative
Positive unrecognized
10
Homogeneous
Speckled
Centromere
Nucleolar
Nuclear dot
Cytoplasm
Negative
Positive unrecognized
8
Homogeneous
Speckled
Centromere
Nucleolar
Nuclear dot
Cytoplasm
Nuclear rim
Mitotic negative
None None 5
Homogeneous
Speckled
Centromere
Nucleolar
Cytoplasm
Negative
Instrument calibration to
minimize variability
Yes Yes Yes Yes Yes No
Integration with slide
processing in 1 instrument
No No No No Yes No
Mahler et al J Immunol Research in press
Automated fluorescence microscopy is increasingly used for image acquisition quantitative analysis and pattern recognition of anti-nuclear antibody
testing
Positivenegative discrimination
bull Exposure time is inversely proportional to intensity of fluorescence
bull Probability value is given to samples
Pattern recognition ANA
bull five patterns ndash Homogeneous
ndash Speckled
ndash Centromere
ndash Nucleolar
ndash Mitochondrial
bull Based on statistical morphological and geometric features
IMAGE ACQUISITION
RNP
PM-Scl
Golgi
Membrane
Review of digital images
harr
manual approach (posneg)
ndash 90 identical interpretation (n=332) (Bonroy et al CCLM 2013)
ndash 88 identical interpretation (n=268) (Bossuyt et al CCA 2013)
Bonroy et al CCLM 2013
FLUORESENCE INTENSITY VERSUS ANTIBODY TITER
HEp-2
-10
10
30
50
70
90
neg 80 160 320 640 1280
Ind
ex
Titer
Outlier Boxplot
Outliers gt 15 and lt 3 IQR
Outliers gt 3 IQR
Midbody centriole few nuclear dots Golgi
Bossuyt et al CCA 2013
G-Sight HEp-2000
0
20
40
60
80
100
neg 180 1160 1320 1640 1gt=1280
Pro
ba
bil
ity i
nd
ex
Antibody titer
Bonroy et al 2013
NOVA View
0
500
1000
1500
2000
2500
3000
3500
Neg 80 160 320 640 gt=1280
Nova
Vie
w F
luo
resce
nce
In
de
x
Titer
Schouwers et al Clin Chem Lab Med 201452547-51
Pattern recognition
Visual inspection Correct assignment by G-Sight HEp-2
Correct assignment by G-sight HEp-2000
Homogeneous (n=42) 68 92
Speckled (n=34) 71 56
Centromere (n=6) 83 42
Pattern recognition (Bonroy et al 2013) Pattern assignment was incorrect in 29 of 132 pos samples No pattern assigned in 45 of samples Global accuracy of pattern assignment 26
FLUORESCENCE INTENSITY IN WELL-DEFINED PATIENT COHORTS
Study Population
n M()F() Median age (range)
Blood donors
108 5149 45 (19-65)
Chronic Fatigue Syndrome
150 1981 41 (16-75)
Diseased Controls 134 2575 45 (17-81)
392
Systemic Lupus Erythematosus
85 1288 355 (15-72)
Sjoumlgrenrsquos Syndrome
36 1486 56 (21-75)
Systemic Sclerosis
76 3466 53 (18-80)
Polymyositis Dermatomyositis
32 4456 50 (24-77)
Mixed Connective Tissue Disease
16 694 315 (16-66)
245
HEp2
-10
10
30
50
70
90
Blooddonor
CFS Discontrols
SLE SCL SS SSc MCTD PM DM
Gro
up
s
Groups
Outlier Boxplot
Outliers gt 15 and lt 3 IQR
Outliers gt 3 IQR
Bossuyt et al CCA 2013
G-Sight HEp-2000
-10
10
30
50
70
90
BloodDonors
CFS Dis Contr SLE SCL SS SSc MCTD PM DM
Pro
ba
bil
ity i
nd
ex
G-Sight HEp-2
Probability index
Blood donor CFS Diseased controls SLE SS SSc MCTD PMDM
le10 11-le30 31-le50 51-le85 gt85
075 024 001 000 000
084 013 001 001 000
050 038 003 007 003
004 009 012 032 043
009 009 009 043 031
001 020 014 042 022
000 000 000 000 100
015 041 011 026 007
Probability index SLE SS SSc MCTD PMDM
le10 11 le30 31 le50 51 le85 gt85
006 (002-02)
04 (02-08)
68 (26-178)
121 (62-236)
439 (160-1204)
01 (004-04)
03 (01-10)
50 (14-186)
160 (79-322)
322 (108-959)
002 (0003-01)
08 (05-13)
85 (33-215)
157 (82-299)
223 (76-651)
1025 (387-2718)
02 (009-05)
16 (10-27)
65 (18-238)
97 (40-229)
76 (14-396)
Bonroy et al CCLM 2013
0
500
1000
1500
2000
2500
3000
3500
HC CVS DC SLE SS SSc PMDM MCTD
L
I
U
Outlier Boxplot
Percentiles (95 of Distribution)
Outliers gt 15 and lt 3 IQR
Outliers gt 3 IQR
NOVA View
NOVA View LR LIU Controls SLE SS SSc PMDM MCTD SARD
Prevalence
lt49 056 006 003 003 013 005
49-120 026 005 006 005 019 007
121-600 013 011 003 009 034 011
601-2000 004 046 061 034 025 006 039
gt2000 001 033 028 049 009 094 038
LR
lt49 011 005 005 023 009
49-120 018 021 020 073 025
121-600 079 021 069 257 085
601-2000 112 150 84 61 15 96
gt2000 291 245 429 83 827 335
NOVA View
009 025 085
10
33
0
10
20
30
40
0
01
02
03
04
05
06
lt49 49-120 121-600 601-2000 gt2000
Like
liho
od
rat
io
Pre
vale
nce
Nuclear Index
controls
SRD
LR
LR 1 no clinical value gt10 lt01 clinically important difference 5 ndash 10 01 ndash 02 modest but substantial difference 2 ndash 5 02 ndash 05 small difference that may be relevant
Post-test odds
=
Pre-test odds x LR
probability rarr odds
02 rarr 02 (1 ndash 02)
025
odds rarr probability
4 rarr 4 (1 + 4)
08
0
02
04
06
08
1
000 020 040 060 080 100
Po
st-t
est
pro
bab
ility
Pre-test probability
lt20
20-50
51-200
gt200
gt2000
Pre-test probability Post-test probability
lt49 120-600 600-2000 gt2000
1 a young women with hair loss and polyarthralgia 007 05 5 25
0
02
04
06
08
1
000 020 040 060 080 100
Po
st-t
est
pro
bab
ility
Pre-test probability
lt20
20-50
51-200
gt200
gt2000
Pre-test probability Post-test probability
lt49 120-600 600-2000 gt2000
10 a young women with photosensitivity and mild leucopenia (3000-3500mm3)
07 55 36 79
0
02
04
06
08
1
000 020 040 060 080 100
Po
st-t
est
pro
bab
ility
Pre-test probability
lt20
20-50
51-200
gt200
gt2000
Pre-test probability Post-test probability
lt49 120-600 600-2000 gt2000
50 a young women with photosensitivity malar rash and symmetrical polyarthritis
65 35 83 97
G-Sight HEp-2
Probability index
Blood donor CFS Diseased controls SLE SS SSc MCTD PMDM
le10 11-le30 31-le50 51-le85 gt85
075 024 001 000 000
084 013 001 001 000
050 038 003 007 003
004 009 012 032 043
009 009 009 043 031
001 020 014 042 022
000 000 000 000 100
015 041 011 026 007
Probability index SLE SS SSc MCTD PMDM
le10 11 le30 31 le50 51 le85 gt85
006 (002-02)
04 (02-08)
68 (26-178)
121 (62-236)
439 (160-1204)
01 (004-04)
03 (01-10)
50 (14-186)
160 (79-322)
322 (108-959)
002 (0003-01)
08 (05-13)
85 (33-215)
157 (82-299)
223 (76-651)
1025 (387-2718)
02 (009-05)
16 (10-27)
65 (18-238)
97 (40-229)
76 (14-396)
Maenhout et al 2014
Maenhout et al 2014
Conclusions
bull High quality image acquisition
bull Significant correlation between intensity and antibody titer
bull Fluorescence intensity provides clinically useful information
bull Enables implementation of a quantitative internal quality
control system
bull Accuracy of pattern recognition is limited
a microdot array based immunoassay developed to allow simultaneous detection of multiple
autoantibodies on a single patient
Cambridge Life Sciences Ltd
ZENITbullAMiDot
bull One patient sample per well ndash 9 x 9 microarray (81 dots)
Cambridge Life Sciences Ltd
ZENITbullAMiDot
bull Each 9 x 9 microarray contains
bull Multiple autoimmune antigen dots
bull Calibration dots
bull Control dots
bull Registration dots
Cambridge Life Sciences Ltd
ZENITbullAMiDot
0
25000
50000
75000
100000
125000
150000
175000
200000
0 10 20 30 40 50 60 70 80 90 100
Raw
Sig
nal
Calibrator Conc (UmL)
Calibration
bullEach 9 x 9 microarray is
bullPrinted on to an activated glass surface
bullEach dot is ~20microm in diameter
bullEach autoimmune antigen calibrator and control is printed in duplicate or triplicate
bullAutomated analysis
bullImage taken by Reader (G-Sight or AMiDot reader)
Cambridge Life Sciences Ltd
ZENITbullAMiDot
Software receives the image analyses the image and produces a patient report
Antigen RecombinantNative Antigen RecombinantNative
Ro60SS-A recombinant PL7PL12 recombinant
Ro52SS-A recombinant MPO native
LaSS-B recombinant PR3 native
Sm native GBM native
U1-snRNP (68kDAC) recombinant Cathepsin native
Jo-1 recombinant SRP-54 recombinant
Scl70 native BPI native
PMScl100 recombinant ASCA native
dsDNA plasmid tTG recombinant
Histones Native deaminated Gliadin recombinant
Mi-2 recombinant TPO recombinant
Centromere B recombinant Intrinsic Factor recombinant
Ku recombinant Gastric Parietal Cell native
PCNA recombinant M2 recombinant
Ribosomal P0 recombinant LKM-1 recombinant
Elastase native LC1 recombinant
ZENITbullAMiDot
Cambridge Life Sciences Ltd
Conclusion AMiDot
bull Allows multiplex detection of autoantibodies
bull Overall a good concordance with results obtained by EliA
bull Multiplex ANA testing is an efficient way to simultaneously test for specific antibodies
bull Small sample volumes can be used
bull Further studies are warranted to prove the reliability of this technique
Acknowledgements
bull Dept of Laboratory Medicine - Immunology
ndash Dr Vermeersch ndash Dr Marieumln Mrs Godefridis ndash S Cooreman ndash S Schouwers
bull Experimental Laboratory
Immunology ndash K Op de Beeacuteck ndash D Dillaerts
bull Dept of Rheumatology Internal
Medicine ndash Dr Verschueren ndash Dr Westhovens ndash Dr Blockmans
bull Menarini ndash Heidi Debaere
bull Instrumentation Laboratory ndash Nathalie Vandeputte
bull KUL - statistics ndash S Fieuws

1
2
3
BioPlex 2200 chromatin Sm ribosomal protein SSA-60 SSB RNP-A and RNP-68 SSA-52 Scl-70 Jo-1 centromere B dsDNA
IIF HEp-2000 (Immunoconcepts) EliA CTD screen (Thermo Fisher) SSARo 52 SSARo 60 SSBLa U1-RNP (RNP-70 A C) Sm centromere B Jo-1 Scl-70 Rib-P fibrillarin RNA Pol III PM-Scl PCNA and Mi-2 dsDNA
IIF 180 IIF 1160 EliA CTD screen BioPlex 2200
Sensitivity
Systemic lupus erythematosus Reference 1 2 (n=80) 925 (84-97) 90 (81-95) 74 (63-82) 79 (69-86) Reference 3 (n=41) 97 (87-99) 95 (83-99) Systemic sclerosis Reference 1 2 (n=69) 97 (90-99) 93 (84-97) 725 (61-82) 72 (61-82) Reference 3 (n=37) 95 (82-98) 865 (72-94) Sjoumlgrenrsquos syndrome Reference 1 2 (n=36) 83 (68-92) 56 (40-70) 89 (75-96) 89 (75-96) Reference 3 (n=40) 76 (62-88) 74 (57-83)
Specificity
Healthy controls (n=125) (Ref 3) 87 (80-92) 95 (90-98) Blood donors (n=149) (Ref1 2) 91 (85-95) 94 (89-97) 97 (93-99) 95 (90-97) Chronic fatigue syndrome (n=139) (Ref1 2)
92 (86-96) 96 (92-98) 97 (92-99) 93 (87-96)
Diseased controls (n=134) (Ref1 2) 75 (67-81) 82 (75-88) 96 (91-98) 89 (82-93)
All controls (n=422) (Ref1 2) 86 (83-89) 91 (88-93) 97 (95-98) 92 (89-94)
0
005
01
015
02
025
Like
liho
od
SLE
0
005
01
015
02
025
Like
liho
od
Systemic sclerosis
0
005
01
015
02
025
03
Like
liho
od
Sjoumlgrens syndrome
LR Systemic lupus erythematosus
Systemic sclerosis Sjoumlgrenrsquos syndrome
IIF(+) (Ref 1 2) 67 (53-86) 71 (55-90) 61 (46-80) IIF(+) (Ref 3) 71 (46-112) 64 (40-101)0 57 (35-59) IIF(-) (Ref 1 2) 008 (004-019) 003 (001-013) 019 (009-040) IIF(-) (Ref 3) 003 (0004-020) 016 (003-035) 026 (015-046) EliA CTD screen (+) 239 (138-415) 235 (135-409) 288 (167-499) EliA CTD screen (-) 027 (019-039) 028 (019-042) 011 (005-029) IIF (+) EliA CTD screen (+) 414 (196-877) 436 (207-468) 468 (220-998) IIF (+) EliA CTD screen (-) 20 (12-31) 20 (13-33) 045 (012-18) IIF (-) EliA CTD screen (+) 35 (10-122) 78 (23-264) IIF (-) EliA CTD screen (-) 003 (0007-012) 003 (0009-013) 006 (002-025)
LR Systemic lupus erythematosus
Systemic sclerosis Sjoumlgrenrsquos syndrome
IIF(+) (Ref 1 2) 67 (53-86) 71 (55-90) 61 (46-80) IIF(+) (Ref 3) 71 (46-112) 64 (40-101)0 57 (35-59) IIF(-) (Ref 1 2) 008 (004-019) 003 (001-013) 019 (009-040) IIF(-) (Ref 3) 003 (0004-020) 016 (003-035) 026 (015-046) EliA CTD screen (+) 239 (138-415) 235 (135-409) 288 (167-499) EliA CTD screen (-) 027 (019-039) 028 (019-042) 011 (005-029) IIF (+) EliA CTD screen (+) 414 (196-877) 436 (207-468) 468 (220-998) IIF (+) EliA CTD screen (-) 20 (12-31) 20 (13-33) 045 (012-18) IIF (-) EliA CTD screen (+) 35 (10-122) 78 (23-264) IIF (-) EliA CTD screen (-) 003 (0007-012) 003 (0009-013) 006 (002-025)
Prevalence
Systemic lupus erythematosus
Systemic sclerosis
Sjoumlgrenrsquos syndrome
Controls
IIF (+) EliA CTD screen (+) 69 72 78 16 IIF (+) EliA CTD screen (-) 24 25 55 12 IIF (-) EliA CTD screen (+) 5 11 14 IIF (-) EliA CTD screen (-) 2 3 55 85
0
02
04
06
08
1
0 02 04 06 08 1
Po
st-t
est
pro
bab
ility
Pre-test probability
FEIA+ IIF+
FEIA+
IIF+
FEIA+ IIF-
FEIA- IIF+
FEIA-
IIF-
FEIA- IIF-
SLE
Comparative analysis of different strategies
1 IIF and FEIA on all samples
2 IIF
If IIF positive FEIA
If IIF negative stop
3 FEIA
4 IIF
Conclusion
Integrated interpretation
of IIF and solid phase assay results adds value
Optimal strategy
depends on the pathology
Bossuyt X Fieuws S Ann Rheum Dis 2014 Mar73(3)
Antinuclear antibodies by automated
indirect immunofluorescence Opportunities for value added
reporting
Xavier Bossuyt Leuven Belgium
Instrument NOVA View AKLIDES EUROPattern Image
Navigator
Helios ZENIT G Sight
Manufacturer INOVA Medipan EUROPattern Immuno Concepts Aesku Menarini
LIMS connection (software) Yes (QUANTA
Link)
Yes Yes
(EUROLabOffice)
Yes (direct) Yes (direct) Yes (ZenIT)
Slide identification via
barcode
Yes by handheld
scanner
Yes by handheld
scanner
Yes by integrated
scanner
Yes Yes by integrated
scanner
Yes by integrated
scanner
Loading capacity 5 slides (up to 60
wells)
5 slides (up to 60
wells)
50 slides (up to 500
wells)
4 slides (up to 84
wells)
20 slides (up to 240
wells)
5 slides (up to 70
wells)
Image acquisition speed ~45swell for 3
images
~40swell lt20swell ~25swell for 4
images
10spicture
Customizable from 1
to 10 images
gt60swell
pictures 5 (small
scan) 50 (medium
scan) 220 (full scan)
100 QC for substrate and
process integrity
counterstaining
Yes DAPI Yes DAPI Yes Propidium
iodide
None None None None None None
Automatic posneg
discrimination incl
presorting of images
Yes Yes Yes Yes Yes Yes
Batchwise verification of
negative samples
Yes Yes Yes Yes Yes Yes
Automatic pattern
recognition
Yes Yes Yes No No Yes
Pattern Analysis method Pattern recognition by
mathematical algorithm
Pattern recognition by
mathematical algorithm
Pattern recognition by
mathematical algorithm
No pattern matching
capabilities
No pattern matching
capabilities
Pattern recognition by
mathematical algorithm
No of recognizable ANA
staining pattern list out
6
Homogeneous
Speckled
Centromere
Nucleolar
Nuclear dot
Cytoplasm
Negative
Positive unrecognized
10
Homogeneous
Speckled
Centromere
Nucleolar
Nuclear dot
Cytoplasm
Negative
Positive unrecognized
8
Homogeneous
Speckled
Centromere
Nucleolar
Nuclear dot
Cytoplasm
Nuclear rim
Mitotic negative
None None 5
Homogeneous
Speckled
Centromere
Nucleolar
Cytoplasm
Negative
Instrument calibration to
minimize variability
Yes Yes Yes Yes Yes No
Integration with slide
processing in 1 instrument
No No No No Yes No
Mahler et al J Immunol Research in press
Automated fluorescence microscopy is increasingly used for image acquisition quantitative analysis and pattern recognition of anti-nuclear antibody
testing
Positivenegative discrimination
bull Exposure time is inversely proportional to intensity of fluorescence
bull Probability value is given to samples
Pattern recognition ANA
bull five patterns ndash Homogeneous
ndash Speckled
ndash Centromere
ndash Nucleolar
ndash Mitochondrial
bull Based on statistical morphological and geometric features
IMAGE ACQUISITION
RNP
PM-Scl
Golgi
Membrane
Review of digital images
harr
manual approach (posneg)
ndash 90 identical interpretation (n=332) (Bonroy et al CCLM 2013)
ndash 88 identical interpretation (n=268) (Bossuyt et al CCA 2013)
Bonroy et al CCLM 2013
FLUORESENCE INTENSITY VERSUS ANTIBODY TITER
HEp-2
-10
10
30
50
70
90
neg 80 160 320 640 1280
Ind
ex
Titer
Outlier Boxplot
Outliers gt 15 and lt 3 IQR
Outliers gt 3 IQR
Midbody centriole few nuclear dots Golgi
Bossuyt et al CCA 2013
G-Sight HEp-2000
0
20
40
60
80
100
neg 180 1160 1320 1640 1gt=1280
Pro
ba
bil
ity i
nd
ex
Antibody titer
Bonroy et al 2013
NOVA View
0
500
1000
1500
2000
2500
3000
3500
Neg 80 160 320 640 gt=1280
Nova
Vie
w F
luo
resce
nce
In
de
x
Titer
Schouwers et al Clin Chem Lab Med 201452547-51
Pattern recognition
Visual inspection Correct assignment by G-Sight HEp-2
Correct assignment by G-sight HEp-2000
Homogeneous (n=42) 68 92
Speckled (n=34) 71 56
Centromere (n=6) 83 42
Pattern recognition (Bonroy et al 2013) Pattern assignment was incorrect in 29 of 132 pos samples No pattern assigned in 45 of samples Global accuracy of pattern assignment 26
FLUORESCENCE INTENSITY IN WELL-DEFINED PATIENT COHORTS
Study Population
n M()F() Median age (range)
Blood donors
108 5149 45 (19-65)
Chronic Fatigue Syndrome
150 1981 41 (16-75)
Diseased Controls 134 2575 45 (17-81)
392
Systemic Lupus Erythematosus
85 1288 355 (15-72)
Sjoumlgrenrsquos Syndrome
36 1486 56 (21-75)
Systemic Sclerosis
76 3466 53 (18-80)
Polymyositis Dermatomyositis
32 4456 50 (24-77)
Mixed Connective Tissue Disease
16 694 315 (16-66)
245
HEp2
-10
10
30
50
70
90
Blooddonor
CFS Discontrols
SLE SCL SS SSc MCTD PM DM
Gro
up
s
Groups
Outlier Boxplot
Outliers gt 15 and lt 3 IQR
Outliers gt 3 IQR
Bossuyt et al CCA 2013
G-Sight HEp-2000
-10
10
30
50
70
90
BloodDonors
CFS Dis Contr SLE SCL SS SSc MCTD PM DM
Pro
ba
bil
ity i
nd
ex
G-Sight HEp-2
Probability index
Blood donor CFS Diseased controls SLE SS SSc MCTD PMDM
le10 11-le30 31-le50 51-le85 gt85
075 024 001 000 000
084 013 001 001 000
050 038 003 007 003
004 009 012 032 043
009 009 009 043 031
001 020 014 042 022
000 000 000 000 100
015 041 011 026 007
Probability index SLE SS SSc MCTD PMDM
le10 11 le30 31 le50 51 le85 gt85
006 (002-02)
04 (02-08)
68 (26-178)
121 (62-236)
439 (160-1204)
01 (004-04)
03 (01-10)
50 (14-186)
160 (79-322)
322 (108-959)
002 (0003-01)
08 (05-13)
85 (33-215)
157 (82-299)
223 (76-651)
1025 (387-2718)
02 (009-05)
16 (10-27)
65 (18-238)
97 (40-229)
76 (14-396)
Bonroy et al CCLM 2013
0
500
1000
1500
2000
2500
3000
3500
HC CVS DC SLE SS SSc PMDM MCTD
L
I
U
Outlier Boxplot
Percentiles (95 of Distribution)
Outliers gt 15 and lt 3 IQR
Outliers gt 3 IQR
NOVA View
NOVA View LR LIU Controls SLE SS SSc PMDM MCTD SARD
Prevalence
lt49 056 006 003 003 013 005
49-120 026 005 006 005 019 007
121-600 013 011 003 009 034 011
601-2000 004 046 061 034 025 006 039
gt2000 001 033 028 049 009 094 038
LR
lt49 011 005 005 023 009
49-120 018 021 020 073 025
121-600 079 021 069 257 085
601-2000 112 150 84 61 15 96
gt2000 291 245 429 83 827 335
NOVA View
009 025 085
10
33
0
10
20
30
40
0
01
02
03
04
05
06
lt49 49-120 121-600 601-2000 gt2000
Like
liho
od
rat
io
Pre
vale
nce
Nuclear Index
controls
SRD
LR
LR 1 no clinical value gt10 lt01 clinically important difference 5 ndash 10 01 ndash 02 modest but substantial difference 2 ndash 5 02 ndash 05 small difference that may be relevant
Post-test odds
=
Pre-test odds x LR
probability rarr odds
02 rarr 02 (1 ndash 02)
025
odds rarr probability
4 rarr 4 (1 + 4)
08
0
02
04
06
08
1
000 020 040 060 080 100
Po
st-t
est
pro
bab
ility
Pre-test probability
lt20
20-50
51-200
gt200
gt2000
Pre-test probability Post-test probability
lt49 120-600 600-2000 gt2000
1 a young women with hair loss and polyarthralgia 007 05 5 25
0
02
04
06
08
1
000 020 040 060 080 100
Po
st-t
est
pro
bab
ility
Pre-test probability
lt20
20-50
51-200
gt200
gt2000
Pre-test probability Post-test probability
lt49 120-600 600-2000 gt2000
10 a young women with photosensitivity and mild leucopenia (3000-3500mm3)
07 55 36 79
0
02
04
06
08
1
000 020 040 060 080 100
Po
st-t
est
pro
bab
ility
Pre-test probability
lt20
20-50
51-200
gt200
gt2000
Pre-test probability Post-test probability
lt49 120-600 600-2000 gt2000
50 a young women with photosensitivity malar rash and symmetrical polyarthritis
65 35 83 97
G-Sight HEp-2
Probability index
Blood donor CFS Diseased controls SLE SS SSc MCTD PMDM
le10 11-le30 31-le50 51-le85 gt85
075 024 001 000 000
084 013 001 001 000
050 038 003 007 003
004 009 012 032 043
009 009 009 043 031
001 020 014 042 022
000 000 000 000 100
015 041 011 026 007
Probability index SLE SS SSc MCTD PMDM
le10 11 le30 31 le50 51 le85 gt85
006 (002-02)
04 (02-08)
68 (26-178)
121 (62-236)
439 (160-1204)
01 (004-04)
03 (01-10)
50 (14-186)
160 (79-322)
322 (108-959)
002 (0003-01)
08 (05-13)
85 (33-215)
157 (82-299)
223 (76-651)
1025 (387-2718)
02 (009-05)
16 (10-27)
65 (18-238)
97 (40-229)
76 (14-396)
Maenhout et al 2014
Maenhout et al 2014
Conclusions
bull High quality image acquisition
bull Significant correlation between intensity and antibody titer
bull Fluorescence intensity provides clinically useful information
bull Enables implementation of a quantitative internal quality
control system
bull Accuracy of pattern recognition is limited
a microdot array based immunoassay developed to allow simultaneous detection of multiple
autoantibodies on a single patient
Cambridge Life Sciences Ltd
ZENITbullAMiDot
bull One patient sample per well ndash 9 x 9 microarray (81 dots)
Cambridge Life Sciences Ltd
ZENITbullAMiDot
bull Each 9 x 9 microarray contains
bull Multiple autoimmune antigen dots
bull Calibration dots
bull Control dots
bull Registration dots
Cambridge Life Sciences Ltd
ZENITbullAMiDot
0
25000
50000
75000
100000
125000
150000
175000
200000
0 10 20 30 40 50 60 70 80 90 100
Raw
Sig
nal
Calibrator Conc (UmL)
Calibration
bullEach 9 x 9 microarray is
bullPrinted on to an activated glass surface
bullEach dot is ~20microm in diameter
bullEach autoimmune antigen calibrator and control is printed in duplicate or triplicate
bullAutomated analysis
bullImage taken by Reader (G-Sight or AMiDot reader)
Cambridge Life Sciences Ltd
ZENITbullAMiDot
Software receives the image analyses the image and produces a patient report
Antigen RecombinantNative Antigen RecombinantNative
Ro60SS-A recombinant PL7PL12 recombinant
Ro52SS-A recombinant MPO native
LaSS-B recombinant PR3 native
Sm native GBM native
U1-snRNP (68kDAC) recombinant Cathepsin native
Jo-1 recombinant SRP-54 recombinant
Scl70 native BPI native
PMScl100 recombinant ASCA native
dsDNA plasmid tTG recombinant
Histones Native deaminated Gliadin recombinant
Mi-2 recombinant TPO recombinant
Centromere B recombinant Intrinsic Factor recombinant
Ku recombinant Gastric Parietal Cell native
PCNA recombinant M2 recombinant
Ribosomal P0 recombinant LKM-1 recombinant
Elastase native LC1 recombinant
ZENITbullAMiDot
Cambridge Life Sciences Ltd
Conclusion AMiDot
bull Allows multiplex detection of autoantibodies
bull Overall a good concordance with results obtained by EliA
bull Multiplex ANA testing is an efficient way to simultaneously test for specific antibodies
bull Small sample volumes can be used
bull Further studies are warranted to prove the reliability of this technique
Acknowledgements
bull Dept of Laboratory Medicine - Immunology
ndash Dr Vermeersch ndash Dr Marieumln Mrs Godefridis ndash S Cooreman ndash S Schouwers
bull Experimental Laboratory
Immunology ndash K Op de Beeacuteck ndash D Dillaerts
bull Dept of Rheumatology Internal
Medicine ndash Dr Verschueren ndash Dr Westhovens ndash Dr Blockmans
bull Menarini ndash Heidi Debaere
bull Instrumentation Laboratory ndash Nathalie Vandeputte
bull KUL - statistics ndash S Fieuws

0
005
01
015
02
025
Like
liho
od
SLE
0
005
01
015
02
025
Like
liho
od
Systemic sclerosis
0
005
01
015
02
025
03
Like
liho
od
Sjoumlgrens syndrome
LR Systemic lupus erythematosus
Systemic sclerosis Sjoumlgrenrsquos syndrome
IIF(+) (Ref 1 2) 67 (53-86) 71 (55-90) 61 (46-80) IIF(+) (Ref 3) 71 (46-112) 64 (40-101)0 57 (35-59) IIF(-) (Ref 1 2) 008 (004-019) 003 (001-013) 019 (009-040) IIF(-) (Ref 3) 003 (0004-020) 016 (003-035) 026 (015-046) EliA CTD screen (+) 239 (138-415) 235 (135-409) 288 (167-499) EliA CTD screen (-) 027 (019-039) 028 (019-042) 011 (005-029) IIF (+) EliA CTD screen (+) 414 (196-877) 436 (207-468) 468 (220-998) IIF (+) EliA CTD screen (-) 20 (12-31) 20 (13-33) 045 (012-18) IIF (-) EliA CTD screen (+) 35 (10-122) 78 (23-264) IIF (-) EliA CTD screen (-) 003 (0007-012) 003 (0009-013) 006 (002-025)
LR Systemic lupus erythematosus
Systemic sclerosis Sjoumlgrenrsquos syndrome
IIF(+) (Ref 1 2) 67 (53-86) 71 (55-90) 61 (46-80) IIF(+) (Ref 3) 71 (46-112) 64 (40-101)0 57 (35-59) IIF(-) (Ref 1 2) 008 (004-019) 003 (001-013) 019 (009-040) IIF(-) (Ref 3) 003 (0004-020) 016 (003-035) 026 (015-046) EliA CTD screen (+) 239 (138-415) 235 (135-409) 288 (167-499) EliA CTD screen (-) 027 (019-039) 028 (019-042) 011 (005-029) IIF (+) EliA CTD screen (+) 414 (196-877) 436 (207-468) 468 (220-998) IIF (+) EliA CTD screen (-) 20 (12-31) 20 (13-33) 045 (012-18) IIF (-) EliA CTD screen (+) 35 (10-122) 78 (23-264) IIF (-) EliA CTD screen (-) 003 (0007-012) 003 (0009-013) 006 (002-025)
Prevalence
Systemic lupus erythematosus
Systemic sclerosis
Sjoumlgrenrsquos syndrome
Controls
IIF (+) EliA CTD screen (+) 69 72 78 16 IIF (+) EliA CTD screen (-) 24 25 55 12 IIF (-) EliA CTD screen (+) 5 11 14 IIF (-) EliA CTD screen (-) 2 3 55 85
0
02
04
06
08
1
0 02 04 06 08 1
Po
st-t
est
pro
bab
ility
Pre-test probability
FEIA+ IIF+
FEIA+
IIF+
FEIA+ IIF-
FEIA- IIF+
FEIA-
IIF-
FEIA- IIF-
SLE
Comparative analysis of different strategies
1 IIF and FEIA on all samples
2 IIF
If IIF positive FEIA
If IIF negative stop
3 FEIA
4 IIF
Conclusion
Integrated interpretation
of IIF and solid phase assay results adds value
Optimal strategy
depends on the pathology
Bossuyt X Fieuws S Ann Rheum Dis 2014 Mar73(3)
Antinuclear antibodies by automated
indirect immunofluorescence Opportunities for value added
reporting
Xavier Bossuyt Leuven Belgium
Instrument NOVA View AKLIDES EUROPattern Image
Navigator
Helios ZENIT G Sight
Manufacturer INOVA Medipan EUROPattern Immuno Concepts Aesku Menarini
LIMS connection (software) Yes (QUANTA
Link)
Yes Yes
(EUROLabOffice)
Yes (direct) Yes (direct) Yes (ZenIT)
Slide identification via
barcode
Yes by handheld
scanner
Yes by handheld
scanner
Yes by integrated
scanner
Yes Yes by integrated
scanner
Yes by integrated
scanner
Loading capacity 5 slides (up to 60
wells)
5 slides (up to 60
wells)
50 slides (up to 500
wells)
4 slides (up to 84
wells)
20 slides (up to 240
wells)
5 slides (up to 70
wells)
Image acquisition speed ~45swell for 3
images
~40swell lt20swell ~25swell for 4
images
10spicture
Customizable from 1
to 10 images
gt60swell
pictures 5 (small
scan) 50 (medium
scan) 220 (full scan)
100 QC for substrate and
process integrity
counterstaining
Yes DAPI Yes DAPI Yes Propidium
iodide
None None None None None None
Automatic posneg
discrimination incl
presorting of images
Yes Yes Yes Yes Yes Yes
Batchwise verification of
negative samples
Yes Yes Yes Yes Yes Yes
Automatic pattern
recognition
Yes Yes Yes No No Yes
Pattern Analysis method Pattern recognition by
mathematical algorithm
Pattern recognition by
mathematical algorithm
Pattern recognition by
mathematical algorithm
No pattern matching
capabilities
No pattern matching
capabilities
Pattern recognition by
mathematical algorithm
No of recognizable ANA
staining pattern list out
6
Homogeneous
Speckled
Centromere
Nucleolar
Nuclear dot
Cytoplasm
Negative
Positive unrecognized
10
Homogeneous
Speckled
Centromere
Nucleolar
Nuclear dot
Cytoplasm
Negative
Positive unrecognized
8
Homogeneous
Speckled
Centromere
Nucleolar
Nuclear dot
Cytoplasm
Nuclear rim
Mitotic negative
None None 5
Homogeneous
Speckled
Centromere
Nucleolar
Cytoplasm
Negative
Instrument calibration to
minimize variability
Yes Yes Yes Yes Yes No
Integration with slide
processing in 1 instrument
No No No No Yes No
Mahler et al J Immunol Research in press
Automated fluorescence microscopy is increasingly used for image acquisition quantitative analysis and pattern recognition of anti-nuclear antibody
testing
Positivenegative discrimination
bull Exposure time is inversely proportional to intensity of fluorescence
bull Probability value is given to samples
Pattern recognition ANA
bull five patterns ndash Homogeneous
ndash Speckled
ndash Centromere
ndash Nucleolar
ndash Mitochondrial
bull Based on statistical morphological and geometric features
IMAGE ACQUISITION
RNP
PM-Scl
Golgi
Membrane
Review of digital images
harr
manual approach (posneg)
ndash 90 identical interpretation (n=332) (Bonroy et al CCLM 2013)
ndash 88 identical interpretation (n=268) (Bossuyt et al CCA 2013)
Bonroy et al CCLM 2013
FLUORESENCE INTENSITY VERSUS ANTIBODY TITER
HEp-2
-10
10
30
50
70
90
neg 80 160 320 640 1280
Ind
ex
Titer
Outlier Boxplot
Outliers gt 15 and lt 3 IQR
Outliers gt 3 IQR
Midbody centriole few nuclear dots Golgi
Bossuyt et al CCA 2013
G-Sight HEp-2000
0
20
40
60
80
100
neg 180 1160 1320 1640 1gt=1280
Pro
ba
bil
ity i
nd
ex
Antibody titer
Bonroy et al 2013
NOVA View
0
500
1000
1500
2000
2500
3000
3500
Neg 80 160 320 640 gt=1280
Nova
Vie
w F
luo
resce
nce
In
de
x
Titer
Schouwers et al Clin Chem Lab Med 201452547-51
Pattern recognition
Visual inspection Correct assignment by G-Sight HEp-2
Correct assignment by G-sight HEp-2000
Homogeneous (n=42) 68 92
Speckled (n=34) 71 56
Centromere (n=6) 83 42
Pattern recognition (Bonroy et al 2013) Pattern assignment was incorrect in 29 of 132 pos samples No pattern assigned in 45 of samples Global accuracy of pattern assignment 26
FLUORESCENCE INTENSITY IN WELL-DEFINED PATIENT COHORTS
Study Population
n M()F() Median age (range)
Blood donors
108 5149 45 (19-65)
Chronic Fatigue Syndrome
150 1981 41 (16-75)
Diseased Controls 134 2575 45 (17-81)
392
Systemic Lupus Erythematosus
85 1288 355 (15-72)
Sjoumlgrenrsquos Syndrome
36 1486 56 (21-75)
Systemic Sclerosis
76 3466 53 (18-80)
Polymyositis Dermatomyositis
32 4456 50 (24-77)
Mixed Connective Tissue Disease
16 694 315 (16-66)
245
HEp2
-10
10
30
50
70
90
Blooddonor
CFS Discontrols
SLE SCL SS SSc MCTD PM DM
Gro
up
s
Groups
Outlier Boxplot
Outliers gt 15 and lt 3 IQR
Outliers gt 3 IQR
Bossuyt et al CCA 2013
G-Sight HEp-2000
-10
10
30
50
70
90
BloodDonors
CFS Dis Contr SLE SCL SS SSc MCTD PM DM
Pro
ba
bil
ity i
nd
ex
G-Sight HEp-2
Probability index
Blood donor CFS Diseased controls SLE SS SSc MCTD PMDM
le10 11-le30 31-le50 51-le85 gt85
075 024 001 000 000
084 013 001 001 000
050 038 003 007 003
004 009 012 032 043
009 009 009 043 031
001 020 014 042 022
000 000 000 000 100
015 041 011 026 007
Probability index SLE SS SSc MCTD PMDM
le10 11 le30 31 le50 51 le85 gt85
006 (002-02)
04 (02-08)
68 (26-178)
121 (62-236)
439 (160-1204)
01 (004-04)
03 (01-10)
50 (14-186)
160 (79-322)
322 (108-959)
002 (0003-01)
08 (05-13)
85 (33-215)
157 (82-299)
223 (76-651)
1025 (387-2718)
02 (009-05)
16 (10-27)
65 (18-238)
97 (40-229)
76 (14-396)
Bonroy et al CCLM 2013
0
500
1000
1500
2000
2500
3000
3500
HC CVS DC SLE SS SSc PMDM MCTD
L
I
U
Outlier Boxplot
Percentiles (95 of Distribution)
Outliers gt 15 and lt 3 IQR
Outliers gt 3 IQR
NOVA View
NOVA View LR LIU Controls SLE SS SSc PMDM MCTD SARD
Prevalence
lt49 056 006 003 003 013 005
49-120 026 005 006 005 019 007
121-600 013 011 003 009 034 011
601-2000 004 046 061 034 025 006 039
gt2000 001 033 028 049 009 094 038
LR
lt49 011 005 005 023 009
49-120 018 021 020 073 025
121-600 079 021 069 257 085
601-2000 112 150 84 61 15 96
gt2000 291 245 429 83 827 335
NOVA View
009 025 085
10
33
0
10
20
30
40
0
01
02
03
04
05
06
lt49 49-120 121-600 601-2000 gt2000
Like
liho
od
rat
io
Pre
vale
nce
Nuclear Index
controls
SRD
LR
LR 1 no clinical value gt10 lt01 clinically important difference 5 ndash 10 01 ndash 02 modest but substantial difference 2 ndash 5 02 ndash 05 small difference that may be relevant
Post-test odds
=
Pre-test odds x LR
probability rarr odds
02 rarr 02 (1 ndash 02)
025
odds rarr probability
4 rarr 4 (1 + 4)
08
0
02
04
06
08
1
000 020 040 060 080 100
Po
st-t
est
pro
bab
ility
Pre-test probability
lt20
20-50
51-200
gt200
gt2000
Pre-test probability Post-test probability
lt49 120-600 600-2000 gt2000
1 a young women with hair loss and polyarthralgia 007 05 5 25
0
02
04
06
08
1
000 020 040 060 080 100
Po
st-t
est
pro
bab
ility
Pre-test probability
lt20
20-50
51-200
gt200
gt2000
Pre-test probability Post-test probability
lt49 120-600 600-2000 gt2000
10 a young women with photosensitivity and mild leucopenia (3000-3500mm3)
07 55 36 79
0
02
04
06
08
1
000 020 040 060 080 100
Po
st-t
est
pro
bab
ility
Pre-test probability
lt20
20-50
51-200
gt200
gt2000
Pre-test probability Post-test probability
lt49 120-600 600-2000 gt2000
50 a young women with photosensitivity malar rash and symmetrical polyarthritis
65 35 83 97
G-Sight HEp-2
Probability index
Blood donor CFS Diseased controls SLE SS SSc MCTD PMDM
le10 11-le30 31-le50 51-le85 gt85
075 024 001 000 000
084 013 001 001 000
050 038 003 007 003
004 009 012 032 043
009 009 009 043 031
001 020 014 042 022
000 000 000 000 100
015 041 011 026 007
Probability index SLE SS SSc MCTD PMDM
le10 11 le30 31 le50 51 le85 gt85
006 (002-02)
04 (02-08)
68 (26-178)
121 (62-236)
439 (160-1204)
01 (004-04)
03 (01-10)
50 (14-186)
160 (79-322)
322 (108-959)
002 (0003-01)
08 (05-13)
85 (33-215)
157 (82-299)
223 (76-651)
1025 (387-2718)
02 (009-05)
16 (10-27)
65 (18-238)
97 (40-229)
76 (14-396)
Maenhout et al 2014
Maenhout et al 2014
Conclusions
bull High quality image acquisition
bull Significant correlation between intensity and antibody titer
bull Fluorescence intensity provides clinically useful information
bull Enables implementation of a quantitative internal quality
control system
bull Accuracy of pattern recognition is limited
a microdot array based immunoassay developed to allow simultaneous detection of multiple
autoantibodies on a single patient
Cambridge Life Sciences Ltd
ZENITbullAMiDot
bull One patient sample per well ndash 9 x 9 microarray (81 dots)
Cambridge Life Sciences Ltd
ZENITbullAMiDot
bull Each 9 x 9 microarray contains
bull Multiple autoimmune antigen dots
bull Calibration dots
bull Control dots
bull Registration dots
Cambridge Life Sciences Ltd
ZENITbullAMiDot
0
25000
50000
75000
100000
125000
150000
175000
200000
0 10 20 30 40 50 60 70 80 90 100
Raw
Sig
nal
Calibrator Conc (UmL)
Calibration
bullEach 9 x 9 microarray is
bullPrinted on to an activated glass surface
bullEach dot is ~20microm in diameter
bullEach autoimmune antigen calibrator and control is printed in duplicate or triplicate
bullAutomated analysis
bullImage taken by Reader (G-Sight or AMiDot reader)
Cambridge Life Sciences Ltd
ZENITbullAMiDot
Software receives the image analyses the image and produces a patient report
Antigen RecombinantNative Antigen RecombinantNative
Ro60SS-A recombinant PL7PL12 recombinant
Ro52SS-A recombinant MPO native
LaSS-B recombinant PR3 native
Sm native GBM native
U1-snRNP (68kDAC) recombinant Cathepsin native
Jo-1 recombinant SRP-54 recombinant
Scl70 native BPI native
PMScl100 recombinant ASCA native
dsDNA plasmid tTG recombinant
Histones Native deaminated Gliadin recombinant
Mi-2 recombinant TPO recombinant
Centromere B recombinant Intrinsic Factor recombinant
Ku recombinant Gastric Parietal Cell native
PCNA recombinant M2 recombinant
Ribosomal P0 recombinant LKM-1 recombinant
Elastase native LC1 recombinant
ZENITbullAMiDot
Cambridge Life Sciences Ltd
Conclusion AMiDot
bull Allows multiplex detection of autoantibodies
bull Overall a good concordance with results obtained by EliA
bull Multiplex ANA testing is an efficient way to simultaneously test for specific antibodies
bull Small sample volumes can be used
bull Further studies are warranted to prove the reliability of this technique
Acknowledgements
bull Dept of Laboratory Medicine - Immunology
ndash Dr Vermeersch ndash Dr Marieumln Mrs Godefridis ndash S Cooreman ndash S Schouwers
bull Experimental Laboratory
Immunology ndash K Op de Beeacuteck ndash D Dillaerts
bull Dept of Rheumatology Internal
Medicine ndash Dr Verschueren ndash Dr Westhovens ndash Dr Blockmans
bull Menarini ndash Heidi Debaere
bull Instrumentation Laboratory ndash Nathalie Vandeputte
bull KUL - statistics ndash S Fieuws

0
005
01
015
02
025
03
Like
liho
od
Sjoumlgrens syndrome
LR Systemic lupus erythematosus
Systemic sclerosis Sjoumlgrenrsquos syndrome
IIF(+) (Ref 1 2) 67 (53-86) 71 (55-90) 61 (46-80) IIF(+) (Ref 3) 71 (46-112) 64 (40-101)0 57 (35-59) IIF(-) (Ref 1 2) 008 (004-019) 003 (001-013) 019 (009-040) IIF(-) (Ref 3) 003 (0004-020) 016 (003-035) 026 (015-046) EliA CTD screen (+) 239 (138-415) 235 (135-409) 288 (167-499) EliA CTD screen (-) 027 (019-039) 028 (019-042) 011 (005-029) IIF (+) EliA CTD screen (+) 414 (196-877) 436 (207-468) 468 (220-998) IIF (+) EliA CTD screen (-) 20 (12-31) 20 (13-33) 045 (012-18) IIF (-) EliA CTD screen (+) 35 (10-122) 78 (23-264) IIF (-) EliA CTD screen (-) 003 (0007-012) 003 (0009-013) 006 (002-025)
LR Systemic lupus erythematosus
Systemic sclerosis Sjoumlgrenrsquos syndrome
IIF(+) (Ref 1 2) 67 (53-86) 71 (55-90) 61 (46-80) IIF(+) (Ref 3) 71 (46-112) 64 (40-101)0 57 (35-59) IIF(-) (Ref 1 2) 008 (004-019) 003 (001-013) 019 (009-040) IIF(-) (Ref 3) 003 (0004-020) 016 (003-035) 026 (015-046) EliA CTD screen (+) 239 (138-415) 235 (135-409) 288 (167-499) EliA CTD screen (-) 027 (019-039) 028 (019-042) 011 (005-029) IIF (+) EliA CTD screen (+) 414 (196-877) 436 (207-468) 468 (220-998) IIF (+) EliA CTD screen (-) 20 (12-31) 20 (13-33) 045 (012-18) IIF (-) EliA CTD screen (+) 35 (10-122) 78 (23-264) IIF (-) EliA CTD screen (-) 003 (0007-012) 003 (0009-013) 006 (002-025)
Prevalence
Systemic lupus erythematosus
Systemic sclerosis
Sjoumlgrenrsquos syndrome
Controls
IIF (+) EliA CTD screen (+) 69 72 78 16 IIF (+) EliA CTD screen (-) 24 25 55 12 IIF (-) EliA CTD screen (+) 5 11 14 IIF (-) EliA CTD screen (-) 2 3 55 85
0
02
04
06
08
1
0 02 04 06 08 1
Po
st-t
est
pro
bab
ility
Pre-test probability
FEIA+ IIF+
FEIA+
IIF+
FEIA+ IIF-
FEIA- IIF+
FEIA-
IIF-
FEIA- IIF-
SLE
Comparative analysis of different strategies
1 IIF and FEIA on all samples
2 IIF
If IIF positive FEIA
If IIF negative stop
3 FEIA
4 IIF
Conclusion
Integrated interpretation
of IIF and solid phase assay results adds value
Optimal strategy
depends on the pathology
Bossuyt X Fieuws S Ann Rheum Dis 2014 Mar73(3)
Antinuclear antibodies by automated
indirect immunofluorescence Opportunities for value added
reporting
Xavier Bossuyt Leuven Belgium
Instrument NOVA View AKLIDES EUROPattern Image
Navigator
Helios ZENIT G Sight
Manufacturer INOVA Medipan EUROPattern Immuno Concepts Aesku Menarini
LIMS connection (software) Yes (QUANTA
Link)
Yes Yes
(EUROLabOffice)
Yes (direct) Yes (direct) Yes (ZenIT)
Slide identification via
barcode
Yes by handheld
scanner
Yes by handheld
scanner
Yes by integrated
scanner
Yes Yes by integrated
scanner
Yes by integrated
scanner
Loading capacity 5 slides (up to 60
wells)
5 slides (up to 60
wells)
50 slides (up to 500
wells)
4 slides (up to 84
wells)
20 slides (up to 240
wells)
5 slides (up to 70
wells)
Image acquisition speed ~45swell for 3
images
~40swell lt20swell ~25swell for 4
images
10spicture
Customizable from 1
to 10 images
gt60swell
pictures 5 (small
scan) 50 (medium
scan) 220 (full scan)
100 QC for substrate and
process integrity
counterstaining
Yes DAPI Yes DAPI Yes Propidium
iodide
None None None None None None
Automatic posneg
discrimination incl
presorting of images
Yes Yes Yes Yes Yes Yes
Batchwise verification of
negative samples
Yes Yes Yes Yes Yes Yes
Automatic pattern
recognition
Yes Yes Yes No No Yes
Pattern Analysis method Pattern recognition by
mathematical algorithm
Pattern recognition by
mathematical algorithm
Pattern recognition by
mathematical algorithm
No pattern matching
capabilities
No pattern matching
capabilities
Pattern recognition by
mathematical algorithm
No of recognizable ANA
staining pattern list out
6
Homogeneous
Speckled
Centromere
Nucleolar
Nuclear dot
Cytoplasm
Negative
Positive unrecognized
10
Homogeneous
Speckled
Centromere
Nucleolar
Nuclear dot
Cytoplasm
Negative
Positive unrecognized
8
Homogeneous
Speckled
Centromere
Nucleolar
Nuclear dot
Cytoplasm
Nuclear rim
Mitotic negative
None None 5
Homogeneous
Speckled
Centromere
Nucleolar
Cytoplasm
Negative
Instrument calibration to
minimize variability
Yes Yes Yes Yes Yes No
Integration with slide
processing in 1 instrument
No No No No Yes No
Mahler et al J Immunol Research in press
Automated fluorescence microscopy is increasingly used for image acquisition quantitative analysis and pattern recognition of anti-nuclear antibody
testing
Positivenegative discrimination
bull Exposure time is inversely proportional to intensity of fluorescence
bull Probability value is given to samples
Pattern recognition ANA
bull five patterns ndash Homogeneous
ndash Speckled
ndash Centromere
ndash Nucleolar
ndash Mitochondrial
bull Based on statistical morphological and geometric features
IMAGE ACQUISITION
RNP
PM-Scl
Golgi
Membrane
Review of digital images
harr
manual approach (posneg)
ndash 90 identical interpretation (n=332) (Bonroy et al CCLM 2013)
ndash 88 identical interpretation (n=268) (Bossuyt et al CCA 2013)
Bonroy et al CCLM 2013
FLUORESENCE INTENSITY VERSUS ANTIBODY TITER
HEp-2
-10
10
30
50
70
90
neg 80 160 320 640 1280
Ind
ex
Titer
Outlier Boxplot
Outliers gt 15 and lt 3 IQR
Outliers gt 3 IQR
Midbody centriole few nuclear dots Golgi
Bossuyt et al CCA 2013
G-Sight HEp-2000
0
20
40
60
80
100
neg 180 1160 1320 1640 1gt=1280
Pro
ba
bil
ity i
nd
ex
Antibody titer
Bonroy et al 2013
NOVA View
0
500
1000
1500
2000
2500
3000
3500
Neg 80 160 320 640 gt=1280
Nova
Vie
w F
luo
resce
nce
In
de
x
Titer
Schouwers et al Clin Chem Lab Med 201452547-51
Pattern recognition
Visual inspection Correct assignment by G-Sight HEp-2
Correct assignment by G-sight HEp-2000
Homogeneous (n=42) 68 92
Speckled (n=34) 71 56
Centromere (n=6) 83 42
Pattern recognition (Bonroy et al 2013) Pattern assignment was incorrect in 29 of 132 pos samples No pattern assigned in 45 of samples Global accuracy of pattern assignment 26
FLUORESCENCE INTENSITY IN WELL-DEFINED PATIENT COHORTS
Study Population
n M()F() Median age (range)
Blood donors
108 5149 45 (19-65)
Chronic Fatigue Syndrome
150 1981 41 (16-75)
Diseased Controls 134 2575 45 (17-81)
392
Systemic Lupus Erythematosus
85 1288 355 (15-72)
Sjoumlgrenrsquos Syndrome
36 1486 56 (21-75)
Systemic Sclerosis
76 3466 53 (18-80)
Polymyositis Dermatomyositis
32 4456 50 (24-77)
Mixed Connective Tissue Disease
16 694 315 (16-66)
245
HEp2
-10
10
30
50
70
90
Blooddonor
CFS Discontrols
SLE SCL SS SSc MCTD PM DM
Gro
up
s
Groups
Outlier Boxplot
Outliers gt 15 and lt 3 IQR
Outliers gt 3 IQR
Bossuyt et al CCA 2013
G-Sight HEp-2000
-10
10
30
50
70
90
BloodDonors
CFS Dis Contr SLE SCL SS SSc MCTD PM DM
Pro
ba
bil
ity i
nd
ex
G-Sight HEp-2
Probability index
Blood donor CFS Diseased controls SLE SS SSc MCTD PMDM
le10 11-le30 31-le50 51-le85 gt85
075 024 001 000 000
084 013 001 001 000
050 038 003 007 003
004 009 012 032 043
009 009 009 043 031
001 020 014 042 022
000 000 000 000 100
015 041 011 026 007
Probability index SLE SS SSc MCTD PMDM
le10 11 le30 31 le50 51 le85 gt85
006 (002-02)
04 (02-08)
68 (26-178)
121 (62-236)
439 (160-1204)
01 (004-04)
03 (01-10)
50 (14-186)
160 (79-322)
322 (108-959)
002 (0003-01)
08 (05-13)
85 (33-215)
157 (82-299)
223 (76-651)
1025 (387-2718)
02 (009-05)
16 (10-27)
65 (18-238)
97 (40-229)
76 (14-396)
Bonroy et al CCLM 2013
0
500
1000
1500
2000
2500
3000
3500
HC CVS DC SLE SS SSc PMDM MCTD
L
I
U
Outlier Boxplot
Percentiles (95 of Distribution)
Outliers gt 15 and lt 3 IQR
Outliers gt 3 IQR
NOVA View
NOVA View LR LIU Controls SLE SS SSc PMDM MCTD SARD
Prevalence
lt49 056 006 003 003 013 005
49-120 026 005 006 005 019 007
121-600 013 011 003 009 034 011
601-2000 004 046 061 034 025 006 039
gt2000 001 033 028 049 009 094 038
LR
lt49 011 005 005 023 009
49-120 018 021 020 073 025
121-600 079 021 069 257 085
601-2000 112 150 84 61 15 96
gt2000 291 245 429 83 827 335
NOVA View
009 025 085
10
33
0
10
20
30
40
0
01
02
03
04
05
06
lt49 49-120 121-600 601-2000 gt2000
Like
liho
od
rat
io
Pre
vale
nce
Nuclear Index
controls
SRD
LR
LR 1 no clinical value gt10 lt01 clinically important difference 5 ndash 10 01 ndash 02 modest but substantial difference 2 ndash 5 02 ndash 05 small difference that may be relevant
Post-test odds
=
Pre-test odds x LR
probability rarr odds
02 rarr 02 (1 ndash 02)
025
odds rarr probability
4 rarr 4 (1 + 4)
08
0
02
04
06
08
1
000 020 040 060 080 100
Po
st-t
est
pro
bab
ility
Pre-test probability
lt20
20-50
51-200
gt200
gt2000
Pre-test probability Post-test probability
lt49 120-600 600-2000 gt2000
1 a young women with hair loss and polyarthralgia 007 05 5 25
0
02
04
06
08
1
000 020 040 060 080 100
Po
st-t
est
pro
bab
ility
Pre-test probability
lt20
20-50
51-200
gt200
gt2000
Pre-test probability Post-test probability
lt49 120-600 600-2000 gt2000
10 a young women with photosensitivity and mild leucopenia (3000-3500mm3)
07 55 36 79
0
02
04
06
08
1
000 020 040 060 080 100
Po
st-t
est
pro
bab
ility
Pre-test probability
lt20
20-50
51-200
gt200
gt2000
Pre-test probability Post-test probability
lt49 120-600 600-2000 gt2000
50 a young women with photosensitivity malar rash and symmetrical polyarthritis
65 35 83 97
G-Sight HEp-2
Probability index
Blood donor CFS Diseased controls SLE SS SSc MCTD PMDM
le10 11-le30 31-le50 51-le85 gt85
075 024 001 000 000
084 013 001 001 000
050 038 003 007 003
004 009 012 032 043
009 009 009 043 031
001 020 014 042 022
000 000 000 000 100
015 041 011 026 007
Probability index SLE SS SSc MCTD PMDM
le10 11 le30 31 le50 51 le85 gt85
006 (002-02)
04 (02-08)
68 (26-178)
121 (62-236)
439 (160-1204)
01 (004-04)
03 (01-10)
50 (14-186)
160 (79-322)
322 (108-959)
002 (0003-01)
08 (05-13)
85 (33-215)
157 (82-299)
223 (76-651)
1025 (387-2718)
02 (009-05)
16 (10-27)
65 (18-238)
97 (40-229)
76 (14-396)
Maenhout et al 2014
Maenhout et al 2014
Conclusions
bull High quality image acquisition
bull Significant correlation between intensity and antibody titer
bull Fluorescence intensity provides clinically useful information
bull Enables implementation of a quantitative internal quality
control system
bull Accuracy of pattern recognition is limited
a microdot array based immunoassay developed to allow simultaneous detection of multiple
autoantibodies on a single patient
Cambridge Life Sciences Ltd
ZENITbullAMiDot
bull One patient sample per well ndash 9 x 9 microarray (81 dots)
Cambridge Life Sciences Ltd
ZENITbullAMiDot
bull Each 9 x 9 microarray contains
bull Multiple autoimmune antigen dots
bull Calibration dots
bull Control dots
bull Registration dots
Cambridge Life Sciences Ltd
ZENITbullAMiDot
0
25000
50000
75000
100000
125000
150000
175000
200000
0 10 20 30 40 50 60 70 80 90 100
Raw
Sig
nal
Calibrator Conc (UmL)
Calibration
bullEach 9 x 9 microarray is
bullPrinted on to an activated glass surface
bullEach dot is ~20microm in diameter
bullEach autoimmune antigen calibrator and control is printed in duplicate or triplicate
bullAutomated analysis
bullImage taken by Reader (G-Sight or AMiDot reader)
Cambridge Life Sciences Ltd
ZENITbullAMiDot
Software receives the image analyses the image and produces a patient report
Antigen RecombinantNative Antigen RecombinantNative
Ro60SS-A recombinant PL7PL12 recombinant
Ro52SS-A recombinant MPO native
LaSS-B recombinant PR3 native
Sm native GBM native
U1-snRNP (68kDAC) recombinant Cathepsin native
Jo-1 recombinant SRP-54 recombinant
Scl70 native BPI native
PMScl100 recombinant ASCA native
dsDNA plasmid tTG recombinant
Histones Native deaminated Gliadin recombinant
Mi-2 recombinant TPO recombinant
Centromere B recombinant Intrinsic Factor recombinant
Ku recombinant Gastric Parietal Cell native
PCNA recombinant M2 recombinant
Ribosomal P0 recombinant LKM-1 recombinant
Elastase native LC1 recombinant
ZENITbullAMiDot
Cambridge Life Sciences Ltd
Conclusion AMiDot
bull Allows multiplex detection of autoantibodies
bull Overall a good concordance with results obtained by EliA
bull Multiplex ANA testing is an efficient way to simultaneously test for specific antibodies
bull Small sample volumes can be used
bull Further studies are warranted to prove the reliability of this technique
Acknowledgements
bull Dept of Laboratory Medicine - Immunology
ndash Dr Vermeersch ndash Dr Marieumln Mrs Godefridis ndash S Cooreman ndash S Schouwers
bull Experimental Laboratory
Immunology ndash K Op de Beeacuteck ndash D Dillaerts
bull Dept of Rheumatology Internal
Medicine ndash Dr Verschueren ndash Dr Westhovens ndash Dr Blockmans
bull Menarini ndash Heidi Debaere
bull Instrumentation Laboratory ndash Nathalie Vandeputte
bull KUL - statistics ndash S Fieuws

LR Systemic lupus erythematosus
Systemic sclerosis Sjoumlgrenrsquos syndrome
IIF(+) (Ref 1 2) 67 (53-86) 71 (55-90) 61 (46-80) IIF(+) (Ref 3) 71 (46-112) 64 (40-101)0 57 (35-59) IIF(-) (Ref 1 2) 008 (004-019) 003 (001-013) 019 (009-040) IIF(-) (Ref 3) 003 (0004-020) 016 (003-035) 026 (015-046) EliA CTD screen (+) 239 (138-415) 235 (135-409) 288 (167-499) EliA CTD screen (-) 027 (019-039) 028 (019-042) 011 (005-029) IIF (+) EliA CTD screen (+) 414 (196-877) 436 (207-468) 468 (220-998) IIF (+) EliA CTD screen (-) 20 (12-31) 20 (13-33) 045 (012-18) IIF (-) EliA CTD screen (+) 35 (10-122) 78 (23-264) IIF (-) EliA CTD screen (-) 003 (0007-012) 003 (0009-013) 006 (002-025)
Prevalence
Systemic lupus erythematosus
Systemic sclerosis
Sjoumlgrenrsquos syndrome
Controls
IIF (+) EliA CTD screen (+) 69 72 78 16 IIF (+) EliA CTD screen (-) 24 25 55 12 IIF (-) EliA CTD screen (+) 5 11 14 IIF (-) EliA CTD screen (-) 2 3 55 85
0
02
04
06
08
1
0 02 04 06 08 1
Po
st-t
est
pro
bab
ility
Pre-test probability
FEIA+ IIF+
FEIA+
IIF+
FEIA+ IIF-
FEIA- IIF+
FEIA-
IIF-
FEIA- IIF-
SLE
Comparative analysis of different strategies
1 IIF and FEIA on all samples
2 IIF
If IIF positive FEIA
If IIF negative stop
3 FEIA
4 IIF
Conclusion
Integrated interpretation
of IIF and solid phase assay results adds value
Optimal strategy
depends on the pathology
Bossuyt X Fieuws S Ann Rheum Dis 2014 Mar73(3)
Antinuclear antibodies by automated
indirect immunofluorescence Opportunities for value added
reporting
Xavier Bossuyt Leuven Belgium
Instrument NOVA View AKLIDES EUROPattern Image
Navigator
Helios ZENIT G Sight
Manufacturer INOVA Medipan EUROPattern Immuno Concepts Aesku Menarini
LIMS connection (software) Yes (QUANTA
Link)
Yes Yes
(EUROLabOffice)
Yes (direct) Yes (direct) Yes (ZenIT)
Slide identification via
barcode
Yes by handheld
scanner
Yes by handheld
scanner
Yes by integrated
scanner
Yes Yes by integrated
scanner
Yes by integrated
scanner
Loading capacity 5 slides (up to 60
wells)
5 slides (up to 60
wells)
50 slides (up to 500
wells)
4 slides (up to 84
wells)
20 slides (up to 240
wells)
5 slides (up to 70
wells)
Image acquisition speed ~45swell for 3
images
~40swell lt20swell ~25swell for 4
images
10spicture
Customizable from 1
to 10 images
gt60swell
pictures 5 (small
scan) 50 (medium
scan) 220 (full scan)
100 QC for substrate and
process integrity
counterstaining
Yes DAPI Yes DAPI Yes Propidium
iodide
None None None None None None
Automatic posneg
discrimination incl
presorting of images
Yes Yes Yes Yes Yes Yes
Batchwise verification of
negative samples
Yes Yes Yes Yes Yes Yes
Automatic pattern
recognition
Yes Yes Yes No No Yes
Pattern Analysis method Pattern recognition by
mathematical algorithm
Pattern recognition by
mathematical algorithm
Pattern recognition by
mathematical algorithm
No pattern matching
capabilities
No pattern matching
capabilities
Pattern recognition by
mathematical algorithm
No of recognizable ANA
staining pattern list out
6
Homogeneous
Speckled
Centromere
Nucleolar
Nuclear dot
Cytoplasm
Negative
Positive unrecognized
10
Homogeneous
Speckled
Centromere
Nucleolar
Nuclear dot
Cytoplasm
Negative
Positive unrecognized
8
Homogeneous
Speckled
Centromere
Nucleolar
Nuclear dot
Cytoplasm
Nuclear rim
Mitotic negative
None None 5
Homogeneous
Speckled
Centromere
Nucleolar
Cytoplasm
Negative
Instrument calibration to
minimize variability
Yes Yes Yes Yes Yes No
Integration with slide
processing in 1 instrument
No No No No Yes No
Mahler et al J Immunol Research in press
Automated fluorescence microscopy is increasingly used for image acquisition quantitative analysis and pattern recognition of anti-nuclear antibody
testing
Positivenegative discrimination
bull Exposure time is inversely proportional to intensity of fluorescence
bull Probability value is given to samples
Pattern recognition ANA
bull five patterns ndash Homogeneous
ndash Speckled
ndash Centromere
ndash Nucleolar
ndash Mitochondrial
bull Based on statistical morphological and geometric features
IMAGE ACQUISITION
RNP
PM-Scl
Golgi
Membrane
Review of digital images
harr
manual approach (posneg)
ndash 90 identical interpretation (n=332) (Bonroy et al CCLM 2013)
ndash 88 identical interpretation (n=268) (Bossuyt et al CCA 2013)
Bonroy et al CCLM 2013
FLUORESENCE INTENSITY VERSUS ANTIBODY TITER
HEp-2
-10
10
30
50
70
90
neg 80 160 320 640 1280
Ind
ex
Titer
Outlier Boxplot
Outliers gt 15 and lt 3 IQR
Outliers gt 3 IQR
Midbody centriole few nuclear dots Golgi
Bossuyt et al CCA 2013
G-Sight HEp-2000
0
20
40
60
80
100
neg 180 1160 1320 1640 1gt=1280
Pro
ba
bil
ity i
nd
ex
Antibody titer
Bonroy et al 2013
NOVA View
0
500
1000
1500
2000
2500
3000
3500
Neg 80 160 320 640 gt=1280
Nova
Vie
w F
luo
resce
nce
In
de
x
Titer
Schouwers et al Clin Chem Lab Med 201452547-51
Pattern recognition
Visual inspection Correct assignment by G-Sight HEp-2
Correct assignment by G-sight HEp-2000
Homogeneous (n=42) 68 92
Speckled (n=34) 71 56
Centromere (n=6) 83 42
Pattern recognition (Bonroy et al 2013) Pattern assignment was incorrect in 29 of 132 pos samples No pattern assigned in 45 of samples Global accuracy of pattern assignment 26
FLUORESCENCE INTENSITY IN WELL-DEFINED PATIENT COHORTS
Study Population
n M()F() Median age (range)
Blood donors
108 5149 45 (19-65)
Chronic Fatigue Syndrome
150 1981 41 (16-75)
Diseased Controls 134 2575 45 (17-81)
392
Systemic Lupus Erythematosus
85 1288 355 (15-72)
Sjoumlgrenrsquos Syndrome
36 1486 56 (21-75)
Systemic Sclerosis
76 3466 53 (18-80)
Polymyositis Dermatomyositis
32 4456 50 (24-77)
Mixed Connective Tissue Disease
16 694 315 (16-66)
245
HEp2
-10
10
30
50
70
90
Blooddonor
CFS Discontrols
SLE SCL SS SSc MCTD PM DM
Gro
up
s
Groups
Outlier Boxplot
Outliers gt 15 and lt 3 IQR
Outliers gt 3 IQR
Bossuyt et al CCA 2013
G-Sight HEp-2000
-10
10
30
50
70
90
BloodDonors
CFS Dis Contr SLE SCL SS SSc MCTD PM DM
Pro
ba
bil
ity i
nd
ex
G-Sight HEp-2
Probability index
Blood donor CFS Diseased controls SLE SS SSc MCTD PMDM
le10 11-le30 31-le50 51-le85 gt85
075 024 001 000 000
084 013 001 001 000
050 038 003 007 003
004 009 012 032 043
009 009 009 043 031
001 020 014 042 022
000 000 000 000 100
015 041 011 026 007
Probability index SLE SS SSc MCTD PMDM
le10 11 le30 31 le50 51 le85 gt85
006 (002-02)
04 (02-08)
68 (26-178)
121 (62-236)
439 (160-1204)
01 (004-04)
03 (01-10)
50 (14-186)
160 (79-322)
322 (108-959)
002 (0003-01)
08 (05-13)
85 (33-215)
157 (82-299)
223 (76-651)
1025 (387-2718)
02 (009-05)
16 (10-27)
65 (18-238)
97 (40-229)
76 (14-396)
Bonroy et al CCLM 2013
0
500
1000
1500
2000
2500
3000
3500
HC CVS DC SLE SS SSc PMDM MCTD
L
I
U
Outlier Boxplot
Percentiles (95 of Distribution)
Outliers gt 15 and lt 3 IQR
Outliers gt 3 IQR
NOVA View
NOVA View LR LIU Controls SLE SS SSc PMDM MCTD SARD
Prevalence
lt49 056 006 003 003 013 005
49-120 026 005 006 005 019 007
121-600 013 011 003 009 034 011
601-2000 004 046 061 034 025 006 039
gt2000 001 033 028 049 009 094 038
LR
lt49 011 005 005 023 009
49-120 018 021 020 073 025
121-600 079 021 069 257 085
601-2000 112 150 84 61 15 96
gt2000 291 245 429 83 827 335
NOVA View
009 025 085
10
33
0
10
20
30
40
0
01
02
03
04
05
06
lt49 49-120 121-600 601-2000 gt2000
Like
liho
od
rat
io
Pre
vale
nce
Nuclear Index
controls
SRD
LR
LR 1 no clinical value gt10 lt01 clinically important difference 5 ndash 10 01 ndash 02 modest but substantial difference 2 ndash 5 02 ndash 05 small difference that may be relevant
Post-test odds
=
Pre-test odds x LR
probability rarr odds
02 rarr 02 (1 ndash 02)
025
odds rarr probability
4 rarr 4 (1 + 4)
08
0
02
04
06
08
1
000 020 040 060 080 100
Po
st-t
est
pro
bab
ility
Pre-test probability
lt20
20-50
51-200
gt200
gt2000
Pre-test probability Post-test probability
lt49 120-600 600-2000 gt2000
1 a young women with hair loss and polyarthralgia 007 05 5 25
0
02
04
06
08
1
000 020 040 060 080 100
Po
st-t
est
pro
bab
ility
Pre-test probability
lt20
20-50
51-200
gt200
gt2000
Pre-test probability Post-test probability
lt49 120-600 600-2000 gt2000
10 a young women with photosensitivity and mild leucopenia (3000-3500mm3)
07 55 36 79
0
02
04
06
08
1
000 020 040 060 080 100
Po
st-t
est
pro
bab
ility
Pre-test probability
lt20
20-50
51-200
gt200
gt2000
Pre-test probability Post-test probability
lt49 120-600 600-2000 gt2000
50 a young women with photosensitivity malar rash and symmetrical polyarthritis
65 35 83 97
G-Sight HEp-2
Probability index
Blood donor CFS Diseased controls SLE SS SSc MCTD PMDM
le10 11-le30 31-le50 51-le85 gt85
075 024 001 000 000
084 013 001 001 000
050 038 003 007 003
004 009 012 032 043
009 009 009 043 031
001 020 014 042 022
000 000 000 000 100
015 041 011 026 007
Probability index SLE SS SSc MCTD PMDM
le10 11 le30 31 le50 51 le85 gt85
006 (002-02)
04 (02-08)
68 (26-178)
121 (62-236)
439 (160-1204)
01 (004-04)
03 (01-10)
50 (14-186)
160 (79-322)
322 (108-959)
002 (0003-01)
08 (05-13)
85 (33-215)
157 (82-299)
223 (76-651)
1025 (387-2718)
02 (009-05)
16 (10-27)
65 (18-238)
97 (40-229)
76 (14-396)
Maenhout et al 2014
Maenhout et al 2014
Conclusions
bull High quality image acquisition
bull Significant correlation between intensity and antibody titer
bull Fluorescence intensity provides clinically useful information
bull Enables implementation of a quantitative internal quality
control system
bull Accuracy of pattern recognition is limited
a microdot array based immunoassay developed to allow simultaneous detection of multiple
autoantibodies on a single patient
Cambridge Life Sciences Ltd
ZENITbullAMiDot
bull One patient sample per well ndash 9 x 9 microarray (81 dots)
Cambridge Life Sciences Ltd
ZENITbullAMiDot
bull Each 9 x 9 microarray contains
bull Multiple autoimmune antigen dots
bull Calibration dots
bull Control dots
bull Registration dots
Cambridge Life Sciences Ltd
ZENITbullAMiDot
0
25000
50000
75000
100000
125000
150000
175000
200000
0 10 20 30 40 50 60 70 80 90 100
Raw
Sig
nal
Calibrator Conc (UmL)
Calibration
bullEach 9 x 9 microarray is
bullPrinted on to an activated glass surface
bullEach dot is ~20microm in diameter
bullEach autoimmune antigen calibrator and control is printed in duplicate or triplicate
bullAutomated analysis
bullImage taken by Reader (G-Sight or AMiDot reader)
Cambridge Life Sciences Ltd
ZENITbullAMiDot
Software receives the image analyses the image and produces a patient report
Antigen RecombinantNative Antigen RecombinantNative
Ro60SS-A recombinant PL7PL12 recombinant
Ro52SS-A recombinant MPO native
LaSS-B recombinant PR3 native
Sm native GBM native
U1-snRNP (68kDAC) recombinant Cathepsin native
Jo-1 recombinant SRP-54 recombinant
Scl70 native BPI native
PMScl100 recombinant ASCA native
dsDNA plasmid tTG recombinant
Histones Native deaminated Gliadin recombinant
Mi-2 recombinant TPO recombinant
Centromere B recombinant Intrinsic Factor recombinant
Ku recombinant Gastric Parietal Cell native
PCNA recombinant M2 recombinant
Ribosomal P0 recombinant LKM-1 recombinant
Elastase native LC1 recombinant
ZENITbullAMiDot
Cambridge Life Sciences Ltd
Conclusion AMiDot
bull Allows multiplex detection of autoantibodies
bull Overall a good concordance with results obtained by EliA
bull Multiplex ANA testing is an efficient way to simultaneously test for specific antibodies
bull Small sample volumes can be used
bull Further studies are warranted to prove the reliability of this technique
Acknowledgements
bull Dept of Laboratory Medicine - Immunology
ndash Dr Vermeersch ndash Dr Marieumln Mrs Godefridis ndash S Cooreman ndash S Schouwers
bull Experimental Laboratory
Immunology ndash K Op de Beeacuteck ndash D Dillaerts
bull Dept of Rheumatology Internal
Medicine ndash Dr Verschueren ndash Dr Westhovens ndash Dr Blockmans
bull Menarini ndash Heidi Debaere
bull Instrumentation Laboratory ndash Nathalie Vandeputte
bull KUL - statistics ndash S Fieuws
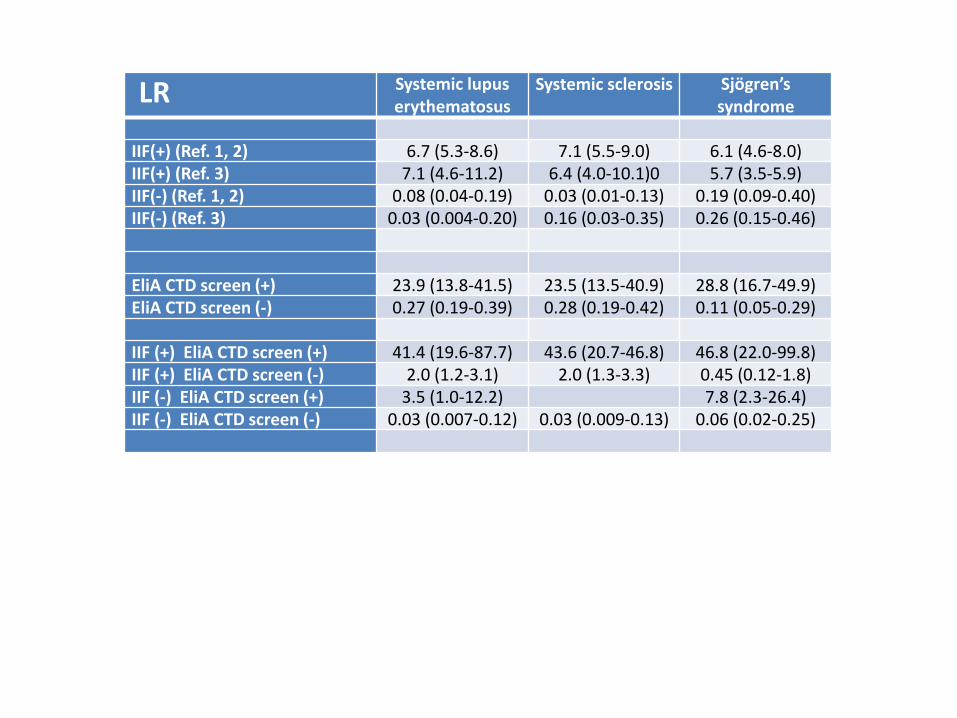
LR Systemic lupus erythematosus
Systemic sclerosis Sjoumlgrenrsquos syndrome
IIF(+) (Ref 1 2) 67 (53-86) 71 (55-90) 61 (46-80) IIF(+) (Ref 3) 71 (46-112) 64 (40-101)0 57 (35-59) IIF(-) (Ref 1 2) 008 (004-019) 003 (001-013) 019 (009-040) IIF(-) (Ref 3) 003 (0004-020) 016 (003-035) 026 (015-046) EliA CTD screen (+) 239 (138-415) 235 (135-409) 288 (167-499) EliA CTD screen (-) 027 (019-039) 028 (019-042) 011 (005-029) IIF (+) EliA CTD screen (+) 414 (196-877) 436 (207-468) 468 (220-998) IIF (+) EliA CTD screen (-) 20 (12-31) 20 (13-33) 045 (012-18) IIF (-) EliA CTD screen (+) 35 (10-122) 78 (23-264) IIF (-) EliA CTD screen (-) 003 (0007-012) 003 (0009-013) 006 (002-025)
Prevalence
Systemic lupus erythematosus
Systemic sclerosis
Sjoumlgrenrsquos syndrome
Controls
IIF (+) EliA CTD screen (+) 69 72 78 16 IIF (+) EliA CTD screen (-) 24 25 55 12 IIF (-) EliA CTD screen (+) 5 11 14 IIF (-) EliA CTD screen (-) 2 3 55 85
0
02
04
06
08
1
0 02 04 06 08 1
Po
st-t
est
pro
bab
ility
Pre-test probability
FEIA+ IIF+
FEIA+
IIF+
FEIA+ IIF-
FEIA- IIF+
FEIA-
IIF-
FEIA- IIF-
SLE
Comparative analysis of different strategies
1 IIF and FEIA on all samples
2 IIF
If IIF positive FEIA
If IIF negative stop
3 FEIA
4 IIF
Conclusion
Integrated interpretation
of IIF and solid phase assay results adds value
Optimal strategy
depends on the pathology
Bossuyt X Fieuws S Ann Rheum Dis 2014 Mar73(3)
Antinuclear antibodies by automated
indirect immunofluorescence Opportunities for value added
reporting
Xavier Bossuyt Leuven Belgium
Instrument NOVA View AKLIDES EUROPattern Image
Navigator
Helios ZENIT G Sight
Manufacturer INOVA Medipan EUROPattern Immuno Concepts Aesku Menarini
LIMS connection (software) Yes (QUANTA
Link)
Yes Yes
(EUROLabOffice)
Yes (direct) Yes (direct) Yes (ZenIT)
Slide identification via
barcode
Yes by handheld
scanner
Yes by handheld
scanner
Yes by integrated
scanner
Yes Yes by integrated
scanner
Yes by integrated
scanner
Loading capacity 5 slides (up to 60
wells)
5 slides (up to 60
wells)
50 slides (up to 500
wells)
4 slides (up to 84
wells)
20 slides (up to 240
wells)
5 slides (up to 70
wells)
Image acquisition speed ~45swell for 3
images
~40swell lt20swell ~25swell for 4
images
10spicture
Customizable from 1
to 10 images
gt60swell
pictures 5 (small
scan) 50 (medium
scan) 220 (full scan)
100 QC for substrate and
process integrity
counterstaining
Yes DAPI Yes DAPI Yes Propidium
iodide
None None None None None None
Automatic posneg
discrimination incl
presorting of images
Yes Yes Yes Yes Yes Yes
Batchwise verification of
negative samples
Yes Yes Yes Yes Yes Yes
Automatic pattern
recognition
Yes Yes Yes No No Yes
Pattern Analysis method Pattern recognition by
mathematical algorithm
Pattern recognition by
mathematical algorithm
Pattern recognition by
mathematical algorithm
No pattern matching
capabilities
No pattern matching
capabilities
Pattern recognition by
mathematical algorithm
No of recognizable ANA
staining pattern list out
6
Homogeneous
Speckled
Centromere
Nucleolar
Nuclear dot
Cytoplasm
Negative
Positive unrecognized
10
Homogeneous
Speckled
Centromere
Nucleolar
Nuclear dot
Cytoplasm
Negative
Positive unrecognized
8
Homogeneous
Speckled
Centromere
Nucleolar
Nuclear dot
Cytoplasm
Nuclear rim
Mitotic negative
None None 5
Homogeneous
Speckled
Centromere
Nucleolar
Cytoplasm
Negative
Instrument calibration to
minimize variability
Yes Yes Yes Yes Yes No
Integration with slide
processing in 1 instrument
No No No No Yes No
Mahler et al J Immunol Research in press
Automated fluorescence microscopy is increasingly used for image acquisition quantitative analysis and pattern recognition of anti-nuclear antibody
testing
Positivenegative discrimination
bull Exposure time is inversely proportional to intensity of fluorescence
bull Probability value is given to samples
Pattern recognition ANA
bull five patterns ndash Homogeneous
ndash Speckled
ndash Centromere
ndash Nucleolar
ndash Mitochondrial
bull Based on statistical morphological and geometric features
IMAGE ACQUISITION
RNP
PM-Scl
Golgi
Membrane
Review of digital images
harr
manual approach (posneg)
ndash 90 identical interpretation (n=332) (Bonroy et al CCLM 2013)
ndash 88 identical interpretation (n=268) (Bossuyt et al CCA 2013)
Bonroy et al CCLM 2013
FLUORESENCE INTENSITY VERSUS ANTIBODY TITER
HEp-2
-10
10
30
50
70
90
neg 80 160 320 640 1280
Ind
ex
Titer
Outlier Boxplot
Outliers gt 15 and lt 3 IQR
Outliers gt 3 IQR
Midbody centriole few nuclear dots Golgi
Bossuyt et al CCA 2013
G-Sight HEp-2000
0
20
40
60
80
100
neg 180 1160 1320 1640 1gt=1280
Pro
ba
bil
ity i
nd
ex
Antibody titer
Bonroy et al 2013
NOVA View
0
500
1000
1500
2000
2500
3000
3500
Neg 80 160 320 640 gt=1280
Nova
Vie
w F
luo
resce
nce
In
de
x
Titer
Schouwers et al Clin Chem Lab Med 201452547-51
Pattern recognition
Visual inspection Correct assignment by G-Sight HEp-2
Correct assignment by G-sight HEp-2000
Homogeneous (n=42) 68 92
Speckled (n=34) 71 56
Centromere (n=6) 83 42
Pattern recognition (Bonroy et al 2013) Pattern assignment was incorrect in 29 of 132 pos samples No pattern assigned in 45 of samples Global accuracy of pattern assignment 26
FLUORESCENCE INTENSITY IN WELL-DEFINED PATIENT COHORTS
Study Population
n M()F() Median age (range)
Blood donors
108 5149 45 (19-65)
Chronic Fatigue Syndrome
150 1981 41 (16-75)
Diseased Controls 134 2575 45 (17-81)
392
Systemic Lupus Erythematosus
85 1288 355 (15-72)
Sjoumlgrenrsquos Syndrome
36 1486 56 (21-75)
Systemic Sclerosis
76 3466 53 (18-80)
Polymyositis Dermatomyositis
32 4456 50 (24-77)
Mixed Connective Tissue Disease
16 694 315 (16-66)
245
HEp2
-10
10
30
50
70
90
Blooddonor
CFS Discontrols
SLE SCL SS SSc MCTD PM DM
Gro
up
s
Groups
Outlier Boxplot
Outliers gt 15 and lt 3 IQR
Outliers gt 3 IQR
Bossuyt et al CCA 2013
G-Sight HEp-2000
-10
10
30
50
70
90
BloodDonors
CFS Dis Contr SLE SCL SS SSc MCTD PM DM
Pro
ba
bil
ity i
nd
ex
G-Sight HEp-2
Probability index
Blood donor CFS Diseased controls SLE SS SSc MCTD PMDM
le10 11-le30 31-le50 51-le85 gt85
075 024 001 000 000
084 013 001 001 000
050 038 003 007 003
004 009 012 032 043
009 009 009 043 031
001 020 014 042 022
000 000 000 000 100
015 041 011 026 007
Probability index SLE SS SSc MCTD PMDM
le10 11 le30 31 le50 51 le85 gt85
006 (002-02)
04 (02-08)
68 (26-178)
121 (62-236)
439 (160-1204)
01 (004-04)
03 (01-10)
50 (14-186)
160 (79-322)
322 (108-959)
002 (0003-01)
08 (05-13)
85 (33-215)
157 (82-299)
223 (76-651)
1025 (387-2718)
02 (009-05)
16 (10-27)
65 (18-238)
97 (40-229)
76 (14-396)
Bonroy et al CCLM 2013
0
500
1000
1500
2000
2500
3000
3500
HC CVS DC SLE SS SSc PMDM MCTD
L
I
U
Outlier Boxplot
Percentiles (95 of Distribution)
Outliers gt 15 and lt 3 IQR
Outliers gt 3 IQR
NOVA View
NOVA View LR LIU Controls SLE SS SSc PMDM MCTD SARD
Prevalence
lt49 056 006 003 003 013 005
49-120 026 005 006 005 019 007
121-600 013 011 003 009 034 011
601-2000 004 046 061 034 025 006 039
gt2000 001 033 028 049 009 094 038
LR
lt49 011 005 005 023 009
49-120 018 021 020 073 025
121-600 079 021 069 257 085
601-2000 112 150 84 61 15 96
gt2000 291 245 429 83 827 335
NOVA View
009 025 085
10
33
0
10
20
30
40
0
01
02
03
04
05
06
lt49 49-120 121-600 601-2000 gt2000
Like
liho
od
rat
io
Pre
vale
nce
Nuclear Index
controls
SRD
LR
LR 1 no clinical value gt10 lt01 clinically important difference 5 ndash 10 01 ndash 02 modest but substantial difference 2 ndash 5 02 ndash 05 small difference that may be relevant
Post-test odds
=
Pre-test odds x LR
probability rarr odds
02 rarr 02 (1 ndash 02)
025
odds rarr probability
4 rarr 4 (1 + 4)
08
0
02
04
06
08
1
000 020 040 060 080 100
Po
st-t
est
pro
bab
ility
Pre-test probability
lt20
20-50
51-200
gt200
gt2000
Pre-test probability Post-test probability
lt49 120-600 600-2000 gt2000
1 a young women with hair loss and polyarthralgia 007 05 5 25
0
02
04
06
08
1
000 020 040 060 080 100
Po
st-t
est
pro
bab
ility
Pre-test probability
lt20
20-50
51-200
gt200
gt2000
Pre-test probability Post-test probability
lt49 120-600 600-2000 gt2000
10 a young women with photosensitivity and mild leucopenia (3000-3500mm3)
07 55 36 79
0
02
04
06
08
1
000 020 040 060 080 100
Po
st-t
est
pro
bab
ility
Pre-test probability
lt20
20-50
51-200
gt200
gt2000
Pre-test probability Post-test probability
lt49 120-600 600-2000 gt2000
50 a young women with photosensitivity malar rash and symmetrical polyarthritis
65 35 83 97
G-Sight HEp-2
Probability index
Blood donor CFS Diseased controls SLE SS SSc MCTD PMDM
le10 11-le30 31-le50 51-le85 gt85
075 024 001 000 000
084 013 001 001 000
050 038 003 007 003
004 009 012 032 043
009 009 009 043 031
001 020 014 042 022
000 000 000 000 100
015 041 011 026 007
Probability index SLE SS SSc MCTD PMDM
le10 11 le30 31 le50 51 le85 gt85
006 (002-02)
04 (02-08)
68 (26-178)
121 (62-236)
439 (160-1204)
01 (004-04)
03 (01-10)
50 (14-186)
160 (79-322)
322 (108-959)
002 (0003-01)
08 (05-13)
85 (33-215)
157 (82-299)
223 (76-651)
1025 (387-2718)
02 (009-05)
16 (10-27)
65 (18-238)
97 (40-229)
76 (14-396)
Maenhout et al 2014
Maenhout et al 2014
Conclusions
bull High quality image acquisition
bull Significant correlation between intensity and antibody titer
bull Fluorescence intensity provides clinically useful information
bull Enables implementation of a quantitative internal quality
control system
bull Accuracy of pattern recognition is limited
a microdot array based immunoassay developed to allow simultaneous detection of multiple
autoantibodies on a single patient
Cambridge Life Sciences Ltd
ZENITbullAMiDot
bull One patient sample per well ndash 9 x 9 microarray (81 dots)
Cambridge Life Sciences Ltd
ZENITbullAMiDot
bull Each 9 x 9 microarray contains
bull Multiple autoimmune antigen dots
bull Calibration dots
bull Control dots
bull Registration dots
Cambridge Life Sciences Ltd
ZENITbullAMiDot
0
25000
50000
75000
100000
125000
150000
175000
200000
0 10 20 30 40 50 60 70 80 90 100
Raw
Sig
nal
Calibrator Conc (UmL)
Calibration
bullEach 9 x 9 microarray is
bullPrinted on to an activated glass surface
bullEach dot is ~20microm in diameter
bullEach autoimmune antigen calibrator and control is printed in duplicate or triplicate
bullAutomated analysis
bullImage taken by Reader (G-Sight or AMiDot reader)
Cambridge Life Sciences Ltd
ZENITbullAMiDot
Software receives the image analyses the image and produces a patient report
Antigen RecombinantNative Antigen RecombinantNative
Ro60SS-A recombinant PL7PL12 recombinant
Ro52SS-A recombinant MPO native
LaSS-B recombinant PR3 native
Sm native GBM native
U1-snRNP (68kDAC) recombinant Cathepsin native
Jo-1 recombinant SRP-54 recombinant
Scl70 native BPI native
PMScl100 recombinant ASCA native
dsDNA plasmid tTG recombinant
Histones Native deaminated Gliadin recombinant
Mi-2 recombinant TPO recombinant
Centromere B recombinant Intrinsic Factor recombinant
Ku recombinant Gastric Parietal Cell native
PCNA recombinant M2 recombinant
Ribosomal P0 recombinant LKM-1 recombinant
Elastase native LC1 recombinant
ZENITbullAMiDot
Cambridge Life Sciences Ltd
Conclusion AMiDot
bull Allows multiplex detection of autoantibodies
bull Overall a good concordance with results obtained by EliA
bull Multiplex ANA testing is an efficient way to simultaneously test for specific antibodies
bull Small sample volumes can be used
bull Further studies are warranted to prove the reliability of this technique
Acknowledgements
bull Dept of Laboratory Medicine - Immunology
ndash Dr Vermeersch ndash Dr Marieumln Mrs Godefridis ndash S Cooreman ndash S Schouwers
bull Experimental Laboratory
Immunology ndash K Op de Beeacuteck ndash D Dillaerts
bull Dept of Rheumatology Internal
Medicine ndash Dr Verschueren ndash Dr Westhovens ndash Dr Blockmans
bull Menarini ndash Heidi Debaere
bull Instrumentation Laboratory ndash Nathalie Vandeputte
bull KUL - statistics ndash S Fieuws

0
02
04
06
08
1
0 02 04 06 08 1
Po
st-t
est
pro
bab
ility
Pre-test probability
FEIA+ IIF+
FEIA+
IIF+
FEIA+ IIF-
FEIA- IIF+
FEIA-
IIF-
FEIA- IIF-
SLE
Comparative analysis of different strategies
1 IIF and FEIA on all samples
2 IIF
If IIF positive FEIA
If IIF negative stop
3 FEIA
4 IIF
Conclusion
Integrated interpretation
of IIF and solid phase assay results adds value
Optimal strategy
depends on the pathology
Bossuyt X Fieuws S Ann Rheum Dis 2014 Mar73(3)
Antinuclear antibodies by automated
indirect immunofluorescence Opportunities for value added
reporting
Xavier Bossuyt Leuven Belgium
Instrument NOVA View AKLIDES EUROPattern Image
Navigator
Helios ZENIT G Sight
Manufacturer INOVA Medipan EUROPattern Immuno Concepts Aesku Menarini
LIMS connection (software) Yes (QUANTA
Link)
Yes Yes
(EUROLabOffice)
Yes (direct) Yes (direct) Yes (ZenIT)
Slide identification via
barcode
Yes by handheld
scanner
Yes by handheld
scanner
Yes by integrated
scanner
Yes Yes by integrated
scanner
Yes by integrated
scanner
Loading capacity 5 slides (up to 60
wells)
5 slides (up to 60
wells)
50 slides (up to 500
wells)
4 slides (up to 84
wells)
20 slides (up to 240
wells)
5 slides (up to 70
wells)
Image acquisition speed ~45swell for 3
images
~40swell lt20swell ~25swell for 4
images
10spicture
Customizable from 1
to 10 images
gt60swell
pictures 5 (small
scan) 50 (medium
scan) 220 (full scan)
100 QC for substrate and
process integrity
counterstaining
Yes DAPI Yes DAPI Yes Propidium
iodide
None None None None None None
Automatic posneg
discrimination incl
presorting of images
Yes Yes Yes Yes Yes Yes
Batchwise verification of
negative samples
Yes Yes Yes Yes Yes Yes
Automatic pattern
recognition
Yes Yes Yes No No Yes
Pattern Analysis method Pattern recognition by
mathematical algorithm
Pattern recognition by
mathematical algorithm
Pattern recognition by
mathematical algorithm
No pattern matching
capabilities
No pattern matching
capabilities
Pattern recognition by
mathematical algorithm
No of recognizable ANA
staining pattern list out
6
Homogeneous
Speckled
Centromere
Nucleolar
Nuclear dot
Cytoplasm
Negative
Positive unrecognized
10
Homogeneous
Speckled
Centromere
Nucleolar
Nuclear dot
Cytoplasm
Negative
Positive unrecognized
8
Homogeneous
Speckled
Centromere
Nucleolar
Nuclear dot
Cytoplasm
Nuclear rim
Mitotic negative
None None 5
Homogeneous
Speckled
Centromere
Nucleolar
Cytoplasm
Negative
Instrument calibration to
minimize variability
Yes Yes Yes Yes Yes No
Integration with slide
processing in 1 instrument
No No No No Yes No
Mahler et al J Immunol Research in press
Automated fluorescence microscopy is increasingly used for image acquisition quantitative analysis and pattern recognition of anti-nuclear antibody
testing
Positivenegative discrimination
bull Exposure time is inversely proportional to intensity of fluorescence
bull Probability value is given to samples
Pattern recognition ANA
bull five patterns ndash Homogeneous
ndash Speckled
ndash Centromere
ndash Nucleolar
ndash Mitochondrial
bull Based on statistical morphological and geometric features
IMAGE ACQUISITION
RNP
PM-Scl
Golgi
Membrane
Review of digital images
harr
manual approach (posneg)
ndash 90 identical interpretation (n=332) (Bonroy et al CCLM 2013)
ndash 88 identical interpretation (n=268) (Bossuyt et al CCA 2013)
Bonroy et al CCLM 2013
FLUORESENCE INTENSITY VERSUS ANTIBODY TITER
HEp-2
-10
10
30
50
70
90
neg 80 160 320 640 1280
Ind
ex
Titer
Outlier Boxplot
Outliers gt 15 and lt 3 IQR
Outliers gt 3 IQR
Midbody centriole few nuclear dots Golgi
Bossuyt et al CCA 2013
G-Sight HEp-2000
0
20
40
60
80
100
neg 180 1160 1320 1640 1gt=1280
Pro
ba
bil
ity i
nd
ex
Antibody titer
Bonroy et al 2013
NOVA View
0
500
1000
1500
2000
2500
3000
3500
Neg 80 160 320 640 gt=1280
Nova
Vie
w F
luo
resce
nce
In
de
x
Titer
Schouwers et al Clin Chem Lab Med 201452547-51
Pattern recognition
Visual inspection Correct assignment by G-Sight HEp-2
Correct assignment by G-sight HEp-2000
Homogeneous (n=42) 68 92
Speckled (n=34) 71 56
Centromere (n=6) 83 42
Pattern recognition (Bonroy et al 2013) Pattern assignment was incorrect in 29 of 132 pos samples No pattern assigned in 45 of samples Global accuracy of pattern assignment 26
FLUORESCENCE INTENSITY IN WELL-DEFINED PATIENT COHORTS
Study Population
n M()F() Median age (range)
Blood donors
108 5149 45 (19-65)
Chronic Fatigue Syndrome
150 1981 41 (16-75)
Diseased Controls 134 2575 45 (17-81)
392
Systemic Lupus Erythematosus
85 1288 355 (15-72)
Sjoumlgrenrsquos Syndrome
36 1486 56 (21-75)
Systemic Sclerosis
76 3466 53 (18-80)
Polymyositis Dermatomyositis
32 4456 50 (24-77)
Mixed Connective Tissue Disease
16 694 315 (16-66)
245
HEp2
-10
10
30
50
70
90
Blooddonor
CFS Discontrols
SLE SCL SS SSc MCTD PM DM
Gro
up
s
Groups
Outlier Boxplot
Outliers gt 15 and lt 3 IQR
Outliers gt 3 IQR
Bossuyt et al CCA 2013
G-Sight HEp-2000
-10
10
30
50
70
90
BloodDonors
CFS Dis Contr SLE SCL SS SSc MCTD PM DM
Pro
ba
bil
ity i
nd
ex
G-Sight HEp-2
Probability index
Blood donor CFS Diseased controls SLE SS SSc MCTD PMDM
le10 11-le30 31-le50 51-le85 gt85
075 024 001 000 000
084 013 001 001 000
050 038 003 007 003
004 009 012 032 043
009 009 009 043 031
001 020 014 042 022
000 000 000 000 100
015 041 011 026 007
Probability index SLE SS SSc MCTD PMDM
le10 11 le30 31 le50 51 le85 gt85
006 (002-02)
04 (02-08)
68 (26-178)
121 (62-236)
439 (160-1204)
01 (004-04)
03 (01-10)
50 (14-186)
160 (79-322)
322 (108-959)
002 (0003-01)
08 (05-13)
85 (33-215)
157 (82-299)
223 (76-651)
1025 (387-2718)
02 (009-05)
16 (10-27)
65 (18-238)
97 (40-229)
76 (14-396)
Bonroy et al CCLM 2013
0
500
1000
1500
2000
2500
3000
3500
HC CVS DC SLE SS SSc PMDM MCTD
L
I
U
Outlier Boxplot
Percentiles (95 of Distribution)
Outliers gt 15 and lt 3 IQR
Outliers gt 3 IQR
NOVA View
NOVA View LR LIU Controls SLE SS SSc PMDM MCTD SARD
Prevalence
lt49 056 006 003 003 013 005
49-120 026 005 006 005 019 007
121-600 013 011 003 009 034 011
601-2000 004 046 061 034 025 006 039
gt2000 001 033 028 049 009 094 038
LR
lt49 011 005 005 023 009
49-120 018 021 020 073 025
121-600 079 021 069 257 085
601-2000 112 150 84 61 15 96
gt2000 291 245 429 83 827 335
NOVA View
009 025 085
10
33
0
10
20
30
40
0
01
02
03
04
05
06
lt49 49-120 121-600 601-2000 gt2000
Like
liho
od
rat
io
Pre
vale
nce
Nuclear Index
controls
SRD
LR
LR 1 no clinical value gt10 lt01 clinically important difference 5 ndash 10 01 ndash 02 modest but substantial difference 2 ndash 5 02 ndash 05 small difference that may be relevant
Post-test odds
=
Pre-test odds x LR
probability rarr odds
02 rarr 02 (1 ndash 02)
025
odds rarr probability
4 rarr 4 (1 + 4)
08
0
02
04
06
08
1
000 020 040 060 080 100
Po
st-t
est
pro
bab
ility
Pre-test probability
lt20
20-50
51-200
gt200
gt2000
Pre-test probability Post-test probability
lt49 120-600 600-2000 gt2000
1 a young women with hair loss and polyarthralgia 007 05 5 25
0
02
04
06
08
1
000 020 040 060 080 100
Po
st-t
est
pro
bab
ility
Pre-test probability
lt20
20-50
51-200
gt200
gt2000
Pre-test probability Post-test probability
lt49 120-600 600-2000 gt2000
10 a young women with photosensitivity and mild leucopenia (3000-3500mm3)
07 55 36 79
0
02
04
06
08
1
000 020 040 060 080 100
Po
st-t
est
pro
bab
ility
Pre-test probability
lt20
20-50
51-200
gt200
gt2000
Pre-test probability Post-test probability
lt49 120-600 600-2000 gt2000
50 a young women with photosensitivity malar rash and symmetrical polyarthritis
65 35 83 97
G-Sight HEp-2
Probability index
Blood donor CFS Diseased controls SLE SS SSc MCTD PMDM
le10 11-le30 31-le50 51-le85 gt85
075 024 001 000 000
084 013 001 001 000
050 038 003 007 003
004 009 012 032 043
009 009 009 043 031
001 020 014 042 022
000 000 000 000 100
015 041 011 026 007
Probability index SLE SS SSc MCTD PMDM
le10 11 le30 31 le50 51 le85 gt85
006 (002-02)
04 (02-08)
68 (26-178)
121 (62-236)
439 (160-1204)
01 (004-04)
03 (01-10)
50 (14-186)
160 (79-322)
322 (108-959)
002 (0003-01)
08 (05-13)
85 (33-215)
157 (82-299)
223 (76-651)
1025 (387-2718)
02 (009-05)
16 (10-27)
65 (18-238)
97 (40-229)
76 (14-396)
Maenhout et al 2014
Maenhout et al 2014
Conclusions
bull High quality image acquisition
bull Significant correlation between intensity and antibody titer
bull Fluorescence intensity provides clinically useful information
bull Enables implementation of a quantitative internal quality
control system
bull Accuracy of pattern recognition is limited
a microdot array based immunoassay developed to allow simultaneous detection of multiple
autoantibodies on a single patient
Cambridge Life Sciences Ltd
ZENITbullAMiDot
bull One patient sample per well ndash 9 x 9 microarray (81 dots)
Cambridge Life Sciences Ltd
ZENITbullAMiDot
bull Each 9 x 9 microarray contains
bull Multiple autoimmune antigen dots
bull Calibration dots
bull Control dots
bull Registration dots
Cambridge Life Sciences Ltd
ZENITbullAMiDot
0
25000
50000
75000
100000
125000
150000
175000
200000
0 10 20 30 40 50 60 70 80 90 100
Raw
Sig
nal
Calibrator Conc (UmL)
Calibration
bullEach 9 x 9 microarray is
bullPrinted on to an activated glass surface
bullEach dot is ~20microm in diameter
bullEach autoimmune antigen calibrator and control is printed in duplicate or triplicate
bullAutomated analysis
bullImage taken by Reader (G-Sight or AMiDot reader)
Cambridge Life Sciences Ltd
ZENITbullAMiDot
Software receives the image analyses the image and produces a patient report
Antigen RecombinantNative Antigen RecombinantNative
Ro60SS-A recombinant PL7PL12 recombinant
Ro52SS-A recombinant MPO native
LaSS-B recombinant PR3 native
Sm native GBM native
U1-snRNP (68kDAC) recombinant Cathepsin native
Jo-1 recombinant SRP-54 recombinant
Scl70 native BPI native
PMScl100 recombinant ASCA native
dsDNA plasmid tTG recombinant
Histones Native deaminated Gliadin recombinant
Mi-2 recombinant TPO recombinant
Centromere B recombinant Intrinsic Factor recombinant
Ku recombinant Gastric Parietal Cell native
PCNA recombinant M2 recombinant
Ribosomal P0 recombinant LKM-1 recombinant
Elastase native LC1 recombinant
ZENITbullAMiDot
Cambridge Life Sciences Ltd
Conclusion AMiDot
bull Allows multiplex detection of autoantibodies
bull Overall a good concordance with results obtained by EliA
bull Multiplex ANA testing is an efficient way to simultaneously test for specific antibodies
bull Small sample volumes can be used
bull Further studies are warranted to prove the reliability of this technique
Acknowledgements
bull Dept of Laboratory Medicine - Immunology
ndash Dr Vermeersch ndash Dr Marieumln Mrs Godefridis ndash S Cooreman ndash S Schouwers
bull Experimental Laboratory
Immunology ndash K Op de Beeacuteck ndash D Dillaerts
bull Dept of Rheumatology Internal
Medicine ndash Dr Verschueren ndash Dr Westhovens ndash Dr Blockmans
bull Menarini ndash Heidi Debaere
bull Instrumentation Laboratory ndash Nathalie Vandeputte
bull KUL - statistics ndash S Fieuws
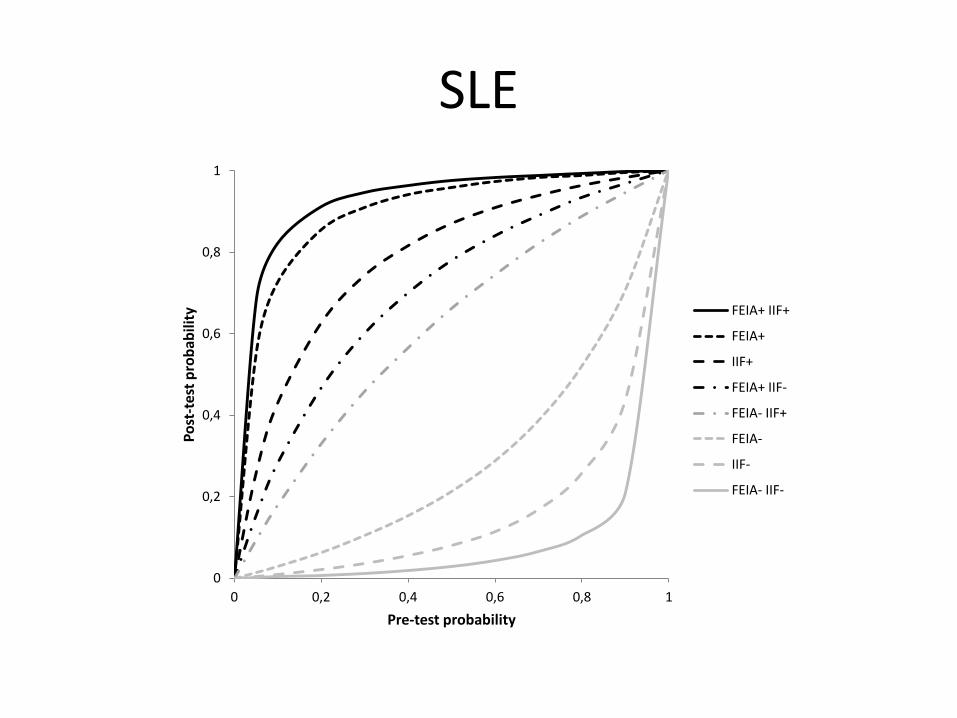

G-Sight HEp-2000
0
20
40
60
80
100
neg 180 1160 1320 1640 1gt=1280
Pro
ba
bil
ity i
nd
ex
Antibody titer
Bonroy et al 2013
NOVA View
0
500
1000
1500
2000
2500
3000
3500
Neg 80 160 320 640 gt=1280
Nova
Vie
w F
luo
resce
nce
In
de
x
Titer
Schouwers et al Clin Chem Lab Med 201452547-51
Pattern recognition
Visual inspection Correct assignment by G-Sight HEp-2
Correct assignment by G-sight HEp-2000
Homogeneous (n=42) 68 92
Speckled (n=34) 71 56
Centromere (n=6) 83 42
Pattern recognition (Bonroy et al 2013) Pattern assignment was incorrect in 29 of 132 pos samples No pattern assigned in 45 of samples Global accuracy of pattern assignment 26
FLUORESCENCE INTENSITY IN WELL-DEFINED PATIENT COHORTS
Study Population
n M()F() Median age (range)
Blood donors
108 5149 45 (19-65)
Chronic Fatigue Syndrome
150 1981 41 (16-75)
Diseased Controls 134 2575 45 (17-81)
392
Systemic Lupus Erythematosus
85 1288 355 (15-72)
Sjoumlgrenrsquos Syndrome
36 1486 56 (21-75)
Systemic Sclerosis
76 3466 53 (18-80)
Polymyositis Dermatomyositis
32 4456 50 (24-77)
Mixed Connective Tissue Disease
16 694 315 (16-66)
245
HEp2
-10
10
30
50
70
90
Blooddonor
CFS Discontrols
SLE SCL SS SSc MCTD PM DM
Gro
up
s
Groups
Outlier Boxplot
Outliers gt 15 and lt 3 IQR
Outliers gt 3 IQR
Bossuyt et al CCA 2013
G-Sight HEp-2000
-10
10
30
50
70
90
BloodDonors
CFS Dis Contr SLE SCL SS SSc MCTD PM DM
Pro
ba
bil
ity i
nd
ex
G-Sight HEp-2
Probability index
Blood donor CFS Diseased controls SLE SS SSc MCTD PMDM
le10 11-le30 31-le50 51-le85 gt85
075 024 001 000 000
084 013 001 001 000
050 038 003 007 003
004 009 012 032 043
009 009 009 043 031
001 020 014 042 022
000 000 000 000 100
015 041 011 026 007
Probability index SLE SS SSc MCTD PMDM
le10 11 le30 31 le50 51 le85 gt85
006 (002-02)
04 (02-08)
68 (26-178)
121 (62-236)
439 (160-1204)
01 (004-04)
03 (01-10)
50 (14-186)
160 (79-322)
322 (108-959)
002 (0003-01)
08 (05-13)
85 (33-215)
157 (82-299)
223 (76-651)
1025 (387-2718)
02 (009-05)
16 (10-27)
65 (18-238)
97 (40-229)
76 (14-396)
Bonroy et al CCLM 2013
0
500
1000
1500
2000
2500
3000
3500
HC CVS DC SLE SS SSc PMDM MCTD
L
I
U
Outlier Boxplot
Percentiles (95 of Distribution)
Outliers gt 15 and lt 3 IQR
Outliers gt 3 IQR
NOVA View
NOVA View LR LIU Controls SLE SS SSc PMDM MCTD SARD
Prevalence
lt49 056 006 003 003 013 005
49-120 026 005 006 005 019 007
121-600 013 011 003 009 034 011
601-2000 004 046 061 034 025 006 039
gt2000 001 033 028 049 009 094 038
LR
lt49 011 005 005 023 009
49-120 018 021 020 073 025
121-600 079 021 069 257 085
601-2000 112 150 84 61 15 96
gt2000 291 245 429 83 827 335
NOVA View
009 025 085
10
33
0
10
20
30
40
0
01
02
03
04
05
06
lt49 49-120 121-600 601-2000 gt2000
Like
liho
od
rat
io
Pre
vale
nce
Nuclear Index
controls
SRD
LR
LR 1 no clinical value gt10 lt01 clinically important difference 5 ndash 10 01 ndash 02 modest but substantial difference 2 ndash 5 02 ndash 05 small difference that may be relevant
Post-test odds
=
Pre-test odds x LR
probability rarr odds
02 rarr 02 (1 ndash 02)
025
odds rarr probability
4 rarr 4 (1 + 4)
08
0
02
04
06
08
1
000 020 040 060 080 100
Po
st-t
est
pro
bab
ility
Pre-test probability
lt20
20-50
51-200
gt200
gt2000
Pre-test probability Post-test probability
lt49 120-600 600-2000 gt2000
1 a young women with hair loss and polyarthralgia 007 05 5 25
0
02
04
06
08
1
000 020 040 060 080 100
Po
st-t
est
pro
bab
ility
Pre-test probability
lt20
20-50
51-200
gt200
gt2000
Pre-test probability Post-test probability
lt49 120-600 600-2000 gt2000
10 a young women with photosensitivity and mild leucopenia (3000-3500mm3)
07 55 36 79
0
02
04
06
08
1
000 020 040 060 080 100
Po
st-t
est
pro
bab
ility
Pre-test probability
lt20
20-50
51-200
gt200
gt2000
Pre-test probability Post-test probability
lt49 120-600 600-2000 gt2000
50 a young women with photosensitivity malar rash and symmetrical polyarthritis
65 35 83 97
G-Sight HEp-2
Probability index
Blood donor CFS Diseased controls SLE SS SSc MCTD PMDM
le10 11-le30 31-le50 51-le85 gt85
075 024 001 000 000
084 013 001 001 000
050 038 003 007 003
004 009 012 032 043
009 009 009 043 031
001 020 014 042 022
000 000 000 000 100
015 041 011 026 007
Probability index SLE SS SSc MCTD PMDM
le10 11 le30 31 le50 51 le85 gt85
006 (002-02)
04 (02-08)
68 (26-178)
121 (62-236)
439 (160-1204)
01 (004-04)
03 (01-10)
50 (14-186)
160 (79-322)
322 (108-959)
002 (0003-01)
08 (05-13)
85 (33-215)
157 (82-299)
223 (76-651)
1025 (387-2718)
02 (009-05)
16 (10-27)
65 (18-238)
97 (40-229)
76 (14-396)
Maenhout et al 2014
Maenhout et al 2014
Conclusions
bull High quality image acquisition
bull Significant correlation between intensity and antibody titer
bull Fluorescence intensity provides clinically useful information
bull Enables implementation of a quantitative internal quality
control system
bull Accuracy of pattern recognition is limited
a microdot array based immunoassay developed to allow simultaneous detection of multiple
autoantibodies on a single patient
Cambridge Life Sciences Ltd
ZENITbullAMiDot
bull One patient sample per well ndash 9 x 9 microarray (81 dots)
Cambridge Life Sciences Ltd
ZENITbullAMiDot
bull Each 9 x 9 microarray contains
bull Multiple autoimmune antigen dots
bull Calibration dots
bull Control dots
bull Registration dots
Cambridge Life Sciences Ltd
ZENITbullAMiDot
0
25000
50000
75000
100000
125000
150000
175000
200000
0 10 20 30 40 50 60 70 80 90 100
Raw
Sig
nal
Calibrator Conc (UmL)
Calibration
bullEach 9 x 9 microarray is
bullPrinted on to an activated glass surface
bullEach dot is ~20microm in diameter
bullEach autoimmune antigen calibrator and control is printed in duplicate or triplicate
bullAutomated analysis
bullImage taken by Reader (G-Sight or AMiDot reader)
Cambridge Life Sciences Ltd
ZENITbullAMiDot
Software receives the image analyses the image and produces a patient report
Antigen RecombinantNative Antigen RecombinantNative
Ro60SS-A recombinant PL7PL12 recombinant
Ro52SS-A recombinant MPO native
LaSS-B recombinant PR3 native
Sm native GBM native
U1-snRNP (68kDAC) recombinant Cathepsin native
Jo-1 recombinant SRP-54 recombinant
Scl70 native BPI native
PMScl100 recombinant ASCA native
dsDNA plasmid tTG recombinant
Histones Native deaminated Gliadin recombinant
Mi-2 recombinant TPO recombinant
Centromere B recombinant Intrinsic Factor recombinant
Ku recombinant Gastric Parietal Cell native
PCNA recombinant M2 recombinant
Ribosomal P0 recombinant LKM-1 recombinant
Elastase native LC1 recombinant
ZENITbullAMiDot
Cambridge Life Sciences Ltd
Conclusion AMiDot
bull Allows multiplex detection of autoantibodies
bull Overall a good concordance with results obtained by EliA
bull Multiplex ANA testing is an efficient way to simultaneously test for specific antibodies
bull Small sample volumes can be used
bull Further studies are warranted to prove the reliability of this technique
Acknowledgements
bull Dept of Laboratory Medicine - Immunology
ndash Dr Vermeersch ndash Dr Marieumln Mrs Godefridis ndash S Cooreman ndash S Schouwers
bull Experimental Laboratory
Immunology ndash K Op de Beeacuteck ndash D Dillaerts
bull Dept of Rheumatology Internal
Medicine ndash Dr Verschueren ndash Dr Westhovens ndash Dr Blockmans
bull Menarini ndash Heidi Debaere
bull Instrumentation Laboratory ndash Nathalie Vandeputte
bull KUL - statistics ndash S Fieuws

NOVA View
0
500
1000
1500
2000
2500
3000
3500
Neg 80 160 320 640 gt=1280
Nova
Vie
w F
luo
resce
nce
In
de
x
Titer
Schouwers et al Clin Chem Lab Med 201452547-51
Pattern recognition
Visual inspection Correct assignment by G-Sight HEp-2
Correct assignment by G-sight HEp-2000
Homogeneous (n=42) 68 92
Speckled (n=34) 71 56
Centromere (n=6) 83 42
Pattern recognition (Bonroy et al 2013) Pattern assignment was incorrect in 29 of 132 pos samples No pattern assigned in 45 of samples Global accuracy of pattern assignment 26
FLUORESCENCE INTENSITY IN WELL-DEFINED PATIENT COHORTS
Study Population
n M()F() Median age (range)
Blood donors
108 5149 45 (19-65)
Chronic Fatigue Syndrome
150 1981 41 (16-75)
Diseased Controls 134 2575 45 (17-81)
392
Systemic Lupus Erythematosus
85 1288 355 (15-72)
Sjoumlgrenrsquos Syndrome
36 1486 56 (21-75)
Systemic Sclerosis
76 3466 53 (18-80)
Polymyositis Dermatomyositis
32 4456 50 (24-77)
Mixed Connective Tissue Disease
16 694 315 (16-66)
245
HEp2
-10
10
30
50
70
90
Blooddonor
CFS Discontrols
SLE SCL SS SSc MCTD PM DM
Gro
up
s
Groups
Outlier Boxplot
Outliers gt 15 and lt 3 IQR
Outliers gt 3 IQR
Bossuyt et al CCA 2013
G-Sight HEp-2000
-10
10
30
50
70
90
BloodDonors
CFS Dis Contr SLE SCL SS SSc MCTD PM DM
Pro
ba
bil
ity i
nd
ex
G-Sight HEp-2
Probability index
Blood donor CFS Diseased controls SLE SS SSc MCTD PMDM
le10 11-le30 31-le50 51-le85 gt85
075 024 001 000 000
084 013 001 001 000
050 038 003 007 003
004 009 012 032 043
009 009 009 043 031
001 020 014 042 022
000 000 000 000 100
015 041 011 026 007
Probability index SLE SS SSc MCTD PMDM
le10 11 le30 31 le50 51 le85 gt85
006 (002-02)
04 (02-08)
68 (26-178)
121 (62-236)
439 (160-1204)
01 (004-04)
03 (01-10)
50 (14-186)
160 (79-322)
322 (108-959)
002 (0003-01)
08 (05-13)
85 (33-215)
157 (82-299)
223 (76-651)
1025 (387-2718)
02 (009-05)
16 (10-27)
65 (18-238)
97 (40-229)
76 (14-396)
Bonroy et al CCLM 2013
0
500
1000
1500
2000
2500
3000
3500
HC CVS DC SLE SS SSc PMDM MCTD
L
I
U
Outlier Boxplot
Percentiles (95 of Distribution)
Outliers gt 15 and lt 3 IQR
Outliers gt 3 IQR
NOVA View
NOVA View LR LIU Controls SLE SS SSc PMDM MCTD SARD
Prevalence
lt49 056 006 003 003 013 005
49-120 026 005 006 005 019 007
121-600 013 011 003 009 034 011
601-2000 004 046 061 034 025 006 039
gt2000 001 033 028 049 009 094 038
LR
lt49 011 005 005 023 009
49-120 018 021 020 073 025
121-600 079 021 069 257 085
601-2000 112 150 84 61 15 96
gt2000 291 245 429 83 827 335
NOVA View
009 025 085
10
33
0
10
20
30
40
0
01
02
03
04
05
06
lt49 49-120 121-600 601-2000 gt2000
Like
liho
od
rat
io
Pre
vale
nce
Nuclear Index
controls
SRD
LR
LR 1 no clinical value gt10 lt01 clinically important difference 5 ndash 10 01 ndash 02 modest but substantial difference 2 ndash 5 02 ndash 05 small difference that may be relevant
Post-test odds
=
Pre-test odds x LR
probability rarr odds
02 rarr 02 (1 ndash 02)
025
odds rarr probability
4 rarr 4 (1 + 4)
08
0
02
04
06
08
1
000 020 040 060 080 100
Po
st-t
est
pro
bab
ility
Pre-test probability
lt20
20-50
51-200
gt200
gt2000
Pre-test probability Post-test probability
lt49 120-600 600-2000 gt2000
1 a young women with hair loss and polyarthralgia 007 05 5 25
0
02
04
06
08
1
000 020 040 060 080 100
Po
st-t
est
pro
bab
ility
Pre-test probability
lt20
20-50
51-200
gt200
gt2000
Pre-test probability Post-test probability
lt49 120-600 600-2000 gt2000
10 a young women with photosensitivity and mild leucopenia (3000-3500mm3)
07 55 36 79
0
02
04
06
08
1
000 020 040 060 080 100
Po
st-t
est
pro
bab
ility
Pre-test probability
lt20
20-50
51-200
gt200
gt2000
Pre-test probability Post-test probability
lt49 120-600 600-2000 gt2000
50 a young women with photosensitivity malar rash and symmetrical polyarthritis
65 35 83 97
G-Sight HEp-2
Probability index
Blood donor CFS Diseased controls SLE SS SSc MCTD PMDM
le10 11-le30 31-le50 51-le85 gt85
075 024 001 000 000
084 013 001 001 000
050 038 003 007 003
004 009 012 032 043
009 009 009 043 031
001 020 014 042 022
000 000 000 000 100
015 041 011 026 007
Probability index SLE SS SSc MCTD PMDM
le10 11 le30 31 le50 51 le85 gt85
006 (002-02)
04 (02-08)
68 (26-178)
121 (62-236)
439 (160-1204)
01 (004-04)
03 (01-10)
50 (14-186)
160 (79-322)
322 (108-959)
002 (0003-01)
08 (05-13)
85 (33-215)
157 (82-299)
223 (76-651)
1025 (387-2718)
02 (009-05)
16 (10-27)
65 (18-238)
97 (40-229)
76 (14-396)
Maenhout et al 2014
Maenhout et al 2014
Conclusions
bull High quality image acquisition
bull Significant correlation between intensity and antibody titer
bull Fluorescence intensity provides clinically useful information
bull Enables implementation of a quantitative internal quality
control system
bull Accuracy of pattern recognition is limited
a microdot array based immunoassay developed to allow simultaneous detection of multiple
autoantibodies on a single patient
Cambridge Life Sciences Ltd
ZENITbullAMiDot
bull One patient sample per well ndash 9 x 9 microarray (81 dots)
Cambridge Life Sciences Ltd
ZENITbullAMiDot
bull Each 9 x 9 microarray contains
bull Multiple autoimmune antigen dots
bull Calibration dots
bull Control dots
bull Registration dots
Cambridge Life Sciences Ltd
ZENITbullAMiDot
0
25000
50000
75000
100000
125000
150000
175000
200000
0 10 20 30 40 50 60 70 80 90 100
Raw
Sig
nal
Calibrator Conc (UmL)
Calibration
bullEach 9 x 9 microarray is
bullPrinted on to an activated glass surface
bullEach dot is ~20microm in diameter
bullEach autoimmune antigen calibrator and control is printed in duplicate or triplicate
bullAutomated analysis
bullImage taken by Reader (G-Sight or AMiDot reader)
Cambridge Life Sciences Ltd
ZENITbullAMiDot
Software receives the image analyses the image and produces a patient report
Antigen RecombinantNative Antigen RecombinantNative
Ro60SS-A recombinant PL7PL12 recombinant
Ro52SS-A recombinant MPO native
LaSS-B recombinant PR3 native
Sm native GBM native
U1-snRNP (68kDAC) recombinant Cathepsin native
Jo-1 recombinant SRP-54 recombinant
Scl70 native BPI native
PMScl100 recombinant ASCA native
dsDNA plasmid tTG recombinant
Histones Native deaminated Gliadin recombinant
Mi-2 recombinant TPO recombinant
Centromere B recombinant Intrinsic Factor recombinant
Ku recombinant Gastric Parietal Cell native
PCNA recombinant M2 recombinant
Ribosomal P0 recombinant LKM-1 recombinant
Elastase native LC1 recombinant
ZENITbullAMiDot
Cambridge Life Sciences Ltd
Conclusion AMiDot
bull Allows multiplex detection of autoantibodies
bull Overall a good concordance with results obtained by EliA
bull Multiplex ANA testing is an efficient way to simultaneously test for specific antibodies
bull Small sample volumes can be used
bull Further studies are warranted to prove the reliability of this technique
Acknowledgements
bull Dept of Laboratory Medicine - Immunology
ndash Dr Vermeersch ndash Dr Marieumln Mrs Godefridis ndash S Cooreman ndash S Schouwers
bull Experimental Laboratory
Immunology ndash K Op de Beeacuteck ndash D Dillaerts
bull Dept of Rheumatology Internal
Medicine ndash Dr Verschueren ndash Dr Westhovens ndash Dr Blockmans
bull Menarini ndash Heidi Debaere
bull Instrumentation Laboratory ndash Nathalie Vandeputte
bull KUL - statistics ndash S Fieuws
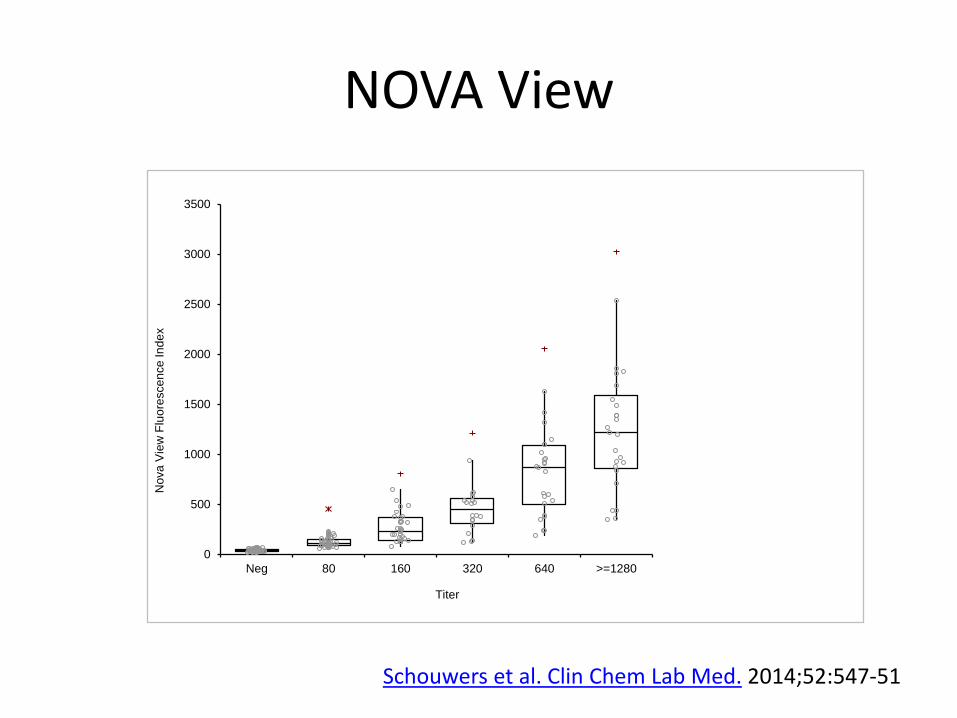

G-Sight HEp-2
Probability index
Blood donor CFS Diseased controls SLE SS SSc MCTD PMDM
le10 11-le30 31-le50 51-le85 gt85
075 024 001 000 000
084 013 001 001 000
050 038 003 007 003
004 009 012 032 043
009 009 009 043 031
001 020 014 042 022
000 000 000 000 100
015 041 011 026 007
Probability index SLE SS SSc MCTD PMDM
le10 11 le30 31 le50 51 le85 gt85
006 (002-02)
04 (02-08)
68 (26-178)
121 (62-236)
439 (160-1204)
01 (004-04)
03 (01-10)
50 (14-186)
160 (79-322)
322 (108-959)
002 (0003-01)
08 (05-13)
85 (33-215)
157 (82-299)
223 (76-651)
1025 (387-2718)
02 (009-05)
16 (10-27)
65 (18-238)
97 (40-229)
76 (14-396)
Bonroy et al CCLM 2013
0
500
1000
1500
2000
2500
3000
3500
HC CVS DC SLE SS SSc PMDM MCTD
L
I
U
Outlier Boxplot
Percentiles (95 of Distribution)
Outliers gt 15 and lt 3 IQR
Outliers gt 3 IQR
NOVA View
NOVA View LR LIU Controls SLE SS SSc PMDM MCTD SARD
Prevalence
lt49 056 006 003 003 013 005
49-120 026 005 006 005 019 007
121-600 013 011 003 009 034 011
601-2000 004 046 061 034 025 006 039
gt2000 001 033 028 049 009 094 038
LR
lt49 011 005 005 023 009
49-120 018 021 020 073 025
121-600 079 021 069 257 085
601-2000 112 150 84 61 15 96
gt2000 291 245 429 83 827 335
NOVA View
009 025 085
10
33
0
10
20
30
40
0
01
02
03
04
05
06
lt49 49-120 121-600 601-2000 gt2000
Like
liho
od
rat
io
Pre
vale
nce
Nuclear Index
controls
SRD
LR
LR 1 no clinical value gt10 lt01 clinically important difference 5 ndash 10 01 ndash 02 modest but substantial difference 2 ndash 5 02 ndash 05 small difference that may be relevant
Post-test odds
=
Pre-test odds x LR
probability rarr odds
02 rarr 02 (1 ndash 02)
025
odds rarr probability
4 rarr 4 (1 + 4)
08
0
02
04
06
08
1
000 020 040 060 080 100
Po
st-t
est
pro
bab
ility
Pre-test probability
lt20
20-50
51-200
gt200
gt2000
Pre-test probability Post-test probability
lt49 120-600 600-2000 gt2000
1 a young women with hair loss and polyarthralgia 007 05 5 25
0
02
04
06
08
1
000 020 040 060 080 100
Po
st-t
est
pro
bab
ility
Pre-test probability
lt20
20-50
51-200
gt200
gt2000
Pre-test probability Post-test probability
lt49 120-600 600-2000 gt2000
10 a young women with photosensitivity and mild leucopenia (3000-3500mm3)
07 55 36 79
0
02
04
06
08
1
000 020 040 060 080 100
Po
st-t
est
pro
bab
ility
Pre-test probability
lt20
20-50
51-200
gt200
gt2000
Pre-test probability Post-test probability
lt49 120-600 600-2000 gt2000
50 a young women with photosensitivity malar rash and symmetrical polyarthritis
65 35 83 97
G-Sight HEp-2
Probability index
Blood donor CFS Diseased controls SLE SS SSc MCTD PMDM
le10 11-le30 31-le50 51-le85 gt85
075 024 001 000 000
084 013 001 001 000
050 038 003 007 003
004 009 012 032 043
009 009 009 043 031
001 020 014 042 022
000 000 000 000 100
015 041 011 026 007
Probability index SLE SS SSc MCTD PMDM
le10 11 le30 31 le50 51 le85 gt85
006 (002-02)
04 (02-08)
68 (26-178)
121 (62-236)
439 (160-1204)
01 (004-04)
03 (01-10)
50 (14-186)
160 (79-322)
322 (108-959)
002 (0003-01)
08 (05-13)
85 (33-215)
157 (82-299)
223 (76-651)
1025 (387-2718)
02 (009-05)
16 (10-27)
65 (18-238)
97 (40-229)
76 (14-396)
Maenhout et al 2014
Maenhout et al 2014
Conclusions
bull High quality image acquisition
bull Significant correlation between intensity and antibody titer
bull Fluorescence intensity provides clinically useful information
bull Enables implementation of a quantitative internal quality
control system
bull Accuracy of pattern recognition is limited
a microdot array based immunoassay developed to allow simultaneous detection of multiple
autoantibodies on a single patient
Cambridge Life Sciences Ltd
ZENITbullAMiDot
bull One patient sample per well ndash 9 x 9 microarray (81 dots)
Cambridge Life Sciences Ltd
ZENITbullAMiDot
bull Each 9 x 9 microarray contains
bull Multiple autoimmune antigen dots
bull Calibration dots
bull Control dots
bull Registration dots
Cambridge Life Sciences Ltd
ZENITbullAMiDot
0
25000
50000
75000
100000
125000
150000
175000
200000
0 10 20 30 40 50 60 70 80 90 100
Raw
Sig
nal
Calibrator Conc (UmL)
Calibration
bullEach 9 x 9 microarray is
bullPrinted on to an activated glass surface
bullEach dot is ~20microm in diameter
bullEach autoimmune antigen calibrator and control is printed in duplicate or triplicate
bullAutomated analysis
bullImage taken by Reader (G-Sight or AMiDot reader)
Cambridge Life Sciences Ltd
ZENITbullAMiDot
Software receives the image analyses the image and produces a patient report
Antigen RecombinantNative Antigen RecombinantNative
Ro60SS-A recombinant PL7PL12 recombinant
Ro52SS-A recombinant MPO native
LaSS-B recombinant PR3 native
Sm native GBM native
U1-snRNP (68kDAC) recombinant Cathepsin native
Jo-1 recombinant SRP-54 recombinant
Scl70 native BPI native
PMScl100 recombinant ASCA native
dsDNA plasmid tTG recombinant
Histones Native deaminated Gliadin recombinant
Mi-2 recombinant TPO recombinant
Centromere B recombinant Intrinsic Factor recombinant
Ku recombinant Gastric Parietal Cell native
PCNA recombinant M2 recombinant
Ribosomal P0 recombinant LKM-1 recombinant
Elastase native LC1 recombinant
ZENITbullAMiDot
Cambridge Life Sciences Ltd
Conclusion AMiDot
bull Allows multiplex detection of autoantibodies
bull Overall a good concordance with results obtained by EliA
bull Multiplex ANA testing is an efficient way to simultaneously test for specific antibodies
bull Small sample volumes can be used
bull Further studies are warranted to prove the reliability of this technique
Acknowledgements
bull Dept of Laboratory Medicine - Immunology
ndash Dr Vermeersch ndash Dr Marieumln Mrs Godefridis ndash S Cooreman ndash S Schouwers
bull Experimental Laboratory
Immunology ndash K Op de Beeacuteck ndash D Dillaerts
bull Dept of Rheumatology Internal
Medicine ndash Dr Verschueren ndash Dr Westhovens ndash Dr Blockmans
bull Menarini ndash Heidi Debaere
bull Instrumentation Laboratory ndash Nathalie Vandeputte
bull KUL - statistics ndash S Fieuws

0
500
1000
1500
2000
2500
3000
3500
HC CVS DC SLE SS SSc PMDM MCTD
L
I
U
Outlier Boxplot
Percentiles (95 of Distribution)
Outliers gt 15 and lt 3 IQR
Outliers gt 3 IQR
NOVA View
NOVA View LR LIU Controls SLE SS SSc PMDM MCTD SARD
Prevalence
lt49 056 006 003 003 013 005
49-120 026 005 006 005 019 007
121-600 013 011 003 009 034 011
601-2000 004 046 061 034 025 006 039
gt2000 001 033 028 049 009 094 038
LR
lt49 011 005 005 023 009
49-120 018 021 020 073 025
121-600 079 021 069 257 085
601-2000 112 150 84 61 15 96
gt2000 291 245 429 83 827 335
NOVA View
009 025 085
10
33
0
10
20
30
40
0
01
02
03
04
05
06
lt49 49-120 121-600 601-2000 gt2000
Like
liho
od
rat
io
Pre
vale
nce
Nuclear Index
controls
SRD
LR
LR 1 no clinical value gt10 lt01 clinically important difference 5 ndash 10 01 ndash 02 modest but substantial difference 2 ndash 5 02 ndash 05 small difference that may be relevant
Post-test odds
=
Pre-test odds x LR
probability rarr odds
02 rarr 02 (1 ndash 02)
025
odds rarr probability
4 rarr 4 (1 + 4)
08
0
02
04
06
08
1
000 020 040 060 080 100
Po
st-t
est
pro
bab
ility
Pre-test probability
lt20
20-50
51-200
gt200
gt2000
Pre-test probability Post-test probability
lt49 120-600 600-2000 gt2000
1 a young women with hair loss and polyarthralgia 007 05 5 25
0
02
04
06
08
1
000 020 040 060 080 100
Po
st-t
est
pro
bab
ility
Pre-test probability
lt20
20-50
51-200
gt200
gt2000
Pre-test probability Post-test probability
lt49 120-600 600-2000 gt2000
10 a young women with photosensitivity and mild leucopenia (3000-3500mm3)
07 55 36 79
0
02
04
06
08
1
000 020 040 060 080 100
Po
st-t
est
pro
bab
ility
Pre-test probability
lt20
20-50
51-200
gt200
gt2000
Pre-test probability Post-test probability
lt49 120-600 600-2000 gt2000
50 a young women with photosensitivity malar rash and symmetrical polyarthritis
65 35 83 97
G-Sight HEp-2
Probability index
Blood donor CFS Diseased controls SLE SS SSc MCTD PMDM
le10 11-le30 31-le50 51-le85 gt85
075 024 001 000 000
084 013 001 001 000
050 038 003 007 003
004 009 012 032 043
009 009 009 043 031
001 020 014 042 022
000 000 000 000 100
015 041 011 026 007
Probability index SLE SS SSc MCTD PMDM
le10 11 le30 31 le50 51 le85 gt85
006 (002-02)
04 (02-08)
68 (26-178)
121 (62-236)
439 (160-1204)
01 (004-04)
03 (01-10)
50 (14-186)
160 (79-322)
322 (108-959)
002 (0003-01)
08 (05-13)
85 (33-215)
157 (82-299)
223 (76-651)
1025 (387-2718)
02 (009-05)
16 (10-27)
65 (18-238)
97 (40-229)
76 (14-396)
Maenhout et al 2014
Maenhout et al 2014
Conclusions
bull High quality image acquisition
bull Significant correlation between intensity and antibody titer
bull Fluorescence intensity provides clinically useful information
bull Enables implementation of a quantitative internal quality
control system
bull Accuracy of pattern recognition is limited
a microdot array based immunoassay developed to allow simultaneous detection of multiple
autoantibodies on a single patient
Cambridge Life Sciences Ltd
ZENITbullAMiDot
bull One patient sample per well ndash 9 x 9 microarray (81 dots)
Cambridge Life Sciences Ltd
ZENITbullAMiDot
bull Each 9 x 9 microarray contains
bull Multiple autoimmune antigen dots
bull Calibration dots
bull Control dots
bull Registration dots
Cambridge Life Sciences Ltd
ZENITbullAMiDot
0
25000
50000
75000
100000
125000
150000
175000
200000
0 10 20 30 40 50 60 70 80 90 100
Raw
Sig
nal
Calibrator Conc (UmL)
Calibration
bullEach 9 x 9 microarray is
bullPrinted on to an activated glass surface
bullEach dot is ~20microm in diameter
bullEach autoimmune antigen calibrator and control is printed in duplicate or triplicate
bullAutomated analysis
bullImage taken by Reader (G-Sight or AMiDot reader)
Cambridge Life Sciences Ltd
ZENITbullAMiDot
Software receives the image analyses the image and produces a patient report
Antigen RecombinantNative Antigen RecombinantNative
Ro60SS-A recombinant PL7PL12 recombinant
Ro52SS-A recombinant MPO native
LaSS-B recombinant PR3 native
Sm native GBM native
U1-snRNP (68kDAC) recombinant Cathepsin native
Jo-1 recombinant SRP-54 recombinant
Scl70 native BPI native
PMScl100 recombinant ASCA native
dsDNA plasmid tTG recombinant
Histones Native deaminated Gliadin recombinant
Mi-2 recombinant TPO recombinant
Centromere B recombinant Intrinsic Factor recombinant
Ku recombinant Gastric Parietal Cell native
PCNA recombinant M2 recombinant
Ribosomal P0 recombinant LKM-1 recombinant
Elastase native LC1 recombinant
ZENITbullAMiDot
Cambridge Life Sciences Ltd
Conclusion AMiDot
bull Allows multiplex detection of autoantibodies
bull Overall a good concordance with results obtained by EliA
bull Multiplex ANA testing is an efficient way to simultaneously test for specific antibodies
bull Small sample volumes can be used
bull Further studies are warranted to prove the reliability of this technique
Acknowledgements
bull Dept of Laboratory Medicine - Immunology
ndash Dr Vermeersch ndash Dr Marieumln Mrs Godefridis ndash S Cooreman ndash S Schouwers
bull Experimental Laboratory
Immunology ndash K Op de Beeacuteck ndash D Dillaerts
bull Dept of Rheumatology Internal
Medicine ndash Dr Verschueren ndash Dr Westhovens ndash Dr Blockmans
bull Menarini ndash Heidi Debaere
bull Instrumentation Laboratory ndash Nathalie Vandeputte
bull KUL - statistics ndash S Fieuws

0
02
04
06
08
1
000 020 040 060 080 100
Po
st-t
est
pro
bab
ility
Pre-test probability
lt20
20-50
51-200
gt200
gt2000
Pre-test probability Post-test probability
lt49 120-600 600-2000 gt2000
50 a young women with photosensitivity malar rash and symmetrical polyarthritis
65 35 83 97
G-Sight HEp-2
Probability index
Blood donor CFS Diseased controls SLE SS SSc MCTD PMDM
le10 11-le30 31-le50 51-le85 gt85
075 024 001 000 000
084 013 001 001 000
050 038 003 007 003
004 009 012 032 043
009 009 009 043 031
001 020 014 042 022
000 000 000 000 100
015 041 011 026 007
Probability index SLE SS SSc MCTD PMDM
le10 11 le30 31 le50 51 le85 gt85
006 (002-02)
04 (02-08)
68 (26-178)
121 (62-236)
439 (160-1204)
01 (004-04)
03 (01-10)
50 (14-186)
160 (79-322)
322 (108-959)
002 (0003-01)
08 (05-13)
85 (33-215)
157 (82-299)
223 (76-651)
1025 (387-2718)
02 (009-05)
16 (10-27)
65 (18-238)
97 (40-229)
76 (14-396)
Maenhout et al 2014
Maenhout et al 2014
Conclusions
bull High quality image acquisition
bull Significant correlation between intensity and antibody titer
bull Fluorescence intensity provides clinically useful information
bull Enables implementation of a quantitative internal quality
control system
bull Accuracy of pattern recognition is limited
a microdot array based immunoassay developed to allow simultaneous detection of multiple
autoantibodies on a single patient
Cambridge Life Sciences Ltd
ZENITbullAMiDot
bull One patient sample per well ndash 9 x 9 microarray (81 dots)
Cambridge Life Sciences Ltd
ZENITbullAMiDot
bull Each 9 x 9 microarray contains
bull Multiple autoimmune antigen dots
bull Calibration dots
bull Control dots
bull Registration dots
Cambridge Life Sciences Ltd
ZENITbullAMiDot
0
25000
50000
75000
100000
125000
150000
175000
200000
0 10 20 30 40 50 60 70 80 90 100
Raw
Sig
nal
Calibrator Conc (UmL)
Calibration
bullEach 9 x 9 microarray is
bullPrinted on to an activated glass surface
bullEach dot is ~20microm in diameter
bullEach autoimmune antigen calibrator and control is printed in duplicate or triplicate
bullAutomated analysis
bullImage taken by Reader (G-Sight or AMiDot reader)
Cambridge Life Sciences Ltd
ZENITbullAMiDot
Software receives the image analyses the image and produces a patient report
Antigen RecombinantNative Antigen RecombinantNative
Ro60SS-A recombinant PL7PL12 recombinant
Ro52SS-A recombinant MPO native
LaSS-B recombinant PR3 native
Sm native GBM native
U1-snRNP (68kDAC) recombinant Cathepsin native
Jo-1 recombinant SRP-54 recombinant
Scl70 native BPI native
PMScl100 recombinant ASCA native
dsDNA plasmid tTG recombinant
Histones Native deaminated Gliadin recombinant
Mi-2 recombinant TPO recombinant
Centromere B recombinant Intrinsic Factor recombinant
Ku recombinant Gastric Parietal Cell native
PCNA recombinant M2 recombinant
Ribosomal P0 recombinant LKM-1 recombinant
Elastase native LC1 recombinant
ZENITbullAMiDot
Cambridge Life Sciences Ltd
Conclusion AMiDot
bull Allows multiplex detection of autoantibodies
bull Overall a good concordance with results obtained by EliA
bull Multiplex ANA testing is an efficient way to simultaneously test for specific antibodies
bull Small sample volumes can be used
bull Further studies are warranted to prove the reliability of this technique
Acknowledgements
bull Dept of Laboratory Medicine - Immunology
ndash Dr Vermeersch ndash Dr Marieumln Mrs Godefridis ndash S Cooreman ndash S Schouwers
bull Experimental Laboratory
Immunology ndash K Op de Beeacuteck ndash D Dillaerts
bull Dept of Rheumatology Internal
Medicine ndash Dr Verschueren ndash Dr Westhovens ndash Dr Blockmans
bull Menarini ndash Heidi Debaere
bull Instrumentation Laboratory ndash Nathalie Vandeputte
bull KUL - statistics ndash S Fieuws

Maenhout et al 2014
Maenhout et al 2014
Conclusions
bull High quality image acquisition
bull Significant correlation between intensity and antibody titer
bull Fluorescence intensity provides clinically useful information
bull Enables implementation of a quantitative internal quality
control system
bull Accuracy of pattern recognition is limited
a microdot array based immunoassay developed to allow simultaneous detection of multiple
autoantibodies on a single patient
Cambridge Life Sciences Ltd
ZENITbullAMiDot
bull One patient sample per well ndash 9 x 9 microarray (81 dots)
Cambridge Life Sciences Ltd
ZENITbullAMiDot
bull Each 9 x 9 microarray contains
bull Multiple autoimmune antigen dots
bull Calibration dots
bull Control dots
bull Registration dots
Cambridge Life Sciences Ltd
ZENITbullAMiDot
0
25000
50000
75000
100000
125000
150000
175000
200000
0 10 20 30 40 50 60 70 80 90 100
Raw
Sig
nal
Calibrator Conc (UmL)
Calibration
bullEach 9 x 9 microarray is
bullPrinted on to an activated glass surface
bullEach dot is ~20microm in diameter
bullEach autoimmune antigen calibrator and control is printed in duplicate or triplicate
bullAutomated analysis
bullImage taken by Reader (G-Sight or AMiDot reader)
Cambridge Life Sciences Ltd
ZENITbullAMiDot
Software receives the image analyses the image and produces a patient report
Antigen RecombinantNative Antigen RecombinantNative
Ro60SS-A recombinant PL7PL12 recombinant
Ro52SS-A recombinant MPO native
LaSS-B recombinant PR3 native
Sm native GBM native
U1-snRNP (68kDAC) recombinant Cathepsin native
Jo-1 recombinant SRP-54 recombinant
Scl70 native BPI native
PMScl100 recombinant ASCA native
dsDNA plasmid tTG recombinant
Histones Native deaminated Gliadin recombinant
Mi-2 recombinant TPO recombinant
Centromere B recombinant Intrinsic Factor recombinant
Ku recombinant Gastric Parietal Cell native
PCNA recombinant M2 recombinant
Ribosomal P0 recombinant LKM-1 recombinant
Elastase native LC1 recombinant
ZENITbullAMiDot
Cambridge Life Sciences Ltd
Conclusion AMiDot
bull Allows multiplex detection of autoantibodies
bull Overall a good concordance with results obtained by EliA
bull Multiplex ANA testing is an efficient way to simultaneously test for specific antibodies
bull Small sample volumes can be used
bull Further studies are warranted to prove the reliability of this technique
Acknowledgements
bull Dept of Laboratory Medicine - Immunology
ndash Dr Vermeersch ndash Dr Marieumln Mrs Godefridis ndash S Cooreman ndash S Schouwers
bull Experimental Laboratory
Immunology ndash K Op de Beeacuteck ndash D Dillaerts
bull Dept of Rheumatology Internal
Medicine ndash Dr Verschueren ndash Dr Westhovens ndash Dr Blockmans
bull Menarini ndash Heidi Debaere
bull Instrumentation Laboratory ndash Nathalie Vandeputte
bull KUL - statistics ndash S Fieuws

Maenhout et al 2014
Conclusions
bull High quality image acquisition
bull Significant correlation between intensity and antibody titer
bull Fluorescence intensity provides clinically useful information
bull Enables implementation of a quantitative internal quality
control system
bull Accuracy of pattern recognition is limited
a microdot array based immunoassay developed to allow simultaneous detection of multiple
autoantibodies on a single patient
Cambridge Life Sciences Ltd
ZENITbullAMiDot
bull One patient sample per well ndash 9 x 9 microarray (81 dots)
Cambridge Life Sciences Ltd
ZENITbullAMiDot
bull Each 9 x 9 microarray contains
bull Multiple autoimmune antigen dots
bull Calibration dots
bull Control dots
bull Registration dots
Cambridge Life Sciences Ltd
ZENITbullAMiDot
0
25000
50000
75000
100000
125000
150000
175000
200000
0 10 20 30 40 50 60 70 80 90 100
Raw
Sig
nal
Calibrator Conc (UmL)
Calibration
bullEach 9 x 9 microarray is
bullPrinted on to an activated glass surface
bullEach dot is ~20microm in diameter
bullEach autoimmune antigen calibrator and control is printed in duplicate or triplicate
bullAutomated analysis
bullImage taken by Reader (G-Sight or AMiDot reader)
Cambridge Life Sciences Ltd
ZENITbullAMiDot
Software receives the image analyses the image and produces a patient report
Antigen RecombinantNative Antigen RecombinantNative
Ro60SS-A recombinant PL7PL12 recombinant
Ro52SS-A recombinant MPO native
LaSS-B recombinant PR3 native
Sm native GBM native
U1-snRNP (68kDAC) recombinant Cathepsin native
Jo-1 recombinant SRP-54 recombinant
Scl70 native BPI native
PMScl100 recombinant ASCA native
dsDNA plasmid tTG recombinant
Histones Native deaminated Gliadin recombinant
Mi-2 recombinant TPO recombinant
Centromere B recombinant Intrinsic Factor recombinant
Ku recombinant Gastric Parietal Cell native
PCNA recombinant M2 recombinant
Ribosomal P0 recombinant LKM-1 recombinant
Elastase native LC1 recombinant
ZENITbullAMiDot
Cambridge Life Sciences Ltd
Conclusion AMiDot
bull Allows multiplex detection of autoantibodies
bull Overall a good concordance with results obtained by EliA
bull Multiplex ANA testing is an efficient way to simultaneously test for specific antibodies
bull Small sample volumes can be used
bull Further studies are warranted to prove the reliability of this technique
Acknowledgements
bull Dept of Laboratory Medicine - Immunology
ndash Dr Vermeersch ndash Dr Marieumln Mrs Godefridis ndash S Cooreman ndash S Schouwers
bull Experimental Laboratory
Immunology ndash K Op de Beeacuteck ndash D Dillaerts
bull Dept of Rheumatology Internal
Medicine ndash Dr Verschueren ndash Dr Westhovens ndash Dr Blockmans
bull Menarini ndash Heidi Debaere
bull Instrumentation Laboratory ndash Nathalie Vandeputte
bull KUL - statistics ndash S Fieuws
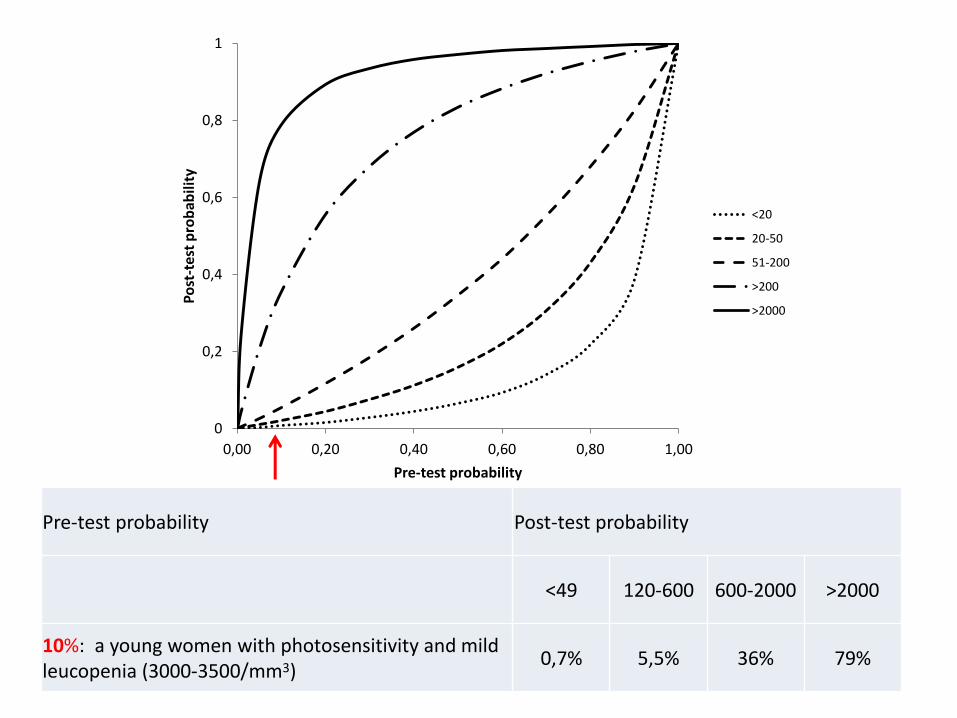