Anti-tuberculosis drug resistance among tuberculosis ... · Anti-tuberculosis drug resistance among...
28
Anti-tuberculosis drug resistance among tuberculosis patients in Ukraine and risk factors for MDR-TB Results of the first national survey, 2013–2014
Transcript of Anti-tuberculosis drug resistance among tuberculosis ... · Anti-tuberculosis drug resistance among...
Anti-tuberculosis drug resistance among tuberculosis patients in
Ukraine and risk factors for MDR-TB
Results of the first national survey, 2013–2014
ABSTRACT
Ukraine is one of the 10 countries in the world with the highest MDR-TB burden. With technical support from WHO, the national TB programme conducted the first countrywide survey from November 2013 to May 2014 to identify MDR-TB levels and its risk factors. MDR-TB was detected in 24.1% (95% CI: 20.7–27.6) of new patients and 58.1% (95% CI: 52.1– 64.1) of previously treated patients. Risk factors that were statistically significant for MDR-TB among new cases were: residence in the south-eastern part of the country (OR: 2.35); HIV (OR: 1.93); poor socioeconomic status (OR: 1.93,); illicit drug use (OR: 1.70); prior incarceration (OR: 1.44) and unemployment (OR: 1.43). Age was inversely associated with MDR-TB (OR: –0.81). Among previously treated patients, statistically significant higher odds of MDR-TB were found in women (OR: 2.40), in the groups aged 34–44 and 45–54 years (OR: 2.83 and 2.31, respectively), and in towns and rural areas with populations of less than 50 000 (OR: 3.44 and 2.54, respectively). The survey provides valuable data for MDR-TB programmatic management planning in Ukraine.
Keywords
ANTITUBERCULAR AGENTS TUBERCULOSIS, MULTIDRUG-RESISTANT – epidemiology RISK FACTORS SENTINEL SURVEILLANCE UKRAINE
Address requests about publications of the WHO Regional Office for Europe to: Publications WHO Regional Office for Europe UN City, Marmorvej 51 DK-2100 Copenhagen Ø, Denmark Alternatively, complete an online request form for documentation, health information, or for permission to quote or translate, on the Regional Office web site (http://www.euro.who.int/pubrequest).
© World Health Organization 2016
All rights reserved. The Regional Office for Europe of the World Health Organization welcomes requests for permission to reproduce or translate its publications, in part or in full.
The designations employed and the presentation of the material in this publication do not imply the expression of any opinion whatsoever on the part of the World Health Organization concerning the legal status of any country, territory, city or area or of its authorities, or concerning the delimitation of its frontiers or boundaries. Dotted lines on maps represent approximate border lines for which there may not yet be full agreement.
The mention of specific companies or of certain manufacturers’ products does not imply that they are endorsed or recommended by the World Health Organization in preference to others of a similar nature that are not mentioned. Errors and omissions excepted, the names of proprietary products are distinguished by initial capital letters.
All reasonable precautions have been taken by the World Health Organization to verify the information contained in this publication. However, the published material is being distributed without warranty of any kind, either express or implied. The responsibility for the interpretation and use of the material lies with the reader. In no event shall the World Health Organization be liable for damages arising from its use. The views expressed by authors, editors, or expert groups do not necessarily represent the decisions or the stated policy of the World Health Organization.
CONTENTS
Page
Acknowledgements ............................................................................................................ iv
Abbreviations ..................................................................................................................... v
Introduction ....................................................................................................................... 1
Study design ...................................................................................................................... 1 Materials and methods ............................................................................................... 1 Patient recruitment and transport of samples ............................................................... 2 Definitions, possible risk factors investigated and patient groupings ............................... 3 Statistical analysis ...................................................................................................... 3 Laboratory procedures ............................................................................................... 4
Results .............................................................................................................................. 4 Analysis of patient intake ............................................................................................ 4 Participants in the study ............................................................................................. 5 First-line drug resistance patterns by treatment history ................................................. 5 Resistance to second-line drugs ................................................................................ 12 Risk factors associated with MDR-TB ......................................................................... 13
Discussion ....................................................................................................................... 18 Main findings ........................................................................................................... 18 Strengths and limitations of the study ........................................................................ 20
Conclusion ....................................................................................................................... 21
References ...................................................................................................................... 22
Anti-tuberculosis drug resistance among tuberculosis patients in Ukraine and risk factors for MDR-TB page iv
Acknowledgements
The WHO Regional Office for Europe would like to thank Dr Svitlana Cherenco, head of the Committee for HIV/AIDS and Other Socially Dangerous Diseases of the Ministry of Health of Ukraine, for her support throughout the survey. The authors of the report would also like to thank the management and staff of the National Centre for Control of Socially Dangerous Diseases of the Ministry of Health of Ukraine, the chief doctors and nurses and the chief TB doctors, nurses and health care staff in the regions, districts and facilities visited. This report was written by:
Andrei Dadu, WHO Regional Office for Europe;
Arax Hovhannesyan, WHO temporary adviser;
Elena Pavlenko, principal co-investigator; and
Anna Barbova, head, Central Reference Laboratory on TB Microbiological Diagnostics of the Ministry of Health, Ukraine, and second principal co-investigator.
The editors were Andrei Dadu and Masoud Dara, WHO Regional Office for Europe. Contributions were received from:
Pierpaolo de Colombani and Masoud Dara, WHO Regional Office for Europe;
Zhanna Tsenilova, Bogdana Shcherbak-Verlan and Andrej Slavuckij, WHO Country Office, Kyiv, Ukraine;
Matteo Zignol, Anna Dean and Andrea Cabibbe, Global TB Programme, WHO headquarters;
Girts Skenders, head, TB Supranational Reference Laboratory, Mycobacteriology Department, Tuberculosis and Lung Disease Centre, Riga East University Hospital, Latvia.
Production of this report was supported by USAID.
Anti-tuberculosis drug resistance among tuberculosis patients in Ukraine and risk factors for MDR-TB page v
Abbreviations
BCG bacille Calmette-Guérin CI confidence interval DST drug susceptibility testing E ethambutol H isoniazid LJ Löwenstein-Jensen MDR-TB multidrug-resistant tuberculosis MGIT mycobacteria growth indicator tube OR odds ratio R rifampicin S streptomycin TB tuberculosis XDR-TB extensively drug-resistant TB

Anti-tuberculosis drug resistance among tuberculosis patients in Ukraine and risk factors for MDR-TB page 1
Introduction
With a population of around 45 million and an estimated incidence of tuberculosis (TB) of nearly one case per 1000 persons (1), Ukraine is the country with the second largest burden of TB in the WHO European Region after the Russian Federation. As in most eastern European countries, efforts to control the epidemic are complicated by the extensive presence of forms of TB which are resistant to the most powerful anti-TB drugs. WHO has listed Ukraine among the 30 countries worldwide with the highest burden of multidrug-resistant TB (MDR-TB), with an estimated incidence of 22 000 cases of MDR-TB in 2015 (1). The real extent of the problem of drug-resistant TB in the country is poorly known. A survey conducted in 2006 in the most heavily populated region of the country (Donetsk) showed levels of MDR-TB of 15.5% and 41.5% among newly diagnosed and previously treated TB patients, respectively (2). More recent data gathered by the national surveillance system in 2012 showed levels of MDR-TB similar to those previously reported (14% in newly diagnosed and 32% in previously treated TB cases) (3). Even though the country can count on a network of 36 laboratories able to perform TB cultures and drug susceptibility testing (DST), concerns remain about the capacity of the national surveillance system to fully capture all existing cases of MDR-TB. Ukraine does not yet meet the benchmark for routine surveillance of anti-TB drug resistance set by WHO (4). In the face of a need to improve understanding of the burden of drug resistance in the country, inform the development of diagnostic algorithms and treatment regimens and guide resource allocation for control of TB and drug-resistant TB, a first national survey of resistance to anti-TB drugs was conducted in 2013–2014, following international standards (4).
Study design
Materials and methods
A one-stage cluster sampling approach was applied to select the TB facilities that notify TB patients in the civilian population. The sample size for new TB patients was based on the number of new sputum smear-positive TB cases notified in Ukraine in 2010 (n=9961) and designed to detect an estimated MDR-TB prevalence of 16% in new TB cases with 3% absolute precision for a 95% confidence interval (CI). Assuming a design effect of two to account for the cluster sampling approach and an expected 20% of losses due to contamination and no growth of cultures, this resulted in a final sample size of 1356 new sputum smear-positive patients. No specific target sample size was set for the previously treated cases. For logistical reasons, the team agreed to select 40 clusters from the study population and limit the study duration to six months. Thus, each cluster was required to enrol 34 consecutively diagnosed newly detected smear-positive cases. All TB facilities that diagnosed and notified TB patients among the civilian population were included in the sampling frame. The selection unit was considered to be a TB facility or group of facilities that could recruit at least 34 new TB patients within six months. To form such groups, the TB facilities with small numbers of patients were merged with the nearest TB facilities into one group to ensure that these groups could recruit the required number of new smear-positive TB patients within six months. A weighted (probability proportional to size) cluster sampling technique was used to select the clusters to ensure that all patients had an equal chance of being included in the study.

Anti-tuberculosis drug resistance among tuberculosis patients in Ukraine and risk factors for MDR-TB page 2
The study protocol was developed by in-country stakeholders with technical support from the WHO Regional Office for Europe and headquarters, in accordance with WHO recommendations (4), and approved by the Ministry of Health. A pilot study limited to two clusters in Kharkov and Kherson regions was conducted over a period of two months by the Strengthening of TB control in Ukraine project (funded by the United States Agency for International Development) before the nationwide roll-out in order to test the study tools, data collection forms and logistics (5). A study coordination team was established in Kyiv to oversee progress. At the field level, a coordinator was assigned to each of the clusters to oversee the recruitment of patients and logistics related to transport of the clinical materials and forms. Before the start of the survey, assigned health care providers from each cluster were trained in interviewing, data collection, survey procedures and logistics. Patient enrolment lasted up to six months. While the study was being carried out, two levels of monitoring were performed: the assigned cluster supervisors conducted periodic monitoring visits to peripheral facilities to ensure that all eligible patients were recruited into the study, and study coordination team members from the national level made periodic visits to the regions to ensure that all data were collected properly and the study was being implemented according to the protocol.
Patient recruitment and transport of samples
All new and previously treated sputum smear-positive pulmonary TB patients aged 15 years and above who consented to participate in the study were eligible for enrolment. Patients who had been treated more than once and smear-negative and extrapulmonary TB cases were not eligible for inclusion in the study. In each cluster, all consecutive eligible patients were enrolled in the survey until the targeted number of new TB patients was achieved. During the intake period, all consecutively diagnosed previously treated TB cases that met the inclusion criteria were also enrolled in the survey. The survey was conducted between November 2013 and May 2014. At the selected facilities, once a patient with a positive smear microscopy result was identified and had given informed consent to participate, sputum was collected before the start of treatment for the culture, identification of M. tuberculosis and DST. Study participants were assigned a unique patient number for the survey. For each patient, information on previous treatment history, sociodemographic characteristics and harmful habits was collected using a standard structured questionnaire. In addition, all patients were offered voluntary counselling and testing for HIV. Collected sputum samples were inoculated on Löwenstein-Jensen (LJ) media at selected cluster level TB laboratories. Culture slants and questionnaires were transported every second week to one of five selected zonal laboratories for first-line DST. After DST results were obtained, all culture slants, together with the questionnaires, were transported on a monthly basis to the national reference laboratory in Kyiv for external quality assessment and further testing for second-line drugs DST. The completed questionnaires were double-entered by two trained data entry specialists on EpiInfo software.1 To ensure the quality of the information collected, at least 10% of randomly selected patients and all MDR-TB patients were re-interviewed by a monitoring team using a new questionnaire. The recruitment of patients was regularly monitored by cross-checking the basic medical unit TB
1 Centers for Disease Control and Prevention, Atlanta (GA), United States.
Anti-tuberculosis drug resistance among tuberculosis patients in Ukraine and risk factors for MDR-TB page 3
register with the cluster register to ensure that all eligible patients were recruited. The characteristics and DST results of patients who were missed or refused to participate were obtained from the TB facilities to assess for any selection bias.
Definitions, possible risk factors investigated and patient groupings
The definitions recommended by WHO for MDR-TB and previous treatment history were used (6). MDR-TB was assigned as the main outcome of interest of the study. The following were investigated as possible explanatory variables: sex, age, place of residence, place of birth, presence of bacillus Calmette-Guérin (BCG) scar, work abroad, house ownership, household size, education, self-perception of social status, alcohol use, drug use and history of incarceration and HIV status. Heavy alcohol use was defined as drinking at least 60 g of pure alcohol on at least one occasion during the week preceding the interview. A history of smoking was defined as the use of any tobacco product on a regular basis in the previous five years. Patients were grouped into age ranges of 15–24 years, 25–34 years, 35–44 years, 45–54 years, 55–64 years and above 64 years. Self-estimated social status was regrouped into two categories: “below average” and “average and above” because of the small number of study subjects in the higher categories (“far above average” and “above average”). Household size was regrouped into three subgroups: “living alone”, “two to four members” and “five members and more”.
Statistical analysis
Data were double-entered into version 3.5.1 of the EpiInfo software package by two specialists. Discrepancies detected between the two databases were corrected by reviewing the original data collection forms. Analysis was performed using version 11.0 of STATA.2 MDR-TB was the main outcome of interest. Association of explanatory variables with MDR-TB was assessed by calculating odds ratios (OR) for categories of the variables and testing for statistical significance of deviation of the OR ratio from one using the chi-square test. For ordered categorical variables, a linear trend of association was tested when appropriate. The Mantel-Haenszel approach was used to calculate association of MDR-TB and explanatory variables adjusted for previous history of treatment and to assess the effect of modification. A test of homogeneity P value below 0.1 was considered as an indication of effect modification. To assess independent risk factors for MDR-TB in new and previously treated cases, all variables with P values below 0.25 were included in a multivariate logistic regression analysis separately for new and retreated TB cases using a forward fitting approach. Each full model was tested against a nested model using the likelihood ratio test. A cut-off of P=0.05 was used to exclude variables from the model. To adjust for cluster design, the random effect approach was applied to the final logistic regression model. The proportions of new and previously treated cases with resistance to first-line drugs were weighted by cluster to account for under- or over-enrolment, that is, they were weighted by the inverse of the total number of new TB cases for which DST results were available in each of the clusters. The final proportion of new and retreated TB cases with MDR-TB was calculated by imputing missing values, applying cluster sample weights and specifying robust standard errors to account for clustering.
2 StataCorp. LP, College Station (TX), United States.
Anti-tuberculosis drug resistance among tuberculosis patients in Ukraine and risk factors for MDR-TB page 4
Laboratory procedures
Sputum samples of all suspected patients were smeared and then examined for acid-fast bacilli by direct microscopy at health centres after Ziehl-Neelsen staining. Samples with positive microscopy results were cultured at the selected 27 regional laboratories on LJ slants. Susceptibility testing was performed using the LJ proportional method at the following concentrations: 40 µg/ml for rifampicin (R), 0.2 µg/ml for isoniazid (H), 2.0 µg/ml for ethambutol (E) and 4.0 µg/ml for streptomycin (S). After completion of DST, culture isolates were sent to the national reference laboratory where DST was repeated for internal quality assurance purposes. Culture isolates were then sent to the supranational reference laboratory in Riga, Latvia, for external quality control for first-line TB drugs and testing for susceptibility to second-line drugs at the following concentrations: kanamycin – LJ 30 µg/ml; amikacin – LJ 30 µg/ml; capreomycin – LJ 40 µg/ml; ofloxacin – mycobacteria growth indicator tube (MGIT) 2 µg/ml; moxifloxacin – MGIT 0.5 µg/ml and 2 µg/ml. In total, 1447 strains were retested at the supranational reference laboratory for first- and second-line DST.
Results
Analysis of patient intake
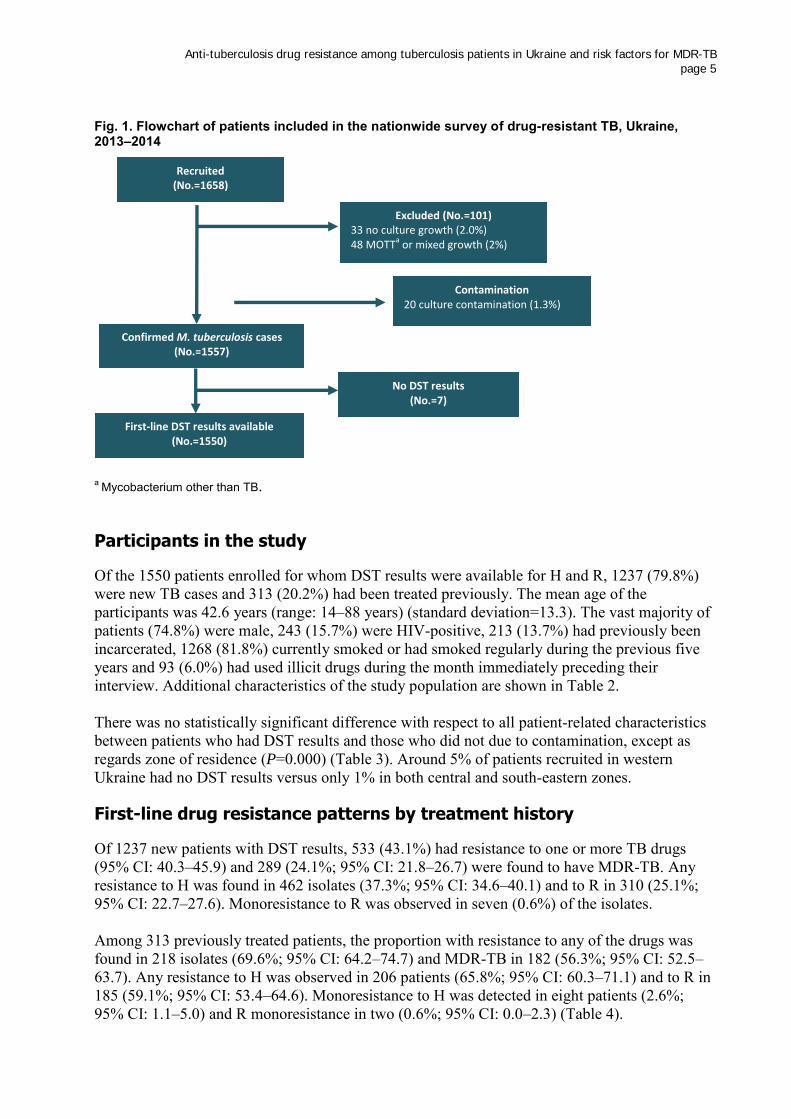
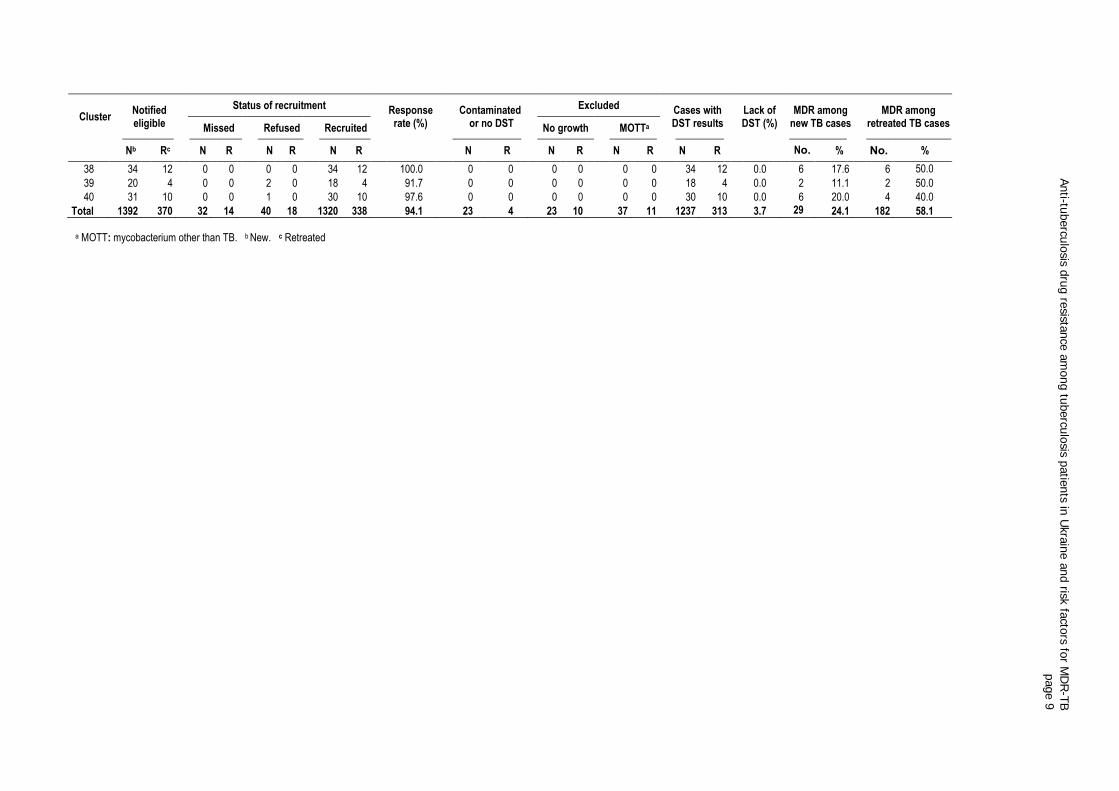
During the study intake period, a total of 2113 sputum smear pulmonary TB cases were notified in the area covered by the selected heath facilities, according to local basic medical unit TB registers. Of these, only 1762 (83.3%) were eligible for inclusion in the study. Of those eligible, 58 (3.2%) refused to give written consent to participate in the study, while supervisory visits to the study sites showed that another 46 (2.6%) cases were missed by data collectors. Thus, a total of 1658 patients (1319 new and 338 previously treated) were enrolled in the survey from the 40 clusters across the country. Of the 1658 sputum smear-positive patients enrolled, 33 (2.0%) cases were culture-negative, 20 (1.2%) had culture contamination, 20 yielded mycobacteria other than TB and 28 had mixed culture containing both M. tuberculosis and mycobacteria other than TB, leaving a total of 1557 cases with positive culture with confirmed M. tuberculosis. All of these were subjected to first-line DST, but in seven cases both LJ slants were contaminated. DST results to all four first-line TB drugs were available for the remaining 1237 new and 313 previously treated TB patients (Fig. 1). Sixteen of 40 clusters failed to recruit the required 34 new sputum smear-positive patients for the following reasons: two clusters (Nos. 1 and 2) in Crimea were unable to continue in the study. The situation in the Donbass region meant that the final batch of biological materials and questionnaires from two clusters in the Luhansk region (Nos. 23 and 24) could not be transported to the zonal laboratory in Donetsk. Twelve clusters did not reach the target sample size because too few patients were registered during the enrolment period. Details of the intake of patients, the yields of culture and DST results are provided in Table 1. The overall study participation rate was 94.1%, ranging from 69.0% to 100.0%. In 36 clusters the response rate was above 90.0%. There was a notable variation in culture recovery across clusters ranging from 49.0% to 100.0%. One of the clusters accounted for 48% (14/28) of the total number of contaminated cultures.
Anti-tuberculosis drug resistance among tuberculosis patients in Ukraine and risk factors for MDR-TB page 5
Fig. 1. Flowchart of patients included in the nationwide survey of drug-resistant TB, Ukraine, 2013–2014
a Mycobacterium other than TB.
Participants in the study
Of the 1550 patients enrolled for whom DST results were available for H and R, 1237 (79.8%) were new TB cases and 313 (20.2%) had been treated previously. The mean age of the participants was 42.6 years (range: 14–88 years) (standard deviation=13.3). The vast majority of patients (74.8%) were male, 243 (15.7%) were HIV-positive, 213 (13.7%) had previously been incarcerated, 1268 (81.8%) currently smoked or had smoked regularly during the previous five years and 93 (6.0%) had used illicit drugs during the month immediately preceding their interview. Additional characteristics of the study population are shown in Table 2. There was no statistically significant difference with respect to all patient-related characteristics between patients who had DST results and those who did not due to contamination, except as regards zone of residence (P=0.000) (Table 3). Around 5% of patients recruited in western Ukraine had no DST results versus only 1% in both central and south-eastern zones.
First-line drug resistance patterns by treatment history
Of 1237 new patients with DST results, 533 (43.1%) had resistance to one or more TB drugs (95% CI: 40.3–45.9) and 289 (24.1%; 95% CI: 21.8–26.7) were found to have MDR-TB. Any resistance to H was found in 462 isolates (37.3%; 95% CI: 34.6–40.1) and to R in 310 (25.1%; 95% CI: 22.7–27.6). Monoresistance to R was observed in seven (0.6%) of the isolates. Among 313 previously treated patients, the proportion with resistance to any of the drugs was found in 218 isolates (69.6%; 95% CI: 64.2–74.7) and MDR-TB in 182 (56.3%; 95% CI: 52.5–63.7). Any resistance to H was observed in 206 patients (65.8%; 95% CI: 60.3–71.1) and to R in 185 (59.1%; 95% CI: 53.4–64.6). Monoresistance to H was detected in eight patients (2.6%; 95% CI: 1.1–5.0) and R monoresistance in two (0.6%; 95% CI: 0.0–2.3) (Table 4).
Recruited (No.=1658)
Excluded (No.=101) 33 no culture growth (2.0%) 48 MOTT
a or mixed growth (2%)
Confirmed M. tuberculosis cases (No.=1557)
No DST results (No.=7)
First-line DST results available (No.=1550)
Contamination 20 culture contamination (1.3%)
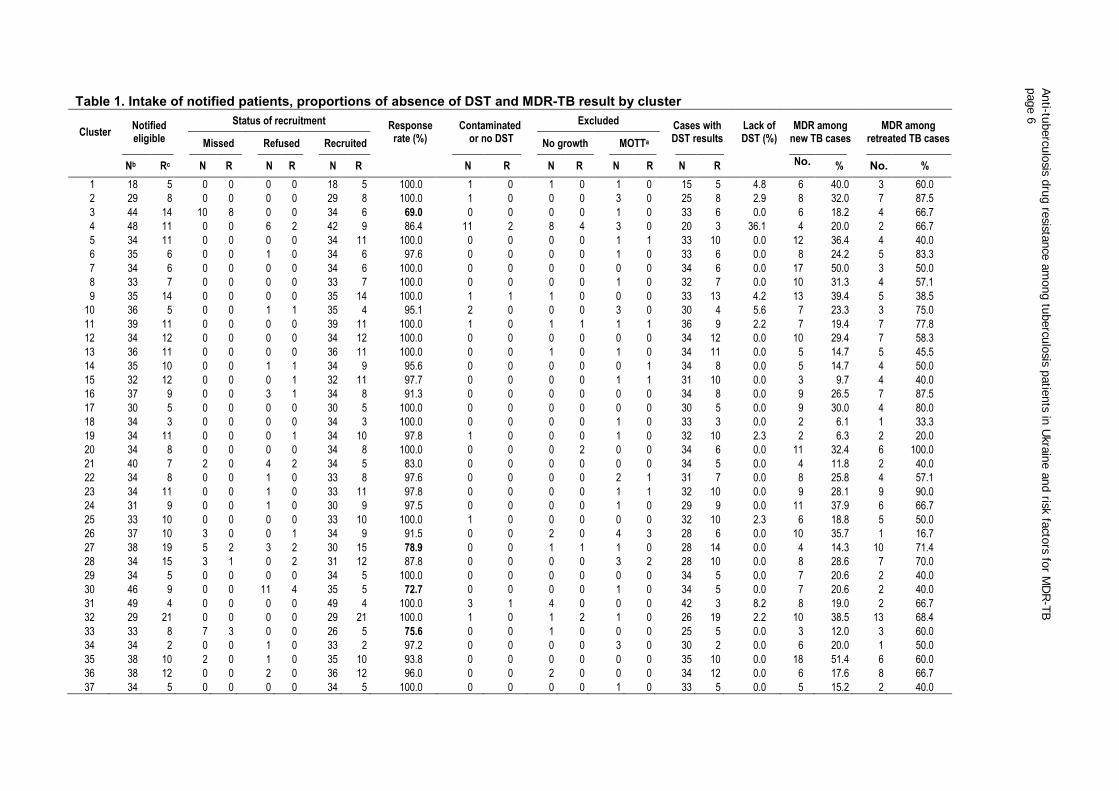
Table 1. Intake of notified patients, proportions of absence of DST and MDR-TB result by cluster
Cluster Notified eligible
Status of recruitment Response rate (%)
Contaminated or no DST
Excluded Cases with DST results
Lack of DST (%)
MDR among new TB cases
MDR among retreated TB cases Missed Refused Recruited No growth MOTTa
Nb Rc N R N R N R
N R N R N R N R
No.
. % No. %
1 18 5 0 0 0 0 18 5 100.0 1 0 1 0 1 0 15 5 4.8 6 40.0 3 60.0
2 29 8 0 0 0 0 29 8 100.0 1 0 0 0 3 0 25 8 2.9 8 32.0 7 87.5
3 44 14 10 8 0 0 34 6 69.0 0 0 0 0 1 0 33 6 0.0 6 18.2 4 66.7
4 48 11 0 0 6 2 42 9 86.4 11 2 8 4 3 0 20 3 36.1 4 20.0 2 66.7
5 34 11 0 0 0 0 34 11 100.0 0 0 0 0 1 1 33 10 0.0 12 36.4 4 40.0
6 35 6 0 0 1 0 34 6 97.6 0 0 0 0 1 0 33 6 0.0 8 24.2 5 83.3
7 34 6 0 0 0 0 34 6 100.0 0 0 0 0 0 0 34 6 0.0 17 50.0 3 50.0
8 33 7 0 0 0 0 33 7 100.0 0 0 0 0 1 0 32 7 0.0 10 31.3 4 57.1
9 35 14 0 0 0 0 35 14 100.0 1 1 1 0 0 0 33 13 4.2 13 39.4 5 38.5
10 36 5 0 0 1 1 35 4 95.1 2 0 0 0 3 0 30 4 5.6 7 23.3 3 75.0
11 39 11 0 0 0 0 39 11 100.0 1 0 1 1 1 1 36 9 2.2 7 19.4 7 77.8
12 34 12 0 0 0 0 34 12 100.0 0 0 0 0 0 0 34 12 0.0 10 29.4 7 58.3
13 36 11 0 0 0 0 36 11 100.0 0 0 1 0 1 0 34 11 0.0 5 14.7 5 45.5
14 35 10 0 0 1 1 34 9 95.6 0 0 0 0 0 1 34 8 0.0 5 14.7 4 50.0
15 32 12 0 0 0 1 32 11 97.7 0 0 0 0 1 1 31 10 0.0 3 9.7 4 40.0
16 37 9 0 0 3 1 34 8 91.3 0 0 0 0 0 0 34 8 0.0 9 26.5 7 87.5
17 30 5 0 0 0 0 30 5 100.0 0 0 0 0 0 0 30 5 0.0 9 30.0 4 80.0
18 34 3 0 0 0 0 34 3 100.0 0 0 0 0 1 0 33 3 0.0 2 6.1 1 33.3
19 34 11 0 0 0 1 34 10 97.8 1 0 0 0 1 0 32 10 2.3 2 6.3 2 20.0
20 34 8 0 0 0 0 34 8 100.0 0 0 0 2 0 0 34 6 0.0 11 32.4 6 100.0
21 40 7 2 0 4 2 34 5 83.0 0 0 0 0 0 0 34 5 0.0 4 11.8 2 40.0
22 34 8 0 0 1 0 33 8 97.6 0 0 0 0 2 1 31 7 0.0 8 25.8 4 57.1
23 34 11 0 0 1 0 33 11 97.8 0 0 0 0 1 1 32 10 0.0 9 28.1 9 90.0
24 31 9 0 0 1 0 30 9 97.5 0 0 0 0 1 0 29 9 0.0 11 37.9 6 66.7
25 33 10 0 0 0 0 33 10 100.0 1 0 0 0 0 0 32 10 2.3 6 18.8 5 50.0
26 37 10 3 0 0 1 34 9 91.5 0 0 2 0 4 3 28 6 0.0 10 35.7 1 16.7
27 38 19 5 2 3 2 30 15 78.9 0 0 1 1 1 0 28 14 0.0 4 14.3 10 71.4
28 34 15 3 1 0 2 31 12 87.8 0 0 0 0 3 2 28 10 0.0 8 28.6 7 70.0
29 34 5 0 0 0 0 34 5 100.0 0 0 0 0 0 0 34 5 0.0 7 20.6 2 40.0
30 46 9 0 0 11 4 35 5 72.7 0 0 0 0 1 0 34 5 0.0 7 20.6 2 40.0
31 49 4 0 0 0 0 49 4 100.0 3 1 4 0 0 0 42 3 8.2 8 19.0 2 66.7
32 29 21 0 0 0 0 29 21 100.0 1 0 1 2 1 0 26 19 2.2 10 38.5 13 68.4
33 33 8 7 3 0 0 26 5 75.6 0 0 1 0 0 0 25 5 0.0 3 12.0 3 60.0
34 34 2 0 0 1 0 33 2 97.2 0 0 0 0 3 0 30 2 0.0 6 20.0 1 50.0
35 38 10 2 0 1 0 35 10 93.8 0 0 0 0 0 0 35 10 0.0 18 51.4 6 60.0
36 38 12 0 0 2 0 36 12 96.0 0 0 2 0 0 0 34 12 0.0 6 17.6 8 66.7
37 34 5 0 0 0 0 34 5 100.0 0 0 0 0 1 0 33 5 0.0 5 15.2 2 40.0
Anti-tu
bercu
losis d
rug re
sistance
am
ong tu
bercu
losis p
atie
nts in
Ukra
ine a
nd risk
facto
rs for M
DR
-TB
page 6
Cluster Notified eligible
Status of recruitment Response rate (%)
Contaminated or no DST
Excluded Cases with DST results
Lack of DST (%)
MDR among new TB cases
MDR among retreated TB cases Missed Refused Recruited No growth MOTTa
Nb Rc N R N R N R
N R N R N R N R
No.
. % No. %
38 34 12 0 0 0 0 34 12 100.0 0 0 0 0 0 0 34 12 0.0 6 17.6 6 50.0
39 20 4 0 0 2 0 18 4 91.7 0 0 0 0 0 0 18 4 0.0 2 11.1 2 50.0
40 31 10 0 0 1 0 30 10 97.6 0 0 0 0 0 0 30 10 0.0 6 20.0 4 40.0
Total 1392 370 32 14 40 18 1320 338 94.1 23 4 23 10 37 11 1237 313 3.7 298
24.1 182 58.1
a MOTT: mycobacterium other than TB. b New. c Retreated
Anti-tu
bercu
losis d
rug re
sistance
am
ong tu
bercu
losis p
atie
nts in
Ukra
ine a
nd risk
facto
rs for M
DR
-TB
page 7
Anti-tu
bercu
losis d
rug re
sistance
am
ong tu
bercu
losis p
atie
nts in
Ukra
ine a
nd risk
facto
rs for M
DR
-TB
page 9
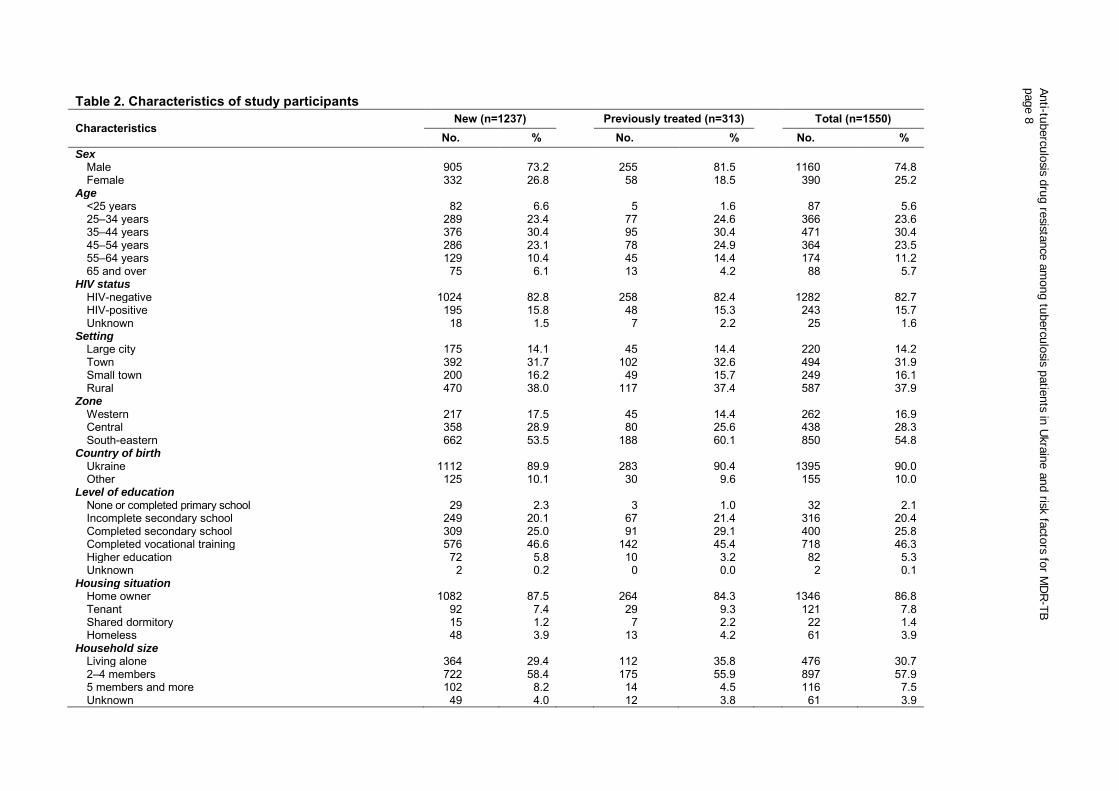
Table 2. Characteristics of study participants
Characteristics New (n=1237) Previously treated (n=313) Total (n=1550)
No. % No. % No. % Sex
Male 905 73.2 255 81.5 1160 74.8 Female 332 26.8 58 18.5 390 25.2
Age <25 years 82 6.6 5 1.6 87 5.6 25–34 years 289 23.4 77 24.6 366 23.6 35–44 years 376 30.4 95 30.4 471 30.4 45–54 years 286 23.1 78 24.9 364 23.5 55–64 years 129 10.4 45 14.4 174 11.2 65 and over 75 6.1 13 4.2 88 5.7
HIV status HIV-negative 1024 82.8 258 82.4 1282 82.7 HIV-positive 195 15.8 48 15.3 243 15.7 Unknown 18 1.5 7 2.2 25 1.6
Setting Large city 175 14.1 45 14.4 220 14.2 Town 392 31.7 102 32.6 494 31.9 Small town 200 16.2 49 15.7 249 16.1 Rural 470 38.0 117 37.4 587 37.9
Zone Western 217 17.5 45 14.4 262 16.9 Central 358 28.9 80 25.6 438 28.3 South-eastern 662 53.5 188 60.1 850 54.8
Country of birth Ukraine 1112 89.9 283 90.4 1395 90.0 Other 125 10.1 30 9.6 155 10.0
Level of education None or completed primary school 29 2.3 3 1.0 32 2.1 Incomplete secondary school 249 20.1 67 21.4 316 20.4 Completed secondary school 309 25.0 91 29.1 400 25.8 Completed vocational training 576 46.6 142 45.4 718 46.3 Higher education 72 5.8 10 3.2 82 5.3 Unknown 2 0.2 0 0.0 2 0.1
Housing situation Home owner 1082 87.5 264 84.3 1346 86.8 Tenant 92 7.4 29 9.3 121 7.8 Shared dormitory 15 1.2 7 2.2 22 1.4 Homeless 48 3.9 13 4.2 61 3.9
Household size Living alone 364 29.4 112 35.8 476 30.7 2–4 members 722 58.4 175 55.9 897 57.9 5 members and more 102 8.2 14 4.5 116 7.5 Unknown 49 4.0 12 3.8 61 3.9
Anti-tu
bercu
losis d
rug re
sistance
am
ong tu
bercu
losis p
atie
nts in
Ukra
ine a
nd risk
facto
rs for M
DR
-TB
page 8
Characteristics New (n=1237) Previously treated (n=313) Total (n=1550)
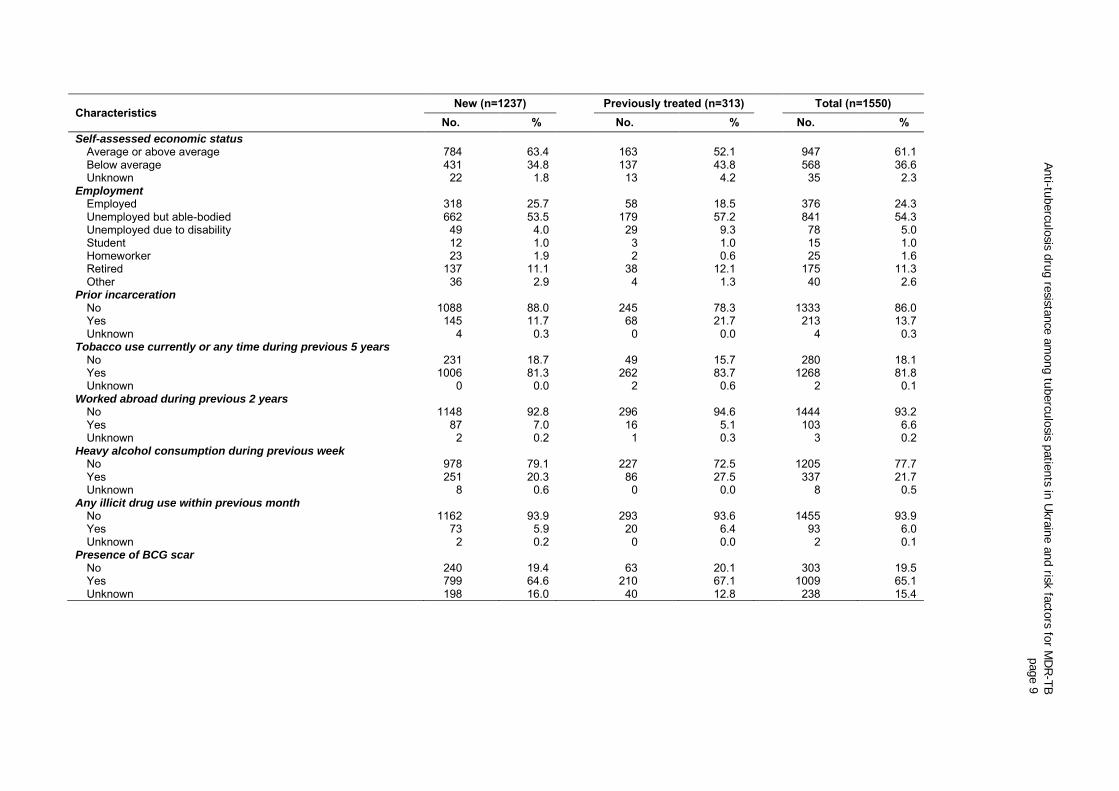
No. % No. % No. % Self-assessed economic status
Average or above average 784 63.4 163 52.1 947 61.1 Below average 431 34.8 137 43.8 568 36.6 Unknown 22 1.8 13 4.2 35 2.3
Employment Employed 318 25.7 58 18.5 376 24.3 Unemployed but able-bodied 662 53.5 179 57.2 841 54.3 Unemployed due to disability 49 4.0 29 9.3 78 5.0 Student 12 1.0 3 1.0 15 1.0 Homeworker 23 1.9 2 0.6 25 1.6 Retired 137 11.1 38 12.1 175 11.3 Other 36 2.9 4 1.3 40 2.6
Prior incarceration No 1088 88.0 245 78.3 1333 86.0 Yes 145 11.7 68 21.7 213 13.7 Unknown 4 0.3 0 0.0 4 0.3
Tobacco use currently or any time during previous 5 years No 231 18.7 49 15.7 280 18.1 Yes 1006 81.3 262 83.7 1268 81.8 Unknown 0 0.0 2 0.6 2 0.1
Worked abroad during previous 2 years No 1148 92.8 296 94.6 1444 93.2 Yes 87 7.0 16 5.1 103 6.6 Unknown 2 0.2 1 0.3 3 0.2
Heavy alcohol consumption during previous week No 978 79.1 227 72.5 1205 77.7 Yes 251 20.3 86 27.5 337 21.7 Unknown 8 0.6 0 0.0 8 0.5
Any illicit drug use within previous month No 1162 93.9 293 93.6 1455 93.9 Yes 73 5.9 20 6.4 93 6.0 Unknown 2 0.2 0 0.0 2 0.1
Presence of BCG scar No 240 19.4 63 20.1 303 19.5 Yes 799 64.6 210 67.1 1009 65.1 Unknown 198 16.0 40 12.8 238 15.4
Anti-tu
bercu
losis d
rug re
sistance
am
ong tu
bercu
losis p
atie
nts in
Ukra
ine a
nd risk
facto
rs for M
DR
-TB
page 9
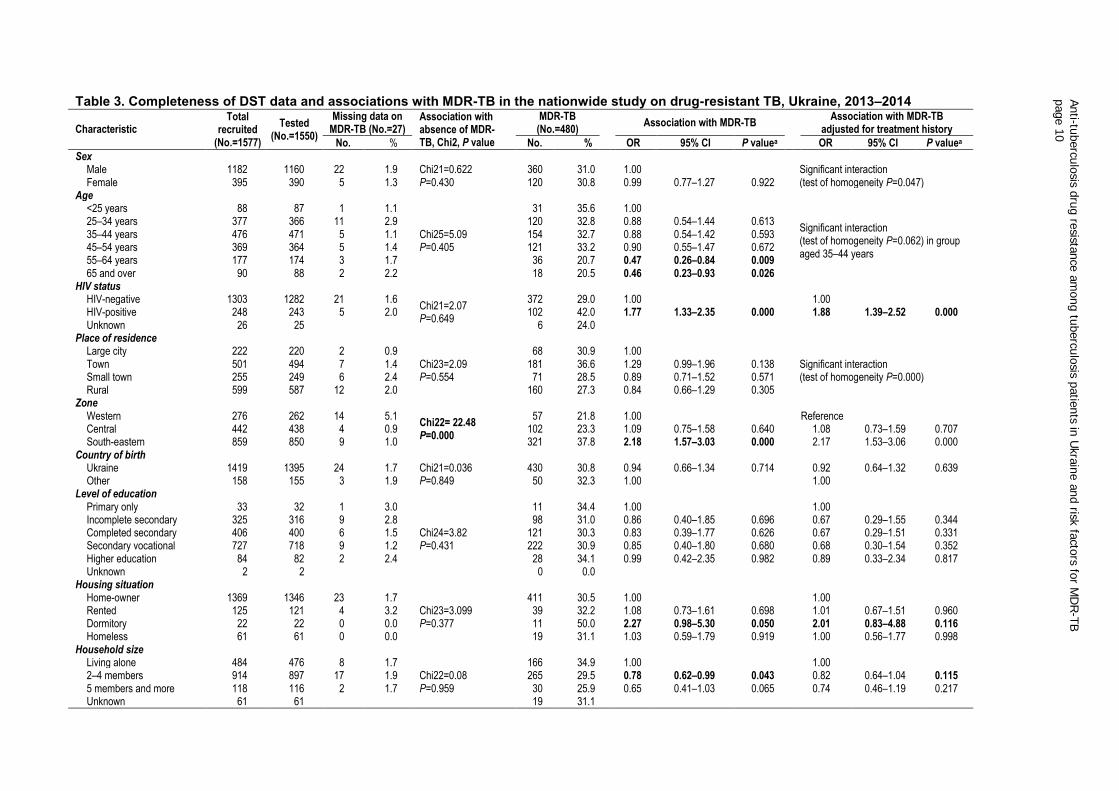
Table 3. Completeness of DST data and associations with MDR-TB in the nationwide study on drug-resistant TB, Ukraine, 2013–2014 Characteristic
Total recruited
(No.=1577)
Tested (No.=1550)
Missing data on MDR-TB (No.=27)
Association with absence of MDR-TB, Chi2, P value
MDR-TB (No.=480)
Association with MDR-TB
Association with MDR-TB adjusted for treatment history
No. % No. % OR 95% CI P valuea OR 95% CI P valuea
Sex
Male 1182 1160 22 1.9 Chi21=0.622
P=0.430 360 31.0 1.00
Significant interaction (test of homogeneity P=0.047) Female 395 390 5 1.3 120 30.8 0.99 0.77–1.27 0.922
Age
<25 years 88 87 1 1.1
Chi25=5.09 P=0.405
31 35.6 1.00
Significant interaction (test of homogeneity P=0.062) in group aged 35–44 years
25–34 years 377 366 11 2.9 120 32.8 0.88 0.54–1.44 0.613 35–44 years 476 471 5 1.1 154 32.7 0.88 0.54–1.42 0.593 45–54 years 369 364 5 1.4 121 33.2 0.90 0.55–1.47 0.672 55–64 years 177 174 3 1.7 36 20.7 0.47 0.26–0.84 0.009 65 and over 90 88 2 2.2 18 20.5 0.46 0.23–0.93 0.026
HIV status
HIV-negative 1303 1282 21 1.6
Chi21=2.07 P=0.649
372 29.0 1.00
1.00 HIV-positive 248 243 5 2.0 102 42.0 1.77 1.33–2.35 0.000 1.88 1.39–2.52 0.000
Unknown 26 25 6 24.0 Place of residence
Large city 222 220 2 0.9 Chi23=2.09 P=0.554
68 30.9 1.00 Significant interaction
(test of homogeneity P=0.000) Town 501 494 7 1.4 181 36.6 1.29 0.99–1.96 0.138 Small town 255 249 6 2.4 71 28.5 0.89 0.71–1.52 0.571 Rural 599 587 12 2.0 160 27.3 0.84 0.66–1.29 0.305
Zone
Western 276 262 14 5.1
Chi22= 22.48 P=0.000
57 21.8 1.00
Reference Central 442 438 4 0.9 102 23.3 1.09 0.75–1.58 0.640 1.08 0.73–1.59 0.707
South-eastern 859 850 9 1.0 321 37.8 2.18 1.57–3.03 0.000 2.17 1.53–3.06 0.000 Country of birth
Ukraine 1419 1395 24 1.7 Chi21=0.036 P=0.849
430 30.8 0.94 0.66–1.34 0.714 0.92 0.64–1.32 0.639 Other 158 155 3 1.9 50 32.3 1.00
1.00
Level of education
Primary only 33 32 1 3.0
Chi24=3.82 P=0.431
11 34.4 1.00
1.00 Incomplete secondary 325 316 9 2.8 98 31.0 0.86 0.40–1.85 0.696 0.67 0.29–1.55 0.344
Completed secondary 406 400 6 1.5 121 30.3 0.83 0.39–1.77 0.626 0.67 0.29–1.51 0.331 Secondary vocational 727 718 9 1.2 222 30.9 0.85 0.40–1.80 0.680 0.68 0.30–1.54 0.352 Higher education 84 82 2 2.4 28 34.1 0.99 0.42–2.35 0.982 0.89 0.33–2.34 0.817 Unknown 2 2 0 0.0
Housing situation Home-owner 1369 1346 23 1.7
Chi23=3.099 P=0.377
411 30.5 1.00
1.00 Rented 125 121 4 3.2 39 32.2 1.08 0.73–1.61 0.698 1.01 0.67–1.51 0.960
Dormitory 22 22 0 0.0 11 50.0 2.27 0.98–5.30 0.050 2.01 0.83–4.88 0.116 Homeless 61 61 0 0.0 19 31.1 1.03 0.59–1.79 0.919 1.00 0.56–1.77 0.998
Household size
Living alone 484 476 8 1.7
Chi22=0.08 P=0.959
166 34.9 1.00
1.00 2–4 members 914 897 17 1.9 265 29.5 0.78 0.62–0.99 0.043 0.82 0.64–1.04 0.115
5 members and more 118 116 2 1.7 30 25.9 0.65 0.41–1.03 0.065 0.74 0.46–1.19 0.217 Unknown 61 61
19 31.1
Anti-tu
bercu
losis d
rug re
sistance
am
ong tu
bercu
losis p
atie
nts in
Ukra
ine a
nd risk
facto
rs for M
DR
-TB
page 1
0
Characteristic Total
recruited (No.=1577)
Tested (No.=1550)
Missing data on MDR-TB n=27
Association with absence of MDR-TB, Chi2, P value
MDR-TB n=480
Association with MDR-TB Association with MDR-TB adjusted
for treatment history
No. % No. % OR 95% CI P valuea OR 95% CI P valuea
Self-assessed economic status
Average or above average 965 947 18 1.9 Chi21=0.48 P=0.482
270 28.5 1.00
1.00 Below average 576 568 8 1.4 195 34.3 1.31 1.05–1.64 0.018 1.19 0.95–1.51 0.135
Unknown 36 35 1 2.8 5 14.3 Employment
Working 383 376 7 1.8
Chi26=3.61 P=0.729
104 27.7 1.00
1.00 Not working 854 841 13 1.5 291 34.6 1.38 1.06–1.81 0.017 1.30 0.97–1.71 0.069
Disabled 79 78 1 1.3 29 37.2 1.55 0.93–2.59 0.093 1.00 0.57–1.85 0.988 Student 15 15 0 0.0 4 26.7 0.95 0.30–3.06 0.933 0.85 0.23–3.11 0.805 Home worker 25 25 0 0.0 6 24.0 0.83 0.32–2.13 0.692 0.96 0.33–2.75 0.938 Retired 179 175 4 2.2 37 21.1 0.70 0.46–1.08 0.103 0.59 0.37–0.94 0.023 Other 42 40 2 4.8 9 22.5 0.76 0.35–1.65 0.486 0.84 0.37–1.86 0.659
Prior detention
No 1357 1333 24 1.8
Chi21=0.16 P=0.69
394 29.6 1.00
1.00 Yes 216 213 3 1.4 85 39.9 1.58 1.17–2.16 0.002 1.32 0.97–1.81 0.081
Unknown 4 4
1 25.0 Tobacco use currently or any time during previous 5 years No 284 280 4 1.4
Chi21=0.19 P=0.661
79 28.2 1.00
1.00 Yes 1291 1268 23 1.8 399 31.5 1.17 0.88–1.55 0.2865 1.12 0.83–1.51 0.453
Unknown 2 2
2 100.0 Worked abroad during previous 2 years
No 1467 1444 23 1.6 Chi21=2.79 P=0.095
449 31.1 1.00
1.00 Yes 107 103 4 3.7 31 30.1 0.95 0.62–1.48 0.833 1.04 0.65–1.64 0.876
Unknown 3 3
0 0.0 Heavy alcohol consumption during previous week
No 1225 1205 20 1.6 Chi21=0.26 P=0.612
368 30.5 1.00
1.00 Yes 344 337 7 2.0 112 33.2 1.13 0.87–1.47 0.345 1.02 0.76–1.35 0.875
Unknown 8 8
0 0.0 Any illicit drug use within previous week
No 1481 1455 26 1.8 Chi21=0.25 P=0.616
446 30.7 1.00
Significant interaction (test of homogeneity P=0.011)
Yes 94 93 1 1.1 33 35.5 1.24 0.80–1.93 0.329 Unknown 2 2 0.0 1 50.0
Presence of BCG scar
Negative 309 303 6 1.9
Chi21=2.80 P=0.246
94 31.0 1.00
1.00 Positive 1029 1009 20 1.9 321 31.8 1.04 0.79–1.37 0.795 1.04 0.78–1.38 0.788
Doubtful or missing 239 238 1 0.4 65 27.3 0.84 0.57–1.22 0.347 0.88 0.50–1.29 0.507 Previously treated for TB
No 1260 1237 23 1.8 Chi21=0.48 P=0.489
298 24.1 1.00 Yes 317 313 4 1.3 182 58.1 4.38 3.34–5.75 0.000
a Chi2 test. .
Anti-tu
bercu
losis d
rug re
sistance
am
ong tu
bercu
losis p
atie
nts in
Ukra
ine a
nd risk
facto
rs for M
DR
-TB
page 1
1
Anti-tuberculosis drug resistance among tuberculosis patients in Ukraine and risk factors for MDR-TB page 12
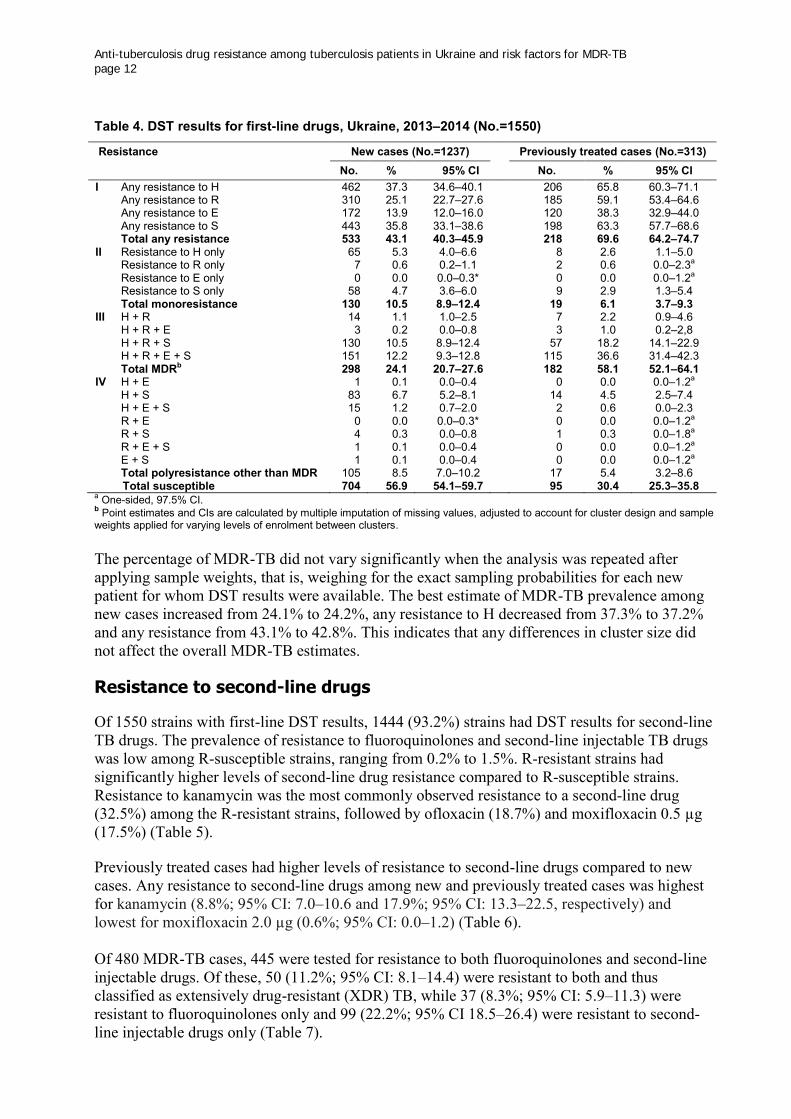
Table 4. DST results for first-line drugs, Ukraine, 2013–2014 (No.=1550)
Resistance New cases (No.=1237) Previously treated cases (No.=313) No. % 95% CI No. % 95% CI I Any resistance to H 462 37.3 34.6–40.1 206 65.8 60.3–71.1 Any resistance to R 310 25.1 22.7–27.6 185 59.1 53.4–64.6 Any resistance to E 172 13.9 12.0–16.0 120 38.3 32.9–44.0 Any resistance to S 443 35.8 33.1–38.6 198 63.3 57.7–68.6 Total any resistance 533 43.1 40.3–45.9 218 69.6 64.2–74.7 II Resistance to H only 65 5.3 4.0–6.6 8 2.6 1.1–5.0 Resistance to R only 7 0.6 0.2–1.1 2 0.6 0.0–2.3a Resistance to E only 0 0.0 0.0–0.3* 0 0.0 0.0–1.2a Resistance to S only 58 4.7 3.6–6.0 9 2.9 1.3–5.4 Total monoresistance 130 10.5 8.9–12.4 19 6.1 3.7–9.3 III H + R 14 1.1 1.0–2.5 7 2.2 0.9–4.6 H + R + E 3 0.2 0.0–0.8 3 1.0 0.2–2,8 H + R + S 130 10.5 8.9–12.4 57 18.2 14.1–22.9 H + R + E + S 151 12.2 9.3–12.8 115 36.6 31.4–42.3 Total MDRb 298 24.1 20.7–27.6 182 58.1 52.1–64.1 IV H + E 1 0.1 0.0–0.4 0 0.0 0.0–1.2a H + S 83 6.7 5.2–8.1 14 4.5 2.5–7.4 H + E + S 15 1.2 0.7–2.0 2 0.6 0.0–2.3 R + E 0 0.0 0.0–0.3* 0 0.0 0.0–1.2a R + S 4 0.3 0.0–0.8 1 0.3 0.0–1.8a R + E + S 1 0.1 0.0–0.4 0 0.0 0.0–1.2a E + S 1 0.1 0.0–0.4 0 0.0 0.0–1.2a Total polyresistance other than MDR 105 8.5 7.0–10.2 17 5.4 3.2–8.6
Total susceptible 704 56.9 54.1–59.7 95 30.4 25.3–35.8 a One-sided, 97.5% CI. b Point estimates and CIs are calculated by multiple imputation of missing values, adjusted to account for cluster design and sample weights applied for varying levels of enrolment between clusters. The percentage of MDR-TB did not vary significantly when the analysis was repeated after applying sample weights, that is, weighing for the exact sampling probabilities for each new patient for whom DST results were available. The best estimate of MDR-TB prevalence among new cases increased from 24.1% to 24.2%, any resistance to H decreased from 37.3% to 37.2% and any resistance from 43.1% to 42.8%. This indicates that any differences in cluster size did not affect the overall MDR-TB estimates.
Resistance to second-line drugs
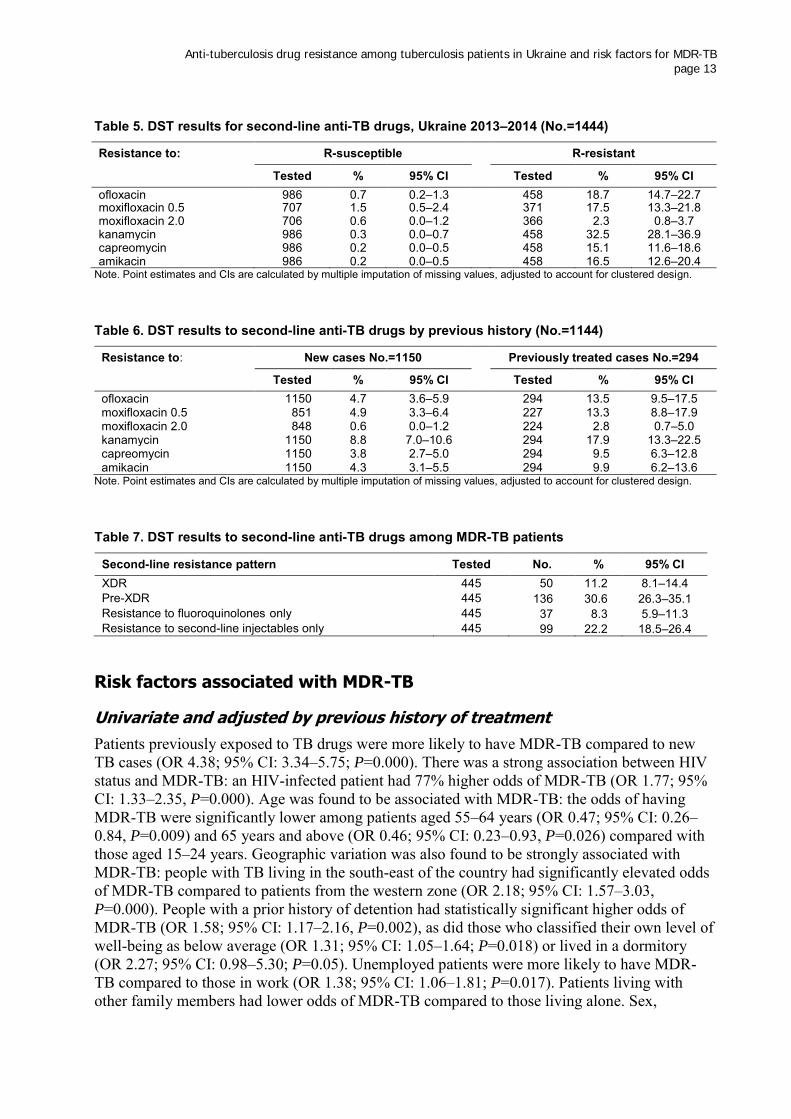
Of 1550 strains with first-line DST results, 1444 (93.2%) strains had DST results for second-line TB drugs. The prevalence of resistance to fluoroquinolones and second-line injectable TB drugs was low among R-susceptible strains, ranging from 0.2% to 1.5%. R-resistant strains had significantly higher levels of second-line drug resistance compared to R-susceptible strains. Resistance to kanamycin was the most commonly observed resistance to a second-line drug (32.5%) among the R-resistant strains, followed by ofloxacin (18.7%) and moxifloxacin 0.5 µg (17.5%) (Table 5). Previously treated cases had higher levels of resistance to second-line drugs compared to new cases. Any resistance to second-line drugs among new and previously treated cases was highest for kanamycin (8.8%; 95% CI: 7.0–10.6 and 17.9%; 95% CI: 13.3–22.5, respectively) and lowest for moxifloxacin 2.0 µg (0.6%; 95% CI: 0.0–1.2) (Table 6). Of 480 MDR-TB cases, 445 were tested for resistance to both fluoroquinolones and second-line injectable drugs. Of these, 50 (11.2%; 95% CI: 8.1–14.4) were resistant to both and thus classified as extensively drug-resistant (XDR) TB, while 37 (8.3%; 95% CI: 5.9–11.3) were resistant to fluoroquinolones only and 99 (22.2%; 95% CI 18.5–26.4) were resistant to second-line injectable drugs only (Table 7).
Anti-tuberculosis drug resistance among tuberculosis patients in Ukraine and risk factors for MDR-TB page 13
Table 5. DST results for second-line anti-TB drugs, Ukraine 2013–2014 (No.=1444)
Resistance to: R-susceptible R-resistant
Tested % 95% CI Tested % 95% CI
ofloxacin 986 0.7 0.2–1.3 458 18.7 14.7–22.7 moxifloxacin 0.5 707 1.5 0.5–2.4 371 17.5 13.3–21.8 moxifloxacin 2.0 706 0.6 0.0–1.2 366 2.3 0.8–3.7 kanamycin 986 0.3 0.0–0.7 458 32.5 28.1–36.9 capreomycin 986 0.2 0.0–0.5 458 15.1 11.6–18.6 amikacin 986 0.2 0.0–0.5 458 16.5 12.6–20.4
Note. Point estimates and CIs are calculated by multiple imputation of missing values, adjusted to account for clustered design.
Table 6. DST results to second-line anti-TB drugs by previous history (No.=1144)
Resistance to: New cases No.=1150 Previously treated cases No.=294
Tested % 95% CI Tested % 95% CI
ofloxacin 1150 4.7 3.6–5.9 294 13.5 9.5–17.5 moxifloxacin 0.5 851 4.9 3.3–6.4 227 13.3 8.8–17.9 moxifloxacin 2.0 848 0.6 0.0–1.2 224 2.8 0.7–5.0 kanamycin 1150 8.8 7.0–10.6 294 17.9 13.3–22.5 capreomycin 1150 3.8 2.7–5.0 294 9.5 6.3–12.8 amikacin 1150 4.3 3.1–5.5 294 9.9 6.2–13.6
Note. Point estimates and CIs are calculated by multiple imputation of missing values, adjusted to account for clustered design.
Table 7. DST results to second-line anti-TB drugs among MDR-TB patients
Second-line resistance pattern Tested No. % 95% CI XDR 445 50 11.2 8.1–14.4 Pre-XDR 445 136 30.6 26.3–35.1 Resistance to fluoroquinolones only 445 37 8.3 5.9–11.3 Resistance to second-line injectables only 445 99 22.2 18.5–26.4
Risk factors associated with MDR-TB
Univariate and adjusted by previous history of treatment
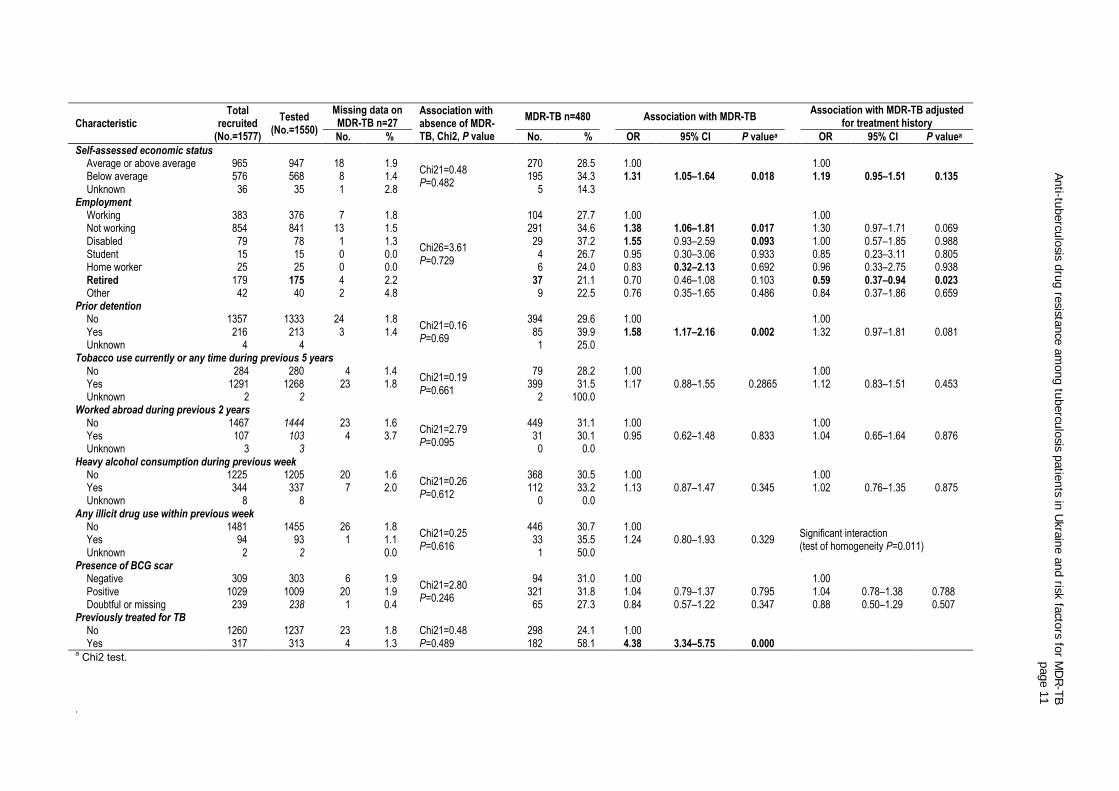
Patients previously exposed to TB drugs were more likely to have MDR-TB compared to new TB cases (OR 4.38; 95% CI: 3.34–5.75; P=0.000). There was a strong association between HIV status and MDR-TB: an HIV-infected patient had 77% higher odds of MDR-TB (OR 1.77; 95% CI: 1.33–2.35, P=0.000). Age was found to be associated with MDR-TB: the odds of having MDR-TB were significantly lower among patients aged 55–64 years (OR 0.47; 95% CI: 0.26–0.84, P=0.009) and 65 years and above (OR 0.46; 95% CI: 0.23–0.93, P=0.026) compared with those aged 15–24 years. Geographic variation was also found to be strongly associated with MDR-TB: people with TB living in the south-east of the country had significantly elevated odds of MDR-TB compared to patients from the western zone (OR 2.18; 95% CI: 1.57–3.03, P=0.000). People with a prior history of detention had statistically significant higher odds of MDR-TB (OR 1.58; 95% CI: 1.17–2.16, P=0.002), as did those who classified their own level of well-being as below average (OR 1.31; 95% CI: 1.05–1.64; P=0.018) or lived in a dormitory (OR 2.27; 95% CI: 0.98–5.30; P=0.05). Unemployed patients were more likely to have MDR-TB compared to those in work (OR 1.38; 95% CI: 1.06–1.81; P=0.017). Patients living with other family members had lower odds of MDR-TB compared to those living alone. Sex,
Anti-tuberculosis drug resistance among tuberculosis patients in Ukraine and risk factors for MDR-TB page 14
education, place of residence, smoking, alcohol use, illicit drug use, BCG scar and country of birth were not associated with MDR-TB in the univariate analysis. After adjusting for the previous history of treatment, the observed association between prior detention, housing situation, household size, self-assessed economic status and MDR-TB disappeared. Due to an observed interaction between sex, age group, setting, illicit drug use and MDR-TB in a stratified analysis by previous treatment history and varying patterns of risk factors, further analyses of risk factors were performed separately among new and retreated cases.
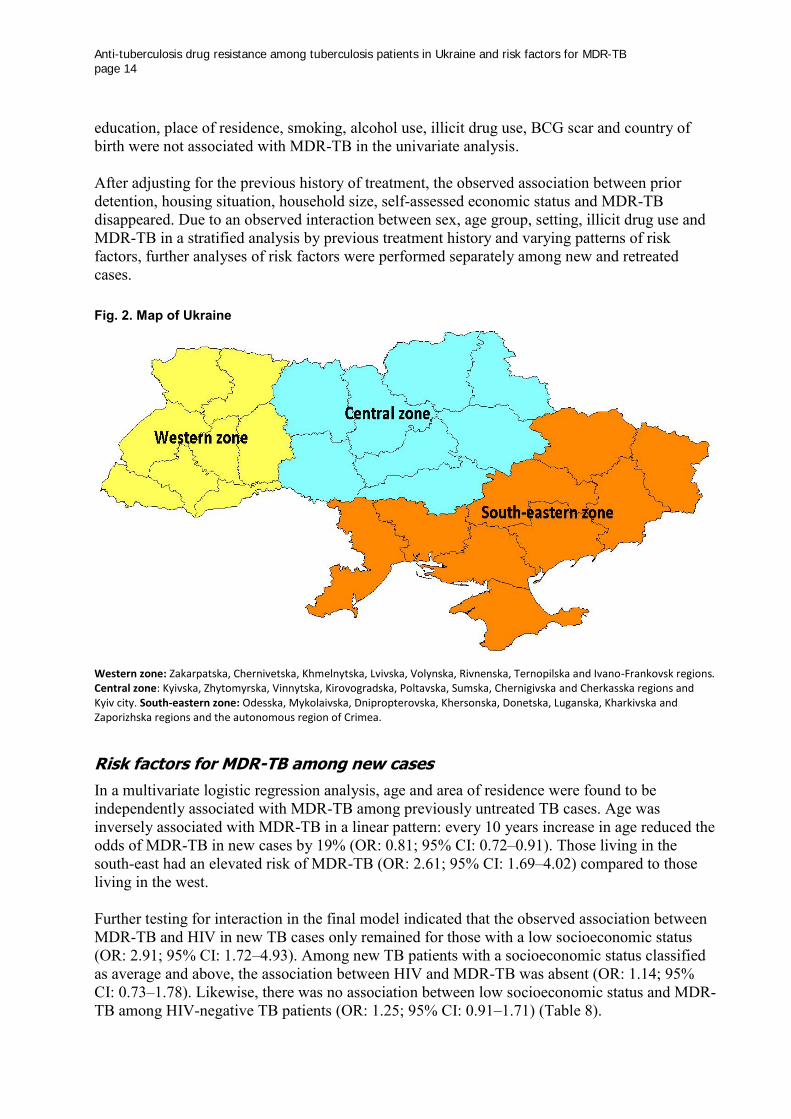
Fig. 2. Map of Ukraine
Western zone: Zakarpatska, Chernivetska, Khmelnytska, Lvivska, Volynska, Rivnenska, Ternopilska and Ivano-Frankovsk regions. Central zone: Kyivska, Zhytomyrska, Vinnytska, Kirovogradska, Poltavska, Sumska, Chernigivska and Cherkasska regions and Kyiv city. South-eastern zone: Odesska, Mykolaivska, Dnipropterovska, Khersonska, Donetska, Luganska, Kharkivska and Zaporizhska regions and the autonomous region of Crimea.
Risk factors for MDR-TB among new cases
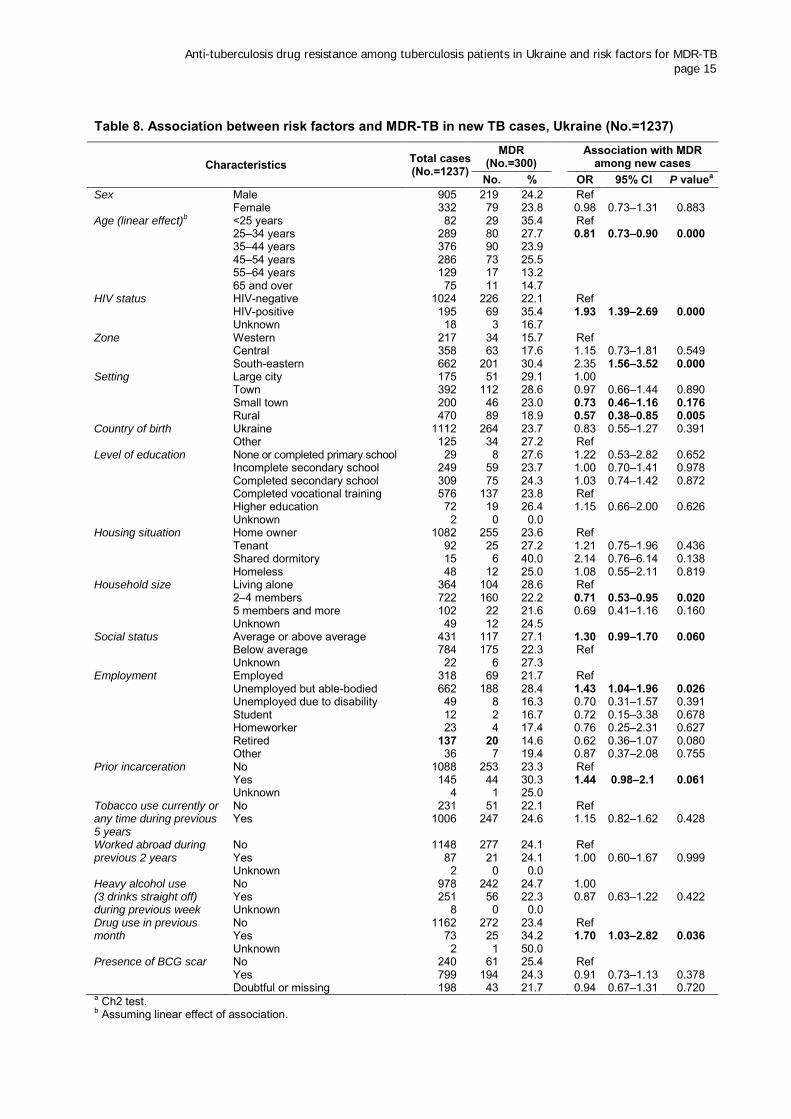
In a multivariate logistic regression analysis, age and area of residence were found to be independently associated with MDR-TB among previously untreated TB cases. Age was inversely associated with MDR-TB in a linear pattern: every 10 years increase in age reduced the odds of MDR-TB in new cases by 19% (OR: 0.81; 95% CI: 0.72–0.91). Those living in the south-east had an elevated risk of MDR-TB (OR: 2.61; 95% CI: 1.69–4.02) compared to those living in the west. Further testing for interaction in the final model indicated that the observed association between MDR-TB and HIV in new TB cases only remained for those with a low socioeconomic status (OR: 2.91; 95% CI: 1.72–4.93). Among new TB patients with a socioeconomic status classified as average and above, the association between HIV and MDR-TB was absent (OR: 1.14; 95% CI: 0.73–1.78). Likewise, there was no association between low socioeconomic status and MDR-TB among HIV-negative TB patients (OR: 1.25; 95% CI: 0.91–1.71) (Table 8).
Anti-tuberculosis drug resistance among tuberculosis patients in Ukraine and risk factors for MDR-TB page 15
Table 8. Association between risk factors and MDR-TB in new TB cases, Ukraine (No.=1237)
Characteristics Total cases (No.=1237)
MDR (No.=300) Association with MDR
among new cases No. % OR 95% CI P valuea
Sex Male 905 219 24.2 Ref
Female 332 79 23.8 0.98 0.73–1.31 0.883
Age (linear effect)b <25 years 82 29 35.4 Ref 25–34 years 289 80 27.7 0.81 0.73–0.90 0.000 35–44 years 376 90 23.9 45–54 years 286 73 25.5 55–64 years 129 17 13.2 65 and over 75 11 14.7
HIV status HIV-negative 1024 226 22.1 Ref HIV-positive 195 69 35.4 1.93 1.39–2.69 0.000 Unknown 18 3 16.7
Zone Western 217 34 15.7 Ref Central 358 63 17.6 1.15 0.73–1.81 0.549 South-eastern 662 201 30.4 2.35 1.56–3.52 0.000
Setting Large city 175 51 29.1 1.00 Town 392 112 28.6 0.97 0.66–1.44 0.890 Small town 200 46 23.0 0.73 0.46–1.16 0.176 Rural 470 89 18.9 0.57 0.38–0.85 0.005
Country of birth Ukraine 1112 264 23.7 0.83 0.55–1.27 0.391 Other 125 34 27.2 Ref
Level of education None or completed primary school 29 8 27.6 1.22 0.53–2.82 0.652 Incomplete secondary school 249 59 23.7 1.00 0.70–1.41 0.978 Completed secondary school 309 75 24.3 1.03 0.74–1.42 0.872 Completed vocational training 576 137 23.8 Ref Higher education 72 19 26.4 1.15 0.66–2.00 0.626 Unknown 2 0 0.0
Housing situation Home owner 1082 255 23.6 Ref Tenant 92 25 27.2 1.21 0.75–1.96 0.436 Shared dormitory 15 6 40.0 2.14 0.76–6.14 0.138 Homeless 48 12 25.0 1.08 0.55–2.11 0.819
Household size Living alone 364 104 28.6 Ref 2–4 members 722 160 22.2 0.71 0.53–0.95 0.020 5 members and more 102 22 21.6 0.69 0.41–1.16 0.160 Unknown 49 12 24.5
Social status Average or above average 431 117 27.1 1.30 0.99–1.70 0.060 Below average 784 175 22.3 Ref
Unknown 22 6 27.3 Employment Employed 318 69 21.7 Ref
Unemployed but able-bodied 662 188 28.4 1.43 1.04–1.96 0.026 Unemployed due to disability 49 8 16.3 0.70 0.31–1.57 0.391 Student 12 2 16.7 0.72 0.15–3.38 0.678 Homeworker 23 4 17.4 0.76 0.25–2.31 0.627 Retired 137 20 14.6 0.62 0.36–1.07 0.080 Other 36 7 19.4 0.87 0.37–2.08 0.755
Prior incarceration No 1088 253 23.3 Ref Yes 145 44 30.3 1.44 0.98–2.1 0.061 Unknown 4 1 25.0
Tobacco use currently or any time during previous 5 years
No 231 51 22.1 Ref Yes 1006 247 24.6 1.15 0.82–1.62 0.428
Worked abroad during previous 2 years
No 1148 277 24.1 Ref Yes 87 21 24.1 1.00 0.60–1.67 0.999 Unknown 2 0 0.0
Heavy alcohol use (3 drinks straight off) during previous week
No 978 242 24.7 1.00 Yes 251 56 22.3 0.87 0.63–1.22 0.422 Unknown 8 0 0.0
Drug use in previous month
No 1162 272 23.4 Ref Yes 73 25 34.2 1.70 1.03–2.82 0.036 Unknown 2 1 50.0
Presence of BCG scar No 240 61 25.4 Ref Yes 799 194 24.3 0.91 0.73–1.13 0.378
Doubtful or missing 198 43 21.7 0.94 0.67–1.31 0.720
a Ch2 test. b Assuming linear effect of association.
Anti-tuberculosis drug resistance among tuberculosis patients in Ukraine and risk factors for MDR-TB page 16
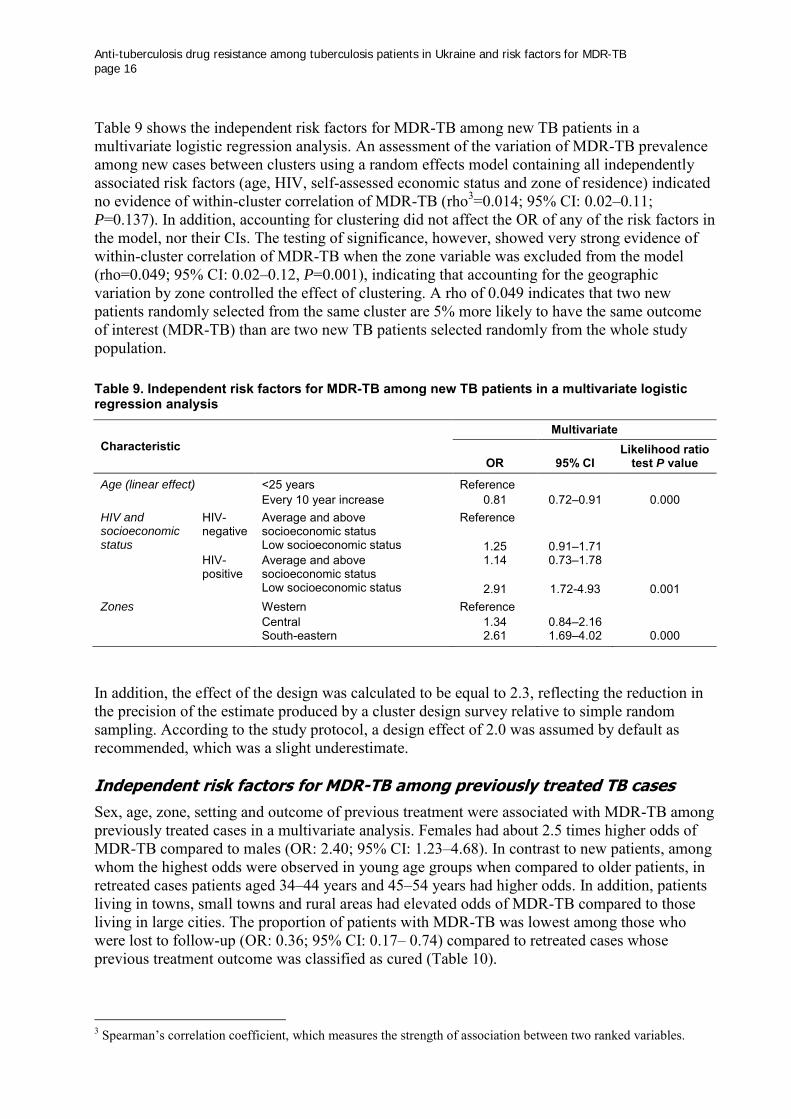
Table 9 shows the independent risk factors for MDR-TB among new TB patients in a multivariate logistic regression analysis. An assessment of the variation of MDR-TB prevalence among new cases between clusters using a random effects model containing all independently associated risk factors (age, HIV, self-assessed economic status and zone of residence) indicated no evidence of within-cluster correlation of MDR-TB (rho3=0.014; 95% CI: 0.02–0.11; P=0.137). In addition, accounting for clustering did not affect the OR of any of the risk factors in the model, nor their CIs. The testing of significance, however, showed very strong evidence of within-cluster correlation of MDR-TB when the zone variable was excluded from the model (rho=0.049; 95% CI: 0.02–0.12, P=0.001), indicating that accounting for the geographic variation by zone controlled the effect of clustering. A rho of 0.049 indicates that two new patients randomly selected from the same cluster are 5% more likely to have the same outcome of interest (MDR-TB) than are two new TB patients selected randomly from the whole study population.
Table 9. Independent risk factors for MDR-TB among new TB patients in a multivariate logistic regression analysis
Characteristic Multivariate
OR 95% CI Likelihood ratio
test P value
Age (linear effect) <25 years Reference
Every 10 year increase 0.81 0.72–0.91 0.000
HIV and socioeconomic status
HIV-negative
Average and above socioeconomic status
Reference
Low socioeconomic status 1.25 0.91–1.71
HIV-positive
Average and above socioeconomic status
1.14 0.73–1.78
Low socioeconomic status 2.91 1.72-4.93 0.001 Zones Western Reference
Central 1.34 0.84–2.16
South-eastern 2.61 1.69–4.02 0.000
In addition, the effect of the design was calculated to be equal to 2.3, reflecting the reduction in the precision of the estimate produced by a cluster design survey relative to simple random sampling. According to the study protocol, a design effect of 2.0 was assumed by default as recommended, which was a slight underestimate. Independent risk factors for MDR-TB among previously treated TB cases
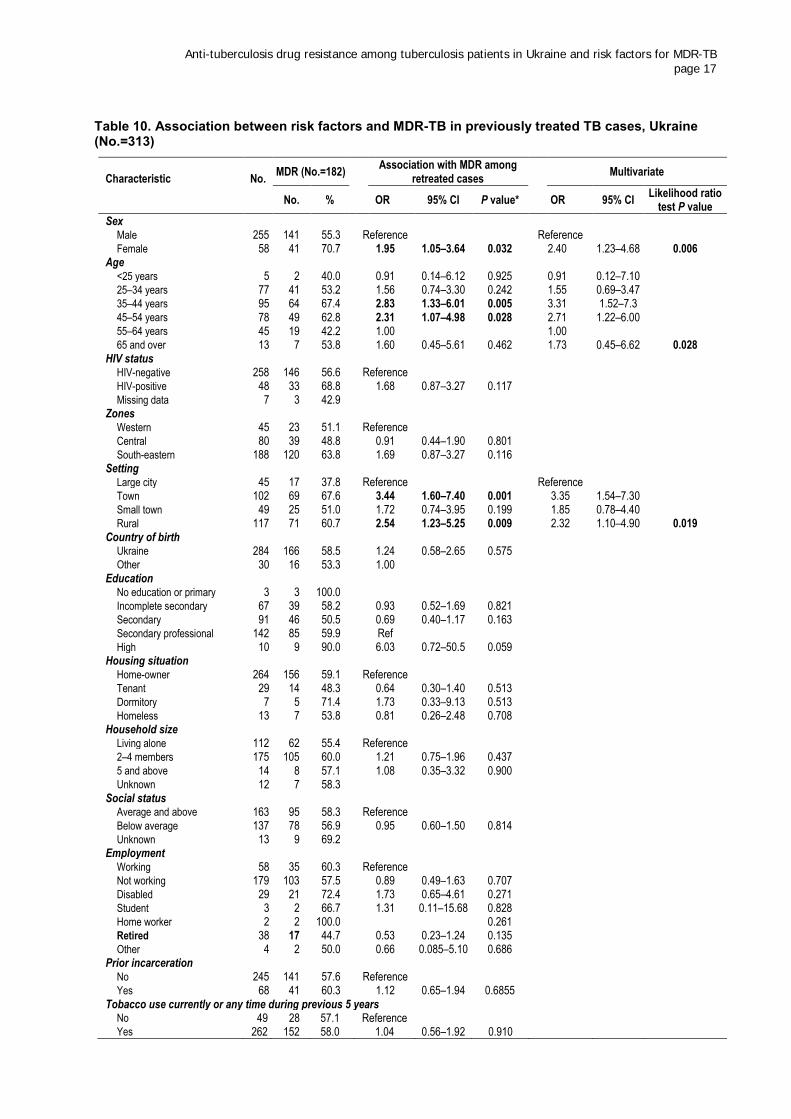
Sex, age, zone, setting and outcome of previous treatment were associated with MDR-TB among previously treated cases in a multivariate analysis. Females had about 2.5 times higher odds of MDR-TB compared to males (OR: 2.40; 95% CI: 1.23–4.68). In contrast to new patients, among whom the highest odds were observed in young age groups when compared to older patients, in retreated cases patients aged 34–44 years and 45–54 years had higher odds. In addition, patients living in towns, small towns and rural areas had elevated odds of MDR-TB compared to those living in large cities. The proportion of patients with MDR-TB was lowest among those who were lost to follow-up (OR: 0.36; 95% CI: 0.17– 0.74) compared to retreated cases whose previous treatment outcome was classified as cured (Table 10).
3 Spearman’s correlation coefficient, which measures the strength of association between two ranked variables.
Anti-tuberculosis drug resistance among tuberculosis patients in Ukraine and risk factors for MDR-TB page 17
Table 10. Association between risk factors and MDR-TB in previously treated TB cases, Ukraine (No.=313)
Characteristic No. MDR (No.=182)
Association with MDR among retreated cases
Multivariate
No. % OR 95% CI P value*
OR 95% CI Likelihood ratio
test P value
Sex Male 255 141 55.3 Reference
Reference
Female 58 41 70.7 1.95 1.05–3.64 0.032 2.40 1.23–4.68 0.006 Age
<25 years 5 2 40.0 0.91 0.14–6.12 0.925 0.91 0.12–7.10 25–34 years 77 41 53.2 1.56 0.74–3.30 0.242 1.55 0.69–3.47 35–44 years 95 64 67.4 2.83 1.33–6.01 0.005 3.31 1.52–7.3
45–54 years 78 49 62.8 2.31 1.07–4.98 0.028 2.71 1.22–6.00 55–64 years 45 19 42.2 1.00
1.00
65 and over 13 7 53.8 1.60 0.45–5.61 0.462 1.73 0.45–6.62 0.028 HIV status
HIV-negative 258 146 56.6 Reference HIV-positive 48 33 68.8 1.68 0.87–3.27 0.117
Missing data 7 3 42.9 Zones Western 45 23 51.1 Reference
Central 80 39 48.8 0.91 0.44–1.90 0.801 South-eastern 188 120 63.8 1.69 0.87–3.27 0.116 Setting
Large city 45 17 37.8 Reference
Reference Town 102 69 67.6 3.44 1.60–7.40 0.001 3.35 1.54–7.30
Small town 49 25 51.0 1.72 0.74–3.95 0.199 1.85 0.78–4.40 Rural 117 71 60.7 2.54 1.23–5.25 0.009 2.32 1.10–4.90 0.019
Country of birth Ukraine 284 166 58.5 1.24 0.58–2.65 0.575
Other 30 16 53.3 1.00 Education
No education or primary 3 3 100.0 Incomplete secondary 67 39 58.2 0.93 0.52–1.69 0.821
Secondary 91 46 50.5 0.69 0.40–1.17 0.163 Secondary professional 142 85 59.9 Ref
High 10 9 90.0 6.03 0.72–50.5 0.059 Housing situation
Home-owner 264 156 59.1 Reference Tenant 29 14 48.3 0.64 0.30–1.40 0.513
Dormitory 7 5 71.4 1.73 0.33–9.13 0.513 Homeless 13 7 53.8 0.81 0.26–2.48 0.708 Household size
Living alone 112 62 55.4 Reference 2–4 members 175 105 60.0 1.21 0.75–1.96 0.437
5 and above 14 8 57.1 1.08 0.35–3.32 0.900 Unknown 12 7 58.3
Social status Average and above 163 95 58.3 Reference
Below average 137 78 56.9 0.95 0.60–1.50 0.814 Unknown 13 9 69.2
Employment Working 58 35 60.3 Reference
Not working 179 103 57.5 0.89 0.49–1.63 0.707 Disabled 29 21 72.4 1.73 0.65–4.61 0.271 Student 3 2 66.7 1.31 0.11–15.68 0.828 Home worker 2 2 100.0
0.261
Retired 38 17 44.7 0.53 0.23–1.24 0.135 Other 4 2 50.0 0.66 0.085–5.10 0.686 Prior incarceration
No 245 141 57.6 Reference Yes 68 41 60.3 1.12 0.65–1.94 0.6855
Tobacco use currently or any time during previous 5 years No 49 28 57.1 Reference
Yes 262 152 58.0 1.04 0.56–1.92 0.910
Anti-tuberculosis drug resistance among tuberculosis patients in Ukraine and risk factors for MDR-TB page 18
Characteristic No. MDR (No.=182)
Association with MDR among retreated cases
Multivariate
No. % OR 95% CI P value*
OR 95% CI Likelihood ratio
test P value
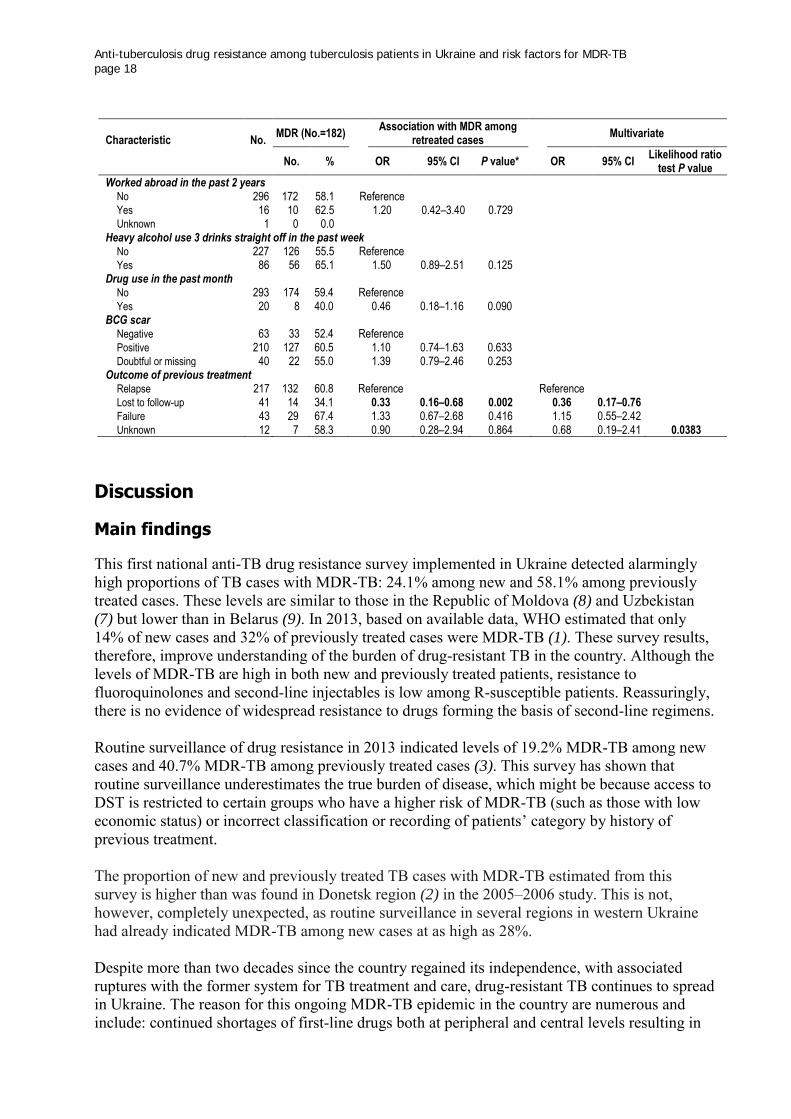
Worked abroad in the past 2 years No 296 172 58.1 Reference
Yes 16 10 62.5 1.20 0.42–3.40 0.729 Unknown 1 0 0.0
Heavy alcohol use 3 drinks straight off in the past week No 227 126 55.5 Reference
Yes 86 56 65.1 1.50 0.89–2.51 0.125 Drug use in the past month
No 293 174 59.4 Reference Yes 20 8 40.0 0.46 0.18–1.16 0.090
BCG scar Negative 63 33 52.4 Reference
Positive 210 127 60.5 1.10 0.74–1.63 0.633 Doubtful or missing 40 22 55.0 1.39 0.79–2.46 0.253 Outcome of previous treatment
Relapse 217 132 60.8 Reference
Reference Lost to follow-up 41 14 34.1 0.33 0.16–0.68 0.002 0.36 0.17–0.76
Failure 43 29 67.4 1.33 0.67–2.68 0.416 1.15 0.55–2.42 Unknown 12 7 58.3 0.90 0.28–2.94 0.864 0.68 0.19–2.41 0.0383
Discussion
Main findings
This first national anti-TB drug resistance survey implemented in Ukraine detected alarmingly high proportions of TB cases with MDR-TB: 24.1% among new and 58.1% among previously treated cases. These levels are similar to those in the Republic of Moldova (8) and Uzbekistan (7) but lower than in Belarus (9). In 2013, based on available data, WHO estimated that only 14% of new cases and 32% of previously treated cases were MDR-TB (1). These survey results, therefore, improve understanding of the burden of drug-resistant TB in the country. Although the levels of MDR-TB are high in both new and previously treated patients, resistance to fluoroquinolones and second-line injectables is low among R-susceptible patients. Reassuringly, there is no evidence of widespread resistance to drugs forming the basis of second-line regimens. Routine surveillance of drug resistance in 2013 indicated levels of 19.2% MDR-TB among new cases and 40.7% MDR-TB among previously treated cases (3). This survey has shown that routine surveillance underestimates the true burden of disease, which might be because access to DST is restricted to certain groups who have a higher risk of MDR-TB (such as those with low economic status) or incorrect classification or recording of patients’ category by history of previous treatment. The proportion of new and previously treated TB cases with MDR-TB estimated from this survey is higher than was found in Donetsk region (2) in the 2005–2006 study. This is not, however, completely unexpected, as routine surveillance in several regions in western Ukraine had already indicated MDR-TB among new cases at as high as 28%. Despite more than two decades since the country regained its independence, with associated ruptures with the former system for TB treatment and care, drug-resistant TB continues to spread in Ukraine. The reason for this ongoing MDR-TB epidemic in the country are numerous and include: continued shortages of first-line drugs both at peripheral and central levels resulting in
Anti-tuberculosis drug resistance among tuberculosis patients in Ukraine and risk factors for MDR-TB page 19
suboptimal treatment; lack of access to second-line full treatment schemes, especially in prison settings, and continuing inadequate case management for pre-XDR-TB and XDR-TB patients; poor infection control, especially in hospital settings; high prevalences of alcohol abuse and substance abuse resulting in poor adherence to treatment, and a highly stigmatizing attitude towards key affected populations on the part of the medical community. Additionally, the national TB protocols for treatment were not in line with WHO recommendations for a long time. There is very weak psychosocial support and a lack of ambulatory care for TB patients. In this survey, the factors affecting MDR-TB differ between new and retreated cases as the pathways for acquisition and transmission of MDR-TB differ. The study demonstrated that independent risk factors for MDR-TB in new TB cases are age, HIV status and poor socioeconomic status. Geographic location also plays an important role. The proportion of MDR-TB among new TB cases decreased linearly from 35.4% in the group aged 14–24 years to 14.7% in those aged above 64 years. Such a pattern of MDR-TB across age groups is an indication of growing transmission of MDR-TB strains over time, as TB in the young population is a result of recent transmission in contrast to older people in whom TB is most often due to reactivation. An increased burden of MDR-TB in the young population has been seen in most of the countries of the former USSR that have experienced rapid growth in MDR-TB, including Belarus (9), Georgia (10), Republic of Moldova (7) and Uzbekistan (8). In the univariate analysis, among new TB cases the study found a strong association between HIV and MDR-TB, which was consistent with the Donetsk study as well as findings observed elsewhere in the Region (9,10). An important highlight from this study is, however, that further analysis allowed the clarification that HIV is associated with MDR-TB among patients with low socioeconomic status only. This supports the hypothesis that most probably the association between MDR-TB and HIV is explained by the fact that people living with HIV in the Region (who, in most cases, belong to marginalized groups) and patients with MDR-TB have overlapping risk factors. An analysis of the surveillance of routine data in Kazakhstan (11) showed that TB/HIV coinfected patients not belonging to poor socioeconomic groups have no increased risk of MDR-TB. Among the retreated cases, the risk of MDR-TB was higher among HIV-positive patients than among HIV-negative patients, although this association was not statistically significant due to the small number of observations, which limited the strength of the study. Another important characteristic of the epidemiology of the MDR-TB epidemic in Ukraine is the striking geographic heterogeneity of the proportion of new patients with MDR-TB. This was already well known from routine surveillance and mortality analysis (12). Despite the study not having the statistical power to assess the proportions of MDR-TB at regional level, the comparison of larger geographic areas demonstrates that in the south-eastern part of the country the proportion of MDR-TB among new cases is about twice as high as in eastern and central Ukraine. Among previously treated TB patients, the independent risk factors for MDR-TB were female sex, residence in towns and rural areas versus large cities, and relapse or failure as the treatment outcome. Previously treated patients living in towns and rural areas had significantly higher odds of harbouring MDR-TB strains compared to those living in large cities. Because MDR-TB in previously treated cases is an indication of a shortfall in appropriate TB treatment and infection control, the higher proportions of MDR-TB in previously treated patients living in rural areas
Anti-tuberculosis drug resistance among tuberculosis patients in Ukraine and risk factors for MDR-TB page 20
may be due to poorer access to quality diagnostics, TB care and infection control measures in remote districts compared to large cities. Resistance to second-line TB drugs was significantly associated with MDR-TB and history of previous treatment and was much lower than the proportions of patients with MDR-TB. It is noteworthy that the proportion of patients with resistance to ofloxacin is similar to those with resistance to moxifloxacin 0.5µg, with 85% cross-resistance among MDR-TB patients. XDR-TB is not associated with previous history of treatment and is strongly related to geographic location: MDR-TB is the lowest in western Ukraine, but the percentage of XDR-TB in the western zone among MDR-TB patients is over twice as high as in the south-east (24.0% and 10.0%, respectively). MDR-TB patients in western Ukraine should be targeted for prompt second-line DST and individualized case management, given the alarmingly high prevalence of XDR-TB among MDR-TB patients.
Strengths and limitations of the study
Despite the difficult conditions, the field operations were implemented successfully. Quality indicators of the survey such as participation rate, culture recovery and contamination rate were satisfactory. Close monitoring by the supervision team allowed the detection and resolution of any problems in the field and improved the overall quality of survey data. Re-interviewing and crosschecking of patient data with the e-TB manager revealed that 23 non-eligible patients were enrolled in the study (with more than one episode of retreatment); of these, three were classified as new cases and 20 as previously treated. There were also cases of misclassification of patients: nine retreated cases were classified as new cases and one new case was classified as retreated. In addition, some health care providers failed to recruit the 32 new and 14 retreated eligible cases. To ensure that the numbers of missed cases and patients who refused to participate in the study did not differ notably from the study population leading to selection bias, the study team obtained routine DST results from the local laboratories. Separate analyses indicated that the proportion of MDR-TB among new and retreated cases who refused or were missed was 14.8% (8/54, 16 had no DST results) and 34.8% (8/23, 11 cases had no DST results), respectively. Certain challenges at different points in the implementation of the survey were beyond the control of the national coordinating team, including the inability to transport samples from certain territories and shortages in the supply of second-line drugs (kanamycin, capremycin, moxifloxacin) and culture (BACTEC™) reagents and equipment. Even so, only 15 samples could not be transported to the laboratory: seven from Luhansk region and eight from Crimea. An important component of the survey outcomes was the detailed analysis of results of the enrolment and quality of services provided to patients enrolled in the survey by those implementing the study in the field (cluster supervisors, laboratory supervisors, TB clinic physicians and heads of TB dispensaries). This permitted an understanding of the reasons for any gaps and ensured that they were addressed. Thus, by the end of the survey, there was significant improvement in the quantity and quality of biological material, interactions between clinicians and laboratory experts, laboratory network operations and administration of treatment. The survey ultimately proved to be a valuable monitoring and evaluation exercise for the national TB programme activities.
Anti-tuberculosis drug resistance among tuberculosis patients in Ukraine and risk factors for MDR-TB page 21
A limitation of the survey is that it was restricted to the civilian population. The previous drug resistance survey conducted in Donetsk province in eastern Ukraine in 2006 demonstrated that the prison population had an increased risk for MDR-TB (2). Although the proportion of cases with MDR-TB found in this national survey was higher than previously estimated, the true levels could be even higher. An anti-TB drug resistance survey is planned for the prison sector in 2016 to explore whether this is the case. Additionally, the proportion of TB cases coinfected with HIV in this national survey (15.6%) was lower than reported through routine surveillance (20%), which may be due to the exclusion of the prison population. Although the initial target size for the samples of study subjects was achieved, the final numbers of new TB cases with DST results varied notably across clusters due to the unequal absence of DST and interruption of the recruitment of patients in the eastern zone. To control for possible selection bias due to unequal sizes of cluster, the proportion of MDR-TB among new patients was weighted by patient enrolment. The study did not detect any evidence of increased MDR-TB among subjects with unhealthy habits such as tobacco use, drug use or heavy alcohol consumption, as seen elsewhere in the countries of the former USSR (13). One reason could be the small number of study subjects reporting these habits, limiting the strength of the study. Another explanation is respondent bias, with a tendency to report socially desirable behaviour during the interview which could obscure any existing association. The data collectors were, however, well trained in advance regarding this issue. To reduce respondent bias, the study questionnaire was designed in a way to allow data collectors to evaluate and record the validity of patient-provided responses, which was accounted for during the analysis. Another explanation is revision of questionnaire: in Belarus and the Republic of Moldova, heavy alcohol users were classified by their pattern of alcohol consumption over the four-week period prior to the survey, while in Ukraine recall time was limited to one week. Limiting the inquiry to one week could lead to bias as patients recently diagnosed with TB and admitted to hospital are likely to demonstrate differing alcohol consumption patterns from their norm. Additionally, no association was found between MDR-TB and a history of prior incarceration. This may reflect a high number of patients lost to follow-up when they are transferred from the prison sector to the civilian health sector for continuing treatment. In a study of 1181 TB patients from prisons in eight provinces in 2013–2014, only 720 (61%) were subsequently registered in the civilian health sector for continuing treatment.
Conclusion
Routine surveillance of drug resistance is suboptimal and underestimates the true burden of drug resistance. Given the wide availability of and access to quality-assured DST throughout the country, the national TB programme should work to move from periodic surveys to routine surveillance of drug resistance by strengthening the system of recording and reporting and paying special attention to correct classification of patients by previous history of treatment. It is highly recommended that a drug resistance survey be carried out in the penitentiary system so as to close the gap related to the extent of drug resistance in the penitentiary system and at the same time to assess and improve the quality of diagnostics and information flow.
Anti-tuberculosis drug resistance among tuberculosis patients in Ukraine and risk factors for MDR-TB page 22
References
1. Global tuberculosis report 2014. Geneva: World Health Organization; 2014 (http://www. who.int/tb/publications/global_report/gtbr14_main_text.pdf?ua=1, accessed 18 July 2016).
2. Dubrovina I, Miskinis K, Lyepshina S, Yann Y, Hoffmann H, Zaleskis R et al. Drug-resistant tuberculosis and HIV in Ukraine: a threatening convergence of two epidemics? Int J Tuberc Lung Dis. 2008;12:756–62.
3. European Centre for Disease Prevention and Control/WHO Regional Office for Europe. Tuberculosis surveillance and monitoring in Europe 2015. Stockholm: European Centre for Disease Prevention and Control; 2015 (http://www.euro.who.int/__data/assets/pdf_file/ 004/273172/Tuberculosis-surveillance-and-monitoring-in-Europe-2015.pdf?ua=1, accessed 18 July 2016).
4. Guidelines for surveillance of drug resistance in tuberculosis, fifth edition. Geneva: World Health Organization; 2015 (http://apps.who.int/iris/bitstream/10665/174897/1/978924154 9134_eng.pdf?ua=1, accessed 18 July 2016).
5. Karnaykhova MM, Dubrovina IV, Kheilo OE. Organization and lessons learned from the pilot study for the MDR-TB prevalence study in Ukraine. Ukrainian Pulmonological Journal. 2014;N2 (in Ukrainian).
6. Treatment of tuberculosis: guidelines, fourth edition. Geneva: World Health Organization; 2009 (http://whqlibdoc.who.int/publications/2010/9789241547833_eng.pdf, accessed 18 July 2016).
7. Jenkins HE, Plesca V, Ciobanu A, Crudu V, Galusca I, Soltan V et al. Assessing spatial heterogeneity of multidrug-resistant tuberculosis in a high-burden country. Eur Respir J. 2012;42:1291–301.
8. Ulmasova DJ, Uzakova G, Tillyashayhov MN, Turaev L, van Gemert W, Hoffmann H et al. Multidrug-resistant tuberculosis in Uzbekistan: results of a nationwide survey, 2010 to 2011. Euro Surveill. 2013;18(42):pii=20609.
9. Skrahina A, Hurevich H, Zalutskaya A, Sahalchyk E, Astrauko A, Hoffner S et al. Multidrug-resistant tuberculosis in Belarus: the size of the problem and associated risk factors. Bull World Health Organ. 2013;91(1):36–45.
10. Mdivani N, Zangaladze E, Volkova N, Kourbatova E, Jibuti T, Shubladze N et al. High prevalence of multidrug-resistant tuberculosis in Georgia. Int J Infect Dis. 2008;12(6):635–44.
11. van den Hof S, Tursynbayeva A, Abildaev T, Adenov M, Pak S, Bekembayeva G et al. Converging risk factors but no association between HIV infection and multidrug resistant tuberculosis in Kazakhstan. Int J Tuberc Lung Dis. 2013;17:526–31.
12. Murphy A, Levchuk N, Stickley A, Robets B, Mckee M. A country divided? Regional variation in mortality in Ukraine. Int J Public Health. 2013;58(6):837–44. doi:10.1007/ s00038-013-0457-2.
13. Fleming MF, Krupitsky E, Tsoy M, Zvartau E, Brazhenko N, Jakubowiak W et al. Alcohol and drug use disorders, HIV status and drug resistance in a sample of Russian TB patients. Int J Tuberc Lung Dis. 2006;10(5):565–70.