Anthropometric characteristics and changes with HIV and ...
117
0 Anthropometric characteristics and changes with HIV and ART in a randomly selected population in the Drakenstein region Western Cape Province By Dillan Charles Beukes MSc (Physiological Sciences) Thesis submitted in complete fulfilment of the requirements for the Degree Magister Scientiae in the Department of Physiological Sciences, in the Faculty of Science at Stellenbosch University. Supervisor : Dr. Theo A Nell Co-Supervisor : Prof. M Faadiel Essop January 2014
Transcript of Anthropometric characteristics and changes with HIV and ...

0
Anthropometric characteristics and changes with
HIV and ART in a randomly selected population in
the Drakenstein region Western Cape Province
By
Dillan Charles Beukes
MSc (Physiological Sciences)
Thesis submitted in complete fulfilment of the requirements for the Degree Magister Scientiae in the
Department of Physiological Sciences, in the Faculty of Science at Stellenbosch University.
Supervisor : Dr. Theo A Nell
Co-Supervisor : Prof. M Faadiel Essop
January 2014

1
I dedicate this thesis to all HIV sufferers
““““We must love, encourage and inspire people who are HIV-positive.”
Nelson Mandela
Stellenbosch University http://scholar.sun.ac.za

2
ACKNOWLEDGEMENTS
This study would not have been possible without the help and support of the following people. I
wish to thank the following persons for their contribution during this study.
• All the patients at TC Newman Community day care centre and Mbekweni Clinic
• My supervisors Dr Theo Nell and Prof. M. Faadiel Essop, thank you for all the guidance and
positive critisms throught all the stages that lead to this final product.
• My family Cobin, Jackie, Anwen, Aunty Rosie, Boeta and Shaylin without your support I could
not have got this far.
• To all my friends at the department Gina, Burger, Charlene, Buin, Tash, Marna, JD, Megan,
Liz, Kirsty, Danzil, Kathlene, Ashwin, Rudo, Jenelle, Peter, Andre, Rachel, Grazelda, Bali,
Aunty Katriena and Johnnifer.
• To all my friends Ola, Buzz, Linn, Candice, Andrea, Allison, Johnny, Striker, Quin, Jamie,
Simeon, Robby, Hassen, Carl, Sami, Ogel, Cassiem, Chene, Jerome, Bianca, Dean, Ross,
Charlie, Odille, Fiki, Keegan, Stanley, Luche, Tracey, Melissa, Nishta, Mikaeel and Fagan.
• All nursing staff (Sr Nancy especially) and Siphokazi with their helping with recruiting (get the
nurses names from TC Newman).
• All medical staff that assissted: Dr. Esme Calitz, Dr Rehana Essop,Dr Patricia van Wyk
• Mrs Sandra Theron and her administrative staff allowing us to execute the research at the
clinics.
• Department of Health, Western Cape Health, Dr Colette Gunst, Dr Surina Neethling
• Harry Crossley Foundation for startup funding as well as Faculty of Science
• Dr Justin Harvey acting as Statistical Consultant and Mrs Moleen Zunza for her help as well.
Stellenbosch University http://scholar.sun.ac.za

3
Table of Contents
ACKNOWLEDGEMENTS ........................................................................................................................... 2
TABLE OF CONTENTS ................................................................................ Error! Bookmark not defined.
List of Tables and Figures ........................................................................................................................ 6
List of Tables ....................................................................................................................................... 6
List of Figures ...................................................................................................................................... 6
List of Equations .................................................................................................................................. 7
List of abbreviations ................................................................................................................................ 8
ABSTRACT ................................................................................................................................................ 9
Opsomming ........................................................................................................................................... 10
CHAPTER 1 INTRODUCTION ............................................................................................................. 11
1. INTRODUCTION ......................................................................................................................... 11
1.1 Background and motivation .............................................................................................. 11
1.2 Use of anthropometry in body composition changes ...................................................... 12
1.2.1 Anthropometrical changes associated with HIV infection ............................................ 12
1.3 Aims and objectives .......................................................................................................... 12
1.4 Relevance of the study ...................................................................................................... 12
1.5 Author constributions ....................................................................................................... 13
1.6 Abstract accepted: Experimental Biology Meeting, San Diego, 26-30 April 2014 ............ 13
1.7 Structure of the dissertation ............................................................................................. 14
CHAPTER 2 LITERATURE SURVEY ..................................................................................................... 15
2.1 Introduction .......................................................................................................................... 15
2.2 HIV burden of disease in South Africa .................................................................................. 17
2.3 Brief physiological background on the HIV ........................................................................... 19
2.3.1 HIV Life cycle ................................................................................................................. 19
2.4 Pathophysiological consequences of HIV infection .............................................................. 20
2.5 Treating HIV .......................................................................................................................... 22
2.5.1 HAART ........................................................................................................................... 22
2.6 Anthropometry and body composition as health assessment tools in HIV ......................... 24
2.7 Bio electrical impedance analysis (BIA) as health assessment tool in HIV .......................... 25
2.8 Body composition changes associated with HIV and ARV medication ................................. 25
2.9 The levels of human body composition ................................................................................ 26
2.9.1 Body mass index (BMI) .................................................................................................. 27
2.9.2 Triceps skinfold (TSF) thickness and the mid-upper arm circumference (MUAC) ........ 28
Stellenbosch University http://scholar.sun.ac.za

4
2.9.3 Waist circumference (WC), hip circumference (HC) waist to hip ratio (WHR) and waist
to height ratio (W:Ht).................................................................................................................... 30
2.9.4 Body cell mass (BCM), FFM and FM .............................................................................. 30
2.9.5 Muscle mass, body protein content & mineral content ............................................... 31
2.9.6 RMR and TBK and TBCa and Glycogen .......................................................................... 32
2.10 The link between HAART and increased risk of cardio-metabolic disease .......................... 33
2.11 Lipodystophy and HIV ........................................................................................................... 34
2.12 Conclusion ............................................................................................................................. 35
CHAPTER 3 RESEARCH METHODS .................................................................................................... 36
3.1 Introduction .......................................................................................................................... 36
3.1.1 Study design and population ........................................................................................ 36
3.1.2 Sample size .................................................................................................................... 36
3.2 Subject recruitment .............................................................................................................. 37
3.2.1 Ethical considerations ................................................................................................... 38
3.2.2 Patient history ............................................................................................................... 38
3.3 Anthropometrical assessment .............................................................................................. 38
3.3.1 Base measurements: height and weight....................................................................... 38
3.3.2 Waist and hip circumference measurements ............................................................... 39
3.3.3 TSF and MUAC measurements ..................................................................................... 39
3.3.4 BIA ................................................................................................................................. 39
3.4 Data management ................................................................................................................ 40
3.4.1 Statistical analysis ......................................................................................................... 40
3.5 Constraints encountered during the method section and data collection .......................... 40
CHAPTER 4 RESULTS ......................................................................................................................... 42
4.1 Context of this chapter ......................................................................................................... 42
4.2 Characteristics of the participants ........................................................................................ 42
4.3 Anthropometric data between genders and treatment groups. .......................................... 46
4.3.1 Body mass index (BMI) (kg/m2) ..................................................................................... 46
4.3.2 Base measurement: weight (kg) ................................................................................... 49
4.3.3 Base measurement: height (m)..................................................................................... 50
4.3.4 Triceps skinfold (TSF) and mid-upper arm circumference (MUAC) .............................. 51
4.3.4 WC, HC, WHR and W:Ht ................................................................................................ 52
4.3.5 W:Ht .............................................................................................................................. 57
4.3.6 FFM and FFM% .............................................................................................................. 58
Stellenbosch University http://scholar.sun.ac.za

5
4.3.7 Fat and Fat% .................................................................................................................. 60
4.3.8 BCM (kg) and ECM (kg) ................................................................................................. 62
4.3.9 Muscle mass .................................................................................................................. 64
4.3.10 Total body protein......................................................................................................... 65
4.3.11 Mineral content ............................................................................................................ 66
4.3.12 Resting metabolic rate (RMR) ....................................................................................... 67
4.3.13 Total body Potassium (TBK) .......................................................................................... 68
4.3.14 Total body Calcium (TBCa) ............................................................................................ 69
4.3.15 Glycogen ........................................................................................................................ 70
4.3.16 Cluster of differentiation 4 (CD4) .................................................................................. 71
4.3.14 Anti-retrovirals (ARVs) ................................................................................................. 72
CHAPTER 5 DISCUSSION, RECOMMENDAITONS AND CONCLUSIONS ............................................. 73
5.1 Introduction .......................................................................................................................... 73
5.2 Major findings of the study ................................................................................................... 73
5.2.1 Anthropometrical findings ............................................................................................ 73
5.2.2 Body composition findings ............................................................................................ 76
5.2.3 CD4 ................................................................................................................................ 79
5.3 Implications of findings ......................................................................................................... 80
5.3.1 Cardiovascular link to HAART ........................................................................................ 80
5.4 Limitations and recommendations ....................................................................................... 82
5.5 Strategies for improvement of quality of life in relation to anthropometric findings ......... 83
5.6 Conclusion ............................................................................................................................. 83
List of Refernces .................................................................................................................................... 85
APPENDIX A: CONSENT FORMS .......................................................................................................... 104
APPENDIX B Bioelecical Impedance Analsis (BIA) Protocol ................................................................ 112
APPENDIX C: ETHICS APPROVAL ......................................................................................................... 113
APPENDIX D: DATA COLLECTION SHEETS............................................................................................ 116
Stellenbosch University http://scholar.sun.ac.za

6
List of Tables and Figures
List of Tables
Table 1. Comparison of the 2001 and 2012 data for HIV prevalence world-wide............................................... 16
Table 2: illustrating the different classes of ARV’s ............................................................................................... 22
Table 3: Summary of general side effects of the different ARV's used in HIV treatment .................................... 24
Table 4: BMI classification and cut off points. ...................................................................................................... 28
Table 5: Summary of anthropometric characterises of all participants ............................................................... 42
Table 6: Summary of bioelectrical impedance characteristics of all participants ................................................ 43
Table 7: Anthropometrical characteristics for male participants per treatment group ....................................... 43
Table 8: Summary of BIA characteristics of for male participants per treatment group ..................................... 44
Table 9: Anthropometrical characteristics for female participants per treatment group. ................................... 44
Table 10: Summary of BIA characteristics of for female participants per treatment group ................................ 45
Table 11: illustrating high and low risk cut off vales for both genders for WC, WHR and W:Ht .......................... 52
Table 12: Summarizing percentage use of medication within groups.................................................................. 72
List of Figures
Figure 1: Illustrates global prevalence rates for HIV............................................................................................. 16 Figure 2: Illustrates that there is a decline in he newly infected adult trends i Sub-Sahran Africa ...................... 17 Figure 3: Illustrates HIV prevalence by metropole areas for 2005 ....................................................................... 19 Figure 4: The five levels of human body composition .......................................................................................... 26 Figure 5: illustrating Drakenstein Municipality in the Western Cape ................................................................... 36 Figure 6: illustration the positioning of electrodes on participants ..................................................................... 39 Figure 7: Constraints encountered during study study ........................................................................................ 41 Figure 8: Distribution of BMI categories within the total sample population. ..................................................... 46 Figure 9: Distribution of BMI categories for the male population........................................................................ 46 Figure 10: Distribution of BMI categories in the female population. ................................................................... 47 Figure 11:BMI according to treatment category and gender ............................................................................... 48 Figure 12: Weight according to gender and treatment categories. ..................................................................... 49 Figure 13: Height according to gender and treatment categories. ...................................................................... 50 Figure 14: TSF according to gender and treatment category. .............................................................................. 51 Figure 15: MUAC according to gender and treatment category. ......................................................................... 52 Figure 16: WC as a percentage of males categorised either as low or high risk. ................................................. 52 Figure 17: Males WC depicting percentage of females with high risk and low risk. ............................................ 53 Figure 18: Males WHR depicting percentage of males with high risk and low risk. ............................................. 53 Figure 19: Females WHR depicting percentage of males with high risk and low risk. ......................................... 53 Figure 20: WC according to gender and treatment category. .............................................................................. 54 Figure 21: HC according to gender and treatment category. ............................................................................... 55 Figure 22: W:H according to gender and treatment category.............................................................................. 56 Figure 23: W:Ht according to gender and treatment category. ........................................................................... 57 Figure 24: FFM according to gender and treatment category. ............................................................................. 58 Figure 25: FFM% according to gender and treatment category. .......................................................................... 59 Figure 26: FAT according to gender and treatment category............................................................................... 60 Figure 27: FAT% according to gender and treatment category. ........................................................................... 61 Figure 28: BCM according to gender and treatment category. ............................................................................ 62
Stellenbosch University http://scholar.sun.ac.za

7
Figure 29: ECM according to gender and treatment category. ............................................................................ 63 Figure 30: Mineral content according to gender and treatment category........................................................... 66 Figure 31: Muscle according to gender and treatment category. ........................................................................ 64 Figure 32: RMR according to gender and treatment category. ............................................................................ 67 Figure 33: Protein according to gender and treatment category. ........................................................................ 65 Figure 34: TBK according to gender and treatment category. ............................................................................. 68 Figure 35: TBCa according to gender and treatment category. ........................................................................... 69 Figure 36: Glycogen according to gender and treatment category. ..................................................................... 70 Figure 37: CD4 according to gender and treatment category. ............................................................................. 71 Figure 38: TDF, 3TC, D4T and AZT use according to gender and treatment category. ........... Error! Bookmark not
defined. Figure 39: EFV and NVP use according to gender and treatment category. ............Error! Bookmark not defined. Figure 40: LOP/r according to gender and treatment category. ..............................Error! Bookmark not defined.
List of Equations
Equation 1: Sample size formula .......................................................................................................................... 36
Stellenbosch University http://scholar.sun.ac.za

8
List of abbreviations AIDS Acquired Immunodeficiency Syndrome ANOVA Analysis of Variance ART Antiretroviral Therapy ARV Antiretroviral AZT Zidovudine BCM Body Cell Mass BF Body Fat BIA Bioelectrical Impedance Analysis CCR4 Chemokine Receptor type 4 CCR5 Chemokine Receptor type 5 CD4 Cluster Designation four DDI Didanosine DEXA Dual energy x-ray absorptiometry D4T Stavudine DNA Deoxyribonucleic acid ECM Extracellular Mass EFV Efaviranz FM Fat Mass FFM Fat Free Mass FTC Emtricitabine GCP Good Clinical Practice HAART Highly Active Antiretroviral Therapy HC Hip Circumference HIV Human Immunodeficiency Virus HREC Human Research Ethics Committee IRSI Immune Reconstitution Inflammatory Syndrome ISAK International Society for the Advancement of Kinanthropometry LBM Lean Body Mass LOP/r Lopinavir/Ritonavir LSD Least Significant Difference MUAC Mid-upper Arm Circumference NNRTIs Non Nucleolus Reverse Transcriptase Inhibitors NRTIs Nucleolus Reverse Transcriptase Inhibitors NVP Nevirapine PI Protease Inhibitors PLWHA People Living With HIV/AIDS RMR Resting Metabolic Rate SAT Subcutaneous Adipose Tissue STI Sexually Transmitted Diseases TBCa Total Body Calcium TBK Total Body Potassium TBM Total Body Mass TBW Total Body Water TSF Triceps Skinfold UNAIDS The Joint United Nations Programme on HIV and AIDS UNMDG United Nations Millennium Development Goals VAT Visceral Adipose Tissue vRNA Viral Ribonucleic Acid WC Waist Circumference WHO World Health Organisation WHR Waist-to-Hip Ratio W:Ht Waist-to-Height Ratio 3TC Lamivudine
Stellenbosch University http://scholar.sun.ac.za
9
ABSTRACT
Background
Highly active antiretroviral therapy (HAART) has extended life expectancy and enhanced the well-being of HIV-
positive individuals. Since there are concerns regarding HAART-mediated onset of cardio-metabolic diseases in
the long-term, we evaluated the anthropometric profile of HIV-infected individuals in the Drakenstein District
(Western Cape, South Africa).
Objective of study
The primary objective of this study was to document the anthropometric characteristics within and HIV
infected population in the Drakenstein region of the Western Cape Province of South Africa.
Methods
HIV-positive patients (n=44 males, n=102 females; 20-40 yrs.) were recruited for three groups: 1) control (HIV-
naïve), 2) HIV-positive (HAART ≤ 0-36 months), and 3) HIV-positive (HAART ≥ 36 months). Participants
underwent a) anthropometric (triceps skin fold [TSF], and b) bioelectrical impedance measurements (body cell
mass [BCM], fat free mass [FFM], protein, muscle mass (MM), mineral, total body potassium (TBK) and calcium
(TBCa), glycogen, and fat mass [FM]).
Results
Our data reveal that HIV-positive males on HAART ≤ 0-36 months displayed a trend for lower body cell mass
(BCM), fat free mass (FFM), fat mass (FM), triceps skinfold (TSF) and protein content (vs. control). Females
exhibited reduced BCM (p=0.001) and lower protein (p=0.003), muscle mass (p=0.001), glycogen (p=0.001), FM
(p=0.0005) and FFM (p=0.002) content. However, with longer-term treatment (HAART ≥ 36 months), females
displayed higher BCM (p=0.0001), protein (p=0.01), muscle mass (p=0.0003), glycogen (p=0.0001), FM
(p=0.00003) and FFM (p=0.0002) vs. the 0-36 months treatment group. Their waist-to-hip ratio also increased
vs. the naïve female group (p=0.02). By contrast, males on HAART ≥ 36 months did not show any significant
increases vs. the HAART ≤ 0-36 month’s group.
Conclusions
This study demonstrates observed striking gender-based anthropometric differences in South African HIV-
positive individuals on HAART. While both genders initially exhibit muscle wasting, HIV-positive females show
a strong improvement with longer-term treatment vs. males. However, higher abdominal fat accumulation in
females with longer-term treatment potentially increases their risk for the future onset of cardio-metabolic
complications.
Key words: HIV, anthropometry, epidemiology, BIA
Stellenbosch University http://scholar.sun.ac.za

10
Opsomming
Agtergrond
Hoogs-aktiewe anti-retrovirale terapie (HAART) het beide die lewensverwagting en lewenskwaliteit van MIV-
positiewe individue verhoog. Omrede daar kommer uitgepsreek is oor die HAART gemedieerde aanvang van
kardio-metaboliese siekte oor die langtermyn, het ons die antropometriese profile van MIV geïnfekteerde
individue in die Drakenstein Distrik (Wes-Kaap Provinsie, Suid Afrika) ondersoek.
Doel van die studie
Die primêre doel van die studie was om die antropometriese eienskappe van ‘n MIV-geïnfekteerde populasie
in die Drakenstein omgewing van die Wes-Kaap Provinsie van Suid Afrika te ondersoek.
Daar is ook verder gepoog om die verwantskap hiermee met die risiko vir kardiometaboliese siekte te probeer
vastel.
Metodes
MIV-positiewe pasiënte (n=44 mans, n=102 vroue; 20-40 jr.) is gewerf in drie groepe: 1) kontrole (HIV-naïef),
2) MIV-positief (HAART ≤ 0-36 maande), en 3) MIV-positiewe (HAART ≥ 36 maande). Deelnemers het a)
antropometriese evaluering ondergaan (trisepsvelvou [TVV], en b) bio-elektriese impedansie metings
(liggaamselmassa [LSM], vetvrye massa [VVM], proteïen, spiermassa (SM), minerale, totale liggaamkalium
(TLK), en kalsium (TLCa), glikogeen, en vetmassa [VM]).
Resultate
Ons data toon aan dat MIV-positiewe mans op HAART ≤ 0-36 maande ‘n laer neiging tot LSM, VVM, VM, TVV
en proteïeninhoud het vergeleke met die kontrole. Vroue het ‘n verlaagde LSM opgelewer (p=0.001) sowel
laer proteïen (p=0.003), spiermassa (p=0.001), glikogeen (p=0.001), VM (p=0.0005) en VVM (p=0.002).
Hoewel, met lang-termyn behandeling (HAART ≥ 36 maande), het vroue ‘n hoër LSM (p=0.0001), proteïen
(p=0.01), spiermassa (p=0.0003), glikogeen (p=0.0001), VM (p=0.00003) en VVM (p=0.0002) opgelewer vs. die
0-36 maande behandelingsgroep. Hulle middel:heup verhouding het ook betekenisvol verhoog vs. die
kontrole vroue groep (p=0.02). Kontrasterend het die mans op HAART ≥ 36 maande geen betekenisvolle
toenames vs. die HAART ≤ 0-36 maande groep opgelewer nie.
Gevolgtrekking
Hierdie studie demonstreer treffende geslagsgebaseerde antropometriese verskille in n Suid Afrikaanse HIV-
positiewe populasie wat op HAART is. Terwyl beide geslagte aanvanglik spierwegkwyning vertoon het, het die
MIV positiewe vroue ‘n goeie verbetering met lang-termyn behandeling vs die mans opgelewer. Alhoewel
daar hoër abdominale vetophoping in die vroue waargeneem is wat op langtermynbehandeling is, kan dit hulle
risiko vir toekomistige aanvang van kardio-metaboliese siekte komplikasies verhoog.
Sleutelwoorde: MIV, antropometrie, epidemiologie, BIA.
Stellenbosch University http://scholar.sun.ac.za

11
CHAPTER 1 INTRODUCTION
1. INTRODUCTION
1.1 Background and motivation
This chapter serves as orientation presenting the context of the thesis. The steps involved in the
concenption and research executed is illustrated in Figure 1.
Figure 1: Contexual frame work of the dissertation
Approximately 60 million people have been infected with HIV since the outbreak of the epidemic in
the early 1980’s. Sub-Saharan Africa is the region most affected and is home to 67% of all people
living with HIV and 25 million people have died of HIV-related causes (UNAIDS, 2010).
South Africa still has the largest HIV population in the world (UNAIDS, 2010; World Health Statistics,
2009; UNAIDS, 2008; Statistics South Africa, 2009). The number of people living with HIV increased
from approximately 4.1 million (2001) to an estimated 5.6 million (2009). Women in the age group
25-29 years are the worst affected with prevalence rates of up to 40%. It is estimated that there is a
10% prevalence among men older than 50 years (UNAIDS, 2010).
HIV prevalence is highest in two of the wealthiest sub-Saharan countries, South Africa (18.8%) and
Botswana (24.1%) (UNAIDS, 2008). An updated version of this report estimated a slight decline in
the prevalence but still considered the highest world-wide (UNAIDS, 2010).
The estimated average prevalence of HIV infection in the Western Cape Province (2002) was 10.7%
which decreased during 2005 (1.9%) and increased until 2008 (3.8%). Much of this decreased
prevalence could be attributed to the ART that was initiated (UNAIDS, 2008). Two Cape Town
metropole health areas of Khayalitsha and Gugulethu/Nyanga registered prevalence rates of 33.0%
and 29.0% respectively, high above the national average.
Co
nce
pti
on
of
rese
arch
qu
etio
n
Planning of research
Lite
ratu
re s
urv
ey Review of available recent literature R
esea
rch
Pro
po
sal
Drafting proposal and submitting to ethical review board IS
AK
en
GC
P c
erti
fica
tio
n
Executing research and data collection St
atis
tica
l an
alys
is
Commencing thesis write-up
Stellenbosch University http://scholar.sun.ac.za

12
The statistics for the Boland district indicate similar patterns of prevalence but no clear data is
available to corroborate the exact statistics.
1.2 Use of anthropometry in body composition changes
Many researchers employ different anthropometrical indices to describe body composition and also
associate this with outcomes before or during disease states as well as assessment of nutritional
status (Banda et al., 2007). Anthropometry is a non-invasive, inexpensive method to evaluate and
characterise body composition or changes as a result of intervention or monitoring health and
disease (Salomon et al., 2002).
1.2.1 Anthropometrical changes associated with HIV infection
Anthropometrical (body composition) changes are common in HIV and AIDS (Menezes et al., 2014).
AIDS sufferers have significantly lower average weights and mid-arm circumferences compared to
controls (Kotler, 2006). HIV is believed to, with progression of the disease; contribute to decrease in
body cell mass but no significant change in body fat stores (Bell et al., 1997). Tuberculosis co-
infection further increase the risk of decreasing muscle mass. In a study of patients with active TB in
the United Kingdom, BMI (13%), muscle mass (13%) and subcutaneous fat stores (20%) were lower
in those with TB compared with healthy age-, sex-, and ethnic-matched controls (Onwubalili, 1988).
1.3 Aims and objectives
The study’s main aim was to estimate the mean anthropometrical characteristics, TSF, MUAC, FFM
as well as other body composition parameters using conventional anthropometrical methods of an
HIV infected population in the Western Cape region (Winelands/Boland) of South Africa.
1.4 Relevance of the study
The South African HIV population’s anthropometrical profiles are unknown. TSF, MUAC and FFM are
non-invasive and inexpensive assessments that can help describe the population’s body
composition. These and other parameters correlate well with outcomes such as ease of contracting
opportunistic infections, nutritional status and disease progression. Using standard methods (ISAK –
International Society for the Advancement of Kinanthropometry) to assess body composition
profiles and changes over time our study aim to investigate the TSF, MUAC and FFM in providing
data that can be used to help understand the characteristics of anthropometry changes in an HIV
burdened South Africa. The data can serve as comparison to follow-up studies (prospective-
longitudinal) and in nutritional/exercise interventions studies. Long term HIV care and treatment
Stellenbosch University http://scholar.sun.ac.za
13
programmes should also aim in improving quality of life and establish applicable guidelines to meet
the goals of the HIV, AIDS and STI Strategic Plan for South Africa (2007-2011).
1.5 Author constributions
The author was responsible for all data collection. All physical parameters were collected
(anthropometric variables) by the author. A very comprehensive literature survey was done
afterwhich data was analysed by Statistical Consultation Services (Dr Justin Harvey).
Data interprestation and technical editing of all results were done by the author.
1.6 Abstract accepted: Experimental Biology Meeting, San Diego, 26-30 April 2014
Distinct gender differences in the anthropometric profile of South African HIV-positive individuals
on highly active anti-retroviral treatment
Theo Nell, Dillan Beukes, M. Faadiel Essop. Cardio-Metabolic Research Group (CMRG), Department of Physiological
Sciences, Stellenbosch University, Stellenbosch, South Africa
Highly active antiretroviral therapy (HAART) has extended life expectancy and enhanced the well-
being of HIV-positive individuals. Since there are concerns regarding HAART-mediated onset of
cardio-metabolic diseases in the long-term, we evaluated the anthropometric profile of HIV-infected
individuals in the Drakenstein District (Western Cape, South Africa). HIV-positive patients (n=44
males, n=102 females; 20-40 yrs) were recruited for 3 groups: 1) control (HIV-naïve), 2) HIV-positive
(HAART ≤ 3 years), and 3) HIV-positive (HAART ≥ 3 years). Participants underwent a) anthropometric
(triceps skin fold [TSF], , and b) bioelectrical impedance measurements (body cell mass [BCM], fat
free mass [FFM], protein, mineral, total body potassium and calcium, glycogen, and fat mass [FM]).
Our data reveal that HIV-positive males on HAART ≤ 3 years displayed a trend for lower BCM, FFM,
FM, TSF and protein content (vs. HIV-naïve). Females exhibited reduced BCM (p=0.001) and lower
protein (p=0.003), muscle (p=0.001), glycogen (p=0.001), FM (p=0.0005) and FFM (p=0.002) content.
However, with longer-term treatment (HAART ≥ 3 years), females displayed higher BCM (p=0.0001),
protein (p=0.01), muscle (p=0.0003), glycogen (p=0.0001), FM (p=0.00003) and FFM (p=0.0002) vs.
the short-term treatment group. Their waist-to-hip ratio also increased vs. the naïve female group
(p=0.02). By contrast, males on HAART ≥ 3 years did not show any significant increases vs. the
HAART ≤ 3 years group. This study demonstrates observed striking gender-based anthropometric
differences in South African HIV-positive individuals on HAART. While both genders initially exhibit
muscle wasting, HIV-positive females show a strong improvement with longer-term treatment vs.
Stellenbosch University http://scholar.sun.ac.za

14
males. However, higher abdominal fat accumulation in females with longer-term treatment
potentially increases their risk for the future onset of cardio-metabolic complications.
1.7 Structure of the dissertation
The thesis is divided into five chapters. A short introduction outlines the structure and contents of
each chapter.
The first chapter orientates the reader to the motivation and objectives of the study. The role
anthropometry plays as an assessment tool in HIV infected patients is highlighted as well as the
accompanied body composition changes associated with the use of highly antiretroviral therapy
(HAART). The relationship between these changes and the increased risk of cardiovascular disease in
this population is emphasiszed.
The second chapter of the thesis consists of a review of recent literature.
In Chapter 3, the methods used in the data collection are meticulously presented followed by the
results of the study (Chapter 4).
Chapter 5 summarise the discussion and conclusions of this study and recommendations for further
research and applications are made.
The results of this research have already been prepared in a manuscript for publication in the
International journal of Aids Reviews.
The contributions of the researcher were as follow:
The researcher had undergone Good Clinical Practice Certification through Tygerberg Human Ethics
Board. He was also trained and accredited as a Level 1 technician anthropometrist. During the first
part of the study he was responsible for the questionnaire development, testing and interviews. He
also collected all anthropometrical assessments (conventional and BIA) and captured the data on MS
Excel 2010.
Stellenbosch University http://scholar.sun.ac.za

15
CHAPTER 2 LITERATURE SURVEY
This chapter focuses on a recent literature survey that focuses on the global, regional and provincial
statistical outlook on HIV infection. The literature survey will also focus briefly on the human
immunodeficiency virus (HIV) situation in South Africa, and how it is treated and monitored. The use
of anthropometrical techniques and body composition will be integrated in this context in which its
usefulness in chronic disease monitoring will be highlighted.
2.1 Introduction
The United Nations Millennium Development Goals (UNMDG) consists of eight goals in which 191
UN Member States agreed upon, and strive to achieve by the year 2015 (WHO, 2012). The United
Nations Millennium Declaration also commits world leaders to combat poverty, hunger, disease,
illiteracy, environmental degradation, and discrimination against women (WHO, 2012). The
UNMDGs are derived from this Declaration, and all have specific targets and indicators.
At the end of 2011, 34 million people were living with HIV (UNAIDS Global Report, 2012). During
that year approximately 2.5 million people became newly infected, and 1.7 million died of AIDS,
including 330 000 children (UNAIDS Global Report, 2012). More than eight million people in low-
and middle-income countries were receiving antiretroviral (ARV) therapy at the end of 2011. The
majority of the people living with HIV/AIDS (PLWHA) still occur in Sub Saharan Africa (UNAIDS Global
Report, 2012). Sub-Saharan Africa still remains the most severely affected region, with nearly one in
every 20 adults (4.9%) living with HIV and accounting for ~70% of the people living with HIV
worldwide (WHO, 2013). With a total estimated population of 902 million, this region contributes
80% of the total deaths and ~70% of global persons living with HIV (UNAIDS, 2011).
Stellenbosch University http://scholar.sun.ac.za

16
Table 1. Comparison of the 2001 and 2012 data for HIV prevalence globally.
Source: UNAIDS, 2013.
Despite these alarming statistics the annual number of new HIV infections among adults and
adolescents decreased by 50% or more in 26 countries between 2001 and 2012 (UNAIDS report on
the global AIDS epidemic 2013).
Figure 2: Global prevalence rates for HIV per global regions
(UNAIDS report on the global AIDS epidemic 2013).
Stellenbosch University http://scholar.sun.ac.za
17
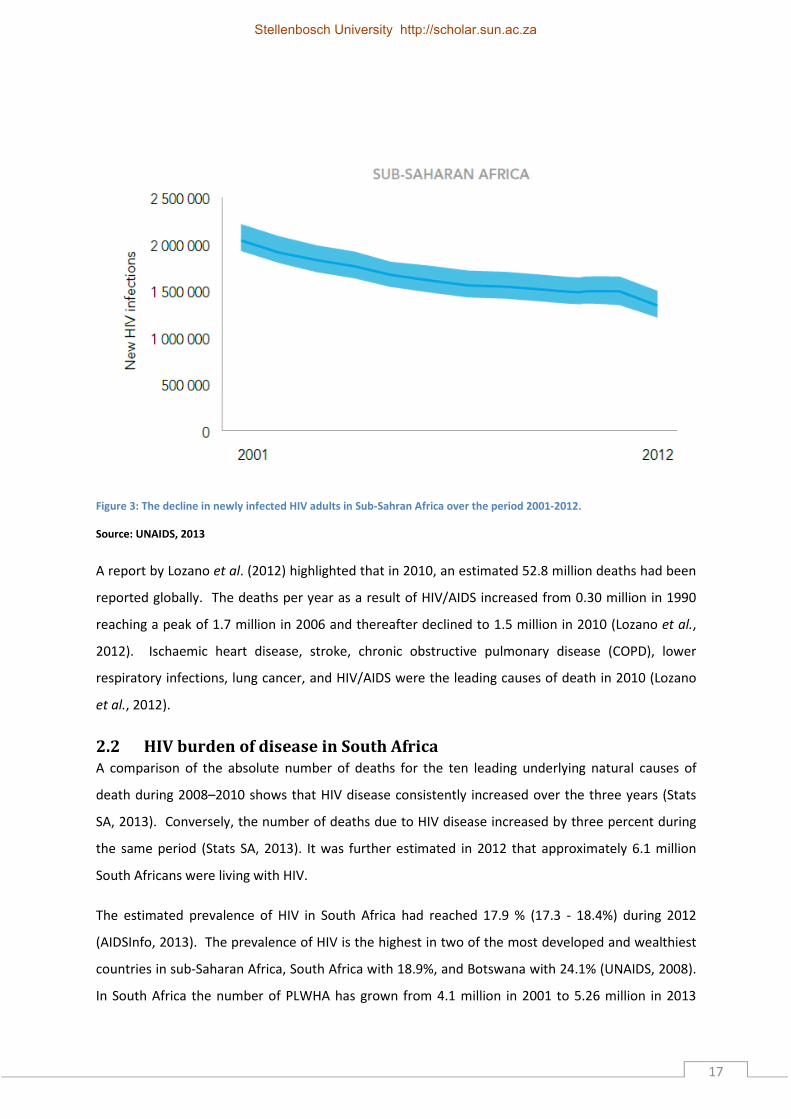
Figure 3: The decline in newly infected HIV adults in Sub-Sahran Africa over the period 2001-2012.
Source: UNAIDS, 2013
A report by Lozano et al. (2012) highlighted that in 2010, an estimated 52.8 million deaths had been
reported globally. The deaths per year as a result of HIV/AIDS increased from 0.30 million in 1990
reaching a peak of 1.7 million in 2006 and thereafter declined to 1.5 million in 2010 (Lozano et al.,
2012). Ischaemic heart disease, stroke, chronic obstructive pulmonary disease (COPD), lower
respiratory infections, lung cancer, and HIV/AIDS were the leading causes of death in 2010 (Lozano
et al., 2012).
2.2 HIV burden of disease in South Africa
A comparison of the absolute number of deaths for the ten leading underlying natural causes of
death during 2008–2010 shows that HIV disease consistently increased over the three years (Stats
SA, 2013). Conversely, the number of deaths due to HIV disease increased by three percent during
the same period (Stats SA, 2013). It was further estimated in 2012 that approximately 6.1 million
South Africans were living with HIV.
The estimated prevalence of HIV in South Africa had reached 17.9 % (17.3 - 18.4%) during 2012
(AIDSInfo, 2013). The prevalence of HIV is the highest in two of the most developed and wealthiest
countries in sub-Saharan Africa, South Africa with 18.9%, and Botswana with 24.1% (UNAIDS, 2008).
In South Africa the number of PLWHA has grown from 4.1 million in 2001 to 5.26 million in 2013
Stellenbosch University http://scholar.sun.ac.za

18
(UNAIDS, 2009; mid-year population estimates, 2013). Women are mostly affected with a
prevalence of 3.4 million in the age group >15 years (UNAIDS HIV and AIDS estimates, 2013).
HIV prevalence levels vary geographically between provinces and within provinces. For example, in
the Western Cape Province, the HIV prevalence shows an increasing trend over the past decade
(Department of Health, Western Cape, 2006). The 2005 Provincial Antenatal HIV Survey calculated
an overall HIV prevalence of 15.7% in the Western Cape Province. The Actuarial Society of South
Africa’s (ASSA’s) demographic model estimates that there were approximately 220 000 people living
with HIV in the Western Cape in 2006. According to this model, this number was expected to
increase to approximately 320 000 by 2010 (ASSA, 2005).
Efforts to monitor and respond to the HIV/AIDS epidemic are complicated by the temporal and
geographical evolution of the many sub–epidemics at the provincial or even sub-district, level. The
interpretation of epidemiological trends is further made more difficult by an inadequate
understanding of how different social, behavioral and epidemiological factors influence the
dynamics of the epidemic within different settings (Rehle et al., 2004).
Although no recent data exists for the Western Cape HIV prevalence levels by area. Earlier findings
had show varying prevalence depending on regions within the metropole and non-metropole areas
(Draper et al., 2007; Shaikh et al., 2006).
Stellenbosch University http://scholar.sun.ac.za

19
Figure 4: HIV prevalence by metropole as well as non-metropole areas for 2005
Two of the Western Cape metro pole areas with the highest prevalence are Gugulethu and
Khayalitsha and these ranked among the highest national averages with 33% and 29% respectively
(Shaikh et al., 2006). The Western Cape projections for 2013 for women between the ages 15 – 49
years were 12.54% and 7.33% for males (Western Cape HIV/AIDS Infection, Mortality and Fertilty
Population Projections, 2005).
2.3 Brief physiological background on the HIV
The human body is constantly exposed to threats such as viruses, bacteria and fungi and the immune
system’s function is to first identifying such threats by a) detecting antigens present on the
“invaders” and b) then trying to effectively neutralise them (Abbas et al., 2012). In cases where the
immune system is weakened such as in HIV infection, the body cannot defend itself by these
invaders and becomes more vulnerable to infections (Thompson et al., 2010).
2.3.1 HIV Life cycle
HIV infected host cells do not survive for long as a result of HIV replication taking place within the
cell. Thus, HIV continuously infects new cells in order to replicate and 10x106 to 10x109 HIV virions
are produced each day.
Stellenbosch University http://scholar.sun.ac.za
20
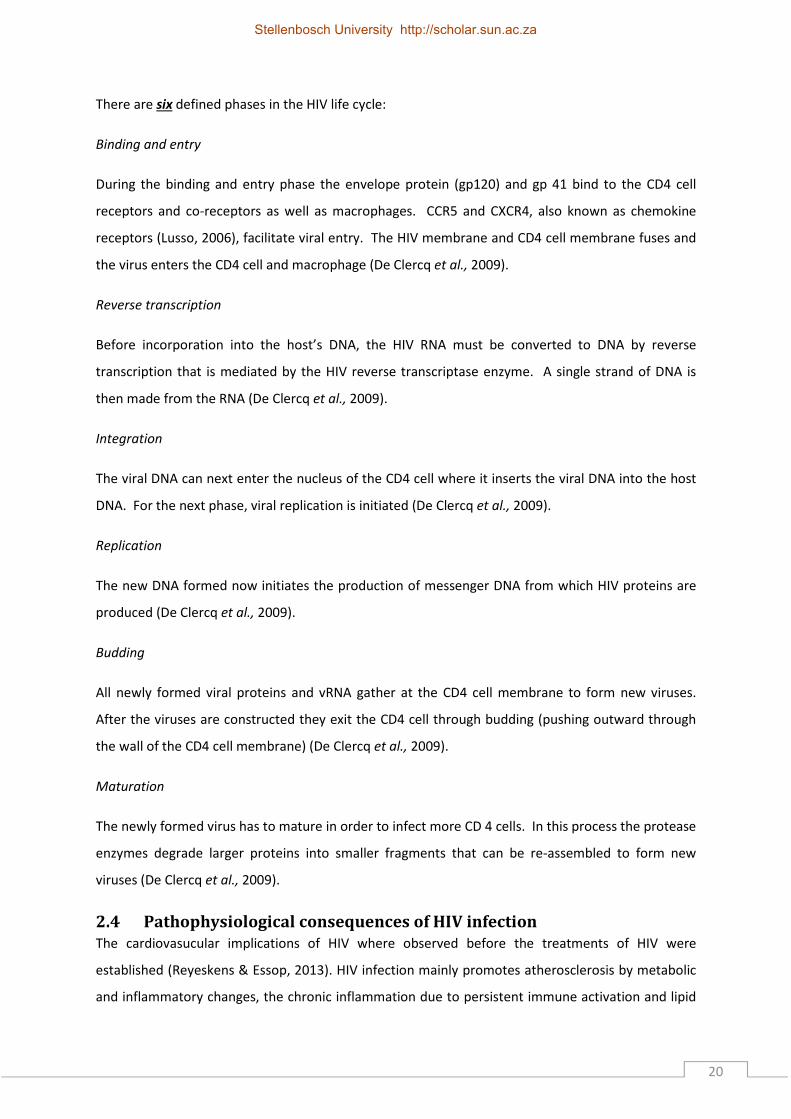
There are six defined phases in the HIV life cycle:
Binding and entry
During the binding and entry phase the envelope protein (gp120) and gp 41 bind to the CD4 cell
receptors and co-receptors as well as macrophages. CCR5 and CXCR4, also known as chemokine
receptors (Lusso, 2006), facilitate viral entry. The HIV membrane and CD4 cell membrane fuses and
the virus enters the CD4 cell and macrophage (De Clercq et al., 2009).
Reverse transcription
Before incorporation into the host’s DNA, the HIV RNA must be converted to DNA by reverse
transcription that is mediated by the HIV reverse transcriptase enzyme. A single strand of DNA is
then made from the RNA (De Clercq et al., 2009).
Integration
The viral DNA can next enter the nucleus of the CD4 cell where it inserts the viral DNA into the host
DNA. For the next phase, viral replication is initiated (De Clercq et al., 2009).
Replication
The new DNA formed now initiates the production of messenger DNA from which HIV proteins are
produced (De Clercq et al., 2009).
Budding
All newly formed viral proteins and vRNA gather at the CD4 cell membrane to form new viruses.
After the viruses are constructed they exit the CD4 cell through budding (pushing outward through
the wall of the CD4 cell membrane) (De Clercq et al., 2009).
Maturation
The newly formed virus has to mature in order to infect more CD 4 cells. In this process the protease
enzymes degrade larger proteins into smaller fragments that can be re-assembled to form new
viruses (De Clercq et al., 2009).
2.4 Pathophysiological consequences of HIV infection
The cardiovasucular implications of HIV where observed before the treatments of HIV were
established (Reyeskens & Essop, 2013). HIV infection mainly promotes atherosclerosis by metabolic
and inflammatory changes, the chronic inflammation due to persistent immune activation and lipid
Stellenbosch University http://scholar.sun.ac.za

21
and other metabolic factors play a major role (Boccara et al., 2013). HIV infection can promote
proliferation of vascular smooth muscle and develop atherosclerosis (Eugenin et al., 2008). Chronic
immune activation and its subsequent inflammation due to the HIV virus can be associated with
changes linked to ageing such as bone demineralization, cancer and immune senescence (Appay &
Sauce, 2008). Chronic activation of the immune system seems to be the key factor in the
development of cardio vascular diseases due to HIV infection (Reyskens & Essop, 2014).
The HIV infection is linked to known cardiovascular risk factors namely higher cholesterol levels,
lipodystophy and the metabolic syndrome (Ford et al., 2011). The effect of HIV itself on health in the
context of disease can only truly be unveiled when the immunological and metabolic system changes
are studied; these effects are ongoing even though treatment suppresses the rate of viral replication
(Deeks et al., 2010). Some forms of treatment even compound cardio metabolic effects, such as
nucleoside reverse trsanscriptase inhibitors (NRTIs), non-nucleoside reverstranscriptase inhibitors
(NNRTIs) and protease inhibitors (PIs).
These risk factors lead to body composition changes such as weight loss in HIV positive individuals,
which occurs due to the malabsorption of the intestine that leads to nutrient loss (Hsu et al., 2005).
This can damage the intestinal villi and Cryptosporidium can then opportunistically infect the gut
(Hsu et al., 2005). The loss of protein and muscle mass are major factors that affect the morbidity
and mortality associated with HIV (Little & Phillips, 2009).
Early studies reported that the mortality from HIV is due to the loss of protein stores and fat free
mass rather than the loss of weight (Prado et al., 2008; Tan et al., 2009; Baracos et al., 2010). This
concept is now well established, eg. Thibault et al. (2012) stated that there is a well demonstrated
link between mortality and the loss of fat free mass in patients with chronic diseases. However,
immune effects, changes in metabolism, weight, fat free mass loss, and the effects of opportunistic
infections all contribute to morbidity and mortality (Hsu et al., 2005; Appay & Sauce, 2008; Little &
Phillips, 2009; Deeks et al., 2010; ), and therefore making it difficult to readily discern the level of risk
each abnormality poses.
The energy shortage in HIV positive individuals are mostly caused by a reduction in dietary intake,
malabsorption, an increase in energy expenditure due to the increased metabolic cost of
inflammation and the utilization of atypical energy substrates(Hsu et al., 2005). All these factors
combined can lead to an increased energy requirement of 20 – 50% for sympomatic HIV and 10% for
asymptomatic HIV (Hsu et al., 2005).
Stellenbosch University http://scholar.sun.ac.za

22
2.5 Treating HIV
2.5.1 HAART
During 2010 only 17.6 % of the South African population had access to medical aid, leaving the rest
of the country to rely on public health care facilities (Statistics South Africa General Household
Survey, 2010). Thus, prior to 2004, antiretroviral treatment was only available to individuals who
could afford medical aid and also to those with work place treatment programmes. For the HIV
positive population this meant that only 3.8 % initiated treatment during 2002-03 (National strategic
plan on HIV and STI 2007-2011). However, with the successful ARV roll-out, ARV coverage increased,
including approximately eight million people (2009-2012) (UNAIDS Global Report, 2012).
Table 2: The different classes of ARV’s
NRTI’s NNRTI’s PI’s Fusion Inhibitors
(FI’s)
Zidovudine AZT Efavirenz EFV Ritanovir RTV Enfuvirtide
Lamivudine 3TC Nevirapine NVP Saquinavir SQV
Emtricitabine FTC Delavirdine DLV Indinavir IDV
Stavudine d4T Nelfinavir NFV
Didanosine ddl Fosamprenavir APV
Tenofovir TDF Lopinavir LPV
Abacavir ABV Atazanavir ATV
Zalcitabine ddC Darunavir DRV
(Han et al., 2007)
There are many classes of anti-retroviral drugs but within the public health system the most
generally used are the nucleoside reverse transcriptase inhibitors (NRTI’s), non-nucleoside reverse
transcriptase inhibitors (NNRTI’s) and the protease inhibitors (PI’s) (The South African Antiretroviral
Treatment Guidelines, 2010). Each class of drug has a different mechanism of action; the NRTI’s
incorporate themselves into the viral DNA by the use of the HIV reverse transcriptase halting the
elongation of the DNA chain.
NNRTI’s bind to reverse transcriptase, while PI’s bind to viral protease and inhibit the subsequent
maturation of virus particles. The other classes namely integrase inhibitors, CCR5 & CCR4 inhibitors
and fusion inhibitors are not widely used in the South African public sector (The South African
Antiretroviral Treatment Guidelines, 2010).
Triple therapy is used due to the high probability of resistance and clinical progression of HIV-
infection with single and dual therapy (Montaner et al., 1998; Ledergerber et al., 1999; Hogg et al.,
Stellenbosch University http://scholar.sun.ac.za

23
2001). The latter involves the use of three drugs simultaneously mostly from two different classes of
ARV drugs (The South African Antiretroviral Treatment Guidelines, 2004). When treatment is
initiated the first regimen is introduced, consisting of two NRTI’s and one NNRTI, when this fails or
the patient becomes resistant to the medication the second regimen is introduced that consists of
two NRTIs and one PI (The South African Antiretroviral Treatment Guidelines, 2010).
During 2010 changes in drug regimens were initiated in South African clinics - due to several side
effects. Recently, stavudine (D4T) has been phased out (for first regimen), and currently Tenofovir
(TDF) and Lamivudine (3TC) are used as the two NRTIs, and either Efaviernz (EFV) or Nevirapine
(NVP) are used as the NNRTI (National Antiretroviral Treatment Guidelines, 2004; The South African
Antiretroviral Treatment Guidelines, 2010).
For the second regimen, Didanosine (DDI) had been removed and replaced with Lamivudine (3TC).
Currently the two NRTIs are Zidovudine (AZT) and Lamivudine (3TC) and the PI is Lopinavir/Ritonavir
(National Antiretroviral Treatment Guidelines, 2004; The South African Antiretroviral Treatment
Guidelines, 2010).
A third line therapy is also available, however not for the public sector (WHO, 2010) and reserved for
those who can afford the highest standard of care worldwide. More recently, a new fixed drug
combination was introduced to the South African health care system – in an attempt to increase
adherence. Here one pill is taken once daily, consisting of a combination of TDF, Emtricitabine (FTC)
and EFV but still has the efficacy of all three drugs separately (Davies, 2013).
Although medication have improved the quality of life, and also the prognosis of HIV-positive
patients they do not come without any adverse effects. Each drug class has side-effects and is
summarised in Table 3.
Stellenbosch University http://scholar.sun.ac.za

24
Table 3: Summary of the general side effects of the different ARV's used in HIV treatment
(Sungkanuparph et al., 2008; Hawkins, 2010)
2.6 Anthropometry and body composition as health assessment tools in
HIV
Anthropometry is defined as the science of acquiring anatomical dimensional measurements
(lengths, breadths, girths and skin folds) by means of standardised equipment (Stewart, 2012).
Using these measurements, body composition of the human body can be quantified (Stewart, 2012).
Monitoring the structure, composition and proportions of the human body can expose certain
profiles that are well-described with the progression and precursors of disease states (Cordeiro et
al., 2010). For example, fat distribution is one important factor that is used in profiling and risk
management of various pathologies and syndromes (Thibault et al., 2012).
Anthropometric techniques can not only be used for profiling for the risk of disease but also discern
those who are suffering from pathology, provide insights into the underlying mechanisms of
pathology or a health intervention and a method of tracking the effectiveness of interventions
(Stewart, 2012). There are several advantages for using anthropometry; (i) it is a portable method,
(ii) it is inexpensive, (iii) does not require complicated training, (iv) delivers very close correlations
between field techniques and laboratory methods (Fourie et al., 2011).
Class Example Mecahnism of action Negative side effects
Nucleoside reverse transcriptase inhibitors (NRTIs)
Tenofivir (TDF) Lamivudine (3TC) Stavudine (D4T) Zidovudine (AZT) Didanosine (DDi) Abacavir (ABC) Emtricitabine (FTC)
Inhibits the incorporation of the viral DNA by inhibiting reverse transcriptase (provides faulty building blocks)
Anemia Cardio vascular disease, Lactic acidosis, Central nervous effects, Diabetes mellitus, Dyslipidemia Gastrointestinal effects, Hepatic effects, Lipodystrophy, Osteoporosis, Peripheral neuropathy.
Non-nucleoside reverse transcripate inhibitors (NNRTIs)
Efavirenz (EFV) Nevirapine (NVP)
Inhibits the incorporation of the viral DNA by inhibiting reverse transcriptase (binds to reverse transcriptase)
Central nervous effects, Gastrointestinal effects Hepatic effects, lipodystrophy, osteoporosis
Protease inhibitors (PI)
Lopinavir Rotinavir Atazanivir
Blocks protease enzyme, prevention of new virus formation
Cardio vascular disease, Diabetes mellitus, Dyslipidemia, Gastrointestinal effects, Hepatic effects, Lipodystrophy, Osteoporosis
Intergrase inhibitors (II)
Raltegravir Elvitegravir
Inhibits the activation of intergrase, stopping the incorporation of viral DNA into hosts genome
Central nervous effects, Lypodystrophy
CCR5 inhibitors (CCRI)
Maraviroc Vicriviroc
Prevents the interaction and binding of CCR5 receptor to the glycoprotein 120 needed for entry of virus
Hepatic inhibitors
Fusion inhibitors (FI)
Enfuvirtide Binds to the glycoprotein 41 on HIV virus preventing fusion with host cell
Hepatic effects
Stellenbosch University http://scholar.sun.ac.za

25
A relationship exists between the type of anthropometric technique and the relative strength of the
risk factor to predict major pathologies. This relationship exposes the principal that cardiovascular
and metabolic health risks are more associated with the distribution of body fat rather than the
abundance of body fat. Skin folds and waist to hip ratios (WHRs) are widely used for characterizing
the distribution of body fat, these methods carry less validity in the evaluation of deep fat deposits
(Eston et al., 2009). Computed tomography (CT) and magnetic resonance imaging (MRI) are
considered the gold standard, and able to measure the deep fat but is not cost effective (Rolland,
2013; Wells, 2012).
2.7 Bio electrical impedance analysis (BIA) as health assessment tool in
HIV
BIA utilizes the electrical potential of biological tissues (Stahn et al., 2012). This is attained by
applying a constant alternating current and measuring the voltage potential that results from that
current (Stahn et al., 2012). Different biological tissues conduct electricity at different rates, at
varying frequencies biological tissues act as insulators or conductors and current flowing through a
system will follow the path of least resistance; these are the basis for this technique, e.g.to
determine fat mass (FM) and fat free mass (FFM). FM contains meagre amounts of water and does
not conduct electrical current very well while FFM has an abundance of water (with electrolytes)
making it a good conductor of electrical current (Stahn et al., 2012).
From measuring the time it takes for the current to reach its destination at different frequencies
total body water (TBW) as well as total body mass (TBM) can be calculated.
With body composition analysis the main tissue that we are interested in is the adipose tissue (fat).
Subsequently, it is easy to determine the amount of lean tissue. This is an easy way to determine the
changes that occur in the whole body and give an indication of disease progression or a precursor for
disease states (Thibault & Pichard, 2012).
2.8 Body composition changes associated with HIV and ARV medication
Body composition can be considered as the chemical or physical components that collectively make
up an organism’s mass, defined in a systematic manner (Stewart, 2010). In order to study or
evaluate different aspects of the components of the body we need to know the sub-units in which
the components come from.
Stellenbosch University http://scholar.sun.ac.za

26
2.9 The levels of human body composition
Body composition and structure can be explained and described using organizational levels. These
levels range from chemical and molecular to anatomical, cell, tissue, organ, system and whole
organism (Wang et al., 1992; Eston et al., 2009).
Figure 5: The five levels of human body composition
(Adapted from: Wang et al., 1992; Eston et al., 2009)
Atomic level
Although there are more or less 50 in total elements in total, 98% of the human body mass consists
of only six elements (hydrogen, oxygen, carbon, nitrogen, phosphorous and calcium) (Eston et al.,
2009). For example, by examing nitrogen content at this level it can provide information regarding
proteins.
Molecular level
There are over 100 000 varieties of molecules in the human body, however the most common are;
water, protein, lipids, minerals and carbohydrates (Stewart, 2012).
Level 1ATOMIC
• Hydrogen
• Carbon
• Oxygen• Nitrogen
• Pottasium
Level 2MOLECULAR
• Protein
• Lipid
• Glycogen• Mineral
• Water
Level 3 CELLULAR
• Extracellular solids
• Extracellular fluids
• Cell mass
Level 4 TISSUES
• Other
• Blood
• Bone• Adipose tissue
• Skeletal muscle
Level 5 WHOLE BODY
• Head, neck
• Torso
• Arms• Legs
CHEMICAL ANATOMICAL
Stellenbosch University http://scholar.sun.ac.za
27
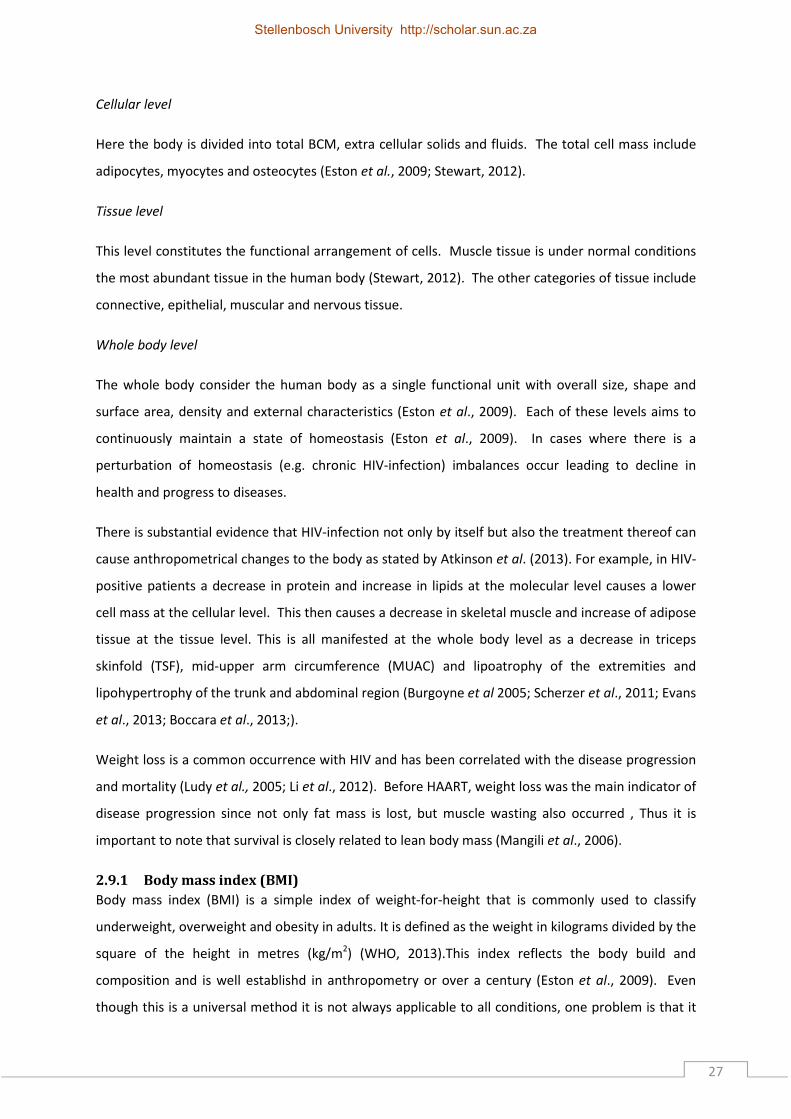
Cellular level
Here the body is divided into total BCM, extra cellular solids and fluids. The total cell mass include
adipocytes, myocytes and osteocytes (Eston et al., 2009; Stewart, 2012).
Tissue level
This level constitutes the functional arrangement of cells. Muscle tissue is under normal conditions
the most abundant tissue in the human body (Stewart, 2012). The other categories of tissue include
connective, epithelial, muscular and nervous tissue.
Whole body level
The whole body consider the human body as a single functional unit with overall size, shape and
surface area, density and external characteristics (Eston et al., 2009). Each of these levels aims to
continuously maintain a state of homeostasis (Eston et al., 2009). In cases where there is a
perturbation of homeostasis (e.g. chronic HIV-infection) imbalances occur leading to decline in
health and progress to diseases.
There is substantial evidence that HIV-infection not only by itself but also the treatment thereof can
cause anthropometrical changes to the body as stated by Atkinson et al. (2013). For example, in HIV-
positive patients a decrease in protein and increase in lipids at the molecular level causes a lower
cell mass at the cellular level. This then causes a decrease in skeletal muscle and increase of adipose
tissue at the tissue level. This is all manifested at the whole body level as a decrease in triceps
skinfold (TSF), mid-upper arm circumference (MUAC) and lipoatrophy of the extremities and
lipohypertrophy of the trunk and abdominal region (Burgoyne et al 2005; Scherzer et al., 2011; Evans
et al., 2013; Boccara et al., 2013;).
Weight loss is a common occurrence with HIV and has been correlated with the disease progression
and mortality (Ludy et al., 2005; Li et al., 2012). Before HAART, weight loss was the main indicator of
disease progression since not only fat mass is lost, but muscle wasting also occurred , Thus it is
important to note that survival is closely related to lean body mass (Mangili et al., 2006).
2.9.1 Body mass index (BMI)
Body mass index (BMI) is a simple index of weight-for-height that is commonly used to classify
underweight, overweight and obesity in adults. It is defined as the weight in kilograms divided by the
square of the height in metres (kg/m2) (WHO, 2013).This index reflects the body build and
composition and is well establishd in anthropometry or over a century (Eston et al., 2009). Even
though this is a universal method it is not always applicable to all conditions, one problem is that it
Stellenbosch University http://scholar.sun.ac.za

28
does not account for muscle mass as well as fat distribution (Vasques et al, 2009). BMI would not be
a good indicator of fatness were sacopenic obesitiy is conserned (Eston et al., 2009), however a
relation between survival and BMI has been observed particularly due to treatment as it reflects
improved health (Crum-Cianflone et al., 2010) and the fact that it is based from measurement that
can be done almost anywhere serves as a practical assessment tool (Eston et al., 2009).
Table 4: BMI classification and cut off points.
Classification BMI(kg/m2)
Principal cut-off points Additional cut-off points
Underweight <18.50 <18.50 • Severe thinness <16.00 <16.00
• Moderate thinness 16.00 - 16.99 16.00 - 16.99
• Mild thinness 17.00 - 18.49 17.00 - 18.49
Normal range 18.50 - 24.99 18.50 - 22.99 23.00 - 24.99
Overweight ≥25.00 ≥25.00 • Pre-obese 25.00 - 29.99 25.00 - 27.49
27.50 - 29.99 Obese ≥30.00 ≥30.00
• Obese class I 30.00 - 34.99 30.00 - 32.49 32.50 - 34.99
• Obese class II 35.00 - 39.99 35.00 - 37.49 37.50 - 39.99
• Obese class III ≥40.00 ≥40.00
Adapted from (WHO, 1995, WHO, 2000 & WHO 2004.)
A higher body mass index has been reported to be protective against tuberculosis among the HIV-
uninfected population, it has also been linked to slowing disease progression in HIV-infected
individuals (Hanrahan et al., 2010). Difficulties exist when comparing BMIs between HIV positive and
negative individuals and this is due to differences in energy expenditure, lipoatrophy and changes in
lean body mass. These are all symptoms of chronic HIV infection and this is quite clear since the
uninfected populations generally display lower BMIs than the HIV infected (Delpierre et al., 2007).
Joy et al. (2008) followed HIV-negative and HIV-positive indivduals and found that BMI differed
significantly between these two groups, males in the HIV-positive group had 1.1kg less fat on there
extremities and females 0.85kg less that there HIV-negative group. A lower BMI is a major risk factor
for early mortality among HIV-positive individuals initiating ARV treatment (Koethe et al., 2013).
2.9.2 Triceps skinfold (TSF) thickness and the mid-upper arm circumference (MUAC)
More than half our body’s fat stores are subcutaneous which can easily be used to predict the
percentage of body fat (Nix, 2013). The TSF thickness is the most commonly used site for the
assessment of subcutaneous fat assessment, body composition and nutritional status (Krause et al.,
2012). This method measures a double fold of skin and adipose using skin fold callipers; this is a
useful non-invasive and easily accessible measurement. The TSF is the most useful measure of body
fatness since the most complete standards and methods of evaluation are available for these sites.
Skinfold thickness measurements are a better predictor of unfavourable health outcomes (Freedman
et al., 2009).
Stellenbosch University http://scholar.sun.ac.za

29
Freedman et al. (2009) reported that BMI and TSF are both accurate in predicting metabolic risk
factors such as lipid levels, fasting insulin and blood pressure. George et al. (2009) observed HIV-
positive patients with and without lypodystrophy and found at baseline measurements individuals
with higher TSF developed lypodystrophy. Even when looking at adults who do not have a vast array
of metabolic changes skinfold thickness is accurate in identifying metabolic risk (Freedman et al.,
2010).
The HIV infection causes a catabolism of skeletal muscle and other proteins leading to HIV wasting or
cachexia, this is the loss of more than ten percent of body weight (Wasserman et al., 2012). HIV
wasiting can present with or without the loss of fat mass and can contribute to mortality (Gullet et
al., 2010). Even though ARVs have become readily availiable and mortality has been reduced, HIV
waisting still remains a problem among the HIV-infected (Liu et al., 2011; Sudfeld et al., 2013).
MUAC measurements are usually taken to assess the change in body weight. The MUAC can further
be utilised to assess protein-energy malnutrition as a result of chronic illness (Scherzer et al. 2011).
MUAC has been proven as a reliable gauge of muscle mass in atrophy patients (Saito et al., 2010).
Ageing leads to an increase of VAT but subcutaneous adipose tissue (SAT) and total body fat (TBF)
increase until the age range 55 – 65 years followed by a decrease (Pou et al., 2009). These changes
are seen much quicker in HIV-positive individuals. The measurements of VAT and SAT are not always
possible in a field setting as they require sophisticated sonographic equipment or expensive imaging
techniques. Therefore, conventional anthropometric assessment such as MUAC and TSF can instead
be used to assess the amount of body fat and lean body mass (Scherzer et al., 2011 & Kruger et al.,
2012).
Scherzer and collages (2011) found a significant interaction between MUAC and VAT on mortality,
when the MUAC was at its lowest an increase in VAT was observed. It has also been reported by
independent research that a decrease in MUAC was associated with mortality in older men
(Wannamethee et al., 2007; Landi et al., 2010).
According to Lemmer et al. (2011) HIV-positive patients with cardiomyopathy have lower MUAC and
BMI when compared to HIV positive patients without cardiomyopathy. These measurements are
usually the only options for the assessment of fat and lean body mass in the sub-Saharan setting as
rural clinics do not have the resources to do sophisticated body compositional analysis (Kruger,
2012).
Stellenbosch University http://scholar.sun.ac.za

30
2.9.3 Waist circumference (WC), hip circumference (HC) waist to hip ratio (WHR) and
waist to height ratio (W:Ht)
WC and HC have been linked to visceral adipose tissue, subcutaneous adipose tissue and therefore
total abdominal adipose tissue in males and females (O’Neill et al., 2013). WC has been associated
with type 2 diabetes and cardio vascular disease (Parker et al., 2009; Koning et al., 2010).
O’Neill et al. (2013) concluded that HIV-positive individuals at risk for cardiovascular disease only
using WC can be even more sensitive if the hip circumference is also taken into consideration. It is
important to note that that an increase in HC lessens the risk for diabetes and cardio vascular
disease (Parker et al., 2009); this shows the importance of WHR as opposed to just taking the waist
circumference.
W:Ht has been predominantly studied in adolescence; it has been associated with metabolic and
cardiovascular risks (Maffeis et al., 2008). However, it has not been extensively studied in adult
populations that are chronically ill. The cut off or high risk values for W:Ht ratio is greater than 0.5
and also independent of age and sex (Garnett et al., 2008; Sung et al., 2008).
Studies have shown that a negative correlation exists between WHR and CD4 gain (Azzoni et al.,
2011). However, HIV-positive individuals having a lower WHR tend to have better immunological
recovery outcome compared to those with a higher WHR (Hamdy et al., 2006). A possible
explanation would be ARVs have less bio-availability and are being metabolized differently in
patients with higher WHR (Azzoni et al., 2011). It can also be due to the metabolic activity of VAT, its
secretory factors can regulate the effects of ARVs and interfere with the immune reconstitution
process (Hamdy et al., 2006).
2.9.4 Body cell mass (BCM), FFM and FM
BCM is primarily made up of organs and muscle that are metabolically active component of the body
(Savvas et al., 2012). BCM is associated with survival since it is involved in oxygen consumption,
carbon dioxide production and resting metabolic rate. Conversely, extracellular mass compartment
which is made up of bone, collagen and fluids and is associated with structure and transport
(Vernaglione et al., 2012).
There are mainly two compartments in the body, FM and FFM that will vary between individuals, FM
is composed of 20% water and 80% adipose, while FFM consists of fat free muscle, bone, fat free
adipose and water (Eston et al., 2009). FFM, FM and nutritional status are considered the most
important evaluations in clinical practice for body composition (Scherzer et al., 2011).
Stellenbosch University http://scholar.sun.ac.za

31
In HIV-infected individuals with co infections there is a decrease in BCM and protein stores that
cannot be tracked only using BMI since there is also an increase in the extracellular volume (Evans et
al., 2013). This highlights the importance of the assessment of BCM (Koethe & Heimburger, 2010).
However, since BCM is determined by FFM or body potassium, and these are not always available in
the clinic or rural setting there is a reliance on BMI, height and weight measurements in this setting
due to ease of such measurements.
Malnutrition is occurs frequently among HIV-infected individuals and is mostly due to insufficient
intake of protein and energy; it has been associated with viral infections predominantly by intestinal
parasites (Koethe et al., 2009). Evans et al. (2013) reported that a mainly high protein nutritional
supplement (Future life) taken when on ARVs is associated with increase in immune response,
weight, improved physical activity and reversing malnutrition. Furthermore, malnutrition is also
associated with a decrease in BCM, while survival is closely related to the amount of lean body mass
(Evans et al., 2013).
While the use of ARVs (PIs & NRTIs) are linked to increased weight gain, it is important to distinguish
between individuals who are gaining weight and lean body mass, and those who are gaining fat and
losing lean mass (Thibault et al., 2012). An increased prevalence of obesity when associated with
chronic disease and the loss of FFM will result in higher prevalence of sarcopenic obesity. With
sarcopenic obesity body composition measurements, BIA is able to measure FFM loss unlike weight
evaluations and BMI (Thibault & Pichard, 2012).
Swaminathan et al. (2008) reported lower FM in a sample female population that were HIV-positive
and TB positive or negative when compared to HIV-negative women. FFM and BCM were also lower
among HIV-positive TB positive or negative makes when compared to HIV-negative counterparts.
2.9.5 Muscle mass, body protein content & mineral content
As the introduction of HAART has blunted the AIDS-defining complicatins there has been an increase
in age related complications, these are appearing earlier among the HIV-infected population when
compared to the uninfected (Deeks, 2011; Buehring et al., 2012).
With advancing age and HIV infection comes the loss of skeletal muscle, it is unclear what
contributes to the accereated muscle loss as the disease itself and also the treatment thereof can
contribute to muscle loss (Yarasheski et al., 2011). Wasserman et al. (2013) reported there midlife
(45< years) male HIV-positive study population displayed similar levels of muscle loss as older (<70
years) HIV-uninfected persons.
Stellenbosch University http://scholar.sun.ac.za

32
Total body potein can be seen as a measurement of the functional mass of muscle, assessing the
BCM or functional component of muscle mass or is important in muscle wasting conditions (Wilson
et al., 2013). When BCM is found to be depleted and fat loss is less than BCM loss, protein is being
catabolized, one method of estimating the depletion of BCM is estimating protein reserves
(Heymsfield, 2005).
The estimation of protein reserves in the body is a common nutritional assessment. Under periods
of nutitional stress these stores are depleted and can cause an increase in morbidity and mortality
due to a dimished activity of the immune system (Lee & Nieman, 2010). The rate of total body
protein turnover decreases with age (Shulman & Peterson, 2012). The loss of functional mass can
result in decreases in strength and bone mass (Wilson et al., 2013).
Low bone mieral density plagues the HIV-infected (McComsey et al., 2010). Brown & Qaqish (2006)
reported that in HIV-infected patients the prevalence of osteoporosis was three times higher. A two
to six percent decrease in bone mineal density is expected within the first two years of treatment
(Brown et al., 2009; Duvivier et al., 2009). There appears to be many factors that play a part in the
low bone mineral density observed in HIV-infecte individuals; (i) Chronic HIV infection, (ii) high
tobacco and alchol use, (iii) low vitamin D levels and (iv) treatment related factors (McComsey et al.,
2010).
2.9.6 RMR and TBK and TBCa and Glycogen
Resting energy expenditure or resting metabolic rate (RMR) is defined as the amount of kilocalories
required to sustain the basic bodily functions (Mittelsteadt et al., 2013). RMR has been observed to
increase in an assortment of medical conditions, such as hypethyroidism, sepsis and untreated HIV
infection to name a few (Kosmiski et al., 2012). RMR is also increased under the conditions brought
about by lipodystrophy. Lipodystrophy due to HIV-infection can be defined as the loss of
subcutaneous fat from the extremities which is directly associated with metabolic distress (Kosmiski
et al., 2012). The amount of FM and FFM both regulate RMR as up to 80% of variantion in RMR is
influenced by body composition (Muller et al., 2009).
BCM and FFM have a specific content of potassium (Sievo & Jebb, 2010). Unlike BCM and FFM, TBK
is not influenced by changes in fluid status (Campbell et al., 2008; Wells et al., 2008; Sievo & Jebb,
2010). Therefore, the measurement of TBK is a helpful tool to reinforcing results obtained by BCM
and FFM.
Most of the calcium in the body is incoprated into bone, however a small amount resides in
extracellular fluid (Baird et al., 2011). Therefore, the measurement of calcium would be a good
Stellenbosch University http://scholar.sun.ac.za

33
indicator of the precise bone mineral changes. Hypocalcaemia or lower levels of calcium in serum
have also been linked to high viral loads and decreased CD4 count (Miguez et al., 2012). However,
the mechanism for this is still unknown. Hypocalcaemia is common in critically ill patients and in
HIV-infected individuals who are treated with Foscavir® (used to treat the herpes viruses and drug
resistant cytomegalovirus) have reported developing hypocalcemia (Ryfeldt et al., 1992; Kelly &
Levine, 2013).
Glycogen is the stored form of carbohydates. Most of the cells in the body store glycogen but the
highest concentratons of glycogen is found in liver and muscle (Shulman & Peterson, 2012). In well
nourished individuals approximately 475g of glycogen are stored, with 325g in muscle, 90g to 110g
in liver and 15g to 20 g in blood (McArdle et al., 2010). To our knowledge the changes in glycogen
storage with duration of ARV treatment has not yet been studied in an observational design.
However, with the loss of muscle mass that is extensively documented (Bonaldo & Sandri, 2013;
Sandri, 2013) and the mitochondrial derangement (Wasserman et al., 2013; Payne et al., 2014;
Reyskens & Essop, 2014) observed due to HIV infection and treatment thereof. Studying what effect
this has on the storage of enegy in HIV is essential.
2.10 The link between HAART and increased risk of cardio-metabolic
disease
In 1998 the first links between PIs and cardiovascular diseases were reported, myocardial infarctions
and increased levels of cholesterol were observed with young HIV-positive individuals (Boccara et
al., 2013). Our previous understanding of the pathogenesis of CVD risk entailed lifestyle and genetic
factors, but in the last decade factors such as inflammation and immune activation have been
proven to account for the pathogenesis of atherosclerosis (Bekau et al., 2007; Ford et al., 2010).
Although HAART has improved life expectancy and quality of life within the HIV-positive populations,
many ARVs are known to be hepatotoxic with long term use (Puoti et al., 2009). The use of PIs in the
treatment of HIV has been linked to atherogenic lipoprotein changes and endothelial dysfunction
(Stein et al., 2001).
The use of PIs and NRTIs has also been linked to hypertension and increased BMI in HIV-infected
patients, compared to treatment naïve patients (Grinspoon & Carr, 2005). Studies have also linked
HAART to alterations and the flux of certain substrates, including free fatty acids, adipokine levels
and reduced PPARy expression (Brandman et al., 2013; Tong et al., 2003).
HIV PIs can promote direct and indirect effects on metabolism which favour metabolic
derangements of glucose and lipid metabolism. These have similar qualities as the metabolic
Stellenbosch University http://scholar.sun.ac.za
34
syndrome, which is a group of risk factors that present as a disorder of the utilization and storage of
energy which leads to obesity. The metabolic syndrome increases the susceptibility of the individual
to CVD and type 2 diabetes mellitus (Reyskens & Essop, 2014).
McGee et al. (2010) reported an increase in mitochondrial function in HIV positive individuals not
receiving ARVs when compared to HIV negative controls, however with six month ARV treatment an
indication of mitochondrial respiration gene dysfunction was observed. The ongoing use of NRTIs
has been associated with cardiotoxicity and the possible mechanism for this is mitochondrial
dysfunction (Liu et al., 2012). When testing this hypothesis in H9C2 cells Liu et al. (2012) observed
increasing mitochondrial morphological damage for both Zidovudine (AZT) alone and Zidovudine and
Didanosine (DDI).
2.11 Lipodystophy and HIV
Lipodystrophy syndrome refers to the accumulation of body fat in abnormal locations (Sutinen,
2009). Wasting occurs in the peripheral regions (lipoatrophy) of the body with fat accumulation
(lipohypertophy) occurring at the dorso-cervical fat pad, neck, breasts, abdominal region and
buttocks (Moreno et al., 2009). Three main types of lipodystrophy have been identified that occur in
association with HIV and HAART; (i) the loss of fat or lipoatrophy, (ii) the fat redistribution due to
ARVs, and (iii) subcutaneous adiposity (Moreno et al., 2009).
The fat loss is due to inadequate dietary intake and fat is used as a source of fuel to balance energy
needs. Lipodystrophy on its own contributes to the risk for the development of cardiovascular
disease, and when the compounding effect of muscle wasting is introduced this combination of
effects can be dangerous (Friis-Moller et al., 2010). Lipodystrophy is usually related to insulin
resistance, hypertriglyceridemia and changes in subcutaneous fat (Hsu et al., 2005; Friis-Moller et
al., 2010).
HAART causes metabolic changes via adipocyte dysfunction leading to lipid and glucose metabolism
changes, which cause the lipodystrophy syndrome (Costagliola et al., 2010). The development of
resistance to ARVs, or the changes in ARVs might lead to changes in the HIV replication copies.
(Scherzer et al., 2011).
HIV-positive patients on HAART also undergo changes in lipid metabolism; an increase in the
oxidation of fatty acid is observed (Rasheed et al., 2008). There is also an increase in the usage of fat
as a fuel source as carbohydrates use is down regulated and proteins are broken down to be used to
balance energy homeostasis (Barbaro & Lacobellis, 2009; Sharma et al., 2011). The increase in
Stellenbosch University http://scholar.sun.ac.za

35
lipolysis due to lipoatrophy causes futile cycling as lipid mobilization is insufficient to sustain lipid
oxidation (Sharma et al., 2011; Figueiredo et al., 2013).
2.12 Conclusion
The roll out of ARVs has increased quality of life and life expectancy of individuals living with HIV but
it has also increased the prevalence of non-communicable disease. It furthermore caused a
premature onset of risk for cardiovascular diseases. A significant proportion of the risk factors
associated with cardiovascular diseases remain unrecognized due to the dependence on BMI.
The importance of distinguishing between sarcopenic and the traditional obesity is paramount as
lean body mass is directly related to increased risk in mortality HIV infected individuals. The weight
gain experienced due to HAART can diminish risk because the patient’s physical appearance displays
recovery when in fact risk is increasing.
Although the effects of HIV and its body composition changes are well documented for many
different populations there is a lack of knowledge in the South Africa with very limited studies
completed. It is therefore important to asses these characteristics (in a comprehensive manner)
within a South African HIV-positive population.
Stellenbosch University http://scholar.sun.ac.za

36
CHAPTER 3 RESEARCH METHODS
3.1 Introduction
3.1.1 Study design and population
A descriptive cross sectional study was followed at the TC Newman Community Day Care Centre and
Mbekweni Community Day Care Centre in the Drakenstein District, Paarl. These health care units
serve as community day care centres and primary health care clinics for the Drakenstein Health
District.
HIV positive patients were randomly
recruited to be research participants
for this study. Subject recruitment
was done between the age groups 20
to 40 years. The sampling took place
between September 2012 and July
2013.
Figure 6: illustrating Drakenstein Municipality in the Western Cape
Source (Western Cape Government, 2013)
3.1.2 Sample size
We were interested in estimating mean values of several continuous anthropometrical values. We
used three parameters (TSF, FFM and MUAC to estimate the sample size). The alpha (α) was set at
5% and the sample size formula used to calculate was calculated as follow (Ludy et al., 2005)
n =1.96
�σ�
d�
Equation 1: Sample size formula
With a total sample size of 510 all anticipated anthropometrical assessments would be determined
with 80% power. To determine our final sample size we needed to recruit at least 85 participants in
each of the three treatment groups per gender.
Stellenbosch University http://scholar.sun.ac.za

37
• 85 males and 85 females in the control group
• 85 males and 85 females in 0-36 Months group
• 85 males and 85 females in the >36 months group
This gives us a total sample size of 510. Accounting for possible incomplete data a 10% addition was
calculated to give a 560 sample size.
The sample population was carefully chosen to act as a representation of the HIV positive population
in the Paarl region of the Drakenstein district. This area constitutes 36.6% of the 8 477 HIV positive
patients being treated in the Cape Winelands District and has the highest number of PLWAs in the
region followed by the Breede Valley Municipality (Drakenstein Municipality Integrated
Development Plan 2011/2012).
3.2 Subject recruitment
At the time of recruitment a total of 1 607 patients were on the outpatient record list for the TC
Newman Community day care centre. A random selection process was followed to ensure that
results are representative and that findings can be inferred back to the total population.
A total of n= 146 were recruited for this study. We are aware of the fact that we did not achieve the
anticipated total of n=560. This issue is discussed in limitations and strengths in Chapter 5, section
4). The administrative nurse at the TC Newman CDC scanned through the patient folders after
patients were identified on the patient lists (Computer based) and selected those that met the
inclusion criteria. A similar system was used at Mbekweni CDC, where the HIV counsellor screened
patient’s files and selected the patients that met our inclusion criteria for the control group.
Inclusion criteria:
• HIV positive males or females that are on treatment, and/or newly diagnosed naïve patients (for controls)
• Between and including the age of 20 and 40 years
• Residents of Paarl, Wellington and the Drakenstein region
• Signed informed consent
Exclusion criteria:
• Younger than 20 years and/or older than 40 years
• Not a resident of the Drakenstein region
Stellenbosch University http://scholar.sun.ac.za

38
• Not agreeing to take part in the study
• Pregnant females
• Acute diseases at the day of the clinic visit
• Prisoners
3.2.1 Ethical considerations
This study was reviewed and approved by the Human Research Ethics Committee (HREC)
(S12/03/073) of the Stellenbosch University, as well as local Western Cape Provincial Health
Department ethical approval (RP100/2012). The researcher had been trained and certified in Good
Clinical Practice (GCP) (December 2011) before the commencement of the data collection.
The aims of the study were explained in the volunteering participant’s home language where
possible. There were a few instances where participants did not understand the content of the
research. In cases such as these a nurse was then asked to assist in explaining what the research
entailed. It was made very clear on several time points that the participants are not obliged to take
part and that they are free to withdraw at any moment of the data collection. It was also made clear
that the research aims are not interfering with seeking primary health care.
After informed consent was obtained by the participants in printed format (both English and/or
Afrikaans), the data collection commenced. Anonimity was ensured at all times. No medical
information was taken from the CDC premises for any of the participants.
3.2.2 Patient history
The interview schedule of the data collection followed after the participants saw the physician. The
questionnaires were standard for each participant. Current living conditions, general health,
demographics, diet and exercise were assessed with a short demographic questionnaire. A pre-test
BIA protocol check list was also marked off.
3.3 Anthropometrical assessment
All anthropometric measurements were performed according to the International Standard for
Advancement of Kinanthropometry (ISAK) (Norton & Olds, 2006; Stewart et al., 2011). The
researcher was trained by a Level 3 Instructor as a Level 1 Technician.
3.3.1 Base measurements: height and weight
Research participants were instructed to remove all heavy clothing, shoes and hats. Height
measurements were taken using a Leicester (Leicester, England) stadiometer. Participants were
instructed to stand under the stadiometer and assume the correct anatomical position, with their
Stellenbosch University http://scholar.sun.ac.za

39
head in the Frankfort position to measure then correct and maximal height. Participants were then
instructed to inhale in accordance with the stretch stature method.
The height was recorded to the nearest 0.5cm. Weight was measure to the nearest 0.5kg using an
electronic scale. Body mass index (BMI) was then calculated by dividing the participants weight in
kilograms by the height squared (Norton & Olds, 2006; Stewart et al., 2011).
3.3.2 Waist and hip circumference measurements
Waist and hip circumferences were measured using a Lufkin (Lufkin, USA) tape measure. The waist
circumference was taken between the 10th lower costal rib and the superior iliac crest at the
narrowest plane of the abdomen. Hip circumference was taken by measuring the largest area
around the gluteal muscles with the participants feet together. These measurements were taken to
the nearest 0.1cm (Norton & Olds, 2006; Stewart et al., 2011).
3.3.3 TSF and MUAC measurements
All measurements were done on the right side for all participants. To assess the TSF a calibrated
Harpenden skinfold calliper (Harpenden®, UK) was used. First, the acromiale and radiale anatomical
landmarks were located. Secondly, the mid-acromiale-radiale was located using a Rosscraft
segmometer (Rosscraft®, Canada). This point was taken as the level where the TSF posteriorly was
taken and the MUAC was taken by using a Lufkin tape measure. The MUAC was measured to the
nearest 0.1cm. The TSF was then taken parallel to the long axes of the arm at the triceps skinfold site
on the posterior surface (Norton & Olds, 2006; Stewart et al., 2011).
3.3.4 BIA
The assessment of the BIA variables was obtained using the BioScan 920-II multi frequency analyser
(Maltron 920 UK). According to the standard pre-test protocol (Addendum X), participants were
asked to remove all jewellery, metal objects as well as cell phones or other electronic equipment as
this would interfere with the analysis.
Participants were then asked to assume a supine position on an examination bed.
Figure 7: Positioning of electrodes on the right arm and leg of participants
Source: Maltron products Bioscan 920 II
Stellenbosch University http://scholar.sun.ac.za

40
The legs and arms were spread slightly form the body so that no part was touching. The skin areas,
where the electrodes were placed, were cleaned using alcohol swabs (see figure 6).
The testing frequencies ranged between 5, 50, 100 and 200 kHz..
Base measurements, weight, height, age and ethnicity were logged in the Maltron Bioscan 920-II.
The participants were then asked to remain still, after which the test commenced.
3.4 Data management
Each research participant that was successfully recruited received a unique identification number.
This number (e.g. 0001) was present on the data capturing sheet as well as stored in the memory of
the BioScan 920-II multi frequency analyser. It was also not possible to link a number to a
participant since the study design was cross-sectional. All data as well as consent forms were
collected and stored in the supervisor’s lockable file cabinet in a lockable office.
3.4.1 Statistical analysis
Research participants were grouped into three treatment categories. The first group (control) was
described as participants who had been newly diagnosed with HIV but were not yet initiated on
treatment. The second group (0-36 months) had been placed on ARV treatment for the timer period
indicated. The third group was described as those participants who had been on ARV treatment for
more than 36 months group. All data was captured and tabled in Microsoft Office Excel 2010. Data
obtained from the study was analysed using Statistica Version 12 (StatSoft Inc, USA). The statistical
significant level was taken at p≤0.05. Descriptive statistics were tabled as means and standard error
of the mean. The least significant difference (LSD) was used to test comparisons between the
treatments (0, 0-36 and >36 months). The analysis of variance (ANOVA) was used to find the least
significant difference between any of the means at p = 0.05 (the level of probability chosen for the t
value).
3.5 Constraints encountered during the method section and data
collection
The timing of the study was a concern since the participants at TC Newman were recruited while
they were waiting to see a medical doctor. The participants were first screened by the nurse on
duty, after which their patient record files were passed onto us.
This sometimes took time since the nurse had other administrative duties and we spent a lot of time
waiting for participants. Some patients only came to the clinics to collect their medication and those
patients were not very eager to take part as they had taken time off from work. At TC Newman
there was only space available to set up for data collection on a Monday, Tuesday, Thursday and
Stellenbosch University http://scholar.sun.ac.za
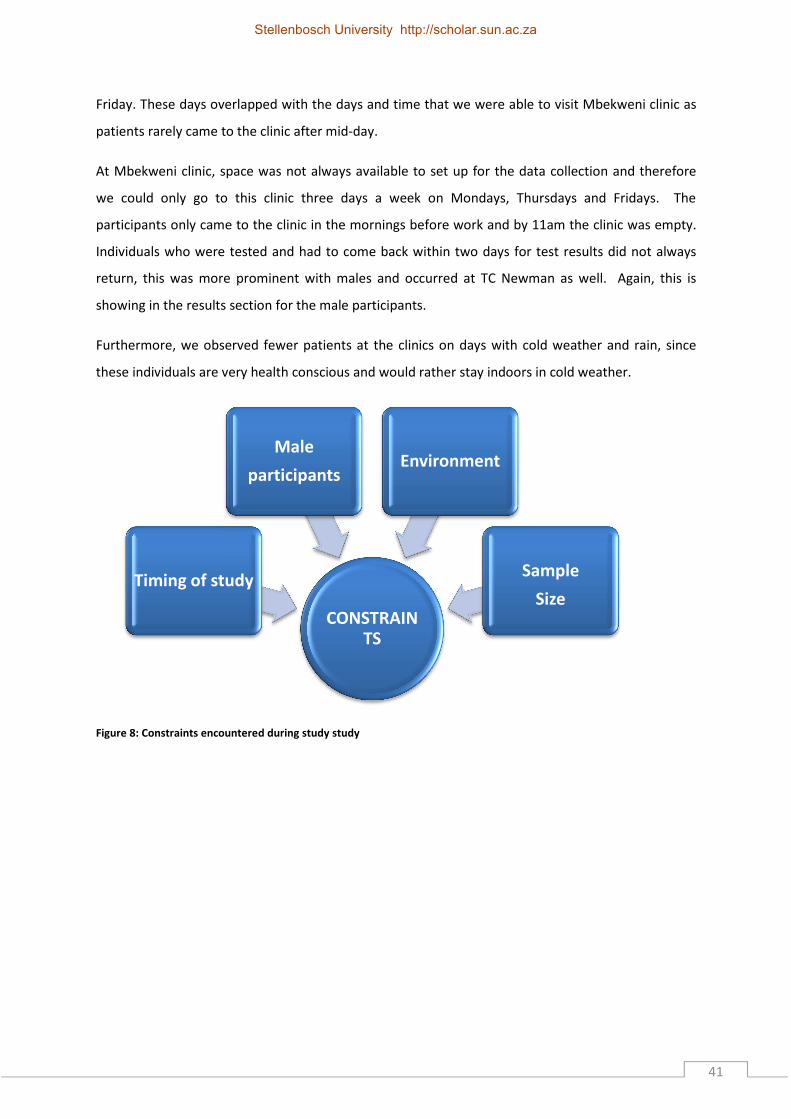
41
Friday. These days overlapped with the days and time that we were able to visit Mbekweni clinic as
patients rarely came to the clinic after mid-day.
At Mbekweni clinic, space was not always available to set up for the data collection and therefore
we could only go to this clinic three days a week on Mondays, Thursdays and Fridays. The
participants only came to the clinic in the mornings before work and by 11am the clinic was empty.
Individuals who were tested and had to come back within two days for test results did not always
return, this was more prominent with males and occurred at TC Newman as well. Again, this is
showing in the results section for the male participants.
Furthermore, we observed fewer patients at the clinics on days with cold weather and rain, since
these individuals are very health conscious and would rather stay indoors in cold weather.
Figure 8: Constraints encountered during study study
CONSTRAINTS
Timing of study
Male
participantsEnvironment
Sample
Size
Stellenbosch University http://scholar.sun.ac.za
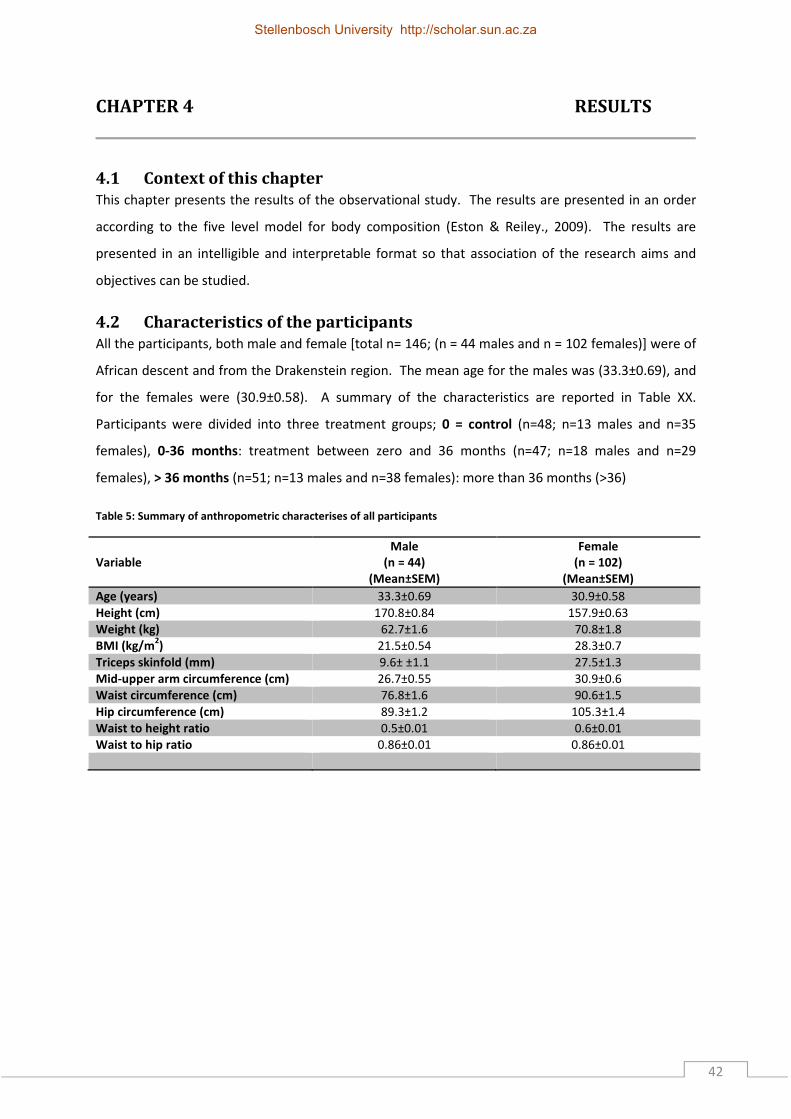
42
CHAPTER 4 RESULTS
4.1 Context of this chapter
This chapter presents the results of the observational study. The results are presented in an order
according to the five level model for body composition (Eston & Reiley., 2009). The results are
presented in an intelligible and interpretable format so that association of the research aims and
objectives can be studied.
4.2 Characteristics of the participants
All the participants, both male and female [total n= 146; (n = 44 males and n = 102 females)] were of
African descent and from the Drakenstein region. The mean age for the males was (33.3±0.69), and
for the females were (30.9±0.58). A summary of the characteristics are reported in Table XX.
Participants were divided into three treatment groups; 0 = control (n=48; n=13 males and n=35
females), 0-36 months: treatment between zero and 36 months (n=47; n=18 males and n=29
females), > 36 months (n=51; n=13 males and n=38 females): more than 36 months (>36)
Table 5: Summary of anthropometric characterises of all participants
Variable
Male
(n = 44)
(Mean±SEM)
Female
(n = 102)
(Mean±SEM)
Age (years) 33.3±0.69 30.9±0.58 Height (cm) 170.8±0.84 157.9±0.63 Weight (kg) 62.7±1.6 70.8±1.8 BMI (kg/m
2) 21.5±0.54 28.3±0.7
Triceps skinfold (mm) 9.6± ±1.1 27.5±1.3 Mid-upper arm circumference (cm) 26.7±0.55 30.9±0.6 Waist circumference (cm) 76.8±1.6 90.6±1.5 Hip circumference (cm) 89.3±1.2 105.3±1.4 Waist to height ratio 0.5±0.01 0.6±0.01 Waist to hip ratio 0.86±0.01 0.86±0.01
Stellenbosch University http://scholar.sun.ac.za

43
Table 6: Summary of BIA characteristics of all participants
Variable
Male
(n = 44)
(Mean±SEM)
Female
(n = 102)
(Mean±SEM)
CD4 314±39.9 388.5±23.5 Body cell mass to Fat free mass ratio 0.587±0.002 0.55±0.0008 Resting metabolic rate (kcal) 1776.4±20.6 1553.7±10.5 Fat free mass(kg) 53.5±0.9 48.3±0.7 Fat free mass percentage (%) 85.9±0.7 70.3±0.9 Fat (kg) 9.2±0.7 22.5±1.1 Fat percentage (%) 14.1±0.7 29.7±0.9 Body cell mass (kg) 30.8±0.5 26.6±0.4 Extracellular mass (kg) 22.7±0.5 21.7±0.3 Protein (kg) 9.2±0.3 9.1±0.1 Mineral (kg) 3.24±0.1 3.71±0.06 Muscle (kg) 27.2±0.5 21.7±0.3 Total body Potassium (g) 146.9±2.1 117.5±1.7 Total body Calcium (g) 1185.3±15.4 972.9±12.1 Glycogen (g) 521.6±7.6 450.4±6.4
Table 7: Anthropometrical characteristics for the male participants per treatment group
Variable
Control
(n = 13)
(Mean±SEM)
0 – 36 months
(n = 18)
(Mean±SEM)
> 36 months
(n = 13)
(Mean±SEM)
Age (years) 32.2±1.4 33.2±1.2 34.4±1.0 Height (cm) 170.1±1.3 170.6±1.5 171.6±1.4 Weight (kg) 65.8±3.2 62.4±2.6 60.0±2.2 BMI (kg/m
2) 22.6±1.0 21.4±0.9 20.4±0.9
Triceps skinfold (mm) 11.4±2.6 10.2±1.9 7.0±0.9 Mid-upper arm circumference (cm) 27.8±1.0 26.6±1.0 25.9±1.0 Waist circumference (cm) 77.0±2.7 76.9±2.8 76.3±2.8 Hip circumference (cm) 91.4±2.4 89.4±1.9 87.1±1.8 Waist to height ratio 0.45±0.01 0.45±0.02 0.45±0.02 Waist to hip ratio 0.84±0.02 0.86±0.02 0.88±0.03
Stellenbosch University http://scholar.sun.ac.za

44
Table 8: Summary of BIA characteristics of for the male participants per treatment group
Variable Control
(n = 13)
(Mean±SEM)
0 – 36 months
(n = 18)
(Mean±SEM)
> 36 months
(n = 13)
(Mean±SEM)
CD4 255.3±0.02 280.9±0.03 426.3±0.03 Body cell mass to Fat free mass ratio 0.57±0.004 0.58±0.003 0.58±0.004 Resting metabolic rate (kcal) 1829.5±40.4 1762.3±35.5 1742.8±26.7 Fat free mass(kg) 56.0±2.0 52.7±1.5 51.9±1.3 Fat free mass percentage (%) 85.8±1.1 85.2±1.2 86.9±1.3 Fat (kg) 9.7±1.3 9.7±1.3 8.2±1.1 Fat percentage (%) 14.2±1.1 14.8±1.2 13.1±1.3 Body cell mass (kg) 32.0±0.9 30.5±0.7 29.9±0.6 Extracellular mass (kg) 24.0±1.1 22.3±0.8 21.9±0.7 Protein (kg) 9.8±0.6 9.2±0.6 8.7±0.6 Mineral (kg) 3.45±0.2 3.2±0.2 3.1±0.2 Muscle (kg) 28.4±0.9 27.0±0.8 26.4±0.7 Total body Potassium (g) 152.9±4.5 145.4±3.5 142.9±2.6 Total body Calcium (g) 1228.6±32.2 1174.7±25.2 1156.7±19.1 Glycogen (g) 542.7±15.7 516.6±12.4 507.5±9.4
Table 9: Anthropometrical characteristics for the female participants per treatment group.
Variable
Control
(n=35)
(Mean±SEM)
0 – 36 months
(n=29)
(Mean±SEM)
> 36 months
n = 38
(Mean±SEM)
Age (years) 29.4±1.1 29.7±1.1 33.2±0.7 Height (cm) 159.1±1 156.2±1.3 158.2±0.9 Weight (kg) 73.9±2.8 59.9±2.9 76.3±2.9 BMI (kg/m
2) 29.2±1.1 24.4±1.1 30.4±1.1
Triceps skinfold (mm) 29.3±2.2 20.6±1.8 30.9±2.1 Mid-upper arm circumference (cm) 31.3±1 27.7±1.1 33.1±0.8 Waist circumference (cm) 91.3±2.5 83.5±2.6 95.5±2.5 Hip circumference (cm) 108.5±2.1 97.7±2.5 108.3±2.3 Waist to height ratio 0.6±0.02 0.5±0.02 0.6±0.02 Waist to hip ratio 0.84±0.01 0.85±0.01 0.88±0.02
Stellenbosch University http://scholar.sun.ac.za

45
Table 10: Summary of BIA characteristics of for the female participants per treatment group
Variable
Control
(n=35)
(Mean±SEM)
0 – 36 months
(n=29)
(Mean±SEM)
> 36 months
n = 38
(Mean±SEM)
CD4 348.6±0.02 307.9±0.02 483.3±0.03 Body cell mass to Fat free mass ratio 0.55±0.001 0.55±0.002 0.55±0.001 Resting metabolic rate (kcal) 1579.3±17 1498.4±20 1572.4±16 Fat free mass(kg) 49.4±1.1 44.2±1.2 50.4±1.1 Fat free mass percentage (%) 68.5±1.4 75.9±1.8 67.7±1.3 Fat (kg) 24.4±1.8 15.9±1.8 25.9±1.9 Fat percentage (%) 31.5±1.4 24.2±1.8 32.3±1.3 Body cell mass (kg) 27.1±0.6 24.4±0.6 27.7±0.6 Extracellular mass (kg) 22.2±0.5 19.8±0.6 22.7±0.5 Protein (kg) 9.5±0.2 8.2±0.3 9.3±0.2 Mineral (kg) 3.9±0.08 3.4±0.12 3.8±0.09 Muscle (kg) 22.2±0.5 19.8±0.5 22.5±0.5 Total body Potassium (g) 120.1±2.6 107.8±2.8 122.6±2.7 Total body Calcium (g) 991.5±18.8 902.4±20.3 1009.5±19.8 Glycogen (g) 460.3±9.9 413.2±10.7 469.5±10.4
Stellenbosch University http://scholar.sun.ac.za

46
4.3 Anthropometric data between genders and treatment groups.
4.3.1 Body mass index (BMI) (kg/m2)
Figure 9: Distribution of BMI categories within the total sample population.
Approximately ~10% (9.7%) of the sample population were classified as underweight, 41% were in
the healthy weight category, whereas, 23.6% were classified under class I overweight, 22.9% were
class II obese, and ~3% (2.8%) were classified as morbidly obese. Only one participant had a BMI
higher than 40kg/m2 (51.2kg/m2).
Figure 10: Distribution of BMI categories for the male population.
Sixty four percent of the male population were considered to be at a healthy weight, 18.2% were
underweight, 13.6% were overweight, and 4.5% were classified as class II obese (Figure 9).
10%
41%
23%
23%
3%
Underweight
Healthy weight
Class I, Overweight
Class II, Obese
Class III, Morbidly obese
n = 146
18%
64%
14%
4%
0%
Underweight
Healthy weight
Class I, Overweight
Class II, Obese
Class III, Morbidly obese
n = 44
Stellenbosch University http://scholar.sun.ac.za

47
Figure 11: Distribution of BMI categories in the female population.
A third of the female population were classified as being ion the healthy weight range (30.4%), 5.9%
were underweight, 27.5% were classified as overweight, 32.4% were obese, and 3.8% morbidly
obese (Figure 10).
6%
30%
28%
32%
4%
Underweight
Healthy weight
Class I, Overweight
Class II, Obese
Class III, Morbidly obese
n = 102
Stellenbosch University http://scholar.sun.ac.za

48
0
10
20
30
40
FemalesMales
Gender
aa Control
> 36 months
0 - 36 months
p=0.001
p=0.00005
Bod
y m
ass
inde
x(kg
/m2)
Figure 12:BMI according to treatment category and gender
No statistically significance per treatment categories was observed in the male population (Figure
11). However, there appears to be a decreasing trend as treatment progressed.
Contrasting, the female population showed a statistically significant decrease
(p = 0.001) between the control group and the 0-36 months group, as well as a statistically
significant (p = 0.00005) increase between the 0-36 months treatment group and the >36 months
treatment group.
Stellenbosch University http://scholar.sun.ac.za

49
4.3.2 Base measurement: weight (kg)
0
20
40
60
80
100
FemalesMales
Gender
aa Control
> 36 months
0 - 36 months
*
p=0.00003
p=0.0004
We
ight
(kg)
Figure 13: Weight according to gender and treatment categories.
There were no significant changes observed within the male population per treatment group.
Overall there was a general decreasing trend observed with increasing treatment duration.
The female data showed a statistically significant decrease (p = 0.004) between the control group
and the 0-36 months treatment group, and a significant increase (p = 0.00003) between the 0-36
months treatment group, and the >36 months treatment group.
Stellenbosch University http://scholar.sun.ac.za

50
4.3.3 Base measurement: height (m)
0
50
100
150
200
FemalesMales
Gender
aa Control
> 36 months
0 - 36 months
*
He
ight
(m)
Figure 14: Height according to gender and treatment categories.
There were no significant changes observed in either gender per treatment group.
Stellenbosch University http://scholar.sun.ac.za

51
4.3.4 Triceps skinfold (TSF) and mid-upper arm circumference (MUAC)
0
10
20
30
40
FemalesMales
Gender
aa Control
> 36 months
0 - 36 months
p=0.002
p=0.0003
Tric
eps
skin
fold
thi
ckne
ss(m
m)
Figure 15: TSF according to gender and treatment category.
Similar patterns were observed in both TSF and MUAC for both genders. All male participants had
lower TSF compared to the female population.
It appears that the males diagnosed with HIV and not yet placed on treatment had higher TSF and
MUAC’s (Figure 14 & 15). After treatment initiation (0-36 months and >36 months) a decreasing
trend is observed.
The female population had a statistically significant (p = 0.002) decrease in the TSF and MUAC
(Figure 14 & 15) between the control group and the 0-36 month treatment group, and a statistically
significant (p = 0.0003) increase between the 0-36 month and >36 month group.
Stellenbosch University http://scholar.sun.ac.za

52
0
10
20
30
40
FemalesMales
aa Control
> 36 months
0 - 36 months
Gender
p=0.006
p=0.00003
Mid
-up
per
arm
circ
umfe
renc
e (
cm)
Figure 16: MUAC according to gender and treatment category.
4.3.4 WC, HC, WHR and W:Ht
Table 11: Cut off vales for WC, WHR and W:Ht between genders
WC WHR W:Ht
Male Female Male Female Both Genders
High risk ≥94cm ≥80cm ≥0.9 ≥0.85 >0.5
Low risk <94cm <80cm <0.9 <0.85 ≤0.5
Source (EGIR, 1999; WHO, 1998; Garnett et al., 2008)
Figure 17: The percentage males categorised as either low or high risk for the WC. -
93%
7%
Low risk
High risk
Stellenbosch University http://scholar.sun.ac.za

53
22%
78%
Low risk
High risk
75%
25%
Low risk
High risk
46%
54%
Low risk
High risk
Figure 18: The percentage of females with high risk and low risk for WC
Figure 19: The percentage of males with high risk and low risk for WHR
Figure 20: The percentage of females with high and low risk or WHR
Stellenbosch University http://scholar.sun.ac.za

54
0
50
100
150
FemalesMales
Gender
aa Control
> 36 months
0 - 36 months
p=0.02
p=0.0005
Wa
ist
crcu
mfe
renc
e(c
m)
Figure 21: WC between the different genders and treatment categories.
No statistically significant changes were observed in the WC (Figure 20) within the male population
accros the different treatment categories. There was however a slight decreasing trend in the HC
(Figure 21). Within the female population data showed a significant decrease (p = 0.02) between the
control group and the 0-36 months treatment group, and a significant increase (p = 0.0005) between
the 0-36 months treatment group and the >36 months treatment group.Both waist- and hip
circumferences had similar trends as treatment progressed.
Stellenbosch University http://scholar.sun.ac.za

55
0
50
100
150
FemalesMales
Gender
aa Control
> 36 months
0 - 36 months
p=0.0005
p=0.0005
Hip
circ
umfe
renc
e(c
m)
Figure 22: HC between the different genders and treatment categories.
Stellenbosch University http://scholar.sun.ac.za
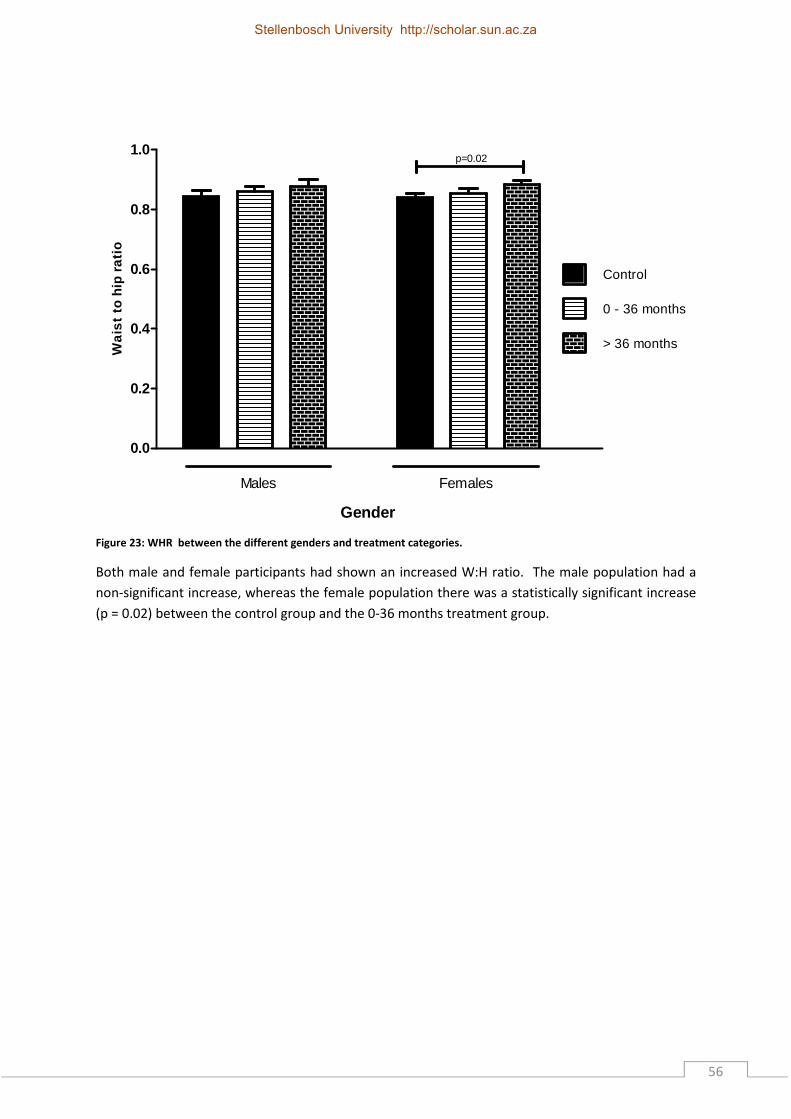
56
0.0
0.2
0.4
0.6
0.8
1.0
FemalesMales
Gender
aa Control
> 36 months
0 - 36 months
p=0.02
Wa
ist
to h
ip r
atio
Figure 23: WHR between the different genders and treatment categories.
Both male and female participants had shown an increased W:H ratio. The male population had a
non-significant increase, whereas the female population there was a statistically significant increase
(p = 0.02) between the control group and the 0-36 months treatment group.
Stellenbosch University http://scholar.sun.ac.za

57
4.3.5 W:Ht
0.0
0.2
0.4
0.6
0.8
FemalesMales
Gender
aa Control
> 36 months
0 - 36 months
p=0.001
Wa
ist
to h
eig
ht r
atio
Figure 24: W:Ht between the different genders and treatment categories.
The W:Ht did not show any statistically significant changes within the male population. However, the
females initially showed a non-significant decrease between the control group and the 0-36 months
treatment group, followed by a statistically significant increase (p = 0.001) between the 0-36 months
and >36 months treatment group. It is noted that the male W:Ht ratio values were all below the 0.5
cut off value . Contrasting, the femaleW:Ht were all above the recommended 0.5 cut off value
Stellenbosch University http://scholar.sun.ac.za

58
4.3.6 FFM and FFM%
0
20
40
60
80
FemalesMales
Gender
aa Control
> 36 months
0 - 36 months
p=0.002
p=0.0002
Fa
t fr
ee
ma
ss(
kg)
Figure 25: FFM according to gender and treatment category.
For the male population there was a statistically decreasing trend for the FFM between the different
treatment groups.
Contrasting, the female data showed a significant decrease (p = 0.002) between the control group
and the 0-36 months treatment group, and a significant increase (p = 0.0002) between the 0-36
months treatment group and the >36 months treatment group.
Stellenbosch University http://scholar.sun.ac.za

59
0
20
40
60
80
100
FemalesMales
Gender
aa Control
> 36 months
0 - 36 months
p=0.00002
p=0.0002
Fa
t fr
ee
ma
ss p
erc
eta
ge(%
)
Figure 26: FFM% between the different genders and treatment categories.
No change with treatment duration was observed for FFM% within the male population. .
The female population had statistically significant increase FFM% (p = 0.0002) between the control
and 0-36 month groups and a significant decrease (p = 0.00002) between the 0-36 month group and
the >36 month treatment group.
Stellenbosch University http://scholar.sun.ac.za

60
4.3.7 Fat and Fat%
0
10
20
30
FemalesMales
Gender
aa Control
> 36 months
0 - 36 months
p=0.00003
p=0.0005
Fa
t(kg
)
Figure 27: FAT according to gender and treatment category.
Males had no change from control to 0-36 month treatment category. However, from the 0-36
month treatment group to the >36 month treatment group there was a non-significant decrease. .
The female population had a significant decrease (p = 0.0005) between the control group and the 0-
36 group and a significant increase (p = 0.00003) between the 0-36 month group and the >36 month
group.
Stellenbosch University http://scholar.sun.ac.za

61
0
10
20
30
40
FemalesMales
Gender
aa Control
> 36 months
0 - 36 months
p=0.00002
p=0.0002
Fa
t pe
rce
nta
ge(%
)
Figure 28: FAT% according to gender and treatment category.
The male population demonstrated a non-significant increase in Fat% for the control group to the 0-
36 month treatment group and a non-significant decrease from the 0-36 month treatment group to
the >36 month treatment group.
The female population had a significant decrease (p = 0.0002) between the control group and the 0-
36 group and a significant increase (p = 0.00002) between the 0-36 month group and the >36 month
group.
Stellenbosch University http://scholar.sun.ac.za

62
4.3.8 BCM (kg) and ECM (kg)
0
10
20
30
40
FemalesMales
Gender
aa Control
> 36 months
0 - 36 months
p=0.001
p=0.0001
Bod
y ce
ll m
ass(
kg)
Figure 29: BCM according to gender and treatment category.
Males demonstrated a steady non-significant decrease in BCM as treatment progressed. There was
however a statistical trend observed between the control and >36 month treatment groups (p=0.1).
The female population had a statistically significant decrease (p = 0.001) between the control group
and the 0-36 group and a statistically significant increase (p = 0.0001) between the 0-36 month
group and the >36 month group.
Stellenbosch University http://scholar.sun.ac.za
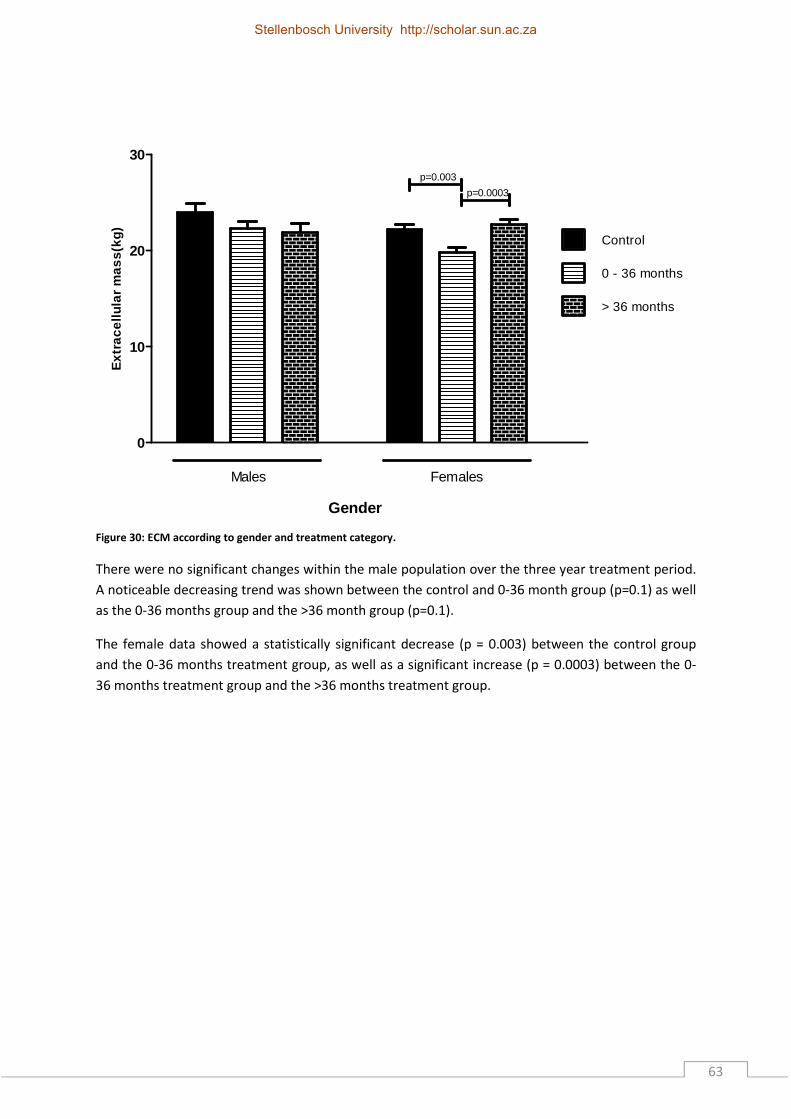
63
0
10
20
30
FemalesMales
aa Control
> 36 months
0 - 36 months
Gender
p=0.003
p=0.0003
Ext
race
llula
r m
ass
(kg)
Figure 30: ECM according to gender and treatment category.
There were no significant changes within the male population over the three year treatment period.
A noticeable decreasing trend was shown between the control and 0-36 month group (p=0.1) as well
as the 0-36 months group and the >36 month group (p=0.1).
The female data showed a statistically significant decrease (p = 0.003) between the control group
and the 0-36 months treatment group, as well as a significant increase (p = 0.0003) between the 0-
36 months treatment group and the >36 months treatment group.
Stellenbosch University http://scholar.sun.ac.za
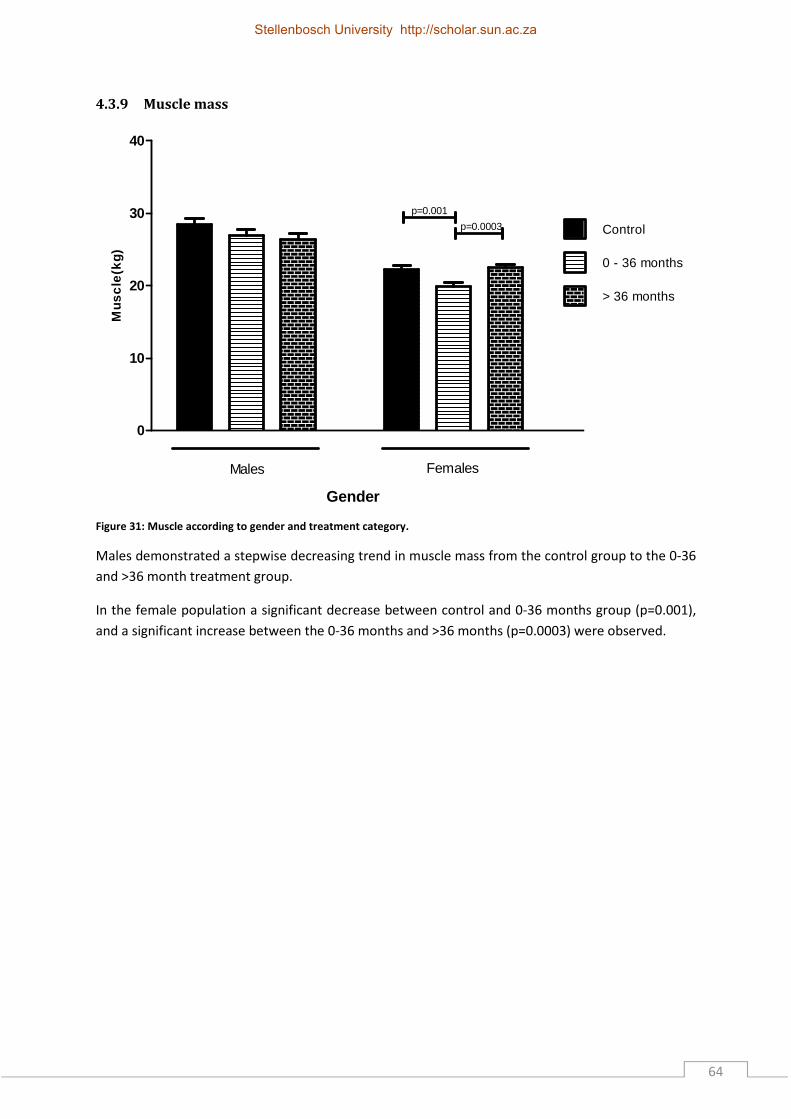
64
4.3.9 Muscle mass
0
10
20
30
40
FemalesMales
Gender
aa Control
> 36 months
0 - 36 months
p=0.001
p=0.0003
Mus
cle
(kg)
Figure 31: Muscle according to gender and treatment category.
Males demonstrated a stepwise decreasing trend in muscle mass from the control group to the 0-36
and >36 month treatment group.
In the female population a significant decrease between control and 0-36 months group (p=0.001),
and a significant increase between the 0-36 months and >36 months (p=0.0003) were observed.
Stellenbosch University http://scholar.sun.ac.za

65
4.3.10 Total body protein
0
5
10
15
FemalesMales
Gender
aa Control
> 36 months
0 - 36 months
p=0.003
p=0.01
Pro
tein
(kg)
Figure 32: Protein according to gender and treatment category.
The total body protein content for the male population showed a non-significant but statistically
decreasing trend between the control and >36 month treatment category (p=0.1). In the female
population a statistically significant decrease between control and 0-36 months group (p=0.003), and
a significant increase between the 0-36 months and >36 months (p=0.01) was observed.
Stellenbosch University http://scholar.sun.ac.za

66
4.3.11 Mineral content
0
1
2
3
4
5
FemalesMales
Gender
aa Control
> 36 months
0 - 36 months
p=0.007
p=0.001
Min
era
l(kg
)
Figure 33: Mineral content according to gender and treatment category.
The mineral content in the male population showed a non-significant decreasing statistical trend
between the control and 0-36 month treatment category (p=0.1). A further decreasing non-
significant trend was also observed between the 0-36 month and >36 month treatment groups
The female population had a significant decrease (p = 0.001) between the control group and the 0-
36 group and a significant increase (p = 0.007) between the 0-36 month group and the >36 month
group.
Stellenbosch University http://scholar.sun.ac.za

67
4.3.12 Resting metabolic rate (RMR)
0
500
1000
1500
2000
FemalesMales
Gender
aa Control
> 36 months
0 - 36 months
p=0.005
p=0.009
Re
stin
g m
eta
bolic
ra
te(k
cal)
Figure 34: RMR according to gender and treatment category.
Males demonstrated a steady decreasing trend in RMR from the control group to the 0-36 month
treatment group (p=0.1) and a further statistical decrease from the 0-36 month treatment group to
the >36 month treatment group (p=0.05).
The female population had a significant decrease (p = 0.005) between the control group and the 0-
36 group followed by a significant increase (p = 0.009) between the 0-36 month group and the >36
month group.
Stellenbosch University http://scholar.sun.ac.za

68
4.3.13 Total body Potassium (TBK)
0
50
100
150
200
FemalesMales
Gender
aa Control
> 36 months
0 - 36 months
p=0.002
p=0.0001
Tota
l bod
y P
ota
ssiu
m(g
)
Figure 35: TBK according to gender and treatment category.
The changes undergone with treatment duration with regards to TBK, TBCa and glycogen for each
gender were similar. However differences between the genders were observed. Males
demonstrated a steady statistical decreasing trend in TBK for the control group to the 0-36 month
treatment group (p=0.2) and a further statistical decrease from the 0-36 month treatment group to
the >36 month treatment group (p=0.1).
The female population had a significant decrease (p = 0.002) between the control group and the 0-
36 group and a significant increase (p = 0.0001) between the 0-36 month group and the >36 month
group.
Stellenbosch University http://scholar.sun.ac.za

69
4.3.14 Total body Calcium (TBCa)
0
500
1000
1500
FemalesMales
aa Control
> 36 months
0 - 36 months
Gender
p=0.002
p=0.0001
Tota
l bod
y C
alci
um(g
)
Figure 36: TBCa according to gender and treatment category.
The results for TBCa are illustrated in the figure 35. Males demonstrated a non-significant but
statistically decreasing trend in TBCa as treatment duration increased between the control and 0-36
month group (p=0.2) and the control and >36 month group (p=0.1).
The female population had a significant decrease (p = 0.002) between the control group and the 0-
36 group and a significant increase (p = 0.0001) between the 0-36 month group and the >36 month
group.
Stellenbosch University http://scholar.sun.ac.za

70
4.3.15 Glycogen
0
200
400
600
FemalesMales
Gender
aa Control
> 36 months
0 - 36 months
p=0.001
p=0.0001
Gly
coge
n(g)
Figure 37: Glycogen according to gender and treatment category.
The glycogen in the male groups showed non-significant but statistically decreasing trend between
the control and >36 month treatment category (p=0.1), whereas the significant decrease in the
female group between control and 0-36 months group (p=0.001) and a significant increase between
the 0-36 months and >36 months (p=0.0001).
Stellenbosch University http://scholar.sun.ac.za

71
4.3.16 Cluster of differentiation 4 (CD4)
0
200
400
600
FemalesMales
Gender
aa Control
> 36 months
0 - 36 months
p=0.02
p=0.02
CD
4(ce
lls/m
m3 )
Figure 38: CD4 according to gender and treatment category.
The CD4 counts in the male groups (Figure 37) showed non-significant but an increasing statistical
trend between the control and >36 months treatment category (p=0.08) as well as the 0-36 month
group and the >36month group (p=0.1).
A significant increase in the female group was observed between control and >36 months (p=0.02)
as well and 0-36 months and >36 months (p=0.02). With regards to CD4 count the male data
showed an increasing non-significant trend with treatment duration.
Stellenbosch University http://scholar.sun.ac.za

72
4.3.14 Anti-retrovirals (ARVs)
Table 12: Summary of the percentage medication use per gender between the different treatment groups
Class & Medication 0-36 months > 36 months
Males Females Males Females
NRTIs Tenofovir (TDF) 88%(n = 16) 90.3%(n = 28) 85.7%(n = 12) 62.9%(n = 22) Lamivudine (3TC) 100%(n = 18) 100%(n = 31) 100%(n = 14) 100%(n = 35) Stavudine (D4T) 5.6%(n = 1) 6.5%(n =2) 7.1%(n = 1) 5.7%(n = 2) Zidovudine (AZT) 0%(n = 0) 3.2%(n = 1) 7.1%(n = 1) 31.4%(n = 11) NNRTIs Efavirenz (EFV) 94%(n = 17) 74.2%(n = 23) 71.4%(n = 10) 28.6%(n = 10) Nevirapine (NVP) 5.6%(n = 1) 19.4%(n = 6) 14.3%(n = 2) 45.7%(n = 16) PIs Lopinavir/Ritinovir(LOP/r) 5.6%(n = 1) 3.2%(n=1) 14.3%(n = 2) 22.9%(n = 8)
4.3.14.1 0-36 Months
NRTIs
All male and female patients were on 3TC. The second highest use included TDF for which a higher
percentage of females were prescribed TDF compared to 88% males.
NNRTIs
Most patients were using EFV followed by NVP.
PIs
Low sample size numbers made the observation of n-=1 (both genders) incomplete and not
representative.
4.3.14.2 >36 Months
NRTIs
The highest use of NRTIs were observed for 3TC followed by TDF, as with the 0-36 month group.
NNRTIs
A higher percentage of males compared to females were using EFV followed by NVP.
PIs
As treatment progressed more patients received LOP/r. However, the low sample size must be
considered.
Stellenbosch University http://scholar.sun.ac.za

73
CHAPTER 5 DISCUSSION, RECOMMENDAITONS AND
CONCLUSIONS
5.1 Introduction
This chapter discusses the major findings of the study. It is integrated and discussed with current
literature and also what the possible implications are. The major findings include; anthropometrical
characteristics, use of ARV’s and how this relates to body composition in this population. Under
each section, the results will be discussed in a chronological order as it was presented in Chapter 4.
5.2 Major findings of the study
The aims of the study were to describe the anthropometrical characteristics of HIV positive patients
and to assess how these would impact on the participants risk for cardio vascular and other lifestyle
diseases.
5.2.1 Anthropometrical findings
Here the observation was that males and females responded differently to HAART treatment at
different stages of infection. However, we are unable to prove causality with these changes as it is
unclear whether the infection or the treatment causes the anthropometric and body compositional
changes.
5.2.1.1 BMI and weight
In South Africa the prevalence of overweight (BMI > 25kg/m2) and obesity (BMI > 30kg/m2) is high,
with 29% or males and 56% of females categorised as being overweight or obese. It is furthermore
estimated that the rates are higher than for other African countries (Goedecke et al., 2006). Thus,
the majority of our female sample population were classified as being overweight or obese while the
males were predominantly within the normal weight range, and 20% being classified as
underweight. We speculate that this finding might be due to cultural and lifestyle choices, some
African cultures encourage overeating and associate luxurious (high in fat and energy) with social
status (Kruger et al., 2005). African women are less pressured to be slim and relate thinness with
illness and HIV/AIDS (Kruger et al, 2005).
South Africa has a wealth of cultural diversity which places various pressures on different ethnic
groups about body image (Goedecke et al., 2006). However, our results should be interpreted with
caution as they are influenced by age, gender, demographics, ethnicity, culture and socio-economic
status. Jacobs et al. (2010) studied non-HIV related mortality and found that the risk factors for
mortality with increased central obesity are at both low and high BMI ranges. African and mixed race
Stellenbosch University http://scholar.sun.ac.za

74
women tend to be overweight and obese, however, males of similar ethnic background tend to be
more in the normal weight range (Goedecke et al., 2006).
It was established that as treatment duration increased marked changes were observed in BMI
between the three groups. Here BMI for males decreased as treatment duration increased, however
females in the 0-36 month treatment group displayed a decrease in BMI and there after an increase
back to control levels. These results were also supported with the changes in weight, waist
circumference and waist-to-hip ratio for females as treatment duration increased.
Esposito (2008) observed an increase in BMI with seventy percent of participants gaining weight
when observing thirty females at baseline, 12 and 24 weeks after the initiation of HAART. This is not
congruent with our results as we observed a decrease in weight and BMI between our ARV naïve
groupd and our 0-36 month group. This could be due to the longer intervals between data sampling
used in our study. However Mosha et al. (2013) reported HIV-positive females had a highwer BMI
than males after one year of ARV treatment.
Males however, displayed a decrease in BMI and weight with treatment duration but not enough to
consitue HIV wasting. The WHO definition for wasting is described as the unexplained loss of more
than 10% of weight, or a BMI of less than 18.5kg/m2 (WHO, 2006). For this study approximately 20%
of the male and 6% of the female population were in a stage of undergoing HIV wasting. It is well
known that opportunistic infections may add to the lower BMIs (17.7 kg/m2) observed in an HIV
population compared to patients who do not exhibit opportunitist infections (21.0 kg/m2) (Ludy et
al., 2005).
Hanrahan and colleagues (2010) studied BMI and its relation to mortality due to infection within a
South African population and observed an increase in mortality with low to normal BMIs. We then
observed female CD4 counts to decrease at the 0-36 month treatment group, contrastingly male
CD4 counts increase between these two groups. This hypothesis requires further investigation and
the underlying mechanism for this observation should be a focus point for future studies.
5.2.1.2 TSF and MUAC
It is well documented from the literature that TSF and MUAC are predictors of survival and also
surrogate parameters for the classification of muscle wasting. . The male population did not show
increases in TSF or MUAC as treatment duration increased. These two parameters are also closely
related to survival, as well as risk for co infections (Swaminathan et al., 2008). The female
population had an increase in TSF and MUAC with treatment duration suggesting that they have a
lower risk of co infection, and an increased chance of survival.
Stellenbosch University http://scholar.sun.ac.za

75
George et al. (2009) observed TSF increasing till ten months and then decreasing till twenty seven
months after the initiation of treatment in a black South African HIV-positive population between
the ages of 18 and 55 years (65% female). These results follow the trend of our results as within the
first 36 months of treatment we observed decreases in TSF, however George et al. (2009) did not
have a 36 months data sampling point.
Wannamethee et al. (2007) observed males aged 60 -79 years (97% white males) and Landi et al.
(2010) observed italian males and females both reported that decreased MUAC was also associated
with higher mortality in older men and women. The results obtained by Landi et al. (2010) was
obtained over a period of a year and are consistant with our results as we saw a decrease in MUAC
within the first 36 months of treatment. Wannamethee et al. (2007) obtained results for a period of
six years and this result is also consistant with our results as our >36 month male treatment group
displayed a decreasing trend in MUAC.
In a cohort, Mallon et al. (2003) followed HIV positive men from the initiation of treatment for 144
weeks and found a noteworthy decrease in limb fat and limb mass from the baseline value.
However, the highest increases in limb fat after the initiation of treatment were correlated with
higher base line central abdominal and truncal fat. This study also observed that males with higher
central abdominal obesity also displayed higher cholesterol, triglycerides, insulin, lower HDL and
higher BMIs after 24 weeks of treatment (Mallon et al., 2003).
5.2.1.3 WC, WHR and W:Ht
The majority of the females in our study were classified as being overweight and obese. This poses a
problem as obesity has been suggested by Krupa (2012) to be associated with detrimental medical
conditions namely, hypertension, diabetes mellius and dyslipidemia. Increased BMI, WC and WHR
are all good predictors for the onset of certain non-communicable diseases (Ng et al., 2010). For
example, such alterations are linked to increased risk for developing type 2 diabetes mellitus and
cardiovascular diseases (Ng et al., 2010).
Furthermore, studies on HIV-positive and negative men found a more rapid increase in WC in HIV-
positive males after controlling for ARVs, suggesting that there is a contrasting rate of age-related
body changes (Brown et al., 2009). Azzoni et al. (2011) reported a negative correlation between
WHR and CD4, speculating that low WHRs will result in improved immune recovery. This was
observed in our results as males having lower WHR than the females displayed a gain in CD4 count
within our 0-36 month treatment group.
Stellenbosch University http://scholar.sun.ac.za

76
Our data from W:Ht ratio compliments the data that we obtained with WC, WHR and BMI. We
observe the same tends within each gender. However, males seem to have a lower cardiovascular
risk profile than females, we observe lower obesity among males. Browning et al. (2010) reported
W:Ht ratio is a suitable assessment tool that can be used in many populations for CVD screening,
diabetes related risk factors and it correlates well with BMI and WC. Ashwell et al. (2011) reported
similar findings for WC and BMI when reviewing this tool for other studies and ethnic groups.
5.2.2 Body composition findings
5.2.2.1 BCM, FFM, FM and ECM
The males from this population generally had higher BCM compared to females. It was also noted
that they do not retain it with treatment duration unlike the females. The decrease in BCM within
the first three years of treatment is more pronounced within the female population, afterwhich it
increases. This is not observed in the males where BCM remain at a steady decline.
FM, FM%, FFM, ECM and BCM decreased initially in females then increased except FFM% which
increased initially and then decreased, even though FFM decreased the proportion of FFM in the
whole body was higher. We speculate that this is due to the FM decreasing more than FFM during
the 0-36 month time point or this is attributed to fluid shifts that with disease, obesity and weight
reduced individuals due to abnormal fluid distribution (Singer et al., 2010; Kunkel et al., 2011;
Horigan etal., 2012). The decrease of lean body mass (or FFM) and muscle mass are the most
important elements of protein energy wasting (Noori et al., 2011).
Thibault & Pichard (2012) reported that an increase prevalence of obesity together with chronic
illness associated with FFM loss will result in an increase in the prevalence of sarcopenic obesity. This
contradicts our results as we observed a greater decrease in FM than FFM in females shown by the
increase in FFM% within the 0-36 month treatment group. The reason for the loss of fat could be
due to peripheral wasting that has been extensily looked at with HIV (Brown et al., 2009; George et
al., 2009), however this can also be a behavioural issue as poor appetite with the initiation of
treatment is also evident from the literaure (Behe et al., 2013; Koethe et al., 2013).
Studies have shown that a build-up of fat stimulates low level inflammation (Greogo & Hotamisligil,
2011; Lumeng & Saltiel, 2011). This increased inflammation has been proposed as a potential
biological pathway that can explain the lack of immune reconstitution in patients receiving HAART
(Muller et al., 2010). Persistent low grade inflammation is a determining factor in the development
of endothelial dysfunction and vascular disease in type 2 diabetes (Reyskens & Essop, 2014).
Stellenbosch University http://scholar.sun.ac.za

77
Within our sample population we see a decrease trend in BCM, FM, FFM and ECM with males this
shows an increased risk of wasting that we do not see with the females as treatment duration
increases. Mallon et al. (2003) observed a decrease trend in FFM from initiation of treatment to 12
weeks and 48 weeks, lipodystrophy with the central abdominal fat became more pronounced. With
clinical lipoatrophy HIV-infected individuals have less VAT than uninfected controls (Bachetti et al.,
2005; Bachetti et al., 2006)..
The depletion of metabolically active tissue (BCM and FFM) is an important feature to note in HIV
infection, this compounds the protein energy malnution and aging that is observed with HIV
infection (Lopes & de Sousa 2013). This is worrying especialy for our male population as changes in
metabolically active tissue displays a decreasing trend with males after treatment initiation,
however with females BCM increases after treatmen for more that 36 months to higher than the
control group values. Thus, the male population seem to be at a higher risk for mortality than
females.
It is hypothesized that decreases in BCM in HIV-positive individuals are due to cells being used as a
form of energy and sustenance that is lacking (Wasserman et al., 2012). If this is indeed correct, then
differences in BCM found between genders in our study can be due to females having alternative
fuel sources available. The increase in FM in females can therefore be seen as protective (Hanrahan
et al., 2010), the excess FM seems to serve as a fuel source slowing disease progression.
5.2.2.2 Muscle mass, body protein content & mineral content
Ageing and disease has long been associated with increased risk of mortality because of the loss of
weight and muscle mass (Landi et al., 2010; Deeks, 2011). There simmilarities between ageing and
the HIV infection are both characterized by increased protein catabolism and decreased muscle
mass. These parameters have been associated with increased mortality risk in the elderly as well as
HIV-infected (Scherzer et al., 2011).
Decreased muscle mass was found to be associated with an increased risk for mortality when
excluding inflammation and other factors proven to increase mortality risk (Scherzer et al., 2010).
From our results we observed similar trends for muscle mass, protein content and mineral mass in
each gender. Males showed a decrease in muscle, protein and mineral mass with treatment
duration. Females displayed a decrease in muscle, protein and mineral mass with treatment
initiation, however unlike males after 36 months of treatment an increase in these parameters was
observed. As expected we observed higher muscle mass within the male population compared to
the female population.
Stellenbosch University http://scholar.sun.ac.za

78
Furthermore, males tend to have lower mineral mass compared to females. However the amount of
protein between genders was similar. On average, males have 61% more muscle mass than females
as a result of higher levels of testosterone (Lassek & Gaulin, 2009). A negative aspect, according to
Lassek & Gaulin (2009), is having a higher muscle mass with HIV there are increased dietary
requirements in a decreased immune functioning system leading to a higher required energy intake
which is not always achieved.
HIV-infection is not the cause of loss of bone mineral density, but this may occur as a result of ARV
treatment (Tebas et al., 2011). This statement agrees with the data observed from our male
particiapnts as a decrease was observed with ARV treatment duration. However, we found an initial
decrease in mineral mass and a recovery later-on in females despite ARV treatment. Suggesting that
with long-term ARV exposure medication may have less of an effect on bone mineral mass.
Contrastingly Bolland et al. (2007) reported ARV treatment is a risk factor for developing low bone
mineral density and reported an increase in bone mineral density among HIV-infected males when
compared to negative controls.
Males seem to be at a higher risk for complications as a decrease of these parameters can increase
morbidity and mortality (Brown et al., 2009; Duvivier et al., 2009; Yarasheski et al., 2011; Shulman &
Peterson, 2012). The declines in these parameters are associated with ageing (Wasserman et al.,
2013) and observing decreases in such a young population is worrying and could have a negative
mpact on life expectancy, however this requies further investigation.
5.2.2.3 RMR, TBK, TBCa and Glycogen
The RMR, one of the main indicators of metabolism in humans, is an important parameter to
monitor in body composition as it affects the body’s internal and external environment (Metsios et
al., 2006). The male population had higher RMR compared to the female population. It is also known
that males have more muscle mass, and at rest, amd therefore burning more calories because it is
more metabolically active than other tissues (Stewart & Sutton, 2012). This is a not ideal as males
display more wasiting than females. Higher caloric requirement would be detrimental and could be
the cause for the higher risk of morbidity and mortality among our male population.
TBK is a method of assessing the BCM and FFM (Siervo & Jebb, 2010), therfore from our results we
see that TBK, BCM and FFM followed the same trend with treatment duration and between genders
this reinforces our observations made for BCM. The amount of potassium in FFM is different
between males and females, it is also lower in obese individuals and is age dependant (Deurenberg
et al., 2009). This could explain the lower TBK observed in females as they had a higher revalence of
obesity. We speculate therefore that TBK is more accurate in the assessment of BCM than FFM. A in
Stellenbosch University http://scholar.sun.ac.za

79
diffenerce of three years in mean age was observed this could also, this could add to the the
difference observed between males and females.
Calcium is the primary constituent of bone mineral, the amount of calcium consumed is observed to
correlate with bone mass (Sutton, 2012). From our data we observed similar changes in mineral
mass and TBCa of both males and females with treatment duration. The results for TBCa reinforce
what was observed with bone mineral changes.
The lower amounts of calcium observed in females and the delayed recovery from a decrease in CD4
count with the initiation of treatment could indicate hypocalemia (Miguez et al., 2012). However this
was not a focus for our study but would be a good focal point in future studies.
The greatest percentage of glycogen in our bodies is found in muscle mass. Males had higher
glycogen compared to females, this is explained by the difference in muscle mass between these
two genders.
Increased glycogen translates to an increase in energy needs, as muscle is a major determining
factor in resting energy requirements (Lassek & Gaulin, 2009).In a well nourished indidivual 475g of
glycogen should be present (McAdle et al., 2010), males in our sample population had more
glycogen present as a decrease was observed with treatemtn duration. However females 0-36
month treatment group displayed lower glycogen than the 475g average. The control and >36
month treatment groups were in the vicinity of this average.
Glycogen the “stored muscle fuel” could be a good indicator of energy depletion in the HIV-positive
population, however this requires future studies to explain how effective it would be as a predictor
of energy muscle energy wasting. To our knowledge this has never been studied in a HIV-positive
population while looking at changes with in ARV treatment duration.
5.2.3 CD4
A higher CD4 count is associated with lower mortality (Cockerham et al., 2010). After the initaion of
treatment we would expect an increase in CD4 count to be observed, this was true for the male
participant. However feamles displayed a decrease in CD4 count at the 0-36 month treatment group
and an increase therafter. Mosha et al. (2013) reported similar findings after a year of treatment
HIV-positive females display lower increases in CD4 count than males.
Nutritional stress could explain the lack of CD4 recovery in females (Lee & Nieman, 2010), however
males due to there higher muscle mass should required more caloric intake than females (Lassek &
Stellenbosch University http://scholar.sun.ac.za
80
Gaulin, 2009). The increased prevalence of obesity and higher WHR among the female participant
can also explain the initial decrease in CD4 count (Hamdy et al., 2006; Azzoni et al., 2011).
A decline in health is more common with patients who were severely immunodeficient upon
initiation of ARV therapy (Burgoyune et al., 2008). This was not observed in our sample population
as the control groups CD4 counts where lower in males than females.
5.3 Implications of findings
5.3.1 Cardiovascular link to HAART
With treatment duration for NRTIs females used TDF less than males as treatment duration
increased. Females used AZT more than males with treatment duration, however very few patients
(both genders) in the 0-36 month group used AZT. A possible reason for the increased use of AZT in
females is that pregnant females are put on AZT during pregnancy and in some cases if the patient is
doing well on the teatment they are not taken off AZT after pregnancy and until the treatment fails
(The South African Antiretroviral Treatment guidelines, 2010). This could explain the fact that
females where more prone to being overweight as AZT has been linked to fat accumulation and
lypodystraphy (Nguyen et al., 2008)
D4T was minimaly used with all treatment groups for both genders. This is in accordance with the
objectives for treatment guidelines set forward by the department of health, which aims to minimize
unnecessary drug toxicities (The South African Antiretroviral Treatment guidelines, 2010).
Among the NNRTIs EFV was used more for male than females treatment, however the use of EFV
decreased for both genders with treatment duration. NVP was mainly used by females and increased
with treatment duration for both males and females. The use of EFV is preferred with TB co-
infection this could be a possible reason for the increased use of EFV over NVP. However increased
NVP use among females can be attributed to the switch from EFV to NVP during pregnancy and
further use after pregnancy (The South African Antiretroviral Treatment Guidelines, 2010). In
disagreement with our results Nguyen et al. (2008) reported a greater association between EFV use
and fat accumulation vs. NVP use. However this study was done with many different ethnic groups
and Black ethnicity was not well represented.
With regards to he PI LOP/r we observed an increase in use as treatment duration increased with
both males and females. This is because PIs are part of the 2nd regimen and the majority of patients
will only go on PIs once 1st regimen has failed. Females had a greater increase in the use of LOP/r
when compared to males. This could explain the increases in obesity we observed with treatment
Stellenbosch University http://scholar.sun.ac.za

81
duration among female participants, as LOP/r use has been associated with fat accumulation and
weight gain (Nguyen et al., 2008).
PIs have been implicated in metabolic changes which are not only systemic but also organ related
(Reyskens & Essop, 2014). Reyskens &Essop reviewed these metabolic changes and reported that; i)
the systemic metabolic changes were similar to that of the metabolic syndrome which prompt risk
factors that could lead to the onset of CVD and type 2 diabetes mellitus. ii) The effects of PIs on the
heart itself also prompted the onset of cardiovascular complications by the production of reactive
oxygen species which are the root of intercellular and mitochondrial damaging effects which lead to
impared mitochondrial function, energy production and later cell death.
Bhowmik et al. (2012) observed 48 patients receiving PIs at baseline, six months and twelve months,
they reported a marked decrease in TSF and an increase in BMI at both the six and twelve month
data collection points. They also reported an increase in LDL and decrease in HDL only at the six
month time point.
Endothelial injury due to PI treatment has been linked to dyslipidemia, oxidative stress as well as
immune senescence (Lefevre et al., 2010; Reyskens & Essop, 2014). However endothelial
dysfunction has also been found to be present in HIV positive individuals not on treatment (Torriani
et al., 2008).
Lin et al. (2011) reported that the administration of TDF cases significant decreases in bone mineral
density to decrease when given as pre exposure prophylaxes. Huang et al. (2013) published similar
results showing that TDF caused the greatest loss of total bone mineral density.
An increase in FM has been correlated with a decrease in bone mineral density with patients on PIs,
when compared to regimens without PIs increases in FM, FFM, triglycerides, WC and leptin was
observed (Bonnet et al., 2013).
Obel et al. (2007) reported an increase in hospitalization for ischemic heart disease between HIV
positive individuals with the first 2 years of treatment, however when compared to controls(HIV
negative) individuals the relative risk did not increase for 8 years. TDF and LOP/r independent of one
another were associated with chronic renal impairment in HIV infected individuals (Ryom et al..,
2013).
Since ARV has become available to the public sector fewer incidence of opportunistic infections have
been observed due to immune reconstitution, however an observation of unique reactions to
opportunistic infections (Inflammatory response) has been observed with some patients after
Stellenbosch University http://scholar.sun.ac.za
82
initiation ARVs (Murdoch et al., 2007). The presentations of these clinical symptoms have been
termed the immune reconstitution inflammatory syndrome (IRIS) (Pean et al., 2011). This
observation could explain the decline in body compositional parameters observed in our 0-36 month
treatment group, however this requires further investigation.
5.4 Limitations and recommendations
The study had some limitations that need to be disclosed. We anticipated a sample size of n=560
during the beginning stages of this cross-sectional study. We could not reach this sample size
because of several reasons; 1) the male participants do not attend clinics. This could also be
explained from literature, as males are less likely to atted clinics and refuse to particiapte (Connolly
et al., 2008). 2) During the winter months it usually rains in the Western Cape and patients then rely
on walking to the clinics. 3) Day workers need to get back to their day jobs or else they are relieved
from their work and thus we did not see many potential participants.
Thus, males and females were not equally represented as statistically calculated. Some of the
reference cut offs used in this study were not validated for this population. Because of the study
design we should be very careful not to infer causality to any of the findings.
We initially planned to include nutritional assessments but time constraints made it impossible for
us to gather this very important information.
There were no HIV negative control groups to track the natural progression of our parameters. BIA
measurements can be affected by disease, during periods of infections fluid shifts occur in the body
increasing extracellular fluid compartments (e.g. renal failure, acidities or nephrotoxicity). It would
be interesting to look at total body water in a future study; this however requires a very strict pre-
test protocol which was not always feasible in our setting.
Further longitudinal studies to assess the changes over time between HIV infected as well as the
uninfected are needed. We are currently in the process of formulating new hypothesis in which we
will look in more depth possibly molecular mechanisms in an on-going project, to explain some of
our findings. Studies should also be carried out in private clinics to assess the anthropometric
characteristics and differences between the ARVs regimens available in the public and private
sectors.
A definite advantage of this study was the multi-disciplinary nature we concluded this phase of the
data collection in. Several other disciplines (biochemistry, psychology, physiotherapy and sport
science, Centre for High Performance Sciences) are all collaborating for the next phase of data
collection.
Stellenbosch University http://scholar.sun.ac.za

83
We do report that both HIV positive males and females with different treatment durations had an
ARV naïve group which served as a before treatment baseline. To our knowledge the reporting on
the anthropometric and body compositional characteristics with treatment duration of this
population has not yet been done.
5.5 Strategies for improvement of quality of life in relation to
anthropometric findings
It was found that the female population had a much higher risk for the development of cardio-
metabolic disease. For the male population, there is the need to look at strategies to improve and
maintain muscle mass to prevent wasting. Nutritional planning combined with a regular exercise
programme might help with this issue. PIs can be phased out and a new drug class (e.g. integrase
inhibitors or chemokine receptor inhibitors) can be considered in cases where dyslipidemia arises.
The prescription of anabolic steroids, exercise and growth hormone can be considered as they have
been proven to restore weight and FFM (Lo et al., 2010; Gullet et al., 2010). The HIV fusion inhibitor,
Enfuvirtide, could be beneficial as it has not caused unwanted changes to fat distribution and
metabolic factors (Cooper et al., 2010).
5.6 Conclusion
The results of this study illustrate the changes in body composition and anthropometric profiles
between both genders as they react differently to treatment duration of ARVs.
The increases in fat and other parameters leave the females at higher risk for developing
cardiovascular diseases. We observed a decrease in TS, MAUC, WC, HC. W:Ht, WHR, weight, BMI,
FFM, FM, BCM, protein and muscle with in the first three years of treatment. This is attributed to a
stabilization period that occurs due to immune reconstitution and stabilization of metabolic changes
undergone due to the infection and the introduction of ARVs. However in the female population
these parameters increased with treatment duration.
W:Ht ratio might be a valid assessment tool for the assessment of metabolic risk factors as the
trends that emerged where congruent with that of BMI, WC and WHR. Even though both genders
exhibited wasting with the initiation of treatment we observed a marked improvement with females
as all the parameters besides WHR and FFM% increased with treatment duration. This was not
evendent in the male population as with all parameters besides WHR, W:Ht and FFM% decreased
with treatment duration.
Stellenbosch University http://scholar.sun.ac.za

84
Future studies should focus on determining the cause of the body compositional changes undergone
with treatment duration and distinguish between the influence of HIV itself and the treatment
thereof.
Stellenbosch University http://scholar.sun.ac.za

85
List of Refernces 1 Abbas, A.K., Lichtman, A.H. & Pillai, S. 2012, Basic immunology: functions and disorders of
the immune system, Saunders WB.
2 Abernethy, P., Olds, T., Eden, B., Neill, M. & Baines, L. 1996, "Anthropometry, health and
body composition", Anthropometrica: A textbook of body measurement for sports and
health courses, , pp. 366-391.
3 Acheson, K.J., Gremaud, G., Meirim, I., Montigon, F., Krebs, Y., Fay, L.B., Gay, L., Schneiter,
P., Schindler, C. & Tappy, L. 2004, "Metabolic effects of caffeine in humans: lipid oxidation or
futile cycling?", The American Journal of Clinical Nutrition, vol. 79, no. 1, pp. 40-46.
4 Appay, V. & Sauce, D. 2008, "Immune activation and inflammation in HIV-1 infection: causes
and consequences", The Journal of pathology, vol. 214, no. 2, pp. 231-241.
5 Arimura, S., Moura, B., Pimentel, G., Silva, M. & Sousa, M. 2011, "Circunferencia de la cintura
es mejor asociado con lipoproteínas de alta densidad (LAD-C) que con el índice de masa
corporal (IMC) en adultos con síndrome metabólico", Nutrición Hospitalaria, vol. 26, no. 6,
pp. 1328-1332.
6 Ashwell, M., Gunn, P. & Gibson, S. 2012, "Waist-to-height ratio is a better screening tool
than waist circumference and BMI for adult cardiometabolic risk factors: systematic review
and meta-analysis", obesity reviews, vol. 13, no. 3, pp. 275-286.
7 Atkinson, B.E., Krishnan, S., Cox, G., Hulgan, T. & Collier, A.C. 2013, "Anthropometric
Differences between HIV-Infected Individuals Prior to Antiretroviral Treatment and the
General Population from 1998–2007: The AIDS Clinical Trials Group Longitudinal Linked
Randomized Trials (ALLRT) Cohort and NHANES", PloS one, vol. 8, no. 6, pp. e65306.
8 Azzoni, L., Foulkes, A.S., Firnhaber, C., Yin, X., Crowther, N.J., Glencross, D., Lawrie, D.,
Stevens, W., Papasavvas, E. & Sanne, I. 2011, "Metabolic and anthropometric parameters
contribute to ART-mediated CD4 T cell recovery in HIV-1-infected individuals: an
observational study", Journal of the International AIDS Society, vol. 14, no. 1, pp. 37.
9 Bacchetti, P., Gripshover, B., Grunfeld, C., Heymsfield, S., McCreath, H., Osmond, D., Saag,
M., Scherzer, R., Shlipak, M. & Tien, P. 2005, "Fat distribution in men with HIV infection.",
Journal of acquired immune deficiency syndromes (1999), vol. 40, no. 2, pp. 121-131.
10 Bacchetti, P., Heymsfield, S., Lewis, C.E., Scherzer, R., Shlipak, M., Tien, P.C., Gripshover, B.,
Shevitz, A., Wanke, C. & Zolopa, A. 2006, "Fat distribution in women with HIV infection",
JAIDS-Journal Of Acquired Immune Deficiency Syndromes, vol. 42, no. 5, pp. 562-571.
11 Baird, G.S. 2011, "Ionized calcium", Clinica Chimica Acta, vol. 412, no. 9, pp. 696-701.
12 Banda, Y., Chapman, V., Goldenberg, R.L., Chi, B.H., Vermund, S.H. & Stringer, J.S. 2007,
"Influence of body mass index on pregnancy outcomes among HIV-infected and HIV-
Stellenbosch University http://scholar.sun.ac.za

86
uninfected Zambian women", Tropical Medicine & International Health, vol. 12, no. 7, pp.
856-861.
13 Baracos, V.E., Reiman, T., Mourtzakis, M., Gioulbasanis, I. & Antoun, S. 2010, "Body
composition in patients with non–small cell lung cancer: a contemporary view of cancer
cachexia with the use of computed tomography image analysis", The American Journal of
Clinical Nutrition, vol. 91, no. 4, pp. 1133S-1137S.
14 Barbaro, G. & Iacobellis, G. 2009, "Metabolic syndrome associated with HIV and highly active
antiretroviral therapy", Current diabetes reports, vol. 9, no. 1, pp. 37-42.
15 Bell, S.J., Bistrian, B.R., Apour Connolly, C. & Armour Forse, R. 1997, "Body composition
changes in patients with human immunodeficiency virus infection", Nutrition, vol. 13, no. 7,
pp. 629-632.
16 Berhe, N., Tegabu, D. & Alemayehu, M. 2013, "Effect of nutritional factors on adherence to
antiretroviral therapy among HIV-infected adults: a case control study in Northern Ethiopia",
BMC infectious diseases, vol. 13, no. 1, pp. 233.
17 Bhowmik, A., De, R., Mahato, M., Das, S.K. & Guha, S.K. 2012, "Study of changes in lipid
profile and fasting blood glucose in protease inhibitor exposed HIV/AIDS patients in School
of Tropical Medicine, Kolkata", BMC Infectious Diseases, vol. 12, no. Suppl 1, pp. P34.
18 Boccara, F., Lang, S., Meuleman, C., Ederhy, S., Mary-Krause, M., Costagliola, D., Capeau, J. &
Cohen, A. 2013, "HIV and Coronary Heart DiseaseTime for a Better Understanding", Journal
of the American College of Cardiology, vol. 61, no. 5, pp. 511-523.
19 Bociaga-Jasik, M., Goralska, J., Polus, A., Sliwa, A., Gruca, A., Razny, U., Zdzienicka, A.,
Garlicki, A., Mach, T. & Dembinska-Kiec, A. 2013, "Mitochondrial Function and Apoptosis of
Peripheral Mononuclear Cells (PBMCs) in the HIV Infected Patients", Current HIV research,
vol. 11, no. 4, pp. 263-270.
20 Bommenel, T., Meynard, J., Launay, O., Simon, A., Mahamat, A., Martinez, V., Gilquin, J.,
Katlama, C., Lascaux, A. & Pradier, C. 2010, "Virological outcomes in ARV-naïve patients
switching or not from a first successful boosted PI-regimen to efavirenz, nevirapine or
abacavir regimens", Journal of the International AIDS Society, vol. 13, no. Suppl 4, pp. O21.
21 Bonaldo, P. & Sandri, M. 2013, "Cellular and molecular mechanisms of muscle atrophy",
Disease models & mechanisms, vol. 6, no. 1, pp. 25-39.
22 Bonnet, E., Ruidavets, J., Genoux, A., Mabile, L., Busato, F., Obadia, M., Prévoteau, F.,
Marchou, B., Massip, P. & Marion-Latard, F. 2013, "Early loss of bone mineral density is
correlated with a gain of fat mass in patients starting a protease inhibitor containing
regimen: the prospective Lipotrip study", BMC infectious diseases, vol. 13, no. 1, pp. 293.
Stellenbosch University http://scholar.sun.ac.za
87
23 Boutayeb, A. 2006, "The double burden of communicable and non-communicable diseases
in developing countries", Transactions of the Royal Society of Tropical Medicine and
Hygiene, vol. 100, no. 3, pp. 191-199.
24 Brandmann, M., Nehls, U. & Dringen, R. 2013, "8-Hydroxy-efavirenz, the Primary Metabolite
of the Antiretroviral Drug Efavirenz, Stimulates the Glycolytic Flux in Cultured Rat
Astrocytes", Neurochemical research, vol. 38, no. 12, pp. 2524-2534.
25 Briot, K., Kolta, S., Flandre, P., Boue, F., Ngo Van, P., Cohen-Codar, I., Norton, M., Delfraissy,
J. & Roux, C. 2011, "Prospective one-year bone loss in treatment-naïve HIV men and women
on single or multiple drug HIV therapies", Bone, vol. 48, no. 5, pp. 1133-1139.
26 Brown, T.T. & Qaqish, R.B. 2006, "Antiretroviral therapy and the prevalence of osteopenia
and osteoporosis: a meta-analytic review", Aids, vol. 20, no. 17, pp. 2165-2174.
27 Brown, T.T., Chu, H., Wang, Z., Palella, F.J., Kingsley, L., Witt, M.D. & Dobs, A.S. 2007,
"Longitudinal increases in waist circumference are associated with HIV-serostatus,
independent of antiretroviral therapy", Aids, vol. 21, no. 13, pp. 1731-1738.
28 Brown, T.T., Xu, X., John, M., Singh, J., Kingsley, L.A., Palella, F.J., Witt, M.D., Margolick, J.B. &
Dobs, A.S. 2009, "Fat distribution and longitudinal anthropometric changes in HIV-infected
men with and without clinical evidence of lipodystrophy and HIV-uninfected controls: a
substudy of the Multicenter AIDS Cohort Study", AIDS Res Ther, vol. 6, no. 8.
29 Brown, T.T., McComsey, G.A., King, M.S., Qaqish, R.B., Bernstein, B.M. & da Silva, B.A. 2009,
"Loss of bone mineral density after antiretroviral therapy initiation, independent of
antiretroviral regimen", JAIDS Journal of Acquired Immune Deficiency Syndromes, vol. 51,
no. 5, pp. 554-561.
30 Browning, L.M., Hsieh, S.D. & Ashwell, M. 2010, "A systematic review of waist-to-height ratio
as a screening tool for the prediction of cardiovascular disease and diabetes: 0· 5 could be a
suitable global boundary value", Nutrition research reviews, vol. 23, no. 2, pp. 247.
31 Buehring, B., Kirchner, E., Sun, Z. & Calabrese, L. 2012, "The Frequency of Low Muscle Mass
and Its Overlap With Low Bone Mineral Density and Lipodystrophy in Individuals With HIV—
A Pilot Study Using DXA Total Body Composition Analysis", Journal of Clinical Densitometry,
vol. 15, no. 2, pp. 224-232.
32 Burgoyne, R.W. & Tan, D.H. 2008, "Prolongation and quality of life for HIV-infected adults
treated with highly active antiretroviral therapy (HAART): a balancing act", Journal of
antimicrobial chemotherapy, vol. 61, no. 3, pp. 469-473.
33 Burgoyne, R., Collins, E., Wagner, C., Abbey, S., Halman, M., Nur, M. & Walmsley, S. 2005,
"The relationship between lipodystrophy-associated body changes and measures of quality
Stellenbosch University http://scholar.sun.ac.za

88
of life and mental health for HIV-positive adults", Quality of life Research, vol. 14, no. 4, pp.
981-990.
34 Campbell, K.L., Ash, S., Bauer, J.D. & Davies, P.S. 2007, "Evaluation of nutrition assessment
tools compared with body cell mass for the assessment of malnutrition in chronic kidney
disease", Journal of Renal Nutrition, vol. 17, no. 3, pp. 189-195.
35 Campbell, K.L., Ash, S., Davies, P.S. & Bauer, J.D. 2008, "Randomized controlled trial of
nutritional counseling on body composition and dietary intake in severe CKD", American
Journal of Kidney Diseases, vol. 51, no. 5, pp. 748-758.
36 Connolly, C., Colvin, M., Shisana, O. & Stoker, D. 2008, "Epidemiology of HIV in South Africa-
results of a national, community-based survey", South African Medical Journal, vol. 94, no. 9,
pp. 776.
37 Cooper, D., Cordery, D., Reiss, P., Henry, K., Nelson, M., O'Hearn, M., Reynes, J., Arastéh, K.,
Chung, J. & Rowell, L. 2011, "The effects of enfuvirtide therapy on body composition and
metabolic parameters over 48 weeks in the TORO body imaging substudy*", HIV medicine,
vol. 12, no. 1, pp. 31-39.
38 Costagliola, D., Lang, S., Mary-Krause, M. & Boccara, F. 2010, "Abacavir and cardiovascular
risk: reviewing the evidence", Current HIV/AIDS Reports, vol. 7, no. 3, pp. 127-133.
39 Council, A. 2011, "Guidelines for the Use of Antiretroviral Agents in HIV-1-Infected Adults
and Adolescents", .
40 Crum-Cianflone, N., Roediger, M.P., Eberly, L., Headd, M., Marconi, V., Ganesan, A.,
Weintrob, A., Barthel, R.V., Fraser, S. & Agan, B.K. 2010, "Increasing rates of obesity among
HIV-infected persons during the HIV epidemic", PLoS One, vol. 5, no. 4, pp. e10106.
41 De Clercq, E. 2009, "Anti-HIV drugs: 25 compounds approved within 25 years after the
discovery of HIV", International journal of antimicrobial agents, vol. 33, no. 4, pp. 307-320.
42 de Koning, L., Gerstein, H., Bosch, J., Diaz, R., Mohan, V., Dagenais, G., Yusuf, S. & Anand, S.
2010, "Anthropometric measures and glucose levels in a large multi-ethnic cohort of
individuals at risk of developing type 2 diabetes", Diabetologia, vol. 53, pp. 1322-1330.
43 Deeks, S.G. 2011, "HIV infection, inflammation, immunosenescence, and aging", Annual
Review of Medicine, vol. 62, pp. 141-155.
44 Delpierre, C., Bonnet, E., Marion-Latard, F., Aquilina, C., Obadia, M., Marchou, B., Massip, P.,
Perret, B. & Bernard, J. 2007, "Impact of HIV Infection on Total Body Composition in
Treatment—Naive Men Evaluated by Dual-Energy X-ray Absorptiometry Comparison of 90
Untreated HIV-Infected Men to 241 Controls", Journal of Clinical Densitometry, vol. 10, no.
4, pp. 376-380.
Stellenbosch University http://scholar.sun.ac.za

89
45 Deurenberg, P. 2009, "Body composition", Introduction to Human Nutrition, vol. 16, pp. 12.
46 Duvivier, C., Kolta, S., Assoumou, L., Ghosn, J., Rozenberg, S., Murphy, R.L., Katlama, C. &
Costagliola, D. 2009, "Greater decrease in bone mineral density with protease inhibitor
regimens compared with nonnucleoside reverse transcriptase inhibitor regimens in HIV-1
infected naive patients", Aids, vol. 23, no. 7, pp. 817-824.
47 Esposito, F. 2008, Impact of highly active antiretroviral therapy (HAART) on body
composition and other anthropometric measures of HIV-infected women in a primary
healthcare setting in KwaZulu-Natal: a pilot study, .
48 Eston, R., Hawes, M., Martin, A. & Reilly, T. 2009, "Human body composition",
Kinanthropometry and exercise physiology laboratory manual: tests, procedures and data,
vol. 1, pp. 3-53.
49 Eugenin, E.A., Morgello, S., Klotman, M.E., Mosoian, A., Lento, P.A., Berman, J.W. &
Schecter, A.D. 2008, "Human Immunodeficiency Virus (HIV) Infects Human Arterial Smooth
Muscle Cells< i> in Vivo</i> and< i> in Vitro</i>: Implications for the Pathogenesis of HIV-
Mediated Vascular Disease", The American journal of pathology, vol. 172, no. 4, pp. 1100-
1111.
50 Evans, D., McNamara, L., Maskew, M., Selibas, K., van Amsterdam, D., Baines, N., Webster, T.
& Sanne, I. 2013, "Impact of nutritional supplementation on immune response, body mass
index and bioelectrical impedance in HIV-positive patients starting antiretroviral therapy",
Nutrition journal, vol. 12, no. 1, pp. 111.
51 Fleischman, A., Johnsen, S., Systrom, D.M., Hrovat, M., Farrar, C.T., Frontera, W., Fitch, K.,
Thomas, B.J., Torriani, M. & Côté, H.C. 2007, "Effects of a nucleoside reverse transcriptase
inhibitor, stavudine, on glucose disposal and mitochondrial function in muscle of healthy
adults", American Journal of Physiology-Endocrinology And Metabolism, vol. 292, no. 6, pp.
E1666-E1673.
52 Ford, E.S., Greenwald, J.H., Richterman, A.G., Rupert, A., Dutcher, L., Badralmaa, Y.,
Natarajan, V., Rehm, C., Hadigan, C. & Sereti, I. 2010, "Traditional risk factors and D-dimer
predict incident cardiovascular disease events in chronic HIV infection", AIDS (London,
England), vol. 24, no. 10, pp. 1509.
53 Fourie, Z., Damstra, J., Gerrits, P.O. & Ren, Y. 2011, "Evaluation of anthropometric accuracy
and reliability using different three-dimensional scanning systems", Forensic science
international, vol. 207, no. 1, pp. 127-134.
54 Freedman, D.S., Katzmarzyk, P.T., Dietz, W.H., Srinivasan, S.R. & Berenson, G.S. 2009,
"Relation of body mass index and skinfold thicknesses to cardiovascular disease risk factors
Stellenbosch University http://scholar.sun.ac.za

90
in children: the Bogalusa Heart Study", The American Journal of Clinical Nutrition, vol. 90,
no. 1, pp. 210-216.
55 Freedman, D.S., Ogden, C.L., Goodman, A.B. & Blanck, H.M. 2013, "Skinfolds and coronary
heart disease risk factors are more strongly associated with BMI than with the body
adiposity index", Obesity, vol. 21, no. 1, pp. E64-E70.
56 Friis-Møller, N., Thiébaut, R., Reiss, P., Weber, R., Monforte, A.D., De Wit, S., El-Sadr, W.,
Fontas, E., Worm, S. & Kirk, O. 2010, "Predicting the risk of cardiovascular disease in HIV-
infected patients: the data collection on adverse effects of anti-HIV drugs study", European
Journal of Cardiovascular Prevention & Rehabilitation, vol. 17, no. 5, pp. 491-501.
57 Garnett, S., Baur, L. & Cowell, C. 2008, "Waist-to-height ratio: a simple option for
determining excess central adiposity in young people", International journal of obesity, vol.
32, no. 6, pp. 1028-1030.
58 George, J.A., Venter, W.D., Van Deventer, H.E. & Crowther, N.J. 2009, "A longitudinal study
of the changes in body fat and metabolic parameters in a South African population of HIV-
positive patients receiving an antiretroviral therapeutic regimen containing stavudine", AIDS
Research and Human Retroviruses, vol. 25, no. 8, pp. 771-781.
59 Gilks, C. & Vitoria, M. 2006, "Antiretroviral therapy for HIV infection in adults and
adolescents: recommendations for a public health approach", .
60 Goedecke J, Steyn K & Lambert V. 2006. Chapter 7: Obesity. (In: Steyn, K, Fourie, J, Temple
N, (eds). Chronic Diseases of Lifestyle in South Africa: 1995 - 2005. MRC Technical Report.
Cape Town: South African Medical Research Council, p. 267.)
61 Gray, D. & Bauer, M. 1991, "The relationship between body fat mass and fat-free mass.",
Journal of the American College of Nutrition, vol. 10, no. 1, pp. 63-68.
62 Gregor, M.F. & Hotamisligil, G.S. 2011, "Inflammatory mechanisms in obesity", Annual
Review of Immunology, vol. 29, pp. 415-445.
63 Grunfeld, C., Michael, S., Cofrancesco Jr, J., Lewis, C.E., Kronmal, R., Heymsfield, S., Tien,
P.C., Bacchetti, P., Shlipak, M. & Scherzer, R. 2010, "Regional adipose tissue measured by
MRI over five years in HIV-infected and control subjects indicates persistence of HIV-
associated lipoatrophy", AIDS (London, England), vol. 24, no. 11, pp. 1717.
64 Gullett, N.P., Hebbar, G. & Ziegler, T.R. 2010, "Update on clinical trials of growth factors and
anabolic steroids in cachexia and wasting", The American Journal of Clinical Nutrition, vol.
91, no. 4, pp. 1143S-1147S.
Stellenbosch University http://scholar.sun.ac.za

91
65 Hamill, M., Ward, K., Pettifor, J., Norris, S. & Prentice, A. 2013, "Bone mass, body
composition and vitamin D status of ARV-naïve, urban, black South African women with HIV
infection, stratified by CD4 count", Osteoporosis International, , pp. 1-7.
66 Hanrahan, C.F., Golub, J.E., Mohapi, L., Tshabangu, N., Modisenyane, T., Chaisson, R.E., Gray,
G.E., McIntyre, J.A. & Martinson, N.A. 2010, "Body mass index and risk of tuberculosis and
death", AIDS (London, England), vol. 24, no. 10, pp. 1501.
67 Hawkins, T. 2010, "Understanding and managing the adverse effects of antiretroviral
therapy", Antiviral Research, vol. 85, no. 1, pp. 201-209.
68 Heymsfield, S. 2005, Human body composition, Human Kinetics 10%.
69 Hogg, R.S., Yip, B., Chan, K.J., Wood, E., Craib, K.J., O'Shaughnessy, M.V. & Montaner, J.S.
2001, "Rates of disease progression by baseline CD4 cell count and viral load after initiating
triple-drug therapy", JAMA: the journal of the American Medical Association, vol. 286, no.
20, pp. 2568-2577.
70 Horigan, A.E. 2012, "Fatigue in Hemodialysis Patients: A Review of Current Knowledge",
Journal of pain and symptom management, .
71 Hsu, J.W., Pencharz, P.B., Macallan, D. & Tomkins, A. 2005, "Macronutrients and HIV/AIDS: a
review of current evidence", World Health Organization, Durban, , pp. 10-13.
72 Hsue, P.Y., Lo, J.C., Franklin, A., Bolger, A.F., Martin, J.N., Deeks, S.G. & Waters, D.D. 2004,
"Progression of atherosclerosis as assessed by carotid intima-media thickness in patients
with HIV infection", Circulation, vol. 109, no. 13, pp. 1603-1608.
73 Huang, J.S., Hughes, M.D., Riddler, S.A., Haubrich, R.H. & Aids Clinical Trials Group A5142
Study Team 2013, "Bone Mineral Density Effects of Randomized Regimen and Nucleoside
Reverse Transcriptase Inhibitor Selection from ACTG A5142", HIV clinical trials, vol. 14, no. 5,
pp. 224-234.
74 Jacobs, E.J., Newton, C.C., Wang, Y., Patel, A.V., McCullough, M.L., Campbell, P.T., Thun, M.J.
& Gapstur, S.M. 2010, "Waist circumference and all-cause mortality in a large US cohort",
Archives of Internal Medicine, vol. 170, no. 15, pp. 1293.
75 Janiszewski, P.M., Ross, R., Despres, J., Lemieux, I., Orlando, G., Carli, F., Bagni, P., Menozzi,
M., Zona, S. & Guaraldi, G. 2011, "Hypertriglyceridemia and waist circumference predict
cardiovascular risk among HIV patients: a cross-sectional study", PloS one, vol. 6, no. 9, pp.
e25032.
76 Joy, T., Keogh, H.M., Hadigan, C., Dolan, S.E., Fitch, K., Liebau, J., Johnsen, S., Lo, J. &
Grinspoon, S.K. 2008, "Relation of body composition to body mass index in HIV-infected
Stellenbosch University http://scholar.sun.ac.za

92
patients with metabolic abnormalities", JAIDS Journal of Acquired Immune Deficiency
Syndromes, vol. 47, no. 2, pp. 174-184.
77 Kelly, A. & Levine, M.A. 2013, "Hypocalcemia in the Critically Ill patient", Journal of intensive
care medicine, vol. 28, no. 3, pp. 166-177.
78 Khan, F.S., Lotia-Farrukh, I., Khan, A.J., Siddiqui, S.T., Sajun, S.Z., Malik, A.A., Burfat, A.,
Arshad, M.H., Codlin, A.J. & Reininger, B.M. 2013, "The burden of non-communicable
disease in transition communities in an Asian megacity: baseline findings from a cohort
study in Karachi, Pakistan", PloS one, vol. 8, no. 2, pp. e56008.
79 Kim, P.S. & Read, S.W. 2010, "Nanotechnology and HIV: potential applications for treatment
and prevention", Wiley Interdisciplinary Reviews: Nanomedicine and Nanobiotechnology,
vol. 2, no. 6, pp. 693-702.
80 Köbberling, J. & Dunnigan, M. 1986, "Familial partial lipodystrophy: two types of an X linked
dominant syndrome, lethal in the hemizygous state.", Journal of medical genetics, vol. 23,
no. 2, pp. 120-127.
81 Koethe, J.R., Chi, B.H., Megazzini, K.M., Heimburger, D.C. & Stringer, J.S. 2009,
"Macronutrient supplementation for malnourished HIV-infected adults: a review of the
evidence in resource-adequate and resource-constrained settings", Clinical infectious
diseases, vol. 49, no. 5, pp. 787-798.
82 Koethe, J.R. & Heimburger, D.C. 2010, "Nutritional aspects of HIV-associated wasting in sub-
Saharan Africa", The American Journal of Clinical Nutrition, vol. 91, no. 4, pp. 1138S-1142S.
83 Koethe, J.R., Blevins, M., Bosire, C., Nyirenda, C., Kabagambe, E.K., Mwango, A., Kasongo,
W., Zulu, I., Shepherd, B.E. & Heimburger, D.C. 2013, "Self-reported dietary intake and
appetite predict early treatment outcome among low-BMI adults initiating HIV treatment in
sub-Saharan Africa", Public health nutrition, vol. 16, no. 03, pp. 549-558.
84 Koshy, C. & Evans, J. 1998, "Facial contour reconstruction in localised lipodystrophy using
free radial forearm adipofascial flaps", British journal of plastic surgery, vol. 51, no. 7, pp.
499-502.
85 Kosmiski, L.A., Sage-El, A., Kealey, E.H. & Bessesen, D.H. 2011, "Brown fat activity is not
apparent in subjects with HIV lipodystrophy and increased resting energy expenditure",
Obesity, vol. 19, no. 10, pp. 2096-2098.
86 Kotler, D.P., Rosenbaum, K., Wang, J. & Pierson, R.N. 1999, "Studies of body composition
and fat distribution in HIV-infected and control subjects", JAIDS Journal of Acquired Immune
Deficiency Syndromes, vol. 20, no. 3, pp. 228-237.
Stellenbosch University http://scholar.sun.ac.za

93
87 Kotler DP. 2006. Body composition studies in HIV-infected individuals. Ann NY Acad Sci.
904: 546-552.
88 Krause, M.V., Mahan, L.K., Escott-Stump, S. & Raymond, J.L. 2012, Krause's food & the
nutrition care process, Elsevier Health Sciences.
89 Kruger, H.S. 2012, "Anthropometry and HIV-Infected Children in Africa" in Handbook of
Anthropometry Springer, , pp. 1163-1177.
90 Krupa, S. 2012, "The Physiological Effects of Obesity in HIV-Infected Patients", Journal of
AIDS & Clinical Research, .
91 Kunkel, S.A. 2011, The use of bioelectrical impedance analysis to assess body composition
and clinical outcomes after gastric bypass surgery, .
92 Landi, F., Russo, A., Liperoti, R., Pahor, M., Tosato, M., Capoluongo, E., Bernabei, R. & Onder,
G. 2010, "Midarm muscle circumference, physical performance and mortality: results from
the aging and longevity study in the Sirente geographic area (ilSIRENTE study)", Clinical
Nutrition, vol. 29, no. 4, pp. 441-447.
93 Lang, S., Mary-Krause, M., Cotte, L., Gilquin, J., Partisani, M., Simon, A., Boccara, F., Bingham,
A. & Costagliola, D. 2010, "Increased risk of myocardial infarction in HIV-infected patients in
France, relative to the general population", Aids, vol. 24, no. 8, pp. 1228-1230.
94 Lang, S., Mary-Krause, M., Cotte, L., Gilquin, J., Partisani, M., Simon, A., Boccara, F. &
Costagliola, D. 2010, "Impact of individual antiretroviral drugs on the risk of myocardial
infarction in human immunodeficiency virus-infected patients: a case-control study nested
within the French Hospital Database on HIV ANRS cohort CO4", Archives of Internal
Medicine, vol. 170, no. 14, pp. 1228.
95 Lassek, W.D. & Gaulin, S.J. 2009, "Costs and benefits of fat-free muscle mass in men:
relationship to mating success, dietary requirements, and native immunity", Evolution and
Human Behavior, vol. 30, no. 5, pp. 322-328.
96 Ledergerber, B., Egger, M., Opravil, M., Telenti, A., Hirschel, B., Battegay, M., Vernazza, P.,
Sudre, P., Flepp, M. & Furrer, H. 1999, "Clinical progression and virological failure on highly
active antiretroviral therapy in HIV-1 patients: a prospective cohort study", The Lancet, vol.
353, no. 9156, pp. 863-868.
97 Lee, R.D. & Nieman, D.C. 2010, Nutritional assessment, Brown and Benchmark.
98 Lefèvre, C., Auclair, M., Boccara, F., Bastard, J., Capeau, J., Vigouroux, C. & Caron-Debarle, M.
2010, "Premature Senescence of Vascular Cells Is Induced by HIV Protease Inhibitors
Implication of Prelamin A and Reversion by Statin", Arteriosclerosis, Thrombosis, and
Vascular Biology, vol. 30, no. 12, pp. 2611-2620.
Stellenbosch University http://scholar.sun.ac.za

94
99 Lemmer, C., Badri, M., Visser, M. & Mayosi, B. 2011, "A lower body mass index is associated
with cardiomyopathy in people with HIV infection: evidence from a case comparison study:
original articles", .
100 Leon, D.A. 2008, "Cities, urbanization and health", International journal of epidemiology, vol.
37, no. 1, pp. 4-8.
101 Li, N., Spiegelman, D., Drain, P., Mwiru, R.S., Mugusi, F., Chalamilla, G. & Fawzi, W.W. 2012,
"Predictors of weight loss after HAART initiation among HIV-infected adults in Tanzania",
AIDS, vol. 26, no. 5, pp. 577-585.
102 Little, J.P. & Phillips, S.M. 2009, "Resistance exercise and nutrition to counteract muscle
wasting", Applied Physiology, Nutrition, and Metabolism, vol. 34, no. 5, pp. 817-828.
103 Liu, A.Y., Vittinghoff, E., Sellmeyer, D.E., Irvin, R., Mulligan, K., Mayer, K., Thompson, M.,
Grant, R., Pathak, S. & O'Hara, B. 2011, "Bone mineral density in HIV-negative men
participating in a tenofovir pre-exposure prophylaxis randomized clinical trial in San
Francisco", PLoS One, vol. 6, no. 8, pp. e23688.
104 Liu, Y., Nguyen, P., Baris, T.Z. & Poirier, M.C. 2012, "Molecular Analysis of Mitochondrial
Compromise in Rodent Cardiomyocytes Exposed Long Term to Nucleoside Reverse
Transcriptase Inhibitors (NRTIs)", Cardiovascular toxicology, vol. 12, no. 2, pp. 123-134.
105 Lo, J., You, S.M., Liebau, J., Lee, H. & Grinspoon, S. 2010, "Effects of low-dose growth
hormone withdrawal in patients with HIV", JAMA: the journal of the American Medical
Association, vol. 304, no. 3, pp. 272-274.
106 Lopes, Hugo Miguel de Sousa 2013, "Body cell mass by anthropometric measures", .
107 LUDY, M., HENDRICKS, K., HOUSER, R., CHETCHOTISAKD, P., MOOTSIKAPUN, P.,
ANUNNATSIRI, S., PRICE, E. & WANKE, C.A. 2005, "Body composition in adults infected with
human immunodeficiency virus in Khon Kaen, Thailand", The American Journal of Tropical
Medicine and Hygiene, vol. 73, no. 4, pp. 815-819.
108 Lumeng, C.N. & Saltiel, A.R. 2011, "Inflammatory links between obesity and metabolic
disease", The Journal of clinical investigation, vol. 121, no. 6, pp. 2111.
109 Maffeis, C., Banzato, C. & Talamini, G. 2008, "Waist-to-height ratio, a useful index to identify
high metabolic risk in overweight children", The Journal of pediatrics, vol. 152, no. 2, pp.
207-213. e2.
110 Mallon, P.W., Miller, J., Cooper, D.A. & Carr, A. 2003, "Prospective evaluation of the effects
of antiretroviral therapy on body composition in HIV-1-infected men starting therapy", Aids,
vol. 17, no. 7, pp. 971-979.
Stellenbosch University http://scholar.sun.ac.za
95
111 Mangili, A., Murman, D., Zampini, A., Wanke, C. & Mayer, K.H. 2006, "Nutrition and HIV
infection: review of weight loss and wasting in the era of highly active antiretroviral therapy
from the nutrition for healthy living cohort", Clinical Infectious Diseases, vol. 42, no. 6, pp.
836-842.
112 McArdle, W.D., Katch, F.I. & Katch, V.L. 2010, Exercise physiology: nutrition, energy, and
human performance, Lippincott Williams & Wilkins.
113 McComsey, G., Rightmire, A., Wirtz, V., Yang, R., Mathew, M. & McGrath, D. 2009, "Changes
in body composition with ritonavir-boosted and unboosted atazanavir treatment in
combination with Lamivudine and Stavudine: a 96-week randomized, controlled study",
Clinical infectious diseases, vol. 48, no. 9, pp. 1323-1326.
114 McComsey, G.A., Tebas, P., Shane, E., Yin, M.T., Overton, E.T., Huang, J.S., Aldrovandi, G.M.,
Cardoso, S.W., Santana, J.L. & Brown, T.T. 2010, "Bone disease in HIV infection: a practical
review and recommendations for HIV care providers", Clinical infectious diseases, vol. 51,
no. 8, pp. 937-946.
115 McGee, K., Boothby, M., Harte, A., Tomlinson, J., Hill, M., Gathercole, L., Kumar, S.,
Shahmanesh, M. & McTernan, P. 2010, "The influence of HIV status and antiretroviral (ARV)
therapy on expression of genes related to mitochondrial metabolism in human adipose
tissue (AT)", .
116 A randomized clinical trial comparing metabolic parameters after 48 weeks of standard- and
low-dose stavudine therapy and tenofovir disoproxil fumarate therapy in HIV-infected South
African patients.
117 Metsios, G.S., Stavropoulos-Kalinoglou, A., Nevill, A.M., Douglas, K.M., Koutedakis, Y. & Kitas,
G.D. 2008, "Cigarette smoking significantly increases basal metabolic rate in patients with
rheumatoid arthritis", Annals of the Rheumatic Diseases, vol. 67, no. 1, pp. 70-73.
118 Míguez, M.J., Burbano-Levy, X., Carmona, T., Quiros, C., Thompson, M., Lewis, J.E., Asthana,
D., Rodríguez, A., Valiathan, R. & Malow, R. 2012, "Hypocalcaemia, alcohol drinking and
viroimmune responses in ART recipients", Alcohol, .
119 Mills, E.J., Bakanda, C., Birungi, J., Chan, K., Ford, N., Cooper, C.L., Nachega, J.B., Dybul, M. &
Hogg, R.S. 2011, "Life expectancy of persons receiving combination antiretroviral therapy in
low-income countries: a cohort analysis from Uganda", Annals of Internal Medicine, vol. 155,
no. 4, pp. 209-216.
120 Mittelsteadt, A.L., Hileman, C.O., Harris, S.R., Payne, K.M., Gripshover, B.M. & McComsey,
G.A. 2013, "Effects of HIV and antiretroviral therapy on resting energy expenditure in adult
Stellenbosch University http://scholar.sun.ac.za
96
HIV-infected women—a matched, prospective, cross-sectional study", Journal of the
Academy of Nutrition and Dietetics, .
121 Modrich, L., Scherzer, R., Zolopa, A., Rimland, D., Lewis, C.E., Bacchetti, P., Grunfeld, C.,
Shlipak, M. & Tien, P.C. 2010, "Association of HIV infection, demographic and cardiovascular
risk factors with all-cause mortality in the recent HAART era", Journal of acquired immune
deficiency syndromes (1999), vol. 53, no. 1, pp. 102.
122 Montaner, J.S., Reiss, P., Cooper, D., Vella, S., Harris, M., Conway, B., Wainberg, M.A., Smith,
D., Robinson, P. & Hall, D. 1998, "A randomized, double-blind trial comparing combinations
of nevirapine, didanosine, and zidovudine for HIV-infected patients", JAMA: the journal of
the American Medical Association, vol. 279, no. 12, pp. 930-937.
123 Mora, S., Diceglie, C., Viganò, A., Giacomet, V., Manfredini, V., Stucchi, S., Fabiano, V.,
Mameli, C., Coletto, S. & Zuccotti, G.V. 2013, "Antiretroviral Therapy and Pregnancy: Effect
on Cortical Bone Status of Human Immunodeficiency Virus–Infected Caucasian Women as
Assessed by Quantitative Ultrasonography", Calcified tissue international, , pp. 1-5.
124 Moreno, S., Miralles, C., Negredo, E., Domingo, P., Estrada, V., Gutiérrez, F., Lozano, F. &
Martínez, E. 2009, "Disorders of body fat distribution in HIV-1-infected patients", AIDS Rev,
vol. 11, no. 3, pp. 126-134.
125 Mosha, F., Muchunguzi, V., Matee, M., Sangeda, R.Z., Vercauteren, J., Nsubuga, P., Lyamuya,
E. & Vandamme, A. 2013, "Gender differences in HIV disease progression and treatment
outcomes among HIV patients one year after starting antiretroviral treatment (ART) in Dar es
Salaam, Tanzania", BMC public health, vol. 13, no. 1, pp. 38.
126 Müller, M., Bosy-Westphal, A., Later, W., Haas, V. & Heller, M. 2009, "Functional body
composition: insights into the regulation of energy metabolism and some clinical
applications", European journal of clinical nutrition, vol. 63, no. 9, pp. 1045-1056.
127 Müller, M., Wandel, S., Colebunders, R., Attia, S., Furrer, H. & Egger, M. 2010, "Immune
reconstitution inflammatory syndrome in patients starting antiretroviral therapy for HIV
infection: a systematic review and meta-analysis", The Lancet infectious diseases, vol. 10,
no. 4, pp. 251-261.
128 Müller, W., Horn, M., Fürhapter-Rieger, A., Kainz, P., Kröpfl, J.M., Ackland, T.R., Lohman,
T.G., Maughan, R.J., Meyer, N.L. & Sundgot-Borgen, J. 2013, "Body composition in sport:
interobserver reliability of a novel ultrasound measure of subcutaneous fat tissue", British
journal of sports medicine, vol. 47, no. 16, pp. 1036-1043.
Stellenbosch University http://scholar.sun.ac.za

97
129 Murdoch, D.M., Venter, W.D., Feldman, C. & Van Rie, A. 2008, "Incidence and risk factors for
the immune reconstitution inflammatory syndrome in HIV patients in South Africa: a
prospective study", Aids, vol. 22, no. 5, pp. 601-610.
130 Ng, N., Hakimi, M., Byass, P., Wilopo, S. & Wall, S. 2010, "Health and quality of life among
older rural people in Purworejo District, Indonesia", Global Health Action Supplement, vol. 2.
131 Ng, S., Zaghloul, S., Ali, H., Harrison, G. & Popkin, B. 2011, "The prevalence and trends of
overweight, obesity and nutrition-related non-communicable diseases in the Arabian Gulf
States", Obesity Reviews, vol. 12, no. 1, pp. 1-13.
132 Nguyen, A., Calmy, A., Schiffer, V., Bernasconi, E., Battegay, M., Opravil, M., Evison, J., Tarr,
P., Schmid, P. & Perneger, T. 2008, "Lipodystrophy and weight changes: data from the Swiss
HIV Cohort Study, 2000–2006", HIV medicine, vol. 9, no. 3, pp. 142-150.
133 Noori, N., Kovesdy, C.P., Bross, R., Lee, M., Oreopoulos, A., Benner, D., Mehrotra, R., Kopple,
J.D. & Kalantar-Zadeh, K. 2011, "Novel equations to estimate lean body mass in maintenance
hemodialysis patients", American Journal of Kidney Diseases, vol. 57, no. 1, pp. 130-139.
134 Núñez, M.J., Martín-Carbonero, L., Moreno, V., Valencia, E., Garcia-Samaniego, J., Castillo,
J.G.D., Barreiro, P., González-Lahoz, J. & Soriano, V. 2006, "Impact of antiretroviral
treatment-related toxicities on hospital admissions in HIV-infected patients", AIDS Research
& Human Retroviruses, vol. 22, no. 9, pp. 825-829.
135 O’Neill, T., Guaraldi, G., Orlando, G., Carli, F., Garlassi, E., Zona, S., Després, J. & Ross, R.
2013, "Combined Use of Waist and Hip Circumference to Identify Abdominally Obese HIV-
Infected Patients at Increased Health Risk", PloS one, vol. 8, no. 5, pp. e62538.
136 Obel, N., Thomsen, H.F., Kronborg, G., Larsen, C.S., Hildebrandt, P.R., Sørensen, H.T. &
Gerstoft, J. 2007, "Ischemic heart disease in HIV-infected and HIV-uninfected individuals: a
population-based cohort study", Clinical Infectious Diseases, vol. 44, no. 12, pp. 1625-1631.
137 Okafor, C.I. 2012, "The metabolic syndrome in Africa: Current trends", Indian journal of
endocrinology and metabolism, vol. 16, no. 1, pp. 56.
138 Onwubalili, J. 1988, "Malnutrition among tuberculosis patients in Harrow, England.",
European journal of clinical nutrition, vol. 42, no. 4, pp. 363-366.
139 Parker, E.D., Pereira, M.A., Stevens, J. & Folsom, A.R. 2009, "Association of Hip
Circumference With Incident Diabetes and Coronary Heart Disease The Atherosclerosis Risk
in Communities Study", American Journal of Epidemiology, vol. 169, no. 7, pp. 837-847.
140 Payne, B.A., Hollingsworth, K.G., Baxter, J., Wilkins, E., Lee, V., Price, D.A., Trenell, M. &
Chinnery, P.F. 2014, "In Vivo Mitochondrial Function in HIV-Infected Persons Treated with
Stellenbosch University http://scholar.sun.ac.za

98
Contemporary Anti-Retroviral Therapy: A Magnetic Resonance Spectroscopy Study", PLOS
ONE, vol. 9, no. 1, pp. e84678.
141 Pean, P., Nerrienet, E., Madec, Y., Borand, L., Laureillard, D., Fernandez, M., Marcy, O., Sarin,
C., Phon, K. & Taylor, S. 2012, "Natural killer cell degranulation capacity predicts early onset
of the immune reconstitution inflammatory syndrome (IRIS) in HIV-infected patients with
tuberculosis", Blood, vol. 119, no. 14, pp. 3315-3320.
142 Peter Wasserman, R., Segal-Maurer, S., Wehbeh, W. & Rubin, D.S. 2012, "Wasting Disease,
Chronic Immune Activation, and Inflammation in the HIV-Infected Patient", Diabetes, .
143 Pou, K.M., Massaro, J.M., Hoffmann, U., Lieb, K., Vasan, R.S., O'Donnell, C.J. & Fox, C.S. 2009,
"Patterns of abdominal fat distribution the Framingham Heart Study", Diabetes care, vol. 32,
no. 3, pp. 481-485.
144 Prado, C.M., Lieffers, J.R., McCargar, L.J., Reiman, T., Sawyer, M.B., Martin, L. & Baracos, V.E.
2008, "Prevalence and clinical implications of sarcopenic obesity in patients with solid
tumours of the respiratory and gastrointestinal tracts: a population-based study", The lancet
oncology, vol. 9, no. 7, pp. 629-635.
145 Puoti, M., Nasta, P., Gatti, F., Matti, A., Prestini, K., Biasi, L. & Carosi, G. 2009, "HIV-related
liver disease: ARV drugs, coinfection, and other risk factors", Journal of the International
Association of Physicians in AIDS Care (JIAPAC), vol. 8, no. 1, pp. 30-42.
146 Rasheed, S., Yan, J.S., Lau, A. & Chan, A.S. 2008, "HIV replication enhances production of free
fatty acids, low density lipoproteins and many key proteins involved in lipid metabolism: a
proteomics study", PLoS One, vol. 3, no. 8, pp. e3003.
147 Rehle, T., Lazzari, S., Dallabetta, G. & Asamoah-Odei, E. 2004, "Second-generation HIV
surveillance: better data for decision-making", Bulletin of the World Health Organization,
vol. 82, no. 2, pp. 121-127.
148 Reyskens, K.M. & Essop, M.F. 2014, "HIV protease inhibitors and onset of cardiovascular
diseases: A central role for oxidative stress and dysregulation of the ubiquitin–proteasome
system", Biochimica et Biophysica Acta (BBA)-Molecular Basis of Disease, vol. 1842, no. 2,
pp. 256-268.
149 Ryan, M.C., Fenster Farin, H.M., Abbasi, F. & Reaven, G.M. 2008, "Comparison of waist
circumference versus body mass index in diagnosing metabolic syndrome and identifying
apparently healthy subjects at increased risk of cardiovascular disease", The American
Journal of Cardiology, vol. 102, no. 1, pp. 40-46.
150 Ryom, L., Mocroft, A., Kirk, O., Worm, S.W., Kamara, D.A., Reiss, P., Ross, M., Fux, C.A.,
Morlat, P. & Moranne, O. 2013, "Association Between Antiretroviral Exposure and Renal
Stellenbosch University http://scholar.sun.ac.za

99
Impairment Among HIV-Positive Persons With Normal Baseline Renal Function: the D: A: D
Studya", Journal of Infectious Diseases, vol. 207, no. 9, pp. 1359-1369.
151 Ryrfeldt, Å., Nordgren, T. & Lundström, J. 1992, "Hypocalcemia induced by foscarnet
(Foscavir) infusion in dogs", Fundamental and Applied Toxicology, vol. 18, no. 1, pp. 126-130.
152 Saint-Marc, T., Partisani, M., Poizot-Martin, I., Rouviere, O., Bruno, F., Avellaneda, R., Lang,
J., Gastaut, J. & Touraine, J. 2000, "Fat distribution evaluated by computed tomography and
metabolic abnormalities in patients undergoing antiretroviral therapy: preliminary results of
the LIPOCO* study", Aids, vol. 14, no. 1, pp. 37-49.
153 Salomon, J., De Truchis, P. & Melchior, J. 2002, "Nutrition and HIV infection", British Journal
of Nutrition, vol. 87, no. 1, pp. 111-120.
154 Sandri, M. 2013, "Protein breakdown in muscle wasting: role of autophagy-lysosome and
ubiquitin-proteasome", The international journal of biochemistry & cell biology, .
155 Scherzer, R., Heymsfield, S.B., Lee, D., Powderly, W.G., Tien, P.C., Bacchetti, P., Shlipak, M.G.
& Grunfeld, C. 2011, "Decreased limb muscle and increased central adiposity are associated
with 5-year all-cause mortality in HIV infection", Aids, vol. 25, no. 11, pp. 1405-1414.
156 Schols, A.M., Broekhuizen, R., Weling-Scheepers, C.A. & Wouters, E.F. 2005, "Body
composition and mortality in chronic obstructive pulmonary disease", The American Journal
of Clinical Nutrition, vol. 82, no. 1, pp. 53-59.
157 Sekhar, R.V., Jahoor, F., White, A.C., Pownall, H.J., Visnegarwala, F., Rodriguez-Barradas,
M.C., Sharma, M., Reeds, P.J. & Balasubramanyam, A. 2002, "Metabolic basis of HIV-
lipodystrophy syndrome", American Journal of Physiology-Endocrinology And Metabolism,
vol. 283, no. 2, pp. E332-E337.
158 Shaikh, N., Abdullah, F., Lombard, C.J., Smit, L., Bradshaw, D. & Makubalo, L. 2008, "Masking
through averages-intraprovincial heterogeneity in HIV prevalence within the Western Cape",
South African Medical Journal, vol. 96, no. 6, pp. 538.
159 Sharma, B. 2011, "Anti-HIV-1 drug toxicity and management strategies", Neurobehav HIV
Med, vol. 3, pp. 27-40.
160 Shulman, G.I. & Peterson, K.F. 2012. Chapter 58: Metabolism. In: Boron, W.F. & Boulpaep
(eds). Medical Physiology, 2e Updated Edition: with STUDENT CONSULT Online Access,
Elsevier Health Sciences.
161 Siervo, M. & Jebb, S.A. 2010, "Body composition assessment: theory into practice:
introduction of multicompartment models", Engineering in Medicine and Biology Magazine,
IEEE, vol. 29, no. 1, pp. 48-59.
Stellenbosch University http://scholar.sun.ac.za

100
162 Singer, L.G. & Herridge, M.S. 2010, "Clinical Year in Review II: Bronchiectasis, Mycobacterial
Infections of the Lung, Sleep-Disordered Breathing, and Lung Transplantation", Proceedings
of the American Thoracic Society, vol. 7, no. 5, pp. 305-311.
163 Slinde, F., Grönberg, A., Engström, C., Rossander-Hulthén, L. & Larsson, S. 2005, "Body
composition by bioelectrical impedance predicts mortality in chronic obstructive pulmonary
disease patients", Respiratory medicine, vol. 99, no. 8, pp. 1004-1009.
164 Somnuek Sungkanuparph, M., Thanomsak Anekthananon, M., Narin Hiransuthikul, M.,
Khuanchai Supparatpinyo, M., Piroon Mootsikapun, M., Ploenchan Chetchotisakd, M.,
Sasisopin Kiertiburanakul, M., Somsit Tansuphaswadikul, M., Wanchai Buppanharun, M. &
Wichai Techasathit, M. 2008, "Guidelines for antiretroviral therapy in HIV-1 infected adults
and adolescents: the recommendations of the Thai AIDS Society (TAS) 2008", J Med Assoc
Thai, vol. 91, no. 12, pp. 1925-1936.
165 Southern African, H. 2013, "Fixed-dose combination for adults accessing antiretroviral
therapy", S Afr J HIV Med, vol. 14, no. 1 Suppl, pp. 41-43.
166 Stahn, A., Terblanche, E. & Gunga, H. 2012, "Use of Bioelectrical Impedance: General
Principles and Overview" in Handbook of Anthropometry Springer, , pp. 49-90.
167 Statistics South Africa. Statistical release P0302. Mid year population estimates. 2009.
p.17.
168 Stein, J.H., Klein, M.A., Bellehumeur, J.L., McBride, P.E., Wiebe, D.A., Otvos, J.D. & Sosman,
J.M. 2001, "Use of human immunodeficiency virus-1 protease inhibitors is associated with
atherogenic lipoprotein changes and endothelial dysfunction", Circulation, vol. 104, no. 3,
pp. 257-262.
169 Stewart, A.D. 2012, "THE CONCEPT OF BODY COMPOSITION AND ITS APPLICATIONS", Body
Composition in Sport, Exercise, and Health, , pp. 1.
170 Sudfeld, C.R., Isanaka, S., Mugusi, F.M., Aboud, S., Wang, M., Chalamilla, G.E., Giovannucci,
E.L. & Fawzi, W.W. 2013, "Weight change at 1 mo of antiretroviral therapy and its
association with subsequent mortality, morbidity, and CD4 T cell reconstitution in a
Tanzanian HIV-infected adult cohort", The American Journal of Clinical Nutrition, vol. 97, no.
6, pp. 1278-1287.
171 Sung, R.Y., So, H., Choi, K., Nelson, E.A., Li, A.M., Yin, J.A., Kwok, C.W., Ng, P. & Fok, T. 2008,
"Waist circumference and waist-to-height ratio of Hong Kong Chinese children", BMC Public
Health, vol. 8, no. 1, pp. 324.
172 Sutinen, J. 2008, "The effects of thiazolidinediones on metabolic complications and
lipodystrophy in HIV-infected patients", PPAR research, vol. 2009.
Stellenbosch University http://scholar.sun.ac.za

101
173 Sutton, L. 2012, "BONE TISSUE", Body Composition in Sport, Exercise, and Health, , pp. 106.
174 Swaminathan, S., Padmapriyadarsini, C., Sukumar, B., Iliayas, S., Kumar, S.R., Triveni, C.,
Gomathy, P., Thomas, B., Mathew, M. & Narayanan, P. 2008, "Nutritional status of persons
with HIV infection, persons with HIV infection and tuberculosis, and HIV-negative individuals
from southern India", Clinical infectious diseases, vol. 46, no. 6, pp. 946-949.
175 Tan, B.H., Birdsell, L.A., Martin, L., Baracos, V.E. & Fearon, K.C. 2009, "Sarcopenia in an
overweight or obese patient is an adverse prognostic factor in pancreatic cancer", Clinical
Cancer Research, vol. 15, no. 22, pp. 6973-6979.
176 Tebas, P., Powderly, W.G., Claxton, S., Marin, D., Tantisiriwat, W., Teitelbaum, S.L. &
Yarasheski, K.E. 2000, "Accelerated bone mineral loss in HIV-infected patients receiving
potent antiretroviral therapy", AIDS (London, England), vol. 14, no. 4, pp. F63.
177 Thibault, R., Genton, L. & Pichard, C. 2012, "Body composition: why, when and for who?",
Clinical Nutrition, vol. 31, no. 4, pp. 435-447.
178 Thibault, R. & Pichard, C. 2011, "The evaluation of body composition: a useful tool for clinical
practice", Annals of Nutrition and Metabolism, vol. 60, no. 1, pp. 6-16.
179 Thompson, M.A., Aberg, J.A., Cahn, P., Montaner, J.S., Rizzardini, G., Telenti, A., Gatell, J.M.,
Günthard, H.F., Hammer, S.M. & Hirsch, M.S. 2010, "Antiretroviral treatment of adult HIV
infection", JAMA: the journal of the American Medical Association, vol. 304, no. 3, pp. 321-
333.
180 Tong, Q., Sankalé, J., Hadigan, C.M., Tan, G., Rosenberg, E.S., Kanki, P.J., Grinspoon, S.K. &
Hotamisligil, G.S. 2003, "Regulation of adiponectin in human immunodeficiency virus-
infected patients: relationship to body composition and metabolic indices", Journal of
Clinical Endocrinology & Metabolism, vol. 88, no. 4, pp. 1559-1564.
181 Torriani, F.J., Komarow, L., Parker, R.A., Cotter, B.R., Currier, J.S., Dubé, M.P., Fichtenbaum,
C.J., Gerschenson, M., Mitchell, C.K. & Murphy, R.L. 2008, "Endothelial Function in Human
Immunodeficiency Virus-Infected Antiretroviral-Naive Subjects Before and After Starting
Potent Antiretroviral TherapyThe ACTG (AIDS Clinical Trials Group) Study 5152s", Journal of
the American College of Cardiology, vol. 52, no. 7, pp. 569-576.
182 UNAIDS, Sub Saharan Africa. Aids epidemic update. 2008. Joint United Nations Programme
on HIV/AIDS (UNAIDS) and World Health Organization (WHO).
183 UNAIDS 2013, Global Report 2012: UNAIDS Report on the Global AIDS Epidemic,
ebookpartnership. com.
184 UNAIDS 2013, UNAIDS HIV and AIDS estimates 2013.
Stellenbosch University http://scholar.sun.ac.za
102
185 Vasques, A.C., Rosado, L., Rosado, G., Ribeiro, R.d.C., Franceschini, S. & Geloneze, B. 2010,
"Anthropometric indicators of insulin resistance", Arquivos Brasileiros de Cardiologia, vol.
95, no. 1, pp. e14-e23.
186 Vernaglione, L., Lomonte, C. & Basile, C. 2012, "Total Body Water in Health and Disease: A
Look at End-Stage Renal Disease" in Handbook of Anthropometry Springer, , pp. 273-286.
187 Vestbo, J., Prescott, E., Almdal, T., Dahl, M., Nordestgaard, B.G., Andersen, T., Sørensen, T.I.
& Lange, P. 2006, "Body mass, fat-free body mass, and prognosis in patients with chronic
obstructive pulmonary disease from a random population sample: findings from the
Copenhagen City Heart Study", American journal of respiratory and critical care medicine,
vol. 173, no. 1, pp. 79-83.
188 Waage, J., Banerji, R., Campbell, O., Chirwa, E., Collender, G., Dieltiens, V., Dorward, A.,
Godfrey-Faussett, P., Hanvoravongchai, P. & Kingdon, G. 2010, "The Millennium
Development Goals: a cross-sectoral analysis and principles for goal setting after 2015:
Lancet and London International Development Centre Commission", The lancet, vol. 376, no.
9745, pp. 991-1023.
189 Wannamethee, S.G., Shaper, A.G., Lennon, L. & Whincup, P.H. 2007, "Decreased muscle
mass and increased central adiposity are independently related to mortality in older men",
The American Journal of Clinical Nutrition, vol. 86, no. 5, pp. 1339-1346.
190 Peter Wasserman, R., Segal-Maurer, S., Wehbeh, W. & Rubin, D.S. 2012, "Wasting Disease,
Chronic Immune Activation, and Inflammation in the HIV-Infected Patient", Diabetes, .
191 Wasserman, P., Segal-Maurer, S. & Rubin, D.S. 2013, "High Prevalence of Low Skeletal
Muscle Mass Associated with Male Gender in Midlife and Older HIV-Infected Persons
Despite CD4 Cell Reconstitution and Viral Suppression", Journal of the International
Association of Providers of AIDS Care, .
192 Wells, J.C. & Fewtrell, M.S. 2008, "Is body composition important for paediatricians?",
Archives of Disease in Childhood, vol. 93, no. 2, pp. 168-172.
193 Wells, J.C. 2012, "Three-Dimensional (3-D) Photonic Scanning: A New Approach to
Anthropometry" in Handbook of Anthropometry Springer, , pp. 205-217.
194 Western Cape HIV/AIDS Infection and Fertility Population Projections, 2005
195 Wierzbicki, A.S., Purdon, S.D., Hardman, T.C., Kulasegaram, R. & Peters, B.S. 2008, "HIV
lipodystrophy and its metabolic consequences: implications for clinical practice", Current
Medical Research and Opinion®, vol. 24, no. 3, pp. 609-624.
196 Willcox, P. & Ferguson, A. 1989, "Chronic obstructive airways disease following treated
pulmonary tuberculosis", Respiratory medicine, vol. 83, no. 3, pp. 195-198.
Stellenbosch University http://scholar.sun.ac.za

103
197 Williams, S.B., Bartsch, G., Muurahainen, N., Collins, G., Raghavan, S.S. & Wheeler, D. 2003,
"Protein intake is positively associated with body cell mass in weight-stable HIV-infected
men", The Journal of nutrition, vol. 133, no. 4, pp. 1143-1146.
198 Wilson, J.P., Strauss, B.J., Fan, B., Duewer, F.W. & Shepherd, J.A. 2013, "Improved 4-
compartment body-composition model for a clinically accessible measure of total body
protein", The American Journal of Clinical Nutrition, vol. 97, no. 3, pp. 497-504.
199 World Health Organization 2009, "UNAIDS (2008)", Male circumcision and HIV prevention:
research implications for policy and programming, pp. 6-8.
200 World Health Organization 2009, World health statistics 2009, World Health Organization.
p.149
201 World Health Organization & UNAIDS, U. 2011, "Global HIV/AIDS response: epidemic update
and health sector progress towards universal access: progress report 2011", Geneva: World
Health Organization.
202 World Health Organization 2011, "Antiretroviral Therapy for HIV Infection in Adults and
Adolescents. Recommendations for a Public Health Approach (2010 revision). Geneva: World
Health Organization, 2010", Available from h
ttp://whqlibdoc.who.int/publications/2010/9789241599764_eng.pdf.[Accessed 9 November
2011], pp. 1-359.
203 Worm, S.W., Sabin, C., Weber, R., Reiss, P., El-Sadr, W., Dabis, F., De Wit, S., Law, M.,
Monforte, A.D. & Friis-Møller, N. 2010, "Risk of myocardial infarction in patients with HIV
infection exposed to specific individual antiretroviral drugs from the 3 major drug classes:
the data collection on adverse events of anti-HIV drugs (D: A: D) study", Journal of Infectious
Diseases, vol. 201, no. 3, pp. 318-330.
204 Yarasheski, K.E., Scherzer, R., Kotler, D.P., Dobs, A.S., Tien, P.C., Lewis, C.E., Kronmal, R.A.,
Heymsfield, S.B., Bacchetti, P. & Grunfeld, C. 2011, "Age-related skeletal muscle decline is
similar in HIV-infected and uninfected individuals", The Journals of Gerontology Series A:
Biological Sciences and Medical Sciences, vol. 66, no. 3, pp. 332-340.
Stellenbosch University http://scholar.sun.ac.za

104
APPENDIX A: CONSENT FORMS
DEELNEMERINLIGTINGSBLAD EN -TOESTEMMINGSVORM TITEL VAN DIE NAVORSINGSPROJEK: ‘n Deursnit studie van die gemiddelde trisepsvelvou (TVV), vetvrymassa (VVM) en middel bo-arm omtrek (MBAO) in ‘n HIV positiewe populasie van die Boland distrik. VERWYSINGSNOMMER:S12/03/073 HOOFNAVORSER: Dr Theo Nell ADRES: Departement Fisiologiese Wetenskappe Mike de Vries Gebou Kamer 2007 Stellenbosch Universiteit KONTAKNOMMER: 021 8083147 U word genooi om deel te neem aan ’n navorsingsprojek. Lees asseblief hierdie inligtingsblad op u tyd deur aangesien die detail van die navorsingsprojek daarin verduidelik word. Indien daar enige deel van die navorsingsprojek is wat u nie ten volle verstaan nie, is u welkom om die navorsingspersoneel of dokter daaroor uit te vra. Dit is baie belangrik dat u ten volle moet verstaan wat die navorsingsprojek behels en hoe u daarby betrokke kan wees. U deelname is ook volkome vrywillig en dit staan u vry om deelname te weier. U sal op geen wyse hoegenaamd negatief beïnvloed word indien u sou weier om deel te neem nie. U mag ook te eniger tyd aan die navorsingsprojek onttrek, selfs al het u ingestem om deel te neem. Hierdie navorsingsprojek is deur die Etiek Komitee oor Gesondheidsnavorsing van die Universiteit Stellenbosch goedgekeur en sal uitgevoer word volgens die etiese riglyne en beginsels van die Internasionale Verklaring van Helsinki en die Etiese Riglyne vir Navorsing van die Mediese Navorsingsraad (MNR). Wat behels hierdie navorsingsprojek?
� Hierdie studie word slegs by die TC Newman hospitaal gedoen. Ons benodig ongeveer 30 pasiënte. Ons poog daarin om inligting in te samel oor liggaamsamestelling van pasiënte wat ‘n HIV kliniek van die TC Newman Hospitaal besoek. Deur hierdie inligting kan ons dieetkundiges en mediese personeel bystaan om u siekte vordering te monitor en sodoende terapie aan te pas (dieet) om u kwaliteit lewe te verbeter.
� U sal deur ‘n professionele mediese wetenskaplike met meer as 10 jaar ondervinding, gemeet word. U liggaamsmassa, lengte en sekere velvoue en omtrekke sal gemeet word. ‘n Masjien wat die liggaamsvet bepaal sal aan u hande en voete gekoppel word. Dit voel net soos ‘n pleister wat aan die vel gesit word en kan u nie skade of ongemak veroorsaak nie.
Stellenbosch University http://scholar.sun.ac.za

105
� Ons wil verder inligting versamel van u fisiese aktiwiteit en eetgewoontes. Dit is nodig vir ons studie om pasiënte ewekansig te kies van alle pasiënte wat hierdie kliniek besoek. Dit maak dit maklik om die resultate na die totale populasie te veralgemeen en maak dit moontlik vir elkeen om ‘n gelyke kans te kry om gekies te word vir die studie.
Waarom is u genooi om deel te neem?
� U siekte maak dat u kwalifiseer vir die insluiting van die studie. Deur u liggaamsamestelling te bepaal kan ons mediese personeel bystaan in die monitering van u siekte vordering. Dit is ‘n metode om besluite te neem oor u liggaamsamestellingveranderinge oor tyd en om dieetkundiges in te lig oor dieetveranderinge en aanbevelings te maak indien nodig.
Wat sal u verantwoordelikhede wees?
� Ons wil u graag meet deur van gespesialiseerde toerusting gebruik te maak. Hierdie toerusting sal u nie skade of ongemak besorg nie. Ons maak merke op die vel met ‘n oogpotlood om velvoue te meet aan die regterkant van die liggaam (arm, heup, skouer). U moet dan ook plat lê waar ons die vet persentasie met ‘n spesiale masjien toets. Dit neem omtrent 30 sekondes. Ons wil verder weet watter voedsel asook hoeveel daarvan u inneem op gereelde tye. Dit neem ongeveer 1 tot 1 ½ uur.
Sal u voordeel trek deur deel te neem aan hierdie navorsingsprojek?
� U sal uit hierdie studie voordeel trek. Indien ons bevind u liggaamsvet en u spiermassa is te laag kan ons die dieetkundige en dokter nader om te besluit indien verandering in behandeling (dieet en oefening) ‘n moontlikheid is.
Is daar enige risiko's verbonde aan u deelname aan hierdie navorsingsprojek?
� Daar is geen risiko verbonde nie. Watter alternatiewe is daar indien u nie instem om deel te neem nie?
� U sal nie standaard behandeling geweier word indien u verkies om nie deel te neem aan die navorsingstudie nie. Die dieetkundige is opgelei om hierdie metings te kan doen en word gewoontlik in roetiene behandeling toegepas.
Wie sal toegang hê tot u mediese rekords?
� Slegs mediese personeel (dokter en dieetkundige en die hoofnavorser) sal toegang hê tot u mediese geskiedenis. Alle inligting sal met die uiterste vertroulikheid behandel word. Onder geen omstandigheide sal die naam of enige ander identifikasie gebruik word nie.
Wat sal gebeur in die onwaarskynlike geval van ’n besering wat mag voorkom as gevolg van u deelname aan hierdie navorsingsprojek?
� Nie hier van toepassing nie. Sal u betaal word vir deelname aan die navorsingsprojek en is daar enige koste verbonde aan deelname?
Stellenbosch University http://scholar.sun.ac.za

106
U sal nie betaal word vir deelname aan die navorsingsprojek nie, maar u vervoer en etes ten opsigte van elke besoek vir die navorsingsprojek sal betaal word. Deelname aan die navorsingsprojek sal u niks kos nie. Is daar enigiets anders wat u moet weet of doen?
� U kan dr Theo Nell. kontak by tel.021 8083147 of 0716889962 indien u enige verdere vrae het of enige probleme ondervind.
� U kan die Etiek Komitee oor Gesondheidsnavorsing kontak by 021-938 9207 indien u enige bekommernis of klagte het wat nie bevredigend deur u studiedokter hanteer is nie.
� U sal ’n afskrif van hierdie inligtings- en toestemmingsvorm ontvang vir u eie rekords.
Verklaring deur deelnemer Met die ondertekening van hierdie dokument onderneem ek,
…….....................……….....……...……….., om deel te neem aan ’n navorsingsprojek
getiteld (Titel van navorsingsprojek).
Ek verklaar dat:
• Ek hierdie inligtings- en toestemmingsvorm gelees het of aan my laat voorlees het en dat dit in ’n taal geskryf is waarin ek vaardig en gemaklik mee is.
• Ek geleentheid gehad het om vrae te stel en dat al my vrae bevredigend beantwoord is.
• Ek verstaan dat deelname aan hierdie navorsingsprojek vrywillig is en dat daar geen druk op my geplaas is om deel te neem nie.
• Ek te eniger tyd aan die navorsingsprojek mag onttrek en dat ek nie op enige wyse daardeur benadeel sal word nie.
• Ek gevra mag word om van die navorsingsprojek te onttrek voordat dit afgehandel is indien die studiedokter of navorser van oordeel is dat dit in my beste belang is, of indien ek nie die ooreengekome navorsingsplan volg nie.
Geteken te (plek) ..............................…………….. op (datum) …………....……….. 2012. .............................................................. ............................................................ Handtekening van deelnemer Handtekening van getuie
Stellenbosch University http://scholar.sun.ac.za

107
Verklaring deur navorser Ek (naam) …………………………………...……………… verklaar dat:
• Ek die inligting in hierdie dokument verduidelik het aan
…………………….............................................………..
• Ek hom/haar aangemoedig het om vrae te vra en voldoende tyd gebruik het om dit te beantwoord.
• Ek tevrede is dat hy/sy al die aspekte van die navorsingsprojek soos hierbo bespreek, voldoende verstaan.
• Ek ’n tolk gebruik het/nie ’n tolk gebruik het nie. (Indien ’n tolk gebruik is, moet die tolk die onderstaande verklaring teken.)
Geteken te (plek) ..............................…………….. op (datum) …………....……….. 2012. .............................................................. ............................................................ Handtekening van navorder Handtekening van getuie Verklaring deur tolk Ek (naam) …………………………………...……………… verklaar dat:
• Ek die navorser (naam) ……….............................………………….
bygestaan het om die inligting in hierdie dokument in Afrikaans/Xhosa aan
(naam van deelnemer) ……………………………......................... te
verduidelik.
• Ons hom/haar aangemoedig het om vrae te vra en voldoende tyd gebruik het om dit te beantwoord.
• Ek ’n feitelik korrekte weergawe oorgedra het van wat aan my vertel is.
• Ek tevrede is dat die deelnemer die inhoud van hierdie dokument ten volle verstaan en dat al sy/haar vrae bevredigend beantwoord is.
Geteken te (plek) ..............................…………….. op (datum) …………....……….. 2012. .............................................................. ............................................................ Handtekening van tolk Handtekening van getuie
Stellenbosch University http://scholar.sun.ac.za

108
PARTICIPANT INFORMATION LEAFLET AND CONSENT FORM
TITLE OF THE RESEARCH PROJECT: A cross-sectional survey of the mean triceps skinfold (TSF), Fat free mass (FFM) and Mid-upper arm circumference (MUAC) in a HIV positive population in the Boland region REFERENCE NUMBER: S12/03/073 PRINCIPAL INVESTIGATOR: Dr Theo Nell ADDRESS: Department of Physiological Sciences Mike de Vries Building Room 2007 Stellenbosch University CONTACT NUMBER: 021 8083147 You are being invited to take part in a research project. Please take some time to read the information presented here, which will explain the details of this project. Please ask the study staff or doctor any questions about any part of this project that you do not fully understand. It is very important that you are fully satisfied that you clearly understand what this research entails and how you could be involved. Also, your participation is entirely voluntary and you are free to decline to participate. If you say no, this will not affect you negatively in any way whatsoever. You are also free to withdraw from the study at any point, even if you do agree to take part. This study has been approved by the Health Research Ethics Committee at Stellenbosch University and will be conducted according to the ethical guidelines and principles of the international Declaration of Helsinki, South African Guidelines for Good Clinical Practice and the Medical Research Council (MRC) Ethical Guidelines for Research. What is this research study all about?
� This study will only be done at the TC Newman Hospital. We will need about 30 subjects. We are trying to gather information on body composition profiles of patients attending a sub-clinic in the TC Newman Hospital. By getting this information we would be able to assist dieticians and medical staff to monitor your disease progress and adjust treatment (dietary) to improve your quality of life.
You will be measured by a professional medical scientist who has more than 10 years’ experience in this type of measurements. Your body weight, height and some skin folds with circumferences will be collected. A machine that is used to measure fat in the body will be used on your hands and feet and feels
Stellenbosch University http://scholar.sun.ac.za

109
like a band aid being attached to the skin. It is not going to cause you any harm of discomfort.
We will also gather information on your physical activity and eating patterns.
� In order for us to generalise the results to this population we will randomly select all patients who are currently coming to this clinic to have a representative sample. Everyone has an equal chance of being selected for this study.
Why have you been invited to participate?
� Your disease makes you eligible for inclusion to assess how your body composition might assist medical staff in monitoring your disease progression. This is a method to make decisions regarding your body composition changes over time and assist dieticians to make dietary recommendations if needed.
What will your responsibilities be?
� We would like to measure you using specialised tools that will not harm or cause you any discomfort. We will make marks on your skin using a pen so we can measure the skin thickness around the right arm and also on the hip and shoulder. You also have to lie down so we can use a machine for not more than 30 seconds to assess your fat mass and measure the amount of body cells. This machine uses a very small non-detectable current to your body to help us understand how your body composition looks like. Further, we would like to look at usual food intake over a period of time. This will take approximately 1-1 ½ hours.
Will you benefit from taking part in this research?
� You will benefit from this initial survey. If we identify a condition where your fat mass is low and also your muscle mass we will advise the dietician and doctor to make the necessary recommendation to intervene. This might be a dietary intervention or exercise if necessary.
Are there in risks involved in your taking part in this research?
� There are no risks. If you do not agree to take part, what alternatives do you have?
� You will not be denied any standard of treatment if you do not wish to take part in this research study. The dietician is trained to do these assessments and is usually done as part of the treatment.
Who will have access to your medical records?
� Only medical staff and the principal researcher will have access to your data and records. All information will be treated with respect and utmost confidentiality. Under no circumstances will your name or any form of identification be used.
Stellenbosch University http://scholar.sun.ac.za

110
What will happen in the unlikely event of some form injury occurring as a direct result of your taking part in this research study?
� Not applicable here. Will you be paid to take part in this study and are there any costs involved?
� No, you will not be paid to take part in the study but your transport and meal costs will be covered for each study visit. There will be no costs involved for you, if you do take part.
Is there any thing else that you should know or do?
� You can contact Dr Theo Nell at tel 0218083147 or 0716889962 if you have any further queries or encounter any problems.
� You can contact the Health Research Ethics Committee at 021-938 9207 if you have any concerns or complaints that have not been adequately addressed by your study doctor.
� You will receive a copy of this information and consent form for your own records.
Declaration by participant By signing below, I …………………………………..…………. agree to take part in a research study entitled (A cross-sectional survey of the mean triceps skinfold (TSF), Fat free mass (FFM) and Mid-upper arm circumference (MUAC) in a HIV positive population in the Boland region). I declare that:
• I have read or had read to me this information and consent form and it is written in a language with which I am fluent and comfortable.
• I have had a chance to ask questions and all my questions have been adequately answered.
• I understand that taking part in this study is voluntary and I have not been pressurised to take part.
• I may choose to leave the study at any time and will not be penalised or prejudiced in any way.
• I may be asked to leave the study before it has finished, if the study doctor or researcher feels it is in my best interests, or if I do not follow the study plan, as agreed to.
Signed at (place) ......................…........…………….. on (date) …………....……….. 2013.
Stellenbosch University http://scholar.sun.ac.za

111
.............................................................. ............................................................ Signature of participant Signature of witness Declaration by investigator I (name) ……………………………………………..……… declare that:
• I explained the information in this document to …………………………………..
• I encouraged him/her to ask questions and took adequate time to answer them.
• I am satisfied that he/she adequately understands all aspects of the research, as discussed above
• I did/did not use a interpreter. (If a interpreter is used then the interpreter must sign the declaration below.
Signed at (place) ......................…........…………….. on (date) …………....……….. 2013. .............................................................. ............................................................ Signature of investigator Signature of witness Declaration by interpreter I (name) ……………………………………………..……… declare that:
• I assisted the investigator (name) ………………………………………. to
explain the information in this document to (name of participant)
……………..…………………………….. using the language medium of
Afrikaans/Xhosa/English.
• We encouraged him/her to ask questions and took adequate time to answer them.
• I conveyed a factually correct version of what was related to me.
• I am satisfied that the participant fully understands the content of this informed consent document and has had all his/her question satisfactorily answered.
Signed at (place) ......................…........…………….. on (date) …………....……………….. .............................................................. ............................................................
Stellenbosch University http://scholar.sun.ac.za

112
APPENDIX B Bioelecical Impedance Analsis (BIA) Protocol
Bioelectrical Impedance Analysis (BIA) Protocol
• Start by showing the participant the BIA testing device and explain clearly where you will place the electrodes and what you will be doing.
• The exam table should be comfortable and free of drafts and electrical source heaters. • Make sure analyzer battery is relatively new and well charged. • Regularly check analyzer calibration and patient cables using a standard protocol.
(See the calibration procedure in your machine’s manual). • The participant should not have exercised or taken a sauna within 8 hours of the procedure. • The participant should refrain from alcohol intake for 12 hours prior to the procedure. • The participant should not be diaphoretic (covered with sweat) or soaked in urine as the
analyzer measures this fluid as fat-free mass. • Make sure that participant lies quietly and without motion during the entire test. • Ask participant to remove their right shoe and sock. • If, for some reason, the procedure must be done on the left side, then make a note of it and
subsequently (next visits) always use the left side. • Have participant lie on his/her back, on the exam table, with arms by his/her sides and arms
and thighs not touching. • Remove any jewelry on the electrode sites. • Gently clean electrode sites with an alcohol wipe, particularly if the skin is moist or covered
with lotion. • Attach the electrodes as follows: Wrist: Place on an imaginary line from the protruding bone
of the wrist straight across to other side of wrist. • Make sure the top of the electrode is toward the shoulder with the tab facing away from the
body. • Hand: Place on middle finger just above hand knuckle. Tab facing away from the body. • Ankle: Place on an imaginary line between the protruding ankle bones straight across to
other side of ankle. • Make sure that the top of the electrode is toward the thigh with tab facing away from the
body. • Foot: Place just behind the middle toes above the knuckles (about 1 cm) of the right • foot with tab facing away from the body. • Attach the leads to the electrodes. • Turn the analyzer on and make sure the subject refrains from movement. • Log variables and start test.
Stellenbosch University http://scholar.sun.ac.za

113
APPENDIX C: ETHICS APPROVAL
Stellenbosch University http://scholar.sun.ac.za

114
Stellenbosch University http://scholar.sun.ac.za

115
Stellenbosch University http://scholar.sun.ac.za

116
APPENDIX D: DATA COLLECTION SHEETS
Data sheet
Clinic TC/Mbek
CD4 count
VL
Co-infections
M/F
Age
WHO stage
Waist circ
Hip circ
MUAC
TSF
Adherence
Type meds
ARV start date
Stellenbosch University http://scholar.sun.ac.za