
Anterra Guide to Improving Your Real Estate Reporting
7
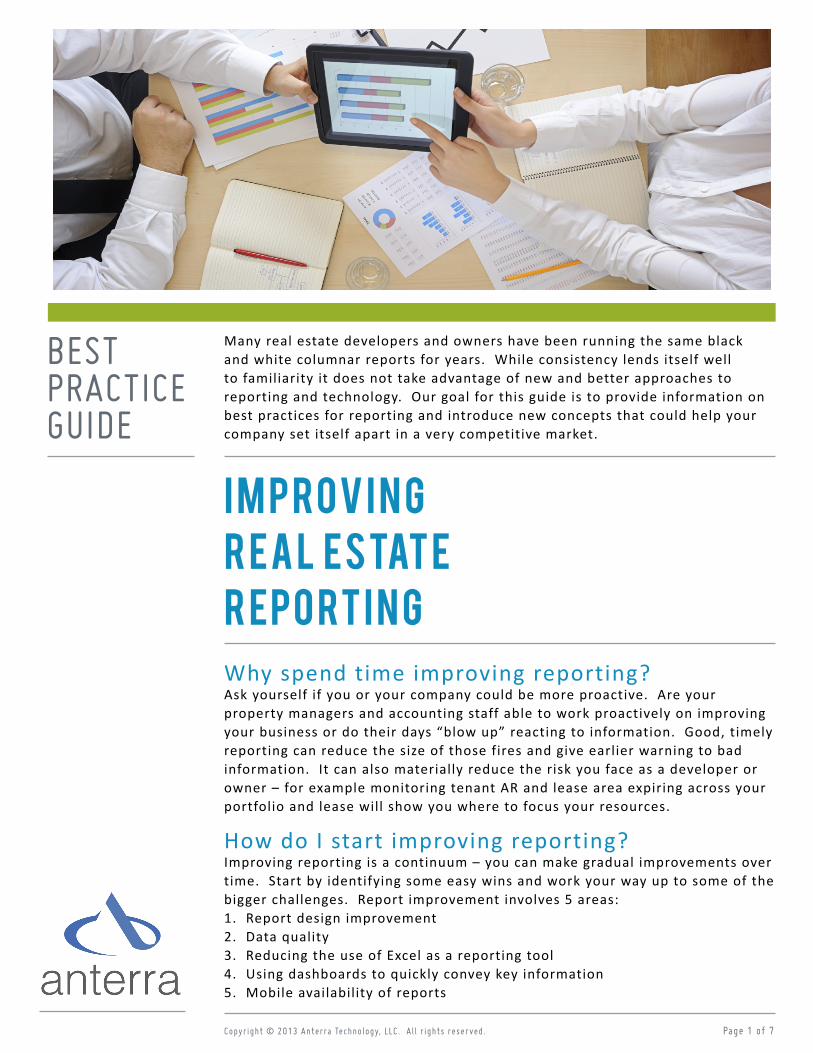
BEST PRACTICE GUIDE Many real estate developers and owners have been running the same black and white columnar reports for years. While consistency lends itself well to familiarity it does not take advantage of new and better approaches to reporting and technology. Our goal for this guide is to provide information on best practices for reporting and introduce new concepts that could help your company set itself apart in a very competitive market. Improving r e a l e s tat e Reporting Why spend time improving reporting? Ask yourself if you or your company could be more proactive. Are your property managers and accounting staff able to work proactively on improving your business or do their days “blow up” reacting to information. Good, timely reporting can reduce the size of those fires and give earlier warning to bad information. It can also materially reduce the risk you face as a developer or owner – for example monitoring tenant AR and lease area expiring across your portfolio and lease will show you where to focus your resources. How do I start improving reporting? Improving reporting is a continuum – you can make gradual improvements over time. Start by identifying some easy wins and work your way up to some of the bigger challenges. Report improvement involves 5 areas: 1. Report design improvement 2. Data quality 3. Reducing the use of Excel as a reporting tool 4. Using dashboards to quickly convey key information 5. Mobile availability of reports Page 1 of 7 Copyright © 2013 Anterra Technology, LLC. All rights reserved.
-
Upload
madhavi-kurra -
Category
Documents
-
view
214 -
download
0
description
df
Transcript of Anterra Guide to Improving Your Real Estate Reporting
BEST PRACTICEGUIDE
Many real estate developers and owners have been running the same black and white columnar reports for years. While consistency lends itself well to familiarity it does not take advantage of new and better approaches to reporting and technology. Our goal for this guide is to provide information on best practices for reporting and introduce new concepts that could help your company set itself apart in a very competitive market.
I m p r o v i n g r e a l e s tat e R e p o rt i n gWhy spend time improving reporting?Ask yourself if you or your company could be more proactive. Are your property managers and accounting staff able to work proactively on improving your business or do their days “blow up” reacting to information. Good, timely reporting can reduce the size of those fires and give earlier warning to bad information. It can also materially reduce the risk you face as a developer or owner – for example monitoring tenant AR and lease area expiring across your portfolio and lease will show you where to focus your resources.
How do I start improving reporting?Improving reporting is a continuum – you can make gradual improvements over time. Start by identifying some easy wins and work your way up to some of the bigger challenges. Report improvement involves 5 areas:1. Report design improvement2. Data quality3. Reducing the use of Excel as a reporting tool4. Using dashboards to quickly convey key information5. Mobile availability of reports
Page 1 of 7Copyright © 2013 Anterra Technology, LLC. Al l r ights reserved.
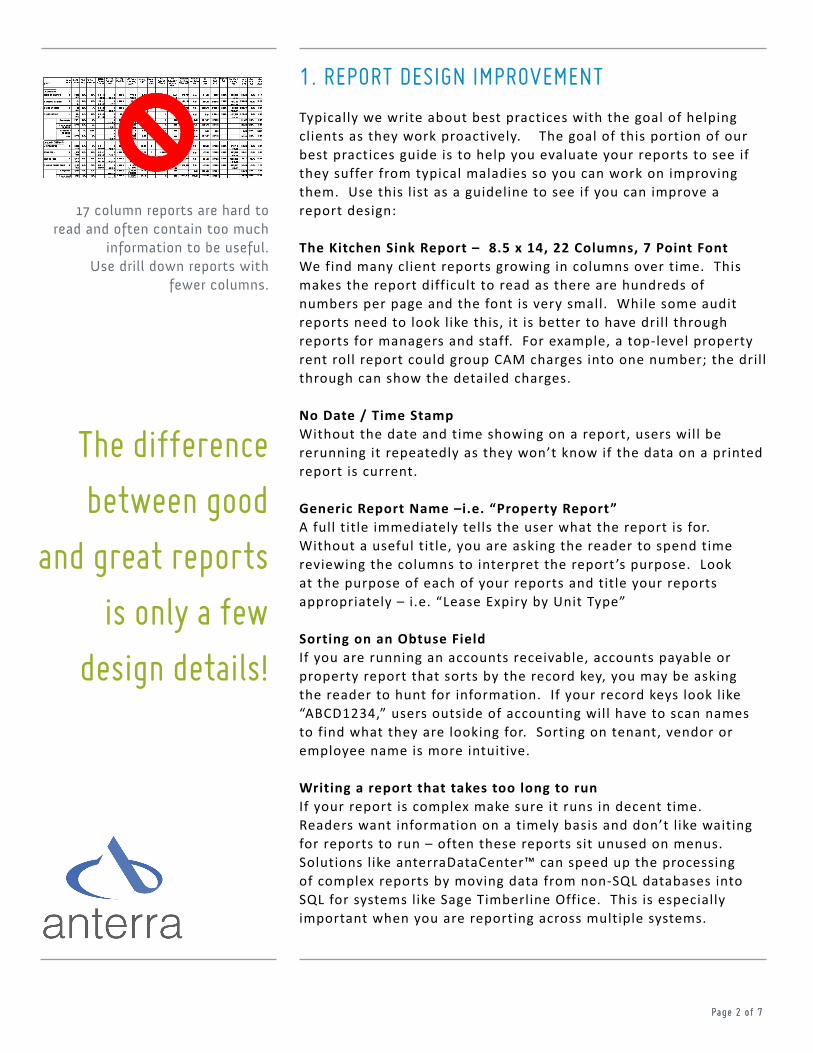
17 column reports are hard to read and often contain too much
information to be useful.Use drill down reports with
fewer columns.
The difference
between good
and great reports
is only a few
design details!
1. REPORT DESIGN IMPROVEMENT
Typically we write about best practices with the goal of helping clients as they work proactively. The goal of this portion of our best practices guide is to help you evaluate your reports to see if they suffer from typical maladies so you can work on improving them. Use this list as a guideline to see if you can improve a report design:
The Kitchen Sink Report – 8.5 x 14, 22 Columns, 7 Point FontWe find many client reports growing in columns over time. This makes the report difficult to read as there are hundreds of numbers per page and the font is very small. While some audit reports need to look like this, it is better to have drill through reports for managers and staff. For example, a top-level property rent roll report could group CAM charges into one number; the drill through can show the detailed charges. No Date / Time StampWithout the date and time showing on a report, users will be rerunning it repeatedly as they won’t know if the data on a printed report is current.
Generic Report Name –i.e. “Property Report” A full title immediately tells the user what the report is for. Without a useful title, you are asking the reader to spend time reviewing the columns to interpret the report ’s purpose. Look at the purpose of each of your reports and title your reports appropriately – i.e. “Lease Expiry by Unit Type”
Sorting on an Obtuse FieldIf you are running an accounts receivable, accounts payable or property report that sorts by the record key, you may be asking the reader to hunt for information. If your record keys look like “ABCD1234,” users outside of accounting will have to scan names to find what they are looking for. Sorting on tenant, vendor or employee name is more intuitive.
Writing a report that takes too long to runIf your report is complex make sure it runs in decent time. Readers want information on a timely basis and don’t like waiting for reports to run – often these reports sit unused on menus. Solutions like anterraDataCenter™ can speed up the processing of complex reports by moving data from non-SQL databases into SQL for systems like Sage Timberline Office. This is especially important when you are reporting across multiple systems.
Page 2 of 7Page 2 of 7
2. DATA QUALITY
The saying “garbage in – garbage out” certainly applies to real estate reporting. That ’s not to say all of your data is garbage but having information that isn’t accurate in one area undermines your whole system. Data quality means that reports are accurate, complete and timely. Data quality is directly related to your internal processes and systems. Good processes yield good data.Here are 3 ways to improve data quality:
Determine root causes of data issuesIf you are in a meeting and the accuracy of data is questioned follow best practices to address the situation:1. Quickly identify the data issue in the meeting if possible. If someone is questioning why some change orders are missing they likely know what is going on with the information.2. Promise to have the issue corrected 3. The most important step – find out why information was wrong. Could it be incorrect on other properties as well? Follow the process through and make any adjustments necessary to prevent this from happening again. If you are coming across the same issues repeatedly you have a process, personnel or systems issue that needs correcting to maintain trust in your reporting.
Hold people accountable for missing dataYour executive team needs to support the processes that run your business. Ask your finance, leasing and property management teams where they spend time chasing information down that is expected to be entered by a certain date or for each lease. One client of ours constantly said that the battles in business should be outside the office walls, not inside. Eliminating internal chasing saves frustration and can dramatically improve productivity.
One example of holding people accountable is to call out the property managers that haven’t submitted the information necessary to complete your budgets. You could highlight the name of the manager on your budget report with a legend to explain that budgets had not been submitted. We had one construction client have us highlight the project manager ’s name in pink on their forecast report where they had not submitted information by the required date. They circulate this report monthly. After a few months the number of late submissions dropped by 90% and there had to be a good reason to be late. It ’s embarrassing to know that you aren’t doing your job properly when others are pulling their weight.
Identify incomplete data in reportsYou can format your reports to tell readers that data is incomplete. For example we’ve formatted income statement numbers in red when they are run for a month that isn’t closed yet. The goal is to
GOOD REPORTS
INCREASE
PRODUCTIVITY!
Page 3 of 7

Using spreadsheets
to create reports
can introduce
significant RISK
and COST to your
organization.
DATA QUALITY, continued...
eliminate misunderstandings between report users and the staff preparing the underlying information. These timing misunder-standings can be stressful!
Preventing bad data is easier than catching itIf you want to improve data quality start reviewing data collection with the highest risk of error – field data. Look at how data is gathered, the forms that are filled out online or on paper and when forms are required to be submitted. It ’s tough to enter data on site, make sure you are only gathering what you need. Look at form design to make sure that information is in a logical order to enter and that the forms are easy to fill out. Spending a day with the people in the property offices working through data entry with them will show you where data entry could be made easier or where data collection methods could be improved.
3. REDUCING SPREADSHEET REPORTS
Microsoft Excel is an excellent analytical tool. It ’s easy to use and inexpensive to purchase. As a reporting tool it doesn’t work so well and may cost you many times its purchase price in time and errors. When you use Excel to create reports you face the following challenges:1. Data that is manually entered is out of date the second it is put in a cell. This is particularly true for financial statements. If you use Excel for financial statements you have to start over every time you find that an entry is missing.2. You spend time creating spreadsheets instead of reviewing results and analyzing. Many spreadsheet users spent more time checking formulas than reviewing the report for its intended purpose. Excel turns you into a programmer creating and checking formulas.3. Spreadsheets have a large risk of material errors. Typically spreadsheets aren’t reviewed by anyone but their creator. Do a web search for “spreadsheet errors” and horror stories abound. 4. Spreadsheet errors creep in over time. If you carry forward last month’s spreadsheet to this month you may miss the fact that someone overwrote a formula with a number or made a change on a linked sheet.
You might be thinking that you can’t completely escape the use of spreadsheets because you have 2 separate systems to report from and can’t link the data together. This is a common problem, especially if you have acquired properties or merged with a company on another accounting system.The key to reporting across systems is an overarching reporting system that can combine information from multiple databases
Page 4 of 7
and systems. At Anterra we’ve developed a cost effective reporting solution based on the best Microsoft reporting technology available today. This can significantly reduce the time your organization spends in spreadsheets increasing your productivity and making your organization more proactive.
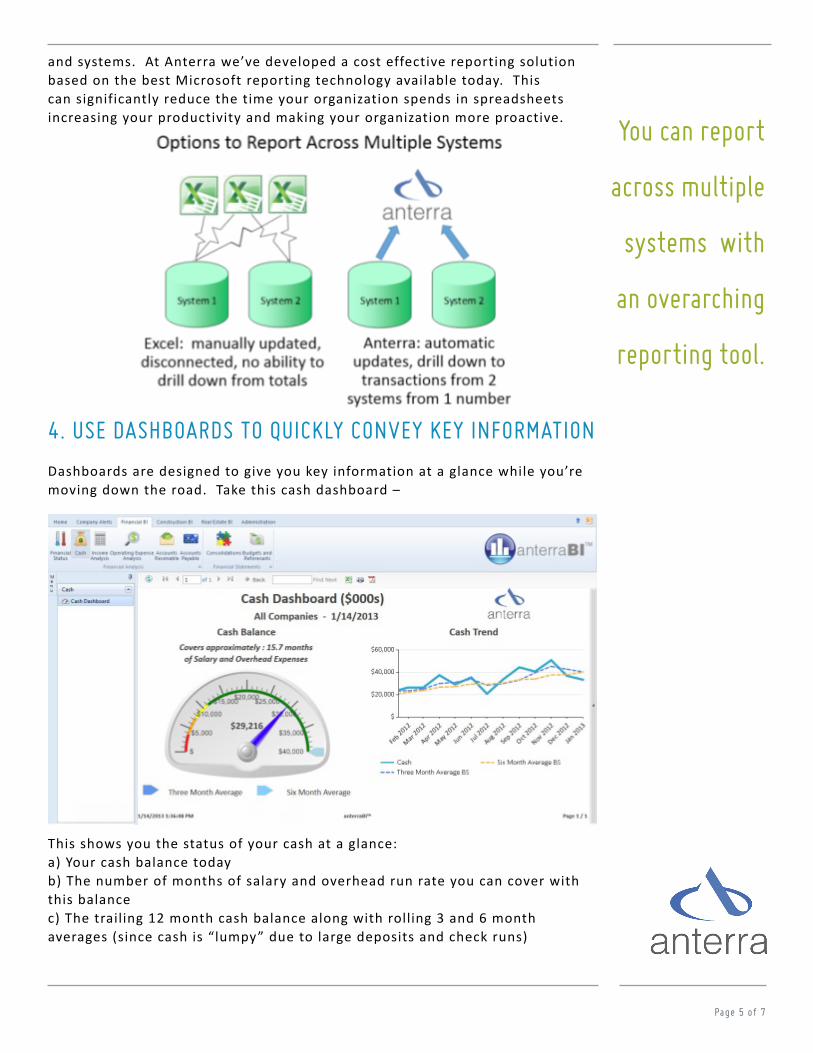
4. USE DASHBOARDS TO QUICKLY CONVEY KEY INFORMATION
Dashboards are designed to give you key information at a glance while you’re moving down the road. Take this cash dashboard –
This shows you the status of your cash at a glance:a) Your cash balance todayb) The number of months of salary and overhead run rate you can cover with this balance c) The trailing 12 month cash balance along with rolling 3 and 6 month averages (since cash is “lumpy” due to large deposits and check runs)
You can report
across multiple
systems with
an overarching
reporting tool.
Page 5 of 7
DASHBOARDS, continued...
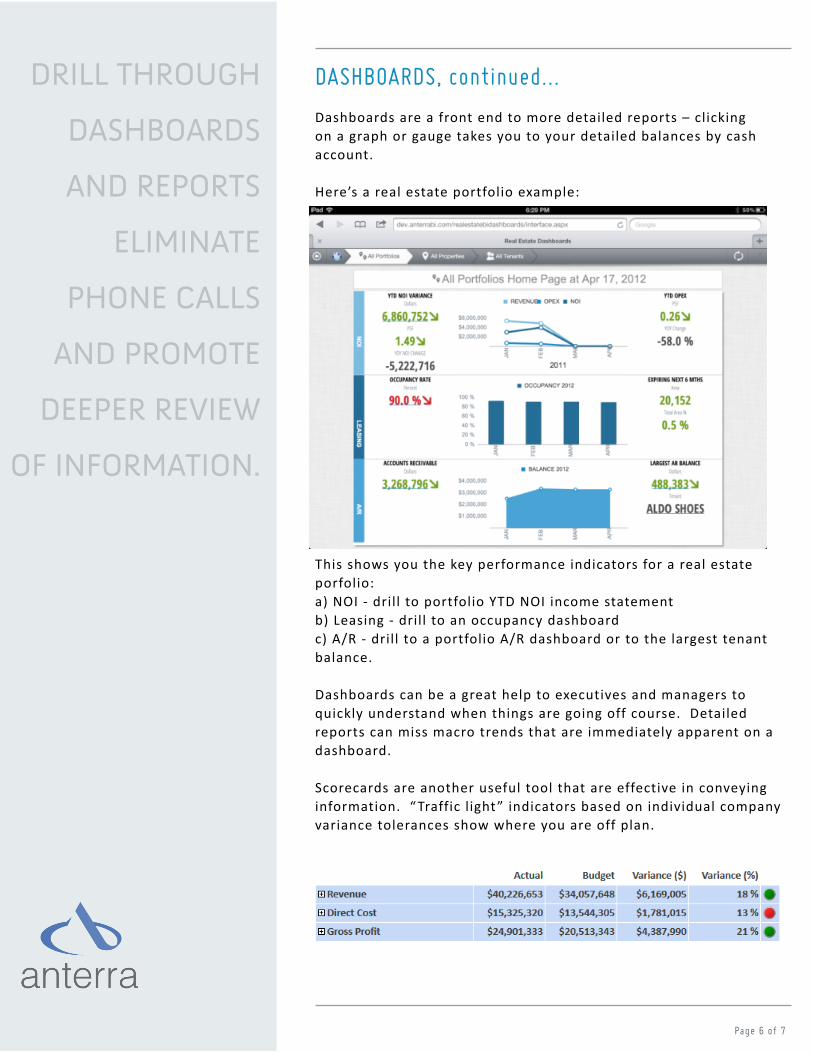
Dashboards are a front end to more detailed reports – clicking on a graph or gauge takes you to your detailed balances by cash account.
Here’s a real estate portfolio example:
This shows you the key performance indicators for a real estate porfolio:a) NOI - drill to portfolio YTD NOI income statementb) Leasing - drill to an occupancy dashboardc) A/R - drill to a portfolio A/R dashboard or to the largest tenant balance.
Dashboards can be a great help to executives and managers to quickly understand when things are going off course. Detailed reports can miss macro trends that are immediately apparent on a dashboard.
Scorecards are another useful tool that are effective in conveying information. “ Traffic light” indicators based on individual company variance tolerances show where you are off plan.
Page 6 of 7
DRILL THROUGH
DASHBOARDS
AND REPORTS
ELIMINATE
PHONE CALLS
AND PROMOTE
DEEPER REVIEW
OF INFORMATION.
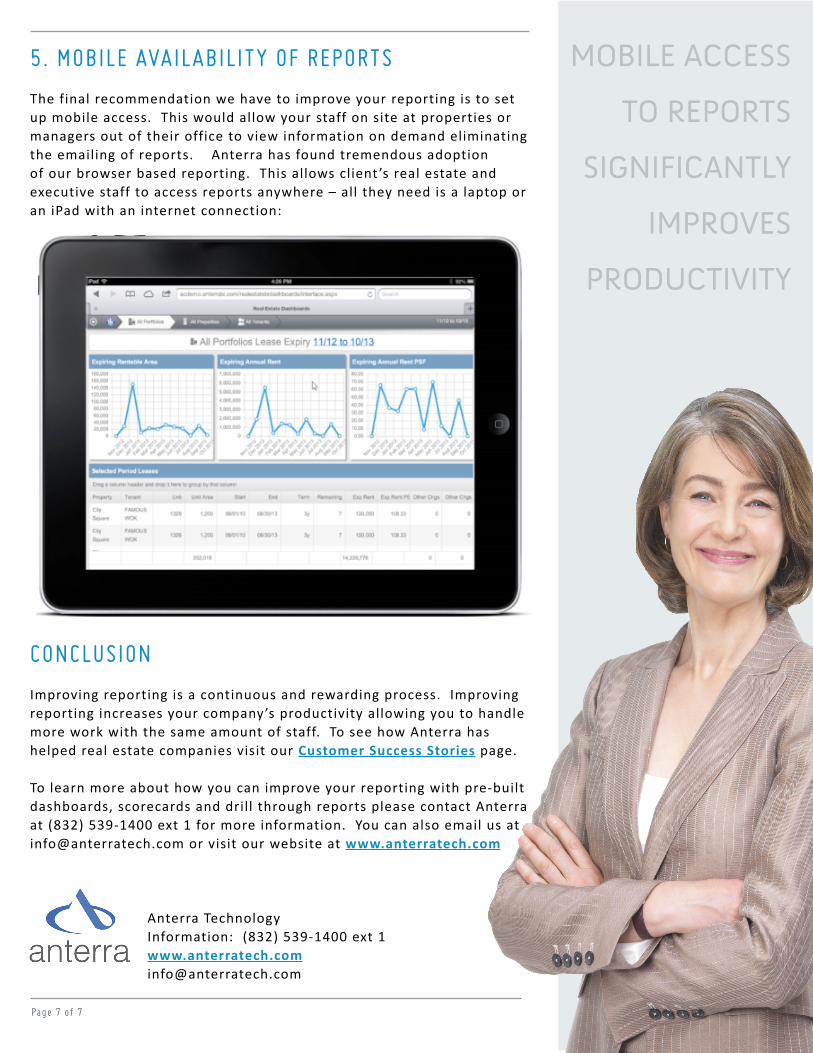
5. MOBILE AVAILABILITY OF REPORTS
The final recommendation we have to improve your reporting is to set up mobile access. This would allow your staff on site at properties or managers out of their office to view information on demand eliminating the emailing of reports. Anterra has found tremendous adoption of our browser based reporting. This allows client ’s real estate and executive staff to access reports anywhere – all they need is a laptop or an iPad with an internet connection:
CONCLUSION
Improving reporting is a continuous and rewarding process. Improving reporting increases your company’s productivity allowing you to handle more work with the same amount of staff. To see how Anterra has helped real estate companies visit our Customer Success Stories page.
To learn more about how you can improve your reporting with pre-built dashboards, scorecards and drill through reports please contact Anterra at (832) 539-1400 ext 1 for more information. You can also email us at [email protected] or visit our website at www.anterratech.com
Anterra Technology Information: (832) 539-1400 ext 1 www.anterratech.com [email protected]
Page 7 of 7
MOBILE ACCESS
TO REPORTS
SIGNIFICANTLY
IMPROVES
PRODUCTIVITY