Antecedent Analytical Variance Factors in Qualitative Bowtie Risk Analysis
94
Analytical Variance in Qualitative Bowtie Risk Analysis Phillip McKenzie Research report submitted in fulfilment of the Degree of Master of Risk Management (by Research) Swinburne University of Technology Faculty of Science, Engineering and Technology 2014
-
Upload
phil-mckenzie -
Category
Documents
-
view
233 -
download
0
Transcript of Antecedent Analytical Variance Factors in Qualitative Bowtie Risk Analysis

Analytical Variance in Qualitative
Bowtie Risk Analysis
Phillip McKenzie
Research report submitted in fulfilment of the
Degree of Master of Risk Management (by Research)
Swinburne University of Technology
Faculty of Science, Engineering and Technology
2014

THIS PAGE INTENTIONALLY LEFT BLANK

Abstract
Companies routinely apply risk assessment tools and methodologies in their risk
management systems. One methodology that is growing in use is qualitative bowtie
analysis. It has been observed that qualitative bowtie analysis often produces
inconsistent analytical results (analytical variance) across comparable analyses. This
is concerning as it potentially calls into question the reliability and validity of the
methodology.
A literature survey has been performed in order to explore the various factors occurring
throughout the bowtie analysis process which may be sources of this observed
variance in the analytical results and also to investigate practical methods and tools to
quantitatively measure the analytical variance.
A typology of analytical variance is developed which demonstrates the sources of
analytical variance and the types of variance factors which are related to these
sources. A system based conceptual model is also developed and presented to
demonstrate where in the analytical process these variance sources and related
variance factor types occur and how they interact with each other to produce analytical
variance.
Finally, three indices of analytical variance with a corresponding measurement tool are
developed, described and validated for performing statistical operations on
comparative qualitative bowtie analyses in order to measure the analytical variance
within the analytical results.

THIS PAGE INTENTIONALLY LEFT BLANK

Acknowledgements
Firstly, I would like to acknowledge and record my appreciation for the assistance and
insightful advice provided by my research supervisor Dr Geoff Dell. I also extend my
thanks to my employer (RPS Energy) who has generously supported my studies and
research over a number of years. Finally, I am grateful to my educational provider,
Swinburne University of Technology and the various unit lecturers who have provided
clear instruction and encouragement in my studies and pursuit of this Master of Risk
Management degree. Of course, I also wish to recognise the forbearance of my family
who have supported my desire to further my professional and academic career with
great understanding.

THIS PAGE INTENTIONALLY LEFT BLANK

Declaration
I declare that this research report contains no material which has been accepted for the
award of any other degree or diploma and that to the best of my knowledge this
research report contains no material previously published or written by any other
person except where due reference is made in the text of this research report.
The research work was performed between March 2014 and December 2014 under the
supervision of Dr Geoff Dell at Swinburne University of Technology.
----------------------------------------------------------------
Signed:
Phil McKenzie
Perth, Western Australia
-----------------------------------------
Date:

THIS PAGE INTENTIONALLY LEFT BLANK

i
Contents
Chapter 1 Introduction 1
1.1 Research Problem .......................................................................................... 1
1.2 Research Rationale ......................................................................................... 3
1.3 Research Objectives and Aims ....................................................................... 4
1.3.1 Research Objectives ................................................................................ 4
1.3.2 Research Aims ......................................................................................... 5
Chapter 2 Literature Review 7
2.1 Antecedent Factors in Qualitative Bowtie Analysis .......................................... 7
2.1.1 Qualitative Analysis .................................................................................. 7
2.1.2 Bowtie Analysis Methodology ................................................................... 8
2.1.2.1 Qualitative Bowtie Analysis Overview ................................................ 9
2.1.2.2 Quantitative Bowtie Analysis Overview ............................................ 12
2.1.2.3 Risk Modelling ................................................................................. 12
2.1.3 Analytical Variance ................................................................................. 16
2.1.3.1 Variance in Qualitative Bowtie Analysis ........................................... 16
2.1.3.2 Variance Typologies ........................................................................ 17
2.1.4 Variance Sources ................................................................................... 20
2.1.4.1 The Analytical Subject ..................................................................... 23
2.1.4.2 The Analytical Methodology ............................................................. 26
2.1.4.3 The Human Analyst ......................................................................... 28
2.1.5 Conclusion ............................................................................................. 31
2.2 Quantitative Measurement of Variance in Qualitative Data ............................ 32
2.2.1 Measurement ......................................................................................... 32
2.2.1.1 The Purpose of Measurement ......................................................... 32
2.2.1.2 Measurement Theory ...................................................................... 33
2.2.1.3 Measurement Defined ..................................................................... 34
2.2.1.4 Measurement Scales ....................................................................... 34
2.2.1.5 Permissible Statistical Operations ................................................... 36
2.2.2 Data Typology ........................................................................................ 37
2.2.2.1 Data Type ........................................................................................ 37

ii
2.2.2.2 Qualitative Data and Categorical Variables...................................... 37
2.2.2.3 Qualitative Bowtie Analysis Data Type Difficulties ........................... 39
2.2.3 Measuring Qualitative Variance .............................................................. 42
2.2.3.1 Current Approaches ........................................................................ 42
2.2.3.2 Meaningful Qualitative Statistical Methods and Data Types ............. 43
2.2.4 Conclusion ............................................................................................. 44
Chapter 3 Research Design 45
3.1 Research Approach ...................................................................................... 45
3.2 Research Procedure ..................................................................................... 45
Chapter 4 Research Findings 47
4.1 Model of the Analytical Variance Process in Qualitative Bowtie Analysis....... 47
4.2 Methodology for Measurement of Analytical Variance in Bowtie Analyses .... 49
4.2.1 Analytical Variance Measurement Methodology ..................................... 49
4.2.2 Meaningful Measurements ..................................................................... 50
4.2.3 Data Sampling Requirements ................................................................. 50
4.2.4 Individual Data Samples and the Total Data Population ......................... 51
4.2.5 Linguistic Uncertainty within the Categories ........................................... 54
4.2.6 Indices of Analytical Variance ................................................................. 55
4.2.6.1 Total Analytical Variance ................................................................. 56
4.2.6.2 Category Analytical Variance ........................................................... 58
4.2.6.3 Sample Analytical Variance ............................................................. 59
4.2.6.4 Group Total Analytical Variance ...................................................... 60
4.2.6.5 Group Sample Analytical Variance .................................................. 61
4.2.7 Analytical Variance Measurement Tool .................................................. 62
4.2.8 Validation Testing ................................................................................... 62
4.3 Research Conclusions .................................................................................. 65
4.4 Future Work .................................................................................................. 66
Appendices 73
Appendix A – Worked Example of the Analytical Variance Measurement Tool ........ 75

iii
List of Figures
Figure 1: Qualitative Bowtie Analysis Diagrammatical Representation (ISO 2009b)...... 2
Figure 2: Quantitative Bowtie Analysis Diagrammatical Representation (ISO 2000) ..... 2
Figure 3: Simplified Model of the Analytical Process ..................................................... 3
Figure 4: Qualitative Bowtie Logic Diagram Showing Linear Analysis Sequence .......... 9
Figure 5: Quantitative Bowtie incorporating FTA & ETA (Markowski et al 2009) ......... 14
Figure 6: Variant Swiss-Cheese Accident Model (Reason 2008) ................................ 15
Figure 7: A Systems Model of Accident Causation (Borys 2000)................................. 16
Figure 8: Potential Sources of Analytical Variance Factors in Risk Analysis ............... 21
Figure 9: Variance Typologies and Sources Comparison from Literature Survey ........ 22
Figure 10: Model of a Socio-Technical System (Bostrom & Heinen 1977) .................. 25
Figure 11: Model of Control Complexity Aligned to the Risk Management Process .... 26
Figure 12: Reason’s Human Error Types (Reason 2008, pp. 29–47) .......................... 30
Figure 13: Deming’s System of Profound Knowledge ................................................. 33
Figure 14: Simple Example of Typical Qualitative Bowtie Model Data ......................... 38
Figure 15: Example of Causes from Three Comparable Bowtie Analyses................... 40
Figure 16: Systems Based Model of the Process Leading to Analytical Variance ....... 48
Figure 17: Methodology for Measuring Analytical Variance ......................................... 49
Figure 18: Category Consolidation from Many Samples into a Total Data Population . 53
Figure 19: Validation Testing Scenarios ...................................................................... 64

iv
THIS PAGE INTENTIONALLY LEFT BLANK

v
List of Equations
Equation 1: Index of Total Analytical Variance ............................................................ 57
Equation 2: Index of Category Analytical Variance ...................................................... 58
Equation 3: Index of Sample Analytical Variance ........................................................ 59

vi
THIS PAGE INTENTIONALLY LEFT BLANK

vii
List of Tables
Table 1: Qualitative Bowtie Analytical Elements and Methodological Sequence ........... 9
Table 2: Main Types of Accident Models (Hollnagel & Goteman 2004) ....................... 13
Table 3: A Simple Typology of Uncertainties (IPCC 2005) .......................................... 18
Table 4: Summary of Uncertainty and Variability Typologies in Risk Analysis ............. 19
Table 5: Reason’s Rule Based Behaviours (Reason 1997, p. 75–82) ........................ 31
Table 6: Measurement Scales and Permissible Statistics (Stevens 1946) .................. 35
Table 7: Simple Example of Typical Qualitative Bowtie Model Data ............................ 38
Table 8: Qualitative Bowtie Analytical Elements as Categorical Variables .................. 52
Table 9: Distribution and Frequency of Categories across the Total Data Population . 53
Table 10: Simple Worked Example of Total Analytical Variance ................................. 58
Table 11: Simple Worked Example of Sample Analytical Variance ............................. 60
Table 12: Simple Worked Example of Group Total Analytical Variance....................... 61
Table 13: Simple Worked Example of Group Sample Analytical Variance .................. 62

viii
THIS PAGE INTENTIONALLY LEFT BLANK

Chapter 1 - Introduction
1
Chapter 1
Introduction
1.1 Research Problem
Organisations which implement formal risk management systems (ISO 2009a) employ
a variety of qualitative and quantitative risk assessment methods. The international
standards organisation (ISO) describes a spectrum of risk assessment methodologies
(ISO 2009b) that are commonly applied within a variety of industrial domains. Bowtie
analysis is one of the risk assessment methods which is briefly described by ISO
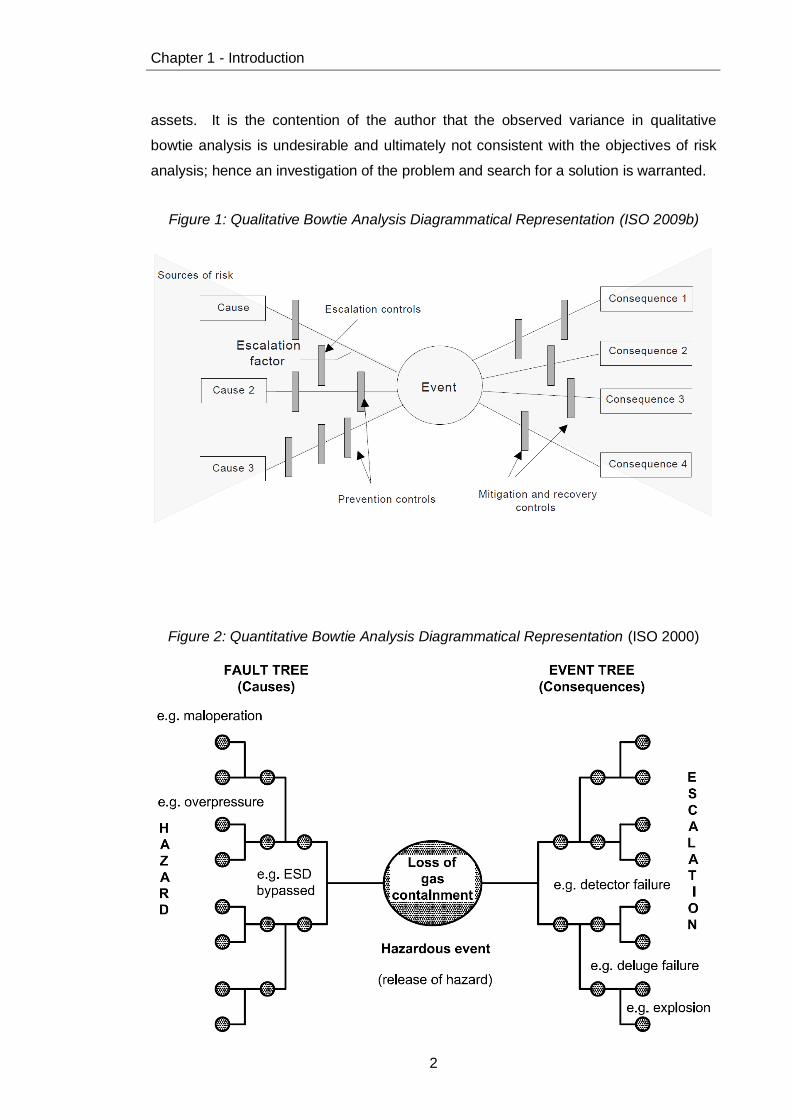
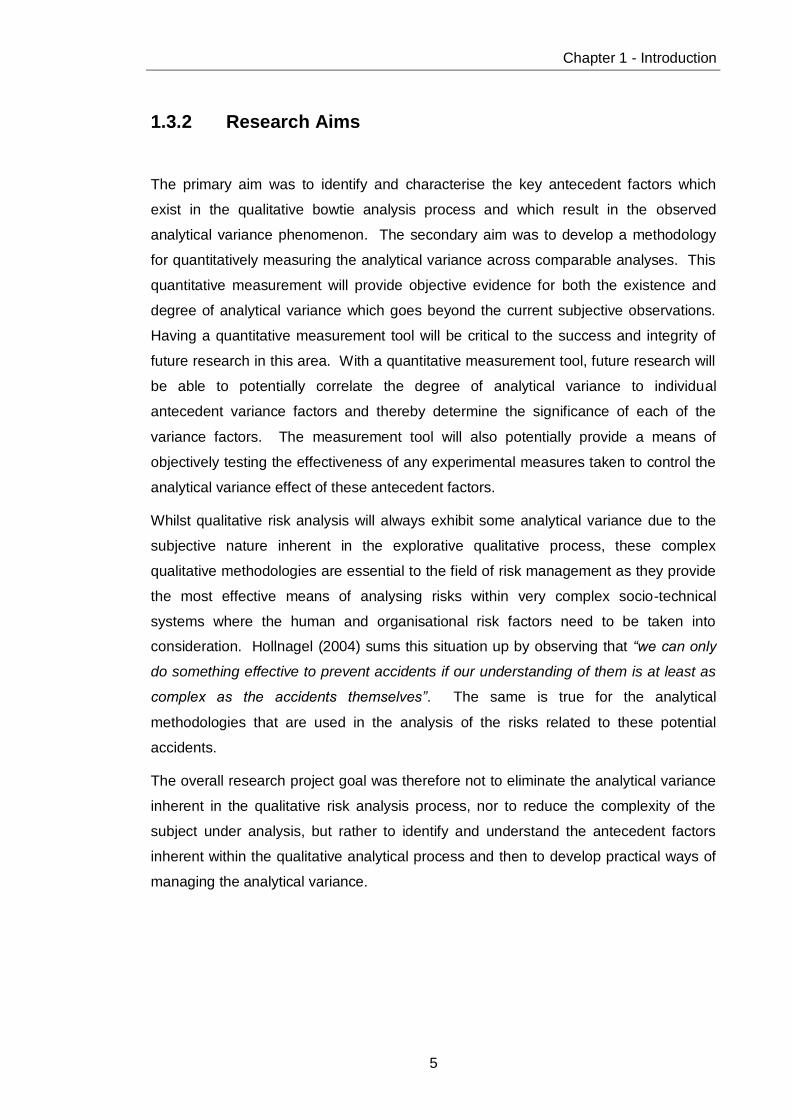
(2009b, pp. 64-66). The bowtie analysis methodology employs a simple logic diagram,
which can be implemented through either a qualitative (see Figure 1) or quantitative
approach (see Figure 2).
Bowtie analysis is growing in use within several industrial domains such as aviation,
petroleum, marine, land transport, health care, etc. It is also recommended for use by
a variety of industrial bodies and regulatory agencies (IADC 2011; FAA 2004; UK HSE
2001; NOPSEMA 2014; Worksafe Victoria 2006; ISO 2009b, 2000).
The author has observed over a number of years of professional practice that the ‘real-
world’ application of the qualitative bowtie analysis methodology on the same analytical
subject by different analysts often produces analytical results which are at significant
variance from each other. The observations made regarding variance within qualitative
analyses is also generally supported within the literature that have been reviewed (Križ
& Skivenes 2013; Ferdous et al. 2012; Emblemsvåg & Kjølstad 2006; Carey &
Burgman 2008).
The concern that arises from this observation is that if the results from the qualitative
bowtie analysis methodology are subject to such significant variance, can they be
relied upon in the field of risk management which uses the analytical results as the
basis for the protection of at risk targets such as health, safety, environment and
Chapter 1 - Introduction
2
assets. It is the contention of the author that the observed variance in qualitative
bowtie analysis is undesirable and ultimately not consistent with the objectives of risk
analysis; hence an investigation of the problem and search for a solution is warranted.
Figure 1: Qualitative Bowtie Analysis Diagrammatical Representation (ISO 2009b)
Figure 2: Quantitative Bowtie Analysis Diagrammatical Representation (ISO 2000)

Chapter 1 - Introduction
3
The research problem and related concepts are illustrated in Figure 3 which presents a
simplified model of analysis wherein it would be expected that given the same
‘analytical subject’ and by application of the same ‘analytical process’, that different
analyses would produce consistent ‘analytical results’. However, the authors
experience shows that there is a significant degree of variance in the analytical results
produced by comparable qualitative bowtie analyses.
That this analytical variance is undesirable is self-evident as it is antithetical to the key
objective of risk analysis which is to develop an understanding of the risk, including
factors such as sources, causes, consequences and controls; upon which risk
evaluations and related decisions can be made (ISO 2009a). It seems intuitive that
given the same analytical question or analytical subject and by application of the same
analytical process, there should be an objective or consistent answer to be found.
Hence, the consistency of the analytical results should not be subject to the
characteristics of the analytical process applied, but rather the results should be driven
by the parameters specified within the analytical question.
The origins of the analytical variance can be attributed in some manner and degree to
the analytical process and to the analytical subject. Hence, an exploration of the
analytical process and analytical subject as it relates to the qualitative bowtie analysis
methodology must be performed.
Figure 3: Simplified Model of the Analytical Process
1.2 Research Rationale
Given the importance of the risk management decisions being made arising from the
use of qualitative bowtie analysis, the findings of this research are highly relevant to
industries and organisations. This research may also have wider significance and
application within the overall domain of qualitative risk analysis across the spectrum of
risk analysis methodologies.
Important risk management decisions are made by organisations on the allocation of
limited resources to effectively and efficiently manage risks based on the findings of
Analytical
Process
Analytical
Subject
Analytical
Results

Chapter 1 - Introduction
4
risk analyses. It is therefore important that organisations can have confidence in the
integrity of the risk analyses and that the analytical results are founded upon a valid
and reliable basis.
1.3 Research Objectives and Aims
1.3.1 Research Objectives
The research project employed an objective based exploration of the phenomenon of
analytical variance in qualitative bowtie analyses. Clear researchable questions arose
in relation to the research problem such as; what are the underlying factors that are
responsible for the creation of this analytical variance; and is it possible to
quantitatively measure the amount of analytical variance that occurs? These questions
have been formulated into two concise research objectives as follows:
Objective 1: To identify and describe the antecedent factors inherent in the
qualitative bowtie analysis process which cause the observed
analytical variance.
Objective 2: To develop a simple and practical methodology and tool for the
quantitative measurement of the analytical variance between
comparable qualitative bowtie analyses.
In addition to achieving these specific research objectives, it was also expected that the
findings of the research project would be suitable for use in the formation of testable
hypotheses for use in future research in the area of analytical variance. The research
project was therefore intended to be very broad and accepting of a wide range of pre-
existing data upon which initial conclusions could be drawn and by which discrete
variables could be identified for selection and control in future ‘experimental
development’ based research (Swinburne University of Technology 2014).
Chapter 1 - Introduction
5
1.3.2 Research Aims
The primary aim was to identify and characterise the key antecedent factors which
exist in the qualitative bowtie analysis process and which result in the observed
analytical variance phenomenon. The secondary aim was to develop a methodology
for quantitatively measuring the analytical variance across comparable analyses. This
quantitative measurement will provide objective evidence for both the existence and
degree of analytical variance which goes beyond the current subjective observations.
Having a quantitative measurement tool will be critical to the success and integrity of
future research in this area. With a quantitative measurement tool, future research will
be able to potentially correlate the degree of analytical variance to individual
antecedent variance factors and thereby determine the significance of each of the
variance factors. The measurement tool will also potentially provide a means of
objectively testing the effectiveness of any experimental measures taken to control the
analytical variance effect of these antecedent factors.
Whilst qualitative risk analysis will always exhibit some analytical variance due to the
subjective nature inherent in the explorative qualitative process, these complex
qualitative methodologies are essential to the field of risk management as they provide
the most effective means of analysing risks within very complex socio-technical
systems where the human and organisational risk factors need to be taken into
consideration. Hollnagel (2004) sums this situation up by observing that “we can only
do something effective to prevent accidents if our understanding of them is at least as
complex as the accidents themselves”. The same is true for the analytical
methodologies that are used in the analysis of the risks related to these potential
accidents.
The overall research project goal was therefore not to eliminate the analytical variance
inherent in the qualitative risk analysis process, nor to reduce the complexity of the
subject under analysis, but rather to identify and understand the antecedent factors
inherent within the qualitative analytical process and then to develop practical ways of
managing the analytical variance.

Chapter 1 - Introduction
6
THIS PAGE INTENTIONALLY LEFT BLANK

Chapter 2 - Literature Review
7
Chapter 2 Literature Review
There are a range of key concepts which are relevant to the research project and the
stated research objectives. These concepts include ‘bowtie analysis’, ‘qualitative
analysis’, ‘measurement’, ‘data types’, ‘measurement types’, ‘statistical methods’ and
the central research concept of ‘analytical variance’. A review of the literature related
to these concepts is presented in this section of the research report. The literature
review has been performed and is presented in two discrete parts corresponding to the
two research objectives.
2.1 Antecedent Factors in Qualitative Bowtie
Analysis
2.1.1 Qualitative Analysis
It is evident that there are two fundamental methods applied in the field of risk analysis;
qualitative and quantitative (Marhavilas, Koulouriotis & Gemeni 2011; Ferdous et al.
2013; Badreddine & Amor 2013; Mokhtari et al. 2011; Cockshott 2005; Delvosalle et al.
2006; Markowski, Mannan & Bigoszewska 2009; UK HSE 2006). Though it is further
claimed by some that there is a ‘hybrid’ or semi-quantitative method that may also be
applied (Jacinto & Silva 2010; Aven 2008; Marhavilas, Koulouriotis & Gemeni 2011;
Cockshott 2005; UK HSE 2006).
Quantitative analysis involves the objective measurement of phenomena combined
with numerical calculation, which is applied through universal explanatory laws of logic
and reasoning. As this analysis approach requires data and relationships in which to
perform the numerical calculations, it tends to work best in simple or linear
environments where the number of analytical elements is relatively limited and
knowable.
Chapter 2 - Literature Review
8
Alternatively, qualitative analysis uses subjective assessments based on human
experience and judgement, which are applied through exploratory inductive and
deductive reasoning. As this approach is not constrained by numerical precision, it
tends to work best in complex or non-linear environments where the number of
analytical elements is relatively large or uncertain.
It is sometimes claimed that quantitative methods are less subject to analytical
variance than qualitative methods and that qualitative methods are inherently disposed
to analytical variance due to the subjective nature of the method. It was not the
purpose of the research project to investigate the differences between these two
methods or to argue for one above another. With respect to these claims, Bouma &
Ling (2005, p. 168) make a comparison of quantitative and qualitative research
methods, wherein they claim that such comparisons should not be based on which
method is better or worse, but rather which method is appropriate to the question being
asked, or in the case of this research project which method is appropriate to the subject
under analysis.
Qualitative analysis methods tend to be more appropriate for application in the field of
complex socio-technical systems (Hollnagel 2004, p. 140) as these qualitative methods
are typically more flexible and capable of modelling the involvement of the
organisational and human factors, which do not have crisp Boolean logic1 and
probabilistic relationships.
It may be that the analytical variance observed in qualitative bowtie analyses, to some
degree, is an emergent characteristic of the inherent complexity of the analytical
subjects themselves to which this method is commonly employed.
2.1.2 Bowtie Analysis Methodology
In practice the quantitative bowtie analysis method described in the literature differs
little from fault tree analysis and event tree analysis; which themselves are
comprehensively represented in the literature. Thus quantitative bowtie analysis is
sometimes referred to as a unification of fault trees (left hand side of bowtie) and event
trees (right hand side of bowtie) (Sutton 2007, p. 49; ISO 2009b). However, the
qualitative bowtie analysis methodology is significantly under-represented in the peer
1 Boolean logic relationships involve the use of a simple mathematical language applied to
logical questions. It is used to determine how two or more elements are related to each other and which produces a logical ‘true’ or ‘false’ result; or which is also presented as a mathematical 1 or 0 numerical result.

Chapter 2 - Literature Review
9
reviewed literature; but is instead most typically discussed in industry papers and
conference proceedings.
2.1.2.1 Qualitative Bowtie Analysis Overview
The qualitative bowtie analysis methodology is applied in a linear sequence of
analytical steps, using both inductive and deductive reasoning (Saud, Israni & Goddard
2013), in which analytical elements within a logic diagram are identified, classified and
related in sequence. A typical application of the analytical elements and analytical
sequence in qualitative bowtie analysis is summarised in Table 1, illustrated in Figure 4
and summarised in the following sections. This description of a typical methodology is
taken from an industry guideline for the application of qualitative bowtie analysis
(McKenzie 2013).
Table 1: Qualitative Bowtie Analytical Elements and Methodological Sequence
No. Analytical Element Common Analytical Element Synonyms
1 Hazard threat energy
2 Top event hazardous event
3 Causes mechanisms, threats
4 Outcomes consequences
5 Controls barriers, safeguards, defences, mitigations
6 Defeating factors escalation factors, preconditions, active failures
7 Defeating factor controls escalation factor controls
Figure 4: Qualitative Bowtie Logic Diagram Showing Linear Analysis Sequence

Chapter 2 - Literature Review
10
Hazards
The first step in the methodology is to identify and describe the hazard. A hazard may
be defined as “anything which is a source of potential injury, damage or loss”. All
subsequent analytical steps are dependent upon this step and hence it is critically
important that the hazard is correct and unambiguous. Any variance at this stage in
the analytical process will be amplified in the later analytical steps.
Top Events
The second step in the methodology is to identify and describe the top event for the
hazard. A top event may be defined as “the point in time when control is lost over the
potentially damaging properties of a hazard”. Identification of the top event is
extremely important, because it is this event whereby all the specific causes, outcomes
and controls will be identified and analysed. There can be more than one top event for
a hazard as there may be more than one way that control over the hazard is lost or
where the nature of the hazard changes depending on its context. Multiple top events
will require multiple logic diagrams to be created.
Causes
The third step in the methodology is to identify and describe the causes which lead to
the release of the damaging potential of the hazard via the occurrence of the top event.
A cause may be defined as “the means by which the damaging properties of a hazard
are released”. Both Viner (1991) and Groeneweg (2002) provide comprehensive
discussions on the difficulties relating to understanding causality. Hence, a word or two
of caution is appropriate in relation to the subject of causes and causality within the
qualitative bowtie analysis method. Despite centuries of philosophical thought and
evidence based scientific research, a universally accepted and consistently applicable
model of causality has still not been found. Identifying the causes of an effect appears
intuitive, but the intuitive approach often leads to a misrepresentation of the nature of
the occurrence or even missing the relevant casual factors altogether. Causality is a
very complex concept and there is a wide range of theories, definitions and models in
existence which seek to provide some guidance on how causality works. In qualitative
bowtie analysis, a cause is typically understood to be the factor which directly results in
the occurrence of the top event. The cause is typically required to be a ‘sufficient’
factor; meaning that without any measures taken to prevent it or without any other
factor enabling the cause, it has sufficient causal ability to result in the top event. This
Chapter 2 - Literature Review
11
type of cause is different to those which are ‘necessary’ causes which by themselves
are not sufficient to result in the top event, but also require some other coinciding factor
to exist.
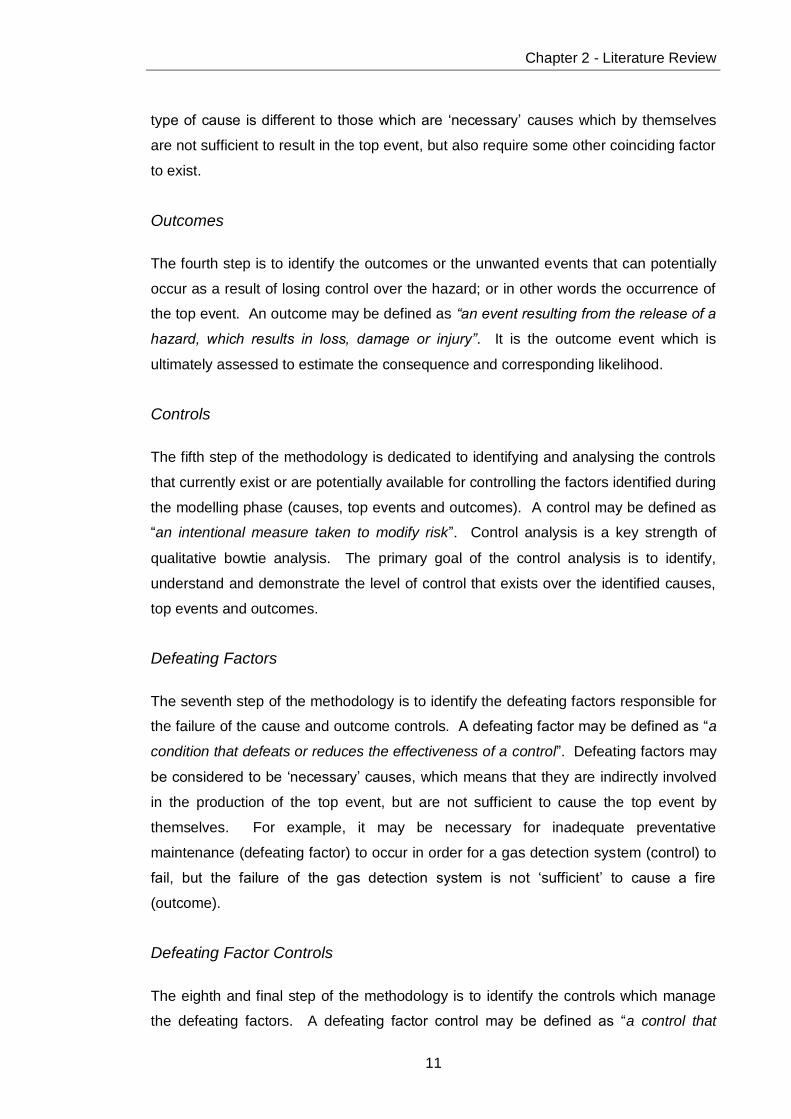
Outcomes
The fourth step is to identify the outcomes or the unwanted events that can potentially
occur as a result of losing control over the hazard; or in other words the occurrence of
the top event. An outcome may be defined as “an event resulting from the release of a
hazard, which results in loss, damage or injury”. It is the outcome event which is
ultimately assessed to estimate the consequence and corresponding likelihood.
Controls
The fifth step of the methodology is dedicated to identifying and analysing the controls
that currently exist or are potentially available for controlling the factors identified during
the modelling phase (causes, top events and outcomes). A control may be defined as
“an intentional measure taken to modify risk”. Control analysis is a key strength of
qualitative bowtie analysis. The primary goal of the control analysis is to identify,
understand and demonstrate the level of control that exists over the identified causes,
top events and outcomes.
Defeating Factors
The seventh step of the methodology is to identify the defeating factors responsible for
the failure of the cause and outcome controls. A defeating factor may be defined as “a
condition that defeats or reduces the effectiveness of a control”. Defeating factors may
be considered to be ‘necessary’ causes, which means that they are indirectly involved
in the production of the top event, but are not sufficient to cause the top event by
themselves. For example, it may be necessary for inadequate preventative
maintenance (defeating factor) to occur in order for a gas detection system (control) to
fail, but the failure of the gas detection system is not ‘sufficient’ to cause a fire
(outcome).
Defeating Factor Controls
The eighth and final step of the methodology is to identify the controls which manage
the defeating factors. A defeating factor control may be defined as “a control that

Chapter 2 - Literature Review
12
modifies risk by managing the factors which reduce the effectiveness of other controls”.
Defeating factor controls are usually organizational systemic controls (e.g. planned
maintenance, supervision, training, auditing, etc.) which should always be in operation
irrespective of the occurrence of causes, top events and outcomes.
2.1.2.2 Quantitative Bowtie Analysis Overview
Quantitative bowtie analysis also begins with the construction of a logic diagram using
the qualitative analysis methods of reasoning and judgement, after which quantitative
methods are used to assign numerical probabilities and consequence values to causal
events, consequential events and control successes and failures. However, more rigid
logic rules are applied in the development of the diagram so as to serve the
subsequent quantification that will be applied.
Therefore, as the quantitative bowtie analysis method is subject to the foregoing
qualitative development of the logic diagram, the quantitative bowtie method is not
entirely unaffected by any analytical variance that occurs within the qualitative
development of the bowtie logic diagram. Hence, this research also has some
applicability to the field of quantitative bowtie analysis.
2.1.2.3 Risk Modelling
To appreciate the wider context and hence importance in which the qualitative bowtie
analysis methodology is positioned within the pantheon of risk modelling methods, a
review of the literature on risk modelling was undertaken. Understanding the methods
used in risk modelling and their differences contributes to an understanding of the
potential antecedent analytical variance factors common to all methods, including
bowtie analysis.
On accident modelling, Hollnagel (2004, p. 44–67; Hollnagel & Goteman 2004)
describes the evolution of accident models in three classes; ‘sequential’,
‘epidemiological’ and ‘systemic’ (see Table 2); wherein the final systemic modelling
method is reported by Hollnagel to be the superior approach. However, it is at the
same time noted that there is a significant increase in information and complexity within
these systemic models in comparison to other models; which presents difficulties.
Sequential models are relatively simple and are closely aligned to quantitative analysis
methods; hence the ability of these sequential models to produce relatively consistent
analytical results may be an emergent characteristic of the low level of information and

Chapter 2 - Literature Review
13
complexity inherent to them. Conversely, the increase in information and complexity
associated with epidemiological and systemic models may potentially be a significant
antecedent factor in the observed analytical variance within qualitative bowtie analysis.
During the literature review, bowtie analysis has been evaluated against Hollnagel’s
three model classes to investigate how this method compares with other modelling
methods described in the literature.
Table 2: Main Types of Accident Models (Hollnagel & Goteman 2004)
Model type Search principle Analysis goals Examples
Sequential Specific causes and well-defined links
Eliminate or contain causes
Linear chain of events
Trees
Networks
Epidemiological Carriers, barriers, and latent conditions
Make defences and barriers stronger
Latent conditions
Carrier-barriers
Pathological systems
Systemic Tight couplings and complex interactions
Monitor and control performance variability
Control theory models
Chaos models
Stochastic resonance
Sequential Models
Sequential accident models represent an accident as a series of related events
occurring in a linear sequential order. Hollnagel (2004) describes significant limitations
in sequential models and claims that they are overly simplistic and thus are not able to
represent and analyse the underlying complexity experienced in a real world accident.
However, they are reasonably good at producing consistent results. Quantitative
bowtie analysis that employs rigid Boolean logic rules (fault and event tree) (Ferdous et
al. 2013; Badreddine & Amor 2013; Ferdous et al. 2012; Shahriar, Sadiq &
Tesfamariam 2012) is a typical sequential model and is therefore a limited and coarse
abstraction of the real world context in which accidents occur (see example in Figure
5). Hence, it should not be surprising that the quantitative bowtie analysis method
produces relatively consistent analytical results when compared to purely qualitative
methods.
Whilst qualitative bowtie analysis also incorporates a simple sequential progression of
events (from cause, to top-event, to outcome) it is also able to incorporate a wide range
of contributory causal factors and escalation factors that are not in the direct linear
sequence of the temporal cause and effect pathway. Hence, it is not entirely accurate
Chapter 2 - Literature Review
14
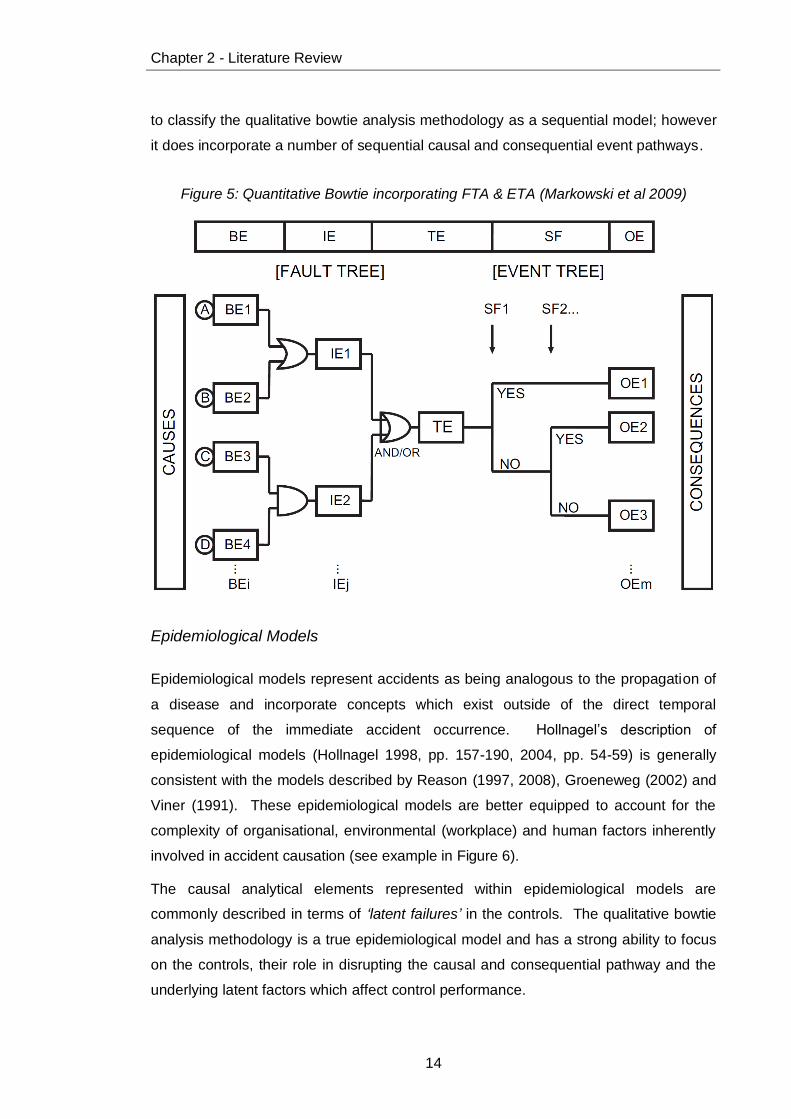
to classify the qualitative bowtie analysis methodology as a sequential model; however
it does incorporate a number of sequential causal and consequential event pathways.
Figure 5: Quantitative Bowtie incorporating FTA & ETA (Markowski et al 2009)
Epidemiological Models
Epidemiological models represent accidents as being analogous to the propagation of
a disease and incorporate concepts which exist outside of the direct temporal
sequence of the immediate accident occurrence. Hollnagel’s description of
epidemiological models (Hollnagel 1998, pp. 157-190, 2004, pp. 54-59) is generally
consistent with the models described by Reason (1997, 2008), Groeneweg (2002) and
Viner (1991). These epidemiological models are better equipped to account for the
complexity of organisational, environmental (workplace) and human factors inherently
involved in accident causation (see example in Figure 6).
The causal analytical elements represented within epidemiological models are
commonly described in terms of ‘latent failures’ in the controls. The qualitative bowtie
analysis methodology is a true epidemiological model and has a strong ability to focus
on the controls, their role in disrupting the causal and consequential pathway and the
underlying latent factors which affect control performance.

Chapter 2 - Literature Review
15
Figure 6: Variant Swiss-Cheese Accident Model (Reason 2008)
Systemic Models
Systemic accident models are relatively new and represent accidents within the context
of the performance of a system as a whole instead of simplistic direct linear cause and
effect relationships or a combination of epidemiological factors which exert influence
upon the system. There is a wider, but still limited discussion of the emergence of
systemic accident models beyond Hollnagel (Hollnagel & Goteman 2004; Hollnagel
2004) in the literature (Borys, Else & Leggett 2009; Borys 2000; Jiao & Zhao 2012;
Stroeve, Blom & Bakker 2009).
Borys systemic model summarises Reason’s latent condition pathways into five
subsystems (Organisation, Equipment, Procedures, People, Environment); however,
Borys (2000, p. 168) states that his model also incorporates Viner’s (1991, p. 94)
generalised time sequence model (GTSM) to add a ‘temporal dimension’ to his
systemic accident model (see example in Figure 7). Even though Borys model shows
that all subsystems are interconnected, it does not present the explicit relationships
that exist between these five subsystems and the actual control failures upon which
they are claimed to exert influence.
None of the current literature on systemic accident models considers the potential for
adaptation of the qualitative bowtie analysis methodology as a systemic accident
model. This is surprising as both modelling approaches are relatively new and also
because the qualitative bowtie analysis methodology has the capacity to relate the
controls which are populated onto a simple temporal pathway (cause, top-event, and
outcome) directly to items within an organisations safety management system. This
mapping of the risk analysis to the systemic items within an organisation is central to
the systemic modelling method.
Management decisions
Organisational
processes
Corporate culture, etc.
Error-producing
conditions
Violation-producing
conditions
Errors
Violations
Organisation Workplace Person Defences
Latent Failure Pathway

Chapter 2 - Literature Review
16
Figure 7: A Systems Model of Accident Causation (Borys 2000)
2.1.3 Analytical Variance
Variance may be simply defined as “the fact or quality of being different, divergent, or
inconsistent” (Oxford University Press 2014). Hence variance is the actual state of
difference between two or more things, though this definition is not instructive as to why
the difference exists. This definition also necessarily requires the existence of a
subject or subjects upon which the difference may be observed. The term ‘analytical
variance’ therefore refers simply to the inconsistent results of multiple comparable
analyses. In the case of this research, analytical variance is the inconsistency
observed in the analytical results of multiple qualitative bowtie analyses.
2.1.3.1 Variance in Qualitative Bowtie Analysis
The analytical variance observed within qualitative bowtie analysis is manifested in the
inconsistencies in the analytical elements represented within the bowtie logic diagram
(Hazard, Top Event, Causes, Outcomes, Defeating Factors, and Controls). The
analytical variance in these analytical elements appears in the following forms:
Omissions of relevant analytical elements
Inclusions of irrelevant analytical elements

Chapter 2 - Literature Review
17
Differences in characterisations of the same analytical elements
Differences in classifications of the same analytical elements
Differences in relationships between the analytical elements
The concept of analytical variance within the literature is predominately discussed in
terms of how inputs influence the ability of a single analysis to reasonably represent the
real world (ANS and IEEE 1983; Ferson & Ginzburg 1996; Regan, Colyvan & Burgman
2002; Carey & Burgman 2008; Markowski, Mannan & Bigoszewska 2009; Ferdous et
al. 2012; Shahriar, Sadiq & Tesfamariam 2012; Ferdous et al. 2013). However, there
is very little discussion of why ‘different analyses’ which use the same method on the
same subject vary in their respective results.
These same authors also demonstrate a strong bias toward discussion of the analytical
variance in quantification of event probabilities and consequences which are used to
derive a numerical estimate of the risk. There is however, comparatively little attention
given to analytical variance in the qualitative development of the bowtie logic diagram
upon which the later quantification is performed.
This bias toward the quantitative method is reflected in the number of methods that are
described in the literature for managing analytical variance in quantitative analyses
(Ferson & Ginzburg 1996; Hoffman & Hammonds 1994; Ferdous et al. 2013; ANS and
IEEE 1983; Badreddine & Amor 2013; Ferdous et al. 2012; Markowski, Mannan &
Bigoszewska 2009; Shahriar, Sadiq & Tesfamariam 2012). However, qualitative
analyses are not commonly subjected to any formal methods to investigate the validity
or repeatability of the analytical results (Burgman 2001; Emblemsvåg & Kjølstad 2006).
Where there are methods proposed for qualitative analytical variance, these are once
again biased toward the estimation of risk (likelihood and consequence) and not on the
development of the logic diagram model itself (Burgman 2001; Carey & Burgman 2008;
Emblemsvåg & Kjølstad 2006).
2.1.3.2 Variance Typologies
General Domain Uncertainty and Variability
The Intergovernmental Panel on Climate Change has published guidance on the
subject of addressing uncertainty (IPCC 2005). The purpose of this guidance is to
assist authors of IPCC reports to identify and deal with uncertainties arising within
complex systems, models and data in a consistent manner. The IPCC arranges
uncertainty into three types including ‘unpredictability’, ‘structural uncertainty’ and

Chapter 2 - Literature Review
18
‘value uncertainty’; which are summarised in Table 3. The IPCC typology of
uncertainties has application within the broad domain of scientific endeavour and is
constructed by a highly authoritative source; however, it does not consider uncertainty
within the specific domain of risk analysis.
Table 3: A Simple Typology of Uncertainties (IPCC 2005)
Type Indicative examples of sources
Unpredictability Projections of human behaviour not easily amenable to prediction.
Chaotic components of complex systems.
Structural uncertainty
Inadequate models
Incomplete or competing conceptual frameworks
Lack of agreement on model structure
Ambiguous system boundaries or definitions
Significant processes or relationships wrongly specified or not considered.
Value uncertainty
Missing
Inaccurate or non-representative data
Inappropriate spatial or temporal resolution
Poorly known or changing model parameters.
Risk Domain Uncertainty and Variability
The problem of analytical variance is consistently discussed in the literature as
resulting from either ‘uncertainty’ or ‘variability’; with uncertainty being the most
prevalent term used and discussed. A survey of the literature relating to uncertainty
and variability typologies relevant to the domain of risk analysis was undertaken and is
summarised in Table 4. This literature survey revealed that there is a wide spectrum of
typologies which use divergent terminology and describe many different manifestations
or ‘types’ of uncertainty and variability in practice.
Uncertainty and variability represent the two most fundamental classes of analytical
variance factors and these provide the beginnings of a useable typology for the study
of analytical variance.
Uncertainty
Uncertainty is most commonly discussed within the literature in relation to a deficiency
of knowledge and is often characterised as an epistemological concept; i.e. the theory
of knowledge (ANS and IEEE 1983; Ferson & Ginzburg 1996; Regan, Colyvan &
Burgman 2002; Carey & Burgman 2008; Markowski, Mannan & Bigoszewska 2009;

Chapter 2 - Literature Review
19
Ferdous et al. 2012; Shahriar, Sadiq & Tesfamariam 2012; Ferdous et al. 2013). A
wide variety of antecedent factors are discussed in the literature in relation to why this
knowledge deficiency occurs. These antecedent factors are categorised and
discussed as different types or forms of uncertainty.
Variability
Whilst variability also relates to an inability to acquire knowledge, the literature applies
this term exclusively in relation to the randomness or complexity of the subject from
which knowledge is being sought. The literature ascribes this variability to types such
as randomness, complexity, chaos, etc. It is because the knowledge is not finite or
because it is subject to unpredictable change that the acquisition of the knowledge is
inhibited.
Table 4: Summary of Uncertainty and Variability Typologies in Risk Analysis
Literature Typologies
(ANS and IEEE
1983)
Data (parameter) uncertainty (Amount of data; Diversity of
data sources; Accuracy of data sources)
Completeness uncertainty (Incomplete list of initiating events;
Incomplete system failure contributors; Incomplete accident
sequence; Incomplete definition of system damage states;
Incomplete list of system interactions; Incomplete accounting of
human factors)
Model uncertainty (Limitations of binary logic models; Skill
and accuracy of analyst; Misapplication of method rules)
(Ferson &
Ginzburg 1996)
Variability (objective uncertainty) (Heterogeneity;
Stochasticity)
Ignorance (epistemic uncertainty) (Systematic measurement
error; Incomplete information)
(Regan, Colyvan
& Burgman 2002)
Linguistic uncertainty (Vagueness; Context dependence;
Ambiguity; Underspecificity; Indeterminacy of theoretical terms)
Epistemic uncertainty (Measurement error; Systematic error;
Natural variation; Inherent randomness; Model uncertainty;
Subjective judgement)
(Carey &
Burgman 2008)
Variability (Naturally occurring; Unpredictable change)
Incertitude (Lack of model parameter knowledge; Lack of
model relationship knowledge)
Linguistic uncertainty (Ambiguity; Vagueness;
Underspecificity; Context dependence)

Chapter 2 - Literature Review
20
Literature Typologies
(Markowski,
Mannan &
Bigoszewska
2009)
Objective uncertainty (Variability; Random behaviour)
Subjective uncertainty (Lack of knowledge; Vagueness in
interpretation)
Completeness uncertainty (Have all significant phenomena
and relationships been considered)
Modelling uncertainty (Inadequacies and deficiencies in
formulation of accident scenario structure)
Parameter uncertainty (Imprecise data; Vague data; Missing
data; Inadequate data)
(Ferdous et al.
2012)
Aleatory uncertainty (variation) (Stochastic; Objective;
Irreducible; Random)
Epistemic uncertainty (knowledge) (Imprecise; Incomplete;
Ambiguous; Ignorance; Inconsistent; Vague)
(Shahriar, Sadiq
& Tesfamariam
2012)
Data uncertainty (epistemic) (Impreciseness; Vagueness;
Lack of knowledge; Incompleteness)
Model uncertainty (Interdependency of event relationships)
(Ferdous et al.
2013)
Aleatory uncertainty (Natural variation; Random behaviour of
a system)
Epistemic uncertainty (Lack of knowledge; Incompleteness)
Data uncertainty (Incomplete; Inconsistent or imprecise data;
Missing or unavailable data; Multi-source data; Vagueness or
inadequacy in input data)
Model uncertainty (Model adequacy; Mathematical and
numerical approximations in the model; Assumptions or
validation of the model)
Quality uncertainty (Knowledge deficiency about a system;
Error in hazard identification; Incorrectness in identification of
consequences and their interactions)
2.1.4 Variance Sources
The variance typologies in the literature show that in addition to these two classes
(uncertainty and variability); analytical variance may also be considered in terms of the
potential sources from which the uncertainty and variability arise. Three sources are
identified from the literature and are summarised below and illustrated in Figure 8.
Analytical subject (knowledge; complexity; randomness)
Analytical methodology (elements; terminology; format; rules; tools)

Chapter 2 - Literature Review
21
Human analyst(s) (language; skill; experience; cognition)
The analytical variance factors identified within the survey of typologies are presented
in relation to these three analytical variance sources in Figure 9 which is based on the
description of the factors included within each article. It is important to note that Figure
9 shows where the analytical variance inherently exists (source) and not where its
effect is finally manifested, such as within the methodology or the analysts perception.
In the main, variability factors discussed in the literature are only related to the
analytical subject data. As qualitative bowtie analysis is a qualitative method, it is less
influenced by data variability, which is more significant for use in quantification.
Qualitative bowtie analysis is expected to be more influenced by factors related to the
methodology and the human analyst. Hence, the variability of human performance was
of specific interest in the research.
Figure 8: Potential Sources of Analytical Variance Factors in Risk Analysis
Analytical Subject Analytical Methodology Human Analysts
Variability(Aleatory Uncertainty)
Uncertainty(Epistemic Uncertainty)
Language - ambiguity
Language - vagueness
Language - underspecificity
Language - context dependence
Performance - skill
Performance - experience
Performance - cognition
Limits - elements
Limits - terminology
Limits - format
Limits - rules
Limits - tools
Propagation
Knowledge - amount
Knowledge - accuracy
Knowledge - completeness
Knowledge - clarity
Variability - randomness
Variability - complexity
Analytical Variance

Chapter 2 - Literature Review
22
Figure 9: Variance Typologies and Sources Comparison from Literature Survey
Variability(Aleatory Uncertainty)
Analytical Subject Analytical Methodology Human Analysts
Data (parameter) uncertainty
Amount of data, Diversity of data
sources, Accuracy of data sources
Completeness uncertainty
List of initiating events, system failure
contributors, accident sequence,
definition of system damage states, list
of system interactions, accounting of
human factors
Model uncertainty
Limitations of binary logic models
Model uncertainty
Skill and accuracy of analyst,
Misapplication of method rules
ANS and IEEE 1983
Variability (objective uncertainty)
Heterogeneity, stochasticity
Ignorance (epistemic uncertainty)
Systematic measurement error,
incomplete information
Ferson & Ginzburg
1996
Epistemic uncertainty
Measurement error, Systematic error,
Natural variation, Inherent randomness
Epistemic uncertainty
Model uncertainty
Linguistic uncertainty
Vagueness, Context dependence,
Ambiguity, Underspecificity,
Indeterminacy of theoretical terms
Epistemic uncertainty
Subjective judgement
Regan, Colyvan &
Burgman 2002
Variability
Naturally occurring, unpredictable
change
Incertitude
Lack of model parameter knowledge,
Lack of model relationship knowledge
Linguistic uncertainty
Ambiguity, Vagueness, Underspecificity,
Context dependenceCarey & Burgman
2008
Objective uncertainty
Variability, Random behaviour
Subjective uncertainty
Lack of knowledge
Parameter uncertainty
Imprecise data, Vague data, Missing
data, Inadequate data
Completeness uncertainty
Have all significant phenomena and
relationships been considered
Modelling uncertainty
Inadequacies and deficiencies in
formulation of accident scenario
structure
Subjective uncertainty
Vagueness in interpretation
Markowski, Mannan &
Bigoszewska 2009
Aleatory uncertainty (variation)
Stochastic, Objective, Irreducible,
Random
Epistemic uncertainty (knowledge)
Imprecise, Incomplete, Ambiguous,
Ignorance, Inconsistent, Vague
Ferdous et al. 2012
Data uncertainty (epistemic)
Impreciseness, Vagueness, Lack of
knowledge, Incompleteness
Model uncertainty
Interdependency of event relationshipsShahriar, Sadiq &
Tesfamariam 2012
Aleatory uncertainty
Natural variation, Random behaviour of
a system
Epistemic uncertainty
Lack of knowledge, Incompleteness
Data uncertainty
Incomplete, Inconsistent or imprecise
data, Missing or unavailable data, Multi-
source data, Vagueness or inadequacy
in input data
Quality uncertainty
Knowledge deficiency about a system
Model uncertainty
Model adequacy, Mathematical and
numerical approximations in the model,
Assumptions or validation of the model
Quality uncertainty
Error in hazard identification,
Incorrectness in identification of
consequences and their interactions
Ferdous et al. 2013
Uncertainty(Epistemic Uncertainty)

Chapter 2 - Literature Review
23
2.1.4.1 The Analytical Subject
The analytical process begins with the consideration of a ‘subject’. The subject needs
to be sufficiently comprehended by the human analyst in order to apply the analytical
methodology. Hence, knowledge of the analytical subject is fundamental to the
analytical process and is very likely to be a source of antecedent factors in the
causation of analytical variance. Comprehension of the analytical subject may be
limited due to uncertainty of knowledge and variability in knowledge. These two factors
operate like knowledge filters which are positioned between the analytical subject and
the human analyst.
Subject Knowledge
Much of the literature discusses the analytical problems associated with a deficiency in
the knowledge of the subject under analysis and presents this in a wide and divergent
spectrum of types (ANS and IEEE 1983; Ferson & Ginzburg 1996; Regan, Colyvan &
Burgman 2002; Carey & Burgman 2008; Markowski, Mannan & Bigoszewska 2009;
Ferdous et al. 2012; Shahriar, Sadiq & Tesfamariam 2012; Ferdous et al. 2013). All of
these knowledge deficiency types can be summarised into four main types as follows:
Knowledge amount (inadequate; source diversity)
Knowledge accuracy (errors; imprecise; inconsistent)
Knowledge completeness (missing; ignorance; incomplete)
Knowledge clarity (vague; ambiguous)
The degree of influence arising from knowledge deficiencies will tend to vary
depending on the analytical methodology used. For example, quantitative methods will
tend to be influenced by the completeness and accuracy of the data; whereas
qualitative methods may be more influenced by the clarity of the knowledge.
Subject Variability
The knowledge related to the analytical subject may not be finite or static. This is
another source of potential knowledge deficiency presented in the literature (Ferson &
Ginzburg 1996; Regan, Colyvan & Burgman 2002; Carey & Burgman 2008; Markowski,
Mannan & Bigoszewska 2009; Ferdous et al. 2012, 2013; Hollnagel 2004). There are
essentially two key types of subject variability which are discussed in the literature:
Subject randomness (stochasticity, natural variation, unpredictability)

Chapter 2 - Literature Review
24
Subject complexity (heterogeneity, irreducibility)
True randomness arises not because of our inability to comprehend the system
mechanisms and processes. Truly random subjects cannot be decomposed down to
any level at which deterministic mechanisms can be identified and understood. In
reality, truly random systems are rare. What is often thought to be randomness is far
more likely to be an illusion resulting from the underlying complexity within the subject
that defies analytical reduction and comprehension (Regan, Colyvan & Burgman 2002).
The degree of influence arising from variability of the subject will therefore be strongly
correlated to the complexity of the system.
Subject Complexity
The complexity of a system is a function of the number and variety of activities, sub-
systems, equipment, operating steps and events (ABS 2000). The more complex a
system is the more uncertainty and variability is likely to exist in relation to analysing
that system. The concept of system complexity also features within the literature as a
reason for uncertainty in risk analysis (Trbojevic 2008; ISO 2009b; Hollnagel &
Goteman 2004; Aven 2008; Jiao & Zhao 2012; Schüller et al. 1997; Borys, Else &
Leggett 2009).
Qualitative bowtie analysis is commonly employed in the risk assessment of large
industrial socio-technical systems such as petroleum exploration and production,
chemical processing, aviation, shipping, rail transportation, healthcare, etc. These
socio-technical systems represent extremely complex analytical subjects comprising a
large number of inter-relationships between the social elements of organisational
structures and people with the technological elements of technology and tasks. The
basic components and inter-relationships in a socio-technical system are illustrated in
Figure 10.
Whilst qualitative bowtie analysis has methodological capacity to address the inherent
complexities in these scenarios, it remains likely that the analytical variance in
qualitative bowtie analysis is an emergent feature of the corresponding complexity of
these analytical subjects.

Chapter 2 - Literature Review
25
Figure 10: Model of a Socio-Technical System (Bostrom & Heinen 1977)
Control Complexity
A key characteristic of qualitative bowtie analysis is its capacity to represent and
analyse controls within the logic diagram. Control analysis is discussed in depth by
Hollnagel (2004), Sklet (2006) and Trbojevic (2008). Whilst quantitative methods often
only incorporate simplistic representations of controls with assigned probabilities of
failure, qualitative methods allow much more explorative analysis of the controls and
also the inclusion of complex non-technology controls related to the organisational
arrangements, people and tasks. Controls related to these social elements are much
harder to quantify and to analyse.
A survey of the literature on the subject of control analysis reveals that controls are
very complex analytical elements with a large number of attributes that impact on the
way in which they manage risk (UKOOA 1999; ISO 2009b, 2009a; Hollnagel 2004;
Standards Australia 2004; Sklet 2006; Trbojevic 2008; NOPSEMA 2014). A model of
control complexity aligned with the risk management process described by ISO (2009a)
has been developed and is illustrated in Figure 11. This model summarises the key
attributes which relate to the selection and evaluation of new controls and the analysis
and monitoring of existing controls. The literature referenced for each control attribute
within the model is only provided for the most significant literature relating to each
Structure
People Tasks
Technology
Social System Technical System

Chapter 2 - Literature Review
26
attribute; however, information on these attributes may also be found within the other
referenced literature as well.
As qualitative bowtie analysis has a strong emphasis on control analysis and allows the
inclusion of the more complex non-technology controls, it is further likely that the
complexity arising from the inclusion of complex controls within qualitative bowtie
analysis is a contributor to the analytical variance.
Figure 11: Model of Control Complexity Aligned to the Risk Management Process
(1) (UKOOA 1999)
(2) (ISO 2009a)
(3) (ISO 2009b)
(4) (Standards Australia 2004)
(5) (Sklet 2006)
(6) (NOPSEMA 2014)
2.1.4.2 The Analytical Methodology
The analytical process involves the application of a defined methodology by human
analysts utilising the knowledge acquired from the analytical subject. Hence, any
inherent limitations or misapplications of the methodology are likely to be sources of
factors in the causation of analytical variance. A basic overview of the qualitative
bowtie analysis methodology is provided in section 2.1.2 of this research report.
Context Type (1)
Risk Aversion (1)
Risk Types (2)
Cost (3)
Risk Targets (4)
Risk Level (2)
Compatibility (4)
Survivability (6)
Maintainability (6)
Ownership (6)
Equity (4)Authority (1) Consequences (4)Acceptability (4)Bases (1) Alternatives (4)
Reliability (5) Adequacy (5)Availability (5) Means Class (5)Objective Class (5)
3
41
2
Robustness (5)
Functionality (5)
Operating Status
Selection Decision
Operating Effect
Selection Context Control
Control evaluation
Define the context Monitor and review
Stakeholders (1)Efficiency (5)
(2)
(2)
(2)
(2)
Dependencies (5)
Specificity (5)
Control analysis

Chapter 2 - Literature Review
27
Methodology Limitations
There are a number of factors within any analytical methodology which may limit or
affect the results of the analysis. The following are the key factors discussed in the
literature and experienced in practice:
Elements (hazards; top-events; causes; controls; outcomes; defeating factors)
Terminology (element definitions; element names; element characteristics)
Format (structure; graphical presentation)
Rules (logic; element identification criteria; element classification criteria)
Tools (software; formulae)
The terminology used within the field of qualitative bowtie analysis to reference the
analytical elements is somewhat varied; however, this terminology variance may not be
overly significant in relation to causing analytical variance as the different terms are
consistently used to refer to the same analytical concepts. However, Sklet (2006)
argues that in relation to the terms used for ‘safety barriers’, the lack of a common
terminology implies a need for clarifying the terminology. Indeed the greatest analytical
variance in qualitative bowtie analysis terminology appears to be in relation to the
concept of barriers; which are variously referred to by others as ‘barriers’, ‘controls’,
‘defences’, ‘safe-guards’, ‘mitigations’, etc. (Sklet 2006). The significance of the
terminology variance discussed by Sklet relates primarily to the effect it may have on
the communication of information, thus resulting in ambiguity and faulty decisions.
It has been observed by the author in practice that there is no universally accepted
qualitative bowtie analysis methodology used by analysts, but the general approach of
a sequential application of a logic rules for the identification and classification of
analytical elements is essentially the same in all approaches. However, there is
significant variance in the actual analytical rules that are applied for the purpose of
creating the logic diagram, identifying and classifying analytical elements. It has also
been observed by the author that even where there are rules defined there is often an
inconsistency or error in their application.
Searches of the EBSCOHost, Scopus and ScienceDirect scientific literature databases
using “Qualitative Bowtie Analysis”, “Qualitative Bow-tie Analysis”, and “Qualitative
Bow tie Analysis” search terms failed to yield any detailed and authoritative articles on
the concept of "qualitative bowtie analysis. However there are a number of general
articles that describe the method at a high level. The international standard (ISO
2009b) on risk assessment techniques only offers the most basic description of the

Chapter 2 - Literature Review
28
methodology and provides no details on the rules of logic, identification or
classification. This absence of an accepted standard for methodological rules is likely
to be a significant source of analytical variance.
Variance Propagation
Propagation is the process of producing offspring. Propagation within analysis is the
effect of variance factors throughout the application of the methodology, which
compounds and produces new variance or amplifies the effect of other variance factors
within the process. The effect of uncertainty and variability propagation throughout the
analytical process is another concept that is discussed in the literature with a variety of
methods proposed to propagate uncertainty through the analysis (Hoffman &
Hammonds 1994; Ferson & Ginzburg 1996; ANS and IEEE 1983; Taroun 2014).
However, these propagation effects are only discussed in relation to the effect on
quantification (i.e. the effect on probability values).
As qualitative bowtie analysis is typically applied in a linear sequence of analytical
steps (see Figure 4), the sequential approach will also propagate the effects of the
qualitative analytical variance factors throughout the model as each subsequent step is
dependent on any analytical variance that is produced in the preceding step.
For example, as all controls for causes are identified and analysed within the relative
context of the cause they are controlling, any analytical variance which occurs in the
identification of the cause will necessarily propagate to the associated controls and
thereby will result in different analyses which have different causes producing different
cause controls. Similarly, any analytical variance experienced in the identification of
the hazard and top event, will also necessarily propagate to the associated causes.
Left untreated, this analytical variance propagation effect will tend to result in an
amplification of the analytical variance in the final qualitative analytical results.
2.1.4.3 The Human Analyst
Analytical methodologies are not physical or real things, but are cognitive constructs
created and applied by humans. Methodologies are therefore fundamentally subject to
the human analyst in its application. As analyses which exhibit analytical variance are
predominantly created by different human analysts using the same analytical subject
and the same analytical methodology, the change or variance in the human analyst is
likely to be a significant source of analytical variance factors.

Chapter 2 - Literature Review
29
Language
Beyond the technical terminology applied within the methodology, the language that is
used to identify (name) and characterise each analytical element is far more likely to be
a significant analytical variance factor. For example, a cause which is vaguely named
‘Human Error’ will very likely be understood differently by different people and may
result in the identification of different controls compared to a cause which is more
specifically named ‘Mental Fatigue Human Error’ (Shappell & Wiegmann 2000). There
also then remains the language uncertainty that may arise from how mental fatigue and
human error are characterised and communicated within the analysis. Hence, it is
easy to see how the use of such underspecified language could produce significant
analytical variance in the subsequent and dependant control analysis steps.
The analytical variance caused by the language used in the analytical process is
discussed in the literature as the concept of linguistic uncertainty (Regan, Colyvan &
Burgman 2002; Carey & Burgman 2008); however, this concept is not widely
recognised in the majority of the relevant literature. Several types of linguistic
uncertainty are identified including:
Ambiguity (words with multiple meanings)
Vagueness (words allowing borderline cases)
Underspecificity (definitions including unwanted generality)
Context dependence (failure to specify context)
With the qualitative analysis process being so subject to the performance of the human
analysts, linguistic uncertainty arising from a variety of antecedent factors is likely to be
a significant analytical variance factor.
Human Performance (Skill; Experience; Cognition)
Beyond the concepts of linguistic uncertainty, human error in general or more precisely
human performance as a source of analytical variance is very under-represented in the
literature; which is surprising as risk analysis is fundamentally a human activity. As
such the role of human performance within the analytical process needs to be taken
into consideration within this research.
Reason (1990, 1997, 2008) presents a detailed theoretical model of human error types
which is illustrated in Figure 12. As the analytical process is driven by knowledge of
the analytical subject and application of the methodology by human analysts through

Chapter 2 - Literature Review
30
cognitive processes, Reason’s error types are likely to be a very significant source of
analytical variance factors. Whilst all human error types will potentially be relevant to
the causation of analytical variance, it is likely that the most significant factors will relate
to Reason’s ‘rule based’ and ‘knowledge based’ mistakes (Reason 2008, pp. 45–46);
which are highlighted in Figure 12. Rule based mistakes will likely have a strong
correlation to the misapplication of the methodological rules; whilst the knowledge
based mistakes will similarly be correlated to the analytical subject.
Reason also claims that there is a general rule which governs almost all forms of
human error; which is ‘underspecification’. The concept of underspecification is closely
related to the two classes of ‘uncertainty’ and ‘variability’ which filter the knowledge of
the analytical subject that the human analyst is able to apprehend.
Figure 12: Reason’s Human Error Types (Reason 2008, pp. 29–47)
Rule Based Behaviour
As the qualitative bowtie analysis methodology incorporates pre-defined rules which
are applied via human cognitive processes, the performance of the human analyst can
be considered using Reason’s rule based behaviour model (Reason 1997, p. 75–82)
Error
Unintended Actions Intended Actions
Slips Lapses Mistakes Violations
Ro
utin
e
Op
timis
ing
Ne
ce
ssa
ry
Ru
le B
ase
d
Kn
ow
led
ge
Ba
se
d
Me
mo
ry F
ailu
res
Re
co
gn
ition
Fa
ilure
s
Mis
ide
ntific
atio
n
No
n-d
ete
ctio
ns
Wro
ng
De
tectio
ns
Inp
ut F
ailu
res
Sto
rag
e F
ailu
res
Re
trieva
l Fa
ilure
s
Atte
ntio
n F
ailu
res
Stro
ng
Ha
bit In
trusio
n
Inte
rfere
nce
Go
od
Ru
le M
isa
pp
lied
Ba
d R
ule
Ap
plie
d
Go
od
Ru
le N
ot A
pp
lied

Chapter 2 - Literature Review
31
which is summarised in Table 5. Reason describes three rule scenarios which may be
encountered as follows:
Good rules
Bad rules
No rules
The ‘bad rule’ and ‘no rule’ scenarios are expected to be exceptional in the application
of a mature and widely used analytical methodology; however, it is noted that where
the bowtie analysis methodology used by the human analyst is not formally established
it remains possible that there are both ‘bad rule’ and ‘no rule’ scenarios which may
contribute to the analytical variance.
With a mature bowtie methodology it is more likely that analytical variance would occur
where some analysts perform correctly and apply a ‘good rule’ (‘correct compliance’)
and other analysts perform erroneously and fail to apply the good rule (‘misvention’).
Table 5: Reason’s Rule Based Behaviours (Reason 1997, p. 75–82)
Good rules Bad rules No rules
Correct
performance
Correct
compliance
Correct
violation
Correct
improvisation
Erroneous
performance Misvention Mispliance Mistake
2.1.5 Conclusion
From the literature review it is concluded that there are a number of factors which are
responsible for the observed variance within the results achieved in comparable
qualitative bowtie analyses. However, the relationships between these factors and
their role in compounding the variance within the analytical process still requires further
description. The description of variance within the analytical process is developed
further within the findings section of the research report.

Chapter 2 - Literature Review
32
2.2 Quantitative Measurement of Variance in
Qualitative Data
In order to develop a practical methodology for measuring analytical variance in
qualitative bowtie analysis, a broad exploration of the fundamentals of measurement
and statistical analysis is called for. Principally we must ascertain what needs to be
measured, by what means and for what purpose. However, of necessity, we must first
concern ourselves with a brief exploration of the fundamentals of measurement theory.
2.2.1 Measurement
2.2.1.1 The Purpose of Measurement
It is an often cited axiom of management that “you can't manage what you don't
measure”. Certainly this is a central truth in the discipline of risk management.
Measurement provides the foundation upon which important risk management
decisions are made and corresponding strategies developed with allocated resources
to achieve desired outcomes.
Deming’s (2000) ‘system of profound knowledge’ (see Figure 13) identifies a concept
known as the “knowledge of variation” as being one of four fundamental principles and
practices of good management. Deming’s knowledge of variation principle requires
managers to understand both the ‘range’ and ‘causes’ of the variation through
application of statistical methods for measurement.
The foregoing literature review in section 2.1 on the subject of antecedent analytical
variance factors has carefully investigated the ‘causes’ of analytical variance in
qualitative bowtie analysis. Hence the next important step in achieving Deming’s
‘knowledge of variation’ is to measure the ‘range’ of this variation through application of
statistical methods.

Chapter 2 - Literature Review
33
Figure 13: Deming’s System of Profound Knowledge
2.2.1.2 Measurement Theory
A review of the literature on the concept of measurement shows that there are three
fundamental theoretical approaches in the field of measurement; ‘representational
theory’; ‘operational theory’ and ‘classical theory’ (Narens & Luce 1986; Sarle 1997;
Michell 1986). Representational theory and classical theory both hold that there is an
underlying ‘reality’ being measured and that subsequent theories can be derived and
explored on the basis of these measurements; which have meaning in terms of the
relationships between the things being measured and the measurements taken.
However, classical measurement theory only permits the objective measurement of
quantitative attributes. In operational theory there is no necessity for the existence of
Chapter 2 - Literature Review
34
any underlying reality to be measured, but instead the theory is only concerned with the
use of precisely specified measurement operations and their comparison.
This research adopted a representational approach to measurement because the
measurements will be obtained through statistical operations upon qualitative data in
order to investigate the existence of an underlying reality in the relationships between
the antecedent analytical variance factors and the variance in qualitative bowtie
analysis results.
2.2.1.3 Measurement Defined
Measurement typically relates to the properties of things known as ‘frequency’, ‘order’
and ‘quantity’ (Sutcliffe 1958). The different ‘data types’ encountered in the field of
measurement necessitate the use of different measurement procedures or ‘rules’,
which in turn result in the use of different measurement ‘scales’. It was the view of
many in the literature that these differences in the data ‘types’, ‘rules’ and ‘scales’
ultimately determine the availability and suitability of statistical operations that may be
performed on the data.
There were many definitions of measurement found within the literature, but
measurement may be simply defined as “the assignment of numbers to objects or
events according to rules” (Stevens 1946). However, more recently, Townsend and
Ashby (1984) provide a fuller and more compelling description of what they refer to as
the “fundamental thesis of measurement” which is (or should be):
“… a process of assigning numbers to objects in such a way that interesting
qualitative empirical relations among the objects are reflected in the numbers
themselves as well as in important properties of the number system.”
This definition takes a representational theory perspective and perfectly resonates with
the research objective of being able to measure the analytical variance in qualitative
bowtie analysis so as to investigate the relationships between these factors and the
variance that they create.
2.2.1.4 Measurement Scales
In his seminal work on the theory of scales of measurement, Stevens (1946) presents a
simple typology of measurement scales based upon a representational theory
perspective; wherein he discusses four fundamental measurement scales; ‘nominal’,
‘ordinal’, ‘interval’ and ‘ratio’. Whilst Stevens’ typology has been subject to some

Chapter 2 - Literature Review
35
disagreement in the more recent literature, his typology of scales is still widely taught
as forming the basis of all measurement; with subtle variations of these being
employed in some limited and specialised cases.
More controversially, Stevens (1946) also briefly discusses the ‘permissible’ application
of statistical operations using the scales in his typology. Stevens’ four measurement
scales and their permissible use for statistical operations are summarised in Table 6
and briefly discussed below. The scales are ordered in the table starting from the
nominal scale, which represents the scale with the lowest statistical measurement
capability, through to the ratio scale representing the highest.
Table 6: Measurement Scales and Permissible Statistics (Stevens 1946)
Measurement scale Empirical operations Permissible statistics
Nominal Determination of equality
Number of cases
Mode
Contingency correlation
Ordinal Determination of greater or less Median
Percentiles
Interval Determination of equality of intervals or differences
Mean
Standard deviation
Rank-order correlation
Product-moment correlation
Ratio Determination of ratios Coefficient of variation
Nominal scales do not require the use of numbers, but are most commonly represented
through the use of natural language. However, where numbers are used in nominal
data they simply serve as identifying labels.
Ordinal scales permit the use of both numerical and non-numerical data and are
employed where the data exist in a spectrum that exhibits a rank order characteristic
and hence can be sorted on the scale from one end of the spectrum to the other.
Interval scales are purely quantitative and only permit the use of numbers. An interval
scale incorporates rank-ordering and also the degree of difference between items on
the scale. Most statistical methods are permissible with data measured on an interval
scale except for where the method requires a true zero point on the scale.

Chapter 2 - Literature Review
36
Ratio scales are also purely quantitative and only permit the use of numbers. They
provide for the measurement of a ratio or percentage magnitude of a continuous
numerical quantity. Each value shown on the ratio scale are per unit magnitudes of the
ratio of the scale. Ratio scales incorporate a unique and non-arbitrary zero value and
support all types of statistical operations.
2.2.1.5 Permissible Statistical Operations
Sutcliffe (1958) discusses the permissibility of different statistical operations in relation
to Stevens’ (1946) typology. Sutcliffe departs from the views of Stevens’ on the subject
of statistical permissibility and generally concludes that “there is thus no a priori
restriction on the permissibility of statistics”; and that the notion of permissibility is
predominantly subject and relative to the interests of the observer. Hence, in Sutcliffe’s
view any statistical operation is permissible if the observer is interested in the scale and
operation for its own sake.
Stevens’ measurement scale typology and correlation to permissible statistics is
comprehensively discussed in the literature and in some more recent articles is
strongly rebutted, especially in relation to his views on the permissibility of the
statistical methods for each scale (Velleman & Wilkinson 1993; Michell 1986).
Michell (1986) discusses this disagreement with Stevens in the literature and reports
that whilst it might be ‘high-handed’ to ban all applications of some statistical methods
against some scales, clearly there are justifiable grounds to limit the use of some
methods in some cases. Michell (1986) advances the knowledge in this area by
discussing the notion of statistical operation permissibility in terms of ‘meaningfulness’
instead of an overly simplistic dichotomy of ‘wright’ and ‘wrong’.
Meaningfulness recognises that whilst some statistical operations might be technically
possible (and hence of interest to operational measurement theorists), the
measurements derived in some measurement scenarios may lack meaning or even
logical rigour. The solution to this problem is therefore to classify the statistical
operations as either ‘meaningful’ or ‘meaningless’ and not permissible.
Despite the apparent disagreement in the exact scales of measurement and the
permissibility of statistical methods, the literature uniformly agrees that some statistical
methods are only appropriate to certain data types and scales. Velleman & Wilkinson
(1993) distil the problem of permissible statistics down to the conclusion that “… data
analysts must take responsibility to apply methods appropriate to their data and to the
questions they wish to answer.”

Chapter 2 - Literature Review
37
2.2.2 Data Typology
2.2.2.1 Data Type
McCrum-Gardner (2008) discusses the question of which is the ‘correct’ statistical test
to use depending on the type of data and the purpose of the analysis. As discussed
earlier, ‘data type’ is a key determining factor in the type of measurement scale that
may be meaningfully used. Hence, understanding the data type involved in the
research was very important. At the highest level of the data typology, data may be
framed in a dichotomy of either qualitative data or quantitative data.
The data type that is encountered within qualitative bowtie analysis is entirely
qualitative; being essentially the arrangement of textual information into a logic diagram
which is arranged based on the categorisation of the data. The preparation of this
qualitative data for statistical analysis will however necessarily result in the production
of some quantitative data such as the frequency (or number of cases) of the qualitative
data occurrence within the analysis.
2.2.2.2 Qualitative Data and Categorical Variables
In statistical analysis qualitative data are typically described as ‘categorical variables’.
Categorical variables are not expressed in terms of numbers, but instead by the use of
natural language employing words, letters and symbols. The categorical variable data
that is encountered within qualitative bowtie analysis is in the form of the natural
language used for declaring the names of analytical elements such as hazard names,
cause names, control names, etc. An example of the typical qualitative data
encountered within bowtie analysis is summarised in Table 7 and illustrated in Figure
14 which shows a simple example of a typical qualitative model of a helicopter
transportation hazard to an offshore location.
As discussed by Stevens (1946) categorical variables can only be measured by using
either a nominal or ordinal measurement scale. The categorical variables encountered
within qualitative bowtie analysis also have no ‘rank’ or ‘order’ characteristic and are
therefore further restricted to being only suitable for measurement with a categorical
nominal (without order) measurement scale. Finally, the qualitative bowtie data type
may be further reduced to being a ‘nominal class’ data type as described by Stevens.
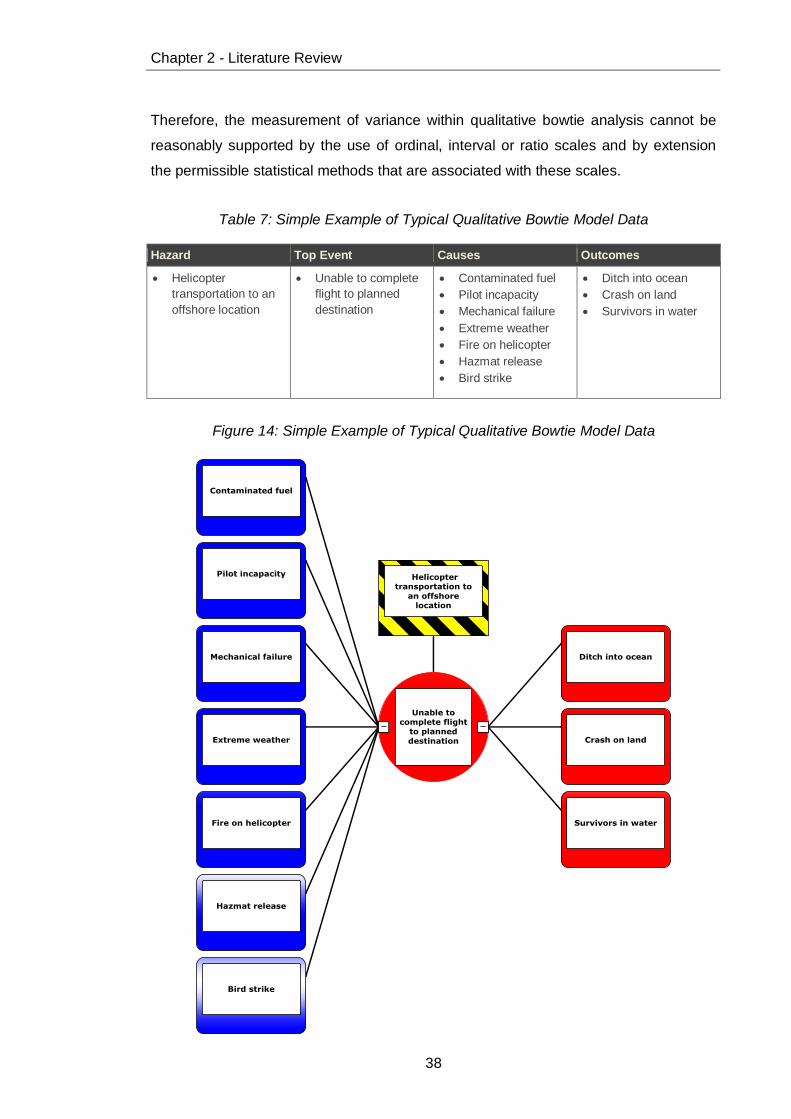
Chapter 2 - Literature Review
38
Therefore, the measurement of variance within qualitative bowtie analysis cannot be
reasonably supported by the use of ordinal, interval or ratio scales and by extension
the permissible statistical methods that are associated with these scales.
Table 7: Simple Example of Typical Qualitative Bowtie Model Data
Hazard Top Event Causes Outcomes
Helicopter
transportation to an
offshore location
Unable to complete
flight to planned
destination
Contaminated fuel
Pilot incapacity
Mechanical failure
Extreme weather
Fire on helicopter
Hazmat release
Bird strike
Ditch into ocean
Crash on land
Survivors in water
Figure 14: Simple Example of Typical Qualitative Bowtie Model Data

Chapter 2 - Literature Review
39
2.2.2.3 Qualitative Bowtie Analysis Data Type Difficulties
It is important to recognise that the characteristics of data can be strongly influenced by
the context in which the data exists. Qualitative bowtie analysis is a highly specialised
area and the corresponding data exhibits some unique characteristics which will result
in some equally unique difficulties in the measurement and statistical processing of the
data. These unique data characteristics arise not so much from the form that the data
takes (i.e. nominal), but rather they emerge from the implied meaning and relationships
that the data inherit from the analytical logic and structure within the bowtie analysis.
The key data type difficulties that may be encountered when attempting statistical
operations on qualitative bowtie analysis are discussed in the following sections.
Linguistic Data Uncertainty
With consideration of the effects of linguistic uncertainty within the data (Regan,
Colyvan & Burgman 2002; Carey & Burgman 2008), the natural language used in
bowtie categorical variables will result in a very large spectrum of potential literal data
values for ostensibly the same concept. Nominal data within qualitative bowtie analysis
is not as discrete and well defined as concepts such as colours (red, blue, green, etc.)
or shapes (circle, square, triangle, etc.), but will instead be more complex or intangible
concepts such as tasks, events, scenarios; which in practice will be declared within a
wide spectrum of potential descriptions.
For example, one bowtie analysis may simply declare a cause as ‘pilot incapacity’; but
other analyses may alternatively include ‘pilot attacked by passenger’ or ‘pilot medical
emergency’, but not include ‘pilot incapacity’ explicitly. These events or nominal data
values could easily be considered to be different categorical variables depending on
the subjective interpretation of the measurer and so a means of addressing the
problem of linguistic uncertainty within the data will be very important in the rules
developed for measuring the qualitative analytical variance.
Non-discrete Data Ranges
In statistical analysis, working on the entire data population is usually different than
working on a sample of the whole population. In most nominal data there is typically a
finite range of potential data points that exists. For example, gender classically only
has a very limited or discrete range of values such as ‘male’, ‘female’ and ‘neuter’.
Even more complex nominal data such as colour as perceived by the human eye,

Chapter 2 - Literature Review
40
which has a very theoretical large range, would still have a practical and theoretically
known finite limit for most practical purposes. However, with qualitative bowtie
analysis, the complete range of potential data values is theoretically not knowable, but
is instead derived through a logical reasoning process which is very likely to be
incomplete no matter how much sampling is undertaken.
For example, finding the causes of why a helicopter is not able to complete a flight to
an offshore location could yield a very large range of qualitative data values in the form
of textual names for the cause events (i.e. ‘contaminated fuel’), but it is still possible
that the list of causes will still be incomplete; without knowing where the data are
incomplete.
Multiple Data Samples
Variance within statistical operations is typically performed on a given single data set or
data population. For example, the question might be asked “what is the variance of
eye colour in a given group of people?” The interesting answer to this question relates
to how eye colour varies or is dispersed within the defined sample population.
Analytical variance in qualitative bowtie analysis only arises where there is more than
one analysis. Hence, we are not interested in how the data within a single bowtie
analysis varies, but rather how does each individual analysis vary in comparison to
other comparable analyses. For example, Figure 15 shows a simple representation of
causes across three comparable bowtie analyses. The measurement of interest in this
case is how much variance is there between these analyses? Even in this very simple
example there are a large number of potential comparisons that need to be made,
which will grow exponentially with the inclusion of all other analytical elements and
more analyses for comparison. The approach developed for the statistical
measurement of variance within qualitative bowtie analysis data will need to include a
practical means of managing this complexity within a large number of data samples.
Figure 15: Example of Causes from Three Comparable Bowtie Analyses
Bowtie Analysis No. 1
Contaminated fuel
Pilot incapacity
Mechanical failure
Fire on helicopter
Bird strike
Bowtie Analysis No. 2
Contaminated fuel
Pilot incapacity
Extreme weather
Hazmat release
Bowtie Analysis No. 3
Pilot incapacity
Extreme weather
Hazmat release
Bird strike
Chapter 2 - Literature Review
41
The problem of knowing the total data population and having multiple different data
samples requires a method of consolidating all comparable bowtie analyses together
into a single data population for statistical comparison as a whole, whilst at the same
time retaining the individual character and origin of the data. Only in this way can
statistical comparisons be made between the analyses individually and as a whole.
Different Data Groups
One of the key areas of difficulty in relation to measuring the qualitative bowtie analysis
data is that it exists in a variety of different groups. For example, there are seven
different analytical elements groups within bowtie analysis, all of which may be
considered to be different categorical variables which need to be included in the
measurement of analytical variance. With consideration of these different data groups,
the measurement of variance between bowtie analyses must make all valid
comparisons between each data group and also must not make any invalid
comparisons between data from different groups. For example, it is valid to compare
the difference between the causes in a number of bowtie analyses, but it is not valid to
compare how causes differ from preventative controls, because they must be different
due to analytical rules.
This circumstance is like asking the question of how multiple groups of people differ in
relation to seven personal characteristics such as their age, gender, race, height, eye-
colour, hair-colour and height; and then also recognising that it is only valid to make
comparisons between some of these characteristics, but not others.
Logic Diagram Data Order and Sequence
Data order here refers to how each analytical element is located within the logic
diagram relative to each other element. For example controls are placed in the
diagram on a branch one after the other and hence there is an order of sorts created.
However, as discussed earlier, the data within bowtie analysis does not exhibit any true
rank or order characteristic. This data ordering does not represent a strongly
significant aspect of the analytical intent of qualitative bowtie analysis. If this ordering
characteristic is to be included within the measurement of analytical variance, the result
will be a vast complication of the measurement and also a dilution of the benefit of the
measurements obtained.
The sequencing characteristic of the data is exhibited in the linear sequence of
analytical steps taken to identify and then locate the data within the bowtie logic
Chapter 2 - Literature Review
42
diagram. For example hazards are identified first, then top events, causes, outcomes,
etc. Differences in the sequencing of the data between different analyses will
necessarily result in the classification of the data as a different element type; i.e. a
cause identified out of sequence may be a defeating factor or an outcome in another
analysis. Hence, differences in the data sequence are considered to be significant
differences and must therefore be considered within the measurement of variance.
2.2.3 Measuring Qualitative Variance
2.2.3.1 Current Approaches
In statistical analysis the primary focus of measuring variance typically relates to
variance of the data from measures of central tendency such as median, mean, mode,
range, semi-interquartile range, average deviation, standard deviation, etc. (Wilcox
1967). However, these measures of central tendency are only available and
appropriate where the data type can be measured on an ordinal, interval or ratio scale;
hence these measures are not permissible for the measurement of variance in
categorical variables such as that included within qualitative bowtie analysis.
The literature on the subject of quantitatively measuring variance in nominal data
shows that there is a wide variety of potentially suitable statistical methods for the
purpose of conducting statistical operations (Wilcox 1967; Lieberson 1969; Perry &
Kader 2005; Kader & Perry 2007; Agresti 2007, 2014; Magurran 2004).
A simple internet search on the subject of qualitative variation measurement methods
was also performed which resulted in a non-authoritative list of a large number of
statistical methods that are available for measuring qualitative variance (Wikipedia
2014). These measurement methods were reviewed in which it was noted that many
of the methods were slight adaptations or variations on common measurement
approaches. The adaptations had been developed for the purposes of making the
statistical methods more suitable for application in specific scenarios. This observation
shows that it is somewhat common or accepted practice to develop new or adapt
existing statistical methods which are specifically suited for application in a given
context.
More detailed reviews were conducted for a number of common statistical methods
that showed initial potential such as Wilcox’s (1967) indices of qualitative variation
(ModVR, RanVR, AvDev, MNDif, VarNC), Mueller & Schuessler’s (1961, p. 177–179)

Chapter 2 - Literature Review
43
index of qualitative variation (IQV); Lieberson’s (1969) measure of population diversity
and Kader’s (2007) coefficient of unalikeability.
VarNC and IQV were shown to be widely used, simple and practical to apply and could
be used with nominal data. The approaches of Lieberson (1969) and Kader (2007)
were also interesting as they applied a different perspective on variance and viewed it
as a measure of the ‘diversity’ of the data within the data population which is consistent
with the type of variance encountered within qualitative bowtie analysis.
Kader (2007) further describes variance as a concept known as ‘unalikeability’; which
he reports as a focus on how often observations differ and not how much they differ.
This concept of unalikeability is precisely the object of interest within qualitative bowtie
analysis variance. We want to know how often analytical elements (e.g. causes) are
observed to be different within all analyses as a whole and also between analyses. In
practice, bowtie analytical elements such as causes are either observed to be alike or
not alike; which can be measured as the number of cases. There is no natural concept
of by how much the causes are different from each other.
Gordon (1986) discusses a concept of ‘within data’ deviations. This concept and the
related statistical operation developed by Gordon is interesting because it provides a
method of calculating a standard deviation without the need for a mean. Gordon’s
approach treats all data points within the data population on an equal basis. This
statistical approach views data in a fashion that is suitable for the type of data
encountered within the nominal bowtie analytical elements; which also has no concept
of a mean. Gordon’s approach was to simply employ a root mean square on the ‘within
data’ deviations (𝑥𝑖 − 𝑥𝑗), wherein he observes that since 𝑖 and 𝑗 both range between
1 and 𝑛 there will be 𝑛2 terms possible within the data summation of which 𝑛 will be
automatically zero when 𝑖 = 𝑗.
2.2.3.2 Meaningful Qualitative Statistical Methods and Data Types
The literature review identified that the nature of the data will determine what statistical
methods are ‘permissible’ or ‘meaningful’ for making measurements (Stevens 1946;
Sutcliffe 1958). Stevens indicates that ‘number of cases’, ‘mode’ and ‘contingency
correlation’ are the only permissible statistical methods for nominal data such as is
encountered within qualitative bowtie analysis. With special consideration of the type
of data encountered within qualitative bowtie analysis it is found that only statistical
operations involving the ‘number of cases’ for each analytical element will be suitable
for the purpose of measuring analytical variance between comparable bowtie analyses.

Chapter 2 - Literature Review
44
2.2.4 Conclusion
The statistical methods reviewed during the literature survey were found to be limited in
relation to measuring variance within qualitative bowtie analysis for a variety of reasons
such as:
They tend to focus on the measurement of categorical data which exists in a
discrete or finite range of possible values (e.g. animal species, ethnicities, etc.).
This limited type of categorical data is not consistent with the highly
heterogeneous qualitative data that is encountered in qualitative bowtie
analysis.
They tend to focus on variation of the data around various statistical functions
related to measures of central tendency; which are not particularly relevant to
this research which is interested in diversity within and between data
populations and not how the data differs from the concept of an average within
the data.
They only address variance within a limited number of non-related categorical
variables; whereas the data in qualitative bowtie analyses represent a complex
mixture of different variables (analytical elements); which are categorically
different from each other, however they are inherently related to each other due
to the sequential and logical bowtie analysis process in which each data item is
identified.
Hence, based on the limitations discussed above and from the literature review it is
concluded that the current statistical methods for calculating analytical variance within
qualitative data are informative, but that no single method exists which is perfectly
suited to the purpose of measuring variance within the results of qualitative bowtie
analyses. Hence, it is apparent that additional methodological development work is
required to create a new and specific approach that is simple, practical and able to
provide meaningful and interesting measurements of the analytical variance within
qualitative bowtie analysis results. The development of this statistical methodology for
measuring analytical variance is included within the findings section of this research
report.

Chapter 3 - Research Design
45
Chapter 3
Research Design
3.1 Research Approach
The research approach applied in the project was ‘strategic basic research’ as
classified and defined by Swinburne University of Technology (2014). Hence, the
research method only employed a theoretical work approach to acquire and describe
new knowledge in the subject area. The design of the research project was built upon
the expectation of discovering new knowledge which be suitable for practical
application in future ‘experimental development’ based research.
3.2 Research Procedure
The procedure that was applied during the research project was simple and is
summarised below.
Conduct a focused literature review on the subject of analytical variance in
qualitative bowtie analysis.
Identify and characterise the antecedent analytical variance factors identified
from the literature review.
Develop a model which illustrates and explains the process of analytical
variance which occurs during qualitative bowtie analysis.
Conduct a focused literature review on the subject of the quantitative
measurement of analytical variance within qualitative data.

Chapter 3 - Research Design
46
Develop a statistical methodology for quantitatively measuring the analytical
variance within qualitative bowtie analysis.
Develop a simple and practical tool to implement the statistical methodology for
quantitatively measuring the analytical variance within qualitative bowtie
analysis.
Conduct validation testing of the statistical methodology and measurement tool.

Chapter 4 - Research Findings
47
Chapter 4
Research Findings
This section of the research report presents the findings or results arising from the
research project. The findings are presented in relation to the two research objectives
listed in section 1.3 of this research report.
4.1 Model of the Analytical Variance Process
in Qualitative Bowtie Analysis
A number of antecedent analytical variance factors and their sources were identified
during the literature review. The research project has sought to find a means of
arranging these factors within a model that both aides in understanding their
significance and also how their relationships may cause the factors to interact and
potentially compound to produce the analytical variance within the analytical results.
The analytical process can be viewed as a simple system. The definition of a system
differs depending on which discipline is applying the term; however, a simple definition
of a system is “an organized or connected group of objects” (Oxford University Press
2014). Expanding on this simple definition, the concept of a system also includes the
notion of the individual connected objects being related to each other in order to form a
whole, which operate or function together to achieve an intended objective. The
functions of these system components typically include four basic operations; ‘input’,
‘processing’, ‘control’ and ‘output’.
By arranging the variance factors and the related variance sources that were identified
within the literature review, a systems based model of the process that leads to
analytical variance has been developed and is presented in Figure 16. This conceptual
model shows the three sources of analytical variance and their interrelationships with
each other. This model clarifies where in the analytical variance process each of the

Chapter 4 - Research Findings
48
antecedent variance factors are located and how they influence each of the
subsequent variance factors and sources. The model also shows how variance factors
which occur early in the process may potentially result in variance propagation as the
effect of the variance factor propagates through the analytical process.
This model makes an important contribution to knowledge in the area of understanding
how variance occurs within bowtie analysis generally, but also in the wider domain of
risk analysis overall. It provides a foundation upon which future research may be
undertaken to explore methods to control and limit the effect of the variance factors
within the risk analysis process.
Figure 16: Systems Based Model of the Process Leading to Analytical Variance
Language - ambiguity
Language - vagueness
Language - underspecificity
Language - context dependence
Performance - skill
Performance - experience
Performance - cognition
Limits - elements
Limits - terminology
Limits - format
Limits - rules
Limits - tools
Variance propagation
Knowledge - amount
Knowledge - accuracy
Knowledge - completeness
Knowledge - clarity
Variability - randomness
Variability - complexity
Human
Error
Knowledge
Uncertainty
Knowledge
Variability
Control
Analytical
Methodology
Input
Analytical
Subject
Processing
Human
Analyst
Output
Analytical
Result
Methodology
Limits
Analytical Process
Variance
Propagation
Analytical
Variance

Chapter 4 - Research Findings
49
4.2 Methodology for Measurement of
Analytical Variance in Bowtie Analyses
The findings of the research project have resulted in the development of a simple and
practical statistical method and tool for quantitatively measuring the analytical variance
within comparable qualitative bowtie analyses.
4.2.1 Analytical Variance Measurement Methodology
The methodological steps required to quantitatively measure analytical variance within
qualitative bowtie analysis are simple and are illustrated in Figure 17 and described
further in the following sections of this research report. However, a number of
important matters relating to measuring the analytical variance are addressed first.
Figure 17: Methodology for Measuring Analytical Variance
Select a number of comparable qualitative bowtie analyses for use as individual
data samples
Create a total data population sample which includes all unique categories included
within all individual data samples
Calculate the total number of unique categories within the total data population
sample
Calculate the frequency of each unique category within all individual data samples
Calculate the variance of each unique category within the total data population
sample
Calculate the cumulative or total analytical variance for all unique categories within
the total data population sample

Chapter 4 - Research Findings
50
4.2.2 Meaningful Measurements
An important pre-requisite for measuring anything is to know what measures are
meaningful or of interest. In relation to the analytical variance in qualitative bowtie
analysis, there are a number of measurements that are of interest and these are listed
below and described in detail in the following sections of this report:
What is the total analytical variance for all analytical bowtie elements (e.g.
causes, outcomes, prevention controls, etc.) that exists within all comparable
analyses? This measurement is referred to as the ‘total analytical variance’.
What is the analytical variance for all analytical elements in a single analysis (or
sample) when compared to all other analyses? This measurement is referred to
as the ‘sample analytical variance’.
What is the analytical variance within a group of analytical elements (e.g.
causes or outcomes) within all comparable analyses? This measurement is
referred to as the ‘group total analytical variance’.
What is the analytical variance within a group of analytical elements in a single
analysis when compared to all other analyses? This measurement is referred
to as the ‘group sample analytical variance’.
What is the analytical variance in a single analytical element (e.g. one cause)
within all comparable analyses? This measurement is referred to as the
‘category analytical variance’.
4.2.3 Data Sampling Requirements
The data sampling approach that is needed by the methodology simply requires that
there be multiple data samples (bowtie analyses) and that they are ‘comparable’.
Whilst any random data samples could technically be used, the measurements derived
from these would be of no practical interest as the analytical variance would intuitively
be expected to be very large. For example, it would be possible to compare the bowtie
analysis of ‘helicopter flight operations’ with ‘marine vessel navigation operations’, but
there is little practical reason for this to be done and the measurements would be
essentially meaningless.

Chapter 4 - Research Findings
51
The whole premise of this research is to understand why risk analysis of the same
analytical subject, using the same analytical methodology (qualitative bowtie analysis),
produces different results. Therefore, the selection of the data samples for
measurement must of necessity ensure that the samples are based on the same (or
comparable) analytical subject as the first principle and secondly the same (or
comparable) analytical methodology.
Ultimately the data sampling approach used is a matter for those researchers who wish
to use the measurement methodology developed in this research. The selection of the
data sample will largely depend on how the researcher wishes to control the
independent variables, i.e. the antecedent analytical variance factors, in order to
influence the dependent variable; which will be the analytical variance in the qualitative
bowtie analysis results.
Hence, the measurement methodology and tool developed in this research only require
that there be more than one data sample for comparison purposes and that there be
some reasonably comparable basis between the data samples. The actual data
sampling technique used is a matter for the design of future experimental research.
4.2.4 Individual Data Samples and the Total Data Population
Measurement of variance within qualitative bowtie analysis differs from other statistical
approaches for a number of reasons; however, the primary reason is simply because
the data under analysis comes from a logical and purposeful process; i.e. qualitative
bowtie risk analysis. The difference in the data emerges from the underlying analytical
meaning and relationship that may be inferred from the data because it has been
manufactured from a logical analytical process.
First and foremost the data differs in that it comprises a number of individual samples
of data (i.e. bowtie analyses) which in isolation are intended to be an accurate and
complete risk analysis of a given subject. The fact that the analyses differ from each
other is what is interesting and what needs to be measured. For this measurement to
be taken, we must be able to process the data both as individual data samples and
also as a unified data sample (i.e. the whole data population). Only by consolidating all
data samples together can we have a baseline from which to make a comparison.
Of course it cannot be reasonably assumed that all data samples include all possible
data values that might exist in reality, but for the purposes of making comparisons
within a finite number of data samples, this problem of a potentially infinite number of

Chapter 4 - Research Findings
52
data values is not of any great significance. It sufficies to say that like most statistical
operations, the more data samples that are included, the more reliable the results
would be expected to be.
The process of creating a unified set of all data samples is simple and is achieved by
taking every unique analytical element (e.g. hazards, top events, causes, etc.) from
each data sample and producing a single unified data sample that includes every
unique analytical element. Each of these analytical elements will then represent a
single categorical variable (or category) against which quantitative frequency
measurements maybe taken within all of the data samples.
The unique categories within the data samples will be one of the seven qualitative
bowtie analysis elements. The nature of qualitative bowtie analysis imposes some
basic limitations on how many times each category can be included within a single
analyses and this must be taken into account when determining the potential for
analytical variance. These category constraints are summarised in Table 8 and as can
be seen there is potential for a category related to controls, defeating factors and
defeating factor controls to be repeated within a single data sample. It should be noted
that even where this repetition occurs, they are not considered to be the same as they
represent a different analytical data value within the analysis and must therefore be
treated as different categories.
Table 8: Qualitative Bowtie Analytical Elements as Categorical Variables
No. Analytical Element Number of cases per analysis Repetition potential per analysis
1 Hazard Only one case per analysis Repetition of category not possible within the same analysis
2 Top Event Only one case per analysis Repetition of category not possible within the same analysis
3 Causes One or more cases per top event Repetition of category not possible within the same analysis
4 Outcomes One or more cases per top event Repetition of category not possible within the same analysis
5 Controls One or more cases per cause or outcome
Repetition of category possible on other causes, outcomes or defeating factors within the same analysis
6 Defeating factors One or more cases per control Repetition of category possible on other controls within the same analysis
7 Defeating factor controls
One or more cases per defeating factor
Repetition possible on other causes, outcomes or defeating factors within the same analysis

Chapter 4 - Research Findings
53
The data sample consolidation process is illustrated in Figure 18 and the results are
summarised in Table 9 which depict some typical causes for a helicopter related risk
analysis. These show how three individual data samples (only comprising of causes
for illustration purposes) can be processed and combined together into a single data
set which includes every unique analytical element and also records the distribution of
the category and the frequency of the category across all data samples. This
consolidated data set is referred to as the ‘total data population’.
This methodological step generates a variety of important quantitative data that will be
used in the calculation of the indices of analytical variance and these are:
The number of data samples (𝑠);
The number of categories (𝑘);
The distribution of categories across all data samples (measured as 1); and
The frequency of categories across all data samples (𝑓𝑘).
Figure 18: Category Consolidation from Many Samples into a Total Data Population
Table 9: Distribution and Frequency of Categories across the Total Data Population
ID Category Sample 1 Sample 2 Sample 3 Frequency (𝒇𝒌)
A Contaminated fuel 1 1 2
B Pilot incapacity 1 1 1 3
C Mechanical failure 1 1
D Extreme weather 1 1 2
E Fire on helicopter 1 1
Bowtie Analysis No. 1 (k = 5)
Category A – Contaminated fuel
Category B – Pilot incapacity
Category C – Mechanical failure
Category E – Fire on helicopter
Category G – Bird strike
Bowtie Analysis No. 2 (k = 4)
Category A – Contaminated fuel
Category B – Pilot incapacity
Category D – Extreme weather
Category F – Hazmat release
Bowtie Analysis No. 3 (k = 4)
Category B – Pilot incapacity
Category D – Extreme weather
Category F – Hazmat release
Category G – Bird strike
Combined Bowtie Analyses (k = 7)
Category A – Contaminated fuel (n = 2)
Category B – Pilot incapacity (n = 3)
Category C – Mechanical failure (n = 1)
Category D – Extreme weather (n = 2)
Category E – Fire on helicopter (n = 1)
Category F – Hazmat release (n = 2)
Category G – Bird strike (n = 2)

Chapter 4 - Research Findings
54
ID Category Sample 1 Sample 2 Sample 3 Frequency (𝒇𝒌)
F Hazmat release 1 1 2
G Bird strike 1 2
Number of unique categories (𝑘) = 7; Number of individual data samples (𝑠) = 3.
4.2.5 Linguistic Uncertainty within the Categories
The simple example of data sample consolidation discussed above is of course an over
simplification of the problem of identifying ‘unique’ categories in the data samples. In
practice there will of course be a wide variety of descriptive language used in recording
each of the analytical elements within the individual data samples. This is the problem
identified and discussed in section 2.1.4.3 as linguistic uncertainty.
For example, the list below shows five potential causes that are similar to each other,
but all exhibit differences in relation to the exact wording used to declare the cause.
Items 1, 2 and 3, might be considered to be sufficiently similar to be recorded as a
single category of the cause in the total data population; whereas items 4 and 5 appear
to be very specific instances of this type of cause and might be recorded as individual
unique categories.
1. Human error
2. Pilot error
3. Pilot makes a mistake
4. Pilot impaired by fatigue
5. Misinterpretation of navigation instruments
This problem of linguistic uncertainty must be handled carefully in the processing of the
data from the individual data samples into the total data population. Whilst it might be
reasonable for the person constructing the total data population to determine if the
categories are sufficiently alike to be considered as the same, this approach relies
upon a subjective interpretation of the meaning of the data. Several methods are
available to address this problem of subjective interpretation and these are
summarised below. These methods are not necessarily exclusive of each other.
Firstly, where multiple independent persons are available, the total data population can
be independently constructed and then comparisons made between the total data
populations produced by each person. These independent persons could then attempt
to arrive at a consensus on the final total data population. Alternatively and perhaps

Chapter 4 - Research Findings
55
preferentially the original bowtie analysts may be directly consulted where there is any
uncertainty in relation to the interpretation of the meaning of the categories. Finally,
where there is any significant doubt in relation to the similarities between the meanings
of analytical elements, these should simply be coded as different categories as this will
be a true and accurate reflection of the difference in the analyses.
A strict application of this methodology would require any language difference in the
analytical elements to be recorded in unique categories; however, it does not seem
reasonable to expect such a high degree of consistency between different analyses
and so some difference in the language should in practice be permitted.
Where categories with slight language differences (e.g. ‘Human Error’ compared to
‘Pilot makes a mistake’) are recorded as being the same unique category in the total
data population, all language variations of the category should be recorded within the
single category in the total data population to record where these have been classified
together.
4.2.6 Indices of Analytical Variance
For the purpose of quantitatively measuring the analytical variance within qualitative
bowtie analyses, three indices of analytical variance have been developed during the
research project:
Index of total analytical variance
Index of category analytical variance
Index of sample analytical variance
These indices of analytical variance are capable of quantitatively presenting the
analytical variance in the analytical results arising from multiple qualitative bowtie
analyses as a number between 0 and 1; where 0 represents no analytical variance, 1
represents total analytical variance and numbers on the index in between these two
extreme values represent the relative degree of analytical variance.
The indices satisfy Wilcox’s (1967) four formal properties of an index of qualitative
variation; which requires that:
1. The maximum value obtainable by the index does not depend on the magnitude
of the number of cases and the number of categories in the sample data.

Chapter 4 - Research Findings
56
2. The minimum value obtainable by the index does not depend on the magnitude
of the number of cases and the number of categories in the sample data.
3. The index must have a standard range of values from 0 to 1.
4. The index value must be 0 where all values in the distribution are included
within a single category; and the index value must be 1 where all values in the
distribution are equal to each other.
The indices of analytical variance actually achieve the inverse of Wilcox’s fourth formal
index property. This inverse of the index value results from the method used for
arranging the categories within the measurement tool. The indices of analytical
variance produce a value of 0 where all categories exist within all data samples and a
value 1 where all categories only exist within a single data sample. However, this
situation has no impact on the validity of the statistical operation and the indices
essentially achieve the same statistical purpose as required by Wilcox; which is that an
index represents the two extreme dispersion possibilities at the two extreme end points
of the index.
Wilcox (1973) later notes that the desirability of his formal properties is somewhat of an
assumption and that these are provided for simplicity and clarity of presentation and to
provide standardisation across indices to permit comparison among different indices.
Importantly, Wilcox notes that it may be more appropriate for some research purposes
to leave an index unstandardized.
4.2.6.1 Total Analytical Variance
The most important measure that needs to be made is the total analytical variance in
more than one comparable qualitative bowtie analysis. This measure is important
because it shows the degree of variance arising for all data samples and all categories.
Essentially it provides the overall picture of the analytical variance within the all
analytical results.
The total analytical variance may be quantitatively measured by application of the
formula presented in Equation 1 and described in detail in this section.
The total analytical variance formula first requires that the frequency of each unique
category within each data sample be determined less one (𝑓 − 1). This modified
frequency value represents the number of possible reoccurrences of each unique
category within all other samples (known as the ‘frequency of reoccurrence’). For
example, if there are five data samples, any unique category that exists anywhere in
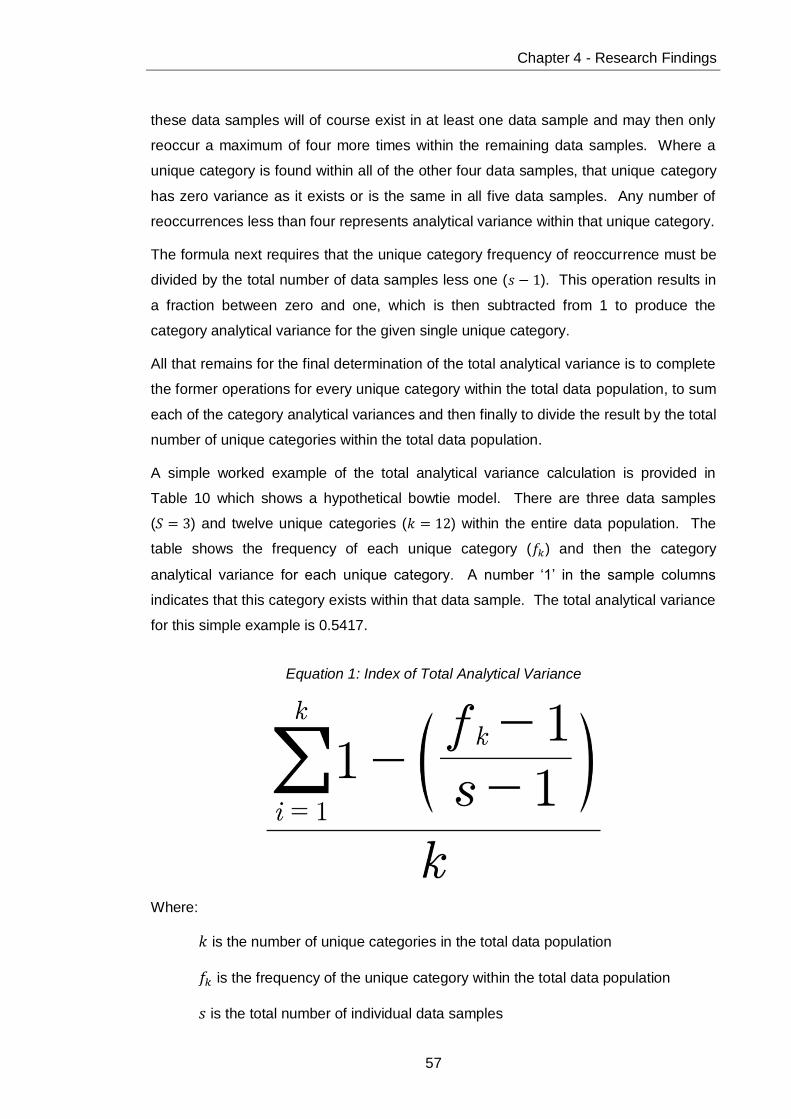
Chapter 4 - Research Findings
57
these data samples will of course exist in at least one data sample and may then only
reoccur a maximum of four more times within the remaining data samples. Where a
unique category is found within all of the other four data samples, that unique category
has zero variance as it exists or is the same in all five data samples. Any number of
reoccurrences less than four represents analytical variance within that unique category.
The formula next requires that the unique category frequency of reoccurrence must be
divided by the total number of data samples less one (𝑠 − 1). This operation results in
a fraction between zero and one, which is then subtracted from 1 to produce the
category analytical variance for the given single unique category.
All that remains for the final determination of the total analytical variance is to complete
the former operations for every unique category within the total data population, to sum
each of the category analytical variances and then finally to divide the result by the total
number of unique categories within the total data population.
A simple worked example of the total analytical variance calculation is provided in
Table 10 which shows a hypothetical bowtie model. There are three data samples
(𝑆 = 3) and twelve unique categories (𝑘 = 12) within the entire data population. The
table shows the frequency of each unique category (𝑓𝑘) and then the category
analytical variance for each unique category. A number ‘1’ in the sample columns
indicates that this category exists within that data sample. The total analytical variance
for this simple example is 0.5417.
Equation 1: Index of Total Analytical Variance
Where:
𝑘 is the number of unique categories in the total data population
𝑓𝑘 is the frequency of the unique category within the total data population
𝑠 is the total number of individual data samples

Chapter 4 - Research Findings
58
Table 10: Simple Worked Example of Total Analytical Variance
𝒌 Categories 𝑺𝟏 𝑺𝟐 𝑺𝟑 𝑓𝑘 Category Variance
1 Hazard - helicopter transportation 1 1 1 3 0.00
2 Top event - loss of aircraft control 1 1 2 0.50
3 Top event - unable to reach destination 1 1 1.00
4 Cause - pilot error 1 1 1 3 0.00
5 Cause - contaminated fuel 1 1 2 0.50
6 Cause - severe weather 1 1 2 0.50
7 Cause - fire on helicopter 1 1 1.00
8 Cause - navigation failure 1 1 2 0.50
9 Outcome - ditch into ocean 1 1 1.00
10 Outcome - crash on land 1 1 2 0.50
11 Outcome - survivor drowning 1 1 2 0.50
12 Outcome - survivor hypothermia 1 1 2 0.50
Total analytical variance 0.5417
4.2.6.2 Category Analytical Variance
As was discussed above, the measurement of category analytical variance is achieved
as a subroutine in the calculation of the total analytical variance. Examples of the
calculation results for categorical analytical variance can be seen in the category
variance column within Table 10. The formula for this calculation is therefore a subset
of the formula for the total analytical variance and is presented in Equation 2. This
measurement will be of interest in the investigation of the factors which create
analytical variance as it provides a fine grain measurement of each individual analytical
element within the qualitative bowtie analysis data.
Equation 2: Index of Category Analytical Variance
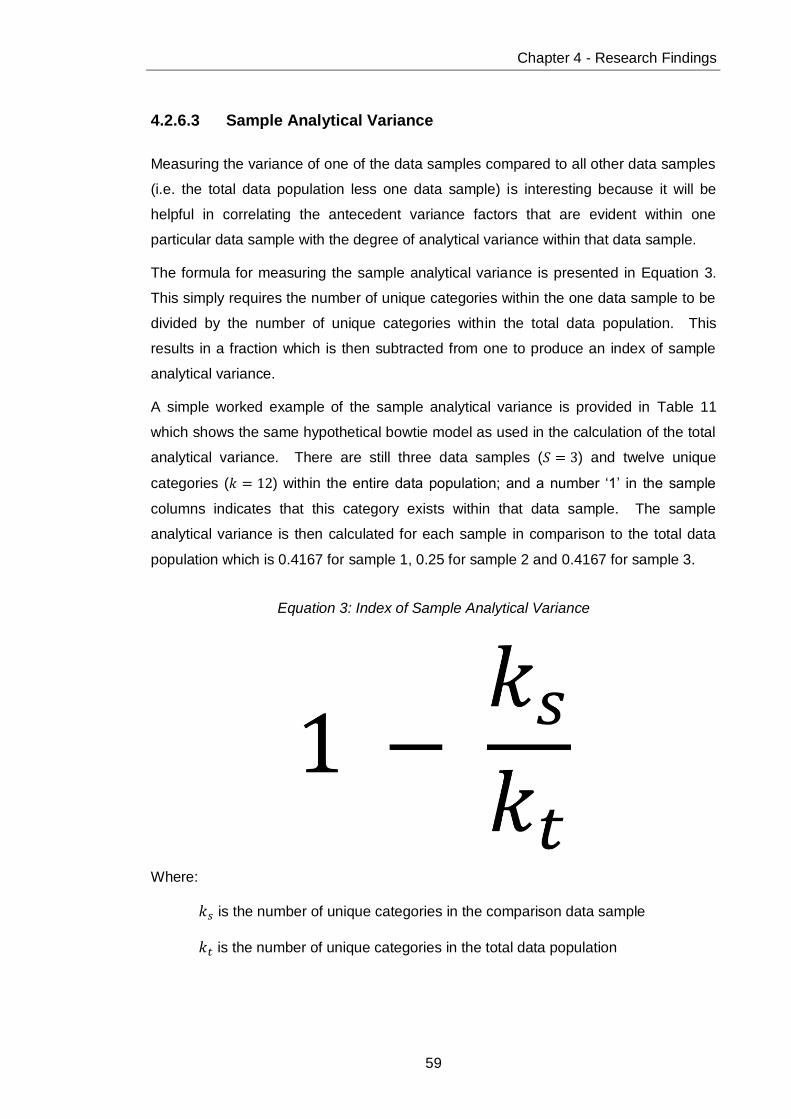
Chapter 4 - Research Findings
59
4.2.6.3 Sample Analytical Variance
Measuring the variance of one of the data samples compared to all other data samples
(i.e. the total data population less one data sample) is interesting because it will be
helpful in correlating the antecedent variance factors that are evident within one
particular data sample with the degree of analytical variance within that data sample.
The formula for measuring the sample analytical variance is presented in Equation 3.
This simply requires the number of unique categories within the one data sample to be
divided by the number of unique categories within the total data population. This
results in a fraction which is then subtracted from one to produce an index of sample
analytical variance.
A simple worked example of the sample analytical variance is provided in Table 11
which shows the same hypothetical bowtie model as used in the calculation of the total
analytical variance. There are still three data samples (𝑆 = 3) and twelve unique
categories (𝑘 = 12) within the entire data population; and a number ‘1’ in the sample
columns indicates that this category exists within that data sample. The sample
analytical variance is then calculated for each sample in comparison to the total data
population which is 0.4167 for sample 1, 0.25 for sample 2 and 0.4167 for sample 3.
Equation 3: Index of Sample Analytical Variance
Where:
𝑘𝑠 is the number of unique categories in the comparison data sample
𝑘𝑡 is the number of unique categories in the total data population

Chapter 4 - Research Findings
60
Table 11: Simple Worked Example of Sample Analytical Variance
𝒌 Categories 𝑺𝟏 𝑺𝟐 𝑺𝟑
1 Hazard - helicopter transportation 1 1 1
2 Top event - loss of aircraft control 1 1
3 Top event - unable to reach destination 1
4 Cause - pilot error 1 1 1
5 Cause - contaminated fuel 1 1
6 Cause - severe weather 1 1
7 Cause - fire on helicopter 1
8 Cause - navigation failure 1 1
9 Outcome - ditch into ocean 1
10 Outcome - crash on land 1 1
11 Outcome - survivor drowning 1 1
12 Outcome - survivor hypothermia 1 1
Sample analytical variance 0.4167 0.25 0.4167
4.2.6.4 Group Total Analytical Variance
The formula required for the calculation of the group total analytical variance is no
different to the calculation of the total analytical variance (See Equation 1). The group
total analytical variance is simply found by limiting the categories within the total data
population to a distinct analytical group such as hazards, top events, causes,
outcomes, etc.
It will be very interesting to see how the analytical variance for each group of analytical
elements changes as the sequential bowtie analysis proceeds. This change in the
degree of variance between analytical elements may provide an indication of the
impact of variance propagation within the bowtie analysis.
A simple worked example of the group total analytical variance is provided in Table 12
which shows the same hypothetical bowtie model and calculation as used in the
calculation of the total analytical variance. However in the calculation of the group total
analytical variance, whilst 𝑆 still equals 3; 𝑘 is restricted to the number of categories
within each group. Thus, the group total analytical variance is then calculated for each
group of categories which is 0.00 for hazards, 0.75 for top events, 0.63 for causes, and
0.63 for outcomes.

Chapter 4 - Research Findings
61
Table 12: Simple Worked Example of Group Total Analytical Variance
𝒌 Categories 𝑺𝟏 𝑺𝟐 𝑺𝟑 𝑓𝑘 Category Variance
1 Hazard - helicopter transportation 1 1 1 3 0.00
Group total analytical variance – Hazard categories 0.00
1 Top event - loss of aircraft control 1 1 2 0.50
2 Top event - unable to reach destination 1 1 1.00
Group total analytical variance – Top event categories 0.75
1 Cause - pilot error 1 1 1 3 0.00
2 Cause - contaminated fuel 1 1 2 0.50
3 Cause - severe weather 1 1 2 0.50
4 Cause - fire on helicopter 1 1 1.00
5 Cause - navigation failure 1 1 2 0.50
Group total analytical variance – Cause categories 0.63
1 Outcome - ditch into ocean 1 1 1.00
2 Outcome - crash on land 1 1 2 0.50
3 Outcome - survivor drowning 1 1 2 0.50
4 Outcome - survivor hypothermia 1 1 2 0.50
Group total analytical variance – Outcome categories 0.63
4.2.6.5 Group Sample Analytical Variance
The formula required for the calculation of the group sample analytical variance is no
different to the calculation of the sample analytical variance (See Equation 3). The
group sample analytical variance is simply found by limiting the categories within the
total data population to a distinct analytical group such as hazards, top events, causes,
outcomes, etc.
A simple worked example of the group sample analytical variance is provided in Table
13 which shows the same hypothetical bowtie model and calculation as used in the
calculation of the sample analytical variance. However in the calculation of the group
sample analytical variance, whilst 𝑆 still equals 3; 𝑘 is restricted to the number of
categories within each group. Thus, the group sample analytical variance is then
calculated for each group of categories within the data sample. For example, the group
sample analytical variance for the causes in data sample 2, which is only missing 1
cause out of a possible total of 5 causes in comparison to the total data population, is
calculated as 0.20.

Chapter 4 - Research Findings
62
Table 13: Simple Worked Example of Group Sample Analytical Variance
𝒌 Categories 𝑺𝟏 𝑺𝟐 𝑺𝟑
1 Hazard - helicopter transportation 1 1 1
Group sample analytical variance – Hazards 0.00 0.00 0.00
1 Top event - loss of aircraft control 1 1
2 Top event - unable to reach destination 1
Group sample analytical variance – Top events 0.50 0.50 0.50
1 Cause - pilot error 1 1 1
2 Cause - contaminated fuel 1 1
3 Cause - severe weather 1 1
4 Cause - fire on helicopter 1
5 Cause - navigation failure 1 1
Group sample analytical variance – Causes 0.40 0.20 0.40
1 Outcome - ditch into ocean 1
2 Outcome - crash on land 1 1
3 Outcome - survivor drowning 1 1
4 Outcome - survivor hypothermia 1 1
Group sample analytical variance – Outcomes 0.50 0.25 0.50
4.2.7 Analytical Variance Measurement Tool
Whilst the indices of analytical variance require relatively simple statistical operations,
they will be numerous and hence a measurement tool has been prepared to assist in
the process of calculating all of the required analytical variance measurements. This
measurement tool has been prepared in Microsoft Excel which implements Equation 1,
Equation 2 and Equation 3 via the inbuilt software mathematical functions of Microsoft
Excel. A worked example of the analytical variance measurement tool is included as
Appendix A to this research report. This measurement tool was also used in the
research for validation testing of the statistical methodology.
4.2.8 Validation Testing
The statistical methods were subjected to validation testing by two different means.
Firstly, simple validation scenarios were created which represented the typical range of
data results that would potentially be processed by the indices of analytical variance.
These simple validation scenarios are illustrated in Figure 19 and are discussed in this
section of the research report.
Chapter 4 - Research Findings
63
The second means of validation was to prepare hypothetical bowtie analyses for
processing with the validation tool. It would have been preferential to actually use real-
world bowtie analyses for this purpose; however, this was discussed with the research
supervisor who agreed that there was not sufficient time available to obtain the
necessary human ethics research approvals to use real data. Notwithstanding this, the
hypothetical data is entirely suitable for the purpose of validating the statistical
calculations to be performed.
The simple validation scenarios use three data categories shown in three rows which
represent the total number of unique categories that exist within three data samples;
which are shown in three columns. A number ‘1’ in the matrix means that the category
exists within the data sample and the absence of a number ‘1’ means that the category
does not exist within the data sample.
Validation Testing Scenarios
Scenario A represents the case where every category exists in every data sample.
Scenario A represents the zero analytical variance case and the statistical operation
correctly arrives at a value of 0 for this case.
Scenario B represents the case where each category only exists within a single
different data sample. This would mean that each bowtie analysis arrived at
completely different results and hence this scenario represents the total analytical
variance case and the statistical operation correctly arrives at a value of 1 for this case.
Scenario C is a highly unlikely case from an analytical perspective and would not be
valid for almost all bowtie analyses. This scenario would only occur where there were
incomplete analyses included in the measurement (which would be an erroneous
operation) or where all analyses except for one did not include any defeating factors or
defeating factor controls. Notwithstanding the highly unlikely nature of the scenario,
the statistical operation still correctly measures the analytical variance at 1 which
shows that none of the analyses which include data are like the one analysis that did
include data. It is noted that comparisons between multiple analyses that did not
include data is not a measurement of them being the same or different, but merely that
they are incomplete.
Scenarios D and E are not valid results for qualitative bowtie analyses and would not
be produced by the process of creating the total data population which is used in the
measurement. You cannot have any unique categories in the total data population that

Chapter 4 - Research Findings
64
do not occur in any data samples. Hence, the analytical variance measurement of 1.5
for scenario E is therefore invalid due to the processing of invalid data.
Scenario F represents a typical distribution of data across the categories and data
samples. There are a large number of combinations of these which will all produce
results ranging between, but not including 0 and 1. The index value in Scenario F is a
typical measure of analytical variance that would be expected to be produced by the
indices of analytical variance.
Figure 19: Validation Testing Scenarios
Scenario A Scenario B Scenario C
s1 s2 s3 s1 s2 s3 s1 s2 s3
k1 1 1 1 0.00% k1 1 100.00% k1 1 100.00%
k2 1 1 1 0.00% k2 1 100.00% k2 1 100.00%
k3 1 1 1 0.00% k3 1 100.00% k3 1 100.00%
0.00 1.00 1.00
Scenario D Scenario E Scenario F
s1 s2 s3 s1 s2 s3 s1 s2 s3
k1 1 1 1 0.00% k1 150.00% k1 1 1 50.00%
k2 150.00% k2 150.00% k2 1 1 50.00%
k3 150.00% k3 150.00% k3 1 1 50.00%
1.00 1.50 0.50
Analytical variance Analytical variance Analytical variance
Analytical variance Analytical variance Analytical variance

Chapter 4 - Research Findings
65
4.3 Research Conclusions
Three overall conclusions have resulted from the research project in relation to the
research objectives that were investigated.
Firstly, the observed analytical variance that occurs in qualitative bowtie analysis
results from a number of identifiable sources and factors which are inherent within the
analytical process. From the research it is concluded that there are three sources of
analytical variance within the analytical process:
The analytical subject
The analytical methodology
The human analyst
It has also been concluded that these sources produce analytical variance through five
primary antecedent analytical variance factors which have corresponding sub class
manifestations:
Subject knowledge (amount, accuracy, completeness, clarity)
Subject variability (randomness, complexity)
Methodology limits (elements, terminology, format, rules, tools)
Human language (ambiguity, vagueness, underspecificity, context dependence)
Human performance (skill, experience, cognition)
Secondly, it has been concluded that these variance sources and factors occur at
different stages within the analytical process and the variance effects that they create
compound within the analytical process, resulting in a variance propagation effect,
which ultimately produces the variance that is observed in the analytical results.
Thirdly, it has been concluded that whilst the apparent qualitative difference or variance
in multiple comparable bowtie analyses may look too complex to characterise, these
differences can be understood by performing simple statistical operations which
produce five quantitative measurements expressed by three indices of the analytical
variance:
The index of total analytical variance
The index of category analytical variance
The index of sample analytical variance
The index of group total analytical variance
The index of group sample analytical variance
Chapter 4 - Research Findings
66
4.4 Future Work
This research was undertaken to achieve specific objectives and to answer specific
questions (See section 1.3.1); however, it also lays the foundation for potential future
research. There are therefore a number of opportunities for future work that arise from
this research and these are as follows:
This research has primarily relied upon a literature review for the identification
and characterisation of the antecedent variance factors for the development of
the model of analytical variance. This model is therefore only considered to be
a preliminary finding and further work is required to validate this model via
consultations with experts in the field.
The validation testing that has been performed has been limited to hypothetical
data only and hence further validation testing of the practicality and
meaningfulness of the quantitative measurement of analytical variance is
required. This future validation must be undertaken with data samples that are
reflective of real-world qualitative bowtie analyses.
Experimental based research also needs to be undertaken to investigate the
significance of the analytical variance factors by measuring how the analytical
variance (dependent variable) is effected by controlling the antecedent variance
factors (independent variables).

References
67
References
ABS 2000, Guidance notes on risk assessment applications for the marine and offshore oil and gas industries, American Bureau of
Shipping, Houston.
Agresti, A 2007, “A Historical Tour of Categorical Data Analysis,” An Introduction to Categorical Data Analysis, pp. 325–331, viewed
<http://dx.doi.org/10.1002/9780470114759.ch11>.
Agresti, A 2014, Categorical data analysis, Wiley series in probability and statistics, 3rd ed, Wiley-Interscience, Hoboken, N.J., p. xv, 710 p. ST – Categorical data
analysis.
ANS and IEEE 1983, PRA Procedures Guide: a guide to the performance of probabilistic risk assessments for nuclear power plants, NUREG/CR-2300., U.S. Nuclear Regulatory
Commission., Washington, D.C.
Aven, T 2008, “A semi-quantitative approach to risk analysis, as an alternative to QRAs,” Reliability Engineering & System Safety, vol.
93, no. 6, pp. 790–797.
Badreddine, A & Amor, N Ben 2013, “A Bayesian approach to construct bow tie diagrams for risk evaluation,” Process Safety and Environmental Protection, vol. 91, no. 3, Institution
of Chemical Engineers, pp. 159–171.
Borys, D 2000, “Seeing the Wood from the Trees: A systems approach to OH&S management,” in W Pearse,
C Gallagher & L Bluff (eds), Occupational Health & Safety Management Systems Proceedings of the First National Conference,
Crown Content, Melbourne, pp. 151–172.
Borys, D, Else, D & Leggett, S 2009, “The fifth age of safety: the adaptive age,” Journal of health and safety research
and practice, vol. 1, no. 1, pp. 19–27.
Bostrom, R & Heinen, J 1977, “MIS problems and failures: A socio-technical perspective,” MIS quarterly,
no. September, pp. 17–33.
Bouma, G & Ling, R 2005, The research process, 5th Ed., Oxford University
Press, South Melbourne, Australia.
Burgman, MA 2001, “Flaws in Subjective Assessments of Ecological Risks and Means for Correcting Them,” Australasian Journal of Environmental Management, vol. 8,
no. 4, pp. 219–226.
Carey, JM & Burgman, M a 2008, “Linguistic uncertainty in qualitative risk analysis and how to minimize it.,” Annals of the New York Academy of Sciences, vol. 1128, pp.
13–17.
Cockshott, JE 2005, “Probability bow-ties: a transparent risk management tool,” Process Safety and Environmental Protection, vol. 83, no. 4, pp. 307–
316.
Delvosalle, C, Fievez, C, Pipart, A & Debray, B 2006, “ARAMIS project: a
References
68
comprehensive methodology for the identification of reference accident scenarios in process industries.,” Journal of hazardous materials, vol.
130, no. 3, pp. 200–219.
Deming, W 2000, The new economics: for industry, government, education, 2nd
ed, Massachusetts Institute of Technology, Cambridge.
Emblemsvåg, J & Kjølstad, LE 2006, “Qualitative risk analysis: some problems and remedies,” Management Decision, vol. 44, no.
3, pp. 395–408.
FAA 2004, Safety Management System Manual, Federal Aviation
Administration.
Ferdous, R, Khan, F, Sadiq, R, Amyotte, P & Veitch, B 2013, “Analyzing system safety and risks under uncertainty using a bow-tie diagram: An innovative approach,” Process Safety and Environmental Protection, vol. 91, no. 1-2,
Institution of Chemical Engineers, pp. 1–18.
Ferdous, R, Khan, F, Sadiq, R, Amyotte, P & Veitch, B 2012, “Handling and updating uncertain information in bow-tie analysis,” Journal of Loss Prevention in the Process Industries,
vol. 25, no. 1, Elsevier Ltd, pp. 8–19.
Ferson, S & Ginzburg, LR 1996, “Different methods are needed to propagate ignorance and variability,” Reliability Engineering & System Safety, vol.
54, no. 2-3, pp. 133–144.
Gordon, T 1986, “Is the Standard Deviation Tied to the Mean?,” Teaching Statistics, vol. 8, no. 2, pp.
40–42.
Groeneweg, J 2002, Controlling the Controllable: Preventing Business Upsets, Second., DSWO Press,
Leiden.
Hoffman, FO & Hammonds, JS 1994, “Propagation of Uncertainty in Risk Assessments: The Need to Distinguish Between Uncertainty Due to Lack of Knowledge and Uncertainty Due to Variability,” Risk
Analysis, vol. 14, no. 5, pp. 707–712.
Hollnagel, E 2004, Barriers and accident prevention, Ashgate Publishing
Company, Burlington.
Hollnagel, E 1998, Cognitive reliability and error analysis method (CREAM),
Elsevier Science Ltd, Oxford.
Hollnagel, E & Goteman, O 2004, “The functional resonance accident model,” Linköping, viewed 5 April, 2014, <http://www.skybrary.aero/bookshelf/
books/403.pdf>.
IADC 2011, Health Safety and Environment Case Guidelines for Mobile Offshore Drilling Units, 3.4
ed, International Association of
Drilling Contractors, Houston.
IPCC 2005, “Guidance Notes for Lead Authors of the IPCC Fourth Assessment Report on Addressing Uncertainties,” Intergovernmental Panel on Climate Change, viewed 1 May, 2014, <http://www.ipcc.ch/meetings/ar4-workshops-express-meetings/uncertainty-guidance-note.pdf>.
ISO 2000, “17776 Petroleum and natural gas industries — Offshore production installations — Guidelines on tools and techniques for hazard identification and risk assessment,” International Standards
Organisation, Geneva, Switzerland.
ISO 2009a, “31000 Risk management — Principles and guidelines,” International Standards
Organisation, Geneva, Switzerland.

References
69
ISO 2009b, “31010 Risk management — Risk assessment techniques,” International Standards Organisation, Geneva, Switzerland.
Jacinto, C & Silva, C 2010, “A semi-quantitative assessment of occupational risks using bow-tie representation,” Safety Science, vol.
48, no. 8, Elsevier Ltd, pp. 973–979.
Jiao, J & Zhao, T 2012, “A mission oriented accident model based on hybrid dynamic system,” 2012 Proceedings Annual Reliability and Maintainability Symposium, Ieee, pp.
1–7.
Kader, G & Perry, M 2007, “Variability for categorical variables,” Journal of Statistics Education, vol. 15, no. 2.
Križ, K & Skivenes, M 2013, “Systemic differences in views on risk: A comparative case vignette study of risk assessment in England, Norway and the United States (California),” Children and Youth Services Review, vol. 35, no. 11, pp. 1862–
1870.
Lieberson, S 1969, “Measuring Population Diversity,” American Sociological
Review, vol. 34, no. 6, p. 850.
Magurran, A 2004, “Measuring biological diversity.”
Marhavilas, PK, Koulouriotis, D & Gemeni, V 2011, “Risk analysis and assessment methodologies in the work sites: On a review, classification and comparative study of the scientific literature of the period 2000–2009,” Journal of Loss Prevention in the Process Industries,
vol. 24, no. 5, Elsevier Ltd, pp. 477–
523.
Markowski, AS, Mannan, MS & Bigoszewska, A 2009, “Fuzzy logic for process safety analysis,” Journal of Loss Prevention in the Process
Industries, vol. 22, no. 6, pp. 695–
702.
McCrum-Gardner, E 2008, “Which is the correct statistical test to use?,” The British journal of oral & maxillofacial surgery, vol. 46, no. 1, pp. 38–41.
McKenzie, P 2013, “Bowtie Analysis,”
RPS Energy, Perth.
Michell, J 1986, “Measurement scales and statistics: A clash of paradigms.,” Psychological bulletin.
Mokhtari, K, Ren, J, Roberts, C & Wang, J 2011, “Application of a generic bow-tie based risk analysis framework on risk management of sea ports and offshore terminals.,” Journal of hazardous materials, vol.
192, no. 2, Elsevier B.V., pp. 465–75.
Mueller, J & Schuessler, K 1961, Statistical reasoning in sociology,
Houghton Mifflin Company, Boston.
Narens, L & Luce, RD 1986, “Measurement: The theory of numerical assignments.,” Psychological Bulletin, vol. 99, no. 2,
pp. 166–180.
NOPSEMA 2014, “Control Measures and Performance Standards,” National Offshore Petroleum Safety and Environmental Management Authority, viewed 5 April, 2014, <http://www.nopsema.gov.au/assets/Guidance-notes/N-04300-GN0271-Control-Measures-and-Performance-Standards.pdf>.
Oxford University Press 2014, “The Oxford English Dictionary,” viewed 5 April, 2014, <http://www.oxforddictionaries.com/d
efinition/english/variance>.
Perry, M & Kader, G 2005, “Variation as unalikeability,” Teaching Statistics,
vol. 27, no. 2, pp. 58–60.

References
70
Reason, J 1990, Human error, Cambridge
University Press, Cambridge.
Reason, J 1997, Managing the Risks of Organizational Accidents, Reason,
Ashgate Publishing Company, Aldershot.
Reason, J 2008, The human contribution: unsafe acts, accidents and heroic
recoveries, Ashgate Publishing, Ltd.
Regan, HM, Colyvan, M & Burgman, MA 2002, “A taxonomy and treatment of uncertainty for ecology and conservation biology,” Ecological
Applications, vol. 12, pp. 618–628.
Sarle, W 1997, “Measurement theory: Frequently asked questions,” SAS Institute Inc., viewed 25 October,
2014, <ftp://ftp.sas.com/pub/neural/measur
ement.html>.
Saud, Y, Israni, K & Goddard, J 2013, “Bow-tie diagrams in downstream hazard identification and risk assessment,” Process Safety
Progress, vol. 00, no. 00.
Schüller, JCH, Brinkman, JL, Van Gestel, PJ & Van Otterloo, RW 1997, Methods for determining and processing probabilities (Red Book),
2nd ed, The Netherlands Organisation of Applied Scientific
Research, The Hague.
Shahriar, A, Sadiq, R & Tesfamariam, S 2012, “Risk analysis for oil & gas pipelines: A sustainability assessment approach using fuzzy based bow-tie analysis,” Journal of Loss Prevention in the Process Industries, vol. 25, no. 3, Elsevier
Ltd, pp. 505–523.
Shappell, SA & Wiegmann, DA 2000, The Human Factors Analysis and Classification System – HFACS, Security, p. 19.
Sklet, S 2006, “Safety barriers: Definition, classification, and performance,” Journal of Loss Prevention in the Process Industries, vol. 19, no. 5, pp.
494–506.
Standards Australia 2004, Handbook HB 436:2004 Risk Management Guidelines Companion to AS/NZS 4360:2004, Standards Australia
International Ltd, Sydney.
Stevens, S 1946, “On the theory of scales of measurement,” vol. 103, no. 2684, pp. 677–680.
Stroeve, SH, Blom, HAP & Bakker, GJ 2009, “Systemic accident risk assessment in air traffic by Monte Carlo simulation,” Safety Science,
vol. 47, no. 2, pp. 238–249.
Sutcliffe, JP 1958, “MEASUREMENT AND PERMISSIBLE STATISTICS,” Australian Journal of Psychology,
vol. 10, no. 3, pp. 257–268.
Sutton, I 2007, Fault Tree Analysis, 2nd ed, Sutton Technical Books,
Houston.
Swinburne University of Technology 2014, “Research Classification Codes,” viewed 8 October, 2014, <http://www.research.swinburne.edu.
au/researchers/resources/codes/>.
Taroun, A 2014, “Towards a better modelling and assessment of construction risk: Insights from a literature review,” International Journal of Project Management, vol. 32, no. 1, Elsevier Ltd and APM
IPMA, pp. 101–115.
Townsend, JT & Ashby, FG 1984, “Measurement scales and statistics: The misconception misconceived.,” Psychological Bulletin, vol. 96, no. 2,
pp. 394–401.
Trbojevic, VM 2008, Optimising hazard management by workforce engagement and supervision, UK

References
71
Health and Safety Executive,
London.
UK HSE 2006, “Guidance on Risk Assessment for Offshore Installations,” viewed 1 May, 2014, <http://www.hse.gov.uk/offshore/she
et32006.pdf>.
UK HSE 2001, Marine risk assessment,
United Kingdom Health and Safety Executive, London.
UKOOA 1999, Industry guidelines on a framework for risk related decision support, 1st ed, United Kingdom
Offshore Operators Association.
Velleman, PF & Wilkinson, L 1993, “Nominal, Ordinal, Interval, and Ratio Typologies Are Misleading,” The American Statistician, vol. 47, no. 1,
p. 65.
Viner, D 1991, Accident analysis and risk control, Derek Viner Pty Ltd,
Melbourne.
Wikipedia 2014, “Qualitative variation,” viewed 12 November, 2014, <http://en.wikipedia.org/wiki/Qualitati
ve_variation>.
Wilcox, AR 1967, Indices of qualitative
variation, Oak Ridge.
Wilcox, AR 1973, “Indices of Qualitative Variation and Political Measurement,” The Western Political Quarterly, vol. 26, no. 2, p. 325,
viewed 11 October, 2014, <http://www.jstor.org/stable/446831?
origin=crossref>.
Worksafe Victoria 2006, “Advice for managing major events safely,” Worksafe Victoria.

Appendices
72
THIS PAGE INTENTIONALLY LEFT BLANK

Appendices
73
Appendices

Appendices
74
THIS PAGE INTENTIONALLY LEFT BLANK

Appendices
75
Appendix A – Worked Example of the Analytical
Variance Measurement Tool

Appendices
76

Number of analyses or 'samples' (s) 3
Number of data points in the total population 190 Sample analytical variances
Total number of analytical elements (k) 88 0.24 0.23 0.38 0.42 Total analytical variance
Analytical Phase Analytical Element ID Categorical Variables (Analytical Elements) Sample 1 Sample 2 Sample 3Category
Frequency
Category
Variance
1 Helicopter transportation to an offshore location 1 1 1 3 0.00
2
3
4
5
0.00 0.00 0.00 0.00Group total analytical variance for
the hazard group
1 Unable to complete flight to planned destination 1 1 1 3 0.00
2
3
4
5
0.00 0.00 0.00 0.00Group total analytical variance for
the top event group
1 Bird strike 1 1 1.00
2 Contaminated helicopter fuel 1 1 1 3 0.00
3 Extreme weather during flight 1 1 1 3 0.00
4 Fire on helicopter 1 1 1.00
5 Hazardous materials released on helicopter 1 1 1.00
6 Helicopter equipment failure 1 1 1 3 0.00
7 Helicopter overloading 1 1 2 0.50
8 Insufficient helicopter fuel 1 1 2 0.50
9 Pilot error 1 1 2 0.50
10 Pilot incapacity 1 1 1 3 0.00
0.30 0.20 0.40 0.38Group total analytical variance for
the cause group
1 Helicopter crash on land 1 1 1.00
2 Helicopter ditch into ocean 1 1 1 3 0.00
3 Helicopter ditch survivors in water 1 1 1.00
0.33 0.33 0.67 0.67Group total analytical variance for
the outcome group
1 (Cause) Bird strike || (Control) Design and specification of helicopter wind shield 1 1 1.00
2 (Cause) Bird strike || (Control) Helicopter engine air intake protection 1 1 1.00
3 (Cause) Contaminated helicopter fuel || (Control) Helicopter fuel logistics management procedures 1 1 1 3 0.00
4 (Cause) Contaminated helicopter fuel || (Control) Helicopter fuel sampling 1 1 1 3 0.00
5 (Cause) Contaminated helicopter fuel || (Control) Helicopter refuelling system filtration unit 1 1 1 3 0.00
6 (Cause) Extreme weather during flight || (Control) Flight operation weather restrictions 1 1 1 3 0.00
7 (Cause) Extreme weather during flight || (Control) Helicopter pre-flight check-list 1 1 1 3 0.00
8 (Cause) Extreme weather during flight || (Control) Helicopter weather radar system 1 1 1 3 0.00
9 (Cause) Extreme weather during flight || (Control) Weather forecasting service 1 1 1 3 0.00
10 (Cause) Fire on helicopter || (Control) Helicopter fire detection system 1 1 1.00
11 (Cause) Fire on helicopter || (Control) Helicopter fire extinguishing system 1 1 1.00
12 (Cause) Hazardous materials released on helicopter || (Control) Baggage inspection screening 1 1 1.00
13 (Cause) Hazardous materials released on helicopter || (Control) Hazardous materials transport restrictions 1 1 1.00
14 (Cause) Hazardous materials released on helicopter || (Control) Separation of hazardous material transportation (baggage compartment) 1 1 1.00
15 (Cause) Helicopter equipment failure || (Control) Design and specification of helicopter systems 1 1 1 3 0.00
16 (Cause) Helicopter equipment failure || (Control) Helicopter monitoring and alarm system 1 1 1 3 0.00
17 (Cause) Helicopter equipment failure || (Control) Helicopter pre-flight check-list 1 1 1 3 0.00
18 (Cause) Helicopter equipment failure || (Control) Planned maintenance of helicopter equipment 1 1 1 3 0.00
19 (Cause) Helicopter overloading || (Control) Passenger and cargo manifesting 1 1 2 0.50
20 (Cause) Helicopter overloading || (Control) Secure loading of cargo in helicopter 1 1 2 0.50
21 (Cause) Insufficient helicopter fuel || (Control) Helicopter fuel monitoring system 1 1 2 0.50
22 (Cause) Insufficient helicopter fuel || (Control) Helicopter fuel planning procedures 1 1 2 0.50
23 (Cause) Insufficient helicopter fuel || (Control) Helicopter pre-flight check-list 1 1 2 0.50
24 (Cause) Pilot error || (Control) Helicopter flight instrumentation 1 1 2 0.50
25 (Cause) Pilot error || (Control) Helicopter pilot licensing and training requirements 1 1 2 0.50
26 (Cause) Pilot error || (Control) Helicopter pre-flight check-list 1 1 2 0.50
27 (Cause) Pilot error || (Control) Two helicopter pilots 1 1 2 0.50
28 (Cause) Pilot incapacity || (Control) Drug and alcohol management procedures 1 1 1 3 0.00
29 (Cause) Pilot incapacity || (Control) Helicopter pilot age limitations 1 1 1 3 0.00
30 (Cause) Pilot incapacity || (Control) Helicopter pilot medical testing 1 1 1 3 0.00
31 (Cause) Pilot incapacity || (Control) Two helicopter pilots 1 1 1 3 0.00
Control
Model
Hazards
Top Events
Causes
Outcomes
Prevention Controls
Category analytical variances for
each hazard category
Category analytical variances for
each cause category
Category analytical variances for
each top event category
Category analytical variances for
each outcome category
Category analytical variances for
each prevention control category
Group sample analytical variances for the cause group
Group sample analytical variances for the top event group
Group sample analytical variances for the hazard group
Group sample analytical variances for the outcome group

Number of analyses or 'samples' (s) 3
Number of data points in the total population 190 Sample analytical variances
Total number of analytical elements (k) 88 0.24 0.23 0.38 0.42 Total analytical variance
Analytical Phase Analytical Element ID Categorical Variables (Analytical Elements) Sample 1 Sample 2 Sample 3Category
Frequency
Category
Variance
0.23 0.16 0.35 0.37Group total analytical variance for
the prevention control group
1 (Outcome) Helicopter crash on land || (Control) Helicopter emergency locator transmitter 1 1 1.00
2 (Outcome) Helicopter crash on land || (Control) Search and rescue services 1 1 1.00
3 (Outcome) Helicopter ditch into ocean || (Control) Design and specification of helicopter seats and passenger restraints 1 1 1 3 0.00
4 (Outcome) Helicopter ditch into ocean || (Control) Flight route planning - alternate landing destination 1 1 1 3 0.00
5 (Outcome) Helicopter ditch into ocean || (Control) Helicopter emergency escape routes 1 1 1 3 0.00
6 (Outcome) Helicopter ditch into ocean || (Control) Helicopter emergency response procedures 1 1 1 3 0.00
7 (Outcome) Helicopter ditch into ocean || (Control) Helicopter floatation devices 1 1 1 3 0.00
8 (Outcome) Helicopter ditch into ocean || (Control) Helicopter satellite flight following system 1 1 1 3 0.00
9 (Outcome) Helicopter ditch survivors in water || (Control) Helicopter emergency locator transmitter 1 1 1.00
10 (Outcome) Helicopter ditch survivors in water || (Control) Helicopter life rafts 1 1 1.00
11 (Outcome) Helicopter ditch survivors in water || (Control) Passenger flight personal protective equipment 1 1 1.00
12 (Outcome) Helicopter ditch survivors in water || (Control) Search and rescue services 1 1 1.00
0.17 0.33 0.50 0.50Group total analytical variance for
the recovery control group
1 (Cause) Contaminated helicopter fuel || (Control) Helicopter refuelling system filtration unit || (Defeating Factor) Failure of helicopter refuelling filtration unit 1 1 1 3 0.00
2 (Cause) Fire on helicopter || (Control) Helicopter fire detection system || (Defeating Factor) Failure of helicopter fire detection system 1 1 1.00
3 (Cause) Fire on helicopter || (Control) Helicopter fire extinguishing system || (Defeating Factor) Failure of helicopter active fire protection system 1 1 1.00
4 (Cause) Helicopter equipment failure || (Control) Planned maintenance of helicopter equipment || (Defeating Factor) Inadequate planned maintenance 1 1 1 3 0.00
5 (Cause) Helicopter equipment failure || (Control) Planned maintenance of helicopter equipment || (Defeating Factor) Inadequate planned maintenance 1 1 1 3 0.00
6 (Cause) Helicopter overloading || (Control) Passenger and cargo manifesting || (Defeating Factor) Ineffective passenger and cargo manifesting 1 1 2 0.50
7 (Cause) Helicopter overloading || (Control) Passenger and cargo manifesting || (Defeating Factor) Ineffective passenger and cargo manifesting 1 1 2 0.50
8 (Cause) Pilot incapacity || (Control) Drug and alcohol management procedures || (Defeating Factor) Drug and alcohol abuse by pilot 1 1 1 3 0.00
9 (Outcome) Helicopter crash on land || (Control) Helicopter emergency locator transmitter || (Defeating Factor) Failure of helicopter emergency locator transmitter 1 1 1.00
10 (Outcome) Helicopter crash on land || (Control) Search and rescue services || (Defeating Factor) Inadequate search and rescue response 1 1 1.00
11 (Outcome) Helicopter ditch into ocean || (Control) Design and specification of helicopter seats and passenger restraints || (Defeating Factor) Failure of helicopter seats and restraints 1 1 1 3 0.00
12 (Outcome) Helicopter ditch into ocean || (Control) Helicopter emergency response procedures || (Defeating Factor) Inadequate pilot emergency response 1 1 1 3 0.00
13 (Outcome) Helicopter ditch into ocean || (Control) Helicopter floatation devices || (Defeating Factor) Failure of helicopter floatation devices 1 1 1 3 0.00
14 (Outcome) Helicopter ditch survivors in water || (Control) Helicopter emergency locator transmitter || (Defeating Factor) Failure of helicopter emergency locator transmitter 1 1 2 0.50
15 (Outcome) Helicopter ditch survivors in water || (Control) Helicopter life rafts || (Defeating Factor) Failure of helicopter life rafts 1 1 2 0.50
0.27 0.27 0.27 0.40Group total analytical variance for
the defeating factor group
1 (Cause) Contaminated helicopter fuel || (Control) Helicopter refuelling system filtration unit || (Defeating Factor) Failure of helicopter refuelling filtration unit || (Control) Planned maintenance of helicopter refuelling equipment 1 1 1 3 0.00
2 (Cause) Fire on helicopter || (Control) Helicopter fire detection system || (Defeating Factor) Failure of helicopter fire detection system || (Control) Planned maintenance of helicopter fire detection system 1 1 1.00
3 (Cause) Fire on helicopter || (Control) Helicopter fire extinguishing system || (Defeating Factor) Failure of helicopter active fire protection system || (Control) Planned maintenance of helicopter active fire protection system 1 1 1.00
4 (Cause) Helicopter equipment failure || (Control) Planned maintenance of helicopter equipment || (Defeating Factor) Inadequate planned maintenance || (Control) Flight safety auditing 1 1 1 3 0.00
5 (Cause) Helicopter equipment failure || (Control) Planned maintenance of helicopter equipment || (Defeating Factor) Inadequate planned maintenance || (Control) Overdue maintenance reporting 1 1 1 3 0.00
6 (Cause) Helicopter overloading || (Control) Passenger and cargo manifesting || (Defeating Factor) Ineffective passenger and cargo manifesting || (Control) Pilot manifest verification 1 1 2 0.50
7 (Cause) Helicopter overloading || (Control) Passenger and cargo manifesting || (Defeating Factor) Ineffective passenger and cargo manifesting || (Control) Planned maintenance of weighing equipment 1 1 2 0.50
8 (Cause) Pilot incapacity || (Control) Drug and alcohol management procedures || (Defeating Factor) Drug and alcohol abuse by pilot || (Control) Drug and alcohol testing 1 1 1 3 0.00
9 (Outcome) Helicopter crash on land || (Control) Helicopter emergency locator transmitter || (Defeating Factor) Failure of helicopter emergency locator transmitter || (Control) Planned maintenance of helicopter emergency locator transmitter 1 1 1.00
10 (Outcome) Helicopter crash on land || (Control) Search and rescue services || (Defeating Factor) Inadequate search and rescue response || (Control) Emergency response simulation exercises 1 1 1.00
11 (Outcome) Helicopter ditch into ocean || (Control) Design and specification of helicopter seats and passenger restraints || (Defeating Factor) Failure of helicopter seats and restraints || (Control) Planned maintenance of helicopter seats and restraints 1 1 1 3 0.00
12 (Outcome) Helicopter ditch into ocean || (Control) Helicopter emergency response procedures || (Defeating Factor) Inadequate pilot emergency response || (Control) Emergency response simulation exercises 1 1 1 3 0.00
13 (Outcome) Helicopter ditch into ocean || (Control) Helicopter floatation devices || (Defeating Factor) Failure of helicopter floatation devices || (Control) Planned maintenance of helicopter floatation devices 1 1 1 3 0.00
14 (Outcome) Helicopter ditch survivors in water || (Control) Helicopter emergency locator transmitter || (Defeating Factor) Failure of helicopter emergency locator transmitter || (Control) Planned maintenance of helicopter emergency locator transmitter 1 1 1.00
15 (Outcome) Helicopter ditch survivors in water || (Control) Helicopter life rafts || (Defeating Factor) Failure of helicopter life rafts || (Control) Planned maintenance of helicopter life rafts 1 1 1.00
0.27 0.27 0.40 0.47Group total analytical variance for
the defeating factor control group
Control
Prevention Controls
Recovery Controls
Defeating Factors
Defeating Factor Controls
Group sample analytical variances for the defeating factor control group
Group sample analytical variances for the defeating factor group
Group sample analytical variances for the recovery control group
Group sample analytical variances for the prevention control group
Category analytical variances for
each recovery control category
Category analytical variances for
each defeating factor category
Category analytical variances for
each defeating factor control
category