Antarctica - NASA · Antarctica is the highest, driest, windiest, emptiest, coldest place on earth....
86
Brian Crucian September 17, 2013 Terrestrial Spaceflight Analogs: Antarctica Photo: ESA/Alex Salam https://ntrs.nasa.gov/search.jsp?R=20140002723 2018-08-31T23:28:19+00:00Z
Transcript of Antarctica - NASA · Antarctica is the highest, driest, windiest, emptiest, coldest place on earth....
Brian Crucian
September 17, 2013
Terrestrial Spaceflight Analogs:
Antarctica
Photo: ESA/Alex Salam
https://ntrs.nasa.gov/search.jsp?R=20140002723 2018-08-31T23:28:19+00:00Z
Spaceflight Physiology
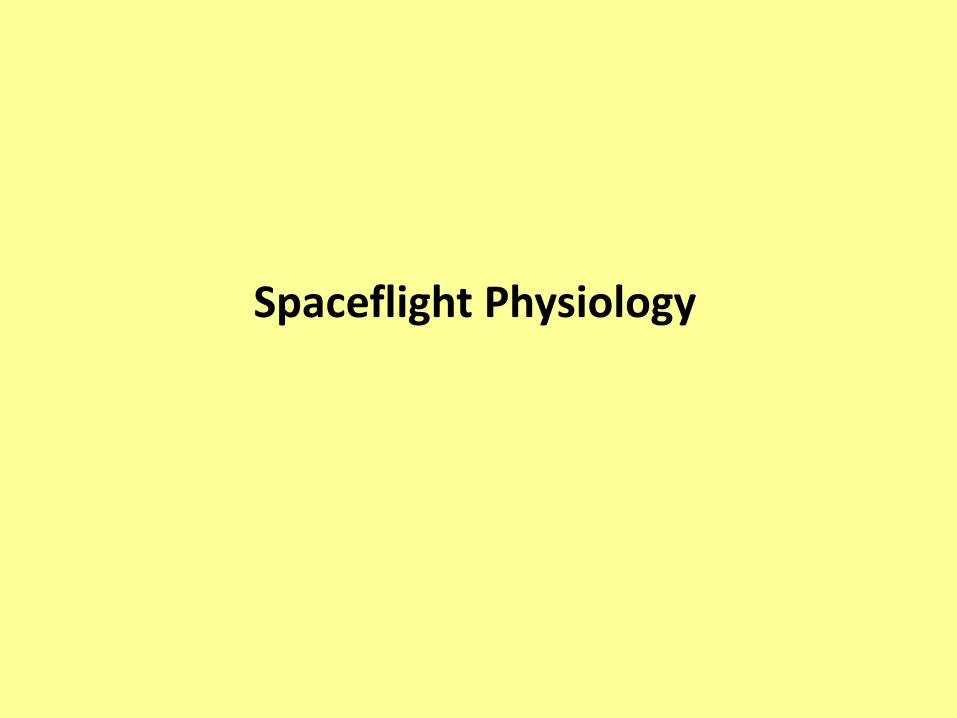
Microgravity Effects on the Human Body
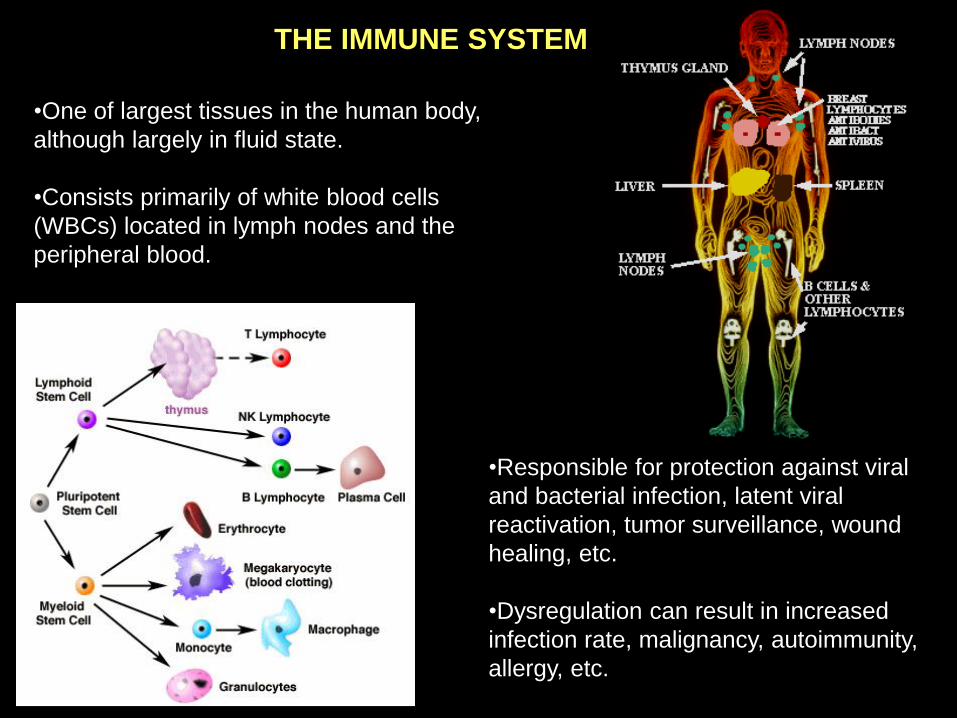
•One of largest tissues in the human body,
although largely in fluid state.
•Consists primarily of white blood cells
(WBCs) located in lymph nodes and the
peripheral blood.
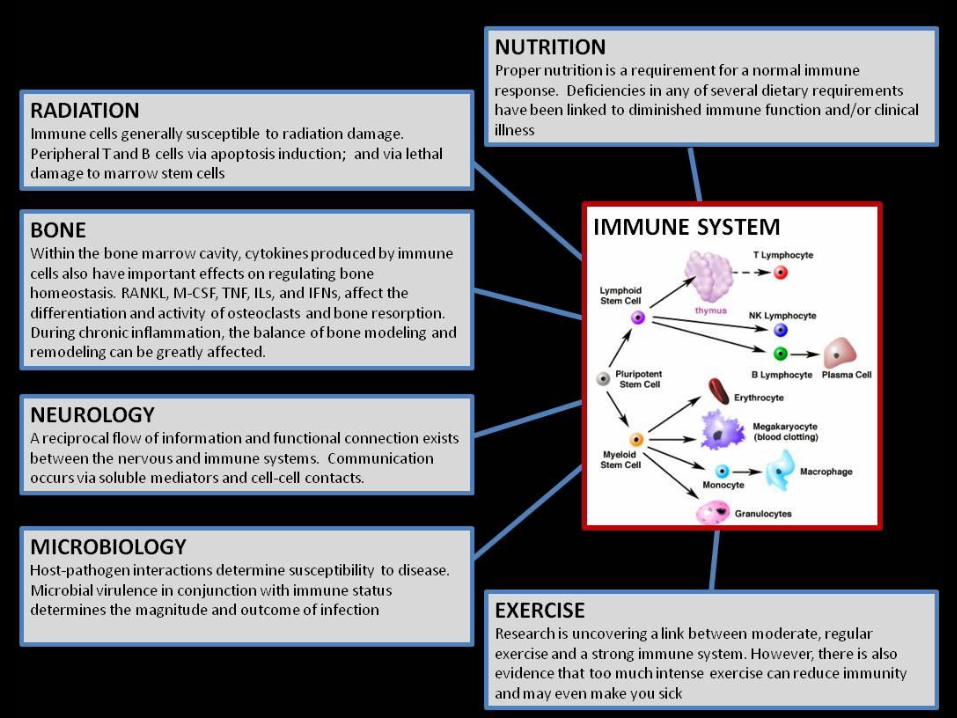
THE IMMUNE SYSTEM
•Responsible for protection against viral
and bacterial infection, latent viral
reactivation, tumor surveillance, wound
healing, etc.
•Dysregulation can result in increased
infection rate, malignancy, autoimmunity,
allergy, etc.
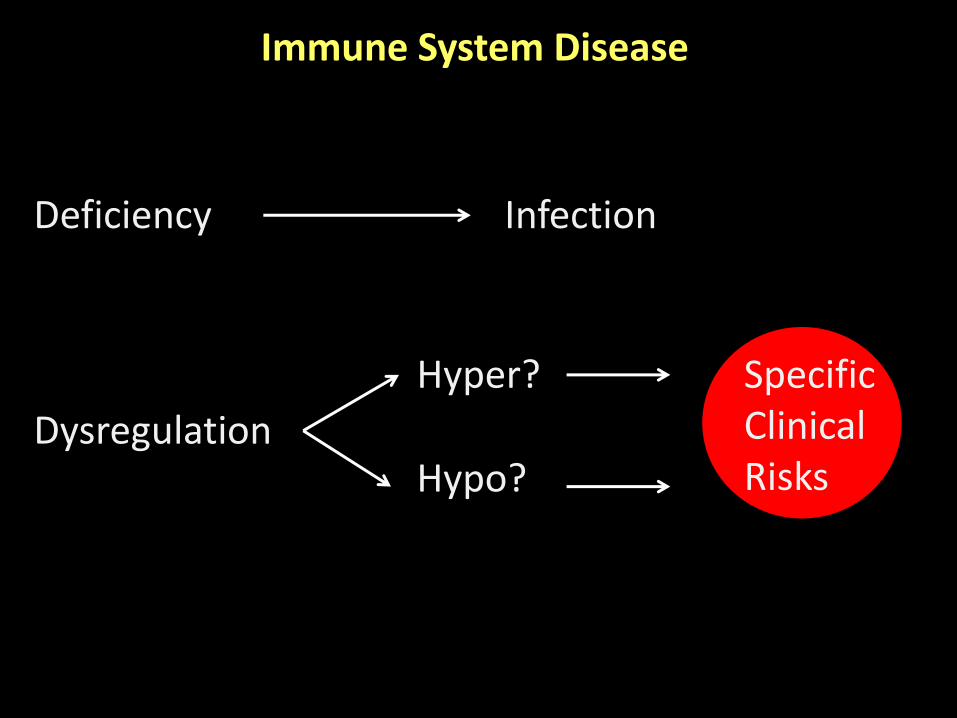
Immune System Disease
Deficiency
Dysregulation
Infection
Hyper?
Hypo?
Specific Clinical Risks
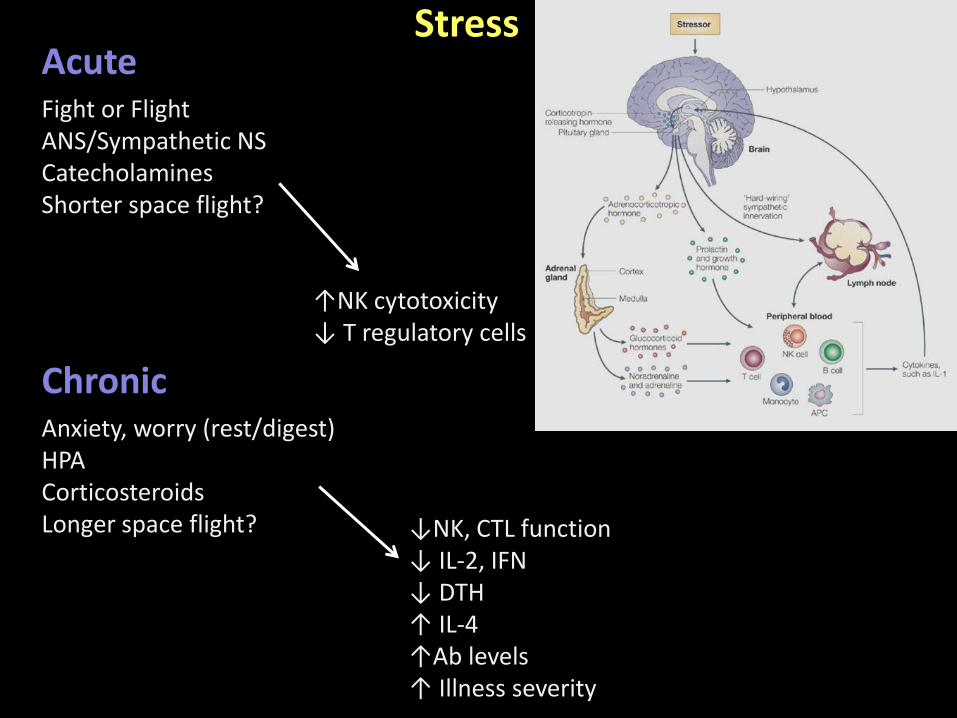
Stress Acute
Chronic
Fight or Flight ANS/Sympathetic NS Catecholamines Shorter space flight?
Anxiety, worry (rest/digest) HPA Corticosteroids Longer space flight?
↑NK cytotoxicity ↓ T regulatory cells
↓NK, CTL function ↓ IL-2, IFN ↓ DTH ↑ IL-4 ↑Ab levels ↑ Illness severity
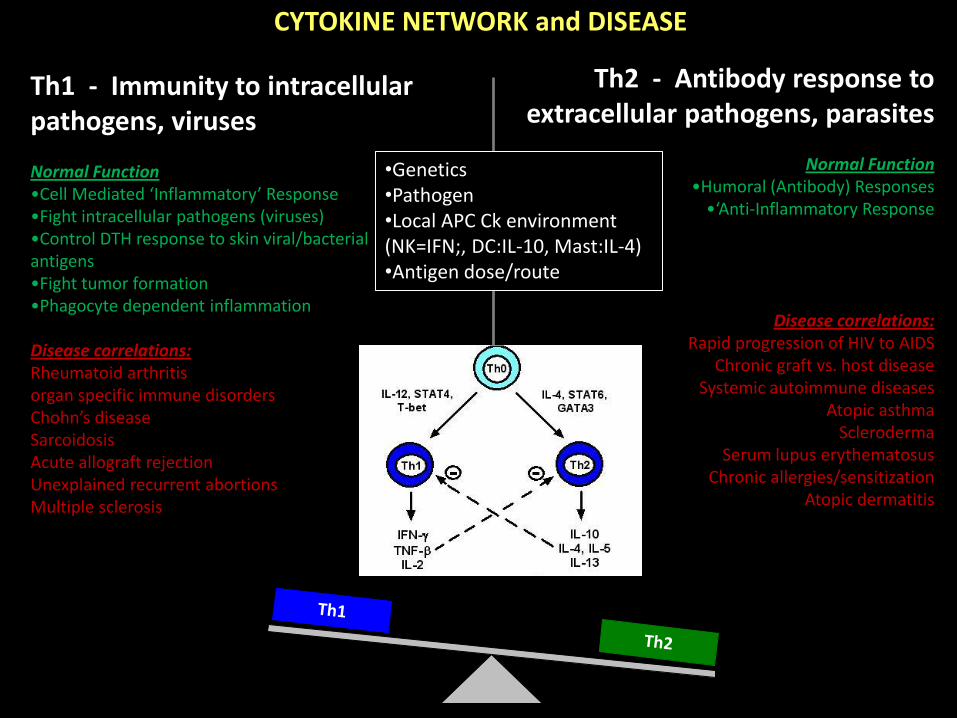
Th1 - Immunity to intracellular pathogens, viruses Normal Function •Cell Mediated ‘Inflammatory’ Response •Fight intracellular pathogens (viruses) •Control DTH response to skin viral/bacterial antigens •Fight tumor formation •Phagocyte dependent inflammation Disease correlations: Rheumatoid arthritis organ specific immune disorders Chohn’s disease Sarcoidosis Acute allograft rejection Unexplained recurrent abortions Multiple sclerosis
Th2 - Antibody response to extracellular pathogens, parasites
Normal Function
•Humoral (Antibody) Responses •‘Anti-Inflammatory Response
Disease correlations: Rapid progression of HIV to AIDS
Chronic graft vs. host disease Systemic autoimmune diseases
Atopic asthma Scleroderma
Serum lupus erythematosus Chronic allergies/sensitization
Atopic dermatitis
•Genetics •Pathogen •Local APC Ck environment (NK=IFN;, DC:IL-10, Mast:IL-4) •Antigen dose/route
CYTOKINE NETWORK and DISEASE

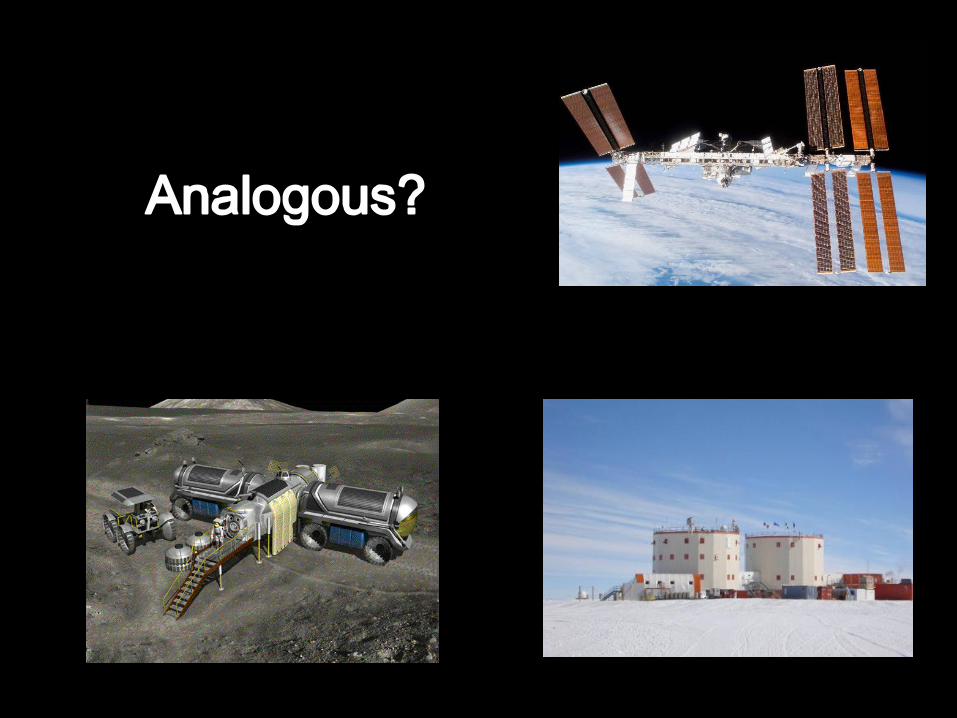
Spaceflight Analogs

SPACEFLIGHT GROUND ANALOGS
•Validation of monitoring strategy,
countermeasures
•Determination of mechanism
•Validation of flight hardware
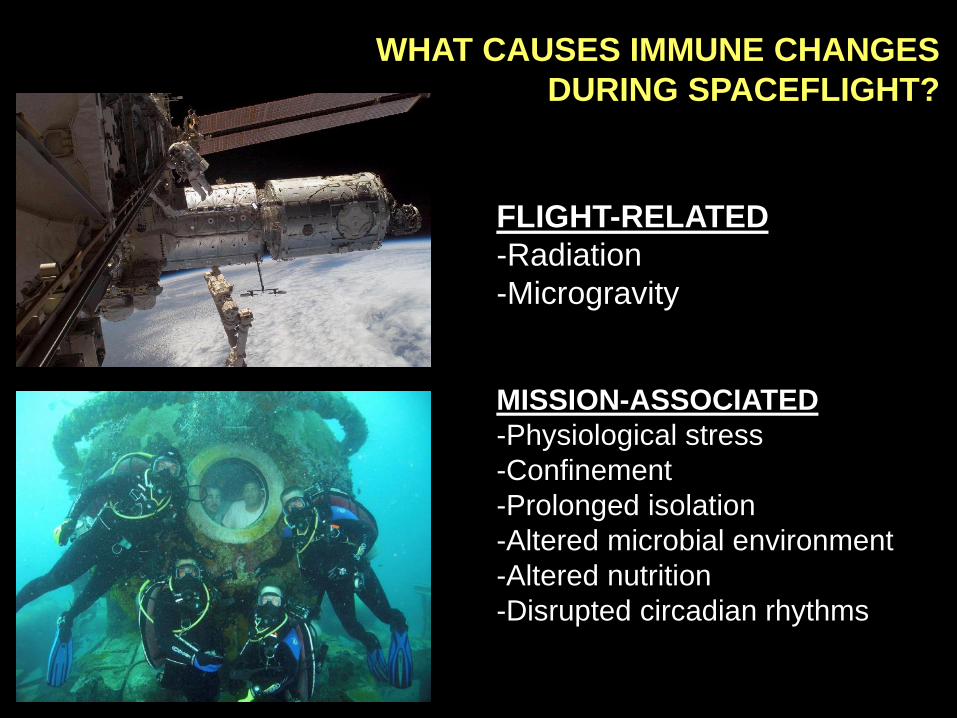
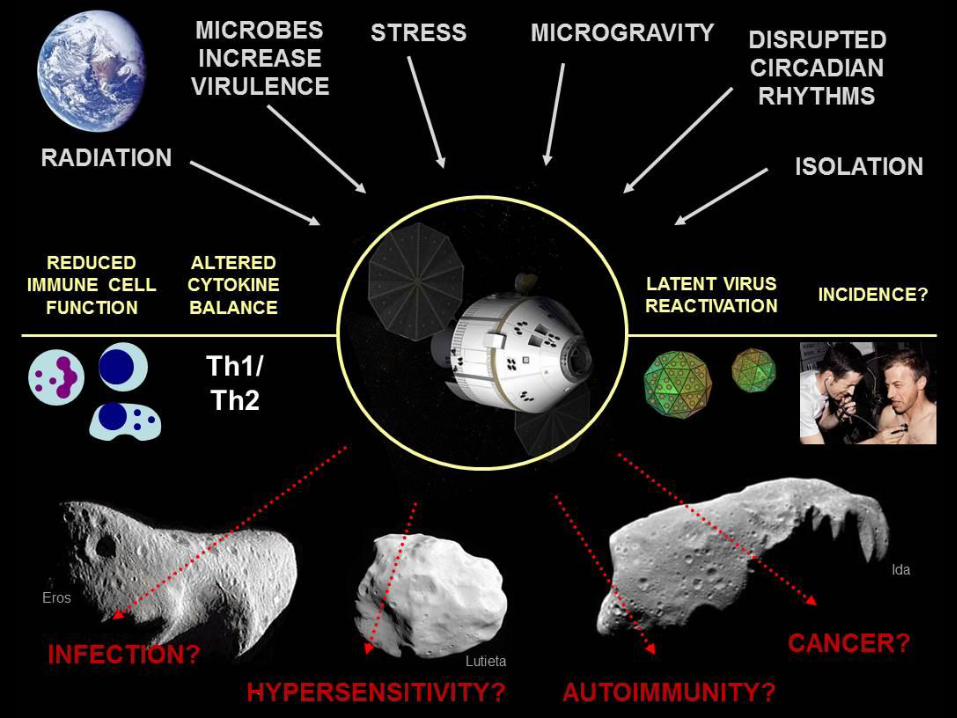
FLIGHT-RELATED
-Radiation
-Microgravity
MISSION-ASSOCIATED
-Physiological stress
-Confinement
-Prolonged isolation
-Altered microbial environment
-Altered nutrition
-Disrupted circadian rhythms
WHAT CAUSES IMMUNE CHANGES
DURING SPACEFLIGHT?
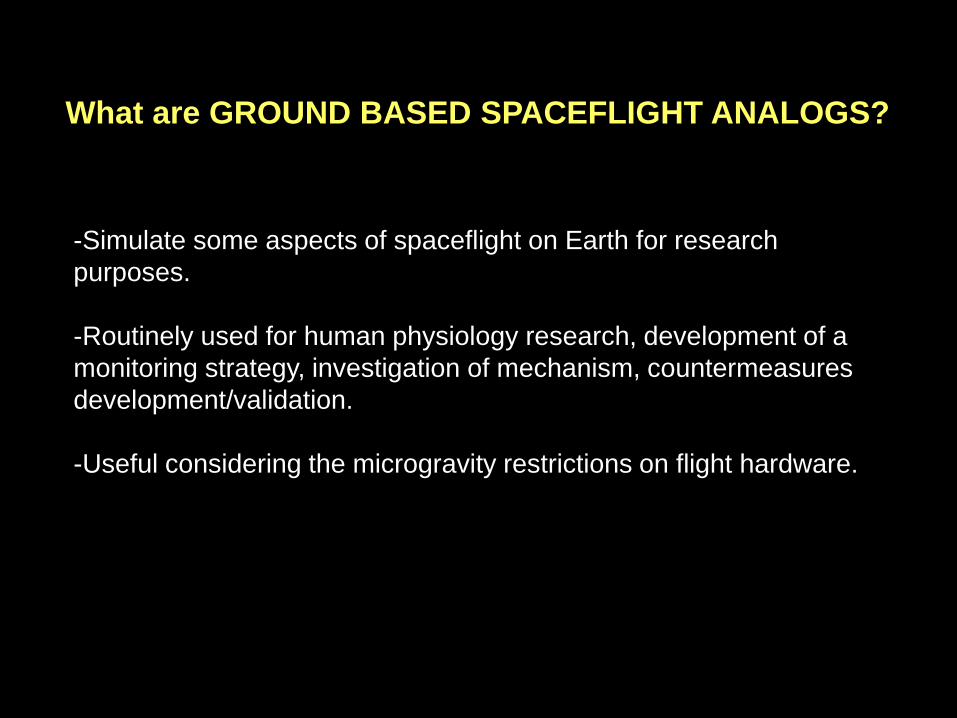
-Simulate some aspects of spaceflight on Earth for research
purposes.
-Routinely used for human physiology research, development of a
monitoring strategy, investigation of mechanism, countermeasures
development/validation.
-Useful considering the microgravity restrictions on flight hardware.
What are GROUND BASED SPACEFLIGHT ANALOGS?
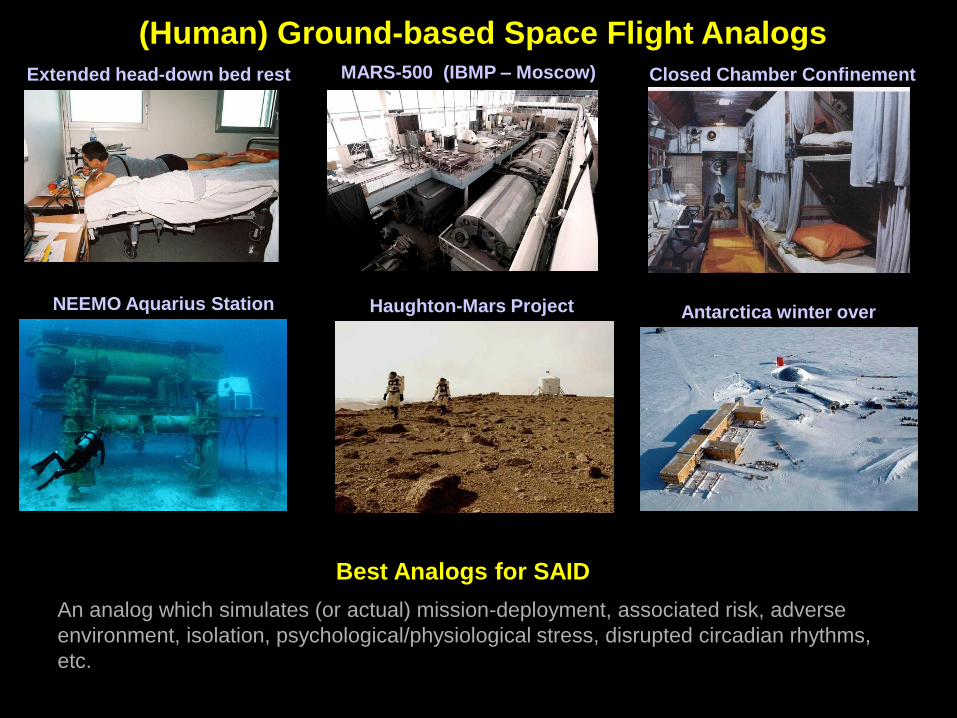
Extended head-down bed rest MARS-500 (IBMP – Moscow)
NEEMO Aquarius Station Antarctica winter over Haughton-Mars Project
Closed Chamber Confinement
(Human) Ground-based Space Flight Analogs
An analog which simulates (or actual) mission-deployment, associated risk, adverse
environment, isolation, psychological/physiological stress, disrupted circadian rhythms,
etc.
Best Analogs for SAID
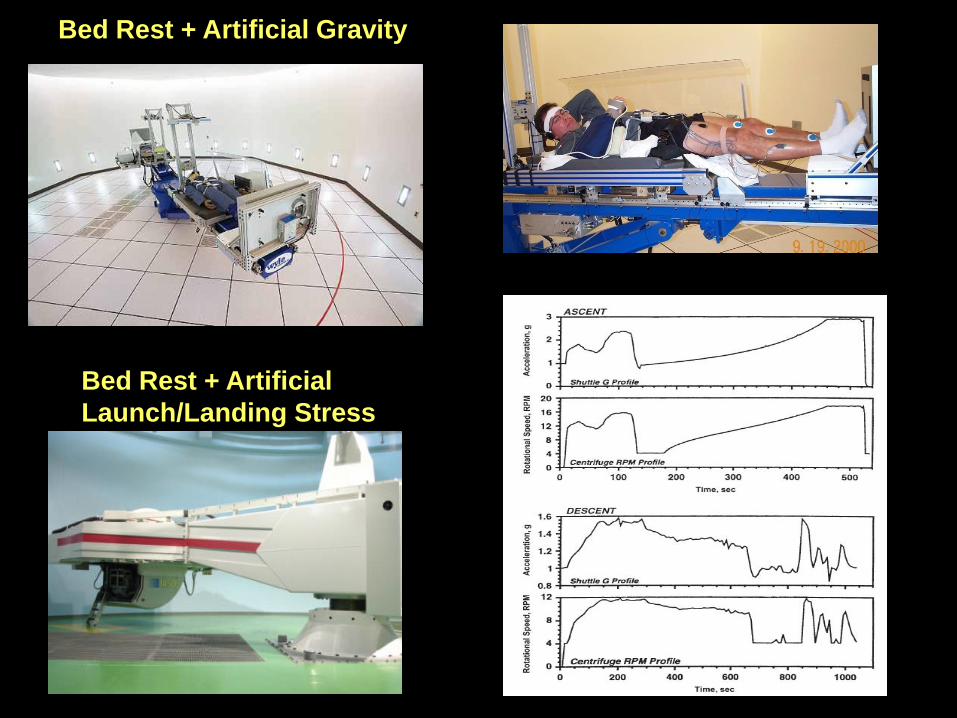
Bed Rest + Artificial Gravity
Bed Rest + Artificial
Launch/Landing Stress
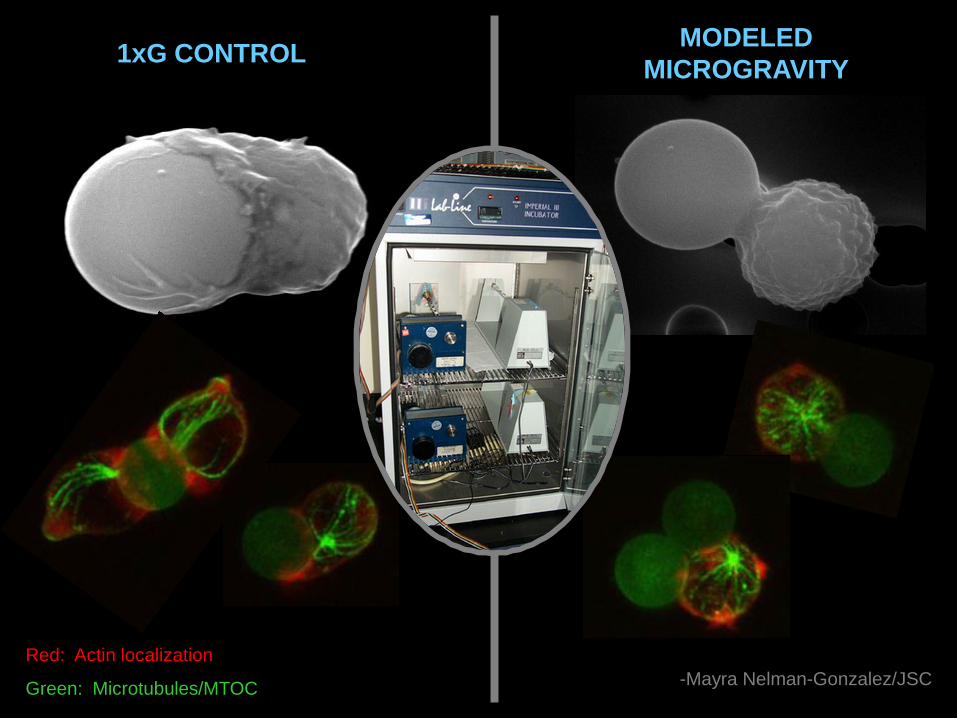
MODELED
MICROGRAVITY 1xG CONTROL
Red: Actin localization
Green: Microtubules/MTOC -Mayra Nelman-Gonzalez/JSC
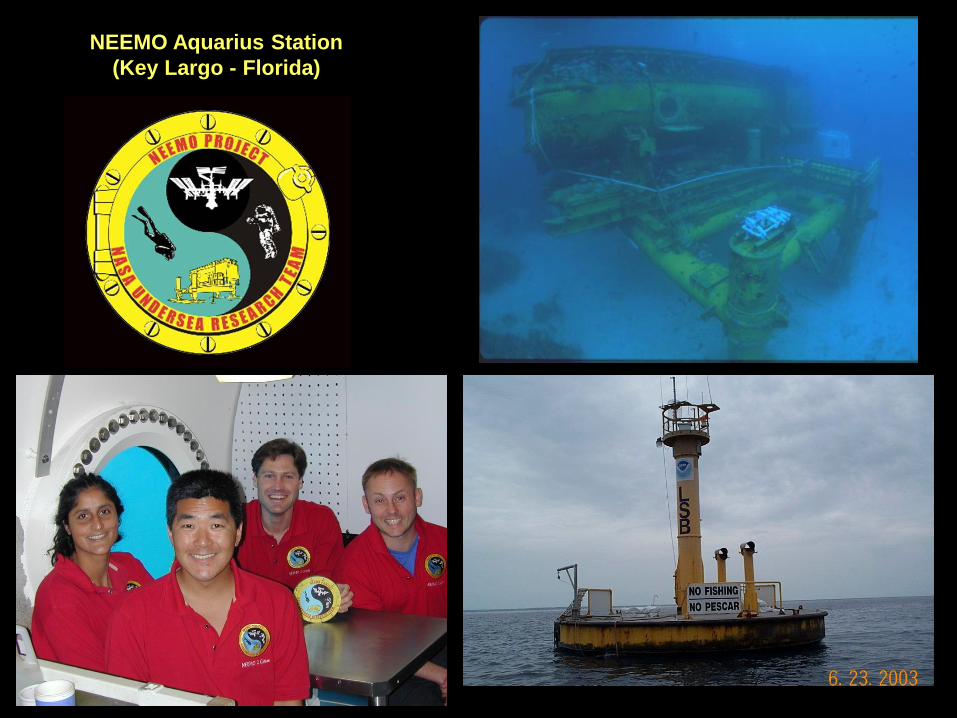
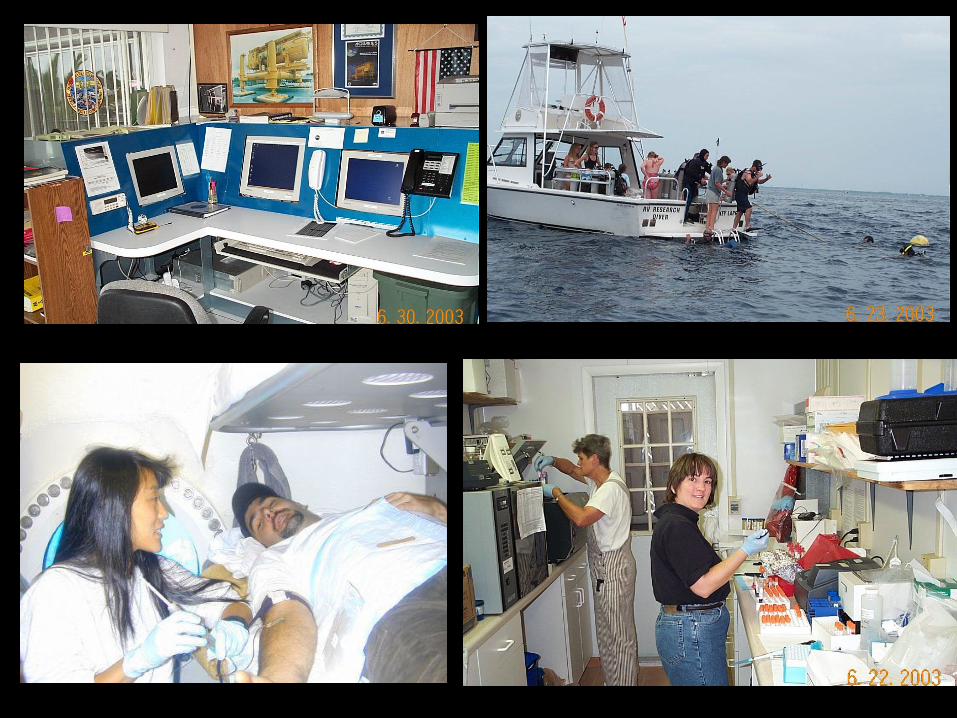
NEEMO Aquarius Station
(Key Largo - Florida)
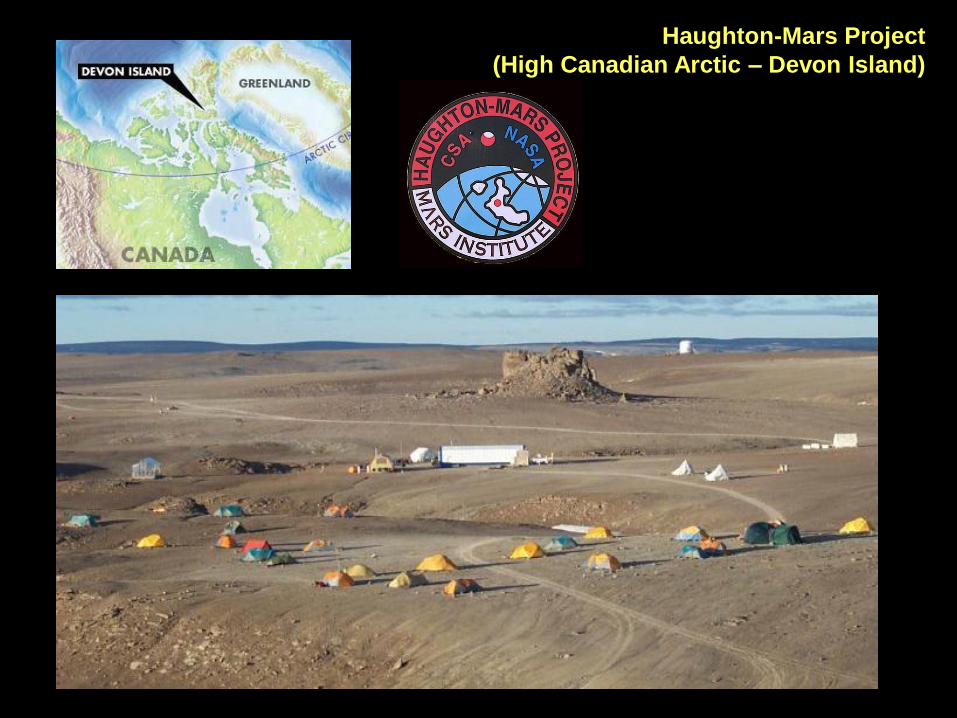
Haughton-Mars Project
(High Canadian Arctic – Devon Island)
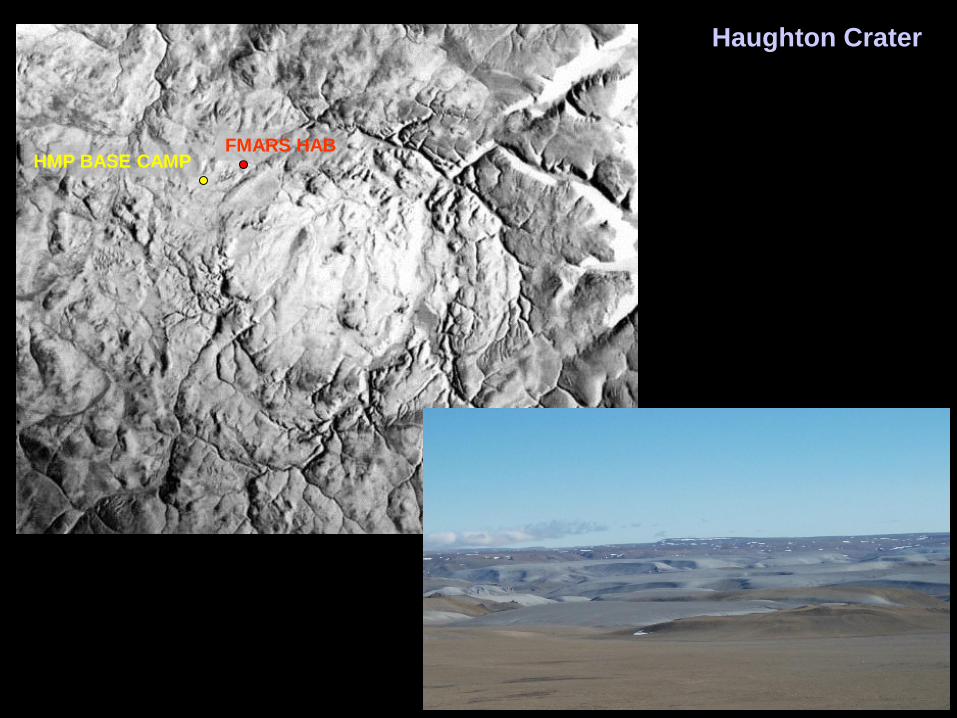
Haughton Crater
HMP BASE CAMP FMARS HAB
Antarctica
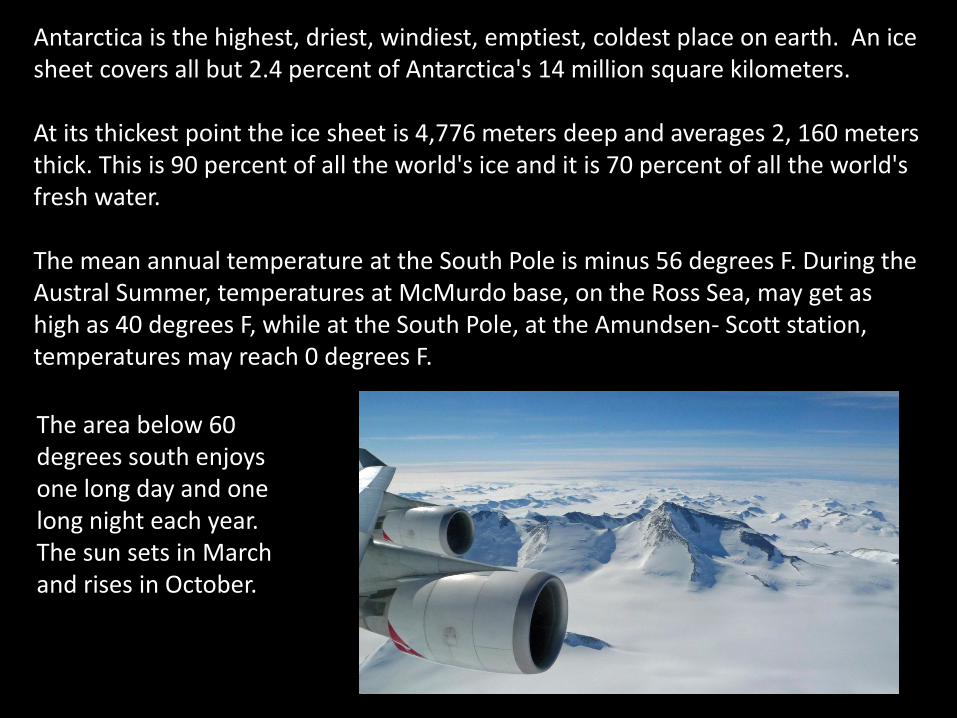
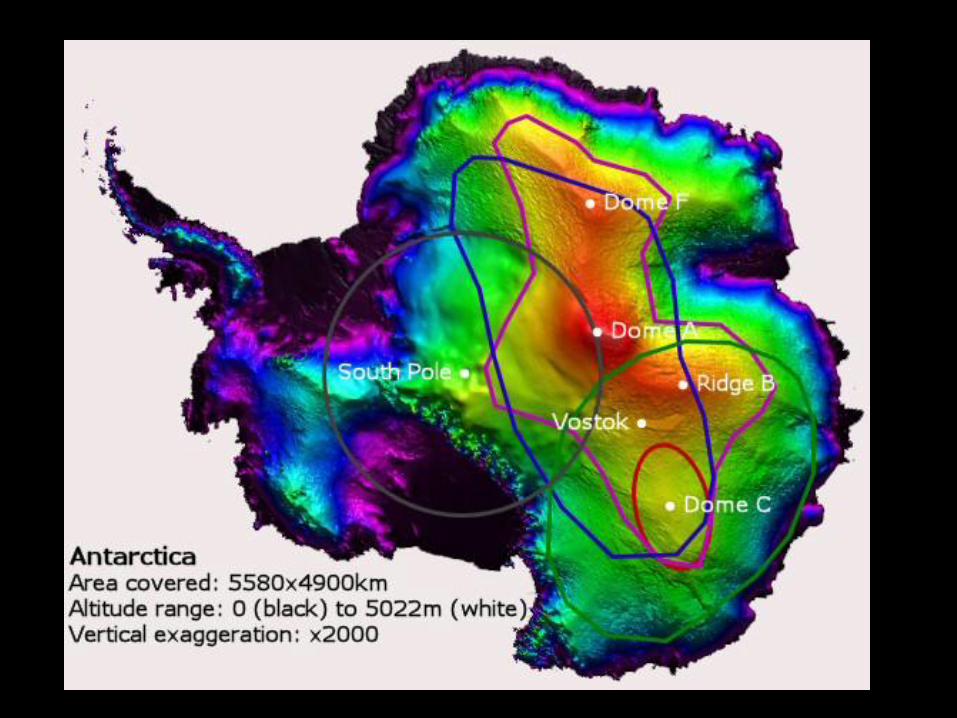
Antarctica is the highest, driest, windiest, emptiest, coldest place on earth. An ice sheet covers all but 2.4 percent of Antarctica's 14 million square kilometers. At its thickest point the ice sheet is 4,776 meters deep and averages 2, 160 meters thick. This is 90 percent of all the world's ice and it is 70 percent of all the world's fresh water. The mean annual temperature at the South Pole is minus 56 degrees F. During the Austral Summer, temperatures at McMurdo base, on the Ross Sea, may get as high as 40 degrees F, while at the South Pole, at the Amundsen- Scott station, temperatures may reach 0 degrees F.
The area below 60 degrees south enjoys one long day and one long night each year. The sun sets in March and rises in October.
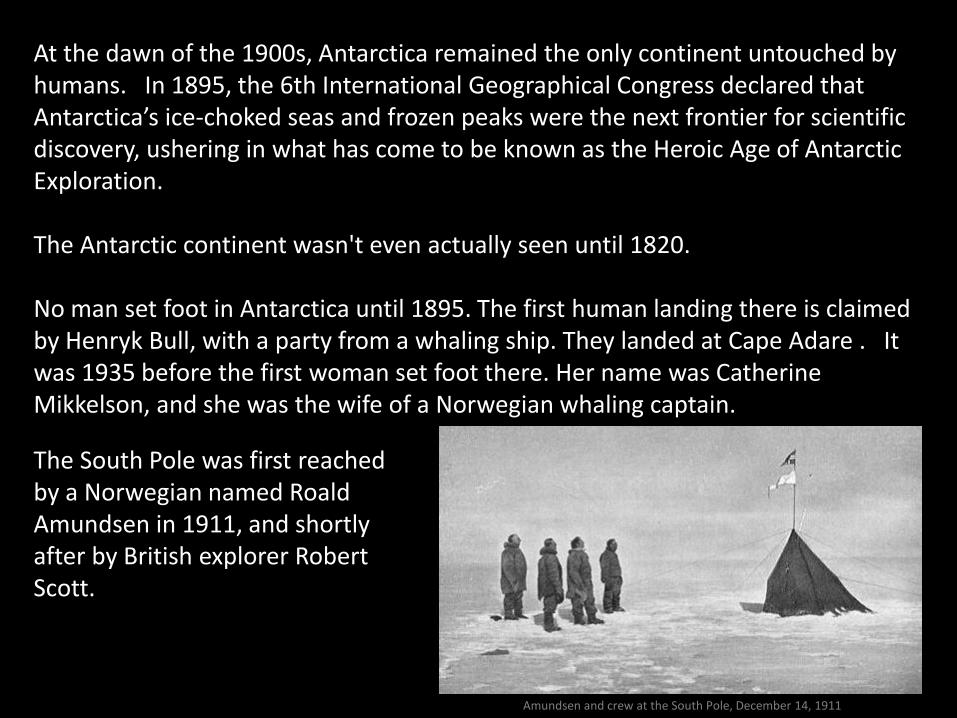
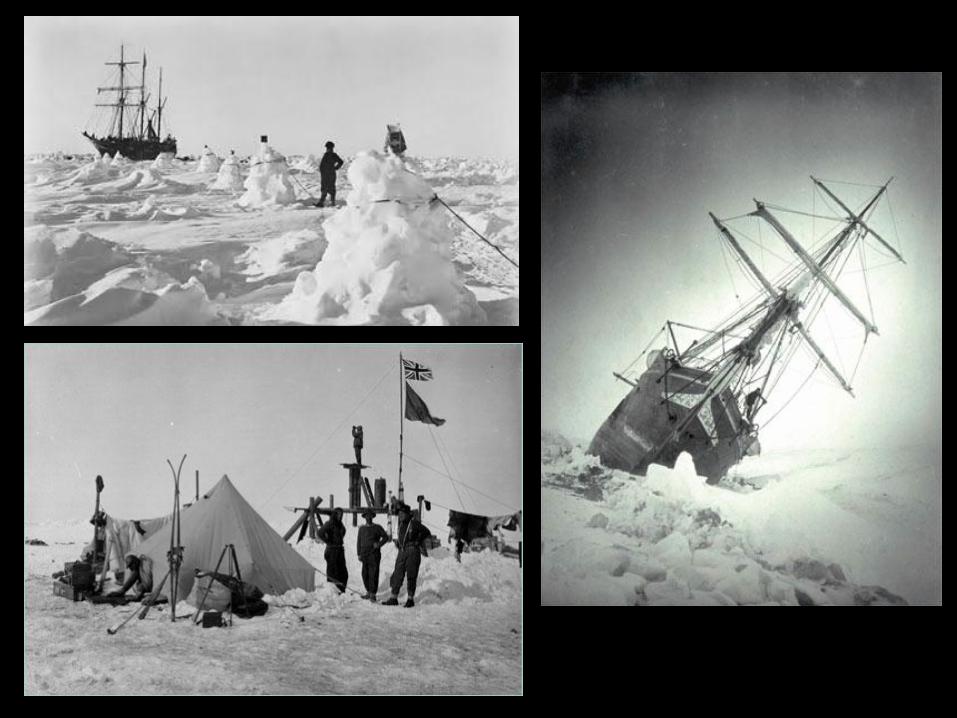
At the dawn of the 1900s, Antarctica remained the only continent untouched by humans. In 1895, the 6th International Geographical Congress declared that Antarctica’s ice-choked seas and frozen peaks were the next frontier for scientific discovery, ushering in what has come to be known as the Heroic Age of Antarctic Exploration. The Antarctic continent wasn't even actually seen until 1820. No man set foot in Antarctica until 1895. The first human landing there is claimed by Henryk Bull, with a party from a whaling ship. They landed at Cape Adare . It was 1935 before the first woman set foot there. Her name was Catherine Mikkelson, and she was the wife of a Norwegian whaling captain.
Amundsen and crew at the South Pole, December 14, 1911
The South Pole was first reached by a Norwegian named Roald Amundsen in 1911, and shortly after by British explorer Robert Scott.

Eskimos and polar bears are found in the ARCTIC, not the Antarctic. All warm-blooded animals living on and around Antarctica--whales, seals, sea birds, penguins--rely on thick layers of blubber to insulate them from the cold. Plants grow in Antarctica in ice-free regions (only about 2 percent of the continent is ice-free). Lichens and moss grow in any favorable niche. There are 21 species of penguins in Antarctica, including Emperor, Rockhopper and Adelie. There are actually more petrels than there are penguins! Petrels include albatrosses, fulmars, prions, shearwaters, storm petrels, diving petrels and Gadfly petrels. Other birds that live in or breed in Antarctica include cormorants, gulls, and skuas
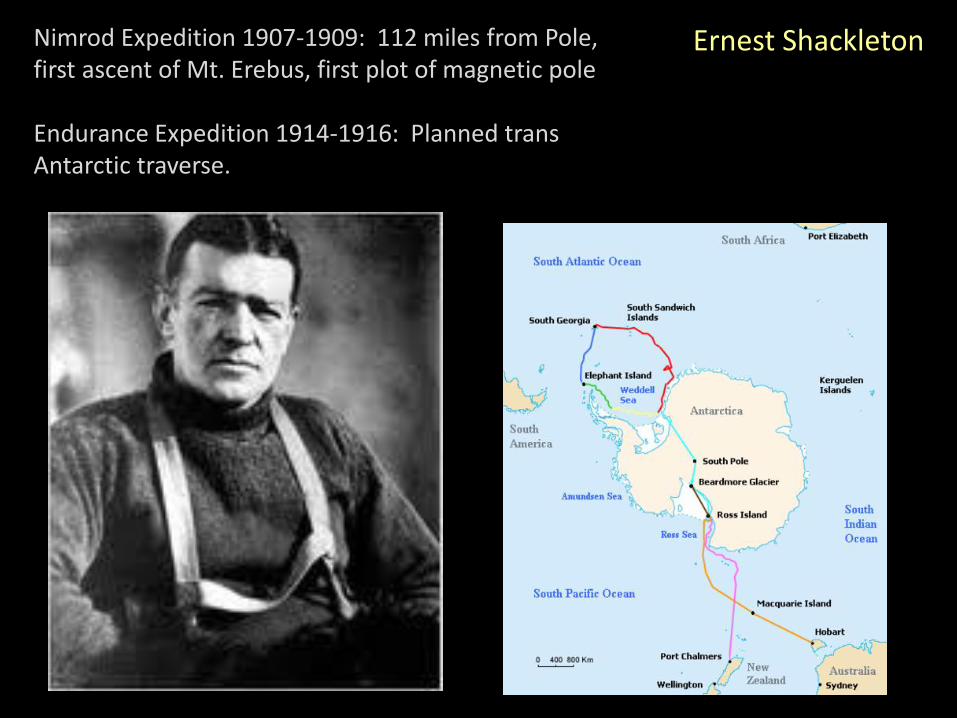
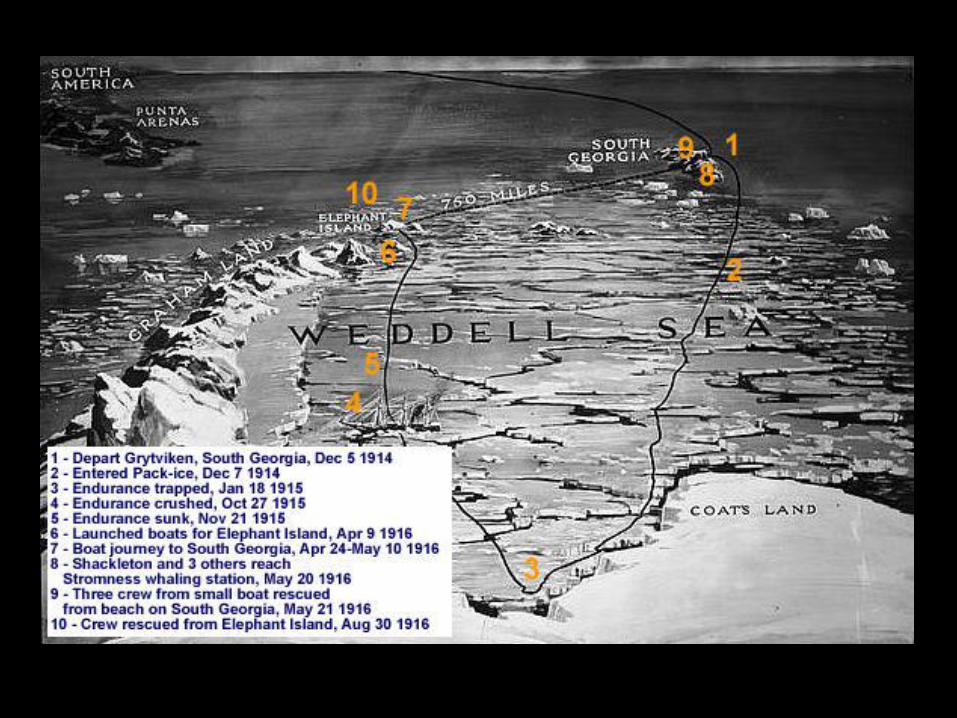
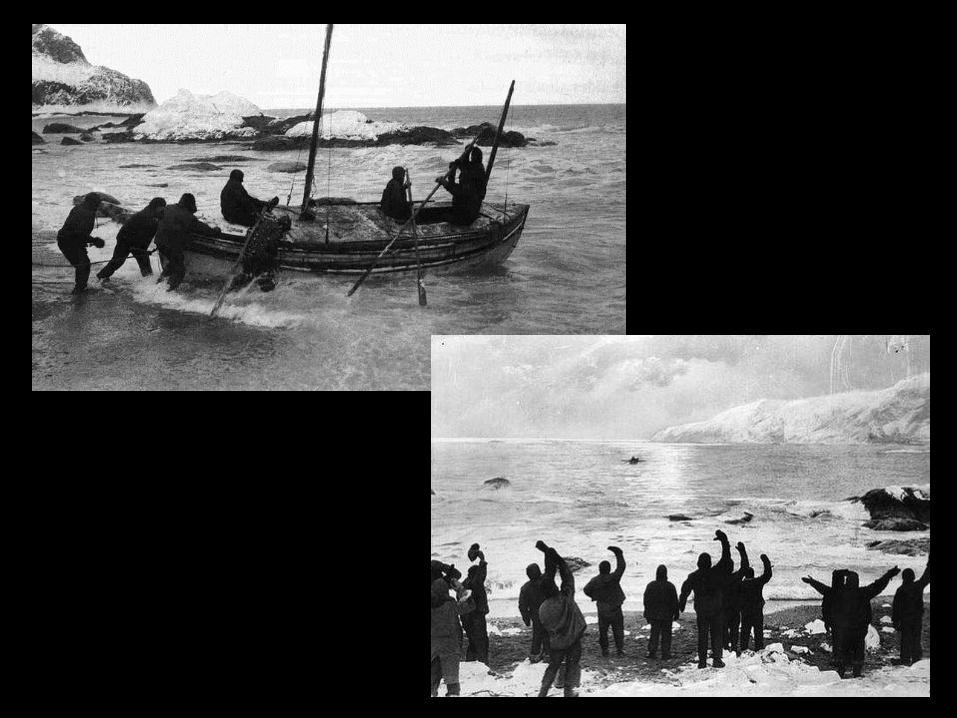
Nimrod Expedition 1907-1909: 112 miles from Pole, first ascent of Mt. Erebus, first plot of magnetic pole Endurance Expedition 1914-1916: Planned trans Antarctic traverse.
Ernest Shackleton
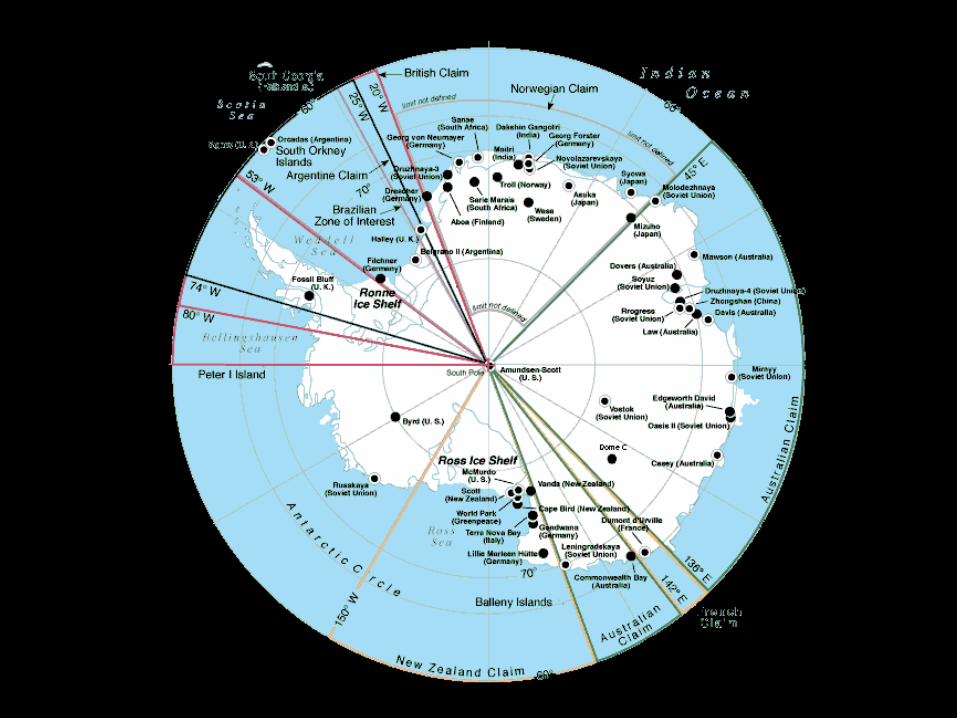

Antarctica covers the South Pole
Midnight at the pole 21st December Midday at the pole 21st June
The Living Earth, Inc. copyright 2006
South
Pole X
South
America
Africa
Australia and NZ
X
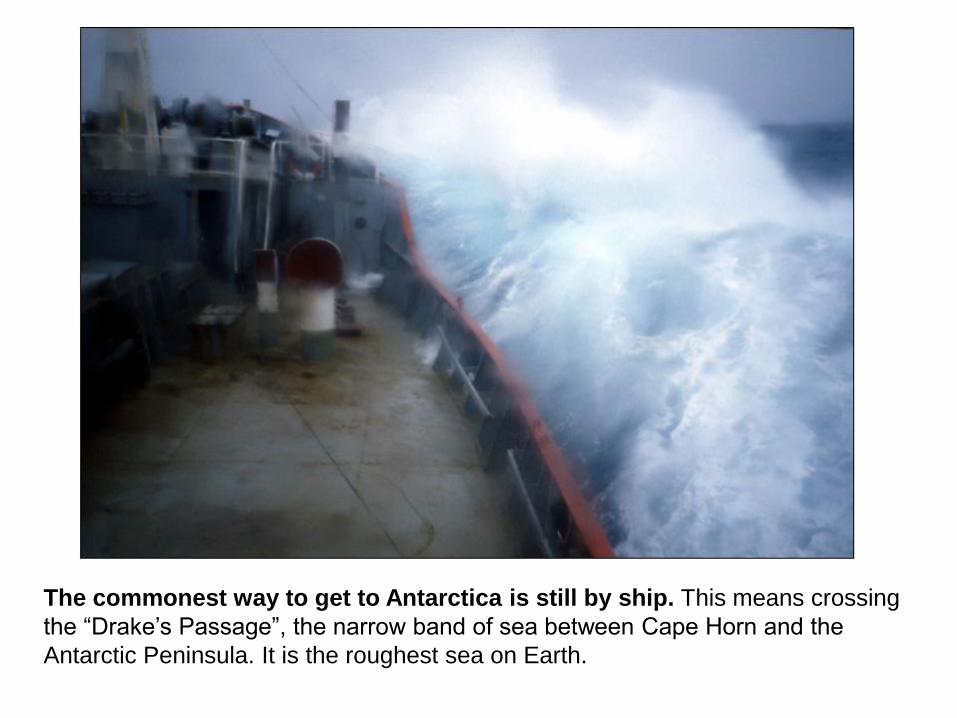
The commonest way to get to Antarctica is still by ship. This means crossing
the “Drake‟s Passage”, the narrow band of sea between Cape Horn and the
Antarctic Peninsula. It is the roughest sea on Earth.
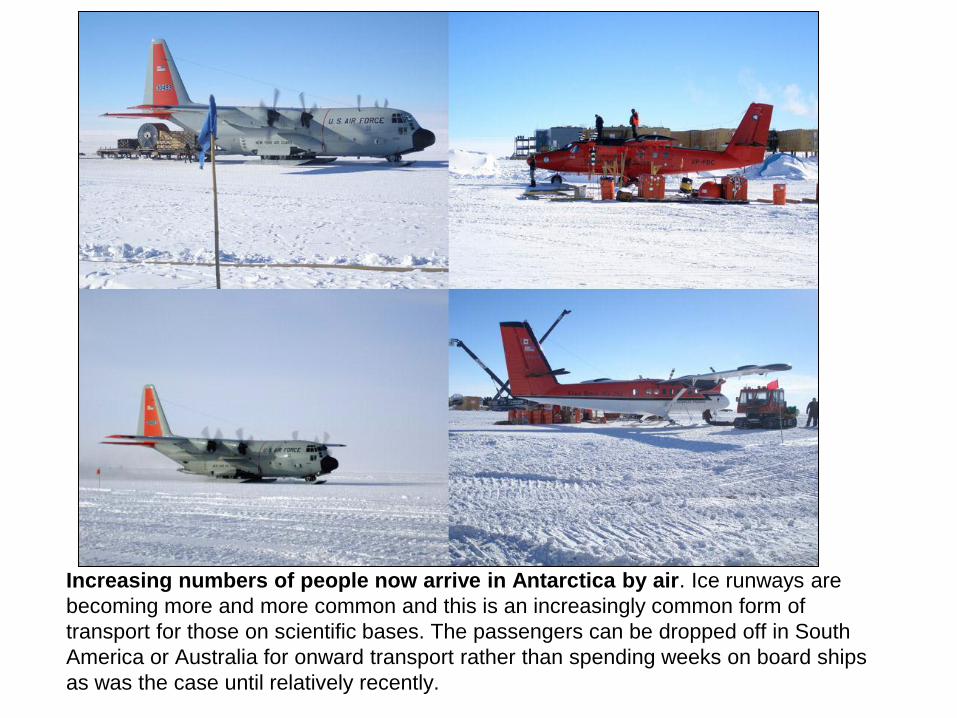
Increasing numbers of people now arrive in Antarctica by air. Ice runways are
becoming more and more common and this is an increasingly common form of
transport for those on scientific bases. The passengers can be dropped off in South
America or Australia for onward transport rather than spending weeks on board ships
as was the case until relatively recently.
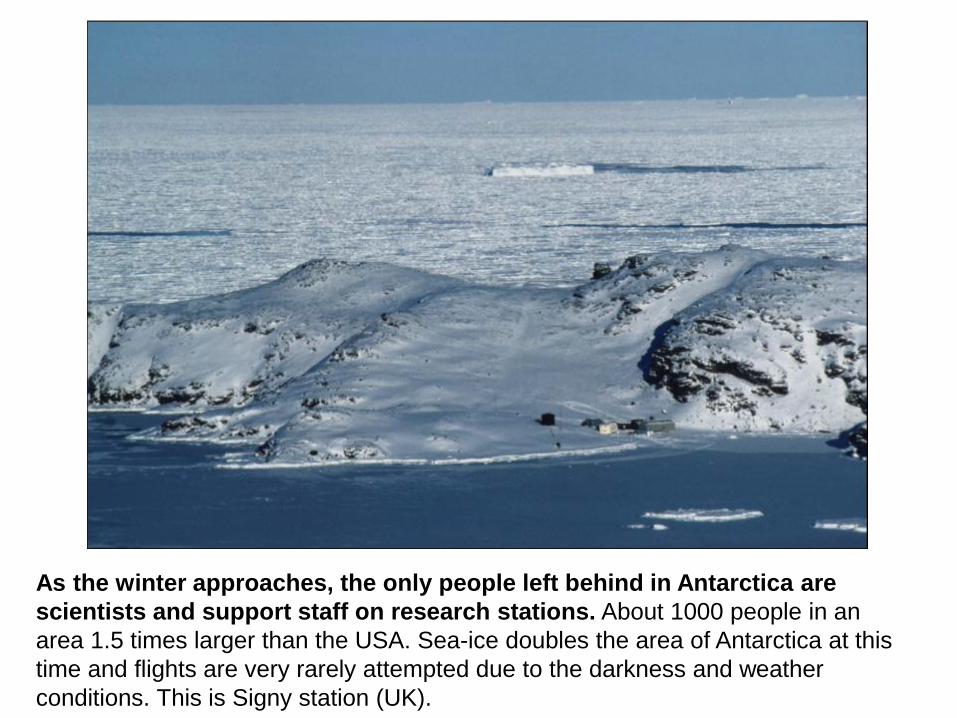
As the winter approaches, the only people left behind in Antarctica are
scientists and support staff on research stations. About 1000 people in an
area 1.5 times larger than the USA. Sea-ice doubles the area of Antarctica at this
time and flights are very rarely attempted due to the darkness and weather
conditions. This is Signy station (UK).
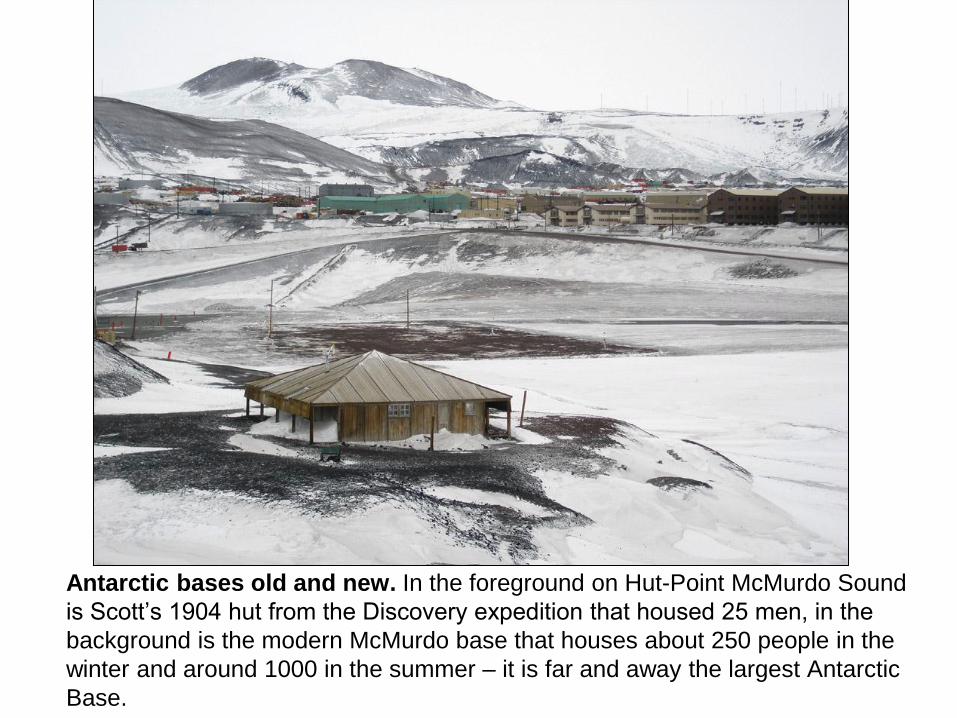
Antarctic bases old and new. In the foreground on Hut-Point McMurdo Sound
is Scott‟s 1904 hut from the Discovery expedition that housed 25 men, in the
background is the modern McMurdo base that houses about 250 people in the
winter and around 1000 in the summer – it is far and away the largest Antarctic
Base.
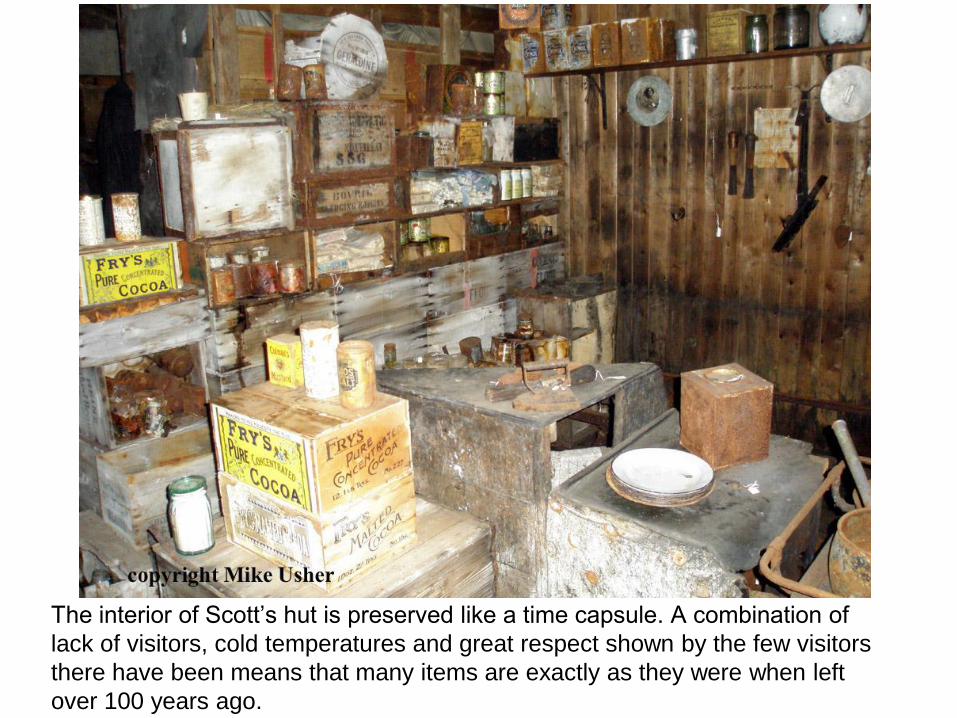
The interior of Scott‟s hut is preserved like a time capsule. A combination of
lack of visitors, cold temperatures and great respect shown by the few visitors
there have been means that many items are exactly as they were when left
over 100 years ago.
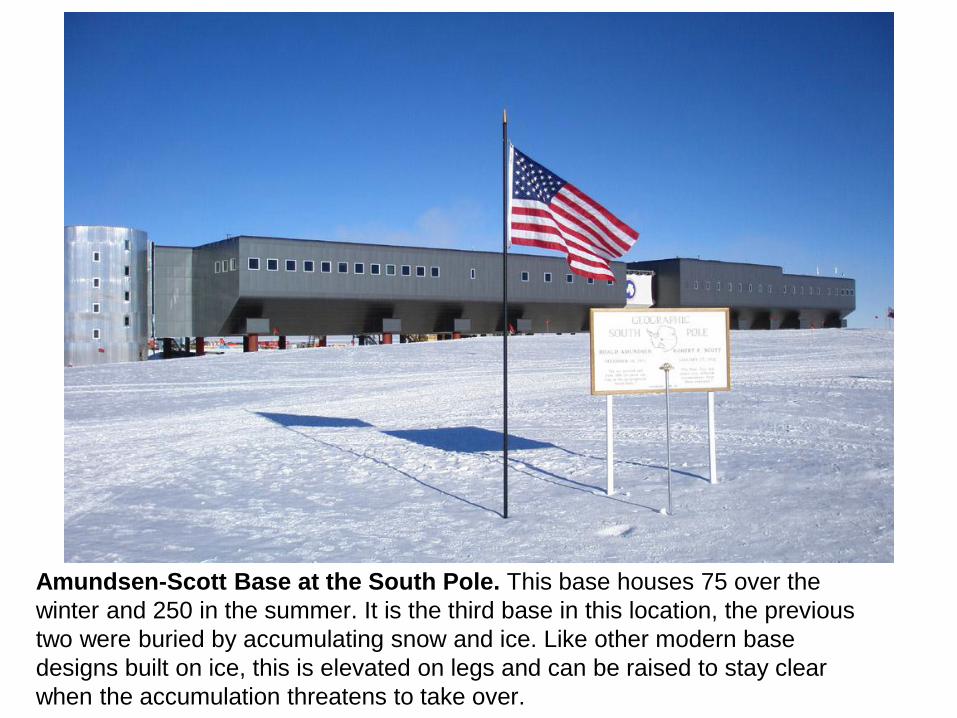
Amundsen-Scott Base at the South Pole. This base houses 75 over the
winter and 250 in the summer. It is the third base in this location, the previous
two were buried by accumulating snow and ice. Like other modern base
designs built on ice, this is elevated on legs and can be raised to stay clear
when the accumulation threatens to take over.
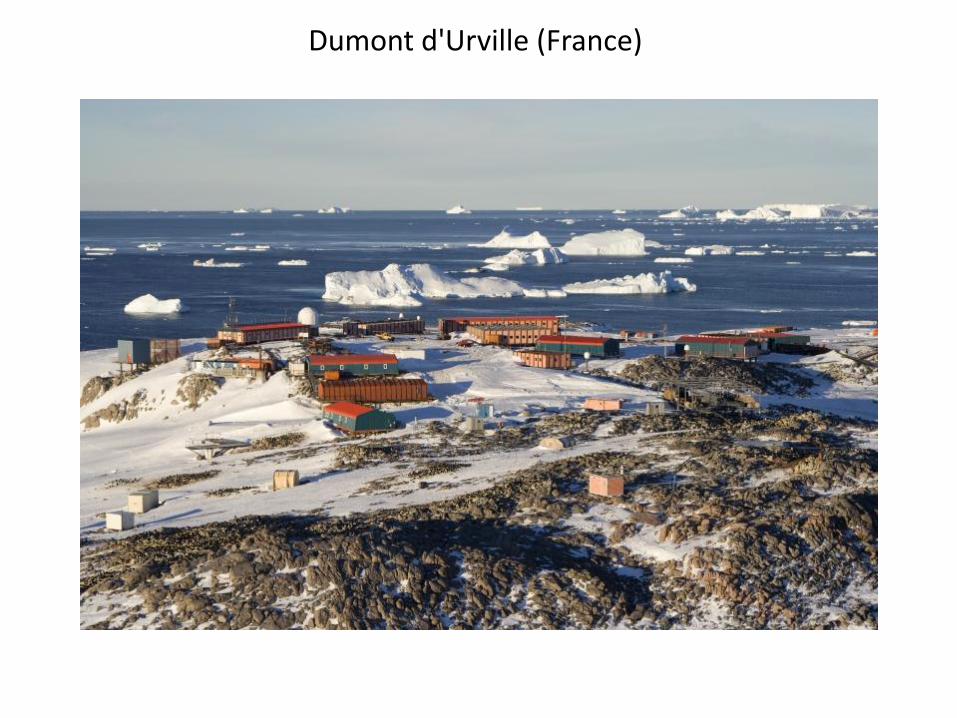
Dumont d'Urville (France)

Mario Zucchelli Station at Terra Nova Bay (Italy)
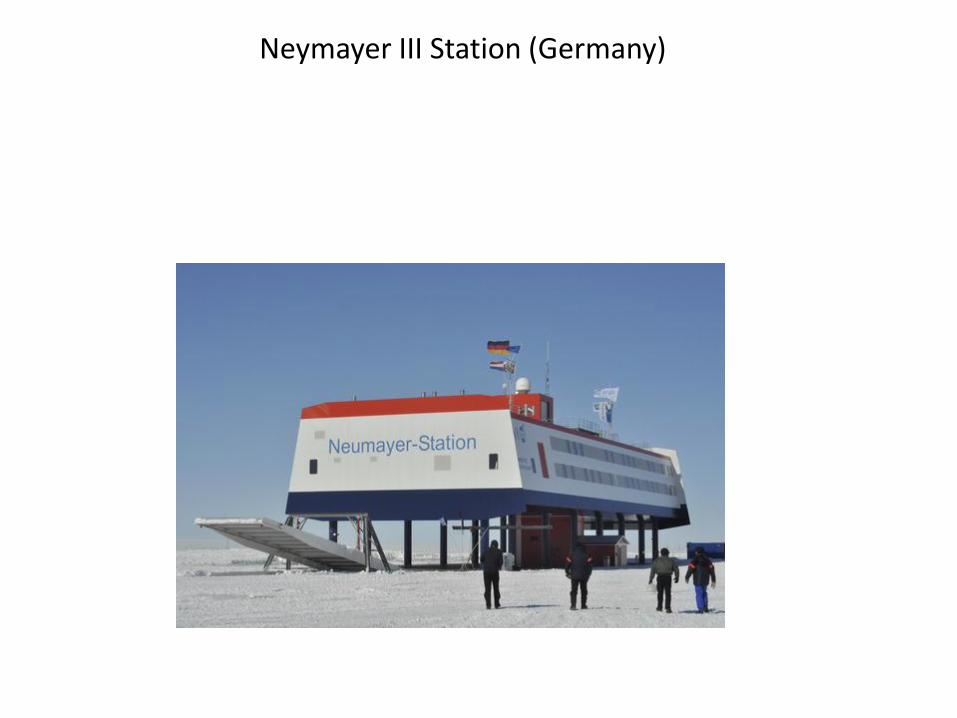
Neymayer III Station (Germany)
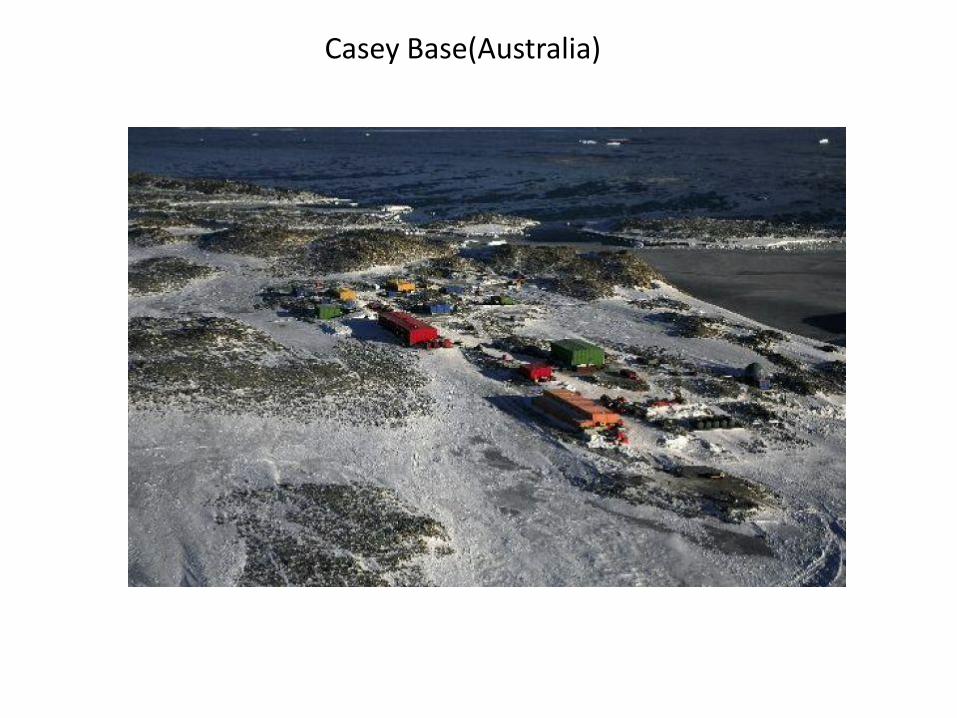
Casey Base(Australia)
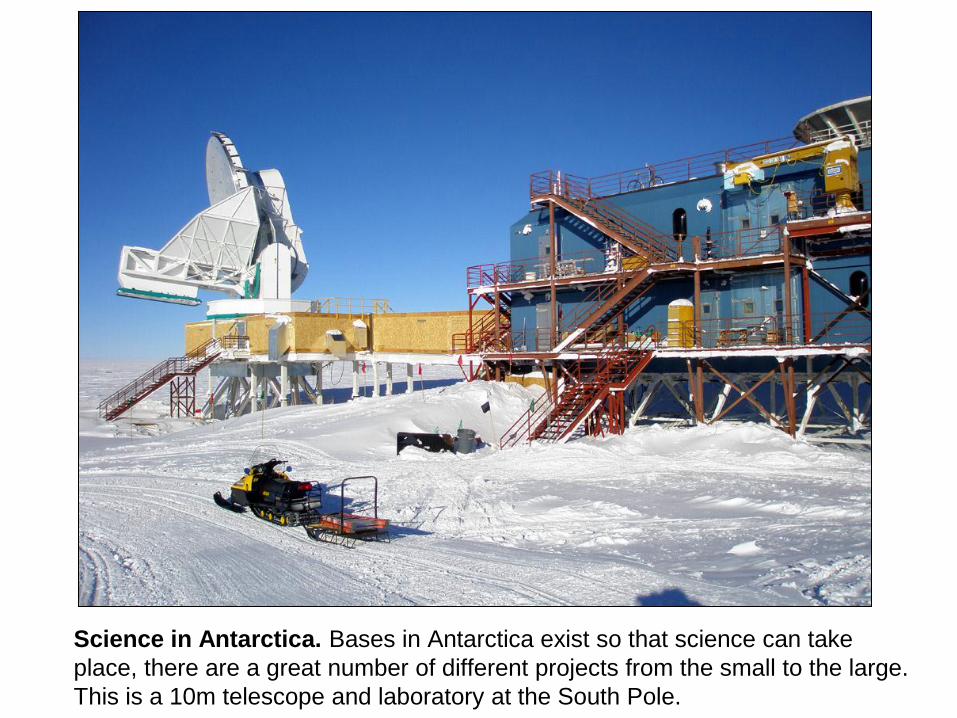
Science in Antarctica. Bases in Antarctica exist so that science can take
place, there are a great number of different projects from the small to the large.
This is a 10m telescope and laboratory at the South Pole.
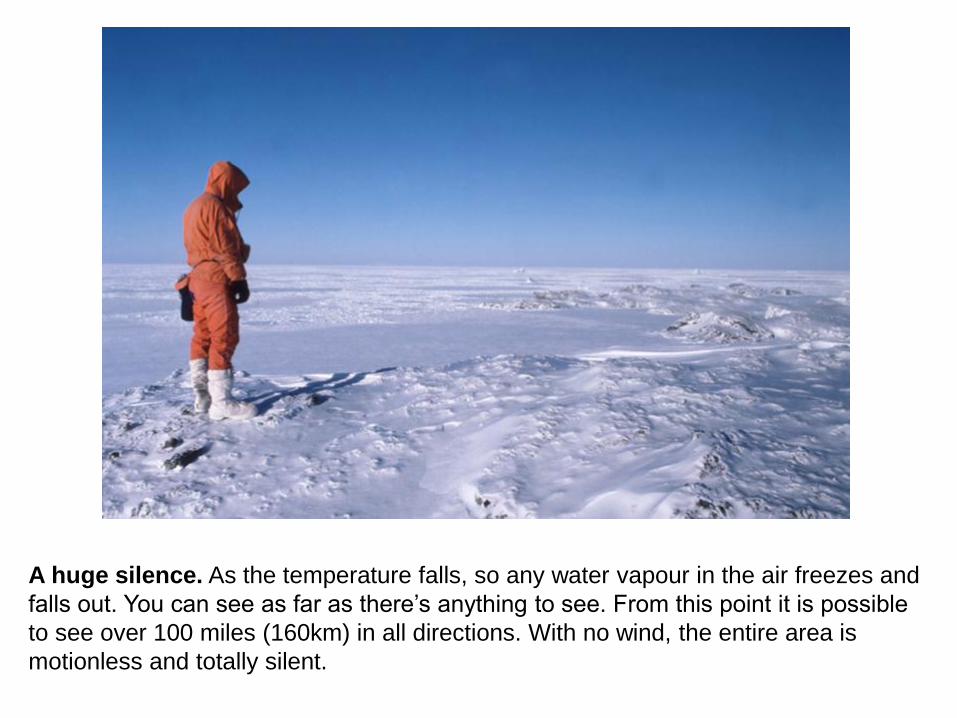
A huge silence. As the temperature falls, so any water vapour in the air freezes and
falls out. You can see as far as there‟s anything to see. From this point it is possible
to see over 100 miles (160km) in all directions. With no wind, the entire area is
motionless and totally silent.
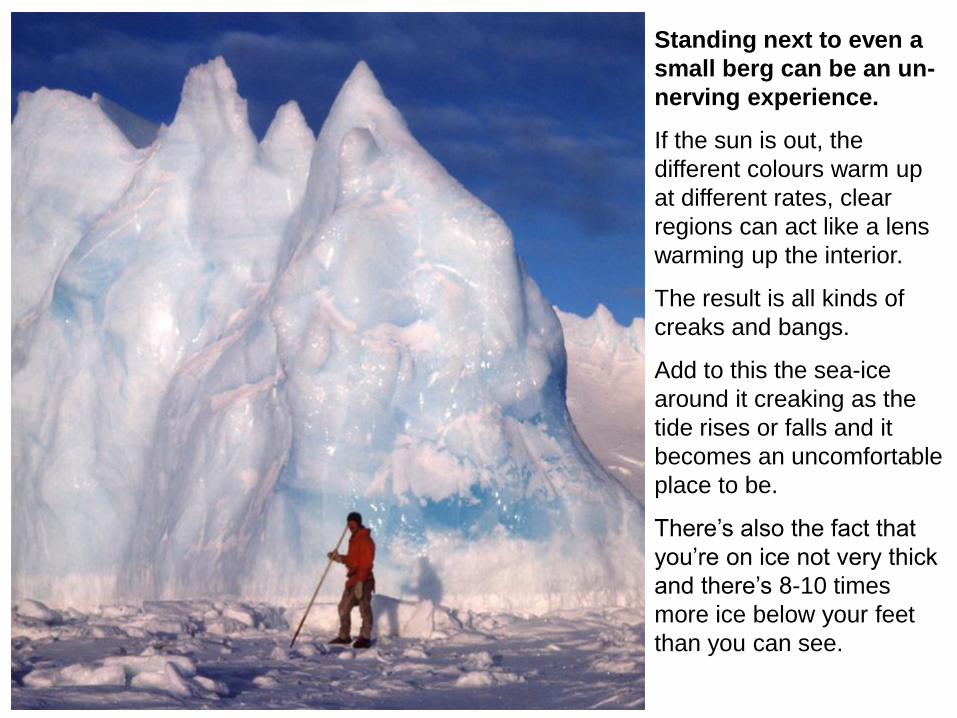
Standing next to even a
small berg can be an un-
nerving experience.
If the sun is out, the
different colours warm up
at different rates, clear
regions can act like a lens
warming up the interior.
The result is all kinds of
creaks and bangs.
Add to this the sea-ice
around it creaking as the
tide rises or falls and it
becomes an uncomfortable
place to be.
There‟s also the fact that
you‟re on ice not very thick
and there‟s 8-10 times
more ice below your feet
than you can see.

Antarctic land transport. Many vehicles are tracked including all that go away
from the bases, wheeled transport is used in and around bases where
conditions are predictable.
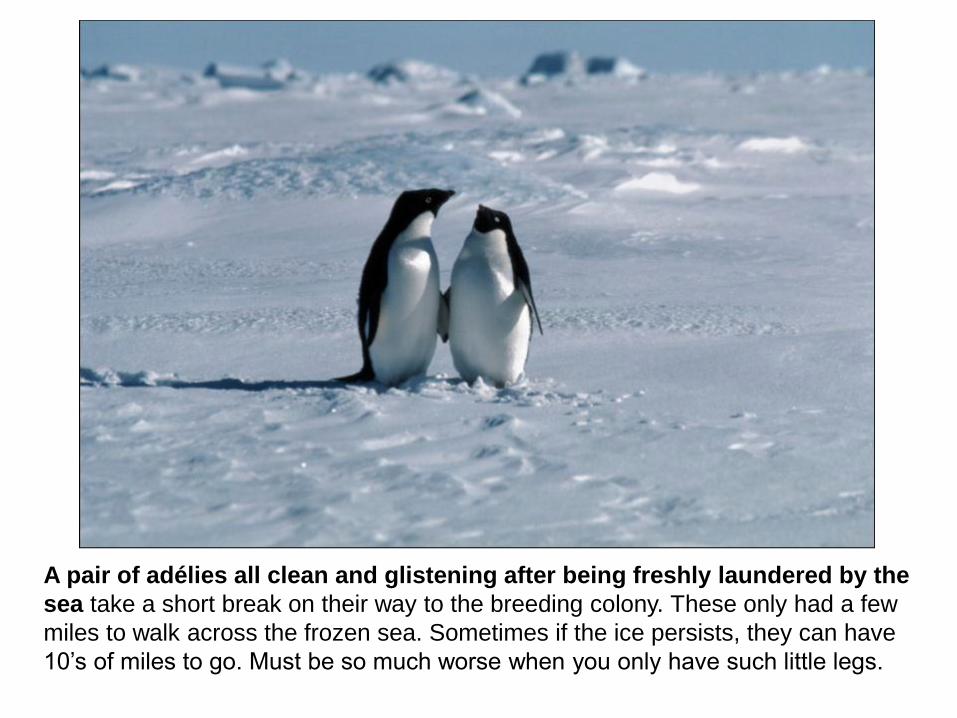
A pair of adélies all clean and glistening after being freshly laundered by the
sea take a short break on their way to the breeding colony. These only had a few
miles to walk across the frozen sea. Sometimes if the ice persists, they can have
10‟s of miles to go. Must be so much worse when you only have such little legs.
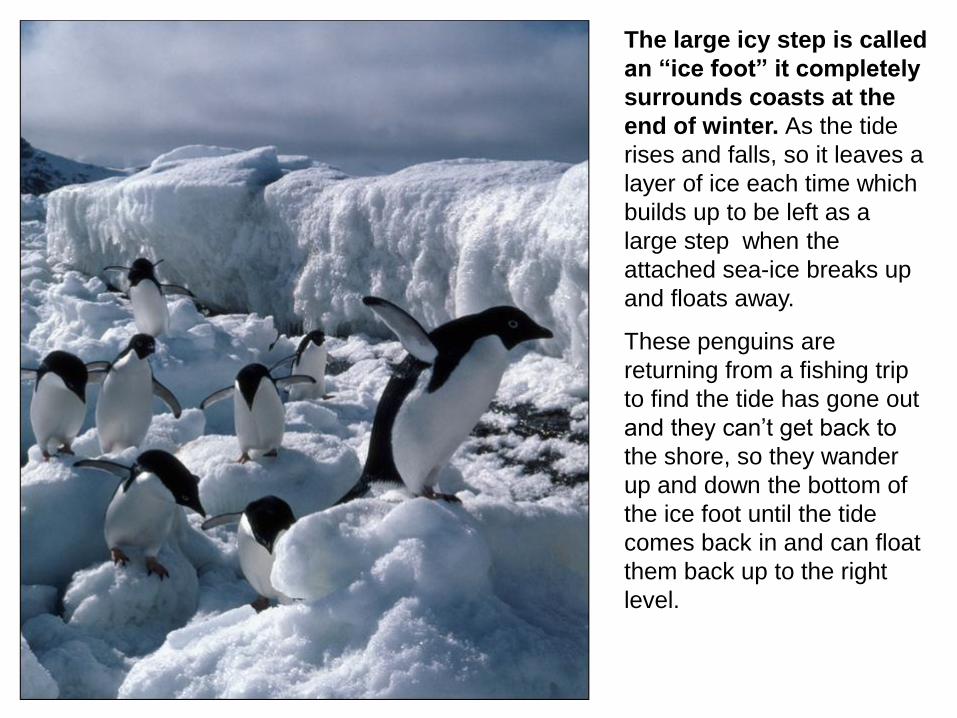
The large icy step is called
an “ice foot” it completely
surrounds coasts at the
end of winter. As the tide
rises and falls, so it leaves a
layer of ice each time which
builds up to be left as a
large step when the
attached sea-ice breaks up
and floats away.
These penguins are
returning from a fishing trip
to find the tide has gone out
and they can‟t get back to
the shore, so they wander
up and down the bottom of
the ice foot until the tide
comes back in and can float
them back up to the right
level.
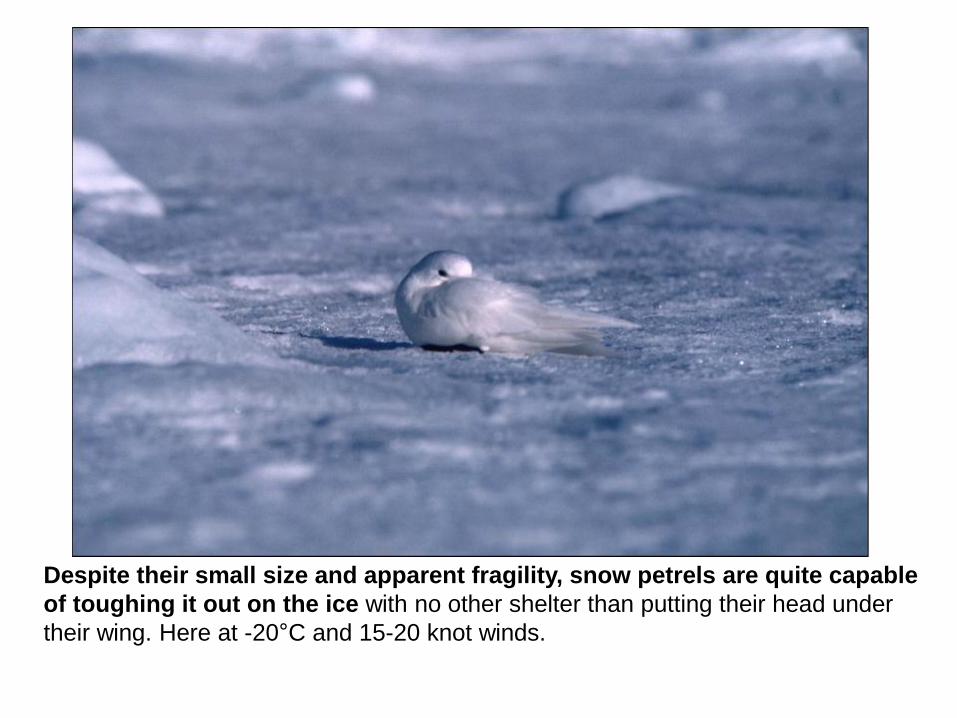
Despite their small size and apparent fragility, snow petrels are quite capable
of toughing it out on the ice with no other shelter than putting their head under
their wing. Here at -20°C and 15-20 knot winds.
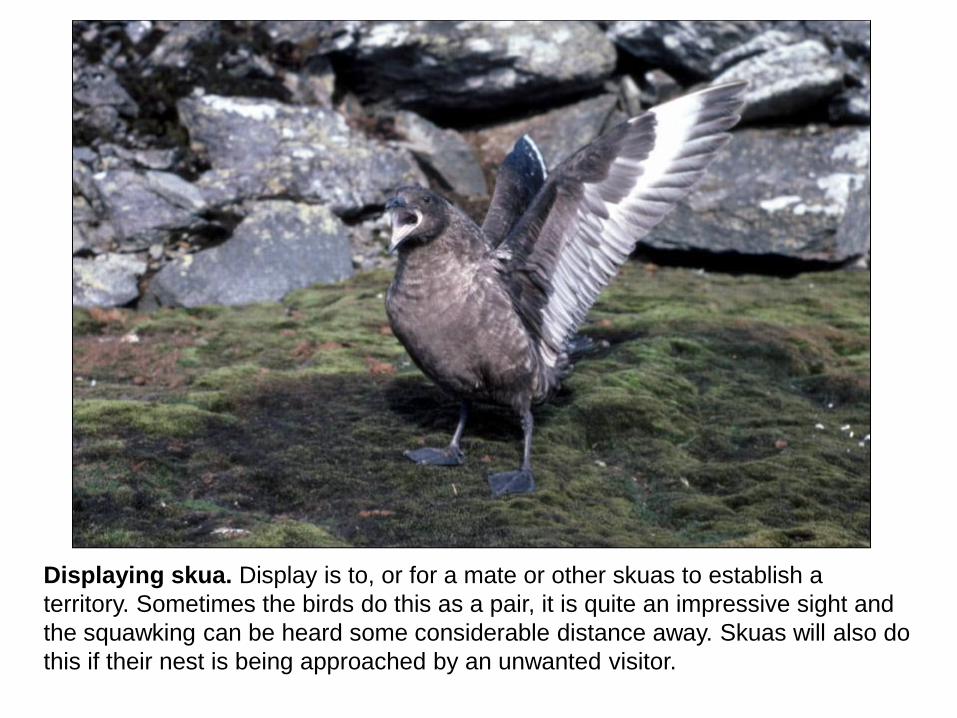
Displaying skua. Display is to, or for a mate or other skuas to establish a
territory. Sometimes the birds do this as a pair, it is quite an impressive sight and
the squawking can be heard some considerable distance away. Skuas will also do
this if their nest is being approached by an unwanted visitor.
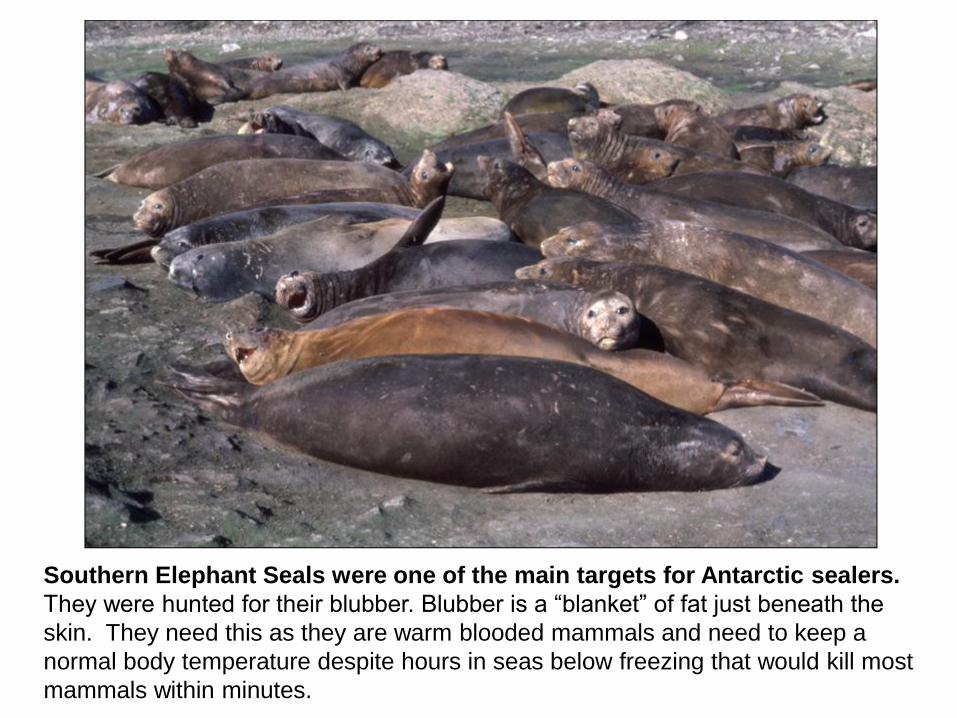
Southern Elephant Seals were one of the main targets for Antarctic sealers.
They were hunted for their blubber. Blubber is a “blanket” of fat just beneath the
skin. They need this as they are warm blooded mammals and need to keep a
normal body temperature despite hours in seas below freezing that would kill most
mammals within minutes.
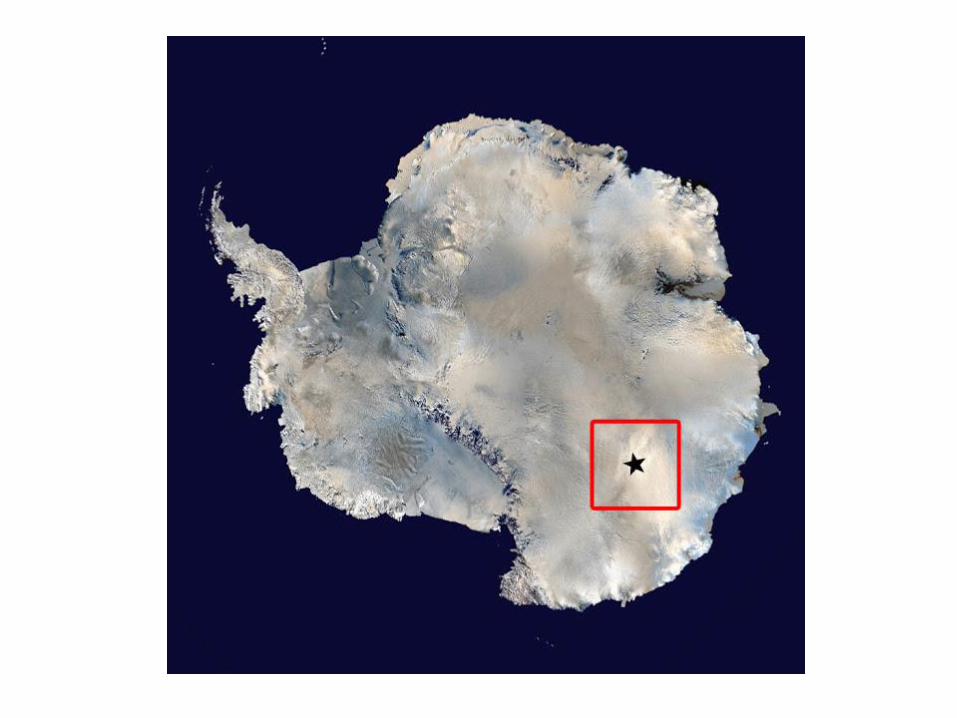
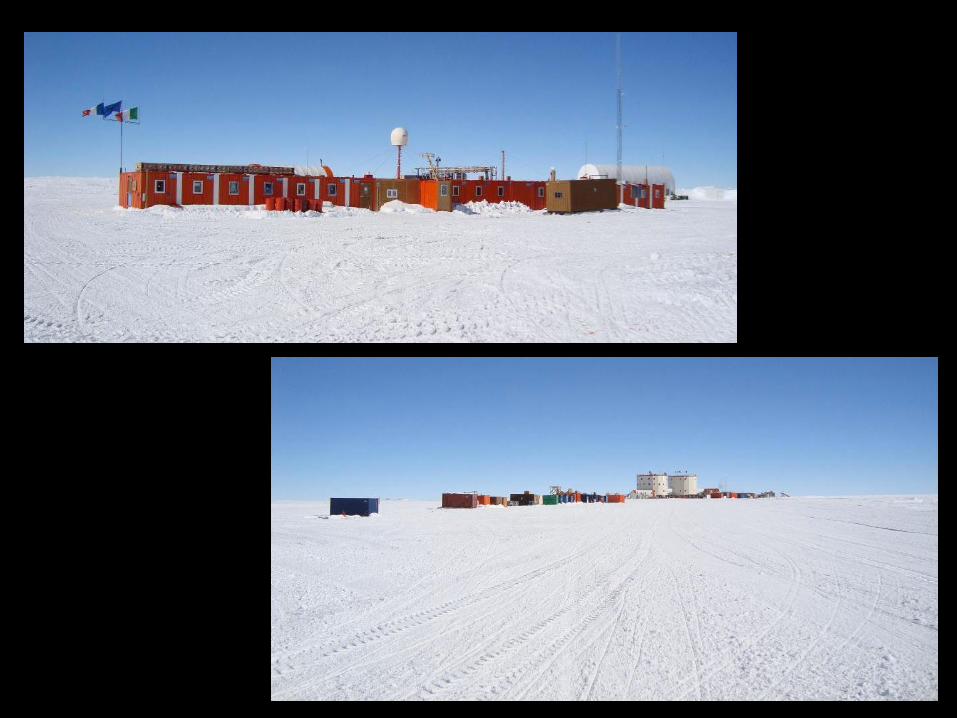
Concordia Station

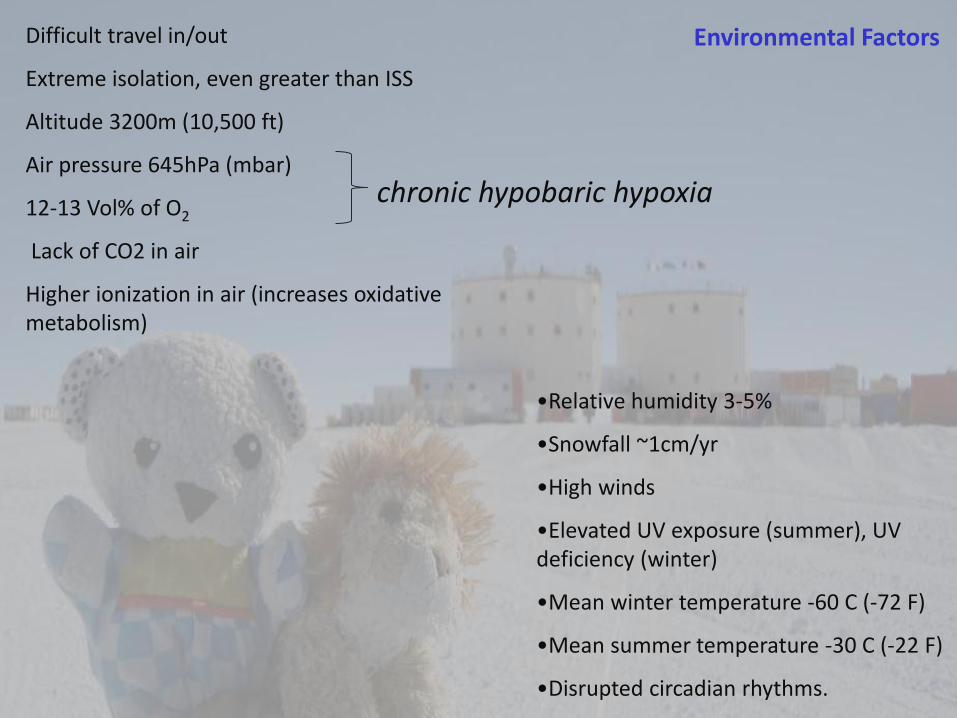
Environmental Factors Difficult travel in/out
Extreme isolation, even greater than ISS
Altitude 3200m (10,500 ft)
Air pressure 645hPa (mbar)
12-13 Vol% of O2
Lack of CO2 in air
Higher ionization in air (increases oxidative metabolism)
•Relative humidity 3-5%
•Snowfall ~1cm/yr
•High winds
•Elevated UV exposure (summer), UV deficiency (winter)
•Mean winter temperature -60 C (-72 F)
•Mean summer temperature -30 C (-22 F)
•Disrupted circadian rhythms.
chronic hypobaric hypoxia
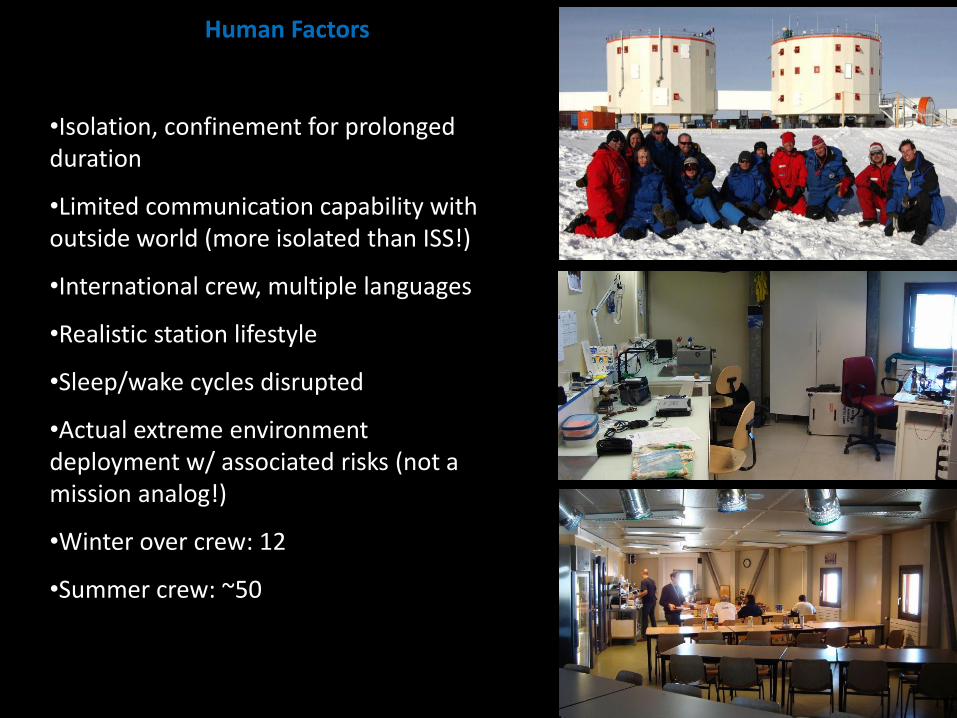
Human Factors
•Isolation, confinement for prolonged duration
•Limited communication capability with outside world (more isolated than ISS!)
•International crew, multiple languages
•Realistic station lifestyle
•Sleep/wake cycles disrupted
•Actual extreme environment deployment w/ associated risks (not a mission analog!)
•Winter over crew: 12
•Summer crew: ~50

CHOICE Study
CONCORDIA STATION, DOME C, ANTARCTICA AS A GROUND-BASED
ANALOG FOR SPACEFLIGHT/PLANETARY EXPLORATION:
The CHOICE* Immunology Study
Brian Crucian, Satish Mehta, Raymond Stowe, Alexander Chouker, Alex Salam, Ales
Rybka, Heather Quiriarte, Duane Pierson and Clarence Sams
Final Data; NASA Assays - February, 2012
*Consequences of both long-term confinement (“Confinement Stress”) and hypobaric
hypoxia (“Hypoxic Stress”) on Immunity (“Immune-Modulation/Suppression”) in the
Antarctic CONCORDIA Environment.
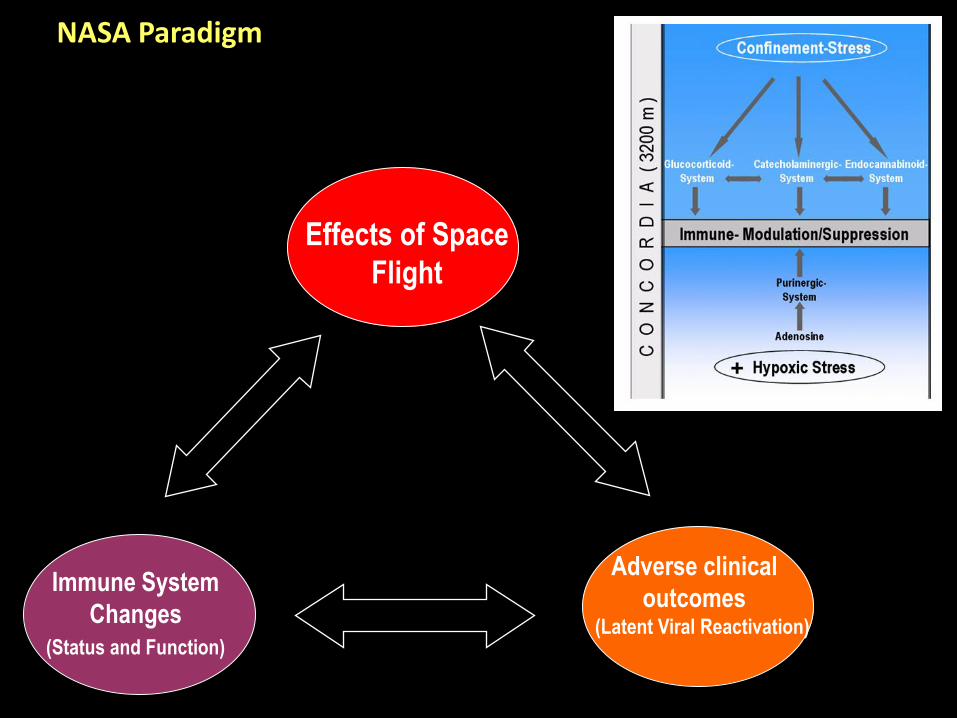
Effects of Space
Flight
Immune System
Changes
Adverse clinical
outcomes (Latent Viral Reactivation)
(Status and Function)
NASA Paradigm
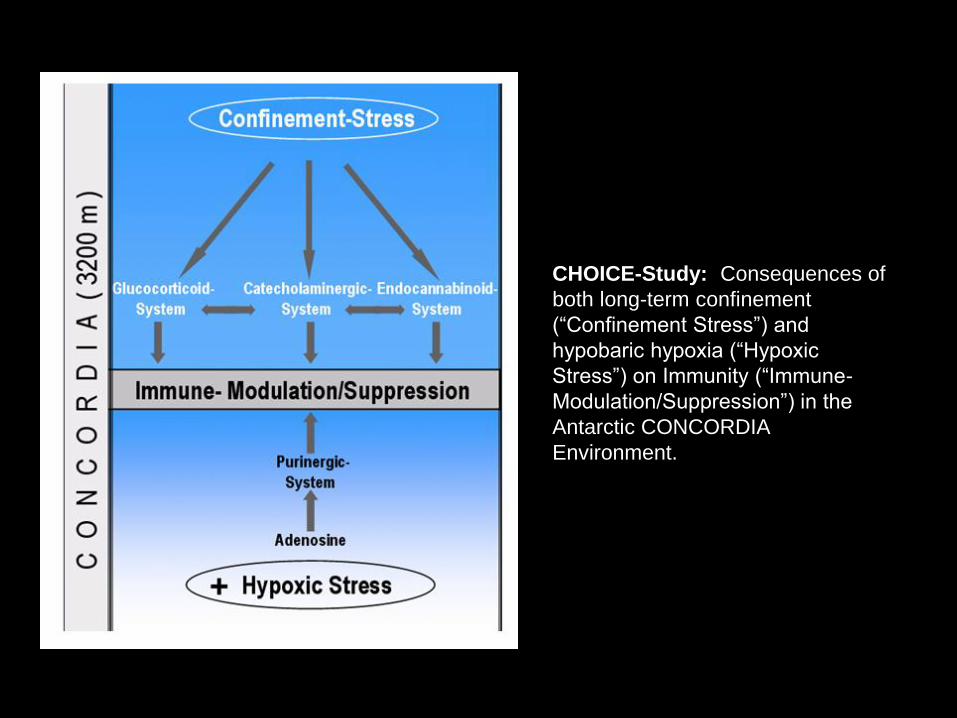
CHOICE-Study: Consequences of
both long-term confinement
(“Confinement Stress”) and
hypobaric hypoxia (“Hypoxic
Stress”) on Immunity (“Immune-
Modulation/Suppression”) in the
Antarctic CONCORDIA
Environment.
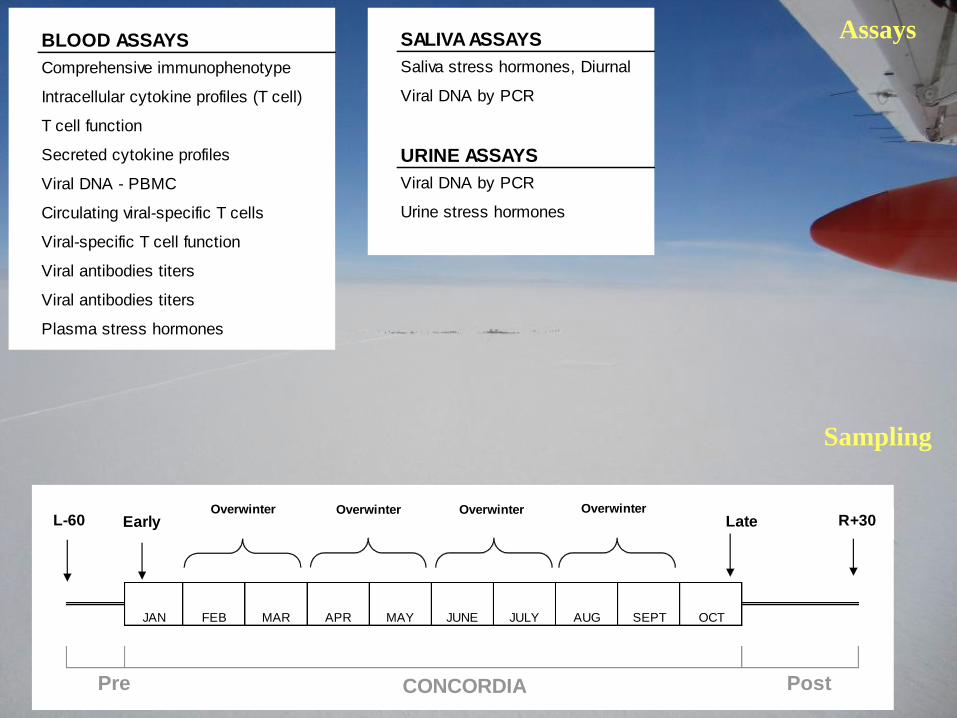
BLOOD ASSAYS
Pre, post
sampling
In-
sampling Details NASA Lab
Comprehensive immunophenotype WB (see panel) Immune
Intracellular cytokine profiles (T cell) WB PMA+ION, LPS Immune
T cell function WB CD3/CD28, A+B Immune
Secreted cytokine profiles WB Th1/Th2, Inflam. Immune
Viral DNA - PBMC WB EBV Mcgn
Circulating viral-specific T cells WB EBV, CMV Mcgn
Viral-specific T cell function WB EBV, CMV Mcgn
Viral antibodies titers Plasma Plasma EBV, CMV Mcgn
Viral antibodies titers Plasma Plasma VZV Micro
Plasma stress hormones Plasma Plasma cortisol Mcgn
SALIVA ASSAYS
Saliva stress hormones, Diurnal Dry Saliva Dry Saliva cortisol, DHEA Micro
Viral DNA by PCR Liquid Saliva Liquid Saliva CMV*, EBV, VZV Micro
URINE ASSAYS
Viral DNA by PCR 24hr. URINE 24hr. URINE CMV Micro
Urine stress hormones 24hr. URINE 24hr. URINE cortisol*, cat.* Micro
Assays
BLOOD ASSAYS
Pre, post
sampling
In-
sampling Details NASA Lab
Comprehensive immunophenotype WB (see panel) Immune
Intracellular cytokine profiles (T cell) WB PMA+ION, LPS Immune
T cell function WB CD3/CD28, A+B Immune
Secreted cytokine profiles WB Th1/Th2, Inflam. Immune
Viral DNA - PBMC WB EBV Mcgn
Circulating viral-specific T cells WB EBV, CMV Mcgn
Viral-specific T cell function WB EBV, CMV Mcgn
Viral antibodies titers Plasma Plasma EBV, CMV Mcgn
Viral antibodies titers Plasma Plasma VZV Micro
Plasma stress hormones Plasma Plasma cortisol Mcgn
SALIVA ASSAYS
Saliva stress hormones, Diurnal Dry Saliva Dry Saliva cortisol, DHEA Micro
Viral DNA by PCR Liquid Saliva Liquid Saliva CMV*, EBV, VZV Micro
URINE ASSAYS
Viral DNA by PCR 24hr. URINE 24hr. URINE CMV Micro
Urine stress hormones 24hr. URINE 24hr. URINE cortisol*, cat.* Micro
JAN FEB MAR APR MAY JUNE JULY AUG SEPT OCT
CONCORDIAPre Post
EarlyOverwinter
Late R+30L-60Overwinter Overwinter Overwinter
Sampling

ASSAY SAMPLE* Pre/Post Overwinter
Mitogen/
Specific Analyte NASA Lab
Comprehensive immunophenotype Whole blood X (see panel) Immune
T cell intracellular cytokine profiles Whole blood X PMA+ION, LPS Immune
T cell function/24hr early blastogenesis Whole blood X CD3/CD28, A+B Immune
Secreted cytokine profiles/48h stimulation Whole blood X Th1/Th2, Inflam. Immune
Viral DNA - PBMC Whole blood X EBV Mcgn
Circulating viral-specific T cells Whole blood X EBV, CMV Mcgn
Viral-specific T cell function Whole blood X EBV, CMV Mcgn
Viral antibodies titers Plasma X X EBV, CMV Mcgn
Viral antibodies titers Plasma X X VZV Micro
Plasma stress hormones Plasma X X cortisol Mcgn
Saliva stress hormones, Diurnal Dry saliva X X cortisol, DHEA Micro
Viral DNA by PCR Liquid saliva X X CMV*, EBV, VZV Micro
Viral DNA by PCR 24h Urine X X CMV Micro
Urine stress hormones 24h Urine X X cortisol*, cat.* Micro
*Pre, post: 5.0 ml heparin whole blood, 1.0 ml saliva, dry saliva book, 10 ml of 24 hr. urine
Overwinter: 0.5 to 1.0 ml frozen plasma, 1.0 ml frozen saliva, dry saliva book, 10 ml of frozen 24 hr. urine

Subjects/Logistics
2008/2009 Summer Transition 2009 Overwinter 2009/2010 Summer Transition 2010 Overwinter 2010/2011 Summer Transition
n=6
n=9

L-60 +2Wk Jan Feb Mar Apr May June July Aug Sept Oct Nov +9Mo R+30
A X X X X X X X
B X X X X X X X
C X X X X X X X
D X X X X X X X
E X X X X X X X
F X X X X X X
G X X C, V X C, V X X
H X Subject withdrawn
J X Subject withdrawn
K X X C, V X C, V X X
L X X C, V X C, V X X
M X X C, V X C, V X X
N X X C, V X C, V X X
O X X C, V X C, V X X
P X X C, V X C, V X X
J* X C, V X C, V X X
*Subject added after deployment; no baseline
X Primary sampling: Phenotype, T cell function, cytokine profiles, viral immunity, viral reactivation.
C Cytokine profiles (culture supernatant)
V Latent viral reactivation (saliva sample)
WO
2009
WO
2010
Deployed to Concordia Station
Overwinter Isolation
Table: Sampling schedule for CHOICE study. Baseline samples (L-60 and R+30) were collected and processed in Europe before/after deployment. Summer transition samples (+2wk, +9mo) were processed at Concordia Station during the high-habitation summer transition period. All other samples were were processed during the high isolation overwinter period. Not all assays were performed at each timepoint, due to technical or sampling constraints.

Unplanned „bonus‟ mid-winter testing
•Partec cytometer plan: bring in/out for support of each early/late timepoint.
•Revised to leave during winter over, with Dr. Salam to process samples.
•Reagents issues
•Consumable supply issues
•Data/training issues
•Additional assays as training/reagents/consumables allowed, phenotype, cell cultures.
•First run: deployment month #2. Samples collected at DC, data acquired at DC, data
emailed to JSC, analysis performed at JSC.
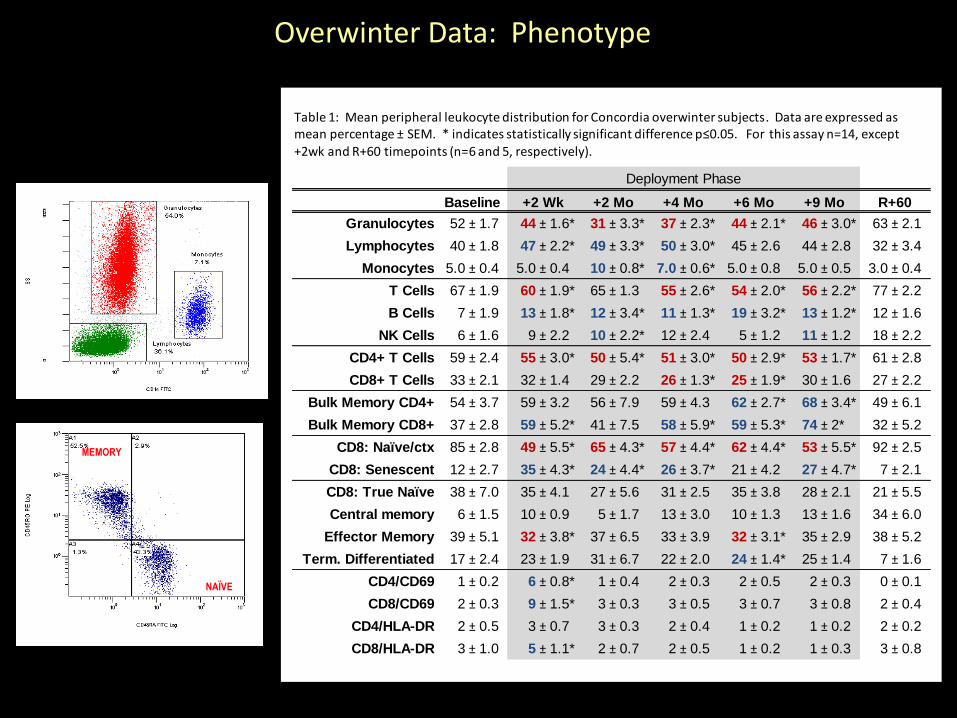
Overwinter Data: Phenotype
NAÏVE
MEMORY
Granulocytes 52 ± 1.7 44 ± 1.6* 31 ± 3.3* 37 ± 2.3* 44 ± 2.1* 46 ± 3.0* 63 ± 2.1
Lymphocytes 40 ± 1.8 47 ± 2.2* 49 ± 3.3* 50 ± 3.0* 45 ± 2.6 44 ± 2.8 32 ± 3.4
Monocytes 5.0 ± 0.4 5.0 ± 0.4 10 ± 0.8* 7.0 ± 0.6* 5.0 ± 0.8 5.0 ± 0.5 3.0 ± 0.4
T Cells 67 ± 1.9 60 ± 1.9* 65 ± 1.3 55 ± 2.6* 54 ± 2.0* 56 ± 2.2* 77 ± 2.2
B Cells 7 ± 1.9 13 ± 1.8* 12 ± 3.4* 11 ± 1.3* 19 ± 3.2* 13 ± 1.2* 12 ± 1.6
NK Cells 6 ± 1.6 9 ± 2.2 10 ± 2.2* 12 ± 2.4 5 ± 1.2 11 ± 1.2 18 ± 2.2
CD4+ T Cells 59 ± 2.4 55 ± 3.0* 50 ± 5.4* 51 ± 3.0* 50 ± 2.9* 53 ± 1.7* 61 ± 2.8
CD8+ T Cells 33 ± 2.1 32 ± 1.4 29 ± 2.2 26 ± 1.3* 25 ± 1.9* 30 ± 1.6 27 ± 2.2
Bulk Memory CD4+ 54 ± 3.7 59 ± 3.2 56 ± 7.9 59 ± 4.3 62 ± 2.7* 68 ± 3.4* 49 ± 6.1
Bulk Memory CD8+ 37 ± 2.8 59 ± 5.2* 41 ± 7.5 58 ± 5.9* 59 ± 5.3* 74 ± 2* 32 ± 5.2
CD8: Naïve/ctx 85 ± 2.8 49 ± 5.5* 65 ± 4.3* 57 ± 4.4* 62 ± 4.4* 53 ± 5.5* 92 ± 2.5
CD8: Senescent 12 ± 2.7 35 ± 4.3* 24 ± 4.4* 26 ± 3.7* 21 ± 4.2 27 ± 4.7* 7 ± 2.1
CD8: True Naïve 38 ± 7.0 35 ± 4.1 27 ± 5.6 31 ± 2.5 35 ± 3.8 28 ± 2.1 21 ± 5.5
Central memory 6 ± 1.5 10 ± 0.9 5 ± 1.7 13 ± 3.0 10 ± 1.3 13 ± 1.6 34 ± 6.0
Effector Memory 39 ± 5.1 32 ± 3.8* 37 ± 6.5 33 ± 3.9 32 ± 3.1* 35 ± 2.9 38 ± 5.2
Term. Differentiated 17 ± 2.4 23 ± 1.9 31 ± 6.7 22 ± 2.0 24 ± 1.4* 25 ± 1.4 7 ± 1.6
CD4/CD69 1 ± 0.2 6 ± 0.8* 1 ± 0.4 2 ± 0.3 2 ± 0.5 2 ± 0.3 0 ± 0.1
CD8/CD69 2 ± 0.3 9 ± 1.5* 3 ± 0.3 3 ± 0.5 3 ± 0.7 3 ± 0.8 2 ± 0.4
CD4/HLA-DR 2 ± 0.5 3 ± 0.7 3 ± 0.3 2 ± 0.4 1 ± 0.2 1 ± 0.2 2 ± 0.2
CD8/HLA-DR 3 ± 1.0 5 ± 1.1* 2 ± 0.7 2 ± 0.5 1 ± 0.2 1 ± 0.3 3 ± 0.8
Deployment Phase
R+60Baseline +2 Wk +2 Mo +4 Mo +6 Mo +9 Mo
Table 1: Mean peripheral leukocyte distribution for Concordia overwinter subjects. Data are expressed as mean percentage ± SEM. * indicates statistically significant difference p≤0.05. For this assay n=14, except+2wk and R+60 timepoints (n=6 and 5, respectively).
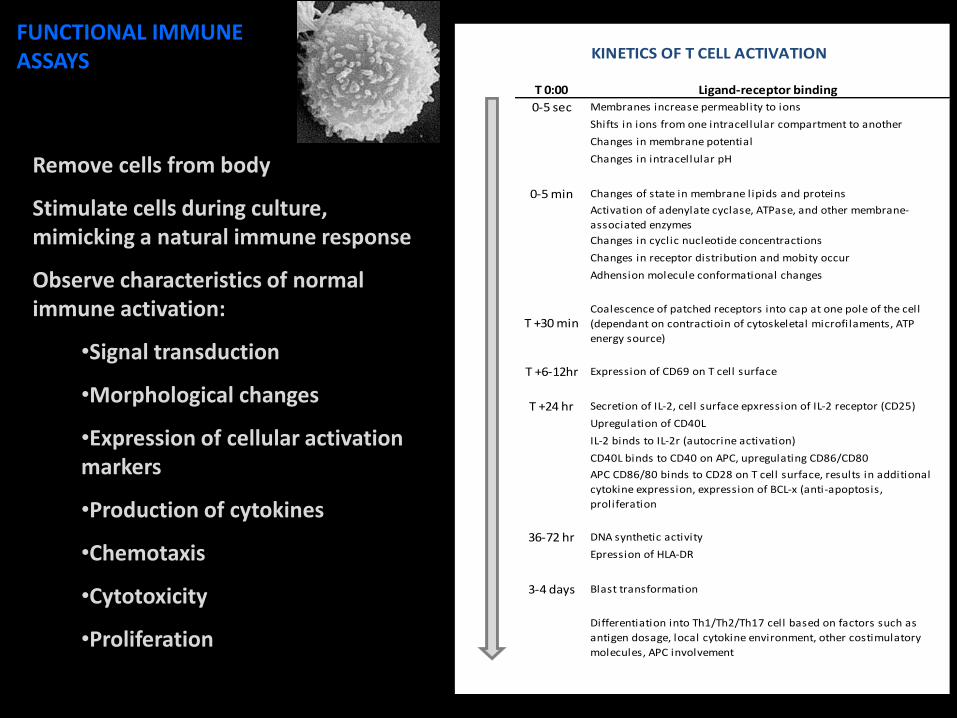
KINETICS OF T CELL ACTIVATION
T 0:00 Ligand-receptor binding
0-5 sec Membranes increase permeablity to ions
Shifts in ions from one intracellular compartment to another
Changes in membrane potential
Changes in intracellular pH
0-5 min Changes of state in membrane lipids and proteins
Activation of adenylate cyclase, ATPase, and other membrane-
associated enzymes
Changes in cyclic nucleotide concentractions
Changes in receptor distribution and mobity occur
Adhension molecule conformational changes
T +30 minCoalescence of patched receptors into cap at one pole of the cell
(dependant on contractioin of cytoskeletal microfilaments, ATP
energy source)
T +6-12hr Expression of CD69 on T cell surface
T +24 hr Secretion of IL-2, cell surface epxression of IL-2 receptor (CD25)
Upregulation of CD40L
IL-2 binds to IL-2r (autocrine activation)
CD40L binds to CD40 on APC, upregulating CD86/CD80
APC CD86/80 binds to CD28 on T cell surface, results in additional
cytokine expression, expression of BCL-x (anti-apoptosis,
proliferation
36-72 hr DNA synthetic activity
Epression of HLA-DR
3-4 days Blast transformation
Differentiation into Th1/Th2/Th17 cell based on factors such as
antigen dosage, local cytokine environment, other costimulatory
molecules, APC involvement
FUNCTIONAL IMMUNE ASSAYS
Remove cells from body
Stimulate cells during culture, mimicking a natural immune response
Observe characteristics of normal immune activation:
•Signal transduction
•Morphological changes
•Expression of cellular activation markers
•Production of cytokines
•Chemotaxis
•Cytotoxicity
•Proliferation
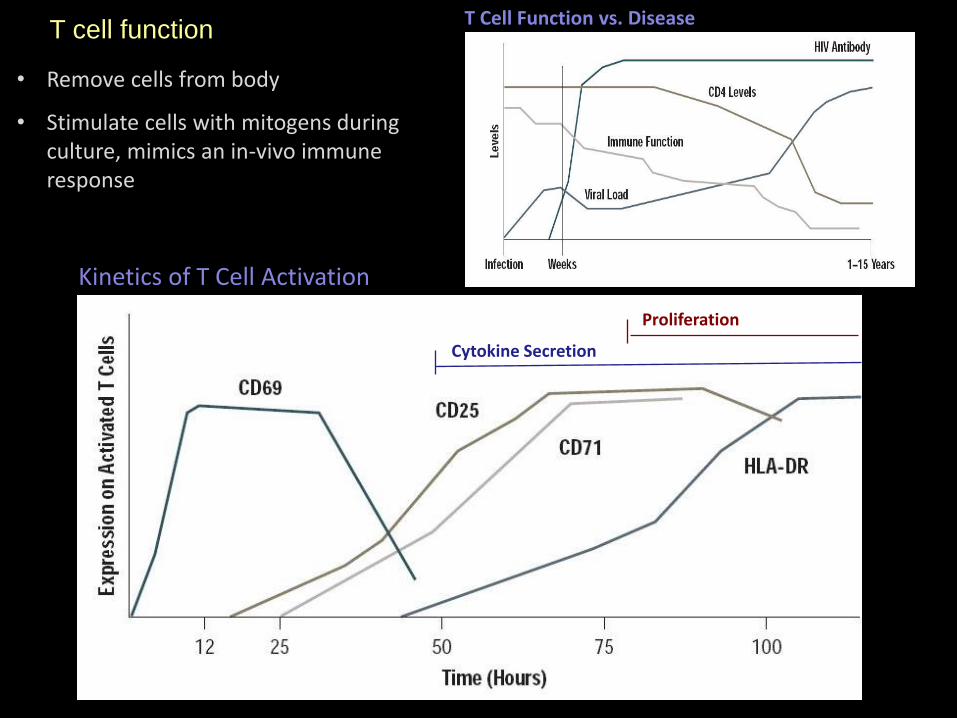
• Remove cells from body
• Stimulate cells with mitogens during culture, mimics an in-vivo immune response
T cell function
Cytokine Secretion
Proliferation
Kinetics of T Cell Activation
T Cell Function vs. Disease

T Cell Mitogen – Mechanism of Action
CD3 CD28
Y Y
Anti-CD3/CD28
SEA+SEB CD25+
Unactivated
1 hr ~24 hr
EM image obtained from Institute Pasteur website
CD
69
+
B7
CD28
Mitogen
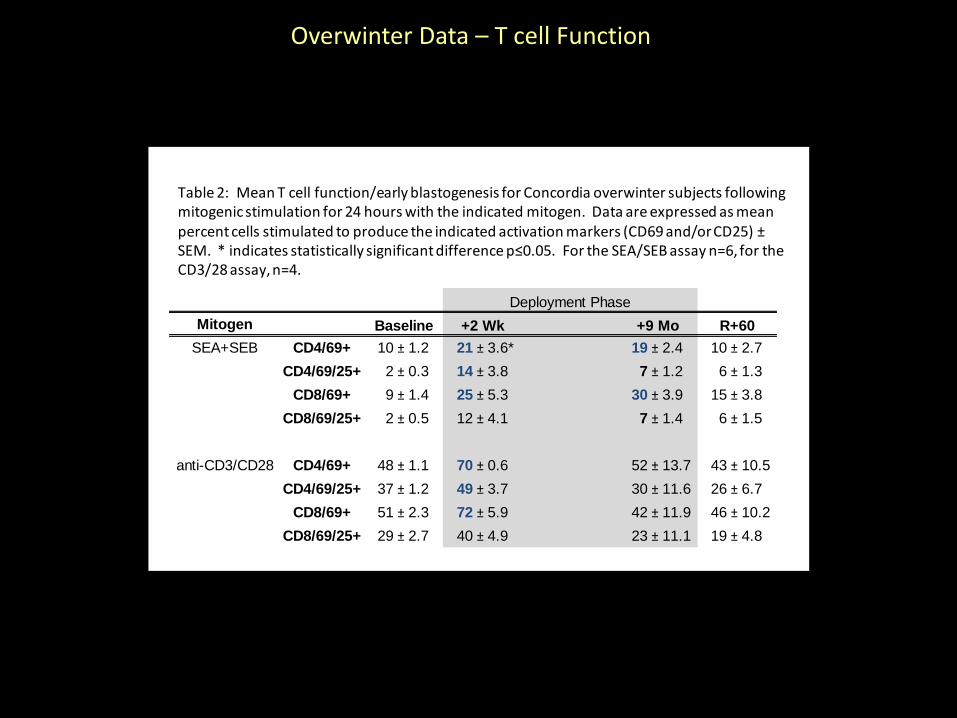
SEA+SEB CD4/69+ 10 ± 1.2 21 ± 3.6* 19 ± 2.4 10 ± 2.7
CD4/69/25+ 2 ± 0.3 14 ± 3.8 7 ± 1.2 6 ± 1.3
CD8/69+ 9 ± 1.4 25 ± 5.3 30 ± 3.9 15 ± 3.8
CD8/69/25+ 2 ± 0.5 12 ± 4.1 7 ± 1.4 6 ± 1.5
anti-CD3/CD28 CD4/69+ 48 ± 1.1 70 ± 0.6 52 ± 13.7 43 ± 10.5
CD4/69/25+ 37 ± 1.2 49 ± 3.7 30 ± 11.6 26 ± 6.7
CD8/69+ 51 ± 2.3 72 ± 5.9 42 ± 11.9 46 ± 10.2
CD8/69/25+ 29 ± 2.7 40 ± 4.9 23 ± 11.1 19 ± 4.8
R+60Baseline +2 Wk +9 Mo
Deployment Phase
Table 2: Mean T cell function/early blastogenesis for Concordia overwinter subjects following mitogenic stimulation for 24 hours with the indicated mitogen. Data are expressed as mean percent cells stimulated to produce the indicated activation markers (CD69 and/or CD25) ±SEM. * indicates statistically significant difference p≤0.05. For the SEA/SEB assay n=6, for the CD3/28 assay, n=4.
Overwinter Data – T cell Function
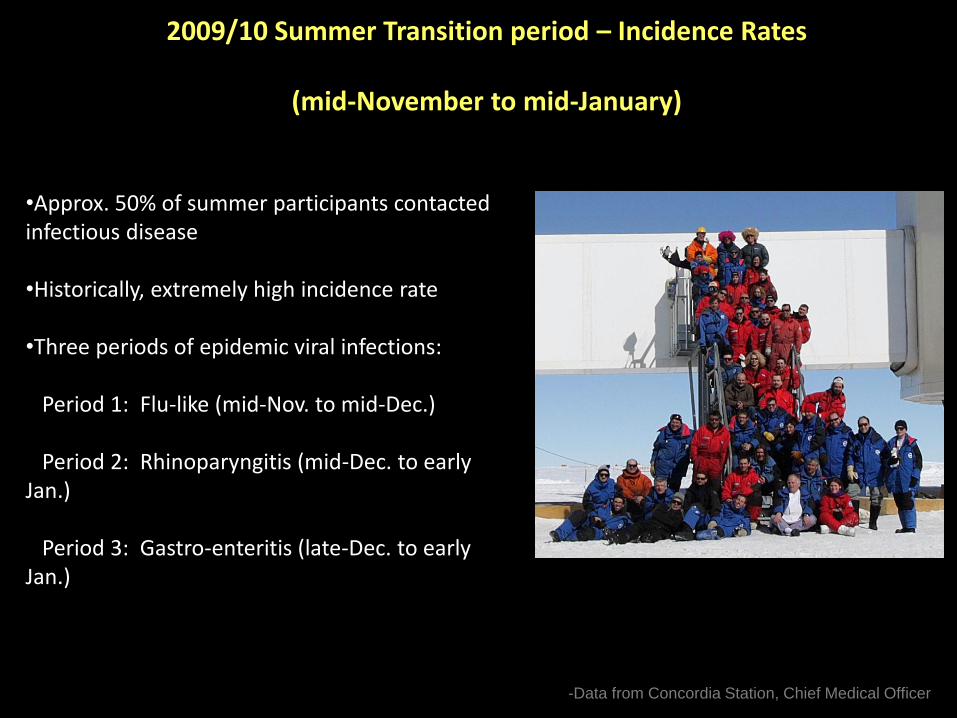
2009/10 Summer Transition period – Incidence Rates
(mid-November to mid-January)
•Approx. 50% of summer participants contacted infectious disease
•Historically, extremely high incidence rate
•Three periods of epidemic viral infections: Period 1: Flu-like (mid-Nov. to mid-Dec.) Period 2: Rhinoparyngitis (mid-Dec. to early Jan.) Period 3: Gastro-enteritis (late-Dec. to early Jan.)
-Data from Concordia Station, Chief Medical Officer
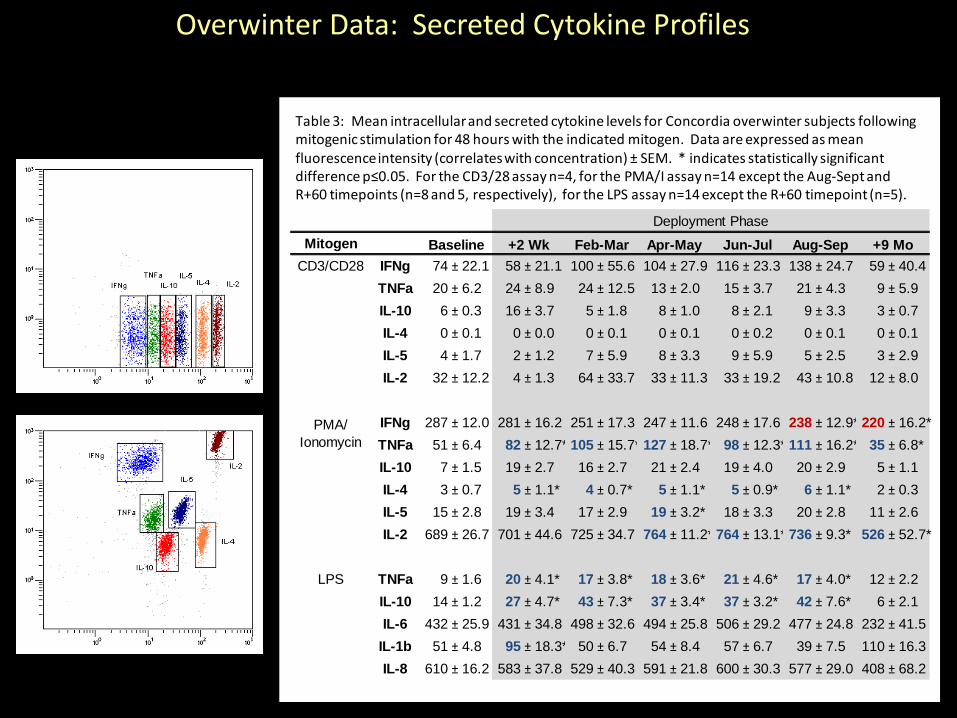
Overwinter Data: Secreted Cytokine Profiles
Mitogen
CD3/CD28 IFNg 74 ± 22.1 58 ± 21.1 100 ± 55.6 104 ± 27.9 116 ± 23.3 138 ± 24.7 59 ± 40.4
TNFa 20 ± 6.2 24 ± 8.9 24 ± 12.5 13 ± 2.0 15 ± 3.7 21 ± 4.3 9 ± 5.9
IL-10 6 ± 0.3 16 ± 3.7 5 ± 1.8 8 ± 1.0 8 ± 2.1 9 ± 3.3 3 ± 0.7
IL-4 0 ± 0.1 0 ± 0.0 0 ± 0.1 0 ± 0.1 0 ± 0.2 0 ± 0.1 0 ± 0.1
IL-5 4 ± 1.7 2 ± 1.2 7 ± 5.9 8 ± 3.3 9 ± 5.9 5 ± 2.5 3 ± 2.9
IL-2 32 ± 12.2 4 ± 1.3 64 ± 33.7 33 ± 11.3 33 ± 19.2 43 ± 10.8 12 ± 8.0
IFNg 287 ± 12.0 281 ± 16.2 251 ± 17.3 247 ± 11.6 248 ± 17.6 238 ± 12.9* 220 ± 16.2*
TNFa 51 ± 6.4 82 ± 12.7* 105 ± 15.7* 127 ± 18.7* 98 ± 12.3* 111 ± 16.2* 35 ± 6.8*
IL-10 7 ± 1.5 19 ± 2.7 16 ± 2.7 21 ± 2.4 19 ± 4.0 20 ± 2.9 5 ± 1.1
IL-4 3 ± 0.7 5 ± 1.1* 4 ± 0.7* 5 ± 1.1* 5 ± 0.9* 6 ± 1.1* 2 ± 0.3
IL-5 15 ± 2.8 19 ± 3.4 17 ± 2.9 19 ± 3.2* 18 ± 3.3 20 ± 2.8 11 ± 2.6
IL-2 689 ± 26.7 701 ± 44.6 725 ± 34.7 764 ± 11.2* 764 ± 13.1* 736 ± 9.3* 526 ± 52.7*
LPS TNFa 9 ± 1.6 20 ± 4.1* 17 ± 3.8* 18 ± 3.6* 21 ± 4.6* 17 ± 4.0* 12 ± 2.2
IL-10 14 ± 1.2 27 ± 4.7* 43 ± 7.3* 37 ± 3.4* 37 ± 3.2* 42 ± 7.6* 6 ± 2.1
IL-6 432 ± 25.9 431 ± 34.8 498 ± 32.6 494 ± 25.8 506 ± 29.2 477 ± 24.8 232 ± 41.5
IL-1b 51 ± 4.8 95 ± 18.3* 50 ± 6.7 54 ± 8.4 57 ± 6.7 39 ± 7.5 110 ± 16.3
IL-8 610 ± 16.2 583 ± 37.8 529 ± 40.3 591 ± 21.8 600 ± 30.3 577 ± 29.0 408 ± 68.2
Deployment Phase
PMA/
Ionomycin
Feb-Mar Apr-May Jun-Jul Aug-Sep +9 MoBaseline +2 Wk
Table 3: Mean intracellular and secreted cytokine levels for Concordia overwinter subjects following mitogenic stimulation for 48 hours with the indicated mitogen. Data are expressed as mean fluorescence intensity (correlates with concentration) ± SEM. * indicates statistically significant difference p≤0.05. For the CD3/28 assay n=4, for the PMA/I assay n=14 except the Aug-Sept and R+60 timepoints (n=8 and 5, respectively), for the LPS assay n=14 except the R+60 timepoint (n=5).

(A) Levels of virus-specific (EBV, CMV) CD8+ T-cells before and during the winter-over period, and (B) Percentage of functional virus-specific T-cells before and during the winter-over period.
Overwinter Data: Viral Immunity

Levels of antiviral antibodies [EBV-VCA (A), EBV-EA (B), and CMV (C)] and EBV DNA in peripheral blood (D) before and during the winter-over period.
Collection Time
Baseline 2 Wk +2 Mo +4 Mo +6 Mo +9 Mo R+60
1e+2
1e+3
1e+4
1e+5
1e+6
*
Collection Time
Baseline +2 Wk +2 Mo +4 Mo +6 Mo +9 Mo R+60
Log 2
Antib
ody T
iter
7
8
9
10
11
VCA
Collection Time
Baseline +2 Wk +2 Mo +4 Mo +6 Mo +9 Mo R+60
Log 2
Antib
ody T
iters
3
4
5
6
7
EA
Collection Time
Baseline +2 Wk +2 Mo +4 Mo +6 Mo +9 Mo R+60
Log 2
Antib
ody T
iter
5
6
7
8
9
10
CMV
B
D
Collection Time
Baseline 2 Wk +2 Mo +4 Mo +6 Mo +9 Mo R+60
EB
V D
NA
Copie
s/m
L
1e+2
1e+3
1e+4
1e+5
1e+6
* *
EBV-VCA Antibody EBV-EA Antibody
CMV Antibody EBV-DNA
Overwinter Data: Viral Immunity

Stress Hormone Levels
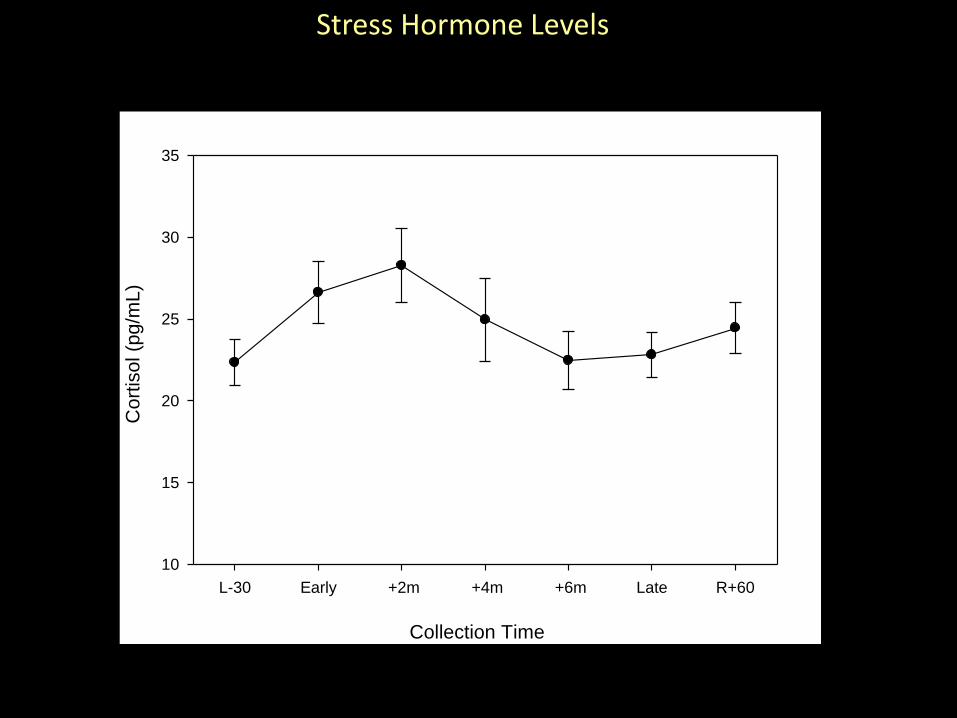
Collection Time
L-30 Early +2m +4m +6m Late R+60
Cort
isol (p
g/m
L)
10
15
20
25
30
35
Stress Hormone Levels
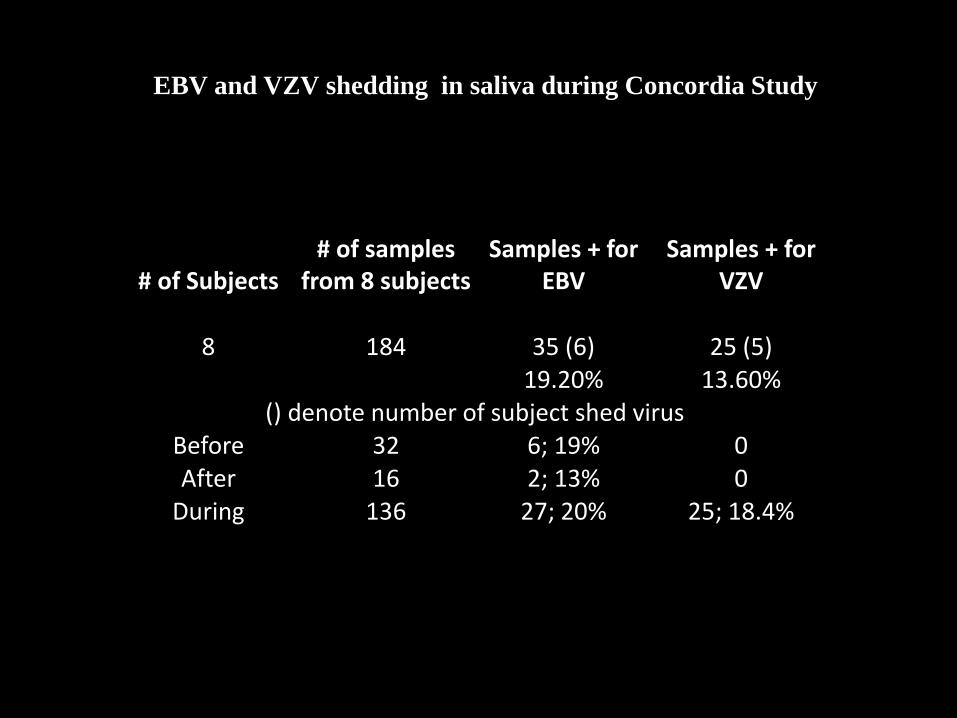
EBV and VZV shedding in saliva during Concordia Study
# of Subjects # of samples
from 8 subjects Samples + for
EBV Samples + for
VZV 8 184 35 (6) 25 (5) 19.20% 13.60%
() denote number of subject shed virus Before 32 6; 19% 0 After 16 2; 13% 0
During 136 27; 20% 25; 18.4%
In- Isolation After Before
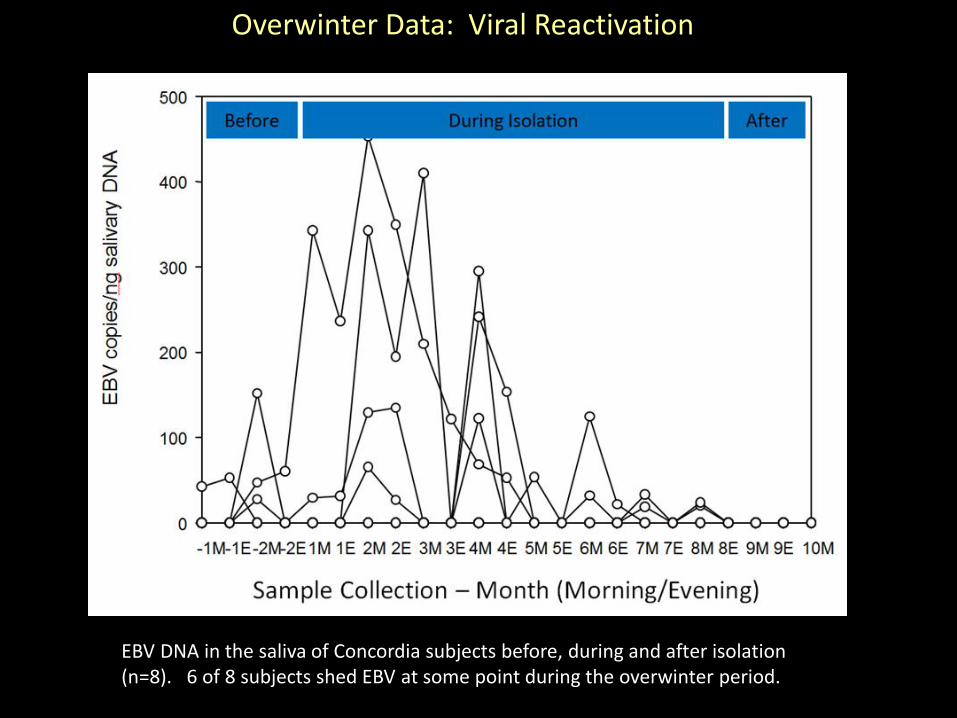
EBV DNA in the saliva of Concordia subjects before, during and after isolation (n=8). 6 of 8 subjects shed EBV at some point during the overwinter period.
Overwinter Data: Viral Reactivation
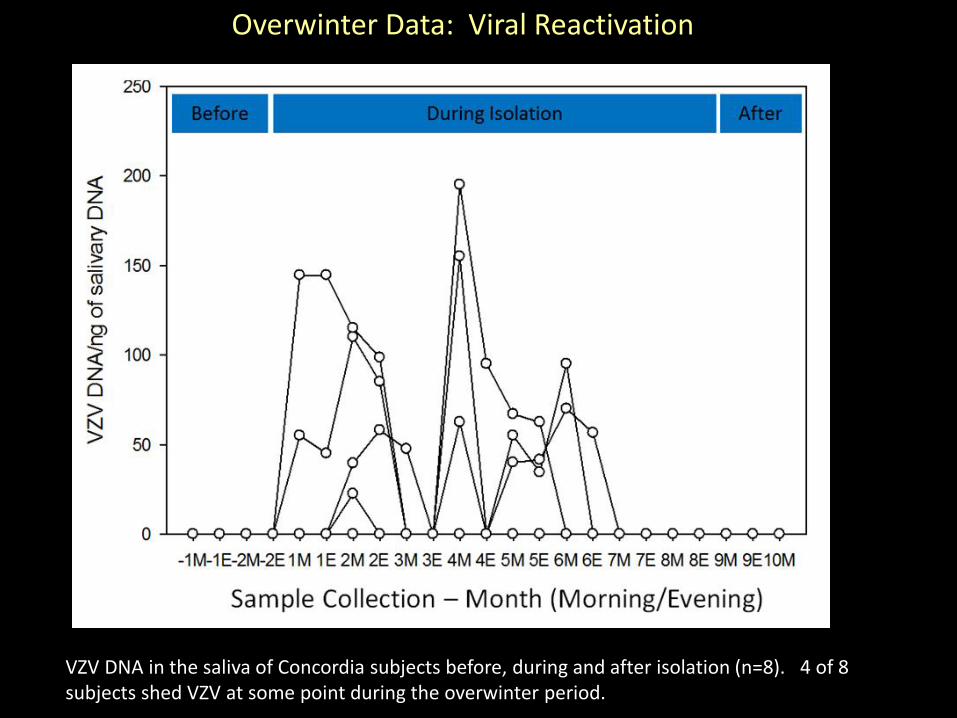
VZV DNA in the saliva of Concordia subjects before, during and after isolation (n=8). 4 of 8 subjects shed VZV at some point during the overwinter period.
Overwinter Data: Viral Reactivation
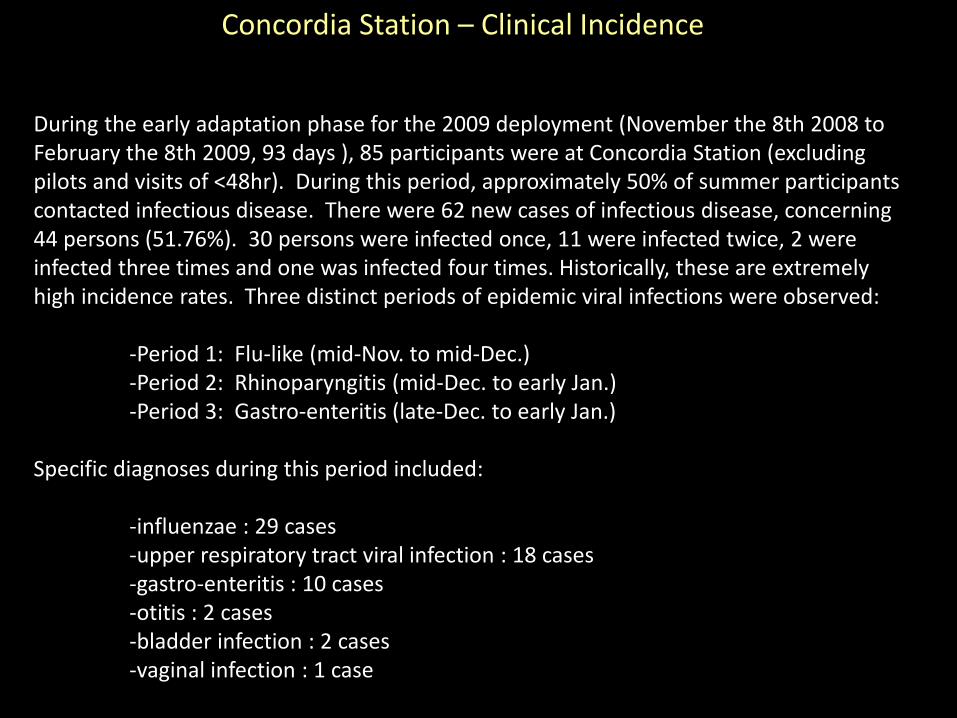
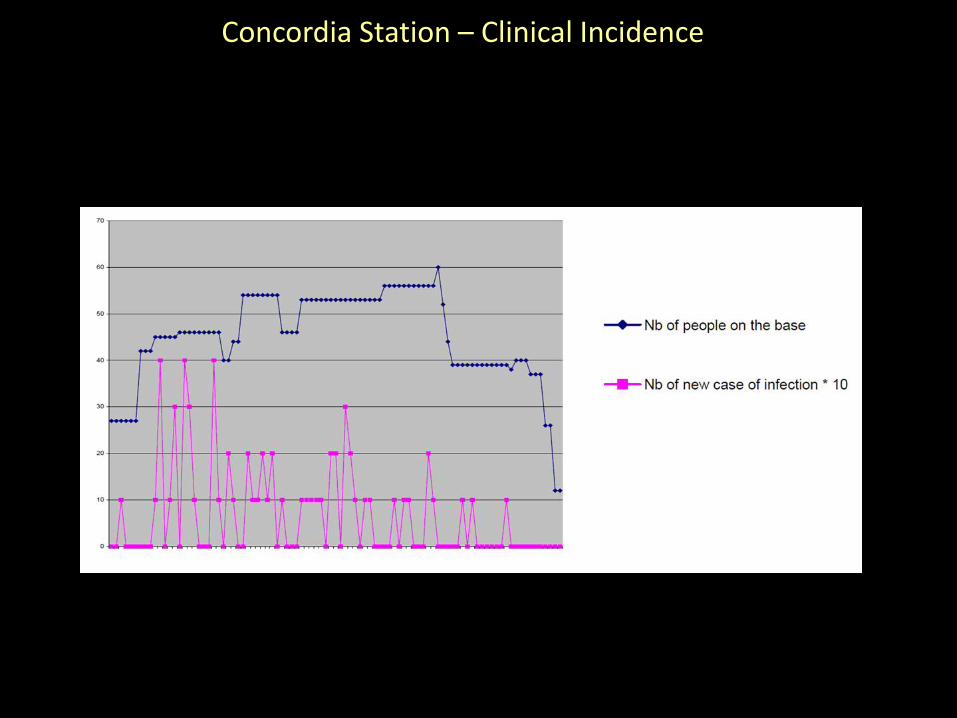
During the early adaptation phase for the 2009 deployment (November the 8th 2008 to February the 8th 2009, 93 days ), 85 participants were at Concordia Station (excluding pilots and visits of <48hr). During this period, approximately 50% of summer participants contacted infectious disease. There were 62 new cases of infectious disease, concerning 44 persons (51.76%). 30 persons were infected once, 11 were infected twice, 2 were infected three times and one was infected four times. Historically, these are extremely high incidence rates. Three distinct periods of epidemic viral infections were observed:
-Period 1: Flu-like (mid-Nov. to mid-Dec.) -Period 2: Rhinoparyngitis (mid-Dec. to early Jan.) -Period 3: Gastro-enteritis (late-Dec. to early Jan.)
Specific diagnoses during this period included:
-influenzae : 29 cases -upper respiratory tract viral infection : 18 cases -gastro-enteritis : 10 cases -otitis : 2 cases -bladder infection : 2 cases -vaginal infection : 1 case
Concordia Station – Clinical Incidence
Concordia Station – Clinical Incidence

Alterations in immune cell distribution and function, circadian misalignment, stress and latent viral reactivation appear to persist during Antarctic winterover at Concordia Station. Some of these changes are similar to those observed in Astronauts, either during or immediately following spaceflight. Others are unique to the Concordia analog. Based on some initial immune data and environmental conditions, Concordia winterover may be an appropriate analog for some flight-associated immune system changes and mission stress effects. An ongoing smaller control study at Neumayer III will address the influence of the hypoxic variable.
‘CHOICE’ Conclusions
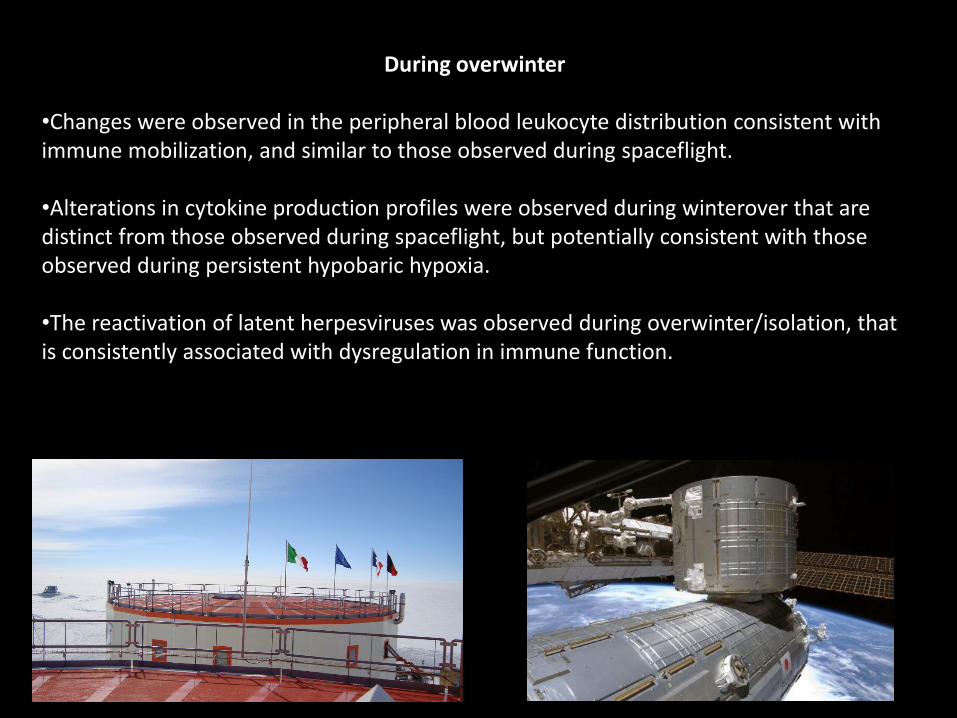
During overwinter
•Changes were observed in the peripheral blood leukocyte distribution consistent with immune mobilization, and similar to those observed during spaceflight.
•Alterations in cytokine production profiles were observed during winterover that are distinct from those observed during spaceflight, but potentially consistent with those observed during persistent hypobaric hypoxia.
•The reactivation of latent herpesviruses was observed during overwinter/isolation, that is consistently associated with dysregulation in immune function.
Questions?
Credit for some general Antarctica slides: Alan Light, Drummond Small, Mike Usher, Paul Ward and the European Space Agency/Alex Salam