Doctor Answering Service Atlanta | Northwest Telephone Answering Service
1

Answering the call National Survey of the Mental Health and Wellbeing of Police and Emergency Services
Detailed Report
David Lawrence
Michael Kyron
Wavne Rikkers
Jennifer Bartlett
Katherine Hafekost
Benjamin Goodsell
Rebecca Cunneen
November 2018
This report has been produced for Beyond Blue as part of the National Mental Health and Wellbeing Study of Police and Emergency Services
Answering the call was conducted by The University of Western Australia in partnership with Roy Morgan Research. The study was funded by Beyond Blue, with additional funding support from the Bushfire and Natural Hazards Cooperative Research Centre.
Additional information This report and additional information about Answering the call can be accessed via
www.beyondblue.org.au/pesresearch
Suggested reference: Lawrence D, Kyron M, Rikkers W, Bartlett J, Hafekost K, Goodsell B, Cunneen R (2018) Answering the call: National Survey of the Mental Health and Wellbeing of Police and Emergency Services. Detailed Report. Perth: Graduate School of Education, The University of Western Australia.
Acknowledgements The ‘Answering the call’ detailed report was developed as part of Beyond Blue’s National Mental Health and Wellbeing Study of Police and Emergency Services. This study is funded by Beyond Blue with additional funding support from the Bushfire and Natural Hazards Cooperative Research Centre. Beyond Blue engaged The University of Western Australia who partnered with Roy Morgan Research to conduct the national survey Answering the call.
The authors would like to thank the following organisations and individuals whose support, cooperation and expertise were integral to the success of the survey:
• The Australian and state and territory governments• The Bushfire and Natural Hazards Cooperative Research Centre• Anna Hunt and Natalie Carolan, The University of Western Australia• Caitlin Bennetto, Tania Sperti, Bruce Packard, David Norrish, Gerry Bardsley, Roy Morgan
Research• The Beyond Blue Workplace and Evaluation and Research teams, in particular the Beyond
Blue project manager Emma Renehan• The 33 participating police and emergency services agencies:
o Ambulance Tasmania; Ambulance Victoria; Australian Capital Territory Ambulance; New South Wales Ambulance; Queensland Ambulance Service; South Australia Ambulance Service; St John Ambulance Northern Territory; St John Ambulance Western Australia;
o Australian Capital Territory Fire and Rescue; Australian Capital Territory Rural Fire Service; Country Fire Authority; Fire and Rescue New South Wales; New South Wales Rural Fire Service; Northern Territory Fire and Rescue Service; Queensland Fire and Emergency Services; South Australian Country Fire Service; Tasmania Fire Service; The Department of Fire and Emergency Services;
o Australian Capital Territory State Emergency Service; Emergency Services Telecommunications Authority; New South Wales State Emergency Service; Northern Territory Emergency Service; Tasmania State Emergency Service; Victoria State Emergency Service;
o Australian Capital Territory Policing; Australian Federal Police; New South Wales Police Force; Northern Territory Police; Queensland Police Service; South Australia Police; Tasmania Police; Victoria Police; Western Australia Police.
• Members of the Study’s Advisory Group – Mr Ken Lay AO APM (Chair); Professor Michael Baigent; Dr John Bates; Ms Catherine Boekel; Mr Mark Burgess; Commissioner Katarina Carroll; Dr Peter Cotton; Ms Nicole Graham; Mr Shane Greentree; Ms Paige Hobbs; Professor Anthony LaMontagne; Professor David Lawrence; Professor Brett McDermott; Commissioner Dominic Morgan; Mr Bruce Packard; Dr Richard Thornton; Dr Alexandra West.
• Members of the national survey’s Technical Advisory Group – Professor David Lawrence(Chair); Ms Tracey Allen; Mr Mick Cameron; Mr Charles Coulton; Ms Fiona Donaldson; Ms Nicole Graham; Professor Anthony LaMontagne; Mr Tim Peck; Mr Ken Lay; Dr Clare Shann; Mr Tim Slade; Ms Farhana Siddique; Dr Alexandra West.

CONTENTS
1 Demographic overview of the police and emergency services sector ........ 1
2 Prevalence of mental health conditions and mental wellbeing .................. 9
3 Suicidal thoughts and behaviours ............................................................ 23
4 Individual risk and protective factors ....................................................... 39
5 Substance use .......................................................................................... 63
6 Risk and protective factors associated with the working environment .... 75
7 Stigma ...................................................................................................... 93
8 Seeking support ..................................................................................... 109
9 Workers’ compensation experiences ..................................................... 141
10 The resilient worker and workplace ....................................................... 151
11 Former employees ................................................................................. 161
12 Conclusion ............................................................................................. 179
Appendix A - Response rates, sample representativeness and weighting ...... 191
Appendix B - Advisory Groups ........................................................................ 197
Appendix C - Glossary .................................................................................... 199
Appendix D - References ................................................................................ 205

1
Chapter 1 — Demographic overview of the police and emergency services sector
Overview
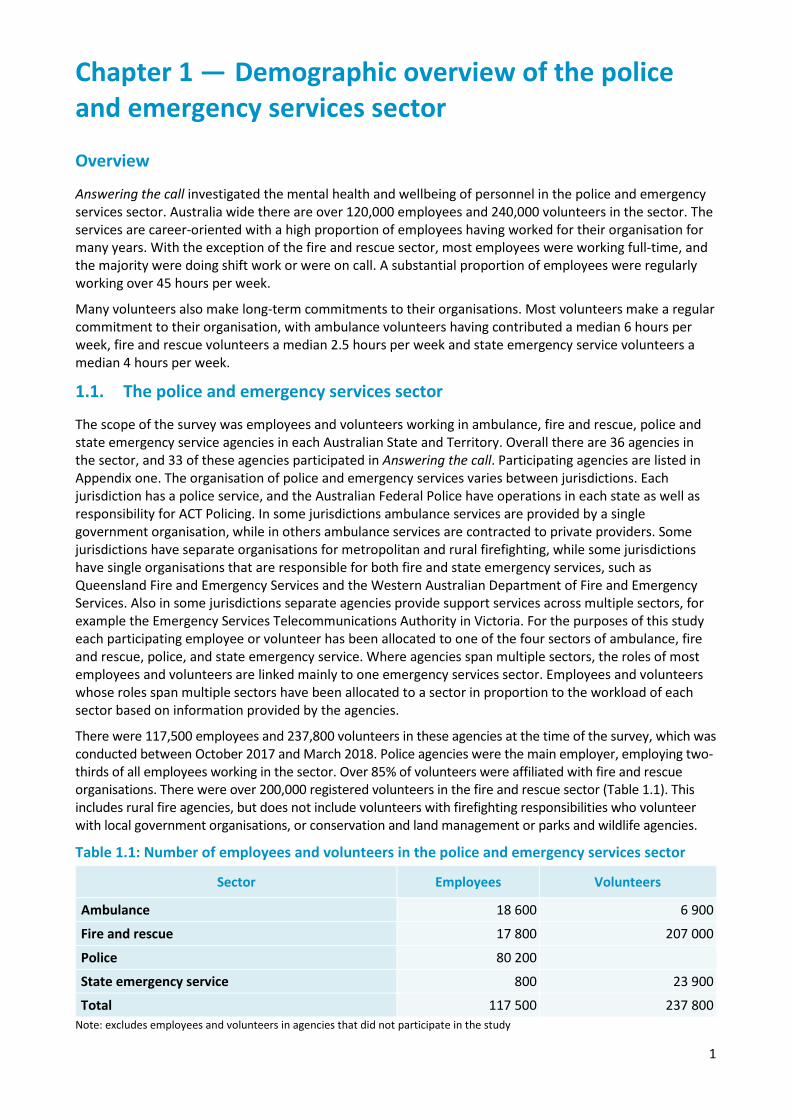
Answering the call investigated the mental health and wellbeing of personnel in the police and emergency services sector. Australia wide there are over 120,000 employees and 240,000 volunteers in the sector. The services are career-oriented with a high proportion of employees having worked for their organisation for many years. With the exception of the fire and rescue sector, most employees were working full-time, and the majority were doing shift work or were on call. A substantial proportion of employees were regularly working over 45 hours per week.
Many volunteers also make long-term commitments to their organisations. Most volunteers make a regular commitment to their organisation, with ambulance volunteers having contributed a median 6 hours per week, fire and rescue volunteers a median 2.5 hours per week and state emergency service volunteers a median 4 hours per week.
1.1. The police and emergency services sector
The scope of the survey was employees and volunteers working in ambulance, fire and rescue, police and state emergency service agencies in each Australian State and Territory. Overall there are 36 agencies in the sector, and 33 of these agencies participated in Answering the call. Participating agencies are listed in Appendix one. The organisation of police and emergency services varies between jurisdictions. Each jurisdiction has a police service, and the Australian Federal Police have operations in each state as well as responsibility for ACT Policing. In some jurisdictions ambulance services are provided by a single government organisation, while in others ambulance services are contracted to private providers. Some jurisdictions have separate organisations for metropolitan and rural firefighting, while some jurisdictions have single organisations that are responsible for both fire and state emergency services, such as Queensland Fire and Emergency Services and the Western Australian Department of Fire and Emergency Services. Also in some jurisdictions separate agencies provide support services across multiple sectors, for example the Emergency Services Telecommunications Authority in Victoria. For the purposes of this study each participating employee or volunteer has been allocated to one of the four sectors of ambulance, fire and rescue, police, and state emergency service. Where agencies span multiple sectors, the roles of most employees and volunteers are linked mainly to one emergency services sector. Employees and volunteers whose roles span multiple sectors have been allocated to a sector in proportion to the workload of each sector based on information provided by the agencies.
There were 117,500 employees and 237,800 volunteers in these agencies at the time of the survey, which was conducted between October 2017 and March 2018. Police agencies were the main employer, employing two-thirds of all employees working in the sector. Over 85% of volunteers were affiliated with fire and rescue organisations. There were over 200,000 registered volunteers in the fire and rescue sector (Table 1.1). This includes rural fire agencies, but does not include volunteers with firefighting responsibilities who volunteer with local government organisations, or conservation and land management or parks and wildlife agencies.
Table 1.1: Number of employees and volunteers in the police and emergency services sector
Sector Employees Volunteers
Ambulance 18 600 6 900
Fire and rescue 17 800 207 000
Police 80 200
State emergency service 800 23 900
Total 117 500 237 800 Note: excludes employees and volunteers in agencies that did not participate in the study

2
While some police agencies do have a small number of volunteers, police volunteers were not included in the study because of the small numbers.
The fire and rescue, and police sectors have a higher proportion of male employees. Over 80% of employees in the fire and rescue sector, and the vast majority of career firefighters were male. Over 60% of police employees were male, while the ambulance and state emergency service sectors had roughly equal numbers of males and females (Table 1.2). Over 60% of ambulance employees had a bachelor’s degree or higher. Three fifths of fire and rescue employees had a Certificate III/IV or a diploma, 70% of police employees had a diploma or higher, and 65% of state emergency service employees had a diploma or higher.
Table 1.2: Demographic characteristics of employees in the police and emergency services sector, by sector
Ambulance
(%) Fire and rescue
(%) Police
(%) State emergency
service (%)
Sex—
Male 53.2 83.3 62.6 45.3
Female 46.8 16.7 37.4 54.7
Age group—
Less than 35 years 33.4 20.3 27.9 17.1
35 - 44 years 25.8 24.6 31.7 28.0
45 - 54 years 25.2 32.6 28.8 34.0
55 years or over 15.7 22.6 11.6 20.8
Marital status—
Single 14.1 8.4 11.7 13.4
Married/De facto 77.3 82.7 78.1 74.2
Widowed, separated or divorced
8.5 8.9 10.2 12.4
Dependent children living at home—
No 57.7 51.5 50.3 62.8
Yes 42.3 48.5 49.7 37.2
Highest educational qualification—
Secondary school to Year 12 6.4 15.5 18.9 12.0
Certificate III/IV 8.3 38.3 11.6 22.6
Diploma 25.1 22.2 34.2 25.8
Bachelor degree 40.8 13.3 22.9 19.8
Postgraduate qualification 19.4 10.8 12.4 19.7
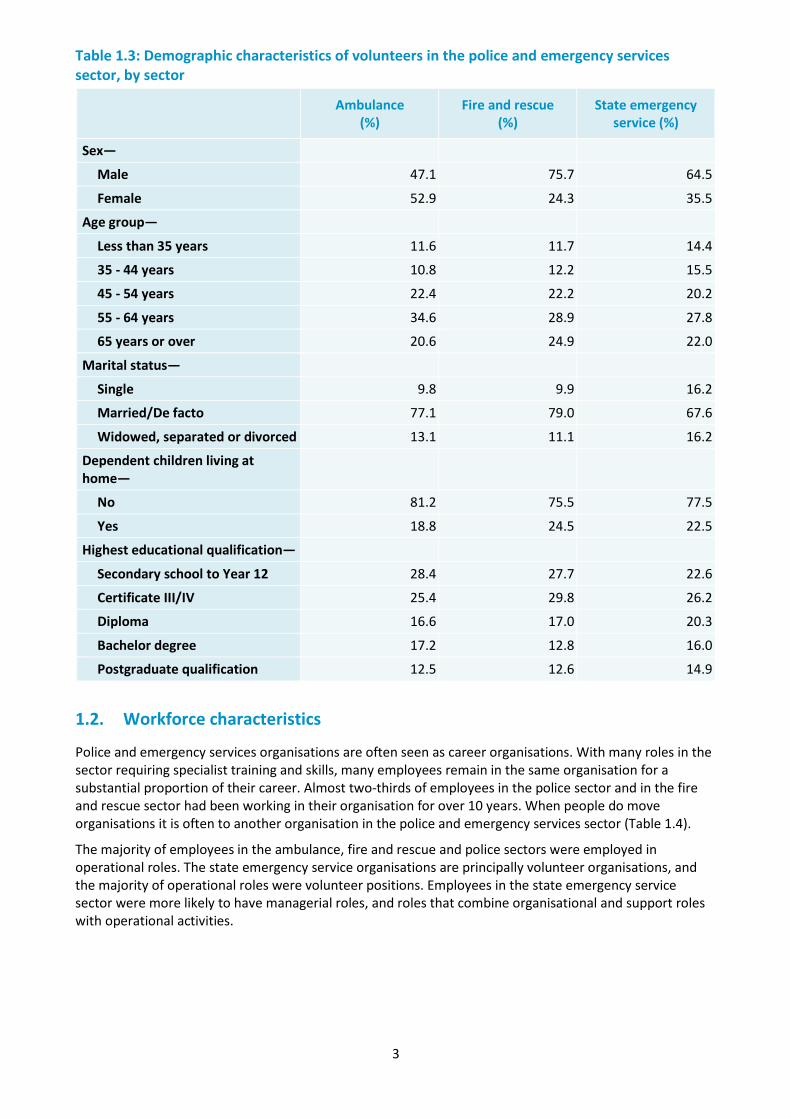
The demographic profile of volunteers was on average older than employees, and they were less likely to have dependent children living at home. Over one fifth of volunteers across all sectors were aged over 65 years, and less than one in four had dependent children at home (Table 1.3).
3
Table 1.3: Demographic characteristics of volunteers in the police and emergency services sector, by sector
Ambulance
(%) Fire and rescue
(%) State emergency
service (%)
Sex—
Male 47.1 75.7 64.5
Female 52.9 24.3 35.5
Age group—
Less than 35 years 11.6 11.7 14.4
35 - 44 years 10.8 12.2 15.5
45 - 54 years 22.4 22.2 20.2
55 - 64 years 34.6 28.9 27.8
65 years or over 20.6 24.9 22.0
Marital status—
Single 9.8 9.9 16.2
Married/De facto 77.1 79.0 67.6
Widowed, separated or divorced 13.1 11.1 16.2
Dependent children living at home—
No 81.2 75.5 77.5
Yes 18.8 24.5 22.5
Highest educational qualification—
Secondary school to Year 12 28.4 27.7 22.6
Certificate III/IV 25.4 29.8 26.2
Diploma 16.6 17.0 20.3
Bachelor degree 17.2 12.8 16.0
Postgraduate qualification 12.5 12.6 14.9
1.2. Workforce characteristics
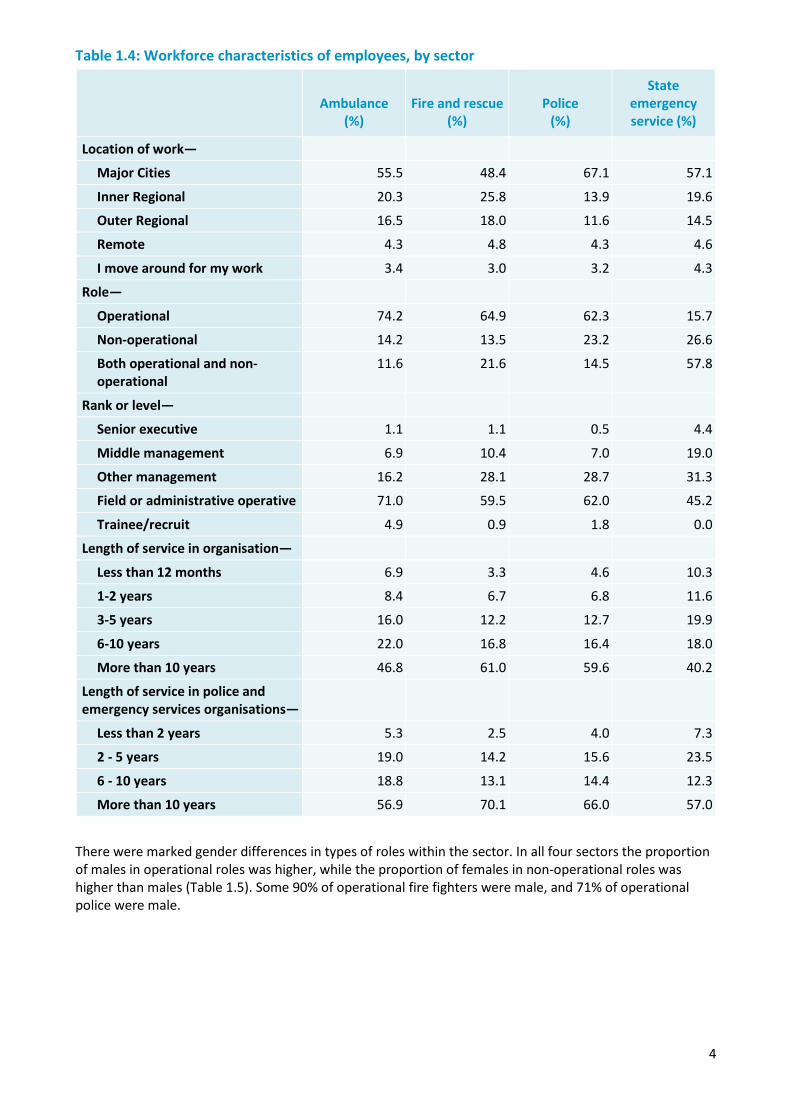
Police and emergency services organisations are often seen as career organisations. With many roles in the sector requiring specialist training and skills, many employees remain in the same organisation for a substantial proportion of their career. Almost two-thirds of employees in the police sector and in the fire and rescue sector had been working in their organisation for over 10 years. When people do move organisations it is often to another organisation in the police and emergency services sector (Table 1.4).
The majority of employees in the ambulance, fire and rescue and police sectors were employed in operational roles. The state emergency service organisations are principally volunteer organisations, and the majority of operational roles were volunteer positions. Employees in the state emergency service sector were more likely to have managerial roles, and roles that combine organisational and support roles with operational activities.
4
Table 1.4: Workforce characteristics of employees, by sector
Ambulance
(%) Fire and rescue
(%) Police
(%)
State emergency service (%)
Location of work—
Major Cities 55.5 48.4 67.1 57.1
Inner Regional 20.3 25.8 13.9 19.6
Outer Regional 16.5 18.0 11.6 14.5
Remote 4.3 4.8 4.3 4.6
I move around for my work 3.4 3.0 3.2 4.3
Role—
Operational 74.2 64.9 62.3 15.7
Non-operational 14.2 13.5 23.2 26.6
Both operational and non-operational
11.6 21.6 14.5 57.8
Rank or level—
Senior executive 1.1 1.1 0.5 4.4
Middle management 6.9 10.4 7.0 19.0
Other management 16.2 28.1 28.7 31.3
Field or administrative operative 71.0 59.5 62.0 45.2
Trainee/recruit 4.9 0.9 1.8 0.0
Length of service in organisation—
Less than 12 months 6.9 3.3 4.6 10.3
1-2 years 8.4 6.7 6.8 11.6
3-5 years 16.0 12.2 12.7 19.9
6-10 years 22.0 16.8 16.4 18.0
More than 10 years 46.8 61.0 59.6 40.2
Length of service in police and emergency services organisations—
Less than 2 years 5.3 2.5 4.0 7.3
2 - 5 years 19.0 14.2 15.6 23.5
6 - 10 years 18.8 13.1 14.4 12.3
More than 10 years 56.9 70.1 66.0 57.0
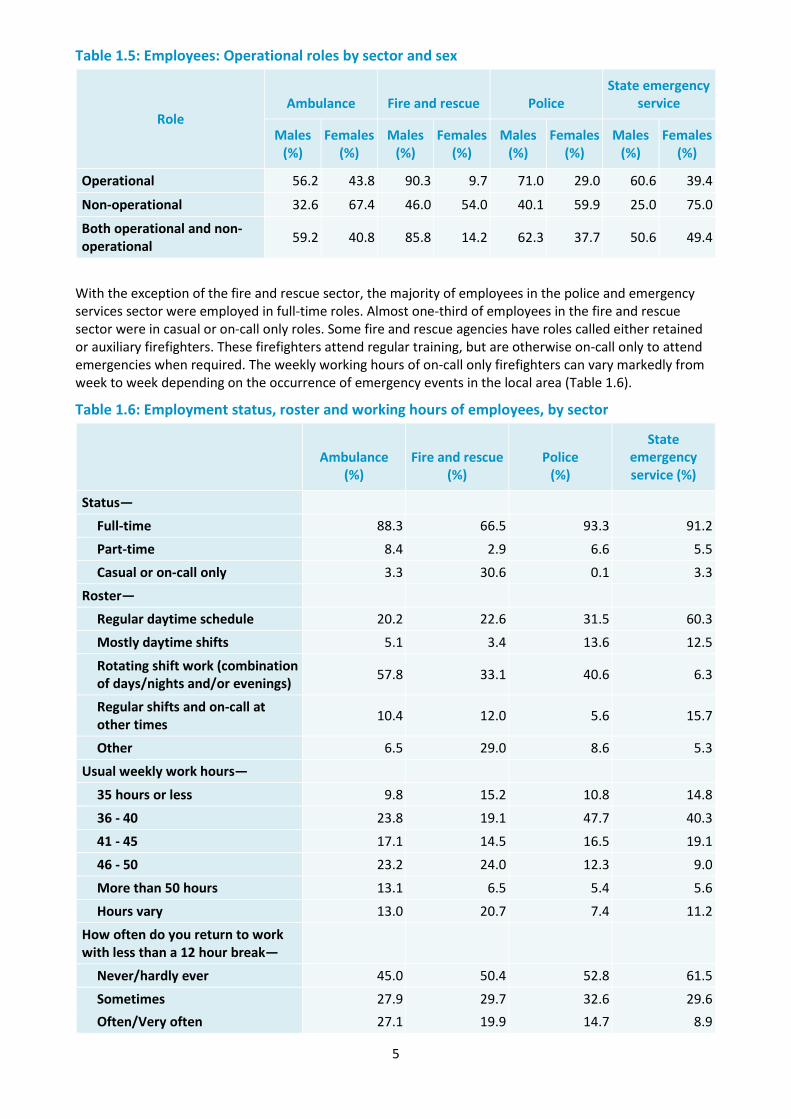
There were marked gender differences in types of roles within the sector. In all four sectors the proportion of males in operational roles was higher, while the proportion of females in non-operational roles was higher than males (Table 1.5). Some 90% of operational fire fighters were male, and 71% of operational police were male.
5
Table 1.5: Employees: Operational roles by sector and sex
Role Ambulance Fire and rescue Police
State emergency service
Males (%)
Females (%)
Males (%)
Females (%)
Males (%)
Females (%)
Males (%)
Females (%)
Operational 56.2 43.8 90.3 9.7 71.0 29.0 60.6 39.4
Non-operational 32.6 67.4 46.0 54.0 40.1 59.9 25.0 75.0
Both operational and non-operational 59.2 40.8 85.8 14.2 62.3 37.7 50.6 49.4
With the exception of the fire and rescue sector, the majority of employees in the police and emergency services sector were employed in full-time roles. Almost one-third of employees in the fire and rescue sector were in casual or on-call only roles. Some fire and rescue agencies have roles called either retained or auxiliary firefighters. These firefighters attend regular training, but are otherwise on-call only to attend emergencies when required. The weekly working hours of on-call only firefighters can vary markedly from week to week depending on the occurrence of emergency events in the local area (Table 1.6).
Table 1.6: Employment status, roster and working hours of employees, by sector
Ambulance
(%) Fire and rescue
(%) Police
(%)
State emergency service (%)
Status—
Full-time 88.3 66.5 93.3 91.2
Part-time 8.4 2.9 6.6 5.5
Casual or on-call only 3.3 30.6 0.1 3.3
Roster—
Regular daytime schedule 20.2 22.6 31.5 60.3
Mostly daytime shifts 5.1 3.4 13.6 12.5
Rotating shift work (combination of days/nights and/or evenings) 57.8 33.1 40.6 6.3
Regular shifts and on-call at other times 10.4 12.0 5.6 15.7
Other 6.5 29.0 8.6 5.3
Usual weekly work hours—
35 hours or less 9.8 15.2 10.8 14.8
36 - 40 23.8 19.1 47.7 40.3
41 - 45 17.1 14.5 16.5 19.1
46 - 50 23.2 24.0 12.3 9.0
More than 50 hours 13.1 6.5 5.4 5.6
Hours vary 13.0 20.7 7.4 11.2
How often do you return to work with less than a 12 hour break—
Never/hardly ever 45.0 50.4 52.8 61.5
Sometimes 27.9 29.7 32.6 29.6 Often/Very often 27.1 19.9 14.7 8.9
6
Because of the nature of the work, many employees either do shift-work or are on-call. Within the ambulance sector, 68% of employees were doing rotating shift work or a combination of shift-work and being on-call at other times. One third of fire and rescue employees and 40% of police employees were doing rotating shift-work (Table 1.6). Across all sectors, 25% of full-time employees usually work more than 45 hours per week.
Table 1.7: Workforce characteristics of volunteers, by sector
Ambulance
(%) Fire and rescue
(%) State emergency
service (%)
Location—
Major Cities 9.8 21.0 41.5
Inner Regional 22.9 39.4 26.1
Outer Regional 38.6 31.1 21.7
Remote 26.3 6.9 7.8
I move around for my work 2.4 1.6 3.0
Employment status—
Not currently employed 31.9 33.5 38.4
Employed in the sector (a) 7.3 7.0 6.6
Employed elsewhere 60.8 59.6 55.0
Previously worked in the sector (a)—
No 88.5 86.8 84.0
Yes 11.5 13.2 16.0
Rank or role—
Senior management 3.6 5.6 13.1
Other management 8.4 21.1 25.2
Field or administrative role 82.5 66.4 53.5
Trainee/recruit 5.5 6.9 8.2
Length of service in organisation—
Less than 12 months 4.9 5.2 8.3
1-2 years 12.6 8.3 16.3
3-5 years 24.2 14.7 20.2
6-10 years 18.5 16.3 20.8
More than 10 years 39.8 55.5 34.5
Length of volunteer service—
Less than 2 years 3.2 3.5 6.3
2 - 5 years 24.3 17.2 27.3
6 - 10 years 19.4 14.0 19.9
More than 10 years 53.1 65.2 46.5 (a) working in an ambulance, fire and rescue, police or state emergency service organisation
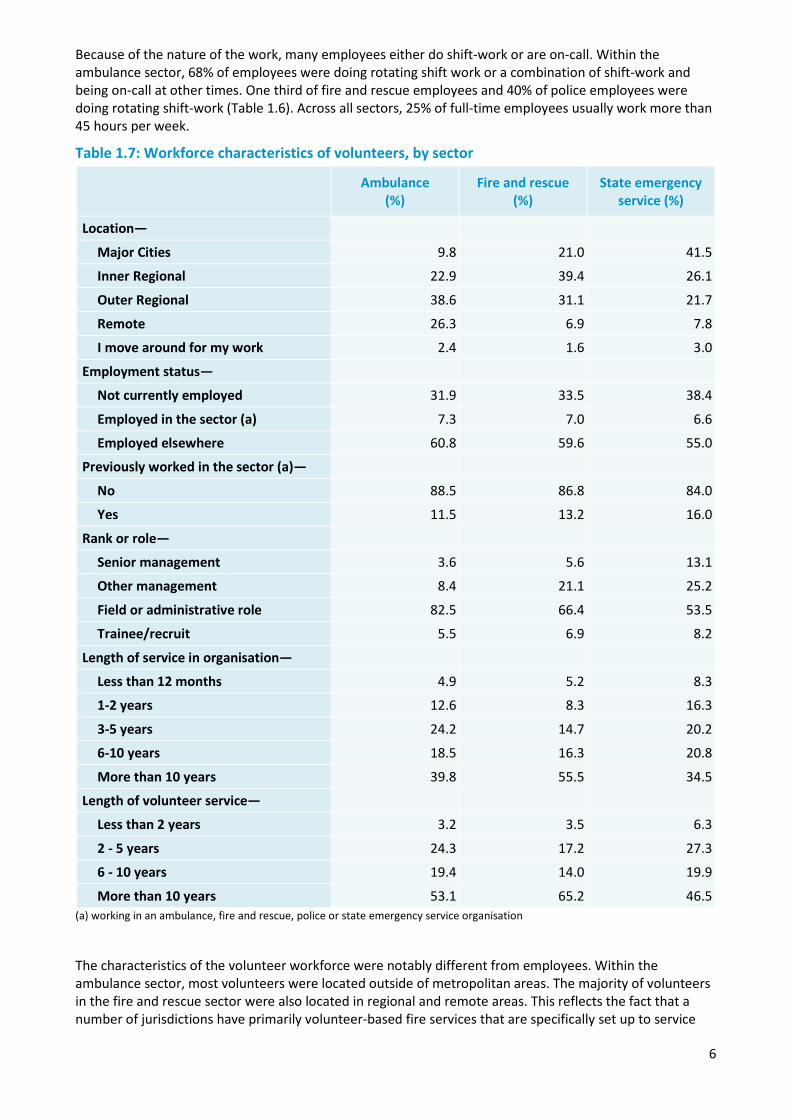
The characteristics of the volunteer workforce were notably different from employees. Within the ambulance sector, most volunteers were located outside of metropolitan areas. The majority of volunteers in the fire and rescue sector were also located in regional and remote areas. This reflects the fact that a number of jurisdictions have primarily volunteer-based fire services that are specifically set up to service
7
rural and regional areas, such as the NSW Rural Fire Service. About one third of volunteers were not currently in employment. About 7% of volunteers were also employed in police and emergency services agencies. Additional to these volunteers, over 10% of volunteers in each sector were previously employed in police and emergency services agencies (Table 1.7).
Many volunteers make long-term commitments to their organisations. Almost 40% of ambulance volunteers, over half of fire and rescue volunteers, and 35% of state emergency service volunteers have volunteered for their organisation for over 10 years. Some volunteers also have a history of volunteering for other emergency services organisations, and 65% of fire and rescue volunteers, 50% of ambulance volunteers, and 47% of state emergency service volunteers have volunteered in the emergency services sector for over 10 years (Table 1.7).
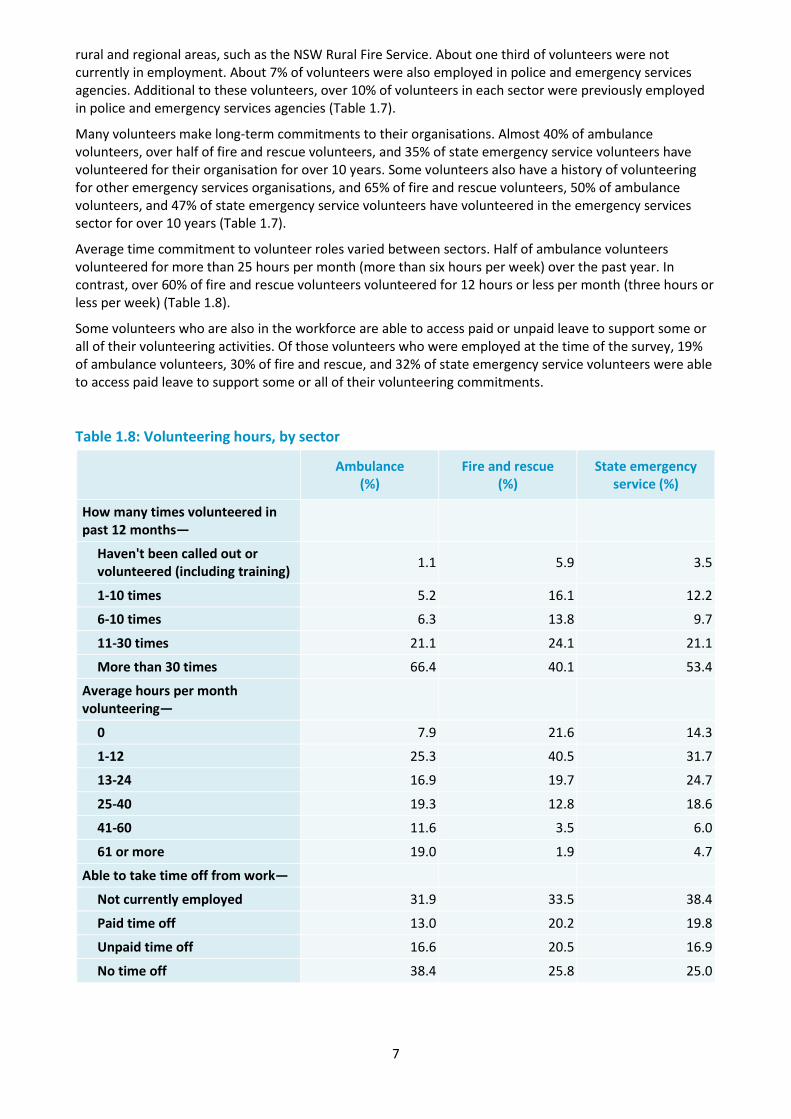
Average time commitment to volunteer roles varied between sectors. Half of ambulance volunteers volunteered for more than 25 hours per month (more than six hours per week) over the past year. In contrast, over 60% of fire and rescue volunteers volunteered for 12 hours or less per month (three hours or less per week) (Table 1.8).
Some volunteers who are also in the workforce are able to access paid or unpaid leave to support some or all of their volunteering activities. Of those volunteers who were employed at the time of the survey, 19% of ambulance volunteers, 30% of fire and rescue, and 32% of state emergency service volunteers were able to access paid leave to support some or all of their volunteering commitments.
Table 1.8: Volunteering hours, by sector
Ambulance
(%) Fire and rescue
(%) State emergency
service (%)
How many times volunteered in past 12 months—
Haven't been called out or volunteered (including training) 1.1 5.9 3.5
1-10 times 5.2 16.1 12.2
6-10 times 6.3 13.8 9.7
11-30 times 21.1 24.1 21.1
More than 30 times 66.4 40.1 53.4
Average hours per month volunteering—
0 7.9 21.6 14.3
1-12 25.3 40.5 31.7
13-24 16.9 19.7 24.7
25-40 19.3 12.8 18.6
41-60 11.6 3.5 6.0
61 or more 19.0 1.9 4.7
Able to take time off from work—
Not currently employed 31.9 33.5 38.4
Paid time off 13.0 20.2 19.8
Unpaid time off 16.6 20.5 16.9
No time off 38.4 25.8 25.0
8
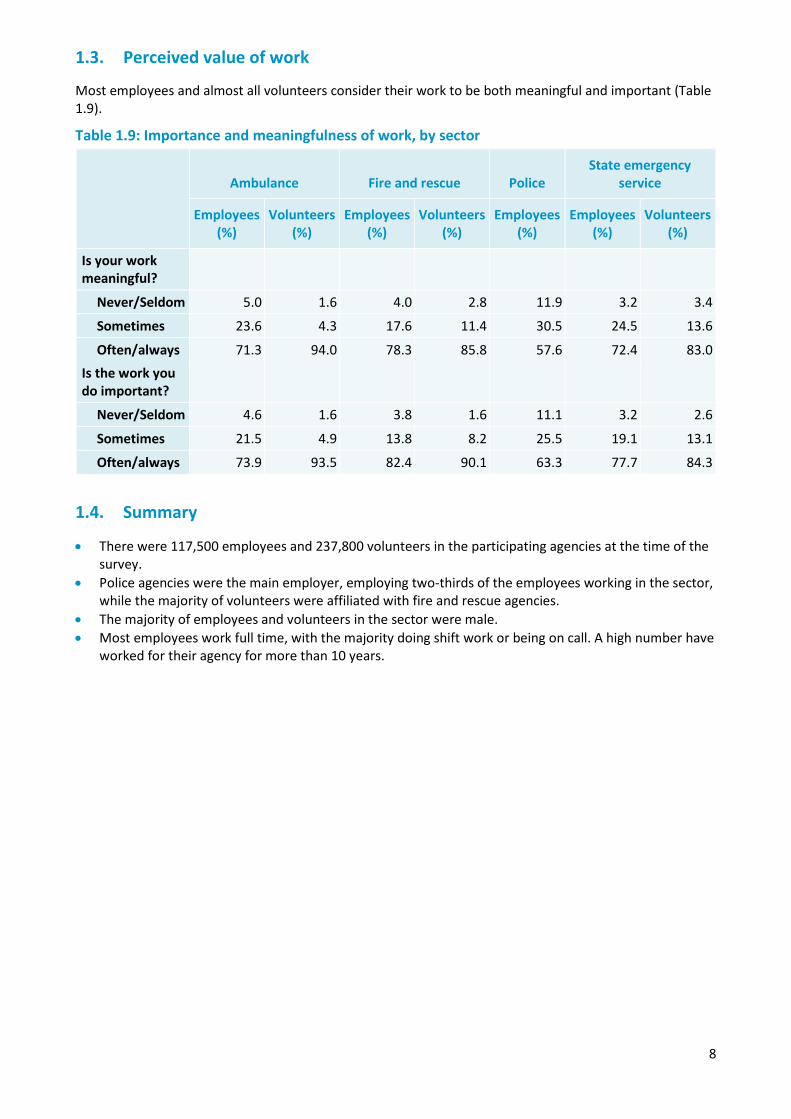
1.3. Perceived value of work
Most employees and almost all volunteers consider their work to be both meaningful and important (Table 1.9).
Table 1.9: Importance and meaningfulness of work, by sector
Ambulance Fire and rescue Police
State emergency service
Employees (%)
Volunteers(%)
Employees (%)
Volunteers (%)
Employees (%)
Employees (%)
Volunteers (%)
Is your work meaningful?
Never/Seldom 5.0 1.6 4.0 2.8 11.9 3.2 3.4
Sometimes 23.6 4.3 17.6 11.4 30.5 24.5 13.6
Often/always 71.3 94.0 78.3 85.8 57.6 72.4 83.0 Is the work you do important?
Never/Seldom 4.6 1.6 3.8 1.6 11.1 3.2 2.6
Sometimes 21.5 4.9 13.8 8.2 25.5 19.1 13.1
Often/always 73.9 93.5 82.4 90.1 63.3 77.7 84.3
1.4. Summary
• There were 117,500 employees and 237,800 volunteers in the participating agencies at the time of the survey.
• Police agencies were the main employer, employing two-thirds of the employees working in the sector, while the majority of volunteers were affiliated with fire and rescue agencies.
• The majority of employees and volunteers in the sector were male. • Most employees work full time, with the majority doing shift work or being on call. A high number have
worked for their agency for more than 10 years.
9
Chapter 2 — Prevalence of mental health conditions and mental wellbeing
Overview
One of the primary aims of Answering the call was to describe the level of mental wellbeing and mental health conditions within the police and emergency services sector. Answering the call measured several aspects of mental health and wellbeing. Several standardised questionnaires have been employed to allow comparability with other population groups. Measures of mental health conditions and wellbeing employed in the survey included:
• Kessler 10 measure of psychological distress (K10) (Furukawa et al., 2003) • Short Warwick-Edinburgh Mental Wellbeing Scale (SWEMWBS) (Ng Fat et al., 2016) • Post-Traumatic Stress Disorder (PTSD) screening scale • Ever diagnosed with a mental health condition, and current diagnosis • Self-perceived mental health conditions • Functional impairment associated with psychological distress • Functional impairment associated with symptoms of PTSD • Anger symptoms • Brief Resilience Scale (Smith et al., 2008) • Shakespeare-Finch two way social support scale
In combination, these measures provide a comprehensive picture of the mental wellbeing of employees and volunteers in the police and emergency services sector.
Summary of findings
The majority of employees and volunteers in the police and emergency services sector have good levels of positive mental wellbeing and resilience and low levels of distress. However, across each of the measures considered in the survey a consistent pattern emerged, of higher levels of distress and mental health conditions in the police and emergency services sector than in the general population. Compared with the general adult population, employees in the police and emergency services sector had substantially higher rates of psychological distress, probable PTSD, anger and impulse control problems, and lower levels of positive wellbeing. Across the four sectors included in the survey, police employees showed the highest level of mental health conditions and the lowest level of positive wellbeing. Levels of psychological distress and probable PTSD were higher among police and emergency services workers than employees in other professional and community services occupations.
Approximately 10% of employees had probable PTSD. Rates of probable PTSD ranged from 6% in the SES sector, to 8% in ambulance, 9% in fire and rescue, and 11% in police. In comparison, the prevalence of PTSD has been estimated at 4% in adults in Australia. About 25% of employees had high psychological distress and 8% had very high psychological distress, much higher than the 8% and 4% respectively among all adults in Australia. Around 33% and 39% of employees and volunteers respectively indicated having been diagnosed with a mental health condition in their life by a mental health professional, compared to 20% of all adults in Australia.
Volunteers showed lower levels of mental health conditions and higher levels of positive wellbeing compared to employees. Volunteers in the ambulance sector had levels of mental health conditions and mental wellbeing that were generally comparable with those of the Australian population. However, levels of mental health conditions were slightly higher in fire and rescue volunteers and higher again in state emergency service volunteers.
10
2.1 Psychological distress
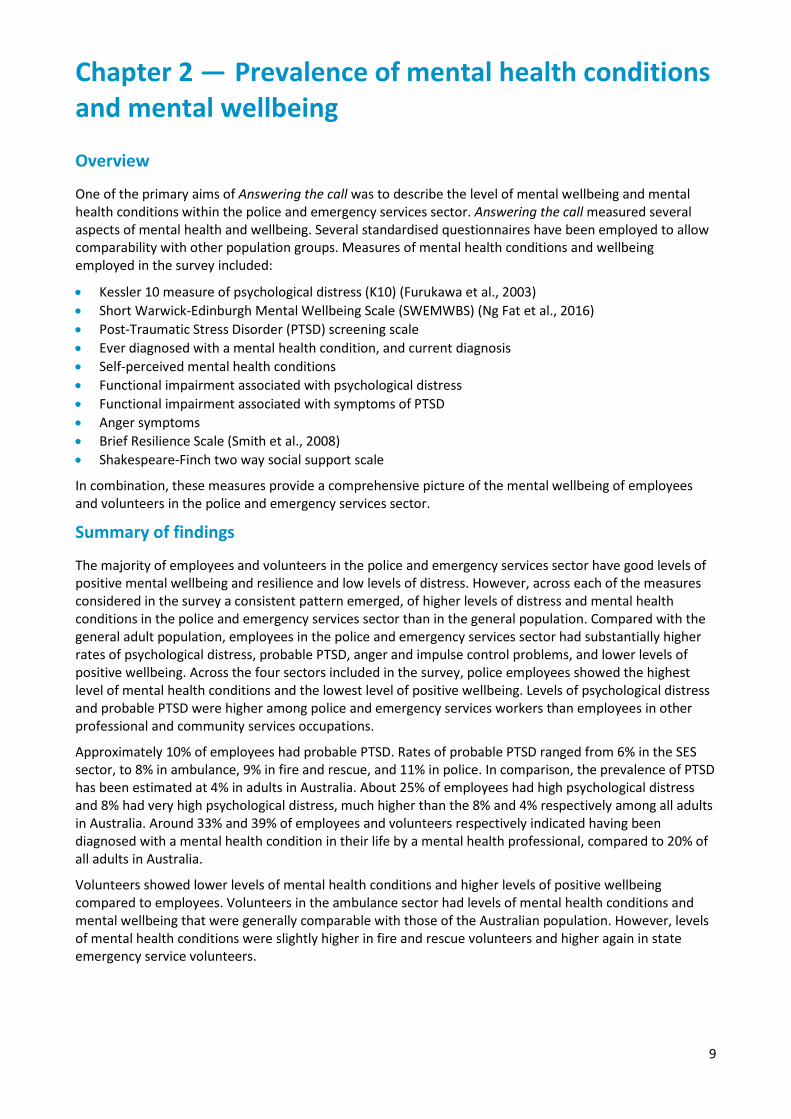
The Kessler 10 scale is a widely used instrument that measures level of psychological distress. It focusses mainly on symptoms of depression and anxiety. The Kessler 10 scale is used in many national studies and is useful for comparing between different populations. The very high category on the Kessler 10 has been designed to match the definition of serious mental illness in the United States. Serious mental illness is defined as mental illness associated with serious functional impairment, which substantially interferes with or limits one or more major life activities. Using this definition, approximately 4% of adults in the United States have a serious mental illness (Substance Abuse and Mental Health Services Administration, 2017), and about 3.7% of Australian adults do (Australian Bureau of Statistics, 2015). Among employed Australians working in professional occupations (Australian and New Zealand Standard Classification of Occupations Category 2), 1.5% are in the very high category on the Kessler 10, and among employed Australians working in Community and Personal Services occupations (ANZSCO Category 4 which includes police, paramedics, fire fighters and emergency services workers) 4% are in the very high category on the K10. Answering the call found that 8% of employees in the ambulance, fire and rescue and SES sectors and 10% of police had very high levels of psychological distress, which is indicative of serious mental illness (Figure 2.1.1).
Among all employees in the police and emergency services sector, 21% (equivalent to an estimated 24,000 employees) had high psychological distress and 9% (an estimated 10,900 employees) had very high psychological distress – substantially higher than the 8% and 4% respectively among all adults in Australia.
Figure 2.1.1: Employees’ level of psychological distress, by sector
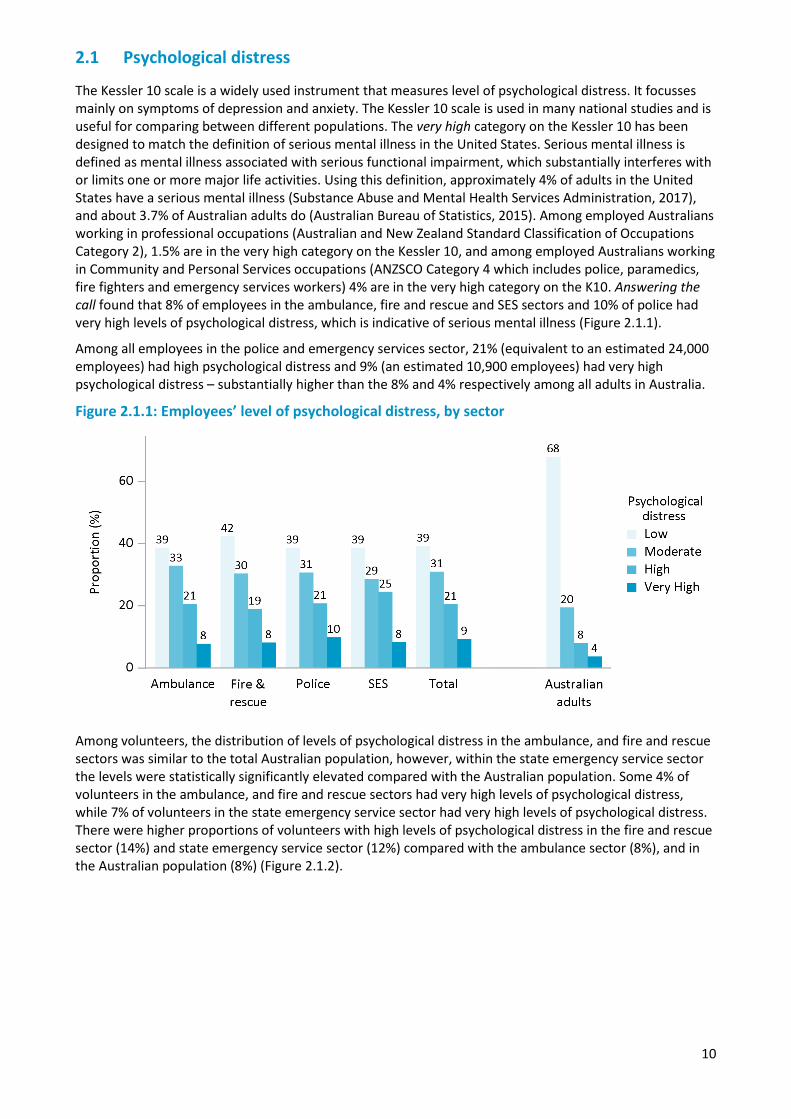
Among volunteers, the distribution of levels of psychological distress in the ambulance, and fire and rescue sectors was similar to the total Australian population, however, within the state emergency service sector the levels were statistically significantly elevated compared with the Australian population. Some 4% of volunteers in the ambulance, and fire and rescue sectors had very high levels of psychological distress, while 7% of volunteers in the state emergency service sector had very high levels of psychological distress. There were higher proportions of volunteers with high levels of psychological distress in the fire and rescue sector (14%) and state emergency service sector (12%) compared with the ambulance sector (8%), and in the Australian population (8%) (Figure 2.1.2).
11
Figure 2.1.2: Volunteers’ level of psychological distress, by sector
2.2 Warwick-Edinburgh Mental Wellbeing Scale (SWEMWBS)
The short form of the Warwick Edinburgh Mental Wellbeing Scale was used to assess mental wellbeing (Ng Fat et al., 2016). It consists of seven positively worded questions that cover both feelings and functioning. The scale was originally developed in the United Kingdom, and reference data for the adult population of Scotland and of England is available. Both the Scottish and English populations are very similar in distribution of mental wellbeing. In comparison to these population references, employees within the police and emergency services sector had much higher rates of low mental wellbeing, and lower rates of high wellbeing. The reference categories for the Scottish and English populations were chosen to identify individuals with mental wellbeing scores in the top 15% and in the bottom 15%. In comparison, only 6% of employees across all sectors (an estimated 24,000 employees) were in the high range of the SWEMWBS distribution and had high levels of mental wellbeing, and 31% had low mental wellbeing (an estimated 46,100 employees). Across the individual sectors, 27% of ambulance employees, 29% of fire and rescue employees, 32% of police employees, and 28% of state emergency service employees were in the low range and had low levels of mental wellbeing, compared with an expected 15% (Figure 2.2.1).
Figure 2.2.1: Levels of mental wellbeing among employees, compared with English reference population, by sector
12
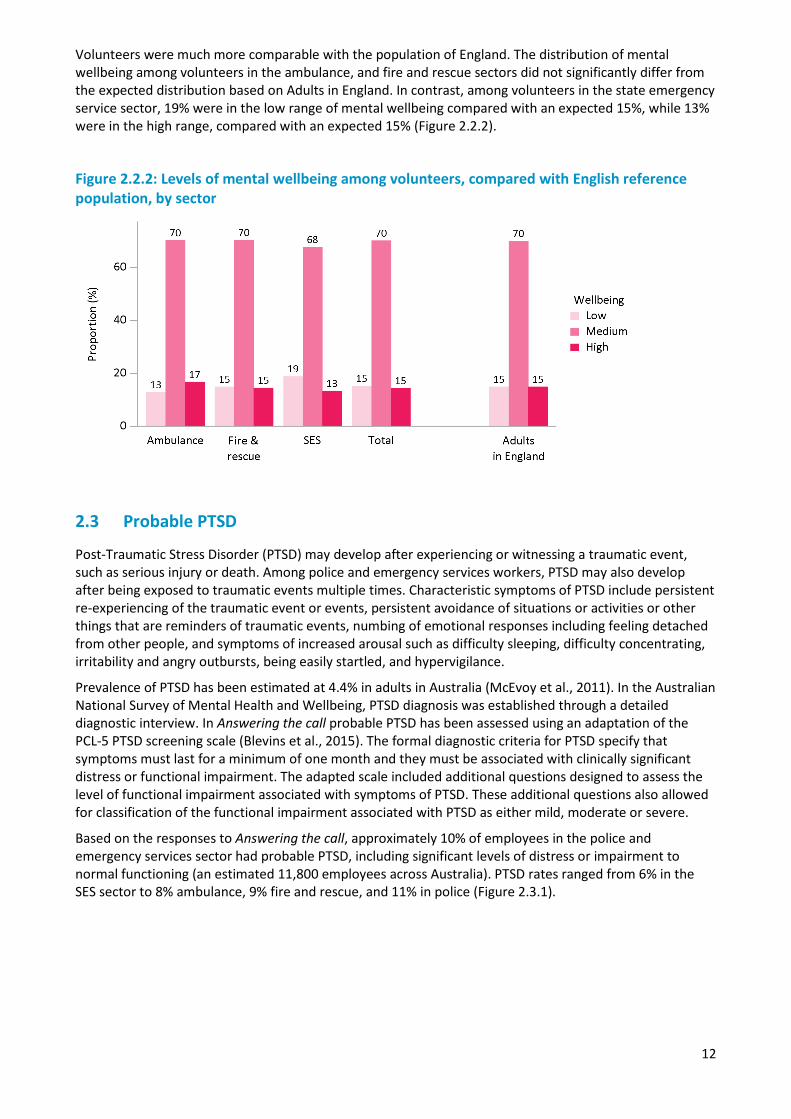
Volunteers were much more comparable with the population of England. The distribution of mental wellbeing among volunteers in the ambulance, and fire and rescue sectors did not significantly differ from the expected distribution based on Adults in England. In contrast, among volunteers in the state emergency service sector, 19% were in the low range of mental wellbeing compared with an expected 15%, while 13% were in the high range, compared with an expected 15% (Figure 2.2.2).
Figure 2.2.2: Levels of mental wellbeing among volunteers, compared with English reference population, by sector
2.3 Probable PTSD
Post-Traumatic Stress Disorder (PTSD) may develop after experiencing or witnessing a traumatic event, such as serious injury or death. Among police and emergency services workers, PTSD may also develop after being exposed to traumatic events multiple times. Characteristic symptoms of PTSD include persistent re-experiencing of the traumatic event or events, persistent avoidance of situations or activities or other things that are reminders of traumatic events, numbing of emotional responses including feeling detached from other people, and symptoms of increased arousal such as difficulty sleeping, difficulty concentrating, irritability and angry outbursts, being easily startled, and hypervigilance.
Prevalence of PTSD has been estimated at 4.4% in adults in Australia (McEvoy et al., 2011). In the Australian National Survey of Mental Health and Wellbeing, PTSD diagnosis was established through a detailed diagnostic interview. In Answering the call probable PTSD has been assessed using an adaptation of the PCL-5 PTSD screening scale (Blevins et al., 2015). The formal diagnostic criteria for PTSD specify that symptoms must last for a minimum of one month and they must be associated with clinically significant distress or functional impairment. The adapted scale included additional questions designed to assess the level of functional impairment associated with symptoms of PTSD. These additional questions also allowed for classification of the functional impairment associated with PTSD as either mild, moderate or severe.
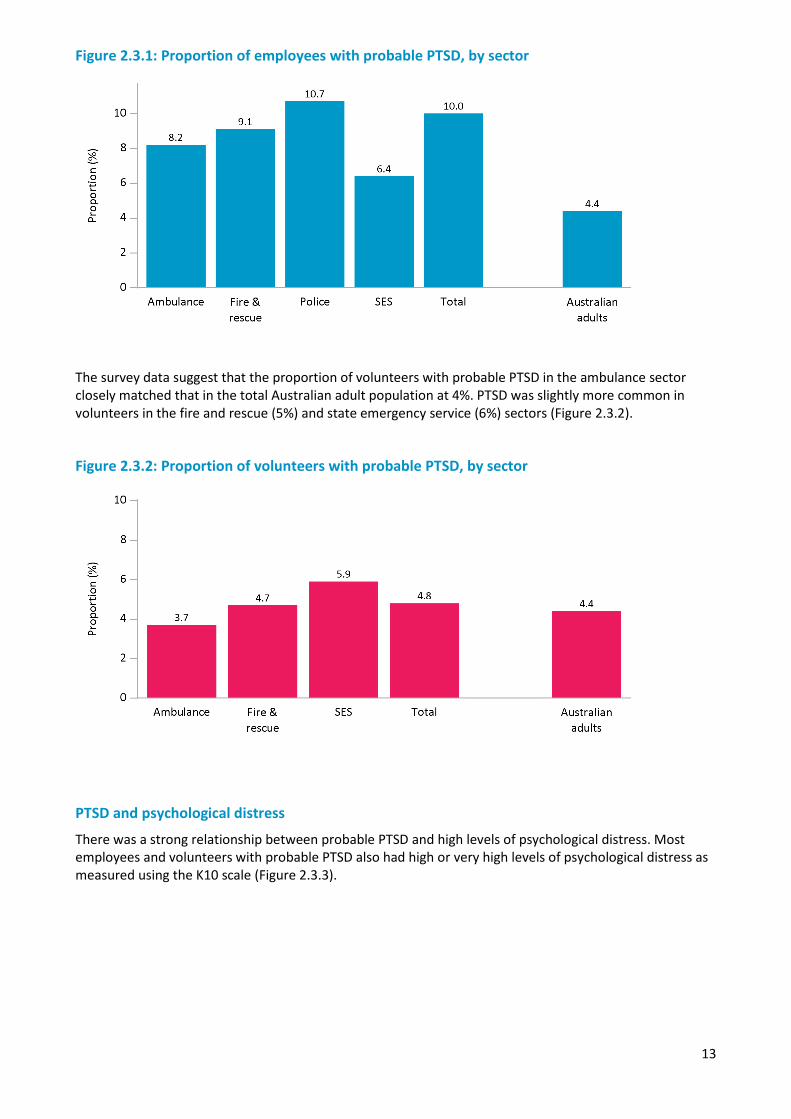
Based on the responses to Answering the call, approximately 10% of employees in the police and emergency services sector had probable PTSD, including significant levels of distress or impairment to normal functioning (an estimated 11,800 employees across Australia). PTSD rates ranged from 6% in the SES sector to 8% ambulance, 9% fire and rescue, and 11% in police (Figure 2.3.1).
13
Figure 2.3.1: Proportion of employees with probable PTSD, by sector
The survey data suggest that the proportion of volunteers with probable PTSD in the ambulance sector closely matched that in the total Australian adult population at 4%. PTSD was slightly more common in volunteers in the fire and rescue (5%) and state emergency service (6%) sectors (Figure 2.3.2).
Figure 2.3.2: Proportion of volunteers with probable PTSD, by sector
PTSD and psychological distress
There was a strong relationship between probable PTSD and high levels of psychological distress. Most employees and volunteers with probable PTSD also had high or very high levels of psychological distress as measured using the K10 scale (Figure 2.3.3).

14
Figure 2.3.3: Level of psychological distress for employees and volunteers with probable PTSD
While the majority of personnel with probable PTSD also have high or very high levels of psychological distress as assessed using the K10, there are substantial numbers of employees and volunteers without probable PTSD who have high or very high levels of psychological distress (Table 2.3.1). The K10 scale is a strong indicator of depression or anxiety conditions. These figures show that while PTSD is a significant mental health issue in police and emergency services, there are larger numbers of personnel who have depression or anxiety conditions. Across all sectors, approximately 10% of employees have probable PTSD and an additional 21% have high or very high levels of psychological distress, indicative of anxiety or depression. About 70% of employees have neither. While this demonstrates that the majority of employees have good mental health, depression and anxiety as well as PTSD are common mental health issues in the police and emergency services sector. Among volunteers, approximately 5% have probable PTSD and an additional 14% have high or very high levels of psychological distress. Over 80% of volunteers have neither.
Table 2.3.1: PTSD and psychological distress, by sector
PTSD and psychological distress (K10) Ambulance
(%) Fire and
rescue (%) Police (%)
State emergency service (%)
Employees
PTSD and high/very high psychological distress 7.4 8.3 9.7 5.8
PTSD 0.8 0.8 1.0 0.6
High/very high psychological distress 21.0 18.9 21.0 27.0
Neither 70.8 72.0 68.4 66.6
Volunteers
PTSD and high/very high psychological distress 3.4 3.8 5.4
PTSD 0.3 0.9 0.5
High/very high psychological distress 8.0 13.7 13.6
Neither 88.4 81.6 80.5
15
2.4 Diagnosis of mental health conditions
Survey participants were asked if they had ever been diagnosed with a mental health condition by a doctor or a mental health professional and, if so, they were asked if they still had this condition.
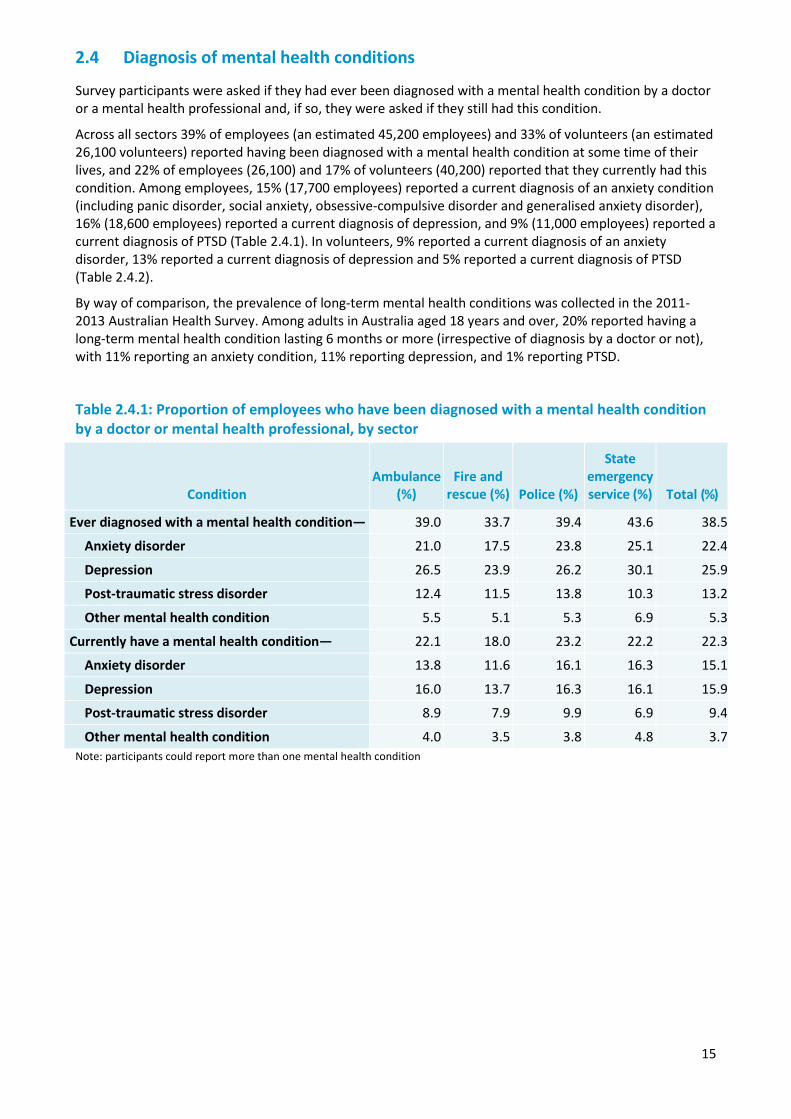
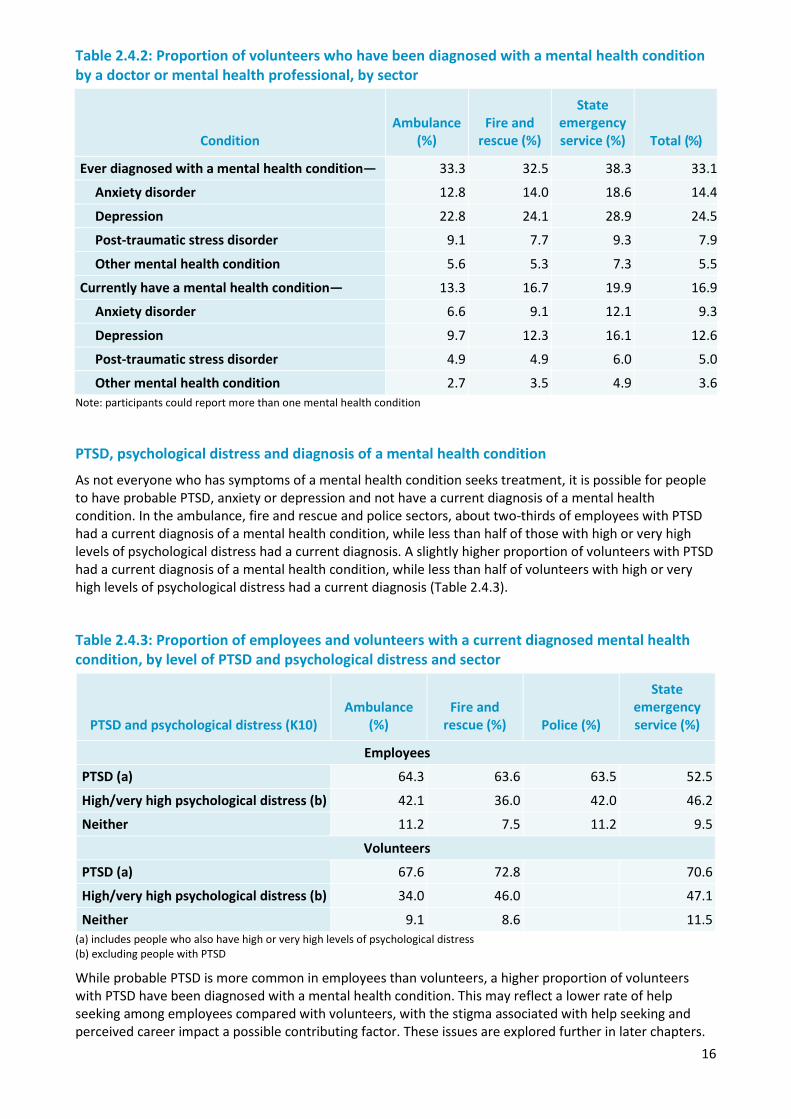
Across all sectors 39% of employees (an estimated 45,200 employees) and 33% of volunteers (an estimated 26,100 volunteers) reported having been diagnosed with a mental health condition at some time of their lives, and 22% of employees (26,100) and 17% of volunteers (40,200) reported that they currently had this condition. Among employees, 15% (17,700 employees) reported a current diagnosis of an anxiety condition (including panic disorder, social anxiety, obsessive-compulsive disorder and generalised anxiety disorder), 16% (18,600 employees) reported a current diagnosis of depression, and 9% (11,000 employees) reported a current diagnosis of PTSD (Table 2.4.1). In volunteers, 9% reported a current diagnosis of an anxiety disorder, 13% reported a current diagnosis of depression and 5% reported a current diagnosis of PTSD (Table 2.4.2).
By way of comparison, the prevalence of long-term mental health conditions was collected in the 2011-2013 Australian Health Survey. Among adults in Australia aged 18 years and over, 20% reported having a long-term mental health condition lasting 6 months or more (irrespective of diagnosis by a doctor or not), with 11% reporting an anxiety condition, 11% reporting depression, and 1% reporting PTSD.
Table 2.4.1: Proportion of employees who have been diagnosed with a mental health condition by a doctor or mental health professional, by sector
Condition Ambulance
(%) Fire and
rescue (%) Police (%)
State emergency service (%) Total (%)
Ever diagnosed with a mental health condition— 39.0 33.7 39.4 43.6 38.5
Anxiety disorder 21.0 17.5 23.8 25.1 22.4
Depression 26.5 23.9 26.2 30.1 25.9
Post-traumatic stress disorder 12.4 11.5 13.8 10.3 13.2
Other mental health condition 5.5 5.1 5.3 6.9 5.3
Currently have a mental health condition— 22.1 18.0 23.2 22.2 22.3
Anxiety disorder 13.8 11.6 16.1 16.3 15.1
Depression 16.0 13.7 16.3 16.1 15.9
Post-traumatic stress disorder 8.9 7.9 9.9 6.9 9.4
Other mental health condition 4.0 3.5 3.8 4.8 3.7 Note: participants could report more than one mental health condition
16
Table 2.4.2: Proportion of volunteers who have been diagnosed with a mental health condition by a doctor or mental health professional, by sector
Condition Ambulance
(%) Fire and
rescue (%)
State emergency service (%) Total (%)
Ever diagnosed with a mental health condition— 33.3 32.5 38.3 33.1
Anxiety disorder 12.8 14.0 18.6 14.4
Depression 22.8 24.1 28.9 24.5
Post-traumatic stress disorder 9.1 7.7 9.3 7.9
Other mental health condition 5.6 5.3 7.3 5.5
Currently have a mental health condition— 13.3 16.7 19.9 16.9
Anxiety disorder 6.6 9.1 12.1 9.3
Depression 9.7 12.3 16.1 12.6
Post-traumatic stress disorder 4.9 4.9 6.0 5.0
Other mental health condition 2.7 3.5 4.9 3.6 Note: participants could report more than one mental health condition
PTSD, psychological distress and diagnosis of a mental health condition
As not everyone who has symptoms of a mental health condition seeks treatment, it is possible for people to have probable PTSD, anxiety or depression and not have a current diagnosis of a mental health condition. In the ambulance, fire and rescue and police sectors, about two-thirds of employees with PTSD had a current diagnosis of a mental health condition, while less than half of those with high or very high levels of psychological distress had a current diagnosis. A slightly higher proportion of volunteers with PTSD had a current diagnosis of a mental health condition, while less than half of volunteers with high or very high levels of psychological distress had a current diagnosis (Table 2.4.3).
Table 2.4.3: Proportion of employees and volunteers with a current diagnosed mental health condition, by level of PTSD and psychological distress and sector
PTSD and psychological distress (K10) Ambulance
(%) Fire and
rescue (%) Police (%)
State emergency service (%)
Employees
PTSD (a) 64.3 63.6 63.5 52.5
High/very high psychological distress (b) 42.1 36.0 42.0 46.2
Neither 11.2 7.5 11.2 9.5
Volunteers
PTSD (a) 67.6 72.8 70.6
High/very high psychological distress (b) 34.0 46.0 47.1
Neither 9.1 8.6 11.5 (a) includes people who also have high or very high levels of psychological distress (b) excluding people with PTSD
While probable PTSD is more common in employees than volunteers, a higher proportion of volunteers with PTSD have been diagnosed with a mental health condition. This may reflect a lower rate of help seeking among employees compared with volunteers, with the stigma associated with help seeking and perceived career impact a possible contributing factor. These issues are explored further in later chapters.
17
Around 10% of employees and volunteers with neither probable PTSD or high or very high levels of psychological distress reported having been diagnosed with a mental health condition and still having that condition at the time of the survey. Most of these employees and volunteers reported that they had been diagnosed with depression, an anxiety condition or PTSD. People whose symptoms of distress or PTSD are being effectively managed by the treatment they are receiving would not be identified as having probable PTSD or high psychological distress in the survey.
2.5 Self-perceived mental health conditions
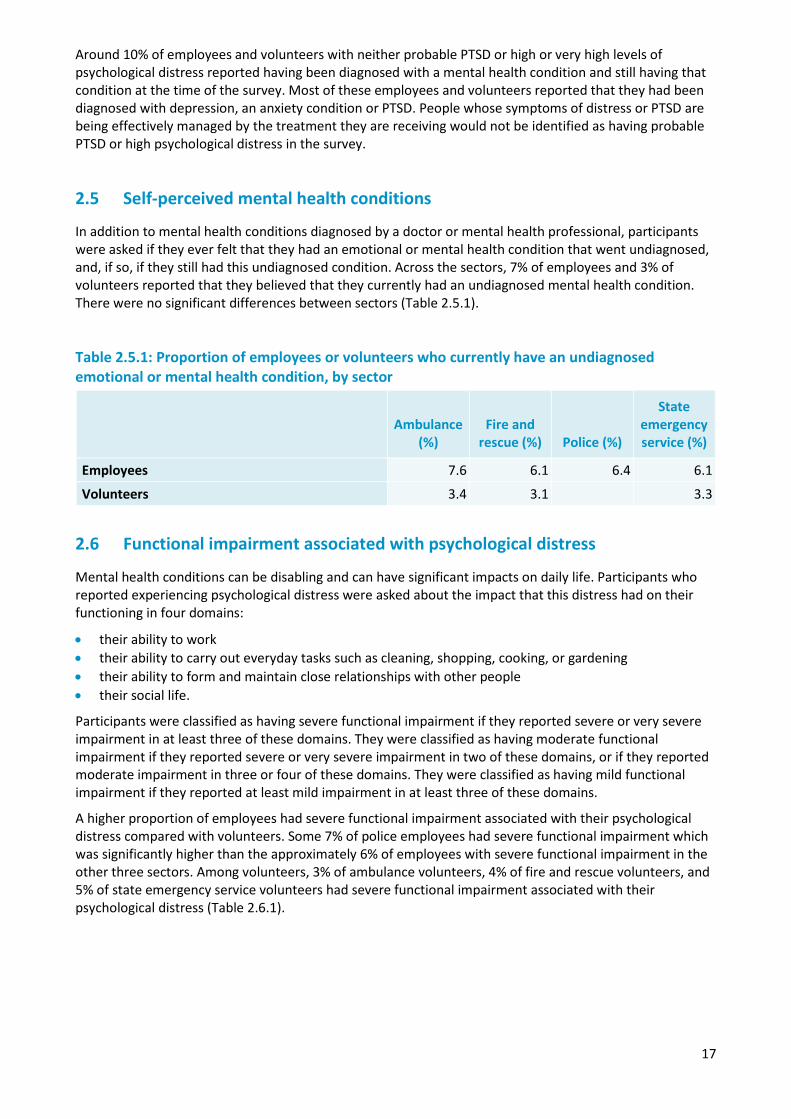
In addition to mental health conditions diagnosed by a doctor or mental health professional, participants were asked if they ever felt that they had an emotional or mental health condition that went undiagnosed, and, if so, if they still had this undiagnosed condition. Across the sectors, 7% of employees and 3% of volunteers reported that they believed that they currently had an undiagnosed mental health condition. There were no significant differences between sectors (Table 2.5.1).
Table 2.5.1: Proportion of employees or volunteers who currently have an undiagnosed emotional or mental health condition, by sector
Ambulance
(%) Fire and
rescue (%) Police (%)
State emergency service (%)
Employees 7.6 6.1 6.4 6.1
Volunteers 3.4 3.1 3.3
2.6 Functional impairment associated with psychological distress
Mental health conditions can be disabling and can have significant impacts on daily life. Participants who reported experiencing psychological distress were asked about the impact that this distress had on their functioning in four domains:
• their ability to work • their ability to carry out everyday tasks such as cleaning, shopping, cooking, or gardening • their ability to form and maintain close relationships with other people • their social life.
Participants were classified as having severe functional impairment if they reported severe or very severe impairment in at least three of these domains. They were classified as having moderate functional impairment if they reported severe or very severe impairment in two of these domains, or if they reported moderate impairment in three or four of these domains. They were classified as having mild functional impairment if they reported at least mild impairment in at least three of these domains.
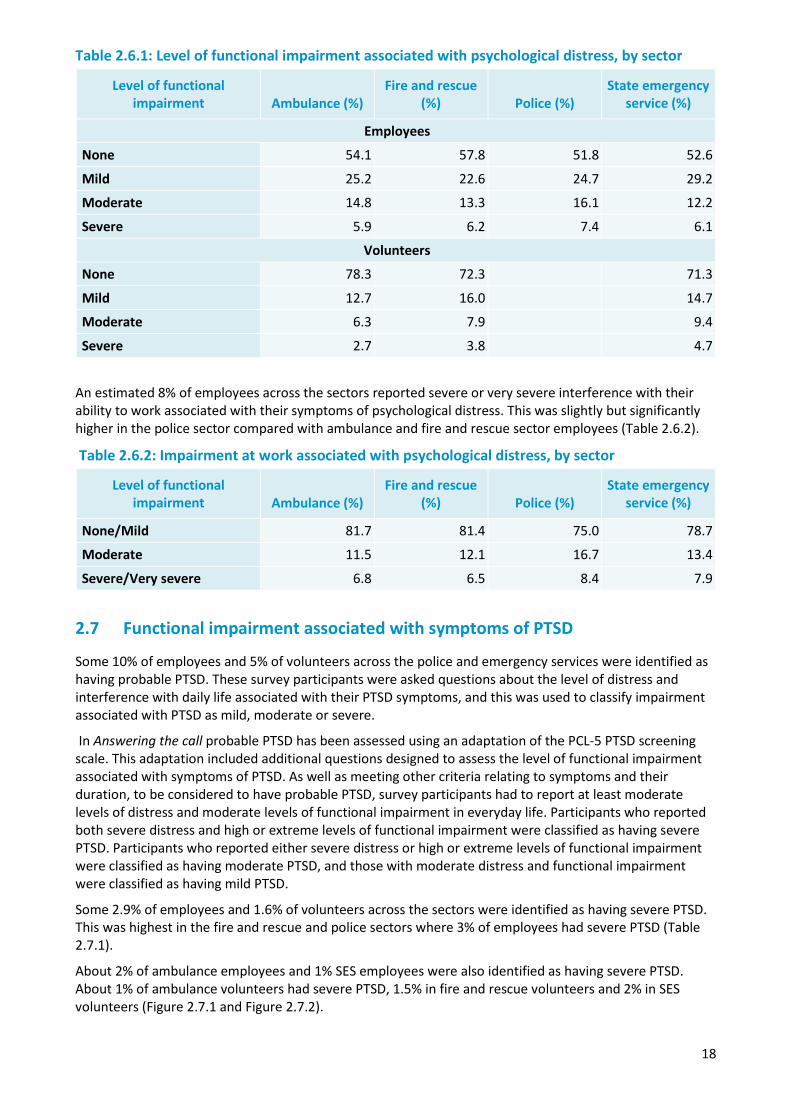
A higher proportion of employees had severe functional impairment associated with their psychological distress compared with volunteers. Some 7% of police employees had severe functional impairment which was significantly higher than the approximately 6% of employees with severe functional impairment in the other three sectors. Among volunteers, 3% of ambulance volunteers, 4% of fire and rescue volunteers, and 5% of state emergency service volunteers had severe functional impairment associated with their psychological distress (Table 2.6.1).
18
Table 2.6.1: Level of functional impairment associated with psychological distress, by sector
Level of functional impairment Ambulance (%)
Fire and rescue (%) Police (%)
State emergency service (%)
Employees
None 54.1 57.8 51.8 52.6
Mild 25.2 22.6 24.7 29.2
Moderate 14.8 13.3 16.1 12.2
Severe 5.9 6.2 7.4 6.1
Volunteers
None 78.3 72.3 71.3
Mild 12.7 16.0 14.7
Moderate 6.3 7.9 9.4
Severe 2.7 3.8 4.7
An estimated 8% of employees across the sectors reported severe or very severe interference with their ability to work associated with their symptoms of psychological distress. This was slightly but significantly higher in the police sector compared with ambulance and fire and rescue sector employees (Table 2.6.2).
Table 2.6.2: Impairment at work associated with psychological distress, by sector
Level of functional impairment Ambulance (%)
Fire and rescue (%) Police (%)
State emergency service (%)
None/Mild 81.7 81.4 75.0 78.7
Moderate 11.5 12.1 16.7 13.4
Severe/Very severe 6.8 6.5 8.4 7.9
2.7 Functional impairment associated with symptoms of PTSD
Some 10% of employees and 5% of volunteers across the police and emergency services were identified as having probable PTSD. These survey participants were asked questions about the level of distress and interference with daily life associated with their PTSD symptoms, and this was used to classify impairment associated with PTSD as mild, moderate or severe.
In Answering the call probable PTSD has been assessed using an adaptation of the PCL-5 PTSD screening scale. This adaptation included additional questions designed to assess the level of functional impairment associated with symptoms of PTSD. As well as meeting other criteria relating to symptoms and their duration, to be considered to have probable PTSD, survey participants had to report at least moderate levels of distress and moderate levels of functional impairment in everyday life. Participants who reported both severe distress and high or extreme levels of functional impairment were classified as having severe PTSD. Participants who reported either severe distress or high or extreme levels of functional impairment were classified as having moderate PTSD, and those with moderate distress and functional impairment were classified as having mild PTSD.
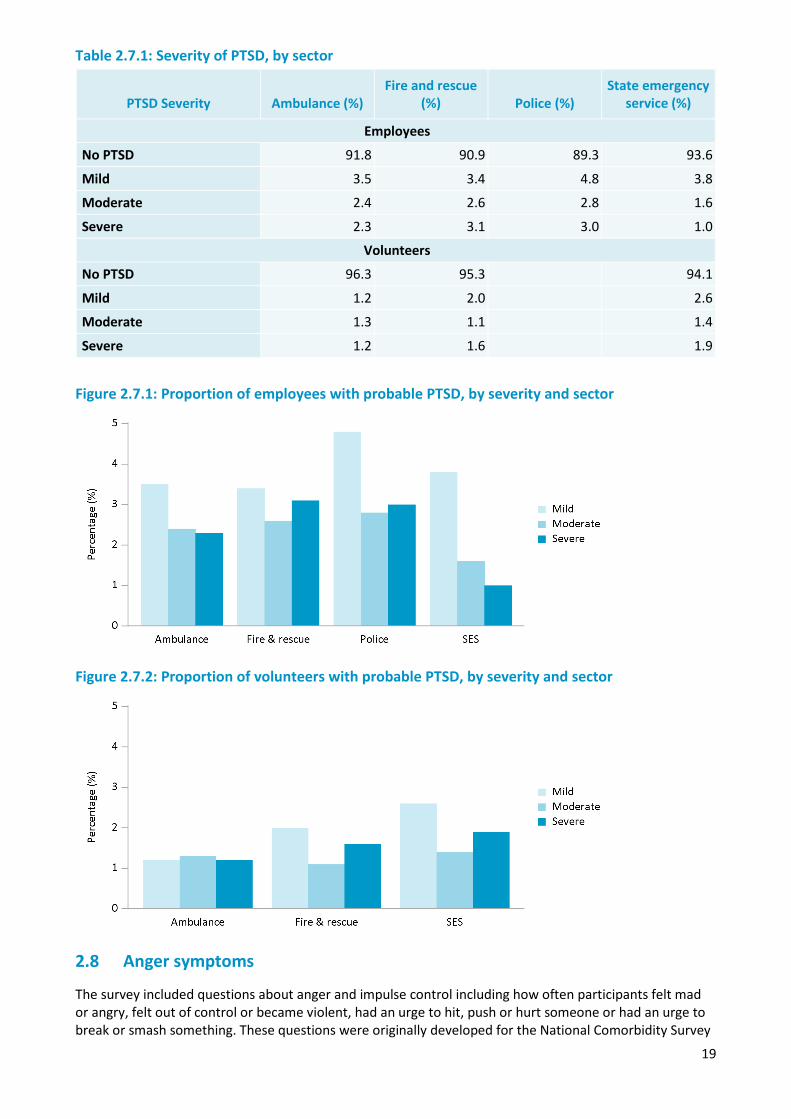
Some 2.9% of employees and 1.6% of volunteers across the sectors were identified as having severe PTSD. This was highest in the fire and rescue and police sectors where 3% of employees had severe PTSD (Table 2.7.1).
About 2% of ambulance employees and 1% SES employees were also identified as having severe PTSD. About 1% of ambulance volunteers had severe PTSD, 1.5% in fire and rescue volunteers and 2% in SES volunteers (Figure 2.7.1 and Figure 2.7.2).
19
Table 2.7.1: Severity of PTSD, by sector
PTSD Severity Ambulance (%) Fire and rescue
(%) Police (%) State emergency
service (%)
Employees
No PTSD 91.8 90.9 89.3 93.6
Mild 3.5 3.4 4.8 3.8
Moderate 2.4 2.6 2.8 1.6
Severe 2.3 3.1 3.0 1.0
Volunteers
No PTSD 96.3 95.3 94.1
Mild 1.2 2.0 2.6
Moderate 1.3 1.1 1.4
Severe 1.2 1.6 1.9
Figure 2.7.1: Proportion of employees with probable PTSD, by severity and sector
Figure 2.7.2: Proportion of volunteers with probable PTSD, by severity and sector
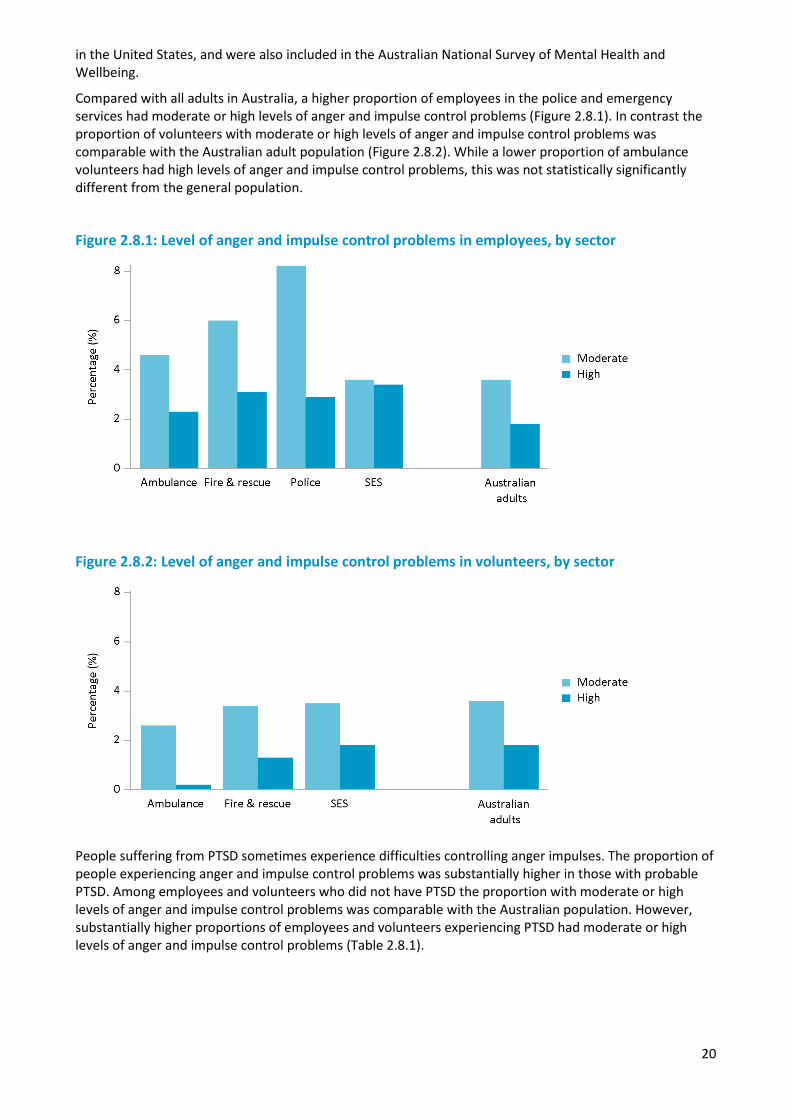
2.8 Anger symptoms
The survey included questions about anger and impulse control including how often participants felt mad or angry, felt out of control or became violent, had an urge to hit, push or hurt someone or had an urge to break or smash something. These questions were originally developed for the National Comorbidity Survey
20
in the United States, and were also included in the Australian National Survey of Mental Health and Wellbeing.
Compared with all adults in Australia, a higher proportion of employees in the police and emergency services had moderate or high levels of anger and impulse control problems (Figure 2.8.1). In contrast the proportion of volunteers with moderate or high levels of anger and impulse control problems was comparable with the Australian adult population (Figure 2.8.2). While a lower proportion of ambulance volunteers had high levels of anger and impulse control problems, this was not statistically significantly different from the general population.
Figure 2.8.1: Level of anger and impulse control problems in employees, by sector
Figure 2.8.2: Level of anger and impulse control problems in volunteers, by sector
People suffering from PTSD sometimes experience difficulties controlling anger impulses. The proportion of people experiencing anger and impulse control problems was substantially higher in those with probable PTSD. Among employees and volunteers who did not have PTSD the proportion with moderate or high levels of anger and impulse control problems was comparable with the Australian population. However, substantially higher proportions of employees and volunteers experiencing PTSD had moderate or high levels of anger and impulse control problems (Table 2.8.1).

21
Table 2.8.1: Level of anger and impulse control problems, by probable PTSD
Level of anger and impulse control problems No PTSD (%) Has PTSD (%)
Employees
Moderate 5.5 23.3
High 1.6 13.8
Volunteers
Moderate 2.7 17.0
High 0.7 12.8
2.9 Resilience
Resilience is an important component of wellbeing, and reflects a person’s ability to bounce back after challenges and stressful events, and to cope with difficult times. The Brief Resilience Scale was used to assess levels of resilience in employees and volunteers (Smith et al., 2008). Most employees and volunteers had high (63,900 employees) or moderate (42,300 employees) levels of resilience. Levels of resilience were higher in volunteers compared with employees (Table 2.9.1).
Table 2.9.1: Level of resilience in employees and volunteers, by sector
Resilience Ambulance
(%) Fire and
rescue (%) Police (%)
State emergency service (%) Total (%)
Employees
High 56.2 56.4 53.5 55.3 54.4
Moderate 35.0 35.7 36.3 38.8 36.0
Low 8.7 7.9 10.1 5.9 9.5
Volunteers
High 70.0 65.8 64.5 65.8
Moderate 26.4 28.4 30.1 28.5
Low 3.6 5.7 5.4 5.6
2.10 Social support
Social support was measured in the survey using a short form of the Shakespeare-Finch two-way social support scale (Shakespeare-Finch and Obst, 2011). The scale assesses the level of social support that a person receives from those around them as well as the ability to provide support to others. Receiving support from others can be an important protective factor for supporting positive mental wellbeing. When the ability to provide support to others is impaired it can be an indicator of problems with mental wellbeing.
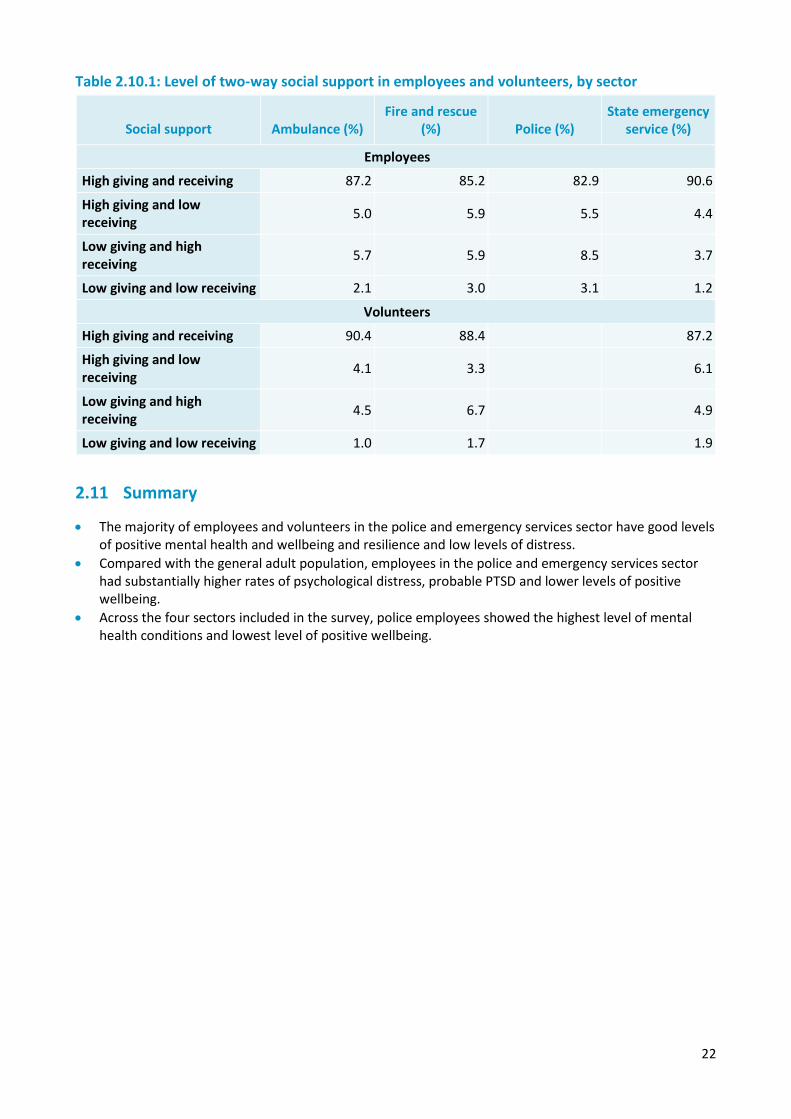
Most employees and volunteers in the police and emergency services sector had high levels of both giving and receiving social support. A higher proportion of employees experienced low levels of support compared with volunteers, and police employees had the lowest proportion of high giving and receiving social support (Table 2.10.1).
22
Table 2.10.1: Level of two-way social support in employees and volunteers, by sector
Social support Ambulance (%) Fire and rescue
(%) Police (%) State emergency
service (%)
Employees
High giving and receiving 87.2 85.2 82.9 90.6
High giving and low receiving 5.0 5.9 5.5 4.4
Low giving and high receiving 5.7 5.9 8.5 3.7
Low giving and low receiving 2.1 3.0 3.1 1.2
Volunteers
High giving and receiving 90.4 88.4 87.2
High giving and low receiving 4.1 3.3 6.1
Low giving and high receiving 4.5 6.7 4.9
Low giving and low receiving 1.0 1.7 1.9
2.11 Summary
• The majority of employees and volunteers in the police and emergency services sector have good levels of positive mental health and wellbeing and resilience and low levels of distress.
• Compared with the general adult population, employees in the police and emergency services sector had substantially higher rates of psychological distress, probable PTSD and lower levels of positive wellbeing.
• Across the four sectors included in the survey, police employees showed the highest level of mental health conditions and lowest level of positive wellbeing.
23
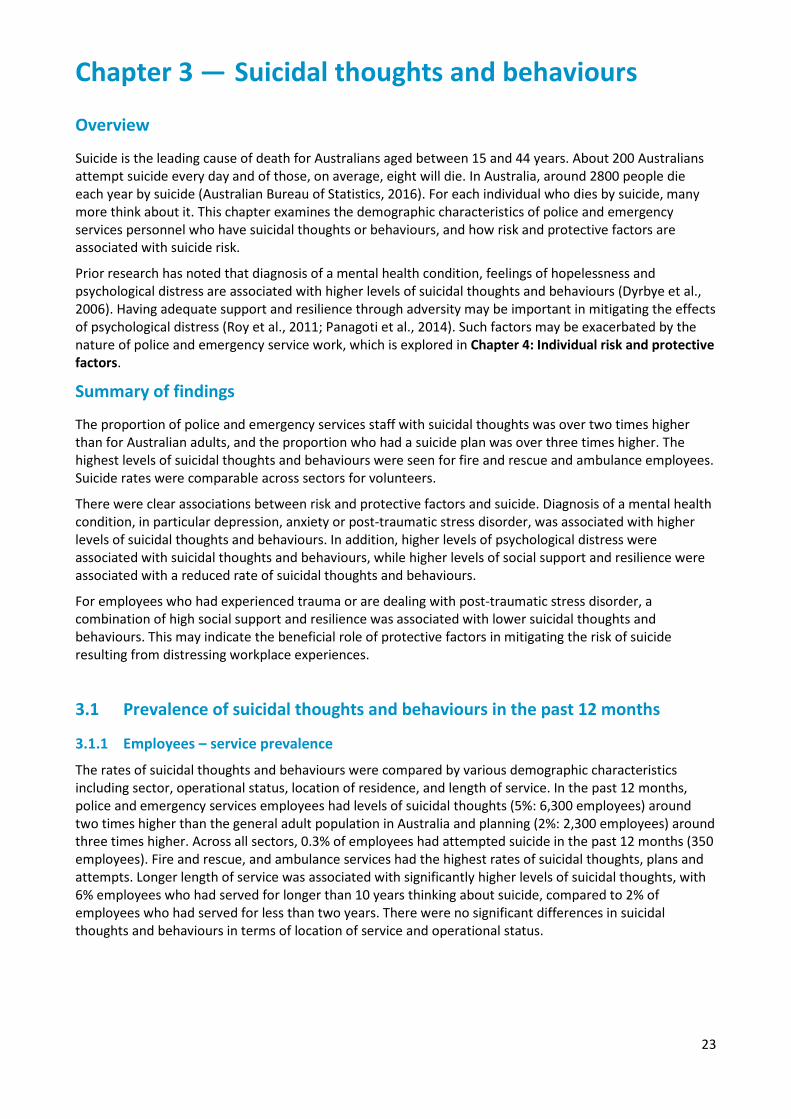
Chapter 3 — Suicidal thoughts and behaviours
Overview
Suicide is the leading cause of death for Australians aged between 15 and 44 years. About 200 Australians attempt suicide every day and of those, on average, eight will die. In Australia, around 2800 people die each year by suicide (Australian Bureau of Statistics, 2016). For each individual who dies by suicide, many more think about it. This chapter examines the demographic characteristics of police and emergency services personnel who have suicidal thoughts or behaviours, and how risk and protective factors are associated with suicide risk.
Prior research has noted that diagnosis of a mental health condition, feelings of hopelessness and psychological distress are associated with higher levels of suicidal thoughts and behaviours (Dyrbye et al., 2006). Having adequate support and resilience through adversity may be important in mitigating the effects of psychological distress (Roy et al., 2011; Panagoti et al., 2014). Such factors may be exacerbated by the nature of police and emergency service work, which is explored in Chapter 4: Individual risk and protective factors.
Summary of findings
The proportion of police and emergency services staff with suicidal thoughts was over two times higher than for Australian adults, and the proportion who had a suicide plan was over three times higher. The highest levels of suicidal thoughts and behaviours were seen for fire and rescue and ambulance employees. Suicide rates were comparable across sectors for volunteers.
There were clear associations between risk and protective factors and suicide. Diagnosis of a mental health condition, in particular depression, anxiety or post-traumatic stress disorder, was associated with higher levels of suicidal thoughts and behaviours. In addition, higher levels of psychological distress were associated with suicidal thoughts and behaviours, while higher levels of social support and resilience were associated with a reduced rate of suicidal thoughts and behaviours.
For employees who had experienced trauma or are dealing with post-traumatic stress disorder, a combination of high social support and resilience was associated with lower suicidal thoughts and behaviours. This may indicate the beneficial role of protective factors in mitigating the risk of suicide resulting from distressing workplace experiences.
3.1 Prevalence of suicidal thoughts and behaviours in the past 12 months
3.1.1 Employees – service prevalence
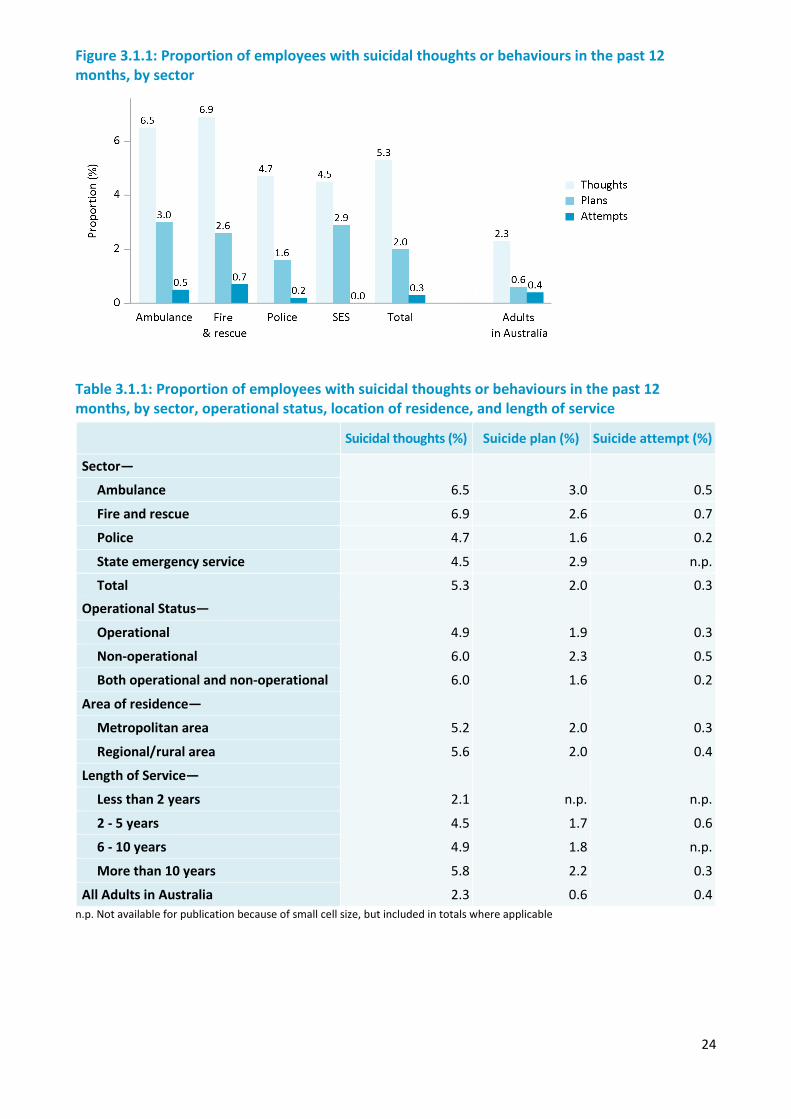
The rates of suicidal thoughts and behaviours were compared by various demographic characteristics including sector, operational status, location of residence, and length of service. In the past 12 months, police and emergency services employees had levels of suicidal thoughts (5%: 6,300 employees) around two times higher than the general adult population in Australia and planning (2%: 2,300 employees) around three times higher. Across all sectors, 0.3% of employees had attempted suicide in the past 12 months (350 employees). Fire and rescue, and ambulance services had the highest rates of suicidal thoughts, plans and attempts. Longer length of service was associated with significantly higher levels of suicidal thoughts, with 6% employees who had served for longer than 10 years thinking about suicide, compared to 2% of employees who had served for less than two years. There were no significant differences in suicidal thoughts and behaviours in terms of location of service and operational status.
24
Figure 3.1.1: Proportion of employees with suicidal thoughts or behaviours in the past 12 months, by sector
Table 3.1.1: Proportion of employees with suicidal thoughts or behaviours in the past 12 months, by sector, operational status, location of residence, and length of service
Suicidal thoughts (%) Suicide plan (%) Suicide attempt (%)
Sector—
6.5 3.0 0.5 Ambulance
Fire and rescue 6.9 2.6 0.7
Police 4.7 1.6 0.2
State emergency service 4.5 2.9 n.p.
Total 5.3 2.0 0.3 Operational Status—
Operational 4.9 1.9 0.3
Non-operational 6.0 2.3 0.5
Both operational and non-operational 6.0 1.6 0.2
Area of residence—
Metropolitan area 5.2 2.0 0.3
Regional/rural area 5.6 2.0 0.4
Length of Service—
Less than 2 years 2.1 n.p. n.p.
2 - 5 years 4.5 1.7 0.6
6 - 10 years 4.9 1.8 n.p.
More than 10 years 5.8 2.2 0.3
All Adults in Australia 2.3 0.6 0.4 n.p. Not available for publication because of small cell size, but included in totals where applicable
25
3.1.2 Employees - demographic characteristics
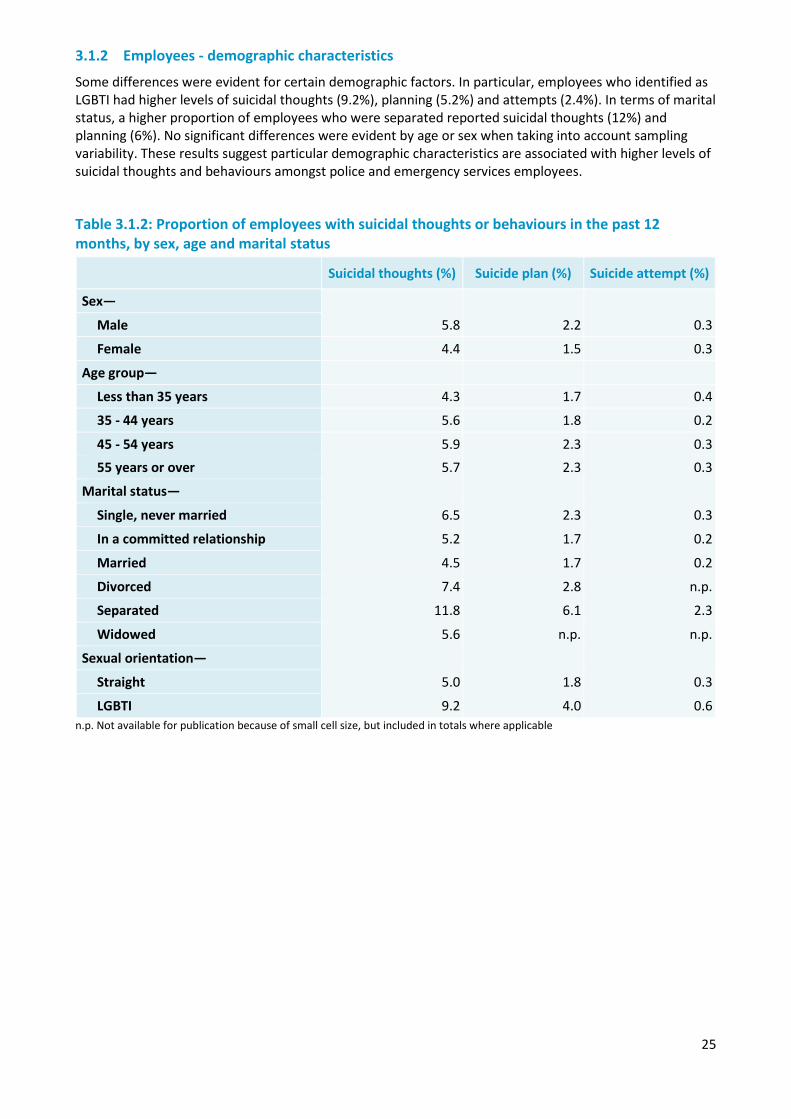
Some differences were evident for certain demographic factors. In particular, employees who identified as LGBTI had higher levels of suicidal thoughts (9.2%), planning (5.2%) and attempts (2.4%). In terms of marital status, a higher proportion of employees who were separated reported suicidal thoughts (12%) and planning (6%). No significant differences were evident by age or sex when taking into account sampling variability. These results suggest particular demographic characteristics are associated with higher levels of suicidal thoughts and behaviours amongst police and emergency services employees.
Table 3.1.2: Proportion of employees with suicidal thoughts or behaviours in the past 12 months, by sex, age and marital status
Suicidal thoughts (%) Suicide plan (%) Suicide attempt (%)
Sex— 5.8
2.2
0.3 Male
Female 4.4 1.5 0.3
Age group—
Less than 35 years 4.3 1.7 0.4
35 - 44 years 5.6 1.8 0.2
45 - 54 years 5.9 2.3 0.3 55 years or over 5.7 2.3 0.3
Marital status—
Single, never married 6.5 2.3 0.3
In a committed relationship 5.2 1.7 0.2
Married 4.5 1.7 0.2
Divorced 7.4 2.8 n.p.
Separated 11.8 6.1 2.3
Widowed 5.6 n.p. n.p.
Sexual orientation—
Straight 5.0 1.8 0.3
LGBTI 9.2 4.0 0.6 n.p. Not available for publication because of small cell size, but included in totals where applicable
26
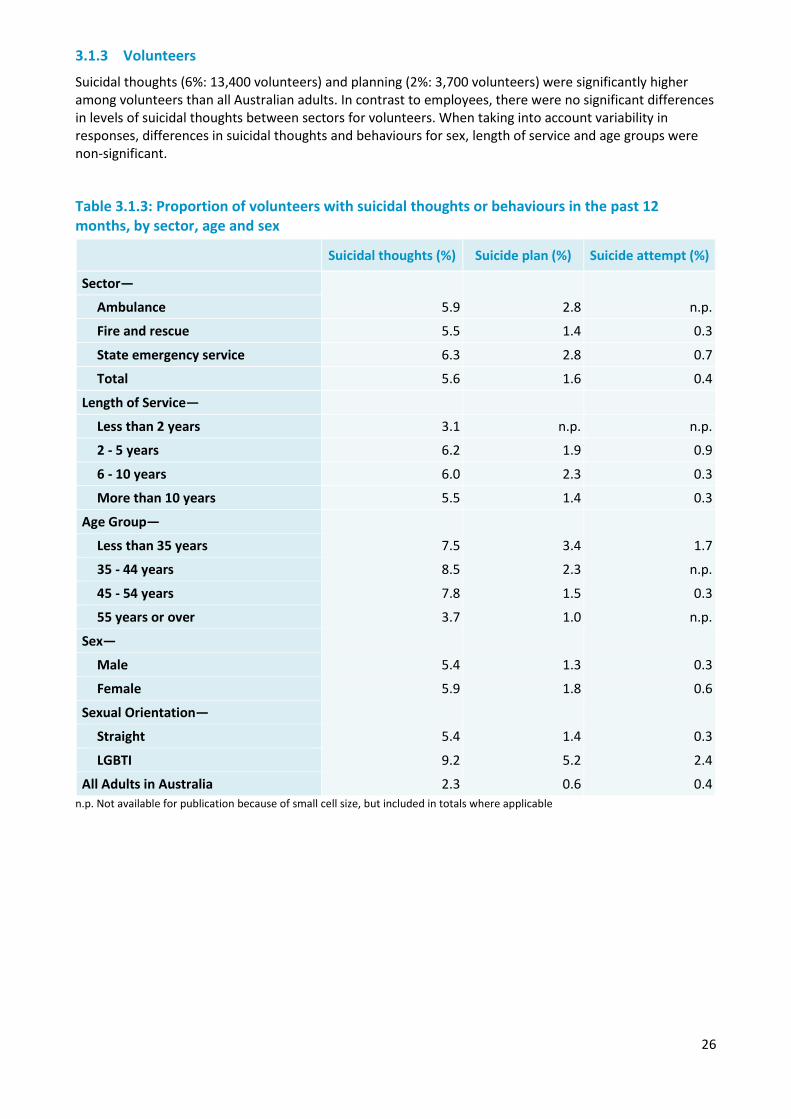
3.1.3 Volunteers
Suicidal thoughts (6%: 13,400 volunteers) and planning (2%: 3,700 volunteers) were significantly higher among volunteers than all Australian adults. In contrast to employees, there were no significant differences in levels of suicidal thoughts between sectors for volunteers. When taking into account variability in responses, differences in suicidal thoughts and behaviours for sex, length of service and age groups were non-significant.
Table 3.1.3: Proportion of volunteers with suicidal thoughts or behaviours in the past 12 months, by sector, age and sex
Suicidal thoughts (%) Suicide plan (%) Suicide attempt (%)
Sector—
5.9 2.8 n.p. Ambulance
Fire and rescue 5.5 1.4 0.3
State emergency service 6.3 2.8 0.7
Total 5.6 1.6 0.4
Length of Service—
Less than 2 years 3.1 n.p. n.p.
2 - 5 years 6.2 1.9 0.9
6 - 10 years 6.0 2.3 0.3
More than 10 years 5.5 1.4 0.3
Age Group—
Less than 35 years 7.5 3.4 1.7
35 - 44 years 8.5 2.3 n.p.
45 - 54 years 7.8 1.5 0.3
55 years or over 3.7 1.0 n.p.
Sex—
Male 5.4 1.3 0.3
Female 5.9 1.8 0.6
Sexual Orientation—
Straight 5.4 1.4 0.3
LGBTI 9.2 5.2 2.4
All Adults in Australia 2.3 0.6 0.4 n.p. Not available for publication because of small cell size, but included in totals where applicable
27
3.2 Lifetime prevalence of suicidal thoughts and behaviours
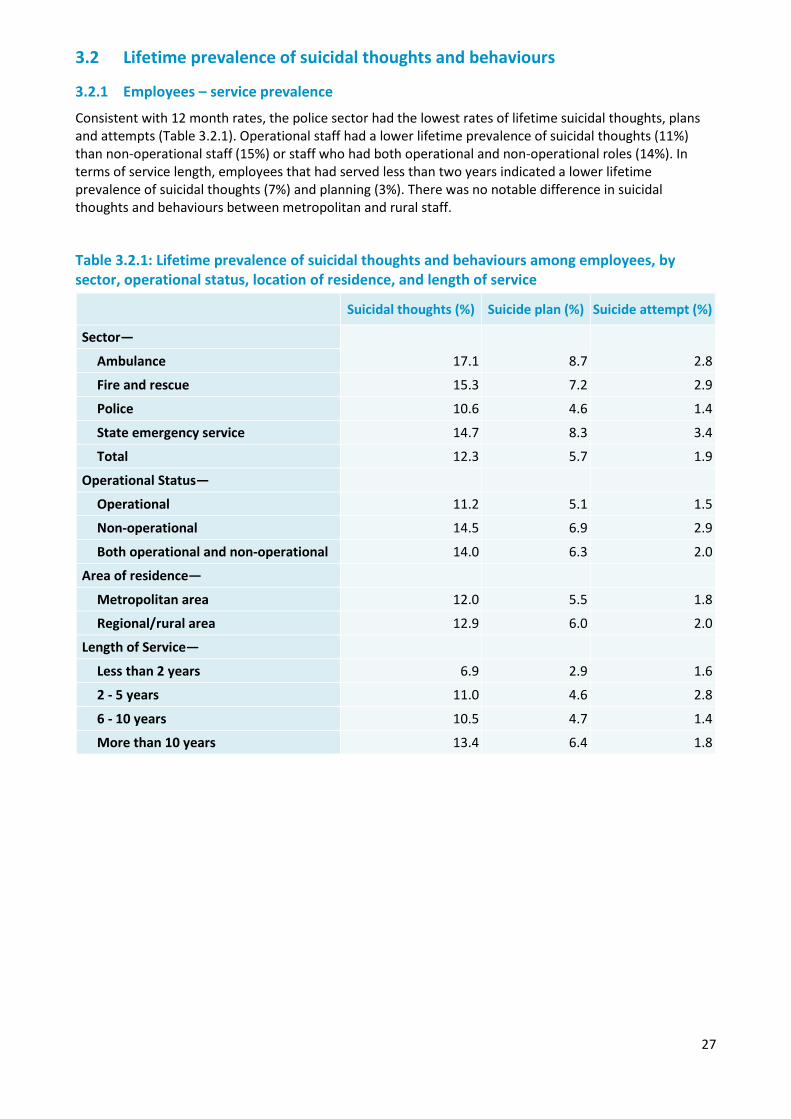
3.2.1 Employees – service prevalence
Consistent with 12 month rates, the police sector had the lowest rates of lifetime suicidal thoughts, plans and attempts (Table 3.2.1). Operational staff had a lower lifetime prevalence of suicidal thoughts (11%) than non-operational staff (15%) or staff who had both operational and non-operational roles (14%). In terms of service length, employees that had served less than two years indicated a lower lifetime prevalence of suicidal thoughts (7%) and planning (3%). There was no notable difference in suicidal thoughts and behaviours between metropolitan and rural staff.
Table 3.2.1: Lifetime prevalence of suicidal thoughts and behaviours among employees, by sector, operational status, location of residence, and length of service
Suicidal thoughts (%) Suicide plan (%) Suicide attempt (%)
Sector—
17.1 8.7 2.8 Ambulance
Fire and rescue 15.3 7.2 2.9
Police 10.6 4.6 1.4
State emergency service 14.7 8.3 3.4
Total 12.3 5.7 1.9
Operational Status—
Operational 11.2 5.1 1.5
Non-operational 14.5 6.9 2.9
Both operational and non-operational 14.0 6.3 2.0
Area of residence—
Metropolitan area 12.0 5.5 1.8
Regional/rural area 12.9 6.0 2.0
Length of Service—
Less than 2 years 6.9 2.9 1.6
2 - 5 years 11.0 4.6 2.8
6 - 10 years 10.5 4.7 1.4
More than 10 years 13.4 6.4 1.8
28
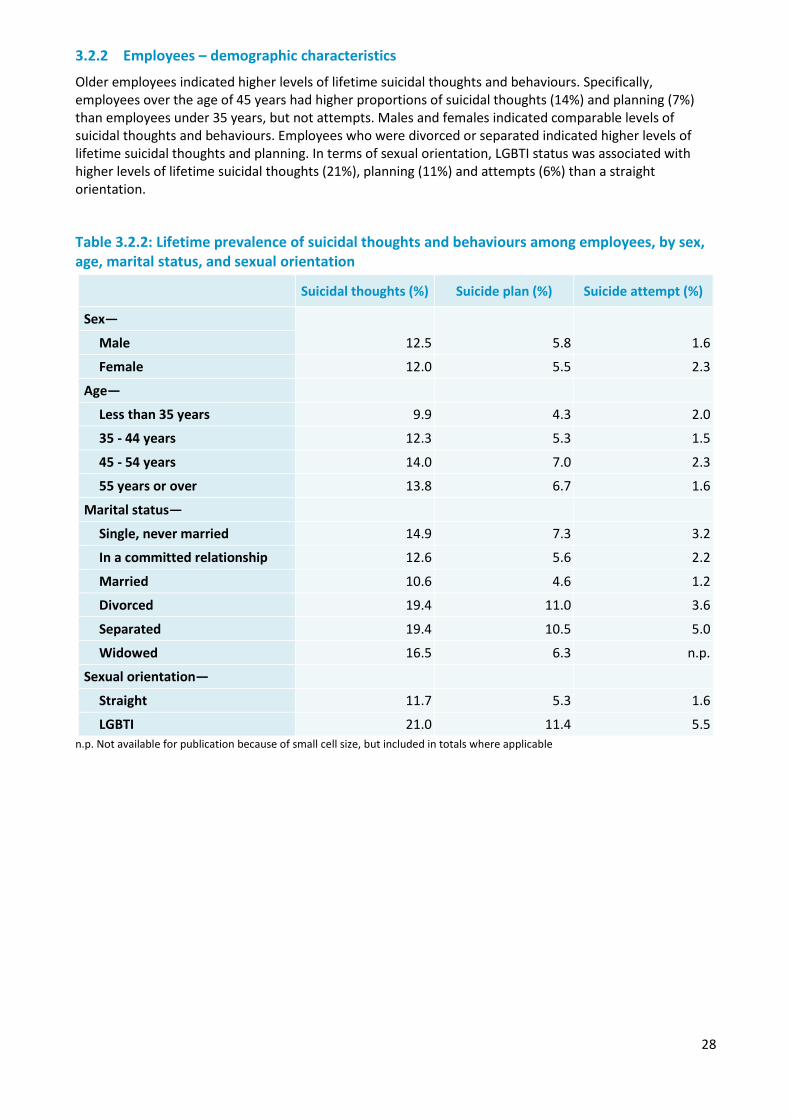
3.2.2 Employees – demographic characteristics
Older employees indicated higher levels of lifetime suicidal thoughts and behaviours. Specifically, employees over the age of 45 years had higher proportions of suicidal thoughts (14%) and planning (7%) than employees under 35 years, but not attempts. Males and females indicated comparable levels of suicidal thoughts and behaviours. Employees who were divorced or separated indicated higher levels of lifetime suicidal thoughts and planning. In terms of sexual orientation, LGBTI status was associated with higher levels of lifetime suicidal thoughts (21%), planning (11%) and attempts (6%) than a straight orientation.
Table 3.2.2: Lifetime prevalence of suicidal thoughts and behaviours among employees, by sex, age, marital status, and sexual orientation
Suicidal thoughts (%) Suicide plan (%) Suicide attempt (%)
Sex—
12.5 5.8 1.6 Male
Female 12.0 5.5 2.3
Age—
Less than 35 years 9.9 4.3 2.0
35 - 44 years 12.3 5.3 1.5
45 - 54 years 14.0 7.0 2.3
55 years or over 13.8 6.7 1.6
Marital status—
Single, never married 14.9 7.3 3.2
In a committed relationship 12.6 5.6 2.2
Married 10.6 4.6 1.2
Divorced 19.4 11.0 3.6
Separated 19.4 10.5 5.0
Widowed 16.5 6.3 n.p.
Sexual orientation—
Straight 11.7 5.3 1.6
LGBTI 21.0 11.4 5.5 n.p. Not available for publication because of small cell size, but included in totals where applicable
29
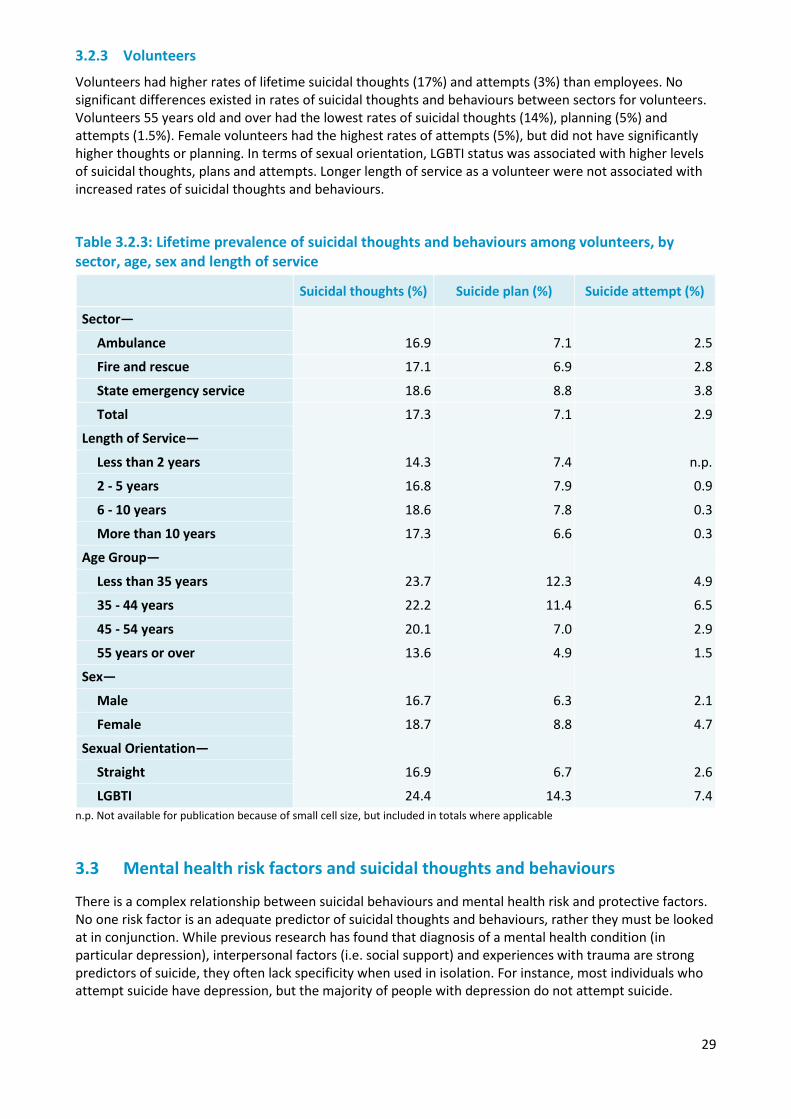
3.2.3 Volunteers
Volunteers had higher rates of lifetime suicidal thoughts (17%) and attempts (3%) than employees. No significant differences existed in rates of suicidal thoughts and behaviours between sectors for volunteers. Volunteers 55 years old and over had the lowest rates of suicidal thoughts (14%), planning (5%) and attempts (1.5%). Female volunteers had the highest rates of attempts (5%), but did not have significantly higher thoughts or planning. In terms of sexual orientation, LGBTI status was associated with higher levels of suicidal thoughts, plans and attempts. Longer length of service as a volunteer were not associated with increased rates of suicidal thoughts and behaviours.
Table 3.2.3: Lifetime prevalence of suicidal thoughts and behaviours among volunteers, by sector, age, sex and length of service
Suicidal thoughts (%) Suicide plan (%) Suicide attempt (%)
Sector—
16.9 7.1 2.5 Ambulance
Fire and rescue 17.1 6.9 2.8
State emergency service 18.6 8.8 3.8
Total 17.3 7.1 2.9
Length of Service—
Less than 2 years 14.3 7.4 n.p.
2 - 5 years 16.8 7.9 0.9
6 - 10 years 18.6 7.8 0.3
More than 10 years 17.3 6.6 0.3
Age Group—
Less than 35 years 23.7 12.3 4.9
35 - 44 years 22.2 11.4 6.5
45 - 54 years 20.1 7.0 2.9
55 years or over 13.6 4.9 1.5
Sex—
Male 16.7 6.3 2.1
Female 18.7 8.8 4.7
Sexual Orientation—
Straight 16.9 6.7 2.6
LGBTI 24.4 14.3 7.4 n.p. Not available for publication because of small cell size, but included in totals where applicable
3.3 Mental health risk factors and suicidal thoughts and behaviours
There is a complex relationship between suicidal behaviours and mental health risk and protective factors. No one risk factor is an adequate predictor of suicidal thoughts and behaviours, rather they must be looked at in conjunction. While previous research has found that diagnosis of a mental health condition (in particular depression), interpersonal factors (i.e. social support) and experiences with trauma are strong predictors of suicide, they often lack specificity when used in isolation. For instance, most individuals who attempt suicide have depression, but the majority of people with depression do not attempt suicide.
30
The following section presents different perspectives of the relationship between risk factors, protective factors, and suicidal thoughts and behaviours over the past 12 months. In particular, it looks at how a combination of diagnoses may heighten suicidal thoughts and behaviours. This follows research which suggests that the relationship between post-traumatic stress disorder (PTSD) and suicidal behaviours is partially mediated by comorbid symptoms of depression. In addition, it looks to assess how social support and resilience together may impact the relationship between trauma, PTSD and suicidal behaviours.
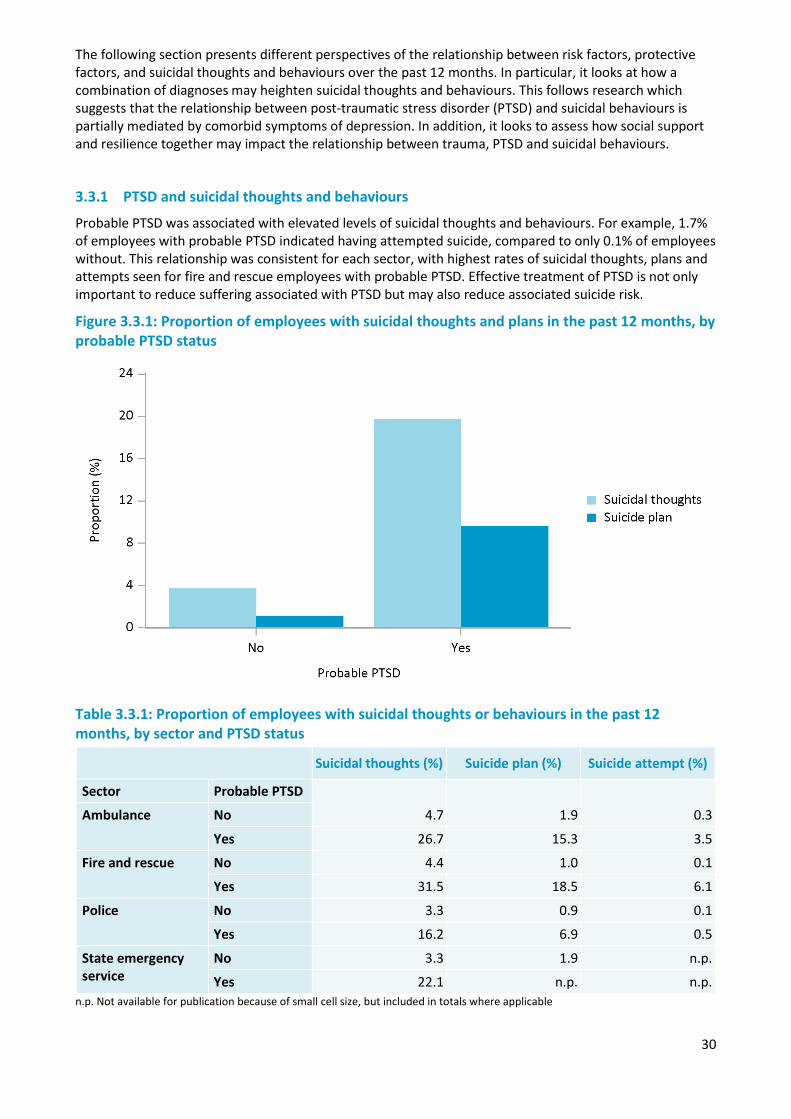
3.3.1 PTSD and suicidal thoughts and behaviours
Probable PTSD was associated with elevated levels of suicidal thoughts and behaviours. For example, 1.7% of employees with probable PTSD indicated having attempted suicide, compared to only 0.1% of employees without. This relationship was consistent for each sector, with highest rates of suicidal thoughts, plans and attempts seen for fire and rescue employees with probable PTSD. Effective treatment of PTSD is not only important to reduce suffering associated with PTSD but may also reduce associated suicide risk.
Figure 3.3.1: Proportion of employees with suicidal thoughts and plans in the past 12 months, by probable PTSD status
Table 3.3.1: Proportion of employees with suicidal thoughts or behaviours in the past 12 months, by sector and PTSD status
Suicidal thoughts (%) Suicide plan (%) Suicide attempt (%)
Sector Probable PTSD
4.7 1.9 0.3 Ambulance No
Yes 26.7 15.3 3.5
Fire and rescue No 4.4 1.0 0.1
Yes 31.5 18.5 6.1
Police No 3.3 0.9 0.1
Yes 16.2 6.9 0.5
State emergency service
No 3.3 1.9 n.p.
Yes 22.1 n.p. n.p. n.p. Not available for publication because of small cell size, but included in totals where applicable
31
Findings from volunteer data support the relationship existent within employees, with probable PTSD being associated with significantly higher levels of suicidal thoughts and behaviours. Almost a third of volunteers with probable PTSD reported suicidal thoughts in the past 12 months (32%), with a considerably higher proportion planning (13%) or attempting (4%) suicide. Ambulance sector volunteers with PTSD had the highest proportion of suicidal thoughts (48%) and planning (27%).
Table 3.3.2: Proportion of volunteers with suicidal thoughts or behaviours in the past 12 months, by sector and PTSD status
Suicidal thoughts (%) Suicide plan (%) Suicide attempt (%)
Sector Probable PTSD
4.3 1.9 n.p. Ambulance No
Yes 47.7 26.5 n.p.
Fire and rescue No 4.2 0.9 0.2
Yes 32.5 11.7 n.p.
State emergency service
No 4.9 1.9 0.4
Yes 28.8 17.0 6.8
Total No 4.3 1.0 0.2
Yes 32.4 12.7 4.2 n.p. Not available for publication because of small cell size, but included in totals where applicable
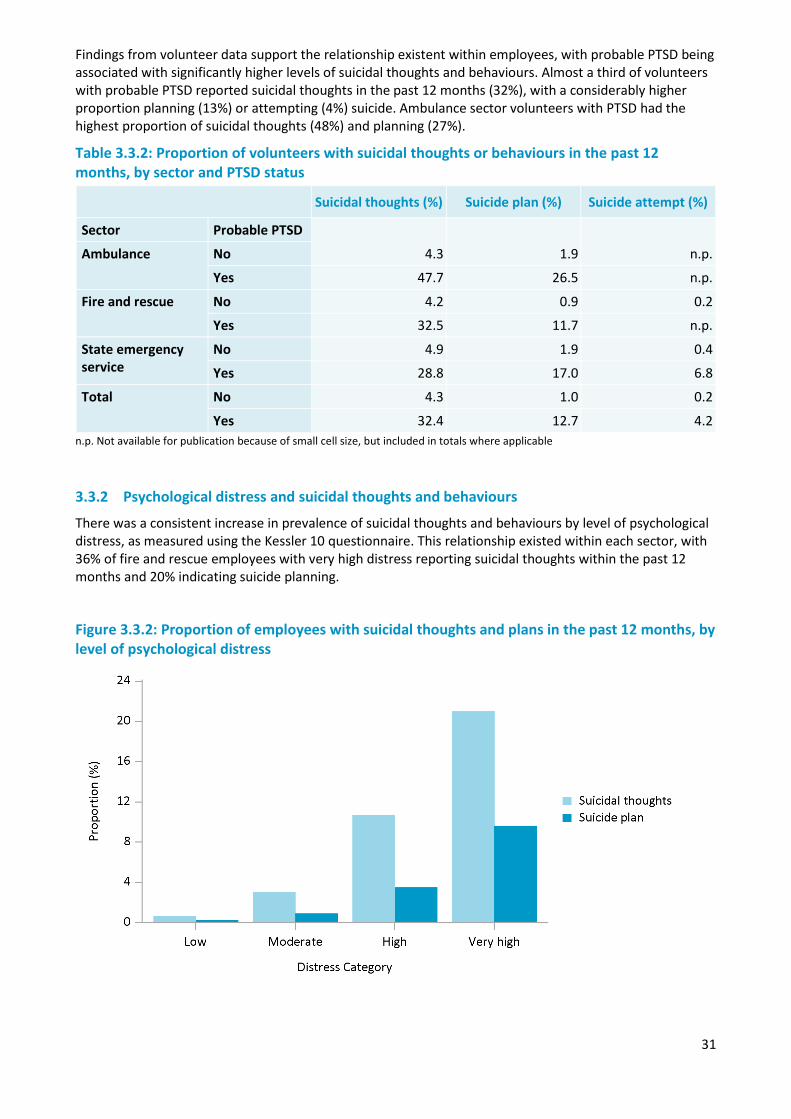
3.3.2 Psychological distress and suicidal thoughts and behaviours
There was a consistent increase in prevalence of suicidal thoughts and behaviours by level of psychological distress, as measured using the Kessler 10 questionnaire. This relationship existed within each sector, with 36% of fire and rescue employees with very high distress reporting suicidal thoughts within the past 12 months and 20% indicating suicide planning.
Figure 3.3.2: Proportion of employees with suicidal thoughts and plans in the past 12 months, by level of psychological distress
32
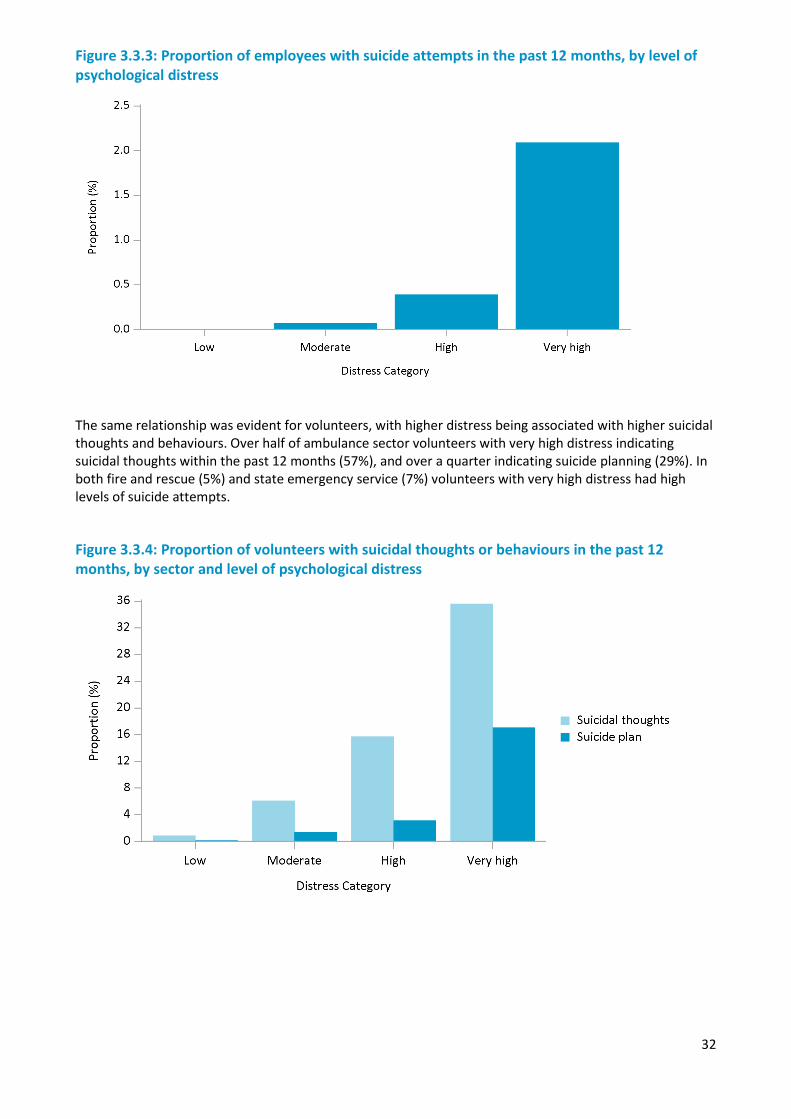
Figure 3.3.3: Proportion of employees with suicide attempts in the past 12 months, by level of psychological distress
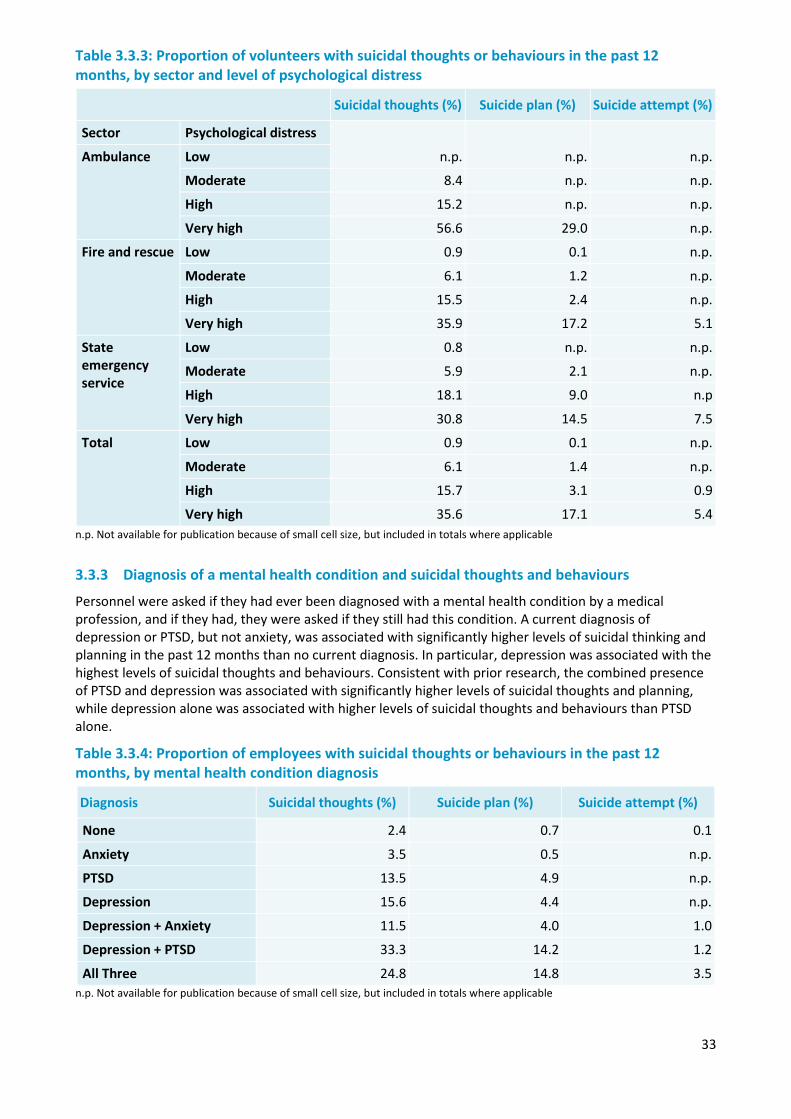
The same relationship was evident for volunteers, with higher distress being associated with higher suicidal thoughts and behaviours. Over half of ambulance sector volunteers with very high distress indicating suicidal thoughts within the past 12 months (57%), and over a quarter indicating suicide planning (29%). In both fire and rescue (5%) and state emergency service (7%) volunteers with very high distress had high levels of suicide attempts.
Figure 3.3.4: Proportion of volunteers with suicidal thoughts or behaviours in the past 12 months, by sector and level of psychological distress
33
Table 3.3.3: Proportion of volunteers with suicidal thoughts or behaviours in the past 12 months, by sector and level of psychological distress
Suicidal thoughts (%) Suicide plan (%) Suicide attempt (%)
Sector Psychological distress
n.p. n.p. n.p. Ambulance Low
Moderate 8.4 n.p. n.p.
High 15.2 n.p. n.p.
Very high 56.6 29.0 n.p.
Fire and rescue Low 0.9 0.1 n.p.
Moderate 6.1 1.2 n.p.
High 15.5 2.4 n.p.
Very high 35.9 17.2 5.1
State emergency service
Low 0.8 n.p. n.p.
Moderate 5.9 2.1 n.p.
High 18.1 9.0 n.p
Very high 30.8 14.5 7.5
Total Low 0.9 0.1 n.p.
Moderate 6.1 1.4 n.p.
High 15.7 3.1 0.9
Very high 35.6 17.1 5.4 n.p. Not available for publication because of small cell size, but included in totals where applicable
3.3.3 Diagnosis of a mental health condition and suicidal thoughts and behaviours
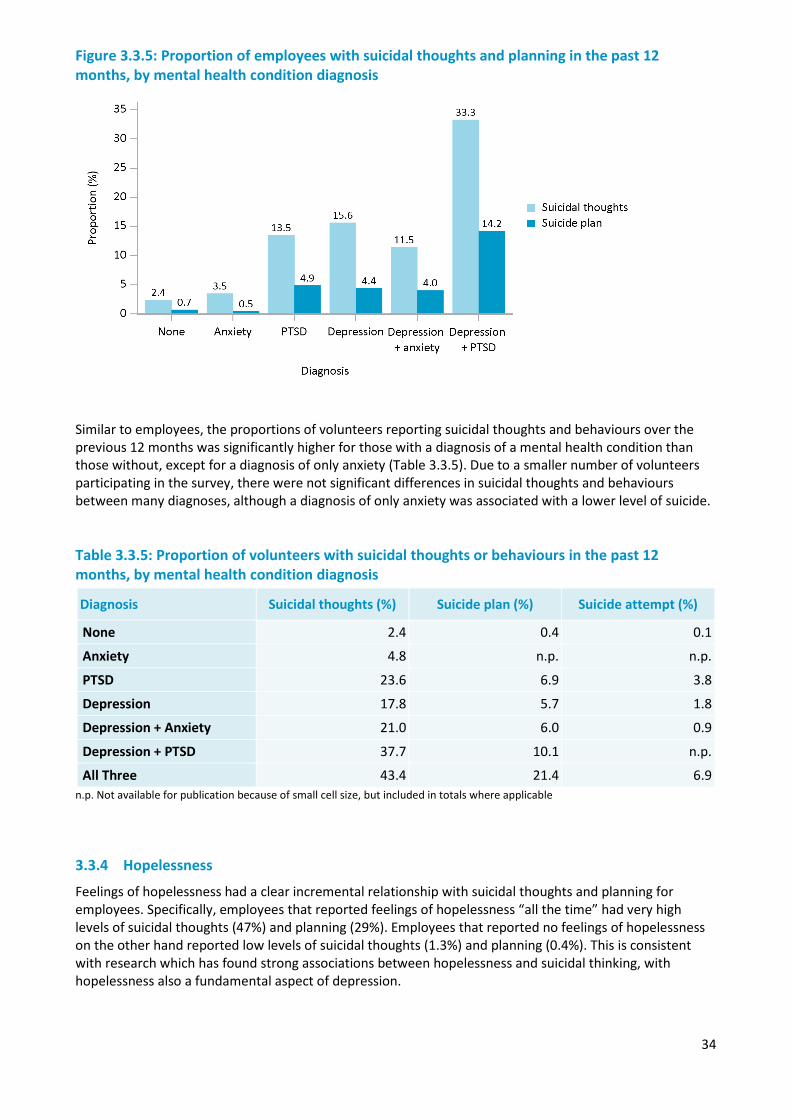
Personnel were asked if they had ever been diagnosed with a mental health condition by a medical profession, and if they had, they were asked if they still had this condition. A current diagnosis of depression or PTSD, but not anxiety, was associated with significantly higher levels of suicidal thinking and planning in the past 12 months than no current diagnosis. In particular, depression was associated with the highest levels of suicidal thoughts and behaviours. Consistent with prior research, the combined presence of PTSD and depression was associated with significantly higher levels of suicidal thoughts and planning, while depression alone was associated with higher levels of suicidal thoughts and behaviours than PTSD alone.
Table 3.3.4: Proportion of employees with suicidal thoughts or behaviours in the past 12 months, by mental health condition diagnosis
Diagnosis Suicidal thoughts (%) Suicide plan (%) Suicide attempt (%)
None 2.4 0.7 0.1
Anxiety 3.5 0.5 n.p.
PTSD 13.5 4.9 n.p.
Depression 15.6 4.4 n.p.
Depression + Anxiety 11.5 4.0 1.0
Depression + PTSD 33.3 14.2 1.2
All Three 24.8 14.8 3.5 n.p. Not available for publication because of small cell size, but included in totals where applicable
34
Figure 3.3.5: Proportion of employees with suicidal thoughts and planning in the past 12 months, by mental health condition diagnosis
Similar to employees, the proportions of volunteers reporting suicidal thoughts and behaviours over the previous 12 months was significantly higher for those with a diagnosis of a mental health condition than those without, except for a diagnosis of only anxiety (Table 3.3.5). Due to a smaller number of volunteers participating in the survey, there were not significant differences in suicidal thoughts and behaviours between many diagnoses, although a diagnosis of only anxiety was associated with a lower level of suicide.
Table 3.3.5: Proportion of volunteers with suicidal thoughts or behaviours in the past 12 months, by mental health condition diagnosis
Diagnosis Suicidal thoughts (%) Suicide plan (%) Suicide attempt (%)
None 2.4 0.4 0.1
Anxiety 4.8 n.p. n.p.
PTSD 23.6 6.9 3.8
Depression 17.8 5.7 1.8
Depression + Anxiety 21.0 6.0 0.9
Depression + PTSD 37.7 10.1 n.p.
All Three 43.4 21.4 6.9 n.p. Not available for publication because of small cell size, but included in totals where applicable
3.3.4 Hopelessness
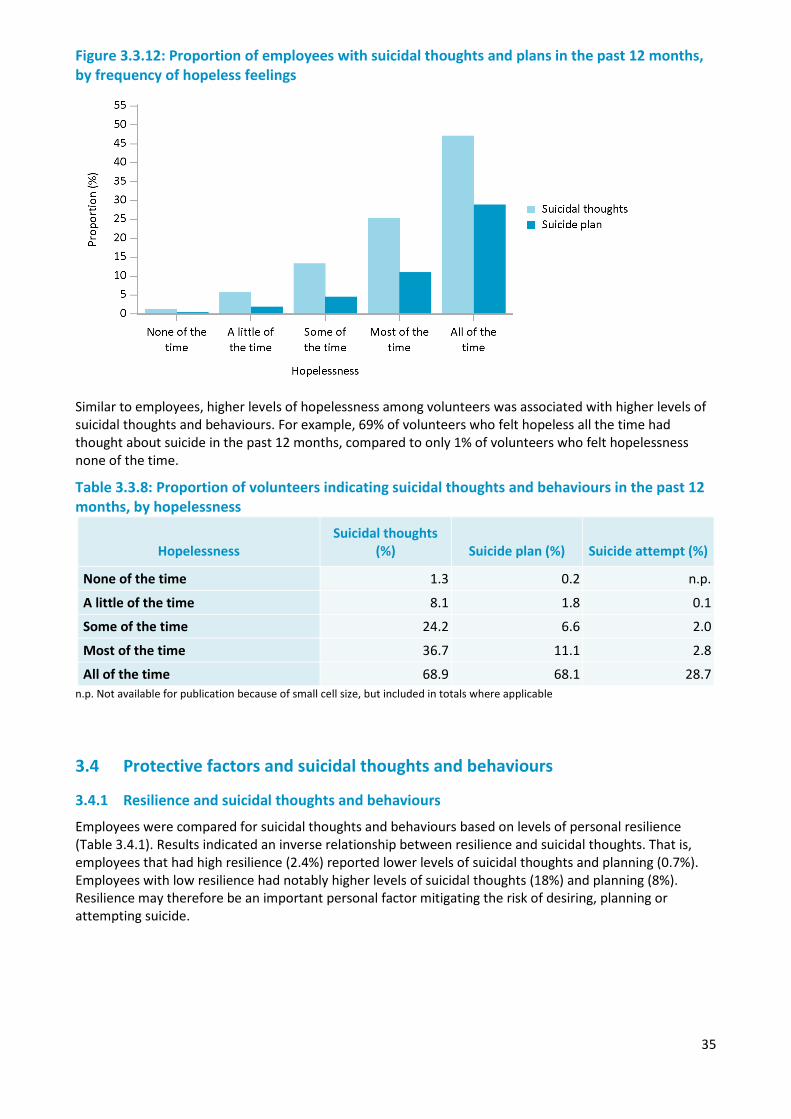
Feelings of hopelessness had a clear incremental relationship with suicidal thoughts and planning for employees. Specifically, employees that reported feelings of hopelessness “all the time” had very high levels of suicidal thoughts (47%) and planning (29%). Employees that reported no feelings of hopelessness on the other hand reported low levels of suicidal thoughts (1.3%) and planning (0.4%). This is consistent with research which has found strong associations between hopelessness and suicidal thinking, with hopelessness also a fundamental aspect of depression.
35
Figure 3.3.12: Proportion of employees with suicidal thoughts and plans in the past 12 months, by frequency of hopeless feelings
Similar to employees, higher levels of hopelessness among volunteers was associated with higher levels of suicidal thoughts and behaviours. For example, 69% of volunteers who felt hopeless all the time had thought about suicide in the past 12 months, compared to only 1% of volunteers who felt hopelessness none of the time.
Table 3.3.8: Proportion of volunteers indicating suicidal thoughts and behaviours in the past 12 months, by hopelessness
Hopelessness Suicidal thoughts
(%) Suicide plan (%) Suicide attempt (%)
None of the time 1.3 0.2 n.p.
A little of the time 8.1 1.8 0.1
Some of the time 24.2 6.6 2.0
Most of the time 36.7 11.1 2.8
All of the time 68.9 68.1 28.7 n.p. Not available for publication because of small cell size, but included in totals where applicable
3.4 Protective factors and suicidal thoughts and behaviours
3.4.1 Resilience and suicidal thoughts and behaviours
Employees were compared for suicidal thoughts and behaviours based on levels of personal resilience (Table 3.4.1). Results indicated an inverse relationship between resilience and suicidal thoughts. That is, employees that had high resilience (2.4%) reported lower levels of suicidal thoughts and planning (0.7%). Employees with low resilience had notably higher levels of suicidal thoughts (18%) and planning (8%). Resilience may therefore be an important personal factor mitigating the risk of desiring, planning or attempting suicide.
36
Table 3.4.1: Proportion of employees that reported suicidal thoughts or behaviours in the past 12 months, by resilience
Resilience Suicidal thoughts (%) Suicide plan (%) Suicide attempt (%)
High 2.4 0.7 0.1
Moderate 6.4 2.3 0.3
Low 17.9 8.1 1.4
The same relationship between suicidal thoughts and behaviours and resilience evident in employees, was also exhibited with volunteers (Table 3.4.2). Volunteers with high resilience had lower levels of suicidal thoughts (3%) and planning (0.5%), than volunteers with low high resilience. This provides supporting evidence as to the role of resilience in potentially reducing the risk of suicide.
Table 3.4.2: Proportion of volunteers that reported suicidal thoughts or behaviours in the past 12 months, separated by resilience
Resilience Suicidal thoughts (%) Suicide plan (%) Suicide attempt (%)
High 3.3 0.5 0.2
Moderate 7.2 2.2 0.6
Low 25.3 10.8 2.0
3.4.2 Social support and suicidal thoughts and behaviours
Like resilience, there was an inverse relationship between social support, and suicidal thoughts and behaviours (Table 3.4.3). Higher levels of social support was associated with lower levels of suicidal thoughts (4%), planning (1.4%) and attempts (0.2%). On the other hand, lower levels of support was associated with higher suicidal thoughts (20%), plans (8%) and attempts (1.5%). Social support may therefore be an important factor for police and emergency services in reducing risk of suicide.
Table 3.4.3: Proportion of employees with suicidal thoughts or behaviours in the past 12 months, by level of social support
Social Support Suicidal thoughts (%) Suicide plan (%) Suicide attempt (%)
Low 19.7 8.1 1.5
High 4.0 1.4 0.2
The same pattern between social support and suicide for employees was evident for volunteers (Table 3.4.4). Volunteers defined as having high social support indicated significantly lower levels of suicidal thoughts (4%), plans (1.2%) and attempts (0.3%). These findings further support the relationship between social support and suicide, and indicate it may be important to target for employees and volunteers in the police and emergency services sector.
Table 3.4.4: Proportion of volunteers with suicidal thoughts or behaviours in the past 12 months, by social support
Social Support Suicidal thoughts (%) Suicide plan (%) Suicide attempt (%)
Low 28.5 8.7 2.2
High 4.4 1.2 0.3
37
3.5 Resilience and social support
3.5.1 Resilience and PTSD
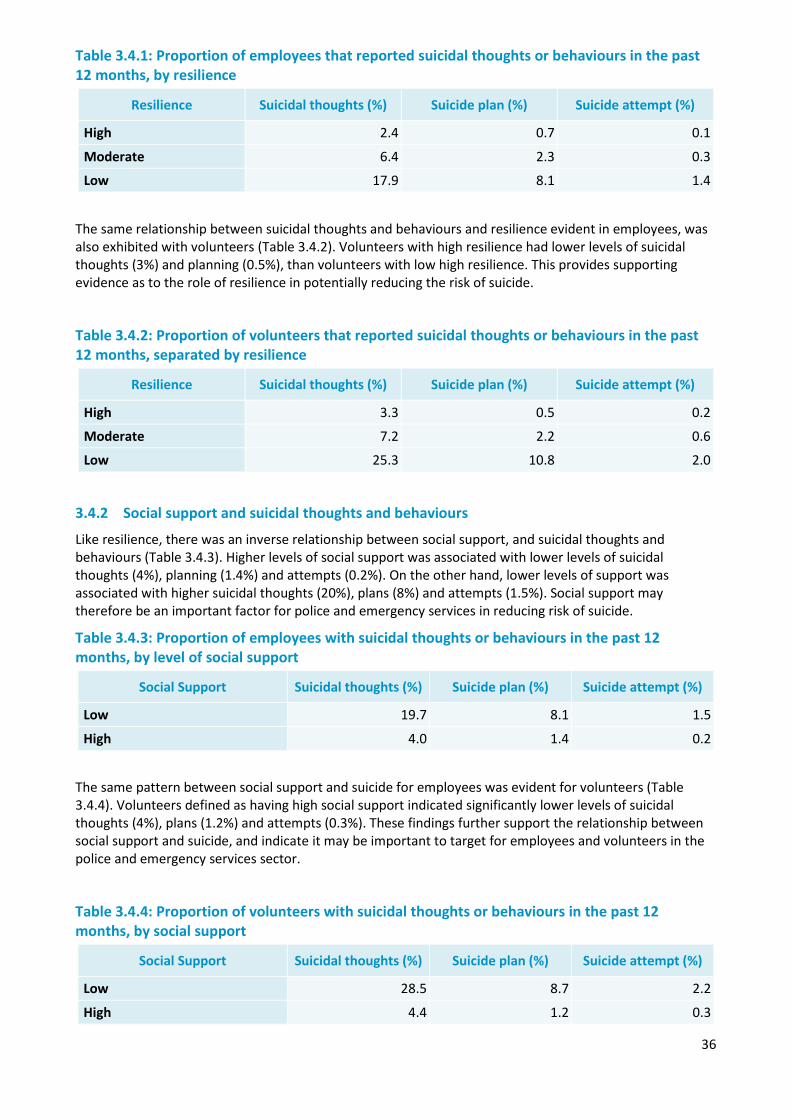
As previously indicated, probable PTSD was associated with heightened levels of suicidal thoughts and behaviours. Resilient employees with probable PTSD had higher levels of suicidal thoughts (17%) and planning (9%) than employees with that do not have PTSD. That is, regardless of resilience levels, PTSD still has a strong effect on suicidal thoughts and behaviours.
However, there were still notable differences in suicidal thoughts and planning between employees with probable PTSD and their level of resilience. Specifically, employees with probable PTSD that had low resilience reported significantly higher levels of suicidal thoughts and behaviours. This suggests that resilience has an important effect in reducing, but not eliminating suicide risk.
Table 3.5.1: Proportion of employees who reported suicidal thoughts or behaviours in the past 12 months, by resilience and probable PTSD
Suicidal thoughts (%) Suicide plan (%) Suicide attempt (%)
Probable PTSD Resilience
2.0 0.5 0.1 No High
Moderate 4.6 1.5 0.1
Low 14.4 4.9 0.9
Yes High 17.3 8.5 n.p.
Moderate 17.5 7.3 1.3
Low 23.8 13.4 2.3 n.p. Not available for publication because of small cell size, but included in totals where applicable
Figure 3.5.1: Proportion of employees that reported suicidal thoughts in the past 12 months, by resilience and probable PTSD
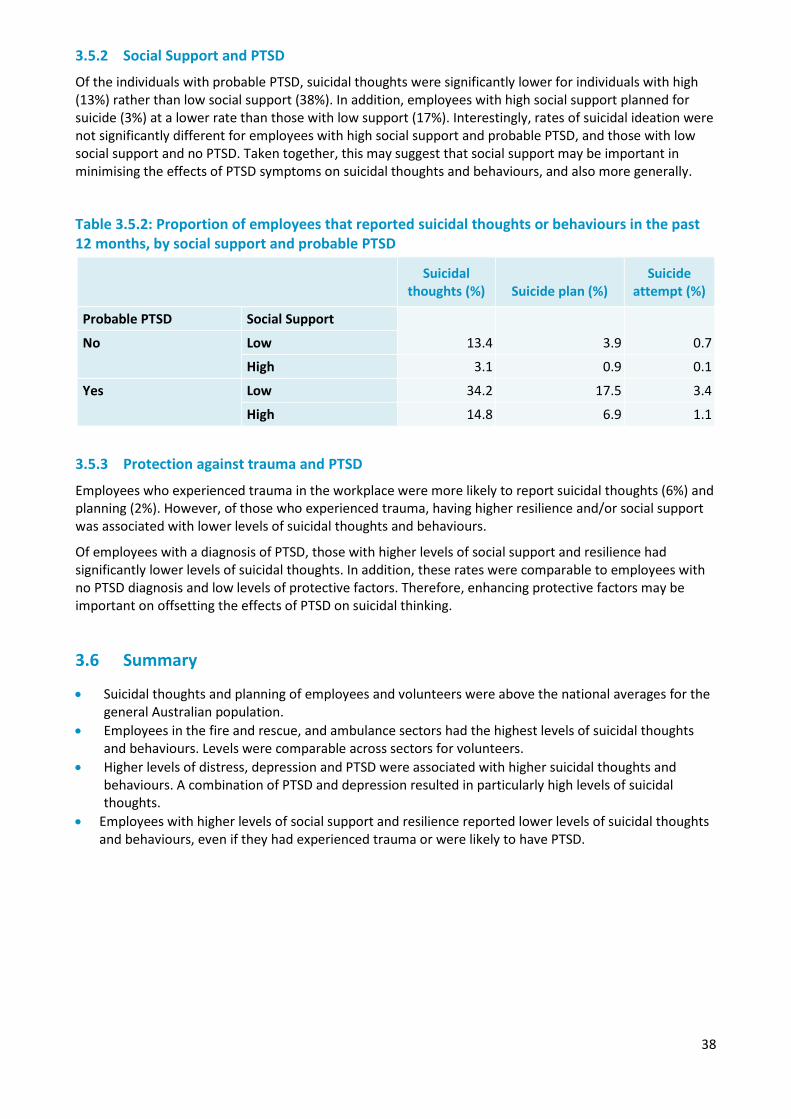
38
3.5.2 Social Support and PTSD
Of the individuals with probable PTSD, suicidal thoughts were significantly lower for individuals with high (13%) rather than low social support (38%). In addition, employees with high social support planned for suicide (3%) at a lower rate than those with low support (17%). Interestingly, rates of suicidal ideation were not significantly different for employees with high social support and probable PTSD, and those with low social support and no PTSD. Taken together, this may suggest that social support may be important in minimising the effects of PTSD symptoms on suicidal thoughts and behaviours, and also more generally.
Table 3.5.2: Proportion of employees that reported suicidal thoughts or behaviours in the past 12 months, by social support and probable PTSD
Suicidal thoughts (%) Suicide plan (%)
Suicide attempt (%)
Probable PTSD Social Support
13.4 3.9 0.7 No Low
High 3.1 0.9 0.1
Yes Low 34.2 17.5 3.4
High 14.8 6.9 1.1
3.5.3 Protection against trauma and PTSD
Employees who experienced trauma in the workplace were more likely to report suicidal thoughts (6%) and planning (2%). However, of those who experienced trauma, having higher resilience and/or social support was associated with lower levels of suicidal thoughts and behaviours.
Of employees with a diagnosis of PTSD, those with higher levels of social support and resilience had significantly lower levels of suicidal thoughts. In addition, these rates were comparable to employees with no PTSD diagnosis and low levels of protective factors. Therefore, enhancing protective factors may be important on offsetting the effects of PTSD on suicidal thinking.
3.6 Summary
• Suicidal thoughts and planning of employees and volunteers were above the national averages for the general Australian population.
• Employees in the fire and rescue, and ambulance sectors had the highest levels of suicidal thoughts and behaviours. Levels were comparable across sectors for volunteers.
• Higher levels of distress, depression and PTSD were associated with higher suicidal thoughts and behaviours. A combination of PTSD and depression resulted in particularly high levels of suicidal thoughts.
• Employees with higher levels of social support and resilience reported lower levels of suicidal thoughts and behaviours, even if they had experienced trauma or were likely to have PTSD.
39
Chapter 4 — Individual risk and protective factors
Overview
Answering the call included questions regarding a range of risk and protective factors that may be associated with mental wellbeing, such as physical health, sleep quality, and social support. Exposure to stressful events at work and away from work were also examined to determine if there were any differences in mental health that may be attributed to the work environments of the police and emergency services sector. Demographic factors, such as sex, age, country of birth, area of residence, and sexual orientation, as well as work factors, such as sector, length of service, and operational status were also examined in relation to mental health and wellbeing outcomes.
The measures used to gauge mental health conditions and wellbeing, and their relationship to risk and protective factors, include:
• Kessler 10 measure of psychological distress (Furukawa et al., 2003) • Short Warwick-Edinburgh Mental Wellbeing Scale (Ng Fat et al., 2016) • Post-traumatic stress disorder (PTSD) screening scale • Brief Resilience Scale (Smith et al., 2008) • Shakespeare-Finch two-way social support scale (Shakespeare-Finch and Obst, 2011)
Key findings from the chapter include:
• A healthy worker effect among new recruits. The rate of probable PTSD in recent recruits is lower than the Australian population average. It appears that services are recruiting mentally healthy employees to their organisations. However, the substantial increase in rate of PTSD with increasing length of service suggests that workplace factors, such as exposure to stressful events in the course of duty, are major factors in the development of PTSD in employees in the police and emergency services sector.
• The increase in levels of poor mental health with increasing length of service was largely driven by the increase observed in the police sector, in which the prevalence of high and very high psychological distress and probable PTSD increased significantly with increasing length of service within the sector.
• High levels of psychological distress and probable PTSD were associated with lower levels of physical health, poor sleep quality, and having less social support. Given the cross sectional nature of the data, it is not possible to determine whether these factors contribute to, or are a symptom of, poor mental health. However, assisting employees to maximise their physical health, improve their sleep quality and build a strong social support network, is likely to help support and improve mental health and wellbeing in the workplace.
4.1 Demographic and work characteristics – employees
Employees provided basic demographic information, including their age, sex and area of residence. In addition, they provided which sector they currently worked in, the total length of time they had spent in the police and emergency services sector, and whether they worked in an operational or non-operational role. A number of these factors were associated with mental health and wellbeing outcomes.
4.1.1 Probable PTSD
The prevalence of probable PTSD was similar between ambulance, fire and rescue, and state emergency service employees, but was significantly higher in the police sector than in the ambulance or state emergency services sectors. Probable PTSD was significantly higher among male employees (11%) compared with female employees (9%), and was over twice as high among employees aged 45 to 54 years (13%) when compared to those aged less than 35 years (6%). The prevalence of probable PTSD was significantly lower among those in metropolitan areas (9%), compared to those in regional or rural areas (12%). While operational status was not associated with prevalence of probable PTSD, length of service
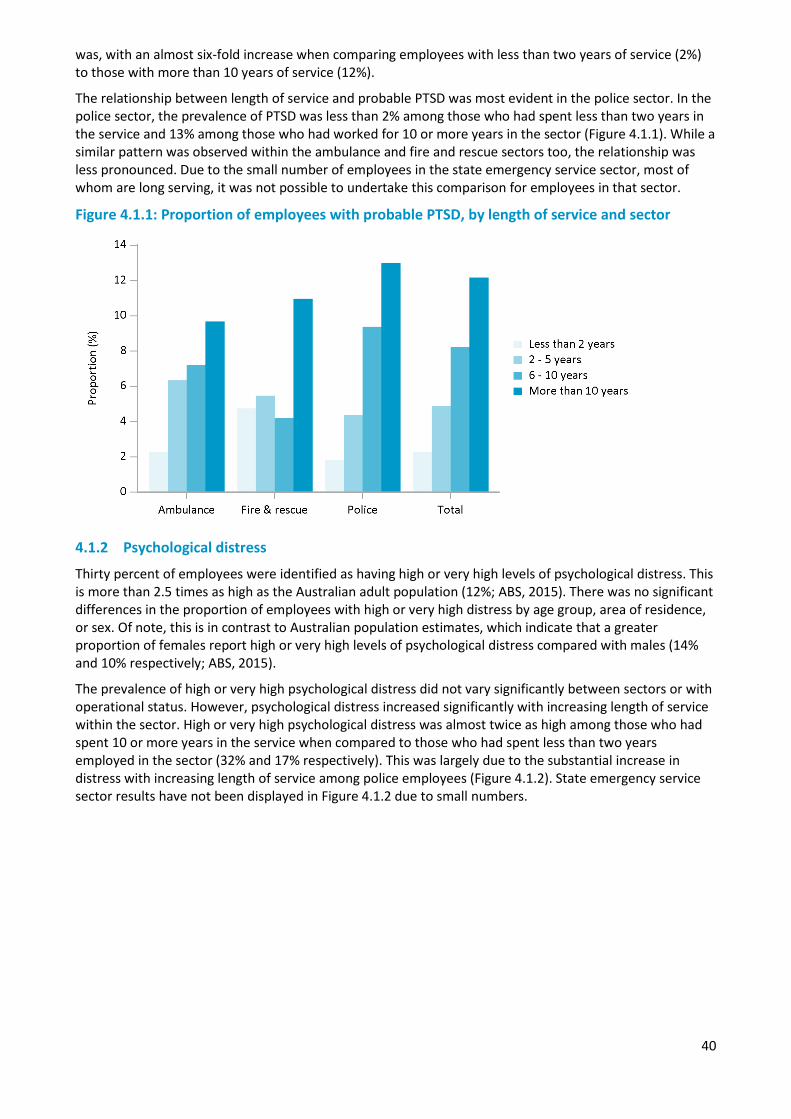
40
was, with an almost six-fold increase when comparing employees with less than two years of service (2%) to those with more than 10 years of service (12%).
The relationship between length of service and probable PTSD was most evident in the police sector. In the police sector, the prevalence of PTSD was less than 2% among those who had spent less than two years in the service and 13% among those who had worked for 10 or more years in the sector (Figure 4.1.1). While a similar pattern was observed within the ambulance and fire and rescue sectors too, the relationship was less pronounced. Due to the small number of employees in the state emergency service sector, most of whom are long serving, it was not possible to undertake this comparison for employees in that sector.
Figure 4.1.1: Proportion of employees with probable PTSD, by length of service and sector
4.1.2 Psychological distress
Thirty percent of employees were identified as having high or very high levels of psychological distress. This is more than 2.5 times as high as the Australian adult population (12%; ABS, 2015). There was no significant differences in the proportion of employees with high or very high distress by age group, area of residence, or sex. Of note, this is in contrast to Australian population estimates, which indicate that a greater proportion of females report high or very high levels of psychological distress compared with males (14% and 10% respectively; ABS, 2015).
The prevalence of high or very high psychological distress did not vary significantly between sectors or with operational status. However, psychological distress increased significantly with increasing length of service within the sector. High or very high psychological distress was almost twice as high among those who had spent 10 or more years in the service when compared to those who had spent less than two years employed in the sector (32% and 17% respectively). This was largely due to the substantial increase in distress with increasing length of service among police employees (Figure 4.1.2). State emergency service sector results have not been displayed in Figure 4.1.2 due to small numbers.
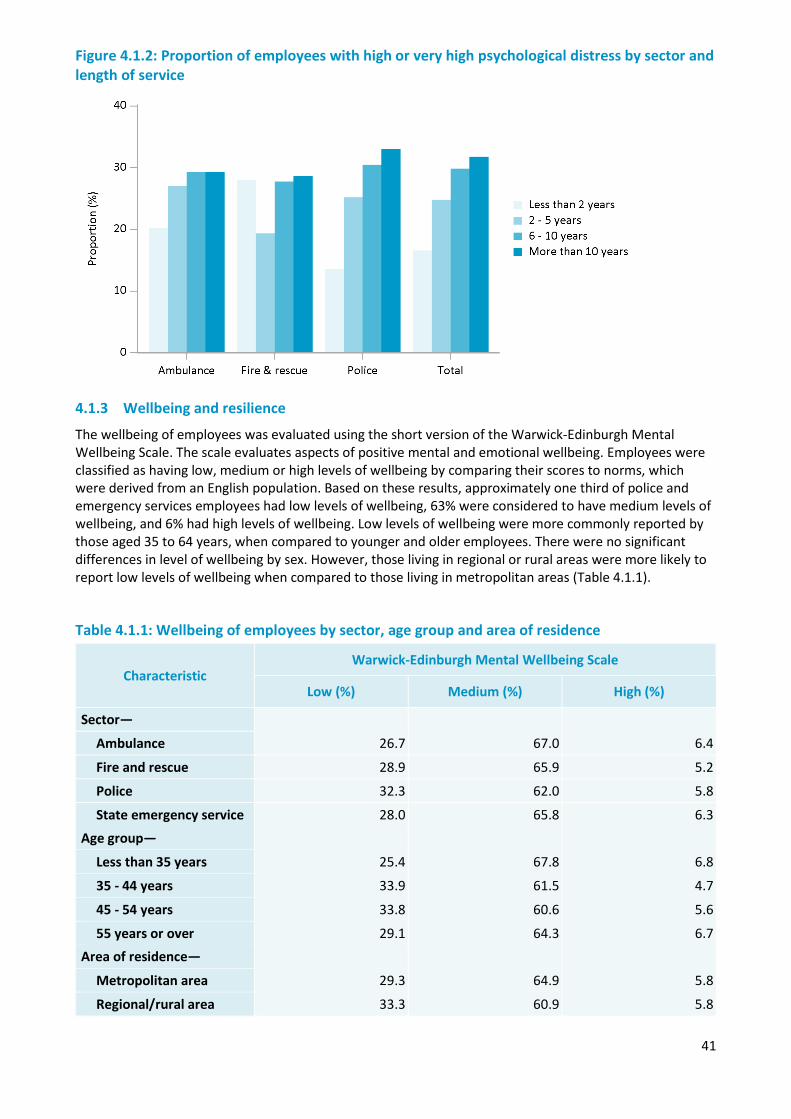
41
Figure 4.1.2: Proportion of employees with high or very high psychological distress by sector and length of service
4.1.3 Wellbeing and resilience
The wellbeing of employees was evaluated using the short version of the Warwick-Edinburgh Mental Wellbeing Scale. The scale evaluates aspects of positive mental and emotional wellbeing. Employees were classified as having low, medium or high levels of wellbeing by comparing their scores to norms, which were derived from an English population. Based on these results, approximately one third of police and emergency services employees had low levels of wellbeing, 63% were considered to have medium levels of wellbeing, and 6% had high levels of wellbeing. Low levels of wellbeing were more commonly reported by those aged 35 to 64 years, when compared to younger and older employees. There were no significant differences in level of wellbeing by sex. However, those living in regional or rural areas were more likely to report low levels of wellbeing when compared to those living in metropolitan areas (Table 4.1.1).
Table 4.1.1: Wellbeing of employees by sector, age group and area of residence
Characteristic Warwick-Edinburgh Mental Wellbeing Scale
Low (%) Medium (%) High (%)
Sector—
26.7 67.0 6.4 Ambulance
Fire and rescue 28.9 65.9 5.2
Police 32.3 62.0 5.8
State emergency service 28.0 65.8 6.3
Age group—
Less than 35 years 25.4 67.8 6.8
35 - 44 years 33.9 61.5 4.7
45 - 54 years 33.8 60.6 5.6
55 years or over 29.1 64.3 6.7 Area of residence—
Metropolitan area 29.3 64.9 5.8
Regional/rural area 33.3 60.9 5.8
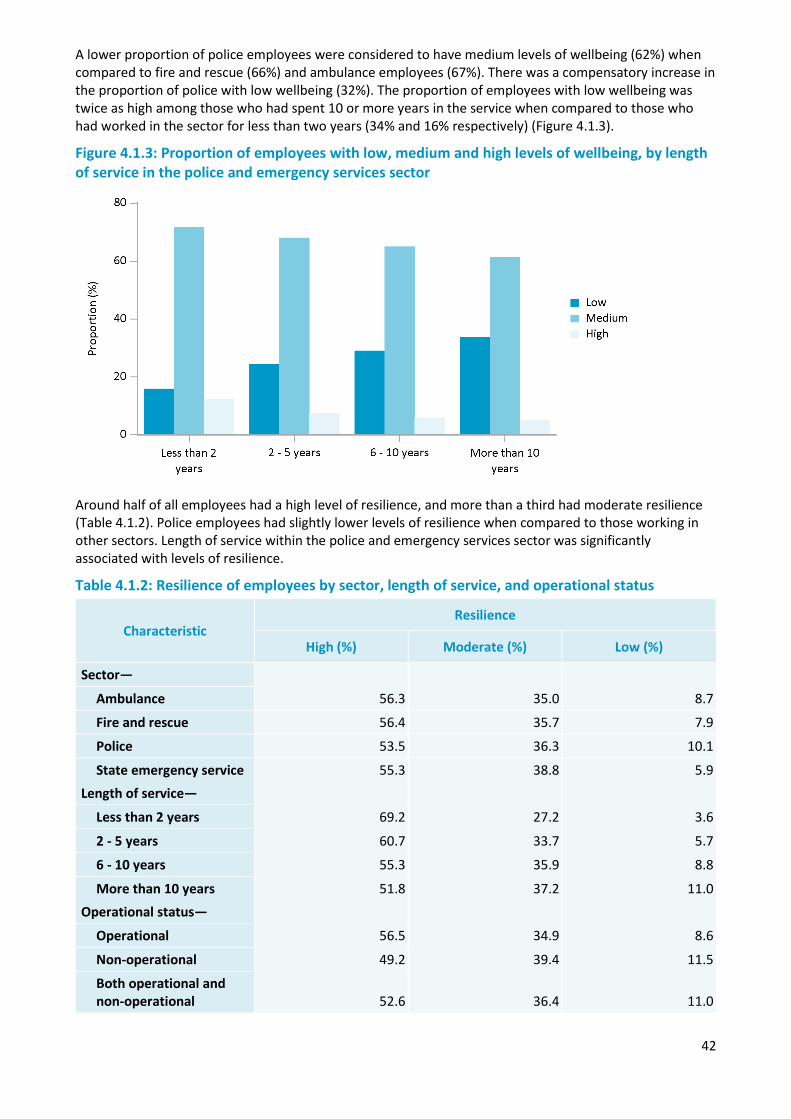
42
A lower proportion of police employees were considered to have medium levels of wellbeing (62%) when compared to fire and rescue (66%) and ambulance employees (67%). There was a compensatory increase in the proportion of police with low wellbeing (32%). The proportion of employees with low wellbeing was twice as high among those who had spent 10 or more years in the service when compared to those who had worked in the sector for less than two years (34% and 16% respectively) (Figure 4.1.3).
Figure 4.1.3: Proportion of employees with low, medium and high levels of wellbeing, by length of service in the police and emergency services sector
Around half of all employees had a high level of resilience, and more than a third had moderate resilience (Table 4.1.2). Police employees had slightly lower levels of resilience when compared to those working in other sectors. Length of service within the police and emergency services sector was significantly associated with levels of resilience.
Table 4.1.2: Resilience of employees by sector, length of service, and operational status
Characteristic Resilience
High (%) Moderate (%) Low (%)
Sector—
56.3 35.0 8.7 Ambulance
Fire and rescue 56.4 35.7 7.9
Police 53.5 36.3 10.1
State emergency service 55.3 38.8 5.9 Length of service—
Less than 2 years 69.2 27.2 3.6
2 - 5 years 60.7 33.7 5.7
6 - 10 years 55.3 35.9 8.8
More than 10 years 51.8 37.2 11.0 Operational status—
Operational 56.5 34.9 8.6
Non-operational 49.2 39.4 11.5
Both operational and non-operational 52.6 36.4 11.0
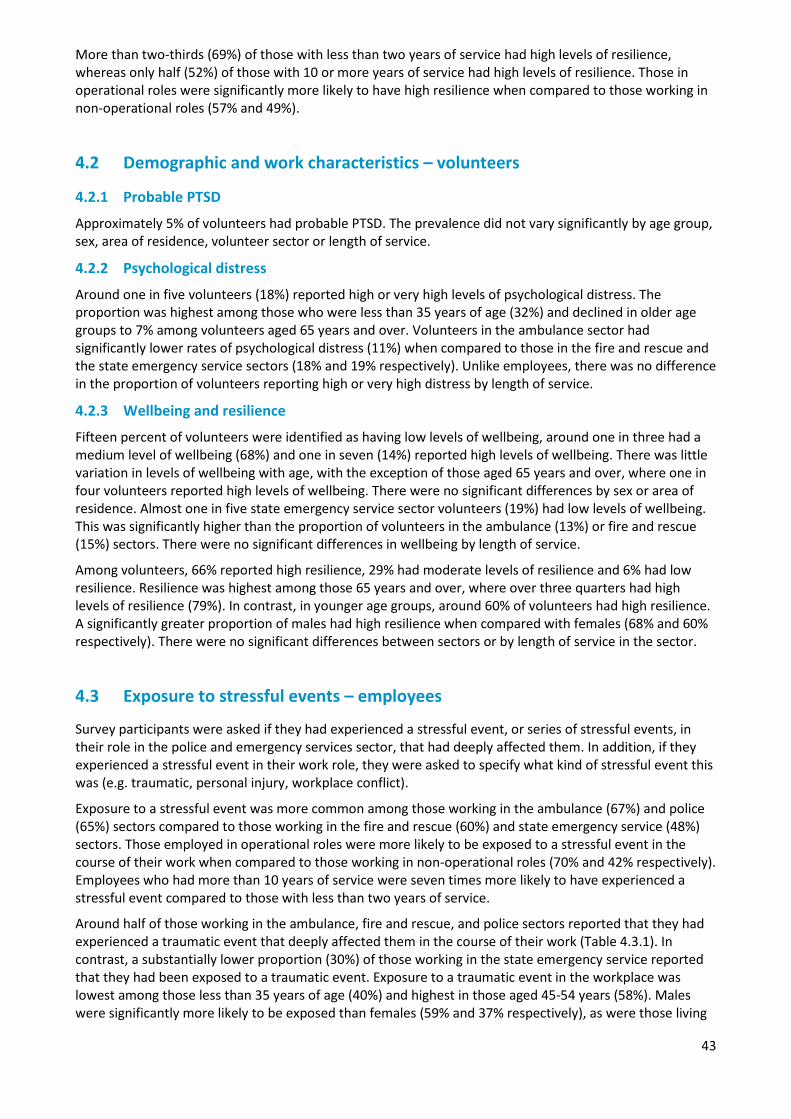
43
More than two-thirds (69%) of those with less than two years of service had high levels of resilience, whereas only half (52%) of those with 10 or more years of service had high levels of resilience. Those in operational roles were significantly more likely to have high resilience when compared to those working in non-operational roles (57% and 49%).
4.2 Demographic and work characteristics – volunteers
4.2.1 Probable PTSD
Approximately 5% of volunteers had probable PTSD. The prevalence did not vary significantly by age group, sex, area of residence, volunteer sector or length of service.
4.2.2 Psychological distress
Around one in five volunteers (18%) reported high or very high levels of psychological distress. The proportion was highest among those who were less than 35 years of age (32%) and declined in older age groups to 7% among volunteers aged 65 years and over. Volunteers in the ambulance sector had significantly lower rates of psychological distress (11%) when compared to those in the fire and rescue and the state emergency service sectors (18% and 19% respectively). Unlike employees, there was no difference in the proportion of volunteers reporting high or very high distress by length of service.
4.2.3 Wellbeing and resilience
Fifteen percent of volunteers were identified as having low levels of wellbeing, around one in three had a medium level of wellbeing (68%) and one in seven (14%) reported high levels of wellbeing. There was little variation in levels of wellbeing with age, with the exception of those aged 65 years and over, where one in four volunteers reported high levels of wellbeing. There were no significant differences by sex or area of residence. Almost one in five state emergency service sector volunteers (19%) had low levels of wellbeing. This was significantly higher than the proportion of volunteers in the ambulance (13%) or fire and rescue (15%) sectors. There were no significant differences in wellbeing by length of service.
Among volunteers, 66% reported high resilience, 29% had moderate levels of resilience and 6% had low resilience. Resilience was highest among those 65 years and over, where over three quarters had high levels of resilience (79%). In contrast, in younger age groups, around 60% of volunteers had high resilience. A significantly greater proportion of males had high resilience when compared with females (68% and 60% respectively). There were no significant differences between sectors or by length of service in the sector.
4.3 Exposure to stressful events – employees
Survey participants were asked if they had experienced a stressful event, or series of stressful events, in their role in the police and emergency services sector, that had deeply affected them. In addition, if they experienced a stressful event in their work role, they were asked to specify what kind of stressful event this was (e.g. traumatic, personal injury, workplace conflict).
Exposure to a stressful event was more common among those working in the ambulance (67%) and police (65%) sectors compared to those working in the fire and rescue (60%) and state emergency service (48%) sectors. Those employed in operational roles were more likely to be exposed to a stressful event in the course of their work when compared to those working in non-operational roles (70% and 42% respectively). Employees who had more than 10 years of service were seven times more likely to have experienced a stressful event compared to those with less than two years of service.
Around half of those working in the ambulance, fire and rescue, and police sectors reported that they had experienced a traumatic event that deeply affected them in the course of their work (Table 4.3.1). In contrast, a substantially lower proportion (30%) of those working in the state emergency service reported that they had been exposed to a traumatic event. Exposure to a traumatic event in the workplace was lowest among those less than 35 years of age (40%) and highest in those aged 45-54 years (58%). Males were significantly more likely to be exposed than females (59% and 37% respectively), as were those living

44
in regional or rural areas when compared to those living in metropolitan areas (57% and 49% respectively). Exposure to traumatic events in the workplace increased significantly with increasing time in the service, from 9% among those who had worked for less than two years in the service, to 62% of those who had spent 10 or more years in the service. Sixty percent of those in operational roles, and 23% of those in non-operational roles, had been exposed to a traumatic event at work.
Table 4.3.1: Proportion of employees who have experienced a stressful event or series of events that deeply affected them at or away from work, by demographic and work characteristics
Exposed to stressful events in the workplace
No (%) Yes - Not traumatic (%) Yes - Traumatic (%)
Sector—
33.3 11.9 54.8 Ambulance
Fire and rescue 39.6 10.4 50.0
Police 34.8 14.4 50.8
State emergency service 51.7 18.8 29.5
Length of service—
88.4 2.9 8.7 Less than 2 years
2 - 5 years 62.8 12.4 24.8
6 - 10 years 41.2 14.1 44.7
More than 10 years 24.1 14.2 61.7
Operational status—
29.6 11.1 59.3 Operational
Non-operational 57.7 19.7 22.6
Both 30.5 14.7 54.9
Survey participants were also asked if they had experienced a stressful event away from work, or at a work role that was external to the police and emergency services sector. A significantly greater proportion of those working in the state emergency service (51%) reported exposure to stressful events external to their police and emergency services role when compared to those employees in the ambulance (41%), fire and rescue (39%), and police (40%) sectors. Stressful events experienced away from their police and emergency services role were more commonly reported by females compared to males (51% and 32% respectively), those who lived in metropolitan areas compared to those living in regional or rural areas (40% and 36% respectively), and those who were in non-operational roles compared to employees in operational roles (52% and 34% respectively).
4.3.1 Probable PTSD
Prevalence of probable PTSD was four times higher among those who had experienced a stressful event at work when compared to those who had not. Of note, the rate of probable PTSD among employees who had not experienced a stressful event at work was comparable to the rate in the Australian general population. The rate of probable PTSD was not significantly different between those who had experienced a traumatic stressful event at work when compared to those who experienced a non-traumatic stressful event in the workplace (e.g. conflict at work, personal injury or dismissal).
Even when taking into account length of service, rates of probable PTSD were still substantially higher among those who had experienced a stressful event when compared to those who had not been exposed
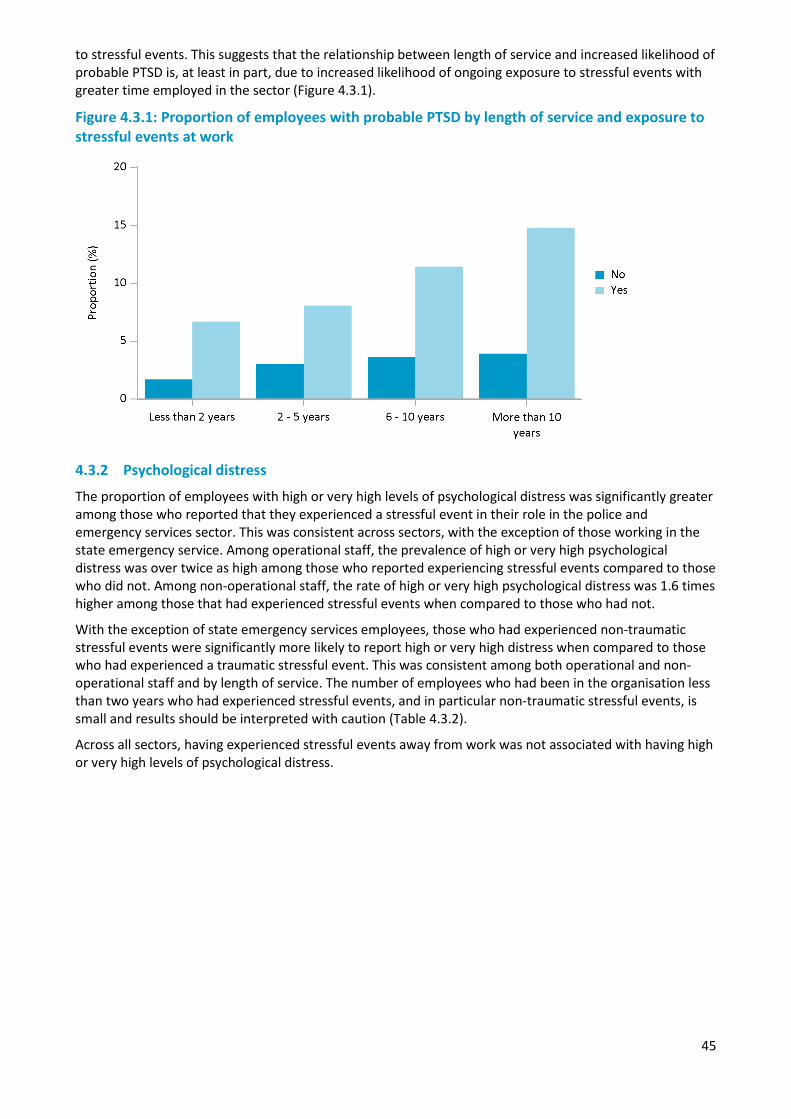
45
to stressful events. This suggests that the relationship between length of service and increased likelihood of probable PTSD is, at least in part, due to increased likelihood of ongoing exposure to stressful events with greater time employed in the sector (Figure 4.3.1).
Figure 4.3.1: Proportion of employees with probable PTSD by length of service and exposure to stressful events at work
4.3.2 Psychological distress
The proportion of employees with high or very high levels of psychological distress was significantly greater among those who reported that they experienced a stressful event in their role in the police and emergency services sector. This was consistent across sectors, with the exception of those working in the state emergency service. Among operational staff, the prevalence of high or very high psychological distress was over twice as high among those who reported experiencing stressful events compared to those who did not. Among non-operational staff, the rate of high or very high psychological distress was 1.6 times higher among those that had experienced stressful events when compared to those who had not.
With the exception of state emergency services employees, those who had experienced non-traumatic stressful events were significantly more likely to report high or very high distress when compared to those who had experienced a traumatic stressful event. This was consistent among both operational and non-operational staff and by length of service. The number of employees who had been in the organisation less than two years who had experienced stressful events, and in particular non-traumatic stressful events, is small and results should be interpreted with caution (Table 4.3.2).
Across all sectors, having experienced stressful events away from work was not associated with having high or very high levels of psychological distress.

46
Table 4.3.2: Proportion of employees with high or very high psychological distress by exposure to stressful events and workplace factors
Exposed to a stressful event in the workplace
No (%) Yes - Not traumatic (%) Yes - Traumatic (%)
Sector—
18.7 41.7 31.4 Ambulance
Fire and rescue 20.3 43.9 29.2
Police 19.5 43.5 34.6
State emergency service 30.4 43.5 30.4
Operational status —
16.2 42.5 32.8 Operational
Non-operational 24.1 45.4 34.1
Both 22.2 41.8 34.6
Length of service —
14.0 70.7 24.0 Less than 2 years
2 - 5 years 20.8 41.5 26.5
6 - 10 years 20.4 47.6 32.8
More than 10 years 19.7 42.4 34.0
4.3.3 Wellbeing and resilience
A significantly greater proportion of employees who had experienced a stressful event in the course of their work were classified as having low levels of wellbeing when compared to those who had not experienced a stressful event (35% and 23% respectively). Further, those who had experienced a non-traumatic stressful event were significantly more likely to have low levels of wellbeing (44%) when compared to those who had experienced a traumatic stressful event (33%) or those who had not experienced a stressful event (23%, Table 4.3.3).
Table 4.3.3: Wellbeing and exposure to workplace stressful events
Exposed to a stressful event in the workplace Warwick-Edinburgh Mental Wellbeing Scale
Low (%) Medium (%) High (%)
No stressful event 22.7 68.4 8.9
Stressful event - not traumatic 44.0 53.1 2.9
Stressful event - traumatic 33.0 62.6 4.4
Employees working in the ambulance, fire and rescue, and police sectors who experienced a stressful event at work had significantly lower levels of resilience when compared to those who did not experience a stressful event. Among those who had experienced a stressful event, or series of stressful events, in the workplace, about half (49%) were identified as having high levels of resilience and 12% had low levels of resilience. In contrast, approximately 65% of employees who had not experienced a stressful event at work had high levels of resilience and only 5% had low levels of resilience.
Those who experienced a non-traumatic stressful event in the workplace were less likely to have high levels of resilience (44%) compared to either those who had experienced a traumatic event (50%) or those who had not experienced a stressful event (65%, Table 4.3.4).
47
Table 4.3.4: Resilience and exposure to work place stressful events
Exposed to a stressful event in the workplace Resilience
High (%) Moderate (%) Low (%)
No stressful event 64.7 29.9 5.4
Stressful event - not traumatic 43.6 41.9 14.5
Stressful event - traumatic 50.2 38.7 11.1
4.4 Exposure to stressful events - volunteers
Volunteers were asked whether they had experienced stressful events, either in the course of their volunteering work within the police and emergency services sector, their paid employment (including work within the police and emergency services sector), their other volunteering roles, or away from paid work or volunteering. For the purpose of this analysis, stressful events in the course of volunteering work includes those experienced while either volunteering or working within the police and emergency services sector.
Approximately half of volunteers in the ambulance sector (53%) had experienced a stressful event in the course of their role within the police and emergency services sector and 47% had experienced a traumatic stressful event. This was significantly higher than other sectors, where around one in three volunteers reported experiencing a stressful event. Thirty percent of fire and rescue volunteers and one in four state emergency services volunteers reported that they had experienced a traumatic stressful event in their role within the sector. A significantly greater proportion of males reported experiencing a traumatic event when compared to females (33% and 22% respectively). However, there was no difference in the proportion of males and females who reported a non-traumatic stressful event in the workplace.
Around half of volunteers reported that they had experienced a stressful event away from their volunteer role. There was no difference between sectors in the proportion of volunteers who had experienced stressful events away from work. However, a significantly greater proportion of females (56%) reported that they had experienced a stressful event away from their volunteering work when compared to males (49%).
4.4.1 Probable PTSD
Experiencing a stressful event, or series of stressful events, while volunteering or working in the police and emergency services sector was associated with a higher rate of probable PTSD among volunteers (Figure 4.4.1). While the rate of probable PTSD was higher among exposed ambulance volunteers when compared to unexposed volunteers, these differences were not statistically significant. Having experienced a non-traumatic stressful event was associated with a higher prevalence of probable PTSD (12%) when compared to those that had experienced traumatic stressful events in the course of their role in the sector (7%). However, these differences were not statistically significant.
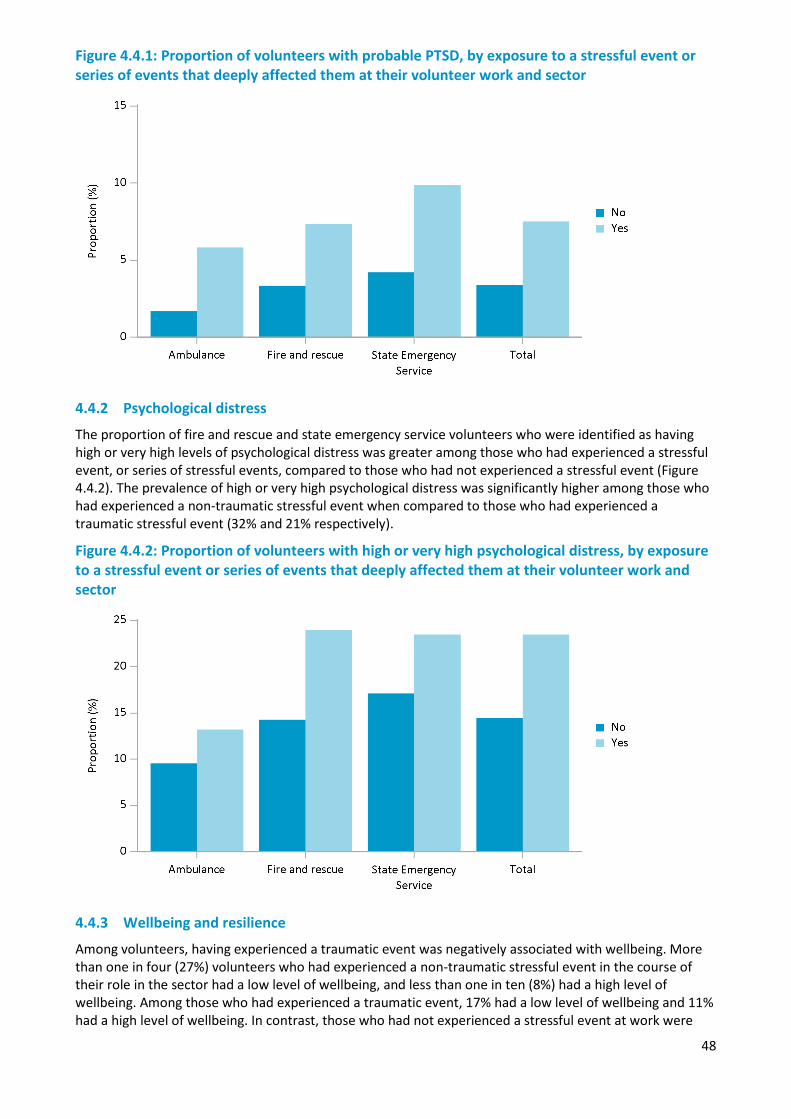
48
Figure 4.4.1: Proportion of volunteers with probable PTSD, by exposure to a stressful event or series of events that deeply affected them at their volunteer work and sector
4.4.2 Psychological distress
The proportion of fire and rescue and state emergency service volunteers who were identified as having high or very high levels of psychological distress was greater among those who had experienced a stressful event, or series of stressful events, compared to those who had not experienced a stressful event (Figure 4.4.2). The prevalence of high or very high psychological distress was significantly higher among those who had experienced a non-traumatic stressful event when compared to those who had experienced a traumatic stressful event (32% and 21% respectively).
Figure 4.4.2: Proportion of volunteers with high or very high psychological distress, by exposure to a stressful event or series of events that deeply affected them at their volunteer work and sector
4.4.3 Wellbeing and resilience
Among volunteers, having experienced a traumatic event was negatively associated with wellbeing. More than one in four (27%) volunteers who had experienced a non-traumatic stressful event in the course of their role in the sector had a low level of wellbeing, and less than one in ten (8%) had a high level of wellbeing. Among those who had experienced a traumatic event, 17% had a low level of wellbeing and 11% had a high level of wellbeing. In contrast, those who had not experienced a stressful event at work were
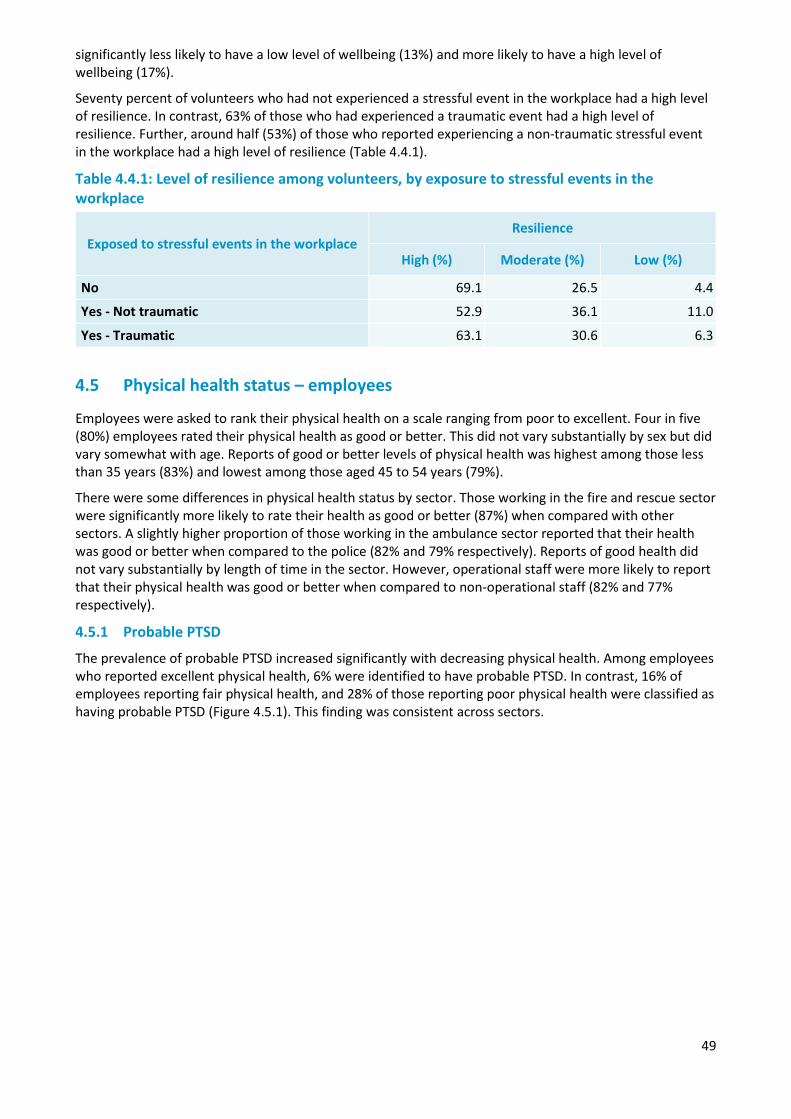
49
significantly less likely to have a low level of wellbeing (13%) and more likely to have a high level of wellbeing (17%).
Seventy percent of volunteers who had not experienced a stressful event in the workplace had a high level of resilience. In contrast, 63% of those who had experienced a traumatic event had a high level of resilience. Further, around half (53%) of those who reported experiencing a non-traumatic stressful event in the workplace had a high level of resilience (Table 4.4.1).
Table 4.4.1: Level of resilience among volunteers, by exposure to stressful events in the workplace
Exposed to stressful events in the workplace Resilience
High (%) Moderate (%) Low (%)
No 69.1 26.5 4.4
Yes - Not traumatic 52.9 36.1 11.0
Yes - Traumatic 63.1 30.6 6.3
4.5 Physical health status – employees
Employees were asked to rank their physical health on a scale ranging from poor to excellent. Four in five (80%) employees rated their physical health as good or better. This did not vary substantially by sex but did vary somewhat with age. Reports of good or better levels of physical health was highest among those less than 35 years (83%) and lowest among those aged 45 to 54 years (79%).
There were some differences in physical health status by sector. Those working in the fire and rescue sector were significantly more likely to rate their health as good or better (87%) when compared with other sectors. A slightly higher proportion of those working in the ambulance sector reported that their health was good or better when compared to the police (82% and 79% respectively). Reports of good health did not vary substantially by length of time in the sector. However, operational staff were more likely to report that their physical health was good or better when compared to non-operational staff (82% and 77% respectively).
4.5.1 Probable PTSD
The prevalence of probable PTSD increased significantly with decreasing physical health. Among employees who reported excellent physical health, 6% were identified to have probable PTSD. In contrast, 16% of employees reporting fair physical health, and 28% of those reporting poor physical health were classified as having probable PTSD (Figure 4.5.1). This finding was consistent across sectors.
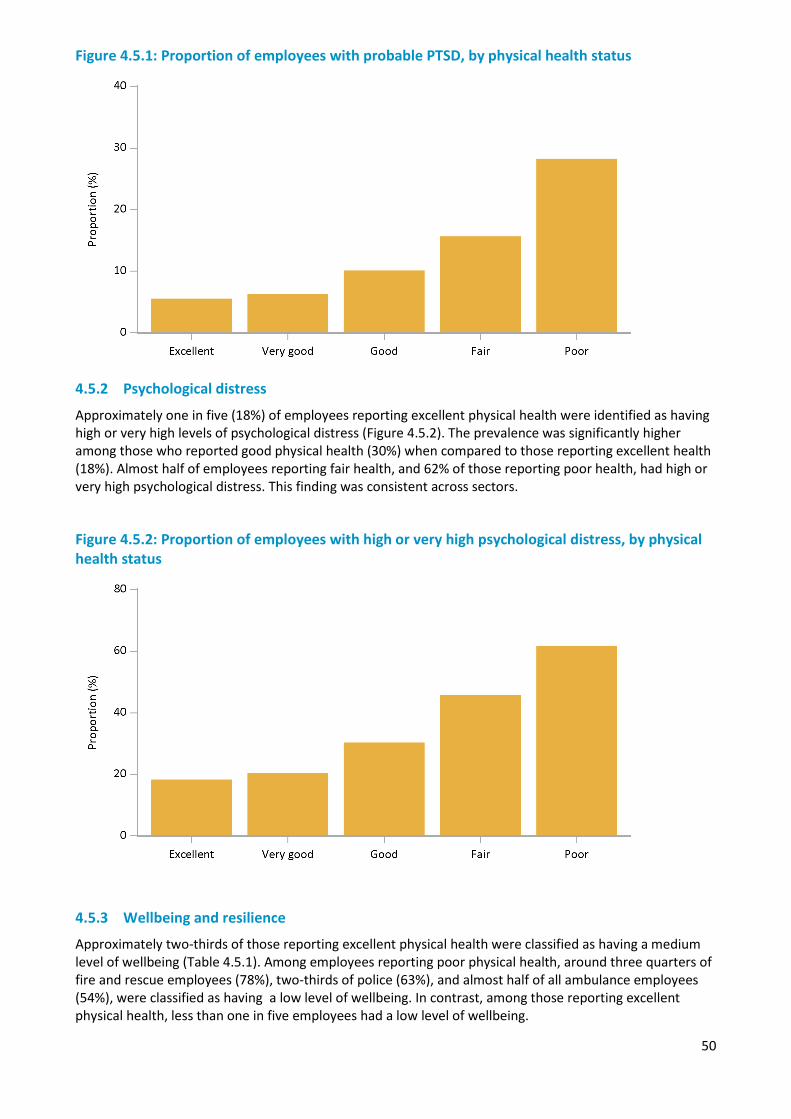
50
Figure 4.5.1: Proportion of employees with probable PTSD, by physical health status
4.5.2 Psychological distress
Approximately one in five (18%) of employees reporting excellent physical health were identified as having high or very high levels of psychological distress (Figure 4.5.2). The prevalence was significantly higher among those who reported good physical health (30%) when compared to those reporting excellent health (18%). Almost half of employees reporting fair health, and 62% of those reporting poor health, had high or very high psychological distress. This finding was consistent across sectors.
Figure 4.5.2: Proportion of employees with high or very high psychological distress, by physical health status
4.5.3 Wellbeing and resilience
Approximately two-thirds of those reporting excellent physical health were classified as having a medium level of wellbeing (Table 4.5.1). Among employees reporting poor physical health, around three quarters of fire and rescue employees (78%), two-thirds of police (63%), and almost half of all ambulance employees (54%), were classified as having a low level of wellbeing. In contrast, among those reporting excellent physical health, less than one in five employees had a low level of wellbeing.
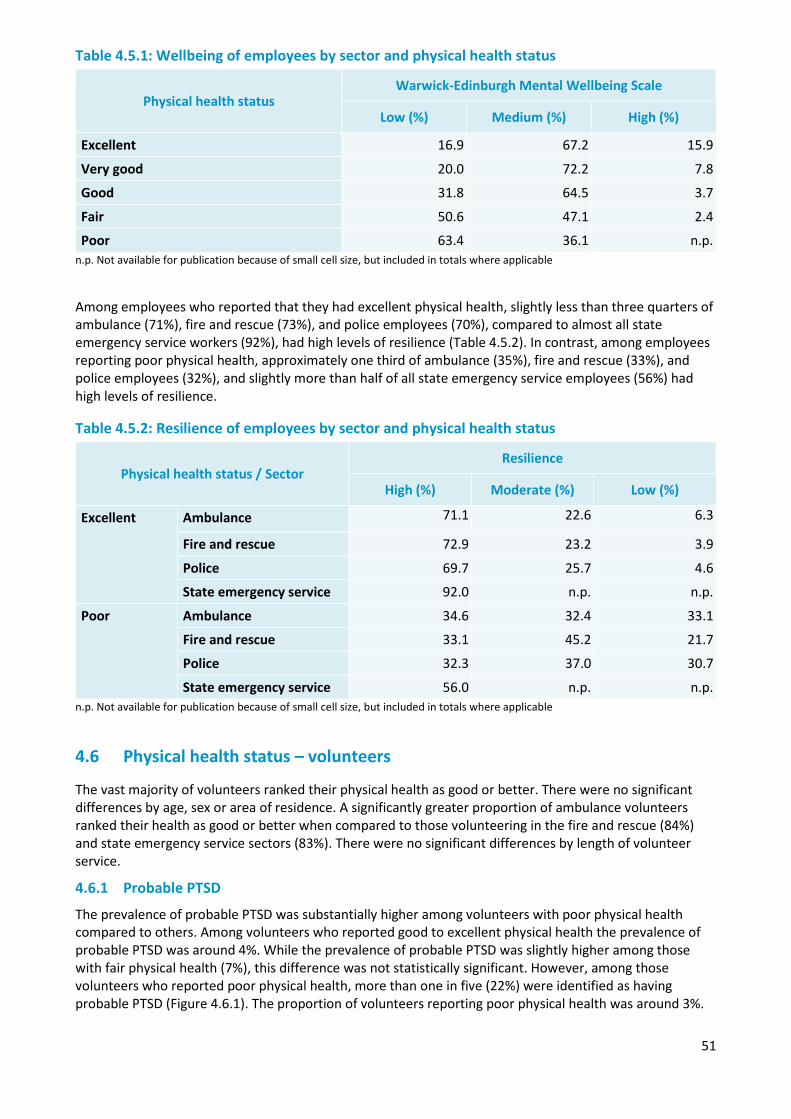
51
Table 4.5.1: Wellbeing of employees by sector and physical health status
Physical health status Warwick-Edinburgh Mental Wellbeing Scale
Low (%) Medium (%) High (%)
Excellent 16.9 67.2 15.9
Very good 20.0 72.2 7.8
Good 31.8 64.5 3.7
Fair 50.6 47.1 2.4
Poor 63.4 36.1 n.p. n.p. Not available for publication because of small cell size, but included in totals where applicable
Among employees who reported that they had excellent physical health, slightly less than three quarters of ambulance (71%), fire and rescue (73%), and police employees (70%), compared to almost all state emergency service workers (92%), had high levels of resilience (Table 4.5.2). In contrast, among employees reporting poor physical health, approximately one third of ambulance (35%), fire and rescue (33%), and police employees (32%), and slightly more than half of all state emergency service employees (56%) had high levels of resilience.
Table 4.5.2: Resilience of employees by sector and physical health status
Physical health status / Sector Resilience
High (%) Moderate (%) Low (%)
Excellent Ambulance 71.1 22.6 6.3
Fire and rescue 72.9 23.2 3.9
Police 69.7 25.7 4.6
State emergency service 92.0 n.p. n.p.
Poor Ambulance 34.6 32.4 33.1
Fire and rescue 33.1 45.2 21.7
Police 32.3 37.0 30.7
State emergency service 56.0 n.p. n.p. n.p. Not available for publication because of small cell size, but included in totals where applicable
4.6 Physical health status – volunteers
The vast majority of volunteers ranked their physical health as good or better. There were no significant differences by age, sex or area of residence. A significantly greater proportion of ambulance volunteers ranked their health as good or better when compared to those volunteering in the fire and rescue (84%) and state emergency service sectors (83%). There were no significant differences by length of volunteer service.
4.6.1 Probable PTSD
The prevalence of probable PTSD was substantially higher among volunteers with poor physical health compared to others. Among volunteers who reported good to excellent physical health the prevalence of probable PTSD was around 4%. While the prevalence of probable PTSD was slightly higher among those with fair physical health (7%), this difference was not statistically significant. However, among those volunteers who reported poor physical health, more than one in five (22%) were identified as having probable PTSD (Figure 4.6.1). The proportion of volunteers reporting poor physical health was around 3%.
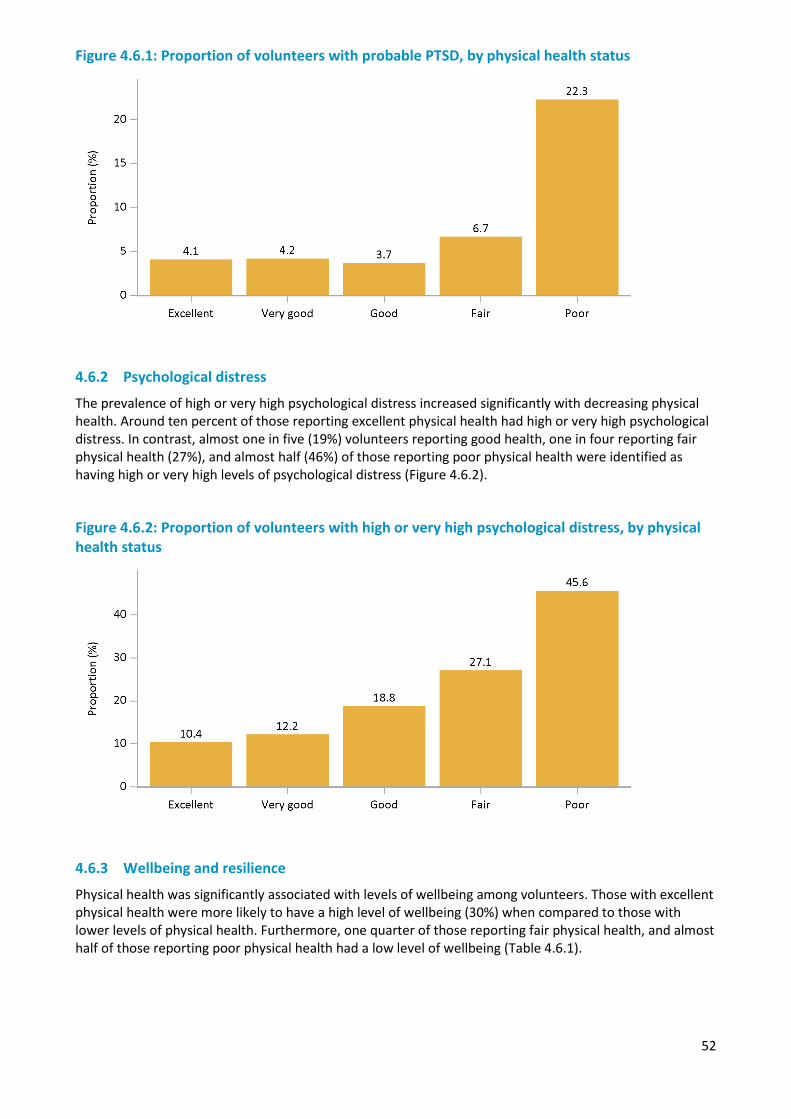
52
Figure 4.6.1: Proportion of volunteers with probable PTSD, by physical health status
4.6.2 Psychological distress
The prevalence of high or very high psychological distress increased significantly with decreasing physical health. Around ten percent of those reporting excellent physical health had high or very high psychological distress. In contrast, almost one in five (19%) volunteers reporting good health, one in four reporting fair physical health (27%), and almost half (46%) of those reporting poor physical health were identified as having high or very high levels of psychological distress (Figure 4.6.2).
Figure 4.6.2: Proportion of volunteers with high or very high psychological distress, by physical health status
4.6.3 Wellbeing and resilience
Physical health was significantly associated with levels of wellbeing among volunteers. Those with excellent physical health were more likely to have a high level of wellbeing (30%) when compared to those with lower levels of physical health. Furthermore, one quarter of those reporting fair physical health, and almost half of those reporting poor physical health had a low level of wellbeing (Table 4.6.1).
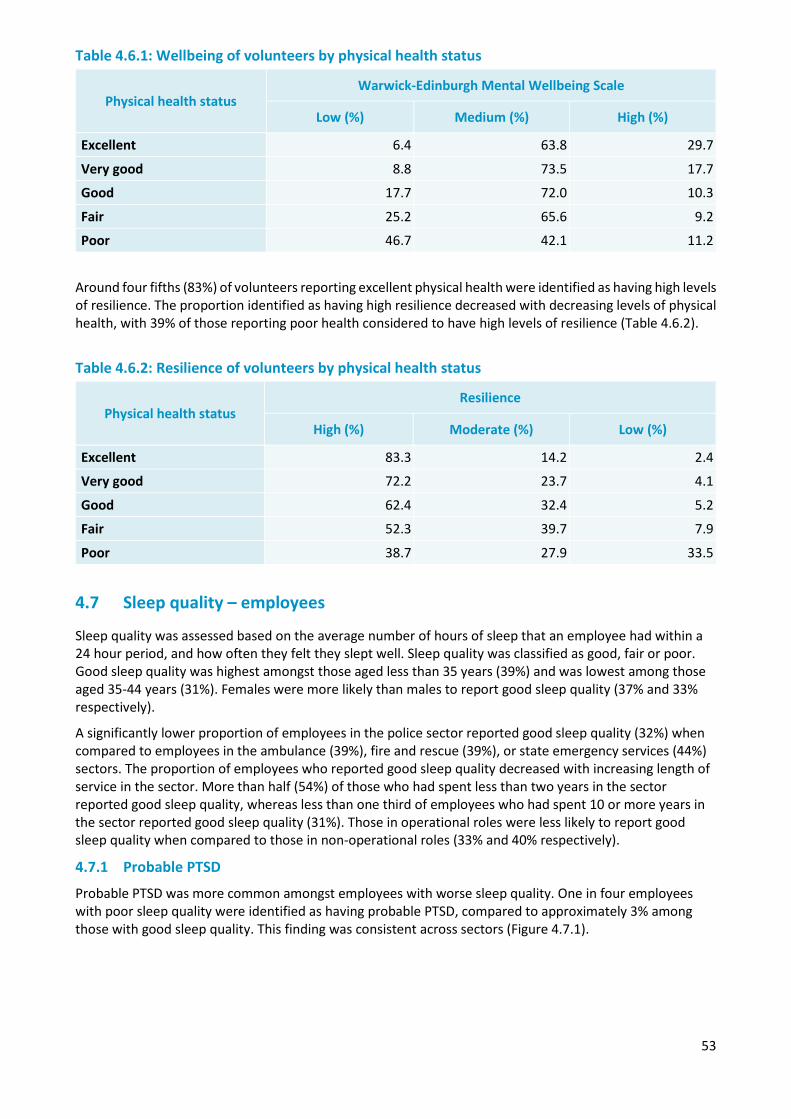
53
Table 4.6.1: Wellbeing of volunteers by physical health status
Physical health status Warwick-Edinburgh Mental Wellbeing Scale
Low (%) Medium (%) High (%)
Excellent 6.4 63.8 29.7
Very good 8.8 73.5 17.7
Good 17.7 72.0 10.3
Fair 25.2 65.6 9.2
Poor 46.7 42.1 11.2
Around four fifths (83%) of volunteers reporting excellent physical health were identified as having high levels of resilience. The proportion identified as having high resilience decreased with decreasing levels of physical health, with 39% of those reporting poor health considered to have high levels of resilience (Table 4.6.2).
Table 4.6.2: Resilience of volunteers by physical health status
Physical health status Resilience
High (%) Moderate (%) Low (%)
Excellent 83.3 14.2 2.4
Very good 72.2 23.7 4.1
Good 62.4 32.4 5.2
Fair 52.3 39.7 7.9
Poor 38.7 27.9 33.5
4.7 Sleep quality – employees
Sleep quality was assessed based on the average number of hours of sleep that an employee had within a 24 hour period, and how often they felt they slept well. Sleep quality was classified as good, fair or poor. Good sleep quality was highest amongst those aged less than 35 years (39%) and was lowest among those aged 35-44 years (31%). Females were more likely than males to report good sleep quality (37% and 33% respectively).
A significantly lower proportion of employees in the police sector reported good sleep quality (32%) when compared to employees in the ambulance (39%), fire and rescue (39%), or state emergency services (44%) sectors. The proportion of employees who reported good sleep quality decreased with increasing length of service in the sector. More than half (54%) of those who had spent less than two years in the sector reported good sleep quality, whereas less than one third of employees who had spent 10 or more years in the sector reported good sleep quality (31%). Those in operational roles were less likely to report good sleep quality when compared to those in non-operational roles (33% and 40% respectively).
4.7.1 Probable PTSD
Probable PTSD was more common amongst employees with worse sleep quality. One in four employees with poor sleep quality were identified as having probable PTSD, compared to approximately 3% among those with good sleep quality. This finding was consistent across sectors (Figure 4.7.1).
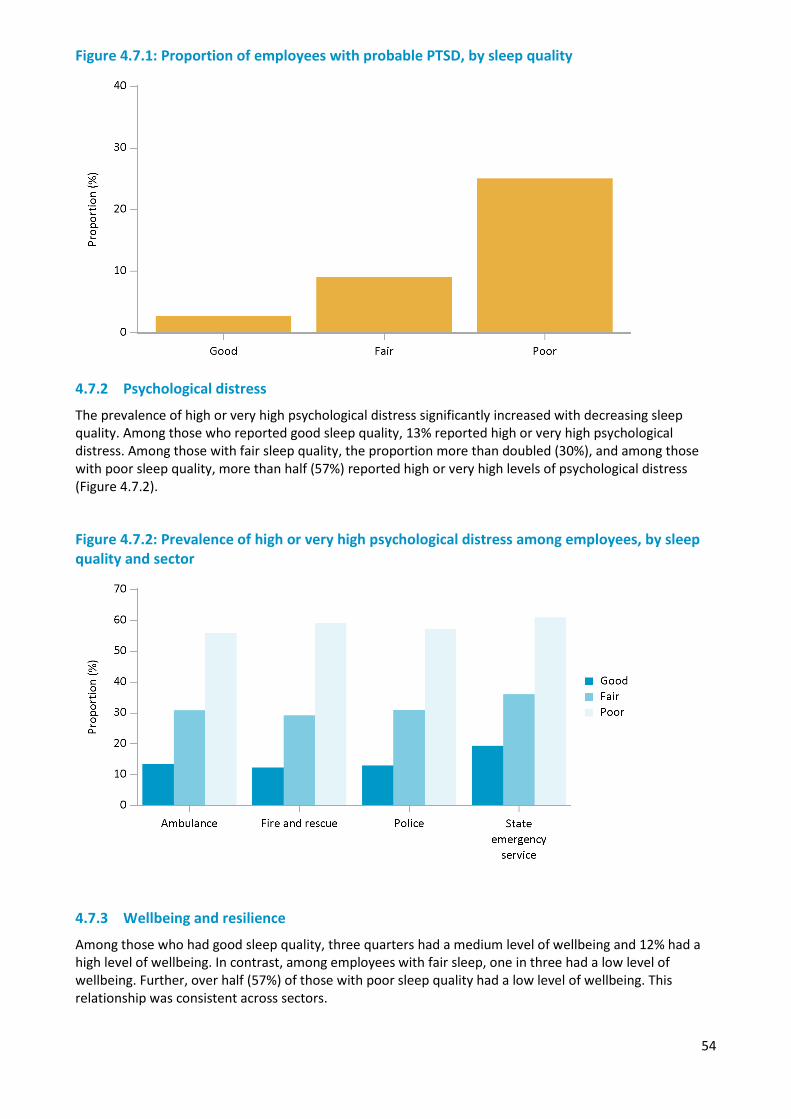
54
Figure 4.7.1: Proportion of employees with probable PTSD, by sleep quality
4.7.2 Psychological distress
The prevalence of high or very high psychological distress significantly increased with decreasing sleep quality. Among those who reported good sleep quality, 13% reported high or very high psychological distress. Among those with fair sleep quality, the proportion more than doubled (30%), and among those with poor sleep quality, more than half (57%) reported high or very high levels of psychological distress (Figure 4.7.2).
Figure 4.7.2: Prevalence of high or very high psychological distress among employees, by sleep quality and sector
4.7.3 Wellbeing and resilience
Among those who had good sleep quality, three quarters had a medium level of wellbeing and 12% had a high level of wellbeing. In contrast, among employees with fair sleep, one in three had a low level of wellbeing. Further, over half (57%) of those with poor sleep quality had a low level of wellbeing. This relationship was consistent across sectors.
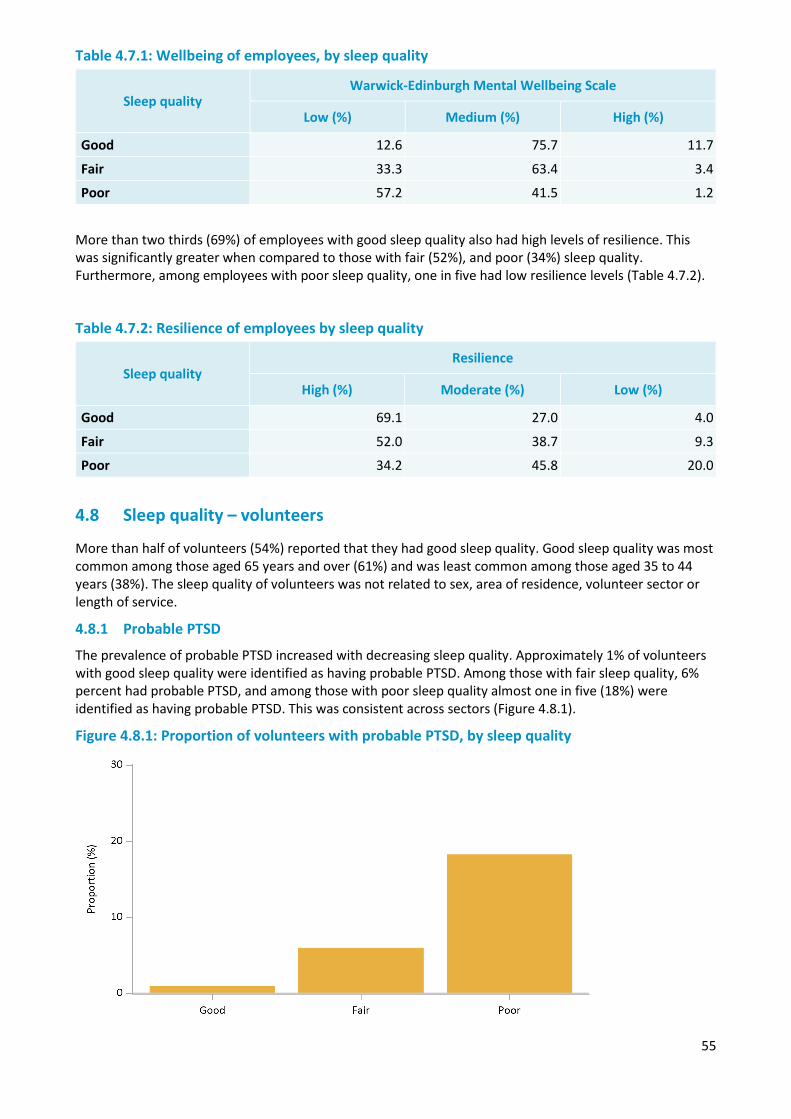
55
Table 4.7.1: Wellbeing of employees, by sleep quality
Sleep quality Warwick-Edinburgh Mental Wellbeing Scale
Low (%) Medium (%) High (%)
Good 12.6 75.7 11.7
Fair 33.3 63.4 3.4
Poor 57.2 41.5 1.2
More than two thirds (69%) of employees with good sleep quality also had high levels of resilience. This was significantly greater when compared to those with fair (52%), and poor (34%) sleep quality. Furthermore, among employees with poor sleep quality, one in five had low resilience levels (Table 4.7.2).
Table 4.7.2: Resilience of employees by sleep quality
Sleep quality Resilience
High (%) Moderate (%) Low (%)
Good 69.1 27.0 4.0
Fair 52.0 38.7 9.3
Poor 34.2 45.8 20.0
4.8 Sleep quality – volunteers
More than half of volunteers (54%) reported that they had good sleep quality. Good sleep quality was most common among those aged 65 years and over (61%) and was least common among those aged 35 to 44 years (38%). The sleep quality of volunteers was not related to sex, area of residence, volunteer sector or length of service.
4.8.1 Probable PTSD
The prevalence of probable PTSD increased with decreasing sleep quality. Approximately 1% of volunteers with good sleep quality were identified as having probable PTSD. Among those with fair sleep quality, 6% percent had probable PTSD, and among those with poor sleep quality almost one in five (18%) were identified as having probable PTSD. This was consistent across sectors (Figure 4.8.1).
Figure 4.8.1: Proportion of volunteers with probable PTSD, by sleep quality
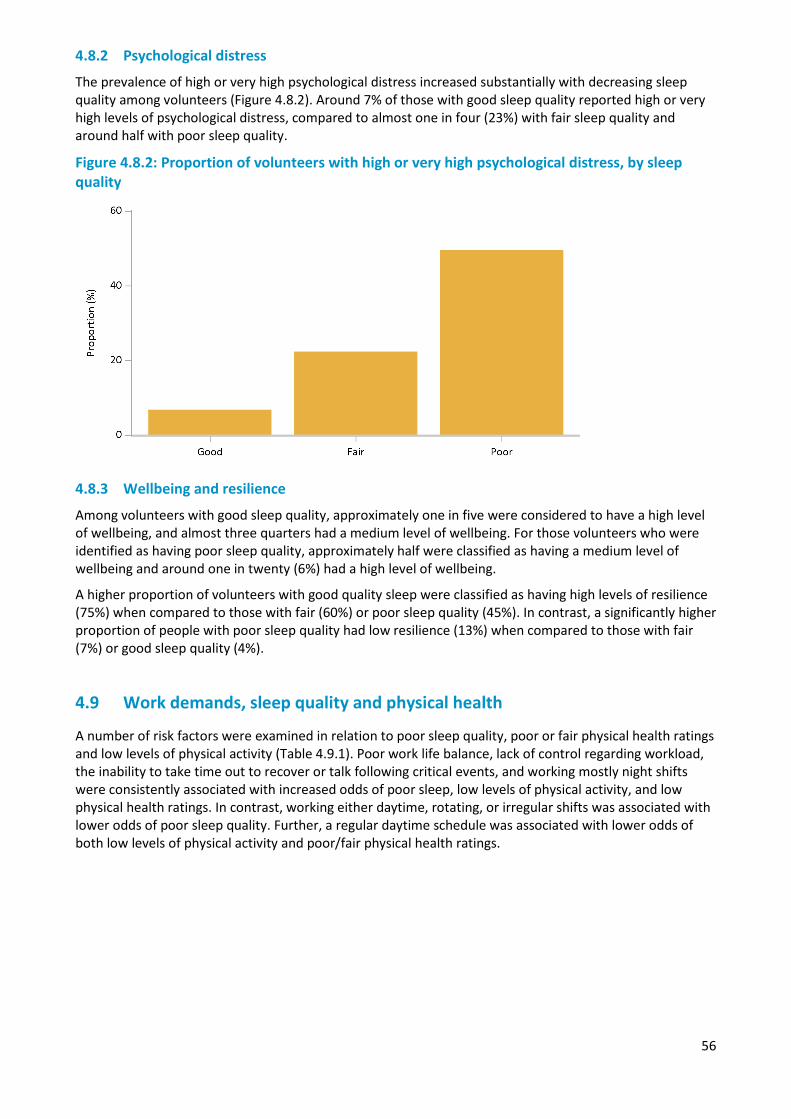
56
4.8.2 Psychological distress
The prevalence of high or very high psychological distress increased substantially with decreasing sleep quality among volunteers (Figure 4.8.2). Around 7% of those with good sleep quality reported high or very high levels of psychological distress, compared to almost one in four (23%) with fair sleep quality and around half with poor sleep quality.
Figure 4.8.2: Proportion of volunteers with high or very high psychological distress, by sleep quality
4.8.3 Wellbeing and resilience
Among volunteers with good sleep quality, approximately one in five were considered to have a high level of wellbeing, and almost three quarters had a medium level of wellbeing. For those volunteers who were identified as having poor sleep quality, approximately half were classified as having a medium level of wellbeing and around one in twenty (6%) had a high level of wellbeing.
A higher proportion of volunteers with good quality sleep were classified as having high levels of resilience (75%) when compared to those with fair (60%) or poor sleep quality (45%). In contrast, a significantly higher proportion of people with poor sleep quality had low resilience (13%) when compared to those with fair (7%) or good sleep quality (4%).
4.9 Work demands, sleep quality and physical health
A number of risk factors were examined in relation to poor sleep quality, poor or fair physical health ratings and low levels of physical activity (Table 4.9.1). Poor work life balance, lack of control regarding workload, the inability to take time out to recover or talk following critical events, and working mostly night shifts were consistently associated with increased odds of poor sleep, low levels of physical activity, and low physical health ratings. In contrast, working either daytime, rotating, or irregular shifts was associated with lower odds of poor sleep quality. Further, a regular daytime schedule was associated with lower odds of both low levels of physical activity and poor/fair physical health ratings.

57
Table 4.9.1: Odds ratios for poor sleep quality, poor physical health and low levels of physical activity by working hours and time pressure factors
Risk factors Poor sleep quality
Poor or fair physical health
Moderate physical activity less than once per week
Odds ratio (95% CI) Odds ratio (95% CI) Odds ratio (95% CI)
Works more than 50 hours a week on average 1.43 (1.38, 1.48)* 1.13 (1.09, 1.17)* 1.05 (1.01, 1.09)*
Less than 6 weeks annual leave in the past two years 0.99 (0.95, 1.03) 1.16 (1.12, 1.2)* 1.21 (1.17, 1.26)*
Often or very often returns to work without 12 hour break 1.67 (1.61, 1.73)* 1.18 (1.14, 1.22)* 1.05 (1.01, 1.08)*
Never/hardly ever/seldom - Enough flexibility to balance work and non-work commitments 2.36 (2.29, 2.44)* 1.81 (1.76, 1.87)* 1.51 (1.47, 1.56)*
Never/ hardly ever- Influence working hours or shifts 1.5 (1.45, 1.55)* 1.1 (1.06, 1.14)* 1.02 (0.99, 1.06)
Never/ hardly ever- If exposed to a critical incident feel can take time out to recover or talk about it 2.51 (2.43, 2.6)* 1.57 (1.51, 1.63)* 1.35 (1.3, 1.4)*
Often/ always - Work drains so much of your energy that it has a negative effect on your private life 3.11 (3.02, 3.21)* 2.36 (2.29, 2.43)* 1.56 (1.51, 1.6)*
Often or Always- Get behind with work 1.49 (1.43, 1.55)* 1.84 (1.77, 1.92)* 1.51 (1.46, 1.58)*
Always- work at high pace throughout the day 1.57 (1.51, 1.64)* 0.97 (0.92, 1.01) 1.4 (1.35, 1.46)*
Never/ hardly ever influence the amount of work assigned 1.46 (1.41, 1.5)* 1.22 (1.18, 1.25)* 1.14 (1.11, 1.17)*
Work schedule
A regular daytime schedule 1.12 (1.09, 1.15)* 0.82 (0.8, 0.84)* 0.79 (0.77, 0.8)*
Mostly daytime shifts 0.95 (0.92, 0.99)* 0.96 (0.93, 1) 1.05 (1.01, 1.09)*
Mostly evening shifts 1.39 (1.2, 1.61)* 1.5 (1.29, 1.74)* 1.28 (1.12, 1.46)*
Mostly night shifts 4.35 (2.97, 6.37)* 1.84 (1.45, 2.33)* 1.3 (1.08, 1.57)*
Rotating shift work 0.91 (0.89, 0.94)* 1.18 (1.16, 1.21)* 1.14 (1.12, 1.17)*
Split shift 1.02 (0.86, 1.21) 1.21 (1, 1.46)* 1.12 (0.95, 1.34)
Irregular shifts 0.74 (0.71, 0.77)* 0.77 (0.74, 0.81)* 0.95 (0.9, 1)
On-call 1.82 (1.68, 1.97)* 1.43 (1.34, 1.54)* 1.35 (1.27, 1.44)*
Regular shifts and on-call at other times 0.97 (0.92, 1.01) 1 (0.95, 1.04) 1.02 (0.98, 1.06)
* Odds ratio significantly different from 1
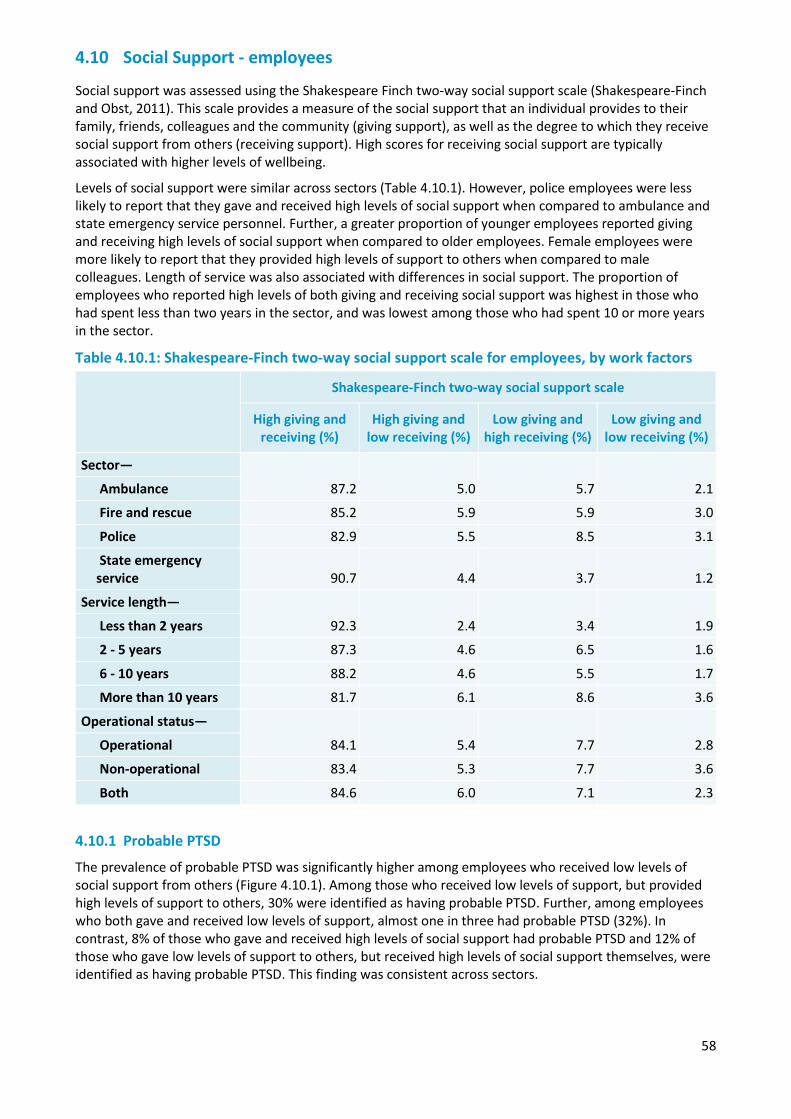
58
4.10 Social Support - employees
Social support was assessed using the Shakespeare Finch two-way social support scale (Shakespeare-Finch and Obst, 2011). This scale provides a measure of the social support that an individual provides to their family, friends, colleagues and the community (giving support), as well as the degree to which they receive social support from others (receiving support). High scores for receiving social support are typically associated with higher levels of wellbeing.
Levels of social support were similar across sectors (Table 4.10.1). However, police employees were less likely to report that they gave and received high levels of social support when compared to ambulance and state emergency service personnel. Further, a greater proportion of younger employees reported giving and receiving high levels of social support when compared to older employees. Female employees were more likely to report that they provided high levels of support to others when compared to male colleagues. Length of service was also associated with differences in social support. The proportion of employees who reported high levels of both giving and receiving social support was highest in those who had spent less than two years in the sector, and was lowest among those who had spent 10 or more years in the sector.
Table 4.10.1: Shakespeare-Finch two-way social support scale for employees, by work factors
Shakespeare-Finch two-way social support scale
High giving and receiving (%)
High giving and low receiving (%)
Low giving and high receiving (%)
Low giving and low receiving (%)
Sector—
87.2 5.0 5.7 2.1 Ambulance
Fire and rescue 85.2 5.9 5.9 3.0
Police 82.9 5.5 8.5 3.1
State emergency service 90.7 4.4 3.7 1.2
Service length—
92.3 2.4 3.4 1.9 Less than 2 years
2 - 5 years 87.3 4.6 6.5 1.6
6 - 10 years 88.2 4.6 5.5 1.7
More than 10 years 81.7 6.1 8.6 3.6
Operational status—
84.1 5.4 7.7 2.8 Operational
Non-operational 83.4 5.3 7.7 3.6
Both 84.6 6.0 7.1 2.3
4.10.1 Probable PTSD
The prevalence of probable PTSD was significantly higher among employees who received low levels of social support from others (Figure 4.10.1). Among those who received low levels of support, but provided high levels of support to others, 30% were identified as having probable PTSD. Further, among employees who both gave and received low levels of support, almost one in three had probable PTSD (32%). In contrast, 8% of those who gave and received high levels of social support had probable PTSD and 12% of those who gave low levels of support to others, but received high levels of social support themselves, were identified as having probable PTSD. This finding was consistent across sectors.
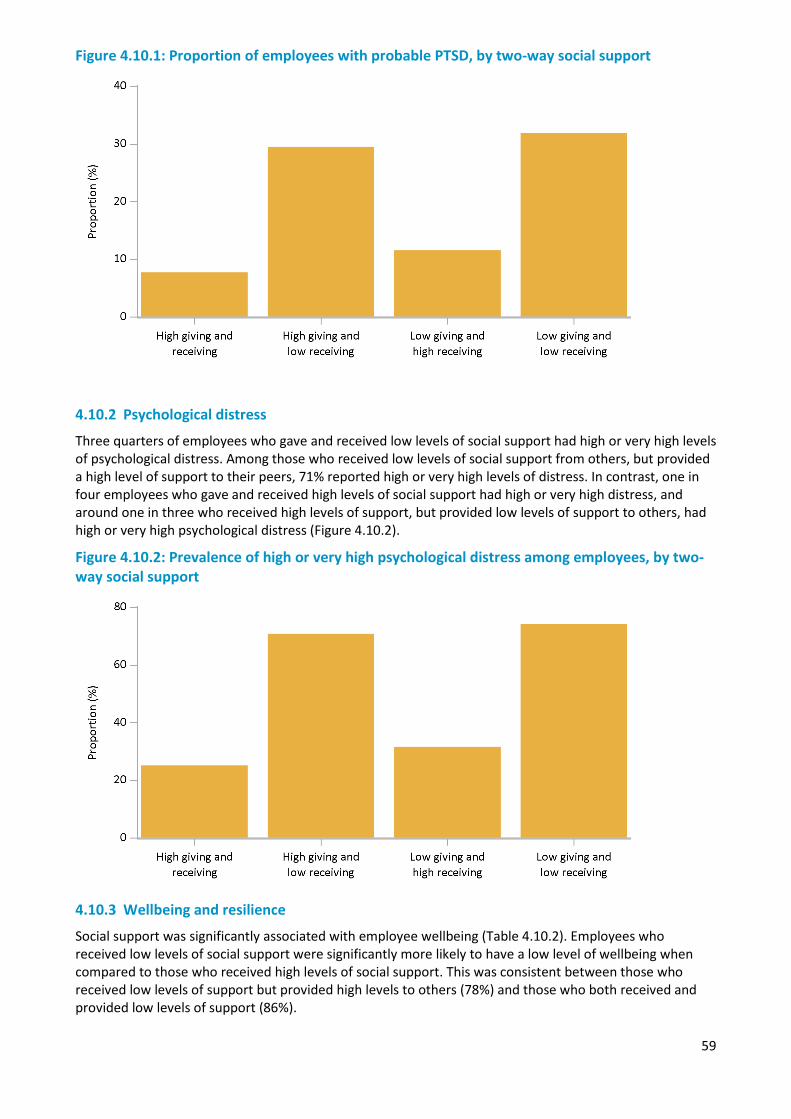
59
Figure 4.10.1: Proportion of employees with probable PTSD, by two-way social support
4.10.2 Psychological distress
Three quarters of employees who gave and received low levels of social support had high or very high levels of psychological distress. Among those who received low levels of social support from others, but provided a high level of support to their peers, 71% reported high or very high levels of distress. In contrast, one in four employees who gave and received high levels of social support had high or very high distress, and around one in three who received high levels of support, but provided low levels of support to others, had high or very high psychological distress (Figure 4.10.2).
Figure 4.10.2: Prevalence of high or very high psychological distress among employees, by two-way social support
4.10.3 Wellbeing and resilience
Social support was significantly associated with employee wellbeing (Table 4.10.2). Employees who received low levels of social support were significantly more likely to have a low level of wellbeing when compared to those who received high levels of social support. This was consistent between those who received low levels of support but provided high levels to others (78%) and those who both received and provided low levels of support (86%).
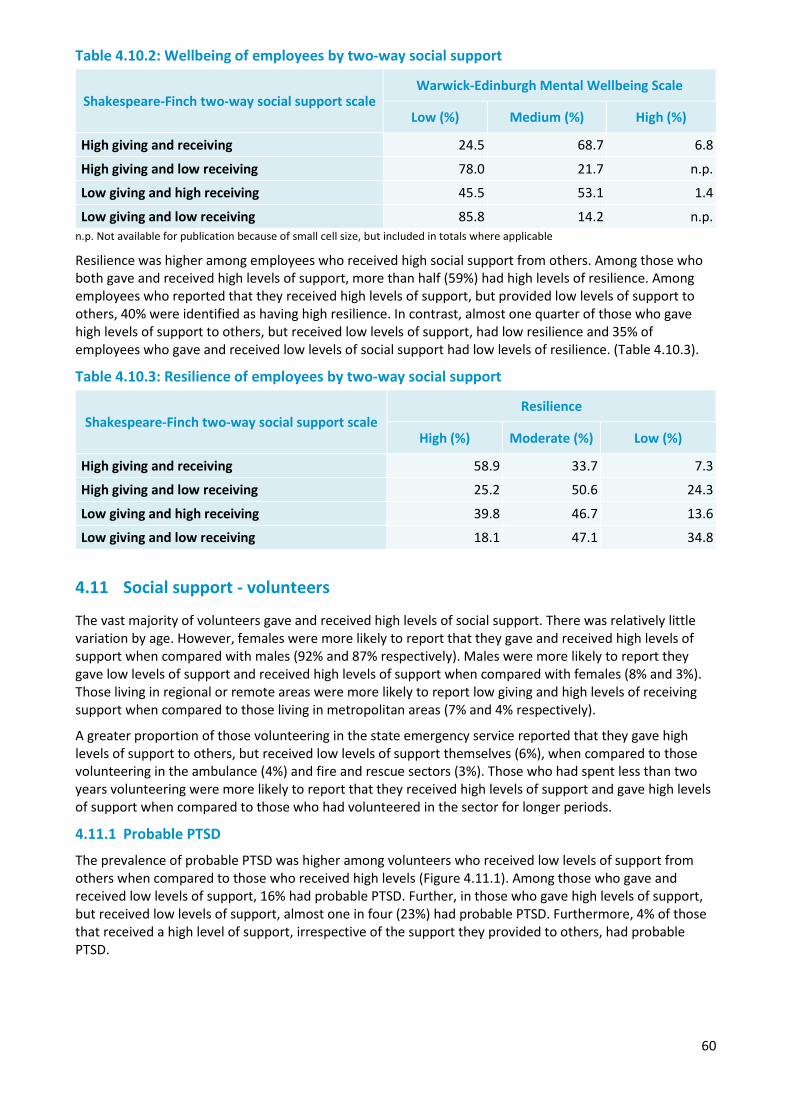
60
Table 4.10.2: Wellbeing of employees by two-way social support
Shakespeare-Finch two-way social support scale Warwick-Edinburgh Mental Wellbeing Scale
Low (%) Medium (%) High (%)
High giving and receiving 24.5 68.7 6.8
High giving and low receiving 78.0 21.7 n.p.
Low giving and high receiving 45.5 53.1 1.4
Low giving and low receiving 85.8 14.2 n.p. n.p. Not available for publication because of small cell size, but included in totals where applicable
Resilience was higher among employees who received high social support from others. Among those who both gave and received high levels of support, more than half (59%) had high levels of resilience. Among employees who reported that they received high levels of support, but provided low levels of support to others, 40% were identified as having high resilience. In contrast, almost one quarter of those who gave high levels of support to others, but received low levels of support, had low resilience and 35% of employees who gave and received low levels of social support had low levels of resilience. (Table 4.10.3).
Table 4.10.3: Resilience of employees by two-way social support
Shakespeare-Finch two-way social support scale Resilience
High (%) Moderate (%) Low (%)
High giving and receiving 58.9 33.7 7.3
High giving and low receiving 25.2 50.6 24.3
Low giving and high receiving 39.8 46.7 13.6
Low giving and low receiving 18.1 47.1 34.8
4.11 Social support - volunteers
The vast majority of volunteers gave and received high levels of social support. There was relatively little variation by age. However, females were more likely to report that they gave and received high levels of support when compared with males (92% and 87% respectively). Males were more likely to report they gave low levels of support and received high levels of support when compared with females (8% and 3%). Those living in regional or remote areas were more likely to report low giving and high levels of receiving support when compared to those living in metropolitan areas (7% and 4% respectively).
A greater proportion of those volunteering in the state emergency service reported that they gave high levels of support to others, but received low levels of support themselves (6%), when compared to those volunteering in the ambulance (4%) and fire and rescue sectors (3%). Those who had spent less than two years volunteering were more likely to report that they received high levels of support and gave high levels of support when compared to those who had volunteered in the sector for longer periods.
4.11.1 Probable PTSD
The prevalence of probable PTSD was higher among volunteers who received low levels of support from others when compared to those who received high levels (Figure 4.11.1). Among those who gave and received low levels of support, 16% had probable PTSD. Further, in those who gave high levels of support, but received low levels of support, almost one in four (23%) had probable PTSD. Furthermore, 4% of those that received a high level of support, irrespective of the support they provided to others, had probable PTSD.
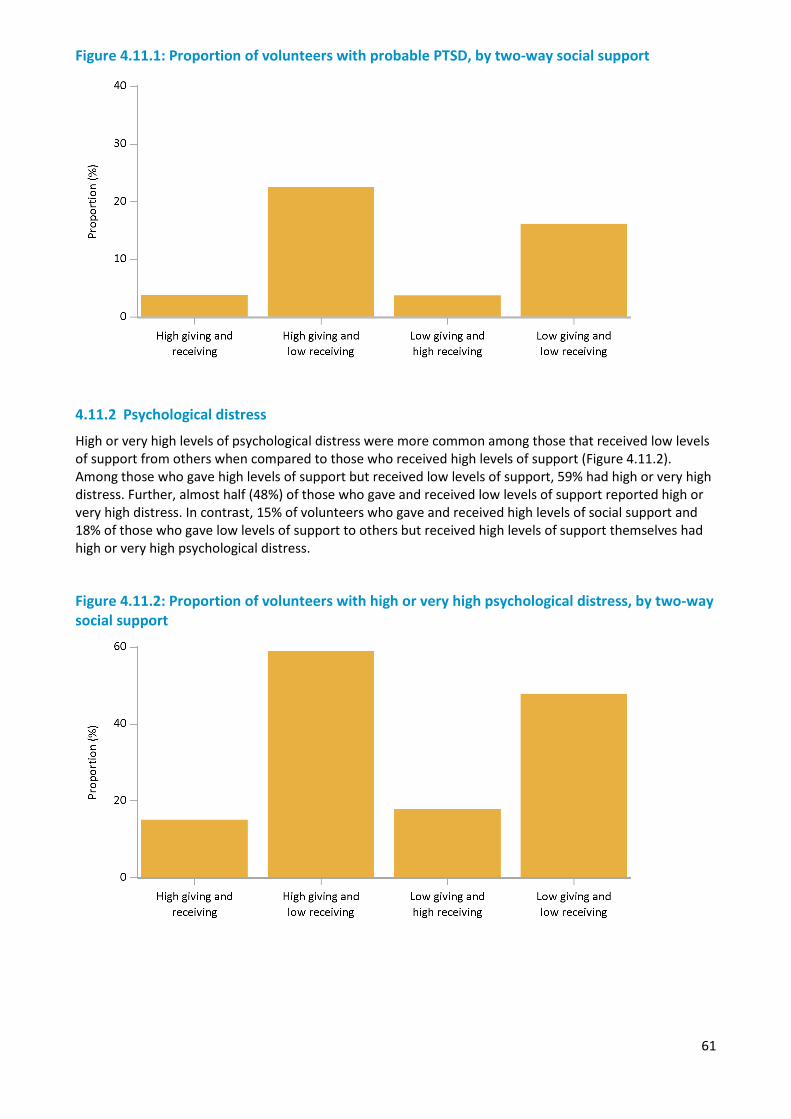
61
Figure 4.11.1: Proportion of volunteers with probable PTSD, by two-way social support
4.11.2 Psychological distress
High or very high levels of psychological distress were more common among those that received low levels of support from others when compared to those who received high levels of support (Figure 4.11.2). Among those who gave high levels of support but received low levels of support, 59% had high or very high distress. Further, almost half (48%) of those who gave and received low levels of support reported high or very high distress. In contrast, 15% of volunteers who gave and received high levels of social support and 18% of those who gave low levels of support to others but received high levels of support themselves had high or very high psychological distress.
Figure 4.11.2: Proportion of volunteers with high or very high psychological distress, by two-way social support
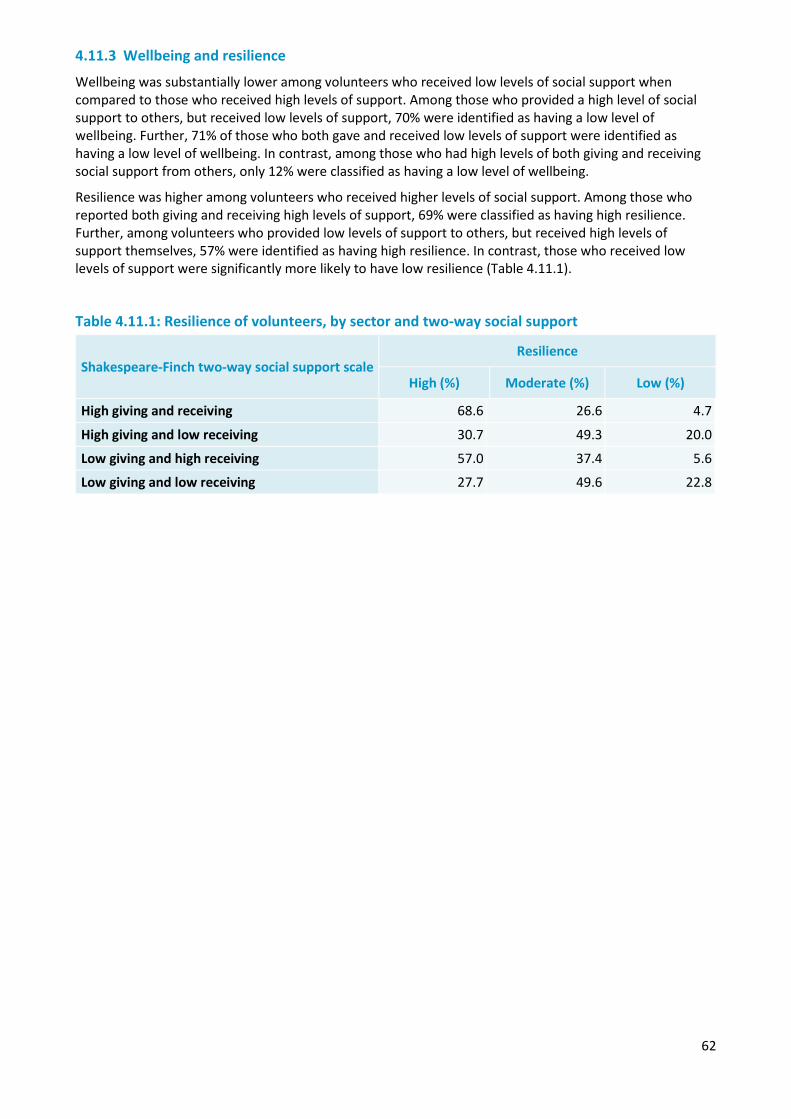
62
4.11.3 Wellbeing and resilience
Wellbeing was substantially lower among volunteers who received low levels of social support when compared to those who received high levels of support. Among those who provided a high level of social support to others, but received low levels of support, 70% were identified as having a low level of wellbeing. Further, 71% of those who both gave and received low levels of support were identified as having a low level of wellbeing. In contrast, among those who had high levels of both giving and receiving social support from others, only 12% were classified as having a low level of wellbeing.
Resilience was higher among volunteers who received higher levels of social support. Among those who reported both giving and receiving high levels of support, 69% were classified as having high resilience. Further, among volunteers who provided low levels of support to others, but received high levels of support themselves, 57% were identified as having high resilience. In contrast, those who received low levels of support were significantly more likely to have low resilience (Table 4.11.1).
Table 4.11.1: Resilience of volunteers, by sector and two-way social support
Shakespeare-Finch two-way social support scale Resilience
High (%) Moderate (%) Low (%)
High giving and receiving 68.6 26.6 4.7
High giving and low receiving 30.7 49.3 20.0
Low giving and high receiving 57.0 37.4 5.6
Low giving and low receiving 27.7 49.6 22.8
63
Chapter 5 — Substance use
Overview
While suicidal thoughts and behaviours (Chapter 3) and substance use are markedly different behaviours, both may represent ways to escape from the heightened distress that is often associated with working in the police and emergency services sector. Excessive levels of alcohol consumption can have negative impacts on mental health and wellbeing. Understanding the prevalence of potentially harmful levels of alcohol and other drug use, and which factors are associated with their use, may assist in promoting more positive and effective coping mechanisms within each sector.
Alcohol use was collected using the AUDIT-C (Saunders et al., 1993) and an additional question on binge drinking. Participants were also asked about the use of illicit drugs and the use of prescription drugs for non-medicinal purposes. The National Health and Medical Research Council (NHMRC) specifies guidelines to reduce health risks from drinking alcohol (NHMRC, 2009). Short-term risk represents the increased risk of accident or injury due to alcohol consumption on any one day, while long-term harm represents the risk of developing alcohol-related diseases from regular drinking over a lifetime. Under these guidelines adults should drink no more than four standard drinks on any occasion to reduce risk of short-term harm, and no more than two standard drinks per day to reduce long-term harm. Higher risk categories were also considered, including drinking 5 or more standard drinks on a single occasion at least weekly (regular binge drinking), and drinking 10 or more standard drinks on a single occasion at least monthly.
As some respondents might feel uncomfortable answering questions about alcohol and drug use, the section was optional within the questionnaire, and respondents were given the option to skip to the next section if they would feel very uncomfortable answering the questions. In total 5% of employees, and 5% of volunteers chose to skip this section of the questionnaire. The results presented in this section are based on the employees and volunteers who completed this section of the survey. Since people with higher levels of alcohol or drug use may have been more likely to feel uncomfortable about answering these questions and skip the section it is possible these results might understate the full extent of alcohol and drug use in the police and emergency services sector.
Summary of findings
Reported consumption of illicit drugs was varied across sectors and demographic factors. The police sector had the lowest rates of illicit drug consumption, while the state emergency services had the lowest rates of daily binge drinking. Whether this is due to particular cultural factors relating to workplaces (i.e. drinking culture), frequency of drug testing within sectors, or the nature of trauma relating to each sector is a matter for future research.
Daily binge drinking, although relatively infrequent when compared with other drinking frequencies (i.e. weekly, monthly), represents one of the most harmful levels of alcohol consumption and is more likely to reflect a coping mechanism for emotional distress. This is reflected in the higher proportion of daily alcohol consumption by employees with a diagnosed mental health condition. In addition, daily binge drinking is more common in employees with lower levels of social support, which indicates the need to ensure support networks are maintained for personnel.
5.1 Alcohol consumption
5.1.1 Frequency of consuming alcohol
According to the National Drug Strategy Household Survey (NDSHS; Australian Institute of Health and Welfare, 2016), around 15% of adults in Australia have not ever consumed alcohol and 23% have not consumed alcohol in the past year. In comparison, when asked “how often do you have a drink containing alcohol?”, only 8% of employees across all sectors reported never consuming alcohol. It is important to note that the NDSHS rates are for individuals aged 14 and over and are therefore not directly comparable
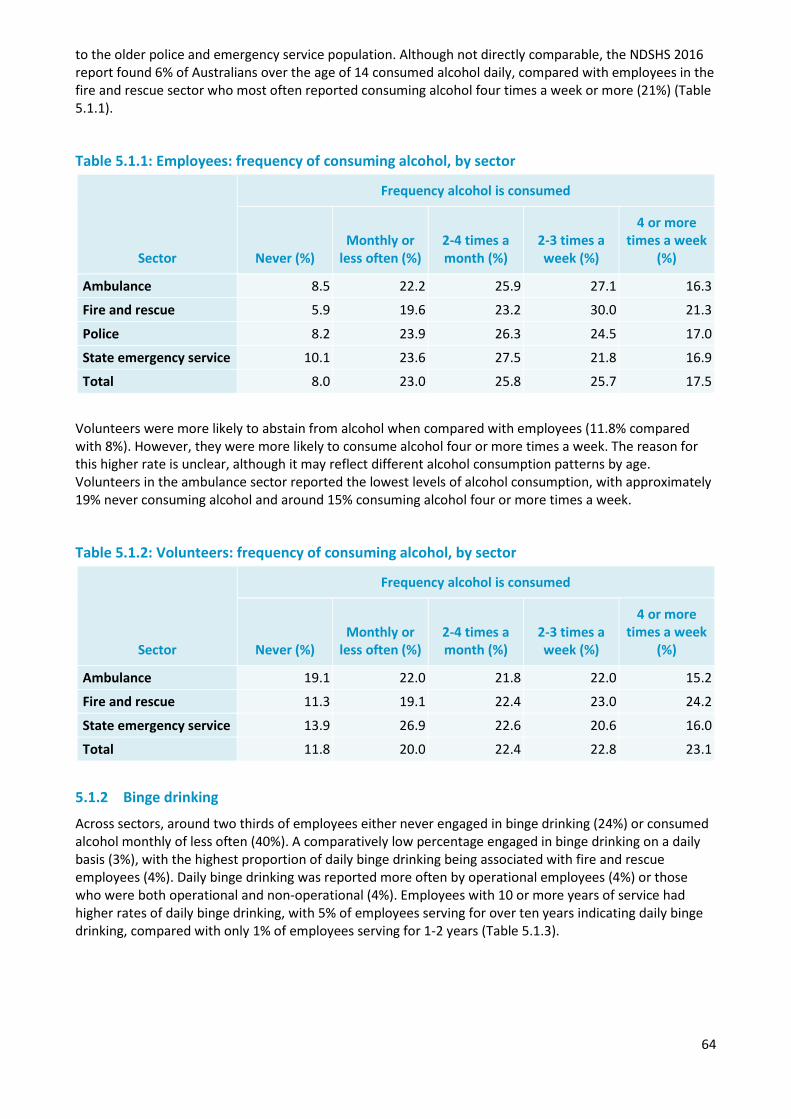
64
to the older police and emergency service population. Although not directly comparable, the NDSHS 2016 report found 6% of Australians over the age of 14 consumed alcohol daily, compared with employees in the fire and rescue sector who most often reported consuming alcohol four times a week or more (21%) (Table 5.1.1).
Table 5.1.1: Employees: frequency of consuming alcohol, by sector
Sector
Frequency alcohol is consumed
Never (%) Monthly or
less often (%) 2-4 times a month (%)
2-3 times a week (%)
4 or more times a week
(%)
Ambulance 8.5 22.2 25.9 27.1 16.3
Fire and rescue 5.9 19.6 23.2 30.0 21.3
Police 8.2 23.9 26.3 24.5 17.0
State emergency service 10.1 23.6 27.5 21.8 16.9
Total 8.0 23.0 25.8 25.7 17.5
Volunteers were more likely to abstain from alcohol when compared with employees (11.8% compared with 8%). However, they were more likely to consume alcohol four or more times a week. The reason for this higher rate is unclear, although it may reflect different alcohol consumption patterns by age. Volunteers in the ambulance sector reported the lowest levels of alcohol consumption, with approximately 19% never consuming alcohol and around 15% consuming alcohol four or more times a week.
Table 5.1.2: Volunteers: frequency of consuming alcohol, by sector
Sector
Frequency alcohol is consumed
Never (%) Monthly or
less often (%) 2-4 times a month (%)
2-3 times a week (%)
4 or more times a week
(%)
Ambulance 19.1 22.0 21.8 22.0 15.2
Fire and rescue 11.3 19.1 22.4 23.0 24.2
State emergency service 13.9 26.9 22.6 20.6 16.0
Total 11.8 20.0 22.4 22.8 23.1
5.1.2 Binge drinking
Across sectors, around two thirds of employees either never engaged in binge drinking (24%) or consumed alcohol monthly of less often (40%). A comparatively low percentage engaged in binge drinking on a daily basis (3%), with the highest proportion of daily binge drinking being associated with fire and rescue employees (4%). Daily binge drinking was reported more often by operational employees (4%) or those who were both operational and non-operational (4%). Employees with 10 or more years of service had higher rates of daily binge drinking, with 5% of employees serving for over ten years indicating daily binge drinking, compared with only 1% of employees serving for 1-2 years (Table 5.1.3).
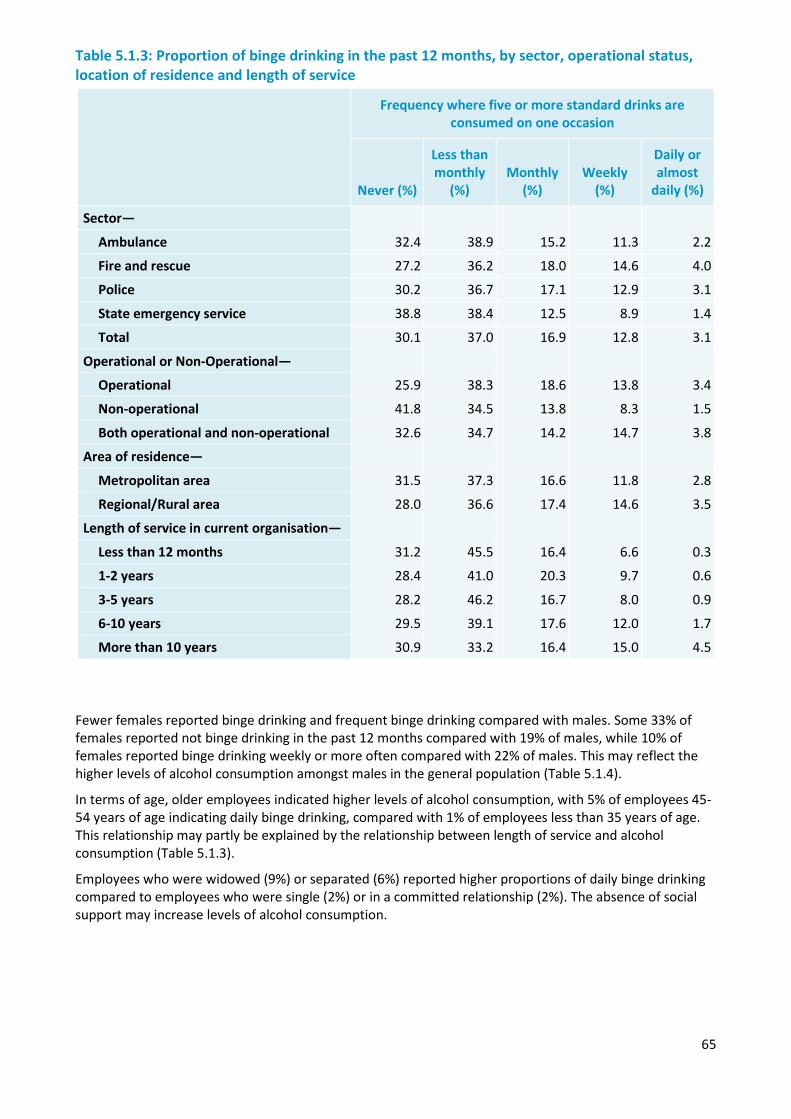
65
Table 5.1.3: Proportion of binge drinking in the past 12 months, by sector, operational status, location of residence and length of service
Frequency where five or more standard drinks are consumed on one occasion
Never (%)
Less than monthly
(%) Monthly
(%) Weekly
(%)
Daily or almost
daily (%)
Sector—
32.4 38.9 15.2 11.3 2.2 Ambulance
Fire and rescue 27.2 36.2 18.0 14.6 4.0
Police 30.2 36.7 17.1 12.9 3.1
State emergency service 38.8 38.4 12.5 8.9 1.4
Total 30.1 37.0 16.9 12.8 3.1
Operational or Non-Operational—
Operational 25.9 38.3 18.6 13.8 3.4
Non-operational 41.8 34.5 13.8 8.3 1.5
Both operational and non-operational 32.6 34.7 14.2 14.7 3.8
Area of residence—
Metropolitan area 31.5 37.3 16.6 11.8 2.8
Regional/Rural area 28.0 36.6 17.4 14.6 3.5
Length of service in current organisation—
Less than 12 months 31.2 45.5 16.4 6.6 0.3
1-2 years 28.4 41.0 20.3 9.7 0.6
3-5 years 28.2 46.2 16.7 8.0 0.9
6-10 years 29.5 39.1 17.6 12.0 1.7
More than 10 years 30.9 33.2 16.4 15.0 4.5
Fewer females reported binge drinking and frequent binge drinking compared with males. Some 33% of females reported not binge drinking in the past 12 months compared with 19% of males, while 10% of females reported binge drinking weekly or more often compared with 22% of males. This may reflect the higher levels of alcohol consumption amongst males in the general population (Table 5.1.4).
In terms of age, older employees indicated higher levels of alcohol consumption, with 5% of employees 45-54 years of age indicating daily binge drinking, compared with 1% of employees less than 35 years of age. This relationship may partly be explained by the relationship between length of service and alcohol consumption (Table 5.1.3).
Employees who were widowed (9%) or separated (6%) reported higher proportions of daily binge drinking compared to employees who were single (2%) or in a committed relationship (2%). The absence of social support may increase levels of alcohol consumption.
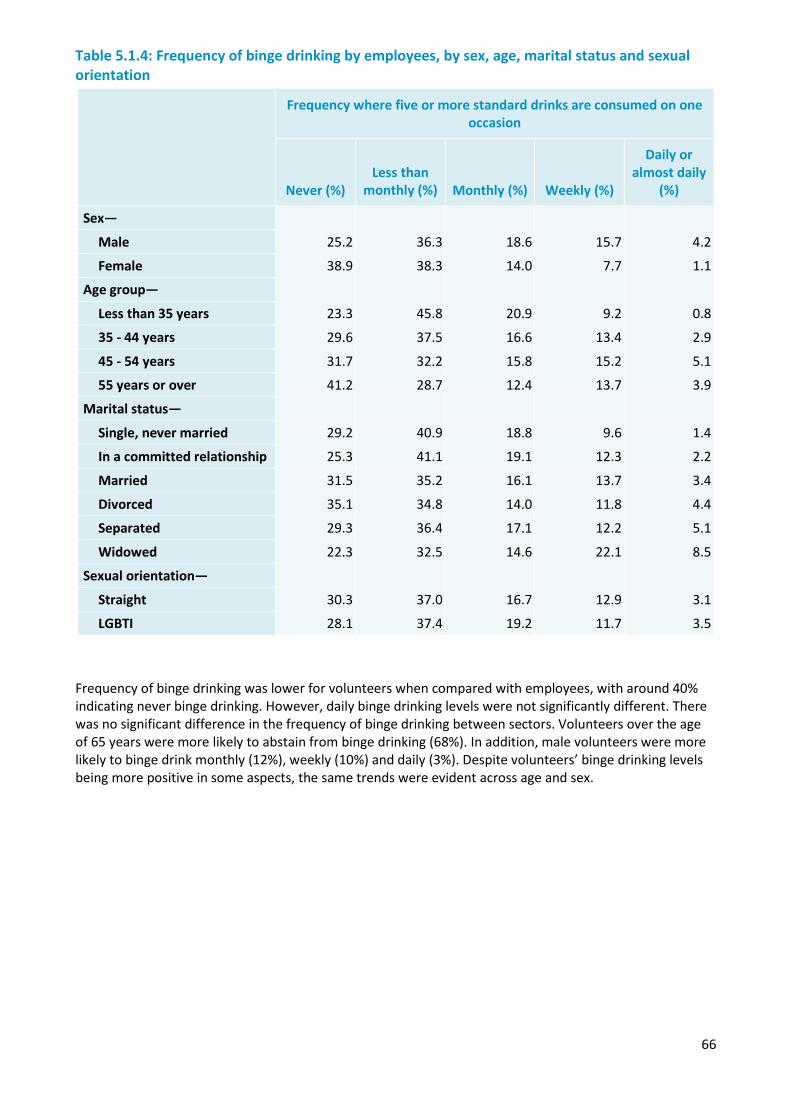
66
Table 5.1.4: Frequency of binge drinking by employees, by sex, age, marital status and sexual orientation
Frequency where five or more standard drinks are consumed on one occasion
Never (%) Less than
monthly (%) Monthly (%) Weekly (%)
Daily or almost daily
(%)
Sex—
Male 25.2 36.3 18.6 15.7 4.2
Female 38.9 38.3 14.0 7.7 1.1
Age group—
Less than 35 years 23.3 45.8 20.9 9.2 0.8
35 - 44 years 29.6 37.5 16.6 13.4 2.9
45 - 54 years 31.7 32.2 15.8 15.2 5.1
55 years or over 41.2 28.7 12.4 13.7 3.9
Marital status—
Single, never married 29.2 40.9 18.8 9.6 1.4
In a committed relationship 25.3 41.1 19.1 12.3 2.2
Married 31.5 35.2 16.1 13.7 3.4
Divorced 35.1 34.8 14.0 11.8 4.4
Separated 29.3 36.4 17.1 12.2 5.1
Widowed 22.3 32.5 14.6 22.1 8.5
Sexual orientation—
Straight 30.3 37.0 16.7 12.9 3.1
LGBTI 28.1 37.4 19.2 11.7 3.5
Frequency of binge drinking was lower for volunteers when compared with employees, with around 40% indicating never binge drinking. However, daily binge drinking levels were not significantly different. There was no significant difference in the frequency of binge drinking between sectors. Volunteers over the age of 65 years were more likely to abstain from binge drinking (68%). In addition, male volunteers were more likely to binge drink monthly (12%), weekly (10%) and daily (3%). Despite volunteers’ binge drinking levels being more positive in some aspects, the same trends were evident across age and sex.
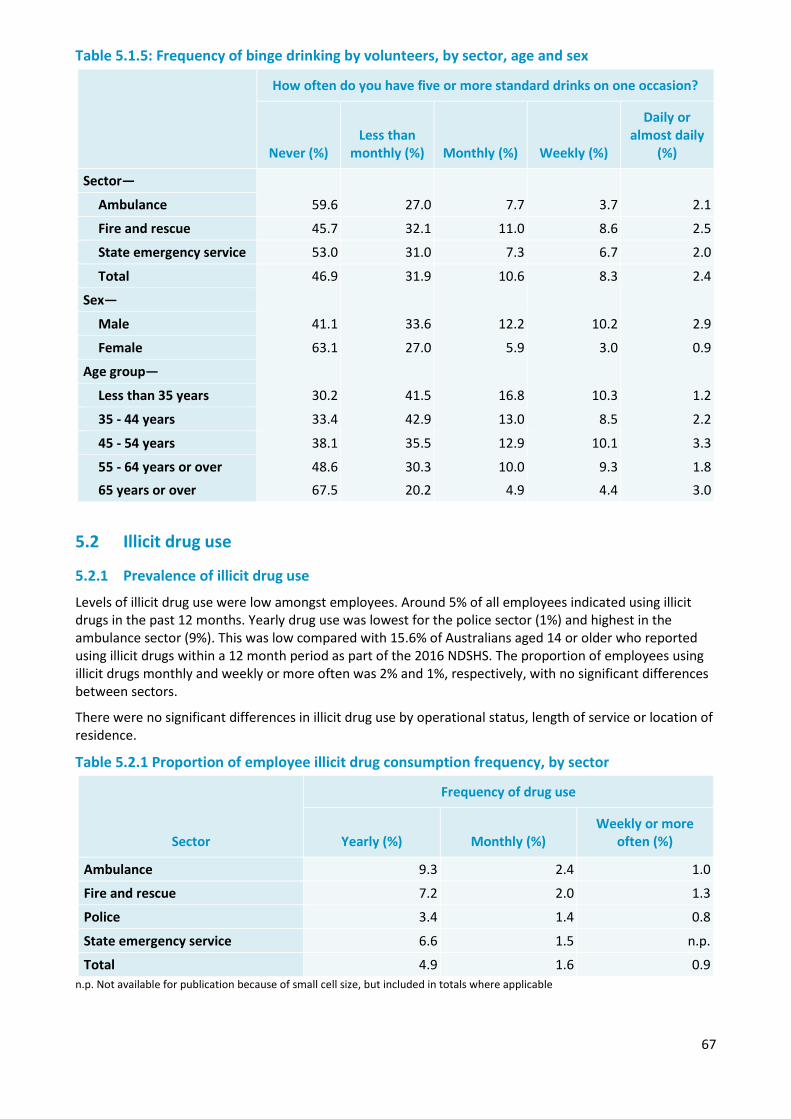
67
Table 5.1.5: Frequency of binge drinking by volunteers, by sector, age and sex
How often do you have five or more standard drinks on one occasion?
Never (%) Less than
monthly (%) Monthly (%) Weekly (%)
Daily or almost daily
(%)
Sector—
59.6 27.0 7.7 3.7 2.1 Ambulance
Fire and rescue 45.7 32.1 11.0 8.6 2.5
State emergency service 53.0 31.0 7.3 6.7 2.0
Total 46.9 31.9 10.6 8.3 2.4
Sex—
Male 41.1 33.6 12.2 10.2 2.9
Female 63.1 27.0 5.9 3.0 0.9
Age group—
Less than 35 years 30.2 41.5 16.8 10.3 1.2
35 - 44 years 33.4 42.9 13.0 8.5 2.2
45 - 54 years 38.1 35.5 12.9 10.1 3.3
55 - 64 years or over 48.6 30.3 10.0 9.3 1.8 65 years or over 67.5 20.2 4.9 4.4 3.0
5.2 Illicit drug use
5.2.1 Prevalence of illicit drug use
Levels of illicit drug use were low amongst employees. Around 5% of all employees indicated using illicit drugs in the past 12 months. Yearly drug use was lowest for the police sector (1%) and highest in the ambulance sector (9%). This was low compared with 15.6% of Australians aged 14 or older who reported using illicit drugs within a 12 month period as part of the 2016 NDSHS. The proportion of employees using illicit drugs monthly and weekly or more often was 2% and 1%, respectively, with no significant differences between sectors.
There were no significant differences in illicit drug use by operational status, length of service or location of residence.
Table 5.2.1 Proportion of employee illicit drug consumption frequency, by sector
Sector
Frequency of drug use
Yearly (%) Monthly (%) Weekly or more
often (%)
Ambulance 9.3 2.4 1.0
Fire and rescue 7.2 2.0 1.3
Police 3.4 1.4 0.8
State emergency service 6.6 1.5 n.p.
Total 4.9 1.6 0.9 n.p. Not available for publication because of small cell size, but included in totals where applicable
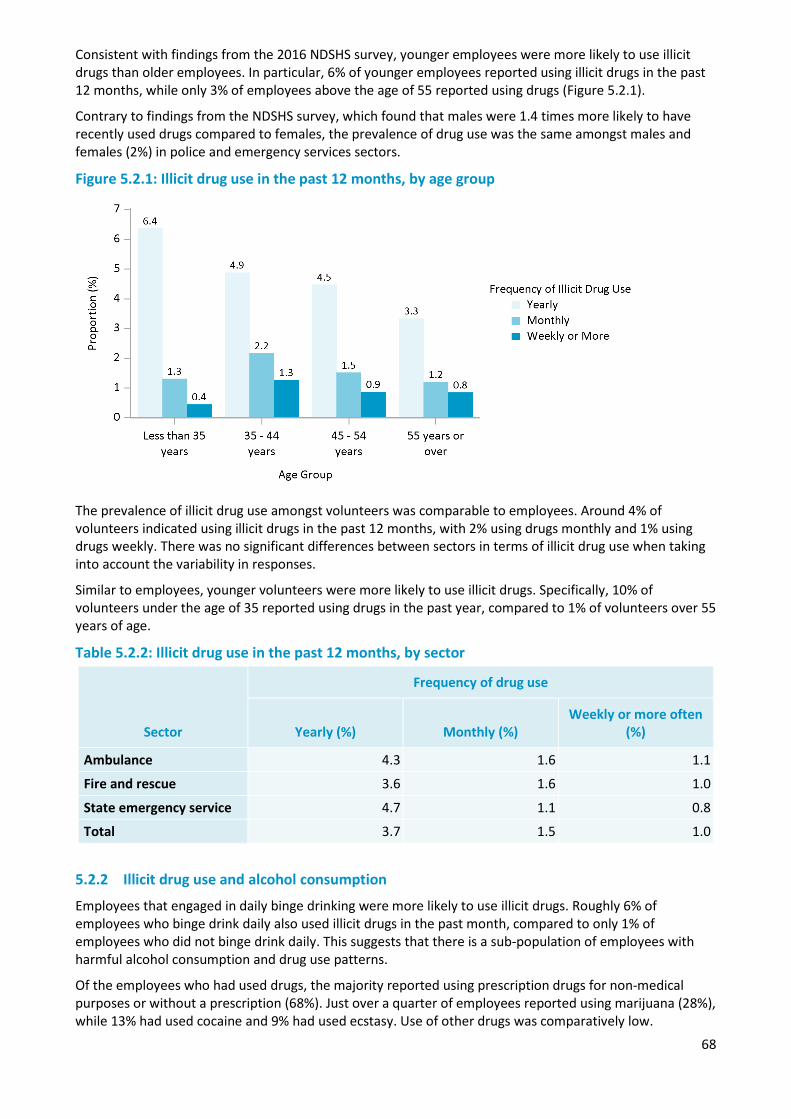
68
Consistent with findings from the 2016 NDSHS survey, younger employees were more likely to use illicit drugs than older employees. In particular, 6% of younger employees reported using illicit drugs in the past 12 months, while only 3% of employees above the age of 55 reported using drugs (Figure 5.2.1).
Contrary to findings from the NDSHS survey, which found that males were 1.4 times more likely to have recently used drugs compared to females, the prevalence of drug use was the same amongst males and females (2%) in police and emergency services sectors.
Figure 5.2.1: Illicit drug use in the past 12 months, by age group
The prevalence of illicit drug use amongst volunteers was comparable to employees. Around 4% of volunteers indicated using illicit drugs in the past 12 months, with 2% using drugs monthly and 1% using drugs weekly. There was no significant differences between sectors in terms of illicit drug use when taking into account the variability in responses.
Similar to employees, younger volunteers were more likely to use illicit drugs. Specifically, 10% of volunteers under the age of 35 reported using drugs in the past year, compared to 1% of volunteers over 55 years of age.
Table 5.2.2: Illicit drug use in the past 12 months, by sector
Sector
Frequency of drug use
Yearly (%) Monthly (%) Weekly or more often
(%)
Ambulance 4.3 1.6 1.1
Fire and rescue 3.6 1.6 1.0
State emergency service 4.7 1.1 0.8
Total 3.7 1.5 1.0
5.2.2 Illicit drug use and alcohol consumption
Employees that engaged in daily binge drinking were more likely to use illicit drugs. Roughly 6% of employees who binge drink daily also used illicit drugs in the past month, compared to only 1% of employees who did not binge drink daily. This suggests that there is a sub-population of employees with harmful alcohol consumption and drug use patterns.
Of the employees who had used drugs, the majority reported using prescription drugs for non-medical purposes or without a prescription (68%). Just over a quarter of employees reported using marijuana (28%), while 13% had used cocaine and 9% had used ecstasy. Use of other drugs was comparatively low.
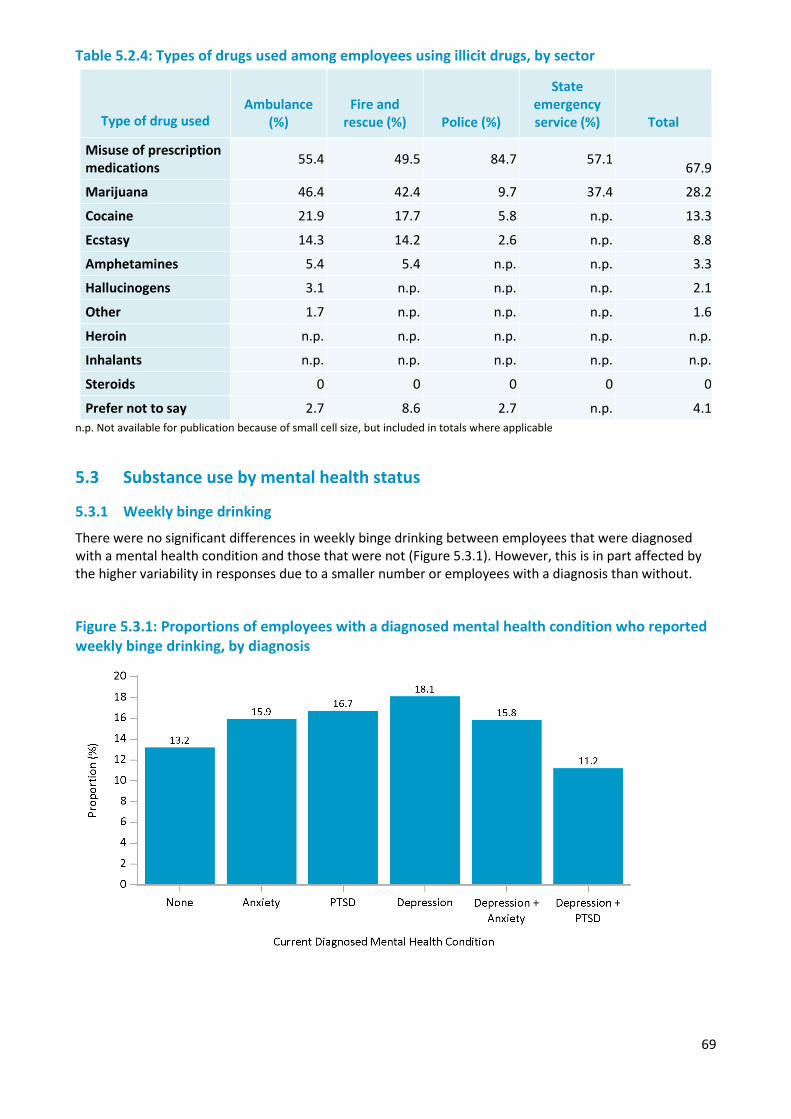
69
Table 5.2.4: Types of drugs used among employees using illicit drugs, by sector
Type of drug used Ambulance
(%) Fire and
rescue (%) Police (%)
State emergency service (%) Total
Misuse of prescription medications 55.4 49.5 84.7 57.1 67.9
Marijuana 46.4 42.4 9.7 37.4 28.2
Cocaine 21.9 17.7 5.8 n.p. 13.3
Ecstasy 14.3 14.2 2.6 n.p. 8.8
Amphetamines 5.4 5.4 n.p. n.p. 3.3
Hallucinogens 3.1 n.p. n.p. n.p. 2.1
Other 1.7 n.p. n.p. n.p. 1.6
Heroin n.p. n.p. n.p. n.p. n.p.
Inhalants n.p. n.p. n.p. n.p. n.p.
Steroids 0 0 0 0 0
Prefer not to say 2.7 8.6 2.7 n.p. 4.1 n.p. Not available for publication because of small cell size, but included in totals where applicable
5.3 Substance use by mental health status
5.3.1 Weekly binge drinking
There were no significant differences in weekly binge drinking between employees that were diagnosed with a mental health condition and those that were not (Figure 5.3.1). However, this is in part affected by the higher variability in responses due to a smaller number or employees with a diagnosis than without.
Figure 5.3.1: Proportions of employees with a diagnosed mental health condition who reported weekly binge drinking, by diagnosis
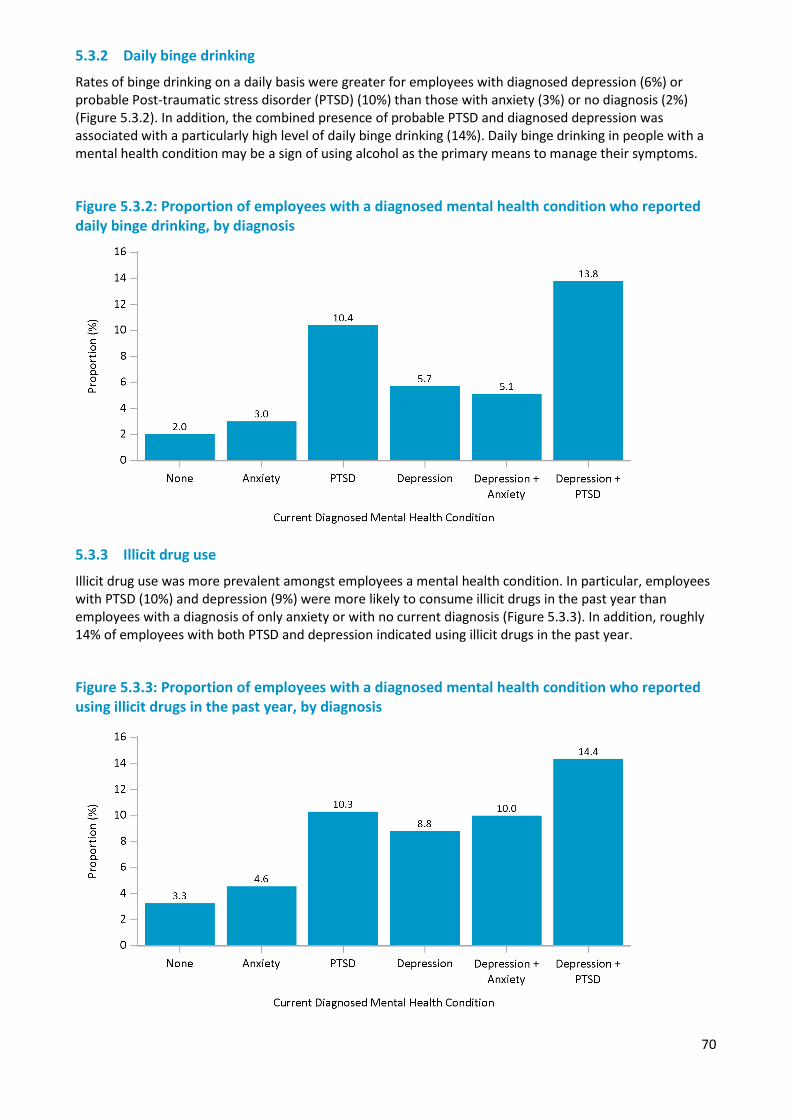
70
5.3.2 Daily binge drinking
Rates of binge drinking on a daily basis were greater for employees with diagnosed depression (6%) or probable Post-traumatic stress disorder (PTSD) (10%) than those with anxiety (3%) or no diagnosis (2%) (Figure 5.3.2). In addition, the combined presence of probable PTSD and diagnosed depression was associated with a particularly high level of daily binge drinking (14%). Daily binge drinking in people with a mental health condition may be a sign of using alcohol as the primary means to manage their symptoms.
Figure 5.3.2: Proportion of employees with a diagnosed mental health condition who reported daily binge drinking, by diagnosis
5.3.3 Illicit drug use
Illicit drug use was more prevalent amongst employees a mental health condition. In particular, employees with PTSD (10%) and depression (9%) were more likely to consume illicit drugs in the past year than employees with a diagnosis of only anxiety or with no current diagnosis (Figure 5.3.3). In addition, roughly 14% of employees with both PTSD and depression indicated using illicit drugs in the past year.
Figure 5.3.3: Proportion of employees with a diagnosed mental health condition who reported using illicit drugs in the past year, by diagnosis
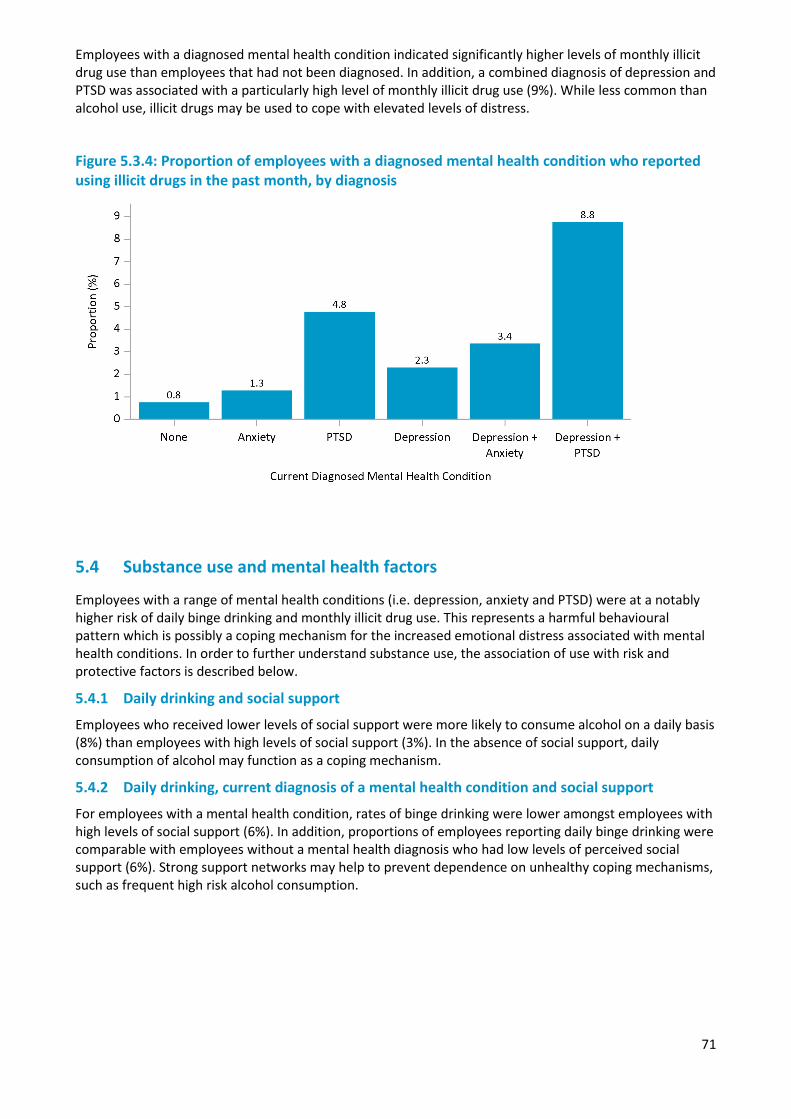
71
Employees with a diagnosed mental health condition indicated significantly higher levels of monthly illicit drug use than employees that had not been diagnosed. In addition, a combined diagnosis of depression and PTSD was associated with a particularly high level of monthly illicit drug use (9%). While less common than alcohol use, illicit drugs may be used to cope with elevated levels of distress.
Figure 5.3.4: Proportion of employees with a diagnosed mental health condition who reported using illicit drugs in the past month, by diagnosis
5.4 Substance use and mental health factors
Employees with a range of mental health conditions (i.e. depression, anxiety and PTSD) were at a notably higher risk of daily binge drinking and monthly illicit drug use. This represents a harmful behavioural pattern which is possibly a coping mechanism for the increased emotional distress associated with mental health conditions. In order to further understand substance use, the association of use with risk and protective factors is described below.
5.4.1 Daily drinking and social support
Employees who received lower levels of social support were more likely to consume alcohol on a daily basis (8%) than employees with high levels of social support (3%). In the absence of social support, daily consumption of alcohol may function as a coping mechanism.
5.4.2 Daily drinking, current diagnosis of a mental health condition and social support
For employees with a mental health condition, rates of binge drinking were lower amongst employees with high levels of social support (6%). In addition, proportions of employees reporting daily binge drinking were comparable with employees without a mental health diagnosis who had low levels of perceived social support (6%). Strong support networks may help to prevent dependence on unhealthy coping mechanisms, such as frequent high risk alcohol consumption.
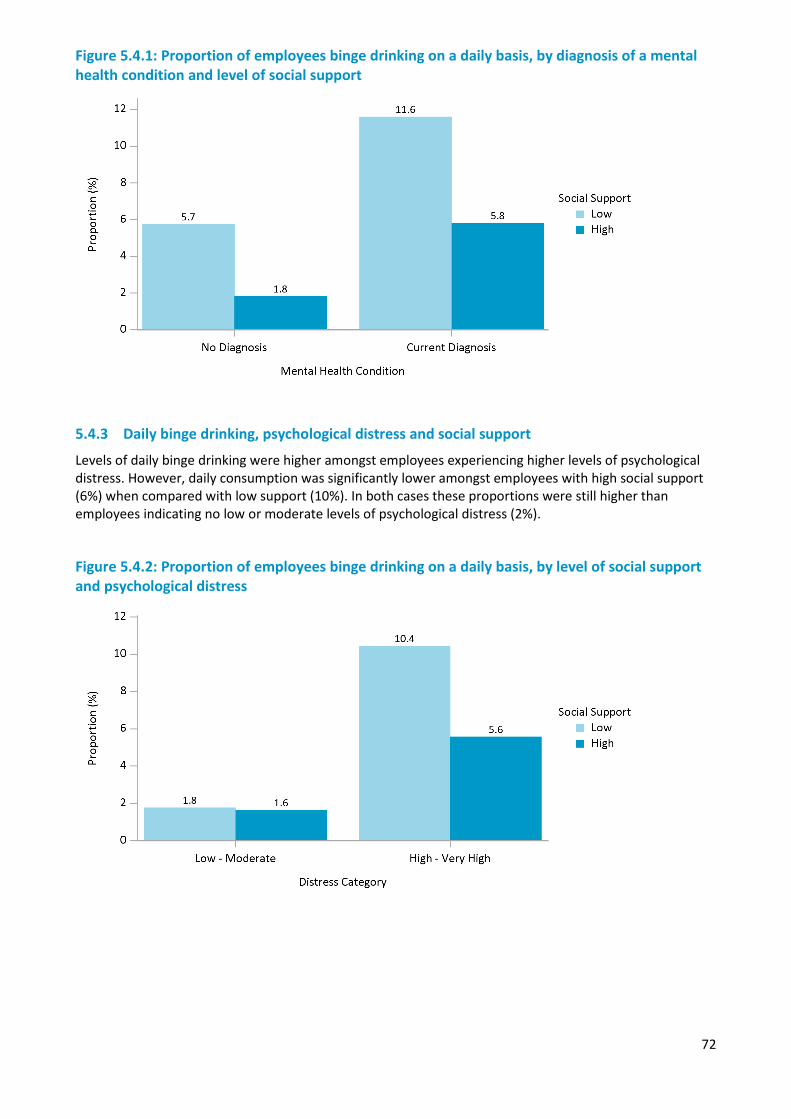
72
Figure 5.4.1: Proportion of employees binge drinking on a daily basis, by diagnosis of a mental health condition and level of social support
5.4.3 Daily binge drinking, psychological distress and social support
Levels of daily binge drinking were higher amongst employees experiencing higher levels of psychological distress. However, daily consumption was significantly lower amongst employees with high social support (6%) when compared with low support (10%). In both cases these proportions were still higher than employees indicating no low or moderate levels of psychological distress (2%).
Figure 5.4.2: Proportion of employees binge drinking on a daily basis, by level of social support and psychological distress
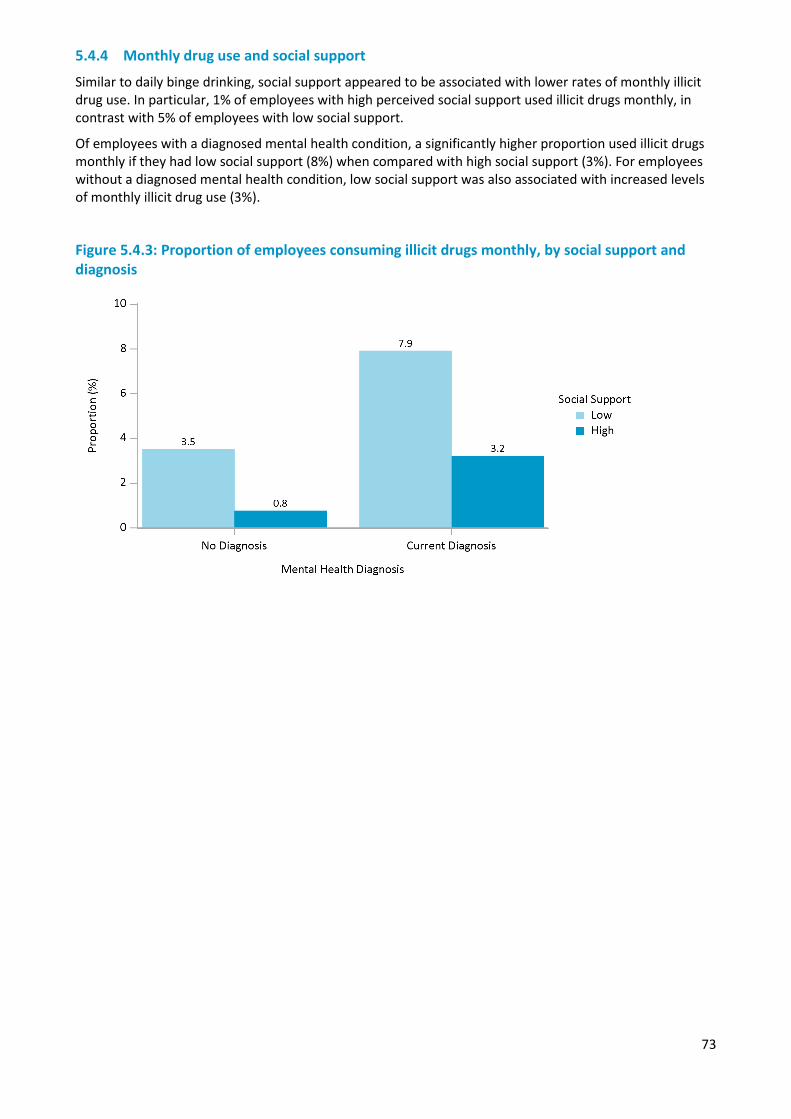
73
5.4.4 Monthly drug use and social support
Similar to daily binge drinking, social support appeared to be associated with lower rates of monthly illicit drug use. In particular, 1% of employees with high perceived social support used illicit drugs monthly, in contrast with 5% of employees with low social support.
Of employees with a diagnosed mental health condition, a significantly higher proportion used illicit drugs monthly if they had low social support (8%) when compared with high social support (3%). For employees without a diagnosed mental health condition, low social support was also associated with increased levels of monthly illicit drug use (3%).
Figure 5.4.3: Proportion of employees consuming illicit drugs monthly, by social support and diagnosis

74
75
Chapter 6 — Risk and protective factors associated with the working environment
Overview
The working environment of employees and volunteers can have an important effect on mental wellbeing, sickness and injury, stress, burnout, and general quality of life. The way a workplace manages stress and social support may be particularly important in mitigating the effect of traumatic incidents, and could prevent harmful consequences (i.e. mental health conditions, substance use, and suicide). This chapter examines key characteristics of the psychosocial working environment and how they relate to mental health and wellbeing. The chapter also reports the prevalence of assaults, bullying and discriminatory practices experienced in the line of work, and the effects on psychological distress and wellbeing.
The psychosocial factors within a workplace are broad, and all can have important influences on the mental health of employees (Kristensen et al., 2005; McCreary and Thompson, 2006). Answering the call assessed the following factors:
• Organisational Support: The level of support provided by management, such as allowing time off after a traumatic incident and management recognition of work done.
• Team Cohesion: The extent to which teams provide an inclusive environment and are available to support each other when needed.
• Workplace Stress: The extent to which general workplace factors may cause stress, such as leadership styles, resource shortages, a negative team environment and excessive administrative duties.
• Work Influence: The extent to which individuals can influence their workload and hours. • Work/Life Balance: The extent to which work impacts on private life.
Describing the working environment of workplaces with better mental health may provide insight into how improvements in mental health can be achieved. The working environments of agencies with either higher or lower psychological distress, post-traumatic stress disorder (PTSD), wellbeing, and resilience were compared. The same analysis was not able to be performed for volunteers, due to the smaller number of agencies assessed.
Employees and volunteers who sought help for mental health issues were compared to those who did not based on their perceptions of their working environment. This was to assess whether particular workplace factors can create an environment that helps motivate staff to seek help. For example, negative environments, such as one with a lack of support, may deter help-seeking.
Summary of findings
There were mixed perceptions of workplace cultural factors in general. Most employees and volunteers were positive regarding the support they received from their organisation or from their team. However, improvements could be made regarding the time employees have to recover from traumatic experiences within the workplace, and also regarding the discussions surrounding these experiences.
Perceptions of a number of workplace factors were different for agencies characterised as having high or low levels of risk or protective mental health factors. Although there were differences between high and low agencies, there was also a degree of consistency between which factors contributed to mental health overall. That is, perceptions of support, inclusiveness, gossip and the ability to take time off, were factors identified as potentially impacting psychological distress and wellbeing.
The relationship between workplace culture and help seeking was also described. Individuals that sought help for a perceived or diagnosed problem, had more positive perceptions of workplace support and work/life balance and indicated lower emotional demands of work. For employees that sought help through their respective organisation, there were more positive perceptions of job strain and workplace support. However, the causal relationship between workplace factors and the decision to seek help is
76
unclear. Attaining support can assist an individual in coping with emotional demands of work and can improve mental health overall.
Physical and verbal assaults in the workplace were fairly common and were associated with higher levels of stress. In addition, formal investigations and media reports surrounding workplace events were associated with higher levels of stress. Workplace bullying and sexual harassment were associated with poorer mental health.
6.1 Psychosocial workplace characteristics
6.1.1 Organisational support - employees
A substantial proportion of employees felt that their work was not recognised by management (36%) and that they were not being provided with the time or opportunity to recover following a traumatic situation (34%). A lower proportion felt that they were not being treated fairly in the workplace (12%).
There were notable differences in workplace factors between sectors, with more police (37%) and ambulance (33%) employees indicating inadequate time to recover compared with state and emergency services employees (12%). Time to recover following the experience of traumatic incidents may be particularly important in preventing mental health conditions, and could be targeted in workplace interventions to promote positive change.
Table 6.1.1: Proportion of employees indicating organisational support factors were unsatisfactory, by sector
Organisational support factor Ambulance Fire and rescue Police
State emergency service
Work is not recognised by management 39.6 28.4 37.4 25.9
Limited time to recover 33.2 20.8 36.8 12.4
Low supervisor support 19.7 15.1 21.0 15.5
Not treated fairly 10.4 9.2 13.2 13.1
6.1.2 Organisational support - volunteers
In general, volunteers perceived more support in the workplace. Only 14% of volunteers indicated not having their work recognised by management, and 6% said they were not being treated fairly. These proportions were comparable across sectors.
Table 6.1.2: Proportion of volunteers indicating organisational support factors were unsatisfactory, by sector
Organisational support factor Ambulance Fire and rescue State emergency
service
Work is not recognised by management 15.2 13.8 15.2
Low supervisor support 13.8 13.3 13.7
Not treated fairly 5.2 6.4 6.4
6.1.3 Team cohesion - employees
A high proportion of employees indicated perceptions of gossip in the workplace (71%), while a much lower proportion indicated having no-one around to open up to (18%). Despite the high levels of workplace gossip, most employees appeared to have supports available when they were needed. State emergency service employees indicated the lowest proportion of gossip in the workplace (62%), while the police sector
77
had the highest proportion (72%). Gossip may be associated with poorer mental health outcomes, and more positive working environments should be promoted.
There were notable differences between sectors in terms of discussions of work experiences or debriefings. Some 42% of employees in the police sector indicated that discussions occurred infrequently or not at all, compared to only 22% of fire and rescue employees. Talking about emotional issues may be particularly important in minimising the effects of traumatic events on mental health.
Table 6.1.3: Proportion of employees indicating team cohesion factors were unsatisfactory, by sector
Team cohesion factor Ambulance Fire and rescue Police
State emergency
service
Gossip 72.1 66.3 72.4 61.9
Infrequent discussions of workplace experiences 34.0 21.9 41.8 28.1
Non-inclusive workplace 32.7 23.9 33.7 26.8
No-one around to talk to 20.8 19.5 24.8 19.9
No-one around to open up to 14.5 17.3 18.3 14.0
6.1.4 Team cohesion – volunteers
In general, volunteers indicated a more supportive team environment, with lower levels of gossip (39%). Less volunteers indicated that discussions of work events occurred infrequently (13%) and a lower proportion reported feeling that the workplace they are a part of is not inclusive (13%).
Table 6.1.4: Proportion of volunteers indicating team cohesion factors were unsatisfactory, by sector
Team cohesion factor Ambulance Fire and rescue State emergency
service
Gossip 41.2 38.4 39.7
Infrequent discussions of workplace experiences 14.3 13.4 12.7
Non-inclusive workplace 14.0 13.2 14.6
No-one around to open up to 8.8 11.7 12.1
No one around to talk to 7.9 11.0 12.7
6.1.5 Workplace stress - employees
There were notable differences in the levels of stress associated with general workplace characteristics. For example, 31% of employees indicated high levels of stress due to both staff shortages and authoritative leadership styles. In contrast, only 10% of employees indicated high levels of stress due to not being able to talk about emotional issues. Employees in the state emergency service (35%) and police (33%) sectors tended to report higher levels of stress associated with staff or resource shortages when compared with fire and rescue employees (22%).
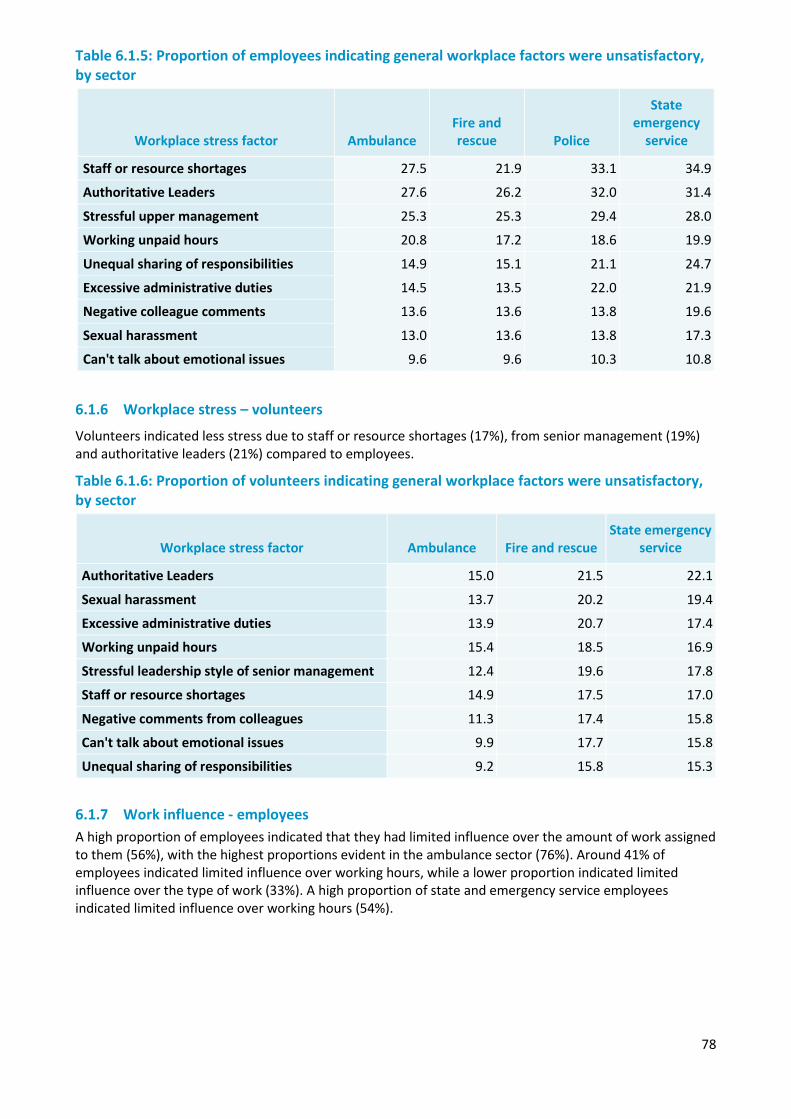
78
Table 6.1.5: Proportion of employees indicating general workplace factors were unsatisfactory, by sector
Workplace stress factor Ambulance Fire and rescue Police
State emergency
service
Staff or resource shortages 27.5 21.9 33.1 34.9
Authoritative Leaders 27.6 26.2 32.0 31.4
Stressful upper management 25.3 25.3 29.4 28.0
Working unpaid hours 20.8 17.2 18.6 19.9
Unequal sharing of responsibilities 14.9 15.1 21.1 24.7
Excessive administrative duties 14.5 13.5 22.0 21.9
Negative colleague comments 13.6 13.6 13.8 19.6
Sexual harassment 13.0 13.6 13.8 17.3
Can't talk about emotional issues 9.6 9.6 10.3 10.8
6.1.6 Workplace stress – volunteers
Volunteers indicated less stress due to staff or resource shortages (17%), from senior management (19%) and authoritative leaders (21%) compared to employees.
Table 6.1.6: Proportion of volunteers indicating general workplace factors were unsatisfactory, by sector
Workplace stress factor Ambulance Fire and rescue State emergency
service
Authoritative Leaders 15.0 21.5 22.1
Sexual harassment 13.7 20.2 19.4
Excessive administrative duties 13.9 20.7 17.4
Working unpaid hours 15.4 18.5 16.9
Stressful leadership style of senior management 12.4 19.6 17.8
Staff or resource shortages 14.9 17.5 17.0
Negative comments from colleagues 11.3 17.4 15.8
Can't talk about emotional issues 9.9 17.7 15.8
Unequal sharing of responsibilities 9.2 15.8 15.3
6.1.7 Work influence - employees A high proportion of employees indicated that they had limited influence over the amount of work assigned to them (56%), with the highest proportions evident in the ambulance sector (76%). Around 41% of employees indicated limited influence over working hours, while a lower proportion indicated limited influence over the type of work (33%). A high proportion of state and emergency service employees indicated limited influence over working hours (54%).
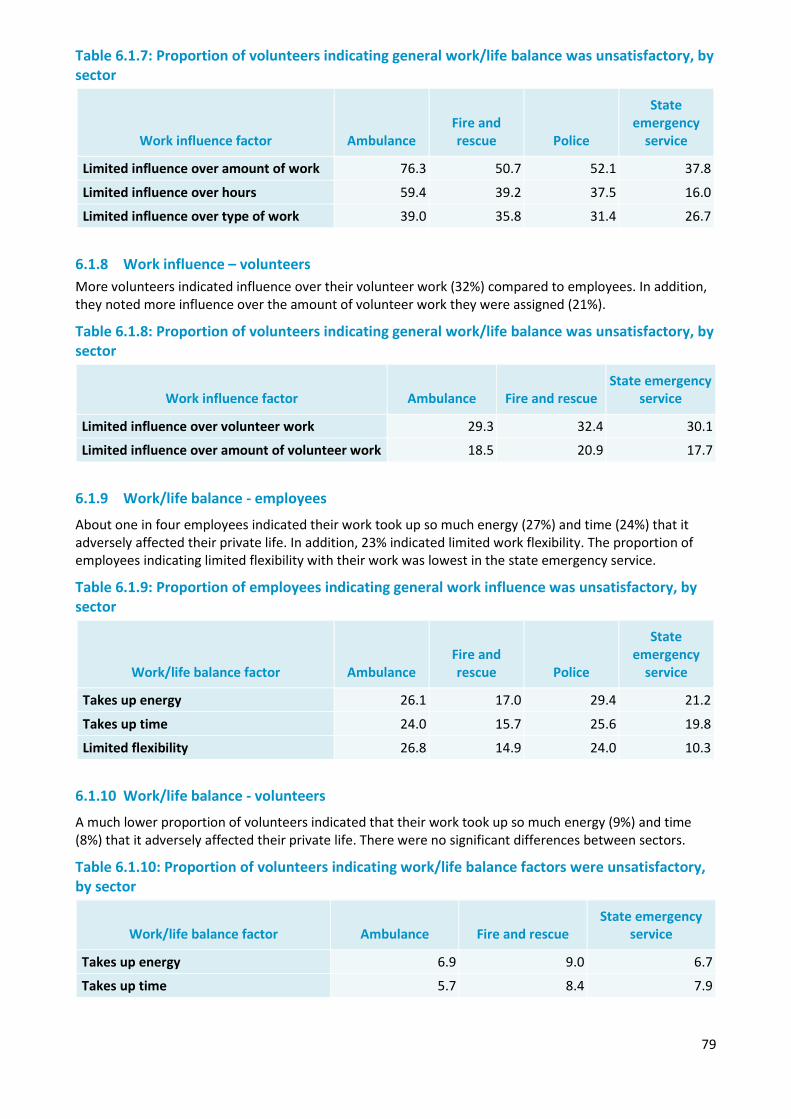
79
Table 6.1.7: Proportion of volunteers indicating general work/life balance was unsatisfactory, by sector
6.1.8 Work influence – volunteers More volunteers indicated influence over their volunteer work (32%) compared to employees. In addition, they noted more influence over the amount of volunteer work they were assigned (21%).
Table 6.1.8: Proportion of volunteers indicating general work/life balance was unsatisfactory, by sector
Work influence factor Ambulance Fire and rescue State emergency
service
Limited influence over volunteer work 29.3 32.4 30.1
Limited influence over amount of volunteer work 18.5 20.9 17.7
6.1.9 Work/life balance - employees
About one in four employees indicated their work took up so much energy (27%) and time (24%) that it adversely affected their private life. In addition, 23% indicated limited work flexibility. The proportion of employees indicating limited flexibility with their work was lowest in the state emergency service.
Table 6.1.9: Proportion of employees indicating general work influence was unsatisfactory, by sector
6.1.10 Work/life balance - volunteers
A much lower proportion of volunteers indicated that their work took up so much energy (9%) and time (8%) that it adversely affected their private life. There were no significant differences between sectors.
Table 6.1.10: Proportion of volunteers indicating work/life balance factors were unsatisfactory, by sector
Work/life balance factor Ambulance Fire and rescue State emergency
service
Takes up energy 6.9 9.0 6.7
Takes up time 5.7 8.4 7.9
Work influence factor Ambulance Fire and rescue Police
State emergency
service
Limited influence over amount of work 76.3 50.7 52.1 37.8
Limited influence over hours 59.4 39.2 37.5 16.0
Limited influence over type of work 39.0 35.8 31.4 26.7
Work/life balance factor Ambulance Fire and rescue Police
State emergency
service
Takes up energy 26.1 17.0 29.4 21.2
Takes up time 24.0 15.7 25.6 19.8
Limited flexibility 26.8 14.9 24.0 10.3
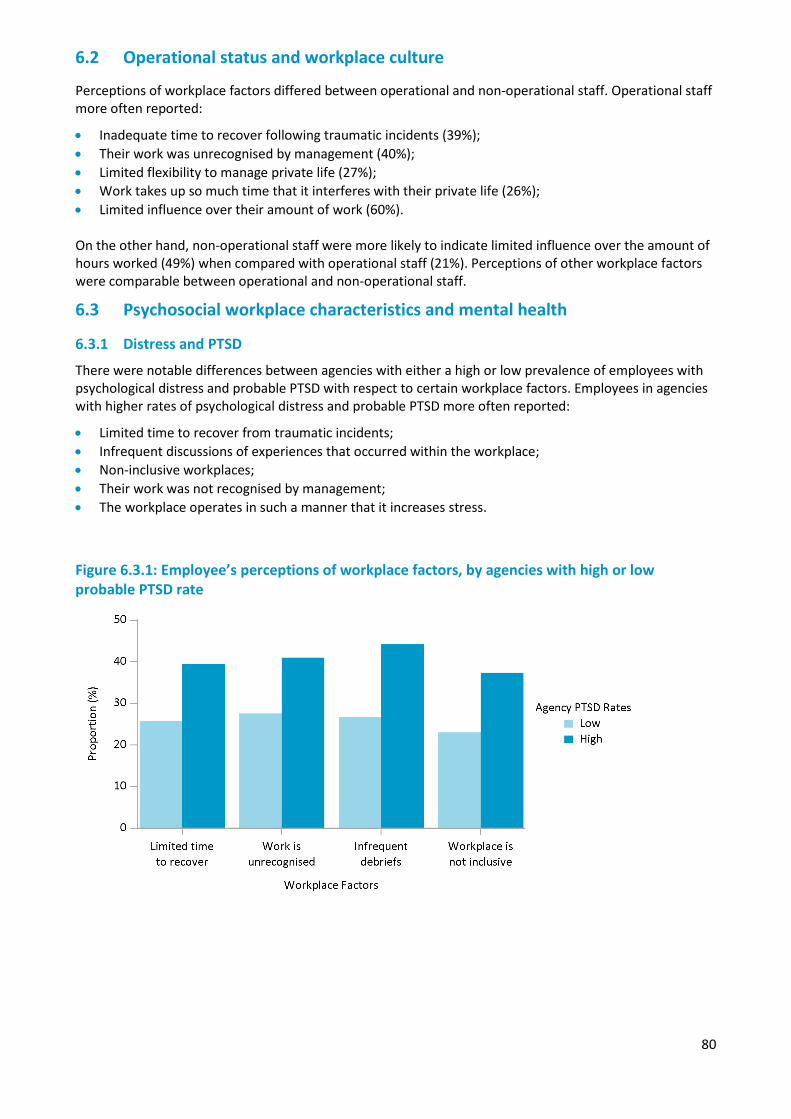
80
6.2 Operational status and workplace culture
Perceptions of workplace factors differed between operational and non-operational staff. Operational staff more often reported:
• Inadequate time to recover following traumatic incidents (39%); • Their work was unrecognised by management (40%); • Limited flexibility to manage private life (27%); • Work takes up so much time that it interferes with their private life (26%); • Limited influence over their amount of work (60%). On the other hand, non-operational staff were more likely to indicate limited influence over the amount of hours worked (49%) when compared with operational staff (21%). Perceptions of other workplace factors were comparable between operational and non-operational staff.
6.3 Psychosocial workplace characteristics and mental health
6.3.1 Distress and PTSD
There were notable differences between agencies with either a high or low prevalence of employees with psychological distress and probable PTSD with respect to certain workplace factors. Employees in agencies with higher rates of psychological distress and probable PTSD more often reported:
• Limited time to recover from traumatic incidents; • Infrequent discussions of experiences that occurred within the workplace; • Non-inclusive workplaces; • Their work was not recognised by management; • The workplace operates in such a manner that it increases stress.
Figure 6.3.1: Employee’s perceptions of workplace factors, by agencies with high or low probable PTSD rate
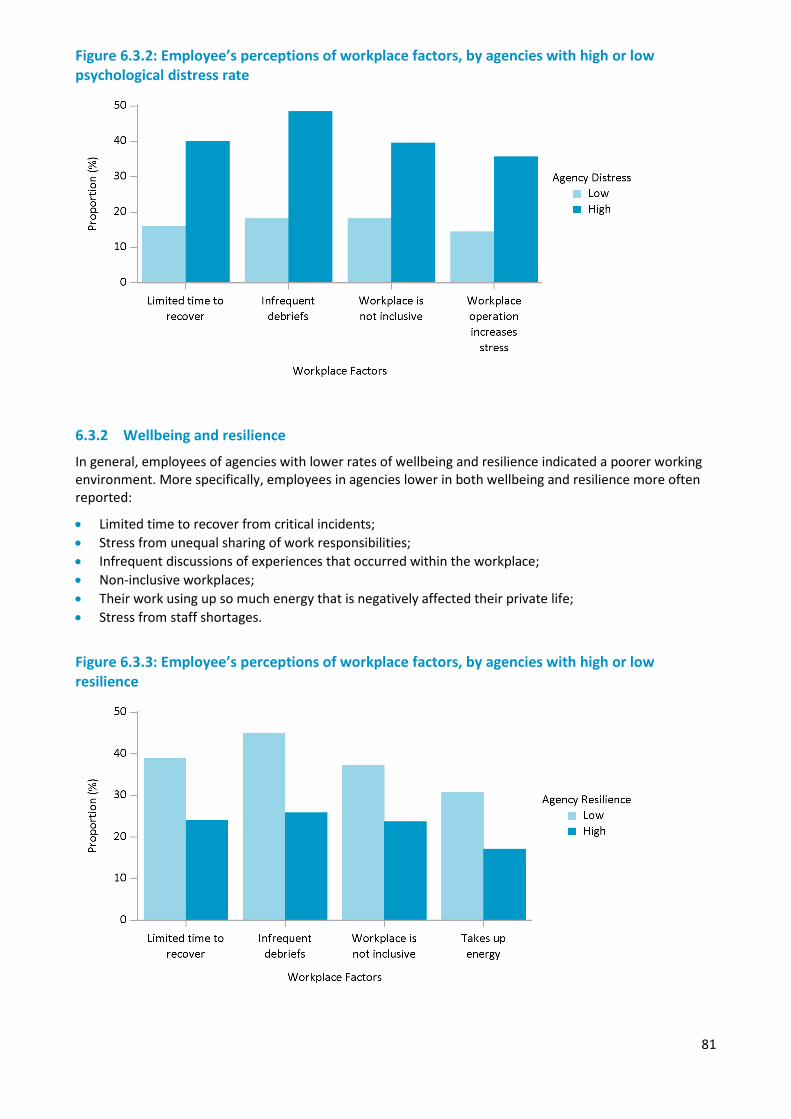
81
Figure 6.3.2: Employee’s perceptions of workplace factors, by agencies with high or low psychological distress rate
6.3.2 Wellbeing and resilience
In general, employees of agencies with lower rates of wellbeing and resilience indicated a poorer working environment. More specifically, employees in agencies lower in both wellbeing and resilience more often reported:
• Limited time to recover from critical incidents; • Stress from unequal sharing of work responsibilities; • Infrequent discussions of experiences that occurred within the workplace; • Non-inclusive workplaces; • Their work using up so much energy that is negatively affected their private life; • Stress from staff shortages.
Figure 6.3.3: Employee’s perceptions of workplace factors, by agencies with high or low resilience
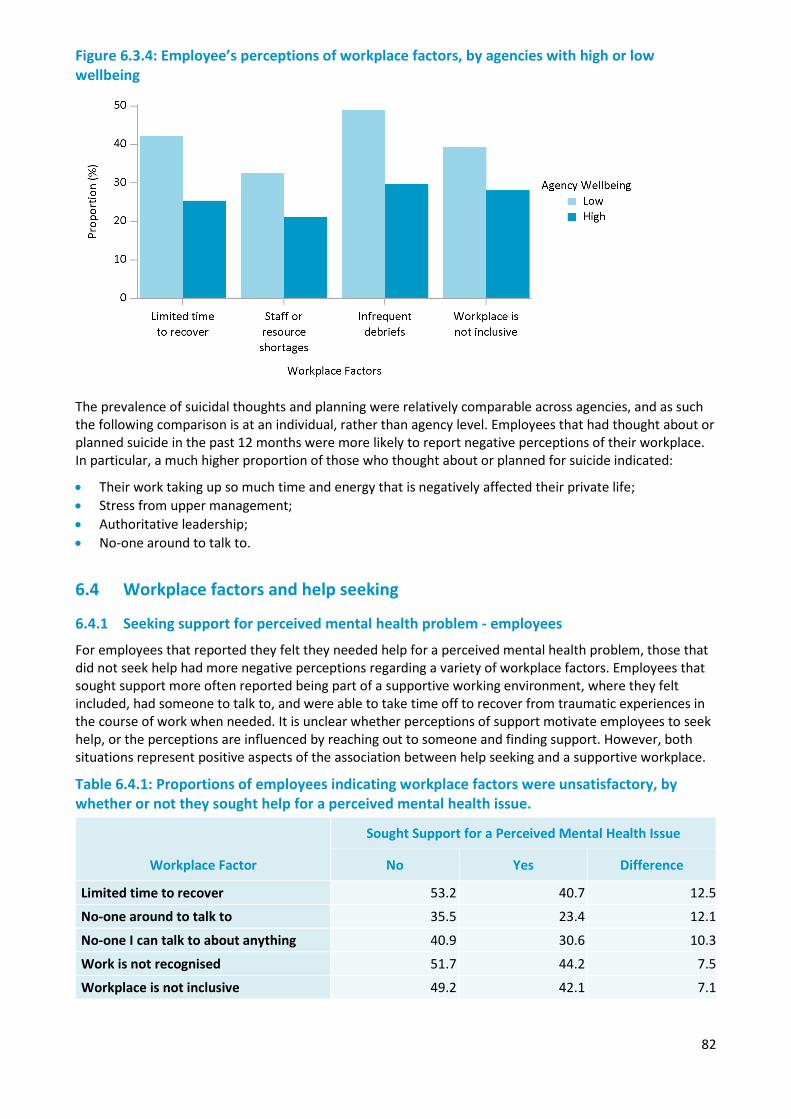
82
Figure 6.3.4: Employee’s perceptions of workplace factors, by agencies with high or low wellbeing
The prevalence of suicidal thoughts and planning were relatively comparable across agencies, and as such the following comparison is at an individual, rather than agency level. Employees that had thought about or planned suicide in the past 12 months were more likely to report negative perceptions of their workplace. In particular, a much higher proportion of those who thought about or planned for suicide indicated:
• Their work taking up so much time and energy that is negatively affected their private life; • Stress from upper management; • Authoritative leadership; • No-one around to talk to.
6.4 Workplace factors and help seeking
6.4.1 Seeking support for perceived mental health problem - employees
For employees that reported they felt they needed help for a perceived mental health problem, those that did not seek help had more negative perceptions regarding a variety of workplace factors. Employees that sought support more often reported being part of a supportive working environment, where they felt included, had someone to talk to, and were able to take time off to recover from traumatic experiences in the course of work when needed. It is unclear whether perceptions of support motivate employees to seek help, or the perceptions are influenced by reaching out to someone and finding support. However, both situations represent positive aspects of the association between help seeking and a supportive workplace.
Table 6.4.1: Proportions of employees indicating workplace factors were unsatisfactory, by whether or not they sought help for a perceived mental health issue.
Workplace Factor
Sought Support for a Perceived Mental Health Issue
No Yes Difference
Limited time to recover 53.2 40.7 12.5
No-one around to talk to 35.5 23.4 12.1
No-one I can talk to about anything 40.9 30.6 10.3
Work is not recognised 51.7 44.2 7.5
Workplace is not inclusive 49.2 42.1 7.1
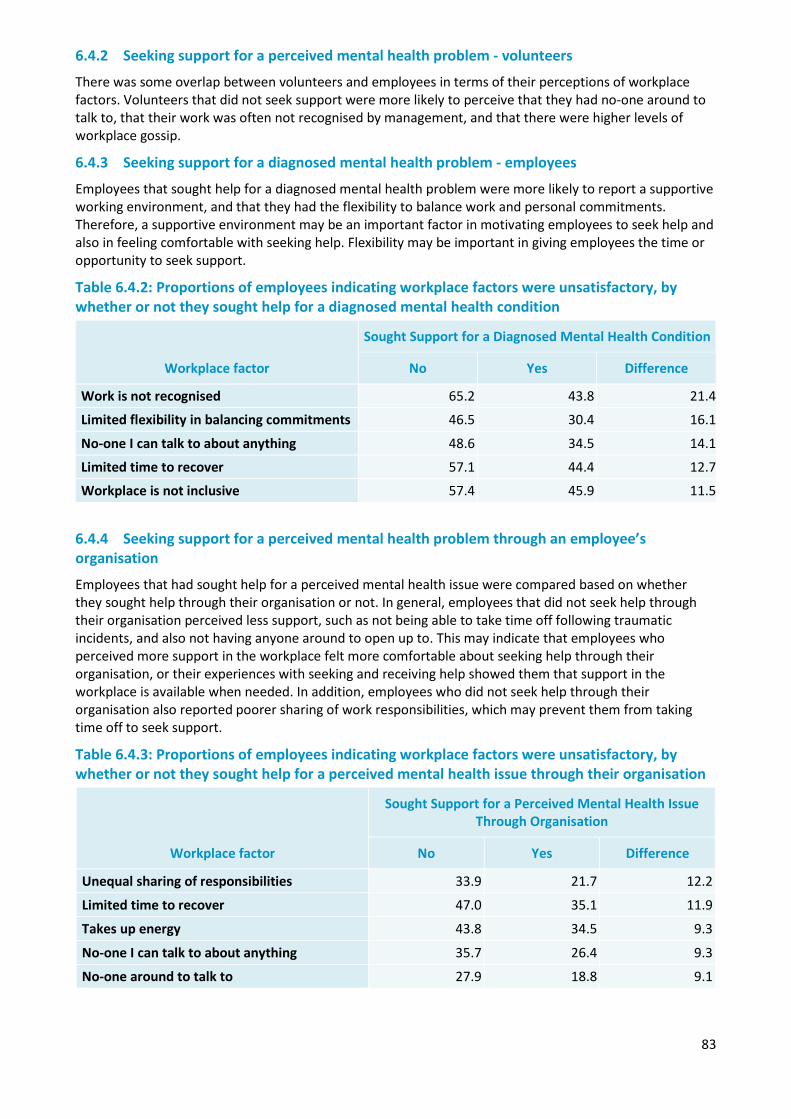
83
6.4.2 Seeking support for a perceived mental health problem - volunteers
There was some overlap between volunteers and employees in terms of their perceptions of workplace factors. Volunteers that did not seek support were more likely to perceive that they had no-one around to talk to, that their work was often not recognised by management, and that there were higher levels of workplace gossip.
6.4.3 Seeking support for a diagnosed mental health problem - employees
Employees that sought help for a diagnosed mental health problem were more likely to report a supportive working environment, and that they had the flexibility to balance work and personal commitments. Therefore, a supportive environment may be an important factor in motivating employees to seek help and also in feeling comfortable with seeking help. Flexibility may be important in giving employees the time or opportunity to seek support.
Table 6.4.2: Proportions of employees indicating workplace factors were unsatisfactory, by whether or not they sought help for a diagnosed mental health condition
Workplace factor
Sought Support for a Diagnosed Mental Health Condition
No Yes Difference
Work is not recognised 65.2 43.8 21.4
Limited flexibility in balancing commitments 46.5 30.4 16.1
No-one I can talk to about anything 48.6 34.5 14.1
Limited time to recover 57.1 44.4 12.7
Workplace is not inclusive 57.4 45.9 11.5
6.4.4 Seeking support for a perceived mental health problem through an employee’s organisation
Employees that had sought help for a perceived mental health issue were compared based on whether they sought help through their organisation or not. In general, employees that did not seek help through their organisation perceived less support, such as not being able to take time off following traumatic incidents, and also not having anyone around to open up to. This may indicate that employees who perceived more support in the workplace felt more comfortable about seeking help through their organisation, or their experiences with seeking and receiving help showed them that support in the workplace is available when needed. In addition, employees who did not seek help through their organisation also reported poorer sharing of work responsibilities, which may prevent them from taking time off to seek support.
Table 6.4.3: Proportions of employees indicating workplace factors were unsatisfactory, by whether or not they sought help for a perceived mental health issue through their organisation
Workplace factor
Sought Support for a Perceived Mental Health Issue Through Organisation
No Yes Difference
Unequal sharing of responsibilities 33.9 21.7 12.2
Limited time to recover 47.0 35.1 11.9
Takes up energy 43.8 34.5 9.3
No-one I can talk to about anything 35.7 26.4 9.3
No-one around to talk to 27.9 18.8 9.1
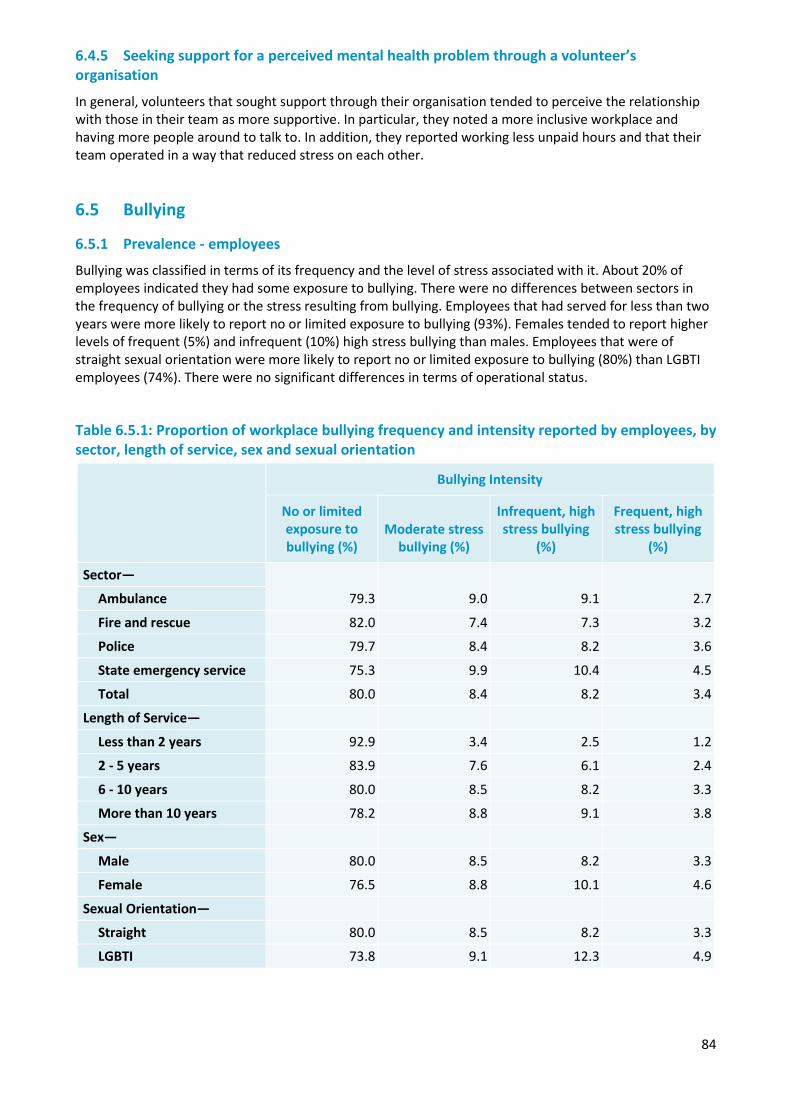
84
6.4.5 Seeking support for a perceived mental health problem through a volunteer’s organisation
In general, volunteers that sought support through their organisation tended to perceive the relationship with those in their team as more supportive. In particular, they noted a more inclusive workplace and having more people around to talk to. In addition, they reported working less unpaid hours and that their team operated in a way that reduced stress on each other.
6.5 Bullying
6.5.1 Prevalence - employees
Bullying was classified in terms of its frequency and the level of stress associated with it. About 20% of employees indicated they had some exposure to bullying. There were no differences between sectors in the frequency of bullying or the stress resulting from bullying. Employees that had served for less than two years were more likely to report no or limited exposure to bullying (93%). Females tended to report higher levels of frequent (5%) and infrequent (10%) high stress bullying than males. Employees that were of straight sexual orientation were more likely to report no or limited exposure to bullying (80%) than LGBTI employees (74%). There were no significant differences in terms of operational status.
Table 6.5.1: Proportion of workplace bullying frequency and intensity reported by employees, by sector, length of service, sex and sexual orientation
Bullying Intensity
No or limited exposure to bullying (%)
Moderate stress bullying (%)
Infrequent, high stress bullying
(%)
Frequent, high stress bullying
(%)
Sector—
79.3 9.0 9.1 2.7 Ambulance
Fire and rescue 82.0 7.4 7.3 3.2
Police 79.7 8.4 8.2 3.6
State emergency service 75.3 9.9 10.4 4.5
Total 80.0 8.4 8.2 3.4
Length of Service—
Less than 2 years 92.9 3.4 2.5 1.2
2 - 5 years 83.9 7.6 6.1 2.4
6 - 10 years 80.0 8.5 8.2 3.3
More than 10 years 78.2 8.8 9.1 3.8
Sex—
Male 80.0 8.5 8.2 3.3
Female 76.5 8.8 10.1 4.6
Sexual Orientation—
Straight 80.0 8.5 8.2 3.3
LGBTI 73.8 9.1 12.3 4.9
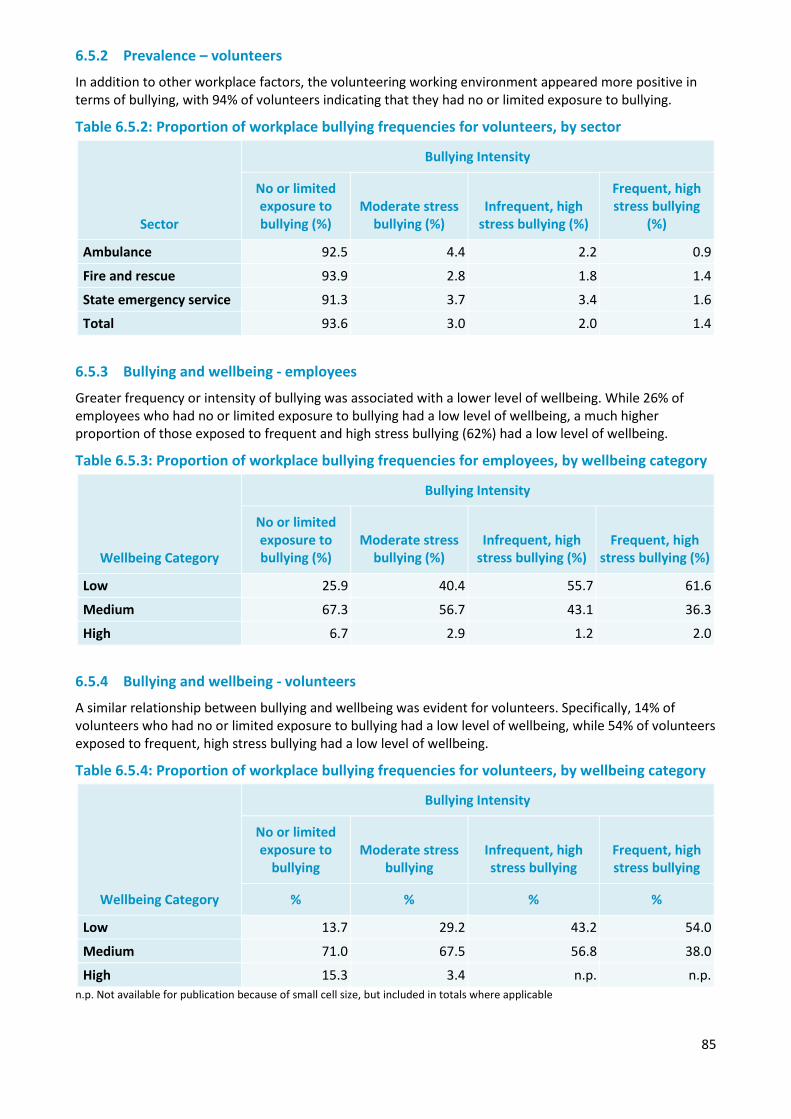
85
6.5.2 Prevalence – volunteers
In addition to other workplace factors, the volunteering working environment appeared more positive in terms of bullying, with 94% of volunteers indicating that they had no or limited exposure to bullying.
Table 6.5.2: Proportion of workplace bullying frequencies for volunteers, by sector
Sector
Bullying Intensity
No or limited exposure to bullying (%)
Moderate stress bullying (%)
Infrequent, high stress bullying (%)
Frequent, high stress bullying
(%)
Ambulance 92.5 4.4 2.2 0.9
Fire and rescue 93.9 2.8 1.8 1.4
State emergency service 91.3 3.7 3.4 1.6
Total 93.6 3.0 2.0 1.4
6.5.3 Bullying and wellbeing - employees
Greater frequency or intensity of bullying was associated with a lower level of wellbeing. While 26% of employees who had no or limited exposure to bullying had a low level of wellbeing, a much higher proportion of those exposed to frequent and high stress bullying (62%) had a low level of wellbeing.
Table 6.5.3: Proportion of workplace bullying frequencies for employees, by wellbeing category
Wellbeing Category
Bullying Intensity
No or limited exposure to bullying (%)
Moderate stress bullying (%)
Infrequent, high stress bullying (%)
Frequent, high stress bullying (%)
Low 25.9 40.4 55.7 61.6
Medium 67.3 56.7 43.1 36.3
High 6.7 2.9 1.2 2.0
6.5.4 Bullying and wellbeing - volunteers
A similar relationship between bullying and wellbeing was evident for volunteers. Specifically, 14% of volunteers who had no or limited exposure to bullying had a low level of wellbeing, while 54% of volunteers exposed to frequent, high stress bullying had a low level of wellbeing.
Table 6.5.4: Proportion of workplace bullying frequencies for volunteers, by wellbeing category
Wellbeing Category
Bullying Intensity
No or limited exposure to
bullying Moderate stress
bullying Infrequent, high stress bullying
Frequent, high stress bullying
% % % %
Low 13.7 29.2 43.2 54.0
Medium 71.0 67.5 56.8 38.0
High 15.3 3.4 n.p. n.p. n.p. Not available for publication because of small cell size, but included in totals where applicable
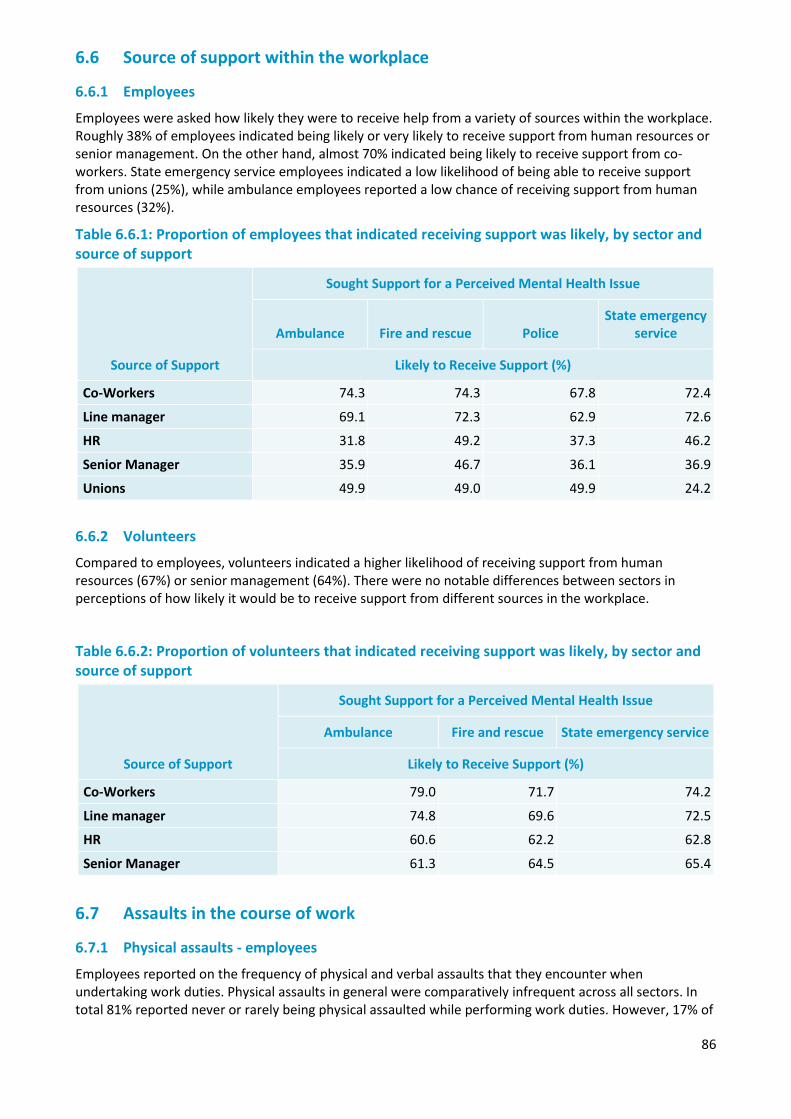
86
6.6 Source of support within the workplace
6.6.1 Employees
Employees were asked how likely they were to receive help from a variety of sources within the workplace. Roughly 38% of employees indicated being likely or very likely to receive support from human resources or senior management. On the other hand, almost 70% indicated being likely to receive support from co-workers. State emergency service employees indicated a low likelihood of being able to receive support from unions (25%), while ambulance employees reported a low chance of receiving support from human resources (32%).
Table 6.6.1: Proportion of employees that indicated receiving support was likely, by sector and source of support
6.6.2 Volunteers
Compared to employees, volunteers indicated a higher likelihood of receiving support from human resources (67%) or senior management (64%). There were no notable differences between sectors in perceptions of how likely it would be to receive support from different sources in the workplace.
Table 6.6.2: Proportion of volunteers that indicated receiving support was likely, by sector and source of support
Source of Support
Sought Support for a Perceived Mental Health Issue
Ambulance Fire and rescue State emergency service
Likely to Receive Support (%)
Co-Workers 79.0 71.7 74.2
Line manager 74.8 69.6 72.5
HR 60.6 62.2 62.8
Senior Manager 61.3 64.5 65.4
6.7 Assaults in the course of work
6.7.1 Physical assaults - employees
Employees reported on the frequency of physical and verbal assaults that they encounter when undertaking work duties. Physical assaults in general were comparatively infrequent across all sectors. In total 81% reported never or rarely being physical assaulted while performing work duties. However, 17% of
Source of Support
Sought Support for a Perceived Mental Health Issue
Ambulance Fire and rescue Police State emergency
service
Likely to Receive Support (%)
Co-Workers 74.3 74.3 67.8 72.4
Line manager 69.1 72.3 62.9 72.6
HR 31.8 49.2 37.3 46.2
Senior Manager 35.9 46.7 36.1 36.9
Unions 49.9 49.0 49.9 24.2
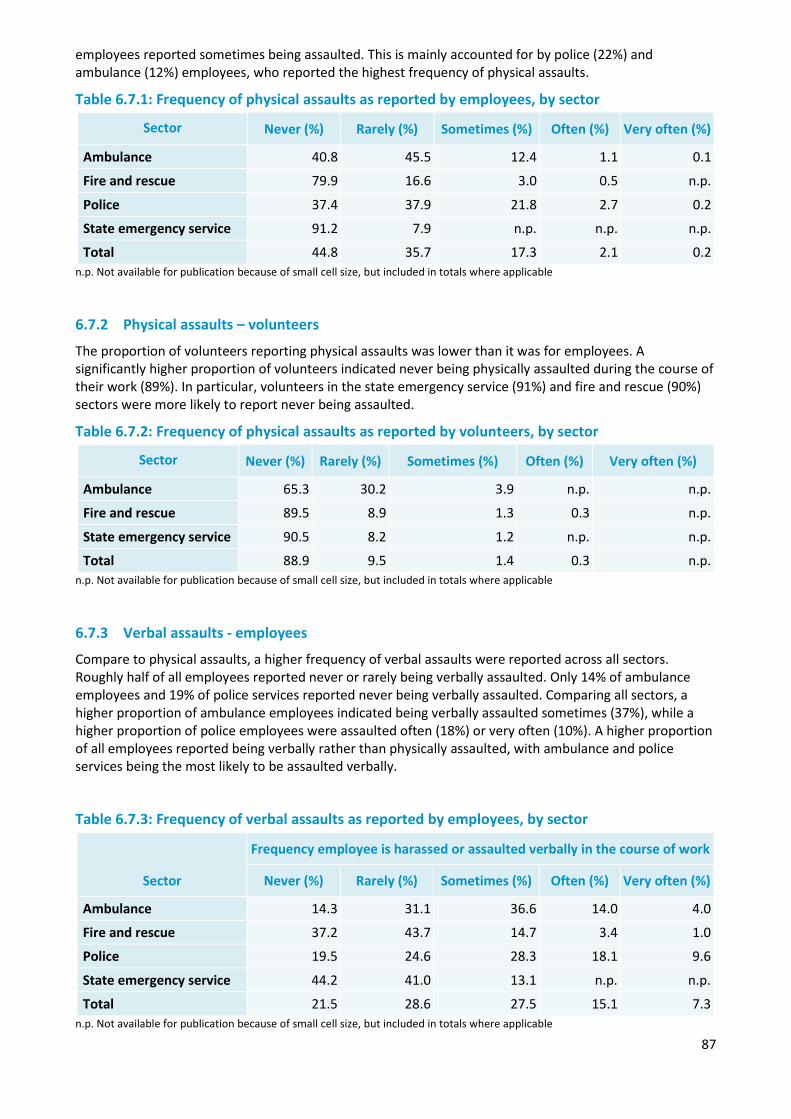
87
employees reported sometimes being assaulted. This is mainly accounted for by police (22%) and ambulance (12%) employees, who reported the highest frequency of physical assaults.
Table 6.7.1: Frequency of physical assaults as reported by employees, by sector
Sector Never (%) Rarely (%) Sometimes (%) Often (%) Very often (%)
Ambulance 40.8 45.5 12.4 1.1 0.1
Fire and rescue 79.9 16.6 3.0 0.5 n.p.
Police 37.4 37.9 21.8 2.7 0.2
State emergency service 91.2 7.9 n.p. n.p. n.p.
Total 44.8 35.7 17.3 2.1 0.2 n.p. Not available for publication because of small cell size, but included in totals where applicable
6.7.2 Physical assaults – volunteers
The proportion of volunteers reporting physical assaults was lower than it was for employees. A significantly higher proportion of volunteers indicated never being physically assaulted during the course of their work (89%). In particular, volunteers in the state emergency service (91%) and fire and rescue (90%) sectors were more likely to report never being assaulted.
Table 6.7.2: Frequency of physical assaults as reported by volunteers, by sector
Sector Never (%) Rarely (%) Sometimes (%) Often (%) Very often (%)
Ambulance 65.3 30.2 3.9 n.p. n.p.
Fire and rescue 89.5 8.9 1.3 0.3 n.p.
State emergency service 90.5 8.2 1.2 n.p. n.p.
Total 88.9 9.5 1.4 0.3 n.p. n.p. Not available for publication because of small cell size, but included in totals where applicable
6.7.3 Verbal assaults - employees
Compare to physical assaults, a higher frequency of verbal assaults were reported across all sectors. Roughly half of all employees reported never or rarely being verbally assaulted. Only 14% of ambulance employees and 19% of police services reported never being verbally assaulted. Comparing all sectors, a higher proportion of ambulance employees indicated being verbally assaulted sometimes (37%), while a higher proportion of police employees were assaulted often (18%) or very often (10%). A higher proportion of all employees reported being verbally rather than physically assaulted, with ambulance and police services being the most likely to be assaulted verbally.
Table 6.7.3: Frequency of verbal assaults as reported by employees, by sector
n.p. Not available for publication because of small cell size, but included in totals where applicable
Sector
Frequency employee is harassed or assaulted verbally in the course of work
Never (%) Rarely (%) Sometimes (%) Often (%) Very often (%)
Ambulance 14.3 31.1 36.6 14.0 4.0
Fire and rescue 37.2 43.7 14.7 3.4 1.0
Police 19.5 24.6 28.3 18.1 9.6
State emergency service 44.2 41.0 13.1 n.p. n.p.
Total 21.5 28.6 27.5 15.1 7.3
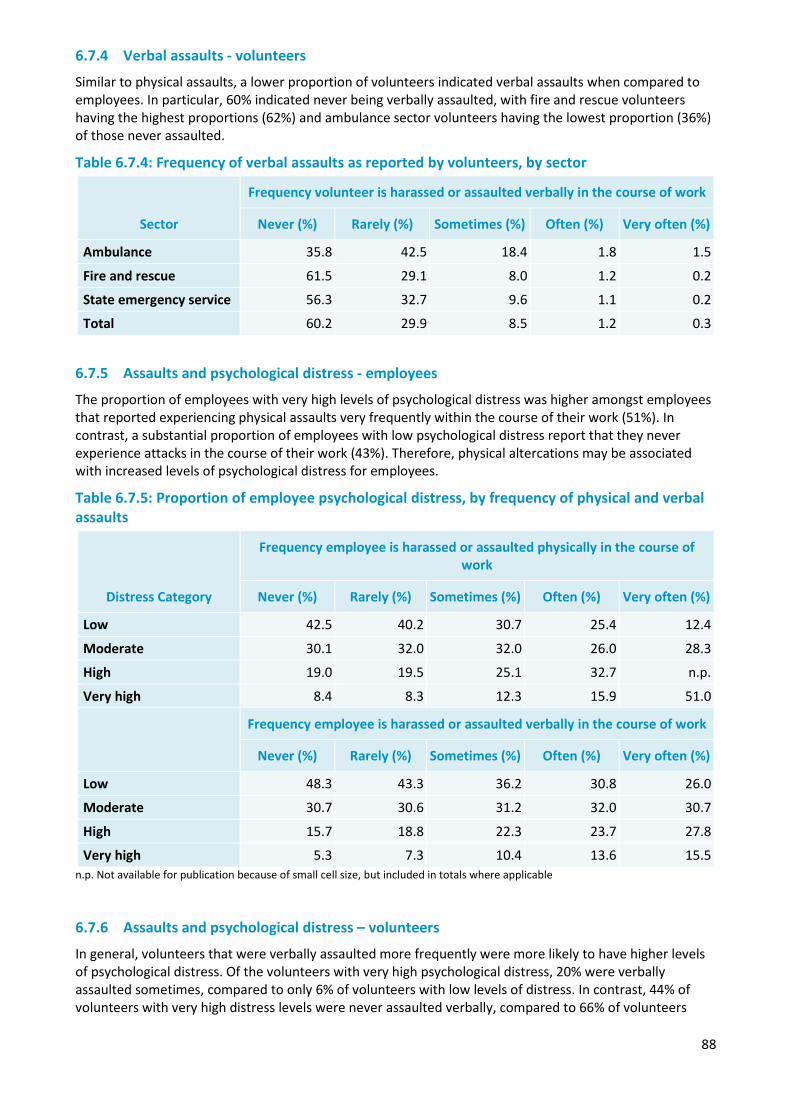
88
6.7.4 Verbal assaults - volunteers
Similar to physical assaults, a lower proportion of volunteers indicated verbal assaults when compared to employees. In particular, 60% indicated never being verbally assaulted, with fire and rescue volunteers having the highest proportions (62%) and ambulance sector volunteers having the lowest proportion (36%) of those never assaulted.
Table 6.7.4: Frequency of verbal assaults as reported by volunteers, by sector
Sector
Frequency volunteer is harassed or assaulted verbally in the course of work
Never (%) Rarely (%) Sometimes (%) Often (%) Very often (%)
Ambulance 35.8 42.5 18.4 1.8 1.5
Fire and rescue 61.5 29.1 8.0 1.2 0.2
State emergency service 56.3 32.7 9.6 1.1 0.2
Total 60.2 29.9 8.5 1.2 0.3
6.7.5 Assaults and psychological distress - employees
The proportion of employees with very high levels of psychological distress was higher amongst employees that reported experiencing physical assaults very frequently within the course of their work (51%). In contrast, a substantial proportion of employees with low psychological distress report that they never experience attacks in the course of their work (43%). Therefore, physical altercations may be associated with increased levels of psychological distress for employees.
Table 6.7.5: Proportion of employee psychological distress, by frequency of physical and verbal assaults
Distress Category
Frequency employee is harassed or assaulted physically in the course of work
Never (%) Rarely (%) Sometimes (%) Often (%) Very often (%)
Low 42.5 40.2 30.7 25.4 12.4
Moderate 30.1 32.0 32.0 26.0 28.3
High 19.0 19.5 25.1 32.7 n.p.
Very high 8.4 8.3 12.3 15.9 51.0
Frequency employee is harassed or assaulted verbally in the course of work
Never (%) Rarely (%) Sometimes (%) Often (%) Very often (%)
Low 48.3 43.3 36.2 30.8 26.0
Moderate 30.7 30.6 31.2 32.0 30.7
High 15.7 18.8 22.3 23.7 27.8
Very high 5.3 7.3 10.4 13.6 15.5 n.p. Not available for publication because of small cell size, but included in totals where applicable
6.7.6 Assaults and psychological distress – volunteers
In general, volunteers that were verbally assaulted more frequently were more likely to have higher levels of psychological distress. Of the volunteers with very high psychological distress, 20% were verbally assaulted sometimes, compared to only 6% of volunteers with low levels of distress. In contrast, 44% of volunteers with very high distress levels were never assaulted verbally, compared to 66% of volunteers
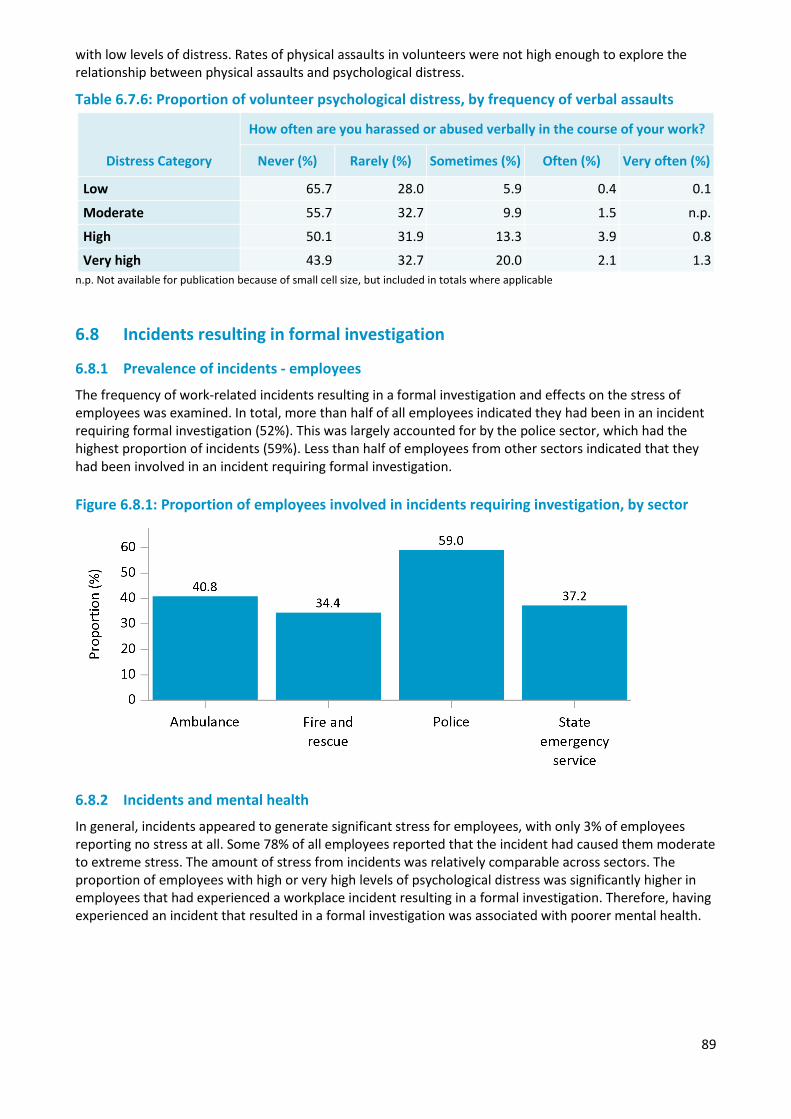
89
with low levels of distress. Rates of physical assaults in volunteers were not high enough to explore the relationship between physical assaults and psychological distress.
Table 6.7.6: Proportion of volunteer psychological distress, by frequency of verbal assaults
Distress Category
How often are you harassed or abused verbally in the course of your work?
Never (%) Rarely (%) Sometimes (%) Often (%) Very often (%)
Low 65.7 28.0 5.9 0.4 0.1
Moderate 55.7 32.7 9.9 1.5 n.p.
High 50.1 31.9 13.3 3.9 0.8
Very high 43.9 32.7 20.0 2.1 1.3 n.p. Not available for publication because of small cell size, but included in totals where applicable
6.8 Incidents resulting in formal investigation
6.8.1 Prevalence of incidents - employees
The frequency of work-related incidents resulting in a formal investigation and effects on the stress of employees was examined. In total, more than half of all employees indicated they had been in an incident requiring formal investigation (52%). This was largely accounted for by the police sector, which had the highest proportion of incidents (59%). Less than half of employees from other sectors indicated that they had been involved in an incident requiring formal investigation. Figure 6.8.1: Proportion of employees involved in incidents requiring investigation, by sector
6.8.2 Incidents and mental health
In general, incidents appeared to generate significant stress for employees, with only 3% of employees reporting no stress at all. Some 78% of all employees reported that the incident had caused them moderate to extreme stress. The amount of stress from incidents was relatively comparable across sectors. The proportion of employees with high or very high levels of psychological distress was significantly higher in employees that had experienced a workplace incident resulting in a formal investigation. Therefore, having experienced an incident that resulted in a formal investigation was associated with poorer mental health.
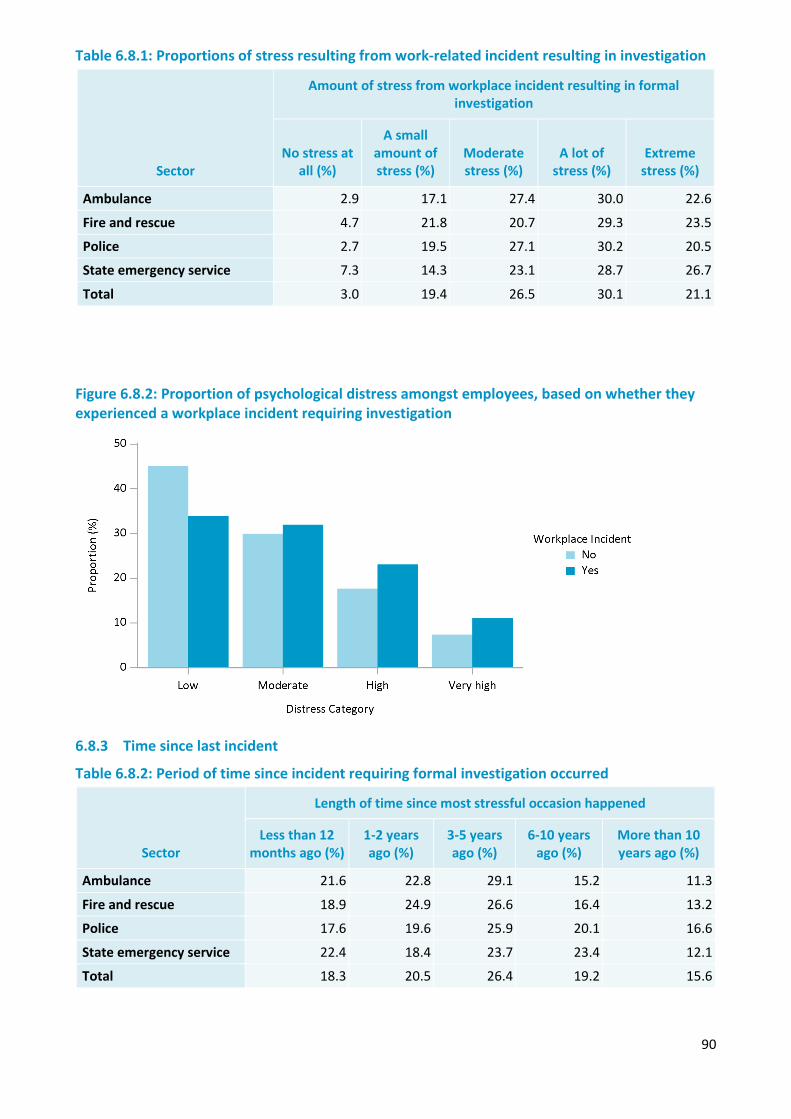
90
Table 6.8.1: Proportions of stress resulting from work-related incident resulting in investigation
Sector
Amount of stress from workplace incident resulting in formal investigation
No stress at all (%)
A small amount of stress (%)
Moderate stress (%)
A lot of stress (%)
Extreme stress (%)
Ambulance 2.9 17.1 27.4 30.0 22.6
Fire and rescue 4.7 21.8 20.7 29.3 23.5
Police 2.7 19.5 27.1 30.2 20.5
State emergency service 7.3 14.3 23.1 28.7 26.7
Total 3.0 19.4 26.5 30.1 21.1
Figure 6.8.2: Proportion of psychological distress amongst employees, based on whether they experienced a workplace incident requiring investigation
6.8.3 Time since last incident
Table 6.8.2: Period of time since incident requiring formal investigation occurred
Sector
Length of time since most stressful occasion happened
Less than 12 months ago (%)
1-2 years ago (%)
3-5 years ago (%)
6-10 years ago (%)
More than 10 years ago (%)
Ambulance 21.6 22.8 29.1 15.2 11.3
Fire and rescue 18.9 24.9 26.6 16.4 13.2
Police 17.6 19.6 25.9 20.1 16.6
State emergency service 22.4 18.4 23.7 23.4 12.1
Total 18.3 20.5 26.4 19.2 15.6
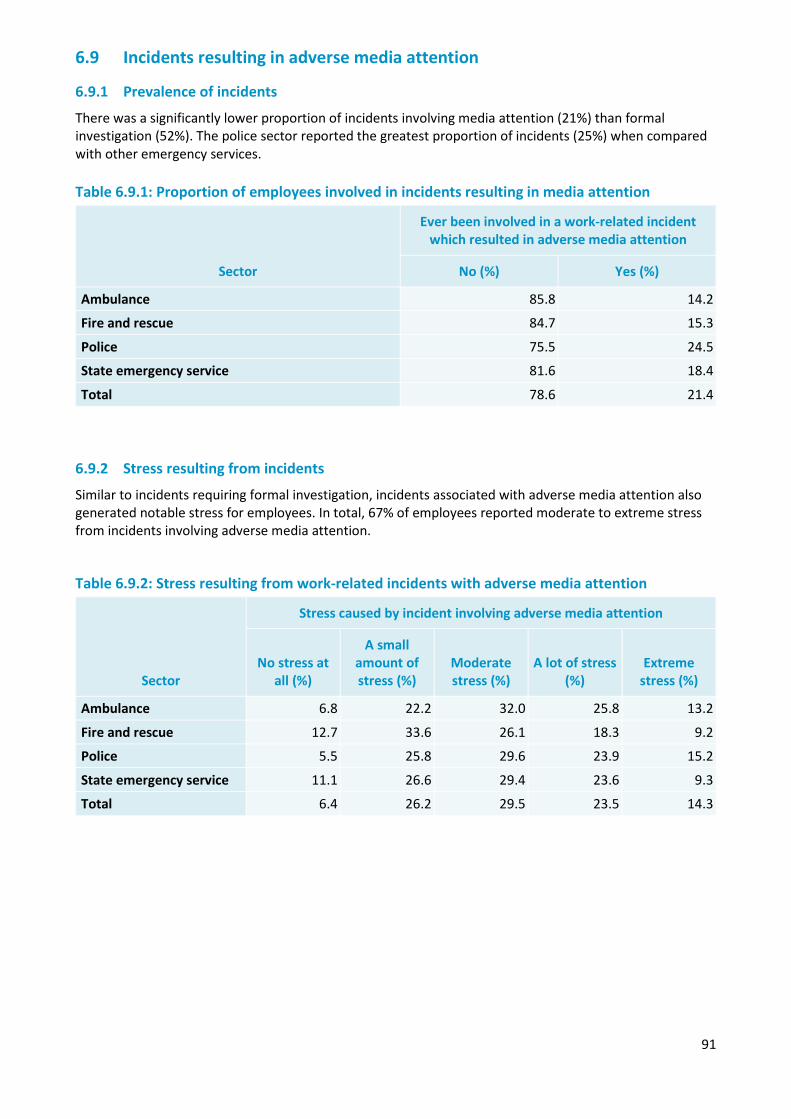
91
6.9 Incidents resulting in adverse media attention
6.9.1 Prevalence of incidents
There was a significantly lower proportion of incidents involving media attention (21%) than formal investigation (52%). The police sector reported the greatest proportion of incidents (25%) when compared with other emergency services. Table 6.9.1: Proportion of employees involved in incidents resulting in media attention
Sector
Ever been involved in a work-related incident which resulted in adverse media attention
No (%) Yes (%)
Ambulance 85.8 14.2
Fire and rescue 84.7 15.3
Police 75.5 24.5
State emergency service 81.6 18.4
Total 78.6 21.4
6.9.2 Stress resulting from incidents
Similar to incidents requiring formal investigation, incidents associated with adverse media attention also generated notable stress for employees. In total, 67% of employees reported moderate to extreme stress from incidents involving adverse media attention.
Table 6.9.2: Stress resulting from work-related incidents with adverse media attention
Sector
Stress caused by incident involving adverse media attention
No stress at all (%)
A small amount of stress (%)
Moderate stress (%)
A lot of stress (%)
Extreme stress (%)
Ambulance 6.8 22.2 32.0 25.8 13.2
Fire and rescue 12.7 33.6 26.1 18.3 9.2
Police 5.5 25.8 29.6 23.9 15.2
State emergency service 11.1 26.6 29.4 23.6 9.3
Total 6.4 26.2 29.5 23.5 14.3
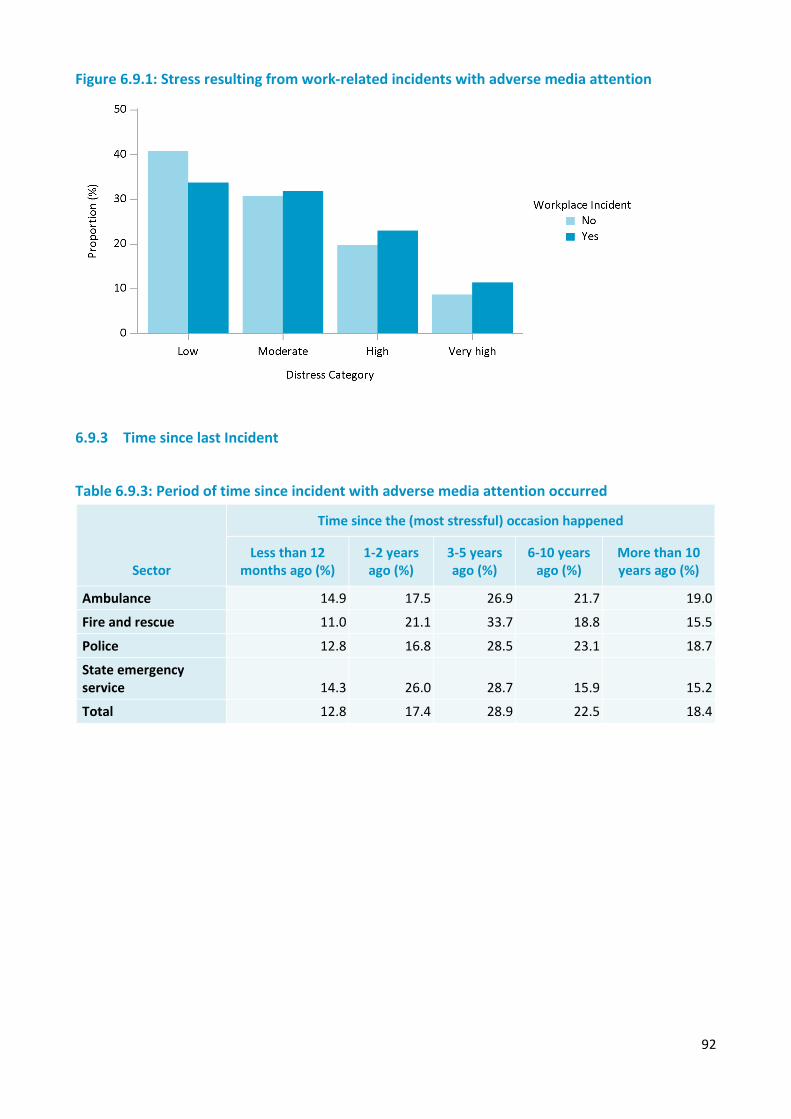
92
Figure 6.9.1: Stress resulting from work-related incidents with adverse media attention
6.9.3 Time since last Incident
Table 6.9.3: Period of time since incident with adverse media attention occurred
Sector
Time since the (most stressful) occasion happened
Less than 12 months ago (%)
1-2 years ago (%)
3-5 years ago (%)
6-10 years ago (%)
More than 10 years ago (%)
Ambulance 14.9 17.5 26.9 21.7 19.0
Fire and rescue 11.0 21.1 33.7 18.8 15.5
Police 12.8 16.8 28.5 23.1 18.7
State emergency service 14.3 26.0 28.7 15.9 15.2
Total 12.8 17.4 28.9 22.5 18.4
93
Chapter 7 — Stigma
Overview
People with mental health issues may experience stigma from those around them. In addition, they may view their own mental health issues with shame and as a burden on others. Not only does this impact personal relationships, it can also have effects on employment. The current chapter describes levels of stigma within the workplace, how it relates to wellbeing and help seeking behaviours.
There are several aspects of stigma, pertaining to perceptions of one’s own mental health conditions and that of others (Beyond Blue, 2015). Firstly, self-stigma was measured to assess employee’s or volunteer’s perceptions about their own mental health conditions:
• Shame surrounding their mental health (i.e. embarrassed about their conditions and seeking help). • Burden their mental health conditions placed on others. • Experiences with others, such as being treated fairly and not being avoided.
Secondly, the personal stigma employees or volunteers holds about the mental health of others was also assessed in two separate ways:
• Knowledge or ignorance surrounding mental health conditions (e.g. “If someone is experiencing depression or anxiety it is a sign of personal weakness”)
• Burden an individual’s mental health conditions places on others (e.g. “I would prefer not to have someone with depression or anxiety working on the same team as me”).
Lastly, several aspects of workplace stigma measured an employee’s or volunteers perceptions of the stigma within their workplace:
• Perceived stigma is the extent to which an employee or volunteer feels others in their workplace perceive mental health conditions to be avoidable and the fault of the person suffering from them, and also a burden on others in the workplace.
• Perceived organisational commitment refers to whether an employee perceived the organisation they were a part of to be committed to and capable of enhancing mental health of the work force.
• Structural stigma referred to what extent an employee or volunteer believes their organisation should support someone with a mental health condition.
Summary of Findings
Employees held more stigma regarding their own mental health than that of others. They more often perceived their colleagues to hold stigma regarding mental health issues, and the organisation they are a part of to lack commitment to promoting wellbeing. This may reflect negative perceptions of others regarding mental health, potentially due to experience, or rather providing social desirability when questions are pertaining to one’s own perceptions of mental health. Regardless, increasing awareness that employees in general hold positive beliefs regarding the mental health of others may help to reduce perceptions of stigma within the workplace, and promote behaviours positive to mental health (i.e. help seeking).
Agencies with low perceived stigma of colleagues and the organisation tended to have employees with more positive perceptions of workplace culture. In particular, employees from low stigma agencies indicated positive perceptions of workplace supportiveness and job strain. Support around the workplace could assist in reducing stigma surrounding mental health, and promote help seeking behaviours.
Employees with a history of mental health issues reported higher levels of shame or perceptions of burden regarding their own mental health. However, they reported more positive experiences with others regarding their own mental health, such as being embraced and treated fairly. Employees from agencies with high wellbeing were more positive regarding their organisations commitment to helping with mental health issues and stigma from their colleagues. Employees higher in wellbeing were also more positive regarding the extent to which colleagues with mental health issues are a burden on the workplace.
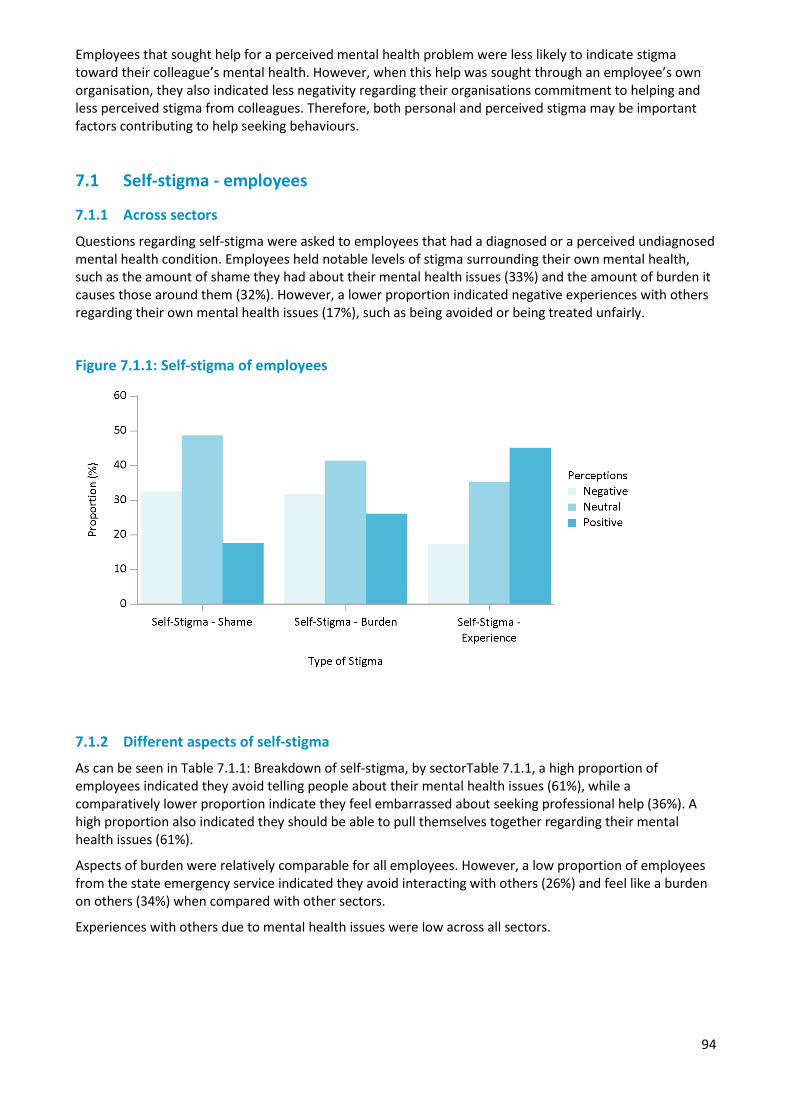
94
Employees that sought help for a perceived mental health problem were less likely to indicate stigma toward their colleague’s mental health. However, when this help was sought through an employee’s own organisation, they also indicated less negativity regarding their organisations commitment to helping and less perceived stigma from colleagues. Therefore, both personal and perceived stigma may be important factors contributing to help seeking behaviours.
7.1 Self-stigma - employees
7.1.1 Across sectors
Questions regarding self-stigma were asked to employees that had a diagnosed or a perceived undiagnosed mental health condition. Employees held notable levels of stigma surrounding their own mental health, such as the amount of shame they had about their mental health issues (33%) and the amount of burden it causes those around them (32%). However, a lower proportion indicated negative experiences with others regarding their own mental health issues (17%), such as being avoided or being treated unfairly.
Figure 7.1.1: Self-stigma of employees
7.1.2 Different aspects of self-stigma
As can be seen in Table 7.1.1: Breakdown of self-stigma, by sectorTable 7.1.1, a high proportion of employees indicated they avoid telling people about their mental health issues (61%), while a comparatively lower proportion indicate they feel embarrassed about seeking professional help (36%). A high proportion also indicated they should be able to pull themselves together regarding their mental health issues (61%).
Aspects of burden were relatively comparable for all employees. However, a low proportion of employees from the state emergency service indicated they avoid interacting with others (26%) and feel like a burden on others (34%) when compared with other sectors.
Experiences with others due to mental health issues were low across all sectors.
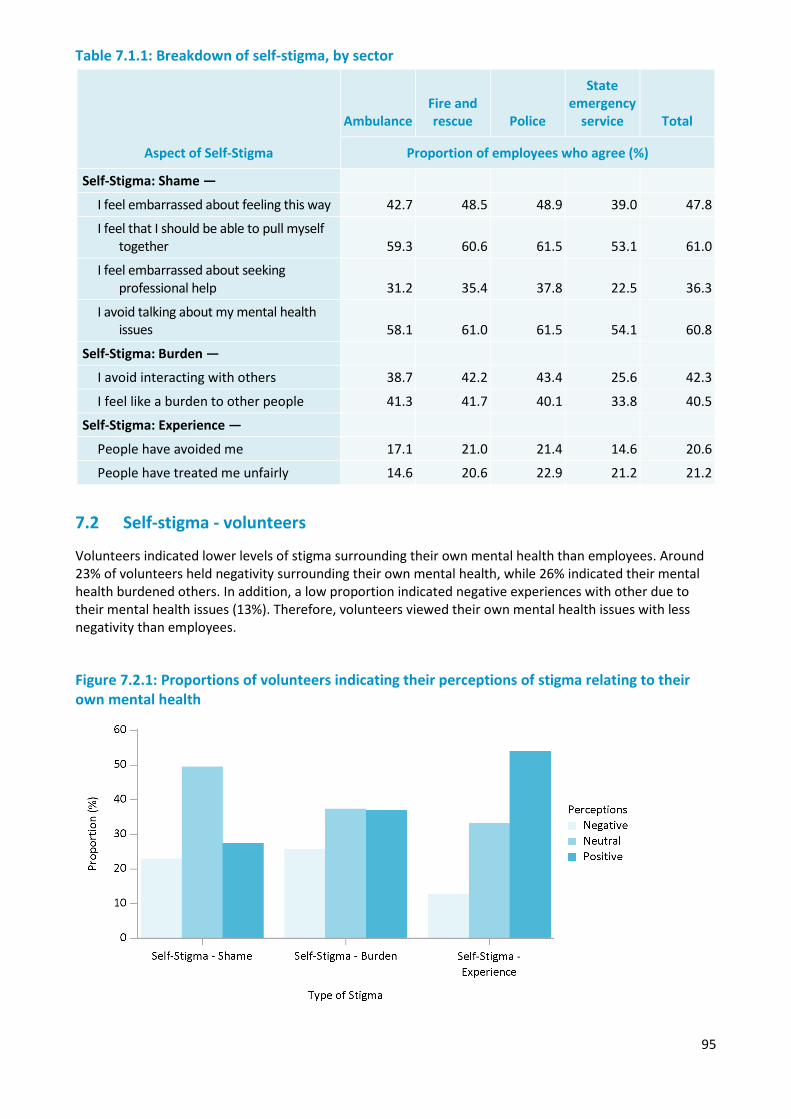
95
Table 7.1.1: Breakdown of self-stigma, by sector
Aspect of Self-Stigma
Ambulance Fire and rescue Police
State emergency
service Total
Proportion of employees who agree (%)
Self-Stigma: Shame —
I feel embarrassed about feeling this way 42.7 48.5 48.9 39.0 47.8
I feel that I should be able to pull myself together 59.3 60.6 61.5 53.1 61.0
I feel embarrassed about seeking professional help 31.2 35.4 37.8 22.5 36.3
I avoid talking about my mental health issues 58.1 61.0 61.5 54.1 60.8
Self-Stigma: Burden —
I avoid interacting with others 38.7 42.2 43.4 25.6 42.3
I feel like a burden to other people 41.3 41.7 40.1 33.8 40.5
Self-Stigma: Experience —
People have avoided me 17.1 21.0 21.4 14.6 20.6
People have treated me unfairly 14.6 20.6 22.9 21.2 21.2
7.2 Self-stigma - volunteers
Volunteers indicated lower levels of stigma surrounding their own mental health than employees. Around 23% of volunteers held negativity surrounding their own mental health, while 26% indicated their mental health burdened others. In addition, a low proportion indicated negative experiences with other due to their mental health issues (13%). Therefore, volunteers viewed their own mental health issues with less negativity than employees.
Figure 7.2.1: Proportions of volunteers indicating their perceptions of stigma relating to their own mental health
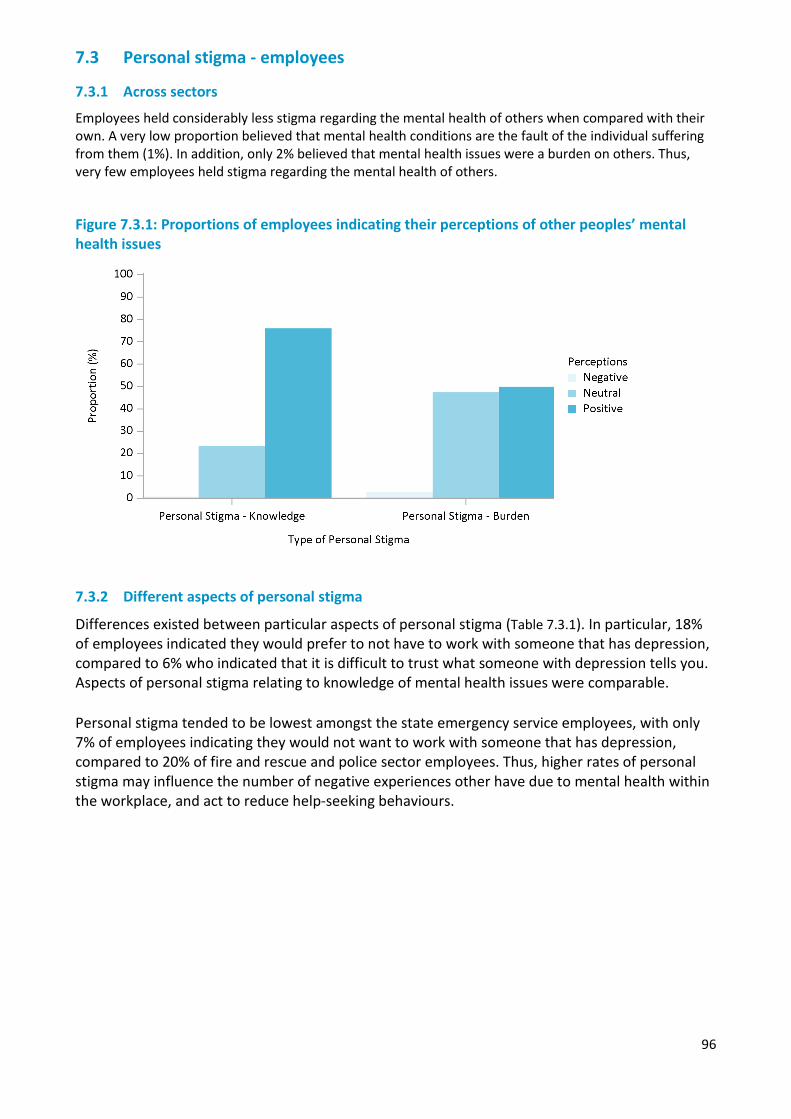
96
7.3 Personal stigma - employees
7.3.1 Across sectors
Employees held considerably less stigma regarding the mental health of others when compared with their own. A very low proportion believed that mental health conditions are the fault of the individual suffering from them (1%). In addition, only 2% believed that mental health issues were a burden on others. Thus, very few employees held stigma regarding the mental health of others.
Figure 7.3.1: Proportions of employees indicating their perceptions of other peoples’ mental health issues
7.3.2 Different aspects of personal stigma
Differences existed between particular aspects of personal stigma (Table 7.3.1). In particular, 18% of employees indicated they would prefer to not have to work with someone that has depression, compared to 6% who indicated that it is difficult to trust what someone with depression tells you. Aspects of personal stigma relating to knowledge of mental health issues were comparable. Personal stigma tended to be lowest amongst the state emergency service employees, with only 7% of employees indicating they would not want to work with someone that has depression, compared to 20% of fire and rescue and police sector employees. Thus, higher rates of personal stigma may influence the number of negative experiences other have due to mental health within the workplace, and act to reduce help-seeking behaviours.
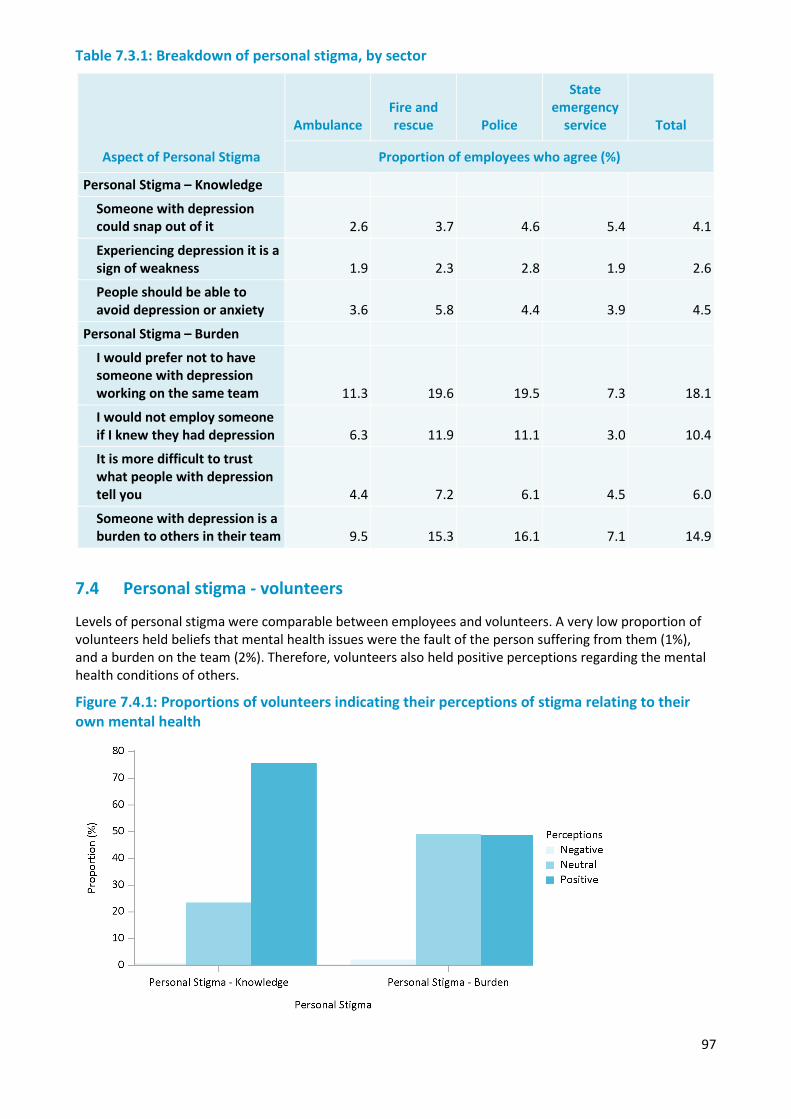
97
Table 7.3.1: Breakdown of personal stigma, by sector
Aspect of Personal Stigma
Ambulance Fire and rescue Police
State emergency
service Total
Proportion of employees who agree (%)
Personal Stigma – Knowledge
Someone with depression could snap out of it 2.6 3.7 4.6 5.4 4.1
Experiencing depression it is a sign of weakness 1.9 2.3 2.8 1.9 2.6
People should be able to avoid depression or anxiety 3.6 5.8 4.4 3.9 4.5
Personal Stigma – Burden
I would prefer not to have someone with depression working on the same team 11.3 19.6 19.5 7.3 18.1
I would not employ someone if I knew they had depression 6.3 11.9 11.1 3.0 10.4
It is more difficult to trust what people with depression tell you 4.4 7.2 6.1 4.5 6.0
Someone with depression is a burden to others in their team 9.5 15.3 16.1 7.1 14.9
7.4 Personal stigma - volunteers
Levels of personal stigma were comparable between employees and volunteers. A very low proportion of volunteers held beliefs that mental health issues were the fault of the person suffering from them (1%), and a burden on the team (2%). Therefore, volunteers also held positive perceptions regarding the mental health conditions of others.
Figure 7.4.1: Proportions of volunteers indicating their perceptions of stigma relating to their own mental health
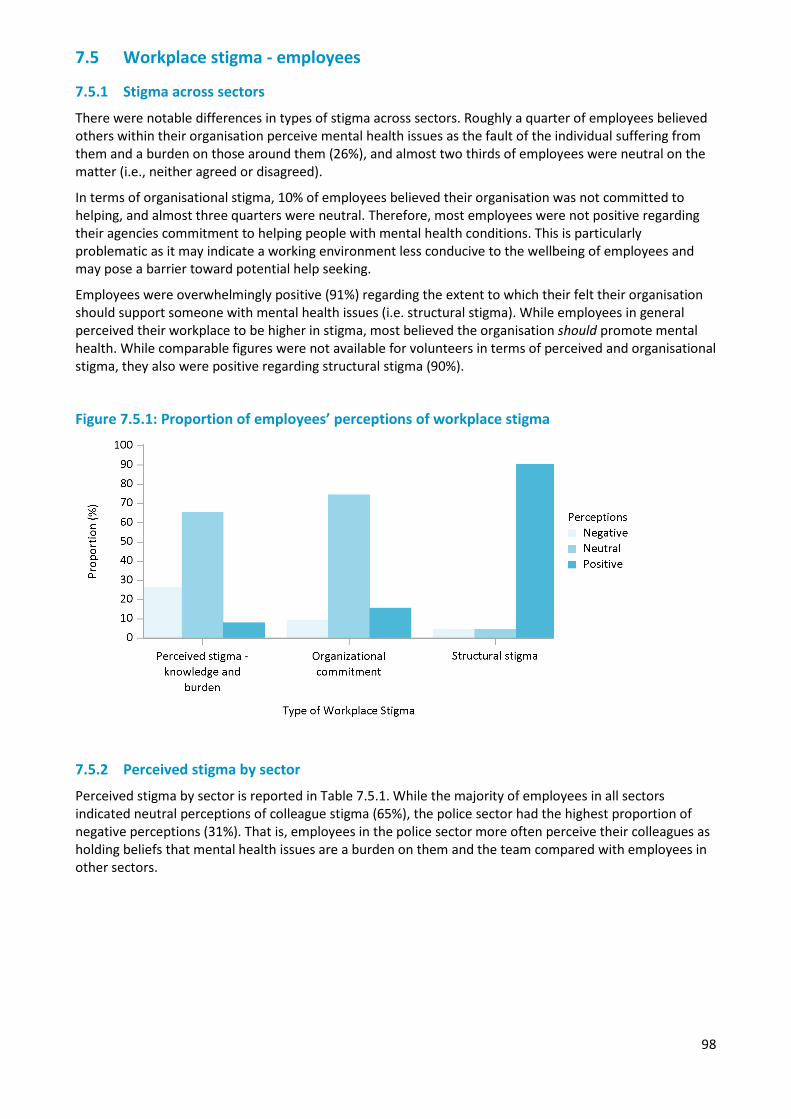
98
7.5 Workplace stigma - employees
7.5.1 Stigma across sectors
There were notable differences in types of stigma across sectors. Roughly a quarter of employees believed others within their organisation perceive mental health issues as the fault of the individual suffering from them and a burden on those around them (26%), and almost two thirds of employees were neutral on the matter (i.e., neither agreed or disagreed).
In terms of organisational stigma, 10% of employees believed their organisation was not committed to helping, and almost three quarters were neutral. Therefore, most employees were not positive regarding their agencies commitment to helping people with mental health conditions. This is particularly problematic as it may indicate a working environment less conducive to the wellbeing of employees and may pose a barrier toward potential help seeking.
Employees were overwhelmingly positive (91%) regarding the extent to which their felt their organisation should support someone with mental health issues (i.e. structural stigma). While employees in general perceived their workplace to be higher in stigma, most believed the organisation should promote mental health. While comparable figures were not available for volunteers in terms of perceived and organisational stigma, they also were positive regarding structural stigma (90%).
Figure 7.5.1: Proportion of employees’ perceptions of workplace stigma
7.5.2 Perceived stigma by sector
Perceived stigma by sector is reported in Table 7.5.1. While the majority of employees in all sectors indicated neutral perceptions of colleague stigma (65%), the police sector had the highest proportion of negative perceptions (31%). That is, employees in the police sector more often perceive their colleagues as holding beliefs that mental health issues are a burden on them and the team compared with employees in other sectors.
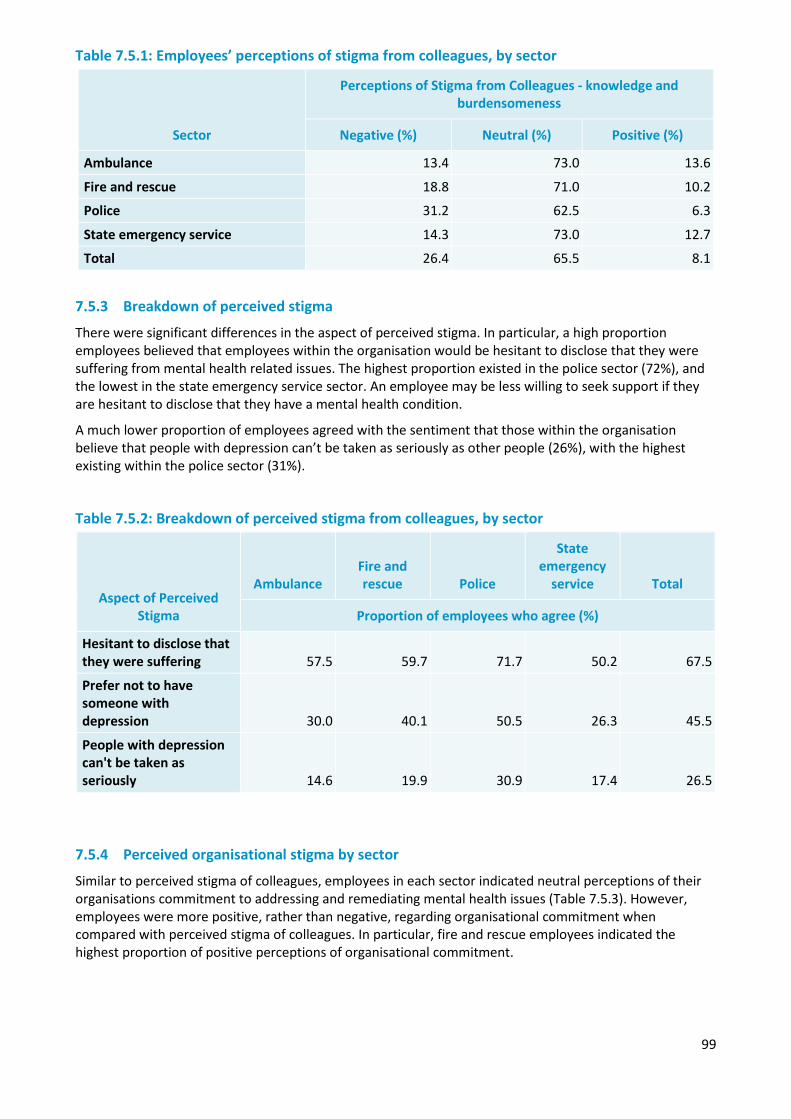
99
Table 7.5.1: Employees’ perceptions of stigma from colleagues, by sector
Sector
Perceptions of Stigma from Colleagues - knowledge and burdensomeness
Negative (%) Neutral (%) Positive (%)
Ambulance 13.4 73.0 13.6
Fire and rescue 18.8 71.0 10.2
Police 31.2 62.5 6.3
State emergency service 14.3 73.0 12.7
Total 26.4 65.5 8.1
7.5.3 Breakdown of perceived stigma
There were significant differences in the aspect of perceived stigma. In particular, a high proportion employees believed that employees within the organisation would be hesitant to disclose that they were suffering from mental health related issues. The highest proportion existed in the police sector (72%), and the lowest in the state emergency service sector. An employee may be less willing to seek support if they are hesitant to disclose that they have a mental health condition.
A much lower proportion of employees agreed with the sentiment that those within the organisation believe that people with depression can’t be taken as seriously as other people (26%), with the highest existing within the police sector (31%).
Table 7.5.2: Breakdown of perceived stigma from colleagues, by sector
Aspect of Perceived Stigma
Ambulance Fire and rescue Police
State emergency
service Total
Proportion of employees who agree (%)
Hesitant to disclose that they were suffering 57.5 59.7 71.7 50.2 67.5
Prefer not to have someone with depression 30.0 40.1 50.5 26.3 45.5
People with depression can't be taken as seriously 14.6 19.9 30.9 17.4 26.5
7.5.4 Perceived organisational stigma by sector
Similar to perceived stigma of colleagues, employees in each sector indicated neutral perceptions of their organisations commitment to addressing and remediating mental health issues (Table 7.5.3). However, employees were more positive, rather than negative, regarding organisational commitment when compared with perceived stigma of colleagues. In particular, fire and rescue employees indicated the highest proportion of positive perceptions of organisational commitment.
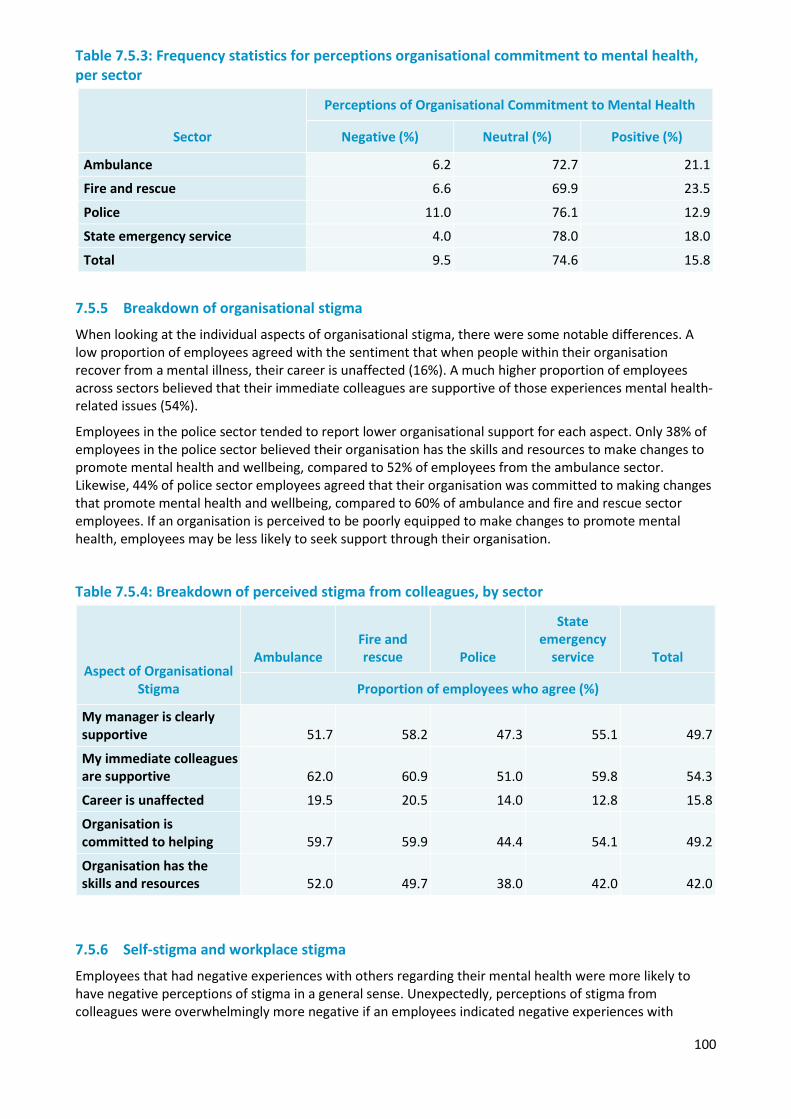
100
Table 7.5.3: Frequency statistics for perceptions organisational commitment to mental health, per sector
7.5.5 Breakdown of organisational stigma
When looking at the individual aspects of organisational stigma, there were some notable differences. A low proportion of employees agreed with the sentiment that when people within their organisation recover from a mental illness, their career is unaffected (16%). A much higher proportion of employees across sectors believed that their immediate colleagues are supportive of those experiences mental health-related issues (54%).
Employees in the police sector tended to report lower organisational support for each aspect. Only 38% of employees in the police sector believed their organisation has the skills and resources to make changes to promote mental health and wellbeing, compared to 52% of employees from the ambulance sector. Likewise, 44% of police sector employees agreed that their organisation was committed to making changes that promote mental health and wellbeing, compared to 60% of ambulance and fire and rescue sector employees. If an organisation is perceived to be poorly equipped to make changes to promote mental health, employees may be less likely to seek support through their organisation.
Table 7.5.4: Breakdown of perceived stigma from colleagues, by sector
Aspect of Organisational Stigma
Ambulance Fire and rescue Police
State emergency
service Total
Proportion of employees who agree (%)
My manager is clearly supportive 51.7 58.2 47.3 55.1 49.7
My immediate colleagues are supportive 62.0 60.9 51.0 59.8 54.3
Career is unaffected 19.5 20.5 14.0 12.8 15.8
Organisation is committed to helping 59.7 59.9 44.4 54.1 49.2
Organisation has the skills and resources 52.0 49.7 38.0 42.0 42.0
7.5.6 Self-stigma and workplace stigma
Employees that had negative experiences with others regarding their mental health were more likely to have negative perceptions of stigma in a general sense. Unexpectedly, perceptions of stigma from colleagues were overwhelmingly more negative if an employees indicated negative experiences with
Sector
Perceptions of Organisational Commitment to Mental Health
Negative (%) Neutral (%) Positive (%)
Ambulance 6.2 72.7 21.1
Fire and rescue 6.6 69.9 23.5
Police 11.0 76.1 12.9
State emergency service 4.0 78.0 18.0
Total 9.5 74.6 15.8
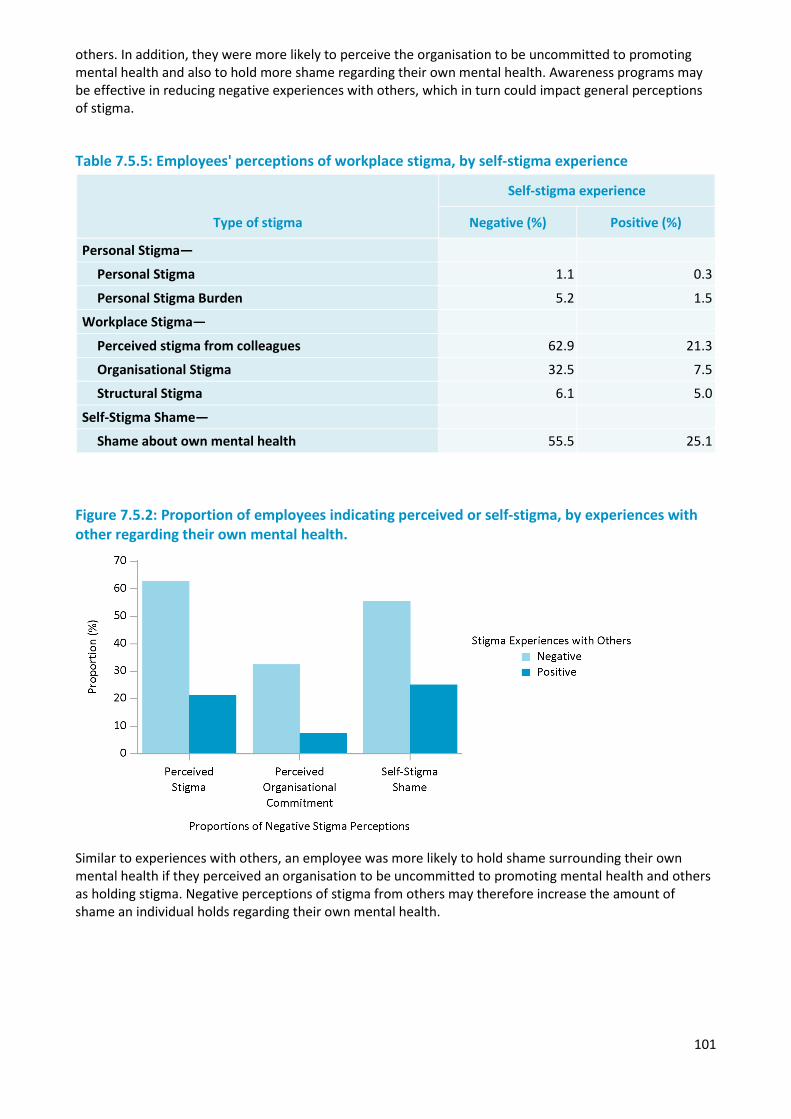
101
others. In addition, they were more likely to perceive the organisation to be uncommitted to promoting mental health and also to hold more shame regarding their own mental health. Awareness programs may be effective in reducing negative experiences with others, which in turn could impact general perceptions of stigma.
Table 7.5.5: Employees' perceptions of workplace stigma, by self-stigma experience
Type of stigma
Self-stigma experience
Negative (%) Positive (%)
Personal Stigma—
Personal Stigma 1.1 0.3
Personal Stigma Burden 5.2 1.5
Workplace Stigma—
Perceived stigma from colleagues 62.9 21.3
Organisational Stigma 32.5 7.5
Structural Stigma 6.1 5.0
Self-Stigma Shame—
Shame about own mental health 55.5 25.1
Figure 7.5.2: Proportion of employees indicating perceived or self-stigma, by experiences with other regarding their own mental health.
Similar to experiences with others, an employee was more likely to hold shame surrounding their own mental health if they perceived an organisation to be uncommitted to promoting mental health and others as holding stigma. Negative perceptions of stigma from others may therefore increase the amount of shame an individual holds regarding their own mental health.
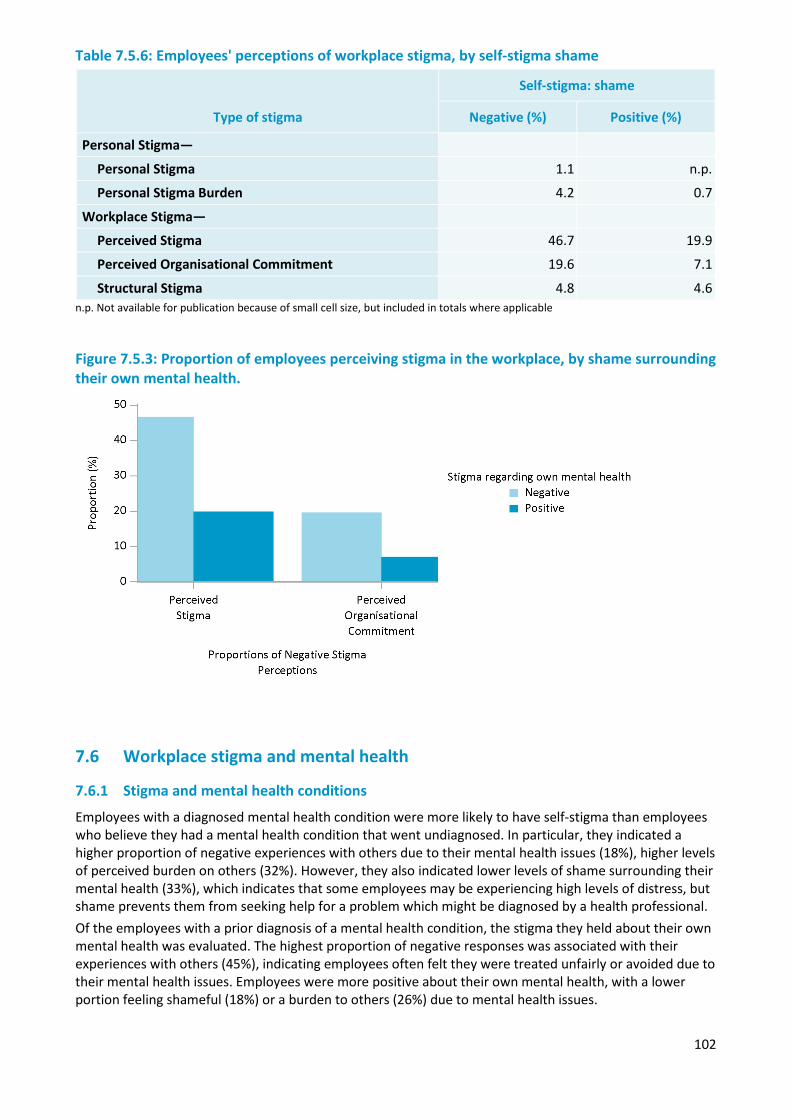
102
Table 7.5.6: Employees' perceptions of workplace stigma, by self-stigma shame
Type of stigma
Self-stigma: shame
Negative (%) Positive (%)
Personal Stigma—
Personal Stigma 1.1 n.p.
Personal Stigma Burden 4.2 0.7
Workplace Stigma—
Perceived Stigma 46.7 19.9
Perceived Organisational Commitment 19.6 7.1
Structural Stigma 4.8 4.6 n.p. Not available for publication because of small cell size, but included in totals where applicable
Figure 7.5.3: Proportion of employees perceiving stigma in the workplace, by shame surrounding their own mental health.
7.6 Workplace stigma and mental health
7.6.1 Stigma and mental health conditions
Employees with a diagnosed mental health condition were more likely to have self-stigma than employees who believe they had a mental health condition that went undiagnosed. In particular, they indicated a higher proportion of negative experiences with others due to their mental health issues (18%), higher levels of perceived burden on others (32%). However, they also indicated lower levels of shame surrounding their mental health (33%), which indicates that some employees may be experiencing high levels of distress, but shame prevents them from seeking help for a problem which might be diagnosed by a health professional. Of the employees with a prior diagnosis of a mental health condition, the stigma they held about their own mental health was evaluated. The highest proportion of negative responses was associated with their experiences with others (45%), indicating employees often felt they were treated unfairly or avoided due to their mental health issues. Employees were more positive about their own mental health, with a lower portion feeling shameful (18%) or a burden to others (26%) due to mental health issues.
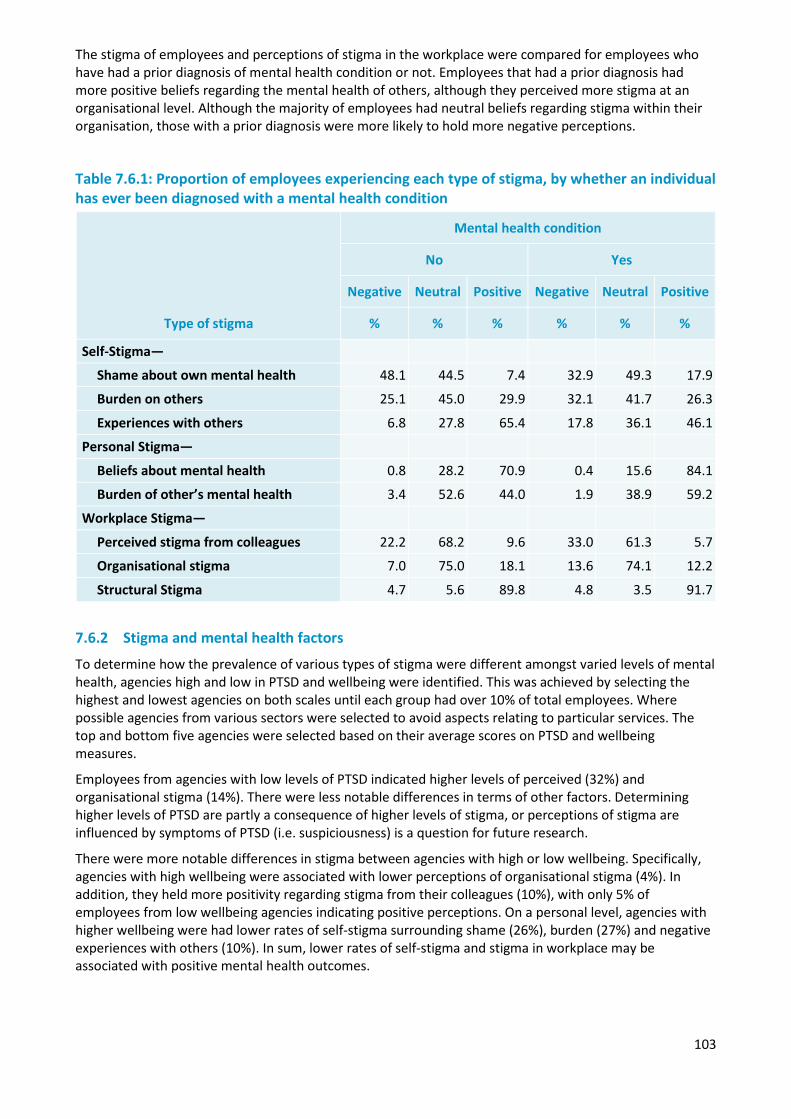
103
The stigma of employees and perceptions of stigma in the workplace were compared for employees who have had a prior diagnosis of mental health condition or not. Employees that had a prior diagnosis had more positive beliefs regarding the mental health of others, although they perceived more stigma at an organisational level. Although the majority of employees had neutral beliefs regarding stigma within their organisation, those with a prior diagnosis were more likely to hold more negative perceptions.
Table 7.6.1: Proportion of employees experiencing each type of stigma, by whether an individual has ever been diagnosed with a mental health condition
Type of stigma
Mental health condition
No Yes
Negative Neutral Positive Negative Neutral Positive
% % % % % %
Self-Stigma—
Shame about own mental health 48.1 44.5 7.4 32.9 49.3 17.9
Burden on others 25.1 45.0 29.9 32.1 41.7 26.3
Experiences with others 6.8 27.8 65.4 17.8 36.1 46.1
Personal Stigma—
Beliefs about mental health 0.8 28.2 70.9 0.4 15.6 84.1
Burden of other’s mental health 3.4 52.6 44.0 1.9 38.9 59.2
Workplace Stigma—
Perceived stigma from colleagues 22.2 68.2 9.6 33.0 61.3 5.7
Organisational stigma 7.0 75.0 18.1 13.6 74.1 12.2
Structural Stigma 4.7 5.6 89.8 4.8 3.5 91.7
7.6.2 Stigma and mental health factors
To determine how the prevalence of various types of stigma were different amongst varied levels of mental health, agencies high and low in PTSD and wellbeing were identified. This was achieved by selecting the highest and lowest agencies on both scales until each group had over 10% of total employees. Where possible agencies from various sectors were selected to avoid aspects relating to particular services. The top and bottom five agencies were selected based on their average scores on PTSD and wellbeing measures.
Employees from agencies with low levels of PTSD indicated higher levels of perceived (32%) and organisational stigma (14%). There were less notable differences in terms of other factors. Determining higher levels of PTSD are partly a consequence of higher levels of stigma, or perceptions of stigma are influenced by symptoms of PTSD (i.e. suspiciousness) is a question for future research.
There were more notable differences in stigma between agencies with high or low wellbeing. Specifically, agencies with high wellbeing were associated with lower perceptions of organisational stigma (4%). In addition, they held more positivity regarding stigma from their colleagues (10%), with only 5% of employees from low wellbeing agencies indicating positive perceptions. On a personal level, agencies with higher wellbeing were had lower rates of self-stigma surrounding shame (26%), burden (27%) and negative experiences with others (10%). In sum, lower rates of self-stigma and stigma in workplace may be associated with positive mental health outcomes.
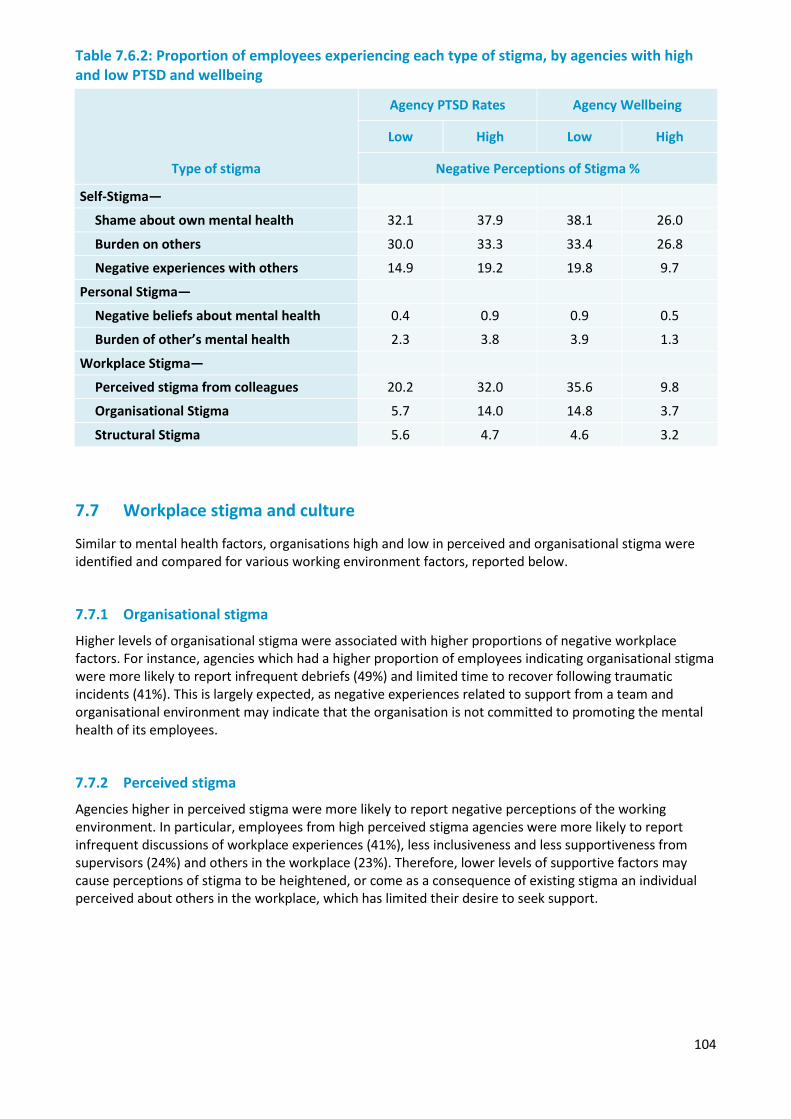
104
Table 7.6.2: Proportion of employees experiencing each type of stigma, by agencies with high and low PTSD and wellbeing
Type of stigma
Agency PTSD Rates Agency Wellbeing
Low High Low High
Negative Perceptions of Stigma %
Self-Stigma—
Shame about own mental health 32.1 37.9 38.1 26.0
Burden on others 30.0 33.3 33.4 26.8
Negative experiences with others 14.9 19.2 19.8 9.7
Personal Stigma—
Negative beliefs about mental health 0.4 0.9 0.9 0.5
Burden of other’s mental health 2.3 3.8 3.9 1.3
Workplace Stigma—
Perceived stigma from colleagues 20.2 32.0 35.6 9.8
Organisational Stigma 5.7 14.0 14.8 3.7
Structural Stigma 5.6 4.7 4.6 3.2
7.7 Workplace stigma and culture
Similar to mental health factors, organisations high and low in perceived and organisational stigma were identified and compared for various working environment factors, reported below.
7.7.1 Organisational stigma
Higher levels of organisational stigma were associated with higher proportions of negative workplace factors. For instance, agencies which had a higher proportion of employees indicating organisational stigma were more likely to report infrequent debriefs (49%) and limited time to recover following traumatic incidents (41%). This is largely expected, as negative experiences related to support from a team and organisational environment may indicate that the organisation is not committed to promoting the mental health of its employees.
7.7.2 Perceived stigma
Agencies higher in perceived stigma were more likely to report negative perceptions of the working environment. In particular, employees from high perceived stigma agencies were more likely to report infrequent discussions of workplace experiences (41%), less inclusiveness and less supportiveness from supervisors (24%) and others in the workplace (23%). Therefore, lower levels of supportive factors may cause perceptions of stigma to be heightened, or come as a consequence of existing stigma an individual perceived about others in the workplace, which has limited their desire to seek support.
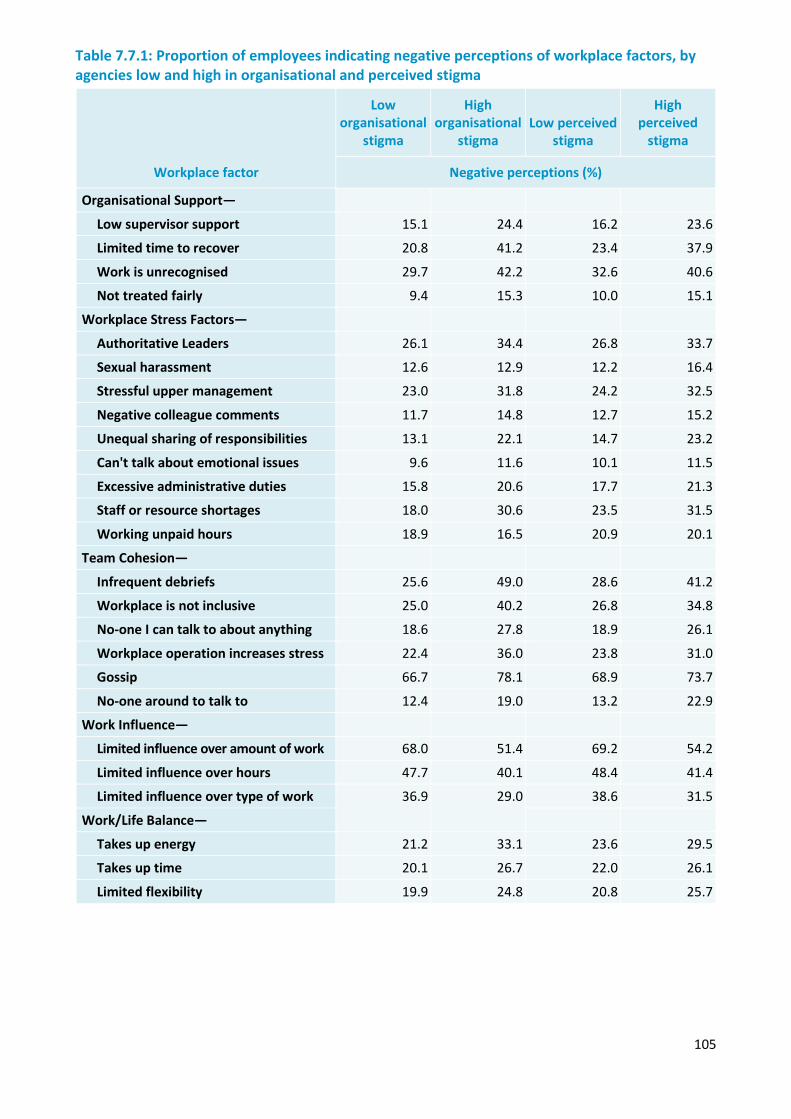
105
Table 7.7.1: Proportion of employees indicating negative perceptions of workplace factors, by agencies low and high in organisational and perceived stigma
Workplace factor
Low organisational
stigma
High organisational
stigma Low perceived
stigma
High perceived
stigma
Negative perceptions (%)
Organisational Support—
Low supervisor support 15.1 24.4 16.2 23.6
Limited time to recover 20.8 41.2 23.4 37.9
Work is unrecognised 29.7 42.2 32.6 40.6
Not treated fairly 9.4 15.3 10.0 15.1
Workplace Stress Factors—
Authoritative Leaders 26.1 34.4 26.8 33.7
Sexual harassment 12.6 12.9 12.2 16.4
Stressful upper management 23.0 31.8 24.2 32.5
Negative colleague comments 11.7 14.8 12.7 15.2
Unequal sharing of responsibilities 13.1 22.1 14.7 23.2
Can't talk about emotional issues 9.6 11.6 10.1 11.5
Excessive administrative duties 15.8 20.6 17.7 21.3
Staff or resource shortages 18.0 30.6 23.5 31.5
Working unpaid hours 18.9 16.5 20.9 20.1
Team Cohesion—
Infrequent debriefs 25.6 49.0 28.6 41.2
Workplace is not inclusive 25.0 40.2 26.8 34.8
No-one I can talk to about anything 18.6 27.8 18.9 26.1
Workplace operation increases stress 22.4 36.0 23.8 31.0
Gossip 66.7 78.1 68.9 73.7
No-one around to talk to 12.4 19.0 13.2 22.9
Work Influence—
Limited influence over amount of work 68.0 51.4 69.2 54.2
Limited influence over hours 47.7 40.1 48.4 41.4
Limited influence over type of work 36.9 29.0 38.6 31.5
Work/Life Balance—
Takes up energy 21.2 33.1 23.6 29.5
Takes up time 20.1 26.7 22.0 26.1
Limited flexibility 19.9 24.8 20.8 25.7
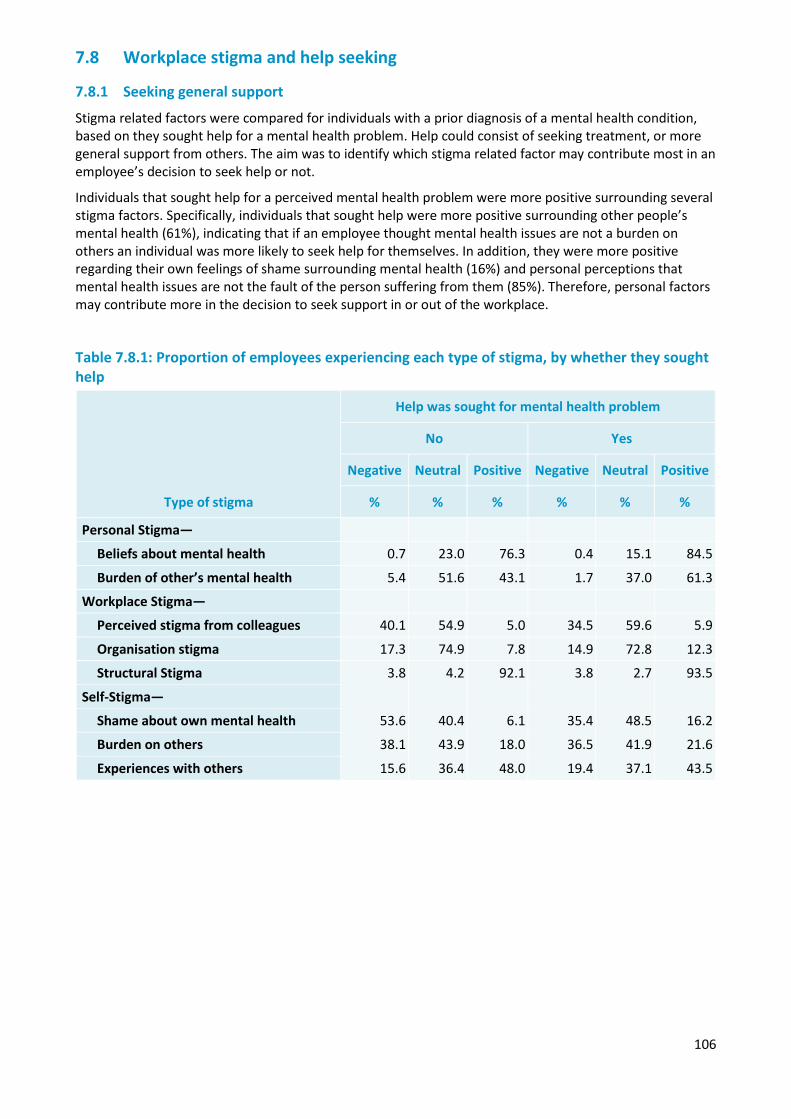
106
7.8 Workplace stigma and help seeking
7.8.1 Seeking general support
Stigma related factors were compared for individuals with a prior diagnosis of a mental health condition, based on they sought help for a mental health problem. Help could consist of seeking treatment, or more general support from others. The aim was to identify which stigma related factor may contribute most in an employee’s decision to seek help or not.
Individuals that sought help for a perceived mental health problem were more positive surrounding several stigma factors. Specifically, individuals that sought help were more positive surrounding other people’s mental health (61%), indicating that if an employee thought mental health issues are not a burden on others an individual was more likely to seek help for themselves. In addition, they were more positive regarding their own feelings of shame surrounding mental health (16%) and personal perceptions that mental health issues are not the fault of the person suffering from them (85%). Therefore, personal factors may contribute more in the decision to seek support in or out of the workplace.
Table 7.8.1: Proportion of employees experiencing each type of stigma, by whether they sought help
Type of stigma
Help was sought for mental health problem
No Yes
Negative Neutral Positive Negative Neutral Positive
% % % % % %
Personal Stigma—
Beliefs about mental health 0.7 23.0 76.3 0.4 15.1 84.5
Burden of other’s mental health 5.4 51.6 43.1 1.7 37.0 61.3
Workplace Stigma—
Perceived stigma from colleagues 40.1 54.9 5.0 34.5 59.6 5.9
Organisation stigma 17.3 74.9 7.8 14.9 72.8 12.3
Structural Stigma 3.8 4.2 92.1 3.8 2.7 93.5
Self-Stigma—
Shame about own mental health 53.6 40.4 6.1 35.4 48.5 16.2
Burden on others 38.1 43.9 18.0 36.5 41.9 21.6
Experiences with others 15.6 36.4 48.0 19.4 37.1 43.5
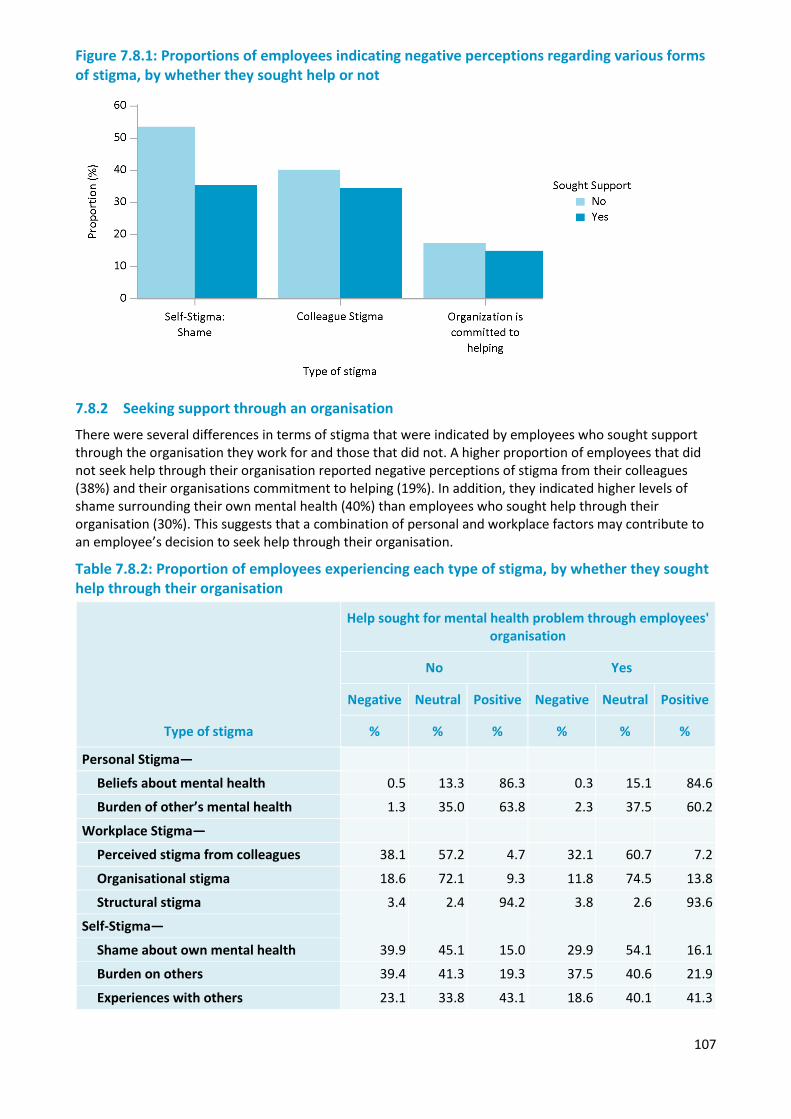
107
Figure 7.8.1: Proportions of employees indicating negative perceptions regarding various forms of stigma, by whether they sought help or not
7.8.2 Seeking support through an organisation
There were several differences in terms of stigma that were indicated by employees who sought support through the organisation they work for and those that did not. A higher proportion of employees that did not seek help through their organisation reported negative perceptions of stigma from their colleagues (38%) and their organisations commitment to helping (19%). In addition, they indicated higher levels of shame surrounding their own mental health (40%) than employees who sought help through their organisation (30%). This suggests that a combination of personal and workplace factors may contribute to an employee’s decision to seek help through their organisation.
Table 7.8.2: Proportion of employees experiencing each type of stigma, by whether they sought help through their organisation
Type of stigma
Help sought for mental health problem through employees' organisation
No Yes
Negative Neutral Positive Negative Neutral Positive
% % % % % %
Personal Stigma—
Beliefs about mental health 0.5 13.3 86.3 0.3 15.1 84.6
Burden of other’s mental health 1.3 35.0 63.8 2.3 37.5 60.2
Workplace Stigma—
Perceived stigma from colleagues 38.1 57.2 4.7 32.1 60.7 7.2
Organisational stigma 18.6 72.1 9.3 11.8 74.5 13.8
Structural stigma 3.4 2.4 94.2 3.8 2.6 93.6
Self-Stigma—
Shame about own mental health 39.9 45.1 15.0 29.9 54.1 16.1
Burden on others 39.4 41.3 19.3 37.5 40.6 21.9
Experiences with others 23.1 33.8 43.1 18.6 40.1 41.3
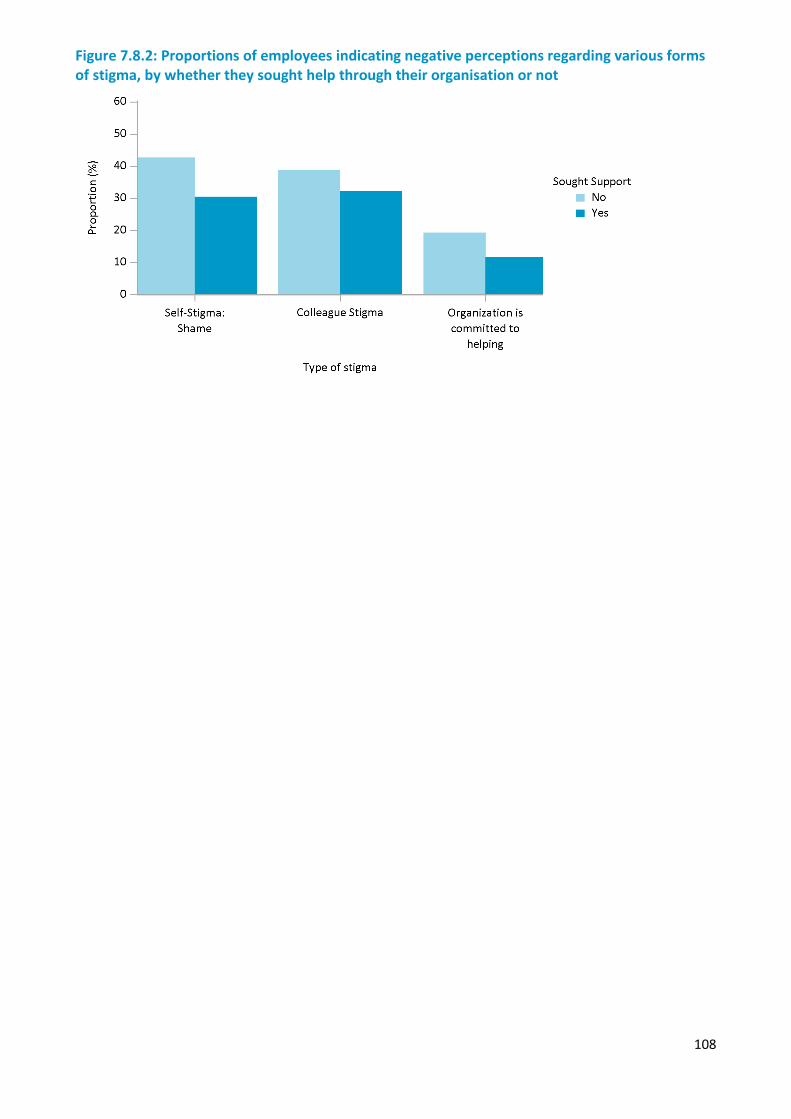
108
Figure 7.8.2: Proportions of employees indicating negative perceptions regarding various forms of stigma, by whether they sought help through their organisation or not
109
Chapter 8 — Seeking support
Overview
This chapter reports on the use of health and support services by employees and volunteers experiencing mental health conditions. This includes the perceived need for help or support for mental or emotional problems, the use of services, barriers to seeking support, organisational support mechanisms that aim to promote mental health and wellbeing, and involvement in peer support work within the organisation.
Key findings from the chapter include:
• Over one third of employees, and one fifth of volunteers, felt that they needed help or support for mental or emotional problems in the previous 12 months.
• Fourteen percent of employees with high or very high distress, and 2% of employees with PTSD, did not feel that they had a mental health or emotional problem in the past 12 months. This is a primary barrier to seeking support and suggests possible issues with mental health literacy and stigma within portions of the sector.
• Fifty three percent of employees and 65% of volunteers felt that, despite accessing services, they did not receive adequate support for their level of need. Of note, employees who felt they needed more help appeared to access similar levels of services as those who reported that they received adequate help. This suggests that, among those who needed more help, the level of need may be higher and they require more intensive or ongoing help and support to address their emotional or mental health issues.
• More than one in five employees with probable PTSD or with very high levels of psychological distress delayed seeking support by more than one year.
• Among employees with probable PTSD, almost 20% did not perceive they had a problem or did not seek help, and over 20% perceived a need for help but did not seek or did not receive help. About 40% sought help but felt they needed more help than they received, and only one in five employees felt they received sufficient help for their needs.
• Around half of psychologist services accessed in the previous year were sourced through or provided by their organisation.
Gaps were identified in seeking support at several levels. Not all of the employees and volunteers experiencing symptoms of mental health problems and functional impairment due to those symptoms perceived the need to seek help or chose to seek help. Of those that did seek help, some delayed seeking help, in some cases by more than a year. Of those that did seek help, many felt they did not receive a sufficient level of help for their problems.
8.1 Perceived need for help or support
A critical first step to seeking support is recognising the need for support. For example, survey participants who were identified as having probable Post-traumatic stress disorder (PTSD) reported symptoms of PTSD and that these symptoms significantly interfered with their daily lives. If people who identified symptoms and functional impairment associated with these symptoms also reported that they did not seek help because they did not believe they had a problem or needed any help or support, this would be suggestive of possible issues with mental health literacy (i.e. not being aware of what types of symptoms indicate possible problems that could benefit from seeking support or treatment, or what types of help and support are available), or with stigma associated with admitting a problem and seeking support.
8.1.1 Employees
More than one in three current employees felt that, in the previous 12 months, they needed help or support for an emotional or mental health problem. There was some variation in the perceived need for support by sector, with the highest rate (42%) among ambulance employees and lowest (32%) in the fire and rescue sector. Across sectors, higher rates of perceived need were identified among employees aged 35 to 54 years, females, and those who had spent more than five years in the organisation (Table 8.1.1).
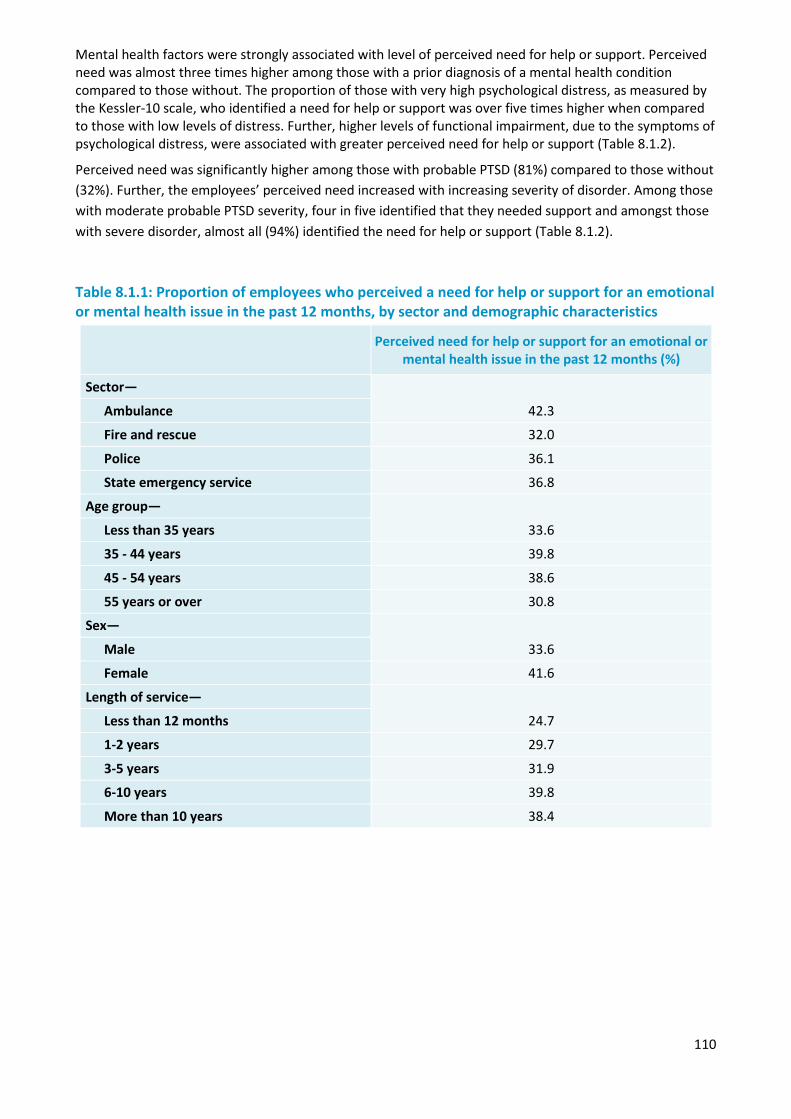
110
Mental health factors were strongly associated with level of perceived need for help or support. Perceived need was almost three times higher among those with a prior diagnosis of a mental health condition compared to those without. The proportion of those with very high psychological distress, as measured by the Kessler-10 scale, who identified a need for help or support was over five times higher when compared to those with low levels of distress. Further, higher levels of functional impairment, due to the symptoms of psychological distress, were associated with greater perceived need for help or support (Table 8.1.2).
Perceived need was significantly higher among those with probable PTSD (81%) compared to those without (32%). Further, the employees’ perceived need increased with increasing severity of disorder. Among those with moderate probable PTSD severity, four in five identified that they needed support and amongst those with severe disorder, almost all (94%) identified the need for help or support (Table 8.1.2).
Table 8.1.1: Proportion of employees who perceived a need for help or support for an emotional or mental health issue in the past 12 months, by sector and demographic characteristics
Perceived need for help or support for an emotional or mental health issue in the past 12 months (%)
Sector—
42.3 Ambulance
Fire and rescue 32.0
Police 36.1
State emergency service 36.8
Age group—
33.6 Less than 35 years
35 - 44 years 39.8
45 - 54 years 38.6
55 years or over 30.8
Sex—
33.6 Male
Female 41.6
Length of service—
24.7 Less than 12 months
1-2 years 29.7
3-5 years 31.9
6-10 years 39.8
More than 10 years 38.4
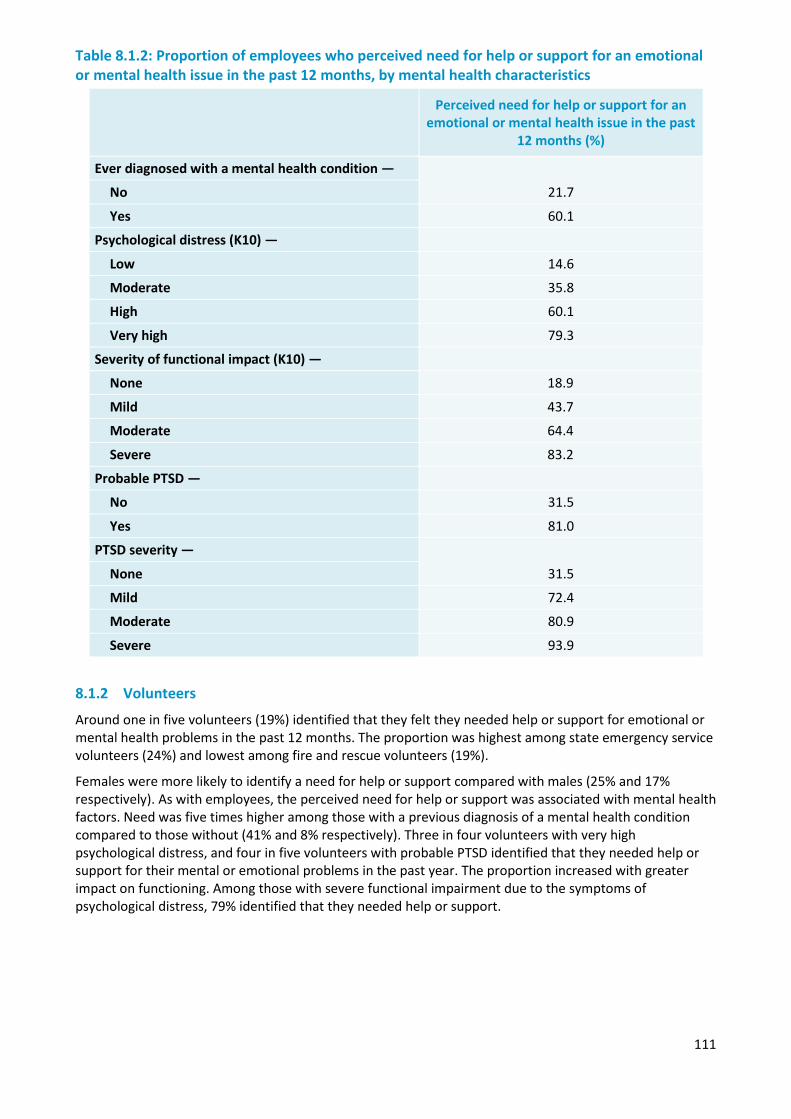
111
Table 8.1.2: Proportion of employees who perceived need for help or support for an emotional or mental health issue in the past 12 months, by mental health characteristics
Perceived need for help or support for an
emotional or mental health issue in the past 12 months (%)
Ever diagnosed with a mental health condition —
21.7 No
Yes 60.1
Psychological distress (K10) —
Low 14.6
Moderate 35.8
High 60.1
Very high 79.3
Severity of functional impact (K10) —
None 18.9
Mild 43.7
Moderate 64.4
Severe 83.2
Probable PTSD —
No 31.5
Yes 81.0
PTSD severity —
31.5 None
Mild 72.4
Moderate 80.9
Severe 93.9
8.1.2 Volunteers
Around one in five volunteers (19%) identified that they felt they needed help or support for emotional or mental health problems in the past 12 months. The proportion was highest among state emergency service volunteers (24%) and lowest among fire and rescue volunteers (19%).
Females were more likely to identify a need for help or support compared with males (25% and 17% respectively). As with employees, the perceived need for help or support was associated with mental health factors. Need was five times higher among those with a previous diagnosis of a mental health condition compared to those without (41% and 8% respectively). Three in four volunteers with very high psychological distress, and four in five volunteers with probable PTSD identified that they needed help or support for their mental or emotional problems in the past year. The proportion increased with greater impact on functioning. Among those with severe functional impairment due to the symptoms of psychological distress, 79% identified that they needed help or support.
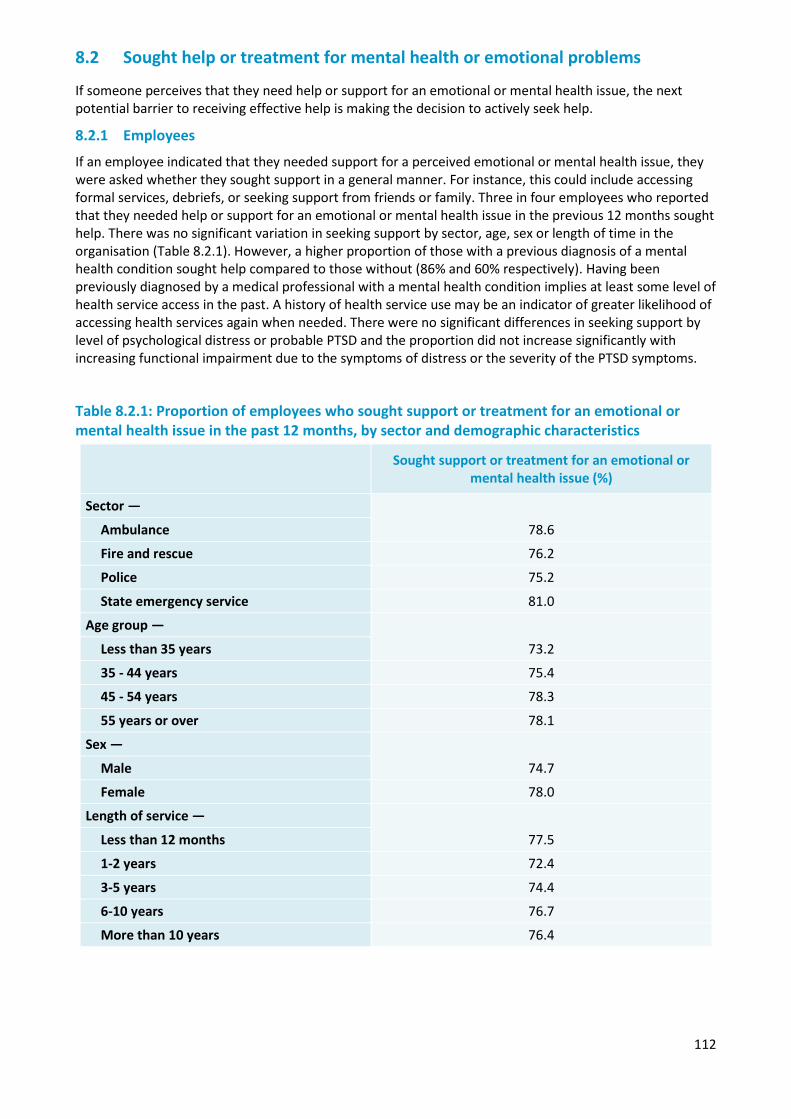
112
8.2 Sought help or treatment for mental health or emotional problems
If someone perceives that they need help or support for an emotional or mental health issue, the next potential barrier to receiving effective help is making the decision to actively seek help.
8.2.1 Employees
If an employee indicated that they needed support for a perceived emotional or mental health issue, they were asked whether they sought support in a general manner. For instance, this could include accessing formal services, debriefs, or seeking support from friends or family. Three in four employees who reported that they needed help or support for an emotional or mental health issue in the previous 12 months sought help. There was no significant variation in seeking support by sector, age, sex or length of time in the organisation (Table 8.2.1). However, a higher proportion of those with a previous diagnosis of a mental health condition sought help compared to those without (86% and 60% respectively). Having been previously diagnosed by a medical professional with a mental health condition implies at least some level of health service access in the past. A history of health service use may be an indicator of greater likelihood of accessing health services again when needed. There were no significant differences in seeking support by level of psychological distress or probable PTSD and the proportion did not increase significantly with increasing functional impairment due to the symptoms of distress or the severity of the PTSD symptoms.
Table 8.2.1: Proportion of employees who sought support or treatment for an emotional or mental health issue in the past 12 months, by sector and demographic characteristics
Sought support or treatment for an emotional or mental health issue (%)
Sector —
78.6 Ambulance
Fire and rescue 76.2
Police 75.2
State emergency service 81.0
Age group —
73.2 Less than 35 years
35 - 44 years 75.4
45 - 54 years 78.3
55 years or over 78.1
Sex —
74.7 Male
Female 78.0
Length of service —
77.5 Less than 12 months
1-2 years 72.4
3-5 years 74.4
6-10 years 76.7
More than 10 years 76.4
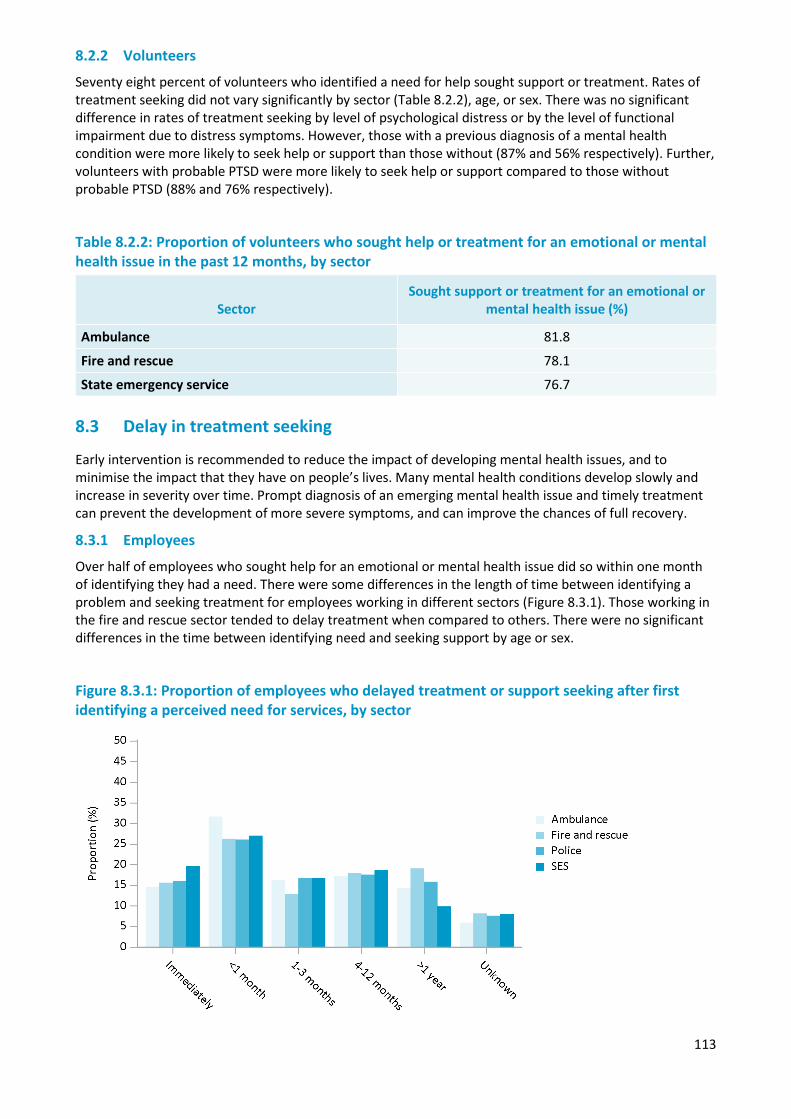
113
8.2.2 Volunteers
Seventy eight percent of volunteers who identified a need for help sought support or treatment. Rates of treatment seeking did not vary significantly by sector (Table 8.2.2), age, or sex. There was no significant difference in rates of treatment seeking by level of psychological distress or by the level of functional impairment due to distress symptoms. However, those with a previous diagnosis of a mental health condition were more likely to seek help or support than those without (87% and 56% respectively). Further, volunteers with probable PTSD were more likely to seek help or support compared to those without probable PTSD (88% and 76% respectively).
Table 8.2.2: Proportion of volunteers who sought help or treatment for an emotional or mental health issue in the past 12 months, by sector
Sector Sought support or treatment for an emotional or
mental health issue (%)
Ambulance 81.8
Fire and rescue 78.1
State emergency service 76.7 8.3 Delay in treatment seeking
Early intervention is recommended to reduce the impact of developing mental health issues, and to minimise the impact that they have on people’s lives. Many mental health conditions develop slowly and increase in severity over time. Prompt diagnosis of an emerging mental health issue and timely treatment can prevent the development of more severe symptoms, and can improve the chances of full recovery.
8.3.1 Employees
Over half of employees who sought help for an emotional or mental health issue did so within one month of identifying they had a need. There were some differences in the length of time between identifying a problem and seeking treatment for employees working in different sectors (Figure 8.3.1). Those working in the fire and rescue sector tended to delay treatment when compared to others. There were no significant differences in the time between identifying need and seeking support by age or sex.
Figure 8.3.1: Proportion of employees who delayed treatment or support seeking after first identifying a perceived need for services, by sector
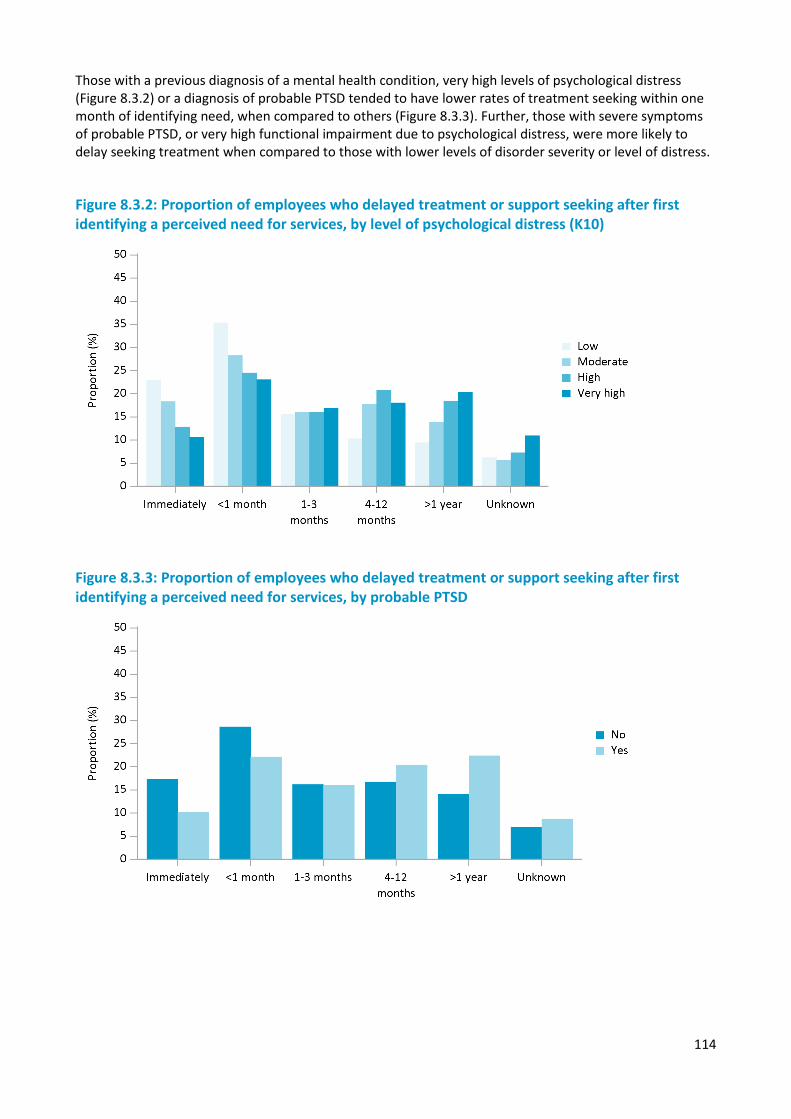
114
Those with a previous diagnosis of a mental health condition, very high levels of psychological distress (Figure 8.3.2) or a diagnosis of probable PTSD tended to have lower rates of treatment seeking within one month of identifying need, when compared to others (Figure 8.3.3). Further, those with severe symptoms of probable PTSD, or very high functional impairment due to psychological distress, were more likely to delay seeking treatment when compared to those with lower levels of disorder severity or level of distress.
Figure 8.3.2: Proportion of employees who delayed treatment or support seeking after first identifying a perceived need for services, by level of psychological distress (K10)
Figure 8.3.3: Proportion of employees who delayed treatment or support seeking after first identifying a perceived need for services, by probable PTSD
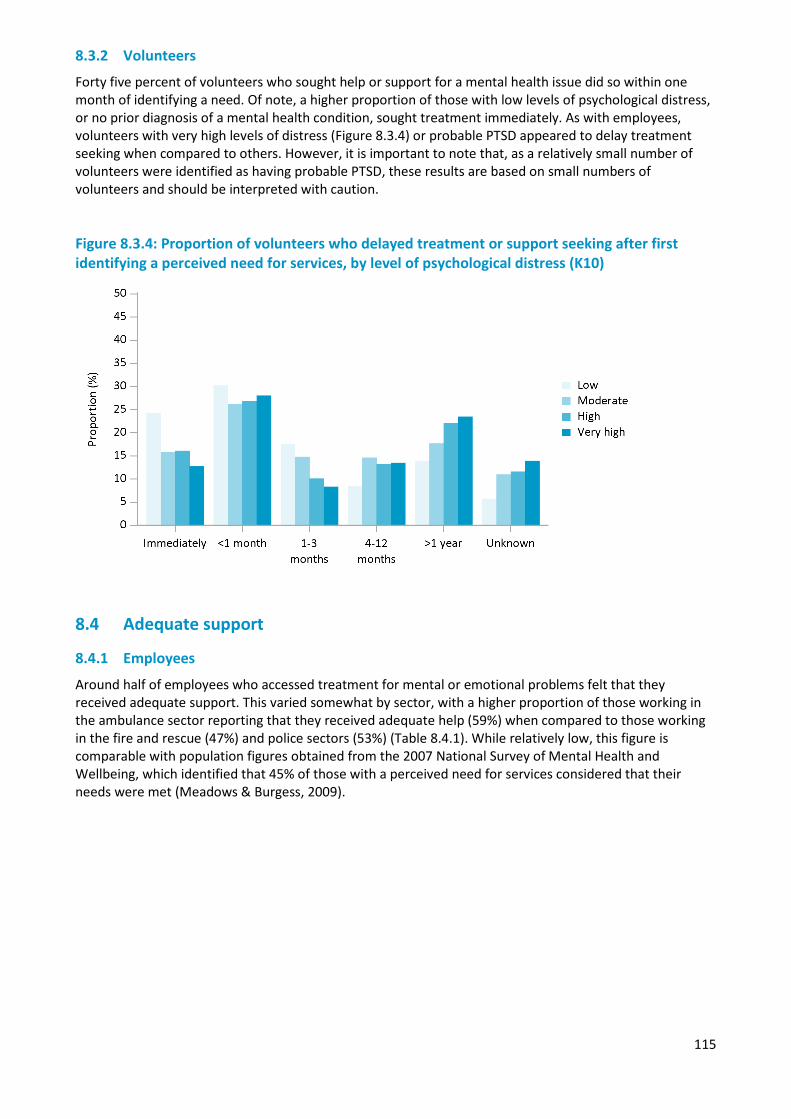
115
8.3.2 Volunteers
Forty five percent of volunteers who sought help or support for a mental health issue did so within one month of identifying a need. Of note, a higher proportion of those with low levels of psychological distress, or no prior diagnosis of a mental health condition, sought treatment immediately. As with employees, volunteers with very high levels of distress (Figure 8.3.4) or probable PTSD appeared to delay treatment seeking when compared to others. However, it is important to note that, as a relatively small number of volunteers were identified as having probable PTSD, these results are based on small numbers of volunteers and should be interpreted with caution.
Figure 8.3.4: Proportion of volunteers who delayed treatment or support seeking after first identifying a perceived need for services, by level of psychological distress (K10)
8.4 Adequate support
8.4.1 Employees
Around half of employees who accessed treatment for mental or emotional problems felt that they received adequate support. This varied somewhat by sector, with a higher proportion of those working in the ambulance sector reporting that they received adequate help (59%) when compared to those working in the fire and rescue (47%) and police sectors (53%) (Table 8.4.1). While relatively low, this figure is comparable with population figures obtained from the 2007 National Survey of Mental Health and Wellbeing, which identified that 45% of those with a perceived need for services considered that their needs were met (Meadows & Burgess, 2009).
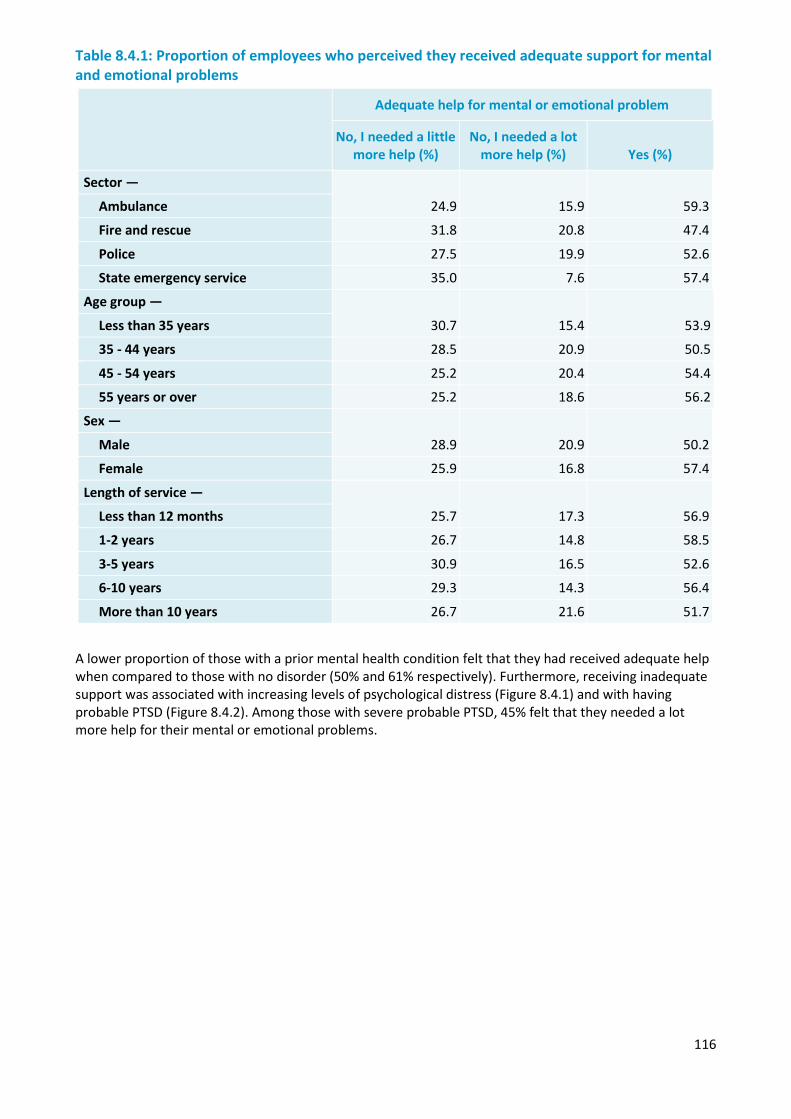
116
Table 8.4.1: Proportion of employees who perceived they received adequate support for mental and emotional problems
Adequate help for mental or emotional problem
No, I needed a little more help (%)
No, I needed a lot more help (%) Yes (%)
Sector —
24.9 15.9 59.3 Ambulance
Fire and rescue 31.8 20.8 47.4
Police 27.5 19.9 52.6
State emergency service 35.0 7.6 57.4
Age group —
30.7 15.4 53.9 Less than 35 years
35 - 44 years 28.5 20.9 50.5
45 - 54 years 25.2 20.4 54.4
55 years or over 25.2 18.6 56.2
Sex —
28.9 20.9 50.2 Male
Female 25.9 16.8 57.4
Length of service —
25.7 17.3 56.9 Less than 12 months
1-2 years 26.7 14.8 58.5
3-5 years 30.9 16.5 52.6
6-10 years 29.3 14.3 56.4
More than 10 years 26.7 21.6 51.7
A lower proportion of those with a prior mental health condition felt that they had received adequate help when compared to those with no disorder (50% and 61% respectively). Furthermore, receiving inadequate support was associated with increasing levels of psychological distress (Figure 8.4.1) and with having probable PTSD (Figure 8.4.2). Among those with severe probable PTSD, 45% felt that they needed a lot more help for their mental or emotional problems.

117
Figure 8.4.1: Proportion of employees who felt they received adequate help for mental or emotional problems, by level of psychological distress (K10)
Figure 8.4.2: Proportion of employees who felt they received adequate help for mental or emotional problems, by probable PTSD
8.4.2 Volunteers
Sixty five percent of volunteers who accessed help or support for their mental or emotional problems felt that they received as much help as they needed. There were no significant differences in the perceived level of support received by sector, age or sex.
While the proportion of those with a prior diagnosis of a mental health condition who reported that they received adequate help was lower than the proportion with no prior diagnosis, these differences were not significant. However, those with probable PTSD were significantly less likely to identify that they received adequate help or support (45%) compared to those without probable PTSD (70%).
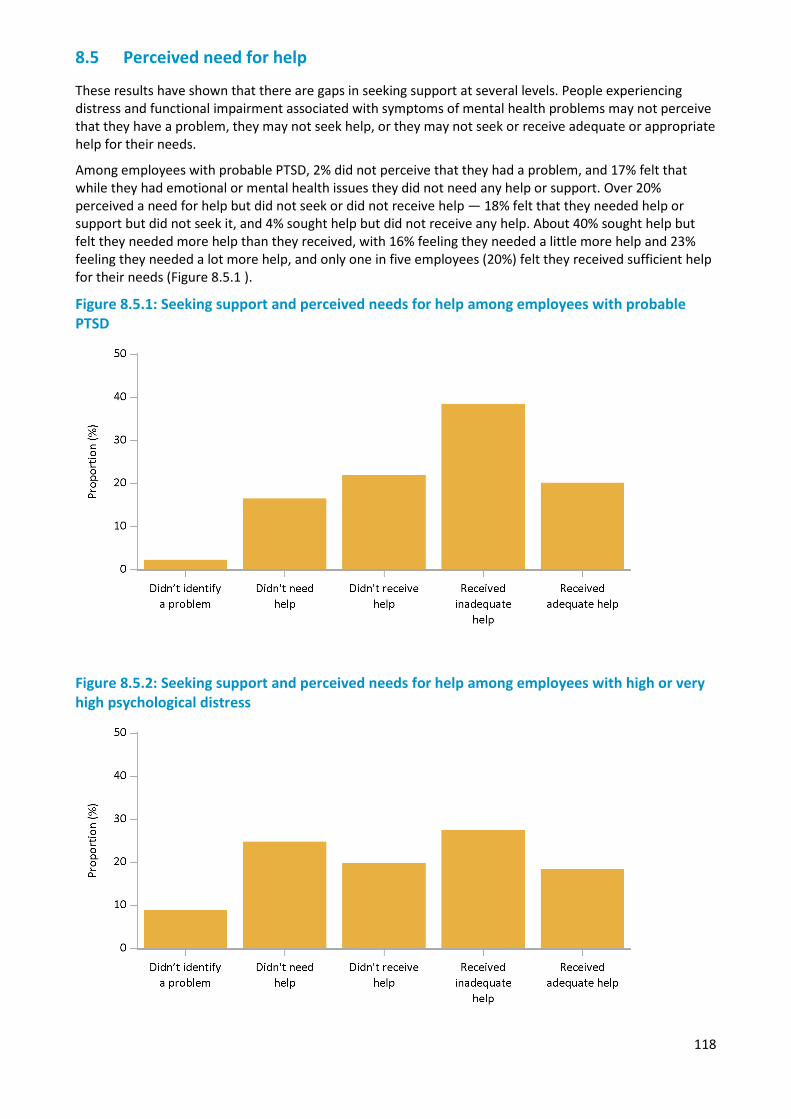
118
8.5 Perceived need for help
These results have shown that there are gaps in seeking support at several levels. People experiencing distress and functional impairment associated with symptoms of mental health problems may not perceive that they have a problem, they may not seek help, or they may not seek or receive adequate or appropriate help for their needs.
Among employees with probable PTSD, 2% did not perceive that they had a problem, and 17% felt that while they had emotional or mental health issues they did not need any help or support. Over 20% perceived a need for help but did not seek or did not receive help — 18% felt that they needed help or support but did not seek it, and 4% sought help but did not receive any help. About 40% sought help but felt they needed more help than they received, with 16% feeling they needed a little more help and 23% feeling they needed a lot more help, and only one in five employees (20%) felt they received sufficient help for their needs (Figure 8.5.1 ).
Figure 8.5.1: Seeking support and perceived needs for help among employees with probable PTSD
Figure 8.5.2: Seeking support and perceived needs for help among employees with high or very high psychological distress
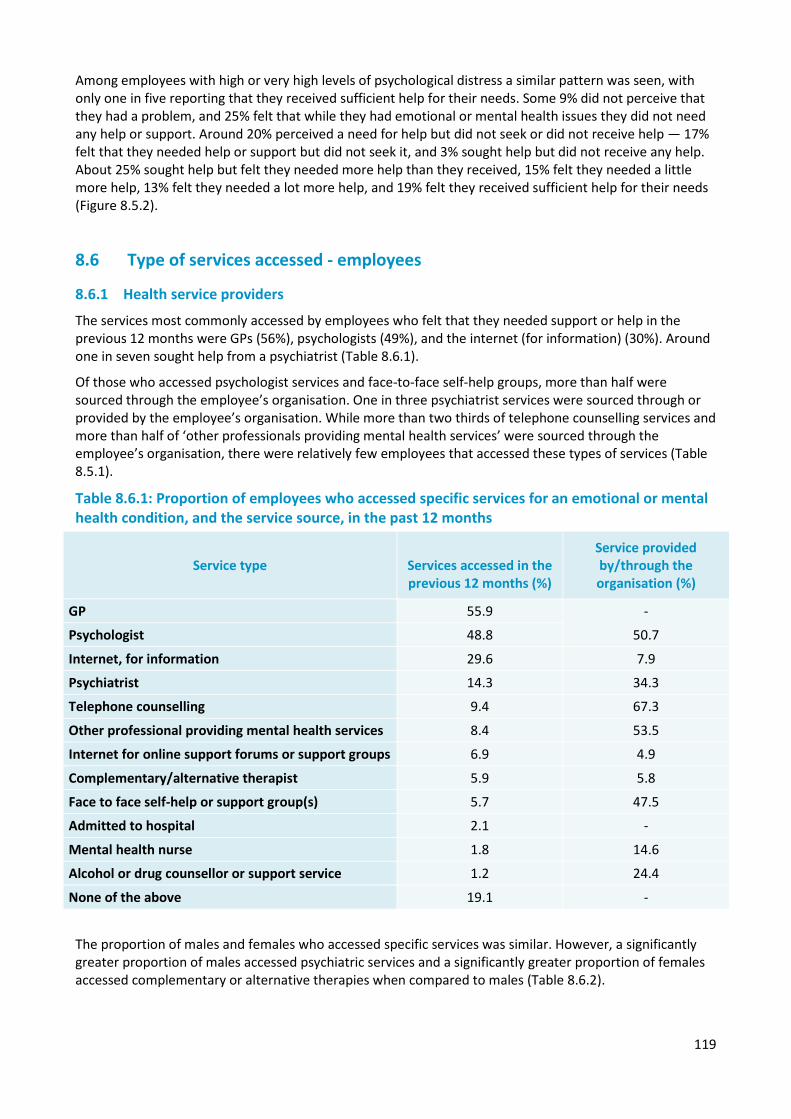
119
Among employees with high or very high levels of psychological distress a similar pattern was seen, with only one in five reporting that they received sufficient help for their needs. Some 9% did not perceive that they had a problem, and 25% felt that while they had emotional or mental health issues they did not need any help or support. Around 20% perceived a need for help but did not seek or did not receive help — 17% felt that they needed help or support but did not seek it, and 3% sought help but did not receive any help. About 25% sought help but felt they needed more help than they received, 15% felt they needed a little more help, 13% felt they needed a lot more help, and 19% felt they received sufficient help for their needs (Figure 8.5.2).
8.6 Type of services accessed - employees
8.6.1 Health service providers
The services most commonly accessed by employees who felt that they needed support or help in the previous 12 months were GPs (56%), psychologists (49%), and the internet (for information) (30%). Around one in seven sought help from a psychiatrist (Table 8.6.1).
Of those who accessed psychologist services and face-to-face self-help groups, more than half were sourced through the employee’s organisation. One in three psychiatrist services were sourced through or provided by the employee’s organisation. While more than two thirds of telephone counselling services and more than half of ‘other professionals providing mental health services’ were sourced through the employee’s organisation, there were relatively few employees that accessed these types of services (Table 8.5.1).
Table 8.6.1: Proportion of employees who accessed specific services for an emotional or mental health condition, and the service source, in the past 12 months
Service type Services accessed in the previous 12 months (%)
Service provided by/through the organisation (%)
GP 55.9 -
Psychologist 48.8 50.7
Internet, for information 29.6 7.9
Psychiatrist 14.3 34.3
Telephone counselling 9.4 67.3
Other professional providing mental health services 8.4 53.5
Internet for online support forums or support groups 6.9 4.9
Complementary/alternative therapist 5.9 5.8
Face to face self-help or support group(s) 5.7 47.5
Admitted to hospital 2.1 -
Mental health nurse 1.8 14.6
Alcohol or drug counsellor or support service 1.2 24.4
None of the above 19.1 -
The proportion of males and females who accessed specific services was similar. However, a significantly greater proportion of males accessed psychiatric services and a significantly greater proportion of females accessed complementary or alternative therapies when compared to males (Table 8.6.2).
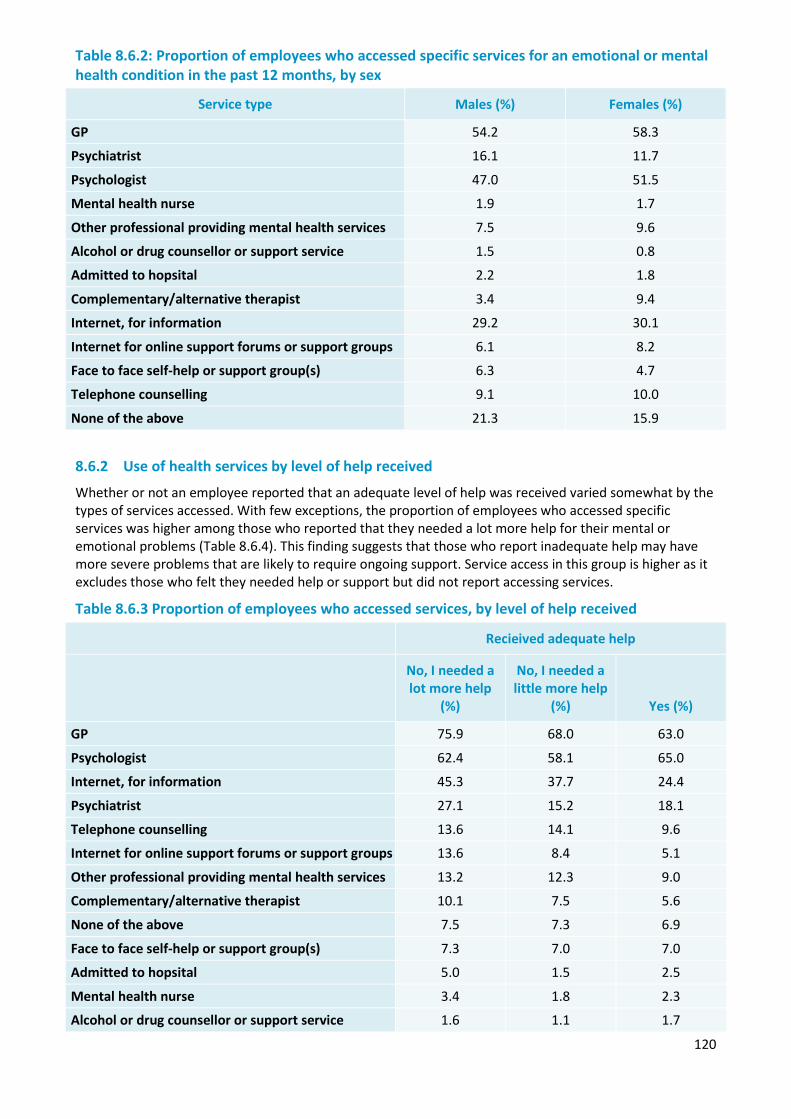
120
Table 8.6.2: Proportion of employees who accessed specific services for an emotional or mental health condition in the past 12 months, by sex
Service type Males (%) Females (%)
GP 54.2 58.3
Psychiatrist 16.1 11.7
Psychologist 47.0 51.5
Mental health nurse 1.9 1.7
Other professional providing mental health services 7.5 9.6
Alcohol or drug counsellor or support service 1.5 0.8
Admitted to hopsital 2.2 1.8
Complementary/alternative therapist 3.4 9.4
Internet, for information 29.2 30.1
Internet for online support forums or support groups 6.1 8.2
Face to face self-help or support group(s) 6.3 4.7
Telephone counselling 9.1 10.0
None of the above 21.3 15.9
8.6.2 Use of health services by level of help received
Whether or not an employee reported that an adequate level of help was received varied somewhat by the types of services accessed. With few exceptions, the proportion of employees who accessed specific services was higher among those who reported that they needed a lot more help for their mental or emotional problems (Table 8.6.4). This finding suggests that those who report inadequate help may have more severe problems that are likely to require ongoing support. Service access in this group is higher as it excludes those who felt they needed help or support but did not report accessing services.
Table 8.6.3 Proportion of employees who accessed services, by level of help received
Recieived adequate help
No, I needed a lot more help
(%)
No, I needed a little more help
(%) Yes (%)
GP 75.9 68.0 63.0
Psychologist 62.4 58.1 65.0
Internet, for information 45.3 37.7 24.4
Psychiatrist 27.1 15.2 18.1
Telephone counselling 13.6 14.1 9.6
Internet for online support forums or support groups 13.6 8.4 5.1
Other professional providing mental health services 13.2 12.3 9.0
Complementary/alternative therapist 10.1 7.5 5.6
None of the above 7.5 7.3 6.9
Face to face self-help or support group(s) 7.3 7.0 7.0
Admitted to hopsital 5.0 1.5 2.5
Mental health nurse 3.4 1.8 2.3
Alcohol or drug counsellor or support service 1.6 1.1 1.7
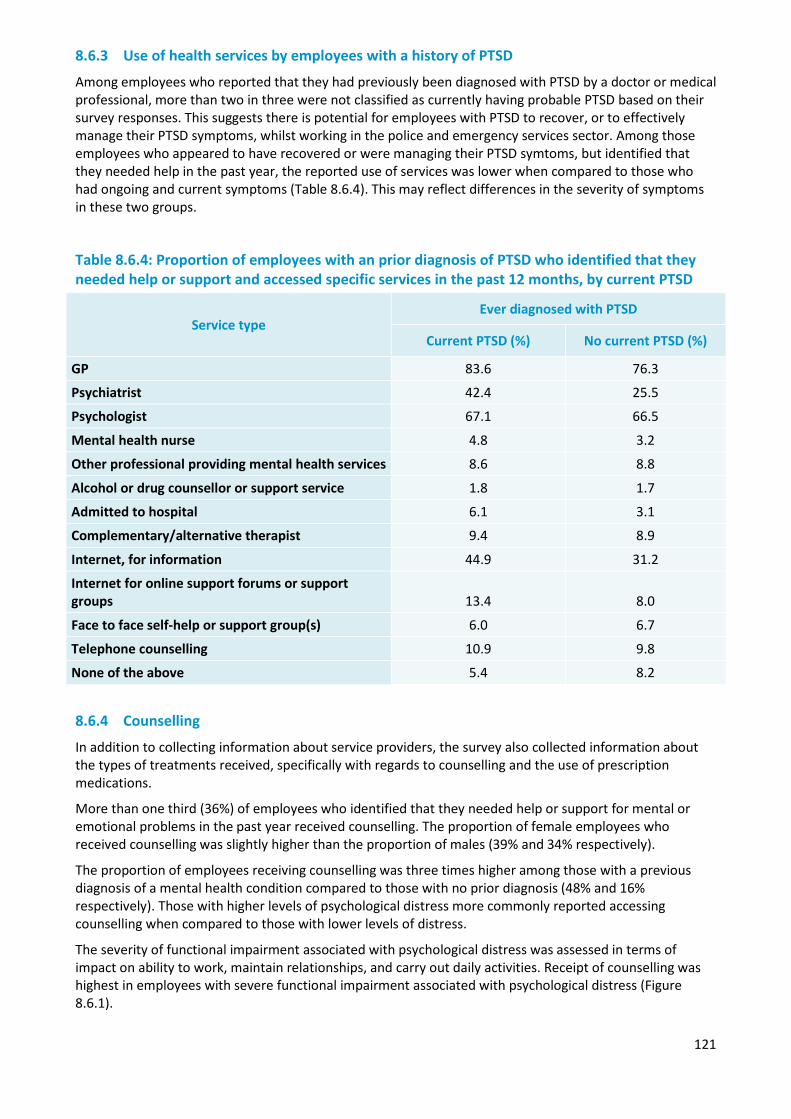
121
8.6.3 Use of health services by employees with a history of PTSD
Among employees who reported that they had previously been diagnosed with PTSD by a doctor or medical professional, more than two in three were not classified as currently having probable PTSD based on their survey responses. This suggests there is potential for employees with PTSD to recover, or to effectively manage their PTSD symptoms, whilst working in the police and emergency services sector. Among those employees who appeared to have recovered or were managing their PTSD symtoms, but identified that they needed help in the past year, the reported use of services was lower when compared to those who had ongoing and current symptoms (Table 8.6.4). This may reflect differences in the severity of symptoms in these two groups.
Table 8.6.4: Proportion of employees with an prior diagnosis of PTSD who identified that they needed help or support and accessed specific services in the past 12 months, by current PTSD
Service type Ever diagnosed with PTSD
Current PTSD (%) No current PTSD (%)
GP 83.6 76.3
Psychiatrist 42.4 25.5
Psychologist 67.1 66.5
Mental health nurse 4.8 3.2
Other professional providing mental health services 8.6 8.8
Alcohol or drug counsellor or support service 1.8 1.7
Admitted to hospital 6.1 3.1
Complementary/alternative therapist 9.4 8.9
Internet, for information 44.9 31.2
Internet for online support forums or support groups 13.4 8.0
Face to face self-help or support group(s) 6.0 6.7
Telephone counselling 10.9 9.8
None of the above 5.4 8.2
8.6.4 Counselling
In addition to collecting information about service providers, the survey also collected information about the types of treatments received, specifically with regards to counselling and the use of prescription medications.
More than one third (36%) of employees who identified that they needed help or support for mental or emotional problems in the past year received counselling. The proportion of female employees who received counselling was slightly higher than the proportion of males (39% and 34% respectively).
The proportion of employees receiving counselling was three times higher among those with a previous diagnosis of a mental health condition compared to those with no prior diagnosis (48% and 16% respectively). Those with higher levels of psychological distress more commonly reported accessing counselling when compared to those with lower levels of distress.
The severity of functional impairment associated with psychological distress was assessed in terms of impact on ability to work, maintain relationships, and carry out daily activities. Receipt of counselling was highest in employees with severe functional impairment associated with psychological distress (Figure 8.6.1).
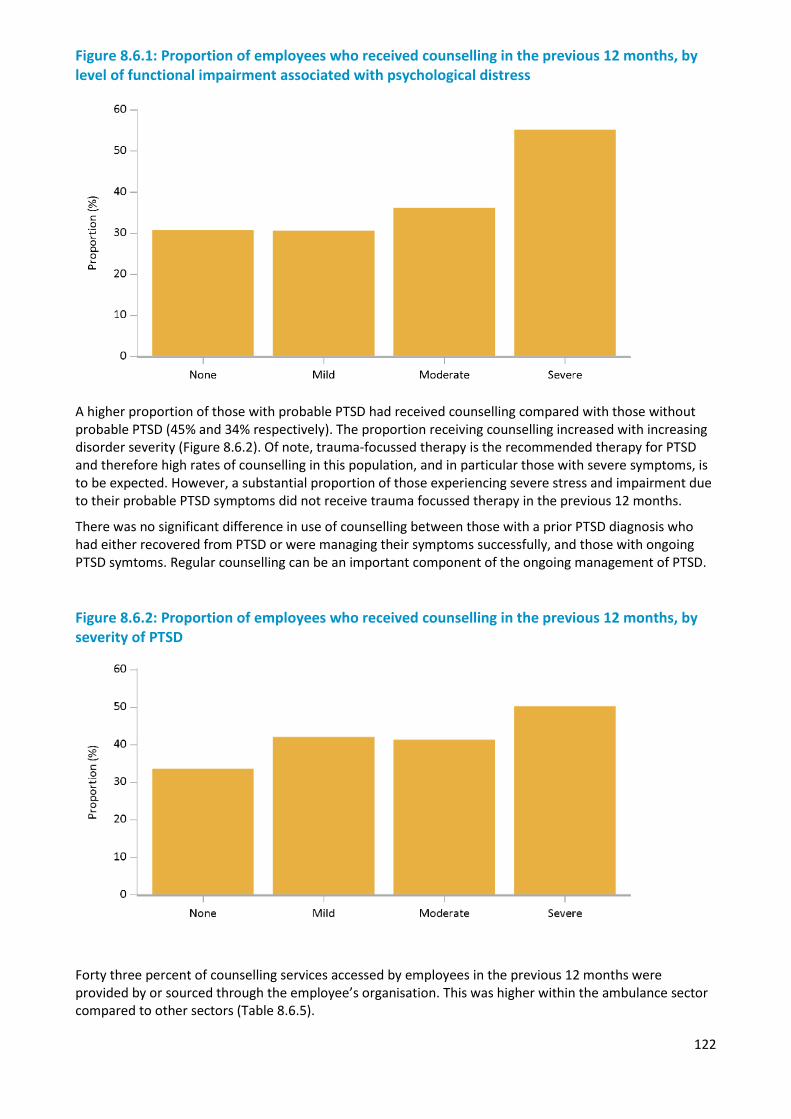
122
Figure 8.6.1: Proportion of employees who received counselling in the previous 12 months, by level of functional impairment associated with psychological distress
A higher proportion of those with probable PTSD had received counselling compared with those without probable PTSD (45% and 34% respectively). The proportion receiving counselling increased with increasing disorder severity (Figure 8.6.2). Of note, trauma-focussed therapy is the recommended therapy for PTSD and therefore high rates of counselling in this population, and in particular those with severe symptoms, is to be expected. However, a substantial proportion of those experiencing severe stress and impairment due to their probable PTSD symptoms did not receive trauma focussed therapy in the previous 12 months.
There was no significant difference in use of counselling between those with a prior PTSD diagnosis who had either recovered from PTSD or were managing their symptoms successfully, and those with ongoing PTSD symtoms. Regular counselling can be an important component of the ongoing management of PTSD.
Figure 8.6.2: Proportion of employees who received counselling in the previous 12 months, by severity of PTSD
Forty three percent of counselling services accessed by employees in the previous 12 months were provided by or sourced through the employee’s organisation. This was higher within the ambulance sector compared to other sectors (Table 8.6.5).
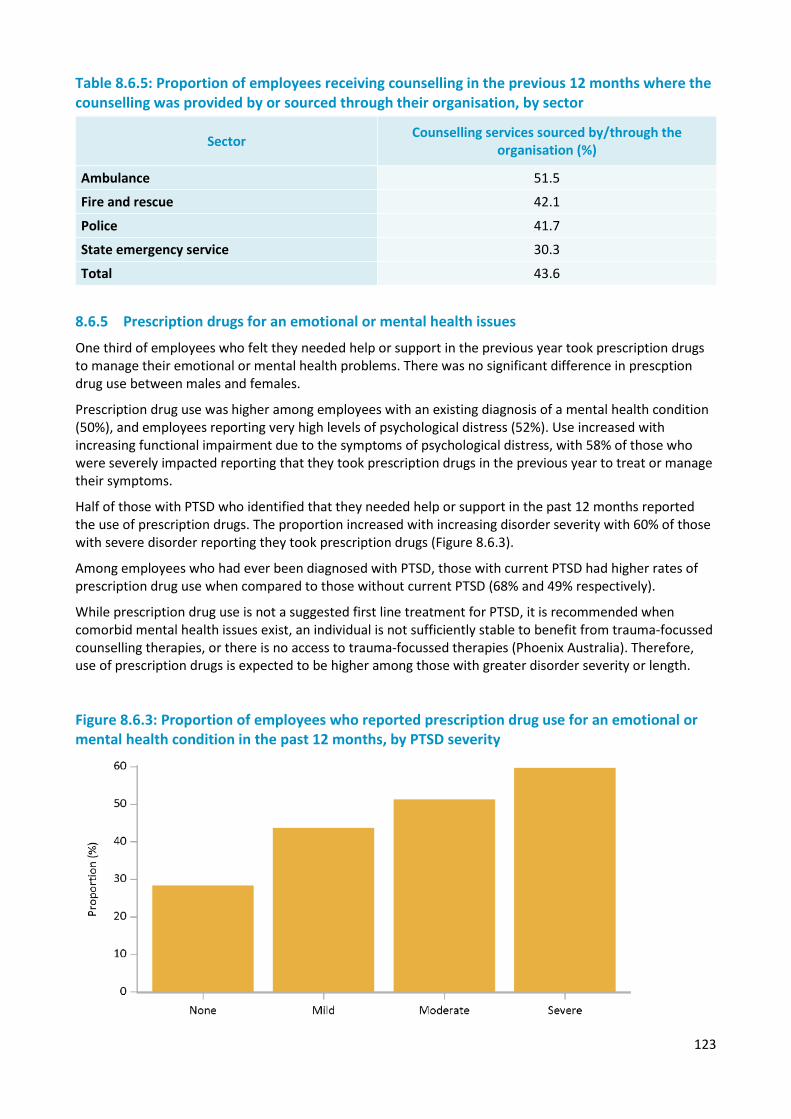
123
Table 8.6.5: Proportion of employees receiving counselling in the previous 12 months where the counselling was provided by or sourced through their organisation, by sector
Sector Counselling services sourced by/through the organisation (%)
Ambulance 51.5 Fire and rescue 42.1
Police 41.7
State emergency service 30.3
Total 43.6
8.6.5 Prescription drugs for an emotional or mental health issues
One third of employees who felt they needed help or support in the previous year took prescription drugs to manage their emotional or mental health problems. There was no significant difference in prescption drug use between males and females.
Prescription drug use was higher among employees with an existing diagnosis of a mental health condition (50%), and employees reporting very high levels of psychological distress (52%). Use increased with increasing functional impairment due to the symptoms of psychological distress, with 58% of those who were severely impacted reporting that they took prescription drugs in the previous year to treat or manage their symptoms.
Half of those with PTSD who identified that they needed help or support in the past 12 months reported the use of prescription drugs. The proportion increased with increasing disorder severity with 60% of those with severe disorder reporting they took prescription drugs (Figure 8.6.3).
Among employees who had ever been diagnosed with PTSD, those with current PTSD had higher rates of prescription drug use when compared to those without current PTSD (68% and 49% respectively).
While prescription drug use is not a suggested first line treatment for PTSD, it is recommended when comorbid mental health issues exist, an individual is not sufficiently stable to benefit from trauma-focussed counselling therapies, or there is no access to trauma-focussed therapies (Phoenix Australia). Therefore, use of prescription drugs is expected to be higher among those with greater disorder severity or length.
Figure 8.6.3: Proportion of employees who reported prescription drug use for an emotional or mental health condition in the past 12 months, by PTSD severity
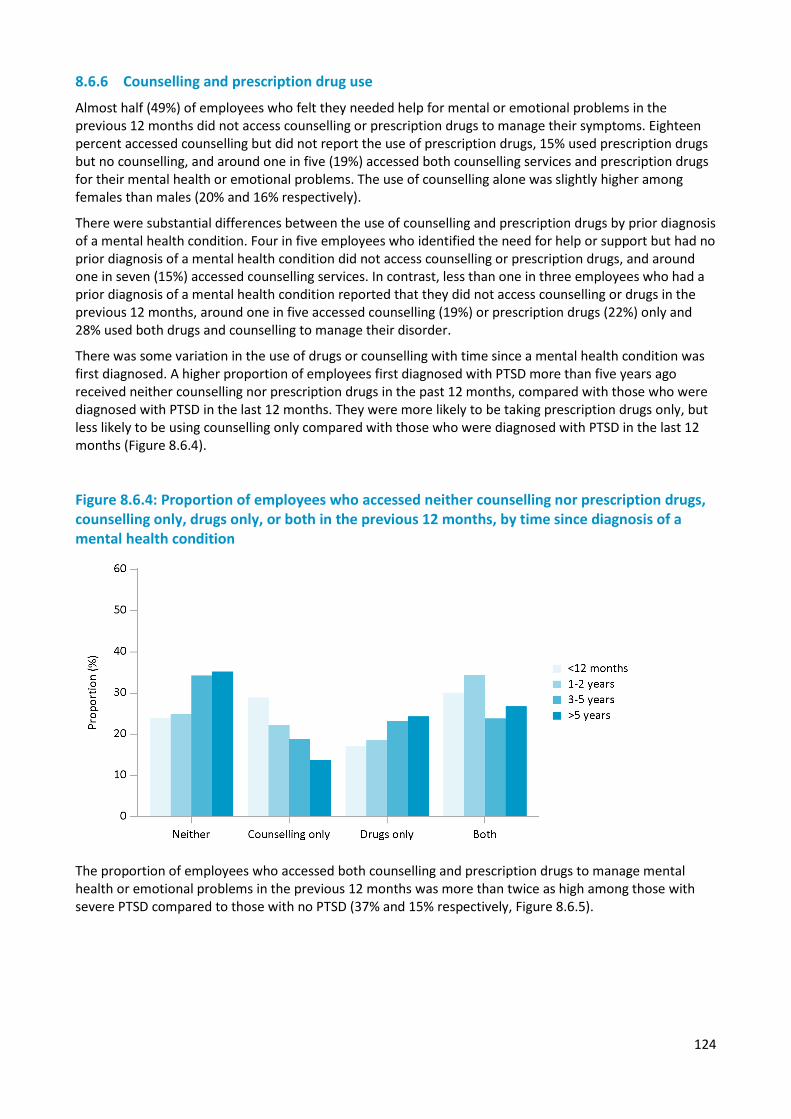
124
8.6.6 Counselling and prescription drug use
Almost half (49%) of employees who felt they needed help for mental or emotional problems in the previous 12 months did not access counselling or prescription drugs to manage their symptoms. Eighteen percent accessed counselling but did not report the use of prescription drugs, 15% used prescription drugs but no counselling, and around one in five (19%) accessed both counselling services and prescription drugs for their mental health or emotional problems. The use of counselling alone was slightly higher among females than males (20% and 16% respectively).
There were substantial differences between the use of counselling and prescription drugs by prior diagnosis of a mental health condition. Four in five employees who identified the need for help or support but had no prior diagnosis of a mental health condition did not access counselling or prescription drugs, and around one in seven (15%) accessed counselling services. In contrast, less than one in three employees who had a prior diagnosis of a mental health condition reported that they did not access counselling or drugs in the previous 12 months, around one in five accessed counselling (19%) or prescription drugs (22%) only and 28% used both drugs and counselling to manage their disorder.
There was some variation in the use of drugs or counselling with time since a mental health condition was first diagnosed. A higher proportion of employees first diagnosed with PTSD more than five years ago received neither counselling nor prescription drugs in the past 12 months, compared with those who were diagnosed with PTSD in the last 12 months. They were more likely to be taking prescription drugs only, but less likely to be using counselling only compared with those who were diagnosed with PTSD in the last 12 months (Figure 8.6.4).
Figure 8.6.4: Proportion of employees who accessed neither counselling nor prescription drugs, counselling only, drugs only, or both in the previous 12 months, by time since diagnosis of a mental health condition
The proportion of employees who accessed both counselling and prescription drugs to manage mental health or emotional problems in the previous 12 months was more than twice as high among those with severe PTSD compared to those with no PTSD (37% and 15% respectively, Figure 8.6.5).
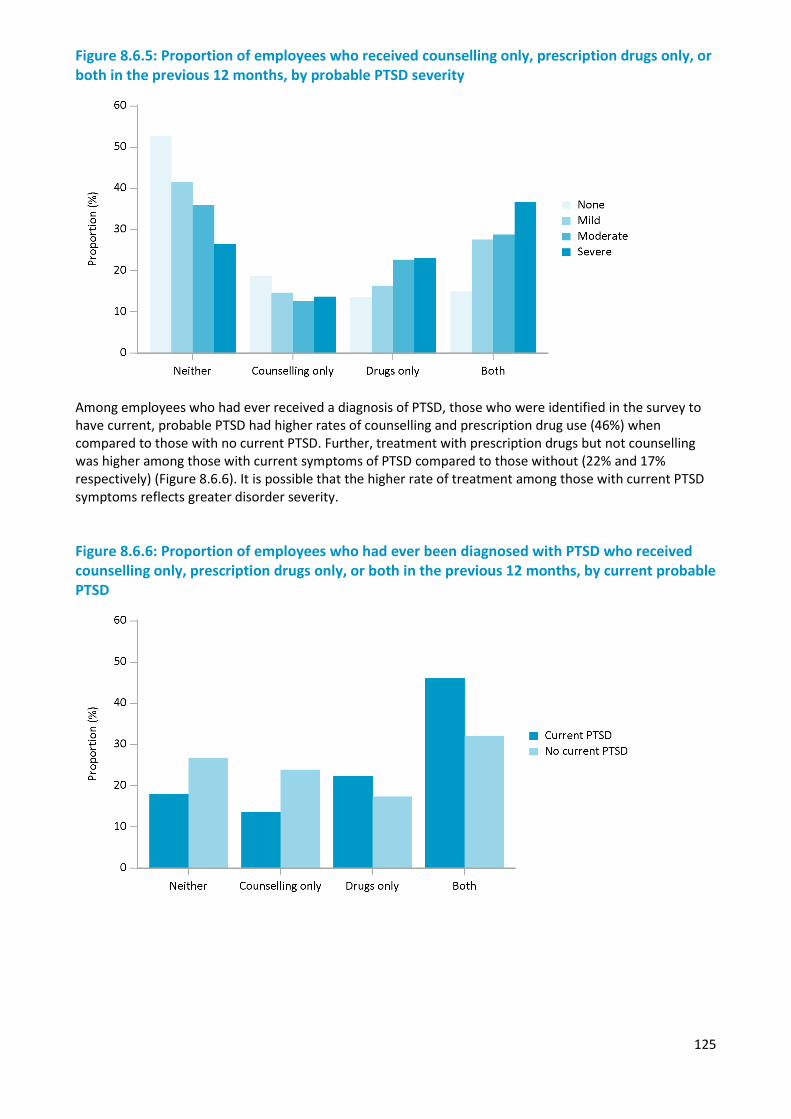
125
Figure 8.6.5: Proportion of employees who received counselling only, prescription drugs only, or both in the previous 12 months, by probable PTSD severity
Among employees who had ever received a diagnosis of PTSD, those who were identified in the survey to have current, probable PTSD had higher rates of counselling and prescription drug use (46%) when compared to those with no current PTSD. Further, treatment with prescription drugs but not counselling was higher among those with current symptoms of PTSD compared to those without (22% and 17% respectively) (Figure 8.6.6). It is possible that the higher rate of treatment among those with current PTSD symptoms reflects greater disorder severity.
Figure 8.6.6: Proportion of employees who had ever been diagnosed with PTSD who received counselling only, prescription drugs only, or both in the previous 12 months, by current probable PTSD
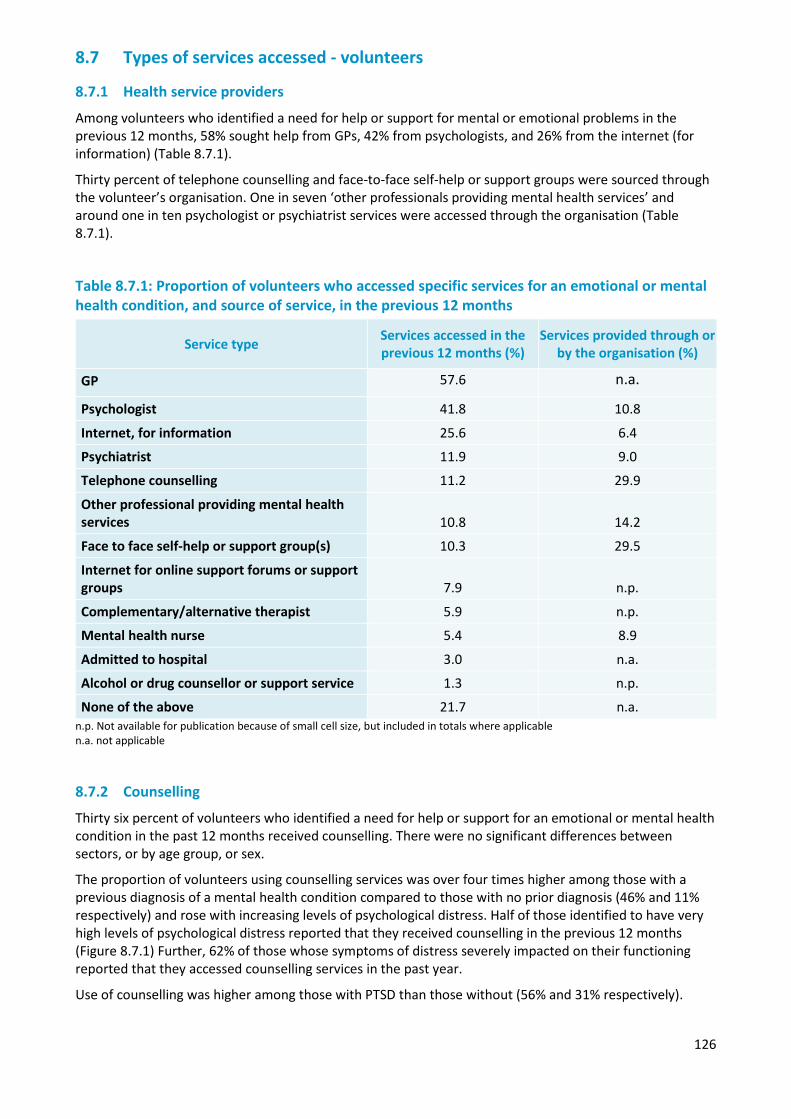
126
8.7 Types of services accessed - volunteers
8.7.1 Health service providers
Among volunteers who identified a need for help or support for mental or emotional problems in the previous 12 months, 58% sought help from GPs, 42% from psychologists, and 26% from the internet (for information) (Table 8.7.1).
Thirty percent of telephone counselling and face-to-face self-help or support groups were sourced through the volunteer’s organisation. One in seven ‘other professionals providing mental health services’ and around one in ten psychologist or psychiatrist services were accessed through the organisation (Table 8.7.1).
Table 8.7.1: Proportion of volunteers who accessed specific services for an emotional or mental health condition, and source of service, in the previous 12 months
Service type Services accessed in the previous 12 months (%)
Services provided through or by the organisation (%)
GP 57.6 n.a.
Psychologist 41.8 10.8
Internet, for information 25.6 6.4
Psychiatrist 11.9 9.0
Telephone counselling 11.2 29.9
Other professional providing mental health services 10.8 14.2
Face to face self-help or support group(s) 10.3 29.5
Internet for online support forums or support groups 7.9 n.p.
Complementary/alternative therapist 5.9 n.p.
Mental health nurse 5.4 8.9
Admitted to hospital 3.0 n.a.
Alcohol or drug counsellor or support service 1.3 n.p.
None of the above 21.7 n.a. n.p. Not available for publication because of small cell size, but included in totals where applicable n.a. not applicable
8.7.2 Counselling
Thirty six percent of volunteers who identified a need for help or support for an emotional or mental health condition in the past 12 months received counselling. There were no significant differences between sectors, or by age group, or sex.
The proportion of volunteers using counselling services was over four times higher among those with a previous diagnosis of a mental health condition compared to those with no prior diagnosis (46% and 11% respectively) and rose with increasing levels of psychological distress. Half of those identified to have very high levels of psychological distress reported that they received counselling in the previous 12 months (Figure 8.7.1) Further, 62% of those whose symptoms of distress severely impacted on their functioning reported that they accessed counselling services in the past year.
Use of counselling was higher among those with PTSD than those without (56% and 31% respectively).
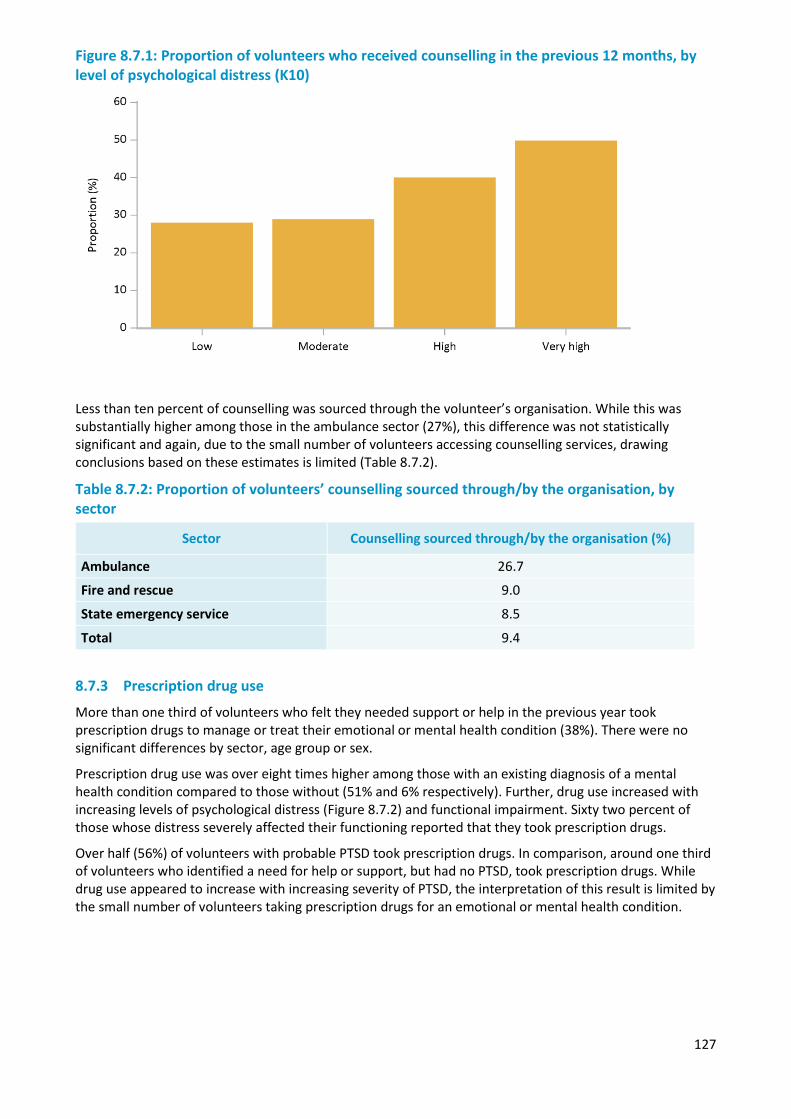
127
Figure 8.7.1: Proportion of volunteers who received counselling in the previous 12 months, by level of psychological distress (K10)
Less than ten percent of counselling was sourced through the volunteer’s organisation. While this was substantially higher among those in the ambulance sector (27%), this difference was not statistically significant and again, due to the small number of volunteers accessing counselling services, drawing conclusions based on these estimates is limited (Table 8.7.2).
Table 8.7.2: Proportion of volunteers’ counselling sourced through/by the organisation, by sector
8.7.3 Prescription drug use
More than one third of volunteers who felt they needed support or help in the previous year took prescription drugs to manage or treat their emotional or mental health condition (38%). There were no significant differences by sector, age group or sex.
Prescription drug use was over eight times higher among those with an existing diagnosis of a mental health condition compared to those without (51% and 6% respectively). Further, drug use increased with increasing levels of psychological distress (Figure 8.7.2) and functional impairment. Sixty two percent of those whose distress severely affected their functioning reported that they took prescription drugs.
Over half (56%) of volunteers with probable PTSD took prescription drugs. In comparison, around one third of volunteers who identified a need for help or support, but had no PTSD, took prescription drugs. While drug use appeared to increase with increasing severity of PTSD, the interpretation of this result is limited by the small number of volunteers taking prescription drugs for an emotional or mental health condition.
Sector Counselling sourced through/by the organisation (%)
Ambulance 26.7
Fire and rescue 9.0
State emergency service 8.5
Total 9.4
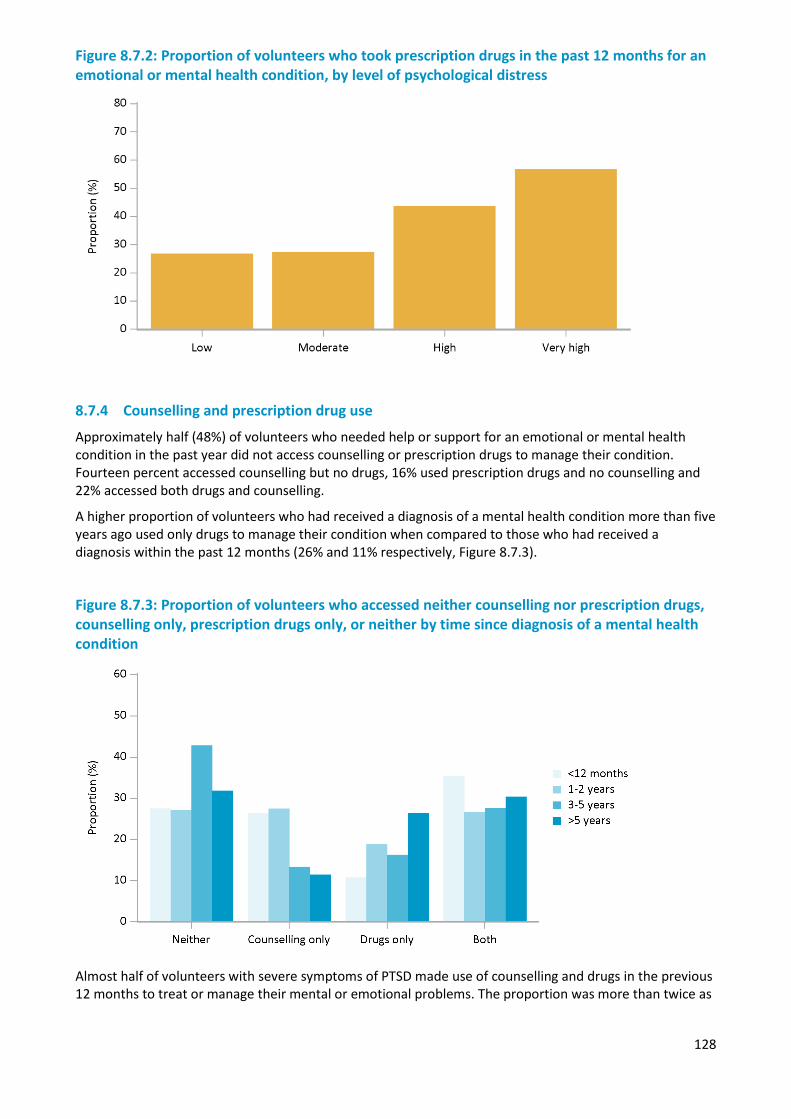
128
Figure 8.7.2: Proportion of volunteers who took prescription drugs in the past 12 months for an emotional or mental health condition, by level of psychological distress
8.7.4 Counselling and prescription drug use
Approximately half (48%) of volunteers who needed help or support for an emotional or mental health condition in the past year did not access counselling or prescription drugs to manage their condition. Fourteen percent accessed counselling but no drugs, 16% used prescription drugs and no counselling and 22% accessed both drugs and counselling.
A higher proportion of volunteers who had received a diagnosis of a mental health condition more than five years ago used only drugs to manage their condition when compared to those who had received a diagnosis within the past 12 months (26% and 11% respectively, Figure 8.7.3).
Figure 8.7.3: Proportion of volunteers who accessed neither counselling nor prescription drugs, counselling only, prescription drugs only, or neither by time since diagnosis of a mental health condition
Almost half of volunteers with severe symptoms of PTSD made use of counselling and drugs in the previous 12 months to treat or manage their mental or emotional problems. The proportion was more than twice as
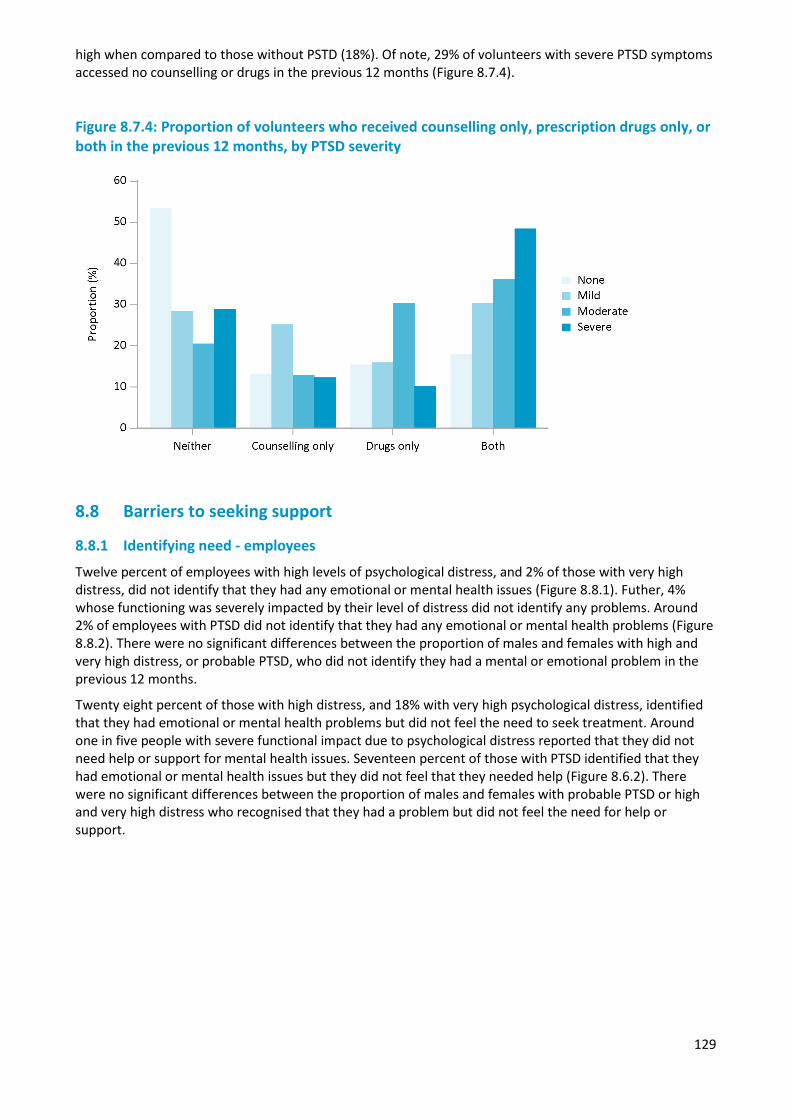
129
high when compared to those without PSTD (18%). Of note, 29% of volunteers with severe PTSD symptoms accessed no counselling or drugs in the previous 12 months (Figure 8.7.4).
Figure 8.7.4: Proportion of volunteers who received counselling only, prescription drugs only, or both in the previous 12 months, by PTSD severity
8.8 Barriers to seeking support
8.8.1 Identifying need - employees
Twelve percent of employees with high levels of psychological distress, and 2% of those with very high distress, did not identify that they had any emotional or mental health issues (Figure 8.8.1). Futher, 4% whose functioning was severely impacted by their level of distress did not identify any problems. Around 2% of employees with PTSD did not identify that they had any emotional or mental health problems (Figure 8.8.2). There were no significant differences between the proportion of males and females with high and very high distress, or probable PTSD, who did not identify they had a mental or emotional problem in the previous 12 months.
Twenty eight percent of those with high distress, and 18% with very high psychological distress, identified that they had emotional or mental health problems but did not feel the need to seek treatment. Around one in five people with severe functional impact due to psychological distress reported that they did not need help or support for mental health issues. Seventeen percent of those with PTSD identified that they had emotional or mental health issues but they did not feel that they needed help (Figure 8.6.2). There were no significant differences between the proportion of males and females with probable PTSD or high and very high distress who recognised that they had a problem but did not feel the need for help or support.
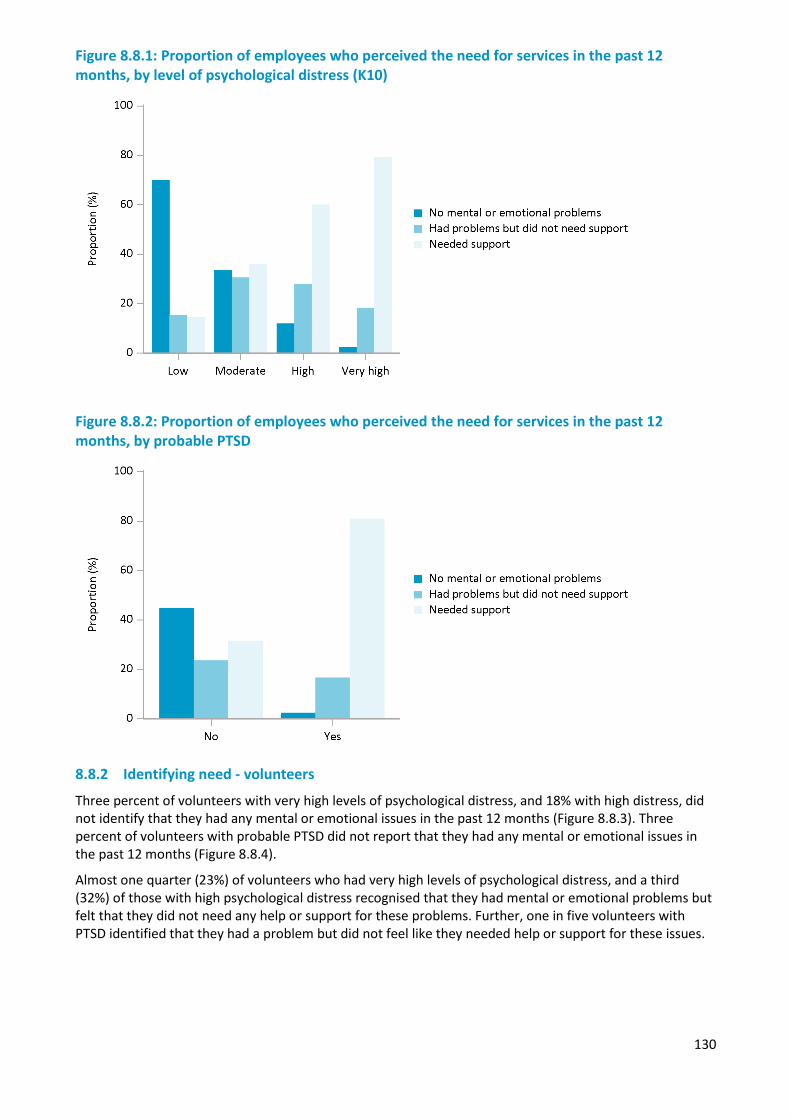
130
Figure 8.8.1: Proportion of employees who perceived the need for services in the past 12 months, by level of psychological distress (K10)
Figure 8.8.2: Proportion of employees who perceived the need for services in the past 12 months, by probable PTSD
8.8.2 Identifying need - volunteers
Three percent of volunteers with very high levels of psychological distress, and 18% with high distress, did not identify that they had any mental or emotional issues in the past 12 months (Figure 8.8.3). Three percent of volunteers with probable PTSD did not report that they had any mental or emotional issues in the past 12 months (Figure 8.8.4).
Almost one quarter (23%) of volunteers who had very high levels of psychological distress, and a third (32%) of those with high psychological distress recognised that they had mental or emotional problems but felt that they did not need any help or support for these problems. Further, one in five volunteers with PTSD identified that they had a problem but did not feel like they needed help or support for these issues.
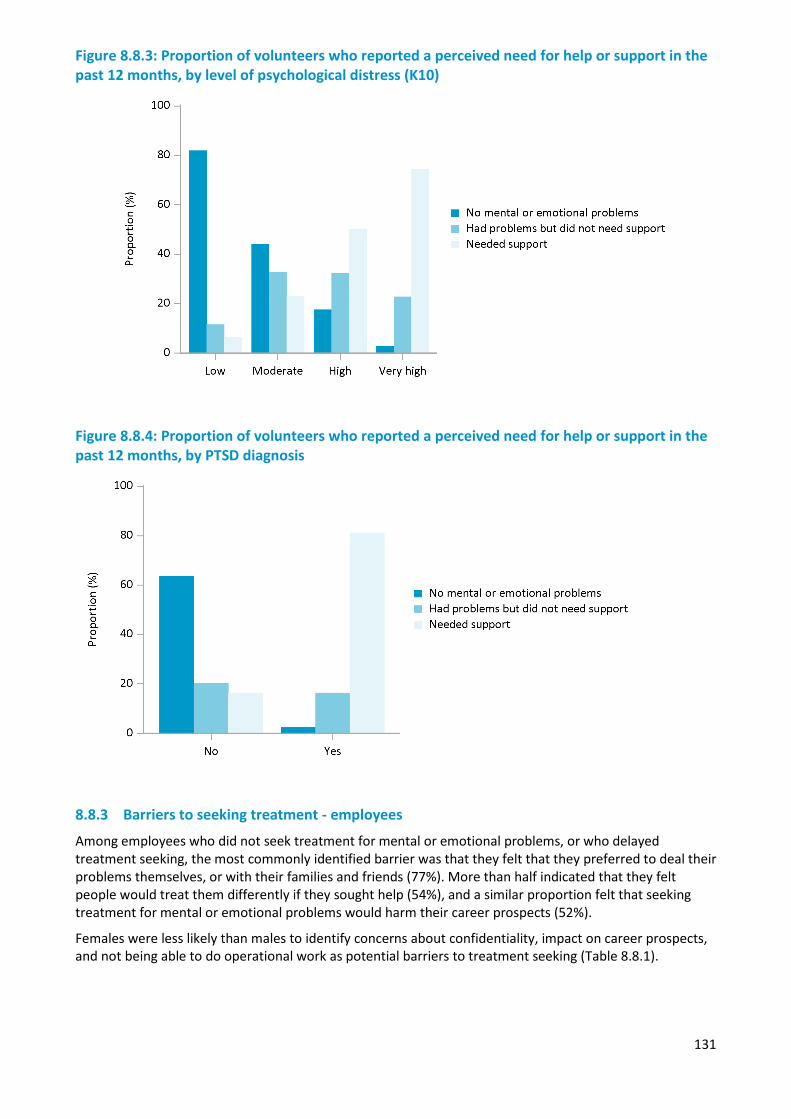
131
Figure 8.8.3: Proportion of volunteers who reported a perceived need for help or support in the past 12 months, by level of psychological distress (K10)
Figure 8.8.4: Proportion of volunteers who reported a perceived need for help or support in the past 12 months, by PTSD diagnosis
8.8.3 Barriers to seeking treatment - employees
Among employees who did not seek treatment for mental or emotional problems, or who delayed treatment seeking, the most commonly identified barrier was that they felt that they preferred to deal their problems themselves, or with their families and friends (77%). More than half indicated that they felt people would treat them differently if they sought help (54%), and a similar proportion felt that seeking treatment for mental or emotional problems would harm their career prospects (52%).
Females were less likely than males to identify concerns about confidentiality, impact on career prospects, and not being able to do operational work as potential barriers to treatment seeking (Table 8.8.1).
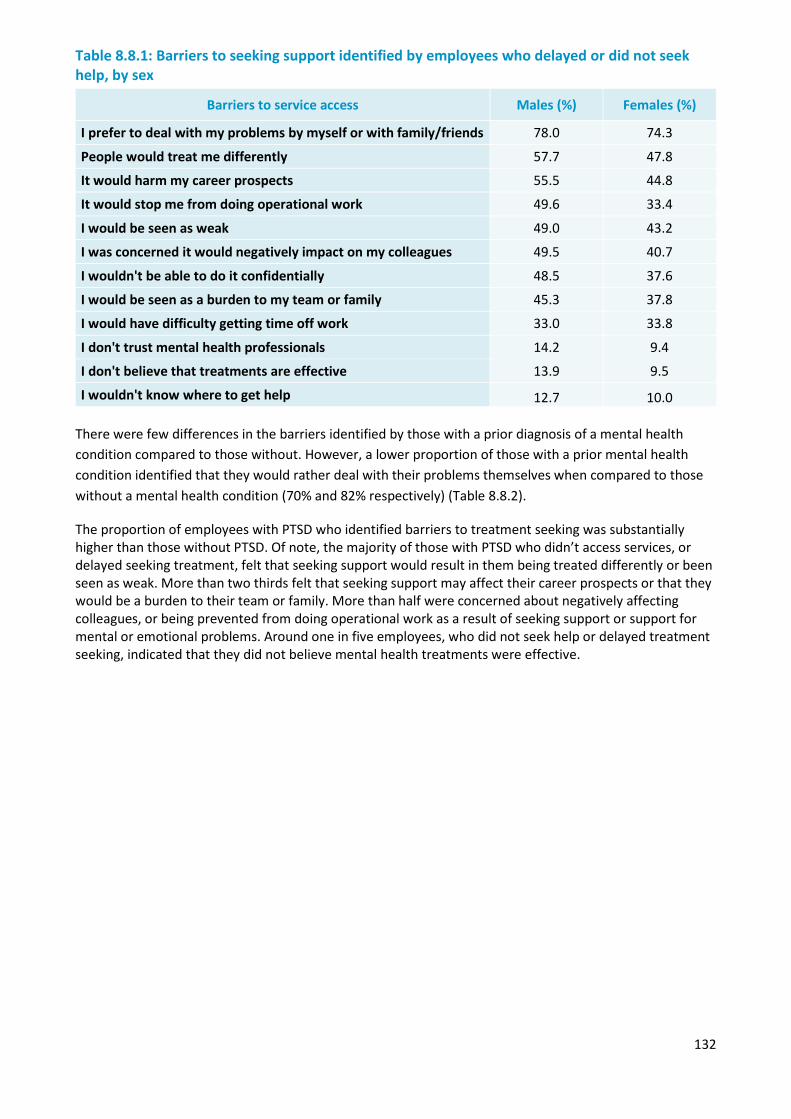
132
Table 8.8.1: Barriers to seeking support identified by employees who delayed or did not seek help, by sex
Barriers to service access Males (%) Females (%)
I prefer to deal with my problems by myself or with family/friends 78.0 74.3
People would treat me differently 57.7 47.8
It would harm my career prospects 55.5 44.8
It would stop me from doing operational work 49.6 33.4
I would be seen as weak 49.0 43.2
I was concerned it would negatively impact on my colleagues 49.5 40.7
I wouldn't be able to do it confidentially 48.5 37.6
I would be seen as a burden to my team or family 45.3 37.8
I would have difficulty getting time off work 33.0 33.8
I don't trust mental health professionals 14.2 9.4
I don't believe that treatments are effective 13.9 9.5
I wouldn't know where to get help 12.7 10.0 There were few differences in the barriers identified by those with a prior diagnosis of a mental health condition compared to those without. However, a lower proportion of those with a prior mental health condition identified that they would rather deal with their problems themselves when compared to those without a mental health condition (70% and 82% respectively) (Table 8.8.2).
The proportion of employees with PTSD who identified barriers to treatment seeking was substantially higher than those without PTSD. Of note, the majority of those with PTSD who didn’t access services, or delayed seeking treatment, felt that seeking support would result in them being treated differently or been seen as weak. More than two thirds felt that seeking support may affect their career prospects or that they would be a burden to their team or family. More than half were concerned about negatively affecting colleagues, or being prevented from doing operational work as a result of seeking support or support for mental or emotional problems. Around one in five employees, who did not seek help or delayed treatment seeking, indicated that they did not believe mental health treatments were effective.
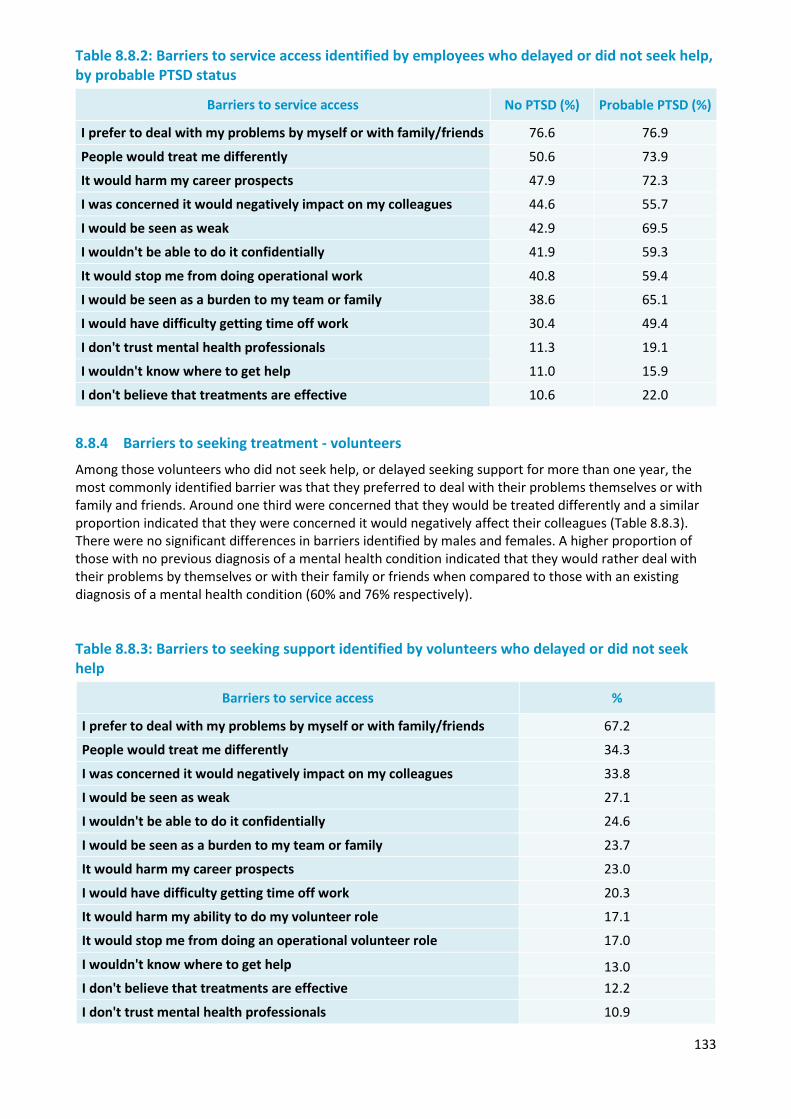
133
Table 8.8.2: Barriers to service access identified by employees who delayed or did not seek help, by probable PTSD status
Barriers to service access No PTSD (%) Probable PTSD (%)
I prefer to deal with my problems by myself or with family/friends 76.6 76.9
People would treat me differently 50.6 73.9
It would harm my career prospects 47.9 72.3
I was concerned it would negatively impact on my colleagues 44.6 55.7
I would be seen as weak 42.9 69.5
I wouldn't be able to do it confidentially 41.9 59.3
It would stop me from doing operational work 40.8 59.4
I would be seen as a burden to my team or family 38.6 65.1
I would have difficulty getting time off work 30.4 49.4
I don't trust mental health professionals 11.3 19.1
I wouldn't know where to get help 11.0 15.9
I don't believe that treatments are effective 10.6 22.0
8.8.4 Barriers to seeking treatment - volunteers
Among those volunteers who did not seek help, or delayed seeking support for more than one year, the most commonly identified barrier was that they preferred to deal with their problems themselves or with family and friends. Around one third were concerned that they would be treated differently and a similar proportion indicated that they were concerned it would negatively affect their colleagues (Table 8.8.3). There were no significant differences in barriers identified by males and females. A higher proportion of those with no previous diagnosis of a mental health condition indicated that they would rather deal with their problems by themselves or with their family or friends when compared to those with an existing diagnosis of a mental health condition (60% and 76% respectively).
Table 8.8.3: Barriers to seeking support identified by volunteers who delayed or did not seek help
Barriers to service access %
I prefer to deal with my problems by myself or with family/friends 67.2
People would treat me differently 34.3
I was concerned it would negatively impact on my colleagues 33.8
I would be seen as weak 27.1
I wouldn't be able to do it confidentially 24.6
I would be seen as a burden to my team or family 23.7
It would harm my career prospects 23.0
I would have difficulty getting time off work 20.3
It would harm my ability to do my volunteer role 17.1
It would stop me from doing an operational volunteer role 17.0
I wouldn't know where to get help 13.0 I don't believe that treatments are effective 12.2
I don't trust mental health professionals 10.9
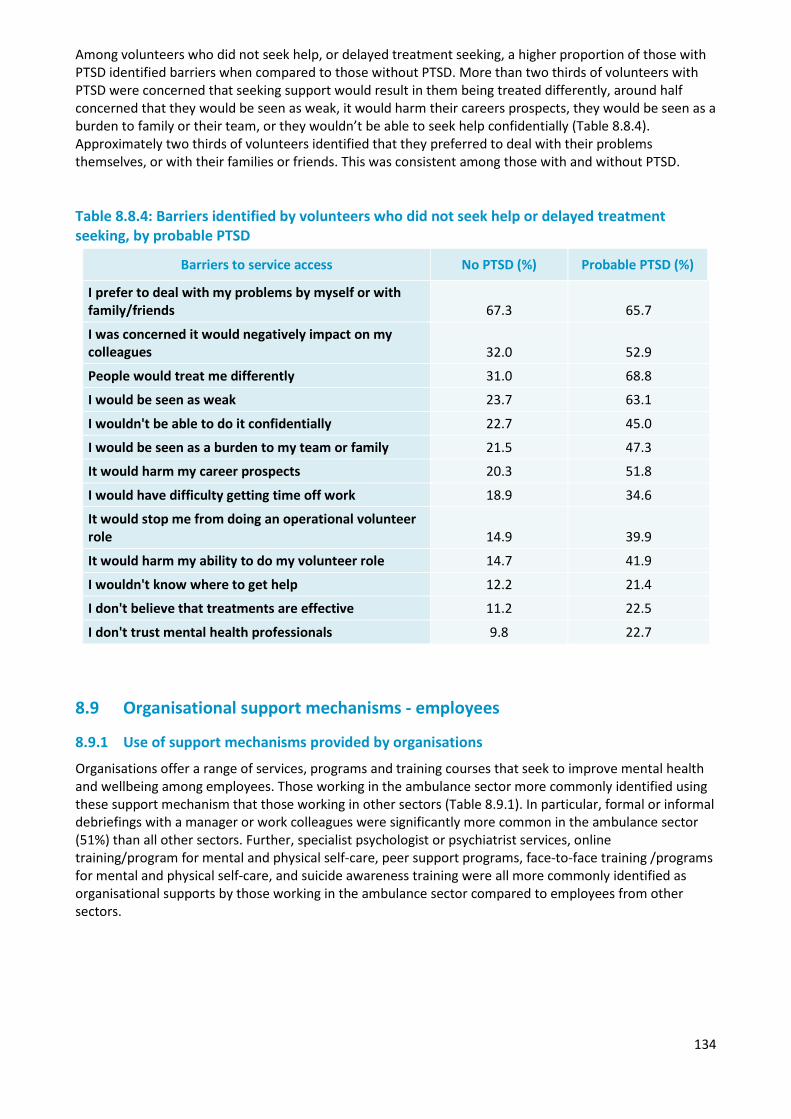
134
Among volunteers who did not seek help, or delayed treatment seeking, a higher proportion of those with PTSD identified barriers when compared to those without PTSD. More than two thirds of volunteers with PTSD were concerned that seeking support would result in them being treated differently, around half concerned that they would be seen as weak, it would harm their careers prospects, they would be seen as a burden to family or their team, or they wouldn’t be able to seek help confidentially (Table 8.8.4). Approximately two thirds of volunteers identified that they preferred to deal with their problems themselves, or with their families or friends. This was consistent among those with and without PTSD.
Table 8.8.4: Barriers identified by volunteers who did not seek help or delayed treatment seeking, by probable PTSD
Barriers to service access No PTSD (%) Probable PTSD (%)
I prefer to deal with my problems by myself or with family/friends 67.3 65.7
I was concerned it would negatively impact on my colleagues 32.0 52.9
People would treat me differently 31.0 68.8
I would be seen as weak 23.7 63.1
I wouldn't be able to do it confidentially 22.7 45.0
I would be seen as a burden to my team or family 21.5 47.3
It would harm my career prospects 20.3 51.8
I would have difficulty getting time off work 18.9 34.6
It would stop me from doing an operational volunteer role 14.9 39.9
It would harm my ability to do my volunteer role 14.7 41.9
I wouldn't know where to get help 12.2 21.4
I don't believe that treatments are effective 11.2 22.5
I don't trust mental health professionals 9.8 22.7
8.9 Organisational support mechanisms - employees
8.9.1 Use of support mechanisms provided by organisations
Organisations offer a range of services, programs and training courses that seek to improve mental health and wellbeing among employees. Those working in the ambulance sector more commonly identified using these support mechanism that those working in other sectors (Table 8.9.1). In particular, formal or informal debriefings with a manager or work colleagues were significantly more common in the ambulance sector (51%) than all other sectors. Further, specialist psychologist or psychiatrist services, online training/program for mental and physical self-care, peer support programs, face-to-face training /programs for mental and physical self-care, and suicide awareness training were all more commonly identified as organisational supports by those working in the ambulance sector compared to employees from other sectors.
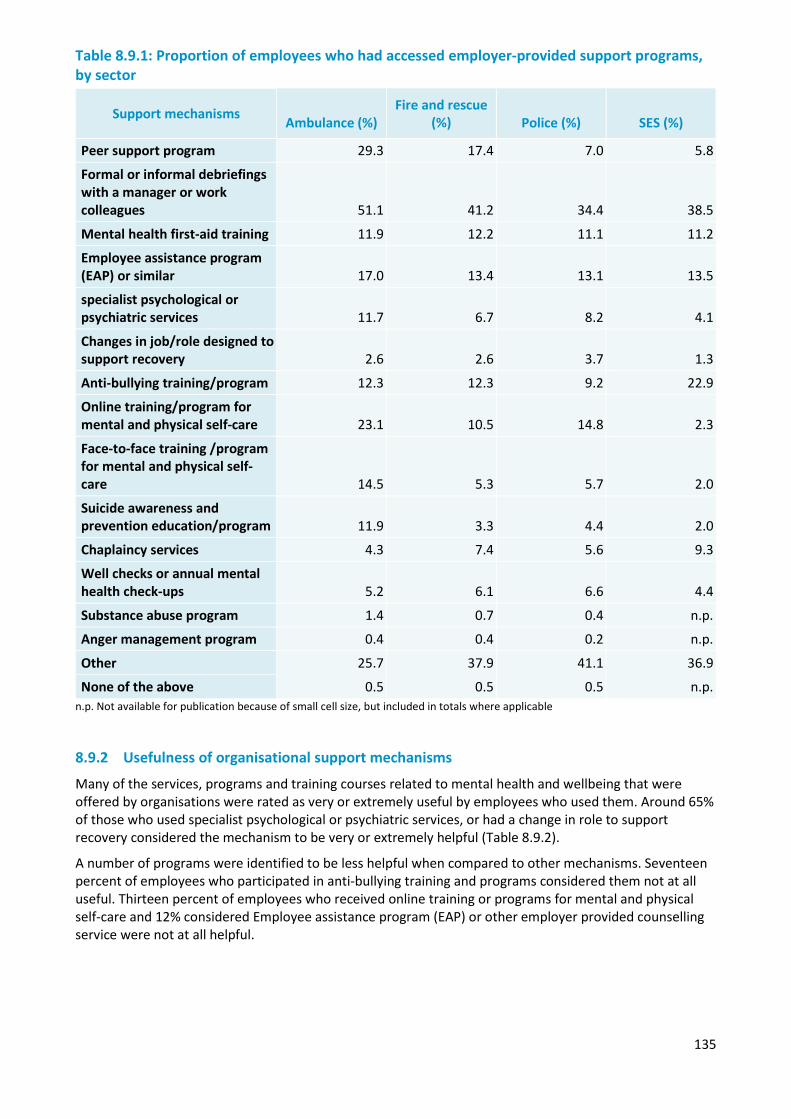
135
Table 8.9.1: Proportion of employees who had accessed employer-provided support programs, by sector
Support mechanisms Ambulance (%) Fire and rescue
(%) Police (%) SES (%)
Peer support program 29.3 17.4 7.0 5.8
Formal or informal debriefings with a manager or work colleagues 51.1 41.2 34.4 38.5
Mental health first-aid training 11.9 12.2 11.1 11.2
Employee assistance program (EAP) or similar 17.0 13.4 13.1 13.5
specialist psychological or psychiatric services 11.7 6.7 8.2 4.1
Changes in job/role designed to support recovery 2.6 2.6 3.7 1.3
Anti-bullying training/program 12.3 12.3 9.2 22.9
Online training/program for mental and physical self-care 23.1 10.5 14.8 2.3
Face-to-face training /program for mental and physical self-care 14.5 5.3 5.7 2.0
Suicide awareness and prevention education/program 11.9 3.3 4.4 2.0
Chaplaincy services 4.3 7.4 5.6 9.3
Well checks or annual mental health check-ups 5.2 6.1 6.6 4.4
Substance abuse program 1.4 0.7 0.4 n.p.
Anger management program 0.4 0.4 0.2 n.p.
Other 25.7 37.9 41.1 36.9
None of the above 0.5 0.5 0.5 n.p. n.p. Not available for publication because of small cell size, but included in totals where applicable
8.9.2 Usefulness of organisational support mechanisms
Many of the services, programs and training courses related to mental health and wellbeing that were offered by organisations were rated as very or extremely useful by employees who used them. Around 65% of those who used specialist psychological or psychiatric services, or had a change in role to support recovery considered the mechanism to be very or extremely helpful (Table 8.9.2).
A number of programs were identified to be less helpful when compared to other mechanisms. Seventeen percent of employees who participated in anti-bullying training and programs considered them not at all useful. Thirteen percent of employees who received online training or programs for mental and physical self-care and 12% considered Employee assistance program (EAP) or other employer provided counselling service were not at all helpful.
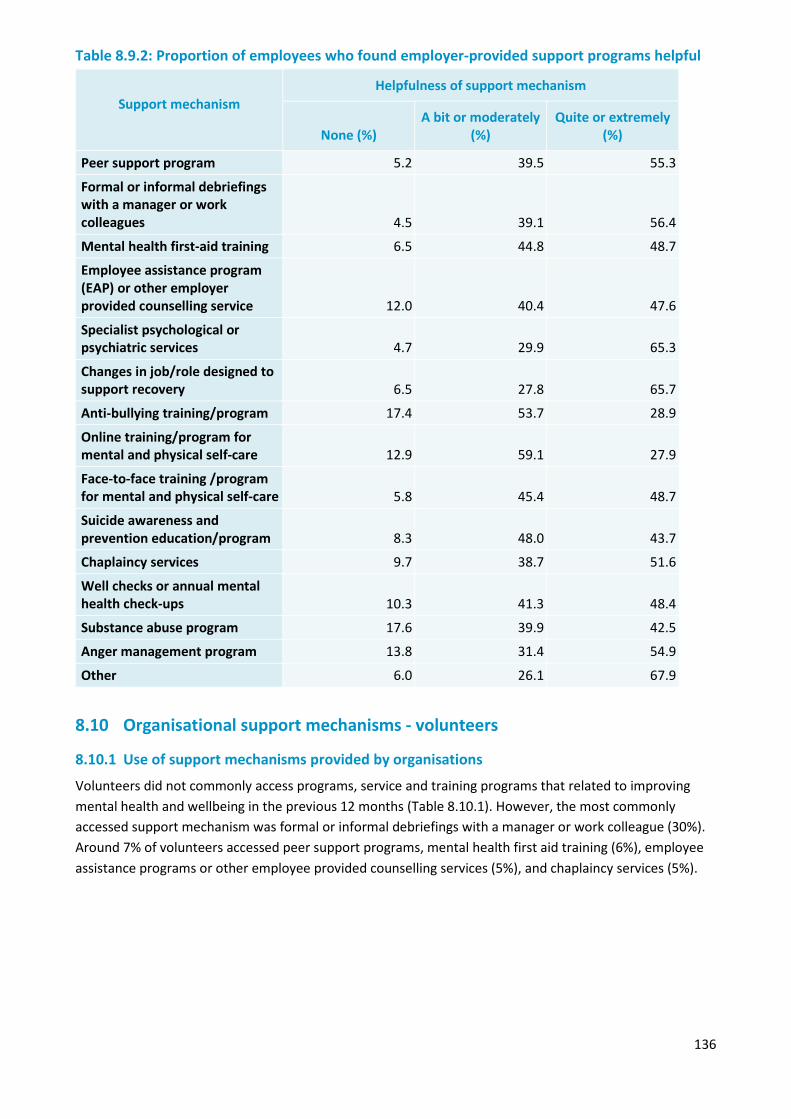
136
Table 8.9.2: Proportion of employees who found employer-provided support programs helpful
Support mechanism Helpfulness of support mechanism
None (%) A bit or moderately
(%) Quite or extremely
(%)
Peer support program 5.2 39.5 55.3
Formal or informal debriefings with a manager or work colleagues 4.5 39.1 56.4
Mental health first-aid training 6.5 44.8 48.7
Employee assistance program (EAP) or other employer provided counselling service 12.0 40.4 47.6
Specialist psychological or psychiatric services 4.7 29.9 65.3
Changes in job/role designed to support recovery 6.5 27.8 65.7
Anti-bullying training/program 17.4 53.7 28.9
Online training/program for mental and physical self-care 12.9 59.1 27.9
Face-to-face training /program for mental and physical self-care 5.8 45.4 48.7
Suicide awareness and prevention education/program 8.3 48.0 43.7
Chaplaincy services 9.7 38.7 51.6
Well checks or annual mental health check-ups 10.3 41.3 48.4
Substance abuse program 17.6 39.9 42.5
Anger management program 13.8 31.4 54.9
Other 6.0 26.1 67.9
8.10 Organisational support mechanisms - volunteers
8.10.1 Use of support mechanisms provided by organisations
Volunteers did not commonly access programs, service and training programs that related to improving mental health and wellbeing in the previous 12 months (Table 8.10.1). However, the most commonly accessed support mechanism was formal or informal debriefings with a manager or work colleague (30%). Around 7% of volunteers accessed peer support programs, mental health first aid training (6%), employee assistance programs or other employee provided counselling services (5%), and chaplaincy services (5%).
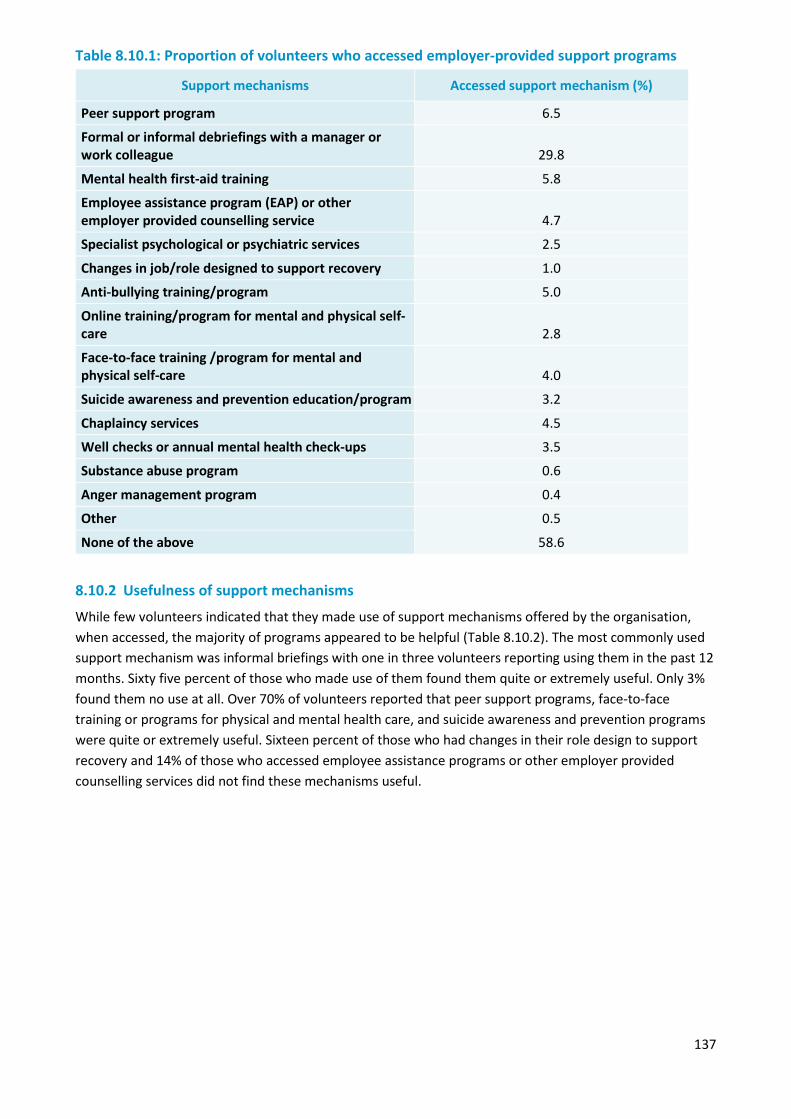
137
Table 8.10.1: Proportion of volunteers who accessed employer-provided support programs
Support mechanisms Accessed support mechanism (%)
Peer support program 6.5
Formal or informal debriefings with a manager or work colleague 29.8
Mental health first-aid training 5.8
Employee assistance program (EAP) or other employer provided counselling service 4.7
Specialist psychological or psychiatric services 2.5
Changes in job/role designed to support recovery 1.0
Anti-bullying training/program 5.0
Online training/program for mental and physical self-care 2.8
Face-to-face training /program for mental and physical self-care 4.0
Suicide awareness and prevention education/program 3.2
Chaplaincy services 4.5
Well checks or annual mental health check-ups 3.5
Substance abuse program 0.6
Anger management program 0.4
Other 0.5
None of the above 58.6
8.10.2 Usefulness of support mechanisms
While few volunteers indicated that they made use of support mechanisms offered by the organisation, when accessed, the majority of programs appeared to be helpful (Table 8.10.2). The most commonly used support mechanism was informal briefings with one in three volunteers reporting using them in the past 12 months. Sixty five percent of those who made use of them found them quite or extremely useful. Only 3% found them no use at all. Over 70% of volunteers reported that peer support programs, face-to-face training or programs for physical and mental health care, and suicide awareness and prevention programs were quite or extremely useful. Sixteen percent of those who had changes in their role design to support recovery and 14% of those who accessed employee assistance programs or other employer provided counselling services did not find these mechanisms useful.
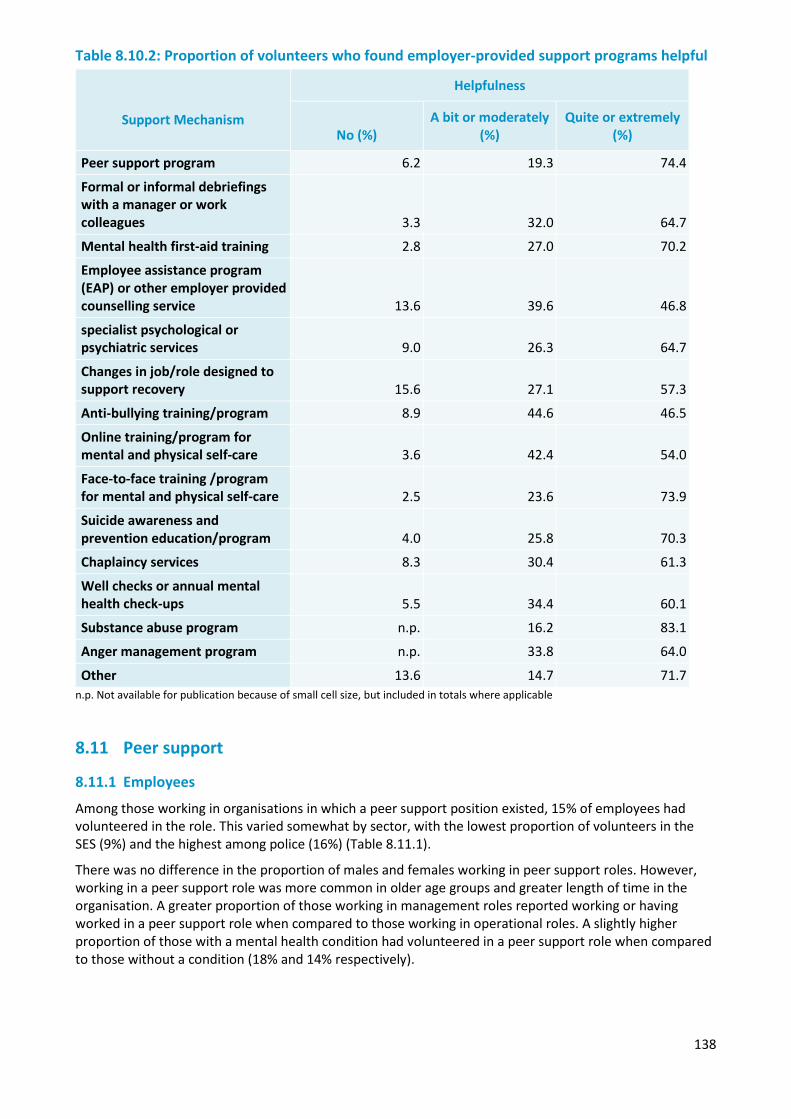
138
Table 8.10.2: Proportion of volunteers who found employer-provided support programs helpful
Support Mechanism
Helpfulness
No (%) A bit or moderately
(%) Quite or extremely
(%)
Peer support program 6.2 19.3 74.4
Formal or informal debriefings with a manager or work colleagues 3.3 32.0 64.7
Mental health first-aid training 2.8 27.0 70.2
Employee assistance program (EAP) or other employer provided counselling service 13.6 39.6 46.8
specialist psychological or psychiatric services 9.0 26.3 64.7
Changes in job/role designed to support recovery 15.6 27.1 57.3
Anti-bullying training/program 8.9 44.6 46.5
Online training/program for mental and physical self-care 3.6 42.4 54.0
Face-to-face training /program for mental and physical self-care 2.5 23.6 73.9
Suicide awareness and prevention education/program 4.0 25.8 70.3
Chaplaincy services 8.3 30.4 61.3
Well checks or annual mental health check-ups 5.5 34.4 60.1
Substance abuse program n.p. 16.2 83.1
Anger management program n.p. 33.8 64.0
Other 13.6 14.7 71.7 n.p. Not available for publication because of small cell size, but included in totals where applicable
8.11 Peer support
8.11.1 Employees
Among those working in organisations in which a peer support position existed, 15% of employees had volunteered in the role. This varied somewhat by sector, with the lowest proportion of volunteers in the SES (9%) and the highest among police (16%) (Table 8.11.1).
There was no difference in the proportion of males and females working in peer support roles. However, working in a peer support role was more common in older age groups and greater length of time in the organisation. A greater proportion of those working in management roles reported working or having worked in a peer support role when compared to those working in operational roles. A slightly higher proportion of those with a mental health condition had volunteered in a peer support role when compared to those without a condition (18% and 14% respectively).
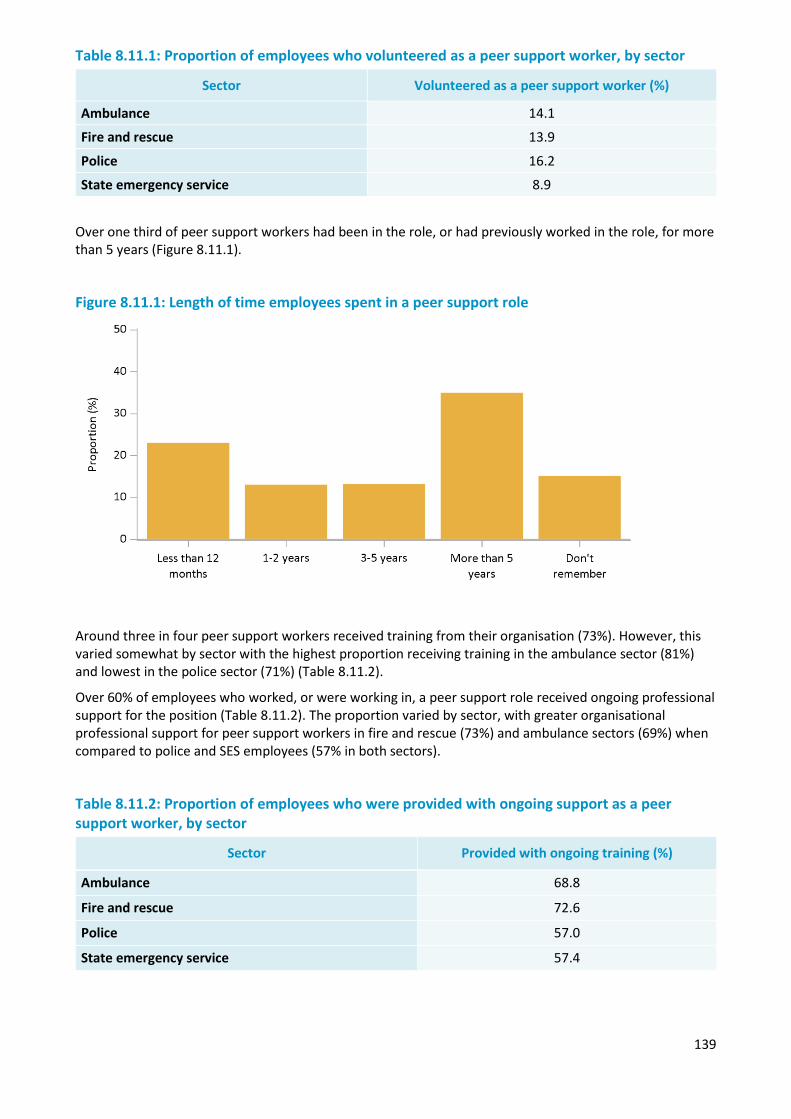
139
Table 8.11.1: Proportion of employees who volunteered as a peer support worker, by sector
Sector Volunteered as a peer support worker (%)
Ambulance 14.1
Fire and rescue 13.9
Police 16.2
State emergency service 8.9
Over one third of peer support workers had been in the role, or had previously worked in the role, for more than 5 years (Figure 8.11.1).
Figure 8.11.1: Length of time employees spent in a peer support role
Around three in four peer support workers received training from their organisation (73%). However, this varied somewhat by sector with the highest proportion receiving training in the ambulance sector (81%) and lowest in the police sector (71%) (Table 8.11.2).
Over 60% of employees who worked, or were working in, a peer support role received ongoing professional support for the position (Table 8.11.2). The proportion varied by sector, with greater organisational professional support for peer support workers in fire and rescue (73%) and ambulance sectors (69%) when compared to police and SES employees (57% in both sectors).
Table 8.11.2: Proportion of employees who were provided with ongoing support as a peer support worker, by sector
Sector Provided with ongoing training (%)
68.8 Ambulance
Fire and rescue 72.6
Police 57.0
State emergency service 57.4
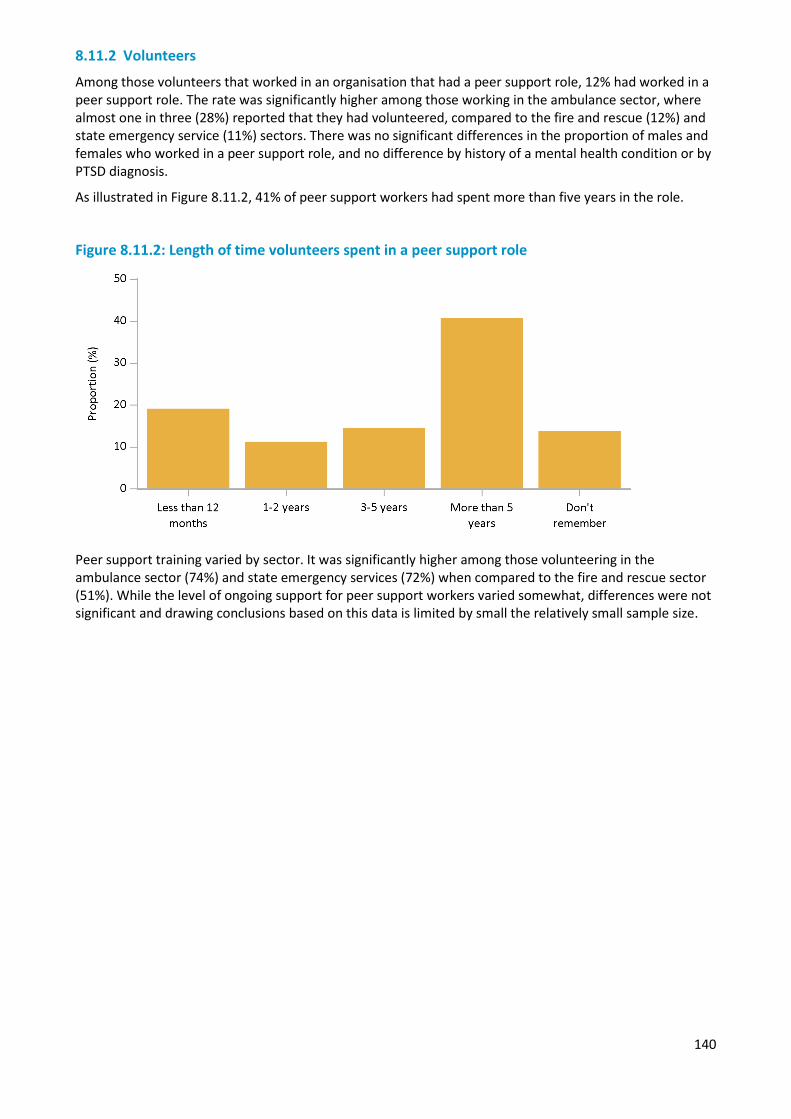
140
8.11.2 Volunteers
Among those volunteers that worked in an organisation that had a peer support role, 12% had worked in a peer support role. The rate was significantly higher among those working in the ambulance sector, where almost one in three (28%) reported that they had volunteered, compared to the fire and rescue (12%) and state emergency service (11%) sectors. There was no significant differences in the proportion of males and females who worked in a peer support role, and no difference by history of a mental health condition or by PTSD diagnosis.
As illustrated in Figure 8.11.2, 41% of peer support workers had spent more than five years in the role.
Figure 8.11.2: Length of time volunteers spent in a peer support role
Peer support training varied by sector. It was significantly higher among those volunteering in the ambulance sector (74%) and state emergency services (72%) when compared to the fire and rescue sector (51%). While the level of ongoing support for peer support workers varied somewhat, differences were not significant and drawing conclusions based on this data is limited by small the relatively small sample size.

141
Chapter 9 — Workers’ compensation experiences
Overview
The rate of workers’ compensation claims related to mental disorders or psychological injuries in the police, fire and rescue and ambulance sectors is about 10 times higher than in the Australian workforce overall (Safe Work Australia, 2015). Mental health conditions, including PTSD, are more common in police and emergency services than the population at large, therefore, the experiences of employees and volunteers with similar workers’ compensation claims were examined in Answering the call. The process of lodging a workers’ compensation claim, and having the claim assessed and adjudicated may be challenging for people who are experiencing symptoms of mental health conditions. In order to prevent exacerbation of symptoms of mental health issues and aid their recovery, it is important that the workers’ compensation process is as supportive and stress free as possible. The current section explores employees’ experiences with the workers’ compensation claims process due to mental health.
Summary of findings
About 14% of employees had made a workers’ compensation claim as a result of psychological trauma, stress or a mental health condition sustained during workplace duties. Many of the employees that had made a compensation claim reported negative experiences with the process. The majority of employees indicated that the process of going through a compensation claim due to mental health conditions had a negative impact on their recovery. In addition, they found the claims experience to be unsupportive and stressful more often than not. A substantial proportion of employees lodging claims had concerns about the fairness of how they were treated, with only a quarter of all employees feeling that they were treated very fairly, and a third indicating being treated unfairly.
In terms of leave, roughly a third of employees had taken time off due to mental health problems. The highest proportion of leave taken was by employees diagnosed with PTSD, when compared with anxiety and depression. It becomes important for an employee to receive adequate support for their help, and also a process of compensation that aids their recovery. A process that hinders recovery not only burdens the employee in question, but it costs agencies in terms of absence and reduced output from workers.
9.1 Number of workers’ compensation claims
9.1.1 Employees
Approximately 14% of employees reported having made one or more workers’ compensation claims associated with trauma, stress or mental health conditions resulting from workplace incidents during the course of their career (Table 9.1). The highest proportion of claims occurred among employees in the police sector, who were most likely to have made a claim once (11%) or multiple times (5%).
Operational employees were most likely to have made a workers’ compensation claim once or more than once, which may represent their increased exposure to traumatic scenarios in the line of duty. Further, employees who had a longer length of service were more likely to report having made a workers’ compensation claim. This also represents the increased likelihood of experiencing trauma, burnout or stressful experiences over time. Males (5%) were significantly more likely to have made a claim more than once when compared with females (3%).
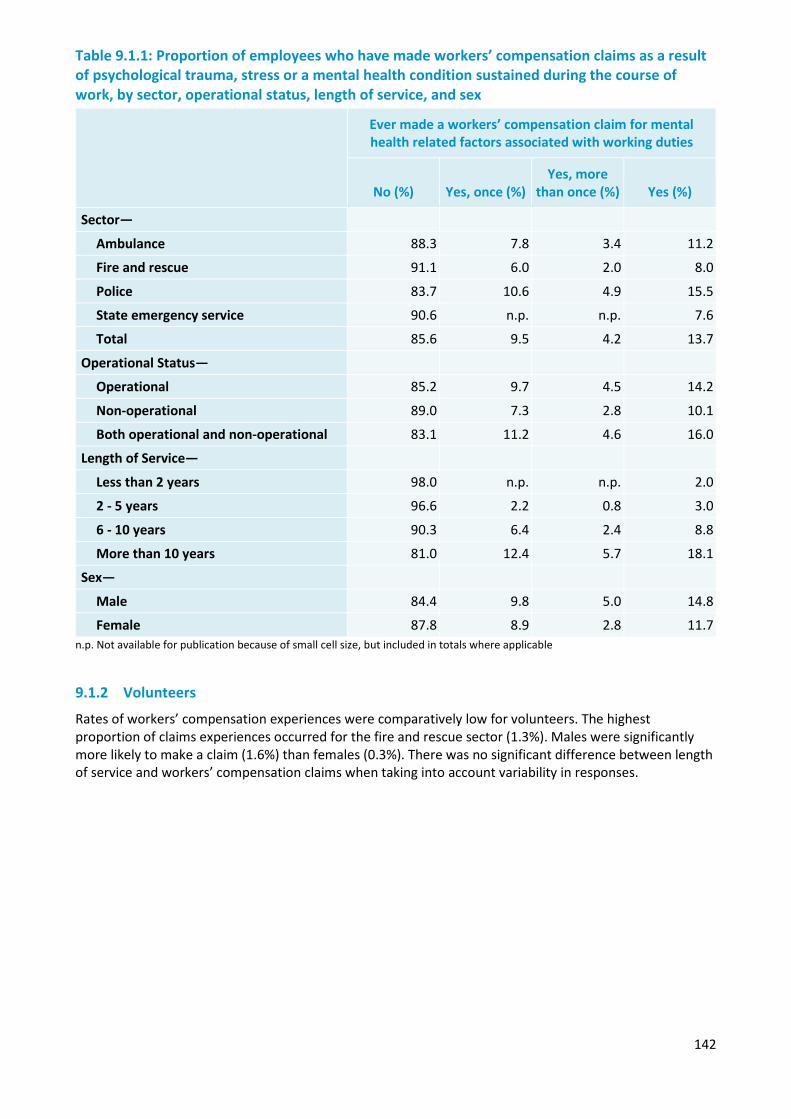
142
Table 9.1.1: Proportion of employees who have made workers’ compensation claims as a result of psychological trauma, stress or a mental health condition sustained during the course of work, by sector, operational status, length of service, and sex
Ever made a workers’ compensation claim for mental health related factors associated with working duties
No (%) Yes, once (%) Yes, more
than once (%) Yes (%)
Sector—
Ambulance 88.3 7.8 3.4 11.2
Fire and rescue 91.1 6.0 2.0 8.0
Police 83.7 10.6 4.9 15.5
State emergency service 90.6 n.p. n.p. 7.6
Total 85.6 9.5 4.2 13.7
Operational Status—
Operational 85.2 9.7 4.5 14.2
Non-operational 89.0 7.3 2.8 10.1
Both operational and non-operational 83.1 11.2 4.6 16.0
Length of Service—
Less than 2 years 98.0 n.p. n.p. 2.0
2 - 5 years 96.6 2.2 0.8 3.0
6 - 10 years 90.3 6.4 2.4 8.8
More than 10 years 81.0 12.4 5.7 18.1
Sex—
Male 84.4 9.8 5.0 14.8
Female 87.8 8.9 2.8 11.7 n.p. Not available for publication because of small cell size, but included in totals where applicable
9.1.2 Volunteers
Rates of workers’ compensation experiences were comparatively low for volunteers. The highest proportion of claims experiences occurred for the fire and rescue sector (1.3%). Males were significantly more likely to make a claim (1.6%) than females (0.3%). There was no significant difference between length of service and workers’ compensation claims when taking into account variability in responses.
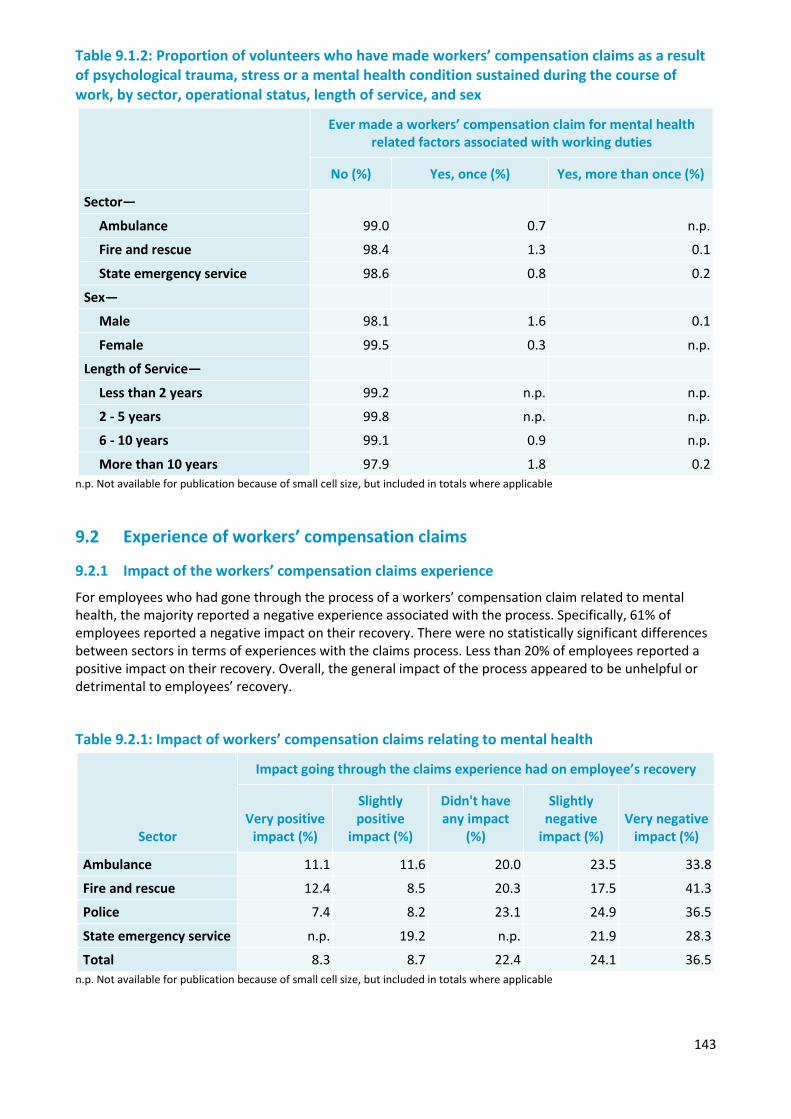
143
Table 9.1.2: Proportion of volunteers who have made workers’ compensation claims as a result of psychological trauma, stress or a mental health condition sustained during the course of work, by sector, operational status, length of service, and sex
Ever made a workers’ compensation claim for mental health related factors associated with working duties
No (%) Yes, once (%) Yes, more than once (%)
Sector—
99.0 0.7 n.p. Ambulance
Fire and rescue 98.4 1.3 0.1
State emergency service 98.6 0.8 0.2
Sex—
Male 98.1 1.6 0.1
Female 99.5 0.3 n.p.
Length of Service—
Less than 2 years 99.2 n.p. n.p.
2 - 5 years 99.8 n.p. n.p.
6 - 10 years 99.1 0.9 n.p.
More than 10 years 97.9 1.8 0.2 n.p. Not available for publication because of small cell size, but included in totals where applicable
9.2 Experience of workers’ compensation claims
9.2.1 Impact of the workers’ compensation claims experience
For employees who had gone through the process of a workers’ compensation claim related to mental health, the majority reported a negative experience associated with the process. Specifically, 61% of employees reported a negative impact on their recovery. There were no statistically significant differences between sectors in terms of experiences with the claims process. Less than 20% of employees reported a positive impact on their recovery. Overall, the general impact of the process appeared to be unhelpful or detrimental to employees’ recovery.
Table 9.2.1: Impact of workers’ compensation claims relating to mental health
Sector
Impact going through the claims experience had on employee’s recovery
Very positive impact (%)
Slightly positive
impact (%)
Didn't have any impact
(%)
Slightly negative
impact (%) Very negative
impact (%)
Ambulance 11.1 11.6 20.0 23.5 33.8
Fire and rescue 12.4 8.5 20.3 17.5 41.3
Police 7.4 8.2 23.1 24.9 36.5
State emergency service n.p. 19.2 n.p. 21.9 28.3
Total 8.3 8.7 22.4 24.1 36.5 n.p. Not available for publication because of small cell size, but included in totals where applicable
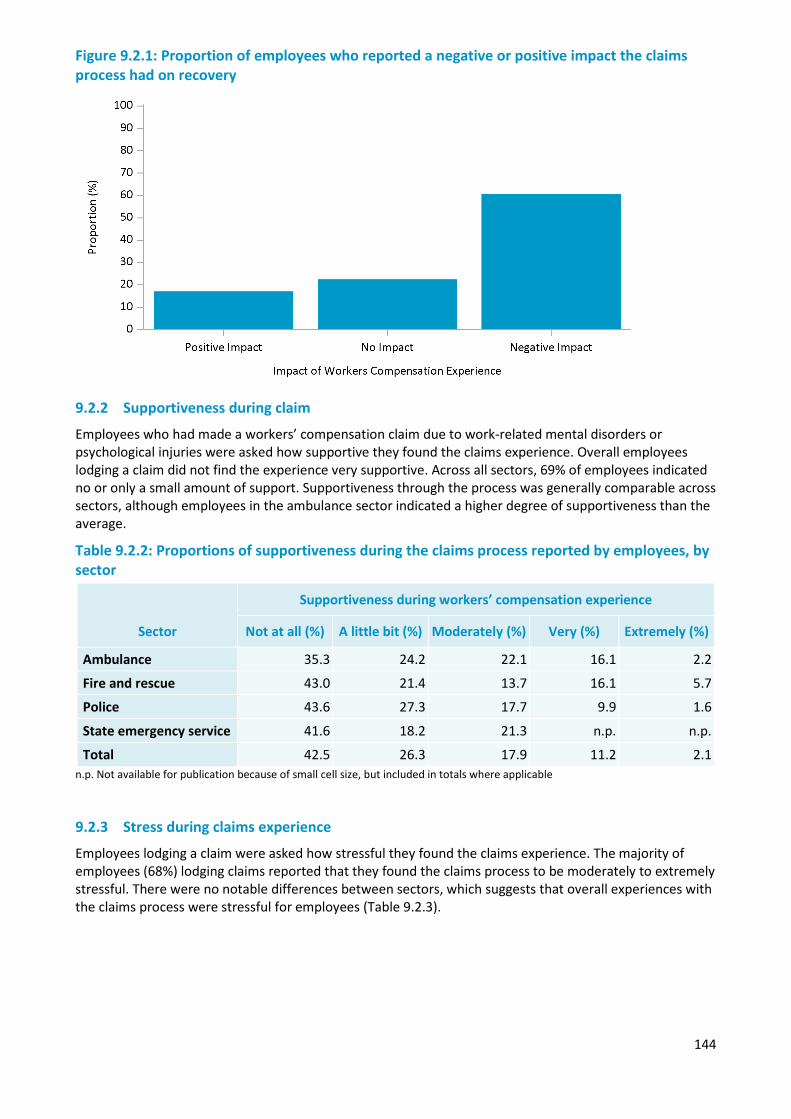
144
Figure 9.2.1: Proportion of employees who reported a negative or positive impact the claims process had on recovery
9.2.2 Supportiveness during claim
Employees who had made a workers’ compensation claim due to work-related mental disorders or psychological injuries were asked how supportive they found the claims experience. Overall employees lodging a claim did not find the experience very supportive. Across all sectors, 69% of employees indicated no or only a small amount of support. Supportiveness through the process was generally comparable across sectors, although employees in the ambulance sector indicated a higher degree of supportiveness than the average.
Table 9.2.2: Proportions of supportiveness during the claims process reported by employees, by sector
Sector
Supportiveness during workers’ compensation experience
Not at all (%) A little bit (%) Moderately (%) Very (%) Extremely (%)
Ambulance 35.3 24.2 22.1 16.1 2.2
Fire and rescue 43.0 21.4 13.7 16.1 5.7
Police 43.6 27.3 17.7 9.9 1.6
State emergency service 41.6 18.2 21.3 n.p. n.p.
Total 42.5 26.3 17.9 11.2 2.1 n.p. Not available for publication because of small cell size, but included in totals where applicable
9.2.3 Stress during claims experience
Employees lodging a claim were asked how stressful they found the claims experience. The majority of employees (68%) lodging claims reported that they found the claims process to be moderately to extremely stressful. There were no notable differences between sectors, which suggests that overall experiences with the claims process were stressful for employees (Table 9.2.3).
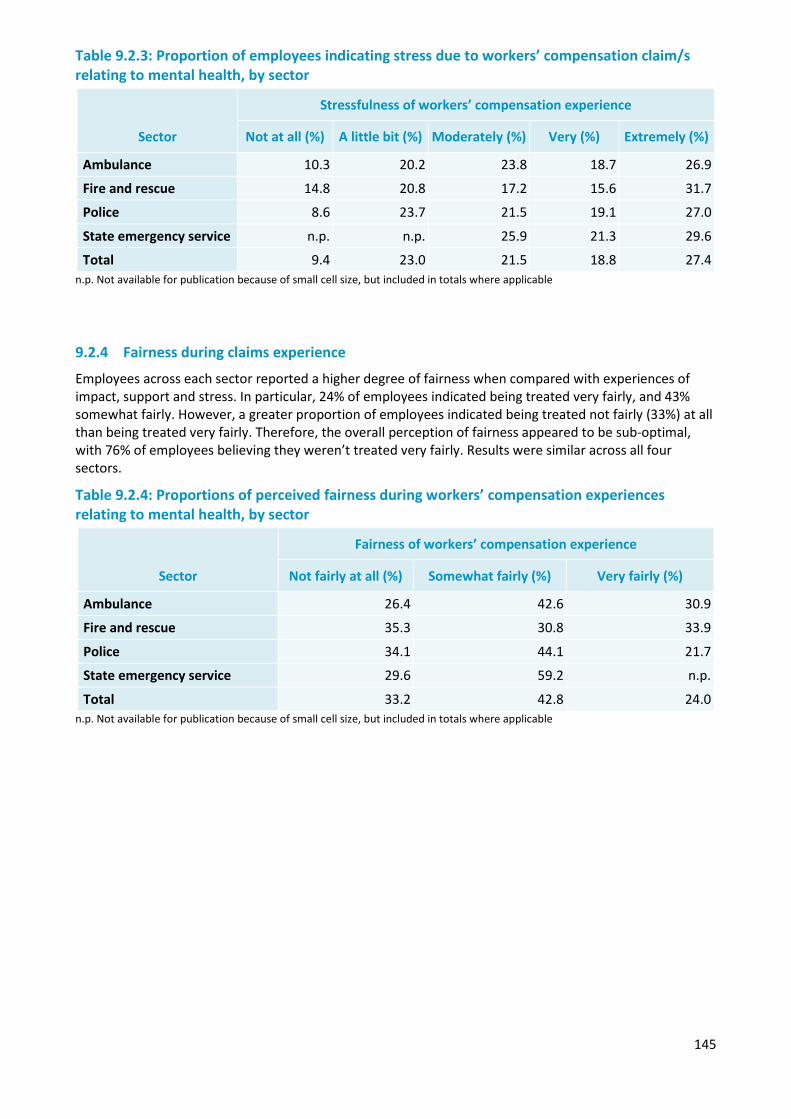
145
Table 9.2.3: Proportion of employees indicating stress due to workers’ compensation claim/s relating to mental health, by sector
Sector
Stressfulness of workers’ compensation experience
Not at all (%) A little bit (%) Moderately (%) Very (%) Extremely (%)
Ambulance 10.3 20.2 23.8 18.7 26.9
Fire and rescue 14.8 20.8 17.2 15.6 31.7
Police 8.6 23.7 21.5 19.1 27.0
State emergency service n.p. n.p. 25.9 21.3 29.6
Total 9.4 23.0 21.5 18.8 27.4 n.p. Not available for publication because of small cell size, but included in totals where applicable
9.2.4 Fairness during claims experience
Employees across each sector reported a higher degree of fairness when compared with experiences of impact, support and stress. In particular, 24% of employees indicated being treated very fairly, and 43% somewhat fairly. However, a greater proportion of employees indicated being treated not fairly (33%) at all than being treated very fairly. Therefore, the overall perception of fairness appeared to be sub-optimal, with 76% of employees believing they weren’t treated very fairly. Results were similar across all four sectors.
Table 9.2.4: Proportions of perceived fairness during workers’ compensation experiences relating to mental health, by sector
Sector
Fairness of workers’ compensation experience
Not fairly at all (%) Somewhat fairly (%) Very fairly (%)
Ambulance 26.4 42.6 30.9
Fire and rescue 35.3 30.8 33.9
Police 34.1 44.1 21.7
State emergency service 29.6 59.2 n.p.
Total 33.2 42.8 24.0 n.p. Not available for publication because of small cell size, but included in totals where applicable
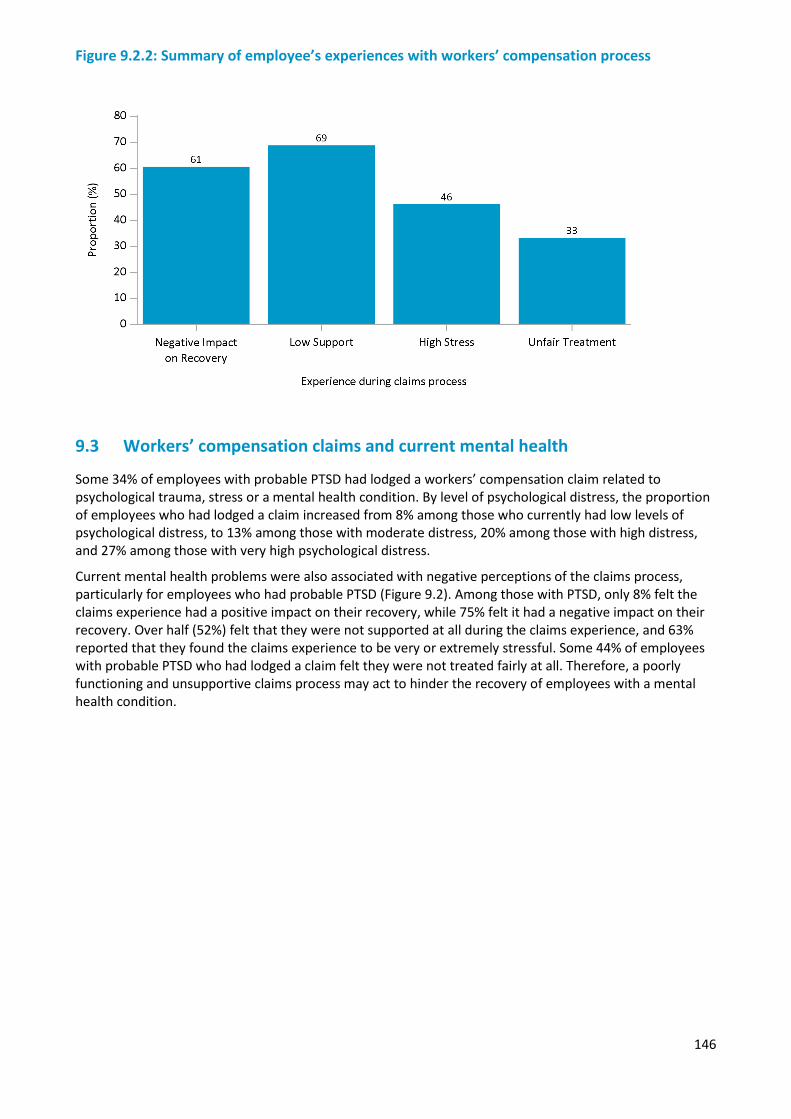
146
Figure 9.2.2: Summary of employee’s experiences with workers’ compensation process
9.3 Workers’ compensation claims and current mental health
Some 34% of employees with probable PTSD had lodged a workers’ compensation claim related to psychological trauma, stress or a mental health condition. By level of psychological distress, the proportion of employees who had lodged a claim increased from 8% among those who currently had low levels of psychological distress, to 13% among those with moderate distress, 20% among those with high distress, and 27% among those with very high psychological distress.
Current mental health problems were also associated with negative perceptions of the claims process, particularly for employees who had probable PTSD (Figure 9.2). Among those with PTSD, only 8% felt the claims experience had a positive impact on their recovery, while 75% felt it had a negative impact on their recovery. Over half (52%) felt that they were not supported at all during the claims experience, and 63% reported that they found the claims experience to be very or extremely stressful. Some 44% of employees with probable PTSD who had lodged a claim felt they were not treated fairly at all. Therefore, a poorly functioning and unsupportive claims process may act to hinder the recovery of employees with a mental health condition.
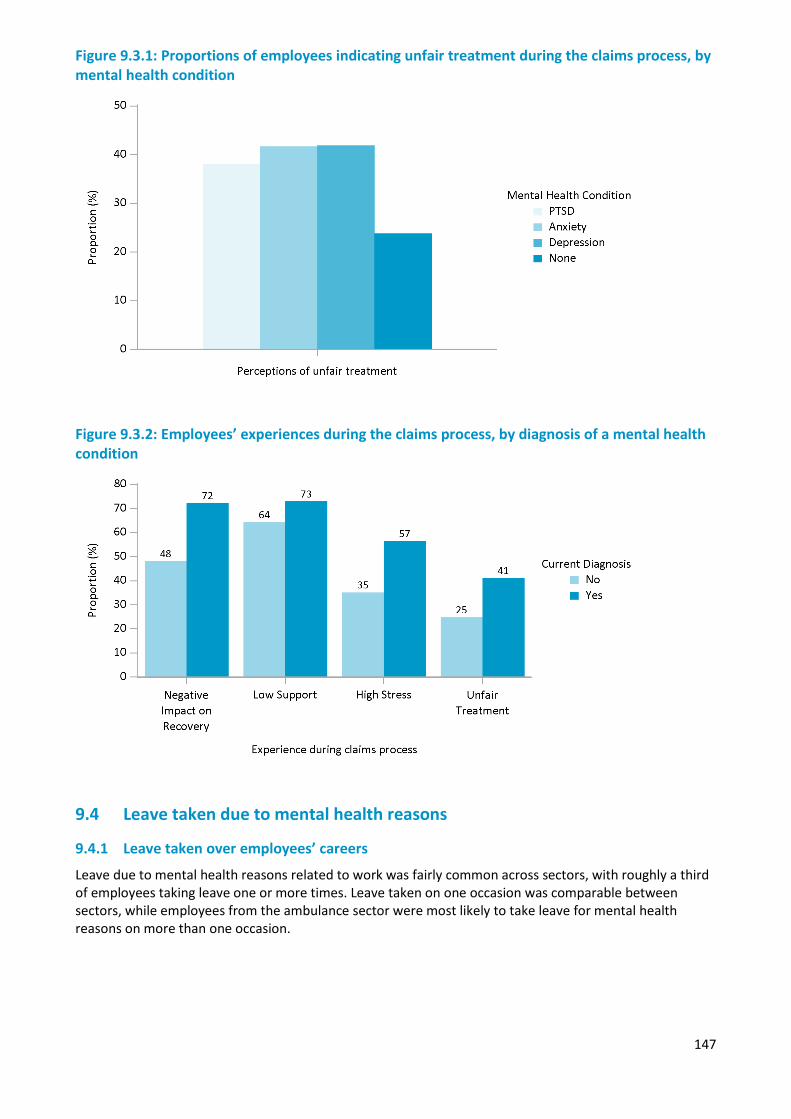
147
Figure 9.3.1: Proportions of employees indicating unfair treatment during the claims process, by mental health condition
Figure 9.3.2: Employees’ experiences during the claims process, by diagnosis of a mental health condition
9.4 Leave taken due to mental health reasons
9.4.1 Leave taken over employees’ careers
Leave due to mental health reasons related to work was fairly common across sectors, with roughly a third of employees taking leave one or more times. Leave taken on one occasion was comparable between sectors, while employees from the ambulance sector were most likely to take leave for mental health reasons on more than one occasion.
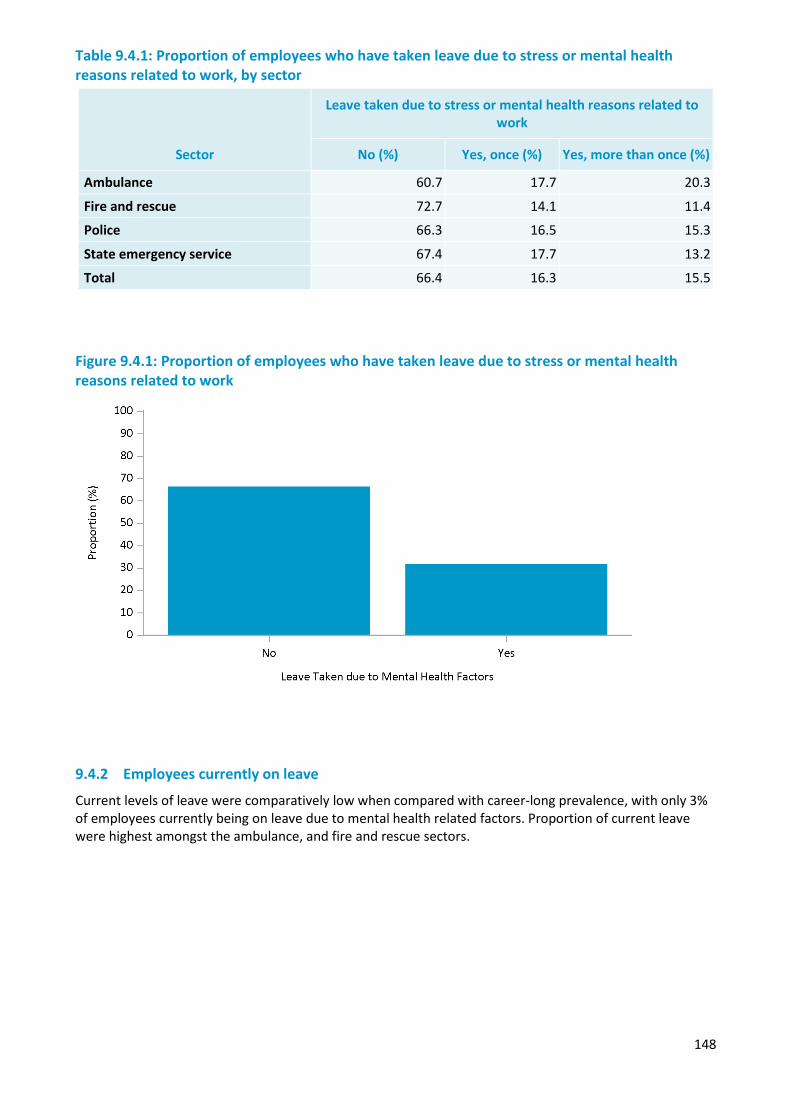
148
Table 9.4.1: Proportion of employees who have taken leave due to stress or mental health reasons related to work, by sector
Sector
Leave taken due to stress or mental health reasons related to work
No (%) Yes, once (%) Yes, more than once (%)
Ambulance 60.7 17.7 20.3
Fire and rescue 72.7 14.1 11.4
Police 66.3 16.5 15.3
State emergency service 67.4 17.7 13.2
Total 66.4 16.3 15.5 Figure 9.4.1: Proportion of employees who have taken leave due to stress or mental health reasons related to work
9.4.2 Employees currently on leave
Current levels of leave were comparatively low when compared with career-long prevalence, with only 3% of employees currently being on leave due to mental health related factors. Proportion of current leave were highest amongst the ambulance, and fire and rescue sectors.
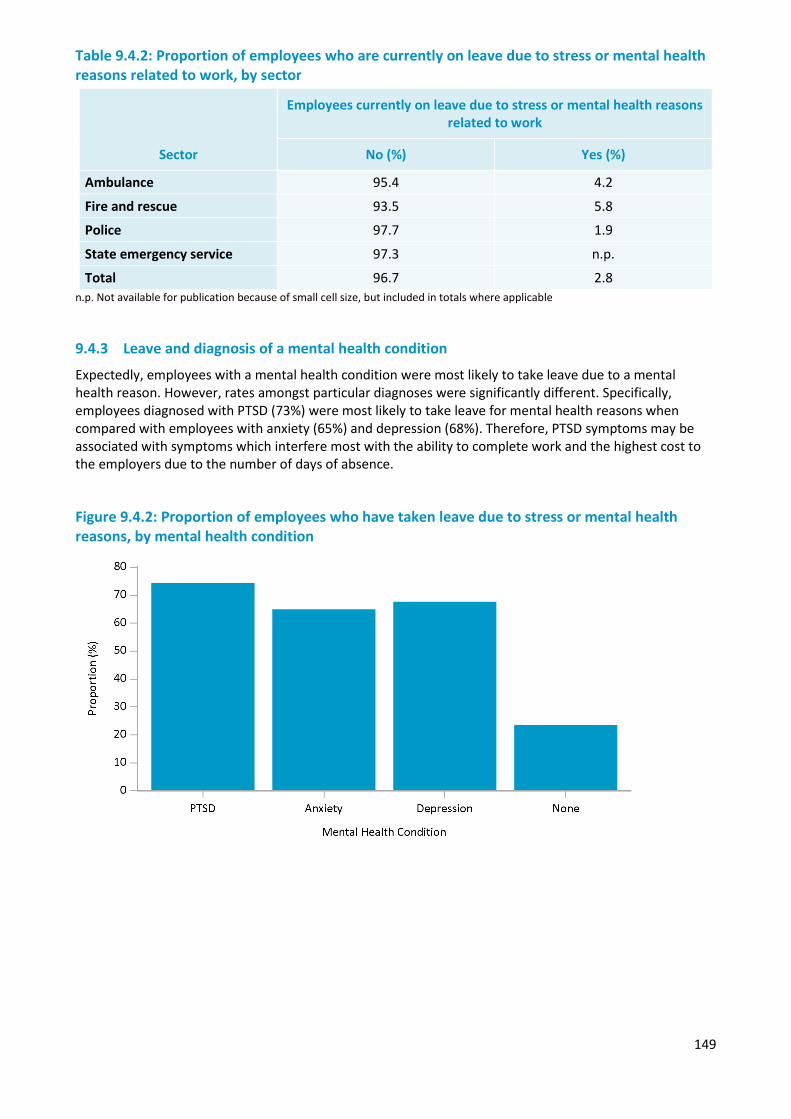
149
Table 9.4.2: Proportion of employees who are currently on leave due to stress or mental health reasons related to work, by sector
Sector
Employees currently on leave due to stress or mental health reasons related to work
No (%) Yes (%)
Ambulance 95.4 4.2
Fire and rescue 93.5 5.8
Police 97.7 1.9
State emergency service 97.3 n.p.
Total 96.7 2.8 n.p. Not available for publication because of small cell size, but included in totals where applicable
9.4.3 Leave and diagnosis of a mental health condition
Expectedly, employees with a mental health condition were most likely to take leave due to a mental health reason. However, rates amongst particular diagnoses were significantly different. Specifically, employees diagnosed with PTSD (73%) were most likely to take leave for mental health reasons when compared with employees with anxiety (65%) and depression (68%). Therefore, PTSD symptoms may be associated with symptoms which interfere most with the ability to complete work and the highest cost to the employers due to the number of days of absence.
Figure 9.4.2: Proportion of employees who have taken leave due to stress or mental health reasons, by mental health condition

150
151
Chapter 10 — The resilient worker and workplace
Overview
A range of personal and workplace factors are related to positive mental health and wellbeing. Regression modelling has been undertaken to determine which factors are most strongly related to wellbeing within police and emergency services. These results have been used to develop a profile of a resilient employee and a resilient workplace.
In Chapter 4: Individual risk and protective factors, several personal factors were identified as associated with resilience including sleep quality, physical health, experiences of trauma, social support, use of support programs, and demographic factors.
Chapter 6: Risk and protective factors associated with the working environment identified a list of workplace support and stress factors which were associated with positive or poor mental health.
The section identifies which of these factors have the strongest independent relationships with resilience, wellbeing and distress. To determine this relationship, a series of structural equation models were developed which aim to summarise the relationship between a variety of factors and mental health outcomes.
Summary of findings
The resilient employee more often has better physical health, sleep quality, social supports and more regular use of support programs, as well as more favourable working hours and a cohesive working environment. Knowledge of these associations may help design approaches to increasing resilience of the workforce.
The resilient workplace was in general more supportive and operated in a way that created less stress for team members. Team cohesiveness and a good work/life balance were associated with lower distress and higher resilience. These workplace factors may vary between teams within the same agency. Addressing these factors consistently across all teams in an agency may help to improve team resilience.
10.1 Characteristics of a resilient employee
10.1.1 General findings
Several factors had a strong relationship with personal resilience. Most notably, stronger social supports were related to higher resilience, which is consistent with prior research. Another notable factor associated with higher resilience was the use of support programs, such as participation in mental health first aid programs, suicide awareness and use of peer support programs. This suggests that these programs are beneficial and that increasing their use may foster increased resilience.
Physical health and sleep quality were associated with higher levels of resilience. In particular, the better an employee’s self-reported physical health and sleep, and the more often they engaged in adequate physical activity, the more likely they were to report higher resilience. However, it is important to note than low levels of resilience may reflect worsening mental health of an employee, of which poor physical health and sleep could be a consequence. Regardless, poor physical health and sleep have been identified as having an effect on mental health through prior research and qualitative analysis of police and emergency service employees, and should be targeted during interventions when possible.
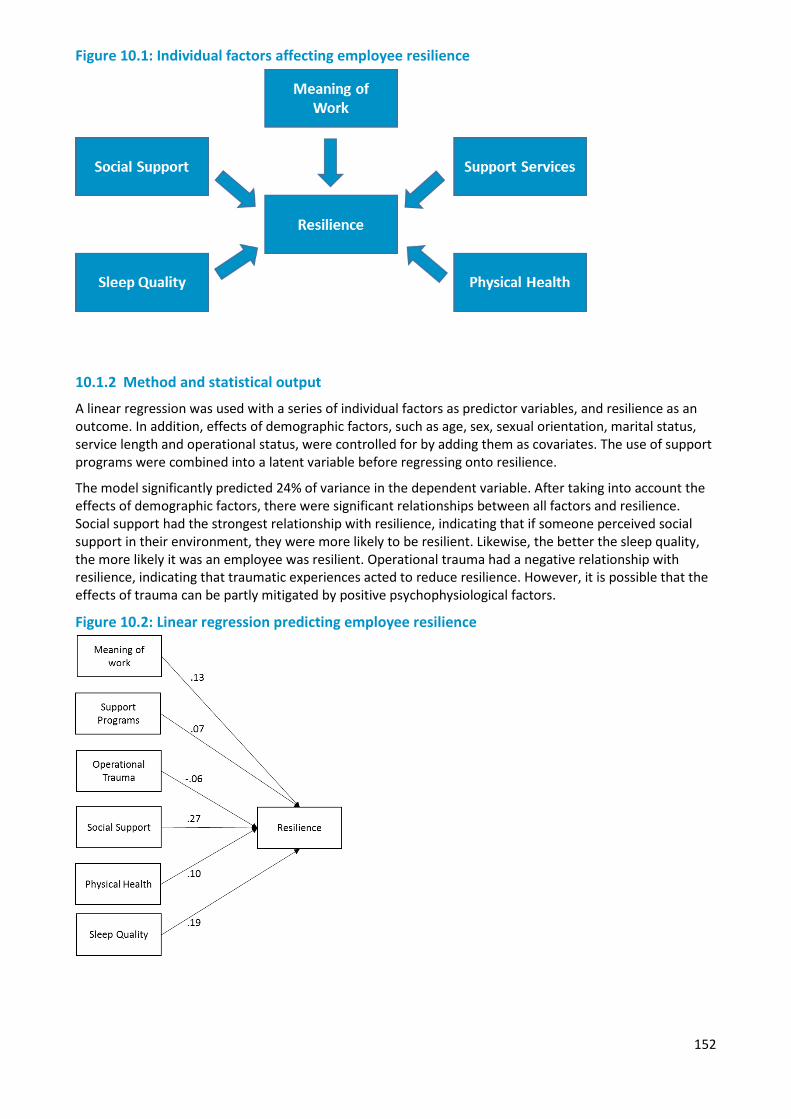
152
Figure 10.1: Individual factors affecting employee resilience
10.1.2 Method and statistical output
A linear regression was used with a series of individual factors as predictor variables, and resilience as an outcome. In addition, effects of demographic factors, such as age, sex, sexual orientation, marital status, service length and operational status, were controlled for by adding them as covariates. The use of support programs were combined into a latent variable before regressing onto resilience.
The model significantly predicted 24% of variance in the dependent variable. After taking into account the effects of demographic factors, there were significant relationships between all factors and resilience. Social support had the strongest relationship with resilience, indicating that if someone perceived social support in their environment, they were more likely to be resilient. Likewise, the better the sleep quality, the more likely it was an employee was resilient. Operational trauma had a negative relationship with resilience, indicating that traumatic experiences acted to reduce resilience. However, it is possible that the effects of trauma can be partly mitigated by positive psychophysiological factors.
Figure 10.2: Linear regression predicting employee resilience
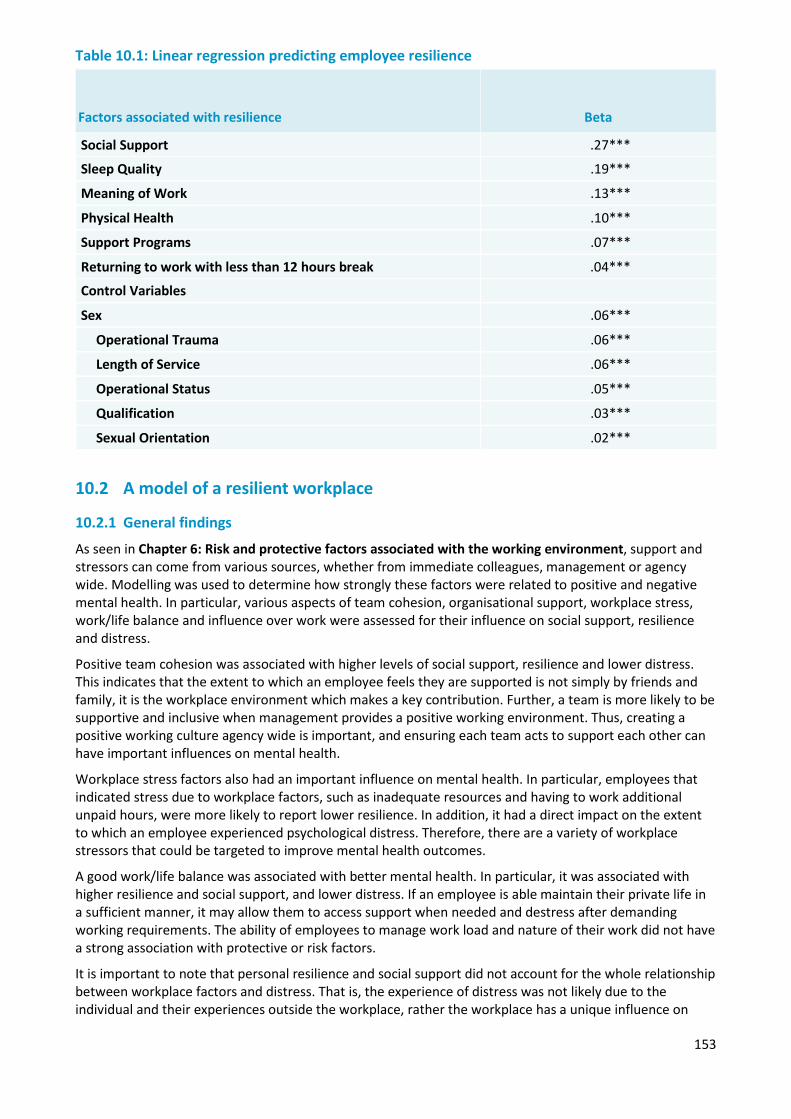
153
Table 10.1: Linear regression predicting employee resilience
Factors associated with resilience Beta
Social Support .27***
Sleep Quality .19***
Meaning of Work .13***
Physical Health .10***
Support Programs .07***
Returning to work with less than 12 hours break .04***
Control Variables
Sex .06***
Operational Trauma .06***
Length of Service .06***
Operational Status .05***
Qualification .03***
Sexual Orientation .02***
10.2 A model of a resilient workplace
10.2.1 General findings
As seen in Chapter 6: Risk and protective factors associated with the working environment, support and stressors can come from various sources, whether from immediate colleagues, management or agency wide. Modelling was used to determine how strongly these factors were related to positive and negative mental health. In particular, various aspects of team cohesion, organisational support, workplace stress, work/life balance and influence over work were assessed for their influence on social support, resilience and distress.
Positive team cohesion was associated with higher levels of social support, resilience and lower distress. This indicates that the extent to which an employee feels they are supported is not simply by friends and family, it is the workplace environment which makes a key contribution. Further, a team is more likely to be supportive and inclusive when management provides a positive working environment. Thus, creating a positive working culture agency wide is important, and ensuring each team acts to support each other can have important influences on mental health.
Workplace stress factors also had an important influence on mental health. In particular, employees that indicated stress due to workplace factors, such as inadequate resources and having to work additional unpaid hours, were more likely to report lower resilience. In addition, it had a direct impact on the extent to which an employee experienced psychological distress. Therefore, there are a variety of workplace stressors that could be targeted to improve mental health outcomes.
A good work/life balance was associated with better mental health. In particular, it was associated with higher resilience and social support, and lower distress. If an employee is able maintain their private life in a sufficient manner, it may allow them to access support when needed and destress after demanding working requirements. The ability of employees to manage work load and nature of their work did not have a strong association with protective or risk factors.
It is important to note that personal resilience and social support did not account for the whole relationship between workplace factors and distress. That is, the experience of distress was not likely due to the individual and their experiences outside the workplace, rather the workplace has a unique influence on

154
their mental health. Psychological distress was shown to be strongly associated with suicidal thoughts and behaviours. Therefore, a poorly functioning workplace may act to heighten distress, which in turn may influence an employee’s levels of suicidal thoughts and behaviours. Adequate and timely interventions in a workplace setting, such as through support programs, are therefore imperative to prevent the development of harmful mental health issues.
Figure 10.3: Workplace factors affecting employee resilience, social support and mental health
10.2.2 Method and statistical output
Workplace factors were developed through the use of factor analysis to determine six distinct components from survey items pertaining to the working environment. Five of these factors were used to assess the influence of the workplace on mental health, with meaning of work included in the model of the resilient work instead, due to it being more related to the individual rather than the workplace.
Given the complexity and strong relationships between predictor variables, various models were developed using path analysis. This was to determine any potential mediating relationships between variables, or how much of the effect of one variable on an outcome can be accounted for by another variable.
In total, three models were created to assess the impact of workplace factors on Resilience (Model 1), Social Support (Model 2), and a combination of protective and risk factors, and its relation to suicide (Model 3).
10.3 Resilience
The first model can be seen in Figure 10.2, with workplace factors regressed on resilience. The strongest relationship was evident between team cohesion and resilience (0.26), followed by work/life balance (0.17). Work influence and organisational support was not significantly associated with resilience. This suggests that a cohesive and supportive team environment may be especially important in heightening the resilience of employees. Resilience was also regressed on distress, with results suggesting a strong and negative association (-0.63), suggesting that employees with higher resilience tended to have lower distress. Therefore, workplace factors were associated with higher resilience, which may assist employees in experiencing lower levels of distress.

155
Figure 10.4: Path analysis of workplace factors affecting employee resilience, social support and mental health
10.4 Social Support
The second model looked at the relationships between workplace factors and social support. As expected, team cohesion had the strongest relationship with social support (0.40). In addition, work/life balance had a weak, but notable association with social support, indicating that if work does not extensively impede on an employee’s private life, they may be able to access supports outside of work (i.e. family, friends).
Figure 10.5: Path analysis of workplace factors affecting employee resilience, social support and mental health
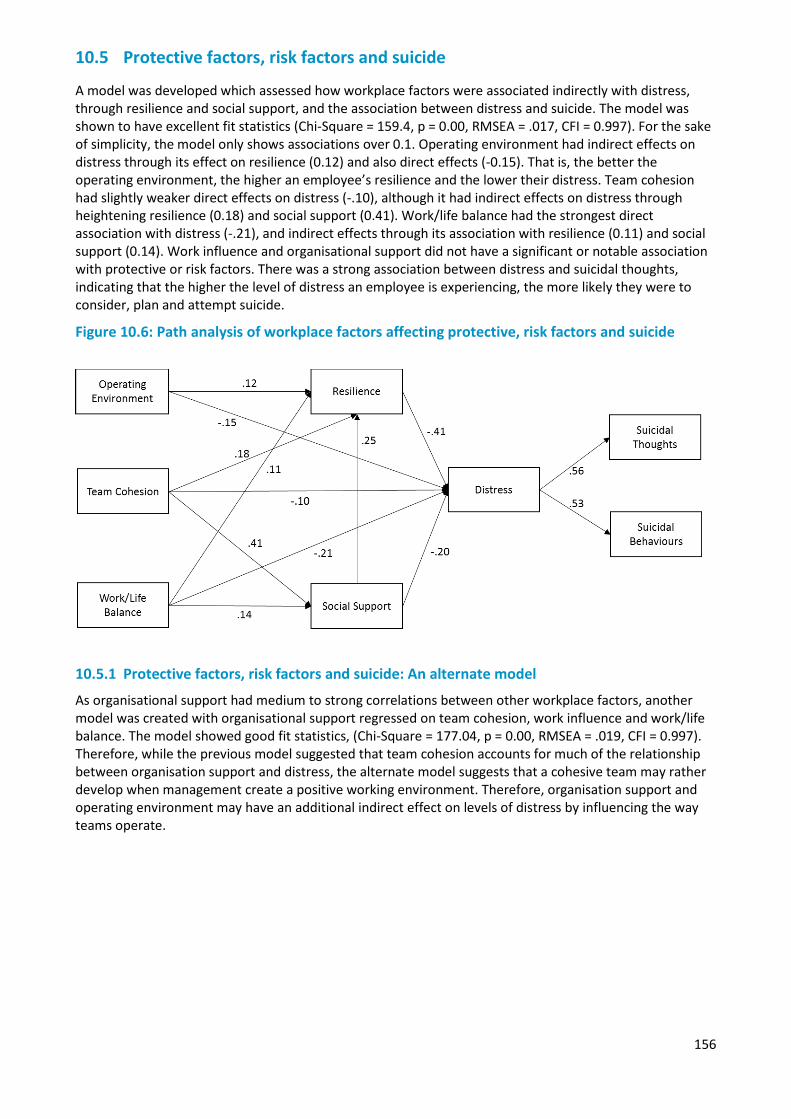
156
10.5 Protective factors, risk factors and suicide
A model was developed which assessed how workplace factors were associated indirectly with distress, through resilience and social support, and the association between distress and suicide. The model was shown to have excellent fit statistics (Chi-Square = 159.4, p = 0.00, RMSEA = .017, CFI = 0.997). For the sake of simplicity, the model only shows associations over 0.1. Operating environment had indirect effects on distress through its effect on resilience (0.12) and also direct effects (-0.15). That is, the better the operating environment, the higher an employee’s resilience and the lower their distress. Team cohesion had slightly weaker direct effects on distress (-.10), although it had indirect effects on distress through heightening resilience (0.18) and social support (0.41). Work/life balance had the strongest direct association with distress (-.21), and indirect effects through its association with resilience (0.11) and social support (0.14). Work influence and organisational support did not have a significant or notable association with protective or risk factors. There was a strong association between distress and suicidal thoughts, indicating that the higher the level of distress an employee is experiencing, the more likely they were to consider, plan and attempt suicide.
Figure 10.6: Path analysis of workplace factors affecting protective, risk factors and suicide
10.5.1 Protective factors, risk factors and suicide: An alternate model
As organisational support had medium to strong correlations between other workplace factors, another model was created with organisational support regressed on team cohesion, work influence and work/life balance. The model showed good fit statistics, (Chi-Square = 177.04, p = 0.00, RMSEA = .019, CFI = 0.997). Therefore, while the previous model suggested that team cohesion accounts for much of the relationship between organisation support and distress, the alternate model suggests that a cohesive team may rather develop when management create a positive working environment. Therefore, organisation support and operating environment may have an additional indirect effect on levels of distress by influencing the way teams operate.
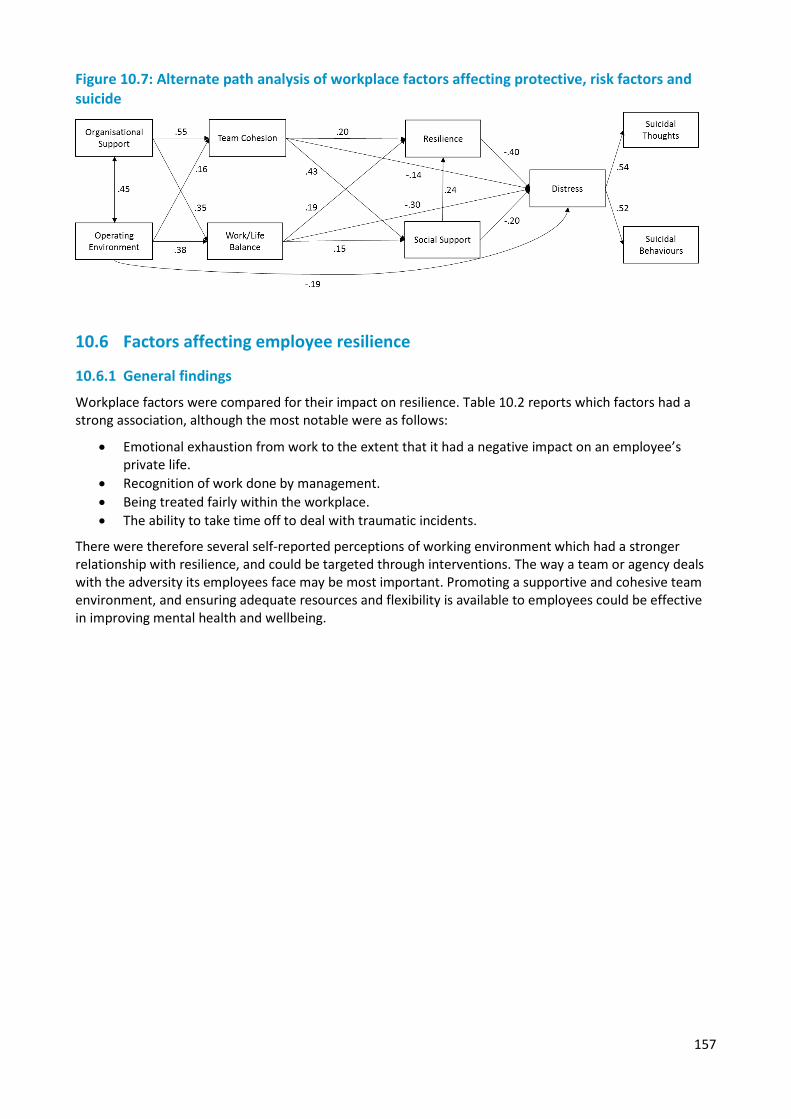
157
Figure 10.7: Alternate path analysis of workplace factors affecting protective, risk factors and suicide
10.6 Factors affecting employee resilience
10.6.1 General findings
Workplace factors were compared for their impact on resilience. Table 10.2 reports which factors had a strong association, although the most notable were as follows:
• Emotional exhaustion from work to the extent that it had a negative impact on an employee’sprivate life.
• Recognition of work done by management.• Being treated fairly within the workplace.• The ability to take time off to deal with traumatic incidents.
There were therefore several self-reported perceptions of working environment which had a stronger relationship with resilience, and could be targeted through interventions. The way a team or agency deals with the adversity its employees face may be most important. Promoting a supportive and cohesive team environment, and ensuring adequate resources and flexibility is available to employees could be effective in improving mental health and wellbeing.
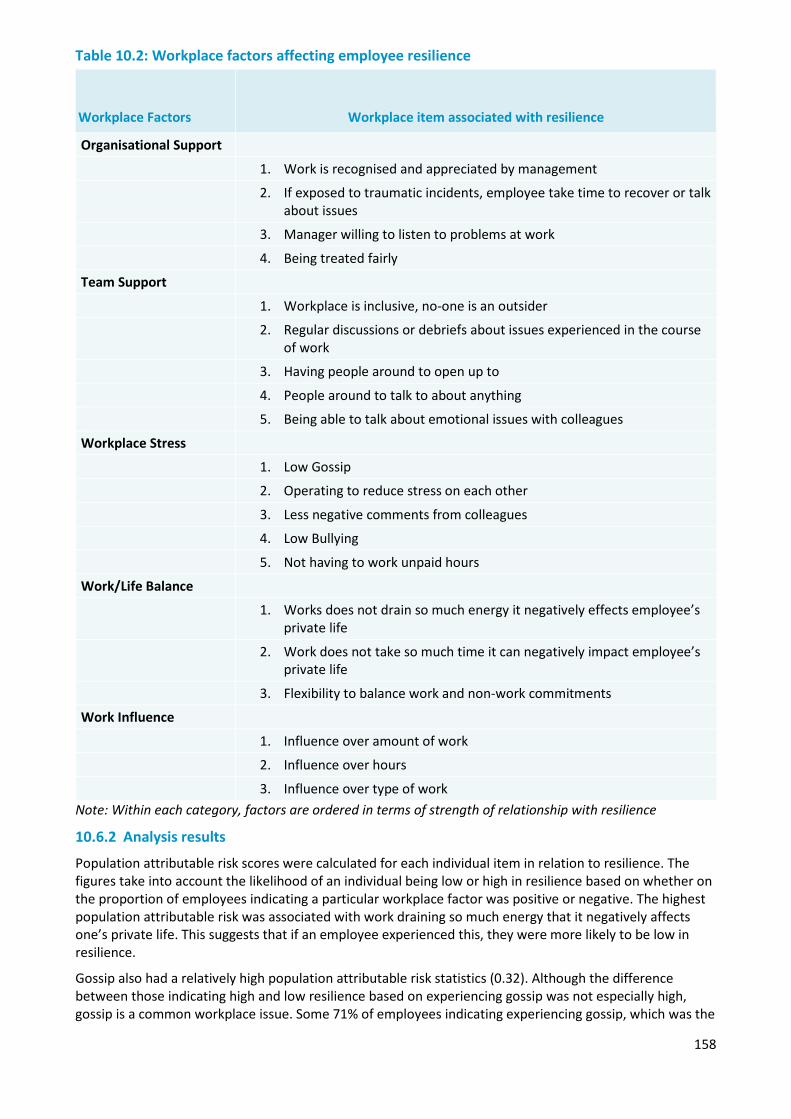
158
Table 10.2: Workplace factors affecting employee resilience
Workplace Factors Workplace item associated with resilience
Organisational Support
1. Work is recognised and appreciated by management
2. If exposed to traumatic incidents, employee take time to recover or talkabout issues
3. Manager willing to listen to problems at work
4. Being treated fairly
Team Support
1. Workplace is inclusive, no-one is an outsider
2. Regular discussions or debriefs about issues experienced in the courseof work
3. Having people around to open up to
4. People around to talk to about anything
5. Being able to talk about emotional issues with colleagues
Workplace Stress
1. Low Gossip
2. Operating to reduce stress on each other
3. Less negative comments from colleagues
4. Low Bullying
5. Not having to work unpaid hours
Work/Life Balance
1. Works does not drain so much energy it negatively effects employee’sprivate life
2. Work does not take so much time it can negatively impact employee’sprivate life
3. Flexibility to balance work and non-work commitments
Work Influence
1. Influence over amount of work
2. Influence over hours
3. Influence over type of workNote: Within each category, factors are ordered in terms of strength of relationship with resilience
10.6.2 Analysis results
Population attributable risk scores were calculated for each individual item in relation to resilience. The figures take into account the likelihood of an individual being low or high in resilience based on whether on the proportion of employees indicating a particular workplace factor was positive or negative. The highest population attributable risk was associated with work draining so much energy that it negatively affects one’s private life. This suggests that if an employee experienced this, they were more likely to be low in resilience.
Gossip also had a relatively high population attributable risk statistics (0.32). Although the difference between those indicating high and low resilience based on experiencing gossip was not especially high, gossip is a common workplace issue. Some 71% of employees indicating experiencing gossip, which was the
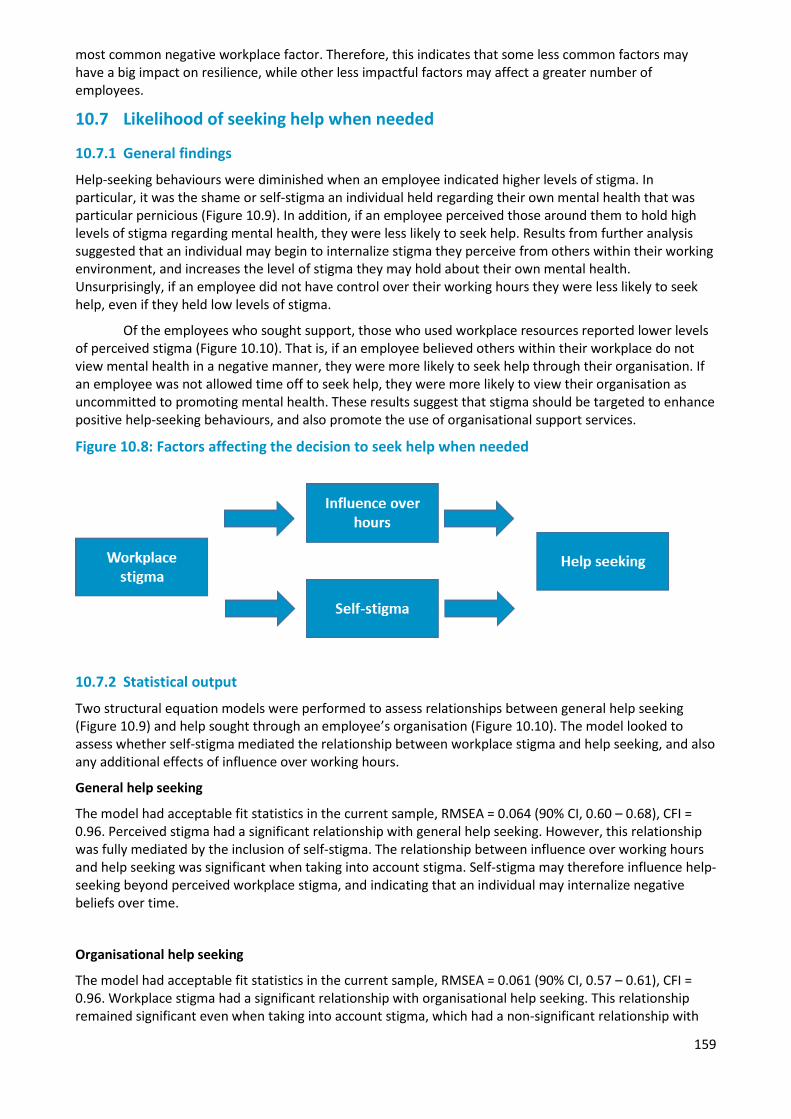
159
most common negative workplace factor. Therefore, this indicates that some less common factors may have a big impact on resilience, while other less impactful factors may affect a greater number of employees.
10.7 Likelihood of seeking help when needed
10.7.1 General findings
Help-seeking behaviours were diminished when an employee indicated higher levels of stigma. In particular, it was the shame or self-stigma an individual held regarding their own mental health that was particular pernicious (Figure 10.9). In addition, if an employee perceived those around them to hold high levels of stigma regarding mental health, they were less likely to seek help. Results from further analysis suggested that an individual may begin to internalize stigma they perceive from others within their working environment, and increases the level of stigma they may hold about their own mental health. Unsurprisingly, if an employee did not have control over their working hours they were less likely to seek help, even if they held low levels of stigma.
Of the employees who sought support, those who used workplace resources reported lower levels of perceived stigma (Figure 10.10). That is, if an employee believed others within their workplace do not view mental health in a negative manner, they were more likely to seek help through their organisation. If an employee was not allowed time off to seek help, they were more likely to view their organisation as uncommitted to promoting mental health. These results suggest that stigma should be targeted to enhance positive help-seeking behaviours, and also promote the use of organisational support services.
Figure 10.8: Factors affecting the decision to seek help when needed
10.7.2 Statistical output
Two structural equation models were performed to assess relationships between general help seeking (Figure 10.9) and help sought through an employee’s organisation (Figure 10.10). The model looked to assess whether self-stigma mediated the relationship between workplace stigma and help seeking, and also any additional effects of influence over working hours.
General help seeking
The model had acceptable fit statistics in the current sample, RMSEA = 0.064 (90% CI, 0.60 – 0.68), CFI = 0.96. Perceived stigma had a significant relationship with general help seeking. However, this relationship was fully mediated by the inclusion of self-stigma. The relationship between influence over working hours and help seeking was significant when taking into account stigma. Self-stigma may therefore influence help-seeking beyond perceived workplace stigma, and indicating that an individual may internalize negative beliefs over time.
Organisational help seeking
The model had acceptable fit statistics in the current sample, RMSEA = 0.061 (90% CI, 0.57 – 0.61), CFI = 0.96. Workplace stigma had a significant relationship with organisational help seeking. This relationship remained significant even when taking into account stigma, which had a non-significant relationship with
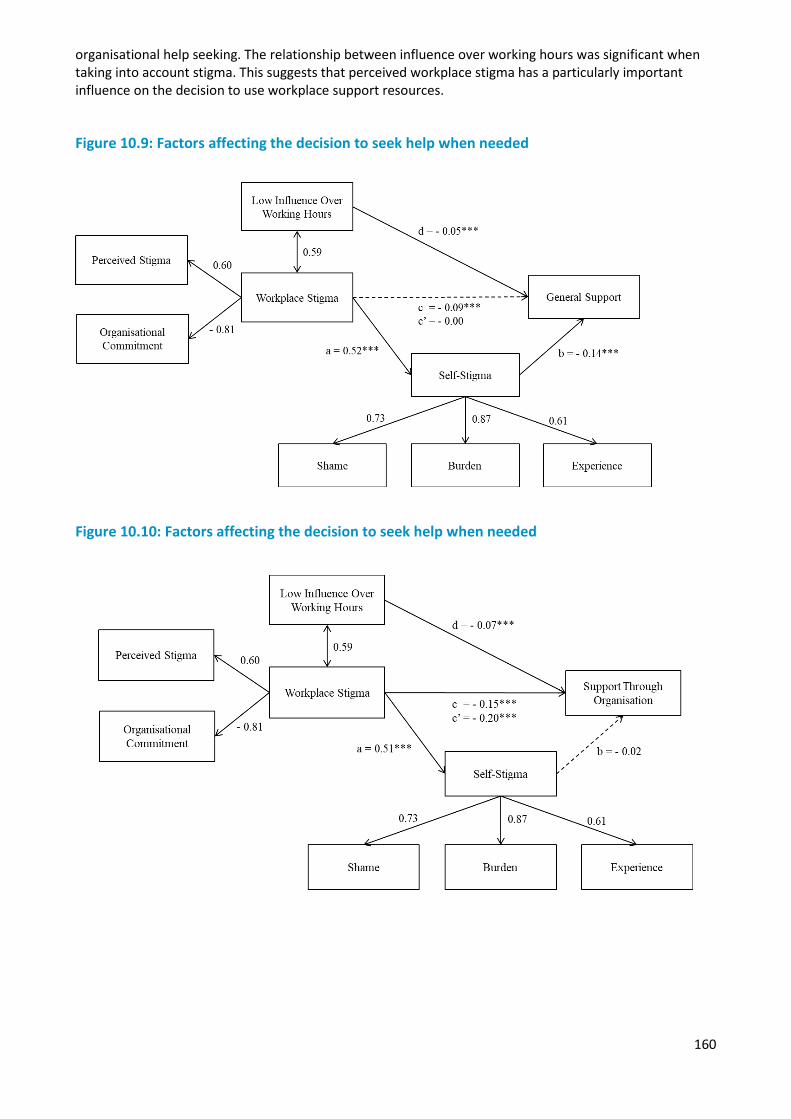
160
organisational help seeking. The relationship between influence over working hours was significant when taking into account stigma. This suggests that perceived workplace stigma has a particularly important influence on the decision to use workplace support resources.
Figure 10.9: Factors affecting the decision to seek help when needed
Figure 10.10: Factors affecting the decision to seek help when needed
161
Chapter 11 — Former employees
Overview
Most of the agencies participating in Answering the call do not maintain lists of former employees in their organisations, and as a result it was not possible to select a random sample of former employees to participate in the survey. A survey of former employees was conducted by advertising the survey through associations of former employees, through contacts that individual agencies maintain, and through employees who are in contact with former employees. As a result, the sample of former employees should not be considered as representing the entire population of people who have previously worked in the police and emergency services sector. The former employee survey data describe the experiences of a group of former employees who were interested in the topic of the survey and chose to participate.
Overall, 661 former employees responded to the survey. Approximately half of the survey respondents previously worked in the police sector (52%, n = 344), followed by fire and rescue (24%, n = 161), ambulance (21%, n = 141), and state emergency service (2%, n = 12). Three respondents specified ‘Other’ as the sector they had previously worked in.
Due to the way the sample was recruited and the potential for bias, estimates from this part of the survey should not be considered to represent the population prevalence of mental health conditions in all former employees. All information must be interpreted with these limitations in mind. This arm of the Answering the call national survey was able to provide insightful information about the circumstances of former employees in the sector, their experiences, well-being, and mental health conditions.
There is clearly a group of former employees who continue to suffer significant distress years after retirement or leaving their jobs in the police and emergency services sector, with the former employees who participated in the survey having high rates of PTSD and psychological distress, and lower levels of resilience. Former employees were much less likely to receive high levels of social support compared with current employees, particularly those former employees currently having probable PTSD or high rates of distress.
11.1 Demographic overview
11.1.1 Demographic characteristics
The majority of former employees participating in the survey were male (88%), aged 55 years or over (83%), were married or in a de facto relationship (79%), and did not have dependent children living at home (66%). The highest education qualification obtained varied by previous sector of employment (Table 11.1.1). Across all sectors, 35% of former employees had completed secondary school to Year 12, 17% had a completed a Certificate III/IV, 29% had a Diploma, 8% had completed a Bachelor degree and 11% had a postgraduate qualification.
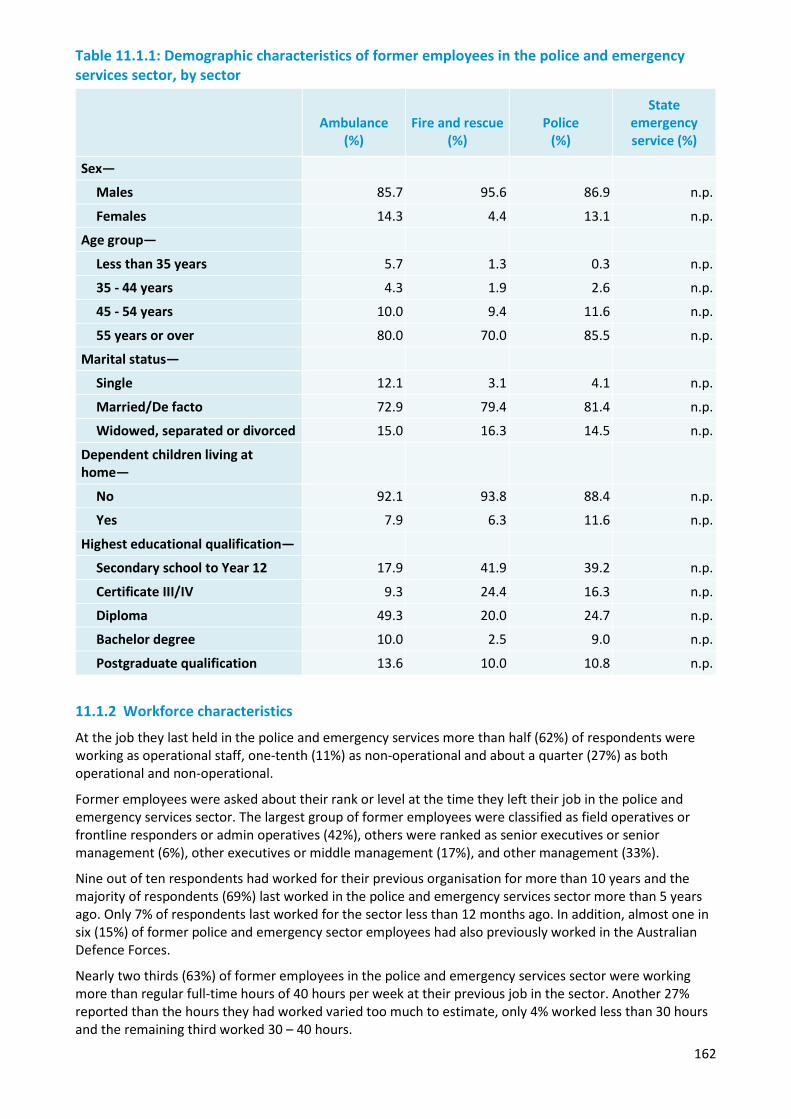
162
Table 11.1.1: Demographic characteristics of former employees in the police and emergency services sector, by sector
Ambulance (%)
Fire and rescue (%)
Police (%)
State emergency service (%)
Sex—
Males 85.7 95.6 86.9 n.p.
Females 14.3 4.4 13.1 n.p.
Age group—
Less than 35 years 5.7 1.3 0.3 n.p.
35 - 44 years 4.3 1.9 2.6 n.p.
45 - 54 years 10.0 9.4 11.6 n.p.
55 years or over 80.0 70.0 85.5 n.p.
Marital status—
Single 12.1 3.1 4.1 n.p.
Married/De facto 72.9 79.4 81.4 n.p.
Widowed, separated or divorced 15.0 16.3 14.5 n.p.
Dependent children living at home—
No 92.1 93.8 88.4 n.p.
Yes 7.9 6.3 11.6 n.p.
Highest educational qualification—
Secondary school to Year 12 17.9 41.9 39.2 n.p.
Certificate III/IV 9.3 24.4 16.3 n.p.
Diploma 49.3 20.0 24.7 n.p.
Bachelor degree 10.0 2.5 9.0 n.p.
Postgraduate qualification 13.6 10.0 10.8 n.p.
11.1.2 Workforce characteristics
At the job they last held in the police and emergency services more than half (62%) of respondents were working as operational staff, one-tenth (11%) as non-operational and about a quarter (27%) as both operational and non-operational.
Former employees were asked about their rank or level at the time they left their job in the police and emergency services sector. The largest group of former employees were classified as field operatives or frontline responders or admin operatives (42%), others were ranked as senior executives or senior management (6%), other executives or middle management (17%), and other management (33%).
Nine out of ten respondents had worked for their previous organisation for more than 10 years and the majority of respondents (69%) last worked in the police and emergency services sector more than 5 years ago. Only 7% of respondents last worked for the sector less than 12 months ago. In addition, almost one in six (15%) of former police and emergency sector employees had also previously worked in the Australian Defence Forces.
Nearly two thirds (63%) of former employees in the police and emergency services sector were working more than regular full-time hours of 40 hours per week at their previous job in the sector. Another 27% reported than the hours they had worked varied too much to estimate, only 4% worked less than 30 hours and the remaining third worked 30 – 40 hours.
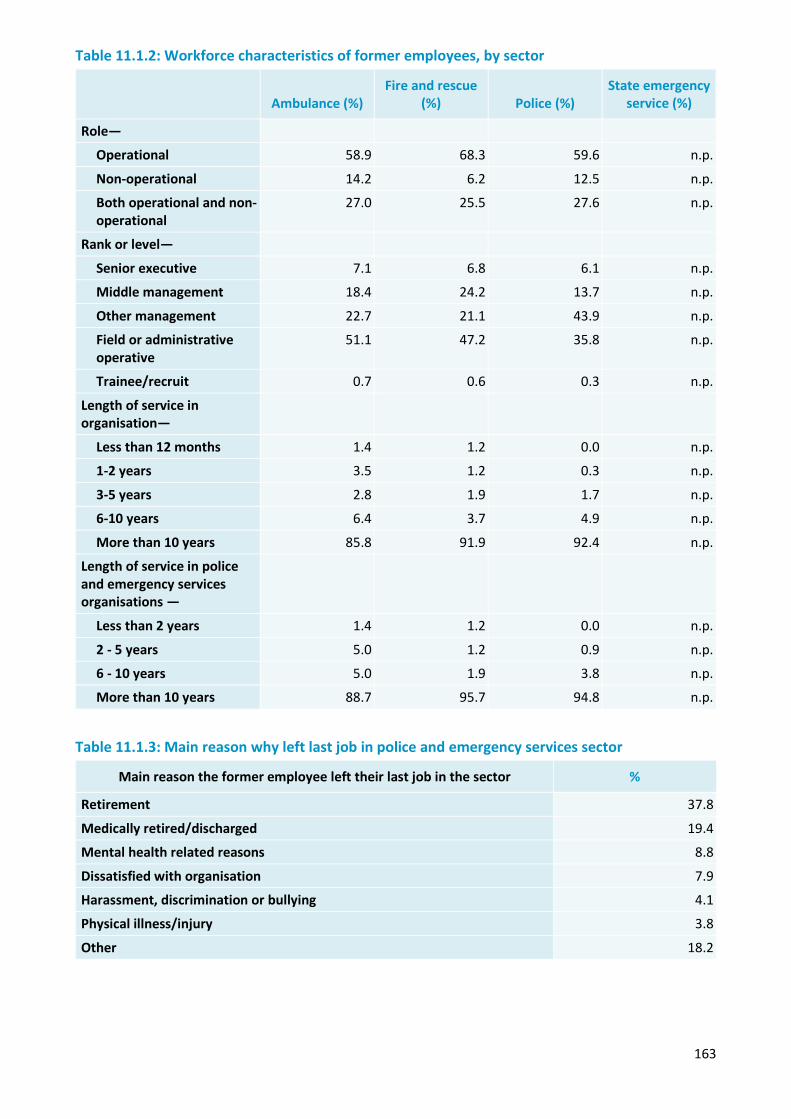
163
Table 11.1.2: Workforce characteristics of former employees, by sector
Ambulance (%) Fire and rescue
(%) Police (%) State emergency
service (%)
Role—
Operational 58.9 68.3 59.6 n.p.
Non-operational 14.2 6.2 12.5 n.p.
Both operational and non-operational
27.0 25.5 27.6 n.p.
Rank or level—
Senior executive 7.1 6.8 6.1 n.p.
Middle management 18.4 24.2 13.7 n.p.
Other management 22.7 21.1 43.9 n.p.
Field or administrative operative
51.1 47.2 35.8 n.p.
Trainee/recruit 0.7 0.6 0.3 n.p.
Length of service in organisation—
Less than 12 months 1.4 1.2 0.0 n.p.
1-2 years 3.5 1.2 0.3 n.p.
3-5 years 2.8 1.9 1.7 n.p.
6-10 years 6.4 3.7 4.9 n.p.
More than 10 years 85.8 91.9 92.4 n.p.
Length of service in police and emergency services organisations —
Less than 2 years 1.4 1.2 0.0 n.p.
2 - 5 years 5.0 1.2 0.9 n.p.
6 - 10 years 5.0 1.9 3.8 n.p.
More than 10 years 88.7 95.7 94.8 n.p.
Table 11.1.3: Main reason why left last job in police and emergency services sector
Main reason the former employee left their last job in the sector %
Retirement 37.8
Medically retired/discharged 19.4
Mental health related reasons 8.8
Dissatisfied with organisation 7.9
Harassment, discrimination or bullying 4.1
Physical illness/injury 3.8
Other 18.2
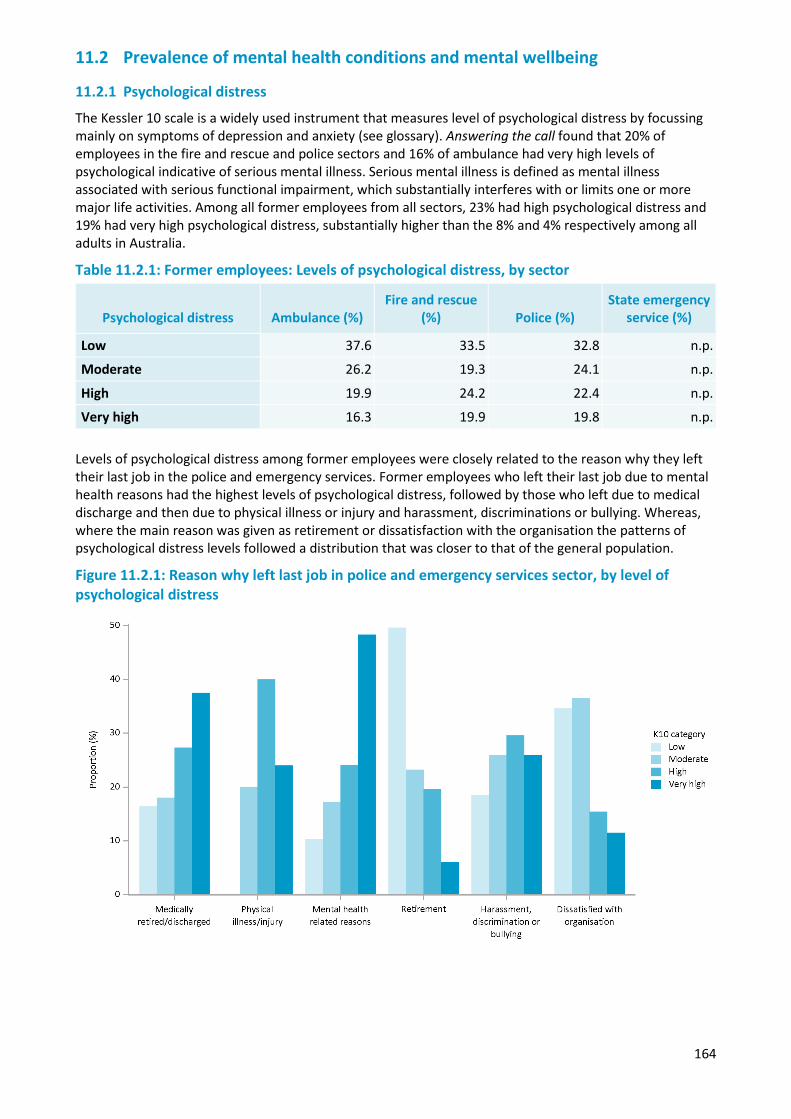
164
11.2 Prevalence of mental health conditions and mental wellbeing
11.2.1 Psychological distress
The Kessler 10 scale is a widely used instrument that measures level of psychological distress by focussing mainly on symptoms of depression and anxiety (see glossary). Answering the call found that 20% of employees in the fire and rescue and police sectors and 16% of ambulance had very high levels of psychological indicative of serious mental illness. Serious mental illness is defined as mental illness associated with serious functional impairment, which substantially interferes with or limits one or more major life activities. Among all former employees from all sectors, 23% had high psychological distress and 19% had very high psychological distress, substantially higher than the 8% and 4% respectively among all adults in Australia.
Table 11.2.1: Former employees: Levels of psychological distress, by sector
Psychological distress Ambulance (%) Fire and rescue
(%) Police (%) State emergency
service (%)
Low 37.6 33.5 32.8 n.p.
Moderate 26.2 19.3 24.1 n.p.
High 19.9 24.2 22.4 n.p.
Very high 16.3 19.9 19.8 n.p.
Levels of psychological distress among former employees were closely related to the reason why they left their last job in the police and emergency services. Former employees who left their last job due to mental health reasons had the highest levels of psychological distress, followed by those who left due to medical discharge and then due to physical illness or injury and harassment, discriminations or bullying. Whereas, where the main reason was given as retirement or dissatisfaction with the organisation the patterns of psychological distress levels followed a distribution that was closer to that of the general population.
Figure 11.2.1: Reason why left last job in police and emergency services sector, by level of psychological distress
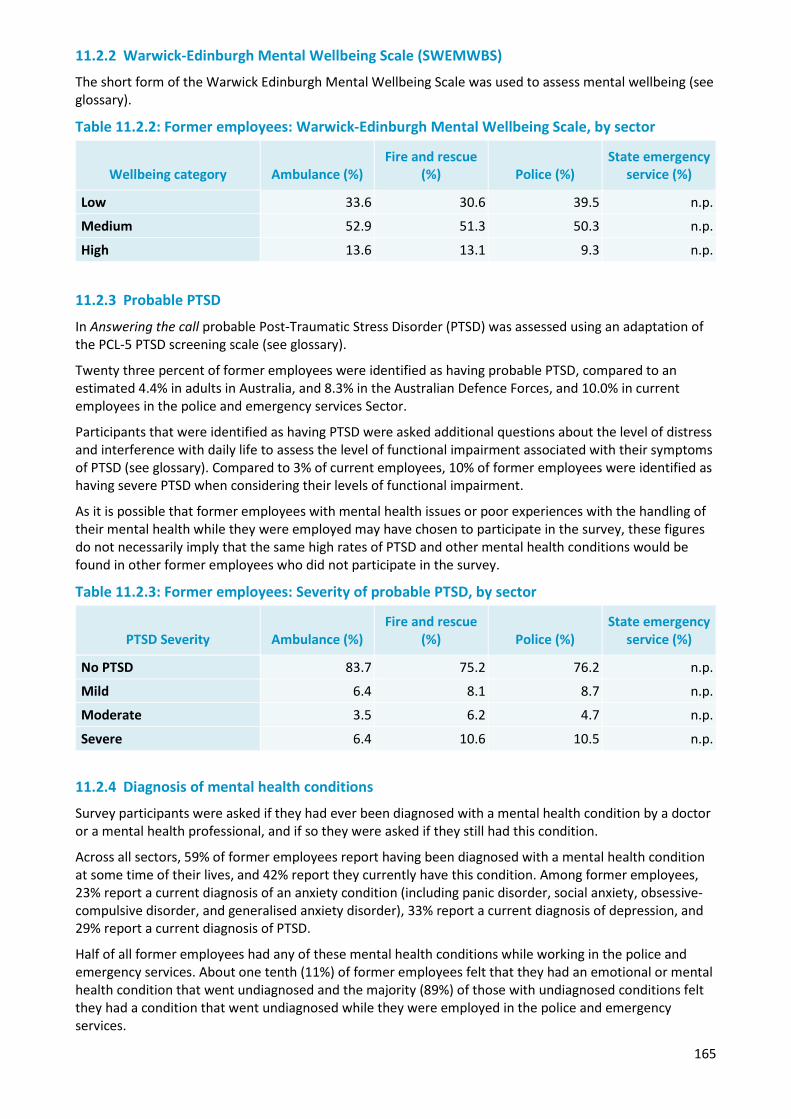
165
11.2.2 Warwick-Edinburgh Mental Wellbeing Scale (SWEMWBS)
The short form of the Warwick Edinburgh Mental Wellbeing Scale was used to assess mental wellbeing (see glossary).
Table 11.2.2: Former employees: Warwick-Edinburgh Mental Wellbeing Scale, by sector
Wellbeing category Ambulance (%) Fire and rescue
(%) Police (%) State emergency
service (%)
Low 33.6 30.6 39.5 n.p.
Medium 52.9 51.3 50.3 n.p.
High 13.6 13.1 9.3 n.p.
11.2.3 Probable PTSD
In Answering the call probable Post-Traumatic Stress Disorder (PTSD) was assessed using an adaptation of the PCL-5 PTSD screening scale (see glossary).
Twenty three percent of former employees were identified as having probable PTSD, compared to an estimated 4.4% in adults in Australia, and 8.3% in the Australian Defence Forces, and 10.0% in current employees in the police and emergency services Sector.
Participants that were identified as having PTSD were asked additional questions about the level of distress and interference with daily life to assess the level of functional impairment associated with their symptoms of PTSD (see glossary). Compared to 3% of current employees, 10% of former employees were identified as having severe PTSD when considering their levels of functional impairment.
As it is possible that former employees with mental health issues or poor experiences with the handling of their mental health while they were employed may have chosen to participate in the survey, these figures do not necessarily imply that the same high rates of PTSD and other mental health conditions would be found in other former employees who did not participate in the survey.
Table 11.2.3: Former employees: Severity of probable PTSD, by sector
PTSD Severity Ambulance (%) Fire and rescue
(%) Police (%) State emergency
service (%)
No PTSD 83.7 75.2 76.2 n.p.
Mild 6.4 8.1 8.7 n.p.
Moderate 3.5 6.2 4.7 n.p.
Severe 6.4 10.6 10.5 n.p.
11.2.4 Diagnosis of mental health conditions
Survey participants were asked if they had ever been diagnosed with a mental health condition by a doctor or a mental health professional, and if so they were asked if they still had this condition.
Across all sectors, 59% of former employees report having been diagnosed with a mental health condition at some time of their lives, and 42% report they currently have this condition. Among former employees, 23% report a current diagnosis of an anxiety condition (including panic disorder, social anxiety, obsessive-compulsive disorder, and generalised anxiety disorder), 33% report a current diagnosis of depression, and 29% report a current diagnosis of PTSD.
Half of all former employees had any of these mental health conditions while working in the police and emergency services. About one tenth (11%) of former employees felt that they had an emotional or mental health condition that went undiagnosed and the majority (89%) of those with undiagnosed conditions felt they had a condition that went undiagnosed while they were employed in the police and emergency services.
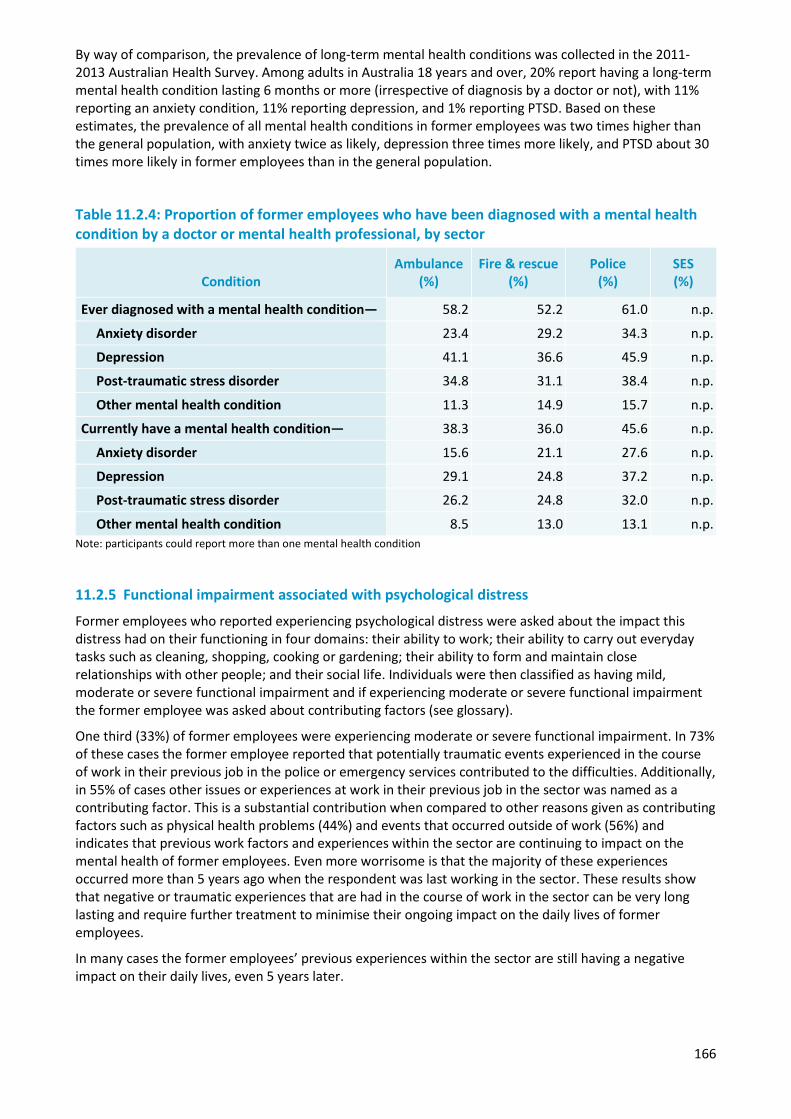
166
By way of comparison, the prevalence of long-term mental health conditions was collected in the 2011-2013 Australian Health Survey. Among adults in Australia 18 years and over, 20% report having a long-term mental health condition lasting 6 months or more (irrespective of diagnosis by a doctor or not), with 11% reporting an anxiety condition, 11% reporting depression, and 1% reporting PTSD. Based on these estimates, the prevalence of all mental health conditions in former employees was two times higher than the general population, with anxiety twice as likely, depression three times more likely, and PTSD about 30 times more likely in former employees than in the general population.
Table 11.2.4: Proportion of former employees who have been diagnosed with a mental health condition by a doctor or mental health professional, by sector
Condition Ambulance
(%) Fire & rescue
(%) Police
(%) SES (%)
Ever diagnosed with a mental health condition— 58.2 52.2 61.0 n.p.
Anxiety disorder 23.4 29.2 34.3 n.p.
Depression 41.1 36.6 45.9 n.p.
Post-traumatic stress disorder 34.8 31.1 38.4 n.p.
Other mental health condition 11.3 14.9 15.7 n.p.
Currently have a mental health condition— 38.3 36.0 45.6 n.p.
Anxiety disorder 15.6 21.1 27.6 n.p.
Depression 29.1 24.8 37.2 n.p.
Post-traumatic stress disorder 26.2 24.8 32.0 n.p.
Other mental health condition 8.5 13.0 13.1 n.p.Note: participants could report more than one mental health condition
11.2.5 Functional impairment associated with psychological distress
Former employees who reported experiencing psychological distress were asked about the impact this distress had on their functioning in four domains: their ability to work; their ability to carry out everyday tasks such as cleaning, shopping, cooking or gardening; their ability to form and maintain close relationships with other people; and their social life. Individuals were then classified as having mild, moderate or severe functional impairment and if experiencing moderate or severe functional impairment the former employee was asked about contributing factors (see glossary).
One third (33%) of former employees were experiencing moderate or severe functional impairment. In 73% of these cases the former employee reported that potentially traumatic events experienced in the course of work in their previous job in the police or emergency services contributed to the difficulties. Additionally, in 55% of cases other issues or experiences at work in their previous job in the sector was named as a contributing factor. This is a substantial contribution when compared to other reasons given as contributing factors such as physical health problems (44%) and events that occurred outside of work (56%) and indicates that previous work factors and experiences within the sector are continuing to impact on the mental health of former employees. Even more worrisome is that the majority of these experiences occurred more than 5 years ago when the respondent was last working in the sector. These results show that negative or traumatic experiences that are had in the course of work in the sector can be very long lasting and require further treatment to minimise their ongoing impact on the daily lives of former employees.
In many cases the former employees’ previous experiences within the sector are still having a negative impact on their daily lives, even 5 years later.
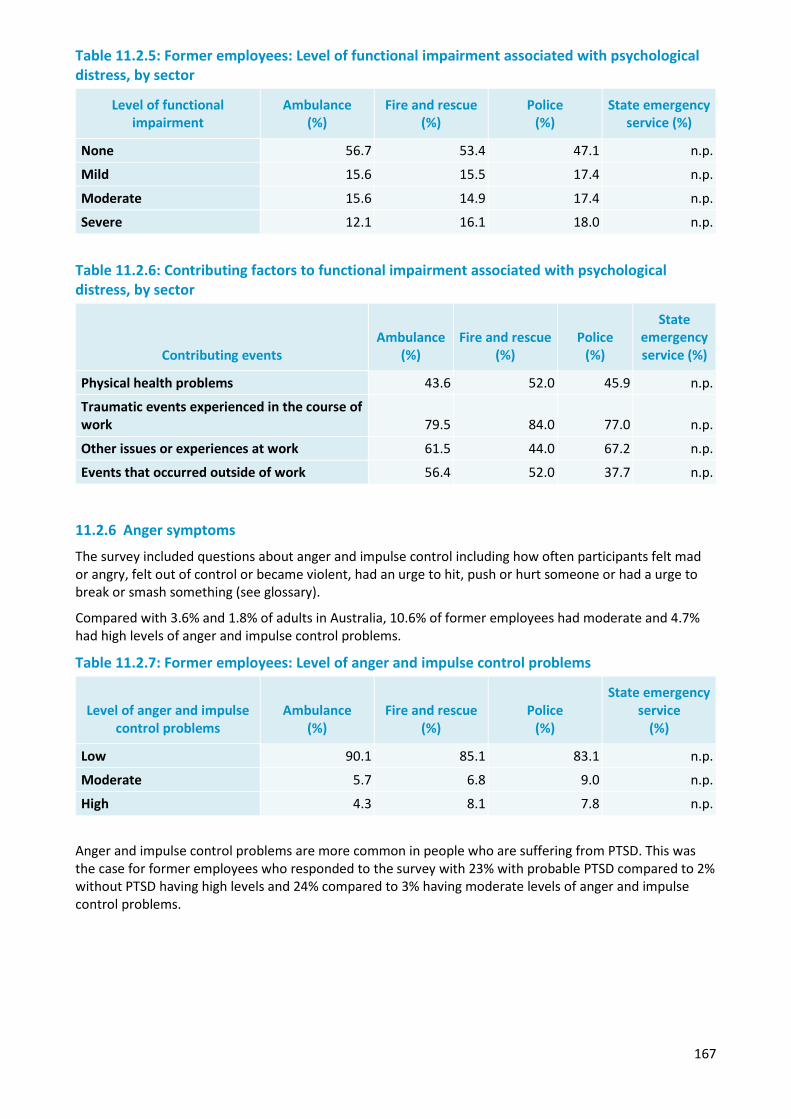
167
Table 11.2.5: Former employees: Level of functional impairment associated with psychological distress, by sector
Level of functional impairment
Ambulance (%)
Fire and rescue (%)
Police (%)
State emergency service (%)
None 56.7 53.4 47.1 n.p.
Mild 15.6 15.5 17.4 n.p.
Moderate 15.6 14.9 17.4 n.p.
Severe 12.1 16.1 18.0 n.p.
Table 11.2.6: Contributing factors to functional impairment associated with psychological distress, by sector
Contributing events Ambulance
(%) Fire and rescue
(%) Police
(%)
State emergency service (%)
Physical health problems 43.6 52.0 45.9 n.p.
Traumatic events experienced in the course of work 79.5 84.0 77.0 n.p.
Other issues or experiences at work 61.5 44.0 67.2 n.p.
Events that occurred outside of work 56.4 52.0 37.7 n.p.
11.2.6 Anger symptoms
The survey included questions about anger and impulse control including how often participants felt mad or angry, felt out of control or became violent, had an urge to hit, push or hurt someone or had a urge to break or smash something (see glossary).
Compared with 3.6% and 1.8% of adults in Australia, 10.6% of former employees had moderate and 4.7% had high levels of anger and impulse control problems.
Table 11.2.7: Former employees: Level of anger and impulse control problems
Level of anger and impulse control problems
Ambulance (%)
Fire and rescue (%)
Police (%)
State emergency service
(%)
Low 90.1 85.1 83.1 n.p.
Moderate 5.7 6.8 9.0 n.p.
High 4.3 8.1 7.8 n.p.
Anger and impulse control problems are more common in people who are suffering from PTSD. This was the case for former employees who responded to the survey with 23% with probable PTSD compared to 2% without PTSD having high levels and 24% compared to 3% having moderate levels of anger and impulse control problems.
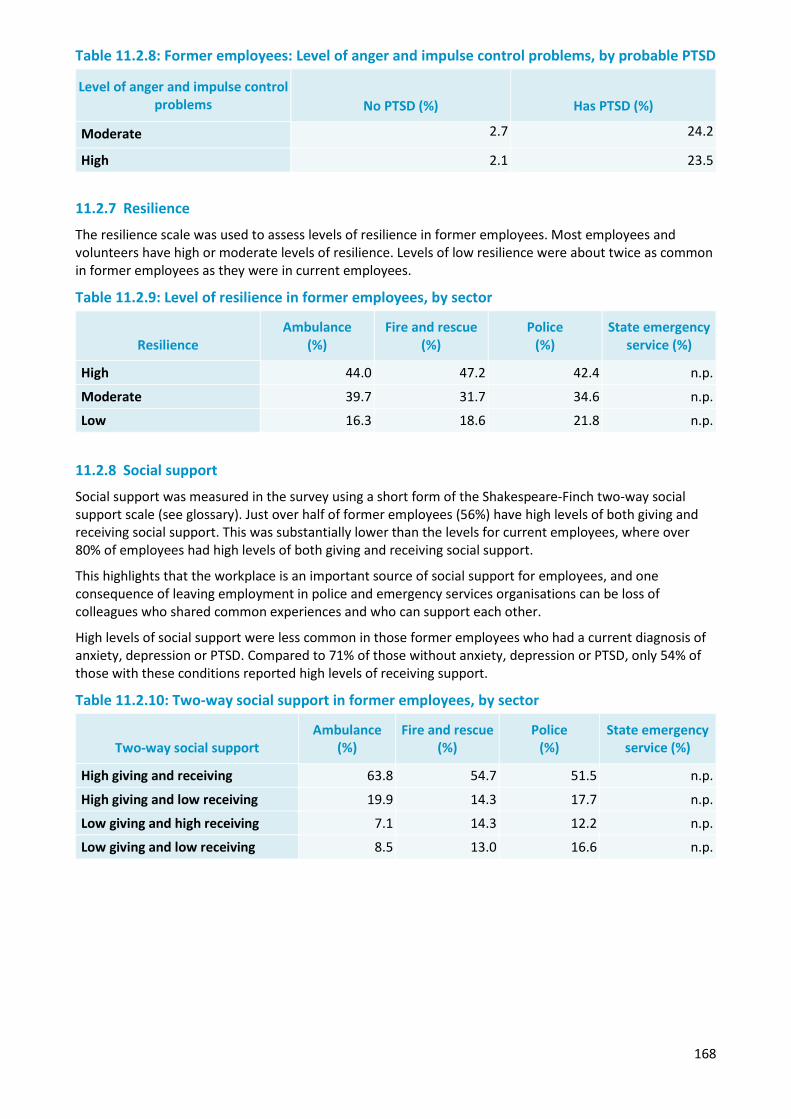
168
Table 11.2.8: Former employees: Level of anger and impulse control problems, by probable PTSD
Level of anger and impulse control problems No PTSD (%) Has PTSD (%)
Moderate 2.7 24.2
High 2.1 23.5
11.2.7 Resilience
The resilience scale was used to assess levels of resilience in former employees. Most employees and volunteers have high or moderate levels of resilience. Levels of low resilience were about twice as common in former employees as they were in current employees.
Table 11.2.9: Level of resilience in former employees, by sector
Resilience Ambulance
(%) Fire and rescue
(%) Police
(%) State emergency
service (%)
High 44.0 47.2 42.4 n.p.
Moderate 39.7 31.7 34.6 n.p.
Low 16.3 18.6 21.8 n.p.
11.2.8 Social support
Social support was measured in the survey using a short form of the Shakespeare-Finch two-way social support scale (see glossary). Just over half of former employees (56%) have high levels of both giving and receiving social support. This was substantially lower than the levels for current employees, where over 80% of employees had high levels of both giving and receiving social support.
This highlights that the workplace is an important source of social support for employees, and one consequence of leaving employment in police and emergency services organisations can be loss of colleagues who shared common experiences and who can support each other.
High levels of social support were less common in those former employees who had a current diagnosis of anxiety, depression or PTSD. Compared to 71% of those without anxiety, depression or PTSD, only 54% of those with these conditions reported high levels of receiving support.
Table 11.2.10: Two-way social support in former employees, by sector
Two-way social support Ambulance
(%) Fire and rescue
(%) Police
(%) State emergency
service (%)
High giving and receiving 63.8 54.7 51.5 n.p.
High giving and low receiving 19.9 14.3 17.7 n.p.
Low giving and high receiving 7.1 14.3 12.2 n.p.
Low giving and low receiving 8.5 13.0 16.6 n.p.
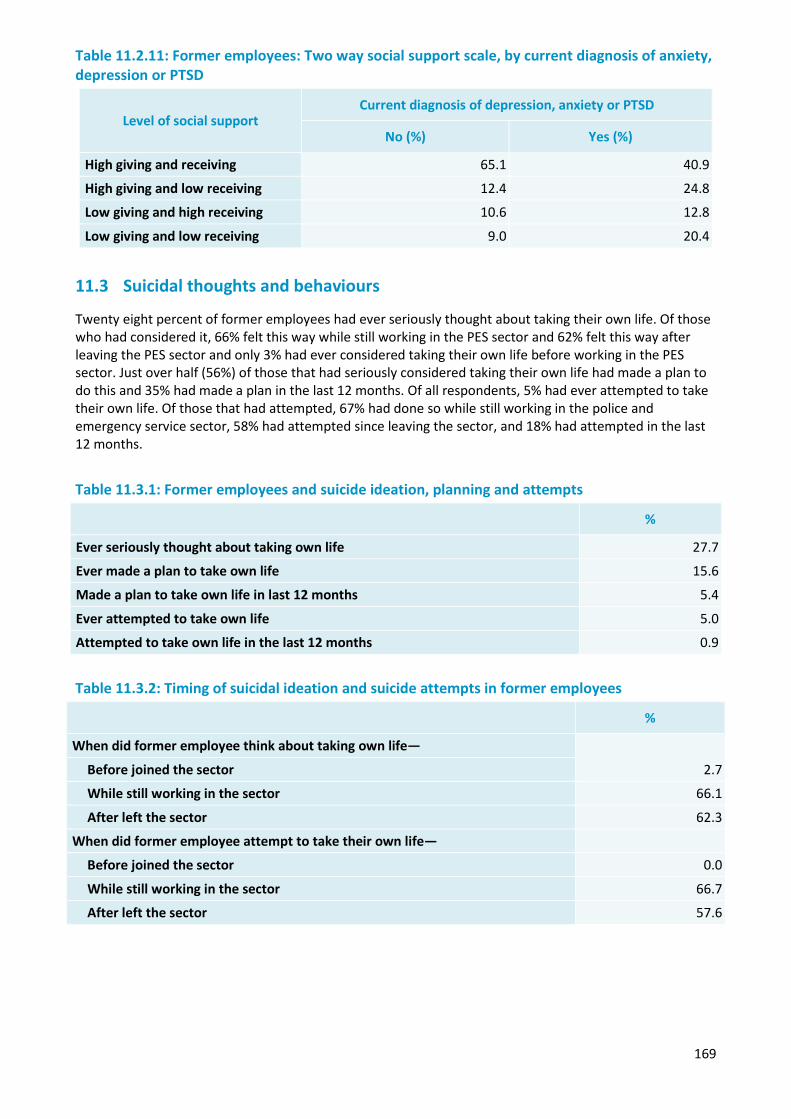
169
Table 11.2.11: Former employees: Two way social support scale, by current diagnosis of anxiety, depression or PTSD
Level of social support Current diagnosis of depression, anxiety or PTSD
No (%) Yes (%)
High giving and receiving 65.1 40.9
High giving and low receiving 12.4 24.8
Low giving and high receiving 10.6 12.8
Low giving and low receiving 9.0 20.4
11.3 Suicidal thoughts and behaviours
Twenty eight percent of former employees had ever seriously thought about taking their own life. Of those who had considered it, 66% felt this way while still working in the PES sector and 62% felt this way after leaving the PES sector and only 3% had ever considered taking their own life before working in the PES sector. Just over half (56%) of those that had seriously considered taking their own life had made a plan to do this and 35% had made a plan in the last 12 months. Of all respondents, 5% had ever attempted to take their own life. Of those that had attempted, 67% had done so while still working in the police and emergency service sector, 58% had attempted since leaving the sector, and 18% had attempted in the last 12 months.
Table 11.3.1: Former employees and suicide ideation, planning and attempts
%
Ever seriously thought about taking own life 27.7
Ever made a plan to take own life 15.6
Made a plan to take own life in last 12 months 5.4
Ever attempted to take own life 5.0
Attempted to take own life in the last 12 months 0.9
Table 11.3.2: Timing of suicidal ideation and suicide attempts in former employees
%
When did former employee think about taking own life—
2.7 Before joined the sector
While still working in the sector 66.1
After left the sector 62.3
When did former employee attempt to take their own life—
Before joined the sector 0.0
While still working in the sector 66.7
After left the sector 57.6
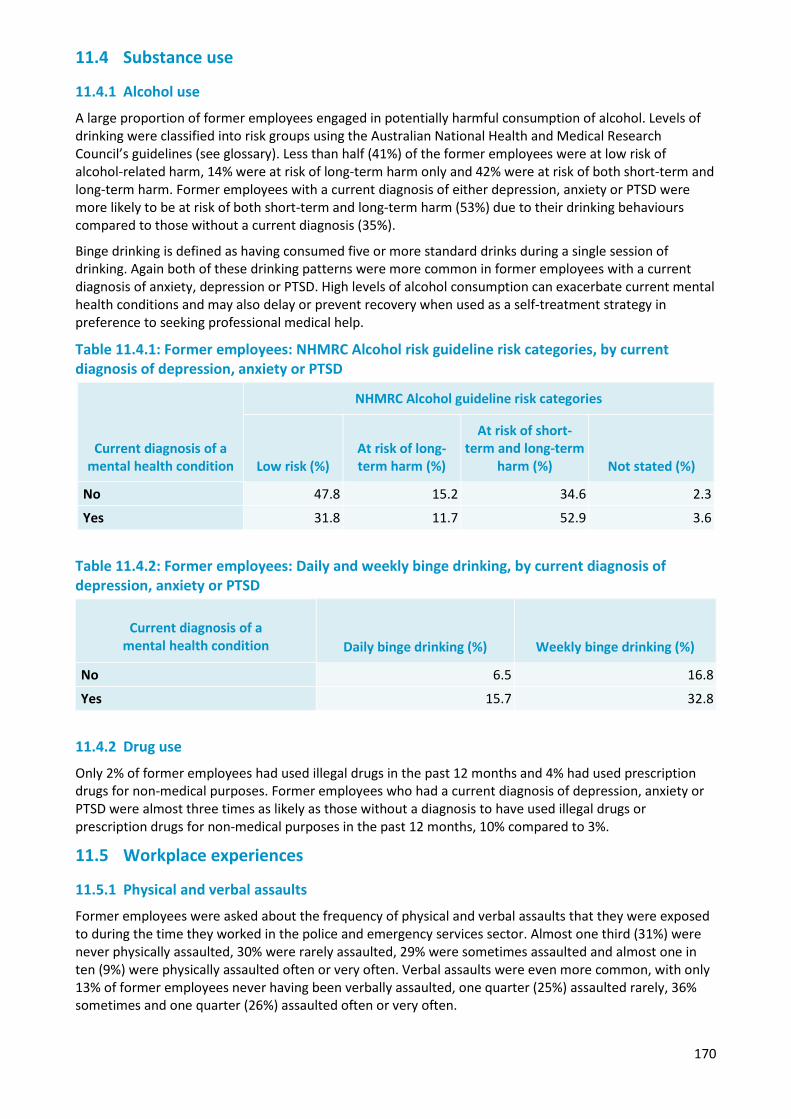
170
11.4 Substance use
11.4.1 Alcohol use
A large proportion of former employees engaged in potentially harmful consumption of alcohol. Levels of drinking were classified into risk groups using the Australian National Health and Medical Research Council’s guidelines (see glossary). Less than half (41%) of the former employees were at low risk of alcohol-related harm, 14% were at risk of long-term harm only and 42% were at risk of both short-term and long-term harm. Former employees with a current diagnosis of either depression, anxiety or PTSD were more likely to be at risk of both short-term and long-term harm (53%) due to their drinking behaviours compared to those without a current diagnosis (35%).
Binge drinking is defined as having consumed five or more standard drinks during a single session of drinking. Again both of these drinking patterns were more common in former employees with a current diagnosis of anxiety, depression or PTSD. High levels of alcohol consumption can exacerbate current mental health conditions and may also delay or prevent recovery when used as a self-treatment strategy in preference to seeking professional medical help.
Table 11.4.1: Former employees: NHMRC Alcohol risk guideline risk categories, by current diagnosis of depression, anxiety or PTSD
Current diagnosis of a mental health condition
NHMRC Alcohol guideline risk categories
Low risk (%) At risk of long-term harm (%)
At risk of short-term and long-term
harm (%) Not stated (%)
No 47.8 15.2 34.6 2.3
Yes 31.8 11.7 52.9 3.6
Table 11.4.2: Former employees: Daily and weekly binge drinking, by current diagnosis of depression, anxiety or PTSD
Current diagnosis of a mental health condition Daily binge drinking (%) Weekly binge drinking (%)
No 6.5 16.8
Yes 15.7 32.8
11.4.2 Drug use
Only 2% of former employees had used illegal drugs in the past 12 months and 4% had used prescription drugs for non-medical purposes. Former employees who had a current diagnosis of depression, anxiety or PTSD were almost three times as likely as those without a diagnosis to have used illegal drugs or prescription drugs for non-medical purposes in the past 12 months, 10% compared to 3%.
11.5 Workplace experiences
11.5.1 Physical and verbal assaults
Former employees were asked about the frequency of physical and verbal assaults that they were exposed to during the time they worked in the police and emergency services sector. Almost one third (31%) were never physically assaulted, 30% were rarely assaulted, 29% were sometimes assaulted and almost one in ten (9%) were physically assaulted often or very often. Verbal assaults were even more common, with only 13% of former employees never having been verbally assaulted, one quarter (25%) assaulted rarely, 36% sometimes and one quarter (26%) assaulted often or very often.
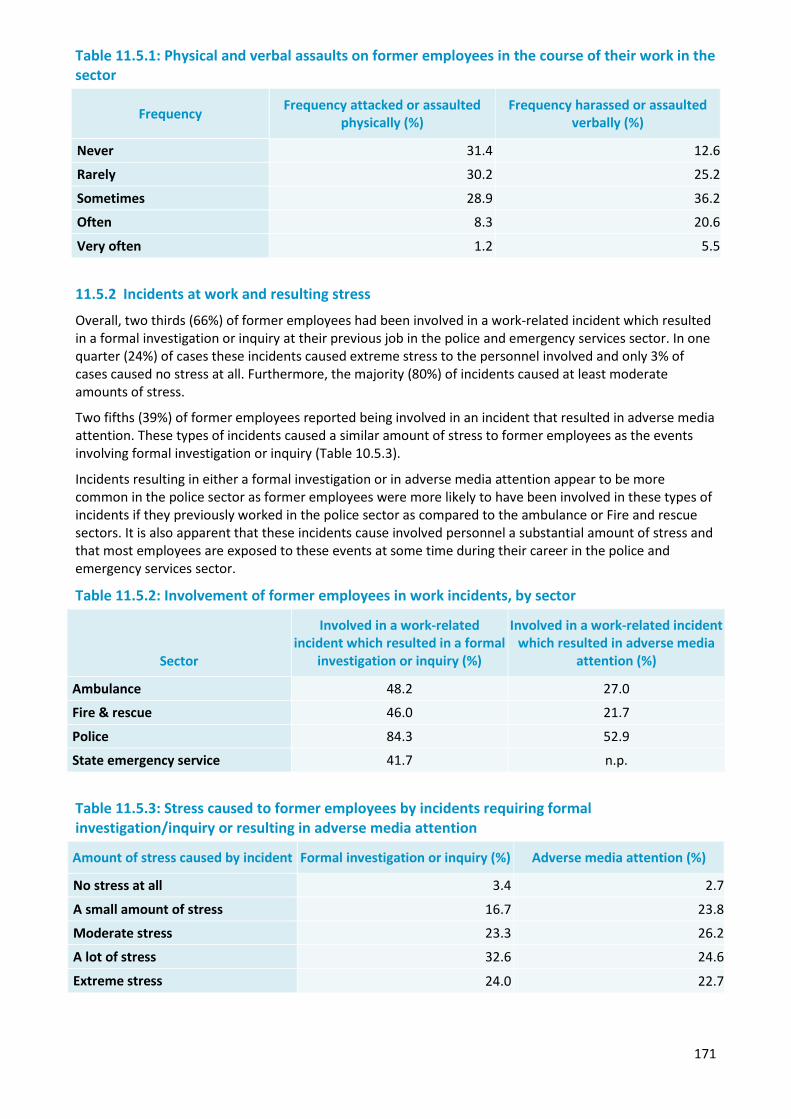
171
Table 11.5.1: Physical and verbal assaults on former employees in the course of their work in the sector
Frequency Frequency attacked or assaulted physically (%)
Frequency harassed or assaulted verbally (%)
Never 31.4 12.6
Rarely 30.2 25.2
Sometimes 28.9 36.2
Often 8.3 20.6
Very often 1.2 5.5
11.5.2 Incidents at work and resulting stress
Overall, two thirds (66%) of former employees had been involved in a work-related incident which resulted in a formal investigation or inquiry at their previous job in the police and emergency services sector. In one quarter (24%) of cases these incidents caused extreme stress to the personnel involved and only 3% of cases caused no stress at all. Furthermore, the majority (80%) of incidents caused at least moderate amounts of stress.
Two fifths (39%) of former employees reported being involved in an incident that resulted in adverse media attention. These types of incidents caused a similar amount of stress to former employees as the events involving formal investigation or inquiry (Table 10.5.3).
Incidents resulting in either a formal investigation or in adverse media attention appear to be more common in the police sector as former employees were more likely to have been involved in these types of incidents if they previously worked in the police sector as compared to the ambulance or Fire and rescue sectors. It is also apparent that these incidents cause involved personnel a substantial amount of stress and that most employees are exposed to these events at some time during their career in the police and emergency services sector.
Table 11.5.2: Involvement of former employees in work incidents, by sector
Sector
Involved in a work-related incident which resulted in a formal
investigation or inquiry (%)
Involved in a work-related incident which resulted in adverse media
attention (%)
Ambulance 48.2 27.0
Fire & rescue 46.0 21.7
Police 84.3 52.9
State emergency service 41.7 n.p.
Table 11.5.3: Stress caused to former employees by incidents requiring formal investigation/inquiry or resulting in adverse media attention
Amount of stress caused by incident Formal investigation or inquiry (%) Adverse media attention (%)
No stress at all 3.4 2.7
A small amount of stress 16.7 23.8
Moderate stress 23.3 26.2
A lot of stress 32.6 24.6
Extreme stress 24.0 22.7
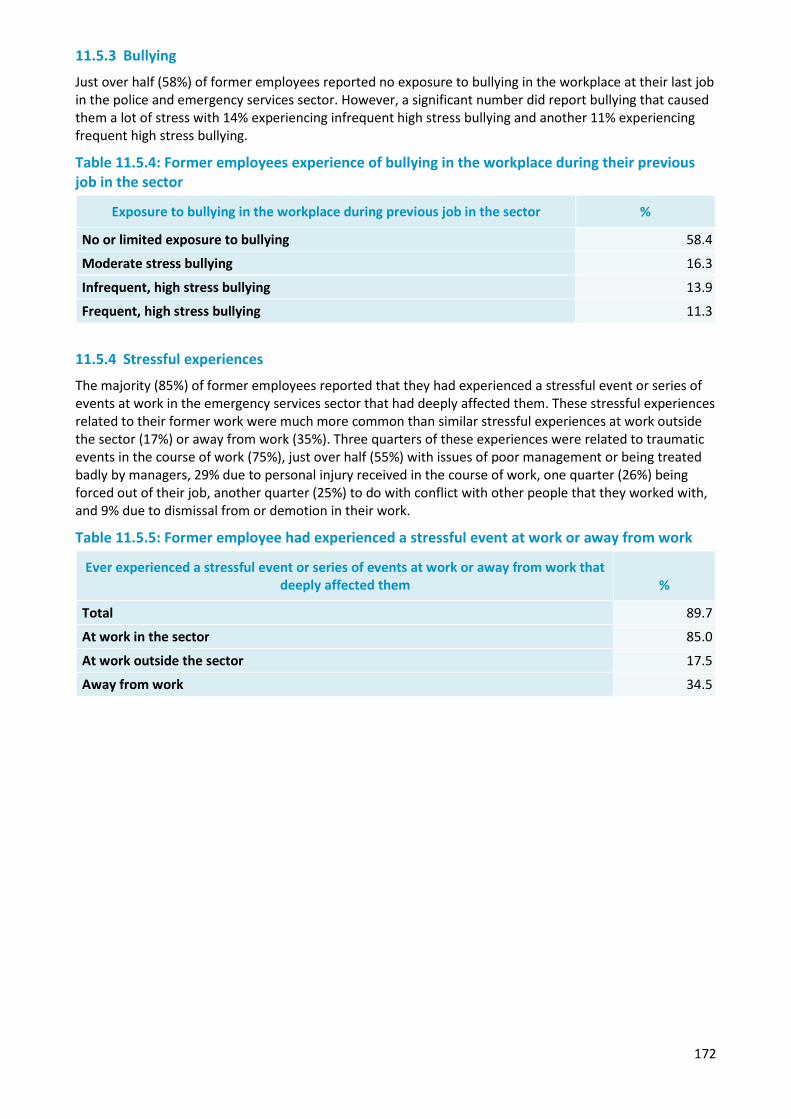
172
11.5.3 Bullying
Just over half (58%) of former employees reported no exposure to bullying in the workplace at their last job in the police and emergency services sector. However, a significant number did report bullying that caused them a lot of stress with 14% experiencing infrequent high stress bullying and another 11% experiencing frequent high stress bullying.
Table 11.5.4: Former employees experience of bullying in the workplace during their previous job in the sector
Exposure to bullying in the workplace during previous job in the sector %
No or limited exposure to bullying 58.4
Moderate stress bullying 16.3
Infrequent, high stress bullying 13.9
Frequent, high stress bullying 11.3
11.5.4 Stressful experiences
The majority (85%) of former employees reported that they had experienced a stressful event or series of events at work in the emergency services sector that had deeply affected them. These stressful experiences related to their former work were much more common than similar stressful experiences at work outside the sector (17%) or away from work (35%). Three quarters of these experiences were related to traumatic events in the course of work (75%), just over half (55%) with issues of poor management or being treated badly by managers, 29% due to personal injury received in the course of work, one quarter (26%) being forced out of their job, another quarter (25%) to do with conflict with other people that they worked with, and 9% due to dismissal from or demotion in their work.
Table 11.5.5: Former employee had experienced a stressful event at work or away from work
Ever experienced a stressful event or series of events at work or away from work that deeply affected them %
Total 89.7
At work in the sector 85.0
At work outside the sector 17.5
Away from work 34.5
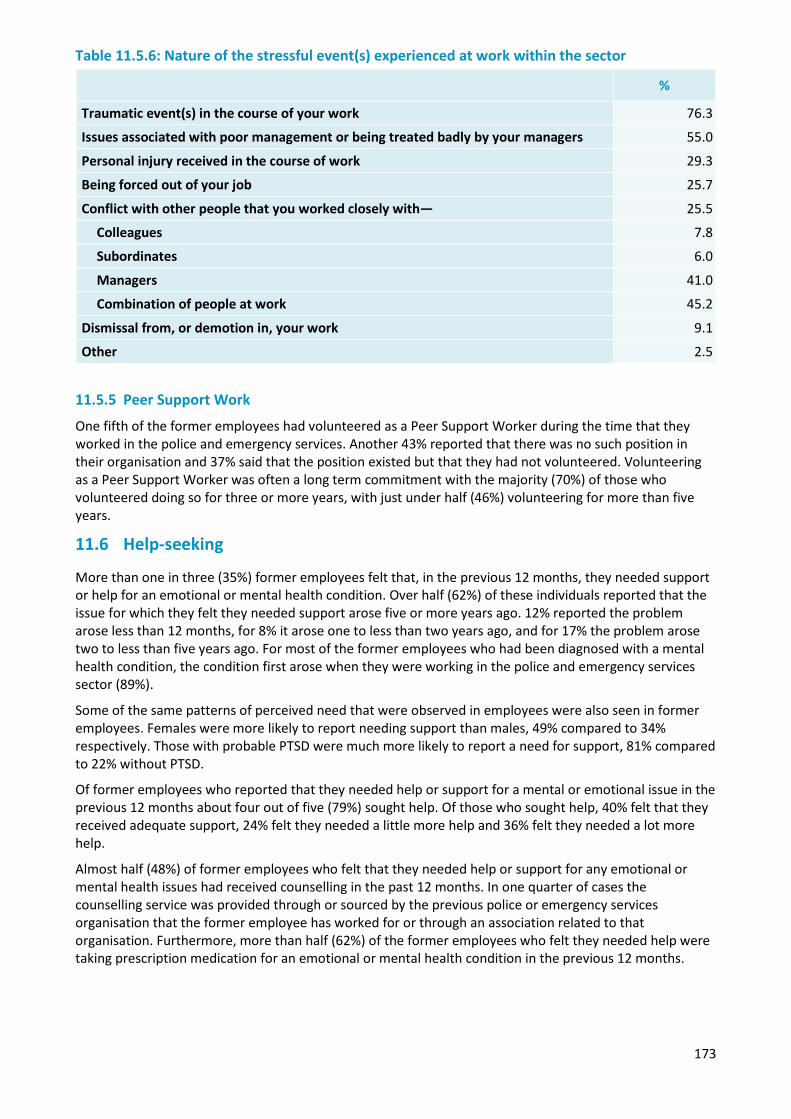
173
Table 11.5.6: Nature of the stressful event(s) experienced at work within the sector
%
Traumatic event(s) in the course of your work 76.3
Issues associated with poor management or being treated badly by your managers 55.0
Personal injury received in the course of work 29.3
Being forced out of your job 25.7
Conflict with other people that you worked closely with— 25.5
Colleagues 7.8
Subordinates 6.0
Managers 41.0
Combination of people at work 45.2
Dismissal from, or demotion in, your work 9.1
Other 2.5
11.5.5 Peer Support Work
One fifth of the former employees had volunteered as a Peer Support Worker during the time that they worked in the police and emergency services. Another 43% reported that there was no such position in their organisation and 37% said that the position existed but that they had not volunteered. Volunteering as a Peer Support Worker was often a long term commitment with the majority (70%) of those who volunteered doing so for three or more years, with just under half (46%) volunteering for more than five years.
11.6 Help-seeking
More than one in three (35%) former employees felt that, in the previous 12 months, they needed support or help for an emotional or mental health condition. Over half (62%) of these individuals reported that the issue for which they felt they needed support arose five or more years ago. 12% reported the problem arose less than 12 months, for 8% it arose one to less than two years ago, and for 17% the problem arose two to less than five years ago. For most of the former employees who had been diagnosed with a mental health condition, the condition first arose when they were working in the police and emergency services sector (89%).
Some of the same patterns of perceived need that were observed in employees were also seen in former employees. Females were more likely to report needing support than males, 49% compared to 34% respectively. Those with probable PTSD were much more likely to report a need for support, 81% compared to 22% without PTSD.
Of former employees who reported that they needed help or support for a mental or emotional issue in the previous 12 months about four out of five (79%) sought help. Of those who sought help, 40% felt that they received adequate support, 24% felt they needed a little more help and 36% felt they needed a lot more help.
Almost half (48%) of former employees who felt that they needed help or support for any emotional or mental health issues had received counselling in the past 12 months. In one quarter of cases the counselling service was provided through or sourced by the previous police or emergency services organisation that the former employee has worked for or through an association related to that organisation. Furthermore, more than half (62%) of the former employees who felt they needed help were taking prescription medication for an emotional or mental health condition in the previous 12 months.
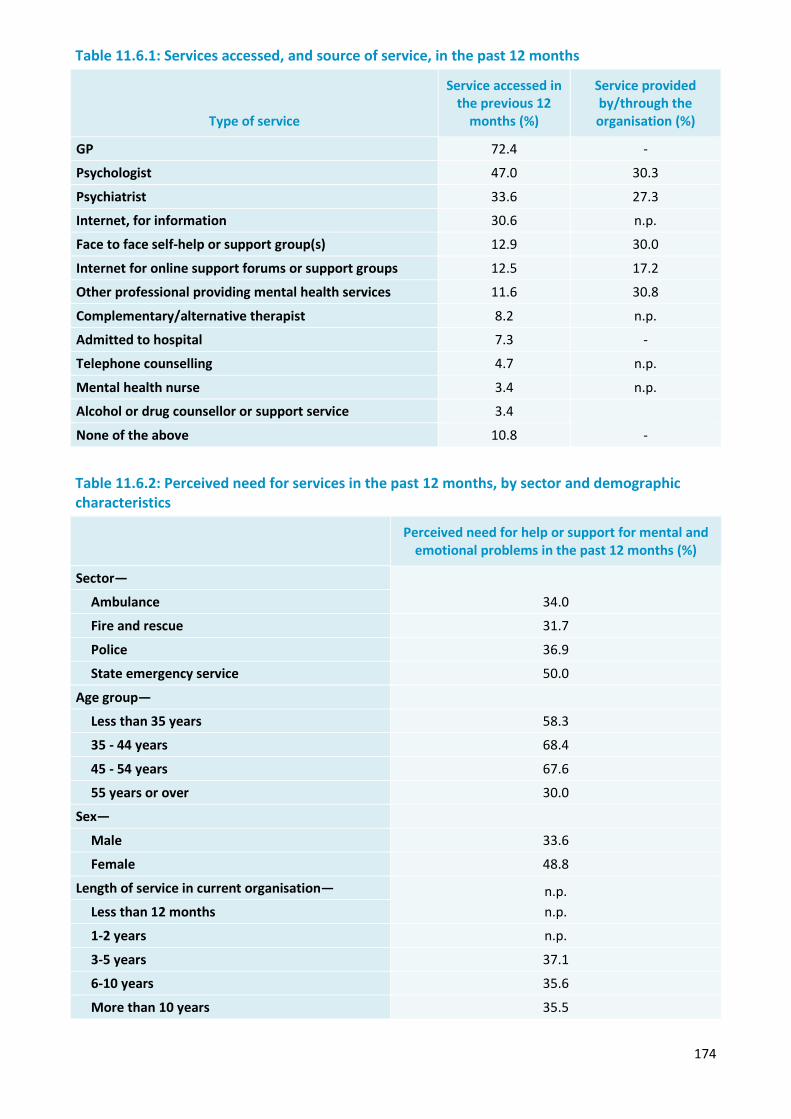
174
Table 11.6.1: Services accessed, and source of service, in the past 12 months
Type of service
Service accessed in the previous 12
months (%)
Service provided by/through the organisation (%)
GP 72.4 -
Psychologist 47.0 30.3
Psychiatrist 33.6 27.3
Internet, for information 30.6 n.p.
Face to face self-help or support group(s) 12.9 30.0
Internet for online support forums or support groups 12.5 17.2
Other professional providing mental health services 11.6 30.8
Complementary/alternative therapist 8.2 n.p.
Admitted to hospital 7.3 -
Telephone counselling 4.7 n.p.
Mental health nurse 3.4 n.p.
Alcohol or drug counsellor or support service 3.4
None of the above 10.8 -
Table 11.6.2: Perceived need for services in the past 12 months, by sector and demographic characteristics
Perceived need for help or support for mental and emotional problems in the past 12 months (%)
Sector—
34.0 Ambulance
Fire and rescue 31.7
Police 36.9
State emergency service 50.0
Age group—
Less than 35 years 58.3
35 - 44 years 68.4
45 - 54 years 67.6
55 years or over 30.0
Sex—
Male 33.6
Female 48.8
Length of service in current organisation— n.p. n.p. Less than 12 months
1-2 years n.p.
3-5 years 37.1
6-10 years 35.6
More than 10 years 35.5
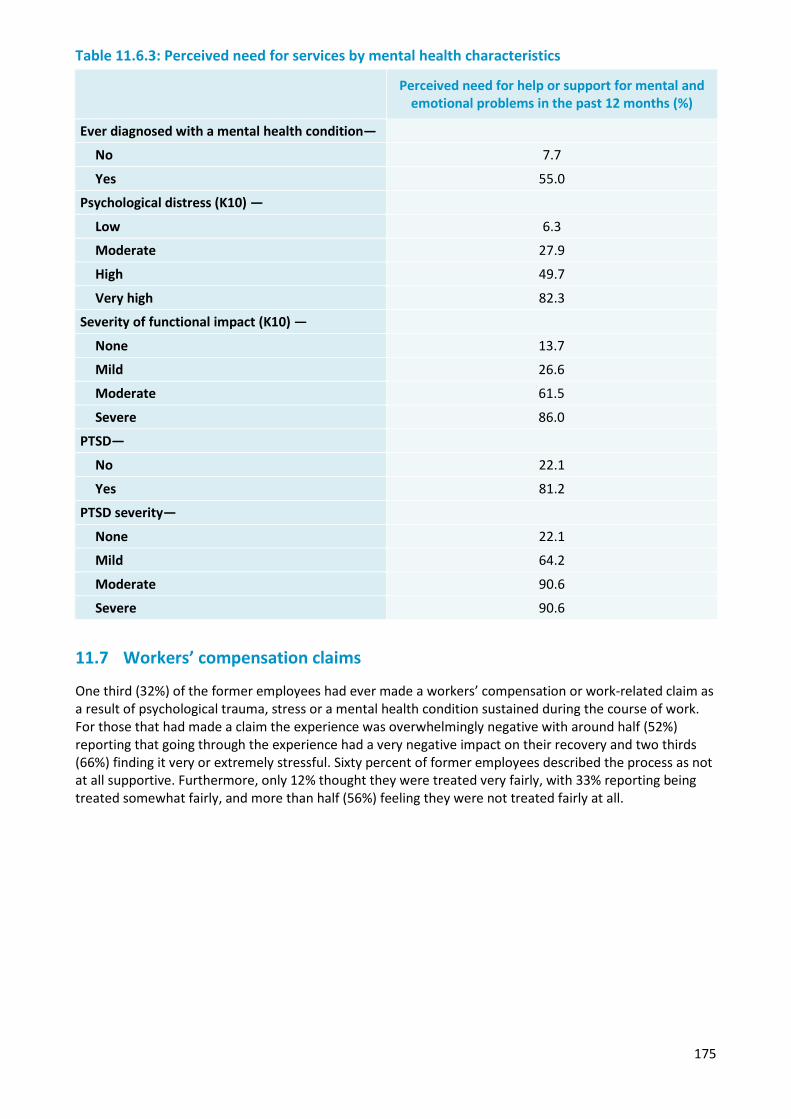
175
Table 11.6.3: Perceived need for services by mental health characteristics
Perceived need for help or support for mental and emotional problems in the past 12 months (%)
Ever diagnosed with a mental health condition—
No 7.7
Yes 55.0
Psychological distress (K10) —
Low 6.3
Moderate 27.9
High 49.7
Very high 82.3
Severity of functional impact (K10) —
None 13.7
Mild 26.6
Moderate 61.5
Severe 86.0
PTSD—
No 22.1
Yes 81.2
PTSD severity—
None 22.1
Mild 64.2
Moderate 90.6
Severe 90.6
11.7 Workers’ compensation claims
One third (32%) of the former employees had ever made a workers’ compensation or work-related claim as a result of psychological trauma, stress or a mental health condition sustained during the course of work. For those that had made a claim the experience was overwhelmingly negative with around half (52%) reporting that going through the experience had a very negative impact on their recovery and two thirds (66%) finding it very or extremely stressful. Sixty percent of former employees described the process as not at all supportive. Furthermore, only 12% thought they were treated very fairly, with 33% reporting being treated somewhat fairly, and more than half (56%) feeling they were not treated fairly at all.
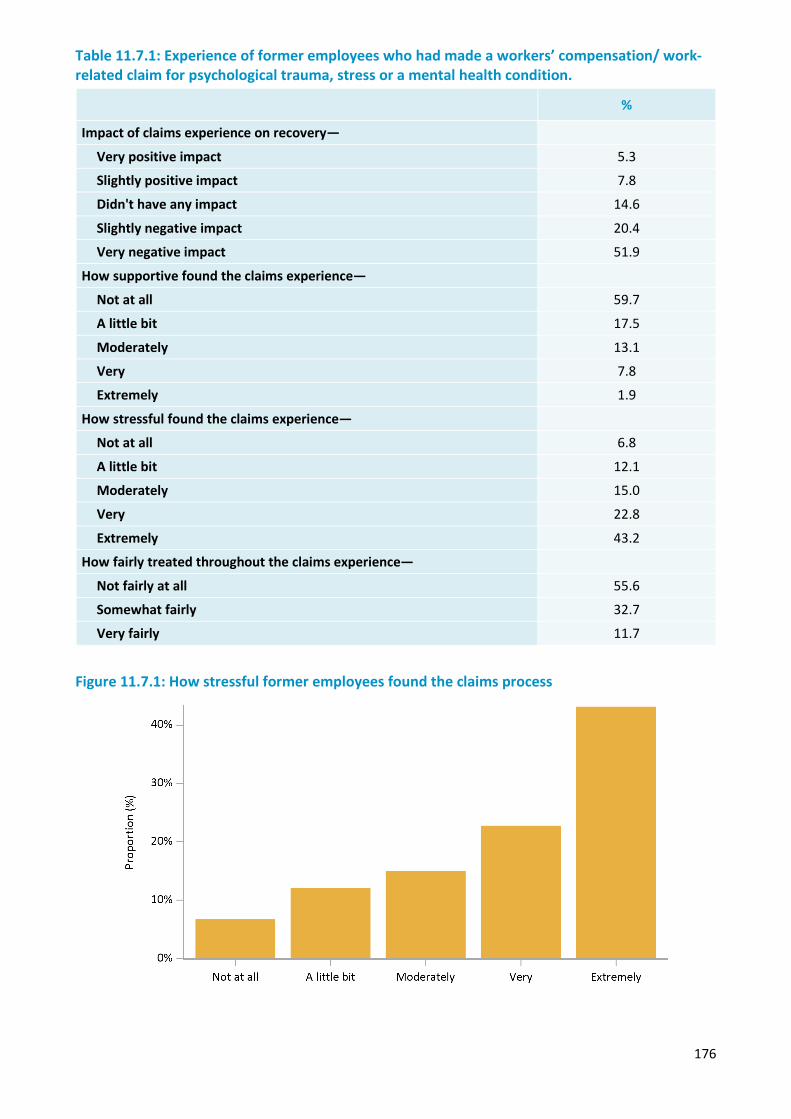
176
Table 11.7.1: Experience of former employees who had made a workers’ compensation/ work-related claim for psychological trauma, stress or a mental health condition.
%
Impact of claims experience on recovery—
Very positive impact 5.3
Slightly positive impact 7.8
Didn't have any impact 14.6
Slightly negative impact 20.4
Very negative impact 51.9
How supportive found the claims experience—
Not at all 59.7
A little bit 17.5
Moderately 13.1
Very 7.8
Extremely 1.9
How stressful found the claims experience—
Not at all 6.8
A little bit 12.1
Moderately 15.0
Very 22.8
Extremely 43.2
How fairly treated throughout the claims experience—
Not fairly at all 55.6
Somewhat fairly 32.7
Very fairly 11.7
Figure 11.7.1: How stressful former employees found the claims process
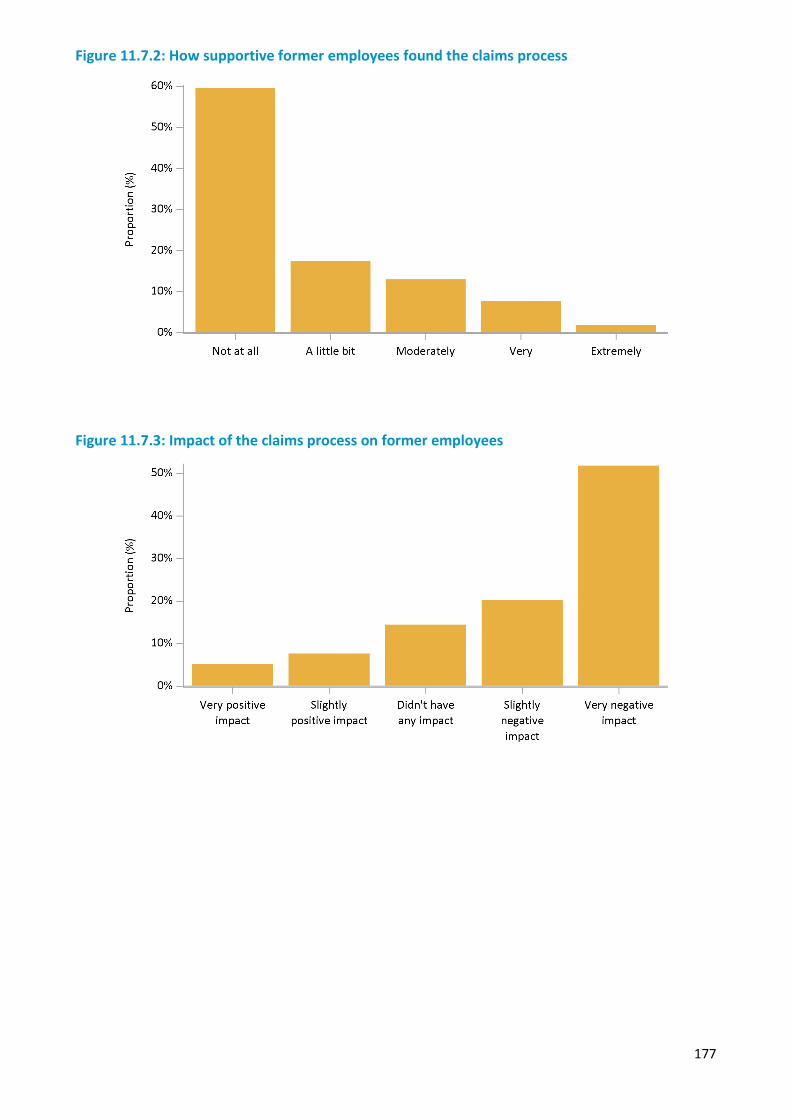
177
Figure 11.7.2: How supportive former employees found the claims process
Figure 11.7.3: Impact of the claims process on former employees

178
Figure 11.7.4: How fair former employees found the claims process
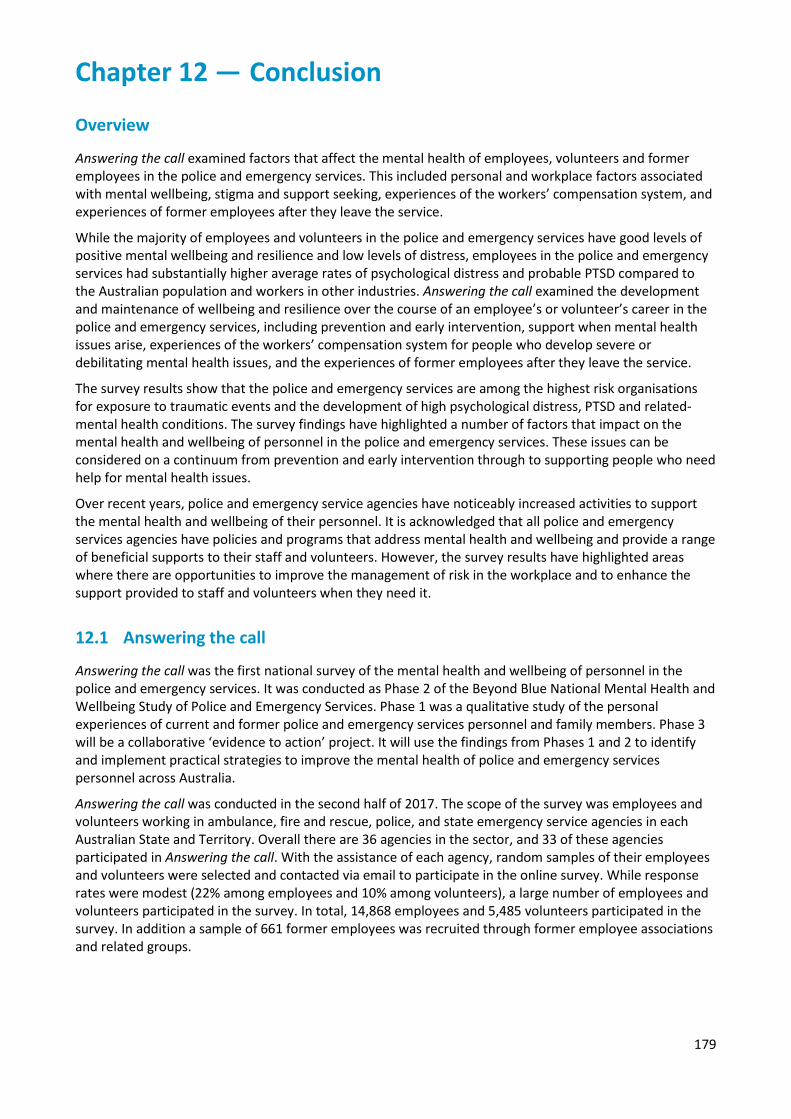
179
Chapter 12 — Conclusion
Overview
Answering the call examined factors that affect the mental health of employees, volunteers and former employees in the police and emergency services. This included personal and workplace factors associated with mental wellbeing, stigma and support seeking, experiences of the workers’ compensation system, and experiences of former employees after they leave the service.
While the majority of employees and volunteers in the police and emergency services have good levels of positive mental wellbeing and resilience and low levels of distress, employees in the police and emergency services had substantially higher average rates of psychological distress and probable PTSD compared to the Australian population and workers in other industries. Answering the call examined the development and maintenance of wellbeing and resilience over the course of an employee’s or volunteer’s career in the police and emergency services, including prevention and early intervention, support when mental health issues arise, experiences of the workers’ compensation system for people who develop severe or debilitating mental health issues, and the experiences of former employees after they leave the service.
The survey results show that the police and emergency services are among the highest risk organisations for exposure to traumatic events and the development of high psychological distress, PTSD and related-mental health conditions. The survey findings have highlighted a number of factors that impact on the mental health and wellbeing of personnel in the police and emergency services. These issues can be considered on a continuum from prevention and early intervention through to supporting people who need help for mental health issues.
Over recent years, police and emergency service agencies have noticeably increased activities to support the mental health and wellbeing of their personnel. It is acknowledged that all police and emergency services agencies have policies and programs that address mental health and wellbeing and provide a range of beneficial supports to their staff and volunteers. However, the survey results have highlighted areas where there are opportunities to improve the management of risk in the workplace and to enhance the support provided to staff and volunteers when they need it.
12.1 Answering the call
Answering the call was the first national survey of the mental health and wellbeing of personnel in the police and emergency services. It was conducted as Phase 2 of the Beyond Blue National Mental Health and Wellbeing Study of Police and Emergency Services. Phase 1 was a qualitative study of the personal experiences of current and former police and emergency services personnel and family members. Phase 3 will be a collaborative ‘evidence to action’ project. It will use the findings from Phases 1 and 2 to identify and implement practical strategies to improve the mental health of police and emergency services personnel across Australia.
Answering the call was conducted in the second half of 2017. The scope of the survey was employees and volunteers working in ambulance, fire and rescue, police, and state emergency service agencies in each Australian State and Territory. Overall there are 36 agencies in the sector, and 33 of these agencies participated in Answering the call. With the assistance of each agency, random samples of their employees and volunteers were selected and contacted via email to participate in the online survey. While response rates were modest (22% among employees and 10% among volunteers), a large number of employees and volunteers participated in the survey. In total, 14,868 employees and 5,485 volunteers participated in the survey. In addition a sample of 661 former employees was recruited through former employee associations and related groups.
180
12.2 Working and volunteering in the police and emergency services sector
There were 117,500 employees and 237,800 volunteers in the participating agencies at the time of the survey. Police agencies had the largest share of the paid workforce, employing two-thirds of those working in the sector, while over 85% of volunteers were affiliated with fire and rescue agencies.
While work in the police and emergency services sector is often stressful and demanding, it is also often meaningful and rewarding. Most staff and volunteers recognise and appreciate the importance and value of the work they do to the communities they serve. Many employees work long hours and do shift work contributing to issues of work-life balance. With the exception of the fire and rescue sector, most employees were working full-time, and the majority were doing shift work or were on call. A substantial proportion of employees were regularly working over 45 hours per week. Most volunteers make a regular commitment to their agency, with Ambulance volunteers having contributed a median 6 hours per week, fire and rescue volunteers having contributed a median 2.5 hours per week and state emergency service volunteers having contributed a median 4 hours per week in the month prior to the survey.
12.2.1 Recruiting a workforce with high levels of resilience and mental wellbeing
Police and emergency services agencies include screening for resilience and mental wellbeing in their recruitment procedures, which have proved very effective. The survey results showed very high levels of mental wellbeing, and very low levels of psychological distress and PTSD in employees and volunteers in the early stages of their careers, well below averages for the working population in Australia.
12.3 Mental health and wellbeing
The survey included a number of measures of mental health and wellbeing including the Kessler 10 measure of psychological distress (K10), the Short Warwick-Edinburgh Mental Wellbeing Scale (SWEMWBS), the PTSD screening scale, whether participants had been diagnosed with a mental health condition, functional impairment measures, anger and impulse control symptoms, the resilience scale and the Shakespeare-Finch two way social support scale. Across all of these measures there was a consistent pattern showing higher rates of poor mental health and lower rates of positive mental wellbeing and resilience in employees in the police and emergency services, compared with the general population and with other industry and occupation groups. However, despite these high rates of poor mental health, it is important to recognise that the majority of employees and volunteers in the police and emergency services sector have good levels of mental health and wellbeing, high levels of resilience and low levels of distress. In addition, volunteers reported lower levels of psychological distress and probable PTSD and higher levels of positive wellbeing than employees.
12.3.1 Employees in police and emergency services have high rates of psychological distress and PTSD
Rates of probable PTSD and psychological distress were very low in employees in their first year or two in the police and emergency services sector. There was a sharp and clear relationship between length of service and rates of probable PTSD. Among employees with less than two years of service 2.3% had probable PTSD, which increased to 12.2% among employees with more than 10 years of service. There was also a clear association between having been exposed to traumatic events at work and risk of PTSD. Rates of PTSD were comparable to the general population in those who reported that they had not been exposed to traumatic events at work. While traumatic events occur outside the workplace in people’s day to day lives as well, and people’s mental health is influenced by a combination of their life experiences both at work and outside of work, the survey findings strongly suggest that the higher rates of PTSD, psychological distress, depression and anxiety in employees in the police and emergency services can be associated with workplace factors.
While rates of poor mental health increase significantly with length of service, again it is important to note that the majority of employees in the police and emergency services have good levels of mental health and
181
wellbeing. It is not inevitable that working in the police and emergency services will lead to mental health issues.
12.3.2 Volunteers may also be exposed to traumatic experiences
In comparison with employees, volunteers had much lower exposure to traumatic events in their volunteer work, and much lower rates of mental health conditions and higher levels of positive wellbeing. The rates of mental health conditions and mental wellbeing among volunteers in the Ambulance sector were closely comparable with the general Australian adult population. In comparison, rates of poor mental health and wellbeing were modestly elevated in volunteers in both the fire and rescue sector and the state emergency service sector.
While many volunteers devote significant amounts of time to their agencies, the time commitment of most volunteers is substantially less than employees, most of whom work full-time hours. Where both career employees and volunteers attend an event, most agencies deploy career employees in the situations that potentially are most risky or potentially traumatic. Additionally, most volunteer agencies have protocols in place to limit volunteers’ exposure to the most potentially traumatic experiences. While this reduces the risks associated with volunteer work compared with career employees, there is still some risk associated with volunteer work in the police and emergency services, and some volunteers are exposed to events or experiences that negatively impact their mental health and wellbeing.
The mental health and wellbeing results from Answering the call highlight the need for dedicated approaches and frameworks to manage the high rates of psychological distress, probable PTSD in employees and suicidal thoughts and planning in employees and volunteers found in the police and emergency services sector. Further national research should be funded to determine best practice interventions and programs for mental health and wellbeing specific to the police and emergency service sector to establish the best ways to provide support.
12.4 Factors affecting wellbeing
The survey identified a number of factors that were associated with both poor mental health outcomes and positive mental health and wellbeing. While some of these factors are generally known to be linked to positive wellbeing and are not specific to police and emergency services, there may still be workplace influences that could promote or impede these. Maintaining a healthy level of physical activity, and getting regular good quality sleep were both positively associated with mental wellbeing. While difficulty sleeping can be a symptom of a mental health condition, it can also be a consequence of irregular shift work, and high levels of stress and work intensity. People undertaking shift work should be encouraged to take active steps to support and improve the quality of their sleep. Rosters should be organised to minimise the requirement to return to work without an adequate break between shifts.
Factors associated with poorer mental health outcomes involved aspects of the working in the police and emergency services such as experience of verbal and physical assaults in the line of duty. Additionally there were a range of workplace issues such as lack of support and influence at work, and experience of sexual harassment, or discrimination. This indicates a need to develop workplace practices which will lead to more supportive work environments for those already experiencing a degree of mental health distress.
12.4.1 Managing workloads and exposure to traumatic events
While the day to day work life of personnel in the police and emergency services can be challenging, there is the chance that from time to time employees or volunteers may be involved in events or exposed to situations that are particularly traumatic, due to the nature of the event itself or some aspect of the event that particularly affects an individual. For some, repeated exposure to traumatic events can have a cumulative effect over time. While this is a risk inherent in the nature of work in the police and emergency services, there are opportunities for agencies to manage workloads in a way that supports people when they experience traumatic events.
182
The nature of police and emergency services work requires people to be able to respond to emergencies whenever they occur at any time of the day or night, and to quickly mobilise resources for the duration that they are needed when emergency situations arise. As such, shift-work, irregular hours, being on call to respond when needed, and intense periods of work is a part of many roles in the police and emergency services sector.
In terms of the mental health and wellbeing of personnel, one of the issues highlighted by the survey is the need to have the time and opportunity to take stock after particularly traumatic or intense events occur, to be able to address issues as they arise, and to be able to rest and recover. Additionally the survey found that it is important for agencies to have sufficient resources to allow their personnel flexibility after traumatic events and to be able to manage overall working hours. As emergency events can occur at random times, and outside the control of agencies, there is always the potential for there to be intense periods of work. However, it is important to ensure that employees and volunteers are not exposed to high intensity of work on an ongoing basis. This may mean ensuring that police and emergency services agencies have sufficient resources to respond to the level of emergency events occurring in their communities and managing workloads to ensure no individuals or teams are regularly being stretched beyond reasonable expectations. It may also involve designing flexibility into work flows and rosters, and monitoring the nature and frequency of events, so that personnel can have downtime built into their schedules when they need it.
12.4.2 Social support
Levels of social support and quality of personal relationships were also positively associated with mental health and wellbeing, and are among the primary indicators of mental wellbeing. Due to the stressful nature of much of the work in the police and emergency services, and sometimes the confidential nature of the work, some personnel are reluctant to talk about their experiences at work with people outside their agency, including family. When people commit a substantial proportion of their time and energy to their work but feel unable to talk about it, it can have negative consequences for their ability to maintain the quality of their personal relationships outside of the work environment. The findings suggest that workplaces that are more inclusive, that provide opportunities to discuss work events and emotional issues, that are more supportive and have more positive communications had lower rates of mental health conditions.
12.4.3 Impact of inquiries and adverse media
Involvement in formal investigations or inquiries is common. About half of employees have been involved in an incident that was the subject of a formal investigation or inquiry, and about one in five had been involved in an incident that received adverse attention in the media. These events were often associated with significant stress. The nature of work in the police and emergency services sector, and the importance of that work to the community means there will always be a level of oversight. The survey findings showed that official or media scrutiny of events can be stressful, and affect the mental health and wellbeing of those involved. Providing a supportive and transparent environment during times when scrutiny is heightened is important for all police and emergency services agencies.
12.5 Suicidal thoughts and behaviours
Suicidal thoughts and behaviours are often, although not always, associated with significant mental health issues. They almost always reflect high levels of distress or difficulty coping and are often associated with a sense of hopelessness to address major life issues. Reducing the risk of suicide is one of the goals of the Beyond Blue Police and Emergency Services Program.
The survey data showed higher rates of suicidal ideation and suicide plans in police and emergency services employees compared with Australian population averages, but rates of suicide attempts comparable to the general population. Previous research on completed suicides in police and emergency services has found mixed results, with some suggesting that increased access to potential means of taking one’s life, including access to lethal drugs and firearms, contributes to elevated suicide rates in police and emergency services
183
personnel. Other research has suggested that having to attend suicides in the course of duty, respond to the aftermath of suicide events, and interact with bereaved families has an impact of reducing suicide attempts in police and emergency services personnel due to a heightened awareness of the impact of suicide on others.
In the survey, suicidal thoughts and behaviours were associated with high levels of psychological distress and diagnosed mental health conditions. While suicidal thoughts and behaviours are often associated with high levels of distress, most people with mental health conditions are not suicidal. The survey data identified that among employees who have experienced trauma or have probable PTSD, high levels of social support and resilience were associated with lower levels of suicidal ideation. Ensuring all employees have access to social support mechanisms, and monitoring and promoting resilience may help improve the mental health of police and emergency services personnel.
12.6 Alcohol use
The survey found high rates of potentially harmful alcohol consumption in police and emergency services personnel. While Australian adults have high rates of alcohol consumption in general, there are specific issues relating to the interaction between alcohol use and mental health issues that need to be considered.
Some people use alcohol to help manage symptoms of mental health conditions that they are experiencing. While alcohol may help to distract someone from their symptoms in the short term, alcohol use is not helpful in the longer term for managing symptoms of mental health conditions, and ongoing harmful drinking can result in poor health and mental health outcomes. Using alcohol instead of seeking appropriate forms of support can result in delays in seeking appropriate support. As a result the issues may become more serious and more difficult to treat by the time support is sought. Alcohol can also negatively impact some symptoms of mental health conditions, including exacerbating symptoms of irritability and anger, and may even further numb emotional responses.
Alcohol use should also be considered in the context of social support. As many police and emergency services personnel are reluctant to talk about workplace issues with people outside of work, having social time with colleagues can be very important in providing social support and opportunities to informally discuss events and situations that occur at work. In this context, many police and emergency services workplaces, in common with many workplaces throughout Australia, have regular after work social occasions involving alcohol.
In workplace environments where the risk of mental health issues and PTSD is real, it is important that personnel are aware of the way that alcohol impacts mental health. People who already have a habit of regularly drinking in a social context may not immediately notice if their use of alcohol suppresses symptoms of a developing mental health issue. If alcohol use also distracts others from noticing a developing issue the result may be a delay in seeking appropriate support.
The survey found higher rates of alcohol consumption in employees with probable PTSD. Almost one in four employees with probable PTSD drank five or more drinks in a single session at least weekly, and more than one in five had drunk 10 or more drinks in a single session in the last month. An increase or change in pattern of alcohol use may be a marker of a developing mental health condition.
The survey identified that employees who have low levels of social support were more likely to drink at harmful levels. Good levels of social support may be protective against harmful levels of drinking, and drinking alone may be particularly unhelpful for people with developing mental health issues.
All police and emergency services personnel should be aware of the risks that regular and heavy alcohol use may pose to their mental health. Workplaces should be encouraged to promote healthy drinking cultures, and be alert to the risks of heavy alcohol use as a coping mechanism. Alternative approaches to coping with stress should also be encouraged, such as participation in physical activity and sporting activities, participating in community groups and social activities, eating together, and stress reduction and wellness strategies such as mindfulness.
184
An increase or change in pattern of alcohol use may be a sign of a developing mental health condition. One component of well-functioning teams where colleagues look out for each other should include watching out for any negative changes in behaviour or usual habits including unhealthy drinking patterns.
12.7 Seeking support
Managing exposure to situations and events that could negatively impact mental health, watching out for early warning signs, and seeking support in a proactive way may help reduce the risk of mental health conditions developing. However, when issues do arise the best outcomes occur when appropriate types and sufficient amounts of support are accessed in a timely way.
The best prognosis for recovery occurs when issues are identified as they start to develop. In the general Australian population, and throughout the world, there are known issues with people not seeking support for mental health conditions and not receiving appropriate support. While there is still much to be learnt about mental health conditions, and there is ongoing vital research into improving treatment for mental health conditions, there are many people throughout the world who do not benefit from the current state of knowledge in mental health treatment because they do not seek support or do not receive the most appropriate evidence-based treatments.
12.7.1 Are needs for support currently being met?
Answering the call collected information on support seeking in people who were experiencing psychological distress, PTSD and other mental health issues. The survey used a model of perceived needs of care that has also been used in the Australian National Survey of Mental Health and Wellbeing. This model considers people who are experiencing symptoms of mental health conditions and related functional impairment in four broad categories:
• People who don’t seek support because they don’t feel they need support• People who don’t seek support even though they recognise they need support• People who do seek support but feel their needs were not fully met by the support they received• People who sought support and feel they received an adequate level of support
The survey found that among employees with probable PTSD, 2% did not perceive that they had a problem, and 17% felt that while they had emotional or mental health issues they did not need any help or support. Over 20% perceived a need for support but did not seek or did not receive support. About 40% sought support but felt they needed more support than they received, and 20% of employees felt they received sufficient support for their needs.
While the proportion of people who receive sufficient support for their needs is low and indicates substantial gaps in health service seeking and use, these figures are similar to what was found for the Australian population overall. In comparison, a higher proportion of police and emergency services employees seek support when they feel they need it when compared to the broader Australian population.
This reflects that the provision of mental health care is suboptimal across the entire population and is not an issue just associated with police and emergency services. The higher than population average rates of support seeking may reflect that police and emergency services agencies do have a range of programs designed to provide help and support to people who need it.
Many of the issues that affect support seeking in the broader community are also relevant in the police and emergency services. There are additional considerations that are specifically relevant to the police and emergency services that also impact on support seeking.
12.7.2 Mental health literacy - knowing when to seek help
Within each of the categories of perceived need, the survey collected information relating to barriers to help seeking. Some employees who reported symptoms of a mental health condition and significant levels of functional impairment did not think they needed help, or did not even think that they had emotional or mental health issues. Others did not seek help because they did not know what they should do.
185
Knowing when to seek help is one component of mental health literacy. This includes:
• having knowledge and understanding of mental health conditions to be able to recognise the signs and symptoms of one developing
• knowing when it’s appropriate to seek support • knowing what types of services and treatments are available • knowing how to seek support, and what to do if initial efforts are not very successful.
A good level of mental health literacy can be valuable in terms of recognising and seeking help for an individual’s own mental health. It can also be helpful in recognising when colleagues may be experiencing difficulties and supporting them. While national studies of mental health literacy indicate that literacy levels have increased in recent years, there are still substantial numbers of people who do not know what types of emotional or behavioural symptoms may indicate mental health issues, when to seek help and what types of help are available and effective for different types of mental health conditions (Reavley & Jorm, 2011).
Providing evidence-informed education and access to resources for all personnel, that focus on addressing mental health literacy should be a key consideration by all police and emergency service agencies. This should focus on increasing the understanding of the signs and symptoms of mental health conditions and strategies to protect mental health and enhance wellbeing across the career life cycle.
12.7.3 Stigma and barriers to seeking support
About one in five employees reported that they recognised they needed support for an emotional or mental health condition, but did not seek any support. This was often because they wanted to deal with their problems by themselves. Commonly cited barriers included concerns about being taken out of an operational role, having an adverse impact on their career, or being perceived as weak. These issues may be linked to real or perceived stigma associated with mental health conditions. Rates of seeking help when needed were also lower among employees who felt shame or embarrassment about their mental health, and among employees who perceived that their agency was not well equipped to support people with mental health conditions.
In the general population help seeking is lower in males compared with females. The higher proportion of males in the police and emergency services may reflect lower levels of help seeking. However, females in the police and emergency services did not have substantially higher rates of help-seeking in the survey. This may reflect the challenges females may face in male dominated workplaces of perceiving they need to be seen as physically and mentally strong and tough to justify their place in the workplace.
Community attitudes to mental health have been changing in recent times. Levels of stigma have been reducing while levels of mental health literacy have been increasing. While changes in levels of stigma and mental health literacy have been positive, there are still improvements to be made in increasing mental health literacy, and reducing the stigma associated with mental health conditions.
While stigma is a barrier to seeking help in the population in general, there are aspects of stigma that are specific to the police and emergency services sector. The nature of police and emergency services work as helping others in times of need, and needing to be perceived as physically and mentally strong to provide these services, and having been selected for the role based in part on physical and mental resilience, can count against help seeking. Some of the roles within the police and emergency services are seen as not suited to people with mental health conditions. Fear of losing the ability to work in an operational role, or fear of adverse career impacts are also factors that motivate some against seeking help, and seeking help in a timely way.
Reviewing and adapting internal policies and practices to combat the unique barriers and stigma to support seeking and ensuring that support services are well promoted and known by all personnel should be a key focus of all police and emergency services agencies.
186
12.7.4 Receiving adequate support
A substantial number of people in the police and emergency services sector who sought support felt they did not receive an adequate level of support. Obtaining an appropriate level of support for a mental health condition can be challenging, and may require persistence. Mental health conditions are typically chronic and develop slowly over a period of time. Effective treatment and recovery also takes time, and persisting with therapies long enough to achieve therapeutic benefits may represent a particular challenge.
These challenges may be associated with limits on the number of sessions or amount of services that may be funded or provided through particular schemes, limits on time and availability to attend sessions, lack of understanding of what progress can reasonably be expected in a given amount of time, and becoming discouraged if recovery is slower than desired.
Ensuring the support services within police and emergency service agencies adequately meet the needs of personnel based on the severity of their mental health condition and building multiple pathways both within and outside the agency is important to increase the likelihood of personnel seeking the right support at the right time.
12.8 Profile of a resilient workplace
As most of Australia’s police and emergency services agencies participated in the survey, there was an opportunity to look at differences between agencies that might identify areas where particular agencies have initiatives that are working well that could be expanded across the sector or where learnings can be taking from the experiences of individual agencies. While there are real differences between agencies in the types and nature of work that they do, in resources and in policies and practices, the survey results have highlighted there are common issues across all agencies. There was a concerning proportion of employees with poor mental health in all agencies. All agencies had high rates of psychological distress and probable PTSD in their employees. All agencies have staff with mental health issues who were not seeking or not receiving adequate help. All agencies have staff who perceived stigma, particularly adverse career impacts, associated with seeking help for mental health conditions. Many of the issues identified in the survey are relevant across all agencies.
Also notable in the survey findings is the differences within individual agencies. Many of Australia’s police and emergency services agencies are large and complex organisations with diverse teams spread over many locations. Attitudes towards mental health and wellbeing can vary significantly between individual workplaces and between individuals within a workplace. While all agencies have policies and programs to support mental health and wellbeing, the extent to which they are applied and are effective varies within agencies. For an agency to effectively embrace policies and programs that promote mental health and wellbeing and resilience requires commitment not only from senior leaders but also from workplaces across the organisation.
The survey identified a range of factors that were associated with more resilient workplaces. Workplaces that provided sufficient opportunity to recover after stressful events, had regular discussions of workplace experiences, more effectively managed emotional demands, had higher levels of support and inclusiveness, were more open about mental health and wellbeing, had lower levels of perceived stigma, and had supportive line management were associated with lower levels of psychological distress and PTSD. These factors were also associated with enhancing the resilience of employees.
12.9 Workers’ compensation
About 14% of employees in the police and emergency services had made a workers’ compensation claim as a result of trauma, stress or a mental health condition sustained during workplace duties, at some time in their careers. This is among the highest rate of claims related to mental health conditions of any industry or occupation group. This high rate of claims is associated with the high rates of PTSD, psychological distress, depression and anxiety seen in the sector.
187
The survey results strongly showed that most employees who had made a compensation claim related to mental health had negative experiences of the process. Most found the experience was unhelpful or negatively impacted their recovery, was unsupportive and stressful, and many felt that they were treated unfairly in the process. It should be noted that most workers’ compensation claims relating to mental health do not result in permanent disability or departure from the workforce.
The survey results strongly suggest that the higher rates of mental health conditions and PTSD in particular are associated with workplace factors. While mental health is influenced by a combination of life experiences both at work and outside of work, the nature of the working environment in the police and emergency services increases the risk of adverse mental health outcomes.
Workers’ compensation processes include safeguards to protect against false or fraudulent claims, and procedures to determine if the mental health issue is related to work. However, the high level of claims for mental health and emotional issues among police and emergency services employees is commensurate with their high rates of psychological distress and probable PTSD, which in turn are directly linked to exposure to traumatic events in the workplace. The burden to prove mental health conditions were caused by workplace factors can heighten distress and hinder recovery.
The survey results provide compelling evidence that fundamental reform is needed to the way that workers’ compensation claims relating to mental health issues are dealt with. Compared to compensation claims that are related to physical injuries, there are particular issues that need to be considered in relation to claims relating to mental health. The symptoms of mental health condtions can directly impact on people’s ability to navigate the claims process, and on their ability to deal with issues that may arise during the process.
The way in which claims are adjudicated, and the rules and regulations relating to them should also be considered. Compared with many physical health conditions that can be objectively measured and quantified, verifying mental health conditions can be more challenging. Clinicians can have differing opinions of the same case, and diagnosing mental health conditions often relies on understanding people’s emotions and reactions to situations that cannot be directly observed in the consulting room.
The survey results highlighted the high rate of probable PTSD among employees in the police and emergency services. Among employees with PTSD who had made a claim, only 8% felt the claims experience had a positive impact on their recovery, while 75% felt it had a negative impact on their recovery. Over half (52%) felt that they were not supported at all during the claims experience, and 63% reported that they found the claims experience to be very or extremely stressful. Some 44% of employees with probable PTSD who had lodged a claim felt they were not treated fairly at all.
Mental health conditions can affect people’s cognitive abilities, decision making processes, relationships and communications skills. As a result people making a claim related to a mental health issue may require a higher level of support through the process. For people suffering from PTSD in particular, the claims process may be particularly challenging. It is important to consider the common symptoms of PTSD and the way that they may impact on people’s experiences and perceptions of the claims process. People with PTSD often experience negative symptoms including hypervigilance and suspiciousness, difficulty with concentration, and numbing of emotional responses including detachment from others and lack of positive hope for the future in their career and other aspects of life. Because of these symptoms it would not be uncommon for someone experiencing PTSD to approach a claims process in which they may feel that the validity of their accounts and experiences is being questioned with suspicion. These negative symptoms of PTSD may be mistakenly interpreted as hostility towards the claims process or lack of compliance with the process if the symptoms of the condition are not taken into account by those administering the process.
These symptoms may negatively impact their ability to navigate a complex, drawn out and time consuming process, and as a result employees experiencing significant mental health distress may require additional levels of support when a lodging workers’ compensation claim.
Prevention of mental health conditions, and early intervention when mental health issues are developing are important objectives in improving the mental health and wellbeing of police and emergency services personnel. However, when serious issues develop, it is important that people are well supported to facilitate recovery and longer term wellbeing. For people who have devoted substantial portions of their
188
lives to helping others in times of crisis, and who expose themselves to personal risk in doing so, the processes that are in place to support them when they need help should be designed to promote recovery and wellbeing and not to exacerbate the symptoms and the distress that they may already be experiencing. In guarding against the possibility of false or fraudulent claims being made it is important not to exacerbate the symptoms and impede the recovery of employees making claims who are suffering serious mental health issues and have a genuine need for help and support.
The Commonwealth Government should take a leading role in driving fundamental reform to the worker’s compensation system with the aim to ensure that personnel receive early diagnoses, accurate assessments and appropriate treatments without delay, to avoid the negative impacts caused by the current system.
12.10 The experiences of former employees
After a career in the police and emergency services, for some former employees retirement can be a challenging period. This may be particularly so for employees who developed mental health issues while working from which they had not fully recovered before they retired. For others the transition to retirement can create challenges where, for instance, they lose access to friends and colleagues and support mechanisms that were important to them.
The survey was conducted in a different way among former employees. As there are few lists of former employees maintained, and due to the way the sample of former employees was recruited via advertising through networks and former employee associations, the sample of former employees should not be considered as a representative, random sample. As such, the information collected in the survey may not represent the experiences of former employees who did not participate in the survey.
Despite these limitations, the survey findings clearly identified a group of former employees who continue to suffer significant distress years after retirement or leaving their jobs in the police and emergency services sector. Former employees who participated in the survey had high rates of PTSD and psychological distress, and low levels of resilience. They were much less likely to receive high levels of social support compared with current employees, particularly those former employees currently having probable PTSD or high rates of distress.
Among the former employees who participated in the survey, a number left their jobs due to mental health related reasons. About one in three former employees in the survey had made a workers’ compensation claim related to a mental health issue, and most reported substantially negative experiences related to their claim. Among former employees who felt they had been treated unfairly or who reported that the experience was unsupportive or negatively impacted their recovery, many were still experiencing distress which they related back to incidents that occurred in their work careers and the way they were managed.
Working in the Australian Defence Force has long been recognised as being associated with higher risk of both mental and physical health problems. Through the Department of Veterans’ Affairs and other mechanisms, veterans of the Australian Defence Force are provided with a range of supports and services long after they are discharged from active duty. In contrast, police and emergency services agencies are not funded to provide support for former employees after they leave the service, and no Australian jurisdiction has a comparable scheme to support the wellbeing of people after they leave the service.
A national approach to better support post-service employees and retirees from the police and emergency services workforce needs to be established and lead by the Commonwealth Government in collaboration with all State and Territory Governments.
12.11 Strengths and limitations of the survey
Answering the call was the first National Survey of the Mental Health and Wellbeing of Police and Emergency Services. The survey has a number of strengths, including the large number of agencies and individuals who participated; representativeness of the police and emergency services with almost all in-scope agencies participating; and large samples of employees and volunteers across a wide range of roles, ranks, workplaces and locations, and at varying points in their careers. While having the support of each of
189
the participating agencies, the survey also benefited from being independent of individual agencies, with the data being collected confidentially and anonymously.
There were some practical limitations on the survey. Because of its large scope and size, there were practical limitations on the length of the survey questionnaire, which was limited to an average 25 minutes duration. As a result, decisions had to be made about the content to include in the survey, and not all questions of interest could be asked in the available time. Also the survey was conducted at a single point in time, and does not include any longitudinal follow-up. There have been other studies, predominantly conducted in individual agencies or workplaces that have used longitudinal designs and more detailed questionnaires. The findings from each of these studies contributes to the evidence base on mental health and wellbeing of police and emergency services personnel.
12.11.1 Response rates and participation bias
While the number of participants was large, the response rates were modest. As such, a thorough analysis was undertaken to evaluate possible evidence of response bias in the survey. A bias could occur if people who participated in the survey were systematically different in some way from those who did not participate. Several approaches were taken to investigate this issue:
• To support the survey, each agency that participated provided details of the composition of theirworkforce and their volunteers by sex, age, length of service, rank and geographic area. All agenciesalso provide information to the Productivity Commission which is used to compile the Report onGovernment Services (RoGS). The RoGS provides information about the composition of the employedand volunteer workforce within the ambulance, fire and rescue, police and state emergency servicesectors. The composition of the sample in each agency was compared with the composition of theagency’s workforce.
• Data were obtained from the 2016 Census of Population and Housing, which provided informationabout the demographic composition of people working in the ambulance, fire and rescue, and policesectors regarding age, sex, marital status, family composition, educational attainment and country ofbirth. These figures were compared with the distribution of the sample participating in Answering thecall.
• The sample data were analysed for evidence of patterns that might be associated with response bias.For instance, if people with mental health conditions might be more inclined to participate in thesurvey, then agencies with lower response rates might have higher rates of mental health conditions,or negative experiences relating to the handling of mental health issues in the workplace. Similarly,participants who completed the survey soon after it was launched may have different characteristicscompared with those who only completed the survey after being sent reminders.
In comparing the demographic characteristics of the sample with the demographic distribution of the workforce as provided by the agencies, as reported in the RoGS report, and as extracted from the 2016 Census, there was evidence of slightly higher proportions of females, non-operational personnel, and older personnel participating in the survey. These differences were incorporated into the weighting strategy, and all survey data for employees and volunteers was weighted to reflect the demographic distribution of the employed and volunteer workforce in each sector. No differences were seen in the demographic composition of the sample compared with the population distribution by family structure, marital status, educational attainment, country of birth or rank.
There was some evidence from the survey to suggest that the lower participation rate among volunteers reflected some agencies including people with limited engagement with the agency on their lists, and some volunteers not actively monitoring communications from their agencies, and thus being unaware of the survey. There was also some evidence to suggest that the volunteers who participated in the survey were more likely to be active volunteers who regularly participated in volunteer activities and training and were more likely to be called out to respond to emergencies. As there is no other source of information on levels of volunteer participation in the emergency services it was not possible to adjust for this in the weighting process. As such, figures relating to volunteers in this survey may over-represent the level of active involvement of volunteers in responding to emergency situations and events.
190
Analysis of possible response patterns did not find any relationship between the response rates in individual agencies and rates of mental health conditions or negative experiences at work. Nor was there any relationship between time since launch of the survey in each agency, and rates of mental health conditions or negative experiences at work.
12.12 Conclusion
Answering the call has provided the first national evidence of the mental health and wellbeing of employees and volunteers in the police and emergency services. While the majority of personnel in the sector have positive mental health and resilience, the survey has highlighted the higher risks of mental health conditions compared with the Australian population in general, and other occupations. Most police and emergency services employees and volunteers perceive their work to be meaningful and important, but it is also often stressful and demanding and can expose people to a range of potentially traumatic situations. These risks, and the way in which they are managed, can lead to mental health issues that can be persistent and significantly impact people’s lives.
The survey has identified a range of issues that are related to mental health and wellbeing in the police and emergency services sector, and areas that could be addressed to improve wellbeing. The survey was conducted as Phase 2 of Beyond Blue’s National Mental Health and Wellbeing Study of Police and Emergency Services. The next phase, Phase 3, is a collaborative ‘evidence to action’ project designed to work in partnership with agencies to develop and implement strategies that aim to improve mental health and wellbeing in the police and emergency services sector.
Many employees and volunteers devote many years to their agencies and to serving their communities. Most employees and volunteers undertake these roles with the knowledge of the associated risks, out of a desire to serve and help others in times of need. The survey both identifies the risks associated with police and emergency services work for mental health and wellbeing, and areas where improvements are needed to better support police and emergency services personnel when problems arise. Beyond Blue is committed to working collaboratively with agencies and the broader community to promote improved mental health and wellbeing in the police and emergency services sector, and to support the people who protect our communities when they need help themselves.
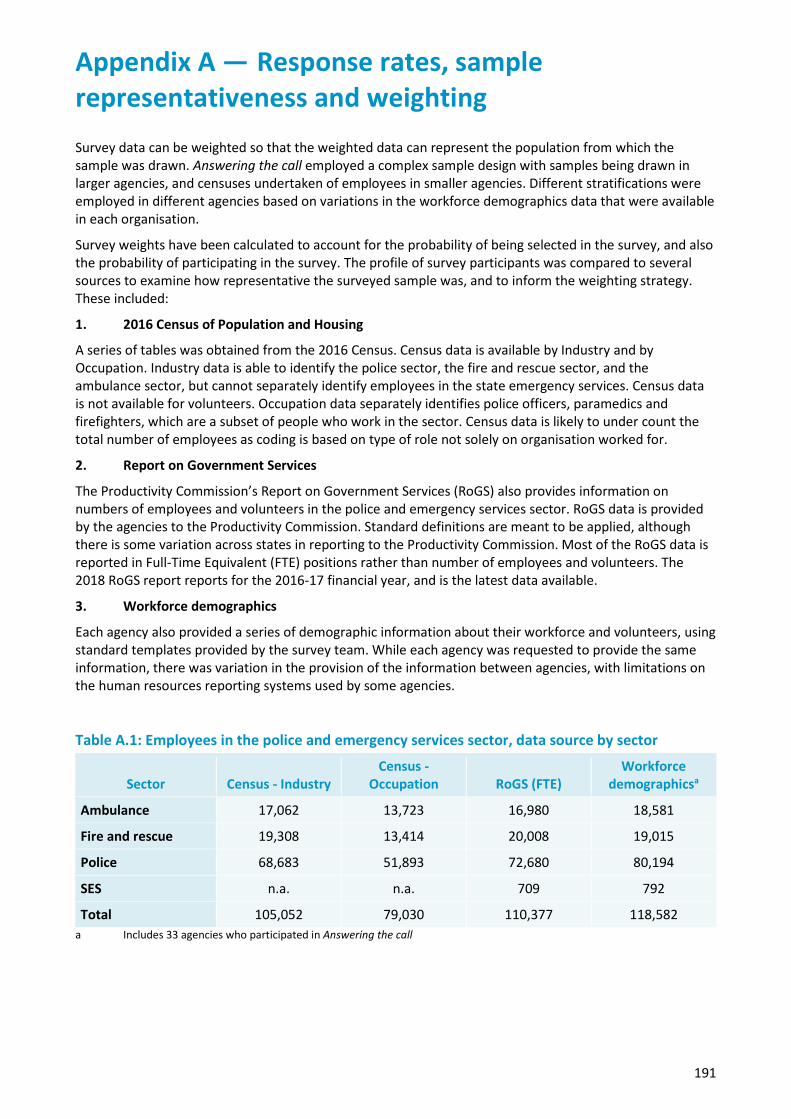
191
Appendix A — Response rates, sample representativeness and weighting Survey data can be weighted so that the weighted data can represent the population from which the sample was drawn. Answering the call employed a complex sample design with samples being drawn in larger agencies, and censuses undertaken of employees in smaller agencies. Different stratifications were employed in different agencies based on variations in the workforce demographics data that were available in each organisation.
Survey weights have been calculated to account for the probability of being selected in the survey, and also the probability of participating in the survey. The profile of survey participants was compared to several sources to examine how representative the surveyed sample was, and to inform the weighting strategy. These included:
1. 2016 Census of Population and Housing
A series of tables was obtained from the 2016 Census. Census data is available by Industry and by Occupation. Industry data is able to identify the police sector, the fire and rescue sector, and the ambulance sector, but cannot separately identify employees in the state emergency services. Census data is not available for volunteers. Occupation data separately identifies police officers, paramedics and firefighters, which are a subset of people who work in the sector. Census data is likely to under count the total number of employees as coding is based on type of role not solely on organisation worked for.
2. Report on Government Services
The Productivity Commission’s Report on Government Services (RoGS) also provides information on numbers of employees and volunteers in the police and emergency services sector. RoGS data is provided by the agencies to the Productivity Commission. Standard definitions are meant to be applied, although there is some variation across states in reporting to the Productivity Commission. Most of the RoGS data is reported in Full-Time Equivalent (FTE) positions rather than number of employees and volunteers. The 2018 RoGS report reports for the 2016-17 financial year, and is the latest data available.
3. Workforce demographics
Each agency also provided a series of demographic information about their workforce and volunteers, using standard templates provided by the survey team. While each agency was requested to provide the same information, there was variation in the provision of the information between agencies, with limitations on the human resources reporting systems used by some agencies.
Table A.1: Employees in the police and emergency services sector, data source by sector
Sector Census - Industry Census -
Occupation RoGS (FTE) Workforce
demographicsa
Ambulance 17,062 13,723 16,980 18,581
Fire and rescue 19,308 13,414 20,008 19,015
Police 68,683 51,893 72,680 80,194
SES n.a. n.a. 709 792
Total 105,052 79,030 110,377 118,582 a Includes 33 agencies who participated in Answering the call

192
A.1 Response rates
Table A.2: Number of participants in Answering the call, by sector
Sector Employees Volunteers Former employees
Ambulance 3,473 559 346
Fire and rescue 2,975 2,626 162
Police 8,088 a 141
SES 332 2,300 12
Total 14,868 5,485 661 a While some police agencies do have a small number of volunteers, police volunteers were not included in the study because of the small numbers.
Overall, there were 21,014 participants who completed the Answering the call survey. Table A.2 shows the number of participating employees, volunteers and former employees by sector. Overall the response rate was 22% among employees, and 10% among volunteers. A response rate and weights could not be calculated for former employees as the sample was not selected using random sampling. Although these response rates are typical for voluntary surveys, when there is non-response it is possible that the respondents who participated in the survey may be systematically different in some way from the population as a whole. This has been investigated in several ways, including comparing the characteristics of the participating sample with census data and workforce demographics provided by agencies, and by looking for patterns in response rates and survey participation that may suggest possible bias.
A.2 Demographic characteristics of the sample compared with census data
Table A.3 compares the distribution of the sample of employees, with demographic characteristics obtained from the census, based on Industry classification. The comparisons suggest that the sample is comparable to the census distribution by Indigenous status, by marital status, and country of birth. However, the sample has a slightly higher proportion of females compared with males in each of the three sectors, and there is a general trend for the sample to have a slightly older age distribution that the workforce in general. It is a common experience in surveys that younger people, particularly young males, have lower response rates. Weighting was used to account for these small differences in gender and age group between the composition of the survey data and the available comparative data.
A.3 Weighting strategy
Separate weights were developed for the employee sample and the volunteer sample. As the sample of former employees was not recruited using random sampling methods, no weighting has been applied to the former employee data. The weighting strategy proceeded as follows:
• design weights were calculated from the inverse of the selection probability within each stratumwithin each agency
• the distribution of each agency’s sample was compared with the reported demographiccomposition of their workforce, and adjustments were made to account for the response rate ineach agency
• the distribution of the sample within each sector was compared with the census distribution for keydemographic variables and a model based approach was used to adjust weights so that thedemographic profile of the weighted sample matched the census distribution.
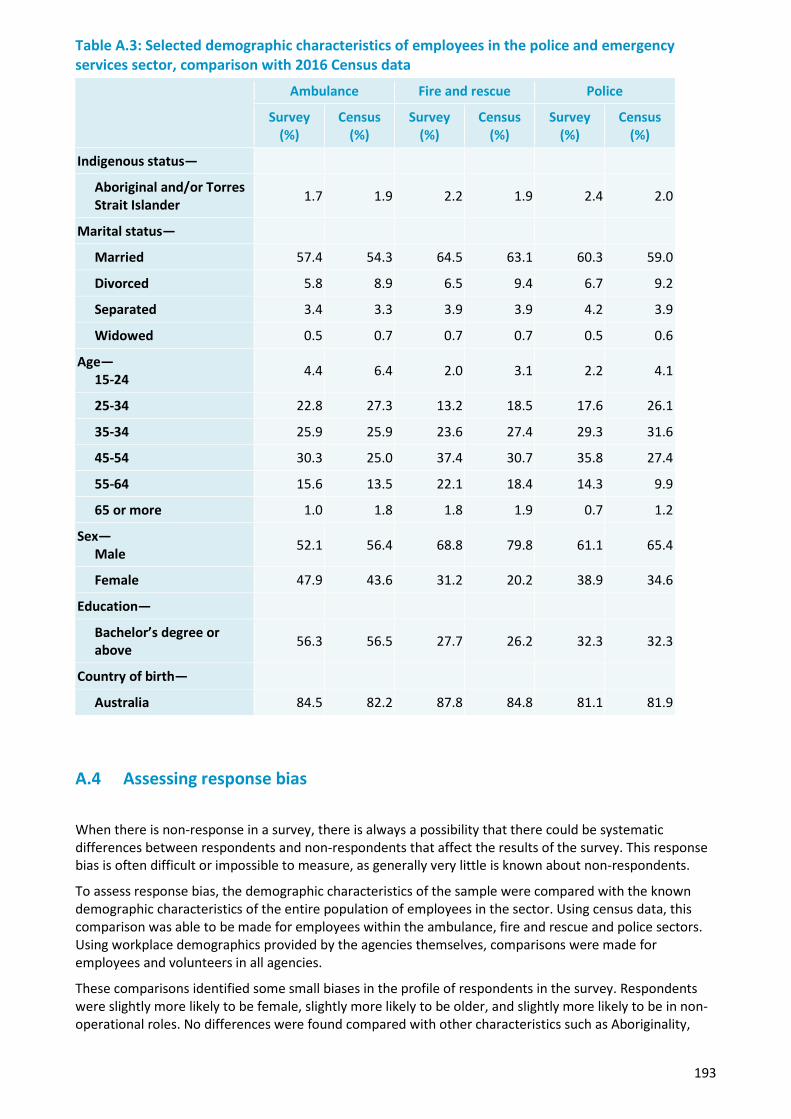
193
Table A.3: Selected demographic characteristics of employees in the police and emergency services sector, comparison with 2016 Census data
Ambulance Fire and rescue Police
Survey (%)
Census (%)
Survey (%)
Census (%)
Survey (%)
Census (%)
Indigenous status—
Aboriginal and/or Torres Strait Islander 1.7 1.9 2.2 1.9 2.4 2.0
Marital status—
Married 57.4 54.3 64.5 63.1 60.3 59.0
Divorced 5.8 8.9 6.5 9.4 6.7 9.2
Separated 3.4 3.3 3.9 3.9 4.2 3.9
Widowed 0.5 0.7 0.7 0.7 0.5 0.6
Age— 15-24 4.4 6.4 2.0 3.1 2.2 4.1
25-34 22.8 27.3 13.2 18.5 17.6 26.1
35-34 25.9 25.9 23.6 27.4 29.3 31.6
45-54 30.3 25.0 37.4 30.7 35.8 27.4
55-64 15.6 13.5 22.1 18.4 14.3 9.9
65 or more 1.0 1.8 1.8 1.9 0.7 1.2
Sex— Male 52.1 56.4 68.8 79.8 61.1 65.4
Female 47.9 43.6 31.2 20.2 38.9 34.6
Education—
Bachelor’s degree or above 56.3 56.5 27.7 26.2 32.3 32.3
Country of birth—
Australia 84.5 82.2 87.8 84.8 81.1 81.9
A.4 Assessing response bias
When there is non-response in a survey, there is always a possibility that there could be systematic differences between respondents and non-respondents that affect the results of the survey. This response bias is often difficult or impossible to measure, as generally very little is known about non-respondents.
To assess response bias, the demographic characteristics of the sample were compared with the known demographic characteristics of the entire population of employees in the sector. Using census data, this comparison was able to be made for employees within the ambulance, fire and rescue and police sectors. Using workplace demographics provided by the agencies themselves, comparisons were made for employees and volunteers in all agencies.
These comparisons identified some small biases in the profile of respondents in the survey. Respondents were slightly more likely to be female, slightly more likely to be older, and slightly more likely to be in non-operational roles. No differences were found compared with other characteristics such as Aboriginality,
194
country of birth, educational status, marital status or number of children. The weighting strategy adjusts for these observed differences.
As the survey was branded as a Beyond Blue project, and clearly identified as a study of mental health and wellbeing it is possible that employees and volunteers in the police and emergency services sector would be more likely to participate in the survey if they had some lived experience of mental health conditions, or if they had poor experiences in the workplace related to mental health issues that they wanted to discuss in the survey.
While the mental health status of people who did not participate in the survey is not known, there are indirect ways to assess the possibility of the survey been affected by a bias of this nature. If we were to assume that people with a mental health condition or negative experiences were more likely to participate in the survey, this would imply that agencies with the lowest response rates would be most affected by this bias, and agencies with higher response rates would be less affected. Similarly, it would be reasonable to expect that people who participated in the survey at the first opportunity would be more likely to have experienced a mental health condition or negative experiences than people who required multiple reminders before participating.
To look for possible evidence of response bias in the survey, we investigated:
• whether rate of mental health issues decreased over time since launch of the study in each agency
• whether there was any association between response rate in individual agencies and rate of mentalhealth conditions in that agency
A.5 Rate of mental health conditions and negative workers’ compensationexperiences by time since launch of study
In each agency, respondents were ordered by the number of days since the launch of the study in that agency. The rates of adverse outcomes were calculated by time since launch of study. These times were calculated separately for each agency, as launch of the study was staggered across agencies. In general, response rates were highest in the first few days after launch, with modest increases when the reminders were sent at one, two and three weeks after launch.
Figure 1 shows the relationship between selected negative outcomes and number of days since launch of the study. Outcomes examined included probable PTSD, very high level of psychological distress, or having had a negative experience of the workers’ compensation system as a result of a claim relating to psychological trauma, stress or a mental health condition (i.e. had a negative impact on their recovery, was not at all supportive, or caused significant stress). There was no significant change in the rate of any of these outcomes by length of time since launch of the survey. This suggests that those employees who took the earliest opportunity to participate in the survey and those who delayed completing the survey, and those who required several reminders to participate in the survey did not differ meaningfully in level of mental health issues or distress. Logistic regression analysis also found no significant association between any of these adverse outcomes and time since launch of the study. In summary, these results provide little evidence of any response bias relating to experience mental health difficulties or to having had a negative experience relating to a workers’ compensation claim for an emotional or mental health issue.
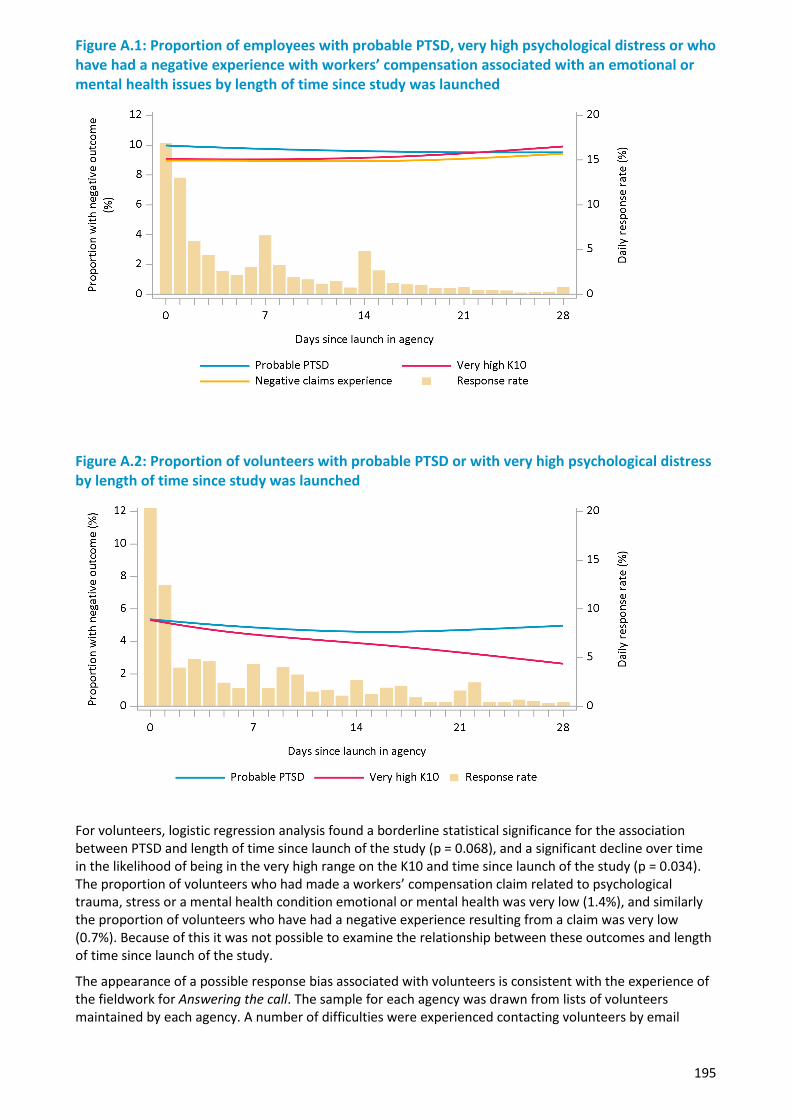
195
Figure A.1: Proportion of employees with probable PTSD, very high psychological distress or who have had a negative experience with workers’ compensation associated with an emotional or mental health issues by length of time since study was launched
Figure A.2: Proportion of volunteers with probable PTSD or with very high psychological distress by length of time since study was launched
For volunteers, logistic regression analysis found a borderline statistical significance for the association between PTSD and length of time since launch of the study (p = 0.068), and a significant decline over time in the likelihood of being in the very high range on the K10 and time since launch of the study (p = 0.034). The proportion of volunteers who had made a workers’ compensation claim related to psychological trauma, stress or a mental health condition emotional or mental health was very low (1.4%), and similarly the proportion of volunteers who have had a negative experience resulting from a claim was very low (0.7%). Because of this it was not possible to examine the relationship between these outcomes and length of time since launch of the study.
The appearance of a possible response bias associated with volunteers is consistent with the experience of the fieldwork for Answering the call. The sample for each agency was drawn from lists of volunteers maintained by each agency. A number of difficulties were experienced contacting volunteers by email
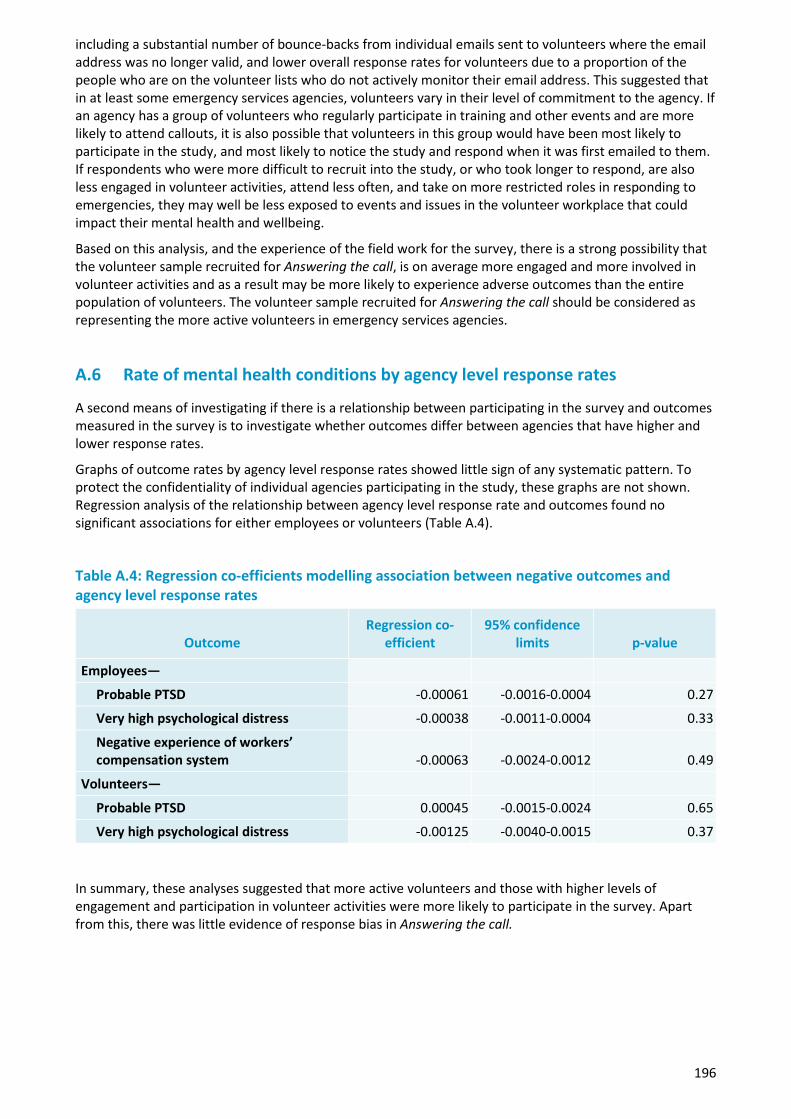
196
including a substantial number of bounce-backs from individual emails sent to volunteers where the email address was no longer valid, and lower overall response rates for volunteers due to a proportion of the people who are on the volunteer lists who do not actively monitor their email address. This suggested that in at least some emergency services agencies, volunteers vary in their level of commitment to the agency. If an agency has a group of volunteers who regularly participate in training and other events and are more likely to attend callouts, it is also possible that volunteers in this group would have been most likely to participate in the study, and most likely to notice the study and respond when it was first emailed to them. If respondents who were more difficult to recruit into the study, or who took longer to respond, are also less engaged in volunteer activities, attend less often, and take on more restricted roles in responding to emergencies, they may well be less exposed to events and issues in the volunteer workplace that could impact their mental health and wellbeing.
Based on this analysis, and the experience of the field work for the survey, there is a strong possibility that the volunteer sample recruited for Answering the call, is on average more engaged and more involved in volunteer activities and as a result may be more likely to experience adverse outcomes than the entire population of volunteers. The volunteer sample recruited for Answering the call should be considered as representing the more active volunteers in emergency services agencies.
A.6 Rate of mental health conditions by agency level response rates
A second means of investigating if there is a relationship between participating in the survey and outcomes measured in the survey is to investigate whether outcomes differ between agencies that have higher and lower response rates.
Graphs of outcome rates by agency level response rates showed little sign of any systematic pattern. To protect the confidentiality of individual agencies participating in the study, these graphs are not shown. Regression analysis of the relationship between agency level response rate and outcomes found no significant associations for either employees or volunteers (Table A.4).
Table A.4: Regression co-efficients modelling association between negative outcomes and agency level response rates
Outcome Regression co-
efficient 95% confidence
limits p-value
Employees—
Probable PTSD -0.00061 -0.0016-0.0004 0.27
Very high psychological distress -0.00038 -0.0011-0.0004 0.33
Negative experience of workers’ compensation system -0.00063 -0.0024-0.0012 0.49
Volunteers—
Probable PTSD 0.00045 -0.0015-0.0024 0.65
Very high psychological distress -0.00125 -0.0040-0.0015 0.37 In summary, these analyses suggested that more active volunteers and those with higher levels of engagement and participation in volunteer activities were more likely to participate in the survey. Apart from this, there was little evidence of response bias in Answering the call.
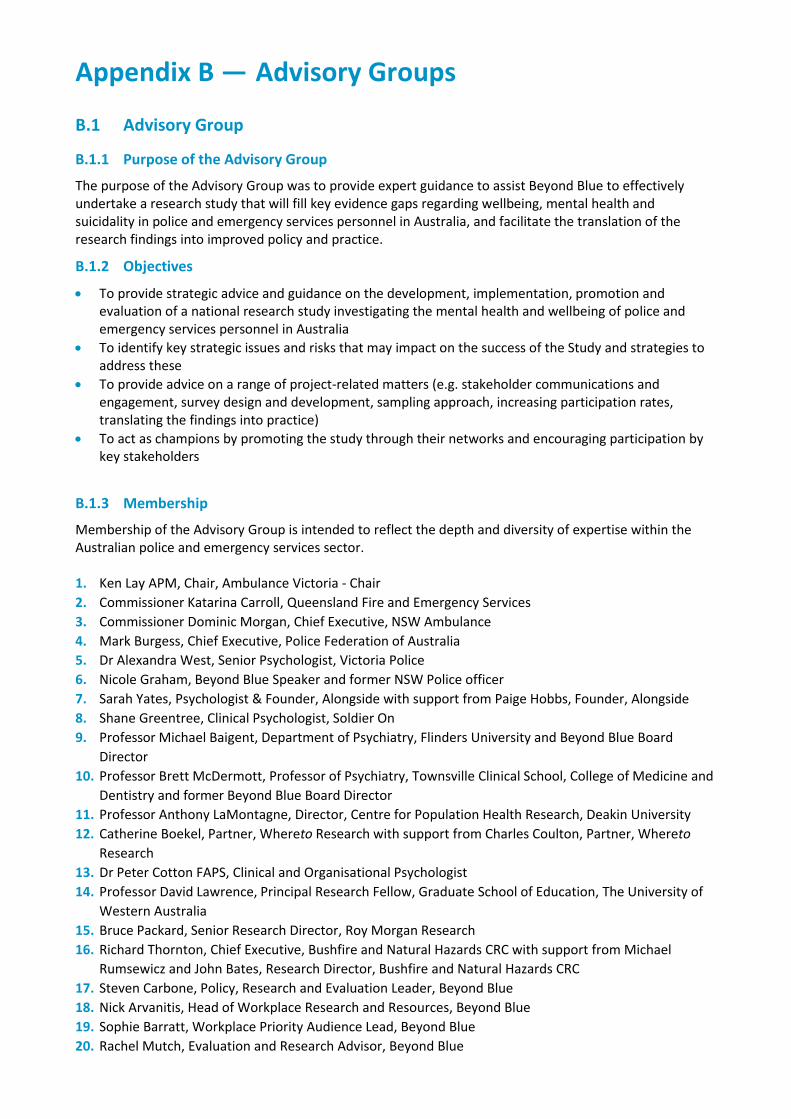
Appendix B — Advisory Groups
B.1 Advisory Group
B.1.1 Purpose of the Advisory Group
The purpose of the Advisory Group was to provide expert guidance to assist Beyond Blue to effectively undertake a research study that will fill key evidence gaps regarding wellbeing, mental health and suicidality in police and emergency services personnel in Australia, and facilitate the translation of the research findings into improved policy and practice.
B.1.2 Objectives
• To provide strategic advice and guidance on the development, implementation, promotion andevaluation of a national research study investigating the mental health and wellbeing of police andemergency services personnel in Australia
• To identify key strategic issues and risks that may impact on the success of the Study and strategies toaddress these
• To provide advice on a range of project-related matters (e.g. stakeholder communications andengagement, survey design and development, sampling approach, increasing participation rates,translating the findings into practice)
• To act as champions by promoting the study through their networks and encouraging participation bykey stakeholders
B.1.3 Membership
Membership of the Advisory Group is intended to reflect the depth and diversity of expertise within the Australian police and emergency services sector.
1. Ken Lay APM, Chair, Ambulance Victoria - Chair2. Commissioner Katarina Carroll, Queensland Fire and Emergency Services3. Commissioner Dominic Morgan, Chief Executive, NSW Ambulance4. Mark Burgess, Chief Executive, Police Federation of Australia5. Dr Alexandra West, Senior Psychologist, Victoria Police6. Nicole Graham, Beyond Blue Speaker and former NSW Police officer7. Sarah Yates, Psychologist & Founder, Alongside with support from Paige Hobbs, Founder, Alongside8. Shane Greentree, Clinical Psychologist, Soldier On9. Professor Michael Baigent, Department of Psychiatry, Flinders University and Beyond Blue Board
Director10. Professor Brett McDermott, Professor of Psychiatry, Townsville Clinical School, College of Medicine and
Dentistry and former Beyond Blue Board Director11. Professor Anthony LaMontagne, Director, Centre for Population Health Research, Deakin University12. Catherine Boekel, Partner, Whereto Research with support from Charles Coulton, Partner, Whereto
Research13. Dr Peter Cotton FAPS, Clinical and Organisational Psychologist14. Professor David Lawrence, Principal Research Fellow, Graduate School of Education, The University of
Western Australia15. Bruce Packard, Senior Research Director, Roy Morgan Research16. Richard Thornton, Chief Executive, Bushfire and Natural Hazards CRC with support from Michael
Rumsewicz and John Bates, Research Director, Bushfire and Natural Hazards CRC17. Steven Carbone, Policy, Research and Evaluation Leader, Beyond Blue18. Nick Arvanitis, Head of Workplace Research and Resources, Beyond Blue19. Sophie Barratt, Workplace Priority Audience Lead, Beyond Blue20. Rachel Mutch, Evaluation and Research Advisor, Beyond Blue
198
Observers • Jennifer Hafekost, Project Manager, The University of Western Australia• Muireann Heussaff, Police and Emergency Services Program Lead, Beyond Blue• Emma Renehan, Police and Emergency Services Project Manager, Beyond Blue• Wavne Rikkers, Senior Research Officer, The University of Western Australia
B.2 Technical Advisory Group
B.2.1 Membership
1. David Lawrence, UWA (Chair)2. Farhana Siddique, WA DFES3. Mick Cameron, Ambulance Victoria4. Charles Coulton, Whereto Research5. Professor Anthony LaMontagne, Deakin University6. Tim Peck, Current/former PES employee7. Nick Arvanitis, Beyond Blue8. Ken Lay, Chairman Ambulance Victoria9. Nicole Graham, Beyond Blue Speaker & former NSW Police officer10. Dr Alexandra West, Victoria Police11. Dr Clare Shann, Shann Advisory12. Rachel Mutch, Beyond Blue13. Fiona Donaldson, WA Police14. Professor Tim Slade, National Drug and Alcohol Research Centre15. Tracey Allen, ACT SES16. Dr Anthony McHugh, The Australian Psychological Society Limited17. Professor Angela Martin, University of Tasmania18. Bruce Packard, Roy Morgan Research
Observers:
• Jennifer Hafekost, UWA• Wavne Rikkers, UWA• Muireann Heussaff, Beyond Blue• Danielle Schembri, Beyond Blue• Rob Heaslip, Beyond Blue• Emma Renehan, Beyond Blue• Sophie Barrett, Beyond Blue• Tom Wren, Student
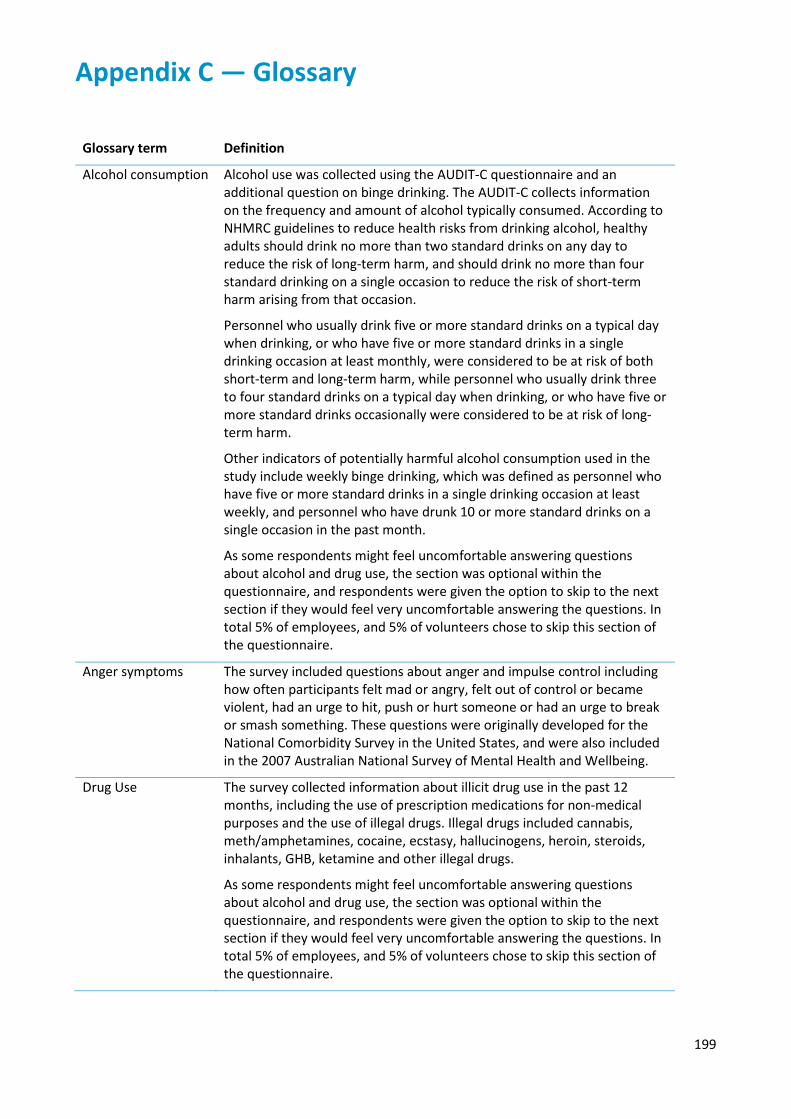
199
Appendix C — Glossary
Glossary term Definition
Alcohol consumption Alcohol use was collected using the AUDIT-C questionnaire and an additional question on binge drinking. The AUDIT-C collects information on the frequency and amount of alcohol typically consumed. According to NHMRC guidelines to reduce health risks from drinking alcohol, healthy adults should drink no more than two standard drinks on any day to reduce the risk of long-term harm, and should drink no more than four standard drinking on a single occasion to reduce the risk of short-term harm arising from that occasion.
Personnel who usually drink five or more standard drinks on a typical day when drinking, or who have five or more standard drinks in a single drinking occasion at least monthly, were considered to be at risk of both short-term and long-term harm, while personnel who usually drink three to four standard drinks on a typical day when drinking, or who have five or more standard drinks occasionally were considered to be at risk of long-term harm.
Other indicators of potentially harmful alcohol consumption used in the study include weekly binge drinking, which was defined as personnel who have five or more standard drinks in a single drinking occasion at least weekly, and personnel who have drunk 10 or more standard drinks on a single occasion in the past month.
As some respondents might feel uncomfortable answering questions about alcohol and drug use, the section was optional within the questionnaire, and respondents were given the option to skip to the next section if they would feel very uncomfortable answering the questions. In total 5% of employees, and 5% of volunteers chose to skip this section of the questionnaire.
Anger symptoms The survey included questions about anger and impulse control including how often participants felt mad or angry, felt out of control or became violent, had an urge to hit, push or hurt someone or had an urge to break or smash something. These questions were originally developed for the National Comorbidity Survey in the United States, and were also included in the 2007 Australian National Survey of Mental Health and Wellbeing.
Drug Use The survey collected information about illicit drug use in the past 12 months, including the use of prescription medications for non-medical purposes and the use of illegal drugs. Illegal drugs included cannabis, meth/amphetamines, cocaine, ecstasy, hallucinogens, heroin, steroids, inhalants, GHB, ketamine and other illegal drugs.
As some respondents might feel uncomfortable answering questions about alcohol and drug use, the section was optional within the questionnaire, and respondents were given the option to skip to the next section if they would feel very uncomfortable answering the questions. In total 5% of employees, and 5% of volunteers chose to skip this section of the questionnaire.
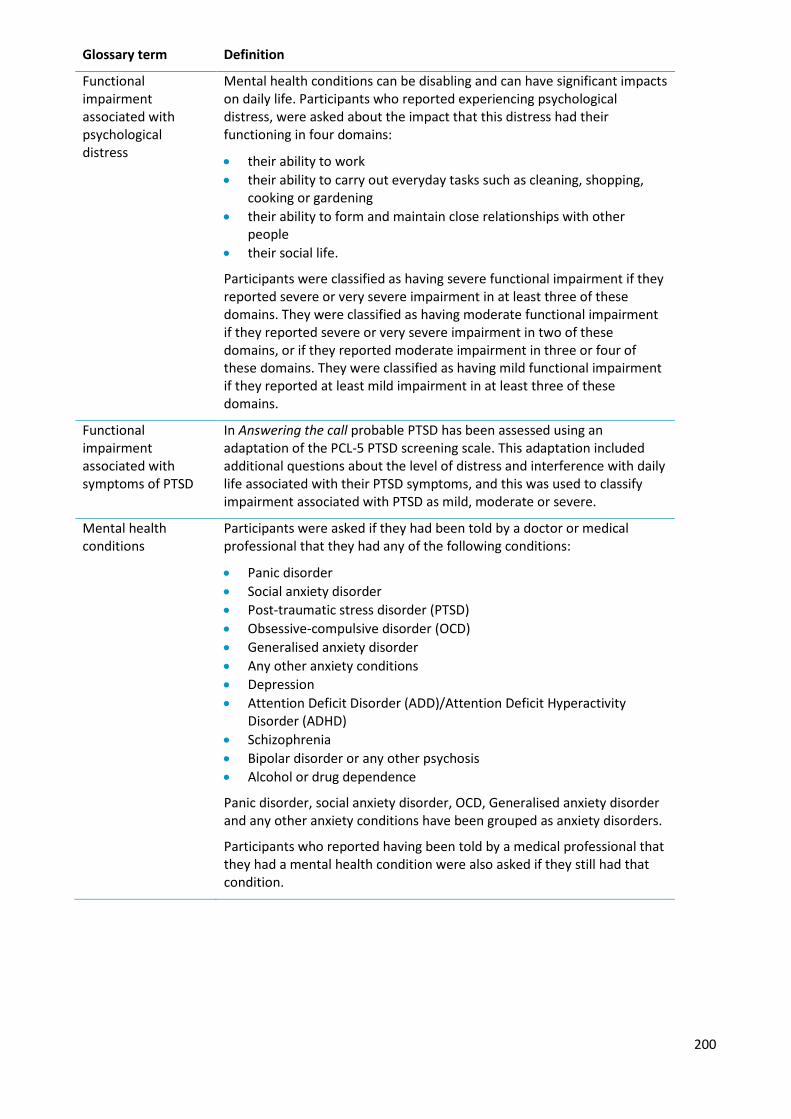
200
Glossary term Definition
Functional impairment associated with psychological distress
Mental health conditions can be disabling and can have significant impacts on daily life. Participants who reported experiencing psychological distress, were asked about the impact that this distress had their functioning in four domains:
• their ability to work• their ability to carry out everyday tasks such as cleaning, shopping,
cooking or gardening• their ability to form and maintain close relationships with other
people• their social life.
Participants were classified as having severe functional impairment if they reported severe or very severe impairment in at least three of these domains. They were classified as having moderate functional impairment if they reported severe or very severe impairment in two of these domains, or if they reported moderate impairment in three or four of these domains. They were classified as having mild functional impairment if they reported at least mild impairment in at least three of these domains.
Functional impairment associated with symptoms of PTSD
In Answering the call probable PTSD has been assessed using an adaptation of the PCL-5 PTSD screening scale. This adaptation included additional questions about the level of distress and interference with daily life associated with their PTSD symptoms, and this was used to classify impairment associated with PTSD as mild, moderate or severe.
Mental health conditions
Participants were asked if they had been told by a doctor or medical professional that they had any of the following conditions:
• Panic disorder• Social anxiety disorder• Post-traumatic stress disorder (PTSD)• Obsessive-compulsive disorder (OCD)• Generalised anxiety disorder• Any other anxiety conditions• Depression• Attention Deficit Disorder (ADD)/Attention Deficit Hyperactivity
Disorder (ADHD)• Schizophrenia• Bipolar disorder or any other psychosis• Alcohol or drug dependence
Panic disorder, social anxiety disorder, OCD, Generalised anxiety disorder and any other anxiety conditions have been grouped as anxiety disorders.
Participants who reported having been told by a medical professional that they had a mental health condition were also asked if they still had that condition.
201
Glossary term Definition
Mental wellbeing The short form of the Warwick-Edinburgh Mental Wellbeing Scale (SWEMWBS) was used to assess mental wellbeing. It consists of seven positively worded questions that cover both feelings and functioning. The scale was originally developed for use in the United Kingdom, and population reference data on the distribution of wellbeing is available for the adult populations of England and Scotland. The scale was designed so that the top 15% of the population would be identified as having high wellbeing, and the bottom 15% would be identified as having low wellbeing.
Physical health Physical health was assessed with the single question, ‘In general, how would you describe your physical health?’ with options of excellent, very good, good, fair and poor.
Probable Post-traumatic stress disorder (PTSD)
PTSD may develop after experiencing or witnessing a traumatic event, such as serious injury or death. Among police and emergency services personnel, PTSD may also develop after being exposed to details of traumatic events multiple times. Characteristic symptoms of PTSD include persistent re-experiencing of the traumatic event or events, persistent avoidance of situations or activities or other things that are reminders of traumatic events, numbing of emotional responses including feeling detached from other people, and symptoms of increased arousal such as difficulty sleeping, difficulty concentrating, irritability and angry outbursts, being easily startled and hypervigilance.
In Answering the call probable PTSD has been assessed using an adaptation of the PCL-5 PTSD screening scale. The formal diagnostic criteria for PTSD specify that symptoms must last for a minimum of one month and they must be associated with clinically significant distress or functional impairment. The adapted scale included additional questions designed to assess the level of functional impairment associated with symptoms of PTSD.
202
Glossary term Definition
Psychological distress
The Kessler Psychological Distress Scale (K10) is a widely used instrument designed to measure levels of psychological distress. The Kessler 10 scale is used in many national studies and is useful for comparing different populations.
The K10 is based on 10 questions about negative emotional states in the four weeks prior to interview. The K10 is scored from zero to 40, with higher scores indicating higher levels of distress. Scores are categorised as follows:
0 –5 Low levels of psychological distress
6–11 Moderate levels of psychological distress
12–19 High levels of psychological distress
20–40 Very high levels of psychological distress.
The very high category on the K10 has been designed to match the definition of serious mental illness in the United States. Serious mental illness is defined as mental illness associated with serious functional impairment, which substantially interferes with or limits one or more major life activities.
Participants were also asked four questions about how much their psychological distress interfered with home management (cleaning, shopping, cooking, gardening), ability to work or undertake volunteer work, ability to form and maintain close relationships, and on their social life.
Resilience Resilience is an important component of wellbeing and reflects a person’s ability to bounce back after challenges and stressful events, and to cope with difficult times. The resilience scale has three items which assess ability to bounce back after hard times or stressful events.
Service use The use of all health and organisational support services, and telephone and online services where these provided structured or personalised information.
Services Comprise all health, telephone and online services defined as follows:
Health services — any service provided by a qualified health professional regardless of where that service was provided (community, hospital inpatient and emergency, and private rooms) and regardless of whether the service was provided by the agency or not.
Telephone and online services where these provided structured or personalised assistance and not just generic information.
Social support Social support was measured using a short-form version of the Shakespeare-Finch Two Way Social Support Scale. This scale provides a measure of the social support that an individual provides to family, friends, colleagues and the community (giving support), and the degree to which they receive social support from others (receiving support).
203
Glossary term Definition
Stressful events Participants were asked if they had experienced a stressful event or series of events that deeply affected them. The survey identified if this happened while working or volunteering in the police and emergency services sector, while working or volunteering elsewhere, or outside of work.
Participants who had experienced a stressful event at work were asked if the event or events were:
• traumatic event(s) in the course of their work• personal injury received in the course of their work• dismissal from, or demotion in their work• being forced out of their job• issues associated with poor management or being treated badly by
managers• conflict with other people they work closely with.
Stigma There are several aspects of stigma, pertaining to perceptions of one’s own mental health. Firstly, self-stigma was measured to assess a person’s perceptions about their own mental health:
• Shame surrounding their mental health (i.e. embarrassed about theirproblems and seeking help).
• Burden of their mental health condition placed on others.• Experiences with others, such as being treated fairly and not being
avoided.
Secondly, the personal stigma a person holds about others was also assessed in two separate ways:
• Knowledge or ignorance surrounding mental health conditions (e.g.“If someone is experiencing depression or anxiety it is a sign ofpersonal weakness”)
• Burden an individual’s mental health condition places on others (e.g.“I would prefer not to have someone with depression or anxietyworking on the same team as me”).
Lastly, several aspects of workplace stigma were measured an employee’s or volunteers perceptions of the stigma within their workplace:
• Perceived stigma is the extent to which an employee or volunteerfeels others in their workplace perceive mental health conditions tobe avoidable and the fault of the person suffering from them, and alsoa burden on others in the workplace.
• Perceived organisational commitment refers to whether an employeeperceived the organisation they were a part of to be committed toenhancing mental health of the work force.
• Structural stigma referred to what extent an employee or volunteerbelieves their organisation should support someone with a mentalhealth condition.
204
Glossary term Definition
Suicidal behaviours Suicidal thoughts and behaviours include suicidal ideation (serious thoughts about taking one’s own life), making suicide plans and suicide attempts where the self-injury is intended to end in one’s own death.
Participants were asked if they had ever had suicidal ideation, made suicide plans or attempted suicide, and whether they had suicide ideation, made a plan or attempted suicide in the past 12 months. Respondents who reported high levels of distress or who had suicidal thoughts or behaviours in the past 12 months were offered the opportunity to confidentially contact the Beyond Blue Support Service or other crisis support services.
Workers’ compensation claims
Participants were asked if they had ever made an insurance claim as a result of psychological trauma, stress or a mental health condition sustained during the course of their work. Participants who had made a claim were asked about the impact going through the insurance claim process had on their recovery, how supportive they found the process, how stressful they found the process, and how fairly they believe they were treated. Participants who had made more than one claim were asked to answer about their most recent claim.
205
Appendix D — References Australian Bureau of Statistics. (2009). Australian and New Zeland Standard Classification of Occupations, First Edition, Revision 1. Canberra: Australian Bureau of Statistics Cat. 1220.0. http://www.abs.gov.au/ausstats/[email protected]/Previousproducts/1220.0Search0First%20Edition,%20Revision%201
Australian Bureau of Statistics. (2015). National Health Survey: First results, 2014-15. Canberra: Australian Bureau of Statistics Cat. 4364.0.55.001. http://www.abs.gov.au/AUSSTATS/[email protected]/productsbyCatalogue/F6CE5715FE4AC1B1CA257AA30014C725
Australian Bureau of Statistics. (2016). Causes of Death, Australia, 2016. Canberra: Australian Bureau of Statistics Cat. No. 3303.0. http://abs.gov.au/AUSSTATS/[email protected]/DetailsPage/3303.02016
Australian Institute of Health and Welfare. (2016). National Drug Strategy Household Survey 2016: Detailed findings. Drug Statistics series no. 31. Cat. No. PHE 214. Canberra: AIHW. https://www.aihw.gov.au/reports/illicit-use-of-drugs/ndshs-2016-detailed/contents/table-of-contents
Barratt P, Stephens L, Palmer M. (2018). When helping hurts: PTSD in first responders. Canberra: Australia21 and Fearless Outreach. australia21.org.au/product/when-helping-hurts-ptsd-in-first-responders/
Beyond Blue. (2015). Information Paper – Stigma and discrimination associated with depression and anxiety. Melbourne: Beyond Blue. beyondblue.org.au/docs/default-source/policy-submissions/stigma-and-discrimination-associated-with-depression-and-anxiety.pdf?sfvrsn=92367eea_2
Beyond Blue. (2016). Good practice framework for mental health and wellbeing in first responder organisations. Melbourne: Beyond Blue. https://das.bluestaronline.com.au/api/prism/document?token=BL/1675
Black Dog Institute. (2015). Expert guidelines: the diagnosis and treatment of post-traumatic stress disorder in emergency service workers. Sydney: Black Dog Institute. https://www.blackdoginstitute.org.au/docs/default-source/research/evidence-and-policy-section/ptsd_expert-guidelines_2015.pdf
Blevins, C. A., Weathers, F. W., Davis, M. T., Witte, T. K., Domino, J. L. (2015). The Posttraumatic Stress Disorder Checklist for DSM-5 (PCL-5): Development and initial psychometric evaluation. Journal of Traumatic Stress. 28: 489-498. doi: 10.1002/jts.22059
Douglas, B., Wodak, J. (Eds.) (2016). Trauma-related stress in Australia. Essays by leading Australian thinkers and researchers. Canberra: Australia 21 and Fearless Outreach. australia21.org.au/product/trauma-related-stress-in-australia-essays-by-leading-thinkers-and-researchers
Dyrbye, L.N., Thomas, M.R., Shanafelt, T.D. (2006). Systematic review of depression, anxiety, and other indicators of psychological distress among US and Canadian medical students. Academic medicine. 81: 354-373.
Furukawa, T.A., Kessler, R.C., Slade, T., Andrews, G. (2003). The performance of the K6 and K10 screening scales for psychological distress in the Australian National Survey of Mental Health and Well-being. Psychological Medicine. 33: 357-362.
206
Kristensen, T.S., Hannerz, H., Høgh, A., Borg, V. (2005). The Copenhagen Psychosocial Questionnaire-a tool for the assessment and improvement of the psychosocial work environment. Scandinavian Journal of Work, Environment and Health. 31: 438-449.
McCreary, D.R., Thompson, M.M. (2006). Development of two reliable and valid measures of stressors in policing: The operational and organizational police stress questionnaires. International Journal of Stress Management. 13: 494-518.
McEvoy, P.M., Grove, R., Slade, T. (2011). Epidemiology of anxiety disorders in the Australian general population: findings of the 2007 Australian National Survey of Mental Health and Wellbeing. Australian and New Zealand Journal Of Psychiatry. 45: 957-967. http://journals.sagepub.com/doi/pdf/10.3109/00048674.2011.624083
McFarlane, A. C., Hodson, S. E., Van Hooff, M., Davies, C. (2011). Mental health in the Australian Defence Force: 2010 ADF Mental Health and Wellbeing Study: Full report. Department of Defence: Canberra. http://www.defence.gov.au/health/dmh/docs/mhpwsreport-fullreport.pdf
Meadows, G.N, Burgess, P.M. (2009). Perceived Need for Mental Health Care: Findings from the 2007 Australian Survey of Mental Health and Wellbeing, Australian and New Zealand Journal of Psychiatry. 43: 624-634. http://journals.sagepub.com/doi/abs/10.1080/00048670902970866
National Health and Medical Research Council. (2009). Australian Guidelines To Reduce Health Risks From Drinking Alcohol. Canberra: National Health and Medical Research Council. https://www.nhmrc.gov.au/guidelines-publications/ds10
Ng Fat, L., Scholes, Sl, Boniface, S., Mindell, J., & Stewart-Brown, S. (2016). Evaluating and establishing national norms for mental wellbeing using the short Warwick-Edinburgh Mental Well-being Scale (SWEMWBS): findings from the Health Survey for England. Quality of Life Research. 26: 1129-1144.
Panagioti, M., Gooding, P.A., Taylor, P.J., Tarrier, N. (2014). Perceived social support buffers the impact of PTSD symptoms on suicidal behavior: Implications into suicide resilience research. Comprehensive psychiatry. 55: 104-112.
Phoenix Australia. (2013) Australian Guidelines for the treatment of acute stress disorder and posttraumatic stress disorder. Melbourne: Phoenix Australia. http://phoenixaustralia.org/resources/emergency-services-ptsd-guidelines/
Reavley, N.J., Jorm, A.F., (2011) Recognition of Mental Disorders and Beliefs about Treatment and Outcome: Findings from an Australian National Survey of Mental Health Literacy and Stigma. Australian and New Zealand Journal of Psychiatry. 45: 947-956. http://journals.sagepub.com/doi/abs/10.3109/00048674.2011.621060
Roy, A., Carli, V., Sarchiapone, M. (2011). Resilience mitigates the suicide risk associated with childhood trauma. Journal of Affective Disorders. 133: 591-594.
Safe Work Australia. (2015). Work-related mental disorders profile. Canberra: Safe Work Australia. www.safeworkaustralia.gov.au/system/files/documents/1702/work-related-mental-disorders-profile.pdf
Saunders, J.B., Aasland, O.G., Babor, T.F., de la Fuente, J.R., Grant, M. (1993). Development of the alcohol use disorders identification test (AUDIT): WHO collaborative project on early detection of persons with harmful alcohol consumption —II. Addiction. 88: 791–803.
Shakespeare-Finch, J., Obst, P.L. (2011). The development of the 2-way social support scale: a measure of giving and receiving emotional and instrumental support. Journal of Personal Assessment. 93: 483-90. doi: 10.1080/00223891.2011.594124
207
Smith, B.W., Dalen, J., Wiggins, K., Tooley E., Christopher, P., Bernard, J. (2008). The brief resilience scale: Assessing the ability to bounce back. International Journal of Behavioral Medicine. 15: 194-200.
Substance Abuse and Mental Health Services Administration (2017). Key substance use and mental health indicators in the United States: Results from the 2016 National Survey on Drug Use and Health (HHS Publication No. SMA 17-5044, NSDUH Series H-52). Rockville, MD: Center for Behavioral Health Statistics and Quality, Substance Abuse and Mental Health Services Administration. samhsa.gov/data/sites/default/files/NSDUH-FFR1-2016/NSDUH-FFR1-2016.htm
Varker, T., Metcalf, O., Forbes, D., Chisolm, K., Harvey, S., Van Hooff, M., McFarlane, A., Bryant, R., Phelps, A.J. (2017). Research into Australian emergency services personnel mental health and wellbeing: an evidence map. Australian and New Zealand Journal of Psychiatry. 52: 129-148. http://journals.sagepub.com/doi/pdf/10.1177/0004867417738054

208