Answering biological questions using large genomic data collections Curtis Huttenhower 10-05-09...
32
Answering biological questions using large genomic data collections Curtis Huttenhower 10-05-09 rvard School of Public Health partment of Biostatistics
-
Upload
hugh-nicholas-simpson -
Category
Documents
-
view
215 -
download
0
Transcript of Answering biological questions using large genomic data collections Curtis Huttenhower 10-05-09...

Answering biological questions using large genomic data collections
Curtis Huttenhower
10-05-09Harvard School of Public HealthDepartment of Biostatistics

2
A Definition ofComputational Functional Genomics
Genomic data Prior knowledge
Data↓
Function
Function↓
Function
Gene↓
Gene
Gene↓
Function

3
MEFIT: A Framework forFunctional Genomics
BRCA1 BRCA2 0.9BRCA1 RAD51 0.8RAD51 TP53 0.85…
Related Gene Pairs
HighCorrelation
LowCorrelation
Fre
quen
cy
MEFIT

4
MEFIT: A Framework forFunctional Genomics
BRCA1 BRCA2 0.9BRCA1 RAD51 0.8RAD51 TP53 0.85…
BRCA2 SOX2 0.1RAD51 FOXP2 0.2ACTR1 H6PD 0.15…
Related Gene Pairs
Unrelated Gene PairsHigh
CorrelationLow
Correlation
Fre
quen
cy
MEFIT

5
MEFIT: A Framework forFunctional Genomics
Golub 1999
Butte 2000
Whitfield 2002
Hansen 1998
Functional Relationship

6
MEFIT: A Framework forFunctional Genomics
Golub 1999
Butte 2000
Whitfield 2002
Hansen 1998
Functional Relationship
Biological Context
Functional areaTissueDisease…

7
Functional Interaction Networks
MEFIT
Global interaction network
Autophagy networkVacuolar transport
network Translation network
Currently have data from30,000 human experimental results,
15,000 expression conditions +15,000 diverse others, analyzed for
200 biological functions and150 diseases

8
Predicting Gene Function
Cell cycle genes
Predicted relationships between genes
HighConfidence
LowConfidence

9
Predicting Gene FunctionPredicted relationships
between genes
HighConfidence
LowConfidence
Cell cycle genes

10
Cell cycle genes
Predicting Gene FunctionPredicted relationships
between genes
HighConfidence
LowConfidence
These edges provide a measure of how likely a gene is to
specifically participate in the process of
interest.

11
Functional Associations Between Contexts
Predicted relationships between genes
HighConfidence
LowConfidence
The average strength of these relationships
indicates how cohesive a process is.
Cell cycle genes

12
Functional Associations Between Contexts
Predicted relationships between genes
HighConfidence
LowConfidence
Cell cycle genes

13
Functional Associations Between Contexts
DNA replication genes
The average strength of these relationships indicates how
associated two processes are.
Predicted relationships between genes
HighConfidence
LowConfidence
Cell cycle genes

14
Functional Associations Between Processes
EdgesAssociations between processes
VeryStrong
ModeratelyStrong
Hydrogen Transport
Electron Transport
Cellular Respiration
Protein ProcessingPeptide
Metabolism
Cell Redox Homeostasis
Aldehyde Metabolism
Energy Reserve
Metabolism
Vacuolar Protein
Catabolism
Negative Regulation of Protein Metabolism
Organelle Fusion
Protein Depolymerization
Organelle Inheritance

15
Functional Associations Between Processes
EdgesAssociations between processes
VeryStrong
ModeratelyStrong
BordersData coverage of processes
WellCovered
SparselyCovered
Hydrogen Transport
Electron Transport
Cellular Respiration
Protein ProcessingPeptide
Metabolism
Cell Redox Homeostasis
Aldehyde Metabolism
Energy Reserve
Metabolism
Vacuolar Protein
Catabolism
Negative Regulation of Protein Metabolism
Organelle Fusion
Protein Depolymerization
Organelle Inheritance

16
Functional Associations Between Processes
EdgesAssociations between processes
VeryStrong
ModeratelyStrong
NodesCohesiveness of processes
BelowBaseline
Baseline(genomic
background)
VeryCohesive
BordersData coverage of processes
WellCovered
SparselyCovered
Hydrogen Transport
Electron Transport
Cellular Respiration
Protein ProcessingPeptide
Metabolism
Cell Redox Homeostasis
Aldehyde Metabolism
Energy Reserve
Metabolism
Vacuolar Protein
Catabolism
Negative Regulation of Protein Metabolism
Organelle Fusion
Protein Depolymerization
Organelle Inheritance
AHP1DOT5GRX1GRX2…
APE3LAP4PAI3PEP4 …

17
HEFalMp: Predicting human gene function
HEFalMp

18
HEFalMp: Predicting humangenetic interactions
HEFalMp

19
HEFalMp: Analyzing human genomic data
HEFalMp

20
HEFalMp: Understanding human disease
HEFalMp

21
Validating Human Predictions
Autophagy
Luciferase(Negative control)
ATG5(Positive control) LAMP2 RAB11A
NotStarved
Starved(Autophagic)
Predicted novel autophagy proteins
5½ of 7 predictions currently confirmed
With Erin Haley, Hilary Coller

22
Comprehensive Validation of Computational Predictions
Genomic data
Computational Predictions of Gene Function
MEFITSPELLHibbs et al 2007
bioPIXIEMyers et al 2005
Genes predicted to function in mitochondrion organization
and biogenesis
Laboratory ExperimentsPetite
frequencyGrowthcurves
Confocal microscopy
New known functions for correctly predicted genes
Retraining
With David Hess, Amy Caudy
Prior knowledge

23
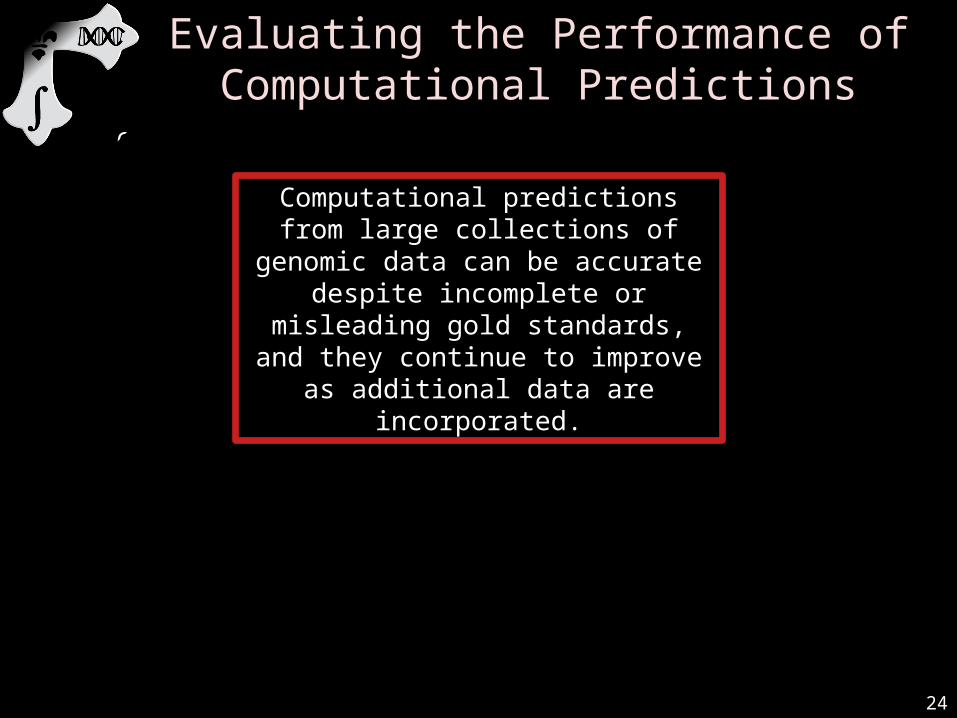
Evaluating the Performance of Computational Predictions
106Original GO Annotations
Genes involved in mitochondrion organization and biogenesis
135Under-annotations
82Novel Confirmations,
First Iteration
17Novel Confirmations,
Second Iteration
340 total: >3x previously known genes in ~5 person-months
24
Evaluating the Performance of Computational Predictions
106Original GO Annotations
Genes involved in mitochondrion organization and biogenesis
95Under-annotations
40Confirmed
Under-annotations
80Novel Confirmations
First Iteration
17Novel Confirmations
Second Iteration
340 total: >3x previously known genes in ~5 person-months
Computational predictions from large collections of genomic data can be
accurate despite incomplete or misleading gold standards, and they
continue to improve as additional data are incorporated.

25
Functional Maps:Focused Data Summarization
ACGGTGAACGTACAGTACAGATTACTAGGACATTAGGCCGTATCCGATACCCGATA
Data integration summarizes an impossibly huge amount of experimental data into an
impossibly huge number of predictions; what next?

26
Functional Maps:Focused Data Summarization
ACGGTGAACGTACAGTACAGATTACTAGGACATTAGGCCGTATCCGATACCCGATA
How can a researcher take advantage of all this data to study
his/her favorite gene/pathway/disease without
losing information?
Functional mapping• Very large collections of genomic data• Specific predicted molecular interactions• Pathway, process, or disease
associations• Underlying experimental results and
functional activities in data

27
Thanks!
NIGMShttp://function.princeton.edu/hefalmp
Interested? I’m accepting students and postdocs!
Hilary CollerErin HaleyTsheko Mutungu
Olga TroyanskayaMatt HibbsChad MyersDavid HessEdo AiroldiFlorian Markowetz
Shuji OginoCharlie Fuchs
http://www.huttenhower.org


29
Next Steps:Microbial Communities
• Data integration is off to a great start in humans– Complex communities of distinct cell types– Very sparse prior knowledge
• Concentrated in a few specific areas
– Variation across populations– Critical to understand mechanisms of disease

30
Next Steps:Microbial Communities
• What about microbial communities?– Complex communities of distinct species/strains– Very sparse prior knowledge
• Concentrated in a few specific species/strains
– Variation across populations– Critical to understand mechanisms of disease

31
Next Steps:Microbial Communities
PKH1
PKH3
PKH2LPD1
CAR1
W04B5.5
pdk-1
R04B3.2
LLC1.3
T21F4.1
PDPK1
ARG1DLD
ARG2
AGA
~120 available expression datasets
~70 species
PKH1
PKH3
PKH2LPD1
CAR1
W04B5.5
pdk-1
R04B3.2
LLC1.3
T21F4.1
PDPK1
ARG1DLD
ARG2
AGA
Weskamp et al 2004
Flannick et al 2006
Kanehisa et al 2008
Tatusov et al 1997
• Data integration works just as well in microbes as it does in humans• We know an awful lot about some microorganisms and almost nothing about others• Purely sequence-based and purely network-based tools for function transfer both fall short• We need data integration to take advantage of both and mine out useful biology!

32
Next Steps:Functional Metagenomics
• Metagenomics: data analysis from environmental samples– Microflora: environment includes us!
• Another data integration problem– Must include datasets from multiple organisms
• Another context-specificity problem– Now “context” can also mean “species”
• What questions can we answer?– How do human microflora interact with diabetes,
obesity, oral health, antibiotics, aging, …– What’s shared within community X?
What’s different? What’s unique?– What’s perturbed in disease state Y?
One organism, or many? Host interactions?– Current methods annotate ~50% of synthetic data,
<5% of environmental data
PKH1
PKH3
PKH2LPD1
CAR1
W04B5.5
pdk-1
R04B3.2
LLC1.3
T21F4.1
PDPK1
ARG1DLD
ARG2
AGA