Answer key to Prof. Urnov’s sectionmcb.berkeley.edu/courses/mcb140/brem_fall_08/final... ·...
12
Answer key to Prof. Urnov’s section 1. The following is Fig. 5.13 from your textbook. It shows one of the most majestic achievements of the scientific method: a map of the Drosophila genome obtained without any knowledge of the chemical basis of heredity – i.e., solely via genetic analysis.
Transcript of Answer key to Prof. Urnov’s sectionmcb.berkeley.edu/courses/mcb140/brem_fall_08/final... ·...

Answer key to Prof. Urnov’s section 1. The following is Fig. 5.13 from your textbook. It shows one of the most majestic achievements of the scientific method: a map of the Drosophila genome obtained without any knowledge of the chemical basis of heredity – i.e., solely via genetic analysis.
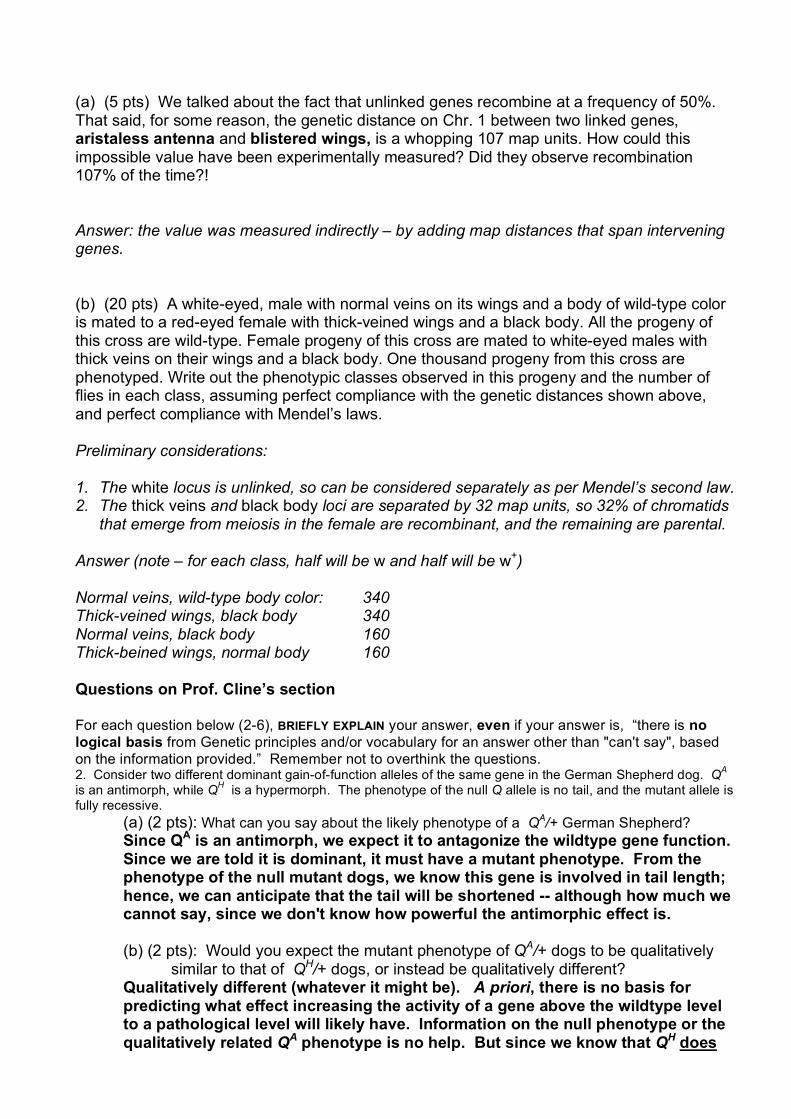
(a) (5 pts) We talked about the fact that unlinked genes recombine at a frequency of 50%. That said, for some reason, the genetic distance on Chr. 1 between two linked genes, aristaless antenna and blistered wings, is a whopping 107 map units. How could this impossible value have been experimentally measured? Did they observe recombination 107% of the time?! Answer: the value was measured indirectly – by adding map distances that span intervening genes. (b) (20 pts) A white-eyed, male with normal veins on its wings and a body of wild-type color is mated to a red-eyed female with thick-veined wings and a black body. All the progeny of this cross are wild-type. Female progeny of this cross are mated to white-eyed males with thick veins on their wings and a black body. One thousand progeny from this cross are phenotyped. Write out the phenotypic classes observed in this progeny and the number of flies in each class, assuming perfect compliance with the genetic distances shown above, and perfect compliance with Mendel’s laws. Preliminary considerations: 1. The white locus is unlinked, so can be considered separately as per Mendel’s second law. 2. The thick veins and black body loci are separated by 32 map units, so 32% of chromatids
that emerge from meiosis in the female are recombinant, and the remaining are parental. Answer (note – for each class, half will be w and half will be w+) Normal veins, wild-type body color: 340 Thick-veined wings, black body 340 Normal veins, black body 160 Thick-beined wings, normal body 160 Questions on Prof. Cline’s section For each question below (2-6), BRIEFLY EXPLAIN your answer, even if your answer is, “there is no logical basis from Genetic principles and/or vocabulary for an answer other than "can't say", based on the information provided.” Remember not to overthink the questions. 2. Consider two different dominant gain-of-function alleles of the same gene in the German Shepherd dog. QA is an antimorph, while QH is a hypermorph. The phenotype of the null Q allele is no tail, and the mutant allele is fully recessive.
(a) (2 pts): What can you say about the likely phenotype of a QA/+ German Shepherd? Since QA is an antimorph, we expect it to antagonize the wildtype gene function. Since we are told it is dominant, it must have a mutant phenotype. From the phenotype of the null mutant dogs, we know this gene is involved in tail length; hence, we can anticipate that the tail will be shortened -- although how much we cannot say, since we don't know how powerful the antimorphic effect is. (b) (2 pts): Would you expect the mutant phenotype of QA/+ dogs to be qualitatively
similar to that of QH/+ dogs, or instead be qualitatively different? Qualitatively different (whatever it might be). A priori, there is no basis for predicting what effect increasing the activity of a gene above the wildtype level to a pathological level will likely have. Information on the null phenotype or the qualitatively related QA phenotype is no help. But since we know that QH does

have a mutant phenotype, and that the universe of possible phenotypes that would be qualitatively different from QA is huge, while only one would be qualitatively similar, the most we can say is that the phenotype is more likely to be qualitatively different.
(c) (2 pts): QA/QH dogs are wildtype. Would it be correct therefore to say that the two
gain-of-function alleles complement? No -- we only use the term complementation (or the complementation test) to apply to the behaviour of loss-of-function alleles. It doesn't really make sense to say one of these alleles provides the function that the other lacks (which is what complementation means), since neither of them really lack anything except proper control. The wildtype phenotype that we see with this heteroallelic combination is not the result of restored proper control (as complementation would demand), but of a balance between the effects of two improperly controlled alleles.
(d) (3 pts): If we "reverted" the dominance of QA and QH, generating QA* and QH*
respectively, what would the likely phenotype be of a QA*/QH* dog? The most likely event to revert the dominance of any gain-of-function mutant allele is the induction of a loss-of-function mutation is cis to the gain-of-function. Hence the QA*/QH* dog would be likely to have no tail (or at least a very short tail) -- the phenotype of an animal homozygous for the null allele (or a hypomorph). (e) (2 pts.): In light of the information given you in part c above, what, if anything, could you predict
about the phenotype of a QA,H/Q+ dog, if you were told that QA and QH satisfy expectations for a cis-trans test for allelism? Assume that QA,H is a doubly mutant allele created by recombination between QA and QH (not very likely, of course).
It will be abnormal in some way. The only expectation from a cis-trans test is that mutations that are allelic will have a different phenotype in cis vs. trans. Since you were told that the trans arrangement is wildtype, and that these mutations satisfy the demands of the cis-trans test, we can infer that QA,H/Q+ arrangement must have a mutant phenotype of some kind.
3. (2 pts.) The mutagen ethylmethane sulfonate will generate null alleles, but it is particularly effective at generating a wide spectrum of hypomorphic point mutants as well. Brenner and crowd used proflavin as the mutagen for the rII gene of phage T4 in their famous experiments exploring the nature of the genetic code. They demonstrated that the genetic code was commaless in part by showing that certain of their point mutant alleles could be suppressed by certain other of their point mutant alleles. Do you think that some of the mutations they induced in rII by proflavin would likely be suppressed by some of the mutations that one might typically induce in rII by ethylmethane sulfonate? No. Proflavin induces frameshift mutation, and Brenner's suppressors had to be frameshift mutations, but of the opposite sign. Ethylmethane sulfonate is not effective at making frameshift mutations, but instead generates base substitutions of the transition category. 4. (2 pts) To move DNA around, fly workers generally use an engineered immobile genetic source of P-element transposase called "delta-2,3", derived from DNA that was originally introduced into an M-strain animal. After many generations, will female flies from the delta-

2,3 strain eventually come to behave like P-strain females and generate eggs with a P cytotype? No. P cytotype is generated by P elements that have become defective in a very different way over time and, as a result, generate a defective transposase that represses P-element transposition. The whole point of delta-2,3 is to move DNA around via P-element ends. It was introduced into an M strain (a strain with no P elements) both so that it could get into the chromosomes, and so that there would be no complications from other P elements. 5. The mechanism of sex determination can be remarkably messy in some species, with different races of the same species having different GSD systems operating. Consider such a species in which race Q has a ZZ-ZW system of the active W type, while race R of the same species (but geographically isolated from the other) has an XX-XY system of the active Y type. The Z and X chromosomes of the two races are essentially identical genetically, and this sex chromosome carries 10% of all the genes. In contrast, the W and Y chromosomes carry very few genes.
(a) (2 pts) Which, if either, of the two races is/are likely to need a sex-chromosome
dosage compensation system? Both will --in each case one sex will have only one copy of 10% of the genome while the other will have two -- a difference for which they will have to compensate.
(b) (2 pts) Which, if either, of these species is likely to use a sex-chromosome:autosome balance system of sex determination?
Neither. You are told that both systems use an active sex-determiner on the heteromorphic chromosome, and by inference then they would not have (because they wouldn't need) the alternative system of sex-determination by the sex-chromosome:autosome balance.
(c) (3 pts) If you crossed a Q strain male with an R strain female, what would you expect the sexual phenotype(s) of the offspring to be?
Can't say, beyond that fact that whatever it is, all the progeny would likely share that phenotype, since they would all have the same hybrid genotype. In this case we would be mating a ZZ male to an XX female, where each parent's sex represents the "default" condition for its race's sex-determination system. there would be neither an active W or Y present. All the progeny would be ZX, hence lacking the active sex-determining chromosome. Since you were told that ZX=XX=ZZ, it must be the case that the different default states for these animals with the equivalent sex-chromosome genotype must be determined by a difference in their autosomal genes. Since there is no way to predict how these differences will interact in a hybrid, there is no way to predict the sexual phenotype of the hybrid.

6. (3 pts) Given the following genotype of fruit fly: FRT a- b+ c- d- e+
a+ b- c+ d+ e- FRT …where a- through e- are recessive, cell-autonomous mutant alleles that can generate distinguishable clone phenotypes on the thorax (back) of the adult. If a brief pulse of "Flippase" were introduced during the development of this fly to induce a single clone of phenotypically e- mutant tissue on the adult thorax (without respect to what other mutant phenotypes that e- clone might exhibit), what would you expect the phenotype to be of the twin-spot partner of that e- clone with respect to these five genes? (no explanation needed) a+b+c+d-e+. Each of the two twin clones would be homozygous for the part of the chromosome centromere distal to the FRT site (i.e. the chromosomal region whose relationship to its centromere had changed) and remain heterozgyous for the rest. Thus genes a, b, and c would remain heterozygous both inside and outside of all clones, with the corresponding phenotype a+ b+ and c+, while a twin-spot would be produced with one clone (the clone given) being homozygous for the alleles on one of the two homologs -- d+ e- -- and its partner homozygous for the bit on the other homolog: d- e+ and hence phenotypically d- e+. 7. (35 pts) Imagine that you are studying genetic differences between the Junglefowl and Leghorn varieties of chicken, whose pictures we saw in class. You mate the parents to generate F1’s and then cross the F1’s among themselves to get 100 F2 birds. You first get interested in the quantitative trait of egg weight. By linkage analysis, you map a very strong locus that appears to explain essentially all the genetic variation in egg weight in the cross. The LOD score is highly significant and you are convinced that the trait is Mendelian, controlled by the single locus you have mapped. The Junglefowl parent is homozygous for one allele, called J; the Leghorn parent is homozygous for another allele, called L. The phenotypes among the F2’s look like this:
(a) (5 pts) What is the effect of gaining an L allele at this locus? 15 g in egg weight are gained for every L allele.
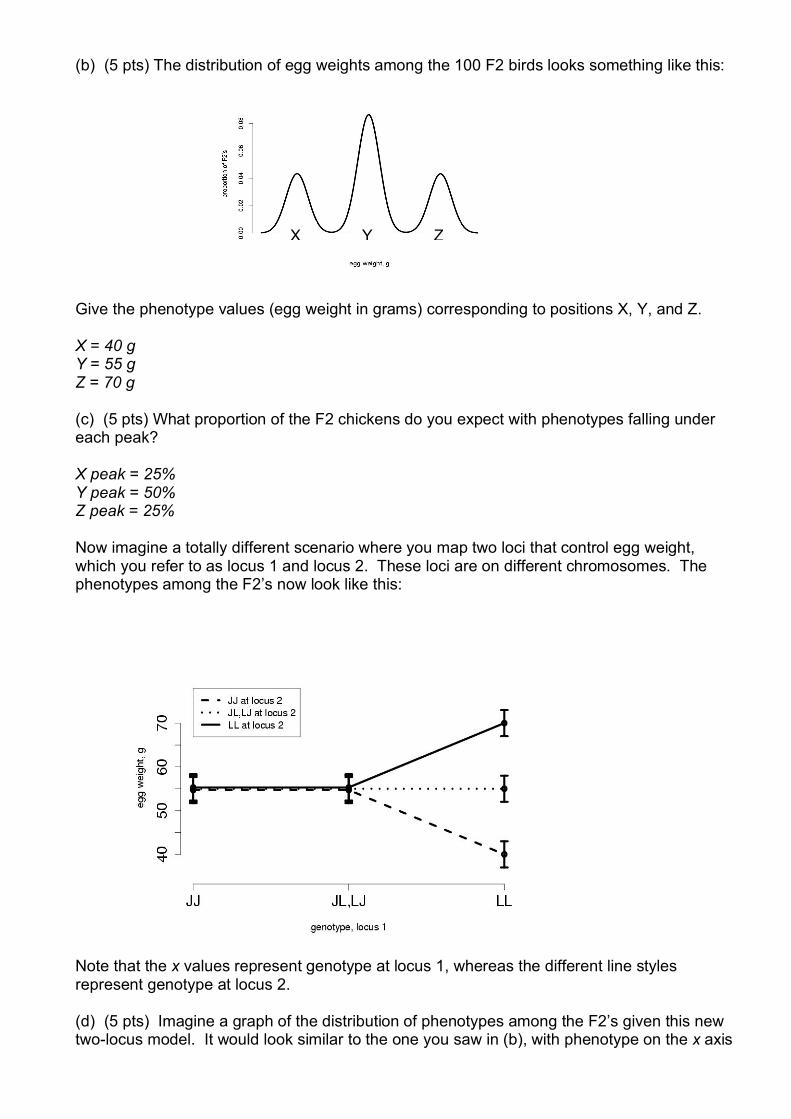
(b) (5 pts) The distribution of egg weights among the 100 F2 birds looks something like this:
Give the phenotype values (egg weight in grams) corresponding to positions X, Y, and Z. X = 40 g Y = 55 g Z = 70 g (c) (5 pts) What proportion of the F2 chickens do you expect with phenotypes falling under each peak? X peak = 25% Y peak = 50% Z peak = 25% Now imagine a totally different scenario where you map two loci that control egg weight, which you refer to as locus 1 and locus 2. These loci are on different chromosomes. The phenotypes among the F2’s now look like this:
Note that the x values represent genotype at locus 1, whereas the different line styles represent genotype at locus 2. (d) (5 pts) Imagine a graph of the distribution of phenotypes among the F2’s given this new two-locus model. It would look similar to the one you saw in (b), with phenotype on the x axis
X Y Z

and the proportion of F2’s on the y axis. How many peaks would the plot have and what would be the values on the x axis for the midpoint of each peak, as in (b)? Three: 40 g, 55 g, and 70 g. (e) (5 pts) What is the genotype of an F1 chicken? Remember that locus 1 and 2 are on different chromosomes. JL at locus 1, JL at locus 2. (f) (5 pts) What is the total number of cells in a Punnett square representing the cross between two F1’s to form an F2? Sixteen. There are four possible genotypes for each gamete: J at locus 1, J at locus 2 J at locus 1, L at locus 2 L at locus 1, J at locus 2 L at locus 1, L at locus 2 Combining two gametes gives a Punnett square with 16 possible combinations. (g) (5 pts) As you just described in (d), the distribution of phenotypes among the F2’s has several peaks. For each peak, give the proportion of F2’s you expect to fall under it. Your answer should consist of several fractions, one for each peak. 1/16 of chickens have egg weights with a mean of 40 g, 14/16 chickens have a mean of 55 g, and 1/16 of chickens have a mean of 70 g. 8. (10 pts) Imagine that peanuts with high oil content make better peanut butter. Explain why a plant breeder selling to farmers would prefer for oil content in peanuts to have a high heritability. Peanuts vary in oil content for reasons mostly to do with genetics rather than environmental variability. This means one can create a (patentable!) strain of high-oil-content peanuts for sale to farmers. 9. (15 pts) Consider a biased coin with a probability of coming up heads of 0.1 on any given flip. (a) (5 pts) If you do four coin flips, what is the probability of all four being heads? 0.14 = (10-1)4 = 10-4 = 0.0001 (b) (5 pts) If you do four coin flips, what is the probability of seeing anything BESIDE the result of all heads? 1 - 0.0001 = 0.9999 (c) (5 pts) If you have a roll of these coins and you give one to each of 100 students, who each do four coin flips, how many students are likely to come up with all heads? 100 * 0.0001 = 0.01; no students are likely to come up with all heads.

10. (15 pts) The segregation of a fully penetrant Mendelian disease in several small families is shown below, along with the genotypes at a DNA sequence marker 30 cM from the disease locus. For each family, infer from the data what the likelihood is that the individual of unknown phenotype is affected with the disease. Family A Family B Family C A. The probability of II-1 passing the disease locus to the child is 50%. B. II-1 has the disease locus on the same chromosome as the 2 allele of the marker. We know III-1 got the 1 allele of the marker from her mother, so the only way she could have inherited the disease allele along with it is via a recombination in gametogenesis in the mother, whose probability is 30%. C. You don’t know the phase in II-1, so the genotypes don’t help you and your sole inference from the data is that the child is 50% likely to be affected. 11. (10 pts) In modern linkage analysis, we look for instances of recombination between a marker locus whose genetic position is known, and the unknown locus causing our phenotype of interest—say, a disease. We count the proportion of recombinants in a pedigree, but then use this number to test different “models” or guesses for the value of the recombination fraction (the probability of recombination) between the marker and the disease locus. Explain why we explore many potential values for this quantity when the number of recombinants in the pedigree is already known. The proportion of recombinants in your empirical data is only an estimate of the probabiliity of a recombination happening between the marker and the disease locus. If the true answer is 10 cM, in a modestly sized family you could get 15%, 25%, or 0% recombinants just by chance. 12. (10 pts) Imagine that you are studying a Mendelian dominant disease via linkage analysis and are focusing on a single marker. You have two large families whose members have been genotyped at the marker and scored for the disease. In Family I there are 10 meioses; in 8 of them, alleles at your marker and the disease locus appear to have been inherited without recombination, and in the other 2 there was a recombination. You test many values of the recombination fraction and discover that r = 0.2 gives the maximum odds ratio, which is 6.87 (LOD = 0.837). In Family II there are 20 meioses; in 17, alleles at the marker and disease locus were inherited without recombination, while 3 meioses represent recombinations. You test many
?
1,2 2,3
1,2
1,3 ?
1,2 2,3
1,2
2,3 ?
1,2 2,3
2,2

values of r and discover that r = 0.15 gives the maximum odds ratio, which is 223.4 (LOD = 2.34). Finally, you know that the way to combine data across Familiy I and Family II is to multiply odds ratios (add LODs), so you do this for a final estimate of the odds of linkage relative to the null as 1534.5 (LOD = 3.19). In one or two sentences explain what’s wrong with this calculation. Your search over many values of the genetic distance between the marker and the disease locus must be done with both families at once. Otherwise, you have odds ratios representing the likelihood of linkage between the marker and disease locus at two different genetic distances; it doesn’t make sense to combine these odds ratios because they represent different models. You must test a single model across both families to give a total estimate of the odds ratio for the model across both families. 13. (15 pts, 5 each) Imagine you are doing a genome-wide linkage analysis study in Finnish families looking for the genetic determinants of blood pressure in humans. You have five multi-generational families; each individual is genotyped at 1000 markers and his/her blood pressure is measured. A recent, published study in Icelandic families identified a highly significant locus on chromosome 10 that was responsible for blood pressure variation. You look through your results and see no significant linkage between the phenotype and the disease in your data. Your nearest marker to this locus is 30 cM away. Give three reasons why you might have failed to find linkage to the chromosome 10 locus. Please explain each reason with one or two sentences, or you will not receive credit for your answer. Locus heterogeneity: the chromosome 10 locus is not polymorphic in your families and not responsible for the disease variation. Complexity: the chromosome 10 locus is polymorphic in your famililes but there are other causative loci also. The latter could interact epistatically with the chromosome 10 locus and obscure its effects when you attempt to study it in isolation. Or the additional loci could have additive effects but simply make the effect of the chromosome 10 locus proportionally less important and harder to find. Marker spacing: your closest marker is too far away to give an odds of linkage (at a maximized recombination fraction of 30 cM) that can be distinguished from the null hypothesis of no linkage. Number of patients: you have too few family members to give an odds of linkage that can be distinguished from the null hypothesis. Environment: the individuals in your families have very different lifestyle habits and this environmental variation swamps out modest genetic effects. Multiple testing: you have too many markers such that the LOD score cutoff you need to use to be convinced of significance is very stringent, and the real causative locus doesn’t have a strong enough effect to give a sufficiently big LOD score. 14. (20 pts) We learned in class about golden, a mutation in zebrafish that arose randomly in a colony of fish of a common strain growing in the lab. Imagine that a colleague is studying a common haploid lab strain of yeast. One day she comes into the lab and sees a hot pink colony on her petri dish, in the midst of hundreds of normal whitish-yellow ones.

Thus, the hot pink strain arose from the progenitor via spontaneous mutation during mitosis under normal lab conditions. She isolates a single cell from the hot pink colony and allows it to grow again into a colony via mitosis; the colony once again is hot pink, confirming that it wasn’t just an environmental fluke. Fascinated, she wants to identify the mutation(s) responsible for the hot pink phenotype. (a) (10 pts) She proposes a genetic experiment as follows: (1) Cross the hot pink strain to the original wild-type progenitor to form a diploid, (2) sporulate it to form F1 haploids, (3) establish a set of markers and genotype all progeny, (4) score all progeny for the hot pink colony phenotype, and then (5) use linkage mapping to find the genetic loci responsible for hot pink colony formation. You know that linkage analysis works fine in haploids. And a simple single-generation cross is also a fine idea, since one can generate lots of progeny in yeast. Nonetheless you have to break it to her that even if the hot pink trait is Mendelian, her idea can’t possibly work. Why not? The problem is step (3). The hot pink strain probably only differs from its progenitor at one or a small number of loci (those responsible for the hot pink phenotype). There will be essentially NO other genetic differences such that identifying hundreds of markers will be impossible. (b) (10 pts) Propose an alternative way to map the hot pink locus. She could cross the hot pink strain to one which is more genetically distinct but still wild-type colored, so as to have more markers. Or she could do a conventional complementation experiment, alluded to in the lecture on golden but on a bigger scale here: she fragments the genome of the hot pink strain into pieces and transforms wild-type strains with one fragment at a time. If there is a strong hot pink locus that acts dominantly, the fragment containing it will confer the hot pink phenotype on the transformant. 15. (10 pts) A mutation in a tumor suppressor gene that causes cancer is usually: (a) (5 pts) A gain or loss of function? Why? Loss of function; tumor suppressor genes usually work in DNA repair or apoptosis pathways; oncogenesis can result if these pathways cease to function. (b) (5 pts) Dominant or recessive? Why? Recessive; usually one functional copy of a tumor suppressor gene is suffcient for its pathway to work properly. 16. (5 pts) We learned in class about two strains of rice differing in their tolerance for submergence under water. The submergence sensitive strain was homozygous for a deletion of the entire Sub1A gene. Assume that the submergence tolerant strain was homozygous for wild-type Sub1A. What would you expect the phenotype of a heterozygote to be and why? Tolerant, because you probably only need one copy of Sub1A to make enough protein to confer tolerance. 17. (10 pts) On a petri dish, C. elegans worms can sense and move toward bacterial cells, which the worms eat. This is thought to be mediated by small molecules in high concentrations near bacteria, since worms will also move toward a drop of certain “attractant” chemicals like salt and cyclic nucleotides. This behavior is called chemotaxis; assume that

rapid chemotaxis toward salt is always critical for the worms to find food. You mutagenize a colony of worm clones and identify a mutant that chemotaxes more slowly to salt than wild-type laboratory worms do. In parallel, a colleague who has been collecting wild C. elegans isolates from mushroom compost shows you that one of her wild strains chemotaxes to salt more slowly than wild-type laboratory worms do. You do a genetic mapping experiment with each strain separately, the mutagenesis product and the wild isolate. In each case you identify the polymorphism that causes slow chemotaxis. In which strain would you expect a more dramatic mutation, like a large deletion or severe amino acid change, and why? Mutagenesis can cause dramatic sequence changes which could strongly impair genes involved in chemotaxis. Such mutations would probably have strongly deleterious effects on fitness in the wild and would be largely eliminated by natural selection, so they would be very rare in a wild population and unlikely to show up in a randomly identified wild isolate. Mutations of more subtle effect would be much more likely in the wild isolate. 18. (20 pts) You are studying leaf length in two strains of Arabidopsis, Col and Ler. In wild-type plants Col leaves are on average 1 cm in length, while those of Ler are 3 cm long. (a) (10 pts) Before bothering with genetic mapping, you get excited about a previously characterized gene, LEAF-1, which you think might be causative for the difference between your parent strains. However, there are no coding polymorphisms in LEAF-1 and its expression isn’t different between the two strains. Undaunted, you decide to test the role of LEAF-1 by engineering each strain with the entire LEAF-1 gene deleted. The leaf lengths of the strains are below. Col Ler Wild-type 1 cm 3 cm LEAF-1 delete 0.2 cm 2.8 cm Assume that the data are all correct and that LEAF-1 does not vary between the strains. Briefly suggest a model to explain why comparing a LEAF-1 knockout in Col to wild-type Col shows a big effect, but comparing a LEAF-1 knockout in Ler relative to wild-type Ler does not show a big effect. This is most easily explained by a naturally occurring polymorphism between Col and Ler in a gene which is important for leaf formation (beside LEAF-1). Call the unknown gene X. As one example, we can envision that Ler has a wild-type version of X while Col has only weak functionality of X. Deleting LEAF-1 cripples leaf growth in Col because this strain is already compromised, whereas Ler is more robust to the LEAF-1 deletion. (b) (10 pts) Now you finally get down to business, doing a cross and a whole-genome linkage scan. You find linkage to a region containing another good candidate, LEAF-2. Expression of LEAF-2 appears the same between the two strains. However, there is a large deletion in the coding sequence of LEAF-2 in Col relative to Ler. Now that you see this big fat polymorphism, you want to confirm the role of LEAF-2 in the cross. So again you do knockouts of this new gene in each strain. The leaf lengths of the strains are below. Col Ler Wild-type 1 cm 3 cm LEAF-2 delete 1 cm 1 cm

Briefly suggest a model to explain why comparing a LEAF-2 knockout in Ler to wild-type Ler shows a big effect, but comparing a LEAF-2 knockout in Col relative to wild-type Col does not show a big effect. Deleting the gene could have different effects depending on its coding sequence. In the extreme, if the deletion renders the protein completely inactive in Col, then deleting it would have no further effect, whereas deleting a wild-type copy of the gene in Ler would have a big effect.