ANSWER KEY - alcaweb.org 8 Answer Key Explorations in Meteorology 37 12. With your partner, examine...
6
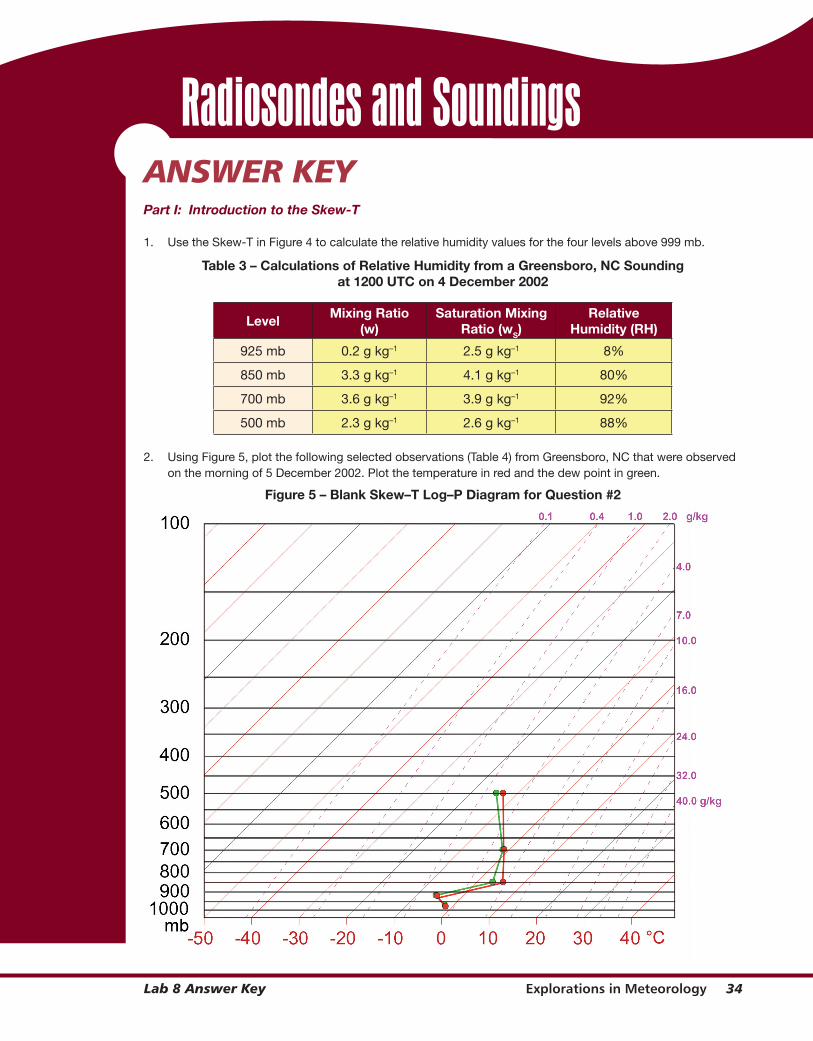
Explorations in Meteorology 34 Lab 8 Answer Key ANSWER KEY Part I: Introduction to the Skew-T 1. Use the Skew-T in Figure 4 to calculate the relative humidity values for the four levels above 999 mb. Table 3 – Calculations of Relative Humidity from a Greensboro, NC Sounding at 1200 UTC on 4 December 2002 Level Mixing Ratio (w) Saturation Mixing Ratio (w S ) Relative Humidity (RH) 925 mb 0.2 g kg –1 2.5 g kg –1 8% 850 mb 3.3 g kg –1 4.1 g kg –1 80% 700 mb 3.6 g kg –1 3.9 g kg –1 92% 500 mb 2.3 g kg –1 2.6 g kg –1 88% 2. Using Figure 5, plot the following selected observations (Table 4) from Greensboro, NC that were observed on the morning of 5 December 2002. Plot the temperature in red and the dew point in green. Figure 5 – Blank Skew–T Log–P Diagram for Question #2
-
Upload
hoangkhanh -
Category
Documents
-
view
223 -
download
0
Transcript of ANSWER KEY - alcaweb.org 8 Answer Key Explorations in Meteorology 37 12. With your partner, examine...
Explorations in Meteorology 34 Lab 8 Answer Key
ANSWER KEYPart I: Introduction to the Skew-T
1. UsetheSkew-TinFigure4tocalculatetherelativehumidityvaluesforthefourlevelsabove999mb.
Table 3 – Calculations of Relative Humidity from a Greensboro, NC Soundingat 1200 UTC on 4 December 2002
LevelMixing Ratio
(w)Saturation Mixing
Ratio (wS)Relative
Humidity (RH)
925mb 0.2gkg–1 2.5gkg–1 8%
850mb 3.3gkg–1 4.1gkg–1 80%
700mb 3.6gkg–1 3.9gkg–1 92%
500mb 2.3gkg–1 2.6gkg–1 88%
2. UsingFigure5,plotthefollowingselectedobservations(Table4)fromGreensboro,NCthatwereobservedonthemorningof5December2002.Plotthetemperatureinredandthedewpointingreen.
Figure 5 – Blank Skew–T Log–P Diagram for Question #2

Explorations in Meteorology 35 Lab 8 Answer Key
3. WhatistheelevationofthesoundingsiteatGreensboro,NC?
Elevation=270m
4. UsingtheSkew-TdiagramyouplottedonFigure5,calculatetherelativehumidity(RH)at850mb,700mb,and500mb.Showyourwork.
RHat850mb=83%(w=5.7gkg–1;ws=6.9gkg–1)
RHat700mb=100%(w=5.5gkg–1;ws=5.5gkg–1)
RHat500mb=89%(w=2.5gkg–1;ws=2.8gkg–1)
5. Using the Skew-T diagram you plotted on Figure 5, describe the changes that occurred at the surfacebetweenDecember4thandDecember5th.
Thesurfacepressuredecreased,thetemperatureincreased,andthehumidityincreasedtosaturation.
6. InFigure5,whichlevelsorlayersaresaturated,asdepictedontheGreensborosounding?Whichlayershaveinversions?
Levelsorlayersthataresaturated985mb,925mb,and700mb
Layerswithinversions925to850mb
7. WhattypeofweatherlikelywasoccurringatthesurfaceinGreensboroat1200UTCon5December2002?
Freezingrain,lowclouds,andfog.
8. HowcriticalwasthesurfacetemperatureforecasttothecitizensofGreensboro,NCon5December2002?Wouldaforecasterrorof3°C,eithercoolerorwarmer,leadtodifferentactionsordecisionsbyGreensborocitizens?
Asurface temperature thatwas3degreeswarmerwould result inaharmlesscold rain rather thanadangerous icestorm.
9. (Advanced Students/Meteorology Majors) Examine the differences between the soundings plotted inFigures4and5.WhatprocessoccurredbetweenDecember4thandDecember5thtochangethesounding?
Evaporationalcooling(i.e.,thewet-bulbeffect)

Explorations in Meteorology 36 Lab 8 Answer Key
Part II: Sounding Interpretation
Forthispartofthelabexercise,studentsshouldworkinpairs.Onestudentshouldplotthe16April2002soundingfromAberdeen,SD(ABR)whiletheotherstudentplotsthe27January2000soundingfromFortWorth,TX(FWD).Usebothsoundingstoanswerthequestionsinthissection.Listyourpartner’snamebelow.
Nameoflabpartner______________________________
10. UsingdatafromeitherAberdeen,SD(Table5)orfromFortWorth,TX(Table6)andtheblankSkew-TLog–Pdiagram (Figure6), plot temperature anddewpointdata versuspressureat only the mandatory levels(notedinboldontable).Usearedpencilforthetemperaturedataandagreenpencilforthedewpointdata.Lightlycircleeachmandatoryleveldotwithablackpencil.Donotconnectthedotsatthistime.
11. UsingtheSkew–TLog–Pdiagramfromquestion10(Figure6),plottheentiredataset(i.e.,bothmandatoryandsignificantlevels)forABR(Table2)orFWD(Table3).Usearedpencilforthetemperaturedataandagreenpencilforthedewpointdata.Usearulertoconnecteachsetofsuccessiveobservations(redforthetemperaturetrace,greenforthedewpointtrace).
Explorations in Meteorology 37 Lab 8 Answer Key
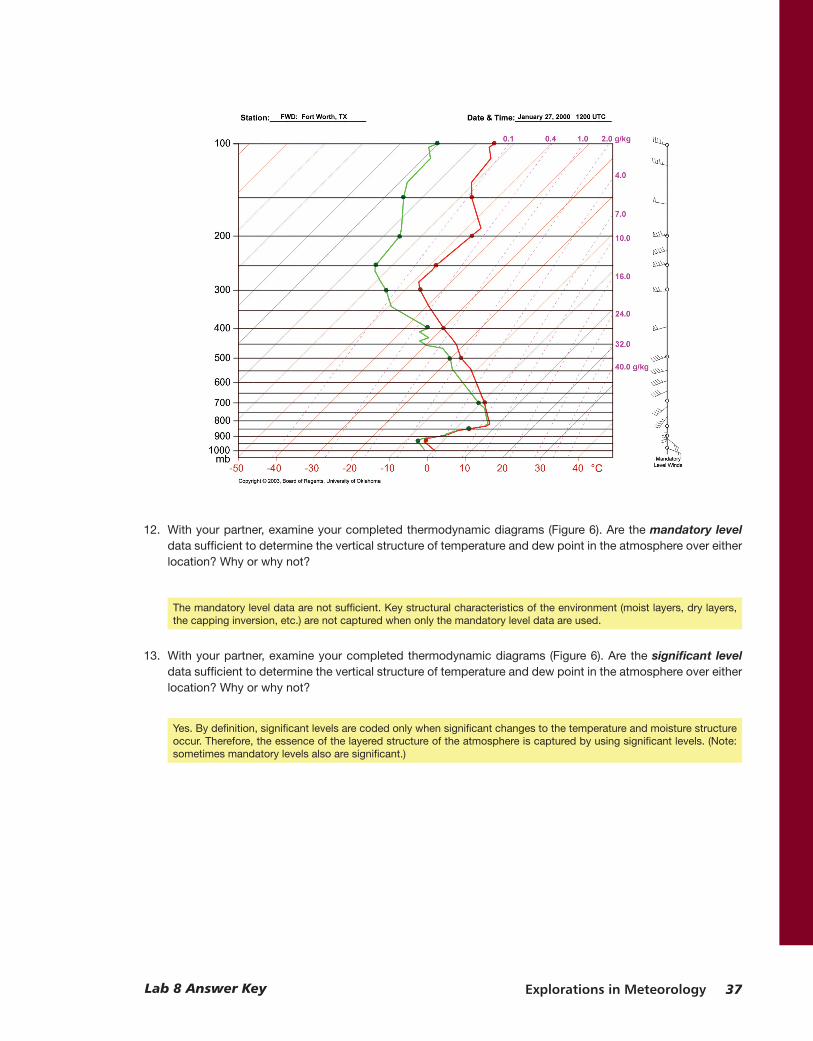
12. Withyourpartner,examineyourcompletedthermodynamicdiagrams(Figure6).Arethemandatory level datasufficienttodeterminetheverticalstructureoftemperatureanddewpointintheatmosphereovereitherlocation?Whyorwhynot?
Themandatoryleveldataarenotsufficient.Keystructuralcharacteristicsoftheenvironment(moistlayers,drylayers,thecappinginversion,etc.)arenotcapturedwhenonlythemandatoryleveldataareused.
13. Withyourpartner,examineyourcompletedthermodynamicdiagrams(Figure6).Arethesignificant leveldatasufficienttodeterminetheverticalstructureoftemperatureanddewpointintheatmosphereovereitherlocation?Whyorwhynot?
Yes.Bydefinition,significantlevelsarecodedonlywhensignificantchangestothetemperatureandmoisturestructureoccur.Therefore,theessenceofthelayeredstructureoftheatmosphereiscapturedbyusingsignificantlevels.(Note:sometimesmandatorylevelsalsoaresignificant.)
Explorations in Meteorology 38 Lab 8 Answer Key
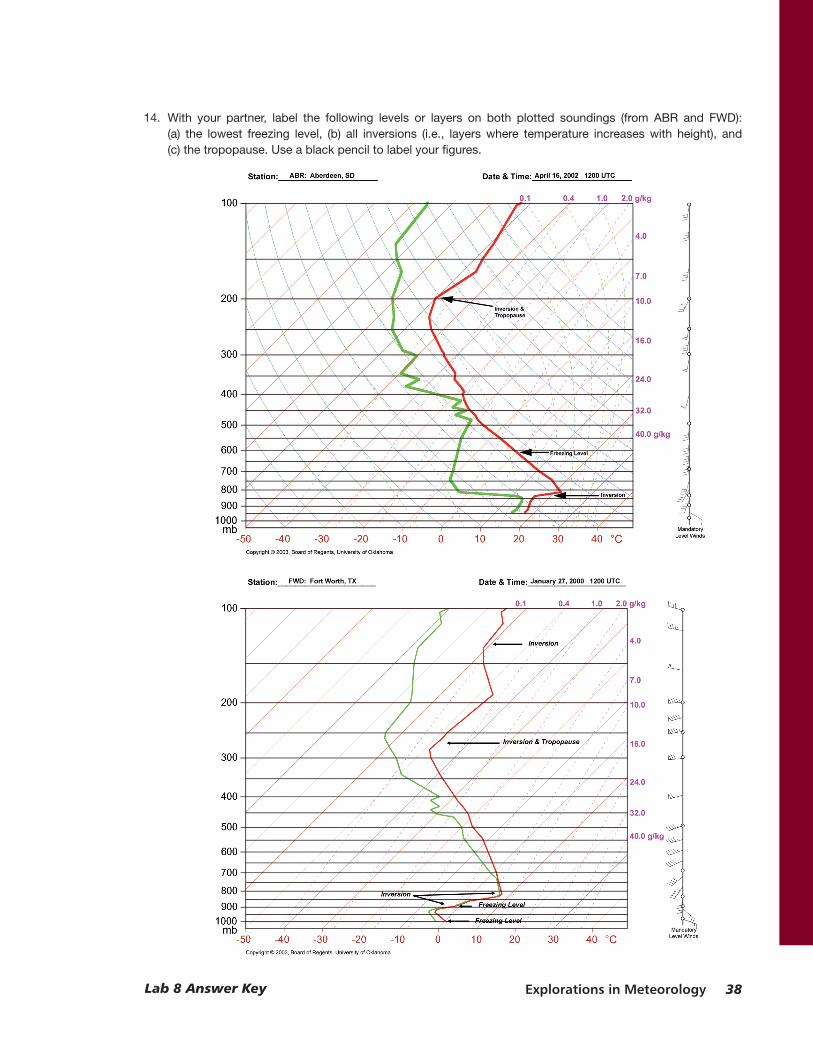
14. With your partner, label the following levels or layers on both plotted soundings (from ABR and FWD):(a) the lowest freezing level, (b) all inversions (i.e., layers where temperature increases with height), and(c)thetropopause.Useablackpenciltolabelyourfigures.
Explorations in Meteorology 39 Lab 8 Answer Key
15. Withyourpartner,examinebothsoundings.Waseitherlocationexperiencingprecipitationatthetimeoftheradiosondelaunch?
AberdeenSounding–Althoughtheboundarylayerisclosetosaturation,moisturewithinthelowerhalfofthetroposphereisnotsufficient to indicate thatprecipitation is falling.There isvery littlemoisturebetween850and500mb.A fewmeasurementsindicatethattheairisnearsaturationjustabove500mb.Atthemost,somemid-levelclouds,suchasaltocumulus,maybeseenatthistime.
FortWorthSounding–Theatmospherewassaturatedfromnearthesurfacetoalmost700mb(~3kmdepth).Itislikelythatatleastlightprecipitationoccurredatthistime.Basedonthesounding(warm,above-freezingairoverthetopofcold,sub-freezingair),theprecipitationlikelywasfallingintheformoflightfreezingrain.Observationsverifiedthatlightfreezingrainwasoccurringatthetimeofthelaunch.
16. (Advanced Students/Meteorology Majors) Both sets of sounding data in this lab contain height dataalongwiththepressure,temperature,moisture,andwindinformation.Theradiosondeinstrumentpackage,however,doesnotmeasureheight.Describehowtheheightdataareobtained.
Usethetemperature(actuallycalculatethevirtualtemperature)andpressurevaluestosolvethehypsometric(thickness)equation(ahydrostaticassumption)forheight.
17. (Advanced Students/Meteorology Majors)Atmospheric thickness isdefinedas thedifference inheightbetweentwopressurelevels.UsingTables2and3,calculatethe1000–500mbthicknessvaluesforbothsoundings.Howdothethicknessvaluesdifferbetween16April2002and27January2000?Usingconceptsdiscussed in lecture or your textbook, what is the physical reason as to why the two thickness valuesdiffer?
1000–500mb thickness forABRon16April 2002at1200UTC5630m–20m=5610meters
1000–500mbthicknessforFWDon27January2000at1200UTC5660m–166m=5494meters
Warmairislessdensethancoldair.Pressurechangesmuchmorerapidlywithheightincoldairthanitdoesinwarmair.ThesmallerJanuaryvaluemeansthatthe1000–500mblayeroccupieslessspacethandoesthesamelayerinAprilbecauseJanuaryairiscolderandmoredense,henceless“thick”thantheAprilair.
18. (Advanced Students/Meteorology Majors)What is thephysical reason for thedifference in tropopauseheightsbetweenthetwosoundings?
ThetropopauseheightintheAprilsoundingwasnear200mb,whileintheJanuarysoundingthetropopauseheightwasnear260mb.BecausethemeanvirtualtemperatureofthetroposphereintheJanuarysoundingiscolderthanintheAprilsounding,thetropopauseshouldbelowerintheJanuarycase.Remember,coldairtakesuplessspacethandoesthesameamountofwarmair.