ANOTHER SLICE OF THE PIE...mantra, facilitated a 4.5% increase in category sales during the fi rst 6...
116
ANOTHER SLICE OF THE PIE RETAILFOODGROUP Annual Report Financial Year Ended 30 June 2012
Transcript of ANOTHER SLICE OF THE PIE...mantra, facilitated a 4.5% increase in category sales during the fi rst 6...
ANOTHER SLICEOF THE PIE
RETAILFOODGROUPAnnual Report
Financial Year Ended 30 June 2012
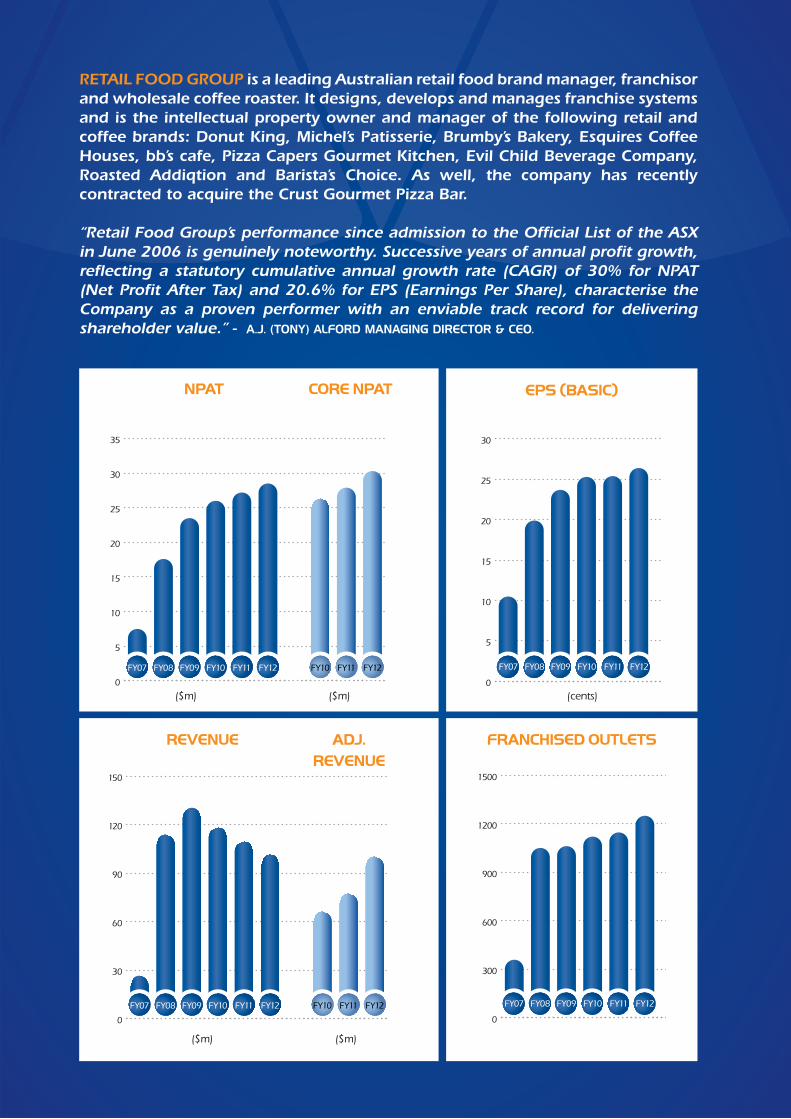
EPS (BASIC)
FRANCHISED OUTLETS
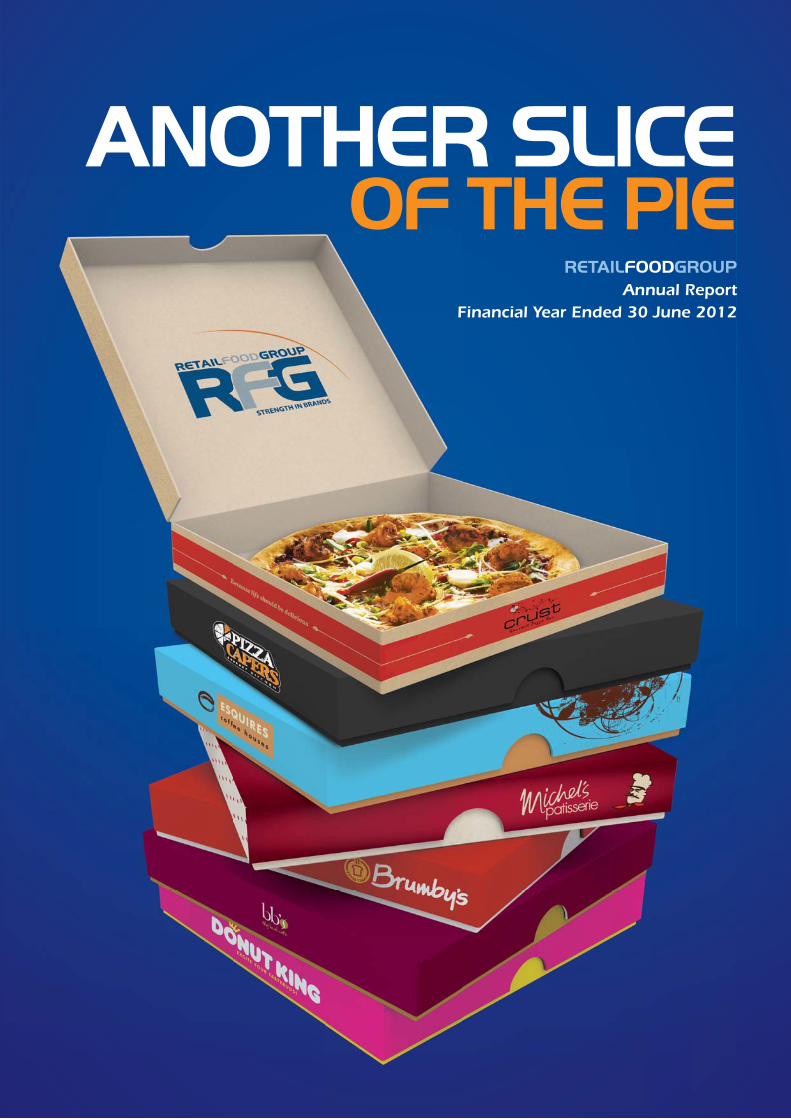
RETAIL FOOD GROUP is a leading Australian retail food brand manager, franchisor
and wholesale coffee roaster. It designs, develops and manages franchise systems
and is the intellectual property owner and manager of the following retail and
coffee brands: Donut King, Michel’s Patisserie, Brumby’s Bakery, Esquires Coffee
Houses, bb’s cafe, Pizza Capers Gourmet Kitchen, Evil Child Beverage Company,
Roasted Addiqtion and Barista’s Choice. As well, the company has recently
contracted to acquire the Crust Gourmet Pizza Bar.
“Retail Food Group’s performance since admission to the Offi cial List of the ASX in June 2006 is genuinely noteworthy. Successive years of annual profi t growth, refl ecting a statutory cumulative annual growth rate (CAGR) of 30% for NPAT (Net Profi t After Tax) and 20.6% for EPS (Earnings Per Share), characterise the Company as a proven performer with an enviable track record for delivering shareholder value.” - A.J. (TONY) ALFORD MANAGING DIRECTOR & CEO.
0
5
10
15
20
25
30
FY12FY11FY10FY09FY08FY07FY12FY11FY10FY09FY08FY07
0
300
600
900
1200
1500
FY12FY11FY10FY09FY08FY07FY12FY11FY10FY09FY08FY07
($m) ($m)
REVENUE ADJ.REVENUE
0
5
10
15
20
25
30
35
FY12FY11FY10 FY12FY11FY10FY09FY08FY07FY12FY11FY10FY12FY11FY10FY09FY08FY07
($m) ($m)
NPAT CORE NPAT
0
30
60
90
120
150
FY12FY11FY12FY11FY10FY09FY08FY07FY12FY11FY10FY12FY11FY10FY09FY08FY07
(cents)
I RETAIL FOOD GROUP LIMITED ANNUAL REPORT 30 JUNE 2012
Retail Food Group has established a well-earned reputation as a long
standing and innovative participant in the development and management
of retail food franchising systems throughout Australia and New Zealand.
To continue to develop as a leader and innovator in food systems management in order to provide benefi ts for all stakeholders through maximising complementary opportunities and delivering real value for our customers.
STRENGTH IN BRANDS DELIVERS
Economies of scale
Cross pollination of products
Collaborative marketing initiatives
Co-branding & leveraging RFG’s
proven management systems
TTo continue to ddevelop aOUR PHILOSOPHY
Is derived from the strength of our iconic franchise systems and the many franchisees that operate under them.
By assembling, enhancing and growing a fortress of retail food franchise systems whose menus are consumer relevant, inventive, and above anything else, demand patronage we will safeguard our brands, franchisees and the future of RFG.
I d i d f h h f

April 2012 witnessed the addition of the then 110 outlet
Pizza Capers Gourmet Kitchen franchise system to RFG’s
stable of iconic retail food brands.
Pizza Capers specialises in the sale of gourmet pizza,
pasta and related products using fresh restaurant quality
ingredients. Importantly, its acquisition represented RFG’s
fi rst genuine entry into the traditional QSR market and the
Company is extremely excited by the growth potential
inherent in the brand.
During 2012 Pizza Capers cemented itself at the top of
the gourmet pizza category in Australia by winning the
coveted Canstar Blue award for Most Satisfi ed Pizza
Customers Australia-wide (for the second year running).
Australian consumers again rated Pizza Capers a superb
5 stars for Taste, Service and Overall Satisfaction ahead of
all competition.
At an operational level, the brand launched one of its most
successful marketing campaigns - “Gourmet Banquet”.
Promoted as a banquet of “4 course meals”, the promotion
provided a novel way of promoting Caper’s unique range
of pizza, pasta, dessert and drinks and facilitated a 12%
boost to year on year average weekly sales during the
campaign period.
Under RFG’s stewardship, the Pizza Capers brand
continues to extend its traditional boundaries with its
quirky irreverent behaviour. The launch of “The Inferno”
pizza did exactly that: daring consumers to try Australia’s
‘Hottest Gourmet Pizza’ but only after fi rst asking them to
sign disclaimer forms before consumption. The campaign
created fantastic You Tube, viral and social media content
which generated great publicity and consumer “talkability.”
As a result, The Inferno campaign delivered the highest
actual AWS of any promotional campaign period in FY12.
Whereas FY12 witnessed the Capers system continue its
focus on improving e-commerce channels, signifi cant
investment in the promotion and enhancement of digital
platforms (including launch of mobile) is scheduled for FY13.
E-commerce channels continue to offer enhanced revenue
opportunity and remains a principle focus for FY13.

In August 2012 RFG signalled the fortifi cation of its entry
into the QSR market by announcing its acquisition of the
Crust Gourmet Pizza Bar system.
The Crust concept originated in Sydney in 2001 with the
ambition of changing perceptions regarding take away pizza
via implementation of a business model dedicated to the
provision of great tasting, quality gourmet home delivered
products. The Crust Brand System is now represented by
circa 120 outlets including international expansion to New
Zealand, Singapore and the United States of America.
Not only does the transaction position another successful retail
food concept under RFG’s management umbrella, it serves
multiple strategic purposes which augment the Company’s
recent entry into QSR via the Pizza Capers Brand System.
Whereas each of the Pizza Capers and Crust concepts
represent distinct brands that have traditionally dominated
separate geographical markets, combined they position
Retail Food Group as the genuine market leader in the QSR
gourmet pizza sector with immediate scale incorporating a
network footprint of circa 250 outlets.
While each pizza brand system will continue to be developed
independently, collectively the Capers and Crust systems
offer unrivalled expertise in the gourmet pizza sector
together with enhanced opportunity for:
· supply side economies;
· operational and franchise service structure effi ciencies;
· cross pollination of products and services; and
· collaborative marketing and R&D activities;
all of which are positioned under an over-arching and
experienced QSR divisional management focused upon a
co-ordinated development strategy designed to ensure
sustainable proliferation of both systems.
RFG’s QSR initiatives also operate: to reduce reliance on
traditional shopping centre environments for organic
growth (with circa 460 Australian outlets, or 35% of RFG’s
total outlet population, now located in external tenancies);
and to broaden the Company’s exposure to all day trading
parts whilst extending RFG’s complement of retail food
brands from impulse, treat and staple offers with lower to
mid-sized Average Transaction Values (ATV) to high ATV
lunch and evening meal time opportunities.
Together the Pizza Capers and Crust acquisitions
demonstrate RFG’s acquisitive philosophy and epitomise the
Company’s “strength in brands” mantra.

Brumby’s Bakery prides itself on being a market leader
in bread innovation with the brand leveraging off this
reputation to launch it’s ‘no numbers, no additives’ Pure
Bake bread range – the biggest innovation within the
Brumby’s system in eight years, not to mention a national
Australian “fi rst“.
The Pure Bake signature clean-label recipe was implemented
in over 180 bread lines amongst the Brumby’s range, and
when coupled with Brumby’s “Baked Today” scratch bake
mantra, facilitated a 4.5% increase in category sales during
the fi rst 6 months following launch of the product.
In February 2012, Brumby’s expanded its healthy options
via launch of an organics range capitalising on the growing
consumer trend toward healthier food options.
The brand will continue to extend its clean label
signature recipe into its artisan brand range throughout
FY13, positioning itself as the brand of choice for health
conscious consumers.
This activity will be supported by further segmentation of
the Brumby’s range into lunch time trade via introduction
of fi lled sandwiches and rolls made fresh in-store using
Pure Bake breads.
Menu extension of this nature not only augments
franchisee average weekly sales, but enhances the baked
from scratch bread experience by offering consumers the
freshest sandwiches on the market.
Proliferation of the Brumby’ GO! sub-brand remained an
FY12 focus with the concept gaining positive traction in
the market.
Brumby’s Go! further capitalises on the brand’s healthy
lunch and snack options by providing customers a quick,
convenient option ‘on the go’ supported by an increased
food and beverage menu.

Michel’s continues to be the leading patisserie in Australia,
offering a unique coffee and cake experience for connoisseurs
at heart.
The brand is famous for its expertise in patisserie and
customised cakes, offering consumers the opportunity to
spoil loved ones by adding personalised photos, messages
and decorations to an extensive cake selection. Together
with successful digital marketing strategies, these options
have translated into an exceptional 42% increase in
customised cake sales over the prior year.
Online ordering also witnessed remarkable growth in
FY12 with sales increasing 273% due to menu extension
and effective promotion via TV and digital channels.
Ecommerce continues to be a focused revenue channel for
Michel’s in FY13 as consumers seek greater convenience.
During FY12, Michel’s reputation for being “a sip above the
rest” was confi rmed when it was named 2011 Roy Morgan
“Coffee Shop of the Year”. This award adds to a long list of
prestigious accolades for Michel’s coffee which include the
2011 Golden Bean Award and having been voted “Best
Tasting Coffee” by CHOICE in 2010.
At a structural level, transition of the franchise network from
a wholesale margin model to a traditional royalty based
model is practically complete, facilitating commencement
of bakery consolidation and supply side solutions which
will ensure the sustainable proliferation of the brand well
into the future.
FY13 is also set to be one of Michel’s most exciting years
as it undergoes extensive brand reinvigoration. With a
more up-market store livery to heighten café experience,
modernisation of cake lines and extension into patisserie
style foods catering for all day consumers, the Michel’s
Patisserie brand is poised to offer greater accessibility and
consumer engagement.

With 48 established outlets, Esquires is one of New
Zealand’s largest coffee house chains.
In FY12 Esquires underwent a major revamp transforming it
into a vibrant, progressive operation. Incorporating a brand
reformulation infl uenced by leading coffee excellence,
technological and sustainability trends, the Esquires
reinvigoration is targeted at achieving enhanced market
position relevance, outlet and AWS growth via:
• new store design;
• a boutique coffee menu;
• excellence in coffee through superior qualifi ed baristas
and beans;
• cutting-edge technology including Wi-Fi, ipad bars,
mobile aps;
• leveraging sustainability and Fair-trade coffee; and
• extended formats including drive-thru and hole in the
wall concepts.
These elements have been incorporated into the rollout of
the Esquires brand within Australia with fl agship stores in
New South Wales and Queensland having been successfully
established in 2012.
Importantly, four bb’s café outlets have now converted to
Esquires, achieving a circa 5% AWS uplift since rebranding.
As the Esquires brand gains further traction in both the
Australian and New Zealand markets, RFG anticipates an
increase in the conversion rate and an exciting future for
the Esquires system.

Donut King is Australia’s leading coffee and donut shop
represented by circa 350 outlets across the nation. A
further 19 outlets have been established internationally,
predominantly in China.
Donut King has evolved under RFG stewardship since
1989 and represents a brand system which has displayed
exceptional resilience in an ever changing retail environment.
The brand’s exclusive roast, “Royal Bean Coffee”, continues
to experience phenomenal growth on the back of
concentrated training, operations and marketing excellence.
During FY12 the number of trained baristas within the
brand increased to 256 (a 44% increase on FY11) and a
successful marketing campaign, “Barista Shout Day”,
further reinforced the brand’s growing coffee expertise.
Showcasing Donut King’s baristas, the campaign offered
consumers the opportunity to taste the brand’s exceptional
Royal Bean Coffee. This resulted in 85,000 engaged
customers being given free coffee and facilitated a 60,000
lift in Donut King’s face-book fan base.
In FY12 Donut King expanded its menu beyond its
traditional sweet food offering with the introduction of
“toasties” and other “hot box” items. These innovations
provided consumers with another reason to engage
with the Donut King brand and results to date have
been very promising.
During FY13 Donut King will further expand its menu as
it launches its ‘store of the future’. The concept store will
incorporate a fresh and exciting new look whilst offering
fun, consumer interactive experiences focused around DK’s
“Excite Your Tastebuds” brand positioning. The new look store
will also facilitate the brand’s expansion into non-traditional
formats including stand alone and drive-thru sites.

Retail Food Group’s wholesale coffee and roasting
operations are a signifi cant contributor to its success with
coffee revenues having increased 31% over FY11.
The September 2011 acquisition of Auckland based
Evolution Coffee Roasters Group signifi cantly bolstered
roasting capacity whilst securing quality coffee supply to the
Company’s New Zealand franchise networks.
The transaction also secured for RFG the “Roasted
Addiqtion” and “Evil Child Beverage Company” brands,
extending RFG’s commercial coffee presence and affording
access to an established wholesale and retail customer base
for premium proprietary coffee blends, syrups and drinking
chocolate powders.
Astute forward buying arrangements and the effi cient
operation of state-of-the-art coffee roasting facilities in
Sydney and Auckland enables RFG to control its coffee
supply chain from crop to cup.
Importantly, notwithstanding green bean commodity pricing
having signifi cantly increased since 2009, RFG’s ability to limit
the increases to wholesale coffee pricing for its franchisee
community demonstrates the benefi ts to be derived from
the effective implementation of vertical integration initiatives
such as that evidenced in the Evolution acquisition.
These initiatives are supported by an unrivalled internal and
franchisee based coffee training program targeted at refi ning
coffee skills, awareness, product quality and outlet sales.
RFG’s Gold Coast based world class training academy
continues to be the cornerstone of the Group’s multi-platform
training approach and is complemented by extensive in-store
and group training sessions together with online modules
which have facilitated a record 1,539 newly qualifi ed coffee
makers and baristas entering the Company’s Brand Systems
during FY12.
Now roasting over 1,000 tonnes annually of green beans,
and wholesaling various proprietary coffee products
amongst its franchise networks and a growing external
customer base, RFG’s coffee operations continue to offer
untapped potential for future growth, vertical integration
and network effi ciencies.
CHAIRMAN'SLETTER BRUCE HANCOX
ixRETAIL FOOD GROUP LIMITED ANNUAL REPORT 30 JUNE 2012
Dear Shareholder,
Following the devastating natural disasters that affected
key markets during early CY11, and given persistent
challenges affecting Australia’s retail landscape, FY12
represented a year in which RFG embarked on a program
designed to maximise performance of existing business
units whilst driving reinvigorated growth.
Fundamental to this process was the implementation in
March of signifi cant organisational restructure pursuant
to which operational and service resources were migrated
from a departmental confi guration to an operational and
servicing ‘brand structure’.
This activity represented a watershed event in terms of
RFG’s organisational framework. It has facilitated the
commissioning of an independent structural, operational
and management hierarchy for each of our Brand Systems
which is focused on the effi cient delivery of enhanced
outcomes for all stakeholders.
Contemporaneous with the above, a dedicated Marketing
and Innovations Department was commissioned to design
and implement the next step in the evolution of each of
our Brand Systems. This multi-faceted ‘Project Evolution’
is targeted at ensuring brand relevance and modernity,
increased outlet sales, improved franchisee profi tability
and outlet sustainability long into the future.
Whilst the deliverables for this project are principally
scheduled for CY13, we are already witnessing positive
outcomes within the Donut King and Esquires Coffee
Houses Brand Systems which are the fi rst to benefi t from
this initiative.
Organisational renewal also facilitated RFG’s entry into
the traditional QSR space via the acquisition in April of the
Pizza Capers Gourmet Kitchen Brand System. This strategic
move offers multiple synergistic opportunities, broadens
the Company’s exposure to all day trading parts and
extends RFG’s complement of retail brands to high ATV
lunch and evening meal time opportunities.
The foregoing are examples of RFG’s dedication not only
to continual reinvigoration and ongoing sustainability for
our existing business units, but to the cultivation of superior
growth and enduring positive outcomes for all stakeholders.
Given the ongoing constricted retail marketplace, and
against the backdrop of feverish activity described above,
RFG’s achievement in delivering shareholders a seventh
successive annual record net profi t is immensely satisfying.
FY12 Net Profi t After Tax of $28.5m represented a 4.9%
increase over the prior year’s result and was built upon
a 31% increase in coffee revenues (over FY11), positive
average weekly sales (AWS) and average transaction
value (ATV) growth amongst our franchise systems, the
establishment of 39 new outlets and contributions from
the Pizza Capers network.
These robust outcomes, allied with a business model which
generates high free cash fl ow, resulted in a 21% increase in
the combined dividends paid to shareholders in respect of
FY12 (FY12: 17.5cps FY11: 14.5cps) and facilitated a payout
ratio of 66.3%.
In closing, RFG’s achievements are a product of the
dedication and hard work applied by management and
staff, and importantly, our many franchisees. On behalf of
the Board of Directors I sincerely thank each of them for
their valuable contribution to the Company’s success.
I would also like to thank you, as a valued shareholder, for
your commitment to Retail Food Group.
BRUCE HANCOXCHAIRMAN, RETAIL FOOD GROUP LIMITED
x RETAIL FOOD GROUP LIMITED ANNUAL REPORT 30 JUNE 2012
MANAGINGDIRECTOR'SREPORTMANAGINGDIRECTOR'SREPORTANTHONY JAMES (TONY) ALFORD
During FY12 RFG again demonstrated the ability of its
unique and resilient business model to deliver record
positive outcomes for all stakeholders. That these results
were achieved notwithstanding prolonged economic
uncertainty and depressed retail trading conditions,
only validates the Company’s strategic commitment to
‘strength in brands’ via the accumulation of multiple
quality complementary Brand Systems that provide
for continued diversifi cation of revenue streams and a
desensitisation to risk.
Retail Food Group’s performance since admission to
the Offi cial List of the ASX in June 2006 is genuinely
noteworthy. Successive years of annual profi t growth,
refl ecting a statutory cumulative annual growth rate
(CAGR) of 30% for NPAT (Net Profi t After Tax) and 20.6%
for EPS (Earnings Per Share), characterise the Company
as a proven performer with an enviable track record for
delivering shareholder value.
RECORD PERFORMANCE
A 29.3% increase in Adjusted Revenue, which excludes
marketing fund revenue and sales derived from Michel’s
Patisserie wholesale bakery supply, underpinned FY12
NPAT of $28.5m – an increase of 4.9% over the Previous
Corresponding Period (PCP).
Core NPAT of $30.3m represented an 8.9% increase over
FY11 ($27.9m) and was the product of:
• a 31% increase in wholesale coffee revenues aided by
the acquisition in September 2011 of the Evolution Coffee
Roasters Group;
• the addition of 149 new outlets of which 110 were the
result of acquisition activity;
• a lower cost of doing business as a consequence of
structural change including migration to the Brand
System model;
• enhanced franchise system revenue derived from the
execution of compelling marketing activity and menu
offer adjustment which both drove average weekly sales
(AWS) and average transaction value (ATV) growth; and
• fortifi cation of licence and other revenues brought
about by the astute management of supply-side
relationships, growing support of corporate retail
operations and leveraging off the Group’s growing
‘strength in brands’.
RETAIL FOOD GROUPAN ENVIABLETRACK RECORD
xxxxxxxxxxxxxxxxxxxxxx
RETAIL FOOD GROUP LIMITED ANNUAL REPORT 30 JUNE 2012
MANAGINGDIRECTOR'SREPORTMANAGINGDIRECTOR'SREPORT
ANTHONY JAMES (TONY) ALFORD
xi
Earnings Per Share (EPS) of 26.4 cents constituted a 4% increase over FY11 (25.4 cents) whilst EPS from Core Operations
was 28 cents – an increase of 7.7% over the PCP.
These robust results provided for declaration of a fi nal, fully franked dividend of 9 cents per share in respect of FY12
refl ecting a 20% increase over that paid in connection with FY11.
When coupled with April’s interim dividend, the Company’s full year dividend of 17.5 cents per share refl ects not only
a 21% increase over FY11, but importantly, an increase in the payout ratio to shareholders equal to 66.3% of NPAT.
This is the highest payout ratio applied since the Company’s Listing which is an extremely satisfying outcome given its
achievement during a period of acquisitive growth and signifi cant organisational reinvigoration.
ORGANISATIONAL CHANGE
In terms of that reinvigoration, March 2012 witnessed implementation of fundamental change to RFG’s organisational
framework by way of the dissolution of the departmental regime that had reliably served the Company for in excess
of 20 years.
This transformative action arose principally as a consequence of the growing number of outlets and Brand Systems
under the Company’s stewardship and a recognition that, to best facilitate growth, a ‘silo’ approach to resource and
asset management was required.
Since 1989 RFG adopted a structure that involved the establishment and resourcing of particular departments who
serviced the franchisee community rather than the Group’s multiple franchise systems. The aforesaid structure was
migrated to one where the strategic, operational and management frameworks are established and driven in respect
of each individual franchise system under RFG stewardship.
Following a comprehensive process of organisational refl ection, franchisee engagement and strategic examination
to determine the most effective management and service structure to accommodate RFG’s existing businesses as well
as facilitating future acquisitive growth, a number of departments were disbanded and their functions integrated so
as to directly service one or more of RFG’s franchise systems within a dedicated structure which aligns resources to
Brand Systems.
As part of this process, a Managing Director was appointed to each Brand System with the necessary authority,
autonomy and resources to develop, set and implement strategy, direction and focus for the relevant Brand System.
This refocus of RFG personnel serves to increase responsiveness, foster individual Brand System growth opportunity,
improve franchise system servicing and better align corporate and Brand System objectives. It also represents the
structure best positioned to accommodate the effi cient integration of newly acquired businesses under RFG’s umbrella.
BOARD OF DIRECTORS
The Board of Directors represents the apex of organisational structure and it is essential to RFG’s long term success,
and the building of shareholder value, that it comprise directors with an appropriate skillset, experience and personal
attributes to enable it to effectively chart the future direction of the Company and its Brand Systems.
Having regard to that necessity, and consistent with the culture of change amongst the remainder of the Company’s
organisational framework, FY12 witnessed signifi cant rejuvenation at Board level.
The fi rst step in this process was the election of Bruce Hancox as Chairman in September 2011. Whilst having ably
served as an independent director since late 2007, this appointment best enabled the Company to take advantage of
Bruce’s considerable corporate experience and commercial nous whilst also providing impetus for the organisational
regeneration indicated herein.
xii RETAIL FOOD GROUP LIMITED ANNUAL REPORT 30 JUNE 2012
MANAGINGDIRECTOR'SREPORTMANAGINGDIRECTOR'SREPORTANTHONY JAMES (TONY) ALFORD
The vacancy arising from John Cowley’s decision not to seek re-election at last year’s AGM resulted in thorough
candidate evaluation, the outcome of which was the appointment of Jessica Buchanan and Tony Williams as non-
executive directors in May 2012.
Both Jessica and Tony have brought to the board specialist marketing, retailing and franchising expertise which complements
the Board’s existing profi ciencies and provides valuable balance during policy and decision making deliberations.
BRAND SYSTEM PERFORMANCE
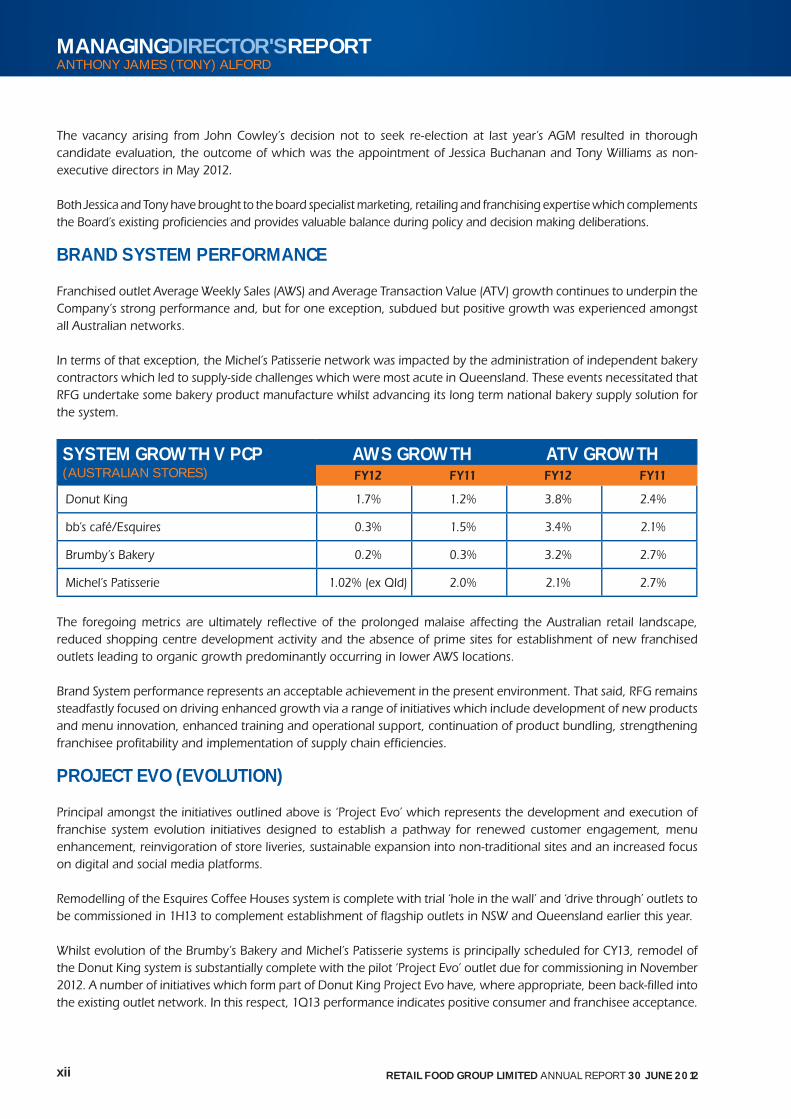
Franchised outlet Average Weekly Sales (AWS) and Average Transaction Value (ATV) growth continues to underpin the
Company’s strong performance and, but for one exception, subdued but positive growth was experienced amongst
all Australian networks.
In terms of that exception, the Michel’s Patisserie network was impacted by the administration of independent bakery
contractors which led to supply-side challenges which were most acute in Queensland. These events necessitated that
RFG undertake some bakery product manufacture whilst advancing its long term national bakery supply solution for
the system.
SYSTEM GROWTH V PCP(AUSTRALIAN STORES)
AWS GROWTH ATV GROWTHFY12 FY11 FY12 FY11
Donut King 1.7% 1.2% 3.8% 2.4%
bb’s café/Esquires 0.3% 1.5% 3.4% 2.1%
Brumby’s Bakery 0.2% 0.3% 3.2% 2.7%
Michel’s Patisserie 1.02% (ex Qld) 2.0% 2.1% 2.7%
The foregoing metrics are ultimately refl ective of the prolonged malaise affecting the Australian retail landscape,
reduced shopping centre development activity and the absence of prime sites for establishment of new franchised
outlets leading to organic growth predominantly occurring in lower AWS locations.
Brand System performance represents an acceptable achievement in the present environment. That said, RFG remains
steadfastly focused on driving enhanced growth via a range of initiatives which include development of new products
and menu innovation, enhanced training and operational support, continuation of product bundling, strengthening
franchisee profi tability and implementation of supply chain effi ciencies.
PROJECT EVO (EVOLUTION)
Principal amongst the initiatives outlined above is ‘Project Evo’ which represents the development and execution of
franchise system evolution initiatives designed to establish a pathway for renewed customer engagement, menu
enhancement, reinvigoration of store liveries, sustainable expansion into non-traditional sites and an increased focus
on digital and social media platforms.
Remodelling of the Esquires Coffee Houses system is complete with trial ‘hole in the wall’ and ‘drive through’ outlets to
be commissioned in 1H13 to complement establishment of fl agship outlets in NSW and Queensland earlier this year.
Whilst evolution of the Brumby’s Bakery and Michel’s Patisserie systems is principally scheduled for CY13, remodel of
the Donut King system is substantially complete with the pilot ‘Project Evo’ outlet due for commissioning in November
2012. A number of initiatives which form part of Donut King Project Evo have, where appropriate, been back-fi lled into
the existing outlet network. In this respect, 1Q13 performance indicates positive consumer and franchisee acceptance.
xiiiRETAIL FOOD GROUP LIMITED ANNUAL REPORT 30 JUNE 2012
MANAGINGDIRECTOR'SREPORTANTHONY JAMES (TONY) ALFORD
COFFEE OPERATIONS
The September 2011 acquisition of Evolution Coffee Roasters Group has been seamlessly integrated, providing a
platform for renewed growth amongst, and sustainability within, the Company’s New Zealand based network.
Indeed, the business has delivered more than was anticipated in terms of its strategic fi t as well as performance with
FY12 green bean throughput some 13% higher than forecast.
In terms of RFG’s coffee operations generally, targeted marketing activity together with addition of the Evolution
business has aided in the achievement of a 31% increase amongst wholesale coffee revenues to $18m. Coffee remains
an integral part of RFG’s business and we anticipate continuing growth for this profi t driver during FY13.
PIZZA
With the exception of gourmet burgers and sushi, premium or gourmet pizza is the principal retail food franchise
category where tangible surveyed growth has been documented.
RFG’s entry in the gourmet pizza segment via acquisition of the market leading Pizza Capers Gourmet Kitchen and
Crust Gourmet Pizza Bar systems is the product of multiple strategic drivers incorporating:
• establishment of a legitimate presence in the traditional QSR (Quick Service Restaurant) sector;
• access to all day trading parts and extension of RFG’s food offer to incorporate genuine meal or dinner options;
• access to signifi cant growth opportunity via a buoyant new outlet pipeline;
• facilitating reduced reliance on shopping centre specifi c site locations; and
• access to multiple synergistic opportunities for RFG’s existing businesses (including back offi ce functions, supply-side
economies, collaborative marketing and cross pollination of products).
Consistent with RFG’s acquisitive rationale, the foregoing acquisitions are immediately EPS accretive and the Pizza
Capers system has to date performed well under RFG stewardship. We are therefore incredibly excited by what the
gourmet pizza category has to offer the Company.
OUTLOOK
During FY12 RFG reinforced its position as an enterprise with franchise systems, business units and revenues remarkably
resilient to protracted depressed retail trading conditions. Whilst we consider that retailing in Australia will remain
challenged during FY13, the Company is not without appropriate levers to sustain profi tability and drive growth.
The Company has built incredible momentum for enhanced stakeholder value and we are therefore optimistic as to
what the future holds.
A.J. (TONY) ALFORD MANAGING DIRECTOR & CEO

xiv RETAIL FOOD GROUP LIMITED ANNUAL REPORT 30 JUNE 2012
1RETAIL FOOD GROUP LIMITED ANNUAL REPORT 30 JUNE 2012
MANAGINGDIRECTOR'SREPORT
RETAIL FOOD GROUP LIMITEDACN 106 840 082
FINANCIAL YEAR ENDED 30 JUNE 2012
CONTENTS
Summary Financial Information 2
Corporate Directory 3
Corporate Governance Statement 4
Directors' Report 14
Auditor's Independence Declaration 35
Independent Auditor’s Report 36
Directors' Declaration 38
Index To Financial Statements 39
Consolidated Statement Of Comprehensive Income 40
Consolidated Statement Of Financial Position 41
Consolidated Statement Of Changes In Equity 42
Consolidated Statement Of Cash Flows 43
Notes To The Financial Statements 44
Additional Stock Exchange Information 96
RAC
FI
Su
C
C
D
A
In
D
In
C
C
C
C
N
A
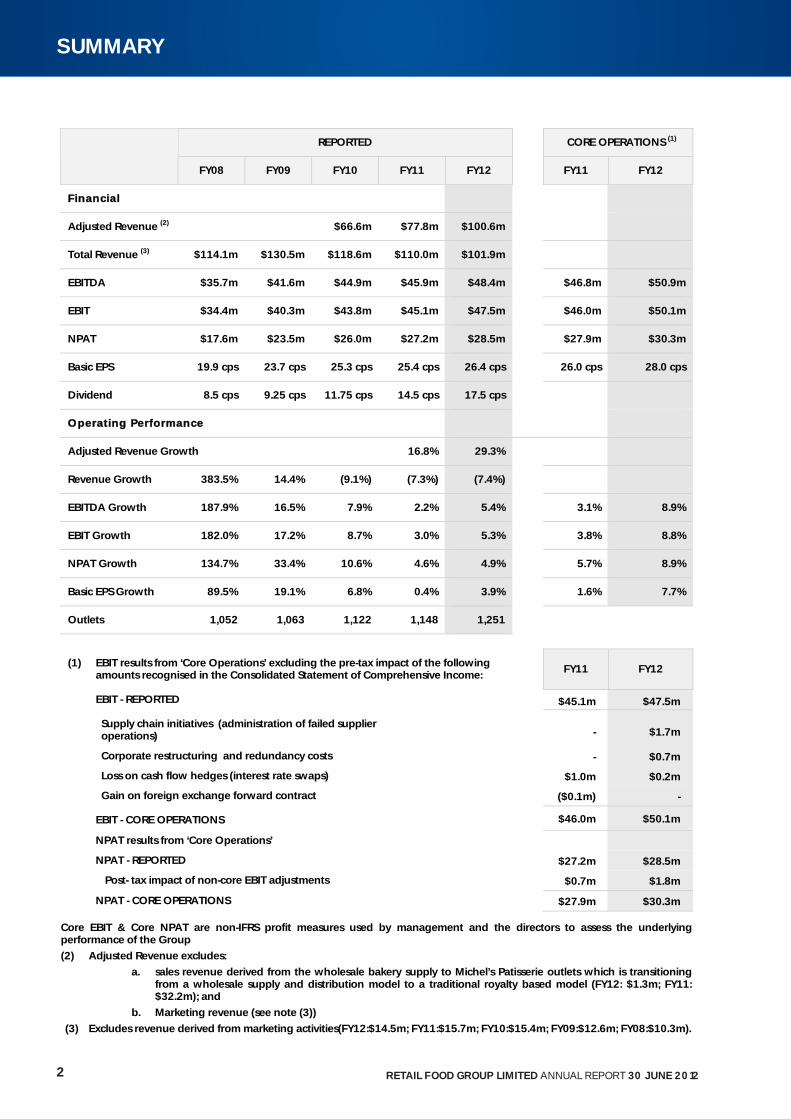
REPORTED CORE OPERATIONS (1)
FY08 FY09 FY10 FY11 FY12 FY11 FY12
FFinancial
Adjusted Revenue (2) $66.6m $77.8m $100.6m
Total Revenue (3) $114.1m $130.5m $118.6m $110.0m $101.9m
EBITDA $35.7m $41.6m $44.9m $45.9m $48.4m $46.8m $50.9m
EBIT $34.4m $40.3m $43.8m $45.1m $47.5m $46.0m $50.1m
NPAT $17.6m $23.5m $26.0m $27.2m $28.5m $27.9m $30.3m
Basic EPS 19.9 cps 23.7 cps 25.3 cps 25.4 cps 26.4 cps 26.0 cps 28.0 cps
Dividend 8.5 cps 9.25 cps 11.75 cps 14.5 cps 17.5 cps
OOperating Performance
Adjusted Revenue Growth 16.8% 29.3%
Revenue Growth 383.5% 14.4% (9.1%) (7.3%) (7.4%)
EBITDA Growth 187.9% 16.5% 7.9% 2.2% 5.4% 3.1% 8.9%
EBIT Growth 182.0% 17.2% 8.7% 3.0% 5.3% 3.8% 8.8%
NPAT Growth 134.7% 33.4% 10.6% 4.6% 4.9% 5.7% 8.9%
Basic EPS Growth 89.5% 19.1% 6.8% 0.4% 3.9% 1.6% 7.7%
Outlets 1,052 1,063 1,122 1,148 1,251
(1) EBIT results from ‘Core Operations’ excluding the pre-tax impact of the following amounts recognised in the Consolidated Statement of Comprehensive Income:
FY11 FY12
EBIT - REPORTED $45.1m $47.5m
Supply chain initiatives (administration of failed supplier operations) - $1.7m
Corporate restructuring and redundancy costs - $0.7m
Loss on cash flow hedges (interest rate swaps) $1.0m $0.2m
Gain on foreign exchange forward contract ($0.1m) -
EBIT - CORE OPERATIONS $46.0m $50.1m
NPAT results from ‘Core Operations’
NPAT - REPORTED $27.2m $28.5m
Post- tax impact of non-core EBIT adjustments $0.7m $1.8m
NPAT - CORE OPERATIONS $27.9m $30.3m
Core EBIT & Core NPAT are non-IFRS profit measures used by management and the directors to assess the underlying performance of the Group
(2) Adjusted Revenue excludes:
a. sales revenue derived from the wholesale bakery supply to Michel’s Patisserie outlets which is transitioning from a wholesale supply and distribution model to a traditional royalty based model (FY12: $1.3m; FY11: $32.2m); and
b. Marketing revenue (see note (3))
(3) Excludes revenue derived from marketing activities(FY12:$14.5m; FY11:$15.7m; FY10:$15.4m; FY09:$12.6m; FY08:$10.3m).
MANAGINGDIRECTOR'SREPORTANTHONY JAMES (TONY) ALFORD
2 RETAIL FOOD GROUP LIMITED ANNUAL REPORT 30 JUNE 2012
SUMMARY
Mr Bruce Alan Hancox
Chairman & Independent Director
Mr Anthony James Alford
Managing Director & Chief Executive Officer
Mr Colin Cameron Archer
Independent Director
Ms Jessica Buchanan
Independent Director
DDirectors
Mr Anthony John Williams
Independent Director
CCompany Seecretary Mr Anthony Mark Connors
RRegistered Office RFG House
1 Olympic Circuit
Southport QLD 4215
PPrincipal Place Of Buusiness RFG House
1 Olympic Circuit
Southport QLD 4215
SShare Reegister Computershare Investor Services
Level 19, 307 Queen Street
Brisbane QLD 4000
SSolicitors McCullough Robertson Lawyers
Level 11, 66 Eagle Street
Brisbane QLD 4000
AAuditors Deloitte Touche Tohmatsu
Level 25, 123 Eagle Street
Brisbane QLD 4000
BBankers National Australia Bank Limited
Level 20, 100 Creek Street
Brisbane QLD 4000
SStock Exchange Liist ings Retail Food Group Limited shares are listed on the Australian Securities Exchange
(ASX:RFG).
WWebsite Adddress www.rfg.com.au
3RETAIL FOOD GROUP LIMITED ANNUAL REPORT 30 JUNE 2012
CORPORATEDIRECTORY
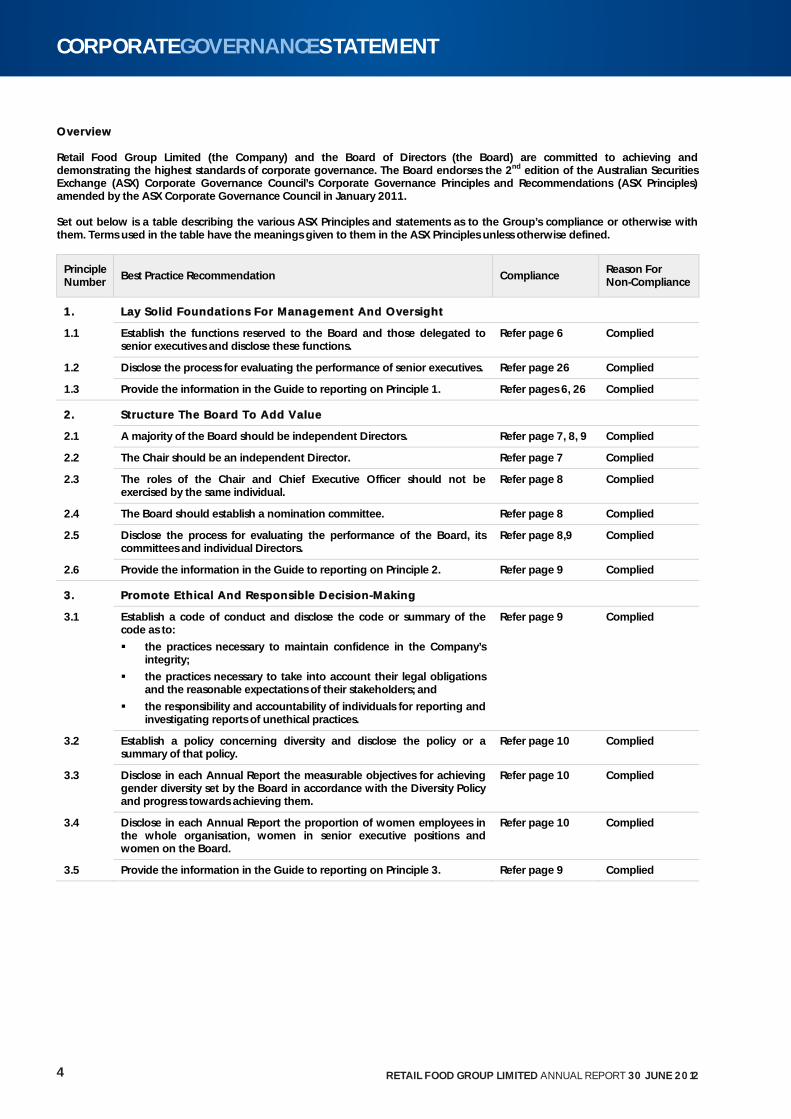
OOverview Retail Food Group Limited (the Company) and the Board of Directors (the Board) are committed to achieving and demonstrating the highest standards of corporate governance. The Board endorses the 2nd edition of the Australian Securities Exchange (ASX) Corporate Governance Council’s Corporate Governance Principles and Recommendations (ASX Principles) amended by the ASX Corporate Governance Council in January 2011. Set out below is a table describing the various ASX Principles and statements as to the Group’s compliance or otherwise with them. Terms used in the table have the meanings given to them in the ASX Principles unless otherwise defined.
Principle Number
Best Practice Recommendation Compliance Reason For Non-Compliance
11. LLay Solid Foundations For Management And Oversight
1.1 Establish the functions reserved to the Board and those delegated to senior executives and disclose these functions.
Refer page 6 Complied
1.2 Disclose the process for evaluating the performance of senior executives. Refer page 26 Complied
1.3 Provide the information in the Guide to reporting on Principle 1. Refer pages 6, 26 Complied
22. SStructure The Board To Add Value
2.1 A majority of the Board should be independent Directors. Refer page 7, 8, 9 Complied
2.2 The Chair should be an independent Director. Refer page 7 Complied
2.3 The roles of the Chair and Chief Executive Officer should not be exercised by the same individual.
Refer page 8 Complied
2.4 The Board should establish a nomination committee. Refer page 8 Complied
2.5 Disclose the process for evaluating the performance of the Board, its committees and individual Directors.
Refer page 8,9 Complied
2.6 Provide the information in the Guide to reporting on Principle 2. Refer page 9 Complied
33. PPromote Ethical And Responsible Decision--MMaking
3.1 Establish a code of conduct and disclose the code or summary of the code as to:
the practices necessary to maintain confidence in the Company’s integrity;
the practices necessary to take into account their legal obligations and the reasonable expectations of their stakeholders; and
the responsibility and accountability of individuals for reporting and investigating reports of unethical practices.
Refer page 9 Complied
3.2 Establish a policy concerning diversity and disclose the policy or a summary of that policy.
Refer page 10 Complied
3.3 Disclose in each Annual Report the measurable objectives for achieving gender diversity set by the Board in accordance with the Diversity Policy and progress towards achieving them.
Refer page 10 Complied
3.4 Disclose in each Annual Report the proportion of women employees in the whole organisation, women in senior executive positions and women on the Board.
Refer page 10 Complied
3.5 Provide the information in the Guide to reporting on Principle 3. Refer page 9 Complied
4 RETAIL FOOD GROUP LIMITED ANNUAL REPORT 30 JUNE 2012
CORPORATEGOVERNANCESTATEMENT
Principle Number Best Practice Recommendation Compliance
Reason For Non-Compliance
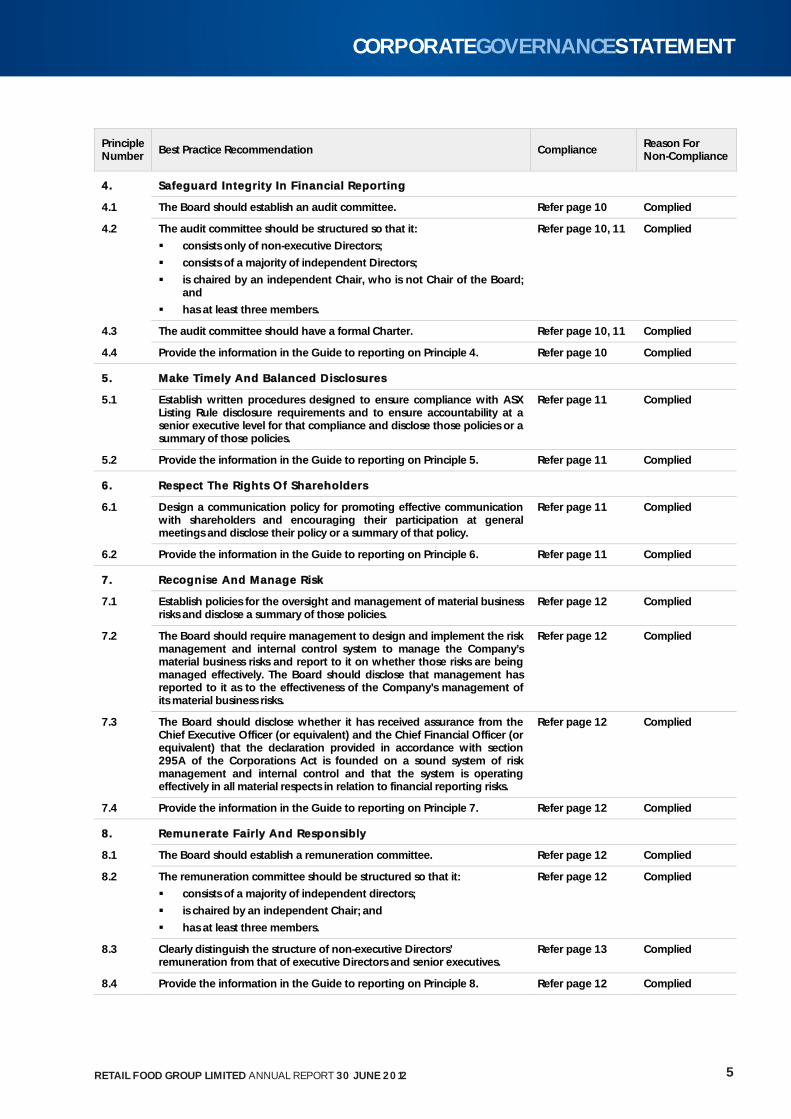
44. SSafeguard Integrity In Financial Reporting
4.1 The Board should establish an audit committee. Refer page 10 Complied
4.2 The audit committee should be structured so that it:
consists only of non-executive Directors;
consists of a majority of independent Directors;
is chaired by an independent Chair, who is not Chair of the Board; and
has at least three members.
Refer page 10, 11 Complied
4.3 The audit committee should have a formal Charter. Refer page 10, 11 Complied
4.4 Provide the information in the Guide to reporting on Principle 4. Refer page 10 Complied
55. MMake Timely And Balanced Disclosures
5.1 Establish written procedures designed to ensure compliance with ASX Listing Rule disclosure requirements and to ensure accountability at a senior executive level for that compliance and disclose those policies or a summary of those policies.
Refer page 11 Complied
5.2 Provide the information in the Guide to reporting on Principle 5. Refer page 11 Complied
66. RRespect The Rights Of Shareholders
6.1 Design a communication policy for promoting effective communication with shareholders and encouraging their participation at general meetings and disclose their policy or a summary of that policy.
Refer page 11 Complied
6.2 Provide the information in the Guide to reporting on Principle 6. Refer page 11 Complied
77. RRecognise And Manage Risk
7.1 Establish policies for the oversight and management of material business risks and disclose a summary of those policies.
Refer page 12 Complied
7.2 The Board should require management to design and implement the risk management and internal control system to manage the Company’s material business risks and report to it on whether those risks are being managed effectively. The Board should disclose that management has reported to it as to the effectiveness of the Company’s management of its material business risks.
Refer page 12 Complied
7.3 The Board should disclose whether it has received assurance from the Chief Executive Officer (or equivalent) and the Chief Financial Officer (or equivalent) that the declaration provided in accordance with section 295A of the Corporations Act is founded on a sound system of risk management and internal control and that the system is operating effectively in all material respects in relation to financial reporting risks.
Refer page 12 Complied
7.4 Provide the information in the Guide to reporting on Principle 7. Refer page 12 Complied
88. RRemunerate Fairly And RResponsibly
8.1 The Board should establish a remuneration committee. Refer page 12 Complied
8.2 The remuneration committee should be structured so that it:
consists of a majority of independent directors;
is chaired by an independent Chair; and
has at least three members.
Refer page 12 Complied
8.3 Clearly distinguish the structure of non-executive Directors’ remuneration from that of executive Directors and senior executives.
Refer page 13 Complied
8.4 Provide the information in the Guide to reporting on Principle 8. Refer page 12 Complied
5RETAIL FOOD GROUP LIMITED ANNUAL REPORT 30 JUNE 2012
CORPORATEGOVERNANCESTATEMENT
The Board has in place Corporate Governance practices that it considers to be the most appropriate for the Company and its controlled entities (together referred to as the ‘Group’ in this statement). The Board continues to review its governance framework and practices to ensure they meet the interests of shareholders. This statement describes the main Corporate Governance practices in place during the year. The Board maintains a comprehensive set of policies to assist in the discharge of its Corporate Governance responsibilities, including:
Code of Conduct;
Board Charter;
Board Nomination Charter;
Audit & Risk Compliance Committee Charter;
Remuneration Committee Charter;
Standing Rules of Committee Charter;
Continuous Disclosure Policy;
Remuneration Policy;
Appointment of Directors Policy;
Share Trading Policy; and
Shareholder Communications Policy. Copies are available from the Company’s registered office or may be downloaded from the Company’s website under the Investor Media section. PPrinciple 1: Lay Solid Foundations For Management And Oversight The Directors are responsible to the shareholders for promoting and managing the performance of the Group in both the short and longer term. Their focus is to enhance the interests of shareholders and other key stakeholders and to ensure the Group is properly managed. The responsibilities of the Board include:
chart strategy and set financial targets for the Group;
monitor the implementation and execution of strategy and performance against financial targets;
appoint and oversee the performance of senior management; and
to take and fulfill an effective leadership role in relation to the Group. The Board has reserved to itself, in addition to those matters reserved to it by law, the following matters and all power and authority in relation to those matters:
composition of the Board itself (including appointment and retirement or removal of Directors);
oversight of the Group including its control and accountability systems;
appointing and removing the Chief Executive Officer;
ratifying the appointment and, where appropriate, the removal of the Chief Financial Officer and the Company Secretary;
reviewing and overseeing the operation of systems of risk management and internal compliance and control, codes of ethics and conduct, and legal and regulatory compliance;
input into and final approval of management’s development of corporate strategy and performance objectives;
monitoring senior management’s performance and implementation of strategy, and ensuring appropriate resources are available;
approving and monitoring the progress of major capital expenditure, capital management, acquisitions and divestitures;
approving and monitoring financial and other reporting;
performance of investment and treasury functions;
monitoring industry developments relevant to the Group and its business;
developing suitable key indicators of financial performance for the Group and its business;
the overall corporate governance of the Group including strategic direction, establishing goals for management and monitoring the achievement of these goals; and
oversight of committees. The Board has delegated specific responsibilities to various Board Committees who act, subject to the terms of their respective charters, in an advisory capacity subject to the oversight of the Board. Day to day management of the Group’s affairs and the implementation of the corporate strategy and policy initiatives are formally delegated by the Board to the Chief Executive Officer and senior management of the Group. These delegations are reviewed as appropriate.
6 RETAIL FOOD GROUP LIMITED ANNUAL REPORT 30 JUNE 2012
CORPORATEGOVERNANCESTATEMENT
PPrinciple 1: Lay Solid Foundations For Management And Oversight (cont.) The Board generally meets on a monthly basis. On an annual basis, the Board sets financial and non-financial performance targets for the Chief Executive Officer and senior management and performance is assessed against these performance targets. A performance assessment for the Chief Executive Officer and senior management last took place in August 2012. Principle 2: Structure The Board To Add Value The Board operates in accordance with the broad principles set out in its charter. The charter details the Board’s composition and responsibilities. Board Composit ion The composition of the Board is determined according to the following principles:
the Board must comprise members with a broad range of experience, expertise, skills and contacts relevant to the Group and its business;
there must be at least four Directors;
the number of Directors may be increased where the Board considers that additional expertise is required in specific areas or when an outstanding candidate is identified;
the Chairman must be a non-executive Director who is also independent; and
at least half of the Board must be non-executive Directors at least two of whom must also be independent. Directors’ Independence The Board has adopted specific principles in relation to Directors’ independence. These state that when determining independence, a Director must be a non-executive and the Board should consider whether the Director:
is a substantial shareholder of the Company or an officer of, or otherwise associated directly with, a substantial shareholder of the Company;
is employed, or has previously been employed in an executive capacity by the Company, and there has not been a period of at least three (3) years between ceasing such employment and serving on the Board;
has within the last three (3) years been a principal of a professional advisor or a significant consultant to the Group, or an employee significantly associated with the service provided except in circumstances where the advisor might be considered to be independent notwithstanding their position as a professional advisor due to the fact that fees payable by the Group to the advisor’s firm represent an insignificant component of its overall revenue;
is a significant supplier or customer of the Group, or an officer of or otherwise associated directly or indirectly with a significant supplier or customer of the Group;
has a material contractual relationship with the Group other than as a Director;
is free from any interest and any business or other relationship, which could, or could reasonably be perceived to, materially interfere with the Director’s ability to act in the best interests of the Group; and
has served on the Board for a period which could, or could reasonably be perceived to, materially interfere with the Director’s ability to act in the best interests of the Group.
The Board assesses independence each year. To enable this process, the Directors must provide all information that may be relevant to the assessment. Board Members The names, skills and experience of the Directors in office at the date of this Statement, and the period of office of each Director, are set out in the Directors’ Report. At the date of signing the Directors’ Report, the Board comprised one executive Director and four non-executive Directors (including the Chairman). The four non-executive Directors have no relationships adversely affecting independence and so are deemed independent under the principles set out above. Mr Anthony (Tony) Alford, an executive Director, is a substantial shareholder of the Company and accordingly is not considered to be independent of the Group based on the ASX guidelines. Mr Alford has a long association with Retail Food Group and the Board considers that it is in the best interests of all shareholders to have a Director with Mr Alford’s industry and business expertise and Group history as a member of the Board. Term Of Office The Company’s Constitution requires that one third (or the nearest number thereto but not less than one third) of the Directors, other than the Managing Director, must retire from office at each Annual General Meeting of the Company. The Director/s who must retire is that Director/s who has been in office longest since last being elected. Director/s retiring by rotation are eligible for re-election.
7RETAIL FOOD GROUP LIMITED ANNUAL REPORT 30 JUNE 2012
CORPORATEGOVERNANCESTATEMENT
CChairman And Chief Executive Officer The Chairman is responsible for leading the Board, ensuring Directors are properly briefed in all matters relevant to their role and responsibilities, facilitating Board discussions and managing the Board’s relationship with the Group’s senior management. In accepting the position, the Chairman has acknowledged that it will require significant time commitment and has confirmed that other positions will not hinder his effective performance in the role of the Chairman. The Chief Executive Officer is responsible for implementing Group strategies and policies. The Board charter specifies that these (the role of the Chairman and Chief Executive Officer) are separate roles to be undertaken by separate people. Induction The induction provided to new Directors enables them to actively participate in Board decision-making as soon as possible. It ensures that they have a full understanding of the Group’s financial position, strategies, operations and risk management policies. It also explains the respective rights, duties, responsibilities and roles of the Board. Commitment The Board held thirteen Board meetings during FY12. Non-executive Directors are expected to spend at least 20 days a year preparing for and attending Board and Committee meetings and associated activities. The number of meetings of the Company’s Board of Directors and each Board Committee held during the year ended 30 June 2012, and the number of meetings attended by each Director is disclosed on page 15. The commitments of non-executive Directors are considered by the Nominations Committee prior to the Director’s appointment to the Board and are reviewed each year as part of the annual performance assessment. Prior to appointment or being submitted for re-election, each non-executive Director is required to specifically acknowledge that they have and will continue to have the time available to discharge their responsibilities to the Company. Independent Professional Advice Directors have the right, in connection with their duties and responsibilities, to seek independent professional advice at the Group’s expense. Prior approval of the Chairman is required, but this will not be unreasonably withheld. The advice obtained must be made available to all Board members in due course, where appropriate. Board Performance The Board undertakes an annual self assessment of the performance of the Board as a whole, its Committees, the Chairman, individual Directors and governance processes that support Board work. Performance of individual Directors is assessed against a range of dimensions including the ability of the Director to consistently create shareholder value, to contribute to the development of strategies and risk identification, to provide clarity of direction to senior management, to listen to the views of fellow Directors and members of management and key third party stakeholders and to provide the time commitment to ensure the discharge of duties and obligations to the Group. Board Committees The Board has established a number of committees to assist in the execution of its duties and to allow detailed consideration of complex issues. Current committees of the Board are the Nominations, Remuneration and Audit and Risk Management Committees. The Nominations, Remuneration and Audit and Risk Management Committees are all entirely comprised of non-executive Directors. Each Committee has its own written charter setting out its role and responsibilities, composition, structure, membership requirements and the manner in which the committee is to operate. All of these charters are reviewed on an annual basis. All matters determined by the committees are submitted to the Board as recommendations for Board consideration. Nominations Committee The Board has a Nominations Committee to assist the Board and make recommendations to it in relation to the appointment of new Directors (both executive and non-executive) and senior management. The Nominations Committee consists of the following Directors:
Mr Bruce Hancox (Committee Chairman);
Mr Colin Archer; and
Ms Jessica Buchanan. 8 RETAIL FOOD GROUP LIMITED ANNUAL REPORT 30 JUNE 2012
CORPORATEGOVERNANCESTATEMENT
NNominations Committee (cont.)
Details of these Directors’ attendance at Nominations Committee meetings are set out in the Directors’ Report on page 15 Functions performed by the Committee include the following:
developing of suitable criteria (as regards experience, expertise, skills, qualifications, diversity, contacts or other qualities) for Board candidates;
identifying individuals who, by virtue of their experience, expertise, skills, qualifications, contacts or other qualities, are suitable candidates for appointment to the Board or to any relevant management position;
recommending individuals accordingly for consideration by the Board;
establishing procedures, for recommendation to the Chairman, for the proper oversight of the Board and senior management; and
ensuring that the performance of each Director, and of all members of senior management, is reviewed and assessed each year in accordance with procedures adopted by the Board;
When a new Director is to be appointed, the Committee reviews the range of skills, experience and expertise on the Board, identifies its needs and prepares a short-list of candidates with appropriate skills and experience. Where necessary, advice may be sought from independent search consultants. The Board then appoints the most suitable candidate who must submit themselves to shareholders for election at the first Annual General Meeting following their appointment. New Directors are provided with a letter of appointment setting out the Company’s expectations including involvement with committee work, their responsibilities, remuneration, including superannuation and expenses, requirement to disclose their interests and any matters which affect the Director’s independence. New Directors are also provided with all relevant policies including the Company’s share trading policy, a copy of the Company’s Constitution, organisational chart and details of indemnity and insurance arrangements. A formal induction program which covers the operation of the Board and its Committees and financial, strategic, operations and risk management issues is also provided to ensure that Directors have significant knowledge about the Group and the industry within which it operates. New Directors are advised of the time commitment required of them in order to appropriately discharge their responsibilities as a Director of the Company. Directors are required to confirm that they have sufficient time to meet this requirement. The Committee also assumes responsibility for overseeing management succession planning, including the implementation of appropriate executive development programmes and ensuring adequate arrangements are in place, so that appropriate candidates are recruited for later promotion to senior positions. The Committee has an advisory role, consistent with its purpose of assisting the Board in relation to the matters with which it is charged with responsibility, and does not have any power to commit the Board to any recommendation or decision made by it but may nevertheless consult independent external expert advisers as it may consider appropriate for the proper performance of its function and charge the costs to the Group. Principle 3: Promote Ethical And Responsible Decision-Making Code Of Conduct The Company has developed a Code of Conduct (the Code) which has been fully endorsed by the Board and applies to all Directors and employees. The Code is regularly reviewed by the Board and updated as necessary. The Code draws together all of the Group’s practices and policies. The Code reflects the Group’s values of:
respect for others;
honesty, integrity and accountability;
leadership and teamwork;
diligence and care in the performance of duties; and
an acknowledgement of the service orientated nature of the Group’s core franchising business. It reinforces the need for Directors, employees, consultants and all other representatives of the Group to always act in good faith, in the Group’s best interests and in accordance with all applicable policies, procedures, laws and regulations relevant to the regions in which the Group operates. Trading In Company Securit ies By Directors, Senior Management And Employees The Company has a detailed Trading Policy which regulates dealings by Directors, senior management and employees in shares, options and other securities issued in the Company. The Trading Policy provides that Restricted Persons (including the Directors and senior management) are normally precluded from trading in the Company’s securities during Closed Periods. Under the Trading Policy, the Closed Periods are the period from 1 January until publication of the Company’s Half Year Report and the period from 1 July until publication of the Company’s Preliminary Final Report. The Trading Policy also imposes an over-riding restriction whereby officers and employees may not trade in the Company’s securities whilst in possession of price sensitive information.
9RETAIL FOOD GROUP LIMITED ANNUAL REPORT 30 JUNE 2012
CORPORATEGOVERNANCESTATEMENT
TTrading In Company Securit ies By Directors, Senior Management And Employees (cont.)
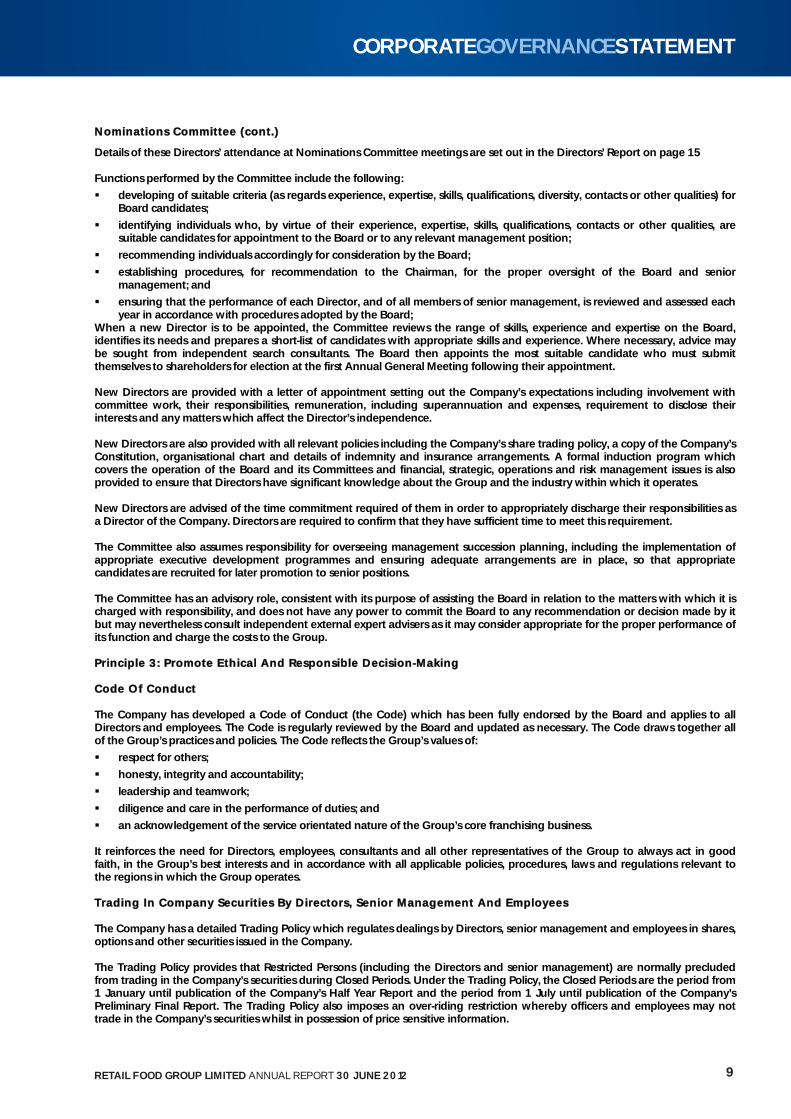
Trading in the Company’s securities during Closed Periods may be authorised under the Trading Policy where the Restricted Person is in severe financial hardship or there are other exceptional circumstances provided that the Restricted Person is not in possession of price sensitive information, such trading would not otherwise be contrary to law and such trading does not relate to financial products issued or created over or in respect of the Company’s securities. There are also limited situations where trading in the Company’s securities is not subject to the Trading Policy (for example, exercising options granted under an employee incentive scheme). Diversity policy The Board is committed to having an appropriate blend of diversity at all levels of employment within the Company. To achieve this objective, the Company has established employment, reward and recognition policies with reference and adherence to relevant provisions of the Fair Work Act 2009 and the Equal Opportunity Act 2010. Appointment or promotion to positions vacant within the Company are based on merit, without regard to the gender, age, cultural background or ethnicity of candidates. The following table shows the proportional representation of women at various levels within the Company as at 30 June 2012:
Women % Gender representation
Actual
Board representation 20%
Key management personnel representation 17%
Group representation 44%
PPrinciple 4: Safeguard Integrity In Financial Reporting Audit And Risk Management Committee The Board has an Audit and Risk Management Committee to advise on the establishment and maintenance of a framework of internal control and appropriate ethical standards for the management of the Company. The Audit and Risk Management Committee consists of the following Directors:
Mr Colin Archer (Committee Chairman);
Mr Bruce Hancox; and
Mr Anthony Williams. Details of these Directors’ qualifications and attendance at Audit and Risk Management Committee meetings are set out in the Directors’ Report on pages 14 and 15 respectively. All members of the Audit and Risk Management Committee are financially literate and have an appropriate understanding of the Group’s business. The Audit and Risk Management Committee has a formal charter and internal control framework. The Committee charter requires that Committee meetings are convened at least four times each year. The Committee has responsibility for the following:
ensuring an appropriate Board and Committee structure is in place so as to facilitate a proper review function by the Board;
monitoring the establishment of an appropriate internal control framework, including information systems, and its operation and considering enhancements;
monitoring corporate risk assessment and compliance with internal controls;
overseeing business continuity planning and risk mitigation arrangements;
assessing the objectivity and performance of the internal audit function and considering enhancements;
reviewing reports on any material defalcations, frauds and thefts from the Group;
reviewing reports on the adequacy of insurance coverage;
reviewing financial statements and other financial information distributed externally;
preparing and recommending for approval by the Board the corporate governance statement for inclusion in the annual report or any other public document;
reviewing external audit reports to ensure that, where major deficiencies or breakdowns in controls or procedures have been identified, appropriate and prompt remedial action is taken by management; and
reviewing and monitoring compliance with the Code of Ethics.
10 RETAIL FOOD GROUP LIMITED ANNUAL REPORT 30 JUNE 2012
CORPORATEGOVERNANCESTATEMENT
AAudit And Risk Management Committee (cont.) In fulfilling its responsibilities, the Audit and Risk Management Committee:
receives regular reports from management and the external auditor;
meets with the external auditor at least twice a year, or more frequently if necessary;
reviews any significant disagreements between the external auditor and management irrespective of whether they have been resolved; and
meets separately with the external auditor at least twice a year without the presence of management. The Audit and Risk Management Committee has authority, within the scope of its responsibilities, to seek any information it requires from any employee or external party. The Audit and Risk Management Committee reports to, and makes recommendations to the Board in relation to each of its functions. The Audit and Risk Management Committee charter is available on the Group’s corporate website. External Auditor The Company and Audit and Risk Management Committee policy is to appoint an external auditor who clearly demonstrates quality and independence. The performance of the external auditor is reviewed annually. Deloitte Touche Tohmatsu (Deloitte) was appointed as the external auditor in 2003. It is Deloitte’s policy to rotate audit engagement partners on listed companies at least every five years, and in accordance with that policy a new audit engagement partner was introduced for the year ended 30 June 2012. An analysis of fees paid to the external auditor, including a break-down of fees for non-audit services, is provided in the notes to the financial statements. It is the policy of the external auditor to provide an annual declaration of their independence to the Audit and Risk Management Committee. The external auditor is requested to attend the Annual General Meeting and be available to answer shareholder questions about the conduct of the audit and the preparation and content of the audit report. Principle 5: Make Timely And Balanced Disclosures The Group has an established policy and procedure for timely disclosure of material information concerning the Group. This includes internal reporting procedures to ensure that any required market announcements are reported to the Company Secretary in a timely manner. The Company Secretary has been nominated as the person responsible for communication with the ASX. This role includes co-ordinating information disclosure to the ASX, analysts, brokers, shareholders, the media and the public. Following confirmation from the ASX that such information has been released by it. All information disclosed to the ASX is posted on the Group’s corporate website as soon as it is disclosed to the ASX. When analysts are briefed following half year and full year results announcements, the material used in the presentations is released to the ASX prior to the commencement of the briefing. This information is also posted on the Group’s corporate website. Procedures have also been established for reviewing whether any price sensitive information has been inadvertently disclosed and, if so, this information is also immediately released to the market. The Group is committed to ensuring that all stakeholders and the market are provided with relevant and accurate information regarding its activities in a timely manner. A copy of the Continuous Disclosure Policy is available on the Group’s corporate website. Principle 6: Respect The Rights Of Shareholders The Group aims to keep shareholders informed of the Group’s performance and all major developments on an ongoing manner. Information is communicated to shareholders through:
the Annual Report and Financial Reports (including the Full Year Financial Report, the Preliminary Final Report, and the Half-Year Financial Report) which are published on the Group’s corporate website and distributed to shareholders where nominated;
the Annual General Meeting, and any other formally convened Company meetings; and
all other information released to the ASX is posted to the Group’s corporate website. The Group’s corporate website maintains, at a minimum, information about the last three years’ press releases or announcements. A copy of the Shareholder Communications Policy is available on the Group’s corporate website.
11RETAIL FOOD GROUP LIMITED ANNUAL REPORT 30 JUNE 2012
CORPORATEGOVERNANCESTATEMENT
PPrinciple 7: Recognise And Manage Risk The Board, through the Audit and Risk Management Committee, is responsible for ensuring the adequacy of the Group’s risk management and compliance framework and system of internal controls and for regularly reviewing its effectiveness. Considerable importance is placed on maintaining a strong control environment. There is an organisation structure with clearly drawn lines of accountability and delegation of authority. The Board actively promotes a culture of quality and integrity. The Group has implemented a risk management system based on ASX Corporate Governance Principles and Recommendations. The framework is based around the following risk activities:
risk identification: identify all significant foreseeable risks associated with business activities in a timely and consistent manner;
risk evaluation: evaluate risks using an agreed risk assessment criteria;
risk treatment/mitigation: develop mitigation plans for risk areas where the residual risk is greater than tolerable risk levels; and
risk monitoring and reporting: report risk management activities and risk specific information to appropriate levels of management in a timely manner.
The Chief Executive Officer and Chief Financial Officer, and other senior management are responsible for identifying, evaluating and monitoring risk in accordance with the risk management framework. Senior management are responsible for the accuracy and validity of risk information reported to the Board and also for ensuring clear communication of the Board and senior management’s position on risk throughout the Group. In particular, at the Board and senior management strategy planning sessions held throughout the year, the Chief Executive Officer and senior management review and identify key business and financial risks which could prevent the Group from achieving its objectives. Additionally, a formal risk assessment process is part of each major capital acquisition with ongoing reviews undertaken of major business acquisitions, major capital expenditures or significant business initiatives. Certif ication Of Financial Reports The Chief Executive Officer and Chief Financial Officer state in writing to the Board each reporting period that:
the Company’s financial reports are complete and present a true and fair view, in all material respects, of the financial condition and operational results of the Company and are in accordance with the relevant Accounting Standards; and,
the above statement is founded on a sound system of risk management and internal compliance and control which implements the policies adopted by the Board and that the Company’s risk management and internal compliance and control is operating efficiently and effectively in all material respects.
Principle 8: Remunerate Fairly And Responsibly Remuneration Committee The Board has a Remuneration Committee to assist the Board and report to it on remuneration and issues relevant to remuneration policies and practices including those for senior management and non-executive Directors. Its current members are:
Mr Bruce Hancox (Committee Chairman);
Mr Colin Archer; and
Ms Jessica Buchanan. Details of these Directors’ attendance at Remuneration Committee meetings are set out in the Directors’ Report on page 15. The Committee has responsibility for the following:
reviewing and evaluating market practices and trends in relation to remuneration relevant to the Group;
reviewing and making recommendations to the Board in relation to the Group’s remuneration policies;
reviewing and making recommendations to the Board in relation to the Group’s remuneration practices;
overseeing the performance of the Chief Executive Officer and Chief Financial Officer and other members of senior management and non-executive Directors;
reviewing and making recommendations to the Board in relation to the remuneration of the Chief Executive Officer and Chief Financial Officer and other members of senior management and of non-executive Directors; and
preparing for the Board any report that may be required under applicable legal or regulatory requirements in relation to remuneration matters.
The Committee reviews and sets key performance indicators (KPI’s) relating to financial and non-financial targets for senior management at the commencement of each financial year. The Remuneration Committee reports to, and makes recommendations to the Board in relation to each of its functions. 12 RETAIL FOOD GROUP LIMITED ANNUAL REPORT 30 JUNE 2012
CORPORATEGOVERNANCESTATEMENT
RRemuneration Committee (cont.) Further information of Directors’ and executives’ remuneration, including principles used to determine remuneration, is set out in the Directors’ Report under the heading “Remuneration Report”. The Remuneration Committee charter is available on the Group’s corporate website. Structure Of Remuneration Details of the nature and amount of each element of remuneration for Directors and senior management of the Group are set out in the “Remuneration Report” section of the Directors’ Report. Remuneration for executive Directors and senior management are appropriately structured for each executive based on the duties allocated to them, the size of the Group’s business and the industry in which the Group operates. Service contracts outline the components of compensation paid to the executives (including executive Directors), but do not prescribe how compensation levels are modified year to year. Compensation levels are reviewed each year to take into account cost-of-living changes, any change in the scope of the role performed by the executive and any changes required to meet the principles of the Remuneration Policy. Fees and payments to non-executive Directors reflect the demands which are made on, and the responsibilities of, the Directors. Non-executive Directors’ fees and payments are reviewed annually by the Board. Non-executive Director remuneration takes the form of a set fee plus superannuation entitlements, however, may comprise other benefits or rewards in certain circumstances. The maximum aggregate amount of fees that can be paid to non-executive Directors is subject to approval by shareholders at the Annual General Meeting. The maximum amount which has been approved by the Company’s shareholders for payment to non-executive Directors is $400,000. Fees for non-executive Directors are not linked to the performance of the Group. However, to align Directors’ interests with shareholder interests, the Directors are encouraged to hold shares in the Company.
13RETAIL FOOD GROUP LIMITED ANNUAL REPORT 30 JUNE 2012
CORPORATEGOVERNANCESTATEMENT
The Directors of Retail Food Group Limited (referred to hereafter as the Company) submit herewith the annual financial report of the Company for the financial year ended 30 June 2012. In order to comply with the provisions of the Corporations Act 2001, the Directors report as follows: IInformation About The Directors And Senior Management The names and particulars of the Directors of the Company during or since the end of the financial year are:
Name Particulars
Mr Bruce Hancox Independent non-executive Chairman, joined the Board 14 December 2007. Mr Hancox has over 35 years corporate experience in manufacturing and retailing including 19 years with Brierley Investments Limited where he occupied the position of Chief Executive Officer and Chairman of the Board. He is a member of the Company’s Nominations, Remuneration and Audit and Risk Management Committees. Mr Hancox was appointed as Chairman to the Board on 20 September 2011.
Mr Anthony (Tony) Alford Chief Executive Officer and Managing Director, Bachelor of Business (Accountancy), CPA, CTA. Mr Alford joined the Board on 28 October 2003. He has been an accountant in public practice for in excess of 20 years. Mr Alford commenced his involvement with Retail Food Group in 1994 in an advisory role, thereafter becoming the Group Financial Controller. In December 1999, he was appointed Managing Director of the Group.
Mr Colin Archer Independent non-executive Director, Bachelor of Economics, CA, joined the Board on 12 April 2006. He has been an accountant in public practice for in excess of 25 years. Mr Archer is a Chartered Accountant, registered auditor and tax agent. He specialises in management and letting rights, property trusts, mergers and acquisitions and corporate governance. Mr Archer is Chairman of the Audit and Risk Management Committee and a member of the Nominations and Remuneration Committees. Mr Archer was re-elected to the Board at the Company’s AGM held on 30 November 2010 following retirement by rotation.
Ms Jessica Buchanan Independent non-executive Director, joined the Board 29 May 2012, Ms Buchanan has over 13 years experience in branding, marketing and advertising. Having commenced her career in the advertising industry working with multi-national agencies such as Wunderman, Young & Rubicam Mattingly and EHS Brann (UK), Ms Buchanan also managed campaigns for various blue chip companies including Ericsson, Tabcorp, Du Pont, Cadbury Schweppes , the Australian Defence Force, British Gas and BMW. Ms Buchanan is a member of the Company’s Nominations and Remuneration Committees.
Mr Anthony Williams Independent non-executive Director, joined the Board 29 May 2012. Mr Williams first became involved in retail food in the early 1970’s when he accepted an invitation to undertake Woolworths management training specialising in cafeteria services. Thereafter, for 15 years he developed, owned and franchised numerous QSR chicken concepts in Western Australia and Queensland. Mr Williams is a founder of Retail Food Group and a former managing director of the Group from 1992 to 1999. Mr Williams is a member of the Audit and Risk Management Committee.
Mr John Cowley Independent non-executive Chairman, joined the Board on 13 October 2005. Mr Cowley was a member of the Audit and Risk Management Committee, and Chairman of the Nominations and Remuneration Committees. Mr Cowley did not seek re-election as a director at the Company’s AGM of 25 November 2011 followng retirement by rotation.
Mr Nigel Nixon Corporate Counsel and Executive Director, Solicitor of the Supreme Court of Queensland and the Australian Capital Territory. Mr Nixon joined the Board on 29 November 2003. Mr Nixon resigned from the Board on 29 May 2012 in order to assume the position of Chief Operating Officer.
DDirectorships Of Other Listed Companies Directorships of other listed companies held by Directors in the 3 years immediately before the end of the financial year are as follows:
Name Company Period Of Directorship
Mr Colin Archer Oaks Hotels and Resorts Limited 24 April 2005 to 26 May 2011
Mr John Cowley Oaks Hotels and Resorts Limited 2 November 2005 to 26 May 2011
14 RETAIL FOOD GROUP LIMITED ANNUAL REPORT 30 JUNE 2012
DIRECTORS'REPORT
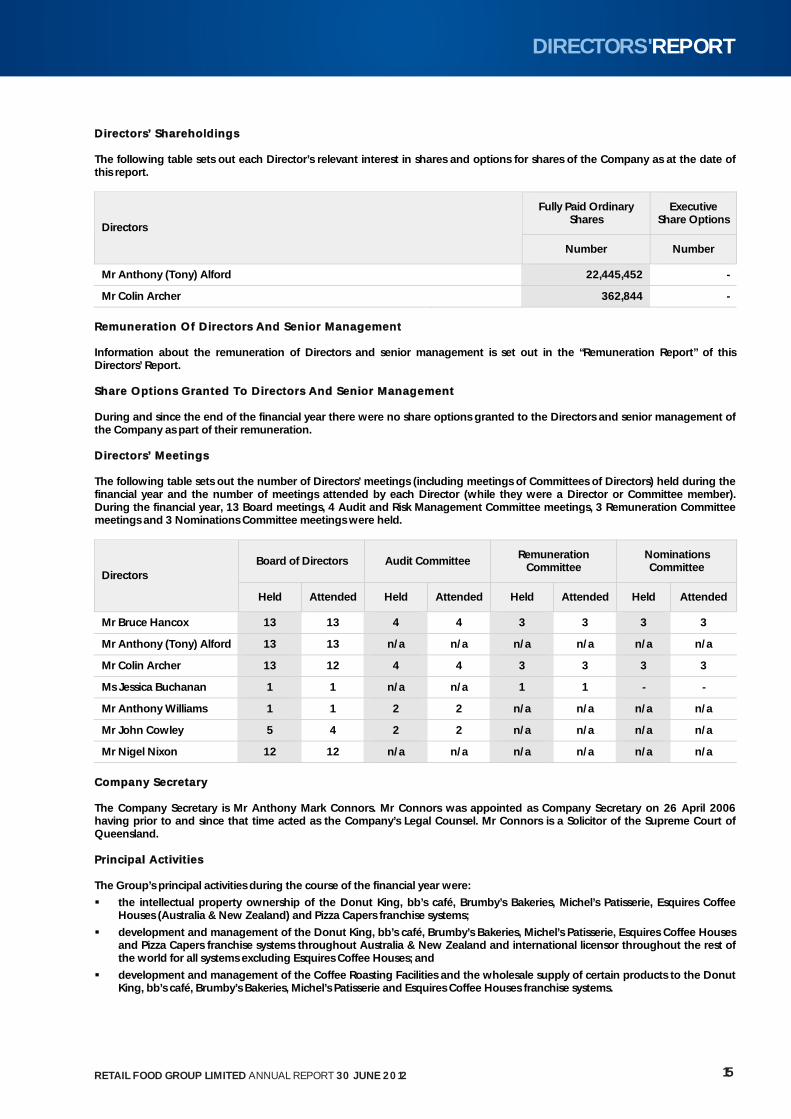
DDirectors’ Shareholdings The following table sets out each Director’s relevant interest in shares and options for shares of the Company as at the date of this report.
Fully Paid Ordinary Shares
Executive Share Options
Directors
Number Number
Mr Anthony (Tony) Alford 22,445,452 -
Mr Colin Archer 362,844 -
RRemuneration Of Directors And Senior Management Information about the remuneration of Directors and senior management is set out in the “Remuneration Report” of this Directors’ Report. Share Options Granted To Directors And Senior Management During and since the end of the financial year there were no share options granted to the Directors and senior management of the Company as part of their remuneration. Directors’ Meetings The following table sets out the number of Directors’ meetings (including meetings of Committees of Directors) held during the financial year and the number of meetings attended by each Director (while they were a Director or Committee member). During the financial year, 13 Board meetings, 4 Audit and Risk Management Committee meetings, 3 Remuneration Committee meetings and 3 Nominations Committee meetings were held.
Board of Directors Audit Committee Remuneration
Committee Nominations Committee
Directors Held Attended Held Attended Held Attended Held Attended
Mr Bruce Hancox 13 13 4 4 3 3 3 3
Mr Anthony (Tony) Alford 13 13 n/a n/a n/a n/a n/a n/a
Mr Colin Archer 13 12 4 4 3 3 3 3
Ms Jessica Buchanan 1 1 n/a n/a 1 1 - -
Mr Anthony Williams 1 1 2 2 n/a n/a n/a n/a
Mr John Cowley 5 4 2 2 n/a n/a n/a n/a
Mr Nigel Nixon 12 12 n/a n/a n/a n/a n/a n/a
CCompany Secretary The Company Secretary is Mr Anthony Mark Connors. Mr Connors was appointed as Company Secretary on 26 April 2006 having prior to and since that time acted as the Company’s Legal Counsel. Mr Connors is a Solicitor of the Supreme Court of Queensland. Principal Activit ies The Group’s principal activities during the course of the financial year were:
the intellectual property ownership of the Donut King, bb’s café, Brumby’s Bakeries, Michel’s Patisserie, Esquires Coffee Houses (Australia & New Zealand) and Pizza Capers franchise systems;
development and management of the Donut King, bb’s café, Brumby’s Bakeries, Michel’s Patisserie, Esquires Coffee Houses and Pizza Capers franchise systems throughout Australia & New Zealand and international licensor throughout the rest of the world for all systems excluding Esquires Coffee Houses; and
development and management of the Coffee Roasting Facilities and the wholesale supply of certain products to the Donut King, bb’s café, Brumby’s Bakeries, Michel’s Patisserie and Esquires Coffee Houses franchise systems.
15RETAIL FOOD GROUP LIMITED ANNUAL REPORT 30 JUNE 2012
DIRECTORS'REPORT
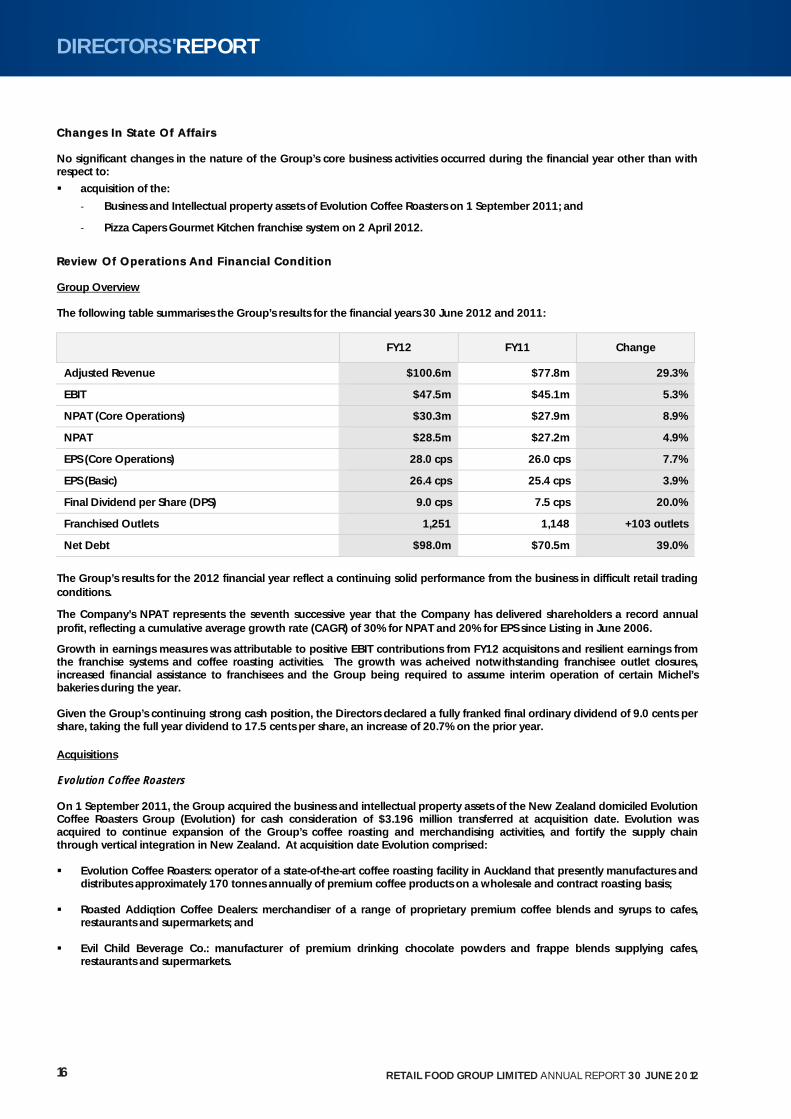
CChanges In State Of Affairs No significant changes in the nature of the Group’s core business activities occurred during the financial year other than with respect to:
acquisition of the:
Business and Intellectual property assets of Evolution Coffee Roasters on 1 September 2011; and
Pizza Capers Gourmet Kitchen franchise system on 2 April 2012.
Review Of Operations And Financial Condition Group Overview The following table summarises the Group’s results for the financial years 30 June 2012 and 2011:
FY12 FY11 Change
Adjusted Revenue $100.6m $77.8m 29.3%
EBIT $47.5m $45.1m 5.3%
NPAT (Core Operations) $30.3m $27.9m 8.9%
NPAT $28.5m $27.2m 4.9%
EPS (Core Operations) 28.0 cps 26.0 cps 7.7%
EPS (Basic) 26.4 cps 25.4 cps 3.9%
Final Dividend per Share (DPS) 9.0 cps 7.5 cps 20.0%
Franchised Outlets 1,251 1,148 +103 outlets
Net Debt $98.0m $70.5m 39.0%
The Group’s results for the 2012 financial year reflect a continuing solid performance from the business in difficult retail trading conditions.
The Company’s NPAT represents the seventh successive year that the Company has delivered shareholders a record annual profit, reflecting a cumulative average growth rate (CAGR) of 30% for NPAT and 20% for EPS since Listing in June 2006.
Growth in earnings measures was attributable to positive EBIT contributions from FY12 acquisitons and resilient earnings from the franchise systems and coffee roasting activities. The growth was acheived notwithstanding franchisee outlet closures, increased financial assistance to franchisees and the Group being required to assume interim operation of certain Michel’s bakeries during the year. Given the Group’s continuing strong cash position, the Directors declared a fully franked final ordinary dividend of 9.0 cents per share, taking the full year dividend to 17.5 cents per share, an increase of 20.7% on the prior year. Acquisitions Evolution Coffee Roasters On 1 September 2011, the Group acquired the business and intellectual property assets of the New Zealand domiciled Evolution Coffee Roasters Group (Evolution) for cash consideration of $3.196 million transferred at acquisition date. Evolution was acquired to continue expansion of the Group’s coffee roasting and merchandising activities, and fortify the supply chain through vertical integration in New Zealand. At acquisition date Evolution comprised: Evolution Coffee Roasters: operator of a state-of-the-art coffee roasting facility in Auckland that presently manufactures and
distributes approximately 170 tonnes annually of premium coffee products on a wholesale and contract roasting basis; Roasted Addiqtion Coffee Dealers: merchandiser of a range of proprietary premium coffee blends and syrups to cafes,
restaurants and supermarkets; and
Evil Child Beverage Co.: manufacturer of premium drinking chocolate powders and frappe blends supplying cafes, restaurants and supermarkets.
16 RETAIL FOOD GROUP LIMITED ANNUAL REPORT 30 JUNE 2012
DIRECTORS'REPORT
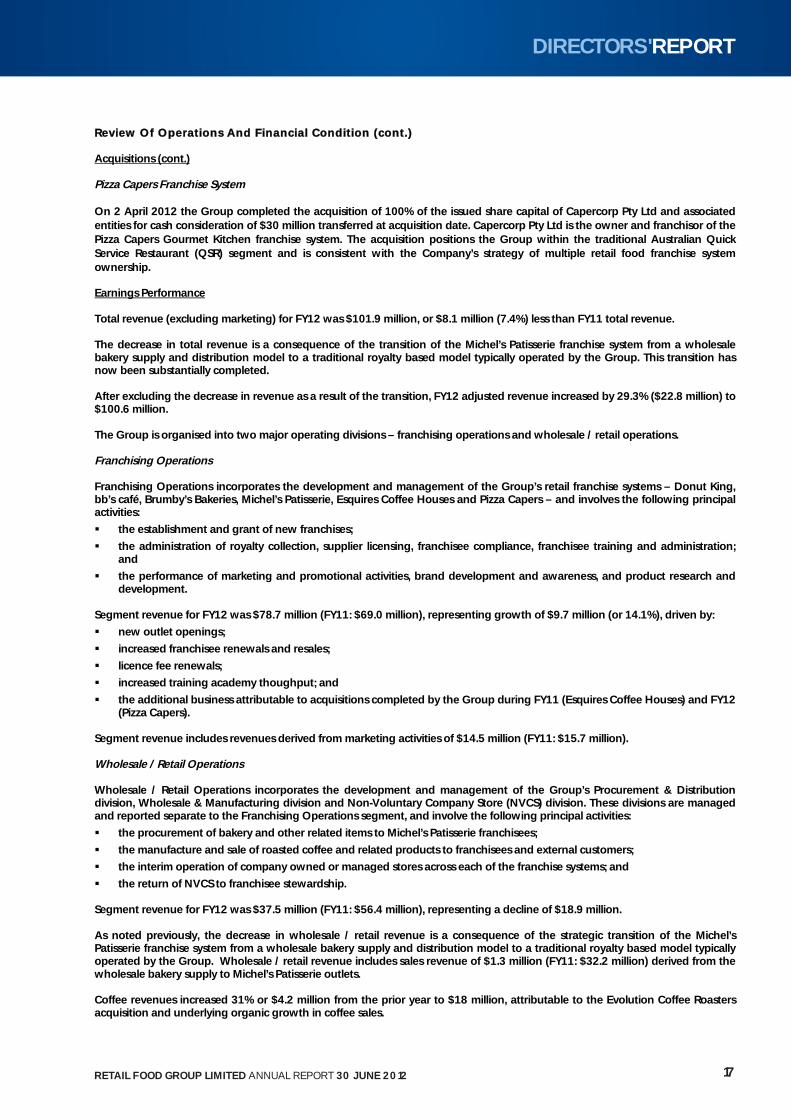
RReview Of Operations And Financial Condition (cont.) Acquisitions (cont.) Pizza Capers Franchise System On 2 April 2012 the Group completed the acquisition of 100% of the issued share capital of Capercorp Pty Ltd and associated entities for cash consideration of $30 million transferred at acquisition date. Capercorp Pty Ltd is the owner and franchisor of the Pizza Capers Gourmet Kitchen franchise system. The acquisition positions the Group within the traditional Australian Quick Service Restaurant (QSR) segment and is consistent with the Company’s strategy of multiple retail food franchise system ownership. Earnings Performance Total revenue (excluding marketing) for FY12 was $101.9 million, or $8.1 million (7.4%) less than FY11 total revenue. The decrease in total revenue is a consequence of the transition of the Michel’s Patisserie franchise system from a wholesale bakery supply and distribution model to a traditional royalty based model typically operated by the Group. This transition has now been substantially completed. After excluding the decrease in revenue as a result of the transition, FY12 adjusted revenue increased by 29.3% ($22.8 million) to $100.6 million. The Group is organised into two major operating divisions – franchising operations and wholesale / retail operations. Franchising Operations Franchising Operations incorporates the development and management of the Group’s retail franchise systems – Donut King, bb’s café, Brumby’s Bakeries, Michel’s Patisserie, Esquires Coffee Houses and Pizza Capers – and involves the following principal activities:
the establishment and grant of new franchises;
the administration of royalty collection, supplier licensing, franchisee compliance, franchisee training and administration; and
the performance of marketing and promotional activities, brand development and awareness, and product research and development.
Segment revenue for FY12 was $78.7 million (FY11: $69.0 million), representing growth of $9.7 million (or 14.1%), driven by:
new outlet openings;
increased franchisee renewals and resales;
licence fee renewals;
increased training academy thoughput; and
the additional business attributable to acquisitions completed by the Group during FY11 (Esquires Coffee Houses) and FY12 (Pizza Capers).
Segment revenue includes revenues derived from marketing activities of $14.5 million (FY11: $15.7 million). Wholesale / Retail Operations Wholesale / Retail Operations incorporates the development and management of the Group’s Procurement & Distribution division, Wholesale & Manufacturing division and Non-Voluntary Company Store (NVCS) division. These divisions are managed and reported separate to the Franchising Operations segment, and involve the following principal activities:
the procurement of bakery and other related items to Michel’s Patisserie franchisees;
the manufacture and sale of roasted coffee and related products to franchisees and external customers;
the interim operation of company owned or managed stores across each of the franchise systems; and
the return of NVCS to franchisee stewardship. Segment revenue for FY12 was $37.5 million (FY11: $56.4 million), representing a decline of $18.9 million. As noted previously, the decrease in wholesale / retail revenue is a consequence of the strategic transition of the Michel’s Patisserie franchise system from a wholesale bakery supply and distribution model to a traditional royalty based model typically operated by the Group. Wholesale / retail revenue includes sales revenue of $1.3 million (FY11: $32.2 million) derived from the wholesale bakery supply to Michel’s Patisserie outlets. Coffee revenues increased 31% or $4.2 million from the prior year to $18 million, attributable to the Evolution Coffee Roasters acquisition and underlying organic growth in coffee sales.
17RETAIL FOOD GROUP LIMITED ANNUAL REPORT 30 JUNE 2012
DIRECTORS'REPORT
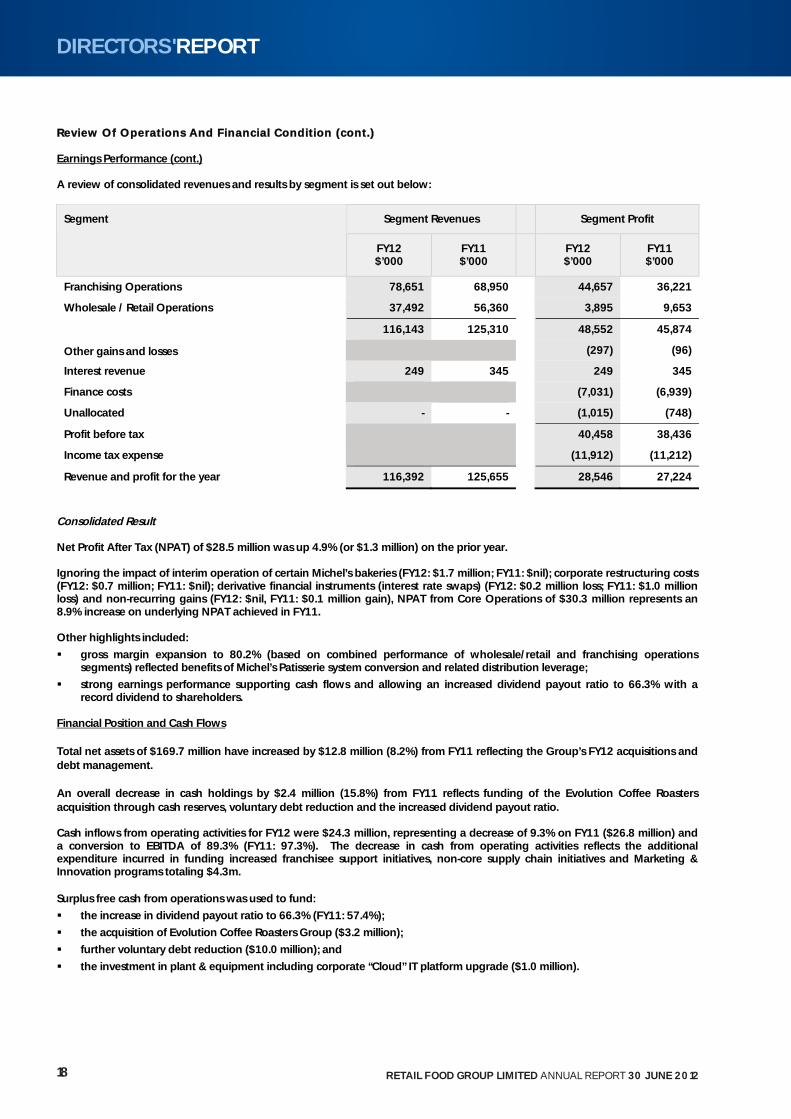
RReview Of Operations And Financial Condition (cont.) Earnings Performance (cont.) A review of consolidated revenues and results by segment is set out below:
Segment Revenues Segment Profit Segment
FY12 $’000
FY11 $’000
FY12 $’000
FY11 $’000
Franchising Operations 78,651 68,950 44,657 36,221
Wholesale / Retail Operations 37,492 56,360 3,895 9,653
116,143 125,310 48,552 45,874
Other gains and losses (297) (96)
Interest revenue 249 345 249 345
Finance costs (7,031) (6,939)
Unallocated - - (1,015) (748)
Profit before tax 40,458 38,436
Income tax expense (11,912) (11,212)
Revenue and profit for the year 116,392 125,655 28,546 27,224
Consolidated Result Net Profit After Tax (NPAT) of $28.5 million was up 4.9% (or $1.3 million) on the prior year. Ignoring the impact of interim operation of certain Michel’s bakeries (FY12: $1.7 million; FY11: $nil); corporate restructuring costs (FY12: $0.7 million; FY11: $nil); derivative financial instruments (interest rate swaps) (FY12: $0.2 million loss; FY11: $1.0 million loss) and non-recurring gains (FY12: $nil, FY11: $0.1 million gain), NPAT from Core Operations of $30.3 million represents an 8.9% increase on underlying NPAT achieved in FY11. Other highlights included:
gross margin expansion to 80.2% (based on combined performance of wholesale/retail and franchising operations segments) reflected benefits of Michel’s Patisserie system conversion and related distribution leverage;
strong earnings performance supporting cash flows and allowing an increased dividend payout ratio to 66.3% with a record dividend to shareholders.
Financial Position and Cash Flows Total net assets of $169.7 million have increased by $12.8 million (8.2%) from FY11 reflecting the Group’s FY12 acquisitions and debt management. An overall decrease in cash holdings by $2.4 million (15.8%) from FY11 reflects funding of the Evolution Coffee Roasters acquisition through cash reserves, voluntary debt reduction and the increased dividend payout ratio. Cash inflows from operating activities for FY12 were $24.3 million, representing a decrease of 9.3% on FY11 ($26.8 million) and a conversion to EBITDA of 89.3% (FY11: 97.3%). The decrease in cash from operating activities reflects the additional expenditure incurred in funding increased franchisee support initiatives, non-core supply chain initiatives and Marketing & Innovation programs totaling $4.3m. Surplus free cash from operations was used to fund:
the increase in dividend payout ratio to 66.3% (FY11: 57.4%);
the acquisition of Evolution Coffee Roasters Group ($3.2 million);
further voluntary debt reduction ($10.0 million); and
the investment in plant & equipment including corporate “Cloud” IT platform upgrade ($1.0 million).
18 RETAIL FOOD GROUP LIMITED ANNUAL REPORT 30 JUNE 2012
DIRECTORS'REPORT
RReview Of Operations And Financial Condition (cont.)
Debt Structure As at 30 June 2012, the Group’s total debt was $110.8 million. This amount is presented as a non-current liability in the Statement of Financial Position, reflecting its maturity date of 30 September 2014. The Group revised its senior debt facility with the National Australia Bank (NAB) during the year, key points of which are as follows:
senior debt revolving facility increased from $95m to $135m;
maturity date extended to 30 September 2014;
the loan structure allows for voluntary debt retirement and redraw;
increased leverage covenant ceiling to 2.5x (from 2.0x);
remaining covenants unchanged (interest cover and gearing); and
margin over BBSY 1.8% - 2.35%. The foregoing is consistent with the Group’s stated capital management policies. The Group continues to be totally compliant with lending covenants. The Group holds some interest rate swaps to manage interest rate exposure. At 30 June 2012, there was one swap remaining, expiring in December 2012, with a notional principal of $60.0 million and an average interest rate of 7.47%. In July 2008, the Group designated the interest rate swaps as hedges, reducing the ongoing volatility in the income statement. The aggregate fair value of the Group’s interest rate swap at 30 June 2012 was $1.2 million payable (FY11: $2.1 million payable). The Group’s leverage ratio of 2.12 times (FY11: 1.51) and gearing ratio of 36.6% (FY11: 30.1%) reflect the execution of an active capital management strategy throughout FY12. Performance Indicators New outlets for FY12 totalled 149 (FY11: 87) and were derived from:
110 by franchise system acquisition – during FY12, the Group acquired the Pizza Capers franchise system; and,
39 by organic growth. The FY12 organic new outlet growth was reflective of depressed shopping centre development, reduced premium site opportunities, tighter lending requirements among financiers and a constricted franchisee candidate market.
Franchise System Details
Donut King 10 new outlet commissionings (FY11: 23) and 11 outlet closures (FY11: 16) resulting in organic net system reduction during FY12 of 1 (FY11: net growth of 7).
As at 30 June 2012 there were 345 Donut King outlets operating in Australia and 19 Donut Kings outlets located internationally as follows:
• 15 in China • 2 in New Zealand • 1 in Papua New Guinea • 1 in Saudi Arabia
Brumby’s Bakeries 10 new outlet commissionings (FY11: 8) and 23 outlet closures (FY11: 11) resulting in Brumby’s Bakeries net system reduction during FY12 of 13 (FY11: 3), primarily attributable to Big Dad’s Pies outlet closures.
As at 30 June 2012 there were 320 Brumby’s Bakeries outlets operating in Australia, 15 Brumby’s Bakeries outlets operating in New Zealand and 1 Brumby’s Bakeries outlet operating in Papua New Guinea.
19RETAIL FOOD GROUP LIMITED ANNUAL REPORT 30 JUNE 2012
DIRECTORS'REPORT
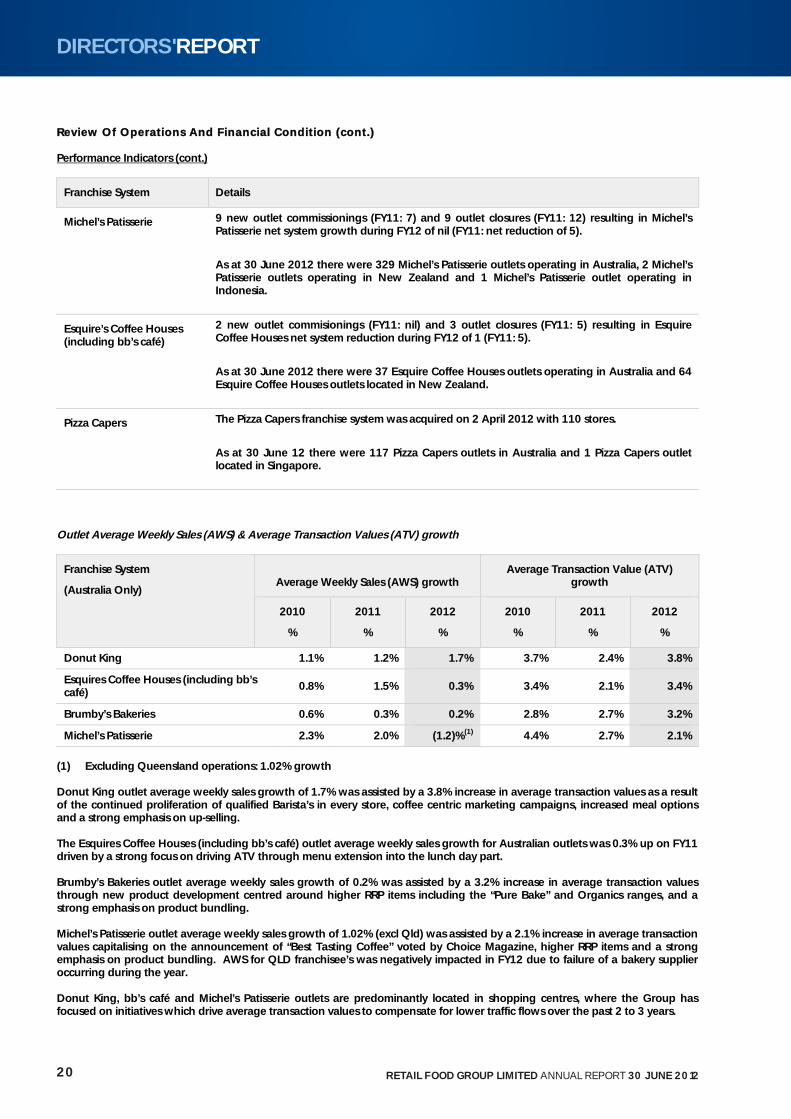
RReview Of Operations And Financial Condition (cont.) Performance Indicators (cont.)
Franchise System Details
Michel’s Patisserie 9 new outlet commissionings (FY11: 7) and 9 outlet closures (FY11: 12) resulting in Michel’s Patisserie net system growth during FY12 of nil (FY11: net reduction of 5).
As at 30 June 2012 there were 329 Michel’s Patisserie outlets operating in Australia, 2 Michel’s Patisserie outlets operating in New Zealand and 1 Michel’s Patisserie outlet operating in Indonesia.
Esquire’s Coffee Houses (including bb’s café)
2 new outlet commisionings (FY11: nil) and 3 outlet closures (FY11: 5) resulting in Esquire Coffee Houses net system reduction during FY12 of 1 (FY11: 5).
As at 30 June 2012 there were 37 Esquire Coffee Houses outlets operating in Australia and 64 Esquire Coffee Houses outlets located in New Zealand.
Pizza Capers The Pizza Capers franchise system was acquired on 2 April 2012 with 110 stores.
As at 30 June 12 there were 117 Pizza Capers outlets in Australia and 1 Pizza Capers outlet located in Singapore.
Outlet Average Weekly Sales (AWS) & Average Transaction Values (ATV) growth
Average Weekly Sales (AWS) growth Average Transaction Value (ATV)
growth Franchise System
(Australia Only)
2010
%
2011
%
2012
%
2010
%
2011
%
2012
%
Donut King 1.1% 1.2% 1.7% 3.7% 2.4% 3.8%
Esquires Coffee Houses (including bb’s café)
0.8% 1.5% 0.3% 3.4% 2.1% 3.4%
Brumby’s Bakeries 0.6% 0.3% 0.2% 2.8% 2.7% 3.2%
Michel’s Patisserie 2.3% 2.0% (1.2)%(1) 4.4% 2.7% 2.1%
(1) Excluding Queensland operations: 1.02% growth Donut King outlet average weekly sales growth of 1.7% was assisted by a 3.8% increase in average transaction values as a result of the continued proliferation of qualified Barista’s in every store, coffee centric marketing campaigns, increased meal options and a strong emphasis on up-selling. The Esquires Coffee Houses (including bb’s café) outlet average weekly sales growth for Australian outlets was 0.3% up on FY11 driven by a strong focus on driving ATV through menu extension into the lunch day part. Brumby’s Bakeries outlet average weekly sales growth of 0.2% was assisted by a 3.2% increase in average transaction values through new product development centred around higher RRP items including the “Pure Bake” and Organics ranges, and a strong emphasis on product bundling. Michel’s Patisserie outlet average weekly sales growth of 1.02% (excl Qld) was assisted by a 2.1% increase in average transaction values capitalising on the announcement of “Best Tasting Coffee” voted by Choice Magazine, higher RRP items and a strong emphasis on product bundling. AWS for QLD franchisee’s was negatively impacted in FY12 due to failure of a bakery supplier occurring during the year. Donut King, bb’s café and Michel’s Patisserie outlets are predominantly located in shopping centres, where the Group has focused on initiatives which drive average transaction values to compensate for lower traffic flows over the past 2 to 3 years.
20 RETAIL FOOD GROUP LIMITED ANNUAL REPORT 30 JUNE 2012
DIRECTORS'REPORT
RReview Of Operations And Financial Condition (cont.) Performance Indicators (cont.) Future Developments New Outlet Growth Total outlets for the Group as at 30 June 2013 are forecast to reflect a positive net organic increase of circa 25 to 30 stores based on forecast organic new store growth of 70-80 outlets, and forecast closures to be consistent with FY12 (circa 46). Organic store growth will be fortified by:
development of non-traditional site opportunities;
the growth profile of the Pizza Capers and Crust (acquisiton to be completed in FY13) franchise systems; and
international outlet commissioning emanating from granting of overseas territorial licences. Outlet Average Weekly Sales (AWS) and Average Transaction Values (ATV) The maintenance of positive weighted average AWS growth across all systems in FY12 continues to support the proposition that the Group’s franchise systems are resilient to significant changes in economic and retail conditions. In addition, an increasing ATV fortifies franchisee and outlet performance against increasing competition and decline in retail traffic flow. The growth strategies below are expected to further enhance the AWS and ATV of the Groups franchise systems. Operational and Financial Targets In FY13, management’s focus will continue to be on sustaining growth and enhancing franchisee profitability. The Group commissioned formation of a dedicated Marketing and Innovation Department in March 2012 to focus on the evolution of all brands (Project Evolution), the focus of which is to broadly achieve sustainability of brands both inside and outside of traditional shopping centres, and deliver on the ‘stores of the future’ concept of increasing brand relevance and modernity. Other growth strategies will continue to be directed towards:
digital innovation: Pioneering of RFG’s brands technologically, a stronger focus on driving e-commerce channels and developing digital solutions to stimulate brand engagement;
further development and establishment of non-traditional sites: modifications to our existing franchise systems via brand evolution will allow for greater site location in strip mall and high street, with the addition of ‘hole in the wall’ and ‘drive through’ concept stores;
the completion of further international licensing opportunities for the Donut King, Brumby’s, Michel’s, Esquires Coffee Houses, Pizza Capers systems;
expansion of coffee opportunities (including third party contracts) domestically and internationally;
fortification of franchise gross margin;
category menu re-invigoration incorporating all parts of the day offers and combination offers;
continual conversion of bb’s café outlets into Esquires Coffee Houses; and
maximising supply-chain efficiencies across all systems, for the benefit of all concerned stakeholders. The Group expects to substantially complete the final phase of the Michel’s Pattisserie transition in FY13, with implementation of a national supply solution. The Group will continue to operate non-core bakeries in the interim period. The Group also expects the strong cash flows of FY12 to continue in FY13, with a view to optimising capital management, reducing its net debt position, and maintaining the current dividend payout ratio. The Group continues to investigate and evaluate potential retail food franchise system and other complementary asset acquisitions. These acquisition targets include both competitor and complementary systems which provide system growth opportunities, synergies, intellectual property enhancement, and are EPS accretive. In this pursuit, the Company will keep the market informed in accordance with its reporting obligations. Disclosure of further information on likely developments in the operations of the Group and the expected results of operations have not been included in this report as the Directors believe it would be likely to result in unreasonable prejudice to the Group.
21RETAIL FOOD GROUP LIMITED ANNUAL REPORT 30 JUNE 2012
DIRECTORS'REPORT
SSignif icant Events After The Balance Date There has not been any matter or circumstance occurring, other than that referred to in this Directors’ Report, the financial statements or notes thereto, that has arisen since the end of the financial year, that has significantly affected, or in the reasonable opinion of the Directors, may significantly affect the operations of the Group, the results of those operations, or the state of affairs of the group in future financial years, other than the following: Final Dividend On 23 August 2012, the Board of Directors declared a final dividend in respect of profits of the financial year ending 30 June 2012. The final dividend of 9.00 cents per share (based on 108,910,114 shares on issue at 23 August 2012), franked to 100% at 30% corporate income tax rate will be paid on 11 October 2012. The final dividend was approved by the Directors following the conclusion of FY12 and therefore was not provided for in the year end financial report. The final FY12 dividend will not constitute an eligible dividend for the purpose of the Company’s Dividend Reinvestment Plan. Acquisition of Crust Gourmet Pizza Bars On 23 August 2012, the Group announced its entry into a conditional Sale & Purchase Agreement (SPA), subject to normal contractual terms and finalisation of due diligence enquiry to it’s satisfaction, by which the business and intellectual property assets of the Crust Gourmet Pizza Bars (‘Crust’) brand system would be acquired. The price for the business will be the equivalent of 7x Crust FY13 adjusted EBIT and will be paid in two tranches:
On settlement: $21m cash and RFG ordinary shares to the value of $3m; and Approximately 12 months from settlement: an amount representing the difference between 7x Crust FY13 adjusted
EBIT less the $24m forming part of the purchase price paid in the initial tranche noted above. The second tranche of the purchase price will be paid in cash or cash and scrip at RFG’s election.
Settlement is scheduled to be completed by early October 2012, with control of the business and intellectual property transferring to the Group at that time. Environmental Regulations The Group, due to the nature of its operations is not required to be environmentally licensed nor is it subject to any conditions which have been imposed by an environmental regulator specifically related to the Group or its operations. In circumstances where the nature of the Group’s operations requires, the Group is committed to compliance with all prescribed environmental laws and regulations.
22 RETAIL FOOD GROUP LIMITED ANNUAL REPORT 30 JUNE 2012
DIRECTORS'REPORT
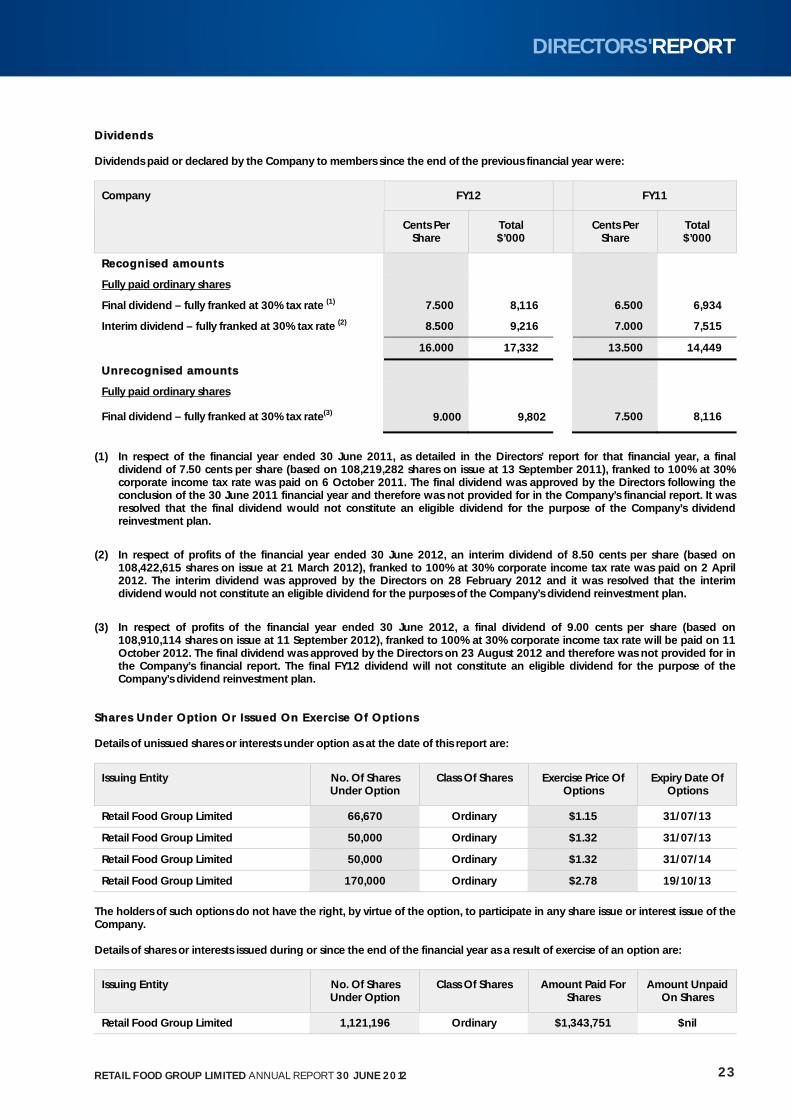
DDividends Dividends paid or declared by the Company to members since the end of the previous financial year were:
FY12 FY11 Company
Cents Per Share
Total $’000
Cents Per Share
Total $’000
RRecognised amounts
Fully paid ordinary shares
Final dividend – fully franked at 30% tax rate (1) 7.500 8,116 6.500 6,934
Interim dividend – fully franked at 30% tax rate (2) 8.500 9,216 7.000 7,515
16.000 17,332 13.500 14,449
UUnrecognised amounts
Fully paid ordinary shares
Final dividend – fully franked at 30% tax rate(3) 9.000 9,802 7.500 8,116
(1) In respect of the financial year ended 30 June 2011, as detailed in the Directors’ report for that financial year, a final dividend of 7.50 cents per share (based on 108,219,282 shares on issue at 13 September 2011), franked to 100% at 30% corporate income tax rate was paid on 6 October 2011. The final dividend was approved by the Directors following the conclusion of the 30 June 2011 financial year and therefore was not provided for in the Company’s financial report. It was resolved that the final dividend would not constitute an eligible dividend for the purpose of the Company’s dividend reinvestment plan.
(2) In respect of profits of the financial year ended 30 June 2012, an interim dividend of 8.50 cents per share (based on 108,422,615 shares on issue at 21 March 2012), franked to 100% at 30% corporate income tax rate was paid on 2 April 2012. The interim dividend was approved by the Directors on 28 February 2012 and it was resolved that the interim dividend would not constitute an eligible dividend for the purposes of the Company’s dividend reinvestment plan.
(3) In respect of profits of the financial year ended 30 June 2012, a final dividend of 9.00 cents per share (based on 108,910,114 shares on issue at 11 September 2012), franked to 100% at 30% corporate income tax rate will be paid on 11 October 2012. The final dividend was approved by the Directors on 23 August 2012 and therefore was not provided for in the Company’s financial report. The final FY12 dividend will not constitute an eligible dividend for the purpose of the Company’s dividend reinvestment plan.
Shares Under Option Or Issued On Exercise Of Options Details of unissued shares or interests under option as at the date of this report are:
Issuing Entity No. Of Shares Under Option
Class Of Shares Exercise Price Of Options
Expiry Date Of Options
Retail Food Group Limited 66,670 Ordinary $1.15 31/07/13
Retail Food Group Limited 50,000 Ordinary $1.32 31/07/13
Retail Food Group Limited 50,000 Ordinary $1.32 31/07/14
Retail Food Group Limited 170,000 Ordinary $2.78 19/10/13
The holders of such options do not have the right, by virtue of the option, to participate in any share issue or interest issue of the Company. Details of shares or interests issued during or since the end of the financial year as a result of exercise of an option are:
Issuing Entity No. Of Shares Under Option
Class Of Shares Amount Paid For Shares
Amount Unpaid On Shares
Retail Food Group Limited 1,121,196 Ordinary $1,343,751 $nil
23RETAIL FOOD GROUP LIMITED ANNUAL REPORT 30 JUNE 2012
DIRECTORS'REPORT
IIndemnification Of Officers And Auditors During the financial year, the Company paid a premium in respect of a contract insuring the Directors of the Company (as named above), the Company Secretary, and all executive officers of the Company and of any related body corporate against a liability incurred as such a Director, Secretary or executive officer to the extent permitted by the Corporations Act 2001. The contract of insurance prohibits disclosure of the nature of the liability and the amount of the premium. The Company has also entered into a Deed Poll indemnifying the Directors, officers and certain other parties in respect of certain claims that may be raised against them relative to the operations of the Company, its former and current subsidiaries. To the maximum permitted by the Corporations Act, the Deed Poll indemnifies those persons (in it) from liabilities incurred as a consequence of the acts of those persons including the giving of personal guarantees on behalf of the Company and its former and current subsidiaries. The Company has not otherwise, during or since the end of the financial year, indemnified or agreed to indemnify an officer or auditor of the Company or of any related body corporate against a liability incurred as such an officer or auditor. Non-audit Services Details of amounts paid or payable to the auditor for non-audit services provided during the year by the auditor are outlined in note 37 to the financial statements. The Directors are satisfied that the provision of non-audit services, during the year, by the auditor (or by another person or firm on the auditor’s behalf) is compatible with the general standard of independence for auditors imposed by the Corporations Act 2001. The Directors are of the opinion that the services as disclosed in note 37 to the financial statements do not compromise the external auditor’s independence, based on advice received from the Audit Committee, for the following reasons:
all non-audit services have been reviewed and approved to ensure that they do not impact the integrity and objectivity of the auditor; and
none of the services undermine the general principles relating to auditor independence as set out in Code of Conduct APES 110 Code of Ethics for Professional Accountants issued by the Accounting Professional & Ethical Standards Board, including reviewing or auditing the auditor’s own work, acting in a management or decision-making capacity for the Company, acting as advocate for the Company or jointly sharing economic risks and rewards.
Auditor’s Independence Declaration The auditor’s independence declaration is included on page 35 of the financial report. Rounding Off Of Amounts The Company is a company of the kind referred to in ASIC Class Order 98/100, dated 10 July 1998, and in accordance with that Class Order amounts in the Directors’ report and the financial report are rounded off to the nearest thousand dollars, unless otherwise indicated.
24 RETAIL FOOD GROUP LIMITED ANNUAL REPORT 30 JUNE 2012
DIRECTORS'REPORT
RRemuneration Report This Remuneration Report, which forms part of the Directors’ Report, sets out information about the remuneration of Retail Food Group Limited’s Directors and its senior management for the financial year ended 30 June 2012. The prescribed details for each person covered by this report are contained below under the following headings:
Director and senior management details;
remuneration policy;
relationship between the remuneration policy and Group performance;
remuneration of Directors and senior management; and
key terms of employment contracts. The information provided in this Remuneration Report has been audited as required by section 308(3C) of the Corporations Act 2001. 1. Director And Senior Management Details The Company does not remunerate any of its Directors, key management personnel or specific executives. Rather, the Directors, key management personnel and specific executives are remunerated via subsidiaries of the Company. The following persons acted as Directors of the Company during or since the end of the financial year:
Mr Bruce Hancox (Chairman & Independent Director) (appointed as Chairman 20 September 2011)
Mr Anthony (Tony) Alford (Managing Director and Chief Executive Officer)
Mr Colin Archer (Independent Director)
Ms Jessica Buchanan (Independent Director) (appointed 29 May 2012)
Mr Anthony Williams (Independent Director) (appointed 29 May 2012)
Mr John Cowley (Chairman & Independent Director) (resigned as Chairman 20 September 2011; resigned as Director 25 November 2011)
Mr Nigel Nixon (Executive Director & Corporate Counsel) (resigned as Director 29 May 2012) The term ‘senior management’ is used in this remuneration report to refer to the following persons. Except as noted, the named persons held their current position for the whole of the financial year and since the end of the financial year:
Mr Peter McGettigan (Chief Financial Officer) (appointed 29 February 2012)
Mr Nigel Nixon (Chief Operating Officer) (appointed 26 March 2012)
Mr Anthony Mark Connors (Deputy Chief Operating Officer and Company Secretary)
Ms Tracey Catterall (Marketing and Innovation Director)
Mr Gary Alford (Head of Manufacturing and Wholesale)
Mr Gavin Nixon (Head of Emerging Markets)
Mr Gary Best (Chief Operating Officer) (ceased 26 March 2012)
Mr Damien Peters (Chief Financial Officer) (resigned 29 February 2012) 2. Remuneration Policy The Group considers it critical to its long term success, and the building of shareholder value, that it attracts, retains and motivates appropriate personnel to lead, manage and serve the Group in an increasingly congested and competitive marketplace. The objectives of the Group’s remuneration policy are to:
motivate executive and non-executive personnel to successfully manage and lead the Group with a view to driving long term growth and shareholder value;
drive successful performance and achievement of long and short term goals and otherwise reinforce the objectives of the Group;
deliver competitive remuneration packages necessary to attract and retain appropriate personnel;
ensure fair remuneration having regard to duties, responsibilities and other demands;
ensure flexibility to enable the Group to cope with planned or unforeseen threats and opportunities;
ensure compliance with relevant laws; and
ensure sustainable value for all stakeholders.
25RETAIL FOOD GROUP LIMITED ANNUAL REPORT 30 JUNE 2012
DIRECTORS'REPORT
RRemuneration Report (cont.) 2. Remuneration Policy (cont.) When determining executive remuneration packages, the Group may have regard to:
the need to attract, retain and motivate appropriate personnel;
market practices;
alternative benefits including incentive programs, fringe benefits and equity schemes;
assessment of individual performance against set goals and targets; and
scope of responsibility, duties and other demands. Executive remuneration shall generally take the form of a base salary plus superannuation, however, may comprise performance bonuses and other benefits or rewards in certain circumstances. When determining non-executive remuneration packages, the Group may have regard to:
the need to attract, retain and motivate appropriately qualified and experienced Directors with diverse backgrounds and experiences best suited to ensure the Board is comprised of a range of skills necessary to properly understand the business environment in which the Group operates;
the scope and complexity of the responsibilities assumed by such Directors in connection with the oversight and leadership of the Group;
comparative market practices; and
alternative benefits including equity schemes. Role of the Remuneration Committee The Board has a Remuneration Committee to assist the Board and report to it on remuneration and issues relevant to remuneration policies and practices including those for senior management and non-executive Directors. Among the functions performed by the Committee are the following:
review and evaluation of market practices and trends on remuneration matters;
recommendations to the Board in relation to the Group’s remuneration policies and practices;
oversight of the performance of the Chief Executive Officer, Chief Financial Officer and other members of senior management and non-executive Directors; and
recommendations to the Board in relation to the remuneration of senior management and non-executive Directors. The Remuneration Committee has adopted the following policies for which it will have regard to when determining the remuneration of executives and senior management members:
annual review of executive and senior management member packages by reference to Group performance, executive performance, comparable information from industry sectors and other listed companies;
the need to attract, retain and motivate the highest calibre executives and reward them for performance which results in long-term growth in shareholder value;
all bonuses, options and incentives must be linked to pre-determined performance criteria; and
any changes must be referential to measurable performance criteria. 3. Relationship Between Remuneration Policy And Group Performance The compensation structures outlined below are designed to attract suitably qualified executives, reward the achievement of strategic objectives, and to achieve the broader outcome of long term success and the building of shareholder value. The compensation structures take into account:
the capability and experience of the executive;
the executive’s ability to control and deliver the Group’s forecast results;
the attainment of pre-determined KPIs developed specially for the executive’s role;
the Group’s performance including:
the Group’s earnings;
the growth in earnings per share and return on shareholder wealth; and
the amount of incentives within each executive’s remuneration package. Remuneration packages include a mix of fixed and variable compensation and short-term and long-term performance-based incentives. The mix of these components is based on the role the individual performs. In addition to their salaries, the Group also provides non-cash benefits to its executives and contributes to a post-employment superannuation plan on their behalf. 26 RETAIL FOOD GROUP LIMITED ANNUAL REPORT 30 JUNE 2012
DIRECTORS'REPORT
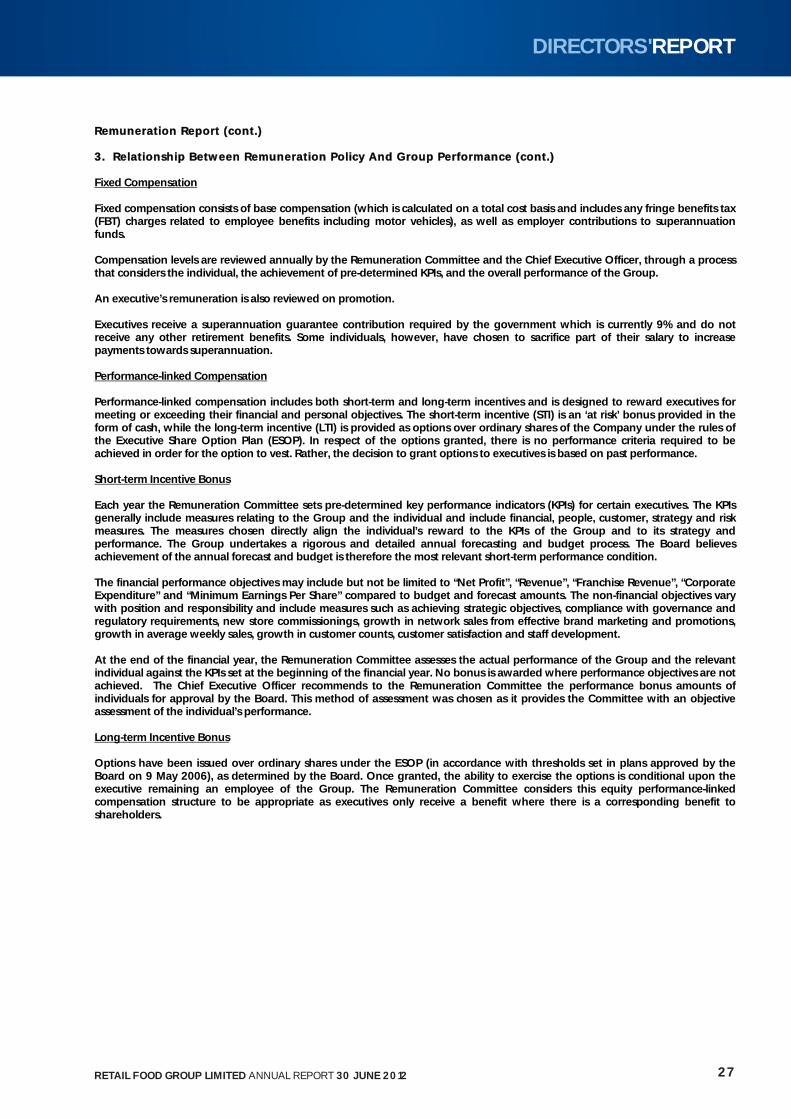
RRemuneration Report (cont.) 3. Relationship Between Remuneration Policy And Group Performance (cont.) Fixed Compensation Fixed compensation consists of base compensation (which is calculated on a total cost basis and includes any fringe benefits tax (FBT) charges related to employee benefits including motor vehicles), as well as employer contributions to superannuation funds. Compensation levels are reviewed annually by the Remuneration Committee and the Chief Executive Officer, through a process that considers the individual, the achievement of pre-determined KPIs, and the overall performance of the Group. An executive’s remuneration is also reviewed on promotion. Executives receive a superannuation guarantee contribution required by the government which is currently 9% and do not receive any other retirement benefits. Some individuals, however, have chosen to sacrifice part of their salary to increase payments towards superannuation. Performance-linked Compensation Performance-linked compensation includes both short-term and long-term incentives and is designed to reward executives for meeting or exceeding their financial and personal objectives. The short-term incentive (STI) is an ‘at risk’ bonus provided in the form of cash, while the long-term incentive (LTI) is provided as options over ordinary shares of the Company under the rules of the Executive Share Option Plan (ESOP). In respect of the options granted, there is no performance criteria required to be achieved in order for the option to vest. Rather, the decision to grant options to executives is based on past performance. Short-term Incentive Bonus Each year the Remuneration Committee sets pre-determined key performance indicators (KPIs) for certain executives. The KPIs generally include measures relating to the Group and the individual and include financial, people, customer, strategy and risk measures. The measures chosen directly align the individual’s reward to the KPIs of the Group and to its strategy and performance. The Group undertakes a rigorous and detailed annual forecasting and budget process. The Board believes achievement of the annual forecast and budget is therefore the most relevant short-term performance condition. The financial performance objectives may include but not be limited to “Net Profit”, “Revenue”, “Franchise Revenue”, “Corporate Expenditure” and “Minimum Earnings Per Share” compared to budget and forecast amounts. The non-financial objectives vary with position and responsibility and include measures such as achieving strategic objectives, compliance with governance and regulatory requirements, new store commissionings, growth in network sales from effective brand marketing and promotions, growth in average weekly sales, growth in customer counts, customer satisfaction and staff development. At the end of the financial year, the Remuneration Committee assesses the actual performance of the Group and the relevant individual against the KPIs set at the beginning of the financial year. No bonus is awarded where performance objectives are not achieved. The Chief Executive Officer recommends to the Remuneration Committee the performance bonus amounts of individuals for approval by the Board. This method of assessment was chosen as it provides the Committee with an objective assessment of the individual’s performance. Long-term Incentive Bonus Options have been issued over ordinary shares under the ESOP (in accordance with thresholds set in plans approved by the Board on 9 May 2006), as determined by the Board. Once granted, the ability to exercise the options is conditional upon the executive remaining an employee of the Group. The Remuneration Committee considers this equity performance-linked compensation structure to be appropriate as executives only receive a benefit where there is a corresponding benefit to shareholders.
27RETAIL FOOD GROUP LIMITED ANNUAL REPORT 30 JUNE 2012
DIRECTORS'REPORT
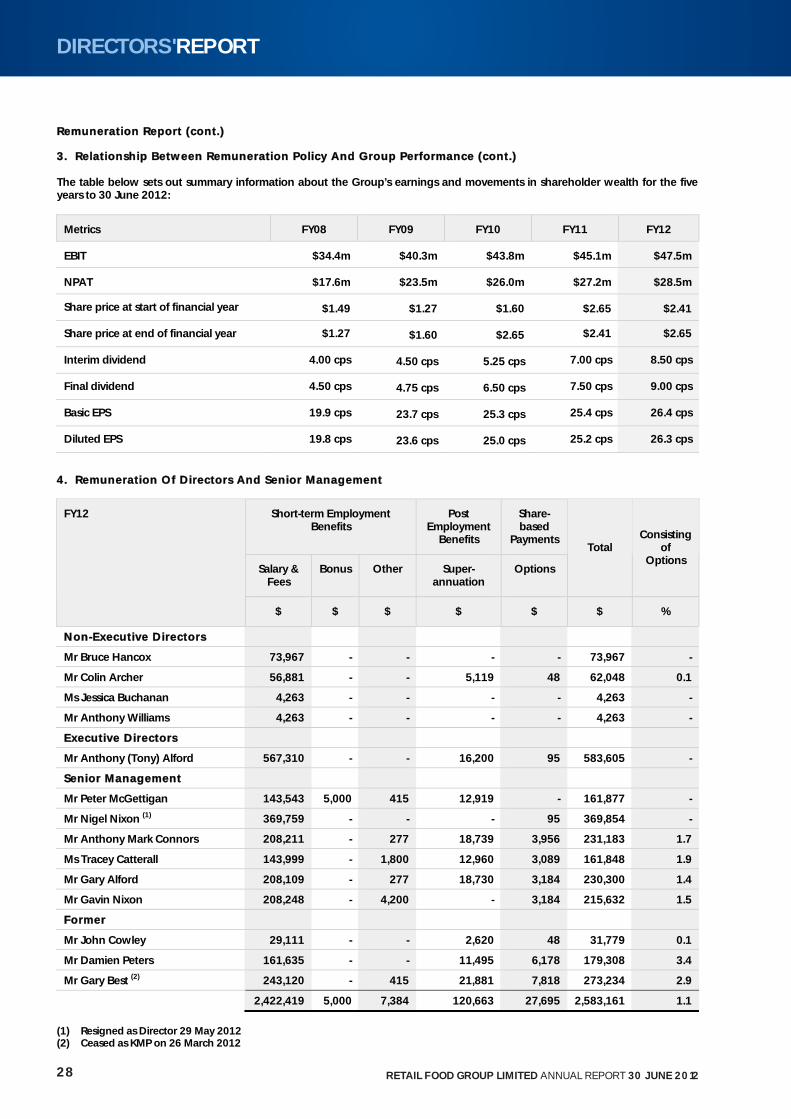
RRemuneration Report (cont.) 3. Relationship Between Remuneration Policy And Group Performance (cont.) The table below sets out summary information about the Group’s earnings and movements in shareholder wealth for the five years to 30 June 2012:
Metrics FY08 FY09 FY10 FY11 FY12
EBIT $34.4m $40.3m $43.8m $45.1m $47.5m
NPAT $17.6m $23.5m $26.0m $27.2m $28.5m
Share price at start of financial year $1.49 $1.27 $1.60 $2.65 $2.41
Share price at end of financial year $1.27 $1.60 $2.65 $2.41 $2.65
Interim dividend 4.00 cps 4.50 cps 5.25 cps 7.00 cps 8.50 cps
Final dividend 4.50 cps 4.75 cps 6.50 cps 7.50 cps 9.00 cps
Basic EPS 19.9 cps 23.7 cps 25.3 cps 25.4 cps 26.4 cps
Diluted EPS 19.8 cps 23.6 cps 25.0 cps 25.2 cps 26.3 cps
4. Remuneration Of Directors And Senior Management
Short-term Employment Benefits
Post Employment
Benefits
Share-based
Payments
Salary & Fees
Bonus Other Super-annuation
Options
Total Consisting
of Options
FY12
$ $ $ $ $ $ %
NNon--EExecutive Directors
Mr Bruce Hancox 73,967 - - - - 73,967 -
Mr Colin Archer 56,881 - - 5,119 48 62,048 0.1
Ms Jessica Buchanan 4,263 - - - - 4,263 -
Mr Anthony Williams 4,263 - - - - 4,263 -
EExecutive Directors
Mr Anthony (Tony) Alford 567,310 - - 16,200 95 583,605 -
SSenior Maanagement
Mr Peter McGettigan 143,543 5,000 415 12,919 - 161,877 -
Mr Nigel Nixon (1) 369,759 - - - 95 369,854 -
Mr Anthony Mark Connors 208,211 - 277 18,739 3,956 231,183 1.7
Ms Tracey Catterall 143,999 - 1,800 12,960 3,089 161,848 1.9
Mr Gary Alford 208,109 - 277 18,730 3,184 230,300 1.4
Mr Gavin Nixon 208,248 - 4,200 - 3,184 215,632 1.5
FFormer
Mr John Cowley 29,111 - - 2,620 48 31,779 0.1
Mr Damien Peters 161,635 - - 11,495 6,178 179,308 3.4
Mr Gary Best (2) 243,120 - 415 21,881 7,818 273,234 2.9
2,422,419 5,000 7,384 120,663 27,695 2,583,161 1.1
(1) Resigned as Director 29 May 2012 (2) Ceased as KMP on 26 March 2012
28 RETAIL FOOD GROUP LIMITED ANNUAL REPORT 30 JUNE 2012
DIRECTORS'REPORT
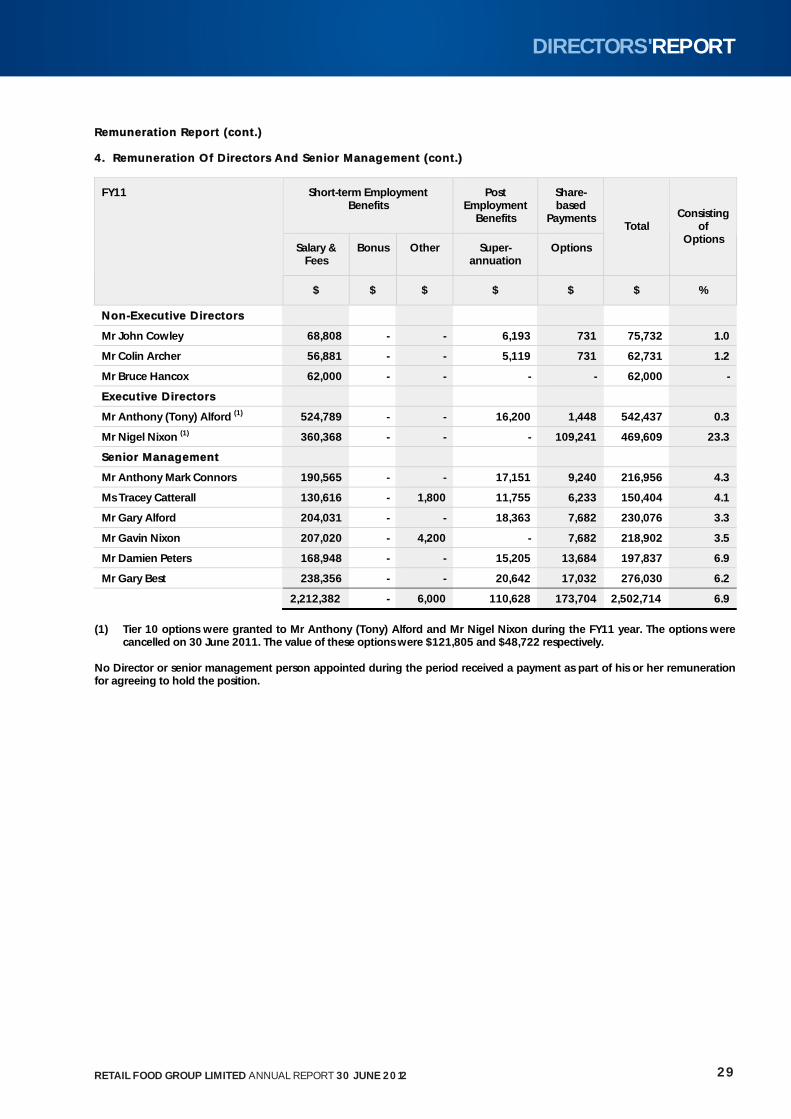
RRemuneration Report (cont.)
4. Remuneration Of Directors And Senior Management (cont.)
Short-term Employment Benefits
Post Employment
Benefits
Share-based
Payments
Salary & Fees
Bonus Other Super-annuation
Options
Total Consisting
of Options
FY11
$ $ $ $ $ $ %
NNon--EExecutive Directors
Mr John Cowley 68,808 - - 6,193 731 75,732 1.0
Mr Colin Archer 56,881 - - 5,119 731 62,731 1.2
Mr Bruce Hancox 62,000 - - - - 62,000 -
EExecutive Directors
Mr Anthony (Tony) Alford (1) 524,789 - - 16,200 1,448 542,437 0.3
Mr Nigel Nixon (1) 360,368 - - - 109,241 469,609 23.3
SSennior Management
Mr Anthony Mark Connors 190,565 - - 17,151 9,240 216,956 4.3
Ms Tracey Catterall 130,616 - 1,800 11,755 6,233 150,404 4.1
Mr Gary Alford 204,031 - - 18,363 7,682 230,076 3.3
Mr Gavin Nixon 207,020 - 4,200 - 7,682 218,902 3.5
Mr Damien Peters 168,948 - - 15,205 13,684 197,837 6.9
Mr Gary Best 238,356 - - 20,642 17,032 276,030 6.2
2,212,382 - 6,000 110,628 173,704 2,502,714 6.9
(1) Tier 10 options were granted to Mr Anthony (Tony) Alford and Mr Nigel Nixon during the FY11 year. The options were
cancelled on 30 June 2011. The value of these options were $121,805 and $48,722 respectively. No Director or senior management person appointed during the period received a payment as part of his or her remuneration for agreeing to hold the position.
29RETAIL FOOD GROUP LIMITED ANNUAL REPORT 30 JUNE 2012
DIRECTORS'REPORT
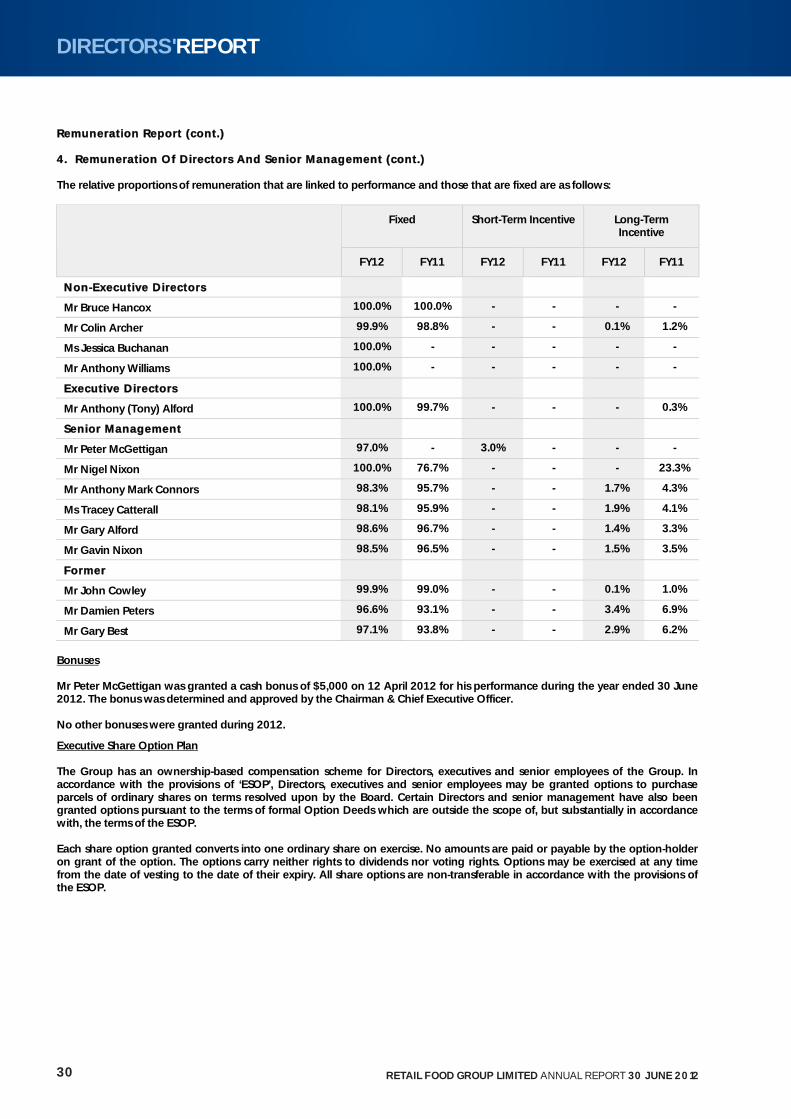
RRemuneration Report (cont.) 4. Remuneration Of Directors And Senior Management (cont.) The relative proportions of remuneration that are linked to performance and those that are fixed are as follows:
Fixed Short-Term Incentive Long-Term Incentive
FY12 FY11 FY12 FY11 FY12 FY11
NNon--EExecutive Directors
Mr Bruce Hancox 100.0% 100.0% - - - -
Mr Colin Archer 99.9% 98.8% - - 0.1% 1.2%
Ms Jessica Buchanan 100.0% - - - - -
Mr Anthony Williams 100.0% - - - - -
EExecutive Directors
Mr Anthony (Tony) Alford 100.0% 99.7% - - - 0.3%
SSenior Management
Mr Peter McGettigan 97.0% - 3.0% - - -
Mr Nigel Nixon 100.0% 76.7% - - - 23.3%
Mr Anthony Mark Connors 98.3% 95.7% - - 1.7% 4.3%
Ms Tracey Catterall 98.1% 95.9% - - 1.9% 4.1%
Mr Gary Alford 98.6% 96.7% - - 1.4% 3.3%
Mr Gavin Nixon 98.5% 96.5% - - 1.5% 3.5%
FFormer
Mr John Cowley 99.9% 99.0% - - 0.1% 1.0%
Mr Damien Peters 96.6% 93.1% - - 3.4% 6.9%
Mr Gary Best 97.1% 93.8% - - 2.9% 6.2%
Bonuses Mr Peter McGettigan was granted a cash bonus of $5,000 on 12 April 2012 for his performance during the year ended 30 June 2012. The bonus was determined and approved by the Chairman & Chief Executive Officer. No other bonuses were granted during 2012.
Executive Share Option Plan The Group has an ownership-based compensation scheme for Directors, executives and senior employees of the Group. In accordance with the provisions of ‘ESOP’, Directors, executives and senior employees may be granted options to purchase parcels of ordinary shares on terms resolved upon by the Board. Certain Directors and senior management have also been granted options pursuant to the terms of formal Option Deeds which are outside the scope of, but substantially in accordance with, the terms of the ESOP. Each share option granted converts into one ordinary share on exercise. No amounts are paid or payable by the option-holder on grant of the option. The options carry neither rights to dividends nor voting rights. Options may be exercised at any time from the date of vesting to the date of their expiry. All share options are non-transferable in accordance with the provisions of the ESOP.
30 RETAIL FOOD GROUP LIMITED ANNUAL REPORT 30 JUNE 2012
DIRECTORS'REPORT
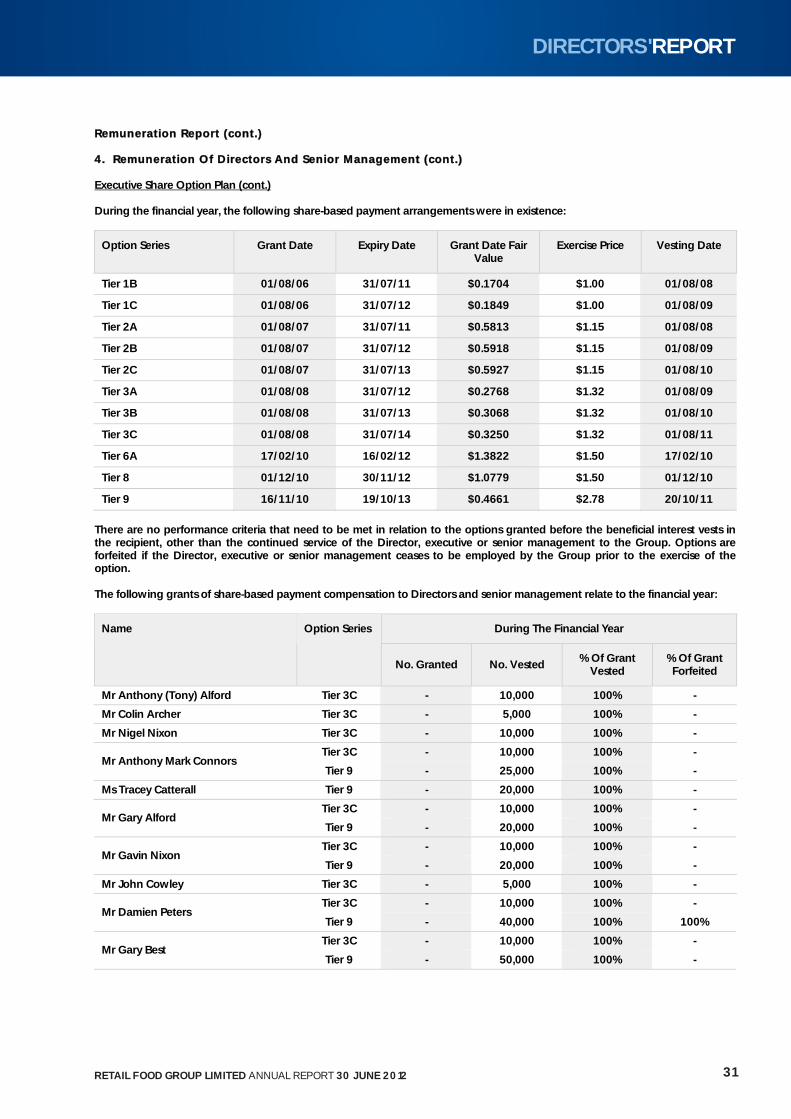
RRemuneration Report (cont.) 4. Remuneration Of Directors And Senior Management (cont.) Executive Share Option Plan (cont.) During the financial year, the following share-based payment arrangements were in existence:
Option Series Grant Date Expiry Date Grant Date Fair Value
Exercise Price Vesting Date
Tier 1B 01/08/06 31/07/11 $0.1704 $1.00 01/08/08
Tier 1C 01/08/06 31/07/12 $0.1849 $1.00 01/08/09
Tier 2A 01/08/07 31/07/11 $0.5813 $1.15 01/08/08
Tier 2B 01/08/07 31/07/12 $0.5918 $1.15 01/08/09
Tier 2C 01/08/07 31/07/13 $0.5927 $1.15 01/08/10
Tier 3A 01/08/08 31/07/12 $0.2768 $1.32 01/08/09
Tier 3B 01/08/08 31/07/13 $0.3068 $1.32 01/08/10
Tier 3C 01/08/08 31/07/14 $0.3250 $1.32 01/08/11
Tier 6A 17/02/10 16/02/12 $1.3822 $1.50 17/02/10
Tier 8 01/12/10 30/11/12 $1.0779 $1.50 01/12/10
Tier 9 16/11/10 19/10/13 $0.4661 $2.78 20/10/11
There are no performance criteria that need to be met in relation to the options granted before the beneficial interest vests in the recipient, other than the continued service of the Director, executive or senior management to the Group. Options are forfeited if the Director, executive or senior management ceases to be employed by the Group prior to the exercise of the option. The following grants of share-based payment compensation to Directors and senior management relate to the financial year:
During The Financial Year Name Option Series
No. Granted No. Vested % Of Grant
Vested % Of Grant Forfeited
Mr Anthony (Tony) Alford Tier 3C - 10,000 100% -
Mr Colin Archer Tier 3C - 5,000 100% -
Mr Nigel Nixon Tier 3C - 10,000 100% -
Tier 3C - 10,000 100% - Mr Anthony Mark Connors
Tier 9 - 25,000 100% -
Ms Tracey Catterall Tier 9 - 20,000 100% -
Tier 3C - 10,000 100% - Mr Gary Alford
Tier 9 - 20,000 100% -
Tier 3C - 10,000 100% - Mr Gavin Nixon
Tier 9 - 20,000 100% -
Mr John Cowley Tier 3C - 5,000 100% -
Tier 3C - 10,000 100% - Mr Damien Peters
Tier 9 - 40,000 100% 100%
Tier 3C - 10,000 100% - Mr Gary Best
Tier 9 - 50,000 100% -
31RETAIL FOOD GROUP LIMITED ANNUAL REPORT 30 JUNE 2012
DIRECTORS'REPORT
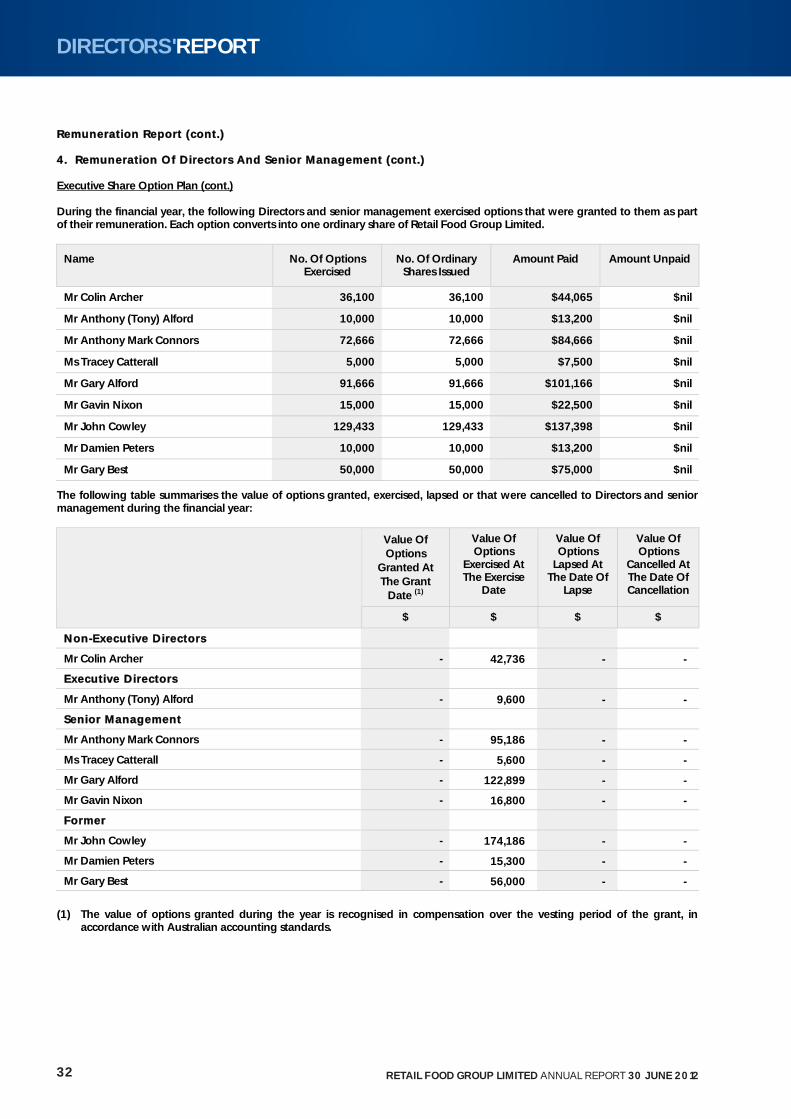
RRemuneration Report (cont.) 4. Remuneration Of Directors And Senior Management (cont.) Executive Share Option Plan (cont.) During the financial year, the following Directors and senior management exercised options that were granted to them as part of their remuneration. Each option converts into one ordinary share of Retail Food Group Limited.
Name No. Of Options Exercised
No. Of Ordinary Shares Issued
Amount Paid Amount Unpaid
Mr Colin Archer 36,100 36,100 $44,065 $nil
Mr Anthony (Tony) Alford 10,000 10,000 $13,200 $nil
Mr Anthony Mark Connors 72,666 72,666 $84,666 $nil
Ms Tracey Catterall 5,000 5,000 $7,500 $nil
Mr Gary Alford 91,666 91,666 $101,166 $nil
Mr Gavin Nixon 15,000 15,000 $22,500 $nil
Mr John Cowley 129,433 129,433 $137,398 $nil
Mr Damien Peters 10,000 10,000 $13,200 $nil
Mr Gary Best 50,000 50,000 $75,000 $nil
The following table summarises the value of options granted, exercised, lapsed or that were cancelled to Directors and senior management during the financial year:
Value Of Options
Granted At The Grant
Date (1)
Value Of Options
Exercised At The Exercise
Date
Value Of Options
Lapsed At The Date Of
Lapse
Value Of Options
Cancelled At The Date Of Cancellation
$ $ $ $
NNon--EExecutive Directors
Mr Colin Archer - 42,736 - -
EExecutive Directors
Mr Anthony (Tony) Alford - 9,600 - -
SSenior MManagement
Mr Anthony Mark Connors - 95,186 - -
Ms Tracey Catterall - 5,600 - -
Mr Gary Alford - 122,899 - -
Mr Gavin Nixon - 16,800 - -
FFormer
Mr John Cowley - 174,186 - -
Mr Damien Peters - 15,300 - -
Mr Gary Best - 56,000 - -
(1) The value of options granted during the year is recognised in compensation over the vesting period of the grant, in accordance with Australian accounting standards.
32 RETAIL FOOD GROUP LIMITED ANNUAL REPORT 30 JUNE 2012
DIRECTORS'REPORT
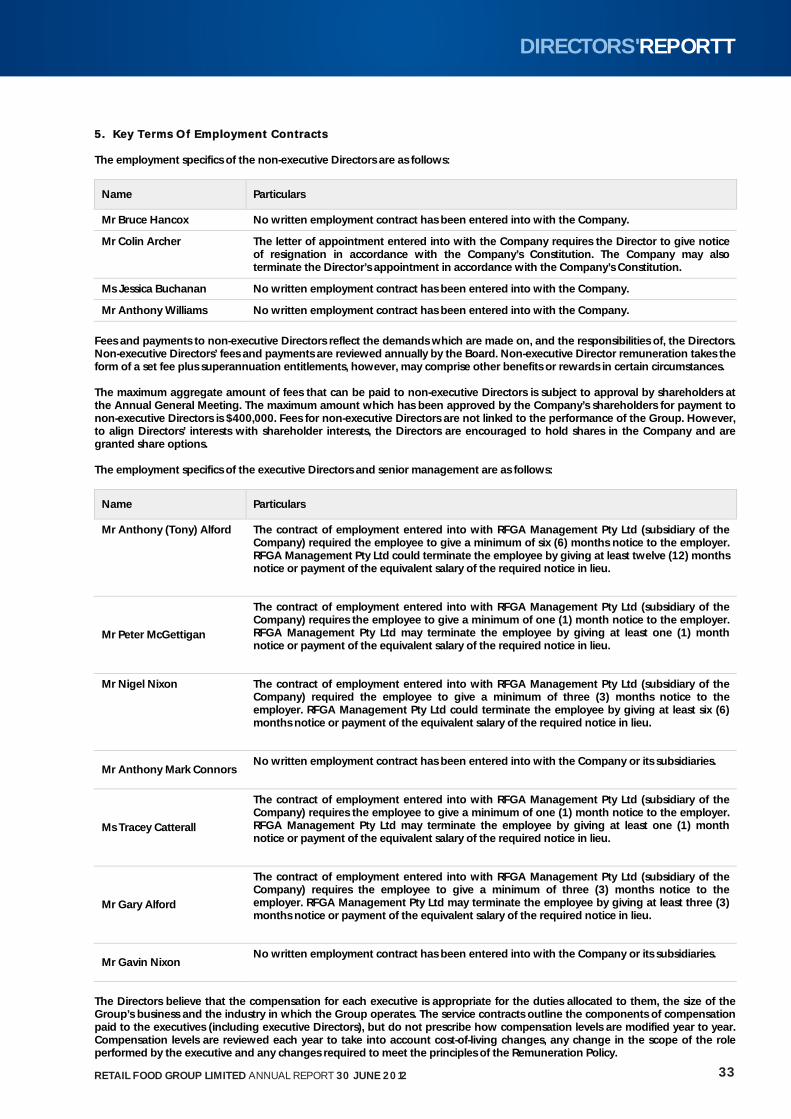
55. Key Terms Of Employment Contracts The employment specifics of the non-executive Directors are as follows:
Name Particulars
Mr Bruce Hancox No written employment contract has been entered into with the Company.
Mr Colin Archer The letter of appointment entered into with the Company requires the Director to give notice of resignation in accordance with the Company’s Constitution. The Company may also terminate the Director’s appointment in accordance with the Company’s Constitution.
Ms Jessica Buchanan No written employment contract has been entered into with the Company.
Mr Anthony Williams No written employment contract has been entered into with the Company.
Fees and payments to non-executive Directors reflect the demands which are made on, and the responsibilities of, the Directors. Non-executive Directors’ fees and payments are reviewed annually by the Board. Non-executive Director remuneration takes the form of a set fee plus superannuation entitlements, however, may comprise other benefits or rewards in certain circumstances. The maximum aggregate amount of fees that can be paid to non-executive Directors is subject to approval by shareholders at the Annual General Meeting. The maximum amount which has been approved by the Company’s shareholders for payment to non-executive Directors is $400,000. Fees for non-executive Directors are not linked to the performance of the Group. However, to align Directors’ interests with shareholder interests, the Directors are encouraged to hold shares in the Company and are granted share options. The employment specifics of the executive Directors and senior management are as follows:
Name Particulars
Mr Anthony (Tony) Alford The contract of employment entered into with RFGA Management Pty Ltd (subsidiary of the Company) required the employee to give a minimum of six (6) months notice to the employer. RFGA Management Pty Ltd could terminate the employee by giving at least twelve (12) months notice or payment of the equivalent salary of the required notice in lieu.
Mr Peter McGettigan
The contract of employment entered into with RFGA Management Pty Ltd (subsidiary of the Company) requires the employee to give a minimum of one (1) month notice to the employer. RFGA Management Pty Ltd may terminate the employee by giving at least one (1) month notice or payment of the equivalent salary of the required notice in lieu.
Mr Nigel Nixon The contract of employment entered into with RFGA Management Pty Ltd (subsidiary of the Company) required the employee to give a minimum of three (3) months notice to the employer. RFGA Management Pty Ltd could terminate the employee by giving at least six (6) months notice or payment of the equivalent salary of the required notice in lieu.
Mr Anthony Mark Connors No written employment contract has been entered into with the Company or its subsidiaries.
Ms Tracey Catterall
The contract of employment entered into with RFGA Management Pty Ltd (subsidiary of the Company) requires the employee to give a minimum of one (1) month notice to the employer. RFGA Management Pty Ltd may terminate the employee by giving at least one (1) month notice or payment of the equivalent salary of the required notice in lieu.
Mr Gary Alford
The contract of employment entered into with RFGA Management Pty Ltd (subsidiary of the Company) requires the employee to give a minimum of three (3) months notice to the employer. RFGA Management Pty Ltd may terminate the employee by giving at least three (3) months notice or payment of the equivalent salary of the required notice in lieu.
Mr Gavin Nixon No written employment contract has been entered into with the Company or its subsidiaries.
The Directors believe that the compensation for each executive is appropriate for the duties allocated to them, the size of the Group’s business and the industry in which the Group operates. The service contracts outline the components of compensation paid to the executives (including executive Directors), but do not prescribe how compensation levels are modified year to year. Compensation levels are reviewed each year to take into account cost-of-living changes, any change in the scope of the role performed by the executive and any changes required to meet the principles of the Remuneration Policy.
33RETAIL FOOD GROUP LIMITED ANNUAL REPORT 30 JUNE 2012
DIRECTORS'REPORTT
This Directors’ report is signed in accordance with a resolution of Directors made pursuant to s.298(2) of the Corporations Act 2001. On behalf of the Directors RRETAIL FOOD GROUP LIMITED
A J (TONY) ALFORD Managing Director and CEO Southport, 27th September 2012
34 RETAIL FOOD GROUP LIMITED ANNUAL REPORT 30 JUNE 2012
DIRECTORS'REPORT
The Board of Directors Retail Food Group Limited RFG House 1 Olympic Circuit Southport QLD 4215 27 September 2012
Dear Directors,
Retail Food Group Limited In accordance with section 307C of the Corporations Act 2001, I am pleased to provide the following declaration of independence to the directors of Retail Food Group Limited. As lead audit partner for the audit of the financial statements of Retail Food Group Limited for the financial year ended 30 June 2012, I declare that to the best of my knowledge and belief, there have been no contraventions of:
(i) the auditor independence requirements of the Corporations Act 2001 in relation to the audit; and
(ii) any applicable code of professional conduct in relation to the audit. Yours sincerely
DELOITTE TOUCHE TOHMATSU
T Mkwananzi Partner Chartered Accountants Liability limited by a scheme approved under Professional Standards Legislation. A member of Deloitte Touche Tohmatsu Limited
Deloitte Touche Tohmatsu ABN 74 490 121 060 Riverside Centre Level 25 123 Eagle Street Brisbane QLD 4000 GPO Box 1463 Brisbane QLD 4001 Australia DX 115 Tel: +61 (0) 7 3308 7000 Fax: +61 (0) 7 3308 7001 www.deloitte.com.au
35RETAIL FOOD GROUP LIMITED ANNUAL REPORT 30 JUNE 2012
AUDITOR'SINDEPENCEDECLARATION
Independent Auditor’s Report to the Members of Retail Food Group Limited Report on the Financial Report
We have audited the accompanying financial report of Retail Food Group Limited, which comprises the statement of financial position as at 30 June 2012, the statement of comprehensive income, the statement of cash flows and the statement of changes in equity for the year ended on that date, notes comprising a summary of significant accounting policies and other explanatory information, and the directors’ declaration of the consolidated entity, comprising the company and the entities it controlled at the year’s end or from time to time during the financial year as set out on pages 38 to 95. Directors’ Responsibility for the Financial Report The directors of the company are responsible for the preparation of the financial report that gives a true and fair view in accordance with Australian Accounting Standards and the Corporations Act 2001 and for such internal control as the directors determine is necessary to enable the preparation of the financial report that gives a true and fair view and is free from material misstatement, whether due to fraud or error. In Note 2, the directors also state, in accordance with Accounting Standard AASB 101 Presentation of Financial Statements, that the consolidated financial statements comply with International Financial Reporting Standards. Auditor’s Responsibility Our responsibility is to express an opinion on the financial report based on our audit. We conducted our audit in accordance with Australian Auditing Standards. Those standards require that we comply with relevant ethical requirements relating to audit engagements and plan and perform the audit to obtain reasonable assurance whether the financial report is free from material misstatement. An audit involves performing procedures to obtain audit evidence about the amounts and disclosures in the financial report. The procedures selected depend on the auditor’s judgement, including the assessment of the risks of material misstatement of the financial report, whether due to fraud or error. In making those risk assessments, the auditor considers internal control, relevant to the company’s preparation of the financial report that gives a true and fair view, in order to design audit procedures that are appropriate in the circumstances, but not for the purpose of expressing an opinion on the effectiveness of the company’s internal control. An audit also includes evaluating the appropriateness of accounting policies used and the reasonableness of accounting estimates made by the directors, as well as evaluating the overall presentation of the financial report. We believe that the audit evidence we have obtained is sufficient and appropriate to provide a basis for our audit opinion. Liability limited by a scheme approved under Professional Standards Legislation. A member of Deloitte Touche Tohmatsu Limited
Deloitte Touche Tohmatsu ABN 74 490 121 060 Riverside Centre Level 25 123 Eagle Street Brisbane QLD 4000 GPO Box 1463 Brisbane QLD 4001 Australia DX 115 Tel: +61 (0) 7 3308 7000 Fax: +61 (0) 7 3308 7001 www.deloitte.com.au
36 RETAIL FOOD GROUP LIMITED ANNUAL REPORT 30 JUNE 2012
INDEPENDENTAUDITOR'SREPORTTO THE MEMBERS OF RETAIL FOOD GROUP LIMITED
Auditor’s Independence Declaration In conducting our audit, we have complied with the independence requirements of the Corporations Act 2001. We confirm that the independence declaration required by the Corporations Act 2001, which has been given to the directors of Retail Food Group Limited, would be in the same terms if given to the directors as at the time of this auditor’s report. Auditor’s Opinion
In our opinion:
(a) the financial report of Retail Food Group Limited is in accordance with the Corporations Act 2001, including:
(i) giving a true and fair view of the consolidated entity’s financial position as at 30 June 2012 and of its
performance for the year ended on that date; and
(ii) complying with Australian Accounting Standards and the Corporations Regulations 2001; and
(b) the consolidated financial statements also comply with International Financial Reporting Standards as
disclosed in Note 2. Report on the Remuneration Report
We have audited the Remuneration Report included in pages 25 to 34 of the directors’ report for the year ended 30 June 2012. The directors of the company are responsible for the preparation and presentation of the Remuneration Report in accordance with section 300A of the Corporations Act 2001. Our responsibility is to express an opinion on the Remuneration Report, based on our audit conducted in accordance with Australian Auditing Standards. Auditor’s Opinion
In our opinion the Remuneration Report of Retail Food Group Limited for the year ended 30 June 2012, complies with section 300A of the Corporations Act 2001.
DELOITTE TOUCHE TOHMATSU
T Mkwananzi Partner Chartered Accountants Brisbane, 27 September 2012
37RETAIL FOOD GROUP LIMITED ANNUAL REPORT 30 JUNE 2012
INDEPENDENTAUDITOR'SREPORTTO THE MEMBERS OF RETAIL FOOD GROUP LIMITED
The Directors declare that:
(i) in the Directors’ opinion, there are reasonable grounds to believe that the Company will be able to pay its debts as and when they become due and payable;
(ii) in the Directors’ opinion, the attached financial statements are in compliance with International Financial Reporting Standards, as stated in note 2 to the financial statements;
(iii) in the Directors’ opinion, the attached financial statements and notes thereto are in accordance with the Corporations Act 2001, including compliance with accounting standards and giving a true and fair view of the financial position and performance of the consolidated entity; and
(iv) the Directors have been given the declarations required by s.295A of the Corporations Act 2001.
Signed in accordance with a resolution of the Directors made pursuant to s.295(5) of the Corporations Act 2001. On behalf of the Directors RRETAIL FOOD GROUP LIMITED
A J (TONY) ALFORD Managing Director and CEO Southport, 27th September 2012
38 RETAIL FOOD GROUP LIMITED ANNUAL REPORT 30 JUNE 2012
DIRECTORS'DECLARATION
Contents Page
Consolidated Statement Of Comprehensive Income 40
Consolidated Statement Of Financial Position 41
Consolidated Statement Of Changes In Equity 42
Consolidated Statement Of Cash Flows 43
Notes To The Financial Statements 44
1 General Information 44
2 Significant Accounting Policies 44
3 Adoption Of New And Revised Accounting Standards 54
4 Critical Accounting Judgments And Key Sources Of Estimation Uncertainty 54
5 Segment Information 56
6 Revenue 57
7 Other Gains And Losses 58
8 Finance Costs 58
9 Income Taxes 58
10 Profit For The Year From Continuing Operations 61
11 Earnings Per Share 62
12 Trade And Other Receivables 63
13 Other Financial Assets 64
14 Inventories 64
15 Other Assets 65
16 Property, Plant And Equipment 65
17 Intangible Assets 66
18 Assets Pledged As Security 68
19 Trade And Other Payables 68
20 Borrowings 68
21 Provisions 68
22 Other Liabilities 69
23 Issued Capital 69
24 Reserves 70
25 Retained Earnings 71
26 Dividends 72
27 Contingent Liabilities 72
28 Leases 73
29 Commitments For Expenditure 74
30 Subsidiaries 74
31 Acquisitions 76
32 Cash And Cash Equivalents 79
33 Financial Instruments 80
34 Share-based Payments 85
35 Key Management Personnel Compensation 89
36 Related Party Transactions 89
37 Remuneration Of Auditors 94
38 Events After The Reporting Period 94
39 Parent Entity Disclosures 95
Additional Stock Exchange Information 96
39RETAIL FOOD GROUP LIMITED ANNUAL REPORT 30 JUNE 2012
INDEXTOFINANCIALSTATEMENTS
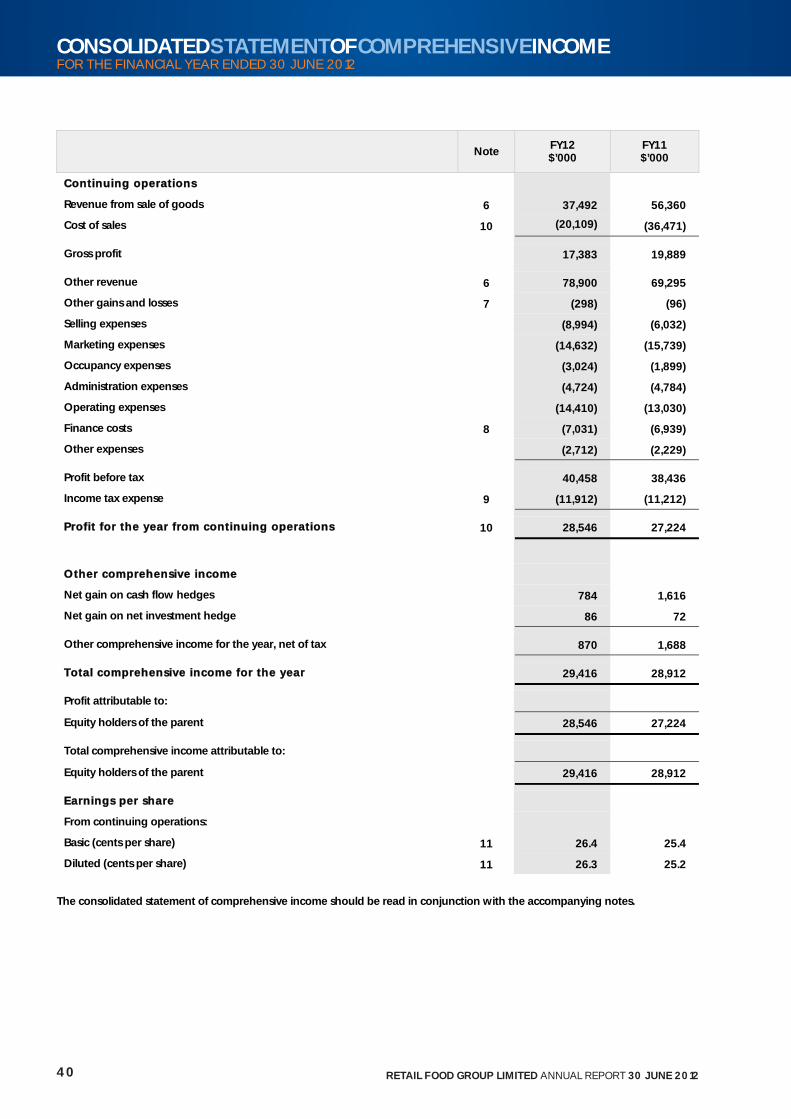
Note FY12 $’000
FY11 $’000
CContinuing operations
Revenue from sale of goods 6 37,492 56,360
Cost of sales 10 (20,109) (36,471)
Gross profit 17,383 19,889
Other revenue 6 78,900 69,295
Other gains and losses 7 (298) (96)
Selling expenses (8,994) (6,032)
Marketing expenses (14,632) (15,739)
Occupancy expenses (3,024) (1,899)
Administration expenses (4,724) (4,784)
Operating expenses (14,410) (13,030)
Finance costs 8 (7,031) (6,939)
Other expenses (2,712) (2,229)
Profit before tax 40,458 38,436
Income tax expense 9 (11,912) (11,212)
PProfit for the year from continuing operations 10 28,546 27,224
OOther comprehensive income
Net gain on cash flow hedges 784 1,616
Net gain on net investment hedge 86 72
Other comprehensive income for the year, net of tax 870 1,688
TTotal ccomprehensive income for the year 29,416 28,912
Profit attributable to:
Equity holders of the parent 28,546 27,224
Total comprehensive income attributable to:
Equity holders of the parent 29,416 28,912
EEarnings per share
From continuing operations:
Basic (cents per share) 11 26.4 25.4
Diluted (cents per share) 11 26.3 25.2
The consolidated statement of comprehensive income should be read in conjunction with the accompanying notes.
40 RETAIL FOOD GROUP LIMITED ANNUAL REPORT 30 JUNE 2012
CONSOLIDATEDSTATEMENTOFCOMPREHENSIVEINCOMEFOR THE FINANCIAL YEAR ENDED 30 JUNE 2012
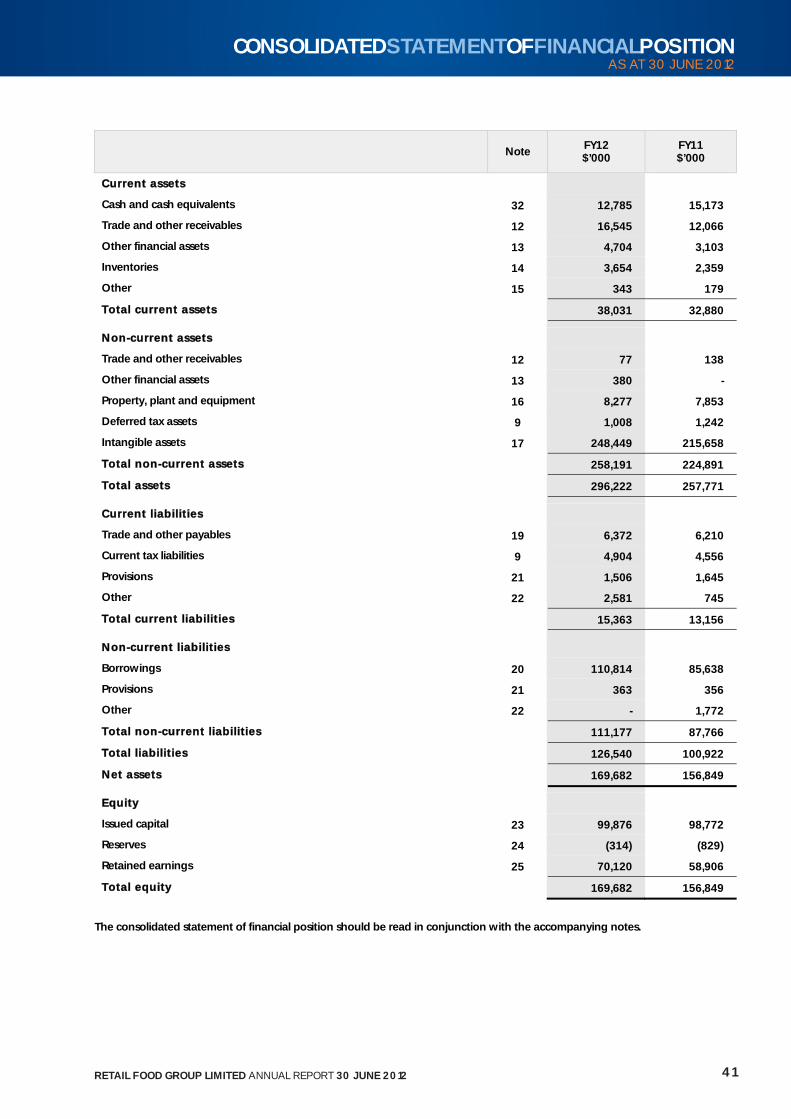
Note FY12 $’000
FY11 $’000
CCurrent assets
Cash and cash equivalents 32 12,785 15,173
Trade and other receivables 12 16,545 12,066
Other financial assets 13 4,704 3,103
Inventories 14 3,654 2,359
Other 15 343 179
TTotal current assets 38,031 32,880
NNon--ccurrent assets
Trade and other receivables 12 77 138
Other financial assets 13 380 -
Property, plant and equipment 16 8,277 7,853
Deferred tax assets 9 1,008 1,242
Intangible assets 17 248,449 215,658
TTotal non--ccurrent assets 258,191 224,891
TTotal assets 296,222 257,771
CCurrent l iabil it ies
Trade and other payables 19 6,372 6,210
Current tax liabilities 9 4,904 4,556
Provisions 21 1,506 1,645
Other 22 2,581 745
TTotal current l iabil it ies 15,363 13,156
NNon--ccurrent l iabil it ies
Borrowings 20 110,814 85,638
Provisions 21 363 356
Other 22 - 1,772
TTotal non--ccurrent l iabil it ies 111,177 87,766
TTotal l iabil it ies 126,540 100,922
NNet assets 169,682 156,849
EEquity
Issued capital 23 99,876 98,772
Reserves 24 (314) (829)
Retained earnings 25 70,120 58,906
TTotal equity 169,682 156,849
The consolidated statement of financial position should be read in conjunction with the accompanying notes.
41RETAIL FOOD GROUP LIMITED ANNUAL REPORT 30 JUNE 2012
CONSOLIDATEDSTATEMENTOFFINANCIALPOSITIONAS AT 30 JUNE 2012
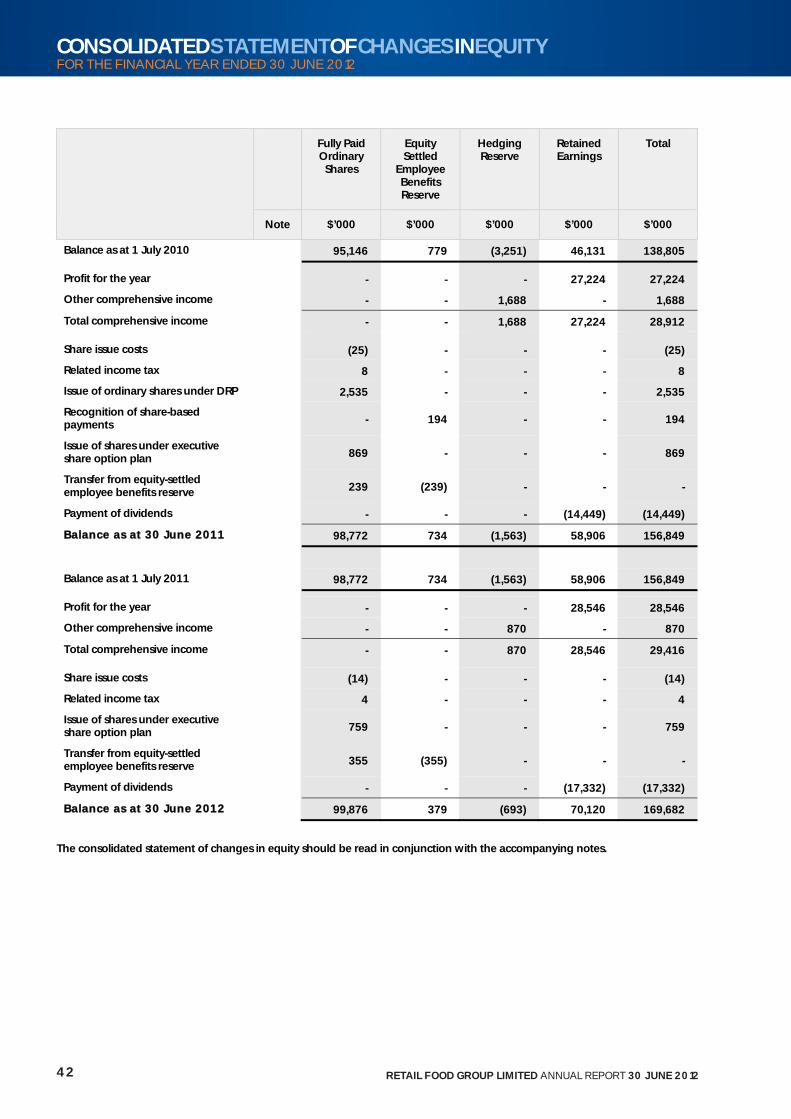
Fully Paid Ordinary
Shares
Equity Settled
Employee Benefits Reserve
Hedging Reserve
Retained Earnings
Total
Note $’000 $’000 $’000 $’000 $’000
Balance as at 1 July 2010 95,146 779 (3,251) 46,131 138,805
Profit for the year - - - 27,224 27,224
Other comprehensive income - - 1,688 - 1,688
Total comprehensive income - - 1,688 27,224 28,912
Share issue costs (25) - - - (25)
Related income tax 8 - - - 8
Issue of ordinary shares under DRP 2,535 - - - 2,535
Recognition of share-based payments
- 194 - - 194
Issue of shares under executive share option plan
869 - - - 869
Transfer from equity-settled employee benefits reserve
239 (239) - - -
Payment of dividends - - - (14,449) (14,449)
BBalance as at 330 June 2011 98,772 734 (1,563) 58,906 156,849
Balance as at 1 July 2011 98,772 734 (1,563) 58,906 156,849
Profit for the year - - - 28,546 28,546
Other comprehensive income - - 870 - 870
Total comprehensive income - - 870 28,546 29,416
Share issue costs (14) - - - (14)
Related income tax 4 - - - 4
Issue of shares under executive share option plan
759 - - - 759
Transfer from equity-settled employee benefits reserve
355 (355) - - -
Payment of dividends - - - (17,332) (17,332)
BBalance as at 330 June 2012 99,876 379 (693) 70,120 169,682
The consolidated statement of changes in equity should be read in conjunction with the accompanying notes.
42 RETAIL FOOD GROUP LIMITED ANNUAL REPORT 30 JUNE 2012
CONSOLIDATEDSTATEMENTOFCHANGESINEQUITYFOR THE FINANCIAL YEAR ENDED 30 JUNE 2012
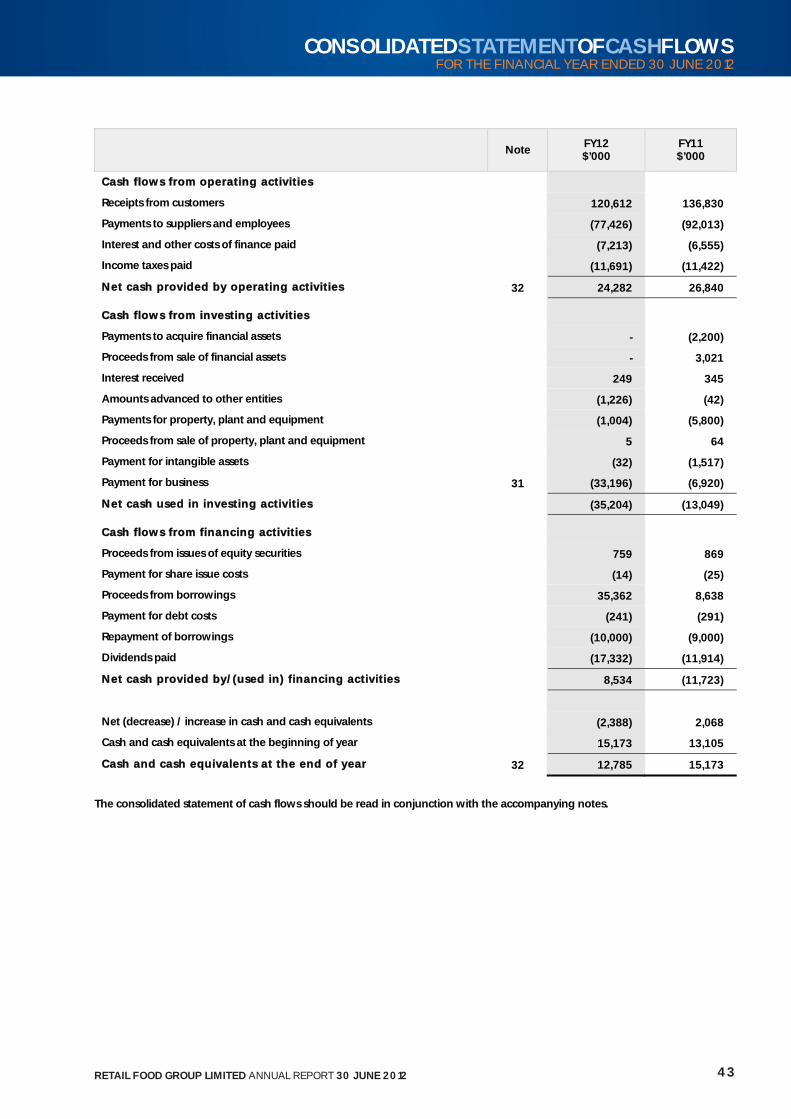
Note FY12 $’000
FY11 $’000
CCash flows from operating activit ies
Receipts from customers 120,612 136,830
Payments to suppliers and employees (77,426) (92,013)
Interest and other costs of finance paid (7,213) (6,555)
Income taxes paid (11,691) (11,422)
NNet cash provided by operating activit ies 32 24,282 26,840
CCash flows from investing activit ies
Payments to acquire financial assets - (2,200)
Proceeds from sale of financial assets - 3,021
Interest received 249 345
Amounts advanced to other entities (1,226) (42)
Payments for property, plant and equipment (1,004) (5,800)
Proceeds from sale of property, plant and equipment 5 64
Payment for intangible assets (32) (1,517)
Payment for business 31 (33,196) (6,920)
NNet cash used in investing activit ies (35,204) (13,049)
CCash flows from financing aactivit ies
Proceeds from issues of equity securities 759 869
Payment for share issue costs (14) (25)
Proceeds from borrowings 35,362 8,638
Payment for debt costs (241) (291)
Repayment of borrowings (10,000) (9,000)
Dividends paid (17,332) (11,914)
NNet cash pprovided by/(uused in)) ff inancing activit ies 8,534 (11,723)
Net (decrease) / increase in cash and cash equivalents (2,388) 2,068
Cash and cash equivalents at the beginning of year 15,173 13,105
CCash and cash equuivalents at the eend of year 32 12,785 15,173
The consolidated statement of cash flows should be read in conjunction with the accompanying notes.
43RETAIL FOOD GROUP LIMITED ANNUAL REPORT 30 JUNE 2012
CONSOLIDATEDSTATEMENTOFCASHFLOWSFOR THE FINANCIAL YEAR ENDED 30 JUNE 2012
11. General Information Retail Food Group Limited (the Company) is a public company listed on the Australian Securities Exchange (ASX: RFG), incorporated in Australia and operating in Australia and New Zealand. Retail Food Group Limited’s registered office and its principal place of business are as follows:
Registered Office Principal Administration Office
RFG House
1 Olympic Circuit
Southport QLD 4215
RFG House
1 Olympic Circuit
Southport QLD 4215
The principal activities of the Company and its subsidiaries (the Group) during the course of the financial year were:
the intellectual property ownership of the Donut King, bb’s café, Brumby’s Bakeries, Michel’s Patisserie, Esquires Coffee Houses and Pizza Capers franchise systems;
development and management of the Donut King, bb’s café, Brumby’s Bakeries, Michel’s Patisserie, Esquires Coffee Houses and Pizza Capers franchise systems throughout Australia and New Zealand, and international licensor throughout the rest of world; and
development and management of the Coffee Roasting Facilities in Australia and New Zealand and the wholesale supply of certain products to the Donut King, bb’s café, Brumby’s Bakeries, Michel’s Patisserie and Esquires Coffee Houses franchise systems.
22. Signif icant Accounting Policies 2.1 Statement Of Compliance These financial statements are general purpose financial statements which have been prepared in accordance with the Corporations Act 2001, Accounting Standards and Interpretations, and comply with other requirements of the law. The financial statements comprise the consolidated financial statements of the Group. For the purpose of preparing the consolidated financial statements, the Group is a for-profit entity. Accounting Standards include Australian Accounting Standards. Compliance with Australian Accounting Standards ensures that the financial statements and notes of the company and the Group comply with International Financial Reporting Standards (‘IFRS’). The financial statements were authorised for issue by the Directors on 27 September 2012. 2.2 Basis Of Preparation The financial report has been prepared on the basis of historical cost, except for the revaluation of certain financial instruments. Cost is based on the fair values of the consideration given in exchange for assets. All amounts are presented in Australian dollars, unless otherwise noted. The Company is a company of the kind referred to in ASIC Class Order 98/100, dated 10 July 1998, and in accordance with that Class Order amounts in the financial report are rounded off to the nearest thousand dollars, unless otherwise indicated. Early Adoption Of Accounting Standards The Directors have elected not to early adopt Accounting Standards that are not applicable to the reporting period ended 30 June 2012. Going Concern Basis The financial report has been prepared on a going concern basis.
44 RETAIL FOOD GROUP LIMITED ANNUAL REPORT 30 JUNE 2012
NOTESTOTHEFINANCIALSTATEMENTS
22. Signif icant Accounting Policies (cont.) The following significant accounting policies have been adopted in the preparation and presentation of the financial report: (a) Basis Of Consolidation
The consolidated financial statements incorporate the financial statements of the Company and entities controlled by the Company (its subsidiaries) (referred to as ‘the Group’ in these financial statements). Control is achieved where the Company has the power to govern the financial and operating policies of an entity so as to obtain benefits from its activities. The results of subsidiaries acquired or disposed of during the year are included in the consolidated statement of comprehensive income from the effective date of acquisition or up to the effective date of disposal, as appropriate. Where necessary, adjustments are made to the financial statements of subsidiaries to bring their accounting policies into line with those used by other members of the Group. All intra-group transactions, balances, income and expenses are eliminated in full on consolidation.
(b) Borrowing Costs Borrowing costs directly attributable to the acquisition, construction or production of qualifying assets, which are assets that necessarily take a substantial period of time to get ready for their intended use or sale, are added to the cost of those assets, until such time as the assets are substantially ready for their intended use or sale. Investment income earned on the temporary investment of specific borrowings pending their expenditure on qualifying assets is deducted from the borrowing costs eligible for capitalisation. All other borrowing costs are recognised in profit or loss in the period in which they are incurred.
(c) Business Combinations Acquisitions of subsidiaries and businesses are accounted for using the acquisition method. The consideration for each acquisition is measured at the aggregate of the fair values (at the date of exchange) of assets given, liabilities incurred or assumed, and equity instruments issued by the Group in exchange for control of the acquiree. Acquisition-related costs are recognised in profit or loss as incurred. Where applicable, the consideration for the acquisition includes any asset or liability resulting from a contingent consideration arrangement, measured at its acquisition-date fair value. Subsequent changes in such fair values are adjusted against the cost of the acquisition where they qualify as measurement period adjustments (see below). All other subsequent changes in the fair value of contingent consideration classified as an asset or liability are accounted for in accordance with relevant Standards. Changes in the fair value of contingent consideration classified as equity are not recognised. Where a business combination is achieved in stages, the Group’s previously held interests in the acquired entity are remeasured to fair value at the acquisition date (i.e. the date the Group attains control) and the resulting gain or loss, if any, is recognised in profit or loss. Amounts arising from interests in the acquiree prior to the acquisition date that have been recognised in other comprehensive income are reclassified to profit or loss, where such treatment would be appropriate if that interest were disposed of. At the acquisition date, the identifiable assets acquired and the liabilities assumed are recognised at their fair value at the acquisition date, except that: deferred tax assets or liabilities and liabilities or assets related to employee benefit arrangements are recognised and
measured in accordance with AASB 112 ‘Income Taxes’ and AASB 119 ‘Employee Benefits’ respectively;
liabilities or equity instruments related to the replacement by the Group of an acquiree’s share-based payment awards are measured in accordance with AASB 2 ‘Share-based Payment’; and
assets (or disposal groups) that are classified as held for sale in accordance with AASB 5 ‘Non-current Assets Held for Sale and Discontinued Operations’ are measured in accordance with that Standard.
If the initial accounting for a business combination is incomplete by the end of the reporting period in which the combination occurs, the Group reports provisional amounts for the items for which the accounting is incomplete. Those provisional amounts are adjusted during the measurement period (see below), or additional assets or liabilities are recognised, to reflect new information obtained about facts and circumstances that existed as of the acquisition date that, if known, would have affected the amounts recognised as of that date. The measurement period is the period from the date of acquisition to the date the Group obtains complete information about facts and circumstances that existed as of the acquisition date – and is subject to a maximum of one year. Business combinations that took place prior to 1 July 2009 were accounted for in accordance with the previous version of AASB 3.
45RETAIL FOOD GROUP LIMITED ANNUAL REPORT 30 JUNE 2012
NOTESTOTHEFINANCIALSTATEMENTS
22. Signif icant Accounting Policies (cont.)
(d) Cash And Cash Equivalents Cash comprises cash on hand and demand deposits. Cash equivalents are short-term, highly liquid investments that are readily convertible to known amounts of cash, which are subject to an insignificant risk of changes in value and have a maturity of three months or less at the date of acquisition. Bank overdrafts are shown within borrowings in current liabilities in the balance sheet.
(e) Derivative Financial Instruments
The Group has entered into interest rate swaps to manage its exposure to interest rate risk. The Group has not entered into any other derivative financial instruments. Further details of derivative financial instruments are disclosed in note 33. Derivatives are initially recognised at fair value at the date the derivative contract is entered into and are subsequently remeasured to their fair value at the end of each reporting period. The resulting gain or loss is recognised in profit or loss immediately unless the derivative is designated and effective as a hedging instrument, in which event, the timing of the recognition in profit or loss depends on the nature of the hedge relationship. The Group designates certain derivatives as either hedges of the fair value of recognised assets or liabilities or firm commitments (fair value hedges), hedges of highly probable forecast transactions or hedges of foreign currency risk of firm commitments (cash flow hedges), or hedges of net investments in foreign operations. A derivative with a positive fair value is recognised as a financial asset; a derivative with a negative fair value is recognised as a financial liability. A derivative is presented as a non-current asset or a non-current liability if the remaining maturity of the instrument is more than 12 months and it is not expected to be realised or settled within 12 months. Other derivatives are presented as current assets or current liabilities. Hedge Accounting At the inception of the hedge relationship, the Group documents the relationship between the hedging instrument and hedged item, along with its risk management objectives and its strategy for undertaking various hedge transactions. Furthermore, at the inception of the hedge and on an ongoing basis, the Group documents whether the hedging instrument is highly effective in offsetting changes in fair values or cash flows of the hedged item. Note 33 sets out details of the fair values of the derivative instruments used for hedging purposes. Cash Flow Hedges The effective portion of changes in the fair value of derivatives that are designated and qualify as cash flow hedges is recognised in other comprehensive income. The gain or loss relating to the ineffective portion is recognised immediately in profit or loss and is separately disclosed. Amounts previously recognised in other comprehensive income and accumulated in equity are reclassified to profit or loss in the periods when the hedged item is recognised in profit or loss, in the same line of the statement of comprehensive income as the recognised hedged item. However, when the forecast transaction that is hedged results in the recognition of a non-financial asset or a non-financial liability, the gains and losses previously accumulated in equity are transferred from equity and included in the initial measurement of the cost of the non-financial asset or non-financial liability. Hedge accounting is discontinued when the Group revokes the hedging relationship, when the hedge instrument expires or is sold, terminated, or exercised, or when it no longer qualifies for hedge accounting. Any gain or loss accumulated in equity at that time remains in equity and is recognised when the forecast transaction is ultimately recognised in profit or loss. When a forecast transaction is no longer expected to occur, the gain or loss accumulated in equity is recognised immediately in profit or loss.
(f) Employee Benefits
A liability is recognised for benefits accruing to employees in respect of wages and salaries, annual leave and long service leave when it is probable that settlement will be required and they are capable of being measured reliably. Liabilities recognised in respect of short-term employee benefits are measured at their nominal values using the remuneration rate expected to apply at the time of settlement. Liabilities recognised in respect of long-term employee benefits are measured as the present value of the estimated future cash outflows to be made by the Group in respect of services provided by employees up to the reporting date. Contributions to defined contribution retirement benefit plans are recognised as an expense when employees have rendered service entitling them to the contributions.
46 RETAIL FOOD GROUP LIMITED ANNUAL REPORT 30 JUNE 2012
NOTESTOTHEFINANCIALSTATEMENTS
22. Signif icant Accounting Policies (cont.)
(g) Financial Assets All financial assets are recognised and derecognised on trade date where the purchase or sale of a financial asset is under a contract whose terms require delivery of the financial asset within the timeframe established by the market concerned, and are initially measured at fair value, plus transaction costs, except for those financial assets classified as at fair value through profit or loss, which are initially measured at fair value. Financial assets are classified into the following specified categories: financial assets ‘at fair value through profit or loss’ (FVTPL), ‘held-to-maturity’ investments, ‘available-for-sale’ (AFS) financial assets and ‘loans and receivables’. The classification depends on the nature and purpose of the financial assets and is determined at the time of initial recognition. Effective Interest Method The effective interest method is a method of calculating the amortised cost of a debt instrument and of allocating interest income over the relevant period. The effective interest rate is the rate that exactly discounts estimated future cash receipts (including all fees on points paid or received that form an integral part of the effective interest rate, transaction costs and other premiums or discounts) through the expected life of the debt instrument, or (where appropriate) a shorter period, to the net carrying amount on initial recognition. Income is recognised on an effective interest basis for debt instruments other than those financial assets classified as at FVTPL. Loans And Receivables Trade receivables, loans, and other receivables that have fixed or determinable payments that are not quoted in an active market are classified as ‘loans and receivables’. Loans and receivables are measured at amortised cost using the effective interest method, less any impairment. Interest income is recognised by applying the effective interest rate, except for short-term receivables when the recognition of interest would be immaterial. Impairment Of Financial Assets Financial assets, other than those at FVTPL, are assessed for indicators of impairment at the end of each reporting period. Financial assets are considered to be impaired when there is objective evidence that, as a result of one or more events that occurred after the initial recognition of the financial asset, the estimated future cash flows of the financial asset have been affected. For financial assets carried at amortised cost, the amount of the impairment loss recognised is the difference between the asset’s carrying amount and the present value of estimated future cash flows, discounted at the financial asset’s original effective interest rate. The carrying amount of the financial asset is reduced by the impairment loss directly for all financial assets with the exception of trade receivables, where the carrying amount is reduced through the use of an allowance account. When a trade receivable is considered uncollectible, it is written off against the allowance account. Subsequent recoveries of amounts previously written off are credited against the allowance account. Changes in the carrying amount of the allowance account are recognised in profit or loss. When an AFS financial asset is considered to be impaired, cumulative gains or losses previously recognised in other comprehensive income are reclassified to profit or loss in the period. With the exception of AFS equity instruments, if, in a subsequent period, the amount of the impairment loss decreases and the decrease can be related objectively to an event occurring after the impairment was recognised, the previously recognised impairment loss is reversed through profit or loss to the extent that the carrying amount of the investment at the date the impairment is reversed does not exceed what the amortised cost would have been had the impairment not been recognised. In respect of AFS equity securities, impairment losses previously recognised in profit or loss are not reversed through profit or loss. Any increase in fair value subsequent to an impairment loss is recognised in other comprehensive income. Derecognition Of Financial Assets The Group derecognises a financial asset only when the contractual rights to the cash flows from the asset expire, or when it transfers the financial asset and substantially all the risks and rewards of ownership of the asset to another entity. If the Group neither transfers nor retains substantially all the risks and rewards of ownership and continues to control the transferred asset, the Group recognises its retained interest in the asset and an associated liability for amounts it may have to pay. If the Group retains substantially all the risks and rewards of ownership of a transferred financial asset, the Group continues to recognise the financial asset and also recognises a collateralised borrowing for the proceeds received.
47RETAIL FOOD GROUP LIMITED ANNUAL REPORT 30 JUNE 2012
NOTESTOTHEFINANCIALSTATEMENTS
22. Signif icant Accounting Policies (cont.)
(h) Financial Liabil it ies And Equity Instruments Issued By The Group Classification As Debt Or Equity Debt and equity instruments are classified as either financial liabilities or as equity in accordance with the substance of the contractual arrangement. Equity Instruments An equity instrument is any contract that evidences a residual interest in the assets of an entity after deducting all of its liabilities. Equity instruments issued by the Group are recognised as the proceeds received, net of direct issue costs. Financial Guarantee Contract Liabilities Financial guarantee contract liabilities are measured initially at their fair values, if not designated as at FVTPL, are subsequently measured at the higher of:
the amount of the obligation under the contract, as determined in accordance with AASB 137 ‘Provisions, Contingent Liabilities and Contingent Assets’; and
the amount initially recognised less, where appropriate, cumulative amortisation, recognised in accordance with the revenue recognition policies set out at note 2(s).
Financial Liabilities Financial liabilities are classified as either financial liabilities ‘at FVTPL’ or ‘other financial liabilities’. Financial Liabilities At FVTPL Financial liabilities are classified as at FVTPL when the financial liability is either held for trading or it is designated as at FVTPL. A financial liability is classified as held for trading if:
it has been acquired principally for the purpose of repurchasing it in the near term; or,
on initial recognition it is part of a portfolio of identified financial instruments that the Group manages together and has a recent actual pattern of short-term profit-taking; or
it is a derivative that is not designated and effective as a hedging instrument. A financial liability other than a financial liability held for trading may be designated as at FVTPL upon initial recognition if:
such designation eliminates or significantly reduces a measurement or recognition inconsistency that would otherwise arise; or,
the financial liability forms part of a group of financial assets or financial liabilities or both, which is managed and its performance is evaluated on a fair value basis, in accordance with the Group's documented risk management or investment strategy, and information about the grouping is provided internally on that basis; or
it forms part of a contract containing one or more embedded derivatives, and AASB 139 ‘Financial Instruments: Recognition and Measurement’ permits the entire combined contract (asset or liability) to be designated as at FVTPL.
Financial liabilities at FVTPL are stated at fair value, with any gains or losses arising on remeasurement recognised in profit or loss. Fair value is determined in the manner described in note 33. Other Financial Liabilities Other financial liabilities, including borrowings, are initially measured at fair value, net of transaction costs. Other financial liabilities are subsequently measured at amortised cost using the effective interest method, with interest expense recognised on an effective yield basis. The effective interest method is a method of calculating the amortised cost of a financial liability and of allocating interest expense over the relevant period. The effective interest rate is the rate that exactly discounts estimated future cash payments through the expected life of the financial liability, or (where appropriate) a shorter period, to the net carrying amount on initial recognition. Derecognition Of Financial Liabilities The Group derecognises financial liabilities when, and only when, the Group’s obligations are discharged, cancelled or they expire.
48 RETAIL FOOD GROUP LIMITED ANNUAL REPORT 30 JUNE 2012
NOTESTOTHEFINANCIALSTATEMENTS
22. Signif icant Accounting Policies (cont.)
( i) Foreign Currencies
The individual financial statements of each group entity are presented in the currency of the primary economic environment in which the entity operates (its functional currency). For the purpose of the consolidated financial statements, the results and financial position of each group entity are expressed in Australian dollars (‘$’), which is the functional currency of the Company and the presentation currency for the consolidated financial statements. In preparing the financial statements of the individual entities, transactions in currencies other than the entity’s functional currency (foreign currencies) are recognised at the rates of exchange prevailing at the dates of the transactions. At the end of each reporting period, monetary items denominated in foreign currencies are retranslated at the rates prevailing at that date. Non-monetary items carried at fair value that are denominated in foreign currencies are retranslated at the rates prevailing at the date when the fair value was determined. Non-monetary items that are measured in terms of historical cost in a foreign currency are not retranslated. Exchange differences are recognised in profit or loss in the period in which they arise except for:
exchange differences on foreign currency borrowings relating to assets under construction for future productive use, which are included in the cost of those assets when they are regarded as an adjustment to interest costs on those foreign currency borrowings;
exchange differences on transactions entered into in order to hedge certain foreign currency risks; and
exchange differences on monetary items receivable from or payable to a foreign operation for which settlement is neither planned nor likely to occur (therefore forming part of the net investment in the foreign operation), which are recognised initially in other comprehensive income and reclassified from equity to profit or loss on disposal or partial disposal of the net investment.
For the purpose of presenting consolidated financial statements, the assets and liabilities of the Group’s foreign operations are expressed in Australian dollars using exchange rates prevailing at the end of the reporting period. Income and expense items are translated at the average exchange rates for the period, unless exchange rates fluctuated significantly during that period, in which case the exchange rates at the dates of the transactions are used. Exchange differences arising, if any, are recognised in other comprehensive income and accumulated in equity. Goodwill and fair value adjustments on identifiable assets and liabilities acquired arising on the acquisition of a foreign operation are treated as assets and liabilities of the foreign operation and translated at the rate of exchange prevailing at the end of each reporting period. Exchange differences arising are recognised in equity.
( j) Goods And Services Tax Revenues, expenses and assets are recognised net of the amount of goods and services tax (GST), except:
where the amount of GST incurred is not recoverable from the taxation authority, it is recognised as part of the cost of acquisition of an asset or as part of an item of expense; or
for receivables and payables which are recognised inclusive of GST.
The net amount of GST recoverable from, or payable to, the taxation authority is included as part of receivables or payables.
Cash flows are included in the statement of cash flows on a gross basis. The GST component of cash flows arising from investing and financing activities which is recoverable from, or payable to, the taxation authority is classified within operating cash flows.
(k) Goodwill
Goodwill arising in a business combination is recognised as an asset at the date that control is acquired (the acquisition date). Goodwill is measured as the excess of the sum of the consideration transferred, the amount of any non-controlling interests in the acquiree, and the fair value of the acquirer’s previously held equity interest in the acquiree (if any) over the net of the acquisition-date amounts of the identifiable assets acquired and the liabilities assumed. If, after reassessment, the Group’s interest in the fair value of the acquiree’s identifiable net assets exceeds the sum of the consideration transferred, the amount of any non-controlling interests in the acquiree and the fair value of the acquirer’s previously held equity interest in the acquiree (if any), the excess is recognised immediately in profit or loss as a bargain purchase gain. Goodwill is not amortised but is reviewed for impairment at least annually. For the purpose of impairment testing, goodwill is allocated to each of the Group’s cash-generating units expected to benefit from the synergies of the combination. Cash-generating units to which goodwill has been allocated are tested for impairment annually, or more frequently when there is an indication that the unit may be impaired. If the recoverable amount of the cash-generating unit is less than its carrying amount, the impairment loss is allocated first to reduce the carrying amount of any goodwill allocated to the unit and then to the other assets of the unit pro-rata on the basis of the carrying amount of each asset in the unit. An impairment loss recognised for goodwill is not reversed in a subsequent period. On disposal of a subsidiary, the attributable amount of goodwill is included in the determination of the profit or loss on disposal. 49RETAIL FOOD GROUP LIMITED ANNUAL REPORT 30 JUNE 2012
NOTESTOTHEFINANCIALSTATEMENTS
22. Signif icant Accounting Policies (cont.)
( l) Impairment Of Tangible And Intangible Assets Excluding Goodwil l At the end of each reporting period, the Group reviews the carrying amounts of its tangible and intangible assets to determine whether there is any indication that those assets have suffered an impairment loss. If any such indication exists, the recoverable amount of the asset is estimated in order to determine the extent of the impairment loss (if any). Where it is not possible to estimate the recoverable amount of an individual asset, the Group estimates the recoverable amount of the cash-generating unit to which the asset belongs. Where a reasonable and consistent basis of allocation can be identified, corporate assets are also allocated to individual cash-generating units, or otherwise they are allocated to the smallest group of cash-generating units for which a reasonable and consistent allocation basis can be identified. Intangible assets with indefinite useful lives and intangible assets not yet available for use are tested for impairment at least annually, and whenever there is an indication that the asset may be impaired. Recoverable amount is the higher of fair value less costs to sell and value in use. In assessing value in use, the estimated future cash flows are discounted to their present value using a pre-tax discount rate that reflects current market assessments of the time value of money and the risks specific to the asset for which the estimates of future cash flows have not been adjusted. If the recoverable amount of an asset (or cash-generating unit) is estimated to be less than its carrying amount, the carrying amount of the asset (or cash-generating unit) is reduced to its recoverable amount. An impairment loss is recognised immediately in profit or loss, unless the relevant asset (or cash generating unit) is carried at a revalued amount, in which case the impairment loss is treated as a revaluation decrease. Where an impairment loss subsequently reverses, the carrying amount of the asset (or cash-generating unit) is increased to the revised estimate of its recoverable amount, but so that the increased carrying amount does not exceed the carrying amount that would have been determined had no impairment loss been recognised for the asset (or cash-generating unit) in prior years. A reversal of an impairment loss is recognised immediately in profit or loss, unless the relevant asset is carried at a revalued amount, in which case the reversal of the impairment loss is treated as a revaluation increase.
(m) Intangible Assets Intangible Assets Acquired Separately Intangible assets acquired separately are carried at cost less accumulated amortisation and accumulated impairment losses. Amortisation is recognised on a straight-line basis over their estimated useful lives. The estimated useful life and amortisation method are reviewed at the end of each annual reporting period, with the effect of any changes in estimate being accounted for on a prospective basis. Intangible Assets Acquired In A Business Combination Intangible assets acquired in a business combination and recognised separately from goodwill are initially recognised at their fair value at the acquisition date (which is regarded as their cost). Subsequent to initial recognition, intangible assets acquired in a business combination are reported at cost less accumulated amortisation and accumulated impairment losses, on the same basis as intangible assets that are acquired separately. Franchise Networks And Intellectual Property Intangible assets include franchise networks (consisting of identifiable franchise systems and brand names) and intellectual property (consisting of trademarks, recipes, manuals and systems). Franchise networks are indentified and recognised at the time of a business combination and recorded at their fair value, if their fair value can be measured reliably. Franchise networks acquired separately and intellectual property are recorded at cost. Franchise networks and intellectual property are not amortised on the basis that they have an indefinite life and are reviewed annually in accordance with note 2(l). Expenditure incurred in maintaining intangible assets is expensed in the period in which it is occurred.
(n) Inventories Inventories are stated at the lower of cost and net realisable value. Costs, including an appropriate portion of fixed and variable overhead expenses, are assigned to inventories by the method most appropriate to each particular class of inventory, with all categories being valued on a first in first out basis. Net realisable value represents the estimated selling price for inventories less all estimated costs of completion and costs necessary to make the sale.
50 RETAIL FOOD GROUP LIMITED ANNUAL REPORT 30 JUNE 2012
NOTESTOTHEFINANCIALSTATEMENTS
22. Signif icant Accounting Policies (cont.)
(o) Leasing Leases are classified as finance leases whenever the terms of the lease transfer substantially all the risks and rewards of ownership to the lessee. All other leases are classified as operating leases. Group As Lessor Rental income from operating leases is recognised on a straight-line basis over the term of the relevant lease. Group As Lessee Operating lease payments are recognised as an expense on a straight-line basis over the lease term, except where another systematic basis is more representative of the time pattern in which economic benefits from the leased asset are consumed. Contingent rentals arising under operating leases are recognised as an expense in the period in which they are incurred. In the event that lease incentives are received to enter into operating leases, such incentives are recognised as a liability. The aggregate benefit of incentives is recognised as a reduction of rental expense on a straight-line basis, except where another systematic basis is more representative of the time pattern in which economic benefits from the leased asset are consumed.
(p) Non-current Assets Held For Sale Non-current assets and disposal groups are classified as held for sale if their carrying amount will be recovered principally through a sale transaction rather than through continuing use. This condition is regarded as met only when the sale is highly probable and the non-current asset (or disposal group) is available for immediate sale in its present condition. Management must be committed to the sale, which should be expected to qualify for recognition as a completed sale within one year from the date of classification.
(q) Property, Plant And Equipment Land and buildings held for use in the production or supply of goods or services, or for administrative purposes, are stated in the statement of financial position at cost, less any subsequent accumulated depreciation and subsequent accumulated impairment losses. Properties in the course of construction for production, supply or administrative purposes, or for purposes not yet determined, are carried at cost, less any recognised impairment loss. Cost includes professional fees and, for qualifying assets, borrowing costs capitalised in accordance with the Group’s accounting policy. Depreciation of these assets, on the same basis as other property assets, commences when the assets are ready for their intended use. Freehold land is not depreciated. Fixtures and equipment are stated at cost less accumulated depreciation and accumulated impairment losses. Depreciation is recognised so as to write off the cost or valuation of assets (other than freehold land and properties under construction) less their residual values over their useful lives, using the straight-line method. The estimated useful lives, residual values and depreciation method are reviewed at each year end, with the effect of any changes in estimate accounted for on a prospective basis. The gain or loss arising on the disposal or retirement of an item of property, plant and equipment is determined as the difference between the sales proceeds and the carrying amount of the asset and is recognised in profit or loss. The following useful lives are used in the calculation of depreciation:
buildings 40 years
leasehold improvements 5 – 10 years
plant and equipment 2 – 20 years
51RETAIL FOOD GROUP LIMITED ANNUAL REPORT 30 JUNE 2012
NOTESTOTHEFINANCIALSTATEMENTS
22. Signif icant Accounting Policies (cont.)
(r) Provisions Provisions are recognised when the Group has a present obligation (legal or constructive) as a result of a past event, it is probable that the Group will be required to settle the obligation, and a reliable estimate can be made of the amount of the obligation. The amount recognised as a provision is the best estimate of the consideration required to settle the present obligation at the end of the reporting period, taking into account the risks and uncertainties surrounding the obligation. Where a provision is measured using the cash flows estimated to settle the present obligation, its carrying amount is the present value of those cash flows. When some or all of the economic benefits required to settle a provision are expected to be recovered from a third party, a receivable is recognised as an asset if it is virtually certain that reimbursement will be received and the amount of the receivable can be measured reliably. Onerous Contracts Present obligations arising under onerous contracts are recognised and measured as provisions. An onerous contract is considered to exist where the Group has a contract under which the unavoidable costs of meeting the obligations under the contract exceed the economic benefits expected to be received under it. Make-good Make-good obligations arising under leases are recognised and measured as provisions. Make-good refer to obligations in respect of restoring sites to their original condition when the premises are vacated. Management has estimated the provision based on historical data in relation to store closure numbers and costs, as well as future trends that could differ from historical amounts. Contingent Liabilities Acquired In A Business Combination Contingent liabilities acquired in a business combination are initially measured at fair value at the acquisition date. At the end of subsequent reporting periods, such contingent liabilities are measured at the higher of the amount that would be recognised in accordance with AASB 137 ‘Provisions, Contingent Liabilities and Contingent Assets’ and the amount initially recognised less cumulative amortisation recognised in accordance with AASB 118 ‘Revenue’.
(s) Revenue Revenue is measured at the fair value of the consideration received or receivable. Sale Of Goods Revenue from the sale of goods is recognised when all the following conditions are satisfied:
the Group has transferred to the buyer the significant risks and rewards of ownership of the goods;
the Group retains neither continuing managerial involvement to the degree usually associated with ownership nor effective control over the goods sold;
the amount of revenue can be measured reliably;
it is probable that the economic benefits associated with the transaction will flow to the entity; and
the costs incurred or to be incurred in respect of the transaction can be measured reliably.
Franchise Income Franchisor income is recognised on an accrual basis in accordance with the substance of the relevant agreement. Royalty revenue is recognised on an accrual basis in accordance with the substance of the relevant agreement (provided that it is probable that the economic benefits will flow to the Group and the amount of revenue can be measured reliably). Dividend And Interest Income Dividend revenue from investments is recognised when the shareholder’s right to receive payment has been established. Interest revenue is recognised when it is probable that the economic benefits will flow to the Group and the amount of revenue can be measured reliably. Interest revenue is accrued on a time basis, by reference to the principal outstanding and at the effective interest rate applicable, which is the rate that exactly discounts estimated future cash receipts through the expected life of the financial asset to that asset’s net carrying amount on initial recognition.
52 RETAIL FOOD GROUP LIMITED ANNUAL REPORT 30 JUNE 2012
NOTESTOTHEFINANCIALSTATEMENTS
22. Signif icant Accounting Policies (cont.)
(t) Share-based Payments Equity-settled share-based payments to employees and others providing similar services are measured at the fair value of the equity instrument at the grant date. Details regarding the determination of the fair value of equity-settled share-based transactions are set out in note 34. The fair value determined at the grant date of the equity-settled share-based payments is expensed on a straight-line basis over the vesting period, based on the Group’s estimate of equity instruments that will eventually vest. At the end of each reporting period, the Group revises its estimate of the number of equity instruments expected to vest. The impact of the revision of the original estimates, if any, is recognised in profit or loss such that the cumulative expense reflects the revised estimate, with a corresponding adjustment to the equity-settled employee benefits reserve. Equity-settled share-based payment transactions with parties other than employees are measured at the fair value of the goods or services received, except where that fair value cannot be estimated reliably, in which case they are measured at the fair value of the equity instruments granted, measured at the date the entity obtains the goods or the counterparty renders the service.
(u) Taxation Income tax expense represents the sum of the tax currently payable and deferred tax. Current Tax The tax currently payable is based on taxable profit for the year. Taxable profit differs from profit as reported in the consolidated statement of comprehensive income because of items of income or expense that are taxable or deductible in other years and items that are never taxable or deductible. The Group’s liability for current tax is calculated using tax rates that have been enacted or substantively enacted by the end of the reporting period. Deferred Tax Deferred tax is recognised on temporary differences between the carrying amounts of assets and liabilities in the financial statements and the corresponding tax bases used in the computation of taxable profit. Deferred tax liabilities are generally recognised for all taxable temporary differences. Deferred tax assets are generally recognised for all deductible temporary differences to the extent that it is probable that taxable profits will be available against which those deductible temporary differences can be utilised. Such deferred tax assets and liabilities are not recognised if the temporary difference arises from goodwill or from the initial recognition (other than in a business combination) of other assets and liabilities in a transaction that affects neither the taxable profit nor the accounting profit. Deferred tax liabilities are recognised for taxable temporary differences associated with investments in subsidiaries and associates, and interests in joint ventures, except where the Group is able to control the reversal of the temporary difference and it is probable that the temporary difference will not reverse in the foreseeable future. Deferred tax assets arising from deductible temporary differences associated with such investments and interests are only recognised to the extent that it is probable that there will be sufficient taxable profits against which to utilise the benefits of the temporary differences and they are expected to reverse in the foreseeable future. The carrying amount of deferred tax assets is reviewed at the end of each reporting period and reduced to the extent that it is no longer probable that sufficient taxable profits will be available to allow all or part of the asset to be recovered. Deferred tax assets and liabilities are measured at the tax rates that are expected to apply in the period in which the liability is settled or the asset realised, based on tax rates (and tax laws) that have been enacted or substantively enacted by the end of the reporting period. The measurement of deferred tax liabilities and assets reflects the tax consequences that would follow from the manner in which the Group expects, at the end of the reporting period, to recover or settle the carrying amount of its assets and liabilities. Deferred tax assets and liabilities are offset when there is a legally enforceable right to set off current tax assets against current tax liabilities and when they relate to income taxes levied by the same taxation authority and the Group intends to settle its current tax assets and liabilities on a net basis. Current And Deferred Tax For The Year Current and deferred tax are recognised as an expense or income in profit or loss, except when they relate to items that are recognised outside profit or loss (whether in other comprehensive income or directly in equity), in which case the tax is also recognised outside profit or loss, or where they arise from the initial accounting for a business combination. In the case of a business combination, the tax effect is included in the accounting for the business combination.
53RETAIL FOOD GROUP LIMITED ANNUAL REPORT 30 JUNE 2012
NOTESTOTHEFINANCIALSTATEMENTS
33. Adoption Of New And Revised Accounting Standards 3.1 Standards And Interpretations Adopted In the Current Period The Group has adopted all of the new and revised Standards and Interpretations issued by the AASB that are relevant to its operations and effective for the current reporting period. The adoption of new Standards and Interpretations during the current reporting period did not have any material effect on the reported results or financial position of the Group, or the presentation and disclosure of amounts in these financial statements. 3.2 Standards And Interpretations In Issue Not Yet Adopted At the date of authorisation of the financial statements, the Standards and Interpretations listed below were in issue but not yet effective. Initial application is not expected to have any material impact on the financial statements of the Group.
Standard/Interpretation Effective For Annual Reporting Periods
Beginning On Or After
Expected To Be Initially Applied In The Financial Year
Ending
AASB 9 ‘Financial Instruments’, AASB 2009-11 ‘Amendments to Australian Accounting Standards arising from AASB 9’ and AASB 2010-7 ‘Amendments to Australian Accounting Standards arising from AASB 9 (December 2010)’
1 January 2013 30 June 2014
AASB 10 ‘Consolidated Financial Statements’ 1 January 2013 30 June 2014
AASB 11 ‘Joint Arrangements’ 1 January 2013 30 June 2014
AASB 12 ‘Disclosure of Interests in Other Entities’ 1 January 2013 30 June 2014
AASB 127 ‘Separate Financial Statements’ (2011) 1 January 2013 30 June 2014
AASB 128 ‘Investments in Associates and Joint Ventures’ (2011 1 January 2013 30 June 2014
AASB 13 ‘Fair Value Measurement’ and AASB 2011-8 ‘Amendments to Australian Accounting Standards arising from AASB 13’ 1 January 2013 30 June 2014
AASB 119 ‘Employee Benefits’ (2011) and AASB 2011-10 ‘Amendments to Australian Accounting Standards arising from ASSB 119 (2011)’ 1 January 2013 30 June 2014
AASB 2010-8 ‘Amendments to Australian Accounting Standards – Deferred Tax: Recovery of Underlying Assets’
1 January 2012 30 June 2013
AASB 2011-4 ‘Amendments to Australian Accounting Standards to Remove Individual Key Management Personnel Disclosure Requirements’
1 July 2013 30 June 2014
AASB 2011-7 ‘Amendments to Australian Accounting Standards arising from the Consolidation and Joint Arrangements standards’
1 January 2013 30 June 2014
AASB 2011-9 ‘Amendments to Australian Accounting Standards – Presentation of Items of Other Comprehensive Income’
1 July 2012 30 June 2013
AASB 2012-5 Amendments to Australian Accounting Standards arising from Annual Improvements 2009 – 2011 Cycle
1 January 2013 30 June 2014
Offsetting Financial Assets and Financial Liabilities (Amendments to IAS 32) 1 January 2014 30 June 2015
Disclosures – Offsetting Financial Assets and Financial Liabilities (Amendments to IFRS 7)
1 January 2013 30 June 2014
Mandatory Effective Date of IFRS 9 and Transition Disclosures (Amendments to IFRS 9 and IFRS 7)
1 January 2015 30 June 2016
44. Crit ical Accounting Judgments And Key Sources of Estimation Uncertainty In the application of the Group’s accounting policies, which are described in note 2, the Directors are required to make judgements, estimates and assumptions about the carrying amounts of assets and liabilities that are not readily apparent from other sources. The estimates and associated assumptions are based on historical experience and other factors that are considered to be relevant. Actual results may differ from these estimates.
54 RETAIL FOOD GROUP LIMITED ANNUAL REPORT 30 JUNE 2012
NOTESTOTHEFINANCIALSTATEMENTS
44. Crit ical Accounting Judgments And Key Sources of Estimation Uncertainty (cont.) The estimates and underlying assumptions are reviewed on an ongoing basis. Revisions to accounting estimates are recognised in the period in which the estimate is revised if the revision affects only that period, or in the period of the revision and future periods if the revision affects both current and future periods. Further details of the nature of these assumptions and conditions may be found in the relevant notes to the financial statements. 4.1 Deferred Tax Assets Deferred tax assets are recognised for deductible temporary differences as management considers that it is probable that future taxable profits will be available to utilise those temporary differences. 4.2 Taxation The Group's accounting policy for taxation requires management's judgment as to the types of arrangements considered to be a tax on income in contrast to an operating cost. Judgment is also required in assessing whether deferred tax assets and certain deferred tax liabilities are recognised on the balance sheet. Deferred tax assets, including those arising from unrecouped tax losses, capital losses and temporary differences, are recognised only where it is considered more likely than not that they will be recovered, which is dependent on the generation of sufficient future taxable profits. Deferred tax liabilities arising from temporary differences in investments, caused principally by retained earnings held in foreign tax jurisdictions, are recognised unless repatriation of retained earnings can be controlled and are not expected to occur in the foreseeable future. Assumptions about the generation of future taxable profits and repatriation of retained earnings depend on management's estimates of future cash flows. These depend on estimates of future production and sales volumes, operating costs, restoration costs, capital expenditure, dividends and other capital management transactions. Judgements are also required about the application of income tax legislation. These judgements and assumptions are subject to risk and uncertainty, hence there is a possibility that changes in circumstances will alter expectations, which may impact the amount of deferred tax assets and deferred tax liabilities recognised on the balance sheet and the amount of other tax losses and temporary differences not yet recognised. In such circumstances, some or all of the carrying amounts of recognised deferred tax assets and liabilities may require adjustment, resulting in a corresponding credit or charge to the statement of comprehensive income. 4.3 Impairment Of Non-financial Assets Other Than Goodwill And Indefinite Life Intangible Assets The Group assesses impairment of all assets at the end of each reporting period by evaluating conditions specific to the Group and to the particular asset that may lead to impairment. These include product and manufacturing performance, technology, economic and political environments and future product expectations. If an impairment trigger exists, the recoverable amount of the asset is determined. Management does not consider that there have been any indicators of impairment and as such these assets have not been tested for impairment in this financial period. 4.4 Impairment Of Goodwill And Indefinite Life Intangible Assets The Group tests annually whether goodwill and indefinite life intangibles have suffered any impairment, in accordance with the accounting policy stated in note 2(k) and 2(l). The recoverable amounts of cash-generating units have been determined based on value-in-use calculations. These calculations require the use of assumptions. Refer to note 17 for details of these assumptions. 4.5 Share-based Payment Transactions The Group measures the cost of equity-settled transactions with employees by reference to the fair value of the equity instruments at the date at which they are granted. The fair value is determined by using the Black-Scholes model, with the assumptions detailed in note 34. The accounting estimates and assumptions relating to equity-settled share-based payments would have no impact on the carrying amounts of assets and liabilities within the next annual reporting period but may impact expenses and equity. 4.6 Estimation Of Useful Lives Of Assets The estimation of the useful lives of assets has been based on historical experience as well as manufacturers' warranties (for plant and equipment), lease terms (for leased equipment) and turnover policies (for motor vehicles). In addition, the condition of the assets is assessed at least once per year and considered against the remaining useful life. Adjustments to useful lives are made when considered necessary.
55RETAIL FOOD GROUP LIMITED ANNUAL REPORT 30 JUNE 2012
NOTESTOTHEFINANCIALSTATEMENTS
44. Crit ical Accounting Judgments And Key Sources of Estimation Uncertainty (cont.) 4.7 Onerous Lease Provisions And Make-good Provisions A provision has been made for the present value of future lease payments that the Group is presently obliged to make payments under non-cancellable onerous lease contracts relating to certain loss-making non-voluntary company stores. A provision has been made for the present value of the Director’s best estimate of the future sacrifice of economic benefits that will be required to restore site occupied by the loss-making non-voluntary company stores that existed at the end of the reporting period, to a condition specified in the relevant lease agreement. The estimate has been made on the basis of quotes obtained from restoration specialists or past experience. The calculation of both provisions requires assumptions such as the likelihood of sale of the non-voluntary company store, the estimated lease termination costs, and the expected costs of making-good the premises. These uncertainties may result in future actual expenditure differing from the amounts currently provided. The provision recognised for each site is periodically reviewed and updated based on the facts and circumstances available at the time. 5. Segment Information AASB 8 requires operating segments to be identified on the basis of internal reports about components of the Group that are reviewed regularly by the chief operating decision maker in order to allocate resources to the segments and to assess their performance. 5.1 Products And Services From Which Reportatble Segments Derive Their Results For management purposes, the Group is organised into two major operating divisions – franchising operations and wholesale / retail operations. These divisions are the basis on which the Group reports its primary segment information. The Group’s reportable segments under AASB 8, and the principal products and services of each, are as follows:
Segment Description
Franchising Operations Franchising Operations incorporates the development and management of the Group’s retail franchise systems – Donut King, bb’s café, Brumby’s Bakeries, Michel’s Patisserie, Esquires Coffee Houses and Pizza Capers – and involves the following principal activities:
the establishment and grant of new franchises;
the administration of royalties collection, supplier licensing, franchise compliance, franchise training and administration; and
the performance of marketing and promotional activities, brand development and awareness, and product research and development.
Wholesale / Retail Operations
Wholesale / Retail Operations incorporates the development and management of the Group’s Procurement & Distribution division, Wholesale & Manufacturing division and Non-Voluntary Company Store (NVCS) division. These divisions are managed and reported separate to the Franchising Operations segment, and involve the following principal activities:
the procurement of bakery and other related items to Michel’s Patisserie franchisees;
the manufacture and sale of roasted coffee and related products to franchisees and external customers;
the interim operation of non-voluntary company owned or company managed stores across each of the franchise systems; and
the return of NVCS to franchisee stewardship.
56 RETAIL FOOD GROUP LIMITED ANNUAL REPORT 30 JUNE 2012
NOTESTOTHEFINANCIALSTATEMENTS
55. Segment Information (cont.) 5.2 Segment Revenues And Results The following is an analysis of the Group’s revenue and results from continuing operations by reportable segment:
Segment Revenues Segment Profit Segment
FY12 $’000
FY11 $’000
FY12 $’000
FY11 $’000
Franchising Operations 78,651 68,950 44,657 36,221
Wholesale / Retail Operations 37,492 56,360 3,895 9,653
116,143 125,310 48,552 45,874
Other gains and losses (297) (96)
Interest revenue 249 345 249 345
Finance costs (7,031) (6,939)
Unallocated - - (1,015) (748)
Profit before tax 40,458 38,436
Income tax expense (11,912) (11,212)
Revenue and profit for the year 116,392 125,655 28,546 27,224
Revenue reported above represents revenue generated from external customers. The accounting policies of the reportable segments are the same as the Group’s accounting policies described in note 2. Segment profit represents the profit earned by each segment without allocation of gains derived / losses incurred from derivative financial instruments, disposals of financial assets and plant and equipment, interest revenue, finance costs, depreciation, corporate expenses and income tax expense. This is the measure reported to the chief operating decision maker for the purpose of resource allocation and assessment of segment performance. 55.3 Geographical Information An insignificant portion of the Group’s activities are located outside of Australia, and hence no geographical information has been disclosed. 6. Revenue An analysis of the Group’s revenue for the year, from continuing operations, is as follows:
Consolidated FY12 $’000
FY11 $’000
Revenue from the sale of goods (1) 37,492 56,360
Revenue from the rendering of services 78,651 68,950
116,143 125,310
Interest revenue:
Bank deposits 238 306
Other loans and receivables 11 39
249 345
116,392 125,655
(1) Excluding sales derived from wholesale bakery sales (relating to Michel’s Patisserie outlets), adjusted revenue from the sale of goods for FY12 was $36.2 million (FY11: $24.2 million).
57RETAIL FOOD GROUP LIMITED ANNUAL REPORT 30 JUNE 2012
NOTESTOTHEFINANCIALSTATEMENTS
77. Other Gains And Losses
Consolidated FY12 $’000
FY11 $’000
Gain on disposal of financial assets - 821
Gain on foreign exchange forward contract - 70
Gain / (loss) on disposal of property, plant and equipment(1) (103) 2
Loss on cash flow hedges (195) (989)
(298) (96)
(1) The FY12 loss represents the write down of leasehold improvements upon exiting the former corporate national office
facility. No other gains or losses have been recognised in respect of loans or receivables, other than impairment losses recognised / reversed in respect of trade receivables (see note 12). 8. Finance Costs
Consolidated FY12 $’000
FY11 $’000
Interest on bank overdrafts and loans 7,018 6,673
Total interest expense 7,018 6,673
Other finance costs 13 266
7,031 6,939
99. Income Taxes 9.1 Income Tax Recognised In Profit Or Loss
Consolidated FY12 $’000
FY11 $’000
Tax expense comprises:
Current tax expense in respect of the current year 12,152 11,436
Tax concessions received in relation to research & development (169) (371)
Deferred tax expense relating to the origination and reversal of temporary differences (71) 147
11,912 11,212
58 RETAIL FOOD GROUP LIMITED ANNUAL REPORT 30 JUNE 2012
NOTESTOTHEFINANCIALSTATEMENTS
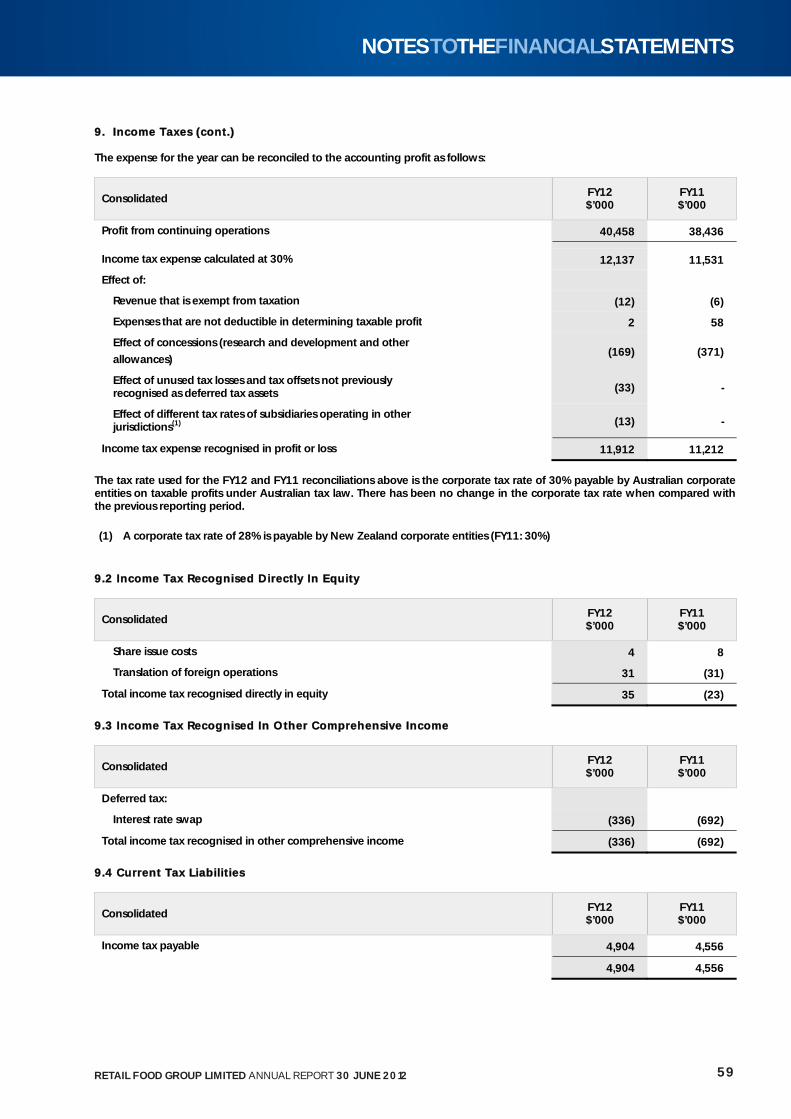
99. Income Taxes (cont.) The expense for the year can be reconciled to the accounting profit as follows:
Consolidated FY12 $’000
FY11 $’000
Profit from continuing operations 40,458 38,436
Income tax expense calculated at 30% 12,137 11,531
Effect of:
Revenue that is exempt from taxation (12) (6)
Expenses that are not deductible in determining taxable profit 2 58
Effect of concessions (research and development and other
allowances) (169) (371)
Effect of unused tax losses and tax offsets not previously recognised as deferred tax assets
(33) -
Effect of different tax rates of subsidiaries operating in other jurisdictions(1)
(13) -
Income tax expense recognised in profit or loss 11,912 11,212
The tax rate used for the FY12 and FY11 reconciliations above is the corporate tax rate of 30% payable by Australian corporate entities on taxable profits under Australian tax law. There has been no change in the corporate tax rate when compared with the previous reporting period.
(1) A corporate tax rate of 28% is payable by New Zealand corporate entities (FY11: 30%)
99.2 Income Tax Recognised Directly In Equity
Consolidated FY12 $’000
FY11 $’000
Share issue costs 4 8
Translation of foreign operations 31 (31)
Total income tax recognised directly in equity 35 (23)
99.3 Income Tax Recognised In Other Comprehensive Income
Consolidated FY12 $’000
FY11 $’000
Deferred tax:
Interest rate swap (336) (692)
Total income tax recognised in other comprehensive income (336) (692)
99.4 Current Tax Liabil it ies
Consolidated FY12 $’000
FY11 $’000
Income tax payable 4,904 4,556
4,904 4,556
59RETAIL FOOD GROUP LIMITED ANNUAL REPORT 30 JUNE 2012
NOTESTOTHEFINANCIALSTATEMENTS
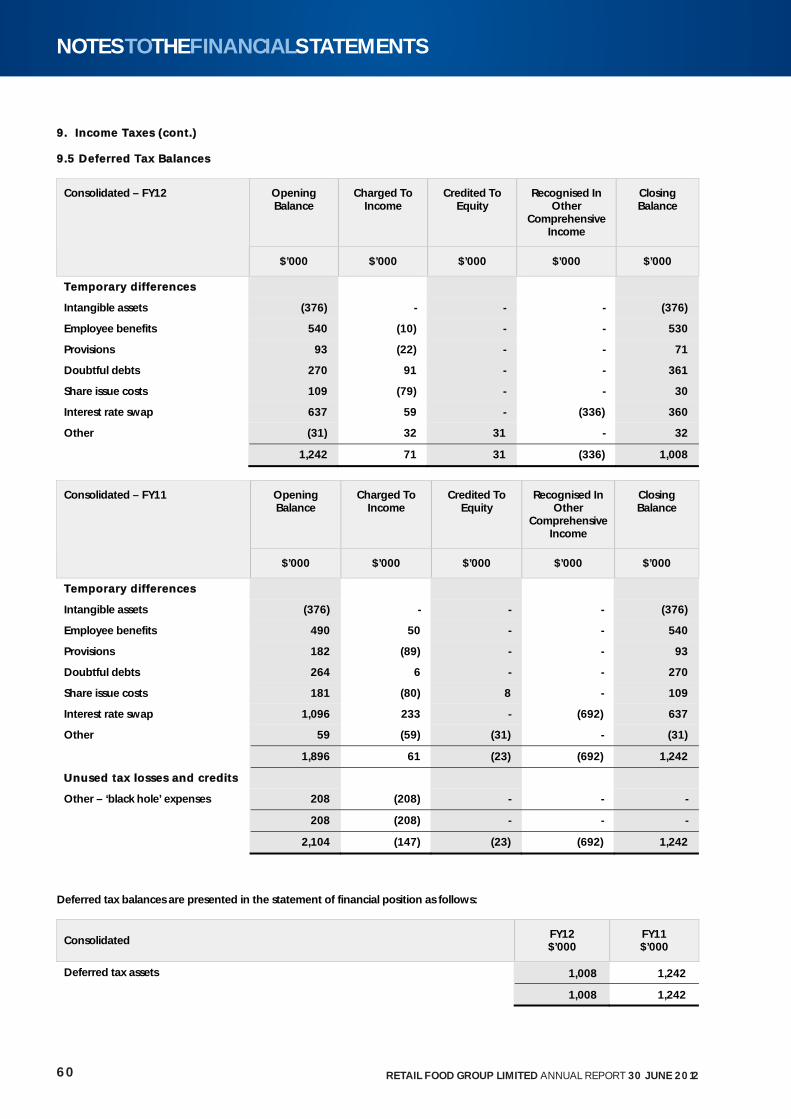
99. Income Taxes (cont.) 9.5 Deferred Tax Balances
Opening Balance
Charged To Income
Credited To Equity
Recognised In Other
Comprehensive Income
Closing Balance
Consolidated – FY12
$’000 $’000 $’000 $’000 $’000
TTemporary differences
Intangible assets (376) - - - (376)
Employee benefits 540 (10) - - 530
Provisions 93 (22) - - 71
Doubtful debts 270 91 - - 361
Share issue costs 109 (79) - - 30
Interest rate swap 637 59 - (336) 360
Other (31) 32 31 - 32
1,242 71 31 (336) 1,008
Opening Balance
Charged To Income
Credited To Equity
Recognised In Other
Comprehensive Income
Closing Balance
Consolidated – FY11
$’000 $’000 $’000 $’000 $’000
TTemporary differences
Intangible assets (376) - - - (376)
Employee benefits 490 50 - - 540
Provisions 182 (89) - - 93
Doubtful debts 264 6 - - 270
Share issue costs 181 (80) 8 - 109
Interest rate swap 1,096 233 - (692) 637
Other 59 (59) (31) - (31)
1,896 61 (23) (692) 1,242
UUnused tax losses and credits
Other – ‘black hole’ expenses 208 (208) - - -
208 (208) - - -
2,104 (147) (23) (692) 1,242
Deferred tax balances are presented in the statement of financial position as follows:
Consolidated FY12 $’000
FY11 $’000
Deferred tax assets 1,008 1,242
1,008 1,242
60 RETAIL FOOD GROUP LIMITED ANNUAL REPORT 30 JUNE 2012
NOTESTOTHEFINANCIALSTATEMENTS
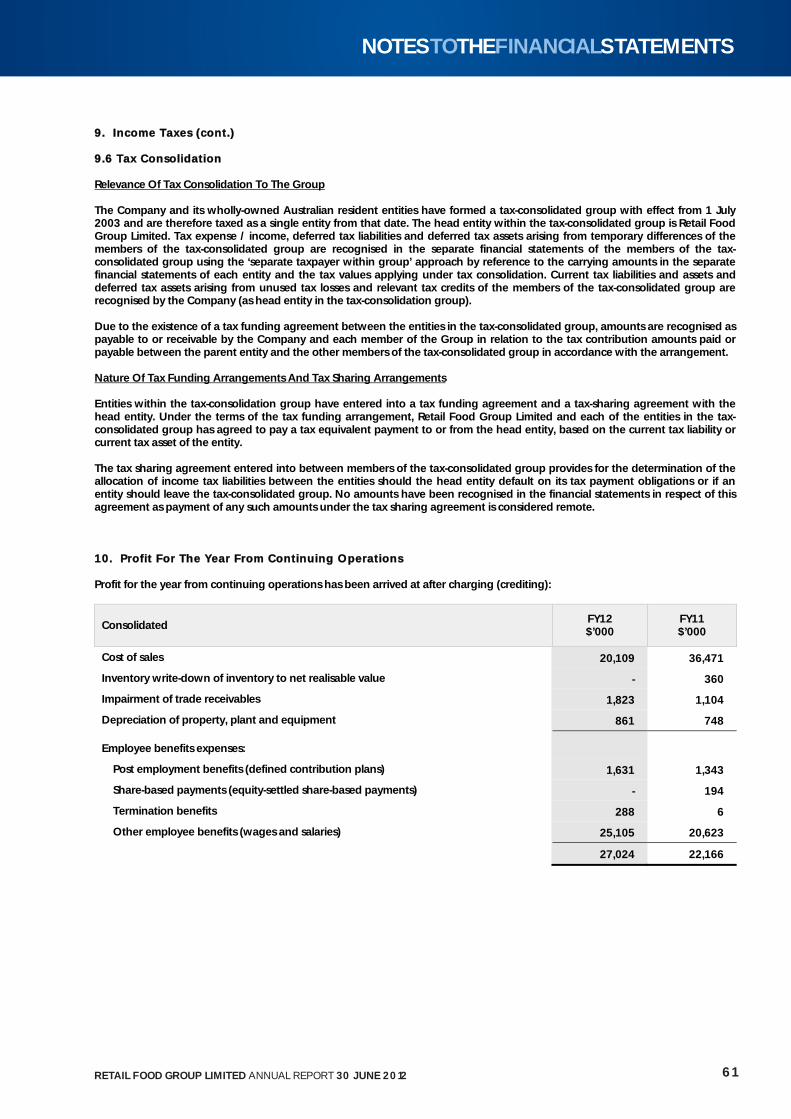
99. Income Taxes (cont.) 9.6 Tax Consolidation Relevance Of Tax Consolidation To The Group The Company and its wholly-owned Australian resident entities have formed a tax-consolidated group with effect from 1 July 2003 and are therefore taxed as a single entity from that date. The head entity within the tax-consolidated group is Retail Food Group Limited. Tax expense / income, deferred tax liabilities and deferred tax assets arising from temporary differences of the members of the tax-consolidated group are recognised in the separate financial statements of the members of the tax-consolidated group using the ‘separate taxpayer within group’ approach by reference to the carrying amounts in the separate financial statements of each entity and the tax values applying under tax consolidation. Current tax liabilities and assets and deferred tax assets arising from unused tax losses and relevant tax credits of the members of the tax-consolidated group are recognised by the Company (as head entity in the tax-consolidation group). Due to the existence of a tax funding agreement between the entities in the tax-consolidated group, amounts are recognised as payable to or receivable by the Company and each member of the Group in relation to the tax contribution amounts paid or payable between the parent entity and the other members of the tax-consolidated group in accordance with the arrangement. Nature Of Tax Funding Arrangements And Tax Sharing Arrangements Entities within the tax-consolidation group have entered into a tax funding agreement and a tax-sharing agreement with the head entity. Under the terms of the tax funding arrangement, Retail Food Group Limited and each of the entities in the tax-consolidated group has agreed to pay a tax equivalent payment to or from the head entity, based on the current tax liability or current tax asset of the entity. The tax sharing agreement entered into between members of the tax-consolidated group provides for the determination of the allocation of income tax liabilities between the entities should the head entity default on its tax payment obligations or if an entity should leave the tax-consolidated group. No amounts have been recognised in the financial statements in respect of this agreement as payment of any such amounts under the tax sharing agreement is considered remote. 10. Profit For The Year From Continuing Operations Profit for the year from continuing operations has been arrived at after charging (crediting):
Consolidated FY12 $’000
FY11 $’000
Cost of sales 20,109 36,471
Inventory write-down of inventory to net realisable value - 360
Impairment of trade receivables 1,823 1,104
Depreciation of property, plant and equipment 861 748
Employee benefits expenses:
Post employment benefits (defined contribution plans) 1,631 1,343
Share-based payments (equity-settled share-based payments) - 194
Termination benefits 288 6
Other employee benefits (wages and salaries) 25,105 20,623
27,024 22,166
61RETAIL FOOD GROUP LIMITED ANNUAL REPORT 30 JUNE 2012
NOTESTOTHEFINANCIALSTATEMENTS
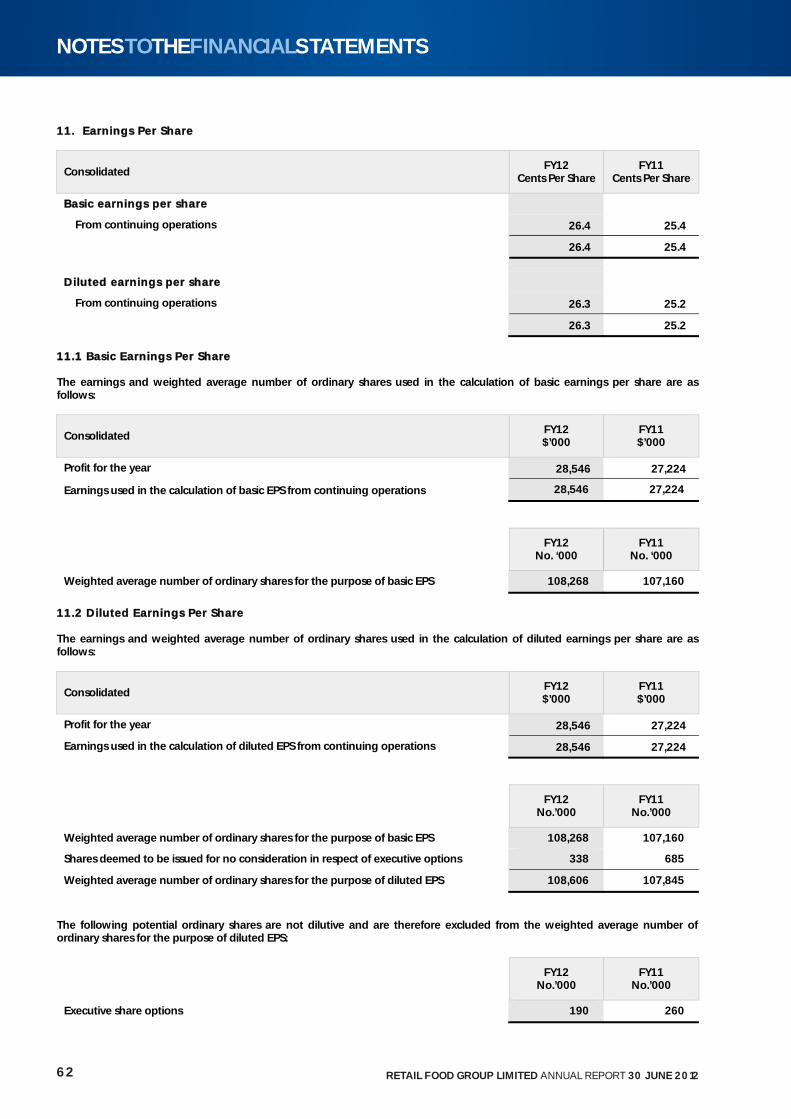
111. Earnings Per Share
Consolidated FY12
Cents Per Share FY11
Cents Per Share
BBasic earnings per share
From continuing operations 26.4 25.4
26.4 25.4
DDiluted earnings per share
From continuing operations 26.3 25.2
26.3 25.2
111.1 Basic Earnings Per Share The earnings and weighted average number of ordinary shares used in the calculation of basic earnings per share are as follows:
Consolidated FY12 $’000
FY11 $’000
Profit for the year 28,546 27,224
Earnings used in the calculation of basic EPS from continuing operations 28,546 27,224
FY12
No. ‘000 FY11
No. ‘000
Weighted average number of ordinary shares for the purpose of basic EPS 108,268 107,160
11.2 Diluted Earnings Per Share The earnings and weighted average number of ordinary shares used in the calculation of diluted earnings per share are as follows:
Consolidated FY12 $’000
FY11 $’000
Profit for the year 28,546 27,224
Earnings used in the calculation of diluted EPS from continuing operations 28,546 27,224
FY12
No.’000 FY11
No.’000
Weighted average number of ordinary shares for the purpose of basic EPS 108,268 107,160
Shares deemed to be issued for no consideration in respect of executive options 338 685
Weighted average number of ordinary shares for the purpose of diluted EPS 108,606 107,845
The following potential ordinary shares are not dilutive and are therefore excluded from the weighted average number of ordinary shares for the purpose of diluted EPS:
FY12
No.’000 FY11
No.’000
Executive share options 190 260
62 RETAIL FOOD GROUP LIMITED ANNUAL REPORT 30 JUNE 2012
NOTESTOTHEFINANCIALSTATEMENTS
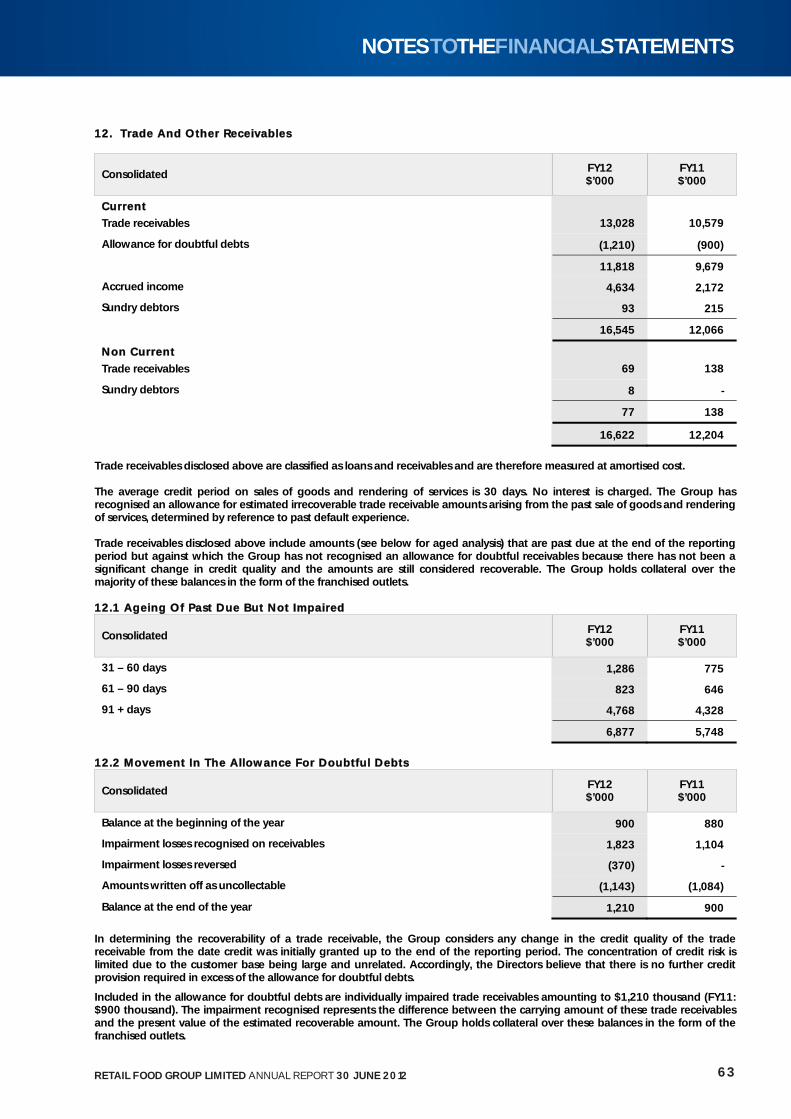
112. Trade And Other Receivables
Consolidated FY12 $’000
FY11 $’000
CCurrent
Trade receivables
13,028
10,579
Allowance for doubtful debts (1,210) (900)
11,818 9,679
Accrued income 4,634 2,172
Sundry debtors 93 215
16,545 12,066
NNonn Current
Trade receivables
69
138
Sundry debtors 8 -
77 138
16,622 12,204
Trade receivables disclosed above are classified as loans and receivables and are therefore measured at amortised cost. The average credit period on sales of goods and rendering of services is 30 days. No interest is charged. The Group has recognised an allowance for estimated irrecoverable trade receivable amounts arising from the past sale of goods and rendering of services, determined by reference to past default experience. Trade receivables disclosed above include amounts (see below for aged analysis) that are past due at the end of the reporting period but against which the Group has not recognised an allowance for doubtful receivables because there has not been a significant change in credit quality and the amounts are still considered recoverable. The Group holds collateral over the majority of these balances in the form of the franchised outlets. 112.1 Ageing Of Past Due But Not Impaired
Consolidated FY12 $’000
FY11 $’000
31 – 60 days 1,286 775
61 – 90 days 823 646
91 + days 4,768 4,328
6,877 5,748
12.2 Movement In The Allowance For Doubtful Debts
Consolidated FY12 $’000
FY11 $’000
Balance at the beginning of the year 900 880
Impairment losses recognised on receivables 1,823 1,104
Impairment losses reversed (370) -
Amounts written off as uncollectable (1,143) (1,084)
Balance at the end of the year 1,210 900
In determining the recoverability of a trade receivable, the Group considers any change in the credit quality of the trade receivable from the date credit was initially granted up to the end of the reporting period. The concentration of credit risk is limited due to the customer base being large and unrelated. Accordingly, the Directors believe that there is no further credit provision required in excess of the allowance for doubtful debts.
Included in the allowance for doubtful debts are individually impaired trade receivables amounting to $1,210 thousand (FY11: $900 thousand). The impairment recognised represents the difference between the carrying amount of these trade receivables and the present value of the estimated recoverable amount. The Group holds collateral over these balances in the form of the franchised outlets.
63RETAIL FOOD GROUP LIMITED ANNUAL REPORT 30 JUNE 2012
NOTESTOTHEFINANCIALSTATEMENTS
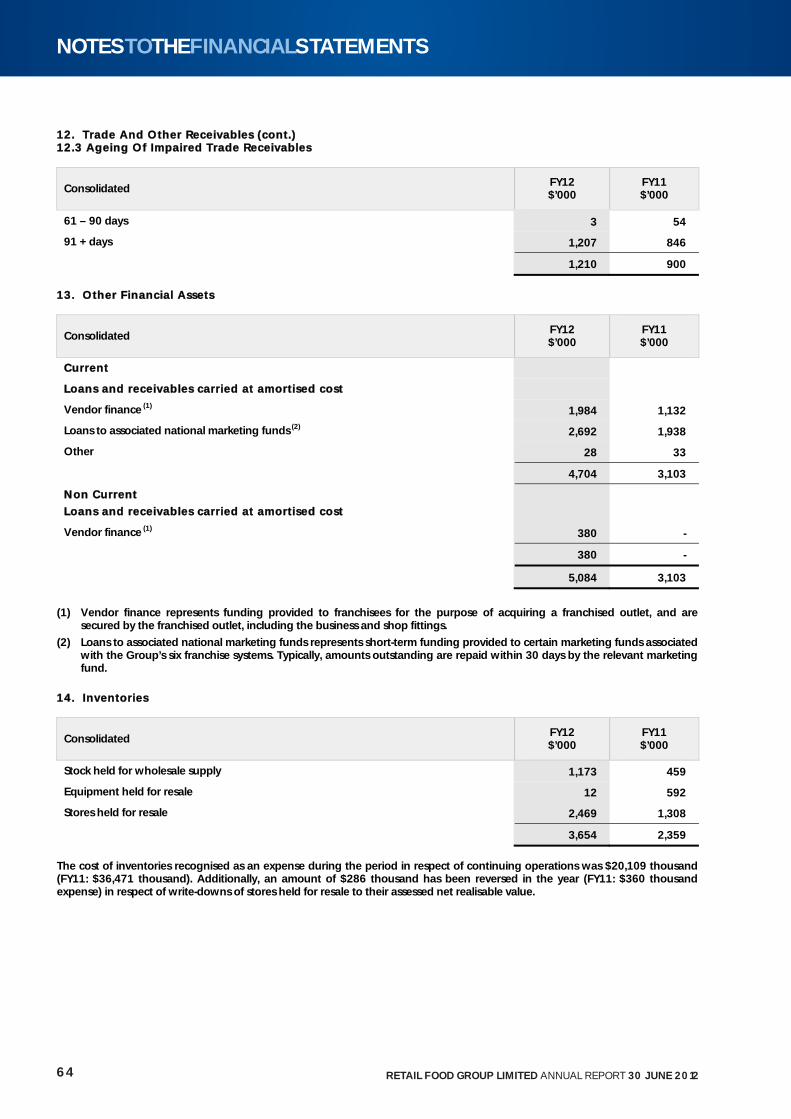
112. Trade And Other Receivables (cont.) 12.3 Ageing Of Impaired Trade Receivables
Consolidated FY12 $’000
FY11 $’000
61 – 90 days 3 54
91 + days 1,207 846
1,210 900
113. Other Financial Assets
Consolidated FY12 $’000
FY11 $’000
CCurrent
LLoans and receivables carried at amortised cost
Vendor finance (1) 1,984 1,132
Loans to associated national marketing funds (2) 2,692 1,938
Other 28 33
4,704 3,103
NNon Current
LLoans and receivables carried at amortised cost
Vendor finance (1) 380 -
380 -
5,084 3,103
(1) Vendor finance represents funding provided to franchisees for the purpose of acquiring a franchised outlet, and are secured by the franchised outlet, including the business and shop fittings.
(2) Loans to associated national marketing funds represents short-term funding provided to certain marketing funds associated with the Group’s six franchise systems. Typically, amounts outstanding are repaid within 30 days by the relevant marketing fund.
114. Inventories
Consolidated FY12 $’000
FY11 $’000
Stock held for wholesale supply 1,173 459
Equipment held for resale 12 592
Stores held for resale 2,469 1,308
3,654 2,359
The cost of inventories recognised as an expense during the period in respect of continuing operations was $20,109 thousand (FY11: $36,471 thousand). Additionally, an amount of $286 thousand has been reversed in the year (FY11: $360 thousand expense) in respect of write-downs of stores held for resale to their assessed net realisable value.
64 RETAIL FOOD GROUP LIMITED ANNUAL REPORT 30 JUNE 2012
NOTESTOTHEFINANCIALSTATEMENTS
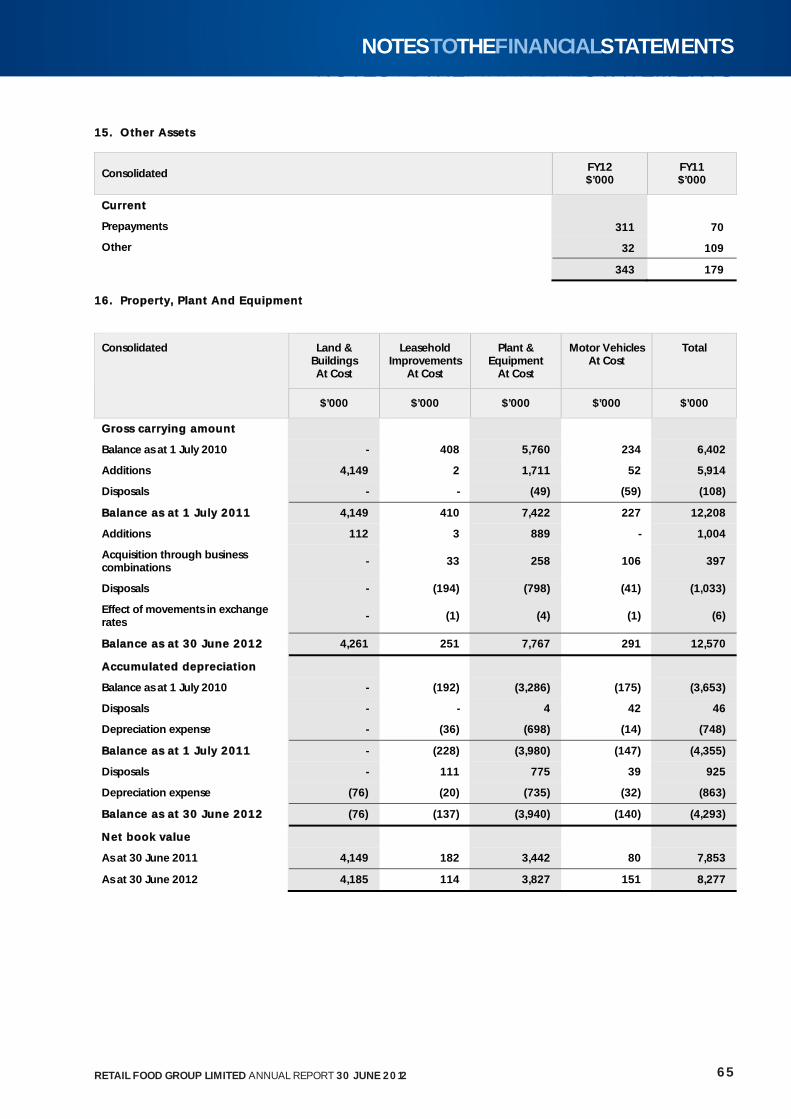
NOTESTOTHEFINANCIALSTATEMENTS
115. Other Assets
Consolidated FY12 $’000
FY11 $’000
CCurrent
Prepayments 311 70
Other 32 109
343 179
116. Property, Plant And Equipment
Land & Buildings At Cost
Leasehold Improvements
At Cost
Plant & Equipment
At Cost
Motor Vehicles At Cost
Total Consolidated
$’000 $’000 $’000 $’000 $’000
GGross carrying amount
Balance as at 1 July 2010 - 408 5,760 234 6,402
Additions 4,149 2 1,711 52 5,914
Disposals - - (49) (59) (108)
BBalance as at 1 July 20111 4,149 410 7,422 227 12,208
Additions 112 3 889 - 1,004
Acquisition through business combinations
- 33 258 106 397
Disposals - (194) (798) (41) (1,033)
Effect of movements in exchange rates
- (1) (4) (1) (6)
BBalance as at 30 June 20122 4,261 251 7,767 291 12,570
AAccumulated depreciation
Balance as at 1 July 2010 - (192) (3,286) (175) (3,653)
Disposals - - 4 42 46
Depreciation expense - (36) (698) (14) (748)
BBalance as at 1 July 20111 - (228) (3,980) (147) (4,355)
Disposals - 111 775 39 925
Depreciation expense (76) (20) (735) (32) (863)
BBalance as at 30 June 20122 (76) (137) (3,940) (140) (4,293)
NNet book value
As at 30 June 2011 4,149 182 3,442 80 7,853
As at 30 June 2012 4,185 114 3,827 151 8,277
65RETAIL FOOD GROUP LIMITED ANNUAL REPORT 30 JUNE 2012
NOTESTOTHEFINANCIALSTATEMENTS
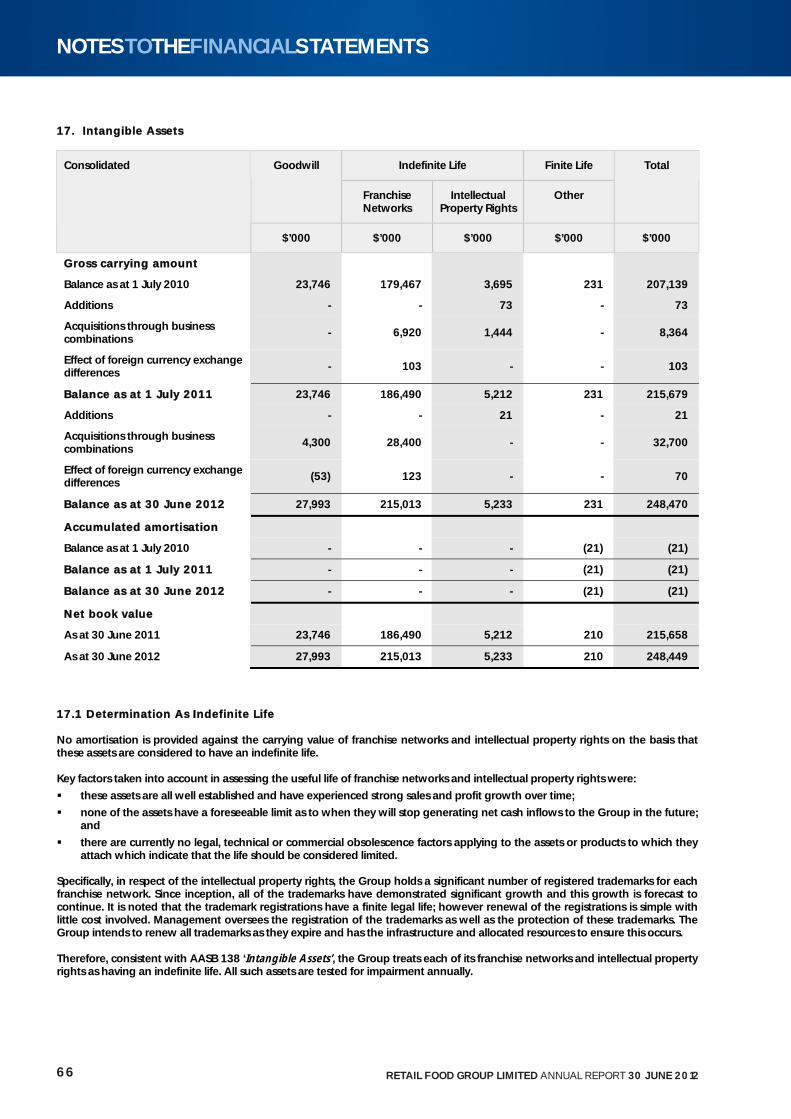
117. Intangible Assets
Indefinite Life Finite Life Goodwill
Franchise Networks
Intellectual Property Rights
Other
Total Consolidated
$’000 $’000 $’000 $’000 $’000
GGross carrying amount
Balance as at 1 July 2010 23,746 179,467 3,695 231 207,139
Additions - - 73 - 73
Acquisitions through business combinations
- 6,920 1,444 - 8,364
Effect of foreign currency exchange differences
- 103 - - 103
BBalance as at 1 July 20111 23,746 186,490 5,212 231 215,679
Additions - - 21 - 21
Acquisitions through business combinations
4,300 28,400 - - 32,700
Effect of foreign currency exchange differences
(53) 123 - - 70
BBalance as at 30 June 20122 27,993 215,013 5,233 231 248,470
AAccumulated amortisation
Balance as at 1 July 2010 - - - (21) (21)
BBalance as at 1 July 20111 - - - (21) (21)
BBalance as at 30 June 20122 - - - (21) (21)
NNet book value
As at 30 June 2011 23,746 186,490 5,212 210 215,658
As at 30 June 2012 27,993 215,013 5,233 210 248,449
17.1 Determination As Indefinite Life No amortisation is provided against the carrying value of franchise networks and intellectual property rights on the basis that these assets are considered to have an indefinite life. Key factors taken into account in assessing the useful life of franchise networks and intellectual property rights were:
these assets are all well established and have experienced strong sales and profit growth over time;
none of the assets have a foreseeable limit as to when they will stop generating net cash inflows to the Group in the future; and
there are currently no legal, technical or commercial obsolescence factors applying to the assets or products to which they attach which indicate that the life should be considered limited.
Specifically, in respect of the intellectual property rights, the Group holds a significant number of registered trademarks for each franchise network. Since inception, all of the trademarks have demonstrated significant growth and this growth is forecast to continue. It is noted that the trademark registrations have a finite legal life; however renewal of the registrations is simple with little cost involved. Management oversees the registration of the trademarks as well as the protection of these trademarks. The Group intends to renew all trademarks as they expire and has the infrastructure and allocated resources to ensure this occurs. Therefore, consistent with AASB 138 ‘Intangible Assets’, the Group treats each of its franchise networks and intellectual property rights as having an indefinite life. All such assets are tested for impairment annually.
66 RETAIL FOOD GROUP LIMITED ANNUAL REPORT 30 JUNE 2012
NOTESTOTHEFINANCIALSTATEMENTS
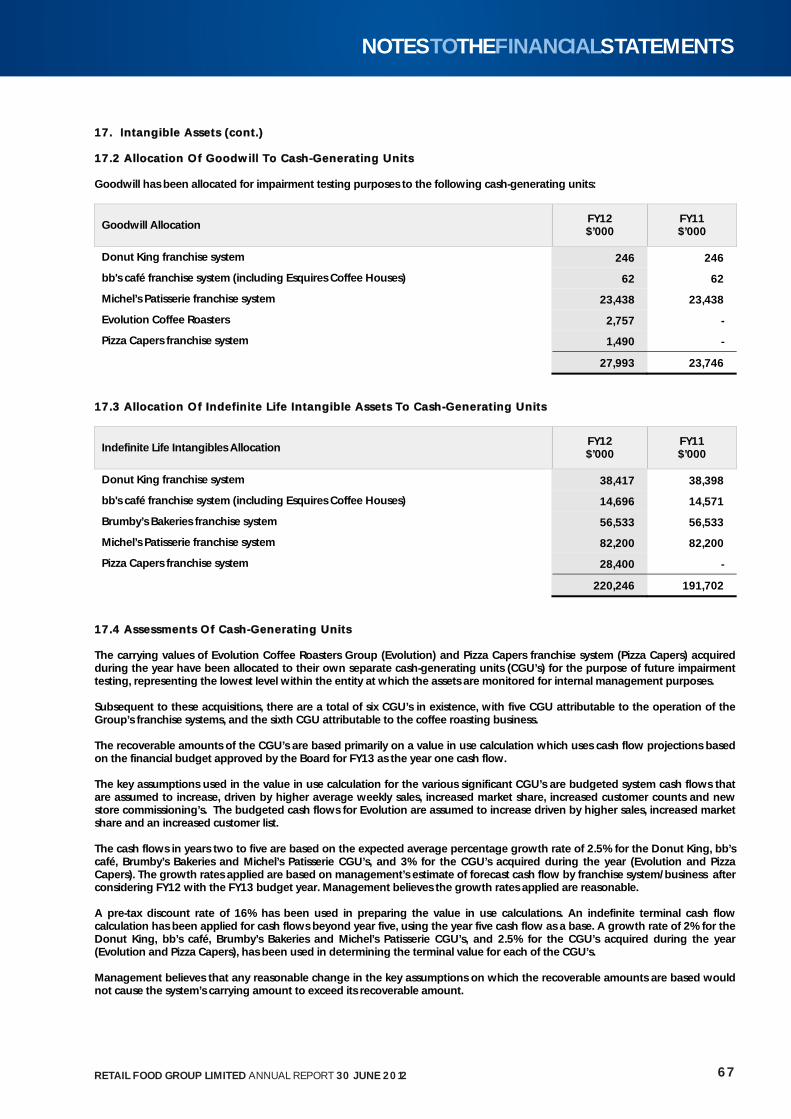
117. Intangible Assets (cont.) 17.2 Allocation Of Goodwill To Cash-Generating Units Goodwill has been allocated for impairment testing purposes to the following cash-generating units:
Goodwill Allocation FY12 $’000
FY11 $’000
Donut King franchise system 246 246
bb's café franchise system (including Esquires Coffee Houses) 62 62
Michel’s Patisserie franchise system 23,438 23,438
Evolution Coffee Roasters 2,757 -
Pizza Capers franchise system 1,490 -
27,993 23,746
117.3 Allocation Of Indefinite Life Intangible Assets To Cash-Generating Units
Indefinite Life Intangibles Allocation FY12 $’000
FY11 $’000
Donut King franchise system 38,417 38,398
bb's café franchise system (including Esquires Coffee Houses) 14,696 14,571
Brumby’s Bakeries franchise system 56,533 56,533
Michel’s Patisserie franchise system 82,200 82,200
Pizza Capers franchise system 28,400 -
220,246 191,702
17.4 Assessments Of Cash-Generating Units The carrying values of Evolution Coffee Roasters Group (Evolution) and Pizza Capers franchise system (Pizza Capers) acquired during the year have been allocated to their own separate cash-generating units (CGU’s) for the purpose of future impairment testing, representing the lowest level within the entity at which the assets are monitored for internal management purposes. Subsequent to these acquisitions, there are a total of six CGU’s in existence, with five CGU attributable to the operation of the Group’s franchise systems, and the sixth CGU attributable to the coffee roasting business. The recoverable amounts of the CGU’s are based primarily on a value in use calculation which uses cash flow projections based on the financial budget approved by the Board for FY13 as the year one cash flow. The key assumptions used in the value in use calculation for the various significant CGU’s are budgeted system cash flows that are assumed to increase, driven by higher average weekly sales, increased market share, increased customer counts and new store commissioning’s. The budgeted cash flows for Evolution are assumed to increase driven by higher sales, increased market share and an increased customer list. The cash flows in years two to five are based on the expected average percentage growth rate of 2.5% for the Donut King, bb’s café, Brumby’s Bakeries and Michel’s Patisserie CGU’s, and 3% for the CGU’s acquired during the year (Evolution and Pizza Capers). The growth rates applied are based on management’s estimate of forecast cash flow by franchise system/business after considering FY12 with the FY13 budget year. Management believes the growth rates applied are reasonable. A pre-tax discount rate of 16% has been used in preparing the value in use calculations. An indefinite terminal cash flow calculation has been applied for cash flows beyond year five, using the year five cash flow as a base. A growth rate of 2% for the Donut King, bb’s café, Brumby’s Bakeries and Michel’s Patisserie CGU’s, and 2.5% for the CGU’s acquired during the year (Evolution and Pizza Capers), has been used in determining the terminal value for each of the CGU’s. Management believes that any reasonable change in the key assumptions on which the recoverable amounts are based would not cause the system’s carrying amount to exceed its recoverable amount. 67RETAIL FOOD GROUP LIMITED ANNUAL REPORT 30 JUNE 2012
NOTESTOTHEFINANCIALSTATEMENTS
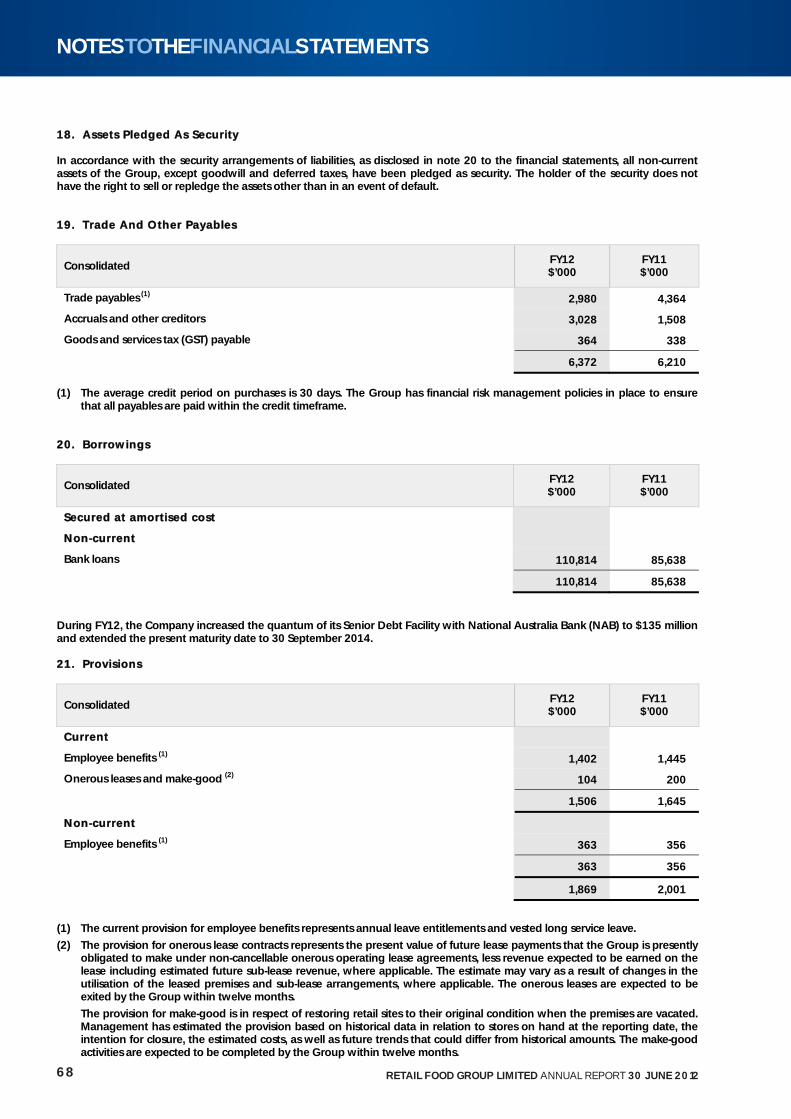
118. Assets Pledged As Security In accordance with the security arrangements of liabilities, as disclosed in note 20 to the financial statements, all non-current assets of the Group, except goodwill and deferred taxes, have been pledged as security. The holder of the security does not have the right to sell or repledge the assets other than in an event of default. 19. Trade And Other Payables
Consolidated FY12 $’000
FY11 $’000
Trade payables (1) 2,980 4,364
Accruals and other creditors 3,028 1,508
Goods and services tax (GST) payable 364 338
6,372 6,210
(1) The average credit period on purchases is 30 days. The Group has financial risk management policies in place to ensure
that all payables are paid within the credit timeframe. 20. Borrowings
Consolidated FY12 $’000
FY11 $’000
SSecured at amortised cost
NNon--ccurrent
Bank loans 110,814 85,638
110,814 85,638
During FY12, the Company increased the quantum of its Senior Debt Facility with National Australia Bank (NAB) to $135 million and extended the present maturity date to 30 September 2014. 21. Provisions
Consolidated FY12 $’000
FY11 $’000
CCurrent
Employee benefits (1) 1,402 1,445
Onerous leases and make-good (2) 104 200
1,506 1,645
NNon--ccurrent
Employee benefits (1) 363 356
363 356
1,869 2,001
(1) The current provision for employee benefits represents annual leave entitlements and vested long service leave.
(2) The provision for onerous lease contracts represents the present value of future lease payments that the Group is presently obligated to make under non-cancellable onerous operating lease agreements, less revenue expected to be earned on the lease including estimated future sub-lease revenue, where applicable. The estimate may vary as a result of changes in the utilisation of the leased premises and sub-lease arrangements, where applicable. The onerous leases are expected to be exited by the Group within twelve months.
The provision for make-good is in respect of restoring retail sites to their original condition when the premises are vacated. Management has estimated the provision based on historical data in relation to stores on hand at the reporting date, the intention for closure, the estimated costs, as well as future trends that could differ from historical amounts. The make-good activities are expected to be completed by the Group within twelve months.
68 RETAIL FOOD GROUP LIMITED ANNUAL REPORT 30 JUNE 2012
NOTESTOTHEFINANCIALSTATEMENTS
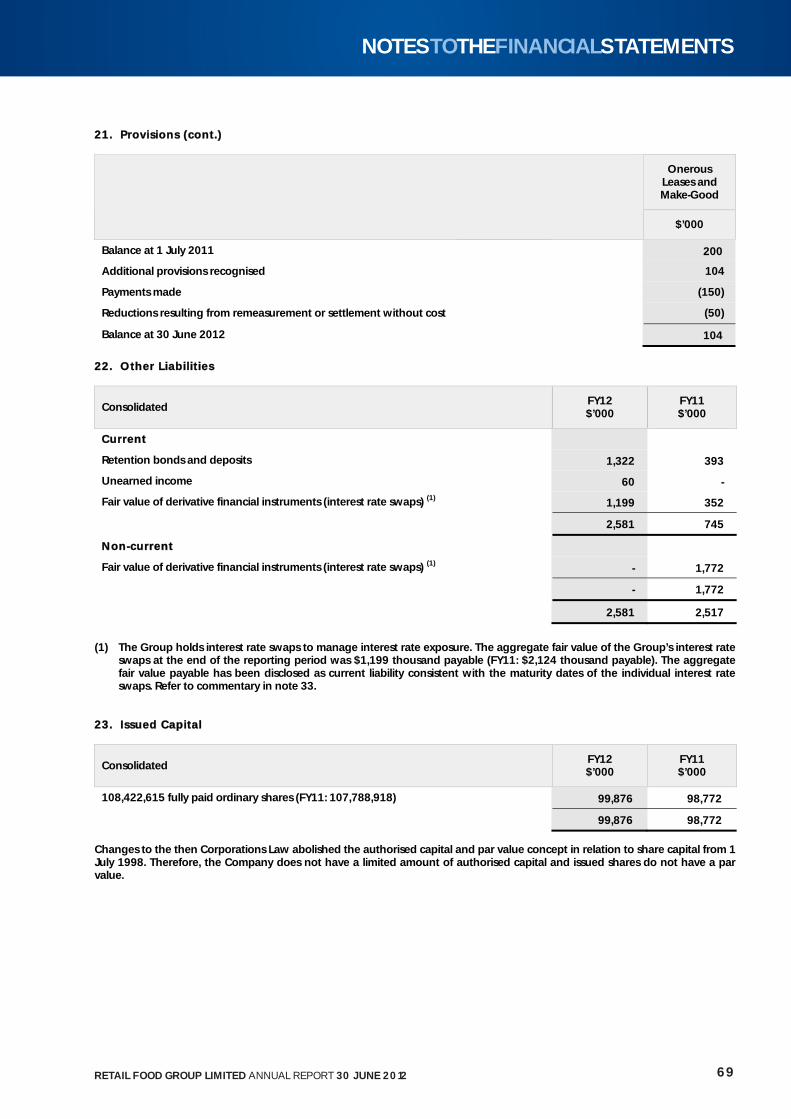
221. Provisions (cont.)
Onerous Leases and Make-Good
$’000
Balance at 1 July 2011 200
Additional provisions recognised 104
Payments made (150)
Reductions resulting from remeasurement or settlement without cost (50)
Balance at 30 June 2012 104
222. Other Liabil it ies
Consolidated FY12 $’000
FY11 $’000
CCurrent
Retention bonds and deposits 1,322 393
Unearned income 60 -
Fair value of derivative financial instruments (interest rate swaps) (1) 1,199 352
2,581 745
NNon--ccurrent
Fair value of derivative financial instruments (interest rate swaps) (1) - 1,772
- 1,772
2,581 2,517
(1) The Group holds interest rate swaps to manage interest rate exposure. The aggregate fair value of the Group’s interest rate swaps at the end of the reporting period was $1,199 thousand payable (FY11: $2,124 thousand payable). The aggregate fair value payable has been disclosed as current liability consistent with the maturity dates of the individual interest rate swaps. Refer to commentary in note 33.
23. Issued Capital
Consolidated FY12 $’000
FY11 $’000
108,422,615 fully paid ordinary shares (FY11: 107,788,918) 99,876 98,772
99,876 98,772
Changes to the then Corporations Law abolished the authorised capital and par value concept in relation to share capital from 1 July 1998. Therefore, the Company does not have a limited amount of authorised capital and issued shares do not have a par value.
69RETAIL FOOD GROUP LIMITED ANNUAL REPORT 30 JUNE 2012
NOTESTOTHEFINANCIALSTATEMENTS
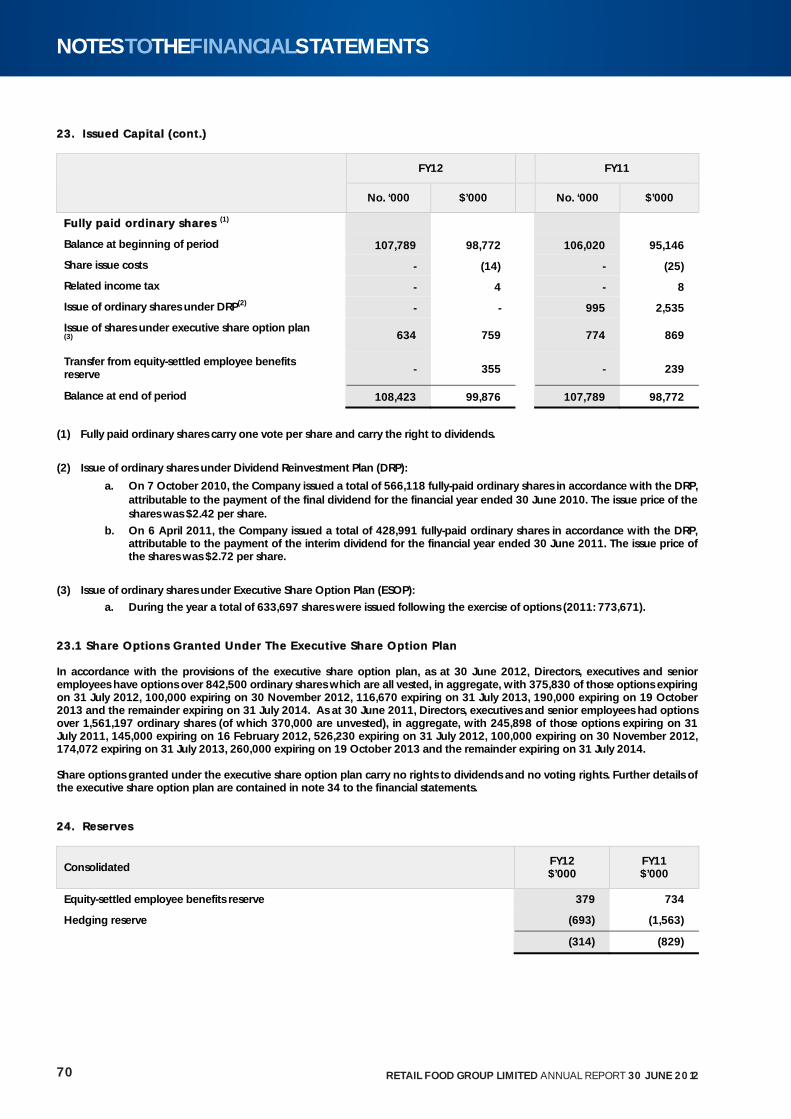
223. Issued Capital (cont.)
FY12 FY11
No. ‘000 $’000 No. ‘000 $’000
FFully paid ordinary shares (1)
Balance at beginning of period 107,789 98,772 106,020 95,146
Share issue costs - (14) - (25)
Related income tax - 4 - 8
Issue of ordinary shares under DRP(2) - - 995 2,535
Issue of shares under executive share option plan (3)
634 759 774 869
Transfer from equity-settled employee benefits reserve
- 355 - 239
Balance at end of period 108,423 99,876 107,789 98,772
(1) Fully paid ordinary shares carry one vote per share and carry the right to dividends.
(2) Issue of ordinary shares under Dividend Reinvestment Plan (DRP):
a. On 7 October 2010, the Company issued a total of 566,118 fully-paid ordinary shares in accordance with the DRP, attributable to the payment of the final dividend for the financial year ended 30 June 2010. The issue price of the shares was $2.42 per share.
b. On 6 April 2011, the Company issued a total of 428,991 fully-paid ordinary shares in accordance with the DRP, attributable to the payment of the interim dividend for the financial year ended 30 June 2011. The issue price of the shares was $2.72 per share.
(3) Issue of ordinary shares under Executive Share Option Plan (ESOP):
a. During the year a total of 633,697 shares were issued following the exercise of options (2011: 773,671).
223.1 Share Options Granted Under The Executive Share Option Plan In accordance with the provisions of the executive share option plan, as at 30 June 2012, Directors, executives and senior employees have options over 842,500 ordinary shares which are all vested, in aggregate, with 375,830 of those options expiring on 31 July 2012, 100,000 expiring on 30 November 2012, 116,670 expiring on 31 July 2013, 190,000 expiring on 19 October 2013 and the remainder expiring on 31 July 2014. As at 30 June 2011, Directors, executives and senior employees had options over 1,561,197 ordinary shares (of which 370,000 are unvested), in aggregate, with 245,898 of those options expiring on 31 July 2011, 145,000 expiring on 16 February 2012, 526,230 expiring on 31 July 2012, 100,000 expiring on 30 November 2012, 174,072 expiring on 31 July 2013, 260,000 expiring on 19 October 2013 and the remainder expiring on 31 July 2014. Share options granted under the executive share option plan carry no rights to dividends and no voting rights. Further details of the executive share option plan are contained in note 34 to the financial statements. 24. Reserves
Consolidated FY12 $’000
FY11 $’000
Equity-settled employee benefits reserve 379 734
Hedging reserve (693) (1,563)
(314) (829)
70 RETAIL FOOD GROUP LIMITED ANNUAL REPORT 30 JUNE 2012
NOTESTOTHEFINANCIALSTATEMENTS
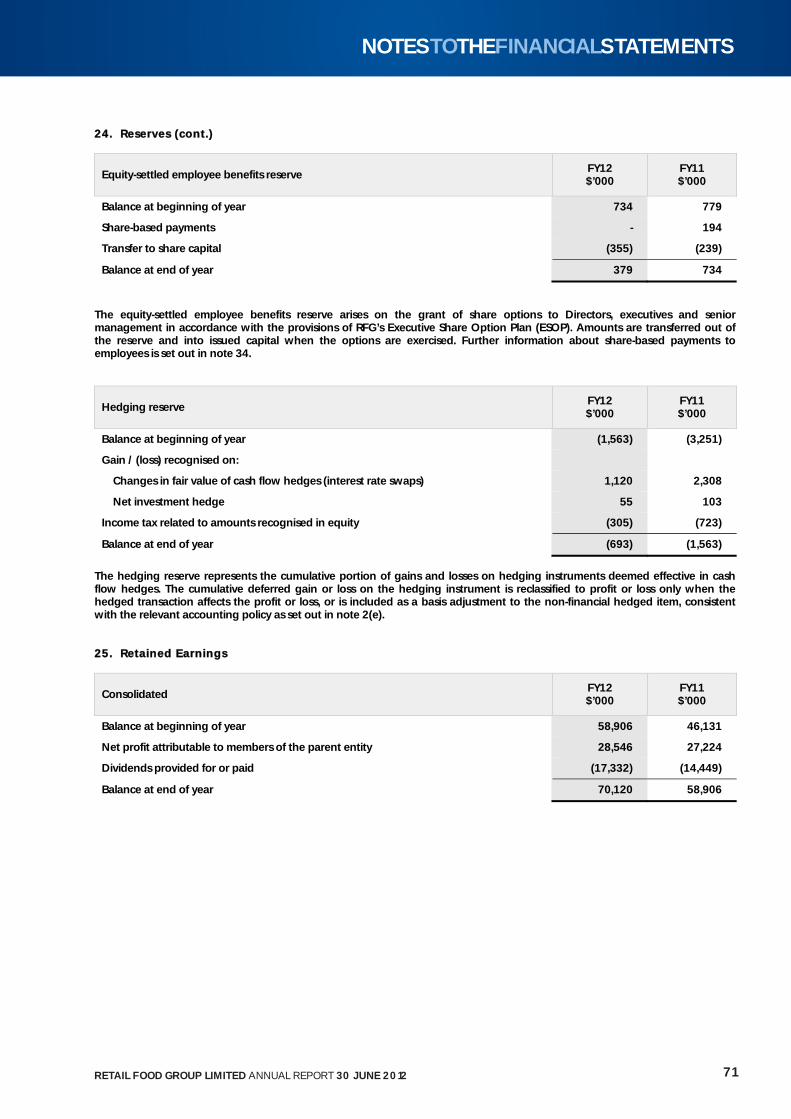
224. Reserves (cont.)
Equity-settled employee benefits reserve FY12 $’000
FY11 $’000
Balance at beginning of year 734 779
Share-based payments - 194
Transfer to share capital (355) (239)
Balance at end of year 379 734
The equity-settled employee benefits reserve arises on the grant of share options to Directors, executives and senior management in accordance with the provisions of RFG’s Executive Share Option Plan (ESOP). Amounts are transferred out of the reserve and into issued capital when the options are exercised. Further information about share-based payments to employees is set out in note 34.
Hedging reserve FY12 $’000
FY11 $’000
Balance at beginning of year (1,563) (3,251)
Gain / (loss) recognised on:
Changes in fair value of cash flow hedges (interest rate swaps) 1,120 2,308
Net investment hedge 55 103
Income tax related to amounts recognised in equity (305) (723)
Balance at end of year (693) (1,563)
The hedging reserve represents the cumulative portion of gains and losses on hedging instruments deemed effective in cash flow hedges. The cumulative deferred gain or loss on the hedging instrument is reclassified to profit or loss only when the hedged transaction affects the profit or loss, or is included as a basis adjustment to the non-financial hedged item, consistent with the relevant accounting policy as set out in note 2(e). 25. Retained Earnings
Consolidated FY12 $’000
FY11 $’000
Balance at beginning of year 58,906 46,131
Net profit attributable to members of the parent entity 28,546 27,224
Dividends provided for or paid (17,332) (14,449)
Balance at end of year 70,120 58,906
71RETAIL FOOD GROUP LIMITED ANNUAL REPORT 30 JUNE 2012
NOTESTOTHEFINANCIALSTATEMENTS
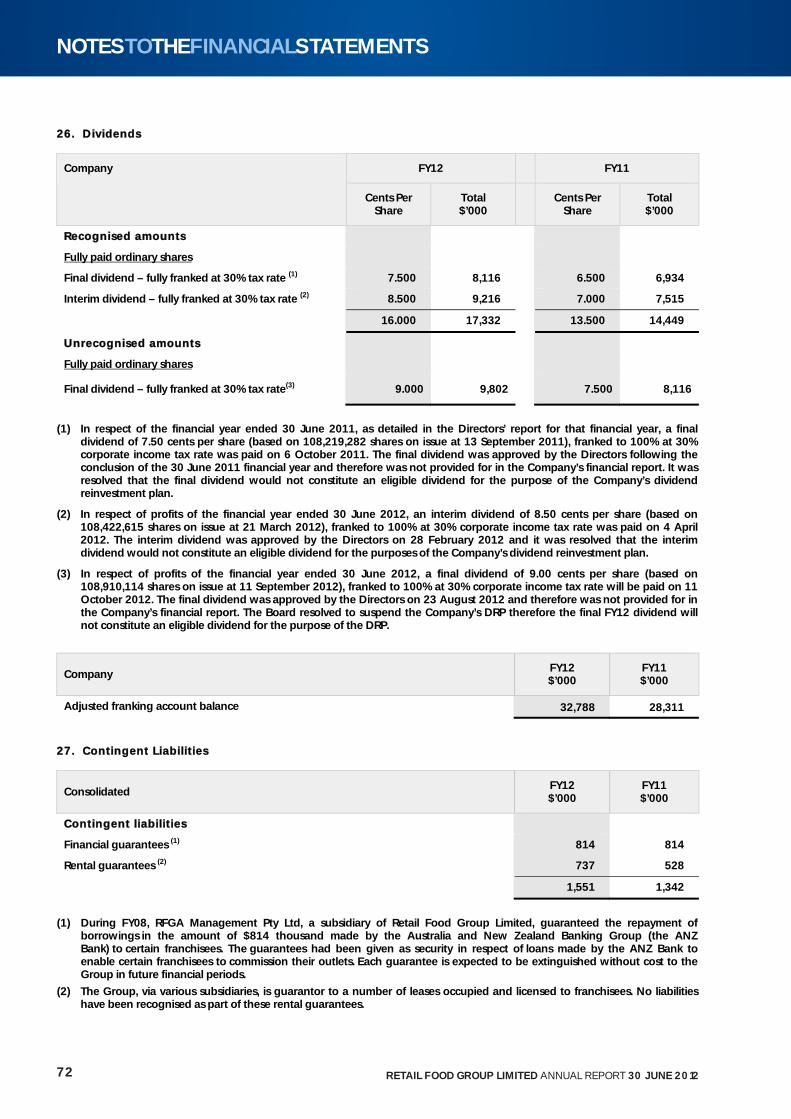
226. Dividends
FY12 FY11 Company
Cents Per Share
Total $’000
Cents Per Share
Total $’000
RRecognised amounts
Fully paid ordinary shares
Final dividend – fully franked at 30% tax rate (1) 7.500 8,116 6.500 6,934
Interim dividend – fully franked at 30% tax rate (2) 8.500 9,216 7.000 7,515
16.000 17,332 13.500 14,449
UUnrecognised amounts
Fully paid ordinary shares
Final dividend – fully franked at 30% tax rate(3) 9.000 9,802 7.500 8,116
(1) In respect of the financial year ended 30 June 2011, as detailed in the Directors’ report for that financial year, a final dividend of 7.50 cents per share (based on 108,219,282 shares on issue at 13 September 2011), franked to 100% at 30% corporate income tax rate was paid on 6 October 2011. The final dividend was approved by the Directors following the conclusion of the 30 June 2011 financial year and therefore was not provided for in the Company’s financial report. It was resolved that the final dividend would not constitute an eligible dividend for the purpose of the Company’s dividend reinvestment plan.
(2) In respect of profits of the financial year ended 30 June 2012, an interim dividend of 8.50 cents per share (based on 108,422,615 shares on issue at 21 March 2012), franked to 100% at 30% corporate income tax rate was paid on 4 April 2012. The interim dividend was approved by the Directors on 28 February 2012 and it was resolved that the interim dividend would not constitute an eligible dividend for the purposes of the Company’s dividend reinvestment plan.
(3) In respect of profits of the financial year ended 30 June 2012, a final dividend of 9.00 cents per share (based on 108,910,114 shares on issue at 11 September 2012), franked to 100% at 30% corporate income tax rate will be paid on 11 October 2012. The final dividend was approved by the Directors on 23 August 2012 and therefore was not provided for in the Company’s financial report. The Board resolved to suspend the Company’s DRP therefore the final FY12 dividend will not constitute an eligible dividend for the purpose of the DRP.
Company FY12 $’000
FY11 $’000
Adjusted franking account balance 32,788 28,311
27. Contingent Liabil it ies
Consolidated FY12 $’000
FY11 $’000
CContingent l iabil it ies
Financial guarantees (1) 814 814
Rental guarantees (2) 737 528
1,551 1,342
(1) During FY08, RFGA Management Pty Ltd, a subsidiary of Retail Food Group Limited, guaranteed the repayment of borrowings in the amount of $814 thousand made by the Australia and New Zealand Banking Group (the ANZ Bank) to certain franchisees. The guarantees had been given as security in respect of loans made by the ANZ Bank to enable certain franchisees to commission their outlets. Each guarantee is expected to be extinguished without cost to the Group in future financial periods.
(2) The Group, via various subsidiaries, is guarantor to a number of leases occupied and licensed to franchisees. No liabilities have been recognised as part of these rental guarantees.
72 RETAIL FOOD GROUP LIMITED ANNUAL REPORT 30 JUNE 2012
NOTESTOTHEFINANCIALSTATEMENTS
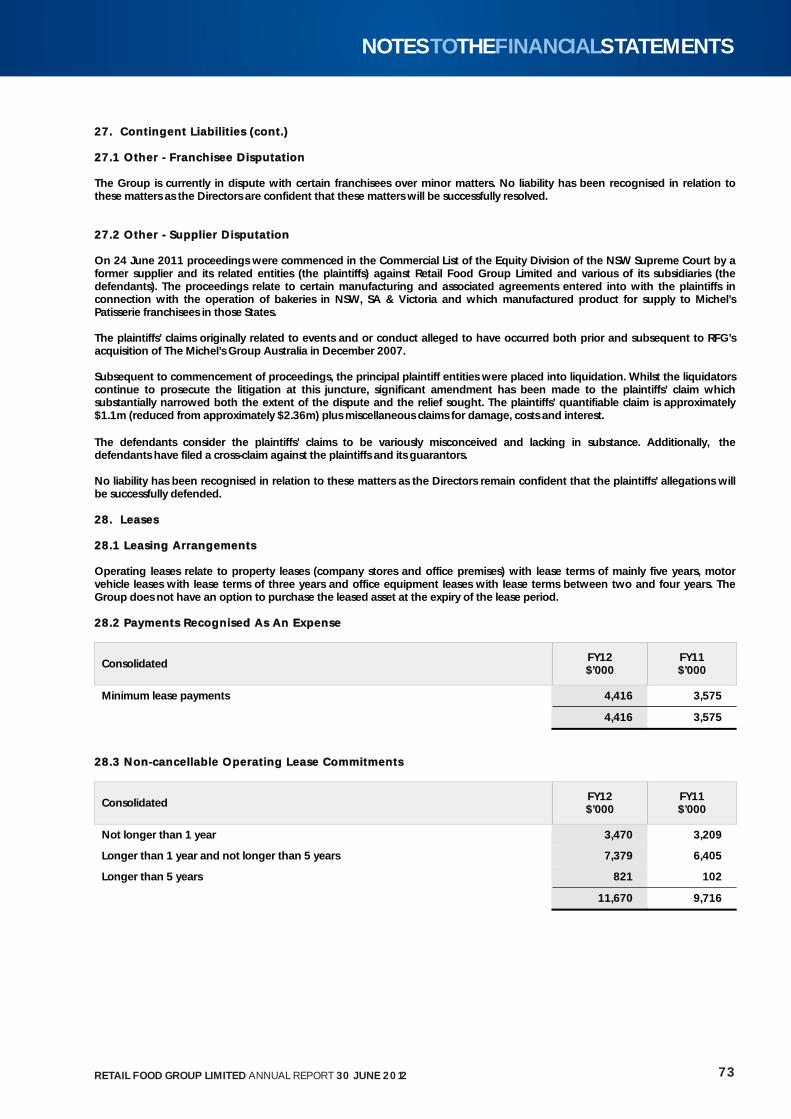
227. Contingent Liabil it ies (cont.) 27.1 Other - Franchisee Disputation The Group is currently in dispute with certain franchisees over minor matters. No liability has been recognised in relation to these matters as the Directors are confident that these matters will be successfully resolved. 27.2 Other - Supplier Disputation On 24 June 2011 proceedings were commenced in the Commercial List of the Equity Division of the NSW Supreme Court by a former supplier and its related entities (the plaintiffs) against Retail Food Group Limited and various of its subsidiaries (the defendants). The proceedings relate to certain manufacturing and associated agreements entered into with the plaintiffs in connection with the operation of bakeries in NSW, SA & Victoria and which manufactured product for supply to Michel’s Patisserie franchisees in those States. The plaintiffs’ claims originally related to events and or conduct alleged to have occurred both prior and subsequent to RFG’s acquisition of The Michel’s Group Australia in December 2007. Subsequent to commencement of proceedings, the principal plaintiff entities were placed into liquidation. Whilst the liquidators continue to prosecute the litigation at this juncture, significant amendment has been made to the plaintiffs’ claim which substantially narrowed both the extent of the dispute and the relief sought. The plaintiffs’ quantifiable claim is approximately $1.1m (reduced from approximately $2.36m) plus miscellaneous claims for damage, costs and interest. The defendants consider the plaintiffs’ claims to be variously misconceived and lacking in substance. Additionally, the defendants have filed a cross-claim against the plaintiffs and its guarantors. No liability has been recognised in relation to these matters as the Directors remain confident that the plaintiffs’ allegations will be successfully defended. 28. Leases 28.1 Leasing Arrangements Operating leases relate to property leases (company stores and office premises) with lease terms of mainly five years, motor vehicle leases with lease terms of three years and office equipment leases with lease terms between two and four years. The Group does not have an option to purchase the leased asset at the expiry of the lease period. 28.2 Payments Recognised As An Expense
Consolidated FY12 $’000
FY11 $’000
Minimum lease payments 4,416 3,575
4,416 3,575
28.3 Non-cancellable Operating Lease Commitments
Consolidated FY12 $’000
FY11 $’000
Not longer than 1 year 3,470 3,209
Longer than 1 year and not longer than 5 years 7,379 6,405
Longer than 5 years 821 102
11,670 9,716
73RETAIL FOOD GROUP LIMITED ANNUAL REPORT 30 JUNE 2012
NOTESTOTHEFINANCIALSTATEMENTS
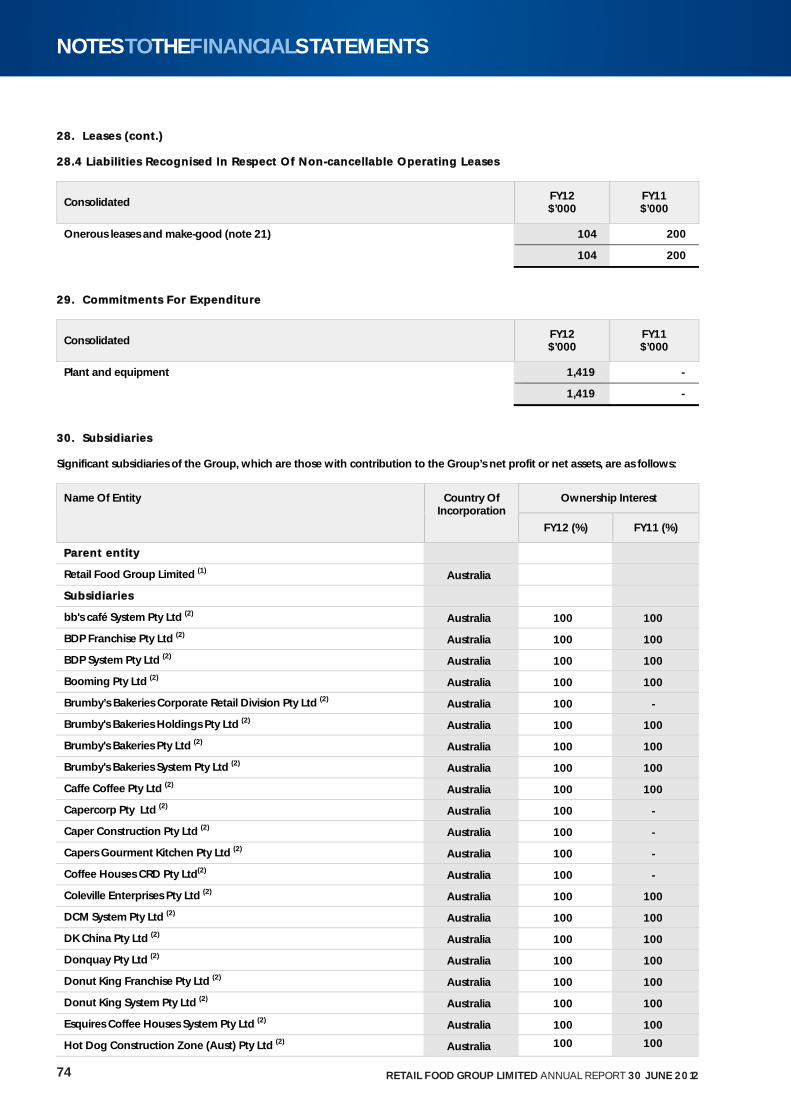
228. Leases (cont.) 28.4 Liabil it ies Recognised In Respect Of Non-cancellable Operating Leases
Consolidated FY12 $’000
FY11 $’000
Onerous leases and make-good (note 21) 104 200
104 200
29. Commitments For Expenditure
Consolidated FY12 $’000
FY11 $’000
Plant and equipment 1,419 -
1,419 -
30. Subsidiaries Significant subsidiaries of the Group, which are those with contribution to the Group’s net profit or net assets, are as follows:
Ownership Interest Name Of Entity Country Of Incorporation
FY12 (%) FY11 (%)
PParent entity
Retail Food Group Limited (1) Australia
SSubsidiaries
bb's café System Pty Ltd (2) Australia 100 100
BDP Franchise Pty Ltd (2) Australia 100 100
BDP System Pty Ltd (2) Australia 100 100
Booming Pty Ltd (2) Australia 100 100
Brumby’s Bakeries Corporate Retail Division Pty Ltd (2) Australia 100 -
Brumby's Bakeries Holdings Pty Ltd (2) Australia 100 100
Brumby's Bakeries Pty Ltd (2) Australia 100 100
Brumby's Bakeries System Pty Ltd (2) Australia 100 100
Caffe Coffee Pty Ltd (2) Australia 100 100
Capercorp Pty Ltd (2) Australia 100 -
Caper Construction Pty Ltd (2) Australia 100 -
Capers Gourment Kitchen Pty Ltd (2) Australia 100 -
Coffee Houses CRD Pty Ltd(2) Australia 100 -
Coleville Enterprises Pty Ltd (2) Australia 100 100
DCM System Pty Ltd (2) Australia 100 100
DK China Pty Ltd (2) Australia 100 100
Donquay Pty Ltd (2) Australia 100 100
Donut King Franchise Pty Ltd (2) Australia 100 100
Donut King System Pty Ltd (2) Australia 100 100
Esquires Coffee Houses System Pty Ltd (2) Australia 100 100
Hot Dog Construction Zone (Aust) Pty Ltd (2) Australia 100 100
74 RETAIL FOOD GROUP LIMITED ANNUAL REPORT 30 JUNE 2012
NOTESTOTHEFINANCIALSTATEMENTS
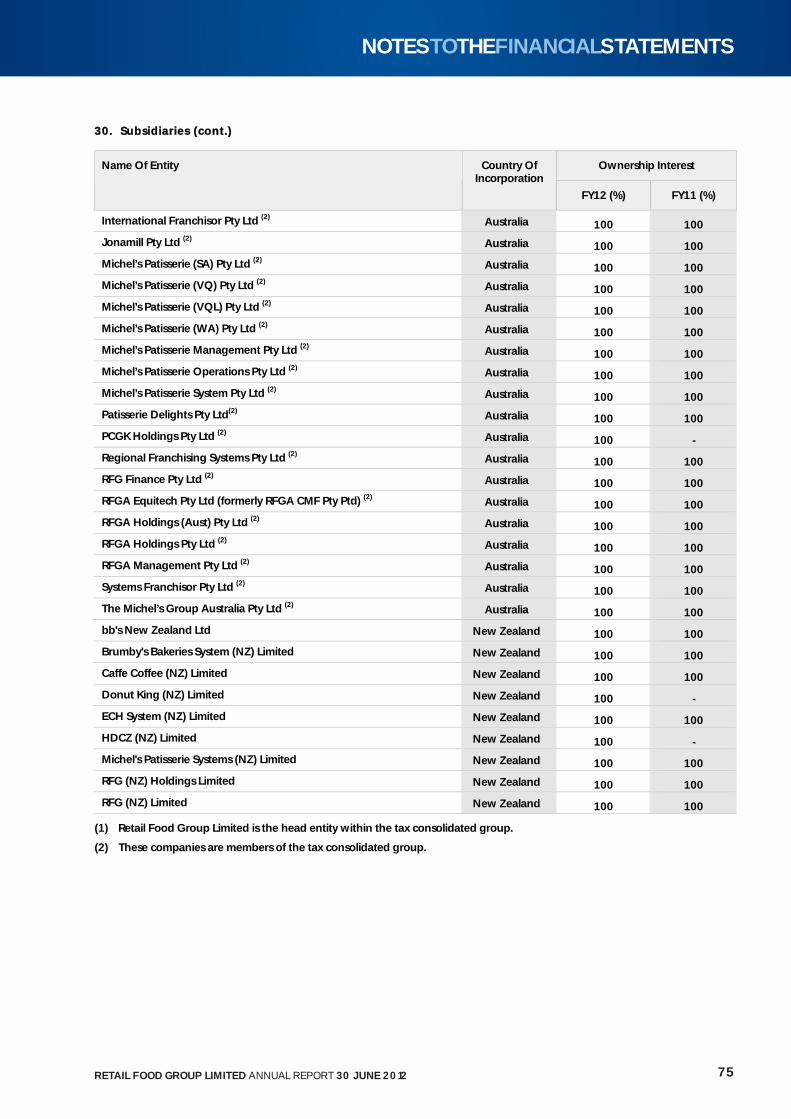
330. Subsidiaries (cont.)
Ownership Interest Name Of Entity Country Of Incorporation
FY12 (%) FY11 (%)
International Franchisor Pty Ltd (2) Australia 100 100 Jonamill Pty Ltd (2) Australia 100 100 Michel’s Patisserie (SA) Pty Ltd (2) Australia 100 100 Michel’s Patisserie (VQ) Pty Ltd (2) Australia 100 100 Michel’s Patisserie (VQL) Pty Ltd (2) Australia 100 100 Michel’s Patisserie (WA) Pty Ltd (2) Australia 100 100 Michel’s Patisserie Management Pty Ltd (2) Australia 100 100 Michel’s Patisserie Operations Pty Ltd (2) Australia 100 100 Michel’s Patisserie System Pty Ltd (2) Australia 100 100 Patisserie Delights Pty Ltd(2) Australia 100 100 PCGK Holdings Pty Ltd (2) Australia 100 -
Regional Franchising Systems Pty Ltd (2) Australia 100 100 RFG Finance Pty Ltd (2) Australia 100 100 RFGA Equitech Pty Ltd (formerly RFGA CMF Pty Ptd) (2) Australia 100 100 RFGA Holdings (Aust) Pty Ltd (2) Australia 100 100 RFGA Holdings Pty Ltd (2) Australia 100 100 RFGA Management Pty Ltd (2) Australia 100 100 Systems Franchisor Pty Ltd (2) Australia 100 100 The Michel’s Group Australia Pty Ltd (2) Australia 100 100 bb's New Zealand Ltd New Zealand 100 100 Brumby's Bakeries System (NZ) Limited New Zealand 100 100 Caffe Coffee (NZ) Limited New Zealand 100 100 Donut King (NZ) Limited New Zealand 100 -
ECH System (NZ) Limited New Zealand 100 100 HDCZ (NZ) Limited New Zealand 100 -
Michel's Patisserie Systems (NZ) Limited New Zealand 100 100 RFG (NZ) Holdings Limited New Zealand 100 100
RFG (NZ) Limited New Zealand 100 100
(1) Retail Food Group Limited is the head entity within the tax consolidated group.
(2) These companies are members of the tax consolidated group.
75RETAIL FOOD GROUP LIMITED ANNUAL REPORT 30 JUNE 2012
NOTESTOTHEFINANCIALSTATEMENTS
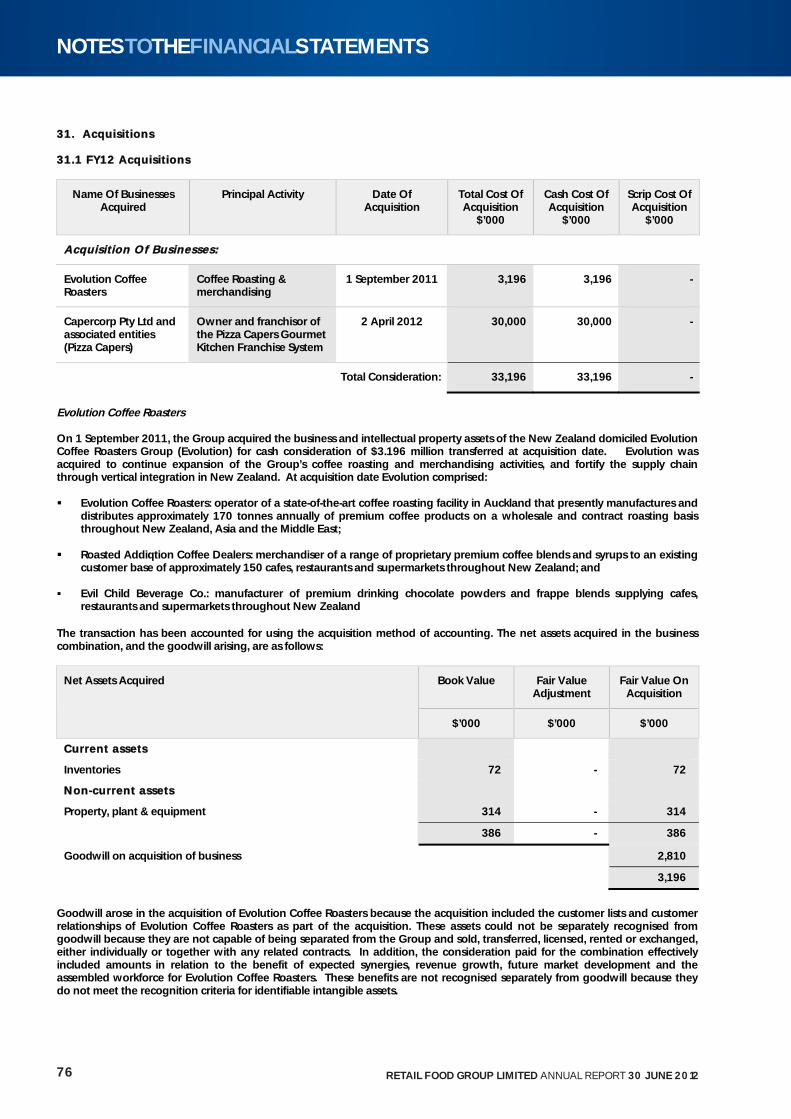
331. Acquisit ions 31.1 FY12 Acquisit ions
Name Of Businesses Acquired
Principal Activity Date Of Acquisition
Total Cost Of Acquisition
$’000
Cash Cost Of Acquisition
$’000
Scrip Cost Of Acquisition
$’000
AAcquisit ion Of Businesses:
Evolution Coffee Roasters
Coffee Roasting & merchandising
1 September 2011 3,196 3,196 -
Capercorp Pty Ltd and associated entities (Pizza Capers)
Owner and franchisor of the Pizza Capers Gourmet Kitchen Franchise System
2 April 2012 30,000 30,000 -
Total Consideration: 33,196 33,196 -
Evolution Coffee Roasters On 1 September 2011, the Group acquired the business and intellectual property assets of the New Zealand domiciled Evolution Coffee Roasters Group (Evolution) for cash consideration of $3.196 million transferred at acquisition date. Evolution was acquired to continue expansion of the Group’s coffee roasting and merchandising activities, and fortify the supply chain through vertical integration in New Zealand. At acquisition date Evolution comprised: Evolution Coffee Roasters: operator of a state-of-the-art coffee roasting facility in Auckland that presently manufactures and
distributes approximately 170 tonnes annually of premium coffee products on a wholesale and contract roasting basis throughout New Zealand, Asia and the Middle East;
Roasted Addiqtion Coffee Dealers: merchandiser of a range of proprietary premium coffee blends and syrups to an existing
customer base of approximately 150 cafes, restaurants and supermarkets throughout New Zealand; and
Evil Child Beverage Co.: manufacturer of premium drinking chocolate powders and frappe blends supplying cafes, restaurants and supermarkets throughout New Zealand
The transaction has been accounted for using the acquisition method of accounting. The net assets acquired in the business combination, and the goodwill arising, are as follows:
Book Value Fair Value Adjustment
Fair Value On Acquisition
Net Assets Acquired
$’000 $’000 $’000
CCuurrent aassets
Inventories 72 - 72
NNon--ccuurrent assets
Property, plant & equipment 314 - 314
386 - 386
Goodwill on acquisition of business 2,810
3,196
Goodwill arose in the acquisition of Evolution Coffee Roasters because the acquisition included the customer lists and customer relationships of Evolution Coffee Roasters as part of the acquisition. These assets could not be separately recognised from goodwill because they are not capable of being separated from the Group and sold, transferred, licensed, rented or exchanged, either individually or together with any related contracts. In addition, the consideration paid for the combination effectively included amounts in relation to the benefit of expected synergies, revenue growth, future market development and the assembled workforce for Evolution Coffee Roasters. These benefits are not recognised separately from goodwill because they do not meet the recognition criteria for identifiable intangible assets.
76 RETAIL FOOD GROUP LIMITED ANNUAL REPORT 30 JUNE 2012
NOTESTOTHEFINANCIALSTATEMENTS
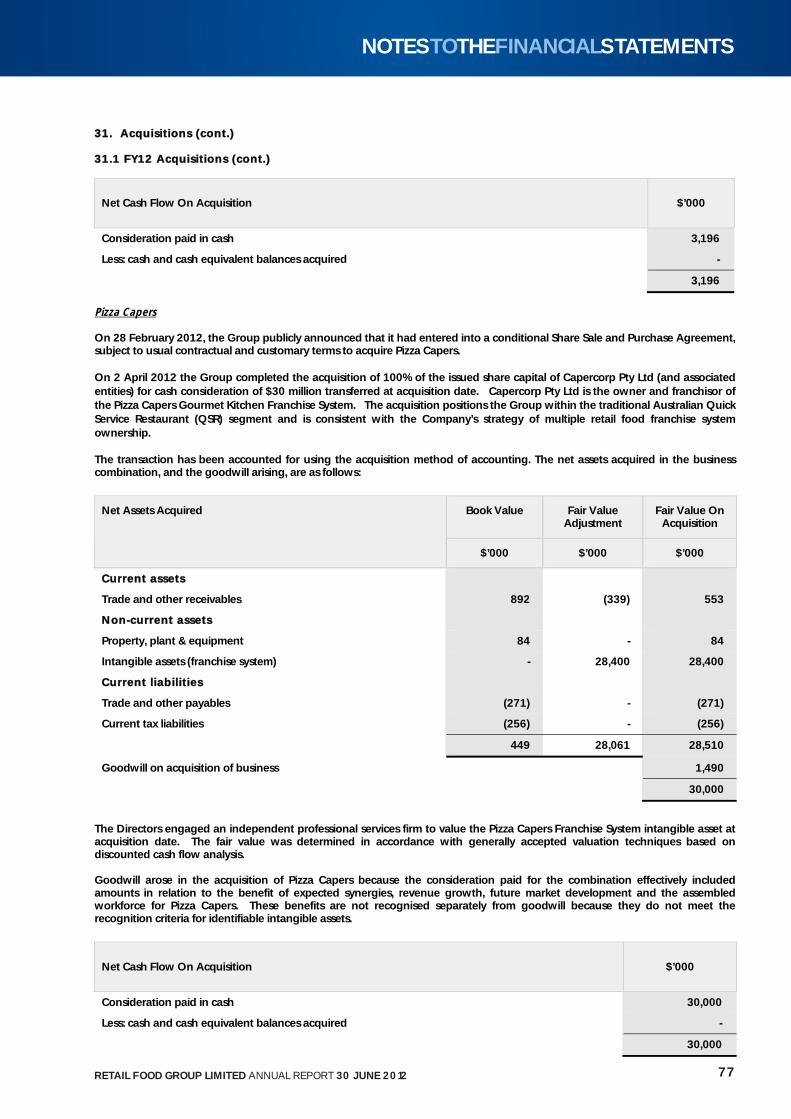
331. Acquisit ions (cont.) 31.1 FY12 Acquisit ions (cont.)
Pizza Capers On 28 February 2012, the Group publicly announced that it had entered into a conditional Share Sale and Purchase Agreement, subject to usual contractual and customary terms to acquire Pizza Capers. On 2 April 2012 the Group completed the acquisition of 100% of the issued share capital of Capercorp Pty Ltd (and associated entities) for cash consideration of $30 million transferred at acquisition date. Capercorp Pty Ltd is the owner and franchisor of the Pizza Capers Gourmet Kitchen Franchise System. The acquisition positions the Group within the traditional Australian Quick Service Restaurant (QSR) segment and is consistent with the Company’s strategy of multiple retail food franchise system ownership. The transaction has been accounted for using the acquisition method of accounting. The net assets acquired in the business combination, and the goodwill arising, are as follows:
Book Value Fair Value Adjustment
Fair Value On Acquisition
Net Assets Acquired
$’000 $’000 $’000
CCurrent assets
Trade and other receivables 892 (339) 553
NNon--ccurrent assets
Property, plant & equipment 84 - 84
Intangible assets (franchise system) - 28,400 28,400
CCurrent l iabil it ies
Trade and other payables (271) - (271)
Current tax liabilities (256) - (256)
449 28,061 28,510
Goodwill on acquisition of business 1,490
30,000
The Directors engaged an independent professional services firm to value the Pizza Capers Franchise System intangible asset at acquisition date. The fair value was determined in accordance with generally accepted valuation techniques based on discounted cash flow analysis. Goodwill arose in the acquisition of Pizza Capers because the consideration paid for the combination effectively included amounts in relation to the benefit of expected synergies, revenue growth, future market development and the assembled workforce for Pizza Capers. These benefits are not recognised separately from goodwill because they do not meet the recognition criteria for identifiable intangible assets.
Net Cash Flow On Acquisition $’000
Consideration paid in cash 30,000
Less: cash and cash equivalent balances acquired -
30,000
Net Cash Flow On Acquisition $’000
Consideration paid in cash 3,196
Less: cash and cash equivalent balances acquired -
3,196
77RETAIL FOOD GROUP LIMITED ANNUAL REPORT 30 JUNE 2012
NOTESTOTHEFINANCIALSTATEMENTS
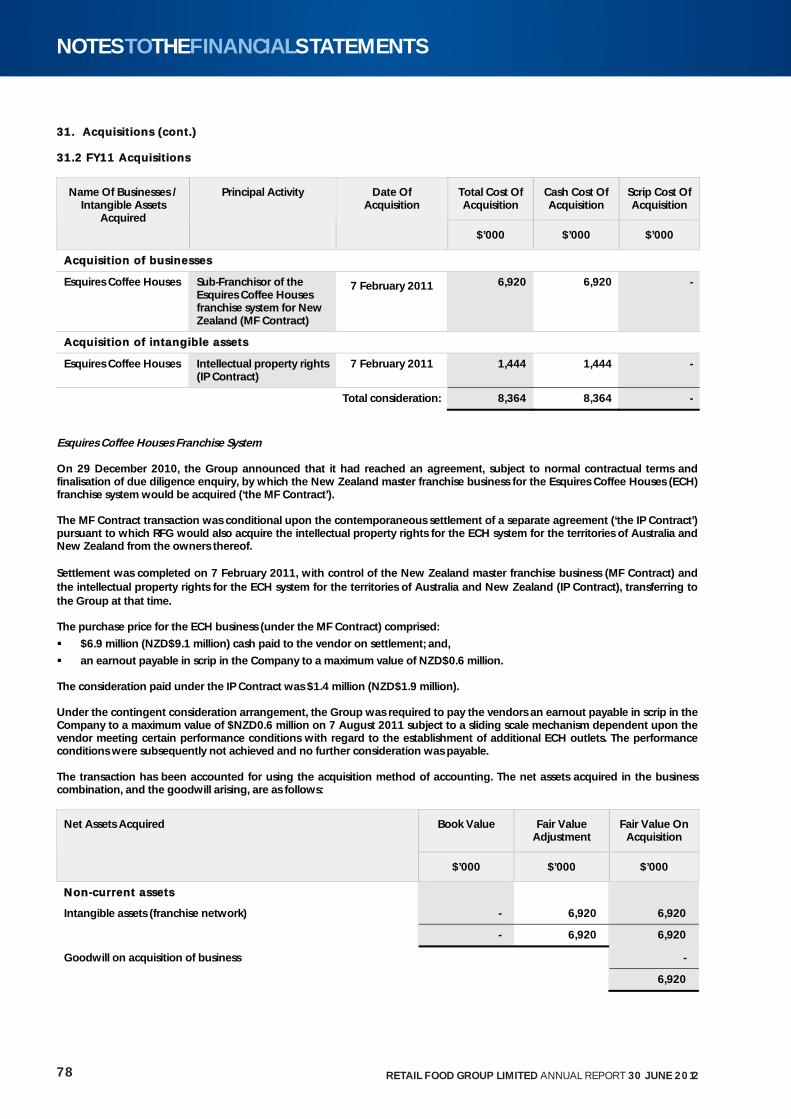
331. Acquisit ions (cont.) 31.2 FY11 Acquisit ions
Total Cost Of Acquisition
Cash Cost Of Acquisition
Scrip Cost Of Acquisition
Name Of Businesses / Intangible Assets
Acquired
Principal Activity Date Of Acquisition
$’000 $’000 $’000
AAcquisit ion of buusinesses
Esquires Coffee Houses Sub-Franchisor of the Esquires Coffee Houses franchise system for New Zealand (MF Contract)
7 February 2011
6,920 6,920 -
AAcquisit ion of intangible asssets
Esquires Coffee Houses Intellectual property rights (IP Contract)
7 February 2011 1,444 1,444 -
Total consideration: 8,364 8,364 -
Esquires Coffee Houses Franchise System On 29 December 2010, the Group announced that it had reached an agreement, subject to normal contractual terms and finalisation of due diligence enquiry, by which the New Zealand master franchise business for the Esquires Coffee Houses (ECH) franchise system would be acquired (‘the MF Contract’). The MF Contract transaction was conditional upon the contemporaneous settlement of a separate agreement (‘the IP Contract’) pursuant to which RFG would also acquire the intellectual property rights for the ECH system for the territories of Australia and New Zealand from the owners thereof. Settlement was completed on 7 February 2011, with control of the New Zealand master franchise business (MF Contract) and the intellectual property rights for the ECH system for the territories of Australia and New Zealand (IP Contract), transferring to the Group at that time. The purchase price for the ECH business (under the MF Contract) comprised:
$6.9 million (NZD$9.1 million) cash paid to the vendor on settlement; and,
an earnout payable in scrip in the Company to a maximum value of NZD$0.6 million.
The consideration paid under the IP Contract was $1.4 million (NZD$1.9 million). Under the contingent consideration arrangement, the Group was required to pay the vendors an earnout payable in scrip in the Company to a maximum value of $NZD0.6 million on 7 August 2011 subject to a sliding scale mechanism dependent upon the vendor meeting certain performance conditions with regard to the establishment of additional ECH outlets. The performance conditions were subsequently not achieved and no further consideration was payable. The transaction has been accounted for using the acquisition method of accounting. The net assets acquired in the business combination, and the goodwill arising, are as follows:
Book Value Fair Value Adjustment
Fair Value On Acquisition
Net Assets Acquired
$’000 $’000 $’000
NNon--ccuurrent assets
Intangible assets (franchise network) - 6,920 6,920
- 6,920 6,920
Goodwill on acquisition of business -
6,920
78 RETAIL FOOD GROUP LIMITED ANNUAL REPORT 30 JUNE 2012
NOTESTOTHEFINANCIALSTATEMENTS
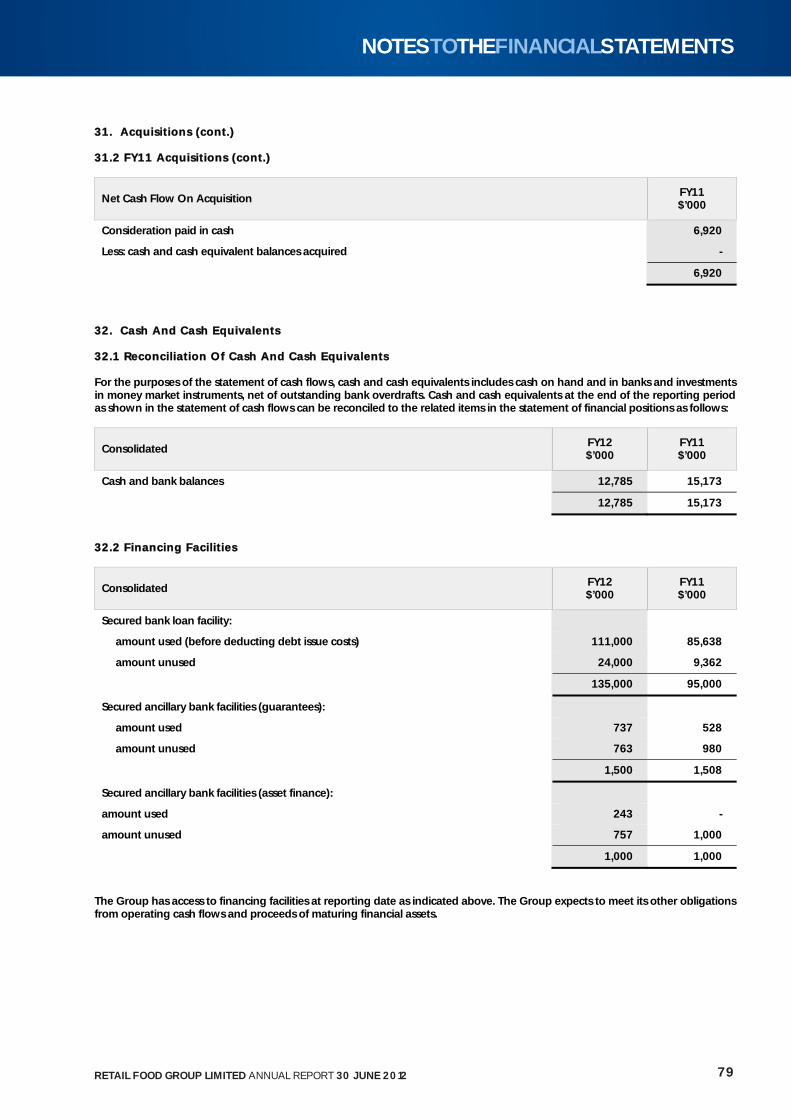
331. Acquisit ions (cont.) 31.2 FY11 Acquisit ions (cont.)
Net Cash Flow On Acquisition FY11 $’000
Consideration paid in cash 6,920
Less: cash and cash equivalent balances acquired -
6,920
332. Cash And Cash Equivalents 32.1 Reconcil iation Of Cash And Cash Equivalents For the purposes of the statement of cash flows, cash and cash equivalents includes cash on hand and in banks and investments in money market instruments, net of outstanding bank overdrafts. Cash and cash equivalents at the end of the reporting period as shown in the statement of cash flows can be reconciled to the related items in the statement of financial positions as follows:
Consolidated FY12 $’000
FY11 $’000
Cash and bank balances 12,785 15,173
12,785 15,173
332.2 Financing Facil it ies
Consolidated FY12 $’000
FY11 $’000
Secured bank loan facility:
amount used (before deducting debt issue costs) 111,000 85,638
amount unused 24,000 9,362
135,000 95,000
Secured ancillary bank facilities (guarantees):
amount used 737 528
amount unused 763 980
1,500 1,508
Secured ancillary bank facilities (asset finance):
amount used 243 -
amount unused 757 1,000
1,000 1,000
The Group has access to financing facilities at reporting date as indicated above. The Group expects to meet its other obligations from operating cash flows and proceeds of maturing financial assets.
79RETAIL FOOD GROUP LIMITED ANNUAL REPORT 30 JUNE 2012
NOTESTOTHEFINANCIALSTATEMENTS
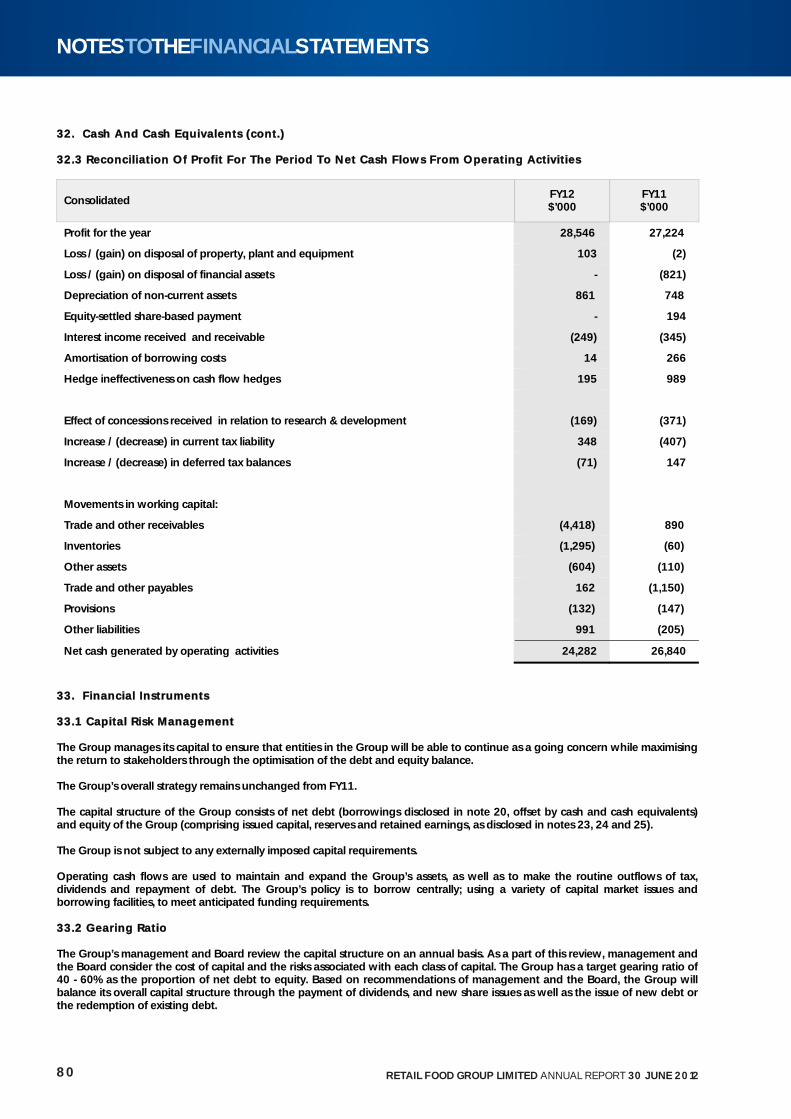
332. Cash And Cash Equivalents (cont.) 32.3 Reconcil iation Of Profit For The Period To Net Cash Flows From Operating Activit ies
Consolidated FY12 $’000
FY11 $’000
Profit for the year 28,546 27,224
Loss / (gain) on disposal of property, plant and equipment 103 (2)
Loss / (gain) on disposal of financial assets - (821)
Depreciation of non-current assets 861 748
Equity-settled share-based payment - 194
Interest income received and receivable (249) (345)
Amortisation of borrowing costs 14 266
Hedge ineffectiveness on cash flow hedges 195 989
Effect of concessions received in relation to research & development (169) (371)
Increase / (decrease) in current tax liability 348 (407)
Increase / (decrease) in deferred tax balances (71) 147
Movements in working capital:
Trade and other receivables (4,418) 890
Inventories (1,295) (60)
Other assets (604) (110)
Trade and other payables 162 (1,150)
Provisions (132) (147)
Other liabilities 991 (205)
Net cash generated by operating activities 24,282 26,840
333. Financial Instruments 33.1 Capital Risk Management The Group manages its capital to ensure that entities in the Group will be able to continue as a going concern while maximising the return to stakeholders through the optimisation of the debt and equity balance. The Group’s overall strategy remains unchanged from FY11. The capital structure of the Group consists of net debt (borrowings disclosed in note 20, offset by cash and cash equivalents) and equity of the Group (comprising issued capital, reserves and retained earnings, as disclosed in notes 23, 24 and 25). The Group is not subject to any externally imposed capital requirements. Operating cash flows are used to maintain and expand the Group’s assets, as well as to make the routine outflows of tax, dividends and repayment of debt. The Group’s policy is to borrow centrally; using a variety of capital market issues and borrowing facilities, to meet anticipated funding requirements. 33.2 Gearing Ratio The Group’s management and Board review the capital structure on an annual basis. As a part of this review, management and the Board consider the cost of capital and the risks associated with each class of capital. The Group has a target gearing ratio of 40 - 60% as the proportion of net debt to equity. Based on recommendations of management and the Board, the Group will balance its overall capital structure through the payment of dividends, and new share issues as well as the issue of new debt or the redemption of existing debt.
80 RETAIL FOOD GROUP LIMITED ANNUAL REPORT 30 JUNE 2012
NOTESTOTHEFINANCIALSTATEMENTS
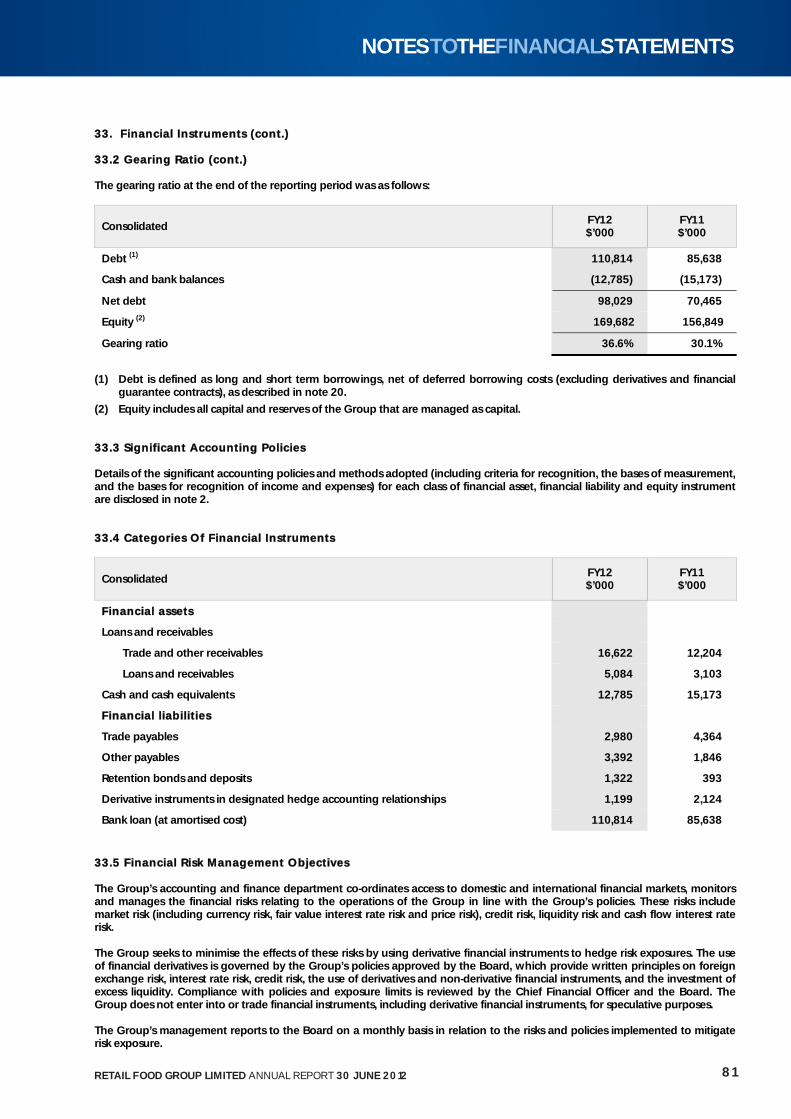
333. Financial Instruments (cont.) 33.2 Gearing Ratio (cont.) The gearing ratio at the end of the reporting period was as follows:
Consolidated FY12 $’000
FY11 $’000
Debt (1) 110,814 85,638
Cash and bank balances (12,785) (15,173)
Net debt 98,029 70,465
Equity (2) 169,682 156,849
Gearing ratio 36.6% 30.1%
(1) Debt is defined as long and short term borrowings, net of deferred borrowing costs (excluding derivatives and financial guarantee contracts), as described in note 20.
(2) Equity includes all capital and reserves of the Group that are managed as capital. 33.3 Signif icant Accounting Policies Details of the significant accounting policies and methods adopted (including criteria for recognition, the bases of measurement, and the bases for recognition of income and expenses) for each class of financial asset, financial liability and equity instrument are disclosed in note 2. 33.4 Categories Of Financial Instruments
Consolidated FY12 $’000
FY11 $’000
FFinancial assets
Loans and receivables
Trade and other receivables 16,622 12,204
Loans and receivables 5,084 3,103
Cash and cash equivalents 12,785 15,173
FFinancial l iabil it ies
Trade payables 2,980 4,364
Other payables 3,392 1,846
Retention bonds and deposits 1,322 393
Derivative instruments in designated hedge accounting relationships 1,199 2,124
Bank loan (at amortised cost) 110,814 85,638
33.5 Financial Risk Management Objectives The Group’s accounting and finance department co-ordinates access to domestic and international financial markets, monitors and manages the financial risks relating to the operations of the Group in line with the Group’s policies. These risks include market risk (including currency risk, fair value interest rate risk and price risk), credit risk, liquidity risk and cash flow interest rate risk. The Group seeks to minimise the effects of these risks by using derivative financial instruments to hedge risk exposures. The use of financial derivatives is governed by the Group’s policies approved by the Board, which provide written principles on foreign exchange risk, interest rate risk, credit risk, the use of derivatives and non-derivative financial instruments, and the investment of excess liquidity. Compliance with policies and exposure limits is reviewed by the Chief Financial Officer and the Board. The Group does not enter into or trade financial instruments, including derivative financial instruments, for speculative purposes. The Group’s management reports to the Board on a monthly basis in relation to the risks and policies implemented to mitigate risk exposure.
81RETAIL FOOD GROUP LIMITED ANNUAL REPORT 30 JUNE 2012
NOTESTOTHEFINANCIALSTATEMENTS
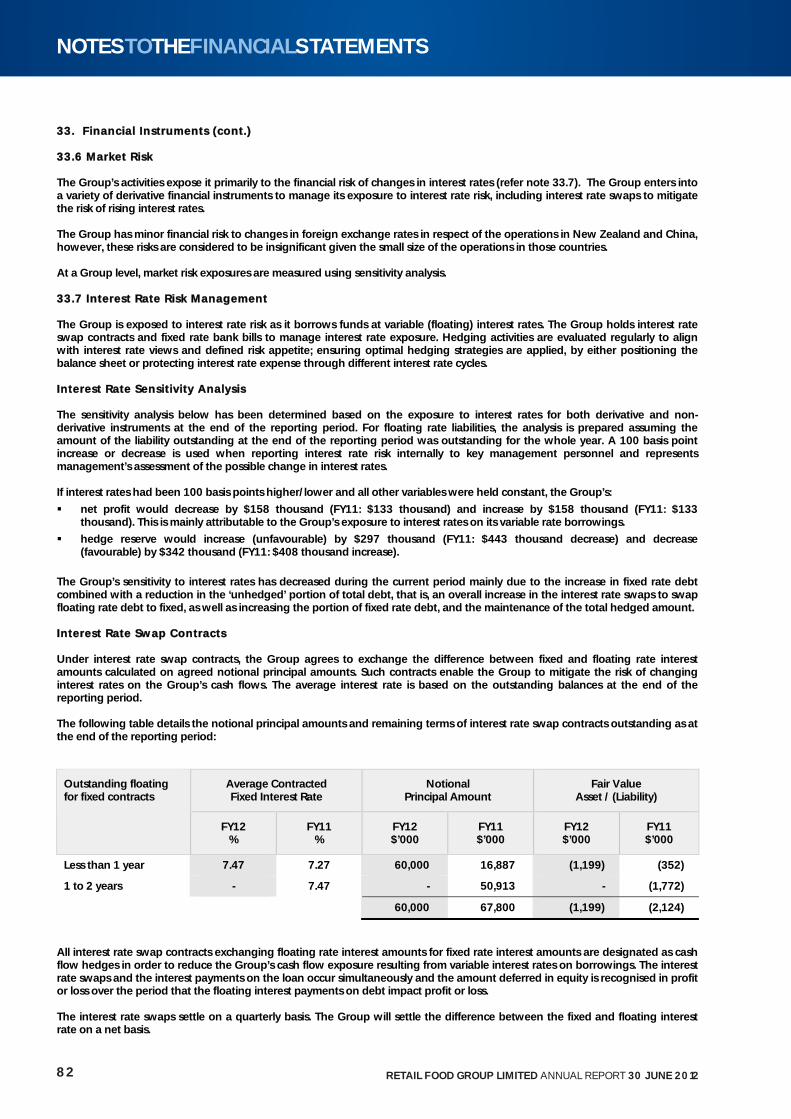
333. Financial Instruments (cont.) 33.6 Market Risk The Group’s activities expose it primarily to the financial risk of changes in interest rates (refer note 33.7). The Group enters into a variety of derivative financial instruments to manage its exposure to interest rate risk, including interest rate swaps to mitigate the risk of rising interest rates. The Group has minor financial risk to changes in foreign exchange rates in respect of the operations in New Zealand and China, however, these risks are considered to be insignificant given the small size of the operations in those countries. At a Group level, market risk exposures are measured using sensitivity analysis. 33.7 Interest Rate Risk Management The Group is exposed to interest rate risk as it borrows funds at variable (floating) interest rates. The Group holds interest rate swap contracts and fixed rate bank bills to manage interest rate exposure. Hedging activities are evaluated regularly to align with interest rate views and defined risk appetite; ensuring optimal hedging strategies are applied, by either positioning the balance sheet or protecting interest rate expense through different interest rate cycles. Interest Rate Sensit ivity Analysis The sensitivity analysis below has been determined based on the exposure to interest rates for both derivative and non-derivative instruments at the end of the reporting period. For floating rate liabilities, the analysis is prepared assuming the amount of the liability outstanding at the end of the reporting period was outstanding for the whole year. A 100 basis point increase or decrease is used when reporting interest rate risk internally to key management personnel and represents management’s assessment of the possible change in interest rates. If interest rates had been 100 basis points higher/lower and all other variables were held constant, the Group’s:
net profit would decrease by $158 thousand (FY11: $133 thousand) and increase by $158 thousand (FY11: $133 thousand). This is mainly attributable to the Group’s exposure to interest rates on its variable rate borrowings.
hedge reserve would increase (unfavourable) by $297 thousand (FY11: $443 thousand decrease) and decrease (favourable) by $342 thousand (FY11: $408 thousand increase).
The Group’s sensitivity to interest rates has decreased during the current period mainly due to the increase in fixed rate debt combined with a reduction in the ‘unhedged’ portion of total debt, that is, an overall increase in the interest rate swaps to swap floating rate debt to fixed, as well as increasing the portion of fixed rate debt, and the maintenance of the total hedged amount. Interest Rate Swap Contracts Under interest rate swap contracts, the Group agrees to exchange the difference between fixed and floating rate interest amounts calculated on agreed notional principal amounts. Such contracts enable the Group to mitigate the risk of changing interest rates on the Group’s cash flows. The average interest rate is based on the outstanding balances at the end of the reporting period. The following table details the notional principal amounts and remaining terms of interest rate swap contracts outstanding as at the end of the reporting period:
Average Contracted Fixed Interest Rate
Notional Principal Amount
Fair Value Asset / (Liability)
Outstanding floating for fixed contracts
FY12 %
FY11 %
FY12 $’000
FY11 $’000
FY12 $’000
FY11 $’000
Less than 1 year 7.47 7.27 60,000 16,887 (1,199) (352)
1 to 2 years - 7.47 - 50,913 - (1,772)
60,000 67,800 (1,199) (2,124)
All interest rate swap contracts exchanging floating rate interest amounts for fixed rate interest amounts are designated as cash flow hedges in order to reduce the Group’s cash flow exposure resulting from variable interest rates on borrowings. The interest rate swaps and the interest payments on the loan occur simultaneously and the amount deferred in equity is recognised in profit or loss over the period that the floating interest payments on debt impact profit or loss. The interest rate swaps settle on a quarterly basis. The Group will settle the difference between the fixed and floating interest rate on a net basis. 82 RETAIL FOOD GROUP LIMITED ANNUAL REPORT 30 JUNE 2012
NOTESTOTHEFINANCIALSTATEMENTS
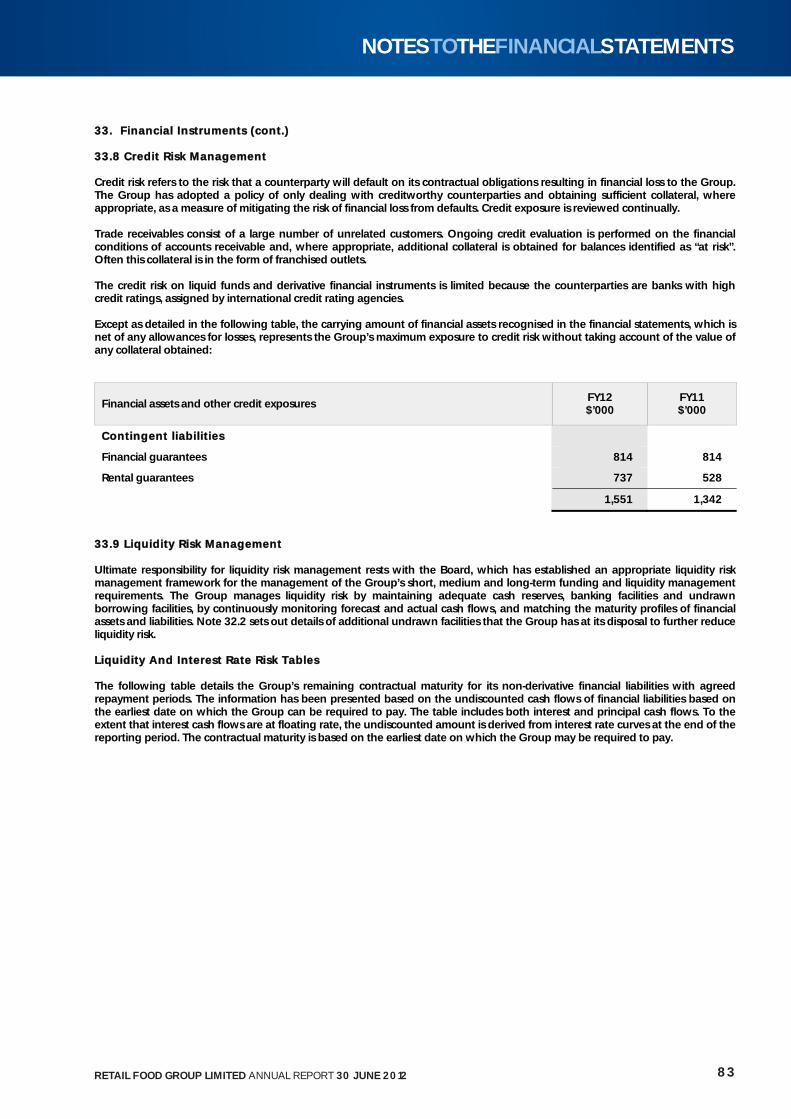
333. Financial Instruments (cont.) 33.8 Credit Risk Management Credit risk refers to the risk that a counterparty will default on its contractual obligations resulting in financial loss to the Group. The Group has adopted a policy of only dealing with creditworthy counterparties and obtaining sufficient collateral, where appropriate, as a measure of mitigating the risk of financial loss from defaults. Credit exposure is reviewed continually. Trade receivables consist of a large number of unrelated customers. Ongoing credit evaluation is performed on the financial conditions of accounts receivable and, where appropriate, additional collateral is obtained for balances identified as “at risk”. Often this collateral is in the form of franchised outlets. The credit risk on liquid funds and derivative financial instruments is limited because the counterparties are banks with high credit ratings, assigned by international credit rating agencies. Except as detailed in the following table, the carrying amount of financial assets recognised in the financial statements, which is net of any allowances for losses, represents the Group’s maximum exposure to credit risk without taking account of the value of any collateral obtained:
Financial assets and other credit exposures FY12 $’000
FY11 $’000
CContingent l iabil it ies
Financial guarantees 814 814
Rental guarantees 737 528
1,551 1,342
333.9 Liquidity Risk Management Ultimate responsibility for liquidity risk management rests with the Board, which has established an appropriate liquidity risk management framework for the management of the Group’s short, medium and long-term funding and liquidity management requirements. The Group manages liquidity risk by maintaining adequate cash reserves, banking facilities and undrawn borrowing facilities, by continuously monitoring forecast and actual cash flows, and matching the maturity profiles of financial assets and liabilities. Note 32.2 sets out details of additional undrawn facilities that the Group has at its disposal to further reduce liquidity risk. Liquidity And Interest Rate Risk Tables The following table details the Group’s remaining contractual maturity for its non-derivative financial liabilities with agreed repayment periods. The information has been presented based on the undiscounted cash flows of financial liabilities based on the earliest date on which the Group can be required to pay. The table includes both interest and principal cash flows. To the extent that interest cash flows are at floating rate, the undiscounted amount is derived from interest rate curves at the end of the reporting period. The contractual maturity is based on the earliest date on which the Group may be required to pay.
83RETAIL FOOD GROUP LIMITED ANNUAL REPORT 30 JUNE 2012
NOTESTOTHEFINANCIALSTATEMENTS
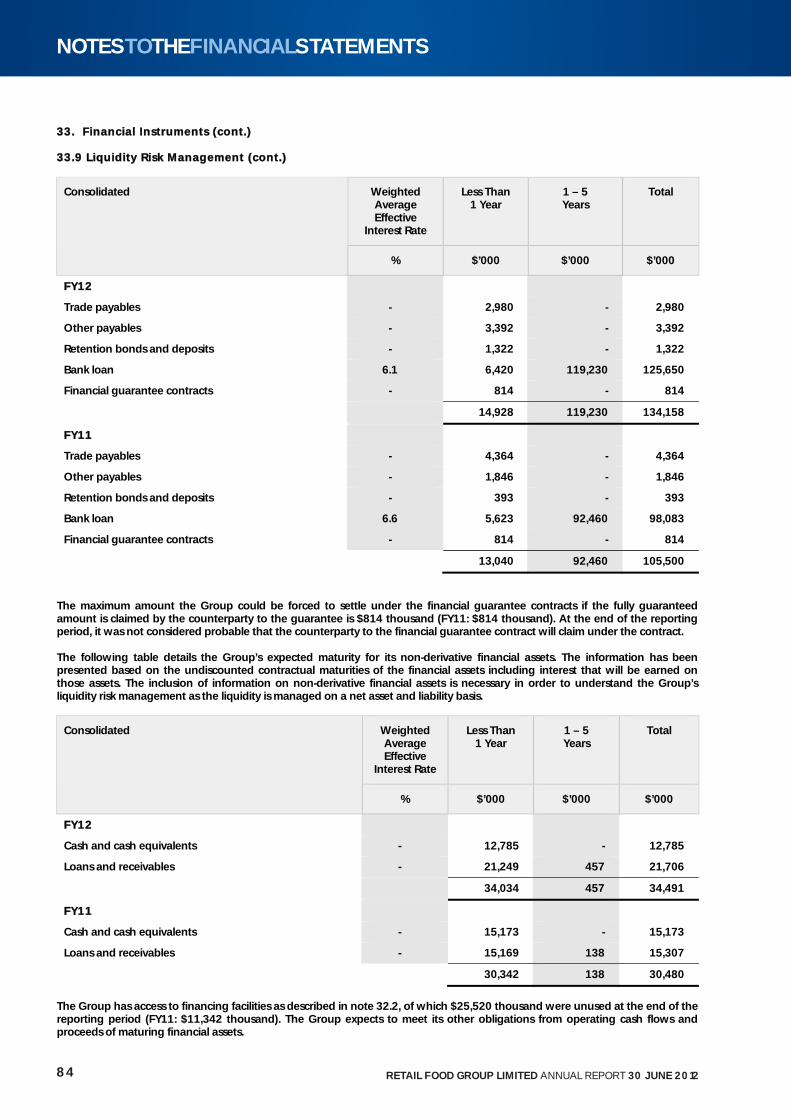
333. Financial Instruments (cont.) 33.9 Liquidity Risk Management (cont.)
Weighted Average Effective
Interest Rate
Less Than 1 Year
1 – 5 Years
Total Consolidated
% $’000 $’000 $’000
FFY122
Trade payables - 2,980 - 2,980
Other payables - 3,392 - 3,392
Retention bonds and deposits - 1,322 - 1,322
Bank loan 6.1 6,420 119,230 125,650
Financial guarantee contracts - 814 - 814
14,928 119,230 134,158
FFY111
Trade payables - 4,364 - 4,364
Other payables - 1,846 - 1,846
Retention bonds and deposits - 393 - 393
Bank loan 6.6 5,623 92,460 98,083
Financial guarantee contracts - 814 - 814
13,040 92,460 105,500
The maximum amount the Group could be forced to settle under the financial guarantee contracts if the fully guaranteed amount is claimed by the counterparty to the guarantee is $814 thousand (FY11: $814 thousand). At the end of the reporting period, it was not considered probable that the counterparty to the financial guarantee contract will claim under the contract. The following table details the Group’s expected maturity for its non-derivative financial assets. The information has been presented based on the undiscounted contractual maturities of the financial assets including interest that will be earned on those assets. The inclusion of information on non-derivative financial assets is necessary in order to understand the Group’s liquidity risk management as the liquidity is managed on a net asset and liability basis.
Weighted Average Effective
Interest Rate
Less Than 1 Year
1 – 5 Years
Total Consolidated
% $’000 $’000 $’000
FFY122
Cash and cash equivalents - 12,785 - 12,785
Loans and receivables - 21,249 457 21,706
34,034 457 34,491
FFY111
Cash and cash equivalents - 15,173 - 15,173
Loans and receivables - 15,169 138 15,307
30,342 138 30,480
The Group has access to financing facilities as described in note 32.2, of which $25,520 thousand were unused at the end of the reporting period (FY11: $11,342 thousand). The Group expects to meet its other obligations from operating cash flows and proceeds of maturing financial assets. 84 RETAIL FOOD GROUP LIMITED ANNUAL REPORT 30 JUNE 2012
NOTESTOTHEFINANCIALSTATEMENTS
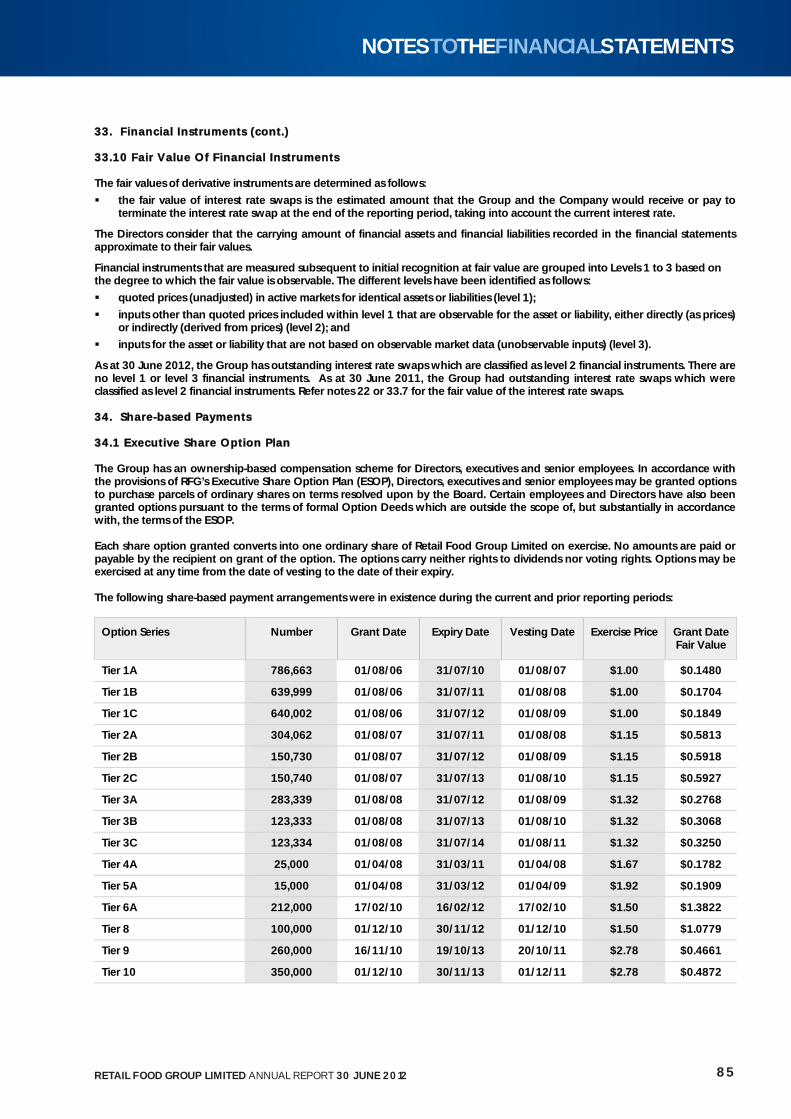
333. Financial Instruments (cont.) 33.10 Fair Value Of Financial Instruments The fair values of derivative instruments are determined as follows:
the fair value of interest rate swaps is the estimated amount that the Group and the Company would receive or pay to terminate the interest rate swap at the end of the reporting period, taking into account the current interest rate.
The Directors consider that the carrying amount of financial assets and financial liabilities recorded in the financial statements approximate to their fair values.
Financial instruments that are measured subsequent to initial recognition at fair value are grouped into Levels 1 to 3 based on the degree to which the fair value is observable. The different levels have been identified as follows: quoted prices (unadjusted) in active markets for identical assets or liabilities (level 1);
inputs other than quoted prices included within level 1 that are observable for the asset or liability, either directly (as prices) or indirectly (derived from prices) (level 2); and
inputs for the asset or liability that are not based on observable market data (unobservable inputs) (level 3).
As at 30 June 2012, the Group has outstanding interest rate swaps which are classified as level 2 financial instruments. There are no level 1 or level 3 financial instruments. As at 30 June 2011, the Group had outstanding interest rate swaps which were classified as level 2 financial instruments. Refer notes 22 or 33.7 for the fair value of the interest rate swaps. 34. Share-based Payments 34.1 Executive Share Option Plan The Group has an ownership-based compensation scheme for Directors, executives and senior employees. In accordance with the provisions of RFG’s Executive Share Option Plan (ESOP), Directors, executives and senior employees may be granted options to purchase parcels of ordinary shares on terms resolved upon by the Board. Certain employees and Directors have also been granted options pursuant to the terms of formal Option Deeds which are outside the scope of, but substantially in accordance with, the terms of the ESOP. Each share option granted converts into one ordinary share of Retail Food Group Limited on exercise. No amounts are paid or payable by the recipient on grant of the option. The options carry neither rights to dividends nor voting rights. Options may be exercised at any time from the date of vesting to the date of their expiry. The following share-based payment arrangements were in existence during the current and prior reporting periods:
Option Series Number Grant Date Expiry Date Vesting Date Exercise Price Grant Date Fair Value
Tier 1A 786,663 01/08/06 31/07/10 01/08/07 $1.00 $0.1480
Tier 1B 639,999 01/08/06 31/07/11 01/08/08 $1.00 $0.1704
Tier 1C 640,002 01/08/06 31/07/12 01/08/09 $1.00 $0.1849
Tier 2A 304,062 01/08/07 31/07/11 01/08/08 $1.15 $0.5813
Tier 2B 150,730 01/08/07 31/07/12 01/08/09 $1.15 $0.5918
Tier 2C 150,740 01/08/07 31/07/13 01/08/10 $1.15 $0.5927
Tier 3A 283,339 01/08/08 31/07/12 01/08/09 $1.32 $0.2768
Tier 3B 123,333 01/08/08 31/07/13 01/08/10 $1.32 $0.3068
Tier 3C 123,334 01/08/08 31/07/14 01/08/11 $1.32 $0.3250
Tier 4A 25,000 01/04/08 31/03/11 01/04/08 $1.67 $0.1782
Tier 5A 15,000 01/04/08 31/03/12 01/04/09 $1.92 $0.1909
Tier 6A 212,000 17/02/10 16/02/12 17/02/10 $1.50 $1.3822
Tier 8 100,000 01/12/10 30/11/12 01/12/10 $1.50 $1.0779
Tier 9 260,000 16/11/10 19/10/13 20/10/11 $2.78 $0.4661
Tier 10 350,000 01/12/10 30/11/13 01/12/11 $2.78 $0.4872
85RETAIL FOOD GROUP LIMITED ANNUAL REPORT 30 JUNE 2012
NOTESTOTHEFINANCIALSTATEMENTS
334. Share-based Payments (cont.) 34.2 Fair Value Of Share Options Granted In The Year No share options were granted during the financial year. The weighted average fair value of the share options granted during the prior financial year was $0.5627. Options were priced using the Black-Scholes model. Where relevant, the expected life used in the model has been adjusted based on management’s best estimate for the effects of non-transferability, exercise restrictions and behavioral considerations. Expected volatility is based on the historical share price volatility for a period consistent with the option life. To allow for the effects of early exercise, it was assumed that executives and senior employees would exercise the options at the mid-point of the expiry period (i.e. mid-point between the grant date and the expiry date).
Inputs Grant date share price
Exercise price
Expected volatility Option life
Dividend yield
Risk-free interest rate
Tier 1A $0.84 $1.00 45.00% 2.5 yrs 6.50% 5.17%
Tier 1B $0.84 $1.00 45.00% 3.5 yrs 6.50% 5.17%
Tier 1C $0.84 $1.00 45.00% 4.5 yrs 6.50% 5.17%
Tier 2A $1.65 $1.15 45.00% 2.5 yrs 6.50% 6.39%
Tier 2B $1.65 $1.15 45.00% 3.5 yrs 6.50% 6.39%
Tier 2C $1.65 $1.15 45.00% 4.5 yrs 6.50% 6.39%
Tier 3A $1.28 $1.32 44.00% 2.5 yrs 6.50% 6.03%
Tier 3B $1.28 $1.32 44.00% 3.5 yrs 6.50% 6.03%
Tier 3C $1.28 $1.32 44.00% 4.5 yrs 6.50% 6.03%
Tier 4A $1.39 $1.67 42.00% 1.5 yrs 5.50% 6.09%
Tier 5A $1.39 $1.92 42.00% 2.5 yrs 5.50% 6.09%
Tier 6A $2.90 $1.50 42.00% 1.0 yrs 3.62% 4.47%
Tier 8 $2.60 $1.50 42.00% 1.0 yrs 5.00% 4.75%
Tier 9 $2.57 $2.78 42.00% 1.93 yrs 5.06% 5.07%
Tier 10 $2.60 $2.78 42.00% 2.0 yrs 5.06% 4.91%
334.3 Movements In Share Options During The Financial Year The following reconciles the outstanding share options granted under the ESOP at the beginning and the end of the financial year:
FY12 FY11
Number Of Options
Weighted Average
Exercise Price
Number Of Options
Weighted Average
Exercise Price
Balance at beginning of the financial year 1,561,197 $1.47 2,004,869 $1.16
Granted during the financial year - - 710,000 $2.60
Forfeited during the financial year (85,000) $2.53 (30,000) $1.26
Exercised during the financial year (633,697) $1.20 (773,672) $1.12
Cancelled during the financial year - - (350,000) $2.78
Balance at end of the financial year 842,500 $1.57 1,561,197 $1.47
Exercisable at end of the financial year 842,500 $1.57 1,191,200 $1.20
86 RETAIL FOOD GROUP LIMITED ANNUAL REPORT 30 JUNE 2012
NOTESTOTHEFINANCIALSTATEMENTS
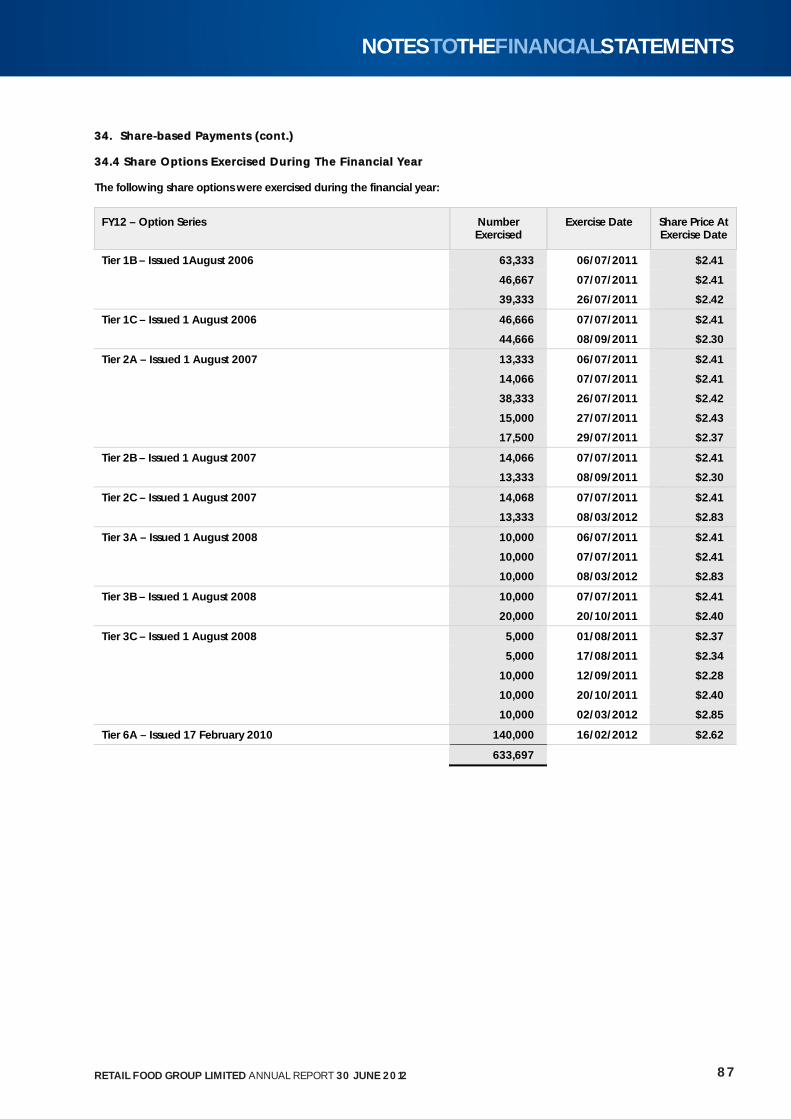
334. Share-based Payments (cont.) 34.4 Share Options Exercised During The Financial Year The following share options were exercised during the financial year:
FY12 – Option Series Number Exercised
Exercise Date Share Price At Exercise Date
Tier 1B – Issued 1August 2006 63,333 06/07/2011 $2.41
46,667 07/07/2011 $2.41
39,333 26/07/2011 $2.42
Tier 1C – Issued 1 August 2006 46,666 07/07/2011 $2.41
44,666 08/09/2011 $2.30
Tier 2A – Issued 1 August 2007 13,333 06/07/2011 $2.41
14,066 07/07/2011 $2.41
38,333 26/07/2011 $2.42
15,000 27/07/2011 $2.43
17,500 29/07/2011 $2.37
Tier 2B – Issued 1 August 2007 14,066 07/07/2011 $2.41
13,333 08/09/2011 $2.30
Tier 2C – Issued 1 August 2007 14,068 07/07/2011 $2.41
13,333 08/03/2012 $2.83
Tier 3A – Issued 1 August 2008 10,000 06/07/2011 $2.41
10,000 07/07/2011 $2.41
10,000 08/03/2012 $2.83
Tier 3B – Issued 1 August 2008 10,000 07/07/2011 $2.41
20,000 20/10/2011 $2.40
Tier 3C – Issued 1 August 2008 5,000 01/08/2011 $2.37
5,000 17/08/2011 $2.34
10,000 12/09/2011 $2.28
10,000 20/10/2011 $2.40
10,000 02/03/2012 $2.85
Tier 6A – Issued 17 February 2010 140,000 16/02/2012 $2.62
633,697
87RETAIL FOOD GROUP LIMITED ANNUAL REPORT 30 JUNE 2012
NOTESTOTHEFINANCIALSTATEMENTS
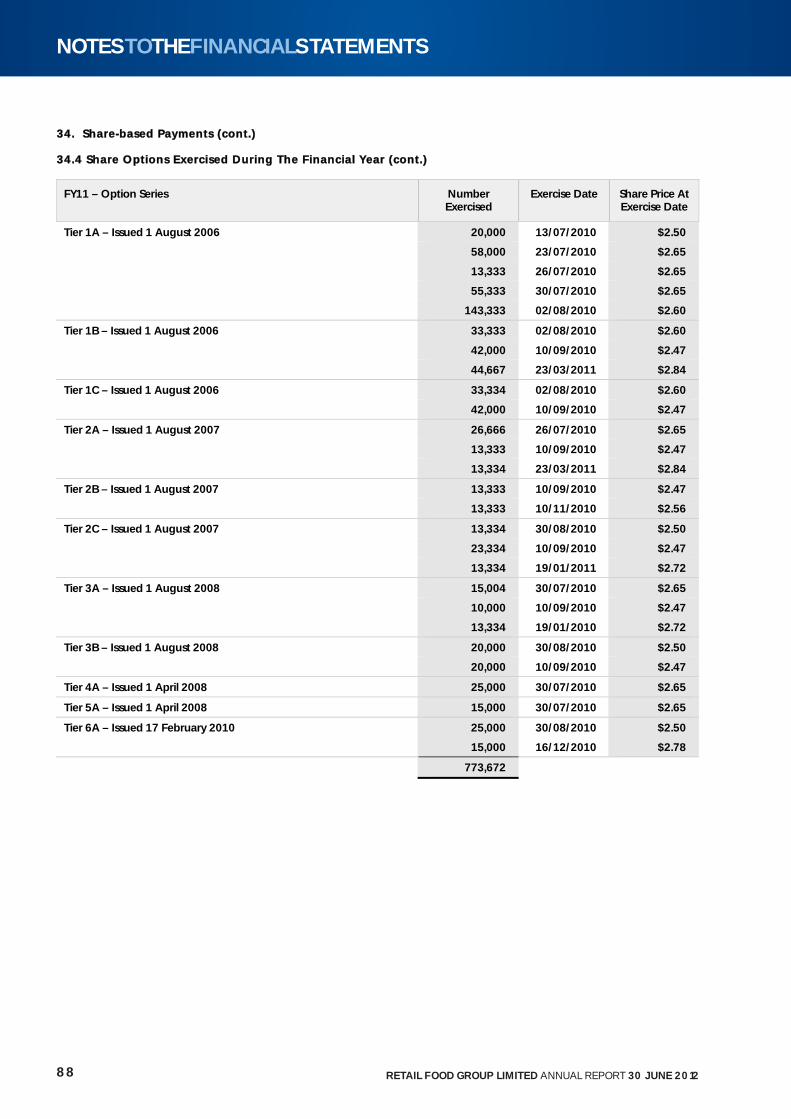
334. Share-based Payments (cont.) 34.4 Share Options Exercised During The Financial Year (cont.)
FY11 – Option Series Number Exercised
Exercise Date Share Price At Exercise Date
Tier 1A – Issued 1 August 2006 20,000 13/07/2010 $2.50
58,000 23/07/2010 $2.65
13,333 26/07/2010 $2.65
55,333 30/07/2010 $2.65
143,333 02/08/2010 $2.60
Tier 1B – Issued 1 August 2006 33,333 02/08/2010 $2.60
42,000 10/09/2010 $2.47
44,667 23/03/2011 $2.84
Tier 1C – Issued 1 August 2006 33,334 02/08/2010 $2.60
42,000 10/09/2010 $2.47
Tier 2A – Issued 1 August 2007 26,666 26/07/2010 $2.65
13,333 10/09/2010 $2.47
13,334 23/03/2011 $2.84
Tier 2B – Issued 1 August 2007 13,333 10/09/2010 $2.47
13,333 10/11/2010 $2.56
Tier 2C – Issued 1 August 2007 13,334 30/08/2010 $2.50
23,334 10/09/2010 $2.47
13,334 19/01/2011 $2.72
Tier 3A – Issued 1 August 2008 15,004 30/07/2010 $2.65
10,000 10/09/2010 $2.47
13,334 19/01/2010 $2.72
Tier 3B – Issued 1 August 2008 20,000 30/08/2010 $2.50
20,000 10/09/2010 $2.47
Tier 4A – Issued 1 April 2008 25,000 30/07/2010 $2.65
Tier 5A – Issued 1 April 2008 15,000 30/07/2010 $2.65
Tier 6A – Issued 17 February 2010 25,000 30/08/2010 $2.50
15,000 16/12/2010 $2.78
773,672
88 RETAIL FOOD GROUP LIMITED ANNUAL REPORT 30 JUNE 2012
NOTESTOTHEFINANCIALSTATEMENTS
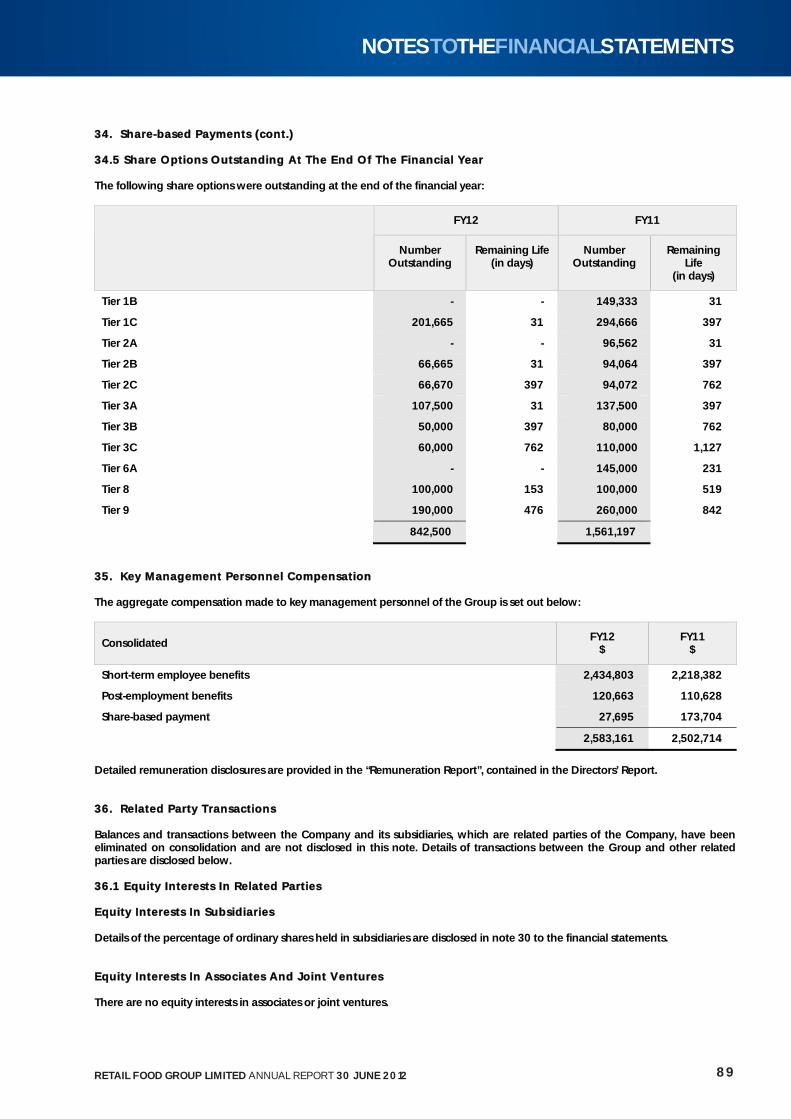
334. Share-based Payments (cont.) 34.5 Share Options Outstanding At The End Of The Financial Year The following share options were outstanding at the end of the financial year:
FY12 FY11
Number Outstanding
Remaining Life (in days)
Number Outstanding
Remaining Life
(in days)
Tier 1B - - 149,333 31
Tier 1C 201,665 31 294,666 397
Tier 2A - - 96,562 31
Tier 2B 66,665 31 94,064 397
Tier 2C 66,670 397 94,072 762
Tier 3A 107,500 31 137,500 397
Tier 3B 50,000 397 80,000 762
Tier 3C 60,000 762 110,000 1,127
Tier 6A - - 145,000 231
Tier 8 100,000 153 100,000 519
Tier 9 190,000 476 260,000 842
842,500 1,561,197
335. Key Management Personnel Compensation The aggregate compensation made to key management personnel of the Group is set out below:
Consolidated FY12
$ FY11
$
Short-term employee benefits 2,434,803 2,218,382
Post-employment benefits 120,663 110,628
Share-based payment 27,695 173,704
2,583,161 2,502,714
Detailed remuneration disclosures are provided in the “Remuneration Report”, contained in the Directors’ Report. 336. Related Party Transactions Balances and transactions between the Company and its subsidiaries, which are related parties of the Company, have been eliminated on consolidation and are not disclosed in this note. Details of transactions between the Group and other related parties are disclosed below. 36.1 Equity Interests In Related Parties Equity Interests In Subsidiaries Details of the percentage of ordinary shares held in subsidiaries are disclosed in note 30 to the financial statements. Equity Interests In Associates And Joint Ventures There are no equity interests in associates or joint ventures.
89RETAIL FOOD GROUP LIMITED ANNUAL REPORT 30 JUNE 2012
NOTESTOTHEFINANCIALSTATEMENTS
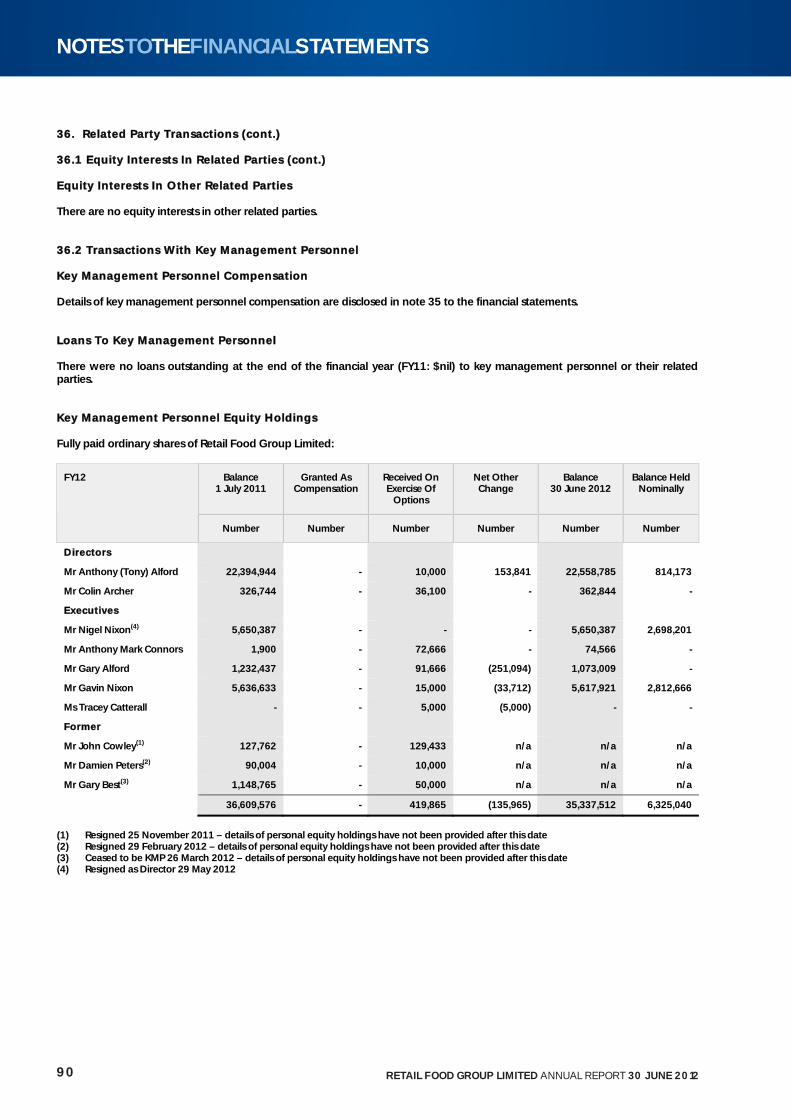
336. Related Party Transactions (cont.) 36.1 Equity Interests In Related Parties (cont.) Equity Interests In Other Related Parties There are no equity interests in other related parties. 36.2 Transactions With Key Management Personnel Key Management Personnel Compensation Details of key management personnel compensation are disclosed in note 35 to the financial statements. Loans To Key Management Personnel There were no loans outstanding at the end of the financial year (FY11: $nil) to key management personnel or their related parties. Key Management Personnel Equity Holdings Fully paid ordinary shares of Retail Food Group Limited:
Balance 1 July 2011
Granted As Compensation
Received On Exercise Of
Options
Net Other Change
Balance 30 June 2012
Balance Held Nominally
FY12
Number Number Number Number Number Number
DDirectors
Mr Anthony (Tony) Alford 22,394,944 - 10,000 153,841 22,558,785 814,173
Mr Colin Archer 326,744 - 36,100 - 362,844 -
EExecutives
Mr Nigel Nixon(4) 5,650,387 - - - 5,650,387 2,698,201
Mr Anthony Mark Connors 1,900 - 72,666 - 74,566 -
Mr Gary Alford 1,232,437 - 91,666 (251,094) 1,073,009 -
Mr Gavin Nixon 5,636,633 - 15,000 (33,712) 5,617,921 2,812,666
Ms Tracey Catterall - - 5,000 (5,000) - -
FFormer
Mr John Cowley(1) 127,762 - 129,433 n/a n/a n/a
Mr Damien Peters(2) 90,004 - 10,000 n/a n/a n/a
Mr Gary Best(3) 1,148,765 - 50,000 n/a n/a n/a
36,609,576 - 419,865 (135,965) 35,337,512 6,325,040
(1) Resigned 25 November 2011 – details of personal equity holdings have not been provided after this date (2) Resigned 29 February 2012 – details of personal equity holdings have not been provided after this date (3) Ceased to be KMP 26 March 2012 – details of personal equity holdings have not been provided after this date (4) Resigned as Director 29 May 2012
90 RETAIL FOOD GROUP LIMITED ANNUAL REPORT 30 JUNE 2012
NOTESTOTHEFINANCIALSTATEMENTS
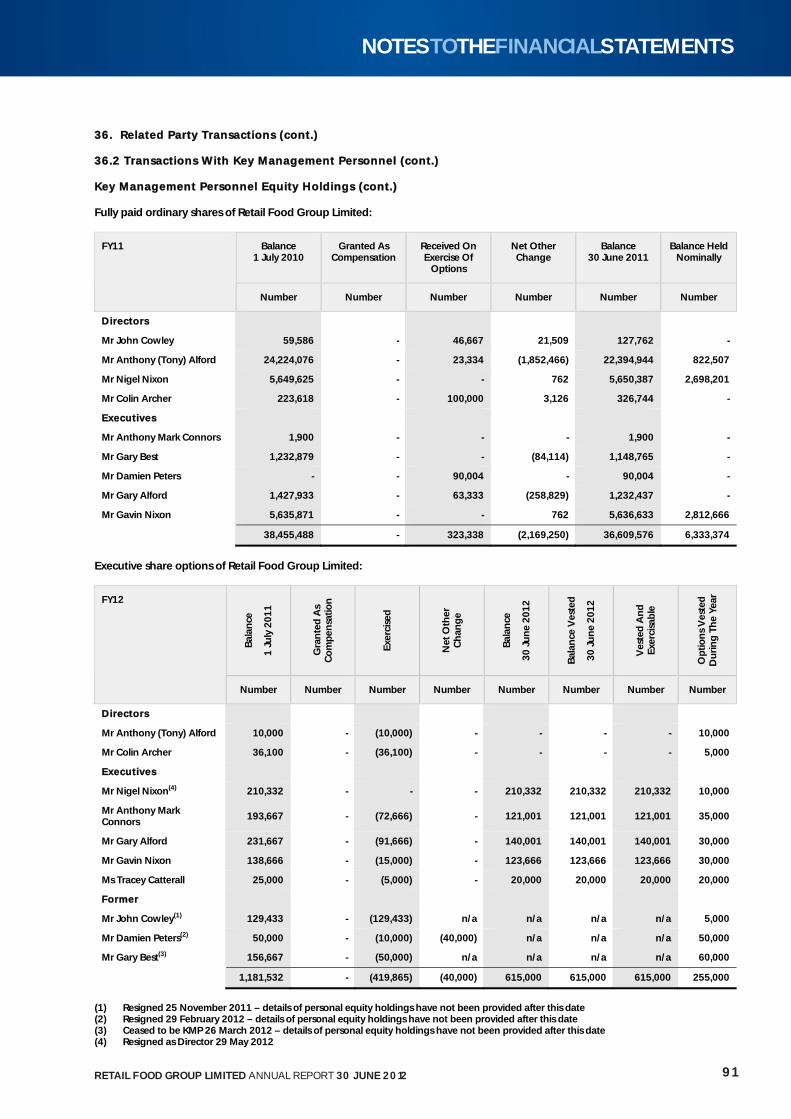
336. Related Party Transactions (cont.) 36.2 Transactions With Key Management Personnel (cont.) Key Management Personnel Equity Holdings (cont.) Fully paid ordinary shares of Retail Food Group Limited:
Balance 1 July 2010
Granted As Compensation
Received On Exercise Of
Options
Net Other Change
Balance 30 June 2011
Balance Held Nominally
FY11
Number Number Number Number Number Number
DDirectors
Mr John Cowley 59,586 - 46,667 21,509 127,762 -
Mr Anthony (Tony) Alford 24,224,076 - 23,334 (1,852,466) 22,394,944 822,507
Mr Nigel Nixon 5,649,625 - - 762 5,650,387 2,698,201
Mr Colin Archer 223,618 - 100,000 3,126 326,744 -
EExecutives
Mr Anthony Mark Connors 1,900 - - - 1,900 -
Mr Gary Best 1,232,879 - - (84,114) 1,148,765 -
Mr Damien Peters - - 90,004 - 90,004 -
Mr Gary Alford 1,427,933 - 63,333 (258,829) 1,232,437 -
Mr Gavin Nixon 5,635,871 - - 762 5,636,633 2,812,666
38,455,488 - 323,338 (2,169,250) 36,609,576 6,333,374
Executive share options of Retail Food Group Limited:
Bal
ance
1 J
uly
20
11
Gra
nte
d A
s C
om
pen
satio
n
Exer
cise
d
Net
Oth
er
Ch
ang
e
Bal
ance
30
Ju
ne
20
12
Bal
ance
Ves
ted
30
Ju
ne
20
12
Ves
ted
An
d
Exer
cisa
ble
Op
tion
s V
este
d
Du
rin
g T
he
Year
FY12
Number Number Number Number Number Number Number Number
DDirectors
Mr Anthony (Tony) Alford 10,000 - (10,000) - - - - 10,000
Mr Colin Archer 36,100 - (36,100) - - - - 5,000
EExecutives
Mr Nigel Nixon(4) 210,332 - - - 210,332 210,332 210,332 10,000
Mr Anthony Mark Connors
193,667 - (72,666) - 121,001 121,001 121,001 35,000
Mr Gary Alford 231,667 - (91,666) - 140,001 140,001 140,001 30,000
Mr Gavin Nixon 138,666 - (15,000) - 123,666 123,666 123,666 30,000
Ms Tracey Catterall 25,000 - (5,000) - 20,000 20,000 20,000 20,000
FFormer
Mr John Cowley(1) 129,433 - (129,433) n/a n/a n/a n/a 5,000
Mr Damien Peters(2) 50,000 - (10,000) (40,000) n/a n/a n/a 50,000
Mr Gary Best(3) 156,667 - (50,000) n/a n/a n/a n/a 60,000
1,181,532 - (419,865) (40,000) 615,000 615,000 615,000 255,000
(1) Resigned 25 November 2011 – details of personal equity holdings have not been provided after this date (2) Resigned 29 February 2012 – details of personal equity holdings have not been provided after this date (3) Ceased to be KMP 26 March 2012 – details of personal equity holdings have not been provided after this date (4) Resigned as Director 29 May 2012 91RETAIL FOOD GROUP LIMITED ANNUAL REPORT 30 JUNE 2012
NOTESTOTHEFINANCIALSTATEMENTS
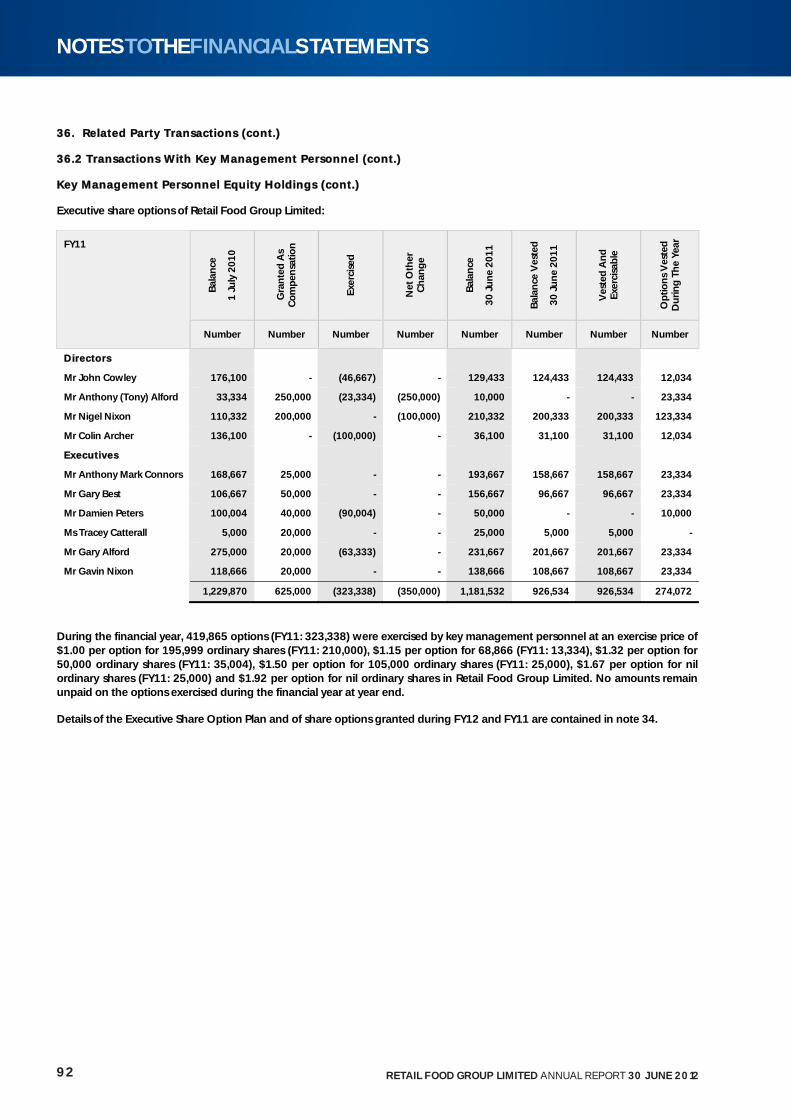
336. Related Party Transactions (cont.) 36.2 Transactions With Key Management Personnel (cont.) Key Management Personnel Equity Holdings (cont.) Executive share options of Retail Food Group Limited:
Bal
ance
1 J
uly
20
10
Gra
nte
d A
s C
om
pen
satio
n
Exer
cise
d
Net
Oth
er
Ch
ang
e
Bal
ance
30
Ju
ne
20
11
Bal
ance
Ves
ted
30
Ju
ne
20
11
Ves
ted
An
d
Exer
cisa
ble
Op
tion
s V
este
d
Du
rin
g T
he
Year
FY11
Number Number Number Number Number Number Number Number
DDirectors
Mr John Cowley 176,100 - (46,667) - 129,433 124,433 124,433 12,034
Mr Anthony (Tony) Alford 33,334 250,000 (23,334) (250,000) 10,000 - - 23,334
Mr Nigel Nixon 110,332 200,000 - (100,000) 210,332 200,333 200,333 123,334
Mr Colin Archer 136,100 - (100,000) - 36,100 31,100 31,100 12,034
EExecutives
Mr Anthony Mark Connors 168,667 25,000 - - 193,667 158,667 158,667 23,334
Mr Gary Best 106,667 50,000 - - 156,667 96,667 96,667 23,334
Mr Damien Peters 100,004 40,000 (90,004) - 50,000 - - 10,000
Ms Tracey Catterall 5,000 20,000 - - 25,000 5,000 5,000 -
Mr Gary Alford 275,000 20,000 (63,333) - 231,667 201,667 201,667 23,334
Mr Gavin Nixon 118,666 20,000 - - 138,666 108,667 108,667 23,334
1,229,870 625,000 (323,338) (350,000) 1,181,532 926,534 926,534 274,072
During the financial year, 419,865 options (FY11: 323,338) were exercised by key management personnel at an exercise price of $1.00 per option for 195,999 ordinary shares (FY11: 210,000), $1.15 per option for 68,866 (FY11: 13,334), $1.32 per option for 50,000 ordinary shares (FY11: 35,004), $1.50 per option for 105,000 ordinary shares (FY11: 25,000), $1.67 per option for nil ordinary shares (FY11: 25,000) and $1.92 per option for nil ordinary shares in Retail Food Group Limited. No amounts remain unpaid on the options exercised during the financial year at year end. Details of the Executive Share Option Plan and of share options granted during FY12 and FY11 are contained in note 34.
92 RETAIL FOOD GROUP LIMITED ANNUAL REPORT 30 JUNE 2012
NOTESTOTHEFINANCIALSTATEMENTS
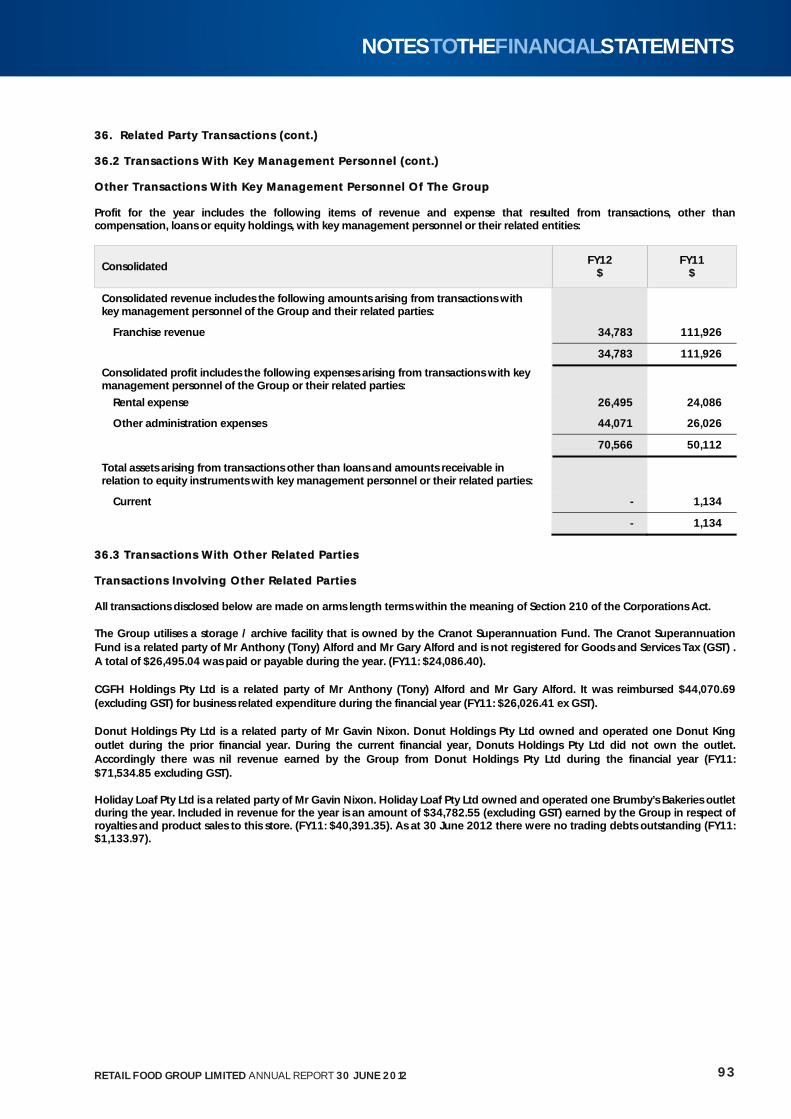
336. Related Party Transactions (cont.) 36.2 Transactions With Key Management Personnel (cont.) Other Transactions With Key Management Personnel Of The Group Profit for the year includes the following items of revenue and expense that resulted from transactions, other than compensation, loans or equity holdings, with key management personnel or their related entities:
Consolidated FY12
$ FY11
$
Consolidated revenue includes the following amounts arising from transactions with key management personnel of the Group and their related parties:
Franchise revenue 34,783 111,926
34,783 111,926
Consolidated profit includes the following expenses arising from transactions with key management personnel of the Group or their related parties:
Rental expense 26,495 24,086
Other administration expenses 44,071 26,026
70,566 50,112
Total assets arising from transactions other than loans and amounts receivable in relation to equity instruments with key management personnel or their related parties:
Current - 1,134
- 1,134
336.3 Transactions With Other Related Parties Transactions Involving Other Related Parties All transactions disclosed below are made on arms length terms within the meaning of Section 210 of the Corporations Act. The Group utilises a storage / archive facility that is owned by the Cranot Superannuation Fund. The Cranot Superannuation Fund is a related party of Mr Anthony (Tony) Alford and Mr Gary Alford and is not registered for Goods and Services Tax (GST) . A total of $26,495.04 was paid or payable during the year. (FY11: $24,086.40). CGFH Holdings Pty Ltd is a related party of Mr Anthony (Tony) Alford and Mr Gary Alford. It was reimbursed $44,070.69 (excluding GST) for business related expenditure during the financial year (FY11: $26,026.41 ex GST). Donut Holdings Pty Ltd is a related party of Mr Gavin Nixon. Donut Holdings Pty Ltd owned and operated one Donut King outlet during the prior financial year. During the current financial year, Donuts Holdings Pty Ltd did not own the outlet. Accordingly there was nil revenue earned by the Group from Donut Holdings Pty Ltd during the financial year (FY11: $71,534.85 excluding GST). Holiday Loaf Pty Ltd is a related party of Mr Gavin Nixon. Holiday Loaf Pty Ltd owned and operated one Brumby’s Bakeries outlet during the year. Included in revenue for the year is an amount of $34,782.55 (excluding GST) earned by the Group in respect of royalties and product sales to this store. (FY11: $40,391.35). As at 30 June 2012 there were no trading debts outstanding (FY11: $1,133.97).
93RETAIL FOOD GROUP LIMITED ANNUAL REPORT 30 JUNE 2012
NOTESTOTHEFINANCIALSTATEMENTS
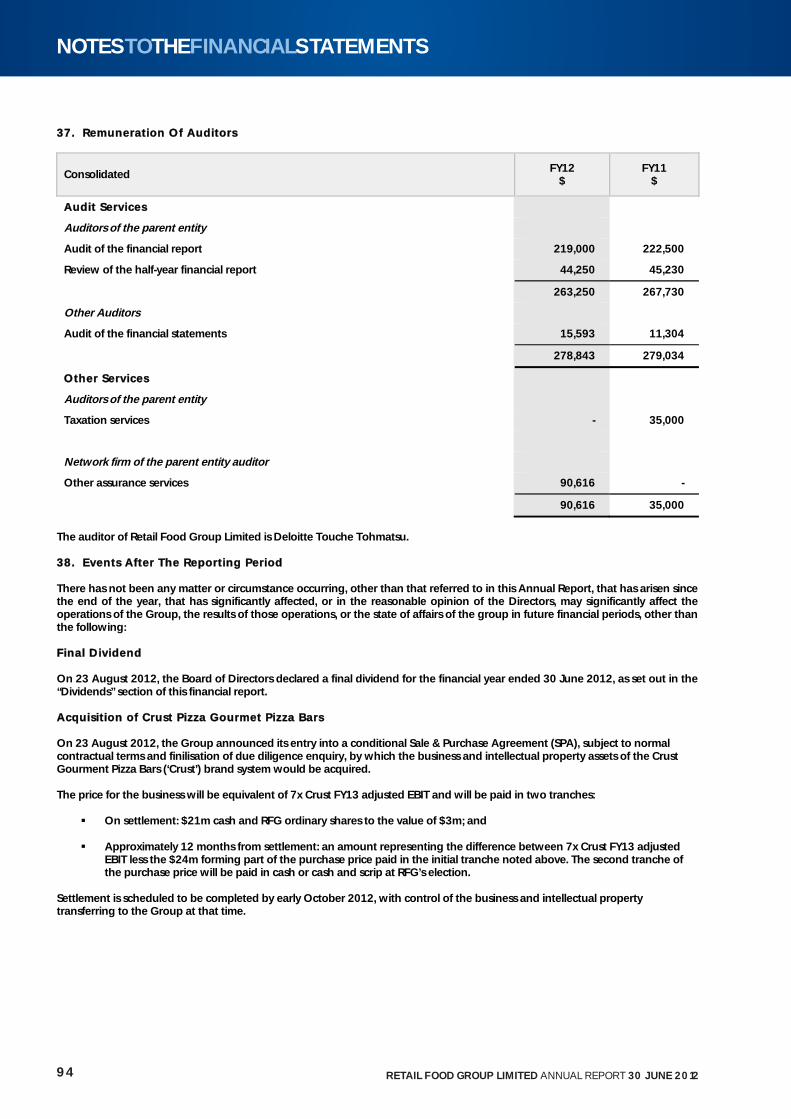
337. Remuneration Of Auditors
Consolidated FY12 $
FY11 $
AAudit Services
Auditors of the parent entity
Audit of the financial report 219,000 222,500
Review of the half-year financial report 44,250 45,230
263,250 267,730
Other Auditors
Audit of the financial statements 15,593 11,304
278,843 279,034
OOther Services
Auditors of the parent entity
Taxation services - 35,000
Network firm of the parent entity auditor
Other assurance services 90,616 -
90,616 35,000
The auditor of Retail Food Group Limited is Deloitte Touche Tohmatsu. 338. Events After The Reporting Period There has not been any matter or circumstance occurring, other than that referred to in this Annual Report, that has arisen since the end of the year, that has significantly affected, or in the reasonable opinion of the Directors, may significantly affect the operations of the Group, the results of those operations, or the state of affairs of the group in future financial periods, other than the following: Final Dividend On 23 August 2012, the Board of Directors declared a final dividend for the financial year ended 30 June 2012, as set out in the “Dividends” section of this financial report. Acquisit ion of Crust Pizza Gourmet Pizza Bars On 23 August 2012, the Group announced its entry into a conditional Sale & Purchase Agreement (SPA), subject to normal contractual terms and finilisation of due diligence enquiry, by which the business and intellectual property assets of the Crust Gourment Pizza Bars (‘Crust’) brand system would be acquired. The price for the business will be equivalent of 7x Crust FY13 adjusted EBIT and will be paid in two tranches:
On settlement: $21m cash and RFG ordinary shares to the value of $3m; and
Approximately 12 months from settlement: an amount representing the difference between 7x Crust FY13 adjusted EBIT less the $24m forming part of the purchase price paid in the initial tranche noted above. The second tranche of the purchase price will be paid in cash or cash and scrip at RFG’s election.
Settlement is scheduled to be completed by early October 2012, with control of the business and intellectual property transferring to the Group at that time.
94 RETAIL FOOD GROUP LIMITED ANNUAL REPORT 30 JUNE 2012
NOTESTOTHEFINANCIALSTATEMENTS
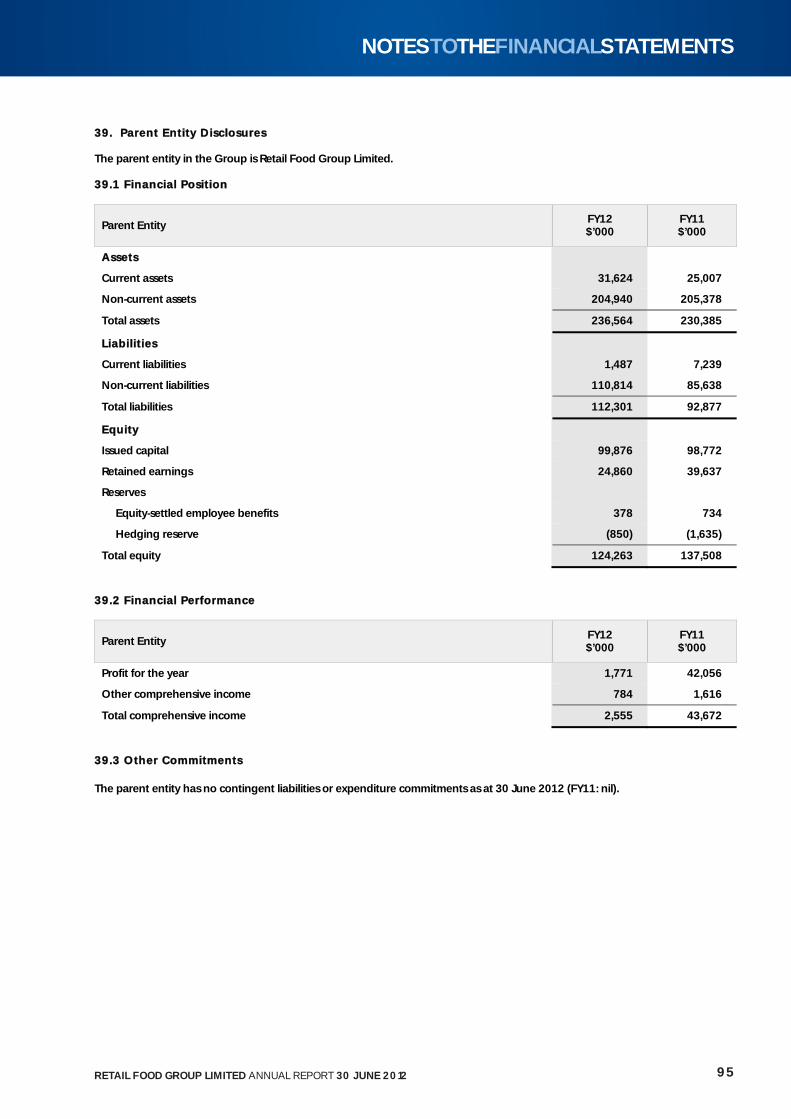
339. Parent Entity Disclosures The parent entity in the Group is Retail Food Group Limited. 39.1 Financial Posit ion
Parent Entity FY12 $’000
FY11 $’000
AAssets
Current assets 31,624 25,007
Non-current assets 204,940 205,378
Total assets 236,564 230,385
LLiabil it ies
Current liabilities 1,487 7,239
Non-current liabilities 110,814 85,638
Total liabilities 112,301 92,877
EEquity
Issued capital 99,876 98,772
Retained earnings 24,860 39,637
Reserves
Equity-settled employee benefits 378 734
Hedging reserve (850) (1,635)
Total equity 124,263 137,508
39.2 Financial Performance
Parent Entity FY12 $’000
FY11 $’000
Profit for the year 1,771 42,056
Other comprehensive income 784 1,616
Total comprehensive income 2,555 43,672
39.3 Other Commitments The parent entity has no contingent liabilities or expenditure commitments as at 30 June 2012 (FY11: nil).
95RETAIL FOOD GROUP LIMITED ANNUAL REPORT 30 JUNE 2012
NOTESTOTHEFINANCIALSTATEMENTS
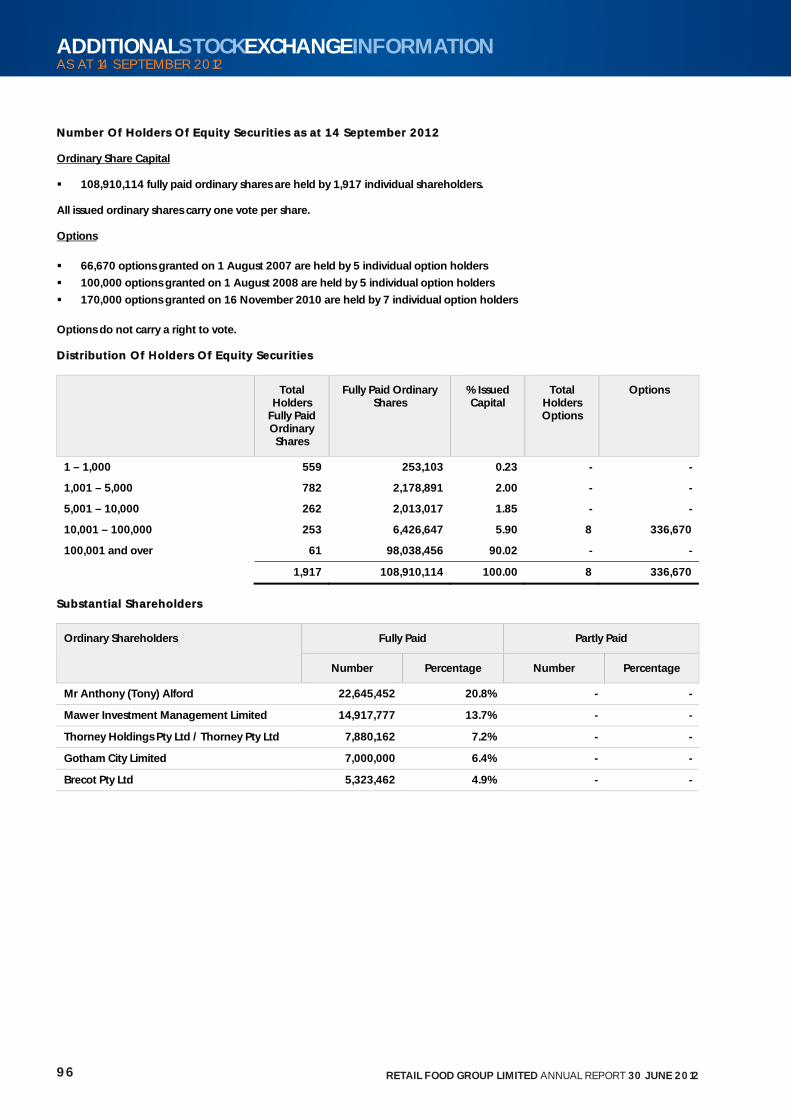
NNumber Of Holders Of Equity Securit ies as at 14 September 2012 Ordinary Share Capital 108,910,114 fully paid ordinary shares are held by 1,917 individual shareholders.
All issued ordinary shares carry one vote per share. Options
66,670 options granted on 1 August 2007 are held by 5 individual option holders
100,000 options granted on 1 August 2008 are held by 5 individual option holders
170,000 options granted on 16 November 2010 are held by 7 individual option holders
Options do not carry a right to vote. Distribution Of Holders Of Equity Securit ies
Total Holders
Fully Paid Ordinary
Shares
Fully Paid Ordinary Shares
% Issued Capital
Total Holders Options
Options
1 – 1,000 559 253,103 0.23 - -
1,001 – 5,000 782 2,178,891 2.00 - -
5,001 – 10,000 262 2,013,017 1.85 - -
10,001 – 100,000 253 6,426,647 5.90 8 336,670
100,001 and over 61 98,038,456 90.02 - -
1,917 108,910,114 100.00 8 336,670
Substantial Shareholders
Fully Paid Partly Paid Ordinary Shareholders
Number Percentage Number Percentage
Mr Anthony (Tony) Alford 22,645,452 20.8% - -
Mawer Investment Management Limited 14,917,777 13.7% - -
Thorney Holdings Pty Ltd / Thorney Pty Ltd 7,880,162 7.2% - -
Gotham City Limited 7,000,000 6.4% - -
Brecot Pty Ltd 5,323,462 4.9% - -
96 RETAIL FOOD GROUP LIMITED ANNUAL REPORT 30 JUNE 2012
ADDITIONALSTOCKEXCHANGEINFORMATIONAS AT 14 SEPTEMBER 2012
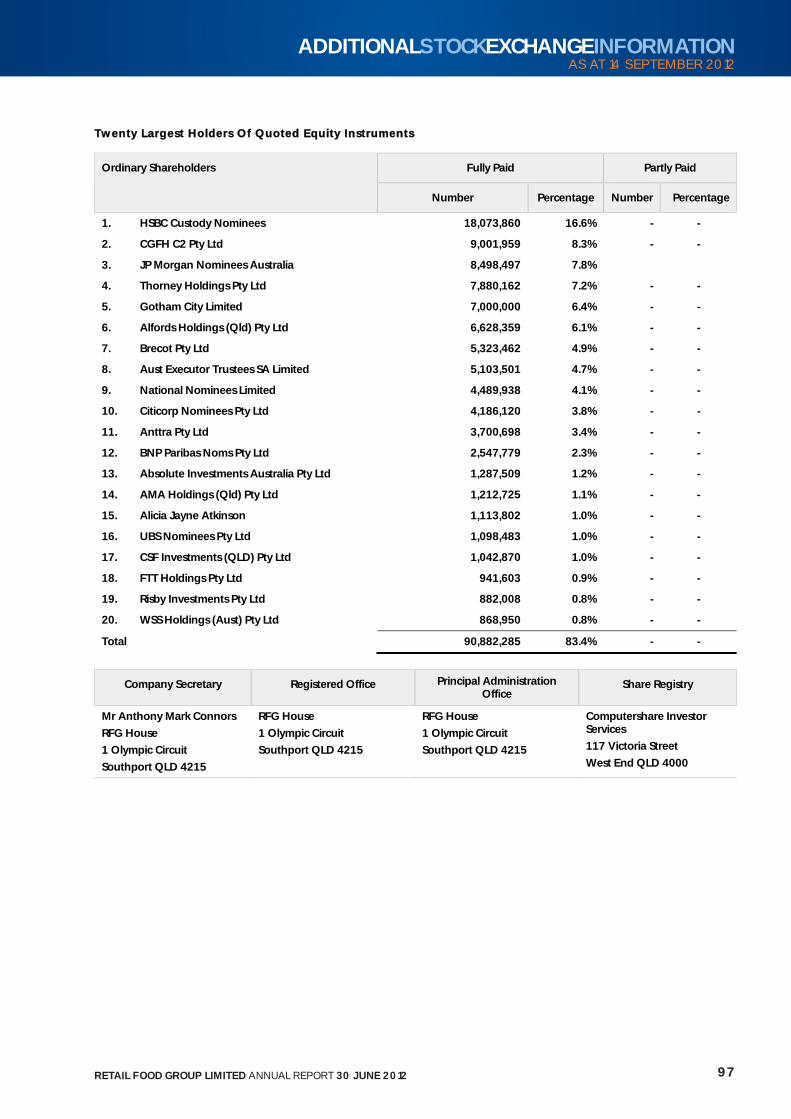
TTwenty Largest Holders Of Quoted Equity Instruments
Fully Paid Partly Paid Ordinary Shareholders
Number Percentage Number Percentage
1. HSBC Custody Nominees 18,073,860 16.6% - -
2. CGFH C2 Pty Ltd 9,001,959 8.3% - -
3. JP Morgan Nominees Australia 8,498,497 7.8%
4. Thorney Holdings Pty Ltd 7,880,162 7.2% - -
5. Gotham City Limited 7,000,000 6.4% - -
6. Alfords Holdings (Qld) Pty Ltd 6,628,359 6.1% - -
7. Brecot Pty Ltd 5,323,462 4.9% - -
8. Aust Executor Trustees SA Limited 5,103,501 4.7% - -
9. National Nominees Limited 4,489,938 4.1% - -
10. Citicorp Nominees Pty Ltd 4,186,120 3.8% - -
11. Anttra Pty Ltd 3,700,698 3.4% - -
12. BNP Paribas Noms Pty Ltd 2,547,779 2.3% - -
13. Absolute Investments Australia Pty Ltd 1,287,509 1.2% - -
14. AMA Holdings (Qld) Pty Ltd 1,212,725 1.1% - -
15. Alicia Jayne Atkinson 1,113,802 1.0% - -
16. UBS Nominees Pty Ltd 1,098,483 1.0% - -
17. CSF Investments (QLD) Pty Ltd 1,042,870 1.0% - -
18. FTT Holdings Pty Ltd 941,603 0.9% - -
19. Risby Investments Pty Ltd 882,008 0.8% - -
20. WSS Holdings (Aust) Pty Ltd 868,950 0.8% - -
Total 90,882,285 83.4% - -
Company Secretary Registered Office Principal Administration Office
Share Registry
Mr Anthony Mark Connors
RFG House
1 Olympic Circuit
Southport QLD 4215
RFG House
1 Olympic Circuit
Southport QLD 4215
RFG House
1 Olympic Circuit
Southport QLD 4215
Computershare Investor Services
117 Victoria Street
West End QLD 4000
97RETAIL FOOD GROUP LIMITED ANNUAL REPORT 30 JUNE 2012
ADDITIONALSTOCKEXCHANGEINFORMATIONAS AT 14 SEPTEMBER 2012


Retail Food Group National Office:1 Olympic Circuit Southport QLD 4215 Australia
Postal Address:
Retail Food Group (Australia)
PO Box 1549 Southport QLD 4215 Australia
Telephone: +61 (07) 5591 3242
Fax: +61 (07) 5591 9021
E-mail: [email protected]
Website: www.rfg.com.au