Anomaly detection made easy
29
Anomaly Detection made easy Piotr Guzik
-
Upload
piotr-guzik -
Category
Data & Analytics
-
view
132 -
download
0
Transcript of Anomaly detection made easy

Anomaly Detectionmade easy
Piotr Guzik

$whoami
2
● Data Engineer @Allegro (Scala, Kafka,
Spark, Ansible, ML)
● Trainer @GetInData
● https://twitter.com/guzik_io
● Data Science flavour

Why anomaly detection is interesting ?
3
Anomaly detection on clickstream is all about:
● SLA (data should be a first-class citizen)
● You should be the first to know if something is wrong
“Engineers in XX Century made mistakes but never by more than
one order of magnitude. In IT it is not that good.”

Motivation and goals
4
Goal: Get quick information if the data is lost
● Losing data is somehow similar to losing money
● “You cannot improve what you cannot measure”
● Team responsible for given service should be alerted when
something is wrong

How to start ? - important questions
5
● How to get the data ?
● Real-time detection ?
● Delay ?
● What is an anomaly ?

Discovering datasource and data itself
6
● Datasource - Druid
● OLAP cube dimensions as domains
● Data aggregated every 15 minutes
● Metric - simplest count

What is a core data ?
7
Data ~= result of the query:
● select count (*) as cnt, category,action,time_window_15_m
from page_views
where category = ‘Search’ and action = ’ShowItem’
group by category, action, time_window_15_m

First look at the data
8

Knowing the data
9
● Clickstream is periodical
● Week == period
● Days of week differs a lot
● There is a rapid increase in web traffic about 6PM and it starts
to fall at about 10PM

Research10
Motto: Solution must be easy. Not only for data scientist.
Available solutions:
● Twitter library - too hard, heavy math, many hyperparameters
● HTM algorithms - way too hard, neural networks, deep
learning, very hard to reason about algorithm and its results
We have to create our own simple model

How our model should be ?11
Perfect model:
● Simple
● Time aware
● Detection is in minutes rather than hours
● Adapt to trends (ads, currently popular items)
● Should not report too many false-positives
● Use confidence intervals

Best tool for inventing algorithm12

Model draft13

F.A.I.L. - first attempt in learning14
Simple statistical model in R
First results:
● Rapid change of metric is a
problem
● Trend is important but cannot
lead to overfitting

Experimenting in progress15
After model evolution:
● Outliers are problematic (sd)
● Outliers == duplicates of data
on HDFS (thank you Camus!)
● Percentiles are great for
outliers removal

Problems with R16
● Only Data Scientist knows R
● There is not an easy way to deploy it
● You cannot monitor it easily
● It is hard to maintain
Decision: we have to rewrite it. From scratch. In Scala.

Input from Druid17

Model18

Some math (ema !)19
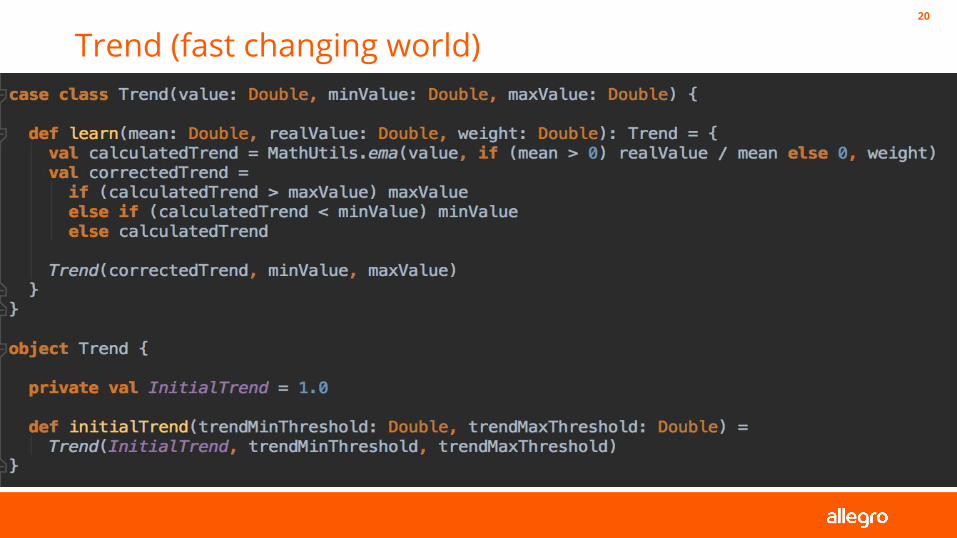
Trend (fast changing world)20

Learning is a difficult process21
What if we learned something that is not valid anymore ?
Mean could be bad, but what about ema ?

Anomaly Detection - almost there ?22
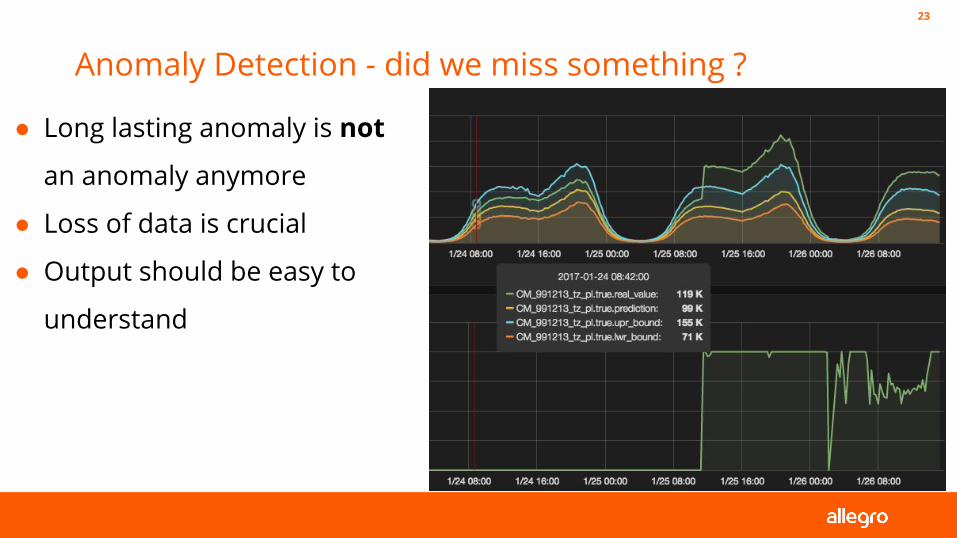
Anomaly Detection - did we miss something ?
23
● Long lasting anomaly is not
an anomaly anymore
● Loss of data is crucial
● Output should be easy to
understand

Long lasting anomalies - key concepts24
Output: probability (with sign) of anomaly
● Small anomalies should be smoothen and larger should be
outraged (monitoring and alerting)
● We define where obvious anomalies starts
● We define after how long we should treat anomalies as a
norm (be careful here)

Long lasting anomalies - fix25
In case of long lasting anomalies, we multiply all model params,
as if we were wrong from the beginning

Deployment26
SaaS model
● Multiple deployments with same codebase
● Different configuration
● Clients define how they want to react

Configuration example27

Whole team - thank you28
It was more than just me and my team involved in this process:
Big thanks to:
● My team for motivation and hot discussions :)
● Paweł Zawistowski - initial model in R
● Other teams for real use cases (that is why you would like to
be in production quickly)

Thank you
Q & A
Piotr Guzik


![Anomaly Detection: Principles, Benchmarking, Explanation ...web.engr.oregonstate.edu/~tgd/...anomaly-detection... · Towards a Theory of Anomaly Detection [Siddiqui, et al.; UAI 2016]](https://static.fdocuments.in/doc/165x107/5fd8992320a65f059c333c6d/anomaly-detection-principles-benchmarking-explanation-webengr-tgdanomaly-detection.jpg)