Anoctamins Novel members of ion channels family with...
110
UNIVERSIDADE DE LISBOA FACULDADE DE CIÊNCIAS DEPARTAMENTO DE QUÍMICA E BIOQUÍMICA Anoctamins – Novel members of ion channels family with extended functions and significance in disease MESTRADO EM BIOQUÍMICA Especialização em Bioquímica Médica Madalena do Carmo Fragoso Pinto Dissertação orientadora por: Professora Doutora Margarida D. Amaral 2015
Transcript of Anoctamins Novel members of ion channels family with...

UNIVERSIDADE DE LISBOA
FACULDADE DE CIÊNCIAS
DEPARTAMENTO DE QUÍMICA E BIOQUÍMICA
Anoctamins – Novel members of ion channels family
with extended functions and significance in disease
MESTRADO EM BIOQUÍMICA
Especialização em Bioquímica Médica
Madalena do Carmo Fragoso Pinto
Dissertação orientadora por:
Professora Doutora Margarida D. Amaral
2015


Table of contents
I
Table of contents
Acknowledgments/Agradecimentos .......................................................................................... IV
Abstract ........................................................................................................................................ VI
Resumo ...................................................................................................................................... VIII
Abbreviations............................................................................................................................... XI
1. Introduction .......................................................................................................................... 1
1.1) Cystic Fibrosis and deficient CFTR-mediated anion secretion .................................... 1
1.1.1) Cystic Fibrosis ........................................................................................................ 1
1.1.2) CFTR – Gene and mutations ................................................................................. 2
1.1.3) CFTR – Protein structure and function ................................................................. 3
1.1.4) CFTR as a major regulator of other epithelial ion channels ................................ 4
1.2) Anoctamins ................................................................................................................... 5
1.2.1) CaCCs and anoctamins.......................................................................................... 5
1.2.2) Anoctamins – Structure and Function .................................................................. 6
1.2.3) Anoctamin related diseases ................................................................................. 9
1.2.4) CFTR and anoctamins ......................................................................................... 10
1.3) Objectives of the present work .................................................................................. 11
2. Materials and Methods ...................................................................................................... 13
2.1) Generation of cell lines overexpressing anoctamin 6, 9 and 10 ............................... 13
2.1.1) Plasmids and cDNAs ........................................................................................... 13
2.1.2) Production of competent bacteria ..................................................................... 13
2.1.3) Transformation of competent bacteria ............................................................. 14
2.1.4) Plasmid DNA extraction and quantification ...................................................... 14
2.1.5) Genomic DNA extraction .................................................................................... 14
2.1.6) DNA sequencing .................................................................................................. 14
2.1.7) Mutagenesis ....................................................................................................... 15
2.1.8) Protein modelling to determine the best localization for the HA tags ............. 16
2.1.9) Cloning ................................................................................................................ 17
2.1.10) Production of lentiviral particles ........................................................................ 18
2.1.11) Lentiviral infection – Generation of stably transduced cells ............................. 18
2.1.12) Cell sorting .......................................................................................................... 19
2.2) Cell culture .................................................................................................................. 19
2.2.1) Cell lines and culture conditions ......................................................................... 19

Table of contents
II
2.2.2) Polarized cells ..................................................................................................... 20
2.2.3) Transient transfections ....................................................................................... 20
2.3) Generation of Knockout cells – CRISPR/Cas9 system................................................ 22
2.3.1) gRNA design and synthesis ................................................................................ 25
2.4) Protein Analysis .......................................................................................................... 25
2.4.1) Immunofluorescence of anoctamins .................................................................. 25
2.4.2) Image acquisition, processing and analysis ....................................................... 27
2.4.3) Western Blot ....................................................................................................... 28
2.4.4) Biotinylation ....................................................................................................... 28
2.5) Functional Analysis ..................................................................................................... 29
2.5.1) Iodide efflux ........................................................................................................ 29
2.5.2) Micro-Ussing chamber ........................................................................................ 30
2.6) Microscopy assay for siRNA screens .......................................................................... 30
2.6.1) siRNAs ................................................................................................................. 30
2.6.2) siRNA pilot screen ............................................................................................... 30
2.7) Statistical Analysis ...................................................................................................... 31
3. Results and discussion ........................................................................................................ 32
3.1) Generation of stable cell lines overexpressing the double-tagged anoctamin
constructs ................................................................................................................................ 32
3.1.1) Characterization of the cell lines ........................................................................ 32
3.1.2) Functional analysis ............................................................................................. 37
3.1.2.1) Iodide Efflux ................................................................................................. 37
3.1.2.2) Micro-Ussing chamber ................................................................................ 39
3.1.3) Intracellular localization of anoctamins ............................................................ 43
3.1.3.1) Immunostaining in polarized cells ............................................................... 43
3.1.3.2) Biotinylation ................................................................................................ 46
3.2) Establishment of microscopy-based assays to be used in siRNA screens ................ 47
4. Concluding remarks ............................................................................................................ 54
5. Future perspectives ............................................................................................................ 55
6. References .......................................................................................................................... 57
7. Appendices.......................................................................................................................... 64
7.1) Appendix 1 – Vectors .................................................................................................. 64
7.2) Appendix 2 – Results from DNA sequencing ............................................................. 65
7.2.1) Primers used for sequencing .............................................................................. 65

Table of contents
III
7.2.2) Sequencing results – 3-HA tag insertion ............................................................ 66
7.3) Appendix 3 – Primers and PCR conditions used ........................................................ 67
7.4) Appendix 4 – Structural models of anoctamins with tags and HA immunostaining
with and without cell permeabilization ................................................................................. 69
7.4.1) Anoctamin 6 ........................................................................................................ 70
7.4.2) Anoctamin 9 ........................................................................................................ 73
7.4.3) Anoctamin 10 ...................................................................................................... 75
7.5) Appendix 5 – Results from cloning and lentiviral production and transduction ..... 77
7.6) Appendix 6 – Antibiotic dose-dependent survival curves for CFBE parental cells ... 79
7.7) Appendix 7 – Results from Flow cytometry: cell sorting ........................................... 80
7.7.1) CFBE Ano6 3-HA GFP ........................................................................................... 80
7.7.2) CFBE Ano9 3-HA GFP ........................................................................................... 82
7.7.3) CFBE mCherry wt-CFTR Ano6 3-HA GFP ............................................................. 84
7.7.4) CFBE mCherry F508del-CFTR Ano6 3-HA GFP ..................................................... 86
7.7.5) CFBE mCherry wt-CFTR Ano9 3-HA GFP ............................................................. 88
7.7.6) CFBE mCherry F508del-CFTR Ano9 3-HA GFP ..................................................... 90
7.8) Appendix 8 – Structure of the CFTR construct ........................................................... 93
7.9) Appendix 9 – CRISPR/Cas9 system ............................................................................. 93
7.9.1) Transfection ........................................................................................................ 93
7.9.2) gRNA design for Ano6 knockout ........................................................................ 94
7.10) Appendix 10 – Antibodies used .............................................................................. 94
7.11) Appendix 11 – siRNA pilot screen .......................................................................... 95

Ackowlegdments/Agradecimentos
IV
Acknowledgments/Agradecimentos
Ao concluir este trabalho não posso deixar de agradecer a todos os que, de alguma
forma, me acompanharam e contribuíram para a sua realização.
Em primeiro lugar queria agradecer à Professora Margarida Amaral, não só por me ter
dado a oportunidade de desenvolver o meu trabalho no seu laboratório (e grupo de
investigação), como também por toda a orientação, acompanhamento e, principalmente,
confiança depositada.
Agradeço à Professora Rita Zilhão, por todo o tempo que despendeu com o meu
trabalho, e cuja ajuda foi absolutamente fundamental para conseguir cumprir os meus primeiros
objetivos. Agradeço também à Professora Mariana Santa-Marta, que, mesmo sem nenhuma
associação ao grupo de investigação, não mostrou qualquer hesitação em ajudar.
Agradeço a todos os meus colegas de laboratório, porque todos me ajudaram à sua
maneira. Primeiramente queria agradecer à Verónica, que me introduziu no mundo da genética
e me fez gostar puramente disto (mesmo quando nada parece fazer sentido...); à Sara Afonso
que, não estando já presente no grupo, me ensinou grande parte do que sei sobre anoctaminas
e me levou a dar os primeiros passos na investigação; à Joana, que me acompanhou ao longo
do meu trabalho, e teve sempre paciência para as minhas “loucuras”, até quando nada parecia
funcionar; ao Hugo e ao Luís Marques cuja paciência infinita (mesmo com prazos e pressões)
foram essenciais para o desenvolvimento deste trabalho e o tornaram definitivamente mais
“bonito”; and I also really need to thank Nikhil, for all his help, for all the things he taught me
about physiology and mainly for all the days “lost” because of my experiments. Obrigada
igualmente ao Simão, e ao seu número mágico das mutagéneses – 53; ao João, e ao nosso
grande Benfica!; ao Luís; ao Zé, que me motiva a não esquecer e a praticar o meu espanhol; e à
Sara, e à sua constante energia e companhia – no 78 ou por vezes no ginásio. Agradeço ainda à
Susana pelas lições, pela ajuda e motivação, pela boa disposição (em português, inglês e
espanhol), pelos doces e frutas, e principalmente por tornar o laboratório num lugar mais
divertido (e com boa música!). I also want to thank Ines, for all the conversations, advices,
patience, support, company, fun and motivation. Danke shön! Por fim, não posso deixar de
agradecer à Margarida e ao Coelho, que, para além da grande amizade fora do trabalho, sempre
me acompanharam e apoiaram nos bons e maus momentos. E que continue a ser assim: “não
se muda a equipa vencedora”.
Agradeço aos meus “migos falsos” por toda a companhia e motivação e porque, sem
vocês, a minha vida não tinha metade da diversão. Particularmente agradeço às melhores
amigas que algum dia poderia pedir, Ana, Inês, Leonor, Margarida e Sílvia, por todos os
momentos que passámos e por esta amizade que, no que depender de mim, será eterna.
Obrigada à minha amiga de sempre e para sempre, Babi, por todo o apoio incondicional,
pela amizade e pela companhia constante.
Obrigada às FOX, por todos os momentos de dança, de convívio e de diversão, porque
sei que estão sempre presentes e, apesar de me acharem “maluca” (excepto a “mana” Ana, que
sabe o quão divertido é ser Bioquímica), nunca deixaram de mostrar o vosso apoio. Obrigada

Aknowledgments/Agradecimentos
V
especialmente à Vera, que mais do que uma “prima” é, desde há muitos anos, uma grande
amiga.
Obrigada ao João, por me conhecer, por estar lá sem ter de pedir. Por tudo.
Não posso deixar de fazer um agradecimento personalizado à Margarida, que mais do
que uma colega de curso, de ginásio, de festas, de viagens, de loucura por animais (e de vídeos
de gatinhos), parceira de bancada do laboratório, boleia, companheira, e “gémea”, é parte da
família que escolhi e a mais verdadeira definição de AMIGA.
A toda a minha família, um muito obrigada por todo o apoio e confiança. Em particular
ao meu tio e aos meus primos Beatriz, Bernardo, Inês e João, que mais do que primos são meus
irmãos e amigos.
Obrigada ao meu irmão Diogo que, apesar de ainda estar a aprender que a investigação
também é um trabalho (“curiosidades”), nunca deixou de me apoiar. Obrigada à minha irmã
Marta, que sempre mostrou o orgulho que tem em mim e que, ao fazer de mim o seu “modelo”,
me torna uma pessoa melhor a cada dia que passa.
À Whitney e à Miu.
Por fim agradeço aos meus pais, porque sem vocês nada disto teria sido possível.
Obrigada a todos! Thank you everyone!

Abstract
VI
Abstract
Cystic Fibrosis (CF) is the most common lethal autosomal recessive disorder in the
Caucasian population, affecting 1 in 2500-6000 new-borns. CF is caused by mutations in the
Cystic Fibrosis Transmembrane Conductance Regulator (CFTR) gene, which encodes a cAMP-
regulated chloride (Cl-) and bicarbonate (HCO3-) channel expressed at the apical membrane of a
variety of epithelial cells. The most common mutation in CF patients is F508del, a three base
pair deletion that causes a single amino acid deletion from CFTR and disrupts its traffic and
function, due to protein misfolding.
Obstructive lung disease is the primary cause of morbidity in CF patients. Other
symptoms of CF include elevated concentrations of sodium chloride (Cl-) in the sweat, pancreatic
insufficiency, and male infertility, among others.
Besides its function as a Cl- channel, CFTR also controls a number of other ion channels
and transporters, being crucial to the ionic flow on epithelia. Among these other channels is the
epithelial sodium (Na+) channel (ENaC) and members of the anoctamin family, some of which
have been shown to function as Cl- channels.
The latter constitutes a class of proteins that is only expressed in eukaryotic organisms.
In mammals the family contains ten members (Ano1 to Ano10), with high sequence
conservation, particularly around the putative channel pore forming region. Since the
identification of Ano1 as a Ca2+-activated Cl- channel (CaCCs), in 2008, anoctamins have raised
high interest as possible alternative Cl- channels to compensate for the loss of functional CFTR
in CF. However, little is known about the regulation of their biogenesis, traffic or whether their
channel function can be activated by other means, other than Ca2+ signalling. Such knowledge
is, nevertheless, essential for their possible therapeutic use as alternative Cl- channels for CFTR.
Anoctamins are involved in a variety of functions that besides ion transport, include
phospholipid scrambling and regulation of other membrane proteins. Several lines of evidence
suggest that anoctamins form homodimers, but the possibility of heterodimer formation has not
been excluded. Also, some family members are reported to interact with each other.
Despite some knowledge on this protein family, the structure and functions of all family
members are not completely defined. The first two members of the family (Ano1 and Ano2)
function as Ca2+-activated Cl− channels (CaCCs), while Ano6 was described as scramblase and
also as a main component of the outwardly rectifying Cl- channels (ORCCs). Other members of
the anoctamin family, such as Ano3, 4, 7, and 9, may work as phospholipid scramblases and/or
ion channels, being their functions still poorly understood.
Mutations in anoctamin genes (ANO3, ANO5, ANO6, and ANO10) cause various genetic
disorders, suggesting the involvement of anoctamins in a variety of cellular functions.
The core objective of this project was to identify novel regulators of Ano6 and also Ano9
and 10 and their interaction with other anoctamin family members and CFTR. To accomplish this
goal three main tasks were proposed, namely, i) To generate novel cell lines stably expressing
double-tagged Ano6, Ano9 and Ano10 constructs; ii) To use these constructs to develop robust
cell-based traffic assays to be used in fluorescence high-throughput microscopy; iii) To use siRNA
microscopy screens to identify novel genes involved in regulating the traffic of Ano6, Ano9 and
Ano10 as potential drug targets for CF.

Abstract
VII
The first task was completed for Ano6 and Ano9, while the second one was only
accomplished for Ano6, and the third just started also for this protein. In summary, in this MSc
project, double-tagged constructs of Ano6, 9 and 10 were created. The constructs of Ano6 and
Ano9 were cloned into lentiviral vectors, and several cell lines expressing the double-tagged
anoctamins under an inducible (Tet-On) promoter were generated. CFBE Ano6/Ano9 3-HA GFP
cells were characterized by immunostaining (with polarized and non-polarized cells) and
Western Blot techniques. Additionally, functional analysis of these proteins was assessed by
both the iodide efflux technique and analysis in perfused micro-Ussing chamber on open circuit
mode. Finally, a pilot screen of a small siRNA library targeting 231 genes (previously tested for
CFTR traffic) was performed for CFBE Ano6 3-HA GFP cells.
Overall the results showed that:
The double-tagged construct of Ano6 is functional as a channel when overexpressed
either in HEK 293T cells or in CFBE cells;
The double-tagged construct of Ano9 seems to increase I- efflux in HEK 293T but shows
no effect on ion currents on CFBE cells;
Overexpressed Ano6 is located at the plasma membrane (and also at the cytoplasm);
Overexpressed Ano9 is mostly intracellularly located but when at the cell membrane
possibly forms dimers;
CFBE cells stably expressing the inducible (Tet-On) Ano6 3-HA GFP construct constitute
a robust cellular model for siRNA screens by automated high-content microscopy
(HCM);
Results from a pilot siRNA screen suggest that Ano6 traffic to the plasma membrane is
affected by genes involved in several biological processes like G-protein coupled
receptor signalling, ion transport, protein phosphorylation, and regulation of apoptosis,
among others.
Additional studies and further validation of these results could potentially constitute a
new attractive approach for CF therapy involving alternative Cl- channels. Indeed, the regulation
of anoctamins’ traffic is largely unknown and its better understanding will allow the exploration
of this pathway to compensate for CFTR deficiency, making possible the development of new
therapies for CF.
Key words: Cystic Fibrosis, CFTR, Anoctamins.

Resumo
VIII
Resumo
A Fibrose Quística (FQ) é a doença autossómica recessiva letal mais comum na
população caucasiana, com uma prevalência de 1 em cada 2500-6000 nascimentos. Esta doença
é causada por mutações no gene Cystic Fibrosis Transmembrane Conductance Regulator (CFTR).
Este gene, localizado no braço longo do cromossoma 7, codifica para uma glicoproteína com
1480 resíduos de aminoácidos localizada na membrana apical de uma grande variedade de
células epiteliais, onde transporta cloreto (Cl-) e bicarbonato (HCO3-).
Entre as mais de 2000 mutações conhecidas no gene CFTR, a mais comum consiste na
deleção de três pares de bases, que resulta na remoção de uma fenilalanina na posição 508
(F508del) da proteína. Esta mutação está presente em aproximadamente 85% dos pacientes
com FQ e afeta o processamento da proteína que, devido a um folding incorreto, fica retida
intracelularmente ao nível do retículo endoplasmático (RE). Neste organelo é rapidamente
enviada para degradação proteassomal, não chegando assim à membrana plasmática.
Para além do seu papel como canal de aniões, a CFTR também funciona como
reguladora de outros canais, tendo um efeito inibitório crítico na absorção de sódio (Na+) pela
proteína ENaC (epithelial Na+ channel). Assim, os pacientes com FQ apresentam uma secreção
de aniões diminuída, acompanhada por um aumento na absorção de Na+, o que leva à
desidratação do líquido que reveste as vias respiratórias, airway surface liquid (ASL), e ao
aumento da viscosidade e espessura do muco. Estas características causam uma eliminação
ineficiente de agentes patogénicos pulmonares, resultando em infecções bacterianas
recorrentes e, consequentemente, em inflamação crónica. Esta inflamação, dominada por
neutrófilos, exacerba os processos de remodelação do tecido pulmonar e acaba por culminar na
fibrose dos tecidos e perda da sua função. A doença pulmonar obstrutiva é a causa de morte
mais comum em pacientes com FQ, sendo responsável por aproximadamente 80% da
mortalidade.
Para além deste fenótipo, outras manifestações da doença incluem a elevada
concentração de NaCl no suor (sendo a base dos testes de diagnóstico mais comuns),
insuficiência pancreática, infertilidade masculina, e ainda outras manifestações menos comuns
como diabetes, ileus meconial, e obstrução intestinal e hepática.
Como referido anteriormente, a CFTR tem um papel importante na regulação de outros
canais e transportadores, sendo fundamental no transporte iónico no epitélio. Para além da
ENaC já evidenciada, outros canais que possivelmente interatuam com a CFTR são os canais de
cloreto ativados por cálcio (CaCC) e os canais de cloreto outwardly rectifying (ORCC), entre
outros.
Os CaCCs funcionam como transportadores iónicos transepiteliais em células secretoras
e são caracterizados por apresentarem uma ativação dependente do aumento dos níveis de Ca2+
intracelular. Por sua vez, os ORCC demonstram uma relação I/V outwardly rectifying e são
ativados por despolarização celular e via PKA e UTP extracelular.
Vários estudos mostram que a CFTR inibe a produção endógena de corrente pelos
CaCCs, estando esta aumentada nas vias respiratórias de pacientes com FQ. No entanto, a
ativação dos ORCC pela PKA encontra-se diminuída no epitélio pulmonar de pacientes.

Resumo
IX
As anoctaminas, proteínas que pertencem a uma família de 10 membros (Ano1 a Ano10)
com elevada semelhança estrutural, foram associadas aos canais já referidos como regulados
pela CFTR. A anoctamina 1 (Ano1) foi identificada como CaCC, sendo a sua função inibida com a
activação da CFTR, enquanto a função de transporte por parte da CFTR é diminuída com a
sobreexpressão da Ano1. Para além disso, a Ano6 foi identificada como componente principal
dos ORCC. Assim, na presença de CFTR não mutada, é observada uma ativação paralela da CFTR
e da Ano6, enquanto a Ano1 é inibida. Pelo contrário, em células com a CFTR mutada, a função
da Ano6 é atenuada e a função da Ano1 aparenta estar aumentada.
O interesse no estudo das anoctaminas aumentou fortemente desde a identificação da
Ano1 como CaCC em 2008. Tal interesse deve-se maioritariamente ao facto destas poderem ser
consideradas possíveis canais de Cl- alternativos para compensar a falta de CFTR funcional na
FQ. Não obstante, o conhecimento sobre a sua biogénese, tráfego e ativação, é ainda muito
reduzido. Tal conhecimento é, no entanto, essencial para o seu possível uso terapêutico como
canais de Cl- alternativos para a CFTR.
As anoctaminas estão envolvidas numa variedade de funções que, para além da função
como transportadoras de iões já referida, ainda incluem scrambling de fosfolípidos e regulação
de outras proteínas membranares. Vários estudos sugerem que as anoctaminas formam
homodímeros, sendo ainda possível a formação de heterodímeros. Estes estudos são
corroborados pela descoberta de interação entre alguns membros da família. Entre estes
encontram-se a Ano1 e a Ano9, uma vez que estudos mostram que a sobreexpressão da Ano9
origina uma forte inibição das correntes produzidas pela Ano1.
Apesar das características já conhecidas das anoctaminas, a estrutura e as funções de
todos os membros da família ainda não estão completamente definidas. Enquanto os dois
primeiros membros da família (Ano1 e Ano2) funcionam como CaCCs, a Ano6 foi descrita como
principal componente dos ORCC e como scramblase. Outros membros da família, tais como
Ano3, 4, 7 e 9, podem ter funções de scramblases e/ou canais de iões, estando ainda as suas
funções concretas por desvendar.
Mutações nos genes das anoctaminas (nomeadamente ANO3, ANO5, ANO6 e ANO10)
causam diferentes doenças genéticas, sugerindo o envolvimento destas proteínas numa
variedade de funções celulares.
O objetivo do presente projeto foi a identificação de novos reguladores da Ano6, e ainda
possivelmente da Ano9 e 10, e a interação das mesmas com outros membros da família de
proteínas e com a CFTR. Para atingir este objetivo foram propostas três tarefas principais,
nomeadamente, i) Criar linhas celulares que sobreexpressam de forma estável os construtos da
Ano6, Ano9 e Ano10 com dois tags, ii) Usar estes construtos para desenvolver ensaios de tráfego
robustos para serem utilizados em microscopia de fluorescência high-throughput, iii) Usar
screens com bibliotecas de siRNAs para identificar novos genes envolvidos na regulação do
tráfego da Ano6, Ano9 e Ano10, que possam ainda vir a ser utilizados como potenciais fármacos
para a FQ.
O primeiro passo foi concluído, tendo o segundo sido apenas realizado para a Ano6 e o
último começado para a mesma. Resumindo, neste projecto de mestrado foram criados
construtos da Ano6, Ano9 e Ano10 com dois tags. Os construtos da Ano6 e Ano9 foram clonados
em vetores lentivirais, e foram criadas várias linhas celulares que expressam estas anoctaminas

Resumo
X
sob o efeito de um promotor indutível Tet-On. As células CFBE Ano6/Ano9 3-HA GFP foram
caraterizadas por imunofluorescência (tanto em células polarizadas como não polarizadas) e por
Western Blot. Adicionalmente a função destas proteínas foi testada em ensaios funcionais
(efluxo de iodeto e micro-Ussing chamber). Por fim, para as células CFBE Ano6 3-HA GFP, foi
feito um screen preliminar de uma pequena biblioteca de siRNAs que afetam 231 genes
(previamente testados para o tráfego da CFTR).
Os resultados obtidos ao longo deste trabalho sugerem que:
O construto com dois tags da Ano6 é funcional como canal quando sobreexpresso tanto
em células HEK 293T como em CFBE;
O construto com dois tags da Ano9 parece aumentar o efluxo de iodeto em células HEK
293T mas não apresenta nenhum efeito no transporte de iões quando sobreexpresso
em células CFBE;
A Ano6 sobreexpressa está localizada na membrana plasmática (e também no
citoplasma);
A Ano9 sobreexpressa está principalmente localizada no citoplasma, mas quando se
localiza na membrana plasmática forma possivelmente dímeros;
As células CFBE que expressam de forma estável o contruto Ano6 3-HA GFP constituem
um modelo celular robusto para realizar screens com siRNAs por Microscopia
Automatizada (Análise de Alto Conteúdo);
Os resultados de um screen de siRNA preliminar sugerem que o tráfego da Ano6 para a
membrana plasmática é afetado por genes envolvidos em vários processos biológicos,
tais como na sinalização de recetores acoplados a proteínas G, transporte de iões,
fosforilação de proteínas e regulação da apoptose, entre outros.
Estudos adicionais e posterior validação destes resultados podem potencialmente
resultar numa nova estratégia apelativa para desenvolver terapias para a FQ envolvendo canais
de Cl- alternativos. A regulação do tráfego das anoctaminas é ainda desconhecida e o seu estudo
aprofundado irá permitir a exploração destas vias para compensar o defeito da CFTR, tornando
possível o desenvolvimento de novas terapias para a FQ.
Palavras-chave: Fibrose Quística, CFTR, Anoctaminas.

Abbreviations
XI
Abbreviations
ABC ATP-binding cassette
Ano1-10 Anoctamin 1-10 (TMEM16A-H, J and K)
ASL Airway surface liquid
ATP Adenosine triphosphate
BSA Bovine serum albumin
C-terminal Carboxyl terminal
CaCC Calcium activated chloride channel
cAMP Cyclic adenosine monophosphate
cDNA Complementary DNA
CF Cystic fibrosis
CFBE41o- /CFBE Cystic Fibrosis Bronchial Epithelial (cell line)
CFTR Cystic Fibrosis Transmembrane Conductance Regulator
CO2 Carbon dioxide
DAG Diacylglycerol
DMEM Dulbecco's Modified Eagle Medium
DMSO Dimethylsulfoxide
Dox Doxycycline
ECL Extracellular loop
EMEM Eagle’s minimum essential medium
ENaC Epithelial sodium channel
ER Endoplasmic reticulum
ERQC Endoplasmic reticulum quality control
FBS Foetal bovine serum
F508del Deletion of phenylalanine (F) residue at position 508
GFP Green fluorescent protein
HEK Human embryonic kidney (cell line)
HeLa Human cervical carcinoma (Henrietta Lacks) (cell line)
IP3 Inositol 1,4,5-trisphosphate
kDa KiloDalton
MCC Mucociliary clearance
MgCl2 Magnesium Chloride
MSD Membrane-spanning domain
NaCl Sodium Chloride

Abbreviations
XII
NBD Nucleotide binding domain
N-terminal Amino-terminal
ORCC Outwardly rectifying chloride channel
PAGE Polyacrylamide gel electrophoresis
PBS Phosphate buffer saline
PBS-T Phosphate buffer saline with tween
PCR Polymerase chain reaction
PDZ PSD-95, Disc-large, and ZO-1
PenStrep Penicillin streptomycin solution
PIP2 Phosphatidylinositol 4,5-bisphosphate
PKA Protein kinase A
PKC Protein kinase C
PLC Phospholipase C
PM Plasma membrane
PVDF Polyvinylidene Fluoride
R domain Regulatory domain
RNA Ribonucleic acid
SDS Sodium dodecyl sulphate
siRNA Small interfering RNA
TMEM16 Transmembrane protein 16 – Anoctamins
Tris Tris(hydroxymethyl)aminomethane
UV Ultraviolet
wt Wild type

Introduction
1
1. Introduction
1.1) Cystic Fibrosis and deficient CFTR-mediated anion secretion
1.1.1) Cystic Fibrosis
Cystic Fibrosis (CF) is the most common lethal autosomal recessive disorder in the
Caucasian population1. CF has an incidence of one in 2500-6000 new-borns and a carrier
frequency of 1 in 25 to 40 individuals2. The frequency of CF varies among different ethnic groups,
the highest being in individuals of Northern European heritage3, 4.
After being first described in 1938 as a digestive disorder5, it was only in 1989, through
chromosome walking and jumping gene cloning techniques, that the gene responsible for CF
was identified and named Cystic Fibrosis Transmembrane Conductance Regulator (CFTR)6. This
gene encodes a cAMP-regulated chloride (Cl-) and bicarbonate (HCO3-) channel expressed at the
apical membrane of a variety of epithelial cells7, and it was found to harbour mutations in all CF
patients analysed8. The basic defect of the disease has been associated with decreased anion
conductance across the apical membrane of epithelial cells6. The most common mutation in CF
patients is F508del, a three base pair deletion that causes a single amino acid deletion from CFTR
and disrupts its traffic and function, due to protein misfolding4.
In addition to functioning as an anion channel, CFTR also regulates other channels,
having a critical inhibitory effect on sodium (Na+) absorption through the epithelial Na+ channel
(ENaC)9, 10. Consequently, CF is characterized by defective epithelial anion secretion and
enhanced Na+ absorption. These features lead to dehydration of the airway surface liquid layer
(ASL), resulting in enhanced mucus viscosity and in impaired mucociliary clearance (MCC) which
causes the accumulation of purulent secretions. As MCC is an important defence mechanism
against pathogens and dust particles11, its reduction in CF patients leads to recurring bacterial
infections, especially by Pseudomonas aeruginosa12. The treatment of these infections is
particularly hard, since P. aeruginosa adapts specifically to the pulmonary microenvironment in
CF patients through the formation of biofilms and the production of a capsular polysaccharide
that inhibits penetration by antimicrobial agents13. Thus, the patients’ lungs develop chronic
neutrophil-dominated inflammation from a very early age, exacerbating tissue remodelling
processes, scarring and fibrosis14. Obstructive lung disease is currently the primary cause of
morbidity in CF patients and is responsible for approximately 80% of mortality15.
Elevated concentrations of Cl- in the sweat is another characteristic of CF patients, being
the basis for one of the most common diagnostic tests for CF: measurement of the sweat Cl-
levels16.
The gastrointestinal tract is also affected in most patients, with approximately 85%
showing pancreatic insufficiency (PI) as a result of the obstruction of the pancreatic ducts17 and
subsequent scarring and destruction of exocrine function. Pancreatic disease is believed to
result from a reduced volume of pancreatic secretions characterized by low concentrations of
HCO3–. Impaired HCO3
- secretion results in poor clearance of the digestive enzymes, and their
premature activation causes the destruction and fibrosis of the pancreas7, 18. In addition, the CF
phenotype may include less common complications such as meconium ileus, distal intestinal
obstruction syndrome (DIOS), pancreatitis, liver disease or diabetes, among others16.

Introduction
2
Finally, infertility is a general condition in males with CF, as a consequence of congenital
bilateral absence of the vas deferens (CBAVD)16. Women are usually fertile but can also show a
lower fertility rate possibly due to the obstruction the thick mucus imposes upon sperm entering
the cervical canal19.
The classical management of CF includes multisystem symptomatic treatments including
chest percussion and mucolytics to improve clearance of thick secretions, administration of
antibiotics to treat bacterial lung infections, anti-inflammatory agents for handling the chronic
neutrophil-dominated airway inflammation, pancreatic enzyme replacement to compensate for
the absence of their physiological secretion, and a vigorous hypercaloric diet to maintain a good
nutritional status4, 20.
With these symptomatic therapies and all the progress in the study of the disease, the
median predicted age of survival in the US has increased from 33.4 years in 2003 to 40.7 years
in 201321. Despite such improvement, the burden of CF therapeutics is still very high and quality
of life and life expectancy of most CF patients are still limited22. Therefore, the disease must be
treated beyond its symptoms in order to effectively halt the cascade of effects downstream of
CFTR dysfunction2. Regarding this goal, attention has turned to the development of treatments
addressing the basic defect of the disease, associated with CFTR gene mutations.
The concept of treating patients through gene therapy, i.e., by inserting a correct copy
of the CF gene into the patients’ cells so that they would produce a functional protein, was a
promising idea that could provide positive results regardless the class of the patients’
mutations23. However, gene therapy trials with adenovirus vectors proved to be impractical
because of the viral immunogenicity and low efficiency of vectors to insert DNA into epithelial
cells. Recently, other potential vectors were considered, like adeno-associated viruses and
liposomes4, 24. Indeed, latest studies showed that monthly lung delivery of plasmid DNA
encoding the CFTR gene complexed with a cationic liposome was associated with a significant,
albeit modest, increase in stabilisation of lung function25.
As an alternative to classical or gene therapies, novel pharmacological approaches based
on rescuing intracellular production, trafficking, or activation of CFTR started to appear as
possible innovative treatments. Thus, novel compounds have emerged as promising drugs
treating the basic defect of CF, namely correctors (agents that correct the localization of the
F508del-CFTR protein from the endoplasmic reticulum – ER – to the cell membrane) and
potentiators (drugs that increase function of CFTR located at the cell membrane) of CFTR22.
Nevertheless, only some mutations can be circumvented by these approaches. Therefore,
treatments to read-through premature stop mutations and manipulate other ion transport
pathways which compensate for CFTR absence (bypass therapies), also have a major importance
in the treatment of CF26, 27.
1.1.2) CFTR – Gene and mutations
The CFTR gene is located on the long arm of chromosome 7 (region q31-q32) and
consists of a highly complex TATA-less promoter and 27 exons spanning about 190 kb of genomic
sequence28.

Introduction
3
About 2,000 CF-causing mutations have been
reported in the CFTR gene, being grouped in 7 different
functional classes, according to the molecular/cellular
defect they confer (Fig.1): Class I mutations abolish
protein production (often being nonsense mutations –
with premature stop codons); Class II mutations result
in defective protein processing and trafficking, due to
protein misfolding; Class III mutations lead to proteins
that have no function due to impaired channel gating;
Class IV mutations cause a defective ion conductance;
Class V mutations result in decreased protein synthesis;
and Class VI mutations diminish retention/anchoring at
the cell surface, often related with decreased protein
stability at the plasma membrane16, 29. A novel class was
recently proposed as those which result from deletions,
insertions and hence are considered to be
“unrescuable” by pharmacological agents30.
The ~2000 mutations found in the CFTR gene are thus distributed in these classes31. As
already referred, the deletion of phenylalanine 508 in the first nucleotide binding domain
(NBD1) of CFTR (F508del-CFTR) is the most common mutation4. This mutation belongs to the
class II (no traffic) and it is present in approximately 85% of CF patients in at least one allele,
being associated with a severe phenotype21. Evidence indicates that F508del-CFTR adopts an
abnormal protein conformation which is recognized and retained by the endoplasmic reticulum
quality control (ERQC), which rapidly targets it for proteasomal degradation. Consequently, only
a small amount or no F508del-CFTR, depending on the cell type, reaches the plasma
membrane32.
1.1.3) CFTR – Protein structure and function
CFTR is a transmembrane protein
expressed in the apical membrane of epithelial
cells in the airways, intestine, reproductive
tissues, and exocrine glands (such as sweat
glands, exocrine pancreas, and salivary
glands)33. CFTR is a symmetrical, polytopic
protein with 1480 amino acid residues6 that
belongs to the superfamily of the ATP-binding
cassette (ABC) transporters.
CFTR is composed of five domains: two
regions that anchor the protein in the
membrane known as membrane-spanning
domains (MSD1 and MSD2), each containing six
alpha helical segments; two cytosolic
nucleotide-binding domains (NBD1 and NBD2) that bind ATP; and a central, highly charged
Figure 1 - Categories of CFTR mutations13.
Figure 2 - Hypothesized structure of CFTR.
Adapted from [13].

Introduction
4
regulatory domain (RD) with multiple phosphorylation consensus sites13. The MSDs contribute
to the formation of the selective pore, the NBDs bind and hydrolyse (NBD2) ATP to regulate
channel gating and RD undergoes phosphorylation by protein kinase A (PKA) to control channel
activity34. Both the amino (N) and carboxyl (C) terminal tails of CFTR are cytoplasmically oriented
and mediate the interaction between CFTR and a variety of binding proteins33. The C-terminus
of CFTR has a consensus sequence recognized by PDZ domains, to which several PDZ-domain
proteins, notably NHERF1, have been shown to bind35.
Like other proteins undergoing the secretory pathway, CFTR assembly starts with
synthesis and folding in the ER, where it is glycosylated. Once checked for correct folding by the
ERQC, this immature form of CFTR migrates to the Golgi complex, where it undergoes glycoside
maturation36.
CFTR functions mainly as a cAMP-regulated anion (Cl- and HCO3-) channel at the apical
membranes of epithelial cells, where it provides a pathway for anion movement across epithelia
and regulates their flow8, 32. Additionally, CFTR has been associated with other processes like
glutathione transport37, regulation of other ion channels38-40, regulation of intracellular vesicle
transport, acidification of intracellular organelles4, transepithelial electroneutral NaCl transport,
control of osmotic water permeability, and apoptosis16, 32. Accordingly, CFTR appears to be truly
a conductance regulator.
1.1.4) CFTR as a major regulator of other epithelial ion channels
As previously outlined, in the lung and in other epithelial tissues of CF patients, there is
a hyper absorption of Na+ mediated by ENaC. The functional relationship between CFTR and
ENaC dictates the ability to clear bacteria and other harmful agents from the lungs by regulating
water levels and composition of ASL. Data suggest that a direct physical interaction occurs
between CFTR and ENaC11. Enhanced Na+ conductance in CF is caused by a lack of
downregulation of ENaC by non-functional CFTR. Co-expression of CFTR inverts PKA mediated
regulation of ENaC by interfering with the gating mechanism of the channel, thus turning
activation of ENaC by PKA into channel inhibition41.
Apart from the well examined effects of CFTR on epithelial Na+ conductance, CFTR also
controls other ion channels and transporters, having a crucial effect on the ionic flow on
epithelia. Among these channels are calcium (Ca2+)-activated Cl- channels (CaCC)41, outwardly
rectifying Cl- channel (ORCC)42, KATP channels (such as ROMK2 and Kir 6.1), water channels and
the volume-regulated anion channel (VRAC)38.
It has been reported that CFTR inhibits endogenous CaCC currents in Xenopus oocytes,
bovine pulmonary artery endothelium, and isolated parotid acinar cells38, 43, 44. Also, CaCC
currents are enhanced in cultured CF airway epithelial cells as well as in freshly excised nasal
tissues from CF patients45, 46. The ORCC regulation by PKA was found to be defective in CF human
airway epithelia when compared to that of normal epithelia44, while VRAC is inhibited by
expression of CFTR38.
The anoctamin protein family was found to be closely associated with these channels
regulated by CFTR. Anoctamin 1 (Ano1) was identified as CaCC47, 48, with its Ca2+-activated Cl-
channel function being inhibited during the activation of CFTR, while CFTR currents are

Introduction
5
attenuated by overexpression of Ano1 and both proteins could be co-immunoprecipitated40.
Also, Ano6 was identified as the main component of ORCC49. Furthermore, anoctamins are
shown to regulate the cellular volume possibly by operating as VRAC, by regulating intracellular
Ca2+ signalling, or by acting as accessory proteins for the recently identified volume-regulated
channel LRRC8A48.
With these data it is clear that anoctamins might play a significant role in epithelial ion
transport in CF. Therefore, the relationship between anoctamins and CFTR deserves further
investigation to find a possible alternative way to conduct Cl- across epithelia and thus
compensate for the severe symptoms caused by lack of functional CFTR in CF.
1.2) Anoctamins
1.2.1) CaCCs and anoctamins
Ca2+-activated Cl− channels (CaCCs) were first described in the 1980s in Xenopus
oocytes51 and salamander photoreceptor inner segments52. CaCCs are ubiquitous and play key
physiological cellular roles, such as transepithelial transport of salt and fluids53, regulation of
electrical membrane excitability in cardiac muscle and neurons54, olfactory transduction55,
regulation of vascular tone56, photoreception57, maintenance of ionic homeostasis and pH, and
cell-volume regulation58.
CaCCs are activated by elevation of cytosolic cAMP or Ca2+, cell swelling, extracellular
acidification, membrane potential changes, or interaction with extracellular ligands. Depending
on the cell type, Ca2+ activates CaCCs either by direct binding to the channel, indirectly through
Ca2+-binding proteins or via phosphorylation through Ca2+/calmodulin-dependent protein kinase
II (CaMKII)59.
A frequently described property of CaCCs is the sensitivity to membrane potential, which
modulates the response to Ca2+. CaCCs are thus characterized by their voltage- and time-
dependence at sub-saturating Ca2+ concentrations (<1 µM). At these low physiological Ca2+
levels, CaCCs are activated and deactivated by positive and negative membrane potentials,
respectively. At micromolar Ca2+ levels, CaCCs are fully activated at all membrane potentials.
Accordingly, the steady-state current-voltage relationship changes from outwardly rectifying to
almost linear as the intracellular free Ca2+ concentration increases. However, this behaviour
does not apply to all CaCCs, as in some cells CaCCs are voltage independent at all Ca2+
concentrations59, 60.
Another feature that characterizes CaCCs is their poor anion selectivity, hardly
discriminating between anions with a selectivity sequence similar to that of Eisenman type I
(SCN- > I- > Br- > Cl- > F-)61.
Several attempts were made in the past to identify the proteins forming CaCCs, but the
ubiquitous expression of CaCCs and the lack of specific inhibitors, turned it into a difficult task.
The proteins that have been proposed as main constituents of CaCCs include members of the Cl-
channel, Ca2+-activated (CLCA) family62, CLC-363, and bestrophins64.

Introduction
6
CLCA proteins are unlikely candidates because the membrane currents elicited by their
expression did not resemble CaCCs in terms of voltage-dependence, Ca2+ affinity, and sensitivity
to pharmacological modulators. Also, CLCAs were excluded as membrane proteins, being
defined as cell adhesion molecules which may be also secreted into the extracellular medium65.
CLC-3 gene expression also causes the appearance of Cl– currents that lack the typical
voltage dependence of CaCCs66. Furthermore, salivary gland cells of CLC-3 knockout mice have
normal CaCC activity.
In addition, bestrophins were proposed as Cl− channels different from CaCCs,
particularly in the small dependence of gating on membrane potential. Similarly, bestrophin-1
knockout mice have normal CaCC currents in cells from the retinal pigment epithelium59, thus
excluding these proteins as possible CaCCs.
Finally, in 2008, Ano1 (also TMEM16A) was identified as being a CaCC by three
independent groups using different approaches. Yang and colleagues used a bioinformatics
approach to identify Ano1, confirming its CaCC function by expression cloning in HEK 293 cells
and using small interfering RNA (siRNA) knockdown in mouse salivary glands47. Caputo et al.,
knowing that interleukin-4 stimulation of airway epithelial cells resulted in increased CaCC
activity, were able to identify Ano1 by microarray analysis. They also demonstrated that Ano1
displays an ion channel activation, inhibition, and anion selectivity profile consistent with native
airway CaCCs48. Lastly, Schroeder and colleagues used an expression cloning approach to identify
the Xenopus orthologue of Ano1 and characterize its function and expression67. These authors
also found that Ano2, a close paralog of Ano1, generates Ca2+-activated Cl− currents.
Thus, the anoctamin family (Ano, also known as TMEM16) exhibits similar characteristics
to those expected for the classical CaCC. Moreover, anoctamins tissue expression has a big
overlay with CaCCs, being found in sensory receptors, different types of smooth muscles, heart,
endothelium, neuronal tissues, and epithelial organs68.
The anoctamin family constitutes a class of proteins that is only expressed in eukaryotic
organisms, including mammals, flies, worms, plants, protozoa and yeast69. In mammals the
family contains ten members (TMEM16A-H, J and K, respectively renamed Ano1-10), with high
sequence conservation, particularly around the putative pore forming region70. In spite of their
close relationship, the proteins of this family combine different functions: some members were
defined as CaCCs while others were defined as Ca2+-activated scramblases, which catalyse the
shuffling of lipids between the inner and outer leaflets of the membrane bilayer71, or both.
Anoctamins have no apparent similarity to other ion channels. Moreover, multiple
alternative splice variants exist in different cell types, suggesting that these proteins are the
product of complex regulatory mechanisms still unknown72, 73.
1.2.2) Anoctamins – Structure and Function
Structure
The term anoctamin was created due to the anion selectivity of the protein, while the
prefix “oct” stood for its assumed eight transmembrane domains predicted from hydropathy
profile analysis47, 69. However, recent crystallographic studies of the TMEM16 protein from the

Introduction
7
fungus Nectria haematococca (nhTMEM16) suggest that these proteins have ten, and not eight,
transmembrane domains74. Nevertheless, the name anoctamin or Ano is the official HUGO
nomenclature and has replaced TMEM16 in Genbank75.
The anoctamins’ structure is still not completely understood. The best structure was
determined with nhTMEM16, which shares a high degree of homology with mammalian
anoctamins74. nhTMEM16 is a homodimer, in which both subunits are related by two-fold
symmetry and show very similar conformations. Both N- and C-termini are located on the
cytoplasmic side of the plasma membrane (Fig.3).
The structure harbours two regions that are presumably in contact with the membrane:
the dimer cavity, at the dimer interface, which is predominantly composed of hydrophobic and
aromatic residues conserved within the protein family; and the subunit cavity, a hydrophilic
membrane-spanning crevice contained within each subunit74.
It is currently not yet clear whether the dimer cavity plays a critical role on protein
function. However, the subunit cavity is linked to Ca2+ activation and probably also to catalytic
properties of the protein. In Ano1, 2, and 6, the subunit cavity may constitute the ion conduction
pore, as suggested by the influence of point mutations of residues facing the subunit cavity on
ion selectivity and conductance76.
Figure 3 – a) Ribbon representation of the nhTMEM16 dimer. The view is from within the membrane and bound Ca2+ ions are shown as blue spheres (black arrow). b) Topology of the nhTMEM16 subunit. The transmembrane domain is shown in green and the N- and C-terminal domains in blue and red, respectively. Adapted from [74].
Studies performed with mouse anoctamins are in agreement with the results obtained
with nhTMEM16, showing that Ano1 forms a stable homodimer77, 78. Ano1 subunits associate
before being trafficked to the plasma membrane and the oligomeric state is independent of
changes in intracellular Ca2+ concentration, suggesting that the homodimeric structure of Ano1
is not a determinant of channel gating73.
Moreover, Ano1 was shown to co-immunoprecipitate with the more closely related
homolog Ano2. The ability for close homologs to interact extends across species, as Xenopus
Ano1 was co-immunoprecipitated by both mouse Ano1 and Ano268.
These results indicate that anoctamins are dimeric proteins, and the interactions
responsible for channel assembly seem to be well-conserved. The N-terminal domain appears

Introduction
8
to be essential and sufficient for dimerization, but there are probably other inter-subunit contact
interfaces present in the dimer79.
Cellular localization and Functions
Proteins of the anoctamin family are widely expressed, namely in epithelia80, 81. Ano6, 8
and 10 are broadly expressed in mouse and human tissues. Ano9 is mostly expressed in epithelial
tissues and Ano1 is expressed in almost every kind of secretory epithelium like salivary gland,
pancreas, gut, mammary gland, prostate tissue, and airway epithelium73. Ano2, 3, and 4 are
preferentially expressed in sensory receptor cells and neuronal tissues80. Ano5 is expressed in
skeletal muscle and thyroid gland and Ano7 seems specifically expressed in prostate60.
Therefore, epithelial tissues express Ano1, 5, 6, 7, 8, 9, and 10.
Subcellular localization of the family members is not completely defined, although
membrane expression is most obvious for Ano1 and Ano280. Studies with HEK 293
overexpressing anoctamins showed that Ano1, 2, 4, 6 and 7 are well expressed in the plasma
membrane while Ano8, 9 and 10 traffic poorly to membrane and are mostly localized in the
cytoplasm82.
Although the functions of some family members are still inconsistent, it is now clear that
Ano1 and Ano2 produce Ca2+-activated Cl- currents47, 83.
Ano1 is the most well studied member of the anoctamin family, and it contributes to
Ca2+-activated epithelial Cl- secretion in a broad range of tissues84, 85. Ano1 is strictly membrane
localized and requires cytoskeletal interactions to be fully activated. This protein is activated by
a rise in intracellular Ca2+ 48, and the Ca2+-binding protein calmodulin seems essential for its
activation81, 86.
Ano2 is the main component of the CaCCs involved in olfactory sensory neurons and in
the photoreceptor synaptic terminals in retina87, 88.
Ano3 was found to co-localize and directly interact with Slack, the protein forming the
Na+-activated K+ channel. When expressed in HEK 293 cells, Ano3 did not form ion channels by
itself but increased the activity of Slack when both proteins were expressed together71, 89.
Finding the correct functions of Ano6 has been a real challenge. Ano6 was shown to act
as a Ca2+ activated non-selective cation channel76, possibly also as CaCC90 and it was identified
as a major component of the ORCC49. These channels are known to be activated upon excision
of the cell membrane from the intact cell and after strong depolarization49, 91 and are also
activated by cAMP and PKA. Ano6 has a role in lipid scrambling by facilitating the exchange of
phosphatidylserine from the inner to the outer leaflet of the bilayer92, a process that is essential
for membrane biogenesis in the ER93, blood coagulation76, 94, and apoptosis49, among other
cellular processes. Ca2+-dependent scrambling activity was also detected in Ano3, Ano4, Ano7
and Ano9, although with different preference to lipid substrates95.
Additionally, Ano1, Ano6 and Ano10 have been found to contribute to cellular volume
regulation48, 96, 97.

Introduction
9
Ano9 and Ano10 have intriguing functions, as both were shown to reduce baseline Cl-
conductance as well as ATP-induced anion currents81. Also co-expression of Ano9 with Ano1 led
to the inhibition of Ano1 activity, and it is conceivable that it may also regulate other family
members82. These data suggest that some anoctamins influence each other, which could be
explained by a heterodimeric architecture80.
Another level of complexity in anoctamins arises from their alternative splicing. For
instance, it was revealed for Ano6 the existence of four isoforms. Since all isoforms shared
similar ion selectivity, the existence of isoforms cannot explain the discrepant results obtained
so far. Therefore, it is possible that phospholipid scrambling is the main function of Ano6
whereas ion transport is a secondary activity that is activated at less physiological conditions98,
99.
Besides all the different cellular functions already described, Ano1 and Ano6 were also
associated with cell migration100, suggesting that anoctamins can also be considered as a novel
family of regulators of cell proliferation and apoptosis, which may be of particular relevance
during development, activation of immune cells101, and cancer102.
1.2.3) Anoctamin related diseases
Anoctamins attracted the interest of cancer biologists for several years before their
identification as ion channels because of their potential role in cell volume regulation and cancer
malignancy103. Although these proteins are up-regulated in tumours, mutations in anoctamins
genes are not linked to carcinogenesis104. Nevertheless, anoctamins may participate in cell
proliferation and/or tumour progression.
As previously stated, some anoctamins, such as Ano1 and Ano6, are associated with cell
volume regulation and migration, so their up-regulation could provide a growth or metastatic
advantage to cancer cells105. Accordingly, splicing variants of Ano6 are associated with
metastatic ability of mammary cancers in mice and are also correlated with poor prognosis of
patients with breast cancer106. Additionally, ANO1 gene is located within the 11q13 amplicon, a
chromosomal locus that is frequently amplified in a number of different human cancers, such as
gastrointestinal stromal tumour (GIST)107, urinary bladder cancer, breast cancer108 and head and
neck squamous cell carcinoma109, 110. Ano7 has also been associated with cancer, being up-
regulated in prostate cancer111.
Anoctamins are also related with several other diseases. Among the members of the
anoctamin family, Ano5 was the first to be associated with human diseases. Gnathodiaphyseal
dysplasia, a rare dominant skeletal syndrome, is caused by mutations in the ANO5 gene112, 113.
ANO3 gene mutations cause an autosomal dominant form of craniocervical dystonia114 and
mutations in the ANO10 gene are linked to autosomal recessive spinocerebellar ataxia and
atrophy115.
Beyond its role in cancer, Ano1 dysfunction causes multiple defects in epithelial organs.
Ano1 knockout mice die early during postnatal phase and exhibit severe tracheomalacia
(tracheal cartilage malformation)116. Moreover, there is also accumulation of mucus in the
lumen of tracheas of Ano1-KO mice, which shows the importance of Ano1 in MCC in mouse
airways84.

Introduction
10
Also, mutations at a splice-acceptor site of the ANO6 gene, that cause the premature
termination of the protein, lead to Scott syndrome. This is a bleeding disorder which results from
a defect in phospholipid scrambling activity of the outer membrane leaflet of platelets117.
These findings point out the relevance of the study of anoctamins to use these proteins
as therapeutic targets.
1.2.4) CFTR and anoctamins
It has been suggested that there is a crosstalk between cAMP and Ca2+ dependent Cl-
secretion (CFTR and anoctamins, respectively). It is known that purinergic receptors such as P2Y2
or P2Y6 couple to both cAMP and Ca2+ 118 and that intracellular Ca2+ controls enzymes such as
adenylate cyclase and phosphodiesterases that determine intracellular cAMP levels119. Also,
other messengers like the IP3 receptor binding protein IRBIT may link IP3/Ca2+ signalling by
binding to CFTR120.
Indeed, as previously discussed, CFTR is a major regulator of ion channels and it can
interact with several proteins, including anoctamins.
CFTR inhibits endogenous Ca2+ activated Cl- conductance in Xenopus oocytes, bovine
pulmonary artery endothelium and parotid acinar cells38, 44, 46. Also, Ano1 knockout mice were
shown to display symptoms that resemble those of CF, like low Cl- secretion and accumulation
of mucus in the airways84, 121. Additionally, Ano1 is present in apical membrane of airway
epithelial cells84, and it was reported that CaCC function of Ano1 is enhanced in CF epithelial
cells and inhibited during activation of CFTR. Inversely, CFTR currents were attenuated by
overexpression of Ano1, which again suggests that both Cl- channels are related40. Moreover,
since the expression of F508del-CFTR does not influence CaCC, it is likely that the CFTR–Ano1
interaction occurs at the plasma membrane38.
Among the remaining members of the anoctamin family, Ano6 also seems to interact
with CFTR, being activated through stimulation of CFTR or during apoptosis. The ORCC regulation
by PKA was found to be defective in CF airway epithelia but it was corrected once complemented
with the wt-CFTR gene42, 122. It has been reported that the NBD1 and the RD of CFTR are essential
for CFTR’s ability to interact with ORCC38. Indeed, CFTR is thought to regulate the ORCC by
facilitating cellular release of ATP. Once released, ATP stimulates the channel through a
purinergic receptor (P2Y2)17.
It is possible that CFTR and Ano1/6 interact directly or through scaffold proteins. Studies
demonstrating that CFTR translocates Gq-coupled receptors to the plasma membrane of
Xenopus oocytes allowing for Ca2+ increase and activation of Ano1123 support the hypothesis of
CFTR/Anoctamins interaction through PDZ binding proteins. Nevertheless, more studies need to
be performed to solve this question and deepen the knowledge on these interactions.
In summary, in the presence of wt-CFTR, parallel activation of CFTR and Ano6 (ORCC) is
observed, while Ano1 (CaCC) is inhibited. In contrast, in CF cells, the ORCC is attenuated while
CaCC currents appear upregulated.
Thus, these discoveries suggest that anoctamins may partially mimic and overcome the
defects caused by CFTR loss, improving CF therapies124. However, although CaCC appears

Introduction
11
enhanced in CF, it may not be able to compensate for defective CFTR. This can be explained by
the small contribution of CaCCs to airway Cl- secretion and by the fact that activation of CaCC is
largely transient, in contrast to the permanent CFTR-dependent Cl− secretion40. Yet, activation
of latent CaCCs could compensate for CFTR loss of function in CF patients47.
Nevertheless, since these alternative ion channels are not expressed in the other
affected organs in patients with CF125, potential benefits of therapeutic targeting are likely
limited to the lungs. Despite this limitation, these strategies can result in an effective treatment
of lung disease in CF patients regardless of their genotype. Importantly, these therapies may
also be beneficial for patients with chronic obstructive pulmonary disease (COPD), or asthma125.
The evidence of CFTR/anoctamins interaction create possible alternative
pharmacological targets for CF that could lead to a more sustained Cl- secretion in the patients,
thus correcting the basic defect of the disease. However, to that end a deeper knowledge on
CaCC/anoctamin function, activation, traffic, regulation and mechanism of interaction with CFTR
is essential.
1.3) Objectives of the present work
The main goals of the present work were to identify novel regulators of anoctamin 6, 9
and 10 and to study their interaction with other anoctamin family members as well as with CFTR.
In order to accomplish this goal, several milestones were established, namely:
1. To generate double-tagged constructs of Ano6, Ano9 and Ano10 to allow quantification
of both their total levels as well as the fraction at the plasma membrane (PM) by
fluorescent microscopy (Fig.4 and 5);
2. To clone the double-tagged constructs of Ano6, Ano9 and Ano10 into an inducible (Tet-
On) lentiviral vector (pLVX-TRE3G);
3. To generate stable cell lines expressing the inducible double-tagged anoctamin
constructs through lentiviral transduction;
4. To perform siRNA microscopy screens to identify genes involved in regulating the traffic
of Ano6, Ano9 and Ano10 as potential drug targets for CF;
5. To perform functional characterization of the stable cell lines overexpressing the
double-tagged anoctamin constructs;
6. To look for physical and functional interactions among anoctamin family members.
Identification of the roles of these proteins and their functional interactions will shed
light into the understanding of their physiological functions. Moreover, this knowledge will allow
the comprehension of the pathogenic role of this protein family in diseases, and will possibly
suggest novel therapeutic approaches to CF.

Introduction
12
Figure 4 – Schematic representation of the Ano6/Ano10 traffic reporter construct, based on the structure predicted in [74]. Topology of the Ano6/Ano10 molecule: GFP was fused to the C-terminus of Ano6 and Ano10, and the 3-HA tag was introduced in their 5th extracellular loop (ECL5).
Figure 5 - Schematic representation of the Ano9 traffic reporter construct, based on the structure predicted in [74]. Topology of the Ano9 molecule: GFP was fused to the C-terminus of Ano9 and the 3-HA tag was introduced in its 1st extracellular loop (ECL1).
Materials and Methods
13
2. Materials and Methods
2.1) Generation of cell lines overexpressing anoctamin 6, 9 and 10
2.1.1) Plasmids and cDNAs
cDNAs of human anoctamins (Anoctamins 6, 9 and 10) containing a GFP (green
fluorescent protein) tag in C-terminus were already cloned into pcDNA3.1 (+) vectors
(Invitrogen, V790-20).
pcDNA™3.1(+) is a 5.4 kb vector derived from pcDNA™3 designed for high-level stable
and non-replicative transient expression in mammalian hosts. The vector contains an ampicillin
resistance gene, which was used for selection of transformed bacteria.
A triple hemagglutinin tag was inserted in the anoctamins’ cDNAs (Anoctamins 6, 9 and
10) constructs containing a GFP tag in C-terminus. The 3-HA tag was inserted in an apparent
extracellular loop in order to be used as a marker of the anoctamins located at the plasma
membrane. Thus, when an immunofluorescence experiment is done with cells transfected with
these constructs, the antibody that binds to the 3-HA tag should stain the membrane proteins
without permeabilization of the plasma membrane.
The double-tagged anoctamin constructs were cloned into pLVX-TRE3G (Clontech,
631191) lentiviral vector using the In Fusion® HD Cloning Kit (Clontech, 631187), with the
purpose of creating lentiviral particles to transduce cells and create stably transfected cell lines.
pLVX-Tet3G (Clontech, 631358) lentiviral vector encoding the Tet-On 3G transactivator protein
was used for inducible gene expression. pLVX-TRE3G contains a puromycin resistance gene and
pLVX-Tet3G contains a G418 (geneticin) resistance gene.
Vectors’ maps and pLVX-TRE3G cloning sites are displayed in Appendix 1.
2.1.2) Production of competent bacteria
The bacterial strain used for cloning, mutagenesis and DNA amplification was XL1-Blue
(Stratagene), which is tetracycline resistant. XL1-Blue cells are endonuclease (endA) deficient,
which greatly improves the quality of miniprep DNA, and are recombination (recA) deficient,
improving insert stability. XL1-Blue Genotype: recA1 endA1 gyrA96 thi-1 hsdR17 supE44 relA1
lac [F´ proAB lacIqZ∆M15 Tn10 (Tetr)].
For production of competent bacteria, 200 μL of XL1-Blue competent cells were grown
in LB medium (NZYTech, MB028) supplemented with tetracycline (NZYTech, MB02201)
overnight at 37°C with vigorous shaking (220 rpm). This solution was diluted 1/100 into a larger
volume of LB medium, typically 200 mL, which was also grown at 37°C (220 rpm) to final
concentration of bacteria corresponding to an absorbance between 0.45 and 0.55 at 590 nm.
Bacteria were transferred to ice and pelleted by centrifugation (1000 g for 15 min at 4°C). The
bacterial pellet was then ressuspended, incubated on ice for 15 min in 33 mL RF1 buffer (100
mM RbCl, 50 mM MnCl2, 30 mM KCH3COO, 10 mM CaCl2, 15% (w/v) glycerol, pH 5.8; all from
Sigma-Aldrich) and re-pelleted by centrifugation (1000 g for 15 min at 4°C). This second pellet
was ressuspended and incubated on ice for 15 min in 8 mL of RF2 buffer (10 mM MOPS, 10 mM
RbCl, 75 mM CaCl2, 15% (w/v) glycerol, pH 6.8; all from Sigma-Aldrich). 200 μl aliquots were then
rapidly frozen with liquid nitrogen and stored at -80°C for further use.

Materials and Methods
14
2.1.3) Transformation of competent bacteria
Bacteria were transformed by incubating a 200 μL aliquot of competent cells with DNA
(10 µL of ligation products; 15 μL of the PCR product – mutagenesis; 10 ng of plasmid DNA) for
30 min on ice, followed by heat-shock (1 min and 30 s at 42°C), incubation for 2 min on ice, and
then incubation in antibiotic-free LB medium for 1 h at 37°C at 300 rpm. Bacteria were then
pelleted (6000 g for 2 min), the supernatant was discarded and the pellet was ressuspended in
the remaining supernatant medium. This suspension was then plated into LB-agar (Sigma-
Aldrich, L2897) supplemented with selection antibiotic (100 μg/mL ampicillin, Sigma-Aldrich,
A9518) and left to grow overnight at 37ºC at 220 rpm.
Transformed bacterial colonies were grown in LB medium supplemented with 100
μg/mL ampicillin and used to extract plasmid DNA. Clones were stored in liquid LB medium
supplemented with 50% (w/v) glycerol at -20°C.
2.1.4) Plasmid DNA extraction and quantification
Small scale plasmid DNA was purified with the NZYMiniprep kit (NZYTech, MB010). The
protocol is based on an alkaline lysis of the bacterial cells in the presence of SDS, to denature
bacterial proteins, followed by a centrifugation step to remove cellular debris, genomic DNA and
denatured proteins, and adsorption of the plasmid DNA in the supernatant to an anionic
exchange matrix in the presence of high saline concentrations. After adsorption, the DNA is
washed and eluted in water. Sequence of plasmid DNA preparations was confirmed by DNA
sequencing (2.1.6 – DNA sequencing) at least once for every plasmid.
Whenever a high quantity of DNA was necessary for further experiments (for example
for lentivirus production), large-scale preparation of highly pure plasmid DNA was achieved
using NZYMaxiprep kit (NZYTech, MB051).
DNA concentration was determined by measurement of absorbance at 260 nm using a
Nanodrop ND-1000 spectrophotometer (Thermo Scientific), and its purity was evaluated by
assessment of the ratio A260/A280 (Absorbance at 260 nm/Absorbance at 280 nm). Only DNA
samples with ratios above 1.8 were considered pure enough for further use.
2.1.5) Genomic DNA extraction
Genomic DNA (gDNA) extraction was performed to confirm the correct insertion of the
anoctamins’ constructs in the genome of stably transfected cells.
To achieve this, cells were trypsinized and harvested in microcentrifuge tubes. Cells
were then pelleted and washed with PBS. Next, the proteins were precipitated, the supernatant
was collected and added to a tube containing isopropanol to precipitate the DNA. The DNA was
then pelleted, washed with ethanol, and air-dried for 15 min. Finally, the DNA was rehydrated
for 1 h at 65ºC.
2.1.6) DNA sequencing
Plasmid DNAs were purified as described in 2.1.4 – Plasmid DNA extraction and
quantification. The sequencing reactions were performed by StabVida using Sanger sequencing.

Materials and Methods
15
The primers used for sequencing were specific for each anoctamin (ordered through StabVida),
and are shown in Appendix 2.
The sequences obtained were analysed through comparison with the reference human
sequence of each anoctamin (Anoctamin 6 – Reference Q4KMQ2, Anoctamin 9 - Reference
A1A5B4, Anoctamin 10 – Reference Q9NW15, all from UniProt126) using the software
Geneious127.
2.1.7) Mutagenesis
The 3-HA (triple hemagglutinin) tag was inserted in Ano6, Ano9, and Ano10-GFP
constructs by mutagenesis. The 3-HA tag was introduced in a predicted extracellular loop for
each anoctamin, as already mentioned above.
In the first mutagenesis attempt for each anoctamin, the localizations of the 3-HA tag
were selected using the predicted structure of these anoctamins available in Uniprot126 (Ano6 –
Reference Q4KMQ2, Ano9 - Reference A1A5B4, Ano10 – Reference Q9NW15). For Ano9, the
first mutagenesis was performed by a co-worker, Sara Afonso. Since the localizations of these
first tags were not adequate (because they were most likely not exposed to the exterior of the
cell) – 2.1.8 – Protein modelling, Appendix 4 – a second mutagenesis was achieved for each
anoctamin. In this second attempt, the localization of the tags were chosen using a predicted
structure of the proteins created by protein modelling based on the crystal structure of
nhTMEM1674 (work performed by a co-worker, Hugo Botelho, see 2.1.8 – Protein modelling to
determine the best localization for the HA tags, Appendix 4).
The mutagenesis reactions were performed using the KOD Hot Start Kit (Novagene,
71086) with complementary pairs of the custom designed HPLC-purified mutagenic primers
described in Appendix 3 – Table 2 (ordered from StabVida).
The mutagenesis reaction is a regular PCR reaction, with primers that are not completely
complementary to the template sequence; instead, they contain the 3-HA tag meant to be
inserted. The PCR programs used are displayed in Appendix 3 – Table 3.
The result of these mutagenesis reactions is a mixture of the template plasmid and a
new plasmid containing the desired insertion. After confirming the amplification by
electrophoresis using a 0.8 % agarose gel, the PCR products were incubated 1 h at 37ºC with
DpnI (Invitrogen, ER1702), a restriction enzyme that specifically hydrolyses methylated DNA.
This results in complete degradation of the template DNA, heavily methylated because of its
bacterial origin, leaving the mutated DNA, synthesized in vitro, intact.
After the hydrolysis step, bacteria were transformed with the PCR products and grown
in LB agar plates with 100 μg/mL ampicillin. The correct insertion of the 3-HA tag was first
confirmed using “colony PCR” with primers that bind at 5’ and 3’ of the inserted sequence
(primers and PCR programs in Appendix 3 – Tables 4 and 5). The “colony PCR” reaction consists
of a normal PCR, using the DNA directly from the bacterial colony (without DNA extraction and
purification). The plasmid DNA of the bacterial colonies with the correct size of the insertion was
then extracted (2.1.4 – Plasmid DNA extraction and quantification) and the insertion was finally
confirmed by DNA sequencing (2.1.6 – DNA sequencing, and Appendix 2).

Materials and Methods
16
2.1.8) Protein modelling to determine the best localization for the HA tags
As already referred, for Ano6, Ano9 and Ano10, it was necessary to insert the 3-HA tag
in two different positions. The first attempt was performed according to the predicted
sequences available in UniProt126.
After DNA sequencing of the mutagenesis products, cells were transfected with the
double-tagged constructs in order to determine whether the 3-HA tag was indeed inserted in a
loop located at the extracellular side of the plasma membrane.
For Ano6, after transient transfection (2.2.3 – Transient transfections) with the first
construct, it was not possible to detect the 3-HA tag staining outside of the cell (i.e. when
performed an immunofluorescence assay without membrane permeabilization – 2.4.1 –
Immunofluorescence of anoctamins – no signal was detected, see Appendix 4 – Fig.40).
Moreover, the number of transfected cells was always low. Regarding this issue, two approaches
were followed. In the first one, an immunofluorescence assay with membrane permeabilization
was made using a membrane antibody as control (E-cadherin), and an antibody for Ano6. The
results obtained suggest that Ano6 was retained in the ER, not trafficking to the membrane, as
no overlay between E-cadherin and Ano6 was observed (Appendix 4 – Fig.42). For the second
approach, Ano6 structural models were generated using the I-TASSER server128 (work performed
by a co-worker, Hugo Botelho and included here with permission, see Appendix 4). With this
method, the predicted structure of Ano6 was found to be completely unfolded, possibly
explaining the ER retention of the protein (Appendix 4 – Fig.38).
I-TASSER (Iterative Threading ASSEmbly Refinement) is a hierarchical method for protein
structure and function prediction. Structural templates are first identified from the PDB,
followed by the construction of full-length atomic models. Finally, the 3D models are developed
using a protein function database.
The amino acid sequences for the three anoctamins were submitted to the server and
the structure of the TMEM16 protein from the fungus Nectria haematococca (nhTMEM16)74 was
used as a template for the modelling. Initially, models were obtained for Ano6, Ano9 and Ano10
structures without the tags (GFP and 3-HA). Using these models it was possible to select with
more confidence a presumable extracellular loop in which the insertion of the 3-HA tag would:
i) be exposed to the exterior of the cell; and ii) be less likely to affect the protein structure. After
choosing the new localizations for the tags, the structural models of the first and second
constructs of each anoctamin were also obtained using the I-TASSER server to determine those
two aspects. All figures were prepared with PyMOL129 (work performed by a co-worker, Hugo
Botelho and included here with permission, see Appendix 4).
For Ano6, the correct localization of the 3-HA tag in the second construct (predicted by
the structural model) was confirmed by an immunofluorescence assay on transiently transfected
cells without plasma membrane permeabilization (Appendix 4 – Fig.43 and 44).
For Ano9, although the transfection rates as well as the GFP expression were high, the
first construct did not show any membrane staining of the 3-HA tag (Appendix 4 – Fig.46).
Nevertheless, the cellular localization of Ano9 is still unknown, with some studies suggesting
that it is mainly cytoplasmic84. However, since the second construct of Ano6 based on the model
showed the desired results, another mutagenesis was performed for Ano9, also choosing the

Materials and Methods
17
localization of the 3-HA tag in a probable extracellular loop (based on the structural model).
After transient transfection with this construct, it was again not possible to detect the 3-HA tag
without membrane permeabilization (Appendix 4 – Fig.48). Even though these results did not
match what it was expected, this construct was used for further experiments, including the
generation of stable cell lines overexpressing Ano9. This decision was made based on the still
unknown localization of this protein, and because the two structural models of the construct
seemed to have the correct localization of the tag. In this case, if Ano9 is not really in the
membrane under normal cellular conditions, maybe the knockdown of other cellular
components could alter this situation. This hypothesis will be further studied with the siRNA
screens.
For Ano10, although the structural model of the first construct appeared to be similar
to the native protein and with the 3-HA tag located in an extracellular loop, it was never possible
to transfect cells with it (Appendix 4 – Fig.50). For this reason, another mutagenesis was
performed. With this second construct the cells could be transfected but with a very low
transfection rate. In this case it was not possible to detect clearly the 3-HA tag without plasma
membrane permeabilization (Appendix 4 – Fig.51). However, similarly to Ano9, the cellular
localization of this protein is still controversial, so the further experiments were also done using
this construct.
2.1.9) Cloning
The double-tagged constructs of Ano6 and Ano9 were cloned into pLVX-TRE3G using the
In Fusion® HD Cloning Kit, with the purpose of creating lentiviral particles to transduce human
cells and thus create stably transfected cell lines with homogeneous transgene expression. As
the Ano10 mutagenesis caused some difficulties, the cloning of this anoctamin into the pLVX-
TRE3G vector is currently being done.
The cDNAs of the constructs were amplified through PCR reactions (primers and PCR
programs in Appendix 3 – Tables 6 and 7) creating 16 bp extensions in both C- and N- terminals.
The pLVX-TRE3G was linearized using BamHI (Promega, R6021) and MluI (Fermentas,
ER0561) (2h at 37ºC) restriction enzymes which create sticky ends complementary to the
anoctamins’ primer extensions.
The linearized vector as well as the anoctamins cDNAs with extensions were spin-
column purified using the NZYGelpure kit (NZYTech, MB011). The In-Fusion cloning reaction was
then performed (In Fusion HD Cloning Kit – Appendix 5 – Table 8) and afterwards competent
cells were transformed with the cloning reaction product. The In-Fusion HD Cloning Kit was first
tested using positive and negative controls provided in the kit (Appendix 5 – Table 9).
The correct insertion was confirmed through “colony PCR” (using primers that bind to
the anoctamin, to confirm that it was inserted in the vector – Appendix 3 – Tables 4 and 5) and
the plasmid DNA of the colonies in which the band size was correct was extracted. The cloning
products were first digested with specific restriction enzymes (that digest differently according
to the presence or absence of the insertion of the anoctamin) and then sequenced (StabVida).

Materials and Methods
18
2.1.10) Production of lentiviral particles
Lentiviral particles with pLVX-Tet-3G, pLVX-TRE3G-Ano6 3-HA GFP and pLVX-TRE3G-
Ano9 3-HA GFP DNAs were produced in HEK (Human embryonic kidney) 293T cells (2.2.1 – Cell
lines and culture conditions and Appendix 5 – Fig.52).
The cells were seeded at a density of 5 x 10⁵ cells per well of a 6-well plate in DMEM
(Dulbecco's Modified Eagle Medium with high glucose and L-glutamine, Lonza - BioWhittaker,
BE12-604F) + 10% Foetal Bovine Serum (FBS, Gibco Life Technologies, 10270) and incubated for
24 h at 37ºC, 5% CO2. Then, cells were transfected with 5 µg of DNA per well – 1.96 µg of pLVX
(pLVX-Tet-3G, pLVX-TRE3G-Ano6 3-HA GFP or pLVX-TRE3G-Ano9 3-HA GFP), 1.96 µg of
packaging plasmid pCMV-dR8.74psPAX2, 0.98 µg of pRev (plasmid containing Rev, a protein
necessary for mRNA translation) and 98 ng of envelop plasmid VSV-G/pMD2.G. The protocol
used for this transfection was the protocol of Jetpei (Polyplus – 2.2.3 – Transient transfections).
The cells were incubated for 18 h at 37ºC, 5% CO2.
The medium was then changed to DMEM + 10% FBS to remove the transfection reagent
and the cells were incubated for 30 h at 37ºC, 5% CO2.
The media containing the lentivirus (the three different lentivirus were produced by
different cells) were harvested and the packaging cells were discarded. The viral particles
harvested were immediately used to transduce cells or were stored at -80ºC for further use.
2.1.11) Lentiviral infection – Generation of stably transduced cells
Cells (CFBE 41o-, CFBE wt- and F508del-CFTR, CFBE mCherry wt- and F508del-CFTR and
HeLa H2B mCherry – 2.2.1 – Cell lines and culture conditions) were plated on p60 plates at a
concentration of 8x10⁵ cells per plate in 3 mL of EMEM (Eagle’s Minimum Essential Media with
L-Glutamine, Lonza - BioWhittaker, BE12-611F)/DMEM (according to the cell type) + 10% FBS
and were incubated for 24 h at 37ºC, 5% CO2.
The cells were co-infected with 1 mL of pLVX-Tet3G, 1 mL of pLVX-TRE3G-Ano6 3-HA
GFP or pLVX-TRE3G-Ano9 3-HA GFP and 1 mL of EMEM + 10% FBS with Polybrene
(Hexadimethrine bromide, Sigma-Aldrich, H9268-5G) infection enhancer (8 µg/mL final
concentration). The plates were centrifuged at 10 g for 1 h at 25ºC and then incubated for 24 h
at 37ºC, 5% CO2.
The medium was changed to EMEM/DMEM + 10% FBS without antibiotics and the cells
were incubated for 24 h at 37ºC, 5% CO2.
The medium was then changed to EMEM/DMEM + 10% FBS containing half of the
concentration needed of each antibiotic to kill all the non-infected cells (1 µg/mL of puromycin
– selection of pLVX-TRE3G-Ano6/9 3-HA GFP – and 200 µg/mL of G418 – selection of pLVX-
Tet3G). The antibiotic concentrations were determined through the results obtained from the
antibiotic dose-dependent survival curves (Appendix 6, Fig. 55 and 56).
The cells were incubated for 48 h at 37ºC, 5% CO2 and the medium was then changed to
EMEM/DMEM + 10% FBS supplemented with 2 µg/mL of puromycin and 400 µg/mL of G418.
Afterwards the medium was changed every 48 h and the cells were kept in culture at 37ºC, 5%
CO2.
Materials and Methods
19
To analyse the expression of the desired proteins in the stably transduced cells, 1 µg/mL
of doxycycline (Sigma-Aldrich, D9891) was added. The protein expression was detected through
its GFP fluorescence.
The correct insertion of the anoctamins’ constructs on the different cell types was
confirmed through sequencing of the extracted gDNA (2.1.5 – Genomic DNA extraction; 2.1.6 –
DNA sequencing) from the cells.
2.1.12) Cell sorting
CFBE 41o- and CFBE mCherry wt and F508del-CFTR stably overexpressing Ano6 or Ano9
3-HA GFP were sorted using BD FACSAria™ II cell sorter in IMM (Instituto de Medicina Molecular,
Lisboa).
The cells were induced with 1 µg/mL of doxycycline in order to be selected according to
their GFP fluorescence intensity.
Using the FSC-A (forward scatter) and SSC (side scatter) parameters it was possible to
look at the mixture of cells and distinguish them based off of size and internal complexity. With
these two parameters only living cells were selected. The next step was to use FSC-A and FSC-H
parameters to select single cells (singlets, i.e. cells that are not attached to other cells) among
the living cells. After these two steps of gating, the GFP negative and the GFP positive cells with
higher fluorescence intensity were selected and sorted.
The results of the sorting as well as the immunofluorescence results with sorted cells
are displayed in Appendix 7 – Fig. 58-87.
2.2) Cell culture
2.2.1) Cell lines and culture conditions
Cystic Fibrosis Bronchial Epithelial cells (CFBE 41o‐ cells)130, further referred to as CFBE,
were cultured in EMEM supplemented with 10% FBS. These immortalized cells were developed
from bronchial epithelial cells from an F508del-CFTR homozygous CF patient and allowed the
development of other types of cells used on this work.
CFBE cells stably overexpressing wt-CFTR or F508del-CFTR (CFBE wt-CFTR or CFBE
F508del-CFTR)131 were grown in EMEM supplemented with 10% FBS and 2 µg/mL of puromycin
(Sigma-Aldrich, P8833).
CFBE cells stably overexpressing wt-CFTR or F508del-CFTR with a mCherry tag in N-
terminus and with a FLAG tag (octapeptide: DYKDDDDK) inserted in the fourth extracellular
loop under Tet-On promoter induction (CFBE mCherry wt-CFTR or CFBE mCherry F508del-CFTR)
were created in our laboratory132. These cells were cultured in DMEM supplemented with 10%
FBS, 2 µg/mL of puromycin and 100 µg/mL of blasticidin (InvivoGEN, ant-bl-1). A schematic
representation of this construct is shown in Appendix 8 – Fig.88.
Human Embryonic Kidney 293T cells (HEK 293T)133, 134 were cultured in DMEM
supplemented with 10% FBS.

Materials and Methods
20
Human cervical carcinoma cells (HeLa Kyoto)135, 136 stably expressing H2B histone
attached to mCherry (HeLa H2B mCherry) were a kind gift from Dr. Gerlich’s Group (IMBA –
Institute of Molecular Biotechnology, Vienna, Austria). The cells were grown in DMEM
supplemented with 10% FBS, and 0.5 µg/mL of puromycin.
CFBE, CFBE wt/F508del CFTR, CFBE mCherry wt/F508del CFTR or HeLa H2B mCherry cells
stably overexpressing Ano6 or Ano9 3-HA GFP under Tet-On promoter induction were produced
as described in 2.1.11 – Lentiviral infection – Generation of stably transduced cells. The selection
of infected cells was made using 400 µg/mL of G418 (Geneticin, Sigma-Aldrich, A1720) and 2
µg/mL of puromycin. Among these cells, only CFBE did not have resistance for puromycin, so the
other cells were only selected by G418. Whenever the presence of a more homogeneous cell
population was required, the cells were sorted as previously described in 2.1.12 - Cell sorting.
All cell lines were maintained at 37ºC in a humidified atmosphere of 5% (v/v) CO2. All
cells were tested for mycoplasma infection, being mycoplasma free.
2.2.2) Polarized cells
For polarization-dependent assays, specifically immunofluorescence assays in polarized
cells and micro-Ussing chamber, cells were seeded onto collagen IV (Sigma-Aldrich, C7521)
coated Costar 12mm Snapwell filter inserts with 0.4 µm Pore Polyester Membrane and 1.12 cm2
surface area (Corning, 3801). Cells were seeded on the apical side of the filter at a density of 3 x
105 cells per filter, using normal cell media without antibiotics. The filters were maintained in
liquid-liquid interface. After 2 days of incubation, the amount of FBS in the media was changed
from 10% to 5%, and cells took 2-7 days to polarize.
The transepithelial electrical resistance (TEER) was routinely measured using a volt-
ohmmeter (Millicell-ERS, Millipore, MERS00001). Experiments were performed when a
confluent monolayer was formed, as judged by a TEER above 600 Ω/cm2. When this was
achieved, cells were induced with 1 µg/mL doxycycline in both basal and apical side.
2.2.3) Transient transfections
CFBE cells or HEK 293T cells were transfected using cationic liposomes or polymers.
Lipofection is based on the ability of cationic lipids to form unilamelar liposomes that
adsorb nucleic acid molecules to their surface and are internalized by the cells. The transfection
result is protein expression (plasmids) or down-regulation of the target genes (siRNAs). In this
work, three liposomal formulations were used, Lipofectamine 2000 (Invitrogen, 11668019),
Fugene HD (Promega, E2311) and JetPei® (Polyplus, 101-40N).
A polymer was also used for transfections (Xfect Transfection Reagent, Clontech,
631317), which is a biodegradable transfection polymer with low cytotoxicity and high
transfection efficiency. It can be used to transfect a broad range of cell types in a serum-
compatible protocol.
For transfection with plasmids which encode for GFP fusion proteins, transfection
efficiency could be estimated by direct counting of fluorescent vs. non fluorescent cells under a

Materials and Methods
21
fluorescence microscope – Leica DMI 6000B. For transfection with siRNAs, the efficiency was
estimated by the decrease of fluorescence of the target gene (namely Ano6).
Transfection with Lipofectamine 2000
Lipofectamine and DNA/siRNA were incubated separately for 5 min in Opti-MEM
Reduced Serum Medium (Gibco, 31985) and then the diluted DNA/siRNA was added to diluted
Lipofectamine (1:2 ratio). DNA/siRNA-lipid complex was incubated for 20-30 min at room
temperature and then added to 70-80% confluent cells (seeded the day before). Medium was
changed after 6 h and 24 h. When using plasmid DNA, the experiments were performed 48 h
post-transfection, and when using siRNA transfections, doxycycline was added 24 h post-
transfection, and the experiments were performed after 48 h of induction.
Also with Lipofectamine, a solid phase reverse transfection protocol was used for siRNA
screens. Plates were coated by Hugo Botelho with customized siRNAs (SilencerH Select,
Ambion)137 in a sucrose and Lipofectamine solution.
The cells were seeded on top of the coating, allowing them to take up the different
siRNAs from the solid phase. Doxycycline was added after 24 h of siRNA transfection, and the
experiments were performed 48 h post-induction.
Transfection with Fugene HD
Fugene and DNA were separately incubated for 5 min in Opti-MEM, in a Fugene:DNA
ratio of 3:1. The solutions were mixed together and allowed to incubate for 15 min at room
temperature. The mix was then added dropwise to either 70-80% confluent cells (seeded the
day before) or to freshly trypsinized cells. Medium was changed after 24 h and the experiments
were performed 48 h post-transfection.
Transfection with JetPei
JetPei and DNA were separately diluted in NaCl 150 mM. The Jetpei-NaCl solution was
added to the DNA-NaCl mix, and this final mixture was incubated for 15 to 30 min at room
temperature. The mix was then added dropwise to attached cells (seeded the day before) with
Opti-MEM medium only. Medium was changed after 6 h and 24 h, and the experiments were
performed 48 h post-transfection.
Transfection with Xfect Transfection Reagent
This transfection protocol was used for transient transfection of HEK 293T cells with the
lentiviral vectors, in order to test if the Tet-On inducible system was functional.
DNA (pLVX-TRE3G-Ano6/9 3-HA GFP and pLVX-Tet3G) was diluted in Xfect Reaction
Buffer and the solution was mixed by vortexing for 5 s. Xfect Polymer was added to the diluted
plasmid DNA (ratio DNA:Xfect Polymer 3:1) and the solutions were mixed by vortexing. The DNA-
Polymer solution was incubated for 10 min at room temperature to allow nanoparticle

Materials and Methods
22
complexes to form. This nanoparticle complex solution was added dropwise to the attached
cells, and the cells were incubated for 4 h at 37ºC. The nanoparticle complexes were removed,
replacing the medium for fresh complete medium containing doxycycline to induce the
expression of the desired anoctamins, and the cells were incubated again at 37ºC until time of
analysis (24 h).
2.3) Generation of Knockout cells – CRISPR/Cas9 system
Bacteria and archaeal clustered regularly interspaced short palindromic repeats
(CRISPR) systems rely on CRISPR RNAs (crRNAs) in complex with CRISPR-associated (Cas)
proteins to direct degradation of complementary sequences present in invading viral and
plasmid DNA. An in vitro reconstitution of the Streptococcus pyogenes type II CRISPR system
demonstrated that crRNA fused to a normally trans-encoded tracrRNA is sufficient to direct Cas9
protein to cleave specific target DNA sequences matching the crRNA. This system is now
explored in eukaryotic organisms, making genome engineering an easier approach138.
In eukaryotic cells, Cas9 can be directed to cleave a sequence of interest using crRNA-
tracrRNA fusion transcripts, or “guide RNAs” (gRNAs). These gRNAs induce precise cleavage at
endogenous genomic loci in human cells, in a process requiring for the PAM (protospacer-
adjacent motif) sequence (a DNA sequence immediately following the DNA sequence targeted
by Cas9)139 (see Fig.6).
Cas9 generates double breaks in the DNA, which are repaired through cellular
mechanisms: Nonhomologous end joining (NHEJ) and High fidelity homology-directed repair
(HDR). NHEJ is a fast repair mechanism that ligates the two broken DNA ends possibly resulting
in point mutations and deletions, frequently disrupting open reading frames and leading to gene
knockouts (see Fig.6). HDR is used for the introduction of specific nucleotide changes in the
target gene, using a homologous template140.

Materials and Methods
23
Figure 6 - CRISPR/Cas9 system for targeted genome editing. Representation of gRNA guiding Cas9 to the target gene, followed by target specific cleavage by Cas9. DNA is then repaired by NHEJ (Nonhomologous end joining), which is a fast repair mechanism that ligates the two broken DNA ends possibly resulting in point mutations and deletions, frequently disrupting open reading frames and leading to gene knockouts. Adapted from [141].
This system was used in CFBE, CFBE wt- and F508del-CFTR cells to achieve the knockout
of Ano6. To accomplish this, cells were seeded in a T25 flask (Thermo Scientific, 130189) at a
concentration of 8 x 10⁵ cells per flask and were incubated for 24 h at 37ºC, 5% CO2. The cells
were then transfected with 5 µg of DNA – 1.5 µg of each gRNA (two different gRNAs were
simultaneously used to improve knockout efficiency), 1.5 µg of Cas9 plasmid with a GFP tag and
500 ng of a plasmid containing the gene that confers resistance to hygromycin – using the Jetpei
protocol (2.2.3 – Transient transfections, and Appendix 9). After 24 h the medium was changed
to EMEM + 10% FBS without antibiotics, and the cells were incubated for 48 h at 37ºC, 5% CO2.
The cells were then trypsinized to a p100 plate (Thermo Scientific, 130182) using EMEM + 10%
FBS with 100 µg/mL hygromycin (Sigma-Aldrich, H772). The cells were again incubated for 48 h
at 37ºC, 5% CO2 and then the medium was changed to EMEM + 10% FBS with 200 µg/mL
hygromycin. The most suitable concentration of hygromycin was determined through the results
obtained from the antibiotic dose-dependent survival curves (Appendix 6 – Fig.57). Afterwards
the medium was changed every 48 h and the cells were kept in culture at 37ºC, 5% CO2. After
approximately 10 days, clones were picked to a 24-well plate (Thermo Scientific, 930186) using
cloning discs with trypsin (Sigma-Aldrich, Z374431).
Due to the slow growth of the clones, the knockout of Ano6 has not yet been confirmed.
However, the transfection could be followed by the green fluorescence of the transfected cells
conferred by Cas9-GFP plasmid (Fig. 7, 8 and 9), and through the survival of the cells when
incubated with hygromycin. Whenever possible, the knockout will be ascertained using Western
Blot and through sequencing (Stabvida).

Materials and Methods
24
Figure 7 – CFBE parental cells transfected with the plasmids necessary for Ano6 knockout. With the GFP fluorescence (bottom left image) it is possible to detect the cells transfected with the Cas9-GFP plasmid, which means that the Ano6 knockout is possible in these cells. Images were acquired with the 10x objective. Scale bar represents 100 µm.
Figure 8 - CFBE wt-CFTR cells transfected with the plasmids necessary for Ano6 knockout. With the GFP fluorescence (bottom left image) it is possible to detect the cells transfected with the Cas9-GFP plasmid, which means that the Ano6 knockout is possible in these cells. Images were acquired with the 10x objective. Scale bar represents 100 µm.

Materials and Methods
25
Figure 9 - CFBE F508del-CFTR cells transfected with the plasmids necessary for Ano6 knockout. With the GFP fluorescence (bottom left image) it is possible to detect the cells transfected with the Cas9-GFP plasmid, which means that the Ano6 knockout is possible in these cells. Images were acquired with the 10x objective. Scale bar represents 100 µm.
2.3.1) gRNA design and synthesis
As already stated, the purpose of using the CRISPR/Cas9 system was to create cells that do
not express Ano6 (Ano6 knockout). To achieve this goal, it was necessary to design proper gRNAs
and to select the genomic sequence of this gene that is specifically recognized by them.
The selected target sequence for Ano6 is a 23 bp genomic site with the form 5’-N20NGG-3’.
Target specificity of Cas9 protein relies on the presence of specific nucleotides 3’ to the
protospacer sequence (the previously referred protospacer adjacent motif (PAM)). However this
PAM motif is only present in the genomic region and it is not included in the gRNAs.
Ano6 DNA sequence from the NCBI database142 was analysed, selecting two different 23 bp
genomic sequences matching the criteria143. This selection was made with the help of a co-
worker, Ines Pankonien. The final sequences were blasted using NCBI’s nucleotide BLAST tool,
in order to select only sequences that were specific for the ANO6 gene.
The gRNA sequences are displayed in Appendix 9.
2.4) Protein Analysis
2.4.1) Immunofluorescence of anoctamins
Non-polarized cells
Cells were grown in cover slips in 24-well plates or in 8-wells labteks (Sigma-Aldrich,
C7182). Two types of protocols were used: one in which the plasma membranes were

Materials and Methods
26
permeabilized (using 0.5% Triton X-100 (v/v) (Amersham Biosciences, 17-1315-01) diluted in
phosphate buffered saline (PBS)) and the other without membrane permeabilization.
In the first protocol, cells were washed 3 times with PBS (137 mM NaCl (Calbiochem,
7760); 2.7 mM KCl (Sigma-Aldrich, P9541); 10 mM Na2HPO4 (Sigma-Aldrich, S9763); 1.8 mM
KH2PO4 (Fluka, 60229); pH 7.4) supplemented with 0.7 mM of CaCl2 (Sigma-Aldrich, 223506) and
1.1 mM of MgCl2 (Merck Millipore, 105833) (termed PBS++ from now on) and fixed for 10 min
with 4% (v/v) paraformaldehyde (PFA) (Merck Millipore, 14003). Next, the cells were washed 3
times with PBS, permeabilized for 5 min with 0.5% Triton X-100 (v/v) and washed again 3 times
with PBS. The cells were then incubated at room temperature with a specific primary antibody
diluted in PBS with bovine serum albumin (BSA) (Sigma-Aldrich, A9647) 1% (w/v) for 1 h (the
negative controls were incubated with PBS with BSA 1% (w/v) instead of the primary antibody).
The cells were washed 3 times with PBS and incubated at room temperature in the dark with
the secondary antibody diluted in PBS with BSA 1% (w/v) for 1 h. The cells were then washed 3
times with PBS and incubated 10 min in the dark with Hoechst 33342 Fluorescent Stain (Life
Technologies, H3570). The cover slips were mounted in glass slides with Vectashield mounting
medium (Vector Laboratories, H-1000) and sealed.
In the protocol without membrane permeabilization, the cells were first washed 3 times
with PBS++ and kept on ice in an ice cold chamber for 15 min. Then they were incubated with
the primary antibody for 2 h in the cold chamber. Next, the cells were washed 3 times with
PBS++ and fixed with 4% (v/v) paraformaldehyde for 10 min, outside the cold chamber. The
remaining protocol is equal to the final steps of the permeabilization protocol (from the
washings before the incubation with the secondary antibody to the mounting in glass slides).
Immunofluorescence staining was observed in the Leica DMI 6000B fluorescence
microscope, which was also used to acquire the images.
The antibodies used for immunofluorescence are displayed in Appendix 10 – Table 11.
Polarized cells
CFBE cells were polarized as described in section 2.2.2 – Polarized cells.
Filters were washed 3 times for 5 min with PBS++ at room temperature on both apical and
basolateral sides. All treatments were applied to both sides of the filters. The cells were fixed
with PFA 4% (v/v) for 30 min, and then washed again 3 times for 5 min with PBS++. Next, the
cells were permeabilized using triton X-100 0.5% (v/v) for 15 min. After a blocking step of 20 min
with BSA 1% (w/v), the filters were removed from their supports using a scalpel. Each filter was
placed in one well of a 12 or 24-well plate (Thermo Scientific, 130185 – 12-well plate) and were
incubated overnight at 4ºC with the primary antibodies in 1% (w/v) BSA. Afterwards the filters
were subjected to a more stringent washing step using PBS with 0.05% of triton X-100. After,
the filters were incubated with a mix of the secondary antibody and nuclear dye ToPro3 Iodide
(Life Technologies, T3605) (1:750) for 1 h at room temperature. Finally, the filters were mounted
on slides with Vectashield anti-fading mounting medium and sealed.
The antibodies used are displayed in Appendix 10 – Table 11.

Materials and Methods
27
Live-cell imaging
HeLa H2B mCherry cells were seeded in a p60 plate in a concentration of 1.5 x 10⁵
cells/mL, using DMEM without phenol red (Lonza, BE12-917F) supplemented with 25 mM HEPES
(Gibco, 15630) and 2 mM L-glutamine (Gibco, A2916801). Images were acquired every 20 min
in Leica DMI 6000B fluorescence microscope during 20 h in bright field and with the mCherry
filter. The cell division was observed through the mCherry staining of the nuclei (H2B histone)
and the acquired images were used to make a film (gif/avi) – Fig.10.
Figure 10 – Live-cell imaging of HeLa H2B mCherry cells. Images were acquired at the beginning of the experiment (0 min) and at 140 min, with the 10x objective. Cell division can be detected through bright field and mCherry nuclear staining, as indicated by arrows. Scale bar represents 50 µm.
HeLa H2B mCherry cells were also stably transfected with Ano6 3-HA GFP or Ano9 3-HA
GFP, but it was not yet possible to sort the cells (selecting only the GFP positive cells). However,
when the cells are sorted, live-cell imaging will also be performed with these cells, in order to
study the cellular localization of overexpressed Ano6 and Ano9. The cell division will be observed
through the mCherry staining of the nuclei, and the localization of these anoctamins will be
assessed using the GFP channel.
2.4.2) Image acquisition, processing and analysis
For non-polarized cells, images were acquired using the Leica DMI6000B microscope.
According to the experiments, all channels available in the microscope were used:
DAPI/Hoechst, GFP, Alexa Fluor 568/mCherry and Alexa Fluor 647/Cy5.
With non-polarized cells used in siRNA screens (anoctamins traffic assay), automatic
imaging was possible using the Leica DMI6000B microscope.
Automatic image analysis was performed with open source software tools (CellProfiler
and R) using specific pipelines appropriate for traffic assays.

Materials and Methods
28
For polarized cells, images were acquired using a Leica TCS SPE confocal microscope with
a 63x oil objective. In this case, fluorescence was accessed in three different channels – GFP,
Alexa Fluor 568 and ToPro3. Image edition was performed using Visage Imaging Amira 5.3.3 for
section’s 3D reconstruction, made available by Professor Sólveig Thorsteindóttir at
DevEM/CE3C.
2.4.3) Western Blot
Cell lysis and protein collection
Cells were grown on 6-well plates or p35 plates. To extract the protein, cells were
washed twice with cold PBS and lysed with sample buffer (1.5% (w/v) SDS; 5% (v/v) glycerol;
0.01% (w/v) bromophenol blue; 0.05 mM dithiotreitol; 0.095 M Tris, pH 6.8). DNA was sheared
using benzonase 25U/mL (Sigma-Aldrich) in the presence of MgCl2 2.5 mM. The cells with sample
buffer were centrifuged at 13000 rpm for 5 min at 4ºC and the supernatant was collect.
Protein quantification
Total protein concentration in different samples was assessed by a Bradford assay144. A
regression line was made using increasing concentrations of BSA.
The protein solutions were incubated 5 min with BioRad Protein Assay Reagent (Bio-
Rad, 500-0006EDU) and the absorbance was measured at 595 nm using the spectrophotometer
(Jasco V-560 UV/Vis Spectrophotometer).
SDS-PAGE
Protein extracts were separated by SDS-Polyacrylamide gel electrophoresis (PAGE) on 7
or 10% (w/v) separating and 4% stacking gels at 100-150V followed by transfer onto PVDF
(Polyvinylidene Fluoride) membranes (Millipore) at 400 mA for 1 h 30 min.
After blocking with 5% (w/v) non-fat milk in phosphate buffered saline (PBS, NaCl 137
mM; KCl 2.7 mM; KH2PO4 1.5 mM; Na2HPO4 6,5 mM, pH 7.4) containing 0.1% (v/v) Tween (PBS-
T) for 1 h, the membranes were probed overnight at 4ºC with primary antibodies diluted in 5%
(w/v) milk in PBS-T.
The cells were then washed three times during 10 min with PBS-T, followed by
incubation for 1 h at RT with horseradish peroxidase-conjugated secondary antibodies in 5%
(w/v) milk-PBS-T. Chemiluminescent detection was performed using Chemidoc XRS+ analyser
(BioRad) and the signal was developed with the Clarity Western ECL Substrate (Bio-Rad, 170-
5061). Finally, the quantification was performed with the ImageLab software (Bio-Rad).
The antibodies used for Western Blot are displayed in Appendix 10 – Table 12.
2.4.4) Biotinylation
Cells were grown in p60 plates until confluence was reached and incubated at 4ºC with
NHS LC Biotin buffer (1 mg biotin (EZ-Link Hydrazide-LC-Biotin, Thermo Scientific, 21339)/1 mL
PBS with 1 mM MgCl2, 0.1 mM CaCl2, pH 8.2) for 1 h protected from the light. Cells were lysed

Materials and Methods
29
with 1 mL of BL buffer (25 mM HEPES, 1% (v/v) Triton X-100, 10% (v/v) glycerol, pH 8.2),
supplemented with a 1x Complete protease inhibitor cocktail (PIC, Roche, 11697498001) and
collected with a cell scraper. Cell membranes and debris were pelleted by centrifugation at
14,000 rcf for 10 min at 4ºC. 100 µL of the supernatants were collected (whole cell lysate). The
remaining samples were incubated overnight at 4ºC with streptavidin beads (Thermo Scientific,
20353). The beads were pelleted, washed 2x with PBS and 1x with BL buffer and the samples
were then analysed by Western Blot.
2.5) Functional Analysis
2.5.1) Iodide efflux
Iodide efflux assays were performed to determine the viability of the double-tagged
anoctamins. Two different protocols were use: one for cells transiently transfected with the
double-tagged anoctamins, and the other for the stably transfected cells.
Protocol for transiently transfected cells
First, HEK 293T cells were seeded in 6-well plates and transfected according to the
Fugene protocol (2.2.3 – Transient transfections). Cells transfected with empty pLVX-TRE3G
vector were used as control, and all transfections were perform in duplicate: one to stimulate
with 100 µM ATP and the other to readout as unstimulated sample.
Loading buffer (136 mM NaI, 3 mM KNO3, 2 mM Ca(NO3)2, 0.5 mM MgSO4, 10 mM
glucose, 20 mM HEPES, pH 7.5) and efflux buffer (136 mM NaNO3, 3 mM KNO3, 2 mM Ca(NO3)2,
0.5 mM MgSO4, 10 mM glucose, 20 mM HEPES, pH 7.5) were pre warmed to 37ºC.
The cells were first washed twice with 2 mL of loading buffer and then incubated with 2
mL of loading buffer for 30 min at 37ºC. Following this incubation period, the cells were washed
four times with 2 mL of efflux buffer. The cells were then equilibrated in 2 mL of efflux buffer
for 10 min at 37ºC. After the equilibration period, 2 mL of efflux buffer was added to the
unstimulated set of cells and 2 mL of efflux buffer with 100 µM ATP was added to the stimulated
set. Both sets were incubated for 5 min at 37ºC. The cells were washed with 3 mL of efflux buffer
and then were lysed with 1 mL of efflux buffer with 0.5% Triton X-100 for 5 min. The lysate was
collected to a 1.5 mL tube and centrifuged at 13,000 rpm for 5 min.
All the samples were read with the iodide electrode to calculate the amount of iodide
remaining in the cells. In order to compare the remaining iodide in the stimulated and
unstimulated cells, 15 µL of the lysate was used for protein quantification (2.4.3 – Western Blot
– Protein quantification).
Protocol for stably transfected cells
Cells were incubated for 1 h in loading buffer (13 mM NaI, 3 mM KNO3, 2 mM Ca(NO3)2,
20 mM HEPES, and 11 mM D-glucose, pH 7.4) and then washed 10 times with efflux buffer (136
mM NaNO3 replacing NaI in the loading buffer). Anoctamin-mediated iodide efflux was
Materials and Methods
30
measured at room temperature using an iodide selective electrode (Thermo Electron Corp,
MP225). The measurements were made at 1 min intervals, being the cells stimulated with 100
µM ATP only from min 1 to 4.
2.5.2) Micro-Ussing chamber
For micro-Ussing chamber experiments, inducible CFBE cells overexpressing Ano6 or
Ano9 3-HA GFP were seeded at approximately 3 x 10⁵ cells/mL onto collagen IV-coated Costar
12 mm Snapwell Insert with 0.4 µm Pore Polyester Membrane and 1.12 cm2 area, as referred in
2.2.2 – Polarized cells. Transepithelial electrical resistance (TEER) was routinely measured using
a volt-ohmmeter.
Monolayers were mounted in modified perfused micro-Ussing chambers and analysed
under open-circuit conditions. Anoctamins’ activity was measured when a confluent monolayer
was formed, as judged by a TEER above 600 Ω/cm2. Anoctamins were activated with ATP (100
µM) and anoctamin inhibition was achieved with CaCCinh-A01 (30 µM).
Briefly, the apical and basolateral surfaces of CFBE cells were continuously perfused with
Ringer solution (145 mM NaCl, 0.4 mM KH2PO4, 1.6 mM K2HPO4, 5 mM D-glucose, 1 mM MgCl2,
and 1.3 mM Ca-gluconate), at a rate of 3-5 mL/min. pH was adjusted to 7.4 and the experiments
were carried out at 37ºC under open circuit conditions.
Following a 15-20 min stabilization period, two additions of ATP 100 µM (anoctamins’
activator) and one of the CaCC inhibitor CaCCinh-A01 were performed sequentially (apical side).
Next, CaCCInh-A01 and ATP were simultaneously added. After a 30 min washout period, ATP was
again added to the apical side, followed by an addition of ATP to the basolateral side of the filter.
Transepithelial resistance (Rte) was determined by applying short (1 s) current pulses (I
= 0.5 µA) and the corresponding changes in transepithelial voltage (Vte) were recorded
continuously. The equivalent short-circuit currents (Ieq-SC) were calculated by Ohm’s law from Vte
and Rte (Ieq-SC = Vte/Rte), with appropriate correction for fluid resistance.
2.6) Microscopy assay for siRNA screens
2.6.1) siRNAs
The siRNAs used in this experiment were part of a library of siRNAs shown to have an
effect (positive or negative) on CFTR traffic to the plasma membrane (“hits” from the CFTR
screen) in a primary screen performed in A549 cells (human alveolar epithelial cells) performed
by Shehrazade Daihimène – [145] and unpublished data. “Scrambled” non-targeting siRNA was
used as a negative control.
2.6.2) siRNA pilot screen
To first try the reverse transfection in the stably transfected cells and to assess the
suitability of the screening platform to the identification of genes that affect Ano6 traffic, a pilot
screen was performed using a labtek coated with 384 spots of different siRNAs pre-mixed with

Materials and Methods
31
lipofectamine. CFBE Ano6 3-HA GFP cells were grown to confluence and then split to 50%
confluence. After 24 h, cells were trypsinized to an antibiotic-free medium and seeded on the
siRNA-spotted labtek (105 cells in 2 mL).
Ano6 expression was induced 24 h after seeding with antibiotic-free medium
supplemented with 1 µg/mL doxycycline. Immunofluorescence experiments were performed 48
h after induction (72 h post-siRNA transfection). Automatic imaging was made using the Leica
DMI6000B microscope.
Automatic image analysis was performed with open source software tools (CellProfiler
and R) using specific pipelines appropriate for traffic assays. The first algorithm used calculated
the illumination correction functions for background subtraction (for each channel). The second
pipeline comprises background subtraction, cell segmentation, fluorescence integration and
basic quality control. These quality control steps exclude cells which do not significantly express
Ano6 3-HA GFP, have atypical morphology or contain saturated pixels. Next, an algorithm for
quantification of GFP (Ano6) or Cy5 (3-HA) signal was used. In this pipeline the nuclei were
identified as primary objects. Cells containing too large or too small nuclei, cells with nuclei with
wrong eccentricity and localized too close to the image border were removed from the data
analysis. Secondary objects were identified expanding from the nuclei on the images acquired
in the GFP or Cy5 channels.
The fluorescence quantification data allowed the determination of the anoctamins
traffic in each cell according to the following formula:
𝐴𝑛𝑜𝑐𝑡𝑎𝑚𝑖𝑛 𝑇𝑟𝑎𝑓𝑓𝑖𝑐 𝐸𝑓𝑓𝑖𝑐𝑖𝑒𝑛𝑐𝑦 = 𝑃𝑀 𝐴𝑁𝑂
𝑇𝑜𝑡𝑎𝑙 𝐴𝑁𝑂=
𝐶𝑦5 𝐼𝑛𝑡𝑒𝑔𝑟𝑎𝑡𝑒𝑑 𝐹𝑙𝑢𝑜𝑟𝑒𝑠𝑐𝑒𝑛𝑐𝑒
𝐺𝐹𝑃 𝐼𝑛𝑡𝑒𝑔𝑟𝑎𝑡𝑒𝑑 𝐹𝑙𝑢𝑜𝑟𝑒𝑠𝑐𝑒𝑛𝑐𝑒
For each image, the anoctamin traffic efficiency was considered the median for all the
cells in the image. After, a custom R script146 was used to exclude out of focus images and images
with high background fluorescence.
After averaging the anoctamin traffic efficiency for all images from the same siRNA
treatment, the effect of different siRNAs on the anoctamins traffic was compared with the
results obtained with the “scrambled” siRNA treatments, using the following formula:
𝐷𝑒𝑣𝑖𝑎𝑡𝑖𝑜𝑛 𝑠𝑐𝑜𝑟𝑒 = 𝑇𝑟𝑎𝑓𝑓𝑖𝑐 𝑒𝑓𝑓𝑖𝑒𝑛𝑐𝑖𝑒𝑛𝑐𝑦 − 𝑇𝑟𝑎𝑓𝑓𝑖𝑐 𝑒𝑓𝑓𝑖𝑐𝑖𝑒𝑛𝑐𝑦𝑆𝑐𝑟𝑎𝑚𝑏𝑙𝑒𝑑
2 × 𝑆𝐸𝑀𝑆𝑐𝑟𝑎𝑚𝑏𝑙𝑒𝑑
SEMScrambled is the standard error of the mean for the “Traffic Efficiency” with the
treatment with scrambled siRNA. Significant effects on the traffic efficiency were considered
when the magnitude was larger than twice the scrambled siRNA SEM. Therefore, genes in which
the deviation score was above +1, were considered traffic enhancers. Accordingly, genes having
a deviation score below -1 were considered traffic inhibitors.
2.7) Statistical Analysis
Student’s t-test for paired or unpaired samples was used as appropriate. P<0.05 was
accepted as significant.

Results and discussion
32
3. Results and discussion
3.1) Generation of stable cell lines overexpressing the double-tagged anoctamin
constructs
3.1.1) Characterization of the cell lines
To achieve the main goal of this project, i.e., to identify regulators of anoctamins’ traffic
and study their interaction with CFTR and other anoctamin family members, it was necessary to
develop a cellular model capable of detecting and discriminating between the total cellular
protein and the membrane fraction of the protein.
Regarding this objective, double-tagged constructs of anoctamin 6, 9 and 10 (Ano6,
Ano9 and Ano10) were generated. These constructs contain a GFP tagged to the C-terminus, as
well as a 3-HA (triple hemagglutinin) tag in a putative transmembrane loop of each anoctamin
so as to be outside the cell whenever the protein is at the plasma membrane (mutagenesis was
performed as described in Materials and methods – 2.1.7 – Mutagenesis). For Ano6 and Ano9 it
was possible to clone the respective constructs into a lentiviral vector (pLVX-TRE3G), allowing
the transduction of CFBE cells and thereby generating stably transfected cell lines under an
inducible (Tet-On) promoter induction.
Since CFBE cells derive from the bronchial epithelium of a CF patient, these cells
represent a good model of the processes occurring in CF. Moreover, the initial experiments were
performed with CFBE 41o- (parental) cells, which do not overexpress other proteins (like CFBE
wt- or F508del-CFTR), having a higher resemblance to in vivo cellular conditions. Additionally,
the microscope used for automated inverted fluorescence (Leica DMI 6000B) shows a leakage
between the GFP and the mCherry channel (GFP – Emission >515 nm; mCherry – Emission >590
nm), as the excitation wavelength of GFP is not narrow enough to prevent simultaneous
mCherry excitation. Consequently, mCherry emission is detected in the GFP channel. Given this
observation, the quantifications of total and membrane proteins are more accurate using these
cells which do not have another fluorescent protein present.
Representative fluorescence images of stably transfected CFBE cells overexpressing
Ano6 or Ano9 3-HA GFP (before and after sorting) are represented in Fig. 11 and 13, respectively.
Signal-to-noise ratios of GFP fluorescence of both cells types, and Cy5 (3-HA tag) signal of Ano6
(also before and after sorting) are represented in Fig. 12 and 14. This measurement compares
the level of a desired signal (in this case, GFP or Cy5 fluorescence intensity) to the level of
background fluorescence. Thus, when it is higher, the desired signal is more easily
distinguishable from the background noise. The signal-to-noise ratio is calculated using the
following formula:
Signal-to-noise ratio = 𝐶𝑒𝑙𝑙 𝑓𝑙𝑢𝑜𝑟𝑒𝑠𝑐𝑒𝑛𝑐𝑒 𝐼𝑛𝑡𝑒𝑛𝑠𝑖𝑡𝑦−𝐵𝑎𝑐𝑘𝑔𝑟𝑜𝑢𝑛𝑑 𝑓𝑙𝑢𝑜𝑟𝑒𝑠𝑐𝑒𝑛𝑐𝑒 𝐼𝑛𝑡𝑒𝑛𝑠𝑖𝑡𝑦
𝐵𝑎𝑐𝑘𝑔𝑟𝑜𝑢𝑛𝑑 𝑓𝑙𝑢𝑜𝑟𝑒𝑠𝑐𝑒𝑛𝑐𝑒 𝐼𝑛𝑡𝑒𝑛𝑠𝑖𝑡𝑦
CFBE Ano6 3-HA GFP cells show a considerable membrane expression of Ano6, as
observed with the anti-HA antibody (Cy5 secondary antibody – Fig.11). However, a large amount
of the protein also appears to be intracellular, more precisely around the nucleus, suggesting a
localization in the endoplasmic reticulum (ER) – Fig.11, GFP panel. Ano6 has been identified as
a major component of the ORCC49 and as a scramblase92, being consequently localized at the
plasma membrane, which is in agreement with these obtained results. On the contrary, some

Results and discussion
33
studies described Ano6 only as an intracellular and possibly ER protein147 which is also partially
observed in the present results. Yet, Ano6 used in the reported experiments was cloned from
mouse tissues and tagged with GFP, while the one used in the present work is human. Moreover,
the first mutagenesis we performed for the insertion of the 3-HA tag in the Ano6 construct
(Material and methods – 2.1.7 – Mutagenesis and Appendix 4 – Fig.42) revealed the same
results, with a total cytoplasmic localization of Ano6. These discrepancies can thus be due to a
structural modification of the protein caused by the insertion of tags, which disrupt the normal
protein traffic to the plasma membrane.
Due to the heterologous Ano6 expression detected in the initial and unsorted
population (Fig.11 – Left panel (before sorting)), these cells were sorted by flow cytometry in
order to select only the cells with the highest GFP signal intensity (Fig.11 – Right panel (after
sorting)). After sorting, both GFP and Cy5 signal-to-noise ratios significantly increased (Fig.12).
Therefore, this sorted cell line appears to be a bona fide model to perform siRNA screens, since
the membrane fraction and the total protein can be correctly distinguished.
Figure 11 - Immunofluorescence images of CFBE cells stably overexpressing Ano6 3-HA GFP. The expression of Ano6
was induced by the addition of 1 µg/mL of doxycycline for 48 h. Left panel – Unsorted cells; Right panel – Cells
sorted for their GFP fluorescence. Hoechst – Nuclei; GFP – Total Ano6; Cy5 – PM Ano6 (detected with an anti-HA
antibody). After sorting (right panel) it is possible to observe a more homogeneous population in both the GFP and
Cy5 channels, being these cells a more adequate model to perform siRNA screens. Images were acquired with the
40x objective in a Leica DMI 6000B microscope. Scale bar represents 30 µm.

Results and discussion
34
Figure 12 - Signal-to-noise ratios of GFP and Cy5 fluorescence in CFBE Ano6 3-HA GFP cells (n = 100 cells). With these results, it is possible to detect a significant increase in the signal-to-noise ratio in both channels when the cells are sorted, meaning that the difference between signal and background is higher. Accordingly, these sorted cells are a better model for siRNA screens. * P<0.05 was accepted as significant.
For CFBE cells stably expressing the Ano9 construct it was possible to detect a higher
GFP fluorescence (higher signal-to-noise ratio) when compared with CFBE cells overexpressing
Ano6 (Fig.14). Moreover, as observed with CFBE Ano6 3-HA GFP cells, the cell sorting for CFBE
Ano9 3-HA GFP significantly increased the GFP signal-to-noise ratio (Fig. 13 and 14).
For this cell line, however, as previously noticed with transient transfections (Materials
and methods – 2.1.8 – Protein modelling to determine the best localization for the HA tags and
Appendix 4 – Fig.48), membrane expression of Ano9 was not detected. This was observed for
the two mutagenesis strategies for this construct (insertion of the 3-HA tag), even though the
second structural model appeared to have the correct localization of the tag, i.e., in an
extracellular loop (Appendix 4 – Fig.45). Nevertheless, the cellular localization of Ano9 is still
controversial, being mostly reported as an intracellular protein80. Therefore, cell lines
overexpressing this Ano9 construct were generated in order to also study the subcellular
localization of this protein. If Ano9 is not in the plasma membrane under physiological cellular
conditions, possibly the knockdown of other cellular components could alter this situation. This
hypothesis will be further studied with the siRNA screens.

Results and discussion
35
Figure 13 – Immunofluorescence images of CFBE cells stably overexpressing Ano9 3-HA GFP. The expression of
Ano9 was induced by the addition of 1 µg/mL of doxycycline for 48 h. Left panel – Unsorted cells; Right panel –
Cells sorted for their GFP fluorescence. Hoechst – Nuclei; GFP – Total Ano9; Cy5 – PM Ano9. After sorting (right
panel) it is possible to observe a more homogeneous GFP expression, being these cells a more adequate model to
perform siRNA screens. However, no membrane signal was detected either before or after sorting. Images were
acquired with the 40x objective in a Leica DMI 6000B microscope. Scale bar represents 30 µm.
Figure 14 - Signal-to-noise ratios of GFP in CFBE Ano9 3-HA GFP cells (n = 100 cells). With these results, it is possible to detect a significant increase in the signal-to-noise ratio of GFP fluorescence when the cells are sorted, meaning that the difference between signal and background is higher. Accordingly, these sorted cells are a better model for siRNA screens. * P<0.05 was accepted as significant.
CFBE Ano6 and Ano9 3-HA GFP were also characterized by Western Blot (Fig.15), where
the results obtained were consistent with what was shown by Immunofluorescence assays. The
protein was extracted from cells induced with 1 µg/mL of doxycycline for 48 h, and the anti-GFP
antibody (Appendix 10 – Table 12) was used to detect both Ano6 and Ano9. This protein analysis
was performed before and after cell sorting. The GFP-Ano quantification was normalized to α-
tubulin (loading control).

Results and discussion
36
Figure 15 – Western Blot of CFBE Ano6/9 3-HA GFP cells before (left) and after (right) cell sorting, using an anti-GFP antibody. CFBE parental cells or non-induced cells were used as negative control and α-tubulin was used as loading control. The expression of Ano6 and Ano9 is only detected with doxycycline induction (+dox), and it was significantly increased after cell sorting – see Fig.16.
As it can be observed in Fig.15 and 16, Ano9 expression (measured through GFP
fluorescence) seems to be higher than that of Ano6 in the respective stable cell lines. Moreover,
as observed with the immunofluorescence assays, GFP signal highly increased after cell sorting,
providing more robust cellular models to use in further experiments.
Figure 16 - Quantification of GFP levels of the Western Blot represented in Fig.15. After sorting it is possible to detect a significant increase in both Ano6 and Ano9 (GFP) expression. * P<0.05 was accepted as significant.
CFBE mCherry wt- and F508del-CFTR cells stably expressing Ano6 or Ano9 3-HA GFP
were also generated and sorted according to their GFP fluorescence intensity. However, due to
the time limitations, the characterization of these cell lines was not yet possible to complete.
CFBE wt- and F508del-CFTR cells as well as HeLa H2B mCherry cells were also stably
transfected with Ano6 and Ano9 constructs, and sorting of these cells is pending.

Results and discussion
37
3.1.2) Functional analysis
3.1.2.1) Iodide Efflux
Before generating the stable cell lines overexpressing Ano6 and Ano9, it was necessary
to test the ion channel function of these proteins to determine whether the insertion of the tags
was not altering their function.
Although Ano9 was previously reported as an intracellular protein with no ion channel
function80, Ano6 was identified as a component of the ORCC49. Hence, the detection of increased
ion currents with cells overexpressing the Ano6 construct is expected. The absence of increased
currents would imply that the tags were probably disrupting the channel function and possibly
its structure, which would preclude the next steps of the project.
Thus, to test the functions of Ano6 and Ano9 3-HA GFP, the Iodide (I-) efflux technique
was firstly used. In this assay, the efflux of I- was measured in HEK 293T cells transiently
transfected with these constructs. HEK 293T cells were used in detriment of CFBE cells since
their transfection rate is considerably higher. HEK 293T cells transfected with the “empty” pLVX-
TRE3G vector were used as control.
This assay was performed as explained in Materials and Methods – 2.5.1 – Iodide efflux.
The amount of I- that remained inside the cell with or without stimulation with ATP was
measured. In order to do relative comparison of the results obtained with different anoctamins,
the intracellular I- concentrations obtained for each were normalized by dividing I- concentration
by the concentration of protein. The efflux of I- was then calculated by subtracting the value of
ATP-stimulated cells from non-stimulated cells. Since this technique is based on the calculation
of the amount of I- that remains inside the cells, it was expected that, when channels are
functional the stimulation with ATP leads to a decrease of intracellular I-.
As shown in Fig.17, HEK 293T cells transfected with Ano6 3-HA GFP show a significant 5-
fold increase in the efflux of I- in comparison to the “empty vector” transfected cells, while cells
transfected with Ano9 3-HA GFP show a 3-fold increase in the ATP response.
Since other possible endogenous ion channels are taken into account with the “empty
vector” transfected cells, these results suggest that the overexpression of the double-tagged
constructs leads to an increase of I- transport. If this increase is due to I- transport directly
conducted by the transfected proteins or if it is caused by a regulation of other channels is still
unknown. However, as already referred, although Ano6 was described as a membrane localized
protein and as an ion channel49, which is in agreement with the present results, Ano9 was mostly
considered an intracellular protein80. Consequently, the increased I- efflux detected with the
overexpression of the Ano9 construct suggests a possible interaction with other ion channels.
Nevertheless, these results support the notion that the insertion of the tags did not
disrupt the function of the proteins, which was essential to proceed with this work.

Results and discussion
38
Figure 17 – Iodide efflux assay for transiently transfected HEK 293T cells. The transfection with the Ano6 construct led to a 5-fold increase of I- export, while the transfection with the Ano9 construct showed a 3-fold increase, when compared with HEK 293T cells transfected with empty vector. * P<0.05 was accepted as significant.
After the generation of stably transfected CFBE cell lines, the activity of the
overexpressed anoctamins was also assessed using the iodide efflux technique. However, for
these cells, the assay used consisted in measuring the I- that goes out (“efflux”) of the cells
(measured in the media) in 1-min intervals, before and after ATP stimulation. This assay is
preferable to the previous one in assessing the proteins’ functions since it measures close time-
points, which enables a more comprehensive view of the response to ATP stimulation. However,
this assay was not used in the previously shown HEK 293T transiently transfected cells because
they detach too easily. Nevertheless, the previous assay also gives valid results.
This assay was performed with CFBE Ano6/Ano9 3-HA GFP cells, and the non-induced
cells (cells without addition of doxycycline) were used as control.
As depicted in Fig.18, only Ano6 overexpression led to an increase of I- transport.
However, the ATP stimulation is not specific for anoctamins, being also highly variable among
different experiments.
Furthermore, the overexpression of Ano9 appears to decrease the I- currents when
compared with the controls. Also, there was almost no variation in this response. Previous
reports have shown that overexpression of Ano9 inhibits Ano1 currents82. This inhibiting role of
Ano9 could help to explain the findings in this work. However, inhibition of other channels may
also be involved. Studies to validate Ano9 communication with other proteins need to be
performed.
Although these results differ from the observed in HEK 293T cells transiently transfected
with Ano6/9 3-HA GFP, these differences can be explained by the specific type of cells used (HEK
293T cells in the first experiment, and CFBE cells in the second). Differences in Ano9 expression
are not a plausible reason for these discrepancies because HEK 293T cells showed a high
transfection rate (above 50%, data not shown), and CFBE Ano9 cells were sorted, so that
overexpressing of this protein is observed in almost every cell. An explanation could be the Ano9

Results and discussion
39
insertion into the genome of the cells, which can affect other proteins and pathways, differently
from what is observed with the transient transfections.
Interestingly, according to different studies, HEK 293T cells do not express endogenous
Ano1 (or if they do, the expression of Ano1 is extremely low)78. Nevertheless, a relationship
between Ano1 and Ano9 has been reported82 which could explain the differences observed in
these two cell types, as CFBE cells express certainly endogenous Ano1.
Another important consideration is the previously mentioned lack of specificity of ATP,
being extremely difficult to identify the channels that are activated with its addition. The use of
inhibitors of anoctamins would be a possible alternative. However, this also presents a
challenge, since there are no specific inhibitors available for each anoctamin148.
Figure 18 – Iodide efflux measurements at 15 time-points using CFBE cells stably overexpressing Ano6 or Ano9. 100 µM ATP was added at 5 min time point. CFBE overexpressing Ano6 show an increased I- efflux when stimulated with ATP compared to the non-induced CFBE Ano6 cells (control), while CFBE overexpressing Ano9 show an apparent decrease in I- efflux in comparison to the control cells (CFBE Ano9 without doxycycline induction).
3.1.2.2) Micro-Ussing chamber
Micro-Ussing chamber experiments were performed in CFBE Ano6 and Ano9 3-HA cells
to confirm the results obtained with the iodide efflux and to test their function in polarized cells,
which represents a more physiological condition. In these experiments, CFBE cells
overexpressing Ano6 or Ano9 were seeded onto collagen IV-coated permeable supports to form
monolayers of polarized cells, as described in Materials and methods – 2.5.2 – Micro-Ussing
chamber. Monolayers were mounted in perfused micro-Ussing chambers and analysed under

Results and discussion
40
open-circuit conditions. Transepithelial voltages (Vte) were measured and equivalent short-
circuit currents (Ieq-SC) were calculated according to Ohm’s law (Fig. 19 and 20). Anoctamins were
activated by 100 µM ATP, and 30 µM of CaCCinh-A01 (CaCC inhibitor) was used to block the
channels. The same CFBE Ano6 and Ano9 cells but without doxycycline induction were used as
controls.
The activation of anoctamins is thought to be achieved through the ATP stimulation of
apical purinergic P2Y2 receptors150. Activation of the P2Y2 receptors leads to the stimulation of
phospholipase C (PLC) and inositol triphosphate (IP3) release, which ultimately causes the
release of calcium (Ca2+) from the ER to the cytoplasm151. The increase of intracellular Ca2+ then
leads to the activation of anoctamins. Additionally, activation of basolateral potassium (K+)
channels, results in hyperpolarization of the cell membrane and increases the driving force for
apical anion efflux152 (see Fig.31).
In this study, using dox-induced CFBE Ano6 3-HA GFP cells, application of ATP from the
apical side originated a negative voltage deflection (Fig.19). Accordingly, the calculated Ieq-SC
increased in comparison to non-induced controls (Fig.19 – D), which is consistent with the iodide
efflux results showing an ion channel function of Ano6. After ATP washout, a second ATP
stimulation was performed. The calculated Ieq-SC significantly decreased compared to the first
addition (Fig.19 – B and D). This result reflects the desensitization of the purinergic receptors153,
causing a smaller release of intracellular Ca2+ and, consequently, a smaller activation of the
channels (Fig.19 – A, B and D).
The addition of ATP to the basolateral side showed only a modest response (small
negative voltage deflection – Fig.19 – C), with no statistical difference compared to the response
of control cells. This result suggests an asymmetric distribution of Ano6 between the apical and
basolateral membranes, being mostly localized at the apical side. However, the occurrence of a
negative voltage deflection can be explained by the activation of basolateral K+ channels, since
basolateral application of ATP to human airway epithelial cells has shown to activate Cl-
secretion indirectly, by activating K+ channels154.
Moreover, the distribution of purinergic receptors in the apical and basolateral sides of
epithelial cells has also been reported as being asymmetric46, 155. Studies performed in
16HBE14o- (Human bronchial epithelial cells) and Caco-2 cells (Human colon epithelial cancer
cells) showed that the P2Y2 receptor was expressed at the apical membrane. However, in
16HBE14o- cells, the receptor was also expressed at lower levels in the lateral membrane below
the tight junctions155, which is in agreement with the small response obtained with the
basolateral addition of ATP in the present work (using CFBE cells – also human bronchial
epithelial cells). Furthermore, ER Ca2+ stores have been reported as preferentially distributed
towards the apical membrane in airway epithelial cells. Accordingly, it has been described that
basolateral activation of P2Y2 receptors with ATP, although causes an increase in intracellular
Ca2+ concentration, failed to activate apical Ca2+ sensitive channels. Apical administration of ATP
has also been shown to be unable to activate basolateral Ca2+-activated K+ cannels, suggesting a
compartmentalization of Ca2+ signalling in airway epithelia149.
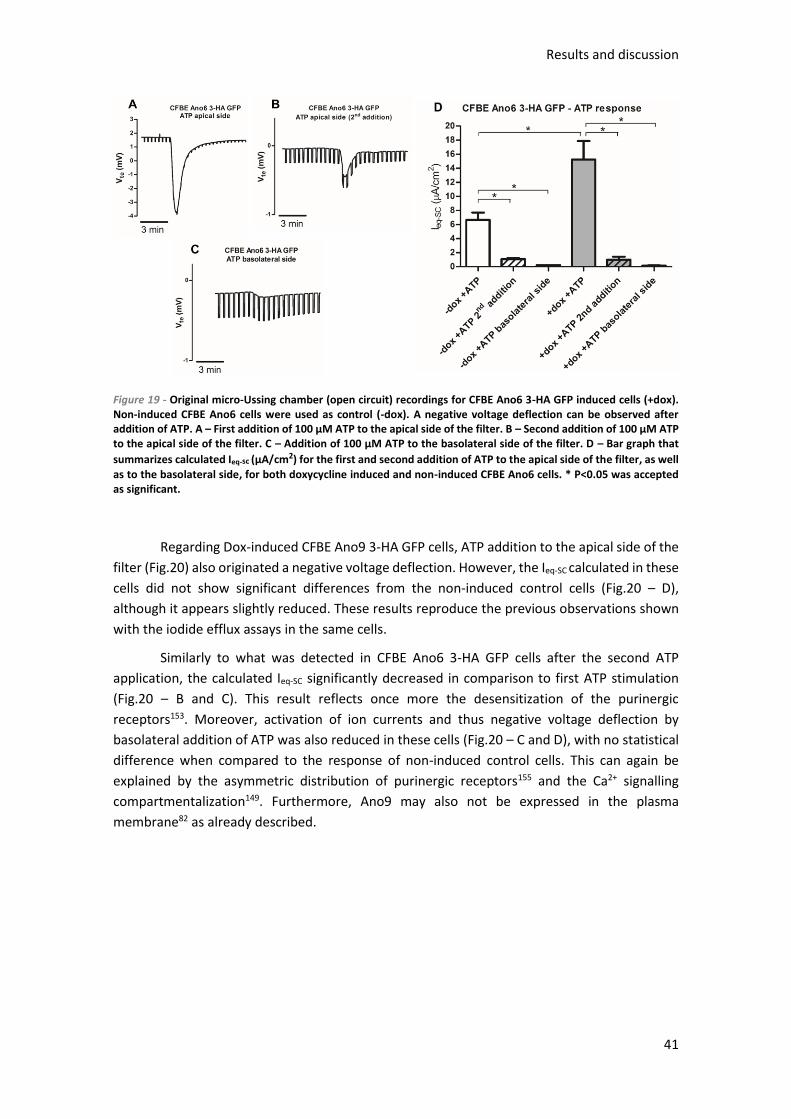
Results and discussion
41
Figure 19 - Original micro-Ussing chamber (open circuit) recordings for CFBE Ano6 3-HA GFP induced cells (+dox). Non-induced CFBE Ano6 cells were used as control (-dox). A negative voltage deflection can be observed after addition of ATP. A – First addition of 100 µM ATP to the apical side of the filter. B – Second addition of 100 µM ATP to the apical side of the filter. C – Addition of 100 µM ATP to the basolateral side of the filter. D – Bar graph that
summarizes calculated Ieq-sc (µA/cm2) for the first and second addition of ATP to the apical side of the filter, as well
as to the basolateral side, for both doxycycline induced and non-induced CFBE Ano6 cells. * P<0.05 was accepted as significant.
Regarding Dox-induced CFBE Ano9 3-HA GFP cells, ATP addition to the apical side of the
filter (Fig.20) also originated a negative voltage deflection. However, the Ieq-SC calculated in these
cells did not show significant differences from the non-induced control cells (Fig.20 – D),
although it appears slightly reduced. These results reproduce the previous observations shown
with the iodide efflux assays in the same cells.
Similarly to what was detected in CFBE Ano6 3-HA GFP cells after the second ATP
application, the calculated Ieq-SC significantly decreased in comparison to first ATP stimulation
(Fig.20 – B and C). This result reflects once more the desensitization of the purinergic
receptors153. Moreover, activation of ion currents and thus negative voltage deflection by
basolateral addition of ATP was also reduced in these cells (Fig.20 – C and D), with no statistical
difference when compared to the response of non-induced control cells. This can again be
explained by the asymmetric distribution of purinergic receptors155 and the Ca2+ signalling
compartmentalization149. Furthermore, Ano9 may also not be expressed in the plasma
membrane82 as already described.

Results and discussion
42
Figure 20 - Original micro-Ussing chamber (open circuit) recordings for CFBE Ano9 3-HA GFP induced cells (+dox). Non-induced CFBE Ano9 cells were used as control (-dox). A negative voltage deflection can be observed after addition of ATP. A – First addition of 100 µM ATP to the apical side of the filter. B – Second addition of 100 µM ATP to the apical side of the filter. C – Addition of 100 µM ATP to the basolateral side of the filter. D – Bar graph that
summarizes calculated Ieq-sc (µA/cm2) for the first and second addition of ATP to the apical side of the filter, as well as to the basolateral side, for both doxycycline induced and non-induced CFBE Ano9 cells. * P<0.05 was accepted as significant.
For both cell types, the stimulation by ATP in the presence of inhibitor CaCCinh-A01
resulted in an extremely reduced Ieq-SC (Fig.21 – A). Hence, this inhibitor can be used to eliminate
almost all currents produced by anoctamins (98.8% and 98.9% of inhibition of CFBE Ano6 and
Ano9, respectively). Furthermore, the effects of CaCCinh-A01 on epithelial ion transport in both
cell types (and controls) were reversible, since after washout of the inhibitor, ATP addition
originated negative voltage deflections (Fig.21 – B). However, these inhibitors are not specific
for anoctamins148, which does not allow discrimination of the currents caused by each
anoctamin or other ion channels.
Figure 21 - Effect of CaCCinh-A01 on Ieq-SC values. A – The simultaneous addition of 30 µM CaCCinh-A01 and 100 µM ATP led to a significant decrease in Ieq-SC in both cell types, meaning that this inhibitor is strongly (although not specifically) inhibiting the activation of anoctamins by ATP. * P<0.05 was accepted as significant. B – Original micro-Ussing chamber recordings of an example of ATP addition (on CFBE Ano6 3-HA GFP cells) after CaCCinh-A01 washout, showing that its inhibitory effect is reversible.

Results and discussion
43
An additional interesting aspect of this experiment is that cells overexpressing Ano6 had
lower transepithelial resistance (TEER) than CFBE Ano9 3-HA cells. These results could suggest
that Ano6 is somehow involved in cellular dedifferentiation, possibly through the “loosening” of
tight junctions, which would be in accordance with the role of Ano6 in cancer progression that
has been seen in several studies100.
3.1.3) Intracellular localization of anoctamins
3.1.3.1) Immunostaining in polarized cells
After performing micro-Ussing chamber experiments, the same CFBE Ano6/9 3-HA GFP
cell monolayers were then stained as described in Materials and methods – 2.4.1 –
Immunofluorescence of anoctamins. Images of cells on filters were acquired using confocal
microscopy.
The staining of these polarized cells for Ano6 and Ano9 3-HA GFP were determined by
GFP fluorescence which confirmed their overexpression in the cells and helped to validate the
micro-Ussing chamber results. However, the main goal of this experiment was to detect
differences in the intracellular localization of these anoctamins in polarized cells.
For an optimal identification of the cellular localization of Ano6 and Ano9, it would be
necessary to compare its expression to (at least) plasma membrane and ER markers. However,
due to the fact that the confocal microscope used only has three lasers (488 nm, 532 nm and
635 nm), and that the TOPRO3 staining was visible in the mCherry channel, it was only possible
to use the lasers of 488 nm (GFP) and 635 nm (TOPRO3).
Nevertheless, the images acquired allow the detection of differences between Ano6 and
Ano9 localization.
In CFBE Ano6 3-HA GFP cells (Fig. 22 and 23), Ano6 seems to be localized at the plasma
membrane, although it can also be detected in the cytoplasm at significant levels. Interestingly,
Ano6 expression was detected not only in the apical membrane, but also, in some cells, in the
basolateral membrane.
Figure 22 – Intracellular localization of Ano6 in CFBE Ano6 3-HA GFP cells as determined by GFP fluorescence. Images were acquired using a Leica TCS SPE confocal microscope with a 63x oil objective. Ano6 (GFP) and nuclei (TOPRO3) are represented in centre and right images, respectively. In the left image Ano6 and nuclei images are merged, corresponding to green and blue colours, respectively. 3D reconstructions were performed along the YZ

Results and discussion
44
and XZ lines represented in the image. Scale bar represents 20 µm (Images acquired by the core-microscopy technician of the laboratory Luis Marques).
Figure 23 – 3D reconstruction of the images represented in Fig.22. Scale bar represents 10 µm. (Images reconstructed by the core-microscopy technician of the laboratory Luis Marques).
In contrast to CFBE Ano6 3-HA GFP cells, for CFBE Ano9 3-HA GFP cells, Ano9 seems to
be mostly localized in the cytoplasm, rather than at the plasma membrane. These observations
result from comparison of images for Ano6 and Ano9 (Fig. 23 and 25, respectively). For Ano6, it
is visible from the GFP fluorescence (Fig.23, GFP panel), that there is almost no separation (or
“space”) between the cells, which means that Ano6 is likely in the plasma membrane. However,
for Ano9, the GFP fluorescence (Fig.25, GFP panel) is mostly located around the nuclei. These
results are in agreement with previous studies reporting that Ano9 is mostly localized in the
cytoplasm82 and are also consistent with our results from the micro-Ussing experiments, where
currents in Dox-induced cells overexpressing Ano9 had no significant difference from the non-
induced control cells.

Results and discussion
45
Figure 24 - Intracellular localization of Ano9 in CFBE Ano9 3-HA GFP cells as determined by GFP fluorescence. Images were acquired using a Leica TCS SPE confocal microscope with a 63x oil objective. Ano9 (GFP) and nuclei (TOPRO3) are represented in centre and right images, respectively. In the left image Ano9 and nuclei images are merged, corresponding to green and blue colours, respectively. 3D reconstructions were performed along the YZ and XZ lines represented in the image. Scale bar represents 20 µm (Images acquired by the core-microscopy technician of the laboratory Luis Marques).
Figure 25 - 3D reconstruction of the images represented in Fig.24. Scale bar represents 10 µm. (Images reconstructed by the core-microscopy technician of the laboratory Luis Marques).
Nonetheless, as already stated, these preliminary results need further confirmation,
namely by using markers for the apical and basolateral membranes, as well as for cell junctions.
Furthermore, the localization of Ano6 to the basolateral membrane is inconsistent with the
almost inexistent currents created by the basolateral addition of ATP in micro-Ussing chamber

Results and discussion
46
experiments. However, as already referred, the lower levels of P2Y2 receptors at the basolateral
membrane155 can explain those differences.
3.1.3.2) Biotinylation
In order to confirm whether overexpressed Ano9 in CFBE cells is trafficking to the plasma
membrane, a cell-surface biotinylation assay was performed. In this assay CFBE cells
overexpressing Ano6 were used as control, since previous experiments with these cells allowed
the detection of Ano6 in the plasma membrane.
In this experiment, a Western Blot was performed using the whole-cell lysate and the
plasma membrane fraction (cell-surface biotinylated) – Fig.26. The anti-GFP antibody was used
to detect both Ano6 and Ano9.
Figure 26 - Western Blot of a biotinylation assay performed with CFBE Ano6 and Ano9 3-HA GFP. A band corresponding to Ano6 3-HA GFP is detected in both the whole-cell lysate sample and membrane fraction (~136 kDa in the first and slightly higher in the second). For Ano9, two bands are detected in the whole-cell lysate, possibly corresponding to a monomer and a dimer of Ano9 (~120 kDa and >245 kDa, respectively), while only the highest is detected in the membrane fraction. α-tubulin, as expected, is only detected in the whole-cell lysate (~55 kDa), meaning that the plasma membrane proteins were correctly isolated.
α-tubulin was used as loading control for the whole-cell lysate and as a control for the
specificity of the cell-surface biotinylation technique to detect only plasma membrane proteins.
Tubulin is not expected to be identified in the plasma membrane fractions since it is a structural
component of microtubules, which are cytoplasmic cytoskeletal elements, and indeed it was not
detected by the cell-surface biotinylation.
As it can be observed in Fig.26, Ano6 was detected in both whole-cell lysate and in the
membrane fraction by cell-surface biotinylation (~136 kDa: Ano6 – 106 kDa, GFP – 27 kDa, 3-HA
– 3 kDa). However, in the membrane fraction, Ano6 appears with a higher molecular weight,
possibly because of the glycosylation it undergoes until reaching the plasma membrane. To
confirm that this corresponds indeed to a glycosylated form, a glycosidase assay needs to be
performed.

Results and discussion
47
In the whole-cell lysate blot for Ano9 (Fig.26) two bands (of ~120 kDa: Ano9 – 90 kDa,
GFP – 27 kDa, 3-HA – 3 kDa; and >245 kDa, respectively) were detected. The lower molecular
weight band matches the expected size for Ano9 3-HA GFP with 120 kDa. In the plasma
membrane fraction, however, it is not possible to detect this lower molecular weight band, while
the one of >245 kDa remains present. Although this band could be due to an unspecific antibody
interaction, it is not detected in CFBE cells overexpressing Ano6 (using the same antibody). This
strongly suggests that this band may represent a homodimer of Ano9 (or a heterodimer of Ano9
and other anoctamin – possibly Ano1), which resists to chemical reduction with DTT (present in
the sample buffer).
Several studies show that anoctamins form homodimers and the occurrence of
heterodimers has not been yet excluded. Moreover, dimerization of Ano1 and Ano2 has already
been reported68, as well as the inhibition of Ano1 currents by Ano9 expression82, as referred
above, which may also suggest a possible interaction between these two family members.
Regarding all these observations, it is possible that the band of higher molecular weight that we
observed (Fig.26) corresponds to an anoctamin homo/heterodimer. We plan to send this band
to be assessed by mass spectrometry to solve this issue.
3.2) Establishment of microscopy-based assays to be used in siRNA screens
In order to determine whether the stable cell lines created are adequate for microscopy-
based siRNA screens, CFBE Ano6 3-HA GFP cells (sorted by flow cytometry and above
characterized) were used to perform a pilot screen. To this end, image acquisition and analysis
were performed as described in Materials and methods – 2.4.2 – Image acquisition, processing
and analysis and 2.6.2 – siRNA pilot screen.
For this pilot screen, we used a labtek spotted with 384 siRNAs which target 231 genes
previously found to affect wt-CFTR traffic in a primary screen using human alveolar epithelial
A549 cells (Amaral lab, unpublished data). “Scrambled” non-targeting siRNA was used as a
negative control.
Results from this pilot screen (Fig.27) identified 71 siRNA hits affecting Ano6 traffic: 34
inhibitor genes, i.e., targeted by Ano6-activating siRNAs, and 37 enhancer genes, i.e., targeted
by siRNAs inhibiting Ano6 traffic. Among the 34 inhibitors of Ano6 traffic, 4 were targeted by 2
siRNAs, and among the 37 enhancers, 5 were targeted by 2 siRNAs.
The summary of these results and the deviation scores of hits targeted by 2 siRNAs are
shown in Fig. 27 and 28, while the images acquired for these hits (with background corrections)
are presented in Fig. 29 and 30. The scores of remaining hits (those resulting from only one
siRNA), are displayed in Tables 13 and 14 in Appendix 11, where the names of the genes affecting
Ano6 traffic as well as their effects on wt- and F508del-CFTR traffic are also specified.

Results and discussion
48
Figure 27 – Workflow of the pilot screen aimed at identifying Ano6 traffic regulators and summary of hits that were found by 2 different siRNAs and respective scores.
Figure 28 – Graph representing screen data for total Ano6, plasma membrane Ano6, ratio total Ano6/PM Ano6 and deviation score of the ratio for the top enhancer and inhibitor hits. Genes with negative deviation scores are enhancers of Ano6 traffic (their siRNAs inhibit Ano6 traffic) and genes with positive deviation scores are inhibitors of Ano6 traffic (their siRNAs enhance Ano6 traffic).

Results and discussion
49
Figure 29 – Representative images of cells under the effect of the top siRNA hits enhancing Ano6 traffic to the plasma membrane. Images were acquired with the 10x objective. Scale bar represents 100 µm.

Results and discussion
50
Figure 30 – Representative images of cells under the effect of the top siRNA hits inhibiting Ano6 traffic to the plasma membrane. Images were acquired with the 10x objective. Scale bar represents 100 µm.
The genes detected as inhibitors and enhancers of Ano6 traffic were separately
clustered using the DAVID (Database for Annotation, Visualization and Integrated Discovery)
Bioinformatics Resource, using a high classification stringency.
The results obtained for the most important biological processes regulated by the genes
inhibiting Ano6 traffic include (from the most to the less significantly enriched): G-protein
coupled receptor protein signalling (8 genes), ion transport (5 genes), establishment of protein
localization (4 genes), neurological system process (4 genes), second-messenger-mediated
signalling (3 genes), response to hormone stimulus (3 genes), intracellular transport (3 genes),
proteolysis (3 genes), protein phosphorylation (3 genes), and cell adhesion (3 genes).
For genes that enhance Ano6 traffic the results obtained include (from the most to the
less significantly enriched): G-protein coupled receptor protein signalling pathway (12 genes),

Results and discussion
51
sensory perception of chemical stimulus (4 genes), regulation of apoptosis (3 genes), and protein
phosphorylation (3 genes).
This pilot screen allowed not only the detection of some genes that influence Ano6
traffic, but also the calculation of this assay’s dynamic range. Dynamic range measures the ratio
between the strongest signal on a fluorescence channel and the minimum discernible signal.
This measurement is particularly important for the detection of PM and total Ano6, in order to
determine if the differences of Ano6 expression in these channels are sufficient to be correctly
quantified in further screens. In this pilot screen the dynamic range was 40 for PM Ano6 and 18
for total Ano6, meaning that the maximum signal of each channel was 40 and 18 times higher,
respectively, compared to the minimum signal. These results then suggest that, with this model,
the differences in PM and total Ano6 signals can be correctly distinguished.
A validation screen for CFTR traffic enhancers and inhibitors, performed on CFBE
mCherry wt- and F508del-CFTR cells in our laboratory by Hugo Botelho145 (and unpublished),
showed some similar hits, suggesting a relationship between CFTR and Ano6 traffic pathways.
The most important biological processes regulated by genes affecting CFTR include: G-protein
coupled receptor protein signalling pathway (e.g.: ITPR2 - Inositol 1,4,5-trisphosphate receptor,
type 2), cell surface receptor linked signal transduction, ion homeostasis (e.g.: ATP2C1 – ATPase,
Ca2+ transporting, type 2C, member 1), neurological system process (e.g.: OR2AG1 – Olfactory
receptor, family 2, subfamily AG, member 1), response to hormone stimulus (e.g.: LDLR – Low
density lipoprotein receptor), protein phosphorylation (e.g.: ROR1 – Receptor tyrosine kinase-
like orphan receptor 1), and intracellular protein transport (e.g.: COPBI – Coatomer protein
complex, subunit beta 1).
The results in this pilot screen for Ano6 traffic showed that G-protein coupled receptor
protein signalling is the most significantly enriched pathway, represented by a total of 20 genes
among the 71 hits. This is consistent with the fact that activation of anoctamins is related with
this signalling pathway, which suggest that Ano6 traffic to the plasma membrane and activation
are correlated. Indeed, ATP binding to Gq-coupled purinergic receptors, particularly P2Y2
receptors (the most predominant receptor in bronchial epithelia156) activates G protein (Gq)
which stimulates phospholipase C (PLC). PLC stimulation catalyses the hydrolysis of
phosphatidylinositol 4,5-bisphosphate (PIP2) into inositol 1,4,5-trisphosphate (IP3) and
diacylglycerol (DAG). IP3 then binds to IP3 receptors, particularly to Ca2+ channels in the ER, which
leads to the increase of cytosolic Ca2+ 151. This increase then causes the activation of Ca2+
activated chloride channels, namely anoctamins. Interestingly, the IP3 receptor type 2 was also
a hit in both the Ano6 pilot screen and CFTR validation screen.
Although targeted by only one siRNA, other channels like ENaC and Ano1 also showed
to have an effect on the traffic of Ano6. The knockdown of these two genes was shown to
increase Ano6 traffic, i.e., these proteins seem to be inhibitors of Ano6 traffic.
Taking together the results obtained in the present work and reported data on
anoctamins, CFTR and ENaC, we propose a working model of these ion channels in airway
epithelial cells (Fig.31).
Extracellular ATP stimulates Cl- secretion through P2Y2 purinergic receptors via both
Ca2+-independent signalling and intracellular Ca2+-dependent pathways by opening CFTR, CaCCs
(Ano1)157 and according to the current study also Ano6. However, Ano6 is only activated by

Results and discussion
52
apical ATP although it locates on both apical and basolateral sides (shown by immunostainings).
Additionally, Cl- secretion in polarized epithelia requires parallel activation of apical Cl- channels
and basolateral K+ channels also by P2Y2 receptors (basolateral) to generate the driving force for
Cl- exit through the apical membrane46. Moreover, apical P2Y2 activation has shown to inhibit
ENaC, possibly by a PIP2-dependent mechanism158. This inhibition consequently diminishes the
Na+ influx and creates an electrochemical driving force leading also to Cl- secretion via Ca2+
activated Cl- channels151, 159.
As already referred, Gq-protein receptor signalling is associated with the activation of
anoctamins and CFTR. Apart from changes of intracellular Ca2+, another consequence of PIP2
hydrolysis is the formation of DAG and its activation of PKC, which regulates Cl- secretion via
CFTR149.
Crosstalk between cAMP- and Ca2+-dependent Cl− secretion may occur at different
levels, strengthening the concept of interaction between anoctamins and CFTR. For example,
purinergic receptors (P2Y2/P2Y6) increase both intracellular cAMP and Ca2+; intracellular Ca2+
affects the activity of enzymes that control intracellular cAMP; and CFTR translocates Gq-coupled
receptors to the plasma membrane that leads to intracellular Ca2+ increase and consequently to
the activation of anoctamins (Ano1 and Ano6)120, 160, 161. Additionally, it has been shown that
Ano6 interacts with CFTR either directly or indirectly via scaffold proteins120. As it has been found
within this thesis Ano6 expression is also affected by Ano1 as well as ENaC by unknown
mechanisms. Furthermore, CFTR is known to regulate ENaC162. Together, all these facts suggest
a relationship between these membrane channels in the airway epithelium. Further research is
required to unravel the mechanisms of this crosstalk.
Another interesting observation resulting from this pilot screen was that regulators of
apoptosis increase Ano6 traffic to the membrane. This supports the notion of Ano6 being
involved in cell death49.
Altogether, these results indicate that the cells expressing double-tagged Ano6 that we
used in this pilot screen constitute a robust model for future high-content siRNA microscopy
screens. Moreover, the results obtained are very encouraging to pursue more in-depth studies
to identify regulators of anoctamins, as well as to further study the interaction between
anoctamins, ENaC and CFTR. Nonetheless, the use of larger siRNA libraries, the increase of
replicates for every siRNA and a secondary validation of primary hits (confirmation with
additional siRNAs for the same gene) are crucial steps to achieve this goal.

Results and discussion
53
Figure 31 - Model of ion transport across airway epithelial cells. A – Apical membrane; B – Basolateral membrane. P2Y2 purinergic receptors (P2Y2-R) are represented in both apical and basolateral membranes, although they have been reported as mostly localized at the apical membrane155. Ano1, Ano6, CFTR and ENaC are represented in the apical membrane. Ano6 is also possibly localized at the basolateral membrane. K+ channel is represented in the basolateral membrane, being responsible for the driving force that increases anion efflux across the apical membrane. Ca2+ channel is located at the ER, where IP3 binds, originating the release of Ca2+ ions to the cytoplasm, which then leads to the activation of Ca2+-activated channels. ATP stimulation of P2Y2-R was also shown to inhibit ENaC-mediated Na+ influx, possibly due to PIP2 hydrolysis. CFTR inhibits ENaC. ENaC and Ano1 possibly interact with Ano6, although through unknown mechanisms.

Concluding remarks
54
4. Concluding remarks
We have herein generated novel cellular models stably expressing 3-HA – GFP double-
tagged Ano6 and Ano9 under an inducible (Tet-On) promoter. The purpose of the new cell
models is to study the traffic of anoctamins in automated fluorescence microscopy screens and
to identify factor that affect their traffic by siRNA-knockdown.
The new cell lines were characterized regarding the anoctamins’ cellular expression,
localization and function. Ano6 was found to be localized at the plasma membrane, and showed
increased ion currents upon stimulation with ATP, confirming its known function as a channel.
In contrast, overexpressed Ano9 showed a predominantly intracellular localization and no ATP-
activated ion currents, which is also suggested by other studies. Thus, these cell lines appear to
be good models for further studies on anoctamins’ traffic, regulation, localization and
interaction with other ion channels/proteins in the airway epithelium. Moreover, these models
are valuable tools to explore the roles of anoctamins in disease, particularly in CF.
In addition, the novel CFBE cell line overexpressing Ano6 was used in a pilot siRNA screen
which identified 71 genes affecting the traffic of Ano6: 34 genes inhibiting and 37 enhancing
Ano6 traffic. The results thus obtained demonstrate that the traffic of Ano6 to the plasma
membrane is affected by several genes that affect CFTR traffic, increasing the interest and
motivation for further studies on these proteins’ interactions. Moreover, these preliminary
results also showed that Ano1 and ENaC affect Ano6 traffic, which further indicates a relation
among these ion channels and reflects the relevance of the study of this protein family of
anoctamins to find alternative therapeutic targets for CF.
Altogether, these results suggest that the new CFBE cell line expressing double-tagged
Ano6, which we generated and validated with this pilot screen, constitutes a bona fide model
for future high-content siRNA microscopy screens.
Future work using the Ano9 overexpressing cell line will demonstrate the feasibility of
this cell line for similar studies. Furthermore, a novel generated Ano10 construct will also be
used to develop a similar stable (inducible) cell line (see next section).
In conclusion, the work developed during this MSc thesis not only supports the
importance of anoctamins’ study to a better comprehension of epithelial ion transport, but also
reinforces the relevance of these proteins for the development of “bypass therapies” to
overcome the ion transport defects caused by the loss of functional CFTR in CF.

Future perspectives
55
5. Future perspectives
The results obtained here with the robust cellular models generated are very
encouraging to further pursue the study of anoctamins’ regulators, as well as the study of the
crosstalk between anoctamins and CFTR.
The main proposed objective for this project (i.e. to perform siRNA screens to detect
traffic regulators of anoctamins) was only initiated in the time frame available for this thesis.
However, since the mutagenesis, cloning, and production of stable cell lines were the limiting
steps of the present work, interesting experiments can now be planned and designed for future
work, as next described.
Firstly, Ano10 is being cloned into the same lentiviral vector as Ano6 and Ano9 (pLVX-
TRE3G), so that similar stable cell lines with inducible expression of double-tagged Ano10 (GFP
and 3-HA) can be generated. This will allow the study of one more “epithelial anoctamin”, and
possibly help unveiling its intriguing functions. As the lentiviral infection is a heterologous
process, resulting in different transgene expression among the stably transfected cells, it will be
necessary (as for the Ano6/Ano9 cells) to perform cell sorting (according to the cells’ GFP
fluorescence) in order to obtain cell populations with more homogeneous anoctamin
expression. When sorted, these cells will provide more reliable results in future experiments.
Secondly, the crosstalk between anoctamins and CFTR and among anoctamins is a highly
interesting topic to study. Thus, to determine whether CFTR and anoctamins physically interact,
co-immunoprecipitation assays of CFTR and Ano6, Ano9 and Ano10 should be performed. To
this end, we could use CFBE wt- and F508del-CFTR stably expressing Ano6, Ano9 and Ano10 to
perform co-immunoprecipitations using anti-CFTR and anti-GFP antibodies.
The interaction among the various anoctamins is also an exciting subject. The results
(blots) presented here from the cell-surface biotinylation assays showed that, besides the
expected band corresponding to Ano9, an additional band of higher molecular weight was also
observed. This band may represent an Ano9 homodimer or a heterodimer. To identify the
unknown protein(s) present in this band, the sample will be sent for analysis by NanoLC-MS/MS
(nanoscale liquid chromatography coupled to tandem mass spectrometry). To further search for
interactions among anoctamin family members, co-immunoprecipitation assays will also be
performed.
Thirdly, to further define the functional interaction between CFTR and anoctamins, it
would be very important to determine how anoctamins affect CFTR currents, and vice-versa. To
this end, it is possible to use cells that overexpress wt- or mutant CFTR, and simultaneously
Ano6, 9 or 10. Functional assays like micro-Ussing chamber and iodide efflux are valuable tools
in this matter, since these techniques allow to detect whether CFTR function is compromised or
enhanced by the overexpression of these anoctamins. Similarly, it would also be pertinent to
study CFTR in cells with absence of each one of the anoctamins under study. To this end, the
Ano6 knockout cell line has already been initiated in CFBE 41o-, CFBE wt- and CFBE F508del-
CFTR cells, although the absence of Ano6 has not yet been confirmed. For the remaining
anoctamins studied in this project, the gRNAs are currently being designed. Since the antibiotic
selection and the growth of the knockout clones are two major limiting steps, the cells
transfected with the plasmids needed for anoctamin knockout (gRNAs and the Cas9 GFP tagged

Future perspectives
56
plasmid) will also be sorted according to their GFP fluorescence. Once the anoctamin knockout
in these cells is confirmed, they could be used to study CFTR function, also by functional assays
like iodide efflux and micro-Ussing chamber. These experiments would allow the detection of
differences in CFTR function caused by the absence of each of these anoctamins. Furthermore,
functional assays using these knockout cells can permit to distinguish the contribution of each
anoctamin to the currents caused by ATP stimulation, overcoming the problem of lack of specific
anoctamin inhibitors. Since there is evidence suggesting that Ano9 overexpression inhibits Ano1
currents, the Ano9 knockout in cells overexpressing Ano1 (created by Joana Lérias, from our
research group) could confirm if the absence of Ano9 enhances the currents created by Ano1. If
Co-IP assays lead to the detection of interactions between anoctamins, those results can also be
confirmed using this knockout strategy.
Fourthly, as anoctamins were shown to affect cell movement and proliferation, wound
healing assays can also be made using anoctamin knockout cells or cells overexpressing
anoctamins. The results obtained with these studies could provide insight into the role of these
proteins in disease. Moreover, HeLa H2B mCherry cells stably expressing double-tagged Ano6, 9
and 10, will be used to perform live-cell imaging assays with the objective of studying the
subcellular localization of overexpressed anoctamins during different phases of the cell cycle.
Fifthly, the first double-tagged constructs of Ano6, Ano9 and Ano10 that were not used
for further experiments (as their HA-tags were not facing the exterior of the cell) might be useful
to study anoctamins’ traffic. Particularly the first Ano6 construct, which probably originates a
misfolded protein, can be used to test compounds that promote the correct protein folding and
trafficking to the membrane. Since some compounds have already been shown to partially
rescue traffic of F508del-CFTR, allowing some amount of protein to reach the plasma
membrane, it would be interesting to study the effect of these compounds in misfolded Ano6.
This would possibly improve the understanding of the mechanism of action of these compounds.
Finally, although there are many experiments that can be performed with these new
cellular models of anoctamins, the main goal is use them to perform high-content siRNA screens
so as to identify novel genes regulating the traffic of Ano6, Ano9 and Ano10. The pilot screen
performed here with CFBE Ano6 cells revealed that this is a robust system to identify novel genes
affecting the traffic of this anoctamin. Accordingly, additional screens will be performed with
the stably transfected cell lines expressing the other anoctamins. The main objective is to use a
high-content siRNA library, so that we gain deep insight into the pathways that regulate
anoctamins traffic.
The continuation of the work developed during this project is thus crucial to deepen the
knowledge on this protein family of increasing biological relevance. The understanding of the
crosstalk between CFTR and anoctamins, as well as their regulation pathways is essential to
possibly find alternative pharmacological targets for CF disease. If the functional interactions
between CFTR and this protein family are indeed revealed, new drugs can be designed to
enhance Cl- secretion (possibly by overstimulating anoctamins, since their expression/activity in
the airways is much lower than that of CFTR) and restore the basic defect in all CF patients,
independently of the CFTR mutation types they bear.

References
57
6. References
[1] Collins, F. S. Cystic Fibrosis: Molecular Biology and Therapeutic Implications. Science. 256, 774–779
(1992);
[2] Amaral, M. D. Novel personalized therapies for cystic fibrosis: treating the basic defect in all patients.
J. Intern. Med. 277, 155–166 (2015);
[3] Bobadilla, J. L., Macek, M., Fine, J. P. & Farrell, P. M. Cystic fibrosis: A worldwide analysis of CFTR
mutations - Correlation with incidence data and application to screening. Hum. Mutat. 19, 575–606
(2002);
[4] O’Sullivan, B. P. & Freedman, S. D. Cystic fibrosis. Lancet 373, 1891–1904 (2009);
[5] Andersen, H. Cystic Fibrosis of the pancreas and its relation to celiac disease. Am J Dis Child 56, 344–
399 (1938);
[6] Riordan, J. R. et al. Identification the Cystic Fibrosis Gene : Cloning and Characterization of
Complementary DNA. Science. 245, 1066–73 (1989);
[7] Hug, M. J., Tamada, T. & Bridges, R. J. CFTR and bicarbonate secretion to epithelial cells. News Physiol.
Sci. 18, 38–42 (2003);
[8] Sheppard, D. N. & Welsh, M. J. Structure and function of the CFTR chloride channel. Physiol. Rev. 79,
S23–S45 (1999);
[9] Reddy, M. M., Light, M. J. & Quinton, P. M. Activation of the epithelial Na+ channel (ENaC) requires
CFTR Cl- channel function. Nature 402, 301–304 (1999);
[10] Kunzelmann, K., Kathöfer, S. & Greger, R. Na+ and Cl- conductances in airway epithelial cells:
increased Na+ conductance in cystic fibrosis. Pflügers Arch. Eur. J. Physiol. 431, 1–9 (1995);
[11] Cohen, T. S. & Prince, A. Cystic fibrosis: a mucosal immunodeficiency syndrome. Nat. Med. 18, 509–
519 (2012);
[12] Gaspar, M. C., Couet, W., Olivier, J.-C., Pais, A. A. C. C. & Sousa, J. J. S. Pseudomonas aeruginosa
infection in cystic fibrosis lung disease and new perspectives of treatment: a review. Eur. J. Clin. Microbiol.
Infect. Dis. 32, 1231–52 (2013);
[13] Rowe, S., Miller, S. & Sorscher, E. Cystic fibrosis. N Engl J Med 352, 1992–2001 (2005);
[14] Saiman, L. Microbiology of early CF lung disease. Paediatr. Respir. Rev. 5, 367–369 (2004);
[15] Cutting, G. R. Cystic fibrosis genetics: from molecular understanding to clinical application. Nat. Rev.
Genet. 16, 45–56 (2014);
[16] Zielenski, J. Genotype and phenotype in cystic fibrosis. Respiration 67, 117–133 (2000);
[17] Kerem, B. et al. Identification of the Cystic Fibrosis gene: Genetic Analysis. Science. 245, 1073–1080
(1989);
[18] Ratjen, F. & Döring, G. Cystic fibrosis. Lancet 361, 681–689 (2003);
[19] Quinton, P. Physiological Basis of Cystic Fibrosis: A Historical Perspective. Physiol Rev 79, S3–S22
(1999);
[20] Stern, M. et al. European Cystic Fibrosis Society Standards of Care: Quality Management in cystic
fibrosis. J. Cyst. Fibros. 13, S43–S59 (2014);
[21] CF Foundation Patient Registry Data: https://www.cff.org/
2013_CFF_Patient_Registry_Annual_Data_Report.pdf;
[22] Amaral, M. D. & Farinha, C. M. Rescuing mutant CFTR: a multi-task approach to a better outcome in
treating cystic fibrosis. Curr. Pharm. Des. 19, 3497–508 (2013);
[23] Crystal, R. G. et al. Administration of an adenovirus containing the human CFTR cDNA to the
respiratory tract of individuals with cystic fibrosis. Nat. Genet. 8, 42–51 (1994);

References
58
[24] Crystal, R. G. The Challenge of Using Gene- or Cell-Based Therapies to Treat Lung Disease. Mol. Ther.
20, 1077–1078 (2012);
[25] Alton, E. W. F. W. et al. Repeated nebulisation of non-viral CFTR gene therapy in patients with cystic
fibrosis: a randomised, double-blind, placebo-controlled, phase 2b trial. Lancet Respir Med 2600, 1–9
(2015);
[26] Riordan, J. R. CFTR function and prospects for therapy. Annu. Rev. Biochem. 77, 701–726 (2008);
[27] Solomon, G. M., Marshall, S. G., Ramsey, B. W. & Rowe, S. M. Breakthrough therapies: Cystic fibrosis
(CF) potentiators and correctors. Pediatr. Pulmonol. (2015);
[28] McCarthy, V. a. & Harris, A. The CFTR gene and regulation of its expression. Pediatr. Pulmonol., 1–8
(2005);
[29] Bell, S. C., De Boeck, K. & Amaral, M. D. New pharmacological approaches for cystic fibrosis: Promises,
progress, pitfalls. Pharmacol. Ther. 145, 19–34 (2014);
[30] De Boeck, K. & Amaral, M. D. Lancet Resp Med, submitted (2015);
[31] The Cystic Fibrosis mutation database. http://www.genet.sickkids.on.ca/app;
[32] Amaral, M. D. & Kunzelmann, K. Molecular targeting of CFTR as a therapeutic approach to cystic
fibrosis. Trends Pharmacol. Sci. 28, 334–341 (2007);
[33] Li, C. & Naren, A. P. Macromolecular complexes of cystic fibrosis transmembrane conductance
regulator and its interacting partners. Pharmacol. Ther. 108, 208–223 (2005);
[34] Gadsby, D. C., Vergani, P. & Csanády, L. The ABC protein turned chloride channel whose failure causes
cystic fibrosis. Nature 440, 477–483 (2006);
[35] Riordan, J. R. Assembly of functional CFTR chloride channels. Annu. Rev. Physiol. 67, 701–718 (2005);
[36] Amaral, M. D. Processing of CFTR: Traversing the cellular maze - How much CFTR needs to go through
to avoid cystic fibrosis? Pediatr. Pulmonol. 39, 479–491 (2005);
[37] Linsdell, P. & Hanrahan, J. W. Glutathione permeability of CFTR. Am. J. Physiol. 275, C323–C326
(1998);
[38] Wei, L. et al. Interaction between calcium-activated chloride channels and the cystic fibrosis
transmembrane conductance regulator. Pflügers Arch. Eur. J. Physiol. 438, 635–641 (1999);
[39] Perez-Cornejo, P. & Arreola, J. Regulation of Ca2+-activated chloride channels by cAMP and CFTR in
parotid acinar cells. Biochem. Biophys. Res. Commun. 316, 612–617 (2004);
[40] Ousingsawat, J., Kongsuphol, P., Schreiber, R. & Kunzelmann, K. CFTR and TMEM16A are separate but
functionally related Cl - channels. Cell. Physiol. Biochem. 28, 715–724 (2011);
[41] Kunzelmann, K. & Schreiber, R. CFTR, a regulator of channels. J. Membr. Biol. 168, 1–8 (1999);
[42] Schwiebert, E. M. et al. CFTR regulates outwardly rectifying chloride channels through an autocrine
mechanism involving ATP. Cell 81, 1063–1073 (1995);
[43] Kunzelmann, K. et al. The cystic fibrosis transmembrane conductance regulator attenuates the
endogenous Ca2+ activated Cl- conductance of Xenopus oocytes. Pflugers Arch. Eur. J. Physiol. 435, 178–
181 (1997);
[44] Perez-Cornejo, P. & Arreola, J. Regulation of Ca2+-activated chloride channels by cAMP and CFTR in
parotid acinar cells. Biochem. Biophys. Res. Commun. 316, 612–617 (2004);
[45] Clarke, LL., Boucher RC. Chloride secretory response to extracellular ATP in human normal and cystic
fibrosis nasal epithelia. Am J Physiol. 263, 348-356 (1992);
[46] Mall, M. et al. Modulation of Ca2+-activated Cl- secretion by basolateral K+ channels in human normal
and cystic fibrosis airway epithelia. Pediatr. Res. 53, 608–618 (2003);
[47] Yang, Y. D. et al. TMEM16A confers receptor-activated calcium-dependent chloride conductance.
Nature 455, 1210–1215 (2008);

References
59
[48] Caputo, A. et al. TMEM16A, a membrane protein associated with calcium-dependent chloride
channel activity. Science 322, 590–594 (2008);
[49] Martins, J. R. et al. Anoctamin 6 is an essential component of the outwardly rectifying chloride
channel. Proc. Natl. Acad. Sci. 108, 18168–18172 (2011);
[50] Kunzelmann, K. TMEM16, LRRC8A, bestrophin: chloride channels controlled by Ca2+ and cell volume.
Trends Biochem. Sci. 1–9 (2015);
[51] Miledi, R. A calcium-dependent transient outward current in Xenopus laevis oocytes. Proc. R. Soc.
Lond. B. Biol. Sci. 215, 491–497 (1982);
[52] Bader, B., Bertrand, D. & Schwartzt, E. A. Voltage-Activated and Calcium-Activated Currents studied
in solitary rod inner segments from the salamander retina. J Physiol 331, 253–284 (1982);
[53] Kunzelmann, K., Milenkovic, V. M., Spitzner, M., Soria, R. B. & Schreiber, R. Calcium-dependent
chloride conductance in epithelia: Is there a contribution by Bestrophin? Pflugers Arch. Eur. J. Physiol. 454,
879–889 (2007);
[54] André, S. et al. Axotomy-induced expression of calcium-activated chloride current in subpopulations
of mouse dorsal root ganglion neurons. J. Neurophysiol. 90, 3764–3773 (2003);
[55] Matthews, H. R. & Reisert, J. Calcium, the two-faced messenger of olfactory transduction and
adaptation. Curr. Opin. Neurobiol. 13, 469–475 (2003);
[56] Angermann, J. E., Sanguinetti, A. R., Kenyon, J. L., Leblanc, N. & Greenwood, I. a. Mechanism of the
inhibition of Ca2+-activated Cl- currents by phosphorylation in pulmonary arterial smooth muscle cells. J.
Gen. Physiol. 128, 73–87 (2006);
[57] Lalonde, M., Kelly, M. & Barnes, S. Calcium-activated chloride channels in the retina. Channels 2, 252–
260 (2008);
[58] Verkman, A. S. & Galietta, L. J. V. Chloride channels as drug targets. Nat. Rev. Drug Discov. 8, 153–
171 (2009);
[59] Ferrera, L., Zegarra-Moran, O. & Galietta, L. J. V. Ca 2+ -Activated Cl − Channels. Compr. Physiol. 1,
2155–2174 (2011);
[60] Galietta, L. J. V. The TMEM16 protein family: a new class of chloride channels? Biophys. J. 97, 3047–
3053 (2009);
[61] Hartzell, C., Putzier, I. & Arreola, J. Calcium-activated chloride channels. Annu. Rev. Physiol. 67, 719–
758 (2005);
[62] Gruber, a D., Schreur, K. D., Ji, H. L., Fuller, C. M. & Pauli, B. U. Molecular cloning and transmembrane
structure of hCLCA2 from human lung, trachea, and mammary gland. Am. J. Physiol. 276, C1261–C1270
(1999);
[63] Huang, P. et al. Regulation of human CLC-3 channels by multifunctional Ca2+/calmodulin-dependent
protein kinase. J. Biol. Chem. 276, 20093–20100 (2001);
[64] Qu, Z., Wei, R. W., Mann, W. & Hartzell, H. C. Two bestrophins cloned from Xenopus laevis oocytes
express Ca(2+)-activated Cl(-) currents. J. Biol. Chem. 278, 49563–49572 (2003);
[65] Gibson, A. et al. HCLCA1 and mCLCA3 are secreted non-integral membrane proteins and therefore
are not ion channels. J. Biol. Chem. 280, 27205–27212 (2005);
[66] Eggermont, J. Calcium-activated chloride channels: (un)known, (un)loved? Proc. Am. Thorac. Soc. 1,
22–27 (2004);
[67] Schroeder, B. C., Cheng, T., Jan, Y. N. & Jan, L. Y. Expression Cloning of TMEM16A as a Calcium-
Activated Chloride Channel Subunit. Cell 134, 1019–1029 (2008);
[68] Kunzelmann, K. et al. Anoctamins. Pflugers Arch. Eur. J. Physiol. 462, 195–208 (2011);
[69] Hartzell, H. C., Yu, K., Xiao, Q., Chien, L.-T. & Qu, Z. Anoctamin/TMEM16 family members are Ca2+-
activated Cl- channels. J. Physiol. 587, 2127–2139 (2009);

References
60
[70] Milenkovic, V. M., Brockmann, M., Stöhr, H., Weber, B. H. & Strauss, O. Evolution and functional
divergence of the anoctamin family of membrane proteins. BMC Evol. Biol. 10, 319 (2010);
[71] Pedemonte, N. & Galietta, L. J. V. Structure and function of TMEM16 proteins (anoctamins). Physiol.
Rev. 94, 419–59 (2014);
[72] Ferrera, L. et al. Regulation of TMEM16A chloride channel properties by alternative splicing. J. Biol.
Chem. 284, 33360–33368 (2009);
[73] Duran, C. & Hartzell, H. C. Physiological roles and diseases of Tmem16/Anoctamin proteins: are they
all chloride channels? Acta Pharmacol. Sin. 32, 685–692 (2011);
[74] Brunner, J. D., Lim, N. K., Schenck, S., Duerst, A. & Dutzler, R. X-ray structure of a calcium-activated
TMEM16 lipid scramblase. Nature 516, 207–212 (2014);
[75] HGNC (HUGO Gene Nomenclature Committee): http://www.genenames.org/;
[76] Yang, H. et al. TMEM16F Forms a Ca2+-Activated Cation Channel Required for Lipid Scrambling in
Platelets during Blood Coagulation. Cell 151, 111–122 (2012);
[77] Fallah, G. et al. TMEM16A(a)/anoctamin-1 shares a homodimeric architecture with CLC chloride
channels. Mol. Cell. Proteomics 10, M110.004697 (2011);
[78] Sheridan, J. T. et al. Characterization of the oligomeric structure of the Ca(2+)-activated Cl- channel
Ano1/TMEM16A. J. Biol. Chem. 286, 1381–1388 (2011);
[79] Tien, J., Lee, H. Y., Minor, D. L., Jan, Y. N. & Jan, L. Y. Identification of a dimerization domain in the
TMEM16A calcium-activated chloride channel (CaCC). Proc. Natl. Acad. Sci. U. S. A. 110, 6352–7 (2013);
[80] Schreiber, R. et al. Expression and function of epithelial anoctamins. J. Biol. Chem. 285, 7838–7845
(2010);
[81] Kunzelmann, K. et al. Expression and function of epithelial anoctamins. Exp. Physiol. 97, 184–192
(2012);
[82] Tian, Y., Schreiber, R. & Kunzelmann, K. Anoctamins are a family of Ca2+ activated Cl- channels. J. Cell
Sci. (2012);
[83] Pifferi, S., Dibattista, M. & Menini, A. TMEM16B induces chloride currents activated by calcium in
mammalian cells. Pflugers Arch. Eur. J. Physiol. 458, 1023–1038 (2009);
[84] Ousingsawat, J. et al. Loss of TMEM16A causes a defect in epithelial Ca2+ -dependent chloride
transport. J. Biol. Chem. 284, 28698–28703 (2009);
[85] Romanenko, V. G. et al. Tmem16A encodes the Ca2+-activated Cl- channel in mouse submandibular
salivary gland acinar cells. J. Biol. Chem. 285, 12990–13001 (2010);
[86] Tian, Y. et al. Calmodulin-dependent activation of the epithelial calcium-dependent chloride channel
TMEM16A. FASEB J. 25, 1058–1068 (2011);
[87] Stöhr, H. et al. TMEM16B, a novel protein with calcium-dependent chloride channel activity,
associates with a presynaptic protein complex in photoreceptor terminals. J. Neurosci. 29, 6809–6818
(2009);
[88] Pifferi, S., Cenedese, V. & Menini, A. Anoctamin 2/TMEM16B: a calcium-activated chloride channel
in olfactory transduction. Exp. Physiol. 97, 193–9 (2012);
[89] Huang, F. et al. TMEM16C facilitates Na(+)-activated K(+) currents in rat sensory neurons and
regulates pain processing. Nat. Neurosci. 16, 1284–1290 (2013);
[90] Shimizu, T. et al. TMEM16F is a component of a Ca2+-activated Cl- channel but not a volume-sensitive
outwardly rectifying Cl- channel. Am. J. Physiol. Cell Physiol. 304, C748–59 (2013);
[91] Kunzelmann, K. et al. Molecular functions of anoctamin 6 (TMEM16F): A chloride channel, cation
channel, or phospholipid scramblase? Pflugers Arch. Eur. J. Physiol. 466, 407–414 (2014);
[92] Suzuki, J. & Nagata, S. Calcium-dependent phospholipid scrambling by TMEM16F. Nature 468, 834–
840 (2010);

References
61
[93] Sanyal, S. & Menon, A. K. Flipping lipids: Why an’ what's the reason for? ACS Chem. Biol. 4, 895–909
(2009);
[94] Lentz, BR. Exposure of platelet membrane phosphatidylserine regulates blood coagulation. Prog Lipid
Res. 42, 423-438 (2003);
[95] Suzuki, J. et al. Calcium-dependent phospholipid scramblase activity of TMEM16 protein family
members. J. Biol. Chem. 288, 13305–16 (2013);
[96] Almaça, J. et al. TMEM16 proteins produce volume-regulated chloride currents that are reduced in
mice lacking TMEM16A. J. Biol. Chem. 284, 28571–28578 (2009);
[97] Juul, C. a. et al. Anoctamin 6 differs from VRAC and VSOAC but is involved in apoptosis and supports
volume regulation in the presence of Ca2+. Pflugers Arch. Eur. J. Physiol. 1–12 (2014);
[98] Malvezzi, M. et al. Ca2+-dependent phospholipid scrambling by a reconstituted TMEM16 ion channel.
Nat Commun 4: 2367 (2013);
[99] Scudieri, P. et al. Ion channel and lipid scramblase activity associated with expression of
TMEM16F/ANO6 isoforms. J. Physiol. 593, 3829–3848 (2015);
[100] Jacobsen, K. S. et al. The role of TMEM16A (ANO1) and TMEM16F (ANO6) in cell migration. Pflugers
Arch. Eur. J. Physiol. 465, 1753–1762 (2013);
[101] Szteyn, K. et al. Expression and Functional Significance of the Ca2+-Activated Cl- Channel ANO6 in
Dendritic Cells. Cell. Physiol. Biochem. 30, 1319–1332 (2012);
[102] Wanitchakool, P. et al. Role of anoctamins in cancer and apoptosis. Phil Trans R Soc B 369, 1–8
(2014);
[103] Galindo, B. E. & Vacquier, V. D. Phylogeny of the TMEM16 protein family: some members are
overexpressed in cancer. Int. J. Mol. Med. 16, 919–924 (2005);
[104] Miwa, S., Nakajima, T., Murai, Y., Takano, Y. & Sugiyama, T. Mutation assay of the novel gene DOG1
in gastrointestinal stromal tumors (GISTs). J. Gastroenterol. 43, 531–537 (2008);
[105] Kunzelmann, K. Ion channels and cancer. J. Membr. Biol. 205, 159–173 (2005);
[106] Dutertre, M. et al. Exon-based clustering of murine breast tumor transcriptomes reveals alternative
exons whose expression is associated with metastasis. Cancer Res. 70, 896–905 (2010);
[107] West, R. B. et al. The novel marker, DOG1, is expressed ubiquitously in gastrointestinal stromal
tumors irrespective of KIT or PDGFRA mutation status. Am. J. Pathol. 165, 107–113 (2004);
[108] Britschgi, A. et al. Calcium-activated chloride channel ANO1 promotes breast cancer progression by
activating EGFR and CAMK signaling. Proc. Natl. Acad. Sci. U. S. A. 110, E1026–34 (2013);
[109] Carles, A. et al. Head and neck squamous cell carcinoma transcriptome analysis by comprehensive
validated differential display. Oncogene 25, 1821–1831 (2006);
[110] Huang, X., Godfrey, T. E., Gooding, W. E. & M.Gollin, S. Comprehensive Genome and Transcriptome
Analysis of the 11q13 Amplicon in Human Oral Cancer and Synteny to the 7F5 Amplicon in Murine Oral
Carcinoma. Genes. Chromosomes Cancer 45, 1058–1069 (2006);
[111] Das, S. et al. NGEP, a prostate-specific plasma membrane protein that promotes the association of
LNCaP cells. Cancer Res. 67, 1594–1601 (2007);
[112] Tsutsumi, S. et al. The novel gene encoding a putative transmembrane protein is mutated in
gnathodiaphyseal dysplasia (GDD). Am. J. Hum. Genet. 74, 1255–1261 (2004);
[113] Marconi, C. et al. A novel missense mutation in ANO5/TMEM16E is causative for gnathodiaphyseal
dyplasia in a large Italian pedigree. Eur. J. Hum. Genet. 21, 613–619 (2013);
[114] Charlesworth, G. et al. Mutations in ANO3 cause dominant craniocervical dystonia: Ion channel
implicated in pathogenesis. Am. J. Hum. Genet. 91, 1041–1050 (2012);
[115] Balreira, A. et al. ANO10 mutations cause ataxia and coenzyme Q10 deficiency. J. Neurol. 261, 2192–
2198 (2014);

References
62
[116] Rock, J. R., Futtner, C. R. & Harfe, B. D. The transmembrane protein TMEM16A is required for normal
development of the murine trachea. Dev. Biol. 321, 141–149 (2008);
[117] Kojima, H. et al. Production and characterization of transformed B-lymphocytes expressing the
membrane defect of Scott syndrome. J. Clin. Invest. 94, 2237–2244 (1994);
[118] Faria, D., Schreiber, R., Kunzelmann, K. CFTR is activated through stimulation of purinergic P2Y2
receptors. Pflugers Arch. Eur. J. Physiol. 457, 1373-1380 (2009);
[119] Namkung, W., Finkbeiner, W. E. & Verkman, A. S. CFTR-Adenylyl Cyclase I Association Responsible
for UTP Activation of CFTR in Well-Differentiated Primary Human Bronchial Cell Cultures. Mol. Biol. Cell
21, 2639–2648 (2010);
[120] Kunzelmann, K. & Mehta, A. CFTR: A hub for kinases and crosstalk of cAMP and Ca2+. FEBS J. 280,
4417–4429 (2013);
[121] Rock, J. R. et al. Transmembrane protein 16A (TMEM16A) is a Ca2+ -regulated Cl- secretory channel
in mouse airways. J. Biol. Chem. 284, 14875–14880 (2009);
[122] Egan, M. et al. Defective regulation of outwardly rectifying Cl− channels by protein kinase A
corrected by insertion of CFTR. Nature 358, 581-584 (1992);
[123] Kongsuphol, P., Schreiber, R., Kraidith, K. & Kunzelmann, K. CFTR induces extracellular acid sensing
in Xenopus oocytes which activates endogenous Ca 2+-activated Cl - conductance. Pflugers Arch. Eur. J.
Physiol. 462, 479–487 (2011);
[124] Anderson, M. P. & Welsh, M. J. Calcium and cAMP activate different chloride channels in the apical
membrane of normal and cystic fibrosis epithelia. Proc. Natl. Acad. Sci. U. S. A. 88, 6003–6007 (1991);
[125] Mall, M. a. & Galietta, L. J. V. Targeting ion channels in cystic fibrosis. J. Cyst. Fibros. 14, 561-570
(2015);
[126] The Universal Protein Resource (UniProt): http://www.uniprot.org/;
[127] Geneious Software: http://www.geneious.com/download;
[128] Y Zhang. I-TASSER server for protein 3D structure prediction. BMC Bioinformatics, 9, 40 (2008).
http://zhanglab.ccmb.med.umich.edu/I-TASSER/;
[129] The PyMOL Molecular Graphics System, Version 1.7.5.0 Schrödinger, LLC ;
[130] Ehrhardt, C. et al. Towards an in vitro model of cystic fibrosis small airway epithelium:
characterisation of the human bronchial epithelial cell line CFBE41o-. Cell Tissue Res. 323, 405–415 (2006);
[131] Bebok, Z. et al. Failure of cAMP agonists to activate rescued deltaF508 CFTR in CFBE41o- airway
epithelial monolayers. J. Physiol. 569, 601–615 (2005);
[132] Almaça, J. et al. Functional Genomics Assays to Study CFTR Traffic and ENaC Function. Methods Mol.
Biol. 742, 249–264 (2011);
[133] Graham, F. L., Smiley, J., Russell, W. C. & Nairn, R. Characteristics of a human cell line transformed
by DNA from human adenovirus type 5. J. Gen. Virol. 36, 59–74 (1977);
[134] Shaw, G., Morse, S., Ararat, M. & Graham, F. L. Preferential transformation of human neuronal cells
by human adenoviruses and the origin of HEK 293 cells. FASEB J. 16, 869–871 (2002);
[135] Hsu, S. et al. Genetic characteristics of the HeLa cell. Science. 191, 392–394 (1976);
[136] Landry, J. J. M. et al. The genomic and transcriptomic landscape of a HeLa cell line. G3 (Bethesda).
3, 1213–24 (2013);
[137] Erfle, H. et al. Reverse transfection on cell arrays for high content screening microscopy. Nat. Protoc.
2, 392–399 (2007);
[138] Mali, P. et al. RNA-Guided Human Genome Engineering via Cas9. Science. 339, 823–6 (2013);
[139] Cong, L., Ran, F., Cox, D., Lin, S. & Barretto, R. Multiplex Genome Engineering Using CRISPR / Cas
Systems. Science. 819, (2013);

References
63
[140] Singh, P., Schimenti, J. C. & Bolcun-Filas, E. A Mouse Geneticist’s Practical Guide to CRISPR
Applications. Genetics. 199, 1–15 (2014);
[141] Clontech CRISPR/Cas9 system for targeted genome editing:
http://www.clontech.com/US/Products/Genome_Editing/CRISPR_Cas9/Resources/About_CRISPR_Cas9;
[142] National Center for Biotechnology Information (NCBI) database:
http://www.ncbi.nlm.nih.gov/gene/;
[143] Tool for gRNA design: http://www.e-crisp.org/E-CRISP/designcrispr.html;
[144] Bradford Protein Assay. Bio-protocol Bio101: e45 (2011). http://www.bio-protocol.org/e45;
[145] Botelho, H. M. et al. Protein Traffic Disorders: an Effective High-Throughput Fluorescence
Microscopy Pipeline for Drug Discovery. Sci. Rep. 5, 9038 (2015);
[146] R: The R Project for Statistical Computing: http://www.r-project.org/;
[147] Duran, C., Qu, Z., Osunkoya, a. O., Cui, Y. & Hartzell, H. C. ANOs 3-7 in the anoctamin/Tmem16 Cl-
channel family are intracellular proteins. AJP Cell Physiol. 302, C482–C493 (2012);
[148] Boedtkjer, D. M. B., Kim, S., Jensen, a B., Matchkov, V. M. & Andersson, K. E. New selective inhibitors
of calcium-activated chloride channels-T16A inh -A01, CaCC inh -A01, and MONNA-what do they inhibit?
Br. J. Pharmacol. (2015);
[149] Paradiso, a M., Ribeiro, C. M. & Boucher, R. C. Polarized signaling via purinoceptors in normal and
cystic fibrosis airway epithelia. J. Gen. Physiol. 117, 53–67 (2001);
[150] Zeng, W., Lee, M. G. & Muallem, S. Membrane-specific regulation of Cl- channels by purinergic
receptors in rat submandibular gland acinar and duct cells. J. Biol. Chem. 272, 32956–32965 (1997);
[151] Kellerman, D., Evans, R., Mathews, D. & Shaffer, C. Inhaled P2Y2 receptor agonists as a treatment
for patients with Cystic Fibrosis lung disease. Adv. Drug Deliv. Rev. 54, 1463–1474 (2002);
[152] Billet, A. & Hanrahan, J. W. The secret life of CFTR as a calcium-activated chloride channel. J. Physiol.
591, 5273–5278 (2013);
[153] Chambers, L. a., Rollins, B. M. & Tarran, R. Liquid movement across the surface epithelium of large
airways. Respir. Physiol. Neurobiol. 159, 256–270 (2007);
[154] Schreiber, R. & Kunzelmann, K. Purinergic P2Y6 receptors induce Ca2+ and CFTR dependent Cl-
secretion in mouse trachea. Cell. Physiol. Biochem. 16, 99–108 (2005);
[155] Wolff, S. C., Qi, A.-D., Harden, T. K. & Nicholas, R. a. Polarized expression of human P2Y receptors in
epithelial cells from kidney, lung, and colon. Am. J. Physiol. Cell Physiol. 288, C624–32 (2005);
[156] Toczyłowska-Mamińska, R. & Dołowy, K. Ion transporting proteins of human bronchial epithelium.
J. Cell. Biochem. 113, 426–432 (2012);
[157] Hwang, T. H., Schwiebert, E. M. & Guggino, W. B. Apical and basolateral ATP stimulates tracheal
epithelial chloride secretion via multiple purinergic receptors. AJP Cell Physiol. 270, C1611–C1623 (1996);
[158] Kunzelmann, K. et al. Purinergic inhibition of the epithelial Na+ transport via hydrolysis of PIP2.
FASEB J. 19, 142–143 (2005);
[159] Idzko, M., Ferrari, D. & Eltzschig, H. K. Nucleotide signalling during inflammation. Nature 509, 310–
317 (2014);
[160] Martins, J. R. et al. F508del-CFTR increases intracellular Ca(2+) signaling that causes enhanced
calcium-dependent Cl(-) conductance in cystic fibrosis. Biochim. Biophys. Acta 1812, 1385–92 (2011);
[161] Kunzelmann, K. et al. Airway epithelial cells - Functional links between CFTR and anoctamin
dependent Cl- secretion. Int. J. Biochem. Cell Biol. 44, 1897–1900 (2012);
[162] Lazarowski, E. R. & Boucher, R. C. Purinergic receptors in airway epithelia. Curr. Opin. Pharmacol. 9,
262–267 (2009);
[163] Santa Cruz Biotechnology CRISPR-Cas9 system: http://www.scbt.com/pt/crispr-cas9_system.html.

Appendices
64
7. Appendices
7.1) Appendix 1 – Vectors
Figure 32 - pcDNA 3.1 plasmid map
Figure 33 - pLVX-Tet3G vector map

Appendices
65
Figure 34 - pLVX-TRE3G vector map
Figure 35 - pLVX-TRE3G multiple cloning site
7.2) Appendix 2 – Results from DNA sequencing
7.2.1) Primers used for sequencing
Table 1 - Primers used for DNA sequencing. All primers are forward.
Anoctamin Primer sequence
Ano6
5’ – GGATCAACAGAC – 3’
5’ – GGCTCTCGGTGTTC – 3’
5’ – GAGCATGGCAGCCC – 3’
5’ – CATGAGAATCACC – 3’
Ano9
5’ – CTGAGCGGATTCTC – 3’
5’ – GAGTGCCACGCCAG – 3’
5’ – GGTTCTGGAGGTG – 3’
Ano10
5’ – GGGAAGACTATGAC – 3’
5’ – CAAGTCATCCTGG – 3’
5’ – GAGGCACTCAAGCAG – 3’

Appendices
66
7.2.2) Sequencing results – 3-HA tag insertion
A)
B)
C)
D)
E)
F)
Figure 36 - Sequencing of 3-HA tag cloned into Anoctamin plasmids. A) and B) Sequencing of the first and second mutagenesis (respectively) of pcDNA 3.1 Ano6 3-HA GFP. C) and D) Sequencing of the first and second mutagenesis of pcDNA 3.1 Ano9 3-HA GFP. E) and F) Sequencing of the first and second mutagenesis of pcDNA 3.1 Ano10 3-HA GFP.

Appendices
67
7.3) Appendix 3 – Primers and PCR conditions used
Table 2 - Primers for mutagenesis reactions. The table presents only the forward primers. For each, a complementary reverse primer was also used. The 3-HA tag insertion is represented in bold.
Name Sequence
Ano6_mut_1 5’ – CTGATATTGGTGGCAAGATCTACCCATACGATGTTCCAGATTACGGCTTACCCATACGA
TGTTCCAGATTACGCTTACCCATACGATGTTCCAGATTACGCTATAATGTGTCCTCAGTGTG – 3’
Ano6_mut_2 5’ – GCAGGTATCGTGATTTCCGATACCCATACGATGTTCCAGATTACGCTTACCCATACGATGTTC
CAGATTACGCTTACCCATACGATGTTCCAGATTACGCTTACCCACCTGGACACCCCC – 3’
Ano9_mut_1 5’ – GGAGATCTGTGAGGCCCACGACTACCCATACGATGTTCCAGATTACGCTTACCCATACGATGT
TCCAGATTACGCTTACCCATACGATGTTCCAGATTACGCTATCCTCATGTGTCCCCTCGGCG – 3’
Ano9_mut_2 5’ – TAGTCTTTCTGAGCGGATTCTACCCATACGATGTTCCAGATTACGCTTACCCATACGAT
GTTCCAGATTACGCTTACCCATACGATGTTCCAGATTACGCTTCGCTGTTTGAGGCCAGCC – 3’
Ano10_mut_1 5’ – GGCCTTGGGTCTACATTACCCATACGATGTTCCAGATTACGCTTACCCATACGA
TGTTCCAGATTACGCTTACCCATACGATGTTCCAGATTACGCTGAGAACAGCGGGTCTG – 3’
Ano10_mut_2 5’ – TGTCACCACAAGTGAATGCATACCCATACGATGTTCCAGATTACGCTTACCCATACGATGTT
CCAGATTACGCTTACCCATACGATGTTCCAGATTACGCTGTCTTTCCAGAATCAAAAG – 3’
Table 3 - PCR programs used for the mutagenesis reactions of each anoctamin. Mutagenesis 1 corresponds to the first mutagenesis attempt in which the 3-HA tag was not in a correct place. Mutagenesis 2 was the second mutagenesis attempt for each anoctamin.
Programs used for: Temperature Time Number of cycles
Mutagenesis of Ano6_1
95ºC 95ºC 48ºC 70ºC
2 min 20 s 10 s
4 min 30 s
25
Mutagenesis of Ano6_2
95ºC 95ºC 57ºC 70ºC
2 min 20 s 10 s
4 min 30 s
25
Mutagenesis of Ano9_1
95ºC 95ºC 60ºC 70ºC
2 min 20 s 10 s
4 min 30 s
25
Mutagenesis of Ano9_2
95ºC 95ºC 56ºC 70ºC
2 min 20 s 10 s
4 min 30 s
25
Mutagenesis of Ano10_1
95ºC 95ºC 53ºC 70ºC
2 min 20 s 10 s
4 min 30 s
25
Mutagenesis of Ano10_2
95ºC 95ºC 53ºC 70ºC
2 min 20 s 10 s
4 min 30 s
25

Appendices
68
Table 4 - Primers for colony PCR reactions.
Name Sequence
Ano6_1 Forward: 5’ – GTTGTAGGAGTGGCTTGC – 3’
Reverse: 5’ – CAAAACTGTCGAAGATGCAC – 3’
Ano6_2 Forward: 5’ – CCACACTTCCTACACCAT – 3’
Reverse: 5’ – GCGTTTTGATACATCGGG – 3’
Ano9_1 and
2
Forward: 5’ – GCAGCCAGTTGATGAAATC – 3’
Reverse: 5’ – CAAAGAGGTGGGTGAGCT – 3’
Ano10_1 Forward: 5’ – CATGGTGTCTTGGGTATC – 3’
Reverse: 5’ – GCACATACAACAGGACAC – 3’
Ano10_2 Forward: 5’ – CAAGTCATCCTGG – 3’
Reverse: 5’ – TTTCATCTGGATATGCCG – 3’
Table 5 - PCR programs used for the colony PCR reactions of each anoctamin.
Programs used for: Temperature Time Number of cycles
Ano6_1
94ºC 94ºC 57ºC 72ºC 72ºC
5 min 30 s 30 s
1 min 6 min
35
Ano6_2
94ºC 94ºC 51ºC 72ºC 72ºC
5 min 30 s 30 s
1 min 6 min
35
Ano9_1 and 2
94ºC 94ºC 56ºC 72ºC 72ºC
5 min 30 s 30 s
1 min 6 min
35
Ano10_1
94ºC 94ºC 54ºC 72ºC 72ºC
5 min 30 s 30 s
1 min 6 min
35
Ano10_2
94ºC 94ºC 46ºC 72ºC 72ºC
5 min 30 s 30 s
1 min 6 min
35

Appendices
69
Table 6 – Primers (forward and reverse) for the PCR reaction of the insertion of 16 bp extensions (extensions in bold).
Name Sequence
Ano6 Forward: 5’ – TCTTATACTTGGATCCATGAAAAAGATGAGCAGGAATGTT – 3’
Reverse: 5’ – ATTCCATATGACGCGTTTACTTGTACAGCTCGTCCATGCC – 3’
Ano9 Forward: 5’ – TCTTATACTTGGATCCATGCAGGGCGAAGAGAGCCTCCGG – 3’
Reverse: 5’ – ATTCCATATGACGCGTTTACTTGTACAGCTCGTCCATGCC – 3’
Ano10 Forward: 5’ – TCTTATACTTGGATCCATGAAAGTGACCTTATCAGCTTTG – 3’
Reverse: 5’ – ATTCCATATGACGCGTTTACTTGTACAGCTCGTCCATGCC – 3’
Table 7 - PCR program used for the insertion of the 16 bp extensions in each anoctamin necessary for cloning into pLVX-TRE3G lentiviral vector.
Program used for: Temperature Time Number of cycles
Insertion of 16 bp
extensions in Ano6, Ano9
and Ano10
95ºC
95ºC
60ºC
70ºC
3 min
20 s
10 s
5 min
35
7.4) Appendix 4 – Structural models of anoctamins with tags and HA
immunostaining with and without cell permeabilization
Figure 37 - Schematic representation of an anoctamin double-tagged construct (3-HA – Triple hemagglutinin tag; GFP – Green Fluorescent Protein) located at the plasma membrane. The predicted dimer structure was obtained using the I-TASSER server (in this case the protein is Ano10 3-HA GFP).

Appendices
70
7.4.1) Anoctamin 6
Figure 38 - Localizations of the 3-HA tag in the two mutagenesis performed for Ano6. Predicted structure of the first and second constructs. (Protein model and image generated by Hugo Botelho, reproduced with permission).
Figure 39 - Predicted structures of the Ano6 dimer and the Ano6 dimer with the 3-HA tag inserted. (Protein model and image generated by Hugo Botelho, reproduced with permission).

Appendices
71
Figure 40 - Immunofluorescence results of CFBE cells transiently transfected with the first double-tagged Ano6 construct. The plasma membrane was not permeabilized and images were acquired with the 20x objective. In the Hoechst channel (upper left) it is possible to see the nuclei, in the GFP channel (upper right) it is possible to see Ano6 (since it has a GFP-tag in the cytoplasmic C-terminal) and in the Cy5 channel (lower left) it should be seen the membrane staining of Ano6 in case the 3-HA tag was exposed to the outside of the cell (Primary antibody – anti-HA; secondary antibody – Cy5). Scale bar represents 30 µm.
Figure 41 - Immunofluorescence results of CFBE cells transiently transfected with the first double-tagged Ano6 construct (40x objective). Conditions as above, except that here the plasma membrane was permeabilized. In contrast to non-permeabilized cells (Fig.40), the HA antibody now detects Ano6, indicating that the 3-HA tag is present but intracellularly localized. Hoechst – Nuclei; GFP – Ano6; Cy5 – HA staining. Scale bar represents 30 µm.

Appendices
72
Figure 42 - Immunofluorescence results of CFBE cells transiently transfected with the first double-tagged Ano6 construct. The plasma membrane was permeabilized and the 20x objective was used. Hoechst – Nuclei; GFP – Ano6; Alexa 568 – Ano6 staining; Cy5 – E-cadherin staining. No overlap is detected between Ano6 and E-cadherin (epithelial cell plasma membrane marker) stainings, meaning that this double-tagged construct of Ano6 is not localized at the plasma membrane. Scale bar represents 30 µm.
Figure 43 - Immunofluorescence results of HEK 293T cells transiently transfected with the second double-tagged construct of Ano6. The plasma membrane was not permeabilized and the 40x objective was used. Hoechst – Nuclei; GFP – Ano6; Cy5 – HA staining. HEK 293T cells transfected with this double-tagged Ano6 show a strong staining of the HA antibody without plasma membrane permeabilization, meaning that this protein is localized at the plasma membrane, and that the 3-HA tag is correctly inserted in an extracellular loop of the protein. Scale bar represents 30 µm.

Appendices
73
Figure 44 - Immunofluorescence results of CFBE cells transiently transfected with the second double-tagged construct of Ano6. The plasma membrane was not permeabilized and the 40x objective was used. Hoechst – Nuclei; GFP – Ano6; Cy5 – HA staining. Similarly to what is observed in Fig.43, these results indicate that this second Ano6 construct is localized at the plasma membrane and that the 3-HA tag is correctly inserted in an extracellular loop of the protein. Scale bar represents 30 µm.
7.4.2) Anoctamin 9
Figure 45 - Predicted structures of the Ano9 dimer and the Ano9 dimer with the 3-HA tags inserted – First and second mutagenesis. (Protein model and image generated by Hugo Botelho, reproduced with permission).

Appendices
74
Figure 46 - Immunofluorescence results of CFBE cells transiently transfected with the first double-tagged Ano9 construct. The plasma membrane was not permeabilized and the 40x objective was used. Hoechst – Nuclei; GFP – Ano6; Cy5 – HA staining. No membrane staining was detected, indicating that either this double-tagged Ano9 is not localized at the plasma membrane or that the 3-HA tag is not inserted in an extracellular loop of the protein. Scale bar represents 30 µm.
Figure 47 - Immunofluorescence results of CFBE cells transiently transfected with the first double-tagged Ano9 construct. Conditions as above, except that here the plasma membrane was permeabilized. In contrast to non-permeabilized cells (Fig.46), the HA antibody now detects Ano9, indicating that the 3-HA is present but intracellularly localized. Hoechst – Nuclei; GFP – Ano6; Cy5 – HA staining. Scale bar represents 30 µm.

Appendices
75
Figure 48 - Immunofluorescence results of CFBE cells transiently transfected with the second double-tagged Ano9 construct. The plasma membrane was not permeabilized and the 40x objective was used. Hoechst – Nuclei; GFP – Ano6; Cy5 – HA staining. No membrane staining was detected, indicating that either this double-tagged Ano9 is not localized at the plasma membrane or that the 3-HA tag is not inserted in an extracellular loop of the protein. Nevertheless, this construct of Ano9 was used for further experiments. Scale bar represents 30 µm.
7.4.3) Anoctamin 10
Figure 49 - Predicted structures of the Ano10 dimer and the Ano10 dimer with the 3-HA tags inserted – First and second mutagenesis. (Protein model and image generated by Hugo Botelho, reproduced with permission).

Appendices
76
Figure 50 - Immunofluorescence results of CFBE cells transiently transfected with the first double-tagged Ano10 construct. The membrane was not permeabilized and the 20x objective was used. Hoechst – Nuclei; GFP – Ano6; Cy5 – HA staining. No GFP signal nor HA staining was detected. Scale bar represents 30 µm.
Figure 51 - Immunofluorescence results of HEK 293T cells transiently transfected with the second double-tagged Ano10 construct. The plasma membrane was not permeabilized and the 20x objective was used. Hoechst – Nuclei; GFP – Ano6; Cy5 – HA staining. With this construct the cells were transfected, but the plasma membrane staining was not conclusive, being only detected for some of the transfected cells. Nevertheless, this construct of Ano10 was used for further experiments. Scale bar represents 30 µm.

Appendices
77
7.5) Appendix 5 – Results from cloning and lentiviral production and transduction
Table 8 - Cloning reaction using the In-Fusion HD cloning kit.
Anoctamin cDNA with primer extensions 200 ng
Linearized vector 50 ng
In-Fusion HD Enzyme Premix 2 µL
H2O To 10 µL
Table 9 - In-Fusion HD Cloning Kit positive and negative controls.
Figure 52 - Inducible expression of transgene by doxycycline (Dox) in stably transduced cells.
In-Fusion Cloning reaction Transformation Competent cells Results
2kb
Control
Insert
pUC19
control
vector
In-Fusion
HD
Enzyme
Premix
H2O Incubation
Volume added
to competent
cells
Competent
cells
Transformation
efficiency
Number
of
colonies
Positive
control 2 μL 1 μL 2 μL 5 μL
15 min @
50 0C 5 μL XL1-B >1 x 10⁸ cfu/μg ≈ 1200
Negative
control - 1 μL 2 μL 7 μL
15 min @
50 0C 5 μL XL1-B >1 x 10⁸ cfu/μg 3

Appendices
78
Figure 53 - HEK 293T cells transiently transduced with lentiviral vectors (pLVX-TRE3G-Ano6 3-HA GFP and pLVX-Tet3G). On the left are represented cells without doxycycline induction, while on the right are represented transfected cells 24h after doxycycline induction, where is possible to observe Ano6 (GFP) expression. The images were acquired with the 10x objective. Scale bar represents 100 µm.
Figure 54 - HEK 293T cells transiently transduced with lentiviral vectors (pLVX-TRE3G-Ano9 3-HA GFP and pLVX-Tet3G). On the left are represented cells without doxycycline induction, while on the right are represented transfected cells 24h after doxycycline induction, where is possible to observe Ano9 (GFP) expression. The images were acquired with the 10x objective. Scale bar represents 100 µm.

Appendices
79
7.6) Appendix 6 – Antibiotic dose-dependent survival curves for CFBE parental
cells
An antibiotic dose-dependent survival curve is a dose response experiment which tests
the maximum concentration of antibiotic that a cell line tolerates (before dying) by testing
incremental doses. With these experiments, performed by a co-worker (Joana Lérias), it was
possible to determine the minimum antibiotic concentration of puromycin, G418 and
hygromycin required to kill all CFBE41o- cells.
Figure 55 - Puromycin resistance curve using CFBE41o- cells. 2 µg/mL of puromycin was the concentration used for further experiments since it was between the two lower concentrations that killed all cells in 8 days. (Results obtained by Joana Lérias, reproduced with permission).
Figure 56 - G418 resistance curve using CFBE41o- cells. 400 µg/mL of G418 was the concentration used for further experiments since it was the lowest concentration that killed almost all cells in 8 days. (Results obtained by Joana Lérias, reproduced with permission).

Appendices
80
Figure 57 - Hygromycin resistance curve using CFBE41o- cells. 200 µg/mL of hygromycin was the concentration used for further experiments since it was the lowest concentration that killed all cells in 7 days. (Results obtained by Joana Lérias, reproduced with permission).
According to the results observed in Fig. 55-57, the final concentrations of antibiotics
used for the experiments were the following:
Table 10 - Concentrations of antibiotics used for the experiments.
Puromycin G418 Hygromycin
Concentration
(µg/mL) 2 400 200
7.7) Appendix 7 – Results from Flow cytometry: cell sorting
7.7.1) CFBE Ano6 3-HA GFP
Figure 58 - Sorting of CFBE Ano6 3-HA GFP cells. The living cells were first selected, followed by a selection of single cells. Finally, the GFP emission intensity was measured and the cells were sorted according to it.

Appendices
81
Figure 59 – GFP positive cells selected from the CFBE Ano6 3-HA GFP heterogeneous population.
Figure 60 - GFP negative cells selected from the CFBE Ano6 3-HA GFP heterogeneous population.
Figure 61 - CFBE Ano6 3-HA sorting statistics. With these results it is possible to conclude that the GFP (Ano6) positive cells were accurately sorted, since no GFP negative cells were detected in the GFP positive population.
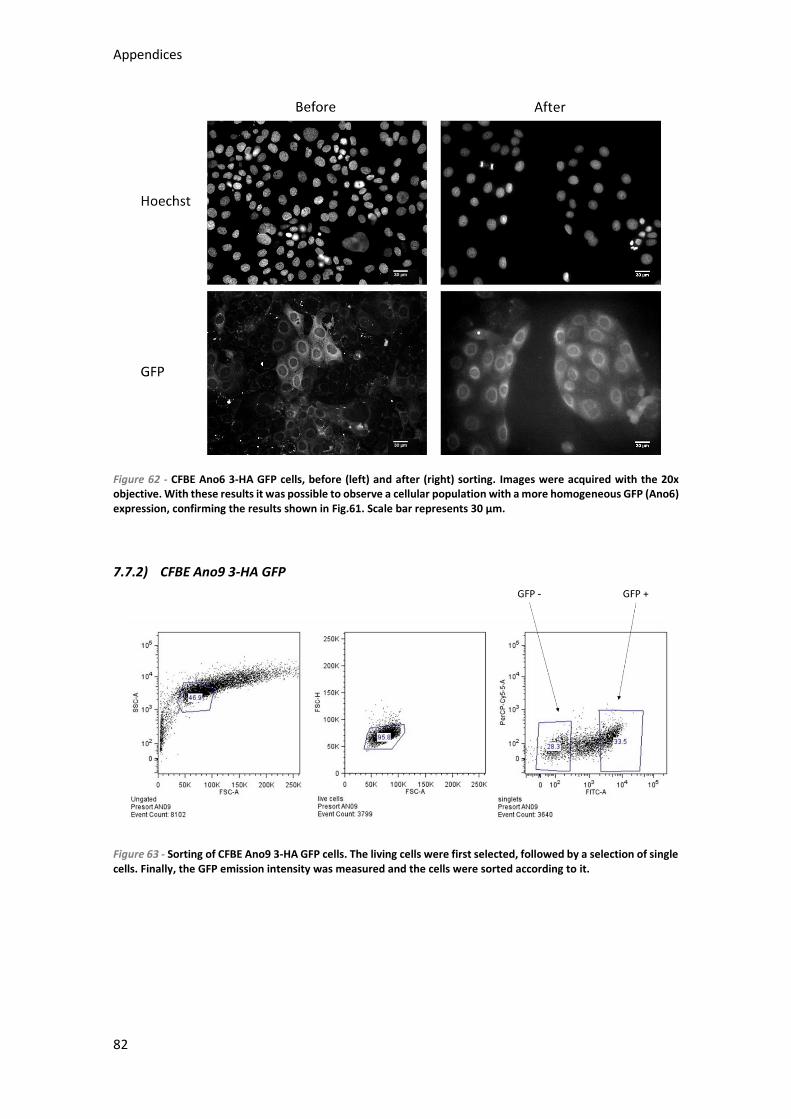
Appendices
82
Figure 62 - CFBE Ano6 3-HA GFP cells, before (left) and after (right) sorting. Images were acquired with the 20x objective. With these results it was possible to observe a cellular population with a more homogeneous GFP (Ano6) expression, confirming the results shown in Fig.61. Scale bar represents 30 µm.
7.7.2) CFBE Ano9 3-HA GFP
Figure 63 - Sorting of CFBE Ano9 3-HA GFP cells. The living cells were first selected, followed by a selection of single cells. Finally, the GFP emission intensity was measured and the cells were sorted according to it.

Appendices
83
Figure 64 - GFP positive cells selected from the CFBE Ano9 3-HA GFP heterogeneous population.
Figure 65 - GFP negative cells selected from the CFBE Ano9 3-HA GFP heterogeneous population.
Figure 66 - CFBE Ano9 3-HA sorting statistics. With these results it is possible to conclude that the GFP (Ano9) positive cells were accurately sorted, since no GFP negative cells were detected in the GFP positive population.

Appendices
84
Figure 67 - CFBE Ano9 3-HA GFP cells, before (left) and after (right) sorting. Images were acquired with the 20x objective. With these results it was possible to observe a cellular population with a more homogeneous GFP (Ano9) expression, confirming the results shown in Fig.66. Scale bar represents 30 µm.
7.7.3) CFBE mCherry wt-CFTR Ano6 3-HA GFP
Figure 68 - Sorting of CFBE mCherry wt-CFTR Ano6 3-HA GFP cells. The living cells were first selected, followed by a selection of single cells. Finally, the GFP and mCherry emission intensities were measured and the cells were sorted accordingly.

Appendices
85
Figure 69 – GFP and mCherry positive cells selected from the CFBE mCherry wt-CFTR Ano6 3-HA GFP heterogeneous population.
Figure 70 - GFP negative and mCherry positive cells selected from the CFBE mCherry wt-CFTR Ano6 3-HA GFP heterogeneous population.
Figure 71 - CFBE mCherry wt-CFTR Ano6 3-HA GFP sorting statistics. With these results it is possible to conclude that the GFP (Ano6) positive cells were accurately sorted, since no GFP negative cells were detected in the GFP positive population.

Appendices
86
Figure 72 - CFBE mCherry wt-CFTR Ano6 3-HA GFP before (left) and after (right) sorting. Images were acquired with the 40x objective. With these results it was possible to observe a cellular population with a more homogeneous GFP (Ano6) expression, confirming the results shown in Fig.71. Scale bar represents 30 µm.
7.7.4) CFBE mCherry F508del-CFTR Ano6 3-HA GFP
Figure 73 - Sorting of CFBE mCherry F508del-CFTR Ano6 3-HA GFP cells. The living cells were first selected, followed by a selection of single cells. Finally, the GFP and mCherry emission intensities were measured and the cells were sorted accordingly.

Appendices
87
Figure 74 - GFP positive cells selected from the CFBE mCherry F508del-CFTR Ano6 3-HA GFP heterogeneous population.
Figure 75 - GFP negative cells selected from the CFBE mCherry F508del-CFTR Ano6 3-HA GFP heterogeneous population.
Figure 76 - CFBE mCherry F508del-CFTR Ano6 3-HA GFP sorting statistics. With these results it is possible to conclude that the GFP (Ano6) positive cells were accurately sorted, since no GFP negative cells were detected in the GFP positive population.

Appendices
88
Figure 77 - CFBE mCherry F508del-CFTR Ano6 3-HA GFP before (left) and after (right) sorting. Images were acquired with the 40x objective. With these results it was possible to observe a cellular population with a more homogeneous GFP (Ano6) expression, confirming the results shown in Fig.76. Scale bar represents 30 µm.
7.7.5) CFBE mCherry wt-CFTR Ano9 3-HA GFP
Figure 78 - Sorting of CFBE mCherry wt-CFTR Ano9 3-HA GFP cells. The living cells were first selected, followed by a selection of single cells. Finally, the GFP and mCherry emission intensities were measured and the cells were sorted accordingly.

Appendices
89
Figure 79 – GFP and mCherry positive cells selected from the CFBE mCherry wt-CFTR Ano9 3-HA GFP heterogeneous population.
Figure 80 - GFP negative and mCherry positive cells selected from the CFBE mCherry wt-CFTR Ano9 3-HA GFP heterogeneous population.
Figure 81 - CFBE mCherry wt-CFTR Ano9 3-HA GFP sorting statistics. With these results it is possible to conclude that the GFP (Ano9) positive cells were accurately sorted, since no GFP negative cells were detected in the GFP positive population.

Appendices
90
Figure 82 - CFBE mCherry wt-CFTR Ano9 3-HA GFP before (left) and after (right) sorting. Images were acquired with the 40x objective. With these results it was possible to observe a cellular population with a more homogeneous GFP (Ano9) expression, confirming the results shown in Fig.81. Scale bar represents 30 µm.
7.7.6) CFBE mCherry F508del-CFTR Ano9 3-HA GFP
Figure 83 - Sorting of CFBE mCherry F508del-CFTR Ano9 3-HA GFP cells. The living cells were first selected, followed by a selection of single cells. Finally, the GFP and mCherry emission intensities were measured and the cells were sorted accordingly.

Appendices
91
Figure 84 - GFP positive cells selected from the CFBE mCherry F508del-CFTR Ano9 3-HA GFP heterogeneous population.
Figure 85 - GFP negative cells selected from the CFBE mCherry F508del-CFTR Ano9 3-HA GFP heterogeneous population.
Figure 86 - CFBE mCherry F508del-CFTR Ano9 3-HA GFP sorting statistics. With these results it is possible to conclude that the GFP (Ano9) positive cells were accurately sorted, since no GFP negative cells were detected in the GFP positive population.

Appendices
92
Figure 87 - CFBE mCherry F508del-CFTR Ano9 3-HA GFP before (left) and after (right) sorting. Images were acquired with the 40x objective. With these results it was possible to observe a cellular population with a more homogeneous GFP (Ano9) expression, confirming the results shown in Fig.86. Scale bar represents 30 µm.

Appendices
93
7.8) Appendix 8 – Structure of the CFTR construct
Figure 88 - Schematic representation of the CFTR traffic reporter construct145. A) Topology of the CFTR molecule. mCherry was fused to the N-terminus of CFTR and the Flag-tag was introduced in the fourth extracellular loop. Both wt and F508del variants were generated. B) Amino acid sequence showing the linker that connects mCherry to CFTR. C) Amino acid sequence of CFTR showing the insertion of the Flag tag between Asn901 and Ser902. Adapted from [145].
7.9) Appendix 9 – CRISPR/Cas9 system
7.9.1) Transfection
Figure 89 - CRISPR/Cas9 system used in this project. Adapted from [163].

Appendices
94
7.9.2) gRNA design for Ano6 knockout
gRNA 1 (represented in bold):
5’- TGTACAAAAAAGCAGGCTTTAAAGGAACCAATTCAGTCGACTGGATCCGGTACCAAGGTCGGGCAG
GAAGAGGGCCTATTTCCCATGATTCCTTCATATTTGCATATACGATACAAGGCTGTTAGAGAGATAATT
AAGAATTAATTTGACTGTAAACACAAAGATATTAGTACAAAATACGTGACGTAGAAAGTAATAATTTCT
TGGGTAGTTTGCAGTTTTAAAATTATGTTTTAAAATGGACTATCATATGCTTACCGTAACTTGAAAGTAT
TTCGATTTCTTGGCTTTATATATCTTGTGGAAAGGACGAAACACCGACGACGACGATGGGGATATG
TTTTAGAGCTAGAAATAGCAAGTTAAAATAAGGCTAGTCCGTTATCAACTTGAAAAAGTGGCACCGAGT
CGGTGCTTTTTTTCTAGACCCAGCTTTCTTGTACAAAGTTGGCATTA -3’
gRNA 2 (represented in bold):
5’-TGTACAAAAAAGCAGGCTTTAAAGGAACCAATTCAGTCGACTGGATCCGGTACCAAGGTCGGGCAG
GAAGAGGGCCTATTTCCCATGATTCCTTCATATTTGCATATACGATACAAGGCTGTTAGAGAGATAATT
AGAATTAATTTGACTGTAAACACAAAGATATTAGTACAAAATACGTGACGTAGAAAGTAATAATTTCTT
GGGTAGTTTGCAGTTTTAAAATTATGTTTTAAAATGGACTATCATATGCTTACCGTAACTTGAAAGTATT
TCGATTTCTTGGCTTTATATATCTTGTGGAAAGGACGAAACACCACAGACAATTGTCCCCGATTGTTT
TAGAGCTAGAAATAGCAAGTTAAAATAAGGCTAGTCCGTTATCAACTTGAAAAAGTGGCACCGAGTCG
GTGCTTTTTTTCTAGACCCAGCTTTCTTGTACAAAGTTGGCATTA -3’
7.10) Appendix 10 – Antibodies used
Table 11 - List of primary and secondary antibodies used for immunofluorescence.
Antigen Host Cat.No. (Brand) Application
(Dilution)
Primary
antibodies
Ano6 Rabbit Gift from Karl’s Lab IF (1:50)
HA Mouse MMS-101P-200, HA.11
16B12 (Covance) IF (1:200)
E-Cadherin Mouse 610181 (BD Transduction
Laboratories) IF (1:500)
Secondary
antibodies
Mouse IgG, Cy5 Goat A10524 (Invitrogen) IF (1:500)
Rabbit IgG, Alexa
568-conjugated Goat A11011 (Invitrogen) IF (1:500)
Table 12 - List of primary and secondary antibodies used for Western Blot.
Antigen Host Cat.No. (Brand) Application
(Dilution)
Primary
antibodies
GFP Mouse 11814460001 (Roche) WB (1:1000)
α-tubulin Mouse T5168 (Sigma-Aldrich) WB (1:3000)
Secondary
antibodies
Anti-mouse IgG –
HRP conjugated Goat 170-6516 (Bio-Rad) WB (1:3000)
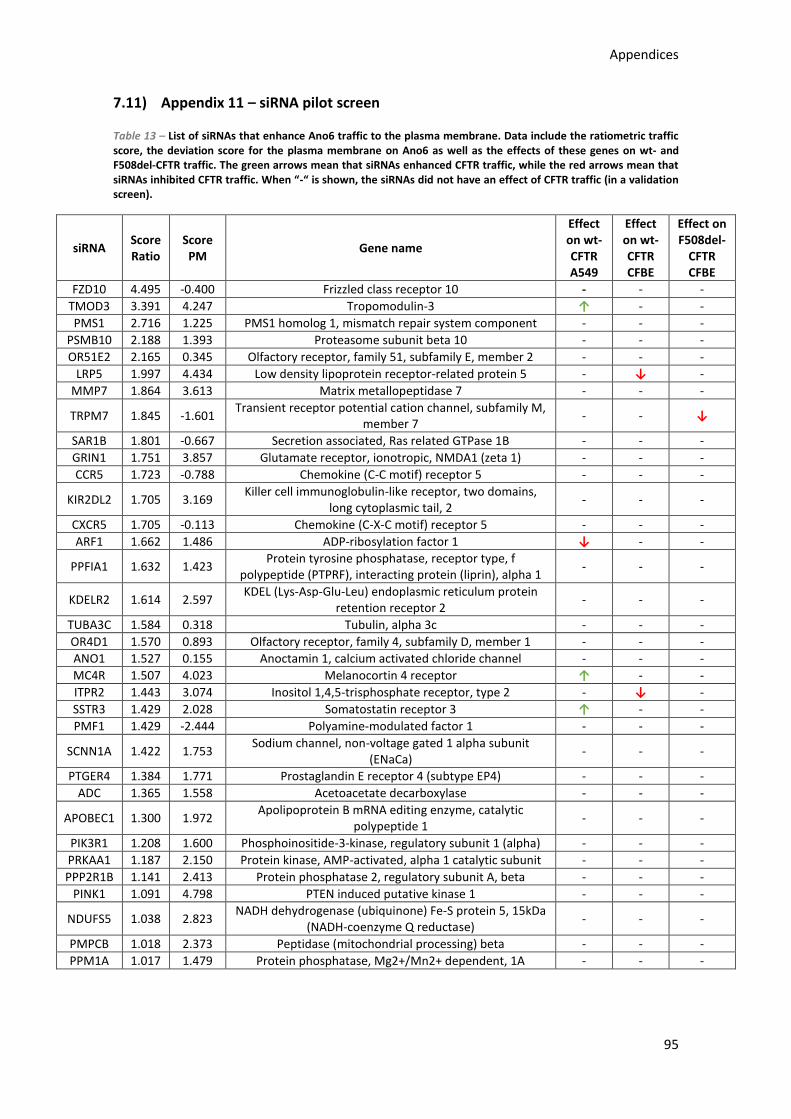
Appendices
95
7.11) Appendix 11 – siRNA pilot screen
Table 13 – List of siRNAs that enhance Ano6 traffic to the plasma membrane. Data include the ratiometric traffic score, the deviation score for the plasma membrane on Ano6 as well as the effects of these genes on wt- and F508del-CFTR traffic. The green arrows mean that siRNAs enhanced CFTR traffic, while the red arrows mean that siRNAs inhibited CFTR traffic. When “-“ is shown, the siRNAs did not have an effect of CFTR traffic (in a validation screen).
siRNA Score Ratio
Score PM
Gene name
Effect on wt-CFTR A549
Effect on wt-CFTR CFBE
Effect on F508del-
CFTR CFBE
FZD10 4.495 -0.400 Frizzled class receptor 10 - - -
TMOD3 3.391 4.247 Tropomodulin-3 ↑ - -
PMS1 2.716 1.225 PMS1 homolog 1, mismatch repair system component - - -
PSMB10 2.188 1.393 Proteasome subunit beta 10 - - -
OR51E2 2.165 0.345 Olfactory receptor, family 51, subfamily E, member 2 - - -
LRP5 1.997 4.434 Low density lipoprotein receptor-related protein 5 - ↓ -
MMP7 1.864 3.613 Matrix metallopeptidase 7 - - -
TRPM7 1.845 -1.601 Transient receptor potential cation channel, subfamily M,
member 7 - - ↓
SAR1B 1.801 -0.667 Secretion associated, Ras related GTPase 1B - - -
GRIN1 1.751 3.857 Glutamate receptor, ionotropic, NMDA1 (zeta 1) - - -
CCR5 1.723 -0.788 Chemokine (C-C motif) receptor 5 - - -
KIR2DL2 1.705 3.169 Killer cell immunoglobulin-like receptor, two domains,
long cytoplasmic tail, 2 - - -
CXCR5 1.705 -0.113 Chemokine (C-X-C motif) receptor 5 - - -
ARF1 1.662 1.486 ADP-ribosylation factor 1 ↓ - -
PPFIA1 1.632 1.423 Protein tyrosine phosphatase, receptor type, f
polypeptide (PTPRF), interacting protein (liprin), alpha 1 - - -
KDELR2 1.614 2.597 KDEL (Lys-Asp-Glu-Leu) endoplasmic reticulum protein
retention receptor 2 - - -
TUBA3C 1.584 0.318 Tubulin, alpha 3c - - -
OR4D1 1.570 0.893 Olfactory receptor, family 4, subfamily D, member 1 - - -
ANO1 1.527 0.155 Anoctamin 1, calcium activated chloride channel - - -
MC4R 1.507 4.023 Melanocortin 4 receptor ↑ - -
ITPR2 1.443 3.074 Inositol 1,4,5-trisphosphate receptor, type 2 - ↓ -
SSTR3 1.429 2.028 Somatostatin receptor 3 ↑ - -
PMF1 1.429 -2.444 Polyamine-modulated factor 1 - - -
SCNN1A 1.422 1.753 Sodium channel, non-voltage gated 1 alpha subunit
(ENaCa) - - -
PTGER4 1.384 1.771 Prostaglandin E receptor 4 (subtype EP4) - - -
ADC 1.365 1.558 Acetoacetate decarboxylase - - -
APOBEC1 1.300 1.972 Apolipoprotein B mRNA editing enzyme, catalytic
polypeptide 1 - - -
PIK3R1 1.208 1.600 Phosphoinositide-3-kinase, regulatory subunit 1 (alpha) - - -
PRKAA1 1.187 2.150 Protein kinase, AMP-activated, alpha 1 catalytic subunit - - -
PPP2R1B 1.141 2.413 Protein phosphatase 2, regulatory subunit A, beta - - -
PINK1 1.091 4.798 PTEN induced putative kinase 1 - - -
NDUFS5 1.038 2.823 NADH dehydrogenase (ubiquinone) Fe-S protein 5, 15kDa
(NADH-coenzyme Q reductase) - - -
PMPCB 1.018 2.373 Peptidase (mitochondrial processing) beta - - -
PPM1A 1.017 1.479 Protein phosphatase, Mg2+/Mn2+ dependent, 1A - - -

Appendices
96
Table 14 - List of siRNAs that inhibit Ano6 traffic to the plasma membrane. Data include the ratiometric traffic score, the deviation score for the plasma membrane on Ano6 as well as the effects of these genes on wt- and F508del-CFTR traffic. The green arrows mean that siRNAs enhanced CFTR traffic, while the red arrows mean that siRNAs inhibited CFTR traffic. When “-“ is shown, the siRNAs did not have an effect of CFTR traffic (in a validation screen).
siRNA Score Ratio
Score PM
Gene name
Effect on wt-CFTR A549
Effect on wt-CFTR CFBE
Effect on F508del-
CFTR CFBE
OR1C1 -1.056 -0.052 Olfactory receptor, family 1, subfamily C, member 1 - - -
GPR97 -1.066 -1.432 Adhesion G protein-coupled receptor G3 - - -
SEC61A2 -1.117 -3.139 Sec61 translocon alpha 2 subunit - - -
MTNR1A -1.138 -1.571 Melatonin receptor 1A - - -
HTR7 -1.152 -2.430 5-hydroxytryptamine (serotonin) receptor 7, adenylate
cyclase-coupled - - -
PPFIA3 -1.195 -1.039 Protein tyrosine phosphatase, receptor type, f
polypeptide (PTPRF), interacting protein (liprin), alpha 3
- - -
NEO1 -1.329 -2.675 Neogenin 1 - - -
FUZ -1.337 -1.643 Fuzzy planar cell polarity protein - - -
DHRS4L2 -1.338 -3.642 Dehydrogenase/reductase (SDR family) member 4 like
2 - - -
AASDH -1.342 -1.431 Aminoadipate-semialdehyde dehydrogenase - - -
USP18 -1.483 -1.344 Ubiquitin specific peptidase 18 - - -
TACR3 -1.513 -1.785 Tachykinin receptor 3 - - -
TMEM11 -1.567 -1.648 Transmembrane protein 11 - - -
HSD17B10 -1.611 -2.483 Hydroxysteroid (17-beta) dehydrogenase 10 - - -
GABRG2 -1.613 -1.987 Gamma-aminobutyric acid (GABA) A receptor, gamma
2 - - -
EIF6 -1.631 -2.872 Eukaryotic translation initiation factor 6 - - -
CHN2 -1.657 -1.632 Chimerin 2 - - -
GRPR -1.678 -2.210 Gastrin-releasing peptide receptor - - -
PIM2 -1.714 -3.610 Pim-2 proto-oncogene, serine/threonine kinase - - -
OTUD7A -1.806 -1.931 OTU deubiquitinase 7A - - -
CA14 -1.817 -2.326 Carbonic anhydrase XIV - - -
TAS1R3 -1.882 -1.964 Taste receptor, type 1, member 3 - - -
AHSA1 -1.910 -2.320 AHA1, activator of heat shock 90kDa protein ATPase
homolog 1 - - -
ADRA2C -1.924 -2.080 Adrenoceptor alpha 2C - - -
NOD2 -1.936 -3.082 Nucleotide-binding oligomerization domain containing
2 - - -
PDE1C -1.963 -3.918 Phosphodiesterase 1C, calmodulin-dependent 70kDa - - -
CDK19 -2.113 -2.864 Cyclin-dependent kinase 19 - - ↑
COPZ2 -2.239 -2.450 Coatomer protein complex, subunit zeta 2 - - -
HSPA14 -2.303 -3.144 Heat shock 70kDa protein 14 - - -
PDE8B -2.505 -3.363 Phosphodiesterase 8B - - -
APLNR -2.745 -3.674 Apelin receptor - - -
PDE10A -2.965 -0.073 Phosphodiesterase 10A - - -
SLC9A3R1 -3.014 -4.229 Solute carrier family 9, subfamily A (NHE3, cation
proton antiporter 3), member 3 regulator 1 - - -
GPR101 -3.158 -4.275 G protein-coupled receptor 101 - - -
OR2B3 -3.581 -4.720 Olfactory receptor, family 2, subfamily B, member 3 - - -
AVEN -3.607 -4.561 Apoptosis, caspase activation inhibitor - - -
FLNB -3.653 -4.700 Filamin B, beta - - -