Annualized Dividend
243
2011 was a disappointing year for Agnico-Eagle. A fire disrupted production at our Meadowbank mine, and geotechnical issues compelled us to suspend operations at Goldex. For a variety of reasons, we missed our production and cost targets. But, without downplaying the challenges, it’s important to acknowledge Agnico-Eagle’s strengths. The Company has good people, a quality asset base, solid financial performance and an outstanding investment track record with strong potential for more. That’s where we stand. Agnico-Eagle Mines Limited 2011 Annual Report Sean Boyd, President and Chief Executive Officer
Transcript of Annualized Dividend

2011 was a disappointing year for Agnico-Eagle. A fire
disrupted production at our Meadowbank mine, and
geotechnical issues compelled us to suspend operations
at Goldex. For a variety of reasons, we missed our
production and cost targets. But, without downplaying the
challenges, it’s important to acknowledge Agnico-Eagle’s
strengths. The Company has good people, a quality asset
base, solid financial performance and an outstanding
investment track record with strong potential for more.
That’s where we stand.
Agnico-Eagle Mines Limited
2011 Annual Report
Sean Boyd, President and Chief Executive Officer

All dollar amounts in this report are in US$ unless otherwise indicated 2011 2010 2009
Operating
Gold production (ounces) 985,460 987,609 492,972Total cash costs per ounce $ 580 $ 451 $ 346Average realized gold price $ 1,573 $ 1,250 $ 1,024
Financial(millions except per share amounts)
Revenue from mining operations $ 1,822 $ 1,422.5 $ 613.8Net income (569)1 332.1 86.5Net income per share (3.36)1 2.05 0.55Annualized dividend per share $ 0.642 $ 0.18 $ 0.18
Total cash costs per ounce is a non-GAAP measure.
This document uses the terms “measured resources,” “indicated resources” and “inferred resources.” We advise investors that while those terms are recognized and required by Canadian regulations, the U.S. Securities and Exchange Commission does not recognize them.
1 2011 net income results impacted in the fourth quarter by the after-tax writedowns of Meadowbank and Goldex of $645 million and $161 million, respectively.2 In February 2012, the Company announced a quarterly dividend of $0.20 per share.
finAnciAl summARy
$0.18$0.18
$0.80
$0.64
Annualized Dividend(per share)
09 10 11 12
Dear shareholders,
There is no other way to look at it. 2011 was
a challenge for our Company. Thankfully, over
our 55 years of operating history, we have
had many more up years than down, and we
have learned to regroup, take the necessary
corrective actions and move forward. It is this
resolve and practicality that have enabled
us to overcome past challenges and deliver
some of the best long-term shareholder
returns in the industry.

2 agnico-eagle mines limited | 2011 annual report
One of our main issues in 2011 was the persistently
high operating costs at our Meadowbank mine in the
Canadian Arctic. Ore dilution, which resulted in lower
than expected grades to the mill, and the cost of
transportation, logistics, labour and maintenance
continued to be much higher than expected. The best
solution was to re-optimize the mine plan based on
this reality and adopt a lower-risk approach. The new
plan forecasts lower gold production over a shorter
mine life but is still expected to allow us to generate
significant free cash flow over the next six years.
The new plan is also significantly de-risked as it
excludes approximately 36% of the previously
budgeted ore and waste tonnes and includes more
conservative dilution estimates than the original plan.
As a result of our estimates for operating costs going
forward, we incurred a $645 million after-tax partial
writedown of the Meadowbank mine.
In October 2011, we had to suspend production at our
Goldex mine in Val-d’Or, Quebec, due to geotechnical
concerns. It was suggested that a weak rock unit
in the hanging wall of the Goldex deposit had failed.
Considering the safety of our employees, and the
integrity of surface infrastructure, the decision was
made to stop production. We have initiated an
investigation, monitoring and remediation plan, which
is continuing into 2012. Due to the uncertainty regarding
any future production at Goldex, a $161 million
after-tax writedown was incurred. In addition, all proven
and probable reserves at Goldex were transferred into
mineral resources.
In light of our challenges, we took the time needed to
re-evaluate our assets and to lay out a plan to begin
2012 on a stronger footing. This included revising our
budgeting, forecasting and reporting processes
and ensuring that our focus remains on the important
issues. The solid, attainable production and cost
guidance issued for the next three years reflects our
work. We are forecasting growth at four of our five
operating mines in 2012, with the fifth, Lapa, expected
to produce approximately the same amount of gold
as in 2011.
At LaRonde, we will start to benefit from the completion
of the deep extension of the orebody, which will enable
us to access higher valued ore. In fact, LaRonde is
expected to be our biggest driver of production growth
over the next few years due to higher gold grades,
which are expected to more than offset the concurrent
decline in base metals grades. At both Kittila and
Pinos Altos, we achieved record annual gold production
in 2011 and are poised to continue the growth in 2012.
Pinos Altos was our highest cash flow generator,
with notably low total cash costs of $299 per ounce
of gold produced. Kittila is expected to exceed its
record gold production from 2011, while Meadowbank
is expected to rebound in 2012 with higher gold
production due to a full year of throughput at more
than 9,000 tonnes per day.
What gets lost in the troubles of last year is the fact
that we generated record mine profit of approximately
$946 million and record cash provided by operating
activities of approximately $663 million in 2011.
We expect reserves, production and cash flows from
our current mines to grow in 2012.
We enjoyed considerable exploration success in 2011,
with continued growth in the Kittila, Meliadine and
Mexican deposits. Kittila is now our largest contributor
to gold reserves at 5.2 million ounces, and is wide
open geologically. In the one and a half years since we
acquired Meliadine, exploration drilling has expanded
the amount of gold contained in reserves and
resources by approximately 40%. There is strong
potential at Meliadine, which is nearly double the size
and double the average reserve grade of the
Meadowbank deposit, and is favourably located near
the western shores of Hudson Bay. In addition, drilling
in 2011 has resulted in an extension of the mine life of
Creston Mascota on the Pinos Altos property by
approximately two years.
letter to shareholders

agnico-eagle mines limited | 2011 annual report 3
letter to shareholders
For 2012, we have budgeted $106 million for
exploration, focused primarily on accelerating the
drilling programs at Kittila, Meliadine, Mascota
and Bravo (near Pinos Altos), and on work at our
newest Mexican properties acquired in the 2011
Grayd Resource Corporation (Grayd) transaction.
Our cash flows are enabling us to fund a larger dividend.
We announced a 25% increase to the quarterly cash
dividend to $0.20 per share. Agnico-Eagle has now
declared a dividend for 30 consecutive years – a rare
accomplishment in the gold mining business. Our goal
is to continue increasing the dividend on a sustainable
basis via continued growth in our production base.
We plan to continue looking for new opportunities to
build value by bringing our mine development and
exploration skills to promising, early-stage gold deposits
and projects. In keeping with our longstanding
approach to mergers and acquisitions, we acquired
Grayd for its 100%-owned advanced-stage La India
gold project and the recently discovered Tarachi gold
deposit in the Sierra Madre gold belt of northern
Mexico. These deposits are approximately 70 kilometres
from our operations at Pinos Altos. La India will be
evaluated in 2012 for its potential as a low-cost open
pit heap leach mine.
With strong growth prospects, solid operating plans in
place, a robust financial position and a re-energized
management team, we are off to a good start in 2012.
Our sights remain firmly fixed on delivering growth in a
variety of per share metrics, consistent with our long
history of creating value for shareholders. It’s worth
noting that in the 5-, 10-, 15- and 20-year periods up
to 2009, Agnico-Eagle dramatically outperformed all
senior gold producers, the gold price and the S&P 500.
We aim to get back on this track.
In conclusion, I would like to publicly recognize the
contributions of Mr. Ebe Scherkus, the former President
and Chief Operating Officer, and Mr. Paul-Henri Girard,
the former Vice-President, Canada. Over his 26 years
with Agnico-Eagle, Ebe helped build and transform the
organization from a single-asset producer to a multi-
mine international gold company. In his 25 years of
service, Paul-Henri was instrumental in the
development of the world-class LaRonde mine and in
building the Company’s mining base. Both men will
continue to serve Agnico-Eagle as advisors. Everyone at
Agnico-Eagle thanks them for their leadership,
commitment and friendship.
Thanks are also extended to our Board of Directors
for their support and counsel this past year, and, most
importantly, to our employees, whose depth of skills,
relentless effort and confidence in the future of
Agnico-Eagle have helped us turn the corner and
move forward.
Sean Boyd
President and Chief Executive Officer
March 19, 2012

4 agnico-eagle mines limited | 2011 annual report
corporate strategy
Increase gold production
Targeting 1,055,000 ounces by 2014
Grow gold reserves
Targeting a 12% increase, net of production, at year-end 2012, to approximately 20 million ounces
Acquire small, think big
Focusing on early-stage mergers and acquisitions with minimal share dilution
Be a low-cost leader
Projecting total cash costs to be in the range of $690 to $750 per ounce in 2012. Corporate goal is to drive costs down
Maintain a solid financial profile
Increasing net free cash flow as production increases and capital expenditures decrease
1
2
3
4
5
Alain BlackburnSenior Vice-President, Exploration
Tim HaldaneSenior Vice-President, Latin America
David SmithSenior Vice-President, Strategic Planning and Investor Relations
Sean BoydPresident and Chief Executive Officer
Ammar Al-JoundiSenior Vice-President Finance
and Chief Financial Officer
Yvon SylvestreSenior Vice-President,
Operations
“We announced a 25% dividend increase for 2012 and aim to raise the dividend even further as we grow gold output.”

agnico-eagle mines limited | 2011 annual report 5
targets anD achievements
2011 TArGeTS wHAT we DelIvereD 2012 TArGeTS
Reduce lost-time accident frequency below a rate of 3.4 for the Agnico-Eagle workforce
Achieved 3.21 Lost-time accident frequency at 3.3 or below for the Agnico-Eagle workforce
No fines or penalties for environmental failures
Achieved No fines or penalties for environmental failures
Zero category 3, 4 or 5 environmental incidents
Achieved Zero category 3, 4 or 5 environmental incidents
1.13 to 1.23 million ounces of gold production
985,460 ounces, largely due to the closure of Goldex and lower than expected grades at Meadowbank and LaRonde
875,000 to 950,000 ounces of gold production
Increase gold production per share Did not achieve our target, largely due to the closure of Goldex and lower than expected grades at Meadowbank and LaRonde
Increase gold production per share
More than 22 million ounces of gold reserves
18.8 million ounces, largely due to the closure of Goldex and the new mining plan and lower reserves at Meadowbank
More than 20 million ounces of gold reserves
Increase gold reserves per share Did not achieve our target, due to 2011 gold production, reclassification of Goldex reserves to resources, and the new mining plan and lower reserves at Meadowbank
Increase gold reserves per share
Total cash costs of $420 to $470 per ounce
Total cash costs of $580 per ounce, primarily due to the impact of high costs at Meadowbank, the loss of Goldex and general mining cost escalation
Total cash costs of $690 to $750 per ounce
Increase operating cash flow per share Achieved. Record operating cash flow of $3.92 per share
Increase operating cash flow per share
Search out acquisition opportunities in low-risk regions that are well matched to our skills and abilities
Acquired Grayd, owner of the La India gold project and the Tarachi gold deposit in northern Mexico
Search out acquisition opportunities in low-risk regions that are well matched to our skills and abilities
Jean robitailleSenior Vice-President, Technical Services and Project Development
Daniel racineSenior Vice-President,
MiningDonald G. Allan
Senior Vice-President, Corporate Development
Marc legaultSenior Vice-President,
Project Evaluations
louise GrondinSenior Vice-President, Environment and Sustainable Development
r. Gregory laingGeneral Counsel, Senior Vice-President, Legal, and Corporate Secretary
Jean-luk PellerinSenior Vice-President,
Human Resources

6 agnico-eagle mines limited | 2011 annual report
agnico-eagle’s mines generated nearly $1 billion
of gross mine profit in 2011. production, reserves
and free cash flow are projected to grow in 2012
and beyond, on the strength of our cornerstone
assets at Kittila, Laronde and meliadine, and
those in mexico.
Lapland, Finland
– Highest level of gold reserves of all our properties
– Remains open geologically
Nunavut, Canada
– Large, long-life deposit continues to grow
– Updated feasibility study expected in late 2013
Quebec, Canada
– Consistent engine of cash flow and earnings
– Production and cash flow projected to increase in 2012
Chihuahua and Sonora States, Mexico
– Pinos Altos mine is our highest cash flow generator
– La India expected to add to production profile within three years
cornerstone assets
MexicoKittila MeliadineLaRonde
1
1
2
3
5
46
LaRonde
2 Goldex
3 Lapa
4 Kittila
5 Pinos Altos
6 Meadowbank
Gold Production(thousands of ounces) includes Goldex excludes Goldex
08 09 10 11 12EST.
13EST.
14EST.
200000
400000
600000
800000
1000000
1200000
219
277
344
803850
985988
493
913990
1,055

agnico-eagle mines limited | 2011 annual report 7
With an increase in gold reserves in
2011, Kittila is now our largest
contributor to proven and probable
gold reserves at 5.2 million ounces.
production and mill recoveries are
steadily improving, achieving record
levels in 2011. the stage has been set
for further expected production growth
in 2012.
The Kittila mine is located in the Lapland region
of northern Finland, approximately 900 kilometres
north of Helsinki and 150 kilometres north of the
Arctic Circle. At current production levels Kittila’s mine
life is expected to last until 2044.
Ongoing exploration in 2011 expanded the Kittila
mineralization in the Rimpi and Roura deposit areas at
depth and to the north, highlighting further exploration
upside at this deposit.
In light of the continued growth of the orebody, we are
evaluating a 25% throughput expansion at Kittila,
which could be supported by the current reserve and
could potentially be operational in 2015.
We are also considering a larger expansion at a later
date, which would include sinking a shaft and
increasing milling capacity. The deposit appears to be
significantly richer and thicker beneath the Rimpi zone
(approximately two kilometres north of the main Suuri
deposit, which is currently being mined). We plan to
spend $16 million in exploration in 2012, focusing on
the Rimpi deposit and on demonstrating continuity of
the mineralization at different depths.
KittiLa
estimated mine life to
2044 5.2million ounces of gold
in reserves
record annual gold production of
143,560ounces
KittiLa

8 agnico-eagle mines limited | 2011 annual report
LaronDe
4.7million ounces of gold
in reserves
gold output estimated to increase to
280,000
ounces in 2014
We have operated our flagship Laronde
mine in northwestern Quebec since
1988. this has been a longstanding
training ground for our employees, and
many have been with the company
since we began mining operations in
the abitibi region of Quebec.
Despite decades of production, LaRonde still contains
4.7 million ounces of proven and probable gold
reserves, which are among the largest gold reserves at
an operating mine in Canada. LaRonde is a consistent
engine of cash flow and earnings for Agnico-Eagle.
With the completion in late 2011 of a deep extension,
which accesses richer ores, the mine promises to be a
primary driver of the Company’s gold production and
cash flow growth over the next several years. It has an
estimated mine life to 2026.
By 2014, we plan to achieve full production levels from
the deeper ore, and are forecasting 280,000 ounces of
gold output in that year. This would more than double
the 2011 production rate of 124,173 ounces.
LaRonde also produces silver, zinc and copper. As we
mine the deeper gold, byproduct grades will decline
significantly, largely due to lower zinc grades at depth.
However, due to the higher gold grade, the operating
profit at the mine is expected to increase significantly.
At metals prices realized in 2011, the average value of
a tonne of ore over the remaining mine life is expected
to increase by more than 50%.
estimated mine life to
2026 LaronDe

agnico-eagle mines limited | 2011 annual report 9
measured and indicated
resources total
1.7million
ounces of gold
2.9million ounces of gold
in reserves
average reserve grade of
7.2 grams per tonne
meLiaDine
agnico-eagle has a strong foothold in
the nunavut territory of canada. While
the remote location and harsh weather
conditions can present their share of
challenges, we are confident in the
potential of our orebodies to create
value for our shareholders and for the
people living in the region.
The advanced-stage Meliadine project is one of our
largest gold deposits in terms of reserves and
resources. Its large size, high grades and optimal
location near the western shore of Hudson Bay
(which is expected to help mitigate high logistics costs)
make it a cornerstone asset. We expect further
exploration success to contribute to a growing reserve,
which is forecasted to be mined over a long life.
An updated feasibility study for Meliadine is expected
in late 2013 and first production is anticipated in 2017.
Since acquiring Meliadine in mid-2010, we have
conducted an extensive drilling program, which has
expanded the gold contained in reserves and resources
by approximately 40%. The gold deposits are within a
large land package that is nearly 80 kilometres long
and largely unexplored. There continues to be strong
exploration upside, and we are budgeting more
than $30 million for drilling in known deposits and
grassroots exploration in 2012.
meLiaDine

10 agnico-eagle mines limited | 2011 annual report
mexico
our position in the sierra madre region
of northern mexico was strengthened in
2011 with the acquisition of grayd,
through which we acquired the La india
gold project and the recently discovered
tarachi gold deposit. these two projects
are approximately 70 kilometres away
from our pinos altos mine. the
promising outlook for these properties
reinforces the growing importance of
our mexican operations as a key
contributor to agnico-eagle’s operating
and growth profile.
Pinos Altos
The Pinos Altos mine achieved record annual gold
production in 2011 of 204,380 ounces at total cash
costs of $299 per ounce. It was our highest cash
flow generator during the year. Production and cost
improvements were largely due to the contribution of
the new heap leach operation at Creston Mascota and
higher throughput in the Pinos Altos mill.
Creston Mascota is a satellite operation located
seven kilometres northwest of the main Santo Niño
deposit. This mine achieved commercial production in
March 2011. Successful exploration results in 2011
added approximately 75,000 ounces of proven and
probable reserves, extending Creston Mascota’s estimated
mine life by approximately two years, through to 2017.
With the significant growth of ore reserves since
Pinos Altos was acquired in 2006, we have begun an
underground expansion that will help offset lower
grades in the latter years of the mine. Increased
underground mine production would likely require a
3.1 million ounces of gold
in reserves
1.85
million ounces of
silver production in 2011
estimated mine life to
2029pinos aLtos
agnico-eagle mines limited | 2011 annual report 11
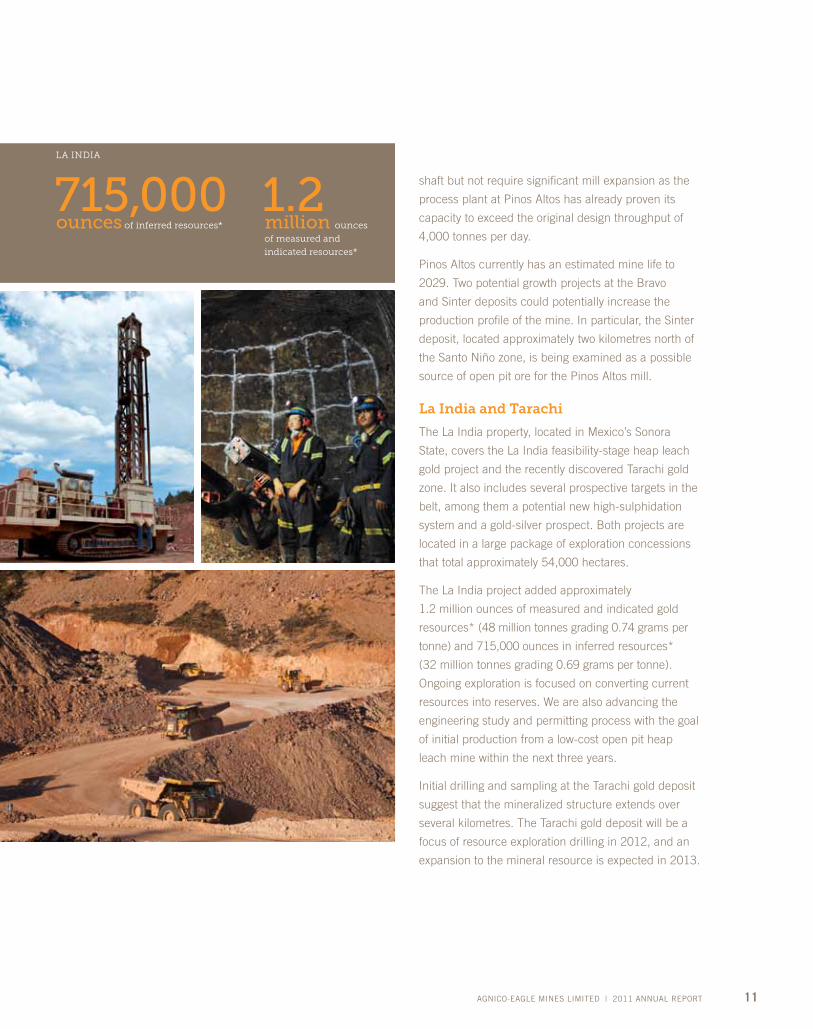
1.2 million ounces
of measured and
indicated resources*
shaft but not require significant mill expansion as the
process plant at Pinos Altos has already proven its
capacity to exceed the original design throughput of
4,000 tonnes per day.
Pinos Altos currently has an estimated mine life to
2029. Two potential growth projects at the Bravo
and Sinter deposits could potentially increase the
production profile of the mine. In particular, the Sinter
deposit, located approximately two kilometres north of
the Santo Niño zone, is being examined as a possible
source of open pit ore for the Pinos Altos mill.
la India and Tarachi
The La India property, located in Mexico’s Sonora
State, covers the La India feasibility-stage heap leach
gold project and the recently discovered Tarachi gold
zone. It also includes several prospective targets in the
belt, among them a potential new high-sulphidation
system and a gold-silver prospect. Both projects are
located in a large package of exploration concessions
that total approximately 54,000 hectares.
The La India project added approximately
1.2 million ounces of measured and indicated gold
resources* (48 million tonnes grading 0.74 grams per
tonne) and 715,000 ounces in inferred resources*
(32 million tonnes grading 0.69 grams per tonne).
Ongoing exploration is focused on converting current
resources into reserves. We are also advancing the
engineering study and permitting process with the goal
of initial production from a low-cost open pit heap
leach mine within the next three years.
Initial drilling and sampling at the Tarachi gold deposit
suggest that the mineralized structure extends over
several kilometres. The Tarachi gold deposit will be a
focus of resource exploration drilling in 2012, and an
expansion to the mineral resource is expected in 2013.
715,000 ounces of inferred resources*
La inDia

12 agnico-eagle mines limited | 2011 annual report
meaDoWBanK, Lapa anD goLDex
2.2million
ounces of gold
in reserves
gold production of
270,801 ounces in 2011
meaDoWBanK
in addition to our cornerstone assets,
our meadowbank and Lapa mines are
important contributors to annual gold
production. although production at the
goldex mine has been suspended, we
continue to evaluate other possible
development options during the ongoing
investigation and remediation phase.
Meadowbank
The Meadowbank mine in northern Canada achieved
commercial production in 2010 but has experienced a
number of issues since start-up. While the mill
throughput exceeded design capacity in the second half
of 2011, the grades continued to be lower than
expected and operating costs were significantly higher.
As a result, we revised the mine plan and incurred a
partial after-tax writedown of $645 million.
The new mine plan forecasts lower gold production
over a shorter mine life, which now extends to 2017
rather than 2020. While it will still allow us to
generate significant cash flow over the next six years,
the lower-risk plan removes approximately 73 million
tonnes, or 36%, of the previously budgeted ore and
waste tonnes and includes more conservative dilution
estimates than the original plan.
Despite the challenges, the mine was our largest gold
producer in 2011. We estimate gold production to be
in the 295,000- to 310,000-ounce range for each of
the next three years.

agnico-eagle mines limited | 2011 annual report 13
lapa
The high-grade Lapa mine is located 11 kilometres
east of our LaRonde mine. Ore is trucked to a
dedicated milling circuit at LaRonde for processing.
Lapa achieved commercial production in 2009 and has
an estimated mine life to 2015. While this is a difficult
orebody to mine due to challenging ground conditions,
the employees have maintained good throughput and
cost control.
For 2012, production and costs are expected to be
in the same range as in 2011, with gold output ranging
from 95,000 to 105,000 ounces and total cash costs
estimated to be $750 per ounce.
Exploration success added 70,000 ounces of gold to
the reserve at Lapa in 2011, resulting in an extension
to the mine life of six months. In 2012, we are looking
to further extend the mine life and will spend
approximately $3 million conducting exploration drilling
from underground drifts to the east of the orebody.
Goldex
While the mine produced 135,478 ounces of gold in
2011, in October we suspended production at our
Goldex mine in Val-d’Or, Quebec, due to geotechnical
concerns. It was suggested that a weak rock unit in
the hanging wall of the deposit had failed. We initiated
an investigation, monitoring and remediation plan,
which is continuing into 2012. We also transferred all
proven and probable reserves at Goldex into mineral
resources. At the same time, we are conducting
exploration drilling to help evaluate the economic
potential of other mineralized zones in the property.
average gold reserve
grade of
6.5 grams
per tonne
Life of mine extended to
2015Lapa

14 agnico-eagle mines limited | 2011 annual report
expLoration anD reserves & resources summary
growing gold reserves on a per share
basis is integral to our strategy and
critical to our long-term performance.
exploration plays a key role in enabling
us to meet this objective. We enjoyed
considerable exploration success in
2011, even though total reserves
declined from 2010 levels due to gold
production, the reclassification of
goldex reserves to resources following
the suspension of mining, and the
revised mine plan at meadowbank.
Among our key advances:
• Kittila’sgoldreservesincreasedbyapproximately
0.3 million ounces, despite gold production and the
impact of more conservative operating cost
assumptions. Reserves were added at the Rimpi and
Roura deposit areas at depth and to the north,
highlighting further exploration upside at this deposit.
• AtMeliadine,resourceconversiondrillingresultedin
an additional 0.3 million ounces of proven and
probable gold reserves, mainly in the Tiriganiaq
zone. In addition, the Wesmeg zone demonstrated
significant growth in gold resources.
• InMexico,approximately75,000ouncesofgold
reserves were added at Creston Mascota, increasing
its expected mine life by approximately two years.
The acquisition of Grayd and its La India project
added approximately 1.2 million ounces of measured
and indicated resources (48 million tonnes grading
0.74 grams per tonne) and 0.7 million ounces in
inferred resources (32 million tonnes grading
0.69 grams per tonne). The acquisition included the
recently discovered Tarachi deposit.

agnico-eagle mines limited | 2011 annual report 15
For 2012, we are projecting year-end reserves to grow to approximately 20 million ounces of gold, or an increase
of approximately 12%, net of production, through a $106 million exploration drilling campaign.
The program will be primarily focused on the acceleration of the drilling programs at Kittila, Meliadine and
Mascota/Bravo, the conversion of resources at La India and the further exploration of Tarachi. These programs
will form part of the feasibility studies at each of these projects, which could add to the Company’s production
growth profile.
reserve Summary
Gold Reserves by Mine/Project Proven and Probable Reserves (thousands of ounces)
2011 2010
LaRonde 4,700 4,818Goldex – 1,566Lapa 501 677Kittila 5,177 4,880Pinos Altos 3,103 3,271Meadowbank 2,201 3,486Meliadine 2,877 2,600Bousquet 191 –
Total 18,750 21,299
Amounts presented in this table have been rounded to the nearest thousand. Please see our website for a detailed breakdown of the Company’s reserves and resources.
Agnico-Eagle’s byproduct proven and probable reserves include approximately 116 million ounces of silver,
324,000 tonnes of zinc and 91,000 tonnes of copper. The byproduct reserves and resources for silver, zinc, copper
and lead contained in the LaRonde orebody, and the silver reserves contained at Pinos Altos, are presented on our
website. These byproduct reserves are not included in Agnico-Eagle’s gold reserve and resource totals.
The assumptions incorporated in the 2011 reserve calculation, as compared with those in 2010, are as follows:
Reserve Assumptions 2011 2010
Gold (US$/oz) 1,255 1,024Silver (US$/oz) 23.00 16.62Copper (US$/lb) 3.25 2.97Zinc (US$/lb) 0.91 0.86C$/US$ 1.05 1.08US$/Euro 1.37 1.40MXP/US$ 12.86 12.43

16 agnico-eagle mines limited | 2011 annual report
Health and Safety
Our overriding goal is zero harm to all workers at our
sites. We achieve this through a combination of safety
standards, safe work practices and procedures,
incident reporting and tracking, knowledge sharing
across our operations and safety audits. Safety
performance improved in 2011, with a 4% decline in
lost-time accident frequency, from 3.32 in 2010
to 3.21.
Our People
With the suspension of mining at Goldex, we
implemented a plan to minimize the impact on the
operation’s 250 employees during the investigation and
remediation phase. As a result, none of our permanent
employees were laid off. Approximately 95 people were
relocated to our other Canadian mining operations,
while others are active at the Goldex mine. Some
are working on the surface injection and remediation
program, and other employees are involved in
an exploration program and the development of an
underground ramp to a deeper mineralized zone.
In the Community
Our Meadowbank mine in Nunavut continued
to advance its partnership with government and
educational leaders within a program aimed at
encouraging students to pursue careers in mining.
Initiatives range from course curriculum to
apprenticeship and co-op programs.
external Codes and Initiatives
We continued our implementation of the Mining
Association of Canada’s (MAC) Towards Sustainable
Mining (TSM) initiative, developed to help mining
companies improve their management systems in
the areas of tailings management, energy use and
greenhouse gas emissions, external outreach and
crisis management planning.
corporate sociaL responsiBiLity
throughout our 55 years of operating history,
we have consistently maintained high standards
of health, safety and environment management,
been a good neighbour in host communities, and
sought to continuously improve our corporate
social responsibility (csr) practices and performance.

agnico-eagle mines limited | 2011 annual report 17
We also signed on to the International Cyanide
Management Code for the manufacture, transport and
use of cyanide in the production of gold. The Code’s
principles and standards are regarded as industry best
practices. An independent third party will conduct a
review of our operations to ensure our compliance.
recognition
Agnico-Eagle was added to the Jantzi Social Index (JSI),
a socially screened, market capitalization-weighted
common stock index modeled on the S&P/TSX 60
consisting of 60 Canadian companies that pass a set of
broadly based environmental, social, and governance
rating criteria. In addition, several of our operations
were recognized by industry and government
organizations for their “best-in-class” achievements:
• PinosAltosreceivedcertificationasaSocially
Responsible Company from the Mexican Centre for
Philanthropy (Centro Mexicano para a Filantropia)
and the Alliance for Social Responsibility of
Enterprises (Alianza por la Responsabilidad Social
Empresarial de Mexico), for the fourth consecutive
year. Our Mexico operation also earned the distinction
awarded by the Mexican government of being an
“equal opportunity” employer, specifically for
providing equality of women’s rights in the workplace.
• Agnico-EaglewasrecognizedbytheRouyn-Noranda
Chamber of Commerce and Industry with an Extra
Award for its commitment to community-focused
initiatives and organizations through its sponsorship
and donations program.
• OurTorontoofficewasselectedasoneofthe
Top Employers in the Greater Toronto Area for the
second year in a row. This designation recognizes
employers that lead their industries in offering
exceptional places to work.
Lost-time accident
frequency declined by
4% pinos altos recognized as a socially
responsible company for the
4th consecutive year
For more detailed information on
our csr performance, please download
a copy of our 2011 csr report at
www.agnico-eagle.com or request a
copy of our summary csr report

18 agnico-eagle mines limited | 2011 annual report
corporate governance
We strive to earn and retain the trust of
shareholders through a steadfast
commitment to sound and effective
corporate governance. our governance
practices reflect the structure and
processes we believe are necessary
to improve company performance and
enhance shareholder value.
Board of Directors
Our Board consists of 13 directors. All but one director
are independent of management and free from any
interest or business that could materially interfere with
their ability to act in the Company’s best interests.
The Board is ultimately responsible for overseeing
the management of the business and affairs of the
Company and, in doing so, is required to act in
the best interests of the Company. It discharges its
responsibilities either directly or through
four committees.
Board Committees
The Corporate Governance Committee advises and
makes recommendations to the Board on corporate
governance matters, the effectiveness of the Board
and its committees, the contributions of individual
directors and the identification and selection of
director nominees.
The Audit Committee assists the Board in its oversight
responsibilities with respect to the integrity of the
Company’s financial statements, compliance with
legal and regulatory requirements, external auditor
qualifications, and the independence and performance
of the Company’s internal and external audit functions.
The Compensation Committee advises and makes
recommendations to the Board on the Company’s
strategy, policies and programs for compensating
and developing senior management and officers and
for compensating directors.
The Health, Safety and Environment (HSE) Committee
advises and makes recommendations to the Board
with respect to monitoring and reviewing HSE policies,
principles, practices and processes; HSE performance;
and regulatory issues relating to health, safety and
the environment.
All of the Board committees are composed entirely of
outside directors who are unrelated to and independent
from Agnico-Eagle. Committee charters are posted to
the corporate website.
ethical Business Conduct
Agnico-Eagle has adopted a Code of Business Conduct
and Ethics that provides a framework for directors,
officers and employees on the conduct and ethical
decision-making integral to their work. We have also
adopted a Code of Business Ethics for consultants and
contractors. The Audit Committee is responsible
for monitoring compliance with these Codes.
In conjunction with the Codes, we have established
a toll-free compliance hotline to allow for anonymous
reporting of suspected violations. More information
is posted on the corporate website.

agnico-eagle mines limited | 2011 annual report 19
BoarD oF Directors
James D. Nasso 1,3,4
Chairman of the Board (Director since 1986)
mr. nasso is now retired and is a graduate of st. Francis xavier university (B.comm.) and a certified director of the institute of corporate Directors (icD.D).
Sean Boyd Vice-Chairman (Director since 1998)
mr. Boyd is the president and chief executive officer and a director of agnico-eagle. mr. Boyd has been with agnico-eagle since 1985 and has served as chief executive officer since 1998, vice-president and chief Financial officer from 1996 to 1998, treasurer and chief Financial officer from 1990 to 1996 and comptroller from 1985 to 1990. prior to joining agnico-eagle in 1985, he was a staff accountant with clarkson gordon (ernst & young). mr. Boyd is a graduate of the university of toronto (B.comm.).
leanne M. Baker 1,2
(Director since 2003)
Dr. Baker is managing Director of investor resources LLc, which acts as a consultant to companies in the mining and financial services industries. previously, Dr. Baker was employed by salomon smith Barney, where she was one of the top-ranked mining sector equity analysts in the united states. Dr. Baker is a graduate of the colorado school of mines (m.s. and ph.D. in mineral economics).
Douglas r. Beaumont 2,3
(Director since 1997)
mr. Beaumont, now retired, was most recently senior vice-president, process technology of snc Lavalin. prior to that, he was executive vice-president of Kilborn engineering and construction. mr. Beaumont is a graduate of Queen’s university (B.sc.).
Martine Celej(Director since 2011)
ms. celej is a vice-president, investment advisor with rBc Dominion securities and has been in the investment industry since 1989. she is a graduate of victoria college at the university of toronto (B.a. honours).
Clifford J. Davis 2,4
(Director since 2008)
mr. Davis is a mining industry veteran and formerly a member of the senior management teams of new gold inc., gabriel resources Ltd. and tvx gold inc. mr. Davis is a graduate of the royal school of mines, imperial college, London university (B.sc., mining engineering).
robert J. Gemmell(Director since 2011)
mr. gemmell, now retired, spent 25 years as an investment banker in the united states and in canada. most recently, he was president and chief executive officer of citigroup global markets canada and its predecessor companies (salomon Brothers canada and salomon smith Barney canada) from 1996 to 2008. in addition, he was a member of the global operating committee of citigroup global markets from 2006 to 2008. mr. gemmell is a graduate of cornell university (B.a.), osgoode hall Law school (LL.B.) and the schulich school of Business (mBa).
Bernard Kraft 1,3
(Director since 1992)
mr. Kraft is a retired senior partner of the toronto accounting firm Kraft, Berger LLp, chartered accountants and now serves as a consultant to that firm. he is also a principal in Kraft yabrov valuations inc. mr. Kraft is recognized as a Designated specialist in investigative and Forensic accounting by the canadian institute of chartered accountants. mr. Kraft is a member of the canadian institute of chartered Business valuators, the association of certified Fraud examiners and the american society of appraisers.
Mel leiderman 1,2
(Director since 2003)
mr. Leiderman is the managing partner of the toronto accounting firm Lipton LLp, chartered accountants. he is a graduate of the university of Windsor (B.a.) and is a certified director of the institute of corporate Directors (icD.D).
Sean riley(Director since 2011)
Dr. riley has served as president of st. Francis xavier university since 1996. prior to 1996, his career was in finance and management, first in corporate banking and later in manufacturing. Dr. riley is a graduate of st. Francis xavier university (B.a. honours) and of oxford university (m. phil, D. phil, international relations).
J. Merfyn roberts 1,3
(Director since 2008)
mr. roberts has been a fund manager and investment advisor for more than 25 years and has been closely associated with the mining industry. mr. roberts is a graduate of Liverpool university (B.sc., geology) and oxford university (m.sc., geochemistry) and is a member of the institute of chartered accountants in england and Wales.
Howard Stockford 2,4
(Director since 2005)
mr. stockford is a retired mining executive with almost 50 years’ experience in the industry. most recently he was executive vice-president of aur resources inc. (aur) and a director of aur from 1984 until august 2007, when it was taken over by teck cominco Limited. mr. stockford has previously served as president of the canadian institute of mining, metallurgy and petroleum and is a member of the association of professional engineers of ontario, the prospectors and Developers association of canada and the society of economic geologists. mr. stockford is a graduate of the royal school of mines, imperial college, London university, uK (B.sc., mining geology).
Pertti voutilainen 3,4
(Director since 2005)
mr. voutilainen is a mining industry veteran. most recently, he was the chairman of the board of directors of riddarhyttan resources aB. previously, mr. voutilainen was the chairman of the board of directors and chief executive officer of Kansallis Banking group and president after its merger with union Bank of Finland until his retirement in 2000. he was also employed by outokumpu corp., Finland’s largest mining and metals company, for 26 years, including as chief executive officer for 11 years. mr. voutilainen holds the honorary title of mining counselor (Bergsrad), which was awarded to him by the president of the republic of Finland in 2003. mr. voutilainen is a graduate of helsinki university of technology (m.sc.), helsinki university of Business administration (m.sc.) and pennsylvania state university (m.eng.).
1 audit committee2 compensation committee3 corporate governance committee4 health, safety and environment committee

20 agnico-eagle mines limited | 2011 annual report
ForWarD-LooKing statement
The information in this annual report has been prepared as at March 19, 2012. Certain statements contained in this annual report constitute “forward-looking statements” within the meaning of the United States Private Securities Litigation Reform Act of 1995 and forward-looking information under Canadian provincial securities laws. When used in this document, the words “anticipate”, “expect”, “estimate”, “forecast”, “planned” and similar expressions are intended to identify forward-looking statements and information.
Such statements include, without limitation: estimates of future mineral production and sales; estimates of future production costs, cash costs, minesite costs and other expenses; estimates of future capital expenditures and other cash needs; statements as to the projected development of certain ore deposits, including estimates of exploration, development, and other capital costs, and estimates of the timing of such development or decisions with respect to such development; estimates of reserves and resources, anticipated future exploration and feasibility study results; the anticipated timing of events with respect to the Company’s minesites; and other statements regarding anticipated trends with respect to the Company’s capital resources and results of operations. Such statements reflect the Company’s views as at the date this annual report was prepared and are subject to certain risks, uncertainties and assumptions. Many factors, known and unknown, could cause the actual results to be materially different from those expressed or implied by such forward-looking statements. Such risks include, but are not limited to: uncertainty of mineral reserve, mineral resource, mineral grade and mineral recovery estimates; uncertainty of future production, capital expenditures and other costs; gold and other metals price volatility; currency fluctuations; mining risks; and governmental and environmental regulation. For a more detailed discussion of such risks and other factors, see the Company’s Annual Information Form and Annual Report on Form 20-F for the year ended December 31, 2011 as well as the Company’s other filings with the Canadian Securities Administrators and the U.S. Securities and Exchange Commission. The Company does not intend, and does not assume any obligation, to update these forward-looking statements.
*Technical Information Please refer to the company press release dated February 16, 2012 for further details on the mineral reserves and resources. The technical information has been prepared under the supervision of, and reviewed by, Marc Legault, P.Eng., Senior Vice-President, Project Evaluations, and a “Qualified Person” for the purposes of National Instrument 43-101.

UNITED STATESSECURITIES AND EXCHANGE COMMISSION
Washington, D.C. 20549
FORM 20-F� REGISTRATION STATEMENT PURSUANT TO SECTION 12(b) OR (g) OF THE SECURITIES EXCHANGE ACT OF 1934
OR� ANNUAL REPORT PURSUANT TO SECTION 13 OR 15(d) OF THE SECURITIES EXCHANGE ACT OF 1934
For the fiscal year ended December 31, 2011OR
� TRANSITION REPORT PURSUANT TO SECTION 13 OR 15(d) OF THE SECURITIES EXCHANGE ACT OF 1934OR
� SHELL COMPANY REPORT PURSUANT TO SECTION 13 OR 15(d) OF THE SECURITIES EXCHANGE ACT OF 1934Date of event requiring this shell company reportFor the transition period from to
Commission file number: 1-13422
AGNICO-EAGLE MINES LIMITED(Exact name of Registrant as Specified in its Charter)
Not Applicable(Translation of Registrant’s Name into English)
Ontario, Canada(Jurisdiction of Incorporation or Organization)
145 King Street East, Suite 400Toronto, Ontario, Canada M5C 2Y7
(Address of Principal Executive Offices)
R. Gregory Laing145 King Street East, Suite 400
Toronto, Ontario, Canada M5C 2Y7Telephone: 416-947-1212 Fax: 416-367-4681
(Name, Telephone, E-mail and/or Facsimile number and Address of Company Contact Person)
Securities registered or to be registered pursuant to Section 12(b) of the Act:Common Shares, without par value The Toronto Stock Exchange and
(Title of Class) the New York Stock Exchange(Name of exchange on which registered)
Securities registered or to be registered pursuant to Section 12(g) of the Act:None
Securities for which there is a reporting obligation pursuant to Section 15(d) of the Act:None
(Title of Class)
Indicate the number of outstanding shares of each of the issuer’s classes of capital or common stock as of the close of the period covered by theannual report.
170,859,604 Common Shares as of December 31, 2011
Indicate by check mark if the registrant is a well-known seasoned issuer, as defined in Rule 405 of the Securities Act.Yes � No �
If this report is an annual or transition report, indicate by check mark if the registrant is not required to file reports pursuant to Section 13 or 15(d) of theSecurities Act.
Yes � No �
Indicate by check mark whether the registrant (1) has filed all reports required to be filed by Section 13 or 15(d) of the Securities Exchange Act of 1934during the preceding 12 months (or for such shorter period that the registrant was required to file such reports) and (2) has been subject to such filingrequirements for the past 90 days.
Yes � No �
Indicate by check mark whether the registrant has submitted electronically and posted on its corporate Web site, if any, every Interactive Data File required tobe submitted and posted pursuant to Rule 405 of Regulation S-T (§232.405 of this chapter) during the preceding 12 months (or for such shorter period thatthe registrant was required to submit and post such files).
Yes � No �
Indicate by check mark whether the registrant is a large accelerated filer, an accelerated filer, or a non-accelerated filer. See definition of ‘‘accelerated filerand large accelerated filer’’ in Rule 12b-2 of the Exchange Act. (Check one)
Large Accelerated Filer � Accelerated Filer � Non-Accelerated Filer �
Indicate by check mark which basis of accounting the registrant has used to prepare the financial statements included in this filing:U.S. GAAP � International Financial Reporting Standards as issued Other �
by the International Accounting Standards Board �
If ‘‘Other’’ has been checked in response to the previous question, indicate by check mark which financial statement item the registrant has elected to follow.Item 17 � Item 18 �
If this is an annual report, indicate by check mark whether the registrant is a shell company (as defined in Rule 12b-2 of the Exchange Act):Yes � No �

TABLE OF CONTENTS
Page
PRELIMINARY NOTE 1
NOTE TO INVESTORS CONCERNING ESTIMATES OF MINERAL RESOURCES 2
Cautionary Note to Investors Concerning Estimates of Measured and Indicated Mineral Resources 2
Cautionary Note to Investors Concerning Estimates of Inferred Mineral Resources 2
NOTE TO INVESTORS CONCERNING CERTAIN MEASURES OF PERFORMANCE 3
PART I 4
ITEM 1 IDENTITY OF DIRECTORS, SENIOR MANAGEMENT AND ADVISERS 4*
ITEM 2 OFFER STATISTICS AND EXPECTED TIMETABLE 4*
ITEM 3 KEY INFORMATION 4
Selected Financial Data 4
Currency Exchange Rates 5
Risk Factors 6
ITEM 4 INFORMATION ON THE COMPANY 16
History and Development of the Company 16
Business Overview 19
Mining Legislation and Regulation 20
Organizational Structure 23
Property, Plant and Equipment 25
ITEM 4A UNRESOLVED STAFF COMMENTS 84
ITEM 5 OPERATING AND FINANCIAL REVIEW AND PROSPECTS 84
ITEM 6 DIRECTORS, SENIOR MANAGEMENT AND EMPLOYEES 116
ITEM 7 MAJOR SHAREHOLDERS AND RELATED PARTY TRANSACTIONS 142
Major Shareholders 142
Related Party Transactions 142
ITEM 8 FINANCIAL INFORMATION 142
Dividend Policy 142
ITEM 9 THE OFFER AND LISTING 143
Market and Listing Details 143
ITEM 10 ADDITIONAL INFORMATION 145
Memorandum and Articles of Incorporation 145
Disclosure of Share Ownership 147
Material Contracts 147
Exchange Controls 151
Restrictions on Share Ownership by Non-Canadians 151
i

Page
Corporate Governance 152
Canadian Federal Income Tax Considerations 152
United States Federal Income Tax Considerations 153
Audit Fees 155
Available Documents 156
ITEM 11 QUANTITATIVE AND QUALITATIVE DISCLOSURES ABOUT MARKET RISK 156
ITEM 12 DESCRIPTION OF SECURITIES OTHER THAN EQUITY SECURITIES 158
PART II 159
ITEM 13 DEFAULTS, DIVIDEND ARREARAGES AND DELINQUENCIES 159
ITEM 14 MATERIAL MODIFICATIONS TO THE RIGHTS OF SECURITY HOLDERS AND USE OF PROCEEDS 159
ITEM 15 CONTROLS AND PROCEDURES 159
ITEM 15T CONTROLS AND PROCEDURES 160
ITEM 16A AUDIT COMMITTEE FINANCIAL EXPERT 160
ITEM 16B CODE OF ETHICS 160
ITEM 16C PRINCIPAL ACCOUNTANT FEES AND SERVICES 160
ITEM 16D EXEMPTIONS FROM THE LISTING STANDARDS FOR AUDIT COMMITTEES 160
ITEM 16E PURCHASES OF EQUITY SECURITIES BY THE ISSUER AND AFFILIATED PURCHASERS 160
ITEM 16F CHANGES IN REGISTRANT’S CERTIFYING ACCOUNTANT 160
ITEM 16G CORPORATE GOVERNANCE 160
PART III 161
ITEM 17 FINANCIAL STATEMENTS 161**
ITEM 18 FINANCIAL STATEMENTS 161
ITEM 19 EXHIBITS 215
SIGNATURES 216
* Omitted pursuant to General Instruction E(b) of Form 20-F.
** Pursuant to General Instruction E(c) of Form 20-F, the registrant has elected to provide the financial statements and related information specified in Item 18.
ii

PRELIMINARY NOTECurrencies: Agnico-Eagle Mines Limited (‘‘Agnico-Eagle’’ or the ‘‘Company’’) presents its consolidated financialstatements in United States dollars. All dollar amounts in this Annual Report on Form 20-F (‘‘Form 20-F’’) are stated inUnited States dollars (‘‘U.S. dollars’’, ‘‘$’’ or ‘‘US$’’), except where otherwise indicated. Certain information in thisForm 20-F is presented in Canadian dollars (‘‘C$’’) or European Union euros (‘‘Euro’’ or ‘‘c’’). See ‘‘Item 3 Key Information –Currency Exchange Rates’’ for a history of exchange rates of Canadian dollars into U.S. dollars.
Generally Accepted Accounting Principles: Agnico-Eagle reports its financial results using United States generallyaccepted accounting principles (‘‘US GAAP’’) due to its substantial U.S. shareholder base and to maintain comparabilitywith other gold mining companies. Unless otherwise specified, all references to financial results herein are to thosecalculated under US GAAP.
Forward-Looking Information: Certain statements in this Form 20-F, referred to herein as ‘‘forward-looking statements’’,constitute ‘‘forward-looking statements’’ within the meaning of the United States Private Securities Litigation Reform Act of1995 and ‘‘forward-looking information’’ under the provisions of Canadian provincial securities laws. These statementsrelate to, among other things, the Company’s plans, objectives, expectations, estimates, beliefs, strategies and intentionsand can generally be identified by the use of words such as ‘‘anticipate’’, ‘‘believe’’, ‘‘budget’’, ‘‘could’’, ‘‘estimate’’, ‘‘expect’’,‘‘forecast’’, ‘‘intend’’, ‘‘likely’’, ‘‘may’’, ‘‘plan’’, ‘‘project’’, ‘‘schedule’’, ‘‘should’’, ‘‘target’’, ‘‘will’’, ‘‘would’’ or other variations ofthese terms or similar words. Forward-looking statements in this report include, but are not limited to, the following:
• the Company’s outlook for 2012 and future periods;
• statements regarding future earnings, and the sensitivity of earnings to gold and other metal prices;
• anticipated levels or trends for prices of gold and byproduct metals mined by the Company or for exchange ratesbetween currencies in which capital is raised, revenue is generated or expenses are incurred by the Company;
• estimates of future mineral production and sales;
• estimates of future costs, including mining costs, total cash costs per ounce, minesite costs per tonne andother expenses;
• estimates of future capital expenditure, exploration expenditure and other cash needs, and expectations as to thefunding thereof;
• statements regarding the projected exploration, development and exploitation of certain ore deposits, includingestimates of exploration, development and production and other capital costs and estimates of the timing of suchexploration, development and production or decisions with respect thereto;
• estimates of mineral reserves, mineral resources and ore grades and statements regarding anticipated futureexploration results;
• estimates of cash flow;
• estimates of mine life;
• anticipated timing of events with respect to the Company’s minesites, mine construction projects and explorationprojects;
• estimates of future costs and other liabilities for environmental remediation;
• statements regarding anticipated legislation and regulation regarding climate change and estimates of the impacton the Company; and
• other anticipated trends with respect to the Company’s capital resources and results of operations.
Forward-looking statements are necessarily based upon a number of factors and assumptions that, while consideredreasonable by Agnico-Eagle as of the date of such statements, are inherently subject to significant business, economicand competitive uncertainties and contingencies. The factors and assumptions of Agnico-Eagle upon which the forward-looking statements in this Form 20-F are based, and which may prove to be incorrect, include, but are not limited to, theassumptions set out elsewhere in this Form 20-F as well as: that there are no significant disruptions affecting Agnico-Eagle’s operations, whether due to labour disruptions, supply disruptions, damage to equipment, natural or man-madeoccurrences, mining or milling issues, political changes, title issues or otherwise; that permitting, development and
12011 ANNUAL REPORT

expansion at each of Agnico-Eagle’s mines and mine development projects proceed on a basis consistent with currentexpectations, and that Agnico-Eagle does not change its exploration or development plans relating to such projects; thatthe exchange rates between the Canadian dollar, Euro, Mexican peso and the U.S. dollar will be approximately consistentwith current levels or as set out in this Form 20-F; that prices for gold, silver, zinc, copper and lead will be consistent withAgnico-Eagle’s expectations; that prices for key mining and construction supplies, including labour costs, remainconsistent with Agnico-Eagle’s current expectations; that production meets expectations; that Agnico-Eagle’s currentestimates of mineral reserves, mineral resources, mineral grades and mineral recovery are accurate; that there are nomaterial delays in the timing for completion of development projects; and that there are no material variations in thecurrent tax and regulatory environment that affect Agnico-Eagle.
The forward-looking statements in this Form 20-F reflect the Company’s views as at the date of this Form 20-F and involveknown and unknown risks, uncertainties and other factors which could cause the actual results, performance orachievements of the Company or industry results to be materially different from any future results, performance orachievements expressed or implied by such forward-looking statements. Such factors include, among others, the RiskFactors set forth in ‘‘Item 3 Key Information – Risk Factors’’. Given these uncertainties, readers are cautioned not to placeundue reliance on these forward-looking statements, which speak only as of the date made. Except as otherwise requiredby law, the Company expressly disclaims any obligation or undertaking to release publicly any updates or revisions to anysuch statements to reflect any change in the Company’s expectations or any change in events, conditions orcircumstances on which any such statement is based. This Form 20-F contains information regarding anticipated totalcash costs per ounce and minesite costs per tonne at certain of the Company’s mines and mine development projects.The Company believes that these generally accepted industry measures are realistic indicators of operating performanceand are useful in allowing year over year comparisons. Investors are cautioned that this information may not be suitable forother purposes.
NOTE TO INVESTORS CONCERNING ESTIMATES OF MINERAL RESOURCESThe mineral reserve and mineral resource estimates contained in this Form 20-F have been prepared in accordance withthe Canadian securities regulatory authorities’ (the ‘‘CSA’’) National Instrument 43-101 Standards of Disclosure for MineralProjects (‘‘NI 43-101’’). These standards are similar to those used by the United States Securities and ExchangeCommission’s (the ‘‘SEC’’) Industry Guide No. 7, as interpreted by Staff at the SEC (‘‘Guide 7’’). However, the definitions inNI 43-101 differ in certain respects from those under Guide 7. Accordingly, mineral reserve information contained orincorporated by reference herein may not be comparable to similar information disclosed by U.S. companies. Under therequirements of the SEC, mineralization may not be classified as a ‘‘reserve’’ unless the determination has been made thatthe mineralization could be economically and legally produced or extracted at the time the reserve determination is made.The SEC does not recognize measures of ‘‘mineral resource’’.
The metal grades reported in the mineral reserve and mineral resource estimates represent in-place grades and do notreflect losses in the recovery process, that is, the metallurgical losses associated with processing the extracted ore. Themineral reserve figures presented herein are estimates, and no assurance can be given that the anticipated tonnages andgrades will be achieved or that the indicated level of recovery will be realized. The Company does not include equivalentgold ounces for byproduct metals contained in mineral reserves in its calculation of contained ounces.
Cautionary Note to Investors Concerning Estimates of Measured and Indicated Mineral Resources
This document uses the terms ‘‘measured mineral resources’’ and ‘‘indicated mineral resources’’. Investors are advisedthat while those terms are recognized and required by Canadian regulations, the SEC does not recognize them. Investorsare cautioned not to assume that any part or all of mineral deposits in these categories will ever be converted into mineralreserves.
Cautionary Note to Investors Concerning Estimates of Inferred Mineral Resources
This document uses the term ‘‘inferred mineral resources’’. Investors are advised that while this term is recognized andrequired by Canadian regulations, the SEC does not recognize it. ‘‘Inferred mineral resources’’ have a great amount ofuncertainty as to their existence and as to their economic and legal feasibility. It cannot be assumed that any part or all ofan inferred mineral resource will ever be upgraded to a higher category. Under Canadian rules, estimates of inferredmineral resources may not form the basis of feasibility or pre-feasibility studies, except in rare cases. Investors arecautioned not to assume that any part or all of an inferred mineral resource exists, or is economically or legally mineable.
2 AGNICO-EAGLE MINES LIMITED

NOTE TO INVESTORS CONCERNING CERTAIN MEASURES OF PERFORMANCEThis Form 20-F presents certain measures, including ‘‘total cash costs per ounce’’ and ‘‘minesite costs per tonne’’, that arenot recognized measures under US GAAP. This data may not be comparable to data presented by other gold producers.For a reconciliation of these measures to the figures presented in the consolidated financial statements prepared inaccordance with US GAAP, see ‘‘Item 5 Operating and Financial Review and Prospects – Results of Operations –Production Costs’’. The Company believes that these generally accepted industry measures are realistic indicators ofoperating performance and are useful in allowing year over year comparisons. However, both of these non-US GAAPmeasures should be considered together with other data prepared in accordance with US GAAP, and these measures,taken by themselves, are not necessarily indicative of operating costs or cash flow measures prepared in accordance withUS GAAP. This Form 20-F also contains information as to estimated future total cash costs per ounce and minesite costsper tonne for projects under development. These estimates are based upon the total cash costs per ounce and minesitecosts per tonne that the Company expects to incur to mine gold at those projects and, consistent with the reconciliationprovided, do not include production costs attributable to accretion expense and other asset retirement costs, which willvary over time as each project is developed and mined. It is therefore not practicable to reconcile these forward-lookingnon-US GAAP financial measures to the most comparable US GAAP measure.
32011 ANNUAL REPORT

PART IITEM 1 IDENTITY OF DIRECTORS, SENIOR MANAGEMENT AND ADVISERSPursuant to the instructions to Item 1 of Form 20-F, this information has not been provided.
ITEM 2 OFFER STATISTICS AND EXPECTED TIMETABLENot applicable.
ITEM 3 KEY INFORMATIONSelected Financial DataThe following selected financial data for each of the years in the five-year period ended December 31, 2011 are derivedfrom the consolidated financial statements of Agnico-Eagle audited by Ernst & Young LLP. The selected financial datashould be read in conjunction with the Company’s operating and financial review and prospects set out in Item 5 of thisForm 20-F, the consolidated financial statements and the notes thereto set out in Item 18 of this Form 20-F and otherfinancial information included elsewhere in this Form 20-F.
Year Ended December 31,
2011 2010 2009 2008 2007
(in thousands of U.S. dollars, US GAAP basis,other than share and per share information)
Income Statement Data
Revenues from mining operations 1,821,799 1,422,521 613,762 368,938 432,205
Production costs 876,078 677,472 306,318 186,862 166,104
Exploration and corporate development 75,721 54,958 36,279 34,704 25,507
Equity loss in junior exploration company – – – – –
Amortization 261,781 192,486 72,461 36,133 27,757
General and administrative 107,926 94,327 63,687 47,187 38,167
Write-down of available-for-sale securities 8,569 – – 74,812 –
Loss (Gain) on derivative financial instruments (3,683) (7,612) – – 5,829
Provincial capital tax 9,223 (6,075) 5,014 5,332 3,202
Interest 55,039 49,493 8,448 2,952 3,294
Interest and sundry income 5,188 (10,254) (16,172) (11,721) (25,142)
Loss on Goldex mine 302,893 – – – –
Impairment loss on Meadowbank mine 907,681 – – – –
Gain on acquisition of Comaplex, net of transaction costs – (57,526) – – –
Gain on sale of available-for-sale-securities (4,907) (19,487) (10,142) (25,626) (4,088)
Foreign exchange (gain) loss (1,082) 19,536 39,831 (77,688) 32,297
Income before income and mining taxes (778,628) 435,203 108,038 95,991 159,278
Income and mining taxes (recoveries) (209,673) 103,087 21,500 22,824 19,933
Net income (568,955) 332,116 86,538 73,167 139,345
Attributed to non-controlling interest (60) – – – –
Attributed to common shareholders (568,895) – – – –
Net income per share – basic (3.36) 2.05 0.55 0.51 1.05
Net income per share – diluted (3.36) 2.00 0.55 0.50 1.04
Weighted average number of shares outstanding – basic 170,275,475 162,342,686 155,942,151 144,740,658 132,768,049
Weighted average number of shares outstanding – diluted 170,275,475 165,842,259 158,620,888 145,888,728 133,957,869
Dividends declared per common share 0.00 0.64 0.18 0.18 0.18
4 AGNICO-EAGLE MINES LIMITED

Year Ended December 31,
2011 2010 2009 2008 2007
(in thousands of U.S. dollars, US GAAP basis,other than share and per share information)
Balance Sheet Data (at end of period)
Mining properties (net) 3,895,355 4,564,563 3,581,798 2,997,500 2,123,397
Total assets 5,034,262 5,500,351 4,247,357 3,378,824 2,735,498
Long-term debt 920,095 650,000 715,000 200,000 –
Reclamation provision and other liabilities 145,988 145,536 96,255 71,770 57,941
Net assets 3,215,163 3,665,450 2,751,761 2,517,756 2,058,934
Common shares 3,181,381 3,078,217 2,378,759 2,299,747 1,931,667
Shareholders’ equity 3,215,163 3,665,450 2,751,761 2,517,756 2,058,934
Total common shares outstanding 170,859,604 168,720,355 156,625,174 154,808,918 142,403,379
Currency Exchange Rates
All dollar amounts in this Form 20-F are in U.S. dollars, except where otherwise indicated. The following tables set out, inCanadian dollars, the exchange rates for the U.S. dollar, based on the noon buying rate as reported by the Bank of Canada(the ‘‘Noon Buying Rate’’). On March 12, 2012, the Noon Buying Rate was US$1.00 equals C$0.9935.
Year Ended December 31,
2011 2010 2009 2008 2007
High 1.0604 1.0778 1.3000 1.2969 1.1853
Low 0.9449 0.9946 1.0292 0.9719 0.9170
End of Period 1.0170 0.9946 1.0466 1.2246 0.9881
Average 0.9891 1.0299 1.1420 1.0660 1.0748
2012 2011
March(to March 12) February January December November October September
High 1.0015 1.10016 1.0272 1.0406 1.0487 1.0604 1.0389
Low 0.9849 0.9866 0.9986 1.0105 1.0126 0.9935 0.9752
End of Period 0.9935 0.9866 1.0052 1.0170 1.0197 0.9935 1.0389
Average 0.9929 0.9965 1.0134 1.0238 1.0258 1.0207 1.0026
On December 31, 2011 and March 12, 2012, US$1.00 equalled c0.7729 and c0.7623, respectively, as reported by theEuropean Central Bank.
52011 ANNUAL REPORT

Risk Factors
The Company’s financial performance and results may fluctuate widely due to volatile and unpredictable commodityprices.
The Company’s earnings are directly related to commodity prices, as revenues are derived from the sale of precious metals(gold and silver), zinc and copper. Gold prices, which have the greatest impact on the Company’s financial performance,fluctuate widely and are affected by numerous factors beyond the Company’s control, including central bank purchasesand sales, producer hedging and de-hedging activities, expectations of inflation, investment demand, the relativeexchange rate of the U.S. dollar with other major currencies, interest rates, global and regional demand, political andeconomic conditions, production costs in major gold-producing regions, speculative positions taken by investors ortraders in gold and changes in supply, including worldwide production levels. The aggregate effect of these factors isimpossible to predict with accuracy. In addition, the price of gold has on occasion been subject to very rapid short-termchanges because of speculative activities. Fluctuations in gold prices may materially adversely affect the Company’sfinancial performance or results of operations. If the market price of gold falls below the Company’s total cash costs perounce of production at one or more of its projects at that time and remains so for any sustained period, the Company mayexperience losses and/or may curtail or suspend some or all of its exploration, development and mining activities at suchprojects or at other projects. In addition, such fluctuations may require changes to the mine plan. Also, the Company’sdecisions to proceed with the operations at its current mines were based on a market price of gold between $400 and$450 per ounce. If the market price of gold falls below these levels, the mines may be rendered uneconomic andproduction may be suspended. Also, the Company’s evaluation of the Meliadine project acquisition was based on anassumption of a market price of gold of $950 per ounce and the evaluation of the La India project acquisition was based onan assumption of a market price of gold of $1,150 per ounce. If the market price of gold falls below these respective levels,future activity at the Meliadine project or the La India project may be rendered uneconomic and activities may besuspended. In addition, the Company’s current mine plans are all based on a gold price of $1,500 per ounce and reserveand resource estimates are based on a gold price of $1,255 per ounce; if the price of gold falls below these levels the mineplans may have to be changed, which may result in reduced production, higher costs than anticipated or both andestimates of reserves and resources may have to be reduced. Further, the prices received from the sale of the Company’sbyproduct metals produced at its LaRonde mine (zinc, silver, lead and copper) and its Pinos Altos mine (silver) affect theCompany’s ability to meet its targets for total cash costs per ounce of gold produced. These byproduct metal pricesfluctuate widely and are also affected by numerous factors beyond the Company’s control. The Company’s policy andpractice is not to sell forward its future gold production; however, under the Company’s price risk management policy,approved by the Company’s board of directors (the ‘‘Board’’), the Company may review this practice on a project by projectbasis. See ‘‘Item 11 Quantitative and Qualitative Disclosures about Market Risk – Derivatives’’ for more details on theCompany’s use of derivative instruments. The Company occasionally uses derivative instruments to mitigate the effects offluctuating byproduct metal prices; however, these measures may not be successful.
The volatility of gold prices is illustrated in the following table which sets out, for the periods indicated, the high, low andaverage afternoon fixing prices for gold on the London Bullion Market (the ‘‘London P.M. Fix’’).
2012(to March 12) 2011 2010 2009 2008 2007
High price ($ per ounce) 1,781 1,895 1,421 1,212 1,011 841
Low price ($ per ounce) 1,598 1,319 1,058 810 712 608
Average price ($ per ounce) 1,698 1,572 1,125 972 872 695
On March 12, 2012, the London P.M. Fix was $1,698 per ounce of gold.
The assumptions that underlie the estimate of future operating results and the strategies used to mitigate the effects ofrisks of metal prices are set out herein and in ‘‘Item 5 Operating and Financial Review and Prospects – Outlook – GoldProduction Growth’’ of this Form 20-F.
6 AGNICO-EAGLE MINES LIMITED

Based on 2012 production estimates, the approximate sensitivities of the Company’s after-tax income to a 10% change incertain metal prices from 2011 market average prices are as follows:
Incomeper share
Gold $ 0.64
Silver $ 0.06
Zinc $ 0.02
Copper $ 0.01
Sensitivities of the Company’s after-tax income to changes in metal prices will increase with increased production.
The Company is largely dependent upon its mining and milling operations at its Meadowbank mine in Nunavut and atits LaRonde mine in Quebec, and any adverse condition affecting those operations may have a material adverse effecton the Company.
The Company’s operations at the Meadowbank mine accounted for approximately 27% of the Company’s gold productionand are expected to account for approximately 30% of the Company’s gold production in 2012 (using 912,500 ounces,being the midpoint of the Company’s production guidance range of 875,000-950,000 ounces). The LaRonde mine in theAbitibi region of northern Quebec accounted for approximately 12.6% of the Company’s gold production in 2011 and isexpected to account for approximately 17% of the Company’s gold production in 2012. In 2011, gold production at theMeadowbank mine was approximately 90,000 ounces below the Company’s expectation as a result of issues that includeda fire that destroyed the minesite’s kitchen facilities and above anticipated dilution. For the year ended December 31,2011, the Company performed a full review of the Meadowbank mine’s operation and updated the related life of mineplan. The review considered the exploration potential of the area, the current mineral reserves and resources, theprojected operating costs in light of persistently high operating costs experienced since the commencement ofcommercial operations, metallurgical performance and gold price. The updated life of mine plan contemplates a shortermine life and reduced reserves and resources and required the Company to incur a pre-tax asset impairment charge of$907.7 million. At the LaRonde mine, the Company is now extracting ore from below Level 245, which was previouslyreferred to as the LaRonde mine extension. The depth of these operations, as well as the new infrastructure required toextract this deeper ore, could pose significant challenges to the Company such as geomechanical risks and ventilation andair conditioning requirements, which could result in difficulties and delays in achieving gold production objectives. Anyadverse condition affecting mining or milling conditions at the Meadowbank or LaRonde mines could be expected to havea material adverse effect on the Company’s financial performance and results of operations. The Company also anticipatesusing revenue generated by its operations at these mines to finance a substantial portion of its capital expenditures in2012, including new projects at the Pinos Altos mine and the Meliadine and La India projects.
The Kittila, Pinos Altos and Lapa mines commenced commercial production in 2009 and commercial production at theCreston Mascota deposit at Pinos Altos was achieved in the first quarter of 2011. However, unless the Company otherwiseacquires significant gold-producing assets in other regions, the Company will continue to be dependent on its operationsat the Meadowbank and LaRonde mines for a substantial portion of its gold production. Further, there can be noassurance that the Company’s current exploration and development programs at the LaRonde or Meadowbank mines willresult in any new economically viable mining operations or yield new mineral reserves to replace and expand currentmineral reserves.
The Company may experience difficulties operating its Meadowbank mine and developing the Meliadine project as aresult of their remote location.
The Company’s Meadowbank mine is located in the Kivalliq District of Nunavut in northern Canada, approximately70 kilometres north of Baker Lake. The closest major city is Winnipeg, Manitoba, approximately 1,500 kilometres to thesouth. Though the Company constructed a 110-kilometre all-weather road from Baker Lake, which provides summershipping access via Hudson Bay to the Meadowbank mine, the Company’s operations will be constrained by theremoteness of the mine, particularly as the port of Baker Lake is only accessible approximately 2.5 months per year. Mostof the materials that the Company requires for the operation of the Meadowbank mine must be transported through the
72011 ANNUAL REPORT

port of Baker Lake during this shipping season, which may be further truncated due to weather conditions. If the Companyis unable to acquire and transport necessary supplies during this time, this may result in a slowdown or stoppage ofoperations at the Meadowbank mine. Furthermore, if major equipment fails, items necessary to replace or repair suchequipment may have to be shipped through Baker Lake during this window. Failure to have available the necessarymaterials required for operations or to repair or replace malfunctioning equipment at the Meadowbank mine may requirethe slowdown or stoppage of operations. For example, the February 2011 fire at the Meadowbank Mine’s kitchen facilitiesrequired the mine to be on reduced operations which resulted in reduced gold production at the mine.
The Company’s Meliadine project, 290 kilometres southeast of the Meadowbank mine, is also located in the KivalliqDistrict of Nunavut, approximately 25 kilometres northwest of the hamlet of Rankin Inlet on the west coast of Hudson Bay.Access to the property is by helicopter from Rankin Inlet year-round and by tracked vehicles overland on a winter roadfrom approximately late December to mid-May. An all-weather access road between the project and Rankin Inlet is at thepermitting stage. The Company’s operations at the Meliadine project may be constrained by its remoteness and, prior tothe completion of the all weather access road, lack of access if the winter road season is shortened by permit delays orunusually warm weather, or if construction of the all-weather road is delayed. Most of the materials that the Companyrequires to operate the advanced exploration program, and may require if it determines to build a mine in the future, mustbe transported through the port of Rankin Inlet during its six-week shipping season. If the Company cannot identify andprocure suitable equipment and materials within a timeframe that permits transporting them to the project within thisshipping season, this could result in delays and/or cost increases in the exploration program and, if the Companydetermines to build a mine, any construction or development on the property.
The remoteness of the Meadowbank mine and Meliadine project also necessitates the use of fly-in/fly-out camps for theaccommodation of site employees and contractors, which may have an impact on the Company’s ability to attract andretain qualified mining, exploration and construction personnel. If the Company is unable to attract and retain sufficientpersonnel or sub-contractors on a timely basis, the Company’s operations at the Meadowbank mine and futuredevelopment plans at the Meliadine project may be adversely affected.
The Company’s recently opened mines, mine construction projects and expansion projects are subject to risksassociated with new mine development, which may result in delays in the start-up of mining operations, delays inexisting operations and unanticipated costs.
The Company’s production forecasts are based on full production being achieved at all of its mines, and the Company’sability to achieve and maintain full production rates at these mines is subject to a number of risks and uncertainties.Production from these mines in 2012 may be lower than anticipated if the anticipated full production rate cannot beachieved.
The LaRonde mine extension, which commenced operation in late 2011, will be one of the deepest operations in theWestern Hemisphere with an expected maximum depth of 3,110 metres. The operations of the LaRonde mine extensionwill rely on new infrastructure for hauling ore and materials to the surface, including a winze (or internal shaft) and a seriesof ramps linking mining deposits to the Penna Shaft that services current operations at the LaRonde mine. The depth ofthe operations could pose significant challenges to the Company such as geomechanical risks and ventilation and airconditioning requirements, which may result in difficulties and delays in achieving gold production objectives.
The development of the Kittila and Pinos Altos mines requires the construction and operation of significant newunderground mining operations. The construction and operation of underground mining facilities is subject to a number ofrisks, including unforeseen geological formations, implementation of new mining processes, delays in obtaining requiredconstruction, environmental or operating permits and engineering and mine design adjustments.
8 AGNICO-EAGLE MINES LIMITED

If the Company experiences mining accidents or other adverse conditions, the Company’s mining operations may yieldless gold than indicated by its estimated gold production.
The Company’s gold production may fall below estimated levels as a result of mining accidents such as cave-ins, rock falls,rock bursts, pit wall failures, fires or flooding or as a result of other operational problems such as a failure of a productionhoist, autoclave, filter press or semi-autogenous grinding (‘‘SAG’’) mill. In addition, production may be reduced if, duringthe course of mining or processing, unfavourable weather conditions, ground conditions or seismic activity areencountered, ore grades are lower than expected, the physical or metallurgical characteristics of the ore are less amenablethan expected to mining or treatment, dilution increases, electrical power is interrupted or heap leach processing results incontainment discharge. In seven of the last nine years, as a result of such adverse conditions, the Company has failed tomeet production forecasts due to: a rock fall, production drilling challenges and lower than planned mill recoveries in2003; higher than expected dilution in 2004; increased stress levels in a sill pillar requiring the temporary closure ofproduction sublevels in 2005; and delays in the commissioning of the Goldex production hoist and the Kittila autoclave in2008. In 2009, gold production was 492,972 ounces, down from the Company’s initial estimate of 590,000 ounces,primarily as a result of delays in the commencement of production at the Kittila mine due to issues with the autoclave, atthe Pinos Altos mine resulting from problems in commissioning the dry tailings filter presses and at the Lapa mineresulting from dilution issues. In 2010, gold production of 987,607 ounces was below the initial anticipated range of1 million to 1.1 million ounces primarily as a result of lower throughput at the Meadowbank mine mill due to a bottleneck inthe crushing circuit and because there were autoclave issues at the Kittila mine in the first half of the year. In 2011, goldproduction of 985,460 ounces was below the initial anticipated range of 1.13 to 1.23 million ounces primarily as a result ofsuspension of mining operations at the Goldex mine due to suspected rock subsidence in the hanging wall above the mainorebody, a fire in the Meadowbank mine kitchen complex which negatively impacted production and lower than expectedgrades at the Meadowbank and LaRonde mines. Occurrences of this nature and other accidents, adverse conditions oroperational problems in future years may result in the Company’s failure to achieve current or future production estimates.
The Company’s total cash costs per ounce of gold production depend, in part, on external factors that are subject tofluctuation and, if such costs increase, some or all of the Company’s activities may become unprofitable.
The Company’s total cash costs per ounce of gold are dependent on a number of factors, including the exchange ratebetween the U.S. dollar and the Canadian dollar, Euro or Mexican peso, smelting and refining charges, productionroyalties, the price of gold and byproduct metals and the cost of inputs used in mining operations. At the LaRonde mine,the Company’s total cash costs per ounce of production are primarily affected by the prices and production levels ofbyproduct zinc, silver and copper, the revenue from which is offset against the cost of gold production. Total cash costs perounce from the Company’s operations at the Pinos Altos mine are affected by the exchange rate between the U.S. dollarand the Mexican peso and the price and production level of byproduct silver, the revenue from which is offset against thecost of gold production. Total cash costs per ounce from the Company’s operations at its mines in Canada and the Kittilamine are affected by changes in the exchange rates between the U.S. dollar and the Canadian dollar and the Euro,respectively. Total cash costs per ounce at all of the Company’s mines are also affected by the costs of inputs used inmining operations, including labour (including contractors), steel, chemical reagents and energy. All of these factors arebeyond the Company’s control. If the Company’s total cash costs per ounce of gold rise above the market price of gold andremain so for any sustained period, the Company may experience losses and may curtail or suspend some or all of itsexploration, development and mining activities.
Total cash costs per ounce is not a recognized measure under US GAAP, and this data may not be comparable to datapresented by other gold producers. Management uses this generally accepted industry measure in evaluating operatingperformance and believes it to be a realistic indicator of such performance and useful in allowing year over yearcomparisons. The data also reflects the Company’s ability to generate cash flow and operating income at various goldprices. This additional information should be considered together with other data prepared in accordance with US GAAPand is not necessarily indicative of operating costs or cash flow measures prepared in accordance with US GAAP. See‘‘Item 5 Operating and Financial Review and Prospects – Results of Operations – Production Costs’’ for reconciliation oftotal cash costs per ounce and minesite costs per tonne to their closest US GAAP measure and ‘‘Note to InvestorsConcerning Certain Measures of Performance’’ for a discussion of these non-US GAAP measures.
The Company may experience operational difficulties at its mines in Finland and Mexico.
The Company’s operations include a mine in Finland and a mine in northern Mexico. These operations are subject tovarious levels of political, economic and other risks and uncertainties that are different from those encountered at theCompany’s Canadian properties. These risks and uncertainties vary from country to country and may include: extreme
92011 ANNUAL REPORT

fluctuations in currency exchange rates; high rates of inflation; labour unrest; risks of war or civil unrest; expropriation andnationalization; renegotiation or nullification of existing concessions, licences, permits and contracts; illegal mining;corruption; restrictions on foreign exchange and repatriation; hostage taking; and changing political conditions andcurrency controls. In addition, the Company must comply with multiple and potentially conflicting regulations in Canada,the United States, Europe and Mexico, including export requirements, taxes, tariffs, import duties and other trade barriers,as well as health, safety and environmental requirements.
Changes, if any, in mining or investment policies or shifts in political attitude in Finland or Mexico may adversely affect theCompany’s operations or profitability. Operations may be affected in varying degrees by government regulations withrespect to matters including restrictions on production, price controls, export controls, currency controls or restrictions,currency remittance, income and other taxes, expropriation of property, foreign investment, maintenance of claims,environmental legislation, land use, land claims of local people, water use and mine safety. Failure to comply strictly withapplicable laws, regulations and local practices relating to mineral rights applications and tenure could result in loss,reduction or expropriation of entitlements or the imposition of additional local or foreign parties as joint venture partnerswith carried or other interests.
In addition, Finland and Mexico have significantly different laws and regulations than Canada and there exist cultural andlanguage differences between these countries and Canada. Also, the Company faces challenges inherent in efficientlymanaging an increased number of employees over large geographical distances, including the challenges of staffing andmanaging operations in several international locations and implementing appropriate systems, policies, benefits andcompliance programs. These challenges may divert management’s attention to the detriment of the Company’s operationsin Canada. There can be no assurance that difficulties associated with the Company’s foreign operations can besuccessfully managed.
Mineral reserve and mineral resource estimates are only estimates and such estimates may not accurately reflectfuture mineral recovery.
The figures for mineral reserves and mineral resources published by the Company are estimates and no assurance can begiven that the anticipated tonnages and grades will be achieved or that the indicated level of recovery of gold will berealized. Mineral reserve and resource estimates are based on gold recoveries in small scale laboratory tests and may notbe indicative of the mineralization in the entire orebody and the Company may not be able to achieve similar results inlarger scale tests under on-site conditions or during production. The ore grade actually recovered by the Company maydiffer from the estimated grades of the mineral reserves and mineral resources. The estimates of mineral reserves andmineral resources have been determined based on assumed metal prices, foreign exchange rates and operating costs.For example, the Company has estimated proven and probable mineral reserves on all of its properties based on, amongother things, a $1,255 per ounce gold price. Monthly average gold prices have been above $1,255 per ounce sinceSeptember 2010; however, prior to that time, monthly average gold prices were below $1,255 per ounce. Prolongeddeclines in the market price of gold (or applicable byproduct metal prices) may render mineral reserves containingrelatively lower grades of mineralization uneconomical to recover and could materially reduce the Company’s mineralreserves. Should such reductions occur, the Company may be required to take a material write-down of its investment inmining properties or delay or discontinue production or the development of new projects, resulting in increased net lossesand reduced cash flow. Market price fluctuations of gold (or applicable byproduct metal prices), as well as increasedproduction costs or reduced recovery rates, may render mineral reserves containing relatively lower grades ofmineralization uneconomical to recover and may ultimately result in a restatement of mineral resources. Short-termfactors relating to the mineral reserve, such as the need for orderly development of orebodies or the processing of new ordifferent grades, may impair the profitability of a mine in any particular accounting period.
Mineral resource estimates for properties that have not commenced production or at deposits that have not yet beenexploited are based, in most instances, on very limited and widely spaced drill hole information, which is not necessarilyindicative of conditions between and around the drill holes. Accordingly, such mineral resource estimates may requirerevision as more drilling information becomes available or as actual production experience is gained.
The Company may experience problems in executing acquisitions or managing and integrating any completedacquisitions with its existing operations.
The Company regularly evaluates opportunities to acquire securities or assets of other mining businesses. Suchacquisitions may be significant in size, may change the scale of the Company’s business and may expose the Company tonew geographic, political, operating, financial or geological risks. The Company’s success in its acquisition activitiesdepends on its ability to identify suitable acquisition candidates, acquire them on acceptable terms and integrate their
10 AGNICO-EAGLE MINES LIMITED

operations successfully with those of the Company. Any acquisition would be accompanied by risks, such as the difficultyof assimilating the operations and personnel of any acquired businesses; the potential disruption of the Company’songoing business; the inability of management to maximize the financial and strategic position of the Company throughthe successful integration of acquired assets and businesses; the maintenance of uniform standards, controls,procedures and policies; the impairment of relationships with employees, customers and contractors as a result of anyintegration of new management personnel; and the potential unknown liabilities associated with acquired assets andbusinesses. In addition, the Company may need additional capital to finance an acquisition. Debt financing related to anyacquisition may expose the Company to the risks related to increased leverage, while equity financing may cause existingshareholders to suffer dilution. The Company is permitted under the terms of its unsecured revolving bank credit facilityand its $600 million of guaranteed senior unsecured notes referred to under the heading ‘‘Item 4 Information on theCompany – History and Development of the Company’’ to incur additional unsecured indebtedness, provided that itmaintains certain financial ratios and meets financial condition covenants and, in the case of the bank credit facility, that itcomplies with certain covenants, including that no default under the bank credit facility has occurred and is continuing, orwould occur as a result of the incurrence or assumption of such indebtedness, the terms of such indebtedness are nomore onerous to the Company than those under the bank credit facility and such indebtedness does not require principalpayments until at least 12 months following the then existing maturity date of the bank credit facility. There can be noassurance that the Company would be successful in overcoming these or any other problems encountered in connectionwith such acquisitions.
Fluctuations in foreign currency exchange rates in relation to the U.S. dollar may adversely affect the Company’sresults of operations.
The Company’s operating results and cash flow are significantly affected by changes in the U.S. dollar/Canadian dollarexchange rate. All of the Company’s revenues are earned in U.S. dollars but the majority of its operating costs at theLaRonde, Goldex, Lapa and Meadowbank mines, as well as the Meliadine project, are incurred in Canadian dollars. TheU.S. dollar/Canadian dollar exchange rate has fluctuated significantly over the last several years. From January 1, 2007 toJanuary 1, 2012, the Noon Buying Rate fluctuated from a high of C$1.3000 per $1.00 to a low of C$0.9170 per $1.00.Historical fluctuations in the U.S. dollar/Canadian dollar exchange rate are not necessarily indicative of future exchangerate fluctuations. Based on the Company’s anticipated 2012 after-tax operating results, a 10% change in theU.S. dollar/Canadian dollar exchange rate from the 2011 market average exchange rate would affect net income byapproximately $0.30 per share. To attempt to mitigate its foreign exchange risk and minimize the impact of exchange ratemovements on operating results and cash flow, the Company has periodically used foreign currency options and forwardforeign exchange contracts to purchase Canadian dollars; however, there can be no assurance that these strategies will beeffective. See ‘‘Item 5 Operating and Financial Review and Prospects – Outlook – Gold Production Growth’’ for adescription of the assumptions underlying the sensitivity and the strategies used to mitigate the effects of risks. In addition,the majority of the Company’s operating costs at the Kittila mine are incurred in Euros and a portion of operating costs atthe Pinos Altos mine and exploration and development costs at the La India project are incurred in Mexican pesos. Each ofthese currencies has fluctuated significantly against the U.S. dollar over the past several years. There can be no assurancethat the Company’s foreign exchange derivatives strategies will be successful or that foreign exchange fluctuations will notmaterially adversely affect the Company’s financial performance and results of operations.
If the Company fails to comply with restrictive covenants in its debt instruments, the Company’s ability to borrow underits unsecured revolving bank credit facility could be limited and the Company may then default under other debtagreements, which could harm the Company’s business.
The Company’s unsecured revolving $1.2 billion bank credit facility limits, among other things, the Company’s ability topermit the creation of certain liens, make investments in a business or carry on business unrelated to mining, dispose ofthe Company’s material assets or, in certain circumstances, pay dividends. In addition, the Company’s $600 millionguaranteed senior unsecured notes limit, among other things, the Company’s ability to permit the creation of certain liens,carry on business unrelated to mining or dispose of the Company’s material assets. The bank credit facility and theguaranteed senior unsecured notes also require the Company to maintain specified financial ratios and meet financialcondition covenants. Events beyond the Company’s control, including changes in general economic and businessconditions, may affect the Company’s ability to satisfy these covenants, which could result in a default under one of thebank credit facility or the notes. At March 12, 2012 there was approximately $320 million drawn under the bank creditfacility, and the Company anticipates that it will continue to draw on the bank credit facility to fund part of the capitalexpenditures required in connection with its current development projects. If an event of default under the bank creditfacility or the notes occurs, the Company would be unable to draw down further on the bank credit facility and the lenders
112011 ANNUAL REPORT

could elect to declare all principal amounts outstanding thereunder at such time, together with accrued interest, to beimmediately due and it could cause an event of default under the notes. An event of default under either the bank creditfacility or the notes may also give rise to an event of default under existing and future debt agreements and, in such event,the Company may not have sufficient funds to repay amounts owing under such agreements.
The exploration of mineral properties is highly speculative, involves substantial expenditures and is frequentlyunsuccessful.
The Company’s profitability is significantly affected by the costs and results of its exploration and development programs.As mines have limited lives based on proven and probable mineral reserves, the Company actively seeks to replace andexpand its mineral reserves, primarily through exploration and development as well as through strategic acquisitions.Exploration for minerals is highly speculative in nature, involves many risks and is frequently unsuccessful. Among themany uncertainties inherent in any gold exploration and development program are the location of economic orebodies, thedevelopment of appropriate metallurgical processes, the receipt of necessary governmental permits and the constructionof mining and processing facilities. Substantial expenditures are required to pursue such exploration and developmentactivities. Assuming discovery of an economic orebody, depending on the type of mining operation involved, several yearsmay elapse from the initial phases of drilling until commercial operations are commenced and during such time theeconomic feasibility of production may change. Accordingly, there can be no assurance that the Company’s current orfuture exploration and development programs will result in any new economically viable mining operations or yield newmineral reserves to replace and expand current mineral reserves.
The mining industry is highly competitive, and the Company may not be successful in competing for new miningproperties.
There is a limited supply of desirable mineral lands available for claim staking, leasing or other acquisitions in the areaswhere the Company contemplates conducting exploration activities. Many companies and individuals are engaged in themining business, including large, established mining companies with substantial capabilities and long earnings records.The Company may be at a competitive disadvantage in acquiring mining properties, as it must compete with thesecompanies and individuals, some of which have greater financial resources and larger technical staff than the Company.Accordingly, there can be no assurance that the Company will be able to compete successfully for new mining properties.
The success of the Company is dependent on good relations with its employees and on its ability to attract and retainemployees and key personnel.
Production at the Company’s mines and mine projects is dependent on the efforts of the Company’s employees andcontractors. The Company competes with mining and other companies on a global basis to attract and retain employees atall levels with appropriate technical skills and operating experience necessary to operate its mines. Relationships betweenthe Company and its employees may be affected by changes in the scheme of labour relations that may be introduced byrelevant government authorities in the jurisdictions that the Company operates. Changes in applicable legislation or in therelationship between the Company and its employees or contractors may have a material adverse effect on the Company’sbusiness, results of operations and financial condition.
The Company is also dependent on a number of key management personnel. The loss of the services of one or more ofsuch key management personnel could have a material adverse effect on the Company. The Company’s ability to manageits operating, development, exploration and financing activities will depend in large part on the efforts of these individuals.
The Company faces significant competition to attract and retain qualified personnel and there can be no assurance thatthe Company will be able to attract and retain such personnel.
The Company may have difficulty financing its additional capital requirements for its planned mine construction,exploration and development.
The sustaining capital required for operations (including potential expansions) and the development of the Meliadine andLa India projects, and the exploration and development of the Company’s properties, including continuing exploration anddevelopment projects in Quebec, Nunavut, Finland, Mexico and Nevada, will require substantial capital expenditures. TheCompany estimates that capital expenditures will be approximately $382.3 million in 2012 and $277.4 million in 2013. Asat March 12, 2012, the Company had approximately $844.4 million available to be borrowed under its bank credit facility.Based on current funding available to the Company and expected cash from operations, the Company believes it hassufficient funds available to fund its projected capital expenditures for all of its current properties. However, if cash from
12 AGNICO-EAGLE MINES LIMITED

operations is lower than expected or capital costs at these mines or projects exceed current estimates, or if the Companyincurs major unanticipated expenses related to exploration, development or maintenance of its properties, or if advancesfrom the bank credit facility are unavailable, the Company may be required to seek additional financing to maintain itscapital expenditures at planned levels. In addition, the Company will have additional capital requirements to the extentthat it decides to expand its present operations and exploration activities, construct additional mining and processingoperations at any of its properties or take advantage of opportunities for acquisitions, joint ventures or other businessopportunities that may arise. Additional financing may not be available when needed or, if available, the terms of suchfinancing may not be favourable to the Company and, if raised by offering equity securities, or securities convertible intoequity securities, any additional financing may involve substantial dilution to existing shareholders. Failure to obtain anyfinancing necessary for the Company’s capital expenditure plans may result in a delay or indefinite postponement ofexploration, development or production on any or all of the Company’s properties, which may have a material adverseeffect on the Company’s business, financial condition and results of operations.
The continuing weakness in the global credit and capital markets could have a material adverse impact on theCompany’s liquidity and capital resources.
The credit and capital markets experienced significant deterioration in 2008, including the failure of significant andestablished financial institutions in the United States and abroad, and continues to show weakness and volatility. Theseunprecedented disruptions in the credit and capital markets have negatively impacted the availability and terms of creditand capital. If uncertainties in these markets continue, or these markets deteriorate further, it could have a materialadverse effect on the Company’s liquidity, ability to raise capital and costs of capital. Failure to raise capital when neededor on reasonable terms may have a material adverse effect on the Company’s business, financial condition and resultsof operations.
Due to the nature of the Company’s mining operations, the Company may face liability, delays and increased productioncosts from environmental and industrial accidents and pollution, and the Company’s insurance coverage may proveinadequate to satisfy future claims against the Company.
The business of gold mining is generally subject to risks and hazards, including environmental hazards, industrialaccidents, unusual or unexpected rock formations, changes in the regulatory environment, cave-ins, rock bursts, rockfalls, pit wall failures and flooding and gold bullion losses. Such occurrences could result in damage to, or destruction of,mineral properties or production facilities, personal injury or death, environmental damage, delays in mining, monetarylosses and possible legal liability. The Company carries insurance to protect itself against certain risks of mining andprocessing in amounts that it considers to be adequate but which may not provide adequate coverage in certainunforeseen circumstances. The Company may also become subject to liability for pollution, cave-ins or other hazardsagainst which it cannot insure or against which it has elected not to insure because of high premium costs or otherreasons, or the Company may become subject to liabilities which exceed policy limits. In these circumstances, theCompany may incur significant costs that could have a material adverse effect on its financial performance and resultsof operations.
The Company’s operations are subject to numerous laws and extensive government regulations which may cause areduction in levels of production, delay or the prevention of the development of new mining properties or otherwisecause the Company to incur costs that adversely affect the Company’s results of operations.
The Company’s mining and mineral processing operations and exploration activities are subject to the laws andregulations of federal, provincial, state and local governments in the jurisdictions in which the Company operates. Theselaws and regulations are extensive and govern prospecting, exploration, development, production, exports, taxes, labourstandards, occupational health and safety, waste disposal, toxic substances, environmental protection, mine safety andother matters. Compliance with such laws and regulations increases the costs of planning, designing, drilling, developing,constructing, operating, closing, reclaiming and rehabilitating mines and other facilities. New laws or regulations,amendments to current laws and regulations governing operations and activities of mining companies or more stringentimplementation or interpretation thereof could have a material adverse impact on the Company, cause a reduction inlevels of production and delay or prevent the development of new mining properties.
Title to the Company’s properties may be uncertain and subject to risks.
The acquisition of title to mineral properties is a very detailed and time-consuming process. Title to, and the area of,mineral concessions may be disputed. Although the Company believes it has taken reasonable measures to ensure proper
132011 ANNUAL REPORT
title to its properties, there is no guarantee that title to any of its properties will not be challenged or impaired. Third partiesmay have valid claims on underlying portions of the Company’s interests, including prior unregistered liens, agreements,transfers or claims, including native land claims, and title may be affected by, among other things, undetected defects. Inaddition, although the Company believes that it has sufficient surface rights for its operations, the Company may be unableto operate its properties as permitted or to enforce its rights in respect of its properties.
Increased regulation of greenhouse gas emissions and climate change issues may adversely affect the Company’soperations.
The Company operates in a number of jurisdictions in which regulatory requirements have been introduced or are beingcontemplated to monitor, report and/or reduce greenhouse gas emissions. Under the Copenhagen Accord, Canada hascommitted to reducing greenhouse gas emissions by 17%, relative to 2005 levels, by 2020, but this commitment issubject to future alignment with reduction targets and regulatory requirements in the United States. Canada is alsoconsidering new regulatory requirements to address greenhouse gas emissions. Similarly, the Province of Quebec is amember of the Western Climate Initiative and has passed legislation enabling the establishment of a greenhouse gasemissions registry, greenhouse gas reduction targets and a cap-and-trade system to achieve Quebec’s commitment toreduce greenhouse gas emissions by 20%, relative to 1990 levels, by 2020. The Company’s operations in Quebec useprimarily hydroelectric power and as a consequence are not large producers of greenhouse gases. The Meadowbank mineproduces approximately 165,110 tonnes of carbon dioxide equivalent per year from its own production of electricity fromdiesel-power generation and it is expected that any mining operation at the Meliadine project would also produce some ofits power from diesel-power generation. The Pinos Altos mine purchases electricity that is largely fossil-fuel generated. ThePinos Altos mine also generates electricity locally with a diesel-powered genset during ‘‘peak’’ periods. As a result, it is theCompany’s second highest greenhouse gas producer at 109,483 tonnes of carbon dioxide equivalent per year. None ofthe Company’s other operations emit more than 30,400 tonnes of carbon dioxide equivalent per year. As a result,notwithstanding the ongoing uncertainty around the regulation of greenhouse gas emissions, new regulatory requirementsin respect of greenhouse gasses and the additional costs required to comply are not expected to have a material effect onthe Company’s operations and financial condition.
The Company is subject to the risk of litigation, the causes and costs of which cannot be known.
The Company is subject to litigation arising in the normal course of business and may be involved in disputes with otherparties in the future which may result in litigation. The causes of potential future litigation cannot be known and may arisefrom, among other things, business activities, environmental laws, volatility in stock price or failure to comply withdisclosure obligations, such as in the litigation referred to in note 21 to the Financial Statements contained in Item 18hereof. The results of litigation cannot be predicted with certainty. If the Company is unable to resolve these disputesfavourably, it may have a material adverse impact on the Company’s financial performance, cash flow and results ofoperations.
In the event of a dispute involving the foreign operations of the Company, the Company may be subject to the exclusivejurisdiction of foreign courts or may not be successful in subjecting foreign persons to the jurisdiction of courts in Canada.The Company’s ability to enforce its rights could have an adverse effect on its future cash flows, earnings, results ofoperations and financial condition.
The use of derivative instruments for the Company’s byproduct metal production may prevent gains from being realizedfrom subsequent byproduct metal price increases.
While the Company’s general policy is not to sell forward its future gold production, the Company has used, and may in thefuture use, various byproduct metal derivative strategies, such as selling future contracts or purchasing put options. TheCompany continually evaluates the potential short- and long-term benefits of engaging in such derivative strategies basedupon current market conditions. No assurance can be given, however, that the use of byproduct metal derivative strategieswill benefit the Company in the future. There is a possibility that the Company could lock in forward deliveries at priceslower than the market price at the time of delivery. In addition, the Company could fail to produce enough byproductmetals to offset its forward delivery obligations, causing the Company to purchase the metal in the spot market at higherprices to fulfill its delivery obligations or, for cash settled contracts, make cash payments to counterparties in excess ofbyproduct revenue. If the Company is locked into a lower than market price forward contract or has to buy additionalquantities at higher prices, its net income could be adversely affected. None of the current contracts establishing thebyproduct metal derivatives positions qualified for hedge accounting treatment under US GAAP and therefore anyyear-end mark-to-market adjustments are recognized in the ‘‘Gain on derivative financial instruments’’ line item of the
14 AGNICO-EAGLE MINES LIMITED
consolidated statements of income and comprehensive income. See ‘‘Item 11 Quantitative and Qualitative Disclosuresabout Market Risk – Derivatives’’.
The trading price for the Company’s securities is volatile.
The trading price of the Company’s common shares and, consequently, the trading price of securities convertible into orexchangeable for the Company’s common shares, have been and may continue to be subject to large fluctuations whichmay result in losses to investors. The trading price of the Company’s common shares and securities convertible into orexchangeable for common shares may increase or decrease in response to a number of events and factors, including:
• changes in the market price of gold or other byproduct metals the Company sells;
• events affecting the economic situation in Canada, the United States and elsewhere;
• trends in the mining industry and the markets in which the Company operates;
• changes in financial estimates and recommendations by securities analysts;
• acquisitions and financings;
• quarterly variations in operating results;
• the operating and share price performance of other companies that investors may deem comparable; and
• purchases or sales of large blocks of the Company’s common shares or securities convertible into or exchangeablefor the Company’s common shares.
Wide price swings are currently common in the markets on which the Company’s securities trade. This volatility mayadversely affect the prices of the Company’s common shares and the securities convertible into or exchangeable for theCompany’s common shares regardless of the Company’s operating performance.
The Company may not be able to comply with the requirements of Section 404 of the Sarbanes-Oxley Act.
Section 404 of the Sarbanes-Oxley Act of 2002 (‘‘SOX’’) requires an annual assessment by management of theeffectiveness of the Company’s internal control over financial reporting. Section 404 of SOX also requires an annualattestation report by the Company’s independent auditors addressing the effectiveness of the Company’s internal controlover financial reporting. The Company has completed its Section 404 assessment and received the auditors’ attestation asof December 31, 2011.
If the Company fails to maintain the adequacy of its internal control over financial reporting, as such standards aremodified, supplemented or amended from time to time, the Company may not be able to conclude that it has effectiveinternal control over financial reporting in accordance with Section 404 of SOX. The Company’s failure to satisfy therequirements of Section 404 of SOX on an ongoing, timely basis could result in the loss of investor confidence in thereliability of its financial statements, which in turn could harm the Company’s business and negatively impact the tradingprice of its common shares and securities convertible or exchangeable for common shares. In addition, any failure toimplement required new or improved controls, or difficulties encountered in their implementation, could harm theCompany’s operating results or cause it to fail to meet its reporting obligations. Future acquisitions of companies mayprovide the Company with challenges in implementing the required processes, procedures and controls in its acquiredoperations. Acquired companies may not have disclosure controls and procedures or internal control over financialreporting that are as thorough or effective as those required by securities laws currently applicable to the Company.
No evaluation can provide complete assurance that the Company’s internal control over financial reporting will preventmisstatement due to error or fraud or will detect or uncover all control issues or instances of fraud, if any. The effectivenessof the Company’s controls and procedures could also be limited by simple errors or faulty judgments. In addition, as theCompany continues to expand, the challenges involved in maintaining adequate internal control over financial reportingwill increase and will require that the Company continue to improve its internal control over financial reporting. Althoughthe Company intends to devote substantial time and incur substantial costs, as necessary, to ensure ongoing compliance,the Company cannot be certain that it will be successful in continuing to comply with Section 404 of SOX.
Potential unenforceability of civil liabilities and judgments.
The Company is incorporated under the laws of the Province of Ontario, Canada. A majority of the Company’s directorsand officers as well as the experts named in this Form 20-F are residents of Canada. Also, almost all of the Company’s
152011 ANNUAL REPORT

assets and the assets of these persons are located outside of the United States. As a result, it may be difficult forshareholders to initiate a lawsuit within the United States against these non-U.S. residents, or to enforce U.S. judgmentsagainst the Company or these persons. The Company’s Canadian counsel has advised the Company that a monetaryjudgment of a U.S. court predicated solely upon the civil liability provisions of U.S. federal securities laws would likely beenforceable in Canada if the U.S. court in which the judgment was obtained had a basis for jurisdiction in the matter thatwas recognized by a Canadian court for such purposes. The Company cannot provide assurance that this will be the case.It is less certain that an action could be brought in Canada in the first instance on the basis of liability predicated solelyupon such laws.
ITEM 4 INFORMATION ON THE COMPANY
History and Development of the Company
The Company is an established Canadian-based international gold producer with mining operations in northwesternQuebec, northern Mexico, northern Finland and Nunavut and exploration activities in Canada, Europe, Latin America andthe United States. The Company’s operating history includes over three decades of continuous gold production primarilyfrom underground operations. Since its formation on June 1, 1972, the Company has produced almost 7.5 million ouncesof gold. For definitions of certain technical terms used in the following discussion, see ‘‘– Property, Plant and Equipment –Glossary of Selected Mining Terms’’.
The Company’s strategy is to focus on the continued exploration, development and expansion of its properties, all of whichare located in politically stable jurisdictions. The Company has spent approximately $2.7 billion on mine development overthe last five years. Through this development program, the Company transformed itself from a regionally focused, singlemine producer to a multi-mine international gold producer with five operating, 100% owned mines.
Since 1988, the LaRonde mine, in the Abitibi region of Quebec, has been the Company’s flagship operation, producingapproximately 4.3 million ounces of gold as well as valuable byproducts. The Lapa mine, the Company’s highest grademetals mine, is 11 kilometres east of the LaRonde mine. The synergies between these sites contribute to the Company’sefforts to reduce costs. The Kittila mine, in Finland, achieved commercial production in May 2009, has a long reserve lifeand has significant production expansion potential. The Pinos Altos mine, in Mexico, achieved commercial production inNovember 2009 and also has significant production expansion potential. The Company’s fifth mine, Meadowbank, inNunavut, achieved commercial production in March 2010 and is expected to produce the most gold (295,000 ounces) in2012. In addition, the Company plans to pursue opportunities for growth in gold production and gold reserves through theprudent acquisition or development of exploration properties, development properties, producing properties and othermining businesses in the Americas and Europe.
In 2011, the Company produced 985,460 ounces of gold at total cash costs per ounce of $580 net of revenues frombyproduct metals. For 2012, the Company expects to produce between 875,000 and 950,000 ounces of gold at a totalcash costs per ounce of gold produced between $690 and $750 net of byproduct revenue. These expected higher totalcash costs compared to 2011 reflect the closure of the Goldex mine, the Company’s second lowest cost mine, inOctober 2011 due to suspected rock subsidence issues; the higher proportion of production coming from theMeadowbank mine, which is expected to have higher total cash costs per ounce compared to the Company’s average;higher costs associated with the transition to underground mining operations at the Pinos Altos mine and the Kittila mine;and increased production from the Company’s mines and mine projects that do not contain byproduct metals, revenuefrom which reduces total cash costs per ounce. In addition, the higher total cash costs per ounce also reflect the Canadiandollar strengthening against the U.S. dollar and continued escalations in labour, shipping and transportation costs. See‘‘Note to Investors Concerning Certain Measures of Performance’’ for a discussion of the use of the non-US GAAP measuretotal cash costs per ounce. The Company has traditionally sold all of its production at the spot price of gold due to itsgeneral policy not to sell forward its future gold production.
The Company operates through four segments: Canada, Europe, Latin America and Exploration.
The Canadian Segment is comprised of the Province of Quebec and the Territory of Nunavut. The Company’s Quebecproperties include the LaRonde mine, the Goldex mine (mining operations suspended in October 2011) and the Lapamine, each of which is held directly by the Company. In 2011, the Quebec properties accounted for 37.2% of theCompany’s gold production, comprised of 12.6% from the LaRonde mine, 13.7% from the Goldex mine and 10.9% fromthe Lapa mine. In 2012, the Company anticipates that its Quebec properties will account for 26.4% of the Company’s goldproduction, of which 17.3% and 9.1% of the Company’s gold production will come from the LaRonde mine and the Lapamine, respectively.
16 AGNICO-EAGLE MINES LIMITED

The Company’s Nunavut properties are comprised of the Meadowbank mine and the Meliadine project, which are bothheld directly by the Company. In 2011, the Meadowbank mine accounted for 27.5% of the Company’s gold productionand the Company anticipates that in 2012 the Meadowbank mine will account for approximately 32.3% of the Company’sgold production.
The Company’s operations in the European Segment are conducted through its indirect subsidiary, Agnico Eagle FinlandOy, which indirectly owns the Kittila mine in Finland. In 2011, the Kittila mine accounted for 14.6% of the Company’s goldproduction and the Company anticipates that in 2012 the Kittila mine will account for approximately 16.9% of theCompany’s gold production.
The Company’s mining operations in the Latin American Region are conducted through its subsidiary, Agnico EagleMexico S.A. de C.V., which owns the Pinos Altos mine, including the Creston Mascota deposit at Pinos Altos. The La Indiaproject is owned by the Company’s indirect subsidiary, Resource Grayd De Mexico, S.A. de C.V.. In 2011, the Pinos Altosmine accounted for 20.7% of the Company’s gold production and the Company anticipates that in 2012 the Pinos Altosmine will account for approximately 22.5% of the Company’s gold production.
The Exploration Segment includes the Company’s grassroots exploration operations in the United States, the Europeanexploration office, the Canadian exploration offices and the Latin American exploration office. In addition, the Companyhas an international exploration office in Reno, Nevada.
Agnico-Eagle’s expertise in acquiring mine projects and developing mines is shown through the launch of five operatingmines. The following table sets out the date of acquisition, the date of commencement of construction and the date ofachieving commercial production for the Company’s mines and mine projects.
Date of Commencement Date of achievingDate of Acquisition of Construction Commercial Production
LaRonde mine 1992 (1) 1985 1988
Goldex mine (suspended in October, 2011) December 1993 (1) July 2005 August 2008
Kittila mine November 2005 June 2006 May 2009
Lapa mine June 2003 (1) June 2006 May 2009
Pinos Altos mine March 2006 August 2007 November 2009
Meadowbank mine April 2007 Pre-April 2007 March 2010
Meliadine project July 2010 2014 (2) 2017 (2)
La India project January 2012 – –
Notes:
(1) Date when 100% ownership was acquired.
(2) Anticipated.
The Company’s exploration program focuses primarily on the identification of new mineral reserves and resources andnew development opportunities in proven gold producing regions. Current exploration activities are concentrated inCanada, Europe, Latin America and the United States. Several projects were evaluated during the year in other countrieswhere the Company believes the potential for gold occurrences is excellent and which the Company believes to bepolitically stable and supportive of the mining industry. The Company currently manages 77 properties in Canada,6 properties in the United States, three groups of properties in Finland, one property in Sweden, six projects in Mexico andone project in Argentina. Exploration activities are managed from offices in Val d’Or, Quebec; Reno, Nevada; Chihuahua,Mexico; Kittila, Finland; and Vancouver, British Columbia.
In addition, the Company continuously evaluates opportunities to make strategic acquisitions, such as the acquisition ofGrayd Resource Corporation (‘‘Grayd’’) completed in January 2012 that resulted in 100% ownership of the La Indiaproject. Five of the Company’s new mines or projects came from relatively recent acquisitions.
In the second quarter of 2004, the Company acquired an approximate 14% ownership interest in Riddarhyttan ResourcesAB (‘‘Riddarhyttan’’), a Swedish precious and base metals exploration and development company that was at the time
172011 ANNUAL REPORT

listed on the Stockholm Stock Exchange. In November 2005, the Company completed a tender offer (the ‘‘RiddarhyttanOffer’’) for all of the issued and outstanding shares of Riddarhyttan that it did not own. The Company issued 10,023,882 ofits common shares and paid and committed an aggregate of $5.1 million cash as consideration to Riddarhyttanshareholders in connection with the Riddarhyttan Offer. On March 28, 2011, Riddarhyttan was merged with Agnico-EagleAB and Agnico-Eagle Sweden AB, with Agnico-Eagle Sweden AB as the continuing entity. The Kittila mine, locatedapproximately 900 kilometres north of Helsinki near the town of Kittila in Finnish Lapland, is currently 100% owned byAgnico-Eagle Finland Oy, which is owned by Agnico-Eagle Sweden AB.
In the first quarter of 2005, the Company entered into an exploration and option agreement with Industrias Penoles S.A. deC.V. (‘‘Penoles’’) to acquire the Pinos Altos property in northern Mexico. The Pinos Altos property is comprised ofapproximately 11,000 hectares in the Sierra Madre gold belt, approximately 225 kilometres west of the city of Chihuahuain the state of Chihuahua in northern Mexico. In February 2006, the Company exercised its option and acquired the PinosAltos property on March 15, 2006. Under the terms of the exploration and option agreement, the purchase price of$66.8 million was comprised of $32.5 million in cash and 2,063,635 common shares of the Company.
In February 2007, the Company made an exchange offer for all of the outstanding shares of Cumberland Resources Ltd.(‘‘Cumberland’’) not already owned by the Company. At the time, Cumberland was a pre-production development stagecompany listed on the Toronto Stock Exchange (the ‘‘TSX’’) and American Stock Exchange whose primary asset was theMeadowbank property. In May 2007, the Company acquired approximately 92% of the issued and outstanding shares ofCumberland that it did not previously own and, in July 2007, the Company completed the acquisition of all Cumberlandshares by way of a compulsory acquisition. The Company issued 13,768,510 of its common shares and paid $9.6 millionin cash as consideration to Cumberland shareholders in connection with its acquisition of Cumberland.
In April 2010, the Company entered into an agreement in principle with Comaplex Minerals Corp. (‘‘Comaplex’’) wherebythe Company would acquire all of the outstanding shares of Comaplex that it did not already own. At the time, Comaplexowned a 100% interest in the advanced stage Meliadine gold property, which is located approximately 300 kilometressoutheast of the Company’s Meadowbank mine. In May 2010, the Company executed the definitive agreements withComaplex and, in July 2010 by plan of arrangement, the Company acquired 100% of the Meliadine gold property throughthe acquisition of Comaplex, which was renamed Meliadine Holdings Inc. (‘‘Meliadine’’). Pursuant to the arrangement,Comaplex transferred to Geomark Exploration Ltd. all assets and related liabilities other than those relating to the Meliadineproject. In connection with the arrangement, the Company issued 10,210,848 of its common shares as consideration toComaplex shareholders. On January 1, 2011, the Company amalgamated with Meliadine.
In September 2011, the Company entered into an acquisition agreement with Grayd, a Canadian-based natural resourcecompany listed on the TSX Venture Exchange, pursuant to which the Company agreed to make an offer to acquire all of theissued and outstanding common shares of Grayd. At the time, Grayd held a 100% interest in the La India project located inthe Mulatos Gold Belt of Sonora, Mexico and had recently discovered the Tarachi gold porphyry prospect locatedapproximately ten kilometres north of the La India project. In October 2011, the Company made the offer by way of atake-over bid circular, as amended and supplemented, and, in November 2011, acquired approximately 95% of theoutstanding common shares of Grayd. In January 2012, the Company completed a compulsory acquisition of theremaining outstanding common shares of Grayd and Grayd became a wholly-owned subsidiary of the Company. Inaggregate, the Company issued 1,319,418 of its common shares and paid C$179.7 million in cash as consideration toGrayd shareholders in connection with the transaction.
In 2011, the Company’s capital expenditures were $482.8 million. The 2011 capital expenditures included $90.7 millionat the LaRonde mine (which included approximately $49.5 million of expenditures relating to the LaRonde mineextension), $42.2 million at the Goldex mine, $86.5 million at the Kittila mine, $18.4 million at the Lapa mine,$40.0 million at the Pinos Altos mine (which included approximately $7.6 million related to the Creston Mascota deposit),$116.9 million at the Meadowbank mine and $73.9 million at the Meliadine project and $14.2 million at other minorprojects. In addition, the Company spent $11.0 million on mine site exploration and $64.7 million on exploration activitiesat the Company’s grassroots exploration properties, including corporate development expenses.
Budgeted 2012 capital expenditures of $382.3 million include $74.8 million at the LaRonde mine, $10.2 million at theLapa mine, $31.5 million at the Pinos Altos mine, $51.9 million at the Kittila mine, $88.5 million at the Meadowbank mineand $44.5 million in capitalized exploration expenditures. In addition, the Company plans exploration expenditures ongrassroots exploration projects of approximately $80.4 million, including $52.0 million at the Meliadine project and$3.5 million at the La India project. Depending on the success of the exploration programs at these and other properties,the Company may be required to make additional capital expenditures for exploration, development and pre-production.
18 AGNICO-EAGLE MINES LIMITED

The financing for the expenditures set out above is expected to be from internally generated cash flow from operations,from the Company’s existing cash balances and from drawdowns of the Company’s bank credit facility. Please see‘‘Item 10 Additional Information – Material Contracts – Credit Agreement’’. Based on current funding available to theCompany and expected cash flows from operations, the Company believes it has sufficient funds available to fund itsprojected capital expenditures for all its properties.
Capital expenditures by the Company in 2010 and 2009 were $512 million and $657 million, respectively. The 2010capital expenditures included $97 million at the LaRonde mine (which included approximately $62 million of expendituresrelating to the LaRonde mine extension), $24 million at the Goldex mine, $72 million at the Kittila mine, $33 million at theLapa mine, $104 million at the Pinos Altos mine (which included approximately $43 million related to the Creston Mascotadeposit at Pinos Altos) and $174 million at the Meadowbank mine and $8 million at the Meliadine project and other minorproperties. In addition, the Company spent $35 million on exploration activities at the Company’s grassroots explorationproperties. The 2009 capital expenditures included $76 million at the LaRonde mine (which included approximately$39 million of expenditures relating to the LaRonde mine extension), $22 million at the Goldex mine, $90 million at theKittila mine (which included $36 million of expenditures on construction of the underground mine), $47 million at theLapa mine (which included $22 million on construction of the mine), $133 million at the Pinos Altos mine and$288 million at the Meadowbank mine. In addition, the Company spent $55 million on exploration activities at theCompany’s grassroots exploration properties.
The Company was formed by articles of amalgamation under the laws of the Province of Ontario on June 1, 1972, as aresult of the amalgamation of Agnico Mines Limited (‘‘Agnico Mines’’) and Eagle Gold Mines Limited (‘‘Eagle’’). AgnicoMines was incorporated under the laws of the Province of Ontario on January 21, 1953 under the name ‘‘CobaltConsolidated Mining Corporation Limited’’. Eagle was incorporated under the laws of the Province of Ontario onAugust 14, 1945.
On December 19, 1989, Agnico-Eagle acquired the remaining 57% interest in Dumagami Mines Limited not alreadyowned by it, as a consequence of the amalgamation of Dumagami Mines Limited with a wholly-owned subsidiary ofAgnico- Eagle, to continue as one company under the name Dumagami Mines Inc. (‘‘Dumagami’’). On December 29,1992, Dumagami transferred all of its property and assets, including the LaRonde mine, to Agnico-Eagle and wassubsequently dissolved.
On December 8, 1993, the Company acquired the remaining 46.3% interest in Goldex Mines Limited not already ownedby it, as a consequence of the amalgamation of Goldex Mines Limited with a wholly-owned subsidiary of the Company, tocontinue as one company under the name Goldex Mines Limited. On January 1, 1996, the Company amalgamated withtwo wholly-owned subsidiaries, including Goldex Mines Limited.
In October 2001, under a plan of arrangement, the Company amalgamated with an associated corporation, MentorExploration and Development Co., Limited (‘‘Mentor’’). In connection with the arrangement, the Company issued 369,348of its common shares in consideration for the acquisition of all of the issued and outstanding shares of Mentor that it didnot already own.
On August 1, 2007, the Company, Agnico-Eagle Acquisition Corporation, Cumberland and a wholly-owned subsidiary ofCumberland, Meadowbank Mining Corporation, amalgamated under the laws of the Province of Ontario and continuedunder the name of Agnico-Eagle Mines Limited.
On January 1, 2011, the Company and 1816276 Ontario Inc. (the successor corporation to Meliadine, which in turn wasthe successor corporation to Comaplex) amalgamated under the laws of the Province of Ontario and continued under thename of Agnico-Eagle Mines Limited.
The Company’s executive and registered office is located at Suite 400, 145 King Street East, Toronto, Ontario, CanadaM5C 2Y7; telephone number (416) 947-1212; website: http://www.agnico-eagle.com. The information contained on thewebsite is not part of this Form 20-F. The Company’s principal place of business in the United States is located at8725 Technology Way, Suite B, Reno, Nevada 89521.
Business Overview
The Company believes that it has a number of key operating strengths that provide distinct competitive advantages.
Growth Profile. The Company has a proven track record of increasing production capacity at existing operations througha combination of acquisitions, operational improvements, expansions and development. The closure of the Goldex mine inOctober 2011 was an unanticipated event and has negatively impacted the growth profile. However, the Company
192011 ANNUAL REPORT

anticipates production of between 875,000 and 950,000 ounces of gold in 2012 with continued growth to 2014. In 2012,the Company expects production increases at the LaRonde, Meadowbank and Kittila mines. The Company’s productiongrowth in 2012 is expected to come principally from the Meadowbank Mine, as well as from the continued operationalimprovements at the Kittila and LaRonde mines. Over the last five years, the Company has spent over $2.7 billion on thedevelopment of five new mines, and its significant extension of the LaRonde mine at depth. With the large majority of minedevelopment projects complete and with five mines having achieved steady state operational status, capital expendituresare expected to decline from 2011 onward, significantly increasing free cash flow. Future capital expenditures areexpected to be primarily for incremental expansion projects and exploration and development of the Meliadine project.
Operations in Politically Stable, Mining-Friendly Regions. The Company and its predecessors have over three decades ofcontinuous gold production experience and expertise in metals mining. The Company’s operations and exploration anddevelopment projects are located in regions that the Company believes are supportive of the mining industry. Two of theCompany’s producing mines are located in northwestern Quebec, one of North America’s principal gold-producingregions. The Company’s Kittila mine in northern Finland, Pinos Altos mine in northern Mexico and Meadowbank mine inNunavut are also located in regions which the Company believes are also supportive of the mining industry.
Strong Operating Base. Through its acquisition, exploration and development program, the Company has beentransformed from a regionally focused, single mine producer to a multi-mine international gold producer with fiveoperating, 100% owned mines. The Company’s existing operations at the LaRonde mine provide a strong base foradditional mineral reserve and production development at the property and in the Abitibi region of northwestern Quebecand for the development of its mines and projects in Nunavut, Finland and Mexico. The experience gained throughbuilding and operating the LaRonde mine has assisted with the Company’s development of its other mine projects. Inaddition, the extensive infrastructure associated with the LaRonde mine supports the nearby Lapa mine.
Highly Experienced Management Team. The members of the Company’s senior management team have an average ofover 22 years of experience in the mining industry. Management’s significant experience has underpinned the Company’shistorical growth and provides a solid base upon which to expand the Company’s operations.
Based on these strengths, the Company’s corporate strategy is to grow production and reserves in mining-friendly regions.
Optimize and Further Expand Operations. The Company continues to focus its resources and efforts on the explorationand development of its properties in Quebec, Nunavut, Finland and Mexico with a view to increasing annual goldproduction and gold mineral reserves.
Leverage Mining Experience. The Company believes it can benefit not only from the existing infrastructure at its minesbut also from the geological knowledge that it has gained in mining and developing its properties. The Company’s strategyis to capitalize on its mining expertise to exploit fully the potential of its properties.
Expand Gold Reserves. The Company is conducting drilling programs at all of its properties with a goal of furtherincreasing its gold reserves. In 2011, on a contained gold ounces basis, the gold reserves of the Company decreased to18.75 million ounces (157 million tonnes grading 3.71 grams of gold per tonne), a decrease from the 21.3 million ouncesreported as at December 31, 2010, primarily as a result of the reclassification of reserves to resources at the Goldex minedue to the suspension of operations and a reduction of reserves at the Meadowbank mine due to a new mine plan.
Growth Through Primary Exploration and Acquisitions. The Company’s growth strategy has been to pursue theexpansion of its development base through the acquisition of additional properties in the Americas and Europe.Historically, the Company’s producing properties have resulted from a combination of investments in advancedexploration companies and primary exploration activities. By investing in pre-development stage companies, the Companybelieves that it has been able to acquire control of projects at favourable prices and reasonable valuations.
Mining Legislation and Regulation
Canada
The mining industry in Canada operates under both federal and provincial or territorial legislation governing prospectingand the exploration, development, operation and decommissioning of mines and mineral processing facilities. Suchlegislation relates to the method of acquisition and ownership of mining rights, labour, occupational or worker health andsafety standards, royalties, mining, exports, reclamation, closure and rehabilitation of mines and other matters.
The mining industry in Canada is also subject to extensive laws and regulations at both the federal and provincial orterritorial levels concerning the protection of the environment. The primary federal regulatory authorities with jurisdiction
20 AGNICO-EAGLE MINES LIMITED

over the Company’s mining operations in respect of environmental matters are the Department of Fisheries and Oceans(Canada) and Environment Canada. The construction, development and operation of a mine, mill or refinery requirescompliance with applicable environmental laws and regulations and/or review processes, including obtaining land usepermits, water permits, air emissions certifications, industrial depollution attestations, hazardous substancesmanagement and similar authorizations from various governmental agencies. Environmental laws and regulations imposehigh standards on the mining industry to reduce or eliminate the effects of waste generated by mining and processingoperations and subsequently deposited on the ground or affecting the air or water. Laws and regulations regarding thedecommissioning, reclamation and rehabilitation of mines may require approval of reclamation plans, provision offinancial guarantees and long-term management of closed mines.
Quebec
In Quebec, mining rights are governed by the Mining Act (Quebec) and, subject to limited exceptions, are owned by theprovince. A mining claim entitles its holder to explore for minerals on the subject land. It remains in force for a term of twoyears from the date it is registered and may be renewed indefinitely subject to continued exploration works in relationthereto. In order to retain title to mining claims, in addition to paying a small bi-annual rental fee currently ranging fromC$27 to C$123 per claim depending on its location and area (as set by Quebec government regulations), exploration work(or an equivalent value cash payment) has to be completed in advance (either on the claim or on adjacent mining claims,concessions or leases) and filed with the Ministry of Natural Resources and Wildlife (Quebec) prior to the date of expiry ofthe claim. The amount of exploration work required bi-annually currently ranges from C$48 to C$3,600 per claimdepending on its location, area and period of validity (as set by Quebec government regulations). In 1966, the miningconcession system set out for lands containing mineralized zones in the Mining Act (Quebec) was replaced by a system ofmining leases, but the mining concessions sold prior to such replacement remain in force. A mining lease entitles itsholder to mine and remove valuable mineral substances from the subject land, provided it pays the annual rent set byQuebec government regulations, which currently ranges from C$21 per hectare (on privately held land) to C$44 perhectare (on land owned by the province). Leases are granted initially for a term of 20 years and are renewable up to threetimes, each for a duration of ten years. After the third renewal, the Minister of Natural Resources and Wildlife (Quebec)may grant an extension thereof on the conditions, for the rental and for the term he or she determines.
Bill 14, An Act respecting the development of mineral resources in keeping with the principles of sustainabledevelopment, was introduced in the Quebec National Assembly in May 2011 and is currently being studied by aparliamentary commission. If adopted, Bill 14 will amend a number of rules relating to the mining regime in Quebec,including measures to stimulate exploration work on claims, to enhance the protection of the environment and to promotesocial acceptability of mining activities, all of which will likely impact the Company’s activities in Quebec. Among otherprovisions of Bill 14, obligations respecting exploration work expenditures on claims will become more stringent; mineoperators will be required to provide a financial guarantee respecting a broader scope of rehabilitation and restorationwork and such financial guarantee will need to be provided within a shorter timeframe; public consultations will berequired before commencing mining operations; in certain urban, residential, vacationing or recreational areas,exploration and mining activities may be restricted; and the Minister of Natural Resources and Wildlife will have anincreased ability to withdraw land from mining activity or otherwise limit mining activities to avoid conflicts with other landuses. Bill 14 will also increase penalties for contraventions of the Mining Act (Quebec).
In Quebec, the primary provincial regulatory authorities with jurisdiction over the Company’s mining operations in respectof environmental matters are the Ministry of Sustainable Development, Environment and Parks (Quebec) and the Ministryof Natural Resources and Wildlife (Quebec).
Nunavut
As a result of the Nunavut Land Claims Agreement (the ‘‘Land Claims Agreement’’) of July 1993, ownership of large tractsof land was granted to the Inuit. These Inuit-owned lands include areas with high mineral potential. Further, as a result ofother rights granted to the Inuit in the Land Claims Agreement, Inuit organizations play an important role in themanagement of natural resources and the environment in Nunavut. These duties are shared among the federal andterritorial governments and Inuit organizations. Under the Land Claims Agreement, the Inuit own surface rights to certainlands representing approximately 16% of Nunavut. For a portion of the Inuit-owned lands representing approximately 2%of Nunavut, the Inuit own mineral (subsurface) rights in addition to the surface rights.
In Nunavut, the Crown’s mineral rights are administered by the Aboriginal Affairs and Northern Development Canada inaccordance with the Northwest Territories and Nunavut Mining Regulations (the ‘‘Territorial Mining Regulations’’) under
212011 ANNUAL REPORT

the Territorial Lands Act (Canada). The Inuit mineral rights in subsurface Inuit-owned lands are owned and administeredby Nunavut Tunngavik Incorporated (‘‘Nunavut Tunngavik’’), a corporation representing the Inuit people of Nunavut.
Future production from Nunavut Tunngavik-administered mineral claims is subject to production leases which include a12% net profits interest royalty from which annual deductions are limited to 85% of gross revenue. Production from Crownmining leases is subject to a royalty of up to 14% of adjusted net profits, as defined in the Territorial Mining Regulations.Before the operation of a Major Development Project, as defined in the Land Claims Agreement, can begin, developersmust also negotiate an Inuit impact benefits agreement with the regional Inuit Association.
The Kivalliq Inuit Association (the ‘‘KIA’’) is the Inuit organization that holds surface title to the Inuit-owned lands in theKivalliq region and is responsible for administering surface rights on these lands on behalf of the Inuit of the region. Inorder to conduct exploration work on Inuit-owned lands, the Company is required to submit a project proposal or workplan. This proposal is subject to approval by the KIA for surface land tenure and to review by other boards established bythe Land Claims Agreement to determine environmental effects and, if needed, to grant water rights. Federal and territorialgovernment departments participate in the reviews conducted by these boards. For mine development, the Companyrequires a surface lease and water compensation agreement with the KIA and a licence under federal legislation for theuse of water, including the deposit of waste.
During mine construction and operations, the Company is subject to additional Nunavut and federal governmentregulations related to environmental, safety, fire and other operational matters.
Finland
Mining legislation in Finland consists of the Mining Act, the Mining Safety Decree and the Mining Hoisting EquipmentDecree. The new Mining Act was implemented on July 1, 2011 and replaced the previous Mining Act (503/1965) as aresult of overall reform of mining legislation in Finland.
In Finland, subject to certain area restrictions, anyone has a right irrespective of land ownership to conduct survey workand take geological measurements and observations, with the right to take small samples from the soil provided that thesemeasures do not cause other than only minor damage or inconvenience. However, before sampling, notice must be givento the owner of the respective land.
A prospecting permit is required for more comprehensive survey work and it entitles its holder to conduct necessaryresearch and explorations in certain areas defined in the prospecting permit in order to discover the quality and extent ofthe deposit and to build or move temporary facilities and machinery onto the prospecting area. The prospecting permitdoes not grant a right to exploit a deposit, for which purpose a mining permit is required, but it grants its holder a priority toreceive the mining permit on the prospecting area.
A mining permit entitles its holder to exploit all minerals found on the mining area defined in the permit as well as allorganic and non-organic surface material and the soil and bedrock as considered necessary for the purposes of themining work. In addition to the mining permit a mining safety permit regarding safety measures of the contemplatedmining operations is required in order to build and operate a mine.
The mining area must either be owned or leased by voluntary agreements by the permit holder for mining work tocommence in accordance with the terms of the permit. In certain cases, if the mining operator and the owner of the landcannot come to a voluntary agreement on the use of the land for mining purposes, the Council of State of Finland maygrant a mining area redemption permit which entitles its holder the right to establish a mining area on the area owned byanother landowner without consent, provided that the mining project is required by public interest.
The Finnish Safety and Chemicals Agency is responsible for granting prospecting permits, mining permits and miningsafety permits upon an application provided that statutory requirements are fulfilled. Prospecting permits are issued forfixed periods of time (a maximum period of four years at a time which can be extended for three-year periods, up to amaximum of 15 years). Mining permits are generally granted without an expiry date. However, the Safety and ChemicalsAgency investigates grounds for the continued existence of the permit at least once every ten years. In some cases,depending on the prevailing circumstances and the deposit, mining permits may only be granted for a fixed period of time(to a maximum period of ten years at a time).
Prospecting permits and mining permits may be cancelled if the holder of the permit does not perform mining operationsin accordance with the permit and its terms or violates rules of the Mining Act.
22 AGNICO-EAGLE MINES LIMITED

Without specific permission of the National Board of Patents and Registrations of Finland a right to apply for and acquire aprospecting permit and mining permit is limited to Finnish corporations and individuals and foreign individuals andcorporations domiciled in a state belonging to the European Economic Area.
All mining operations must be carried out in accordance with the permit terms and with laws and regulations concerningconservation and environmental protection issues. Under the Environmental Protection Act, mining activities require anenvironmental permit which may be issued either for a definite or indefinite period of time. The Environmental ProtectionAct is based on the principles of prevention and minimization of damages and hazards, application of the best availabletechnology, application of the best environmental practice and the ‘‘polluter pays’’ principle.
The Act on Compensation for Environmental Damage includes provisions on the compensation for damage to a person ora property resulting from pollution of water, air, soil, noise, vibration, radiation, light, heat, smell or other similar nuisances,caused by an activity carried out at a fixed location. This act is based on the principle of strict liability.
In addition to the permits listed above, mining operators may require several other permits and may be subject to otherobligations under Finnish legislation.
According to the Act on Environmental Impact Assessment Procedure, certain projects require compliance with anenvironmental impact assessment procedure. These include major projects with a considerable impact on theenvironment, such as the excavation, enrichment and handling of metals and other minerals in cases where the excavatedmaterial is estimated to exceed 550,000 tonnes annually. A permit authority may not give its approval to an activity coveredby the scope of the Act on the Environmental Impact Assessment Procedure without having taken an environmentalimpact assessment report into consideration.
Mexico
Mining in Mexico is subject to the Mining Law, a federal law. Under the Mexican Constitution, all minerals belong to theMexican Nation. Private parties may explore and extract minerals pursuant to mining concessions granted by theexecutive branch of the Mexican government, as a general rule to whoever first claims them. While the Mining Lawtouches briefly upon labour, occupational and worker health and safety standards, these are primarily dealt with by theFederal Labour Law. The Mining Law also briefly addresses environmental matters, which are primarily regulated by theGeneral Law of Ecological Balance and Protection of the Environment, also of federal jurisdiction.
The primary agencies with jurisdiction over mining activities are the Ministry of the Economy, the Ministry of Labor andSocial Welfare and the Ministry of the Environment and Natural Resources. The National Water Commission hasjurisdiction regarding the granting of water rights and the Ministry of Defense with respect to the use of explosives.
Concessions are granted for 50 years, renewable once. The main obligations to keep concessions current are thesemi-annual payment of mining duties (taxes), based on the surface area of the concession, and the performance of workin the areas covered by the concessions, which is evidenced by minimum expenditures or by the extraction of ore.
Organizational Structure
The Company’s significant subsidiaries (all of which are directly or indirectly wholly-owned by the Company, unlessotherwise indicated) are 1715495 Ontario Inc., Agnico-Eagle Mines Sweden Cooperatie U.A., which owns all of the sharesof Agnico-Eagle Sweden AB, a Swedish company through which the Company holds its interest in Oijarvi Resources Oy,and Agnico-Eagle Finland Oy, a Finnish company through which the Kittila mine is held. In addition, the Company’sinterest in the Pinos Altos mine in northern Mexico is held through its indirect wholly-owned Mexican subsidiary, AgnicoEagle Mexico S.A. de C.V., which is owned, in part, by 1641315 Ontario Inc. and Tenedora Agnico Eagle Mexico S.A. deC.V., which is owned in part by Agnico-Eagle Mines Mexico Cooperatie U.A. and the Company’s interest in the La Indiaproject in Mexico is held through its indirect wholly-owned Mexican subsidiary, Resource Grayd De Mexico, S.A. de C.V.,which is owned by Grayd, which is directly wholly owned by the Company, and Tenedora Agnico Eagle Mexico S.A. de C.V.The LaRonde mine, the Lapa mine, the Goldex mine, the Meadowbank mine and the Meliadine project are owned directlyby the Company.
The Company’s wholly-owned subsidiaries, Servicios Agnico Eagle Mexico, S.A. de C.V., Servicios Pinos Altos, S.A. de C.V.and Minera Agave, S.A. de C.V. provide services in connection with the Company’s operations in Mexico. The Company’soperations in the United States are conducted through Agnico-Eagle (USA) Limited.
232011 ANNUAL REPORT
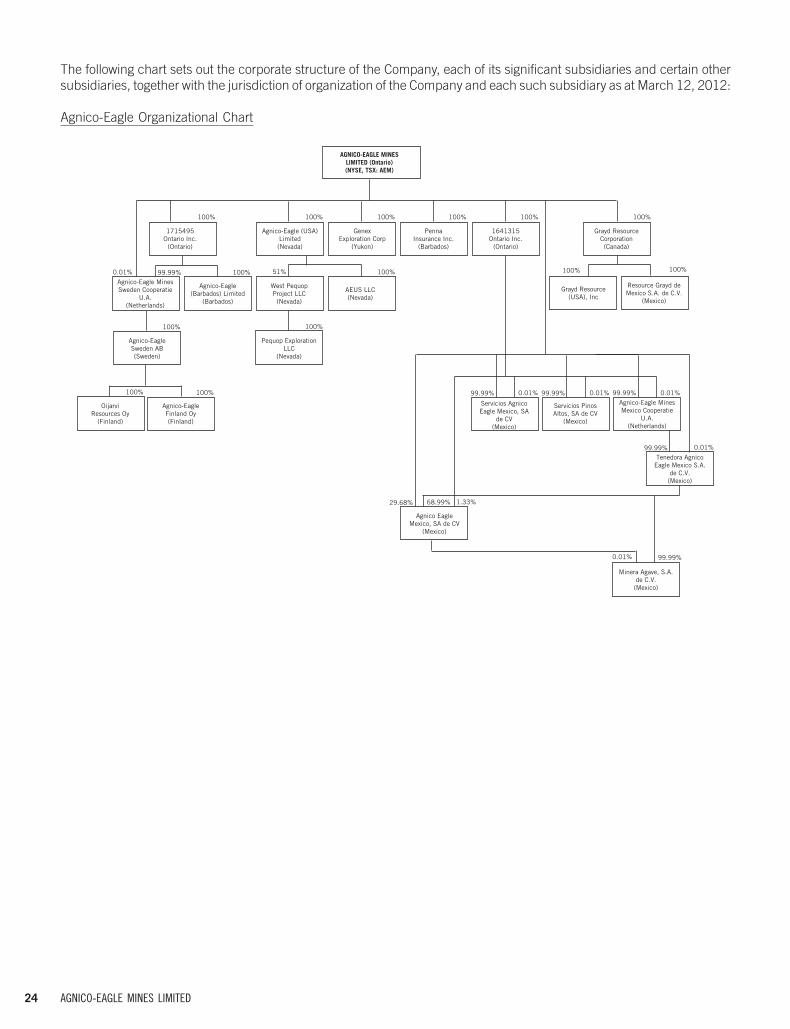
28MAR201202492268
The following chart sets out the corporate structure of the Company, each of its significant subsidiaries and certain othersubsidiaries, together with the jurisdiction of organization of the Company and each such subsidiary as at March 12, 2012:
Agnico-Eagle Organizational Chart
100%
1641315Ontario Inc.
(Ontario)
100%
GenexExploration Corp
(Yukon)
PennaInsurance Inc.
(Barbados)
100%
Agnico-Eagle (USA)Limited(Nevada)
100%
AGNICO-EAGLE MINESLIMITED (Ontario)(NYSE, TSX: AEM)
100%
1715495Ontario Inc.
(Ontario)
100%
100%
Agnico-EagleSweden AB(Sweden)
Agnico-Eagle(Barbados) Limited
(Barbados)
Agnico-Eagle MinesSweden Cooperatie
U.A.(Netherlands)
99.99%0.01%
Agnico-EagleFinland Oy(Finland)
100%100%
OijarviResources Oy
(Finland)
99.99% 0.01%
Tenedora AgnicoEagle Mexico S.A.
de C.V.(Mexico)
68.99% 1.33%
Agnico EagleMexico, SA de CV
(Mexico)
Servicios AgnicoEagle Mexico, SA
de CV(Mexico)
Servicios PinosAltos, SA de CV
(Mexico)
29.68%
99.99% 0.01% 99.99% 0.01%Agnico-Eagle MinesMexico Cooperatie
U.A.(Netherlands)
99.99% 0.01%
West PequopProject LLC(Nevada)
AEUS LLC(Nevada)
Minera Agave, S.A.de C.V.(Mexico)
99.99%0.01%
Pequop ExplorationLLC
(Nevada)
100%51%
100%
Grayd ResourceCorporation(Canada)
100%
Grayd Resource(USA), Inc
Resource Grayd deMexico S.A. de C.V.
(Mexico)
100% 100%
24 AGNICO-EAGLE MINES LIMITED

28MAR201202490885
Property, Plant and Equipment
Location Map of the Abitibi Region
LaRonde Mine
The LaRonde mine is situated approximately halfway between the City of Rouyn-Noranda and the City of Val d’Or innorthwestern Quebec (approximately 470 kilometres northwest of Montreal, Quebec) in the municipalities of Preissac andCadillac. At December 31, 2011, the LaRonde mine was estimated to contain proven and probable mineral reserves ofapproximately 4.7 million ounces of gold comprised of 33.2 million tonnes of ore grading 4.40 grams per tonne. TheCompany’s LaRonde mine consists of the LaRonde property and the adjacent El Coco and Terrex properties, each of whichis 100% owned and operated by the Company. The LaRonde mine can be accessed either from Val d’Or in the east or fromRouyn-Noranda in the west, which are located approximately 60 kilometres from the LaRonde mine via Quebec provincialhighway No. 117. The LaRonde mine is situated approximately two kilometres north of highway No. 117 on Quebecregional highway No. 395. The Company has access to the Canadian National Railway at Cadillac, Quebec, approximatelysix kilometres from the LaRonde mine.
The LaRonde mine operates under mining leases obtained from the Ministry of Natural Resources and Wildlife (Quebec)and under certificates of approval granted by the Ministry of Sustainable Development, Environment and Parks (Quebec).The LaRonde property consists of 35 contiguous mining claims and one provincial mining lease and covers in total1,044.9 hectares. The El Coco property consists of 22 contiguous mining claims and one provincial mining lease andcovers in total 356.7 hectares. The Terrex property consists of 21 mining claims that cover in total 424.4 hectares. Themining leases on the LaRonde and El Coco properties expire in 2018 and 2021, respectively, and are automaticallyrenewable for three further ten-year terms upon payment of a small fee. The Company also has three surface rights leasesthat cover in total approximately 301.5 hectares that relate to the water pipeline right of way from Lake Preissac and theeastern extension of the LaRonde tailings pond #7 on the El Coco property. The surface rights leases are renewableannually.
252011 ANNUAL REPORT

28MAR201202494994
Location Map of the LaRonde Mine
The LaRonde mine includes underground operations at the LaRonde and El Coco properties that can both be accessedfrom the Penna Shaft, a mill, a treatment plant, a secondary crusher building and related facilities. The El Coco property issubject to a 50% net profits interest in favour of Barrick Gold Corporation (‘‘Barrick’’) on future production fromapproximately 500 metres east of the LaRonde property boundary. The remaining 1,500 metres is subject to a 4% netsmelter return royalty. This area of the property is now substantially mined out and the Company has not paid royaltiessince 2004 and does not expect to pay royalties in 2012. In 2003, exploration work started to extend outside of theLaRonde property onto the Terrex property where a down-plunge extension of Zone 20 North was discovered. The Terrexproperty is subject to a 5% net profits royalty to Delfer Gold Mines Inc. and a 2% net smelter return royalty to Barrick. TheCompany does not expect to pay royalties on this part of the property in 2012. In addition, the Company owns 100% of theSphinx property immediately to the east of the El Coco property.
In 2012, payable gold production at the LaRonde mine is expected to increase to approximately 157,500 ounces, and totalcash costs per ounce are expected to be approximately $570.
The Abitibi region has a continental climate with average annual rainfall of 64 centimetres and average annual snowfall of318 centimetres. The average monthly temperatures range from a minimum of �23 degrees Celsius in January to amaximum of 23 degrees Celsius in July. Under normal circumstances, mining operations are conducted year-roundwithout interruption due to weather conditions. The Company believes that the Abitibi region of northwestern Quebec hassufficient experienced mining personnel to staff its operations in the Abitibi region. The elevation is 337 metres above sealevel. The LaRonde property is relatively flat with a maximum relief of approximately 40 metres. The topography gentlyslopes down from north to south and is characterized by boreal-type forest at LaRonde and the nearby properties. All of theLaRonde mine’s power requirements are supplied by Hydro-Quebec through connections to its main power transmissiongrid. Water used in the LaRonde mine’s operations is sourced from Lake Preissac and is transported approximately fourkilometres to the minesite through a surface pipeline.
26 AGNICO-EAGLE MINES LIMITED

28MAR201202495490
Mining and Milling Facilities
Surface Plan of the LaRonde Mine
The LaRonde mine was originally developed utilizing a 1,207-metre shaft (Shaft #1) and an underground ramp accesssystem. The ramp access system is available down to Level 25 of Shaft #1 and continues down to Level 248 at the PennaShaft. The mineral reserve accessible from Shaft #1 was depleted in September 2000 and Shaft #1 is no longer in use. Asecond production shaft (Shaft #2), located approximately 1.2 kilometres to the east of Shaft #1, was completed in 1994 toa depth of 525 metres and was used to mine Zones 6 and 7. Both ore zones were depleted in March 2000 and theworkings were allowed to flood up to Level 6 (approximately 280 metres). A third shaft (the Penna Shaft), locatedapproximately 800 metres to the east of Shaft #1, was completed down to a depth of 2,250 metres in March 2000. ThePenna Shaft is used to mine Zones 20 North, 20 South, 6 and 7. In 2009, as part of the LaRonde mine extension, theCompany completed construction of an 823-metre internal shaft from Level 203 to access the ore below Level 245,approximately 2,858 metres below surface.
Mining Methods
Four mining methods have historically been used at the LaRonde mine: open pit for the three surface deposits; sublevelretreat; longitudinal retreat with cemented rock backfill or paste backfill; and transverse open stoping with paste,cemented rock backfill or unconsolidated backfill. The primary source of ore at the LaRonde mine continues to be fromunderground mining methods. During 2011, two mining methods were used: longitudinal retreat with cemented rockbackfill or paste backfill and transverse open stoping with cemented rock backfill, paste or unconsolidated backfill. In theunderground mine, sublevels are driven at between 30-metre and 40-metre vertical intervals, depending on the depth.Stopes are undercut in 15-metre wide panels. In the longitudinal method, panels are mined in 15-metre sections andbackfilled with 100% cemented rock backfill or paste backfill. The paste backfill plant was completed in 2000 and is
272011 ANNUAL REPORT

located on the surface at the processing facility. In the transverse open stoping method, approximately 50% of the ore ismined in the first pass and filled with cemented rock backfill or paste backfill. On the second pass, the remainder of theore is mined and filled with unconsolidated waste rock backfill or cemented paste backfill.
Surface Facilities
Surface facilities at the LaRonde mine include a processing plant with a daily capacity of 7,200 tonnes of ore, which hasbeen expanded four times since 1987 from the original rate of 1,630 tonnes per day. Beginning in 1999, transition to theLaRonde mine poly-metallic massive sulphide orebody required several modifications to the processing plant whichconsisted of a new coarse ore handling system, new SAG and ball mill, the addition of a zinc flotation circuit and capacityincreases to the existing copper flotation and precious metals circuits. In 2008, the installation of a limited copper/leadseparation flotation circuit, following the copper flotation circuit, was completed. Also in 2008, operation of a smallcyanidation plant, for the treatment of sulphide concentrate from the Goldex mine, began. A new carbon-in-leach circuit isunder construction and will replace the existing LaRonde precious metal Merrill Crowe circuit by year end. The LaRondemine is also the site for the Lapa mine ore processing plant (1,500 tonnes per day), which the Company commissioned inthe second quarter of 2009.
The ore requires a series of grinding, copper/lead flotation and separation, zinc flotation and zinc tails precious metalsleaching circuits, followed by a counter-current decantation circuit and Merrill Crowe precipitation. Paste backfill andcyanide destruction plants operate intermittently. The tailings area has a dedicated cyanide destruction and metalsprecipitation plant that water passes through prior to recirculating to the mill. A biological water treatment plant wascommissioned in 2005 to address the build-up of thiocyanate in the tailings ponds at the LaRonde mine. This build-upwas the result of the high sulphide content of the LaRonde mine ore and 90% recirculation of the process water. The plantuses bacteria to oxidize and destroy thiocyanate and removes phosphate from the water before it is released to theenvironment.
The Goldex concentrate circuit consists of pulp received from the Goldex mill via truck and subsequent leaching of thepulp with cyanide. The leached material is sent to the Lapa cyanide leach with carbon circuit (‘‘CIL’’) for gold recovery withLapa residual pulp. The Goldex circuit ceased to operate in November 2011 following the suspension of mining operationsat Goldex on October 19, 2011. This circuit is currently on standby pending a decision regarding future production fromthe Goldex operations.
The Lapa process consists of a two-stage grinding circuit to reduce the granularity of the ore. A gravity recovery circuit thatis incorporated into the grinding circuit recovers up to 45% of the available gold, depending on feed grades. The residualpulp is leached in a conventional CIL circuit to dissolve the balance of the precious metal. Prior to November 2011, whenthe Goldex circuit ceased operations, the leached slurry from the Goldex concentrate circuit was mixed with the Lapa pulpfor carbon contact. A carbon strip circuit recovers the gold from the carbon which is recycled to the leach circuit.
2012 annual production at the LaRonde mill is expected to consist of approximately 2,100,000 ounces of silver,4,800 tonnes of copper, up to 570 tonnes of lead and 33,000 tonnes of zinc. Gold recovery at the LaRonde mine isdistributed approximately 73% in the copper concentrate, 1.5% in the lead concentrate, 4.25% in the zinc concentrateand 12.4% via leaching.
Mineral Recoveries
During 2011, gold and silver recovery averaged 89.6% and 88.3%, respectively. Zinc recovery averaged 86.9% with aconcentrate quality of 56% zinc. Copper recovery averaged 77.1% with a concentrate quality of 8.66% copper.Approximately 2.4 million tonnes of ore were processed averaging 7,027 tonnes of ore per day at 93.8% of available time.
28 AGNICO-EAGLE MINES LIMITED

The following table sets out the metal recoveries, concentrate grades and contained metals for the 2.4 million tonnes of oreextracted by the Company at the LaRonde mine in 2011.
Copper Zinc LeadConcentrate Concentrate Concentrate
(41,970 tonnes (115,717 tonnes (4,006 tonnesproduced) produced) produced)
OverallHead Metal Payable
Grades Grade Recovery Grade Recovery Grade Recovery Recoveries Production
Gold 1.79 g/t 54.8 g/t 53.35% 1.7 g/t 4.68% 108.2 g/t 10.29% 89.64% 124,173 oz
Silver 54.42 g/t 1,226 g/t 39.30% 175 g/t 15.40% 3,319 g/t 10.39% 88.28% 3,196,496 oz
Copper 0.20% 8.66% 77.12% – – – – 77.10% 3,216 t
Lead 0.36% – – – – 60.33% 28.33% 28.33% 2,342 t
Zinc 3.09% – – 55.9% 86.87% – – 86.87% 54,894 t
Environmental Matters
Currently, water is treated at various facilities at the LaRonde mine operations. Water contained in the tailings to be used asunderground backfill is treated to degrade cyanide using a sulphur dioxide and air process. The tailings entering thetailings pond are first decanted and the clear water subjected to natural cyanide degradation. This water is thentransferred to sedimentation pond #1 to undergo a secondary treatment at a plant located between sedimentation ponds#1 and #2 that uses a peroxy-silicate process to destroy cyanide, lime and coagulant to precipitate metals. The tailingspond occupies an area of about 175 hectares. Waste rock that is not used underground for backfill is brought up to thesurface and stored in close proximity to the tailings pond to be used to build coffer dams inside the pond. A waste rock pilecontaining approximately 500,000 tonnes of waste and occupying about nine hectares is located west of the mill.
Due to the high sulphur content of the LaRonde mine ore, the Company has had to address toxicity issues in the tailingsponds since the 1990s. Since introducing and optimizing a biological treatment plant in 2004, the treatment process isnow stable and the effluent has remained non-toxic since 2006. In 2006, the Company commenced an ammoniastripping operation involving an effluent partially treated by the biological treatment plant which allowed an increase intreatment flow rate, while keeping the final effluent toxicity-free. In 2009, to further increase the treatment flow rate of thebiological plant, the Company commenced construction of ammonia stripping towers, which became operational inJune 2010. In addition, water from mine dewatering and drainage water are treated to remove metals prior to discharge ata lime treatment plant located at the LaRonde mill.
Capital Expenditures
In 2006, the Company initiated construction to extend the infrastructure at the LaRonde mine to access the ore belowLevel 245, referred to as the LaRonde mine extension. Hoisting from the LaRonde mine extension began in the fourthquarter of 2011 and commercial production was achieved in November 2011. The LaRonde mine extension infrastructureincludes a 823-metre internal shaft (completed in November 2009) starting from Level 203, which provides a total depthof 2,858 metres. A ramp is used to access the lower part of the orebody up to 3,110 metres in depth. The internal winzesystem is used to hoist ore from depth to facilities on Level 215, approximately 2,150 metres below surface, where it istransferred to the Penna Shaft hoist.
Capital expenditures at the LaRonde mine during 2011 were approximately $93 million, which included $41 million onsustaining capital expenditures and $52 million comprised primarily of expenditures on the LaRonde mine extension.Budgeted 2012 capital expenditures at the LaRonde mine are $74 million, including $21 million on sustaining capitalexpenditures and capitalized exploration and $43 million on the LaRonde mine extension. Another $10 million will beadded to the carbon-in-pulp (‘‘CIP’’) / high density sludge (‘‘HDS’’) project. Total capital expenditures for the LaRonde mineand the LaRonde mine extension are estimated at $366 million from 2012 to 2024 (including the CIP/HDS project).
292011 ANNUAL REPORT

Development
In 2011, a total of 14,116 metres of lateral development was completed. Development was focused on stope preparationof mining blocks for production in 2011 and 2012, especially the preparation of the lower mine production horizon. A totalof 4,925 metres of development work was completed for the LaRonde mine extension infrastructure and the ramp toaccess the LaRonde mine extension.
A total of 14,500 metres of lateral development is planned for 2012. The main focus of development work continues to bestope preparation. The Company plans to develop and prepare the access to Zone 20 South down to Level 245. For theLaRonde mine extension, a total of 6,370 metres of development is planned, mainly to develop the ramp access to theorebody and for future ventilation infrastructure. At the same time, development work will continue to prepare for miningbelow Level 245.
As the LaRonde mine extension has substantially been completed and will be the primary location of mining going forward,the ‘‘extension’’ designation will be dropped and the entire complex will be referred to as the LaRonde mine.
Geology, Mineralization and Exploration
Geology
The LaRonde property is located near the southern boundary of the Archean-age (2.7 billion years old) AbitibiSubprovince and the Pontiac Subprovince within the Superior Geological Province of the Canadian Shield. The mostimportant regional structure is the Cadillac-Larder Lake (‘‘CLL’’) fault zone marking the contact between the Abitibi andPontiac Subprovinces, located approximately two kilometres to the south of the LaRonde property.
The geology that underlies the LaRonde mine consists of three east-west-trending, steeply south-dipping and generallysouth-facing regional groups of rock formations. From north to south, they are: (i) 400 metres (approximate true thickness)of the Kewagama Group, which is made up of a thick band of interbedded wacke; (ii) 1,500 metres of the Blake RiverGroup, a volcanic assemblage that hosts all the known economic mineralization on the property; and (iii) 500 metres of theCadillac Group, made up of a thick band of wacke interbedded with pelitic schist and minor iron formation.
Zones of strong sericite and chlorite alteration that enclose massive to disseminated sulphide mineralization (including theore that is mined for gold, silver, zinc, copper and lead at the LaRonde mine) follow steeply dipping, east-west-trending,anastomosing shear zone structures within the Blake River Group volcanic units across the property. These shear zonesare part of the larger Doyon-Dumagami Structural Zone that hosts several important gold occurrences (including theDoyon gold mine, the Westwood project and the former Bousquet mines) and has been traced for over ten kilometreswithin the Blake River Group, from the LaRonde mine westward to the Mouska gold mine.
Mineralization
The gold-bearing zones at the LaRonde mine are lenses of disseminated stringers through to massive, aggregates ofcoarse pyrite with zinc, copper and silver content. Ten zones that vary in size from 50,000 to 40,000,000 tonnes havebeen identified, of which four are (or are believed to be) economic. Gold content is not proportional to the total sulphidecontent but does increase with copper content. Gold values are also higher in areas where the pyrite lenses are crosscut bytightly spaced north-south fractures.
These historical relationships, which were noted at LaRonde Shaft #1’s Main Zone, are maintained at the Penna Shaftzones. The zinc-silver (i.e., Zone 20 North) mineralization with lower gold values, common in the upper mine, grades intogold-copper mineralization within the lower mine. Gold value enhancement associated with crosscutting north-southfractures also occurs within the LaRonde mine. The predominant base metal sulphides within the LaRonde mine arechalcopyrite (copper) and sphalerite (zinc).
The Company believes that Zone 20 North is one of the largest gold-bearing massive sulphide mineralized zones known inthe world and one of the largest mineralized zones known in the Abitibi region of Ontario and Quebec. Zone 20 Northcontains the majority of the mineral reserves and resources at the LaRonde mine, including 33,113,000 tonnes of provenand probable mineral reserves grading 4.51 grams of gold per tonne, representing 94% of the total proven and probablemineral reserves at the LaRonde mine, 5,419,000 tonnes of indicated mineral resources grading 1.61 grams of gold pertonne, representing 75% of the total measured and indicated mineral resources at the LaRonde mine, and9,297,000 tonnes of inferred mineral resources grading 4.00 grams of gold per tonne, representing 82% of the totalinferred mineral resources at LaRonde.
30 AGNICO-EAGLE MINES LIMITED

The depth of Zone 20 North extends between 700 metres below surface and 3,500 metres below surface, and possiblylower. With increased access on the lower levels of the mine (i.e. from Level 215 to Level 255), the transformation from a‘‘zinc/silver’’ orebody to a ‘‘gold/copper’’ deposit is expected to continue during 2012.
Zone 20 North can be divided into an upper zinc/silver-enriched gold-poor zone and a lower gold/copper-enriched gold-rich zone. The zinc zone has been traced over a vertical distance of 1,700 metres and a horizontal distance of 570 metres,with thicknesses approaching 40 metres. The gold zone has been traced over a vertical distance of over 2,200 metres anda horizontal distance of 900 metres, with thicknesses varying from three to 40 metres. The zinc zone consists of massivezinc/silver mineralization containing 50% to 90% massive pyrite and 10% to 50% massive light brown sphalerite. The goldzone mineralization consists of 30% to 70% finely disseminated to massive pyrite containing 1% to 10% chalcopyriteveinlets, minor disseminated sphalerite and rare specks of visible gold. Gold grades are generally related to thechalcopyrite or copper content. At depth, the massive sulphide lens becomes richer in gold and copper. During 2011,2.2 million tonnes of ore grading 1.72 grams of gold per tonne, 57.18 grams of silver per tonne, 3.27% zinc, 0.20% copperand 0.39% lead were mined from Zone 20 North.
Exploration
The combined tonnage of proven and probable mineral reserves at the LaRonde mine for year-end 2011 is 33.2 milliontonnes which represents a 4% decrease in the amount compared to year-end 2010 (34.7 million tonnes). This mineralreserve includes the replacement of 2.4 million tonnes of ore that were mined in 2011. The reduction in reserves isprincipally associated with the tonnes mined during 2011.
Diamond drilling is used for exploration on the LaRonde property. In 2011, a total of 181 holes were drilled on the LaRondeproperty for a total length of 16,190 metres, compared to 212 holes for a total length of 19,188 metres in 2010. Of thedrilling in 2011, 165 holes (8,181 metres) were for production stope delineation, 12 holes (2,614 metres) were fordefinition drilling and 4 holes (5,396 metres) were for exploration. In 2010, 187 holes (5,397 metres) were for productionstope delineation, 21 holes (6,016 metres) were for definition drilling and 4 holes (5,403 metres) were for exploration.Expenditures on diamond drilling at the LaRonde mine during 2011 were approximately $2.41 million, including$0.97 million in definition and delineation drilling expenses charged to operating costs at the LaRonde mine. Expenditureson exploration in 2011 were $1.44 million, and are expected to be $1.15 million in 2012.
The main focus of the 2011 exploration program was continuing the investigation of Zone 20 North at depth. This programwas conducted from the Level 215 exploration drift, approximately 2,150 metres below the surface. The first hole of theprogram was completed at the end of 2009 to a final length of 1,852 metres. This hole intersected Zone 20 North at adepth of 3,520 metres below surface, which is approximately 410 metres below the current reserve envelope. Theintersection returned 14.3 metres (true width) grading 3.03 grams of gold per tonne. In 2010, a second branch was drilledfrom this mother hole and returned 4.1 metres grading 1.77 grams of gold per tonne at a depth of 3,595 metres belowsurface. Another hole was initiated in 2011 and drilling was still in progress at the end of the year. The drilling will continuein 2012. Another important focus of 2011 drilling was to start the deep exploration campaign to the east of the currentreserves from the 086 level exploration drift. The purpose of this campaign is to explore stratigraphy to the east at a depthof 2,000 to 2,500 metres below surface which is similar to structures at the LaRonde mine that often containmineralisation. In 2011, two holes were completed with no significant values and another hole was in progress at year end.
In addition, definition and delineation drilling was undertaken in the 20 North and 20 South Zones to assist in finalizingmining stope designs. Zone 20 North was the main focus of the definition drilling in 2011. Infill drilling from Level 260 toLevel 236 confirmed the previous Zone 20 North reserves with a significant gain of 16,000 ounces mainly located in thewestern edge of the orebody.
Bousquet and Ellison Properties
The Bousquet property is located immediately west of the LaRonde mine and consists of two mining leases covering80.0 hectares and 31 claims covering 384.9 hectares. The property, along with various equipment and other miningproperties, was acquired from Barrick in September 2003 for $2.9 million in cash, $1.1 million in common shares of theCompany and the assumption of specific reclamation and other obligations related to the Bousquet property. The propertyis subject to a 2% net smelter return royalty interest in favour of Barrick.
From 2004 to 2007, the Company recovered 108,407 tonnes of ore grading 2.33 grams of gold per tonne from Zone 4 in asmall open pit. In 2006 and 2007, the Company recovered 99,342 tonnes of ore grading 7.02 grams of gold per tonnefrom two small ore blocks underground at Bousquet. There has been no mining of this property since 2007.
312011 ANNUAL REPORT

In 2011, the Company completed a diamond drilling program consisting primarily of twinning and resampling historicholes to evaluate the production potential of an open pit at Bousquet Zone 5. This work led to a new resource estimate forZone 5 and an internal feasibility study has been conducted for a resumption of production in the Zone 5 open pit. Thisstudy led to a positive scenario and a final estimate of new probable reserves of approximately 0.2 million ounces of goldcomprised of 3.2 million tonnes of ore grading 1.88 grams per tonne. For the whole Bousquet property, including Zone 5,the December 31, 2011 indicated mineral resource is approximately 9.8 million tonnes grading 2.44 grams of gold pertonne. The inferred mineral resource is 4.6 million tonnes grading 4.04 grams of gold per tonne. Expenditures onexploration in 2011 were $2.40 million, which includes the cost of drilling 18,616 metres in 70 holes. In 2012, theCompany expects to spend $1.5 million in exploration including $0.3 million in drilling of 3,000 metres at Bousquet andcontinue optimisation of the feasibility study.
The Ellison property is located immediately west of the Bousquet property and consists of eight claims covering101.0 hectares. The property was acquired in August 2002 for $0.32 million in cash and a commitment to spend$0.49 million in exploration over four years. The commitment was fulfilled in 2004 and the property is 100% owned by theCompany. The property is subject to a net smelter return royalty interest in favour of Yorbeau Resources Inc. that variesbetween 1.5% and 2.5% depending on the price of gold. Should commercial production from the Ellison propertycommence, the Company will be required to pay Yorbeau Resources Inc. an additional C$0.5 million in cash.
From 2009 to 2011, the Company conducted drilling for a total of 12,465 metres on the deep exploration program on theEllison property, at a cost of $7.4 million in order to better define the mineralization at depth, interpreted to be in theWestwood horizon. The potential exists for a large gold resource with similar geology to the LaRonde mine extension.
The December 31, 2011 indicated mineral resource at Ellison is approximately 0.4 million tonnes grading 5.68 grams ofgold per tonne, and the inferred resource is 0.8 million tonnes grading 5.81 grams of gold per tonne. A follow-upexploration program was approved for Ellison in 2012, including 3,600 metres of drilling at a budget of $1.0 million.
Goldex Mine
The Goldex mine, which achieved commercial production in August 2008, is located in the City of Val d’Or, Quebec,approximately 60 kilometres east of the LaRonde mine. On October 19, 2011, the Company suspended mining operationsand gold production at Goldex, following the receipt of recommendations from independent consultants to haltunderground mining operations during the investigation into ground stability issues. As a result, the Company wrote offsubstantially all of its investment in the Goldex mine (approximately $254 million), took a closure provision ofapproximately $44 million and reclassified all of the remaining 1.6 million ounces of proven and probable gold reserves(approximately 0.9 million ounces of gold in proven reserves (14.8 million tonnes grading 1.87 grams of gold per tonne)and approximately 0.7 million ounces of gold in probable reserves (13.0 million tonnes grading 1.6 grams of gold pertonne) estimated as of December 31, 2010), other than the ore stockpiled on surface, as mineral resources in the thirdquarter of 2011. The surface stockpile was processed in the Goldex mill by October 30, 2011. The Goldex property is nowconsidered an advanced exploration project with significant measured, indicated and inferred mineral resources inseveral zones, but no mineral reserves.
32 AGNICO-EAGLE MINES LIMITED

28MAR201208580547
At the present time, development work continues underground on the M-Zone (as defined below) and the explorationramp into the D-Zone (as defined below), and exploration continues, with diamond drilling from surface and underground.
Location Map of the Goldex Mine
The Goldex property is accessible by provincial highway. The elevation is approximately 302 metres above sea level. All ofthe Goldex mine’s power requirements were supplied by Hydro-Quebec through connections to its main powertransmission grid. All of the water that was required at the Goldex mine was sourced directly by aqueduct from theThompson River immediately adjacent to the minesite or through recirculation of water from the surface pond and theauxiliary tailings pond. For additional information regarding the Abitibi region in which the Goldex mine is located,including information with respect to climate, topography, vegetation and mining personnel, see ‘‘– Property, Plant andEquipment – LaRonde Mine’’.
The Goldex mine operated under a mining lease obtained from the Ministry of Natural Resources and Wildlife (Quebec)and under certificates of approval granted by the Ministry of Sustainable Development, Environment and Parks (Quebec).The Goldex property, in which the Company has a 100% working interest, consists of 22 contiguous mining claims and,since April 2006, one provincial mining lease (98.6 hectares), covering an aggregate of 331.2 hectares. The property ismade up of three blocks: the Probe block (130.7 hectares); the Dalton block (10.4 hectares); and the Goldex Extensionblock (190.1 hectares). The claims are renewable every second year upon payment of a small fee. The mining leaseexpires in 2028 and is automatically renewable for three further ten-year terms upon payment of a small fee. TheCompany also has one lease covering 418.5 hectares of surface rights that are used for the auxiliary tailings pond. Thislease is renewable annually upon payment of a small fee.
The Goldex mine includes underground operations that can be accessed from two shafts, a processing plant, an orestorage facility and other related facilities. The Goldex Extension Zone (‘‘GEZ’’), which was the gold deposit on which theCompany was focusing its production efforts before production was suspended indefinitely on October 19, 2011, wasdiscovered in 1989 on the Goldex Extension block (although the Company believes a small portion of the GEZ occurs onthe Probe block). Probe Mines Ltd. holds a 5% net smelter return royalty interest on the Probe block. In 2011, explorationand development work continued on the zone located on the Probe block 150 metres above the western end of the GEZ(the ‘‘M-Zone’’).
332011 ANNUAL REPORT

28MAR201202492760
In late 1997, the Company completed a mining study that indicated the deposit was not economically viable to mine at thethen-prevailing gold price (approximately $323 per ounce of gold) using the mining approach chosen anddrill-hole-indicated grade. The property was placed on care and maintenance and the workings were allowed to flood. InFebruary 2005, a new mineral reserve and resource estimate was completed for the GEZ which, coupled with a feasibilitystudy, led to a probable mineral reserve estimate of 1.6 million ounces of gold contained in 20.1 million tonnes of oregrading 2.54 grams of gold per tonne. The GEZ resource model was revised and, in March 2005, the Company approved afeasibility study and the construction of the Goldex mine. The mine achieved commercial production on August 1, 2008and consistently operated at or above the designed rate of 6,900 tonnes per day until its operations were suspended inOctober 2011.
Based on the results of a scoping study completed in July 2009, the Company determined to expand the mine and milloperations at the Goldex mine to 8,000 tonnes per day. This project was completed in 2010. Capital costs in connectionwith the expansion totalled $10 million. The crusher for the expansion was commissioned at the end of the first quarter of2010 at a rate of 7,811 tonnes per day.
The Goldex mine produced 135,478 ounces of gold in 2011 at total cash costs of $472 per ounce. The Goldex mine is notexpected to produce more gold until the suspected rock stability issues are resolved.
Mining and Milling Facilities
Surface Plan of the Goldex Mine
At the time the Company commenced construction of the Goldex mine, the surface facilities included a headframe, ahoistroom, a surface building containing a mechanical shop, a warehouse and an office. In addition, the Goldex propertyhad a 790-metre deep shaft (Shaft #1), which provided access to underground workings. Shaft #1 is predominantly usedto hoist waste rock from development activities.
34 AGNICO-EAGLE MINES LIMITED

The sinking of a new production shaft was completed in 2007. This shaft (Shaft #2) is a 5.5-metre diameter shaft with a50-centimetre thick concrete lining and is used for ventilation as well as hoisting services. Shaft #2 is 865 metres deep andincludes five stations. A refurbished friction hoist was installed for production and service duties, and an auxiliary hoist wasinstalled for emergency and personnel service. The production hoist is equipped with one cageskip. Each skip has a21.5-tonne capacity and the shaft can hoist an average of 7,000 to 8,000 tonnes of ore per day.
Mining Method
Prior to the suspension of mining operations on October 19, 2011, the Goldex mine used a high volume bulk miningmethod, which was made possible through the use of large mining stopes. Drilling and blasting of 165-millimetreproduction holes was used to obtain a muck size large enough to be economically efficient. Using this method required apercentage of the broken ore to be kept in the stope to reduce the backfilling cost and to reduce sloughing on the walls.Little ore and waste development was necessary to mine out the deposit. Following the suspension of mining onOctober 19, 2011, future mining methods, if any, are under evaluation.
Surface Facilities
Plant construction at the Goldex mine commenced in the second quarter of 2006 and was completed in the first quarter of2008. The plant reached design capacity in the second quarter of 2009. Grinding at the Goldex mill was done through atwo-stage circuit comprised of a SAG mill and a ball mill. As part of the expansion project commenced in 2009, a surfacecrusher was added to reduce the size of ore transferred to the surface from 150 millimetres to 50 millimetres. A lamellardecanter was also added to recover small particles present in the water overflow of the concentrate thickener. Theunderflow pump of this thickener was upgraded following flotation circuit modification to increase the pull rate of the smallparticles. Approximately two-thirds of the gold was recovered through a gravity circuit, passed over shaking tables andsmelted on site. The remainder of the gold and pyrite was recovered by a flotation process. The concentrate was thenthickened and trucked to the mill at the LaRonde mine where it was further treated by cyanidation. Gold recovered wasconsolidated with precious metals from the LaRonde and Lapa mines. The Company reached an average gold recovery of93.38% in 2011, prior to the suspension of mining.
In addition, surface facilities at the Goldex property include an electrical sub-station, a compressor building, a servicebuilding for administration and changing rooms, a warehouse building, a concrete headframe above Shaft #2, ahazardous waste storage facility and a dome covering the ore stockpile.
Mineral Recoveries
Prior to the suspension of mining operations on October 19, 2011, the Goldex mill processed approximately 2.48 milliontonnes of ore, averaging approximately 8,173 tonnes of ore treated per day and operating at approximately 95% ofavailable time. The following table sets out the metal recoveries at the Goldex mine in 2011.
Head Flotation-Cyanidation PayableGrades Gravity Recovery Recovery Global Recovery Production
Gold 1.82 g/t 67.76% 25.63% 93.38% 135,478 oz
Environmental Matters
Environmental permits for the construction and operation of an ore extracting infrastructure at the Goldex mine werereceived from the Ministry of Sustainable Development, Environment and Parks (Quebec) in October 2005. The permitsalso covered the construction and operation of a sedimentation pond for mine water treatment and sewage facilities, andthese facilities have been built at the Goldex mine site. In June 2009, the permits were revised to allow the expansion of themine and mill operations to 8,500 tonnes per day.
In November 2006, the Company and the Quebec government signed an agreement permitting the Company to disposeof the Goldex tailings at the Manitou minesite, a tailings site formerly used by an unrelated third party and abandoned tothe Quebec government. The Manitou tailings site has issues relating to acid drainage and the construction of tailingsfacilities by the Company and the deposit of tailings from the Goldex plant on the Manitou tailings site was accepted by theMinistry of Sustainable Development, Environment and Parks (Quebec) as a valid rehabilitation plan to address the acidgeneration problem at Manitou. Under the agreement, the Company managed the construction and operation of thetailings facilities and the Quebec government paid all additional costs above the Company’s budget for tailings facilities set
352011 ANNUAL REPORT

out in the Goldex feasibility study. The Quebec government retains responsibility for all environmental contamination at theManitou tailings site and for final closure of the facilities. In addition, the Company has built a separate tailings deposit area(auxiliary tailings pond) near the Goldex mine. Environmental permits for the construction and operation of the auxiliarytailings pond at the Goldex mine were received in March 2007. In 2011, 237,615 tonnes of Goldex tailings weredischarged to the auxiliary pond for a total to date of 764,077 tonnes. At the Manitou site, 2.20 million tonnes of Goldextailings were discharged for a total to date of 8.095 million tonnes.
A new dyke was built in the summer of 2011 in the auxiliary tailings pond to create a second polishing basin to reduce totalsuspended solids in the discharged water during spring time. Construction of this dyke was necessary following a notice ofinfraction received in 2011 from the Quebec Ministry of Environment for exceeding of the permitted total suspendedsolids.
Following suspension of mining operations at the Goldex property, the mine closure costs were revised to account for thechange in conditions at the site. The estimated total for the closure costs of the Goldex mine is approximately$51.4 million, comprised of the following: $1.2 million for demolition, $1 million for engineering, $0.45 million for sitepreliminary works, $5.4 million for mining site rehabilitation (primarily for backfilling of the zone with high subsidence),$23.2 million for rock grouting and soil improvement, $0.26 million for revegetation of the site, $0.06 million to rehabilitatethe sedimentation pond, $0.2 million to rehabilitate the waste rock pile, $1.03 million to rehabilitate the South Tailingsbasin area, $0.7 million for geotechnical and environmental monitoring; $17.6 million for property purchases and$0.3 million for Baie-Doree road rehabilitation. In addition, a separate provision of approximately $4.6 million exists for theremaining participation of the Company in the rehabilitation of the Manitou site.
Capital Expenditures
Prior to the suspension of mining operations on October 19, 2011, capital expenditures at the Goldex mine in 2011 wereapproximately $48.4 million, which included $7.8 million on sustaining capital expenditures, $7.1 million on theconstruction of facilities in the M-Zone and water management, $10.7 million in deferred development expenses,$16.3 million for remediation work at the surface and $5.3 million in exploration expense. For 2012, an interim budget of$69.8 million has been approved to further develop the M-Zone, complete remediation work, perform crown pillarinvestigations and explore the D-Zone.
Development
During 2011, approximately 4,256 metres of lateral and vertical development were completed at a cost of $15.3 million,including development following the suspension of mining operations on October 19, 2011. At the present time,development work continues underground on the M-Zone and the exploration ramp into the D-Zone, and explorationcontinues with diamond drilling. For 2012, 900 metres of development at a cost of $6.1 million is planned to develop theM-Zone and for exploration of the D-Zone.
Geology, Mineralization and Exploration
Geology
Geologically, the Goldex property is similar to the LaRonde property and is located near the southern boundary of theArchean-age (2.7 billion years old) Abitibi Subprovince, a typical granite-greenstone terrane located within the SuperiorProvince of the Canadian Shield. The southern contact of the Abitibi Subprovince with the Pontiac Subprovince is markedby the east-southeast trending CLL Fault Zone, the most important regional structural feature. The Goldex deposit ishosted within a quartz diorite sill, the ‘‘Goldex Granodiorite’’, located in a succession of mafic to ultramafic volcanic rocksthat are all generally oriented west-northwest.
The GEZ extends from 500 to 800 metres below the surface and is entirely hosted by the Goldex Granodiorite. The limits ofthe zone are defined by the intensity of the quartz vein stockwork envelope and by gold assays. The zone is almostegg-shaped; it is over 300 metres tall by 450 metres long (in a west-northwest direction) and its thickness increasesrapidly from 25 metres along the east-west edges to almost 150 metres in the centre.
In 2011, exploration efforts at Goldex were focused on the satellite M-Zone and D-Zone. These satellite zones are definedby quartz tourmaline veins and gold assays that are similar to the GEZ. The M-Zone has been defined as having a length of160 metres, a height of 120 metres and a thickness of 115 metres. The D-Zone is approximately 150 metres below theGEZ and close to 1,350 metres below the surface. It appears to have an approximate length of 500 metres.
36 AGNICO-EAGLE MINES LIMITED

Mineralization
Gold mineralization at Goldex corresponds to the quartz-tourmaline vein deposit type. The Goldex gold-bearing quartz-tourmaline-pyrite veins and veinlets have strong structural control. The most significant structure directly related tomineralization is a discrete shear zone, the Goldex Mylonite, that is up to five metres wide and occurs within the GoldexGranodiorite, just south of the GEZ and most other gold occurrences. The quartz-tourmaline-pyrite vein mineralization iscontrolled by minor fracture zones that are oriented west-northwest and dip steeply north or south. The fractures areparallel to, but north of, the Goldex Mylonite. Within the GEZ are three vein sets, the most important of which areextensional-shear veins dipping 30 degrees south and usually less than 10 centimetres thick. The vein sets andassociated alteration combine to form stacked envelopes up to 30 metres thick.
Strong albite-sericite alteration of the host-rock quartz diorite surrounds the quartz-tourmaline-pyrite veins and coversalmost 80% of the mineralized zone; outside of the envelopes, prior chlorite alteration affects the quartz diorite and gives ita darker grey-green colour. Occasionally, enclaves of relatively unaltered medium grey-green-coloured quartz diorite (withno veining or gold) are found within the GEZ; they are included exceptionally as internal waste to allow for a smooth shape,required for mining purposes.
Most of the gold occurs as microscopic particles that are almost always associated with pyrite, generally adjacent to grainsand crystals but also 20% included within the pyrite. The gold-bearing pyrite occurs in the quartz-tourmaline veins and innarrow fractures in the sericite-albite-altered quartz diorite (generally immediately adjacent to the veins). Less than 1.5%of the gold occurs as the mineral calaverite, a gold telluride.
Exploration
In 2011, $7.8 million was spent on exploration at Goldex. A total of 107 holes were drilled using diamond drilling methodsat the Goldex mine for a total length of approximately 47 kilometres, compared to 122 holes for a total length of44 kilometres in 2010. The expenses include an exploration ramp drifted on a length of 475 metres from Level 86to explore the D-Zone at depth. Three different zones in the Goldex Granodiorite intrusive were drilled in 2011. The mainexploration focus (83%) with 38.8 kilometres of drilling was for the D-Zone, the remaining 7.4 kilometres (16%) weredrilled for the top of the M-Zone and 750m (1%) for the sector to the East of the GEZ.
The 2012 exploration program is budgeted to include 8,000 metres of diamond drilling at a cost of $1.2 million. Theprimary target is the D-Zone.
Kittila Mine
The Kittila mine, which commenced commercial production in May 2009, is located approximately 900 kilometres northof Helsinki and 50 kilometres northeast of the town of Kittila in northern Finland. At December 31, 2011, the Kittila minewas estimated to contain proven and probable mineral reserves of 5.2 million ounces of gold comprised of 34.6 milliontonnes of ore grading 4.66 grams per tonne. The Kittila mine is accessible by paved road from the village of Kiistala, whichis located on the southern portion of the main claim block. The gold deposit is located near the small village of Rouravaara,approximately ten kilometres north of the village of Kiistala, accessible via a paved road. The property is close toinfrastructure, including hydro power, an airport and the town of Kittila. The project also has access to a qualified labourforce, including mining and construction contractors.
The total landholdings surrounding and including the Kittila mine comprise one mining licence covering an area ofapproximately 847 hectares, 120 individual tenements (prospecting permits) covering approximately 10,652 hectaresand 168 prospecting permit applications covering approximately 14,910 hectares. The mineral titles form a continuousblock around the Kittila mining licence. The block has been divided into the Suurikuusikko area, the Suurikuusikko Westarea and the Kittila mining licence centred at 25.4110 degrees longitude east and 67.9683 degrees latitude north.
The boundary of the mining licence is determined by ground-surveyed points whereas the boundaries of the othertenements are not required to be surveyed. All of the tenements in the Kittila mine are registered in the name of Agnico-Eagle Finland Oy, an indirect, wholly-owned subsidiary of the Company. According to the Finnish government’s landtenure records, all tenements are in good standing. The expiry dates of the tenements vary from May 2012 up toJune 2015. Tenements are initially valid for four years, provided exploration work in the area is reported annually and asmall annual fee is paid to maintain title; extensions for titles can be granted for 11 additional years on payment of a slightlyhigher fee and active exploration in the area. Agnico-Eagle Finland Oy also holds the mining licence in respect of the Kittilamine. The mine is subject to a 2.0% net smelter return royalty payable to the Republic of Finland.
372011 ANNUAL REPORT

28MAR201202493110
The Kittila mine area is sparsely populated and is situated between 200 and 245 metres above sea level. The topography ischaracterized by low rolling forested hills separated by marshes, lakes and interconnected rivers. The gold deposit issituated on an area of land that has no special use at present and there is sufficient land available for tailings facilities.Water requirements for the Kittila mine are sourced from the nearby Seurujoki River, recirculation of water from pitdewatering and tailings pond water. The Kittila region is located within the South-West Lapland zone of the northern borealvegetation zone characterized by spruce forests, marshes and bogs.
The mine is located within the Arctic Circle but the climate is moderated by the Gulf Stream off the coast of Norway suchthat northern Finland’s climate is comparable to that of eastern Canada. Winter temperatures range from �10 to�30 degrees Celsius, whereas summer temperatures range from 10 degrees Celsius to the mid-20s. Exploration andmining work can be carried out year-round. Because of its northern latitude, winter days are extremely short with a briefperiod of 24-hour darkness around the winter solstice. Conversely, summer days are very long with a brief period of24-hour daylight in early summer around the summer solstice. Annual precipitation varies between five and50 centimetres, one-third of which falls as snow. Snow accumulation usually begins in November and remains until Marchor April.
Location Map of the Kittila Mine
The Company acquired its 100%, indirect interest in the Kittila mine through the acquisition of Riddarhyttan completed inNovember 2005. See ‘‘– History and Development of the Company’’. In June 2006, on the basis of an independentlyreviewed feasibility study, the Company approved construction of the Kittila mine. The Kittila mine is currently an open pitmining operation with underground mining via ramp access. The current open pits will be mined out by the end of 2012and from 2013 onward all mining will be from the underground portion of the mine. The initial underground stope was
38 AGNICO-EAGLE MINES LIMITED

28MAR201202493707
mined in early 2010. Ore is processed in a 3,000-tonne per day surface processing plant that was commissioned in late2008. Limited gold concentrate production started in September 2008 and gold dore bar production commenced inJanuary 2009. During 2010 throughput at the Kittila mine approached design levels and gold recoveries continued toimprove. The Kittila mine is anticipated to produce approximately 155,000 ounces of gold in 2012 at estimated total cashcosts per ounce of approximately $650. Over the period of 2012 to 2038, total annual average gold production ofapproximately 150,000 ounces is anticipated. A scoping study is underway to assess the feasibility of significantlyincreasing the annual gold production.
Mining and Milling Facilities
Surface Plan of the Kittila Mine
The orebodies at Kittila are being mined initially from two open pits, followed by underground operations to mine thedeposits at depth. Additional, smaller open pits will be used to mine any remaining mineral reserves close to the surface inthe future. Open pit mining started in May 2008 and the extracted ore was stockpiled. As of December 2011, a total of2.8 million tonnes of ore have been processed, 0.4 million tonnes of ore have been stockpiled and 31.5 million tonnes ofwaste rock have been excavated. Work on the ramp to access the underground reserves continued throughout 2011 andtotal underground development to date is approximately 14,521 metres. Underground mining commenced in the fourth
392011 ANNUAL REPORT

quarter of 2010 and, as of December 2011, a total of 0.45 million tonnes of ore have been mined from the undergroundportions of the mine.
Mining Methods
The Kittila mine currently mines the Suurikuusikko orebody with a 160-metre deep open pit. Ore is mined in 7.5-metrebenches together with waste rock using buffer blasting techniques and is loaded selectively to minimize dilution andmaximize ore recovery. Hydraulic excavators load ore into 100-tonne trucks that haul the ore to the crusher and the wasterock to the waste disposal area. Approximately 3,000 tonnes of ore per day are fed to the concentrator. Surface mining isexpected to continue through 2012. Underground development continued throughout the year and ore production fromthe underground started at a steady rate in the fourth quarter of 2011.
The underground mining method is open stoping with delayed backfill. Stopes are between 25 and 40 metres high andyield approximately 10,000 tonnes of ore per stope. To ensure sufficient ore production is available to supply the mill,approximately 6,000 metres of tunnels will be developed each year. After extraction, stopes will be filled with cementedbackfill or paste backfill to enable the safe extraction of ore in adjacent stopes. Ore will be trucked to the surface crushervia the ramp access system.
Surface Facilities
Construction of the processing plant and associated equipment was completed in 2008 and facilities on site include anoffice building, a maintenance facility for the open pit equipment, a warehouse, a maintenance shop, an oxygen plant, aprocessing plant, a tank farm, a crusher, conveyor housings and an ore bin. In addition, some temporary structures housecontractor offices and work areas.
The ore at Kittila is treated by grinding, flotation, pressure oxidation and carbon-in-leach circuits. Gold is recovered fromthe carbon in a Zadra elution circuit and is recovered from the solution using electrowinning and then poured into dorebars using an electric induction furnace.
Mineral Recoveries
In 2011, the Kittila mill processed 1.1 million tonnes of ore with an availability of 84% for an average throughput of2,824 tonnes per day. Low mill availability was caused by maintenance issues associated with the autoclave and scrubber,mainly related to leaking mechanical seals, brick lining failures in the autoclave and blocked pipelines on the autoclaveand the scrubber.
The following table sets out the gold production at the Kittila mine in 2011:
OverallHead Metal Payable
Grade Recovery Production
Gold 5.11 g/t 84.6% 143,560 oz
Ore processing at Kittila consists of two stages. In the first stage, ore is enriched by flotation and in the second stage thegold is extracted by pressure oxidation and cyanide-in-leach processes. Flotation recoveries were stable during 2011 andflotation recovery averaged 93% during the year. Trials are still in progress with the aim to try to further increase theflotation recovery. An in-house metallurgical laboratory was built in 2011 and will allow further flotation test work to beundertaken to attempt to optimize flotation recoveries.
Recoveries in the second stage of the process were also relatively stable in 2011. Lower recoveries in the second quarter of2011 were related to mechanical failures and operating difficulties in the autocalve. Modifications inside the autoclaveallowed for better oxygen distribution management, which resulted in better sludge flow and oxidation within theautoclave, leading to better recovery availability. Also, further optimizing and improved control of the process enabledcontinuous improvement in recoveries.
A large amount of test work was done in 2011 and the testing and optimization of the process will continue in 2012. Large-scale test-work is ongoing to find optimized pressure oxidation and results are expected in 2012.
40 AGNICO-EAGLE MINES LIMITED

Environmental Matters
The Company currently holds a mining licence, an environmental permit and operational permits in respect of the Kittilamine. All permits necessary to begin production were received during 2008.
The construction of the first phase of the tailings dam and waterproof bottom layer was completed in the fall of 2008. Thisfirst phase is sufficient to hold tailings from three years of production. Work began on the second phase in 2009 andcontinues according to plans and permit requirements. Water from dewatering the mine and water used in the mine andmill is collected and treated by sedimentation. Emissions and environmental impact are monitored in accordance with thecomprehensive monitoring program that has been approved by the Finnish environmental authorities. To further improveenvironmental performance, scrubbing of mill-off gas will be enhanced and this work was initiated in the fourth quarter of2011. There are no material environmental liabilities related to the Kittila mine.
Capital Expenditures
Capital expenditures at the Kittila mine during 2011 were approximately $92 million, which included paste backfill plantconstruction, mill modification costs, underground mine development costs, exploration and conversion drilling costswithin the mining licence area and sustaining capital costs. The Company expects capital expenditures at the Kittila mineto be approximately $67 million in 2012, most of which will be used for mill scrubber improvements, mining equipment forunderground mining, development and construction of underground mining infrastructure, construction of the pastebackfill plant and exploration and conversion drilling.
Development
Mining at the Suurikuusikko and Roura open pits progressed throughout 2011 with a total of 650,000 tonnes of ore and5.7 million tonnes of waste mined from the open pit. The Company expects that 600,000 tonnes of ore and 1.6 milliontonnes of waste will be mined from the Suurikuusikko and Roura pits during 2012. Total costs for open pit development in2011 were $2.8 million.
In 2011, underground development progressed in both the Rouravaara and Suurikuusikko zones with 6,440 metres oframp and sublevel access development completed during the year. A total of 103,000 tonnes of ore from developmentand 280,000 tonnes of stope ore were mined in 2011. The Company expects to complete 6,000 metres of lateraldevelopment and 400 metres of vertical development during 2012.
Geology, Mineralization and Exploration
Geology
The Kittila mine is situated within the Kittila Greenstone belt, part of the Lapland Greenstone belt in the Proterozoic-ageSvecofennian geologic province. The appearance and geology of the area is similar to that of the Abitibi region of theCanadian Shield. In northern Finland, the bedrock is typically covered by a thin but uniform blanket of unconsolidatedglacial till. Bedrock exposures are scarce and irregularly distributed.
The mine area is underlain by mafic volcanic and sedimentary rocks metamorphosed to greenschist assemblages andassigned to the Kittila group. The major rock units trend north to north-northeast and are near-vertical. The volcanics arefurther sub-divided into iron-rich tholeiitic basalts (Kautoselka Formation) located to the west and magnesium-richtholeiitic basalt, coarse volcaniclastic units, graphitic schist and minor chemical sedimentary rocks (VesmajarviFormation) located to the east. The contact between these two rock units consists of a transitional zone (the PorkonenFormation) varying between 50 and 200 metres in thickness. This zone is strongly sheared, brecciated and characterizedby intense hydrothermal alteration and gold mineralization, features consistent with major brittle-ductile deformationzones. It includes the north-northeast-oriented Suurikuusikko Trend.
Mineralization
The Porkonen Formation hosts the Kittila gold deposit, which contains multiple mineralized zones stretching over a strikelength of more than 25 kilometres. Most of the work has been focused on the 4.5-kilometre stretch that hosts the knowngold reserves and resources. From north to south, the zones are Rimminvuoma (‘‘Rimpi-S’’), North Rouravaara(‘‘Roura-N’’), Central Rouravaara (‘‘Roura-C’’), depth extension of Rouravaara and Suurikuusikko (‘‘Suuri/Roura Deep’’),Suurikuusikko (‘‘Suuri’’), Etela and Ketola. The Suuri and Suuri/Roura Deep zones include several parallel sub-zones thathave previously been referred to as Main East, Main Central and Main West. The Suuri zone hosts approximately 34% ofthe current probable gold reserve estimate on a contained-gold basis, while Suuri Deep has approximately 20%, Roura-C
412011 ANNUAL REPORT

approximately 11%, Roura Deep approximately 25%, Roura-N approximately 2%, Rimpi-S approximately 6%, Ketolaapproximately 1% and Etela approximately 0.1%.
Gold mineralization in these zones is associated with intense hydrothermal alteration (carbonate-albite-sulphide), and isalmost exclusively refractory, locked inside fine-grained sulphide minerals: arsenopyrite (approximately 73%) or pyrite(approximately 23%). The rest is ‘‘free gold’’, which is manifested as extremely small grains of gold in pyrite.
Exploration
In 1986, the discovery of coarse visible gold in quartz-carbonate veining along a road cut near the village of Kiistala alertedthe Geological Survey of Finland (‘‘GTK’’) to the gold exploration potential of the area. Following this discovery, GTKinitiated regional exploration over the area and deployed a wide range of indirect exploration tools to explore this relativelyunexplored area. Over the period from 1987 to 2005, GTK and later Riddarhyttan undertook drilling programs and othertesting on the property. After it acquired the property in 1998, Riddarhyttan continued to investigate the metallurgicalproperties of the refractory gold mineralization with the objective of demonstrating its recoverability and assessing suitableprocessing scenarios and initiated engineering and environmental studies to assess the feasibility of a mining project.
Diamond drilling is used for exploration on the Kittila property. Most of the work on the mining licence area has focused onthe Suuri and Roura zones. Up to the end of December 2011, a total of 2,315 drill holes, totalling 639,774 metres, havebeen completed on the property. In 2011, between six and eight drill machines worked on the Kittila property: two drills onunderground infill drilling; three to six drills on mine exploration; and one to two drills on resource-to-reserve conversiondrilling. A total of 445 holes were completed for a length of 82,377 metres. Of these drill holes, 353 drill holes(30,197 metres) were for definition drilling, 44 drill holes (20,535 metres) were for conversion drilling and 48 drill holes(31,645 metres) were related to mine exploration. Total expenditures for diamond drilling in 2011 were $17.5 million,including $3.7 million for definition and delineation drilling.
Exploration during 2011 increased proven and probable gold reserves to 5.2 million ounces (34.6 million tonnes of oregrading 4.66 grams per tonne). Most of the increase came from the Roura Deep zone (239,002 ounces) and the Rimpizone (119,753 ounces). Indicated mineral resources decreased by 2.4 million tonnes to 13.0 million tonnes of ore grading2.46 grams per tonne. Inferred mineral resources tonnage decreased by 0.4 million tonnes to 8.0 million tonnes of oregrading 4.55 grams per tonne, but because of higher gold grades the contained gold ounces in this category increasedby 74%.
The decrease in indicated mineral resources reflects the successful conversion of resources to reserves, especially in theRoura Deep and Rimpi zones.
The successful deep drilling program in 2011 at the Roura Deep zone, which is located immediately below the Roura zoneand north of the Suuri Deep zone, has confirmed that most of the Roura ore lenses are present in the Roura Deep zone andmost of the ore lenses in the Suuri Deep zone continue north to the Roura Deep zone. The gold mineralization is open atdepth and to the north.
A resource-to-reserve conversion drilling campaign was carried out at Suuri, Roura and Roura-N in 2011. As a result ofthis work, probable reserves increased by 119,753 ounces from Rimpi, but drilling at Suuri did not increase reservessignificantly. Suuri will be the main target for resource-to-reserve conversion drilling in 2012.
Outside of the Kittila mining licence area, systematic geochemical sampling and diamond drilling continued on targetsalong the Suurikuusikko Trend, and a number of new targets were tested by diamond drilling. Encouraging results werereceived from a new gold zone in the Kuotko area located approximately ten kilometres north of the mine construction site.A total of 68 diamond drill holes totalling 19,948 metres were drilled on exploration targets outside of the mining licencearea in 2011.
The 2012 exploration budget for the Kittila mine is approximately $13.5 million ($10.3 million for minesite exploration,$1.2 million for resource-to-reserve conversion and $2.0 million for 400 metres of development in an exploration ramp atthe 600-metre mine level), and includes over 39,700 metres in diamond drilling (32,200 metres for minesite explorationand 7,500 metres for resource-to-reserve conversion), using up to five drills throughout the year to help further identify thegold reserve and resource potential of the Kittila property. In addition, $2.9 million of exploration expenditures, includingan estimated 10,900 metres of diamond drilling, is planned for exploration along the 25-kilometre Suurikuusikko Trend.
42 AGNICO-EAGLE MINES LIMITED

28MAR201202494191
Lapa Mine
The Lapa mine, which achieved commercial production in May 2009, is located approximately 11 kilometres east of theLaRonde mine near Cadillac, Quebec. At December 31, 2011, the Lapa mine was estimated to contain proven andprobable mineral reserves of 0.5 million ounces of gold comprised of 2.38 million tonnes of ore grading 6.54 grams pertonne. The Lapa property is made up of the Tonawanda property, which consists of 43 contiguous mining claims and oneprovincial mining lease covering an aggregate of 702.4 hectares, and the Zulapa property, which consists of one miningconcession of 93.5 hectares.
Location Map of the Lapa Mine
The Company’s initial interest in the Lapa property was acquired in 2002 through an option agreement with BreakwaterResources Ltd. (‘‘Breakwater’’). The Company undertook an aggressive exploration program and discovered a new golddeposit almost 300 metres below the surface. In 2003, the Company purchased the Lapa property from Breakwater for apayment of $8.9 million, a 1% net smelter return royalty on the Tonawanda property and a 0.5% net smelter return royaltyon the Zulapa property. In 2008, the Company purchased all royalties from Breakwater for C$6.35 million. In addition,both the Zulapa and Tonawanda properties are subject to a 5% net profit royalty payable to Alfer Inc. and Rene Amyot. In2004, an additional claim of 9.4 hectares was added to the Company’s holdings at the Lapa mine. In January 2009, amining lease covering 66.8 hectares was entered into with the Ministry of Natural Resources and Wildlife (Quebec).
The Lapa mine is accessible by provincial highway. The elevation varies between approximately 320 and 390 metresabove sea level. All of the Lapa mine’s power requirements are supplied by Hydro-Quebec through connections to its mainpower transmission grid. All of the water required at the Lapa mine is sourced from the Heva river located 3.5 kilometres tothe south of the mine. The water is pumped into an existing open pit nearby the property that has been allowed to flood andfrom which the mine is supplied. The topography slopes relatively gently from north to south. The property is generallycovered by a boreal-type forest consisting mainly of black spruce and white pine with minor amounts of birch and poplar.
For additional information regarding the Abitibi region in which the Lapa mine is located, see ‘‘– Property, Plant andEquipment – LaRonde Mine’’.
Gold production during 2012 at the Lapa mine is expected to be approximately 100,000 ounces at estimated total cashcosts per ounce of approximately $750.
432011 ANNUAL REPORT

28MAR201202494608
Mining and Milling Facilities
Surface Plan of the Lapa Mine
The Lapa site hosts an underground mining operation and the ore is trucked to the processing facility at the LaRondemine, which has been modified to treat the ore, recover the gold and store the residues. Tailings from the Lapa mine aredeposited in the tailings pond at the LaRonde mine.
In July 2004, the Company initiated the sinking of an 825-metre deep shaft at the Lapa property. In April 2006,2,800 tonnes of ore development was extracted at Lapa and was estimated to contain on average 10.65 grams of gold pertonne. These results and results from other sampling methods were incorporated into a feasibility study and in June 2006,the Company accelerated construction of the Lapa mine. This construction included extending the shaft to a depth of1,369 metres, which was completed in October 2007. Significant additional construction was required in order for theLapa mine to achieve commercial production in May 2009, including the construction of the mill.
Mining Methods
Two underground mining methods are used at the Lapa mine: longitudinal retreat with cemented backfill and locallytransverse open stoping with cemented backfill. Sublevels are driven at 30-metre vertical intervals. Stopes are mined in12-metre sections and backfilled with 100% cemented rock backfill. Excavated ore from the Lapa site is trucked viaprovincial highway to the processing facility at the LaRonde mine.
44 AGNICO-EAGLE MINES LIMITED

Surface Facilities
The infrastructure on the Lapa property includes the refurbished former LaRonde Shaft #1 headframe and shafthouse,service buildings, offices, a settling pond for waste water, dry facilities, an ore bin, a diesel reservoir and a water treatmentplant. In November 2007, lateral development began on three horizons. A backfill plant was commissioned inDecember 2008 and the sedimentation pond was extended in 2007 to control suspended solids from undergrounddewatering discharge.
Ore at the Lapa mine is processed through grinding, gravity and leaching circuits. Dedicated milling facilities have beenintegrated into the mill at the LaRonde mine. Based on an average ore head grade of 6.63 grams per tonne, gold recoveryaveraged 81% in 2011. With an average production in excess of 1,700 tonnes per day in 2011, the mine operatedconsistently above its design rate of 1,500 tonnes per day. The Company is attempting to reduce the mining dilutioncaused by weaker than expected rock conditions in the south wall, which is mainly composed of talc chlorite schist.
Mineral Recoveries
In 2011, the Lapa mine produced 598,464 tonnes of ore grading 6.63 grams of gold per tonne. The Lapa processingfacility treated 620,712 tonnes of ore in 2011 (approximately 1,700 tonnes per day) and operated at about 96% ofavailable time.
OverallHead Metal Payable
Grades Recoveries Production
Gold 6.63 g/t 81.04% 107,068 oz
Environmental Matters
Water used underground at the Lapa mine was initially re-circulated from mine dewatering after settling in thesedimentation pond. The re-circulation led to ammonia concentration in the water, and the Company experiencedoccasional toxicity problems in the water pond in 2008 and 2009. To address the ammonia content in the water, theCompany built a 3.5-kilometre pipeline to obtain fresh water from the Heva River. The pipeline was commissioned inNovember 2009. The Company also commissioned a water treatment plant on site in 2010, which was completed in thefourth quarter of 2010, to reduce the ammonia from mine dewatering. Output is currently within the target range atapproximately eight parts per million of ammonia and average efficiency is at approximately 70%. Optimization of the plantis ongoing.
A sedimentation pond is used to remove suspended solids from the dewatering water before either release to theenvironment or re-use in the underground mining operation. The waste rock pile naturally drains towards thesedimentation pond. A waste rock sampling program implemented during the shaft sinking phase verified the non-acidgenerating nature of the waste rock. Water effluent from the sedimentation pond is being sampled as required under theQuebec mining effluent guidelines, and is expected to comply with the water quality criteria. The mill residues will be sentto the LaRonde mine tailings area.
There are no known environmental liabilities associated with the Lapa site. The Certificates of Authorization to proceedwith mine production and with mill construction were issued by the Ministry of Sustainable Development, Environmentand Parks (Quebec) in October and December 2007, respectively. The Certificate of Authorization for mill and tailingsproduction was received in 2008.
Capital Expenditures
The Company incurred approximately $18.0 million in capital expenditures at the Lapa mine in 2011 and expects to incurapproximately $13.8 million in 2012, of which $8.9 million relates to deferred development, $2.8 million to sustainingcapital expenditures (including underground construction and mining equipment) and $3.0 million for exploration.
Development
In 2011, a total of 5,685 metres of lateral development was completed. Development focused on permanent drifts (rampsand haulage way), stope preparation of mining blocks set for production in 2011 and 2012, and access to the newly
452011 ANNUAL REPORT

discovered East Zone, which is expected to begin production in early 2012. Since mid-2010, all three main mininghorizons are linked via a ramp.
Geology, Mineralization and Exploration
Geology
The Lapa property is geologically similar to the LaRonde property and is also located near the southern boundary of theArchean-age (2.7 billion years old) Abitibi Subprovince and the Pontiac Subprovince within the Superior Province of theCanadian Shield. The most important regional structure is the CLL fault zone marking the contact between the Abitibi andPontiac Subprovinces. The fault zone passes through the property from west to east, and is marked by schists and mafic toultramafic volcanic flows that comprise the Piche group (up to approximately 300 metres thick in the mine area). On theLapa property, the fault zone displays a ‘‘Z’’ shaped fold to which all of the lithologic groups in the region conform.Feldspathic dykes cut the Piche group, especially near the fold. North of the Piche group lies the Cadillac sedimentarygroup, which consists of 500 metres or more of well-banded wacke, conglomerate and siltstone with intercalations of ironformation. The Pontiac group sedimentary rocks (up to approximately 300 metres thick) that occur to the south of thePiche group are similar to the Cadillac group but do not contain conglomerate nor iron formation.
Mineralization
All of the known gold mineralization along the CLL fault zone is epigenetic (late) vein type, controlled by the structure. Themineralization is associated with the fault zone and occurs within or immediately adjacent to the Piche group rocks.
The Lapa deposit is comprised of the Contact zone and five satellite zones. The Contact zone accounts for approximately82% of the mineral reserves.
The ore zones are made up of multiple quartz veins and veinlets, often smoky and anastomosing, within a sheared andaltered envelope containing minor sulphides and visible gold. The Contact zone is generally located at the contact betweenthe Piche group and the Cadillac group. The satellite zones are located within the Piche group at a distance varying fromten to 50 metres from the contact with the Cadillac group, except for the Contact North zone, which is locatedapproximately ten metres north of the Contact zone within the Cadillac group. The sheared envelope consists ofmillimetre-thick foliation bands of biotite or sericite with silica and, in places, cuts across rock units. Quartz veins andmillimetre-sized veinlets parallel to the foliation account for 5% to 25% of the mineralization. Visible gold is common in theveins and veinlets but can also be found in the altered host rock. Sulphides account for 1% to 3% of the mineralization; themost common sulphides, in order of decreasing importance, are arsenopyrite, pyrite, pyrrhotite and stibnite. Graphite isalso rarely observed as inclusions in smoky quartz veins.
The Contact and satellite zones are tabular mineralized envelopes oriented east-west and dipping very steeply to the north,turning south at depth. The economic portion of the zone has been traced from depths of approximately 450 metres tomore than 1,300 metres below surface. The Contact zone has an average strike length of 300 metres, varies in thicknessfrom 2.8 to 5.0 metres and is open at depth. Locally some thicker intervals have been intersected but their continuity hasnot been demonstrated. The satellite zones have thicknesses similar to the Contact zone.
Exploration
Two exploration diamond drilling programs occurred at the Lapa mine during 2011. The first program concentrated onconfirming and expanding the known orebodies (Contact zone and the other satellite zones) in the immediate vicinity ofthe ore zones. The drilling tested the eastern area of the Contact zone reserve at roughly 1,000 metres depth below thesurface and 300 metres east of the Contact zone reserve limit. Good results, including visible gold, were returned andadditional resources were identified. This area was added in the mine plan in March 2011. The 2012 program will focus onexpanding mineral resources in this area. Additional drilling was done below Level 128 (the deepest producing level).Technical services will evaluate the economics of this area during 2012. The second program was executed from thenewly excavated exploration track drift on Level 101 (one kilometre deep) toward the east. This program will continuethrough 2013.
Overall, there was a reduction of approximately 175,000 ounces of gold in reserves at Lapa from 2010 to 2011 after mining129,000 ounces of gold. The net reduction of 46,000 ounces in reserves was a result of a lower-than-expected grade from2011 delineation diamond drilling. Mineral underground resources at the Lapa mine remained mostly unchanged.Approximately 0.5 million tonnes of inferred resources were added on surface following surface drilling in 2010 and 2011.Drilling and evaluation will continue in 2012. In 2011, a total of 231 holes were drilled on the Lapa property for a total
46 AGNICO-EAGLE MINES LIMITED

28MAR201202503810
length of 28,386 metres, compared to 264 holes for a total length of 25,660 metres in 2010. Of the drilling in 2011,165 holes (9,257 metres) were for production stope delineation and 66 holes (19,129 metres) were for exploration. In2010, 207 holes (13,263 metres) were for production stope delineation, 8 holes (1,477 metres) were for definition drillingand 49 holes (10,920 metres) were for exploration. Expenditure on diamond drilling at the Lapa mine during 2011 wasapproximately $2.39 million, including $0.76 million in definition and delineation drilling expenses charged to operatingcosts.
In 2012, the Company expects to spend $3.0 million on exploration, including $0.76 million on the excavation of a trackdrift toward the east. In 2012, 18% of the exploration drilling budget will be used for exploration in close vicinity of the mineinfrastructure and 82% will be used for drilling from the exploration drift.
Pinos Altos Mine
The Pinos Altos mine achieved commercial production in November 2009. It is located on an 11,000-hectare property inthe Sierra Madre gold belt, 285 kilometres west of the City of Chihuahua in the State of Chihuahua in northern Mexico. AtDecember 31, 2011, the Pinos Altos mine was estimated to contain proven and probable mineral reserves of 3.1 millionounces of gold and 88.5 million ounces of silver comprised of 46.8 million tonnes of ore grading 2.06 grams of gold pertonne and 58.85 grams of silver per tonne. The Pinos Altos property is made up of two blocks: the Agnico Eagle MexicoConcessions (22 concessions, 26,810.2 hectares), and the Minerales El-Madrono Concessions (18 concessions,5,053.1 hectares).
Location Map of the Pinos Altos Mine
The Madrono Concessions (which cover approximately 74% of the current mineral resources) are subject to a net smelterroyalty of 3.5% payable to Minerales El Madrono S.A. de C.V. (‘‘Madrono’’). The Pinos Altos Concession (which coversapproximately 26% of the current mineral resources) is subject to a 2.5% net smelter return royalty payable to the Consejode Recursos Minerales, a Mexican Federal Government agency. After 2029, this portion of the property will also be subjectto a 3.5% net smelter return royalty payable to Madrono. The assets at Pinos Altos acquired by the Company in 2006included an assignment of rights under contracts to explore and exploit the Madrono Concessions and the Pinos AltosConcession, the right to use up to 400 hectares of land owned by Madrono for mining installations for a period of 20 yearsafter formal mining operations have been initiated and sole ownership of the Parrena Concessions. During 2008, theCompany and Madrono entered an agreement under which the Company acquired further surface rights for open pit
472011 ANNUAL REPORT

mining operations and additional facilities. Infrastructure payments, surface rights payments and advance royaltypayments totalling $35.5 million were made to Madrono in 2009 in respect of this agreement.
In 2006, the Company concluded negotiations with communal land owners (ejidos) and others for the purchase of5,745 hectares of land contained within the Parrena and Pinos Altos Concessions. In addition, a temporary occupationagreement with a 30-year term expiring in 2036 was negotiated with ejido Jesus del Monte for 1,470 hectares of landcovered by these same concession blocks. The acquisition of these surface rights for the geologically prospective landswithin the district surrounding Pinos Altos will facilitate future exploration and mining development in these areas.
The Pinos Altos mine is directly accessible by a paved interstate highway that links the cities of Chihuahua and Hermosilloand is within ten kilometres of an extension of the state power grid. Existing and planned underground mine workings willintercept water resources sufficient to sustain the requirements for future operation. The land position is sufficient forconstruction of all planned surface, infrastructure and mining facilities at the Pinos Altos mine, including its tailingsimpoundment area. The Company further believes that a sufficient local and trained workforce is available in northernMexico to support the operation of the mine.
The Pinos Altos property is characterized by moderate to rough terrain with mixed forest (pine and oak) and altitudes thatvary from 1,770 metres to 2,490 metres above sea level. The climate is sub-humid, with about one metre of annualprecipitation. The average annual temperature is 18.3 degrees Celsius. Exploration and mining work can be carriedout year-round.
In August 2007, on the basis of an independently reviewed feasibility study, the Company approved construction of a mineat Pinos Altos. The mine achieved commercial production in November 2009.
Combined production from the Pinos Altos mine and the Creston Mascota deposit at Pinos Altos was 204,380 ounces ofgold and 1.85 million ounces of silver in 2011 at total cash costs per ounce of gold of $299. In 2012, combined goldproduction from the Pinos Altos mine and the Creston Mascota deposit at Pinos Altos is expected to be approximately205,000 ounces and silver production is expected to be approximately 2.0 million ounces. Total cash costs per ounce ofgold are forecast at approximately $415. From 2012 to 2026, combined gold production from the Pinos Altos mine,including the Creston Mascota deposit at Pinos Altos, is expected to average approximately 170,000 ounces of goldper year.
Based on a feasibility study prepared in 2009, the Company determined to build a stand-alone heap leach operation at thesatellite open pit Creston Mascota deposit at Pinos Altos. Creston Mascota is expected to produce approximately50,000 ounces of gold per year during its five-year mine life. Capital costs in connection with the project wereapproximately $65 million, of which approximately $12 million was incurred in 2011. The first gold pour from the CrestonMascota deposit at Pinos Altos occurred on December 28, 2010 and commercial production from the Creston Mascotadeposit at Pinos Altos was achieved in the first quarter of 2011.
The Company has engaged the local communities in the project area with hiring, local contracts, education support andmedical support programs to ensure that the project provides long-term benefits to the residents living and working in theregion. Approximately two-thirds of the operating workforce at Pinos Altos are locally hired and more than 99% of thepermanent workforce are Mexican nationals.
48 AGNICO-EAGLE MINES LIMITED

28MAR201202504613
Mining and Milling Facilities
Surface Plan of the Pinos Altos Mine
In 2011, the Creston Mascota deposit at Pinos Altos achieved commercial production and the optimization of the PinosAltos mine continued. Milling operations at Pinos Altos averaged 4,770 tonnes processed per day as compared to thedesign expectation of 4,000 tonnes per day. In its first full year of operation, the underground mine at Pinos Altos producedan average 2,983 tonnes of ore per day as compared to the design expectation of 3,000 tonnes per day. The open pitmines at Pinos Altos and the Creston Mascota deposit at Pinos Altos produced 28.5 million tonnes of ore, overburden andwaste in 2011, which met the expectation of the mine plan for the year.
Mining Methods
The surface operations at the Pinos Altos mine use traditional open pit mining techniques with bench heights of sevenmetres and double benches on the footwall and single benching on the hanging wall. Mining is accomplished with frontend loaders, trucks, track drills and various support equipment. Based upon geotechnical evaluations, the final pit slopeswill vary between 45 degrees and 50 degrees. Performance at the open pit mining operation at Pinos Altos during 2011continues to indicate that the equipment, mining methods and personnel selected for the project are satisfactory for futureproduction phases. Approximately 28.5 million tonnes of ore, overburden and waste were mined during 2011, meetingthe expected production for the year. During the first ten years of the project’s life, it is expected that approximately half ofthe ore volume processed will be derived from open pit operations, principally at Santo Nino, Oberon de Weber and theCreston Mascota at Pinos Altos. Underground mine production will produce the balance of the ore for the processingplant.
The underground mine, which commenced operations in the second quarter of 2010, uses the long hole sublevel stopingmethod to extract the ore. The Company has considerable expertise with this mining method, having used the samemethod at the LaRonde mine in Quebec. This method has also been used at various other Mexican mining operations. Thestope height is planned at 30 metres and the stope width at 15 metres. Ore is hauled to the surface utilizing undergroundtrucks via a ramp system. The paste backfill system and ventilation system were commissioned in the fourth quarter of2010 and are now fully operational. During 2011, approximately 1,090,000 tonnes of ore were produced from theunderground portion of the mine, averaging 2,984 tonnes per day. At full capacity, the underground mine is expected toproduce an average of 3,000 tonnes of ore per day. Performance of the underground mine continues to indicate that theequipment, mining methods, ground control and personnel selected are satisfactory for future production phases. A
492011 ANNUAL REPORT

scoping study is expected to be completed in the second quarter of 2012 to evaluate the potential benefit of building ashaft installation to improve the capacity and increase the efficiency of the underground mine. Total lateral developmentcompleted as of December 31, 2011 was approximately 22.6 kilometres.
Surface Facilities
The principal mineral processing facilities at the Pinos Altos mine are designed to process 4,000 tonnes of ore per day in aconventional process plant circuit which includes single stage crushing, grinding in a SAG and ball mill in closed loop,gravity separation followed by agitated leaching, counter current decantation and metals recovery in the Merrill Croweprocess. Tailings are detoxified and filtered and then used for paste backfill in the underground mine or deposited as drytailings in an engineered tailings impoundment area. The Pinos Altos mill processed an average of 4,770 tonnes of ore perday during 2011. Low grade ore at Pinos Altos is processed in a heap leach system designed to accommodateapproximately five million tonnes of mineralized material over the life of the project. The production from heap leachoperations is expected to be relatively minor, contributing about 5% of total metal production planned for the life ofthe mine.
A separate heap leach operation and ancillary support facilities were built at the Creston Mascota deposit at Pinos Altos,which is designed to process approximately 4,000 tonnes of ore per day in a three stage crushing, agglomeration and heapleach circuit with carbon adsorption. This project began commissioning in the latter part of 2010, with commercialproduction achieved in the first quarter of 2011. During 2011, a total of 1,452,708 tonnes of ore were produced at theCreston Mascota deposit at Pinos Altos, averaging 3,980 tonnes per day. Based on early performance of the mine andprocess facilities at the Creston Mascota deposit at Pinos Altos, the equipment, mining methods and personnel aresatisfactory for completion of the planned production phases. The Creston Mascota deposit at Pinos Altos is expected toproduce approximately 50,000 ounces of gold per year during a five-year remaining mine life.
Surface facilities at the Pinos Altos mine include a heap leach pad, pond, liner and pumping system; administrativesupport offices and change room facilities; camp facilities; a laboratory; a process plant shop; a maintenance shop; agenerated power station; surface power transmission lines and substations; the engineered tailings management system;and a warehouse.
Over the life of the mine, recoveries of gold and silver in the milling circuit at Pinos Altos (other than from the CrestonMascota deposit at Pinos Altos operation) are expected to average approximately 93% and 49%, respectively. Preciousmetals recovery from low grade ore processed in the Pinos Altos heap leach facility will average about 68% for gold and12% for silver. Heap leach recoveries for Creston Mascota ore are expected to average 71% for gold and 16% for silver.
Mineral Recoveries
During 2011, the Pinos Altos mill processed 1.74 million tonnes of ore, averaging approximately 4,770 tonnes of oretreated per day and operating at approximately 93.3% of available time. The following table sets out the metal recoveries atthe Pinos Altos mill in 2011.
OverallHead Metal Payable
Grade Recovery Production
Gold 2.86 g/t 93.7% 149,867 oz
Silver 65.73 g/t 43.1% 1,545,773 oz
An additional 992,992 tonnes of ore were processed and placed on the heap leach pad at Pinos Altos, with an averagegrade of 0.65 grams of gold per tonne and 17.45 grams of silver per tonne. Cumulative metals recovery on the heap leachpad at Pinos Altos are 57.5% gold and 11.7% silver. Heap leach recovery is following the expected cumulative recoverycurve and it is anticipated that the ultimate recovery of 68% for gold and 12% for silver will be achieved when leachingis completed.
An additional 1,452,708 tonnes of ore were processed and placed on the heap leach pad at the Creston Mascota depositat Pinos Altos, with an average grade of 1.52 grams of gold per tonne and 7.5 grams of silver per tonne. Cumulative metalsrecovery on the heap leach pad at the Creston Mascota deposit at Pinos Altos are 48.0% gold and 4.8% silver. Heap leach
50 AGNICO-EAGLE MINES LIMITED

recovery is following the expected cumulative recovery curve and it is anticipated that the ultimate recovery of 71% for goldand 16% for silver will be achieved when leaching is completed.
Total metal production (from mill and heap leach) at Pinos Altos, including the Creston Mascota deposit, during 2011 was204,380 ounces of gold and approximately 1.85 million ounces of silver.
Environmental Matters
The Pinos Altos mine has received the necessary permit authorizations for construction and operation of a mine, includinga Change of Land Use permit and an Environmental Impact Study approval from the Mexican environmental agency(‘‘SEMARNAT’’). As of December 31, 2011, all permits necessary for the operation of the Pinos Altos mine, including theoperations at the Creston Mascota deposit at Pinos Altos, had been received and requests for modifications to allow forfuture expansion of facilities, including at the Creston Mascota deposit at Pinos Altos, had been approved or were underreview by SEMARNAT. Pinos Altos uses the dry stack tailings technology to minimize the geotechnical and environmentalrisk that can be associated with the rainfall intensities and topographic relief in the Sierra Madre region of Mexico. All of theMexican environmental regulatory requirements are expected to be met or exceeded by the Pinos Altos mine (includingoperations at the Creston Mascota deposit at Pinos Altos). Operations at Pinos Altos and the Creston Mascota deposit atPinos Altos were deemed to qualify for the ‘‘Industria Limpia’’ (clean industry) designation by SEMARNAT in 2011.
Capital Expenditures
Capital expenditures at the Pinos Altos mine during 2011 were approximately $24 million. Capital expenditures relating tooperations at the Creston Mascota deposit at Pinos Altos during 2011 were approximately $12 million.
The Company expects sustaining and deferred capital expenditures at Pinos Altos to be approximately $31 million in 2012with average sustaining and deferred capital of approximately $15.7 million per year for a projected mine life ofapproximately 17 years. Approximately $0.5 million in development capital is forecast at the Creston Mascota deposit atPinos Altos in 2012 with sustaining capital expenditures of $10 million during its anticipated five-year mine life.
Development
At December 31, 2011 more than 71.7 million tonnes of overburden and waste had been removed from the open pit mineat Pinos Altos and more than 22.6 kilometres of lateral development had been completed in the underground mine. At theCreston Mascota deposit at Pinos Altos, approximately 10.6 million tonnes of ore and overburden had been removed fromthe open pit mine as of December 31, 2011.
Geology, Mineralization and Exploration
Geology
The Pinos Altos mine is in the northern part of the Sierra Madre geologic province, on the northeast margin of the OcampoCaldera, which hosts many epithermal gold and silver occurrences including the nearby Ocampo mining operation andMoris mine.
The property is underlain by Tertiary-age (less than 45 million years old) volcanic and intrusive rocks that have beendisturbed by faulting. The volcanic rocks belong to the lower volcanic complex and the discordantly-overlying uppervolcanic supergroup. The lower volcanic complex is represented on the property by the Navosaigame conglomerates(including thinly-bedded sandstone and siltstone) and the El Madrono volcanics (felsic tuffs and lavas intercalated withrhyolitic tuffs, sandy volcanoclastics and sediments). The upper volcanic group is made up of the Victoria ignimbrites(explosive felsic volcanics), the Frijolar andesites (massive to flow-banded, porphyritic flows) and the Buenavistaignimbrites (dacitic to rhyolitic pyroclastics).
Intermediate and felsic dykes as well as rhyolitic domes intrude all of these units. The Santo Nino andesite is a dyke thatintrudes along the Santo Nino fault zone.
Structure on the property is dominated by a 10-kilometre by 3-kilometre horst, a fault-uplifted block structure orientedwest-northwest, that is bounded on the south by the south-dipping Santo Nino fault and on the north by the north-dippingReyna de Plata fault. Quartz-gold vein deposits are emplaced along these faults and along transfer faults that splay fromthe Santo Nino fault.
512011 ANNUAL REPORT

Mineralization
Gold and silver mineralization at the Pinos Altos mine consists of low sulphidation epithermal type hydrothermal veins andbreccias. The Santo Nino structure outcrops over a distance of roughly six kilometres. It strikes at 060 degrees azimuth onits eastern portion and turns to strike roughly 090 degrees azimuth on its western fringe. The structure dips at 70 degreestowards the south. The four mineralized sectors hosted by the Santo Nino structure consist of discontinuous quartz richlenses named from east to west: El Apache, Oberon de Weber, Santo Nino and Cerro Colorado.
The El Apache lens is the most weakly mineralized. The area hosts a weakly developed white quartz dominated breccia.Gold values are low and erratic over its roughly 750 metre strike length. Past drilling suggests that this zone is of limitedextent at depth.
The Oberon de Weber lens has been followed on surface and by diamond drilling over an extent of roughly 500 metres.Shallow holes drilled by the Company show good continuity both in grade and thickness over roughly 550 metres. Fromprevious drilling done by Penoles, continuity at depth appears to be erratic with a weakly defined western rake.
The Santo Nino lens is the most vertically extensive of these lenses. It has been traced to a depth of approximately750 metres below surface. The vein is followed on surface over a distance of 550 metres and discontinuously up to650 metres. Beyond its western and eastern extents, the Santo Nino andesite is massive and only weakly altered. Goldgrades found are systematically associated with green quartz brecciated andesite.
The Cerro Colorado lens is structurally more complex than the three described above. Near the surface, it is marked by acomplex superposition of brittle faults with mineralized zones which are difficult to correlate from hole to hole. Its relation tothe Santo Nino fault zone is not clearly defined. Two deeper holes drilled by the Company suggest better grade continuity ispossible at depth.
The San Eligio zone is located approximately 250 metres north of Santo Nino. The host rock is brecciated VictoriaIgnimbrite, occasionally with stockworks. There is no andesite in this sector. Unlike the other lenses, the San Eligio lensdips towards the north. The lateral extent seems to be continuous for 950 metres. Its average width is five metres andnever exceeds 15 metres. Surface mapping and prospecting has suggested good potential for additional mineralization onstrike and at depths below 150 metres. Visible gold has been seen in the drill core.
Several other promising zones are associated with the horst feature in the northwest part of the property. The CrestonMascota deposit at Pinos Altos is 7 kilometres northwest of the Santo Nino deposit, and is similar, but dips shallowly to thewest. The Creston Mascota deposit at Pinos Altos is about 1,000 metres long and 4 to 40 metres wide, and extends fromsurface to more than 200 metres depth. Ore production from the Creston Mascota deposit at Pinos Altos began inJuly 2010, with the first gold poured in December 2010 and commercial productions commencing in February 2011.
Exploration
In 2011, minesite exploration activities were primarily focused on definition and delineation of the resources at Santo Nino,Oberon de Weber, San Eligio and Creston Mascota. A total of 15 kilometres of minesite exploration drilling, 10.1 kilometresof definition drilling and 4.4 kilometres of delineation drilling were completed during the year. Regional exploration in 2011focused on the El Cubiro prospect. Diamond drilling consisted of 30.6 kilometres in 84 drill holes. More than 6,000 coresamples and 1,250 rock samples were sent to a certified laboratory and assayed mainly for gold and silver.
The recently discovered Cubiro mineralization is two kilometres west of the Creston Mascota deposit at Pinos Altos. Cubirois a surface deposit that strikes northwest, has a steep dip and has been followed along strike for approximately850 metres. Drilling has intersected significant gold and silver mineralization up to 30 metres wide. The Cubiro deposit issplit by a fault that caused 200 metres of displacement to the west, which has been traced by drilling. The zone is still opento the southeast and possibly at depth.
The Sinter zone is 1,500 metres north northeast of the Santo Nino zone and is part of the Reyna de Plata gold structure.The steeply dipping mineralization is four to 35 metres wide and almost 900 metres long, with over 350 metres of verticaldepth. Sinter is being evaluated for its open pit mining and heap leach potential.
Other identified mineral resources in the Pinos Altos region include the Bravo and Carola zones adjacent to the CrestonMascota deposit at Pinos Altos and the Reyna de la Plata prospect further to the east. Exploration efforts will be allocated tothese zones as the development continues at Pinos Altos and the Creston Mascota deposit at Pinos Altos.
In 2012 the Company expects to spend $4.7 million on exploration at the Pinos Altos mine, including $3.2 million on11,800 metres of conversion drilling and $1.5 million on 5,000 metres of exploration drilling. In addition, $1.1 million isexpected to be spent on regional exploration on the Pinos Altos property, including 3,000 metres of drilling at the Cubiro,Escalon and Penasco deposits.
52 AGNICO-EAGLE MINES LIMITED
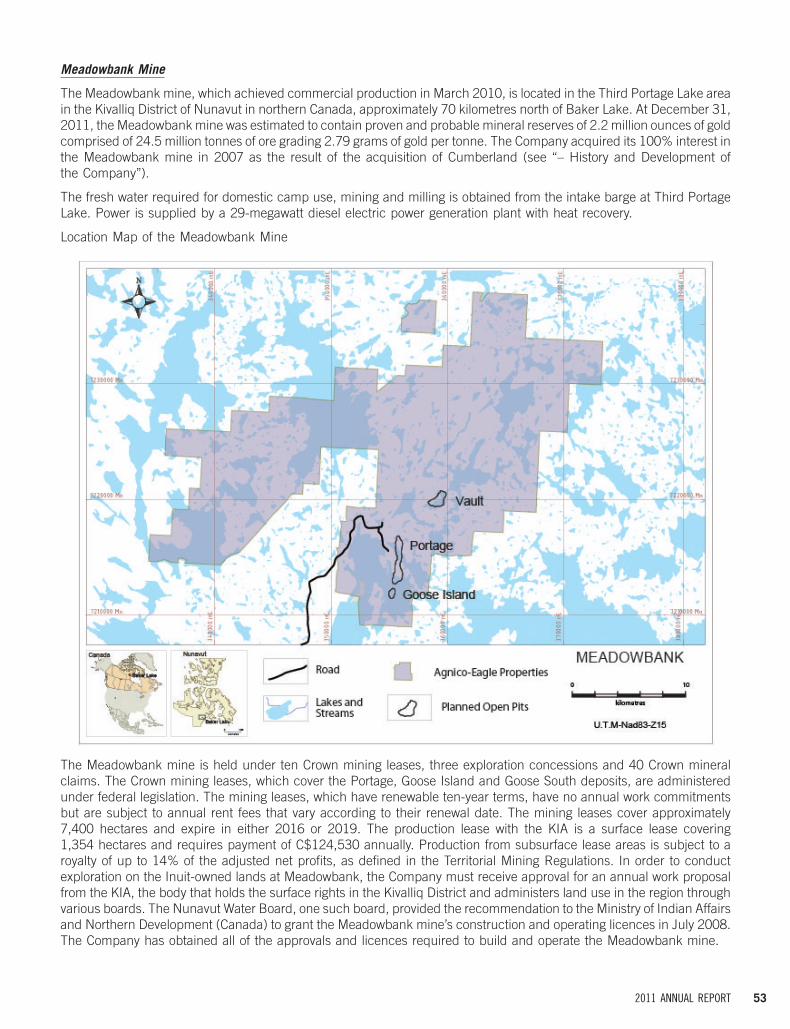
28MAR201202500367
Meadowbank Mine
The Meadowbank mine, which achieved commercial production in March 2010, is located in the Third Portage Lake areain the Kivalliq District of Nunavut in northern Canada, approximately 70 kilometres north of Baker Lake. At December 31,2011, the Meadowbank mine was estimated to contain proven and probable mineral reserves of 2.2 million ounces of goldcomprised of 24.5 million tonnes of ore grading 2.79 grams of gold per tonne. The Company acquired its 100% interest inthe Meadowbank mine in 2007 as the result of the acquisition of Cumberland (see ‘‘– History and Development ofthe Company’’).
The fresh water required for domestic camp use, mining and milling is obtained from the intake barge at Third PortageLake. Power is supplied by a 29-megawatt diesel electric power generation plant with heat recovery.
Location Map of the Meadowbank Mine
The Meadowbank mine is held under ten Crown mining leases, three exploration concessions and 40 Crown mineralclaims. The Crown mining leases, which cover the Portage, Goose Island and Goose South deposits, are administeredunder federal legislation. The mining leases, which have renewable ten-year terms, have no annual work commitmentsbut are subject to annual rent fees that vary according to their renewal date. The mining leases cover approximately7,400 hectares and expire in either 2016 or 2019. The production lease with the KIA is a surface lease covering1,354 hectares and requires payment of C$124,530 annually. Production from subsurface lease areas is subject to aroyalty of up to 14% of the adjusted net profits, as defined in the Territorial Mining Regulations. In order to conductexploration on the Inuit-owned lands at Meadowbank, the Company must receive approval for an annual work proposalfrom the KIA, the body that holds the surface rights in the Kivalliq District and administers land use in the region throughvarious boards. The Nunavut Water Board, one such board, provided the recommendation to the Ministry of Indian Affairsand Northern Development (Canada) to grant the Meadowbank mine’s construction and operating licences in July 2008.The Company has obtained all of the approvals and licences required to build and operate the Meadowbank mine.
532011 ANNUAL REPORT

The three Meadowbank exploration concessions comprise approximately 23,100 hectares and are granted by NunavutTunngavik, the corporation responsible for administering subsurface mineral rights on Inuit-owned lands in Nunavut.Exploration concessions cover the Vault deposit at Meadowbank and in 2012 will require annual rental fees ofapproximately C$92,504 and exploration expenditures of approximately C$693,780. During the exploration phase, theconcessions can be held for up to 20 years and the concessions can be converted into production leases with annual feesof C$1 per hectare, but no annual work commitments. Production from the concessions is subject to a 12% net profitsinterest royalty from which annual deductions are limited to 85% of the gross revenue.
The 40 Crown mineral claims cover approximately 36,433 hectares at Meadowbank and are subject to land fees and workcommitments. Land fees are payable only when work is filed. The most recent filing was in 2011, when approximatelyC$8,998 in land fees were paid and approximately C$2,266,670 in assessment work was submitted.
The Kivalliq region in which the Meadowbank mine is located has an arid arctic climate. The Meadowbank property issituated in an area characterized by low, rolling hills that are covered predominantly in heath tundra with numerous lakesand ponds. Elevation ranges from approximately 130 metres at lakeshores up to 200 metres on ridge crests. Operations atthe Meadowbank mine are expected to be year-round with only minor weather-related interruptions to mining operations;however, these interruptions are not expected to affect ore availability for milling operations or other operating activities.
The Meadowbank mine is accessible from Baker Lake, located 70 kilometres to the south, over a 110-kilometreall-weather road completed in March 2008. Baker Lake provides 2.5 months of summer shipping access via Hudson Bayand year-round airport facilities. The Meadowbank mine also has a 1,100-metre long gravel airstrip, permitting access byair. The Company uses ocean transportation for fuel, equipment, bulk materials and supplies from Montreal, Quebec,(or Hudson Bay port facilities) via barges and ships into Baker Lake during the summer port access period that starts at theend of July in each year. Fuel and supplies are transported year-round to the site from Baker Lake by conventional tractortrailer units using an all-weather private access road. Transportation for personnel and air cargo are provided onscheduled or chartered flights. The permanent bases for employees from which to service the Meadowbank mine are ValD’Or and Montreal in Quebec and the Kivalliq communities. Since February 2009, all chartered flights have landeddirectly at Meadowbank.
The Meadowbank mine achieved commercial production in March 2010 and produced 270,801 ounces of gold in 2011at total cash costs per ounce of $1,000. In 2012, total cash costs at Meadowbank are expected to be approximately$1,040 per ounce.
In 2012, payable gold production at Meadowbank is expected to be approximately 295,000 ounces, reflecting a slowerthan expected ramp-up to design rates as a result of a number of issues during startup over the past two years. While themill throughput is now exceeding the original design rate, the grades to the mill continue to be lower than expected. This,combined with the unexpected rise in minesite costs has resulted in a new mine plan which forecasts lower goldproduction over a shorter mine life. The mine life now extends to 2017 rather than 2020.
54 AGNICO-EAGLE MINES LIMITED

28MAR201202500768
Mining and Milling Facilities
Surface Plan of the Meadowbank Mine
Meadowbank has three major deposits that have sufficient drilling definition to sustain reserves; Portage, Goose and Vault.By the end of 2009, all of the camp infrastructure (dormitories and kitchen), a mill, a service building shop and generatorbuildings were built. All required aggregates used in the mining process are produced from waste material taken from thenorth end of the Portage pit. In 2008, a dewatering dyke was constructed in order to access the north half of the Portage pitin preparation for production in 2010. Construction of the Bay-Goose dyke, a major dewatering dike required to access thesouthern portion of the Portage and the Goose Island pits, commenced in the summer of 2009 and was completed in thespring of 2011. Three tailings impoundment dykes, Saddle Dam 1, Saddle Dam 2 and Stormwater Dykes, were built in2009 and 2010. Also, the first phase of the main tailings impoundment dyke, Central Dyke, was started in 2011 and will bein construction for the duration of the mine life. The eight-kilometer long access road to the Vault pit was started in 2011and will be completed in 2012.
Mining Methods
Mining at the Meadowbank mine is done by open pit with trucks and excavators. The ore is extracted conventionally usingdrilling and blasting, then hauled by trucks to a primary gyratory crusher adjacent to the mill. The marginal-grade material(material grading under the cut-off grade at a gold price of $1,255 per ounce but which has the potential to increase thereserves at the end of the mine life if the metal prices justify its processing) is stockpiled separately. Also, a sub-gradematerial stockpile (material for which extraction has already been paid but currently is lower than the mill feed grade) has
552011 ANNUAL REPORT

been created for potential processing at the end of the mine life. Waste rock is hauled to one of two waste storages on theproperty, used for dyke construction or construction material or backfilled into the mined out area.
Mining first commenced in the Portage pit in 2010 and was the only mine in production in 2011. Mining is scheduled tocommence in March 2012 in the Goose pit and in 2014 in the Vault pit.
Surface Facilities
The accommodations complex at the Meadowbank mine consists of a permanent camp and a temporary camp toaccommodate extra workers. The camp is supported with a sewage treatment, solid waste disposal and potable waterplant. In 2008, the exploration group was relocated eight kilometres south of the minesite location to a separate camp withan 80-person capacity.
Plant site facilities include a mill building, a maintenance mechanical shop building, a generator building, an assay laband a heavy vehicle maintenance shop. A structure comprised of two separate crushers flank the main process complex.Power is supplied by an 29-megawatt diesel electric power generation plant with heat recovery and an onsite fuel storage(5.6 million litres) and distribution system. The mill-service-power complex is connected to the accommodations complexby enclosed corridors. In addition, the Company will build peripheral infrastructure including tailings and wasteimpoundment areas.
Facilities constructed at Baker Lake include a barge landing site located three kilometres east of the community and astorage compound. A fuel storage and distribution complex with a 60-million litre capacity has been built next to the bargelanding facility.
The process design is based on a conventional gold plant flowsheet consisting of two-stage crushing, grinding, gravityconcentration, cyanide leaching and gold recovery in a CIP circuit. The mill is designed for year-round operations with adesign capacity of 9,800 tonnes per day. The overall gold recovery is projected to be approximately 92.9%, based onprojections from metallurgical test work, with approximately 15% typically recovered in the gravity circuit.
The run-of-mine ore is transported to the crusher using an off-road truck. The ore is dumped into the gyratory crusher orinto designated ore-type stockpiles. The product from the primary crusher is conveyed to the cone crusher in closedcircuit with a vibrating screen. The crushed ore is delivered to the coarse ore stockpile and ore from the stockpile isconveyed to the mill. The grinding circuit is comprised of a primary SAG mill operated in open circuit and a secondary ballmill operated in closed circuit with cyclones. A portion of the cyclone underflow stream is sent to the concentrator, whichseparates the heavy minerals from the ore. The grinding circuit incorporates a gravity process to recover free gold and thefree gold concentrate is leached in an intensive cyanide leach-direct electrowinning recovery process.
The cyclone overflow is sent to the grinding thickener. The clarified overflow is recycled to the grinding circuit andthickened underflow is pumped to a pre-aeration and leach circuit. The cyanide circuit consists of seven tanks providingapproximately 42 hours retention time. The leached slurry flows to a train of six CIP tanks. Gold in the solution flowing fromthe leaching circuit is adsorbed into the activated carbon. Gold is recovered from the carbon in a Zadra elution circuit andis recovered from the solution using an electrowinning recovery process. The gold sludge is then poured into dore barsusing an electric induction furnace.
The CIP tailings are treated for the destruction of cyanide using the standard sulphur-dioxide-air process. The detoxifiedtailings are then pumped to the permanent tailings facility. The tailings storage is designed for zero discharge, with allprocess water being reclaimed for re-use in the mill to minimize water requirements.
Mineral Recoveries
Gold recoveries are expected to average 92.9% for all deposits. The different ore zones have slightly different grindsensitivities to gold recovery and, as such, different particle size distributions are recommended as target grinds in theprocess. The use of a slightly coarser grind for the Vault ores will allow all three of the ore zones to be processed at aconsistent process throughput.
56 AGNICO-EAGLE MINES LIMITED

During 2011, gold recovery averaged 93.8%. Approximately 2,977,723 tonnes of ore were processed, averaging8,158 tonnes of ore per day with the mill operating 87.19% of available time. The following table sets out the metalrecoveries contained for the 2,977,723 tonnes of ore extracted at the Meadowbank mine in 2011.
OverallHead Metal Payable
Grade Recovery Production
Gold 3.01 g/t 93.82% 270,801 oz
Environmental Matters (including Inuit Impact and Benefit Agreement)
The development of the Meadowbank mine was subject to an extensive environmental review process under the NunavutLand Claims Agreement administered by the Nunavut Impact Review Board (the ‘‘NIRB’’). On December 30, 2006, apredecessor to the Company received the Project Certificate from the NIRB, which includes the terms and conditions toensure the integrity of the development process. The Nunavut Water Board provided the recommendation to the Ministryof Aboriginal Affairs and Northern Development Canada to grant the Meadowbank mine’s construction and operationunder a water licence in July 2008.
In February 2007, a predecessor to the Company and the Nunavut government signed a Development PartnershipAgreement (the ‘‘DPA’’) with respect to the Meadowbank mine. The DPA provides a framework for stakeholders includingthe federal and municipal governments and the KIA, to maximize the long-term socio-economic benefits of theMeadowbank mine to Nunavut.
An Inuit Impact Benefit Agreement for the Meadowbank mine (the ‘‘IIBA’’) was signed with the KIA in March 2006. Thisagreement was renegotiated and a revised IIBA was signed October 18, 2011. The IIBA ensures that local employment,training and business opportunities arising from all phases of the project are accessible to the Kivalliq Inuit. The IIBA alsooutlines the special considerations and compensation that Cumberland agreed to provide to the Inuit regarding traditional,social and cultural matters.
The Company currently holds a renewable exploration lease from the KIA that expires December 31, 2015. In July 2008,the Company signed a production lease for the construction and the operation of the mine, the mill and all relatedactivities. In April 2008, the Company and KIA signed a water compensation agreement for the Meadowbank mineaddressing Inuit rights under the Land Claims Agreement respecting compensation for water use and water impactsassociated with the project.
The Meadowbank mine consists of several gold-bearing deposits: Portage, Goose and Vault. A series of six dykes havebeen built to isolate the mining activities at the Portage and Goose deposits from neighbouring lakes. An additional dykewill be built in 2013 to isolate the mining activities at the Vault deposit. Waste rock from the Portage, Goose Island andVault pits will primarily be stored in the Portage and Vault rock storage facility, and a portion of the waste will be stored inthe Portage Pit. The control strategy to minimize the onset of oxidation and the subsequent generation of acid minedrainage includes freeze control of the waste rock through permafrost encapsulation and capping with an insulatingconvective layer of neutralizing rock (ultramafic and non-acid generating volcanic rocks). Because the site is underlain byabout 450 metres of permafrost, the waste rock below the capping layer is expected to freeze, resulting in low rates of acidrock drainage generation in the long term.
Tailings are stored in the Second Portage arm. Initially the tailings will be deposited in a subaqueous environment, but themajority of tailings will be deposited on tailings beaches. A reclamation pond will be operated within the tailings storagefacility. The control strategy to minimize water infiltration into the tailings storage facility and the migration of constituentsout of the facility includes freeze control of the tailings through permafrost encapsulation. A four-metre-thick dry cover ofacid neutralizing ultramafic rock backfill will be placed over the tailings as an insulating convective layer to confine thepermafrost active layer within relatively inert materials.
The water management objective for the project is to minimize the potential impact on the quality of surface water andgroundwater resources at the site. Diversion ditches will be constructed in 2012 to avoid the contact of clean runoff waterwith areas affected by the mine or mining activities. Contact water originating from affected areas is intercepted, collected,conveyed to the tailings storage facility for re-use in process or decanted to treatment (if needed) prior to release toreceiving lakes.
572011 ANNUAL REPORT

Capital Expenditures/Development
A total of $86.1 million has been budgeted to be spent at the Meadowbank mine (excluding exploration) in 2012,including $55 million on dyke construction, $29.1 million on sustaining capital and equipment and $4 million onconstruction projects carried over from 2011. As well, $1.6 million has been budgeted for 5,000 metres of diamonddrilling to convert resources to reserves in the Vault deposit area. Regional exploration in the Meadowbank area has beenbudgeted at $5.1 million and will include 13,000 metres of exploration diamond drilling.
The Meadowbank mine started production in 2010. Total capital costs of construction incurred since the date ofacquisition by the Company amounted to $838 million. The mine life is expected to be six years.
Geology, Mineralization and Exploration
Geology
The Meadowbank mine comprises a number of Archean-age gold deposits hosted within polydeformed volcanic andsedimentary rocks of the Woodburn Lake Group, part of the Western Churchill supergroup in northern Canada.
Three minable gold deposits – Goose, Portage and Vault – have been discovered along the 25-kilometre longMeadowbank gold trend, and the PDF deposit (a fourth deposit) has been outlined on the northeast gold trend. Theseknown gold resources are within 225 metres of the surface, making the project amenable to open pit mining.
Mineralization
The predominant gold mineralization found in the Portage and Goose deposits is associated with iron sulfides, mainlypyrite and pyrrhotite, which occur as a replacement of magnetite in the oxide facies iron formation host rock. To a lesserextent, pyrite and chalcopyrite may be found and, on rare occasions, arsenopyrite may be associated with the othersulphides. Gold is mainly observed in native form (electrum), occurring in isolated specs or as plating around sulfidegrains. The ore zones are typically 6-7 metres wide, following the contacts between the iron formation units and thesurrounding host rock. Zones extend up to several hundred metres along strike and at depth. The sulphides primarilyoccur as replacement of the primary magnetite layers, as well as narrow stringers or bands of disseminated sulphides thatalmost always crosscut the main foliation and/or bedding which would imply an epigenetic mode of emplacement. Thepercentage of sulphides is quite variable and may range from trace to semi-massive amounts over several centimetres toseveral metres in length. The higher gold grades and the occasional occurrence of visible gold are almost alwaysassociated with greater than 20% sulphide content.
The main mineralized banded iron formation unit is bounded by an ultramafic unit to the west which locally occursinterlayered with the banded iron formation and to the east by an intermediate to felsic metavolcaniclastic unit.
In the Vault deposit, pyrite is the principal ore bearing sulphide. The disseminated sulphides occur along sheared horizonsthat have been sericitized and silicified. These zones are several metres wide and may continue for hundreds of metresalong strike and down dip.
Three of the four known gold deposits are currently planned to be mined. The Goose Island and Portage deposits arehosted within highly deformed, magnetite-rich iron formation rocks, while intermediate volcanic rock assemblages hostthe majority of the mineralization at the more northerly Vault deposit. The fourth deposit, PDF, shows the samecharacteristics as Vault, though it is not currently anticipated to be a mineable deposit.
Defined over a 1.85-kilometre strike length and across lateral extents ranging from 100 to 230 metres, the geometry of thePortage deposit consists of general north-northwest-striking ore zones that are highly folded. The mineralization in thelower limb of the fold is typically six to eight metres in true thickness, reaching up to 20 metres in the hinge area.
The Goose Island deposit is located just south of the Portage deposit and is also associated with iron formation but exhibitsdifferent geometry, with a north-south trend and a steep westerly dip. Mineralized zones typically occur as a single unitnear surface, splaying into several limbs at depth. The deposit is currently defined over a 750-metre strike length anddown to 500 metres at depth (mainly in the southern end), with true thicknesses of three to 12 metres (reaching up to20 metres locally). The Goose underground resource (100 to 500 metres at depth) extends 700 metres to the south of theGoose pit. The ore zones show the same characteristics as the Goose pit, which is two to five main zones sub-parallel andundulating. The average thickness rarely exceeds three to five metres.
The Vault deposit is located seven kilometres northeast of the Portage and Goose deposits. It is planar and shallow-dippingwith a defined strike of 1,100 metres. The deposit has been disturbed by two sets of normal faults striking east-west and
58 AGNICO-EAGLE MINES LIMITED

north-south and dipping moderately to the southeast and steeply to the east, respectively. The main lens has an averagetrue thickness of eight to 12 metres, reaching as high as 18 metres locally. The hanging wall lenses are typically three tofive metres, and up to seven metres, in true thickness.
Exploration
Grass roots exploration in the project area began as early as 1980. As some interesting targets arose, several companiesconducted various types of work between 1980 and 2007. Throughout these years, six deposits were the main focus ofexploration: Portage, Cannu, Bay Zone, Goose, Vault and PDF. Over time, the Cannu, Bay Zone and Portage deposits werecombined into one mineable deposit referred to as Portage. Exploration has extended the Goose Island deposit southward,adding the Goose South and Gosling zones.
In 2009, the mine exploration group took over the pit and adjacent areas. Three goals were targeted: exploration drilling,resource conversion and waste pad condemnation.
In 2010, 102 holes totalling 37,928 metres were drilled. The focus of the exploration campaign was testing theunderground potential of the Goose deposit, resource conversions at the Vault deposit and on the south continuity of thePortage and Goose deposits. On the Goose underground deposit, a total of 23 holes for 11,145 metres were drilled from200 to 750 metres in depth. These holes contributed to increase the continuity and understanding of the mineralization.The drilling was predominantly to expand the Goose deposit at depth and towards the south, as well as to conduct infilldrilling in areas where large gaps occurred between auriferous intersections. The program was successful in expandingthe Goose deposit at depth and towards the south.
On the Vault deposit, a total of 39 holes for 5,943 metres were drilled from 25 to 200 metres in depth. These holes wereaimed at converting resources close to the pit shell and also to extending resources to the south-west continuity towardsthe Tern Lake porphyry.
On the southern portion of the Portage deposit, a total of 18 holes for 8,070 metres were drilled from 50 to 250 metres indepth with the aim of converting resources directly south of the Portage pit and other inferred occurrences within a closeproximity to the pit.
On the Goose south trend, a total of 13 holes for 7,320 metres were drilled from 150 to 250 metres in depth. These holeswere aimed at following the south trend of the Portage-Goose iron formation.
In 2011, 284 diamond drill holes totalling 24,229 metres were drilled. The exploration program had four goals: exploringthe southern trend of the Goose deposit at depth; following-up on the regional results of testing on the Farwest IronFormation and the geophysics of the Tern Lake porphyry completed in 2010; continuing resource conversion workinitiated on the Vault deposit in 2010 and extending resources on the south west part of deposit; and a resourcesconversion with a definition program in Portage pit.
The definition program on the Portage pit was conducted in phases from May to December 2011 and represented165 holes totalling 11,431 metres of diamond drilling. In addition, a new method was tried in the Portage pit for definitiondrilling, a reverse circulation drill was used to drill over 42 holes totalling 1,074 metres. This method will reduce the costof drilling.
On the Goose South trend, 6 holes totalling 2,382 metres were drilled. On the Farwest Iron Formation, 7 holes for a total of2,721 metres were drilled along the trend and verified the potential of the west contact with the granitic mass. On the TernLake porphyry, 19 holes totalling 931 metres were drilled.
At the Vault pit, 19 holes were drilled for a total of 1,250 metres, 43 holes totalling 3,545 metres were drilled in Vault Southand 25 holes totalling 1,969 metres were drilled in Vault East.
Drilling carried out during the period of 2009 to 2011 returned significant results on the Goose underground and Vaultdeposits. At the Goose underground deposit, the increase in indicated mineral resources comes from a confirmation ofcontinuity towards the south and at depth. At the Vault deposit, the increase in mineral reserves is the result of convertingresources to reserves along the east pit wall. Positive drill results show continuity of mineralization toward the southwest,indicating that the pit can be expanded in that direction.
592011 ANNUAL REPORT

Meliadine Project
The Meliadine project is an advanced exploration property located near the western shore of Hudson Bay in the Kivalliqregion of Nunavut, about 25 kilometres north of the hamlet of Rankin Inlet and 290 kilometres southeast of theMeadowbank mine. The closest major city is Winnipeg, Manitoba, about 1,500 kilometres to the south.
Agnico-Eagle acquired its 100% interest in the Meliadine project through its acquisition of Comaplex in July 2010 (see‘‘– History and Development of the Company’’).
The mineral reserves and resources of the Meliadine project are estimated at December 31, 2011, to contain proven andprobable mineral reserves of 2.9 million ounces of gold in 12.5 million tonnes of ore grading 7.18 grams per tonne. Inaddition, the project has 12.6 million tonnes of indicated mineral resources grading 4.09 grams of gold per tonne, and12.7 million tonnes of inferred mineral resources grading 5.98 grams of gold per tonne.
The Meliadine property is a large, almost entirely contiguous land package that is nearly 80 kilometres long. It consists of55,603 hectares of mineral rights, of which 52,173 hectares are held under the Canada Mining Regulations andadministered by the Department of Indian Affairs and Northern Development and referred to as Crown Land. The CrownLand is made up of mining claims covering 887 hectares and mineral leases covering 51,285 hectares. There are also3,430 hectares of subsurface Nunavut Tunngavik Inc. concessions administered by a division of the Nunavut Territorialgovernment.
The Kivalliq region has an arid arctic climate. The Meliadine property is mainly covered by glacial overburden with thepresence of deep-seated permafrost. The property is about 60 metres above sea level in low-lying topography withnumerous lakes. Surface waters are usually frozen by early October and remain frozen until early June. Surface geologicalwork can be carried out from mid-May to mid-October, while exploration drilling can take place throughout the year,though is reduced in January and February due to cold and darkness.
Equipment, fuel and dry goods are transported on the annual warm-weather sealift by barge to Rankin Inlet via HudsonBay. Ocean-going barges from Churchill, Manitoba or eastern Canadian ports can access the community from late June toearly October. Churchill, which is approximately 470 kilometres south of Rankin Inlet, has a deep-water port facility and ayear-round rail link to locations to the south.
Personnel, perishables and lighter goods arrive at the Rankin Inlet regional airport by commercial or charter airline, fromwhich they can be flown to the property by chartered helicopter. An all-weather gravel road extends from Rankin Inlet towithin two kilometres of the Meliadine River, which is approximately 15 kilometres away from the property, but there iswinter-road access for tracked vehicles from Rankin Inlet directly to the Meliadine project exploration camp from Januaryto mid-May. The Company has proposed the building of a 23.8-kilometre long all-weather gravel road linking Rankin Inletwith the project site to support ongoing exploration activities at the Meliadine project property. An application to constructthis road was submitted to the NIRB and other regulatory agencies in 2011. A positive decision from the NIRB on theapplication was received in February, 2012 and approvals from other regulatory agencies are pending. A positive decisionwill allow construction to begin in 2012, in which case the road is expected to be completed by the summer of 2013.
Exploration personnel for the Meliadine project are mainly sourced from other parts of Canada on a fly-in/fly-out rotationfrom Val d’Or, Quebec, and Winnipeg, Manitoba, approximately 1,500 kilometres south of the Meliadine project property,respectively, although there is preferential employment of qualified people from the Kivalliq region. The hamlet of RankinInlet has developed a strong taskforce of entrepreneurs that provide a wide variety of services, such as freight expediting,equipment supply and outfitting.
60 AGNICO-EAGLE MINES LIMITED

28MAR201202502607
Location Map of the Meliadine Project
612011 ANNUAL REPORT

28MAR201202501289
Facilities
Surface Plan of the Meliadine Project
Current facilities at the Meliadine project include the Meliadine project exploration camp located on the shore of MeliadineLake, approximately 2.3 kilometres north of the Tiriganiaq deposit. The camp is constructed of Weatherhaven tents andcan accommodate up to 150 personnel. Covered wooden walkways connect all tents to the washrooms and kitchenfacilities. A 100-person, self-contained trailer camp, complete with two diesel generators, was installed adjacent to theexisting exploration camp in early 2011. A second 100-person, self-contained trailer camp is expected to be installed inthe first half of 2012.
Power is currently generated using diesel generators for the Meliadine exploration camp on an as-required basis. Potablewater for the Meliadine project camp is pumped from Meliadine Lake and water for the previous underground operationsand surface drill programmes is pumped from Pump Lake. The current water licence allows for a maximum daily wateruse of 290 cubic metres (Meliadine West), while a request for an amendment to the water licence was filed inOctober 2010 with the Nunavut Water Board (Meliadine East) to increase water use to 299 cubic metres per day.
The Meliadine project exploration camp has an incinerator on site to burn all flammable materials, such as camp and foodwastes. Plastics and metal objects, along with incinerator ash, are set aside for transport to be disposed of in the RankinInlet landfill. All hazardous and liquid wastes are held at the Meliadine project site for transport to a waste managementcompany in southern Canada.
62 AGNICO-EAGLE MINES LIMITED

Sewage has been treated through a Biodisk treatment system since the summer of 2010. Run-off water is contained in theprimary water containment area and released only when sampling results meet acceptable water quality standards.Routine water sampling has been conducted since the mid-1990s and reported on a monthly basis to the authorities.
The Meliadine East camp on Atulik Lake was decommissioned during the summer of 2010, with completion in the winterof 2010 and 2011. The core shack and storage building remain at the former camp site.
An underground portal allowing access to an exploration decline was built at the Tiriganiaq deposit in 2007 and 2008 inorder to extract a bulk sample for study purposes. A waste rock and ore storage pad was generated during excavation ofthe decline and a sampling tower was installed for processing the bulk sample. There is a two-kilometre road between theMeliadine project exploration camp and the portal site. Another bulk sample was taken from underground via this portal in2011 and results are expected to be available in early 2012.
Environmental Matters (including Inuit Impact Benefit Agreement)
Land and environmental management in the region of the Meliadine project is generally governed by the provisions of theNunavut Land Claims Agreement (‘‘NLCA’’). Pursuant to the NLCA, land use leases must be obtained from the KIA. TheMeliadine project has been granted a commercial lease for exploration and underground development activity, aprospecting and land use lease for exploration and development activities, an exploration land use lease for explorationand drilling on the Inuit-owned lands of Meliadine East and a parcel drilling permit for drilling activity on Inuit-owned lands.A number of right-of-way leases covering road access to the Meliadine project property and esker quarrying on the Inuit-owned lands were also granted by the KIA.
Pursuant to the NLCA, an exploration water licence and a bulk sample water licence were granted by the Nunavut WaterBoard (the ‘‘NWB’’). An application was made to the NIRB and the NWB for the construction of an access road to theMeliadine project camp to be able to carry out the exploration program year-round.
A Project Certificate from the NIRB is the next approval required by the Meliadine project. Other operating permits andlicences can only be issued after such Project Certificate is received. An Inuit Impact Benefit Agreement and an InuitWater Compensation Agreement will also need to be negotiated with the KIA.
Geology, Mineralization and Exploration
Geology and Mineralization
Archean volcanic and sedimentary rocks of the Meliadine greenstone belt underlie the property, which is mainly coveredby glacial overburden with deep-seated permafrost and is part of the Western Churchill supergroup in northern Canada.The rock layers have been folded, sheared and metamorphosed, and have been truncated by the Pyke Fault, a regionalstructure that extends the entire 80-kilometre length of the large property.
The Pyke Fault appears to control gold mineralization on the Meliadine project property. At the southern edge of the fault isa series of oxide iron formations that host all six Meliadine project deposits currently known. The deposits consist ofmultiple lodes of mesothermal quartz-vein stockworks, laminated veins and sulphidized iron formation mineralization withstrike lengths of up to three kilometres. The Upper Oxide iron formation hosts the Tiriganiaq and Wolf North zones. The twoLower Lean iron formations contain the F Zone, Pump, Wolf Main and Wesmeg deposits, which are all within fivekilometres of Tiriganiaq. The Discovery deposit is 17 kilometres east southeast of Tiriganiaq and is hosted by the UpperOxide iron formation. Each of these deposits has mineralization within 120 metres of surface, making them potentiallymineable by open pit methods. They also have deeper ore that could potentially be mined with underground methods.
Exploration
The Meliadine property has been explored for gold from 1987 through 2010 at a cost of C$166.8 million by former ownersAsamera Inc., Rio Algom Limited, Comaplex, Cumberland and Western Mining International, as well as the Company andnumerous reputable consultants. For many years the property was divided into two halves – Meliadine East and MeliadineWest – which were consolidated into the Meliadine property in December 2009. A detailed history of exploration on theproperty is given in a technical report by the Company posted on SEDAR on March 8, 2011.
Lack of outcropping bedrock in the area resulted in the use of high-density magnetic surveying followed by diamonddrilling as the most common and successful exploration strategy on the property. This has included 193,318 metres ofdrilling in 682 holes from 1993 through 2010, as well as geophysical surveying, prospecting and sampling. In 2007 and2008, there was an underground exploration and bulk sample program on the Tiriganiaq deposit. This was followed by a
632011 ANNUAL REPORT

28MAR201202500009
Preliminary Assessment for the property in 2009, which indicated the potential of the project to support a miningoperation.
In 2010, there were 128 exploration drill holes (32,000 metres) at the Meliadine project, of which 53% were drilled by theCompany after acquiring the property in July 2010. Agnico-Eagle spent $10 million on exploration from July throughDecember 2010.
The Company initiated a $129.6 million exploration program in the summer of 2010. Approximately 200,000 metres ofdrilling is planned through early 2013, mainly to convert mineral resources to reserves at Tiriganiaq. At the end of 2011,the Company spent $74.7 million, principally in diamond drilling (105,000 metres), bulk sample, updated feasibility study,permitting, all-weather road and camp expansion. Another $54.9 million has been budgeted through early 2013 tocomplete the exploration program (diamond drilling, feasibility study, permitting and the construction of an all-weatherroad linking the project to Rankin Inlet). The Company spent an additional $12 million in 2011 for the ramp project andhas budgeted $16.1 million for this purpose in 2012.
La India Project
Location Map of the La India Project
The La India project is located in the Mulatos Gold Belt in the municipality of Sahuaripa, southeast Sonora State innorthern Mexico. The Mulatos Gold Belt is part of the Sierra Madre gold and silver belt that also hosts the operatingMulatos gold mine immediately southeast of the La India project property and the Pinos Altos mine and Creston Mascotaat Pinos Altos deposit 70 kilometres to the southeast.
The La India project includes the La India feasibility-stage heap leach gold project as well as the recently discoveredTarachi gold zone and several other prospective targets in the belt. The property consists of 43 mining concessionstotalling approximately 56,000 hectares, making the Company the largest mineral title holder by area in the Mulatos Gold
64 AGNICO-EAGLE MINES LIMITED

Belt. The climate is semi-arid with seasonal temperatures ranging from 35 degrees Celsius to –2 degrees Celsius, andtorrential rainfall from July to September. Exploration activities may be conducted year-round.
The project is located between the small rural towns of Tarachi and Matarachi, which offer basic infrastructure in the formof roads, rural telephone service, small grocery stores and unpaved air strips. More services are available in the town ofSahuaripa located 60 kilometres by gravel road (about 2.5 hours) northwest of the La India project. The population of thedistrict is estimated to be a few thousand, with most of the inhabitants involved in cattle ranching, farming, forestry andmining and exploration. An adequate supply of labour for mining operations can be drawn from the region. Trainedexploration personnel for the La India project are mainly sourced from northern Mexico including Hermosillo, Sonora.
The closest major city with an international airport is Hermosillo, the capital of Sonora, located 210 kilometreswest-northwest of the La India project. Road travel from Hermosillo to the site takes approximately seven hours.Alternatively, the project can be accessed by small aircraft. The federally owned and operated electric transmission gridextends to within approximately 60 kilometres of the project.
Grayd began to actively explore the project in 2004, and began preliminary metallurgical test work in 2006. Graydproduced NI-43-101 compliant technical reports as of 2004, 2006, 2008, 2009 and May 2010. A Preliminary EconomicAssessment (‘‘PEA’’) was completed on behalf of Grayd on December 6, 2010 by independent consultants, based on onlythe oxide portion of the La India project resources (as reported in May 2010). The PEA envisioned an open pit mine withgold recovery of 80% by heap leach with an overall average annual production of 92,000 ounces over its nine-year life.According to the PEA, annual production could range from a low of 66,000 ounces in year six to a high of 108,000 ouncesin year seven.
As of December 31, 2011, the La India project consisting of the La India feasibility-stage heap leach gold project andTarachi gold zone had a measured resource of 3.7 million tonnes of ore grading 1.06 grams of gold per tonne, and anindicated resource of 44.5 million tonnes of ore grading 0.72 grams of gold per tonne and inferred resources of32.1 million tonnes grading 0.69 grams of gold per tonne, using a cut-off of 0.40 grams of gold per tonne. These resourcesare in the North and Main zones of the La India project and the Tarachi gold zone.
The defined mineral resources and all lands required for infrastructure as proposed by the PEA for the La India project arewholly contained within three privately held properties.
At the Tarachi gold zone, the surface rights in the project area are owned by the Matarachi Ejido (agrarian community) andprivate parties. All measured, indicated and inferred project resources lie within privately owned or ejido possessed land.Surface access lease agreements have been executed with the property owners or possessors for all identified targetareas. The existing agreements permit exploration activities only; if mining activity is contemplated in this exploration areathe Company will require further negotiations to acquire the surface rights needed for project development.
Mining and Milling Facilities
Surface Facilities
Current facilities at the La India project include an exploration camp, which consists of former ranch house buildings thathave been modified for housing requirements. The power for the exploration camp is supplied by diesel generators, wateris supplied by a local spring and septic discharges are managed in a leach field. Non-organic waste from the camp isdisposed in the Matarachi Ejido landfill. The camp will be modified and expanded as the Company develops the La Indiaproject in 2012.
Environmental Matters
Baseline environmental information has been collected at the La India project since late 2008. This information includessurface water sampling, archeological assessment and soil, fauna and flora assessments.
The La India project is not located in an area with a special Federal environmental protection designation. Therefore, basicexploration activities are regulated under Norma Oficial Mexicana NOM-120-ECOL-1997, which allows for mostexploration activities including mapping, geochemical sampling, geophysical surveys, mechanized trenching, roadbuilding and drilling. Mine construction and operation activities generally require the preparation of a Manifesto deImpacto Ambiental (MIA, an environmental impact statement), and a Cambio de Uso de Suelo (CUS, a land usechange) permit.
No factors have been identified that would be expected to hinder authorization of Federal and State environmental permitsrequired for construction and operation of a mine at the La India project. Some historic mining has been observed in the
652011 ANNUAL REPORT

area but the remaining waste dumps and tailings are small and are not considered to present significant environmentalissues. No obstacles to obtaining the permits are anticipated providing Agnico-Eagle obtains the necessary surface rightsand meets the design and mitigation criteria required by the Mexican permitting authorities. The Company hasconsiderable permitting experience in Mexico and is familiar with the regulatory requirements as a result of its ongoingoperations at the Pinos Altos mine and the Creston Mascota deposit at Pinos Altos.
Agreements & Licences
The mining concessions for the La India project and Tarachi are controlled by the Company by means of direct ownershipand by 11 separate agreements whereby Agnico-Eagle can earn a 100% interest in certain concessions by making cashand share payments. For the La India project, should the Company elect to acquire all currently optioned concessions, anadditional $2.3 million in payments would be required. Payment has been made in full for the claims that host most of themeasured, indicated and inferred resources. Some concessions are subject to underlying net smelter royalties varyingbetween 1% and 3%, some of which may be purchased by the Company which would result in net smelter royaltiesbetween 0% and 0.5%.
For the Tarachi gold zone, payments totalling $3.3 million and shares with value equivalent to $967,500 over an eight yearperiod are required for the Company to earn a 100% interest in the relevant concessions. To date $1 million has been paidtoward these concessions. Should the Company elect to acquire all currently optioned concessions, an additional$2.3 million in payments would be required. Some concessions are subject to underlying net smelter royalties varyingbetween 1% and 3%, some of which may be purchased by the Company, which would result in net smelter royaltiesbetween 0% and 0.5%.
The defined mineral reserve and resource and all lands required for infrastructure as proposed by the PEA are whollycontained within three privately-held properties. Agnico-Eagle has acquired the surface rights for the Bronces y Bajios andla Armagosa ranches and negotiations are underway with the owner of the el Duraznito ranch. The current landagreements are sufficient to permit exploration activities that are conducted under environmental regulation NOM-120.Construction and mine development could begin on the Bronces y Bajios and la Armagosa ranches subject to receipt ofnecessary permits, and the development of mining activity on the el Duraznito ranch is pending a final surface agreement.
At the Tarachi gold zone, the surface rights in the project area are owned by the Matarachi Ejido and private parties. Allmeasured, indicated and inferred project resources lie within privately owned or ejido possessed land. Surface accesslease agreements have been executed with the property owners or possessors for all identified target areas. The existingagreements permit exploration activities only, further negotiation would be required for any future mine development at theTarachi gold zone.
Geology, Mineralization and Exploration
Geology and Mineralization
The La India project lies within the Sierra Madre Occidental (‘‘SMO’’) province, an extensive Eocene to Miocene volcanicfield from the United States-Mexico border to central Mexico. The La India project lies within the western limits of the SMOin an area dominated by outcrops of andesite and dacitic tuffs, overlain by rhyolites and rhyolitic tuffs that were affected bylarge-scale north-northwest-striking normal faults and intruded by granodiorite and diorite stocks. Incised fluvial canyonscut the uppermost strata and expose the Lower Series volcanic strata.
The project area is predominantly underlain by a volcanic sequence comprised of andesitic and felsic extrusive volcanicstrata with interbedded epiclastic volcaniclastic strata of similar composition. The mineral occurrences present in theproject area, and the deposit type being sought, are volcanic-hosted epithermal, high-sulphidation gold-silver deposits.Such deposits may be present as veins and/or disseminated deposits. The La India project deposit area is one of severalhigh-sulphidation epithermal mineralization centres recognized in the region.
Epithermal high-sulphidation mineralization at the La India project developed as a cluster of gold zones (Main and North)aligned north-south within a genetically related zone of hydrothermal alteration in excess of 20 square kilometres in area.Gold mineralization is confined to the Late Eocene rocks within zones of intermediate and advanced argillitic alterationoriginally containing sulphides, and subsequently oxidized by supergene processes. The North and Main zones are withintwo kilometres of each other.
66 AGNICO-EAGLE MINES LIMITED

Surface outcrop mapping and drill-hole data so far indicate that the gold system at the Tarachi gold zone is likely bestclassified as a gold porphyry deposit.
Exploration
Gold was discovered at the Mulatos deposit by the Spanish colonials in 1806, but indigenous peoples likely exploited thenative-gold-bearing oxidized zone of the deposit prior to this. Small underground mines and prospects are presentthroughout the La Cruz and La Viruela areas, where modern exploration was conducted by New Golden SceptreMinerals Ltd. and New Goliath Minerals Ltd. (late 1980s), Noranda Inc. (early 1990s) and San Fernando Mining Co. Ltd.(from 1993).
Grayd began to actively explore the project in 2004, including geologic mapping, geochemical rock chip sampling,airborne and ground geophysical surveys, photogrammetric topographic mapping, diamond drilling, reverse circulationdrilling, baseline environmental studies and metallurgical testing. Newmont Mining Corp. funded the work betweenJuly 2005 and July 2006 and then declined to continue, retaining no interest in the property. The Tarachi gold zone,located approximately 10 kilometres north of the La India project on the same property, was discovered in 2010.
From 2004 through February 7, 2011, Grayd completed 129 diamond drill holes (13,834 metres) and 560 reversecirculation drill holes (49,552 metres) at the La India project. In 2011, 13 diamond drill holes (1,119 metres) and30 reverse circulation drill holes (2,728 metres) were drilled at the La India project and 25 diamond drill holes(5,400 metres) and 67 reverse circulation drill holes (16,144 metres) were drilled at the Tarachi gold zone.
The La India feasibility-stage heap leach gold project deposit and the Tarachi gold zone will continue to be activelyexplored by Agnico-Eagle. The Company has initiated an $18.6 million exploration and development program at theLa India feasibility-stage heap leach gold project deposit for 2012 that will include infill drilling, technical studies, landacquisition, water acquisition, infrastructure and permitting efforts. At the Tarachi gold zone, the Company has planned a$5 million exploration program with approximately 9,850 metres of diamond drilling and 10,000 metres of reversecirculation drilling planned in 2012.
Regional Exploration Activities
During 2011, the Company continued to actively explore in Quebec, Ontario, Nunavut, Nevada, Finland, Sweden, Mexicoand Argentina. The Canadian exploration activities were focused on the Ellison/Bousquet and Maritime/Lapa properties inQuebec, as well as on the Meadowbank property in Nunavut where activities were conducted both within and outside themining lease and the Meliadine project, also in Nunavut. In the United States, exploration activities during 2011 wereconcentrated on the West Pequop project located in northeast Nevada and the Rattlesnake project located in Wyoming. Atthe LaRonde, Goldex, Lapa, Pinos Altos and Kittila mines, the Company continued exploration programs around themines. Most of the exploration budget was spent on drilling programs near the mine infrastructure, along previouslyrecognized gold trends.
At the end of 2011, the Company’s land holdings in Canada consisted of 77 projects comprised of 2,879 mineral titlescovering an aggregate of 270,513 hectares. Land holdings in the United States consisted of 6 properties comprised of3,486 mineral titles covering an aggregate of 30,552 hectares. Land holdings in Finland consisted of three groups ofproperties comprised of 133 mineral titles covering an aggregate of 11,757 hectares. Land holdings in Sweden consistedof one project comprised of four mineral titles covering an aggregate of 2,830 hectares. Land holdings in Mexico consistedof six projects comprised of 111 mining concession titles covering an aggregate of 125,820 hectares. Land holdings inArgentina consisted of one project with two mineral titles covering an aggregate of 2,691 hectares.
The total amount spent on regional exploration in 2011 was $76.1 million, which included drilling 775 holes for anaggregate of approximately 216 kilometres. The budget for regional exploration expenditures in 2012 is approximately$67.4 million, including approximately 212 kilometres of drilling.
Mineral Reserves and Mineral Resources
Cautionary Note to Investors Concerning Estimates of Measured and Indicated Mineral Resources
This section uses the terms ‘‘measured mineral resources’’ and ‘‘indicated mineral resources’’. Investors are advised thatwhile these terms are recognized and required by Canadian regulations, the SEC does not recognize them. Investors arecautioned not to assume that any part or all of mineral deposits in these categories will ever be converted into mineralreserves.
672011 ANNUAL REPORT

Cautionary Note to Investors Concerning Estimates of Inferred Mineral Resources
This section uses the term ‘‘inferred mineral resources’’. Investors are advised that while this term is recognized andrequired by Canadian regulations, the SEC does not recognize it. ‘‘Inferred mineral resources’’ have a great amount ofuncertainty as to their existence, and great uncertainty as to their economic and legal feasibility. It cannot be assumed thatany part or all of an inferred mineral resource will ever be upgraded to a higher category. Under Canadian rules, estimatesof inferred mineral resources may not form the basis of feasibility or pre-feasibility studies, except in rare cases. Investorsare cautioned not to assume that any part or all of an inferred mineral resource exists, or is economically or legally mineable.
The preparation of the information set forth below with respect to the mineral reserves at the LaRonde mine (whichincludes mineral reserves at the LaRonde mine extension), the Lapa, Kittila, Pinos Altos and Meadowbank mines and theMeliadine and Bousquet projects has been supervised by the Company’s Vice-President, Project Development, MarcLegault, P.Eng, a ‘‘qualified person’’ as that term is defined in NI 43-101. The Company’s mineral reserves estimate wasderived from internally generated data or geology reports.
The criteria set forth in NI 43-101 for reserve definitions and guidelines for classification of mineral reserve are similar tothose used by Guide 7. However, the definitions in NI 43-101 differ in certain respects from those under Guide 7. UnderGuide 7, among other things, a mineral reserve estimate must have a ‘‘final’’ or ‘‘bankable’’ feasibility study. Guide 7 alsorequires the use of commodity prices that reflect current economic conditions at the time of reserve determination whichStaff of the SEC has interpreted to mean historic three-year average prices. In addition to the differences noted above,Guide 7 does not recognize mineral resources.
The assumptions used for the 2011 mineral reserves and resources estimate reported by the Company in this Form 20-Fwere based on three-year average prices for the period ending December 31, 2011 of $1,255 per ounce gold, $23.00 perounce silver, $0.91 per pound zinc, $3.25 per pound copper, $0.95 per pound lead and exchange rates of C$1.05 per$1.00, 12.86 Mexican pesos per $1.00 and $1.37 per c1.00. The assumptions used for the 2010 mineral reserves andresources estimate reported by the Company in this Form 20-F were based on three-year average prices for the periodending December 31, 2010 of $1,024 per ounce gold, $16.62 per ounce silver, $0.86 per pound zinc, $2.97 per poundcopper, $0.90 per pound lead and exchange rates of C$1.08 per $1.00, 12.43 Mexican pesos per $1.00 and $1.40 perc1.00. The assumptions used for the 2009 mineral reserves and resources estimate used by the Company in thisForm 20-F were based on three-year average prices for the period ending December 31, 2009 of $848 per ounce gold,$14.35 per ounce silver, $1.03 per pound zinc, $3.15 per pound copper, $0.97 per pound lead and exchange rates ofC$1.09 per $1.00, 11.00 Mexican pesos per $1.00 and $1.37 per c1.00. Other assumptions used for estimating 2010and 2009 mineral reserve and resource information may be found in the Company’s annual filings in respect of the yearsended December 31, 2010 and December 31, 2009, respectively.
68 AGNICO-EAGLE MINES LIMITED

Set out below are the reserve estimates as of December 31, 2011, as calculated in accordance with NI 43-101 andGuide 7, respectively (tonnages and contained gold quantities are rounded to the nearest thousand):
National Instrument 43-101 Industry Guide No. 7
Gold GoldGrade Contained Grade Contained
Property Tonnes (g/t) Gold (oz) Tonnes (g/t) Gold (oz)
Proven ReservesLaRonde mine (underground) 5,331,000 2.60 445,000 5,331,000 2.60 445,000
Kittila mine (open pit) 319,000 3.86 40,000 319,000 3.86 40,000
Kittila mine (underground) 383,000 6.11 75,000 383,000 6.11 75,000
Kittila mine total proven 702,000 5.09 115,000 702,000 5.09 115,000
Lapa mine (underground) 1,044,000 6.45 217,000 1,044,000 6.45 217,000
Meliadine project (open pit) 34,000 7.31 8,000 34,000 7.31 8,000
Pinos Altos mine (open pit) 848,000 0.80 22,000 848,000 0.80 22,000
Pinos Altos mine (underground) 1,139,000 2.59 95,000 1,139,000 2.59 95,000
Pinos Altos mine total proven 1,987,000 1.83 117,000 1,987,000 1.83 117,000
Meadowbank mine (open pit) 1,931,000 1.49 92,000 1,931,000 1.49 92,000
Total Proven Reserves 11,029,000 2.80 994,000 11,029,000 2.80 994,000
Probable Reserves
LaRonde mine (underground) 27,901,000 4.74 4,255,000 27,901,000 4.74 4,255,000
Bousquet (open pit) 3,165,000 1.88 191,000 3,165,000 1.88 191,000
Kittila mine (open pit) 802,000 5.66 146,000 802,000 5.66 146,000
Kittila mine (underground) 33,060,000 4.63 4,916,000 33,060,000 4.63 4,916,000
Kittila mine total probable 33,862,000 4.65 5,062,000 33,862,000 4.65 5,062,000
Lapa mine (underground) 1,340,000 6.61 285,000 1,340,000 6.61 285,000
Meliadine project (open pit) 5,292,000 5.80 987,000 5,292,000 5.80 987,000
Meliadine project (underground) 7,142,000 8.20 1,882,000 7,142,000 8.20 1,882,000
Meliadine project total probable 12,434,000 7.18 2,869,000 12,434,000 7.18 2,869,000
Pinos Altos mine (open pit) 19,599,000 1.68 1,059,000 19,599,000 1.68 1,059,000
Pinos Altos mine (underground) 25,193,000 2.38 1,927,000 25,193,000 2.38 1,927,000
Pinos Altos mine total probable 44,792,000 2.07 2,986,000 44,792,000 2.07 2,986,000
Meadowbank mine (open pit) 22,563,000 2.91 2,109,000 22,563,000 2.91 2,109,000
Total Probable Reserves 146,057,000 3.78 17,757,000 146,057,000 3.78 17,757,000
Total Proven and Probable Reserves 157,086,000 3.71 18,750,000 157,086,000 3.71 18,750,000
In the following tables setting out mineral reserve information about the Company’s mineral projects, tonnage informationis rounded to the nearest thousand tonnes, the total contained gold ounces stated do not include equivalent gold ouncesfor byproduct metals contained in the mineral reserve, and the reported metal grades in the estimates represent in-placegrades and do not reflect losses in the recovery process, that is, the metallurgical losses associated with processing theextracted ore. The mineral reserve and mineral resource figures presented in this Form 20-F are estimates, and noassurance can be given that the anticipated tonnages and grades will be achieved or that the indicated level of recoverywill be realized.
692011 ANNUAL REPORT

LaRonde Mine Mineral Reserves and Mineral Resources
As at December 31,
2011 2010 2009
Gold-Rich OrebodyProven mineral reserves – tonnes 4,100,000 3,200,000 2,700,000
Average grade – gold grams per tonne 3.10 3.07 3.37
Probable mineral reserves – tonnes 26,700,000 27,900,000 26,500,000
Average grade – gold grams per tonne 4.91 4.90 5.16
Gold-Poor Orebody
Proven mineral reserves – tonnes 1,200,000 1,600,000 2,100,000
Average grade – gold grams per tonne 0.97 0.95 1.03
Probable mineral reserves – tonnes 1,200,000 2,000,000 3,100,000
Average grade – gold grams per tonne 1.22 1.01 0.99
Total proven and probable mineral reserves – tonnes 33,200,000 34,700,000 34,400,000
Average grade – gold grams per tonne 4.40 4.32 4.39
Total contained gold ounces 4,700,000 4,818,000 4,849,000
Notes:
(1) The 2011 proven and probable mineral reserves set forth in the table above are based on a net smelter return cut-off value of the ore that varies between C$82.00 per tonne andC$103.00 per tonne depending on the deposit. The Company’s historical metallurgical recovery rates at the LaRonde mine from January 1, 2004 to December 31, 2011 averaged90.8% for gold, 87.0% for silver, 86.3% for zinc and 81.8% for copper. The historical metallurgical recovery rate for lead from January 1, 2008 to December 31, 2011 was 14.8%.The Company estimates that a 10% change in the gold price would result in an approximate 0.9% change in mineral reserves.
(2) In addition to the mineral reserves set out above, at December 31, 2011, the LaRonde mine contained indicated mineral resources of 7,225,000 tonnes grading 1.79 grams ofgold per tonne and inferred mineral resources of 11,400,000 tonnes grading 3.68 grams of gold per tonne.
(3) The following table shows the reconciliation of mineral reserves (in nearest thousand tonnes) at the LaRonde mine by category at December 31, 2011 with those at December 31,2010. Revision means additional mineral reserves converted from mineral resources or other categories of mineral reserves and mineral reserves added from explorationactivities during 2011.
Proven Probable Total
December 31, 2010 4,838 29,892 34,729
Mined in 2011 2,406 0 2,406
Revision 2,899 (1,991) 909
December 31, 2011 5,331 27,901 33,232
(4) Complete information on the verification procedures, the quality assurance program, quality control procedures, parameters and methods and other factors that may materiallyaffect scientific and technical information presented in this Form 20-F relating to the LaRonde mine may be found in the Technical Report on the 2005 LaRonde MineralResource & Mineral Reserve Estimate filed with Canadian securities regulatory authorities on SEDAR on March 23, 2005.
(5) At December 31, 2011, the Bousquet project contained probable mineral reserves of 3,165,000 tonnes grading 1.88 grams of gold per tonne. In addition, the Bousquet projectcontained indicated mineral resources of 9,805,000 tonnes grading 2.44 grams of gold per tonne and inferred mineral resources of 4,567,000 tonnes grading 4.04 grams of goldper tonne.
70 AGNICO-EAGLE MINES LIMITED

Goldex Mine Mineral Reserves and Mineral Resources
As at December 31,
2011 2010 2009
GoldProven mineral reserves – tonnes – 14,804,000 5,217,000
Average grade – gold grams per tonne – 1.87 2.02
Probable mineral reserves – tonnes – 12,990,000 19,524,000
Average grade – gold grams per tonne – 1.62 2.06
Total proven and probable mineral reserves – tonnes – 27,794,000 24,741,000
Average grade – gold grams per tonne – 1.75 2.05
Total contained gold ounces – 1,566,000 1,630,000
Notes:
(1) The suspension of mining operations at the Goldex mine on October 19, 2011 resulted in a restatement, as of that date, of all Goldex proven or probable reserves (as stated onDecember 31, 2010), that had not already been mined, as indicated resources, except stockpiled ore on surface that was reclassified as measured resources.
(2) As at December 31, 2011, the Goldex mine contained measured mineral resources of 12,360,000 tonnes grading 1.86 grams of gold per tonne, indicated mineral resources of24,448,000 tonnes grading 1.72 grams of gold per tonne and inferred mineral resources of 31,081,000 tonnes grading 1.59 grams of gold per tonne.
(3) The following table shows the reconciliation of mineral reserves (in nearest thousand tonnes) at the Goldex mine by category at December 31, 2011 with those at December 31,2010. Revision means additional mineral reserves converted from mineral resources or other categories of mineral reserves and the restatement of mineral reserves to anothercategory.
Proven Probable Total
December 31, 2010 14,804 12,990 27,794
Mined in 2011 2,477 0 2,477
Revision (12,327) (12,990) (25,317)
December 31, 2011 – – –
(4) Complete information on the verification procedures, the quality assurance program, quality control procedures, parameters and methods and other factors that may materiallyaffect scientific and technical information presented in this Form 20-F relating to the Goldex mine may be found in the Technical Report on Restatement of the Mineral Resourcesat Goldex Mine, Quebec, Canada as at October 19, 2011 filed with the Canadian securities regulatory authorities on SEDAR on December 5, 2011.
712011 ANNUAL REPORT

Kittila Mine Mineral Reserves and Mineral Resources
As at December 31,
2011 2010 2009
GoldProven mineral reserves – tonnes 702,000 403,000 257,000
Average grade – gold grams per tonne 5.09 4.23 3.71
Probable mineral reserves – tonnes 33,862,000 32,329,000 25,704,000
Average grade – gold grams per tonne 4.65 4.64 4.83
Total proven and probable mineral reserves – tonnes 34,564,000 32,732,000 25,961,000
Average grade – gold grams per tonne 4.66 4.64 4.82
Total contained gold ounces 5,177,000 4,880,000 4,025,000
Notes:
(1) The 2011 proven and probable mineral reserve and mineral resource estimates were calculated using a metallurgical gold recovery of 89%. Gold cut-off grades used were1.90 grams per tonne, undiluted (1.69 grams per tonne, diluted) for open pit reserves and between 2.97 grams per tonne and 3.24 grams per tonne, undiluted (between2.52 grams per tonne and 2.80 grams per tonne, diluted), depending on the deposit, for underground reserves. The open pit operating cost was estimated to be e43.28 per tonnein 2011, while the underground cost averaged e68.30 per tonne. The Company estimates that a 10% change in the gold price would result in an approximate 6% change inmineral reserves.
(2) In addition to the mineral reserves set out above, at December 31, 2011, the Kittila mine contained indicated mineral resources of 12,978,000 tonnes grading 2.46 grams of goldper tonne and inferred mineral resources of 7,953,000 tonnes grading 4.55 grams of gold per tonne.
(3) The breakdown of proven and probable mineral reserves between planned open pit operations and underground operations at the Kittila mine (with tonnage and containedounces rounded to the nearest thousand) at December 31, 2011 is:
Gold Grade ContainedCategory Mining Method Tonnes (g/t) Gold (oz)
Proven mineral reserves Open pit 319,000 3.86 40,000
Proven mineral reserves Underground 383,000 6.11 75,000
Total proven mineral reserves 702,000 5.09 115,000
Probable mineral reserves Open pit 802,000 5.66 146,000
Probable mineral reserves Underground 33,060,000 4.63 4,916,000
Total probable mineral reserves 33,862,000 4.65 5,062,000
(4) The following table shows the reconciliation of mineral reserves (in nearest thousand tonnes) at the Kittila mine by category at December 31, 2011 with those at December 31,2010. Revision means additional mineral reserves converted from mineral resources or other categories of mineral reserves and mineral reserves added from explorationactivities during 2011.
Proven Probable Total
December 31, 2010 403 32,329 32,732
Mined in 2011 1,031 0 1,031
Revision 1,330 1,533 2,863
December 31, 2011 702 33,862 34,564
(5) Complete information on the verification procedures, the quality assurance program, quality control procedures, parameters and methods and other factors that may materiallyaffect scientific and technical information presented in this Form 20-F relating to the Kittila mine may be found in the Technical Report on the December 31, 2009, MineralResource and Mineral Reserve Estimate and the Suuri Extension Project, Kittila Mine, Finland, filed with the Canadian securities regulatory authorities on SEDAR onMarch 4, 2010.
72 AGNICO-EAGLE MINES LIMITED

Lapa Mine Mineral Reserves and Mineral Resources
As at December 31,
2011 2010 2009
GoldProven mineral reserves – tonnes 1,044,000 1,122,000 897,000
Average grade – gold grams per tonne 6.45 7.24 8.33
Probable mineral reserves – tonnes 1,340,000 1,709,000 2,319,000
Average grade – gold grams per tonne 6.61 7.56 8.09
Total proven and probable mineral reserves – tonnes 2,384,000 2,831,000 3,216,000
Average grade – gold grams per tonne 6.54 7.43 8.16
Total contained gold ounces 501,000 677,000 843,000
Notes:
(1) The 2011 mineral reserve and mineral resource estimates were calculated using an assumed metallurgical gold recovery of 74.7% and a cut-off grade of 3.80 grams of gold pertonne. The operating cost per tonne estimate for the Lapa mine in 2011 was C$119.41. The Company estimates that a 10% change in the gold price would result in anapproximate 4% change in mineral reserves.
(2) In addition to the mineral reserves set out above, at December 31, 2011, the Lapa mine contained indicated mineral resources of 1,964,000 tonnes grading 4.08 grams of goldper tonne and inferred mineral resources of 719,000 tonnes grading 4.74 grams of gold per tonne.
(3) The following table shows the reconciliation of mineral reserves (in nearest thousand tonnes) at the Lapa mine by category at December 31, 2011 with those at December 31,2010. Revision means additional mineral reserves converted from mineral resources or other categories of mineral reserves and mineral reserves added from explorationactivities during 2011.
Proven Probable Total
December 31, 2010 1,122 1,709 2,831
Mined in 2011 621 0 621
Revision 543 (369) 174
December 31, 2011 1,044 1,340 2,384
(4) Complete information on the verification procedures, the quality assurance program, quality control procedures, parameters and methods and other factors that may materiallyaffect scientific and technical information presented in this Form 20-F relating to the Lapa mine may be found in the Technical Report on the Lapa Gold Project, CadillacTownship, Quebec, Canada filed with Canadian securities regulatory authorities on SEDAR on June 8, 2006.
732011 ANNUAL REPORT
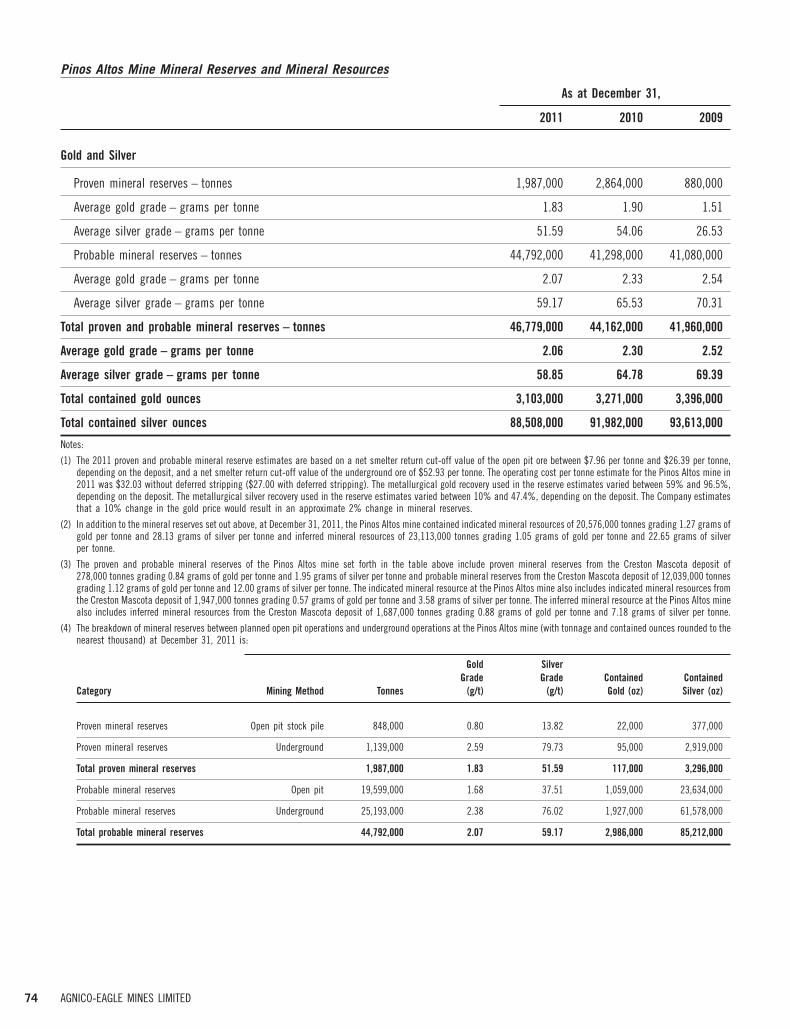
Pinos Altos Mine Mineral Reserves and Mineral Resources
As at December 31,
2011 2010 2009
Gold and Silver
Proven mineral reserves – tonnes 1,987,000 2,864,000 880,000
Average gold grade – grams per tonne 1.83 1.90 1.51
Average silver grade – grams per tonne 51.59 54.06 26.53
Probable mineral reserves – tonnes 44,792,000 41,298,000 41,080,000
Average gold grade – grams per tonne 2.07 2.33 2.54
Average silver grade – grams per tonne 59.17 65.53 70.31
Total proven and probable mineral reserves – tonnes 46,779,000 44,162,000 41,960,000
Average gold grade – grams per tonne 2.06 2.30 2.52
Average silver grade – grams per tonne 58.85 64.78 69.39
Total contained gold ounces 3,103,000 3,271,000 3,396,000
Total contained silver ounces 88,508,000 91,982,000 93,613,000
Notes:
(1) The 2011 proven and probable mineral reserve estimates are based on a net smelter return cut-off value of the open pit ore between $7.96 per tonne and $26.39 per tonne,depending on the deposit, and a net smelter return cut-off value of the underground ore of $52.93 per tonne. The operating cost per tonne estimate for the Pinos Altos mine in2011 was $32.03 without deferred stripping ($27.00 with deferred stripping). The metallurgical gold recovery used in the reserve estimates varied between 59% and 96.5%,depending on the deposit. The metallurgical silver recovery used in the reserve estimates varied between 10% and 47.4%, depending on the deposit. The Company estimatesthat a 10% change in the gold price would result in an approximate 2% change in mineral reserves.
(2) In addition to the mineral reserves set out above, at December 31, 2011, the Pinos Altos mine contained indicated mineral resources of 20,576,000 tonnes grading 1.27 grams ofgold per tonne and 28.13 grams of silver per tonne and inferred mineral resources of 23,113,000 tonnes grading 1.05 grams of gold per tonne and 22.65 grams of silverper tonne.
(3) The proven and probable mineral reserves of the Pinos Altos mine set forth in the table above include proven mineral reserves from the Creston Mascota deposit of278,000 tonnes grading 0.84 grams of gold per tonne and 1.95 grams of silver per tonne and probable mineral reserves from the Creston Mascota deposit of 12,039,000 tonnesgrading 1.12 grams of gold per tonne and 12.00 grams of silver per tonne. The indicated mineral resource at the Pinos Altos mine also includes indicated mineral resources fromthe Creston Mascota deposit of 1,947,000 tonnes grading 0.57 grams of gold per tonne and 3.58 grams of silver per tonne. The inferred mineral resource at the Pinos Altos minealso includes inferred mineral resources from the Creston Mascota deposit of 1,687,000 tonnes grading 0.88 grams of gold per tonne and 7.18 grams of silver per tonne.
(4) The breakdown of mineral reserves between planned open pit operations and underground operations at the Pinos Altos mine (with tonnage and contained ounces rounded to thenearest thousand) at December 31, 2011 is:
Gold SilverGrade Grade Contained Contained
Category Mining Method Tonnes (g/t) (g/t) Gold (oz) Silver (oz)
Proven mineral reserves Open pit stock pile 848,000 0.80 13.82 22,000 377,000
Proven mineral reserves Underground 1,139,000 2.59 79.73 95,000 2,919,000
Total proven mineral reserves 1,987,000 1.83 51.59 117,000 3,296,000
Probable mineral reserves Open pit 19,599,000 1.68 37.51 1,059,000 23,634,000
Probable mineral reserves Underground 25,193,000 2.38 76.02 1,927,000 61,578,000
Total probable mineral reserves 44,792,000 2.07 59.17 2,986,000 85,212,000
74 AGNICO-EAGLE MINES LIMITED

(5) The following table shows the reconciliation of mineral reserves (in nearest thousand tonnes) at the Pinos Altos mine by category at December 31, 2011 with those atDecember 31, 2010. Revision means additional mineral reserves converted from mineral resources or other categories of mineral reserves and mineral reserves added fromexploration activities during 2011.
Proven Probable Total
December 31, 2010 2,864 41,298 44,162
Mined in 2011 4,509 0 4,509
Revision 3,632 3,494 7,126
December 31, 2011 1,987 44,792 46,779
(6) Complete information on the verification procedures, the quality assurance program, quality control procedures, parameters and methods and other factors that may materiallyaffect scientific and technical information presented in this Form 20-F relating to the Pinos Altos mine may be found in the Pinos Altos Gold-Silver Mining Project, ChihuahuaState, Mexico, Technical Report on the Mineral Resources and Reserves as of December 31, 2008 filed with the Canadian securities regulatory authorities on SEDAR onMarch 25, 2009.
Meadowbank Mine Mineral Reserves and Mineral Resources
As at December 31,
2011 2010 2009
GoldProven mineral reserves – tonnes 1,931,000 839,000 600,000
Average grade – gold grams per tonne 1.49 3.13 4.57
Probable mineral reserves – tonnes 22,563,000 33,259,000 31,600,000
Average grade – gold grams per tonne 2.91 3.18 3.51
Total proven and probable mineral reserves – tonnes 24,494,000 34,098,000 32,200,000
Average grade – gold grams per tonne 2.79 3.18 3.53
Total contained gold ounces 2,201,000 3,486,000 3,655,000
Notes:
(1) The 2011 mineral reserve and mineral resource estimates were calculated using a metallurgical gold recovery of 91.0% or 94.0% depending on the deposit. The economic cut-offgrade used to determine the open pit reserves varied from 1.40 grams of gold per tonne to 1.47 grams of gold per tonne, depending on the deposit, and is 1.02 grams of gold pertonne as a marginal cut-off grade. The estimated ore-based operating costs used for the 2011 mineral reserve estimate varied between C$52.84 per tonne and C$53.63 pertonne, depending on the deposit, with an additional haulage cost of C$4.95 for Vault deposit reserves. The Company estimates that a 10% change in the gold price would resultin an approximate 2% change in mineral reserves.
(2) In addition to the mineral reserves set out above, at December 31, 2011, the Meadowbank mine contained indicated mineral resources of 17,213,000 tonnes grading 2.38 gramsof gold per tonne and inferred mineral resources of 3,745,000 tonnes of ore grading 3.81 grams of gold per tonne.
(3) The following table shows the reconciliation of mineral reserves (in nearest thousand tonnes) at the Meadowbank mine by category at December 31, 2011 with those atDecember 31, 2010. Revision means additional mineral reserves converted from mineral resources or other categories of mineral reserves, an update to mineral reserves basedon changed mine plans, and mineral reserves added from exploration activities during 2011.
Proven Probable Total
December 31, 2010 839 33,259 34,098
Mined in 2011 2,978 0 2,978
Revision 4,070 (10,696) (6,626)
December 31, 2011 1,931 22,563 24,494
(4) Complete information on the verification procedures, the quality assurance program, quality control procedures, parameters and methods and other factors that may materiallyaffect scientific and technical information presented in this Form 20-F relating to the Meadowbank mine may be found in the Technical Report on the Mineral Resources andMineral Reserves dated February 15, 2012, Meadowbank Gold Project, Nunavut, Canada filed with Canadian securities regulatory authorities on SEDAR on March 23, 2012.
752011 ANNUAL REPORT

Meliadine Project Mineral Reserves and Mineral Resources
As at December 31,
2011 2010 2009
GoldProven mineral reserves – tonnes 34,000 0 –
Average grade – gold grams per tonne 7.31 – –
Probable mineral reserves – tonnes 12,434,000 9,467,000 –
Average grade – gold grams per tonne 7.18 8.54 –
Total proven and probable mineral reserves – tonnes 12,468,000 9,467,000 –
Average grade – gold grams per tonne 7.18 8.54 –
Total contained gold ounces 2,877,000 2,600,000 –
Notes:(1) The 2011 mineral reserve and mineral resource estimates were calculated using metallurgical gold recovery curves for Tiriganiaq and F-Zone. The curves give a maximum
recovery of 96% for Tiriganiaq and 93% for F-Zone. The 2011 mineral resource estimates for all others were calculated using a metallurgical gold recovery of 92%. The cut-offgrade used to determine the open pit reserves was 2.19 grams of gold per tonne, undiluted (1.91 grams of gold per tonne, diluted), and the cut-off grade used to determine theunderground reserves was 5.29 grams of gold per tonne, undiluted (4.10 grams of gold per tonne, diluted). The estimated operating cost used for the 2011 mineral reserveestimate was C$74.71 per tonne for open pit and C$165.65 per tonne for underground. The Company estimates that a 10% change in the gold price would result in anapproximate 3.4% change in mineral reserves.
(2) In addition to the mineral reserves set out above, at December 31, 2011, the Meliadine project contained indicated mineral resources of 12,621,000 tonnes grading 4.09 gramsof gold per tonne and inferred mineral resources of 12,687,000 tonnes of ore grading 5.98 grams of gold per tonne.
(3) The breakdown of mineral reserves between planned open pit operations and underground operations at the Meliadine project (with tonnage and contained ounces rounded tothe nearest thousand) at December 31, 2011 is:
Gold Grade ContainedCategory Mining Method Tonnes (g/t) Gold (oz)
Proven mineral reserves Open pit stockpile 34,000 7.31 8,000
Probable mineral reserves Open pit 5,292,000 5.80 987,000
Probable mineral reserves Underground 7,142,000 8.20 1,882,000
Total proven and probable mineral reserves 12,468,000 7.18 2,877,000
(4) Complete information on the verification procedures, the quality assurance program, quality control procedures, parameters and methods and other factors that may materiallyaffect scientific and technical information presented in this Form 20-F relating to the Meliadine project may be found in the Technical Report on the December 31, 2010 MineralResource and Mineral Reserve Estimate, Meliadine Gold Project, Nunavut, Canada, dated February 16, 2011, filed with the Canadian securities regulatory authorities on SEDARon March 8, 2011.
La India Project Mineral Reserves and Mineral Resources
At December 31, 2011, the La India project, consisting of the La India feasibility-stage heap leach gold project and theTarachi gold zone, contained no proven or probable mineral reserves, but contained measured mineral resources of3,730,000 tonnes grading 1.06 grams of gold per tonne, indicated mineral resources of 44,496,000 tonnes grading0.72 grams of gold per tonne and inferred mineral resources of 32,125,000 tonnes grading 0.69 grams of gold per tonne.
Risk Mitigation
The Company mitigates the likelihood and potential severity of the various risks it encounters in its day-to-day operationsthrough the application of high standards in the planning, construction and operation of mining facilities. In addition,emphasis is placed on hiring and retaining competent personnel and developing their skills through training in safety andloss control. The Company’s operating and technical personnel have a solid track record of developing and operatingprecious metal mines and several of the Company’s mines have been recognized for excellence in this regard with varioussafety and development awards. Nevertheless, the Company and its employees continue with a focused effort to improveworkplace safety and the Company has placed additional emphasis on safety procedure training for both mining andsupervisory employees.
The Company also mitigates some of the Company’s normal business risk through the purchase of insurance coverage. AnInsurable Risk Management Policy, approved by the Board, governs the purchase of insurance coverage and only permitsthe purchase of coverage from insurance companies of the highest credit quality. For a more complete list of the riskfactors affecting the Company, please see ‘‘Item 3 Key Information – Risk Factors’’.
76 AGNICO-EAGLE MINES LIMITED

Glossary of Selected Mining Terms
‘‘alteration’’ Any physical or chemical change in a rock or mineral subsequent to formation.Milder and more localized than metamorphism.
‘‘anastomosing’’ A network of branching and rejoining fault or vein surfaces or surface traces.
‘‘andesite’’ A dark-coloured igneous, calc-alkaline volcanic rock, of intermediate composition(containing between 52-63% silica).
‘‘assay’’ An analysis to determine the presence, absence or concentration of one or morechemical components.
‘‘bedrock’’ The solid rock underlying surface deposits.
‘‘breccia’’ Said of rock formations consisting mostly of angular fragments hosted by afine-grained matrix.
‘‘brittle’’ Of minerals, proneness to fracture under low stress. A quality affecting behaviourduring comminution of ore, whereby one species fractures more readily thanothers in the material being crushed.
‘‘bulk mining’’ A mining method in which large quantities of low-grade ore are mined without anattempt to segregate the high-grade portions.
‘‘byproduct metal’’ A secondary or additional metal recovered from the processing of rock.
‘‘carbon-in-leach process’’ A process step in which granular activated carbon particles much larger than theground ore particles are introduced into the ore pulp. Cyanide leaching andprecious metal adsorption onto the activated carbon occur simultaneously. Theloaded activated carbon is mechanically screened to separate it from the barrenore pulp and processed to remove the precious metals and prepare it for reuse.
‘‘carbon-in-pulp (CIP) circuit’’ A process by which soluble gold within a finely ground slurry is recovered byadsorption onto coarser activated carbon. A CIP circuit comprises a series oftanks through which leached slurry flows. Gold is captured onto captive activatedcarbon that will periodically be moved counter-currently from tank to tank. Headtank carbon is extracted periodically to further recover adsorbed gold beforebeing returned to the circuit tails tank.
‘‘clast’’ A fragment of mineral, rock or organic structure that has been moved individuallyfrom its place of origin.
‘‘concentrate’’ The clean product recovered in froth flotation.
‘‘conglomerate’’ A sedimentary rock consisting of rounded, water-worn pebbles or boulderscemented into a solid mass.
‘‘counter-current decantation’’ Clarifying wash water and concentrating tailings by use of several thickeners inseries. The water flows in the opposite direction from the solids. The finalproducts are slurry that is removed as fluid mud and clear water that is reused inthe circuit.
‘‘crosscut’’ A horizontal opening driven from a shaft at or near right angles to the strike of avein or other orebody.
‘‘cut-off grade’’ (A) In respect of mineral resources, the lowest grade below which the mineralizedrock currently cannot reasonably be expected to be economically extracted.
(B) In respect of mineral reserves, the lowest grade below which the mineralizedrock currently cannot be economically extracted as demonstrated by either apreliminary feasibility study or a feasibility study.
Cut-off grades vary between deposits depending upon the amenability of ore togold extraction and upon costs of production and metal prices.
772011 ANNUAL REPORT

‘‘deposit’’ A mineralized body that has been physically delineated by sufficient drilling,trenching and/or underground work and found to be of sufficient average grade ofmetal or metals to warrant further exploration and/or development expenditures;such a deposit does not qualify as a commercially mineable orebody or ascontaining mineral reserves, until final legal, technical and economic factors havebeen resolved.
‘‘development’’ The preparation of a mining property or area so that an orebody can be analyzedand its tonnage and quality estimated. Development is an intermediate stagebetween exploration and mining.
‘‘diamond drill hole’’ A borehole drilled using a bit inset with diamonds as the rock-cutting tool. The bitcuts a circular channel around a core of rock that can be recovered to provide amore-or-less continuous and complete columnar sample of the rock penetrated.
‘‘dilution’’ The effect of waste rock or low-grade ore being included in mined ore, increasingtonnage mined and lowering the overall ore grade.
‘‘dip’’ The angle at which a surface is inclined from the horizontal.
‘‘discordant’’ Said of a contact between an igneous intrusion and the country rock that is notparallel to the foliation or the bedding planes of the latter.
‘‘disseminated’’ Said of a mineral deposit (especially of metals) in which the desired mineralsoccur as scattered particles in the rock, but in sufficient quantity to make thedeposit an ore. Some disseminated deposits are very large.
‘‘drift’’ A horizontal underground opening that follows along the length of a vein or rockformation, as opposed to a crosscut that crosses the rock formation.
‘‘ductile’’ Of rock, able to sustain, under a given set of conditions, 5% to 10% deformationbefore fracturing or faulting.
‘‘dyke’’ An earthen embankment, as around a drill sump or tank, or to impound a bodyof water or mill tailings. Also, a tabular body of igneous rock that cuts across thestructure of adjacent rocks.
‘‘electrowinning’’ An electrochemical process in which a metal dissolved within an electrolyte isplated onto an electrode. Used to recover metals such as copper and gold fromsolution in the leaching of concentrates, etc.
‘‘envelope’’ 1. The outer or covering part of a fold, especially of a folded structure thatincludes some sort of structural break.
2. A metamorphic rock surrounding an igneous intrusion.
3. In a mineral, an outer part different in origin from an inner part.
‘‘epigenetic’’ An orebody formed by hydrothermal fluids and gases that were introduced intothe host rocks from elsewhere, filling cavities in the host rock.
‘‘epithermal’’ A hydrothermal mineral deposit formed within one kilometre of the Earth’s surfaceand in the temperature range of 50 to 200 degrees Celsius, occurring mainly asveins. Also, said of that depositional environment.
‘‘extensional-shear vein’’ A vein put in place in an extension fracture caused by the deformation of a rock.
‘‘fault’’ A fracture or a fracture zone in crustal rocks along which there has beendisplacement of the two sides relative to one another parallel to the fracture. Thedisplacement may be a few inches or many kilometres long.
78 AGNICO-EAGLE MINES LIMITED

‘‘feasibility study’’ A comprehensive study of a mineral deposit in which all geological, engineering,legal, operating, economic, social, environmental and other relevant factors areconsidered in sufficient detail that it could reasonably serve as the basis for afinal decision by a financial institution about whether to finance the developmentof the deposit for mineral production.
A ‘‘preliminary feasibility study’’ or ‘‘pre-feasibility study’’ is a comprehensive studyof the viability of a mineral project that has advanced to a stage where the miningmethod (in the case of underground mining) or the pit configuration (in the caseof an open pit) has been established, and an effective method of mineralprocessing has been determined. It includes a financial analysis based onreasonable assumptions of technical, engineering, legal, operating, economic,social and environmental factors and the evaluation of other relevant factors thatare sufficient for a qualified person, acting reasonably, to determine if all or partof the mineral resource may be classified as a mineral reserve.
‘‘flotation’’ A process for concentrating minerals based on the selective adhesion of certainminerals to air bubbles in a mixture of water and ground ore. When the rightchemicals are added to a frothy water bath of ore that has been ground to theconsistency of talcum powder, the minerals will float to the surface. Themetal-rich flotation concentrate is then skimmed off the surface.
‘‘foliation’’ A general term for a planar arrangement of textural or structural features in anytype of rock, especially the planar structure that results from flattening of theconstituent grains of a metamorphic rock.
‘‘fracture’’ A general term for any break in a rock, whether or not it causes displacement,due to mechanical failure by stress. Fractures include cracks, joints and faults.
‘‘free gold’’ Gold not combined with other substances.
‘‘glacial till’’ Dominantly unsorted and unstratified drift, generally unconsolidated, depositeddirectly by and underneath a glacier without subsequent reworking by meltwater,and consisting of a heterogeneous mixture of clay, silt, sand, gravel and bouldersranging widely in size and shape. Also referred to as ‘‘till’’ and ice-laid drift.
‘‘grade’’ The relative quality of the percentage of metal content in a mineralized body,i.e., grams of gold per tonne of rock.
‘‘head grade’’ The average grade of ore fed into a mill.
‘‘hectare’’ A metric measurement of area. 1 hectare = 10,000 square metres = 2.47 acres.
‘‘horst’’ An up-faulted block of rock.
‘‘hydrothermal alteration’’ Alteration of rocks or minerals by reaction with hydrothermal fluids.
‘‘indicated mineral resource’’ The part of a mineral resource for which quantity, grade or quality, densities,shape and physical characteristics can be estimated with a level of confidencesufficient to allow the appropriate application of technical and economicparameters and to support mine planning and evaluation of the economic viabilityof the deposit. The estimate is based on detailed and reliable exploration andtesting information gathered through appropriate techniques from locations suchas outcrops, trenches, pits, workings and drill holes that are spaced closelyenough for geological and grade continuity to be reasonably assumed. Mineralresources that are not mineral reserves do not have demonstrated economicviability.
While this term is recognized and required by Canadian regulations, the SEC doesnot recognize it. Investors are cautioned not to assume that any part or all of themineral deposits in this category will ever be converted into mineral reserves.
792011 ANNUAL REPORT

‘‘inferred mineral resource’’ The part of a mineral resource for which quantity and grade or quality can beestimated on the basis of geological evidence and limited sampling andreasonably assumed, but not verified, geological and grade continuity. Theestimate is based on limited information and sampling gathered throughappropriate techniques from locations such as outcrops, trenches, pits, workingsand drill holes.
While this term is recognized and required by Canadian regulations, the SEC doesnot recognize it. Investors are cautioned not to assume that any part or all of themineral deposits in this category will ever be converted into mineral reserves.Investors are cautioned not to assume that part of or all of an inferred mineralresource exists, or is economically or legally mineable.
‘‘infill drilling’’ Drilling within a defined mineralized area to improve the definition of knownmineralization.
‘‘intrusive’’ A body of igneous rock formed by the consolidation of magma intruded belowsurface into other rocks, in contrast to lavas, which are extruded upon the Earth’ssurface.
‘‘iron formation’’ A chemical sedimentary rock, typically thin-bedded or finely laminated, containingat least 15% iron of sedimentary origin and commonly containing layers of chert.
‘‘kilometre’’ A metric measurement of distance. 1.0 kilometre = 0.62 miles.
‘‘lens’’ Generally used to describe a body of ore that is thick in the middle and taperstowards the ends, resembling a convex lens.
‘‘lithologic groups’’ Geological groups.
‘‘lode’’ A mineral deposit consisting of a zone of veins, veinlets or disseminations.
‘‘longitudinal retreat’’ An underground mining method where the ore is excavated in horizontal slicesalong the orebody and the stoping starts below and advances upwards. The ore isrecovered underneath in the stope.
‘‘massive’’ Said of a mineral deposit, especially of sulphides, characterized by a greatconcentration of ore in one place, as opposed to a disseminated or vein-likedeposit. Said of any rock that has a homogeneous texture or fabric over a largearea, with an absence of layering or any similar directional structure.
‘‘matrix’’ The non-valuable minerals in an ore, i.e., gangue.
‘‘measured mineral resource’’ The part of a mineral resource for which quantity, grade or quality, densities,shape and physical characteristics are so well established that they can beestimated with confidence sufficient to allow the appropriate application oftechnical and economic parameters and to support mine planning and evaluationof the economic viability of the deposit. The estimate is based on detailed andreliable exploration, sampling and testing information gathered throughappropriate techniques from locations such as outcrops, trenches, pits, workingsand drill holes that are spaced closely enough to confirm both geological andgrade continuity.
While this term is recognized and required by Canadian regulations, the SEC doesnot recognize it. Investors are cautioned not to assume that any part or all of themineral deposits in this category will ever be converted into mineral reserves.
‘‘Merrill-Crowe process’’ A separation technique for removing gold from a cyanide solution. The solution isseparated from the ore by methods such as filtration and counter-currentdecantation, and then the gold is precipitated onto zinc dust. Silver and coppermay also precipitate. The precipitate is filtered to capture the gold slimes, whichare further refined, e.g., by smelting, to remove the zinc and by treating withnitric acid to dissolve the silver.
80 AGNICO-EAGLE MINES LIMITED

‘‘mesothermal deposit’’ A mineral deposit formed at moderate temperature and pressure by depositionfrom hydrothermal fluids along a fissure or other opening in rock at anintermediate depth.
‘‘metallurgical properties’’ Properties characterizing metals and minerals behaviour under various processingtechniques.
‘‘metamorphism’’ The process by which the form or structure of sedimentary or igneous rocks ischanged by heat and pressure.
‘‘mill’’ A mineral treatment plant in which crushing, wet grinding and further treatmentof ore is conducted.
‘‘mineral reserve’’ The economically mineable part of a mineral resource. The economics of themineral reserve should be demonstrated by a feasibility study. This study mustinclude adequate information on mining, processing, metallurgical, economic andother relevant factors that demonstrate, at the time of reporting, that economicextraction is justified. A mineral reserve includes diluting materials and allowancesfor losses that may occur when the material is mined.
‘‘mineral resource’’ A concentration or occurrence of natural solid inorganic material or natural solidfossilized organic material in or on the Earth’s crust in such form and quantityand of such a grade or quality that it has reasonable prospects for economicextraction. The location, quantity, grade, geological characteristics and continuityof a mineral resource are known, estimated or interpreted from specific geologicalevidence and knowledge. Investors are cautioned not to assume that any or all ofa mineral resource will ever be converted into a mineral reserve.
‘‘muck’’ Finely blasted rock (ore or waste) underground.
‘‘net smelter return royalty’’ A phrase used to describe a royalty payment made by a producer of metalsbased on gross metal production from the property, less deduction of certainlimited costs including smelting, refining, transportation and insurance costs.
‘‘ounce’’ A measurement of mass. 1 troy ounce = 31.1035 grams.
‘‘outcrop’’ An exposure of bedrock at the surface.
‘‘oxidation’’ A chemical reaction caused by exposure to oxygen, which results in a change inthe chemical composition of a mineral.
‘‘oxidative’’ Descriptive of an oxidation reaction.
‘‘phenocryst’’ A term for large crystals or mineral grains occurring in the matrix or groundmassof a porphyry.
‘‘plunge’’ The inclination of a fold axis or other linear structure from a horizontal plane,measured in the vertical plane.
‘‘polydeformed’’ A rock that has been subjected to more than one instance of folding, faulting,shearing, compression or extension as a result of various tectonic forces.
‘‘porphyritic’’ Rock texture in which one or more minerals has a larger grain size than theaccompanying minerals.
‘‘porphyry’’ Any igneous rock in which relatively large crystals, called phenocrysts, are set ina fine-grained groundmass.
‘‘pressure oxidation process’’ A process by which sulphide minerals are oxidized in order to expose gold that isencapsulated in the mineral lattice. The main component of a pressure oxidationcircuit consists of one or more pressurized vessels (autoclaves). Oxygen level,process temperature and acidity are the primary control parameters of such units.
‘‘probable mineral reserve’’ The economically mineable part of an indicated mineral resource demonstratedby a feasibility study.
812011 ANNUAL REPORT

‘‘proven mineral reserve’’ The economically mineable part of a measured mineral resource demonstrated bya feasibility study.
‘‘pyroclastic’’ Produced by explosive or aerial ejection of ash, fragments and glassy materialfrom a volcanic vent. Term applicable to the rocks and rock layers as well as tothe textures so formed.
‘‘recovery’’ A term used in process metallurgy to indicate the proportion of valuable materialobtained in the processing of an ore. It is generally stated as a percentage ofvaluable metal in the ore that is recovered compared to the total valuable metalpresent in the ore before processing.
‘‘reverse circulation drilling’’ A type of drilling into rock using a solid bit to produce a hole and deliver rockchips (rather than core) to surface for analysis. Less expensive and faster thandiamond drilling but not as accurate.
‘‘run-of-mine ore’’ The mined ore as it is delivered, prior to sorting, stockpiling or treatment.
‘‘schist’’ A strongly foliated crystalline rock that can be readily split into think flakes orslabs due to the well developed parallelism of more than 50% of the mineralspresent in it.
‘‘scrubber’’ A device for separating particulate material from a waste gas stream.
‘‘semi-autogenous grinding’’ or‘‘SAG’’ A method of grinding rock whereby larger chunks of the rock itself and steel balls
form the grinding media.
‘‘shear’’ or ‘‘shearing’’ The deformation of rocks by lateral movement along innumerable parallel planes,generally resulting from pressure and producing such metamorphic structures ascleavage and schistosity.
‘‘sill’’ An intrusive sheet of igneous rock of roughly uniform thickness that has beenforced between the bedding planes of existing rock.
‘‘slurry’’ Fine rock particles in circulating water.
‘‘stope development’’ Driving subsidiary openings to prepare blocks of ore for extraction by stoping.
‘‘strike’’ The bearing of the outcrop of an inclined bed, vein or fault plane on a horizontalsurface; the direction of a horizontal line perpendicular to the direction of the dip.
‘‘stringers’’ Mineral veinlets or filaments occurring in a discontinuous subparallel pattern in ahost rock.
‘‘sublevel retreat’’ An underground mining method in which the ore is excavated in horizontal slicesalong the orebody, starting below and advancing upwards. The ore is recoveredunderneath in the stope.
‘‘tabular’’ Said of a feature having two dimensions that are much larger or longer than thethird, such as a dyke.
‘‘tailings’’ Material rejected from the mill after most of the recoverable valuable mineralshave been extracted.
‘‘tailings dam’’ A natural or man-made confined area suitable for depositing tailings.
‘‘tailings pond’’ A low-lying depression used to confine tailings, the prime function of which is toallow enough time for metals to settle out or for cyanide to be naturally destroyedbefore the water is discharged into the local watershed.
‘‘tenement’’ A synonym of mineral title.
‘‘thickness’’ The distance at right angles between the hanging wall and the footwall of a lodeor lens.
‘‘tonne’’ A metric measurement of mass. 1 tonne = 1,000 kilograms = 2,204.6 pounds.
82 AGNICO-EAGLE MINES LIMITED

‘‘transfer fault’’ A structure that can accommodate lateral variations of deformation and strain.
‘‘transverse open stoping’’ An underground mining method in which the ore is excavated in horizontal slicesperpendicular to the orebody length and the stoping starts below and advancesupwards. The ore is recovered underneath the stope through a drawpoint system.
‘‘twinned drill hole’’ A borehole drilled very close to an original hole in the same direction and dip inorder to verify the results from the original drill hole.
‘‘vein’’ Minerals filling a fissure, fault or crack in rock.
‘‘wacke’’ A ‘‘dirty’’ sandstone that consists of a mixture of poorly sorted mineral and rockfragments in an abundant matrix of clay and fine silt.
‘‘winze’’ An internal mine shaft.
‘‘Zadra elution circuit’’ The process in this part of a gold mill strips gold and silver from carbon granulesand puts them into solution.
‘‘zone’’ An area of distinct mineralization, i.e., a deposit.
832011 ANNUAL REPORT

ITEM 4A UNRESOLVED STAFF COMMENTSNone.
ITEM 5 OPERATING AND FINANCIAL REVIEW AND PROSPECTSResults of Operations
Revenues from Mining Operations
In 2011, revenue from mining operations increased 28% to $1,822 million from $1,423 million in 2010. The increase inrevenue was mainly attributable to higher sales prices realized on gold and silver in 2011 compared with 2010.
In 2011, sales of precious metals (gold and silver) accounted for 95% of revenues, up from 93% in 2010 and 87% in2009. The increase in the percentage of revenues from precious metals when compared to 2010 is due to an increase ingold and silver prices, offset partially by decreases in both zinc and copper sales volumes and average realized prices.Revenue from mining operations are accounted for net of related smelting, refining, transportation and other charges. Thetable below sets out net revenue, production volumes and sales volumes by metal:
2011 2010 2009
(thousands)
Revenues from mining operations:
Gold $ 1,563,760 $ 1,216,249 $ 474,875
Silver 171,725 104,544 59,155
Zinc 70,522 77,544 57,034
Copper 14,451 22,219 22,571
Lead 1,341 1,965 127
$ 1,821,799 $ 1,422,521 $ 613,762
Production volumes:
Gold (ounces) 985,460 987,609 492,972
Silver (000s ounces) 5,080 4,812 4,035
Zinc (tonnes) 54,894 62,544 56,186
Copper (tonnes) 3,216 4,224 6,671
Sales volumes:
Gold (ounces) 996,090 973,057 463,660
Silver (000s ounces) 5,089 4,722 3,871
Zinc (tonnes) 54,499 59,566 58,391
Copper (tonnes) 3,194 4,223 6,689
Revenue from gold sales increased by $347.5 million, or 29%, in 2011. Gold production decreased to 985,460 ounces in2011 from 987,609 ounces in 2010. The decrease in gold production levels between 2010 and 2011 was due primarily tothe suspension of production at the Goldex mine on October 19, 2011 and to lower grades and throughput at the LaRondemine, offset partially by the achievement of commercial production at the Creston Mascota deposit at Pinos Altos onMarch 1, 2011. Average realized gold price increased 26% in 2011 to $1,573 per ounce from $1,250 per ounce in 2010.
Silver revenue increased by $67.2 million, or 64%, in 2011 when compared to 2010 due to an increase in the realizedsales price and increased production. Revenue from zinc sales decreased by $7.0 million, or 9%, in 2011 when comparedto 2010. The decrease in zinc revenue was due to decreases in realized zinc sales prices and production. Revenue fromcopper sales decreased by $7.8 million, or 35%, in 2011 when compared to the previous year due to decreases in realizedzinc sales prices and production.
84 AGNICO-EAGLE MINES LIMITED

Interest and Sundry Income (Expense)
Interest and sundry income (expense) consists mainly of acquisition costs of $(3.8) million related to the acquisition ofGrayd during 2011 and a net loss recorded on asset disposals, partially offset by interest earned on cash balances. Interestand sundry expense was $(5.2) million in 2011 compared with interest and sundry income of $10.3 million in 2010.
Available-for-sale Securities
From time to time, the Company takes minority equity positions in other mining and exploration companies. As part of theCompany’s procedures to assess whether the value of its available-for-sale securities portfolio is reasonable for accountingpurposes, it was determined (in accordance with the requirements of Accounting Standards Codification (‘‘ASC’’) 320Investments – Debt and Equity Securities) that a non-cash write-down of $8.6 million was required in 2011. These write-downs do not necessarily reflect management’s long-term outlook on the value of the securities, but rather an‘‘other-than-temporary’’ impairment as defined in ASC 320. In 2010 and 2009, this determination resulted in no write-downs relating to the Company’s various investments.
In 2011, the sale of various available-for-sale securities resulted in a gain before taxes of $4.9 million compared with$19.5 million in 2010. During 2010, there was a net gain on the acquisition of Comaplex of $57.5 million. The gain wasdriven by the mark-to-market gain on the shares of Comaplex purchased prior to the announcement of the acquisition thatwere accumulated within other comprehensive income and were reversed through the Consolidated Statements ofIncome upon acquisition of control, partially offset by the costs of the acquisition.
Production Costs
In 2011, total production costs were $876.1 million compared to $677.5 million in 2010. This increase is mainly due to afull year of production and persistently high costs at the Meadowbank mine in 2011 which achieved commercialproduction on March 1, 2010, and the achievement of commercial production at the Creston Mascota deposit at PinosAltos on March 1, 2011. The increase in production costs from these factors was partially offset by the suspension ofoperations at the Goldex mine on October 19, 2011. The table below sets out the components of production costs:
Production Costs 2011 2010 2009
(thousands)
LaRonde $ 209,947 $ 189,146 $ 164,221
Goldex 56,939 61,561 54,342
Kittila 110,477 87,740 42,464
Lapa 68,599 66,199 33,472
Pinos Altos 145,614 90,293 11,819
Meadowbank 284,502 182,533 –
Production costs per Consolidated Statement of Income $ 876,078 $ 677,472 $ 306,318
Production costs at the LaRonde mine during 2011 were $209.9 million, an increase of approximately 11% as comparedto 2010. During 2011, LaRonde processed an average of 6,592 tonnes of ore per day, compared to 7,102 tonnes of oreper day during 2010. Minesite costs per tonne were C$79 in the fourth quarter of 2011, compared with C$79 in the fourthquarter of 2010. For the full year 2011, minesite costs per tonne were C$84 compared with C$75 per tonne in 2010. Theincrease in minesite costs per tonne during 2011 is attributable to lower throughput due to issues with sequencing anddilution, and the achievement of commercial production at the LaRonde mine extension on December 1, 2011, meaningthat many costs began to be expensed.
Production costs at the Goldex mine were $56.9 million compared with $61.6 million in 2010. The decrease is due to thesuspension of Goldex mine operations on October 19, 2011. Minesite costs per tonne were C$21 in the fourth quarter of2011 when the remaining surface stockpile was milled compared to C$21 in the fourth quarter of 2010. For the full year,minesite costs per tonne were C$21 compared with C$22 per tonne in 2010.
852011 ANNUAL REPORT

25MAR201212364697
Production costs at the Kittila mine during 2011 were $110.5 million compared with $87.7 million in 2010. The increase ismainly due to a full year of commercial production in the underground mine where costs are higher as compared to theopen pit and to unbudgeted tonnes being mined during the remediation of a slip in the Suuri pit east wall. The mine alsoexperienced higher costs for energy and chemical reagents in 2011 as compared to 2010. During 2011, Kittila processedan average of 2,824 tonnes of ore per day, above the 2010 average production of 2,631 tonnes of ore per day. Theprocessing design capacity of the Kittila mill is approximately 3,000 tonnes per day. The underachievement in actualprocessing versus capacity was mainly due to several unplanned shutdowns during 2011. Minesite costs per tonne werec80 in the fourth quarter of 2011 compared to c79 in the fourth quarter of 2010. For the full year, the minesite costs pertonne were c75, compared with c66 per tonne in 2010.
Production costs at the Lapa mine during 2011 were $68.6 million compared with $66.2 million in 2010. During 2011,Lapa processed an average of 1,701 tonnes of ore per day, above the 2010 average production of 1,512 tonnes of ore perday due to the realization of design efficiencies. The processing design capacity of the Lapa mill is approximately1,500 tonnes per day. Minesite costs per tonne were C$117 in the fourth quarter of 2011 compared to C$115 in the fourthquarter of 2010. For the full year, the minesite costs per tonne were C$110, compared with C$114 per tonne in 2010. Withtotal production costs essentially unchanged and a decrease in minesite costs per tonne between 2010 and 2011, theoverall improved operating performance is attributable to realized efficiencies as the Company gained experience with theorebody.
Production costs at the Pinos Altos mine during 2011 were $145.6 million compared with $90.3 million in 2010. Theincrease is mainly due to the achievement of commercial production at the Creston Mascota deposit at Pinos Altos onMarch 1, 2011. During 2011, Pinos Altos processed an average of 12,355 tonnes of ore per day, significantly higher thanthe 2010 average production of 3,638 tonnes of ore per day due primarily to the addition of the Creston Mascota deposit atPinos Altos. Minesite costs per tonne were $24 in the fourth quarter of 2011, compared to $35 in the fourth quarter of2010. For the full year, the minesite costs per tonne were $27 compared with $35 per tonne in 2010. The decrease inminesite costs per tonne between 2010 and 2011 is mainly attributable to a greater proportion of lower cost heap leachtonnes processed from the Creston Mascota deposit at Pinos Altos.
Production costs at the Meadowbank mine during 2011 were $284.5 million compared with $182.5 million in 2010. Theincrease is due primarily to a full year of production in 2011 versus 10 months of production in 2010 as the Meadowbankmine achieved commercial production on March 1, 2010 and to higher costs realized in nearly all aspects of operating themine in 2011. During 2011, the Meadowbank mine processed an average of 8,158 tonnes of ore per day, above the 2010average production of 6,653 tonnes of ore per day due primarily to the June 2011 addition of the permanent secondarycrusher, but below design capacity of 8,500 tonnes per day. Minesite costs per tonne were $98 in the fourth quarter of2011, compared to $91 in the fourth quarter of 2010. For the full year, the minesite costs per tonne were $91 comparedwith $95 per tonne in 2010. The decrease in minesite costs per tonne between 2010 and 2011 is mainly attributable toincreased throughput.
Total Production Costs by Category
Labour28%
Contractors17%
Energy13%
Chemical8%
Consumables/Others34%
86 AGNICO-EAGLE MINES LIMITED

In 2011, total cash costs per ounce of gold increased to $580 from $451 in 2010 and $346 in 2009, representing aweighted average over all the Company’s producing mines. In 2011, the LaRonde mine total cash costs per ounce were$77, the Goldex mine total cash costs per ounce were $401, the Kittila mine total cash costs per ounce were $739, theLapa mine total cash costs per ounce were $650, the Pinos Altos mine total cash costs per ounce were $299 and theMeadowbank mine total cash costs per ounce were $1,000. Total cash costs per ounce are comprised of minesite costsincurred during the period and, for the LaRonde and Pinos Altos mines, reduced by their related net byproduct revenue.Total cash costs per ounce are affected by various factors such as the quantity of gold produced, operating costs,exchange rates and, at the LaRonde and Pinos Altos mines, the quantity of byproduct metals produced and byproductmetal prices. The Company has decided to report total cash costs using the more common industry practice of deferringcertain stripping costs that can be attributed to future production. The methodology is in line with the Gold InstituteProduction Cost Standard. The purpose of adjusting for these stripping costs is to enhance the comparability of cash coststo the majority of the Company’s peers within the mining industry.
Total cash costs per ounce is not a recognized measure under US GAAP and this data may not be comparable to datapresented by other gold producers. Management believes that this generally accepted industry measure is a realisticindication of operating performance and is useful in allowing year-over-year comparisons. This measure is calculated byadjusting production costs as shown in the Consolidated Statements of Income (Loss) and Comprehensive Income (Loss)for net byproduct revenues, royalties, inventory adjustments, certain stripping costs that can be attributed to futureproduction and asset retirement provisions and then dividing by the number of ounces of gold produced. Total cash costsper ounce is intended to provide investors with information about the cash generating capabilities of mining operations.Management uses this measure to monitor the performance of mining operations. Since market prices for gold are quotedon a per ounce basis, using this per ounce measure allows management to assess a mine’s cash generating capabilities atvarious gold prices. Management is aware that this per ounce measure of performance is affected by fluctuations inbyproduct metal prices and exchange rates. Management compensates for the limitations inherent in this measure byusing it in conjunction with minesite costs per tonne (discussed below) as well as other data prepared in accordance withUS GAAP. Management also performs sensitivity analyses in order to quantify the effects of fluctuating metal prices andexchange rates.
Minesite costs per tonne is not a recognized measure under US GAAP and this data may not be comparable to datapresented by other gold producers. This measure is calculated by adjusting production costs as shown in the ConsolidatedStatement of Income (Loss) and Comprehensive Income (Loss) for inventory adjustments, certain stripping costs that canbe attributed to future production and asset retirement provisions and then dividing by tonnes of ore processed throughthe mill. Since total cash costs per ounce data can be affected by fluctuations in byproduct metals prices, exchange ratesand other adjusting items, management believes this measure provides additional information regarding the performanceof mining operations and allows management to monitor operating costs on a more consistent basis as the per tonnemeasure eliminates the cost variability associated with varying production levels. Management also uses this measure todetermine the economic viability of mining blocks. As each mining block is evaluated based on the net realizable value ofeach tonne mined, in order to be economically viable the estimated revenue on a per tonne basis must be in excess of theminesite costs per tonne. Management is aware that this per tonne measure is affected by fluctuations in production levelsand thus uses this measure as an evaluation tool in conjunction with production costs prepared in accordance with USGAAP. This measure supplements production cost information prepared in accordance with US GAAP and allowsinvestors to distinguish between changes in production costs resulting from changes in level of production versus changesin operating performance.
Both of these non-US GAAP measures used should be considered together with other data prepared in accordance withUS GAAP, and none of the measures taken by themselves is necessarily indicative of production costs or cash flowmeasures prepared in accordance with US GAAP. The tables below reconcile total cash costs per ounce and minesitecosts per tonne to the production costs presented in the consolidated financial statements prepared in accordance withUS GAAP.
872011 ANNUAL REPORT

Total Production Costs by Mine
2011 2010 2009
(thousands, except as noted)
Total production costs per Consolidated Statements of Income and Comprehensive Income $ 876,078 $ 677,472 $ 306,318
Attributable to LaRonde 209,947 189,146 164,221
Attributable to Goldex 56,939 61,561 54,342
Attributable to Lapa 68,599 66,199 33,472
Attributable to Kittila 110,477 87,740 42,464
Attributable to Pinos Altos 145,614 90,293 11,819
Attributable to Meadowbank 284,502 182,533 –
Total $ 876,078 $ 677,472 $ 306,318
Reconciliation of Production Costs to Total Cash Costs per Ounce of Gold by Mine
LaRonde Total Cash Costs per Ounce 2011 2010 2009
(thousands, except as noted)
Production costs per Consolidated Statements of Income and Comprehensive Income $ 209,947 $ 189,146 $ 164,221
Adjustments:
Byproduct metal revenues, net of smelting, refining and marketing charges (194,000) (192,155) (138,262)
Inventory and other adjustments(i) (2,309) 3,287 (3,809)
Non-cash reclamation provision (4,062) (1,344) (1,198)
Cash operating costs $ 9,576 $ (1,066) $ 20,952
Gold production (ounces) 124,173 162,806 203,494
Total cash costs (per ounce)(ii) $ 77 $ (7) $ 103
Goldex Total Cash Costs per Ounce 2011 2010 2009
(thousands, except as noted)
Production costs per Consolidated Statements of Income and Comprehensive Income $ 56,939 $ 61,561 $ 54,342
Adjustments:
Byproduct metal revenues, net of smelting, refining and marketing charges 395 727 –
Inventory and other adjustments(i) (2,778) (253) 383
Non-cash reclamation provision (173) (216) (196)
Cash operating costs $ 54,383 $ 61,819 $ 54,529
Gold production (ounces) 135,478 184,386 148,849
Total cash costs (per ounce)(ii) $ 401 $ 335 $ 366
88 AGNICO-EAGLE MINES LIMITED

Lapa Total Cash Costs per Ounce 2011 2010 2009
(thousands, except as noted)
Production costs per Consolidated Statements of Income and Comprehensive Income $ 68,599 $ 66,199 $ 33,472
Adjustments:
Byproduct metal revenues, net of smelting, refining and marketing charges 663 644 –
Inventory and other adjustments(i) 631 (4,683) 6,072
Non-cash reclamation provision (348) (57) (25)
Cash operating costs $ 69,545 $ 62,103 $ 39,519
Gold production (ounces) 107,068 117,456 52,602
Total cash costs (per ounce)(ii) $ 650 $ 529 $ 751
Kittila Total Cash Costs per Ounce 2011 2010 2009
(thousands, except as noted)
Production costs per Consolidated Statements of Income and Comprehensive Income $ 110,477 $ 87,740 $ 42,464
Adjustments:
Byproduct metal revenues, net of smelting, refining and marketing charges 152 252 –
Inventory and other adjustments(i) (1,267) (4,774) 1,565
Non-cash reclamation provision (206) (334) (254)
Stripping costs (capitalized vs expensed)(iii) (3,018) – –
Cash operating costs $ 106,138 $ 82,884 $ 43,775
Gold production (ounces) 143,560 126,205 65,547
Total cash costs (per ounce)(ii) $ 739 $ 657 $ 668
Pinos Altos Total Cash Costs per Ounce 2011 2010 2009
(thousands, except as noted)
Production costs per Consolidated Statements of Income and Comprehensive Income $ 145,614 $ 90,293 $ 11,819
Adjustments:
Byproduct metal revenues, net of smelting, refining and marketing charges (60,653) (25,052) (625)
Inventory adjustments(i) 1,871 2,925 (5,356)
Non-cash reclamation provision (1,372) (858) (100)
Stripping costs (capitalized vs expensed)(iii) (24,260) (11,857) (253)
Cash operating costs $ 61,200 $ 55,451 $ 5,485
Gold production (ounces) 204,380 130,431 9,634
Total cash costs (per ounce)(ii) $ 299 $ 425 $ 570
892011 ANNUAL REPORT

Meadowbank Total Cash Costs per Ounce 2011 2010 2009
(thousands, except as noted)
Production costs per Consolidated Statements of Income and Comprehensive Income $ 284,502 $ 182,533 $ –
Adjustments:
Byproduct metal revenues, net of smelting, refining and marketing charges (546) (584) –
Inventory adjustments(i) (1,670) 6,911 –
Non-cash reclamation provision (1,679) (1,315) –
Stripping costs (capitalized vs expensed)(iii) (9,746) (4,321) –
Cash operating costs $ 270,861 $ 183,224 $ –
Gold production (ounces) 270,801 264,576 –
Total cash costs (per ounce)(ii) $ 1,000 $ 693 $ –
Reconciliation of Production Costs to Minesite Costs per Tonne by Mine
LaRonde Minesite Costs per Tonne 2011 2010 2009
(thousands, except as noted)
Production costs $ 209,947 $ 189,146 $ 164,221
Adjustments:
Inventory and other adjustments(iv) (22) 3,287 234
Non-cash reclamation provision (4,062) (1,344) (1,198)
Minesite operating costs (US$) $ 205,863 $ 191,089 $ 163,257
Minesite operating costs (C$) $ 202,957 $ 194,993 $ 184,233
Tonnes of ore milled (000s tonnes) 2,406 2,592 2,546
Minesite costs per tonne (C$)(v) $ 84 $ 75 $ 72
Goldex Minesite Costs per Tonne 2011 2010 2009
Production costs $ 56,939 $ 61,561 $ 54,342
Adjustments:
Inventory and other adjustments(iv) (2,407) (253) 383
Non-cash reclamation provision (173) (216) (196)
Minesite operating costs (US$) $ 54,359 $ 61,092 $ 54,529
Minesite operating costs (C$) $ 53,208 $ 62,545 $ 60,986
Tonnes of ore milled (000s tonnes) 2,477 2,782 2,615
Minesite costs per tonne (C$)(v) $ 21 $ 22 $ 23
90 AGNICO-EAGLE MINES LIMITED

Lapa Minesite Costs per Tonne 2011 2010 2009
Production costs $ 68,599 $ 66,199 $ 33,472
Adjustments:
Inventory and other adjustments(iv) 1,071 (4,683) 6,072
Non-cash reclamation provision (348) (57) (26)
Minesite operating costs (US$) $ 69,322 $ 61,459 $ 39,518
Minesite operating costs (C$) $ 68,403 $ 62,771 $ 42,055
Tonnes of ore milled (000s tonnes) 621 552 299
Minesite costs per tonne (C$)(v) $ 110 $ 114 $ 140
Kittila Minesite Costs per Tonne 2011 2010 2009
Production costs $ 110,477 $ 87,740 $ 42,464
Adjustments:
Inventory and other adjustments(iv) (1,324) (4,774) 1,565
Non-cash reclamation provision (206) (334) (254)
Stripping costs (capitalized vs expensed)(iii) (3,018) – –
Minesite operating costs (US$) $ 105,929 $ 82,632 $ 43,775
Minesite operating costs (e) e 76,817 e 63,464 e 30,568
Tonnes of ore milled (000s tonnes) 1,031 960 563
Minesite costs per tonne (e)(v) e 75 e 66 e 54
Pinos Altos Minesite Costs per Tonne 2011 2010 2009
Production costs $ 145,614 $ 90,293 $ 11,819
Adjustments:
Inventory and other adjustments(iv) (169) 2,925 (5,356)
Non-cash reclamation provision (1,372) (858) (100)
Stripping costs (capitalized vs expensed)(iii) (24,260) (11,857) (253)
Minesite operating costs (US$) $ 119,813 $ 80,503 $ 6,110
Tonnes of ore milled (000s tonnes) 4,509 2,318 227
Minesite costs per tonne (US$)(v) $ 27 $ 35 $ 27
912011 ANNUAL REPORT

Meadowbank Minesite Costs per Tonne 2011 2010 2009
Production costs $ 284,502 $ 182,533 $ –
Adjustments:
Inventory and other adjustments(iv) 253 6,911 –
Non-cash reclamation provision (1,679) (1,315) –
Stripping costs (capitalized vs expensed)(iii) (9,746) (4,321) –
Minesite operating costs (US$) $ 273,330 $ 183,808 $ –
Minesite operating costs (C$) $ 272,157 $ 190,980 $ –
Tonnes of ore milled (000s tonnes) 2,978 2,001 –
Minesite costs per tonne (C$)(v) $ 91 $ 95 $ –
Notes:
(i) Under the Company’s revenue recognition policy, revenue is recognized on concentrates when legal title passes. Since total cash costs are calculated on a production basis, thisinventory adjustment reflects the sales margin on the portion of concentrate production for which revenue has not been recognized in the period.
(ii) Total cash cost per ounce is not a recognized measure under US GAAP and this data may not be comparable to data presented by other gold producers. The Company believesthat this generally accepted industry measure is a realistic indication of operating performance and is useful in allowing year over year comparisons. As illustrated in the tablesabove, this measure is calculated by adjusting production costs as shown in the Consolidated Statements of Income and Comprehensive Income for net byproduct revenues,royalties, inventory adjustments and asset retirement provisions. This measure is intended to provide investors with information about the cash generating capabilities of theCompany’s mining operations. Management uses this measure to monitor the performance of the Company’s mining operations. Since market prices for gold are quoted on a perounce basis, using this per ounce measure allows management to assess the mine’s cash generating capabilities at various gold prices. Management is aware that this perounce measure of performance can be impacted by fluctuations in byproduct metal prices and exchange rates. Management compensates for the limitation inherent with thismeasure by using it in conjunction with the minesite costs per tonne measure (discussed below) as well as other data prepared in accordance with US GAAP. Management alsoperforms sensitivity analyses in order to quantify the effects of fluctuating metal prices and exchange rates.
(iii) The Company has decided to report total cash costs per ounce and minesite costs per tonne using the more common industry practice of deferring certain stripping costs thatcan be attributed to future production. The methodology is in line with the Gold Institute Production Cost Standard. The purpose of adjusting for these stripping costs is toenhance the comparability of cash costs to the majority of the Company’s peers within the mining industry.
(iv) This inventory adjustment reflects production costs associated with unsold concentrates.
(v) Minesite costs per tonne is not a recognized measure under US GAAP and this data may not be comparable to data presented by other gold producers. As illustrated in the tablesabove, this measure is calculated by adjusting production costs as shown in the Consolidated Statements of Income and Comprehensive Income for inventory, asset retirementprovisions and deferred stripping costs, and then dividing by tonnes processed through the mill. Since total cash costs data can be affected by fluctuations in byproduct metalprices and exchange rates, management believes minesite costs per tonne provides additional information regarding the performance of mining operations and allowsmanagement to monitor operating costs on a more consistent basis as the per tonne measure eliminates the cost variability associated with varying production levels.Management also uses this measure to determine the economic viability of mining blocks. As each mining block is evaluated based on the net realizable value of each tonnemined, in order to be economically viable the estimated revenue on a per tonne basis must be in excess of the minesite costs per tonne. Management is aware that this per tonnemeasure is impacted by fluctuations in production levels and thus uses this evaluation tool in conjunction with production costs prepared in accordance with US GAAP. Thismeasure supplements production cost information prepared in accordance with US GAAP and allows investors to distinguish between changes in production costs resulting fromchanges in production versus changes in operating performance.
The Company’s operating results and cash flow are significantly affected by changes in the US dollar/Canadian dollarexchange rate due to its operating mines located in Canada. Exchange rate movements can have a significant impact as allof the Company’s revenues are earned in US dollars but most of its operating costs and a substantial portion of its capitalcosts are in Canadian dollars. The US dollar/Canadian dollar exchange rate has varied significantly over the past severalyears. During the period from January 1, 2005 to December 31, 2011, the noon buying rate, as reported by the Bank ofCanada has fluctuated between C$0.92 per US$1.00 and C$1.30 per US$1.00. In addition, a significant portion of theCompany’s expenditures at the Kittila mine and the Pinos Altos mine are denominated in Euros and Mexican pesos,respectively. Each of these currencies has varied significantly against the US dollar over the past several years as well.
Exploration and Corporate Development Expense
Proven and probable gold reserves decreased to 18.8 million ounces in 2011 from 21.3 million ounces in 2010. Thedecrease is attributed to 2011 gold production, the October 19, 2011 suspension of mining operations at the Goldex mineand the associated reclassification of its reserves to resources and the new mine plan at the Meadowbank mine thatresulted in lower reserves.
Set out below is a summary of the significant exploration and corporate development activities undertaken in 2011:
• Canadian regional exploration expenditures were $29.9 million in 2011, an increase of $1.6 million compared with2010.
92 AGNICO-EAGLE MINES LIMITED

• Approximately $8.3 million of regional exploration expenses were incurred on the Pinos Altos mine in Mexico. Themost concentrated drill programs in 2011 focused on the potential at satellite deposits including Cubiro, Sinter andSan Eligio.
• The Company incurred exploration expenditures of $7.5 million during 2011 in Nevada and Wyoming, an increaseof $0.5 million compared with 2010. Exploration activities during 2011 were concentrated on the West Pequopproperty located in the northeastern region of Nevada and on the Rattlesnake Hills property located in thesouthwestern region of Wyoming.
• During 2011, regional exploration expenditures in Finland amounted to $6.3 million, an increase of $1.8 millioncompared with 2010. The Company continued its exploration program at the Suurikuusikko structures around theKittila mine.
• During 2011, mining operations at the Goldex mine were suspended as a result of rock subsidence above thenortheastern limit of the deposit. Investigation expenditures of $19.7 million were incurred which included rockmechanic and mining studies, drilling and development exploration of the deeper D zone and care andmaintenance of general infrastructure.
• The Company’s corporate development team was active in 2011 in evaluating new properties and possibleacquisition opportunities. During 2011, the team’s accomplishments included the Grayd acquisition.
The table below sets out exploration expense by region and total corporate development expense:
2011 2010 2009
(thousands)
Canada $ 29,885 $ 28,346 $ 11,194
Latin America 8,263 8,268 9,212
United States 7,520 7,042 7,176
Europe 6,332 4,569 5,325
Goldex mine 19,656 – –
Corporate development expense 4,065 6,733 3,372
$ 75,721 $ 54,958 $ 36,279
General and Administrative Expenses
General and administrative expenses increased to $107.9 million in 2011 from $94.3 million in 2010, attributableprimarily to increases in salaries, benefits, insurance, and office and information technology costs. There was an increasein stock option expense due to an increase in the number of stock options granted and an increase in the Black-Scholescalculated value of the options granted. Of the total general and administrative expenses, stock-based compensation was$42.2 million and $38.1 million in 2011 and 2010, respectively.
Provincial Capital Taxes
These taxes are assessed on the Company’s capitalization (paid-up capital and debt) less certain allowances and taxcredits for exploration expenses incurred. Ontario capital tax was eliminated on July 1, 2010, while Quebec capital tax waseliminated at the end of 2010. There was however, a government audit assessment related to prior years concluded in2011 that resulted in a $9.2 million expense. In 2010, the Company had a recovery of $6.1 million due to non-recurringitems relating to prior years. The provincial capital tax expense is expected to be nil going forward.
Amortization Expense
The consolidated amortization expense for the year increased to $261.8 million in 2011, compared to $192.5 million in2010, largely as a result of a full year of production at the Meadowbank mine and the underground operations at the Kittilaand Pinos Altos mines in 2011. Additionally, commercial production commenced at the Creston Mascota deposit at Pinos
932011 ANNUAL REPORT

Altos and the LaRonde mine extension in 2011. Amortization expense commences once a mine achieves commercialproduction.
Interest Expense
In 2011, interest expense increased to $55.0 million from $49.5 million in 2010 and $8.4 million in 2009. The table belowshows the components of interest expense:
2011 2010 2009
(thousands)
Stand-by fees on credit facilities $ 7,345 $ 8,159 $ 2,730
Amortization of credit facilities, financing and note issuance costs 4,810 3,507 2,392
Government interest, penalties and other 3,078 2,165 3,326
Interest on credit facilities 1,764 10,795 15,470
Interest on notes 39,067 29,423 –
Interest capitalized to construction in progress (1,025) (4,556) (15,470)
$ 55,039 $ 49,493 $ 8,448
Foreign Currency Translation Gain (Loss)
The foreign currency translation gain was $1.1 million in 2011 compared with a loss of $19.5 million in 2010 as the USdollar strengthened against the Canadian dollar, Euro and the Mexican peso during 2011. The gain in 2011 is dueprimarily to the impact of translation on liabilities denominated in Euros, Canadian dollars and Mexican pesos, offsetpartially by the impact of translation on cash balances denominated in Canadian dollars.
Income and Mining Taxes
In 2011, the Company had an effective tax rate of 26.9% compared with 23.7% in 2010 and 19.9% in 2009. The taxprovision for 2011 was a recovery due to the write-downs of the Goldex and Meadowbank mines. The effective tax rate of26.9% was lower than the statutory tax rate of 27.8% due to permanent differences, principally stock-basedcompensation that is not deductible for tax purposes in Canada, and various other minor adjustments.
Supplies Inventory
The supplies inventory balance as of December 31, 2011 increased to $182.4 million, compared to the December 31,2010 balance of $149.6 million. This increase is mainly attributable to the build-up of supplies inventory at theMeadowbank mine to facilitate operations, including the June 2011 startup of the permanent secondary crusher, andincreased maintenance requirements. In addition, supplies inventory at the Pinos Altos mine increased to supportunderground mining operations and operations at the Creston Mascota deposit at Pinos Altos, which achieved commercialproduction on March 1, 2011.
Liquidity and Capital Resources
At the end of 2011, the Company’s cash and cash equivalents, short-term investments and restricted cash totalled$221.5 million, compared to $104.6 million at the end of 2010. This increase, which resulted from financing andoperating activities, was partially offset by investing activities. Cash provided by financing activities of $182.5 million in2011 compared with cash used in financing activities of $21.9 million in 2010 due primarily to a change from netrepayments of long-term debt in 2010 to net proceeds from long-term debt of $270.0 million in 2011. Cash flow providedby operating activities increased significantly to $663.5 million in 2011 from $483.5 million in 2010 mainly due to anincrease in gold prices realized. The increase in cash flow provided by operating activities was offset to some degree by thesuspension of production at the Goldex mine on October 19, 2011 and by lower grades and throughput realized at theLaRonde mine as it transitions into the LaRonde mine extension. In 2011, cash used in investing activities increased to$760.5 million from $523.3 million in 2010, due primarily to the November 2011 acquisition of Grayd, an increase in
94 AGNICO-EAGLE MINES LIMITED

available-for-sale securities investments, and an increase in restricted cash relating to the environmental remediation ofthe Goldex mine.
In 2011, the Company invested $482.8 million of cash in new projects and sustaining capital expenditures. Majorexpenditures in 2011 included $116.9 million on construction at the Meadowbank mine, $73.9 million on construction atthe Meliadine project, $49.5 million on construction at the LaRonde mine extension, and $220.8 million for sustainingcapital expenditures at the Kittila, Goldex, LaRonde, Pinos Altos and Lapa mines. Capital expenditures to complete theCompany’s growth initiatives are expected to be funded by cash provided by operating activities and cash on hand. Asignificant portion of the Company’s cash and cash equivalents are denominated in US dollars.
During 2011, the Company received net proceeds on available-for-sale securities equal to $9.4 million compared to$36.6 million during 2010. Also during 2011, the Company purchased available-for-sale securities amounting to$91.1 million compared to $42.5 million in 2010. On July 27, 2011, the Company made a strategic investment in RubiconMetals Corporation in a non-brokered private placement for cash consideration of approximately $73.8 million.
Subsequent to year end on February 16, 2012, the Company declared a dividend, its 30th consecutive year paying a cashdividend. During 2011, the Company paid dividends of $98.4 million. Although the Company expects to continue payingdividends, future dividends will be at the discretion of the Board and will be subject to factors such as income, financialcondition and capital requirements. Also in 2011, the Company issued common shares for gross proceeds of$26.5 million. This was mainly due to stock option exercises and issuances under the Company’s employee sharepurchase plan.
In 2010, the Company increased amounts available from the syndicate of banks that comprised its lenders from anaggregate of $900 million to $1.2 billion in a transaction under which the Company also terminated one of its bank creditfacilities. In 2011, the maturity date of the remaining credit facility was extended two years from June 22, 2014 to June 22,2016 (see note 5 to the Company’s audited consolidated financial statements).
As at December 31, 2011, the Company had drawn $320.0 million from its bank credit facility. In addition, the amountsavailable under the credit facility are reduced by letters of credit drawn under the facility. Letters of credit outstandingunder the credit facility at December 31, 2011 totaled $30.6 million. Accordingly, the amount available for futuredrawdowns as at December 31, 2011, was approximately $849.4 million. The credit facility requires the Company tomaintain specified financial ratios and meet financial condition covenants. These financial condition covenants were metas of December 31, 2011.
In June 2009, the Company entered into a C$95 million financial security guarantee issuance agreement with ExportDevelopment Canada (the ‘‘EDC Facility’’). Under the agreement, which matures in June 2014, Export DevelopmentCanada agreed to provide guarantees in respect of letters of credit issued on behalf of the Company in favour of certainbeneficiaries in respect of obligations relating to the Meadowbank mine. As at December 31, 2011, outstanding letters ofcredit drawn under the EDC Facility totaled C$79.6 million.
On April 7, 2010, the Company closed a note offering with institutional investors in the United States and Canada of aprivate placement of $600 million of guaranteed senior unsecured notes due in 2017, 2020 and 2022 (the ‘‘Notes’’). Atissuance, the Notes had a weighted average maturity of 9.84 years and weighted average yield of 6.59%. Proceeds fromthe offering of Notes were used to repay amounts under the Company’s then outstanding credit facilities.
952011 ANNUAL REPORT

Agnico-Eagle’s contractual obligations as at December 31, 2011 are set out below:
Less than More thanContractual Obligations Total 1 Year 1-3 Years 4-5 Years 5 Years
(millions)
Letter of credit obligations $ 2.2 $ – $ 2.2 $ – $ –
Reclamation obligations(i) 336.2 26.1 16.5 2.9 290.7
Purchase commitments 62.3 11.5 15.0 9.4 26.4
Pension obligations(ii) 4.5 0.4 1.0 0.9 2.2
Capital and operating leases 49.2 14.4 26.1 4.9 3.8
Long-term debt repayment obligations(iii) 920.1 – 0.1 320.0 600.0
Total(iv) $ 1,374.5 $ 52.4 $ 60.9 $ 338.1 $ 923.1
Notes:
(i) Mining operations are subject to environmental regulations that require companies to reclaim and remediate land disturbed by mining operations. The Company has submittedclosure plans to the appropriate governmental agencies which estimate the nature, extent and costs of reclamation for each of its mining properties. The estimatedundiscounted cash outflows of these reclamation obligations are presented here. These estimated costs are recorded in the Company’s consolidated financial statements on adiscounted basis in accordance with ASC 410-20 – Asset Retirement Obligations and on an undiscounted basis in accordance with ASC 410-30 – Environmental Obligations.See Note 6(a) to the audited consolidated financial statements.
(ii) The Company has retirement compensation arrangement plans (the ‘‘RCA Plans’’) with certain executives. The RCA Plans provide pension benefits to each of these executivesequal to 2% of the executive’s final three-year average pensionable earnings for each year of service with the Company, less the annual pension payable under the Company’sbasic defined contribution plan. Payments under the RCA Plans are secured by letter of credit from a Canadian chartered bank. The figures presented in this table have beenactuarially determined.
(iii) For the purposes of the Company’s obligations to repay amounts outstanding under its credit facility, the Company has assumed that the indebtedness will be repaid at thecurrent expiry date of the credit facility.
(iv) The Company’s estimated future positive cash flows are expected to be sufficient to satisfy the obligations set out above.
96 AGNICO-EAGLE MINES LIMITED

Off-Balance Sheet Arrangements
The Company has the following off-balance sheet arrangements: operating leases (see Note 13(b) to the auditedconsolidated financial statements) and $119.0 million of outstanding letters of credit for environmental and site restorationcosts, custom credits, government grants and other general corporate purposes (see Note 12 to the audited consolidatedfinancial statements). If the Company were to terminate these off-balance sheet arrangements, the penalties or obligationswould be insignificant based on the Company’s liquidity position, as outlined in the table below.
2012 Liquidity and Capital Resources Analysis
The Company believes that it has sufficient capital resources to satisfy its 2012 mandatory expenditure commitments(including the future obligations set out above) and discretionary expenditure commitments. The following table sets outexpected future capital requirements and resources for 2012:
Amount
(millions)
2012 Mandatory Commitments:
Contractual obligations (from table above) $ 52
Dividend payable (declared in February 2012) 34
Environmental remediation liability 26
Goldex government grant 1
Total 2012 mandatory expenditure commitments $ 113
2012 Discretionary Commitments:
Budgeted capital expenditures $ 382
Dividend payable 103
Total 2012 discretionary expenditure commitments 485
Total 2012 mandatory and discretionary expenditure commitments $ 572
2012 Capital Resources:
Cash, cash equivalents and short term investments (at December 31, 2011) $ 186
Estimated 2012 operating cash flow 490
Working capital (at December 31, 2011) (excluding cash, cash equivalents and short-term investments) 381
Available under the Credit Facilities 849
Total 2012 Capital Resources $ 1,906
While the Company believes its capital resources will be sufficient to satisfy all 2012 commitments (mandatory anddiscretionary), the Company may choose to decrease certain of its discretionary expenditure commitments, whichincludes its construction projects and future dividends, should extremely negative financial circumstances arise inthe future.
Outlook
The following section contains ‘‘forward-looking statements’’ and ‘‘forward-looking information’’ within the meaning ofapplicable securities laws. Please see ‘‘Preliminary Note – Forward-Looking Information’’ for a discussion of assumptionsand risks relating to such statements and information.
972011 ANNUAL REPORT

Gold Production Growth
LaRonde Mine Extension
In 2012, payable gold production at the LaRonde mine is expected to be approximately 150,000 - 165,000 ounces ofgold. The commencement of production at the LaRonde mine extension, which achieved commercial production onDecember 1, 2011, is expected to provide higher grade ore. Over the 2012 to 2014 period, annual average goldproduction is expected to be approximately 219,167 ounces.
Total cash costs per ounce at the LaRonde mine are expected to be approximately $570 in 2012, reflecting expectations oflower grades and metal prices for the mine’s byproducts going forward. However, depending on prevailing byproductprices over the next several years, the potential exists to extend the life of the upper mine by mining lower grade(predominantly zinc) ore that becomes economic. The effect of this would likely be lower total cash costs per ounce due tothe byproduct metal revenue.
Kittila Mine
In 2012, the Kittila mine is expected to produce approximately 150,000 - 160,000 ounces of gold, while from 2012through 2014, it is expected to produce an average of 160,000 ounces per year. Total cash costs per ounce in 2012 areexpected to be approximately $650 per ounce due to improvements in the overall cost structure.
Reflecting the continued growth of the Kittila mine’s orebody, it is expected that a study on a 25% throughput expansion atthe Kittila mine will be completed by the end of 2012. It is believed that a smaller initial expansion supported by currentreserves followed by the possibility of a larger expansion at a later date would be prudent.
Lapa Mine
Gold production during 2012 is expected to be approximately 95,000 - 105,000 ounces at estimated total cash costs perounce of approximately $750. Over the period of 2012 to 2014, annual average gold production of approximately101,667 ounces is expected. The current forecast reflects lower grades to the mill than previously expected.
Pinos Altos Mine
Total gold production in 2012 is expected to be approximately 200,000 - 210,000 ounces at estimated total cash costs perounce of approximately $415. Over the period of 2012 to 2014, the mine (including production from the Creston Mascotadeposit at Pinos Altos) is expected to produce an average of 201,667 ounces of gold per year. Construction on the satelliteCreston Mascota deposit at Pinos Altos was completed with the first gold production occurring during the fourth quarter of2010. Commercial production at this heap leach operation was achieved in March 2011.
New reserves at the Creston Mascota deposit at Pinos Altos have resulted in a new, larger open pit design. Explorationresults indicate that the Creston Mascota deposit at Pinos Altos may extend further to the southwest to include theadjacent Bravo/Carola deposits, increasing the potential for a significantly larger open pit that would include all threedeposits. The Sinter deposit, located approximately two kilometers north of the main Santo Nino zone at the Pinos Altosmine, is being examined as a possible source of open pit ore for the mill at the Pinos Altos mine, potentially extending itsmine life.
Meadowbank Mine
Gold production in 2012 is expected to be approximately 280,000 - 310,000 ounces at estimated total cash costs perounce of approximately $1,040. The mine is expected to produce an average of 303,333 ounces of gold per year from2012 to 2014.
The Meadowbank mine has experienced a number of issues during its start-up over the past two years and while the millthroughput is now exceeding the original design rate, the grades to the mill continued to be lower than expected throughthe end of 2011. The ore body geometry is more complex than originally thought making selective mining difficult andmore costly, resulting in persistently high operating costs. These facts, as previously discussed, has resulted in a new mineplan that forecasts lower gold production over a shorter mine life. The mine life now extends to 2017 rather than 2020.
Meliadine Project
In July 2010, the Company acquired Comaplex, which owned the Meliadine project located in Nunavut, Canada,290 kilometres southeast of the Company’s existing Meadowbank mine. The Company expects to achieve efficiencies by
98 AGNICO-EAGLE MINES LIMITED

leveraging experience gained from the development of the Meadowbank mine, if it determines to build a mine at theMeliadine project.
The 2011 drilling program at the Meliadine project was primarily focused on the Tiriganiaq and Wesmeg zones. With afocus on reserve conversion drilling continuing in 2012 and the completion of a feasibility study expected in late 2013, adetermination by the Company to commence mining operations may be made at the Meliadine project. If a decision tobuild a mine at Meliadine is made, first production is not anticipated prior to 2017 with capital expenditures expected to bedistributed over the 2012 to 2016 period.
La India Project and Tarachi Exploration Property
The La India project in Sonora State, Mexico, acquired in November 2011 as part of the Grayd acquisition, is currentlyundergoing drilling with the goal of converting current resources into reserves. Additionally, the Company is advancing theengineering study and permitting process. The Company anticipates that any mining operations at La India would be a lowcost open pit, heap leach mine. First production at a mine, if built, is not expected prior to 2015.
The Tarachi exploration property is located approximately ten kilometers to the northwest of the La India project in SonoraState, Mexico. Initial drilling and sampling suggest that the mineralized structure extends over several kilometers. Thisproperty is expected to be a focus of exploration drilling in 2012.
Growth Summary
With the achievement of commercial production of the Kittila, Lapa and Pinos Altos mines in 2009, the Meadowbank minein March 2010, and the Creston Mascota deposit at Pinos Altos and LaRonde mine extension in 2011, the Companycontinues its transformation from a one mine operation to a five mine company resulting in record cash provided byoperating activities in 2011. As the Company begins the next growth phase from its expanded production platform, itexpects to continue to deliver on its vision and strategy. Based on exploration results to date and planned explorationprograms in 2012, the Company is targeting reserves to grow to approximately 20.0 million ounces of gold in 2012compared with 18.8 million ounces in 2011. Further internal growth opportunities are expected to add to production in thefuture. In summary, the Company anticipates that the main contributors to the targeted increase in gold production, goldreserves and increases to gold resources could include:
• Continued conversion of Agnico-Eagle’s current gold resources to reserves.
• Increased production from the higher grade orebody in the LaRonde mine extension.
• The 2011 acquisition of the La India project and Tarachi exploration property in Mexico.
• A positive conclusion on the 25% throughput expansion at the Kittila mine, reflecting continued growth of orebody.
• Potential extension of the Creston Mascota deposit at Pinos Altos to include the adjacent Bravo/Carola deposits.
• The Sinter deposit as a possible source of open pit ore for the mill at the Pinos Altos mine.
992011 ANNUAL REPORT

Financial Outlook
Mining Revenue and Production Costs
In 2012, the Company expects to continue to generate strong cash flow as production volumes are expected to bebetween 875,000 and 950,000 ounces, down from 985,460 ounce in 2011 due primarily to the suspension of productionat the Goldex mine on October 19, 2011. Metal prices will have a large impact on financial results and, although theCompany cannot predict the prices that will be realized in 2012, gold prices in early 2012 (to March 12, 2012) haveremained strong. On March 12, 2012, the gold spot price closed at $1,701 per ounce.
The table below sets out actual production for 2011 and estimated production in 2012.
2012 Estimate 2011 Actual
Gold (ounces) 875,000 - 950,000 985,460
Silver (000s ounces) 4,508 5,080
Zinc (tonnes) 33,044 54,894
Copper (tonnes) 5,650 3,216
For 2012, the Company is expecting total cash costs per ounce at the LaRonde mine to be $570 compared to $77 in 2011.In calculating estimates of total cash costs per ounce, net silver, zinc and copper revenue is treated as a reduction ofproduction costs, and therefore production and price assumptions for these metals play an important role in theseestimates for the LaRonde mine, due to its large byproduct production. An increase in byproduct metal prices aboveforecast levels would result in improved cash costs for the LaRonde mine. In addition, the Pinos Altos mine containssignificant byproduct silver.
In 2012, total cash costs per ounce at the Kittila, Lapa, Pinos Altos and Meadowbank mines are expected to be $650,$750, $415 and $1,040, respectively. As production costs at the LaRonde, Lapa and Meadowbank mines aredenominated mostly in Canadian dollars, production costs at the Kittila mine are denominated mostly in Euros andproduction costs at the Pinos Altos mine are denominated mostly in Mexican pesos, the Canadian dollar/US dollar,Euro/US dollar and Mexican peso/US dollar exchange rates also affect the estimates.
The table below sets out the metal price assumptions and exchange rate assumptions used in deriving the estimated totalcash costs per ounce for 2012 (production estimates for each metal are shown in the table above) as well as the marketaverage closing prices for each variable for the period of January 1 to March 12, 2012.
Cash Cost MarketAssumptions Average
Silver (per ounce) $ 30.00 $ 32.74
Zinc (per tonne) $ 1,800 $ 2,028
Copper (per tonne) $ 7,000 $ 8,283
C$/US$ exchange rate $ 1.0000 $ 0.9967
Euro/US$ exchange rate $ 0.7407 $ 0.7640
100 AGNICO-EAGLE MINES LIMITED

The table below sets out the estimated approximate sensitivity of the Company’s 2012 estimated total cash costs perounce to a change in metal price and exchange rate assumptions:
Impact ontotal cash
Change in variable(i) costs
($/oz.)
$1/oz Silver $ 5
$100/per tonne of Zinc $ 3
$100/per tonne of Copper $ 1
1% C$/US$ $ 7
1% Euro/US$ $ 1
Note:(i) The sensitivities presented are based on the production and price assumptions set out above. Operating costs are not affected by fluctuations in byproduct metal prices. The
Company may use derivative strategies to limit the downside risk associated with fluctuating byproduct metal prices and enters into forward contracts to lock in exchange ratesbased on projected Canadian dollar, Euro and Mexican peso operating and capital needs. Please see ‘‘Risk Profile – Metal Price and Foreign Currency’’ and ‘‘Item 11 Quantitativeand Qualitative Disclosures about Market Risk – Risk Profile – Financial Instruments’’. Please see ‘‘– Results of Operations – Production Costs’’ above for a discussion aboutthe use of the non-US GAAP financial measure total cash costs per ounce.
Exploration Expense
In 2012, Agnico-Eagle expects expenditures of $106.3 million on minesite exploration, grassroots exploration andcorporate development $61.9 million is expected to spent on grassroots exploration outside of the Company’s currentlycontemplated mining areas in Canada, Latin America, Finland and the United States. Exploration is success driven andthus these estimates could change materially based on the success of the various exploration programs. In addition, whenit is determined that a mining property can be economically developed as a result of established proven and probablereserves, the costs of drilling to further delineate the ore body on such property are capitalized. In 2012, the Companyexpects to capitalize $39.9 million on drilling related to further delineating ore bodies and converting resourcesinto reserves.
Other Expenses
Cash general and administrative expenses are not expected to increase significantly in 2012; however non-cash variancesmay occur as a result of variances in the Black-Scholes pricing of any stock options granted by the Company in 2012. In2012, provincial capital taxes are expected to be nil since the Ontario provincial capital tax was eliminated on July 1, 2010and Quebec capital tax was eliminated at the end of 2010. Amortization is expected to be approximately $265.6 million in2012. Interest expense in 2012 is expected to be approximately $48.1 million due to long-term debt and standby feesassociated with the $1.2 billion credit facility and the $600 million Notes. The Company’s effective tax rate is expected tobe approximately 35% to 40% in 2012 compared to an effective rate of 26.9% in 2011. The 2011 effective rate was due tothe factors mentioned in ‘‘– Results of Operations – Income and Mining Taxes’’ above.
Capital Expenditures
Agnico-Eagle’s gold growth program remains well funded. Capital expenditures, including construction and developmentcosts, sustaining capital and capitalized exploration costs, are expected to total approximately $382.3 million in 2012.During 2012, the Company expects to generate internal cash flow from the sale of 875,000 - 950,000 ounces of gold andthe associated byproduct metals. The major components of the 2012 capital expenditures program are as follows:
• $88.5 million in sustaining capital expenditures related to the Meadowbank mine;
• $74.8 million in sustaining capital expenditures related to the LaRonde mine;
• $52.0 million in capital expenditures related to construction and development of the Meliadine project;
• $51.9 million in sustaining capital expenditures related to the Kittila mine;
• $44.5 million in capitalized drilling expenditures;
• $42.9 million in capital expenditures related to the Pinos Altos mine;
1012011 ANNUAL REPORT

• $10.2 million in sustaining capital expenditures related to the Lapa mine; and
• $3.5 million in capital expenditures related to construction and development at the La India project.
The Company continues to examine other possible corporate development opportunities which may result in theacquisition of companies or assets with securities, cash or a combination thereof. If cash is used, depending on the size ofthe acquisition, Agnico-Eagle may be required to borrow money or issue securities to fund such cash requirements.
Outstanding Securities
The following table sets out the maximum number of common shares that would be outstanding if all dilutive instrumentsoutstanding at March 12, 2012 were exercised:
Common shares outstanding at March 12, 2012 170,928,545
Employee stock options 11,657,901
Warrants 8,600,000
191,186,446
Critical Accounting Estimates
The preparation of the consolidated financial statements in accordance with US GAAP requires management to makeestimates and judgments that affect the reported amounts of assets, liabilities, revenues and expenses. The Companyevaluates the estimates periodically, including those relating to trade receivables, inventories, deferred tax assets andliabilities, mining properties and asset retirement obligations. In making judgments about the carrying value of assets andliabilities, the Company uses estimates based on historical experience and various assumptions that are consideredreasonable in the circumstances. Actual results may differ from these estimates.
The Company believes the following critical accounting policies relate to its more significant judgments and estimatesused in the preparation of its audited consolidated financial statements. Management has discussed the development andselection of the following critical accounting policies with the Audit Committee of the Board and the Audit Committee hasreviewed the Company’s disclosure in this Form 20-F.
Mining Properties, Plant and Equipment and Mine Development Costs
Significant payments related to the acquisition of land and mineral rights are capitalized as mining properties at cost. If amineable ore body is discovered, such costs are amortized to income when production begins, using theunit-of-production method, based on estimated proven and probable reserves. If no mineable ore body is discovered,such costs are expensed in the period in which it is determined the property has no future economic value.
Expenditures for new facilities and improvements that can extend the useful lives of existing facilities are capitalized asplant and equipment at cost. Interest costs incurred for the construction of projects are capitalized.
Mine development costs incurred after the commencement of production are capitalized or deferred to the extent thatthese costs benefit the entire ore body. Costs incurred to access single ore blocks are expensed as incurred; otherwise,such vertical and horizontal development is classified as mine development costs.
Agnico-Eagle records amortization on both plant and equipment and mine development costs used in commercialproduction on a unit-of-production basis based on the estimated tonnage of proven and probable mineral reserves of themine. The unit-of-production method defines the denominator as the total proven and probable tonnes of reserves.
Repairs and maintenance expenditures are charged to income as production costs. Assets under construction are notdepreciated until the end of the construction period. Upon achievement of commercial production, the capitalizedconstruction costs are transferred to the various categories of plant and equipment.
Mineral exploration costs are charged to income in the year in which they are incurred. When it is determined that a miningproperty can be economically developed as a result of established proven and probable reserves, the costs of drilling anddevelopment to further delineate the ore body on such property are capitalized. The establishment of proven and probablereserves is based on results of final feasibility studies, which indicate whether a property is economically feasible. Uponcommencement of the commercial production of a development project, these costs are transferred to the appropriateasset category and are amortized to income using the unit-of-production method mentioned above. Mine developmentcosts, net of salvage values, relating to a property that is abandoned or considered uneconomic for the foreseeable futureare written off.
102 AGNICO-EAGLE MINES LIMITED

The carrying values of mining properties, plant and equipment and mine development costs are periodically reviewed forpossible impairment, when impairment factors exist, based on the future undiscounted net cash flows of the operatingmine or development property. If it is determined that the estimated net recoverable amount is less than the carrying value,then a write down to the estimated fair value amount is made with a charge to income. Estimated future cash flows of anoperating mine and development properties include estimates of recoverable ounces of gold based on the proven andprobable mineral reserves. To the extent that economic value exists beyond the proven and probable mineral reserves ofan operating mine or development property, this value is included as part of the estimated future cash flows. Estimatedfuture cash flows also involve estimates regarding metal prices (considering current and historical prices, price trends andrelated factors), production levels, capital and reclamation costs, and related income and mining taxes, all based ondetailed engineering life-of-mine plans. Cash flows are subject to risks and uncertainties and changes in the estimates ofthe cash flows may affect the recoverability of long-lived assets.
Goodwill
Business combinations are accounted for using the purchase method whereby assets and liabilities acquired are recordedat their fair values as of the date of acquisition and any excess of the purchase price over such fair values is recorded asgoodwill. As of the date of acquisition, goodwill is allocated to reporting units by determining estimates of the fair value ofeach reporting unit and comparing this amount to the fair values of assets and liabilities in the reporting unit. Goodwill isnot amortized.
The Company performs goodwill impairment tests on an annual basis as well as when events and circumstances indicatethat the carrying amounts may no longer be recoverable. In performing the impairment tests, the Company estimates thefair values of its reporting units that include goodwill and compares those fair values to the reporting units’ carryingamounts. If a reporting unit’s carrying amount exceeds its fair value, the Company compares the implied fair value of thereporting unit’s goodwill to the carrying amount, and any excess of the carrying amount of goodwill over the implied fairvalue is charged to earnings.
Revenue Recognition
Revenue is recognized when the following conditions are met:
(a) persuasive evidence of an arrangement to purchase exists;
(b) the price is determinable;
(c) the product has been delivered; and
(d) collection of the sales price is reasonably assured.
Revenue from gold and silver in the form of dore bars is recorded when the refined gold and silver is sold and delivered tothe customer. Generally, all the gold and silver in the form of dore bars recovered in the Company’s milling process is soldin the period in which it is produced.
Under the terms of concentrate sales contracts with third-party smelters, final prices for the gold, silver, zinc, copper andlead in the concentrate are set based on the prevailing spot market metal prices on a specified future date, which is basedon the date that the concentrate is delivered to the smelter. Agnico-Eagle records revenues under these contracts basedon forward prices at the time of delivery, which is when transfer of legal title to concentrate passes to the third-partysmelters. The terms of the contracts result in differences between the recorded estimated price at delivery and the finalsettlement price. These differences are adjusted through revenue at each subsequent financial statement date.
Revenues from mining operations consist of gold revenues, net of smelting, refining and other marketing charges.Revenues from byproduct metals sales are shown net of smelter charges as part of revenues from mining operations.
Reclamation Costs
On an annual basis, the Company assesses cost estimates and other assumptions used in the valuation of AssetRetirement Obligations (‘‘ARO’’) at each of its mineral properties to reflect events, changes in circumstances and newinformation available. Changes in these cost estimates and assumptions have a corresponding impact on the fair value ofthe ARO. For closed mines, any change in the fair value of AROs results in a corresponding charge or credit within otherexpense, whereas at operating mines the charge is recorded as an adjustment to the carrying amount of thecorresponding asset. The Company has recorded adjustments for changes in estimates of the AROs at our operatingmines in 2011. AROs arise from the acquisition, development, construction and operation of mining property, plant andequipment, due to government controls and regulations that protect the environment on the closure and reclamation of
1032011 ANNUAL REPORT

mining properties. The major parts of the carrying amount of AROs relate to tailings and heap leach padclosure/rehabilitation; demolition of buildings/mine facilities; ongoing water treatment; and ongoing care and maintenanceof closed mines. The fair values of AROs are measured by discounting the expected cash flows using a discount factor thatreflects the credit-adjusted risk-free rate of interest. The Company prepares estimates of the timing and amount ofexpected cash flows when an ARO is incurred. Expected cash flows are updated to reflect changes in facts andcircumstances. The principal factors that can cause expected cash flows to change are: the construction of newprocessing facilities; changes in the quantities of material in reserves and a corresponding change in the life of mine plan;changing ore characteristics that impact required environmental protection measures and related costs; changes in waterquality that impact the extent of water treatment required; and changes in laws and regulations governing the protection ofthe environment. When expected cash flows increase, the revised cash flows are discounted using a current discountfactor, whereas when expected cash flows decrease, the reduced cash flows are discounted using the historical discountfactor used in the original estimation of the expected cash flows. In either case, any change in the fair value of the ARO isrecorded. Agnico-Eagle records the fair value of an ARO when it is incurred. AROs are adjusted to reflect the passage oftime (accretion), which is calculated by applying the discount factor implicit in the initial fair value measurement to thebeginning-of-period carrying amount of the AROs. For producing mines, accretion expense is recorded in the cost ofgoods sold each period. Upon settlement of an ARO, Agnico-Eagle records a gain or loss if the actual cost differs from thecarrying amount of the ARO. Settlement gains/losses are recorded in other (income) expense.
Environmental remediation liabilities are differentiated from AROs in that they do not arise from environmentalcontamination in the normal operation of a long-lived asset or from a legal obligation to treat environmental contaminationresulting from the acquisition, construction, or development of a long-lived asset. The Company is required to recognize aliability for obligations associated with environmental remediation liabilities arising from past acts.
Other environmental remediation costs that are not AROs or environmental remediation liabilities as defined by ASC 410 –Asset Retirement and Environmental Obligations and 410-30 – Environmental Obligations, respectively, are expensedas incurred.
Deferred Tax Assets and Liabilities
Agnico-Eagle follows the liability method of tax allocation for accounting for income taxes. Under this method of taxallocation, deferred income and mining tax bases of assets and liabilities are measured using the enacted tax rates andlaws expected to be in effect when the differences are expected to reverse.
The Company’s operations involve dealing with uncertainties and judgments in the application of complex tax regulationsin multiple jurisdictions. The final taxes paid are dependent upon many factors, including negotiations with taxingauthorities in various jurisdictions and resolution of disputes arising from federal, provincial, state and international taxaudits. The Company recognizes the effect of uncertain tax positions and records tax liabilities for anticipated tax auditissues in Canada and other tax jurisdictions where it is more likely than not based on technical merits that the positionwould not be sustained. The Company recognizes the amount of any tax benefits that have greater than 50 percentlikelihood of being ultimately realized upon settlement.
Changes in judgment related to the expected ultimate resolution of uncertain tax positions are recognized in the year ofsuch change. Accrued interest and penalties related to unrecognized tax benefits are recorded in income tax expense inthe current year. The Company adjusts these reserves in light of changing facts and circumstances; however, due to thecomplexity of some of these uncertainties, the ultimate resolution may result in a payment that is materially different fromthe Company’s current estimate of the tax liabilities. If the Company’s estimate of tax liabilities proves to be less than theultimate assessment, an additional charge to expense would result. If the estimate of tax liabilities proves to be greater thanthe ultimate assessment, a tax benefit would result.
During the second quarter of 2010, the Company executed the newly enacted Quebec foreign currency election tocommence using the U.S. dollar as its functional currency for Quebec income tax purposes. As the related tax legislationwas enacted in the second quarter of 2010, this election applies to taxation years ended December 31, 2008 andsubsequent. This election resulted in a deferred tax benefit of $21.8 million for the year ended December 31, 2010.
Financial Instruments
Agnico-Eagle uses derivative financial instruments, primarily option and forward contracts, to manage exposure tofluctuations of byproduct metal prices, interest rates and foreign currency exchange rates and may use such means tomanage exposure to certain input costs as well. Agnico-Eagle does not hold financial instruments or derivative financialinstruments for trading purposes.
104 AGNICO-EAGLE MINES LIMITED

The Company recognizes all derivative financial instruments in the consolidated financial statements at fair valueregardless of the purpose or intent for holding the instrument. Changes in the fair value of derivative financial instrumentsare either recognized periodically in the consolidated statement of income (loss) or in shareholders’ equity as a componentof accumulated other comprehensive income (loss), depending on the nature of the derivative financial instrument andwhether it qualifies for hedge accounting. Financial instruments designated as hedges are tested for effectiveness on aquarterly basis. Gains and losses on those contracts that are proven to be effective are reported as a component of therelated transaction.
Stock-Based Compensation
The Company’s Stock Option Plan provides for the granting of options to directors, officers, employees and serviceproviders to purchase common shares. Options have exercise prices equal to market price on the day prior to the date ofgrant. The fair value of these options is recognized in the consolidated statement of income (loss) or in the consolidatedbalance sheet if capitalized as part of property, plant and mine development over the applicable vesting period as acompensation cost. Any consideration paid by employees on exercise of options or purchase of common shares iscredited to share capital.
Fair value is determined using the Black-Scholes option valuation model which requires the Company to estimate theexpected volatility of the Company’s share price and the expected life of the stock options. Limitations with existing optionvaluation models and the inherent difficulties associated with estimating these variables create difficulties in determining areliable single measure of the fair value of stock option grants. The dilutive impact of stock option grants is factored into theCompany’s reported diluted income per share.
Commercial Production
The Company assesses each mine construction project to determine when a mine moves into the production stage. Thecriteria used to assess the start date are determined based on the nature of each mine construction project, such as thecomplexity of a plant and its location. The Company considers various relevant criteria to assess when the mine issubstantially complete and ready for its intended use and moved into the production stage. The criteria consideredinclude: (1) the completion of a reasonable period of testing of mine plant and equipment; (2) the ability to produceminerals in saleable form (within specifications); and (3) the ability to sustain ongoing production of minerals. When amine construction project moves into the production stage, the capitalization of certain mine construction costs ceasesand costs are either capitalized to inventory or expensed, except for sustaining capital costs related to property, plant andequipment and underground mine development or reserve development.
Stripping Costs
Pre-production stripping costs are capitalized until an ‘‘other than de minimis’’ level of mineral is produced, after whichtime such costs are either capitalized to inventory or expensed. The Company considers various relevant criteria to assesswhen an ‘‘other than de minimis’’ level of mineral is produced. The criteria considered include: (1) the number of ouncesmined compared to total ounces in mineral reserves; (2) the quantity of ore mined compared to the total quantity of oreexpected to be mined over the life of the mine; (3) the current stripping ratio compared to the expected stripping ratio overthe life of the mine; and (4) the ore grade compared to the expected ore grade over the life of the mine. Please refer tonotes (ii) and (iii) of the ‘‘Reconciliation of Production Costs to Total Cash Costs per Ounce of Gold by Mine’’ section for adiscussion of stripping costs with regards to ‘‘cash costs’’.
Recently Issued Accounting Pronouncements and Developments
Under the SEC Staff Accounting Bulletin 74, the Company is required to disclose information related to new accountingstandards that have not yet been adopted. The Company is currently evaluating the impact that the adoption of thesestatements will have on the Company’s consolidated financial position, results of operations and disclosures.
Comprehensive Income
In June 2011, ASC guidance was issued related to comprehensive income. Under the updated guidance, an entity willhave the option to present the total of comprehensive income either in a single continuous statement of comprehensiveincome or in two separate but consecutive statements. In addition, the update requires certain disclosure requirementswhen reporting other comprehensive income. The update does not change the items reported in other comprehensiveincome or when an item of other comprehensive income must be reclassified to income. In December 2011, updatedguidance was issued to defer the effective date pertaining to reclassification adjustments out of accumulated othercomprehensive income until the Financial Accounting Standards Board (the ‘‘FASB’’) is able to reconsider those
1052011 ANNUAL REPORT

paragraphs. The Company does not expect the updated guidance to have an impact on the consolidated financialposition, results of operations or cash flows.
Fair Value Accounting
In May 2011, ASC guidance was issued related to disclosures around fair value accounting. The updated guidanceclarifies different components of fair value accounting including the application of the highest and best use and valuationpremise concepts, measuring the fair value of an instrument classified in a reporting entity’s shareholders’ equity anddisclosing quantitative information about the unobservable inputs used in fair value measurements that are categorized inLevel 3 of the fair value hierarchy. The update is effective for the Company’s fiscal year beginning January 1, 2012. TheCompany does not expect the updated guidance to have a significant impact on the consolidated financial position, resultsof operations or cash flows.
Goodwill Impairment
In September 2011, ASC guidance was issued related to testing goodwill for impairment. Under the updated guidance,entities are permitted to first assess qualitative factors to determine whether it is more likely than not that the fair value of areporting unit is less than its carrying amount as a basis for determining whether it is necessary to perform the two-stepgoodwill impairment test per Topic 350. Previous guidance required an entity to test goodwill for impairment, on at least anannual basis, by comparing the fair value of a reporting unit with its carrying amount, including goodwill. If the fair value ofa reporting unit is less than its carrying amount, then the second step of the test would be performed to measure theamount of the impairment loss, if any. An entity is no longer required to calculate the fair value of a reporting unit unless theentity determines that it is more likely than not that its fair value is less than its carrying amount. The update is effective forthe Company’s fiscal year beginning January 1, 2012, with earlier application permitted. The Company does not expectthe updated guidance to have a significant impact on the consolidated financial position, results of operations orcash flows.
Disclosures about Offsetting Assets and Liabilities
In November 2011, ASC guidance was issued related to disclosures around offsetting financial instrument and derivativeinstrument assets and liabilities. Under the updated guidance, entities are required to disclose both gross information andnet information about both instruments and transactions eligible for offset in the statements of financial position andinstruments and transactions subject to an agreement similar to a master netting arrangement. The update is effective forthe Company’s fiscal year beginning January 1, 2013. The Company is evaluating the potential impact of adopting thisguidance on the Company’s consolidated financial position, results of operations and cash flows.
International Financial Reporting Standards
Based on recent guidance from the Canadian Securities Administrators and the SEC, as a Canadian issuer and existing USGAAP filer, the Company will continue to be permitted to use US GAAP as its principal basis of accounting. The SEC hasnot yet committed to a timeline which would require the Company to adopt International Financial Reporting Standards(‘‘IFRS’’). A decision to voluntarily adopt IFRS has not been made.
An IFRS project group and a steering committee have been established by the Company and a high level project plan hasbeen formulated. The implementation of IFRS would be done through three distinct phases:
(i) diagnostics;
(ii) detailed IFRS analysis and conversion; and
(iii) implement IFRS in daily business.
The initial diagnostics phase has been completed, and the detailed IFRS analysis has commenced. A report has beenprepared with the primary objective to understand, identify and assess the overall effort required by the Company toproduce financial information in accordance with IFRS. The key areas for the diagnostics work was to review theconsolidated financial statements of the Company to obtain a detailed understanding of the differences between IFRS andUS GAAP to be able to identify potential system and process changes required as a result of converting to IFRS.
106 AGNICO-EAGLE MINES LIMITED

SUMMARIZED QUARTERLY DATA
CONSOLIDATED FINANCIAL DATA
Three months ended
March 31, June 30, September 30, December 31, Total2010 2010 2010 2010 2010
(thousands of United States dollars, except where noted)
Operating margin
Revenues from mining operations $ 237,583 $ 347,456 $ 398,478 $ 439,004 $ 1,422,521
Production costs 118,227 166,573 196,674 195,998 677,472
Operating margin $ 119,356 $ 180,883 $ 201,804 $ 243,006 $ 745,049
Income contribution analysis
LaRonde mine $ 45,388 $ 43,614 $ 48,722 $ 65,516 $ 203,240
Goldex mine 26,423 42,635 44,349 50,122 163,529
Kittila mine 11,470 16,625 26,838 17,467 72,400
Lapa mine 21,273 20,204 17,764 25,477 84,718
Pinos Altos mine 12,631 22,626 15,089 34,998 85,344
Meadowbank mine 2,171 35,179 49,042 49,426 135,818
Operating margin 119,356 180,883 201,804 243,006 745,049
Amortization 30,503 44,003 48,145 69,835 192,486
Corporate expenses 47,579 28,331 (9,818) 51,268 117,360
Income before tax 41,274 108,549 163,477 121,903 435,203
Income and mining taxes 18,942 8,189 42,016 33,940 103,087
Net income for the period $ 22,332 $ 100,360 $ 121,461 $ 87,963 $ 332,116
Net income per share – basic $ 0.14 $ 0.64 $ 0.73 $ 0.53 $ 2.05
Net income per share – diluted $ 0.14 $ 0.63 $ 0.71 $ 0.51 $ 2.00
Cash flows
Operating cash flow $ 74,491 $ 161,574 $ 156,829 $ 90,576 $ 483,470
Investing cash flow $ (119,329) $ (116,826) $ (163,798) $ (123,353) $ (523,306)
Financing cash flow $ (1,646) $ (10,422) $ 531 $ (10,408) $ (21,945)
Realized prices
Gold (per ounce) $ 1,111 $ 1,222 $ 1,235 $ 1,387 $ 1,250
Silver (per ounce) $ 17.87 $ 19.29 $ 20.53 $ 31.96 $ 22.56
Zinc (per tonne) $ 2,235 $ 1,890 $ 2,151 $ 2,391 $ 2,165
Copper (per tonne) $ 7,288 $ 6,581 $ 8,689 $ 10,311 $ 8,182
1072011 ANNUAL REPORT

Three months ended
March 31, June 30, September 30, December 31, Total2010 2010 2010 2010 2010
(thousands of United States dollars, except where noted)
Payable production:(i)
Gold (ounces)
LaRonde mine 45,036 41,533 37,832 38,405 162,806
Goldex mine 42,269 48,334 50,672 43,111 184,386
Kittila mine 24,547 31,593 40,344 29,721 126,205
Lapa mine 31,553 28,927 27,687 29,289 117,456
Pinos Altos mine 26,228 29,665 35,248 39,289 130,431
Creston Mascota deposit at Pinos Altos – – – 666 666
Meadowbank mine 18,599 77,676 93,395 75,990 265,659
188,232 257,728 285,178 256,471 987,609
Silver (ounces in thousands)
LaRonde mine 875 860 1,080 766 3,581
Pinos Altos mine 222 248 290 427 1,185
Creston Mascota deposit at Pinos Altos – – – – –
Meadowbank mine 2 12 18 14 46
1,099 1,120 1,388 1,207 4,812
Zinc (LaRonde mine) (tonnes) 14,224 18,465 14,915 14,939 62,544
Copper (LaRonde mine) (tonnes) 1,052 1,056 1,181 935 4,224
Payable metal sold:
Gold (ounces)
LaRonde mine 45,240 41,666 36,979 39,896 163,781
Goldex mine 37,863 48,310 49,117 48,067 183,357
Kittila mine 30,674 28,588 41,655 28,722 129,639
Lapa mine 34,193 31,920 25,846 31,177 123,136
Pinos Altos mine 20,965 30,634 31,759 39,156 122,514
Meadowbank mine 7,103 70,182 93,495 79,849 250,629
176,038 251,300 278,851 266,867 973,056
Note:
(i) Payable production means the quantity of mineral produced during a period contained in products that are or will be sold by the Company, whether such products are sold duringthe period or held as inventory at the end of the period.
108 AGNICO-EAGLE MINES LIMITED

CONSOLIDATED FINANCIAL DATA
Three months ended
March 31, June 30, September 30, December 31, Total2011 2011 2011 2011 2011
(thousands of United States dollars, except where noted)
Operating margin
Revenues from mining operations $ 412,068 $ 433,691 $ 520,537 $ 455,503 $ 1,821,799
Production costs 198,567 212,754 237,190 227,567 876,078
Operating margin 213,501 220,937 283,347 227,936 945,721
Income contribution analysis
LaRonde mine 48,983 46,017 59,081 34,581 188,662
Goldex mine 40,333 46,739 48,974 24,677 160,723
Kittila mine 27,831 18,934 34,751 33,619 115,135
Lapa mine 19,178 27,737 28,286 23,736 98,937
Pinos Altos mine 47,259 52,568 65,777 67,111 232,715
Meadowbank mine 29,917 28,942 46,478 44,212 149,549
Operating margin 213,501 220,937 283,347 227,936 945,721
Amortization 61,929 59,235 67,104 73,513 261,781
Impairment Loss – – – 907,681 907,681
Loss on Goldex – – 298,183 4,710 302,893
Corporate expenses 74,210 56,936 28,644 92,204 251,994
Income (loss) before tax 77,362 104,766 (110,584) (850,172) (778,628)
Income and mining taxes 32,098 35,941 (28,970) (248,742) (209,673)
Net income (loss) for the period $ 45,264 $ 68,825 $ (81,614) $ (601,430) $ (568,955)
Attributed to non-controlling interest $ – $ – $ – $ (60) $ (60)
Attributed to common shareholders $ 45,264 $ 68,825 $ (81,614) $ (601,370) $ (568,895)
Net income (loss) per share – basic $ 0.27 $ 0.41 $ (0.48) $ (3.53) $ (3.36)
Net income (loss) per share – diluted $ 0.26 $ 0.40 $ (0.48) $ (3.53) $ (3.36)
Cash flows
Operating cash flow $ 171,043 $ 162,821 $ 197,570 $ 132,028 $ 663,462
Investing cash flow $ (89,956) $ (116,173) $ (247,772) $ (306,583) $ (760,484)
Financing cash flow $ (68,842) $ (22,180) $ 29,106 $ 244,461 $ 182,545
1092011 ANNUAL REPORT

Three months ended
March 31, June 30, September 30, December 31, Total2011 2011 2011 2011 2011
(thousands of United States dollars, except where noted)
Realized prices
Gold (per ounce) $ 1,400 $ 1,530 $ 1,717 $ 1,640 $ 1,573
Silver (per ounce) $ 36 $ 39 $ 37 $ 27 $ 34
Zinc (per tonne) $ 2,509 $ 2,257 $ 2,166 $ 2,188 $ 1,892
Copper (per tonne) $ 10,027 $ 8,565 $ 8,561 $ 8,510 $ 7,162
Payable production:(i)
Gold (ounces)
LaRonde mine 36,893 27,525 29,069 30,686 124,173
Goldex mine 38,500 41,998 40,224 14,756 135,478
Kittila mine 40,317 30,811 37,924 34,508 143,560
Lapa mine 26,914 28,552 27,881 23,721 107,068
Pinos Altos mine 48,001 51,066 52,739 52,574 204,380
Meadowbank mine 61,737 59,376 78,141 71,547 270,801
252,362 239,328 265,978 227,792 985,460
Silver (ounces in thousands)
LaRonde mine 680 736 968 785 3,169
Pinos Altos mine 406 452 485 508 1,851
Meadowbank mine 13 13 16 18 60
1,099 1,201 1,469 1,311 5,080
Zinc (LaRonde mine) (tonnes) 11,941 14,678 15,684 12,591 54,894
Copper (LaRonde mine) (tonnes) 817 666 731 1,002 3,216
Payable metal sold:
Gold (ounces)
LaRonde mine 37,459 28,589 26,729 31,342 124,119
Goldex mine 41,895 41,564 37,380 20,863 141,702
Kittila mine 40,698 29,794 36,745 37,769 145,006
Lapa mine 25,776 29,749 27,955 23,854 107,334
Pinos Altos mine 45,484 48,847 54,297 55,611 204,239
Meadowbank mine 61,928 58,767 74,416 78,579 273,690
253,240 237,310 257,522 248,018 996,090
Note:
(i) Payable production means the quantity of mineral produced during a period contained in products that are or will be sold by the Company, whether such products are sold duringthe period or held as inventory at the end of the period.
110 AGNICO-EAGLE MINES LIMITED

FIVE YEAR FINANCIAL AND OPERATING SUMMARY
FINANCIAL DATA
2011 2010 2009 2008 2007
(thousands of United States dollars, except where noted)
Revenues from mining operations $ 1,821,799 $ 1,422,521 $ 613,762 $ 368,938 $ 432,205
Interest, sundry income and gain on available-for-salesecurities (5,167) 94,879 26,314 (37,465) 29,230
1,816,632 1,517,400 640,076 331,473 461,435
Costs and expenses 2,595,260 1,082,197 532,038 235,482 302,157
Income (loss) before income taxes (778,628) 435,203 108,038 95,991 159,278
Income and mining taxes (209,673) 103,087 21,500 22,824 19,933
Net income (loss) $ (568,955) $ 332,116 $ 86,538 $ 73,167 $ 139,345
Attributed to non-controlling interest $ (60) $ – $ – $ – $ –
Attributed to common shareholders $ (568,895) $ 332,116 $ 86,538 $ 73,167 $ 139,345
Net income (loss) per share – basic $ (3.36) $ 2.05 $ 0.55 $ 0.51 $ 1.05
Net income (loss) per share – diluted $ (3.36) $ 2.00 $ 0.55 $ 0.50 $ 1.04
Operating cash flow $ 663,462 $ 483,470 $ 115,106 $ 121,175 $ 246,329
Investing cash flow $ (760,484) $ (523,306) $ (587,611) $ (917,549) $ (373,099)
Financing cash flow $ 182,545 $ (21,945) $ 559,818 $ 558,072 $ 126,508
Dividends declared per share $ – $ 0.64 $ 0.18 $ 0.18 $ 0.18
Capital expenditures $ 482,831 $ 511,641 $ 657,175 $ 908,853 $ 523,793
Average gold price per ounce realized $ 1,573 $ 1,250 $ 1,024 $ 879 $ 748
Average exchange rate – C$ per $ C$ 0.9893 C$ 1.0301 C$ 1.1415 C$ 1.0669 C$ 1.0738
Weighted average number of common sharesoutstanding (in thousands) 169,353 162,343 155,942 144,741 132,768
Working capital (including undrawn credit lines) $ 1,472,300 $ 1,491,471 $ 598,581 $ 508,335 $ 751,587
Total assets $ 5,026,564 $ 5,500,351 $ 4,427,357 $ 3,378,824 $ 2,735,498
Long-term debt $ 920,095 $ 650,000 $ 715,000 $ 200,000 $ –
Shareholders’ equity $ 3,215,163 $ 3,665,450 $ 2,751,761 $ 2,517,756 $ 2,058,934
1112011 ANNUAL REPORT

2011 2010 2009 2008 2007
(thousands of United States dollars, except where noted)
Operating Summary
LaRonde mine
Revenues from mining operations $ 398,609 $ 392,386 $ 352,221 $ 330,652 $ 432,205
Production costs 209,947 189,146 164,221 166,496 166,104
Gross profit (exclusive of amortization shown below) $ 188,662 $ 203,240 $ 188,000 $ 164,156 $ 266,101
Amortization 31,089 30,404 28,392 28,285 27,757
Gross profit $ 157,573 $ 172,836 $ 159,608 $ 135,871 $ 238,344
Tonnes of ore milled 2,406,342 2,592,252 2,545,831 2,638,691 2,673,463
Gold – grams per tonne 2 2 3 3 3
Gold production – ounces 124,173 162,806 203,494 216,208 230,992
Silver production – ounces (in thousands) 3,169 3,581 3,919 4,079 4,920
Zinc production – tonnes 54,894 62,544 56,186 65,755 71,577
Copper production – tonnes 3,216 4,224 6,671 6,922 7,482
Total cash costs (per ounce):
Production costs $ 1,691 $ 1,162 $ 807 $ 770 $ 719
Less:
Net byproduct revenues (1,562) (1,180) (699) (658) (1,082)
Inventory adjustments (19) 19 1 – 4
Accretion expense and other (33) (8) (6) (6) (6)
Total cash costs (per ounce)(i) $ 77 $ (7) $ 103 $ 106 $ (365)
Minesite costs per tonne(i) C$ 84 C$ 75 C$ 72 C$ 67 C$ 66
Note:
(i) Total cash costs per ounce and minesite costs per tonne are non-US GAAP measures of performance that the Company uses to monitor the performance of its operations. See‘‘– Results of Operations – Production Costs’’ above.
112 AGNICO-EAGLE MINES LIMITED

2011 2010 2009 2008 2007
Goldex mine
Revenues from mining operations $ 217,662 $ 225,090 $ 142,493 $ 38,286 $ –
Production costs 56,939 61,561 54,342 20,366 –
Operating margin $ 160,723 $ 163,529 $ 88,151 $ 17,920 $ –
Amortization 16,910 21,428 21,716 7,250 –
Gross profit $ 143,813 $ 142,101 $ 66,435 $ 10,670 $ –
Tonnes of ore milled 2,476,515 2,781,564 2,614,645 1,118,543 –
Gold – grams per tonne 1.79 2.21 1.98 1.86 –
Gold production – ounces 135,478 184,386 148,849 57,436 –
Total cash costs (per ounce):
Production costs $ 420 $ 333 $ 365 $ 430 $ –
Less:
Net byproduct revenues 3 4
Inventory adjustments (21) (1) 3 (9) –
Accretion expense and other (1) (1) (1) (2) –
Total cash costs (per ounce)(i) $ 401 $ 335 $ 367 $ 419 $ –
Minesite costs per tonne(i) C$ 21 C$ 22 C$ 23 C$ 27 C$ –
Lapa mine
Revenues from mining operations $ 167,536 $ 150,917 $ 43,409 $ – $ –
Production costs 68,599 66,199 33,472 – –
Operating margin $ 98,937 $ 84,718 $ 9,937 $ – $ –
Amortization 37,954 31,986 9,906 – –
Gross profit $ 60,983 $ 52,732 $ 31 $ – $ –
Tonnes of ore milled 620,712 551,739 299,430 – –
Gold – grams per tonne 6.62 8.26 7.29 – –
Gold production – ounces 107,068 117,456 52,602 – –
Total cash costs (per ounce):
Production costs $ 641 $ 564 $ 636 $ – $ –
Less:
Net byproduct revenues 6 5 – – –
Inventory adjustments 6 (40) 115 – –
Accretion expense and other (3) – – – –
Total cash costs (per ounce)(i) $ 650 $ 529 $ 751 $ – $ –
Minesite costs per tonne(i) C$ 110 C$ 114 C$ 140 C$ – C$ –
Note:
(i) Total cash costs per ounce and minesite costs per tonne are non-US GAAP measures of performance that the Company uses to monitor the performance of its operations. See‘‘– Results of Operations – Production Costs’’ above.
1132011 ANNUAL REPORT
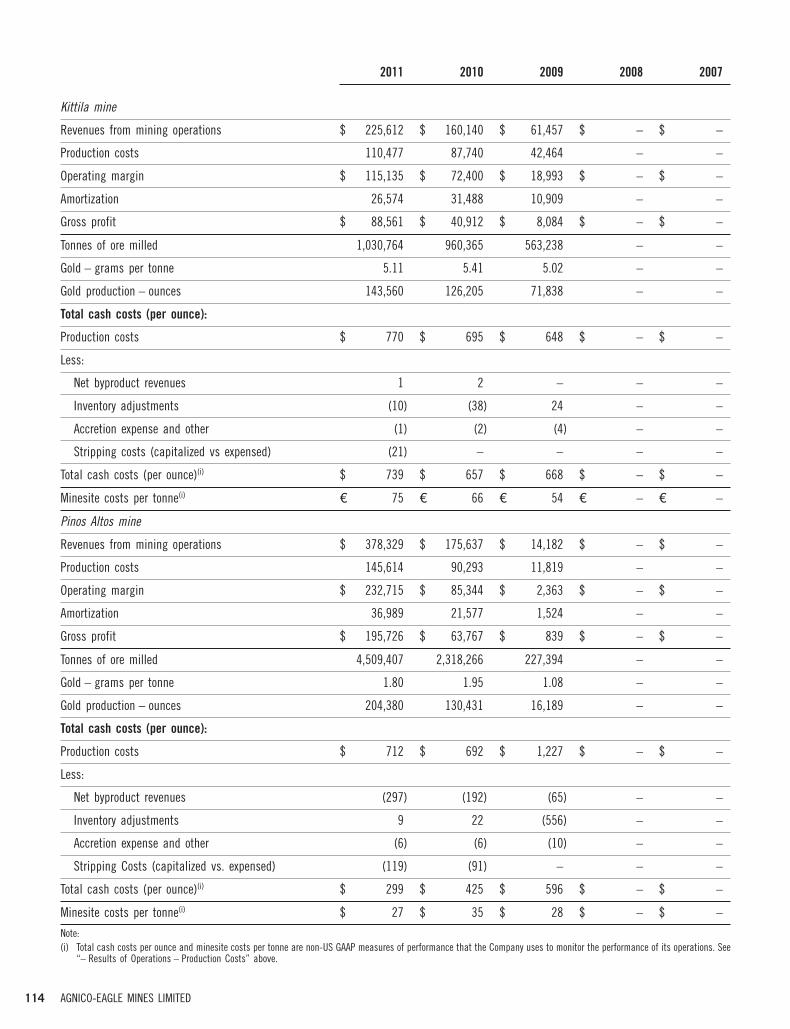
2011 2010 2009 2008 2007
Kittila mine
Revenues from mining operations $ 225,612 $ 160,140 $ 61,457 $ – $ –
Production costs 110,477 87,740 42,464 – –
Operating margin $ 115,135 $ 72,400 $ 18,993 $ – $ –
Amortization 26,574 31,488 10,909 – –
Gross profit $ 88,561 $ 40,912 $ 8,084 $ – $ –
Tonnes of ore milled 1,030,764 960,365 563,238 – –
Gold – grams per tonne 5.11 5.41 5.02 – –
Gold production – ounces 143,560 126,205 71,838 – –
Total cash costs (per ounce):
Production costs $ 770 $ 695 $ 648 $ – $ –
Less:
Net byproduct revenues 1 2 – – –
Inventory adjustments (10) (38) 24 – –
Accretion expense and other (1) (2) (4) – –
Stripping costs (capitalized vs expensed) (21) – – – –
Total cash costs (per ounce)(i) $ 739 $ 657 $ 668 $ – $ –
Minesite costs per tonne(i) e 75 e 66 e 54 e – e –
Pinos Altos mine
Revenues from mining operations $ 378,329 $ 175,637 $ 14,182 $ – $ –
Production costs 145,614 90,293 11,819 – –
Operating margin $ 232,715 $ 85,344 $ 2,363 $ – $ –
Amortization 36,989 21,577 1,524 – –
Gross profit $ 195,726 $ 63,767 $ 839 $ – $ –
Tonnes of ore milled 4,509,407 2,318,266 227,394 – –
Gold – grams per tonne 1.80 1.95 1.08 – –
Gold production – ounces 204,380 130,431 16,189 – –
Total cash costs (per ounce):
Production costs $ 712 $ 692 $ 1,227 $ – $ –
Less:
Net byproduct revenues (297) (192) (65) – –
Inventory adjustments 9 22 (556) – –
Accretion expense and other (6) (6) (10) – –
Stripping Costs (capitalized vs. expensed) (119) (91) – – –
Total cash costs (per ounce)(i) $ 299 $ 425 $ 596 $ – $ –
Minesite costs per tonne(i) $ 27 $ 35 $ 28 $ – $ –
Note:(i) Total cash costs per ounce and minesite costs per tonne are non-US GAAP measures of performance that the Company uses to monitor the performance of its operations. See
‘‘– Results of Operations – Production Costs’’ above.
114 AGNICO-EAGLE MINES LIMITED

2011 2010 2009 2008 2007
Meadowbank mine
Revenues from mining operations $ 434,051 $ 318,351 $ – $ – $ –
Production costs 284,502 182,533 – – –
Operating margin $ 149,549 $ 135,818 $ – $ – $ –
Amortization 112,624 55,604 – – –
Gross profit $ 36,925 $ 80,214 $ – $ – $ –
Tonnes of ore milled 2,977,722 2,000,792 – – –
Gold – grams per tonne 3.02 4.34 – – –
Gold production – ounces 270,801 265,659 – – –
Total cash costs (per ounce):
Production costs $ 1,051 $ 690 $ – $ – $ –
Less:
Net byproduct revenues (2) (2) – – –
Inventory adjustments (6) 26 – – –
Accretion expense and other (7) (5) – – –
Stripping Costs (capitalized vs. expensed) (36) (16) – – –
Total cash costs (per ounce)(i) $ 1,000 $ 693 $ – $ – $ –
Minesite costs per tonne(i) C$ 91 C$ 95 C$ – C$ – C$ –
Note:
(i) Total cash costs per ounce and minesite costs per tonne are non-US GAAP measures of performance that the Company uses to monitor the performance of its operations. See‘‘– Results of Operations – Production Costs’’ above.
1152011 ANNUAL REPORT

ITEM 6 DIRECTORS, SENIOR MANAGEMENT AND EMPLOYEES
Directors and Senior Management
The articles of Agnico-Eagle provide for a minimum of five and a maximum of fifteen directors. By special resolution of theshareholders of Agnico-Eagle approved at the annual and special meeting of Agnico-Eagle held on June 27, 1996, theshareholders authorized the Board to determine the number of directors within that minimum and maximum. The numberof directors to be elected is thirteen as determined by the Board by resolution passed on February 15, 2012.
The by-laws of Agnico-Eagle provide that directors will hold office for a term expiring at the next annual meeting ofshareholders of Agnico-Eagle or until their successors are elected or appointed or the position is vacated. The Boardannually appoints the officers of Agnico-Eagle, who are subject to removal by resolution of the Board at any time, with orwithout cause (in the absence of a written agreement to the contrary).
The following is a brief biography of each of Agnico-Eagle’s directors:
Dr. Leanne M. Baker, 59, of Sebastopol, California, is an independent director of Agnico-Eagle. Dr. Baker is the Presidentand Chief Executive Officer and a director of Sutter Gold Mining Inc. (‘‘Sutter’’), a gold company that is developing itsLincoln Project in California’s Mother Load. Sutter’s shares trade on the TSX Venture Exchange and the OTCQX. Previously,Dr. Baker was employed by Salomon Smith Barney where she was one of the top-ranked mining sector equity analysts inthe United States. Dr. Baker is a graduate of the Colorado School of Mines (M.S. and Ph.D. in mineral economics).Dr. Baker has been a director of Agnico-Eagle since January 1, 2003, and is also a director of Reunion Gold Corporation(a mining exploration company traded on the TSX Venture Exchange), McEwen Mining Inc. and Kimber Resources Inc.(mining exploration companies traded on the NYSE Arca and the TSX). Area of expertise: Corporate Finance and MineralEconomics.
Douglas R. Beaumont, P.Eng., 79, of Mississauga, Ontario, is an independent director of Agnico-Eagle. Mr. Beaumont, nowretired, was most recently Senior Vice-President, Process Technology of SNC Lavalin. Prior to that, he was ExecutiveVice-President of Kilborn Engineering and Construction. Mr. Beaumont is a graduate of Queen’s University (B.Sc.).Mr. Beaumont has been a director of Agnico-Eagle since February 25, 1997. Area of expertise: Mining and Metallurgy.
Sean Boyd, CA, 53, of Toronto, Ontario, is the Vice-Chairman, President and Chief Executive Officer and a director ofAgnico-Eagle. Mr. Boyd has been with Agnico-Eagle since 1985. Prior to his appointment as Vice-Chairman, Presidentand Chief Executive Officer in February 2012, Mr. Boyd served as Vice-Chairman and Chief Executive Officer from 2005 to2012 and as President and Chief Executive Officer from 1998 to 2005, Vice-President and Chief Financial Officer from1996 to 1998, Treasurer and Chief Financial Officer from 1990 to 1996, Secretary Treasurer during a portion of 1990 andComptroller from 1985 to 1990. Prior to joining Agnico-Eagle in 1985, he was a staff accountant with Clarkson Gordon(Ernst & Young). Mr. Boyd is a Chartered Accountant and a graduate of the University of Toronto (B.Comm.). Mr. Boyd hasbeen a director of Agnico-Eagle since April 14, 1998. Area of expertise: Executive Management, Finance.
Martine A. Celej, 46, of Toronto, Ontario, is an independent director of Agnico-Eagle. Ms Celej is currently theVice-President, Investment Advisor with RBC Dominion Securities and has been in the investment industry since 1989.She is a graduate of Victoria College at the University of Toronto (B.A. (Honours)). Ms Celej became a director of Agnico-Eagle on February 14, 2011. Area of expertise: Investment Management.
Clifford J. Davis, 69, of Kemble, Ontario, is an independent director of Agnico-Eagle. Mr. Davis is a mining industry veteranand formerly a member of the senior management teams of New Gold Inc., Gabriel Resources Ltd. and TVX Gold Inc.Mr. Davis is a graduate of the Royal School of Mines, Imperial College, London University (B.Sc., Mining Engineering).Mr. Davis has been a director of Agnico-Eagle since June 17, 2008 and is also a director and member of the CompensationCommittee, Nominating and Corporate Governance Committee and Audit Committee of Zenyatta Ventures Ltd. Area ofexpertise: Mining.
Robert J. Gemmell, 55, of Toronto, Ontario, is an independent director of Agnico-Eagle. Now retired, Mr. Gemmell spent25 years as an investment banker in the United States and in Canada. Most recently, he was President and Chief ExecutiveOfficer of Citigroup Global Markets Canada and its predecessor companies (Salomon Brothers Canada and SalomonSmith Barney Canada) from 1996 to 2008. In addition, he was a member of the Global Operating Committee of CitigroupGlobal Markets from 2006 to 2008. Mr. Gemmell is a graduate of Cornell University (B.A.), Osgoode Hall Law School(LL.B) and the Schulich School of Business (M.B.A.). Mr. Gemmell became a director of Agnico-Eagle on January 1,2011. Area of expertise: Corporate Finance and Business Strategy.
Bernard Kraft, CA, 81, of Toronto, Ontario, is an independent director of Agnico-Eagle. Mr. Kraft is a retired senior partner ofthe Toronto accounting firm Kraft, Berger LLP, Chartered Accountants and now serves as a consultant to that firm. He is
116 AGNICO-EAGLE MINES LIMITED

also a principal in Kraft Yabrov Valuations Inc. Mr. Kraft is recognized as a Designated Specialist in Investigative andForensic Accounting by the Canadian Institute of Chartered Accountants. Mr. Kraft is a member of the Canadian Instituteof Chartered Business Valuators, the Association of Certified Fraud Examiners and the American Society of Appraisers.Mr. Kraft has been a director of Agnico-Eagle since March 12, 1992, and is also a director and a member of the AuditCommittee, Governance Committee and Health, Safety and Environment Committee of St. Andrews Goldfields Limitedand a director and a member of the Audit Committee of Harte Gold Corp. Area of expertise: Audit and Accounting.
Mel Leiderman, CA, TEP, ICD.D, 59, of Toronto, Ontario, is an independent director of Agnico-Eagle. Mr. Leiderman is themanaging partner of the Toronto accounting firm Lipton LLP, Chartered Accountants. He is a graduate of the University ofWindsor (B.A.) and is a certified director of the Institute of Corporate Directors (ICD.D). He has been a director of Agnico-Eagle since January 1, 2003 and is also a director and a member of the Audit Committee and Corporate Governance andCompensation Committee of Colossus Minerals Inc. Area of expertise: Audit and Accounting.
James D. Nasso, ICD.D, 78, of Toronto, Ontario, is Chairman of the Board of Directors and an independent director ofAgnico-Eagle. Mr. Nasso is now retired and is a graduate of St. Francis Xavier University (B.Comm.) and is a certifieddirector of the Institute of Corporate Directors (ICD.D). Mr. Nasso has been a director of Agnico-Eagle since June 27, 1986.Area of expertise: Management and Business Strategy.
Dr. Sean Riley, 58, of Antigonish, Nova Scotia, is an independent director of Agnico-Eagle. Dr. Riley has served asPresident of St. Francis Xavier University since 1996. Prior to 1996, his career was in finance and management, first incorporate banking and later in manufacturing. Dr. Riley is a graduate of St. Francis Xavier University (B.A. (Honours)) andof Oxford University (M. Phil, D. Phil, International Relations)). Dr. Riley became a director of Agnico-Eagle on January 1,2011. Area of Expertise: Management and Business Strategy.
J. Merfyn Roberts, CA, 61, of London, England, is an independent director of Agnico-Eagle. Mr. Roberts has been a fundmanager and investment advisor for more than 25 years and has been closely associated with the mining industry.Mr. Roberts is a graduate of Liverpool University (B.Sc., Geology) and Oxford University (M.Sc., Geochemistry) and is amember of the Institute of Chartered Accountants in England and Wales. He has been a director of Agnico-Eagle sinceJune 17, 2008, and is also a director and a member of the Audit Committee and Compensation and CorporateGovernance Committee of Eastern Platinum Limited, a director and a member of the Remuneration Committee and AuditCommittee of Rambler Metals and Mining plc, a director of Mena Hydrocarbons Inc. and a director of BlackheathResources Inc. Area of expertise: Investment Management.
Howard R. Stockford, P.Eng., 70, of Toronto, Ontario, is an independent director of Agnico-Eagle. Mr. Stockford is a retiredmining executive with 50 years of experience in the industry. Most recently he was Executive Vice-President of AurResources Inc. (‘‘Aur’’) and a director of Aur from 1984 until August 2007, when it was taken over by Teck ComincoLimited. Mr. Stockford has previously served as President of the Canadian Institute of Mining, Metallurgy and Petroleumand is a member of the Association of Professional Engineers of Ontario, the Prospectors and Developers Association ofCanada and the Society of Economic Geologists. Mr. Stockford is a graduate of the Royal School of Mines, Imperial College,London University, U.K. (B.Sc., Mining Geology). Mr. Stockford has been a director of Agnico-Eagle since May 6, 2005,and is also a director, a member of the Audit Committee, the Corporate Governance Committee and the TechnicalCommittee of Victory Nickel Inc. Area of expertise: Executive Management, Mining.
Pertti Voutilainen, M.Sc., M.Eng., 70, of Espoo, Finland, is an independent director of Agnico-Eagle. Mr. Voutilainen is amining industry veteran. Most recently, he was the Chairman of the board of directors of Riddarhyttan Resources AB.Previously, Mr. Voutilainen was the Chairman of the board of directors and Chief Executive Officer of Kansallis BankingGroup and President after its merger with Union Bank of Finland until his retirement in 2000. He was also employed byOutokumpu Corp., Finland’s largest mining and metals company, for 26 years, including as Chief Executive Officer for11 years. Mr. Voutilainen holds the honorary title of Mining Counselor (Bergsrad), which was awarded to him by thePresident of the Republic of Finland in 2003. Mr. Voutilainen is a graduate of Helsinki University of Technology (M.Sc.),Helsinki University of Business Administration (M.Sc.) and Pennsylvania State University (M.Eng.). He has been a directorof Agnico-Eagle since December 13, 2005. Area of expertise: Mining and Finance.
The following is a brief biography of each of Agnico-Eagle’s senior officers:
Ammar Al-Joundi, 48, of Toronto, Ontario, is Senior Vice-President, Finance and Chief Financial Officer of Agnico-Eagle.Mr. Al-Joundi joined Agnico-Eagle as Senior Vice-President, Chief Financial Officer in 2010. Prior to joining Agnico-Eagle,Mr. Al-Joundi spent 11 years at Barrick in various senior financial roles including Senior Vice-President of Finance, SeniorVice-President of Business Strategy and Capital Allocation and two years as Executive Director and CFO of Barrick SouthAmerica. Prior to that, Mr. Al-Joundi spent eight years as an investment banker with Citibank Canada. Mr. Al-Joundi is a
1172011 ANNUAL REPORT

graduate of the Ivey Business School (M.B.A.) at the University of Western Ontario and is a graduate of the University ofToronto (B.Eng., Mechanical Engineering).
Donald G. Allan, 56, of Toronto, Ontario, is Senior Vice-President, Corporate Development of Agnico-Eagle, a position hehas held since December 14, 2006. Prior to that, Mr. Allan had been Vice-President, Corporate Development since May 6,2002. Prior to that, Mr. Allan spent 16 years as an investment banker covering the mining and natural resources sectorswith the firms Salomon Smith Barney and Merrill Lynch. Mr. Allan is a graduate of the Amos Tuck School, DartmouthCollege (M.B.A.) and the University of Toronto (B.Comm.). Mr. Allan is also qualified as a Chartered Accountant.
Alain Blackburn, P.Eng., 55, of Oakville, Ontario, is Senior Vice-President, Exploration of Agnico-Eagle, a position he hasheld since December 14, 2006. Prior to that, Mr. Blackburn had been Vice-President, Exploration since October 1, 2002.Prior to that, Mr. Blackburn served as Agnico-Eagle’s Manager, Corporate Development from January 1999 andExploration Manager from September 1996 to January 1999. Mr. Blackburn joined Agnico-Eagle in 1988 as ChiefGeologist at the LaRonde mine. Mr. Blackburn is a graduate of Universite du Quebec de Chicoutimi (P.Eng.) andUniversite du Quebec en Abitibi-Temiscamingue (M.Sc.).
Louise Grondin, Ing. P.Eng., 58, of Toronto, Ontario, is Senior Vice-President, Environment and Sustainable Development ofAgnico-Eagle, a position she has held since January 1, 2011. Prior to that, Ms. Grondin was Vice President, Environmentand Sustainable Development and before that she was the Regional Environmental Manager and Environmental Manager,LaRonde Division. Prior to her employment with Agnico-Eagle, Ms. Grondin worked for Billiton Canada Ltd. as ManagerEnvironment, Human Resources and Safety. Ms. Grondin is a graduate of the University of Ottawa (B.Sc.) and McGillUniversity (M.Sc.).
Tim Haldane, P.Eng., 55, of Tucson, Arizona, is Senior Vice-President, Latin America of Agnico-Eagle. Prior to joiningAgnico-Eagle in May 2006, he was Vice President, Development for Glamis Gold Inc. where he participated in numerousacquisition and development activities in North America and Central America. Mr. Haldane is a graduate of the MontanaSchool of Mines and Technology (B.S. Metallurgical Engineering) and has 30 years of experience in the precious metalsand base metals industries.
R. Gregory Laing, B.A., LL.B., 53, of Oakville, Ontario, is General Counsel, Senior Vice-President, Legal and CorporateSecretary of Agnico-Eagle, a position he has held since December 14, 2006, prior to which, Mr. Laing had been GeneralCounsel, Vice-President, Legal and Corporate Secretary since September 19, 2005. Prior to that, he was Vice President,Legal of Goldcorp Inc. from October 2003 to June 2005 and General Counsel, Vice President, Legal and CorporateSecretary of TVX Gold Inc. from October 1995 to January 2003. He worked as a corporate securities lawyer for twoprominent Toronto law firms prior to that. Mr. Laing is a director of Andina Minerals Inc. (a mining exploration company), aTSX Venture Exchange listed company and Hy Lake Gold Inc. (a mining exploration company), traded on the CanadianNational Stock Exchange. Mr. Laing is a graduate of the University of Windsor (LL.B.) and Queen’s University (B.A.).
Marc H. Legault, P.Eng, 52, of Mississauga, Ontario, is Senior Vice-President, Project Evaluations of Agnico-Eagle, aposition he has held since February 2012. Prior to that, he was Vice-President, Project Development since 2007.Mr. Legault has been with Agnico-Eagle since 1988, when he was hired as an exploration geologist in Val d’Or, Quebec.Since then, he has taken on successively increasing responsibilities in the Company’s exploration, mine geology andproject evaluation activities. Mr. Legault is a graduate of Carleton University (M.Sc. in geology in 1985) and Queen’sUniversity at Kingston (B.Sc.H. in Geological Engineering in 1982). Marc is a registered Professional Engineer. He is also adirector of Golden Goliath Resources Ltd., a mining exploration company that trades on the TSX Venture Exchange.
Jean-Luk Pellerin, 55, of Toronto, Ontario, is Senior Vice-President, Human Resources. Mr. Pellerin joined Agnico-Eagle inJanuary 2012. Prior to that, he spent four years at Transat A.T. Inc. as Senior Vice-President, Human Resources and ChiefTalent Officer. Before Transat, Mr. Pellerin spent six years in consulting at the helm of his own firm and as National Partnerwith Mercer Consulting. Prior to that, he held senior management and executive positions at Bombardier Inc., DomtarCorporation and General Electric. Mr. Pellerin has also taught in the MBA program at the H.E.C. Montreal in the Master’sprogram in Organizational Development, as well as at American University and at the McGill International ExecutiveInstitute. Mr. Pellerin is a graduate of the University of Laval in Industrial Relations.
Daniel Racine, Ing., P.Eng., 49, of Oakville, Ontario, is Senior Vice-President, Mining of Agnico-Eagle, a position he has heldsince June 2008. Prior to his appointment, he served Agnico-Eagle in various capacities for 22 years, includingVice-President, Operations, Operations Manager, LaRonde mine Manager, Underground Superintendent and MineCaptain. Prior to joining Agnico-Eagle, Mr. Racine worked as a mining engineer for several mining companies. Mr. Racinegraduated as a mining engineer from Laval University (B.Sc.) in December 1986.
118 AGNICO-EAGLE MINES LIMITED

Jean Robitaille, 49, of Oakville, Ontario, is Senior Vice-President, Technical Services and Project Development of Agnico-Eagle, a position he has held since June 2008. Prior to his appointment, he served Agnico-Eagle in various capacities formore than 22 years, most recently as Vice-President, Metallurgy & Marketing, General Manager, Metallurgy & Marketingand Mill Superintendent and Project Manager for the expansion of the LaRonde mill. Prior to joining Agnico-Eagle,Mr. Robitaille worked as a metallurgist with Teck Mining Group. Mr. Robitaille is a mining graduate of the College del’Abitibi-Temiscamingue with a specialty in mineral processing.
David Smith, P.Eng., 48, of Toronto, Ontario, is Senior Vice-President, Strategic Planning and Investor Relations of Agnico-Eagle, a position he has held since January 1, 2011. Prior to that he was Vice-President, Investor Relations. He startedwork in investor relations at Agnico-Eagle in February 2005. Prior to that, he was a mining analyst at Dominion BondRating Service for more than five years. Mr. Smith’s professional experience also includes a variety of engineering positionsin the mining industry, both in Canada and abroad. He is a graduate of Queen’s University (B.Sc.) and the University ofArizona (M.Sc.). Mr. Smith is also a Professional Engineer.
Yvon Sylvestre, 50, of Mississauga, Ontario, is Senior Vice-President, Operations, a position he has held sinceFebruary 2012. Prior to that, he was Vice-President, Construction; Mine General Manager at the Goldex division of Agnico-Eagle and, previously, Mill Superintendent at the LaRonde division. Mr. Sylvestre is a Metallurgical Engineering Technologygraduate from Cambrian College in Sudbury. Following graduation, he served as Mettallurgist and Mill Superintendent atthe Joutel division of Agnico-Eagle and also held the position of Mill Superintendent at the Trollus division of Inmet MiningCorporation.
There are no arrangements or understandings between any director or executive officer and any other person pursuant towhich such director or executive officer was selected to serve, nor are there any family relationships between anysuch persons.
Compensation of Executive Officers
The senior officers of Agnico-Eagle are:
• Sean Boyd, Vice-Chairman, President and Chief Executive Officer
• Ammar Al-Joundi, Senior Vice-President, Finance and Chief Financial Officer
• Donald G. Allan, Senior Vice-President, Corporate Development
• Alain Blackburn, Senior Vice-President, Exploration
• Louise Grondin, Senior Vice-President, Environment and Sustainable Development
• Tim Haldane, Senior Vice-President, Latin America
• R. Gregory Laing, General Counsel, Senior Vice-President, Legal and Corporate Secretary
• Marc Legault, Senior Vice-President, Project Evaluations
• Jean-Luk Pellerin, Senior Vice-President, Human Resources
• Daniel Racine, Senior Vice-President, Mining
• Jean Robitaille, Senior Vice-President, Technical Services and Project Development
• David Smith, Senior Vice-President, Strategic Planning and Investor Relations
• Yvon Sylvestre, Senior Vice-President, Operations
1192011 ANNUAL REPORT

The following Summary Compensation Table sets out compensation during the three fiscal year ended December 31,2011 for the Vice-Chairman, President and Chief Executive Officer, the Senior Vice-President, Finance and Chief FinancialOfficer and the three other most highly compensated officers (the ‘‘Named Executive Officers’’) of Agnico-Eagle measuredby total compensation earned during the fiscal years ended December 31, 2011, 2010 and 2009.
Summary Compensation Table – Agnico-Eagle Mines Limited
Non-EquityIncentive Plan
Compensation(1)
Long-Share- Option- Annual Term
Name and Principal based based Incentive Incentive Pension All Other TotalPosition Year Salary Awards(2) Awards(3) Plans Plans Value Compensation(4) Compensation(5)
(C$) (C$) (C$) (C$) (C$) (C$) (C$) (C$)
Sean Boyd 2011 1,260,000 52,000 4,120,800 1,197,000 n/a 257,642 95,005 6,982,447Vice-Chairman and 2010 1,200,000 46,250 4,893,000 1,656,000 n/a 290,182 19,200 8,104,632Chief Executive Officer 2009 925,000 39,000 6,147,500 1,175,000 n/a 1,025,107 21,264 9,332,871
Eberhard Scherkus 2011 800,000 38,750 2,403,800 656,000 n/a 172,669 100,707 4,171,926President and 2010 775,000 33,000 2,854,250 775,000 n/a 132,035 19,200 4,588,485Chief Operating Officer 2009 660,000 33,000 4,303,250 596,000 n/a 410,055 21,944 6,024,249
Ammar Al-Joundi 2011 490,000 23,750 1,030,200 457,000 n/a 119,080 56,202 2,154,832Senior Vice-President, 2010 151,635 7,308 1,615,500 6 322,000 n/a nil 5,908 2,102,351Finance andChief Financial Officer
Alain Blackburn 2011 438,000 15,600 1,030,200 335,000 n/a 92,980 55,092 1,966,872Senior Vice-President, 2010 425,000 15,600 1,631,000 344,000 n/a 92,900 19,200 2,527,700Exploration 2009 340,000 15,600 2,459,000 260,000 n/a 68,000 23,444 3,166,044
Donald G. Allan 2011 420,000 16,900 1,030,200 378,000 n/a 96,730 57,216 1,999,046Senior Vice-President, 2010 400,000 13,000 1,223,250 276,000 n/a 78,950 19,700 2,010,900Corporate Development 2009 340,000 14,300 1,844,250 175,000 n/a 55,250 19,700 2,448,500
(1) All amounts earned on non-equity incentive plan compensation were paid during the financial year.
(2) This represents the Company’s contribution to shares purchased by the Named Executive Officers pursuant to the Employee Share Purchase Plan.
(3) The value of option-based awards, being C$17.17 (2010 – C$16.31; 2009 – C$24.59) per Option, was determined using the Black-Scholes option pricing model. The Black-Scholes option pricing model is a commonly used pricing model that assumes the valued option can only be exercised at expiration. All options were granted at an exercise priceof C$76.60 (2010 – C$56.92; 2009 – C$62.77), which was the closing price for the common shares of the Company on the TSX on the day prior to the date of grant. Keyadditional assumptions used were: (i) the risk free interest rate, which was 1.96% (2010 – 1.87%; 2009 – 1.3%); (ii) current time to expiration of the option which wasassumed to be 2.5 years; (iii) the volatility for the common shares of the Company on the TSX, which was 34.63% (2010 – 44%; 2009 – 64%); and (iv) the dividend yield for thecommon shares of the Company, which was 0.88% (2010 – 0.43%; 2009 – 0.42%).
(4) Consists of premiums paid for term life and health insurance, automobile allowances, education and fitness benefits and, beginning in 2011, extended health coverage andcomputer-related allowances for the Named Executive Officers.
(5) The total compensation was paid in Canadian dollars. The Company reports its financial statements in United States dollars. On December 31, 2011 the Noon Buying Rate wasC$1.00 equals US$1.0170.
(6) Mr. Al-Joundi joined the Company as Senior Vice-President, Finance and Chief Financial Officer on September 1, 2010 and received a grant of options with a Black-Scholes valueof C$14.46 on that date based an exercise price of C$69.44, a risk-free interest rate of 1.51%, a time to expiration of 5 years, a volatility of 31.4% and dividend yield of 0.24%.
Stock Option Plan
Under the Stock Option Plan, options to purchase common shares may be granted to directors, officers, employees andconsultants of the Company. The exercise price of options granted may be denominated in Canadian dollars orUnited States dollars, but generally may not be less than the closing market price for the common shares of the Companyon the TSX or the NYSE, repectively, on the trading day prior to the date of grant. The maximum term of options grantedunder the Stock Option Plan is five years and the maximum number of options that can be issued in any year is 2% of theCompany’s outstanding common shares. In addition, a maximum of 25% of the options granted in an option grant vest
120 AGNICO-EAGLE MINES LIMITED

upon the date they are granted with the remaining options vesting equally on the next three anniversaries of the optiongrant. The value of options granted to non-executive directors participating in the Stock Option Plan is limited toC$100,000 per year; however, in July 2011, the Board amended its director compensation program such thatnon-executive directors now receive restricted share units (‘‘RSUs’’) instead of options. The number of common shareswhich may be reserved for issuance to any one person pursuant to options (under the Stock Option Plan or otherwise),warrants, share purchase plans or other compensation arrangements may not exceed 5% of the outstanding commonshares. Additionally, the number of common shares which may be reserved for issuance to insiders of the Companypursuant to options (under the Stock Option Plan or otherwise), warrants, share purchase plans or other compensationarrangements, at any time, cannot exceed 10% of outstanding common shares and the number of common shares issuedto insiders of the Company pursuant to options (under the Stock Option Plan or otherwise), warrants, share purchaseplans or other compensation arrangements, within any one year period, cannot exceed 10% of the outstandingcommon shares.
The Stock Option Plan provides for the termination of an option held by an option holder in the following circumstances:
• the option expires (no later than five years after the option was granted);
• 30 days after the option holder ceases to be an employee, officer, director of or consultant to the Company or anysubsidiary of the Company;
• twelve months after the death of the option holder; and
• where such option holder is a director, four years after the date he or she resigns or retires from the Board (providedthat in no event will any option expire later than five years after the option was granted).
An option granted under the Stock Option Plan may only be assigned to eligible assignees, including a spouse, a minorchild, a minor grandchild, a trust governed by a registered retirement savings plan of an eligible participant, a corporationcontrolled by such participant and of which all other shareholders are eligible assignees or a family trust of which suchparticipant is a trustee and of which all beneficiaries are eligible assignees. Assignments must be approved by the Boardand any stock exchange or other authority.
The Board may amend or revise the terms of the Stock Option Plan without the approval of shareholders as permitted bylaw and subject to any required approval by any stock exchange or other authority, including amendments of a‘‘housekeeping’’ nature, amendments necessary to comply with applicable law (including, without limitation, the rules,regulations and policies of the TSX), amendments respecting administration of the Stock Option Plan (provided suchamendment does not entail an extension beyond the original expiry date), any amendment to the vesting provisions of theStock Option Plan or any option, any amendment to the early termination provisions of the Stock Option Plan or any option,whether or not such option is held by an insider (provided such amendment does not entail an extension beyond theoriginal expiry date), the addition or modification of a cashless exercise feature, amendments necessary to suspend orterminate the Stock Option Plan and any other amendment, whether fundamental or otherwise, not requiring shareholderapproval under applicable law (including, without limitation, the rules, regulations and policies of the TSX). Noamendment or revision to the Stock Option Plan which adversely affects the rights of any option holder under any optiongranted under the Stock Option Plan can be made without the consent of the option holder whose rights arebeing affected.
In addition, no amendments to the Stock Option Plan to increase the maximum number of common shares reserved forissuance, to reduce the exercise price for any option, to extend the term of an option held by an insider, to increase anylimit on grants of options to insiders of the Company, to amend the designation of who is an eligible participant or eligibleassignee, to change the participation limits in any given year for non-executive directors or to grant additional powers to theBoard to amend the Stock Option Plan or entitlements can be made without first obtaining the approval of the Company’sshareholders. In response to a TSX staff notice regarding amendments to security based compensation arrangements, theStock Option Plan was amended in 2007 such that where the Company has imposed trading restrictions on directors andofficers that fall within ten trading days of the expiry of an option, such option’s expiry date shall be the tenth day followingthe termination of such restrictions. The Stock Option Plan does not expressly entitle participants to convert an option intoa stock appreciation right.
Under the Stock Option Plan, only eligible persons who are not directors or officers of the Company are entitled to receiveloans, guarantees or other support arrangements from the Company to facilitate option exercises. During 2011, no loans,guarantees or other financial assistance were provided under the plan.
1212011 ANNUAL REPORT

The number of common shares currently reserved for issuance under the Stock Option Plan is 12,221,186 commonshares (comprised of 11,657,901 common shares relating to options issued but unexercised and 563,285 commonshares relating to options available to be issued), being 7.1% of the Company’s 170,928,545 common shares issued andoutstanding as at March 12, 2012.
In 2011, officers exercised options to receive notional proceeds of, in aggregate, C$4,089,391 (7 people) (C$21,775,538(17 people) in 2010; C$23,741,131 (17 people) in 2009). In 2011, the Company received proceeds from the exercise ofoptions in the amount of $3,822,087 (C$76,129,773 in 2010; C$42,395,941 in 2009).
The following table sets out the value vested during the most recently completed financial year of the Company of incentiveplan awards granted to the Named Executive Officers.
Incentive Plan Awards Table – Value Vested or Earned During Fiscal Year 2011
Non-EquityOption-Based Share-Based Incentive Plan
Awards – Awards – Compensation –Value Vested Value Vested Value Earned
Name During the Year During the Year During the Year
(C$) (C$) (C$)
Sean Boyd nil n/a 1,197,000
Eberhard Scherkus nil n/a 656,000
Ammar Al-Joundi nil n/a 457,000
Alain Blackburn nil n/a 335,000
Donald G. Allan nil n/a 378,000
122 AGNICO-EAGLE MINES LIMITED

The following table sets out the outstanding option awards of the Named Executive Officers as at December 31, 2011.
Outstanding Incentive Plan Awards Table
Option-Based Awards Share-Based Awards
Market orPayout
Market or Value ofNumber of Payout Vested
Number of Shares or Value of Share BasedSecurities Value of Units of Share-Based Awards
Underlying Option Option Unexercised Shares Awards not Paid OutUnexercised Exercise Expiration In-The-Money that have that have or
Name Options Price Date Options(1) not Vested not Vested Distributed
(#) (C$) (C$) (#) (C$) (C$)
Sean Boyd 100,000 48.09 1/2/2012 nil nil nil nil200,000 54.42 1/2/2013 nil250,000 62.77 1/2/2014 nil300,000 56.92 1/4/2015 nil240,000 76.60 1/4/2016 nil
Eberhard Scherkus 75,000 48.09 1/2/2012 nil nil nil nil125,000 54.42 1/2/2013 nil175,000 62.77 1/2/2014 nil175,000 56.92 1/4/2015 nil140,000 76.60 1/4/2016 nil
Ammar Al-Joundi 75,000 69.44 9/1/2015 nil nil nil nil60,000 76.60 1/4/2016 nil
Alain Blackburn 39,750 54.42 1/2/2013 nil nil nil nil100,000 62.77 1/2/2014 nil100,000 56.92 1/4/2015 nil
60,000 76.60 1/4/2016 nil
Donald G. Allan 30,000 48.09 1/2/2012 nil nil nil nil60,000 54.42 1/2/2013 nil75,000 62.77 1/2/2014 nil75,000 56.92 1/4/2015 nil60,000 76.60 1/4/2016 nil
(1) Based on a closing price of the Company’s shares on the TSX of $37.05 on December 31, 2011. On December 31, 2011, the Noon Buying Rate was C$1.00 equals US$1.0170.
1232011 ANNUAL REPORT

The following table shows, as at December 31, 2011, compensation plans under which equity securities of Agnico-Eagleare authorized for issuance from treasury. The information has been aggregated by plans approved by shareholders andplans not approved by shareholders, of which there are none.
Equity Compensation Plan Information
Number ofsecuritiesremaining
Number of availablesecurities to Weighted for futurebe issued on average issuances
exercise of exercise price under equityoutstanding of outstanding compensation
Plan Category options options plans
Equity compensation plans approved by shareholders 8,959,051 C$62.88 3,262,135
Equity compensation plans not approved by shareholders nil nil nil
Employee Share Purchase Plan
In 1997, the shareholders of Agnico-Eagle approved the Employee Share Purchase Plan to encourage directors, officersand full-time employees of Agnico-Eagle to purchase common shares of Agnico-Eagle. In 2009, the Employee SharePurchase Plan was amended to prohibit non-executive directors from participating in the plan. Full-time employees whohave been continuously employed by Agnico-Eagle or its subsidiaries for at least twelve months are eligible at thebeginning of each fiscal year to elect to participate in the Employee Share Purchase Plan. Eligible employees maycontribute up to 10% of their basic annual salary through monthly payroll deductions or quarterly payments by cheque.Agnico-Eagle contributes an amount equal to 50% of the individual’s contributions and issues common shares that have amarket value equal to the total contributions (individual and Company) under the Employee Share Purchase Plan. In2008, the shareholders of Agnico-Eagle approved an amendment to the Employee Share Purchase Plan to increase thenumber of shares available under such plan to 5,000,000 common shares. Of the 5,000,000 common shares approved,Agnico-Eagle has, as of March 12, 2012, reserved 2,150,088 common shares remaining for issuance under the EmployeeShare Purchase Plan.
Pension Plan Benefits
The Company’s basic defined contribution pension plan (the ‘‘Basic Plan’’) provides pension benefits to employees ofAgnico-Eagle generally, including the Named Executive Officers. Under the Basic Plan, the Company contributes anamount equal to 15% of each designated executive’s pensionable earnings (including salary and short-term bonus) to theBasic Plan. The Company’s contributions cannot exceed the money purchase limit, as defined in the Income Tax Act(Canada). Upon termination, the Company’s contribution to the Basic Plan ceases and the participant is entitled to apension benefit in the amount of the vested account balance. All contributions to the Basic Plan are invested in a variety offunds offered by the plan administrator, at the direction of the participant.
In addition to the Basic Plan, effective January 1, 2008, in line with the Company’s compensation policy thatcompensation must be competitive in order to help attract and retain the executives needed to lead and grow theCompany’s business and to address the weakness of the Company’s retirement benefits when compared to its peers in thegold production industry, the Company adopted a supplemental defined contribution plan (the ‘‘Supplemental Plan’’) fordesignated executives at the level of Vice-President or above. On December 31 of each year, the Company credits eachdesignated executive’s account an amount equal to 15% of the designated executive’s pensionable earnings for the year(including salary and short term bonus), less the Company’s contribution to the Basic Plan. In addition, on December 31of each year, the Company will credit each designated executive’s account a notional investment return equal to thebalance of such designated executive’s account at the beginning of the year multiplied by the yield rate for Government ofCanada marketable bonds with average yields over ten years. Upon retirement, after attaining the minimum age of 55, thedesignated executive’s account will be paid out in either (a) five annual installments subsequent to the date of retirement,or (b) by way of lump sum payment, at the executive’s option. If the designated executive’s employment is terminated prior
124 AGNICO-EAGLE MINES LIMITED

to reaching the age of 55, such designated executive will receive, by way of lump sum payment, the total amount creditedto his or her account.
The RCA Plans for Messrs. Boyd and Scherkus provide pension benefits which are generally equal (on an after-tax basis)to what the pension benefits would be if they were provided directly from a registered pension plan. There are no pensionbenefit limits under the RCA Plans. The RCA Plans provide an annual pension at age 60 equal to 2% of the executive’sfinal three-year average pensionable earnings for each year of continuous service with the Company, less the annualpension payable under the Company’s Basic Plan. The pensionable earnings for the purposes of the RCA Plans consist ofall basic remuneration and do not include benefits, bonuses, automobile or other allowances, or unusual payments.Payments under the RCA Plans are secured by a letter of credit from a Canadian chartered bank. Messrs. Boyd andScherkus may retire early, any time after reaching age 55, with a benefit based on service and final average earnings at thedate of retirement, with no early retirement reduction. The Company does not have a policy to grant extra years of serviceunder its pension plans. With the departure of Mr Scherkus from the Company in March 2012, his pension plans,including his RCA Plan, were triggered.
The following table sets forth the benefits to Messrs. Boyd and Scherkus and the associated costs to the Company inexcess of the costs under the Company’s Basic Plan.
Defined Benefit Plan Table
Annual BenefitsAccrued
AccruedNumber of Obligation at Non- Accrued
Years of At Year the Start of Compensatory Compensatory Obligation atName Service(1) End(1) At age 60 the Year Change Change Year End
(#) (C$) (C$) (C$) (C$) (C$) (C$)
Sean Boyd 26 759,643 955,064 6,230,164 257,642 1,421,450 7,909,256
Eberhard Scherkus 26 367,008 368,043 4,263,286 172,669 709,329 5,145,284
(1) As at December 31, 2011
The following tables set forth summary information about the Basic Plan and the Supplemental Plan for each of theNamed Executive Officers as at December 31, 2011.
Defined Contribution Plan Table – Basic Plan
Accumulated AccumulatedValue at Non- Value at
Name Start of Year Compensatory Compensatory Year End
(C$) (C$) (C$) (C$)
Sean Boyd 397,580 22,970 (27,578) 392,972
Eberhard Scherkus 353,373 22,970 13,507 389,850
Ammar Al-Joundi 22,450 22,970 4,470 41,000
Alain Blackburn 287,608 22,970 (24,250) 286,328
Donald G. Allan 171,902 22,970 11,110 183,763
1252011 ANNUAL REPORT

Defined Contribution Plan Table – Supplemental Plan
Accumulated AccumulatedValue at Non- Value at
Name Start of Year Compensatory Compensatory Year End
(C$) (C$) (C$) (C$)
Sean Boyd(1) nil nil nil nil
Eberhard Scherkus(1) nil nil nil nil
Ammar Al-Joundi nil 119,080 nil 119,080
Alain Blackburn 217,423 92,980 5,261 315,664
Donald G. Allan 187,690 96,730 4,452 288,962
(1) Messrs. Boyd and Scherkus do not participate in the Supplemental Plan.
In 2011, the Company’s management retained Mercer (Canada) Limited (‘‘Mercer’’) to provide consulting services withrespect to a market review of the total direct compensation levels for the Named Executive Officers relative to 11 gold andbase metals companies in Agnico Eagle’s peer group. Mercer was also retained to review Agnico Eagle’s long-termincentive structure and to compare it with Agnico Eagle’s mining peer group and best practices. In 2011, the Companypaid a total of C$29,275 in fees to Mercer. The information provided by Mercer was used by the Compensation Committeeand the Board in recommending and approving, respectively, the revised long-term incentive structure for Agnico Eagle’ssenior executives. In recommending these revisions to the compensation of the senior executives, the CompensationCommittee also considered the PricewaterhouseCoopers LLP 2011 ‘‘Mining Industry Salary Survey – Corporate Report’’
Employment Contracts/Termination Arrangements
Agnico-Eagle has employment agreements with all of its executive officers that provide for an annual base salary, bonusand certain pension, health, dental and other insurance and automobile benefits. These amounts may be increased at thediscretion of the Board of Directors upon the recommendation of the Compensation Committee. For the current basesalary for each Named Executive Officer see ‘‘Summary Compensation Table’’ above. If the individual agreements areterminated other than for cause, death or disability, or upon their resignation following certain events, all of the NamedExecutive Officers would be entitled to a payment equal to two and one-half times their annual base salary at the date oftermination plus an amount equal to two and one-half times their annual bonus (averaged over the preceding two yearsbut not including options) and a continuation of benefits for up to two and one-half years (or, at the election of theemployee, the amount equal to the Company’s cost in providing such benefits) or until the individual commences newemployment. Certain events that would trigger a severance payment are:
• termination of employment without cause;
• substantial alteration of responsibilities;
• reduction of base salary or benefits;
• office relocation of greater than 100 kilometres;
• failure to obtain a satisfactory agreement from any successor to assume the individual’s employment agreement orprovide the individual with a comparable position, duties, salary and benefits; or
• any change in control of the Company.
If a severance payment triggering event had occurred on December 31, 2011, the severance payments that would bepayable to each of the Named Executive Officers, other than Mr. Scherkus, would be approximately as follows: Mr. Boyd –C$6,953,763; Mr. Al-Joundi – C$2,339,256; Mr. Blackburn – C$2,081,482; and Mr. Allan – C$2,010,539.
126 AGNICO-EAGLE MINES LIMITED

Compensation of Directors and Other Information
Mr. Boyd, who is a director and the Vice-Chairman, President and Chief Executive Officer of the Company, does not receiveany remuneration for his services as director of the Company. In addition, Mr. Scherkus, who was a director and thePresident and Chief Operating Officer of the Company (until February 2012), did not receive any remuneration for hisservices as a director of the Company in 2011.
Effective as of July 1, 2011, director compensation was amended to more closely align the equity component of directorcompensation with shareholder interests by discontinuing the former practice of granting options to non-executivedirectors and replacing such Option grants with grants of RSUs. As RSUs are effectively shares, the equity value of directorcompensation will now correspond directly with share price movements, thereby directly aligning director and shareholderinterests.
The tables below set out the annual retainers (annual retainers for the Chairs of the Board of Directors and otherCommittees are in addition to the base annual retainer) and attendance fees paid to the other directors during the yearended December 31, 2011. Directors do not receive meeting attendance fees.
Compensation duringthe period between
January 1, 2011 andJune 30, 2011(1)
Annual Board retainer (base) C$115,000
Additional Annual retainer for Chairman of the Board C$125,000
Additional Annual retainer for Chairman of the Audit Committee C$25,000
Additional Annual retainer for Chairpersons of other Board Committees C$10,000
(1) The annualized retainers set out above were prorated for a period of six months during which these retainers were in effect.
Compensation duringthe period between
June 30, 2011(1) andDecember 31, 2011
Annual Board retainer (base) C$120,000
Additional Annual retainer for Chairman of the Board C$120,000
Additional Annual retainer for Chairman of the Audit Committee C$25,000
Additional Annual retainer for Chairs of other Board Committees C$10,000
(1) The annualized retainers set out above were prorated for a period of six months during which these retainers were in effect.
In addition, each non-executive director received a grant of options in January 2011 (February 2011 for Ms Celej, whojoined the Board on February 14, 2011) having a value per director of not greater than C$100,000.
Beginning in 2012, each director will receive an annual grant of 3,000 RSUs (Chairman of the Board – 4,000 RSUs). If adirector meets the minimum share ownership requirement (as described under ‘‘Director Shareholding Guidelines’’below), he or she can elect to receive cash in lieu of a portion of the RSUs to be granted, subject to receipt of a minimumgrant of 1,000 RSUs. No RSUs were granted to non-executive directors in 2011.
1272011 ANNUAL REPORT

Director Shareholding Guidelines
To align the interests of directors with those of shareholders, directors, other than Mr. Boyd, are required to own aminimum of 10,000 Agnico-Eagle common shares and/or RSUs. Directors have a period of the later of: (i) two years fromthe date of adoption of this policy (August 24, 2011) or (ii) five years from the date of joining the Board, to achieve thisownership level through open market purchases of common shares, grants of RSUs or the exercise of options held.
As of March 12, 2012, all of the directors have achieved the minimum share ownership requirement, other than Dr. Rileywho has until January 1, 2016 and Ms Celej who has until February 14, 2016 (five years from the time each became adirector) and Dr. Baker, Mr. Davis, Mr. Leiderman, Mr. Roberts and Mr. Stockford, who have until August 24, 2013(two years from the date of adoption of this policy), to achieve the minimum share ownership requirement.
The table below sets out the number and the value of common shares and RSUs held by each director of the Company; alldirectors have increased their total shareholding (common shares and RSUs) in the Company since the last ManagementProxy Circular.
Aggregate common shares and RSUs owned by director andaggregate value thereof as of March 12, 2012
Aggregate AggregateNumber of Value of Aggregate Aggregate
Common Common Number of Value of Deadline toName Shares Shares(1) RSUs RSUs(1) meet Guideline
(#) (C$) (#) (C$)
Leanne M. Baker 5,500 192,610 3,000 105,060 August 24, 2013
Douglas R. Beaumont 17,960 628,959 1,000 35,020 Meets Guideline
Sean Boyd 116,812 4,090,756 24,660 863,593 n/a
Martine A. Celej 2,000 70,040 3,000 105,060 February 14, 2016
Clifford J. Davis 6,000 210,120 3,000 105,060 August 24, 2013
Robert J. Gemmell 10,000 350,200 3,000 105,060 Meets Guideline
Bernard Kraft 12,657 443,248 1,000 35,020 Meets Guideline
Mel Leiderman 6,000 210,120 3,000 105,060 August 24, 2013
James D. Nasso 18,289 640,480 4,000 140,080 Meets Guideline
Sean Riley 2,000 70,040 3,000 105,060 January 1, 2016
John Merfyn Roberts 6,000 210,120 3,000 105,060 August 24, 2013
Howard R. Stockford 6,068 212,250 3,000 105,060 August 24, 2013
Pertti Voutilainen 21,000 735,420 1,000 35,050 Meets Guideline
(1) The valuation is based on C$35.02, being the closing price of the Company’s shares on the TSX on March 12, 2012.
128 AGNICO-EAGLE MINES LIMITED

The following table sets out the compensation provided to the members of the Board of Directors, other than Messrs. Boydand Scherkus, for the Company’s most recently completed financial year.
Director Compensation Table
Share- Option- Non-EquityFees Based Based Incentive Plan Pension All Other
Name Earned Awards Awards(1)(2) Compensation Value Compensation Total(3)
(C$) (C$) (C$) (C$) (C$) (C$) (C$)
Leanne M. Baker 138,750 n/a 99,998 n/a n/a n/a 238,748
Douglas R. Beaumont 120,000 n/a 99,998 n/a n/a n/a 219,998
Martine A.Celej 117,500 n/a 99,991 n/a n/a n/a 217,491
Clifford J. Davis 125,000 n/a 99,998 n/a n/a n/a 224,998
Robert Gemmell 125,000 n/a 99,998 n/a n/a n/a 224,998
Bernard Kraft 117,500 n/a 99,998 n/a n/a n/a 217,498
Mel Leiderman 123,500 n/a 99,998 n/a n/a n/a 223,498
James D. Nasso 240,000 n/a 99,998 n/a n/a n/a 339,998
John Merfyn Roberts 125,000 n/a 99,998 n/a n/a n/a 224,998
Sean Riley 117,500 n/a 99,998 n/a n/a n/a 217,498
Howard R. Stockford 120,000 n/a 99,998 n/a n/a n/a 219,998
Pertti Voutilainen 117,500 n/a 99,998 n/a n/a n/a 217,498
(1) For a discussion of the key assumptions underlying the value of the option-based awards, other than for Ms Celej, see Note 1 to the ‘‘Summary Compensation Table’’. For theoption grant for Ms Celej, the value of the option-based award, being C$21.18, was determined using the Black-Scholes option pricing model. The Black-Scholes option pricingmodel is a commonly used pricing model that assumes the valued option can only be exercised at expiration. The options for Ms Celej were granted at an exercise price ofC$70.28, which was the closing price for the common shares of the Company on the TSX on the day prior to the date of grant. Key additional assumptions used were: (i) the riskfree interest rate, which was 2.97%; (ii) current time to expiration of the Option which was assumed to be 2.5 years; (iii) the volatility for the common shares of the Company onthe TSX, which was 31.27%; and (iv) the dividend yield for the common shares of the Company, which was 0.98%.
(2) Option-based awards given to non-executive directors are limited to the lesser of: (a) 1% of the outstanding common shares at any given point in time; and (b) an annual equityaward value of C$100,000.
(3) Set out in Canadian dollars. On December 31, 2011 the Noon Buying Rate was C$1.00 equals US$1.0170.
1292011 ANNUAL REPORT
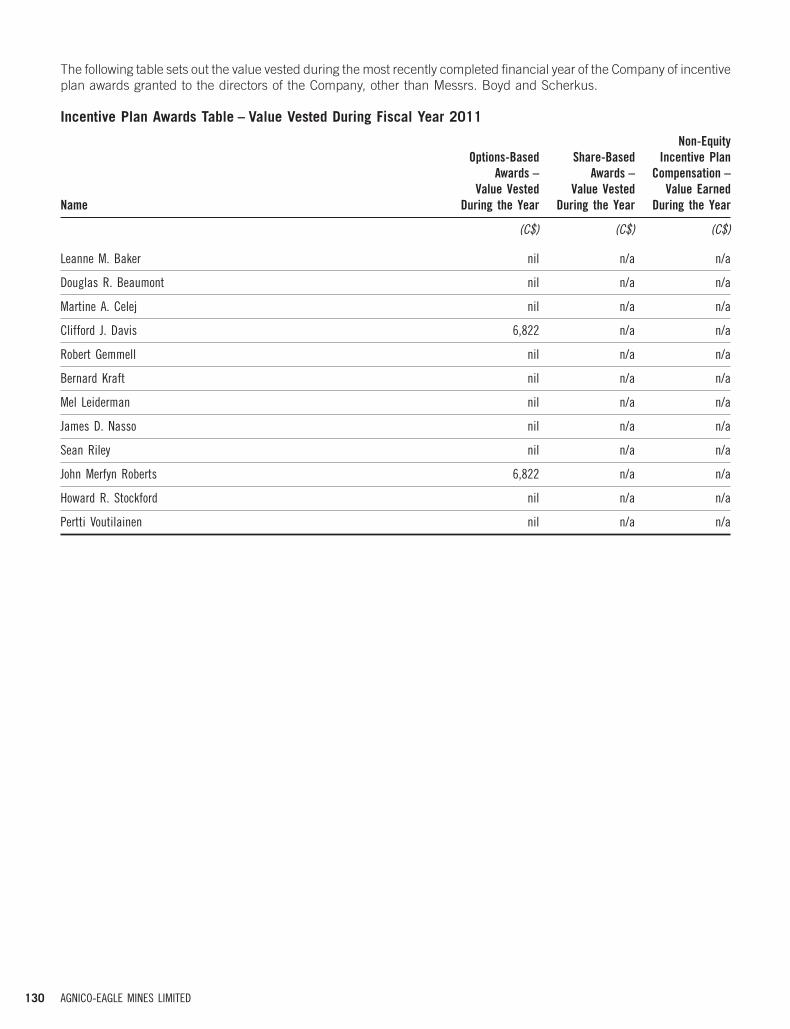
The following table sets out the value vested during the most recently completed financial year of the Company of incentiveplan awards granted to the directors of the Company, other than Messrs. Boyd and Scherkus.
Incentive Plan Awards Table – Value Vested During Fiscal Year 2011
Non-EquityOptions-Based Share-Based Incentive Plan
Awards – Awards – Compensation –Value Vested Value Vested Value Earned
Name During the Year During the Year During the Year
(C$) (C$) (C$)
Leanne M. Baker nil n/a n/a
Douglas R. Beaumont nil n/a n/a
Martine A. Celej nil n/a n/a
Clifford J. Davis 6,822 n/a n/a
Robert Gemmell nil n/a n/a
Bernard Kraft nil n/a n/a
Mel Leiderman nil n/a n/a
James D. Nasso nil n/a n/a
Sean Riley nil n/a n/a
John Merfyn Roberts 6,822 n/a n/a
Howard R. Stockford nil n/a n/a
Pertti Voutilainen nil n/a n/a
130 AGNICO-EAGLE MINES LIMITED

The following table sets out the outstanding option awards of the directors of the Company, other than Messrs. Boyd andScherkus, as at December 31, 2011.
Outstanding Incentive Plan Awards TableOption-Based Awards Share-Based Awards
Market orNumber of Payout
Number of Shares or Value ofSecurities Value of Units of Share-Based
Underlying Option Option Unexercised Shares AwardsUnexercised Exercise Expiration In-The-Money that have that have
Name Options Price Date Options(1) not Vested not Vested
(#) (C$) (C$) (#) (C$)
Leanne M. Baker 35,000 54.63(2) 1/2/2013 nil nil nil4,000 51.33(2) 1/4/20146,120 54.00(2) 1/2/20155,824 76.70(2) 1/4/2016
Douglas R. Beaumont 25,000 48.09 1/2/2012 nil nil nil35,000 54.42 1/2/2013
4,000 62.77 1/2/20146,120 56.92 1/2/20155,824 76.60 1/4/2016
Martine A. Celej 4,721 70.26 2/21/2016 nil nil nil
Clifford J. Davis 1,800 33.26 11/3/2013 6,822 nil nil4,000 62.77 1/2/20146,120 56.92 1/4/20155,824 76.60 1/4/2016
Robert Gemmell 5,824 76.60 1/4/2016 nil nil nil
Bernard Kraft 4,000 62.77 1/2/2014 nil nil nil6,120 56.92 1/4/20155,824 76.60 1/4/2016
Mel Leiderman 25,000 54.42 1/2/2013 nil nil nil4,000 62.77 1/2/20146,120 56.92 1/4/20155,824 76.60 1/4/2016
James D. Nasso 53,000 54.42 1/2/2013 nil nil nil4,000 62.77 1/2/20146,120 56.92 1/4/20155,824 76.60 1/4/2016
John Merfyn Roberts 7,200 33.26 11/3/2013 27,288 nil nil4,000 62.77 1/2/20146,120 56.92 1/4/20155,824 76.60 1/4/2016
Sean Riley 5,824 76.60 1/1/2016 nil nil nil
Howard R. Stockford 28,750 54.42 1/2/2013 nil nil nil4,000 62.77 1/2/20146,120 56.92 1/4/20155,824 76.60 1/4/2016
Pertti Voutilainen 35,000 54.42 1/2/2013 nil nil nil4,000 62.77 1/2/20146,120 56.92 1/4/20155,824 76.60 1/4/2016
(1) Based on a closing price of the Company’s shares on the TSX of C$37.05 on December 31, 2011.(2) Value of Dr. Baker’s awards are in United States dollars and based on a closing price of the Company’s shares on the New York Stock Exchange (the ‘‘NYSE’’) of US$36.32 on
December 31, 2011.
1312011 ANNUAL REPORT

In 2009, shareholders of Agnico-Eagle approved an amendment to the Employee Share Purchase Plan to prohibitparticipation by non-executive directors. During the year ended December 31, 2011, Agnico-Eagle issued a total of5,077 common shares to the following executive directors under its Employee Share Purchase Plan as follows:
● Mr. Boyd 2,910
● Mr. Scherkus 2,167
The following table sets out the attendance of each of the directors to the Board of Directors meetings and the BoardCommittee meetings held in 2011.
Board CommitteeMeetings Meetings
Director Attended Attended
Leanne M. Baker 9 of 11 7 of 8
Douglas R. Beaumont 11 of 11 7 of 7
Sean Boyd 11 of 11 N/A
Martine A. Celej 11 of 11 3 of 3
Clifford J. Davis 10 of 11 6 of 6
Robert Gemmell 11 of 11 3 of 3
Bernard Kraft 11 of 11 8 of 8
Mel Leiderman 11 of 11 8 of 8
James D. Nasso 11 of 11 8 of 8
John Merfyn Roberts 11 of 11 8 of 8
Eberhard Scherkus 11 of 11 8 of 8
Sean Riley 11 of 11 2 of 2
Howard R. Stockford 11 of 11 7 of 7
Pertti Voutilainen 11 of 11 6 of 6
Indebtedness of Directors, Executive Officers and Senior Officers
There is no outstanding indebtedness to Agnico-Eagle by any of its directors or officers. Agnico-Eagle’s policy is to notmake any loans to directors and officers.
Directors’ and Officers’ Liability Insurance
The Company has purchased, at its expense, directors’ and officers’ liability insurance policies to provide insuranceagainst possible liabilities incurred by its directors and officers in their capacity as directors and officers of the Company.The premium for these policies for the period from December 31, 2011 to December 31, 2012 is C$748,437. The policiesprovide coverage of up to C$100 million per occurrence to a maximum of C$100 million per annum. There is nodeductible for directors and officers and a C$2,500,000 deductible for each claim made by the Company (C$1 milliondeductible for securities claims). The insurance applies in circumstances where the Company may not indemnify itsdirectors and officers for their acts or omissions.
Board Practices
The Board and management have been following the developments in corporate governance requirements and bestpractices standards in both Canada and the United States. As these requirements and practices have evolved, theCompany has responded in a positive and proactive way by assessing its practices against these requirements and
132 AGNICO-EAGLE MINES LIMITED

modifying, or targeting for modification, practices to bring them into compliance with these corporate governancerequirements and best practices standards. The Company revises, from time to time, the Board Mandate and the chartersfor the Audit Committee, the Compensation Committee, the Corporate Governance Committee and the Health, Safety andEnvironment Committee to reflect the new and evolving corporate governance requirements and what it believes to be bestpractices standards in Canada and the United States.
The Board believes that effective corporate governance contributes to improved corporate performance and enhancedshareholder value. The Company’s governance practices reflect the Board’s assessment of the governance structure andprocess which can best serve to realize these objectives in the Company’s particular circumstance. The Company’sgovernance practices are subject to review and evaluation through the Board’s Corporate Governance Committee toensure that, as the Company’s business evolves, changes in structure and process necessary to ensure continued goodgovernance are identified and implemented.
The Company is required under the rules of the CSA to disclose its corporate governance practices and provide adescription of the Company’s system of corporate governance. This Statement of Corporate Governance Practices hasbeen prepared by the Board’s Corporate Governance Committee and approved by the Board.
Director Independence
The Board consists of thirteen directors. The Board has made an affirmative determination that twelve of its thirteencurrent members are ‘‘independent’’ within the meaning of the CSA rules and the standards of the New York StockExchange. With the exception of Mr. Boyd, all directors are independent of management and free from any interest or anybusiness that could materially interfere with their ability to act as a director with a view to the best interests of the Company.In reaching this determination, the Board considered the circumstances and relationships with the Company and itsaffiliates of each of its directors. In determining that all directors except Mr. Boyd are independent, the Board took intoconsideration the facts that none of the remaining directors is an officer or employee of the Company or party to anymaterial contract with the Company and that none receives remuneration from the Company other than directors’ fees andoption and RSU grants for service on the Board. Mr. Boyd is considered related because he is an officer of the Company.All directors, other than Mr. Boyd, also meet the independence standard as set out in the Sarbanes-Oxley Act of2002 (‘‘SOX’’).
The Board may meet independently of management at the request of any director or may excuse members ofmanagement from all or a portion of any meeting where a potential conflict of interest arises or where otherwiseappropriate. The Board also meets without management before or after each Board meeting, including after each Boardmeeting held to consider interim and annual financial statements. In 2011, the Board met without management at eachBoard meeting, being eleven separate occasions, including the four regularly scheduled quarterly meetings.
To promote the exercise of independent judgment by directors in considering transactions and agreements, any director orofficer who has a material interest in the matter being considered may not be present for discussions relating to the matterand any such director may not participate in any vote on the matter.
Chairman
Mr. Nasso is the Chairman of the Board and Mr. Boyd is the Vice-Chairman, President and Chief Executive Officer of theCompany. Mr. Nasso is not a member of management. The Board believes that the separation of the offices of Chairmanand Chief Executive Officer enhances the ability of the Board to function independently of management and does notforesee that the offices of Chairman and Chief Executive Officer will be held by the same person.
The Board has adopted a position description for the Chairman of the Board. The Chairman’s role is to provide leadershipto directors in discharging their duties and obligations as set out in the mandate of the Board. The specific responsibilitiesof the Chairman include providing advice, counsel and mentorship to the Chief Executive Officer, appointing the Chair ofeach of the Board’s committees and promoting the delivery of information to the members of the Board on a timely basis tokeep them fully apprised of all matters which are material to them at all times. The Chairman’s responsibilities also includescheduling, overseeing and presiding over meetings of the Board and presiding over meetings of the Company’sshareholders.
1332011 ANNUAL REPORT

Board Mandate
The Board’s mandate is to provide stewardship of the Company, to oversee the management of the Company’s businessand affairs, to maintain its strength and integrity, to oversee the Company’s strategic direction, its organization structureand succession planning of senior management and to perform any other duties required by law. The Board’s strategicplanning process consists of an annual review of the Company’s future business plans and, from time to time (and at leastannually), a meeting focused on strategic planning matters. As part of this process, the Board reviews and approves thecorporate objectives proposed by the Chief Executive Officer and advises management on the development of a corporatestrategy to achieve those objectives. The Board also reviews the principal risks inherent in the Company’s business,including environmental, industrial and financial risks, and assesses the systems to manage these risks. The Board alsomonitors the performance of senior management against the business plan through a periodic review process (at leastevery quarter) and reviews and approves promotion and succession matters.
The Board holds management responsible for the development of long-term strategies for the Company. The role of theBoard is to review, question, validate and ultimately approve the strategies and policies proposed by management. TheBoard relies on management to perform the data gathering, analysis and reporting functions which are critical to the Boardfor effective corporate governance. In addition, the Vice-Chairman, President and Chief Executive Officer, the SeniorVice-President, Finance and Chief Financial Officer, the Senior Vice-President, Corporate Development, the SeniorVice-President, Exploration and the Senior Vice-President, Technical Services report to the Board at least every quarter onthe Company’s progress in the preceding quarter and on the strategic, operational and financial issues facingthe Company.
Management is authorized to act, without Board approval, on all ordinary course matters relating to the Company’sbusiness. Management seeks the Board’s prior approval for significant changes in the Company’s affairs such as majorcapital expenditures, financing arrangements and significant acquisitions and divestitures. Board approval is required forany venture outside of the Company’s existing businesses and for any change in senior management. Recommendationsof committees of the Board require the approval of the full Board before being implemented. In addition, the Boardoversees and reviews significant corporate plans and initiatives, including the annual five-year business plan and budgetand significant matters of corporate strategy or policy. The Company’s authorization policy and risk management policyensure compliance with good corporate governance practices. Both policies formalize controls over the management orother employees of the Company by stipulating internal approval processes for transactions, investments, commitmentsand expenditures and, in the case of the risk management policy, establishing objectives and guidelines for metal pricehedging, foreign exchange and short-term investment risk management and insurance. The Board, directly and throughits Audit Committee, also assesses the integrity of the Company’s internal control and management information systems.
The Board oversees the Company’s approach to communications with shareholders and other stakeholders and approvesspecific communications initiatives from time to time. The Company conducts an active investor relations program. Theprogram involves responding to shareholder inquiries, briefing analysts and fund managers with respect to reportedfinancial results and other announcements by the Company and meeting with individual investors and other stakeholders.Senior management reports regularly to the Board on these matters. The Board reviews and approves the Company’smajor communications with shareholders and the public, including quarterly and annual financial results, the annualreport and the management information circular. The Board has a Disclosure Policy which establishes standards andprocedures relating to contacts with analysts and investors, news releases, conference calls, disclosure of materialinformation, trading restrictions and blackout periods.
The Board’s mandate is posted on the Company’s website at www.Agnico-Eagle.com.
Position Descriptions
Chief Executive Officer
The Board has adopted a position description for the Chief Executive Officer, who has full responsibility for the day-to-dayoperation of the Company’s business in accordance with the Company’s strategic plan and current year operating andcapital expenditure budgets as approved by the Board. In discharging his responsibility for the day-to-day operation ofAgnico-Eagle’s business, subject to the oversight by the Board, the Chief Executive Officer’s specific responsibilitiesinclude:
• providing leadership and direction to the other members of Agnico-Eagle’s senior management team;
• fostering a corporate culture that promotes ethical practices and encourages individual integrity;
134 AGNICO-EAGLE MINES LIMITED

• maintaining a positive and ethical work climate that is conducive to attracting, retaining and motivating top-qualityemployees at all levels;
• working with the Chairman in determining the matters and materials that should be presented to the Board;
• together with the Chairman, developing and recommending to the Board a long-term strategy and vision forAgnico-Eagle that leads to enhancement of shareholder value;
• developing and recommending to the Board annual business plans and budgets that support Agnico-Eagle’slong-term strategy;
• ensuring that the day-to-day business affairs of Agnico-Eagle are appropriately managed;
• consistently striving to achieve Agnico-Eagle’s financial and operating goals and objectives;
• designing or supervising the design and implementation of effective disclosure and internal controls;
• maintaining responsibility for the integrity of the financial reporting process;
• seeking to secure for Agnico-Eagle a satisfactory competitive position within its industry;
• ensuring that Agnico-Eagle has an effective management team below the level of the Chief Executive Officer andhas an active plan for management development and succession;
• ensuring, in cooperation with the Chairman and the Board, that there is an effective succession plan in place forthe position of Chief Executive Officer; and
• serving as the primary spokesperson for Agnico-Eagle.
The Chief Executive Officer is to consult with the Chairman on matters of strategic significance to the Company and alertthe Chairman on a timely basis of any material changes or events that may impact upon the risk profile, financial affairs orperformance of the Company.
Chairs of Board Committees
The Board has adopted written position descriptions for each of the Chairs of the Board’s committees, which include theAudit Committee, the Corporate Governance Committee, the Compensation Committee and the Health, Safety andEnvironment Committee. The role of each of the Chairs is to ensure the effective functioning of his or her committee andprovide leadership to its members in discharging the mandate as set out in the committee’s charter. The responsibilities ofeach Chair include, among others:
• establishing procedures to govern his or her committee’s work and ensure the full discharge of its duties;
• chairing every meeting of his or her committee and encouraging free and open discussion at such meetings;
• reporting to the Board on behalf of his or her committee; and
• attending every meeting of shareholders and responding to such questions from shareholders as may be put to theChair of his or her committee.
Each of the Chairs is also responsible for carrying out other duties as requested by the Board, depending on need andcircumstances.
Orientation and Continuing Education
The Corporate Governance Committee is responsible for overseeing the development and implementation of orientationprograms for new directors and continuing education for all directors.
The Company maintains a collection of director orientation materials, which include the Board Mandate, the charters ofthe Board’s committees, a memorandum on the duties of a director of a public company and a glossary of mining andaccounting terms. A copy of such materials is given to each director and updated annually.
The Company holds periodic educational sessions with its directors and legal counsel to review and assess the Board’scorporate governance policies. This allows new directors to become familiar with the corporate governance policies of theCompany as they relate to its business. In addition, the Company provides extensive reports on all operations to thedirectors at each quarterly Board meeting and conducts yearly site tours for the directors at a different mine site each year.
1352011 ANNUAL REPORT

The Corporate Governance Committee conducts an annual assessment that addresses the performance of the Board, theBoard’s committees and the individual directors. These assessments help identify opportunities for continuing Board anddirector development. In addition, it is open to any director to take a continuing education course related to the skill andknowledge necessary to meet his or her obligations as a director at the expense of the Company.
Ethical Business Conduct
The Board has adopted a Code of Business Conduct and Ethics, which provides a framework for directors, officers andemployees on the conduct and ethical decision making integral to their work. In addition, the Board has adopted a Code ofBusiness Conduct and Ethics for Consultants and Contractors. The Audit Committee is responsible for monitoringcompliance with these codes of ethics and any waivers or amendments thereto can only be made by the Board or a Boardcommittee. These codes are available on www.sedar.com.
The Board has also adopted a Confidential Anonymous Complaint Reporting Policy, which provides procedures for officersand employees who believe that a violation of the Code of Business Conduct and Ethics has occurred to report thisviolation on a confidential and anonymous basis. Complaints can be made internally to the General Counsel, SeniorVice-President, Legal and Corporate Secretary or the Senior Vice-President, Finance and Chief Financial Officer.Complaints can also be made anonymously by telephone, e-mail or postal letter through a hotline provided by anindependent third party service provider. The General Counsel, Senior Vice-President, Legal and Corporate Secretaryperiodically prepares a written report to the Audit Committee regarding the complaints, if any, received through theseprocedures.
The Board believes that providing a procedure for employees and officers to raise concerns about ethical conduct on ananonymous and confidential basis fosters a culture of ethical conduct within the Company.
Nomination of Directors
The Corporate Governance Committee, which is comprised entirely of independent directors, is responsible forparticipating in the recruitment and recommendation of new nominees for appointment or election to the Board. Whenconsidering a potential candidate, the Corporate Governance Committee considers the qualities and skills that the Board,as a whole, should have and assesses the competencies and skills of the current members of the Board. Based on thetalent already represented on the Board, the Corporate Governance Committee then identifies the specific skills, personalqualities or experiences that a candidate should possess in light of the opportunities and risks facing the Company. TheCorporate Governance Committee may maintain a list of potential director candidates for its future consideration and mayengage outside advisors to assist in identifying potential candidates. Potential candidates are screened to ensure that theypossess the requisite qualities, including integrity, business judgment and experience, business or professional expertise,independence from management, international experience, financial literacy, excellent communications skills and theability to work well in a team situation. The Corporate Governance Committee also considers the existing commitments of apotential candidate to ensure that such candidate will be able to fulfill his or her duties as a Board member.
Compensation
Remuneration is paid to the Company’s directors based on several factors, including time commitments, risk, workloadand responsibility demanded by their positions. The Compensation Committee periodically reviews and fixes the amountand composition of the compensation of directors. For a summary of remuneration paid to directors, please see‘‘Compensation of Directors and Other Information’’ and the description of the Compensation Committee below.
Board Committees
The Board has four Committees: the Audit Committee, the Compensation Committee, the Corporate GovernanceCommittee and the Health, Safety and Environment Committee.
Audit Committee
The Audit Committee is composed entirely of directors who are unrelated to and independent from the Company(currently, Dr. Baker (Chair), Mr. Kraft, Mr. Leiderman and Dr. Riley), each of whom is financially literate, as the term isused in the CSA’s Multilateral Instrument 52-110 – Audit Committees. In addition, Mr. Leiderman and Mr. Kraft areChartered Accountants; Mr. Leiderman is currently in private practice and Mr. Kraft while retired, remains active in theprofession and the Board has determined that both of them qualify as audit committee financial experts, as the term isdefined in the rules of the United States Securities and Exchange Commission (the ‘‘SEC’’). The education and experience
136 AGNICO-EAGLE MINES LIMITED

of each member of the Audit Committee is set out under ‘‘– Directors and Senior Management’’. Fees paid to theCompany’s auditors, Ernst & Young LLP, are set out under ‘‘Item 10 Additional Information – Audit Fees’’. The AuditCommittee met six times in 2011.
The Audit Committee has two primary objectives. The first is to advise the Board of Directors in its oversight responsibilitiesregarding:
• the quality and integrity of the Company’s financial reports and information;
• the Company’s compliance with legal and regulatory requirements;
• the effectiveness of the Company’s internal controls for finance, accounting, internal audit, ethics and legal andregulatory compliance;
• the performance of the Company’s auditing, accounting and financial reporting functions;
• the fairness of related party agreements and arrangements between the Company and related parties; and
• the independent auditors’ performance, qualifications and independence.
The second primary objective of the Audit Committee is to prepare the reports required to be included in the managementproxy circular in accordance with applicable laws or the rules of applicable securities regulatory authorities.
The Board has adopted an Audit Committee charter, which provides that each member of the Audit Committee must beunrelated to and independent from the Company as determined by the Board in accordance with the applicablerequirements of the laws governing the Company, the applicable stock exchanges on which the Company’s securities arelisted and applicable securities regulatory authorities. In addition, each member must be financially literate and at leastone member of the Audit Committee must be an audit committee financial expert, as the term is defined in the rules of theSEC. The Audit Committee must pre-approve all audit and permitted non-audit services to be provided by the externalauditors to the Company.
The Audit Committee is responsible for reviewing all financial statements prior to approval by the Board, all otherdisclosure containing financial information and all management reports which accompany any financial statements. TheAudit Committee is also responsible for all internal and external audit plans, any recommendation affecting the Company’sinternal controls, the results of internal and external audits and any changes in accounting practices or policies. The AuditCommittee reviews any accruals, provisions, estimates or related party transactions that have a significant impact on theCompany’s financial statements and any litigation, claim or other contingency that could have a material effect upon theCompany’s financial statements. In addition, the Audit Committee is responsible for assessing management’s programsand policies relating to the adequacy and effectiveness of internal controls over the Company’s accounting and financialsystems. The Audit Committee reviews and discusses with the Chief Executive Officer and Chief Financial Officer theprocedures undertaken in connection with their certifications for annual filings in accordance with the requirements ofapplicable securities regulatory authorities. The Audit Committee is also responsible for recommending to the Board theexternal auditor to be nominated for shareholder approval who will be responsible for preparing audited financialstatements and completing other audit, review or attest services. The Audit Committee also recommends to the Board thecompensation to be paid to the external auditor and directly oversees its work. The Company’s external auditor reportsdirectly to the Audit Committee. The Audit Committee reports directly to the Board of Directors.
The Audit Committee is entitled to retain (at the Company’s expense) and determine the compensation of anyindependent counsel, accountants or other advisors to assist the Audit Committee in its oversight responsibilities.
Compensation Committee
The Compensation Committee is composed entirely of directors who are unrelated to and independent from the Company(currently, Mr. Gemmell (Chair), Mr. Beaumont, Ms Celej and Mr. Stockford). The Compensation Committee met five timesin 2011.
The Compensation Committee is responsible for, among other things:
• recommending to the Board policies relating to compensation of the Company’s executive officers;
• recommending to the Board the amount and composition of annual compensation to be paid to the Company’sexecutive officers;
• matters relating to pension, option and other incentive plans for the benefit of executive officers;
1372011 ANNUAL REPORT

• administering the Stock Option Plan;
• reviewing and fixing the amount and composition of annual compensation to be paid to members of the Board andcommittees; and
• reviewing and assessing the design and competitiveness of the Company’s compensation and benefits programsgenerally.
The Compensation Committee reports directly to the Board. The charter of the Compensation Committee provides thateach member of the Compensation Committee must be unrelated and independent.
The Board considers Messrs. Gemmell and Beaumont particularly well-qualified to serve on the Compensation Committeegiven the expertise they have accrued during their business careers: Mr. Gemmell as a senior manager of divisions of amajor financial services company (where part of his duties included assessing personnel and setting compensation rates)and Mr. Beaumont as a former founder and senior executive of an international engineering services company (where partof his duties included oversight of the establishment of appropriate compensation structures for the organization).
Corporate Governance Committee
The Corporate Governance Committee is composed entirely of directors who are unrelated to and independent from theCompany (currently, Mr. Roberts (Chair), Mr. Kraft, Mr. Nasso and Mr. Voutilainen). The Corporate Governance Committeemet four times in 2011.
The Corporate Governance Committee is responsible for, among other things:
• evaluating the Company’s governance practices;
• developing its response to the Company’s Statement of Corporate Governance and recommending changes to theCompany’s governance structures or processes as it may from time to time consider necessary or desirable;
• reviewing on an annual basis the charters of the Board and of each committee of the Board and recommendingany changes;
• assessing annually the effectiveness of the Board as a whole and recommending any changes;
• reviewing on a periodic basis the composition of the Board to ensure that there remain an appropriate number ofindependent directors; and
• participating in the recruitment and recommendation of new nominees for appointment or election to the Board.
The Corporate Governance Committee also provides a forum for a discussion of matters not readily discussed in a fullBoard meeting. The charter of the Corporate Governance Committee provides that each member of the CorporateGovernance Committee must be independent, as such term is defined in the CSA rules.
Health, Safety and Environment Committee
The Health, Safety and Environment Committee is comprised of three directors who are unrelated to and independentfrom the Company (currently Mr. Davis (Chair), Mr. Beaumont and Mr. Stockford). The Health, Safety and EnvironmentCommittee met four times in 2011.
The Health, Safety and Environment Committee is responsible for, among other things:
• monitoring and reviewing health, safety and environmental policies, principles, practices and processes;
• overseeing health, safety and environmental performance; and
• monitoring and reviewing current and future regulatory issues relating to health, safety and the environment.
The Health, Safety and Environment Committee reports directly to the Board and provides a forum to review health, safetyand environmental issues in a more thorough and detailed manner than could be adopted by the full Board. The Health,Safety and Environment Committee charter provides that a majority of the members of the Committee be unrelated andindependent.
138 AGNICO-EAGLE MINES LIMITED

Assessment of Directors
The Company’s Corporate Governance Committee (see description of the Corporate Governance Committee above) isresponsible for the assessment of the effectiveness of the Board as a whole and participates in the recruitment andrecommendation of new nominees for appointment or election to the Board of Directors.
Each of the directors participates in a detailed annual assessment of the Board and Board committees. The assessmentaddresses performance of the Board, each Board committee and individual directors, including through a peer to peerevaluation. A broad range of topics is covered such as Board and Board committee structure and composition, successionplanning, risk management, director competencies and Board processes and effectiveness. The assessment helpsidentify opportunities for continuing Board and director development and also forms the basis of continuing Boardparticipation.
Employees
As of December 31, 2011, the Company had 5,106 employees comprised of 3,600 permanent employees,1,197 contractors, 253 temporary employees and 56 students. Of the permanent employees, 794 were employed at theLaRonde mine, 232 at the Goldex mine, 212 at the Lapa mine, 1,098 at the Pinos Altos mine, 386 at the Kittila mine,558 at the Meadowbank mine (with 555 at Baker Lake and Meadowbank and 3 in Quebec), 13 at the Meliadine project,26 in the Exploration group in Canada and the U.S., 177 at the regional technical office in Abitibi and 104 at the corporatehead office in Toronto. The number of permanent employees of the Company at the end of 2011, 2010 and 2009 was3,600, 3,243 and 2,781, respectively.
Share Ownership
As at March 12, 2012, the Named Executive Officers and directors as a group (17 persons) beneficially owned orcontrolled (excluding options to purchase 3,440,365 common shares) an aggregate of 436,406 common shares or about0.2553% of the 170,928,545 issued and outstanding common shares. See also ‘‘– Compensation of Executive Officers’’.
1392011 ANNUAL REPORT
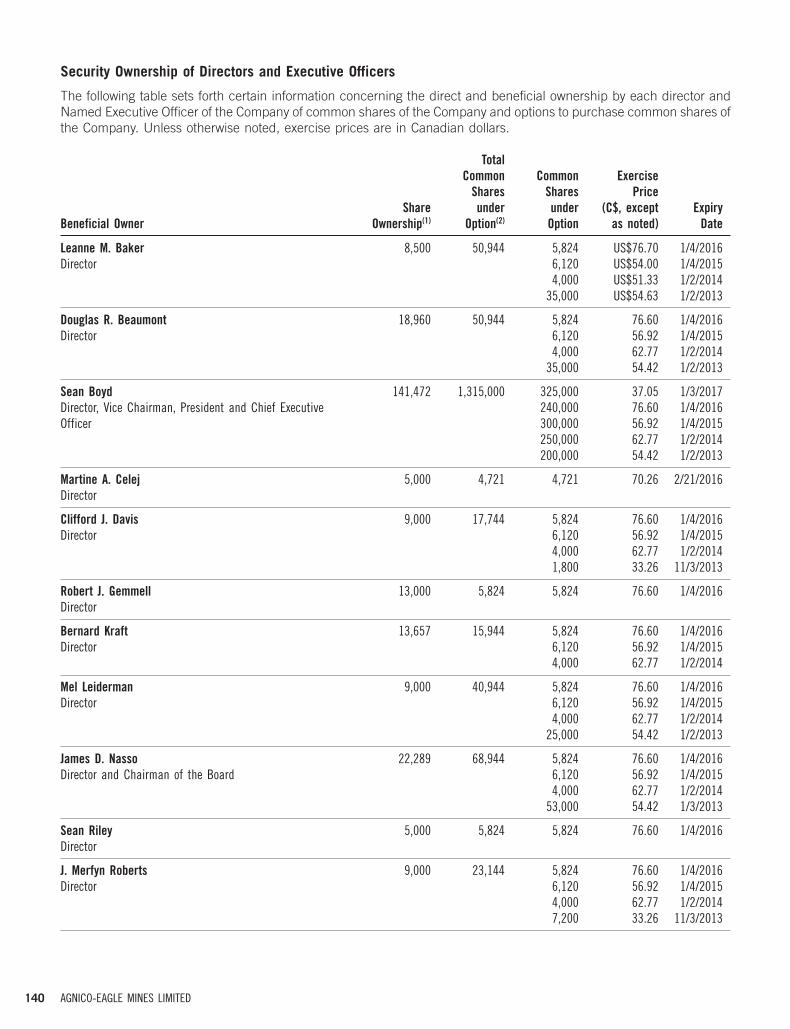
Security Ownership of Directors and Executive Officers
The following table sets forth certain information concerning the direct and beneficial ownership by each director andNamed Executive Officer of the Company of common shares of the Company and options to purchase common shares ofthe Company. Unless otherwise noted, exercise prices are in Canadian dollars.
TotalCommon Common Exercise
Shares Shares PriceShare under under (C$, except Expiry
Beneficial Owner Ownership(1) Option(2) Option as noted) Date
Leanne M. Baker 8,500 50,944 5,824 US$76.70 1/4/2016Director 6,120 US$54.00 1/4/2015
4,000 US$51.33 1/2/201435,000 US$54.63 1/2/2013
Douglas R. Beaumont 18,960 50,944 5,824 76.60 1/4/2016Director 6,120 56.92 1/4/2015
4,000 62.77 1/2/201435,000 54.42 1/2/2013
Sean Boyd 141,472 1,315,000 325,000 37.05 1/3/2017Director, Vice Chairman, President and Chief Executive 240,000 76.60 1/4/2016Officer 300,000 56.92 1/4/2015
250,000 62.77 1/2/2014200,000 54.42 1/2/2013
Martine A. Celej 5,000 4,721 4,721 70.26 2/21/2016Director
Clifford J. Davis 9,000 17,744 5,824 76.60 1/4/2016Director 6,120 56.92 1/4/2015
4,000 62.77 1/2/20141,800 33.26 11/3/2013
Robert J. Gemmell 13,000 5,824 5,824 76.60 1/4/2016Director
Bernard Kraft 13,657 15,944 5,824 76.60 1/4/2016Director 6,120 56.92 1/4/2015
4,000 62.77 1/2/2014
Mel Leiderman 9,000 40,944 5,824 76.60 1/4/2016Director 6,120 56.92 1/4/2015
4,000 62.77 1/2/201425,000 54.42 1/2/2013
James D. Nasso 22,289 68,944 5,824 76.60 1/4/2016Director and Chairman of the Board 6,120 56.92 1/4/2015
4,000 62.77 1/2/201453,000 54.42 1/3/2013
Sean Riley 5,000 5,824 5,824 76.60 1/4/2016Director
J. Merfyn Roberts 9,000 23,144 5,824 76.60 1/4/2016Director 6,120 56.92 1/4/2015
4,000 62.77 1/2/20147,200 33.26 11/3/2013
140 AGNICO-EAGLE MINES LIMITED

TotalCommon Common Exercise
Shares Shares PriceShare under under (C$, except Expiry
Beneficial Owner Ownership(1) Option(2) Option as noted) Date
Howard R. Stockford 9,068 44,694 5,824 76.60 1/4/2016Director 6,120 56.92 1/4/2015
4,000 62.77 1/2/201428,750 54.42 1/2/2013
Pertti Voutilainen 22,000 50,944 5,824 76.60 1/4/2016Director 6,120 56.92 1/4/2015
4,000 62.77 1/2/201435,000 54.42 1/2/2013
Eberhard Scherkus 85,726 790,000 175,000 37.50 1/3/2017Director, President and 140,000 76.60 1/4/2016Chief Operating Officer 175,000 56.92 1/4/2015
175,000 62.77 1/2/2014125,000 54.42 1/2/2013
Ammar Al-Joundi 29,498 235,000 100,000 37.05 1/3/2017Senior Vice-President, Finance and Chief Financial Officer 60,000 76.60 1/4/2016
75,000 69.44 9/1/2015
Donald G. Allan 21,881 345,000 75,000 37.05 1/3/2017Senior Vice-President, Corporate Development 60,000 76.60 1/2/2016
75,000 56.92 1/4/201575,000 62.77 1/2/201460,000 54.42 1/2/2013
Alain Blackburn 13,355 374,750 75,000 37.05 1/3/2017Senior Vice-President, Exploration 60,000 76.60 1/4/2016
100,000 56.92 1/4/2015100,000 62.77 1/2/2014
39,750 54.42 1/2/2013
Notes:
(1) As at March 12, 2012. In each case, shareholdings (which includes common shares and RSUs) constitute less than one percent of the issued and outstanding common shares ofthe Company. The total number of common shares and RSUs held by directors and named executive officers constitutes less than 0.2553% of the issued and outstandingcommon shares of the Company.
(2) As at March 12, 2012.
1412011 ANNUAL REPORT

ITEM 7 MAJOR SHAREHOLDERS AND RELATED PARTY TRANSACTIONS
Major Shareholders
To the knowledge of the directors and senior officers of the Company, as of March 12, 2012, no person or corporationbeneficially owns or exercises control or direction over common shares of the Company carrying more than 5% of thevoting rights attached to all common shares of the Company other than as set out below:
Percentage ofNumber of outstanding
Major Shareholder common shares common shares
BlackRock, Inc.(1) 18,161,284 10.64%
Van Eck Associates Corporation(2) 11,253,461 6.59%
Notes:
(1) According to reports filed with applicable securities regulators dated January 7, 2011, February 7, 2011, November 10, 2011 and January 6, 2012, the percentage ownership ofcommon shares of the Company held by BlackRock, Inc. has varied from 10.31% to 9.69% to 10.80% to 10.64%, respectively.
(2) According to a report filed with applicable securities regulators dated February 14, 2012.
None of the Company’s major shareholders have different voting rights than other holders of the Company’scommon shares.
As of March 12, 2012, there were 3,696 holders of record of Agnico-Eagle’s 170,928,545 outstanding common shares, ofwhich 641 holders of record were in Canada and held 122,266,828 common shares or about 71.53% of the outstandingcommon shares.
The Company is not aware of any arrangements the operation of which may at a subsequent date result in a change incontrol of the Company. To the knowledge of the Company, it is not directly or indirectly owned or controlled by anothercorporation, by any government or by any natural or legal person severally or jointly.
Related Party Transactions
The Company has not entered into any material related party transactions since January 1, 2011.
ITEM 8 FINANCIAL INFORMATION
The consolidated financial statements furnished pursuant to Item 18 are presented in accordance with US GAAP.
During the period under review, inflation has not had a significant impact on the Company’s operations.
The Company is not aware of any legal or arbitration proceedings which may have, or have had in the recent past, asignificant effect on the Company’s financial position or profitability.
Dividend Policy
The Company’s policy is to pay annual dividends on its common shares and, on February 15, 2012, the Companyannounced that it had declared a quarterly dividend of $0.20 per common share, payable on March 15, 2012. In 2011,the dividend paid was $0.64 per common share (quarterly payments of $0.16 per common share) and in each of 2010,2009 and 2008, the dividend paid was $0.18 per common share, in 2007, the dividend paid was $0.12 per commonshare and, from 2003 to 2006, the dividend paid was $0.03 per common share. Although the Company expects tocontinue paying a cash dividend, future dividends will be at the discretion of the Board and will be subject to such factorsas the Company’s earnings, financial condition and capital requirements. The Company’s bank credit facility containscovenants that restrict the Company’s ability to declare or pay dividends if a default under the bank credit facility hasoccurred or would result from the declaration or payment of the dividend.
142 AGNICO-EAGLE MINES LIMITED

ITEM 9 THE OFFER AND LISTING
Market and Listing Details
The Company’s common shares are listed and traded in Canada on the TSX and in the United States on the NYSE.
The following table sets forth the high and low sale prices and the average daily trading volume for Agnico-Eagle’s commonshares on the TSX and the NYSE for each of the fiscal years in the five-year period ended December 31, 2011 and for eachquarter during the fiscal years ended December 31, 2010 and 2011.
TSX (C$) NYSE ($)
Average Daily Average DailyHigh Low Volume High Low Volume
2007 55.86 35.70 913,173 59.45 33.25 2,076,082
2008 82.80 26.60 1,184,654 83.45 20.87 3,842,836
2009 77.32 50.80 979,369 74.00 42.65 4,172,474
2010 88.52 53.16 750,312 88.20 49.64 2,508,059
2011 75.39 35.35 856,906 77.00 34.50 2,285,842
2010
First Quarter 64.12 53.16 718,042 61.80 49.64 2,956,480
Second Quarter 68.16 57.05 837,814 66.80 55.43 2,870,655
Third Quarter 73.41 56.08 759,806 71.33 54.12 2,081,771
Fourth Quarter 88.52 70.00 698,995 88.20 67.66 2,151,791
2011
First Quarter 75.39 62.93 781,613 77.00 63.53 2,534,857
Second Quarter 66.17 58.82 733,270 70.00 59.78 2,059,362
Third Quarter 72.51 53.05 952,868 73.09 54.19 2,297,630
Fourth Quarter 64.14 35.35 960,318 61.17 34.50 2,255,181
1432011 ANNUAL REPORT

The following table sets forth the high and low sale prices and the average daily trading volume for the Company’s commonshares on the TSX and the NYSE since January 1, 2011.
TSX (C$) NYSE ($)
Average Daily Average DailyHigh Low Volume High Low Volume
2011
January 72.40 66.78 897,886 77.00 66.79 3,091,655
February 75.39 67.07 766,727 76.49 68.36 2,521,990
March 70.96 62.93 734,800 72.91 63.53 2,164,700
April 66.17 60.53 886,100 70.00 62.61 2,700,100
May 65.84 58.82 673,700 69.44 60.42 2,042,200
June 64.66 59.00 750,900 66.60 59.78 1,739,900
July 63.90 53.14 745,400 66.60 55.68 2,269,100
August 68.68 53.05 1,232,100 70.25 54.19 2,862,300
September 72.51 60.51 960,600 73.09 58.60 2,016,600
October 64.14 42.04 1,388,700 61.17 42.21 3,243,700
November 48.48 41.73 814,800 47.68 40.39 1,988,000
December 46.01 35.35 791,000 45.30 34.50 1,798,100
2012
January 39.68 34.51 754,100 39.64 34.03 1,914,300
February 38.03 31.50 1,356,500 38.14 34.42 2,884,400
March (to March 12) 36.64 34.84 838,600 37.24 34.76 2,578,800
On March 12, 2012 the closing price of the common shares was C$35.02 on the TSX and $35.24 on the NYSE. Theregistrar and transfer agent for the common shares is Computershare Trust Company of Canada, Toronto, Ontario.
144 AGNICO-EAGLE MINES LIMITED

The following table sets forth the high and low sale prices and average daily trading volume for the Company’s commonshare purchase warrants (the ‘‘Warrants’’) on the TSX since January 1, 2011.
TSX ($)
Average DailyHigh Low Volume
2011
January 30.15 25.21 5,038
February 31.48 25.00 9,753
March 26.76 20.86 17,209
April 24.49 20.21 14,740
May 21.89 18.99 9,655
June 22.31 18.87 9,070
July 22.11 15.16 6,584
August 26.67 15.26 12,777
September 27.67 18.42 3,993
October 20.33 9.54 6,245
November 12.43 9.02 8,825
December 9.69 5.36 6,355
2012
January 6.72 6.38 3,194
February 6.03 5.70 5,750
March (to March 12) 5.24 5.16 1,278
On March 12, 2012, the closing price of the Warrants was $4.90 on the TSX. The registrar and transfer agent for theWarrants is Computershare Trust Company of Canada, Toronto, Ontario.
ITEM 10 ADDITIONAL INFORMATION
Memorandum and Articles of Incorporation
Articles of Amendment
The Company’s articles of incorporation do not place any restrictions on the Company’s objects and purposes. For moreinformation, see the Articles of Amalgamation filed as Exhibit 1.01 to this Form 20-F.
Certain Powers of Directors
The Business Corporations Act (Ontario) (the ‘‘OBCA’’) requires that every director who is a party to, or who is a director orofficer of, or has a material interest in, any person who is a party to, a material contract or transaction or a proposedmaterial contract or transaction with the Company, must disclose in writing to the Company or request to have entered inthe minutes of the meetings of directors the nature and extent of his or her interest, and must refrain from attending anypart of a meeting of directors during which the contract or transaction is discussed and from voting in respect of thecontract or transaction unless the contract or transaction is: (a) one relating primarily to his or her remuneration as adirector of the corporation or an affiliate; (b) one for indemnity of or insurance for directors as contemplated under theOBCA; or (c) one with an affiliate. However, a director who is prohibited by the OBCA from voting on a material contract orproposed material contract may be counted in determining whether a quorum is present for the purpose of the resolution,
1452011 ANNUAL REPORT

if the director disclosed his or her interest in accordance with the OBCA and the contract or transaction was reasonableand fair to the corporation at the time it was approved.
The Company’s by-laws provide that the Board will from time to time determine the remuneration to be paid to thedirectors, which will be in addition to the salary paid to any officer or employee of the Company who is also a director. Thedirectors may also, by resolution, award special remuneration to any director for undertaking any special services on theCompany’s behalf, other than the normal work ordinarily required of a director of the Company. The by-laws provide thatconfirmation of any such resolution by the Company’s shareholders is not required.
The Company’s by-laws also provide that the directors may: (a) borrow money upon the credit of the Company; (b) issue,reissue, sell or pledge bonds, debentures, notes or other evidences of indebtedness or guarantee of the Company, whethersecured or unsecured; (c) to the extent permitted by the OBCA, give directly or indirectly financial assistance to any personby means of a loan, a guarantee on behalf of the Company to secure performance of any present or future indebtedness,liability or other obligation of any person, or otherwise; and (d) mortgage, hypothecate, pledge or otherwise create asecurity interest in all or any currently owned or subsequently acquired real or personal, movable or immovable, tangibleor intangible property of the Company to secure any such bonds, debentures, notes or other evidences of indebtedness orguarantee or any other present or future indebtedness, liability or other obligation of the Company.
The directors may, by resolution, amend or repeal any by-laws that regulate the business or affairs of the Company. TheOBCA requires the directors to submit any such amendment or repeal to the Company’s shareholders at the next meetingof shareholders, and the shareholders may confirm, reject or amend the amendment or repeal.
Retirement of Directors
The Board does not have a mandatory retirement policy for directors based solely on age. Due in part to the Company’spractice of conducting annual Board, Committee and individual director evaluations, the Board approved and adopted aresignation policy primarily based on directors’ performance, commitment, skills and experience. As set out in greaterdetail under ‘‘Item 6 Directors, Senior Management and Employees – Board Practices – Assessment of Directors’’, eachdirector’s performance is evaluated annually.
Directors’ Share Ownership
Directors, other than Mr. Boyd, are required to own a minimum of 10,000 RSUs or common shares of the Company.Directors have a period of the later of (i) August 24, 2013 and (ii) five years from the date they first became directors, toachieve this ownership level.
Meetings of Shareholders
The OBCA requires the Company to call an annual shareholders’ meeting not later than 15 months after holding the lastpreceding annual meeting and permits the Company to call a special shareholders’ meeting at any time. In addition, inaccordance with the OBCA, the holders of not less than 5% of the Company’s shares carrying the right to vote at a meetingsought to be held may requisition the directors to call a special shareholders’ meeting for the purposes stated in therequisition. The Company is required to mail a notice of meeting and management information circular to registeredshareholders not less than 21 days and not more than 50 days prior to the date of any annual or special shareholders’meeting. These materials are also filed with Canadian securities regulatory authorities and furnished to the SEC. TheCompany’s by-laws provide that a quorum of two shareholders in person or represented by proxy holding or representingby proxy at least 25% of the Company’s issued shares carrying the right to vote at the meeting is required to transactbusiness at a shareholders’ meeting. Shareholders, and their duly appointed proxies and corporate representatives, aswell as the Company’s auditors, are entitled to be admitted to the Company’s annual and special shareholders’ meetings.
Authorized Capital
The Company’s authorized capital consists of an unlimited number of shares of one class designated as common shares.All outstanding common shares of the Company are fully paid and non-assessable. The holders of the common shares areentitled to one vote per share at meetings of shareholders and to receive dividends if, as and when declared by thedirectors of the Company. In the event of voluntary or involuntary liquidation, dissolution or winding-up of the Company,after payment of all outstanding debts, the remaining assets of the Company available for distribution would be distributedrateably to the holders of the common shares. Holders of the common shares of the Company have no pre-emptive,redemption, exchange or conversion rights. The Company may not create any class or series of shares or make any
146 AGNICO-EAGLE MINES LIMITED

modification to the provisions attaching to the Company’s common shares without the affirmative vote of two-thirds of thevotes cast by the holders of the common shares.
Majority Voting Policy
As part of its ongoing review of corporate governance practices, on February 20, 2008, the Board adopted a policyproviding that in an uncontested election of directors, any nominee who receives a greater number of votes ‘‘withheld’’than votes ‘‘for’’ will tender his or her resignation to the Chairman of the Board promptly following the shareholders’meeting. The Corporate Governance Committee will consider the offer of resignation and will make a recommendation tothe Board on whether to accept it. In considering whether or not to accept the resignation, the Corporate GovernanceCommittee will consider all factors deemed relevant by members of such Committee. The Corporate GovernanceCommittee will be expected to accept the resignation except in situations where the considerations would warrant theapplicable director continuing to serve on the Board. The Board will make its final decision and announce it in a newsrelease within 90 days following the shareholders’ meeting. A director who tenders his or her resignation pursuant to thispolicy will not participate in any meeting of the Board or the Corporate Governance Committee at which the resignationis considered.
Disclosure of Share Ownership
The Securities Act (Ontario) currently provides that the directors and certain officers of an issuer and its subsidiaries andany person or company that beneficially owns, directly or indirectly, voting securities of an issuer or that exercises controlor direction over voting securities of an issuer or a combination of both, carrying more than 10% of the voting rightsattached to all the issuer’s outstanding voting securities (a ‘‘significant shareholder’’), as well as the directors and officers ofany significant shareholder, (each an ‘‘insider’’) must, within 10 days of becoming an insider, file a report in the requiredform effective the date on which the person became an insider, disclosing any direct or indirect beneficial ownership of, orcontrol or direction over, securities of the reporting issuer. The Securities Act (Ontario) also provides for the filing of a reportby an insider of a reporting issuer who acquires or transfers securities of the issuer or who enters into, materially amends orterminates an arrangement the effect of which is to alter the insider’s economic interest in a security of the issuer or theinsider’s economic exposure to the issuer. These reports must be filed within five days after the reportable event. TheSecurities Act (Ontario) also requires these reports to be filed by reporting insiders within five days after the applicableevent, though are only required by the Chief Executive Officer, Chief Financial Officer, Chief Operating Officer, directors,any person or company responsible for a principal business unit and significant shareholders of the Company.
The Securities Act (Ontario) also provides that a person or company that acquires (whether or not by way of a take-overbid, offer to acquire or subscription from treasury) beneficial ownership of voting or equity securities or securitiesconvertible into voting or equity securities of a reporting issuer that, together with previously held securities brings the totalholdings of such holder to 10% or more of the outstanding securities of that class, must (a) issue and file forthwith a newsrelease containing certain prescribed information and (b) file a report within two business days containing the sameinformation set out in the news release. The acquiring person or company must also issue a news release and file a reporteach time it acquires, in the aggregate, an additional 2% or more of the outstanding securities of the same class and everytime there is a change to any material fact in the news release and report previously issued and filed.
The rules in the United States governing the ownership threshold above which shareholder ownership must be disclosedare more stringent than those discussed above. Section 13(d) of the Securities Exchange Act of 1934, as amended(the ‘‘Exchange Act’’), imposes reporting requirements on persons who acquire beneficial ownership (as such term isdefined in Rule 13d-3 under the Exchange Act) of more than 5% of a class of an equity security registered underSection 12 of the Exchange Act. In general, such persons must file, within ten days after such acquisition, a report ofbeneficial ownership with the SEC containing the information prescribed by the regulations under Section 13(d) of theExchange Act and promptly file an amendment to such report to disclose any material change to the information reported,including any acquisition or disposition of 1% or more of the outstanding securities of the registered class. Certaininstitutional investors that acquire shares in the ordinary course of business and not with the purpose or with the effect ofchanging or influencing the control of the issuer, are subject to lesser disclosure obligations.
Material Contracts
The Company believes the following contracts constitute the only material contracts to which it is a party.
1472011 ANNUAL REPORT

Credit Agreement
The Company entered into an amended and restated bank credit facility (the ‘‘Credit Facility’’) on August 4, 2011 with agroup of financial institutions providing for a $1.2 billion unsecured revolving bank credit facility that replaced theCompany’s previous unsecured revolving bank credit facility. The Credit Facility matures and all indebtedness thereunderis due and payable on June 22, 2016. The Company, with the consent of lenders representing at least 662⁄3% of theaggregate commitments under the facility, has the option to extend the term of the facility for additional one-year terms.The Credit Facility is available in multiple currencies through prime rate and base rate advances, priced at the applicablerate plus a margin that ranges from 0.50% to 1.75% depending on certain financial ratios and through LIBOR advances,bankers’ acceptances and letters of credit, priced at the applicable rate plus a margin that ranges from 1.50% to 2.50%depending on certain financial ratios. The lenders under the Credit Facility are each paid a standby fee at a rate thatranges from 0.375% to 0.6875% of the undrawn portion of the facility, depending on certain financial ratios. Where creditexposure for all lenders is in the aggregate equal to or greater than 50% of the aggregate commitments, the standby feeand letter of credit fee shall be increased by 0.125%, provided that, if and so long as the Company has a credit rating byS&P of at least BBB, DBRS of at least BBB or Moody’s of at least Baa2, such increase shall not apply. Payment andperformance of the Company’s obligations under the Credit Facility are guaranteed by each of its significant subsidiariesand certain of its other subsidiaries (the ‘‘Guarantors’’ and, together with the Company, each an ‘‘Obligor’’).
The Credit Facility contains covenants that limit, among other things, the ability of an Obligor to:
• incur additional indebtedness;
• pay or declare dividends or make other restricted distributions or payments in respect of any shares of theCompany’s equity securities after a default or an event of default that is continuing or if a default would occur as aresult of such distribution;
• make sales or other dispositions of material assets;
• create liens on its existing or future assets, other than permitted liens;
• enter into transactions with affiliates other than the Obligors, except on a commercially reasonable basis as if it weredealing with such person at arm’s length;
• make any loans to or investments in businesses other than: those related to mining or a business ancillary orcomplementary to mining; investments in cash equivalents; or inter-company investments;
• enter into or maintain certain derivative instruments; and
• amalgamate or otherwise transfer its assets.
The Company is also required to maintain a total net debt to EBITDA ratio below a specified maximum value as well as aminimum tangible net worth. Events of default under the Credit Facility include, among other things:
• the failure to pay principal when due and payable or interest, fees or other amounts payable within five businessdays of such amounts becoming due and payable;
• the breach by the Company of any financial covenant;
• the breach by any Obligor of any other term, covenant or other agreement that is not cured within 30 business daysafter written notice of the breach has been given to the Company;
• a default under any other indebtedness of the Obligors if the effect of such default is to accelerate, or to permit theacceleration of, the due date of such indebtedness in an aggregate amount of $50 million or more;
• a change in control of the Company which is defined to occur upon (a) the acquisition, directly or indirectly, by anymeans whatsoever, by any person, or group of persons acting jointly or in concert, (collectively, an ‘‘offeror’’) ofbeneficial ownership of, or the power to exercise control or direction over, or securities convertible or exchangeableinto, any securities of the Company carrying in aggregate (assuming the exercise of all such conversion orexchange rights in favour of the offeror) more than 50% of the aggregate votes represented by the voting stock thenissued and outstanding or otherwise entitling the offeror to elect a majority of the board of directors of the Company,or (b) the replacement by way of election or appointment at any time of one-half or more of the total number of thethen incumbent members of the board of directors of the Company, or the election or appointment of new directorscomprising one-half or more of the total number of members of the board of directors in office immediatelyfollowing such election or appointment; unless, in any such case, the nomination of such directors for election or
148 AGNICO-EAGLE MINES LIMITED

their appointment is approved by the board of directors of the Company in office immediately preceding suchnomination or appointment in circumstances where such nomination or appointment is made other than as aresult of a dissident public proxy solicitation, whether actual or threatened; and
• various events relating to the bankruptcy or insolvency or winding-up, liquidation or dissolution or cessation ofbusiness of any Obligor.
As at March 12, 2012 there was approximately $355.6 million in the aggregate drawn under the Credit Facility, including$35.6 million in letters of credit.
Note Purchase Agreement
On April 7, 2010 the Company entered into a note purchase agreement (the ‘‘Note Purchase Agreement’’) with certaininstitutional investors, providing for the issuance of $115,000,000 6.13% guaranteed senior unsecured notes due 2017,$360,000,000 6.67% guaranteed senior unsecured notes due 2020 and $125,000,000 6.77% guaranteed seniorunsecured notes due 2022. Payment and performance of the Company’s obligations under the Note PurchaseAgreement, the notes issued pursuant thereto and the obligations of the Guarantors under the guarantees are guaranteedby the Guarantors.
The Note Purchase Agreement contains restrictive covenants that limit, among other things, the ability of an Obligor to:
• enter into transactions with affiliates other than the Obligors, except on a commercially reasonable basis uponterms no less favourable to the Obligor than would be obtainable in a comparable arm’s length transaction;
• amalgamate or otherwise transfer its assets;
• carry on business other than those related to mining or a business ancillary or complementary to mining;
• engage in any dealings or transactions with any person or entity identified under certain anti-terrorism regulations;
• create liens on its existing or future assets, other than permitted liens;
• incur subsidiary indebtedness where the Obligor is a subsidiary of the Company; and
• make sales or other dispositions of material assets.
The Company is also required to maintain the same financial ratios and the same minimum tangible net worth under theNote Purchase Agreement as under the Credit Facility. Events of default under the Note Purchase Agreement include,among other things:
• the failure to pay principal or make whole amounts when due and payable or interest, fees or other amountspayable within five business days of such amounts becoming due and payable;
• the breach by any Obligor of any other term or covenant that is not cured within 30 business days after the earlier ofwritten notice of the breach having been given to the Company or actual knowledge of the breach is obtained;
• the finding that any representation or warranty made by an Obligor was false or incorrect in any material respect onthe date as of which it was made;
• a default under any other indebtedness of the Obligors if the effect of such default is to accelerate, or to permit theacceleration of, the due date of such indebtedness in an aggregate amount of $50 million or more; and
• various events relating to the bankruptcy or insolvency or winding-up, liquidation or dissolution or cessation ofbusiness of any Obligor.
The Note Purchase Agreement provides that, upon certain events of default, the notes automatically become due andpayable without any further action. In addition, the Note Purchase Agreement contains a ‘‘Most Favored Lender’’ clausewhich acts to incorporate into the Note Purchase Agreement any grace periods upon an event of default that are shorter inthe Credit Facility than in the Note Purchase Agreement. A copy of the Note Purchase Agreement is filed as Exhibit 4.05to this Form 20-F.
Warrant Indenture
The Company issued common share purchase warrants (the ‘‘Warrants’’) as part of a private placement on December 3,2008. Effective April 4, 2009, the Warrants were amended and are governed by a warrant indenture (the ‘‘Indenture’’)between the Company and Computershare Trust Company of Canada (the ‘‘Trustee’’).
1492011 ANNUAL REPORT

Each whole Warrant entitles the holder to purchase one common share of the Company at a price of $47.25, subject toadjustment as summarized below. The Warrants are exercisable at any time prior to 4:30 p.m. (Eastern Standard Time) onDecember 2, 2013, after which the Warrants will expire and become void and of no effect. Warrants may be surrenderedfor exercise or transfer at the principal office of the Trustee in Toronto.
The Indenture provides for adjustment in the number of common shares issuable on the exercise of the Warrants and/orthe exercise price per Warrant on the occurrence of certain events, including:
• the declaration of a dividend or making of a distribution on the common shares payable in common shares orsecurities exchangeable for or convertible into common shares to the holders of the common shares in proportionto their respective ownership of common shares;
• the subdivision, consolidation or change of the outstanding common shares into a different number ofcommon shares;
• the fixing of a record date for the issuance of rights, options or warrants to all or substantially all of the holders of thecommon shares under which such holders are entitled, during a period expiring not more than 45 days after suchrecord date, to subscribe for or purchase common shares, or securities exchangeable for or convertible intocommon shares, at a price per share to the holder (or at a conversion or exchange price per share) of less than 95%of the Current Market Price (as defined in the Indenture) on such record date; and
• the fixing of a record date for the issue or distribution to all or substantially all of the holders of the common sharesof securities of the Company (including rights, options or warrants to purchase any securities of the Company),evidence of the Company’s indebtedness or any property or assets (including cash or shares of any othercorporation but excluding any dividends paid in accordance with a dividend policy established by the board ofdirectors of the Company) and such issue or distribution does not constitute an event listed in (a) to (c) above.
The Indenture also provides for adjustment in the class and/or number of securities issuable on the exercise of theWarrants and/or exercise price per security in the event of the following additional events: (i) reorganization,reclassification or other change of the common shares into other securities; (ii) consolidation, amalgamation, arrangementor merger of the Company with or into another entity (other than consolidations, amalgamations, arrangements or mergerswhich do not result in any reclassification of the common shares or a change of the common shares into other shares);(iii) exchange of common shares for other shares or other securities or property, including cash, pursuant to the exercise ofa statutory compulsory acquisition right; or (iv) sale, conveyance or transfer of the Company’s undertakings or assets as anentirety or substantially as an entirety to another corporation or other entity or the completion of a take-over bid (as suchterm is defined under the Securities Act (Ontario)) resulting in the offeror, together with any persons acting jointly or inconcert with the offeror, holding at least two-thirds of the then outstanding common shares in which the holders ofcommon shares are entitled to receive shares, other securities or property, including cash.
No adjustment in the exercise price or the number of common shares purchasable on the exercise of the Warrants will berequired to be made unless the cumulative effect of such adjustment or adjustments would change the exercise price byat least one percent or the number of common shares purchasable on exercise by at least one one-hundredth of a share;provided however, that any such adjustment that is not made will be carried forward and taken into account in anysubsequent adjustment.
The Company covenanted in the Indenture that, during the period in which the Warrants are exercisable, it will give noticeto holders of Warrants of any event that requires or may require an adjustment in any of the exercise rights pursuant to anyof the Warrants at least ten days prior to the record date or effective date, as the case may be, of such event.
No fractional common shares will be issuable on the exercise of any Warrants. The Company will not pay cash or otherconsideration to the holder of a Warrant in lieu of fractional common shares. Holders of Warrants will not have any votingrights or any other rights which a holder of common shares would have (including, without limitation, the right to receivenotice of or to attend meetings of shareholders or any right to receive dividends or other distributions). Holders of Warrantswill have no pre-emptive rights to acquire securities of the Company.
From time to time, the Company and the Trustee, without the consent of the holders of Warrants, may amend orsupplement the Indenture for certain purposes, including curing defects or inconsistencies or making any change that, inthe opinion of the Trustee, does not prejudice the rights of the Trustee or the holders of the Warrants. Any amendment orsupplement to the Indenture that prejudices the interests of the holders of the Warrants may only be made by‘‘extraordinary resolution’’, which is defined in the Indenture as a resolution either (i) passed at a meeting of the holders ofWarrants at which there are holders of Warrants present in person or represented by proxy representing at least 25% of the
150 AGNICO-EAGLE MINES LIMITED

then outstanding Warrants (at least 50% for any amendment that would increase the exercise price per security, decreasethe number of securities issuable upon the exercise of Warrants or shorten the term of the Warrants), or such lesserpercentage constituting a quorum for this purpose under the Indenture, and passed by the affirmative vote of holders ofWarrants representing not less than 662⁄3% of the then outstanding Warrants represented at the meeting and voted on thepoll on such resolution; or (ii) adopted by an instrument in writing signed by the holders of Warrants representing not lessthan 662⁄3% of the then outstanding Warrants.
The Warrants may not be exercised by or on behalf of a U.S. person (a ‘‘U.S. Person’’), as defined in Rule 902(k) ofRegulation S under the United States Securities Act of 1933, as amended (the ‘‘U.S. Securities Act’’), a person in theUnited States or for the account or benefit of a U.S. Person or a person in the United States (each a ‘‘Restricted Person’’)unless registered under the U.S. Securities Act and the securities laws of all applicable states of the United States or anexemption from such registration requirements is available. The Company does not intend to register the Warrants, or thecommon shares issuable upon exercise of the Warrants, in the United States. The Company and Trustee will not acceptsubscriptions for common shares pursuant to the exercise of Warrants from any holder of Warrants who does not certifythat it is not a Restricted Person.
Notwithstanding the foregoing, a Warrant may be exercised by or on behalf of Restricted Person if:
(a) the Warrant is a U.S. Warrant (as defined in the Indenture) and is exercised by an Initial U.S. Holder (as defined inthe Indenture);
(b) the Warrant is a U.S. Warrant and the holder delivers a letter in the form of Schedule B to the Indenture to theTrustee; or
(c) the holder delivers to the Trustee a written opinion of United States counsel reasonably acceptable to the Company tothe effect that either the Warrants and the common shares have been registered under the U.S. Securities Act or, thatupon exercise of the Warrant, the common shares may be issued to the holder without registration under theU.S. Securities Act and any applicable securities laws of any state of the United States.
Warrants may not be transferred except under circumstances that will not result in a violation of the U.S. Securities Act,any applicable state securities laws or any applicable Canadian securities laws. Warrants may only be transferred:
(a) outside the United States in accordance with Regulation S under the U.S. Securities Act; or
(b) in the United States in compliance with the exemption from registration provided by Rule 144 under theU.S. Securities Act, if available, or in another transaction that does not require registration under theU.S. Securities Act.
Stock Option Plan
The Company has a Stock Option Plan for directors, officers, employees and service providers to the Company. See‘‘Item 6 Directors, Senior Management and Employees – Compensation of Executive Officers – Stock Option Plan’’. A copyof the Stock Option Plan is filed as Exhibit 4.02 to this Form 20-F.
Employee Share Purchase Plan
The Company has an Employee Share Purchase Plan for officers and full-time employees of the Company. See ‘‘Item 6Directors, Senior Management and Employees – Compensation of Executive Officers – Employee Share Purchase Plan’’.A copy of the Employee Share Purchase Plan is filed as Exhibit 4.03 to this Form 20-F.
Exchange Controls
Canada has no system of exchange controls. There are no Canadian restrictions on the repatriation of capital or earnings ofa Canadian public company to non-resident investors. There are no laws in Canada or exchange restrictions affecting theremittance of dividends, profits, interest, royalties and other payments to non-resident holders of the Company’ssecurities, except as discussed in ‘‘– Canadian Federal Income Tax Considerations’’ below.
Restrictions on Share Ownership by Non-Canadians
There are no limitations under the laws of Canada or in the constating documents of the Company on the right of foreignersto hold or vote securities of the Company, except that the Investment Canada Act may require review and approval by theMinister of Industry (Canada) of certain acquisitions of ‘‘control’’ of the Company by a ‘‘non-Canadian’’. The threshold for
1512011 ANNUAL REPORT

acquisitions of ‘‘control’’ is generally defined as being one-third or more of the voting shares of the Company.‘‘Non-Canadian’’ generally means an individual who is not a Canadian citizen or a permanent resident of Canada, or acorporation, partnership, trust or joint venture that is ultimately controlled by non-Canadians.
Corporate Governance
The Company is subject to a variety of corporate governance guidelines and requirements enacted by the TSX, the CSA,the NYSE and the SEC. Today, the Company believes that it meets and often exceeds not only corporate governance legalrequirements in Canada and the United States, but also the best practices recommended by securities regulators. TheCompany is listed on the NYSE and, although the Company is not required to comply with most of the NYSE corporategovernance requirements to which the Company would be subject if it were a U.S. corporation, the Company’s governancepractices differ from those required of U.S. domestic issuers in only the following respects. The NYSE rules forU.S. domestic issuers require shareholder approval of all equity compensation plans (as defined in the NYSE rules)regardless of whether new issuances, treasury shares or shares that the Company has purchased in the open market areused. The TSX rules require shareholder approval of share compensation arrangements involving new issuances ofshares, and of certain amendments to such arrangements, but do not require such approval if the compensationarrangements involve only shares purchased by the company in the open market. The NYSE rules for U.S. domesticissuers also require shareholder approval of certain transactions or series of related transactions that result in the issuanceof common shares, or securities convertible into or exercisable for common shares, that has, or will have upon issuance,voting power equal to or in excess of 20% of the voting power outstanding prior to the transaction or if the issuance ofcommon shares, or securities convertible into or exercisable for common shares, is, or will be upon issuance, equal to or inexcess of 20% of the number of common shares outstanding prior to the transaction. The TSX rules require shareholderapproval of acquisition transactions resulting in dilution in excess of 25%. The TSX also has broad general discretion torequire shareholder approval in connection with any issuances of listed securities. The Company complies with theTSX rules.
Canadian Federal Income Tax Considerations
The following is a brief summary of some of the principal Canadian federal income tax consequences generally applicableto a holder of common shares of the Company (a ‘‘U.S. holder’’) who deals at arm’s length with the Company, holds theshares as capital property and who, for the purposes of the Income Tax Act (Canada) (the ‘‘Act’’) and the Canada-United States Income Tax Convention (1980) (the ‘‘Treaty’’), is at all relevant times resident in the United States, is not andis not deemed to be resident in Canada and does not use or hold and is not deemed to use or hold the shares in carrying ona business in Canada. Special rules, which are not discussed below, may apply to a U.S. holder which is an insurer thatcarries on business in Canada and elsewhere.
This summary is of a general nature only and is not, and should not be interpreted as, legal or tax advice to any particularU.S. holder and no representation is made with respect to the Canadian federal income tax consequences to anyparticular person. Accordingly, U.S. holders are advised to consult their own tax advisors with respect to their particularcircumstances.
Under the Act and the Treaty, a U.S. holder of common shares (including an individual or estate) who is entitled to benefitsunder the Treaty will generally be subject to a 15% withholding tax on dividends paid or credited or deemed by the Act tohave been paid or credited on such shares. The dividends may be exempt from such withholding in the case of someU.S. holders such as qualifying pension funds and charities. A U.S. holder who is not entitled to benefits under the Treaty(or to the benefits of the Dividends Article of the Treaty) will generally be subject to Canadian withholding tax at the rate of25% on such dividends.
In general, a U.S. holder will not be subject to Canadian income tax on capital gains arising on the disposition of shares ofthe Company unless, at the time of disposition, the shares are ‘‘taxable Canadian property’’ (as defined in the Act) andsuch gains are not exempted from such income tax by virtue of the Treaty. Where the shares are listed on a designatedstock exchange (which includes the TSX and the NYSE) at the time of disposition, the shares will not generally be taxableCanadian property, unless at any time in the 60-month period immediately preceding the disposition (i) 25% or more ofthe shares of any class or series of the capital stock of the Company was owned by or belonged to one or more of theU.S. holder and persons with whom the U.S. holder did not deal at arm’s length, and (ii) more than 50% of the fair marketvalue of the shares was derived directly or indirectly from one or more of real or immovable property situated in Canada,Canadian resource properties, timber resource properties or options in respect of the foregoing or interests therein. Incertain circumstances, the shares may be deemed to be taxable Canadian property of a U.S. holder. A U.S. holder who isentitled to benefits under the Treaty will be so exempted under the Treaty where the value of the shares of the Company at
152 AGNICO-EAGLE MINES LIMITED

the time of disposition is not derived principally from real property (as defined in the Treaty) situated in Canada. For thispurpose, the Treaty defines real property situated in Canada to include rights to explore for or exploit mineral deposits andother natural resources situated in Canada, rights to amounts computed by reference to the amount or value of productionfrom such resources and certain other rights in respect of natural resources situated in Canada.
United States Federal Income Tax Considerations
The following is a brief summary of some of the principal U.S. federal income tax consequences to a holder of commonshares of the Company, who deals at arm’s length with the Company, holds the shares as a capital asset and who, for thepurposes of the Internal Revenue Code of 1986, as amended (the ‘‘Code’’) and the Treaty, is at all relevant times a U.SStockholder (as defined below).
As used herein, the term ‘‘U.S. Stockholder’’ means a holder of common shares of the Company who (for United Statesfederal income tax purposes): (a) is a citizen or resident of the United States; (b) is a corporation created or organized in orunder the laws of the United States or of any state therein; (c) is an estate the income of which is subject to United Statesfederal income taxation regardless of its source; or (d) is a trust that either (i) has validly elected to be treated as aU.S. person or (ii) is subject to both the primary supervision of a U.S. court and the control of one or more U.S. personswith respect to all substantial trust decisions.
This summary is based on the Code, final and temporary Treasury Regulations promulgated thereunder, United Statescourt decisions, published rulings and administrative positions of the U.S. Internal Revenue Service (the ‘‘IRS’’)interpreting the Code, and the Treaty, as applicable and, in each case, as in effect and available as of the date of thisForm 20-F. Any of the authorities on which this summary is based could be changed in a material and adverse manner atany time, and any such change could be applied on a retroactive basis and could affect the United States federal incometax consequences described in this summary. This summary does not discuss the potential effects, whether adverse orbeneficial, of any proposed legislation that, if enacted, could be applied on a retroactive basis.
This summary does not describe United States federal estate and gift tax considerations, nor does it describe regional,state and local tax considerations within the United States. The following summary does not purport to be acomprehensive description of all of the possible tax considerations that may be relevant to a decision to purchase, hold ordispose of the common shares. In particular, this summary only deals with a holder who will hold the common shares as acapital asset and who does not own, directly or indirectly, 10% or more of our voting shares or of any of our direct orindirect subsidiaries. This summary does not address all of the tax consequences that may be relevant to holders in light oftheir particular circumstances, including but not limited to application of alternative minimum tax or rules applicable totaxpayers in special circumstances. Special rules may apply, for instance, to tax-exempt entities, banks, insurancecompanies, S corporations, dealers in securities or currencies, persons who will hold common shares as a position in a‘‘straddle’’, hedge, constructive sale or ‘‘conversion transaction’’ for U.S. tax purposes, persons who have a ‘‘functionalcurrency’’ other than the U.S. dollar or persons subject to U.S. taxation as expatriates. Furthermore, in general, thisdiscussion does not address the tax consequences applicable to holders that are treated as partnerships or otherpass-through entities for United States federal income tax purposes.
This summary is of a general nature only and is not, and should not be interpreted as, legal or tax advice to any particularU.S. Stockholder and no representation is made with respect to the U.S. income tax consequences to any particularperson. Accordingly, U.S. Stockholders are advised to consult their own tax advisors with respect to their particularcircumstances.
Dividends
For United States federal income tax purposes, the gross amount of all distributions, if any, paid with respect to thecommon shares out of current or accumulated earnings and profits (‘‘E&P’’) to a U.S. Stockholder generally will be treatedas foreign source dividend income to such holder, even though the U.S. Stockholder generally receives only a portion ofthe gross amount (after giving effect to the Canadian withholding tax as potentially reduced by the Treaty). United Statescorporations that hold the common shares generally will not be entitled to the dividends received deduction that applies todividends received from United States corporations. To the extent a distribution exceeds E&P, it will be treated first as areturn of capital to the extent of the U.S. Stockholder’s adjusted basis and then as gain from the sale of a capital asset.
In the case of certain non-corporate U.S. Stockholders, including individuals and certain estates and trusts, gainsrecognized prior to 2013 from the sale of a capital asset held for longer than 12 months are taxable at a maximum federalincome tax rate of 15%, while gains from the sale of a capital asset that do not meet such holding period are taxable at therates applicable to ordinary income. Certain dividends paid prior to 2013 to certain non-corporate U.S. Stockholders,
1532011 ANNUAL REPORT

including individuals and certain estates and trusts, generally are also subject to the 15% maximum rate. The reduced taxrates generally are available only with respect to dividends received from U.S. corporations, and fromnon-U.S. corporations (a) that are eligible for the benefits of a comprehensive income tax treaty with the United States thatthe U.S. Treasury Department determines to be satisfactory and that contains an exchange of information program, or(b) whose stock is readily tradeable on an established securities market in the United States. In addition, the reduced taxrates are not available with respect to dividends received from a foreign corporation that was a passive foreign investmentcompany in either the taxable year of the distribution or the preceding taxable year. Special rules may apply, however, tocause such dividends to be taxable at the higher rates applicable to ordinary income. For example, the reduced tax ratesare not available with respect to a dividend on shares where the U.S. Stockholder does not continuously own such sharesfor more than 60 days during the 120-day period beginning 60 days before the ex-dividend date. Many other complex andspecial rules may apply as a condition to, or as a result of, the application of the reduced tax rate on dividends.U.S. Stockholders are advised to consult their own tax advisors.
For United States federal income tax purposes, the amount of any dividend paid in Canadian dollars will be theUnited States dollar value of the Canadian dollars at the exchange rate in effect on the date the dividend is properlyincluded in income, whether or not the Canadian dollars are converted into United States dollars at that time. Gain or lossrecognized by a U.S. Stockholder on a sale or exchange of the Canadian dollars will generally be United States sourceordinary income or loss.
The withholding tax imposed by Canada generally is a creditable foreign tax for United States federal income tax purposes.Therefore, the U.S. Stockholder generally will be entitled to include the amount withheld as a foreign tax paid in computinga foreign tax credit (or in computing a deduction for foreign income taxes paid, if the holder does not elect to use theforeign tax credit provisions of the Code). The Code, however, imposes a number of limitations on the use of foreign taxcredits, based on the particular facts and circumstances of each taxpayer. Investors should consult their tax advisorsregarding the availability of the foreign tax credit. U.S. Stockholders that do not elect to claim foreign tax credit for a taxableyear may be eligible to deduct such withholding tax imposed by Canada.
Capital Gains
Subject to the discussion below under the heading ‘‘– Passive Foreign Investment Company Considerations’’, gain or lossrecognized by a U.S. Stockholder on the sale or other disposition of the common shares will be subject to United Statesfederal income taxation as capital gain or loss in an amount equal to the difference between such U.S. Stockholder’sadjusted basis in the common shares and the amount realized upon its disposition.
Gain on the sale of common shares held for more than one year by certain non-corporate U.S. Stockholders, includingindividuals and certain estates and trusts, will be taxable at a maximum rate of 15%. A reduced rate does not apply tocapital gains realized by a U.S. Stockholder that is a corporation. Capital losses are generally deductible only againstcapital gains and not against ordinary income. In the case of an individual, however, unused capital losses in excess ofcapital gains may offset up to $3,000 annually of ordinary income.
Capital gain or loss recognized by a U.S. Stockholder on the sale or other disposition of common shares will generally besourced in the United States.
Passive Foreign Investment Company Considerations
The Company will be classified as a passive foreign investment company (a ‘‘PFIC’’) for United States federal income taxpurposes if either (i) 75% or more of its gross income is passive income or (ii) on average for the taxable year, 50% or moreof its assets (by value) produce or are held for the production of passive income. Based on projections of the Company’sincome and assets and the manner in which the Company intends to manage its business, the Company expects that theCompany will not be a PFIC. However, there can be no assurance that this will actually be the case.
If the Company were to be classified as a PFIC, the consequences to a U.S. Stockholder will depend in part on whether theU.S. Stockholder has made a ‘‘Mark-to-Market Election’’ or a ‘‘QEF Election’’ with respect to the Company. If the Companyis a PFIC during a U.S. Stockholder’s holding period and the U.S. Stockholder does not make a Mark-to-Market Election ora QEF Election, the U.S. Stockholder will generally be subject to special rules including interest charges.
If a U.S. Stockholder makes a Mark-to-Market Election, the U.S. Stockholder would generally be required to include in itsincome the excess of the fair market value of the common shares as of the close of each taxable year over theU.S. Stockholder’s adjusted basis therein. If the U.S. Stockholder’s adjusted basis in the common shares is greater thanthe fair market value of the common shares as of the close of the taxable year, the U.S. Stockholder may deduct such
154 AGNICO-EAGLE MINES LIMITED

excess, but only up to the aggregate amount of ordinary income previously included as a result of the Mark-to-MarketElection, reduced by any previous deduction taken. The U.S. Stockholder’s adjusted basis in its common shares will beincreased by the amount of income or reduced by the amount of deductions resulting from the Mark-to-Market Election.
A U.S. Stockholder who makes a QEF Election would generally be currently taxable on its pro rata share of the Company’sordinary earnings and net capital gain (at ordinary income and capital gains rates, respectively) for each taxable year thatthe Company is classified as a PFIC, even if no dividend distributions were received.
If for any year the Company determines that it is properly classified as a PFIC, it will comply with all reporting requirementsnecessary for a U.S. Stockholder to make a QEF Election and will, promptly following the end of such year and each yearthereafter for which the Company is properly classified as a PFIC, provide to U.S. Stockholders the information required bythe QEF Election.
Under current U.S. law, if the Company is a PFIC in any year, a U.S. Stockholder must file an annual return on IRSForm 8621, which describes the income received (or deemed to be received pursuant to a QEF Election) from theCompany, any gain realized on a disposition of common shares and certain other information.
Information Reporting; Backup Withholding Tax
Dividends on and proceeds arising from a sale of common shares generally will be subject to information reporting andbackup withholding tax, currently at the rate of 28%, if (a) a U.S. Stockholder fails to furnish the U.S. Stockholder’s correctUnited States taxpayer identification number (generally on Form W-9), (b) the withholding agent is advised theU.S. Stockholder furnished an incorrect United States taxpayer identification number, (c) the withholding agent is notifiedby the IRS that the U.S. Stockholder has previously failed to properly report items subject to backup withholding tax, or(d) the U.S. Stockholder fails to certify, under penalty of perjury, that the U.S. Stockholder has furnished its correctU.S. taxpayer identification number and that the IRS has not notified the U.S. Stockholder that it is subject to backupwithholding tax. However, U.S. Stockholders that are corporations generally are excluded from these information reportingand backup withholding tax rules. Amounts withheld as backup withholding may be credited against a U.S. Stockholder’sUnited States federal income tax liability, and a U.S. Stockholder may obtain a refund of any excess amounts withheldunder the backup withholding rules by filing the appropriate claim for refund with the IRS and furnishing any requiredinformation.
Recently enacted legislation requires U.S. individuals to report an interest in any ‘‘specified foreign financial asset’’ if theaggregate value of such assets owned by the U.S. individual exceeds $50,000 (or such higher amount as the IRS mayprescribe in future guidance). Stock issued by a foreign corporation is treated as a specified foreign financial asset forthis purpose.
Audit Fees
Fees paid to Ernst & Young LLP for 2011 and 2010 are set out below.
Year Ended December 31,
2011 2010
(C$ thousands)
Audit fees 2,655 2,264
Audit-related fees 21 18
Tax fees 72 103
All other fees 76 97
Total 2,824 2,482
Audit fees were paid for professional services rendered by the auditors for the audit of Agnico-Eagle’s annual financialstatements and related statutory and regulatory filings and for the quarterly review of Agnico-Eagle’s interim financialstatements. Audit fees also include prospectus-related fees for professional services rendered by the auditors inconnection with corporate financing activities. These services consisted of the audit or review, as required, of financialstatements included in the prospectuses, the review of documents filed with securities regulatory authorities,
1552011 ANNUAL REPORT

correspondence with securities regulatory authorities and all other services required by regulatory authorities inconnection with the filing of these documents.
Audit-related fees consist of fees paid for assurance and related services performed by the auditors that are reasonablyrelated to the performance of the audit of the Company’s financial statements. This includes consultation with respect tofinancial reporting, accounting standards and compliance with Section 404 of SOX.
Tax fees were paid for professional services relating to tax compliance, tax advice and tax planning. These servicesincluded the review of tax returns and tax planning and advisory services in connection with international and domestictaxation issues.
All other fees were paid for services other than the fees listed above and include fees for professional services rendered bythe auditors in connection with the translation of securities regulatory filings required to comply with securities laws incertain Canadian jurisdictions.
No other fees were paid to auditors in the previous two years.
The Audit Committee has adopted a policy that requires the pre-approval of all fees paid to Ernst & Young LLP prior to thecommencement of the specific engagement, and all fees referred to above were pre-approved in accordance withsuch policy.
Available Documents
The Company’s filings with the SEC, including exhibits and schedules filed with this Form 20-F, may be reviewed andcopied at prescribed rates at the SEC’s public reference room located at 100 F Street, N.E., Washington, D.C. 20549.Further information on the public reference rooms may be obtained by calling the SEC at 1-800-SEC-0330. The SECmaintains a web site (www.sec.gov) that contains reports, proxy and information statements and other informationregarding registrants that file electronically with the SEC. Agnico- Eagle began to file electronically with the SEC inAugust 2002.
Any reports, statements or other information that the Company files with the SEC may be read at the addresses indicatedabove and may also be accessed electronically at the web site set forth above. These SEC filings are also available to thepublic from commercial document retrieval services.
The Company also files reports, statements and other information with the CSA and these can be accessed electronicallyat the CSA’s System for Electronic Document Analysis and Retrieval web site at www.sedar.com.
The Company’s filings with the SEC and CSA may also be accessed electronically from the Company’s website atwww.agnico-eagle.com.
ITEM 11 QUANTITATIVE AND QUALITATIVE DISCLOSURES ABOUT MARKET RISK
Metal Price and Foreign Currency
Agnico-Eagle’s net income is most sensitive to metal prices and the Canadian dollar/US dollar and Euro/US dollarexchange rates. For the purpose of the sensitivities set out in the table below, Agnico-Eagle used the following metal priceand exchange rate assumptions:
• Gold – $1,500 per ounce;
• Silver – $30.00 per ounce;
• Zinc – $1,800 per tonne;
• Copper – $7,000 per tonne;
• Canadian dollar/US dollar – C$1.00 per $1.00; and
• Euro/US dollar – c0.74 per $1.00.
Changes in the market price of gold are due to numerous factors such as demand, global mine production levels, forwardselling by producers, central bank sales and investor sentiment. Changes in the market prices of other metals are due tofactors such as demand and global mine production levels. Changes in the exchange rates are due to factors such as
156 AGNICO-EAGLE MINES LIMITED

supply and demand for currencies and economic conditions in each country or currency area. In 2011, the ranges ofmetal prices and exchange rates were as follows:
• Gold: $1,308 – $1,921 per ounce, averaging $1,571 per ounce;
• Silver: $26 – $50 per ounce, averaging $35 per ounce;
• Zinc: $1,720 – $2,569 per tonne, averaging $2,189 per tonne;
• Copper: $6,722 – $10,180 per tonne, averaging $8,813 per tonne;
• Canadian dollar/US dollar: C$0.9407 – C$1.0658 per $1, averaging C$0.9893 per $1; and
• Euro/US dollar: c0.6693 – c0.7777 per $1, averaging c0.7183 per $1.
The following table sets out the estimated impact on 2012 total cash costs per ounce of a 10% change in assumed metalprices and exchange rates. A 10% change in each variable was considered in isolation while holding all other assumptionsconstant. Based on historical market data and 2011 price ranges shown above, a 10% change in assumed metal pricesand exchange rates is reasonably likely in 2012.
Impacton total
cash costsChanges in variable per ounce
Silver $ 14
Zinc $ 6
Copper $ 4
Canadian dollar/US dollar $ 74
Euro/US dollar $ 10
In order to mitigate the impact of fluctuating byproduct metal prices, the Company occasionally enters into derivativetransactions under its Metal Price Risk Management Policy, approved by the Board. The Company’s policy and practice isnot to sell forward its gold production. However, the policy does allow the Company to use other hedging strategies whereappropriate to mitigate foreign exchange and byproduct metal pricing risks. The Company occasionally buys put options,enters into price collars and enters into forward contracts to protect minimum byproduct metal prices while maintainingfull exposure to gold price. The Risk Management Committee has approved the strategy of using short-term call options inan attempt to enhance the realized byproduct metal prices. The Company’s policy does not allow speculative trading.
The Company receives payment for all of its metal sales in US dollars and pays most of its operating and capital costs inCanadian dollars, Euros or Mexican pesos. This gives rise to significant currency risk exposure. From time to time theCompany has entered into currency hedging transactions under the Company’s Foreign Exchange Risk ManagementPolicy, approved by the Board, to hedge part of its foreign currency exposure. The policy does not permit the hedging oftranslation exposure (that is, the gains and losses that arise from the accounting translation of Canadian dollar, Euro orMexican peso denominated assets and liabilities into US dollars), as these do not give rise to cash exposure. TheCompany’s foreign currency derivative strategy includes the use of purchased puts, sold calls, collars and forwards. TheCompany’s policy does not allow speculative trading.
Cost Inputs
The Company also considers and may enter into risk management strategies to mitigate price risk on certain consumables(including, but not limited to, energy). These strategies have largely been confined to longer term purchasing contracts butmay include financial and derivative instruments.
Interest Rates
The Company’s current exposure to market risk for changes in interest rates relates primarily to the drawdown on its creditfacility and its investment portfolio. Drawdowns on the credit facility are used, primarily, to fund a portion of the capitalexpenditures related to the Company’s development projects and working capital requirements. As at December 31,
1572011 ANNUAL REPORT

2011, the Company had drawn down $320.0 million on the credit facility. In addition, the Company invests its cash ininvestments with short maturities or with frequent interest reset terms and a credit rating of R1-High or better. As a result,the Company’s interest income fluctuates with short-term market conditions. As at December 31, 2011, short-terminvestments amounted to $6.6 million.
Amounts drawn under the credit facility are subject to floating interest rates based on benchmark rates available in theUnited States and Canada or on LIBOR. In the past, the Company has entered into derivative instruments to hedge againstunfavorable changes in interest rates. The Company will continue to monitor its interest rate exposure and may enter intosuch agreements to manage its exposure to fluctuating interest rates. In 2011, there were no interest rate derivativeinstruments in place.
Financial Instruments
The Company, from time to time, enters into contracts to limit the risk associated with decreased byproduct metal prices,increased foreign currency costs (including capital expenditures) and input costs. The contracts act as economic hedgesof underlying exposures and are not held for speculative purposes. Agnico-Eagle does not use complex derivativecontracts to hedge exposures. The Company uses simple contracts, such as puts and calls, collars and forwards.
Using financial instruments creates various financial risks. Credit risk is the risk that the counterparties to financialcontracts will fail to perform on an obligation to the Company. Credit risk is partially mitigated by dealing with high qualitycounterparties such as major banks. Market liquidity risk is the risk that a financial position cannot be liquidated quickly.The Company primarily mitigates market liquidity risk by spreading out the maturity of financial contracts over time,usually based on projected production levels for the specific metal being hedged, such that the relevant markets will beable to absorb the contracts. Mark-to-market risk is the risk that an adverse change in market prices for metals will affectfinancial condition. Since derivative contracts are used as economic hedges, for most of the contracts, changes in themark-to-market value will affect income. For a description of the accounting treatment of derivative contracts, please see‘‘Item 5 Operating and Financial Review and Prospects – Critical Accounting Estimates – Financial Instruments’’.
ITEM 12 DESCRIPTION OF SECURITIES OTHER THAN EQUITY SECURITIES
None/not applicable.
158 AGNICO-EAGLE MINES LIMITED

PART II
ITEM 13 DEFAULTS, DIVIDEND ARREARAGES AND DELINQUENCIES
None.
ITEM 14 MATERIAL MODIFICATIONS TO THE RIGHTS OF SECURITY HOLDERS AND USEOF PROCEEDS
None.
ITEM 15 CONTROLS AND PROCEDURES
Evaluation of disclosure controls and procedures
The Company’s management, with the participation of the Company’s Chief Executive Officer and Chief Financial Officer,evaluated the effectiveness of the Company’s disclosure controls and procedures as of December 31, 2011 pursuant toRule 13a-15 under the Exchange Act. In designing and evaluating the disclosure controls and procedures, managementrecognizes that any controls and procedures, no matter how well designed and operated, can provide only reasonableassurance of achieving the desired control objectives. In addition, the design of disclosure controls and procedures mustreflect the fact that there are resource constraints and that management is required to apply its judgment in evaluating thebenefits of possible controls and procedures relative to their costs.
Based on such evaluation, the Company’s Chief Executive Officer and Chief Financial Officer concluded that, as ofDecember 31, 2011, the Company’s disclosure controls and procedures are designed at a reasonable assurance level andare effective to provide reasonable assurance that information the Company is required to disclose in reports that theCompany files or submits under the Exchange Act is recorded, processed, summarized and reported within the timeperiods specified in SEC rules and forms, and that such information is accumulated and communicated to the Company’smanagement, including the Company’s Chief Executive Officer and Chief Financial Officer, as appropriate, to allow timelydecisions regarding required disclosure.
Management’s report on internal control over financial reporting
Management of the Company is responsible for establishing and maintaining adequate internal control over financialreporting. Internal control over financial reporting is a process designed by, or under the supervision of, the Company’sChief Executive Officer and Chief Financial Officer and effected by the Company’s Board, management and otherpersonnel to provide reasonable assurance regarding the reliability of financial reporting and the preparation of financialstatements for external purposes in accordance with generally accepted accounting principles. Because of its inherentlimitations, internal control over financial reporting may not prevent or detect misstatements. Also, projections of anyevaluation of effectiveness to future periods are subject to risk that controls may become inadequate because of changesin conditions, or that the degree of compliance with the policies or procedures may deteriorate.
The Company’s management, including the Company’s Chief Executive Officer and Chief Financial Officer, assessed theeffectiveness of the Company’s internal control over financial reporting as of December 31, 2011. In making thisassessment, the Company’s management used the criteria set forth by the Committee of Sponsoring Organizations of theTreadway Commission in Internal Control – Integrated Framework. Based upon its assessment, management concludedthat, as of December 31, 2011, the Company’s internal control over financial reporting was effective.
The effectiveness of the Company’s internal control over financial reporting as of December 31, 2011 has been audited byErnst & Young LLP, an independent registered public accounting firm, as stated in their report which appears herein.
The Company will continue to periodically review its disclosure controls and procedures and internal control over financialreporting and may make modifications from time to time as considered necessary or desirable.
Attestation report of the registered public accounting firm
Please see ‘‘Item 18 Financial Statements – Report of Independent Registered Public Accounting Firm’’ included in theCompany’s Consolidated Financial Statements which is incorporated by reference to this Item 15.
1592011 ANNUAL REPORT

Changes in internal control over financial reporting
Management regularly reviews its system of internal control over financial reporting and makes changes to the Company’sprocesses and systems to improve controls and increase efficiency, while ensuring that the Company maintains aneffective internal control environment. Changes may include such activities as implementing new, more efficient systems,consolidating activities, and migrating processes.
There was no change in the Company’s internal control over financial reporting that occurred during the period covered bythis Annual Report on Form 20-F that has materially affected, or is reasonably likely to materially affect, the Company’sinternal control over financial reporting.
ITEM 15T CONTROLS AND PROCEDURES
Not applicable.
ITEM 16A AUDIT COMMITTEE FINANCIAL EXPERT
The Board has determined that the Company shall have at least one ‘‘audit committee financial expert’’ (as defined inItem 16A of Form 20-F) and that Messrs. Bernard Kraft and Mel Leiderman are the Company’s ‘‘audit committee financialexperts’’ serving on the Audit Committee of the Board. Each of the Audit Committee financial experts is ‘‘independent’’under applicable listing standards.
ITEM 16B CODE OF ETHICS
The Company has adopted a ‘‘code of ethics’’ (as defined in Item 16B of Form 20-F) that applies to its Chief ExecutiveOfficer, Chief Financial Officer, principal accounting officer, controller and persons performing similar functions. A copy ofthis code of ethics was filed as Exhibit 2 to the Form 6-K filed on December 13, 2005 and is incorporated by referencehereto. The code of ethics is available on the Company’s website at www.agnico-eagle.com or, without charge, uponrequest from the Corporate Secretary, Agnico-Eagle Mines Limited, Suite 400, 145 King Street East, Toronto, OntarioM5C 2Y7 (telephone 416-947-1212).
There were no amendments to our waivers, express or implicit, of the code of ethics during the year ended December 31,2011.
ITEM 16C PRINCIPAL ACCOUNTANT FEES AND SERVICES
The Audit Committee establishes the independent auditors’ compensation. In 2003, the Audit Committee established apolicy to pre-approve all services provided by the Company’s independent public accountant, Ernst & Young LLP. TheAudit Committee determines which non-audit services the independent auditors are prohibited from providing andauthorizes permitted non-audit services to be performed by the independent auditors to the extent those services arepermitted by SOX and other applicable legislation. A summary of all fees paid to Ernst & Young LLP for the fiscal yearsended December 31, 2011 and 2010 can be found under ‘‘Item 10 Additional Information – Audit Fees’’ which isincorporated by reference into this Item 16C. All fees paid to Ernst & Young LLP in 2011 were pre-approved by the AuditCommittee. Ernst & Young LLP has served as the Company’s independent public accountant for each of the fiscal years inthe three-year period ended December 31, 2011 for which audited financial statements appear in this Annual Report onForm 20-F.
ITEM 16D EXEMPTIONS FROM THE LISTING STANDARDS FOR AUDIT COMMITTEES
None/Not applicable.
ITEM 16E PURCHASES OF EQUITY SECURITIES BY THE ISSUER AND AFFILIATED PURCHASERS
None/Not applicable.
ITEM 16F CHANGES IN REGISTRANT’S CERTIFYING ACCOUNTANT
None/Not applicable.
ITEM 16G CORPORATE GOVERNANCE
See ‘‘Item 10 Additional Information – Corporate Governance’’ which is incorporated by reference into this Item 16G.
160 AGNICO-EAGLE MINES LIMITED

ITEM 16H MINE SAFETY DISCLOSURE
Not applicable.
PART III
ITEM 17 FINANCIAL STATEMENTS
The Company has elected to provide financial statements and related information pursuant to Item 18.
ITEM 18 FINANCIAL STATEMENTS
Pursuant to General Instruction E(c) of Form 20-F, the registrant has elected to provide the financial statements andrelated information specified in Item 18.
1612011 ANNUAL REPORT

REPORT OF INDEPENDENT REGISTERED PUBLIC ACCOUNTING FIRMThe Board of Directors and Shareholders of Agnico-Eagle Mines Limited:
We have audited the effectiveness of Agnico-Eagle Mines Limited’s internal control over financial reporting as ofDecember 31, 2011, based on criteria established in Internal Control – Integrated Framework issued by the Committee ofSponsoring Organizations of the Treadway Commission (the COSO criteria). Agnico-Eagle Mines Limited’s management isresponsible for maintaining effective internal control over financial reporting, and for its assessment of the effectiveness ofinternal control over financial reporting included in the accompanying Management’s report on internal control overfinancial reporting. Our responsibility is to express an opinion on the company’s internal control over financial reportingbased on our audit.
We conducted our audit in accordance with the standards of the Public Company Accounting Oversight Board(United States). Those standards require that we plan and perform the audit to obtain reasonable assurance aboutwhether effective internal control over financial reporting was maintained in all material respects. Our audit includedobtaining an understanding of internal control over financial reporting, assessing the risk that a material weakness exists,testing and evaluating the design and operating effectiveness of internal control based on the assessed risk, andperforming such other procedures as we considered necessary in the circumstances. We believe that our audit provides areasonable basis for our opinion.
A company’s internal control over financial reporting is a process designed to provide reasonable assurance regarding thereliability of financial reporting and the preparation of financial statements for external purposes in accordance withgenerally accepted accounting principles. A company’s internal control over financial reporting includes those policiesand procedures that (1) pertain to the maintenance of records that, in reasonable detail, accurately and fairly reflect thetransactions and dispositions of the assets of the company; (2) provide reasonable assurance that transactions arerecorded as necessary to permit preparation of financial statements in accordance with generally accepted accountingprinciples, and that receipts and expenditures of the company are being made only in accordance with authorizations ofmanagement and directors of the company; and (3) provide reasonable assurance regarding prevention or timelydetection of unauthorized acquisition, use, or disposition of the company’s assets that could have a material effect on thefinancial statements.
Because of its inherent limitations, internal control over financial reporting may not prevent or detect misstatements. Also,projections of any evaluation of effectiveness to future periods are subject to the risk that controls may become inadequatebecause of changes in conditions, or that the degree of compliance with the policies or procedures may deteriorate.
In our opinion, Agnico-Eagle Mines Limited maintained, in all material respects, effective internal control over financialreporting as of December 31, 2011, based on the COSO criteria.
We have also audited, in accordance with the standards of the Public Company Accounting Oversight Board(United States), the consolidated balance sheets of Agnico-Eagle Mines Limited as of December 31, 2011 and 2010, andthe related consolidated statements of income and comprehensive income, shareholders’ equity and cash flows for eachof the years in the three-year period ended December 31, 2011 and our report dated March 28, 2012, expressed anunqualified opinion thereon.
Toronto, Canada /s/ ERNST & YOUNG LLPMarch 28, 2012 Chartered Accountants
Licensed Public Accountants
162 AGNICO-EAGLE MINES LIMITED

MANAGEMENT CERTIFICATIONManagement of Agnico-Eagle Mines Limited (the ‘‘Company’’) is responsible for establishing and maintaining adequateinternal control over financial reporting. Internal control over financial reporting is a process designed by, or under thesupervision of, the Company’s Chief Executive Officer and Chief Financial Officer and effected by the Company’s Board ofDirectors, management and other personnel, to provide reasonable assurance regarding the reliability of financialreporting and the preparation of financial statements for external purposes in accordance with generally acceptedaccounting principles. Because of its inherent limitations, internal control over financial reporting may not prevent ordetect misstatements. Also, projections of any evaluation of effectiveness to future periods are subject to risk that controlsmay become inadequate because of changes in conditions, or that the degree of compliance with the policies orprocedures may deteriorate.
The Company’s management, including the Company’s Chief Executive Officer and Chief Financial Officer, assessed theeffectiveness of the Company’s internal control over financial reporting as of December 31, 2011. In making thisassessment, the Company’s management used the criteria set forth by the Committee of Sponsoring Organizations of theTreadway Commission in Internal Control – Integrated Framework. Based upon its assessment, management concludedthat, as of December 31, 2011, the Company’s internal control over financial reporting was effective.
The effectiveness of the Company’s internal control over financial reporting as of December 31, 2011 has been audited byErnst & Young LLP, an independent registered public accounting firm, as stated in their report which appears herein.
Toronto, Canada By: /s/ SEAN BOYD
March 28, 2012 Sean BoydVice Chairman, President and Chief Executive Officer
By: /s/ AMMAR AL-JOUNDI
Ammar Al-JoundiSenior Vice-President, Finance andChief Financial Officer
1632011 ANNUAL REPORT

REPORT OF INDEPENDENT REGISTERED PUBLIC ACCOUNTING FIRMTo the Board of Directors and Shareholders of Agnico-Eagle Mines Limited:
We have audited the accompanying consolidated balance sheets of Agnico-Eagle Mines Limited as of December 31, 2011and 2010, and the related consolidated statements of income and comprehensive income, shareholders’ equity and cashflows for each of the years in the three-year period ended December 31, 2011. These financial statements are theresponsibility of the Company’s management. Our responsibility is to express an opinion on these financial statementsbased on our audits.
We conducted our audits in accordance with the standards of the Public Company Accounting Oversight Board(United States). Those standards require that we plan and perform the audit to obtain reasonable assurance aboutwhether the financial statements are free of material misstatement. An audit includes examining, on a test basis, evidencesupporting the amounts and disclosures in the financial statements. An audit also includes assessing the accountingprinciples used and significant estimates made by management, as well as evaluating the overall financial statementpresentation. We believe that our audits provide a reasonable basis for our opinion.
In our opinion, the financial statements referred to above present fairly, in all material respects, the consolidated financialposition of Agnico-Eagle Mines Limited at December 31, 2011 and 2010, and the consolidated results of its operationsand its cash flows for each of the years in the three-year period ended December 31, 2011, in conformity withUnited States generally accepted accounting principles.
We have also audited, in accordance with the standards of the Public Company Accounting Oversight Board(United States), the effectiveness of Agnico-Eagle Mines Limited’s internal control over financial reporting as ofDecember 31, 2011, based on criteria established in Internal Control – Integrated Framework issued by the Committee ofSponsoring Organizations of the Treadway Commission and our report dated March 28, 2012 expressed an unqualifiedopinion thereon.
Toronto, Canada /s/ ERNST & YOUNG LLPMarch 28, 2012 Chartered Accountants
Licensed Public Accountants
164 AGNICO-EAGLE MINES LIMITED

SUMMARY OF SIGNIFICANT ACCOUNTING POLICIESThese consolidated financial statements of Agnico-Eagle are expressed in thousands of United States dollars(‘‘US dollars’’, ‘‘US$’’ or ‘‘$’’), except where noted, and have been prepared in accordance with US GAAP. Certaininformation in the consolidated financial statements is presented in Canadian dollars (‘‘C$’’). Since a precisedetermination of assets and liabilities depends on future events, the preparation of consolidated financial statements for aperiod necessarily involves the use of estimates and approximations. Actual results may differ from such estimates andapproximations. The consolidated financial statements have, in management’s opinion, been prepared within reasonablelimits of materiality and within the framework of the significant accounting policies referred to below.
Basis of consolidation
These consolidated financial statements include the accounts of the Company and its wholly-owned subsidiaries andentities in which it has a controlling financial interest after the elimination of intercompany accounts and transactions. TheCompany has a controlling financial interest if it owns a majority of the outstanding voting common stock or has significantcontrol over an entity through contractual arrangements or economic interests of which the Company is the primarybeneficiary.
Cash and cash equivalents
Cash and cash equivalents include cash on hand and short-term investments in money market instruments withremaining maturities of three months or less at the date of purchase. Short-term investments are designated as held tomaturity for accounting purposes and are carried at amortized cost, which approximates market value given theshort-term nature of these investments. Agnico-Eagle places its cash and cash equivalents and short-term investments inhigh quality securities issued by government agencies, financial institutions and major corporations and limits the amountof credit exposure by diversifying its holdings.
Inventories
Inventories consist of ore stockpiles, concentrates, dore bars and supplies. Amounts are removed from inventory based onaverage cost. The current portion of stockpiles, ore on leach pads and inventories are determined based on the expectedamounts to be processed within the next 12 months. Stockpiles, ore on leach pads and inventories not expected to beprocessed within the next 12 months are classified as long term.
Stockpiles
Stockpiles consist of coarse ore that has been mined and hoisted from underground or delivered from an open pit that isavailable for further processing and in-stope ore inventory in the form of drilled and blasted stopes ready to be mucked andhoisted to the surface. The stockpiles are measured by estimating the tonnage, contained ounces (based on assays) andrecovery percentages (based on actual recovery rates achieved for processing similar ore). Specific tonnages are verifiedand compared to original estimates once the stockpile is milled. Ore stockpiles are valued at the lower of net realizablevalue and mining costs incurred up to the point of stockpiling the ore. The net realizable value of stockpiled ore is assessedby comparing the sum of the carrying value plus future processing and selling costs to the expected revenue to be earned,which is based on the estimated volume and grade of stockpiled ore.
Mining costs include all costs associated with mining operations and are allocated to each tonne of stockpiled ore. Costsfully absorbed into inventory values include direct and indirect materials and consumables, direct labour, utilities andamortization of mining assets incurred up to the point of stockpiling the ore. Royalty expenses and production taxes areincluded in production costs, but are not capitalized into inventory. Stockpiles are generally processed within twelvemonths of extraction, with the exception of certain amounts of the Pinos Altos mine’s, Kittila mine’s and Meadowbankmine’s ore stockpiles. Due to the structure of these ore bodies, a significant amount of drilling and blasting is incurred inthe early years of its mine life, which results in a long-term stockpile. The decision to process stockpiled ore is based on anet smelter return analysis. The Company processes its stockpiled ore if its estimated revenue, on a per tonne basis andnet of estimated smelting and refining costs, is greater than the related mining and milling costs. The Company has neverelected to not process stockpiled ore and does not anticipate departing from this practice in the future. Stockpiled ore onthe surface is exposed to the elements, but the Company does not expect its condition to deteriorate significantly asa result.
1652011 ANNUAL REPORT

Pre-production stripping costs are capitalized until an ‘‘other than de minimis’’ level of mineral is produced, after whichtime such costs are either capitalized to inventory or expensed. The Company considers various relevant criteria to assesswhen an ‘‘other than de minimis’’ level of mineral is produced. The criteria considered include: (1) the number of ouncesmined compared to total ounces in mineral reserves; (2) the quantity of ore mined compared to the total quantity of oreexpected to be mined over the life of the mine; (3) the current stripping ratio compared to the expected stripping ratio overthe life of the mine; and (4) the ore grade compared to the expected ore grade over the life of the mine.
Concentrates and dore bars
Concentrates and dore bar inventories consist of concentrates and dore bars for which legal title has not yet passed tothird-party smelters. Concentrates and dore bar inventories are measured based on assays of the processed concentratesand are valued based on the lower of net realizable value and the fully absorbed mining and milling costs associated withextracting and processing the ore.
Supplies
Supplies, consisting of mine stores inventory, are valued at the lower of average cost and replacement cost.
Mining properties, plant and equipment and mine development costs
Significant payments related to the acquisition of land and mineral rights are capitalized as mining properties at cost. If amineable ore body is discovered, such costs are amortized to income when production begins, using theunit-of-production method, based on estimated proven and probable reserves. If no mineable ore body is discovered,such costs are expensed in the period in which it is determined that the property has no future economic value.
Expenditures for new facilities and improvements that can extend the useful lives of existing facilities are capitalized asplant and equipment at cost. Interest costs incurred for the construction of significant projects are capitalized.
Mine development costs incurred after the commencement of production are capitalized or deferred to the extent thatthese costs benefit the entire ore body. Costs incurred to access single ore blocks are expensed as incurred; otherwise,such vertical and horizontal developments are classified as mine development costs.
Agnico-Eagle records amortization on both plant and equipment and mine development costs used in commercialproduction on a unit-of-production basis based on the estimated tonnage of proven and probable mineral reserves of themine. The unit-of-production method defines the denominator as the total proven and probable tonnes of reserves.
Repairs and maintenance expenditures are charged to income as production costs. Assets under construction are notdepreciated until the end of the construction period. Upon achieving commercial production, the capitalized constructioncosts are transferred to the various categories of plant and equipment.
Mineral exploration costs are charged to income in the year in which they are incurred. When it is determined that a miningproperty can be economically developed as a result of established proven and probable reserves, the costs of drilling anddevelopment to further delineate the ore body on such property are capitalized. The establishment of proven and probablereserves is based on results of final feasibility studies, which indicate whether a property is economically feasible. Uponcommencement of the commercial production of a development project, these costs are transferred to the appropriateasset category and are amortized to income using the unit-of-production method mentioned above. Mine developmentcosts, net of salvage values, relating to a property that is abandoned or considered uneconomic for the foreseeable futureare written off.
The carrying values of mining properties, plant and equipment and mine development costs are reviewed periodically,when impairment factors exist, for possible impairment, based on the future undiscounted net cash flows of the operatingmine or development property. If it is determined that the estimated net recoverable amount is less than the carrying value,then a write down to the estimated fair value amount is made with a charge to income. Estimated future cash flows of anoperating mine or development property include estimates of recoverable ounces of gold based on proven and probablereserves. To the extent that economic value exists beyond the proven and probable reserves of an operating mine ordevelopment property, this value is included as part of the estimated future cash flows. Estimated future cash flows alsoinvolve estimates regarding metal prices (considering current and historical prices, price trends and related factors),production levels, capital and reclamation costs, and related income and mining taxes, all based on detailed engineeringlife-of-mine plans. Cash flows are subject to risks and uncertainties and changes in the estimates of the cash flows mayaffect the recoverability of long-lived assets.
166 AGNICO-EAGLE MINES LIMITED

Goodwill
Business combinations are accounted for using the purchase method whereby assets and liabilities acquired are recordedat their fair values as of the date of acquisition and any excess of the purchase price over such fair values is recorded asgoodwill. As of the date of acquisition, goodwill is allocated to reporting units by determining estimates of the fair valueallocated to each reporting unit and comparing this amount to the fair values of identifiable assets and liabilities allocatedto each reporting unit. Goodwill is not amortized.
The Company performs goodwill impairment tests on an annual basis as well as when events and circumstances indicatethat the carrying amounts may no longer be recoverable. In performing the impairment tests, the Company estimates thefair values of its reporting units that include goodwill and compares those fair values to the reporting units’ carryingamounts. If a reporting unit’s carrying amount exceeds its fair value, the Company compares the implied fair value of thereporting unit’s goodwill to the carrying amount and any excess of the carrying amount of goodwill over the implied fairvalue is charged to income.
Financial instruments
From time to time, Agnico-Eagle uses derivative financial instruments, primarily option and forward contracts, to manageexposure to fluctuations in byproduct metal prices, interest rates and foreign currency exchange rates. Agnico-Eagle doesnot hold financial instruments or derivative financial instruments for trading purposes.
The Company recognizes all derivative financial instruments in the consolidated financial statements at fair valueregardless of the purpose or intent for holding the instrument. Changes in the fair value of derivative financial instrumentsare either recognized periodically in the consolidated statement of income (loss) or in shareholders’ equity as a componentof accumulated other comprehensive income (loss), depending on the nature of the derivative financial instrument andwhether it qualifies for hedge accounting. Financial instruments designated as hedges are tested for effectiveness on aquarterly basis. Gains and losses on those contracts that are proven to be effective are reported as a component of therelated transaction.
Revenue recognition
Revenue is recognized when the following conditions are met:
(a) persuasive evidence of an arrangement to purchase exists;
(b) the price is determinable;
(c) the product has been delivered; and
(d) collection of the sales price is reasonably assured.
Revenue from gold and silver in the form of dore bars is recorded when the refined gold or silver is sold and delivered to thecustomer. Generally, all the gold and silver in the form of dore bars recovered in the Company’s milling process is sold inthe period in which it is produced.
Under the terms of the Company’s concentrate sales contracts with third-party smelters, final prices for the metalscontained in the concentrate are set based on the prevailing spot market metal prices on a specified future date, which isbased on the date that the concentrate is delivered to the smelter. The Company records revenues under these contractsbased on forward prices at the time of delivery, which is when transfer of legal title to concentrate passes to the third-partysmelters. The terms of the contracts result in differences between the recorded estimated price at delivery and the finalsettlement price. These differences are adjusted through revenue at each subsequent financial statement date.
Revenues from mining operations consist of gold revenues, net of smelting, refining, transportation and other marketingcharges. Revenues from byproduct metals sales are shown, net of smelter charges, as part of revenues from miningoperations.
Foreign currency translation
The functional currency for each of the Company’s operations is the US dollar. Monetary assets and liabilities of Agnico-Eagle’s operations denominated in a currency other than the US dollar are translated into US dollars using the exchangerate in effect at year end. Non-monetary assets and liabilities are translated at historical exchange rates while revenuesand expenses are translated at the average exchange rate during the year, with the exception of amortization, which istranslated at historical exchange rates. Exchange gains and losses are included in income except for gains and losses on
1672011 ANNUAL REPORT

foreign currency contracts used to hedge specific future commitments in foreign currencies. Gains and losses on thesecontracts are accounted for as a component of the related hedge transactions.
Reclamation costs
On an annual basis, the Company assesses cost estimates and other assumptions used in the valuation of ARO at each ofits mineral properties to reflect events, changes in circumstances and new information available. Changes in these costestimates and assumptions have a corresponding impact on the fair value of the ARO. For closed mines, any change in thefair value of AROs results in a corresponding charge or credit within other expenses, whereas at operating mines thecharge is recorded as an adjustment to the carrying amount of the corresponding asset. AROs arise from the acquisition,development, construction and normal operation of mining property, plant and equipment due to government controlsand regulations that protect the environment on the closure and reclamation of mining properties. The major parts of thecarrying amount of AROs relate to tailings and heap leach pad closure/rehabilitation; demolition of buildings/minefacilities; ongoing water treatment; and ongoing care and maintenance of closed mines. The fair values of AROs aremeasured by discounting the expected cash flows using a discount factor that reflects the credit-adjusted risk-free rate ofinterest. The Company prepares estimates of the timing and amount of expected cash flows when an ARO is incurred.Expected cash flows are updated to reflect changes in facts and circumstances. The principal factors that can causeexpected cash flows to change are: the construction of new processing facilities; changes in the quantities of material inreserves and a corresponding change in the life of mine plan; changing ore characteristics that have an impact onrequired environmental protection measures and related costs; changes in water quality that have an impact on the extentof water treatment required; and changes in laws and regulations governing the protection of the environment. Whenexpected cash flows increase, the revised cash flows are discounted using a current discount factor; whereas whenexpected cash flows decrease, the reduced cash flows are discounted using the historical discount factor used in theoriginal estimation of the expected cash flows, and then in both cases any change in the fair value of the ARO is recorded.Agnico-Eagle records the fair value of an ARO when it is incurred. AROs are adjusted to reflect the passage of time(accretion), which is calculated by applying the discount factor implicit in the initial fair value measurement to thebeginning of period carrying amount of the ARO. For producing mines, accretion expense is recorded in the cost of goodssold each period. Upon settlement of an ARO, Agnico-Eagle records a gain or loss if the actual cost differs from thecarrying amount of the ARO. Settlement gains/losses are recorded in other (income) expenses.
Environmental remediation liabilities are differentiated from AROs in that they do not arise from environmentalcontamination in the normal operation of a long-lived asset or from a legal obligation to treat environmental contaminationresulting from the acquisition, construction, or development of a long-lived asset. The Company is required to recognize aliability for obligations associated with environmental remediation liabilities arising from past acts.
Other environmental remediation costs that are not AROs or environmental remediation liabilities as defined by the FASBASC 410-20 – Asset Retirement Obligations and 410-30 – Environmental Obligations, respectively, are expensedas incurred.
Income and mining taxes
Agnico-Eagle follows the liability method of tax allocation for accounting for income taxes. Under this method of taxallocation, deferred income and mining tax bases of assets and liabilities are measured using the enacted tax rates andlaws expected to be in effect when the differences are expected to reverse.
The Company’s operations involve dealing with uncertainties and judgments in the application of complex tax regulationsin multiple jurisdictions. The final taxes paid are dependent upon many factors, including negotiations with taxationauthorities in various jurisdictions and resolution of disputes arising from federal, provincial, state and international taxaudits. The Company recognizes the effect of uncertain tax positions and records tax liabilities for anticipated tax auditissues in Canada and other tax jurisdictions where it is more likely than not based on technical merits that the positionwould not be sustained. The Company recognizes the amount of any tax benefits that have a greater than 50 percentlikelihood of being ultimately realized upon settlement.
Changes in judgment related to the expected ultimate resolution of uncertain tax positions are recognized in the year ofsuch changes. Accrued interest and penalties related to unrecognized tax benefits are recorded in income tax expensewhen incurred. The Company adjusts these reserves in light of changing facts and circumstances; however, due to thecomplexity of some of these uncertainties, the ultimate resolution may result in a payment that is materially different fromthe Company’s current estimate of the tax liabilities. If the Company’s estimate of tax liabilities proves to be less than the
168 AGNICO-EAGLE MINES LIMITED

ultimate assessment, an additional charge to expenses would result. If the estimate of tax liabilities proves to be greaterthan the ultimate assessment, a tax benefit would result.
Stock-based compensation
Agnico-Eagle has two stock-based compensation plans. The Stock Option Plan and the Incentive Share Purchase Plan aredescribed in note 8(a) and note 8(b), respectively, to the consolidated financial statements. The Company issues commonshares to settle its obligations under both plans.
The Stock Option Plan provides for the granting of options to directors, officers, employees and service providers topurchase common shares. Options have exercise prices equal to the market price on the day prior to the date of grant. Thefair value of these options is recognized in the consolidated statements of income (loss) or in the consolidated balancesheets if capitalized as part of property, plant and mine development over the applicable vesting period as a compensationcost. Any consideration paid by employees on exercise of options or purchase of common shares is credited toshare capital.
Fair value is determined using the Black-Scholes option valuation model which requires the Company to estimate theexpected volatility of the Company’s share price and the expected life of the stock options. Limitations with existing optionvaluation models and the inherent difficulties associated with estimating these variables create difficulties in determining areliable single measure of the fair value of stock option grants. The dilutive impact of stock option grants is factored into theCompany’s reported diluted net income per share.
Net income (loss) per share
Basic net income (loss) per share is calculated on net income (loss) for the year using the weighted average number ofcommon shares outstanding during the year. The weighted average number of common shares used to determine dilutednet income per share includes an adjustment, using the treasury stock method, for stock options outstanding andwarrants outstanding. Under the treasury stock method:
• the exercise of options or warrants is assumed to be at the beginning of the period (or date of issuance, if later);
• the proceeds from the exercise of options or warrants, plus, in the case of options, the future period compensationexpense on options granted on or after January 1, 2003, are assumed to be used to purchase common shares atthe average market price during the period; and
• the incremental number of common shares (the difference between the number of shares assumed issued and thenumber of shares assumed purchased) is included in the denominator of the diluted net income per sharecomputation.
Pension costs and obligations and post-retirement benefits
In Canada, Agnico-Eagle maintains a defined contribution plan covering all of its employees. The plan is funded byCompany contributions based on a percentage of income for services rendered by employees. In addition, the Companyhas a supplemental plan for designated executives at the level of Vice-President or above. Under this plan an additional10% of the designated executives’ income are contributed by the Company. The Company does not offer any otherpost-retirement benefits to its employees.
Agnico-Eagle also provides a non-registered supplementary executive retirement defined benefit plan for certain seniorofficers (the ‘‘Executives Plan’’). The Executives Plan benefits are generally based on the employee’s years of service andlevel of compensation. Pension expense related to the Executives Plan is the net of the cost of benefits provided, theinterest cost of projected benefits, return on plan assets and amortization of experience gains and losses. Pension fundassets are measured at current fair values. Actuarially determined plan surpluses or deficits, experience gains or lossesand the cost of pension plan improvements are amortized on a straight-line basis over the expected average remainingservice life of the employee group.
Commercial production
The Company assesses each mine construction project to determine when a mine moves into the production stage. Thecriteria used to assess the start date are determined based on the nature of each mine construction project, such as thecomplexity of a plant and its location. The Company considers various relevant criteria to assess when the mine issubstantially complete and ready for its intended use and moved into the production stage. The criteria considered
1692011 ANNUAL REPORT

include: (1) the completion of a reasonable period of testing of mine plant and equipment; (2) the ability to produceminerals in saleable form (within specifications); and (3) the ability to sustain ongoing production of minerals. When amine construction project moves into the production stage, the capitalization of certain mine construction costs ceasesand costs are either capitalized to inventory or expensed, except for sustaining capital costs related to property, plant andequipment and underground mine development or reserve development.
Other accounting developments
Recently adopted accounting pronouncements
Fair Value Accounting
In January 2010, the ASC guidance for fair value measurements and disclosure was updated to require additionaldisclosures. The updated guidance was effective for the Company’s fiscal year beginning on January 1, 2010, with theexception of the level 3 disaggregation which was effective for the Company’s fiscal year beginning January 1, 2011.Adoption of this updated guidance had no impact on the Company’s consolidated financial position, results of operationsor cash flows. See Note 4 for details regarding the Company’s financial assets and liabilities measured at fair value.
Business Combinations
In December 2010, the ASC guidance for business combinations was updated to clarify existing guidance which requiresa public entity to disclose pro forma revenue and earnings of the combined entity as though the business combination(s)that occurred during the current year had occurred as of the beginning of the comparable prior year. The update alsoexpands the supplemental pro forma disclosures required to include a description of the nature and amount of material,non-recurring pro forma adjustments directly attributable to the business combination included in the reported pro formarevenue and earnings. The updated guidance was effective for the Company’s fiscal year beginning January 1, 2011. SeeNote 10 for the application of this updated guidance to business combinations that occurred during the year endedDecember 31, 2011.
Revenue Recognition – Multiple-Deliverable Revenue Arrangements
In October 2009, the FASB issued an amendment to its guidance on multiple-deliverable revenue arrangements which iseffective for fiscal years beginning on or after June 15, 2010. This updated guidance addresses accounting and reportingfor arrangements under which the vendor will perform multiple revenue-generating activities, including how to separatedeliverables and measure and allocate the arrangement consideration. This amendment also significantly expands thedisclosure requirements related to a vendor’s multiple-deliverable revenue arrangement. Based on the Company’sassessment, these changes do not have an impact on its current accounting for revenue or required disclosures.
Recently issued accounting pronouncements and developments
Under the SEC Staff Accounting Bulletin 74, the Company is required to disclose information related to new accountingstandards that have not yet been adopted. The Company is currently evaluating the impact that the adoption of thesestandards will have on the Company’s consolidated financial position, results of operations and disclosures.
Comprehensive Income
In June 2011, ASC guidance was issued related to comprehensive income. Under the updated guidance, an entity willhave the option to present the total of comprehensive income either in a single continuous statement of comprehensiveincome or in two separate but consecutive statements. In addition, the update requires certain disclosure requirementswhen reporting other comprehensive income. The update does not change the items reported in other comprehensiveincome or when an item of other comprehensive income must be reclassified to income. In December 2011, updatedguidance was issued to defer the effective date pertaining to reclassification adjustments out of accumulated othercomprehensive income until the FASB is able to reconsider those paragraphs. The Company does not expect the updatedguidance to have an impact on its consolidated financial position, results of operations or cash flows.
Fair Value Accounting
In May 2011, ASC guidance was issued related to disclosures around fair value accounting. The updated guidanceclarifies different components of fair value accounting including the application of the highest and best use and valuationpremise concepts, measuring the fair value of an instrument classified in a reporting entity’s shareholders’ equity and
170 AGNICO-EAGLE MINES LIMITED

disclosing quantitative information about the unobservable inputs used in fair value measurements that are categorized inLevel 3 of the fair value hierarchy. The update is effective for the Company’s fiscal year beginning on January 1, 2012. TheCompany does not expect the updated guidance to have a significant impact on its consolidated financial position, resultsof operations or cash flows.
Goodwill Impairment
In September 2011, ASC guidance was issued related to testing goodwill for impairment. Under the updated guidance,entities are permitted to first assess qualitative factors to determine whether it is more likely than not that the fair value of areporting unit is less than its carrying amount as a basis for determining whether it is necessary to perform the two-stepgoodwill impairment test per Topic 350. Previous guidance required an entity to test goodwill for impairment, on at least anannual basis, by comparing the fair value of a reporting unit with its carrying amount, including goodwill. If the fair value ofa reporting unit is less than its carrying amount, then the second step of the test would be performed to measure theamount of the impairment loss, if any. An entity is no longer required to calculate the fair value of a reporting unit unless theentity determines that it is more likely than not that its fair value is less than its carrying amount. The update is effective forthe Company’s fiscal year beginning on January 1, 2012, with earlier application permitted. The Company does not expectthe updated guidance to have a significant impact on its consolidated financial position, results of operations or cash flows.
Disclosures about Offsetting Assets and Liabilities
In November 2011, ASC guidance was issued related to disclosures around offsetting financial instrument and derivativeinstrument assets and liabilities. Under the updated guidance, entities are required to disclose both gross information andnet information about both instruments and transactions eligible for offset in the statements of financial position andinstruments and transactions subject to an agreement similar to a master netting arrangement. The update is effective forthe Company’s fiscal year beginning on January 1, 2013. The Company is evaluating the potential impact of adopting thisguidance on the Company’s consolidated financial position, results of operations and cash flows.
International Financial Reporting Standards
Based on recent guidance from the CSA and the SEC, as a Canadian issuer and existing US GAAP filer, the Company willcontinue to be permitted to use US GAAP as its principal basis of accounting. The SEC has not yet committed to a timelinewhich would require the Company to adopt IFRS. A decision to voluntarily adopt IFRS has not been made.
An IFRS project group and a steering committee have been established by the Company and a high level project plan hasbeen formulated. The implementation of IFRS would be done through three distinct phases:
(i) diagnostics;
(ii) detailed IFRS analysis and conversion; and
(iii) implementation of IFRS in daily business.
The initial diagnostics phase has been completed and the detailed IFRS analysis has commenced. A report has beenprepared with the primary objective to understand, identify and assess the overall effort required by the Company toproduce financial information in accordance with IFRS. The key areas for the diagnostics work were to review theconsolidated financial statements of the Company and obtain a detailed understanding of the differences between IFRSand US GAAP to be able to identify potential system and process changes required as a result of converting to IFRS.
Comparative figures
Certain figures in the comparative consolidated financial statements have been reclassified from statements previouslypresented to conform to the presentation of the 2011 consolidated financial statements.
1712011 ANNUAL REPORT

AGNICO-EAGLE MINES LIMITEDCONSOLIDATED BALANCE SHEETS(thousands of United States dollars, US GAAP basis)
As at December 31,
2011 2010
ASSETS
Current
Cash and cash equivalents $ 179,447 $ 95,560
Short-term investments 6,570 6,575
Restricted cash (note 14) 35,441 2,510
Trade receivables (note 1) 75,899 112,949
Inventories:
Ore stockpiles 28,155 67,764
Concentrates and dore bars 57,528 50,332
Supplies 182,389 149,647
Income taxes recoverable 371 –
Available-for-sale securities (note 2(b)) 145,411 99,109
Other current assets (note 2(a)) 110,369 89,776
Total current assets 821,580 674,222
Other assets (note 2(c)) 88,048 61,502
Goodwill (note 10) 229,279 200,064
Property, plant and mine development (note 3) 3,895,355 4,564,563
$ 5,034,262 $ 5,500,351
172 AGNICO-EAGLE MINES LIMITED
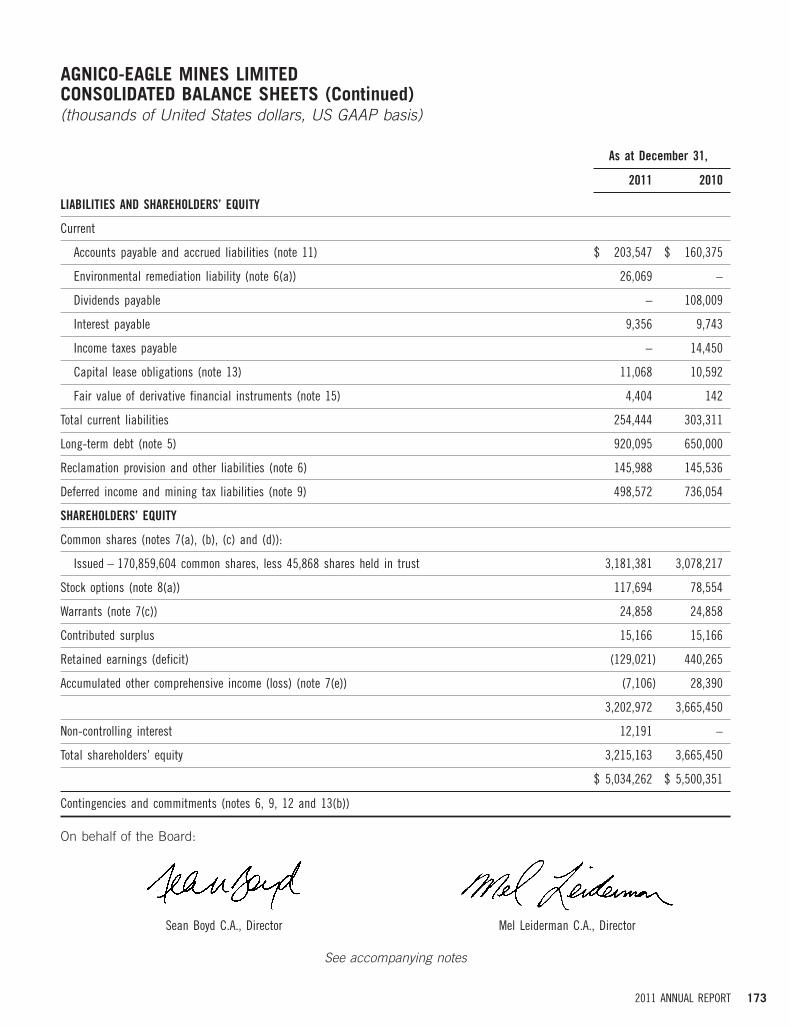
11JAN200511295811 20MAR200616471143
AGNICO-EAGLE MINES LIMITEDCONSOLIDATED BALANCE SHEETS (Continued)(thousands of United States dollars, US GAAP basis)
As at December 31,
2011 2010
LIABILITIES AND SHAREHOLDERS’ EQUITY
Current
Accounts payable and accrued liabilities (note 11) $ 203,547 $ 160,375
Environmental remediation liability (note 6(a)) 26,069 –
Dividends payable – 108,009
Interest payable 9,356 9,743
Income taxes payable – 14,450
Capital lease obligations (note 13) 11,068 10,592
Fair value of derivative financial instruments (note 15) 4,404 142
Total current liabilities 254,444 303,311
Long-term debt (note 5) 920,095 650,000
Reclamation provision and other liabilities (note 6) 145,988 145,536
Deferred income and mining tax liabilities (note 9) 498,572 736,054
SHAREHOLDERS’ EQUITY
Common shares (notes 7(a), (b), (c) and (d)):
Issued – 170,859,604 common shares, less 45,868 shares held in trust 3,181,381 3,078,217
Stock options (note 8(a)) 117,694 78,554
Warrants (note 7(c)) 24,858 24,858
Contributed surplus 15,166 15,166
Retained earnings (deficit) (129,021) 440,265
Accumulated other comprehensive income (loss) (note 7(e)) (7,106) 28,390
3,202,972 3,665,450
Non-controlling interest 12,191 –
Total shareholders’ equity 3,215,163 3,665,450
$ 5,034,262 $ 5,500,351
Contingencies and commitments (notes 6, 9, 12 and 13(b))
On behalf of the Board:
Sean Boyd C.A., Director Mel Leiderman C.A., Director
See accompanying notes
1732011 ANNUAL REPORT

AGNICO-EAGLE MINES LIMITEDCONSOLIDATED STATEMENTS OF INCOME (LOSS) AND COMPREHENSIVE INCOME(LOSS)(thousands of United States dollars, except per share amounts, US GAAP basis)
Year Ended December 31,
2011 2010 2009
REVENUES
Revenues from mining operations (note 1) $ 1,821,799 $ 1,422,521 $ 613,762
COSTS, EXPENSES AND OTHER INCOME
Production 876,078 677,472 306,318
Exploration and corporate development 75,721 54,958 36,279
Amortization of property, plant and mine development (note 13) 261,781 192,486 72,461
General and administrative (note 16) 107,926 94,327 63,687
Write-down of available-for-sale securities 8,569 – –
Provincial capital tax 9,223 (6,075) 5,014
Interest expense (note 5) 55,039 49,493 8,448
Interest and sundry expense (income) 5,188 (10,254) (12,580)
Impairment loss on Meadowbank mine (note 18) 907,681 – –
Loss on Goldex mine (note 17) 302,893 – –
Gain on acquisition of Comaplex Minerals Corp., net of transaction costs (note 10) – (57,526) –
Gain on derivative financial instruments (note 15) (3,683) (7,612) (3,592)
Gain on sale of available-for-sale securities (note 2(b)) (4,907) (19,487) (10,142)
Foreign currency translation loss (gain) (1,082) 19,536 39,831
Income (loss) before income and mining taxes (778,628) 435,203 108,038
Income and mining taxes (note 9) (209,673) 103,087 21,500
Net income (loss) for the year $ (568,955) $ 332,116 $ 86,538
Attributed to non-controlling interest $ (60) $ – $ –
Attributed to common shareholders $ (568,895) $ 332,116 $ 86,538
Net income (loss) per share – basic (note 7(f)) $ (3.36) $ 2.05 $ 0.55
Net income (loss) per share – diluted (note 7(f)) $ (3.36) $ 2.00 $ 0.55
Cash dividends declared per common share $ – $ 0.64 $ 0.18
174 AGNICO-EAGLE MINES LIMITED

AGNICO-EAGLE MINES LIMITEDCONSOLIDATED STATEMENTS OF INCOME (LOSS) AND COMPREHENSIVE INCOME(LOSS) (Continued)(thousands of United States dollars, except per share amounts, US GAAP basis)
Year Ended December 31,
2011 2010 2009
COMPREHENSIVE INCOME (LOSS)
Net income (loss) for the year $ (568,955) $ 332,116 $ 86,538
Other comprehensive income (loss):
Unrealized gain (loss) on hedging activities (5,863) – 16,287
Adjustments for derivative instruments maturing during the year 1,459 – (7,399)
Unrealized gain (loss) on available-for-sale securities (26,874) 64,649 76,037
Adjustments for realized gain on available-for-sale securities due to dispositions andwrite-downs during the year (4,907) (19,487) (10,142)
Net amount reclassified to net income due to acquisition of business (note 10) – (64,508) –
Change in unrealized loss on pension liability (1,055) (4,093) (727)
Tax effect of other comprehensive income (loss) items 1,744 780 (2,399)
Other comprehensive income (loss) for the year (35,496) (22,659) 71,657
Comprehensive income (loss) for the year $ (604,451) $ 309,457 $ 158,195
Attributed to non-controlling interest $ (60) $ – $ –
Attributed to common shareholders $ (604,391) $ 309,457 $ 158,195
See accompanying notes
1752011 ANNUAL REPORT

AGNICO-EAGLE MINES LIMITEDCONSOLIDATED STATEMENTS OF SHAREHOLDERS’ EQUITY(thousands of United States dollars, US GAAP basis)
Common Shares
AccumulatedRetained Other Non-
Contributed Earnings Comprehensive controllingShares Amount Stock Options Warrants Surplus (Deficit) Income (Loss) Interest
Balance December 31, 2008 154,808,918 $2,299,747 $ 41,052 $ 24,858 $ 15,166 $ 157,541 $ (20,608) $ –
Shares issued under Employee Stock 1,238,000 48,313 (11,683) – – – –Option Plan (note 8(a)) –
Stock options – – 36,402 – – – – –
Shares issued under the Incentive Share 196,649 11,290 – – – – –Purchase Plan (note 8(b)) –
Shares issued under flow-through share 358,900 19,153 – – – – –private placement (note 7(b)) –
Shares issued under the Company’s 18,764 912 – – – – –dividend reinvestment plan –
Shares issued for purchase of mining 33,825 894 – – – – –property (note 7(c)) –
Net income for the year – – – – – 86,538 – –
Dividends declared ($0.18 per share) – – – – (27,921) –(note 7(a)) –
Other comprehensive income for the year – – – – – – 71,657 –
Restricted share unit plan (note 8(c)) (29,882) (1,550) – – – – – –
Balance December 31, 2009 156,625,174 $2,378,759 $ 65,771 $ 24,858 $ 15,166 $ 216,158 $ 51,049 $ –
Shares issued under Employee Stock 1,627,766 104,111 (29,447) – – – –Option Plan (note 8(a)) –
Stock options – – 42,230 – – – – –
Shares issued under the Incentive Share 229,583 14,963 – – – – –Purchase Plan (note 8(b)) –
Shares issued under the Company’s 25,243 1,404 – – – – –dividend reinvestment plan –
Shares issued for purchase of mining 10,225,848 579,800 – – – – –property (note 7(c) and (d)) –
Net income for the year – – – – – 332,116 – –
Dividends declared ($0.64 per share) – – – – – (108,009) –(note 7(a)) –
Other comprehensive loss for the year – – – – – – (22,659) –
Restricted share unit plan (note 8(c)) (13,259) (820) – – – – – –
Balance December 31, 2010 168,720,355 $3,078,217 $ 78,554 $ 24,858 $ 15,166 $ 440,265 $ 28,390 $ –
176 AGNICO-EAGLE MINES LIMITED

AGNICO-EAGLE MINES LIMITEDCONSOLIDATED STATEMENTS OF SHAREHOLDERS’ EQUITY (Continued)(thousands of United States dollars, US GAAP basis)
Common Shares
AccumulatedRetained Other Non-
Contributed Earnings Comprehensive controllingShares Amount Stock Options Warrants Surplus (Deficit) Income (Loss) Interest
Shares issued under Employee Stock 308,688 18,094 (4,396) – – – –Option Plan (note 8(a)) –
Stock options – – 43,536 – – – – –
Shares issued under the Incentive Share 360,833 19,229 – – – – –Purchase Plan (note 8(b)) –
Shares issued under the Company’s 176,110 10,130 – – – – –dividend reinvestment plan –
Shares issued for purchase of mining 1,250,477 56,146 – – – – –property (note 7(d)) –
Non-controlling interest addition upon – – – – – – –acquisition 12,251
Net loss for the year attributed to common – – – – – (568,895) –shareholders –
Net loss for the year attributed to – – – – – – –non-controlling interest (60)
Dividends declared (nil per share) – – – – – (391) –(note 7(a)) –
Other comprehensive loss for the year – – – (35,496) –
Restricted share unit plan (note 8(c)) (2,727) (435) – – – – – –
Balance December 31, 2011 170,813,736 $3,181,381 $ 117,694 $ 24,858 $ 15,166 $(129,021) $ (7,106) $ 12,191
See accompanying notes
1772011 ANNUAL REPORT

AGNICO-EAGLE MINES LIMITEDCONSOLIDATED STATEMENTS OF CASH FLOWS(thousands of United States dollars, US GAAP basis)
Years ended December 31,
2011 2010 2009
Operating activities
Net income (loss) for the year $ (568,955) $ 332,116 $ 86,538
Add (deduct) items not affecting cash
Impairment loss on Meadowbank mine 907,681 – –
Amortization of propery, plant and mine development 261,781 192,486 72,461
Deferred income and mining taxes (275,773) 66,928 20,309
Loss on Goldex mine 302,893 – –
Environmental remediation (7,616) – –
Gain on sale of available-for-sale securities (4,907) (19,487) (10,142)
Stock-based compensation 48,150 41,635 28,753
Gain on acquisition of Comaplex Minerals Corp. (note 10) – (64,508) –
Foreign currency translation loss (gain) (1,082) 19,536 39,831
Other 31,561 13,015 (5,214)
Changes in non-cash working capital balances
Trade receivables 37,050 (19,378) (47,930)
Income taxes (payable) recoverable (29,867) 9,949 (313)
Inventories (43,066) (91,306) (90,772)
Other current assets (25,838) (28,729) 4,834
Accounts payable and accrued liabilities 31,837 23,136 28,552
Prepaid royalty – – (13,321)
Interest payable (387) 8,077 1,520
Cash provided by operating activities 663,462 483,470 115,106
Investing activities
Additions to property, plant and mine development (482,831) (511,641) (657,175)
Acquisition of Grayd Resource Corporation, net of cash acquired (note 10) (163,047) – –
Decrease (increase) in short-term investments 5 (3,262) (3,313)
Net proceeds on available-for-sale securities 9,435 36,586 48,258
Purchase of available-for-sale securities (91,115) (42,479) (6,380)
Decrease (increase) in restricted cash (32,931) (2,510) 30,999
Cash used in investing activities (760,484) (523,306) (587,611)
178 AGNICO-EAGLE MINES LIMITED

AGNICO-EAGLE MINES LIMITEDCONSOLIDATED STATEMENTS OF CASH FLOWS (Continued)(thousands of United States dollars, US GAAP basis)
Years ended December 31,
2011 2010 2009
Financing activities
Dividends paid (98,354) (26,830) (27,132)
Repayment of capital lease obligations (13,092) (16,019) (13,177)
Sale-leaseback financing – 14,017 21,389
Proceeds from long-term debt 475,000 1,311,000 625,000
Repayment of long-term debt (205,000) (1,376,000) (110,000)
Credit facility financing costs (2,545) (12,772) (4,784)
Common shares issued 26,536 84,659 68,522
Cash provided by (used in) financing activities 182,545 (21,945) 559,818
Effect of exchange rate changes on cash and cash equivalents (1,636) (2,939) 4,585
Net increase (decrease) in cash and cash equivalents during the year 83,887 (64,720) 91,898
Cash and cash equivalents, beginning of year 95,560 160,280 68,382
Cash and cash equivalents, end of year $ 179,447 $ 95,560 $ 160,280
Supplemental cash flow information
Interest paid $ 52,833 $ 41,429 $ 17,189
Income and mining taxes paid $ 110,889 $ 25,199 $ 8,792
See accompanying notes
1792011 ANNUAL REPORT

AGNICO-EAGLE MINES LIMITEDNOTES TO CONSOLIDATED FINANCIAL STATEMENTS(thousands of United States dollars, except per share amounts, unless otherwise indicated)December 31, 2011
1. TRADE RECEIVABLES AND REVENUES FROM MINING OPERATIONS
Agnico-Eagle is a gold mining company with mining operations in Canada, Finland and Mexico. The Company earnsa significant proportion of its revenues from the production and sale of gold in both dore bar and concentrate form.The remainder of revenue and cash flow is generated by the production and sale of byproduct metals. The revenuefrom byproduct metals is mainly generated by production at the LaRonde mine in Canada (silver, zinc, copper andlead) and the Pinos Altos mine in Mexico (silver).
Revenues are generated from operations in Canada, Finland and Mexico. The cash flow and profitability of theCompany’s operations are significantly affected by the market price of gold and, to a lesser extent, silver, zinc, copperand lead. The prices of these metals can fluctuate widely and are affected by numerous factors beyond theCompany’s control.
As gold can be sold through numerous gold market traders worldwide, the Company is not economically dependenton a limited number of customers for the sale of its product.
Trade receivables are recognized once the transfer of ownership for the metals sold has occurred and reflect theamounts owing to the Company in respect of its sales of dore bars or concentrates to third parties prior to thesatisfaction in full of the payment obligations of the third parties.
2011 2010
Dore bars awaiting settlement $ – $ 24,281
Concentrates awaiting settlement 75,899 88,668
$ 75,899 $ 112,949
2011 2010 2009
Revenues from mining operations:
Gold $ 1,563,760 $ 1,216,249 $ 474,875
Silver 171,725 104,544 59,155
Zinc 70,522 77,544 57,034
Copper 14,451 22,219 22,571
Lead 1,341 1,965 127
$ 1,821,799 $ 1,422,521 $ 613,762
In 2011, precious metals (gold and silver) accounted for 95% of Agnico-Eagle’s revenues from mining operations(2010 – 93%; 2009 – 87%). The remaining revenues from mining operations consisted of net byproduct metalsrevenues. In 2011, these net byproduct metals revenues as a percentage of total revenues from mining operationswere 4% from zinc (2010 – 5%; 2009 – 9%) and 1% from copper (2010 – 2%; 2009 – 4%).
180 AGNICO-EAGLE MINES LIMITED

AGNICO-EAGLE MINES LIMITEDNOTES TO CONSOLIDATED FINANCIAL STATEMENTS (Continued)(thousands of United States dollars, except per share amounts, unless otherwise indicated)December 31, 2011
2. OTHER ASSETS
(a) Other current assets
2011 2010
Federal, provincial and other sales taxes receivable $ 51,603 $ 63,553
Prepaid expenses 25,540 10,449
Meadowbank insurance receivable 8,765 –
Prepaid royalty(i) 7,684 5,282
Employee loans receivable 5,567 4,498
Other 11,210 5,191
Government refundables for local community improvements – 803
$ 110,369 $ 89,776
(i) The prepaid royalty relates to the Pinos Altos mine in Mexico.
(b) Available-for-sale securities
In 2011, the Company realized proceeds of $9.4 million (2010 – $36.6 million; 2009 – $41.0 million) and recognizeda gain before income taxes of $4.9 million (2010 – $19.5 million; 2009 – $10.1 million) on the sale of certainavailable-for-sale securities. Available-for-sale securities consist of equity securities whose cost basis is determinedusing the average cost method. Available-for-sale securities are carried at fair value and comprise the following:
2011 2010
Available-for-sale securities in an unrealized gain position
Cost (net of impairments) $ 127,344 $ 50,958
Unrealized gains in accumulated other comprehensive income 16,408 48,151
Estimated fair value 143,752 99,109
Available-for-sale securities in an unrealized loss position
Cost (net of impairments) 1,717 –
Unrealized losses in accumulated other comprehensive income (58) –
Estimated fair value 1,659 –
Total estimated fair value of available-for-sale securities $ 145,411 $ 99,109
The Company’s investments in available-for-sale securities consist primarily of investments in common shares ofentities in the mining industry. During the course of the year, certain investments fell into an unrealized loss position.In each case, the Company evaluated the near-term prospects of the issuers in relation to the severity and duration ofthe impairment. As a result of these evaluations, the Company wrote down certain available-for-sale securities by$8.6 million during the year ended December 31, 2011 that were considered other-than-temporarily impaired.
1812011 ANNUAL REPORT

AGNICO-EAGLE MINES LIMITEDNOTES TO CONSOLIDATED FINANCIAL STATEMENTS (Continued)(thousands of United States dollars, except per share amounts, unless otherwise indicated)December 31, 2011
2. OTHER ASSETS (Continued)
For the remainder of the investments after the other-than-temporary impairment write-downs approximately 1.1% ofthe total fair value of investments are in an unrealized loss position. At December 31, 2011, the fair value ofinvestments in an unrealized loss position was $1.7 million with a total unrealized loss of $0.1 million. The Companyalso evaluated these securities in relation to the severity and duration (less than six months in all cases) of theimpairment. Based on that evaluation and the Company’s ability and intent to hold those investments for a reasonableperiod of time sufficient for a forecasted recovery of fair value, the Company does not consider those investments tobe other-than-temporarily impaired as at December 31, 2011.
(c) Other assets
2011 2010
Deferred financing costs, less accumulated amortization of $5,809 (2010 – $2,249) $ 15,777 $ 16,780
Long-term ore in stockpile(i) 64,392 27,409
Prepaid royalty(ii) – 8,777
Other 7,879 8,536
$ 88,048 $ 61,502
(i) Due to the structure of the Goldex mine, Pinos Altos mine, Kittila mine, and Meadowbank mine ore bodies, a significant amount of drilling and blasting is incurred in theearly years of its mine life resulting in a long-term stockpile. The value of the stockpile at December 31, 2011 is nil (2010 – $15.0 million) for the Goldex mine,$7.1 million (2010 – $12.4 million) for the Pinos Altos mine, $8.0 million (2010 – nil) for the Kittila mine and $49.3 million (2010 – nil) for the Meadowbank mine.
(ii) The prepaid royalty relates to the Pinos Altos mine in Mexico.
3. PROPERTY, PLANT AND MINE DEVELOPMENT
2011 2010
Accumulated Net Accumulated NetCost Amortization Book Value Cost Amortization Book Value
Mining properties $1,228,523(i) $ 111,567 $ 1,116,956 $1,885,476(i) $ 44,823 $ 1,840,653
Plant and equipment 2,467,300 437,706 2,029,594 2,123,191 321,907 1,801,284
Mine development costs 869,746 190,399 679,347 853,927 171,869 682,058
Construction in Progress:
LaRonde mine extension – – – 185,905 – 185,905
Creston Mascota deposit at Pinos Altos – – – 54,663 – 54,663
Meliadine project 69,458 – 69,458 – – –
$4,635,027 $ 739,672 $ 3,895,355 $5,103,162 $ 538,599 $ 4,564,563
(i) The decline in mining properties’ cost between 2010 and 2011 is primarily attributed to the loss on Goldex mine (note 17) and the impairment loss on Meadowbank mine(note 18) recorded during 2011.
182 AGNICO-EAGLE MINES LIMITED
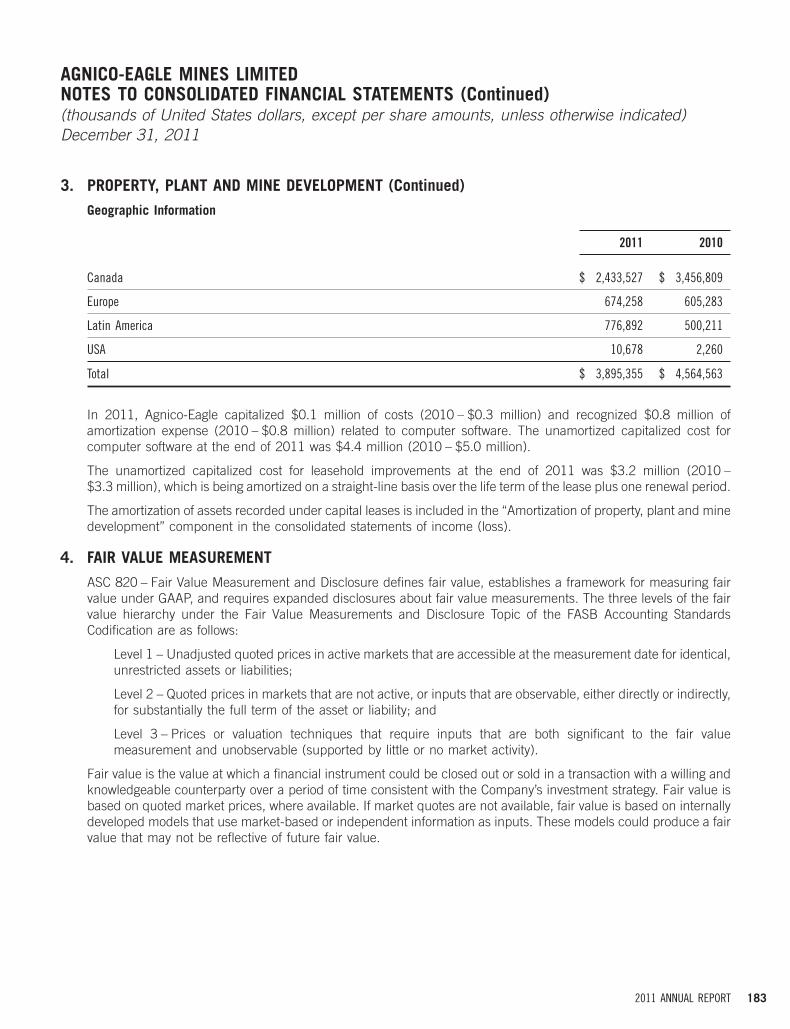
AGNICO-EAGLE MINES LIMITEDNOTES TO CONSOLIDATED FINANCIAL STATEMENTS (Continued)(thousands of United States dollars, except per share amounts, unless otherwise indicated)December 31, 2011
3. PROPERTY, PLANT AND MINE DEVELOPMENT (Continued)
Geographic Information
2011 2010
Canada $ 2,433,527 $ 3,456,809
Europe 674,258 605,283
Latin America 776,892 500,211
USA 10,678 2,260
Total $ 3,895,355 $ 4,564,563
In 2011, Agnico-Eagle capitalized $0.1 million of costs (2010 – $0.3 million) and recognized $0.8 million ofamortization expense (2010 – $0.8 million) related to computer software. The unamortized capitalized cost forcomputer software at the end of 2011 was $4.4 million (2010 – $5.0 million).
The unamortized capitalized cost for leasehold improvements at the end of 2011 was $3.2 million (2010 –$3.3 million), which is being amortized on a straight-line basis over the life term of the lease plus one renewal period.
The amortization of assets recorded under capital leases is included in the ‘‘Amortization of property, plant and minedevelopment’’ component in the consolidated statements of income (loss).
4. FAIR VALUE MEASUREMENT
ASC 820 – Fair Value Measurement and Disclosure defines fair value, establishes a framework for measuring fairvalue under GAAP, and requires expanded disclosures about fair value measurements. The three levels of the fairvalue hierarchy under the Fair Value Measurements and Disclosure Topic of the FASB Accounting StandardsCodification are as follows:
Level 1 – Unadjusted quoted prices in active markets that are accessible at the measurement date for identical,unrestricted assets or liabilities;
Level 2 – Quoted prices in markets that are not active, or inputs that are observable, either directly or indirectly,for substantially the full term of the asset or liability; and
Level 3 – Prices or valuation techniques that require inputs that are both significant to the fair valuemeasurement and unobservable (supported by little or no market activity).
Fair value is the value at which a financial instrument could be closed out or sold in a transaction with a willing andknowledgeable counterparty over a period of time consistent with the Company’s investment strategy. Fair value isbased on quoted market prices, where available. If market quotes are not available, fair value is based on internallydeveloped models that use market-based or independent information as inputs. These models could produce a fairvalue that may not be reflective of future fair value.
1832011 ANNUAL REPORT

AGNICO-EAGLE MINES LIMITEDNOTES TO CONSOLIDATED FINANCIAL STATEMENTS (Continued)(thousands of United States dollars, except per share amounts, unless otherwise indicated)December 31, 2011
4. FAIR VALUE MEASUREMENT (Continued)
The following table sets out the Company’s financial assets and liabilities measured at fair value within the fair valuehierarchy:
Total Level 1 Level 2 Level 3
Financial assets:
Cash equivalents and short-term investments $ 7,645 $ – $ 7,645(i) $ –
Available-for-sale securities 145,411 142,490(ii) 2,921(iii) –
Trade receivables 75,899 – 75,899(iv) –
$ 228,955 $ 142,490 $ 86,465 $ –
Financial liabilities:
Fair value of derivative financial instruments(iii) $ 4,404 $ – $ 4,404 $ –
(i) Fair value approximates the carrying value due to short-term nature.
(ii) Recorded at fair value using quoted market prices.
(iii) Recorded at fair value based on broker-dealer quotations.
(iv) Trade receivables from provisional invoices for concentrate sales are included within Level 2 as they are valued using quoted forward rates derived from observablemarket data based on the month of expected settlement.
Both the Company’s cash equivalents and short-term investments are classified within Level 2 of the fair valuehierarchy because they are held to maturity and are valued using interest rates observable at commonly quotedintervals. Cash equivalents are marketable securities with remaining maturities of three months or less at the date ofpurchase. The short-term investments are marketable securities with remaining maturities of over three months atthe date of purchase.
The Company’s available-for-sale securities are recorded at fair value using quoted market prices or broker-dealerquotations. The Company’s available-for-sale securities that are valued using quoted market prices are classified asLevel 1 of the fair value hierarchy. The Company’s available-for-sale securities classified as Level 2 of the fair valuehierarchy consist of equity warrants, which are recorded at fair value based on broker-dealer quotations.
In the event that a decline in the fair value of an investment occurs and the decline in value is considered to beother-than-temporary, an impairment charge is recorded in the consolidated statements of income (loss) andcomprehensive income (loss) and a new cost basis for the investment is established. The Company assesses whethera decline in value is considered to be other-than-temporary by considering available evidence, including changes ingeneral market conditions, specific industry and individual company data, the length of time and the extent to whichthe fair value has been less than cost, the financial condition and the near-term prospects of the individualinvestment. New evidence could become available in future periods which would affect this assessment and thuscould result in material impairment charges with respect to those investments for which the cost basis exceeds itsfair value.
5. LONG-TERM DEBT
The Company entered into a credit agreement on January 10, 2008 with a group of financial institutions relating to anew $300 million unsecured revolving credit facility (the ‘‘First Credit Facility’’). The Company’s previous $300 millionsecured revolving credit facility was terminated. The First Credit Facility was scheduled to mature on January 10,
184 AGNICO-EAGLE MINES LIMITED

AGNICO-EAGLE MINES LIMITEDNOTES TO CONSOLIDATED FINANCIAL STATEMENTS (Continued)(thousands of United States dollars, except per share amounts, unless otherwise indicated)December 31, 2011
5. LONG-TERM DEBT (Continued)
2013. However, the Company, with the consent of lenders representing 662⁄3% of the aggregate commitments underthe facility, had the option to extend the term of this facility for additional one-year terms.
On September 4, 2008, the Company entered into a further credit agreement with a separate group of financialinstitutions relating to an additional $300 million unsecured revolving credit facility (the ‘‘Second Credit Facility’’). TheSecond Credit Facility was scheduled to mature on September 4, 2010.
On June 15, 2009, the Company amended and restated the First Credit Facility and the Second Credit Facility. Theamount available under the Second Credit Facility was increased by $300 million to $600 million, and the scheduledmaturity date was extended to June 2012.
On June 22, 2010, the Company terminated the First Credit Facility and amended and restated the Second CreditFacility to increase the amount available to $1.2 billion and extend the scheduled maturity date to June 22, 2014(as so amended and restated, the ‘‘Amended Second Credit Facility’’).
On August 4, 2011, the Company entered into the Credit Facility, which amended and restated the Amended SecondCredit Facility. The total amount available under the Credit Facility is $1.2 billion; however, the maturity date wasextended from June 22, 2014 to June 22, 2016.
Payment and performance of the Company’s obligations under the Credit Facility is guaranteed by the Guarantors.The Credit Facility contains covenants that restrict, among other things, the ability of the Company to incur additionalindebtedness, make distributions in certain circumstances, sell material assets and carry on a business other thanone related to the mining business. The Company is also required to maintain a total net debt to EBITDA ratio below aspecified minimum value as well as a minimum tangible net worth. At December 31, 2011, the Credit Facility wasdrawn down by $320 million (2010 – $50 million). This drawdown, together with outstanding letters of credit underthe Credit Facility, decrease the amounts available under the Credit Facility such that $849.4 million was available forfuture drawdowns at December 31, 2011.
In addition, on June 2, 2009, Agnico-Eagle entered into the EDC Facility with Export Development Canada. Thisagreement matures in June 2014 and is used to provide letters of credit for environmental obligations or in relation tolicence or permit bonds relating to the Meadowbank mine. As at December 31, 2011, outstanding letters of creditdrawn against this agreement totalled C$79.6 million (2010 – C$75.6 million).
On April 7, 2010, the Company closed the offering of the Notes. Net proceeds from the offering of the Notes wereused to repay amounts owed under the Company’s then existing credit facilities. Payment and performance of theCompany’s obligations under the Notes is guaranteed by the Guarantors. The Notes contain covenants that restrict,among other things, the ability of the Company to amalgamate or otherwise transfer its assets, sell material assets andcarry on a business other than one related to the mining business and the ability of the Guarantors to incurindebtedness. The Notes also require the Company to maintain the same financial ratios and same minimum tangiblenet worth as under the Credit Facility. The Notes and the Credit Facility rank equally in seniority.
1852011 ANNUAL REPORT

AGNICO-EAGLE MINES LIMITEDNOTES TO CONSOLIDATED FINANCIAL STATEMENTS (Continued)(thousands of United States dollars, except per share amounts, unless otherwise indicated)December 31, 2011
5. LONG-TERM DEBT (Continued)
The following are the individual series of the issued Notes:
Principal Interest Rate Maturity Date
Series A $115,000 6.13% 7/4/2017
Series B 360,000 6.67% 7/4/2020
Series C 125,000 6.77% 7/4/2022
$600,000
For the year ended December 31, 2011, total interest expense was $55.0 million (2010 – $49.5 million; 2009 –$8.4 million) and total cash interest payments were $52.8 million (2010 – $41.4 million; 2009 – $17.2 million). In2011, cash interest on the Credit Facility was $1.7 million (2010 – $12.3 million; 2009 – $14.0 million), cash standbyfees on the Credit Facility was $8.6 million (2010 – $6.7 million; 2009 – $2.4 million), and cash interest on the Noteswas $39.5 million (2010 – $19.8 million, 2009 – n/a). In 2011, $1.0 million (2010 – $4.6 million; 2009 –$15.5 million) of the total interest expense was capitalized to construction in progress.
The Company’s weighted average interest rate on all of its long-term debt as at December 31, 2011 was 5.02%(2010 – 5.43%).
6. RECLAMATION PROVISION AND OTHER LIABILITIES
Reclamation provision and other liabilities consist of the following:
2011 2010
Reclamation and closure costs (note 6(a)) $ 105,443 $ 91,641
Long-term portion of capital lease obligations (note 13(a)) 26,184 38,019
Pension benefits (note 6(c)) 13,991 11,307
Goldex mine government grant and other (note 6(b)) 370 4,569
Total $ 145,988 $ 145,536
(a) Reclamation and closure costs
Reclamation estimates are based on current legislation, third party estimates, management’s estimates and feasibilitystudy calculations.
Due to the suspension of mining operations at the Goldex mine on October 19, 2011, an environmental remediationliability was recognized (note 17), of which $26.1 million was classified as a current liability. The remainder of theGoldex mine environmental remediation liability along with the Company’s other accrued reclamation and closurecosts are long-term in nature and thus no portion of these costs has been reclassified to current liabilities.
186 AGNICO-EAGLE MINES LIMITED

AGNICO-EAGLE MINES LIMITEDNOTES TO CONSOLIDATED FINANCIAL STATEMENTS (Continued)(thousands of United States dollars, except per share amounts, unless otherwise indicated)December 31, 2011
6. RECLAMATION PROVISION AND OTHER LIABILITIES (Continued)
The following table reconciles the beginning and ending carrying amounts of asset retirement obligations andenvironmental remediation liabilities:
2011 2010
Asset retirement obligations, beginning of year $ 91,641 $ 62,847
Current year additions and changes in estimate, net 9,653 23,058
Current year accretion 4,953 3,176
Liabilities settled – (277)
Foreign exchange revaluation (804) 2,837
Asset retirement obligations and environmental remediation liabilities, end of year $ 105,443 $ 91,641
(b) Goldex mine government grant and other
The Company has received funds (the ‘‘Grant’’) from the Quebec government in respect of the construction of theGoldex mine. The Company has agreed to repay a portion of the Grant to the Quebec government, to a maximumamount of 50% of the Grant. The repayment amount is calculated and paid annually for fiscal years 2010, 2011 and2012 if the agreed criteria are met. For each of these three years, if the yearly average gold price is higher than $620per ounce, 50% of the Grant must be repaid.
For fiscal year 2010, the agreed criteria had been met and the Company recorded a current liability of $1.5 million asof December 31, 2010. This amount was paid to the Quebec government in 2011.
For fiscal year 2011, the agreed criteria had also been met and the Company recorded a current liability of$1.5 million as of December 31, 2011. This amount is to be paid to the Quebec government in 2012 at which time theGrant will have been repaid in full.
(c) Pension benefits
Agnico-Eagle provides the Executives Plan for certain senior officers. The funded status of the Executives Plan isbased on actuarial valuations performed as of July 1, 2011 and projected to December 31, 2013.
1872011 ANNUAL REPORT

AGNICO-EAGLE MINES LIMITEDNOTES TO CONSOLIDATED FINANCIAL STATEMENTS (Continued)(thousands of United States dollars, except per share amounts, unless otherwise indicated)December 31, 2011
6. RECLAMATION PROVISION AND OTHER LIABILITIES (Continued)
The components of Agnico-Eagle’s net pension plan expense are as follows:
2011 2010 2009
Service cost – benefits earned during the year $ 996 $ 981 $ 509
Interest cost on projected benefit obligation 663 613 448
Amortization of net transition asset, past service liability and net experiencegains 171 164 148
Prior service cost 26 25 23
Recognized net actuarial loss (gain) 245 – (142)
Net pension plan expense $ 2,101 $ 1,783 $ 986
Assets for the Executives Plan consist of deposits on hand with regulatory authorities which are refundable whenbenefit payments are made or on the ultimate wind-up of the plan. The accumulated benefit obligation for this plan atDecember 31, 2011 was $11.4 million (2010 – $9.6 million). At the end of 2011, the remaining unamortized nettransition obligation was $0.5 million (2010 – $0.7 million) for the Executives Plan.
The following table provides the net amounts recognized in the consolidated balance sheets as at December 31relating to the Executives Plan:
2011 2010
Accrued employee benefit liability $ 7,292 $ 6,634
Accumulated other comprehensive income:
Initial transition obligation 500 681
Past service liability 76 104
Net experience losses 3,550 2,179
Net liability $ 11,418 $ 9,598
The following table provides the components of the expected recognition in 2012 of amounts in accumulated othercomprehensive income relating to the Executives Plan:
Transition obligation $ 166
Past service cost 25
Net actuarial loss 704
$ 895
188 AGNICO-EAGLE MINES LIMITED

AGNICO-EAGLE MINES LIMITEDNOTES TO CONSOLIDATED FINANCIAL STATEMENTS (Continued)(thousands of United States dollars, except per share amounts, unless otherwise indicated)December 31, 2011
6. RECLAMATION PROVISION AND OTHER LIABILITIES (Continued)
The funded status of the Executives Plan for 2011 and 2010 is as follows:
2011 2010
Reconciliation of the market value of plan assets
Fair value of plan assets, beginning of year $ 2,443 $ 1,635
Agnico-Eagle’s contribution 1,156 1,397
Benefit payments (578) (699)
Effect of exchange rate changes (69) 110
Fair value of plan assets, end of year 2,952 2,443
Reconciliation of projected benefit obligation
Projected benefit obligation, beginning of year 12,041 7,998
Service cost 996 981
Interest cost 663 613
Actuarial losses 1,704 2,718
Benefit payments (696) (812)
Effect of exchange rate changes (338) 543
Projected benefit obligation, end of year 14,370 12,041
Deficiency of plan assets compared with projected benefit obligation $ (11,418) $ (9,598)
Comprised of:
Unamortized transition liability $ (500) $ (681)
Unamortized net experience loss (3,626) (2,283)
Accrued liabilities (7,292) (6,634)
$ (11,418) $ (9,598)
Weighted average discount rate – net periodic pension cost 5.20% 7.00%
Weighted average discount rate – projected benefit obligation 4.45% 5.20%
Weighted average expected long-term rate of return n/a n/a
Weighted average rate of compensation increase 3.00% 3.00%
Estimated average remaining service life for the plan (in years)(i) 3.0 4.0
(i) Estimated average remaining service life for the Executives Plan was developed for individual senior officers.
1892011 ANNUAL REPORT

AGNICO-EAGLE MINES LIMITEDNOTES TO CONSOLIDATED FINANCIAL STATEMENTS (Continued)(thousands of United States dollars, except per share amounts, unless otherwise indicated)December 31, 2011
6. RECLAMATION PROVISION AND OTHER LIABILITIES (Continued)
The estimated benefits to be paid from the Executives Plan in the next ten years are presented below:
2012 $ 415
2013 $ 472
2014 $ 469
2015 $ 465
2016 $ 461
2017 – 2021 $ 2,229
In addition to the Executives Plan, the Company also has the Basic Plan and the Supplemental Plan. Under the BasicPlan, Agnico-Eagle contributes 5% of certain employee’s base employment compensation to a defined contributionplan. The expense in 2011 was $10.7 million (2010 – $8.8 million; 2009 – $6.5 million). Effective January 1, 2008the Company adopted the Supplemental Plan for designated executives at the level of Vice-President or above. Underthis plan, an additional 10% of the designated executive’s earnings for the year (including salary and short-termbonus) is contributed by the Company. In 2011, $0.9 million (2010 – $1.1 million; 2009 – $0.9 million) wascontributed to the Supplemental Plan. The Supplemental Plan is accounted for as a cash balance plan.
7. SHAREHOLDERS’ EQUITY
(a) Common shares
The Company’s authorized share capital includes an unlimited number of common shares with issued commonshares of 170,859,604 (2010 – 168,763,496), less 45,868 common shares held by a trust in connection with theCompany’s restricted share unit (‘‘RSU’’) plan (2010 – less 43,141 common shares). The trust is treated as a variableinterest entity and, as a result, its holdings of shares are offset against the Company’s issued shares in theconsolidation (note 7(c)).
In 2011, the Company declared dividends on its common shares of nil per share (2010 – $0.64 per share; 2009 –$0.18 per share).
(b) Flow-through common share private placements
In 2011, Agnico-Eagle issued nil (2010 – nil; 2009 – 358,900) common shares under flow-through share privateplacements, which increased share capital by nil (2010 – nil; 2009 – $19.2 million), net of share issue costs.Effective December 31, 2011, the Company renounced to its investors nil (2010 – nil; 2009 – C$30.6 million) of suchexpenses for income tax purposes. The Company does not have an obligation to incur any exploration expendituresrelated to the expenditures previously renounced.
The difference between the flow-through share issuance price and the market price of Agnico-Eagle’s shares at thetime of purchase is recorded as a liability at the time the flow-through shares are issued. This liability terminates whenthe exploration expenditures are renounced to investors. The difference between the flow-through share issuanceprice and market price reduces the deferred tax expense charged to income as this difference represents proceedsreceived by the Company for the sale of deferred tax deductions to investors in the flow-through shares.
190 AGNICO-EAGLE MINES LIMITED

AGNICO-EAGLE MINES LIMITEDNOTES TO CONSOLIDATED FINANCIAL STATEMENTS (Continued)(thousands of United States dollars, except per share amounts, unless otherwise indicated)December 31, 2011
7. SHAREHOLDERS’ EQUITY (Continued)
(c) Private placements and warrants
On December 3, 2008, the Company closed a private placement of 9.2 million units. Each unit consisted of onecommon share and one-half of one common share purchase warrant. Each whole warrant entitles the holder topurchase one common share of the Company at a price of $47.25 per share at any time during the five-year term ofthe warrant. As consideration for the lead purchaser’s commitment, the Company issued to the lead purchaser anadditional 4 million warrants. The net proceeds of the private placement were approximately $281 million, afterdeducting share issue costs of $8.8 million. If all outstanding warrants are exercised, the Company would issue anadditional 8.6 million common shares. No warrants have been exercised as of December 31, 2011.
On May 26, 2009, the Company issued 15,825 shares with a market value of $0.9 million in connection with theacquisition of a 100% participating interest in 52 mining claims, located in the Abitibi region of Quebec.
On July 24, 2009, the Company issued 18,000 shares upon payment of the exercise price of $500 in connection withthe exercise of an option granted by a predecessor to the Company relating to the acquisition of certain propertiesrelated to the Goldex mine.
On July 26, 2010, the Company issued 15,000 shares with a market value of $0.8 million in connection with thepurchase of mining property.
(d) Public issuance of common shares
There were no public issuances of common shares in 2009.
On July 6, 2010, the Company issued 10,210,848 shares with a market value of $579.0 million in connection with theacquisition of Comaplex (note 10).
On November 18, 2011, the Company issued 1,250,477 shares with a market value of $56.1 million in connectionwith the acquisition of Grayd (note 10).
(e) Accumulated other comprehensive income (loss)
The cumulative translation adjustment in accumulated other comprehensive income (loss) in 2011 and 2010 of$(16.2) million resulted from Agnico-Eagle changing to the US dollar as its principal currency of measurement. Priorto this change, the Canadian dollar had been used as the reporting currency. Prior periods’ consolidated financialstatements were translated into US dollars by the current rate method using the year end or the annual averageexchange rate where appropriate. This translation approach was applied from January 1, 1994. This translation gaverise to a deficit in the cumulative translation adjustment account within accumulated other comprehensive income(loss) as at December 31, 2011 and December 31, 2010.
1912011 ANNUAL REPORT

AGNICO-EAGLE MINES LIMITEDNOTES TO CONSOLIDATED FINANCIAL STATEMENTS (Continued)(thousands of United States dollars, except per share amounts, unless otherwise indicated)December 31, 2011
7. SHAREHOLDERS’ EQUITY (Continued)
The following table sets out the components of accumulated other comprehensive income (loss), net of relatedtax effects:
2011 2010
Cumulative translation adjustment from electing US dollar as principal reporting currency $ (16,206) $ (16,206)
Unrealized net gain on available-for-sale securities 16,350 48,151
Unrealized loss on derivative contracts (4,404) –
Unrealized loss on pension liability (5,219) (4,420)
Tax effect of unrealized loss on derivative contracts 1,491 –
Tax effect of unrealized loss on pension liability 882 865
$ (7,106) $ 28,390
In 2011, a $4.9 million gain (2010 – $19.5 million gain; 2009 – $10.1 million gain) was reclassified fromaccumulated other comprehensive income (loss) to net income (loss) to reflect the realization of gains onavailable-for-sale securities due to the disposition of those securities.
(f) Net income (loss) per share
The following table provides the weighted average number of common shares used in the calculation of basic anddiluted net income (loss) per share:
2011 2010 2009
Weighted average number of common shares outstanding – basic 169,352,896 162,342,686 155,942,151
Add: Dilutive impact of employee stock options – 1,192,530 1,256,103
Dilutive impact of warrants – 2,263,902 1,392,752
Dilutive impact of shares related to RSU plan – 43,141 29,882
Weighted average number of common shares outstanding – diluted 169,352,896 165,842,259 158,620,888
The calculation of diluted net income (loss) per share has been computed using the treasury stock method. Inapplying the treasury stock method, options and warrants with an exercise price greater than the average quotedmarket price of the common shares, for the period outstanding, are not included in the calculation of diluted netincome (loss) per share, as the effect is anti-dilutive. In 2010 and 2009, a total of 58,750 and 42,500 options,respectively, were excluded from the calculation as the effect was anti-dilutive. In 2011, the impact of any additionalshares issued under the employee stock option plan, as a result of the conversion of warrants, or related to the RSUplan would be anti-dilutive as a result of the net loss position. Consequently, diluted net loss per share would becomputed in the same manner as basic net loss per share.
192 AGNICO-EAGLE MINES LIMITED

AGNICO-EAGLE MINES LIMITEDNOTES TO CONSOLIDATED FINANCIAL STATEMENTS (Continued)(thousands of United States dollars, except per share amounts, unless otherwise indicated)December 31, 2011
8. STOCK-BASED COMPENSATION
(a) Employee Stock Option Plan (‘‘ESOP’’)
The Company’s ESOP provides for the granting of options to directors, officers, employees and service providers topurchase common shares. Under this plan, options are granted at the fair market value of the underlying shares onthe day prior to the date of grant. The number of shares subject to option for any one person may not exceed 5% ofthe Company’s common shares issued and outstanding at the date of grant.
Up to May 31, 2001, the number of common shares reserved for issuance under the ESOP was 6,000,000 andoptions granted under the ESOP had a maximum term of ten years. On April 24, 2001, the Compensation Committeeof the Board of Directors adopted a policy pursuant to which options granted after that date have a maximum term offive years. In 2001, the shareholders approved a resolution to increase the number of common shares reserved forissuance under the ESOP by 2,000,000 to 8,000,000. In 2004, 2006, 2008, 2010 and 2011, the shareholdersapproved a further 2,000,000, 3,000,000, 6,000,000, 1,300,000 and 3,000,000 common shares for issuance underthe ESOP, respectively.
Of the 2,630,785 options granted under the ESOP in 2011, 657,696 options vested immediately and expire in 2016.The remaining options expire in 2016 and vest in equal installments, on each anniversary date of the grant, over athree-year period. Of the 2,926,080 options granted under the ESOP in 2010, 731,520 options vested immediatelyand expire in 2015. The remaining options expire in 2015 and vest in equal installments, on each anniversary date ofthe grant, over a three-year period. Of the 2,276,000 options granted under the ESOP in 2009, 569,000 optionsvested immediately and expire in 2014. The remaining options expire in 2014 and vest in equal installments, on eachanniversary date of the grant, over a three-year period.
Upon the exercise of options under the ESOP, the Company issues new common shares to settle the obligation.
The following summary sets out the activity with respect to Agnico-Eagle’s outstanding stock options:
2011 2010 2009
Weighted Weighted WeightedNumber of Average Number of Average Number of Average
Options Exercise Price Options Exercise Price Options Exercise Price
Outstanding, beginning of year 6,762,704 C$ 56.94 5,707,940 C$ 53.85 4,752,440 C$ 44.57
Granted 2,630,785 76.12 2,926,080 57.55 2,276,000 62.65
Exercised (308,688) 43.62 (1,627,766) 47.02 (1,238,000) 34.28
Forfeited (125,750) 67.47 (243,550) 58.03 (82,500) 55.99
Outstanding, end of year 8,959,051 C$ 62.88 6,762,704 C$ 56.94 5,707,940 C$ 53.85
Options exercisable at end of year 5,178,172 2,972,857 2,445,615
1932011 ANNUAL REPORT

AGNICO-EAGLE MINES LIMITEDNOTES TO CONSOLIDATED FINANCIAL STATEMENTS (Continued)(thousands of United States dollars, except per share amounts, unless otherwise indicated)December 31, 2011
8. STOCK-BASED COMPENSATION (Continued)
The following table sets out the activity with respect to Agnico-Eagle’s nonvested stock options:
2011
Weighted AverageNumber of Grant Date
Options Fair Value
Nonvested, beginning of year 3,789,847 C$ 18.71
Granted 2,630,785 C$ 17.05
Vested (2,537,253) C$ 18.40
Forfeited (unvested) (102,500) C$ 17.77
Nonvested, end of year 3,780,879 C$ 17.79
Cash received for options exercised in 2011 was $13.6 million (2010 – $74.7 million; 2009 – $36.6 million).
The total intrinsic value of options exercised in 2011 was C$8.0 million (2010 – C$46.5 million; 2009 –C$43.8 million).
The weighted average grant date fair value of options granted in 2011 was C$17.05 (2010 – C$16.31; 2009 –C$24.52). The total fair value of options vested during 2011 was $46.7 million (2010 – $36.7 million; 2009 –$27.4 million). The following table summarizes information about Agnico-Eagle’s stock options outstanding andexercised at December 31, 2011:
Options Outstandingp Options Exercisable
Weighted AverageNumber Remaining Weighted Average Number Weighted Average
Outstanding Contractual Life Exercise Price Exercisable Exercise Price
Range of Exercise Prices
C$23.02 – C$36.23 16,000 1.84 years C$33.26 16,000 C$33.26
C$39.18 – C$59.71 4,361,866 2.00 years 54.94 3,070,576 54.17
C$60.72 – C$83.08 4,581,185 3.16 years 70.55 2,091,596 67.22
C$23.02 – C$83.08 8,959,051 2.59 years C$62.88 5,178,172 C$59.38
The weighted average remaining contractual term of options exercisable at December 31, 2011 was 2.6 years.
The Company has reserved for issuance 8,959,051 common shares in the event that these options are exercised.
The number of shares available for the granting of options as at December 31, 2011, 2010 and 2009 was 3,262,135,2,771,420 and 4,155,750, respectively.
194 AGNICO-EAGLE MINES LIMITED

AGNICO-EAGLE MINES LIMITEDNOTES TO CONSOLIDATED FINANCIAL STATEMENTS (Continued)(thousands of United States dollars, except per share amounts, unless otherwise indicated)December 31, 2011
8. STOCK-BASED COMPENSATION (Continued)
Subsequent to the year ended December 31, 2011 and on January 3, 2012, 3,072,000 options were granted underthe ESOP, of which 768,000 options vested immediately and expire in the year 2017. The remaining options expire in2017 and vest in equal installments on each anniversary date of the grant, over a three-year period.
Agnico-Eagle estimated the fair value of options under the Black-Scholes option pricing model using the followingweighted average assumptions:
2011 2010 2009
Risk-free interest rate 1.95% 1.86% 1.27%
Expected life of options (in years) 2.5 2.5 2.5
Expected volatility of Agnico-Eagle’s share price 34.70% 43.80% 64.00%
Expected dividend yield 0.89% 0.42% 0.42%
The Company uses historical volatility in estimating the expected volatility of Agnico-Eagle’s share price. The expectedterm of options granted is derived from historical data on employee exercise and post-vesting employmenttermination experience.
The aggregate intrinsic value of options outstanding at December 31, 2011 was C$(231.4) million. The aggregateintrinsic value of options exercisable at December 31, 2011 was C$(115.6) million.
The total compensation expense for the ESOP recognized in the general and administrative line item of theconsolidated statements of income (loss) for the current year was $42.2 million (2010 – $37.8 million; 2009 –$27.7 million). The total compensation cost related to non-vested options not yet recognized is $32.8 million as ofDecember 31, 2011 and the weighted average period over which it is expected to be recognized is 1.7 years. Of thetotal compensation cost for the ESOP, $1.4 million was capitalized as part of property, plant and mine development in2011 (2010 – $1.3 million; 2009 – $8.7 million).
(b) Incentive Share Purchase Plan
On June 26, 1997, the shareholders approved an incentive share purchase plan (the ‘‘Purchase Plan’’) to encouragedirectors, officers and employees (‘‘Participants’’) to purchase Agnico-Eagle’s common shares at market value. In2009, the Purchase Plan was amended to remove non-executive directors as eligible Participants in the plan.
Under the Purchase Plan, Participants may contribute up to 10% of their basic annual salaries, and the Companycontributes an amount equal to 50% of each Participant’s contribution. All shares subscribed for under the PurchasePlan are newly issued by the Company. The total compensation cost recognized in 2011 related to the Purchase Planwas $6.4 million (2010 – $5.0 million; 2009 – $3.8 million).
In 2011, 360,833 common shares were subscribed for under the Purchase Plan (2010 – 229,583; 2009 – 196,649)for a value of $19.2 million (2010 – $15.0 million; 2009 – $11.3 million). In May 2008, shareholders approved anincrease in the maximum number of shares reserved for issuance under the Purchase Plan to 5,000,000 from2,500,000. As at December 31, 2011, Agnico-Eagle has reserved for issuance 2,150,088 common shares (2010 –2,510,921; 2009 – 2,740,504) under the Purchase Plan.
1952011 ANNUAL REPORT

AGNICO-EAGLE MINES LIMITEDNOTES TO CONSOLIDATED FINANCIAL STATEMENTS (Continued)(thousands of United States dollars, except per share amounts, unless otherwise indicated)December 31, 2011
8. STOCK-BASED COMPENSATION (Continued)
(c) Restricted Share Unit Plan
In 2009, the Company implemented the RSU plan for certain employees. A deferred compensation balance wasrecorded for the total grant date value on the date of grant. The deferred compensation balance was recorded as areduction of shareholders’ equity and is being amortized as compensation expense (or capitalized to construction inprogress) over the applicable vesting period of two years.
The Company funded the plan by transferring $3.7 million (2010 – $4.0 million; 2009 – $3.0 million) to an employeebenefit trust (the ‘‘Trust’’) that then purchased shares of the Company in the open market. Compensation cost forRSUs incorporates an expected forfeiture rate. The forfeiture rate is estimated based on the Company’s historicalemployee turnover rates and expectations of future forfeiture rates that incorporate various factors that includehistorical ESOP forfeiture rates. For 2009 through 2011, the impact of forfeitures was not material. For accountingpurposes, the Trust is treated as a variable interest entity and consolidated in the accounts of the Company. Onconsolidation, the dividends paid on the shares held by the Trust are eliminated. The shares purchased and held bythe Trust are treated as not being outstanding for the basic earnings per share (‘‘EPS’’) calculations. They areamortized back into basic EPS over the vesting period. All of the shares held by the Trust were excluded from thediluted EPS calculations as they were anti-dilutive for 2011 due to the net loss position. The shares held by the trustwere included in previous period diluted EPS calculations.
Compensation cost related to the RSU plan was $3.3 million in 2011 (2010 – $3.0 million), with nil (2010 –$0.1 million) being capitalized to the ‘‘Property, plant and mine development’’ line item in the consolidated balancesheets. The $3.3 million (2010 – $2.9 million) of compensation expense is included as components of theProduction, General and administrative, and Exploration and corporate development line items of the consolidatedstatements of income (loss), consistent with the classification of other elements of compensation expense for thoseemployees who held RSUs.
9. INCOME AND MINING TAXES
Income and mining taxes expense (recovery) is made up of the following geographic components:
2011 2010 2009
Current provision
Canada $ 58,752 $ 34,217 $ 1,171
Mexico 3,496 1,942 –
Finland 222 – –
62,470 36,159 1,171
Deferred provision (recovery)
Canada (337,408) 47,083 27,083
Mexico 54,996 18,759 –
Finland 10,269 1,086 (6,754)
(272,143) 66,928 20,329
$ (209,673) $ 103,087 $ 21,500
196 AGNICO-EAGLE MINES LIMITED

AGNICO-EAGLE MINES LIMITEDNOTES TO CONSOLIDATED FINANCIAL STATEMENTS (Continued)(thousands of United States dollars, except per share amounts, unless otherwise indicated)December 31, 2011
9. INCOME AND MINING TAXES (Continued)
Cash income and mining taxes paid in 2011 were $110.9 million (2010 – $25.2 million; 2009 – $8.8 million).
The income and mining taxes expense (recovery) is different from the amount that would have been computed byapplying the Canadian statutory income tax rate as a result of the following:
2011 2010 2009
Combined federal and composite provincial tax rates 27.8% 29.6% 30.9%
Increase (decrease) in tax rates resulting from:
Provincial mining duties 5.9 6.8 16.1
Tax law change (2.7) (5.1) (24.4)
Impact of foreign tax rates (0.2) (0.5) (4.9)
Permanent differences (1.6) (4.2) 2.2
Valuation allowance (0.3) (0.2) –
Effect of changes in income tax rates (2.0) (2.7) –
Actual rate as a percentage of pre-tax income 26.9% 23.7% 19.9%
As at December 31, 2011 and December 31, 2010, Agnico-Eagle’s deferred income and mining tax assets andliabilities were as follows:
2011 2010
(Assets)/ (Assets)/Liabilities Liabilities
Mining properties $ 704,379 $ 966,485
Net operating and capital loss carry forwards (104,332) (133,042)
Mining duties (88,670) (71,492)
Reclamation provisions (51,926) (30,752)
Valuation allowance 39,121 4,855
Deferred income and mining tax liabilities $ 498,572 $ 736,054
All of Agnico-Eagle’s deferred income tax assets and liabilities were denominated in the local currency based on thejurisdiction in which the Company paid taxes, except for Canada, and were translated into US dollars using theexchange rate in effect at the consolidated balance sheet dates. For Canadian income tax purposes, forDecember 31, 2008 and subsequent years, the Company elected to use the US dollar as its functional currency.
The Company operates in different jurisdictions and, accordingly, it is subject to income and other taxes under thevarious tax regimes in the countries in which it operates. The tax rules and regulations in many countries are highly
1972011 ANNUAL REPORT

AGNICO-EAGLE MINES LIMITEDNOTES TO CONSOLIDATED FINANCIAL STATEMENTS (Continued)(thousands of United States dollars, except per share amounts, unless otherwise indicated)December 31, 2011
9. INCOME AND MINING TAXES (Continued)
complex and subject to interpretation. The Company may be subject in the future to a review of its historic incomeand other tax filings and in connection with such reviews, disputes can arise with the taxing authorities over theinterpretation or application of certain tax rules and regulations to the Company’s business conducted within thecountry involved.
A reconciliation of the beginning and ending amounts of the unrecognized tax benefits is as follows:
2011 2010
Unrecognized tax benefits, beginning of year $ 1,630 $ 5,608
Reductions (430) (3,978)
Unrecognized tax benefit, end of year $ 1,200 $ 1,630
The full amount of unrecognized tax benefits, if recognized, would reduce the Company’s annual effective tax rate.The Company does not expect its unrecognized tax benefits to change significantly over the next 12 months.
The Company is subject to taxes in the following significant jurisdictions: Canada, Mexico, Sweden and Finland, eachwith varying statutes of limitations. The 2007 through 2011 taxation years generally remain subject to examination.
10. ACQUISITIONS
Grayd Resource Corporation
In September 2011, Agnico-Eagle entered into an acquisition agreement with Grayd, a Canadian-based naturalresource company listed on the TSX Venture Exchange, pursuant to which the Company agreed to make an offer toacquire all of the issued and outstanding common shares of Grayd. At the time, Grayd held a 100% interest in theLa India project located in the Mulatos Gold Belt of Sonora, Mexico (approximately 70 kilometers northwest of Agnico-Eagle’s Pinos Altos gold mine) and had recently discovered the Tarachi exploration property located approximatelyten kilometres north of the La India project. On October 13, 2011, the Company made the offer by way of a take-overbid circular, as amended and supplemented on October 21, 2011.
On November 18, 2011, Agnico-Eagle acquired 94.77% of the outstanding shares of Grayd, on a fully-diluted basis,by way of a take-over bid. The November 18, 2011 purchase price of $222.1 million was comprised of $166.0 millionin cash and 1,250,477 newly issued Agnico-Eagle shares.
The related transaction costs associated with the acquisition totaling $3.8 million were expensed through the Interestand sundry expense (income) line of the consolidated statements of income (loss) during the fourth quarter of 2011.The Company has accounted for the purchase of Grayd as a business combination.
Grayd owns a 100% interest in the La India project located in the Mulatos Gold Belt of Sonora, Mexico (approximately70 kilometers northwest of Agnico-Eagle’s Pinos Altos gold mine). Grayd also owns a 100% interest in the Tarachiexploration property located approximately 10 kilometers north of the La India project. The La India project hosts aNational Instrument 43-101 compliant measured and indicated gold resource. This acquisition has the potential tocontribute to the ongoing growth in Agnico-Eagle’s gold production and cash flows.
198 AGNICO-EAGLE MINES LIMITED

AGNICO-EAGLE MINES LIMITEDNOTES TO CONSOLIDATED FINANCIAL STATEMENTS (Continued)(thousands of United States dollars, except per share amounts, unless otherwise indicated)December 31, 2011
10. ACQUISITIONS (Continued)
The following table sets forth the allocation of the purchase price to assets acquired and liabilities assumed, based onmanagement’s estimates of fair value.
Total purchase price:
Cash paid for acquisition $ 165,954
Agnico-Eagle shares issued for acquisition 56,146
Total purchase price to allocate $ 222,100
Fair value of assets acquired and liabilities assumed:
Mining properties $ 282,000
Goodwill 29,215
Cash and cash equivalents 2,907
Trade receivables 469
Other current assets 1,700
Equipment 56
Accounts payable and accrued liabilities (9,767)
Deferred tax liability (72,229)
Non-controlling interest (12,251)
Net assets acquired $ 222,100
The Company believes that goodwill for the Grayd acquisition arose principally because of the following factors:(1) the going concern value implicit in the Company’s ability to sustain and/or grow its business by increasing reservesand resources through new discoveries; and (2) the requirement to record a deferred tax liability for the differencebetween the assigned values and the tax bases of assets acquired and liabilities assumed in a business combinationat amounts that do not reflect fair value.
Pro forma results of operations for Agnico-Eagle assuming the acquisition of Grayd described above had occurred asof January 1, 2010 are shown below. On a pro forma basis, there would have been no effect on Agnico-Eagle’sconsolidated revenues:
2011 2010
Unaudited
Pro forma net income (loss) attributed to common shareholders $ (582,762) $ 324,708
Pro forma net income (loss) per share – basic $ (3.42) $ 1.98
Subsequent to the year ended December 31, 2011 and on January 23, 2012, the Company acquired the remainingoutstanding shares of Grayd it did not already own, pursuant to a previously announced compulsory acquisition
1992011 ANNUAL REPORT

AGNICO-EAGLE MINES LIMITEDNOTES TO CONSOLIDATED FINANCIAL STATEMENTS (Continued)(thousands of United States dollars, except per share amounts, unless otherwise indicated)December 31, 2011
10. ACQUISITIONS (Continued)
carried out under the provisions of the Business Corporations Act (British Columbia). The January 23, 2012 purchaseprice of $11.8 million was comprised of $9.3 million in cash and 68,941 newly issued Agnico-Eagle shares.
Summit Gold Project
On December 20, 2011, the Company completed the acquisition of 100% of the Summit Gold project from ColumbusGold Corporation, subject to a 2% net smelter returns mineral production royalty reserved by Cordilleran ExplorationCompany. The Nevada-based project’s purchase price of $8.5 million, including transaction costs, was comprisedentirely of cash. This transaction was accounted for as an asset acquisition.
Comaplex Minerals Corp.
On April 1, 2010, Agnico-Eagle and Comaplex jointly announced that they reached an agreement in principlewhereby Agnico-Eagle would acquire all of the shares of Comaplex (the ‘‘Comaplex Shares’’) that it did not alreadyown. The transaction was completed under a plan of arrangement under the Business Corporations Act (Alberta).Under the terms of the transaction, each shareholder of Comaplex, other than Agnico-Eagle, received 0.1576 of anAgnico-Eagle share per Comaplex share. Additionally, at closing, each Comaplex shareholder, other than Agnico-Eagle and Perfora Investments S.a.r.l. (‘‘Perfora’’), received one common share of a newly formed, wholly-owned,subsidiary of Comaplex, Geomark Exploration Ltd. (‘‘Geomark’’), in respect of each Comaplex Share and Comaplextransferred to Geomark all of the assets and related liabilities of Comaplex other than those relating to the Meliadinegold exploration properties in Nunavut, Canada. The Geomark assets included all of Comaplex’s net working capital,the non-Meliadine mineral properties, all oil and gas properties and investments. Under the plan of arrangement,Comaplex changed its name to Meliadine Holdings Inc.
Prior to the announcement of the transaction, Perfora and Agnico-Eagle had entered into a support agreementpursuant to which Perfora agreed to, among other things, support the transaction and vote all of the shares it held inComaplex in favour of the plan of arrangement. Perfora held approximately 17.3% and Agnico-Eagle heldapproximately 12.3%, on a fully diluted basis, of the outstanding shares of Comaplex prior to the announcement ofthe acquisition.
On July 6, 2010, the transactions relating to the plan of arrangement closed and Agnico-Eagle issued a total of10,210,848 shares to the shareholders of Comaplex, other than Agnico-Eagle, for a total value of $579.0 million. Therelated transaction costs associated with the acquisition totalling $7.0 million were expensed through the Interest andsundry expense (income) line of the consolidated statements of income (loss) during the third quarter of 2010. TheCompany has accounted for the purchase of Comaplex as a business combination.
200 AGNICO-EAGLE MINES LIMITED

AGNICO-EAGLE MINES LIMITEDNOTES TO CONSOLIDATED FINANCIAL STATEMENTS (Continued)(thousands of United States dollars, except per share amounts, unless otherwise indicated)December 31, 2011
10. ACQUISITIONS (Continued)
The following table sets forth the allocation of the purchase price to assets acquired and liabilities assumed, based onmanagement’s estimates of fair value.
Total purchase price:
Comaplex shares previously purchased $ 88,683
Agnico-Eagle shares issued for acquisition 578,955
Total purchase price to allocate $ 667,638
Fair value of assets acquired and liabilities assumed:
Property $ 642,610
Goodwill 200,064
Supplies 542
Equipment 2,381
Asset retirement obligation (3,400)
Deferred tax liability (174,559)
Net assets acquired $ 667,638
The Comaplex shares purchased prior to the April 1, 2010 announcement of the acquisition had a cost base of$24.1 million and a fair value at July 6, 2010 of $88.6 million. Upon the acquisition of Comaplex, the non-cash gain of$64.5 million on those shares within accumulated other comprehensive income (loss) was reversed into theconsolidated statements of income (loss) as a gain during the third quarter of 2010.
The Company believes that goodwill for the Comaplex acquisition arose principally because of the following factors:(1) the going concern value implicit in the Company’s ability to sustain and/or grow its business by increasing reservesand resources through new discoveries; and (2) the requirement to record a deferred tax liability for the differencebetween the assigned values and the tax basis of assets acquired and liabilities assumed in a business combination atamounts that do not reflect fair value.
Pro forma results of operations for Agnico-Eagle assuming the acquisition of Comaplex described above had occurredas of January 1, 2009 are shown below. On a pro forma basis, there would have been no effect on Agnico-Eagle’sconsolidated revenues:
2010 2009
Unaudited
Pro forma net income attributed to common shareholders $ 331,516 $ 85,371
Pro forma net income per share – basic $ 2.04 $ 0.55
2012011 ANNUAL REPORT

AGNICO-EAGLE MINES LIMITEDNOTES TO CONSOLIDATED FINANCIAL STATEMENTS (Continued)(thousands of United States dollars, except per share amounts, unless otherwise indicated)December 31, 2011
11. ACCOUNTS PAYABLE AND ACCRUED LIABILITIES
2011 2010
Trade payables $ 104,699 $ 91,974
Wages payable 27,247 21,583
Accrued liabilities 47,462 33,390
Goldex mine government grant (note 6(b)) 1,452 1,485
Other liabilities 22,687 11,943
$ 203,547 $ 160,375
In 2011 and 2010, the other liabilities balance mainly consisted of various employee payroll tax withholdings andother payroll taxes.
12. COMMITMENTS AND CONTINGENCIES
As part of its ongoing business and operations, the Company has been required to provide assurance in the form ofletters of credit for environmental and site restoration costs, custom credits, government grants and other generalcorporate purposes. As at December 31, 2011, the total amount of these guarantees was $119.0 million.
Certain of the Company’s properties are subject to royalty arrangements. The following are the most significantroyalties:
The Company has a royalty agreement with the Finnish government relating to the Kittila mine. Starting 12 monthsafter the mining operations commenced, the Company is required to pay 2% on net smelter returns, defined asrevenue less processing costs. The royalty is paid on a yearly basis the following year.
The Company is committed to pay a royalty on production from the Meadowbank mine. The Nunavut Tunngavik-administered mineral claims are subject to production leases including a 12% net profits interest royalty from whichannual deductions are limited to 85% of gross revenue. Production from Crown mining leases is subject to a royalty ofup to 14% of adjusted net profits, as defined in the Northwest Territories and Nunavut Mining Regulations under theTerritorial Lands Act (Canada).
The Company is committed to pay a royalty on production from certain properties in the Abitibi area. The type ofroyalty agreements include but are not limited to net profits interest royalty and net smelter return royalty, withpercentages ranging from 0.5% to 5%.
The Company is committed to pay a royalty on production from certain properties in the Pinos Altos mine area. Thetype of royalty agreements include but are not limited to net profits interest royalty and net smelter return royalty, withpercentages ranging from 2.5% to 3.5%.
The Company is committed to pay a 2% royalty on future net smelter returns on the production of minerals from theSummit Gold project, acquired on December 20, 2011.
202 AGNICO-EAGLE MINES LIMITED

AGNICO-EAGLE MINES LIMITEDNOTES TO CONSOLIDATED FINANCIAL STATEMENTS (Continued)(thousands of United States dollars, except per share amounts, unless otherwise indicated)December 31, 2011
12. COMMITMENTS AND CONTINGENCIES (Continued)
In addition, the Company has the following purchase commitments:
PurchaseCommitments
2012 $ 11,481
2013 7,141
2014 7,853
2015 4,671
2016 4,716
Subsequent years 26,452
Total $ 62,314
13. LEASES
(a) Capital Leases
In each of 2010 and 2009, the Company entered into five sale-leaseback agreements with third parties for variousfixed and mobile equipment within Canada. These arrangements represent sale-leaseback transactions inaccordance with ASC 840-40 – Sale-Leaseback Transactions. The sale-leaseback agreements have an averageeffective annual interest rate of 6.18% and the average length of the contracts is 4.5 years.
All of the sale-leaseback agreements have end of lease clauses that qualify as bargain purchase options that theCompany expects to execute. The total gross amount of assets recorded under sale-leaseback capital leases amountsto $33.6 million (2010 – $33.6 million).
The Company has agreements with third party providers of mobile equipment that are used at the Meadowbank andKittila mines. These arrangements represent capital leases in accordance with the guidance in ASC 840-30 – CapitalLeases. The leases for mobile equipment at the Kittila mine are for 5 years and the leases for mobile equipment at theMeadowbank mine are for 5 years. The effective annual interest rate on the lease for mobile equipment at theMeadowbank mine is 5.64%. The effective annual interest rate on the lease for mobile equipment at the Kittila mineis 4.99%.
2032011 ANNUAL REPORT

AGNICO-EAGLE MINES LIMITEDNOTES TO CONSOLIDATED FINANCIAL STATEMENTS (Continued)(thousands of United States dollars, except per share amounts, unless otherwise indicated)December 31, 2011
13. LEASES (Continued)
The following is a schedule of future minimum lease payments under capital leases together with the present value ofthe net minimum lease payments as at December 31, 2011:
Year ending December 31:
$ 12,7142012
2013 15,520
2014 8,829
2015 3,567
2016 –
Thereafter –
Total minimum lease payments 40,630
Less amount representing interest 3,378
Present value of net minimum lease payments $ 37,252
The Company’s capital lease obligations at December 31 are comprised of the following:
2011 2010
Total future lease payments $ 40,630 $ 54,476
Less: interest 3,378 5,865
37,252 48,611
Less: current portion 11,068 10,592
Long-term portion of capital lease obligations $ 26,184 $ 38,019
At the end of 2011, the gross amount of assets recorded under capital leases, including sale-leaseback capital leaseswas $56.9 million (2010 – $56.9 million; 2009 – $51.7 million). The charge to income resulting from the amortizationof assets recorded under capital leases is included in the ‘‘Amortization of property, plant and mine development’’component of the consolidated statements of income (loss).
(b) Operating Leases
The Company has a number of operating lease agreements involving office space. Some of the leases for officefacilities contain escalation clauses for increases in operating costs and property taxes. Future minimum lease
204 AGNICO-EAGLE MINES LIMITED
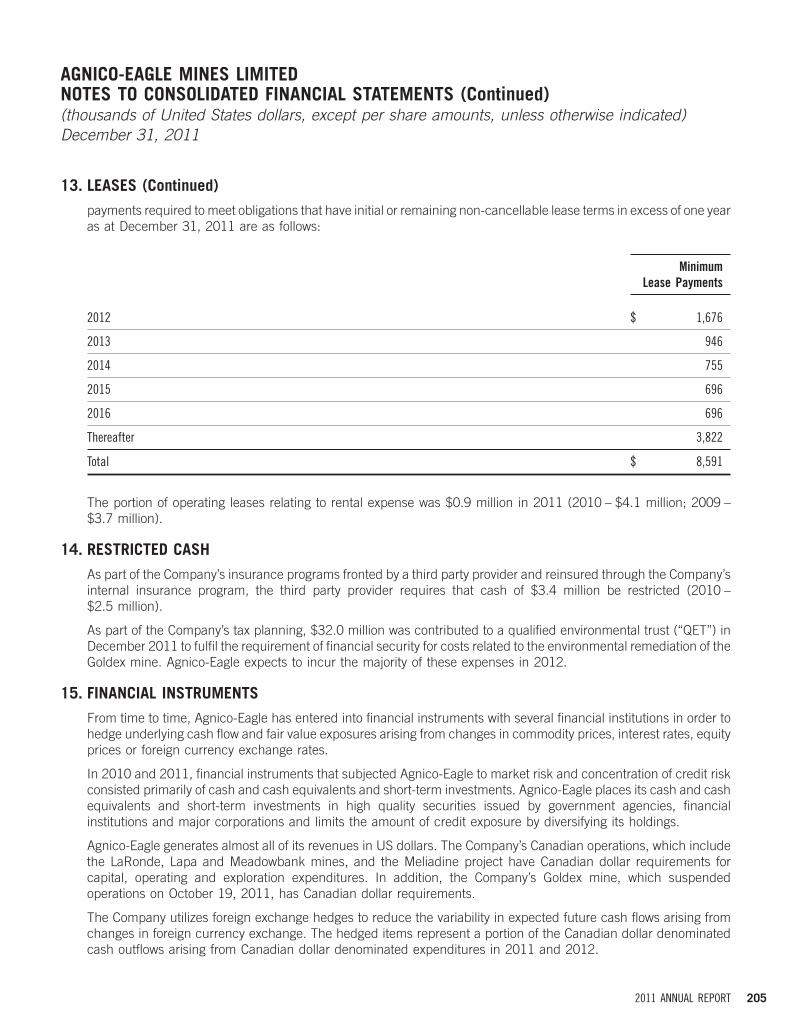
AGNICO-EAGLE MINES LIMITEDNOTES TO CONSOLIDATED FINANCIAL STATEMENTS (Continued)(thousands of United States dollars, except per share amounts, unless otherwise indicated)December 31, 2011
13. LEASES (Continued)
payments required to meet obligations that have initial or remaining non-cancellable lease terms in excess of one yearas at December 31, 2011 are as follows:
MinimumLease Payments
2012 $ 1,676
2013 946
2014 755
2015 696
2016 696
Thereafter 3,822
Total $ 8,591
The portion of operating leases relating to rental expense was $0.9 million in 2011 (2010 – $4.1 million; 2009 –$3.7 million).
14. RESTRICTED CASH
As part of the Company’s insurance programs fronted by a third party provider and reinsured through the Company’sinternal insurance program, the third party provider requires that cash of $3.4 million be restricted (2010 –$2.5 million).
As part of the Company’s tax planning, $32.0 million was contributed to a qualified environmental trust (‘‘QET’’) inDecember 2011 to fulfil the requirement of financial security for costs related to the environmental remediation of theGoldex mine. Agnico-Eagle expects to incur the majority of these expenses in 2012.
15. FINANCIAL INSTRUMENTS
From time to time, Agnico-Eagle has entered into financial instruments with several financial institutions in order tohedge underlying cash flow and fair value exposures arising from changes in commodity prices, interest rates, equityprices or foreign currency exchange rates.
In 2010 and 2011, financial instruments that subjected Agnico-Eagle to market risk and concentration of credit riskconsisted primarily of cash and cash equivalents and short-term investments. Agnico-Eagle places its cash and cashequivalents and short-term investments in high quality securities issued by government agencies, financialinstitutions and major corporations and limits the amount of credit exposure by diversifying its holdings.
Agnico-Eagle generates almost all of its revenues in US dollars. The Company’s Canadian operations, which includethe LaRonde, Lapa and Meadowbank mines, and the Meliadine project have Canadian dollar requirements forcapital, operating and exploration expenditures. In addition, the Company’s Goldex mine, which suspendedoperations on October 19, 2011, has Canadian dollar requirements.
The Company utilizes foreign exchange hedges to reduce the variability in expected future cash flows arising fromchanges in foreign currency exchange. The hedged items represent a portion of the Canadian dollar denominatedcash outflows arising from Canadian dollar denominated expenditures in 2011 and 2012.
2052011 ANNUAL REPORT

AGNICO-EAGLE MINES LIMITEDNOTES TO CONSOLIDATED FINANCIAL STATEMENTS (Continued)(thousands of United States dollars, except per share amounts, unless otherwise indicated)December 31, 2011
15. FINANCIAL INSTRUMENTS (Continued)
During the year, the Company entered into forward contracts with an ineffective cash flow hedging relationship thatdid not qualify for hedge accounting. The forward contracts hedged $150 million of 2011 expenditures and nil of2012 expenditures at an average rate of US$1.00 = C$0.99. There were no similar foreign exchange forwardcontracts in 2010. The hedges that expired during the year resulted in a realized loss of $1.4 million. As ofDecember 31, 2011 all ineffective cash flow hedges had expired.
The forward contracts with a cash flow hedging relationship that did qualify for hedge accounting, hedged $60 millionof 2011 expenditures at an average rate of US$1.00 = C$0.99 and $300 million of 2012 expenditures. $25 million willexpire each month during 2012 at an average rate of US$1.00 = C$1.01. There were no similar effective foreignexchange forward contracts in 2010. The $60 million of hedges that expired during the year resulted in a realized lossof $1.5 million. As of December 31, 2011, the Company recognized a mark-to-market loss of $4.4 million inaccumulated other comprehensive income (loss). Amounts deferred in accumulated other comprehensive income(loss) are reclassified to Production costs on the statements of income (loss) and comprehensive income (loss), asapplicable, when the hedged transaction has occurred. The mark-to-market loss is recorded at fair value based onbroker-dealer quotations that utilize period end forward pricing of the currency hedged.
The Company’s other foreign currency derivative strategies in 2011 consisted mainly of writing US dollar call optionswith short maturities to generate premiums that would, in essence, enhance the spot transaction rate received whenexchanging US dollars to Canadian dollars. All of these derivative transactions expired prior to year-end such that noderivatives were outstanding as of December 31, 2011. The Company’s foreign currency derivative strategygenerated $5.0 million in call option premiums for the year ended December 31, 2011 (2010 – $4.9 million) thatwere recognized in the ‘‘Gain on derivative financial instruments’’ line item of the consolidated statements of income(loss) and comprehensive income (loss).
In addition, the Company recognized a loss of $3.4 million (2010 – $3.1 million) on intra-quarter silver financialinstruments associated with timing of sales of silver products during 2011 that were recognized in the ‘‘Gain onderivative financial instruments’’ line item of the consolidated statements of income (loss) and comprehensiveincome (loss). There were no silver financial instruments outstanding at December 31, 2011 or December 31, 2010.
In the first quarter of 2011, to mitigate the risks associated with fluctuating zinc prices, the Company entered into azero-cost collar to hedge the price on a portion of zinc associated with the LaRonde mine’s 2011 production. Thepurchase of zinc put options was financed through selling zinc call options at a higher level such that the net premiumpayable to the counterparty by the Company is nil.
A total of 20,000 metric tonnes (2010 – 15,000 metric tonnes) of zinc call options were written at a strike price of$2,500 (2010 – $2,500) per metric tonne with 2,000 metric tonnes (2010 – 1,500 metric tonnes) expiring eachmonth beginning February 28, 2011 (2010 – March 31, 2010). A total of 20,000 metric tonnes (2010 –15,000 metric tonnes) of zinc put options were purchased at a strike price of $2,200 (2010 – $2,200) per metrictonne with 2,000 metric tonnes (2010 – 1,500 metric tonnes) expiring each month beginning February 28, 2011(2010 – March 31, 2010). While setting a minimum price, the zero-cost collar strategy also limits participation to zincprices above $2,500 (2010 – $2,500) per metric tonne. These contracts did not qualify for hedge accounting underASC 815 – Derivatives and Hedging. Gains or losses, along with mark-to-market adjustments, were recognized in the‘‘Gain on derivative financial instruments’’ line item of the consolidated statements of income (loss) andcomprehensive income (loss). All options entered into during the year expired during the year resulting in a realizedgain of $3.4 million (2010 – $3.7 million).
The following table sets out the changes in the Accumulated other comprehensive income (loss) (‘‘AOCI’’) balancesrecorded in the consolidated financial statements pertaining to the foreign exchange hedging activities. The fair
206 AGNICO-EAGLE MINES LIMITED

AGNICO-EAGLE MINES LIMITEDNOTES TO CONSOLIDATED FINANCIAL STATEMENTS (Continued)(thousands of United States dollars, except per share amounts, unless otherwise indicated)December 31, 2011
15. FINANCIAL INSTRUMENTS (Continued)
values, based on calculated mark-to-market valuations, of recorded derivative related assets and liabilities and theircorresponding entries to AOCI reflect the netting of the fair values of individual derivative financial instruments.
2011 2010
AOCI, beginning of year $ – $ –
Loss reclassified from AOCI into production cost 1,459 –
Loss recognized in OCI (5,863) –
AOCI, end of year $ (4,404) $ –
As at December 31, 2011 and 2010, there were no metal derivative positions. The Company may from time to timeutilize short-term (including intra-quarter) financial instruments as part of its strategy to minimize risks and optimizereturns on its byproduct metal sales.
Other required derivative disclosures can be found in note 7(e), Accumulated other comprehensive income (loss).
The following table provides a summary of the amounts recognized in the ‘‘Gain on derivative financial instruments’’line item of the consolidated statements of income (loss) and comprehensive income (loss):
2011 2010 2009
Premiums realized on written foreign exchange call options $ 4,995 $ 4,845 $ 4,494
Realized gain on foreign exchange extendible flat forward – 1,797 –
Realized loss on foreign exchange forwards (1,407) – –
Realized gain on foreign exchange collar – 711 –
Mark-to-market gain on foreign exchange extendible flat forward – 142 –
Realized gain (loss) on zinc financial instruments 3,419 3,733 (752)
Realized gain (loss) on copper financial instruments 79 (558) (150)
Realized loss on silver financial instruments (3,403) (3,058) –
$ 3,683 $ 7,612 $ 3,592
Agnico-Eagle’s exposure to interest rate risk at December 31, 2011 relates to its cash and cash equivalents,short-term investments and restricted cash totaling $221.5 million (2010 – $104.6 million) and the Credit Facility.The Company’s short-term investments and cash equivalents have a fixed weighted average interest rate of 0.61%(2010 – 0.56%).
The fair values of Agnico-Eagle’s current financial assets and liabilities approximate their carrying values as atDecember 31, 2011.
2072011 ANNUAL REPORT

AGNICO-EAGLE MINES LIMITEDNOTES TO CONSOLIDATED FINANCIAL STATEMENTS (Continued)(thousands of United States dollars, except per share amounts, unless otherwise indicated)December 31, 2011
16. GENERAL AND ADMINISTRATIVE
Due to a kitchen fire at the Meadowbank mine in March 2011, the Company recognized a loss on disposal of thekitchen of $6.9 million, incurred related costs of $7.4 million, and also recognized an insurance receivable for$11.2 million. The difference of $3.1 million was recognized in the ‘‘General and administrative’’ line item of theconsolidated statements of income (loss) and comprehensive income (loss) during the year. The Company’sexposure to insurance losses related to this claim is limited to the $3.1 million exposure through its captive insurancecompany.
During the year, $2.4 million of insurance proceeds were received and as at December 31, 2011 the Company had aremaining insurance receivable of $8.8 million (note 2(a)).
17. LOSS ON GOLDEX MINE
On October 19, 2011, the Company announced that it was suspending mining operations and gold production at theGoldex mine in Quebec, Canada effective immediately. This decision followed the receipt of an opinion from a secondrock mechanics consulting firm which recommended that underground mining operations be halted. It appearedthat a weak volcanic rock unit in the hanging wall of the Goldex mine deposit had failed. This rock failure is thought toextend between the top of the deposit and surface. As a result, this structure has allowed an increase in ground waterto flow into the mine. This water flow has likely contributed to further weakening and movement of the rock mass.
Agnico-Eagle has written off its investment in the Goldex mine (net of expected residual value), written off theunderground ore stockpile, and recorded a provision for the anticipated costs of environmental remediation. Giventhe amount of uncertainty in estimating the fair value of the Goldex mine property, plant, and mine development, theCompany determined that the fair value was equal to the residual value. All of the remaining 1.6 million ounces ofproven and probable gold reserves at the Goldex mine, other than the ore stockpiled on surface, have beenreclassified as mineral resources. The Goldex mine is part of the ‘‘Canada’’ segment as shown in Note 19.
The mill processed feed from the remaining surface stockpile at the Goldex mine in October 2011.
Impairment loss on Goldex mine property, plant, and mine development $ 237,110
Loss on underground ore stockpile 16,641
Supplies inventory obsolescence provision 1,915
Increase in environmental remediation liability 47,227
Loss on Goldex mine (before income and mining taxes) $ 302,893
The environmental remediation liability for the anticipated costs of remediation associated with the Company’s Goldexmine requires management to make estimates and judgments that affect the reported amount. In making judgmentsin accordance with US GAAP, the Company uses estimates based on historical experience and various assumptionsthat are considered reasonable in the circumstances. Actual results may differ from these estimates.
18. IMPAIRMENT LOSS ON MEADOWBANK MINE
For the year ended December 31, 2011 the Company performed a full review of the Meadowbank mine operationsand updated the related life of mine plan. This review considered the exploration potential of the area, the currentmineral reserves and resources, the projected operating costs in light of the persistently high operating costsexperienced since commencement of commercial operations, metallurgical performance and gold price. Theseserved as inputs into pit optimizations to determine which reserves and resources could be economically mined andbe considered as mineable mineral reserves. As a result of these factors, an updated mine plan with a shorter mine
208 AGNICO-EAGLE MINES LIMITED

AGNICO-EAGLE MINES LIMITEDNOTES TO CONSOLIDATED FINANCIAL STATEMENTS (Continued)(thousands of United States dollars, except per share amounts, unless otherwise indicated)December 31, 2011
18. IMPAIRMENT LOSS ON MEADOWBANK MINE (Continued)
life was developed and cash flows calculated, resulting in an impairment charge to the Meadowbank mine carryingvalue of $907.7 million. The Meadowbank mine previously had a property, plant and mine development book value ofapproximately $1.7 billion.
Net estimated future cash flows from the Meadowbank mine were calculated, on an undiscounted basis, based onbest estimates of future gold production, which were based on long-term gold prices from $1,250 to $1,553 perounce (in real terms), foreign exchange rates from US$0.92:C$1 to US$0.97:C$1, increased cost estimates based onrevised operating levels, average gold recovery of 92.9% and expected continuation of operations to 2017, includingthe processing of stockpiled ore. Future expected operating costs, capital expenditures, and asset retirementobligations were based on the updated life of mine plan. The fair value was calculated by discounting the estimatedfuture net cash flows using a 5% interest rate (in real terms), commensurate with the estimated level of risk.Management’s estimate of future cash flows is subject to risk and uncertainties. Therefore, it is reasonably possiblethat changes could occur which may affect the recoverability of the Company’s long-lived assets and may have amaterial effect on the Company’s results of operations and financial position. The Meadowbank mine is a part of the‘‘Canada’’ segment as shown in Note 19.
19. SEGMENTED INFORMATION
Agnico-Eagle operates in a single industry, namely exploration for and production of gold. The Company’s primaryoperations are in Canada, Mexico, and Finland. The Company identifies its reportable segments as those operationswhose operating results are reviewed by the Chief Executive Officer and Chief Operating Officer, and that representmore than 10% of the combined revenue, profit or loss or total assets of all reported operating segments. Thefollowing are the reporting segments of the Company and reflect how the Company manages its business and how itclassifies its operations for planning and measuring performance:
Canada: LaRonde mine, Lapa mine, Goldex mine, Meadowbank mine, Meliadine project and the Regional OfficeEurope: Kittila mineLatin America: Pinos Altos mine, Creston Mascota deposit at Pinos Altos and the La India projectExploration: USA Exploration office, Europe Exploration office, Canada Exploration offices, and the Latin America Exploration
office
The accounting policies of the reporting segments are the same as those described in the summary of significantaccounting policies. There are no transactions between the reported segments affecting revenue. Production costsfor the reported segments are net of intercompany transactions. Of the $229.3 million of goodwill reflected on theconsolidated balance sheets at December 31, 2011, $200.1 million relates to the Meliadine project that is acomponent of the Canada segment and $29.2 million relates to the La India project that is a component of the LatinAmerica segment.
Corporate Head Office assets are included in the ‘‘Canada’’ segment and specific corporate income and expenseitems are noted separately below.
Certain items in the comparative segmented information relating to the Meliadine project have been reclassified fromthe ‘‘Exploration’’ segment to the ‘‘Canada’’ segment.
On May 1, 2009, both the Lapa mine and the Kittila mine achieved commercial production. The Pinos Altos mineachieved commercial production on November 1, 2009. The Meadowbank mine achieved commercial production on
2092011 ANNUAL REPORT

AGNICO-EAGLE MINES LIMITEDNOTES TO CONSOLIDATED FINANCIAL STATEMENTS (Continued)(thousands of United States dollars, except per share amounts, unless otherwise indicated)December 31, 2011
19. SEGMENTED INFORMATION (Continued)
March 1, 2010. The Creston Mascota deposit at Pinos Altos achieved commercial production on March 1, 2011. TheLaRonde mine extension achieved commercial production on December 1, 2011.
ForeignRevenues Currency Impairment
from Exploration Translation Loss on SegmentYear Ended Mining Production and Corporate Loss Loss on Meadowbank IncomeDecember 31, 2011 Operations Costs Amortization Development (Gain) Goldex Mine Mine (Loss)
Canada $1,217,858 $ 619,987 $ 198,219 $ – $ 2,825 $ 302,893 $ 907,681 $(813,747)
Europe 225,612 110,477 26,574 – 1,063 – – 87,498
Latin America 378,329 145,614 36,988 – (4,955) – – 200,682
Exploration – – – 75,721 (15) – – (75,706)
$1,821,799 $ 876,078 $ 261,781 $ 75,721 $ (1,082) $ 302,893 $ 907,681 $(601,273)
Segment loss $(601,273)
Corporate and Other
Interest and sundry expense (5,188)
Net loss on sale and write-down of available-for-sale securities (3,662)
Gain on derivative financial instruments 3,683
General and administrative (107,926)
Provincial capital tax (9,223)
Interest expense (55,039)
Loss before income and mining taxes $(778,628)
210 AGNICO-EAGLE MINES LIMITED

AGNICO-EAGLE MINES LIMITEDNOTES TO CONSOLIDATED FINANCIAL STATEMENTS (Continued)(thousands of United States dollars, except per share amounts, unless otherwise indicated)December 31, 2011
19. SEGMENTED INFORMATION (Continued)
ForeignRevenues Currency
from Exploration Translation SegmentYear Ended Mining Production & Corporate Loss IncomeDecember 31, 2010 Operations Costs Amortization Development (Gain) (Loss)
Canada $ 1,086,744 $ 499,621 $ 140,024 $ – $ 22,815 $ 424,284
Europe 160,140 87,735 31,231 – (2,780) 43,954
Latin America 175,637 90,116 21,134 – (2,126) 66,513
Exploration – – 97 54,958 1,627 (56,682)
$ 1,422,521 $ 677,472 $ 192,486 $ 54,958 $ 19,536 $ 478,069
Segment income $ 478,069
Corporate and Other
Interest and sundry income 10,254
Gain on acquisition of Comaplex, net 57,526
Gain on sale of available-for-sale securities 19,487
Gain on derivative financial instruments 7,612
General and administrative (94,327)
Provincial capital tax 6,075
Interest expense (49,493)
Income before income and mining taxes $ 435,203
2112011 ANNUAL REPORT

AGNICO-EAGLE MINES LIMITEDNOTES TO CONSOLIDATED FINANCIAL STATEMENTS (Continued)(thousands of United States dollars, except per share amounts, unless otherwise indicated)December 31, 2011
19. SEGMENTED INFORMATION (Continued)
ForeignRevenues Currency
from Exploration Translation SegmentYear Ended Mining Production & Corporate Loss IncomeDecember 31, 2009 Operations Costs Amortization Development (Gain) (Loss)
Canada $ 538,123 $ 252,035 $ 60,028 $ – $ 36,499 $ 189,561
Europe 61,457 42,464 10,909 – 3,582 4,502
Latin America 14,182 11,819 1,524 – (250) 1,089
Exploration – – – 36,279 – (36,279)
$ 613,762 $ 306,318 $ 72,461 $ 36,279 $ 39,831 $ 158,873
Segment income $ 158,873
Corporate and Other
Interest and sundry income 12,580
Gain on sale of available-for-sale securities 10,142
Gain on derivative financial instruments 3,592
General and administrative (63,687)
Provincial capital tax (5,014)
Interest expense (8,448)
Income before income and mining taxes $ 108,038
212 AGNICO-EAGLE MINES LIMITED
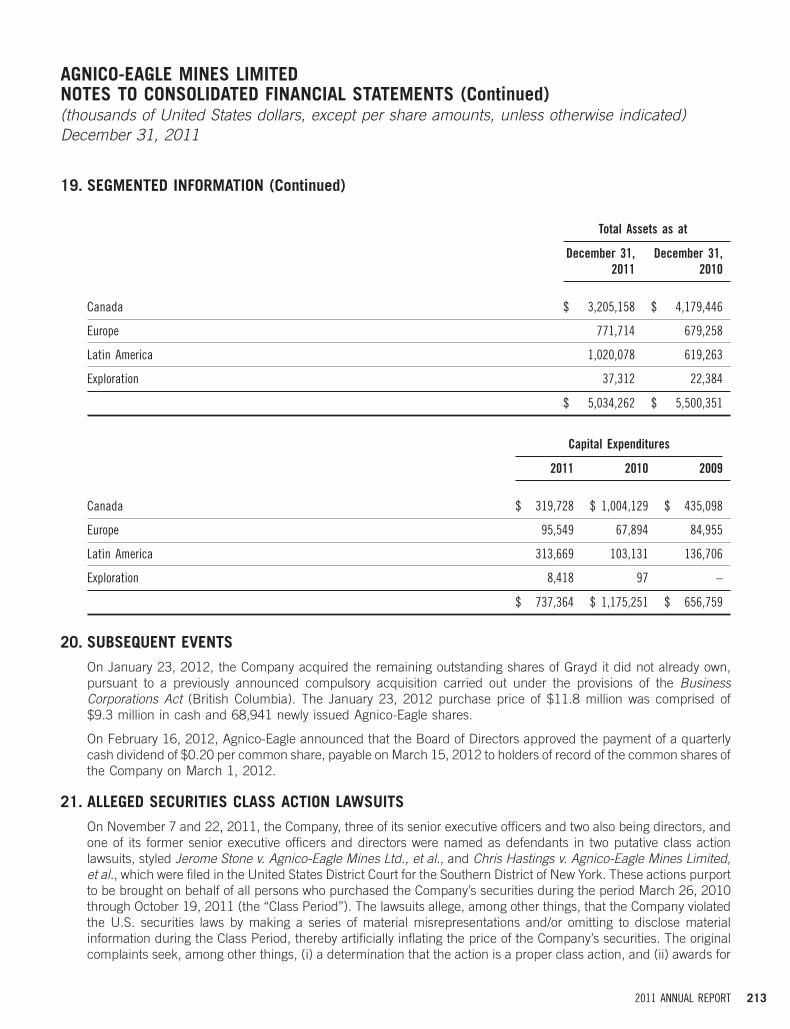
AGNICO-EAGLE MINES LIMITEDNOTES TO CONSOLIDATED FINANCIAL STATEMENTS (Continued)(thousands of United States dollars, except per share amounts, unless otherwise indicated)December 31, 2011
19. SEGMENTED INFORMATION (Continued)
Total Assets as at
December 31, December 31,2011 2010
Canada $ 3,205,158 $ 4,179,446
Europe 771,714 679,258
Latin America 1,020,078 619,263
Exploration 37,312 22,384
$ 5,034,262 $ 5,500,351
Capital Expenditures
2011 2010 2009
Canada $ 319,728 $ 1,004,129 $ 435,098
Europe 95,549 67,894 84,955
Latin America 313,669 103,131 136,706
Exploration 8,418 97 –
$ 737,364 $ 1,175,251 $ 656,759
20. SUBSEQUENT EVENTS
On January 23, 2012, the Company acquired the remaining outstanding shares of Grayd it did not already own,pursuant to a previously announced compulsory acquisition carried out under the provisions of the BusinessCorporations Act (British Columbia). The January 23, 2012 purchase price of $11.8 million was comprised of$9.3 million in cash and 68,941 newly issued Agnico-Eagle shares.
On February 16, 2012, Agnico-Eagle announced that the Board of Directors approved the payment of a quarterlycash dividend of $0.20 per common share, payable on March 15, 2012 to holders of record of the common shares ofthe Company on March 1, 2012.
21. ALLEGED SECURITIES CLASS ACTION LAWSUITS
On November 7 and 22, 2011, the Company, three of its senior executive officers and two also being directors, andone of its former senior executive officers and directors were named as defendants in two putative class actionlawsuits, styled Jerome Stone v. Agnico-Eagle Mines Ltd., et al., and Chris Hastings v. Agnico-Eagle Mines Limited,et al., which were filed in the United States District Court for the Southern District of New York. These actions purportto be brought on behalf of all persons who purchased the Company’s securities during the period March 26, 2010through October 19, 2011 (the ‘‘Class Period’’). The lawsuits allege, among other things, that the Company violatedthe U.S. securities laws by making a series of material misrepresentations and/or omitting to disclose materialinformation during the Class Period, thereby artificially inflating the price of the Company’s securities. The originalcomplaints seek, among other things, (i) a determination that the action is a proper class action, and (ii) awards for
2132011 ANNUAL REPORT

AGNICO-EAGLE MINES LIMITEDNOTES TO CONSOLIDATED FINANCIAL STATEMENTS (Continued)(thousands of United States dollars, except per share amounts, unless otherwise indicated)December 31, 2011
21. ALLEGED SECURITIES CLASS ACTION LAWSUITS (Continued)
unspecified damages and interest, costs and expenses. On February 6, 2012, the court entered an orderconsolidating the Stone and Hastings actions under the caption In re Agnico-Eagle Mines Ltd. Securities Litigationand appointing a lead plaintiff (not one of the plaintiffs who filed the original complaints). The lead plaintiff has untilApril 6, 2012 to file a consolidated amended complaint. Defendants will then respond to the consolidated amendedcomplaint, including filing a motion to dismiss for failure to state a claim under the U.S. securities laws, if they deemit appropriate. Eberhard Scherkus, one of the three executives employed by Agnico-Eagle at the time the case wasfiled and named as a defendant in the lawsuits, resigned as a director and officer of the company effectiveFebruary 15, 2012.
On March 8, 2012, a Notice of Action was issued by AF A Livforsakringsaktiebolag, AF A Sjukforsakringsaktiebolag,AF A Trygg Hetsforsakrfngsaktiebolag, Kollektiv a Vtalsstfftelsen Trygghetsfonden TSL, and William Leslie against theCompany and certain of its current and former officers and directors. The Notice alleges, among other things, that theCompany failed to disclose the specific risks regarding ongoing water inflow at the Goldex mine. The Notice wasissued by the plaintiffs as a proposed class action on behalf of all persons who acquired securities of the Companyduring the period March 26, 2010 to October 19, 2011. The plaintiffs seek to certify the action as a class action andseek damages of $250 million.
214 AGNICO-EAGLE MINES LIMITED

ITEM 19 EXHIBITSExhibits and Exhibit Index. The following Exhibits are filed as part of this Annual Report and incorporated herein byreference to the extent applicable.
EXHIBIT INDEX
Exhibit No. Description
1.01 Articles of Amalgamation of the Company. *
1.02 Amended and Restated By-Laws of the Company (incorporated by reference to Exhibit 99.1 to the *Company’s Form 6-K (File No. 001-13422) furnished to the SEC on March 28, 2008).
4 .01 Amended and Restated Credit Agreement, dated as of August 4, 2011, between the Company, the *guarantors party thereto, the lenders party thereto and The Bank of Nova Scotia.
4 .02 Amended and Restated Stock Option Plan (incorporated by reference to Exhibit 4.1 to the Company’s *Registration Statement on Form S-8 (File No. 333-152004), filed with the SEC on August 19, 2008).**
4.03 Amended and Restated Incentive Share Purchase Plan (incorporated by reference to Exhibit 4.2 to the *Company’s Registration Statement on Form S-8 (File No. 333-152004) filed with the SEC on August 19,2008).**
4.04 Warrant Indenture, dated as of April 4, 2009, between the Company and Computershare Trust Company of *Canada (incorporated by reference to Exhibit 4.05 to the Company’s Annual Report on Form 20-F (FileNo. 001-13422) for the fiscal year ended December 31, 2009, filed with the SEC on March 26, 2010).
4 .05 Note Purchase Agreement, dated as of April 7, 2010, between the Company and the purchasers party *thereto (incorporated by reference to Exhibit 4.05 to the Company’s Annual Report on Form 20-F (FileNo. 001-13422) for the fiscal year ended December 31, 2010, filed with the SEC on March 28, 2011).
8 .01 List of subsidiaries of the Company. *
11.01 Code of Ethics (incorporated by reference to Exhibit 2 to the Company’s Form 6-K (File No. 001-13422) *furnished to the SEC on December 21, 2005).
12.01 Certification Pursuant to Section 302 of the Sarbanes-Oxley Act of 2002 (Subsections (A) and (B) of *Section 1350, Chapter 63 of Title 18, United States Code) (Sean Boyd).
12.02 Certification Pursuant to Section 302 of the Sarbanes-Oxley Act of 2002 (Subsections (A) and (B) of *Section 1350, Chapter 63 of Title 18, United States Code) (Ammar Al-Joundi).
13.01 Certification pursuant to Title 18, United States Code, Section 1350 as adopted pursuant to Section 906 of *the Sarbanes-Oxley Act of 2002 (Sean Boyd).***
13.02 Certification pursuant to Title 18, United States Code, Section 1350 as adopted pursuant to Section 906 of *the Sarbanes-Oxley Act of 2002 (Ammar Al-Joundi).***
15.01 Consent of Independent Registered Public Accounting Firm. *
15.02 Audit Committee Charter (incorporated by reference to Exhibit 15.04 to the Company’s Annual Report onForm 20-F (File No. 001-13422) for the fiscal year ended December 31, 2005 filed with the SEC onMarch 28, 2006).
15.03 Consent of Marc Legault
101 The following financial information from Agnico-Eagle Mines Limited’s Comparative Audited ConsolidatedFinancial Statements, formatted in XBRL (Extensible Business Reporting Language) and furnishedelectronically herewith: (i) the Consolidated Statements of Income; (ii) the Consolidated Statements ofCash Flow; (iii) the Consolidated Balance Sheets; (iv) the Consolidated Statements of Shareholders’ Equity;(v) the Consolidated Statements of Comprehensive Income; and (vi) the Notes to Consolidated FinancialStatements, tagged as blocks of text.
* Such exhibits and other information filed by the Company with the SEC are available to shareholders upon request at the SEC’s public reference section, may be inspected andcopied at prescribed rates at the public reference room maintained by the SEC located at 110 F Street, N.E., Room 1580, Washington, D.C. 20549, U.S.A. or may be accessedelectronically at the SEC’s website (www.sec.gov).
** Management contracts or compensatory plan, contract or arrangements required to be filed and herein incorporated as an exhibit.
*** Pursuant to the SEC Release No. 33-8212 and 34-47551, this certification will be treated as ‘‘accompanying’’ this Annual Report on Form 20-F and not ‘‘filed’’ as part of suchreport for purposes of Section 18 of the Exchange Act, or otherwise subject to the liability of Section 18 of the Exchange Act, and this certification will not be incorporated byreference into any filing under the U.S. Securities Act or the Exchange Act, except to the extent that the Company specifically incorporates it by reference.
2152011 ANNUAL REPORT

SIGNATURESThe registrant hereby certifies that it meets all of the requirements for filing on Form 20-F and that it has duly caused andauthorized the undersigned to sign this Annual Report on its behalf.
AGNICO-EAGLE MINES LIMITED
Toronto, CanadaMarch 28, 2012
By: /s/ AMMAR AL-JOUNDI
Ammar Al-JoundiSenior Vice-President, Finance andChief Financial Officer
216 AGNICO-EAGLE MINES LIMITED

officeRs
shAReholdeR infoRmAtion
Auditors
Ernst & Young LLP
Solicitors
Davies Ward Philips & Vineberg LLP (Toronto and New York)
Listings
The New York Stock Exchange and the Toronto Stock Exchange Stock Symbol: AEM
Transfer Agent
Computershare Trust Company of Canada 1-800-564-6253
Investor Relations
(416) 947-1212
Annual Meeting of Shareholders
Friday, April 27, 2012, at 11:00 am The Harbour Ballroom Westin Harbour Castle Toronto, Ontario, Canada M5J 1A6
Corporate Head Office
Agnico-Eagle Mines Limited 145 King Street East, Suite 400 Toronto, Ontario, Canada M5C 2Y7 (416) 947-1212
facebook.com/agnicoeagle
twitter.com/agnicoeagle
agnico-eagle.comCon
cept
and
Des
ign:
Th
e W
or
ks
De
sig
n C
om
mu
niC
aTio
ns
LTD
. w
ww
.wor
ksde
sign
.com
P
rintin
g: m
er
riL
L C
or
Po
raT
ion
Ca
na
Da
Sean BoydPresident and Chief Executive Officer
Ammar Al-JoundiSenior Vice-President Finance and Chief Financial Officer
Donald G. AllanSenior Vice-President, Corporate Development
Alain BlackburnSenior Vice-President, Exploration
Louise GrondinSenior Vice-President, Environment and Sustainable Development
Tim HaldaneSenior Vice-President, Latin America
R. Gregory LaingGeneral Counsel, Senior Vice-President, Legal, and Corporate Secretary
Marc LegaultSenior Vice-President, Project Evaluations
Jean-Luk PellerinSenior Vice-President, Human Resources
Daniel RacineSenior Vice-President, Mining
Jean RobitailleSenior Vice-President, Technical Services and Project Development
David SmithSenior Vice-President, Strategic Planning and Investor Relations
Yvon SylvestreSenior Vice-President, Operations
Luis Felipe Medina AguirreVice-President, Mexico
Pierre BureauVice-President, Construction
Lino CafazzoVice-President, Information Technology
Mathew CookVice-President, Controller
Paul CousinVice-President, Metallurgy
Picklu DattaVice-President, Treasurer
Patrice GilbertVice-President, Human Resources
Guy GosselinVice-President, Exploration
Ingmar E. HagaVice-President, Europe
Michel LeclercVice-President, Project Evaluations
Christian ProvencherVice-President, Canada
Ag
nico
-Eag
le Min
es Lim
ited 2
011 A
nn
ual R
ep
ort
Agnico-Eagle Mines Limited 145 King Street East, Suite 400 Toronto, Canada M5C 2Y7
agnico-eagle.com
Where we stand.