Annual - Sydney · PDF fileSydney Water Annual Report Project Manager Corporate Public Affairs...
226
Annual Report 2015–16
Transcript of Annual - Sydney · PDF fileSydney Water Annual Report Project Manager Corporate Public Affairs...

Annual Report
2015–16


About this reportThis is Sydney Water’s full Annual Report for 1 July 2015 to 30 June 2016. It covers financial, social and environmental performance, statutory information, financial statements and other regulatory information.
The full report and a 30 page summary report are available on our website: sydneywater.com.au
If you have any comments about the Annual Report 2015–16, please email [email protected] or write to:
Sydney WaterAnnual Report Project ManagerCorporate Public AffairsPO Box 399PARRAMATTA NSW 2124
Letter to Shareholder MinistersDear Treasurer and Minister Perrottet
Report on performance for the year ended 30 June 2016
We are pleased to submit the Annual Report of Sydney Water Corporation (Sydney Water) for the year ended 30 June 2016 for presentation to Parliament. The full report includes financial statements, and we publish a 30 page summary on our website.
Our Annual Report 2015–16 was prepared according to section 24A of the State Owned Corporations Act 1989 and the Annual Reports (Statutory Bodies) Act 1984. The financial statements for 2015–16, which form part of the Annual Report 2015–16, were certified by the Auditor-General of New South Wales.
Yours sincerely,
Bruce Morgan | Chairman Kevin Young | Managing Director BComm, FCA, FAICD BEng (Hons), MBA, FIE Aust, CPENG, FAICD
1 Sydney Water Annual Report 2015–16 Sydney Water Annual Report 2015–2016 1

ContentsAbout this report 1
Letter to Shareholder Ministers 1
Contents 2
1. Overview 5
About Sydney Water 6
Our vision 6
Our stakeholders 7
A snapshot of our business 9
Our operations 10
The year in review 14
Our performance 17
This year’s highlights 17
Our awards and recognition 22
Our Corporate Strategy 23
Strategic success measures: Our performance 25
Balanced sustainability scorecard 32
2. Corporate governance 35
Our Corporate Governance Framework 36
Sydney Water Board Directors 39
Board meetings 48
Organisational chart 49
3. Customer at the heart 51
Our sustainability performance 52
Our service guarantee 58
Social programs 60
Multicultural policies and services program 62
Community investments 64
Privacy 65
Communicating with our customers 66
4. World class performance 67
Our sustainability performance 68
Our ecological footprint 77
Risk management and performance 78
Legal events 80
Capital expenditure 81
Research and development 85
Heritage delegation actions 91
Statement on the implementation of our special objectives 93
Threatened Species Conservation Act 1995 104
2 Sydney Water Annual Report 2015–16

5. High performance culture 107
Our sustainability performance 108
Workplace health and safety 112
Executive performance and remuneration 115
Workforce diversity 116
Staff and industrial relations 119
Consultant engagements 119
Overseas travel 120
6. Financial statements 123
Financial performance summary 124
Pricing 129
Auditor-General’s statutory audit report 134
Financial statements for the year ended 30 June 2016 136
7. Appendixes 205
Appendix 1: Exemptions from reporting provisions 206
Appendix 2: Government Information (Public Access) (GIPA) 207
Appendix 3: Public Interest Disclosures 211
Appendix 4: External production costs 211
Glossary 212
Statutory information index 218
Index of figures, maps and tables 221
2 Sydney Water Annual Report 2015–16 Sydney Water Annual Report 2015–2016 3


1.Overview

About Sydney WaterAt Sydney Water, we exist for our customers. We provide safe, refreshing drinking water to almost five million people across Sydney, the Blue Mountains and the Illawarra. We look after wastewater and some stormwater services to protect the health of our rivers and beaches.
As Australia’s largest water and wastewater service provider, we’re proud to play a key role in Sydneysiders’ continuing enjoyment of this great city and iconic outdoor way of life.
We need to be both responsible for and responsive to our community to ensure all our customers can continue to enjoy the benefits of safe drinking water, and healthy rivers and beaches. This will help us meet our challenges now and as our city grows in the future.
Our vision
Our vision is to be the lifestream of Sydney for generations to come. The services we provide help sustain and grow new life. We’ve been supplying high quality services to our customers for more than 128 years and we’re passionate about contributing to the lifestyle of Sydney now and in the future.
We want to provide more and better choices for customers, while ensuring our essential services remain fair for all. It’s our mission to be world–class, delivering essential services that our customers love, in our great city. To achieve this, we’re focusing on three objectives that make up our Corporate Strategy.
Customer at the heart
We provide high quality water and wastewater services to more than 4.9 million people every day. We’re changing the way we do things to ensure the voice of customers drives our business.
World class performance
We want to deliver more and better services for customers, underpinned by a well-organised, efficient business. To do this, we’re investing in the right tools and using innovative solutions.
High performance culture
Our focus on culture defines our values and guides how we work and interact with each other, our customers and the community. Our people bring a diverse range of thought, experience and knowledge to Sydney Water, and more than ever, they’re on board and connected to bringing our strategy to life.
We are a State Owned Corporation, wholly owned by the New South Wales Government. Our performance targets and service standards are set out in our Operating Licence 2015–2020, which is governed by the Independent Pricing and Regulatory Tribunal (IPART).
We operate under the Sydney Water Act 1994, which assigns our principle objectives to:
• protect public health
• protect the environment
• be a successful business.
6 Overview | Sydney Water Annual Report 2015–16| Sydney Water Annual Report 2015

Our stakeholders
We work with a range of stakeholders across various sectors representing government, community and industry groups. We are committed to involving stakeholders in our decision-making through effective engagement and relationship building.
Collaborating with our stakeholders helps us align our decision-making with the needs and expectations of the communities we operate within. We support the health and growth of
our strategic long-term relationships through face-to-face interaction, communication, negotiation, collaborative action, and shared thinking and planning.
We apply the International Association for Public Participation (IAP2) standard for engagement. The IAP2 core values set the industry benchmark for best-practice engagement.
Our engagement objectives – to guide, build and strengthen relationships – reflect Sydney Water’s signature behaviours:
1Focus on solutionsEngagement is a two-way process. We are committed to collaborating with and working in partnership with stakeholders to deliver solutions and outcomes for our customers.
2Stand up and contributeWe seek out and involve those potentially interested or affected by our work, policies and processes. We commit to providing feedback to customers, the community and stakeholders on how their input contributed to our decision-making.
3Do what we say We will actively listen to and consider stakeholder needs, seeking to understand how they want to be engaged. We honour the commitments we make and will ensure information is accessible and objective, and facilitates engagement with all stakeholders who have an interest. We are committed to providing accurate and timely information.
4Support and encourage We are open and honest. We will respond to the values and needs of our customers, community and stakeholders, while fostering a culture of shared ideas. We are inclusive and will work to engage with those that are harder to reach for reasons such as language, culture, age or mobility.
5Own the outcome We work with our customers, community and stakeholders to identify, mitigate and resolve issues to improve outcomes for all. We will evaluate our performance so we can continuously improve our processes.
We operate within a complex matrix of stakeholder groups. We value all of our stakeholder relationships, but we invest more time and resources on particular relationships, because of their interest and impact on our operations.
These include:
• customers – business and residential
• staff and contractors
• developers
• state and local government
• regulators
• advocacy and special interest groups.
Overview
Corporate
governanceC
ustomer at
the heartW
orld class perform
anceH
igh performance
cultureFinancial
statements
Appendixes
6 Overview | Sydney Water Annual Report 2015–16 Sydney Water Annual Report 2015–16 | Overview 7| Sydney Water Annual Report 2015

Figure 1: Our stakeholders
Action groups
SBC
Tradeand national
outlets
Educationgroups
Bureau of Meteorology
Portfolio Minister
ShareholderMinisters
ROCS
LGNSW
Combined councilgroups
Members of Parliament
Division ofLocal Gov.
Greater Sydney Commission
TfNSW
RMS SES
Infrastructure partners
Stormwaterindustry
Other key developers
UnionsStaff
Contractors
Com
munity
Governm
ent
Staff
Industry
PIAC PWD TEC ECC COTA
Multicultural NSW NCC EWON NCOSS
Other utilitiesPlumbers
IWA
UniversitiesExperts
CustomerLiaison
Committees
Major plantsNew assets
Maintenance
AWAWSAA
BPB UDIA PCA IPA Urban Growth
UrbanTaskforce
Deliverypartners
DigitalNational
MetroRegional
Social
CustomerCouncil
BusinessCustomer
Forum
WaterNSW
All localcouncils
IPARTEPAOEH
NSW Health
PortfolioMinisters forEnvironment,
Health &PlanningBoard
Executive
OOWINSW
TreasuryDPEDPIDPC
Majorcontractors
Plantoperators
Dep
art/Authorities
Parliament
StaffContractors
Deve
lope
rs
Wat
erLo
cal
Med
ia
Advocacy Federal
Local
Regulato
rs
ABS
Legend
ABS Australian Bureau of Statistics
AWA Australian Water Association
BPB Building Professionals Board
COTA Council on the Ageing
DPC Department of Premier and Cabinet
DPE Department of Planning and Environment
DPI Department of Primary Industries
ECC Ethnic Communities Council
EPA NSW Environment Protection Authority
EWON Energy and Water Ombudsman NSW
GSC Greater Sydney Commission
IPA Infrastructure Partnerships Australia
IPART Independent Pricing and Regulatory Tribunal
IWA International Water Association
INSW Infrastructure Partnerships NSW
LGNSW Local Government NSW
NCC Nature Conservation Council of NSW
NCOSS NSW Council of Social Services
OEH Office of Environment and Heritage
OOW Office of Water
PCA Property Council of Australia
PENGOs Peak Environment Non-Government Organisatons
PIAC Public Interest Advocacy Centre
PWD People with Disability
RMS Roads and Maritime Services
ROCS Regional Organisation of Councils
SBC Sydney Business Chamber
SES State Emergency Services
TEC Total Environment Centre
TfNSW Transport for NSW
UDIA Urban Development Institute of Australia
WSAA Water Services Association of Australia
8 Overview | Sydney Water Annual Report 2015–16| Sydney Water Annual Report 2015

A snapshot of our business
Figure 2: Key statistics, 2015–16
Our network
We buy water from 11 major dams.Our 9 water treatmentplants filtered528,620 millionlitres of drinking water between July 2015 andJune 2016
We manage 243 water reservoirs and 150 water pumping stations
There are 21,784 km of water mains in our area of operations.
We manage 25,355 km of wastewater mains and 677 wastewater pumping stations.
We have 16 wastewater treatment plants. We collected and treated 546,605 million litres of wastewater through 25 wastewater systems1 in the last 12 months
Our area of operationscovers 12,700 sq km across Sydney, the Blue Mountains and the Illawarra.
We recycle 113 million litres of water a day through14 water recycling plants. We have 9 recycled water reservoirs and 10 recycled water pumping stations in service.
Our services
We test the drinking water at 650 homes each month, for more than 70 different water characteristics.
We manage 448 km of stormwater channelsand pipes, providing stormwaterservices to 592,118 properties. We deliver water,
wastewater and some recycled water servicesto 4.9 million customers.1
1. Estimated population serviced by drinking water – 4,910,000 people, serviced by wastewater – 4,798,000 people, serviced by recycled water – 84,000 people. Population data is estimated based on number of residential properties served in the customer billing system, the ABS Estimated Resident Population and the Department of Planning Population Projections, both published in 2014.2. 24 licensed systems with the EPA plus one system (Wilton) serviced by WICA scheme (Bingara Gorge). 3. Population serviced by recycled water refers to Rouse Hill only and is an estimate as at June 2016.
In the last year we supplied water servicesto 1,899,234 properties and wastewater services to 1,851,913 properties.
Between July 2015 andJune 2016 we delivered43,341 million litres of recycled water through 677 kilometres of recycled water mains.
1. 24 licensed systems with the EPA plus one system (Wilton) serviced by the Water Industry Competition Act 2006 (WICA) scheme, (Bingara Gorge).2. Estimated population serviced by drinking water: 4,9100,000; wastewater: 4,798,000; recycled water: 84,000. We estimate population data based
on the number of residential properties serviced according to the customer billing system, the ABS Estimated Resident Population and the Department of Planning Population Projections, both published in 2014. Population serviced by recycled water refers to Rouse Hill only and is an estimate as at June 2016.
Overview
Corporate
governanceC
ustomer at
the heartW
orld class perform
anceH
igh performance
cultureFinancial
statements
Appendixes
8 Overview | Sydney Water Annual Report 2015–16 Sydney Water Annual Report 2015–16 | Overview 9| Sydney Water Annual Report 2015

Our operations
Map 1: Full area of operations
10 Overview | Sydney Water Annual Report 2015–16| Sydney Water Annual Report 2015

Map 2: Water delivery systems
Overview
Corporate
governanceC
ustomer at
the heartW
orld class perform
anceH
igh performance
cultureFinancial
statements
Appendixes
10 Overview | Sydney Water Annual Report 2015–16 Sydney Water Annual Report 2015–16 | Overview 11| Sydney Water Annual Report 2015

Map 3: Wastewater delivery systems
12 Overview | Sydney Water Annual Report 2015–16| Sydney Water Annual Report 2015

Map 4: Stormwater catchment areas
Overview
Corporate
governanceC
ustomer at
the heartW
orld class perform
anceH
igh performance
cultureFinancial
statements
Appendixes
12 Overview | Sydney Water Annual Report 2015–16 Sydney Water Annual Report 2015–16 | Overview 13| Sydney Water Annual Report 2015

The year in review A message from our Chairman and our Managing Director
A successful year of growth, change and engagement
This year has seen many achievements and milestones as we reach the end of the second year of our Lifestream strategy. Our staff have been working together to bring the strategy to life.
Our focus on safety leadership is stronger than ever. We’ve done a lot of good work and have improved our staff safety results. We know there’s still more work to do, as even one injury is one too many. Our task now is to maintain our focus and ensure safety remains a top priority for all staff.
As we transform into a more customer-focused utility, we’re getting better every day at understanding our customers and providing services they value – and it shows. Customer trust in Sydney Water has been moving up steadily, and hit a peak rating of 7.1 out of 10 in February. Our corporate reputation score also peaked at 6.7 in September 2015.
Since our last pricing submission we have worked to become more efficient without compromising the high quality service we offer our customers. We’ve taken advantage of the reduced cost of running our business (thanks to efficiencies in both capital and operational expenditure) and we’re passing the savings on to customers. For the first time in history we’re lowering customers’ bills, with most customers saving about $100 a year on their water bill.
Not surprisingly, this means our customers continue to rate us highly when it comes to providing value for money. We scored 7 out of 10 in recent research results, ahead of other industry benchmarks including those for everyday banking and telecommunications service providers. Over 40% of bill payers rate our value for money as ‘excellent’.
In August 2015, we introduced our 2015–16 Corporate Plan, outlining our commitments, initiatives and targets for the next 12 months. We’re aligning our structure and processes to make sure our business is focused on doing what’s best for our customers and community. There’s significant change on the way, and it will be difficult, but we’re confident we can be successful if we continue to work as one team.
There were some changes to our Executive team this year. We were pleased to welcome Sian Leydon, who leads our Customer, Strategy and Regulation team, and our Chief Information Officer, George Hunt.
We’re connecting with customers and the community.
Our drinking water is world class, just like our city. That’s why we were surprised to learn through our customer research that about 20% of customers don’t drink water straight from the tap because they are concerned about its quality. As a result of this research, we have developed a comprehensive community education and engagement program to help build customer trust in our drinking water, and more broadly in us as an organisation.
Our staff have been connecting with customers through community events, such as the Royal Easter Show and Sculpture by the Sea. As part of a trial volunteer program, staff educated the community about who we are, what we do and why Sydney’s drinking water is the sustainable hydration choice. We will expand the trial volunteer program over the next year.
14 Overview | Sydney Water Annual Report 2015–16| Sydney Water Annual Report 2015

Working with WaterNSW and NSW Health, we have also introduced a comprehensive online drinking water quality report. This report provides unprecedented insight for customers into what happens behind the scenes to supply safe, world class drinking water.
We know our work can impact local communities. As part of becoming a customer-centric business, we’re starting to engage with communities affected by proposed work before we develop our projects, instead of after. We did this in December 2015 when developing our Wet Weather Overflow Abatement Proposal for submission to IPART. We engaged extensively with the community by holding 18 workshops; participating in briefings with government, industry and media; and keeping customers informed through social media.
We’re listening to our customers and delivering services they want, particularly when it comes to interacting with us online. About 44% of customers view our website on a mobile device, so we have been working to make sure our website is responsive on smartphones and tablets as well as desktop computers. Our website is now 99% responsive for smartphone and tablet users. This means a smoother experience for customers who access our website using these devices.
We’re a safe, diverse and engaged workforce
Safety will always be a strong focus for our organisation. In December 2015, all managers took part in a Safety Leadership Challenge and committed to personal safety action plans, which they shared with their teams. Bringing all staff on the safety journey and having real conversations with our people helps reinforce the safety message: that there is no task so important and no service so urgent that we cannot take the time to do it safely.
More staff are reporting hazards and incidents, which helps us identify where people are most likely to be hurt so we can take the necessary mitigating action.
However, about ten people a month are still getting hurt, which we know is ten people too many. We will continue controlling and ultimately eliminating our hazards, while we investigate, learn and implement changes to meet the goal of zero injuries.
Our quarterly Employee Pulse survey tells us what we’re doing well and where we can improve. It measures staff engagement and commitment to change, and how connected staff are to our Corporate Strategy. The latest survey results (taken in June 2016) show that many staff feel our objectives are clear, and they understand how their daily work contributes to meeting these objectives. Most staff also feel proud to work here; from frontline staff who maintain essential services or help our customers with enquiries, to our scientists, engineers, planners and office employees.
We also measure our organisational culture every two years, using an Organisational Culture Inventory (OCI) and an Organisational Effectiveness Inventory (OEI). The OCI maps the culture of the organisation across three behavioural styles: constructive, aggressive-defensive, and passive-defensive. Our latest OCI results show a significant increase in constructive behaviour styles across the organisation since launching our Lifestream strategy in 2014. This is exactly the sort of shift in mindset we need from everyone to achieve our Lifestream vision.
In March 2016, we launched our new Diversity and Inclusion Program. We’re proud to be ahead of the market, with one of the lowest gender pay gaps (3.9% in 2016, compared with the industry average of 8.9%). However, this is still unacceptable, and we’re working to remove the gender pay gap entirely by 2020. We’re investigating a number of initiatives to help us get there, including greater use of flexible work arrangements, reverse mentoring, and targeted leadership programs for women.
We’ve also established a Diversity and Inclusion Advisory Council, made up of 10 passionate, talented staff from across the organisation who are committed to promoting diversity, inclusion and a sustainable workforce.
Overview
Corporate
governanceC
ustomer at
the heartW
orld class perform
anceH
igh performance
cultureFinancial
statements
Appendixes
14 Overview | Sydney Water Annual Report 2015–16 Sydney Water Annual Report 2015–16 | Overview 15| Sydney Water Annual Report 2015

We’re leading the way forward while learning from our past
This year we celebrated 25 years of deep ocean outfalls, which have helped make Sydney’s beaches some of the cleanest in the world. The State of the Beaches report 2014–15 (NSW OEH) shows our beaches have improved dramatically since the first outfall began operating at Malabar in 1990. This improvement is reflected across Sydney and the Illawarra, with 94% of Sydney and 100% of Illawarra swimming sites rated as ‘good’ or ‘very good’.
Sydney doesn’t grow without us, and we support that growth by providing services that enhance our customers’ quality of life while continuing to protect the natural environment. We’ll spend $856 million to provide services for about 138,000 new homes between 2014 and 2019. Almost 90% of this investment is for priority greenfield sites in the North West and South West Growth Centres, Western Sydney and the Illawarra.
In May 2016, we announced an exciting new trial at our Cronulla Wastewater Treatment Plant. We’re using food waste to generate renewable energy, producing more than 60% of the energy the plant needs to run. This will save about 150,000 wheelie bins of fruit and vegetables a year from landfill, and is a great example of Sydney Water connecting with local businesses to develop solutions that benefit the environment and the local community.
While we face the future with excitement, we know we must also protect our assets to ensure security for our business and our customers. As the largest water utility in Australia, we’re leading the industry when it comes to protecting customer data. In 2015–16, we updated our standard for security management from ISO 27001:2005 to ISO/IEC 27001:2013, in recognition of best-practice security controls. This means our customers can trust us to protect their personal information, as well as our water and wastewater networks. We’re investing in reviewing, maintaining and improving how we store data, to ensure our customers continue to trust our organisation.
As is true in any organisation, we have faced our share of challenges this year. Severe storms in December and June tested our systems and our emergency response management, but through strong collaboration and a focus on solutions, our staff worked hard to ensure inconveniences to customers were kept to a minimum.
Sydney Water also entered into an enforceable undertaking with the NSW Environmental Protection Authority (NSW EPA) after a water pollution incident involving an unlicensed discharge of untreated wastewater from a Sydney Water sewer pipe into the Parramatta River at Rydalmere in June 2015. Under this enforceable undertaking we’re contributing $200,000 to City of Parramatta Council for use by the Parramatta River Catchment Group. We will continue to work with the NSW EPA and the community to implement learnings from this incident and prevent similar occurrences in the future.
Looking at the year ahead
Over the next 12 months we will continue implementing our new Operating Model to ensure we have the right fit of people, processes and technology to transform our business and build a truly focused, customer-centric business by 2020. By next year, the organisational structure will be finalised to support and align with this model.
We’re well on our way to building a strong, safe, collaborative workforce, and it’s exciting to think about where we’ll be a year from now. We’re progressing our ‘customer at the heart’ approach and we’re working on a new digital strategy to transform the business, ensuring we put the customer at the heart of everything we do.
Thank you to our staff and the Board for another successful year. The next 12 months will be about embracing the changes that will help us not just face the future, but shape our future.
Bruce Morgan Kevin Young Chairman Managing Director
16 Overview | Sydney Water Annual Report 2015–16| Sydney Water Annual Report 2015

Our performanceThis year’s highlights
Customer at the heart Connecting with customers and the community
Having customers at the heart of everything we do means making decisions with customers in mind. It means connecting with our customers and the communities we work in to listen and understand their needs and expectations. We are focusing what we do and aligning our ways of working to make it easy for customers to connect with us now and as our city grows.
Over the past four years, we have improved customer satisfaction, created efficiencies and ensured bills remain as low as possible. Under IPART’s new pricing determination, customers will now save about $100 a year over the next four years. Over the next regulatory pricing period (2016–2020), we will continue to deliver high quality services while keeping bills down. We’re also focusing on enhanced customer engagement by better aligning services to meet customer expectations and deliver better outcomes.
Last year we introduced our campaign to ‘Keep wipes out of the pipes’, to increase awareness of the growing impact of blockages on our wastewater system and the environment, especially the cost. This year, the result of our work with the community and industry groups is starting to show. We have reached about 15 million people through our innovative media and social media campaigns, and we are starting to see the impact, with 50% fewer Sydney Water customers believing it’s acceptable to flush wipes down the toilet. We’re starting to influence the wipes industry too – a leading manufacturer recently committed to developing clearer product labelling and packaging guidelines. We’re also working with the Water Services Association of Australia (WSAA) to develop standards around these products to help better protect customers and the wastewater system.
The more we get to know our customers, the more we recognise their diversity, and that a ‘one size fits all’ solution to customer service does not work. This year we’ve increased our focus on connecting with customers from a culturally and linguistically diverse (CALD) background and have gained some valuable insights. We engaged with five different CALD communities – Indian, Cantonese, Mandarin, Iranian and Filipino – to better understand how these communities prefer to receive information, and who they trust to provide it. This was also a great opportunity to educate participants about the safety of our drinking water, saving water around their homes, looking after their wastewater systems, paying bills and financial assistance options. We will use what we’ve learned to provide more tailored information and advice, to ensure all of our customers have fair access to our information and services.
Overview
Corporate
governanceC
ustomer at
the heartW
orld class perform
anceH
igh performance
cultureFinancial
statements
Appendixes
16 Overview | Sydney Water Annual Report 2015–16 Sydney Water Annual Report 2015–16 | Overview 17| Sydney Water Annual Report 2015

Using smarter analytics on leak, rebate and water consumption data, we developed a new sophisticated algorithm to proactively identify customers with higher than normal water use – an indicator of potential leaks. We have also developed a proactive customer notification process, so when we find an anomaly in a customer’s water use, we send them a letter and a clear, simple fact sheet to help check for leaks in their homes. To date, we have issued more than 1,200 ‘high-use notification’ letters, which has proactively identified 141 concealed leaks. This is a great outcome for customers, and will potentially reduce the financial burden on some customers facing abnormally high water bills.
We continue to work with river groups, local councils and other stakeholders to improve the health of local waterways. We’re part of the working group for the ‘Our Living River’ initiative to make Parramatta River swimmable again by 2025 – something that hasn’t happened in more than 50 years. Strong collaboration with councils, government agencies and community groups is a key part of making this initiative a success.
In August 2015, we completed our naturalisation work of the Cooks River. We replaced steep, deteriorated, concrete panels with gently sloped riverbanks and stabilised these with sandstone and native plants. This has not only improved the health of the waterway, but has also created an attractive recreational area for the local community.
In September 2015, we announced our sponsorship of Cricket NSW. As the official hydration Partner for Cricket NSW, we’ve been able to educate communities about the many benefits of Sydney’s drinking water over bottled water and sports drinks. The partnership is an Australian first, and has helped us reach and engage with more than 2.2 million people through social media, at matches and community activities to spread the benefits of drinking tap water.
World class performanceConnected to the future
To help us achieve our vision, we must make sure we have the right capabilities and that we run an efficient business that makes good commercial decisions. Through world class performance we’ll deliver great customer outcomes. If our business is in good shape we will continue to be the lifestream of Sydney for generations to come.
We have developed a new online report on drinking water quality, which provides powerful insight into what happens behind the scenes to make drinking water safe. Customers can go online to see where their water comes from, view daily quality results, and learn how we filter and monitor drinking water to ensure it’s safe to drink straight from the tap. This work is an excellent example of Sydney Water staff, NSW Health and Water NSW collaborating to achieve a great outcome for customers. We were also recognised by the World Health Organization, which highlighted how we are leading the way in providing transparent, comprehensive water quality information to our customers every day.
18 Overview | Sydney Water Annual Report 2015–16| Sydney Water Annual Report 2015

We are always looking for ways to reduce our carbon footprint. In the last 12 months we generated 21% of the electricity we used across all our sites. Our Bondi Wastewater Treatment Plant now produces enough renewable energy from waste to power the entire plant. We use cogeneration to convert the biogas (waste methane gas), produced by the plant, into renewable energy. This is not only great for the environment, it also enables us to return 13% of the net energy produced at the Bondi plant back to the grid, and it’s reducing greenhouse gas emissions at our Bondi site alone by over 8,000 tonnes a year.
In May 2015, we launched a three-year trial to produce more renewable energy at our Cronulla Wastewater Treatment Plant – using existing digestion and cogeneration assets to convert over 600 wheelie bins a day of food scraps into electricity. This prevents a huge amount of waste from going to landfill, with Sydney Water and local businesses working together to look outside the square and develop solutions which benefit the environment and the local community.
We’re connecting with public and private sector stakeholders to investigate best-practice opportunities for a water-sensitive approach to urban planning. As part of an interagency water working group, we are reviewing our current approach and looking at integrated water planning. This collaborative approach supports more sustainable, resilient, productive and liveable cities, and will enhance and protect the health of urban waterways while mitigating flood risk. Water-sensitive urban design also provides enhanced public amenities that harvest, clean and recycle water; increase urban biodiversity; and reduce urban ‘heat island’ effects.
In 2015–16, we partnered with the IT industry to consolidate our telecommunications spend, saving money and improving our business. Our voice and data contract will enable us to achieve cost savings year-on-year, and enhance mobile phone management, innovation and corporate network efficiencies.
We realise more and more customers are completing tasks and finding information online. We continue to work on solutions to make it easier for customers to interact with us when and where it suits them. In August 2015, we launched a mobile version of our Supply and Service radar – a regularly updated map showing planned and unplanned water outages in real time. Since the initial launch in April 2015, the map has attracted 81,900 page views (excluding staff views). Over 72% of these were ‘unique’ views and visitors spent an average of 4.41 minutes on the page.
Our social media presence continues to grow. Over the past 12 months, our Facebook followers (people who ‘like’ our Facebook page) have increased on average by about 200 new fans each month. The average business page growth is 80 new fans a month. In April 2016, we also took part in our first live chat, connecting with customers and the community to answer questions about water efficiency and checking for leaks. Our reach and engagement on Twitter and LinkedIn has also increased, with over 1,000 new connections on LinkedIn since the beginning of the year, and steadily increasing ‘impressions’ (the number of people reached) on Twitter. In January 2016, we had 246,000 total impressions, which by July had increased to 408,000.
Overview
Corporate
governanceC
ustomer at
the heartW
orld class perform
anceH
igh performance
cultureFinancial
statements
Appendixes
18 Overview | Sydney Water Annual Report 2015–16 Sydney Water Annual Report 2015–16 | Overview 19| Sydney Water Annual Report 2015

High performance cultureOur connected workforce
To truly be a customer-centric business we need a high performing, customer-focused culture working constructively as one team. We are innovative, and our people are empowered to deliver great customer outcomes. We understand our role as customer ambassadors, no matter what part of the business we work in.
We are maintaining our strong focus on safety and wellbeing, as we know that nothing we deliver is worth it if we hurt ourselves in the process. This year we held the Safety Leadership Challenge to make sure all people managers across the organisation understand our safety performance and to encourage visible safety leadership. All managers have developed personal safety action plans for the next 12 months, to demonstrate and encourage commitment to a safe workplace.
We’ve consulted with staff, management and other utilities to identify the highest potential fatal risks to our people. From this, we developed 16 fatal risk standards as part of our new Work Health and Safety Management System framework. Covering topics such as driving, worker fatigue, confined space and working with electricity, the standards clearly outline the risks, and requirements for managing these risks.
We observed National Safe Work Month in October 2015. Staff were able to attend safety roadshows at various sites, provide feedback on new safety initiatives and share their ideas for improving safety at Sydney Water. This was an excellent opportunity to reaffirm our commitment to working safely together every day.
Staff from our Service Delivery team developed an innovative method to clean wastewater pumping stations using our Integrated Instrumentation Control Automation and Telemetry System (IICATS). Traditionally, crews were regularly required to clean these manually. This was not only expensive, but also a safety risk. The new method eliminates the need to enter the pumping station at all, reduces the need to manually clean it and reduces odour problems and noise concerns. Following a successful trial, we will introduce this method to all 677 wastewater pumping stations, and anticipate savings of more than $1 million a year when fully implemented.
20 Overview | Sydney Water Annual Report 2015–16| Sydney Water Annual Report 2015

We are changing the way we work together, continuing our transformation to a great, customer-centric, world class organisation. We have been too siloed in the past, and our focus on putting the customer at the heart of everything we do means we must be responsive to changing customer expectations, and have the right people and processes in the right place to support our activities. To achieve this, we are revising our operating model.
Our new customer-centric structure is in place from July 2016 and is made up of six groups:
1. Customer, Strategy and Regulation
2. Liveable City Solutions
3. Customer Delivery
4. Finance Services
5. People and Corporate Services
6. Digital Services.
Figure 3: Our new organisation structure (as at 4 July 2016)
Customer at the heart
Live
able
City
Solu
tions Custom
er Delivery
Customer Strategy & Regulatio
n
People & Corporate Services
Finance Services Digita
l Ser
vice
s
Overview
Corporate
governanceC
ustomer at
the heartW
orld class perform
anceH
igh performance
cultureFinancial
statements
Appendixes
20 Overview | Sydney Water Annual Report 2015–16 Sydney Water Annual Report 2015–16 | Overview 21| Sydney Water Annual Report 2015

Our awards and recognition
As an organisation, the work we do spans several industries. The awards listed here recognise our achievements during 2015–16, in fields from innovation in research and training to security performance.
Australian Water Association (AWA) Awards 2016
We won a number of AWA Awards in 2016:
• Our research team, in partnership with other Australian water utilities, universities and international utilities, won the NSW and National AWA Research Innovation Awards for their work on the Advanced Condition Assessment and Pipe Failure Prediction Project.
• Sydney Water graduate Kathryn Silvester, won the NSW and National 2016 Young Water Professional of the Year Award.
• Sally Armstrong, who leads our Customer Direction and Experience team, was a finalist for the Kamal Fernando Mentoring Award – NSW.
• Catherine Port, Manager Product & Service Strategy, won the Award for Best Ozwater Paper and Presentation for her paper ‘A risk-based approach for management and regulation of wet weather overflows’.
National Infrastructure Awards 2016
Sydney Water won the Service Provider Excellence Award category of the Infrastructure Australia Awards for our long-term investment in IICATS.
Australian Red Cross Awards 2016
We were honoured to receive the Australian Red Cross Blood Service’s National Award as the Highest Donation Frequency Organisation with 1,000 – 4,999 staff.
Outstanding Security Performance Awards 2015
Our Security Services team won the Outstanding Security Performance Award 2015 in the In-house Security Team category.
Auscontact Awards 2015
Our Customer Interaction team won the NSW Award for Innovation, recognising the COACH program, a cultural change program that challenges staff to think differently about how they interact with customers and each other.
Stormwater Awards for Excellence 2015
Sydney Water won the Award for Excellence in Integrated Stormwater Design for the Cooks River Naturalisation Project.
LearnX Impact Awards 2015
Our Environmental Accountabilities eLearning module won the Silver Award for Best Bespoke/Custom eLearning module at the 2015 LearnX Impact Awards.
22 Overview | Sydney Water Annual Report 2015–16| Sydney Water Annual Report 2015

Our Corporate Strategy
Our lifestream journey began in mid-2014 with the launch of our new Corporate Strategy, and with it, our three strategic objectives:
• to ensure that our customers are at the heart of everything we do. Our customers trust us to look after our water, wastewater and stormwater services, and they find us easy to deal with and transparent
• to be a world class business. We provide great value while maintaining a high standard of quality. We work with the community and our partners to create a sustainable future together
• to build a high performance culture. Our customers will see us living our values and experience the difference in the way we do things. We will take ownership and own our outcomes.
Since our journey began, we have focused on how we will achieve success over the next five years with one critical element standing out: our customers.
Transforming our business to a customer-centric organisation is what will take us from being a good organisation to a great one, and will help us achieve our vision of being the lifestream of Sydney for generations to come.
Overview
Corporate
governanceC
ustomer at
the heartW
orld class perform
anceH
igh performance
cultureFinancial
statements
Appendixes
22 Overview | Sydney Water Annual Report 2015–16 Sydney Water Annual Report 2015–16 | Overview 23| Sydney Water Annual Report 2015

What we’ve achieved so far
We are on track to reach our target customer experience score of 8.2 by 2020. Customer experience measures help us understand what our customers go through when interacting with us, and what we need to do to make that experience a great one. To help shift this score, we’re engaging with customers and stakeholders to understand the processes that annoy or frustrate them, and what we can do improve. It seems customers are noticing our efforts. Since we first started measuring this in 2007, we have improved from an overall rating of 6.9 to a rating of 7.8 in the last survey.
Our engagement with customers showed that those who call us to report a fault are not always told when that fault is repaired. This can cause frustration and lead to a lack of trust. We have now introduced a simple SMS/email notification process to update customers when a fault they have reported is fixed. This has been very well received by customers.
We incorporated customer preferences for bill stability and control in our proposal for water use prices and our pricing regulator, the Independent Pricing and Regulatory Tribunal (IPART) accepted this change. We will continue to engage our economic regulators and advocate for customer-centric decisions. We will also continue engaging with our customers to understand their preferences – and willingness to pay – for new services.
We’re delivering more for customers while running our business more efficiently. Our modern mobile workforce initiative has cut the cost of delivering ten key Service Delivery tasks by more than 18%. This means we’re getting the right people to the right place, with the right equipment, the first time around.
The new People, Leadership and Culture (PLC) Business Centre, established in March 2016, is allowing us to be more efficient by enabling staff to access human resources and payroll services and advice quickly and easily. The Business Centre has been well received by staff, with 90% of staff very satisfied with their experience.
Our culture is becoming more constructive. Moving from defensive to constructive behaviours means we spend less energy on conflict, negotiation and opposing attitudes, and more energy on improving our systems and processes to provide a better experience for customers. Staff are also showing a stronger connection to the Corporate Strategy and know that our behaviour influences our results.
Our safety performance is improving and fewer people are being injured at work. Our people managers are leading the way, taking part in safety leadership challenges and committing to developing and implementing their own personal safety action plans. In saying that, people are still being injured, and even one injury is too many. We know there is still more work to do to meet our targets.
24 Overview | Sydney Water Annual Report 2015–16| Sydney Water Annual Report 2015

Strategic success measures: Our performance
Our strategic success measures help track the progress we are making towards our strategy and help us understand where to focus our efforts.
We use our four Tier 1 Strategic Success Measures (SSMs) to guide our business through its strategic journey to 2020. These measures focus on customer experience and our corporate reputation, supported by business sustainability, organisational culture and safety.
Table 1: Tier 1 SSM performance, 2015–16
Strategic theme Metric Actual result2015–16 target 2020 target
Customer trust Corporate reputation score
6.6/10 6.5/10 7/10
Customer experience Customer experience score
7.8/10 7.8/10 8.2/10
Business sustainability Strategic value add $11.7 billion > $11.4 billion Year-on-year increase
Organisational culture Constructive styles 32.25% 31% 51%
Passive-aggressive/ defensive styles
56.63% 54% 34%
Customer trust
Our corporate reputation continues to build, increasing from 4.5/10 to a new high of 6.7 in the third quarter of 2015–16. We are closing the gap on the banks, mobile service providers and Australia Post.
Customer experience
After three years of flat performance, customer experience has shown a slight uplift for 2015–16. This must be viewed in the context of a change in data collection methods for the last quarter of 2015–16, from telephone to online surveys. The actual result for the June 2016 quarter was 7.9 using the new data collection method. The result of 7.8 was determined by replicating the telephone surveys previously used.
Overview
Corporate
governanceC
ustomer at
the heartW
orld class perform
anceH
igh performance
cultureFinancial
statements
Appendixes
24 Overview | Sydney Water Annual Report 2015–16 Sydney Water Annual Report 2015–16 | Overview 25| Sydney Water Annual Report 2015

Business sustainability
• Based on the 2016–17 Statement of Corporate Intent (SCI), enterprise value (excluding terminal value) forecast is $11.7 billion, an increase of $300m over last year’s enterprise value calculation of $11.4 billion.
• Valuation is preliminary and indicative, pending actual results for 2015–16 being completed and rolled over into the 2016–17 SCI.
• We attribute the increase in value to investments in cash flow generating assets during 2015–16.
Organisational culture
• We have exceeded the target for an increase in constructive behaviour styles. We also reduced passive-defensive and aggressive-defensive styles. While these decreases did not meet our targets, we are progressing well.
• The culture foundations program has enabled substantial progress on people aspects of our culture. We continue to address systemic levers of cultural change such as decision-making structures, policy and processes.
• In 2015–16, 74% of staff attended workshops to debrief the 2015 culture results and build an understanding of cultural outcomes at individual, team and organisational levels.
26 Overview | Sydney Water Annual Report 2015–16| Sydney Water Annual Report 2015

Financial highlightsFigure 4: Our total income – $2.8 billion
Service charges (50%) $1,422m
Usage charges (42%)$1,197m
Capital contributions (5%)$152m
Other income (3%)$73m
50%42%
3%
5%
Our total income for 2015–16 was $2.8 billion. We received higher income due to IPART – determined price rises for service and usage charges in 2015–16.
Figure 5: Our total operating expenditure – $1.4 billion
Staff costs (27%)$362m
Bulk water and filtration (38%)$514m
Service contractors (20%)$278m
Electricity (3%)$38m
Property and transport (2%) $24m
Other expenses (7%)$102m
Materials (3%)$39m
27%
38%
20%
3%3%2%7%
Our total operating expenditure for 2015–16 was $1.4 billion, $34 million higher than in 2014–15. Wages and other cost escalations were partly offset by ongoing efficiencies.
Overview
Corporate
governanceC
ustomer at
the heartW
orld class perform
anceH
igh performance
cultureFinancial
statements
Appendixes
26 Overview | Sydney Water Annual Report 2015–16 Sydney Water Annual Report 2015–16 | Overview 27| Sydney Water Annual Report 2015

Figure 6: Our total asset investment – $681 million
Business efficiency (10%)$69m
Renewals (52%)$353m
Reliability (3%)$24m
Mandatory standards (4%)$26m
Government programs (2%)$16m
Growth (29%)$195m
52%
10%
29%
3%
2%
4%
In 2015–16 we invested in:
• replacing or rehabilitating water and wastewater pipelines
• renewing water and wastewater treatment plants
• providing for growth in existing areas and the north-west and south-west of Sydney.
Figure 7: Our profit after tax – $548 million
$ m
illio
n
600
500
0
100
200
300
2011–12 2012–13 2013–14 2014–15 2015–16
400
Our profit after tax for 2015–16 was $548 million, $35 million higher than in 2014–15. This was due to the higher income we made from service and usage charges ($99 million higher than in 2014–15), but was partly offset by higher asset charges ($23 million higher than in 2014–15) and the increased income tax expense ($19 million higher than in 2014–15).
28 Overview | Sydney Water Annual Report 2015–16| Sydney Water Annual Report 2015

Figure 8: Our historical capital expenditure
$ m
illio
n
700
600
500
0
100
200
300
2011–12 2012–13 2013–14 2014–15 2015–16
400
Our capital investment program for 2015–16 included continued major investments in core water and wastewater assets, to ensure reliability and growth. Total capital expenditure over the past five years has focused on core investment, such as renewals and to provide for growth.
Figure 9: Our debt and gearing
7,000
8,000
6,000
$0
2,000
1,000
3,000
4,000
Total debt ($m)
5,000
Gearing %
$ m
illio
n
2011–12 2012–13 2013–14 2014–15 2015–1640%
41%
42%
43%
44%
45%
46%
47%
48%
49%
50%
Debt increased by around $620 million in 2015–16 to assist in funding new capital investment. Our gearing (debt divided by debt plus equity) remained relatively flat in 2015–16, with increased system asset values offsetting the increased debt.
Overview
Corporate
governanceC
ustomer at
the heartW
orld class perform
anceH
igh performance
cultureFinancial
statements
Appendixes
28 Overview | Sydney Water Annual Report 2015–16 Sydney Water Annual Report 2015–16 | Overview 29| Sydney Water Annual Report 2015

Table 2: Summary profit and loss*
2011–12 $m
2012–13 $m
2013–14 $m
2014–15 $m
2015–16 $m
Total income 2,671 2,521 2,615 2,728 2,844
Operating expenses 1,204 1,343 1,301 1,324 1,357
Earnings before interest, tax, depreciation and amortisation
1,467 1,178 1,314 1,404 1,487
Depreciation, amortisation and impairments
298 245 261 252 276
Interest expense 557 398 414 422 428
Profit before tax 612 536 640 730 783
Taxation expense 245 163 175 216 235
Profit after tax 367 372 464 513 548
Dividend payable 242 291 252 664 389
* All figures are rounded to whole dollars million. All figures before 2012–13 represent the Consolidated Group. All subsidiaries are now divested.
Earnings before interest, tax, depreciation and amortisation were almost $1.5 billion. This was $83 million higher than in 2014–15 due to higher income from IPART-determined price rises.
Depreciation, amortisation and impairments were $276 million. This was $24 million higher than in 2014–15, due to higher depreciation on the larger system asset base and more losses on asset disposals.
Interest expense was $428 million. This was $6 million higher than in 2014–15, with the impact of a higher government guarantee fee largely offset by transferring more interest costs to capital.
Tax expense for the year was $235 million. This was $19 million higher than in 2014–15, in line with the higher profit result.
The dividend payable of $389 million is lower than the $664 million target in the 2015–16 Statement of Corporate Intent (SCI) and reflects changed shareholder expectations.
Table 3: Summary balance sheet*
2011–12 $m
2012–13 $m
2013–14 $m
2014–15 $m
2015–16 $m
Property, plant and equipment 13,450 13,949 14,635 15,471 17,333
Other assets 567 502 483 475 514
Total assets 14,017 14,451 15,118 15,946 17,647
Total debt 5,412 5,866 6,059 6,160 6,779
Other liabilities 2,673 2,620 2,665 3,319 3,869
Total liabilities 8,085 8,486 8,724 9,479 10,648
Net assets/equity 5,932 5,965 6,394 6,467 6,998
* All figures are rounded to whole dollars million. All figures before 2013–14 represent the Consolidated Group. All subsidiaries are now divested.
30 Overview | Sydney Water Annual Report 2015–16| Sydney Water Annual Report 2015

Total assets were valued at $17.6 billion, $1.7 billion higher than in 2014–15. This was driven by capital expenditure on renewing existing assets and adding new assets, together with the year-end uplift in system assets to ‘fair value’.
Total liabilities were $10.6 billion. This was $1.2 billion higher than in 2014–15, due to additional borrowings, higher finance lease liabilities and higher defined benefit superannuation liabilities.
Table 4: Summary cash flow*
2011–12 $m
2012–13 $m
2013–14 $m
2014–15 $m
2015–16 $m
Sources
Receipts from operations 2,231 2,405 2,477 2,520 2,614
Grants, interest, community service obligations and other operational receipts
182 155 172 165 167
Borrowings 610 440 174 89 601
Other receipts 2,223 26 92 102 113
Total sources 5,246 3,026 2,915 2,876 3,495
Uses
Operational expense payments 1,328 1,405 1,443 1,431 1,454
Capital expenditure payments 666 593 527 588 662
Dividends paid 230 368 291 252 664
Income tax paid 92 181 188 149 239
Interest paid 557 464 449 436 456
Borrowing reduction and other payments
2,413 17 17 18 21
Total uses 5,286 3,028 2,915 2,874 3,495
Increase (decrease) in cash (41) (2) 0 2 0
* All figures are rounded to whole dollars million. All figures before 2013–14 represent the Consolidated Group. All subsidiaries are now divested. Interest paid includes the government guarantee fee and capital expenditure payments include payments for intangibles.
Cash receipts from operations in 2015–16 were $2.6 billion ($96 million higher than in 2014–15). This increased because of IPART-determined price increases. Total cash inflows were $3.5 billion ($619 million more than in 2014–15) including increased borrowings.
Cash used for operational purposes in 2015–16 was $1.5 billion. This was just $23 million higher than in 2014–15, in line with cost containment.
A total of $662 million was used to fund the asset investment program.
Total interest paid includes interest and the government guarantee fee paid on Sydney Water’s borrowings. Total interest paid was $456 million ($20 million higher than in 2014–15) due to higher total debt.
We paid a dividend of $664 million to the NSW Government in 2015–16, which reflected the target in the 2015–16 Statement of Corporate Intent (SCI).
Overview
Corporate
governanceC
ustomer at
the heartW
orld class perform
anceH
igh performance
cultureFinancial
statements
Appendixes
30 Overview | Sydney Water Annual Report 2015–16 Sydney Water Annual Report 2015–16 | Overview 31| Sydney Water Annual Report 2015

Balanced sustainability scorecard
In this scorecard, we assess progress against our sustainability indicators each year, and reflect the results in the summary statements and ratings for a range of performance areas. We include performance data and commentary on the sustainability indicators in this report.
Sustainability indicator key
Expectations met or exceeded Indicators show a positive long-term trend towards the goal.
Areas to improve Indicators show mixed results, with positive trends for some and negative trends for others.
Action required Indicators show a negative long-term trend towards the goal.
– Not applicable Performance not reported.
Table 5: Customer at the heart – balanced sustainability scorecard
Customer at the heart – performance summary
Progress rating
2013
–14
2014
–15
2015
–16
Customer satisfaction: Customers have a positive view of the overall quality of service we deliver. We aim to resolve customer enquiries and complaints quickly, efficiently and to the customer’s satisfaction.
Social assistance: We continued to support customers in need by providing flexible payment arrangements and tailored assistance for customers experiencing financial hardship.
Service quality and system performance: We maintained high levels of water and wastewater system performance and met licence targets.
Water efficiency: Our water efficiency initiatives saved more than 43 billion litres of water in 2015–16. We are continuing to implement a range of cost-effective water efficiency, leak management and recycled water programs that meet individual customer needs.
Water drawn: Customers are still using water efficiently, maintaining historically low levels of total water use following drought restrictions. Our customers have adopted water-efficient practices as part of their everyday life.
Water quality: We continue to supply our customers with safe drinking water that complies with the requirements of the Australian Drinking Water Guidelines 2011 to the satisfaction of NSW Health.
32 Overview | Sydney Water Annual Report 2015–16| Sydney Water Annual Report 2015

Table 6: World class performance – balanced sustainability scorecard
World class performance – performance summary
Progress rating
2013
–14
2014
–15
2015
–16
Profitability: Profitability was above target due to higher income from water use, assets received free of charge and lower operating costs. This was driven mostly by lower contractor costs, and lower borrowing costs due to lower interest rates.
Debt servicing: We managed our borrowing costs better. This was due to a combination of higher income, lower costs and lower interest charges.
Return on assets and equity: Our return on assets and equity was marginally higher than the target. This was due to a combination of higher income from water use and developers, and operating cost efficiencies.
Infrastructure management: We continue to invest in programs to renew, rehabilitate and maintain our infrastructure to reliably deliver essential services.
Recycled water: We support 23 recycled water schemes that provide recycled water for use in homes and businesses, and to irrigate parks, farms and playing fields.
Wastewater treatment system discharges: We met licence requirements to help protect the local environment and public health.
Water leakage: We manage leaks by proactively finding concealed leaks; maintaining fast response times to reported leaks and breaks; and renewing water mains, saving more than 30 billion litres of water each year.
Trade waste agreements: We managed trade waste agreements to meet wastewater discharge limits and ensure biosolids met required standards.
Environmental compliance: We received two penalty notices from the EPA during the reporting period, for dry weather overflows that occurred at Cronulla and Bardwell Creek. The EPA also accepted our proposal for an enforceable undertaking relating to an effluent leak into the Parramatta River at Rydalmere. No proceedings or penalty notices were issued to Sydney Water contractors during 2015–16.
Heritage compliance: We have detailed processes in place to identify risks to Aboriginal and built heritage sites from operational, maintenance and construction activities. We introduced this indicator in 2015–16.
– –
Environmental footprint: Our full supply chain carbon footprint and ecological footprint remained stable in 2014–15. Data for 2015–16 was not available in time for publication of this report.
–
Overview
Corporate
governanceC
ustomer at
the heartW
orld class perform
anceH
igh performance
cultureFinancial
statements
Appendixes
32 Overview | Sydney Water Annual Report 2015–16 Sydney Water Annual Report 2015–16 | Overview 33| Sydney Water Annual Report 2015

World class performance – performance summary
Progress rating
2013
–14
2014
–15
2015
–16
Energy use and greenhouse gas emissions: We surrendered the last of our bank of NSW Greenhouse Gas Abatement Certificates in 2015–16, increasing net greenhouse gas emissions. However, our gross greenhouse gas emissions decreased by 7.2%. Our energy generation was equivalent to 21% of electricity used, which is our highest energy generation to date.
Environmental performance monitoring: Long-term monitoring results show that water quality and ecosystem health of inland and coastal waterways are being maintained.
Flora and fauna: We revegetated disturbed land, resulting in a net cumulative gain of 15.97 hectares of native vegetation over the last five years.
By-products: We continued to meet our target of beneficially using 100% of the biosolids we generate.
Waste reduction: Our overall recycling rate fell to 71% largely due to an increase in construction and demolition waste sent to landfill by our contractors. We’ll continue to work with our contract partners to divert as much material from landfill as possible.
Table 7: High performance culture – balanced sustainability scorecard
High performance culture – performance summary
Progress rating20
13–1
4
2014
–15
2015
–16
Safety: We are very pleased with our steps forward in relation to safety and wellbeing. We have improved our safety performance in 2015–16. Our Lost Time Injury Frequency Rate (LTIFR) decreased by 42% for our staff and 25% for our contractors, compared to 2014–15. We introduced a new indicator, the Total Recordable Injury Frequency Rate (TRIFR) in 2015–16. We must continue to focus on delivering our Safe and Wellbeing Strategy to further improve our performance in this area.
Diversity: We are committed to building a diverse and inclusive workforce that supports our strategic aspirations, reflects our values and is reinforced through our signature behaviours.
– –
Capability: We provide diverse training programs and professional development opportunities to help improve staff skills and knowledge. We continue to receive a high number of applications for our entry-level programs.
Staff engagement: Employee engagement was consistently above target throughout 2015–16.
– –
34 Overview | Sydney Water Annual Report 2015–16| Sydney Water Annual Report 2015

2.Corporate governance

The Sydney Water Board and Executive are committed to conducting the business of Sydney Water in accordance with the highest standards of corporate governance and in the best interests of our Shareholders.
Our Corporate Governance Framework
The Board and Executive believe good corporate governance is essential to being a high performing organisation with a sustainable future. Our governance framework helps us:
• deliver the outcomes our Shareholders expect
• support our people and business operations
• set the framework for sound ethical, financial and risk management practices, and effective compliance and auditing programs.
The Sydney Water Board adopts the Australian Institute of Company Directors (AICD) Corporate Governance Framework which outlines the practices of good corporate governance across four major quadrants of focus and engagement.
Figure 10: AICD Corporate Governance Framework
Board
Stakeholder
Individual
Organisational
The framework serves as a basis for measuring and comparing the activities of the Board and management against the best practices of corporate governance. It is also used as part of the Board’s performance assessment process as outlined in the Board Charter.
The framework aligns with the ASX Corporate Governance Principles and Recommendations (3rd Edition) and the NSW Audit Office Governance Lighthouse Model.
Board of Directors
In line with the Sydney Water Act 1994 (NSW), the State Owned Corporations Act 1989 (NSW) and the Constitution of Sydney Water, the Board consists of a Chairperson and up to nine other Directors appointed by the Shareholders. The Chief Executive Officer may be appointed as a Director, and if so is known as the Managing Director.
All members of the Board except the Managing Director are appointed for terms of up to five years, and Shareholders may renew appointments. The Portfolio Minister advertises publicly for nominations for Board members. Each Non-Executive Director’s remuneration is set by the Shareholders and paid by Sydney Water.
36 Corporate governance | Sydney Water Annual Report 2015–16| Sydney Water Annual Report 2015

The Board’s role and responsibilities
The Board is responsible for the corporate governance of Sydney Water. This includes:
• setting the strategic direction
• establishing performance targets as set out in the Statement of Corporate Intent
• monitoring the achievement of those targets.
The Board’s role is to govern Sydney Water rather than manage it. The Directors must act in the best interests of Sydney Water and its Shareholders at all times, according to governing legislation.
The Board serves the interests of the Shareholders, staff, suppliers, customers and the broader community, honestly, fairly and diligently. It delegates responsibility to the Managing Director for implementing the strategic direction and managing Sydney Water’s day-to-day operations. The Board of Directors operates according to its Board Charter, which complements the Constitution and the Board’s Code of Conduct.
Board Committees
The Board has established Committees under Article 19.11 of Sydney Water’s Constitution to provide strategic guidance to Sydney Water. The Board Committees in 2015–16 are:
• Audit and Risk.
• Corporate Governance.
• Environment and Health.
• Finance and Asset Strategy.
• People and Remuneration.
• Safety and Wellbeing.
• Nominations.
Figure 11: Sydney Water’s governance structure
Oversight through reporting
Corporate Secretary
Delegation
Accountability
Accountability
Delegation
Delegation
Board
Executive
ManagingDirector
People andRemuneration
Audit and Risk
Safety andWellbeing
CorporateGovernance
Nominations
Environment and Health
Finance andAsset Strategy
36 Corporate governance | Sydney Water Annual Report 2015–16 Sydney Water Annual Report 2015–16 | Corporate governance 37
Overview
Co
rpo
rate govern
ance
Custom
er at the heart
World class
performance
High perform
ance culture
Financial statem
entsA
ppendixes
| Sydney Water Annual Report 2015

Board skills matrix
The Board considers that its membership should comprise Directors with a broad range of skills, expertise, and experience from a diverse range of backgrounds. The Board recently completed a skill set assessment process, which involved developing a Board skills matrix to identify desired skills, knowledge, experience and capabilities, agreeing on the level of competency required and how the current Board composition meets these requirements. This matrix enables the Board Nominations Committee to determine how the Sydney Water Board is currently constituted and also how it should be constituted in the future to align with our Corporate Strategy.
The Board skills matrix is set out below.
Table 8: Board of Directors skills matrix
Skill set Target number of Directors at desired
specialist level of competency Status
Commercial/Business experience and acumen
2
Engineering and Safety 2
Health 1
Environment 1
Financial Literacy 2
Strategy Development and Implementation
3
Corporate Governance 2
Risk Management 2
Law 1
Information Technology 1
Government/State Owned Corporations
2
Capital markets/investments 1
Public affairs/economic reputation
2
It is not expected that all Directors will have specialist skills in all areas. Rather, the Board as a whole should have the necessary skills. The collective skills and experience of the Board of Directors, as shown above, enables the strong and effective corporate governance of Sydney Water.
Performance indicator key
Target met
Target not met
38 Corporate governance | Sydney Water Annual Report 2015–16| Sydney Water Annual Report 2015

Sydney Water Board Directors
Bruce Morgan ChairmanBComm, FCA, FAICD
Appointment term:
Director: 1 January 2012 to 31 December 2014
Chairman: 1 October 2013 to 30 September 2016
Chairman: 1 October 2016 to 30 September 2019
Committees
• Chair of the People and Remuneration Committee, and the Nominations Committee.
Current Directorships
• Director of the Origin Energy, Caltex Australia Limited, the European Australian Business Council, the University of NSW Foundation, and Redkite.
Bruce is Chairman of Sydney Water (since 2013, previously a Director from January 2012) and was reappointed for a further three years from 1 October 2016 to 30 September 2019. He is also Chairman of Redkite (elected on April 2015). He is a Director of Caltex Australia Ltd (since June 2013), Origin Energy Ltd (since November 2012), the European Australian Business Council and University of NSW Foundation.
Bruce’s career was in professional services, having been a partner with the leading global firm PricewaterhouseCoopers (PwC) for over 25 years. Bruce served as Chairman of the Australian PwC Board for six years until 2012 and was a member of the PwC International Board for four years. He previously held roles as managing partner of the PwC’s Sydney and Brisbane offices. Bruce practised as an audit partner focused on the financial services, energy and mining sectors. He retired as a partner of PwC in October 2012.
Bruce holds a Bachelor of Commerce (Accounting and Finance) from the University of NSW. He is a Fellow of Chartered Accountants Australia and New Zealand and of the Australian Institute of Company Directors.
38 Corporate governance | Sydney Water Annual Report 2015–16 Sydney Water Annual Report 2015–16 | Corporate governance 39
Overview
Co
rpo
rate govern
ance
Custom
er at the heart
World class
performance
High perform
ance culture
Financial statem
entsA
ppendixes
| Sydney Water Annual Report 2015

Kevin Young Managing DirectorBEng (Hons), MBA, FIE Aust, CPENG, FAICD
Appointment term:
1 August 2011 to a term equivalent to his appointment as Managing Director of Sydney Water. Kevin was reappointed as Managing Director on 1 August 2016.
All committees
• Member of all Sydney Water Board Committees.
Current Directorships
• Chairman of the Water Services Association of Australia (WSAA) Utility Excellence Committee.
• Director of WaterAid Australia
Kevin has over 30 years’ experience working for the private sector and government authorities within Australia and overseas.
Kevin was previously the Managing Director of Hunter Water and a Director of Hunter Water Australia Pty Limited.
Kevin was previously Chairman of the Water Services Association of Australia (WSAA) whose members serve over 17 million Australians every day with water and wastewater services. Kevin is currently Chairman of WSAA’s Utility Excellence Committee.
Kevin has a Civil Engineering degree with Honours from the University of Newcastle and a Master of Business Administration. Kevin is a Fellow of the Institution of Engineers Australia and a Fellow of the Australian Institute of Company Directors. For the last four years he has been selected in Australia’s top 100 influential engineers, as determined by the Institution of Engineers Australia.
40 Corporate governance | Sydney Water Annual Report 2015–16| Sydney Water Annual Report 2015

Appointment term:
1 January 2013 to 31 December 2015
1 January 2016 to 31 December 2018
Dr Abby Bloom BA (High Hons), MPH, PhD, FAICD
Committees
• Chair of the Environment and Health Committee.
• Member of the Finance and Asset Strategy Committee, the People and Remuneration Committee, and the Nominations Committee.
Current Directorships
• Director of the Western Sydney Local Health District.
• Member of the NSW Ministerial Advisory Committee on Ageing, and the Griffith University Enterprise Advisory Board.
Abby is an experienced company director and former senior executive and corporate advisor specialising in healthcare and health financing, water and wastewater, and ageing. During 10 years in the US Department of State, Abby was the Senior Health, Water and Sanitation Policy Advisor responsible for US foreign aid water and health policy globally.
She has worked in Australia, the USA and more than 20 emerging economies as a consultant and project manager in health reform and infrastructure. She is also the founder of three medical device companies, including a biomedical flow control technology company.
A graduate of Yale and Sydney universities, Abby is also Adjunct Professor, Sydney Medical School, Menzies Centre for Health Policy.
40 Corporate governance | Sydney Water Annual Report 2015–16 Sydney Water Annual Report 2015–16 | Corporate governance 41
Overview
Co
rpo
rate govern
ance
Custom
er at the heart
World class
performance
High perform
ance culture
Financial statem
entsA
ppendixes
| Sydney Water Annual Report 2015

Appointment term:
10 February 2014 to 9 February 2017
Trevor Bourne BSc.(Mech. Eng.), MBA, FAICD
Committees
• Chair of the Safety and Wellbeing Committee.
• Member of the People and Remuneration Committee, the Finance and Asset Strategy Committee, and the Nominations Committee.
Current Directorships
• Director of Caltex Australia (Chairman of the Occupational Health and Safety Committee, and member of the Audit and Remuneration Committee).
• Chairman of Senex Energy Ltd.
Trevor is a highly experienced non-executive Director having served on public and private company boards in Australia and Asia for more than 15 years.
Trevor recently retired from the board of Origin Energy after 12 years, having served through the substantial growth period following the demerger from Boral.
At Origin he chaired the Remuneration Committee and was a member of the Audit and Safety Committees.
Trevor’s executive career included 15 years at BHP, eight years with the then Orica subsidiary Incitec and 15 years with Brambles – the last six of which as Managing Director of Australasia.
Trevor has an extensive background in manufacturing, logistics, engineering and large-scale project management. He holds a Mechanical Engineering degree (University of NSW), an MBA, and is a Fellow of the Australian Institute of Company Directors.
42 Corporate governance | Sydney Water Annual Report 2015–16| Sydney Water Annual Report 2015

Appointment term:
1 June 2012 to 31 May 2015
1 June 2015 to 31 May 2018
Dr Diana Day BA (Hons), DipEd, PhD, FAICD
Committees
• Member of the Environment and Health Committee, the Finance and Asset Strategy Committee, the Safety and Wellbeing Committee, and the Nominations Committee.
Diana is an experienced independent company director of federal and state statutory authorities, businesses, universities and not-for-profit boards. As a physical and social scientist and educator, she has held senior academic and public sector roles in water and environmental management. In these roles she worked on addressing water quality and security challenges in power development, mining, rural, riverine and metropolitan contexts.
Diana has been a director of the Murray-Darling Basin Authority, the Commonwealth Research Centre for Irrigation Futures, Meat and Livestock Australia Ltd, the Fisheries Research and Development Corporation and the Australian Maritime College. She was formerly Associate Professor in Indigenous Education at the University of Sydney.
Diana is Adjunct Professor at the University of NSW Global Water Institute. She is also an independent career and business coach and consultant for executives, managers and professionals and a member of the Australian Institute of Company Directors Coach and Mentor Connect program. She holds a First-Class Honours Degree (Geography) and Diploma in Education from the University of Newcastle NSW, where she also served as University Council Member and Director of the Centre for Environmental Management.
Diana holds a Doctorate in the fluvial geomorphology and hydrology of drainage systems from the University of New England, NSW where she undertook post-doctoral research into run-off generation and monitoring of erosion and sedimentation using environmental isotopes such as Caesium-137, a universal fallout product of atmospheric nuclear weapons testing. Diana has been published extensively in the international and national literature.
42 Corporate governance | Sydney Water Annual Report 2015–16 Sydney Water Annual Report 2015–16 | Corporate governance 43
Overview
Co
rpo
rate govern
ance
Custom
er at the heart
World class
performance
High perform
ance culture
Financial statem
entsA
ppendixes
| Sydney Water Annual Report 2015

Appointment term:
10 February 2014 to 9 February 2017
Dr Marlene Kanga AM B.Tech. M.Sc., Ph.D, Hon. FIEAust, Hon.FIChemE FTSE, FAICD
Committees
• Member of the Audit and Risk Committee, the Corporate Governance Committee, the Safety and Wellbeing Committee, and the Nominations Committee.
Current Directorships
• Member of the Board of Innovation Australia and Chair of the Board’s Research & Development (R&D) Incentives Committee, the largest government support program for industry R&D in Australia.
• President Elect and Executive Board Member of the World Federation of Engineering Organisations.
• Founder of a company providing risk engineering services and co-founder of a software company in intelligent video analytics.
Marlene is an experienced business leader and company director in the process industry. She has more than 30 years’ experience in safety and risk engineering in Australia and New Zealand. Marlene has extensive experience in advising public and private corporations in the area of safety, risk management and corporate governance. Marlene holds degrees in chemical engineering from the Indian Institute of Technology Bombay and Imperial College, University of London and a doctorate in Finance from Macquarie University. She is a Fellow of the Academy of Technology, Science and Engineering, an Honorary Fellow of the Institution of Engineers Australia, an Honorary Fellow of the Institution of Chemical Engineers (UK), and a Fellow of the Australian Institute of Company Directors.
44 Corporate governance | Sydney Water Annual Report 2015–16| Sydney Water Annual Report 2015

Appointment term:
15 September 2014 to 14 September 2017
Paul Leaming B.Bus, FCPA
Committees
• Chair of the Finance and Asset Strategy Committee.
• Member of the Audit and Risk Committee, the Corporate Governance Committee and the Nominations Committee.
Current Directorships
• Director of the AMP Foundation Limited.
• Director of the Newcastle Jockey Club.
Paul has had an extensive executive career spanning 30 years in financial services. Paul held the role of Chief Financial Officer at AMP Limited and before that, served as Chief Financial Officer and in other senior finance roles at Macquarie Bank Limited. He retired from AMP Limited in December 2011.
44 Corporate governance | Sydney Water Annual Report 2015–16 Sydney Water Annual Report 2015–16 | Corporate governance 45
Overview
Co
rpo
rate govern
ance
Custom
er at the heart
World class
performance
High perform
ance culture
Financial statem
entsA
ppendixes
| Sydney Water Annual Report 2015

Appointment term:
1 January 2012 to 31 December 2014
1 July 2015 to 1 July 2018
Richard Fisher AM MEc, LLB, MAICD
Committees
• Chair of the Corporate Governance Committee.
• Member of the Audit and Risk Committee, the People and Remuneration Committee, and the Nominations Committee.
Current Directorships
• Chairman of InvoCare.
Richard is General Counsel of the University of Sydney, and an Adjunct Professor in its Faculty of Law. Richard was Chairman of Partners at Blake Dawson (now Ashurst). He specialised in corporate law during his 25 years as partner at that firm.
He has been a director of InvoCare since 2003 and was appointed its Chairman in 2013. He is a former part-time Commissioner of the Australian Law Reform Commission and was an international consultant for the Asian Development Bank.
Richard was a member of the Library Council of NSW from 2004 to 2013. Richard holds a Master of Economics from the University of New England and a Bachelor of Law from the University of Sydney.
46 Corporate governance | Sydney Water Annual Report 2015–16| Sydney Water Annual Report 2015

Appointment term:
13 August 2013 to 24 March 20161
Anne McDonald B.Ec, FCA, FAICD
Committees
• Chair of the Audit and Risk Committee.
• Member of the Environment and Health Committee, and the Corporate Governance Committee.
Anne is an experienced company director. She has over 30 years of broad-based business and financial experience, gained through working with a wide cross-section of international and local companies, assisting them with audit, transaction due diligence, regulatory and accounting requirements.
Anne resigned as a member of the Sydney Water Board in March 2016 to accept the role of Chair of WaterNSW. She is currently a director of the GPT Group, Spark Infrastructure, Specialty Fashion Group Limited and Westpac Bank’s Life and General Insurance businesses. Anne also provides an advisory role to the Norton Rose Fulbright Australian Partnership Council.
Before pursuing a full time career as a non-executive director, Anne was a Partner of Ernst & Young for 15 years until 2005, and during that time served as a Board Member of Ernst & Young Australia for seven years.
Anne holds a Bachelor of Economics from the University of Sydney, is a Fellow of the Institute of Chartered Accountants and a graduate of the Australian Institute of Company Directors.
1 Resigned on 24 March 2016 to accept the role of Chair of WaterNSW
46 Corporate governance | Sydney Water Annual Report 2015–16 Sydney Water Annual Report 2015–16 | Corporate governance 47
Overview
Co
rpo
rate govern
ance
Custom
er at the heart
World class
performance
High perform
ance culture
Financial statem
entsA
ppendixes
| Sydney Water Annual Report 2015

Board meetings
The Board meets monthly, except in January and June. Meetings are held in line with Sydney Water’s Constitution, following an annual schedule of set meeting dates and additional meetings called when the Directors see fit.
Table 9: Attendance at Board and Committee meetings 2015–16
Director Board of Directors Meeting
Attended (number
held)2
Audit and Risk
Committee
Attended (number
held)
Corporate Governance Committee
Attended (number
held)
Environment and Health Committee
Attended (number
held)
Finance and Asset
Strategy Committee
Attended (number
held)
People and Remuneration
Committee
Attended (number
held)
Safety and Wellbeing
Committee
Attended (number
held)
Nominations Committee
Attended (number
held)
B Morgan (C) 10 (11) (C) 5 (5) (C) 3 (3)
A Bloom 11 (11) (C) 4 (4) 4 (4) 5 (5) 2 (2)3
T Bourne 11 (11) 2(4) 5 (5) (C) 4 (4) 3 (3)
D Day 8 (10) 4 (4) 4 (4) 4 (4) 3 (3)
R Fisher (C) 10 (11)4 7 (7) (C) 4 (4) 3 (5) (C) 3 (3)5
M Kanga 10 (10) 7 (7) 3 (4) 4 (4) 2 (3)
A McDonald6 7 (7) (C) 6 (6) 1 (3) 3 (3) 2 (2)6
P Leaming 9 (10) (C) 6 (7)7 4 (4) (C) 4 (4) 3 (3)
K Young 11 (11) 7 (7) 4 (4) 4 (4) 4 (4) 5 (5) 4 (4) 3 (3)
(C) stands for Chairperson for Board or Committee meeting
2 The Board completed a strategy session with the Executive on 21 July 2015. This session is not counted as a Directors’ meeting. There was a special meeting of the Board on 19 November 2015, which was called without notice. Directors who were available, due to the People & Remuneration Committee meeting held on the same day, were invited to attend.
3 Dr Abby Bloom had a material conflict of interest for the 21 July 2015 Nominations Committee meeting, so was not invited to participate.
4 Mr Fisher chaired the Board meeting on 25 May 2016 as Mr Morgan was an apology.
5 Mr Fisher chaired the Nominations Committee meeting on 24 February 2016, as Mr Morgan had a material conflict of interest.
6 Ms Anne McDonald resigned as a Director on 24 March 2016.
7 Mr Paul Leaming chaired the Audit & Risk Committee meeting on 18 May 2016.
Managing conflicts of interest
To safeguard their independent status, all Directors are subject to the statutory duties and responsibilities regarding conflicts of interest. The Corporate Secretary maintains the Register of Disclosures, which is reviewed annually to ensure our information is up to date and conflicts of interests (perceived or actual) are discussed at the start of each Board meeting.
Indemnity and insurance
In line with the State Owned Corporations Act 1989 and Sydney Water’s Constitution, all Directors have been granted a Deed of Indemnity with the approval of our Shareholders.
Sydney Water has a policy of insurance for Directors’ and Officers’ liability, which underpins and augments the Deed of Indemnity. Insurance does not extend to deliberate acts of fraud or dishonesty.
48 Corporate governance | Sydney Water Annual Report 2015–16| Sydney Water Annual Report 2015

Organisational chart
Figure 12: Sydney Water Executive and organisational chart (as at 30 June 2016)
Business Strategy and Resilience
General ManagerPaul Freeman BEng (Mech) (Hons)
Corporate Public Affairs
Competition and Regulation
Corporate Secretariat
Corporate Strategy
Legal
Internal Audit
Risk and Resilience
Finance and Corporate Services
Chief Financial OfficerJim MitchellBCom, FCPA, MAICD
Business Governance
Corporate Services
Procurement
Financial Accounting
Management Accounting
Customer Services
General ManagerGary Hurley
Business Customer Services
Customer Insight and Solutions
Commercial Products and Services
Customer Accounts and Billing
Customer Interaction
Towards 2020 Program Business Change
Service Delivery
General ManagerEric de Rooy BEng (Civil) (Hons), MBA
Business Strategy and Assurance (SIRIUS Program)
Civil Delivery
Networks
Product and Asset Management
Projects and Services
Treatment
People, Leadership and Culture
General Manager Angela Tsoukatos BSocWk, MM, GAICD
Capability, Talent and Performance
People Strategy, Change and Insights
Safety and Wellness
PLC Business Partner: Corporate and Enabling
PLC Business Partner: Service Delivery
PLC Business Centre
Information Technology
Chief Information Officer George Hunt BSc (Hons) MSc (Distinction)
IT Capability Partner
Commercial
Applications Portfolio
Architecture and Solutions
IT Business Strategy and Assurance
Technology Services
Transformation
General Manager Sian Leydon BEng (Hons), MEngSc, MBA, DipProjMgt, GAICD
Organisational Strategic Initiatives
Organisational Transformation Projects
Liveable City Solutions
General Manager Paul Plowman BEng (Civil), MBA
Engineering and Environmental Services
Delivery Management
Infrastructure Project Management Office
Asset Knowledge
Liveable City Program
Product and Service Strategy
Urban Growth
Business Change and Optimisation
Board of DirectorsChairman
Bruce Morgan
Managing DirectorKevin Young
Non-Executive Directors
Abby BloomRichard FisherTrevor Bourne
Paul LeamingDiana DayMarlene Kanga
Corporate SecretaryLisa Coletta
48 Corporate governance | Sydney Water Annual Report 2015–16 Sydney Water Annual Report 2015–16 | Corporate governance 49
Overview
Co
rpo
rate govern
ance
Custom
er at the heart
World class
performance
High perform
ance culture
Financial statem
entsA
ppendixes
| Sydney Water Annual Report 2015


3.Customer at the heart

Our sustainability performance• We surveyed more than 2,000 customers
to find out how they would rate the overall quality of service we deliver. The results show that customers continue to have a positive view of the overall quality of our service, with an average satisfaction rating of 7.9 out of 10. This reflects our commitment to maintaining quality services.
• Customers’ satisfaction rating with our drinking water quality remains high at 7.7 out of 10. Even though this is lower than last year’s rating, we’ve seen fewer complaints about our water quality this year.
• We continued to see a downward trend in the total number of complaints made about us, from 7,598 in 2011–12 to 5,412 in 2015–16. This decrease is mainly due to significantly fewer complaints about account–meter adjustments.
• We continued to meet our Operating Licence service quality and system performance targets in 2015–16.
• Water use in Sydney remains at historically low levels thanks to our customers adopting water-efficient practices as part of their everyday lives. In 2015–16, our customers used 529,939 million litres of water or about 293 litres per person per day (LPD), well under the Operating Licence target of 329 LPD. This is similar to the level of water used during 2013–14 (despite a six per cent increase in Sydney’s population) and in 2005–06 when Level 3 water restrictions were in place.
• Most of the drinking water we supply comes from rainwater collected from natural catchment areas. It’s filtered and treated to the high standards set by NSW Health and the Australian Drinking Water Guidelines 2011 to ensure it’s safe to drink straight from the tap. We continued to perform well against the requirements of the guidelines to the satisfaction of NSW Health.
• Keeping the customer at the heart of everything we do has led to an overall reduction in customer complaints across the business.
52 Customer at the heart | Sydney Water Annual Report 2015–16| Sydney Water Annual Report 2015

Performance indicator key
Expectations met or exceeded Indicators show a positive long-term trend towards the goal.
Areas to improve Indicators show mixed results, with positive trends for some and negative trends for others.
Action required Indicators show a negative long-term trend towards the goal.
– Not applicable Performance not reported.
Table 9: Customer at the heart sustainability performance indicators
Indicator 2011–12 2012–13 2013–14 2014–15 2015–16
Customer satisfaction
Average rating of the overall quality of service delivered, measured through customer surveys (on a scale where 0 = extremely poor and 10 = excellent)
7.5 7.7 7.7 7.7 7.9
Average rating of customers satisfied with the overall quality of drinking water (on a scale where 0 = extremely poor and 10 = excellent)
8.4 8.2 8.4 8.4 7.7
We asked customers to rate the overall quality of drinking water that comes out of their taps on a scale of zero (extremely poor) to 10 (excellent). In 2015–16, customer satisfaction with drinking water quality was rated 7.7. This result is not comparable with previous years as we changed our data collection method from telephone surveys to a more cost-effective online survey. This has disrupted the established trend, particularly on water quality, as the online sample demographic represents younger generation. Previous research has shown that typically this demographic is known to give lower rating for water quality.
Total number of customer complaints (including to the Energy & Water Ombudsman NSW)*
7,598 8,296 6,981 6,050 5,412
Under our Operating Licence 2010–15, we define a complaint as ‘an expression of dissatisfaction made to Sydney Water, related to its products or services, or the complaints handling process itself, where a response or resolution is explicitly or implicitly expected’. If a customer is dissatisfied with the action we take to resolve a complaint, they may contact the Energy & Water Ombudsman NSW (EWON) at ewon.com.au and ask them to independently review the complaint.
During 2015–16, we received 4,911 complaints which makes up less than 1% of the more than 752,000 calls we received. In addition, EWON received 501 complaints about us, which is a reduction of 18% compared to 2014–15.* The data reported for previous years has been corrected to reflect total complaints received and determined as Sydney
Water’s responsibility.
52 Customer at the heart | Sydney Water Annual Report 2015–16 Sydney Water Annual Report 2015–16 | Customer at the heart 53
Overview
Corporate
governanceC
usto
mer at
the h
eartW
orld class perform
anceH
igh performance
cultureFinancial
statements
Appendixes
| Sydney Water Annual Report 2015

Indicator 2011–12 2012–13 2013–14 2014–15 2015–16
Complaints resolved within 10 business days (%)
86.3 90.2 91.3 90.9 88.9
We aim to resolve customer enquiries and complaints quickly, efficiently and to customers’ satisfaction. In 2015–16, we resolved 88.9% of complaints within 10 business days.
Complaints to EWON are not lodged with Sydney Water and are not included in this indicator.
Social assistance – –
Number of customers, per 1,000 residential properties, who are experiencing financial difficulty and are being assisted through our hardship program or payment plans
– – 12.2 10.6 9.1
Sydney Water offers customers in financial difficulty the option of requesting a payment extension or entering into a payment arrangement. We can also register customers for Centrepay, which allows customers receiving Centrelink benefits to pay bills through regular deductions from their Centrelink payment. For more information, see Our service guarantee on page 58 of this report.
This indicator was introduced in 2013–14.
Service quality and system performance
Number of properties that experience unplanned water interruptions
Of more than five hours (Operating Licence condition ≤40,000 properties)
31,519 31,626 32,568 37,189 27,224
Of more than one hour (Operating Licence condition ≤14,000 properties experience three or more unplanned interruptions)
5,790 6,363 4,978 8,005 6,524
Water main breaks can cause significant disruption for our customers. They often result from moisture changes in the soil causing movement in the pipes, accidental damage by third parties and loss of strength from long-term corrosion. We have programs to minimise unplanned water interruptions and to respond quickly when they do occur. We met our Operating Licence targets for unplanned water interruptions in 2015–16.
54 Customer at the heart | Sydney Water Annual Report 2015–16| Sydney Water Annual Report 2015

Indicator 2011–12 2012–13 2013–14 2014–15 2015–16
Number of water main breaks (per 100 km of water main)
22 29 30 26 26
Percentage of water main breaks we attended to within priority response times (%)
Priority 6 jobs responded to within three hours
92 93 92 92 91
Priority 5 jobs responded to within six hours
93 93 91 92 90
Priority 5 jobs responded to within 24 hours*
- - - - 100
Priority 4 jobs responded to within five days
92 91 94 91 91
Wastewater main breaks and chokes (per 100 km of sewer main)
49 46 61 69 58
Number of properties that experience low water pressure (Operating Licence target ≤6,000)
572 1,280 661 133 129
Properties affected by uncontrolled wastewater overflows (Operating Licence target ≤14,000)
7,708 6,908 8,869 10,118 8,874
Number of properties that experience repeat (≥3) wastewater overflows (Operating Licence target ≤175)
43 39 66 80 58
We respond to water main breaks and leaks reported by customers based on priority (severity). The priority system ranges from 1 (least urgent) to 6 (most urgent).* This indicator was introduced in 2015–16.
Water conservation
Total volume of drinking water saved each year by water efficiency programs (million litres)
44,435 48,199 45,478 43,768 43,060
The reported figures do not include water savings from PlumbAssist®, WaterFix® or water saving programs that we no longer run.
For more information, see our Water Conservation Report 2015–16 available at sydneywater.com.au.
54 Customer at the heart | Sydney Water Annual Report 2015–16 Sydney Water Annual Report 2015–16 | Customer at the heart 55
Overview
Corporate
governanceC
usto
mer at
the h
eartW
orld class perform
anceH
igh performance
cultureFinancial
statements
Appendixes
| Sydney Water Annual Report 2015

Indicator 2011–12 2012–13 2013–14 2014–15 2015–16
Water drawn
Total water use (million litres) (see Figure 14)
481,930 516,442 532,575 515,834 523,939
Total water use includes drinking water and unfiltered water provided for industrial use in the Illawarra. Recycled water is not included.
Total water use in 2015-16 was 293 litres per person per day(LPD, weather corrected), which is well below our Operating Licence target of 329 litres per person per day.
For more information, see our Water Conservation Report 2015–16 at sydneywater.com.au.
Water quality
Number of zones where we achieved microbiological compliance (out of 13 supply systems (see Figure 15)
13 13 13 13 13
Compliance with the Australian Drinking Water Guidelines 2011 (ADWG) health guideline values to the satisfaction of NSW Health in each water delivery system (%)
99.97 99.98 99.99 100 100
Compliance with the ADWG aesthetic guideline values to the satisfaction of NSW Health in each water delivery system (%)
99.23 99.54 99.62 99.5 99.5
For more information see our Quarterly Drinking Water Quality Report at sydneywater.com.au
Figure 13: Total number of customer complaints 2011–12 to 2015–16
9,000
8,000
7,000
6,000
5,000
4,000
3,000
2,000
1,000
02011-12 2012-13 2013-14 2014-15 2015-16
7,598
8,296
6,981
6,050
5,412
56 Customer at the heart | Sydney Water Annual Report 2015–16| Sydney Water Annual Report 2015

Figure 14: Daily water use in greater Sydney was 293 LPD in 2015–16
Wat
er s
up
plie
d p
er p
erso
n p
er d
ay (
litre
s p
er p
erso
n p
er d
ay)
Calendar Year
Wea
ther
co
rrec
tio
n (
litre
s p
er d
ay)
280
1999
200
0
2001
2002
2003
2004
2005
2006
2007
2008
2009
2010
2011
2012
2013
2014
2015
300
320
340
360
380
400
420
440
-20
-10
0
10
20
30
40
50
60
2016
Pre
-res
tric
tio
ns
Vo
lun
tary
res
tric
tio
ns
Man
dat
ory
res
tric
tio
ns
Wat
er W
ise
Ru
les
Observed (365-day moving average) Weather corrected (365-day moving average) Weather correction Zero line for correction
For more information, see our Water Conservation Report 2015–16 at sydneywater.com.au
Figure 15: Percentage of water tests that met the ADWG for E. coli in 2015–16
Perc
enta
ge
Customer supply systemNor
th R
ichm
ond
All
syst
ems
Cas
cade
s
Wor
onor
a
Illaw
arra
Mac
arth
ur
Nep
ean
War
raga
mba
Pott
s H
ill
Ryd
e
Pros
pect
Eas
t
Pros
pect
Nor
th
Pros
pect
Sou
th
Orc
hard
Hill
s
100%
99%
98%
97%
96%
95%
94%
93%
92%
91%
90%
Compliance target
For more information, see our Quarterly Drinking Water Quality Report at sydneywater.com.au
56 Customer at the heart | Sydney Water Annual Report 2015–16 Sydney Water Annual Report 2015–16 | Customer at the heart 57
Overview
Corporate
governanceC
usto
mer at
the h
eartW
orld class perform
anceH
igh performance
cultureFinancial
statements
Appendixes
| Sydney Water Annual Report 2015

Our service guarantee
Customer Contract
Our Customer Contract explains how we manage customers’ access to water, wastewater and stormwater services.
The Customer Contract outlines our obligations to customers, including:
• which services we maintain, and what customers must maintain
• how and when we charge customers for services
• how we can help customers experiencing hardship
• when we restrict, disconnect and restore services
• how we respond to customer enquiries and complaints.
Payment assistance programs
We continue to implement the Payment Assistance Program, which we developed in consultation with our Customer Council. This ensures we follow industry best practice in meeting the needs of customers experiencing hardship, now and in the future.
Our customer service policies and programs help customers in financial hardship maintain access to essential water and wastewater services. We also work with over 360 community welfare agency partners to help us deliver these programs.
In 2015–16 we continued helping customers through the following customer assistance programs.
Payment arrangements
We help customers facing financial difficulty by offering flexible payment plans. We can defer customer payments for a short time, or arrange smaller, regular payments using the customer’s preferred payment method.
BillAssist®
Our team of qualified professional case coordinators work with residential customers experiencing financial hardship. We provide personalised support, advice and payment assistance, and refer customers to other external specialist support services.
Payment Assistance Scheme
Our Payment Assistance Scheme (PAS) helps customers who are having difficulty paying their water bill. After completing a hardship assessment, BillAssist® Case Coordinators or accredited community welfare agencies can approve credit directly to the customer’s Sydney Water bill. This service is available to customers who own and occupy their home, or private tenants responsible for paying for their water use. Customers must agree to a payment plan if they have already received PAS credits in the last 12 months.
Pensioner concessions
In 2015–16, we gave concessions to more than 230,000 pensioners on their water bills. Pensioners are eligible for concessions if they hold a Pensioner Concession Card, a Department of Veterans’ Affairs Gold Card or if they receive a Department of Veterans’ Affairs intermediate rate pension.
58 Customer at the heart | Sydney Water Annual Report 2015–16| Sydney Water Annual Report 2015

PlumbAssist®
We provide essential or emergency plumbing repairs to improve water efficiency and reduce water costs, or where there is a risk to health or public safety. To be eligible for our PlumbAssist® service, customers must own and live in their home, and be experiencing financial hardship that prevents them from affording plumbing repairs. We normally repair leaks and repair or replace broken taps, showerheads and toilets through our PlumbAssist® service.
Centrepay referral
Customers who receive payments through Centrelink can choose to pay bills through regular deductions from their Centrelink payments. We can register customers for Centrepay over the phone. This is a free service.
To find out more about our financial support programs, visit the ‘Help with your bill’ page on our website: sydneywater.com.au.
Outreach
We attend community and stakeholder events and work with community welfare agencies to increase awareness of our payment assistance options and concession entitlements. In 2015–16, Sydney Water trained 51 people from 13 different community welfare agencies on our PAS. We now have 363 agencies accredited to assess customers in financial hardship and apply PAS credits to their bill.
We continue to educate customers on a range of topics through our outreach program. These topics include checking properties for leaks, water efficiency, wastewater education and bill payment and financial support options.
In the past 12 months we have attended community days, interagency meetings, public schools and information sessions with Culturally and Linguistically Diverse (CALD) community groups.
58 Customer at the heart | Sydney Water Annual Report 2015–16 Sydney Water Annual Report 2015–16 | Customer at the heart 59
Overview
Corporate
governanceC
usto
mer at
the h
eartW
orld class perform
anceH
igh performance
cultureFinancial
statements
Appendixes
| Sydney Water Annual Report 2015

Social programsSydney Water runs several social programs under the direction of the NSW Government. The main goal of the programs is to give all our customers adequate access to water, wastewater and stormwater services. We provide concessions to eligible recipients and the NSW Government reimburses us.
During 2015–16, Sydney Water incurred costs to the value of about $166 million.
Table 11: Social programs
2011–12 $m
2012–13 $m
2013–14 $m
2014–15 $m
2015–16 $m
Pensioner Rebate Scheme 133.8 135.1 137.5 140.5 140.7
Exempt Properties Scheme 15.1 19.1 19.3 21.3 23.9
Hardship Support Scheme 1.0 1.1 0.9 0.9 1.1
Blue Mountains Septic Pump-out Scheme
0.3 0.2 0.2 0.3 0.2
Total 151.9 155.5 173.6 167.8 165.9
Pensioner Rebate Scheme
We provide rebates to pensioners for water, wastewater and stormwater service charges. The rebates cover:
• 100% of the water service charge
• 50% of the stormwater service charge
• 80% of the wastewater service charge (from 1 July 2016).
All valid pensioner concession cardholders are eligible for this scheme.
In 2015–16, we gave more than 230,000 pensioner households rebates on water, wastewater and stormwater service charges. The typical rebate was about $600 per person, at a total cost of $140.7 million.
Exempt Properties Scheme
The Sydney Water Act 1994 states that certain types of properties are exempt from paying service charges. We give exemptions following an application and on-site inspection. Land owned and used by not-for-profit community services organisations is generally exempt.
During 2015–16, we granted service charge exemptions to over 10,000 properties. We spent just under $24 million on the scheme.
60 Customer at the heart | Sydney Water Annual Report 2015–16| Sydney Water Annual Report 2015

Hardship Support Scheme
We provide various forms of help to customers experiencing financial hardship or with a low income. Our aim is to enable customers having financial difficulties to manage payments, reduce debts and use mainstream payment channels. Under this scheme, we give customers experiencing financial hardship credit on their service charges to ensure they can maintain their connection to essential water and wastewater services.
We spent over $1 million on this scheme in 2015–16.
Blue Mountains Septic Pump-out Scheme
In 2015–16, at the direction of the NSW Government, we continued the Blue Mountains Septic Pump-out Scheme subsidy. Up to 72 properties with wastewater pump-out services benefit from the scheme, either through an up-front payment to help install a new on-site system, or through assistance with ongoing pump-out costs. In 2015–16 we spent about $220,000 on this scheme.
Figure 16: Five-year social program expenditure
Pensioner Rebate Scheme
Exempt Properties Scheme
Hardship Support Scheme
Priority Sewerage Program
Blue Mountains Septic Pump-out Scheme
$ million
160 180140100
2011–12
2012–13
2013–14
2014–15
2015–16
120
60 Customer at the heart | Sydney Water Annual Report 2015–16 Sydney Water Annual Report 2015–16 | Customer at the heart 61
Overview
Corporate
governanceC
usto
mer at
the h
eartW
orld class perform
anceH
igh performance
cultureFinancial
statements
Appendixes
| Sydney Water Annual Report 2015

Multicultural policies and services programWe recognise that many of our customers are from culturally and linguistically diverse (CALD) communities. We’ve implemented a number of initiatives to help us better connect with these communities in 2015–16.
Table 12: CALD initiatives 2015–16
Strategy Key initiatives and achievementsDevelop and implement strategies targeting CALD customers, based on demographic information, needs analysis and market research.
• We know that specific customer groups can be unable or unwilling to access information about services, entitlements and support options due to barriers such as language, computer proficiency or cultural differences.
• We recognise that our customer base is changing, and that we need to respond to the changing demographics of our customers. In some local government areas, 70% of residents are from CALD backgrounds.
• We want to make it easy for all customers to interact with us, which means making sure our information and services are easy to access and understand.
• We have partnered with 23 different CALD welfare agencies and organisations to increase awareness of our payment assistance options among our CALD customers.
• In 2015–16, we engaged with our Customer Council representatives from the Ethnic Communities Council and Multicultural NSW to understand the best ways to communicate with our CALD customers. They provided feedback on our planning and operations regarding the interests of our CALD customers, and the best ways to provide information to ensure it’s accessed and understood.
• We held information sessions with five different CALD senior community groups to promote our safe drinking water, water efficiency tips, checking for leaks, and bill payment and financial assistance options.
• We will continue to engage with CALD communities in 2016–17 through targeted events and by translating relevant information in common native languages.
62 Customer at the heart | Sydney Water Annual Report 2015–16| Sydney Water Annual Report 2015

Strategy Key initiatives and achievementsProvide equitable and accessible services.
We have free phone interpreter services for customers who need translation services. We also provide multilingual brochures and information for customers experiencing financial hardship in Cantonese, Korean, Mandarin, Vietnamese, Arabic, Greek, Italian and English.
We have formed partnerships with 23 community agencies that specialise in assisting people from CALD backgrounds to help distribute this information. These agencies are also trained to assess and provide credits on water bills for customers experiencing hardship.
In 2016–17, we will translate relevant information in some languages, with a focus on drinking water, water efficiency, wastewater education and bill payment. This enables further access to information and services for CALD customers with limited or no English speaking skills.
62 Customer at the heart | Sydney Water Annual Report 2015–16 Sydney Water Annual Report 2015–16 | Customer at the heart 63
Overview
Corporate
governanceC
usto
mer at
the h
eartW
orld class perform
anceH
igh performance
cultureFinancial
statements
Appendixes
| Sydney Water Annual Report 2015

Community investments
Sponsorships and partnerships
Our research8 tells us that our customers want to have stronger engagement with and education from us. Sponsorship delivers on our customers’ expectations by helping us connect with and educate our community through events, in places and on programs that are important to them.
Our community sponsorships are part of our community involvement program. Through these sponsorships we can educate on our key priorities, including our great quality drinking water, the urban water cycle, and the importance of environmental protection and sustainability. We also have business sponsorships that support professional development and stakeholder networks.
In the last year we welcomed Cricket NSW and Sydney Festival as partners, as well as supporting the Australian Water Association’s Young Water Professionals Conference in Sydney.
As Hydration Partner of Cricket NSW, we were able to promote drinking water as the sustainable choice, reaching over 1.2 million people through social media. We took our portable water units to the Sydney Festival, which helped over 300,000 festival-goers stay hydrated throughout the three-week event. In February 2016, we proudly supported the Young Water Professionals Conference, which brought together the best young minds in the water industry from across the country.
In 2015–16 we:
• connected with more than 900,000 people at community events and conferences – an increase of 15,000 from 2014–15
• reached over 2.2 million people through social media, almost 13 times last year’s reach
• doubled print, online and television coverage of our activities and educational messages reminding people that drinking tap water is the best source of hydration.
Donations
We are committed to supporting the communities in which we work and live, and communities overseas that lack access to the clean, safe water and sanitation that Australians take for granted.
In the last year, we donated more than $57,000 to community organisations through our continued support of WaterAid, the Cyclone Winston Appeal (through Red Cross and CARE Australia), and our donation-matching program for staff, which benefits a range of organisations including the RSPCA, Cancer Council NSW, Mates in Construction, Oxfam, Westmead Children’s Hospital and Red Cross.
Table 13: Funds granted to organisations in 2015–16
Program 2015-16
Community sponsorships and partnerships9
$552,346
Business sponsorships and partnerships9
$38,250
Donations $57,021
Partnership servicing10 $572,895
Total $1,220,512
8 Quarterly customer sentiment monitor, June 2016.9 Sponsorship contracts contain commercial information. We follow standard business practice to keep details commercial-in-
confidence.10 Partnership servicing is money we spend to provide services like mobile water refill units, education activities and community
engagement and information at events.
64 Customer at the heart | Sydney Water Annual Report 2015–16| Sydney Water Annual Report 2015

PrivacyWe’re committed to protecting the personal information of our customers, the general public, business partners and staff. Since 2002, we’ve voluntarily complied with the principles of the Privacy and Personal Information Protection Act 1998 (PPIPA). This commitment is publicly stated in clause 13.3 of our Customer Contract. We’re also subject to the Health Records Information Protection Act 2002 (HRIPA).
We ensure that we:
• only collect relevant personal information for lawful purposes directly related to our activities
• protect personal information from misuse and unauthorised access
• take reasonable steps to check the accuracy of personal information before we use it
• don’t give personal information to other organisations for marketing. If we’re asked to give water usage details for a specific community or suburb, we only disclose
the information if individual properties can’t be identified
• only use personal information for the purpose it was collected, or for related purposes
• ensure staff who deal with personal information are aware of their obligations to protect privacy
• do not disclose a customer’s personal information when performing customer validation checks over the phone
• only disclose personal information to third parties if:
– we’re authorised or required to by law
– we’ve obtained verbal or written authority from the person
– we can reasonably assume in the circumstances that the person would consent
– there’s a danger of injury or loss of life
– our contractors need the information for essential activities.
Table 14: Privacy activity in 2015–16
Requests for information
Issues (complaints) Total Still open
Internal 28 1 29 0
External 0 3 3 0
Over 2015–16 we:
• implemented recommended changes to our Operating Licence, Customer Contract, website and IT system contracts, as part of a comprehensive independent review of our privacy compliance framework
• continued implementing changes to procedures, training and support material, and mitigating measures for several high-risk systems
• refreshed and published our Privacy Policy
• refreshed our online privacy awareness staff training module
• defined a process to assess privacy and data-sharing requests from the NSW Government Data Analytics Centre
• retained the services of Salinger Privacy for specialised privacy advice
• monitored changes to the legal environment, precedents and best practice
• participated in the NSW Privacy Practitioners Network, which provides access to relevant privacy awareness services and literature.
64 Customer at the heart | Sydney Water Annual Report 2015–16 Sydney Water Annual Report 2015–16 | Customer at the heart 65
Overview
Corporate
governanceC
usto
mer at
the h
eartW
orld class perform
anceH
igh performance
cultureFinancial
statements
Appendixes
| Sydney Water Annual Report 2015

Communicating with our customersProviding services to almost five million customers of varying ages and cultures requires us to produce numerous communication materials in a mix of both traditional and digital formats. Customer research helps us learn how our customers like to interact with us, so we can better tailor our information to their needs. We’re also exploring new ways to reach our culturally and linguistically diverse (CALD) customer base.
Some of our publications are reports and information we must communicate by law, while others inform or instruct customers and the community about our water, recycled water, wastewater and stormwater services.
We produce fact sheets, newsletters, booklets, calling cards and other material targeted to specific customers regarding our activities in their community, construction and maintenance projects and our customer programs. We publish these on our website and other digital channels, and may email, or print and mail these to customers and stakeholders, or distribute them at events.
Our most widespread communication is through the quarterly customer newsletters Water wrap and Business update, which we send with the customer bill. These meet our regulatory requirements to communicate on water quality, payment assistance, complaints procedures and pricing, but also include information on customer programs.
We engage with our customers and stakeholders on Facebook, Instagram, Twitter, YouTube, and our online interactive forum Sydney Water Talk. Over the last 12 months our daily ‘page reach’ has climbed to 1.1 million users.
We create graphics and videos for all of our channels to help make our information more accessible to everyone.
If customers want more specific information than we have published during the year, they can apply under the Government Information (Public Access) Act 2009 (see page 207 of this report).
66 Customer at the heart | Sydney Water Annual Report 2015–16| Sydney Water Annual Report 2015

4.World class performance

Our sustainability performance• We continue to treat Sydney’s wastewater
to a high standard, in line with environment protection licences issued by the NSW Environment Protection Authority (EPA).
• We work closely with industrial customers to ensure they comply with their trade waste agreements. In 2015–16, we achieved a high level of customer compliance, with 97% of industrial customers complying with their agreements, ensuring our biosolids meet the required standards.
• Energy-intensive water recycling, tighter quality treatment standards and a growing population put continuous pressure on our outputs. Despite this, through our energy efficiency and waste reduction programs and policies, we maintained stable carbon and ecological footprints in 2014–15*. We’re working to reduce our carbon and ecological footprints and we expect to achieve this in time, through our energy efficiency and renewable energy projects.
• In 2015–16, our total gross greenhouse gas emissions decreased by 7.2% compared to 2014–15, but have been relatively stable for the last four years. Reduced grid electricity consumption – primarily due to increased renewable energy generation – was the main reason for the decrease.
• This year we surrendered the last of our NSW Greenhouse Gas Abatement Certificates to offset our emissions, but we did not have enough to maintain our net emissions at the previous levels achieved since 2011–12. As a result, our net greenhouse gas emissions for 2015–16 increased by 74.5% compared to 2014–15. Net emissions will increase again in 2016–17 as we will have no NGACs to offset emissions.
• Sydney Water’s renewable energy generation in 2015–16 is equivalent to 21% of the 409 million kWh electricity used during the year. Total renewable generation increased by 18.2% compared to renewable energy generation in 2014–15, and is the highest energy generation we have achieved to date.
• Since 2011–12, we’ve cleared a total of 22.87 hectares of native vegetation and revegetated 38.84 hectares, to achieve a net increase of 15.97 hectares. Much of the clearing is temporary, and the disturbed land has been revegetated through bush regeneration.
• We again met our target of beneficially using 100% of biosolids produced at our wastewater treatment plants. We’ve consistently achieved this target since 2005.
*Data for 2015-16 was not available in time for publication in this report.
68 World class performance | Sydney Water Annual Report 2015–16| Sydney Water Annual Report 2015

Performance indicator key
Expectations met or exceeded Indicators show a positive long-term trend towards the goal.
Areas to improve Indicators show mixed results, with positive trends for some and negative trends for others.
Action required Indicators show a negative long-term trend towards the goal.
– Not applicable Performance not reported.
Table 14: World class performance sustainability performance indicators
Indicator 2011–12 2012–13 2013–14 2014–15 2015–16
Profitability
Net profit after tax (NPAT) ($m) 367 372 464 513 548
Debt servicing
Funds flow from operations ($m) 436 518 603 708 687
Funds flow from operations interest cover ratio (times)
1.8 2.0 2.1 2.4 2.3
Funds flow from operations 2015–16 target was $671 million.
Funds flow from operations interest cover ratio (times) 2015–16 target was 2.1.
Return on assets and equity
Return on assets (%) 8.0 7.0 7.1 7.4 7.2
Return on equity (%) 6.2 6.9 7.5 8.0 8.1
Our return on assets in 2015–16 was 0.3% higher than the target of 6.9%. Our return on equity in 2015–16 was 0.9% higher than the target of 7.2%. This was due to a combination of higher water use and non-regulated income, and lower asset charges and borrowing costs.
68 World class performance | Sydney Water Annual Report 2015–16 Sydney Water Annual Report 2015–16 | World class performance 69
Overview
Corporate
governanceC
ustomer at
the heartW
orld
class p
erform
ance
High perform
ance culture
Financial statem
entsA
ppendixes
| Sydney Water Annual Report 2015
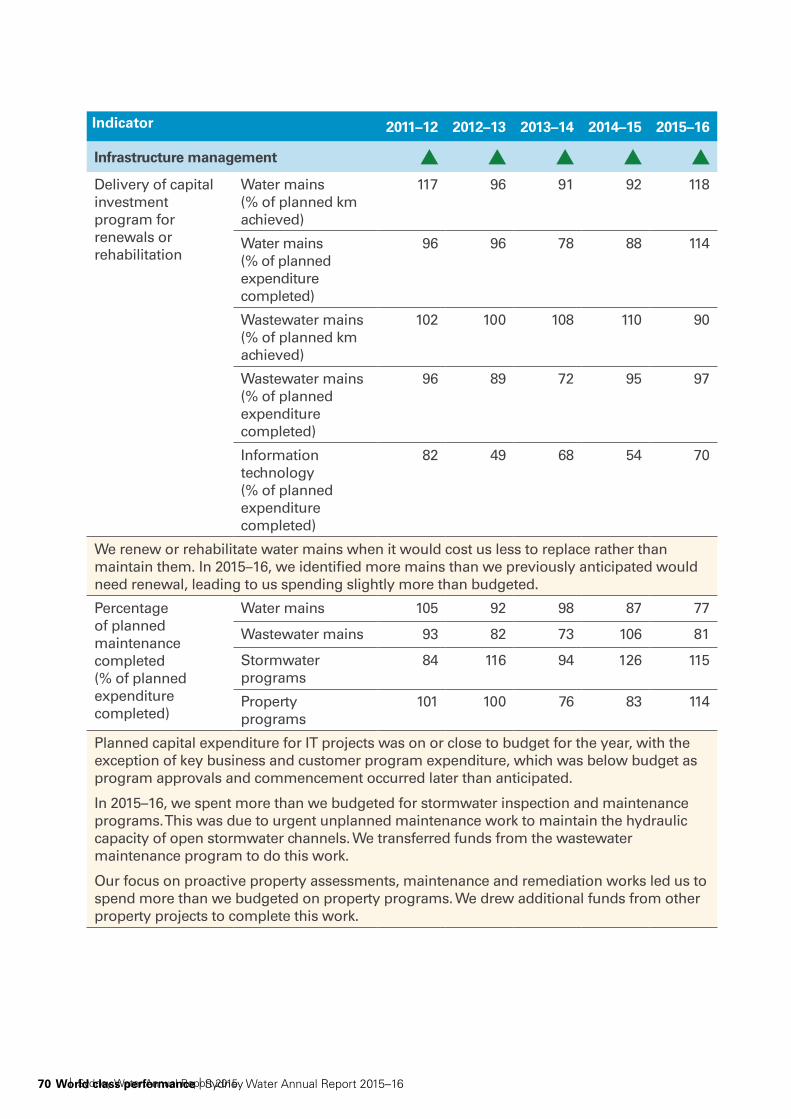
Indicator 2011–12 2012–13 2013–14 2014–15 2015–16
Infrastructure management
Delivery of capital investment program for renewals or rehabilitation
Water mains (% of planned km achieved)
117 96 91 92 118
Water mains (% of planned expenditure completed)
96 96 78 88 114
Wastewater mains (% of planned km achieved)
102 100 108 110 90
Wastewater mains (% of planned expenditure completed)
96 89 72 95 97
Information technology (% of planned expenditure completed)
82 49 68 54 70
We renew or rehabilitate water mains when it would cost us less to replace rather than maintain them. In 2015–16, we identified more mains than we previously anticipated would need renewal, leading to us spending slightly more than budgeted.
Percentage of planned maintenance completed (% of planned expenditure completed)
Water mains 105 92 98 87 77
Wastewater mains 93 82 73 106 81
Stormwater programs
84 116 94 126 115
Property programs
101 100 76 83 114
Planned capital expenditure for IT projects was on or close to budget for the year, with the exception of key business and customer program expenditure, which was below budget as program approvals and commencement occurred later than anticipated.
In 2015–16, we spent more than we budgeted for stormwater inspection and maintenance programs. This was due to urgent unplanned maintenance work to maintain the hydraulic capacity of open stormwater channels. We transferred funds from the wastewater maintenance program to do this work.
Our focus on proactive property assessments, maintenance and remediation works led us to spend more than we budgeted on property programs. We drew additional funds from other property projects to complete this work.
70 World class performance | Sydney Water Annual Report 2015–16| Sydney Water Annual Report 2015

Indicator 2011–12 2012–13 2013–14 2014–15 2015–16
Recycled water
Total volume of recycled water supplied (ML)
45,929 46,951 46,943 43,075 43,302
We take wastewater that’s been used in homes and businesses, and put it through a multi-step treatment process to remove impurities. The purified water can be used in many ways around your home, by businesses and in industrial processes.
Wastewater treatment system discharges
Wastewater volume treated that was compliant with our environmental protection licences (%)
99.5 99.7 100 99.7 99.0
Total volume of controlled wastewater overflows in dry weather, as a percentage of total treated wastewater discharged to the environment (%)
<0.001 0.001 0.001 0.002 0.002
We monitor our wastewater treatment systems and must immediately notify the NSW EPA and other authorities of any incident causing or threatening material harm to the environment. We report to the NSW EPA on minor licence non-compliances (those which don’t cause or threaten environmental harm) in line with the conditions of our environment protection licences.
For more information, see our Sewage Treatment System Impact Monitoring Program Report at sydneywater.com.au.
Water leakage
Real water losses from distribution (ML/day)
115 120 107 99 103
Our Operating Licence sets an upper limit for water leakage of 121 ML a day. The average water leakage for 2015–16 is estimated to be 103 ML a day, which is within our target range.
Trade waste agreements –
Trade waste customers (industrial) complying with their wastewater discharge limits (%)
– 92 95.2 97.5 97.0
In 2015–16, 97% of our 728 industrial trade waste customers complied with their trade waste agreement wastewater discharge limits.
We began reporting this indicator in 2012–13. For more information see our Operating Licence Environment Report at sydneywater.com.au.
70 World class performance | Sydney Water Annual Report 2015–16 Sydney Water Annual Report 2015–16 | World class performance 71
Overview
Corporate
governanceC
ustomer at
the heartW
orld
class p
erform
ance
High perform
ance culture
Financial statem
entsA
ppendixes
| Sydney Water Annual Report 2015

Indicator 2011–12 2012–13 2013–14 2014–15 2015–16
Environmental compliance
Total number of prosecutions and penalty notices issued under the Protection of the Environment Operations Act 1997
Sydney Water 0 1 4 2 2
Contractors 1 1 0 0 0
We received two penalty notices from the NSW EPA during the reporting period. The penalty notices related to dry weather wastewater overflows that occurred at Cronulla (August 2015) and Bardwell Creek (September 2015).
Sydney Water entered into an enforceable undertaking with the NSW EPA after a water pollution incident that involved an unlicensed discharge of untreated sewage/wastewater from a Sydney Water sewer pipe into the Parramatta River at Rydalmere in June 2015. Under the enforceable undertaking Sydney Water is contributing $200,000 to City of Parramatta Council for use by the Parramatta River Catchment Group for the purposes of funding environmental initiatives pursuant to the Parramatta River Master Plan. Sydney Water acknowledges that its failure to comply with aspects of its asset condition maintenance program contributed to the incident and Sydney Water has implemented significant improvements to its maintenance procedures in an effort to prevent the recurrence of a similar incident.
Notices of penalties and prosecutions are published on the NSW EPA Public Register at epa.nsw.gov.au or for more information see our Environmental Compliance and Performance Report at sydneywater.com.au.
Heritage compliance
Number of fines or prosecutions issued under the Heritage Act 1977 (NSW)
– – – – 0
Number of fines or prosecutions issued under the National Parks and Wildlife Act 1974
– – – – 0
We have detailed processes in place to identify risks to European and Aboriginal heritage sites from operational, maintenance and construction activities. In 2015–2016, there were no heritage fines or prosecutions issued under the Heritage Act 1977 (NSW) or the National Parks and Wildlife Act 1974 (NSW).
These heritage indicators were introduced in 2015–16.
72 World class performance | Sydney Water Annual Report 2015–16| Sydney Water Annual Report 2015

Indicator 2011–12 2012–13 2013–14 2014–15 2015–16
Environmental footprint
Full supply chain carbon footprint for operations and capital works (million tonnes of carbon dioxide equivalent emissions) (see Figure 17)
0.9 0.9 0.9 0.9 Not available
Ecological footprint of business activities (hectares) (see Map 5)
110,000 110,000 110,000 110,000 Not available
We report our footprint as a gross number (before accounting for carbon offsets) because this reflects our carbon risk exposure.
Our ecological footprint represents the land area taken up by our infrastructure and our disposed waste, land disturbed to produce the materials we use, and land forecast to be disturbed as a result of greenhouse gas emissions from our carbon footprint.
Data for 2015–16 was not available in time for publication in this report.
Energy use and greenhouse gas emissions
Total electricity used or generated by Sydney Water (million kWh)
Used 414.4 404.1 407.9 414.3 409.2
Self-generated 69.0 65.6 65.1 72.6 85.8
Electricity generated by Sydney Water (%) 16.6 16.2 16.0 17.5 21
In 2015–16, our energy generation from renewable sources was equivalent to 21% of electricity we used, which is our highest energy generation to date.
Gross greenhouse gas emissions per 1,000 properties tonnes CO2 (see Figure 18)
206 189 195 197 180
Gross emissions are total emissions from electricity, fuel and gas use before accounting for offsets from renewable energy. Results are based on emission factors published by the Commonwealth Department of Climate Change and Energy Efficiency. We have maintained our gross greenhouse gas emissions at less than 200 tonnes of CO2 per 1,000 properties since 2012–13.
Net greenhouse gas emissions (per 1,000 properties) tonnes CO2
87 85 85 84 144
Net emissions are the total gross emissions less the NSW Greenhouse Gas Abatement Certificates (NGACs) surrendered to offset emissions. This year we surrendered the last of the NGACs issued to us under the NSW Government’s Greenhouse Gas Abatement Scheme, which ended on 1 July 2012. The number of NGACs we had available to offset our greenhouse gas emissions was not enough to maintain our net emissions at the levels previously achieved.
For more information, see our Environment Compliance and Performance Report 2015–16 at sydneywater.com.au.
72 World class performance | Sydney Water Annual Report 2015–16 Sydney Water Annual Report 2015–16 | World class performance 73
Overview
Corporate
governanceC
ustomer at
the heartW
orld
class p
erform
ance
High perform
ance culture
Financial statem
entsA
ppendixes
| Sydney Water Annual Report 2015

Indicator 2011–12 2012–13 2013–14 2014–15 2015–16
Environmental performance monitoring
Ecosystem health downstream of inland wastewater treatment plant discharges
Health maintained
downstream of 8 of the 12 inland
plants
Health maintained
downstream of 9 of the 12 inland
plants
Health maintained
downstream of 9 of the 12 inland
plants
Health maintained
downstream of 10 of the
12 inland plants
Health maintained
downstream of 8 of the 12 inland
plants
Ecosystem impacts of deep water ocean discharges
No impact
No impact
No impact
No impact
Results not yet
available
Minor localised ecosystem impacts occurred in the creeks downstream of four of our inland plants. We found no evidence of impacts on the Hawkesbury-Nepean River system which these creeks flow into.
We regularly assess the impact of discharges from Malabar, Bondi and North Head wastewater treatment plants on the offshore marine environment through the Ocean Sediment Program. This is a three-year cyclical program that assesses benthic macro invertebrate health and ocean sediment quality. We also test the toxicity of treated wastewater from ocean plants.
For more information, see our Sewage Treatment System Impact Monitoring Program Report at sydneywater.com.au.
Flora and fauna
Total area of native vegetation cleared (hectares)
4.0 0.02 7.94 7.99 2.92
Total area of native vegetation rehabilitated (hectares)
2.3 3.9 7.38 19.03 6.23
Total area of native vegetation net gain or loss (hectares)
-1.7 3.88 -0.56 11.04 3.31
Area of riparian land managed by Sydney Water under a plan of management (hectares)
418.5 421.8 422.1 423.3 424.8
We report on native vegetation if the area of a project is more than 0.01 hectares or 100 square metres. We have no targets for these native vegetation indicators, as much of the clearing is temporary and we revegetate the disturbed land through bush regeneration.
Since 2011–12, we’ve cleared a total of 22.87 hectares and revegetated 38.84 hectares, to achieve a net increase of 15.97 hectares of native vegetation.
We also manage over 400 hectares of riparian lands, wetlands and naturalised stormwater assets under plans of management. This year we restored almost 200 hectares of that land through bush regeneration activities.
For more information, see our Environment Compliance and Performance Report at sydneywater.com.au.
74 World class performance | Sydney Water Annual Report 2015–16| Sydney Water Annual Report 2015

Indicator 2011–12 2012–13 2013–14 2014–15 2015–16
By-products
Percentage of biosolids beneficially used (%)
100 100 100 100 100
We produced 39,370 dry tonnes of biosolids in 2015-16. For more information, see our Environment Compliance and Performance Report at sydneywater.com.au
Waste reduction
Percentage of solid waste recycled or used (%)
72 57 88 88 71
The overall waste recycling rate is a combination of the recycling rates of construction and demolition waste from Sydney Water and contractor projects together with office waste and process waste.
Our overall recycling rate fell to 71% in 2015–16. This was largely due to a decline in the recycling rate of construction and demolition waste generated by our contractors.
For more information, see our Environment Compliance and Performance Report at sydneywater.com.au.
74 World class performance | Sydney Water Annual Report 2015–16 Sydney Water Annual Report 2015–16 | World class performance 75
Overview
Corporate
governanceC
ustomer at
the heartW
orld
class p
erform
ance
High perform
ance culture
Financial statem
entsA
ppendixes
| Sydney Water Annual Report 2015

Figure 17: Sydney Water’s carbon footprint trends 2006–07 to 2014–1511
Direct emissions (Scope 1) Electricity emissions (Scope 2)
Operations indirect emissions (Scope 3) Capital works indirect emissions (Scope 3)
Ton
nes
car
bo
n d
ioxi
de
equ
ival
ent
(t C
O2-
e)
400,000
0
800,000
1,200,000
1,600,000
2006–07 2007–08 2008–09 2009–10 2010–11 2011–12 2012–13 2014–152013–14
Figure 18: Total gross greenhouse gas emissions per 1,000 properties, 2011–12 to 2015–16
Gro
ss to
nnes
CO
2 equ
ival
ent (
CO2-e
)pe
r 1,0
00 p
rope
rtie
s
250
300
200
50
100
Year ended 30 June
150
2011–12 2012–13 2013–14 2014–15 2015–16
11 Data for 2015-16 was not available in time for publication of this report.
76 World class performance | Sydney Water Annual Report 2015–16| Sydney Water Annual Report 2015

Our ecological footprintMap 5: Sydney Water’s ecological footprint, 2011–12 to 2014–15
76 World class performance | Sydney Water Annual Report 2015–16 Sydney Water Annual Report 2015–16 | World class performance 77
Overview
Corporate
governanceC
ustomer at
the heartW
orld
class p
erform
ance
High perform
ance culture
Financial statem
entsA
ppendixes
| Sydney Water Annual Report 2015

Risk management and performance
Risk management
Sydney Water has a Corporate Risk Management Framework that helps us meet our strategic objectives and corporate governance accountabilities.
We systematically manage risks to minimise the potential adverse impacts of uncertainty, while maximising opportunities to create better value for our customers and shareholders, and achieve our corporate goals.
Our framework is consistent with the risk management standard AS/NZS ISO 31000 Risk management – Principles and guidelines. We voluntarily conform to TPP 15-03 Internal Audit and Risk Management Policy for the NSW Public Sector.
Our Risk and Opportunity Management Policy includes the Board’s Risk Appetite Statements, which help us:
• guide our business
• identify risk drivers and develop mitigation strategies to manage these risks consistently
• act appropriately within the limits of our risk appetite.
Our Board is supported by sub-committees that oversee risks related to their respective core functions, such as public health and environment, safety and financial matters. The Board’s Audit and Risk Committee monitors the overall effectiveness of the Risk Management Framework as well as the robustness of the control environment. Our Executive team monitors risks relating to our day-to-day operations and delivering corporate objectives.
78 World class performance | Sydney Water Annual Report 2015–16| Sydney Water Annual Report 2015
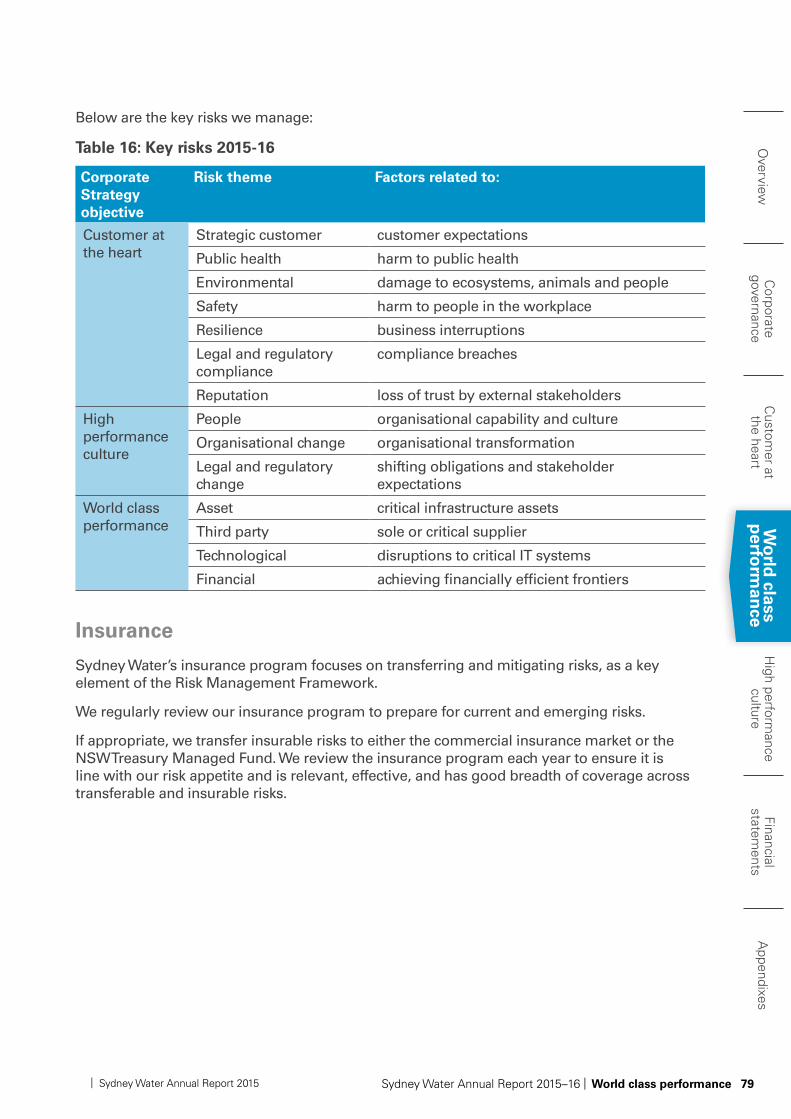
Below are the key risks we manage:
Table 16: Key risks 2015-16
Corporate Strategy objective
Risk theme Factors related to:
Customer at the heart
Strategic customer customer expectations
Public health harm to public health
Environmental damage to ecosystems, animals and people
Safety harm to people in the workplace
Resilience business interruptions
Legal and regulatory compliance
compliance breaches
Reputation loss of trust by external stakeholders
High performance culture
People organisational capability and culture
Organisational change organisational transformation
Legal and regulatory change
shifting obligations and stakeholder expectations
World class performance
Asset critical infrastructure assets
Third party sole or critical supplier
Technological disruptions to critical IT systems
Financial achieving financially efficient frontiers
Insurance
Sydney Water’s insurance program focuses on transferring and mitigating risks, as a key element of the Risk Management Framework.
We regularly review our insurance program to prepare for current and emerging risks.
If appropriate, we transfer insurable risks to either the commercial insurance market or the NSW Treasury Managed Fund. We review the insurance program each year to ensure it is line with our risk appetite and is relevant, effective, and has good breadth of coverage across transferable and insurable risks.
78 World class performance | Sydney Water Annual Report 2015–16 Sydney Water Annual Report 2015–16 | World class performance 79
Overview
Corporate
governanceC
ustomer at
the heartW
orld
class p
erform
ance
High perform
ance culture
Financial statem
entsA
ppendixes
| Sydney Water Annual Report 2015

Legal events
Significant changes to legislation affecting Sydney Water
Government Sector Employment Amendment (Transfers to Non-Government Sector) Regulation 2016 (NSW)
The Government Sector Employment Amendment (Transfers to Non-Government Sector) Regulation 2016 says that if a government employee leaves the government organisation to do similar work in a non-government organisation in the same industry, they are not entitled to any severance or redundancy payment. State–Owned Corporations are considered a non-government sector body under the Regulation.
Independent Commission Against Corruption Amendment Act 2015 (NSW)
In September 2015, the Independent Commission Against Corruption Amendment Act 2015 (NSW) amended the Independent Commission Against Corruption Act 1988 No. 35 (NSW) to implement recommendations following an independent panel review of the Independent Commission Against Corruption (ICAC)’s jurisdiction. This follows the decision of the High Court in ICAC v Cunneen [2015] HCA 14 (15 April 2015), which excluded certain conduct of private persons from the definition of ‘corrupt conduct’ under the principal Act, which was previously presumed to be within the ICAC’s jurisdiction.
Specifically, the amending Act:
a) extends ICAC’s jurisdiction in respect of ‘corrupt conduct’ to include certain specified acts of non-public officials that could impair public confidence in public administration
b) provides that ICAC’s education, advisory and prevention functions can be used generally to promote the integrity and good repute of public administration
c) limits ICAC’s power to make findings of ‘corrupt conduct’ against an individual to cases where the corrupt conduct is serious
d) implements the panel’s recommendation that ICAC be given jurisdiction to investigate possible criminal offences under electoral and lobbying laws (without extending the meaning of ‘corrupt conduct’) should the Parliament of NSW consider that breaches of those laws should be made the subject of the ICAC’s jurisdiction.
80 World class performance | Sydney Water Annual Report 2015–16| Sydney Water Annual Report 2015

Capital expenditure
The capital works program aims to: • renew and upgrade existing assets
• improve business efficiencies
• deliver government programs
• support urban growth.
In 2015–16, Sydney Water spent about $681 million on capital works, which was three percent below the $705 million budget.
Table 17: Major capital works projects completed 2015–16
Project Project benefits
Wastewater main renewals12
We renewed 9 km of key wastewater mains that were near the end of their service life to reduce the impact of failures on the community and the environment.
We rehabilitated 21.5 km of reticulation wastewater mains to reduce dry weather and repeat overflows affecting customers.
Water main renewals12
We renewed 53.7 km of water reticulation mains to maintain water supply and reduce interruptions.
We renewed 13.4 km of water trunk mains to maintain water supply and reduce interruptions.
Galston and Glenorie sewerage schemes
We constructed wastewater pipes to connect about 687 properties. The scheme will protect the environment and reduce risks to public health. The scheme was available for customer connections in June 2015. We completed these projects on time and within budget.
Metropolitan Integrated Instrumentation Control Automation Telemetry System (IICATS) water remote terminal unit renewal
We replaced remote terminal units used to control and monitor assets at 324 sites to meet current and future operational needs. We completed the program within budget, but four months later than planned, due to needing additional approved minor telemetry works at various sites.
West Dapto (Package 1)
We constructed water and wastewater infrastructure to service growth in the West Dapto urban release area. We completed the project under budget and two months later than planned, due to fixing minor defects that we identified during commissioning.
North West Growth Centre (NWGC) Package 3A, Cattai Creek
We provided wastewater services for around 2,000 dwellings for the Cattai Creek area of the NWGC. We completed the project on time and within budget.
12 Outputs achieved in 2015–16
80 World class performance | Sydney Water Annual Report 2015–16 Sydney Water Annual Report 2015–16 | World class performance 81
Overview
Corporate
governanceC
ustomer at
the heartW
orld
class p
erform
ance
High perform
ance culture
Financial statem
entsA
ppendixes
| Sydney Water Annual Report 2015

Project Project benefits
Northern Suburbs Ocean Outfall Sewer (NSOOS) chemical dosing units
We installed chemical dosing units, and reduced corrosion in the NSOOS to extend the life of associated wastewater assets. We completed the project on time and within budget.
New wastewater pumping station SPS 1146 at Balmain (to replace SPS 008)
We constructed a new wastewater pumping station to provide more reliable wastewater services to the Balmain area. The project was completed under budget and 18 months later than planned, due to delays caused by contractor issues which we satisfactorily addressed.
South West Growth Centre (SWGC), wastewater pumping station upgrade
We provided a second rising main to satisfy wet weather licence requirements and service growth in the Camden area. We completed the project on time and within budget.
Table 18: Major capital works in progress as at 30 June 2016
Project Forecast completion
date
Budget $m
Cost to date
$m
Riverstone Wastewater Treatment Plant Upgrade Stage1: Increase capacity at the plant to meet licence requirements and provide for growth in the catchment.
December 2018
125 3
Malabar Wastewater Treatment Plant Improvement Program: Upgrade to improve reliability, capability and performance of the plant.
April 2019 106 79
Wastewater treatment plant renewals: Continue to replace equipment near the end of its service life.
Ongoing 85/year* Ongoing
Information technology projects: Continue minor projects to reduce operating expenditure, renew IT systems and equipment, and deliver new systems and capabilities. Major projects include a new billing system.
Ongoing 80/year* Ongoing
Wastewater reticulation and wastewater trunk main renewals: Continue program to replace and rehabilitate wastewater mains near the end of their service life to reduce the impact of failures on the community and the environment.
Ongoing 75/year* Ongoing
Water reticulation main and water trunk main renewals: Continue to replace water mains near the end of their service life to reduce interruptions to supply.
Ongoing 54/year* Ongoing
Green Square Trunk Stormwater: Increase stormwater drainage capacity in Green Square Town Centre and reduce the risk of flooding and facilitate development.
December 2017
53 41
82 World class performance | Sydney Water Annual Report 2015–16| Sydney Water Annual Report 2015

Project Forecast completion
date
Budget $m
Cost to date
$m
South West Growth Centre (SWGC) Second Release Precincts (wastewater): Construct wastewater infrastructure to service growth in the precincts of East Leppington, Leppington North, Leppington and Emerald Hills.
July 2016 46 31
North Head Wastewater Treatment Plant Odour Scrubber: Replace an odour scrubber to reduce corrosion and odour emissions.
June 2017 44 35
Picton Sewerage Scheme Amplification (Stage 2): Conduct amplification and upgrade works to the Picton wastewater recycling plant to accommodate growth. The project is forecast to be completed $5 million over the original budget, due to additional scope identified during detailed design.
January 2018
35 5
Astrolabe Park stormwater renewal: Replace existing stormwater culverts.
March 2017 30 16
Oran Park Wastewater Servicing (Stage 2, Package 1): Provide wastewater infrastructure to support continuing growth in Oran Park and South Catherine Fields.
June 2017 27 2
St Marys Wastewater Growth: Construct a new wastewater pumping station and wastewater mains to service growth and maintain wet weather performance in the St Marys area.
August 2016
17 11
Menangle Park Wastewater (Stage 1): Construct a new wastewater pumping station and wastewater mains to service growth within the Menangle Park Release Area.
December 2016
23 12
SWGC First Release Precincts, Turner Road: Provide water-related infrastructure to service growth in the SWGC.
January 2017
21 18
Reservoir Renewal and Reliability Program: Continue to ensure reservoirs and associated equipment operate at lowest costs, while complying with regulatory requirements.
Ongoing 19/year* Ongoing
Riverstone Wastewater lead-ins mains: Provide wastewater-related services in the NWGC to service growth. This is part of the Accelerated Housing Program.
July 2016 19 13
SWGC, Austral Precinct: Provide wastewater-related infrastructure in the Austral precinct of the SWGC to service growth.
August 2016
19 14
Powells Creek Stormwater Renewal: Renew a section of the channel to protect public safety and reduce the risk of flooding, creek erosion and subsidence.
July 2018 18 1
82 World class performance | Sydney Water Annual Report 2015–16 Sydney Water Annual Report 2015–16 | World class performance 83
Overview
Corporate
governanceC
ustomer at
the heartW
orld
class p
erform
ance
High perform
ance culture
Financial statem
entsA
ppendixes
| Sydney Water Annual Report 2015

Project Forecast completion
date
Budget $m
Cost to date
$m
Strangers Creek trunk drainage construction: Provide stormwater services for growth and help manage flooding, safety and negative impacts on the environment.
September 2018
17 1
Wastewater pumping station renewals: Continue to replace equipment near the end of its service life.
Ongoing 16/year* Ongoing
Emerald Hills and Central Hills Growth Servicing: Provide wastewater infrastructure to support continuing growth in Emerald Hills, Central Hills and East Leppington.
February 2017
14 8
Servicing Growth at Calderwood: Provide water and wastewater services in Calderwood for residential and employment growth.
January 2017
12 3
Water pumping stations: Continue to improve reliability and safety and minimise life cycle costs of water pumping stations.
Ongoing 12/year* Ongoing
Picton Sewerage Scheme Amplification (Stage 1): Conduct amplification and upgrade works to the Picton Water Recycling Plant to accommodate growth.
September 2016
12 12
Meter replacement program: Continue ongoing program targeted at improving measurement and monitoring of water volume and service reliability.
Ongoing 9/year* Ongoing
*denotes five-year average in nominal dollars
Drivers of planned capital expenditure for the next financial year
Our capital works budget for 2016–17 is $721 million (nominal – not including capital borrowing cost). Drivers of planned capital expenditure are:
• asset renewal and rehabilitation of assets to meet system performance regulations and customer service levels ($412 million13)
• development of new water, wastewater, recycled water and stormwater infrastructure to meet the needs of urban growth in both infill (existing) and greenfield (new) areas, including North West and South West growth sectors ($231 million13)
• business efficiency measures, such as information technology or energy saving projects, which reduce operating expenditure ($51 million13)
• new regulatory standards, such as wastewater system performance under environmental protection licences ($28 million13).
Over the next five years, from 2016–17 to 2020–21, we expect to deliver a capital works program of about $3.3 billion in nominal (escalated) dollars.
13 2016–17 forecast.
84 World class performance | Sydney Water Annual Report 2015–16| Sydney Water Annual Report 2015

Research and developmentSydney Water invested $6.4 million dollars in 39 research and development (R&D) projects in 2015–16. Of this, $462,000 was for key national and international research alliances through Water Services Association of Australia (WSAA) and $115,000 through the Low Carbon Living Cooperative Research Centre (LCLCRC). We also committed $43,000 through arrangements with our Build-Own-Operate (BOO) water filtration plant partners.
The key drivers of the research program are to:
• maintain safe, high-quality drinking water
• improve environmental performance and health
• operate a successful and resilient business.
Table 19: Major alliance and collaborative research investment
Research partner Area of focus Sydney Water investment
2015–16
WSAA
• Water Research Foundation
• Water Environment Research Foundation
• Water Reuse Association
Drinking water quality and public health, asset management practices, sustainable water supplies and climate change.
Water quality research and innovative technologies for improving the water environment through water quality and environmental performance.
$461,723
Low Carbon Living – Cooperative Research Centre
Opportunities for lower-carbon manufacturing.
A more efficient and productive built environment sector as a whole.
Engaged communities participating in low carbon living.
Tools, technologies and techniques to ensure the sector remains globally competitive.
$115,000
Water filtration plants: BOO R&D
Water quality and public health, treatment technologies and wastewater treatment.
$43,274 (Excludes funding from BOO
partners)
Total alliance and collaborative subscriptions
$619,997
84 World class performance | Sydney Water Annual Report 2015–16 Sydney Water Annual Report 2015–16 | World class performance 85
Overview
Corporate
governanceC
ustomer at
the heartW
orld
class p
erform
ance
High perform
ance culture
Financial statem
entsA
ppendixes
| Sydney Water Annual Report 2015

Table 20: Completed projects (>$100,000), 2015–16
Project title Sydney Water investment to 30 June 2015*
Sydney Water investment to 30 June 2016*
Estimated total project investment (all partners)
Outcomes
Assessment of decentralised water management systems
$214,511 $214,511 $300,000 Understand key risks, barriers and opportunities of using decentralised wastewater management systems.
Nutrient removal and fouling in membrane bioreactor (MBR) technology
$167,084 $167,084 $1,143,000 Identified novel chemical regimes to clean inorganic fouling of membranes used in membrane bioreactors in wastewater treatment.
Climate change risk management framework tool – AdaptWater™
$575,965 $575,965 $1,025,000 AdaptWaterTM will allow Sydney Water to assess and quantify the impact of climate change and extreme events on its water supply and wastewater assets, and compare adaptation responses.
Energy R&D program
$747,616 $747,616 $762,500 Investigate cost-effective opportunities for optimising existing wastewater treatment processes and explore new approaches for energy and other resource recovery.
*Cumulative totals
86 World class performance | Sydney Water Annual Report 2015–16| Sydney Water Annual Report 2015

Table 21: Ongoing projects (>$100,000), 2015–16
Project title Sydney Water investment to 30 June 2015*
Sydney Water investment to 30 June 2016*
Estimated total project investment (all partners)
Outcomes
Optimal management of corrosion and odour in sewers
$1,728,357 $1,799,833 $21,000,000 Using the research outputs for model development, ventilation assessment and corrosion rate determination will significantly reduce the annual renewal program.
Advanced condition assessment and pipe failure prediction
$4,759,473 $5,361,343 $13,400,000 Improve how we predict water mains failure, saving on renewals and preventative maintenance.
Innovative failure data analysis to target critical mains for condition assessment
$198,734 $198,848 $225,000 Target high-risk pipes for water and concrete wastewater main renewals, reducing costs and minimising inconvenience to customers when the water main breaks.
A new management tool for effective wastewater source control
$1,225,704 $1,297,180 $3,665,000 Build capability in online monitoring to address future servicing needs, improve asset performance, and enhance trade waste capabilities and health and safety.
Biosolids R&D $1,966,955 $2,020,495 $4,796,857 Develop options for reducing biosolids and improving quality to support beneficial re-use markets.
*Cumulative totals
86 World class performance | Sydney Water Annual Report 2015–16 Sydney Water Annual Report 2015–16 | World class performance 87
Overview
Corporate
governanceC
ustomer at
the heartW
orld
class p
erform
ance
High perform
ance culture
Financial statem
entsA
ppendixes
| Sydney Water Annual Report 2015

Project title Sydney Water investment to 30 June 2015*
Sydney Water investment to 30 June 2016*
Estimated total project investment (all partners)
Outcomes
Hawkesbury-Nepean water quality modelling
$4,801,138 $5,020,840 $6,000,000 Provides science-based evidence to discuss our environmental protection licence requirements with the Environment Protection Authority. It also informs the planning process for the northwest and southwest growth sectors (a future investment of $2 billion)
Public barriers to recycled water use
$96,547 $105,547 $10,138,000 The National Demonstration, Education and Engagement Program (NDEEP), used research to develop a suite of high-quality, evidence-based information, tools and engagement strategies the water industry can use when considering water recycling for drinking purposes.
Environmental E. coli
$48,847 $58,178 $1,060,000 Develop a monitoring and management response to suspected E. coli blooms in source waters to inform the selection of E.coli counts for risk assessments for the ADWG 2011.
*Cumulative totals
88 World class performance | Sydney Water Annual Report 2015–16| Sydney Water Annual Report 2015

Project title Sydney Water investment to 30 June 2015*
Sydney Water investment to 30 June 2016*
Estimated total project investment (all partners)
Outcomes
Climate change adaptation
$348,512 $357,969 $365,000 Ensure research activities are meeting customer expectations in addressing business impacts from long-term climate change and short-term climate variability.
Waterways modelling (Sydney Harbour and Botany Bay)
$2,379,455 $3,142,786 $4,500,000 The models will help us develop an evidence-based, affordable program of long-term wet weather overflow targets, reflecting environmental, public health, amenity benefits and value to customers with respect to waterways.
Predictive analytics for sewer corrosion
$246,509 $750,000 Determine the applicability of data analytics techniques in low-data environments to predict sewer corrosion.
Economic benefit of Deep Ocean Outfalls
$95,405 $100,000 Determine the long-term benefits as a socio-economic and environmental performance assessment.
Bureau of Meteorology data acquisition
$510,404 $1,000,000 Sourcing fit for purpose data and developing a customised portal for real time feed of information.
*Cumulative totals
88 World class performance | Sydney Water Annual Report 2015–16 Sydney Water Annual Report 2015–16 | World class performance 89
Overview
Corporate
governanceC
ustomer at
the heartW
orld
class p
erform
ance
High perform
ance culture
Financial statem
entsA
ppendixes
| Sydney Water Annual Report 2015

Project title Sydney Water investment to 30 June 2015*
Sydney Water investment to 30 June 2016*
Estimated total project investment (all partners)
Outcomes
Scoping research requirements for natural organic matter study
$100,629 $200,000 Research into how rising levels of natural organic matter (NOM) in raw water impedes ability to produce drinking water to meet customer demand and water quality guidelines.
Putting photonics in sewers
$152,067 $300,000 New method to measure corrosion rates and detect the onset of corrosion. Research will focus on novel photonics technologies (using optical fibres) and imaging techniques to predict and minimise sewer corrosion.
*Cumulative totals
90 World class performance | Sydney Water Annual Report 2015–16| Sydney Water Annual Report 2015

Heritage delegation actionsWe have the regulatory power to approve and endorse certain work on Sydney Water assets listed on the State Heritage Register.
Sydney Water also has the regulatory power to grant excavation permits and/or exempt work that could impact archaeological sites in our area of operations.
We can also endorse conservation management plans and strategies for assets listed on the register.
Table 22: Decisions made under the Heritage Council of NSW delegation, 2015–16
Site Work completed Decision
Wahroonga Reservoir Subdivision of land Approved under s. 57(2) – Standard Exemption 7
Whites Creek Aqueduct Tree removal Approved under s. 57(2) – Standard Exemption 7
Tank Stream Stormwater Channel
Works on adjacent road and footpath
Approved under s. 57(2) – Standard Exemption 4
Bombo Quarry Headland Site remediation Approved under s. 57(2) – Standard Exemption 7
Western Main Outfall Sewer Works on adjacent cycleway and road
Approved under s. 57(2) – Standard Exemption 7
Prospect Reservoir New access gate installation Approved under s. 57(2) – Standard Exemption 7
Ashfield Reservoir Site remediation and access road works
Approved under s. 57(2) – Standard Exemption 7
Sewer Vent and Cottage, Stanmore
Site remediation and soil replacement
Approved under s. 57(2) – Standard Exemption 7
Chatswood Reservoirs and site
Chemical dosing plant replacement
Approved under s. 57(2) – Standard Exemption 7
Potts Hill Reservoirs and site Excavation for geotechnical survey
Approved under s. 57(2) – Standard Exemption 7
Chatswood Reservoirs and site
Entry gate relocation and replacement
Approved under s. 57(2) – Standard Exemption 7
Sydenham Pit and Drainage Pumping Station
High voltage electrical transformer relocation
Approved under s. 57(2) – Standard Exemption 7
Potts Hill Reservoirs and site Temporary structures installed for filming
Approved under s. 57(2) – Standard Exemption 7 + 11
90 World class performance | Sydney Water Annual Report 2015–16 Sydney Water Annual Report 2015–16 | World class performance 91
Overview
Corporate
governanceC
ustomer at
the heartW
orld
class p
erform
ance
High perform
ance culture
Financial statem
entsA
ppendixes
| Sydney Water Annual Report 2015

Site Work completed Decision
Sewer Vent – Obelisk Temporary artwork installation Approved under s. 57(2) – Standard Exemption 11
Prospect Reservoir Re-commissioning of pilot and prototype plants
Approved under s. 57(2) – Standard Exemption 7
Middle Harbour Syphons Works adjacent to the Clontarf aqueduct
Approved under s. 57(2) – Standard Exemption 7
Mount Dorothy Reservoir Security fence installation Approved under s. 57(2) – Standard Exemption 7
Prospect Reservoir Additional works for pilot and prototype plants
Approved under s. 57(2) – Standard Exemption 7
92 World class performance | Sydney Water Annual Report 2015–16| Sydney Water Annual Report 2015

Statement on the implementation of our special objectives
Our business is underpinned by three principal objectives outlined in the Sydney Water Act 1994 (the Act): 1. To be a successful business.
2. To protect the environment by conducting its operations in compliance with the principles of ecologically sustainable development (ESD).
3. To protect public health by supplying safe drinking water to its customers.
These objectives enable us to achieve a sustainable future by balancing social, economic and environmental considerations.
In addition to this, section 22 of the Act states that in implementing the principal objectives, we have two special objectives:
1. To reduce risks to human health.
2. To prevent the degradation of the environment.
We interpret and implement these objectives by referring to the means specified in section 22 of the Act and section 6 of the Protection of the Environment Administration Act 1991, so far as they are relevant to our business.
We have prepared this statement to meet the requirements of section 22(6) of the Act to summarise and demonstrate how we addressed the means identified in the Act between 1 July 2015 and 30 June 2016. It should be read with other reports available on our website.
Implementing the special objectives
Sydney Water integrates environmental and public health management into its business decision-making and operational activities. We implement special objectives as part of our total business view, rather than as discrete considerations. This ensures that balancing social, economic, public health and environmental considerations is part of the standard way we provide services.
We have established a number of management systems, plans and frameworks to support our business operations and ensure we continue to address the special objectives. These include our:
• ISO14001-certified Environmental Management system which provides a systematic, planned approach to managing environmental risks
• Environment Plan, which provides clear objectives, targets and actions so we can protect the environment while we address the challenges of our growing cities
• Environmental Policy, which outlines our commitment to environmental protection using principles of ecologically sustainable development and sets the framework for continual improvement in our environmental performance
92 World class performance | Sydney Water Annual Report 2015–16 Sydney Water Annual Report 2015–16 | World class performance 93
Overview
Corporate
governanceC
ustomer at
the heartW
orld
class p
erform
ance
High perform
ance culture
Financial statem
entsA
ppendixes
| Sydney Water Annual Report 2015

• Drinking Water Management System, aligned with the Australian Drinking Water Guidelines 2011, which describes the methods we use to ensure the quality and quantity of drinking water we supply to our customers
• Recycled Water Management System, aligned with the Australian Guidelines for Water Recycling 2006, which describes the methods we use to supply high-quality recycled water to our customers and minimise risks to human health
• Quality Management and Assurance Framework, which we are transitioning to an ISO 9001-certified Quality Management System, to drive us towards achieving world’s best practice across the entire business.
We publish a number of comprehensive performance reports on our website which demonstrate our implementation of the special objectives.
Please refer to the following documents available at sydneywater.com.au for more information.
• Environment Compliance and Performance Report: details our corporate performance information on our environmental objectives, targets and indicators.
• Water Efficiency Report: outlines how we are meeting our water conservation requirements and contributing to water efficiency, leak management, and water recycling initiatives.
• Sewage Treatment System Impact Monitoring Program (STSIMP) Report: a summary of wastewater discharge quality, quantity and loads data for key pollutants relating to regulatory limits. This report also contains inland and ocean receiving water quality, wastewater overflows and recycled water data.
We consider the following means, derived from the Act and the Protection of the Environment Administration Act 1991, when demonstrating our implementation of the special objectives.
1. Reduce the impact of our discharges to the environment.
2. Reduce our use of energy, water and other substances by exploring appropriate technology and practices to re-use, recycle and recover valuable resources.
3. Responsibly manage waste and minimise waste streams where possible.
4. Connect with our customers and stakeholders to share knowledge and build community value into our decision-making.
1 Reduce the impact of our discharges to the environment.
We deliver water, wastewater, recycled water and some stormwater services to more than 4.9 million people in Sydney, the Illawarra and the Blue Mountains. It’s important we provide these services in an environmentally responsible manner.
Key performance indicators Page
Principal statistics - Our network 9
Principal statistics - Our services 9
Service quality and system performance
54
Wastewater treatment system discharges
71
Environmental compliance 72
Environmental performance monitoring
74
94 World class performance | Sydney Water Annual Report 2015–16| Sydney Water Annual Report 2015

Water and wastewater network
We supply water through about 22,000 km of pipes, 150 pumping stations and 243 reservoirs. Our wastewater network consists of more than 25,000 km of pipes and 677 wastewater pumping stations. The weather presents challenges in managing this extensive network. During heavy rain, stormwater enters the wastewater network through illegal connections and cracked pipes. Our network is designed with additional capacity to cope with heavier flow during wet weather, but if the combined wastewater and stormwater flow travelling through the network is more than the network can hold, it discharges to creeks or waterways at various planned overflow points. This is called a wet weather overflow. These overflow points prevent wastewater from backing up into our customers’ homes and businesses.
Waterway models for Sydney Harbour and Botany Bay have increased our understanding of the existing health of waterways and the potential impacts of wet weather overflows. We continue to work with the NSW Environment Protection Authority (EPA) to implement a new outcomes-based regulation for wet weather overflows that will enable us to deliver better environmental and community outcomes more cost-effectively, improving the liveability of greater Sydney. The new approach involves a risk assessment process that assesses the potential impact from wet weather overflows against three waterway values: waterway ecosystem health, public health and aesthetics.
During dry weather, overflows are most commonly caused by tree roots blocking wastewater pipes. In 2015–16 maintenance field crews responded to more than 15,000 dry weather sewer main blockages, of which 244 (about 1.6%) overflowed into waterways. Over the last 12 months, we’ve used tree canopy mapping to better target preventive maintenance. This has proved very effective, identifying 30% more pipes for repair or rehabilitation compared to the same length of pipes inspected by closed-circuit television.
In 2015–16 we continued our programs to maintain and renew our network, including the:
• Avoid Fail Sewer Program (renewing sewers near high-risk sites like swimming areas, hospitals and schools)
• Dry Weather Overflow Reduction Program (reducing blockages in small diameter sewers)
• Wet Weather Overflow Program (reducing wet weather overflows and stormwater entering the network)
• Trunk and Reticulation Water Main Renewals Programs (replacing water mains that are not performing to the required standard) and Active Leak Detection Program (proactively searching for hidden leaks on our water mains).
Our ongoing investment in these programs has delivered some good results. We have:
• reduced the five-year average of overflows from network blockages from 83 (in 2002–07) to 58 for every 100 km in 2011–16
• reduced the number of dry weather overflows from pumping stations from over 35 (in 2001) to five or less each year since 2007
• enabled a downward trend in water main breaks and leaks since 2003–04.
Stormwater network
Stormwater assets help protect people and property from flooding, and form part of our urban waterways. Our stormwater network is a small but critical part of the metropolitan drainage system, draining 15% of Sydney’s urban area. Local councils own and maintain most of the city’s stormwater assets. In many areas of Sydney, poor quality stormwater is highly detrimental to waterway health and amenity.
94 World class performance | Sydney Water Annual Report 2015–16 Sydney Water Annual Report 2015–16 | World class performance 95
Overview
Corporate
governanceC
ustomer at
the heartW
orld
class p
erform
ance
High perform
ance culture
Financial statem
entsA
ppendixes
| Sydney Water Annual Report 2015

We maintain our network, removing silt and rubbish from over 60 stormwater quality improvement devices, which prevented 2,279 m3 of debris from entering Sydney’s waterways in 2015–16. We also take the opportunity to improve waterway health and amenity by naturalising stormwater assets in suitable locations when they reach the end of their structural life.
To manage flooding and improve both the quality of stormwater and the overall health of our urban waterways, we collaborate with local councils and other stakeholders to take a whole-of-catchment approach.
Private networks
At times, collective action by everyone is required to protect our waterways. There are about 25,000 km of privately owned wastewater pipes connecting homes to our network. Problems with these privately-owned pipes have a big impact on the performance of the entire wastewater system and our ability to manage the overall system. Property owners may be unaware that they own and are responsible for maintaining these pipes.
Leaking sewers and stormwater infiltration increase the risk of wet weather overflows, and rubbish that goes down drains and toilets can block both household plumbing and the wider wastewater system.
In recent years, the number of wet wipes entering our wastewater system has increased. We remove about 500 tonnes of wet wipes from our wastewater system every year. Wipes can get stuck in pipes, increasing the risk of breaks and overflows to our local creeks or customers’ homes. In fact, we estimate that 75% of sewer blockages we respond to involve wet wipes. Our ‘Keep wipes out of the pipes’ campaign has improved customer awareness and behaviour. We also directly engaged the wet wipes industry, with one major brand committing to developing clearer labelling on its products.
Wastewater treatment plants
Treating the community’s wastewater plays a huge role in healthy waterways. Our wastewater system spans 16 wastewater treatment plants and 14 water recycling plants, licensed by the NSW EPA. Our plants receive wastewater from a range of sources and discharge treated wastewater to a number of inland fresh waterways and the ocean.
We treat about 80% of Sydney’s wastewater at the three largest wastewater treatment plants – at North Head, Bondi and Malabar. These plants disperse primary treated wastewater through deep ocean outfalls about two to four kilometres offshore, where the water is 60 to 80 metres deep. Strong ocean currents further dilute the treated wastewater.
We monitor the environment within our area of operations to determine general trends in water quality over time. We have found no accumulation of contaminants (including pesticides and metals) and no evidence of long-term effluent toxicity.
We also monitor ocean sediments to see if there are any impacts on marine ecosystem health near our deep ocean outfall locations. We have been monitoring the environment for more than 10 years and our data shows there has been no measurable impact on marine ecosystems.
The deep ocean outfalls play a key role in keeping our beaches and swimming areas clean. The State of the Beaches Report for 2014–15 graded 37 out of 38 Sydney ocean beaches as ‘very good’ or ‘good’.
Sydney Water’s inland plants discharge into the Hawkesbury-Nepean River system. Considerable urban growth is planned for the Hawkesbury-Nepean catchment over the next 30 years, to accommodate Sydney’s growing population. This offers the opportunity to provide water services in new and better ways.
96 World class performance | Sydney Water Annual Report 2015–16| Sydney Water Annual Report 2015

To understand the potential impacts to water services and the environment, we use our water quality and hydrodynamic model of the Hawkesbury-Nepean catchments to test different catchment, environmental flow, wastewater and land use options over time.
We are also supporting the NSW EPA in its review of the regulatory framework for nutrient discharges into the Hawkesbury-Nepean River system. With insights from our Hawkesbury-Nepean water quality and hydrodynamic model, as well as community involvement, the new regulatory framework will enable smarter integrated water solutions that provide the best balance of social, economic and environmental outcomes for this iconic river catchment.
Incidents
We recognise that the impact wastewater overflows have on the environment and the community is unacceptable, and we work hard to prevent them. We have rigorous maintenance programs in place to ensure our assets are operating as intended. However, managing a network as large as ours is challenging, and factors like fluctuating weather conditions and the age of some of our assets mean wastewater overflows occur from time to time.
When an incident does occur, we act quickly to fix the issue and minimise the impact to the environment and the community. Our reporting protocols ensure incidents are reported to the relevant authorities when necessary. Following an incident, we investigate the circumstances that led to it occurring and improve the way we operate to prevent them recurring.
Occasionally, our regulators may issue compliance and enforcement actions in response to an incident. In 2015–16, we received two penalty notices for dry weather wastewater overflows that occurred at Cronulla and Bexley.
We also entered into an enforceable undertaking with the NSW EPA after a water pollution incident that involved an unlicensed discharge of wastewater from an effluent pipe into the Parramatta River at Rydalmere. Please see page 72 of this report for more information.
2Reduce our use of energy, water and other substances by exploring appropriate technology
and practices to re-use, recycle and recover valuable resources.
Water, more than any other substance, is essential for human survival. Responsible water stewardship is critical for all of us and the future of our business. Water brings life, and how well we provide our water service influences the quality of life in Sydney, the Illawarra and the Blue Mountains.
Sydney Water is a major consumer of electricity. Emissions from generating coal-fired electricity contributes to global warming. We aim to implement cost-effective opportunities to reduce our energy use and generate renewable energy.
Our commitment to optimising the use of other resources led to the recent implementation of our Procurement policy, which embeds sustainability principles into how we source and procure goods and services.
96 World class performance | Sydney Water Annual Report 2015–16 Sydney Water Annual Report 2015–16 | World class performance 97
Overview
Corporate
governanceC
ustomer at
the heartW
orld
class p
erform
ance
High perform
ance culture
Financial statem
entsA
ppendixes
| Sydney Water Annual Report 2015

We also support and develop the capabilities of our human resources – our staff, contractors and suppliers. We inform and educate our staff about their environmental accountabilities and train our contractors in environmental management.
Key performance indicators Page
Water conservation 55
Water drawn 56
Recycled water performance 71
Energy use and greenhouse gas emissions
73
Environmental footprint 73, 76, 77
Water leakage 71
Water recycling
We support 23 schemes that provide recycled water for use in thousands of homes and businesses, and to irrigate parks, farms and playing fields. We also use recycled water at our plants for process and cleaning needs. We recycled more than 43 billion litres of water in 2015–16, saving more than 13 billion litres of drinking water.
There are currently eight sewer mining schemes in Sydney Water’s area of operations. Sewer mining involves tapping into a wastewater system (either before or after the wastewater treatment plant) and extracting wastewater, which is treated on-site before being used as recycled water.
There are also eight private on-site re-use schemes that produce recycled water by capturing, treating and re-using wastewater from a site’s buildings or facilities. This includes Sydney Water’s head office building in Parramatta.
We continue to encourage water recycling and sewer mining where it can replace the use of drinking water and benefit the community. In 2015–16, we continued to consult with stakeholders on potential new recycled water schemes and signed two new sewer mining agreements with third parties.
Water efficiency
We own and maintain about 22,000 km of pipes that deliver water to our customers. We also maintain almost 1.9 million connections to customer properties. We reduce the likelihood of leaks occurring in our own network by actively detecting and repairing leaks, managing pressure in the network, monitoring our response time and continuing our Pipe Renewal Program. Managing leaks saves more than 30 billion litres of water a year. In 2015–16, water leakage rates from our drinking water network averaged 103 megalitres a day, which complies with our Operating Licence target of 121 megalitres a day.
Environmental flows
We also use recycled water for environmental flows, which is when we introduce additional water to a waterway to improve ecosystem health and value. For example, the flows may enable fish to move up and down a river to breed. We release environmental flows into the Nepean River at Penrith from the advanced water recycling plant in St Marys. In 2015–16, over 10 billion litres of recycled water helped maintain environmental flows in the Hawkesbury-Nepean River.
Electricity use
The water industry is energy-intensive and we use large amounts of electricity in our treatment operations and pipe networks. We’ve worked for many years to reduce our energy use and pave the way for a low energy future.
We aim to keep our energy use, emissions and costs down, despite an increasing population and its demands for more services. We achieve this by:
• generating our own renewable energy
• developing energy efficiency projects
• optimising our electricity purchases
• optimising resource recovery and co-digestion.
98 World class performance | Sydney Water Annual Report 2015–16| Sydney Water Annual Report 2015

Renewable energy and energy efficiency
We continue to investigate innovative technologies to enable new and better ways to deliver cost-effective products and services. We are one of the industry partners in a game-changing R&D project to store renewable energy. The Australian Renewable Energy Agency (ARENA) has contributed $2.7 million to the project. We’re also collaborating with the University of Wollongong and other industry partners over the next four years to develop low-cost, high-density renewable batteries, which can be used for renewable energy storage for our pumping stations under extreme weather conditions.
The ability to store solar energy will increase the resilience of our plants, lower our operating costs, and support our commitment to cost-effectively generate and source electricity from renewable sources.
We currently generate the equivalent of 21% of our total on-site electricity needs from our eight cogeneration facilities, three hydroelectric plants and solar photovoltaic systems. In 2015–16 we:
• increased the generation capacity at Prospect Water Filtration Plant by 131%
• increased generation at North Head and Cronulla wastewater treatment plants through new generators installed in 2014–15
• installed 63.7 kW of solar panels across six of our sites.
Our Energy Efficiency Management Program has improved our operations, saving about $4 million a year. We only invest in cost-effective projects, and we verify our savings to the standard required to create Energy Saving Certificates under the NSW Government’s Energy Savings Scheme.
We also report our energy use and greenhouse gas emissions each year, under the National Greenhouse and Energy Reporting Act 2007.
We plan for the future by understanding lifecycle costs when we invest in new assets, and look for resource recovery and renewable energy options at our wastewater treatment plants.
Biogas
Since 1998 we’ve been capturing biogas, a by-product of biosolid production, and using it to run cogeneration engines. We now have eight cogeneration facilities that power treatment plants and heat the biosolid digesters. We also operate five smaller facilities with anaerobic digesters that either use the biogas to directly heat the digesters or flare the gas, so we don’t emit methane to the environment. Our Bondi Wastewater Treatment Plant now generates more electricity than we need to run the plant. We are investigating opportunities to make other treatment plants as self-sufficient.
In 2011, we started investigating co-digestion of sludge with organic waste to increase biogas production. In 2014, we began a pilot project that delivered promising results. As a result, we introduced co-digestion at our Cronulla wastewater treatment plant in June 2016 to increase our renewable energy generation. This could provide future waste disposal opportunities for other organisations and waste types, delivering better environmental outcomes.
98 World class performance | Sydney Water Annual Report 2015–16 Sydney Water Annual Report 2015–16 | World class performance 99
Overview
Corporate
governanceC
ustomer at
the heartW
orld
class p
erform
ance
High perform
ance culture
Financial statem
entsA
ppendixes
| Sydney Water Annual Report 2015

3Responsibly manage waste and minimise waste streams where possible.
One of the greatest challenges in developing and expanding urban living is removing waste and managing landfills that are reaching or exceeding their capacity. We aim to prevent and minimise the waste we generate, re-use materials and waste, and create value from them. Resource recovery goes one step further than re-use and considers what resources we have available, how we use them and where we can achieve value. We continue to investigate how we can capture energy and nutrients in a way that our community and customers value.
Key performance indicators Page
Trade waste agreements 71
Environmental footprint 73, 76, 77
By-product 75
Waste reduction 75
Waste generation and recovery
Most of the waste material we generate comes from our construction and demolition projects. The nature of this work means that the amount of waste we generate and the classification of that waste can fluctuate from year to year. We also generate waste through our daily operations. We continue to work with our contract partners to maximise the amount of waste material we divert from landfill through recycling programs.
In 2015–16, we generated 190,230 tonnes of solid waste, a decrease of 42% from 2014–15. This decrease is primarily due to a reduction in construction and demolition waste which accounted for about 83% of our waste.
We recycled or re-used about 71% of the waste we created in 2015–16.
Biosolids
During wastewater treatment, we separate solids from the liquid wastewater. We treat these solids in digesters to break down organic matter. The final material produced by the digesters is called biosolids. We monitor these biosolids and test them to ensure they comply with EPA guidelines before agricultural re-use. This provides value for biosolids users by reducing fertiliser costs and improving soil properties.
In 2015–16, we produced almost 40,000 tonnes of biosolids from waste material that would have been discharged to the environment or sent to landfill.
Since 2003, we have re-used 100% of our biosolids as an agricultural soil conditioner or compost and continue to re-use 90% of grit and screening waste.
Trade wastewater
Accepting trade wastewater to our wastewater system is a risk for Sydney Water. Commercial and industrial business customers must enter into a trade waste agreement with us before they can discharge trade wastewater to our system. These agreements outline:
• the allowed loads and concentrations of liquid waste business customers may discharge
• acceptance standards
• sampling and analysis requirements
• any specific pre-treatment we require.
Our Business Customer Representatives visit customers to manage their connections and use of our assets and services, as well as ensuring they continue to comply with our requirements.
We may disconnect a customer’s service if they discharge trade waste without our approval or if they breach their trade waste agreement.
100 World class performance | Sydney Water Annual Report 2015–16| Sydney Water Annual Report 2015

Industrial customers have more complex processes that can pose a higher risk to our treatment systems and the environment. Our trade waste monitoring program focuses on industrial customers to ensure they comply with their trade waste agreements. In 2015–16, 97% of our industrial customers complied with the conditions of their trade waste agreements.
4Connect with our customers and stakeholders to share knowledge and build community value into
our decision-making
Having the customer at the heart of everything we do is one of the values of our 2015–20 Corporate Strategy and underpins all our decision-making. We are committed to understanding the needs and expectations of our customers and stakeholders, and we continually seek new and better ways of delivering our water, wastewater and stormwater services to improve customer experience and value.
The way our customers experience water in their daily life affects the value they place on water services and the enjoyment and comfort they receive from their urban surroundings. We engage with our customers to understand what makes their city more liveable. We partner with organisations to broaden the benefits our services provide. We also look for new and better ways for our services to support the amenity, productivity and sustainability of a vibrant, competitive and growing Sydney.
Key performance indicators Page
Our stakeholders 7–8
Our performance – Customer at the heart
17–18
Community investment 64
Communicating with our customers
66
Community involvement
We seek opportunities to engage with our customers at events, in places and on programs that are important to them, their communities and our stakeholders. These engagement opportunities allow us to educate customers about the great quality of tap water, the urban water cycle and the importance of environmental protection and sustainability.
In 2015–16, we’ve implemented a number of initiatives to educate our customers about the health, financial and environmental benefits of drinking water, so they are empowered to make choices that are better for their families and their local environment. These activities include:
• sponsorship of Cricket NSW
• our Water Bar at the Easter Show and Sydney Festival
• portable hydration stations at community events all around Sydney
• heritage tours of the Tank Stream, West Ryde Boiler House, Prospect Reservoir and Potts Hill sites.
• school excursions of our water filtration plants
• media and social media content to spread the word about the benefits of drinking water.
We engaged with about 900,000 people at these events, and gave out 56,638 litres of water, which is estimated to have saved:
• 90 kg of plastic waste from going to landfill (equivalent to 94,397 x 600 ml plastic bottles)
• 141,595 litres of water and 66,266 kWh of energy being consumed during the production and supply of bottled water.
100 World class performance | Sydney Water Annual Report 2015–16 Sydney Water Annual Report 2015–16 | World class performance 101
Overview
Corporate
governanceC
ustomer at
the heartW
orld
class p
erform
ance
High perform
ance culture
Financial statem
entsA
ppendixes
| Sydney Water Annual Report 2015

Connect with our customers and stakeholders
We have an extensive customer and stakeholder research program and a variety of stakeholder and customer forums to ensure we include customer, stakeholder and community needs and values into our environmental planning and decision-making. Our stakeholder and customer engagement in 2015–16 includes the following examples.
• We ran a series of engagement activities to inform the community and stakeholders of our proposal to the EPA to change our wastewater licences for the four major coastal wastewater systems. Participants provided feedback on our proposed approach and told us how they expected us to manage waterways in the future. This helped us refine our proposal to the EPA.
• Together with the University of Technology Sydney (UTS), we engaged customers and the community on a range of issues relating to stormwater pricing and tariff structures. We gained insight into how customers value stormwater in creating liveable cities, including their willingness to pay for stormwater services that would improve environmental, water quality, amenity or flood mitigation outcomes.
• We commissioned UTS to benchmark and gain insight into stakeholder perceptions about biosolids. The findings showed a mostly positive sentiment towards biosolids re-use, and satisfaction with our management of biosolids.
• The ‘Keep wipes out of the pipes’ campaign improved customer awareness and behaviour around the use of wet wipes, with a 50% drop in the number of customers who think it’s okay to flush wipes down the toilet. We’ve also seen product improvements and a commitment to clearer labelling through direct engagement with a leading manufacturer. We continue to educate the community about our water and wastewater system through social media, community events and education programs.
• Community consultative groups are
key communication focal points for our wastewater treatment plants at Bondi, Malabar and North Head. We regularly meet with community representatives to discuss our operations and provide feedback on how we can interact better with the community. A community reference group for the Picton Water Recycling Plant upgrade is providing input on the best ways to use the additional recycled water gained after an upgrade.
• To deliver better services to customers and the community, we’ve formed closer ties with local councils. We achieved this by establishing a relationship manager for each of the 44 local councils in our area of operations.
• We’ve developed an online resource in partnership with the NSW EPA, to help council officers detect, investigate and regulate wastewater leaks and illegal connections. Officers from 41 councils across our network have been trained, and feedback from the training sessions indicates an increased capacity and confidence in council officers when it comes to investigating wastewater leaks.
• We have observed an upward trend in the number of people who see Sydney Water as ‘environmentally responsible’. This is measured through the Customer Sentiment Monitor, an online survey of customer attitudes toward our service and performance.
Customer Council
We operate a Customer Council in accordance with our Operating Licence and Customer Council Charter. The charter was developed in partnership with Customer Council members and is available on our website. The Customer Council meets each quarter and includes representatives from a diverse range of organisations representing our customer base. We seek advice and feedback from the council members on a range of services and projects and encourage them to share any issues concerns or ideas they may have. We value their input and incorporate their advice where possible.
102 World class performance | Sydney Water Annual Report 2015–16| Sydney Water Annual Report 2015

Water efficiency programs
Over the past 20 years, we’ve implemented some of the largest water efficiency programs in the world. Due to the efforts of our customers, these programs were highly successful.
Our customers continue to use water efficiently and water use has remained at a record low since 2008, even though we are no longer in drought. Our customers have adopted water-efficient practices as part of their everyday life. Due to the high levels of participation in our water efficiency programs, it is now less effective to target all customers. We have completed our first decision framework for demand management, which allows us to better target our future water saving programs.
We also understand our responsibility as an educator, to ensure people are aware of the role they play in protecting our natural resources. We provide information on our website to help people make informed decisions on how to save water. We run educational tours at 11 operational sites which include water filtration, water recycling and wastewater treatment plants and we have a Water Recycling Education Centre at the Advanced Water Treatment Plant at St Marys.
Land and biodiversity management
We develop and implement management plans for key wetland, riparian land and bushland assets, as well as broader vegetation management strategies for our land holdings. These focus on:
• improving waterway health
• managing flood risks
• enhancing natural environments
• aligning land management with community values.
Since we began monitoring in 2005, we have achieved a net gain of 40 hectares of native vegetation through protection, rehabilitation and replanting.
We also have a responsibility to promote the beneficial use of land and groundwater that has been contaminated in the past by previously commonplace activities. Along with our contractors, we routinely conduct environmental assessments to ensure we consider and manage the environmental impacts of our activities. We design the environmental assessment for each specific activity, depending on the level of environmental risk.
Contaminated land management
We assess the contamination risks of our properties, as required by the Contaminated Land Management Act 1997. We are currently managing one site declared to be significantly contaminated according to the applicable Management Orders.
Active use of our built heritage assets today ensures their longevity. We also recognise the inherent risks in using our historic buildings and have developed hazardous building material registers for our sites.
Our Pollution Incident Response Management Plan for water and wastewater services is available on our website. The plan details how we’ll respond to water and wastewater pollution incidents, and provides our contact information, including our 24-hour emergency service line.
102 World class performance | Sydney Water Annual Report 2015–16 Sydney Water Annual Report 2015–16 | World class performance 103
Overview
Corporate
governanceC
ustomer at
the heartW
orld
class p
erform
ance
High perform
ance culture
Financial statem
entsA
ppendixes
| Sydney Water Annual Report 2015

Threatened Species Conservation Act 1995Section 70 of the Threatened Species Conservation Act 1995 requires public authorities to report on their implementation of recovery plans.
Sydney Water is responsible for implementing measures included in threatened species recovery plans for:
• Eastern Suburbs Banksia scrub
• Coastal Saltmarsh
• an endangered population of bandicoots (Perameles nasuta) at North Head
• Downy Wattle (Acacia pubescens)
• Green and Golden Bell Frog (Litoria aurea)
• Grevillea caleyi
• Cumberland Plain Woodland
• Tadgell’s Bluebell (Wahlenbergia multicaulis Benth).
We have completed 140 Property Environmental Management Plans for the most environmentally sensitive sites that we own. The sites include all of those with known threatened species, communities and populations. We have included relevant requirements from recovery plans in each site-specific plan.
We have reviewed the implementation of these plans to improve results and ensure better environmental outcomes for threatened species, communities and populations.
Actions we’ve taken to implement measures included in threatened species recovery plans are listed here.
Eastern Suburbs Banksia Scrub
We have a management plan for Botany Wetlands covering the wetlands and Bonnie Doon, Eastlakes and The Lakes golf courses, which contain remnants of Eastern Suburbs Banksia Scrub (ESBS). Under the plan, the clubs responsible for the golf courses must implement environmental management plans to ensure their operations protect the ESBS. Sydney Water also directly protects and maintains patches of ESBS not on golf course land. Protective measures include:
• physical protection
• bush regeneration
• weed management.
We continued these protective activities during 2015–16.
We also prepared Property Environmental Management Plans for North Head Wastewater Treatment Plant (WWTP) and Maroubra Reservoir. We manually remove fuel over several years to reduce bushfire hazards at North Head WWTP and protect the ESBS.
Coastal Saltmarsh
We have a plan of management for Eve Street Wetland, Arncliffe, which contains Coastal Saltmarsh. Our protective measures include:
• physical protection
• bush regeneration
• weed management
• maintenance of the wetland’s tidal regime.
104 World class performance | Sydney Water Annual Report 2015–16| Sydney Water Annual Report 2015

As part of the Cooks River naturalisation project, we planted Coastal Saltmarsh at two sites in March 2015. This created over 850 m2 of new saltmarsh as well as a much larger area of new saltmarsh habitat on the naturalised banks where it will grow naturally. Maintenance of these new saltmarsh areas continued in 2015–16.
We have mapped vegetation around all of Sydney Water’s tidal stormwater assets and added this information into our Geographic Information System (GIS).
We made significant progress on bank stabilisation along 300 m of Alexandra Canal next to Tempe Reserve in 2015–16. This has introduced new saltmarsh habitat within voids in the sandstone block canal bank.
We added four deteriorated tidal assets (Johnsons Creek, St Lukes Park, Whites Creek and Muddy Creek) to our renewal program in 2015–16. All these sites could potentially provide significant new areas of saltmarsh, if a naturalisation-type renewal is assessed to be feasible. We have started concept design and will continue this into 2016–17.
Endangered population of bandicoots at North Head WWTP
We have a Property Environmental Management Plan for North Head WWTP, which sets out how we help protect an endangered population of bandicoots (Perameles nasuta). We contribute to feral animal control and other measures at North Head.
Downy Wattle (Acacia pubescens)
We have Property Environmental Management Plans for Potts Hill Reservoir and the Pipehead to Potts Hill pipeline. Some of the stands of Acacia pubescens at Potts Hill are included in areas covered by a Voluntary Conservation Agreement (VCA). We have fenced off and signposted the VCA area to protect the new growth of the species. A VCA is now in place to manage the environmental values as required, including monitoring and reporting on the A. pubescens.
We have prepared a Property Environmental Management Plan for Prospect Reservoir.
We are implementing the management plan for Chullora Wetlands, which includes weed management and potential habitat protection.
Green and Golden Bell Frog
We have prepared Property Environmental Management Plans for Cronulla WWTP, St Marys Water Recycling Plant and Prospect Reservoir.
Botany, Eve St and Chullora Wetlands are potential habitats for the Green and Golden Bell Frog (Litoria aurea). Management plans for these wetlands aim to protect and enhance this habitat.
We recently completed work on the Cooks River naturalisation which aims to restore potential Green and Golden Bell Frog habitat at three locations along the river.
104 World class performance | Sydney Water Annual Report 2015–16 Sydney Water Annual Report 2015–16 | World class performance 105
Overview
Corporate
governanceC
ustomer at
the heartW
orld
class p
erform
ance
High perform
ance culture
Financial statem
entsA
ppendixes
| Sydney Water Annual Report 2015
Grevillea caleyi
We have prepared a Property Environmental Management Plan for Site 2 south (Mona Vale Road), Tumbledown Hill and Terrey Hills.
Cumberland Plain Woodland
The recovery plan for Cumberland Plain Woodland identifies properties that contain Cumberland Plain Woodland. We have Property Environmental Management Plans for the most significant of these sites.
We have carried out vegetation mapping for our trunk drainage land in the Rouse Hill development area. This includes several areas of Cumberland Plain Woodland. We are protecting and enhancing these remnants through bush regeneration and weed management in line with the management plan for Sydney Water Trunk Drainage Land in the Rouse Hill Development Area. Bush regeneration and weed management was ongoing in 2015–16.
Tadgell’s Bluebell (Wahlenbergia multicaulis Benth)
Our plants have been identified in a draft recovery plan for Tadgell’s Bluebell (Wahlenbergia multicaulis Benth). The only known plants on our property are in an isolated pocket of land that is rarely accessed, so we are not currently taking any action.
106 World class performance | Sydney Water Annual Report 2015–16| Sydney Water Annual Report 2015

5.High performance culture

Our sustainability performance• We’re committed to achieving our
safety goal of zero injuries to our staff, contractors and visitors. We’ve been working with key business stakeholders to develop a new initiative that helps us meet our Corporate Strategy objectives. This is to provide a safe environment for our staff, contractors and the public. Our safety theme is ‘‘Safe and Well Together’.
• We’re building staff capability through training and development programs, and the entry level program. We received around 1,500 applications for the Graduate Program in 2015–16, and welcomed 14 new graduates into the program.
• Sydney Water was named in the top 25 Intern Programs by the Australian Association of Graduate Employers (AAEG) in 2016*.
• We continue to receive industry recognition for the quality of our training programs. We received the Silver Award for Best Bespoke/Custom eLearning module at the 2015 LearnX Impact Awards for our Environmental Accountabilities eLearning module. Additionally, we were finalists at the 2015 Australian Institute of Training and Development (AITD) Awards in the category of Best Use of Gamification/Simulation for Learning.
• Employee engagement was consistently above our target of 70% for each quarter during 2015–16. Most staff told us that they are proud to tell others they work for Sydney Water and would recommend us as an employer to a friend looking for a job. More than 80% of our workforce would like to continue working for the organisation for the next twelve months. We continue to investigate what inspires our staff to do their best work to help us improve employee engagement.
• We have developed a Diversity and Inclusion Plan to 2020, demonstrating our commitment to building a diverse and inclusive workforce that supports our strategic aspirations, reflects our values and is reinforced through our signature behaviours.
*AAGE online http://www.topinternprograms.com.au
108 High performance culture | Sydney Water Annual Report 2015–16| Sydney Water Annual Report 2015

Performance indicator key
Expectations met or exceeded Indicators show a positive long-term trend towards the goal.
Areas to improve Indicators show mixed results, with positive trends for some and negative trends for others.
Action required Indicators show a negative long-term trend towards the goal.
– Not applicable Performance not reported.
Table 23: High performance culture sustainability performance indicators
Indicator 2011–12 2012–13 2013–14 2014–15 2015–16
Safety
Lost time injury frequency rate (LTIFR)
Sydney Water staff 6.28 2.29 6.16 4.71 2.8
Contractors 3.19 1.04 2.01 2.72 1.8
Total recordable injury frequency rate (TRIFR)
Sydney Water staff – – – – 14.2
Contractors – – – – 7.7
LTIFR is the number of lost time injuries for each million hours worked. An injury is a ‘lost time injury’ if the person was away from work for one day/shift or more. The TRIFR is the sum of all lost time injuries plus the number of work-related injuries or illnesses requiring medical treatment per million hours worked.
We have seen an improvement in our safety performance in 2015–16. The LTIFR decreased by 42% for our staff and by 25% for our contractors compared to 2014–15. TRIFR is a new indicator we introduced in 2015–16.
Results reflect the most recent data at the time of reporting and the number of contractor hours reported to us. We update historical data to include any notifications received since the previous reporting periods.
108 High performance culture | Sydney Water Annual Report 2015–16 Sydney Water Annual Report 2015–16 | High performance culture 109
Overview
Corporate
governanceC
ustomer at
the heartW
orld class perform
anceH
igh
perfo
rman
ce cu
lture
Financial statem
entsA
ppendixes
| Sydney Water Annual Report 2015

Indicator 2011–12 2012–13 2013–14 2014–15 2015–16
Diversity
Percentage of leadership roles held by female staff (as defined in our Diversity and Inclusion Plan)
– – – – 31.8
Women in technical, trade and engineering roles^ (%)
– – – – 7.4
Gender pay gap (%) – – – – 3.5
We are committed to building a diverse and inclusive workforce that supports our strategic aspirations, reflects our values and is reinforced through our signature behaviours.
While we are currently performing better than the utility sector industry average for each of the diversity indicators reported here, we know we still have some work to do to improve our performance.
‘Women in technical, trade and engineering roles’ includes all roles identified as non-traditional roles by the Australian Human Rights Commission.
Capability
Training investment per staff member ($) 1,010 1,115 1,097 1,187 1,269
We are committed to the ongoing professional development of staff to facilitate a safe, capable and committed workforce.
In 2015–16, we invested an average of $1,269 to train each staff member. Staff also participated in additional activities to build capability that didn’t result in a cost measured by this benchmark.
Number of staff in an entry-level program (total at 30 June)
80 78 68 84 74
Numbers of staff in entry-level programs change throughout the year as we recruit new participants and others move into permanent positions. Entry-level staff represent the following proportions of full-time equivalent staff:
• 2.9% in 2015–16
• 3.3% in 2014–15
• 2.6% in 2013–14
• 2.9% in 2012–13
• 2.8% in 2011–12
Results are based on a 12-month rolling average.
110 High performance culture | Sydney Water Annual Report 2015–16| Sydney Water Annual Report 2015

Indicator 2011–12 2012–13 2013–14 2014–15 2015–16
Staff-initiated turnover for staff with five years of service or less (%)
8.7 8.0 8.6 8.0 8.8
This indicator enables us to track our performance in retaining staff skills and knowledge. Sydney Water internal targets for staff-initiated turnover for staff with five years of service or less are:
• 15% for less than one year of service
• 10% for one to less than three years of service
• 7% for three to five years of service
Staff engagement – – – –
The Engagement Index incorporates five statements that measure the extent to which staff feel proud, attached, motivated, inspired and willing to recommend their organisation as a great place to work (%)
– – – – 74
Employee engagement is measured through an internal quarterly staff survey. The results of the survey for 2015–16 indicated that employee engagement was consistently above target for each quarter during 2015–16.
This is a new indicator introduced for 2015–16. Data from previous years is not available.
110 High performance culture | Sydney Water Annual Report 2015–16 Sydney Water Annual Report 2015–16 | High performance culture 111
Overview
Corporate
governanceC
ustomer at
the heartW
orld class perform
anceH
igh
perfo
rman
ce cu
lture
Financial statem
entsA
ppendixes
| Sydney Water Annual Report 2015

Workplace health and safetyWe are very pleased with the strong improvement in our safety performance over the last year. We have seen a substantial, sustained improvement in our staff lost time injury frequency rate (LTIFR) with a drop from 4.9 to 2.8. This is a 42% improvement and significantly lower than our target of 4.3.
Thanks to dedicated efforts to improve hazard reporting across the business, we’ve seen an increase of 27% in near-miss reporting and over four times more hazard reporting. This is enabling more consistent, accurate identification of high-potential incidents, allowing us to focus on controlling our most significant risks in the business.
However, there is a lot more to be done in this area and our performance is still much poorer than where we need to be. Safety will continue to be a focus in 2016–17 and the years ahead.
Our Safe and Well Together Strategy is progressing well and we’ve reached some key milestones in all three pillars:
• Safe and Healthy Place
• Safe and Healthy Systems
• Safe and Well People
Safe and Healthy Place
We have focused on understanding and controlling our fatal risks. We’ve identified 16 fatal risks by investigating and analysing our previous incidents, and consulting with business and industry stakeholders. For each fatal risk we have established a set of clear standards and are currently reviewing our processes against those fatal standards. To support this we’re also developing a set of ‘Lifesaver rules’ which we will implement in early 2017.
Safe and Healthy Systems
We have worked to develop the Work Health and Safety Management System, aligning nine corporate health and safety management standards, the 16 fatal risk standards and a set of supporting procedures. We developed the system in consultation with many areas across the business. We are now assessing our performance against these standards, with all areas of the business required to meet – or have a plan to meet – the standards by 1 January 2017.
We’ve also upgraded our performance indicators, developing a new set of lead and lag indicators. This helps us focus more on where our key risks are and how to address them. We now know we must review the way we manage contractors to ensure clear consistent standards across the organisation. Reviewing our high-potential incidents has also identified two significant emerging risks:
• underground and overhead services
• lock-out / tag-out management.
We will conduct deep-dive investigations to help us understand how to best address these critical risks.
Safe and Well People
To support the wellbeing of our workers, we are reviewing our wellbeing programs to help our staff be the best they can be. We’re also building on this work by ensuring that wellbeing is a primary focus at Sydney Water. We aim to develop and roll out these programs in November 2016.
112 High performance culture | Sydney Water Annual Report 2015–16| Sydney Water Annual Report 2015

In the first half of 2016, we conducted comprehensive consultation to introduce an ‘Alcohol and Other Drugs’ Program to staff. The program aims to promote wellbeing and protect people from harm associated with interacting with people affected by alcohol and other drugs while at work. We intend to roll this out from October 2016.
Our ‘Safe and Well People’ focus is progressing well. Late last year we held a Safety Leadership Challenge for all people leaders across Sydney Water, to review our safety performance and commit to making real changes. As part of this, all people leaders developed safety action plans and regularly review these plans with their manager.
This year we also piloted a visible leadership and behaviour-based safety program in our Networks area. We’re reviewing the results of the pilot and will use these to make sure our people leaders have the skills they need to demonstrate visible safety leadership. We will use our leadership model to shape this program in the future ensuring we take a consistent approach to visible safety leadership over time.
We are working on a just and fair decision-making process, which will guide us in demonstrating fairness when responding to safety errors and violations. This is currently being rolled out across the organisation.
We are very pleased with our steps forward for safety and wellbeing, however we recognise this is a journey. We must continue to focus on delivering our strategy to achieve our goal: improved safety and wellbeing performance for all.
Figure 19: Lost time injury frequency rate (LTIFR) for staff and contractors
The LTIFR is the number of lost time injuries for each million hours worked. An injury is a ‘lost time injury’ if the person was away from work for one day/shift or more.
Day
s lo
st p
er m
illio
ns
ho
urs
The frequency rate is the number of lost time injuries for each one million hours worked.
The formula used for calculating frequency rates is: Frequency rate = (number of LTIs/number of hours worked) x 1,000,000
0
5
10
15
20
25
30
35
95–96 96–97 97–98 98–99 99–00 00–01 01–02 02–03 03–04 04–05 05–06 06–07 07–08 08–09 09–10 10–11 11–12 12–13 13–14 14–15LTIFR 28.46 25.45 21.40 21.78 18.19 11.86 12.34 10.28 9.70 14.83 8.20 6.65 5.25 3.68 4.86 6.14 6.43 2.29 6.16 4.71
15–162.80
Note: Results reflect the most recent data at the time of reporting. Historical data is updated to include any LTI notifications received since previous reporting periods.
112 High performance culture | Sydney Water Annual Report 2015–16 Sydney Water Annual Report 2015–16 | High performance culture 113
Overview
Corporate
governanceC
ustomer at
the heartW
orld class perform
anceH
igh
perfo
rman
ce cu
lture
Financial statem
entsA
ppendixes
| Sydney Water Annual Report 2015

Figure 20: Lost time injury frequency rate and lost time injuries for staff and contractors
0
5
10
20
25
Sydney Water LTIs per month
Sydney Water LTIFR
Contractor LTIs per month
Contractor LTIFR
Jul-1
4
Aug
-14
Sep
-14
Oct
-14
Nov
-14
Dec
-14
Jan
-15
Feb
-15
Mar
-15
Apr
-15
May
-15
Jun
-15
Jul-1
5
Aug
-15
Sep
-15
Oct
-15
Nov
-15
Dec
-15
Jan-
16
Feb
-16
Mar
-16
Apr
-16
May
-16
Jun
-16
Notes1. Results reflect the most recent data at the time of reporting. Historical data is updated to include any LTI notifications received
since previous reporting periods.2. Results are based on the number of contractor hours reported to Sydney Water.
Figure 21: Total recordable injury frequency rate (TRIFR) for staff and contractors
0
5
10
20
25
Sydney Water TRIs per month
Sydney Water TRIFR
Contractor TRIs per month
Contractor TRIFR
Jul-1
4
Aug
-14
Sep
-14
Oct
-14
Nov
-14
Dec
-14
Jan
-15
Feb
-15
Mar
-15
Apr
-15
May
-15
Jun
-15
Jul-1
5
Aug
-15
Sep
-15
Oct
-15
Nov
-15
Dec
-15
Jan-
16
Feb
-16
Mar
-16
Apr
-16
May
-16
Jun
-16
Notes1. Results reflect the most recent data at time of reporting. Historical data is updated to include any fatal injury, LTI and medical
treatment injury (MTI) notifications received since previous reporting periods.2. Results are based on the number of contractor hours reported to Sydney Water.
114 High performance culture | Sydney Water Annual Report 2015–16| Sydney Water Annual Report 2015

Executive performance and remunerationAt 30 June 2016, about 18% of Sydney Water’s staff-related expenditure was for staff remunerated at an equivalent level to the Senior Executive Service (SES) salary bands.
Table 24: Executive remuneration, 2015–16
2016 2015 Average remuneration
SES band equivalent Female Male Female Male 2016 2015
Above band 4 equivalent 0 1 0 1 $734,552 $715,938
Band 4 equivalent 0 0 0 0 0 0
Band 3 equivalent 2 5 3 5 $385,573 $371,840
Band 2 equivalent 9 23 7 28 $274,869 $264,683
Band 1 equivalent 62 177 62 189 $199,959 $194,778
Totals 73 206 72 223
Grand total 279 295
Sydney Water does not use NSW SES remuneration package ranges. There is no direct alignment. Sydney Water reports all staff on individual contract that are paid at an equivalent total remuneration package to the SES bands.
114 High performance culture | Sydney Water Annual Report 2015–16 Sydney Water Annual Report 2015–16 | High performance culture 115
Overview
Corporate
governanceC
ustomer at
the heartW
orld class perform
anceH
igh
perfo
rman
ce cu
lture
Financial statem
entsA
ppendixes
| Sydney Water Annual Report 2015

Workforce diversityStatistical information on equal employment opportunity (EEO) target groups
Table 25: Trends in the representation of EEO groups15
Target/benchmark
2011–12 2012–13 2013–14 2014–15 2015–16
No. % No. % No. % No. % No. %
Women 50% 780 27.1 749 27.5 750 29.5 776 29.9 808 30.9
Aboriginal people and Torres Strait Islanders
2.6%16 21 0.7 24 0.9 29 1.1 27 1.0 25 1.1
People whose first language is not English
19.0% 553 19.2 490 18.0 453 17.8 445 17.2 425 16.3
People with a disability
N/A17 79 2.7 76 2.8 62 2.4 59 2.3 49 16.3
People with a disability requiring a work-related adjustment
1.5%18 19 0.7 20 0.7 14 0.6 14 0.5 13 0.5
Total staff 2,874 2,722 2,543 2,593 2,611
Table 26: Trends in the distribution of EEO groups19, 20 – distribution index
EEO group Target/benchmark
2012 2013 2014 2015 2016
Women 100 98 99 99 98 99
Aboriginal people and Torres Strait Islanders
100 79 72 70 76 77
People whose first language is not English
100 99 98 104 106 106
People with a disability 100 90 89 91 91 91
People with a disability requiring a work-related adjustment
100 95 91 N/A N/A N/A
15 Staff numbers are as at 30 June 2016.16 Minimum target by 2016.17 Percentage employment levels are reported but a benchmark level has not been set.18 Minimum annual incremental targets 1.3% (2012), 1.5% (2013).19 Information in this table is provided by the NSW Public Service Commission.20 A distribution index of 100 indicates that the centre for the distribution for the EEO group across salary levels is equivalent to
that of other staff. Values less than 100 mean that the EEO group tends to be more concentrated at lower salary levels than is the case for other staff. The more pronounced this tendency, the lower the index will be. In some cases the index may be more than 100, indicating that the EEO group is less concentrated at lower salary levels. The distribution index is not calculated where EEO group or non-EEO group numbers are less than 20. Calculations exclude casual staff.
116 High performance culture | Sydney Water Annual Report 2015–16| Sydney Water Annual Report 2015

Initiatives to remove discrimination in employment and promote workforce diversity
Diversity and Inclusion Plan
We have developed a Diversity and Inclusion Plan to 2020 to demonstrate our commitment to building a diverse and inclusive workforce. This plan supports our strategic aspirations, reflects our values and is reinforced through our signature behaviours.
The plan focuses on four priority areas:
• building an inclusive culture
• promoting and supporting a flexible work environment
• encouraging and harnessing diversity of thought
• building a sustainable workforce.
Diversity and Inclusion Advisory Council
We have introduced a Diversity and Inclusion Advisory Council to support and embed initiatives across the organisation. The council’s role is to:
• advise on the latest diversity and inclusion (D&I) research and practice
• advise on issues and barriers to D&I experienced by staff across the business
• champion D&I and supporting initiatives.
Targets and measures
To help us achieve our three strategic objectives, we have set a number of long and medium-term aspirational targets. We introduced these measures to staff on International Women’s Day in March 2016, and have now embedded them in the Executive and leadership dashboards.
Inclusive leadership
Awareness of unconscious bias and inclusive leadership is being built into leader learning modules as part of the ‘Leadership at Sydney Water’ development program. All recruiting managers have completed inclusive recruitment and attraction sessions, which are part of our staff lifecycle processes.
We have also recently become a member of Diversity Council Australia and the Australian Network on Disability. This will enable us to build our knowledge and exchange information for use in programs, awareness initiatives and capabilities throughout the organisation.
People with a disability
The Diversity and Inclusion Advisory Council met with specialist agencies to help us build our capability to recruit and retain people with a disability. Our participation in a ‘Transition to Work’ program has been very successful and will lead to renewed policies and processes to make it easier for recruiting managers to build this capability. We have also joined the Australian Network on Disability to access expert advice in this area.
Increasing participation by women
We are rolling out gender equality conversations across the organisation. These sessions encourage dialogue, shared understanding and insight into the benefits of gender equality for all staff.
To support women in leadership, we are sponsoring four places on the Macquarie Graduate School of Management (MGSM) Women in Masters of Business Administration (WiMBA) program. Research suggests that time and cost are the primary barriers for women in completing MBA study.
Our Service Delivery business also engaged Professor Marian Baird to research the enablers, constraints and barriers for women in trade, technical and engineering roles.
116 High performance culture | Sydney Water Annual Report 2015–16 Sydney Water Annual Report 2015–16 | High performance culture 117
Overview
Corporate
governanceC
ustomer at
the heartW
orld class perform
anceH
igh
perfo
rman
ce cu
lture
Financial statem
entsA
ppendixes
| Sydney Water Annual Report 2015

Table 27: Workforce numbers
Human resources 2011–12 2012–13 2013–14 2014–15 2015–16
FTE – permanent 2,604 2,459 2,288 2,376 2,228
FTE – temporary 111 108 115 72 145
FTE – part-time 118 112 106 110 140
Total 2,833 2,679 2,509 2,558 2,513
Other
Agency staff 108 100 123 167 191
Redundancies 160 149 77 46 35
Appointments 121 140 205 230 200
Average turnover (%) 3.5 4.6 4.9 4.0 4.8
Unplanned absences (%) 4.3 3.1 3.4 3.5 3.2
Calculations:
• Staff numbers: We calculate staff numbers by apportioning the full-time equivalent (FTE) hours worked to the actual head count numbers.
• Average turnover: Staff-initiated terminations per rolling 12 months, divided by the average staff headcount for the same time period.
• Unplanned absences: Total unplanned absence hours per rolling 12 months, divided by total paid hours for the same time period.
Mentoring program
Sydney Water is involved in the University of Western Sydney WiSE (Women in Science and Engineering) mentoring program and the upcoming University of NSW mentoring program for STEM (Science, Technology, Engineering and Mathematics) students.
We are also piloting a mentoring program for staff, which we are planning to expand in late 2016. This mentoring program aims to bring together staff from diverse roles, backgrounds and interests to gain insights, build understanding, develop skills and share knowledge.
Flexible work arrangements
We have done a lot of work to better understand and remove the barriers and constraints that discourage staff from adopting flexible work arrangements. We have developed a new policy based on approaching requests with an open mind and a ‘can do’ attitude.
This encourages open conversation based on trust and respect and promotes the balance of individual, business and customer needs.
Sustainable workforce
A number of staff have attended Envisage® – Create Your Future workshops to help them navigate later career paths and/or transition into retirement while balancing their relationships, finances, health and personal life.
Aboriginal and Torres Strait Islander representation
Sydney Water continues to celebrate National Aboriginal Indigenous Day Observation Committee (NAIDOC) week with staff and their families. We also offer traineeships and industry experience to Indigenous students.
We have invited staff and our Indigenous and non-Indigenous business partners to help us develop and implement our Reconciliation Action Plan.
118 High performance culture | Sydney Water Annual Report 2015–16| Sydney Water Annual Report 2015

Staff and industrial relationsThis year we focused on implementing the commitments we agreed to with the union as part of the 2015 Enterprise Agreement process.
Working groups made up of Sydney Water and union representatives have been working together to address a range of issues that will support our strategic aims of achieving world class performance and a high performance workforce.
In 2015–16, the union did not lodge any disputes against us with the Fair Work Commission. This is evidence of the continued improvement in our relationships with staff and their representatives, which exemplifies our overall direction towards quality customer service.
Consultant engagementsTable 28: Payments to consultants for engagements over $50,000 from 1 July 2015 to 30 June 2016
Vendor name Contract number
Contract description Amount ($)
Alchemy Asset Management Pty Ltd
PO 5000398676
Consult on the inventory and warehouse project.
51,000.75
SAS TTI Joint Venture
PO 5000398994
Consult on services for Bondi Wastewater Treatment Plant new access tunnel
57,357.75
Parsons Brinckerhoff Australia Pty Ltd
26185 Consult on contaminated land 60,346.80
Frontier Economics Pty Ltd
27312 Consult on overflow abatement strategy and regulation
144,633.87
The Hackett Group Australia Pty Ltd
PO 5000394255
Consult on the T2020 Program future state operating model
201,599.10
KPMG 27065 Consult on Corporate Project Portfolio Management Framework
564,664.42
Price Waterhouse Coopers
27396 Consult on the T2020 Program customer information billing project
1,083,129.23
Total payments to consultants over $50,000
2,162,731.17
118 High performance culture | Sydney Water Annual Report 2015–16 Sydney Water Annual Report 2015–16 | High performance culture 119
Overview
Corporate
governanceC
ustomer at
the heartW
orld class perform
anceH
igh
perfo
rman
ce cu
lture
Financial statem
entsA
ppendixes
| Sydney Water Annual Report 2015

Overseas travelTable 29: Overseas travel, 2015–16
Date of travel Name Destination Purpose
July 2015 P. Bennett Porto, Portugal
Attended and presented at the Green Lines Institute of Sustainable Development conference. Travel was funded by the staff member with Sydney Water contributing to the conference registration and accommodation only.
September 2015
P. Cox Malmo, Sweden and Lisbon, Portugal
Attended the:
• International Water Association Specialist Conference on Natural Organic Matter in Water (Sweden)
• International Symposium on Health Related Water Microbiology (Portugal).
September – October 2015
D. Van Rys Chicago, USA
Attended and presented at the Water Environmental Research Federation (WERF) conference.
October 2015 K. Silvester Brussels, Belgium
Participated in the Strategic Council of the International Water Association (IWA) and approved the nomination by the Australian IWA for a two-year position on the IWA Strategic Council. This includes travel to council meetings twice a year.
October 2015 I. Fairburn and A. Kirkwood
Suva, Fiji Helped develop a water efficiency program and liquid trade waste policy, as part of a memorandum of understanding (MoU) with the Water Authority of Fiji (WAF). Travel was fully funded by the Asian Development Bank.
October – November 2015
S. Murphy London, UK Attended the International Organization for Standardization (ISO) technical working group meeting on flushable products and visited the Water Services Regulation Authority (Ofwat) to discuss other issues.
November 2015
D. Zhang Seoul, South Korea
Attended asset management forum at K-Water. Airfare and accommodation were fully funded by K-Water and the staff member covered all other expenses.
November – December 2015
R. Shi Paris, France Presented at the Water, Megacities and Global Change Conference at the UNESCO Headquarters.
120 High performance culture | Sydney Water Annual Report 2015–16| Sydney Water Annual Report 2015

Date of travel Name Destination Purpose
February 2016 K. Silvester Amsterdam, the Netherlands
Participated in the Strategic Council of the International Water Association (IWA) meeting.
February – March 2016
G. Landers Various cities in the USA including New York, Washington and Pittsburgh
Completed training in performance contracting methodology and attended a utilities management conference as part of a Veolia fellowship. Travel was fully funded by Veolia.
March 2016 C. Rajanayagam
Tokyo, Japan Participated in a TRILITY fellowship to assess innovations and technologies available. Travel was fully funded by TRILITY.
March – April 2016
A. Bhandari Paris, France and Brussels, Belgium
Participated in a fellowship offered by Suez to learn about technologies available to assess natural organic matter in catchments and storages. Travel was fully funded by Suez.
April – May 2016
E. Cooper and C. Pierce
Singapore, England, France, Belgium, Germany and the Netherlands
Participated in a fellowship program to evaluate international best-practice laboratory practices relating to automation and sample management. Travel was fully funded by Veolia.
May – June 2016
A. Kirkwood and M. Bovoro
Suva, Fiji Helped develop a water efficiency program and liquid trade waste policy, as part of an MoU with the Water Authority of Fiji (WAF). Travel was fully funded by the Asian Development Bank.
June – July 2016
S. Cabardo Grenoble, France
Attended an ISO technical working group meeting to contribute to the technical specification on flushable products.
120 High performance culture | Sydney Water Annual Report 2015–16 Sydney Water Annual Report 2015–16 | High performance culture 121
Overview
Corporate
governanceC
ustomer at
the heartW
orld class perform
anceH
igh
perfo
rman
ce cu
lture
Financial statem
entsA
ppendixes
| Sydney Water Annual Report 2015


6.Financial statements

Financial performance summaryWe have to balance our objectives to protect public health and the environment while providing affordable services and return to shareholders. The challenge is to do this while continuing to achieve business efficiency.
As a State Owned Corporation, we are required to operate as efficiently as any comparable business and maximise the net worth of the NSW Government’s investment.
During 2015–16, our profit after tax was $548 million, $86 million above the Statement of Corporate Intent (SCI) target of $462 million. This was due to higher water usage income, additional non-regulated income, lower asset charges, and lower borrowing costs due to lower interest rates.
Net profit after tax (versus Statement of Corporate Intent)
Sydney Water’s Board agrees on a Statement of Corporate Intent (SCI) each year with the shareholders. The SCI includes key business objectives, commercial performance and income targets, operational expenditure and capital investment. It also forms the basis of our yearly budget.
Earnings before interest, tax, depreciation and amortisation (EBITDA) for the year were $1,487 million, $59 million above the SCI target of $1,428 million. Net profit after tax (NPAT) for 2015–16 was $548 million, $86 million above the SCI target of $462 million.
Our profit improved due to higher water and sewer usage income; more income from service charges; additional non-regulated income; and lower asset charges and borrowing costs.
Table 30: Profit and loss statement 2012–13 to 2015–16
Financial performance target
2012–13
result
2013–14
result
2014–15
result
2015–16
result
2015–16
SCI budget
2015–16 variance
to SCI budget
Total income ($m) 2,521 2,615 2,728 2,844 2,766 78*Operating expenses ($m)
1,343 1,301 1,324 1,357 1,338 19#
EBITDA ($m) 1,178 1,314 1,404 1,487 1,428 59*Depreciation, amortisation, impairments and loss on asset sales ($m)
245 261 252 276 295 19*
Borrowing expenses ($m)
398 414 422 428 468 40*
Total expenses ($m) 1,986 1,976 1,999 2,061 2,101 40*Net profit before tax (NPBT) ($m)
536 640 730 783 664^ 119*
Income tax expense ($m)
163 175 216 235 202 33#
Net profit after tax (NPAT) ($m)
372 464 513 548 462 86*
124 Financial statements | Sydney Water Annual Report 2015–16| Sydney Water Annual Report 2015

Financial performance target
2012–13
result
2013–14
result
2014–15
result
2015–16
result
2015–16
SCI budget
2015–16 variance
to SCI budget
Dividend payable ($m) 291 252 664 389 622 233*Return on assets (%) 7.0 7.1 7.4 7.2 6.9 0.3*Funds flow interest cover (times)
2.0 2.1 2.4 2.3 2.1 0.2*
Capital investment program ($m)
610 548 627 681 705 24*
Gearing ratio (%) 49 49 49 49 52 3** Favourable variance compared to SCI.# Unfavourable variance compared to SCI.^ Incorrectly reported as $654 million in the Annual Report 2014–15.
Income
Total income for the year was $2,844 million, $78 million above the SCI target of $2,766 million.
Regulated income was $2,633 million, $46 million above the SCI target of $2,587 million. This was due to higher water usage income from higher water supply together with higher than anticipated price escalation.
Non-regulated income was $211 million, $32 million above the SCI target of $179 million. This was due to a combination of income from granting of easements, gains on surplus property sales and market gains on Greenhouse credits.
Property sales
During 2015–16, we sold 14 properties surplus to our needs at a total gross sale price of $47 million, net of GST. We placed proceeds from the sales in general revenue. We made all sales in line with accepted NSW Government disposal standards and guidelines. Request to access documents relating to property disposal may be made in accordance with the Government Information (Public Access) Act 2009.
Expenditure
Operating expenses for the year were $1,357 million, $19 million above the SCI target of $1,338 million. This was mostly a classification issue impacted by delayed renegotiation of water filtration agreement finance leases.
Total asset charges (depreciation, amortisation, impairments and sales for assets) for the year were $276 million, $19 million below the SCI target of $295 million. This was mostly due to lower depreciation charges from lower transfers of completed assets from work-in-progress, plus fewer losses on the disposal of system assets.
Total borrowing expenses (interest expense and government guarantee fees) for the year were $428 million, $40 million lower than budget. This was due to a combination of lower interest rates, low indexation and the impact of delayed renegotiation of water filtration plant finance leases.
124 Financial statements | Sydney Water Annual Report 2015–16 Sydney Water Annual Report 2015–16 | Financial statements 125
Overview
Corporate
governanceC
ustomer at
the heartW
orld class perform
anceH
igh performance
cultureFin
ancial
statemen
tsA
ppendixes
| Sydney Water Annual Report 2015

Income tax
Income tax expense for the year was $235 million, $33 million above the SCI target of $202 million. This was due to the higher profit result.
Dividends
For 2015–16, we recognised a dividend payable of $389 million, which was below the SCI target of $622 million and reflected changed shareholder expectations.
Time for payment of accounts
We did not make any penalty interest payments during 2015–16 for late payments to creditors.
Table 31: Funds flow from operations interest cover, 2011–12 to 2015–16
Funds flow2011–12 2012–13 2013–14 2014–15 2015–16 2015–16
targetFunds flow from operations ($m)
436 518 603 708 687 671
Funds flow from operations interest cover
1.8 2.0 2.1 2.4 2.3 2.1
Funds flow from operations
Cash (funds flow) from our operations in 2015–16 was $687 million. This is $16 million higher than our target due to higher water sales, partly offset by higher tax payments.
Funds flow from operations interest cover
The funds flow from operations interest cover ratio was 2.3. This was above the target of 2.1 due to a combination of higher sales income and lower interest charges.
Investment management
We benchmark our investment portfolio’s performance against the NSW Treasury Corporation’s Hour-Glass cash facility. This meets NSW Treasury guidelines and increases our investment returns while maintaining risk controls.
In 2015–16, our investment performance was 1.85% compared to the benchmark of 2.33%, with an average investment balance of $500,000. This reflected the short-term nature of our investments, with the return closely in line with the Reserve Bank of Australia cash rate.
At 30 June 2016, we had $5.3 million cash in the bank.
Table 32: Cash and investments, 2015–16
Sydney Water BenchmarkMarket valuation ($m) at 30 June 2016 5.3 N/AYearly return 2015–16 (%) 1.85 2.33
126 Financial statements | Sydney Water Annual Report 2015–16| Sydney Water Annual Report 2015

Debt management
At 30 June 2016, our total debt was $6.779 billion. Our debt portfolio was sourced almost entirely through NSW Treasury Corporation and we manage it actively to limit the cost of funds.
We continued to use Treasury Corporation’s short-term borrowing facility to help meet cash requirements and reduce our fixed borrowings.
At 30 June 2016, 64% of our total debt was fixed-rate debt maturing out to 2041, with the remaining 36% inflation-indexed debt maturing out to 2035.
Table 33: Debt management, 2015–16
Sydney Water BenchmarkMarket valuation ($m) at 30 June 2016* 7,570 7,642Generalised cost of funds (%) 5.37 4.98
Weighted average yield at 30 June 2016 (%) 4.38 4.40
* Market value of debt represents the value if all debt had to be retired and is different to the capital value, which is the value in the financial statements.
Cash flow
Cash receipts from operations in 2015–16 were $2,614 million, $94 million higher than in 2014–15. This increased mostly because of price increases determined by the Independent Pricing and Regulatory Tribunal (IPART). Total cash inflows were $3.5 billion, $620 million more than in 2014–15.
Cash used for operational purposes in 2015–16 was $1,454 million, just $23 million higher than in 2014–15 due to ongoing cost containment.
A total of $662 million was used to fund the asset investment program.
Total interest paid includes both interest and the payment of the Government Guarantee fee paid on Sydney Water’s borrowings. Total interest paid was $456 million, $20 million higher than in 2014–15, due to higher total debt.
126 Financial statements | Sydney Water Annual Report 2015–16 Sydney Water Annual Report 2015–16 | Financial statements 127
Overview
Corporate
governanceC
ustomer at
the heartW
orld class perform
anceH
igh performance
cultureFin
ancial
statemen
tsA
ppendixes
| Sydney Water Annual Report 2015

Return on assets and equity
We measure return on assets by dividing our earnings before interest and tax (EBIT) by the average value of our total assets. We measure return on equity by dividing the profit after tax by the average value of total shareholder funds (total equity).
Our return on assets for 2015–16 was 7.2%, 0.3% higher than the target of 6.9%. The return on equity was 8.1%, 0.9% higher than the target of 7.2%. This was due to a combination of higher water usage and non-regulated income and lower asset charges and borrowing costs.
The historic results are low for a regulated utility with Sydney Water’s level of commercial risk.
Table 34: Return on assets and equity, 2011–12 to 2015–16
2011–12 2012–13 2013–14 2014–15 2015–16 2015–16 target
Return on assets (%) 8.0 7.0 7.1 7.4 7.2 6.9Return on equity (%) 6.2 6.9 7.5 8.0 8.1 7.2
Setting our prices and budgets
IPART set prices for Sydney Water’s services in June 2016, for the period from July 2016 to June 2020.
As a government-owned monopoly service provider, our prices are regulated to cover the cost of conducting business while generating an adequate return on assets.
Table 35: 2016–17 budget
MeasureBudget 2016–17
$mTotal income 2,588Total operating expenses 1,333Depreciation, amortisation, impairments and loss on asset sales 288Borrowing costs 481Total expenses 2,102Profit before tax 485Income tax expense 146Profit after tax 340
Figures are rounded.
128 Financial statements | Sydney Water Annual Report 2015–16| Sydney Water Annual Report 2015

PricingHow we set our prices
Our services are declared monopoly services under section 4 of the Independent Pricing and Regulatory Tribunal Act 1992 (the IPART Act). The tribunal sets and regulates our prices to ensure they are fair for our customers, while allowing us to cover costs and generate an adequate return on our assets.
We must set prices according to the IPART- determined methodology or maximum price. We cannot charge less than this price without the NSW Treasurer’s approval.
In 2015–16 we set our prices in line with IPART’s pricing determinations, apart from some recycled water developer charges, which are explained below.
Recycled water developer charges
Sydney Water has registered a Development Servicing Plan (DSP) for the Rouse Hill Recycled Water scheme according to IPART’s Determination No. 8, 2006.
Sydney Water understands that it has not complied with IPART’s Determination No.8, 2006, which sets a methodology for fixing the maximum prices that a water agency may charge for Recycled Water Developer Charges, as reported in our Annual Report 2014–15. This includes an ongoing non-compliance in relation to collecting of capital contributions for the Hoxton Park recycled water scheme.
To rectify this non-compliance, we prepared a draft DSP for the Hoxton Park scheme, and placed it on public exhibition on 17 June 2016, in accordance with IPART’s Determination No. 8, 2006. In the draft DSP Sydney Water seeks to set a developer charge for Hoxton Park below that set in Determination No. 8, 2006. We did this to ensure that the charge set is the lowest cost to society to meet the Building Sustainability Index (BASIX) requirements.
To ensure compliance with IPART’s Determination No. 8, 2006 and the IPART Act, the NSW Treasurer has approved setting this lower developer charge. The final DSP was registered with IPART in August 2016.
We also reported in our Annual Report 2014–15 a historical non-compliance for the Oran Park/Turner Road recycled water scheme, where we levied recycled water capital contributions without using the methodology stipulated in IPART’s Recycled Water Developer Charges Determination No. 8, 2006. This non-compliance occurred in 2009 and 2010. We are now aware that we have had a further non-compliance for the scheme relating to levying capital contributions in 2015–16. The non-compliance happened because we collected capital contributions for the scheme without a registered DSP in place, and without seeking Treasurer approval to charge a price that was very likely less than the maximum price under the methodology. We have now taken steps to limit this non-compliance as much as possible.
128 Financial statements | Sydney Water Annual Report 2015–16 Sydney Water Annual Report 2015–16 | Financial statements 129
Overview
Corporate
governanceC
ustomer at
the heartW
orld class perform
anceH
igh performance
cultureFin
ancial
statemen
tsA
ppendixes
| Sydney Water Annual Report 2015

Table 36: Recycled water schemes, developer charges to be levied
Recycled Water Scheme
Status of DSP Developer charge to be levied ($16–17)
Compliance status against the determination
Rouse Hill Registered $4,186/ET* CompliantHoxton Park Registered $7,428/ ET* Non-compliant in 2015–16. DSP
registered in August 2016Oran Park/Turner Road
No DSP N/A Historical non-compliance in 2009 and 2010, and non-compliant in 2015–16
Colebee No DSP N/A Historical non-compliance in 2009 and 2010
Ropes Crossing Under preparation To be determined Compliant
* ET refers to an average residential dwelling, defined as one ‘equivalent tenement’.
Final pricing determination 2016–2020
In June 2016, IPART published its final determination (Determination No. 5, 2016), which sets out IPART’s decisions on the prices we can charge from 1 July 2016 to 30 June 2020.
IPART accepted our proposal to reduce bills, which means that from 1 July 2016, customers will save about $100 a year for the next four years. We’re pleased to be able to pass on savings to our customers.
More information on how prices are determined and charged is available on our website.
We will report on the implementation of Determination No. 5, 2016 in next year’s Annual Report.
130 Financial statements | Sydney Water Annual Report 2015–16| Sydney Water Annual Report 2015

IPART pricing table
Table 37: IPART pricing table
IPART determined
price (in 2012–13
value)
Adjustment for
desalination by IPART
determined method
(in 2015-16 value)
Inflated IPART
maximum price (at
rate of 6.9%)(in 2015-16
value)
Sydney Water
price set Jul–Sepa
Sydney Water
price set Oct–Jun
Service charges ($)
Residential properties
WaterIndividually metered $96.40 -$0.52 $102.53 $25.64 $25.63Multi-premises with a common meter
$96.40 -$0.52 $102.53 $25.64 $25.63
Unmetered $479.80 -$0.52 $512.38 $128.11 $128.09
Wastewater $569.82 $609.13 $152.29 $152.28
Stormwater (drainage)Stand-alone premises $80.47 $86.02 $21.52 $21.50
Multi-premises $29.51 $31.54 $7.90 $7.88
Non-residential properties
Water
Meter size (mm):b
Single 20 mm $96.40 -$0.52 $102.53 $25.64 $25.63
Common or multi 20 mm
$122.06 -$0.65 $129.83 $32.48 $32.45
25 $190.72 -$1.02 $202.85 $50.72 $50.71
32 $312.48 -$1.66 $332.38 $83.11 $83.0940 $488.25 -$2.59 $519.34 $129.85 $129.8350 $762.89 -$4.05 $811.47 $202.89 $202.8680 $1,953.01 -$10.36 $2,077.40 $519.35 $519.35100 $3,051.58 -$16.19 $3,245.94 $811.50 $811.48150 $6,866.05 -$36.41 $7,303.39 $1,825.87 $1,825.84200 $12,206.31 -$64.73 $12,983.81 $3,245.96 $3,245.95250 $19,072.00 -$101.14 $20,286.82 $5,071.72 $5,071.70300 $27,463.68 -$145.64 $29,213.03 $7,303.28 $7,303.25500 $76,288.00 -$404.54 $81,147.33 $20,286.84 $20,286.83600 $109,854.72 -$582.54 $116,852.15 $29,213.06 $29,213.03Unmetered $479.80 -$0.52 $512.38 $128.11 $128.09
130 Financial statements | Sydney Water Annual Report 2015–16 Sydney Water Annual Report 2015–16 | Financial statements 131
Overview
Corporate
governanceC
ustomer at
the heartW
orld class perform
anceH
igh performance
cultureFin
ancial
statemen
tsA
ppendixes
| Sydney Water Annual Report 2015
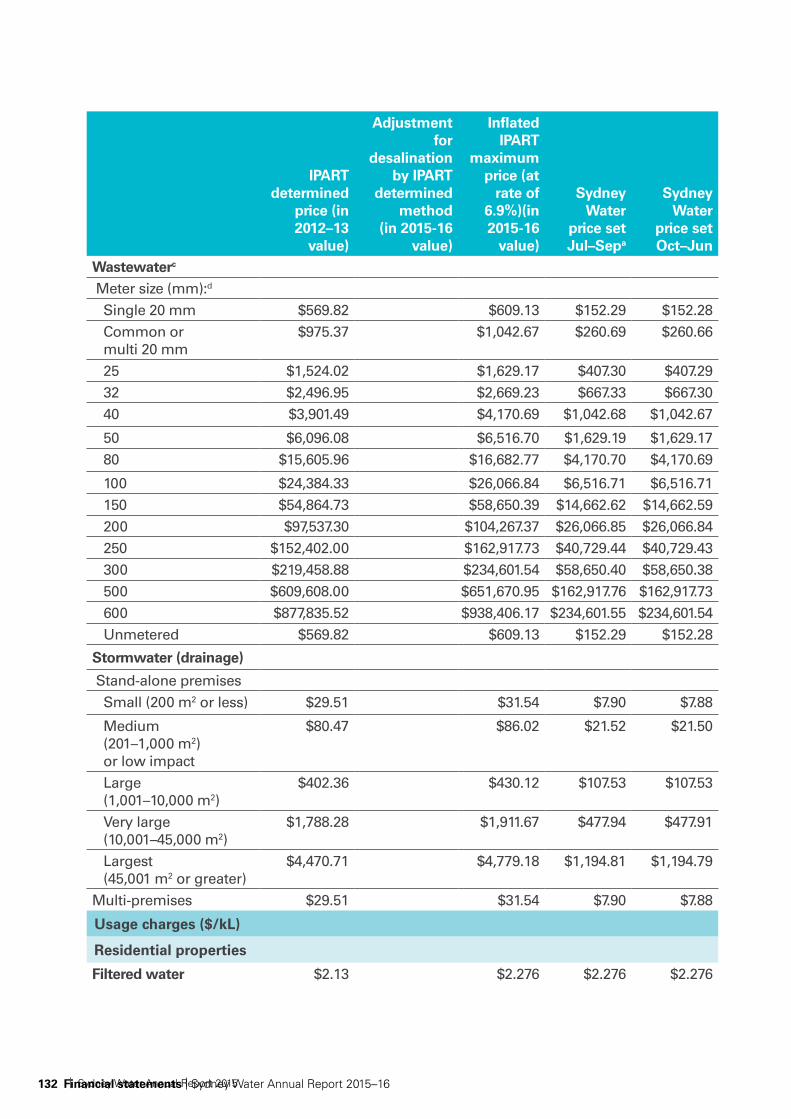
IPART determined
price (in 2012–13
value)
Adjustment for
desalination by IPART
determined method
(in 2015-16 value)
Inflated IPART
maximum price (at
rate of 6.9%)(in 2015-16
value)
Sydney Water
price set Jul–Sepa
Sydney Water
price set Oct–Jun
Wastewaterc
Meter size (mm):d
Single 20 mm $569.82 $609.13 $152.29 $152.28Common or multi 20 mm
$975.37 $1,042.67 $260.69 $260.66
25 $1,524.02 $1,629.17 $407.30 $407.2932 $2,496.95 $2,669.23 $667.33 $667.3040 $3,901.49 $4,170.69 $1,042.68 $1,042.67
50 $6,096.08 $6,516.70 $1,629.19 $1,629.1780 $15,605.96 $16,682.77 $4,170.70 $4,170.69
100 $24,384.33 $26,066.84 $6,516.71 $6,516.71150 $54,864.73 $58,650.39 $14,662.62 $14,662.59200 $97,537.30 $104,267.37 $26,066.85 $26,066.84250 $152,402.00 $162,917.73 $40,729.44 $40,729.43300 $219,458.88 $234,601.54 $58,650.40 $58,650.38500 $609,608.00 $651,670.95 $162,917.76 $162,917.73600 $877,835.52 $938,406.17 $234,601.55 $234,601.54Unmetered $569.82 $609.13 $152.29 $152.28
Stormwater (drainage)
Stand-alone premisesSmall (200 m2 or less) $29.51 $31.54 $7.90 $7.88
Medium (201–1,000 m2) or low impact
$80.47 $86.02 $21.52 $21.50
Large (1,001–10,000 m2)
$402.36 $430.12 $107.53 $107.53
Very large (10,001–45,000 m2)
$1,788.28 $1,911.67 $477.94 $477.91
Largest (45,001 m2 or greater)
$4,470.71 $4,779.18 $1,194.81 $1,194.79
Multi-premises $29.51 $31.54 $7.90 $7.88
Usage charges ($/kL)
Residential properties
Filtered water $2.13 $2.276 $2.276 $2.276
132 Financial statements | Sydney Water Annual Report 2015–16| Sydney Water Annual Report 2015

IPART determined
price (in 2012–13
value)
Adjustment for
desalination by IPART
determined method
(in 2015-16 value)
Inflated IPART
maximum price (at
rate of 6.9%)(in 2015-16
value)
Sydney Water
price set Jul–Sepa
Sydney Water
price set Oct–Jun
Non-residential properties
Filtered water $2.13 $2.276 $2.276 $2.276Wastewater (> 0.822kL per day wastewater discharge)e,f
$1.10 $1.10 $1.10 $1.10
Recycled water services from the Rouse Hill recycled water plant
Recycled water usage charge ($/kL)
$1.70 $1.817 $1.817 $1.817
a) Sydney Water’s charges applied from 1 July 2015.b) IPART’s maximum determined water service charge for meter sizes not specified in its Determination is calculated using the
following formula: (meter size)2 x 25mm charge/625.c) The prices assume the application of a Discharge Factor (df%) of 100%. The relevant df% may vary from case to case, as
determined by the Sydney Water Corporation. A pro rata adjustment shall be made where the df% is less than 100%.d) IPART’s maximum determined sewerage charge for meter sizes not specified in its Determination is calculated using the
following formula: (meter size)2 x 25mm charge/625 x df%.e) For non-residential properties, the sewerage usage charge will apply when a property’s discharge into the sewerage system
exceeds 0.822kL/day.f) All IPART’s maximum determined prices are subject to CPI adjustment except for the sewerage usage charge.
Note: Other charging arrangements – including Rouse Hill stormwater drainage, boarding houses, metered standpipes, trade waste and ancillary charges – were set in accordance with IPART’s determined maximum price.
In 2012 determination, IPART determined the maximum Rouse Hill land charge for new properties was $969.21 per year for five years. However, it was reduced to $237 per year. This reduction was approved by the NSW Treasurer in 2013.
132 Financial statements | Sydney Water Annual Report 2015–16 Sydney Water Annual Report 2015–16 | Financial statements 133
Overview
Corporate
governanceC
ustomer at
the heartW
orld class perform
anceH
igh performance
cultureFin
ancial
statemen
tsA
ppendixes
| Sydney Water Annual Report 2015

Auditor-General’s statutory audit reportAt the completion of the audit of Sydney Water’s financial statements for the year ended 30 June 2016, the Auditor-General provided Sydney Water with a Statutory Audit Report as required under the Public Finance and Audit Act 1983.
The Statutory Audit Report made comment on one matter, to which Sydney Water is required to respond to in its Annual Report. The matter, along with Sydney Water’s response, is provided below:
Auditor-General’s comment
Information Technology Projects
The Corporation has established a governance framework to achieve efficient and effective management of its major information technology (IT) projects.
The IT projects relate to the implementation of:
• a new customer billing system at a budget of $184 million
• an integrated enterprise resource planning system at a budget of $54.5 million.
The projects are complex in nature as they include sophisticated engineering, multiple system components and cutting-edge applications.
Such projects have significant inherent risks with a high potential for cost overruns and delays. The Corporation needs to be satisfied that governance arrangements are robust enough to prevent such issues, which can lead to reputational damage and financial loss.
We will continue to monitor the status of the projects and the implications for financial reporting in future audits.
Sydney Water’s response
The Audit Office has recognised the robust governance arrangements established for the successful management of Sydney Water’s two key technology projects – the Business Experience Platform (ERP) and the Customer Experience Platform (customer relationship management and billing).
We support the Audit Office Director’s opinion that these are complex projects with high inherent potential for cost overruns and program delays. The Board and Executive of Sydney Water in recognition of these risks have established robust program governance including:
• Appointment of an Executive Sponsor to lead the program, reporting directly to the Managing Director
• Appointment of PwC as an independent Board advisor for the duration of the program, reporting to the Board and the Board’s Audit and Risk Committee
• Establishment of a strong Third Line of Assurance for the program with independent audit led by Sydney Water’s internal audit team and specialist IT auditor Centium
• Establishment of a Program Control Board (PCB) of Executive stakeholders to help the Executive Sponsor to shape and direct the program. The PCB includes a senior representative from SAP and NSW Department of Finance, Services and Innovation
• Establishment of an independent reference group of ‘seasoned’ ERP and Billing system experts
134 Financial statements | Sydney Water Annual Report 2015–16| Sydney Water Annual Report 2015

• Appointment of senior business change leads supported by business change management practitioners to help the business effect the required changes and realise the business benefits
• Appointment of an experienced program director
• Engagement of SAP to provide solution assurance for Sydney Water
• Robust selection process to engage an experienced Implementation Services Partner (Systems Integrator) for the program
• Appointment by SAP of a senior executive to sponsor the program from SAP’s perspective and establishment of a Strategic Governance Board with SAP Germany to ensure issues and concerns around the software can be escalated quickly to the Board level with SAP
• Development of clear governance documents including roles, accountabilities, authorities, management of program contingency, decision making processes, risk and issue registers et al, to support the program team in effective program control
• Establishment of a Program Management Office to support program schedule management, program assurance and reporting consistent with Sydney Water’s program management standards (MSP, PRINCE 2)
Sydney Water’s Executive Sponsor has commenced engagement with the Audit Office to establish how the program team can share information with the Audit Office as the program proceeds to enable the program to benefit from the insights the Audit Office can bring with its wide review of similar activity across the NSW Government sector.
134 Financial statements | Sydney Water Annual Report 2015–16 Sydney Water Annual Report 2015–16 | Financial statements 135
Overview
Corporate
governanceC
ustomer at
the heartW
orld class perform
anceH
igh performance
cultureFin
ancial
statemen
tsA
ppendixes
| Sydney Water Annual Report 2015

Sydney Water Corporation
Financial Statements
for the year ended 30 June 2016
136 Financial statements | Sydney Water Annual Report 2015–16| Sydney Water Annual Report 2015

Sydney Water Corporation
Financial Statements
for the year ended 30 June 2016
Statement of profit or loss and other comprehensive income Page 138 Statement of financial position Page 139 Statement of changes in equity Page 140 Statement of cash flows Page 141 About these financial statements Page 142 Notes to the financial statements Page 143 Performance for the reporting period Page 143
1. Income Page 143
2. Expenses Page 145
3. Taxation Page 149
Assets and fair values
4. Property, plant and equipment Page 152
5. Intangible assets Page 162
Working capital management
6. Cash and cash equivalents Page 167
Trade and other receiveables Page 168
8. Inventories Page 170
9. Other current assets Page 170
10. Trade and other payables Page 171
Debt management
11. Borrowings and other financial liabilities Page 172
Other liabilities
12. Provisions Page 175
13. Deferred Government grant Page 185
14. Dividends payable Page 185
Equity
15. Share capital Page 186
16. Reserves Page 187
17. Retained earnings Page 187
Unrecognised items
18. Commitments Page 188
19. Contingencies Page 190
Other notes
20. Financial risk management Page 191
21. Related party disclosures Page 198
22. Consultants Page 198
23. Auditors’ remuneration Page 198
24. Accounting standards and interpretations issued but not yet effective Page 199
Directors Declaration Page 201 Independent Auditor’s Report Page 202
Contents
136 Financial statements | Sydney Water Annual Report 2015–16 Sydney Water Annual Report 2015–16 | Financial statements 137
Overview
Corporate
governanceC
ustomer at
the heartW
orld class perform
anceH
igh performance
cultureFin
ancial
statemen
tsA
ppendixes
| Sydney Water Annual Report 2015

Sydney Water Corporation – 30 June 2016 Page 3
Statement of profit or loss and other comprehensive income
for the year ended 30 June 2016
Note 2016
$’000
2015
$’000
Revenue 1(a) 2,826,982 2,715,999
Other income 1(b) 17,128 12,335
Finance costs 2(a) (428,045) (422,189)
Other expenses 2(b) (1,633,066) (1,576,542)
Profit before income tax 782,999 729,603
Income tax expense 3(a) (234,985) (216,105)
Profit for the period 548,014 513,498
Other comprehensive income
Items that will not be reclassified subsequently to profit or loss:
Gain on revaluation of property, plant and equipment 16(b) 888,063 371,928
Income tax effect 3(b) (266,419) (111,578)
621,644 260,350
Remeasurement of defined benefit superannuation net liability (374,552) (53,851)
Income tax effect 3(b) 112,365 16,155
(262,187) (37,696)
Total items that will not be reclassified subsequently to profit or
loss, net of income tax 359,457 222,654
Other comprehensive income for the period net of income tax 359,457 222,654
Total comprehensive income for the period 907,471 736,152
This statement should be read in conjunction with the accompanying notes.
Start of audited financial statements
Sydney Water Corporation – 30 June 2016 Page 4
Statement of financial position
as at 30 June 2016
Note 2016
$’000
2015
$’000
Current assets
Cash and cash equivalents 6 5,319 5,752
Trade and other receivables 7 307,551 291,306
Inventories 8 1,858 1,065
Other current assets 9 3,668 2,695
Current tax asset 3(c) 397 1,239
318,793 302,057
Non-current assets classified as held for sale 4(h) 35,088 12,694
Total current assets 353,881 314,751
Non-current assets
Property, plant and equipment 4 17,133,481 15,471,384
Intangible assets 5 159,147 159,632
Total non-current assets 17,292,628 15,631,016
Total assets 17,646,509 15,945,767
Current liabilities
Trade and other payables 10 528,939 534,614
Borrowings and other financial liabilities 11 13,105 7,140
Current tax liability 3(c) 38,922 74,510
Dividends payable 14 389,232 664,024
Provisions 12 195,078 196,020
Total current liabilities 1,165,276 1,476,308
Non-current liabilities
Borrowings and other financial liabilities 11 7,201,728 6,332,838
Deferred tax liabilities 3(c) 894,272 708,466
Provisions 12 1,376,967 951,628
Deferred Government grant 13 10,000 10,000
Total non-current liabilities 9,482,967 8,002,932
Total liabilities 10,648,243 9,479,240
Net assets 6,998,266 6,466,527
Equity
Share capital 15 3,161,854 3,148,354
Reserves 16 2,176,009 1,561,746
Retained earnings 17 1,660,403 1,756,427
Total equity 6,998,266 6,466,527
This statement should be read in conjunction with the accompanying notes.
138 Financial statements | Sydney Water Annual Report 2015–16| Sydney Water Annual Report 2015

Sydney Water Corporation – 30 June 2016 Page 3
Statement of profit or loss and other comprehensive income
for the year ended 30 June 2016
Note 2016
$’000
2015
$’000
Revenue 1(a) 2,826,982 2,715,999
Other income 1(b) 17,128 12,335
Finance costs 2(a) (428,045) (422,189)
Other expenses 2(b) (1,633,066) (1,576,542)
Profit before income tax 782,999 729,603
Income tax expense 3(a) (234,985) (216,105)
Profit for the period 548,014 513,498
Other comprehensive income
Items that will not be reclassified subsequently to profit or loss:
Gain on revaluation of property, plant and equipment 16(b) 888,063 371,928
Income tax effect 3(b) (266,419) (111,578)
621,644 260,350
Remeasurement of defined benefit superannuation net liability (374,552) (53,851)
Income tax effect 3(b) 112,365 16,155
(262,187) (37,696)
Total items that will not be reclassified subsequently to profit or
loss, net of income tax 359,457 222,654
Other comprehensive income for the period net of income tax 359,457 222,654
Total comprehensive income for the period 907,471 736,152
This statement should be read in conjunction with the accompanying notes.
Start of audited financial statements
Sydney Water Corporation – 30 June 2016 Page 4
Statement of financial position
as at 30 June 2016
Note 2016
$’000
2015
$’000
Current assets
Cash and cash equivalents 6 5,319 5,752
Trade and other receivables 7 307,551 291,306
Inventories 8 1,858 1,065
Other current assets 9 3,668 2,695
Current tax asset 3(c) 397 1,239
318,793 302,057
Non-current assets classified as held for sale 4(h) 35,088 12,694
Total current assets 353,881 314,751
Non-current assets
Property, plant and equipment 4 17,133,481 15,471,384
Intangible assets 5 159,147 159,632
Total non-current assets 17,292,628 15,631,016
Total assets 17,646,509 15,945,767
Current liabilities
Trade and other payables 10 528,939 534,614
Borrowings and other financial liabilities 11 13,105 7,140
Current tax liability 3(c) 38,922 74,510
Dividends payable 14 389,232 664,024
Provisions 12 195,078 196,020
Total current liabilities 1,165,276 1,476,308
Non-current liabilities
Borrowings and other financial liabilities 11 7,201,728 6,332,838
Deferred tax liabilities 3(c) 894,272 708,466
Provisions 12 1,376,967 951,628
Deferred Government grant 13 10,000 10,000
Total non-current liabilities 9,482,967 8,002,932
Total liabilities 10,648,243 9,479,240
Net assets 6,998,266 6,466,527
Equity
Share capital 15 3,161,854 3,148,354
Reserves 16 2,176,009 1,561,746
Retained earnings 17 1,660,403 1,756,427
Total equity 6,998,266 6,466,527
This statement should be read in conjunction with the accompanying notes.
138 Financial statements | Sydney Water Annual Report 2015–16 Sydney Water Annual Report 2015–16 | Financial statements 139
Overview
Corporate
governanceC
ustomer at
the heartW
orld class perform
anceH
igh performance
cultureFin
ancial
statemen
tsA
ppendixes
| Sydney Water Annual Report 2015

Sydney Water Corporation – 30 June 2016 Page 5
Statement of changes in equity
for the year ended 30 June 2016
Note
Share capital
$’000
Asset revaluation
reserve
$’000
Retained earnings
$’000
Total Equity
$’000
Balances at 1 July 2015 3,148,354 1,561,746 1,756,427 6,466,527
Comprehensive income for this period:
Profit for the period 17 - - 548,014 548,014
Other comprehensive income - 621,644 (262,187) 359,457
Total comprehensive income for the period
- 621,644 285,827 907,471
Transfers between equity items on disposal of assets 16(b), 17 - (7,381) 7,381 -
Total transfers between equity items - (7,381) 7,381 -
Transactions with owners in their capacity as owners:
Shared capital issued 15(b) 13,500 - - 13,500
Dividends recognised as a liability 14, 17 - - (389,232) (389,232)
Total transactions with owners in their capacity as owners 13,500 - (389,232) (375,732)
Balances at 30 June 2016 3,161,854 2,176,009 1,660,403 6,998,266
Balances at 1 July 2014 3,148,354 1,307,795 1,938,250 6,394,399
Comprehensive income for this period:
Profit for the period 17 - - 513,498 513,498
Other comprehensive income - 260,350 (37,696) 222,654
Total comprehensive income for the period
- 260,350 475,802 736,152
Transfers between equity items on disposal of assets 16(b), 17 - (6,399) 6,399 -
Total transfers between equity items - (6,399) 6,399 -
Transactions with owners in their capacity as owners:
Shared capital issued 15(b) - - - -
Dividends recognised as a liability 14, 17 - - (664,024) (664,024)
Total transactions with owners in their capacity as owners - - (664,024) (664,024)
Balances at 30 June 2015 3,148,354 1,561,746 1,756,427 6,466,527
This statement should be read in conjunction with the accompanying notes.
Sydney Water Corporation – 30 June 2016 Page 6
Statement of cash flows
for the year ended 30 June 2016
Note 2016
$’000
2015
$’000
Cash flows from operating activities
Cash receipts in the course of operations (inclusive of Goods and Services Tax) 2,613,954 2,519,796
Cash payments in the course of operations (inclusive of Goods and Services Tax) (1,454,093) (1,431,232)
Cash generated from operations 1,159,861 1,088,564
Revenue grants received from Commonwealth Government 41 70
Cash receipts for social programs 165,841 163,173
Interest received 156 234
Income tax refunds received 1,254 1,640
Interest paid (358,660) (337,524)
Government guarantee fee paid (97,813) (98,548)
Income tax paid (239,232) (148,872)
Net cash from operating activities
6(b) 631,448 668,737
Cash flows from investing activities
Proceeds from sale of property, plant and equipment 45,920 59,924
Capital contributions received for social programs - 4,830
Capital grants received from NSW Government 13 - 10,000
Other capital contributions received 13,554 14,908
Security and other deposits received 24,401 12,039
Cash received from renegotiated water filtration plant agreements 15,919 -
Payments for property, plant and equipment (625,469) (534,531)
Payments for intangible assets (36,044) (53,290)
Security and other deposits released (12,274) (5,883)
Net cash from investing activities
(573,993) (492,003)
Cash flows from financing activities
Proceeds from issue of share capital 15 13,500 -
Proceeds from borrowings 601,250 88,746
Repayment of borrowings (1,210) (6,207)
Other finance payments (7,404) (5,443)
Dividends paid 14 (664,024) (252,000)
Net cash from financing activities
(57,888) (174,904)
Net increase (decrease) in cash and cash equivalents (433) 1,830
Cash and cash equivalents at beginning of period 5,752 3,922
Cash and cash equivalents at end of period
6(a) 5,319 5,752
This statement should be read in conjunction with the accompanying notes.
140 Financial statements | Sydney Water Annual Report 2015–16| Sydney Water Annual Report 2015
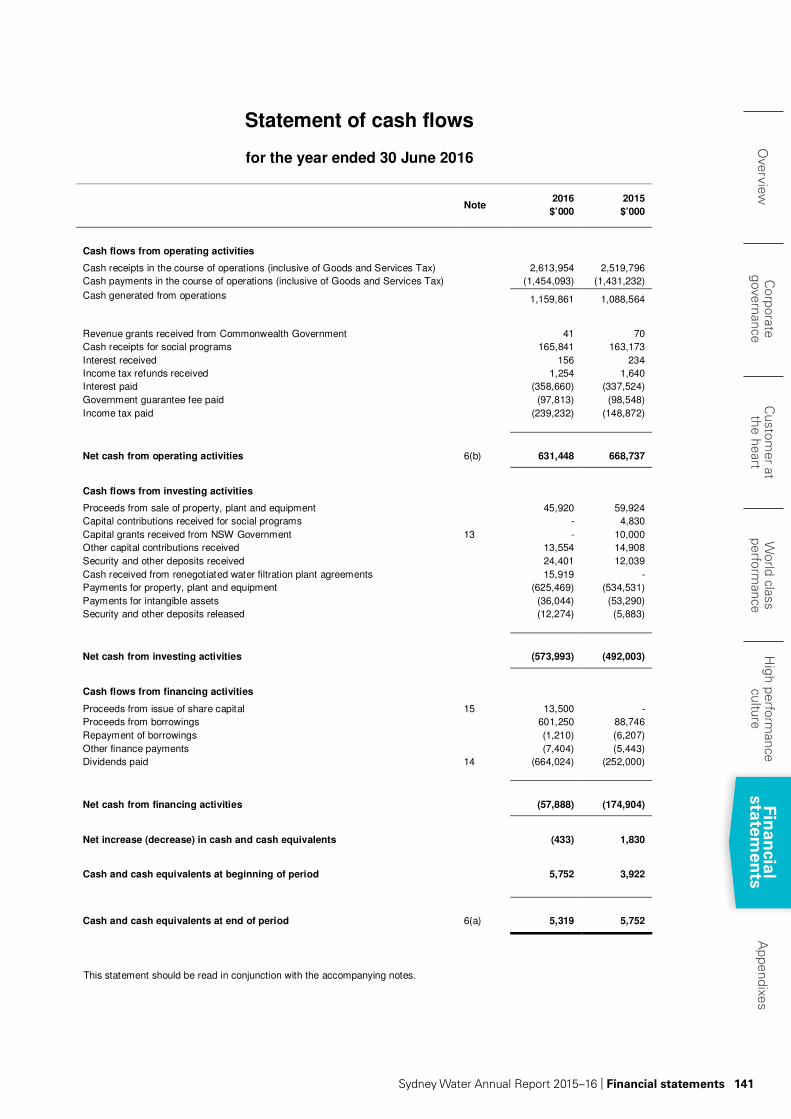
Sydney Water Corporation – 30 June 2016 Page 5
Statement of changes in equity
for the year ended 30 June 2016
Note
Share capital
$’000
Asset revaluation
reserve
$’000
Retained earnings
$’000
Total Equity
$’000
Balances at 1 July 2015 3,148,354 1,561,746 1,756,427 6,466,527
Comprehensive income for this period:
Profit for the period 17 - - 548,014 548,014
Other comprehensive income - 621,644 (262,187) 359,457
Total comprehensive income for the period
- 621,644 285,827 907,471
Transfers between equity items on disposal of assets 16(b), 17 - (7,381) 7,381 -
Total transfers between equity items - (7,381) 7,381 -
Transactions with owners in their capacity as owners:
Shared capital issued 15(b) 13,500 - - 13,500
Dividends recognised as a liability 14, 17 - - (389,232) (389,232)
Total transactions with owners in their capacity as owners 13,500 - (389,232) (375,732)
Balances at 30 June 2016 3,161,854 2,176,009 1,660,403 6,998,266
Balances at 1 July 2014 3,148,354 1,307,795 1,938,250 6,394,399
Comprehensive income for this period:
Profit for the period 17 - - 513,498 513,498
Other comprehensive income - 260,350 (37,696) 222,654
Total comprehensive income for the period
- 260,350 475,802 736,152
Transfers between equity items on disposal of assets 16(b), 17 - (6,399) 6,399 -
Total transfers between equity items - (6,399) 6,399 -
Transactions with owners in their capacity as owners:
Shared capital issued 15(b) - - - -
Dividends recognised as a liability 14, 17 - - (664,024) (664,024)
Total transactions with owners in their capacity as owners - - (664,024) (664,024)
Balances at 30 June 2015 3,148,354 1,561,746 1,756,427 6,466,527
This statement should be read in conjunction with the accompanying notes.
Sydney Water Corporation – 30 June 2016 Page 6
Statement of cash flows
for the year ended 30 June 2016
Note 2016
$’000
2015
$’000
Cash flows from operating activities
Cash receipts in the course of operations (inclusive of Goods and Services Tax) 2,613,954 2,519,796
Cash payments in the course of operations (inclusive of Goods and Services Tax) (1,454,093) (1,431,232)
Cash generated from operations 1,159,861 1,088,564
Revenue grants received from Commonwealth Government 41 70
Cash receipts for social programs 165,841 163,173
Interest received 156 234
Income tax refunds received 1,254 1,640
Interest paid (358,660) (337,524)
Government guarantee fee paid (97,813) (98,548)
Income tax paid (239,232) (148,872)
Net cash from operating activities
6(b) 631,448 668,737
Cash flows from investing activities
Proceeds from sale of property, plant and equipment 45,920 59,924
Capital contributions received for social programs - 4,830
Capital grants received from NSW Government 13 - 10,000
Other capital contributions received 13,554 14,908
Security and other deposits received 24,401 12,039
Cash received from renegotiated water filtration plant agreements 15,919 -
Payments for property, plant and equipment (625,469) (534,531)
Payments for intangible assets (36,044) (53,290)
Security and other deposits released (12,274) (5,883)
Net cash from investing activities
(573,993) (492,003)
Cash flows from financing activities
Proceeds from issue of share capital 15 13,500 -
Proceeds from borrowings 601,250 88,746
Repayment of borrowings (1,210) (6,207)
Other finance payments (7,404) (5,443)
Dividends paid 14 (664,024) (252,000)
Net cash from financing activities
(57,888) (174,904)
Net increase (decrease) in cash and cash equivalents (433) 1,830
Cash and cash equivalents at beginning of period 5,752 3,922
Cash and cash equivalents at end of period
6(a) 5,319 5,752
This statement should be read in conjunction with the accompanying notes.
140 Financial statements | Sydney Water Annual Report 2015–16 Sydney Water Annual Report 2015–16 | Financial statements 141
Overview
Corporate
governanceC
ustomer at
the heartW
orld class perform
anceH
igh performance
cultureFin
ancial
statemen
tsA
ppendixes
| Sydney Water Annual Report 2015

Sydney Water Corporation – 30 June 2016 Page 7
About these Financial Statements
Corporate information Sydney Water Corporation (‘the Corporation’) is a NSW statutory state owned corporation established on 1 January 1999 following the enactment of the Water Legislation Amendment (Drinking Water and Corporate Structure) Act 1998 and legislative amendments to the Sydney Water Act 1994. The address of the Corporation’s head office is 1 Smith Street, Parramatta, NSW 2150. The Corporation provides water and water-related services under its Operating Licence to customers in its area of operations in NSW. It operates under the commercial disciplines of the NSW Government’s Commercial Policy Framework and accordingly the directors have determined that it is a for-profit entity for financial reporting purposes. The Corporation’s ultimate parent is the NSW Government. Accordingly, the Corporation’s financial statements form part of the consolidated NSW Total State Sector Accounts. The Corporation’s financial statements for the year ended 30 June 2016 were authorised for issue in accordance with a resolution of the board of directors on 18 August 2016. Basis of preparation These general purpose financial statements have been prepared in accordance with applicable Australian Accounting Standards (including Australian Interpretations) issued by the Australian Accounting Standards Board (AASB), mandates issued by NSW Treasury and other mandatory and statutory reporting requirements, including NSW Treasury Circulars adopted in the Corporation’s Statement of Corporate Intent, Part 3 of the Public Finance and Audit Act 1983 and the associated requirements of the Public Finance and Audit Regulation 2015. The financial statements have been prepared on the historical cost basis, except for the following material items:
• certain classes of property, plant and equipment are stated at the lower of fair value and recoverable amount;
• non-current assets classified as held for sale are stated at the lower of carrying amount and fair value less costs to sell;
• borrowings are measured at amortised cost;
• defined benefit superannuation liabilities are stated at the present value of accrued defined benefit obligations less the fair value of fund assets; and
• other non-current provisions are stated at the present value of the future estimated obligations for the relevant liabilities concerned.
Performance for the reporting period The financial statements cover the financial performance and cash flows of the Corporation for the reporting period 1 July 2015 to 30 June 2016, and its financial position as at 30 June 2016. Presentation currency The financial statements are presented in Australian dollars and all values are rounded to the nearest thousand dollars ($’000). Comparative information Where relevant, comparative amounts are restated to conform to the current reporting period’s presentation. This could arise as a result of the requirements of new or revised Australian Accounting Standards and Australian Interpretations, a voluntary change in accounting policy or a reclassification of items presented. Key judgements and estimates The Corporation makes estimates and assumptions concerning the future that are regularly evaluated based on historical experience and other factors. This includes expectations of future events that may have a financial effect on the Corporation and that are believed to be reasonable under the circumstances. Actual results may therefore differ from these estimates. Estimates and judgments that are material to the financial statements are found in the following notes:
• Note 4 Property, plant and equipment
• Note 5 Intangible assets
• Note 7 Trade and other receivables
• Note 12 Provisions
• Note 18 Commitments
Accounting policies The accounting policies described in these financial statements are based on the requirements applicable to for-profit entities and have been consistently applied to all reporting periods presented. Significant accounting policies that summarise the basis of recognition and measurement of material items presented in these financial statements are provided in each applicable note about those items. Notes structure The notes to the financial statements are organised into logical groupings. Each note in most cases is structured to disclose quantitative disclosures first, followed by relevant accounting policies and then any other relevant additional information. Notes for the more material items that are relevant to an understanding of the financial statements are presented earlier in the document, with other required note disclosures located more at the rear of the document. Significant changes in the current reporting period There were no changes in accounting policy during the reporting period, nor did the introduction of new Accounting Standards lead to any change in measurement or disclosure in these financial statements. Details of new Accounting Standards introduced during the reporting period, but which are not yet effective and which have not been early adopted by the Corporation, are provided in note 24.
Sydney Water Corporation – 30 June 2016 Page 8
Notes to the Financial Statements
Performance for the reporting period
Note 1. Income
(a) Revenue
Regulated Non- Regulated Total
2016 $’000
2015 $’000
2016 $’000
2015 $’000
2016 $’000
2015 $’000
Service availability charges (Customer redress rebates)
1,261,360 1,204,451 (5,628) (5,070) 1,255,732 1,199,381
Usage charges 1,182,913 1,138,289 12,856 12,758 1,195,769 1,151,047
Ancillary services 15,735 15,468 3,070 2,801 18,805 18,269
Sundry revenue 1,060 930 22,252 13,615 23,312 14,545
Interest revenue - - 2,319 2,599 2,319 2,599
NSW Government grants for social programs
165,869 163,091 - 4,830 165,869 167,921
Grants from Commonwealth Government - - 41 70 41 70
Rent revenue from operating leases 6,277 5,513 6,441 5,728 12,718 11,241
Developer contributions (repayments)
42 (422) 152,375 151,348 152,417 150,926
Total revenue 2,633,256 2,527,320 193,726 188,679 2,826,982 2,715,999
Recognition and measurement
Revenue is income that arises in the course of ordinary activities. Revenue is recognised and measured at the fair value of the consideration received or receivable to the extent that it is probable that the economic benefits will flow to the Corporation and the revenue can be reliably measured. Rendering of services Revenue from the rendering of water, wastewater and stormwater services is made up of:
• Service availability charges, which are a fixed charge to customers covering the cost of making the Corporation's water, wastewater and stormwater services available.
• Usage charges, which reflect revenue derived from the consumption and use made of the Corporation's water, wastewater and trade waste services.
• Ancillary services, which are provided to customers for water, wastewater and stormwater related services including building approvals and the provision of information such as plans and diagrams.
Revenue from these services is recognised on an accrual basis as the services are provided. In regard to usage charges covering water usage, sewer usage, trade waste and recycled water charges, the Corporation recognises an estimate for the accrued revenue earned from the unbilled consumption of these services where meters have not been read as at the reporting date. (Refer note 7). Interest revenue Interest revenue is recognised as the interest accrues, using the effective interest method. Government grants Grants that compensate the Corporation for expenses incurred or revenue foregone are recognised as revenue in profit or loss in the same periods in which the expenses are incurred or the revenue is foregone. Conditional government grants are recognised in the statement of financial position initially as deferred income when there is reasonable assurance that they will be received and that the Corporation will comply with the conditions attaching to them. They are then transferred to profit or loss as revenue as the conditions are fulfilled, unless they are of a material amount that compensates the Corporation for the cost of a specific identifiable asset or assets, in which case they are recognised in profit or loss as revenue on a systematic basis over the useful life of the asset or assets. (Refer note 13).
142 Financial statements | Sydney Water Annual Report 2015–16| Sydney Water Annual Report 2015

Sydney Water Corporation – 30 June 2016 Page 7
About these Financial Statements
Corporate information Sydney Water Corporation (‘the Corporation’) is a NSW statutory state owned corporation established on 1 January 1999 following the enactment of the Water Legislation Amendment (Drinking Water and Corporate Structure) Act 1998 and legislative amendments to the Sydney Water Act 1994. The address of the Corporation’s head office is 1 Smith Street, Parramatta, NSW 2150. The Corporation provides water and water-related services under its Operating Licence to customers in its area of operations in NSW. It operates under the commercial disciplines of the NSW Government’s Commercial Policy Framework and accordingly the directors have determined that it is a for-profit entity for financial reporting purposes. The Corporation’s ultimate parent is the NSW Government. Accordingly, the Corporation’s financial statements form part of the consolidated NSW Total State Sector Accounts. The Corporation’s financial statements for the year ended 30 June 2016 were authorised for issue in accordance with a resolution of the board of directors on 18 August 2016. Basis of preparation These general purpose financial statements have been prepared in accordance with applicable Australian Accounting Standards (including Australian Interpretations) issued by the Australian Accounting Standards Board (AASB), mandates issued by NSW Treasury and other mandatory and statutory reporting requirements, including NSW Treasury Circulars adopted in the Corporation’s Statement of Corporate Intent, Part 3 of the Public Finance and Audit Act 1983 and the associated requirements of the Public Finance and Audit Regulation 2015. The financial statements have been prepared on the historical cost basis, except for the following material items:
• certain classes of property, plant and equipment are stated at the lower of fair value and recoverable amount;
• non-current assets classified as held for sale are stated at the lower of carrying amount and fair value less costs to sell;
• borrowings are measured at amortised cost;
• defined benefit superannuation liabilities are stated at the present value of accrued defined benefit obligations less the fair value of fund assets; and
• other non-current provisions are stated at the present value of the future estimated obligations for the relevant liabilities concerned.
Performance for the reporting period The financial statements cover the financial performance and cash flows of the Corporation for the reporting period 1 July 2015 to 30 June 2016, and its financial position as at 30 June 2016. Presentation currency The financial statements are presented in Australian dollars and all values are rounded to the nearest thousand dollars ($’000). Comparative information Where relevant, comparative amounts are restated to conform to the current reporting period’s presentation. This could arise as a result of the requirements of new or revised Australian Accounting Standards and Australian Interpretations, a voluntary change in accounting policy or a reclassification of items presented. Key judgements and estimates The Corporation makes estimates and assumptions concerning the future that are regularly evaluated based on historical experience and other factors. This includes expectations of future events that may have a financial effect on the Corporation and that are believed to be reasonable under the circumstances. Actual results may therefore differ from these estimates. Estimates and judgments that are material to the financial statements are found in the following notes:
• Note 4 Property, plant and equipment
• Note 5 Intangible assets
• Note 7 Trade and other receivables
• Note 12 Provisions
• Note 18 Commitments
Accounting policies The accounting policies described in these financial statements are based on the requirements applicable to for-profit entities and have been consistently applied to all reporting periods presented. Significant accounting policies that summarise the basis of recognition and measurement of material items presented in these financial statements are provided in each applicable note about those items. Notes structure The notes to the financial statements are organised into logical groupings. Each note in most cases is structured to disclose quantitative disclosures first, followed by relevant accounting policies and then any other relevant additional information. Notes for the more material items that are relevant to an understanding of the financial statements are presented earlier in the document, with other required note disclosures located more at the rear of the document. Significant changes in the current reporting period There were no changes in accounting policy during the reporting period, nor did the introduction of new Accounting Standards lead to any change in measurement or disclosure in these financial statements. Details of new Accounting Standards introduced during the reporting period, but which are not yet effective and which have not been early adopted by the Corporation, are provided in note 24.
Sydney Water Corporation – 30 June 2016 Page 8
Notes to the Financial Statements
Performance for the reporting period
Note 1. Income
(a) Revenue
Regulated Non- Regulated Total
2016 $’000
2015 $’000
2016 $’000
2015 $’000
2016 $’000
2015 $’000
Service availability charges (Customer redress rebates)
1,261,360 1,204,451 (5,628) (5,070) 1,255,732 1,199,381
Usage charges 1,182,913 1,138,289 12,856 12,758 1,195,769 1,151,047
Ancillary services 15,735 15,468 3,070 2,801 18,805 18,269
Sundry revenue 1,060 930 22,252 13,615 23,312 14,545
Interest revenue - - 2,319 2,599 2,319 2,599
NSW Government grants for social programs
165,869 163,091 - 4,830 165,869 167,921
Grants from Commonwealth Government - - 41 70 41 70
Rent revenue from operating leases 6,277 5,513 6,441 5,728 12,718 11,241
Developer contributions (repayments)
42 (422) 152,375 151,348 152,417 150,926
Total revenue 2,633,256 2,527,320 193,726 188,679 2,826,982 2,715,999
Recognition and measurement
Revenue is income that arises in the course of ordinary activities. Revenue is recognised and measured at the fair value of the consideration received or receivable to the extent that it is probable that the economic benefits will flow to the Corporation and the revenue can be reliably measured. Rendering of services Revenue from the rendering of water, wastewater and stormwater services is made up of:
• Service availability charges, which are a fixed charge to customers covering the cost of making the Corporation's water, wastewater and stormwater services available.
• Usage charges, which reflect revenue derived from the consumption and use made of the Corporation's water, wastewater and trade waste services.
• Ancillary services, which are provided to customers for water, wastewater and stormwater related services including building approvals and the provision of information such as plans and diagrams.
Revenue from these services is recognised on an accrual basis as the services are provided. In regard to usage charges covering water usage, sewer usage, trade waste and recycled water charges, the Corporation recognises an estimate for the accrued revenue earned from the unbilled consumption of these services where meters have not been read as at the reporting date. (Refer note 7). Interest revenue Interest revenue is recognised as the interest accrues, using the effective interest method. Government grants Grants that compensate the Corporation for expenses incurred or revenue foregone are recognised as revenue in profit or loss in the same periods in which the expenses are incurred or the revenue is foregone. Conditional government grants are recognised in the statement of financial position initially as deferred income when there is reasonable assurance that they will be received and that the Corporation will comply with the conditions attaching to them. They are then transferred to profit or loss as revenue as the conditions are fulfilled, unless they are of a material amount that compensates the Corporation for the cost of a specific identifiable asset or assets, in which case they are recognised in profit or loss as revenue on a systematic basis over the useful life of the asset or assets. (Refer note 13).
142 Financial statements | Sydney Water Annual Report 2015–16 Sydney Water Annual Report 2015–16 | Financial statements 143
Overview
Corporate
governanceC
ustomer at
the heartW
orld class perform
anceH
igh performance
cultureFin
ancial
statemen
tsA
ppendixes
| Sydney Water Annual Report 2015

Sydney Water Corporation – 30 June 2016 Page 9
Social program reimbursements The Corporation delivers a number of non-commercial social programs of the NSW Government. These include pensioner rebates, properties exempt from service and usage charges and expenditures for priority sewerage areas. The Corporation is reimbursed for the full cost of all social programs. Such reimbursements are recognised as revenue on an accrual basis at the same time as the related social program items are recognised in profit or loss. Where such reimbursements are received in advance, they are recognised initially as deferred income in the statement of financial position and subsequently as revenue when the costs incurred or revenues foregone for which they are intended to compensate are recognised in profit or loss. Rent revenue from operating leases Rent revenue from operating leases is recognised on a straight-line basis over the lease term. Developer contributions Developer contributions may be in the form of monetary or non-monetary resources, and include cash advances received free of repayment obligation towards the construction of assets, and assets that are acquired at no cost. Developer contributions are recognised as revenue in profit or loss at their fair value. Developer contributions in the form of cash are now mainly applicable to recycling works. Their fair value is the amount of cash received from the developer and they are recognised as revenue when received. Developer contributions in the form of assets are recognised upon certification by the Corporation that the assets are in accordance with the Corporation’s standards and when control of the assets is transferred to the Corporation. Their fair value at initial recognition is an estimate of the sub-contractor’s cost, which in effect represents replacement cost as at the date of acceptance.
(b) Other income
2016
$’000 2015
$’000
Net gain on disposal of property, plant and equipment 8,622 8,123
Net gain on disposal of greenhouse trading certificates 159 -
Net fair value unrealised gain on greenhouse trading certificates 8,347 4,212
Total other income recognised in profit or loss 17,128 12,335
Other income is non-regulated.
Recognition and measurement
Other income includes gains arising from the disposal or re-measurement to fair value of assets or liabilities, where those gains are required to be taken to profit or loss. Disposal of assets The net gain or loss on disposal of other current assets is calculated as the difference between the carrying amount of the assets at the time of disposal and the net proceeds on disposal and is recognised in profit or loss in the period of disposal. Gains or losses arising from the sale of property holdings are recognised at the date that the risks and rewards of ownership have been transferred to the purchaser and the Corporation has no continuing involvement with the property. This is normally considered to be when legal title passes to the purchaser at the date of settlement. Net losses on disposal are reclassified as expenses. Fair value gains through profit and loss. Refer accounting policies for derivative financial instruments (note 20(d)) and greenhouse trading certificates (note 9). Net fair value losses are reclassified as expenses.
Sydney Water Corporation – 30 June 2016 Page 10
Note 2. Expenses
Note
2016 $’000
2015 $’000
(a) Finance costs
Financial liabilities not at fair value through profit and loss using the effective
interest method:
Interest expense 334,994 331,873
Amortisation of deferred discounts (premiums) on loans 6(b) (5,241) (676)
Total interest expense using effective interest method 329,753 331,197
Government guarantee fee expense
Indexation of CPI bonds
Other
6(b)
117,095
24,597
11
97,813
19,224
9
471,456
448,243
Less amount capitalised 6(b) (43,411) (26,054)
Total finance costs expense recognised in profit or loss
428,045
422,189
Recognition and measurement Interest and other borrowing costs are expensed as incurred within finance costs in profit or loss unless they relate to qualifying capital assets, in which case they are capitalised as part of the cost of those assets. Qualifying capital assets are assets that take a substantial period of time (12 months or more) to get ready for their intended use or sale. Borrowing costs are capitalised where there is a direct relationship between the borrowings and the projects giving rise to qualifying capital assets. Typically, these are projects whose total budgeted expenditure is approximately $3 million or greater. Where funds are borrowed specifically for the acquisition, construction or production of a qualifying capital asset, the amount of borrowing costs capitalised is net of any interest earned on those borrowings. Where funds are borrowed generally, borrowing costs are capitalised using a weighted average. The government guarantee fee represents the fee paid by the Corporation to NSW Treasury for the guarantee that the NSW Government provides in relation to the Corporation’s borrowings.
144 Financial statements | Sydney Water Annual Report 2015–16| Sydney Water Annual Report 2015
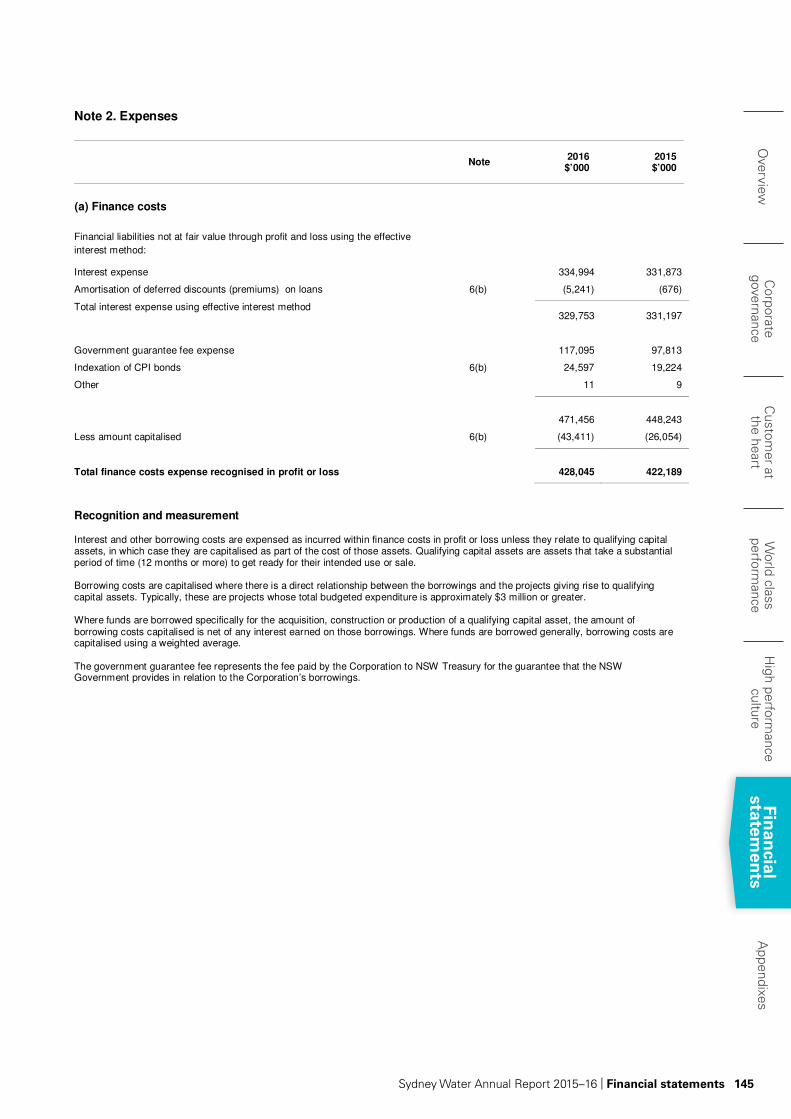
Sydney Water Corporation – 30 June 2016 Page 9
Social program reimbursements The Corporation delivers a number of non-commercial social programs of the NSW Government. These include pensioner rebates, properties exempt from service and usage charges and expenditures for priority sewerage areas. The Corporation is reimbursed for the full cost of all social programs. Such reimbursements are recognised as revenue on an accrual basis at the same time as the related social program items are recognised in profit or loss. Where such reimbursements are received in advance, they are recognised initially as deferred income in the statement of financial position and subsequently as revenue when the costs incurred or revenues foregone for which they are intended to compensate are recognised in profit or loss. Rent revenue from operating leases Rent revenue from operating leases is recognised on a straight-line basis over the lease term. Developer contributions Developer contributions may be in the form of monetary or non-monetary resources, and include cash advances received free of repayment obligation towards the construction of assets, and assets that are acquired at no cost. Developer contributions are recognised as revenue in profit or loss at their fair value. Developer contributions in the form of cash are now mainly applicable to recycling works. Their fair value is the amount of cash received from the developer and they are recognised as revenue when received. Developer contributions in the form of assets are recognised upon certification by the Corporation that the assets are in accordance with the Corporation’s standards and when control of the assets is transferred to the Corporation. Their fair value at initial recognition is an estimate of the sub-contractor’s cost, which in effect represents replacement cost as at the date of acceptance.
(b) Other income
2016
$’000 2015
$’000
Net gain on disposal of property, plant and equipment 8,622 8,123
Net gain on disposal of greenhouse trading certificates 159 -
Net fair value unrealised gain on greenhouse trading certificates 8,347 4,212
Total other income recognised in profit or loss 17,128 12,335
Other income is non-regulated.
Recognition and measurement
Other income includes gains arising from the disposal or re-measurement to fair value of assets or liabilities, where those gains are required to be taken to profit or loss. Disposal of assets The net gain or loss on disposal of other current assets is calculated as the difference between the carrying amount of the assets at the time of disposal and the net proceeds on disposal and is recognised in profit or loss in the period of disposal. Gains or losses arising from the sale of property holdings are recognised at the date that the risks and rewards of ownership have been transferred to the purchaser and the Corporation has no continuing involvement with the property. This is normally considered to be when legal title passes to the purchaser at the date of settlement. Net losses on disposal are reclassified as expenses. Fair value gains through profit and loss. Refer accounting policies for derivative financial instruments (note 20(d)) and greenhouse trading certificates (note 9). Net fair value losses are reclassified as expenses.
Sydney Water Corporation – 30 June 2016 Page 10
Note 2. Expenses
Note
2016 $’000
2015 $’000
(a) Finance costs
Financial liabilities not at fair value through profit and loss using the effective
interest method:
Interest expense 334,994 331,873
Amortisation of deferred discounts (premiums) on loans 6(b) (5,241) (676)
Total interest expense using effective interest method 329,753 331,197
Government guarantee fee expense
Indexation of CPI bonds
Other
6(b)
117,095
24,597
11
97,813
19,224
9
471,456
448,243
Less amount capitalised 6(b) (43,411) (26,054)
Total finance costs expense recognised in profit or loss
428,045
422,189
Recognition and measurement Interest and other borrowing costs are expensed as incurred within finance costs in profit or loss unless they relate to qualifying capital assets, in which case they are capitalised as part of the cost of those assets. Qualifying capital assets are assets that take a substantial period of time (12 months or more) to get ready for their intended use or sale. Borrowing costs are capitalised where there is a direct relationship between the borrowings and the projects giving rise to qualifying capital assets. Typically, these are projects whose total budgeted expenditure is approximately $3 million or greater. Where funds are borrowed specifically for the acquisition, construction or production of a qualifying capital asset, the amount of borrowing costs capitalised is net of any interest earned on those borrowings. Where funds are borrowed generally, borrowing costs are capitalised using a weighted average. The government guarantee fee represents the fee paid by the Corporation to NSW Treasury for the guarantee that the NSW Government provides in relation to the Corporation’s borrowings.
144 Financial statements | Sydney Water Annual Report 2015–16 Sydney Water Annual Report 2015–16 | Financial statements 145
Overview
Corporate
governanceC
ustomer at
the heartW
orld class perform
anceH
igh performance
cultureFin
ancial
statemen
tsA
ppendixes
| Sydney Water Annual Report 2015

Sydney Water Corporation – 30 June 2016 Page 11
(b) Other expenses
Note 2016
$’000
2015
$’000
Employee-related expenses:
Total employee-related expenses
432,422
411,598
Less amount capitalised (70,142) (62,350)
Employee-related expenses
362,280 349,248
Non employee-related expenses:
Availability charges and purchases of bulk water from Water NSW (Sydney Catchment Authority from 1 July 2014 to 31 December 2014)
215,278 207,231
Availability charges from Sydney Desalination Plant Pty Limited 195,289 195,980
Tariff expenses from water filtration plant service agreements 103,811 110,011
Maintenance services expenses 167,862 164,271
Operational services expenses
Materials, plant and equipment expenses
109,897
39,069
99,909
40,118
Operating lease (minimum lease payments) expenses 53,798 51,724
Electricity and other energy expenses 38,090 41,451
Transport expenses (excluding leases) 2,265 2,438
Property expenses (excluding leases) 21,621 21,125
Data management expenses (excluding leases) 19,432 18,340
Other expenses from ordinary activities 48,185 38,927
1,014,597 991,525
Less amount capitalised (19,363) (16,846)
Non employee-related expenses 995,234 974,679
Total core operations expenses 1,357,514 1,323,927
Depreciation and amortisation expenses 4(g), 5(d), 6(b) 251,330 239,924
Total other expenses in the course of ordinary activities 1,608,844 1,563,851
Net losses from disposal of:
Property, plant and equipment 17,247 9,073
Intangible assets 6(b) - 179
Greenhouse trading certificates - 154
17,247 9,406
Impairment losses expensed (reversed) through profit or loss:
Receivables 7(c) (818) (39)
Property, plant and equipment 4, 6(b) 6,019 3,824
Intangible assets 5, 6(b) 1,774 (500)
6,975 3,285
Total other expenses recognised in profit or loss 1,633,066 1,576,542
Sydney Water Corporation – 30 June 2016 Page 12
Additional dissections of expenses
Note 2016
$’000
2015
$’000
Superannuation expense (gain) recognised in profit or loss: Defined benefit schemes
Total expense advised by Pillar Administration 12(b) 37.805 45,099
Other movements (1,900) (3,116)
35,905 41,963 Less amount capitalised (3,804) (3,568)
32,101 38,415
Defined contribution schemes
Total expense 12,617 11,636
Less amount capitalised (1,090) (989)
11,527 10,647
Total superannuation expense (gain) recognised in profit or loss 43,628 49,062
Maintenance expenses Maintenance-related employee expenses 63,534 64,343 (included in employee-related expenses)
Maintenance expenses 167,862 164,271 (excluding maintenance-related employee expenses)
Total maintenance expenses 231,396 228,614
Recognition and measurement Expenses are recognised in profit or loss when incurred. Expenses include items that are incurred in the course of ordinary activities as well as various losses that arise from either the disposal of recognised assets or the re-measurement of some items at the reporting date that are required to be taken to profit or loss under the relevant applicable Australian Accounting Standards including Australian Interpretations. The line item ‘Other expenses’ is comprised of core operations expenses, expenses that arise from asset adjustments and various losses recognised in profit or loss that are considered non-core. Examples of losses are those arising from the disposal of property, plant and equipment and asset impairment losses not able to be taken to the asset revaluation reserve. Expenses are disclosed in these financial statements by nature.
146 Financial statements | Sydney Water Annual Report 2015–16| Sydney Water Annual Report 2015

Sydney Water Corporation – 30 June 2016 Page 11
(b) Other expenses
Note 2016
$’000
2015
$’000
Employee-related expenses:
Total employee-related expenses
432,422
411,598
Less amount capitalised (70,142) (62,350)
Employee-related expenses
362,280 349,248
Non employee-related expenses:
Availability charges and purchases of bulk water from Water NSW (Sydney Catchment Authority from 1 July 2014 to 31 December 2014)
215,278 207,231
Availability charges from Sydney Desalination Plant Pty Limited 195,289 195,980
Tariff expenses from water filtration plant service agreements 103,811 110,011
Maintenance services expenses 167,862 164,271
Operational services expenses
Materials, plant and equipment expenses
109,897
39,069
99,909
40,118
Operating lease (minimum lease payments) expenses 53,798 51,724
Electricity and other energy expenses 38,090 41,451
Transport expenses (excluding leases) 2,265 2,438
Property expenses (excluding leases) 21,621 21,125
Data management expenses (excluding leases) 19,432 18,340
Other expenses from ordinary activities 48,185 38,927
1,014,597 991,525
Less amount capitalised (19,363) (16,846)
Non employee-related expenses 995,234 974,679
Total core operations expenses 1,357,514 1,323,927
Depreciation and amortisation expenses 4(g), 5(d), 6(b) 251,330 239,924
Total other expenses in the course of ordinary activities 1,608,844 1,563,851
Net losses from disposal of:
Property, plant and equipment 17,247 9,073
Intangible assets 6(b) - 179
Greenhouse trading certificates - 154
17,247 9,406
Impairment losses expensed (reversed) through profit or loss:
Receivables 7(c) (818) (39)
Property, plant and equipment 4, 6(b) 6,019 3,824
Intangible assets 5, 6(b) 1,774 (500)
6,975 3,285
Total other expenses recognised in profit or loss 1,633,066 1,576,542
Sydney Water Corporation – 30 June 2016 Page 12
Additional dissections of expenses
Note 2016
$’000
2015
$’000
Superannuation expense (gain) recognised in profit or loss: Defined benefit schemes
Total expense advised by Pillar Administration 12(b) 37.805 45,099
Other movements (1,900) (3,116)
35,905 41,963 Less amount capitalised (3,804) (3,568)
32,101 38,415
Defined contribution schemes
Total expense 12,617 11,636
Less amount capitalised (1,090) (989)
11,527 10,647
Total superannuation expense (gain) recognised in profit or loss 43,628 49,062
Maintenance expenses Maintenance-related employee expenses 63,534 64,343 (included in employee-related expenses)
Maintenance expenses 167,862 164,271 (excluding maintenance-related employee expenses)
Total maintenance expenses 231,396 228,614
Recognition and measurement Expenses are recognised in profit or loss when incurred. Expenses include items that are incurred in the course of ordinary activities as well as various losses that arise from either the disposal of recognised assets or the re-measurement of some items at the reporting date that are required to be taken to profit or loss under the relevant applicable Australian Accounting Standards including Australian Interpretations. The line item ‘Other expenses’ is comprised of core operations expenses, expenses that arise from asset adjustments and various losses recognised in profit or loss that are considered non-core. Examples of losses are those arising from the disposal of property, plant and equipment and asset impairment losses not able to be taken to the asset revaluation reserve. Expenses are disclosed in these financial statements by nature.
146 Financial statements | Sydney Water Annual Report 2015–16 Sydney Water Annual Report 2015–16 | Financial statements 147
Overview
Corporate
governanceC
ustomer at
the heartW
orld class perform
anceH
igh performance
cultureFin
ancial
statemen
tsA
ppendixes
| Sydney Water Annual Report 2015

Sydney Water Corporation – 30 June 2016 Page 13
Water filtration plant agreements The Corporation has contractual arrangements with the owner/operators of water filtration plants at Prospect, Macarthur, Illawarra and Woronora for the filtration of bulk water. The contractual arrangements and the accounting policies adopted are described below:
Prospect, Macarthur, Illawarra and Woronora
The water filtration agreements that previously existed in respect of the Prospect, Woronora and Illawarra plants were renegotiated during the current reporting period. The conditions precedent relating to the Prospect plant agreement were satisfied in June 2016 with the new charges taking effect from 1 July 2016. Similarly, the conditions precedent for the Woronora and Illawarra plants were satisfied in September 2015, with the new charges taking effect from 1 October 2015. The water filtration agreement in respect of the Macarthur plant was renegotiated during the 2010-11 reporting period, with the new agreement taking effect from 1 March 2011. Up until these dates, the previous agreements were service agreements and all charges incurred were recognised as an expense within profit or loss. The new agreement for the Prospect plant extends to 30 November 2035. The new agreement for the Woronora and Illawarra plants extends to 30 November 2036, while the agreement for the Macarthur plant extends to 8 September 2030. These agreements now have within them a number of different conditions and tariff components. The tariff components comprise both service element components and also capital components that relate to the acquisition of the plants by the end of the agreements, at which time legal title transfers to the Corporation for a nominal value of $1. The capital components of the tariffs that are specifically related to the acquisition of the plants over the terms of the new agreements meet the criteria of a finance lease and accordingly finance lease assets and finance lease liabilities have been recognised in the statement of financial position. (Refer notes 4 and 11). Disclosure of the Corporation’s finance lease commitments in respect of these agreements is shown in note 18(c).
Operating lease expenses Payments made under operating leases are representative of the pattern of benefits derived from the leased assets and accordingly they are recognised as an expense in profit or loss in the periods in which they are incurred. In most cases, recognition as an expense occurs on a straight-line basis over the term of the lease. Lease incentives received are recognised as an integral part of the total lease expense in profit or loss. Depreciation and amortisation Refer to note 4(g) for details on depreciation of property, plant and equipment and note 5(d) for details on amortisation of intangible assets.
Sydney Water Corporation – 30 June 2016 Page 14
Note 3. Taxation
Note 2016 $’000
2015 $’000
(a) Income tax expense recognised in profit or loss
Current tax expense
Current year 202,623 202,984
Adjustments for prior years 610 (481)
203,233 202,503
Deferred tax expense
Origination and reversal of temporary differences 33,340 14,258
Adjustments for prior years (1,588) (656)
31,752 13,602
Total income tax expense in profit or loss 234,985 216,105
Reconciliation between income tax expense and profit before income tax
Profit before income tax 782,999 729,603
Income tax expense calculated using the domestic corporation tax rate of 30% (2015: 30%) 234,900 218,881
Increase in tax expense due to:
Non-deductible expenses 1,383
378
Decrease in tax expense due to:
Research and development concession (320) (1,239)
Non-assessable items - (778)
235,963 217,242
Under (Over)-provided in prior year (978) (1,137)
Income tax expense 234,985 216,105
(b) Income tax on other comprehensive income
Deferred tax relating to:
Revaluation of property, plant and equipment 16(b) 266,419 111,578
Remeasurement of defined benefit superannuation net liability 17 (112,365) (16,155)
154,054 95,423
148 Financial statements | Sydney Water Annual Report 2015–16| Sydney Water Annual Report 2015

Sydney Water Corporation – 30 June 2016 Page 13
Water filtration plant agreements The Corporation has contractual arrangements with the owner/operators of water filtration plants at Prospect, Macarthur, Illawarra and Woronora for the filtration of bulk water. The contractual arrangements and the accounting policies adopted are described below:
Prospect, Macarthur, Illawarra and Woronora
The water filtration agreements that previously existed in respect of the Prospect, Woronora and Illawarra plants were renegotiated during the current reporting period. The conditions precedent relating to the Prospect plant agreement were satisfied in June 2016 with the new charges taking effect from 1 July 2016. Similarly, the conditions precedent for the Woronora and Illawarra plants were satisfied in September 2015, with the new charges taking effect from 1 October 2015. The water filtration agreement in respect of the Macarthur plant was renegotiated during the 2010-11 reporting period, with the new agreement taking effect from 1 March 2011. Up until these dates, the previous agreements were service agreements and all charges incurred were recognised as an expense within profit or loss. The new agreement for the Prospect plant extends to 30 November 2035. The new agreement for the Woronora and Illawarra plants extends to 30 November 2036, while the agreement for the Macarthur plant extends to 8 September 2030. These agreements now have within them a number of different conditions and tariff components. The tariff components comprise both service element components and also capital components that relate to the acquisition of the plants by the end of the agreements, at which time legal title transfers to the Corporation for a nominal value of $1. The capital components of the tariffs that are specifically related to the acquisition of the plants over the terms of the new agreements meet the criteria of a finance lease and accordingly finance lease assets and finance lease liabilities have been recognised in the statement of financial position. (Refer notes 4 and 11). Disclosure of the Corporation’s finance lease commitments in respect of these agreements is shown in note 18(c).
Operating lease expenses Payments made under operating leases are representative of the pattern of benefits derived from the leased assets and accordingly they are recognised as an expense in profit or loss in the periods in which they are incurred. In most cases, recognition as an expense occurs on a straight-line basis over the term of the lease. Lease incentives received are recognised as an integral part of the total lease expense in profit or loss. Depreciation and amortisation Refer to note 4(g) for details on depreciation of property, plant and equipment and note 5(d) for details on amortisation of intangible assets.
Sydney Water Corporation – 30 June 2016 Page 14
Note 3. Taxation
Note 2016 $’000
2015 $’000
(a) Income tax expense recognised in profit or loss
Current tax expense
Current year 202,623 202,984
Adjustments for prior years 610 (481)
203,233 202,503
Deferred tax expense
Origination and reversal of temporary differences 33,340 14,258
Adjustments for prior years (1,588) (656)
31,752 13,602
Total income tax expense in profit or loss 234,985 216,105
Reconciliation between income tax expense and profit before income tax
Profit before income tax 782,999 729,603
Income tax expense calculated using the domestic corporation tax rate of 30% (2015: 30%) 234,900 218,881
Increase in tax expense due to:
Non-deductible expenses 1,383
378
Decrease in tax expense due to:
Research and development concession (320) (1,239)
Non-assessable items - (778)
235,963 217,242
Under (Over)-provided in prior year (978) (1,137)
Income tax expense 234,985 216,105
(b) Income tax on other comprehensive income
Deferred tax relating to:
Revaluation of property, plant and equipment 16(b) 266,419 111,578
Remeasurement of defined benefit superannuation net liability 17 (112,365) (16,155)
154,054 95,423
148 Financial statements | Sydney Water Annual Report 2015–16 Sydney Water Annual Report 2015–16 | Financial statements 149
Overview
Corporate
governanceC
ustomer at
the heartW
orld class perform
anceH
igh performance
cultureFin
ancial
statemen
tsA
ppendixes
| Sydney Water Annual Report 2015

Syd
ney
Wate
r C
orp
ora
tion –
30 J
un
e 2
016
P
ag
e 1
5
(c)
Defe
rre
d t
ax a
sse
ts a
nd
lia
bilit
ies
Rec
og
nis
ed
in
Sta
tem
en
t o
f fi
nan
cia
l p
osit
ion
:
As
sets
Lia
bilit
ies
N
et
20
16
20
15
20
16
20
15
2016
20
15
$’0
00
$’0
00
$’0
00
$’0
00
$’0
00
$’0
00
Pro
pert
y, p
lant
an
d e
qu
ipm
ent
-
- 1,3
82,6
98
1,0
73,7
74
1,3
82,6
98
1,0
73,7
74
Accru
ed inte
rest
revenu
e
-
- 49
6
39
9
49
6
39
9
Con
sum
ab
le s
tore
s
-
- 55
7
32
0
55
7
32
0
Pre
paid
exp
en
ses
-
- 75
- 75
-
Em
plo
yee b
en
efit
s
(4
42,8
50)
(31
8,1
61)
- -
(44
2,8
50)
(31
8,1
61)
Pro
visi
on
s n
ot
curr
ently
ded
uctible
(21,9
32)
(19,8
81)
- -
(21,9
32)
(19,8
81)
Anticip
ate
d r
eceip
ts a
nd a
ccru
ed e
xpenses
(1
,64
0)
(5,1
44)
- -
(1,6
40)
(5,1
44)
Cap
ital gra
nts
fro
m N
SW
Govern
ment
(3
,00
0)
(3,0
00)
- -
(3,0
00)
(3,0
00)
Oth
er
fin
ancia
l in
str
um
ents
(19,0
32)
(19,0
32)
- -
(19,0
32)
(19,0
32)
Gre
enh
ou
se t
radin
g c
ert
ificate
s
(1
,10
0)
(809)
- -
(1,1
00)
(80
9)
Tax
(assets
) lia
bili
ties
(4
89,5
54)
(36
6,0
27)
1,3
83,8
26
1,0
74,4
93
89
4,2
72
708,4
66
Set-
off o
f ta
x
489,5
54
36
6,0
27
(4
89,5
54)
(366,0
27)
- -
Net
tax
(assets
) /
liabili
ties
-
- 894,2
72
70
8,4
66
89
4,2
72
708,4
66
T
here
were
no u
nre
cogn
ised d
efe
rred t
ax
assets
an
d lia
bili
ties
for
the C
orp
ora
tion a
t th
e r
ep
ort
ing d
ate
.
M
ovem
en
ts i
n t
em
po
rary
dif
fere
nc
es:
B
ala
nc
e
1 J
uly
201
5
R
eco
gn
ised
in
p
rofi
t o
r lo
ss
R
ec
og
nis
ed
in
o
ther
c
om
pre
he
nsiv
e
inc
om
e
B
ala
nc
e
30 J
un
e 2
01
6
B
ala
nc
e
1 J
uly
201
4
R
ec
og
nis
ed
in
p
rofi
t o
r lo
ss
R
eco
gn
ised
in
o
ther
co
mp
reh
en
siv
e
inc
om
e
B
ala
nc
e
30 J
un
e 2
01
5
$’0
00
$’0
00
$’0
00
$’0
00
$’0
00
$’0
00
$’0
00
$’0
00
Pro
pert
y, p
lant
an
d e
qu
ipm
ent
1,0
73,7
74
42,5
05
26
6,4
19
1,3
82,6
98
92
8,0
77
34,1
19
111,5
78
1,0
73,7
74
Accru
ed inte
rest
revenu
e
39
9
97
-
49
6
27
8
12
1
- 39
9
Con
sum
ab
le s
tore
s
32
0
23
7
- 55
7
27
1
49
-
32
0
Pre
paid
exp
en
ses
-
75
-
75
-
- -
- E
mplo
yee b
en
efit
s
(3
18,1
61)
(12,3
24)
(112,3
65)
(442,8
50)
(29
0,9
49)
(11,0
57)
(16,1
55)
(31
8,1
61)
Pro
visi
on
s n
ot
curr
ently
ded
uctible
(19,8
81)
(2,0
51)
- (2
1,9
32)
(20,2
51)
37
0
- (1
9,8
81)
Anticip
ate
d r
eceip
ts a
nd a
ccru
ed e
xpenses
(5
,14
4)
3,5
04
-
(1,6
40)
(70)
(5,0
74)
- (5
,14
4)
Cap
ital gra
nts
fro
m N
SW
Govern
ment
(3
,00
0)
- -
(3,0
00)
- (3
,00
0)
- (3
,00
0)
Oth
er
fin
ancia
l in
str
um
ents
(19,0
32)
- -
(19,0
32)
(19,0
32)
- -
(19,0
32)
Gre
enh
ou
se t
radin
g c
ert
ificate
s
(8
09)
(29
1)
- (1
,10
0)
1,1
17
(1
,92
6)
- (8
09)
Net
tax
(assets
) /
liabili
ties
70
8,4
66
31,7
52
15
4,0
54
89
4,2
72
59
9,4
41
13,6
02
95,4
23
708,4
66
Sydney Water Corporation – 30 June 2016 Page 16
Recognition and Measurement Income tax The Corporation is subject to notional taxation in accordance with the State Owned Corporations Act 1989. Notional income tax is payable to the NSW Government through the Office of State Revenue. Taxation liability is assessed according to the National Tax Equivalent Regime (NTER). The NTER closely mirrors the Commonwealth Income Tax Assessment Acts of 1936 and 1997 (as amended) and is administered by the Australian Taxation Office (ATO). Income tax expense comprises both current and deferred tax. Income tax is recognised in profit or loss except to the extent that it relates to items recognised in equity, in which case the income tax is itself recognised in equity as part of other comprehensive income.
Current tax asset and liability Current tax is the expected tax payable or receivable on the taxable income for the reporting period, using tax rates enacted or substantively enacted at the reporting date, and any adjustment to tax payable or receivable in respect of previous years. Current tax for current and prior periods is recognised as a liability (or asset) to the extent that it is unpaid (or refundable). At the reporting date, the Corporation had both a current tax asset of $0.397 million (2015: $1.239 million) receivable in respect of the previous reporting period, and a current tax liability balance of $38.922 million (2015: $74.510 million) outstanding in respect of the current reporting period. These balances represent the remaining balance of income taxes payable (or, if a current tax asset, receivable) at the reporting date in respect of current and prior periods, after allowing for payments already made during the reporting periods on a pay-as-you-go basis. The income tax payable in respect of the operating result for the reporting period was $202.623 million (2015: $202.984 million). Deferred taxes The Corporation applies the ‘balance sheet method’ of tax-effect accounting to determine income tax expense and current and deferred tax assets and liabilities. Deferred tax represents future assessable or deductible amounts that arise due to temporary differences existing at the reporting date between the carrying amounts of assets and liabilities for financial reporting purposes and the amounts used for taxation purposes (their tax bases). Deferred tax balances are not recognised for temporary differences that arise from the initial recognition of assets or liabilities in a transaction that is not a business combination and that affect neither accounting profit nor taxable profit. Deferred tax assets and liabilities provided are based on the expected manner of realisation or settlement of the carrying amount of assets and liabilities to which they relate. They are measured at the tax rates that are expected to be applied to the temporary differences when they reverse, based on the tax laws enacted or substantively enacted at the reporting date. The carrying amount of deferred tax assets is reviewed at each reporting date and reduced to the extent that it is no longer probable that sufficient taxable profit will be available to allow all or part of the deferred tax asset to be utilised. Current and deferred tax assets are offset with current and deferred tax liabilities respectively where they relate to income taxes levied by the same taxation authority and the Corporation intends to settle current tax assets and liabilities with that taxation authority on a net basis.
Goods and services tax Revenue, expenses and assets are recognised excluding any amount of Goods and Services Tax (GST), except where the amount of GST incurred by the Corporation as a purchaser is not recoverable from the ATO. In such cases, the GST incurred is recognised as part of the cost of acquisition of an asset or as part of an item of expense. Receivables and payables are stated with the amount of GST included. The net amount of GST recoverable from the ATO is included as a current asset or liability in the statement of financial position. Cash flows of GST are included in the statement of cash flows on a gross basis. The GST components of cash flows arising from investing and financing activities that are recoverable from, or payable to, the ATO are classified as cash flows from operating activities. Commitments are disclosed inclusive of GST where applicable. (Refer note 18).
150 Financial statements | Sydney Water Annual Report 2015–16| Sydney Water Annual Report 2015

Sydney Water Corporation – 30 June 2016 Page 16
Recognition and Measurement Income tax The Corporation is subject to notional taxation in accordance with the State Owned Corporations Act 1989. Notional income tax is payable to the NSW Government through the Office of State Revenue. Taxation liability is assessed according to the National Tax Equivalent Regime (NTER). The NTER closely mirrors the Commonwealth Income Tax Assessment Acts of 1936 and 1997 (as amended) and is administered by the Australian Taxation Office (ATO). Income tax expense comprises both current and deferred tax. Income tax is recognised in profit or loss except to the extent that it relates to items recognised in equity, in which case the income tax is itself recognised in equity as part of other comprehensive income.
Current tax asset and liability Current tax is the expected tax payable or receivable on the taxable income for the reporting period, using tax rates enacted or substantively enacted at the reporting date, and any adjustment to tax payable or receivable in respect of previous years. Current tax for current and prior periods is recognised as a liability (or asset) to the extent that it is unpaid (or refundable). At the reporting date, the Corporation had both a current tax asset of $0.397 million (2015: $1.239 million) receivable in respect of the previous reporting period, and a current tax liability balance of $38.922 million (2015: $74.510 million) outstanding in respect of the current reporting period. These balances represent the remaining balance of income taxes payable (or, if a current tax asset, receivable) at the reporting date in respect of current and prior periods, after allowing for payments already made during the reporting periods on a pay-as-you-go basis. The income tax payable in respect of the operating result for the reporting period was $202.623 million (2015: $202.984 million). Deferred taxes The Corporation applies the ‘balance sheet method’ of tax-effect accounting to determine income tax expense and current and deferred tax assets and liabilities. Deferred tax represents future assessable or deductible amounts that arise due to temporary differences existing at the reporting date between the carrying amounts of assets and liabilities for financial reporting purposes and the amounts used for taxation purposes (their tax bases). Deferred tax balances are not recognised for temporary differences that arise from the initial recognition of assets or liabilities in a transaction that is not a business combination and that affect neither accounting profit nor taxable profit. Deferred tax assets and liabilities provided are based on the expected manner of realisation or settlement of the carrying amount of assets and liabilities to which they relate. They are measured at the tax rates that are expected to be applied to the temporary differences when they reverse, based on the tax laws enacted or substantively enacted at the reporting date. The carrying amount of deferred tax assets is reviewed at each reporting date and reduced to the extent that it is no longer probable that sufficient taxable profit will be available to allow all or part of the deferred tax asset to be utilised. Current and deferred tax assets are offset with current and deferred tax liabilities respectively where they relate to income taxes levied by the same taxation authority and the Corporation intends to settle current tax assets and liabilities with that taxation authority on a net basis.
Goods and services tax Revenue, expenses and assets are recognised excluding any amount of Goods and Services Tax (GST), except where the amount of GST incurred by the Corporation as a purchaser is not recoverable from the ATO. In such cases, the GST incurred is recognised as part of the cost of acquisition of an asset or as part of an item of expense. Receivables and payables are stated with the amount of GST included. The net amount of GST recoverable from the ATO is included as a current asset or liability in the statement of financial position. Cash flows of GST are included in the statement of cash flows on a gross basis. The GST components of cash flows arising from investing and financing activities that are recoverable from, or payable to, the ATO are classified as cash flows from operating activities. Commitments are disclosed inclusive of GST where applicable. (Refer note 18).
150 Financial statements | Sydney Water Annual Report 2015–16 Sydney Water Annual Report 2015–16 | Financial statements 151
Overview
Corporate
governanceC
ustomer at
the heartW
orld class perform
anceH
igh performance
cultureFin
ancial
statemen
tsA
ppendixes
| Sydney Water Annual Report 2015

Syd
ney
Wate
r C
orp
ora
tion –
30 J
un
e 2
01
6
P
ag
e 1
7
As
sets
an
d f
air
valu
es
No
te 4
. P
rop
ert
y,
pla
nt
an
d e
qu
ipm
en
t
Mo
ve
me
nts
an
d c
arr
yin
g a
mo
un
ts
Year
en
de
d 3
0 J
un
e 2
016
Mark
et
land
an
d b
uild
ings
L
easeh
old
pro
pert
y
S
yst
em
ass
ets
-
Infr
ast
ructu
re
inclu
din
g s
yst
em
lan
d
(ow
ned)
S
yst
em a
ssets
-
Infr
ast
ructu
re
(un
der
fin
ance
lease)
P
lant
an
d
eq
uip
ment
C
om
pute
r equip
ment
W
ork
in
pro
gre
ss
T
ota
l (F
air v
alu
e
hie
rarc
hy
– L
evel 3)
$’0
00
$’0
00
$’0
00
$’0
00
$’0
00
$’0
00
$’0
00
$’0
00
A
t 1 J
uly
20
15 –
net
carr
ying a
mou
nt
20
3,5
31
12,8
50
14,4
99,4
36
43,1
50
66,9
96
9,7
12
63
5,7
09
15,4
71,3
84
Add
itio
ns
to w
ork
in p
rogre
ss
- -
- -
- -
67
7,6
33
67
7,6
33
A
dd
itio
ns
transfe
rred f
rom
work
in p
rogre
ss
3,1
70
1,0
46
45
7,5
08
3,3
38
5,1
11
7,2
45
(4
77,4
18)
- A
dd
itio
ns
– o
ther
an
d a
dju
stm
ents
-
- 13
8,8
63
246,9
43
(15
6)
- -
38
5,6
50
Dis
posals
(8
4)
- (1
6,4
86)
- (1
,01
9)
(7)
- (1
7,5
96)
R
ecla
ssifi
ed a
s asse
ts h
eld
for
sale
(5
9,3
45)
- -
- -
- -
(59,3
45)
O
ther
recla
ssifi
cation
s
6,1
65
-
(6,1
76)
- 11
- (4
,97
2)
(4,9
72)
R
evalu
ation incre
ases
(+)
or
decre
ases
(-)
recog
nis
ed in t
he a
sset
revalu
ation r
eserv
e
18,3
89
-
- -
- -
-
18,3
89
Im
pair
ment
losse
s (-
) re
cogn
ised in t
he
ass
et
reva
luation r
eserv
e
- -
- -
- -
- -
Im
pair
ment
losse
s re
vers
ed (
+)
and
recog
nis
ed in t
he a
sset
revalu
ation r
eserv
e
2,1
61
-
86
5,0
54
2,4
59
- -
-
86
9,6
74
Im
pair
ment
losse
s or
revalu
ati
on
decre
ments
(-)
recog
nis
ed in p
rofit
or
loss
in
the lin
e ite
m ‘O
ther
exp
enses’
(3
,90
8)
(8
85)
-
-
-
-
(2
,33
4)
(7
,12
7)
Im
pair
ment
losse
s re
vers
ed o
r re
valu
ation
incre
ments
(+)
recognis
ed in p
rofit
or
loss
in
the lin
e ite
m ‘O
ther
exp
enses’
1,1
08
-
-
-
-
-
-
1,1
08
Depre
cia
tion c
harg
e
(32
9)
(21
7)
(178,5
19)
(3,6
44)
(12,5
08)
(6,1
00)
- (2
01,3
17)
A
t 30 J
une 2
01
6 –
net
carr
yin
g a
mount
17
0,8
58
12,7
94
15,7
59,6
80
292,2
46
58,4
35
10,8
50
82
8,6
18
17,1
33,4
81
Syd
ney
Wate
r C
orp
ora
tion –
30 J
une 2
016
P
ag
e 1
8
Mark
et
land
build
ing
s
L
easeh
old
pro
pert
y
S
yst
em
Ass
ets
-
Infr
ast
ructu
re
inclu
din
g s
yst
em
lan
d
(ow
ned)
S
yst
em
Ass
ets
-
Infr
ast
ructu
re
(un
der
fin
ance
lease)
P
lant
an
d
eq
uip
ment
C
om
pute
r equip
ment
W
ork
in
pro
gre
ss
T
ota
l (F
air v
alu
e
hie
rarc
hy
– L
evel 3)
$’0
00
$’0
00
$’0
00
$’0
00
$’0
00
$’0
00
$’0
00
$’0
00
A
t 1 J
uly
2015
F
air v
alu
e –
Level 3 (
an
d v
alu
ation t
echn
iqu
e):
C
ost
-
- -
- 157,2
26
55,3
08
63
5,7
09
84
8,2
43
M
ark
et
valu
ation -
20
15
22
7,4
46
12,9
80
-
- -
- -
24
0,4
26
F
air v
alu
e –
incom
e a
ppro
ach
-
- 14,4
99,4
36
43,1
50
- -
- 14,5
42,5
86
22
7,4
46
12,9
80
14,4
99,4
36
43,1
50
157,2
26
55,3
08
63
5,7
09
15,6
31,2
55
A
ccum
ula
ted d
epre
cia
tion o
r am
ort
isation
- -
- -
(90,2
30)
(45,5
96)
- (1
35,8
26)
Accum
ula
ted im
pairm
ent
(23,9
15)
(13
0)
- -
- -
- (2
4,0
45)
(2
3,9
15)
(13
0)
- -
(90,2
30)
(45,5
96)
- (1
59,8
71)
N
et
carr
yin
g a
mou
nt
20
3,5
31
12,8
50
14,4
99,4
36
43,1
50
66,9
96
9,7
12
63
5,7
09
15,4
71,3
84
A
t 30 J
un
e 2
01
6
F
air v
alu
e –
Level 3 (
an
d v
alu
ation t
echn
iqu
e):
Cost
-
- -
- 159,3
44
51,5
50
82
8,6
18
1,0
39,5
12
M
ark
et
valu
ation -
20
16
19
3,3
97
12,9
70
-
- -
- -
20
6,3
67
F
air v
alu
e –
incom
e a
ppro
ach
-
- 15,7
59,6
80
292,2
46
- -
- 16,0
51,9
26
19
3,3
97
12,9
70
15,7
59,6
80
292,2
46
159,3
44
51,5
50
82
8,6
18
17,2
97,8
05
A
ccum
ula
ted d
epre
cia
tion o
r am
ort
isation
(36)
(43)
- -
(10
0,9
09)
(40,7
00)
- (1
41,6
88)
Accum
ula
ted im
pairm
ent
(22,5
03)
(13
3)
- -
- -
- (2
2,6
36)
(2
2,5
39)
(17
6)
- -
(10
0,9
09)
(40,7
00)
- (1
64,3
24)
N
et
carr
yin
g a
mou
nt
17
0,8
58
12,7
94
15,7
59,6
80
292,2
46
58,4
35
10,8
50
82
8,6
18
17,1
33,4
81
R
ev
alu
ed
ass
ets
ba
se
d o
n c
os
t m
od
el:
Cost
55,2
21
19,3
87
17,7
52,4
84
432,2
82
A
ccum
ula
ted d
epre
cia
tion o
r am
ort
isation
(7,2
20)
(4,5
16)
(4,2
20,6
38)
(89,4
31)
Accum
ula
ted im
pairm
ent
(12,0
48)
(4,2
33)
- -
(1
9,2
68)
(8,7
49)
(4,2
20,6
38)
(89,4
31)
N
et
carr
yin
g a
mou
nt
30 J
un
e 2
016
35,9
53
10,6
38
13,5
31,8
46
342,8
51
152 Financial statements | Sydney Water Annual Report 2015–16| Sydney Water Annual Report 2015

Syd
ney
Wate
r C
orp
ora
tion –
30 J
une 2
016
P
ag
e 1
8
Mark
et
land
build
ing
s
L
easeh
old
pro
pert
y
S
yst
em
Ass
ets
-
Infr
ast
ructu
re
inclu
din
g s
yst
em
lan
d
(ow
ned)
S
yst
em
Ass
ets
-
Infr
ast
ructu
re
(un
der
fin
ance
lease)
P
lant
an
d
eq
uip
ment
C
om
pute
r equip
ment
W
ork
in
pro
gre
ss
T
ota
l (F
air v
alu
e
hie
rarc
hy
– L
evel 3)
$’0
00
$’0
00
$’0
00
$’0
00
$’0
00
$’0
00
$’0
00
$’0
00
A
t 1 J
uly
2015
F
air v
alu
e –
Level 3 (
an
d v
alu
ation t
echn
iqu
e):
C
ost
-
- -
- 157,2
26
55,3
08
63
5,7
09
84
8,2
43
M
ark
et
valu
ation -
20
15
22
7,4
46
12,9
80
-
- -
- -
24
0,4
26
F
air v
alu
e –
incom
e a
ppro
ach
-
- 14,4
99,4
36
43,1
50
- -
- 14,5
42,5
86
22
7,4
46
12,9
80
14,4
99,4
36
43,1
50
157,2
26
55,3
08
63
5,7
09
15,6
31,2
55
A
ccum
ula
ted d
epre
cia
tion o
r am
ort
isation
- -
- -
(90,2
30)
(45,5
96)
- (1
35,8
26)
Accum
ula
ted im
pairm
ent
(23,9
15)
(13
0)
- -
- -
- (2
4,0
45)
(2
3,9
15)
(13
0)
- -
(90,2
30)
(45,5
96)
- (1
59,8
71)
N
et
carr
yin
g a
mou
nt
20
3,5
31
12,8
50
14,4
99,4
36
43,1
50
66,9
96
9,7
12
63
5,7
09
15,4
71,3
84
A
t 30 J
un
e 2
01
6
F
air v
alu
e –
Level 3 (
an
d v
alu
ation t
echn
iqu
e):
Cost
-
- -
- 159,3
44
51,5
50
82
8,6
18
1,0
39,5
12
M
ark
et
valu
ation -
20
16
19
3,3
97
12,9
70
-
- -
- -
20
6,3
67
F
air v
alu
e –
incom
e a
ppro
ach
-
- 15,7
59,6
80
292,2
46
- -
- 16,0
51,9
26
19
3,3
97
12,9
70
15,7
59,6
80
292,2
46
159,3
44
51,5
50
82
8,6
18
17,2
97,8
05
A
ccum
ula
ted d
epre
cia
tion o
r am
ort
isation
(36)
(43)
- -
(10
0,9
09)
(40,7
00)
- (1
41,6
88)
Accum
ula
ted im
pairm
ent
(22,5
03)
(13
3)
- -
- -
- (2
2,6
36)
(2
2,5
39)
(17
6)
- -
(10
0,9
09)
(40,7
00)
- (1
64,3
24)
N
et
carr
yin
g a
mou
nt
17
0,8
58
12,7
94
15,7
59,6
80
292,2
46
58,4
35
10,8
50
82
8,6
18
17,1
33,4
81
R
ev
alu
ed
ass
ets
ba
se
d o
n c
os
t m
od
el:
Cost
55,2
21
19,3
87
17,7
52,4
84
432,2
82
A
ccum
ula
ted d
epre
cia
tion o
r am
ort
isation
(7,2
20)
(4,5
16)
(4,2
20,6
38)
(89,4
31)
Accum
ula
ted im
pairm
ent
(12,0
48)
(4,2
33)
- -
(1
9,2
68)
(8,7
49)
(4,2
20,6
38)
(89,4
31)
N
et
carr
yin
g a
mou
nt
30 J
un
e 2
016
35,9
53
10,6
38
13,5
31,8
46
342,8
51
152 Financial statements | Sydney Water Annual Report 2015–16 Sydney Water Annual Report 2015–16 | Financial statements 153
Overview
Corporate
governanceC
ustomer at
the heartW
orld class perform
anceH
igh performance
cultureFin
ancial
statemen
tsA
ppendixes
| Sydney Water Annual Report 2015
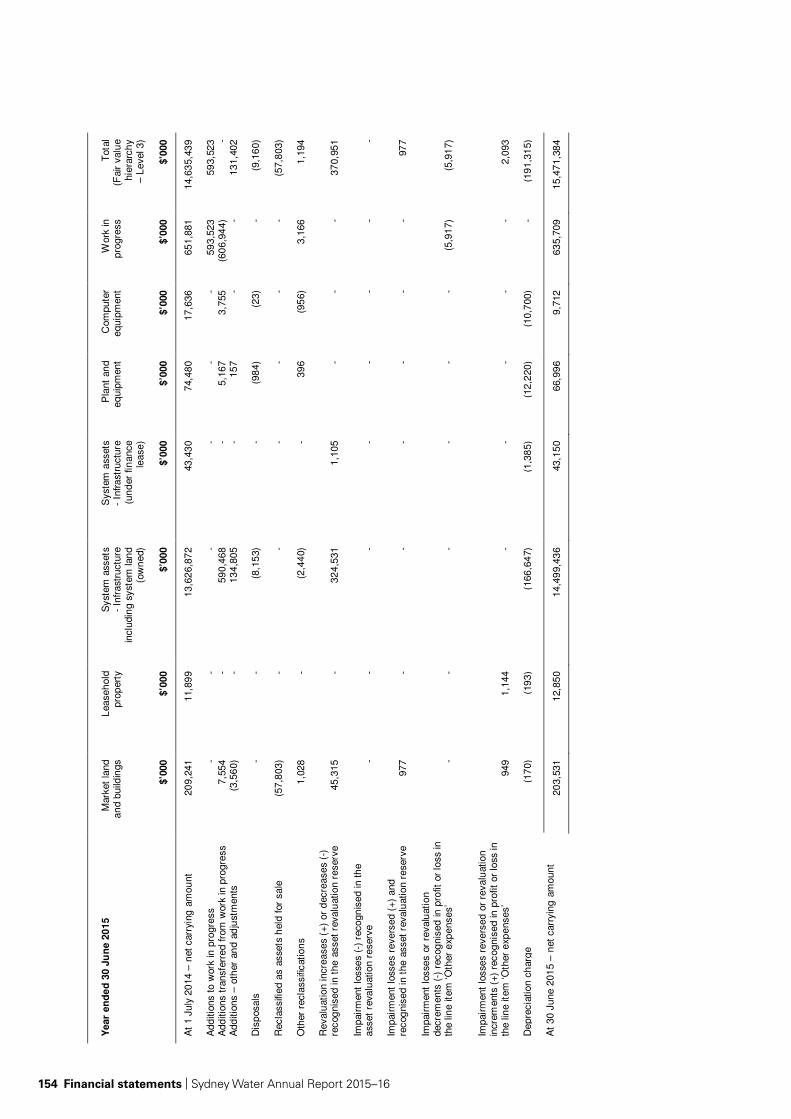
Syd
ney
Wate
r C
orp
ora
tion –
30 J
une 2
016
P
ag
e 1
9
Year
en
de
d 3
0 J
un
e 2
015
Mark
et
land
an
d b
uild
ings
L
easeh
old
pro
pert
y
S
yst
em
ass
ets
-
Infr
ast
ructu
re
inclu
din
g s
yst
em
lan
d
(ow
ned)
S
yst
em a
ssets
-
Infr
ast
ructu
re
(un
der
fin
ance
lease)
P
lant
an
d
eq
uip
ment
C
om
pute
r equip
ment
W
ork
in
pro
gre
ss
T
ota
l (F
air v
alu
e
hie
rarc
hy
– L
evel 3)
$’0
00
$’0
00
$’0
00
$’0
00
$’0
00
$’0
00
$’0
00
$’0
00
A
t 1 J
uly
20
14 –
net
carr
ying a
mou
nt
20
9,2
41
11,8
99
13,6
26,8
72
43,4
30
74,4
80
17,6
36
65
1,8
81
14,6
35,4
39
Add
itio
ns
to w
ork
in p
rogre
ss
- -
- -
- -
59
3,5
23
59
3,5
23
A
dd
itio
ns
transfe
rred f
rom
work
in p
rogre
ss
7,5
54
-
59
0,4
68
-
5,1
67
3,7
55
(6
06,9
44)
- A
dd
itio
ns
– o
ther
an
d a
dju
stm
ents
(3
,56
0)
- 13
4,8
05
-
15
7
- -
13
1,4
02
Dis
posals
-
- (8
,15
3)
- (9
84)
(23)
- (9
,16
0)
R
ecla
ssifi
ed a
s asse
ts h
eld
for
sale
(5
7,8
03)
- -
- -
- -
(57,8
03)
O
ther
recla
ssifi
cation
s
1,0
28
-
(2,4
40)
- 39
6
(95
6)
3,1
66
1,1
94
Revalu
ation incre
ases
(+)
or
decre
ases
(-)
recog
nis
ed in t
he a
sset
revalu
ation r
eserv
e
45,3
15
-
32
4,5
31
1,1
05
- -
-
37
0,9
51
Im
pair
ment
losse
s (-
) re
cogn
ised in t
he
ass
et
reva
luation r
eserv
e
- -
- -
- -
- -
Im
pair
ment
loss
es
revers
ed (
+)
and
recog
nis
ed in t
he a
sset
revalu
ation r
eserv
e
977
-
- -
- -
-
97
7
Impair
ment
losse
s or
revalu
ati
on
decre
ments
(-)
recog
nis
ed in p
rofit
or
loss
in
the lin
e ite
m ‘O
ther
exp
enses’
-
-
-
-
-
-
(5
,91
7)
(5
,91
7)
Im
pair
ment
losse
s re
vers
ed o
r re
valu
ation
incre
ments
(+)
recognis
ed in p
rofit
or
loss
in
the lin
e ite
m ‘O
ther
exp
enses’
949
1,1
44
-
-
-
-
-
2,0
93
Depre
cia
tion c
harg
e
(17
0)
(19
3)
(166,6
47)
(1,3
85)
(12,2
20)
(10,7
00)
- (1
91,3
15)
A
t 30 J
une 2
01
5 –
net
carr
yin
g a
mount
20
3,5
31
12,8
50
14,4
99,4
36
43,1
50
66,9
96
9,7
12
63
5,7
09
15,4
71,3
84
Syd
ney
Wate
r C
orp
ora
tion –
30 J
une 2
016
P
ag
e 2
0
Mark
et
land
build
ing
s
L
easeh
old
pro
pert
y
S
yst
em
Ass
ets
-
Infr
ast
ructu
re
inclu
din
g s
yst
em
lan
d
(ow
ned)
S
yst
em
Ass
ets
-
Infr
ast
ructu
re
(un
der
fin
ance
lease)
P
lant
an
d
eq
uip
ment
C
om
pute
r equip
ment
W
ork
in
pro
gre
ss
T
ota
l (F
air v
alu
e
hie
rarc
hy
– L
evel 3)
$’0
00
$’0
00
$’0
00
$’0
00
$’0
00
$’0
00
$’0
00
$’0
00
A
t 1 J
uly
2014
F
air v
alu
e –
Level 3 (
an
d v
alu
ation t
echn
iqu
e):
C
ost
-
- -
- 157,8
83
63,0
66
65
1,8
81
87
2,8
30
M
ark
et
valu
ation -
20
14
23
4,1
07
12,1
00
-
- -
- -
24
6,2
07
F
air v
alu
e –
incom
e a
ppro
ach
-
- 13,6
26,8
72
43,4
30
- -
- 13,6
70,3
02
23
4,1
07
12,1
00
13,6
26,8
72
43,4
30
157,8
83
63,0
66
65
1,8
81
14,7
89,3
39
A
ccum
ula
ted d
epre
cia
tion o
r am
ort
isation
(71)
(80)
- -
(83,4
03)
(45,4
30)
- (1
28,9
84)
Accum
ula
ted im
pairm
ent
(24,7
95)
(12
1)
- -
- -
- (2
4,9
16)
(2
4,8
66)
(20
1)
- -
(83,4
03)
(45,4
30)
- (1
53,9
00)
N
et
carr
yin
g a
mou
nt
20
9,2
41
11,8
99
13,6
26,8
72
43,4
30
74,4
80
17,6
36
65
1,8
81
14,6
35,4
39
A
t 30 J
un
e 2
01
5
F
air v
alu
e –
Level 3 (
an
d v
alu
ation t
echn
iqu
e):
Cost
-
- -
- 157,2
26
55,3
08
63
5,7
09
84
8,2
43
M
ark
et
valu
ation -
20
15
22
7,4
46
12,9
80
-
- -
- -
24
0,4
26
F
air v
alu
e –
incom
e a
ppro
ach
-
- 14,4
99,4
36
43,1
50
- -
- 14,5
42,5
86
22
7,4
46
12,9
80
14,4
99,4
36
43,1
50
157,2
26
55,3
08
63
5,7
09
15,6
31,2
55
A
ccum
ula
ted d
epre
cia
tion o
r am
ort
isation
- -
- -
(90,2
30)
(45,5
96)
- (1
35,8
26)
Accum
ula
ted im
pairm
ent
(23,9
15)
(13
0)
- -
- -
- (2
4,0
45)
(2
3,9
15)
(13
0)
- -
(90,2
30)
(45,5
96)
- (1
59,8
71)
N
et
carr
yin
g a
mou
nt
20
3,5
31
12,8
50
14,4
99,4
36
43,1
50
66,9
96
9,7
12
63
5,7
09
15,4
71,3
84
R
ev
alu
ed
ass
ets
ba
se
d o
n c
os
t m
od
el:
Cost
54,8
13
19,3
87
17,3
09,8
35
104,6
23
A
ccum
ula
ted d
epre
cia
tion o
r am
ort
isation
(6,7
70)
(4,2
83)
(4,0
14,8
10)
(14,6
25)
Accum
ula
ted im
pairm
ent
(9,2
48)
(3,3
48)
- -
(1
6,0
18)
(7,6
31)
(4,0
14,8
10)
(14,6
25)
N
et
carr
yin
g a
mou
nt
30 J
un
e 2
015
38,7
95
11,7
56
13,2
95,0
25
89,9
98
154 Financial statements | Sydney Water Annual Report 2015–16| Sydney Water Annual Report 2015

Syd
ney
Wate
r C
orp
ora
tion –
30 J
une 2
016
P
ag
e 2
0
Mark
et
land
build
ing
s
L
easeh
old
pro
pert
y
S
yst
em
Ass
ets
-
Infr
ast
ructu
re
inclu
din
g s
yst
em
lan
d
(ow
ned)
S
yst
em
Ass
ets
-
Infr
ast
ructu
re
(un
der
fin
ance
lease)
P
lant
an
d
eq
uip
ment
C
om
pute
r equip
ment
W
ork
in
pro
gre
ss
T
ota
l (F
air v
alu
e
hie
rarc
hy
– L
evel 3)
$’0
00
$’0
00
$’0
00
$’0
00
$’0
00
$’0
00
$’0
00
$’0
00
A
t 1 J
uly
2014
F
air v
alu
e –
Level 3 (
an
d v
alu
ation t
echn
iqu
e):
C
ost
-
- -
- 157,8
83
63,0
66
65
1,8
81
87
2,8
30
M
ark
et
valu
ation -
20
14
23
4,1
07
12,1
00
-
- -
- -
24
6,2
07
F
air v
alu
e –
incom
e a
ppro
ach
-
- 13,6
26,8
72
43,4
30
- -
- 13,6
70,3
02
23
4,1
07
12,1
00
13,6
26,8
72
43,4
30
157,8
83
63,0
66
65
1,8
81
14,7
89,3
39
A
ccum
ula
ted d
epre
cia
tion o
r am
ort
isation
(71)
(80)
- -
(83,4
03)
(45,4
30)
- (1
28,9
84)
Accum
ula
ted im
pairm
ent
(24,7
95)
(12
1)
- -
- -
- (2
4,9
16)
(2
4,8
66)
(20
1)
- -
(83,4
03)
(45,4
30)
- (1
53,9
00)
N
et
carr
yin
g a
mou
nt
20
9,2
41
11,8
99
13,6
26,8
72
43,4
30
74,4
80
17,6
36
65
1,8
81
14,6
35,4
39
A
t 30 J
un
e 2
01
5
F
air v
alu
e –
Level 3 (
an
d v
alu
ation t
echn
iqu
e):
Cost
-
- -
- 157,2
26
55,3
08
63
5,7
09
84
8,2
43
M
ark
et
valu
ation -
20
15
22
7,4
46
12,9
80
-
- -
- -
24
0,4
26
F
air v
alu
e –
incom
e a
ppro
ach
-
- 14,4
99,4
36
43,1
50
- -
- 14,5
42,5
86
22
7,4
46
12,9
80
14,4
99,4
36
43,1
50
157,2
26
55,3
08
63
5,7
09
15,6
31,2
55
A
ccum
ula
ted d
epre
cia
tion o
r am
ort
isation
- -
- -
(90,2
30)
(45,5
96)
- (1
35,8
26)
Accum
ula
ted im
pairm
ent
(23,9
15)
(13
0)
- -
- -
- (2
4,0
45)
(2
3,9
15)
(13
0)
- -
(90,2
30)
(45,5
96)
- (1
59,8
71)
N
et
carr
yin
g a
mou
nt
20
3,5
31
12,8
50
14,4
99,4
36
43,1
50
66,9
96
9,7
12
63
5,7
09
15,4
71,3
84
R
ev
alu
ed
ass
ets
ba
se
d o
n c
os
t m
od
el:
Cost
54,8
13
19,3
87
17,3
09,8
35
104,6
23
A
ccum
ula
ted d
epre
cia
tion o
r am
ort
isation
(6,7
70)
(4,2
83)
(4,0
14,8
10)
(14,6
25)
Accum
ula
ted im
pairm
ent
(9,2
48)
(3,3
48)
- -
(1
6,0
18)
(7,6
31)
(4,0
14,8
10)
(14,6
25)
N
et
carr
yin
g a
mou
nt
30 J
un
e 2
015
38,7
95
11,7
56
13,2
95,0
25
89,9
98
154 Financial statements | Sydney Water Annual Report 2015–16 Sydney Water Annual Report 2015–16 | Financial statements 155
Overview
Corporate
governanceC
ustomer at
the heartW
orld class perform
anceH
igh performance
cultureFin
ancial
statemen
tsA
ppendixes
| Sydney Water Annual Report 2015

Sydney Water Corporation – 30 June 2016 Page 21
Recognition, measurement and valuation
(a) Asset classes The Corporation has the following asset classes comprising property, plant and equipment: System assets These are infrastructure assets that deliver water, wastewater and stormwater services to customers through an integrated network of various asset categories. This class also includes system land and water meters. System land is land upon which the various system asset categories are located and which has no other alternative use. System assets that are subject to a finance lease arrangement are shown separately to those that are owned by the Corporation. Market land and buildings These are properties held and owned by the Corporation and that have potential for alternative use. Leasehold property This is a property held by the Corporation under a 99 year lease. Plant and equipment These are assets that comprise vehicles, office equipment and operating plant and machinery. Computer equipment These are assets that comprise computer hardware, such as servers, desktop computers, laptops and other associated computer peripherals.
(b) Acquisitions and capitalisation Property, plant and equipment assets are recognised initially at the cost of acquisition, which includes costs directly attributable to bringing the relevant asset to the location and condition necessary for it to operate as intended. Items costing $5,000 or more individually and having a minimum expected working life of three years are capitalised. In the case of system asset categories that work together to form an entire network (‘system assets’), all expenditures are capitalised regardless of cost. For system assets constructed by the Corporation for its own use, the initial cost capitalised includes the cost of construction including direct labour, materials, contractors’ services costs, inspection costs, capital support costs and borrowing costs. These costs are capitalised initially as work in progress and then reclassified as completed assets when the asset becomes operational. Inspection costs are capitalised when incurred and are depreciated over the period until the next inspection. Restoration costs are also capitalised when a decision to decommission the asset has been made. This also gives rise to the recognition of a corresponding liability as a provision. (Refer note 12(c)). Where system assets are handed over by developers free of charge, they are initially recognised at fair value using the cost approach (see below under (d) Fair value measurement) based on an estimate of the sub-contractor’s cost, which in effect represents their replacement cost as at the date of acceptance.
(c) Asset revaluations After initial recognition, each class of property, plant and equipment is stated at fair value less any accumulated depreciation and accumulated impairment losses. Adoption of the revaluation model, rather than the cost model, is required under NSW Treasury mandates for NSW public sector entities. For system assets, market land and buildings and leasehold properties, re-measurement to fair value is undertaken by way of an asset revaluation. For these asset classes, revaluation increments are recognised in other comprehensive income and credited to an asset revaluation reserve within equity in the statement of financial position. Plant and equipment, computer equipment and work in progress are not subject to revaluations as their carrying amounts closely approximate their fair value. Where a revaluation decrement or an impairment loss reverses a previous revaluation increment within the asset revaluation reserve, the revaluation decrement or impairment loss is debited to that reserve until the original credit is extinguished. Any excess debit above the original credit is recognised as an expense in profit or loss. Revaluation increments and decrements are offset against one another on an ‘individual asset’ basis. For system assets, the ‘individual asset’ is considered to be the entire system asset network at the whole of entity level. This is because all of the system asset categories work together as an integrated network to provide services to customers and to generate cash flows, rather than individually. For market land and buildings and the leasehold property, the ‘individual asset’ is considered to be each individual land parcel together with any building improvements on the land parcel. When revaluing system assets, market buildings and leasehold property to fair value, any accumulated depreciation or amortisation is netted against the gross carrying amount and the resulting balance is then increased or decreased by the revaluation adjustment. Upon disposal of assets that have been revalued, any asset revaluation reserve balance relating to the disposed assets is transferred to retained earnings.
Sydney Water Corporation – 30 June 2016 Page 22
(d) Fair value approaches and hierarchy levels Fair value is defined as ‘the price that would be received to sell an asset or paid to transfer a liability in an orderly transaction between market participants at the measurement date.’ This is sometimes referred to as an ‘exit price’. There are three approaches to calculating fair value: • the market approach, where fair value is determined using prices and other relevant information generated by market transactions
involving identical or comparable assets or groups of assets.
• the income approach, where fair value is determined by converting future cash flows to a single current (ie discounted) amount.
• the cost approach, where fair value is determined by calculating the current replacement cost of an asset, which represents the amount that would be required currently to replace the service capacity of an asset.
Fair value measurement is classified into three levels of a hierarchy based on the inputs used: • Quoted prices in active markets (level 1)
• Other observable inputs (level 2)
• Unobservable inputs (level 3).
Due to the unique nature of the Corporation’s assets, the inputs used to determine fair value are unobservable, and so are considered to be level 3 valuations. This also applies to intangible assets in note 5.
(e) Fair value measurement of asset classes The relevant valuation technique used for each class of property, plant and equipment is as follows: System assets – income approach Market land and buildings – market approach Leasehold property – market approach Plant and equipment – cost approach Computer equipment – cost approach System assets The income approach is used to value system assets, as there is generally no active market for assets of such a specialised nature. The income approach calculates fair value using the stream of future net cash flows (discounted to their present value) from the whole, integrated network of system assets held by the Corporation. Determining fair value under this approach is highly dependent on the inputs and assumptions used to estimate the future net cash flows. (Refer (f) below). The Corporation aligns its approach to determining the future cash flows with the pricing methodology applied by its regulator, the Independent Pricing and Regulatory Tribunal (IPART). In addition to the cash flows for regulated assets under this approach, the Corporation’s fair value calculations also include estimated cash flows from non-regulated assets, which are not included in IPART’s methodology. System assets are assessed as an integrated network because of the interdependent nature of their operations, and they are grouped at a whole of entity level because the IPART pricing methodology assesses future cash flows at that level. This is considered to be more relevant to a market participant than the estimated depreciated current replacement cost of these assets. As IPART’s methodology assesses the total fair value of all the Corporation’s regulated assets, the asset values of non-regulated assets are added in order to determine the total fair value of all assets. The fair value of system assets is then derived by deducting the fair value of other classes of assets (that are shown separately) from the total fair value of all assets. Market land and buildings, and leasehold property The market approach is used to value these assets. Fair value is measured based on valuations of the open market value of the property by independent valuers. Inputs to the valuations are sale prices of similar properties in the same or comparable localities, rental income and applicable lease term. Estimates of the costs to sell are regarded as an impairment to the realisation of fair value and are deducted from the independent market valuations when determining their recoverable amount. Where land is environmentally contaminated and reliable estimates of remediation costs have been determined, this is also deducted (as an impairment to fair value). Independent market valuations are obtained every three years, unless market conditions necessitate an earlier valuation. Market land and buildings acquired between valuations are stated at directors’ valuation for the reporting period and revalued at the next valuation date, unless there is a specific need to obtain an independent valuation earlier. At each reporting date, a review of the property market is undertaken to see if there has been a material change in the fair values of market land and buildings since the revaluation date. Where there has been a material change, the carrying amounts in the statement of financial position are adjusted accordingly. Plant and equipment, computer equipment and work in progress Fair value of plant and equipment, computer equipment and work in progress is based on the cost approach. Depreciated historical cost is considered to be an acceptable surrogate for a market-based fair value for plant and equipment and computer equipment. Cost is considered to be the most accurate fair value measurement of assets under construction and within work in progress.
156 Financial statements | Sydney Water Annual Report 2015–16| Sydney Water Annual Report 2015

Sydney Water Corporation – 30 June 2016 Page 21
Recognition, measurement and valuation
(a) Asset classes The Corporation has the following asset classes comprising property, plant and equipment: System assets These are infrastructure assets that deliver water, wastewater and stormwater services to customers through an integrated network of various asset categories. This class also includes system land and water meters. System land is land upon which the various system asset categories are located and which has no other alternative use. System assets that are subject to a finance lease arrangement are shown separately to those that are owned by the Corporation. Market land and buildings These are properties held and owned by the Corporation and that have potential for alternative use. Leasehold property This is a property held by the Corporation under a 99 year lease. Plant and equipment These are assets that comprise vehicles, office equipment and operating plant and machinery. Computer equipment These are assets that comprise computer hardware, such as servers, desktop computers, laptops and other associated computer peripherals.
(b) Acquisitions and capitalisation Property, plant and equipment assets are recognised initially at the cost of acquisition, which includes costs directly attributable to bringing the relevant asset to the location and condition necessary for it to operate as intended. Items costing $5,000 or more individually and having a minimum expected working life of three years are capitalised. In the case of system asset categories that work together to form an entire network (‘system assets’), all expenditures are capitalised regardless of cost. For system assets constructed by the Corporation for its own use, the initial cost capitalised includes the cost of construction including direct labour, materials, contractors’ services costs, inspection costs, capital support costs and borrowing costs. These costs are capitalised initially as work in progress and then reclassified as completed assets when the asset becomes operational. Inspection costs are capitalised when incurred and are depreciated over the period until the next inspection. Restoration costs are also capitalised when a decision to decommission the asset has been made. This also gives rise to the recognition of a corresponding liability as a provision. (Refer note 12(c)). Where system assets are handed over by developers free of charge, they are initially recognised at fair value using the cost approach (see below under (d) Fair value measurement) based on an estimate of the sub-contractor’s cost, which in effect represents their replacement cost as at the date of acceptance.
(c) Asset revaluations After initial recognition, each class of property, plant and equipment is stated at fair value less any accumulated depreciation and accumulated impairment losses. Adoption of the revaluation model, rather than the cost model, is required under NSW Treasury mandates for NSW public sector entities. For system assets, market land and buildings and leasehold properties, re-measurement to fair value is undertaken by way of an asset revaluation. For these asset classes, revaluation increments are recognised in other comprehensive income and credited to an asset revaluation reserve within equity in the statement of financial position. Plant and equipment, computer equipment and work in progress are not subject to revaluations as their carrying amounts closely approximate their fair value. Where a revaluation decrement or an impairment loss reverses a previous revaluation increment within the asset revaluation reserve, the revaluation decrement or impairment loss is debited to that reserve until the original credit is extinguished. Any excess debit above the original credit is recognised as an expense in profit or loss. Revaluation increments and decrements are offset against one another on an ‘individual asset’ basis. For system assets, the ‘individual asset’ is considered to be the entire system asset network at the whole of entity level. This is because all of the system asset categories work together as an integrated network to provide services to customers and to generate cash flows, rather than individually. For market land and buildings and the leasehold property, the ‘individual asset’ is considered to be each individual land parcel together with any building improvements on the land parcel. When revaluing system assets, market buildings and leasehold property to fair value, any accumulated depreciation or amortisation is netted against the gross carrying amount and the resulting balance is then increased or decreased by the revaluation adjustment. Upon disposal of assets that have been revalued, any asset revaluation reserve balance relating to the disposed assets is transferred to retained earnings.
Sydney Water Corporation – 30 June 2016 Page 22
(d) Fair value approaches and hierarchy levels Fair value is defined as ‘the price that would be received to sell an asset or paid to transfer a liability in an orderly transaction between market participants at the measurement date.’ This is sometimes referred to as an ‘exit price’. There are three approaches to calculating fair value: • the market approach, where fair value is determined using prices and other relevant information generated by market transactions
involving identical or comparable assets or groups of assets.
• the income approach, where fair value is determined by converting future cash flows to a single current (ie discounted) amount.
• the cost approach, where fair value is determined by calculating the current replacement cost of an asset, which represents the amount that would be required currently to replace the service capacity of an asset.
Fair value measurement is classified into three levels of a hierarchy based on the inputs used: • Quoted prices in active markets (level 1)
• Other observable inputs (level 2)
• Unobservable inputs (level 3).
Due to the unique nature of the Corporation’s assets, the inputs used to determine fair value are unobservable, and so are considered to be level 3 valuations. This also applies to intangible assets in note 5.
(e) Fair value measurement of asset classes The relevant valuation technique used for each class of property, plant and equipment is as follows: System assets – income approach Market land and buildings – market approach Leasehold property – market approach Plant and equipment – cost approach Computer equipment – cost approach System assets The income approach is used to value system assets, as there is generally no active market for assets of such a specialised nature. The income approach calculates fair value using the stream of future net cash flows (discounted to their present value) from the whole, integrated network of system assets held by the Corporation. Determining fair value under this approach is highly dependent on the inputs and assumptions used to estimate the future net cash flows. (Refer (f) below). The Corporation aligns its approach to determining the future cash flows with the pricing methodology applied by its regulator, the Independent Pricing and Regulatory Tribunal (IPART). In addition to the cash flows for regulated assets under this approach, the Corporation’s fair value calculations also include estimated cash flows from non-regulated assets, which are not included in IPART’s methodology. System assets are assessed as an integrated network because of the interdependent nature of their operations, and they are grouped at a whole of entity level because the IPART pricing methodology assesses future cash flows at that level. This is considered to be more relevant to a market participant than the estimated depreciated current replacement cost of these assets. As IPART’s methodology assesses the total fair value of all the Corporation’s regulated assets, the asset values of non-regulated assets are added in order to determine the total fair value of all assets. The fair value of system assets is then derived by deducting the fair value of other classes of assets (that are shown separately) from the total fair value of all assets. Market land and buildings, and leasehold property The market approach is used to value these assets. Fair value is measured based on valuations of the open market value of the property by independent valuers. Inputs to the valuations are sale prices of similar properties in the same or comparable localities, rental income and applicable lease term. Estimates of the costs to sell are regarded as an impairment to the realisation of fair value and are deducted from the independent market valuations when determining their recoverable amount. Where land is environmentally contaminated and reliable estimates of remediation costs have been determined, this is also deducted (as an impairment to fair value). Independent market valuations are obtained every three years, unless market conditions necessitate an earlier valuation. Market land and buildings acquired between valuations are stated at directors’ valuation for the reporting period and revalued at the next valuation date, unless there is a specific need to obtain an independent valuation earlier. At each reporting date, a review of the property market is undertaken to see if there has been a material change in the fair values of market land and buildings since the revaluation date. Where there has been a material change, the carrying amounts in the statement of financial position are adjusted accordingly. Plant and equipment, computer equipment and work in progress Fair value of plant and equipment, computer equipment and work in progress is based on the cost approach. Depreciated historical cost is considered to be an acceptable surrogate for a market-based fair value for plant and equipment and computer equipment. Cost is considered to be the most accurate fair value measurement of assets under construction and within work in progress.
156 Financial statements | Sydney Water Annual Report 2015–16 Sydney Water Annual Report 2015–16 | Financial statements 157
Overview
Corporate
governanceC
ustomer at
the heartW
orld class perform
anceH
igh performance
cultureFin
ancial
statemen
tsA
ppendixes
| Sydney Water Annual Report 2015

Sydney Water Corporation – 30 June 2016 Page 23
(f) Fair value model A discounted cash flow model is used to determine the total fair value of all of the Corporation’s asset classes, including market land and buildings, leasehold property, system assets, plant and equipment and computer equipment, and also intangible assets (see note 5). Fair value is calculated based on discounting the future cash flows derived from the IPART methodology for regulated assets and including estimated cash flows from non-regulated assets. For the current reporting period, future revenues were estimated as follows: • For future years where IPART has set prices in their last Pricing Determination (the current ‘Price Path’ – 1 July 2016 to 30 June
2020), the revenue requirement determined by IPART was used. • For future years subsequent to the current Price Path, the methodology applied by IPART was used together with the long-term
earning rate of 5.3% per annum (real post-tax) applicable to public trading enterprises as recommended by NSW Treasury. This methodology involves determining a regulatory asset base (RAB) for the purpose of calculating an ‘annual revenue requirement’, and therefore the future cash flows, that will be generated by the Corporation’s assets. The ‘annual revenue requirement’ is the revenue needed to pay for the Corporation’s investment in its assets (‘return of’ capital), obtain an investment return (‘return on’ capital) and pay for operating expenses. It also covers an allowance for a theoretical income tax amount and working capital.
Estimates of future cash flows were calculated for a total period of 10 years together with an estimate of ‘terminal value’. Benefits accruing from franking credits that could accompany future dividends paid by the Corporation to a hypothetical investor (in the private sector) were excluded from future cash flows and in determining the discount rate.
In the previous reporting period, the ‘annual revenue requirement’ based on the IPART methodology was calculated for all future periods and was not limited to the years after the current Price Path as shown above for the current reporting period. In addition, future cash flows were estimated using a 100 year model.
The major assumptions and inputs used in the Corporation’s fair value model are below:
Input
Impact on fair value measurement
30 June 2016
30 June 2015
Discount rate
The asset value would increase with a reduction in the discount rate.
Post-tax WACC of 6.5% pa ‘nominal’ (equivalent to a pre-tax ‘real’ rate of 5.7% pa). The rate was determined after a market assessment of rate parameters.
Pre-tax WACC of 4.9% pa ‘real’. The rate was determined using expected rate parameters applied by IPART.
CPI rate
The asset value would increase/decrease with CPI.
RAB was escalated from the previous reporting date by the CPI rate of 2.5% prior to determining the annual revenue requirement for years after the current Price Path (from 1 July 2020). Modelling was undertaken in a ‘nominal’ framework.
RAB was escalated (from the previous reporting date) by the CPI rate of 2.4% prior to determining the annual revenue requirement. Otherwise, modelling was undertaken in a ‘real’ framework.
Period of discounting
Asset values would be slightly lower as future earnings would be based on a reduced and more recent time period and would not include future earnings that may be derived from additional capital investment in the outer years.
10 years (with an estimate of ‘terminal value’)
100 years or the economic lives of the assets as determined by IPART, whichever is the shorter.
Sydney Water Corporation – 30 June 2016 Page 24
Input
Relationship to fair value measurement
30 June 2016
30 June 2015
Cash inflows:
Service and usage revenue
The asset value would be higher if future revenues were considered to be higher.
Estimates of future revenue earnings were drawn from the Corporation’s Statement of Corporate Intent and were based on: - IPART’s June 2016 Pricing
Determination. - the RAB determined by
IPART from the June 2016 Pricing Determination and rolled forward thereafter, and
- capital spending over the future forecast / discount period.
.
Estimates of future earnings were based on the ‘annual revenue requirement’ for the full period of discounting, based on: - the RAB determined by
IPART from the June 2012 Pricing Determination and rolled forward to 30 June 2015, and
- capital spending in future
years to complete capital projects in progress at 30 June 2015.
Other non-regulated revenue
The asset value would be higher if non-regulated revenue (including developer charges on unregulated recycled water assets) was higher.
Cash flows from non-regulated recycled water assets are added to future regulated income streams. Investment/interest income is excluded.
Cash flows from non-regulated recycled water assets are added to future regulated income streams. Investment/interest income is excluded.
Cash outflows:
Operating expenditure
Asset value would be higher if operating expenditure was lower than that incorporated into prices over the current Price Path and no effect thereafter as it is assumed that operating expenditure would be fully funded (‘passed through’) in future IPART Pricing Determinations.
Operating expenditure from budgets in the Corporation’s Statement of Corporate Intent, excluding non-cash items such as depreciation and impairment expenses.
Operating expenditure from budgets in the Corporation’s Statement of Corporate Intent, excluding non-cash items such as depreciation and impairment expenses.
Capital expenditure
Asset value would be higher if capital expenditure was higher.
Capital expenditure over the 10 year forecast / discount period.
Capital expenditure required to complete capital projects in progress at 30 June 2015.
Sensitivity analysis
Rate Applied %
If higher +0.25%
If lower -0.25%
(i) Discount rate
Nominal post-tax rate 6.50% 6.75% 6.25% Calculated fair value of property, plant and equipment ($000) 17,136,495 16,201,495 18,211,495 Resulting change ($’000) (935,000) 1,075,000
Rate Applied %
If higher +1.0%
If lower -1.0%
(ii) Estimated future service and usage revenue
Statement of Corporate Intent 2016-17 100% 101% 99% Calculated fair value of property, plant and equipment ($000) 17,136,495 17,595,495 16,677,495 Resulting change ($’000) 459,000 (459,000)
158 Financial statements | Sydney Water Annual Report 2015–16| Sydney Water Annual Report 2015

Sydney Water Corporation – 30 June 2016 Page 23
(f) Fair value model A discounted cash flow model is used to determine the total fair value of all of the Corporation’s asset classes, including market land and buildings, leasehold property, system assets, plant and equipment and computer equipment, and also intangible assets (see note 5). Fair value is calculated based on discounting the future cash flows derived from the IPART methodology for regulated assets and including estimated cash flows from non-regulated assets. For the current reporting period, future revenues were estimated as follows: • For future years where IPART has set prices in their last Pricing Determination (the current ‘Price Path’ – 1 July 2016 to 30 June
2020), the revenue requirement determined by IPART was used. • For future years subsequent to the current Price Path, the methodology applied by IPART was used together with the long-term
earning rate of 5.3% per annum (real post-tax) applicable to public trading enterprises as recommended by NSW Treasury. This methodology involves determining a regulatory asset base (RAB) for the purpose of calculating an ‘annual revenue requirement’, and therefore the future cash flows, that will be generated by the Corporation’s assets. The ‘annual revenue requirement’ is the revenue needed to pay for the Corporation’s investment in its assets (‘return of’ capital), obtain an investment return (‘return on’ capital) and pay for operating expenses. It also covers an allowance for a theoretical income tax amount and working capital.
Estimates of future cash flows were calculated for a total period of 10 years together with an estimate of ‘terminal value’. Benefits accruing from franking credits that could accompany future dividends paid by the Corporation to a hypothetical investor (in the private sector) were excluded from future cash flows and in determining the discount rate.
In the previous reporting period, the ‘annual revenue requirement’ based on the IPART methodology was calculated for all future periods and was not limited to the years after the current Price Path as shown above for the current reporting period. In addition, future cash flows were estimated using a 100 year model.
The major assumptions and inputs used in the Corporation’s fair value model are below:
Input
Impact on fair value measurement
30 June 2016
30 June 2015
Discount rate
The asset value would increase with a reduction in the discount rate.
Post-tax WACC of 6.5% pa ‘nominal’ (equivalent to a pre-tax ‘real’ rate of 5.7% pa). The rate was determined after a market assessment of rate parameters.
Pre-tax WACC of 4.9% pa ‘real’. The rate was determined using expected rate parameters applied by IPART.
CPI rate
The asset value would increase/decrease with CPI.
RAB was escalated from the previous reporting date by the CPI rate of 2.5% prior to determining the annual revenue requirement for years after the current Price Path (from 1 July 2020). Modelling was undertaken in a ‘nominal’ framework.
RAB was escalated (from the previous reporting date) by the CPI rate of 2.4% prior to determining the annual revenue requirement. Otherwise, modelling was undertaken in a ‘real’ framework.
Period of discounting
Asset values would be slightly lower as future earnings would be based on a reduced and more recent time period and would not include future earnings that may be derived from additional capital investment in the outer years.
10 years (with an estimate of ‘terminal value’)
100 years or the economic lives of the assets as determined by IPART, whichever is the shorter.
Sydney Water Corporation – 30 June 2016 Page 24
Input
Relationship to fair value measurement
30 June 2016
30 June 2015
Cash inflows:
Service and usage revenue
The asset value would be higher if future revenues were considered to be higher.
Estimates of future revenue earnings were drawn from the Corporation’s Statement of Corporate Intent and were based on: - IPART’s June 2016 Pricing
Determination. - the RAB determined by
IPART from the June 2016 Pricing Determination and rolled forward thereafter, and
- capital spending over the future forecast / discount period.
.
Estimates of future earnings were based on the ‘annual revenue requirement’ for the full period of discounting, based on: - the RAB determined by
IPART from the June 2012 Pricing Determination and rolled forward to 30 June 2015, and
- capital spending in future
years to complete capital projects in progress at 30 June 2015.
Other non-regulated revenue
The asset value would be higher if non-regulated revenue (including developer charges on unregulated recycled water assets) was higher.
Cash flows from non-regulated recycled water assets are added to future regulated income streams. Investment/interest income is excluded.
Cash flows from non-regulated recycled water assets are added to future regulated income streams. Investment/interest income is excluded.
Cash outflows:
Operating expenditure
Asset value would be higher if operating expenditure was lower than that incorporated into prices over the current Price Path and no effect thereafter as it is assumed that operating expenditure would be fully funded (‘passed through’) in future IPART Pricing Determinations.
Operating expenditure from budgets in the Corporation’s Statement of Corporate Intent, excluding non-cash items such as depreciation and impairment expenses.
Operating expenditure from budgets in the Corporation’s Statement of Corporate Intent, excluding non-cash items such as depreciation and impairment expenses.
Capital expenditure
Asset value would be higher if capital expenditure was higher.
Capital expenditure over the 10 year forecast / discount period.
Capital expenditure required to complete capital projects in progress at 30 June 2015.
Sensitivity analysis
Rate Applied %
If higher +0.25%
If lower -0.25%
(i) Discount rate
Nominal post-tax rate 6.50% 6.75% 6.25% Calculated fair value of property, plant and equipment ($000) 17,136,495 16,201,495 18,211,495 Resulting change ($’000) (935,000) 1,075,000
Rate Applied %
If higher +1.0%
If lower -1.0%
(ii) Estimated future service and usage revenue
Statement of Corporate Intent 2016-17 100% 101% 99% Calculated fair value of property, plant and equipment ($000) 17,136,495 17,595,495 16,677,495 Resulting change ($’000) 459,000 (459,000)
158 Financial statements | Sydney Water Annual Report 2015–16 Sydney Water Annual Report 2015–16 | Financial statements 159
Overview
Corporate
governanceC
ustomer at
the heartW
orld class perform
anceH
igh performance
cultureFin
ancial
statemen
tsA
ppendixes
| Sydney Water Annual Report 2015

Sydney Water Corporation – 30 June 2016 Page 25
(g) Depreciation and amortisation Items of property, plant and equipment (excluding freehold land) that are either owned or under a finance lease are depreciated or amortised on a straight-line basis over their estimated useful lives, making allowance where appropriate for residual values. The lives are reviewed annually, taking into account assessments of asset condition, commercial and technical obsolescence and expected normal wear and tear. Work in progress is not depreciated until the assets are brought into service and are available for use. The normal life expectancies of major asset classes and categories of property, plant and equipment when initially installed are as follows:
Depreciable asset classes and categories of property, plant and equipment
Number of Years
System asset network categories: Dams (non-catchment)
200
Stormwater wetlands infrastructure 200 Canals and tunnels 100 Major pipelines (above ground) 140 Weirs 100 Submarine outfalls 100 Water mains 55 to 150 Wastewater mains - Gravity mains – pipe conduit only
55 to 130
- Pressure mains 55 to 130 Stormwater drains and basins 80 to 150 System buildings 20 to 50 Water, sewage and stormwater pumping stations: - Civil component - Electrical component - Mechanical component - Electronic component
50 to 100 25 to 30 25 to 40
15 Water and sewage treatment plants and water filtration plants under a finance lease: - Civil component - Electrical component - Mechanical component - Electronic component
50 to 100 25 to 30 25 to 40
15 Reservoirs: - Civil component - Electrical component - Mechanical component - Electronic component Integrated control systems
20 to 150
30 40 15
3 to 10 Water meters 8 to 20 Other classes: Market buildings 20 to 40 Leasehold property 99 Plant and equipment 5 to 12 Computer equipment 3 to 12
For wastewater gravity mains greater than 100mm in diameter, the hole/cavity component is considered to be non-depreciable as these mains are capable of being repeatedly relined in the future (rather than being entirely replaced through excavation) and hence only the pipe conduit component for these mains shown above under the category of wastewater mains is considered to be depreciable.
Sydney Water Corporation – 30 June 2016 Page 26
(h) Classification as Assets held for sale Assets classified as held for sale are assets that are expected to be recovered primarily through sale rather than use. These are shown under current assets in the statement of financial position. Classification as held for sale occurs only when:
• the Corporation is committed to a plan to sell the asset
• an active program to locate a buyer and complete the plan has been initiated
• the asset is being actively marketed for sale at a price that is reasonable in relation to its current fair value
• the sale is expected to occur within one year from the date of classification.
Immediately before classification as held for sale, the measurement of the asset is updated consistent with the revaluation policies for property, plant and equipment. On initial classification as held for sale, the asset is measured at the lower of its carrying amount and its fair value less costs to sell. Any subsequent impairment losses of assets held for sale are recognised as an expense in profit or loss. Any reversals of impairment are also recognised in profit or loss, but not exceeding the amount of impairment losses previously recognised as an expense before the asset was classified as held for sale. Once a depreciable asset is classified as held for sale, depreciation ceases for that asset. At the reporting date, there were 18 properties (2015: seven properties) classified as assets held for sale totalling $35.088 million (2015: $12.694 million). Three of the properties were previously used (or partly used) as maintenance depots and the remainder were used for locating infrastructure (system assets). These properties are now considered to be surplus to the needs of the Corporation. Cumulative valuation increments recognised as other comprehensive income (over the current and past reporting periods) totalled $33.401 million (2015: $8.928 million). (i) Leased assets Finance Leases Leases where the Corporation assumes substantially all the risks and rewards of ownership are classified as finance leases. Finance leases are capitalised at the inception of the lease at the fair value of the leased asset or at the present value of the minimum lease payments, whichever is lower. Any initial direct costs incurred or amounts received as a condition precedent are included in fair value. A finance lease liability is also established at inception, at the present value of the future minimum lease payments. Each lease payment thereafter is allocated between the liability in the statement of financial position and finance costs in profit or loss. Capitalised finance lease assets that are reasonably certain to be acquired at the end of the lease term are depreciated on a straight-line basis over the expected useful life of the asset. If there is no reasonable certainty of acquisition, it is depreciated over the shorter of the lease term and the useful life. Operating Leases Leases of property, plant and equipment where the Corporation as a lessor retains substantially all the risks and rewards of ownership are classified as operating leases. Initial direct costs incurred in negotiating an operating lease are added to the carrying amount of the leased asset and recognised over the lease term on a straight-line basis.
(j) Impairment testing At each reporting date, the carrying amount of property, plant and equipment assets is reviewed to determine whether there is an indication of impairment. If any indication of impairment exists, an estimate of the recoverable amount of the assets affected is made. Recoverable amount is determined as the higher of fair value less costs to sell, and the value in use of the assets. Value in use is also determined by discounting future cash flows generated by the Corporation’s assets using the IPART regulatory pricing methodology. Impairment losses occur when the carrying amount of an asset within a cash-generating unit, or of the cash-generating unit taken as a whole, exceeds the recoverable amount for that asset or cash-generating unit respectively. Impairment losses are recognised as an expense in profit or loss, unless the impairment loss can be applied to a revaluation increment that exists for the asset in the asset revaluation reserve. Impairment losses for a cash-generating unit taken as a whole are allocated to reduce the carrying amount of each asset in the cash-generating unit on a pro rata basis, except for those assets that have a separately determinable recoverable amount. The Corporation has a single cash-generating unit at the whole of entity level. Impairment losses are reversed if there has been a change in the estimates used to determine recoverable amount or if an event or significant changes have occurred during the reporting period that have led, or will lead, to a benefit to the Corporation because of the manner in which the asset is expected to be used. Impairment losses are reversed only to the extent that the asset’s carrying amount does not exceed the carrying amount that would have been determined, net of depreciation or amortisation, if no impairment loss had been recognised.
160 Financial statements | Sydney Water Annual Report 2015–16| Sydney Water Annual Report 2015

Sydney Water Corporation – 30 June 2016 Page 25
(g) Depreciation and amortisation Items of property, plant and equipment (excluding freehold land) that are either owned or under a finance lease are depreciated or amortised on a straight-line basis over their estimated useful lives, making allowance where appropriate for residual values. The lives are reviewed annually, taking into account assessments of asset condition, commercial and technical obsolescence and expected normal wear and tear. Work in progress is not depreciated until the assets are brought into service and are available for use. The normal life expectancies of major asset classes and categories of property, plant and equipment when initially installed are as follows:
Depreciable asset classes and categories of property, plant and equipment
Number of Years
System asset network categories: Dams (non-catchment)
200
Stormwater wetlands infrastructure 200 Canals and tunnels 100 Major pipelines (above ground) 140 Weirs 100 Submarine outfalls 100 Water mains 55 to 150 Wastewater mains - Gravity mains – pipe conduit only
55 to 130
- Pressure mains 55 to 130 Stormwater drains and basins 80 to 150 System buildings 20 to 50 Water, sewage and stormwater pumping stations: - Civil component - Electrical component - Mechanical component - Electronic component
50 to 100 25 to 30 25 to 40
15 Water and sewage treatment plants and water filtration plants under a finance lease: - Civil component - Electrical component - Mechanical component - Electronic component
50 to 100 25 to 30 25 to 40
15 Reservoirs: - Civil component - Electrical component - Mechanical component - Electronic component Integrated control systems
20 to 150
30 40 15
3 to 10 Water meters 8 to 20 Other classes: Market buildings 20 to 40 Leasehold property 99 Plant and equipment 5 to 12 Computer equipment 3 to 12
For wastewater gravity mains greater than 100mm in diameter, the hole/cavity component is considered to be non-depreciable as these mains are capable of being repeatedly relined in the future (rather than being entirely replaced through excavation) and hence only the pipe conduit component for these mains shown above under the category of wastewater mains is considered to be depreciable.
Sydney Water Corporation – 30 June 2016 Page 26
(h) Classification as Assets held for sale Assets classified as held for sale are assets that are expected to be recovered primarily through sale rather than use. These are shown under current assets in the statement of financial position. Classification as held for sale occurs only when:
• the Corporation is committed to a plan to sell the asset
• an active program to locate a buyer and complete the plan has been initiated
• the asset is being actively marketed for sale at a price that is reasonable in relation to its current fair value
• the sale is expected to occur within one year from the date of classification.
Immediately before classification as held for sale, the measurement of the asset is updated consistent with the revaluation policies for property, plant and equipment. On initial classification as held for sale, the asset is measured at the lower of its carrying amount and its fair value less costs to sell. Any subsequent impairment losses of assets held for sale are recognised as an expense in profit or loss. Any reversals of impairment are also recognised in profit or loss, but not exceeding the amount of impairment losses previously recognised as an expense before the asset was classified as held for sale. Once a depreciable asset is classified as held for sale, depreciation ceases for that asset. At the reporting date, there were 18 properties (2015: seven properties) classified as assets held for sale totalling $35.088 million (2015: $12.694 million). Three of the properties were previously used (or partly used) as maintenance depots and the remainder were used for locating infrastructure (system assets). These properties are now considered to be surplus to the needs of the Corporation. Cumulative valuation increments recognised as other comprehensive income (over the current and past reporting periods) totalled $33.401 million (2015: $8.928 million). (i) Leased assets Finance Leases Leases where the Corporation assumes substantially all the risks and rewards of ownership are classified as finance leases. Finance leases are capitalised at the inception of the lease at the fair value of the leased asset or at the present value of the minimum lease payments, whichever is lower. Any initial direct costs incurred or amounts received as a condition precedent are included in fair value. A finance lease liability is also established at inception, at the present value of the future minimum lease payments. Each lease payment thereafter is allocated between the liability in the statement of financial position and finance costs in profit or loss. Capitalised finance lease assets that are reasonably certain to be acquired at the end of the lease term are depreciated on a straight-line basis over the expected useful life of the asset. If there is no reasonable certainty of acquisition, it is depreciated over the shorter of the lease term and the useful life. Operating Leases Leases of property, plant and equipment where the Corporation as a lessor retains substantially all the risks and rewards of ownership are classified as operating leases. Initial direct costs incurred in negotiating an operating lease are added to the carrying amount of the leased asset and recognised over the lease term on a straight-line basis.
(j) Impairment testing At each reporting date, the carrying amount of property, plant and equipment assets is reviewed to determine whether there is an indication of impairment. If any indication of impairment exists, an estimate of the recoverable amount of the assets affected is made. Recoverable amount is determined as the higher of fair value less costs to sell, and the value in use of the assets. Value in use is also determined by discounting future cash flows generated by the Corporation’s assets using the IPART regulatory pricing methodology. Impairment losses occur when the carrying amount of an asset within a cash-generating unit, or of the cash-generating unit taken as a whole, exceeds the recoverable amount for that asset or cash-generating unit respectively. Impairment losses are recognised as an expense in profit or loss, unless the impairment loss can be applied to a revaluation increment that exists for the asset in the asset revaluation reserve. Impairment losses for a cash-generating unit taken as a whole are allocated to reduce the carrying amount of each asset in the cash-generating unit on a pro rata basis, except for those assets that have a separately determinable recoverable amount. The Corporation has a single cash-generating unit at the whole of entity level. Impairment losses are reversed if there has been a change in the estimates used to determine recoverable amount or if an event or significant changes have occurred during the reporting period that have led, or will lead, to a benefit to the Corporation because of the manner in which the asset is expected to be used. Impairment losses are reversed only to the extent that the asset’s carrying amount does not exceed the carrying amount that would have been determined, net of depreciation or amortisation, if no impairment loss had been recognised.
160 Financial statements | Sydney Water Annual Report 2015–16 Sydney Water Annual Report 2015–16 | Financial statements 161
Overview
Corporate
governanceC
ustomer at
the heartW
orld class perform
anceH
igh performance
cultureFin
ancial
statemen
tsA
ppendixes
| Sydney Water Annual Report 2015

Syd
ney
Wate
r C
orp
ora
tion –
30 J
un
e 2
01
6
P
ag
e 2
7
No
te 5
. In
tan
gib
le a
ss
ets
Mo
ve
me
nts
an
d c
arr
yin
g a
mo
un
ts
Year
en
de
d 3
0 J
un
e 2
016
C
om
pute
r soft
ware
–
inte
rnally
d
evelo
ped
C
om
pute
r soft
ware
–
acqu
ired f
rom
ext
ern
al part
ies
T
ota
l com
pute
r soft
ware
E
asem
ents
an
d o
ther
rights
of
access
A
cquis
itio
ns
in p
rogre
ss
T
ota
l (F
air v
alu
e
hie
rarc
hy
– L
evel 3)
$’0
00
$’0
00
$’0
00
$’0
00
$’0
00
$’0
00
At
1 J
uly
20
15 –
net
carr
ying a
mou
nt
28,1
31
83,9
51
112,0
82
9,3
37
38,2
13
15
9,6
32
A
dd
itio
ns
to a
cquis
itio
ns
in p
rogre
ss
-
- -
- 46,3
30
46,3
30
A
dd
itio
ns
transfe
rred f
rom
acq
uis
itio
ns
in p
rogre
ss
24,5
32
3,1
54
27,6
86
(70)
(27,6
16)
- A
dd
itio
ns
- oth
er
-
- -
- -
-
D
isp
osals
- -
- -
- -
Recla
ssifi
cations
-
- -
- 4,9
72
4,9
72
Im
pair
ment
losse
s or
revalu
ati
on d
ecre
ments
(-)
re
cog
nis
ed in p
rofit
or
loss
in t
he lin
e ite
m ‘O
ther
exp
en
ses’
-
-
-
-
(2
,297)
(2
,29
7)
Impair
ment
losse
s re
vers
ed o
r re
valu
ation
incre
ments
(+)
recognis
ed in p
rofit
or
loss
in t
he lin
e
item
‘O
ther
exp
en
ses’
-
-
-
52
3
-
52
3
Am
ort
isation c
harg
e
(1
9,4
76)
(30,5
37)
(50,0
13)
- -
(50,0
13)
At
30 J
une 2
01
6 –
net
carr
yin
g a
mount
33,1
87
56,5
68
89,7
55
9,7
90
59,6
02
15
9,1
47
Syd
ney
Wate
r C
orp
ora
tion –
30 J
un
e 2
016
P
ag
e 2
8
C
om
pute
r soft
ware
–
inte
rnally
d
evelo
ped
C
om
pute
r softw
are
–
acqu
ired f
rom
ext
ern
al p
art
ies
T
ota
l com
pute
r soft
ware
E
asem
ents
and o
ther
rig
hts
of
acc
ess
A
cquis
itio
ns
in p
rogre
ss
T
ota
l (F
air v
alu
e
hie
rarc
hy
– L
evel 3)
$’0
00
$’0
00
$’0
00
$’0
00
$’0
00
$’0
00
At
1 J
uly
2015
Fair v
alu
e –
Level 3 (
an
d v
alu
ation t
echn
iqu
e):
Cost
10
4,9
42
347,0
25
451,9
67
- 38,2
13
49
0,1
80
Fair v
alu
e –
incom
e a
ppro
ach
- -
- 9,3
37
-
9,3
37
10
4,9
42
347,0
25
451,9
67
9,3
37
38,2
13
49
9,5
17
A
ccum
ula
ted a
mort
isation
(7
6,8
11)
(26
3,0
74)
(33
9,8
85)
- -
(33
9,8
85)
Accum
ula
ted im
pairm
ent
-
- -
- -
-
(7
6,8
11)
(26
3,0
74)
(33
9,8
85)
- -
(33
9,8
85)
Net
carr
yin
g a
mou
nt
28,1
31
83,9
51
112,0
82
9,3
37
38,2
13
15
9,6
32
At
30 J
un
e 2
01
6
Fair v
alu
e –
Level 3 (
an
d v
alu
ation t
echn
iqu
e):
Cost
12
3,5
94
341,9
90
465,5
84
- 59,6
02
52
5,1
86
F
air v
alu
e –
incom
e a
ppro
ach
- -
- 9,7
90
-
9,7
90
12
3,5
94
341,9
90
465,5
84
9,7
90
59,6
02
53
4,9
76
A
ccum
ula
ted a
mort
isation
(9
0,4
07)
(28
5,4
22)
(37
5,8
29)
- -
(37
5,8
29)
Accum
ula
ted im
pairm
ent
-
- -
- -
-
(9
0,4
07)
(28
5,4
22)
(37
5,8
29)
- -
(37
5,8
29)
Net
carr
yin
g a
mou
nt
33,1
87
56,5
68
89,7
55
9,7
90
59,6
02
15
9,1
47
Re
va
lue
d a
sse
ts b
ase
d o
n c
ost
mo
de
l C
ost
27,4
52
Accum
ula
ted a
mort
isation
-
A
ccum
ula
ted im
pairm
ent
(17,6
62)
(1
7,6
62)
Net
carr
yin
g a
mou
nt
9,7
90
162 Financial statements | Sydney Water Annual Report 2015–16| Sydney Water Annual Report 2015

Syd
ney
Wate
r C
orp
ora
tion –
30 J
un
e 2
016
P
ag
e 2
8
C
om
pute
r soft
ware
–
inte
rnally
d
evelo
ped
C
om
pute
r softw
are
–
acqu
ired f
rom
ext
ern
al p
art
ies
T
ota
l com
pute
r soft
ware
E
asem
ents
and o
ther
rig
hts
of
acc
ess
A
cquis
itio
ns
in p
rogre
ss
T
ota
l (F
air v
alu
e
hie
rarc
hy
– L
evel 3)
$’0
00
$’0
00
$’0
00
$’0
00
$’0
00
$’0
00
At
1 J
uly
2015
Fair v
alu
e –
Level 3 (
an
d v
alu
ation t
echn
iqu
e):
Cost
10
4,9
42
347,0
25
451,9
67
- 38,2
13
49
0,1
80
Fair v
alu
e –
incom
e a
ppro
ach
- -
- 9,3
37
-
9,3
37
10
4,9
42
347,0
25
451,9
67
9,3
37
38,2
13
49
9,5
17
A
ccum
ula
ted a
mort
isation
(7
6,8
11)
(26
3,0
74)
(33
9,8
85)
- -
(33
9,8
85)
Accum
ula
ted im
pairm
ent
-
- -
- -
-
(7
6,8
11)
(26
3,0
74)
(33
9,8
85)
- -
(33
9,8
85)
Net
carr
yin
g a
mou
nt
28,1
31
83,9
51
112,0
82
9,3
37
38,2
13
15
9,6
32
At
30 J
un
e 2
01
6
Fair v
alu
e –
Level 3 (
an
d v
alu
ation t
echn
iqu
e):
Cost
12
3,5
94
341,9
90
465,5
84
- 59,6
02
52
5,1
86
F
air v
alu
e –
incom
e a
ppro
ach
- -
- 9,7
90
-
9,7
90
12
3,5
94
341,9
90
465,5
84
9,7
90
59,6
02
53
4,9
76
A
ccum
ula
ted a
mort
isation
(9
0,4
07)
(28
5,4
22)
(37
5,8
29)
- -
(37
5,8
29)
Accum
ula
ted im
pairm
ent
-
- -
- -
-
(9
0,4
07)
(28
5,4
22)
(37
5,8
29)
- -
(37
5,8
29)
Net
carr
yin
g a
mou
nt
33,1
87
56,5
68
89,7
55
9,7
90
59,6
02
15
9,1
47
Re
va
lue
d a
sse
ts b
ase
d o
n c
ost
mo
de
l C
ost
27,4
52
Accum
ula
ted a
mort
isation
-
A
ccum
ula
ted im
pairm
ent
(17,6
62)
(1
7,6
62)
Net
carr
yin
g a
mou
nt
9,7
90
162 Financial statements | Sydney Water Annual Report 2015–16 Sydney Water Annual Report 2015–16 | Financial statements 163
Overview
Corporate
governanceC
ustomer at
the heartW
orld class perform
anceH
igh performance
cultureFin
ancial
statemen
tsA
ppendixes
| Sydney Water Annual Report 2015

Syd
ney
Wate
r C
orp
ora
tion –
30 J
un
e 2
016
P
ag
e 2
9
Year
en
de
d 3
0 J
un
e 2
015
C
om
pute
r soft
ware
–
inte
rnally
d
evelo
ped
C
om
pute
r soft
ware
–
acqu
ired f
rom
ext
ern
al part
ies
T
ota
l com
pute
r soft
ware
E
asem
ents
an
d o
ther
rights
of
access
A
cquis
itio
ns
in p
rogre
ss
T
ota
l (F
air v
alu
e
hie
rarc
hy
– L
evel 3)
$’0
00
$’0
00
$’0
00
$’0
00
$’0
00
$’0
00
At
1 J
uly
20
14 –
net
carr
ying a
mou
nt
32,4
35
10
6,9
43
139,3
78
8,4
75
6,6
03
15
4,4
56
A
dd
itio
ns
to a
cquis
itio
ns
in p
rogre
ss
-
- -
- 54,6
58
54,6
58
A
dd
itio
ns
transfe
rred f
rom
acq
uis
itio
ns
in p
rogre
ss
10,0
15
10,5
18
20,5
33
36
4
(20,8
97)
- A
dd
itio
ns
- oth
er
-
- -
- -
-
D
isp
osals
- (1
77)
(17
7)
(2)
- (1
79)
Recla
ssifi
cations
98
1
(24)
95
7
- (2
,151)
(1,1
94)
Impair
ment
losse
s or
revalu
ati
on d
ecre
ments
(-)
re
cog
nis
ed in p
rofit
or
loss
in t
he lin
e ite
m ‘O
ther
exp
en
ses’
-
-
-
-
-
-
Im
pair
ment
losse
s re
vers
ed o
r re
valu
ation
incre
ments
(+)
recognis
ed in p
rofit
or
loss
in t
he lin
e
item
‘O
ther
exp
en
ses’
-
-
-
50
0
-
50
0
Am
ort
isation c
harg
e
(1
5,3
00)
(33,3
09)
(48,6
09)
- -
(48,6
09)
At
30 J
une 2
01
5 –
net
carr
yin
g a
mount
28,1
31
83,9
51
112,0
82
9,3
37
38,2
13
15
9,6
32
Syd
ney
Wate
r C
orp
ora
tion –
30 J
un
e 2
016
P
ag
e 3
0
C
om
pute
r soft
ware
–
inte
rnally
d
evelo
ped
C
om
pute
r softw
are
–
acqu
ired f
rom
ext
ern
al p
art
ies
T
ota
l com
pute
r soft
ware
E
asem
ents
and o
ther
rig
hts
of
acc
ess
A
cquis
itio
ns
in p
rogre
ss
T
ota
l (F
air v
alu
e
hie
rarc
hy
– L
evel 3)
$’0
00
$’0
00
$’0
00
$’0
00
$’0
00
$’0
00
At
1 J
uly
2014
Fair v
alu
e –
Level 3 (
an
d v
alu
ation t
echn
iqu
e):
Cost
97,2
73
345,9
63
443,2
36
-
6,6
03
44
9,8
39
F
air v
alu
e –
incom
e a
ppro
ach
- -
- 8,4
75
-
8,4
75
97,2
73
345,9
63
443,2
36
8,4
75
6,6
03
45
8,3
14
Accum
ula
ted a
mort
isation
(6
4,8
38)
(23
9,0
20)
(30
3,8
58)
- -
(30
3,8
58)
Accum
ula
ted im
pairm
ent
-
- -
- -
-
(6
4,8
38)
(23
9,0
20)
(30
3,8
58)
- -
(30
3,8
58)
Net
carr
yin
g a
mou
nt
32,4
35
106,9
43
139,3
78
8,4
75
6,6
03
15
4,4
56
A
t 30 J
un
e 2
01
5
Fair v
alu
e –
Level 3 (
an
d v
alu
ation t
echn
iqu
e):
Cost
10
4,9
42
347,0
25
451,9
67
- 38,2
13
49
0,1
80
F
air v
alu
e –
incom
e a
ppro
ach
- -
- 9,3
37
-
9,3
37
10
4,9
42
347,0
25
451,9
67
9,3
37
38,2
13
49
9,5
17
A
ccum
ula
ted a
mort
isation
(7
6,8
11)
(26
3,0
74)
(33
9,8
85)
- -
(33
9,8
85)
Accum
ula
ted im
pairm
ent
-
- -
- -
-
(7
6,8
11)
(26
3,0
74)
(33
9,8
85)
- -
(33
9,8
85)
Net
carr
yin
g a
mou
nt
28,1
31
83,9
51
112,0
82
9,3
37
38,2
13
15
9,6
32
Re
va
lue
d a
sse
ts b
ase
d o
n c
ost
mo
de
l C
ost
27,4
53
Accum
ula
ted a
mort
isation
-
A
ccum
ula
ted im
pairm
ent
(18,1
16)
(1
8,1
16)
Net
carr
yin
g a
mou
nt
9,3
37
164 Financial statements | Sydney Water Annual Report 2015–16| Sydney Water Annual Report 2015

Syd
ney
Wate
r C
orp
ora
tion –
30 J
un
e 2
016
P
ag
e 3
0
C
om
pute
r soft
ware
–
inte
rnally
d
evelo
ped
C
om
pute
r softw
are
–
acqu
ired f
rom
ext
ern
al p
art
ies
T
ota
l com
pute
r soft
ware
E
asem
ents
and o
ther
rig
hts
of
acc
ess
A
cquis
itio
ns
in p
rogre
ss
T
ota
l (F
air v
alu
e
hie
rarc
hy
– L
evel 3)
$’0
00
$’0
00
$’0
00
$’0
00
$’0
00
$’0
00
At
1 J
uly
2014
Fair v
alu
e –
Level 3 (
an
d v
alu
ation t
echn
iqu
e):
Cost
97,2
73
345,9
63
443,2
36
-
6,6
03
44
9,8
39
F
air v
alu
e –
incom
e a
ppro
ach
- -
- 8,4
75
-
8,4
75
97,2
73
345,9
63
443,2
36
8,4
75
6,6
03
45
8,3
14
Accum
ula
ted a
mort
isation
(6
4,8
38)
(23
9,0
20)
(30
3,8
58)
- -
(30
3,8
58)
Accum
ula
ted im
pairm
ent
-
- -
- -
-
(6
4,8
38)
(23
9,0
20)
(30
3,8
58)
- -
(30
3,8
58)
Net
carr
yin
g a
mou
nt
32,4
35
106,9
43
139,3
78
8,4
75
6,6
03
15
4,4
56
A
t 30 J
un
e 2
01
5
Fair v
alu
e –
Level 3 (
an
d v
alu
ation t
echn
iqu
e):
Cost
10
4,9
42
347,0
25
451,9
67
- 38,2
13
49
0,1
80
F
air v
alu
e –
incom
e a
ppro
ach
- -
- 9,3
37
-
9,3
37
10
4,9
42
347,0
25
451,9
67
9,3
37
38,2
13
49
9,5
17
A
ccum
ula
ted a
mort
isation
(7
6,8
11)
(26
3,0
74)
(33
9,8
85)
- -
(33
9,8
85)
Accum
ula
ted im
pairm
ent
-
- -
- -
-
(7
6,8
11)
(26
3,0
74)
(33
9,8
85)
- -
(33
9,8
85)
Net
carr
yin
g a
mou
nt
28,1
31
83,9
51
112,0
82
9,3
37
38,2
13
15
9,6
32
Re
va
lue
d a
sse
ts b
ase
d o
n c
ost
mo
de
l C
ost
27,4
53
Accum
ula
ted a
mort
isation
-
A
ccum
ula
ted im
pairm
ent
(18,1
16)
(1
8,1
16)
Net
carr
yin
g a
mou
nt
9,3
37
164 Financial statements | Sydney Water Annual Report 2015–16 Sydney Water Annual Report 2015–16 | Financial statements 165
Overview
Corporate
governanceC
ustomer at
the heartW
orld class perform
anceH
igh performance
cultureFin
ancial
statemen
tsA
ppendixes
| Sydney Water Annual Report 2015

Sydney Water Corporation – 30 June 2016 Page 31
Recognition, measurement and valuation (a) Asset classes Intangible assets are identifiable non-monetary assets without physical substance. The Corporation has the following asset classes forming intangible assets: Computer application software Computer application software that is not an integral part of any related hardware is classified as an intangible asset. Software that is an integral part of related hardware is incorporated within the relevant class of physical assets, such as computer equipment or system assets, under property, plant and equipment. Computer application software is dissected between software that has been internally developed and software that has been acquired from external sources. Easements and other rights of access Easements or licences are entered into to allow the Corporation to access system assets situated on or under land owned by other parties. (b) Acquisition and capitalisation Intangible assets are capitalised initially at cost. Costs incurred on incomplete intangible assets that are being progressively acquired are recognised as acquisitions in progress at the reporting date. These assets are reclassified as completed intangible assets when the assets are fully acquired and are operational or available for use. (c) Fair value measurement of asset classes The relevant valuation technique used for each class of intangible assets is as follows: Computer software – cost approach Easements and other rights of access – income approach Fair values determined under these approaches are assessed to be Level 3. (Refer note 4(d)). Computer application software Fair value of computer software is based on the cost approach as it is considered that there is no active market that can be referenced to obtain a market-based fair value. In this case, amortised historical cost is considered to be an acceptable surrogate for depreciated replacement cost under the cost approach. Easements and other rights of access Fair value of easements and other rights of access is determined using the income approach as part of the fair value model used for system assets, as the easements are directly related to those assets. (Refer notes 4(e) and 4(f)). Easements and other rights of access are included in the calculation of fair value of system assets. Any valuation adjustment that is applied to system assets is also applied to easements and other rights of access. Such adjustments are recognised in profit or loss. (d) Amortisation
Computer application software has a finite life and accordingly it is amortised on a straight-line basis over its expected useful life. Easements have indefinite lives, as there is no finite period over which their use is fully consumed, and so they are not amortised. Other rights of access that have a defined licensing period are amortised over that period on a straight-line basis. Easements are only derecognised when a management decision has been made to relocate the relevant system asset component and the need for the easement no longer exists. Acquisitions in progress of intangible assets with finite lives are not amortised until the assets are brought into service and are available for use. The normal life expectancies of intangible asset classes are as follows:
Intangible assets subject to amortisation Number of
Years
Computer application software 3 to 9
Sydney Water Corporation – 30 June 2016 Page 32
Working capital management
Note 6. Cash and cash equivalents
(a) Balances at the reporting date Cash at the end of the reporting period is recorded as $5.319 million (2015: $5.752 million) in the statement of financial position and statement of cash flows. The Corporation does not currently hold any cash equivalents (2015: $Nil). Recognition and measurement Cash and cash equivalents in the statement of financial position comprise positive cash balances and short-term investments with a maturity period of three months or less that are readily convertible to known amounts of cash and which are subject to an insignificant risk of changes in value. During the reporting period, the cash book balance can fluctuate from a positive balance to a negative (overdraft) balance. When the cash book balance is negative at the reporting date, it is shown as a bank overdraft under borrowings in the statement of financial position. (Refer note 11). Cash balances earn interest at bank rates. Short-term investments maturing three months or less are considered cash equivalents. These usually consist of interest-bearing deposits held by the Corporation. There were no interest-bearing deposits or other cash equivalents at the current or previous reporting dates.
(b) Notes to the statement of cash flows
Reconciliation of profit to net cash from operating activities
Note 2016
$’000
2015
$’000
Profit for the period 548,014 513,498
Adjustments for:
Profit or loss items classified as either investing or financing:
Net loss (gain) on disposal of property, plant and equipment (including assets held for sale)
8,625
951
Net loss (gain) on disposal of intangible assets 2(b) - 179
Developer contributions (152,417) (155,756)
Depreciation and amortisation 2(b) 251,330 239,924
Interest expense capitalised to work in progress 2(a) (43,411) (26,054)
Interest expense on developer agreements 192 (235)
Amortisation of deferred discounts (premiums) on loans 2(a) (5,241) (676)
Indexation of CPI bonds 2(a) 24,597 19,224
Impairment loss recognised (reversed) for property, plant and equipment
2(b), 4 6,019 3,824
Impairment loss recognised (reversed) for intangible assets 2(b), 5 1,774 (500)
Net movement in statement of financial position items applicable to operating activities:
Inventories (518) (108)
Greenhouse trading certificates (972) 1,026
Trade and other receivables (16,245) 20,521
Trade and other payables (34,180) (51,875)
Provisions 46,874 35,920
Income tax assets and liabilities (2,993) 68,874
Net cash from operating activities 631,448 668,737
166 Financial statements | Sydney Water Annual Report 2015–16| Sydney Water Annual Report 2015

Sydney Water Corporation – 30 June 2016 Page 31
Recognition, measurement and valuation (a) Asset classes Intangible assets are identifiable non-monetary assets without physical substance. The Corporation has the following asset classes forming intangible assets: Computer application software Computer application software that is not an integral part of any related hardware is classified as an intangible asset. Software that is an integral part of related hardware is incorporated within the relevant class of physical assets, such as computer equipment or system assets, under property, plant and equipment. Computer application software is dissected between software that has been internally developed and software that has been acquired from external sources. Easements and other rights of access Easements or licences are entered into to allow the Corporation to access system assets situated on or under land owned by other parties. (b) Acquisition and capitalisation Intangible assets are capitalised initially at cost. Costs incurred on incomplete intangible assets that are being progressively acquired are recognised as acquisitions in progress at the reporting date. These assets are reclassified as completed intangible assets when the assets are fully acquired and are operational or available for use. (c) Fair value measurement of asset classes The relevant valuation technique used for each class of intangible assets is as follows: Computer software – cost approach Easements and other rights of access – income approach Fair values determined under these approaches are assessed to be Level 3. (Refer note 4(d)). Computer application software Fair value of computer software is based on the cost approach as it is considered that there is no active market that can be referenced to obtain a market-based fair value. In this case, amortised historical cost is considered to be an acceptable surrogate for depreciated replacement cost under the cost approach. Easements and other rights of access Fair value of easements and other rights of access is determined using the income approach as part of the fair value model used for system assets, as the easements are directly related to those assets. (Refer notes 4(e) and 4(f)). Easements and other rights of access are included in the calculation of fair value of system assets. Any valuation adjustment that is applied to system assets is also applied to easements and other rights of access. Such adjustments are recognised in profit or loss. (d) Amortisation
Computer application software has a finite life and accordingly it is amortised on a straight-line basis over its expected useful life. Easements have indefinite lives, as there is no finite period over which their use is fully consumed, and so they are not amortised. Other rights of access that have a defined licensing period are amortised over that period on a straight-line basis. Easements are only derecognised when a management decision has been made to relocate the relevant system asset component and the need for the easement no longer exists. Acquisitions in progress of intangible assets with finite lives are not amortised until the assets are brought into service and are available for use. The normal life expectancies of intangible asset classes are as follows:
Intangible assets subject to amortisation Number of
Years
Computer application software 3 to 9
Sydney Water Corporation – 30 June 2016 Page 32
Working capital management
Note 6. Cash and cash equivalents
(a) Balances at the reporting date Cash at the end of the reporting period is recorded as $5.319 million (2015: $5.752 million) in the statement of financial position and statement of cash flows. The Corporation does not currently hold any cash equivalents (2015: $Nil). Recognition and measurement Cash and cash equivalents in the statement of financial position comprise positive cash balances and short-term investments with a maturity period of three months or less that are readily convertible to known amounts of cash and which are subject to an insignificant risk of changes in value. During the reporting period, the cash book balance can fluctuate from a positive balance to a negative (overdraft) balance. When the cash book balance is negative at the reporting date, it is shown as a bank overdraft under borrowings in the statement of financial position. (Refer note 11). Cash balances earn interest at bank rates. Short-term investments maturing three months or less are considered cash equivalents. These usually consist of interest-bearing deposits held by the Corporation. There were no interest-bearing deposits or other cash equivalents at the current or previous reporting dates.
(b) Notes to the statement of cash flows
Reconciliation of profit to net cash from operating activities
Note 2016
$’000
2015
$’000
Profit for the period 548,014 513,498
Adjustments for:
Profit or loss items classified as either investing or financing:
Net loss (gain) on disposal of property, plant and equipment (including assets held for sale)
8,625
951
Net loss (gain) on disposal of intangible assets 2(b) - 179
Developer contributions (152,417) (155,756)
Depreciation and amortisation 2(b) 251,330 239,924
Interest expense capitalised to work in progress 2(a) (43,411) (26,054)
Interest expense on developer agreements 192 (235)
Amortisation of deferred discounts (premiums) on loans 2(a) (5,241) (676)
Indexation of CPI bonds 2(a) 24,597 19,224
Impairment loss recognised (reversed) for property, plant and equipment
2(b), 4 6,019 3,824
Impairment loss recognised (reversed) for intangible assets 2(b), 5 1,774 (500)
Net movement in statement of financial position items applicable to operating activities:
Inventories (518) (108)
Greenhouse trading certificates (972) 1,026
Trade and other receivables (16,245) 20,521
Trade and other payables (34,180) (51,875)
Provisions 46,874 35,920
Income tax assets and liabilities (2,993) 68,874
Net cash from operating activities 631,448 668,737
166 Financial statements | Sydney Water Annual Report 2015–16 Sydney Water Annual Report 2015–16 | Financial statements 167
Overview
Corporate
governanceC
ustomer at
the heartW
orld class perform
anceH
igh performance
cultureFin
ancial
statemen
tsA
ppendixes
| Sydney Water Annual Report 2015

Sydney Water Corporation – 30 June 2016 Page 33
Non-cash financing and investing activities Assets that are acquired by the Corporation under finance leases or other similar financing arrangements, and assets handed over at no cost by developers, are not included in the statement of cash flows as these are regarded as non-cash. The amount capitalised during the current reporting period in respect of assets handed over at no cost by developers to the Corporation was $138.863 million (2015: $136.018 million). During the reporting period, finance lease assets and liabilities totalling $262.862 million were recognised from the renegotiated agreements for the Prospect, Woronora and Illawarra water filtration plants. (Refer note 2(b)). There were no new finance leases during the previous reporting period. Standby credit arrangements Details of financial accommodation facilities for the Corporation are disclosed in note 11(b). Cash balance not recognised Under the terms of an agreement between Parramatta City Council and the Corporation, the Corporation is contributing to the overall development of the Civic Place public domain at Parramatta. At the reporting date, an amount of $3.700 million (2015: $3.638 million) is currently placed in an interest-bearing bank account administered by the Corporation in accordance with the agreement. The balance of cash in this bank account has not been recognised by the Corporation as an asset because officers of Parramatta City Council are also signatories to the account and restrict its use so that the cash is not able to be used for any other purpose by the Corporation. Funds can only be released from the bank account when Parramatta City Council provides to the Corporation certification of public domain works procured by the Council in relation to the Civic Place development. At that time, the Corporation must hand over to the Council 14.3 per cent of the certified value of the public domain work completed. Any funds remaining unexpended in the bank account as at 31 December 2018 will return to the Corporation’s normal cash management activities and restrictions over the use of this cash will cease.
Note 7. Trade and other receivables
(a) Balances at the reporting date
2016
$’000
2015
$’000
Trade receivables
Outstanding service availability and usage charges billed 87,714 93,279
Allowance for impairment - (1,246)
87,714 92,033
Accrued unbilled usage charges on unread meters:
Water usage 154,583 135,050
Sewer usage 12,638 12,345
Other usage 5,458 5,516
172,679 152,911
Other trade debtors billed 5,395 5,633
Allowance for impairment (32) (2)
5,363 5,631
Total trade receivables 265,756 250,575
Other receivables
Other debtors and accrued revenue 30,638 33,999
Prepayments 11,157 6,732
Total other receivables 41,795 40,731
Total current trade and other receivables 307,551 291,306
Sydney Water Corporation – 30 June 2016 Page 34
Recognition and measurement Trade and other receivables are amounts receivable for services to customers prior to the end of the reporting period and that are yet to be collected. They are recognised initially and subsequently carried at original invoice amount less any impairment losses for amounts considered to be either doubtful or uncollectible. The recoverability of trade receivables is regularly reviewed. Known bad debts are written off against the allowance when identified. Receivables that are due greater than 12 months are discounted to amortised cost using the Government bond rate. Accrued unbilled usage charges on unread meters comprises estimates for accrued revenue for water usage, sewer usage, trade waste and recycled water charges where meters have not been read as at the reporting date. These charges are billed to customers with actual consumption once meters are read. The Corporation estimates the accrual based on consumption data and other inputs. Outstanding debts for service availability and usage charges are required to be settled within 21 days. Other debts are generally required to be settled between 14 and 60 days. Accrued investment income is receivable within a maximum of six months. All other current receivables are expected to be realised within 12 months of the reporting date. (b) Ageing analysis of trade receivables billed to customers
Gross
Amount
2016
$’000
Allowance for
Impairment
2016
$’000
Net
amount
2016
$’000
Gross
Amount
2015
$’000
Allowance for
Impairment
2015
$’000
Net
amount
2015
$’000
Outstanding service and usage charges
billed
Not past due 1,167 - 1,167 7,390 - 7,390
Past due 22 - 30 days 14,564 - 14,564 13,231 - 13,231
Past due 31 - 60 days 17,414 - 17,414 14,767 - 14,767
Past due 61 - 90 days 9,711 - 9,711 9,597 - 9,597
Past due 91 - 180 days 30,656 - 30,656 34,076 - 34,076
Past due 181 - 365 days 7,156 - 7,156 7,800 - 7,800
Past due > 365 days 7,046 - 7,046 6,418 (1,246) 5,172
87,714 - 87,714 93,279 (1,246) 92,033
Other trade debtors billed
Not past due 4,857 - 4,857 4,812 - 4,812
Past due 15 - 30 days 67 - 67 46 - 46
Past due 31 - 60 days 57 (3) 54 469 - 469
Past due 61 - 90 days 41 (3) 38 103 - 103
Past due 91 - 180 days 235 (8) 227 77 - 77
Past due 181 - 365 days 100 (16) 84 64 (1) 63
Past due > 365 days 38 (2) 36 62 (1) 61
5,395 (32) 5,363 5,633 (2) 5,631
All other balances within trade and other receivables are not past due and are expected to be realised at the amounts carried in the statement of financial position when due.
(c) Movement in allowance for impairment
Outstanding
Service and Usage charges
Other trade debtors Total
2016 2015 2016 2015 2016 2015
$’000 $’000 $’000 $’000 $’000 $’000
Carrying amount at beginning of period (1,246) (1,232) (2) (79) (1,248) (1,311)
Charge for impairment reversal (expense) 849 (33) (31) 72 818 39
Amounts written off 397 19 1 5 398 24
Carrying amount at end of period - (1,246) (32) (2) (32) (1,248)
168 Financial statements | Sydney Water Annual Report 2015–16| Sydney Water Annual Report 2015

Sydney Water Corporation – 30 June 2016 Page 33
Non-cash financing and investing activities Assets that are acquired by the Corporation under finance leases or other similar financing arrangements, and assets handed over at no cost by developers, are not included in the statement of cash flows as these are regarded as non-cash. The amount capitalised during the current reporting period in respect of assets handed over at no cost by developers to the Corporation was $138.863 million (2015: $136.018 million). During the reporting period, finance lease assets and liabilities totalling $262.862 million were recognised from the renegotiated agreements for the Prospect, Woronora and Illawarra water filtration plants. (Refer note 2(b)). There were no new finance leases during the previous reporting period. Standby credit arrangements Details of financial accommodation facilities for the Corporation are disclosed in note 11(b). Cash balance not recognised Under the terms of an agreement between Parramatta City Council and the Corporation, the Corporation is contributing to the overall development of the Civic Place public domain at Parramatta. At the reporting date, an amount of $3.700 million (2015: $3.638 million) is currently placed in an interest-bearing bank account administered by the Corporation in accordance with the agreement. The balance of cash in this bank account has not been recognised by the Corporation as an asset because officers of Parramatta City Council are also signatories to the account and restrict its use so that the cash is not able to be used for any other purpose by the Corporation. Funds can only be released from the bank account when Parramatta City Council provides to the Corporation certification of public domain works procured by the Council in relation to the Civic Place development. At that time, the Corporation must hand over to the Council 14.3 per cent of the certified value of the public domain work completed. Any funds remaining unexpended in the bank account as at 31 December 2018 will return to the Corporation’s normal cash management activities and restrictions over the use of this cash will cease.
Note 7. Trade and other receivables
(a) Balances at the reporting date
2016
$’000
2015
$’000
Trade receivables
Outstanding service availability and usage charges billed 87,714 93,279
Allowance for impairment - (1,246)
87,714 92,033
Accrued unbilled usage charges on unread meters:
Water usage 154,583 135,050
Sewer usage 12,638 12,345
Other usage 5,458 5,516
172,679 152,911
Other trade debtors billed 5,395 5,633
Allowance for impairment (32) (2)
5,363 5,631
Total trade receivables 265,756 250,575
Other receivables
Other debtors and accrued revenue 30,638 33,999
Prepayments 11,157 6,732
Total other receivables 41,795 40,731
Total current trade and other receivables 307,551 291,306
Sydney Water Corporation – 30 June 2016 Page 34
Recognition and measurement Trade and other receivables are amounts receivable for services to customers prior to the end of the reporting period and that are yet to be collected. They are recognised initially and subsequently carried at original invoice amount less any impairment losses for amounts considered to be either doubtful or uncollectible. The recoverability of trade receivables is regularly reviewed. Known bad debts are written off against the allowance when identified. Receivables that are due greater than 12 months are discounted to amortised cost using the Government bond rate. Accrued unbilled usage charges on unread meters comprises estimates for accrued revenue for water usage, sewer usage, trade waste and recycled water charges where meters have not been read as at the reporting date. These charges are billed to customers with actual consumption once meters are read. The Corporation estimates the accrual based on consumption data and other inputs. Outstanding debts for service availability and usage charges are required to be settled within 21 days. Other debts are generally required to be settled between 14 and 60 days. Accrued investment income is receivable within a maximum of six months. All other current receivables are expected to be realised within 12 months of the reporting date. (b) Ageing analysis of trade receivables billed to customers
Gross
Amount
2016
$’000
Allowance for
Impairment
2016
$’000
Net
amount
2016
$’000
Gross
Amount
2015
$’000
Allowance for
Impairment
2015
$’000
Net
amount
2015
$’000
Outstanding service and usage charges
billed
Not past due 1,167 - 1,167 7,390 - 7,390
Past due 22 - 30 days 14,564 - 14,564 13,231 - 13,231
Past due 31 - 60 days 17,414 - 17,414 14,767 - 14,767
Past due 61 - 90 days 9,711 - 9,711 9,597 - 9,597
Past due 91 - 180 days 30,656 - 30,656 34,076 - 34,076
Past due 181 - 365 days 7,156 - 7,156 7,800 - 7,800
Past due > 365 days 7,046 - 7,046 6,418 (1,246) 5,172
87,714 - 87,714 93,279 (1,246) 92,033
Other trade debtors billed
Not past due 4,857 - 4,857 4,812 - 4,812
Past due 15 - 30 days 67 - 67 46 - 46
Past due 31 - 60 days 57 (3) 54 469 - 469
Past due 61 - 90 days 41 (3) 38 103 - 103
Past due 91 - 180 days 235 (8) 227 77 - 77
Past due 181 - 365 days 100 (16) 84 64 (1) 63
Past due > 365 days 38 (2) 36 62 (1) 61
5,395 (32) 5,363 5,633 (2) 5,631
All other balances within trade and other receivables are not past due and are expected to be realised at the amounts carried in the statement of financial position when due.
(c) Movement in allowance for impairment
Outstanding
Service and Usage charges
Other trade debtors Total
2016 2015 2016 2015 2016 2015
$’000 $’000 $’000 $’000 $’000 $’000
Carrying amount at beginning of period (1,246) (1,232) (2) (79) (1,248) (1,311)
Charge for impairment reversal (expense) 849 (33) (31) 72 818 39
Amounts written off 397 19 1 5 398 24
Carrying amount at end of period - (1,246) (32) (2) (32) (1,248)
168 Financial statements | Sydney Water Annual Report 2015–16 Sydney Water Annual Report 2015–16 | Financial statements 169
Overview
Corporate
governanceC
ustomer at
the heartW
orld class perform
anceH
igh performance
cultureFin
ancial
statemen
tsA
ppendixes
| Sydney Water Annual Report 2015
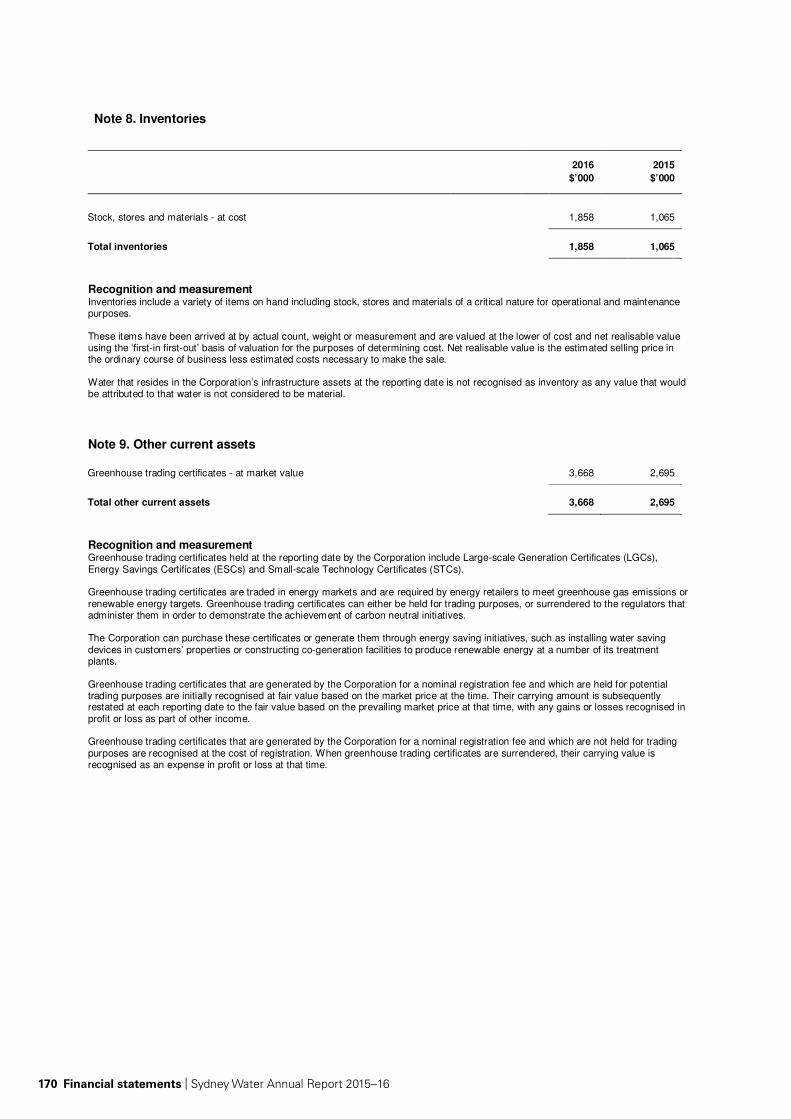
Sydney Water Corporation – 30 June 2016 Page 35
Note 8. Inventories
2016
$’000
2015
$’000
Stock, stores and materials - at cost 1,858 1,065
Total inventories 1,858 1,065
Recognition and measurement Inventories include a variety of items on hand including stock, stores and materials of a critical nature for operational and maintenance purposes. These items have been arrived at by actual count, weight or measurement and are valued at the lower of cost and net realisable value using the ‘first-in first-out’ basis of valuation for the purposes of determining cost. Net realisable value is the estimated selling price in the ordinary course of business less estimated costs necessary to make the sale. Water that resides in the Corporation’s infrastructure assets at the reporting date is not recognised as inventory as any value that would be attributed to that water is not considered to be material.
Note 9. Other current assets
Greenhouse trading certificates - at market value 3,668 2,695
Total other current assets 3,668 2,695
Recognition and measurement Greenhouse trading certificates held at the reporting date by the Corporation include Large-scale Generation Certificates (LGCs), Energy Savings Certificates (ESCs) and Small-scale Technology Certificates (STCs). Greenhouse trading certificates are traded in energy markets and are required by energy retailers to meet greenhouse gas emissions or renewable energy targets. Greenhouse trading certificates can either be held for trading purposes, or surrendered to the regulators that administer them in order to demonstrate the achievement of carbon neutral initiatives. The Corporation can purchase these certificates or generate them through energy saving initiatives, such as installing water saving devices in customers’ properties or constructing co-generation facilities to produce renewable energy at a number of its treatment plants. Greenhouse trading certificates that are generated by the Corporation for a nominal registration fee and which are held for potential trading purposes are initially recognised at fair value based on the market price at the time. Their carrying amount is subsequently restated at each reporting date to the fair value based on the prevailing market price at that time, with any gains or losses recognised in profit or loss as part of other income. Greenhouse trading certificates that are generated by the Corporation for a nominal registration fee and which are not held for trading purposes are recognised at the cost of registration. When greenhouse trading certificates are surrendered, their carrying value is recognised as an expense in profit or loss at that time.
Sydney Water Corporation – 30 June 2016 Page 36
Note 10. Trade and other payables
2016
$’000
2015
$’000
Current
Trade payables 56,576 53,844
Non-trade payables 62,038 50,772
Income in advance 5,268 17,049
Accrued expenses 405,057 412,949
Total trade and other payables 528,939 534,614
Recognition and measurement Trade and other payables mainly represents unpaid liabilities, both invoiced and accrued, for goods and services provided to the Corporation prior to the end of the reporting period. It also includes security deposits received and overpaid receipts that are repayable, as well as other liabilities such as statutory taxes payable and income received in advance that has not as yet been earned. Recognition of trade and other payables in relation to goods or services purchased by the Corporation occurs when the goods or services have been received and an obligation to make future payments arises. Income received in advance is recognised initially as a current liability and subsequently recognised as revenue in profit or loss in the period in which it has been earned. Trade and other payables are recognised at cost, which is considered to approximate amortised cost due to their short-term nature. They are not discounted, as the effect of discounting would not be material for these liabilities. Trade accounts payable and accrued expenses (other than for interest on loans) are normally settled within 30 days. Accrued interest on loans and advances is generally payable within a maximum period of six months. Other non-trade payables are payable at various times throughout the reporting period. Trade and other payables are not secured against the assets of the Corporation. Details in relation to liquidity risk and market risk generally are disclosed in note 20, including a maturity analysis of these payables and all other financial assets and financial liabilities.
170 Financial statements | Sydney Water Annual Report 2015–16| Sydney Water Annual Report 2015

Sydney Water Corporation – 30 June 2016 Page 35
Note 8. Inventories
2016
$’000
2015
$’000
Stock, stores and materials - at cost 1,858 1,065
Total inventories 1,858 1,065
Recognition and measurement Inventories include a variety of items on hand including stock, stores and materials of a critical nature for operational and maintenance purposes. These items have been arrived at by actual count, weight or measurement and are valued at the lower of cost and net realisable value using the ‘first-in first-out’ basis of valuation for the purposes of determining cost. Net realisable value is the estimated selling price in the ordinary course of business less estimated costs necessary to make the sale. Water that resides in the Corporation’s infrastructure assets at the reporting date is not recognised as inventory as any value that would be attributed to that water is not considered to be material.
Note 9. Other current assets
Greenhouse trading certificates - at market value 3,668 2,695
Total other current assets 3,668 2,695
Recognition and measurement Greenhouse trading certificates held at the reporting date by the Corporation include Large-scale Generation Certificates (LGCs), Energy Savings Certificates (ESCs) and Small-scale Technology Certificates (STCs). Greenhouse trading certificates are traded in energy markets and are required by energy retailers to meet greenhouse gas emissions or renewable energy targets. Greenhouse trading certificates can either be held for trading purposes, or surrendered to the regulators that administer them in order to demonstrate the achievement of carbon neutral initiatives. The Corporation can purchase these certificates or generate them through energy saving initiatives, such as installing water saving devices in customers’ properties or constructing co-generation facilities to produce renewable energy at a number of its treatment plants. Greenhouse trading certificates that are generated by the Corporation for a nominal registration fee and which are held for potential trading purposes are initially recognised at fair value based on the market price at the time. Their carrying amount is subsequently restated at each reporting date to the fair value based on the prevailing market price at that time, with any gains or losses recognised in profit or loss as part of other income. Greenhouse trading certificates that are generated by the Corporation for a nominal registration fee and which are not held for trading purposes are recognised at the cost of registration. When greenhouse trading certificates are surrendered, their carrying value is recognised as an expense in profit or loss at that time.
Sydney Water Corporation – 30 June 2016 Page 36
Note 10. Trade and other payables
2016
$’000
2015
$’000
Current
Trade payables 56,576 53,844
Non-trade payables 62,038 50,772
Income in advance 5,268 17,049
Accrued expenses 405,057 412,949
Total trade and other payables 528,939 534,614
Recognition and measurement Trade and other payables mainly represents unpaid liabilities, both invoiced and accrued, for goods and services provided to the Corporation prior to the end of the reporting period. It also includes security deposits received and overpaid receipts that are repayable, as well as other liabilities such as statutory taxes payable and income received in advance that has not as yet been earned. Recognition of trade and other payables in relation to goods or services purchased by the Corporation occurs when the goods or services have been received and an obligation to make future payments arises. Income received in advance is recognised initially as a current liability and subsequently recognised as revenue in profit or loss in the period in which it has been earned. Trade and other payables are recognised at cost, which is considered to approximate amortised cost due to their short-term nature. They are not discounted, as the effect of discounting would not be material for these liabilities. Trade accounts payable and accrued expenses (other than for interest on loans) are normally settled within 30 days. Accrued interest on loans and advances is generally payable within a maximum period of six months. Other non-trade payables are payable at various times throughout the reporting period. Trade and other payables are not secured against the assets of the Corporation. Details in relation to liquidity risk and market risk generally are disclosed in note 20, including a maturity analysis of these payables and all other financial assets and financial liabilities.
170 Financial statements | Sydney Water Annual Report 2015–16 Sydney Water Annual Report 2015–16 | Financial statements 171
Overview
Corporate
governanceC
ustomer at
the heartW
orld class perform
anceH
igh performance
cultureFin
ancial
statemen
tsA
ppendixes
| Sydney Water Annual Report 2015

Sydney Water Corporation – 30 June 2016 Page 37
Debt Management
Note 11. Borrowings and other financial liabilities
2016
$’000
2015
$’000
Current
Current portion of long-term borrowings 184 1,210
Other financial liabilities:
Current portion of obligation under Blue Mountains Sewage Transfer scheme
2,303
2,164
Current portion of finance lease liabilities 10,618 3,766
Total current borrowings and other financial liabilities 13,105 7,140
Non-current
Long-term borrowings 6,778,921 6,158,498
Other financial liabilities:
Long-term obligation under Blue Mountains Sewage Transfer Scheme 51,543 53,846
Long-term obligation under finance lease liabilities 371,264 120,494
Total non-current borrowings and other financial liabilities 7,201,728 6,332,838
(a) Recognition and measurement Borrowings Interest-bearing borrowings obtained by the Corporation from the NSW Treasury Corporation are recognised initially at the fair value of the consideration received, which incorporates any transaction costs associated with the borrowing. Subsequent to initial recognition, they are stated at amortised cost using the effective interest method. This includes capital indexed bonds whose carrying amount is restated at each reporting date by way of an indexation adjustment based on the Consumer Price Index (CPI) in Australia. Amortised cost is calculated by taking into account any differences between the initial fair value and the final redemption value of the borrowings, such as discounts or premiums. These differences are amortised to profit or loss as part of finance costs over the period of the borrowings on an effective interest basis. Indexation adjustments on CPI indexed bonds are also recognised as part of finance costs in profit or loss. Gains or losses are recognised in profit or loss when liabilities are derecognised, such as through a debt restructuring or early repayment of debt, as well as through the amortisation process. Interest-bearing borrowings are classified as current liabilities only if the borrowing is due to be settled within 12 months after the reporting date and there is no discretion on the part of the Corporation to extend or refinance the obligation on a long-term basis with the respective lender. All other interest-bearing borrowings are classified as non-current liabilities, including those in which the Corporation has the discretion to refinance or roll over the borrowings for at least 12 months after the reporting date even if they are due to mature within a shorter period. Other financial liabilities Other financial liabilities comprise liabilities for the Corporation’s obligations under the Blue Mountains Sewage Transfer Scheme agreement and finance lease liabilities. (Refer notes 2(b) and 4(i) in relation to the water filtration plant agreements). These are described below under (c).
Sydney Water Corporation – 30 June 2016 Page 38
(b) Financial accommodation The Corporation obtains financial accommodation from the following facilities:
• a bank overdraft facility with its corporate banker
• a purchase credit card facility with its corporate banker
• a bank guarantee facility with either its corporate banker or NSW Treasury Corporation
• a ‘Come and Go’ short-term borrowing facility with NSW Treasury Corporation
• long-term borrowing facilities with NSW Treasury Corporation.
These financing facilities are approved by the NSW Treasurer under the Public Authorities (Financial Arrangements) Act 1987. The NSW Treasurer’s approval of the facilities relating to the Corporation is in place until amended or revoked. Details in relation to each of these facilities at the reporting date are provided below.
Financial accommodation Utilised
2016
$’000
Not
Utilised
2016
$’000
Total
Facility
2016
$’000
Utilised
2015
$’000
Not
Utilised
2015
$’000
Total
Facility
2015
$’000
Bank overdraft facility - 10,000 10,000 - 10,000 10,000
Purchase credit card facility 139 2,361 2,500 74 2,426 2,500
Bank guarantee facility 21,883 8,117 30,000 23,886 31,114 55,000
Come and Go facility - 100,000 100,000 - 100,000 100,000
Long-term borrowings facility 6,779,105 464,895 7,244,000 6,159,708 436,292 6,596,000
6,801,127 585,373 7,386,500 6,183,668 579,832 6,763,500
Bank overdraft facility The Corporation has a bank overdraft facility with its corporate banker. The bank overdraft facility is used as and when required as part of the Corporation’s daily cash management functions. Overdraft interest is charged on the basis of the corporate banker’s debit rate that is calculated daily and applied to any overdrawn balances. Purchase credit card facility The Corporation has the NSW Treasurer’s approval for a purchase credit card facility limit of up to $5 million (2015: $5 million). The facility in place with the Corporation’s banker is $2.5 million (2015: $2.5 million). The purchase credit card facility is used by the Corporation only as an efficient means for staff to purchase low value monetary items for the Corporation. Bank guarantee facility The Corporation has the NSW Treasurer’s approval for obtaining a total bank guarantee facility of up to $30 million (2015: $55 million) from either the Corporation’s corporate banker, NSW Treasury Corporation or a combination of both. This facility is predominantly used by the Corporation to provide a bank guarantee to the WorkCover Authority in respect of the Corporation’s remaining self-insurance workers’ compensation liability. The facility can also be used from time to time whenever a bank guarantee is required, in lieu of security deposits, under contractual arrangements with external parties. ‘Come and Go’ short-term borrowing facility The Corporation has a ‘Come and Go’ short term borrowing facility in place with the NSW Treasury Corporation. The ‘Come and Go’ facility is used extensively as part of the Corporation’s daily cash management function during the reporting period. Long- term borrowing facilities The Corporation has the NSW Treasurer’s approval to obtain long-term borrowing facilities from the central borrowing authority, the NSW Treasury Corporation. The Corporation cannot borrow in its own name from the market without the NSW Treasurer’s approval. Accordingly, both new loans and the refinancing of maturing existing loans are arranged via the NSW Treasury Corporation. Long-term borrowings consist mostly of NSW Treasury Corporation loans. They also consist of the remaining loans that the Corporation obtained from other entities prior to the existence of NSW Treasury Corporation and which are still yet to mature. They are referred to as Other advances. NSW Treasury Corporation loans are negotiated with either a floating interest rate, in which case the rate is reset periodically, or at a fixed rate where interest is paid half-yearly in arrears or on maturity. Additionally, the NSW Treasury Corporation provides CPI indexed bonds and resettable loans to the Corporation.
172 Financial statements | Sydney Water Annual Report 2015–16| Sydney Water Annual Report 2015

Sydney Water Corporation – 30 June 2016 Page 37
Debt Management
Note 11. Borrowings and other financial liabilities
2016
$’000
2015
$’000
Current
Current portion of long-term borrowings 184 1,210
Other financial liabilities:
Current portion of obligation under Blue Mountains Sewage Transfer scheme
2,303
2,164
Current portion of finance lease liabilities 10,618 3,766
Total current borrowings and other financial liabilities 13,105 7,140
Non-current
Long-term borrowings 6,778,921 6,158,498
Other financial liabilities:
Long-term obligation under Blue Mountains Sewage Transfer Scheme 51,543 53,846
Long-term obligation under finance lease liabilities 371,264 120,494
Total non-current borrowings and other financial liabilities 7,201,728 6,332,838
(a) Recognition and measurement Borrowings Interest-bearing borrowings obtained by the Corporation from the NSW Treasury Corporation are recognised initially at the fair value of the consideration received, which incorporates any transaction costs associated with the borrowing. Subsequent to initial recognition, they are stated at amortised cost using the effective interest method. This includes capital indexed bonds whose carrying amount is restated at each reporting date by way of an indexation adjustment based on the Consumer Price Index (CPI) in Australia. Amortised cost is calculated by taking into account any differences between the initial fair value and the final redemption value of the borrowings, such as discounts or premiums. These differences are amortised to profit or loss as part of finance costs over the period of the borrowings on an effective interest basis. Indexation adjustments on CPI indexed bonds are also recognised as part of finance costs in profit or loss. Gains or losses are recognised in profit or loss when liabilities are derecognised, such as through a debt restructuring or early repayment of debt, as well as through the amortisation process. Interest-bearing borrowings are classified as current liabilities only if the borrowing is due to be settled within 12 months after the reporting date and there is no discretion on the part of the Corporation to extend or refinance the obligation on a long-term basis with the respective lender. All other interest-bearing borrowings are classified as non-current liabilities, including those in which the Corporation has the discretion to refinance or roll over the borrowings for at least 12 months after the reporting date even if they are due to mature within a shorter period. Other financial liabilities Other financial liabilities comprise liabilities for the Corporation’s obligations under the Blue Mountains Sewage Transfer Scheme agreement and finance lease liabilities. (Refer notes 2(b) and 4(i) in relation to the water filtration plant agreements). These are described below under (c).
Sydney Water Corporation – 30 June 2016 Page 38
(b) Financial accommodation The Corporation obtains financial accommodation from the following facilities:
• a bank overdraft facility with its corporate banker
• a purchase credit card facility with its corporate banker
• a bank guarantee facility with either its corporate banker or NSW Treasury Corporation
• a ‘Come and Go’ short-term borrowing facility with NSW Treasury Corporation
• long-term borrowing facilities with NSW Treasury Corporation.
These financing facilities are approved by the NSW Treasurer under the Public Authorities (Financial Arrangements) Act 1987. The NSW Treasurer’s approval of the facilities relating to the Corporation is in place until amended or revoked. Details in relation to each of these facilities at the reporting date are provided below.
Financial accommodation Utilised
2016
$’000
Not
Utilised
2016
$’000
Total
Facility
2016
$’000
Utilised
2015
$’000
Not
Utilised
2015
$’000
Total
Facility
2015
$’000
Bank overdraft facility - 10,000 10,000 - 10,000 10,000
Purchase credit card facility 139 2,361 2,500 74 2,426 2,500
Bank guarantee facility 21,883 8,117 30,000 23,886 31,114 55,000
Come and Go facility - 100,000 100,000 - 100,000 100,000
Long-term borrowings facility 6,779,105 464,895 7,244,000 6,159,708 436,292 6,596,000
6,801,127 585,373 7,386,500 6,183,668 579,832 6,763,500
Bank overdraft facility The Corporation has a bank overdraft facility with its corporate banker. The bank overdraft facility is used as and when required as part of the Corporation’s daily cash management functions. Overdraft interest is charged on the basis of the corporate banker’s debit rate that is calculated daily and applied to any overdrawn balances. Purchase credit card facility The Corporation has the NSW Treasurer’s approval for a purchase credit card facility limit of up to $5 million (2015: $5 million). The facility in place with the Corporation’s banker is $2.5 million (2015: $2.5 million). The purchase credit card facility is used by the Corporation only as an efficient means for staff to purchase low value monetary items for the Corporation. Bank guarantee facility The Corporation has the NSW Treasurer’s approval for obtaining a total bank guarantee facility of up to $30 million (2015: $55 million) from either the Corporation’s corporate banker, NSW Treasury Corporation or a combination of both. This facility is predominantly used by the Corporation to provide a bank guarantee to the WorkCover Authority in respect of the Corporation’s remaining self-insurance workers’ compensation liability. The facility can also be used from time to time whenever a bank guarantee is required, in lieu of security deposits, under contractual arrangements with external parties. ‘Come and Go’ short-term borrowing facility The Corporation has a ‘Come and Go’ short term borrowing facility in place with the NSW Treasury Corporation. The ‘Come and Go’ facility is used extensively as part of the Corporation’s daily cash management function during the reporting period. Long- term borrowing facilities The Corporation has the NSW Treasurer’s approval to obtain long-term borrowing facilities from the central borrowing authority, the NSW Treasury Corporation. The Corporation cannot borrow in its own name from the market without the NSW Treasurer’s approval. Accordingly, both new loans and the refinancing of maturing existing loans are arranged via the NSW Treasury Corporation. Long-term borrowings consist mostly of NSW Treasury Corporation loans. They also consist of the remaining loans that the Corporation obtained from other entities prior to the existence of NSW Treasury Corporation and which are still yet to mature. They are referred to as Other advances. NSW Treasury Corporation loans are negotiated with either a floating interest rate, in which case the rate is reset periodically, or at a fixed rate where interest is paid half-yearly in arrears or on maturity. Additionally, the NSW Treasury Corporation provides CPI indexed bonds and resettable loans to the Corporation.
172 Financial statements | Sydney Water Annual Report 2015–16 Sydney Water Annual Report 2015–16 | Financial statements 173
Overview
Corporate
governanceC
ustomer at
the heartW
orld class perform
anceH
igh performance
cultureFin
ancial
statemen
tsA
ppendixes
| Sydney Water Annual Report 2015

Sydney Water Corporation – 30 June 2016 Page 39
CPI indexed bonds are either restated by an indexation adjustment based on the Australian CPI on a quarterly basis, or they pay the CPI indexation semi-annually along with the interest payment. Resettable loans are loans where the interest rate resets in line with the regulatory Pricing Determination period. These loans are usually refinanced at maturity. Short-term debt facilities have a term to maturity of between one and six months, while fixed rate loans currently have maturities up to 25 years (2015: 26 years) for the Corporation. CPI indexed bonds have a maximum term to maturity of 19 years to 2035 (2015: 20 years to 2035). None of these categories are secured against the assets of the Corporation. (c) Other financial liabilities Blue Mountains Sewage Transfer Scheme agreement The Corporation has a service agreement with the legal owner of a sewage tunnel in the Blue Mountains for the transfer of sewage to a sewage treatment plant owned by the Corporation. The term of the agreement is for 35 years, with the Corporation having an option to extend to 50 years. A tariff is payable to the legal owner on a quarterly basis, separated into principal and interest, and the legal title of the tunnel will transfer to the Corporation for a nominal consideration of $1 at the end of the agreement. The Corporation considers that, in substance, it presently controls the tunnel and that the future payments to be made to the legal owner are, in substance, for the acquisition of the tunnel over the term of the agreement. Accordingly, the Corporation has capitalised the cost of the tunnel asset as an item of property, plant and equipment and has recognised a liability in the statement of financial position for the obligation to make future tariff payments to the legal owner. The liability is now stated at amortised cost, using the effective interest method. Finance lease liabilities As mentioned in note 2(b), the Corporation has identified finance leases within the renegotiated water filtration agreements with the owners of the Prospect, Macarthur, Illawarra and Woronora Water Filtration Plants. The new agreement for the Prospect plant extends to 30 November 2035. The new agreement for the Woronora and Illawarra plants extends to 30 November 2036 while the agreement for the Macarthur plant extends to 8 September 2030. These agreements now have within them a number of different conditions and tariff components. The tariff components comprise both service element components and also capital components that relate to the acquisition of the plants by the end of the agreements, at which time legal title transfers to the Corporation for a terminal nominal value of $1.
The capital components of the tariffs that are specifically related to the acquisition of the plants over the terms of the new agreements meet the criteria of a finance lease and accordingly finance lease assets and finance lease liabilities have been recognised in the statement of financial position. The finance lease liabilities represent the net present value of the future payment stream of these lease payments at the reporting date. The interest rate used for discounting the payment stream of lease payments under these agreements is a ‘real’ pre-tax discount rate of 7.5% per annum, which is equivalent to a nominal rate of 10.19% per annum. This is the rate implicit in the renegotiated agreements. Lease payments are allocated between repayment of principal and interest, the latter of which is recognised within finance costs in profit or loss. Refer note 20(f) for a maturity analysis of Borrowings and Other financial liabilities.
Sydney Water Corporation – 30 June 2016 Page 40
Other liabilities
Note 12. Provisions
(a) Carrying amounts
2016
$’000
2015
$’000
Current
Short-term provisions:
Annual leave 33,047 32,490
Termination benefits 16,310 6,349
Employee benefits on-costs 2,206 1,912
Road restoration 6,099 7,218
57,662 47,969
Current portion of long-term provisions:
Long service leave 109,950 107,101
Employee benefits on-costs 5,992 5,837
Superannuation 202 92
Workers’ compensation self-insurance 1,812 1,843
General insurance 1,279 838
Restoration of leased premises 65 -
Restoration costs from decommissioning system asset network components 18,116 32,340
137,416 148,051
Total current provisions 195,078 196,020
Non-current
Long-term provisions:
Employee benefits for long service leave 11,394 9,159
Employee benefits on-costs 621 499
Post-employment benefits from superannuation 1,296,446 897,098
Workers’ compensation self-insurance 20,989 20,245
General insurance 2,563 3,482
Restoration of leased premises 10,603 7,993
Restoration costs from decommissioning system asset network components 34,351 13,152
Total non-current provisions 1,376,967 951,628
Under current liabilities, the Corporation expects to make payments totalling $21.202 million (2015: $20.861 million) for annual leave, and payments totalling $18.349 million (2015: $18.074 million) for long-service leave in the next reporting period. All other provisions under current liabilities are expected to be paid in the next reporting period for the amount recognised.
174 Financial statements | Sydney Water Annual Report 2015–16| Sydney Water Annual Report 2015

Sydney Water Corporation – 30 June 2016 Page 39
CPI indexed bonds are either restated by an indexation adjustment based on the Australian CPI on a quarterly basis, or they pay the CPI indexation semi-annually along with the interest payment. Resettable loans are loans where the interest rate resets in line with the regulatory Pricing Determination period. These loans are usually refinanced at maturity. Short-term debt facilities have a term to maturity of between one and six months, while fixed rate loans currently have maturities up to 25 years (2015: 26 years) for the Corporation. CPI indexed bonds have a maximum term to maturity of 19 years to 2035 (2015: 20 years to 2035). None of these categories are secured against the assets of the Corporation. (c) Other financial liabilities Blue Mountains Sewage Transfer Scheme agreement The Corporation has a service agreement with the legal owner of a sewage tunnel in the Blue Mountains for the transfer of sewage to a sewage treatment plant owned by the Corporation. The term of the agreement is for 35 years, with the Corporation having an option to extend to 50 years. A tariff is payable to the legal owner on a quarterly basis, separated into principal and interest, and the legal title of the tunnel will transfer to the Corporation for a nominal consideration of $1 at the end of the agreement. The Corporation considers that, in substance, it presently controls the tunnel and that the future payments to be made to the legal owner are, in substance, for the acquisition of the tunnel over the term of the agreement. Accordingly, the Corporation has capitalised the cost of the tunnel asset as an item of property, plant and equipment and has recognised a liability in the statement of financial position for the obligation to make future tariff payments to the legal owner. The liability is now stated at amortised cost, using the effective interest method. Finance lease liabilities As mentioned in note 2(b), the Corporation has identified finance leases within the renegotiated water filtration agreements with the owners of the Prospect, Macarthur, Illawarra and Woronora Water Filtration Plants. The new agreement for the Prospect plant extends to 30 November 2035. The new agreement for the Woronora and Illawarra plants extends to 30 November 2036 while the agreement for the Macarthur plant extends to 8 September 2030. These agreements now have within them a number of different conditions and tariff components. The tariff components comprise both service element components and also capital components that relate to the acquisition of the plants by the end of the agreements, at which time legal title transfers to the Corporation for a terminal nominal value of $1.
The capital components of the tariffs that are specifically related to the acquisition of the plants over the terms of the new agreements meet the criteria of a finance lease and accordingly finance lease assets and finance lease liabilities have been recognised in the statement of financial position. The finance lease liabilities represent the net present value of the future payment stream of these lease payments at the reporting date. The interest rate used for discounting the payment stream of lease payments under these agreements is a ‘real’ pre-tax discount rate of 7.5% per annum, which is equivalent to a nominal rate of 10.19% per annum. This is the rate implicit in the renegotiated agreements. Lease payments are allocated between repayment of principal and interest, the latter of which is recognised within finance costs in profit or loss. Refer note 20(f) for a maturity analysis of Borrowings and Other financial liabilities.
Sydney Water Corporation – 30 June 2016 Page 40
Other liabilities
Note 12. Provisions
(a) Carrying amounts
2016
$’000
2015
$’000
Current
Short-term provisions:
Annual leave 33,047 32,490
Termination benefits 16,310 6,349
Employee benefits on-costs 2,206 1,912
Road restoration 6,099 7,218
57,662 47,969
Current portion of long-term provisions:
Long service leave 109,950 107,101
Employee benefits on-costs 5,992 5,837
Superannuation 202 92
Workers’ compensation self-insurance 1,812 1,843
General insurance 1,279 838
Restoration of leased premises 65 -
Restoration costs from decommissioning system asset network components 18,116 32,340
137,416 148,051
Total current provisions 195,078 196,020
Non-current
Long-term provisions:
Employee benefits for long service leave 11,394 9,159
Employee benefits on-costs 621 499
Post-employment benefits from superannuation 1,296,446 897,098
Workers’ compensation self-insurance 20,989 20,245
General insurance 2,563 3,482
Restoration of leased premises 10,603 7,993
Restoration costs from decommissioning system asset network components 34,351 13,152
Total non-current provisions 1,376,967 951,628
Under current liabilities, the Corporation expects to make payments totalling $21.202 million (2015: $20.861 million) for annual leave, and payments totalling $18.349 million (2015: $18.074 million) for long-service leave in the next reporting period. All other provisions under current liabilities are expected to be paid in the next reporting period for the amount recognised.
174 Financial statements | Sydney Water Annual Report 2015–16 Sydney Water Annual Report 2015–16 | Financial statements 175
Overview
Corporate
governanceC
ustomer at
the heartW
orld class perform
anceH
igh performance
cultureFin
ancial
statemen
tsA
ppendixes
| Sydney Water Annual Report 2015

Sydney Water Corporation – 30 June 2016 Page 41
Recognition and measurement General Provisions are liabilities of uncertain timing or amount. A provision is recognised when there is a present legal or constructive obligation as a result of a past event, it is probable that an outflow of economic benefits will be required to settle the obligation and a reliable estimate can be made of the amount of the obligation. If the obligation is to be settled greater than 12 months after the reporting date and the effect is material, a provision is determined by discounting the expected future cash flows required to settle the obligation at a pre-tax rate that reflects current market assessments of the time value of money and, where appropriate, the risks specific to the liability. This is usually the risk free rate on Government bonds that most closely matches the timing of the expected future payments, except where noted below. If the obligation is due to be settled less than 12 months after the reporting date, the provision is stated at the best estimate available and is not discounted. When some or all of a provision is expected to be reimbursed from a third party, the reimbursement receivable is recognised as an asset only when the reimbursement is virtually certain. The expense relating to any provision is presented in profit or loss net of any reimbursement. A provision is classified as a current liability if the Corporation does not have an unconditional right to defer settlement of the liability for at least 12 months after the reporting date. Accordingly, employee benefits provisions which are due to be settled wholly within 12 months, such as annual leave entitlements and the unconditional component of long service leave entitlements, must be classified as current liabilities regardless of when they are expected to be settled. Employee benefits provisions Short-term employee benefits Short-term employee benefits are employee benefits (other than termination benefits) that are expected to be settled wholly before 12 months after the end of the annual reporting period in which the employees render the related service. They include wages, salaries and sick leave. All short-term employee benefits that are payable at the reporting date are measured on an undiscounted basis at the nominal amount expected to be paid. Expenses for wages and salaries are recognised on an accrual basis as services are rendered by employees. (Refer Note 2(b)). Expenses for sick leave, which is non-vesting, are recognised when the absences occur. Liabilities for wages and salaries are included within Trade and other payables (refer Note 10), while liabilities for any non-vesting sick leave, where applicable, are included within provisions in the statement of financial position. Termination benefits Termination benefits are employee benefits provided in exchange for the termination of an employee’s employment as a result of either: (a) an entity’s decision to terminate an employee’s employment before the normal retirement date; or
(b) an employee’s decision to accept an offer of benefits in exchange for the termination of employment.
In the case of the Corporation, this refers specifically to redundancy benefits payable to employees as a result of organisational restructures. A liability and expense for termination benefits are recognised either when the Corporation can no longer withdraw an offer of termination benefits or when the Corporation recognises costs for a restructuring that involves the payment of termination benefits, whichever is the earlier. For termination benefits payable as a result of an entity’s decision to terminate an employee’s employment, the time when the Corporation can no longer withdraw the offer of those benefits is when it has communicated a plan of termination to the affected employees and unions. This is considered to be when:
• actions required to complete the plan indicate that it is unlikely that there will be any significant change to the plan
• the plan identifies the number of employees affected, their job classifications or functions and their locations and the expected completion date, and
• the plan outlines sufficient details for the employees to determine the amount and type of termination benefits to be received.
A provision is recognised under these circumstances even when the plan does not identify each individual employee affected by the plan. For termination benefits payable as a result of (b) above, the time when the Corporation can no longer withdraw the offer of termination benefits is the earlier of when the employee accepts the offer and, if applicable, when a restriction takes effect on the Corporation’s ability to withdraw the offer. If such a restriction exists at the time of the offer, this would be when the offer was made. The liability for termination benefits for specific employees that have accepted an offer of termination benefits is measured at the calculated entitlement that will be paid to those employees. This liability is usually settled in the following reporting period and thus is not discounted. When specific employees are not known, an estimate for a provision is calculated on the basis of the number of employees expected to accept an offer of termination benefits in accordance with the termination plan. The liability is only discounted, using market yields on Government bonds, if the termination benefits are not expected to be settled wholly before 12 months after the annual reporting date.
Sydney Water Corporation – 30 June 2016 Page 42
Other long-term employee benefits Other long-term employee benefits are long service leave and annual leave. These liabilities are classified as long-term as they are not expected to be settled wholly within 12 months of the reporting date. The liabilities for these employee benefits represent the present value of the future benefits that employees have earned in return for their service in the current and prior reporting periods, less the fair value of any related assets (where applicable) at that date. Both long service leave and annual leave employee benefits are actuarially calculated. Actuarial calculations consider assumptions related to expected wages and salary levels, experience of employee departures and periods of service. The discount rate used is the yield at the reporting date on Government bonds that have maturity dates approximating to the terms of these obligations. The liabilities and expenses for these employee benefits are recognised when employees render service that increases their entitlement to future benefits. The expense in each case is recognised as one net amount that encompasses a number of components, such as current service cost and the interest cost from discounting. Unconditional entitlements to long service leave benefits are classified as current liabilities in the statement of financial position, while conditional and pre-conditional entitlements are classified as non-current liabilities. Liabilities for annual leave are classified as current liabilities in the statement of financial position regardless of when they are expected to be settled. Employee benefit on-costs Costs that are a consequence of employment but which are not employee benefits themselves, such as payroll tax, are recognised as liabilities and expenses when the employment to which they relate has occurred. Payroll tax payable at the reporting date in relation to wages and salaries paid during the previous month is recognised as part of Trade and other payables in the statement of financial position, consistent with the classification of any recognised liability for wages and salaries. Payroll tax payable in respect of annual leave, long service leave or termination benefits to be made in the future is recognised as part of provisions, consistent with the classification of the liabilities for these employee benefits. Post-employment benefits Post-employment benefits are benefits provided to employees and former employees through superannuation schemes. The Corporation contributes to two types of superannuation schemes: Defined contribution schemes and Defined benefit schemes.
• Defined contribution superannuation schemes Contributions to these schemes are recognised as an expense in profit or loss as incurred. The liability recognised at the reporting date represents the contributions to be paid to these schemes in the following month. The Corporation contributes to the First State Superannuation Scheme and other private schemes nominated by employees to a lesser extent.
• Defined benefit superannuation schemes
The Corporation’s net obligation in respect of defined benefit schemes is actuarially calculated separately for each scheme by estimating the amount of future benefit that employees have earned in return for their service in the current and prior reporting periods. That benefit is discounted to determine its present value, and the fair value of any scheme assets is deducted. The discount rate is the yield at the reporting date on Government bonds that have maturity dates approximating to the terms of the Corporation’s obligations. Calculations are performed by the Pooled Fund’s actuary using the projected unit credit method and they are advised to individual agencies for recognition and disclosure purposes in their financial statements. Where the present value of the defined benefit obligation in respect of a scheme exceeds the fair value of the scheme’s assets, a liability for the difference is recognised in the statement of financial position. Where the fair value of a scheme’s assets exceeds the present value of the scheme’s defined benefit obligation, an asset is recognised in the statement of financial position. Any superannuation asset recognised is limited to the total of any unrecognised past service cost and the present value of any economic benefits that may be available in the form of refunds from the schemes or reductions in future contributions to the schemes, as advised by the Pooled Fund’s actuary. The Corporation discloses defined benefit superannuation liabilities or assets as non-current as this best reflects when the Corporation expects to settle (realise) the liabilities (assets). Remeasurements of the net defined benefit liability or asset are recognised in other comprehensive income (directly through retained earnings) in the reporting period in which they occur. Such remeasurements include actuarial gains or losses, the return on plan assets (excluding amounts included in net interest on the defined benefit liability or asset) and any change in effect of the asset ceiling (excluding amounts included in net interest on the defined benefit liability or asset). Disclosures in relation to defined benefit schemes are shown below in (b).
176 Financial statements | Sydney Water Annual Report 2015–16| Sydney Water Annual Report 2015
Sydney Water Corporation – 30 June 2016 Page 41
Recognition and measurement General Provisions are liabilities of uncertain timing or amount. A provision is recognised when there is a present legal or constructive obligation as a result of a past event, it is probable that an outflow of economic benefits will be required to settle the obligation and a reliable estimate can be made of the amount of the obligation. If the obligation is to be settled greater than 12 months after the reporting date and the effect is material, a provision is determined by discounting the expected future cash flows required to settle the obligation at a pre-tax rate that reflects current market assessments of the time value of money and, where appropriate, the risks specific to the liability. This is usually the risk free rate on Government bonds that most closely matches the timing of the expected future payments, except where noted below. If the obligation is due to be settled less than 12 months after the reporting date, the provision is stated at the best estimate available and is not discounted. When some or all of a provision is expected to be reimbursed from a third party, the reimbursement receivable is recognised as an asset only when the reimbursement is virtually certain. The expense relating to any provision is presented in profit or loss net of any reimbursement. A provision is classified as a current liability if the Corporation does not have an unconditional right to defer settlement of the liability for at least 12 months after the reporting date. Accordingly, employee benefits provisions which are due to be settled wholly within 12 months, such as annual leave entitlements and the unconditional component of long service leave entitlements, must be classified as current liabilities regardless of when they are expected to be settled. Employee benefits provisions Short-term employee benefits Short-term employee benefits are employee benefits (other than termination benefits) that are expected to be settled wholly before 12 months after the end of the annual reporting period in which the employees render the related service. They include wages, salaries and sick leave. All short-term employee benefits that are payable at the reporting date are measured on an undiscounted basis at the nominal amount expected to be paid. Expenses for wages and salaries are recognised on an accrual basis as services are rendered by employees. (Refer Note 2(b)). Expenses for sick leave, which is non-vesting, are recognised when the absences occur. Liabilities for wages and salaries are included within Trade and other payables (refer Note 10), while liabilities for any non-vesting sick leave, where applicable, are included within provisions in the statement of financial position. Termination benefits Termination benefits are employee benefits provided in exchange for the termination of an employee’s employment as a result of either: (a) an entity’s decision to terminate an employee’s employment before the normal retirement date; or
(b) an employee’s decision to accept an offer of benefits in exchange for the termination of employment.
In the case of the Corporation, this refers specifically to redundancy benefits payable to employees as a result of organisational restructures. A liability and expense for termination benefits are recognised either when the Corporation can no longer withdraw an offer of termination benefits or when the Corporation recognises costs for a restructuring that involves the payment of termination benefits, whichever is the earlier. For termination benefits payable as a result of an entity’s decision to terminate an employee’s employment, the time when the Corporation can no longer withdraw the offer of those benefits is when it has communicated a plan of termination to the affected employees and unions. This is considered to be when:
• actions required to complete the plan indicate that it is unlikely that there will be any significant change to the plan
• the plan identifies the number of employees affected, their job classifications or functions and their locations and the expected completion date, and
• the plan outlines sufficient details for the employees to determine the amount and type of termination benefits to be received.
A provision is recognised under these circumstances even when the plan does not identify each individual employee affected by the plan. For termination benefits payable as a result of (b) above, the time when the Corporation can no longer withdraw the offer of termination benefits is the earlier of when the employee accepts the offer and, if applicable, when a restriction takes effect on the Corporation’s ability to withdraw the offer. If such a restriction exists at the time of the offer, this would be when the offer was made. The liability for termination benefits for specific employees that have accepted an offer of termination benefits is measured at the calculated entitlement that will be paid to those employees. This liability is usually settled in the following reporting period and thus is not discounted. When specific employees are not known, an estimate for a provision is calculated on the basis of the number of employees expected to accept an offer of termination benefits in accordance with the termination plan. The liability is only discounted, using market yields on Government bonds, if the termination benefits are not expected to be settled wholly before 12 months after the annual reporting date.
Sydney Water Corporation – 30 June 2016 Page 42
Other long-term employee benefits Other long-term employee benefits are long service leave and annual leave. These liabilities are classified as long-term as they are not expected to be settled wholly within 12 months of the reporting date. The liabilities for these employee benefits represent the present value of the future benefits that employees have earned in return for their service in the current and prior reporting periods, less the fair value of any related assets (where applicable) at that date. Both long service leave and annual leave employee benefits are actuarially calculated. Actuarial calculations consider assumptions related to expected wages and salary levels, experience of employee departures and periods of service. The discount rate used is the yield at the reporting date on Government bonds that have maturity dates approximating to the terms of these obligations. The liabilities and expenses for these employee benefits are recognised when employees render service that increases their entitlement to future benefits. The expense in each case is recognised as one net amount that encompasses a number of components, such as current service cost and the interest cost from discounting. Unconditional entitlements to long service leave benefits are classified as current liabilities in the statement of financial position, while conditional and pre-conditional entitlements are classified as non-current liabilities. Liabilities for annual leave are classified as current liabilities in the statement of financial position regardless of when they are expected to be settled. Employee benefit on-costs Costs that are a consequence of employment but which are not employee benefits themselves, such as payroll tax, are recognised as liabilities and expenses when the employment to which they relate has occurred. Payroll tax payable at the reporting date in relation to wages and salaries paid during the previous month is recognised as part of Trade and other payables in the statement of financial position, consistent with the classification of any recognised liability for wages and salaries. Payroll tax payable in respect of annual leave, long service leave or termination benefits to be made in the future is recognised as part of provisions, consistent with the classification of the liabilities for these employee benefits. Post-employment benefits Post-employment benefits are benefits provided to employees and former employees through superannuation schemes. The Corporation contributes to two types of superannuation schemes: Defined contribution schemes and Defined benefit schemes.
• Defined contribution superannuation schemes Contributions to these schemes are recognised as an expense in profit or loss as incurred. The liability recognised at the reporting date represents the contributions to be paid to these schemes in the following month. The Corporation contributes to the First State Superannuation Scheme and other private schemes nominated by employees to a lesser extent.
• Defined benefit superannuation schemes
The Corporation’s net obligation in respect of defined benefit schemes is actuarially calculated separately for each scheme by estimating the amount of future benefit that employees have earned in return for their service in the current and prior reporting periods. That benefit is discounted to determine its present value, and the fair value of any scheme assets is deducted. The discount rate is the yield at the reporting date on Government bonds that have maturity dates approximating to the terms of the Corporation’s obligations. Calculations are performed by the Pooled Fund’s actuary using the projected unit credit method and they are advised to individual agencies for recognition and disclosure purposes in their financial statements. Where the present value of the defined benefit obligation in respect of a scheme exceeds the fair value of the scheme’s assets, a liability for the difference is recognised in the statement of financial position. Where the fair value of a scheme’s assets exceeds the present value of the scheme’s defined benefit obligation, an asset is recognised in the statement of financial position. Any superannuation asset recognised is limited to the total of any unrecognised past service cost and the present value of any economic benefits that may be available in the form of refunds from the schemes or reductions in future contributions to the schemes, as advised by the Pooled Fund’s actuary. The Corporation discloses defined benefit superannuation liabilities or assets as non-current as this best reflects when the Corporation expects to settle (realise) the liabilities (assets). Remeasurements of the net defined benefit liability or asset are recognised in other comprehensive income (directly through retained earnings) in the reporting period in which they occur. Such remeasurements include actuarial gains or losses, the return on plan assets (excluding amounts included in net interest on the defined benefit liability or asset) and any change in effect of the asset ceiling (excluding amounts included in net interest on the defined benefit liability or asset). Disclosures in relation to defined benefit schemes are shown below in (b).
176 Financial statements | Sydney Water Annual Report 2015–16 Sydney Water Annual Report 2015–16 | Financial statements 177
Overview
Corporate
governanceC
ustomer at
the heartW
orld class perform
anceH
igh performance
cultureFin
ancial
statemen
tsA
ppendixes
| Sydney Water Annual Report 2015

Sydney Water Corporation – 30 June 2016 Page 43
(b) Defined Benefit Superannuation
The Corporation contributes to three closed defined benefit superannuation schemes in the NSW public sector Pooled Fund. The schemes are:
• State Superannuation Scheme (SSS)
• State Authorities Superannuation Scheme (SASS)
• State Authorities Non-contributory Superannuation Scheme (SANCS).
The Pooled Fund holds in trust the investments of these schemes. The following disclosures in relation to these schemes have been provided by Pillar Administration. Nature of benefits provided by the Fund As these schemes are defined benefit schemes, at least a component of the final benefit is derived from a multiple of member salary and years of membership. Members receive lump sum or pension benefits on retirement, death, disablement and withdrawal. These schemes are closed to new members. The regulatory framework The above schemes in the Pooled Fund are established and governed by the following NSW legislation: Superannuation Act 1916, State Authorities Superannuation Act 1987, State Authorities Non-Contributory Superannuation Scheme Act 1987, and their associated regulations. The schemes in the Pooled Fund are exempt public sector superannuation schemes under the Commonwealth Superannuation Industry (Supervision) Act 1993 (SIS). The SIS Legislation treats exempt public sector superannuation funds as complying funds for concessional taxation and superannuation guarantee purposes. Under a Heads of Government agreement, the NSW Government undertakes to ensure that the Pooled Fund will conform with the principles of the Commonwealth’s retirement incomes policy relating to preservation, vesting and reporting to members and that members’ benefits are adequately protected. The NSW Government prudentially monitors and audits the Pooled Fund and the Trustee Board activities in a manner consistent with the prudential controls of the SIS legislation. These provisions are in addition to other legislative obligations on the Trustee Board and internal processes that monitor the Trustee Board’s adherence to the principles of the Commonwealth’s retirement incomes policy. An actuarial investigation of the Pooled Fund is performed every three years. The last actuarial investigation was performed as at 30 June 2015. The next actuarial investigation will be performed at 30 June 2018. Other entities’ responsibilities for the governance of the Pooled Fund The Pooled Fund’s Trustee is responsible for the governance of the Fund. The Trustee has a legal obligation to act solely in the best interests of fund beneficiaries. The Trustee has the following roles: • Administration of the Fund and payment to the beneficiaries from Fund assets when required in accordance with the Fund rules;
• Management and investment of the Fund assets; and
• Compliance with other applicable regulations.
Risks There are a number of risks to which the Pooled Fund exposes the Corporation. The more significant risks relating to the defined benefits are: • Investment risk – The risk that investment returns will be lower than assumed and the Corporation will need to increase
contributions to offset this shortfall.
• Longevity risk – The risk that pensioners live longer than assumed, increasing future pensions.
• Pension indexation risk – The risk that pensions will increase at a rate greater than assumed, increasing future pensions.
• Salary growth risk – The risk that wages or salaries (on which future benefit amounts for active members will be based) will rise more rapidly than assumed, increasing defined benefit amounts and thereby requiring additional employer contributions.
• Legislative risk – The risk that legislative changes could be made which increase the cost of providing the defined benefits.
The defined benefit Fund assets are invested with independent fund managers and have a diversified asset mix. The Fund has no significant concentration of investment risk or liquidity risk. Significant events There were no Fund amendments, curtailments or settlements during the reporting period.
Sydney Water Corporation – 30 June 2016 Page 44
SASS SANCS SSS Total
2016 2015 2016 2015 2016 2015 2016 2015
$’000 $’000 $’000 $’000 $’000 $’000 $’000 $’000 Reconciliation of the net defined benefit liability (asset) Net defined benefit liability (asset) at beginning of period
106,309 104,271 34,699 33,386 756,090 674,297 897,098 811,954
Current service cost 6,192 6,273 2,060 2,229 2,568 7,857 10,820 16,359 Net interest on the net defined benefit liability (asset)
3,131 3,616 1,026 1,161 22,828 23,963 26,985 28,740
Past service cost - - - - - - - - (Gains)/losses arising from settlements
- - - - - - - -
Actual return on Fund assets less interest income
(390) (13,264) 90 (1,336) (914) (67,942) (1,214) (82,542)
Actuarial (gains) losses arising from changes in demographic assumptions
2,931 2,340 (826) 322 71,671 (7,342) 73,776 (4,680)
Actuarial (gains) losses arising from changes in financial assumptions
25,867 10,428 3,722 1,863 260,127 133,578 289,716 145,869
Actuarial (gains) losses arising from liability experience
6,857 (1,406) 1,554 (1,163) 3,862 (2,227) 12,273 (4,796)
Adjustment for effect of asset ceiling - - - - - - - - Employer contributions (5,977) (5,949) (1,679) (1,763) (5,352) (6,094) (13,008) (13,806)
Net defined benefit liability (asset) at end of period
144,920 106,309 40,646 34,699 1,110,880 756,090 1,296,446 897,098
Reconciliation of the fair value of fund assets Fair value of fund assets at beginning of period
185,249 166,875 19,504 19,779 908,425 859,885 1,113,178 1,046,539
Interest income 5,292 5,646 540 670 26,649 29,775 32,481 36,091 Actual return on Fund assets less interest income
390 13,264 (90) 1,336 914 67,942 1,214 82,542
Employer contributions 5,977 5,949 1,679 1,763 5,352 6,094 13,008 13,806 Contributions by participants 2,843 2,859 - - 3,332 4,001 6,175 6,860 Benefits paid (11,598) (13,323) (4,778) (4,010) (61,995) (64,175) (78,371) (81,508) Taxes, premiums and expenses paid (1,544) 3,979 (345) (34) 1,762 4,903 (127) 8,848 Transfers in - - - - - - - - Contributions to accumulation section - - - - - - - - Settlements - - - - - - - - Exchange rate changes - - - - - - - -
Fair value of fund assets at end of period
186,609 185,249 16,510 19,504 884,439 908,425 1,087,558 1,113,178
Reconciliation of the defined benefit obligation Present value of defined benefit obligations at beginning of period
291,558 271,146 54,203 53,165 1,664,515 1,534,182 2,010,276 1,858,493
Current service cost 6,192 6,273 2,060 2,229 2,568 7,857 10,820 16,359 Interest cost 8,423 9,262 1,566 1,831 49,477 53,738 59,466 64,831 Contributions by fund participants 2,843 2,859 - - 3,332 4,001 6,175 6,860 Actuarial (gains) losses arising from changes in demographic assumptions
2,931 2,340 (826) 322 71,671 (7,342) 73,776 (4,680)
Actuarial (gains) losses arising from changes in financial assumptions
25,867 10,428 3,722 1,863 260,127 133,578 289,716 145,869
Actuarial (gains) losses arising from liability experience
6,857 (1,406) 1,554 (1,163) 3,862 (2,227) 12,273 (4,796)
Benefits paid (11,598) (13,323) (4,778) (4,010) (61,995) (64,175) (78,371) (81,508) Taxes, premiums and expenses paid (1,544) 3,979 (345) (34) 1,762 4,903 (127) 8,848 Transfers in - - - - - - - - Contributions to accumulation section - - - - - - - - Past service cost - - - - - - - - Settlements - - - - - - - - Exchange rate changes - - - - - - - -
Present value of defined benefit obligations at end of period
331,529 291,558 57,156 54,203 1,995,319 1,664,515 2,384,004 2,010,276
178 Financial statements | Sydney Water Annual Report 2015–16| Sydney Water Annual Report 2015

Sydney Water Corporation – 30 June 2016 Page 43
(b) Defined Benefit Superannuation
The Corporation contributes to three closed defined benefit superannuation schemes in the NSW public sector Pooled Fund. The schemes are:
• State Superannuation Scheme (SSS)
• State Authorities Superannuation Scheme (SASS)
• State Authorities Non-contributory Superannuation Scheme (SANCS).
The Pooled Fund holds in trust the investments of these schemes. The following disclosures in relation to these schemes have been provided by Pillar Administration. Nature of benefits provided by the Fund As these schemes are defined benefit schemes, at least a component of the final benefit is derived from a multiple of member salary and years of membership. Members receive lump sum or pension benefits on retirement, death, disablement and withdrawal. These schemes are closed to new members. The regulatory framework The above schemes in the Pooled Fund are established and governed by the following NSW legislation: Superannuation Act 1916, State Authorities Superannuation Act 1987, State Authorities Non-Contributory Superannuation Scheme Act 1987, and their associated regulations. The schemes in the Pooled Fund are exempt public sector superannuation schemes under the Commonwealth Superannuation Industry (Supervision) Act 1993 (SIS). The SIS Legislation treats exempt public sector superannuation funds as complying funds for concessional taxation and superannuation guarantee purposes. Under a Heads of Government agreement, the NSW Government undertakes to ensure that the Pooled Fund will conform with the principles of the Commonwealth’s retirement incomes policy relating to preservation, vesting and reporting to members and that members’ benefits are adequately protected. The NSW Government prudentially monitors and audits the Pooled Fund and the Trustee Board activities in a manner consistent with the prudential controls of the SIS legislation. These provisions are in addition to other legislative obligations on the Trustee Board and internal processes that monitor the Trustee Board’s adherence to the principles of the Commonwealth’s retirement incomes policy. An actuarial investigation of the Pooled Fund is performed every three years. The last actuarial investigation was performed as at 30 June 2015. The next actuarial investigation will be performed at 30 June 2018. Other entities’ responsibilities for the governance of the Pooled Fund The Pooled Fund’s Trustee is responsible for the governance of the Fund. The Trustee has a legal obligation to act solely in the best interests of fund beneficiaries. The Trustee has the following roles: • Administration of the Fund and payment to the beneficiaries from Fund assets when required in accordance with the Fund rules;
• Management and investment of the Fund assets; and
• Compliance with other applicable regulations.
Risks There are a number of risks to which the Pooled Fund exposes the Corporation. The more significant risks relating to the defined benefits are: • Investment risk – The risk that investment returns will be lower than assumed and the Corporation will need to increase
contributions to offset this shortfall.
• Longevity risk – The risk that pensioners live longer than assumed, increasing future pensions.
• Pension indexation risk – The risk that pensions will increase at a rate greater than assumed, increasing future pensions.
• Salary growth risk – The risk that wages or salaries (on which future benefit amounts for active members will be based) will rise more rapidly than assumed, increasing defined benefit amounts and thereby requiring additional employer contributions.
• Legislative risk – The risk that legislative changes could be made which increase the cost of providing the defined benefits.
The defined benefit Fund assets are invested with independent fund managers and have a diversified asset mix. The Fund has no significant concentration of investment risk or liquidity risk. Significant events There were no Fund amendments, curtailments or settlements during the reporting period.
Sydney Water Corporation – 30 June 2016 Page 44
SASS SANCS SSS Total
2016 2015 2016 2015 2016 2015 2016 2015
$’000 $’000 $’000 $’000 $’000 $’000 $’000 $’000 Reconciliation of the net defined benefit liability (asset) Net defined benefit liability (asset) at beginning of period
106,309 104,271 34,699 33,386 756,090 674,297 897,098 811,954
Current service cost 6,192 6,273 2,060 2,229 2,568 7,857 10,820 16,359 Net interest on the net defined benefit liability (asset)
3,131 3,616 1,026 1,161 22,828 23,963 26,985 28,740
Past service cost - - - - - - - - (Gains)/losses arising from settlements
- - - - - - - -
Actual return on Fund assets less interest income
(390) (13,264) 90 (1,336) (914) (67,942) (1,214) (82,542)
Actuarial (gains) losses arising from changes in demographic assumptions
2,931 2,340 (826) 322 71,671 (7,342) 73,776 (4,680)
Actuarial (gains) losses arising from changes in financial assumptions
25,867 10,428 3,722 1,863 260,127 133,578 289,716 145,869
Actuarial (gains) losses arising from liability experience
6,857 (1,406) 1,554 (1,163) 3,862 (2,227) 12,273 (4,796)
Adjustment for effect of asset ceiling - - - - - - - - Employer contributions (5,977) (5,949) (1,679) (1,763) (5,352) (6,094) (13,008) (13,806)
Net defined benefit liability (asset) at end of period
144,920 106,309 40,646 34,699 1,110,880 756,090 1,296,446 897,098
Reconciliation of the fair value of fund assets Fair value of fund assets at beginning of period
185,249 166,875 19,504 19,779 908,425 859,885 1,113,178 1,046,539
Interest income 5,292 5,646 540 670 26,649 29,775 32,481 36,091 Actual return on Fund assets less interest income
390 13,264 (90) 1,336 914 67,942 1,214 82,542
Employer contributions 5,977 5,949 1,679 1,763 5,352 6,094 13,008 13,806 Contributions by participants 2,843 2,859 - - 3,332 4,001 6,175 6,860 Benefits paid (11,598) (13,323) (4,778) (4,010) (61,995) (64,175) (78,371) (81,508) Taxes, premiums and expenses paid (1,544) 3,979 (345) (34) 1,762 4,903 (127) 8,848 Transfers in - - - - - - - - Contributions to accumulation section - - - - - - - - Settlements - - - - - - - - Exchange rate changes - - - - - - - -
Fair value of fund assets at end of period
186,609 185,249 16,510 19,504 884,439 908,425 1,087,558 1,113,178
Reconciliation of the defined benefit obligation Present value of defined benefit obligations at beginning of period
291,558 271,146 54,203 53,165 1,664,515 1,534,182 2,010,276 1,858,493
Current service cost 6,192 6,273 2,060 2,229 2,568 7,857 10,820 16,359 Interest cost 8,423 9,262 1,566 1,831 49,477 53,738 59,466 64,831 Contributions by fund participants 2,843 2,859 - - 3,332 4,001 6,175 6,860 Actuarial (gains) losses arising from changes in demographic assumptions
2,931 2,340 (826) 322 71,671 (7,342) 73,776 (4,680)
Actuarial (gains) losses arising from changes in financial assumptions
25,867 10,428 3,722 1,863 260,127 133,578 289,716 145,869
Actuarial (gains) losses arising from liability experience
6,857 (1,406) 1,554 (1,163) 3,862 (2,227) 12,273 (4,796)
Benefits paid (11,598) (13,323) (4,778) (4,010) (61,995) (64,175) (78,371) (81,508) Taxes, premiums and expenses paid (1,544) 3,979 (345) (34) 1,762 4,903 (127) 8,848 Transfers in - - - - - - - - Contributions to accumulation section - - - - - - - - Past service cost - - - - - - - - Settlements - - - - - - - - Exchange rate changes - - - - - - - -
Present value of defined benefit obligations at end of period
331,529 291,558 57,156 54,203 1,995,319 1,664,515 2,384,004 2,010,276
178 Financial statements | Sydney Water Annual Report 2015–16 Sydney Water Annual Report 2015–16 | Financial statements 179
Overview
Corporate
governanceC
ustomer at
the heartW
orld class perform
anceH
igh performance
cultureFin
ancial
statemen
tsA
ppendixes
| Sydney Water Annual Report 2015

Sydney Water Corporation – 30 June 2016 Page 45
SASS SANCS SSS Total
2016 2015 2016 2015 2016 2015 2016 2015
$’000 $’000 $’000 $’000 $’000 $’000 $’000 $’000
Reconciliation of the effect of the Asset Ceiling
Adjustment for effect of asset ceiling
ceiling at beginning of period
- - - - - - - -
Change in the effect of the asset
ceiling
- - - - - - - -
Adjustment for effect of asset
ceiling at end of period - - - - - - - -
The adjustment for the effect of any asset ceiling is determined based on the maximum economic benefit available to the Corporation in the form of reductions in future employer contributions. Fair value of fund assets All Pooled Fund assets are invested by SAS Trustee Corporation (STC) at arm’s length through independent fund managers, assets are not separately invested for each entity and it is not possible or appropriate to disaggregate and attribute fund assets to individual entities. As such, the disclosures below relate to total assets of the Pooled Fund:
Quoted prices in active markets for
identical assets
Significant observable inputs
Unobservable inputs
Asset category Total $’000
Level 1 $’000
Level 2 $’000
Level 3 $’000
As at 30 June 2016:
Short term securities 2,050,414 2,044,454 5,960 -
Australian fixed interest 2,720,590 2,724 2,717,865 -
International fixed interest 834,374 (1,358) 835,731 -
Australian equities 9,720,877 9,171,767 549,087 24
International equities 12,093,667 9,026,207 2,078,766 988,694
Property 3,650,267 1,113,253 618,946 1,918,068
Alternatives 7,115,949 470,130 3,122,185 3,523,634
Total 38,186,138 21,827,178 9,928,540 6,430,420
As at 30 June 2015:
Short term securities 2,641,516 95,603 2,545,913 -
Australian fixed interest 2,656,598 958 2,638,759 16,881
International fixed interest 1,003,849 (110) 1,003,959 -
Australian equities 10,406,940 9,898,541 503,999 4,400
International equities 13,111,481 9,963,287 2,585,150 563,044
Property 3,452,609 948,421 718,406 1,785,782
Alternatives 7,170,187 622,102 3,020,225 3,527,860
Total 40,443,180 21,528,802 13,016,411 5,897,967
The percentage invested in each asset class at the reporting date is as follows:
2016 %
2015 %
Short term securities 5.4 6.5
Australian fixed interest 7.1 6.6
International fixed interest 2.2 2.5
Australian equities 25.5 25.7
International equities 31.7 32.4
Property 9.5 8.6
Alternatives 18.6 17.7
100.0 100.0
Sydney Water Corporation – 30 June 2016 Page 46
Additional to the assets disclosed above, at the reporting date the Pooled Fund has provisions for receivables (payables) estimated to be around $2.83 billion (2015: $1.74 billion). This gives total estimated assets of $41.01 billion (2015: $42.2 billion). Level 1 – quoted prices in active markets for identical assets or liabilities. The assets in this level are listed shares and listed unit trusts. Level 2 – inputs other than quoted prices observable for the asset or liability either directly or indirectly. The assets in this level are cash; notes; government, semi-government and corporate bonds; unlisted trusts where quoted prices are available in active markets for identical assets or liabilities. Level 3 – inputs for the asset or liability that are not based on observable market data. The assets in this level are unlisted property, unlisted shares, unlisted infrastructure, distressed debt and hedge funds. Derivatives, including futures and options, can be used by investment managers. However, each manager’s investment mandate clearly states that derivatives may only be used to facilitate efficient cash flow management or to hedge the portfolio against market movements and cannot be used for speculative purposes or gearing of the investment portfolio. As such, managers make limited use of derivatives. Fair value of the fund’s financial instruments The fair value of the Pooled Fund’s total assets as at the reporting date include $189.6 million (2015: $209.2 million) in NSW Government bonds. Of the direct properties owned by the Pooled Fund: • SAS Trustee Corporation occupies part of a property 100% owned by the Pooled Fund with a fair value of $222 million (2015:
$159 million).
• Health Administration Corporation occupies part of a property 50% owned by the Pooled Fund with a fair value of $243 million (2015: $204 million).
Significant actuarial assumptions at the reporting date
2016 2015
Discount rate 1.99% pa 3.03% pa Salary increase rate (excluding promotional increases): 2015-16 - 2.50% pa 2016-17 to 2018-19 2.50% pa 2.50% pa 2019-20 to 2020-21 3.50% pa 3.50% pa 2021-22 to 2024-25 3.00% pa 3.00% pa 2025-26 3.00% pa 3.50% pa Thereafter 3.50% pa 3.50% pa Rate of CPI increase 2015-16 1.50% pa 2.50% pa 2016-17 1.75% pa 2.75% pa 2017-18 2.25% pa 2.75% pa Thereafter 2.50% pa 2.50% pa Pensioner mortality: The pensioner mortality assumptions are as per the 2015 Actuarial investigation of the Pooled Fund. These assumptions are disclosed in the actuarial investigation report available from the Trustee’s website. The report shows the pension mortality rates for each age.
180 Financial statements | Sydney Water Annual Report 2015–16| Sydney Water Annual Report 2015

Sydney Water Corporation – 30 June 2016 Page 45
SASS SANCS SSS Total
2016 2015 2016 2015 2016 2015 2016 2015
$’000 $’000 $’000 $’000 $’000 $’000 $’000 $’000
Reconciliation of the effect of the Asset Ceiling
Adjustment for effect of asset ceiling
ceiling at beginning of period
- - - - - - - -
Change in the effect of the asset
ceiling
- - - - - - - -
Adjustment for effect of asset
ceiling at end of period - - - - - - - -
The adjustment for the effect of any asset ceiling is determined based on the maximum economic benefit available to the Corporation in the form of reductions in future employer contributions. Fair value of fund assets All Pooled Fund assets are invested by SAS Trustee Corporation (STC) at arm’s length through independent fund managers, assets are not separately invested for each entity and it is not possible or appropriate to disaggregate and attribute fund assets to individual entities. As such, the disclosures below relate to total assets of the Pooled Fund:
Quoted prices in active markets for
identical assets
Significant observable inputs
Unobservable inputs
Asset category Total $’000
Level 1 $’000
Level 2 $’000
Level 3 $’000
As at 30 June 2016:
Short term securities 2,050,414 2,044,454 5,960 -
Australian fixed interest 2,720,590 2,724 2,717,865 -
International fixed interest 834,374 (1,358) 835,731 -
Australian equities 9,720,877 9,171,767 549,087 24
International equities 12,093,667 9,026,207 2,078,766 988,694
Property 3,650,267 1,113,253 618,946 1,918,068
Alternatives 7,115,949 470,130 3,122,185 3,523,634
Total 38,186,138 21,827,178 9,928,540 6,430,420
As at 30 June 2015:
Short term securities 2,641,516 95,603 2,545,913 -
Australian fixed interest 2,656,598 958 2,638,759 16,881
International fixed interest 1,003,849 (110) 1,003,959 -
Australian equities 10,406,940 9,898,541 503,999 4,400
International equities 13,111,481 9,963,287 2,585,150 563,044
Property 3,452,609 948,421 718,406 1,785,782
Alternatives 7,170,187 622,102 3,020,225 3,527,860
Total 40,443,180 21,528,802 13,016,411 5,897,967
The percentage invested in each asset class at the reporting date is as follows:
2016 %
2015 %
Short term securities 5.4 6.5
Australian fixed interest 7.1 6.6
International fixed interest 2.2 2.5
Australian equities 25.5 25.7
International equities 31.7 32.4
Property 9.5 8.6
Alternatives 18.6 17.7
100.0 100.0
Sydney Water Corporation – 30 June 2016 Page 46
Additional to the assets disclosed above, at the reporting date the Pooled Fund has provisions for receivables (payables) estimated to be around $2.83 billion (2015: $1.74 billion). This gives total estimated assets of $41.01 billion (2015: $42.2 billion). Level 1 – quoted prices in active markets for identical assets or liabilities. The assets in this level are listed shares and listed unit trusts. Level 2 – inputs other than quoted prices observable for the asset or liability either directly or indirectly. The assets in this level are cash; notes; government, semi-government and corporate bonds; unlisted trusts where quoted prices are available in active markets for identical assets or liabilities. Level 3 – inputs for the asset or liability that are not based on observable market data. The assets in this level are unlisted property, unlisted shares, unlisted infrastructure, distressed debt and hedge funds. Derivatives, including futures and options, can be used by investment managers. However, each manager’s investment mandate clearly states that derivatives may only be used to facilitate efficient cash flow management or to hedge the portfolio against market movements and cannot be used for speculative purposes or gearing of the investment portfolio. As such, managers make limited use of derivatives. Fair value of the fund’s financial instruments The fair value of the Pooled Fund’s total assets as at the reporting date include $189.6 million (2015: $209.2 million) in NSW Government bonds. Of the direct properties owned by the Pooled Fund: • SAS Trustee Corporation occupies part of a property 100% owned by the Pooled Fund with a fair value of $222 million (2015:
$159 million).
• Health Administration Corporation occupies part of a property 50% owned by the Pooled Fund with a fair value of $243 million (2015: $204 million).
Significant actuarial assumptions at the reporting date
2016 2015
Discount rate 1.99% pa 3.03% pa Salary increase rate (excluding promotional increases): 2015-16 - 2.50% pa 2016-17 to 2018-19 2.50% pa 2.50% pa 2019-20 to 2020-21 3.50% pa 3.50% pa 2021-22 to 2024-25 3.00% pa 3.00% pa 2025-26 3.00% pa 3.50% pa Thereafter 3.50% pa 3.50% pa Rate of CPI increase 2015-16 1.50% pa 2.50% pa 2016-17 1.75% pa 2.75% pa 2017-18 2.25% pa 2.75% pa Thereafter 2.50% pa 2.50% pa Pensioner mortality: The pensioner mortality assumptions are as per the 2015 Actuarial investigation of the Pooled Fund. These assumptions are disclosed in the actuarial investigation report available from the Trustee’s website. The report shows the pension mortality rates for each age.
180 Financial statements | Sydney Water Annual Report 2015–16 Sydney Water Annual Report 2015–16 | Financial statements 181
Overview
Corporate
governanceC
ustomer at
the heartW
orld class perform
anceH
igh performance
cultureFin
ancial
statemen
tsA
ppendixes
| Sydney Water Annual Report 2015

Sydney Water Corporation – 30 June 2016 Page 47
Sensitivity analysis The Corporation’s total defined benefit obligation as at the current reporting date under several scenarios is presented below. The total defined benefit obligation disclosed is inclusive of the contribution tax provision which is calculated based on the asset level at the current reporting date. Scenarios A to F relate to sensitivity of the total defined benefit obligation of the Pooled Fund to economic assumptions, and scenarios G and H relate to sensitivity to demographic assumptions.
Base case Scenario A Scenario B -1.0%
discount rate +1.0%
discount rate
Discount rate 1.99% 0.99% 2.99% Rate of CPI increase As above As above As above Salary inflation rate As above As above As above Defined benefit obligation ($’000) 2,384,004 2,778,811 2,068,508
Base case Scenario C Scenario D +0.5% rate of
CPI increase -0.5% rate of CPI increase
Discount rate As above As above As above Above rates Above rates Rate of CPI increase As above plus 0.5% pa less 0.5% pa Salary inflation rate As above As above As above Defined benefit obligation ($’000) 2,384,004 2,553,181 2,230,857
Base case Scenario E Scenario F +0.5% salary
increase rate -0.5% salary
increase rate
Discount rate As above As above As above Rate of CPI increase As above As above As above Above rates Above rates Salary inflation rate As above plus 0.5% pa less 0.5% pa Defined benefit obligation ($’000) 2,384,004 2,399,456 2,369,166
Base case Scenario G Scenario H Higher mortality * Lower mortality **
Defined benefit obligation ($’000) 2,384,004 2,357,763 2,426,002
* Assumes the long term pensioner mortality improvement factors for years post 2021 also apply for years 2016 to 2021. ** Assumes the short term pensioner mortality improvement factors for years 2016 – 2021 also apply for years after 2021. The defined benefit obligation has been recalculated by changing the assumptions as outlined above, whilst retaining all other assumptions. Asset – Liability matching strategies The Trustee monitors its asset-liability risk continuously in setting its investment strategy. It also monitors cash flows to manage liquidity requirements. No explicit asset-liability matching strategy is used by the Trustee.
Sydney Water Corporation – 30 June 2016 Page 48
Funding arrangements Funding arrangements are reviewed at least every three years following the release of the triennial actuarial review and was last reviewed following completion of the triennial review as at 30 June 2015. Contribution rates are set after discussions between the employer, STC and NSW Treasury. Funding positions are reviewed annually and funding arrangements may be adjusted as required after each annual review. (i) Surplus/deficit The following is a summary of the 30 June 2016 and 30 June 2015 financial position of the Fund calculated in accordance with Australian Accounting Standard AAS 25 ‘Financial Reporting by Superannuation Plans’.
SASS SANCS SSS Total
2016 2015 2016 2015 2016 2015 2016 2015 $’000 $’000 $’000 $’000 $’000 $’000 $’000 $’000
Accrued benefits * 231,016 217,447 40,474 37,883 942,660 862,286 1,214,150 1,117,616Net market value of fund assets (186,609) (185,249) (16,510) (19,504) (884,439) (908,425) (1,087,558) (1,113,178)
Net (surplus) deficit 44,407 32,198 23,964 18,379 58,221 (46,139) 126,592 4,438
. * There is no allowance for a contribution tax provision in the accrued benefits figure. Allowance for contribution tax is made when setting the contribution rates
(ii) Contribution recommendations Recommended contribution rates for the Corporation are: Multiple of member contributions 1.9 1.9 - - 1.6 1.6 Percentage of member salary - - 2.50 2.50 - -
(iii) Economic assumptions The economic assumptions adopted for the 30 June 2015 actuarial investigation of the Pooled Fund were: Weighted Average Assumptions: Expected rate of return on Fund assets backing current pension liabilities
7.8% pa
Expected rate of return on Fund assets backing other liabilities
6.8% pa
Expected salary increase rate (excluding promotional salary increases)
3.0% pa to 30 June 2019 then 3.5% pa thereafter
Expected rate of CPI increase
2.5% pa
Expected contributions
SASS SANCS SSS Total
2016 2015 2016 2015 2016 2015 2016 2015 $’000 $’000 $’000 $’000 $’000 $’000 $’000 $’000
Expected employer contributions to be paid in the next report period
5,402 5,433 1,733 1,872 5,331 6,403 12,466 13,708
Maturity profile of defined benefit obligation The weighted average duration of the defined benefit obligation is 14.5 years (2015: 13.5 years).
182 Financial statements | Sydney Water Annual Report 2015–16| Sydney Water Annual Report 2015

Sydney Water Corporation – 30 June 2016 Page 47
Sensitivity analysis The Corporation’s total defined benefit obligation as at the current reporting date under several scenarios is presented below. The total defined benefit obligation disclosed is inclusive of the contribution tax provision which is calculated based on the asset level at the current reporting date. Scenarios A to F relate to sensitivity of the total defined benefit obligation of the Pooled Fund to economic assumptions, and scenarios G and H relate to sensitivity to demographic assumptions.
Base case Scenario A Scenario B -1.0%
discount rate +1.0%
discount rate
Discount rate 1.99% 0.99% 2.99% Rate of CPI increase As above As above As above Salary inflation rate As above As above As above Defined benefit obligation ($’000) 2,384,004 2,778,811 2,068,508
Base case Scenario C Scenario D +0.5% rate of
CPI increase -0.5% rate of CPI increase
Discount rate As above As above As above Above rates Above rates Rate of CPI increase As above plus 0.5% pa less 0.5% pa Salary inflation rate As above As above As above Defined benefit obligation ($’000) 2,384,004 2,553,181 2,230,857
Base case Scenario E Scenario F +0.5% salary
increase rate -0.5% salary
increase rate
Discount rate As above As above As above Rate of CPI increase As above As above As above Above rates Above rates Salary inflation rate As above plus 0.5% pa less 0.5% pa Defined benefit obligation ($’000) 2,384,004 2,399,456 2,369,166
Base case Scenario G Scenario H Higher mortality * Lower mortality **
Defined benefit obligation ($’000) 2,384,004 2,357,763 2,426,002
* Assumes the long term pensioner mortality improvement factors for years post 2021 also apply for years 2016 to 2021. ** Assumes the short term pensioner mortality improvement factors for years 2016 – 2021 also apply for years after 2021. The defined benefit obligation has been recalculated by changing the assumptions as outlined above, whilst retaining all other assumptions. Asset – Liability matching strategies The Trustee monitors its asset-liability risk continuously in setting its investment strategy. It also monitors cash flows to manage liquidity requirements. No explicit asset-liability matching strategy is used by the Trustee.
Sydney Water Corporation – 30 June 2016 Page 48
Funding arrangements Funding arrangements are reviewed at least every three years following the release of the triennial actuarial review and was last reviewed following completion of the triennial review as at 30 June 2015. Contribution rates are set after discussions between the employer, STC and NSW Treasury. Funding positions are reviewed annually and funding arrangements may be adjusted as required after each annual review. (i) Surplus/deficit The following is a summary of the 30 June 2016 and 30 June 2015 financial position of the Fund calculated in accordance with Australian Accounting Standard AAS 25 ‘Financial Reporting by Superannuation Plans’.
SASS SANCS SSS Total
2016 2015 2016 2015 2016 2015 2016 2015 $’000 $’000 $’000 $’000 $’000 $’000 $’000 $’000
Accrued benefits * 231,016 217,447 40,474 37,883 942,660 862,286 1,214,150 1,117,616Net market value of fund assets (186,609) (185,249) (16,510) (19,504) (884,439) (908,425) (1,087,558) (1,113,178)
Net (surplus) deficit 44,407 32,198 23,964 18,379 58,221 (46,139) 126,592 4,438
. * There is no allowance for a contribution tax provision in the accrued benefits figure. Allowance for contribution tax is made when setting the contribution rates
(ii) Contribution recommendations Recommended contribution rates for the Corporation are: Multiple of member contributions 1.9 1.9 - - 1.6 1.6 Percentage of member salary - - 2.50 2.50 - -
(iii) Economic assumptions The economic assumptions adopted for the 30 June 2015 actuarial investigation of the Pooled Fund were: Weighted Average Assumptions: Expected rate of return on Fund assets backing current pension liabilities
7.8% pa
Expected rate of return on Fund assets backing other liabilities
6.8% pa
Expected salary increase rate (excluding promotional salary increases)
3.0% pa to 30 June 2019 then 3.5% pa thereafter
Expected rate of CPI increase
2.5% pa
Expected contributions
SASS SANCS SSS Total
2016 2015 2016 2015 2016 2015 2016 2015 $’000 $’000 $’000 $’000 $’000 $’000 $’000 $’000
Expected employer contributions to be paid in the next report period
5,402 5,433 1,733 1,872 5,331 6,403 12,466 13,708
Maturity profile of defined benefit obligation The weighted average duration of the defined benefit obligation is 14.5 years (2015: 13.5 years).
182 Financial statements | Sydney Water Annual Report 2015–16 Sydney Water Annual Report 2015–16 | Financial statements 183
Overview
Corporate
governanceC
ustomer at
the heartW
orld class perform
anceH
igh performance
cultureFin
ancial
statemen
tsA
ppendixes
| Sydney Water Annual Report 2015

Sydney Water Corporation – 30 June 2016 Page 49
(c) Other provisions Reconciliations of movements in carrying amounts for the current reporting period
Road restoration
$’000
Workers’ compensation self-insurance
$’000
General insurance
$’000
Restoration of leased premises
$’000
Restoration costs from decommissioning
system asset network components
$’000
Carrying amounts at beginning of period
Current 7,218 1,843 838 - 32,340 Non-current - 20,245 3,482 7,993 13,152
7,218 22,088 4,320 7,993 45,492
Movement during the period: Provisions made (reversed)
13,272
1,997
10,739
2,483
19,186
Provisions used (14,391) (1,708) (11,314) (31) (12,453) Unwinding of discount - 424 97 223 242
(1,119) 713 (478) 2,675 6,975
Carrying amounts at end of period Current 6,099 1,812 1,279 65 18,116 Non-current - 20,989 2,563 10,603 34,351
6,099 22,801 3,842 10,668 52,467
Road restoration This provision recognises obligations for payment of road restoration costs to local government councils. Such obligations arise where roads need to be restored to their original condition at the completion of construction or maintenance activity. There is uncertainty in relation to the amount and timing of payment and the Corporation’s estimates are based on past experience of works undertaken. Road restoration costs are capitalised as part of the cost of an asset that is constructed. Where no asset is created and road restoration costs are incurred, the costs are expensed in profit or loss. Workers’ compensation self-insurance and general insurance These provisions recognise the Corporation’s remaining self-insurance liability for workers’ compensation injury claims prior to 1 March 2007, and its proportion of insured and uninsured claims where the Corporation is liable to pay for damage, costs, loss or injury (other than for workers’ compensation) respectively. These provisions are actuarially calculated on a discounted cash flow basis, using information including estimates of the probable cost of each claim, the type of injuries and claims, potential recoveries and industry wide experience. The workers’ compensation liability also includes an estimate for incurred but not reported claims based on past experience, and is based on a likelihood of adequacy of 50%. There is uncertainty about a number of factors such as probable costs, discount rates, settlement period, the likelihood of adequacy and estimations of future claims, and claims incurred and not yet reported. In relation to workers’ compensation self-insurance, the actuary has estimated expected recoveries totalling $0.481 million (2015: $0.205 million). These recoveries have not been recognised as an asset as they are not considered to be virtually certain. In relation to general insurance, the amount recognised for covered claims is not greater than the deductible stated on the relevant policy. Restoration of leased premises This provision recognises the Corporation’s obligation to pay restoration costs for leased premises where the Corporation must restore the premises back to their original state at the end of the lease term. Estimates of restoration costs are discounted using the yield on government bonds. The main uncertainty is in relation to the actual restoration costs that will ultimately be incurred. Estimates will also change if there is a change in the discount rate. Restoration costs are separately capitalised against assets that have been acquired as part of leasing the premises, such as fitouts. Where the Corporation has not incurred expenditure to acquire assets as part of leasing the premises, the restoration costs are expensed in profit or loss.
Sydney Water Corporation – 30 June 2016 Page 50
Restoration costs from decommissioning system asset network components This provision recognises the Corporation’s obligation for restoration costs from decommissioning system asset network components, including costs of dismantling, decommissioning, removing a system asset network component and restoring the site on which it was located. It also includes constructive obligations for rectification works where safety issues have been identified, such as electrical cabling repairs and asbestos removal. Obligations arise when it is known that an asset is being constructed for a temporary period or when a management decision is made to decommission a system asset, or when investigations reveal that safety issues require rectification. The liability is calculated on a discounted cash flow basis, based on government bond yields. Estimates of costs are made on a case by case basis at the reporting date. Estimates are also made in relation to the period over which the system asset network component will be decommissioned, or the constructive obligation is expected to be settled. These estimates are inherently uncertain. Estimates will also change if there is a change in the discount rate. Any changes to the liability that result from changes in the estimated timing or amount of the outflow of economic benefits required to settle the obligation, or a change in the discount rate, are recognised through the asset revaluation reserve to the extent of any existing credit balance, otherwise it is expensed in profit or loss. Any changes to the liability from the unwinding of the discount due to the passage of time is recognised as a finance cost in profit or loss.
Note 13. Deferred Government grant
2016
$’000
2015
$’000
NSW Government capital grant for Housing Acceleration Fund 10,000 10,000
Recognition and measurement Conditional Government grants are recognised in the statement of financial position initially as deferred income when there is reasonable assurance that they will be received and that the Corporation will comply with the conditions attaching to them. They are then transferred to profit or loss as revenue as the conditions are fulfilled, unless they are of a material amount that compensates the Corporation for the cost of a specific identifiable asset or assets, in which case they are recognised in profit or loss as revenue on a systematic basis over the useful life of the asset or assets. During the previous reporting period, the Corporation received a capital grant from the NSW Government towards capital works on stormwater assets in the Green Square development under the Housing Acceleration Fund scheme (Stage 2). This grant has been recognised initially as deferred income and will be subsequently transferred progressively to profit or loss on a systematic and rational basis over the useful lives of the related assets when they are ultimately constructed and begin to depreciate. There were no new capital grants received from the NSW Government in the current reporting period.
Note 14. Dividends payable
Dividends recognised during the period:
Dividend on ordinary shares held by the Corporation’s shareholders and recognised as a liability at 12.31 cents per share (2015: 21.09 cents per share)
389,232
664,024
Under the NTER, the Corporation is not required to maintain a dividend franking account. Dividends paid during the period: Dividend on ordinary shares paid to the Corporation’s shareholders at 21.09 cents per share (2015: 8.00 cents per share)
664,024 252,000
Recognition and measurement A liability for dividends payable is recognised in the reporting period in which the dividend is declared. Dividends are regarded as declared when they are appropriately authorised as no longer at the discretion of the Corporation. This occurs through a formal process whereby the Board recommends the dividend to its voting Shareholder Ministers and the final agreed dividend is accepted and approved by the Shareholder Ministers prior to the end of the reporting period.
184 Financial statements | Sydney Water Annual Report 2015–16| Sydney Water Annual Report 2015
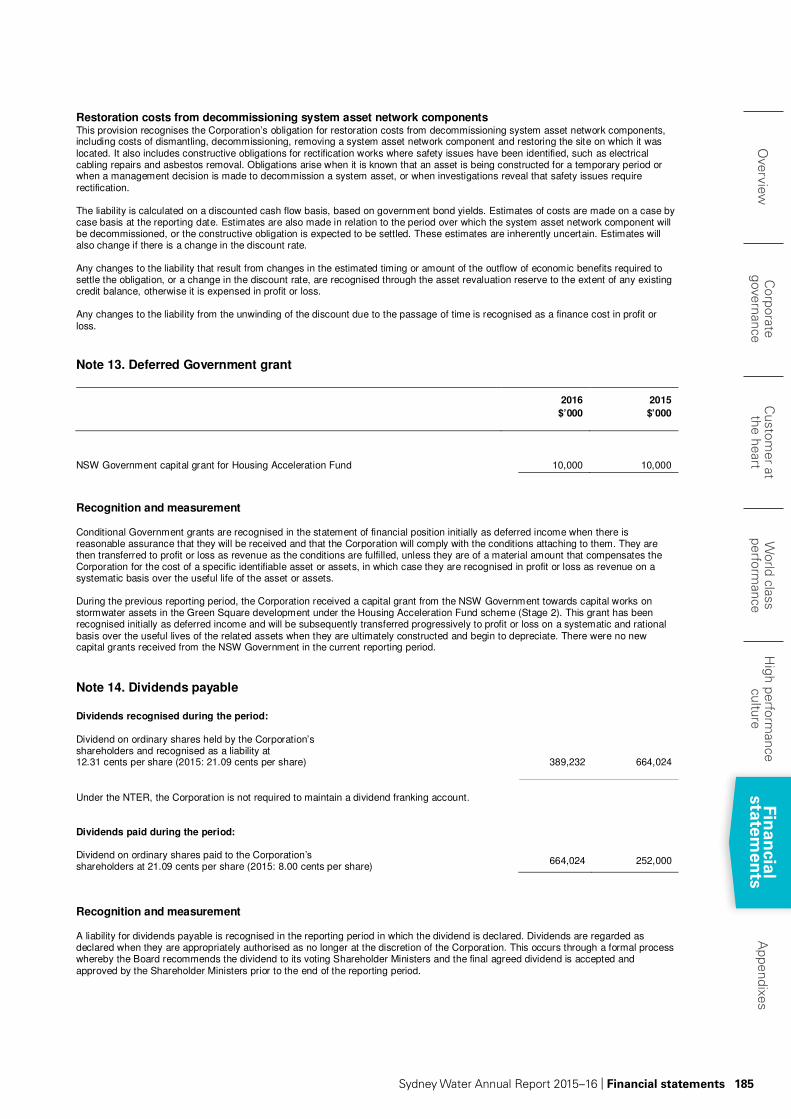
Sydney Water Corporation – 30 June 2016 Page 49
(c) Other provisions Reconciliations of movements in carrying amounts for the current reporting period
Road restoration
$’000
Workers’ compensation self-insurance
$’000
General insurance
$’000
Restoration of leased premises
$’000
Restoration costs from decommissioning
system asset network components
$’000
Carrying amounts at beginning of period
Current 7,218 1,843 838 - 32,340 Non-current - 20,245 3,482 7,993 13,152
7,218 22,088 4,320 7,993 45,492
Movement during the period: Provisions made (reversed)
13,272
1,997
10,739
2,483
19,186
Provisions used (14,391) (1,708) (11,314) (31) (12,453) Unwinding of discount - 424 97 223 242
(1,119) 713 (478) 2,675 6,975
Carrying amounts at end of period Current 6,099 1,812 1,279 65 18,116 Non-current - 20,989 2,563 10,603 34,351
6,099 22,801 3,842 10,668 52,467
Road restoration This provision recognises obligations for payment of road restoration costs to local government councils. Such obligations arise where roads need to be restored to their original condition at the completion of construction or maintenance activity. There is uncertainty in relation to the amount and timing of payment and the Corporation’s estimates are based on past experience of works undertaken. Road restoration costs are capitalised as part of the cost of an asset that is constructed. Where no asset is created and road restoration costs are incurred, the costs are expensed in profit or loss. Workers’ compensation self-insurance and general insurance These provisions recognise the Corporation’s remaining self-insurance liability for workers’ compensation injury claims prior to 1 March 2007, and its proportion of insured and uninsured claims where the Corporation is liable to pay for damage, costs, loss or injury (other than for workers’ compensation) respectively. These provisions are actuarially calculated on a discounted cash flow basis, using information including estimates of the probable cost of each claim, the type of injuries and claims, potential recoveries and industry wide experience. The workers’ compensation liability also includes an estimate for incurred but not reported claims based on past experience, and is based on a likelihood of adequacy of 50%. There is uncertainty about a number of factors such as probable costs, discount rates, settlement period, the likelihood of adequacy and estimations of future claims, and claims incurred and not yet reported. In relation to workers’ compensation self-insurance, the actuary has estimated expected recoveries totalling $0.481 million (2015: $0.205 million). These recoveries have not been recognised as an asset as they are not considered to be virtually certain. In relation to general insurance, the amount recognised for covered claims is not greater than the deductible stated on the relevant policy. Restoration of leased premises This provision recognises the Corporation’s obligation to pay restoration costs for leased premises where the Corporation must restore the premises back to their original state at the end of the lease term. Estimates of restoration costs are discounted using the yield on government bonds. The main uncertainty is in relation to the actual restoration costs that will ultimately be incurred. Estimates will also change if there is a change in the discount rate. Restoration costs are separately capitalised against assets that have been acquired as part of leasing the premises, such as fitouts. Where the Corporation has not incurred expenditure to acquire assets as part of leasing the premises, the restoration costs are expensed in profit or loss.
Sydney Water Corporation – 30 June 2016 Page 50
Restoration costs from decommissioning system asset network components This provision recognises the Corporation’s obligation for restoration costs from decommissioning system asset network components, including costs of dismantling, decommissioning, removing a system asset network component and restoring the site on which it was located. It also includes constructive obligations for rectification works where safety issues have been identified, such as electrical cabling repairs and asbestos removal. Obligations arise when it is known that an asset is being constructed for a temporary period or when a management decision is made to decommission a system asset, or when investigations reveal that safety issues require rectification. The liability is calculated on a discounted cash flow basis, based on government bond yields. Estimates of costs are made on a case by case basis at the reporting date. Estimates are also made in relation to the period over which the system asset network component will be decommissioned, or the constructive obligation is expected to be settled. These estimates are inherently uncertain. Estimates will also change if there is a change in the discount rate. Any changes to the liability that result from changes in the estimated timing or amount of the outflow of economic benefits required to settle the obligation, or a change in the discount rate, are recognised through the asset revaluation reserve to the extent of any existing credit balance, otherwise it is expensed in profit or loss. Any changes to the liability from the unwinding of the discount due to the passage of time is recognised as a finance cost in profit or loss.
Note 13. Deferred Government grant
2016
$’000
2015
$’000
NSW Government capital grant for Housing Acceleration Fund 10,000 10,000
Recognition and measurement Conditional Government grants are recognised in the statement of financial position initially as deferred income when there is reasonable assurance that they will be received and that the Corporation will comply with the conditions attaching to them. They are then transferred to profit or loss as revenue as the conditions are fulfilled, unless they are of a material amount that compensates the Corporation for the cost of a specific identifiable asset or assets, in which case they are recognised in profit or loss as revenue on a systematic basis over the useful life of the asset or assets. During the previous reporting period, the Corporation received a capital grant from the NSW Government towards capital works on stormwater assets in the Green Square development under the Housing Acceleration Fund scheme (Stage 2). This grant has been recognised initially as deferred income and will be subsequently transferred progressively to profit or loss on a systematic and rational basis over the useful lives of the related assets when they are ultimately constructed and begin to depreciate. There were no new capital grants received from the NSW Government in the current reporting period.
Note 14. Dividends payable
Dividends recognised during the period:
Dividend on ordinary shares held by the Corporation’s shareholders and recognised as a liability at 12.31 cents per share (2015: 21.09 cents per share)
389,232
664,024
Under the NTER, the Corporation is not required to maintain a dividend franking account. Dividends paid during the period: Dividend on ordinary shares paid to the Corporation’s shareholders at 21.09 cents per share (2015: 8.00 cents per share)
664,024 252,000
Recognition and measurement A liability for dividends payable is recognised in the reporting period in which the dividend is declared. Dividends are regarded as declared when they are appropriately authorised as no longer at the discretion of the Corporation. This occurs through a formal process whereby the Board recommends the dividend to its voting Shareholder Ministers and the final agreed dividend is accepted and approved by the Shareholder Ministers prior to the end of the reporting period.
184 Financial statements | Sydney Water Annual Report 2015–16 Sydney Water Annual Report 2015–16 | Financial statements 185
Overview
Corporate
governanceC
ustomer at
the heartW
orld class perform
anceH
igh performance
cultureFin
ancial
statemen
tsA
ppendixes
| Sydney Water Annual Report 2015

Sydney Water Corporation – 30 June 2016 Page 51
Equity
Note 15. Share capital
2016
$’000
2015
$’000
Issued and fully paid up share capital (a) Carrying amounts Share capital
3,161,854
3,148,354
(b) Movements during the reporting period
Balance at beginning of period:
3,148,354,000 (2015: 3,148,354,000) ordinary shares 3,148,354 3,148,354 Shares issued and fully paid up during the period: 13,500,000 (2015: Nil) ordinary shares 13,500 - Balance at end of period: 3,161,854,000 (2015: 3,148,354,000) ordinary shares 3,161,854 3,148,354
Significant terms and conditions The Corporation’s two shareholders are: • the Treasurer and Minister for Industrial Relations
• the Minister for Finance, Services and Property.
Each shareholder holds 1,580,927,000 (2015: 1,574,177,000) ordinary shares non-beneficially on behalf of the NSW Government. The shares entitle the NSW Government to a dividend from the Corporation. The amount of the dividend is determined as part of the annual process of negotiating and agreeing the Corporation’s Statement of Corporate Intent with the shareholders. Any changes to the Corporation’s share capital can only be undertaken in accordance with the Corporation’s constitution and with the agreement of its shareholders. During the current reporting period, the Corporation received an equity cash contribution of $13.500 million from its shareholders and issued ordinary shares of an equivalent amount. The purpose of this share capital contribution was to provide the Corporation with funding for works being undertaken under the NSW Government’s Housing Acceleration Fund scheme. There were no equity contributions received or issues of shares in the previous reporting period.
Sydney Water Corporation – 30 June 2016 Page 52
Note 16. Reserves
2016
$’000
2015
$’000
(a) Carrying amounts Asset revaluation reserve 2,176,009 1,561,746
Total reserves 2,176,009 1,561,746
The asset revaluation reserve relates to system and property assets within property, plant and equipment and non-current assets classified as held for sale (prior to their reclassification to current assets), and comprises after-tax revaluation increments and decrements for these assets and any applicable impairment write-downs to recoverable amount on an individual asset basis. (Refer note 4(c)). (b) Movements during the reporting period Asset revaluation reserve Balance at beginning of period 1,561,746 1,307,795 Net gain (loss) before tax on revaluation of system and property assets 888,063 371,928 Transfer from (to) retained earnings 17 (7,381) (6,399) Tax effect of asset revaluation 3(b) (266,419) (111,578)
Balance at end of period 2,176,009 1,561,746
Note 17. Retained earnings
Balance at beginning of period 1,756,427 1,938,250 Profit for period 548,014 513,498 Remeasurement of defined benefit superannuation net liability 2(b), 12(b) (374,552) (53,851) Income tax (expense) revenue on remeasurement of defined benefit
superannuation net liability 3(b)
112,365
16,155
Transfer from (to) asset revaluation reserve 16(b) 7,381 6,399 Dividends recognised as a liability 14 (389,232) (664,024)
Balance at end of period 1,660,403 1,756,427
186 Financial statements | Sydney Water Annual Report 2015–16| Sydney Water Annual Report 2015

Sydney Water Corporation – 30 June 2016 Page 51
Equity
Note 15. Share capital
2016
$’000
2015
$’000
Issued and fully paid up share capital (a) Carrying amounts Share capital
3,161,854
3,148,354
(b) Movements during the reporting period
Balance at beginning of period:
3,148,354,000 (2015: 3,148,354,000) ordinary shares 3,148,354 3,148,354 Shares issued and fully paid up during the period: 13,500,000 (2015: Nil) ordinary shares 13,500 - Balance at end of period: 3,161,854,000 (2015: 3,148,354,000) ordinary shares 3,161,854 3,148,354
Significant terms and conditions The Corporation’s two shareholders are: • the Treasurer and Minister for Industrial Relations
• the Minister for Finance, Services and Property.
Each shareholder holds 1,580,927,000 (2015: 1,574,177,000) ordinary shares non-beneficially on behalf of the NSW Government. The shares entitle the NSW Government to a dividend from the Corporation. The amount of the dividend is determined as part of the annual process of negotiating and agreeing the Corporation’s Statement of Corporate Intent with the shareholders. Any changes to the Corporation’s share capital can only be undertaken in accordance with the Corporation’s constitution and with the agreement of its shareholders. During the current reporting period, the Corporation received an equity cash contribution of $13.500 million from its shareholders and issued ordinary shares of an equivalent amount. The purpose of this share capital contribution was to provide the Corporation with funding for works being undertaken under the NSW Government’s Housing Acceleration Fund scheme. There were no equity contributions received or issues of shares in the previous reporting period.
Sydney Water Corporation – 30 June 2016 Page 52
Note 16. Reserves
2016
$’000
2015
$’000
(a) Carrying amounts Asset revaluation reserve 2,176,009 1,561,746
Total reserves 2,176,009 1,561,746
The asset revaluation reserve relates to system and property assets within property, plant and equipment and non-current assets classified as held for sale (prior to their reclassification to current assets), and comprises after-tax revaluation increments and decrements for these assets and any applicable impairment write-downs to recoverable amount on an individual asset basis. (Refer note 4(c)). (b) Movements during the reporting period Asset revaluation reserve Balance at beginning of period 1,561,746 1,307,795 Net gain (loss) before tax on revaluation of system and property assets 888,063 371,928 Transfer from (to) retained earnings 17 (7,381) (6,399) Tax effect of asset revaluation 3(b) (266,419) (111,578)
Balance at end of period 2,176,009 1,561,746
Note 17. Retained earnings
Balance at beginning of period 1,756,427 1,938,250 Profit for period 548,014 513,498 Remeasurement of defined benefit superannuation net liability 2(b), 12(b) (374,552) (53,851) Income tax (expense) revenue on remeasurement of defined benefit
superannuation net liability 3(b)
112,365
16,155
Transfer from (to) asset revaluation reserve 16(b) 7,381 6,399 Dividends recognised as a liability 14 (389,232) (664,024)
Balance at end of period 1,660,403 1,756,427
186 Financial statements | Sydney Water Annual Report 2015–16 Sydney Water Annual Report 2015–16 | Financial statements 187
Overview
Corporate
governanceC
ustomer at
the heartW
orld class perform
anceH
igh performance
cultureFin
ancial
statemen
tsA
ppendixes
| Sydney Water Annual Report 2015

Sydney Water Corporation – 30 June 2016 Page 53
Unrecognised Items
Note 18. Commitments
2016
$’000
2015
$’000
(a) Capital expenditure commitments The total amount of contractual commitments for capital expenditure (covering both property, plant and equipment and intangible assets) at the reporting date (inclusive of GST) is $724.327 million for the Corporation (2015: $901.050 million). The amount of GST included in this amount that is recoverable from the ATO is $65.848 million (2015: $81.914 million). (b) Operating lease commitments Payable as lessee
Future operating lease rentals not provided for in the financial statements and payable:
Not later than one year 45,679 43,857 Later than one year and not later than five years 164,285 160,229 Later than five years 292,294 350,303
502,258 554,389
Representing: Cancellable operating leases 26,521 18,956 Non-cancellable operating leases 475,737 535,433
` 502,258 554,389
Non-cancellable operating lease rentals are payable: Not later than one year 36,707 36,867 Later than one year and not later than five years 146,760 148,298 Later than five years 292,270 350,268
475,737 535,433
The Corporation leases property and motor vehicles under operating leases. It also has an agreement to obtain recycled water from a plant that is owned and operated by an external party in the Rosehill/Camellia area. This recycled water plant was constructed under a privately financed project (PFP) that is in substance an operating lease for the Corporation in relation to the payments made to obtain the recycled water, which is subsequently sold to a small number of foundation customers for industrial and irrigation purposes. Leases for property generally have terms of one to 10 years’ duration with option periods following, ranging up to 15 years. The only exception is a 99-year ground lease at Homebush that does not expire until 2086. Where no option periods exist under these leases, it is necessary to negotiate a new lease with the owner, who has the right to require vacant possession. Where there are option periods, the option to continue occupation rests with the Corporation alone. The leasing of the Head Office building at 1 Smith Street, Parramatta is by way of an operating lease of 15 years (ending in May 2024) with two 5-year option periods. Leases for motor vehicles are predominantly for terms between two and five years and provide the Corporation with an option to replace at the end of the lease term. The lease agreement involving the recycled water plant at Rosehill/Camellia is for a term of 20 years, extending to 2031-32. Amounts disclosed for these commitments include total GST of $15.912 million (2015: $16.324 million) for the Corporation that is recoverable from the ATO.
Sydney Water Corporation – 30 June 2016 Page 54
2016
$’000
2015
$’000
Receivable as lessor Future operating lease rentals not provided for in the financial statements and receivable:
Not later than one year 13,390 12,783 Later than one year and not later than five years 8,799 7,841 Later than five years 13,996 12,422
36,185 33,046
Operating leases are non-cancellable and are mainly in respect of residential, commercial and industrial properties, open space and space for telecommunication towers. Operating leases are for terms ranging from less than one year to 50 years, with the longest remaining term expiring in 2039. Lease rentals are generally reviewed annually. Amounts disclosed for these commitments include total GST of $3.289 million (2015: $3.004 million) that is payable to the ATO. (c) Finance lease commitments Payable as lessee
Future minimum lease payments payable:
Not later than one year 47,359 15,738 Later than one year and not later than five years 191,689 62,823 Later than five years 559,853 160,046
798,901 238,607
Less future finance costs 417,019 114,347
Finance lease liabilities – present value 381,882 124,260
Current 10,618 3,766 Non-current 371,264 120,494
Financial lease liabilities in statement of financial position 11 381,882 124,260
These finance lease commitments represent the future payments arising from finance leases within the agreements for the Prospect, Macarthur, Illawarra and Woronora Water Filtration Plants. (Refer also note 2(b)). The amounts for the previous reporting period only relate to the finance lease within the Macarthur Water Filtration Plant agreement. These agreements contain a bargain purchase option for the Corporation to acquire the Plants for a nominal value of $1 at the end of the agreements. The discount rate used to derive the net present value of the future lease payments is a ‘real’ pre-tax rate of 7.50% per annum. This is equivalent to a ‘nominal’ pre-tax rate of 10.19% per annum. Amounts disclosed for these commitments do not include GST as they are comprised of principal and interest payments. The additional GST that would be applicable when making these payments and which would be recoverable from the ATO by the Corporation is $79.890 million (2015: $23.861 million).
188 Financial statements | Sydney Water Annual Report 2015–16| Sydney Water Annual Report 2015

Sydney Water Corporation – 30 June 2016 Page 53
Unrecognised Items
Note 18. Commitments
2016
$’000
2015
$’000
(a) Capital expenditure commitments The total amount of contractual commitments for capital expenditure (covering both property, plant and equipment and intangible assets) at the reporting date (inclusive of GST) is $724.327 million for the Corporation (2015: $901.050 million). The amount of GST included in this amount that is recoverable from the ATO is $65.848 million (2015: $81.914 million). (b) Operating lease commitments Payable as lessee
Future operating lease rentals not provided for in the financial statements and payable:
Not later than one year 45,679 43,857 Later than one year and not later than five years 164,285 160,229 Later than five years 292,294 350,303
502,258 554,389
Representing: Cancellable operating leases 26,521 18,956 Non-cancellable operating leases 475,737 535,433
` 502,258 554,389
Non-cancellable operating lease rentals are payable: Not later than one year 36,707 36,867 Later than one year and not later than five years 146,760 148,298 Later than five years 292,270 350,268
475,737 535,433
The Corporation leases property and motor vehicles under operating leases. It also has an agreement to obtain recycled water from a plant that is owned and operated by an external party in the Rosehill/Camellia area. This recycled water plant was constructed under a privately financed project (PFP) that is in substance an operating lease for the Corporation in relation to the payments made to obtain the recycled water, which is subsequently sold to a small number of foundation customers for industrial and irrigation purposes. Leases for property generally have terms of one to 10 years’ duration with option periods following, ranging up to 15 years. The only exception is a 99-year ground lease at Homebush that does not expire until 2086. Where no option periods exist under these leases, it is necessary to negotiate a new lease with the owner, who has the right to require vacant possession. Where there are option periods, the option to continue occupation rests with the Corporation alone. The leasing of the Head Office building at 1 Smith Street, Parramatta is by way of an operating lease of 15 years (ending in May 2024) with two 5-year option periods. Leases for motor vehicles are predominantly for terms between two and five years and provide the Corporation with an option to replace at the end of the lease term. The lease agreement involving the recycled water plant at Rosehill/Camellia is for a term of 20 years, extending to 2031-32. Amounts disclosed for these commitments include total GST of $15.912 million (2015: $16.324 million) for the Corporation that is recoverable from the ATO.
Sydney Water Corporation – 30 June 2016 Page 54
2016
$’000
2015
$’000
Receivable as lessor Future operating lease rentals not provided for in the financial statements and receivable:
Not later than one year 13,390 12,783 Later than one year and not later than five years 8,799 7,841 Later than five years 13,996 12,422
36,185 33,046
Operating leases are non-cancellable and are mainly in respect of residential, commercial and industrial properties, open space and space for telecommunication towers. Operating leases are for terms ranging from less than one year to 50 years, with the longest remaining term expiring in 2039. Lease rentals are generally reviewed annually. Amounts disclosed for these commitments include total GST of $3.289 million (2015: $3.004 million) that is payable to the ATO. (c) Finance lease commitments Payable as lessee
Future minimum lease payments payable:
Not later than one year 47,359 15,738 Later than one year and not later than five years 191,689 62,823 Later than five years 559,853 160,046
798,901 238,607
Less future finance costs 417,019 114,347
Finance lease liabilities – present value 381,882 124,260
Current 10,618 3,766 Non-current 371,264 120,494
Financial lease liabilities in statement of financial position 11 381,882 124,260
These finance lease commitments represent the future payments arising from finance leases within the agreements for the Prospect, Macarthur, Illawarra and Woronora Water Filtration Plants. (Refer also note 2(b)). The amounts for the previous reporting period only relate to the finance lease within the Macarthur Water Filtration Plant agreement. These agreements contain a bargain purchase option for the Corporation to acquire the Plants for a nominal value of $1 at the end of the agreements. The discount rate used to derive the net present value of the future lease payments is a ‘real’ pre-tax rate of 7.50% per annum. This is equivalent to a ‘nominal’ pre-tax rate of 10.19% per annum. Amounts disclosed for these commitments do not include GST as they are comprised of principal and interest payments. The additional GST that would be applicable when making these payments and which would be recoverable from the ATO by the Corporation is $79.890 million (2015: $23.861 million).
188 Financial statements | Sydney Water Annual Report 2015–16 Sydney Water Annual Report 2015–16 | Financial statements 189
Overview
Corporate
governanceC
ustomer at
the heartW
orld class perform
anceH
igh performance
cultureFin
ancial
statemen
tsA
ppendixes
| Sydney Water Annual Report 2015

Sydney Water Corporation – 30 June 2016 Page 55
Note 19. Contingencies
(a) Contingent liabilities Details of contingent liabilities by class are set out below. These are matters in which provisions are not required as it is not probable that a future sacrifice of economic benefits will be required or the amount is not capable of reliable measurement. Litigation There were no claims made against the Corporation in which there is a risk of financial exposure (other than matters covered by workers’ compensation self-insurance and general insurance provisions – refer note 12(c)) and which have been referred to lawyers (2015: $Nil). There are other claims that are in existence at the reporting date but they cannot be reliably measured at this time. In the directors’ opinion, disclosure of any further information would be prejudicial to the interests of the Corporation. Site contamination and licence compliance The Corporation has risk exposures from normal operations in the form of contaminated land/infrastructure and environmental incidents. These risks are managed in conjunction with the Office of Environment and Heritage. There is an ongoing program for management of contamination and its remediation. It is not possible to estimate these contingent liabilities reliably, as the need for and the type of remediation are dependent on future events that cannot be determined at this time. Matters identified in which there is a risk of financial exposure due to matters relating to contamination and environmental incidents amounted to $6.800 million (2015: $6.800 million) Operational activities Risk exposures occur as a result of past or existing contracts or other operational activities. It is not possible to estimate these contingent liabilities reliably as most exposures require clarification of the extent of loss. Matters identified in which there is a risk of financial exposure from operational activities amounted to $3.739 million (2015: $1.039 million). Guarantees provided Under the Workers’ Compensation Act 1987, as the Corporation was a self-insurer until 1 March 2007 and as a state owned corporation was deemed to not have government employer status, the Corporation is required to provide a bank guarantee to the WorkCover Authority that secures the Corporation’s remaining self-insurance workers’ compensation liability. The value of the bank guarantee at the reporting date was $21.883 million (2015: $23.886 million). (Refer also note 11(b)). There are other indemnities that are in existence at the reporting date. However, they are considered remote or not able to be reliably measured at this time.
(b) Contingent assets The Corporation is seeking to recover costs incurred under contractual arrangements through litigation. It is also seeking to settle a number of outstanding insurance claims and recover costs or losses from insurers. In the directors’ opinion, disclosure of any further information about these claims would be prejudicial to the interests of the Corporation and cannot be reliably measured at this time.
Sydney Water Corporation – 30 June 2016 Page 56
Other Notes
Note 20. Financial risk management
(a) Financial instruments and financial risk factors The Corporation has the following financial instruments:
• cash and cash equivalents (refer note 6)
• trade and other receivables (refer note 7)
• trade and other payables (refer note 10)
• borrowings (refer note 11)
• other financial liabilities (refer note 11)
These financial instruments expose the Corporation to a range of financial risks in its normal course of business operations. These risks include liquidity risk, credit risk, market risk (both interest rate risk and foreign currency risk) and regulatory risk. (b) Financial risk exposures Liquidity risk Liquidity risk is the risk that an entity will encounter difficulty in meeting obligations associated with financial liabilities. During the current and previous reporting periods, there were no defaults or breaches on any loans payable. No assets have been pledged as collateral. The Corporation’s exposure to liquidity risk is deemed low based on previous reporting periods’ data and current reassessment of risk. Liquidity risk is managed by the Corporation through the maintenance of extensive short-term and long-term cash flow forecasting models, and through the availability of financial accommodation facilities approved by the NSW Treasurer under the Public Authorities (Financial Arrangements) Act 1987. (Refer note 11(b)) The objective is to maintain a balance of funding and flexibility in ensuring cash is available each day to meet the Corporation’s financial obligations, whilst maintaining a daily bank balance with minimum surplus funds (with a target of between $Nil and $4 million on at least 80% of calendar days). In addition, the Corporation’s treasury management policies limit debt with terms to maturity of less than three months to 30% of total borrowings within the Corporation’s debt portfolio. During the current reporting period, the Corporation’s liquidity risk increased due to the additional funding required to meet commitments under its extensive capital works program, given the Corporation’s revenue levels under its current IPART Pricing Determination. The exposure to this increased liquidity risk was managed by obtaining the approval of the NSW Treasurer to secure appropriate long-term and short-term borrowing facilities with NSW Treasury Corporation, and using the facilities in accordance with approved policies for cash flow management, so that all commitments could be met as and when they fell due. While current liabilities are greater than current assets, the Corporation continues to operate as a going concern. The Corporation derives the majority of its revenue from the operation of its infrastructure assets. (Refer note 4). Credit risk Credit risk is the risk that one party to a financial instrument will cause a financial loss for the other party by failing to discharge an obligation. In this context, it refers to the risk that indebted counterparties will default on their contractual obligations, resulting in financial loss to the Corporation. Exposures to credit risk for the Corporation are primarily in relation to trade and other receivables, but can exist in respect of all financial assets recognised in the statement of financial position, such as cash and cash equivalents, investments in marketable securities and derivative financial instruments (if any). In respect of trade and other receivables, the Corporation monitors balances outstanding on an ongoing basis and has policies in place for the recovery or write-off of amounts outstanding. In respect of cash and cash equivalents, investments in marketable securities and derivative financial instruments (if any), the Corporation only deals with creditworthy counterparties and recognised financial intermediaries as a means of mitigating the risk of financial losses from defaults. Policies are in place to monitor the credit ratings of counterparties and to limit the amount of funds placed with those counterparties, depending on their credit rating. In addition, only highly liquid marketable securities are used for investment purposes. There was no change to the level of credit risk exposure for the Corporation during the current reporting period. At the reporting date, there were no significant concentrations of credit risk in which the Corporation is significantly exposed to any single counterparty or group of counterparties having similar characteristics or similar geographical locations. At the reporting date, the maximum exposure to credit risk for the Corporation is represented by the carrying amount of each financial asset in the statement of financial position. (Refer notes 6 and 7).
190 Financial statements | Sydney Water Annual Report 2015–16| Sydney Water Annual Report 2015

Sydney Water Corporation – 30 June 2016 Page 55
Note 19. Contingencies
(a) Contingent liabilities Details of contingent liabilities by class are set out below. These are matters in which provisions are not required as it is not probable that a future sacrifice of economic benefits will be required or the amount is not capable of reliable measurement. Litigation There were no claims made against the Corporation in which there is a risk of financial exposure (other than matters covered by workers’ compensation self-insurance and general insurance provisions – refer note 12(c)) and which have been referred to lawyers (2015: $Nil). There are other claims that are in existence at the reporting date but they cannot be reliably measured at this time. In the directors’ opinion, disclosure of any further information would be prejudicial to the interests of the Corporation. Site contamination and licence compliance The Corporation has risk exposures from normal operations in the form of contaminated land/infrastructure and environmental incidents. These risks are managed in conjunction with the Office of Environment and Heritage. There is an ongoing program for management of contamination and its remediation. It is not possible to estimate these contingent liabilities reliably, as the need for and the type of remediation are dependent on future events that cannot be determined at this time. Matters identified in which there is a risk of financial exposure due to matters relating to contamination and environmental incidents amounted to $6.800 million (2015: $6.800 million) Operational activities Risk exposures occur as a result of past or existing contracts or other operational activities. It is not possible to estimate these contingent liabilities reliably as most exposures require clarification of the extent of loss. Matters identified in which there is a risk of financial exposure from operational activities amounted to $3.739 million (2015: $1.039 million). Guarantees provided Under the Workers’ Compensation Act 1987, as the Corporation was a self-insurer until 1 March 2007 and as a state owned corporation was deemed to not have government employer status, the Corporation is required to provide a bank guarantee to the WorkCover Authority that secures the Corporation’s remaining self-insurance workers’ compensation liability. The value of the bank guarantee at the reporting date was $21.883 million (2015: $23.886 million). (Refer also note 11(b)). There are other indemnities that are in existence at the reporting date. However, they are considered remote or not able to be reliably measured at this time.
(b) Contingent assets The Corporation is seeking to recover costs incurred under contractual arrangements through litigation. It is also seeking to settle a number of outstanding insurance claims and recover costs or losses from insurers. In the directors’ opinion, disclosure of any further information about these claims would be prejudicial to the interests of the Corporation and cannot be reliably measured at this time.
Sydney Water Corporation – 30 June 2016 Page 56
Other Notes
Note 20. Financial risk management
(a) Financial instruments and financial risk factors The Corporation has the following financial instruments:
• cash and cash equivalents (refer note 6)
• trade and other receivables (refer note 7)
• trade and other payables (refer note 10)
• borrowings (refer note 11)
• other financial liabilities (refer note 11)
These financial instruments expose the Corporation to a range of financial risks in its normal course of business operations. These risks include liquidity risk, credit risk, market risk (both interest rate risk and foreign currency risk) and regulatory risk. (b) Financial risk exposures Liquidity risk Liquidity risk is the risk that an entity will encounter difficulty in meeting obligations associated with financial liabilities. During the current and previous reporting periods, there were no defaults or breaches on any loans payable. No assets have been pledged as collateral. The Corporation’s exposure to liquidity risk is deemed low based on previous reporting periods’ data and current reassessment of risk. Liquidity risk is managed by the Corporation through the maintenance of extensive short-term and long-term cash flow forecasting models, and through the availability of financial accommodation facilities approved by the NSW Treasurer under the Public Authorities (Financial Arrangements) Act 1987. (Refer note 11(b)) The objective is to maintain a balance of funding and flexibility in ensuring cash is available each day to meet the Corporation’s financial obligations, whilst maintaining a daily bank balance with minimum surplus funds (with a target of between $Nil and $4 million on at least 80% of calendar days). In addition, the Corporation’s treasury management policies limit debt with terms to maturity of less than three months to 30% of total borrowings within the Corporation’s debt portfolio. During the current reporting period, the Corporation’s liquidity risk increased due to the additional funding required to meet commitments under its extensive capital works program, given the Corporation’s revenue levels under its current IPART Pricing Determination. The exposure to this increased liquidity risk was managed by obtaining the approval of the NSW Treasurer to secure appropriate long-term and short-term borrowing facilities with NSW Treasury Corporation, and using the facilities in accordance with approved policies for cash flow management, so that all commitments could be met as and when they fell due. While current liabilities are greater than current assets, the Corporation continues to operate as a going concern. The Corporation derives the majority of its revenue from the operation of its infrastructure assets. (Refer note 4). Credit risk Credit risk is the risk that one party to a financial instrument will cause a financial loss for the other party by failing to discharge an obligation. In this context, it refers to the risk that indebted counterparties will default on their contractual obligations, resulting in financial loss to the Corporation. Exposures to credit risk for the Corporation are primarily in relation to trade and other receivables, but can exist in respect of all financial assets recognised in the statement of financial position, such as cash and cash equivalents, investments in marketable securities and derivative financial instruments (if any). In respect of trade and other receivables, the Corporation monitors balances outstanding on an ongoing basis and has policies in place for the recovery or write-off of amounts outstanding. In respect of cash and cash equivalents, investments in marketable securities and derivative financial instruments (if any), the Corporation only deals with creditworthy counterparties and recognised financial intermediaries as a means of mitigating the risk of financial losses from defaults. Policies are in place to monitor the credit ratings of counterparties and to limit the amount of funds placed with those counterparties, depending on their credit rating. In addition, only highly liquid marketable securities are used for investment purposes. There was no change to the level of credit risk exposure for the Corporation during the current reporting period. At the reporting date, there were no significant concentrations of credit risk in which the Corporation is significantly exposed to any single counterparty or group of counterparties having similar characteristics or similar geographical locations. At the reporting date, the maximum exposure to credit risk for the Corporation is represented by the carrying amount of each financial asset in the statement of financial position. (Refer notes 6 and 7).
190 Financial statements | Sydney Water Annual Report 2015–16 Sydney Water Annual Report 2015–16 | Financial statements 191
Overview
Corporate
governanceC
ustomer at
the heartW
orld class perform
anceH
igh performance
cultureFin
ancial
statemen
tsA
ppendixes
| Sydney Water Annual Report 2015

Sydney Water Corporation – 30 June 2016 Page 57
Interest rate risk Interest rate risk is the risk that the fair value or future cash flows of a financial instrument will fluctuate because of changes in market interest rates. The objective in managing interest rate risk is to manage the impact that changes in interest rates will have on the Corporation’s financial outcomes, and thus support the delivery of financial targets contained in the Corporation’s Statement of Corporate Intent. The Corporation is exposed to changes in market interest rates, primarily from the Corporation’s portfolio of interest-bearing short and long-term borrowings. The Corporation manages this exposure by implementing various treasury management policies and controls approved by the Board that are designed to ensure debt maturities are spread across the yield curve. These controls include approved parameters specifying the minimum and maximum percentages of debt issuance in maturity bands, approved parameters limiting the maximum exposure to floating interest rate debt products, portfolio duration and weighted average life management targets and approved trading bands. In addition, the Corporation is able to enter into derivative financial instruments, such as interest rate swaps, to assist in managing interest rate risk (if required). The Corporation regularly analyses its interest rate exposure, giving consideration to potential renewals of existing positions, possible hedging strategies and the appropriate mix of fixed rate, floating variable rate and CPI indexed debt undertaken in light of current and expected conditions in the economy that may affect interest rates. Debt portfolios are constantly repositioned and compared with approved benchmark positions in order to manage the impact of interest rates on finance costs over the long term and to measure portfolio performance. The Corporation’s exposure to interest rate risk at the reporting date increased compared to the previous reporting date due to higher debt levels. However, sustained low official cash rates and longer term bond rates have led to stable debt financing costs. The Corporation’s interest rate exposures are being managed strategically by placing new and maturing debt for fixed maturity periods in fixed and floating rate debt instruments as appropriate in line with parameters approved by the Board under current treasury management policies. Long-term fixed rate and CPI indexed bonds with maturities to 2041 have been issued in order to maintain a high modified duration of the debt portfolio over time. At the reporting date, the debt portfolio was comprised of 64% of fixed rate bond debt and 36% CPI indexed debt. The Corporation’s Treasury Management Policy has been approved by the Board, allowing debt management strategies to manage the financial impact of regulatory risks that occur in the current regulatory pricing environment. (See below under Regulatory risk). The following table details the carrying amounts of financial assets and financial liabilities, including their weighted average interest rates, that are exposed to interest rate risk at the reporting date and that are not designated in cash flow hedges:
Sensitivity analysis The following table shows the effect on profit and equity after tax at the reporting date if nominal interest rates had been 100 basis points (that is, one percentage point) higher or lower than current levels, with all other variables being held constant and taking into account all underlying exposures and related hedges if any. Based on the value of the Australian short-term interest rates (one month Bank Bill Swap Rate – BBSW) at the reporting date of 1.845% (2014: 2.04%), a 100 basis points increase would increase the rate to 2.845% (2015: 3.04%) and a 100 basis points decrease would reduce the rate to 0.845% (2015: 1.04%). This is broadly representative of recent interest rate increases and decreases within a certain range, which is reasonably possible given historical movements in official interest rates by the Reserve Bank of Australia (RBA). Historically, the RBA official cash rate has fluctuated between 4.75% and 1.75% over the past five years.
Weighted average interest rate
Carrying amount
Note 2016 %
2015 %
2016 $,000
2015 $,000
Financial assets
At amortised cost:
Cash 6 1.55 1.80 5,319 5,752
5,319 5,752
Financial liabilities At amortised cost:
Borrowings NSW Treasury corporation loans 11 4.38 5.04 6,778,884 6,158,277 Commonwealth Government loans 11 - 10.20 - 961 Other advances 11 9.67 9.77 221 470 Obligation under Blue Mountains Sewage Transfer Scheme 11 6.25 6.25 53,846 56,010 Finance lease liabilities 11 10.19 10.19 381,882 124,260
7,214,833 6,339,978
Sydney Water Corporation – 30 June 2016 Page 58
Finance Costs Higher (lower)
Post Tax Profit Higher (lower)
Equity Higher (lower)
2016 $’000
2015 $’000
2016 $’000
2015 $’000
2016 $’000
2015 $’000
Judgement of reasonably possible events
Interest rates 100 basis points higher (53) 4,064 37 (2,845) 37 (2,845) Interest rates 100 basis points lower 53 (4,064) (37) 2,845 (37) 2,845 The impact shown above is before capitalisation to qualifying capital assets and any consequential adjustments to fair value. After capitalisation and consequential adjustments to fair value, there would be no impact on finance costs or post tax profit. However, equity would be lower by $0.037 million (2015: $2.845 million lower) for a 100 basis point increase, and vice versa. For the current reporting period shown above, the sensitivity to changes in interest rates at the reporting date relates to the bank account balance only, as no debt was subject to changes in interest rates at the reporting date.
Foreign currency Recognition and measurement Transactions in foreign currencies are translated to Australian Dollars at the foreign exchange rate ruling at the date of the transaction. Monetary assets and liabilities denominated in foreign currencies at the reporting date are translated to Australian Dollars at the foreign exchange rate ruling on that date. Foreign exchange differences arising on translation are recognised in profit or loss. Non-monetary assets and liabilities that are measured in terms of historical cost in a foreign currency are translated using the exchange rate at the date of the transaction. Non-monetary assets and liabilities denominated in foreign currencies that are stated at fair value are translated to Australian Dollars at foreign exchange rates ruling at the dates the fair value was determined. Net foreign exchange gains are classified as other income and net foreign exchange losses are classified as expenses. Foreign currency risk Foreign currency risk is the risk that the fair value or future cash flows of a financial instrument will fluctuate because of changes in foreign exchange rates. The objective in managing foreign currency risk is to minimise the impact that changes in foreign exchange rates will have on the Corporation’s financial outcomes. During the current reporting period, the Corporation’s exposure to foreign currency risk was low. This normally arises from contractual arrangements for the purchase or supply of goods and services where payment is either required to be made in foreign currency or is pegged to foreign currency rates. The policies for management of foreign currency risks for these arrangements are contained in the Corporation’s Treasury Management Policy manual. These policies include hedging of all foreign currency exposures in excess of Australian Dollars (AUD) 1,000,000 and foreign currency exposures above AUD 500,000 that exceed 90 days. The Corporation generally manages foreign exchange exposures by entering into derivative financial instruments in the form of forward foreign exchange contracts to hedge the relevant purchase and sale commitments. It is the Corporation’s policy not to enter into forward foreign exchange contracts until a firm commitment is in place and to negotiate the terms of these cash flow hedging derivatives to match the terms of the hedged item in order to maximise hedge effectiveness. Under forward foreign exchange contracts, the Corporation agrees to exchange specified amounts of various currencies at an agreed future date at a specified exchange rate. Forward foreign exchange contracts can vary in duration from less than one month to several years and they are settled in net terms.
Regulatory risk Regulatory risk is the risk that the Corporation’s actual cost of debt will not be fully compensated through the methodology employed by IPART in determining the Corporation’s prices to be charged to customers. The main components of regulatory risk are real interest rate risk, debt margin risk and inflation risk. Regulatory risk is managed by the Corporation through policies and strategies to hedge the components of regulatory risk. These include strategies that align the debt portfolio structure to IPART’s cost of debt determination methodology. The objective of managing regulatory risk is to ensure that the Corporation’s actual cost of debt does not vary significantly from the cost of debt included by IPART in the regulatory Pricing Determination, and so that this does not impact negatively on financial ratios and the Corporation’s corporate credit rating.
192 Financial statements | Sydney Water Annual Report 2015–16| Sydney Water Annual Report 2015

Sydney Water Corporation – 30 June 2016 Page 57
Interest rate risk Interest rate risk is the risk that the fair value or future cash flows of a financial instrument will fluctuate because of changes in market interest rates. The objective in managing interest rate risk is to manage the impact that changes in interest rates will have on the Corporation’s financial outcomes, and thus support the delivery of financial targets contained in the Corporation’s Statement of Corporate Intent. The Corporation is exposed to changes in market interest rates, primarily from the Corporation’s portfolio of interest-bearing short and long-term borrowings. The Corporation manages this exposure by implementing various treasury management policies and controls approved by the Board that are designed to ensure debt maturities are spread across the yield curve. These controls include approved parameters specifying the minimum and maximum percentages of debt issuance in maturity bands, approved parameters limiting the maximum exposure to floating interest rate debt products, portfolio duration and weighted average life management targets and approved trading bands. In addition, the Corporation is able to enter into derivative financial instruments, such as interest rate swaps, to assist in managing interest rate risk (if required). The Corporation regularly analyses its interest rate exposure, giving consideration to potential renewals of existing positions, possible hedging strategies and the appropriate mix of fixed rate, floating variable rate and CPI indexed debt undertaken in light of current and expected conditions in the economy that may affect interest rates. Debt portfolios are constantly repositioned and compared with approved benchmark positions in order to manage the impact of interest rates on finance costs over the long term and to measure portfolio performance. The Corporation’s exposure to interest rate risk at the reporting date increased compared to the previous reporting date due to higher debt levels. However, sustained low official cash rates and longer term bond rates have led to stable debt financing costs. The Corporation’s interest rate exposures are being managed strategically by placing new and maturing debt for fixed maturity periods in fixed and floating rate debt instruments as appropriate in line with parameters approved by the Board under current treasury management policies. Long-term fixed rate and CPI indexed bonds with maturities to 2041 have been issued in order to maintain a high modified duration of the debt portfolio over time. At the reporting date, the debt portfolio was comprised of 64% of fixed rate bond debt and 36% CPI indexed debt. The Corporation’s Treasury Management Policy has been approved by the Board, allowing debt management strategies to manage the financial impact of regulatory risks that occur in the current regulatory pricing environment. (See below under Regulatory risk). The following table details the carrying amounts of financial assets and financial liabilities, including their weighted average interest rates, that are exposed to interest rate risk at the reporting date and that are not designated in cash flow hedges:
Sensitivity analysis The following table shows the effect on profit and equity after tax at the reporting date if nominal interest rates had been 100 basis points (that is, one percentage point) higher or lower than current levels, with all other variables being held constant and taking into account all underlying exposures and related hedges if any. Based on the value of the Australian short-term interest rates (one month Bank Bill Swap Rate – BBSW) at the reporting date of 1.845% (2014: 2.04%), a 100 basis points increase would increase the rate to 2.845% (2015: 3.04%) and a 100 basis points decrease would reduce the rate to 0.845% (2015: 1.04%). This is broadly representative of recent interest rate increases and decreases within a certain range, which is reasonably possible given historical movements in official interest rates by the Reserve Bank of Australia (RBA). Historically, the RBA official cash rate has fluctuated between 4.75% and 1.75% over the past five years.
Weighted average interest rate
Carrying amount
Note 2016 %
2015 %
2016 $,000
2015 $,000
Financial assets
At amortised cost:
Cash 6 1.55 1.80 5,319 5,752
5,319 5,752
Financial liabilities At amortised cost:
Borrowings NSW Treasury corporation loans 11 4.38 5.04 6,778,884 6,158,277 Commonwealth Government loans 11 - 10.20 - 961 Other advances 11 9.67 9.77 221 470 Obligation under Blue Mountains Sewage Transfer Scheme 11 6.25 6.25 53,846 56,010 Finance lease liabilities 11 10.19 10.19 381,882 124,260
7,214,833 6,339,978
Sydney Water Corporation – 30 June 2016 Page 58
Finance Costs Higher (lower)
Post Tax Profit Higher (lower)
Equity Higher (lower)
2016 $’000
2015 $’000
2016 $’000
2015 $’000
2016 $’000
2015 $’000
Judgement of reasonably possible events
Interest rates 100 basis points higher (53) 4,064 37 (2,845) 37 (2,845) Interest rates 100 basis points lower 53 (4,064) (37) 2,845 (37) 2,845 The impact shown above is before capitalisation to qualifying capital assets and any consequential adjustments to fair value. After capitalisation and consequential adjustments to fair value, there would be no impact on finance costs or post tax profit. However, equity would be lower by $0.037 million (2015: $2.845 million lower) for a 100 basis point increase, and vice versa. For the current reporting period shown above, the sensitivity to changes in interest rates at the reporting date relates to the bank account balance only, as no debt was subject to changes in interest rates at the reporting date.
Foreign currency Recognition and measurement Transactions in foreign currencies are translated to Australian Dollars at the foreign exchange rate ruling at the date of the transaction. Monetary assets and liabilities denominated in foreign currencies at the reporting date are translated to Australian Dollars at the foreign exchange rate ruling on that date. Foreign exchange differences arising on translation are recognised in profit or loss. Non-monetary assets and liabilities that are measured in terms of historical cost in a foreign currency are translated using the exchange rate at the date of the transaction. Non-monetary assets and liabilities denominated in foreign currencies that are stated at fair value are translated to Australian Dollars at foreign exchange rates ruling at the dates the fair value was determined. Net foreign exchange gains are classified as other income and net foreign exchange losses are classified as expenses. Foreign currency risk Foreign currency risk is the risk that the fair value or future cash flows of a financial instrument will fluctuate because of changes in foreign exchange rates. The objective in managing foreign currency risk is to minimise the impact that changes in foreign exchange rates will have on the Corporation’s financial outcomes. During the current reporting period, the Corporation’s exposure to foreign currency risk was low. This normally arises from contractual arrangements for the purchase or supply of goods and services where payment is either required to be made in foreign currency or is pegged to foreign currency rates. The policies for management of foreign currency risks for these arrangements are contained in the Corporation’s Treasury Management Policy manual. These policies include hedging of all foreign currency exposures in excess of Australian Dollars (AUD) 1,000,000 and foreign currency exposures above AUD 500,000 that exceed 90 days. The Corporation generally manages foreign exchange exposures by entering into derivative financial instruments in the form of forward foreign exchange contracts to hedge the relevant purchase and sale commitments. It is the Corporation’s policy not to enter into forward foreign exchange contracts until a firm commitment is in place and to negotiate the terms of these cash flow hedging derivatives to match the terms of the hedged item in order to maximise hedge effectiveness. Under forward foreign exchange contracts, the Corporation agrees to exchange specified amounts of various currencies at an agreed future date at a specified exchange rate. Forward foreign exchange contracts can vary in duration from less than one month to several years and they are settled in net terms.
Regulatory risk Regulatory risk is the risk that the Corporation’s actual cost of debt will not be fully compensated through the methodology employed by IPART in determining the Corporation’s prices to be charged to customers. The main components of regulatory risk are real interest rate risk, debt margin risk and inflation risk. Regulatory risk is managed by the Corporation through policies and strategies to hedge the components of regulatory risk. These include strategies that align the debt portfolio structure to IPART’s cost of debt determination methodology. The objective of managing regulatory risk is to ensure that the Corporation’s actual cost of debt does not vary significantly from the cost of debt included by IPART in the regulatory Pricing Determination, and so that this does not impact negatively on financial ratios and the Corporation’s corporate credit rating.
192 Financial statements | Sydney Water Annual Report 2015–16 Sydney Water Annual Report 2015–16 | Financial statements 193
Overview
Corporate
governanceC
ustomer at
the heartW
orld class perform
anceH
igh performance
cultureFin
ancial
statemen
tsA
ppendixes
| Sydney Water Annual Report 2015

Sydney Water Corporation – 30 June 2016 Page 59
(c) Financial risk management policies, objectives and reporting The risks outlined above are managed centrally by the Corporation’s Treasury Management Unit in its Finance and Corporate Services Division, in accordance with treasury management policies approved by the Board. These policies provide a framework of strict controls to manage the impact of these exposures, within the overall framework of the Public Authorities (Financial Arrangements) Act 1987 in NSW. The policies cover a number of aspects such as: • approved delegation levels and segregation of duties for dealing, authorising and settling treasury management transactions
• approved credit limits for dealing with counterparties
• the types of treasury transactions, including derivatives, that the Corporation can enter into
• approved limits for hedging foreign exchange exposures
• the structure of debt and investment portfolios
• approved benchmarks for managing performance.
Treasury and financial risk management performance is reported to a designated sub-committee of the Board on a quarterly basis. Treasury management strategies and performance are also reported on and reviewed on a monthly basis by a Treasury Committee of senior finance managers. In addition, the NSW Treasury conducts regular reviews of the Corporation’s treasury management activities as to its compliance with the Public Authorities (Financial Arrangements) Act 1987.
(d) Use of derivative financial instruments and hedge accounting The Corporation enters into a small number of derivative financial instruments from time to time, mainly to manage its exposure to certain risks, such as foreign currency risk noted above. Derivative financial instruments are only used for hedging purposes and they are not entered into or traded for speculative purposes. Strict internal guidelines and treasury management policies approved by the Board exist to control the use of derivative financial instruments. There were no derivative financial instruments at either the current or previous reporting date. (e) Capital management The Corporation’s objective when managing capital is to safeguard the Corporation’s ability to continue as a going concern, so that it can continue to provide appropriate returns for its shareholders and benefits for the community within its area of operations. This is achieved by maintaining an optimal capital structure that aims to minimise or reduce the cost of capital, whilst at the same time ensuring the Corporation’s operations and capital works objectives are achieved. The capital structure of the Corporation is monitored on the basis of key performance indicators, which includes: • the level of gearing for the Corporation (see below), and
• its debt to equity ratio.
In determining appropriate prices for the Corporation to charge its customers, IPART, the Corporation’s pricing regulator, has adopted a standard gearing assumption of 60 per cent for the purposes of determining the Corporation’s weighted average cost of capital (WACC). The WACC is a key input in IPART’s regulatory pricing methodology in which a regulated asset base is used to determine the Corporation’s ‘annual revenue requirement’ (and ultimately prices to be charged to customers) based on the efficient use of resources and an appropriate rate of return on capital invested. The table below shows the level of capital employed at the reporting date for the Corporation, as well as financial ratios used in the management of capital based on the definitions within the NSW Treasury’s Commercial Policy Framework.
Note
2016 $’000
2015 $’000
Interest-bearing debt
11
6,779,105
6,159,708
Other interest-bearing liabilities 11 435,728 180,270
Total interest-bearing liabilities 7,214,833 6,339,978
Total equity 6,998,266 6,466,527
Total capital employed 14,213,099 12,806,505
% %
Gearing ratio (Interest-bearing debt / Interest-bearing debt + Total equity) 49.20 48.78 Debt to equity ratio (Total interest-bearing liabilities / Total equity) 103.09 98.04
Syd
ney
Wate
r C
orp
ora
tion –
30 J
une 2
016
P
ag
e 6
0
(f)
Ma
turi
ty a
na
lysis
of
fin
an
cia
l a
ssets
an
d f
ina
ncia
l lia
bilit
ies r
ec
og
nis
ed
in
th
e s
tate
men
t o
f fi
na
nc
ial
po
sit
ion
.
Th
e f
ollo
win
g t
able
s re
flect
the m
atu
rity
band
s fo
r sett
lem
ent
of th
e c
arr
yin
g a
mounts
of
financia
l assets
an
d f
inancia
l lia
bili
ties
recog
nis
ed
in t
he s
tate
ment
of
financia
l p
osi
tion a
t th
e r
ep
ort
ing d
ate
.
Rep
ricin
g o
r m
atu
rin
g i
n:
No
te
Les
s t
ha
n
1 y
ear
1 t
o 2
years
2 t
o 3
ye
ars
3 t
o 4
ye
ars
4 t
o 5
years
M
ore
th
an
5 y
ears
T
ota
l
$’0
00
$’0
00
$’0
00
$’0
00
$’0
00
$’0
00
$’0
00
2016
Fin
an
cia
l a
ss
ets
At
am
ort
ise
d c
ost:
C
ash
6
5,3
19
-
- -
- -
5,3
19
T
rade a
nd o
ther
receiv
ab
les
*
26
9,1
09
-
- -
- -
26
9,1
09
27
4,4
28
-
- -
- -
27
4,4
28
Fin
an
cia
l li
ab
ilit
ies
A
t am
ort
ise
d c
ost:
Tra
de a
nd o
ther
payable
s *
51
4,2
02
-
- -
- -
51
4,2
02
B
orr
ow
ing
s
C
om
mon
wealth g
overn
ment
loan
s 11
-
- -
- -
- -
O
ther
ad
vances
11
18
4
25
12
-
- -
22
1
N
SW
Tre
asury
Corp
ora
tion L
oan
s
11
1,0
43,8
02
275,0
27
59
9,7
30
71
9,0
69
784,7
42
3,3
56,5
14
6,7
78,8
84
O
blig
ation u
nd
er
Blu
e M
ounta
ins
Sew
ag
e T
ransf
er
Sch
em
e
11
-
- -
- -
53,8
46
53,8
46
F
inancia
l le
ase lia
bili
ties
11
-
- -
- -
38
1,8
82
38
1,8
82
1,5
58,1
88
275,0
52
59
9,7
42
71
9,0
69
784,7
42
3,7
92,2
42
7,7
29,0
35
2015
Fin
an
cia
l a
ss
ets
At
am
ort
ise
d c
ost:
C
ash
6
5,7
52
-
- -
- -
5,7
52
T
rade a
nd o
ther
receiv
ab
les
*
25
3,8
55
-
- -
- -
25
3,8
55
25
9,6
07
-
- -
- -
25
9,6
07
F
inan
cia
l li
ab
ilit
ies
At
am
ort
ise
d c
ost:
T
rade a
nd o
ther
payable
s *
50
8,2
35
-
- -
- -
50
8,2
35
B
orr
ow
ing
s
C
om
mon
wealth g
overn
ment
loan
s 11
96
1
- -
- -
- 96
1
O
ther
ad
vances
11
24
9
18
4
25
12
-
- 47
0
N
SW
Tre
asury
Corp
ora
tion L
oan
s
11
1,0
37,3
91
1,0
35,1
55
27
0,7
02
59
0,0
42
665,4
71
2,5
59,5
16
6,1
58,2
77
O
blig
ation u
nd
er
Blu
e M
ounta
ins
Sew
ag
e T
ransf
er
Sch
em
e
11
-
- -
- -
56,0
10
56,0
10
F
inancia
l le
ase lia
bili
ties
11
-
- -
- -
12
4,2
60
12
4,2
60
1,5
46,8
36
1,0
35,3
39
27
0,7
27
59
0,0
54
665,4
71
2,7
39,7
86
6,8
48,2
13
* T
hese b
ala
nces d
iffer
from
the s
tate
men
t of fin
ancia
l po
siti
on a
s th
ey e
xclu
de p
rep
aym
en
ts a
nd
sta
tuto
ry taxes r
eceiv
able
in th
e c
ase o
f tr
ad
e a
nd
oth
er
rece
ivable
s, a
nd
incom
e in
ad
vance a
nd
sta
tuto
ry taxe
s p
ayab
le in
th
e c
ase o
f tr
ad
e a
nd
oth
er
payab
les. Th
ese
ite
ms a
re o
ut o
f sc
op
e in
rela
tion
to th
ese d
iscl
osu
res.
194 Financial statements | Sydney Water Annual Report 2015–16| Sydney Water Annual Report 2015

Sydney Water Corporation – 30 June 2016 Page 59
(c) Financial risk management policies, objectives and reporting The risks outlined above are managed centrally by the Corporation’s Treasury Management Unit in its Finance and Corporate Services Division, in accordance with treasury management policies approved by the Board. These policies provide a framework of strict controls to manage the impact of these exposures, within the overall framework of the Public Authorities (Financial Arrangements) Act 1987 in NSW. The policies cover a number of aspects such as: • approved delegation levels and segregation of duties for dealing, authorising and settling treasury management transactions
• approved credit limits for dealing with counterparties
• the types of treasury transactions, including derivatives, that the Corporation can enter into
• approved limits for hedging foreign exchange exposures
• the structure of debt and investment portfolios
• approved benchmarks for managing performance.
Treasury and financial risk management performance is reported to a designated sub-committee of the Board on a quarterly basis. Treasury management strategies and performance are also reported on and reviewed on a monthly basis by a Treasury Committee of senior finance managers. In addition, the NSW Treasury conducts regular reviews of the Corporation’s treasury management activities as to its compliance with the Public Authorities (Financial Arrangements) Act 1987.
(d) Use of derivative financial instruments and hedge accounting The Corporation enters into a small number of derivative financial instruments from time to time, mainly to manage its exposure to certain risks, such as foreign currency risk noted above. Derivative financial instruments are only used for hedging purposes and they are not entered into or traded for speculative purposes. Strict internal guidelines and treasury management policies approved by the Board exist to control the use of derivative financial instruments. There were no derivative financial instruments at either the current or previous reporting date. (e) Capital management The Corporation’s objective when managing capital is to safeguard the Corporation’s ability to continue as a going concern, so that it can continue to provide appropriate returns for its shareholders and benefits for the community within its area of operations. This is achieved by maintaining an optimal capital structure that aims to minimise or reduce the cost of capital, whilst at the same time ensuring the Corporation’s operations and capital works objectives are achieved. The capital structure of the Corporation is monitored on the basis of key performance indicators, which includes: • the level of gearing for the Corporation (see below), and
• its debt to equity ratio.
In determining appropriate prices for the Corporation to charge its customers, IPART, the Corporation’s pricing regulator, has adopted a standard gearing assumption of 60 per cent for the purposes of determining the Corporation’s weighted average cost of capital (WACC). The WACC is a key input in IPART’s regulatory pricing methodology in which a regulated asset base is used to determine the Corporation’s ‘annual revenue requirement’ (and ultimately prices to be charged to customers) based on the efficient use of resources and an appropriate rate of return on capital invested. The table below shows the level of capital employed at the reporting date for the Corporation, as well as financial ratios used in the management of capital based on the definitions within the NSW Treasury’s Commercial Policy Framework.
Note
2016 $’000
2015 $’000
Interest-bearing debt
11
6,779,105
6,159,708
Other interest-bearing liabilities 11 435,728 180,270
Total interest-bearing liabilities 7,214,833 6,339,978
Total equity 6,998,266 6,466,527
Total capital employed 14,213,099 12,806,505
% %
Gearing ratio (Interest-bearing debt / Interest-bearing debt + Total equity) 49.20 48.78 Debt to equity ratio (Total interest-bearing liabilities / Total equity) 103.09 98.04
Syd
ney
Wate
r C
orp
ora
tion –
30 J
une 2
016
P
ag
e 6
0
(f)
Ma
turi
ty a
na
lysis
of
fin
an
cia
l a
ssets
an
d f
ina
ncia
l lia
bilit
ies r
ec
og
nis
ed
in
th
e s
tate
men
t o
f fi
na
nc
ial
po
sit
ion
.
Th
e f
ollo
win
g t
able
s re
flect
the m
atu
rity
band
s fo
r sett
lem
ent
of th
e c
arr
yin
g a
mounts
of
financia
l assets
an
d f
inancia
l lia
bili
ties
recog
nis
ed
in t
he s
tate
ment
of
financia
l p
osi
tion a
t th
e r
ep
ort
ing d
ate
.
Rep
ricin
g o
r m
atu
rin
g i
n:
No
te
Les
s t
ha
n
1 y
ear
1 t
o 2
years
2 t
o 3
ye
ars
3 t
o 4
ye
ars
4 t
o 5
years
M
ore
th
an
5 y
ears
T
ota
l
$’0
00
$’0
00
$’0
00
$’0
00
$’0
00
$’0
00
$’0
00
2016
Fin
an
cia
l a
ss
ets
At
am
ort
ise
d c
ost:
C
ash
6
5,3
19
-
- -
- -
5,3
19
T
rade a
nd o
ther
receiv
ab
les
*
26
9,1
09
-
- -
- -
26
9,1
09
27
4,4
28
-
- -
- -
27
4,4
28
Fin
an
cia
l li
ab
ilit
ies
A
t am
ort
ise
d c
ost:
Tra
de a
nd o
ther
payable
s *
51
4,2
02
-
- -
- -
51
4,2
02
B
orr
ow
ing
s
C
om
mon
wealth g
overn
ment
loan
s 11
-
- -
- -
- -
O
ther
ad
vances
11
18
4
25
12
-
- -
22
1
N
SW
Tre
asury
Corp
ora
tion L
oan
s
11
1,0
43,8
02
275,0
27
59
9,7
30
71
9,0
69
784,7
42
3,3
56,5
14
6,7
78,8
84
O
blig
ation u
nd
er
Blu
e M
ounta
ins
Sew
ag
e T
ransf
er
Sch
em
e
11
-
- -
- -
53,8
46
53,8
46
F
inancia
l le
ase lia
bili
ties
11
-
- -
- -
38
1,8
82
38
1,8
82
1,5
58,1
88
275,0
52
59
9,7
42
71
9,0
69
784,7
42
3,7
92,2
42
7,7
29,0
35
2015
Fin
an
cia
l a
ss
ets
At
am
ort
ise
d c
ost:
C
ash
6
5,7
52
-
- -
- -
5,7
52
T
rade a
nd o
ther
receiv
ab
les
*
25
3,8
55
-
- -
- -
25
3,8
55
25
9,6
07
-
- -
- -
25
9,6
07
F
inan
cia
l li
ab
ilit
ies
At
am
ort
ise
d c
ost:
T
rade a
nd o
ther
payable
s *
50
8,2
35
-
- -
- -
50
8,2
35
B
orr
ow
ing
s
C
om
mon
wealth g
overn
ment
loan
s 11
96
1
- -
- -
- 96
1
O
ther
ad
vances
11
24
9
18
4
25
12
-
- 47
0
N
SW
Tre
asury
Corp
ora
tion L
oan
s
11
1,0
37,3
91
1,0
35,1
55
27
0,7
02
59
0,0
42
665,4
71
2,5
59,5
16
6,1
58,2
77
O
blig
ation u
nd
er
Blu
e M
ounta
ins
Sew
ag
e T
ransf
er
Sch
em
e
11
-
- -
- -
56,0
10
56,0
10
F
inancia
l le
ase lia
bili
ties
11
-
- -
- -
12
4,2
60
12
4,2
60
1,5
46,8
36
1,0
35,3
39
27
0,7
27
59
0,0
54
665,4
71
2,7
39,7
86
6,8
48,2
13
* T
hese b
ala
nces d
iffer
from
the s
tate
men
t of fin
ancia
l po
siti
on a
s th
ey e
xclu
de p
rep
aym
en
ts a
nd
sta
tuto
ry taxes r
eceiv
able
in th
e c
ase o
f tr
ad
e a
nd
oth
er
rece
ivable
s, a
nd
incom
e in
ad
vance a
nd
sta
tuto
ry taxe
s p
ayab
le in
th
e c
ase o
f tr
ad
e a
nd
oth
er
payab
les. Th
ese
ite
ms a
re o
ut o
f sc
op
e in
rela
tion
to th
ese d
iscl
osu
res.
194 Financial statements | Sydney Water Annual Report 2015–16 Sydney Water Annual Report 2015–16 | Financial statements 195
Overview
Corporate
governanceC
ustomer at
the heartW
orld class perform
anceH
igh performance
cultureFin
ancial
statemen
tsA
ppendixes
| Sydney Water Annual Report 2015

Syd
ney
Wate
r C
orp
ora
tion –
30 J
une 2
016
P
ag
e 6
1
(g)
Co
ntr
actu
al m
atu
riti
es o
f a
ll c
ash
flo
ws f
rom
fin
an
cia
l lia
bilit
ies
Th
e f
ollo
win
g t
able
s re
flect
the m
atu
rity
band
s fo
r all
un
dis
cou
nte
d c
ontr
actu
al p
aym
ents
for
sett
lem
ent,
inclu
din
g r
ep
aym
ents
of
pri
ncip
al an
d inte
rest
, re
sultin
g f
rom
recog
nis
ed f
inancia
l lia
bili
ties
as
at
the r
ep
ort
ing d
ate
. C
ash f
low
s fo
r fin
ancia
l lia
bili
ties
with
out
fixe
d a
mou
nt
or
timin
g a
re b
ased o
n t
he
con
ditio
ns
exi
stin
g a
t th
e r
ep
ort
ing d
ate
.
Rep
ricin
g o
r m
atu
rin
g i
n:
Less t
ha
n
1 y
ear
1 t
o 2
ye
ars
2 t
o 3
years
3 t
o 4
years
4 t
o 5
years
M
ore
th
an
5 y
ears
T
ota
l
$’0
00
$’0
00
$’0
00
$’0
00
$’0
00
$’0
00
$’0
00
2016
At
am
ort
ise
d c
ost:
Tra
de a
nd o
ther
payable
s *
51
4,2
02
-
- -
- -
51
4,2
02
B
orr
ow
ing
s
C
om
mon
wealth g
overn
ment
loan
s
- -
- -
- -
- O
ther
ad
vances
19
7
27
13
-
- -
23
7
N
SW
Tre
asu
ry C
orp
ora
tion L
oan
s
27
0,2
43
29
4,2
99
650,5
29
1,7
87,1
15
1,4
35,9
73
4,1
81,5
77
8,6
19,7
36
O
blig
ation u
nd
er
Blu
e M
ounta
ins
Sew
ag
e T
ransf
er
Sch
em
e
13,2
12
13,7
66
14,3
42
14,9
42
15,5
67
190,4
41
26
2,2
70
F
inancia
l le
ase lia
bili
ties
47,3
60
47,5
59
47,7
74
48,1
05
48,2
50
559,8
53
79
8,9
01
84
5,2
14
35
5,6
51
712,6
58
1,8
50,1
62
1,4
99,7
90
4,9
31,8
71
10,1
95,3
46
2015
A
t am
ort
ise
d c
ost:
T
rade a
nd o
ther
payable
s *
50
8,2
35
-
- -
- -
50
8,2
35
B
orr
ow
ing
s
C
om
mon
wealth g
overn
ment
loans
1,0
36
-
- -
- -
1,0
36
O
ther
ad
vances
28
3
19
7
27
13
- -
52
0
N
SW
Tre
asury
Corp
ora
tion L
oan
s
1,3
25,6
71
1,3
04,4
88
466,6
47
78
5,9
73
813,6
12
3,2
27,8
10
7,9
24,2
01
O
blig
ation u
nd
er
Blu
e M
ounta
ins
Sew
ag
e T
ransf
er
Sch
em
e
13,0
21
13,5
84
14,1
71
14,7
84
15,4
22
214,4
13
28
5,3
95
F
inancia
l le
ase lia
bili
ties
15,7
38
15,6
95
15,6
95
15,6
95
15,7
38
160,0
46
23
8,6
07
1,8
63,9
84
1,3
33,9
64
496,5
40
81
6,4
65
844,7
72
3,6
02,2
69
8,9
57,9
94
* T
hese b
ala
nces d
iffer
from
the s
tate
men
t of fin
ancia
l po
siti
on a
s th
ey e
xclu
de incom
e in
advan
ce a
nd s
tatu
tory
ta
xes p
ayable
. Th
ese
ite
ms a
re o
ut of scop
e in
rela
tion
to these d
isclo
sure
s.
Sydney Water Corporation – 30 June 2016 Page 62
(h) Fair values of financial assets and financial liabilities Fair values of financial assets and financial liabilities are determined on the following bases:
Item Basis of fair value Cash Carrying amount Cash equivalents Discounted cash flows using valuation rates supplied by independent market sources
Investments in marketable securities
Discounted cash flows using valuation rates supplied by independent market sources
Trade and other receivables Carrying amount Derivative financial instruments Valuation rates and valuations supplied by independent market sources Trade and other payables Carrying amount
Bank overdraft balances Carrying amount NSW Treasury Corporation loans Discounted cash flows using valuation rates supplied by independent market sources
All other loans Discounted cash flows using equivalent interest rate swap rates supplied by independent market sources
Obligation under Blue Mountains Sewage Transfer Scheme
Discounted cash flows using equivalent interest rate swap rates supplied by independent market sources
Finance lease liabilities Discounted cash flows using the independently determined yield at the inception of the lease
The following table details the carrying amounts and fair values at the reporting date for all financial instruments:
Carrying amount
Fair Value Note 2016 2015 2016 2015 $’000 $’000 $’000 $’000
Financial assets
Cash 6 5,319 5,752 5,319 5,752 Trade and other receivables * 269,109 253,855 269,109 253,855
274,428 259,607 274,428 259,607
Financial liabilities Trade and other payables * 514,202 508,235 514,202 508,235 Borrowings: Commonwealth government loans 11 - 961 - 1,020 Other advances 11 221 470 235 509 NSW Treasury Corporation Loans 11 6,778,884 6,158,277 7,570,078 6,903,174 Obligation under Blue Mountains Sewage Transfer Scheme 11 53,846 56,010 181,468 184,637 Financial lease liabilities 11 381,882 124,260 381,882 124,260
7,729,035 6,848,213 8,647,865 7,721,835
* These balances differ from the statement of financial position as they exclude prepayments and statutory taxes receivable in the case of trade and other receivables, and income in advance and statutory taxes payable in the case of trade and other payables. These items are out of scope in relation to these disclosures.
The face value of NSW Treasury Corporation loans at the reporting date is $7,133.307 million (2015: $6,168.542 million). The carrying amount shown above for Other advances, and in the previous reporting period also for Commonwealth Government loans, is equal to their face value.
Fair value hierarchy There were no financial instruments at either the current or previous reporting date that were carried in the statement of financial position at fair value determined by any of the three valuation methods defined in note 4(d).
196 Financial statements | Sydney Water Annual Report 2015–16| Sydney Water Annual Report 2015

Sydney Water Corporation – 30 June 2016 Page 62
(h) Fair values of financial assets and financial liabilities Fair values of financial assets and financial liabilities are determined on the following bases:
Item Basis of fair value Cash Carrying amount Cash equivalents Discounted cash flows using valuation rates supplied by independent market sources
Investments in marketable securities
Discounted cash flows using valuation rates supplied by independent market sources
Trade and other receivables Carrying amount Derivative financial instruments Valuation rates and valuations supplied by independent market sources Trade and other payables Carrying amount
Bank overdraft balances Carrying amount NSW Treasury Corporation loans Discounted cash flows using valuation rates supplied by independent market sources
All other loans Discounted cash flows using equivalent interest rate swap rates supplied by independent market sources
Obligation under Blue Mountains Sewage Transfer Scheme
Discounted cash flows using equivalent interest rate swap rates supplied by independent market sources
Finance lease liabilities Discounted cash flows using the independently determined yield at the inception of the lease
The following table details the carrying amounts and fair values at the reporting date for all financial instruments:
Carrying amount
Fair Value Note 2016 2015 2016 2015 $’000 $’000 $’000 $’000
Financial assets
Cash 6 5,319 5,752 5,319 5,752 Trade and other receivables * 269,109 253,855 269,109 253,855
274,428 259,607 274,428 259,607
Financial liabilities Trade and other payables * 514,202 508,235 514,202 508,235 Borrowings: Commonwealth government loans 11 - 961 - 1,020 Other advances 11 221 470 235 509 NSW Treasury Corporation Loans 11 6,778,884 6,158,277 7,570,078 6,903,174 Obligation under Blue Mountains Sewage Transfer Scheme 11 53,846 56,010 181,468 184,637 Financial lease liabilities 11 381,882 124,260 381,882 124,260
7,729,035 6,848,213 8,647,865 7,721,835
* These balances differ from the statement of financial position as they exclude prepayments and statutory taxes receivable in the case of trade and other receivables, and income in advance and statutory taxes payable in the case of trade and other payables. These items are out of scope in relation to these disclosures.
The face value of NSW Treasury Corporation loans at the reporting date is $7,133.307 million (2015: $6,168.542 million). The carrying amount shown above for Other advances, and in the previous reporting period also for Commonwealth Government loans, is equal to their face value.
Fair value hierarchy There were no financial instruments at either the current or previous reporting date that were carried in the statement of financial position at fair value determined by any of the three valuation methods defined in note 4(d).
196 Financial statements | Sydney Water Annual Report 2015–16 Sydney Water Annual Report 2015–16 | Financial statements 197
Overview
Corporate
governanceC
ustomer at
the heartW
orld class perform
anceH
igh performance
cultureFin
ancial
statemen
tsA
ppendixes
| Sydney Water Annual Report 2015

Sydney Water Corporation – 30 June 2016 Page 63
Note 21. Related party disclosures The Corporation has related party relationships with key management personnel (refer (a) and (b) below). (a) Key management personnel compensation Key management personnel are those persons having authority and responsibility for planning, directing and controlling the activities of the Corporation, directly or indirectly. This comprises all directors, whether executive or non-executive, and senior executives who lead the various divisions of the Corporation. Key management personnel compensation is as follows:
2016 $’000
2015 $’000
Short-term employee benefits
3,802
3,769
Post-employment benefits 518 545 Other long-term benefits 6 30 Termination benefits 281 -
4,607 4,344
This comprises compensation relating to: Directors:
Executive 735 716 Non-executive 665 607
1,400 1,323
Senior executives 3,207 3,021
4,607 4,344
The above disclosures for senior executives are based on actual payments made for employee benefits during the reporting period. (b) Other transactions with key management personnel and related entities From time to time, key management personnel may purchase goods or services from the Corporation. These purchases are on the same terms and conditions as those entered into by other customers and are trivial or domestic in nature. There were no related party transactions during either the current or previous reporting periods with other entities related to the Corporation’s key management personnel.
Note 22. Consultants
The total amount paid or payable to consultants engaged by the Corporation during the reporting period was $3.254 million (2015: $0.951 million).
Note 23. Auditors' remuneration
The audit fee for the audit of the financial statements by the Audit Office of NSW is $0.460 million (2015: $0.446 million).
Sydney Water Corporation – 30 June 2016 Page 64
Note 24. Accounting Standards and Interpretations issued but not yet effective
At the reporting date, a number of Australian Accounting Standards and Australian Interpretations have been issued by the AASB that are not yet effective and which have not been early adopted by the Corporation. These are listed below:
Standard/interpretation Issued date
Applicable to
periods
beginning on or
after
Applicable
reporting
period
AASB 2014-1 ‘Amendments to Australian Accounting Standards’
Part A: Annual Improvements 2010-2012 and 2011-2013 Cycles, as applicable to AASB
9 ‘Financial Instruments’
Part D: Consequential Amendments arising from AASB 14
June 2014
1 January 2018
1 January 2016
2018-19
2016-17
AASB 14 ‘Regulatory Deferral Accounts’ June 2014 1 January 2016 2016-17
AASB 2014-3 ‘Amendments to Australian Accounting Standards – Accounting for Acquisitions of
Interests in Joint Operations [AASB 1 & AASB 11]’ August 2014 1 January 2016 2016-17
AASB 2014-4 ‘Amendments to Australian Accounting Standards – Clarification of Acceptable Methods
of Depreciation and Amortisation [AASB 116 & AASB 138]’ August 2014 1 January 2016 2016-17
AASB 2014-6 ‘Amendments to Australian Accounting Standards – Agriculture: Bearer Plants [AASB
101, AASB 116, AASB 117, AASB 123, AASB 136, AASB 140 & AASB 141]’ December 2014 1 January 2016 2016-17
AASB 2014-9 ‘Amendments to Australian Accounting Standards – Equity Method in Separate
Financial Statements [AASB 1, AASB 127 & AASB 128]’ December 2014 1 January 2016 2016-17
AASB 2014-10 ‘Amendments to Australian Accounting Standards – Sale or Contribution of Assets
between an Investor and its Associate or Joint Venture [AASB 10 & AASB 128]’ December 2014 1 January 2016 2016-17
AASB 2015-1 ‘Amendments to Australian Accounting Standards – Annual Improvements to Australian
Accounting Standards 2012-2014 Cycle [AASB 1, AASB 2, AASB 3, AASB 5, AASB 7, AASB 11,
AASB 110, AASB 119, AASB 121, AASB 133, AASB 134, AASB 137 & AASB 140]
January 2015 1 January 2016 2016-17
AASB 2015-2 ‘Amendments to Australian Accounting Standards – Disclosure Initiative: Amendments
to AASB 101 [AASB 7, AASB 101, AASB 134 & AASB 1049]’ January 2015 1 January 2016 2016-17
AASB 2015-5 ‘Amendments to Australian Accounting Standards – Investment Entities: Applying the
Consolidation Exception [AASB 10, AASB 12 & AASB 128]’ January 2015 1 January 2016 2016-17
AASB 1056 ‘Superannuation Entities’ June 2014 1 July 2016 2016-17
AASB 2015-6 ‘Amendments to Australian Accounting Standards – Extending Related Party
Disclosures to Not-for-Profit Public Sector Entities [AASB 10, AASB 124 & AASB 1049]’ March 2015 1 July 2016 2016-17
AASB 2015-7 ‘Amendments to Australian Accounting Standards – Fair Value Disclosures of Not-for-
Profit Public Sector Entities [AASB 13] July 2015 1 July 2016 2016-17
AASB 2015-9 ‘Amendments to Australian Accounting Standards – Scope and Application Paragraphs’
[AASB 8, AASB 133 & AASB 1057] November 2015 1 January 2016 2016-17
AASB 2015-10 ‘Amendments to Australian Accounting Standards – Effective Date of Amendments to
AASB 10 and AASB 128’ December 2015 1 January 2016 2016-17
AASB 2009-11 ‘Amendments to Australian Accounting Standards arising from AASB 9 [AASB 1, 3, 4,
5, 7, 101, 102, 108, 112, 118, 121, 127, 128, 131, 132, 136, 139, 1023 & 1038 and Interpretations 10
& 12]’
December 2009 1 January 2017 2017-18
AASB 2010-7 ‘Amendments to Australian Accounting Standards arising from AASB 9 (December
2010) [AASB 1, 3, 4, 5, 7, 101, 102, 108, 112, 118, 120, 121, 127, 128, 131, 132, 136, 137, 139, 1023
& 1038 and Interpretations 2, 5, 10, 12, 19 & 127]
December 2010 1 January 2017 2017-18
AASB 2015-8 ‘Amendments to Australian Accounting Standards – Effective Date of AASB 15’ October 2015 1 January 2017 2017-18
AASB 2016-1 ‘Amendments to Australian Accounting Standards – Recognition of Deferred Tax Assets
for Unrealised Losses [AASB 112] February 2016 1 January 2017 2017-18
AASB 2016-2 ‘Amendments to Australian Accounting Standards – Disclosure Initiative: Amendments
to AASB 107’ March 2016 1 January 2017 2017-18
AASB 2016-4 ‘Amendments to Australian Accounting Standards – Recoverable Amount of Non-Cash-
Generating Specialised Assets of Not-for-Profit Entities’ June 2016 1 January 2017 2017-18
AASB 2014-5 ‘Amendments to Australian Accounting Standards arising from AASB 15’ December 2014 1 January 2018 * 2018-19
AASB 15 ‘Revenue from Contracts with Customers’ December 2014 1 January 2018 * 2018-19
AASB 2016-3 ‘Amendments to Australian Accounting Standards – Clarifications to AASB 15’ May 2016 1 January 2018 2018-19
AASB 9 ‘Financial Instruments’ December 2014 1 January 2018 2018-19
198 Financial statements | Sydney Water Annual Report 2015–16| Sydney Water Annual Report 2015

Sydney Water Corporation – 30 June 2016 Page 63
Note 21. Related party disclosures The Corporation has related party relationships with key management personnel (refer (a) and (b) below). (a) Key management personnel compensation Key management personnel are those persons having authority and responsibility for planning, directing and controlling the activities of the Corporation, directly or indirectly. This comprises all directors, whether executive or non-executive, and senior executives who lead the various divisions of the Corporation. Key management personnel compensation is as follows:
2016 $’000
2015 $’000
Short-term employee benefits
3,802
3,769
Post-employment benefits 518 545 Other long-term benefits 6 30 Termination benefits 281 -
4,607 4,344
This comprises compensation relating to: Directors:
Executive 735 716 Non-executive 665 607
1,400 1,323
Senior executives 3,207 3,021
4,607 4,344
The above disclosures for senior executives are based on actual payments made for employee benefits during the reporting period. (b) Other transactions with key management personnel and related entities From time to time, key management personnel may purchase goods or services from the Corporation. These purchases are on the same terms and conditions as those entered into by other customers and are trivial or domestic in nature. There were no related party transactions during either the current or previous reporting periods with other entities related to the Corporation’s key management personnel.
Note 22. Consultants
The total amount paid or payable to consultants engaged by the Corporation during the reporting period was $3.254 million (2015: $0.951 million).
Note 23. Auditors' remuneration
The audit fee for the audit of the financial statements by the Audit Office of NSW is $0.460 million (2015: $0.446 million).
Sydney Water Corporation – 30 June 2016 Page 64
Note 24. Accounting Standards and Interpretations issued but not yet effective
At the reporting date, a number of Australian Accounting Standards and Australian Interpretations have been issued by the AASB that are not yet effective and which have not been early adopted by the Corporation. These are listed below:
Standard/interpretation Issued date
Applicable to
periods
beginning on or
after
Applicable
reporting
period
AASB 2014-1 ‘Amendments to Australian Accounting Standards’
Part A: Annual Improvements 2010-2012 and 2011-2013 Cycles, as applicable to AASB
9 ‘Financial Instruments’
Part D: Consequential Amendments arising from AASB 14
June 2014
1 January 2018
1 January 2016
2018-19
2016-17
AASB 14 ‘Regulatory Deferral Accounts’ June 2014 1 January 2016 2016-17
AASB 2014-3 ‘Amendments to Australian Accounting Standards – Accounting for Acquisitions of
Interests in Joint Operations [AASB 1 & AASB 11]’ August 2014 1 January 2016 2016-17
AASB 2014-4 ‘Amendments to Australian Accounting Standards – Clarification of Acceptable Methods
of Depreciation and Amortisation [AASB 116 & AASB 138]’ August 2014 1 January 2016 2016-17
AASB 2014-6 ‘Amendments to Australian Accounting Standards – Agriculture: Bearer Plants [AASB
101, AASB 116, AASB 117, AASB 123, AASB 136, AASB 140 & AASB 141]’ December 2014 1 January 2016 2016-17
AASB 2014-9 ‘Amendments to Australian Accounting Standards – Equity Method in Separate
Financial Statements [AASB 1, AASB 127 & AASB 128]’ December 2014 1 January 2016 2016-17
AASB 2014-10 ‘Amendments to Australian Accounting Standards – Sale or Contribution of Assets
between an Investor and its Associate or Joint Venture [AASB 10 & AASB 128]’ December 2014 1 January 2016 2016-17
AASB 2015-1 ‘Amendments to Australian Accounting Standards – Annual Improvements to Australian
Accounting Standards 2012-2014 Cycle [AASB 1, AASB 2, AASB 3, AASB 5, AASB 7, AASB 11,
AASB 110, AASB 119, AASB 121, AASB 133, AASB 134, AASB 137 & AASB 140]
January 2015 1 January 2016 2016-17
AASB 2015-2 ‘Amendments to Australian Accounting Standards – Disclosure Initiative: Amendments
to AASB 101 [AASB 7, AASB 101, AASB 134 & AASB 1049]’ January 2015 1 January 2016 2016-17
AASB 2015-5 ‘Amendments to Australian Accounting Standards – Investment Entities: Applying the
Consolidation Exception [AASB 10, AASB 12 & AASB 128]’ January 2015 1 January 2016 2016-17
AASB 1056 ‘Superannuation Entities’ June 2014 1 July 2016 2016-17
AASB 2015-6 ‘Amendments to Australian Accounting Standards – Extending Related Party
Disclosures to Not-for-Profit Public Sector Entities [AASB 10, AASB 124 & AASB 1049]’ March 2015 1 July 2016 2016-17
AASB 2015-7 ‘Amendments to Australian Accounting Standards – Fair Value Disclosures of Not-for-
Profit Public Sector Entities [AASB 13] July 2015 1 July 2016 2016-17
AASB 2015-9 ‘Amendments to Australian Accounting Standards – Scope and Application Paragraphs’
[AASB 8, AASB 133 & AASB 1057] November 2015 1 January 2016 2016-17
AASB 2015-10 ‘Amendments to Australian Accounting Standards – Effective Date of Amendments to
AASB 10 and AASB 128’ December 2015 1 January 2016 2016-17
AASB 2009-11 ‘Amendments to Australian Accounting Standards arising from AASB 9 [AASB 1, 3, 4,
5, 7, 101, 102, 108, 112, 118, 121, 127, 128, 131, 132, 136, 139, 1023 & 1038 and Interpretations 10
& 12]’
December 2009 1 January 2017 2017-18
AASB 2010-7 ‘Amendments to Australian Accounting Standards arising from AASB 9 (December
2010) [AASB 1, 3, 4, 5, 7, 101, 102, 108, 112, 118, 120, 121, 127, 128, 131, 132, 136, 137, 139, 1023
& 1038 and Interpretations 2, 5, 10, 12, 19 & 127]
December 2010 1 January 2017 2017-18
AASB 2015-8 ‘Amendments to Australian Accounting Standards – Effective Date of AASB 15’ October 2015 1 January 2017 2017-18
AASB 2016-1 ‘Amendments to Australian Accounting Standards – Recognition of Deferred Tax Assets
for Unrealised Losses [AASB 112] February 2016 1 January 2017 2017-18
AASB 2016-2 ‘Amendments to Australian Accounting Standards – Disclosure Initiative: Amendments
to AASB 107’ March 2016 1 January 2017 2017-18
AASB 2016-4 ‘Amendments to Australian Accounting Standards – Recoverable Amount of Non-Cash-
Generating Specialised Assets of Not-for-Profit Entities’ June 2016 1 January 2017 2017-18
AASB 2014-5 ‘Amendments to Australian Accounting Standards arising from AASB 15’ December 2014 1 January 2018 * 2018-19
AASB 15 ‘Revenue from Contracts with Customers’ December 2014 1 January 2018 * 2018-19
AASB 2016-3 ‘Amendments to Australian Accounting Standards – Clarifications to AASB 15’ May 2016 1 January 2018 2018-19
AASB 9 ‘Financial Instruments’ December 2014 1 January 2018 2018-19
198 Financial statements | Sydney Water Annual Report 2015–16 Sydney Water Annual Report 2015–16 | Financial statements 199
Overview
Corporate
governanceC
ustomer at
the heartW
orld class perform
anceH
igh performance
cultureFin
ancial
statemen
tsA
ppendixes
| Sydney Water Annual Report 2015

Sydney Water Corporation – 30 June 2016 Page 65
Standard/interpretation (cont’d) Issued date
Applicable to
periods
beginning on or
after
Applicable
reporting
period
AASB 2014-7 ‘Amendments to Australian Accounting Standards arising from AASB 9 (December
2014)’
December 2014 1 January 2018 2018-19
AASB 2014-8 ‘Amendments to Australian Accounting Standards arising from AASB 9 (December
2014) – Application of AASB 9 (December 2009) and AASB 9 (December 2010) [AASB 9 (December
2009] & AASB 9 (December 2010]’
December 2014 1 January 2018 2018-19
AASB 2016-5 ‘Amendments to Australian Accounting Standards – Classification and Measurement of
Share-based Payment Transactions’ [AASB 2] July 2016 1 January 2018 2018-19
AASB 16 ‘Leases’ February 2016 1 January 2019 2019-20
* The original effective date of reporting periods beginning on or after 1 January 2017 for these standards has been amended to reporting periods beginning on or after 1 January 2018 (ie 2018-19) by AASB 2015-8 issued in October 2015 in the above table. The above Accounting Standards are not expected to have a material impact on the financial results of the Corporation in the reporting period when they become operative, with the exception of AASB 16 ‘Leases’. (See below). Australian Accounting Standard AASB 16 ‘Leases’ When operative, Australian Accounting Standard AASB 16 will require the Corporation to recognise, as a lessee, assets and liabilities for all leases with a term of more than 12 months, unless the underlying asset within those leases is of low value. This will mean that all leases currently classified as operating leases that meet these criteria will result in a right-of-use asset and a corresponding lease liability being recognised in the statement of financial position, similar to the current accounting treatment of finance leases by lessees. Accordingly, these operating leases will no longer be off-balance sheet. The right-of-use asset represents the lessee’s right to use the underlying leased asset and will be measured similar to other non-financial assets (such as property, plant and equipment). Accordingly, this new asset will be depreciated similar to existing finance lease assets. The lease liability represents the lessee’s obligations to make lease payments. The lease liability will be initially measured as the present value of the lease payments that are not paid at that date. The lease payments shall be discounted using the interest rate implicit in the lease or the incremental borrowing rate of the lessee if the first option is not readily available. Lease payments will be dissected into a principal portion and an interest portion, with the principal portion reducing the lease liability over time. This new accounting treatment for leases means that operating lease payments that are currently expensed in profit or loss will be replaced by depreciation of the recognised right-of-use asset and the interest expense incurred on the lease liability. This impact is not able to be measured at the present time as each individual lease would need to be assessed and it is not possible to determine the impact of future leases that have not yet been entered into. However, based on the operating leases existing at the reporting date, assets and liabilities in the range of approximately $300 million to $500 million would be recognised in the statement of financial position for the first time when the Standard becomes operative. End of audited financial statements
200 Financial statements | Sydney Water Annual Report 2015–16| Sydney Water Annual Report 2015

Sydney Water Corporation – 30 June 2016 Page 66
200 Financial statements | Sydney Water Annual Report 2015–16 Sydney Water Annual Report 2015–16 | Financial statements 201
Overview
Corporate
governanceC
ustomer at
the heartW
orld class perform
anceH
igh performance
cultureFin
ancial
statemen
tsA
ppendixes
| Sydney Water Annual Report 2015

Sydney Water Corporation – 30 June 2016 Page 67
Sydney Water Corporation – 30 June 2016 Page 68
202 Financial statements | Sydney Water Annual Report 2015–16| Sydney Water Annual Report 2015
Sydney Water Corporation – 30 June 2016 Page 68
202 Financial statements | Sydney Water Annual Report 2015–16 Sydney Water Annual Report 2015–16 | Financial statements 203
Overview
Corporate
governanceC
ustomer at
the heartW
orld class perform
anceH
igh performance
cultureFin
ancial
statemen
tsA
ppendixes
| Sydney Water Annual Report 2015

Sydney Water Corporation – 30 June 2016 Page 69
204 Financial statements | Sydney Water Annual Report 2015–16| Sydney Water Annual Report 2015

7.Appendixes

Appendix 1: Exemptions from reporting provisions
Table 38: List of annual reporting exemptions
Statutory requirements Statutory references# Comments
Format of financial statements Section 41B(c) PF&AA Exemption from preparing manufacturing, trading and profit and loss statements. Required to prepare an Operating Statement.
Paying accounts
• performance in paying accounts, including action to improve payment performance
Schedule 1 ARSBR Statutory State Owned Corporations are not subject to account payment provisions in section 13 of the Public Finance and Audit Regulation 2015
Time for paying
• reasons for late payment
• interest paid due to late payments
Schedule 1 ARSBR As above
# Reference:PF&AA = Public Finance and Audit Act 1983.ARSBR = Annual Reports (Statutory Bodies) Regulation 2015.
206 Appendixes | Sydney Water Annual Report 2015–16| Sydney Water Annual Report 2015

Appendix 2: Government Information (Public Access) (GIPA)
We received 62 valid applications under the Government Information (Public Access) Act 2009 (GIPA Act) during the 2015–16 financial year. We also decided three applications carried over from 2014–15, allowing for the processing period under the Act.
Out of the 62 valid applications we received, the processing period for 10 applications will extend into 2016–17.
In 2015–16, 53 applications were decided.
• We granted 43 applications in full.
• We partly granted one application, because there were overriding public interest concerns against disclosing some information (as listed in table, section 14 of the GIPA Act).
• We refused four applications because applicants failed to provide the advance deposit for the processing charge.
• One application was for information already publicly available.
• Four applications were for information not held by Sydney Water.
The remaining two applications were withdrawn by the applicant.
Sydney Water aims to proactively make information publicly available on its website, in line with the GIPA Act. We do this by identifying:
• the categories of information people often ask about
• initiatives, developments or projects that we want the public to know about
• important information we’ve produced since the last review
• information that it would be in the public interest for us to disclose.
You can learn more about what information is available and how to access it at sydneywater.com.au/SW/about-us/ourorganisation/Howweprovideinformation/index.htm
206 Appendixes | Sydney Water Annual Report 2015–16 Sydney Water Annual Report 2015–16 | Appendixes 207
Overview
Corporate
governanceC
ustomer at
the heartW
orld class perform
anceH
igh performance
cultureFinancial
statements
Ap
pen
dixes
| Sydney Water Annual Report 2015

Table A: Number of applications by type of applicant and outcome*
Applicant Acc
ess
gra
nte
d in
fu
ll
Acc
ess
gra
nte
d in
par
t
Acc
ess
refu
sed
in f
ull
Info
rmat
ion
no
t h
eld
Info
rmat
ion
alr
ead
y av
aila
ble
Ref
use
to
dea
l wit
h a
pp
licat
ion
Ref
use
to
co
nfi
rm/d
eny
w
het
her
info
rmat
ion
is h
eld
Ap
plic
atio
n w
ith
dra
wn
Media 3 1 0 0 0 0 0 0Members of Parliament 0 0 0 0 0 0 0 0
Private sector business 14 0 0 2 0 2 0 0
Not-for-profit organisations or community groups
0 0 0 0 0 0 0 0
Members of the public (application by legal representative)
17 0 0 2 0 2 0 1
Members of the public (other) 9 0 0 0 1 0 0 1
* More than one decision can be made in respect of a particular access application. If so, a recording must be made in relation to each such decision. This also applies to Table B.
Table B: Number of applications by type of applicant and outcome*
Applicant Acc
ess
gra
nte
d in
fu
ll
Acc
ess
gra
nte
d in
par
t
Acc
ess
refu
sed
in f
ull
Info
rmat
ion
no
t h
eld
Info
rmat
ion
alr
ead
y av
aila
ble
Ref
use
to
dea
l wit
h a
pp
licat
ion
Ref
use
to
co
nfi
rm/d
eny
w
het
her
info
rmat
ion
is h
eld
Ap
plic
atio
n w
ith
dra
wn
Personal information applications* 4 0 0 0 0 0 0 0Access applications (other than personal information applications)
38 1 0 4 1 4 0 2
Access applications that are partly personal information applications and partly other
1 0 0 0 0 0 0 0
* A ‘personal information application’ is an access application for personal information (as defined in clause 4 of Schedule 4 to the Act) about the applicant (the applicant being an individual).
208 Appendixes | Sydney Water Annual Report 2015–16| Sydney Water Annual Report 2015

Table C: Invalid applications
Reason for invalidity Number of applications
Application does not comply with formal requirements (GIPA Act, section 41)
4
Application is for excluded information of the agency (GIPA Act, section 43)
0
Application contravenes restraint order (GIPA Act, section 110) 0Total number of invalid applications received 7Invalid applications that subsequently became valid applications 3
Table D: Conclusive presumption of overriding public interest against disclosure – matters listed in GIPA Act, Schedule 1
Number of times consideration used*
Overriding secrecy laws 0Cabinet information 0Executive Council information 0
Contempt 0Legal professional privilege 1Excluded information 1Documents affecting law enforcement and public safety 0Transport safety 0Adoption 0Care and protection of children 0Ministerial code of conduct 0Aboriginal and environmental heritage 0
* More than one public interest consideration may apply in relation to a particular access application and, if so, each such consideration is to be recorded (but only once per application). This also applies in relation to Table E.
Table E: Other public interest considerations against disclosure – matters listed in table in GIPA Act, section 14
Number of occasions when application
not successful
Responsible and effective government 3Law enforcement and security 0Individual rights, judicial processes and natural justice 1
Business interests of agencies and other persons 2Environment, culture, economy and general matters 0Secrecy provisions 0Exempt documents under interstate Freedom of Information legislation
0
208 Appendixes | Sydney Water Annual Report 2015–16 Sydney Water Annual Report 2015–16 | Appendixes 209
Overview
Corporate
governanceC
ustomer at
the heartW
orld class perform
anceH
igh performance
cultureFinancial
statements
Ap
pen
dixes
| Sydney Water Annual Report 2015

Table F: Timeliness
Number of applications
Decided within the statutory timeframe (20 days plus any extensions)
53
Decided after 35 days (by agreement with applicant) 0Not decided within time (deemed refusal) 0
Total 53
Table G: Number of applications reviewed under Part 5 of the GIPA Act (by type of review and outcome)
Decision varied
Decision upheld Total
Internal review 0 0 0Review by Information Commissioner* 2 0 2Internal review following recommendation under GIPA Act, section 93
0 2 2
Review by NCAT 0 0 0
Total 2 2 4
* The Information Commissioner does not have the authority to vary decisions, but can make recommendations to the original decision-maker. The data in this case indicates that a recommendation to vary or uphold the original decision has been made.
Table H: Applications for review under Part 5 of the GIPA Act (by type of applicant)
Number of applications for review
Applications by access applicants 2Applications by persons to whom information the subject of access application relates (see GIPA Act, section 54)
0
Table I: Applications transferred to other agencies
Number of applications transferred
Agency-initiated transfer 2Applicant-initiated transfer 0
210 Appendixes | Sydney Water Annual Report 2015–16| Sydney Water Annual Report 2015

Appendix 3: Public Interest Disclosures
Public interest disclosures
Number of applications for review
Number of public officials who made public interest disclosures to Sydney Water
1
Number of public interest disclosures received by Sydney Water 1Of the public interest disclosures received, how many were primarily about:
• corrupt conduct
• maladministration
• serious and substantial waste
• government information contravention
• local government pecuniary interest contravention
1
0
0
0
0Number of public interest disclosures that have been finalised in this reporting period22
3
We have an established internal reporting policy to the Managing Director and Executive. We raise staff awareness through:
• the e-learning program delivered annually
• a quarterly integrity update on current issues
• awareness articles in our weekly staff newsletter
• face-to-face training for teams.
Appendix 4: External production costs
We have outsourced some aspects of producing this year’s Annual Report due to limitations with our in-house facilities and resources.
The total estimated expenditure on the external production for the Annual Report 2015-16 is $18,50023.
22 Two of the public interest disclosures finalised during 2015-16 were made in prior reporting years.23 Figure is correct at the time of reporting.
210 Appendixes | Sydney Water Annual Report 2015–16 Sydney Water Annual Report 2015–16 | Appendixes 211
Overview
Corporate
governanceC
ustomer at
the heartW
orld class perform
anceH
igh performance
cultureFinancial
statements
Ap
pen
dixes
| Sydney Water Annual Report 2015

Glossary
A
Acacia pubescens
A vulnerable species of shrub with bright yellow flowers, also known as Downy Wattle.
AdaptWater™
An online climate change analysis tool developed by Sydney Water, the Water Services Association of Australia and Climate Risk Pty Ltd.
Australian Water Association (AWA)
Australia’s membership association for water professionals and organisations.
Average
The sum of scores divided by the total number of results.
B
BillAssist®
Sydney Water’s customer assistance program to help customers with payment difficulties and/or growing debt.
Biosolids
Nutrient-rich, organic waste products that can be used in agriculture, composting and land rehabilitation.
Bypass
Partially treated wastewater discharged from a wastewater treatment plant.
C
Carbon footprint
Sydney Water’s carbon footprint is a result of the greenhouse gas emissions produced by our operations, and in supplying the materials, energy and services that we need to operate.
Catchment
An area of land surrounding a dam or water storage or the area served by a wastewater treatment plant. Rain falling over a water catchment drains to a dam and may contain nutrients, minerals and contaminants collected from the land surfaces. Waste is collected from homes and businesses in wastewater pipes (sewers) within a wastewater catchment and drains by gravity or is pumped to a specific wastewater plant.
Centrepay
A regular payment arrangement that allows customers receiving income support from Centrelink to pay bills through regular deductions from their Centrelink payment.
Conservation
Resource use, management and protection to prevent degrading, depleting or wasting resources, ensuring resources are available for present and future generations.
Culturally and linguistically diverse (CALD)
People who come from a background other than English-speaking Caucasian Australian. Our CALD customers generally have English as a second language.
212 Glossary Sydney Water Annual Report 2015–16
D
Desalination
Process that removes salt from seawater to make it suitable for treating to drinking water standards.
Drinking water
Water treated to comply with the Australian Drinking Water Guidelines 2011 guidelines to the satisfaction of NSW Health.
E
E. coli
A type of bacteria that is nearly always present in the gut of humans and other warm-blooded animals. The presence of E. coli in water indicates faecal contamination, so is an important indicator for public health.
Ecological footprint
Measures the amount of productive land required for Sydney Water uses.
Energy & Water Ombudsman NSW (EWON)
The NSW Government-approved dispute resolution scheme for electricity, gas and water customers in New South Wales.
Environment Protection Authority (EPA)
An independent body that regulates and responds to activities that can affect the health of the NSW environment and its people.
Environment Protection Licences (EPL)
The Environment Protection Authority issues EPLs under the Protection of the Environment Operations Act 1997. Licence conditions prevent and monitor pollution and promote cleaner production through recycling and re-using resources and adhering to best practice.
F
Filtration (water)
A process for removing particles from water by passing it through a porous barrier, such as a screen, membrane, sand or gravel.
G
Greenhouse gas emissions
Gases such as carbon dioxide, methane and nitrous oxide that contribute to the greenhouse effect.
Grevillea caleyi
An endangered species of shrub.
I
Independent Commission Against Corruption (ICAC)
A NSW Government body that investigates and exposes corrupt conduct in the NSW public sector as determined in the Independent Commission Against Corruption Act 1988. ICAC prevents corruption through advice and assistance, and educates the community and public sector about corruption and its effects.
Independent Pricing and Regulatory Tribunal (IPART)
The independent pricing regulator for water, public transport, local government, electricity and gas industries, as well as the licence administrator of water, electricity and gas.
K
Kilolitre
One thousand litres or one tonne of water.
Kilowatt hours (kWh)
A unit of energy equivalent to that transferred or expended in one hour by one kilowatt of power.
212 Glossary Sydney Water Annual Report 2015–16 Sydney Water Annual Report 2015–16 Glossary 213

L
Litre (L)
A measure of liquid volume.
Lost time injury (LTI)
A work-related injury or illness that results in an individual being unable to work on a subsequent scheduled workday or shift.
Lost time injury frequency rate (LTIFR)
The main measure of safety performance in many Australian companies. LTIFR is the number of lost-time injuries multiplied by one million divided by the number of hours worked in the reporting period.
M
Mass
A measure of weight.
Megalitre
One million litres or one thousand tonnes of water.
Minimum
The lowest recorded reading.
Mitigation
The act of lessening or moderating the severity of anything distressing (such as carbon mitigation).
Monitoring
An ongoing testing program to assess potential changes in circumstances.
N
Naturalise
Adding natural features, such as trees and rocks, to improve environmental and social values.
NSW Civil and Administrative Tribunal (NCAT)
NCAT is the specialist tribunal service in NSW dealing with a broad and diverse range of matters, including the administrative review of government decisions.
Nutrients
Compounds that plants and other organisms so they are able to grow. Major plant nutrients are phosphorus and nitrogen.
O
Office of Environment and Heritage (OEH)
The OEH regulates industry; protects and conserves the NSW environment; manages more than 850 national parks and reserves; and protects the natural, cultural and built heritage in NSW.
Operating Licence
This licence, issued under the Sydney Water Act 1994, sets many of our performance standards and is administered by IPART.
P
Pathogens
Disease-causing organisms, such as bacteria, viruses and single-celled parasitic organisms.
PlumbAssist®
A service that helps customers in financial hardship make emergency or essential plumbing repairs.
R
Recycled water
Highly treated wastewater used in industrial processes; for irrigation in agriculture, urban parks and landscapes; and in households for flushing toilets, washing cars and watering gardens. It is not for drinking or personal use.
214 Glossary Sydney Water Annual Report 2015–16

Recycling
Collecting and processing a resource so that it can be re-used.
Regulators
Organisations that set regulations and standards. Sydney Water’s regulators include IPART, the EPA and NSW Health.
Rehabilitate
To restore to good condition.
Renew
To make new, to restore or to make effective for an additional period.
Reservoir
A man-made water storage area. Water is transferred from dams and treatment plants by gravity or pumping stations to reservoirs, which are usually on high land. The water then flows through a system of mains and smaller pipes to our customers.
Revegetate
To grow again as plants do, or to provide with vegetation again.
Riparian land
Land that is next to or surrounds a body of water, including natural wetlands and areas around stormwater assets.
Risk assessment
The process of gathering data and making assessments to estimate the short- and long-term harmful effects on human health or the environment from exposure to hazards from a particular product or activity.
S
Sewage
See Wastewater.
Sewage overflow
See Wastewater overflow.
Sludge
Solid matter removed during wastewater or water treatment, which can be processed into a material that can be beneficially used (see Biosolids).
Staff engagement
The extent to which staff commit to someone or something in their organisation, as well as how hard they work and how long they stay as a result of that commitment.
Stormwater
Rainwater that runs off the land, frequently carrying various forms of pollution such as litter, debris, animal droppings and dissolved chemicals. This untreated water is carried in stormwater channels and discharged directly into creeks, rivers, the harbour and the ocean.
Stormwater system
The system of pipes, canals and other channels used to carry stormwater to bodies of water, such as rivers or oceans. The system does not usually involve treatment.
Streamwatch
A water quality monitoring program formerly run by Sydney Water and the Sydney Catchment Authority, and now transferred to the Australian Museum.
Sustainability Indicators Scorecard
An overview of our sustainability performance based on our goals, which integrate the social, economic and environmental aspects of our performance.
214 Glossary Sydney Water Annual Report 2015–16 Sydney Water Annual Report 2015–16 Glossary 215

T
Tadgell’s Bluebell (Wahlenbergia multicaulis Benth)
An endangered species of herb.
Total recordable injury frequency rate (TRIFR)
TRIFR is the sum of all lost time injuries plus the number of work-related injuries or illnesses requiring medical treatment, per million hours worked.
Trade waste
Industrial or commercial wastewater with significant potential contaminants with limits usually set by agreements.
Trade waste agreements
Agreements between Sydney Water and industrial and commercial customers to restrict the amount of toxic and other potentially harmful substances discharged to the wastewater system.
Treatment (water)
The filtration and disinfection process.
Toxicity
How poisonous or harmful something is.
V
Volume
The size, measure or amount of anything in three dimensions.
W
Waste
Discarded, rejected, unwanted, surplus or abandoned substances. Does not include gas, water, wastewater, beneficially used biosolids or re-used water.
Wastewater
The dirty water that goes down the drains of homes and businesses and into the wastewater system.
Wastewater overflow
A wastewater overflow occurs when wastewater escapes from the wastewater system due to insufficient capacity or a blockage in the pipe.
Wastewater system
The system of pipes and pumping stations that collect and transport wastewater from each property to the wastewater treatment plant.
Wastewater treatment plant
The place where we put wastewater through filtration and other treatment processes. Once the waste is treated we then either discharge it to the environment or recycle it.
Water demand
Total amount of water needed for drinking, agriculture, industry, recreation and gardening. This amount is seasonal and highly influenced by the weather.
Water filtration plant
A treatment plant that improves water quality by removing impurities through filtration.
Water Industry Competition Act 2006 (WICA)
This Act aims to foster competition in the urban water sector.
Water pumping stations
These stations house mechanical pumping equipment used to transport water from lower ground to higher ground through pipes.
216 Glossary Sydney Water Annual Report 2015–16

Water quality
The physical, chemical and biological measures of water.
Water re-use
The use of water more than once, after wastewater has been treated to an appropriate standard and delivered to the point of use.
Water Services Association of Australia (WSAA)
The peak industry body that brings together and supports the Australian urban water industry. Members provide water and wastewater services to more than 16 million Australians and provide services to many of the country’s largest industries and commercial enterprises.
Waterways
All streams, creeks, rivers, estuaries, inlets and harbours.
Wetland
A low-lying area often covered by shallow bodies of water, such as marshes, mangroves, swamps, bogs or billabongs. Rich in biodiversity, wetlands store and filter water and replenish underground water supplies.
216 Glossary Sydney Water Annual Report 2015–16 Sydney Water Annual Report 2015–16 Glossary 217

Statutory information indexAnnual Reports (Statutory Bodies) Act 1984s. 7(1)(a)(i) The financial report Pages 136–201
s. 7(1)(a)(ii) Auditor’s opinion (financial report) Pages 202–204
s. 7(1)(a)(iia) Response to Auditor General’s report Pages 134–135
s. 7(1)(a)(iii) Detailed budget Pages 124–125
s. 9(1) Nature of report of operations:
(a) charter (b) aims and objectives (c) access (d) management and structure (e) summary review of operations (f) legal change
Please refer to individual items listed under Schedule 1 within this Statutory index
s. 9A Letter of submission Page 1
Annual Reports (Statutory Bodies) Regulation 2015Regulation 5 Identification of audited financial statements Pages 134–204Regulation 7 Detailed budget Pages 124–125Regulation 8 (1) Significant matters Pages 124–125Regulation 8 (2)(a) External production costs Page 211Regulation 8 (2)(b) Internet address Back coverRegulation 8 (1)(b)(c) Privacy and Personal Information Protection
Act 1998 Page 65
Regulation 10 Comparison of investment performance Page 126Regulation 11 Comparison of liability management Page 127Regulation 12 Number and remuneration of senior executive Page 115Regulation 14 (2) Content index Pages 221–223Regulation 14 (2) Table of contents Pages 2–3Regulation 16 (2)(a) Annual Report on internet Back coverRegulation 17 (4) Exemptions from reporting Page 206Schedule 1 Charter Page 6Schedule 1 Aims and objectives Pages 6, 9–13Schedule 1 Access Back coverSchedule 1 Management and structure
(including organisation chart) Pages 37–49
Schedule 1 Summary review of operations Pages 9–13; 27–34Schedule 1 Funds granted to non-government community
organisations Page 64
Schedule 1 Social programs Pages 60–61Schedule 1 Legal change Page 80
218 Glossary Sydney Water Annual Report 2015–16

Schedule 1 Economic or other factors Pages 14–16, 25Schedule 1 Management and activities Pages 17–20, 23–34,
53–56, 69–76, 81–84, 109–111, 124–204
Schedule 1 Research and development Pages 85–90Schedule 1 Human resources Pages 116–119Schedule 1 Consultants Page 119Schedule 1 Workforce diversity Pages 108–110,
116–118Schedule 1 Land disposal Page 125Schedule 1 Promotion – overseas travel Pages 120–121Schedule 1 Consumer response Pages 52–54Schedule 1 Payment of accounts Page 206
Schedule 1 Time for payment of accounts Pages 126, 206
Schedule 1 Risk management and insurance activities Pages 78–79
Schedule 1 Controlled entities Not applicable
Schedule 1 Multicultural policies and services program Pages 62–63
Schedule 1 Agreements with Multicultural NSW Not applicable
Schedule 1 Work health and safety Pages 14, 15, 108–109, 112–114
Government Information (Public Access) Act 2009
s. 125 Reports to Parliament Pages 207–210
Heritage Act 1977
s. 169 Heritage delegations Pages 91–92
Independent Pricing and Regulatory Tribunal Act 1992
s. 18 Pricing implementation Pages 129–130
s. 18 Pricing table Pages 131–133
Public Interest Disclosures Act 1994
s. 31 Reports to Parliament Page 211
State Owned Corporations Act 1989
s. 24A (3)(a) Performance against Statement of Corporate Intent Pages 27–31, 124–125
s. 24A (3)(b) Departures from performance targets Pages 124–127
Sydney Water Act 1994
s. 22(6) Special objective statement Pages 93–103
218 Glossary Sydney Water Annual Report 2015–16 Sydney Water Annual Report 2015–16 Glossary 219

Schedule 5(2) Budgetary information Pages 124–125
Schedule 5(3)(a) Specific particulars – research and development Pages 85–90
Schedule 5(3)(b) Specific particulars – human resources Page 118
Schedule 5(3)(c) Specific particulars – consultants Page 119
Schedule 5(3)(d) Specific particulars – equal employment opportunity
Page 116
Schedule 5(3)(e)(i) Specific particulars – promotion Page 66
Schedule 5(3)(e)(ii) Specific particulars – overseas travel Pages 120-121
Schedule 5(3)(f) Specific particulars – consumer response Pages 52-54
Schedule 5(3)(g) Specific particulars – guarantee of service Pages 58-59
Schedule 5(3)(h) Specific particulars – time for payment of accounts Pages 126, 206
Schedule 5(4) Comparison of investment performance Page 126
Schedule 5(5) Comparison of liability management performance Page 127
Threatened Species Conservation Act 1995
s. 70 Threatened species – recovery plans Pages 104-106
220 Glossary Sydney Water Annual Report 2015–16

Index of figures, maps and tables
Figures
Figure 1 Our stakeholders 8
Figure 2 Key statistics 2015–16 9
Figure 3 Our new organisation structure (as at 4 July 2016) 21
Figure 4 Our total income $2.8 billion 27
Figure 5 Our total operating expenditure $1.4 billion 27
Figure 6 Our total asset investment $681 million 28
Figure 7 Our profit after tax $548 million 28
Figure 8 Our historical capital expenditure 29
Figure 9 Our debt and gearing 29
Figure 10 AICD Corporate Governance Framework 36
Figure 11 Sydney Water’s governance structure 37
Figure 12 Sydney Water Executive and organisational chart (as at 30 June 2016) 49
Figure 13 Total number of customer complaints 2011–12 to 2015–16 56
Figure 14 Daily water use in greater Sydney 293 LPD in 2015–16 57
Figure15 Percentage of water tests that met the ADWG 2011 for E. coli in 2015–16 57
Figure 16 Five-year social program expenditure 61
Figure 17 Sydney Water’s carbon footprint trends 2006–07 to 2013–14 76
Figure 18 Total gross greenhouse gas emissions per 1,000 properties 76
Figure 19 Lost time injury frequency rate (LTIFR) for Sydney Water staff and contractors 113
Figure 20 Lost time injury frequency rate and lost time injuries for Sydney Water staff and contractors 114
Figure 21 Total recordable injury frequency rate (TRIFR) for Sydney Water staff and contractors 114
220 Glossary Sydney Water Annual Report 2015–16 Sydney Water Annual Report 2015–16 Glossary 221

Maps
Map 1 Full area of operations 10
Map 2 Water delivery systems 11
Map 3 Wastewater delivery systems 12
Map 4 Stormwater catchment areas 13
Map 5 Sydney Water’s ecological footprint 2010–11 to 2013–14 77
Tables
Table 1 Tier 1 SSM performance, 2015–16 25
Table 2 Summary profit and loss 30
Table 3 Summary balance sheet 30
Table 4 Summary cash flow 31
Table 5 Customer at the heart – balanced sustainability scorecard 32
Table 6 World class performance – balanced sustainability scorecard 33
Table 7 High performance culture – balanced sustainability scorecard 34
Table 8 Board of Directors skills matrix 38
Table 9 Attendance at Board and Committee meetings 2015–16 48
Table 10 Customer at the heart sustainability performance indicators 53
Table 11 Social programs 60
Table 12 CALD initiatives, 2015–16 62
Table 13 Funds granted to organisations in 2015–16 64
Table 14 Privacy activity in 2015–16 65
Table 15 World class performance sustainability performance indicators 69
Table 16 Key risks, 2015–16 79
Table 17 Major capital works projects completed, 2015–16 81
Table 18 Major capital works in progress as at 30 June 2016 82
Table 19 Major alliance and collaborative research investment 85
Table 20 Completed projects (>$100,000), 2015–16 86
Table 21 Ongoing projects (>$100,000), 2015–16 87
Table 22 Decisions made under the Heritage Council of NSW delegation, 2015–16 91
Table 23 High performance culture sustainability performance indicators 109
Table 24 Executive remuneration 2015–16 115
Table 25 Trends in the representation of EEO groups 116
Table 26 Trends in the distribution of EEO groups – distribution index 116
222 Glossary Sydney Water Annual Report 2015–16

Table 27 Workforce numbers 118
Table 28 Payments to consultants for engagements over $50,000 1 July 2015 – 30 June 2016 119
Table 29 Overseas travel, 2015–16 120
Table 30 Profit and loss statement, 2012–13 to 2015–16 124
Table 31 Funds flow from operations interest cover, 2011–12 to 2015–16 126
Table 32 Cash and investments, 2015–16 126
Table 33 Debt management, 2015–16 127
Table 34 Return on assets and equity, 2011–12 to 2015–16 128
Table 35 2016–17 budget 128
Table 36 Recycled water schemes, developer charges to be levied 130
Table 37 IPART pricing table 131
Table 38 List of annual reporting exemptions 206
Table A Number of applications by type of applicant and outcome 208
Table B Number of applications by type of application and outcome 208
Table C Invalid applications 209
Table D Conclusive presumption of overriding public interest against disclosure: matters listed in GIPA Act, Schedule 1 209
Table E Other public interest considerations against disclosure: matters listed in the table in GIPA Act, Schedule 14 209
Table F Timeliness 210
Table G Number of applications reviewed under Part 5 of the GIPA Act (by type of review and outcome) 210
Table H Applications for review under Part 5 of the GIPA Act (by type of applicant) 210
Table I Applications transferred to other agencies 210
222 Glossary Sydney Water Annual Report 2015–16 Sydney Water Annual Report 2015–16 Glossary 223

Contact us
By telephone
Customer enquiries: 13 20 92 (Monday – Friday, 8.30 am – 5.30 pm) Help with leaks and faults: 13 20 90 (24 hours every day) Corruption hotline: Freecall 1800 500 965 (24 hours every day) Interpreter service: 13 14 50
We offer a free teletypewriter (TTY) service for customers with hearing and speech difficulties. Call the National Relay Service on 13 36 77 and enter the phone number 13 20 90 (24 hours every day).
By post
Sydney Water PO Box 399 PARRAMATTA NSW 2124
On the web
sydneywater.com.au facebook.com/SydneyWater twitter.com/sydneywaternews
By email
For Annual Report enquiries: [email protected]
For general enquiries: [email protected]
Annual Report online
Visit sydneywater.com.au/annualreport to read the Annual Report 2015–16 and previous reports.
SW138 10/16
ISSN: 2207- 4139