Annual Statistics 2015 - · PDF fileTotal Number of Plants ... United Kingdom 4,286 4,477...
32
Annual Statistics 2015
Transcript of Annual Statistics 2015 - · PDF fileTotal Number of Plants ... United Kingdom 4,286 4,477...

Annual Statistics
2015
FEFCO ANNUAL STATISTICS 2015
Tables: Page
Key Statistics 2
Total Shipments (Millions of m²) (including Non-Members) 3
Total Shipments ('000 Tonnes) (including Non-Members) 4
Shipments of Member Companies (Millions of m²) 5
Shipments of Member Companies ('000 Tonnes) 6
Total Number of Companies (including Non-Members) 7
Total Number of Plants (including Non-Members) 8
Total Number of Corrugators (including Non-Members) 9
Average Weight of Board in g/m² (including Non-Members) 10
Die Cut Boxes (as % of Total Shipments in m²) (including Non-Members & Sheetplants) 11
Shipments in Sheets (as % of Total Shipments in m²) (including Non-Members) 12
Total Consumption of Raw Materials ('000 Tonnes) (including Non-Members) 13
Consumption of Kraftliner as % of Total Consumption of Raw Materials 14
Consumption of Brown Kraftliner as % of Total Consumption of Raw Materials 15
Consumption of Testliner, as % of Total Consumption of Raw Materials 16
Consumption of White Top Testliner 17
Consumption of Other Recycled Liner as % of Total Consumption of Raw Materials 18
Consumption of Semi-Chemical Fluting, as % of Total Consumption of Raw Materials 19
Consumption of Recycled Fluting as % of Total Consumption of Raw Materials 20
Total number of Personnel 21
Production per Head ('000 m²) 22
Nominal Working Time per Person (Hours per Year) 23
Classification by End Use (seperate sheet) 24
Fluting Types in % of Total Shipments (seperate sheet) 25
Printing Colours (seperate sheet) 26
Diagramms 27-31
1 Fefco Annual Statistics 2015

FEFCO ANNUAL REPORT 2015 Key Statstics
2014 2015 % Change
41,933 43,286 3.20
21,685 22,279 2.70
30,173 30,939 2.50
15,505 17,694 12.40
395 395 0
676 666 -1.50
515 515 0
42.8 43.1 4.20
17.5 17.4 2.70
18,128 18,713 3.20
5.3 4.9 -8.20
14.0 14.6 4.10
29.3 27.8 -5.40
5.7 5.7 0
5.1 5.0 -2.00
36.5 36.9 1.10
69,750 70,734 1.40
Average Weight of Board in g/m²
(including Non-Members)
Die Cut Boxes (as % of Total Shipments in m²)
(including Non-Members & Sheetplants)
Total Shipments (Millions of m²)
(including Non-Members)
Total Shipments ('000 Tonnes)
(including Non-Members)
Shipments of Member Companies
(Millions of m²)
Shipments of Member Companies
('000 Tonnes)
Total Number of Companies
(including Non-Members)
Total Number of Plants
(including Non-Members)
Shipments in Sheets (as % of Total Shipments
in m²) (including Non-Members)
Total Consumption of Raw Materials
('000 Tonnes) (including Non-Members)
Consumption of Kraftliner
as % of Total Consumption of Raw Materials
Consumption of Semi-chemical Fluting
as % of Total Consumption of Raw Materials
Consumption of Recycled Fluting
as % of Total Consumption of Raw Materials
Consumption of Other Recycled Liner
as % of Total Consumption of Raw Materials
Consumption of Brown Kraftliner
as % of Total Consumption of Raw Materials
Consumption of Testliner
as % of Total Consumption of Raw Materials
Total Personnel
2 Fefco Annual Statistics 2015

Total Shipments in Millions of m²
(including Non-Members)
2014 2015% Change
2014/2015
Members
Only
Austria 944 961 1.80 Y / Y
Czech Republic 968 1,039 7.33 N / N
France 5,403 5,430 0.50 N / N
Germany 9,650 9,873 2.31 N / N
Hungary 562 571 1.60 N / N
Italy 6,349 6,456 1.69 N / N
Norway 207 208 0.48 Y / Y
Poland 3,574 3,795 6.18 N / N
Romania 603 665 10.28 Y / Y
Spain 4,543 4,759 4.75 n.a. / N
Sweden 641 644 0.47 Y / Y
Switzerland 455 443 -2.64 Y / Y
Turkey 3,748 3,965 5.79 N / N
United Kingdom 4,286 4,477 4.46 N / N
TOTAL EUROPE 41,933 43,286 3.20
3 Fefco Annual Statistics 2015

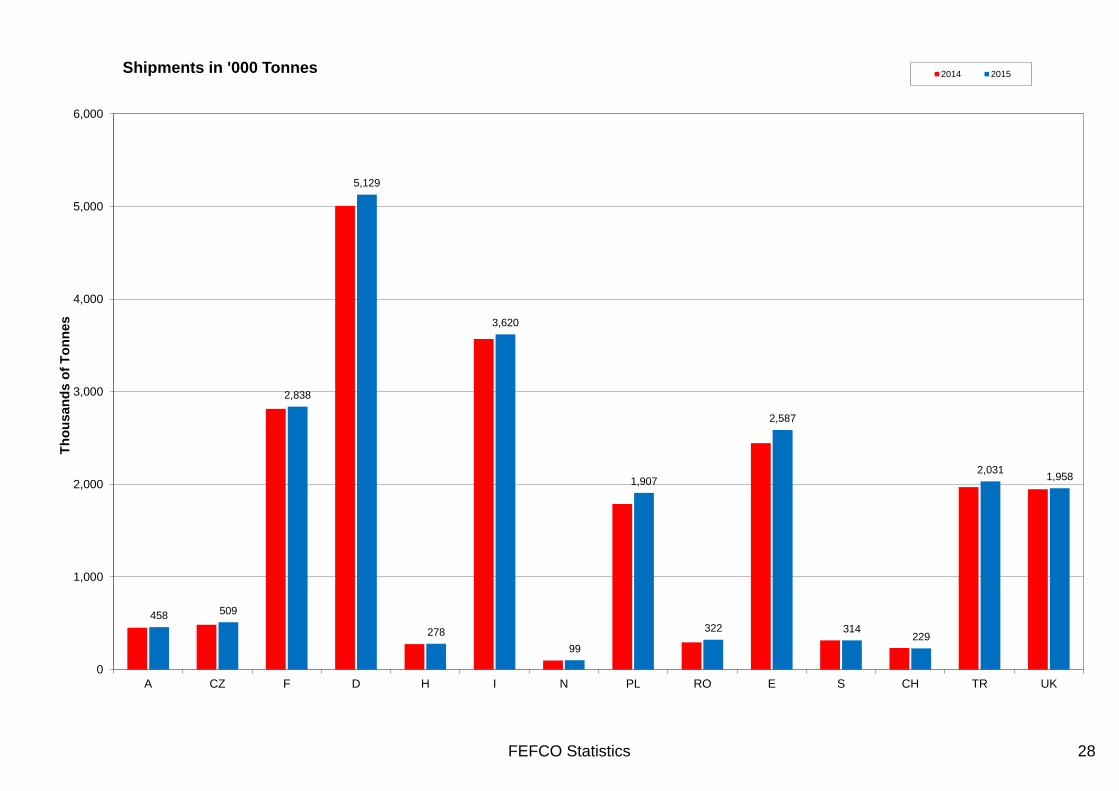
Total Shipments in 000's Tonnes
(including Non-Members)
2014 2015% Change
2014/2015
Austria 450 458 1.78
Czech Republic 484 509 5.17
France 2,815 2,838 0.82
Germany 5,007 5,129 2.44
Hungary 274 278 1.46
Italy 3,570 3,620 1.40
Norway 97 99 2.06
Poland 1,787 1,907 6.72
Romania 292 322 10.27
Spain 2,445 2,587 5.81
Sweden 315 314 -0.32
Switzerland 232 229 -1.29
Turkey 1,970 2,031 3.10
United Kingdom 1,947 1,958 0.56
TOTAL EUROPE 21,685 22,279 2.70
4 Fefco Annual Statistics 2015
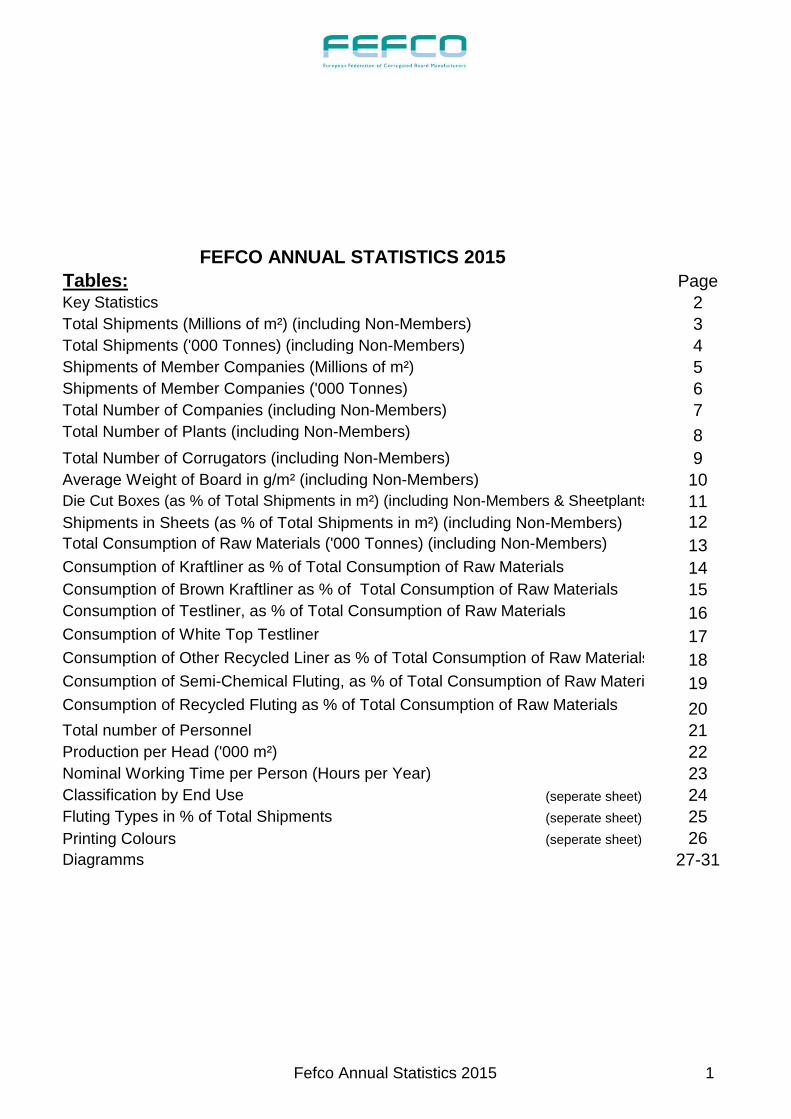
Shipments of Member Companies in Millions of m²
2014 2015% Change
2014/2015
Austria 944 961 1.80
Czech Republic 628 677 7.80
France 3,895 3,914 0.49
Germany 7,390 7,478 1.19
Hungary 519 531 2.31
Italy 5,684 5,800 2.04
Norway 207 208 0.48
Poland 2,932 3,113 6.17
Romania 603 665 10.28
Spain n.a. 3,478 n.a.
Sweden 641 644 0.47
Switzerland 455 443 -2.64
Turkey 2,671 2,780 4.08
United Kingdom 3,604 3,725 3.36
Membership Total 30,173 34,417 2.50
5 Fefco Annual Statistics 2015
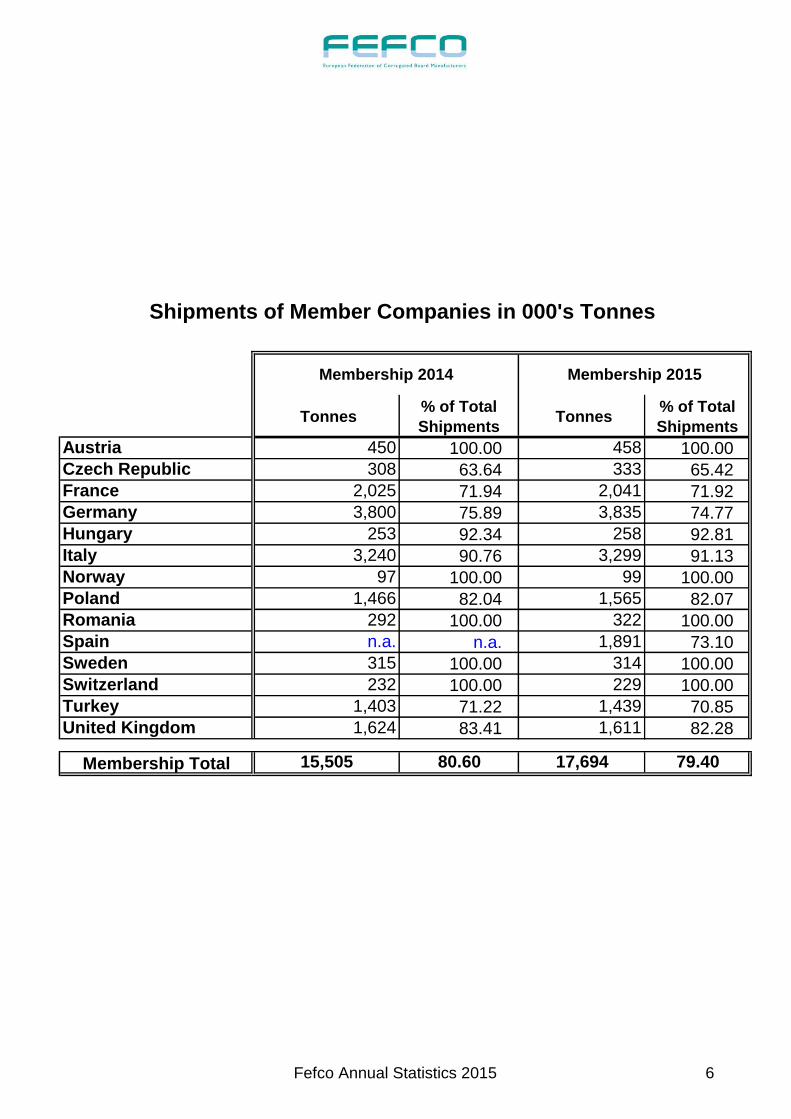
Shipments of Member Companies in 000's Tonnes
Membership 2014 Membership 2015
Tonnes % of Total
Shipments Tonnes
% of Total
Shipments
Austria 450 100.00 458 100.00
Czech Republic 308 63.64 333 65.42
France 2,025 71.94 2,041 71.92
Germany 3,800 75.89 3,835 74.77
Hungary 253 92.34 258 92.81
Italy 3,240 90.76 3,299 91.13
Norway 97 100.00 99 100.00
Poland 1,466 82.04 1,565 82.07
Romania 292 100.00 322 100.00
Spain n.a. n.a. 1,891 73.10
Sweden 315 100.00 314 100.00
Switzerland 232 100.00 229 100.00
Turkey 1,403 71.22 1,439 70.85
United Kingdom 1,624 83.41 1,611 82.28
Membership Total 15,505 80.60 17,694 79.40
6 Fefco Annual Statistics 2015

Total Number of Companies
(including Non-Members)
2014 2015
Austria 7 7
Czech Republic 7 7
France 17 17
Germany 44 44
Hungary 7 8
Italy 52 52
Norway 3 3
Poland 34 37
Romania 10 10
Spain 73 69
Sweden 4 4
Switzerland 6 6
Turkey 103 103
United Kingdom 28 28
TOTAL EUROPE 395 395
7 Fefco Annual Statistics 2015
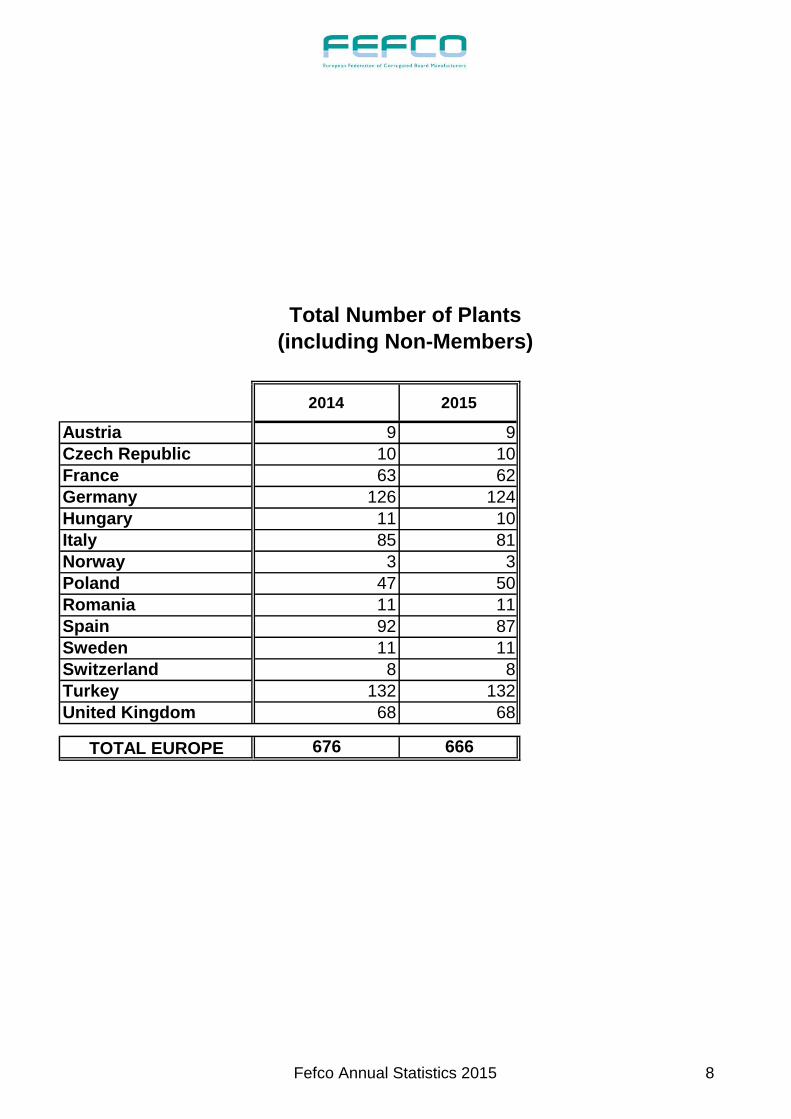
Total Number of Plants
(including Non-Members)
2014 2015
Austria 9 9
Czech Republic 10 10
France 63 62
Germany 126 124
Hungary 11 10
Italy 85 81
Norway 3 3
Poland 47 50
Romania 11 11
Spain 92 87
Sweden 11 11
Switzerland 8 8
Turkey 132 132
United Kingdom 68 68
TOTAL EUROPE 676 666
8 Fefco Annual Statistics 2015

Total Number of Corrugators (including Non-Members)
2015
<2m >2 <2,5m > 2,5m Result
Austria 2 7 1 10
Czech Republic 1 8 1 10
France n.a. n.a. n.a. n.a.
Germany 6 75 22 103
Hungary 2 8 1 11
Italy 7 74 12 93
Norway n.a. 2 1 3
Poland n.a. n.a. n.a. n.a.
Romania 1 10 n.a. 11
Spain 10 77 6 93
Sweden n.a. 11 n.a. 11
Switzerland 2 6 n.a. 8
Turkey n.a. n.a. n.a. n.a.
United Kingdom 24 44 9 77
TOTAL EUROPE 55 322 53 430
9 Fefco Annual Statistics 2015
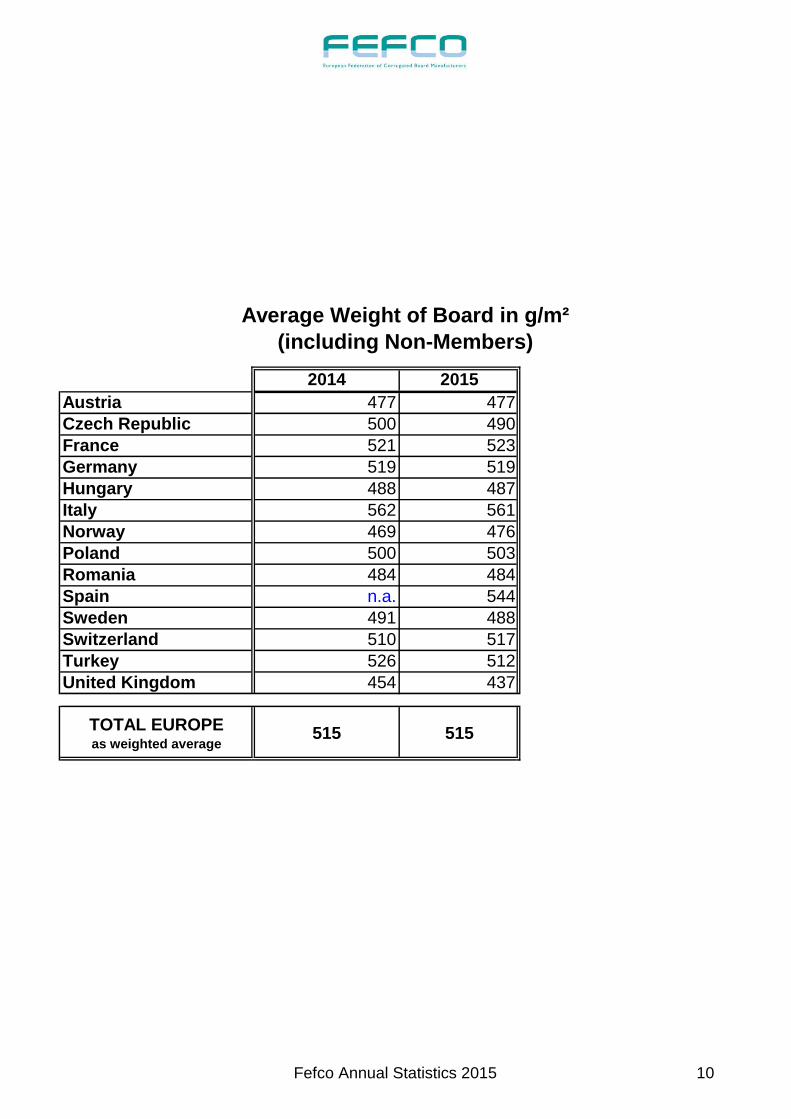
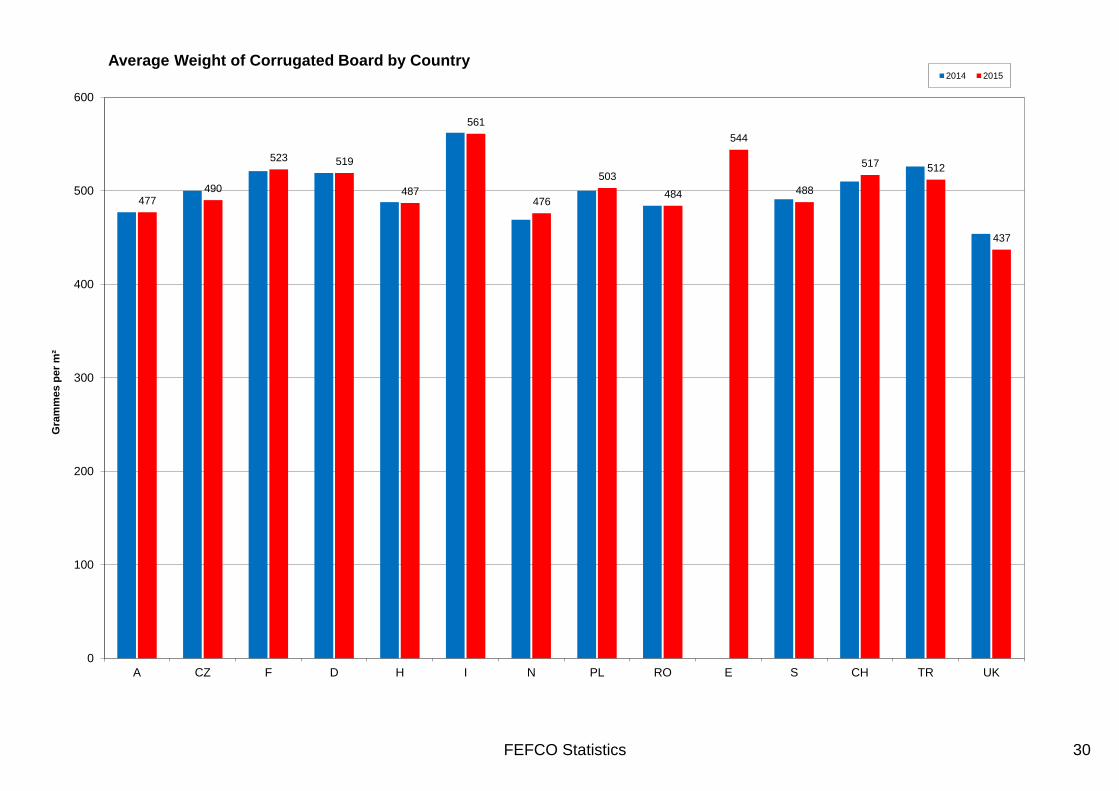
Average Weight of Board in g/m²
(including Non-Members)
2014 2015
Austria 477 477
Czech Republic 500 490
France 521 523
Germany 519 519
Hungary 488 487
Italy 562 561
Norway 469 476
Poland 500 503
Romania 484 484
Spain n.a. 544
Sweden 491 488
Switzerland 510 517
Turkey 526 512
United Kingdom 454 437
TOTAL EUROPEas weighted average
515 515
10 Fefco Annual Statistics 2015
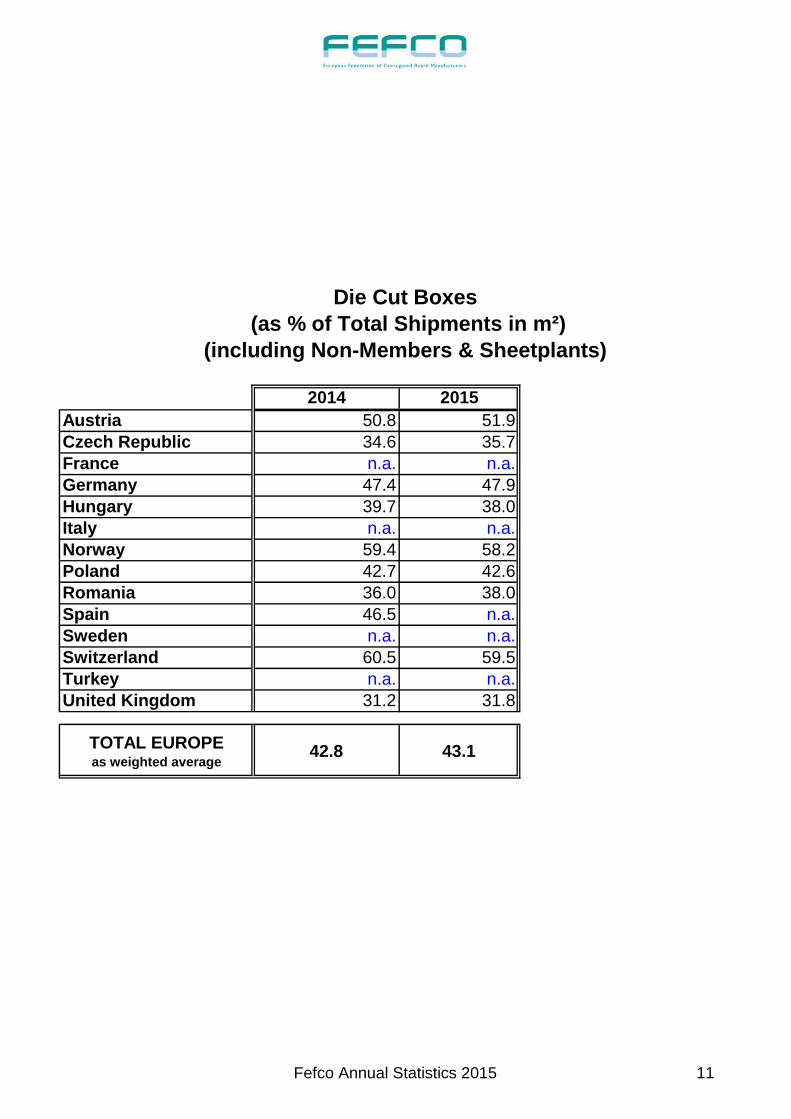
Die Cut Boxes
(as % of Total Shipments in m²)
(including Non-Members & Sheetplants)
2014 2015
Austria 50.8 51.9
Czech Republic 34.6 35.7
France n.a. n.a.
Germany 47.4 47.9
Hungary 39.7 38.0
Italy n.a. n.a.
Norway 59.4 58.2
Poland 42.7 42.6
Romania 36.0 38.0
Spain 46.5 n.a.
Sweden n.a. n.a.
Switzerland 60.5 59.5
Turkey n.a. n.a.
United Kingdom 31.2 31.8
TOTAL EUROPEas weighted average
42.8 43.1
11 Fefco Annual Statistics 2015
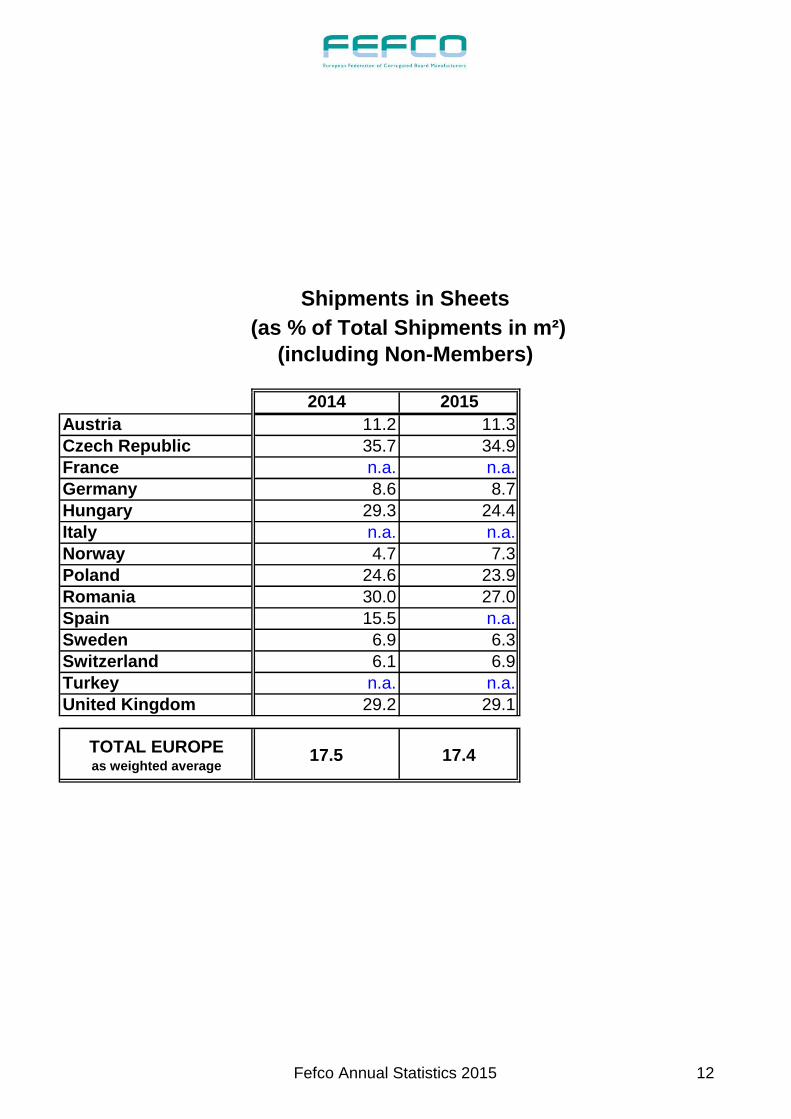
Shipments in Sheets
(as % of Total Shipments in m²)
(including Non-Members)
2014 2015
Austria 11.2 11.3
Czech Republic 35.7 34.9
France n.a. n.a.
Germany 8.6 8.7
Hungary 29.3 24.4
Italy n.a. n.a.
Norway 4.7 7.3
Poland 24.6 23.9
Romania 30.0 27.0
Spain 15.5 n.a.
Sweden 6.9 6.3
Switzerland 6.1 6.9
Turkey n.a. n.a.
United Kingdom 29.2 29.1
TOTAL EUROPEas weighted average
17.5 17.4
12 Fefco Annual Statistics 2015
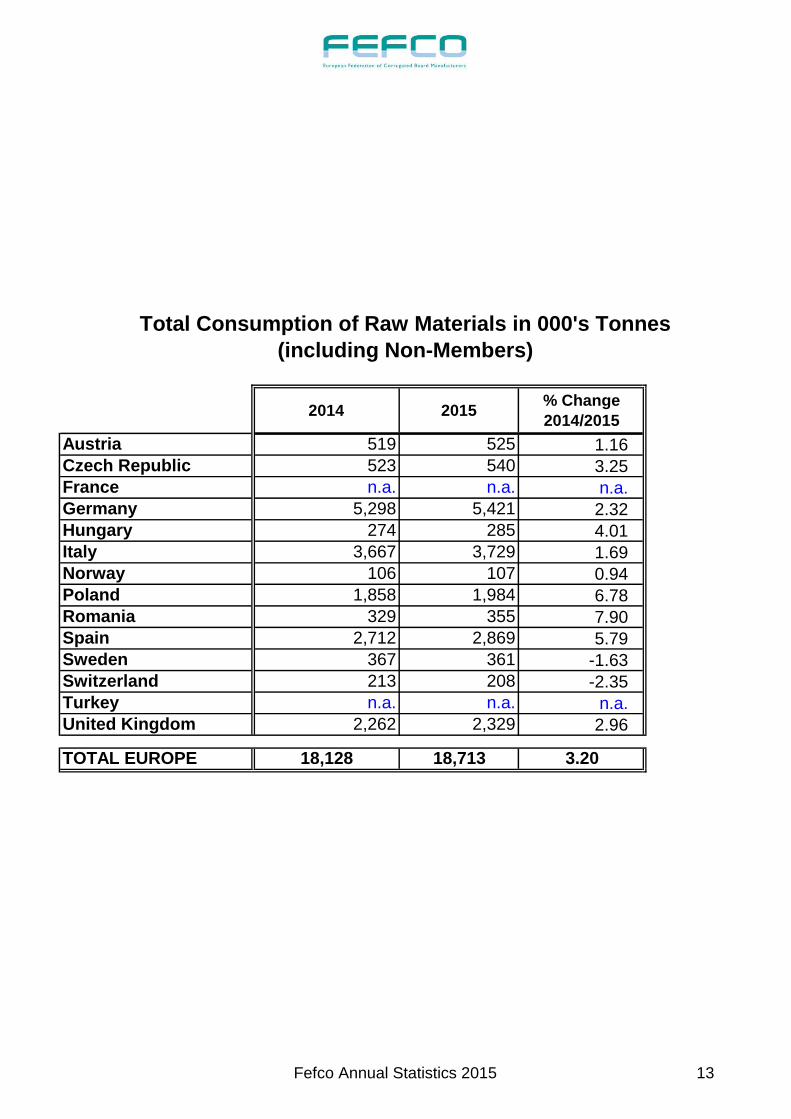
Total Consumption of Raw Materials in 000's Tonnes
(including Non-Members)
2014 2015% Change
2014/2015
Austria 519 525 1.16
Czech Republic 523 540 3.25
France n.a. n.a. n.a.
Germany 5,298 5,421 2.32
Hungary 274 285 4.01
Italy 3,667 3,729 1.69
Norway 106 107 0.94
Poland 1,858 1,984 6.78
Romania 329 355 7.90
Spain 2,712 2,869 5.79
Sweden 367 361 -1.63
Switzerland 213 208 -2.35
Turkey n.a. n.a. n.a.
United Kingdom 2,262 2,329 2.96
TOTAL EUROPE 18,128 18,713 3.20
13 Fefco Annual Statistics 2015
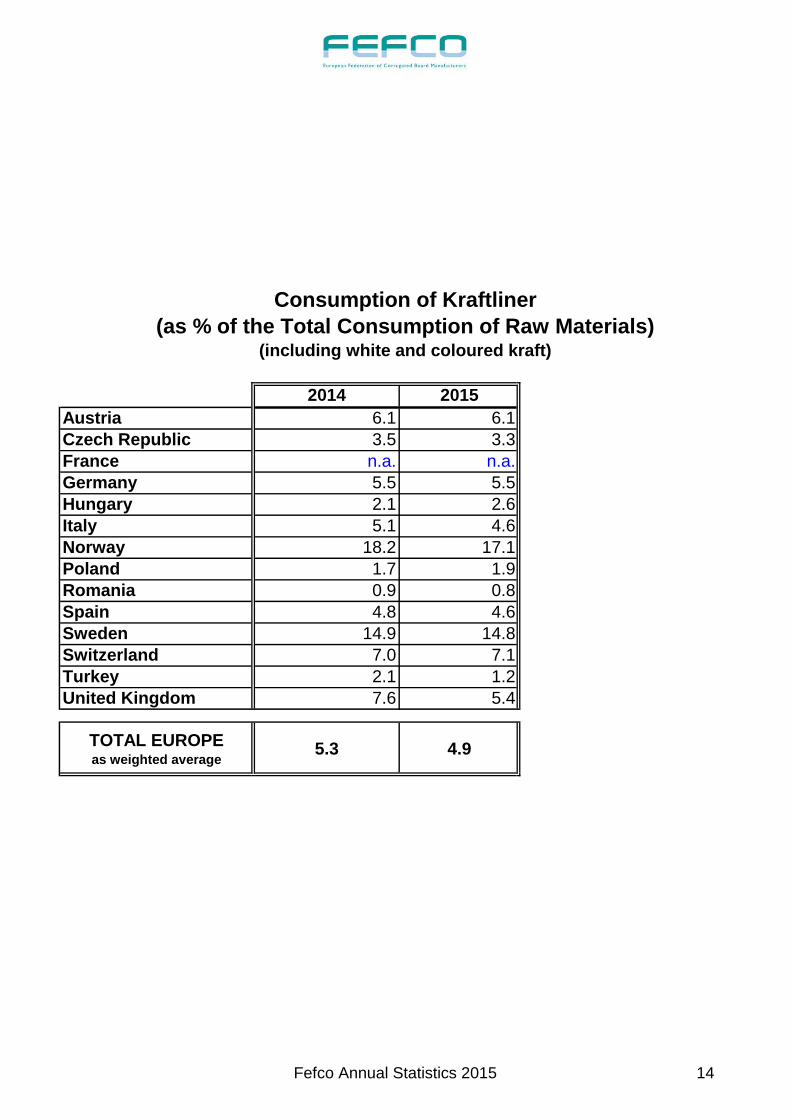
Consumption of Kraftliner
(as % of the Total Consumption of Raw Materials)(including white and coloured kraft)
2014 2015
Austria 6.1 6.1
Czech Republic 3.5 3.3
France n.a. n.a.
Germany 5.5 5.5
Hungary 2.1 2.6
Italy 5.1 4.6
Norway 18.2 17.1
Poland 1.7 1.9
Romania 0.9 0.8
Spain 4.8 4.6
Sweden 14.9 14.8
Switzerland 7.0 7.1
Turkey 2.1 1.2
United Kingdom 7.6 5.4
TOTAL EUROPEas weighted average
5.3 4.9
14 Fefco Annual Statistics 2015

Consumption of Brown Kraftliner
(as % of the Total Consumption of Raw Materials)
2014 2015
Austria 13.0 13.5
Czech Republic 13.1 10.7
France n.a. n.a.
Germany 14.2 14.7
Hungary 13.2 12.0
Italy 18.3 18.7
Norway 14.4 14.4
Poland 7.7 9.5
Romania 10.5 10.9
Spain 14.9 15.4
Sweden 14.9 14.8
Switzerland 16.6 15.9
Turkey 20.9 19.7
United Kingdom 11.3 12.9
TOTAL EUROPEas weighted average
14.0 14.6
15 Fefco Annual Statistics 2015
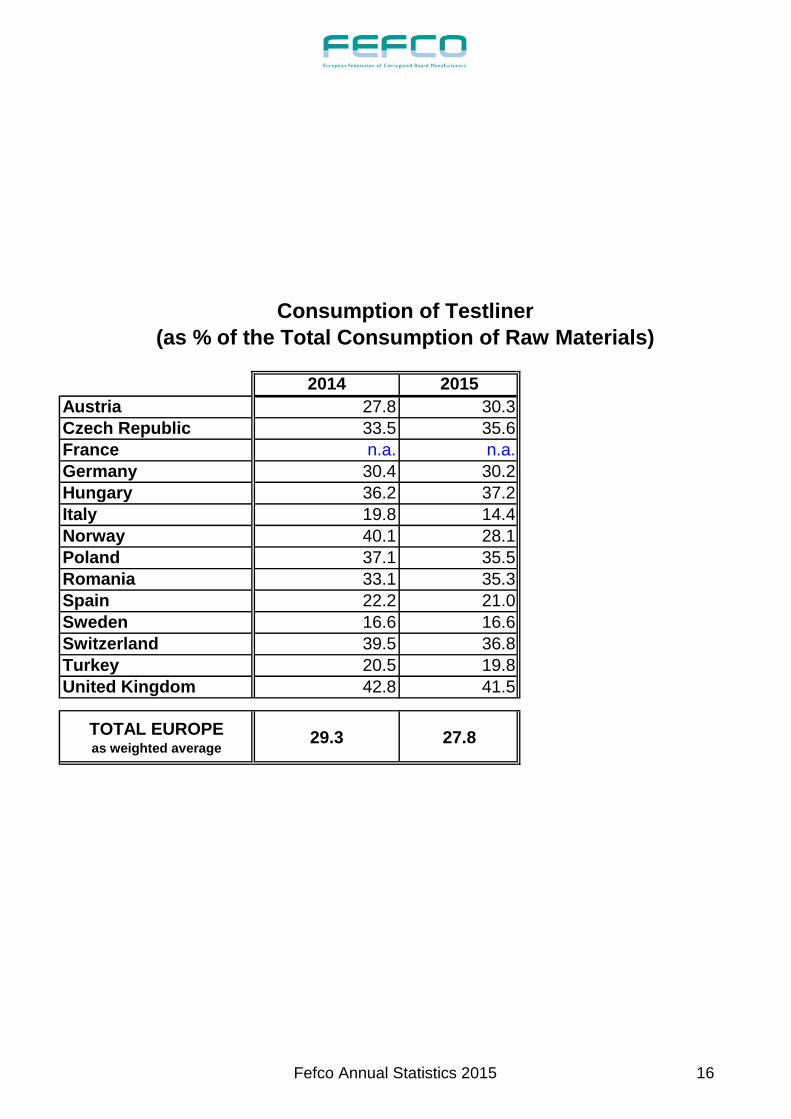
Consumption of Testliner
(as % of the Total Consumption of Raw Materials)
2014 2015
Austria 27.8 30.3
Czech Republic 33.5 35.6
France n.a. n.a.
Germany 30.4 30.2
Hungary 36.2 37.2
Italy 19.8 14.4
Norway 40.1 28.1
Poland 37.1 35.5
Romania 33.1 35.3
Spain 22.2 21.0
Sweden 16.6 16.6
Switzerland 39.5 36.8
Turkey 20.5 19.8
United Kingdom 42.8 41.5
TOTAL EUROPEas weighted average
29.3 27.8
16 Fefco Annual Statistics 2015
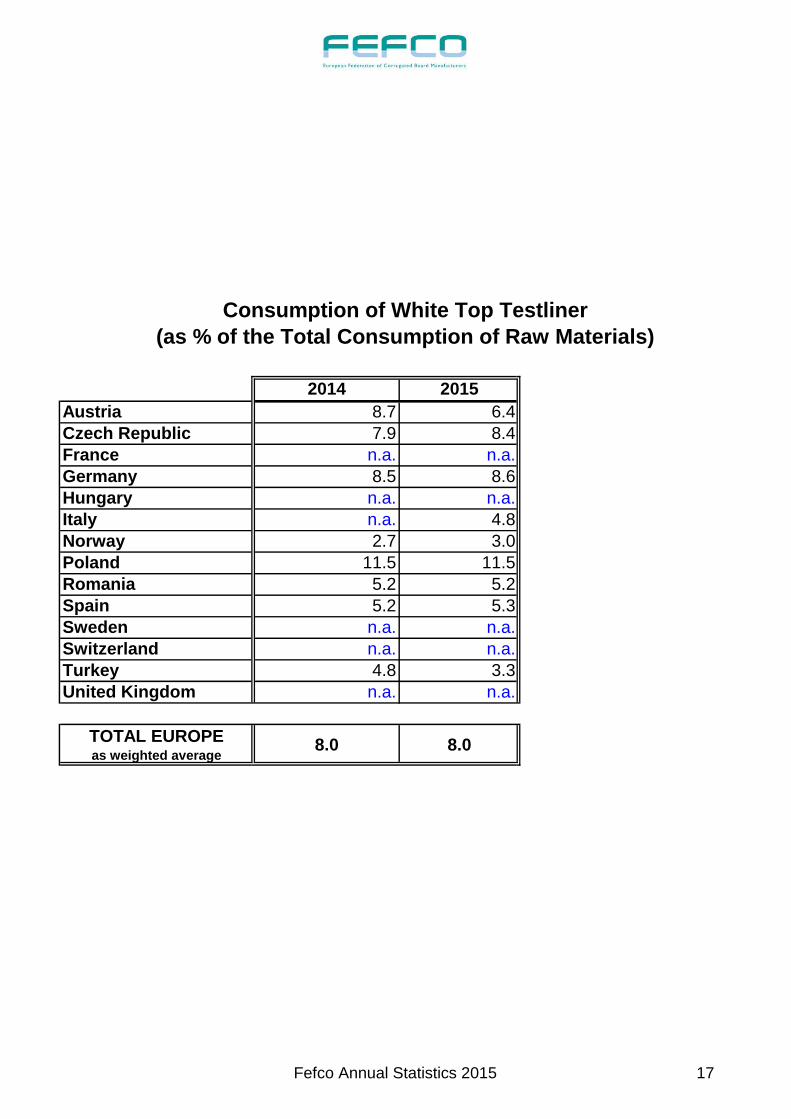
Consumption of White Top Testliner
(as % of the Total Consumption of Raw Materials)
2014 2015
Austria 8.7 6.4
Czech Republic 7.9 8.4
France n.a. n.a.
Germany 8.5 8.6
Hungary n.a. n.a.
Italy n.a. 4.8
Norway 2.7 3.0
Poland 11.5 11.5
Romania 5.2 5.2
Spain 5.2 5.3
Sweden n.a. n.a.
Switzerland n.a. n.a.
Turkey 4.8 3.3
United Kingdom n.a. n.a.
TOTAL EUROPEas weighted average
8.0 8.0
17 Fefco Annual Statistics 2015

Consumption of schrenz and other liners
(as % of the Total Consumption of Raw Materials)
2014 2015
Austria 4.2 3.6
Czech Republic 0.9 n.a.
France n.a. n.a.
Germany 1.8 1.6
Hungary 9.4 10.5
Italy 9.4 10.5
Norway 0.5 0.7
Poland 1.8 2.0
Romania 10.9 10.2
Spain 8.9 8.1
Sweden 16.6 16.6
Switzerland 4.5 3.7
Turkey 6.2 5.2
United Kingdom n.a. n.a.
TOTAL EUROPEas weighted average
5.7 5.7
18 Fefco Annual Statistics 2015
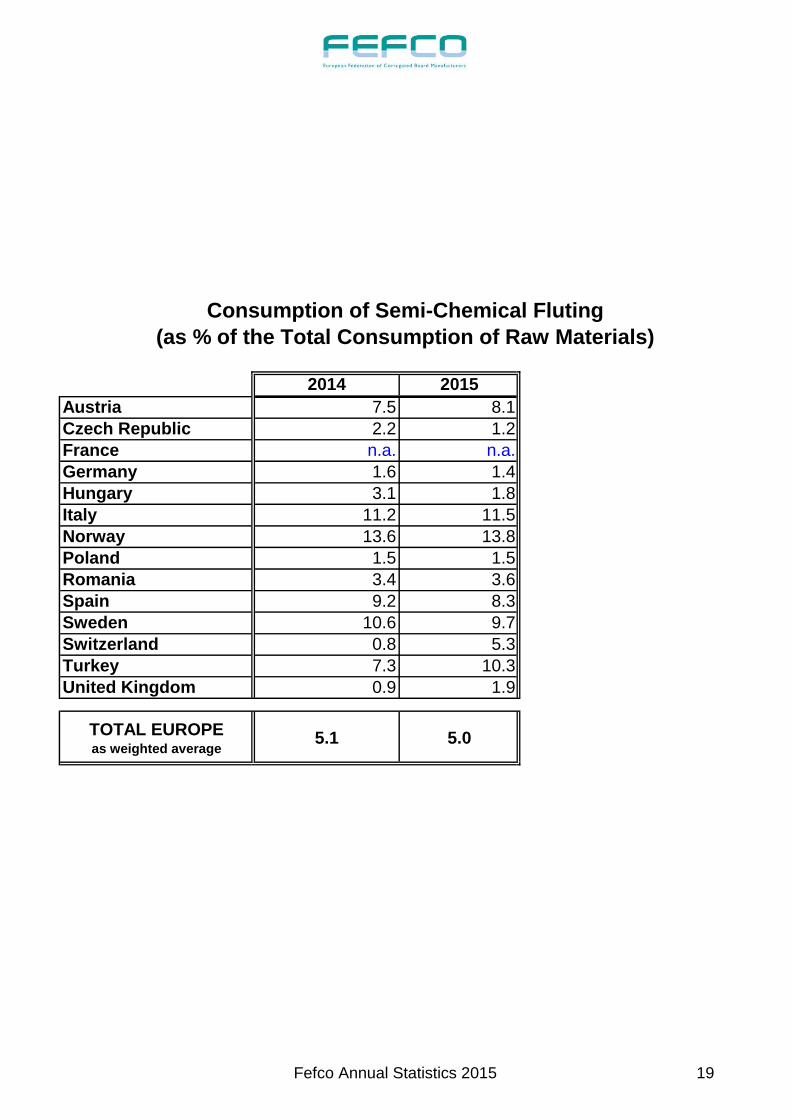
Consumption of Semi-Chemical Fluting
(as % of the Total Consumption of Raw Materials)
2014 2015
Austria 7.5 8.1
Czech Republic 2.2 1.2
France n.a. n.a.
Germany 1.6 1.4
Hungary 3.1 1.8
Italy 11.2 11.5
Norway 13.6 13.8
Poland 1.5 1.5
Romania 3.4 3.6
Spain 9.2 8.3
Sweden 10.6 9.7
Switzerland 0.8 5.3
Turkey 7.3 10.3
United Kingdom 0.9 1.9
TOTAL EUROPEas weighted average
5.1 5.0
19 Fefco Annual Statistics 2015

Consumption of wellenstoff and other fluting
(as % of the Total Consumption of Raw Materials)
2014 2015
Austria 32.7 32.0
Czech Republic 38.9 40.8
France n.a. n.a.
Germany 38.0 38.0
Hungary 36.0 35.9
Italy 36.2 35.5
Norway 10.5 22.9
Poland 38.7 38.1
Romania 36.0 34.0
Spain 34.8 37.3
Sweden 26.4 27.5Switzerland 31.6 31.2
Turkey 38.2 40.5
United Kingdom 37.4 38.3
TOTAL EUROPEas weighted average
36.5 36.9
20 Fefco Annual Statistics 2015
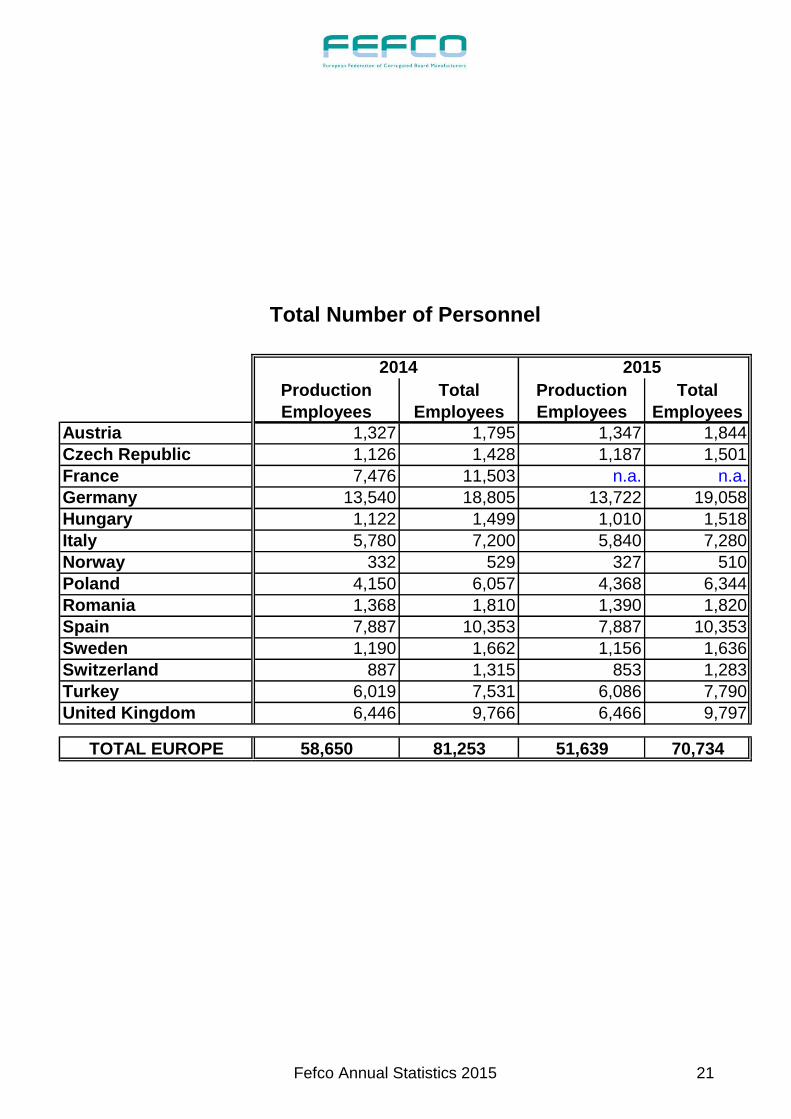
Total Number of Personnel
2014 2015
Production
Employees
Total
Employees
Production
Employees
Total
Employees
Austria 1,327 1,795 1,347 1,844
Czech Republic 1,126 1,428 1,187 1,501
France 7,476 11,503 n.a. n.a.
Germany 13,540 18,805 13,722 19,058
Hungary 1,122 1,499 1,010 1,518
Italy 5,780 7,200 5,840 7,280
Norway 332 529 327 510
Poland 4,150 6,057 4,368 6,344
Romania 1,368 1,810 1,390 1,820
Spain 7,887 10,353 7,887 10,353
Sweden 1,190 1,662 1,156 1,636
Switzerland 887 1,315 853 1,283
Turkey 6,019 7,531 6,086 7,790
United Kingdom 6,446 9,766 6,466 9,797
TOTAL EUROPE 58,650 81,253 51,639 70,734
21 Fefco Annual Statistics 2015

Production per Head in 1000 m²
2014 2015
Austria 711 713
Czech Republic 860 875
France 723 n.a.
Germany 713 720
Hungary 501 565
Italy 1,098 1,105
Norway 623 636
Poland 861 869
Romania 441 478
Spain 576 603
Sweden 539 557
Switzerland 513 519
Turkey 623 651
United Kingdom 665 692
TOTAL EUROPE 715 838
22 Fefco Annual Statistics 2015

Nominal Working Time and Productivity per Head
Working Time [hours / year] Productivity [m²/man hour]
2014 2015 2014 2015
Austria 1,695 1,695 420 421
Czech Republic 1,830 1,826 470 479
France n.a. n.a. n.a. n.a.
Germany 1,850 1,850 385 389
Hungary 1,848 1,848 271 306
Italy 1,896 1,896 579 583
Norway 1,725 1,725 361 369
Poland 2,000 2,016 431 431
Romania 1,904 1,880 232 254
Spain 1,768 1,768 326 341
Sweden 1,500 1,486 359 375
Switzerland 2,084 2,149 246 242
Turkey 2,040 2,040 305 319
United Kingdom 1,710 1,710 389 405
TOTAL EUROPE 1,835 1,838 367 378
23 Fefco Annual Statistics 2015

Classification of shipment by end-use sector, as a percentage of turnover 2015
Au
str
ia
C
zech
Rep
ub
lic
F
ran
ce
G
erm
an
y
H
un
ga
ry
It
aly
N
orw
ay
P
ola
nd
R
om
an
ia
S
pa
in
S
wed
en
S
wit
zerl
an
d
T
urk
ey
U
nit
ed
Kin
gd
om
W
eig
hte
d
Avera
ge
1 27.5 26.0 n.a. 29.3 19.8 10.7 30.0 32.6 26.5 16.5 30.3 42.2 30.6 n.a. n.a. n.a. 26.6
2 8.9 2.0 n.a. 3.4 7.2 37.1 25.0 7.0 6.0 23.3 1.7 4.1 5.7 n.a. n.a. n.a. 8.7
3 9.3 5.8 n.a. 4.8 2.2 9.5 5.4 6.6 6.5 15.0 4.4 6.1 4.2 n.a. n.a. n.a. 7.3
4 2.3 1.5 n.a. 0.5 1.2 1.2 0.2 1.1 1.5 1.6 0.0 0.7 1.0 n.a. n.a. n.a. 0.9
Subtotal 48.0 35.3 n.a. 38.0 30.4 58.5 60.6 47.3 40.5 56.4 36.4 53.1 41.5 n.a. n.a. n.a. 43.4
5 1.9 0.4 n.a. 1.7 0.8 1.8 0.5 1.4 1.6 1.0 0.3 1.1 3.5 n.a. n.a. n.a. 1.3
6 1.3 2.1 n.a. 1.6 1.1 2.0 3.2 4.4 20.0 1.0 5.6 1.1 4.1 n.a. n.a. n.a. 2.6
7 3.2 6.6 n.a. 3.9 6.2 12.0 6.2 2.7 2.0 2.5 15.9 4.1 2.7 n.a. n.a. n.a. 4.1
8 3.6 2.2 n.a. 5.8 2.4 4.6 3.7 2.4 1.5 2.0 6.1 7.0 1.5 n.a. n.a. n.a. 4.1
9 3.9 8.4 n.a. 4.5 12.1 7.3 0.9 6.6 1.7 3.0 0.0 3.0 3.8 n.a. n.a. n.a. 4.5
10 4.0 3.4 n.a. 3.9 0.3 0.7 0.0 0.9 0.8 1.0 0.0 1.3 1.5 n.a. n.a. n.a. 2.4
11 2.8 6.3 n.a. 1.2 1.0 6.9 0.2 1.5 1.9 3.0 1.0 0.5 4.2 n.a. n.a. n.a. 1.8
12 7.9 1.4 n.a. 3.2 2.6 1.2 1.7 0.6 0.2 0.5 3.8 1.6 1.5 n.a. n.a. n.a. 2.1
13 2.3 0.9 n.a. 2.0 1.2 0.3 0.5 0.1 4.8 1.4 0.0 1.3 1.2 n.a. n.a. n.a. 1.5
14 1.9 1.5 n.a. 2.7 3.8 0.3 1.5 1.8 1.0 1.9 1.6 2.5 2.1 n.a. n.a. n.a. 2.3
15 0.3 4.1 n.a. 0.5 3.6 0.6 0.3 3.8 0.2 3.5 0.0 0.0 1.3 n.a. n.a. n.a. 1.8
16 0.3 0.4 n.a. 1.1 6.9 0.3 0.2 1.1 3.0 1.5 0.0 0.9 4.5 n.a. n.a. n.a. 1.3
17 0.5 3.4 n.a. 2.7 1.5 1.0 6.7 0.3 0.0 1.5 0.0 0.6 3.1 n.a. n.a. n.a. 2.0
18 0.2 0.0 n.a. 0.7 1.5 0.3 0.0 0.1 0.1 0.9 0.0 0.5 0.2 n.a. n.a. n.a. 0.6
19 1.6 5.4 n.a. 0.0 2.3 0.4 1.1 3.2 2.0 1.0 0.0 6.9 2.7 n.a. n.a. n.a. 1.0
20 0.6 2.6 n.a. 0.7 5.4 0.7 0.0 0.1 2.0 2.0 0.0 0.7 0.1 n.a. n.a. n.a. 1.1
21 2.1 2.2 n.a. 3.5 1.1 0.5 0.0 0.9 1.5 2.5 0.0 0.9 0.0 n.a. n.a. n.a. 2.5
22 8.2 5.7 n.a. 16.3 12.1 0.0 1.1 13.3 13.2 11.3 19.6 9.3 15.5 n.a. n.a. n.a. 14.1
23 5.4 7.7 n.a. 6.0 3.7 0.6 11.6 7.5 2.0 2.1 9.7 3.6 5.0 n.a. n.a. n.a. 5.5
Subtotal 52.0 64.7 n.a. 62.0 69.6 41.5 39.4 52.7 59.5 43.6 63.6 46.9 58.5 n.a. n.a. n.a. 56.6
Total 100.0 100.0 n.a. 100.0 100.0 100.0 100.0 100.0 100.0 100.0 100.0 100.0 100.0 n.a. n.a. n.a.
Categories for classification:
1 Foodstuffs 13 Machines and parts
2 Agricultural Produce and Fresh Food 14 Electrical equipment and accessories (except domestic appliance)
3 Beverages 15 Audio, video and communication equipments
4 Tobacco Products 16 Electric appliances
5 Textiles, clothing, leather goods 17 Means of transport
6 Wooden goods and furniture 18 Precision instruments, optical equipment and watches
7 Paper goods and printed matter 19 Other industrial product
8 Chemicals and related products 20 Sportswear and accessories, toys
9 Detergents, soaps, perfumes, cosmetics, etc. 21 Direct mail companies, dispatching houses
10 Rubber goods 22 Corrugated Board converters (sheet plans)
11 Glassware, ceramicware and other non minerals 23 All other not classified above
12 Metalware
24
Fefco Annual Statistics 2015
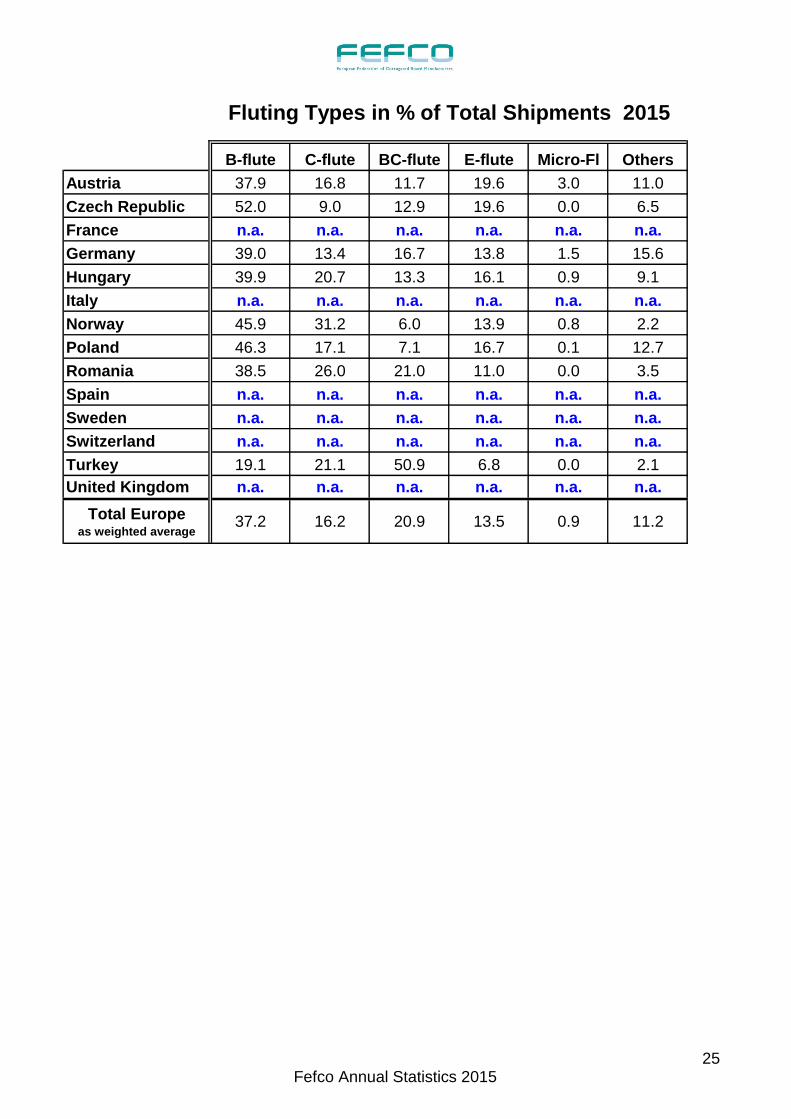
Fluting Types in % of Total Shipments 2015
B-flute C-flute BC-flute E-flute Micro-Fl Others
Austria 37.9 16.8 11.7 19.6 3.0 11.0
Czech Republic 52.0 9.0 12.9 19.6 0.0 6.5
France n.a. n.a. n.a. n.a. n.a. n.a.
Germany 39.0 13.4 16.7 13.8 1.5 15.6
Hungary 39.9 20.7 13.3 16.1 0.9 9.1
Italy n.a. n.a. n.a. n.a. n.a. n.a.
Norway 45.9 31.2 6.0 13.9 0.8 2.2
Poland 46.3 17.1 7.1 16.7 0.1 12.7
Romania 38.5 26.0 21.0 11.0 0.0 3.5
Spain n.a. n.a. n.a. n.a. n.a. n.a.
Sweden n.a. n.a. n.a. n.a. n.a. n.a.
Switzerland n.a. n.a. n.a. n.a. n.a. n.a.
Turkey 19.1 21.1 50.9 6.8 0.0 2.1
United Kingdom n.a. n.a. n.a. n.a. n.a. n.a.
Total Europe as weighted average
37.2 16.2 20.9 13.5 0.9 11.2
25Fefco Annual Statistics 2015
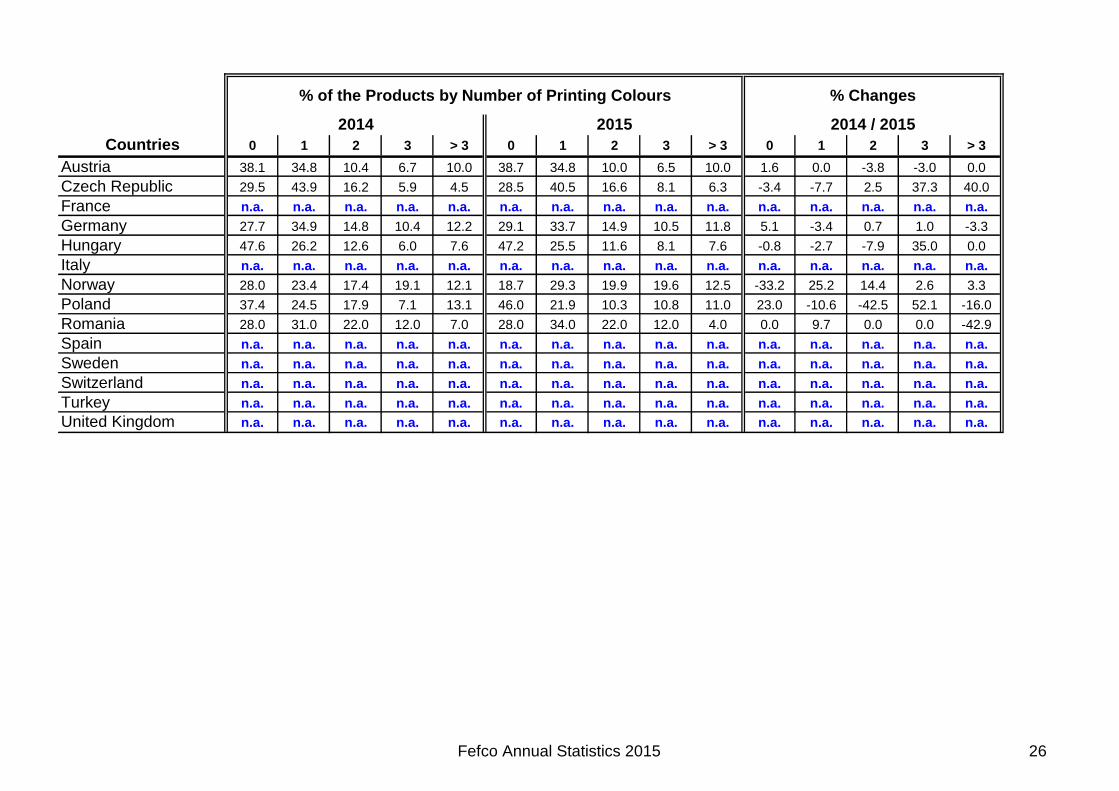
% of the Products by Number of Printing Colours % Changes
2014 2015 2014 / 2015
Countries 0 1 2 3 > 3 0 1 2 3 > 3 0 1 2 3 > 3
Austria 38.1 34.8 10.4 6.7 10.0 38.7 34.8 10.0 6.5 10.0 1.6 0.0 -3.8 -3.0 0.0
Czech Republic 29.5 43.9 16.2 5.9 4.5 28.5 40.5 16.6 8.1 6.3 -3.4 -7.7 2.5 37.3 40.0
France n.a. n.a. n.a. n.a. n.a. n.a. n.a. n.a. n.a. n.a. n.a. n.a. n.a. n.a. n.a.
Germany 27.7 34.9 14.8 10.4 12.2 29.1 33.7 14.9 10.5 11.8 5.1 -3.4 0.7 1.0 -3.3
Hungary 47.6 26.2 12.6 6.0 7.6 47.2 25.5 11.6 8.1 7.6 -0.8 -2.7 -7.9 35.0 0.0
Italy n.a. n.a. n.a. n.a. n.a. n.a. n.a. n.a. n.a. n.a. n.a. n.a. n.a. n.a. n.a.
Norway 28.0 23.4 17.4 19.1 12.1 18.7 29.3 19.9 19.6 12.5 -33.2 25.2 14.4 2.6 3.3
Poland 37.4 24.5 17.9 7.1 13.1 46.0 21.9 10.3 10.8 11.0 23.0 -10.6 -42.5 52.1 -16.0
Romania 28.0 31.0 22.0 12.0 7.0 28.0 34.0 22.0 12.0 4.0 0.0 9.7 0.0 0.0 -42.9
Spain n.a. n.a. n.a. n.a. n.a. n.a. n.a. n.a. n.a. n.a. n.a. n.a. n.a. n.a. n.a.
Sweden n.a. n.a. n.a. n.a. n.a. n.a. n.a. n.a. n.a. n.a. n.a. n.a. n.a. n.a. n.a.
Switzerland n.a. n.a. n.a. n.a. n.a. n.a. n.a. n.a. n.a. n.a. n.a. n.a. n.a. n.a. n.a.
Turkey n.a. n.a. n.a. n.a. n.a. n.a. n.a. n.a. n.a. n.a. n.a. n.a. n.a. n.a. n.a.
United Kingdom n.a. n.a. n.a. n.a. n.a. n.a. n.a. n.a. n.a. n.a. n.a. n.a. n.a. n.a. n.a.
26Fefco Annual Statistics 2015

FEFCO Statistics 27
961 1,039
5,430
9,873
571
6,456
208
3,795
665
4,759
644443
3,965
4,477
0
2,000
4,000
6,000
8,000
10,000
12,000
A CZ F D H I N PL RO E S CH TR UK
Millio
ns m
²
Shipments in Millions m2
2014 2015
FEFCO Statistics 28
458 509
2,838
5,129
278
3,620
99
1,907
322
2,587
314229
2,0311,958
0
1,000
2,000
3,000
4,000
5,000
6,000
A CZ F D H I N PL RO E S CH TR UK
Th
ou
san
ds o
f T
on
nes
Shipments in '000 Tonnes 2014 2015

FEFCO Statistics 29
2.2 2.4
12.5
22.8
1.3
14.9
0.5
8.8
1.5
11.0
1.51.0
9.2
10.3
.000
5.000
10.000
15.000
20.000
25.000
A CZ F D H I N PL RO E S CH TR UK
Perc
en
tag
eRelative Share of Total Shipments by Country (based on m2)
2014 2015
FEFCO Statistics 30
477490
523 519
487
561
476
503
484
544
488
517 512
437
0
100
200
300
400
500
600
A CZ F D H I N PL RO E S CH TR UK
Gra
mm
es p
er
m²
Average Weight of Corrugated Board by Country2014 2015

FEFCO Statistics 31
0
10
20
30
40
50
60
70
80
90
100
A CZ F D H I N PL RO E S CH TR UK
Perc
en
tag
e
Fluting Type
B-flute C-flute BC-flute E-flute Micro-Fl Others