Annual Statistical Review 2014/15 - Queensland Police Service · Annual Statistical Review...
174
Annual Statistical Review 2014/15 Queensland Police Service
Transcript of Annual Statistical Review 2014/15 - Queensland Police Service · Annual Statistical Review...
1Queensland Police Service - Annual Statistical Review 2014/15
Annual Statistical Review 2014/15
Queensland Police Service


‘Members of the community work with Queensland police
to stop crime and make Queensland safer.’
Vision of the Queensland Police Service
© The State of Queensland (Queensland Police Service) 2015Copyright in this publication is owned by the State of Queensland acting through the Queensland Police Service (QPS). No part may be reproduced, communicated, modified or stored without the written permission of the Queensland Police Service except as permitted under the Copyright Act 1968 (Cwlth).
Written requests for permission should be addressed to:The IP CoordinatorMinisterial and Executive Services, Public Safety Business AgencyGPO Box 1440 Brisbane QLD 4001PH: 3364 3958 FX: 3364 3942
DISCLAIMERWhile all care has been taken in preparing this publication, the State of Queensland, acting through the QPS does not warrant that the content is complete, accurate or current. The QPS expressly disclaims any liability for any damage resulting from the use of the material contained in this publication and will not be responsible for any loss, howsoever arising, from use of or reliance on this material. The user must make the enquiries relevant to their use in relation to the material available in this publication.
ISSN 1441-4589
Produced by:Statistical Services, AnalyticsInformation and Data ServicesFrontline and Digital ServicesPublic Safety Business Agency
The Queensland Police Service web address is “www.police.qld.gov.au”.Past and current copies of the Queensland Police Service’s Annual Statistical Review and Annual Report are available at the above web address. Whilst the Annual Statistical Review provides a wealth of information relating to the activities of the Queensland Police Service, the Annual Report provides a range of performance management information, successful initiatives and includes the Service’s financial statements.
http://creativecommons.org/licenses/by/4.0/au/legalcode
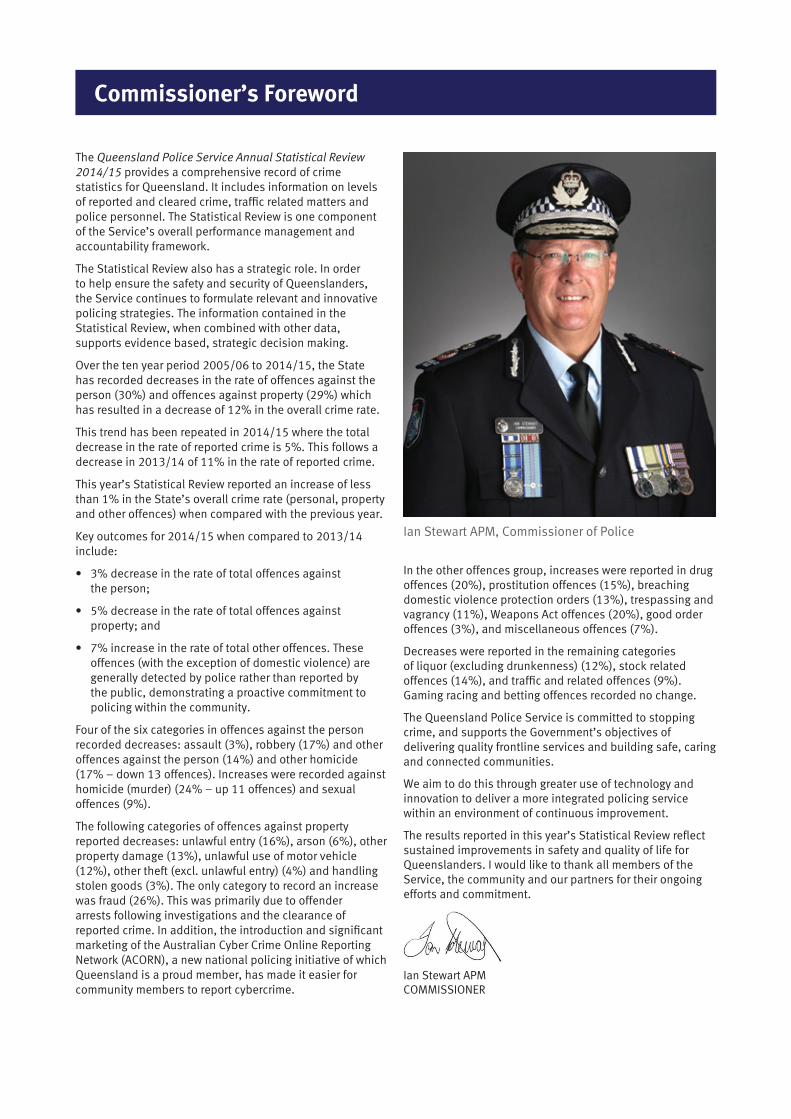
Commissioner’s Foreword
The Queensland Police Service Annual Statistical Review 2014/15 provides a comprehensive record of crime statistics for Queensland. It includes information on levels of reported and cleared crime, traffic related matters and police personnel. The Statistical Review is one component of the Service’s overall performance management and accountability framework.
The Statistical Review also has a strategic role. In order to help ensure the safety and security of Queenslanders, the Service continues to formulate relevant and innovative policing strategies. The information contained in the Statistical Review, when combined with other data, supports evidence based, strategic decision making.
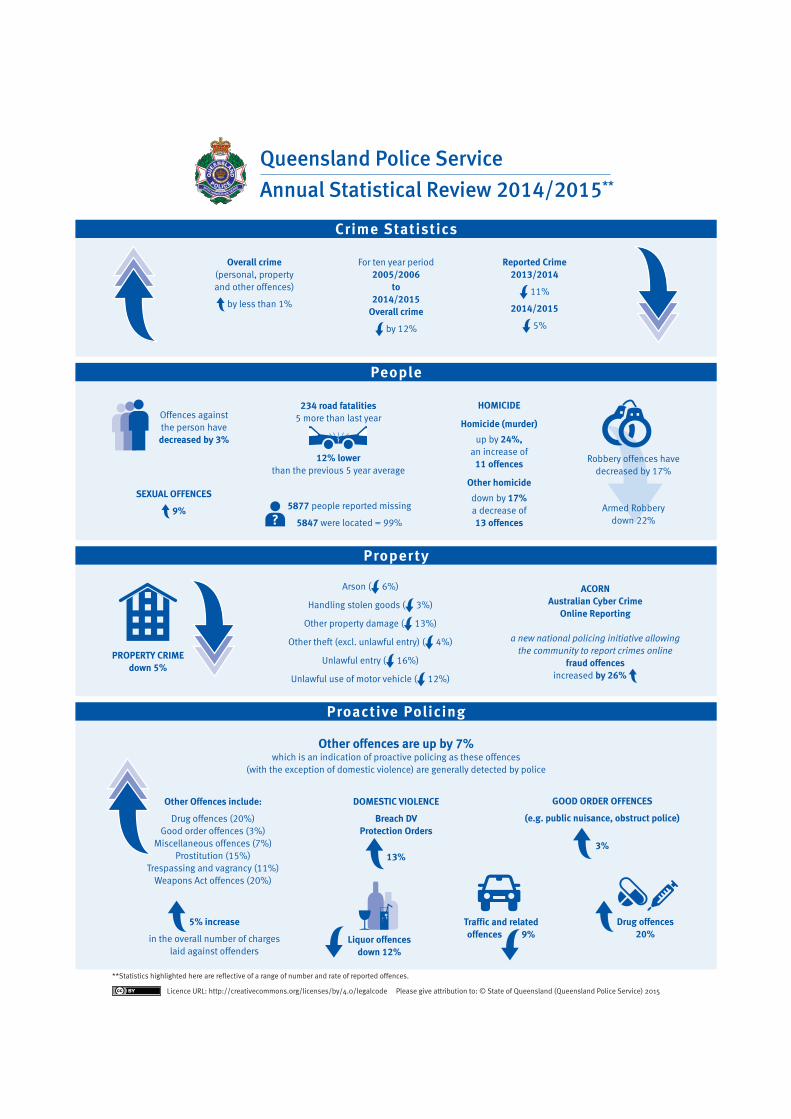
Over the ten year period 2005/06 to 2014/15, the State has recorded decreases in the rate of offences against the person (30%) and offences against property (29%) which has resulted in a decrease of 12% in the overall crime rate.
This trend has been repeated in 2014/15 where the total decrease in the rate of reported crime is 5%. This follows a decrease in 2013/14 of 11% in the rate of reported crime.
This year’s Statistical Review reported an increase of less than 1% in the State’s overall crime rate (personal, property and other offences) when compared with the previous year.
Key outcomes for 2014/15 when compared to 2013/14 include:
• 3% decrease in the rate of total offences against the person;
• 5% decrease in the rate of total offences against property; and
• 7% increase in the rate of total other offences. These offences (with the exception of domestic violence) are generally detected by police rather than reported by the public, demonstrating a proactive commitment to policing within the community.
Four of the six categories in offences against the person recorded decreases: assault (3%), robbery (17%) and other offences against the person (14%) and other homicide (17% – down 13 offences). Increases were recorded against homicide (murder) (24% – up 11 offences) and sexual offences (9%).
The following categories of offences against property reported decreases: unlawful entry (16%), arson (6%), other property damage (13%), unlawful use of motor vehicle (12%), other theft (excl. unlawful entry) (4%) and handling stolen goods (3%). The only category to record an increase was fraud (26%). This was primarily due to offender arrests following investigations and the clearance of reported crime. In addition, the introduction and significant marketing of the Australian Cyber Crime Online Reporting Network (ACORN), a new national policing initiative of which Queensland is a proud member, has made it easier for community members to report cybercrime.
In the other offences group, increases were reported in drug offences (20%), prostitution offences (15%), breaching domestic violence protection orders (13%), trespassing and vagrancy (11%), Weapons Act offences (20%), good order offences (3%), and miscellaneous offences (7%).
Decreases were reported in the remaining categories of liquor (excluding drunkenness) (12%), stock related offences (14%), and traffic and related offences (9%). Gaming racing and betting offences recorded no change.
The Queensland Police Service is committed to stopping crime, and supports the Government’s objectives of delivering quality frontline services and building safe, caring and connected communities.
We aim to do this through greater use of technology and innovation to deliver a more integrated policing service within an environment of continuous improvement.
The results reported in this year’s Statistical Review reflect sustained improvements in safety and quality of life for Queenslanders. I would like to thank all members of the Service, the community and our partners for their ongoing efforts and commitment.
Ian Stewart APM COMMISSIONER
Ian Stewart APM, Commissioner of Police
Property
For ten year period 2005/2006
to 2014/2015
Overall crime
by 12%
**Statistics highlighted here are reflective of a range of number and rate of reported offences.
Licence URL: http://creativecommons.org/licenses/by/4.0/legalcode Please give attribution to: © State of Queensland (Queensland Police Service) 2015
Overall crime (personal, property and other offences)
by less than 1%
Other offences are up by 7% which is an indication of proactive policing as these offences
(with the exception of domestic violence) are generally detected by police
ACORN Australian Cyber Crime
Online Reporting
a new national policing initiative allowing the community to report crimes online
fraud offences increased by 26%
Arson ( 6%)
Handling stolen goods ( 3%)
Other property damage ( 13%)
Other theft (excl. unlawful entry) ( 4%)
Unlawful entry ( 16%)
Unlawful use of motor vehicle ( 12%)
PROPERTY CRIME down 5%
HOMICIDE
Homicide (murder)
up by 24%, an increase of
11 offences
Other homicide
down by 17% a decrease of 13 offences
Traffic and related offences 9%
Reported Crime 2013/2014
11%
2014/2015
5%
234 road fatalities 5 more than last year
12% lower than the previous 5 year average
5877 people reported missing
5847 were located = 99%?
SEXUAL OFFENCES
9%
Offences against the person have decreased by 3%
Robbery offences have decreased by 17%
Armed Robbery down 22%
Other Offences include:
Drug offences (20%) Good order offences (3%)
Miscellaneous offences (7%) Prostitution (15%)
Trespassing and vagrancy (11%) Weapons Act offences (20%)
5% increase
in the overall number of charges laid against offenders
Drug offences 20%
GOOD ORDER OFFENCES
(e.g. public nuisance, obstruct police)
3%
DOMESTIC VIOLENCE
Breach DV Protection Orders
13%
Liquor offences down 12%
Queensland Police Service
Annual Statistical Review 2014/2015**
Proactive Policing
People
Crime Statistics
Contents
Queensland Crime 1
Crime 2014/15 9
Monthly Crime Trends 17
Annual Crime Trends 35
Regional Comparisons 45
Victims of Crime 63
Offender/Victim Relationships 71
Offenders 77
Crime Locations 95
District Crime 99
Missing Persons 129
Traffic 135
Crime Statistics in Focus 143
Personnel 153
Police Regions and Districts 159
Explanatory Notes 161
Glossary 165

1Queensland Police Service - Annual Statistical Review 2014/15
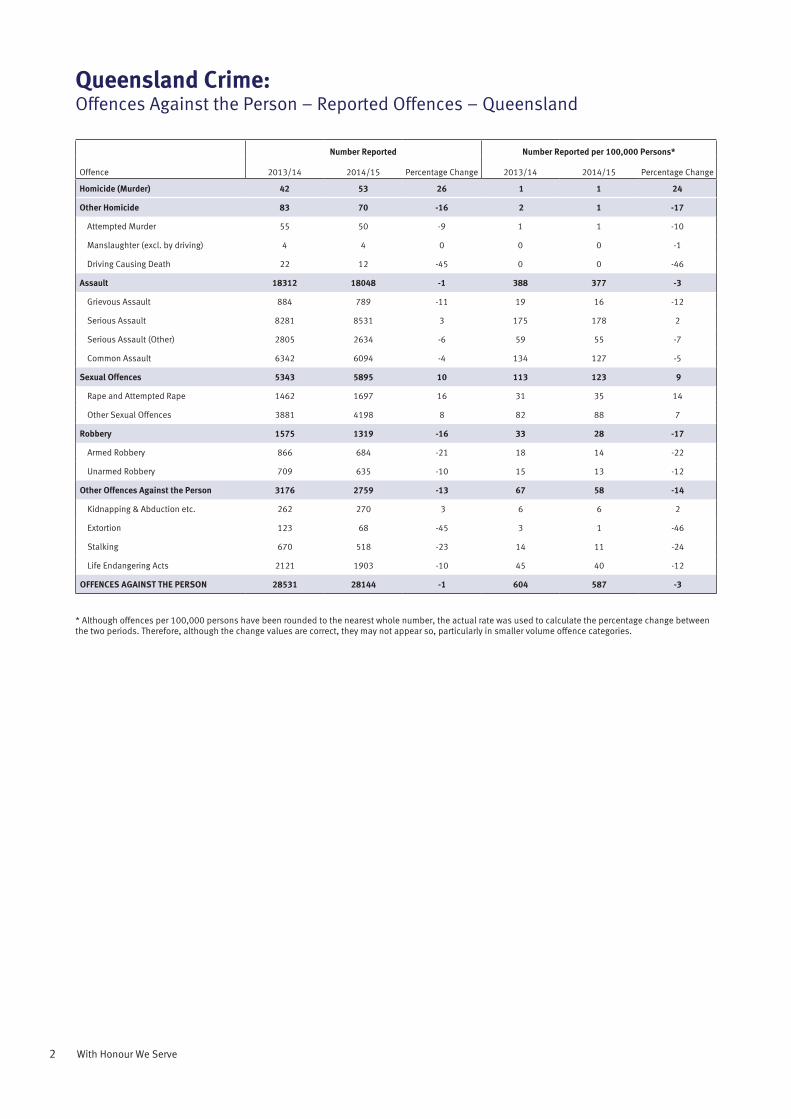
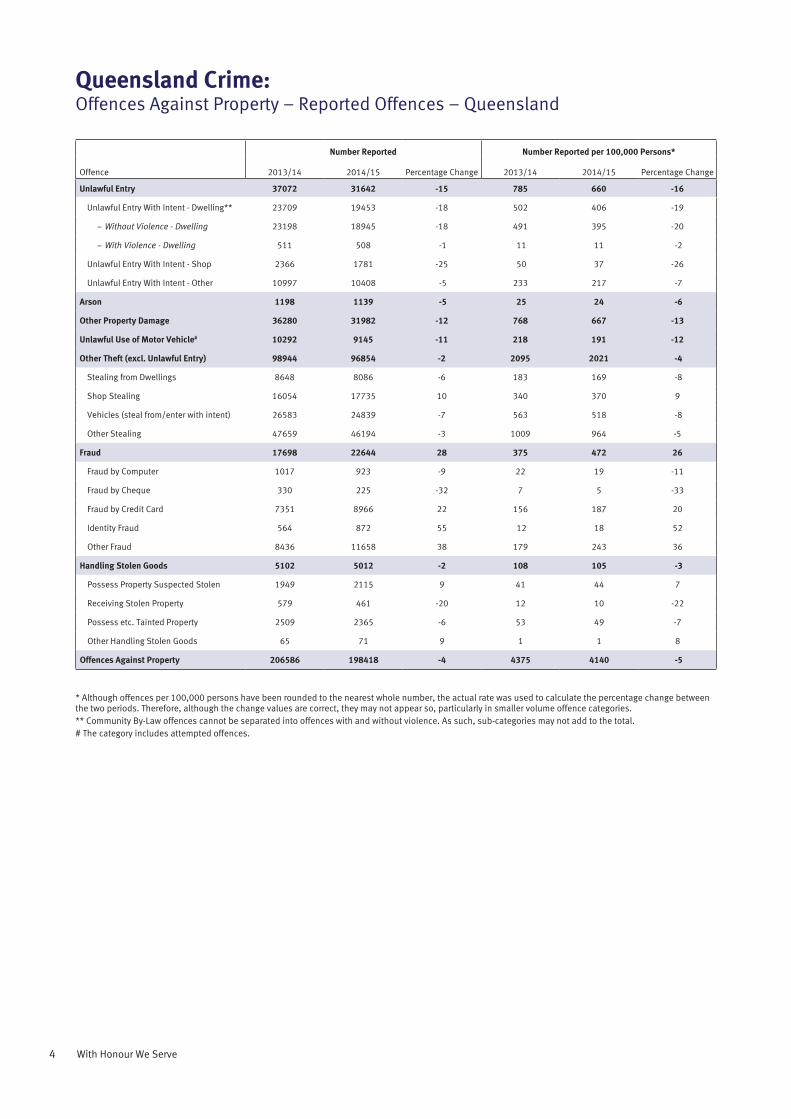
The following tables provide statistics for Queensland for the 2013/14 and 2014/15 financial years, for reported and cleared offences against the person and offences against property and reported other offences.
Reported offence data are presented as both numbers and rates (offences reported per 100,000 persons), together with a percentage change indicator to provide the reader with a clear and balanced picture of the level of crime in Queensland.
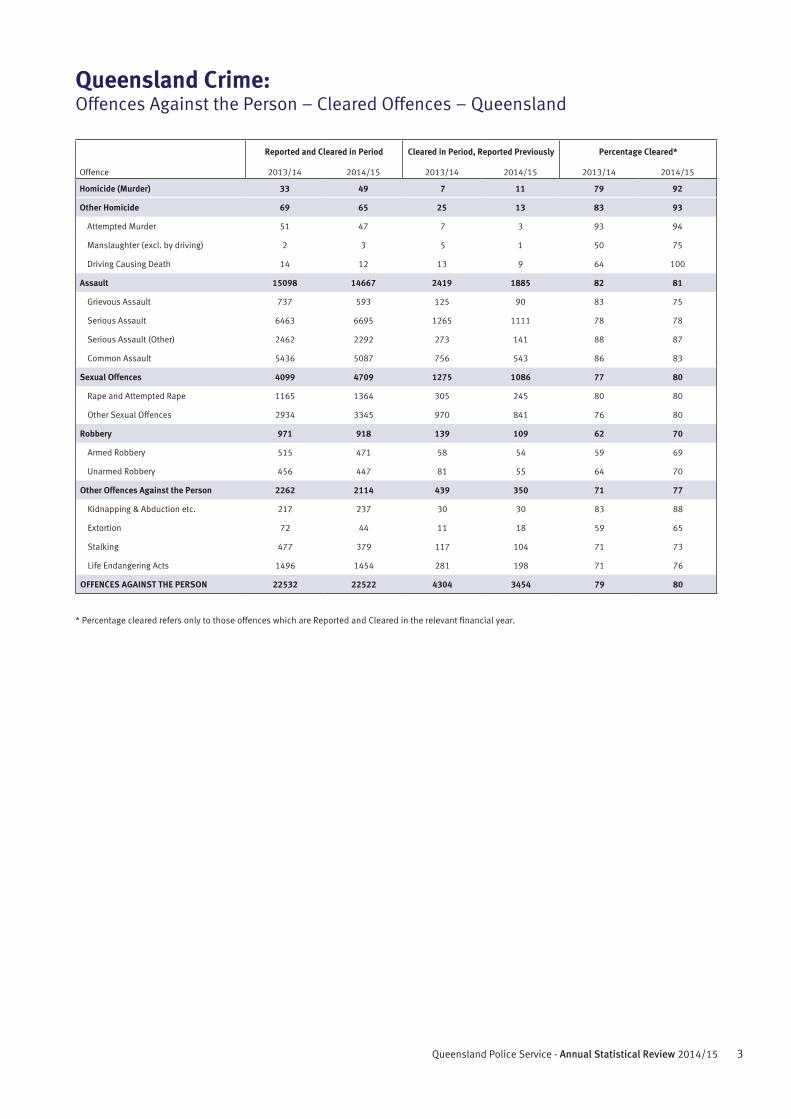
Cleared offences are displayed as ‘Reported and Cleared in Period’ and ‘Cleared in Period, Reported Previously’. The ‘Percentage Cleared’ figures refer only to those offences reported and cleared in the relevant financial year.
Queensland Crime
2 With Honour We Serve
Number Reported Number Reported per 100,000 Persons*
Offence 2013/14 2014/15 Percentage Change 2013/14 2014/15 Percentage Change
Homicide (Murder) 42 53 26 1 1 24
Other Homicide 83 70 -16 2 1 -17
Attempted Murder 55 50 -9 1 1 -10
Manslaughter (excl. by driving) 4 4 0 0 0 -1
Driving Causing Death 22 12 -45 0 0 -46
Assault 18312 18048 -1 388 377 -3
Grievous Assault 884 789 -11 19 16 -12
Serious Assault 8281 8531 3 175 178 2
Serious Assault (Other) 2805 2634 -6 59 55 -7
Common Assault 6342 6094 -4 134 127 -5
Sexual Offences 5343 5895 10 113 123 9
Rape and Attempted Rape 1462 1697 16 31 35 14
Other Sexual Offences 3881 4198 8 82 88 7
Robbery 1575 1319 -16 33 28 -17
Armed Robbery 866 684 -21 18 14 -22
Unarmed Robbery 709 635 -10 15 13 -12
Other Offences Against the Person 3176 2759 -13 67 58 -14
Kidnapping & Abduction etc. 262 270 3 6 6 2
Extortion 123 68 -45 3 1 -46
Stalking 670 518 -23 14 11 -24
Life Endangering Acts 2121 1903 -10 45 40 -12
OFFENCES AGAINST THE PERSON 28531 28144 -1 604 587 -3
Queensland Crime:Offences Against the Person – Reported Offences – Queensland
* Although offences per 100,000 persons have been rounded to the nearest whole number, the actual rate was used to calculate the percentage change between the two periods. Therefore, although the change values are correct, they may not appear so, particularly in smaller volume offence categories.
3Queensland Police Service - Annual Statistical Review 2014/15
Reported and Cleared in Period Cleared in Period, Reported Previously Percentage Cleared*
Offence 2013/14 2014/15 2013/14 2014/15 2013/14 2014/15
Homicide (Murder) 33 49 7 11 79 92
Other Homicide 69 65 25 13 83 93
Attempted Murder 51 47 7 3 93 94
Manslaughter (excl. by driving) 2 3 5 1 50 75
Driving Causing Death 14 12 13 9 64 100
Assault 15098 14667 2419 1885 82 81
Grievous Assault 737 593 125 90 83 75
Serious Assault 6463 6695 1265 1111 78 78
Serious Assault (Other) 2462 2292 273 141 88 87
Common Assault 5436 5087 756 543 86 83
Sexual Offences 4099 4709 1275 1086 77 80
Rape and Attempted Rape 1165 1364 305 245 80 80
Other Sexual Offences 2934 3345 970 841 76 80
Robbery 971 918 139 109 62 70
Armed Robbery 515 471 58 54 59 69
Unarmed Robbery 456 447 81 55 64 70
Other Offences Against the Person 2262 2114 439 350 71 77
Kidnapping & Abduction etc. 217 237 30 30 83 88
Extortion 72 44 11 18 59 65
Stalking 477 379 117 104 71 73
Life Endangering Acts 1496 1454 281 198 71 76
OFFENCES AGAINST THE PERSON 22532 22522 4304 3454 79 80
Queensland Crime:Offences Against the Person – Cleared Offences – Queensland
* Percentage cleared refers only to those offences which are Reported and Cleared in the relevant financial year.
4 With Honour We Serve
Number Reported Number Reported per 100,000 Persons*
Offence 2013/14 2014/15 Percentage Change 2013/14 2014/15 Percentage Change
Unlawful Entry 37072 31642 -15 785 660 -16
Unlawful Entry With Intent - Dwelling** 23709 19453 -18 502 406 -19
− Without Violence - Dwelling 23198 18945 -18 491 395 -20
− With Violence - Dwelling 511 508 -1 11 11 -2
Unlawful Entry With Intent - Shop 2366 1781 -25 50 37 -26
Unlawful Entry With Intent - Other 10997 10408 -5 233 217 -7
Arson 1198 1139 -5 25 24 -6
Other Property Damage 36280 31982 -12 768 667 -13
Unlawful Use of Motor Vehicle# 10292 9145 -11 218 191 -12
Other Theft (excl. Unlawful Entry) 98944 96854 -2 2095 2021 -4
Stealing from Dwellings 8648 8086 -6 183 169 -8
Shop Stealing 16054 17735 10 340 370 9
Vehicles (steal from/enter with intent) 26583 24839 -7 563 518 -8
Other Stealing 47659 46194 -3 1009 964 -5
Fraud 17698 22644 28 375 472 26
Fraud by Computer 1017 923 -9 22 19 -11
Fraud by Cheque 330 225 -32 7 5 -33
Fraud by Credit Card 7351 8966 22 156 187 20
Identity Fraud 564 872 55 12 18 52
Other Fraud 8436 11658 38 179 243 36
Handling Stolen Goods 5102 5012 -2 108 105 -3
Possess Property Suspected Stolen 1949 2115 9 41 44 7
Receiving Stolen Property 579 461 -20 12 10 -22
Possess etc. Tainted Property 2509 2365 -6 53 49 -7
Other Handling Stolen Goods 65 71 9 1 1 8
Offences Against Property 206586 198418 -4 4375 4140 -5
Queensland Crime:Offences Against Property – Reported Offences – Queensland
* Although offences per 100,000 persons have been rounded to the nearest whole number, the actual rate was used to calculate the percentage change between the two periods. Therefore, although the change values are correct, they may not appear so, particularly in smaller volume offence categories.** Community By-Law offences cannot be separated into offences with and without violence. As such, sub-categories may not add to the total.# The category includes attempted offences.
5Queensland Police Service - Annual Statistical Review 2014/15
Reported and Cleared in Period Cleared in Period, Reported Previously Percentage Cleared*
Offence 2013/14 2014/15 2013/14 2014/15 2013/14 2014/15
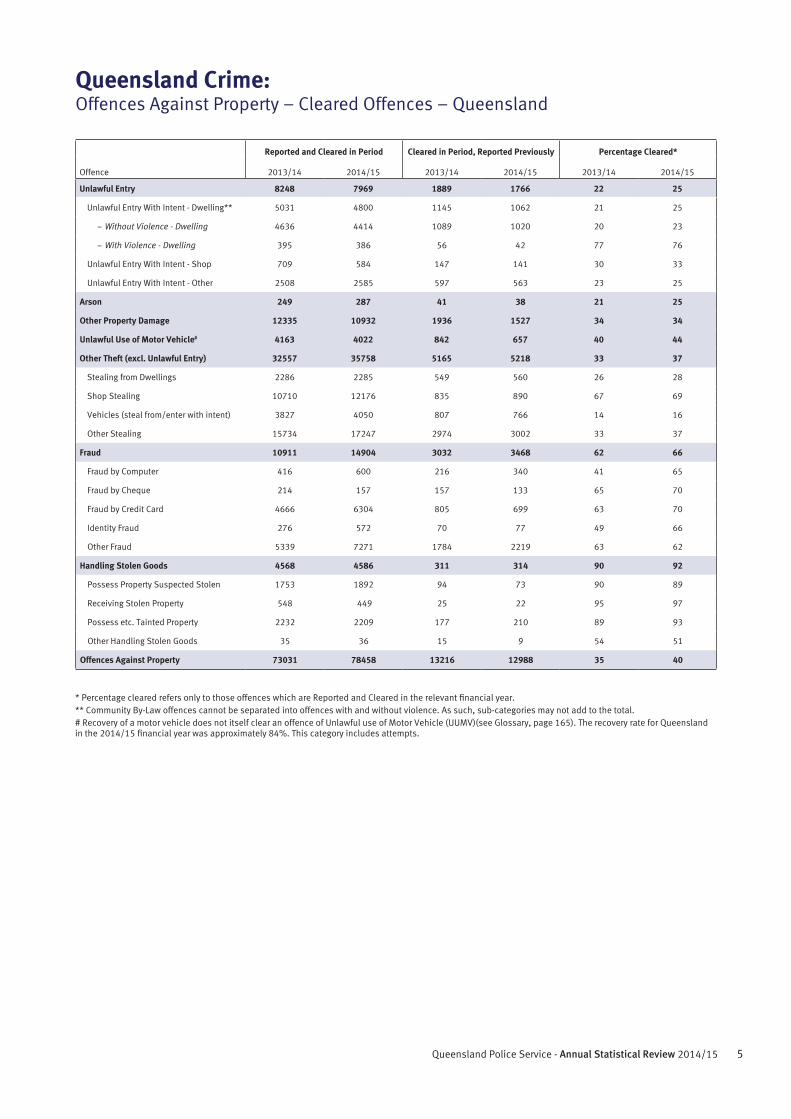
Unlawful Entry 8248 7969 1889 1766 22 25
Unlawful Entry With Intent - Dwelling** 5031 4800 1145 1062 21 25
− Without Violence - Dwelling 4636 4414 1089 1020 20 23
− With Violence - Dwelling 395 386 56 42 77 76
Unlawful Entry With Intent - Shop 709 584 147 141 30 33
Unlawful Entry With Intent - Other 2508 2585 597 563 23 25
Arson 249 287 41 38 21 25
Other Property Damage 12335 10932 1936 1527 34 34
Unlawful Use of Motor Vehicle# 4163 4022 842 657 40 44
Other Theft (excl. Unlawful Entry) 32557 35758 5165 5218 33 37
Stealing from Dwellings 2286 2285 549 560 26 28
Shop Stealing 10710 12176 835 890 67 69
Vehicles (steal from/enter with intent) 3827 4050 807 766 14 16
Other Stealing 15734 17247 2974 3002 33 37
Fraud 10911 14904 3032 3468 62 66
Fraud by Computer 416 600 216 340 41 65
Fraud by Cheque 214 157 157 133 65 70
Fraud by Credit Card 4666 6304 805 699 63 70
Identity Fraud 276 572 70 77 49 66
Other Fraud 5339 7271 1784 2219 63 62
Handling Stolen Goods 4568 4586 311 314 90 92
Possess Property Suspected Stolen 1753 1892 94 73 90 89
Receiving Stolen Property 548 449 25 22 95 97
Possess etc. Tainted Property 2232 2209 177 210 89 93
Other Handling Stolen Goods 35 36 15 9 54 51
Offences Against Property 73031 78458 13216 12988 35 40
Queensland Crime:Offences Against Property – Cleared Offences – Queensland
* Percentage cleared refers only to those offences which are Reported and Cleared in the relevant financial year.** Community By-Law offences cannot be separated into offences with and without violence. As such, sub-categories may not add to the total.# Recovery of a motor vehicle does not itself clear an offence of Unlawful use of Motor Vehicle (UUMV)(see Glossary, page 165). The recovery rate for Queensland in the 2014/15 financial year was approximately 84%. This category includes attempts.
6 With Honour We Serve
Number Reported Number Reported per 100,000 Persons*
Offence 2013/14 2014/15 Percentage Change 2013/14 2014/15 Percentage Change
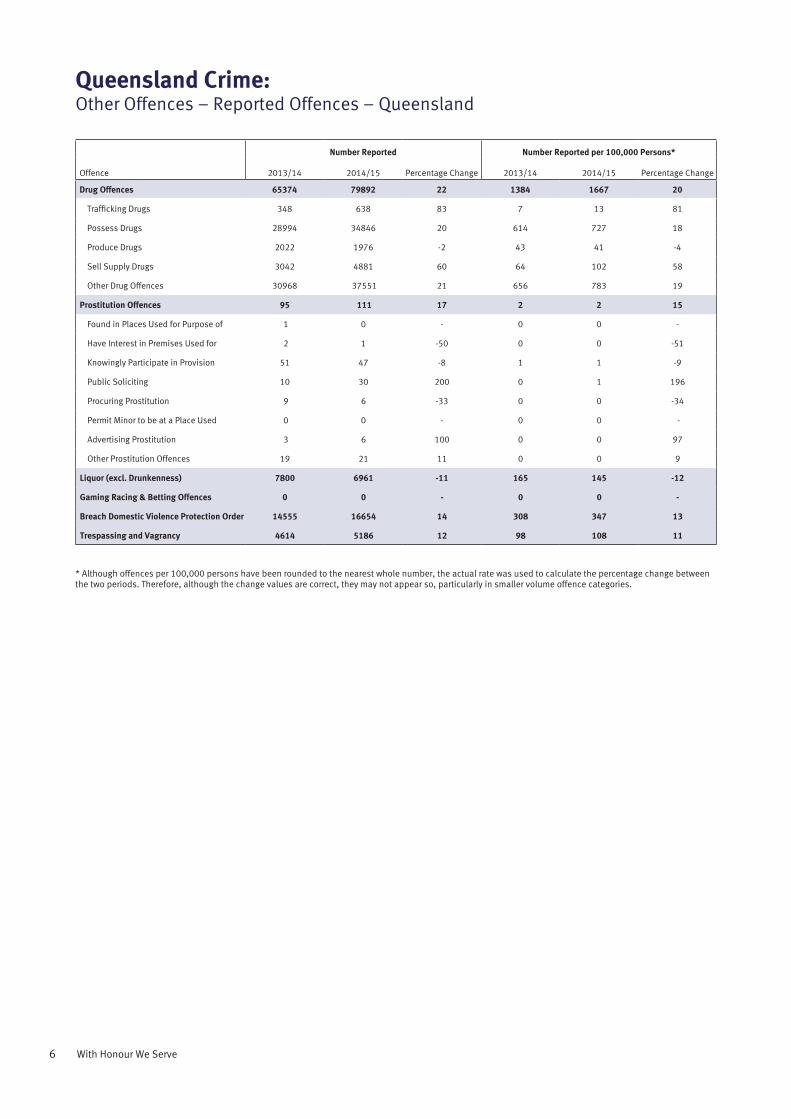
Drug Offences 65374 79892 22 1384 1667 20
Trafficking Drugs 348 638 83 7 13 81
Possess Drugs 28994 34846 20 614 727 18
Produce Drugs 2022 1976 -2 43 41 -4
Sell Supply Drugs 3042 4881 60 64 102 58
Other Drug Offences 30968 37551 21 656 783 19
Prostitution Offences 95 111 17 2 2 15
Found in Places Used for Purpose of 1 0 - 0 0 -
Have Interest in Premises Used for 2 1 -50 0 0 -51
Knowingly Participate in Provision 51 47 -8 1 1 -9
Public Soliciting 10 30 200 0 1 196
Procuring Prostitution 9 6 -33 0 0 -34
Permit Minor to be at a Place Used 0 0 - 0 0 -
Advertising Prostitution 3 6 100 0 0 97
Other Prostitution Offences 19 21 11 0 0 9
Liquor (excl. Drunkenness) 7800 6961 -11 165 145 -12
Gaming Racing & Betting Offences 0 0 - 0 0 -
Breach Domestic Violence Protection Order 14555 16654 14 308 347 13
Trespassing and Vagrancy 4614 5186 12 98 108 11
Queensland Crime:Other Offences – Reported Offences – Queensland
* Although offences per 100,000 persons have been rounded to the nearest whole number, the actual rate was used to calculate the percentage change between the two periods. Therefore, although the change values are correct, they may not appear so, particularly in smaller volume offence categories.
7Queensland Police Service - Annual Statistical Review 2014/15
Number Reported Number Reported per 100,000 Persons*
Offence 2013/14 2014/15 Percentage Change 2013/14 2014/15 Percentage Change
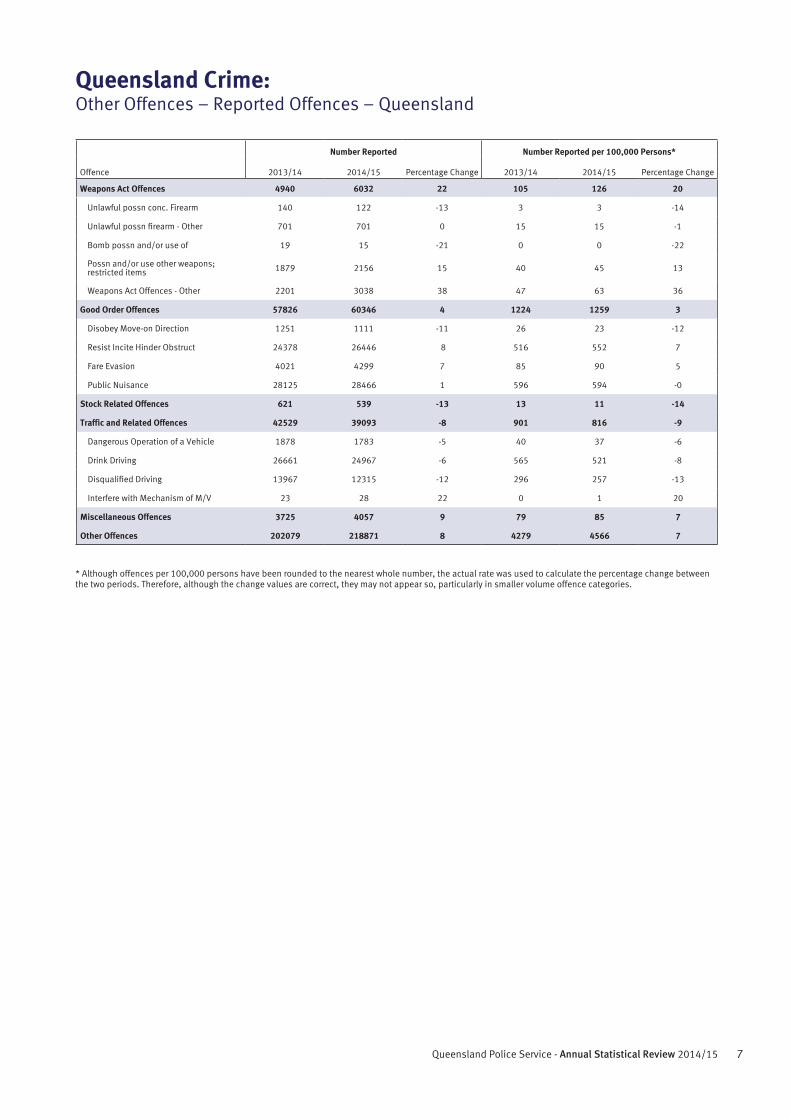
Weapons Act Offences 4940 6032 22 105 126 20
Unlawful possn conc. Firearm 140 122 -13 3 3 -14
Unlawful possn firearm - Other 701 701 0 15 15 -1
Bomb possn and/or use of 19 15 -21 0 0 -22
Possn and/or use other weapons; restricted items 1879 2156 15 40 45 13
Weapons Act Offences - Other 2201 3038 38 47 63 36
Good Order Offences 57826 60346 4 1224 1259 3
Disobey Move-on Direction 1251 1111 -11 26 23 -12
Resist Incite Hinder Obstruct 24378 26446 8 516 552 7
Fare Evasion 4021 4299 7 85 90 5
Public Nuisance 28125 28466 1 596 594 -0
Stock Related Offences 621 539 -13 13 11 -14
Traffic and Related Offences 42529 39093 -8 901 816 -9
Dangerous Operation of a Vehicle 1878 1783 -5 40 37 -6
Drink Driving 26661 24967 -6 565 521 -8
Disqualified Driving 13967 12315 -12 296 257 -13
Interfere with Mechanism of M/V 23 28 22 0 1 20
Miscellaneous Offences 3725 4057 9 79 85 7
Other Offences 202079 218871 8 4279 4566 7
Queensland Crime:Other Offences – Reported Offences – Queensland
* Although offences per 100,000 persons have been rounded to the nearest whole number, the actual rate was used to calculate the percentage change between the two periods. Therefore, although the change values are correct, they may not appear so, particularly in smaller volume offence categories.

8 With Honour We Serve
9Queensland Police Service - Annual Statistical Review 2014/15
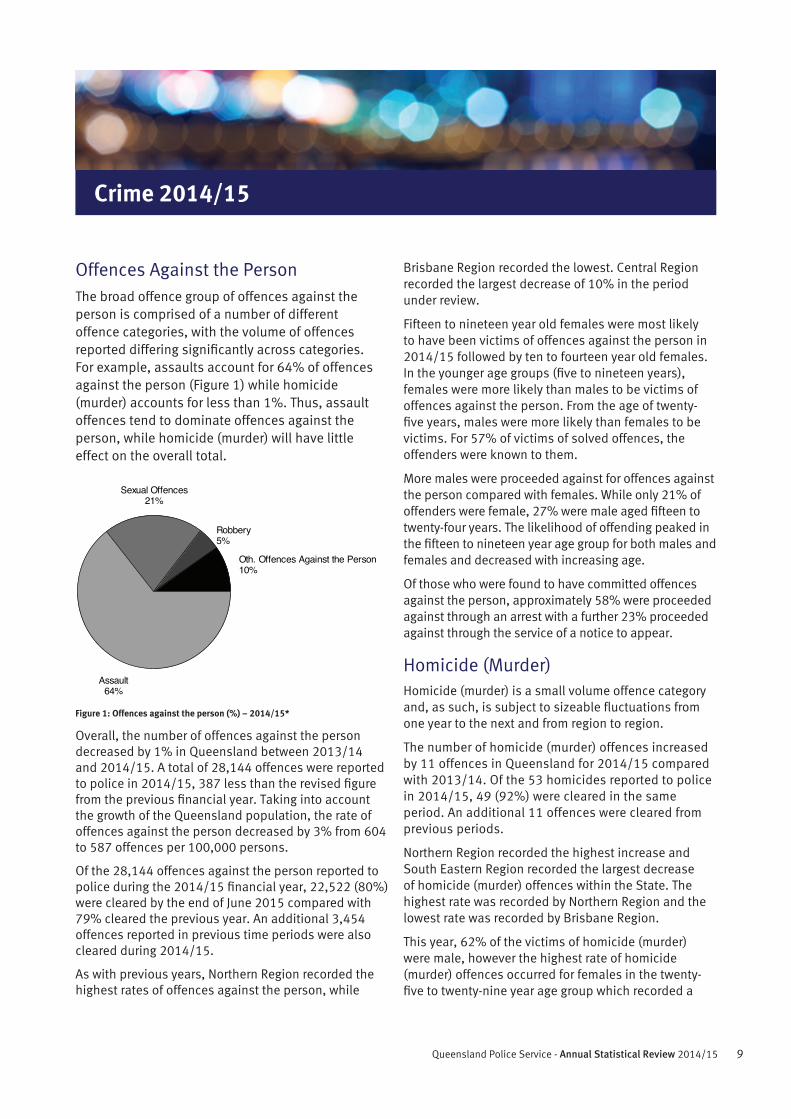
Offences Against the PersonThe broad offence group of offences against the person is comprised of a number of different offence categories, with the volume of offences reported differing significantly across categories. For example, assaults account for 64% of offences against the person (Figure 1) while homicide (murder) accounts for less than 1%. Thus, assault offences tend to dominate offences against the person, while homicide (murder) will have little effect on the overall total.
Figure 1: Offences against the person (%) – 2014/15*
Overall, the number of offences against the person decreased by 1% in Queensland between 2013/14 and 2014/15. A total of 28,144 offences were reported to police in 2014/15, 387 less than the revised figure from the previous financial year. Taking into account the growth of the Queensland population, the rate of offences against the person decreased by 3% from 604 to 587 offences per 100,000 persons.
Of the 28,144 offences against the person reported to police during the 2014/15 financial year, 22,522 (80%) were cleared by the end of June 2015 compared with 79% cleared the previous year. An additional 3,454 offences reported in previous time periods were also cleared during 2014/15.
As with previous years, Northern Region recorded the highest rates of offences against the person, while
Brisbane Region recorded the lowest. Central Region recorded the largest decrease of 10% in the period under review.
Fifteen to nineteen year old females were most likely to have been victims of offences against the person in 2014/15 followed by ten to fourteen year old females. In the younger age groups (five to nineteen years), females were more likely than males to be victims of offences against the person. From the age of twenty-five years, males were more likely than females to be victims. For 57% of victims of solved offences, the offenders were known to them.
More males were proceeded against for offences against the person compared with females. While only 21% of offenders were female, 27% were male aged fifteen to twenty-four years. The likelihood of offending peaked in the fifteen to nineteen year age group for both males and females and decreased with increasing age.
Of those who were found to have committed offences against the person, approximately 58% were proceeded against through an arrest with a further 23% proceeded against through the service of a notice to appear.
Homicide (Murder)Homicide (murder) is a small volume offence category and, as such, is subject to sizeable fluctuations from one year to the next and from region to region.
The number of homicide (murder) offences increased by 11 offences in Queensland for 2014/15 compared with 2013/14. Of the 53 homicides reported to police in 2014/15, 49 (92%) were cleared in the same period. An additional 11 offences were cleared from previous periods.
Northern Region recorded the highest increase and South Eastern Region recorded the largest decrease of homicide (murder) offences within the State. The highest rate was recorded by Northern Region and the lowest rate was recorded by Brisbane Region.
This year, 62% of the victims of homicide (murder) were male, however the highest rate of homicide (murder) offences occurred for females in the twenty-five to twenty-nine year age group which recorded a
Oth. Offences Against the Person10%
Robbery5%
Sexual Offences21%
Assault64%
Crime 2014/15
10 With Honour We Serve
rate of 4 offences per 100,000 resident persons. In 54% of all solved homicide cases, the offender was known to the victim.
Males were significantly more likely than females to commit homicide (murder) (85%). In 2014/15, males aged twenty to twenty-four and thirty-five to thirty-nine years were most likely to offend. In 95% of cases, the offender was proceeded against through an arrest.
Other HomicideAs with homicide (murder), other homicide is a low-volume offence category. Therefore, it is subject to marked fluctuations from year to year and from area to area. The number of other homicide offences decreased by 16% during 2014/15, as a result of decreases in attempted murder (5 offences) and driving causing death (10 offences).
Factoring in the increase of the Queensland estimated resident population, other homicide offences decreased by 17% to a rate of 1 offence per 100,000 persons. Of the 70 offences reported to police in 2014/15, 65 (93%) were cleared in the same period. Additionally, 13 offences were cleared from previous periods.
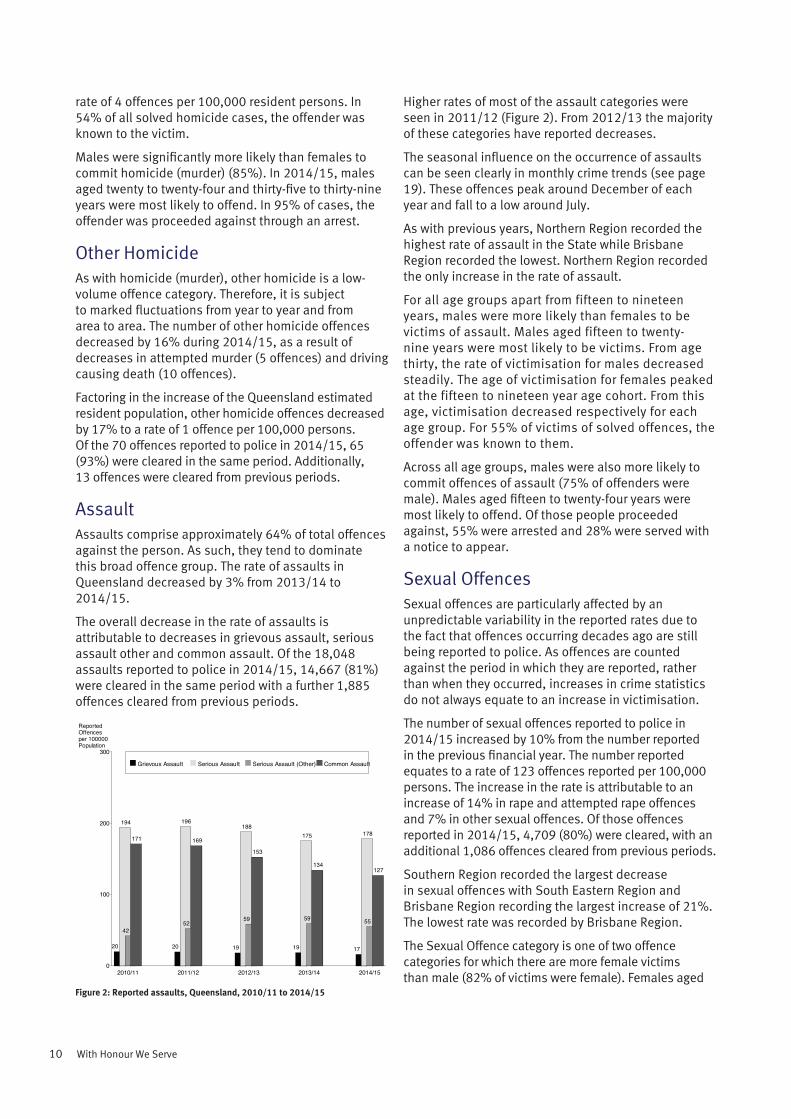
AssaultAssaults comprise approximately 64% of total offences against the person. As such, they tend to dominate this broad offence group. The rate of assaults in Queensland decreased by 3% from 2013/14 to 2014/15.
The overall decrease in the rate of assaults is attributable to decreases in grievous assault, serious assault other and common assault. Of the 18,048 assaults reported to police in 2014/15, 14,667 (81%) were cleared in the same period with a further 1,885 offences cleared from previous periods.
Figure 2: Reported assaults, Queensland, 2010/11 to 2014/15
ReportedOffencesper 100000Population
0
100
200
300
2010/11 2011/12 2012/13 2013/14 2014/15
Grievous Assault Serious Assault Serious Assault (Other) Common Assault
20
194
42
171
20
196
52
169
19
188
59
153
19
175
59
134
17
178
55
127
Higher rates of most of the assault categories were seen in 2011/12 (Figure 2). From 2012/13 the majority of these categories have reported decreases.
The seasonal influence on the occurrence of assaults can be seen clearly in monthly crime trends (see page 19). These offences peak around December of each year and fall to a low around July.
As with previous years, Northern Region recorded the highest rate of assault in the State while Brisbane Region recorded the lowest. Northern Region recorded the only increase in the rate of assault.
For all age groups apart from fifteen to nineteen years, males were more likely than females to be victims of assault. Males aged fifteen to twenty-nine years were most likely to be victims. From age thirty, the rate of victimisation for males decreased steadily. The age of victimisation for females peaked at the fifteen to nineteen year age cohort. From this age, victimisation decreased respectively for each age group. For 55% of victims of solved offences, the offender was known to them.
Across all age groups, males were also more likely to commit offences of assault (75% of offenders were male). Males aged fifteen to twenty-four years were most likely to offend. Of those people proceeded against, 55% were arrested and 28% were served with a notice to appear.
Sexual OffencesSexual offences are particularly affected by an unpredictable variability in the reported rates due to the fact that offences occurring decades ago are still being reported to police. As offences are counted against the period in which they are reported, rather than when they occurred, increases in crime statistics do not always equate to an increase in victimisation.
The number of sexual offences reported to police in 2014/15 increased by 10% from the number reported in the previous financial year. The number reported equates to a rate of 123 offences reported per 100,000 persons. The increase in the rate is attributable to an increase of 14% in rape and attempted rape offences and 7% in other sexual offences. Of those offences reported in 2014/15, 4,709 (80%) were cleared, with an additional 1,086 offences cleared from previous periods.
Southern Region recorded the largest decrease in sexual offences with South Eastern Region and Brisbane Region recording the largest increase of 21%. The lowest rate was recorded by Brisbane Region.
The Sexual Offence category is one of two offence categories for which there are more female victims than male (82% of victims were female). Females aged
11Queensland Police Service - Annual Statistical Review 2014/15
between ten and nineteen years were most likely to be victims of sexual offences. Females in this age group comprise 44% of total victims. For 75% of victims of solved offences, the offender was known to them. In 35% of solved cases, the offender was a family member.
In total, 125 females committed sexual offences in 2014/15. Thus, 95% of offenders were male. The age distribution of male offenders is unique for this offence type in that the distribution is almost uniform across all age groups with the exception of fifteen to nineteen year olds. The number of offenders is only slightly lower in the older age groups, with males aged fifty years and over representing 20% of all sexual offenders. For those proceeded against, 59% were arrested and 9% were served with a notice to appear.
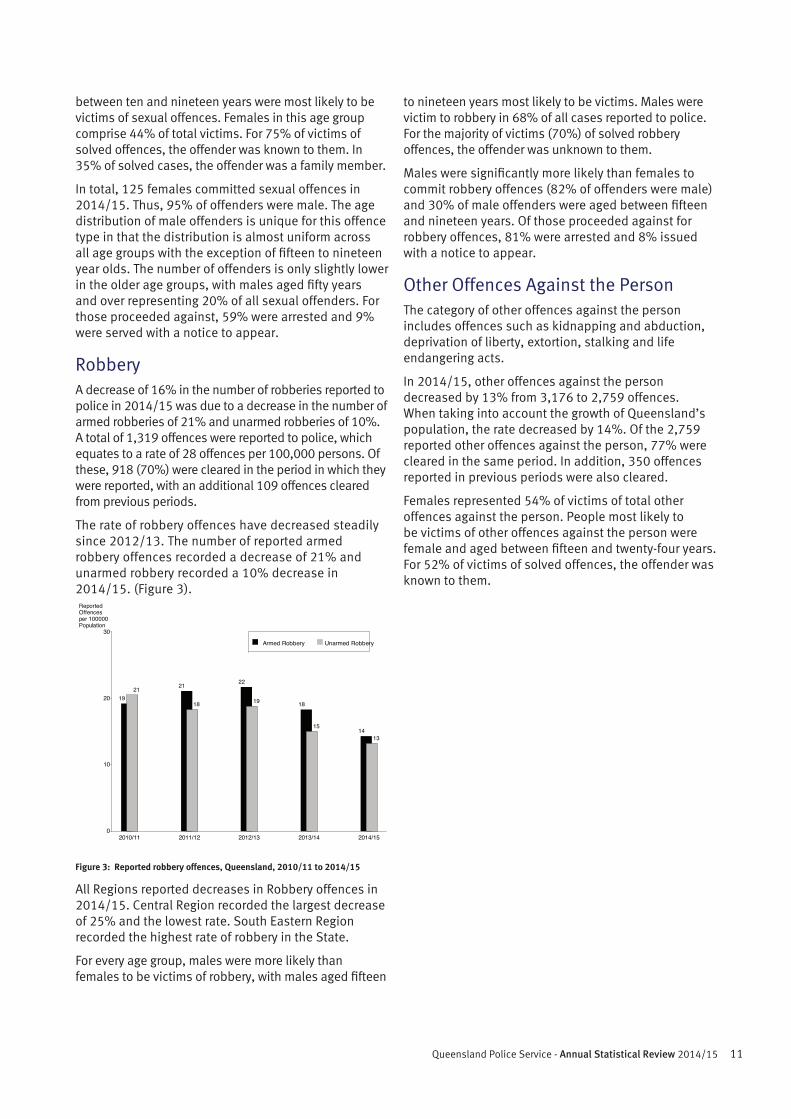
RobberyA decrease of 16% in the number of robberies reported to police in 2014/15 was due to a decrease in the number of armed robberies of 21% and unarmed robberies of 10%. A total of 1,319 offences were reported to police, which equates to a rate of 28 offences per 100,000 persons. Of these, 918 (70%) were cleared in the period in which they were reported, with an additional 109 offences cleared from previous periods.
The rate of robbery offences have decreased steadily since 2012/13. The number of reported armed robbery offences recorded a decrease of 21% and unarmed robbery recorded a 10% decrease in 2014/15. (Figure 3).
Figure 3: Reported robbery offences, Queensland, 2010/11 to 2014/15
All Regions reported decreases in Robbery offences in 2014/15. Central Region recorded the largest decrease of 25% and the lowest rate. South Eastern Region recorded the highest rate of robbery in the State.
For every age group, males were more likely than females to be victims of robbery, with males aged fifteen
ReportedOffencesper 100000Population
0
10
20
30
2010/11 2011/12 2012/13 2013/14 2014/15
Armed Robbery Unarmed Robbery
1921 21
18
22
19 18
1514
13
to nineteen years most likely to be victims. Males were victim to robbery in 68% of all cases reported to police. For the majority of victims (70%) of solved robbery offences, the offender was unknown to them.
Males were significantly more likely than females to commit robbery offences (82% of offenders were male) and 30% of male offenders were aged between fifteen and nineteen years. Of those proceeded against for robbery offences, 81% were arrested and 8% issued with a notice to appear.
Other Offences Against the PersonThe category of other offences against the person includes offences such as kidnapping and abduction, deprivation of liberty, extortion, stalking and life endangering acts.
In 2014/15, other offences against the person decreased by 13% from 3,176 to 2,759 offences. When taking into account the growth of Queensland’s population, the rate decreased by 14%. Of the 2,759 reported other offences against the person, 77% were cleared in the same period. In addition, 350 offences reported in previous periods were also cleared.
Females represented 54% of victims of total other offences against the person. People most likely to be victims of other offences against the person were female and aged between fifteen and twenty-four years. For 52% of victims of solved offences, the offender was known to them.
12 With Honour We Serve
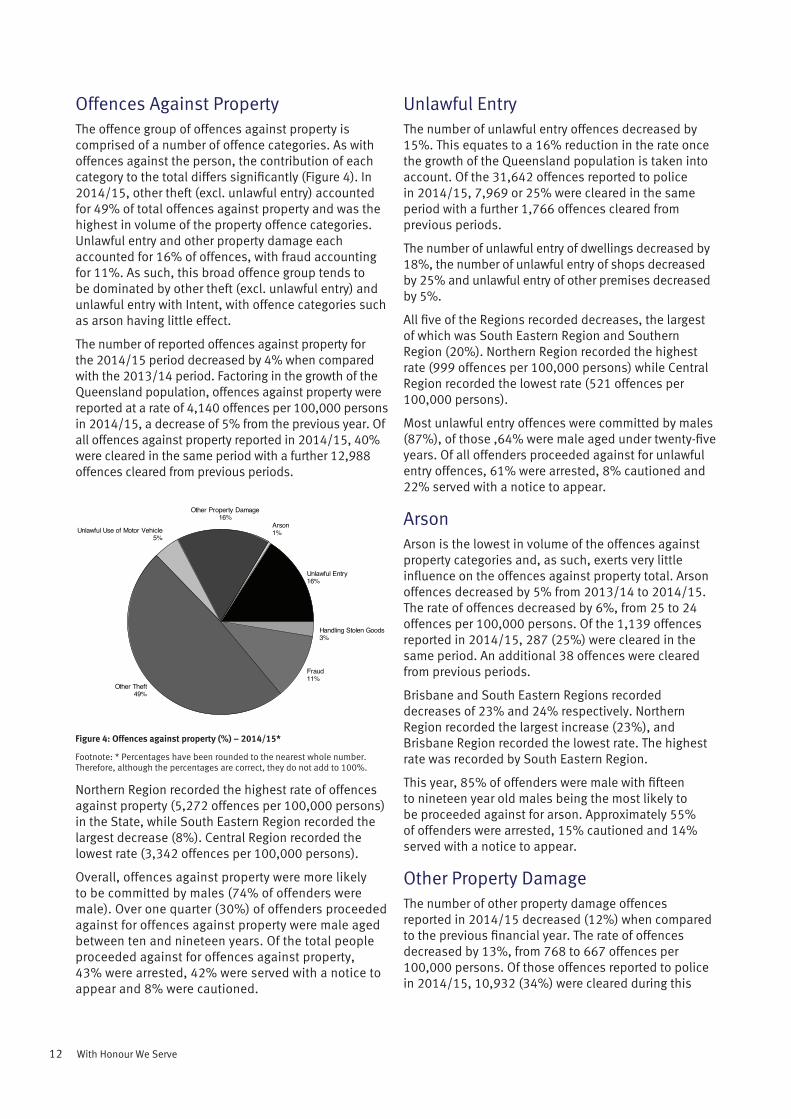
Offences Against PropertyThe offence group of offences against property is comprised of a number of offence categories. As with offences against the person, the contribution of each category to the total differs significantly (Figure 4). In 2014/15, other theft (excl. unlawful entry) accounted for 49% of total offences against property and was the highest in volume of the property offence categories. Unlawful entry and other property damage each accounted for 16% of offences, with fraud accounting for 11%. As such, this broad offence group tends to be dominated by other theft (excl. unlawful entry) and unlawful entry with Intent, with offence categories such as arson having little effect.
The number of reported offences against property for the 2014/15 period decreased by 4% when compared with the 2013/14 period. Factoring in the growth of the Queensland population, offences against property were reported at a rate of 4,140 offences per 100,000 persons in 2014/15, a decrease of 5% from the previous year. Of all offences against property reported in 2014/15, 40% were cleared in the same period with a further 12,988 offences cleared from previous periods.
Figure 4: Offences against property (%) – 2014/15*
Footnote: * Percentages have been rounded to the nearest whole number. Therefore, although the percentages are correct, they do not add to 100%.
Northern Region recorded the highest rate of offences against property (5,272 offences per 100,000 persons) in the State, while South Eastern Region recorded the largest decrease (8%). Central Region recorded the lowest rate (3,342 offences per 100,000 persons).
Overall, offences against property were more likely to be committed by males (74% of offenders were male). Over one quarter (30%) of offenders proceeded against for offences against property were male aged between ten and nineteen years. Of the total people proceeded against for offences against property, 43% were arrested, 42% were served with a notice to appear and 8% were cautioned.
Unlawful Entry16%
Arson1%
Other Property Damage16%
Unlawful Use of Motor Vehicle5%
Other Theft49%
Fraud11%
Handling Stolen Goods3%
Unlawful EntryThe number of unlawful entry offences decreased by 15%. This equates to a 16% reduction in the rate once the growth of the Queensland population is taken into account. Of the 31,642 offences reported to police in 2014/15, 7,969 or 25% were cleared in the same period with a further 1,766 offences cleared from previous periods.
The number of unlawful entry of dwellings decreased by 18%, the number of unlawful entry of shops decreased by 25% and unlawful entry of other premises decreased by 5%.
All five of the Regions recorded decreases, the largest of which was South Eastern Region and Southern Region (20%). Northern Region recorded the highest rate (999 offences per 100,000 persons) while Central Region recorded the lowest rate (521 offences per 100,000 persons).
Most unlawful entry offences were committed by males (87%), of those ,64% were male aged under twenty-five years. Of all offenders proceeded against for unlawful entry offences, 61% were arrested, 8% cautioned and 22% served with a notice to appear.
ArsonArson is the lowest in volume of the offences against property categories and, as such, exerts very little influence on the offences against property total. Arson offences decreased by 5% from 2013/14 to 2014/15. The rate of offences decreased by 6%, from 25 to 24 offences per 100,000 persons. Of the 1,139 offences reported in 2014/15, 287 (25%) were cleared in the same period. An additional 38 offences were cleared from previous periods.
Brisbane and South Eastern Regions recorded decreases of 23% and 24% respectively. Northern Region recorded the largest increase (23%), and Brisbane Region recorded the lowest rate. The highest rate was recorded by South Eastern Region.
This year, 85% of offenders were male with fifteen to nineteen year old males being the most likely to be proceeded against for arson. Approximately 55% of offenders were arrested, 15% cautioned and 14% served with a notice to appear.
Other Property DamageThe number of other property damage offences reported in 2014/15 decreased (12%) when compared to the previous financial year. The rate of offences decreased by 13%, from 768 to 667 offences per 100,000 persons. Of those offences reported to police in 2014/15, 10,932 (34%) were cleared during this
13Queensland Police Service - Annual Statistical Review 2014/15
period, with an additional 1,527 offences cleared from previous time periods.
Northern Region recorded the highest rate of 1,135 offences per 100,000 persons. The largest decrease was recorded by Brisbane Region (20%) where the lowest rate was also reported (494 offences per 100,000 persons.
As with most offence types, fifteen to nineteen year old males were most likely to be proceeded against for other property damage offences. Only 18% of offenders were female and only 10% of all offenders were aged forty years or more. In total, 44% of offenders were arrested for this offence type, 12% were cautioned and 36% were served with a notice to appear.
Unlawful Use of Motor VehicleThe rate of unlawful use of motor vehicle offences decreased by 12% in 2014/15. This reduction is equivalent to 1,147 fewer offences reported during 2014/15.
In 2014/15, 9,145 unlawful use of motor vehicle offences were reported to police. Of these, 4,022 (44%) were cleared during this period, with an additional 657 offences cleared from previous periods (note: for recovery rates see page 13). In 2014/15, unlawful use of motor vehicle offences were reported at a rate of 191 offences for every 100,000 persons.
The largest decrease in unlawful use of motor vehicle offences was recorded in Southern Region. The highest rate was reported in South Eastern Region and Central Region reported the lowest rate of 113 offences per 100,000 persons.
Males aged fifteen to nineteen years were most likely to commit unlawful use of motor vehicle offences (33% of male offenders were in this group). Thirty six percent of female offenders were aged fifteen to nineteen years. Approximately 64% of offenders were arrested and 23% were served with a notice to appear.
Other Theft (excluding Unlawful Entry)The rate of other theft (excluding unlawful entry) offences decreased by 4% from 2013/14 to 2014/15. This category is the highest in volume of the offences against property categories and thus exerts a significant influence on property crime as a total. In 2014/15, 96,854 other theft offences were reported to police, of which 37% were cleared during this period. A further 5,218 were cleared from previous periods.
Three of the four sub-categories of other theft offences recorded decreases in the number of offences reported: stealing from dwellings (6%), steal from vehicles (7%), and other stealing (3%).
The highest rate of other theft (excluding unlawful entry) occurred in South Eastern Region while the lowest rate was recorded in Central Region in the year under review. Southern Region recorded the largest decrease (7%) of other theft (excluding unlawful entry) offences during 2014/15.
The proportion of female offenders for other theft was higher than for most other offence types at 34%, or just under one third. For both males and females, those in the fifteen to nineteen year age group were most likely to commit other theft offences. Arrest rates are low for this offence type at 34%, while 51% were served with a notice to appear. Ninety-four percent of offenders cautioned were juvenile (i.e. aged between ten and sixteen years).
FraudQueensland recorded an increase in the number of offences per 100,000 persons in most sub-categories of fraud offences during the current period; fraud by credit card offences (20%), Identity fraud offences (52%) and other fraud offences (36%). This resulted in an overall increase of 26% in total fraud offences. Fraud by computer and fraud by cheque offences reported decreases of 11% and 33% respectively in 2014/15.
Of the 22,644 offences reported in 2014/15, 14,904 (66%) were cleared in the same period with a further 3,468 offences cleared from previous periods.
Southern Region recorded the highest rate of fraud offences as well as the largest increase in these offences. Central Region recorded the lowest rate in the State.
A relatively higher proportion of females commit fraud offences compared with other offence types. Approximately 35% of offenders were female. Males aged fifteen to nineteen years and females aged twenty-five to twenty-nine years were most likely to commit fraud offences. Forty percent of offenders were arrested, while 47% were issued with a notice to appear.
Handling Stolen GoodsHandling stolen goods offences recorded a decrease in the number of offences reported. The rate of offences decreased by 3%, from 108 to 105 offences per 100,000 persons. Of the total 5,012 offences reported to police in 2014/15, 4,586 (92%) were cleared in the same period, with a further 314 offences cleared from previous periods.
Northern Region recorded the highest rate of handling stolen goods offences while Southern Region recorded the only increase (6%). Central Region recorded the lowest rate and Brisbane Region recorded the greatest decrease (8%) in the year under review.
14 With Honour We Serve
As with most offence categories, males were most likely to commit handling stolen goods offences (73% of offenders were male) and males in the fifteen to nineteen year age group were most likely to offend. Offenders were more likely to be served with a notice to appear (52%) although 41% were arrested.
Other OffencesOther offences comprises a range of disparate offence categories. These categories are distinct from offences against the person and property in that they are generally offences detected by police rather than being reported by the public. Drug offences, traffic offences and prostitution offences are examples of this. Trends and patterns in the levels of other offences are therefore often indicative of specific and proactive initiatives of the Police Service rather than being indicative of the level of crime actually occurring. As such, increases are often seen as a positive improvement of police detection rates.
As a total, the number of other offences increased by 8% state-wide from 202,079 offences recorded in 2013/14 to 218,871 offences recorded in 2014/15. This equates to a rate of 4,566 offences per 100,000 persons in 2014/15.
Northern Region recorded the highest rate of other offences in the state while Brisbane Region recorded the lowest rate. The greatest increase was recorded by Southern Region.
Drug OffencesIncreases in four of the five sub-categories of drug offences contributed to an overall increase of 22%. When taking into account the growth of Queensland’s population, drug offences recorded an increase of 20%.
Southern Region recorded the highest rate of drug offences in the State. All five Regions reported increases with South Eastern Region recording the largest increase. The lowest rate was recorded by Brisbane Region (1,318 offences per 100,000 persons).
Breach of Domestic Violence Protection Orders
Breach of domestic violence protection orders are a breach of a court order and, as such, are classed as “Regina” offences; hence, the inclusion under other offences and not offences against the person.
The 2014/15 financial year saw a 14% increase in the number of breach of domestic violence protection orders. A total of 16,654 offences were reported to police, equating to a rate of 347 offences per 100,000 persons.
Brisbane Region recorded the lowest rate of Breach of Domestic Violence Protection Order offences in the State, while Northern Region recorded the highest. South Eastern Region recorded the largest increase (22%).
Weapons Act OffencesThe number of Weapons Act offences increased by 22% from 4,940 offences reported in 2013/14 to 6,032 offences reported in 2014/15. The overall increase is attributable to increases in two of the five weapons sub-categories. Increases were recorded in possession and/or use other weapons; restricted items (15%) and Weapons Act offences – other (38%).
All five regions recorded increases in Weapons Act offences during the 2014/15 financial year. Northern Region recorded the largest increase of 33%. During 2014/15, Southern Region recorded the highest rate of 167 offences per 100,000 persons while Brisbane Region recorded the lowest rate of 82 offences per 100,000 persons.
Good Order OffencesThe number of good order offences increased by 4% from 2013/14 to 2014/15. A total of 60,346 offences were detected by police which equates to a rate of 1,259 offences for every 100,000 persons. An increase in resist incite hinder obstruct, fare evasion and public nuisance offences contributed to the overall increase.
Northern Region recorded the largest increase of 5% and the highest rate of good order offences. The lowest rate was recorded by Brisbane Region and the only decrease was reported by South Eastern Region.
15Queensland Police Service - Annual Statistical Review 2014/15
Traffic and Related OffencesTraffic and related offences decreased by 8% from 42,529 to 39,093 offences. Three of the four sub-categories recorded decreases of which the largest was a 12% decrease in disqualified driving. Drink driving is the largest in volume of the sub-categories and, as such, exerts the greatest influence on the traffic and related offences total. The rates for this sub-category recorded an 8% decrease per 100,000 persons.
South Eastern Region recorded the largest decrease while Brisbane Region recorded the lowest rate. Northern Region recorded the highest rate of 1,229 offences per 100,000 persons.
Please note that the traffic and related offences category referred to above includes dangerous operation of a vehicle, drink driving, disqualified driving and interfere with the mechanism of a motor vehicle only. For information on Speed and Red Light Camera Notices or Random Breath Tests please refer to the traffic section on pages 135-142.

16 With Honour We Serve
17Queensland Police Service - Annual Statistical Review 2014/15
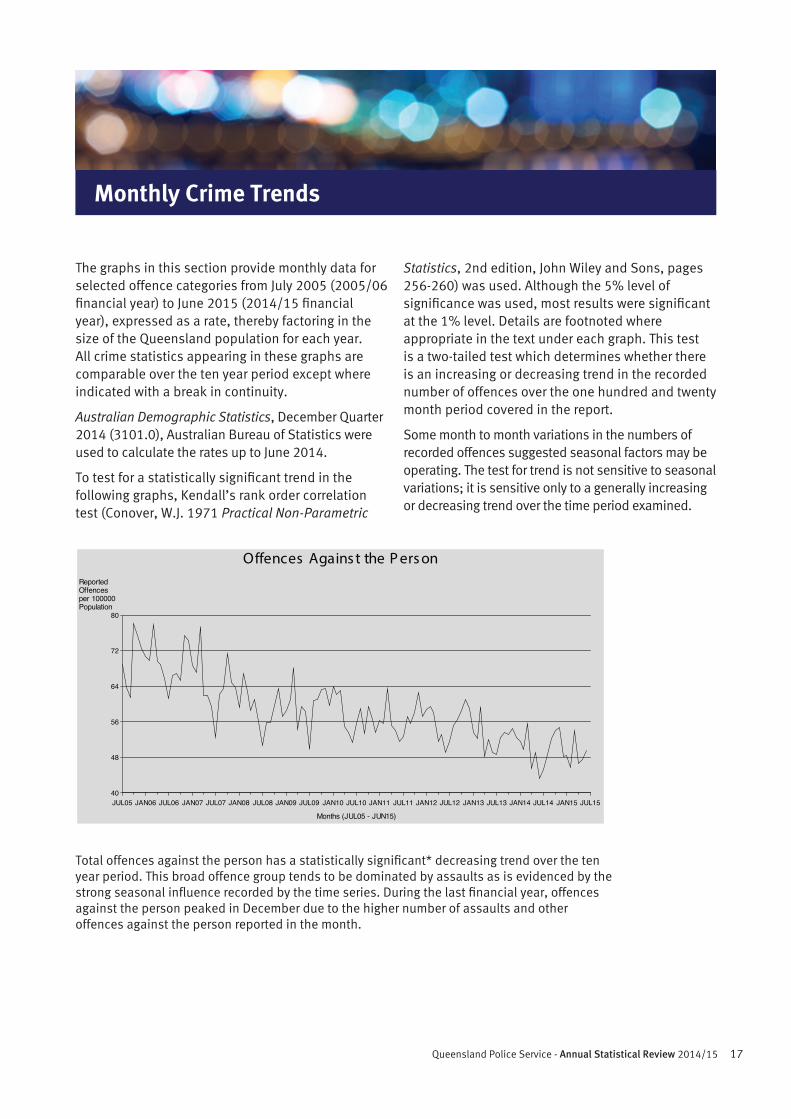
The graphs in this section provide monthly data for selected offence categories from July 2005 (2005/06 financial year) to June 2015 (2014/15 financial year), expressed as a rate, thereby factoring in the size of the Queensland population for each year. All crime statistics appearing in these graphs are comparable over the ten year period except where indicated with a break in continuity.
Australian Demographic Statistics, December Quarter 2014 (3101.0), Australian Bureau of Statistics were used to calculate the rates up to June 2014.
To test for a statistically significant trend in the following graphs, Kendall’s rank order correlation test (Conover, W.J. 1971 Practical Non-Parametric
Statistics, 2nd edition, John Wiley and Sons, pages 256-260) was used. Although the 5% level of significance was used, most results were significant at the 1% level. Details are footnoted where appropriate in the text under each graph. This test is a two-tailed test which determines whether there is an increasing or decreasing trend in the recorded number of offences over the one hundred and twenty month period covered in the report.
Some month to month variations in the numbers of recorded offences suggested seasonal factors may be operating. The test for trend is not sensitive to seasonal variations; it is sensitive only to a generally increasing or decreasing trend over the time period examined.
Monthly Crime Trends
Total offences against the person has a statistically significant* decreasing trend over the ten year period. This broad offence group tends to be dominated by assaults as is evidenced by the strong seasonal influence recorded by the time series. During the last financial year, offences against the person peaked in December due to the higher number of assaults and other offences against the person reported in the month.
ReportedOffencesper 100000Population
40
48
56
64
72
80
Months (JUL05 - JUN15)
JUL05 JAN06 JUL06 JAN07 JUL07 JAN08 JUL08 JAN09 JUL09 JAN10 JUL10 JAN11 JUL11 JAN12 JUL12 JAN13 JUL13 JAN14 JUL14 JAN15 JUL15
Offences Agains t the P ers on
18 With Honour We Serve
Monthly Crime Trends
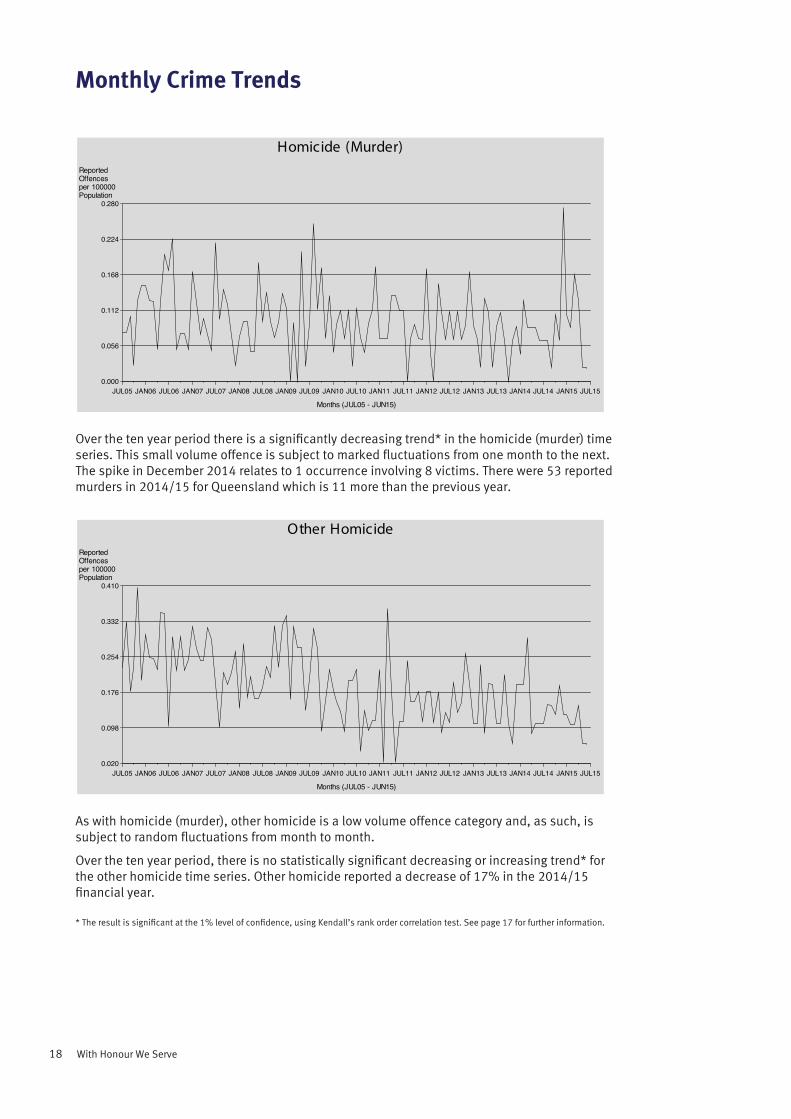
Over the ten year period there is a significantly decreasing trend* in the homicide (murder) time series. This small volume offence is subject to marked fluctuations from one month to the next. The spike in December 2014 relates to 1 occurrence involving 8 victims. There were 53 reported murders in 2014/15 for Queensland which is 11 more than the previous year.
As with homicide (murder), other homicide is a low volume offence category and, as such, is subject to random fluctuations from month to month.
Over the ten year period, there is no statistically significant decreasing or increasing trend* for the other homicide time series. Other homicide reported a decrease of 17% in the 2014/15 financial year.
* The result is significant at the 1% level of confidence, using Kendall’s rank order correlation test. See page 17 for further information.
ReportedOffencesper 100000Population
0.000
0.056
0.112
0.168
0.224
0.280
Months (JUL05 - JUN15)
JUL05 JAN06 JUL06 JAN07 JUL07 JAN08 JUL08 JAN09 JUL09 JAN10 JUL10 JAN11 JUL11 JAN12 JUL12 JAN13 JUL13 JAN14 JUL14 JAN15 JUL15
Homicide (Murder)
ReportedOffencesper 100000Population
0.020
0.098
0.176
0.254
0.332
0.410
Months (JUL05 - JUN15)
JUL05 JAN06 JUL06 JAN07 JUL07 JAN08 JUL08 JAN09 JUL09 JAN10 JUL10 JAN11 JUL11 JAN12 JUL12 JAN13 JUL13 JAN14 JUL14 JAN15 JUL15
Other Homicide
19Queensland Police Service - Annual Statistical Review 2014/15
Monthly Crime Trends
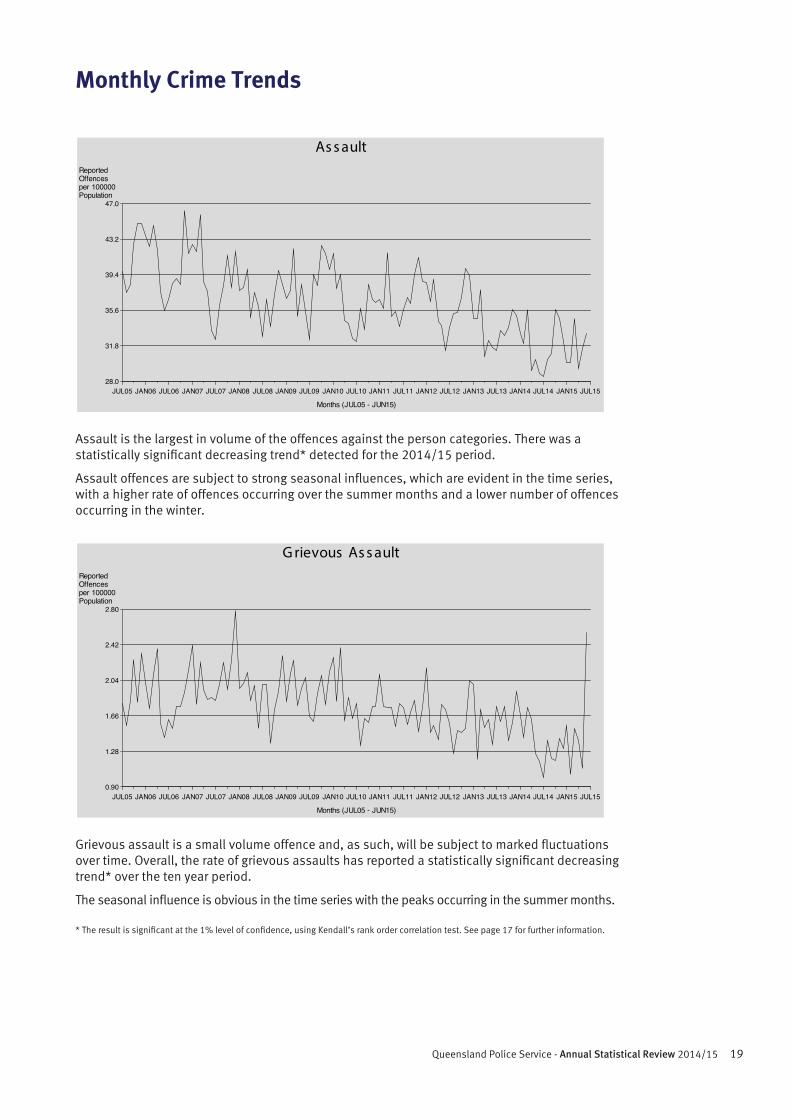
Assault is the largest in volume of the offences against the person categories. There was a statistically significant decreasing trend* detected for the 2014/15 period.
Assault offences are subject to strong seasonal influences, which are evident in the time series, with a higher rate of offences occurring over the summer months and a lower number of offences occurring in the winter.
Grievous assault is a small volume offence and, as such, will be subject to marked fluctuations over time. Overall, the rate of grievous assaults has reported a statistically significant decreasing trend* over the ten year period.
The seasonal influence is obvious in the time series with the peaks occurring in the summer months.
* The result is significant at the 1% level of confidence, using Kendall’s rank order correlation test. See page 17 for further information.
ReportedOffencesper 100000Population
28.0
31.8
35.6
39.4
43.2
47.0
Months (JUL05 - JUN15)
JUL05 JAN06 JUL06 JAN07 JUL07 JAN08 JUL08 JAN09 JUL09 JAN10 JUL10 JAN11 JUL11 JAN12 JUL12 JAN13 JUL13 JAN14 JUL14 JAN15 JUL15
As s ault
ReportedOffencesper 100000Population
0.90
1.28
1.66
2.04
2.42
2.80
Months (JUL05 - JUN15)
JUL05 JAN06 JUL06 JAN07 JUL07 JAN08 JUL08 JAN09 JUL09 JAN10 JUL10 JAN11 JUL11 JAN12 JUL12 JAN13 JUL13 JAN14 JUL14 JAN15 JUL15
G rievous As s ault
20 With Honour We Serve
Monthly Crime Trends
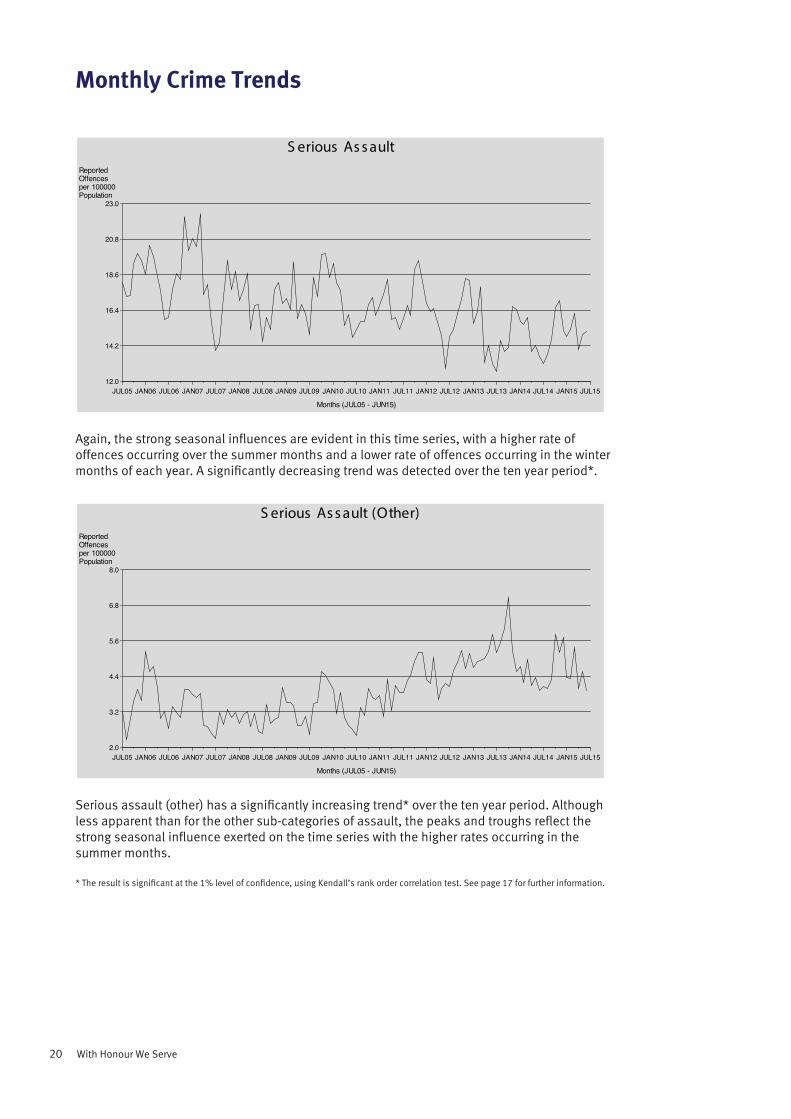
Again, the strong seasonal influences are evident in this time series, with a higher rate of offences occurring over the summer months and a lower rate of offences occurring in the winter months of each year. A significantly decreasing trend was detected over the ten year period*.
Serious assault (other) has a significantly increasing trend* over the ten year period. Although less apparent than for the other sub-categories of assault, the peaks and troughs reflect the strong seasonal influence exerted on the time series with the higher rates occurring in the summer months.
* The result is significant at the 1% level of confidence, using Kendall’s rank order correlation test. See page 17 for further information.
ReportedOffencesper 100000Population
12.0
14.2
16.4
18.6
20.8
23.0
Months (JUL05 - JUN15)
JUL05 JAN06 JUL06 JAN07 JUL07 JAN08 JUL08 JAN09 JUL09 JAN10 JUL10 JAN11 JUL11 JAN12 JUL12 JAN13 JUL13 JAN14 JUL14 JAN15 JUL15
S erious As s ault
ReportedOffencesper 100000Population
2.0
3.2
4.4
5.6
6.8
8.0
Months (JUL05 - JUN15)
JUL05 JAN06 JUL06 JAN07 JUL07 JAN08 JUL08 JAN09 JUL09 JAN10 JUL10 JAN11 JUL11 JAN12 JUL12 JAN13 JUL13 JAN14 JUL14 JAN15 JUL15
S erious As s ault (Other)
21Queensland Police Service - Annual Statistical Review 2014/15
Monthly Crime Trends
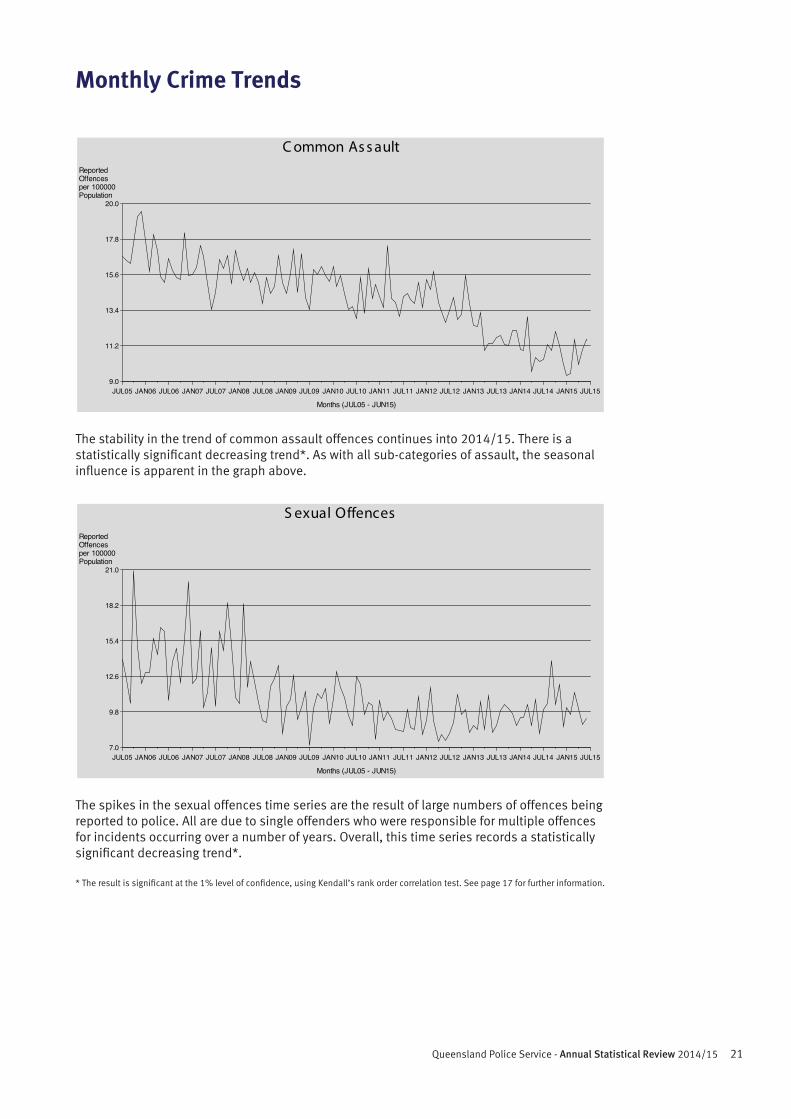
The stability in the trend of common assault offences continues into 2014/15. There is a statistically significant decreasing trend*. As with all sub-categories of assault, the seasonal influence is apparent in the graph above.
The spikes in the sexual offences time series are the result of large numbers of offences being reported to police. All are due to single offenders who were responsible for multiple offences for incidents occurring over a number of years. Overall, this time series records a statistically significant decreasing trend*.
* The result is significant at the 1% level of confidence, using Kendall’s rank order correlation test. See page 17 for further information.
ReportedOffencesper 100000Population
9.0
11.2
13.4
15.6
17.8
20.0
Months (JUL05 - JUN15)
JUL05 JAN06 JUL06 JAN07 JUL07 JAN08 JUL08 JAN09 JUL09 JAN10 JUL10 JAN11 JUL11 JAN12 JUL12 JAN13 JUL13 JAN14 JUL14 JAN15 JUL15
C ommon As s ault
ReportedOffencesper 100000Population
7.0
9.8
12.6
15.4
18.2
21.0
Months (JUL05 - JUN15)
JUL05 JAN06 JUL06 JAN07 JUL07 JAN08 JUL08 JAN09 JUL09 JAN10 JUL10 JAN11 JUL11 JAN12 JUL12 JAN13 JUL13 JAN14 JUL14 JAN15 JUL15
S exual Offences
22 With Honour We Serve
Monthly Crime Trends
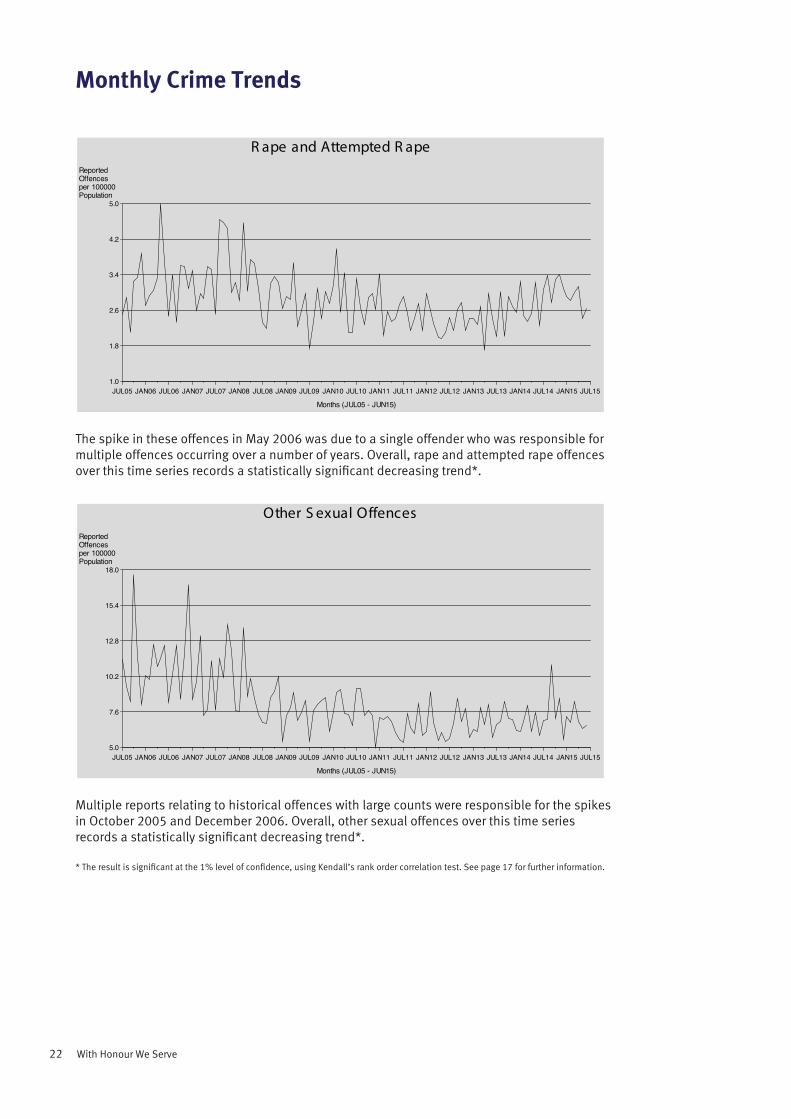
The spike in these offences in May 2006 was due to a single offender who was responsible for multiple offences occurring over a number of years. Overall, rape and attempted rape offences over this time series records a statistically significant decreasing trend*.
Multiple reports relating to historical offences with large counts were responsible for the spikes in October 2005 and December 2006. Overall, other sexual offences over this time series records a statistically significant decreasing trend*.
* The result is significant at the 1% level of confidence, using Kendall’s rank order correlation test. See page 17 for further information.
ReportedOffencesper 100000Population
1.0
1.8
2.6
3.4
4.2
5.0
Months (JUL05 - JUN15)
JUL05 JAN06 JUL06 JAN07 JUL07 JAN08 JUL08 JAN09 JUL09 JAN10 JUL10 JAN11 JUL11 JAN12 JUL12 JAN13 JUL13 JAN14 JUL14 JAN15 JUL15
R ape and Attempted R ape
ReportedOffencesper 100000Population
5.0
7.6
10.2
12.8
15.4
18.0
Months (JUL05 - JUN15)
JUL05 JAN06 JUL06 JAN07 JUL07 JAN08 JUL08 JAN09 JUL09 JAN10 JUL10 JAN11 JUL11 JAN12 JUL12 JAN13 JUL13 JAN14 JUL14 JAN15 JUL15
Other S exual Offences
23Queensland Police Service - Annual Statistical Review 2014/15
Monthly Crime Trends
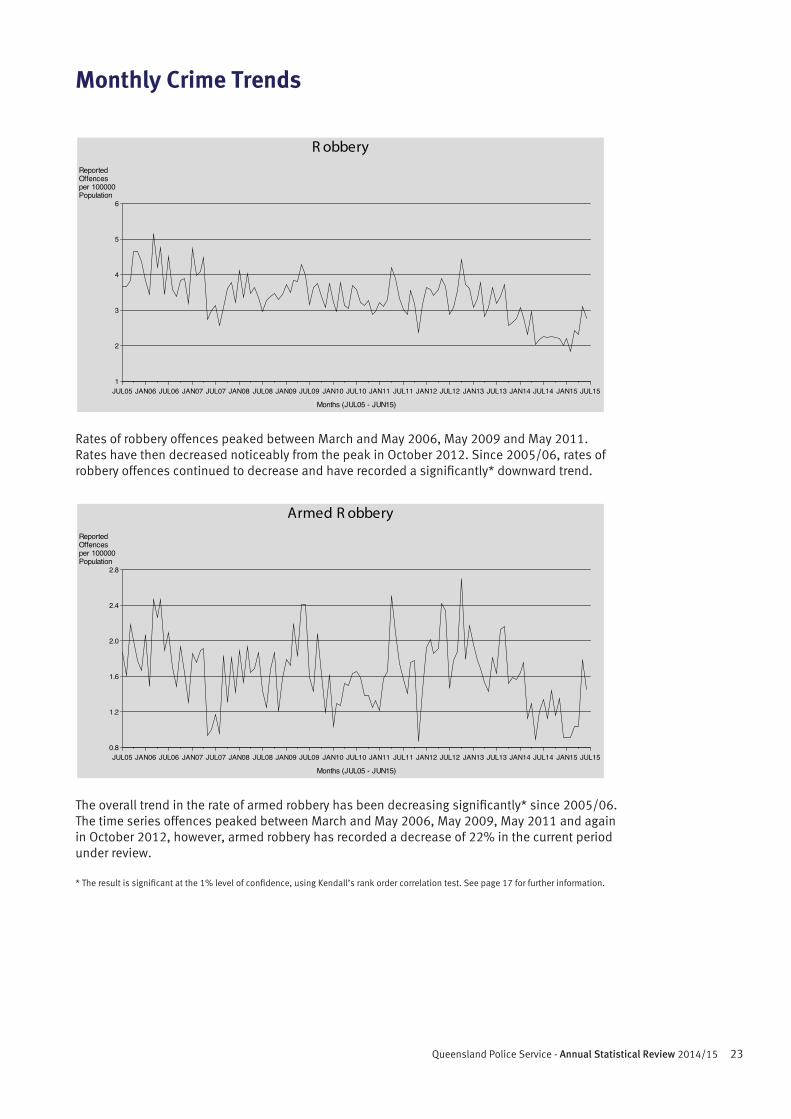
Rates of robbery offences peaked between March and May 2006, May 2009 and May 2011. Rates have then decreased noticeably from the peak in October 2012. Since 2005/06, rates of robbery offences continued to decrease and have recorded a significantly* downward trend.
The overall trend in the rate of armed robbery has been decreasing significantly* since 2005/06. The time series offences peaked between March and May 2006, May 2009, May 2011 and again in October 2012, however, armed robbery has recorded a decrease of 22% in the current period under review.
* The result is significant at the 1% level of confidence, using Kendall’s rank order correlation test. See page 17 for further information.
ReportedOffencesper 100000Population
1
2
3
4
5
6
Months (JUL05 - JUN15)
JUL05 JAN06 JUL06 JAN07 JUL07 JAN08 JUL08 JAN09 JUL09 JAN10 JUL10 JAN11 JUL11 JAN12 JUL12 JAN13 JUL13 JAN14 JUL14 JAN15 JUL15
R obbery
ReportedOffencesper 100000Population
0.8
1.2
1.6
2.0
2.4
2.8
Months (JUL05 - JUN15)
JUL05 JAN06 JUL06 JAN07 JUL07 JAN08 JUL08 JAN09 JUL09 JAN10 JUL10 JAN11 JUL11 JAN12 JUL12 JAN13 JUL13 JAN14 JUL14 JAN15 JUL15
Armed R obbery
24 With Honour We Serve
Monthly Crime Trends
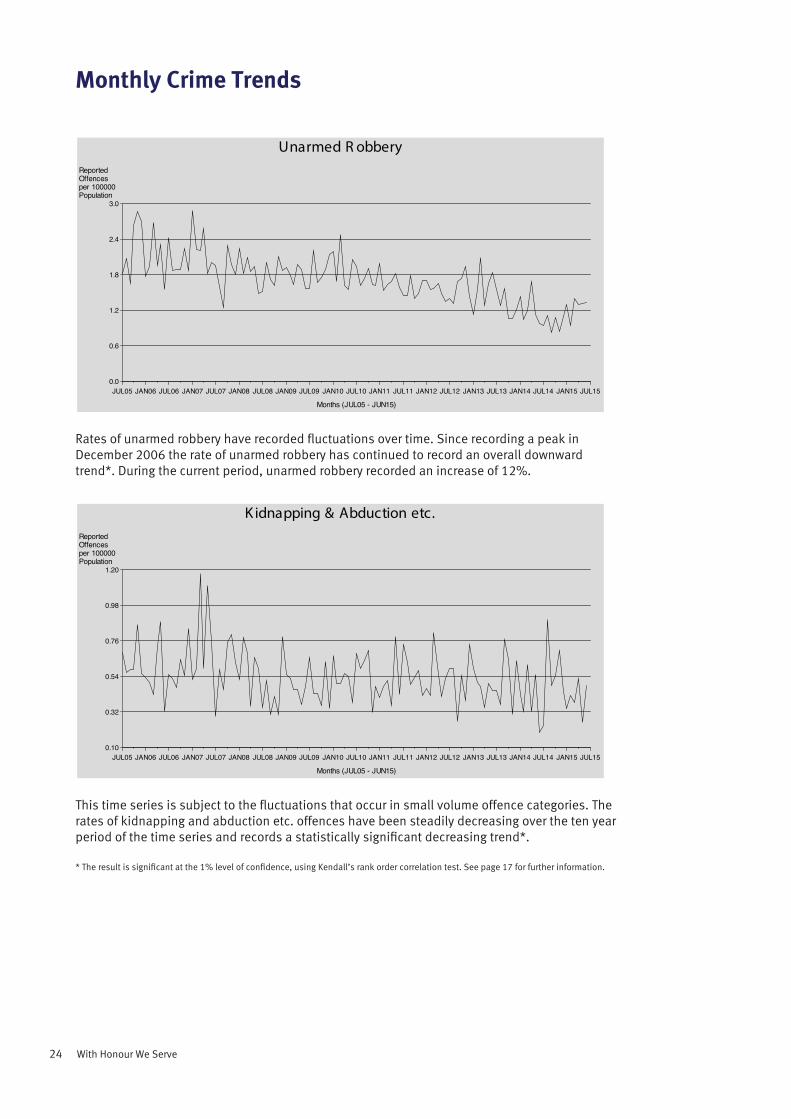
Rates of unarmed robbery have recorded fluctuations over time. Since recording a peak in December 2006 the rate of unarmed robbery has continued to record an overall downward trend*. During the current period, unarmed robbery recorded an increase of 12%.
This time series is subject to the fluctuations that occur in small volume offence categories. The rates of kidnapping and abduction etc. offences have been steadily decreasing over the ten year period of the time series and records a statistically significant decreasing trend*.
* The result is significant at the 1% level of confidence, using Kendall’s rank order correlation test. See page 17 for further information.
ReportedOffencesper 100000Population
0.0
0.6
1.2
1.8
2.4
3.0
Months (JUL05 - JUN15)
JUL05 JAN06 JUL06 JAN07 JUL07 JAN08 JUL08 JAN09 JUL09 JAN10 JUL10 JAN11 JUL11 JAN12 JUL12 JAN13 JUL13 JAN14 JUL14 JAN15 JUL15
Unarmed R obbery
ReportedOffencesper 100000Population
0.10
0.32
0.54
0.76
0.98
1.20
Months (JUL05 - JUN15)
JUL05 JAN06 JUL06 JAN07 JUL07 JAN08 JUL08 JAN09 JUL09 JAN10 JUL10 JAN11 JUL11 JAN12 JUL12 JAN13 JUL13 JAN14 JUL14 JAN15 JUL15
K idnapping & Abduction etc.
25Queensland Police Service - Annual Statistical Review 2014/15
Monthly Crime Trends
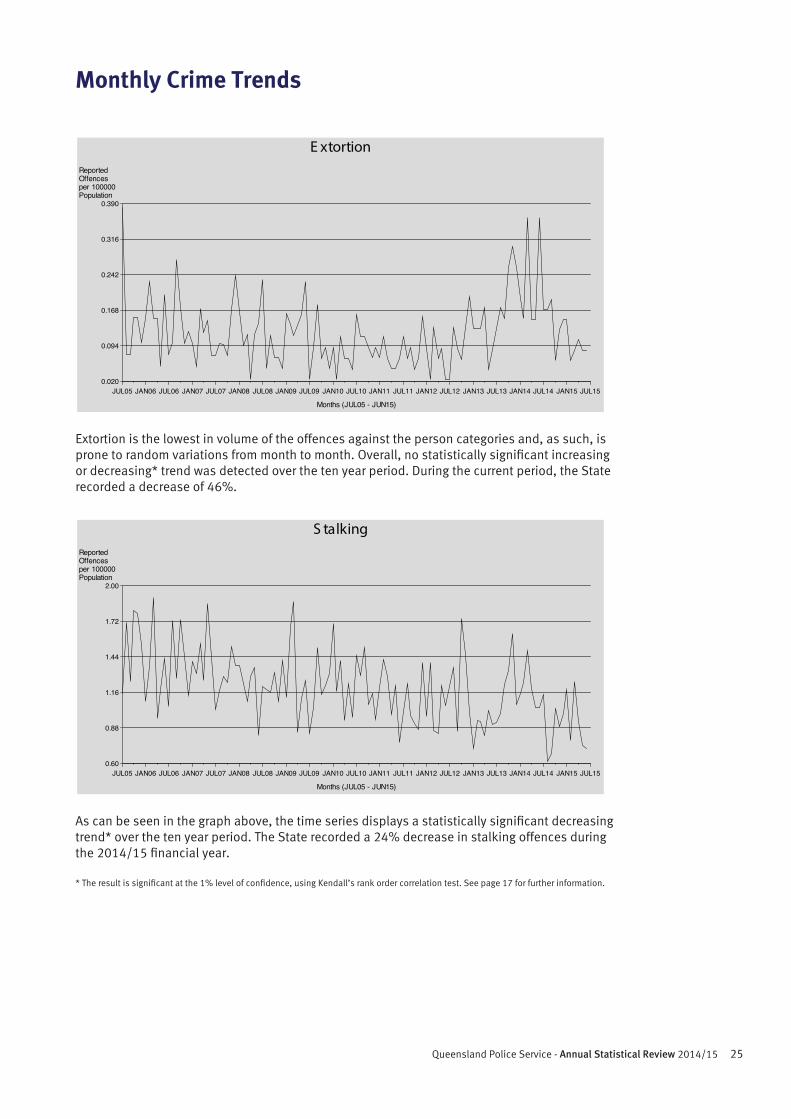
Extortion is the lowest in volume of the offences against the person categories and, as such, is prone to random variations from month to month. Overall, no statistically significant increasing or decreasing* trend was detected over the ten year period. During the current period, the State recorded a decrease of 46%.
As can be seen in the graph above, the time series displays a statistically significant decreasing trend* over the ten year period. The State recorded a 24% decrease in stalking offences during the 2014/15 financial year.
* The result is significant at the 1% level of confidence, using Kendall’s rank order correlation test. See page 17 for further information.
ReportedOffencesper 100000Population
0.020
0.094
0.168
0.242
0.316
0.390
Months (JUL05 - JUN15)
JUL05 JAN06 JUL06 JAN07 JUL07 JAN08 JUL08 JAN09 JUL09 JAN10 JUL10 JAN11 JUL11 JAN12 JUL12 JAN13 JUL13 JAN14 JUL14 JAN15 JUL15
E xtortion
ReportedOffencesper 100000Population
0.60
0.88
1.16
1.44
1.72
2.00
Months (JUL05 - JUN15)
JUL05 JAN06 JUL06 JAN07 JUL07 JAN08 JUL08 JAN09 JUL09 JAN10 JUL10 JAN11 JUL11 JAN12 JUL12 JAN13 JUL13 JAN14 JUL14 JAN15 JUL15
S talking
26 With Honour We Serve
Monthly Crime Trends
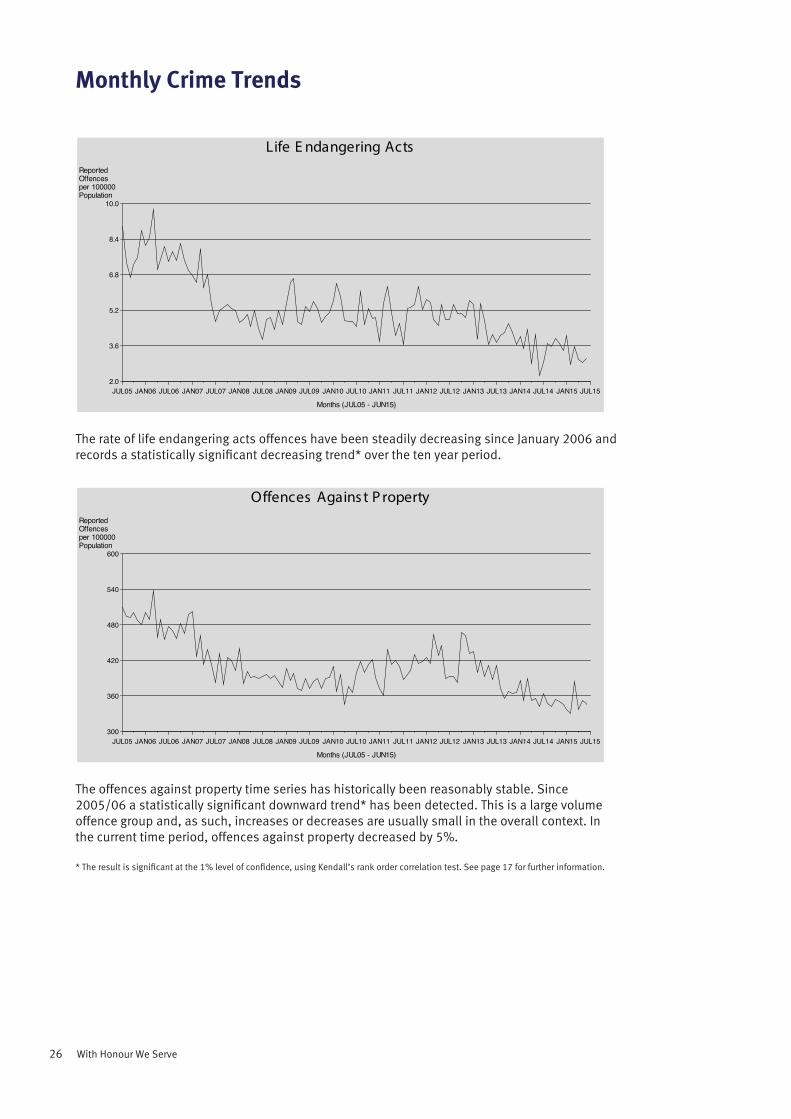
The rate of life endangering acts offences have been steadily decreasing since January 2006 and records a statistically significant decreasing trend* over the ten year period.
The offences against property time series has historically been reasonably stable. Since 2005/06 a statistically significant downward trend* has been detected. This is a large volume offence group and, as such, increases or decreases are usually small in the overall context. In the current time period, offences against property decreased by 5%.
* The result is significant at the 1% level of confidence, using Kendall’s rank order correlation test. See page 17 for further information.
ReportedOffencesper 100000Population
2.0
3.6
5.2
6.8
8.4
10.0
Months (JUL05 - JUN15)
JUL05 JAN06 JUL06 JAN07 JUL07 JAN08 JUL08 JAN09 JUL09 JAN10 JUL10 JAN11 JUL11 JAN12 JUL12 JAN13 JUL13 JAN14 JUL14 JAN15 JUL15
Life E ndangering Acts
ReportedOffencesper 100000Population
300
360
420
480
540
600
Months (JUL05 - JUN15)
JUL05 JAN06 JUL06 JAN07 JUL07 JAN08 JUL08 JAN09 JUL09 JAN10 JUL10 JAN11 JUL11 JAN12 JUL12 JAN13 JUL13 JAN14 JUL14 JAN15 JUL15
Offences Agains t P roperty
27Queensland Police Service - Annual Statistical Review 2014/15
Monthly Crime Trends
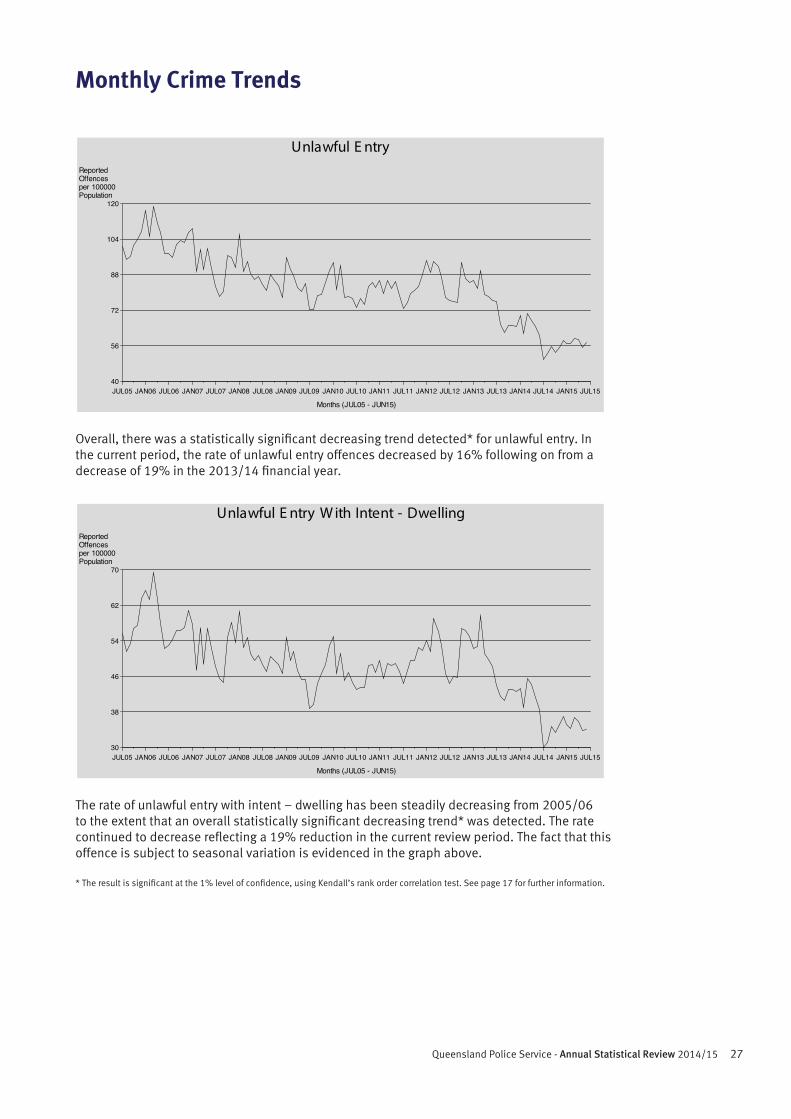
Overall, there was a statistically significant decreasing trend detected* for unlawful entry. In the current period, the rate of unlawful entry offences decreased by 16% following on from a decrease of 19% in the 2013/14 financial year.
The rate of unlawful entry with intent – dwelling has been steadily decreasing from 2005/06 to the extent that an overall statistically significant decreasing trend* was detected. The rate continued to decrease reflecting a 19% reduction in the current review period. The fact that this offence is subject to seasonal variation is evidenced in the graph above.
* The result is significant at the 1% level of confidence, using Kendall’s rank order correlation test. See page 17 for further information.
ReportedOffencesper 100000Population
40
56
72
88
104
120
Months (JUL05 - JUN15)
JUL05 JAN06 JUL06 JAN07 JUL07 JAN08 JUL08 JAN09 JUL09 JAN10 JUL10 JAN11 JUL11 JAN12 JUL12 JAN13 JUL13 JAN14 JUL14 JAN15 JUL15
Unlawful E ntry
ReportedOffencesper 100000Population
30
38
46
54
62
70
Months (JUL05 - JUN15)
JUL05 JAN06 JUL06 JAN07 JUL07 JAN08 JUL08 JAN09 JUL09 JAN10 JUL10 JAN11 JUL11 JAN12 JUL12 JAN13 JUL13 JAN14 JUL14 JAN15 JUL15
Unlawful E ntry W ith Intent - Dwelling
28 With Honour We Serve
Monthly Crime Trends
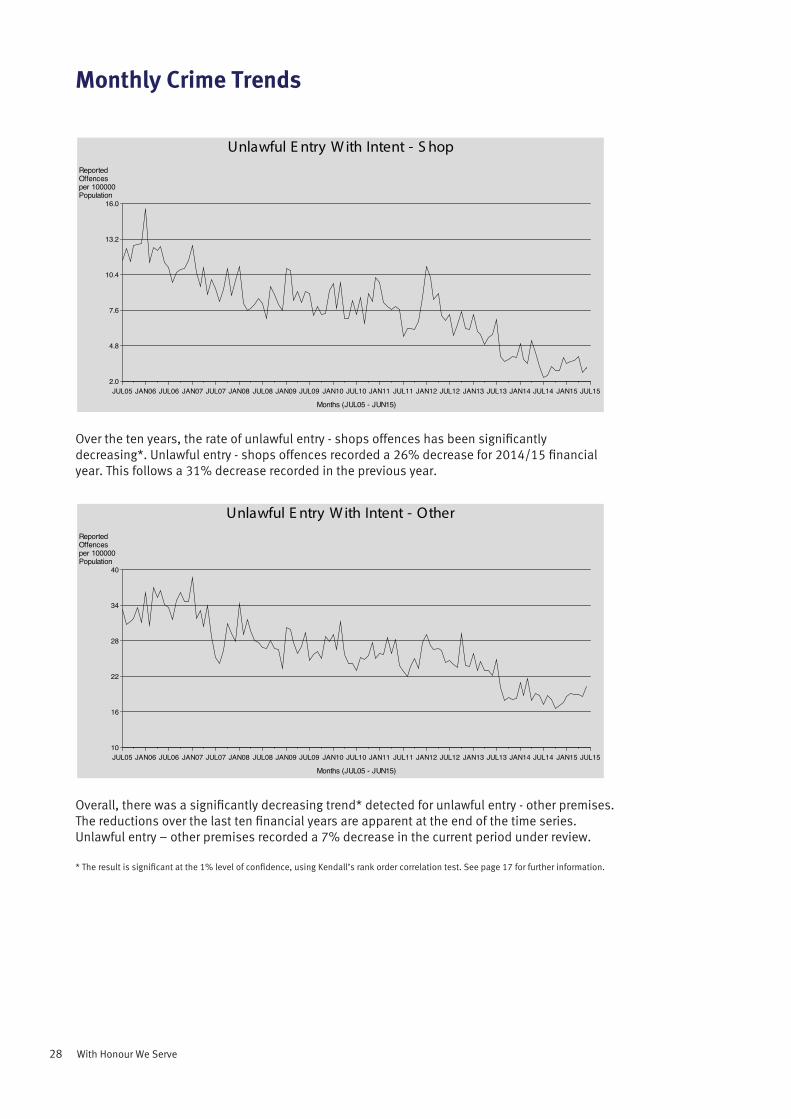
Over the ten years, the rate of unlawful entry - shops offences has been significantly decreasing*. Unlawful entry - shops offences recorded a 26% decrease for 2014/15 financial year. This follows a 31% decrease recorded in the previous year.
Overall, there was a significantly decreasing trend* detected for unlawful entry - other premises. The reductions over the last ten financial years are apparent at the end of the time series. Unlawful entry – other premises recorded a 7% decrease in the current period under review.
* The result is significant at the 1% level of confidence, using Kendall’s rank order correlation test. See page 17 for further information.
ReportedOffencesper 100000Population
2.0
4.8
7.6
10.4
13.2
16.0
Months (JUL05 - JUN15)
JUL05 JAN06 JUL06 JAN07 JUL07 JAN08 JUL08 JAN09 JUL09 JAN10 JUL10 JAN11 JUL11 JAN12 JUL12 JAN13 JUL13 JAN14 JUL14 JAN15 JUL15
Unlawful E ntry W ith Intent - S hop
ReportedOffencesper 100000Population
10
16
22
28
34
40
Months (JUL05 - JUN15)
JUL05 JAN06 JUL06 JAN07 JUL07 JAN08 JUL08 JAN09 JUL09 JAN10 JUL10 JAN11 JUL11 JAN12 JUL12 JAN13 JUL13 JAN14 JUL14 JAN15 JUL15
Unlawful E ntry W ith Intent - Other
29Queensland Police Service - Annual Statistical Review 2014/15
Monthly Crime Trends
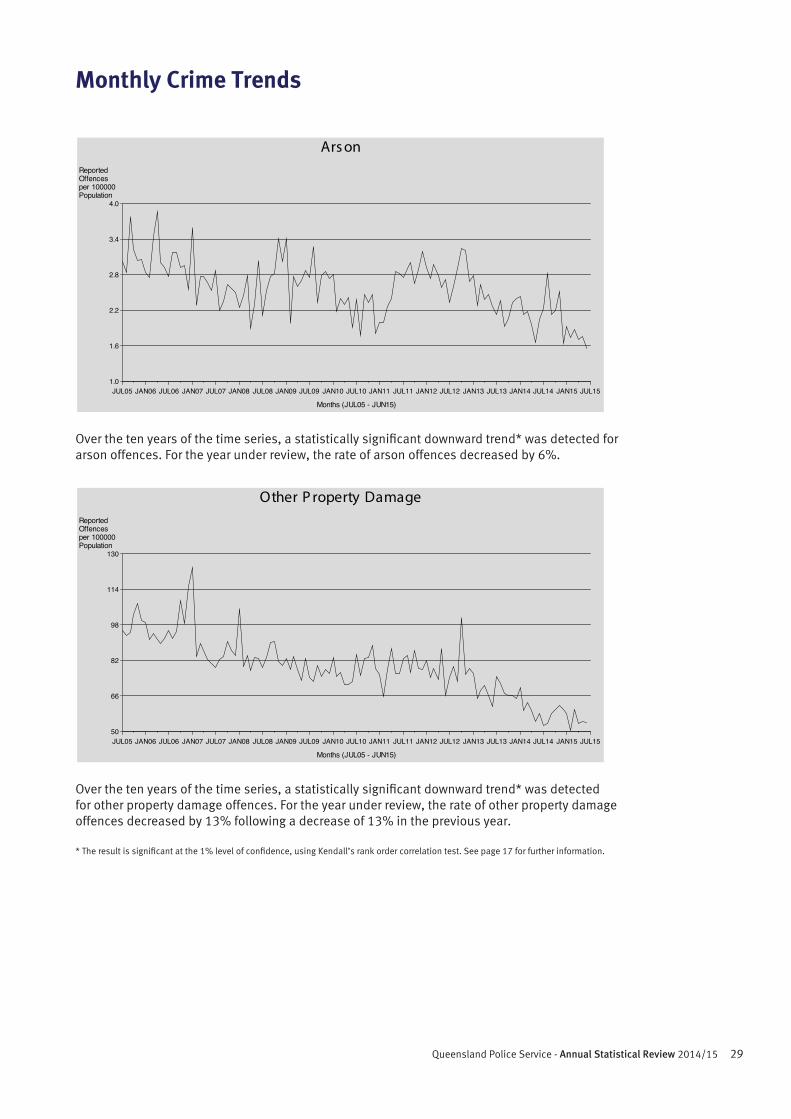
Over the ten years of the time series, a statistically significant downward trend* was detected for arson offences. For the year under review, the rate of arson offences decreased by 6%.
Over the ten years of the time series, a statistically significant downward trend* was detected for other property damage offences. For the year under review, the rate of other property damage offences decreased by 13% following a decrease of 13% in the previous year.
* The result is significant at the 1% level of confidence, using Kendall’s rank order correlation test. See page 17 for further information.
ReportedOffencesper 100000Population
1.0
1.6
2.2
2.8
3.4
4.0
Months (JUL05 - JUN15)
JUL05 JAN06 JUL06 JAN07 JUL07 JAN08 JUL08 JAN09 JUL09 JAN10 JUL10 JAN11 JUL11 JAN12 JUL12 JAN13 JUL13 JAN14 JUL14 JAN15 JUL15
Ars on
ReportedOffencesper 100000Population
50
66
82
98
114
130
Months (JUL05 - JUN15)
JUL05 JAN06 JUL06 JAN07 JUL07 JAN08 JUL08 JAN09 JUL09 JAN10 JUL10 JAN11 JUL11 JAN12 JUL12 JAN13 JUL13 JAN14 JUL14 JAN15 JUL15
Other P roperty Damage
30 With Honour We Serve
Monthly Crime Trends
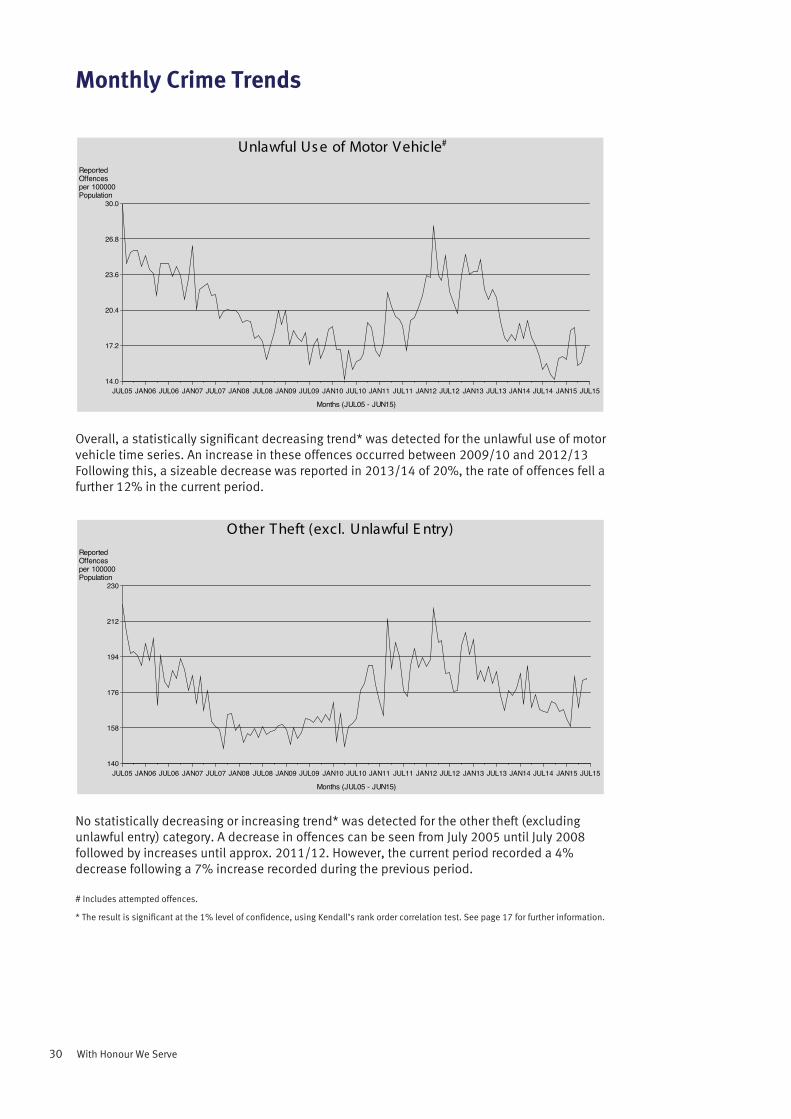
Overall, a statistically significant decreasing trend* was detected for the unlawful use of motor vehicle time series. An increase in these offences occurred between 2009/10 and 2012/13 Following this, a sizeable decrease was reported in 2013/14 of 20%, the rate of offences fell a further 12% in the current period.
No statistically decreasing or increasing trend* was detected for the other theft (excluding unlawful entry) category. A decrease in offences can be seen from July 2005 until July 2008 followed by increases until approx. 2011/12. However, the current period recorded a 4% decrease following a 7% increase recorded during the previous period.
# Includes attempted offences.
* The result is significant at the 1% level of confidence, using Kendall’s rank order correlation test. See page 17 for further information.
ReportedOffencesper 100000Population
14.0
17.2
20.4
23.6
26.8
30.0
Months (JUL05 - JUN15)
JUL05 JAN06 JUL06 JAN07 JUL07 JAN08 JUL08 JAN09 JUL09 JAN10 JUL10 JAN11 JUL11 JAN12 JUL12 JAN13 JUL13 JAN14 JUL14 JAN15 JUL15
Unlawful Us e of Motor Vehicle#
ReportedOffencesper 100000Population
140
158
176
194
212
230
Months (JUL05 - JUN15)
JUL05 JAN06 JUL06 JAN07 JUL07 JAN08 JUL08 JAN09 JUL09 JAN10 JUL10 JAN11 JUL11 JAN12 JUL12 JAN13 JUL13 JAN14 JUL14 JAN15 JUL15
Other Theft (excl. Unlawful E ntry)
31Queensland Police Service - Annual Statistical Review 2014/15
Monthly Crime Trends
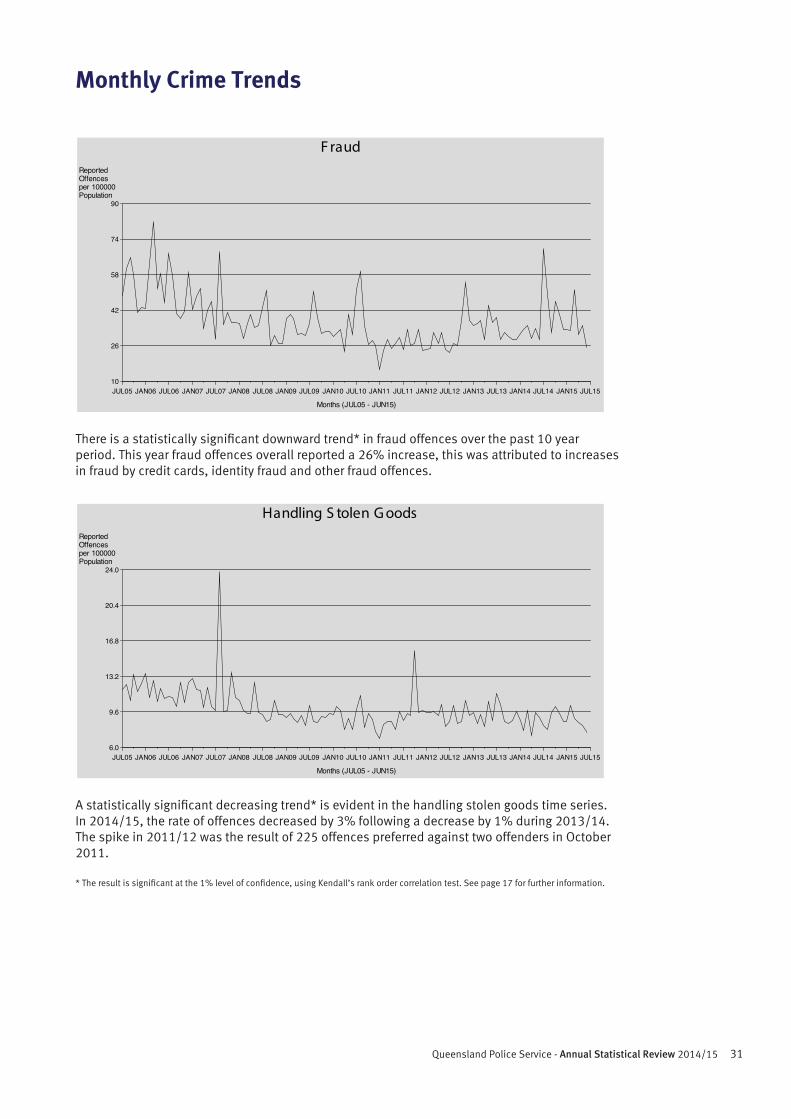
There is a statistically significant downward trend* in fraud offences over the past 10 year period. This year fraud offences overall reported a 26% increase, this was attributed to increases in fraud by credit cards, identity fraud and other fraud offences.
A statistically significant decreasing trend* is evident in the handling stolen goods time series. In 2014/15, the rate of offences decreased by 3% following a decrease by 1% during 2013/14. The spike in 2011/12 was the result of 225 offences preferred against two offenders in October 2011.
* The result is significant at the 1% level of confidence, using Kendall’s rank order correlation test. See page 17 for further information.
ReportedOffencesper 100000Population
10
26
42
58
74
90
Months (JUL05 - JUN15)
JUL05 JAN06 JUL06 JAN07 JUL07 JAN08 JUL08 JAN09 JUL09 JAN10 JUL10 JAN11 JUL11 JAN12 JUL12 JAN13 JUL13 JAN14 JUL14 JAN15 JUL15
F raud
ReportedOffencesper 100000Population
6.0
9.6
13.2
16.8
20.4
24.0
Months (JUL05 - JUN15)
JUL05 JAN06 JUL06 JAN07 JUL07 JAN08 JUL08 JAN09 JUL09 JAN10 JUL10 JAN11 JUL11 JAN12 JUL12 JAN13 JUL13 JAN14 JUL14 JAN15 JUL15
Handling S tolen G oods
32 With Honour We Serve
Monthly Crime Trends
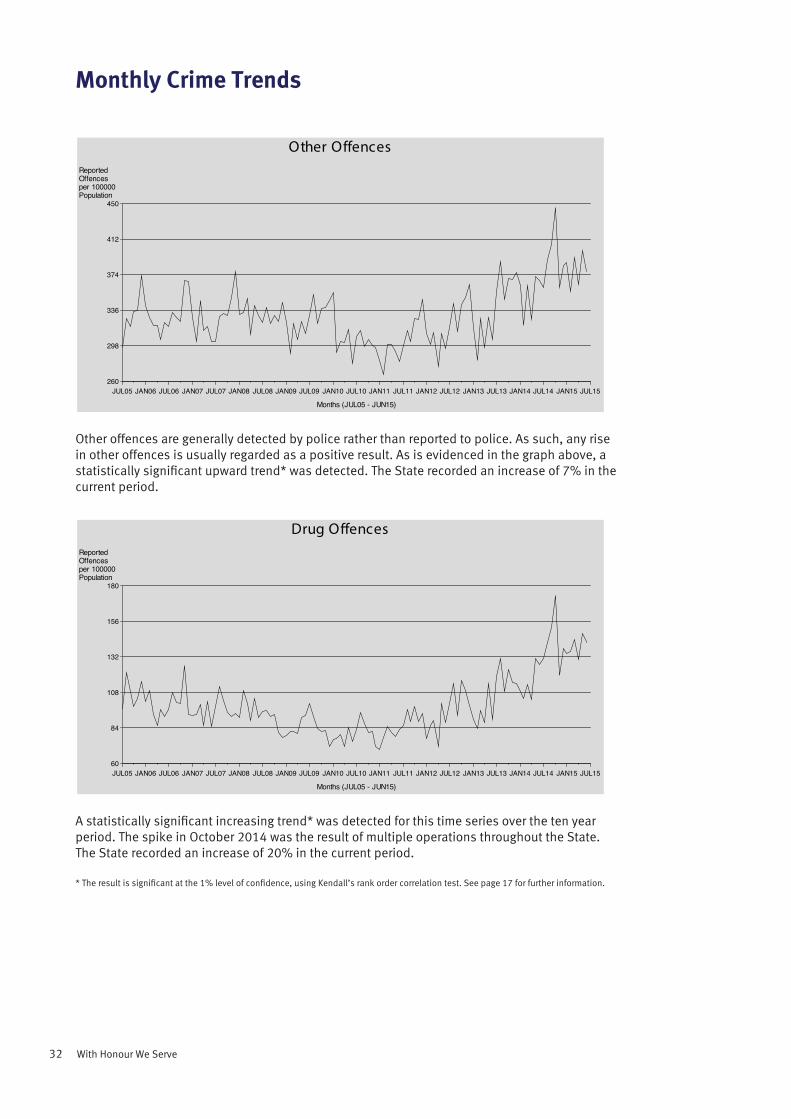
Other offences are generally detected by police rather than reported to police. As such, any rise in other offences is usually regarded as a positive result. As is evidenced in the graph above, a statistically significant upward trend* was detected. The State recorded an increase of 7% in the current period.
A statistically significant increasing trend* was detected for this time series over the ten year period. The spike in October 2014 was the result of multiple operations throughout the State. The State recorded an increase of 20% in the current period.
* The result is significant at the 1% level of confidence, using Kendall’s rank order correlation test. See page 17 for further information.
ReportedOffencesper 100000Population
260
298
336
374
412
450
Months (JUL05 - JUN15)
JUL05 JAN06 JUL06 JAN07 JUL07 JAN08 JUL08 JAN09 JUL09 JAN10 JUL10 JAN11 JUL11 JAN12 JUL12 JAN13 JUL13 JAN14 JUL14 JAN15 JUL15
Other Offences
ReportedOffencesper 100000Population
60
84
108
132
156
180
Months (JUL05 - JUN15)
JUL05 JAN06 JUL06 JAN07 JUL07 JAN08 JUL08 JAN09 JUL09 JAN10 JUL10 JAN11 JUL11 JAN12 JUL12 JAN13 JUL13 JAN14 JUL14 JAN15 JUL15
Drug Offences
33Queensland Police Service - Annual Statistical Review 2014/15
Monthly Crime Trends
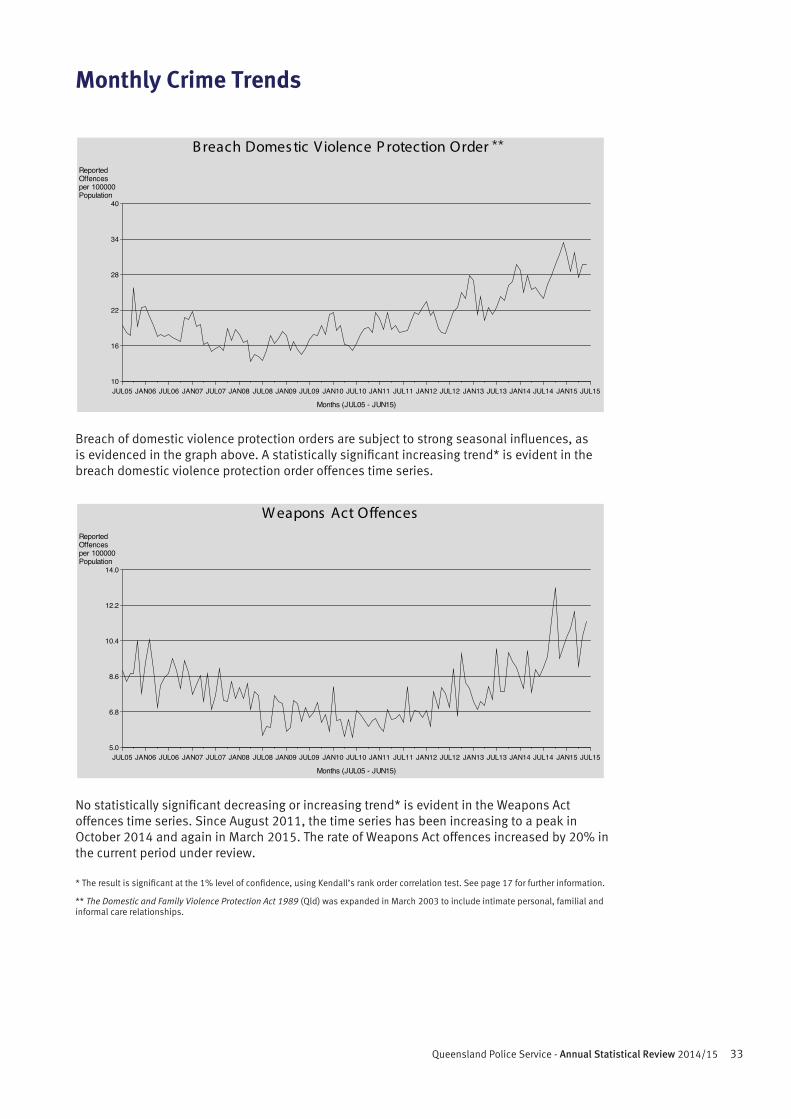
Breach of domestic violence protection orders are subject to strong seasonal influences, as is evidenced in the graph above. A statistically significant increasing trend* is evident in the breach domestic violence protection order offences time series.
No statistically significant decreasing or increasing trend* is evident in the Weapons Act offences time series. Since August 2011, the time series has been increasing to a peak in October 2014 and again in March 2015. The rate of Weapons Act offences increased by 20% in the current period under review.
* The result is significant at the 1% level of confidence, using Kendall’s rank order correlation test. See page 17 for further information.
** The Domestic and Family Violence Protection Act 1989 (Qld) was expanded in March 2003 to include intimate personal, familial and informal care relationships.
ReportedOffencesper 100000Population
10
16
22
28
34
40
Months (JUL05 - JUN15)
JUL05 JAN06 JUL06 JAN07 JUL07 JAN08 JUL08 JAN09 JUL09 JAN10 JUL10 JAN11 JUL11 JAN12 JUL12 JAN13 JUL13 JAN14 JUL14 JAN15 JUL15
B reach Domes tic Violence P rotection Order
ReportedOffencesper 100000Population
5.0
6.8
8.6
10.4
12.2
14.0
Months (JUL05 - JUN15)
JUL05 JAN06 JUL06 JAN07 JUL07 JAN08 JUL08 JAN09 JUL09 JAN10 JUL10 JAN11 JUL11 JAN12 JUL12 JAN13 JUL13 JAN14 JUL14 JAN15 JUL15
W eapons Act Offences
**
34 With Honour We Serve
Monthly Crime Trends
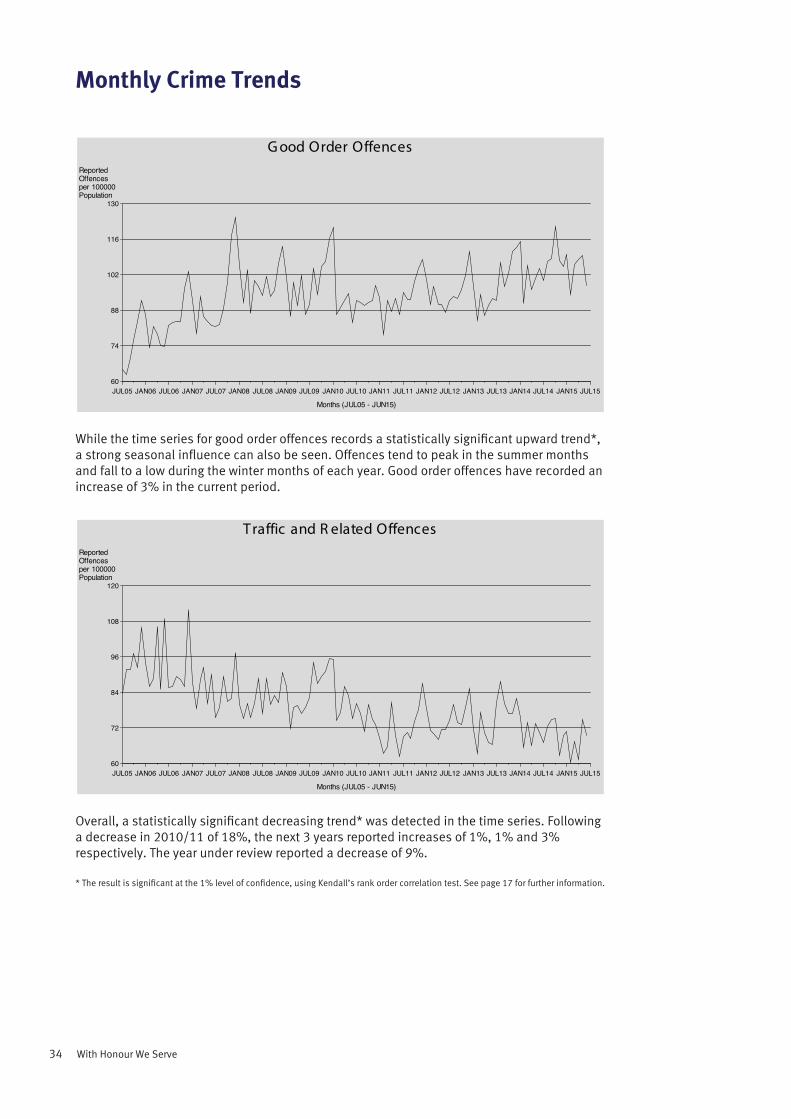
While the time series for good order offences records a statistically significant upward trend*, a strong seasonal influence can also be seen. Offences tend to peak in the summer months and fall to a low during the winter months of each year. Good order offences have recorded an increase of 3% in the current period.
Overall, a statistically significant decreasing trend* was detected in the time series. Following a decrease in 2010/11 of 18%, the next 3 years reported increases of 1%, 1% and 3% respectively. The year under review reported a decrease of 9%.
* The result is significant at the 1% level of confidence, using Kendall’s rank order correlation test. See page 17 for further information.
ReportedOffencesper 100000Population
60
74
88
102
116
130
Months (JUL05 - JUN15)
JUL05 JAN06 JUL06 JAN07 JUL07 JAN08 JUL08 JAN09 JUL09 JAN10 JUL10 JAN11 JUL11 JAN12 JUL12 JAN13 JUL13 JAN14 JUL14 JAN15 JUL15
G ood Order Offences
ReportedOffencesper 100000Population
60
72
84
96
108
120
Months (JUL05 - JUN15)
JUL05 JAN06 JUL06 JAN07 JUL07 JAN08 JUL08 JAN09 JUL09 JAN10 JUL10 JAN11 JUL11 JAN12 JUL12 JAN13 JUL13 JAN14 JUL14 JAN15 JUL15
Traffic and R elated Offences
35Queensland Police Service - Annual Statistical Review 2014/15
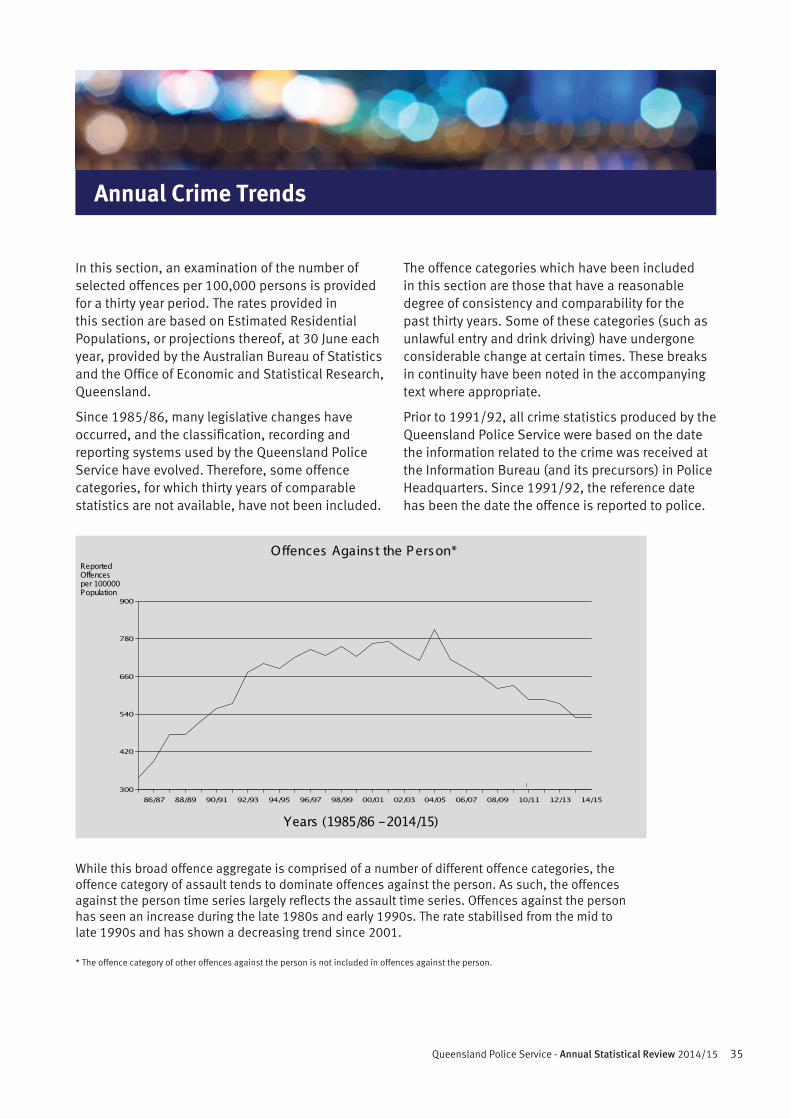
In this section, an examination of the number of selected offences per 100,000 persons is provided for a thirty year period. The rates provided in this section are based on Estimated Residential Populations, or projections thereof, at 30 June each year, provided by the Australian Bureau of Statistics and the Office of Economic and Statistical Research, Queensland.
Since 1985/86, many legislative changes have occurred, and the classification, recording and reporting systems used by the Queensland Police Service have evolved. Therefore, some offence categories, for which thirty years of comparable statistics are not available, have not been included.
The offence categories which have been included in this section are those that have a reasonable degree of consistency and comparability for the past thirty years. Some of these categories (such as unlawful entry and drink driving) have undergone considerable change at certain times. These breaks in continuity have been noted in the accompanying text where appropriate.
Prior to 1991/92, all crime statistics produced by the Queensland Police Service were based on the date the information related to the crime was received at the Information Bureau (and its precursors) in Police Headquarters. Since 1991/92, the reference date has been the date the offence is reported to police.
Annual Crime Trends
ReportedOffencesper 100000Population
Years (1985/86 - 2014/15)
O�ences Agains t the P ers on*
300
420
540
660
780
900
86/87 88/89 90/91 92/93 94/95 96/97 98/99 00/01 02/03 04/05 06/07 08/09 10/11 12/13 14/15
While this broad offence aggregate is comprised of a number of different offence categories, the offence category of assault tends to dominate offences against the person. As such, the offences against the person time series largely reflects the assault time series. Offences against the person has seen an increase during the late 1980s and early 1990s. The rate stabilised from the mid to late 1990s and has shown a decreasing trend since 2001.
* The offence category of other offences against the person is not included in offences against the person.
36 With Honour We Serve
Annual Crime Trends
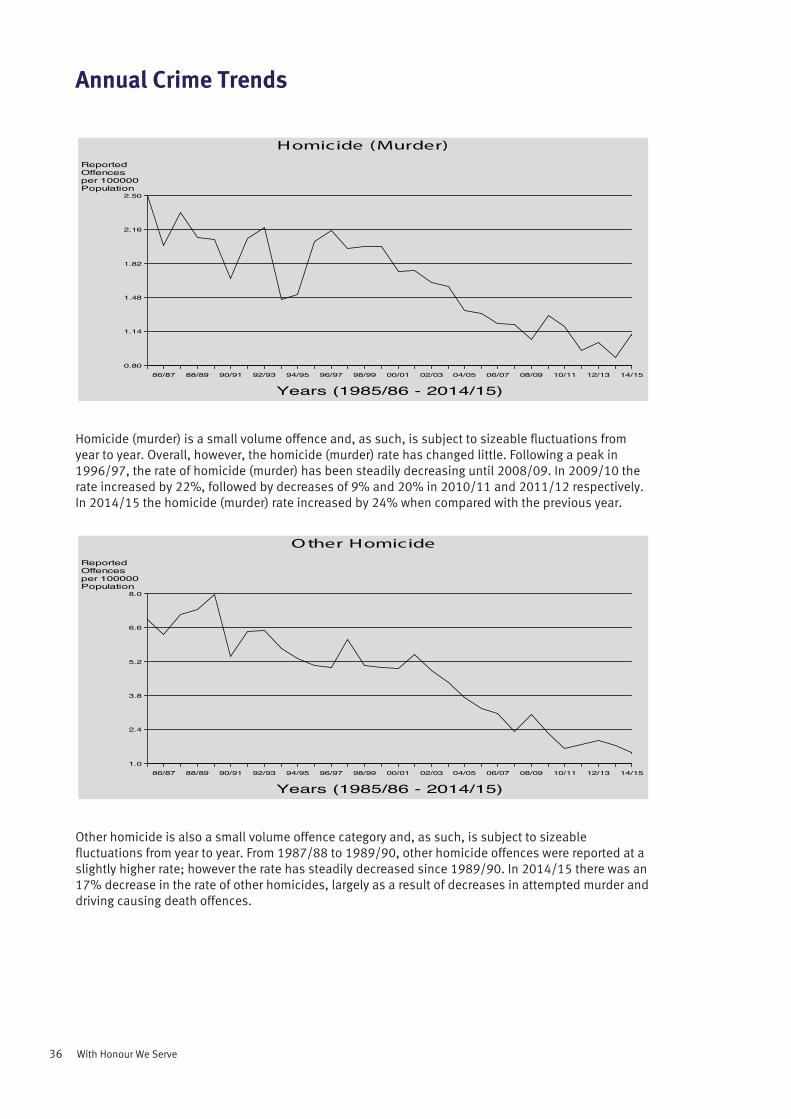
Homicide (murder) is a small volume offence and, as such, is subject to sizeable fluctuations from year to year. Overall, however, the homicide (murder) rate has changed little. Following a peak in 1996/97, the rate of homicide (murder) has been steadily decreasing until 2008/09. In 2009/10 the rate increased by 22%, followed by decreases of 9% and 20% in 2010/11 and 2011/12 respectively. In 2014/15 the homicide (murder) rate increased by 24% when compared with the previous year.
Other homicide is also a small volume offence category and, as such, is subject to sizeable fluctuations from year to year. From 1987/88 to 1989/90, other homicide offences were reported at a slightly higher rate; however the rate has steadily decreased since 1989/90. In 2014/15 there was an 17% decrease in the rate of other homicides, largely as a result of decreases in attempted murder and driving causing death offences.
ReportedOffencesper 100000Population
0.80
1.14
1.48
1.82
2.16
2.50
Years (1985/86 - 2014/15)86/87 88/89 90/91 92/93 94/95 96/97 98/99 00/01 02/03 04/05 06/07 08/09 10/11 12/13 14/15
Homicide (Murder)
ReportedOffencesper 100000Population
1.0
2.4
3.8
5.2
6.6
8.0
Years (1985/86 - 2014/15)86/87 88/89 90/91 92/93 94/95 96/97 98/99 00/01 02/03 04/05 06/07 08/09 10/11 12/13 14/15
Other Homicide
37Queensland Police Service - Annual Statistical Review 2014/15
Annual Crime Trends
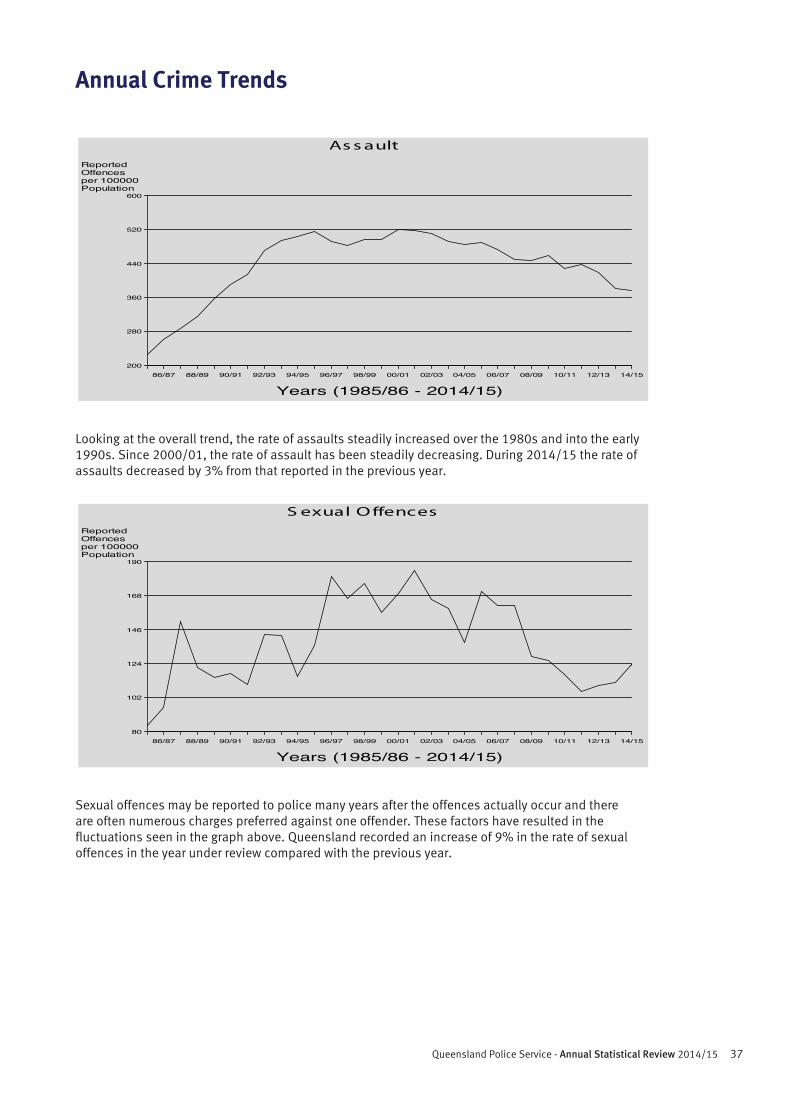
Looking at the overall trend, the rate of assaults steadily increased over the 1980s and into the early 1990s. Since 2000/01, the rate of assault has been steadily decreasing. During 2014/15 the rate of assaults decreased by 3% from that reported in the previous year.
Sexual offences may be reported to police many years after the offences actually occur and there are often numerous charges preferred against one offender. These factors have resulted in the fluctuations seen in the graph above. Queensland recorded an increase of 9% in the rate of sexual offences in the year under review compared with the previous year.
ReportedOffencesper 100000Population
200
280
360
440
520
600
Years (1985/86 - 2014/15)86/87 88/89 90/91 92/93 94/95 96/97 98/99 00/01 02/03 04/05 06/07 08/09 10/11 12/13 14/15
As s ault
ReportedOffencesper 100000Population
80
102
124
146
168
190
Years (1985/86 - 2014/15)86/87 88/89 90/91 92/93 94/95 96/97 98/99 00/01 02/03 04/05 06/07 08/09 10/11 12/13 14/15
S exual Offences
38 With Honour We Serve
Annual Crime Trends
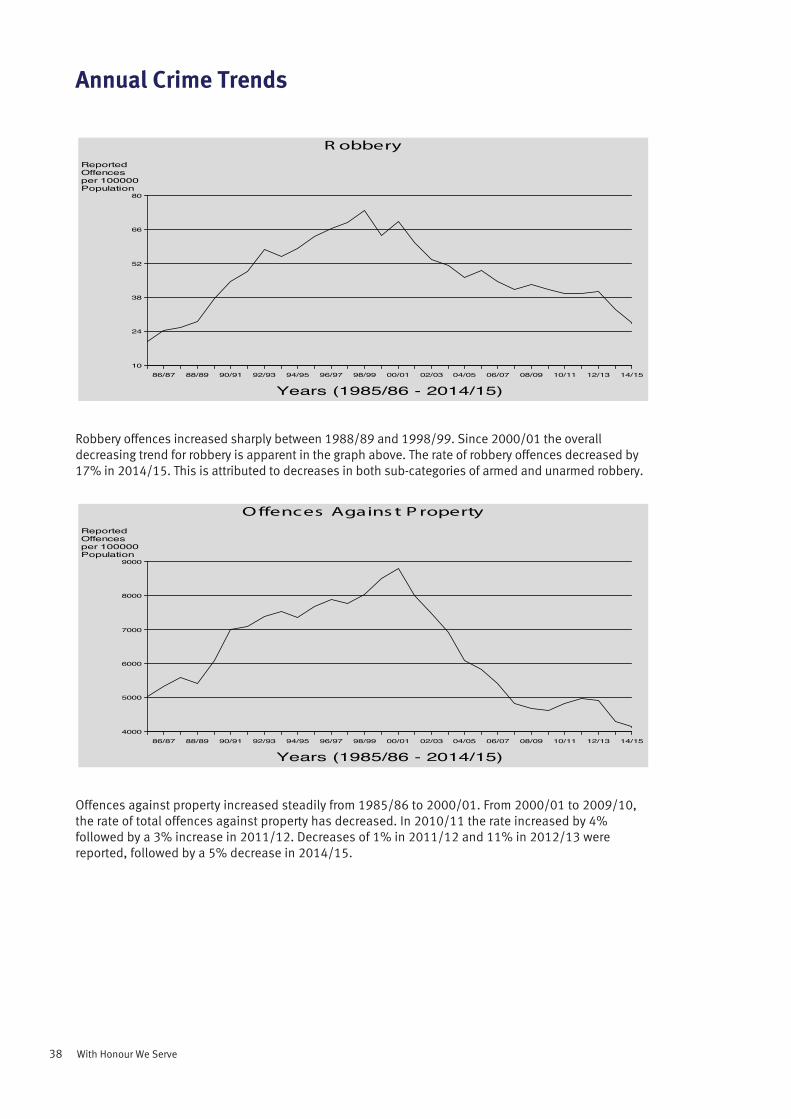
Robbery offences increased sharply between 1988/89 and 1998/99. Since 2000/01 the overall decreasing trend for robbery is apparent in the graph above. The rate of robbery offences decreased by 17% in 2014/15. This is attributed to decreases in both sub-categories of armed and unarmed robbery.
Offences against property increased steadily from 1985/86 to 2000/01. From 2000/01 to 2009/10, the rate of total offences against property has decreased. In 2010/11 the rate increased by 4% followed by a 3% increase in 2011/12. Decreases of 1% in 2011/12 and 11% in 2012/13 were reported, followed by a 5% decrease in 2014/15.
ReportedOffencesper 100000Population
10
24
38
52
66
80
Years (1985/86 - 2014/15)86/87 88/89 90/91 92/93 94/95 96/97 98/99 00/01 02/03 04/05 06/07 08/09 10/11 12/13 14/15
R obbery
ReportedOffencesper 100000Population
4000
5000
6000
7000
8000
9000
Years (1985/86 - 2014/15)86/87 88/89 90/91 92/93 94/95 96/97 98/99 00/01 02/03 04/05 06/07 08/09 10/11 12/13 14/15
Offences Agains t P roperty
39Queensland Police Service - Annual Statistical Review 2014/15
Annual Crime Trends
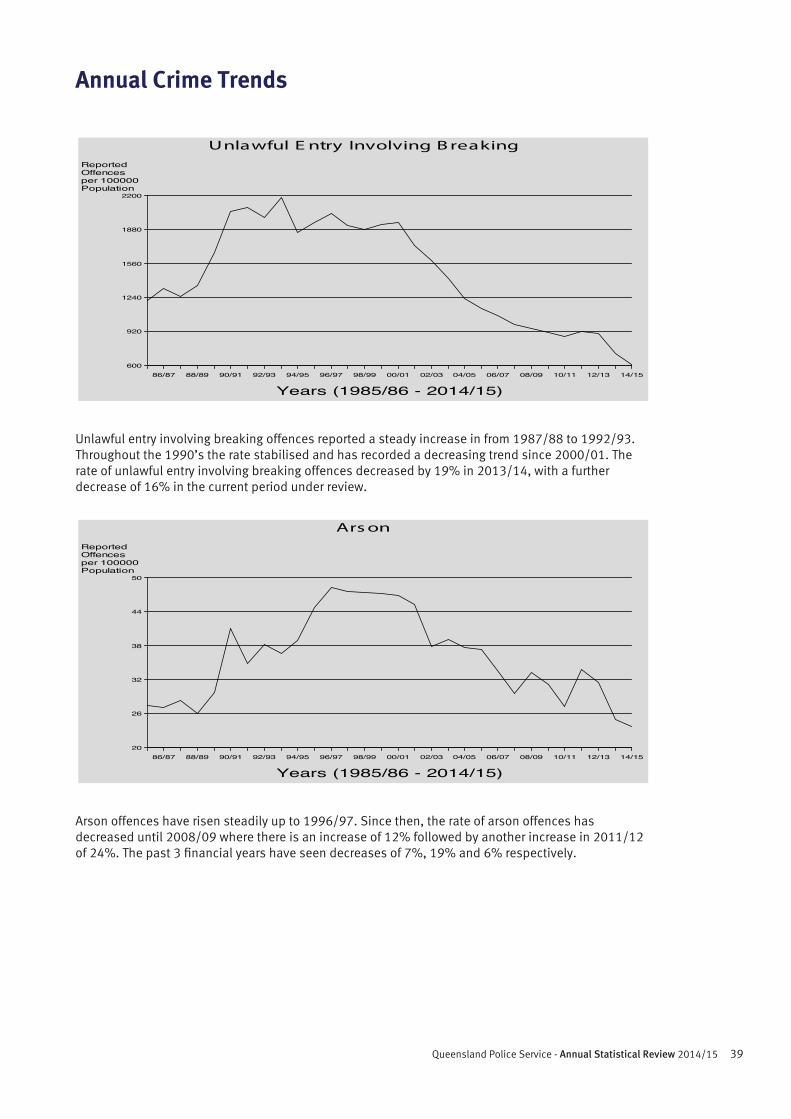
Unlawful entry involving breaking offences reported a steady increase in from 1987/88 to 1992/93. Throughout the 1990’s the rate stabilised and has recorded a decreasing trend since 2000/01. The rate of unlawful entry involving breaking offences decreased by 19% in 2013/14, with a further decrease of 16% in the current period under review.
Arson offences have risen steadily up to 1996/97. Since then, the rate of arson offences has decreased until 2008/09 where there is an increase of 12% followed by another increase in 2011/12 of 24%. The past 3 financial years have seen decreases of 7%, 19% and 6% respectively.
ReportedOffencesper 100000Population
600
920
1240
1560
1880
2200
Years (1985/86 - 2014/15)86/87 88/89 90/91 92/93 94/95 96/97 98/99 00/01 02/03 04/05 06/07 08/09 10/11 12/13 14/15
Unlawful E ntry Involving B reaking
ReportedOffencesper 100000Population
20
26
32
38
44
50
Years (1985/86 - 2014/15)86/87 88/89 90/91 92/93 94/95 96/97 98/99 00/01 02/03 04/05 06/07 08/09 10/11 12/13 14/15
Ars on
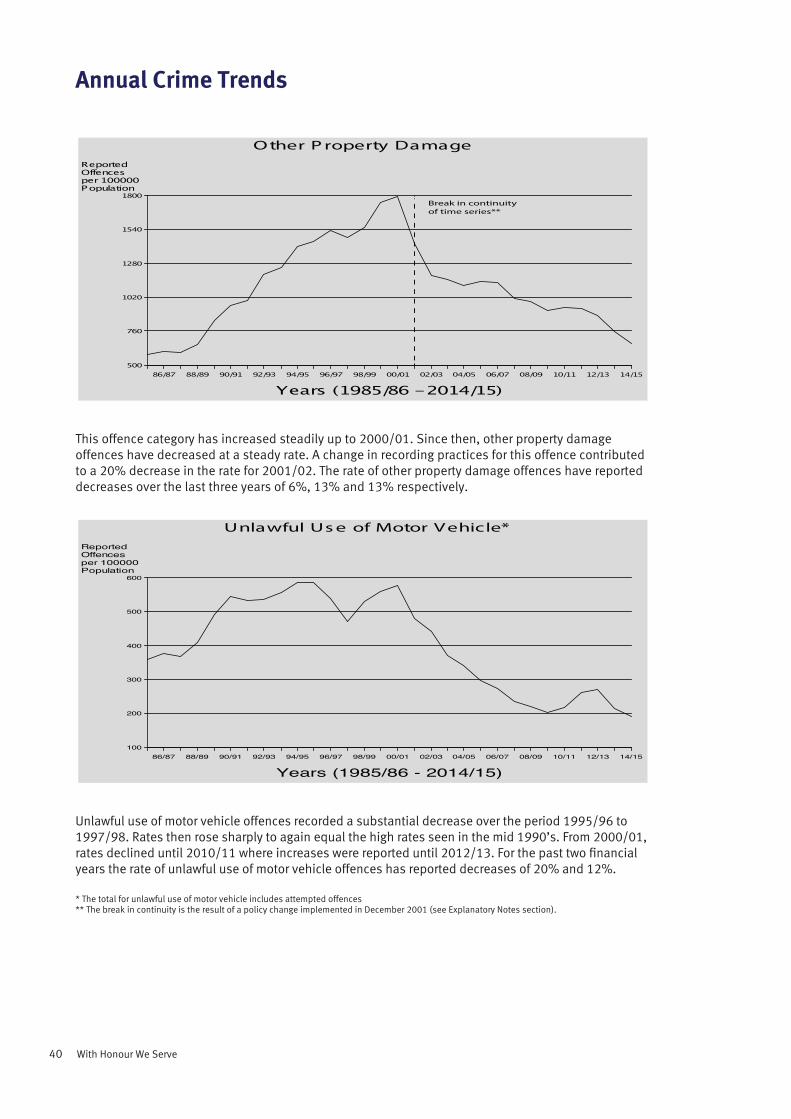
40 With Honour We Serve
Annual Crime Trends
This offence category has increased steadily up to 2000/01. Since then, other property damage offences have decreased at a steady rate. A change in recording practices for this offence contributed to a 20% decrease in the rate for 2001/02. The rate of other property damage offences have reported decreases over the last three years of 6%, 13% and 13% respectively.
Unlawful use of motor vehicle offences recorded a substantial decrease over the period 1995/96 to 1997/98. Rates then rose sharply to again equal the high rates seen in the mid 1990’s. From 2000/01, rates declined until 2010/11 where increases were reported until 2012/13. For the past two financial years the rate of unlawful use of motor vehicle offences has reported decreases of 20% and 12%.
* The total for unlawful use of motor vehicle includes attempted offences** The break in continuity is the result of a policy change implemented in December 2001 (see Explanatory Notes section).
ReportedOffencesper 100000Population
500
760
1020
1280
1540
1800
Years (1985/86 - 2014/15)86/87 88/89 90/91 92/93 94/95 96/97 98/99 00/01 02/03 04/05 06/07 08/09 10/11 12/13 14/15
Other P roperty Damage
Break in continuity of time series**
ReportedOffencesper 100000Population
100
200
300
400
500
600
Years (1985/86 - 2014/15)86/87 88/89 90/91 92/93 94/95 96/97 98/99 00/01 02/03 04/05 06/07 08/09 10/11 12/13 14/15
Unlawful Us e of Motor Vehicle*
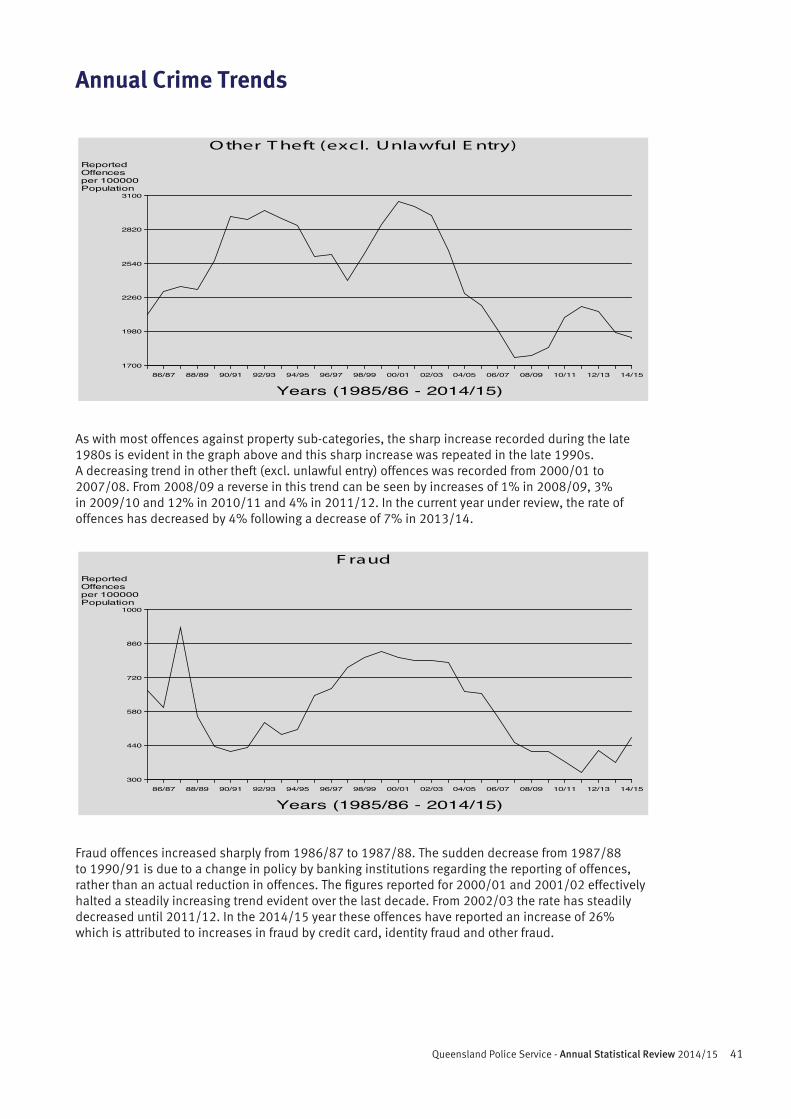
41Queensland Police Service - Annual Statistical Review 2014/15
Annual Crime Trends
As with most offences against property sub-categories, the sharp increase recorded during the late 1980s is evident in the graph above and this sharp increase was repeated in the late 1990s. A decreasing trend in other theft (excl. unlawful entry) offences was recorded from 2000/01 to 2007/08. From 2008/09 a reverse in this trend can be seen by increases of 1% in 2008/09, 3% in 2009/10 and 12% in 2010/11 and 4% in 2011/12. In the current year under review, the rate of offences has decreased by 4% following a decrease of 7% in 2013/14.
Fraud offences increased sharply from 1986/87 to 1987/88. The sudden decrease from 1987/88 to 1990/91 is due to a change in policy by banking institutions regarding the reporting of offences, rather than an actual reduction in offences. The figures reported for 2000/01 and 2001/02 effectively halted a steadily increasing trend evident over the last decade. From 2002/03 the rate has steadily decreased until 2011/12. In the 2014/15 year these offences have reported an increase of 26% which is attributed to increases in fraud by credit card, identity fraud and other fraud.
ReportedOffencesper 100000Population
1700
1980
2260
2540
2820
3100
Years (1985/86 - 2014/15)86/87 88/89 90/91 92/93 94/95 96/97 98/99 00/01 02/03 04/05 06/07 08/09 10/11 12/13 14/15
Other T heft (excl. Unlawful E ntry)
ReportedOffencesper 100000Population
300
440
580
720
860
1000
Years (1985/86 - 2014/15)86/87 88/89 90/91 92/93 94/95 96/97 98/99 00/01 02/03 04/05 06/07 08/09 10/11 12/13 14/15
F raud
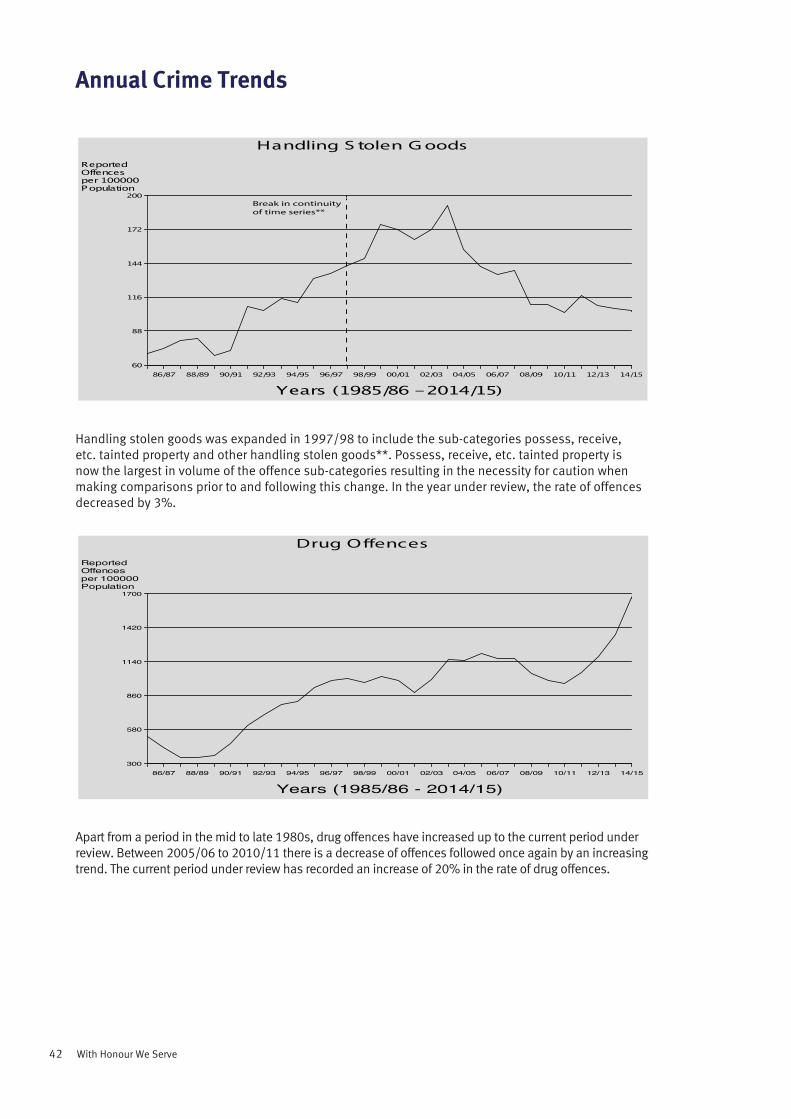
42 With Honour We Serve
Annual Crime Trends
Handling stolen goods was expanded in 1997/98 to include the sub-categories possess, receive, etc. tainted property and other handling stolen goods**. Possess, receive, etc. tainted property is now the largest in volume of the offence sub-categories resulting in the necessity for caution when making comparisons prior to and following this change. In the year under review, the rate of offences decreased by 3%.
Apart from a period in the mid to late 1980s, drug offences have increased up to the current period under review. Between 2005/06 to 2010/11 there is a decrease of offences followed once again by an increasing trend. The current period under review has recorded an increase of 20% in the rate of drug offences.
ReportedOffencesper 100000Population
60
88
116
144
172
200
Years (1985/86 - 2014/15)86/87 88/89 90/91 92/93 94/95 96/97 98/99 00/01 02/03 04/05 06/07 08/09 10/11 12/13 14/15
Handling S tolen G oods
Break in continuity of time series**
ReportedOffencesper 100000Population
300
580
860
1140
1420
1700
Years (1985/86 - 2014/15)86/87 88/89 90/91 92/93 94/95 96/97 98/99 00/01 02/03 04/05 06/07 08/09 10/11 12/13 14/15
Drug Offences
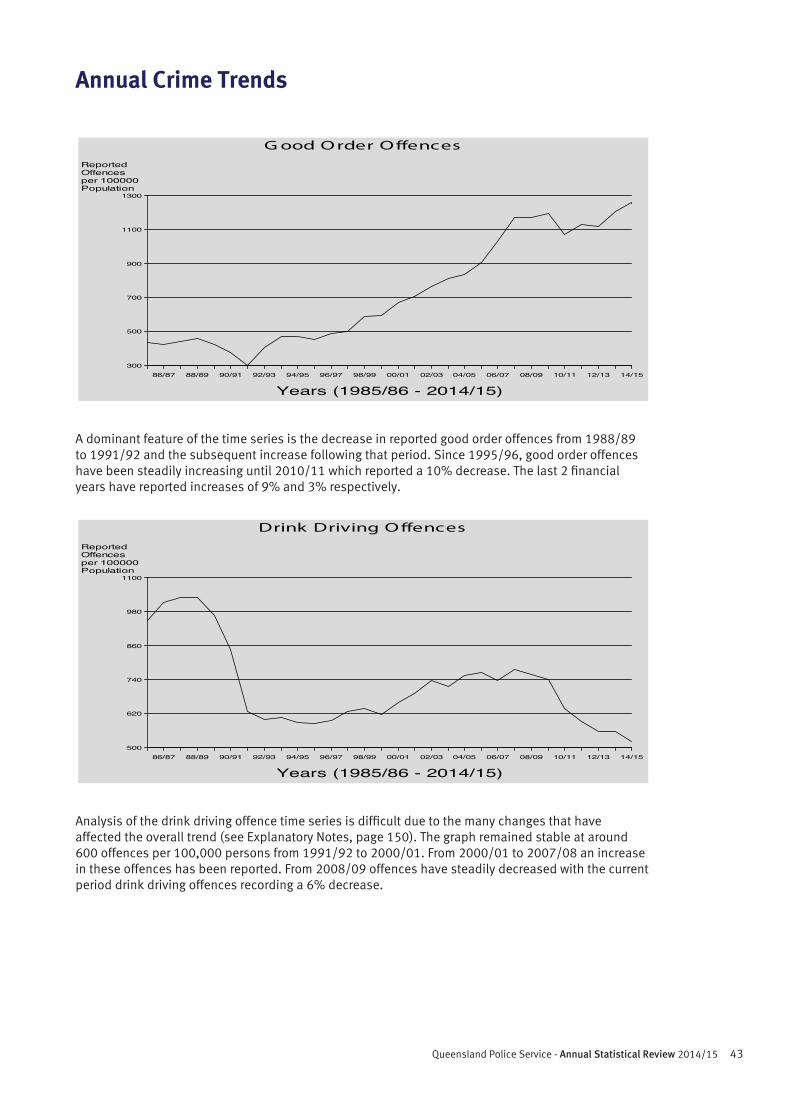
43Queensland Police Service - Annual Statistical Review 2014/15
Annual Crime Trends
A dominant feature of the time series is the decrease in reported good order offences from 1988/89 to 1991/92 and the subsequent increase following that period. Since 1995/96, good order offences have been steadily increasing until 2010/11 which reported a 10% decrease. The last 2 financial years have reported increases of 9% and 3% respectively.
Analysis of the drink driving offence time series is difficult due to the many changes that have affected the overall trend (see Explanatory Notes, page 150). The graph remained stable at around 600 offences per 100,000 persons from 1991/92 to 2000/01. From 2000/01 to 2007/08 an increase in these offences has been reported. From 2008/09 offences have steadily decreased with the current period drink driving offences recording a 6% decrease.
ReportedOffencesper 100000Population
300
500
700
900
1100
1300
Years (1985/86 - 2014/15)86/87 88/89 90/91 92/93 94/95 96/97 98/99 00/01 02/03 04/05 06/07 08/09 10/11 12/13 14/15
G ood Order Offences
ReportedOffencesper 100000Population
500
620
740
860
980
1100
Years (1985/86 - 2014/15)86/87 88/89 90/91 92/93 94/95 96/97 98/99 00/01 02/03 04/05 06/07 08/09 10/11 12/13 14/15
Drink Driving Offences

44 With Honour We Serve
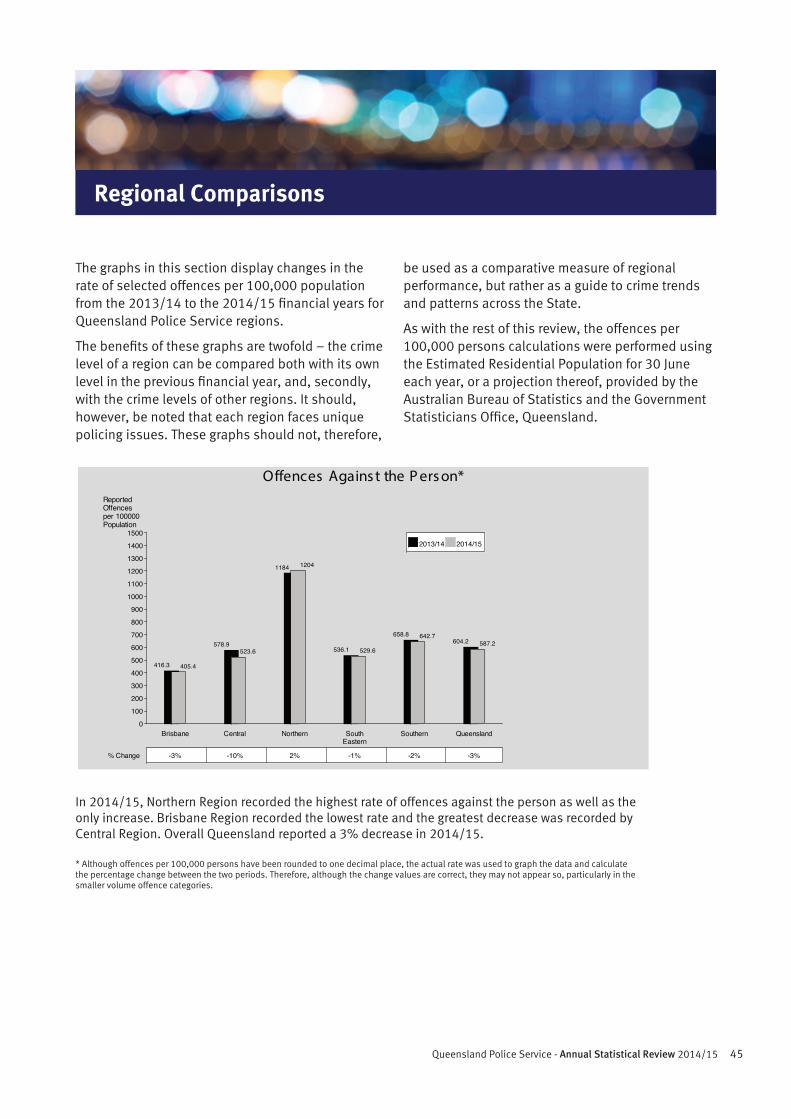
45Queensland Police Service - Annual Statistical Review 2014/15
Regional Comparisons
Offences Agains t the P ers on*ReportedOffencesper 100000Population
0
100
200
300
400
500
600
700
800
900
1000
1100
1200
1300
1400
1500
Brisbane Central Northern SouthEastern
Southern Queensland
% Change
2013/14 2014/15
416.3 405.4
-3%
578.9523.6
-10%
1184 1204
2%
536.1 529.6
-1%
658.8 642.7
-2%
604.2 587.2
-3%
The graphs in this section display changes in the rate of selected offences per 100,000 population from the 2013/14 to the 2014/15 financial years for Queensland Police Service regions.
The benefits of these graphs are twofold – the crime level of a region can be compared both with its own level in the previous financial year, and, secondly, with the crime levels of other regions. It should, however, be noted that each region faces unique policing issues. These graphs should not, therefore,
be used as a comparative measure of regional performance, but rather as a guide to crime trends and patterns across the State.
As with the rest of this review, the offences per 100,000 persons calculations were performed using the Estimated Residential Population for 30 June each year, or a projection thereof, provided by the Australian Bureau of Statistics and the Government Statisticians Office, Queensland.
In 2014/15, Northern Region recorded the highest rate of offences against the person as well as the only increase. Brisbane Region recorded the lowest rate and the greatest decrease was recorded by Central Region. Overall Queensland reported a 3% decrease in 2014/15.
* Although offences per 100,000 persons have been rounded to one decimal place, the actual rate was used to graph the data and calculate the percentage change between the two periods. Therefore, although the change values are correct, they may not appear so, particularly in the smaller volume offence categories.
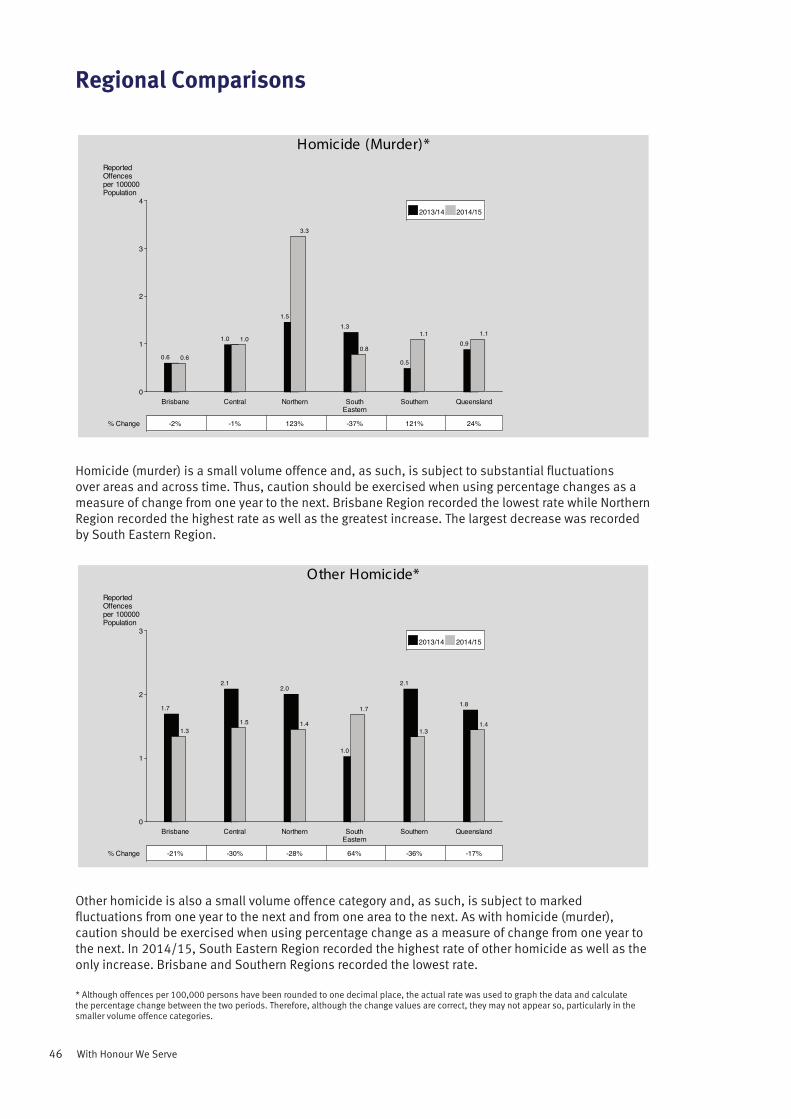
46 With Honour We Serve
Regional Comparisons
Homicide (murder) is a small volume offence and, as such, is subject to substantial fluctuations over areas and across time. Thus, caution should be exercised when using percentage changes as a measure of change from one year to the next. Brisbane Region recorded the lowest rate while Northern Region recorded the highest rate as well as the greatest increase. The largest decrease was recorded by South Eastern Region.
Other homicide is also a small volume offence category and, as such, is subject to marked fluctuations from one year to the next and from one area to the next. As with homicide (murder), caution should be exercised when using percentage change as a measure of change from one year to the next. In 2014/15, South Eastern Region recorded the highest rate of other homicide as well as the only increase. Brisbane and Southern Regions recorded the lowest rate.
* Although offences per 100,000 persons have been rounded to one decimal place, the actual rate was used to graph the data and calculate the percentage change between the two periods. Therefore, although the change values are correct, they may not appear so, particularly in the smaller volume offence categories.
Homicide (Murder)*ReportedOffencesper 100000Population
0
1
2
3
4
Brisbane Central Northern SouthEastern
Southern Queensland
% Change
2013/14 2014/15
0.6 0.6
-2%
1.0 1.0
-1%
1.5
3.3
123%
1.3
0.8
-37%
0.5
1.1
121%
0.91.1
24%
Other Homicide*ReportedOffencesper 100000Population
0
1
2
3
Brisbane Central Northern SouthEastern
Southern Queensland
% Change
2013/14 2014/15
1.7
1.3
-21%
2.1
1.5
-30%
2.0
1.4
-28%
1.0
1.7
64%
2.1
1.3
-36%
1.8
1.4
-17%
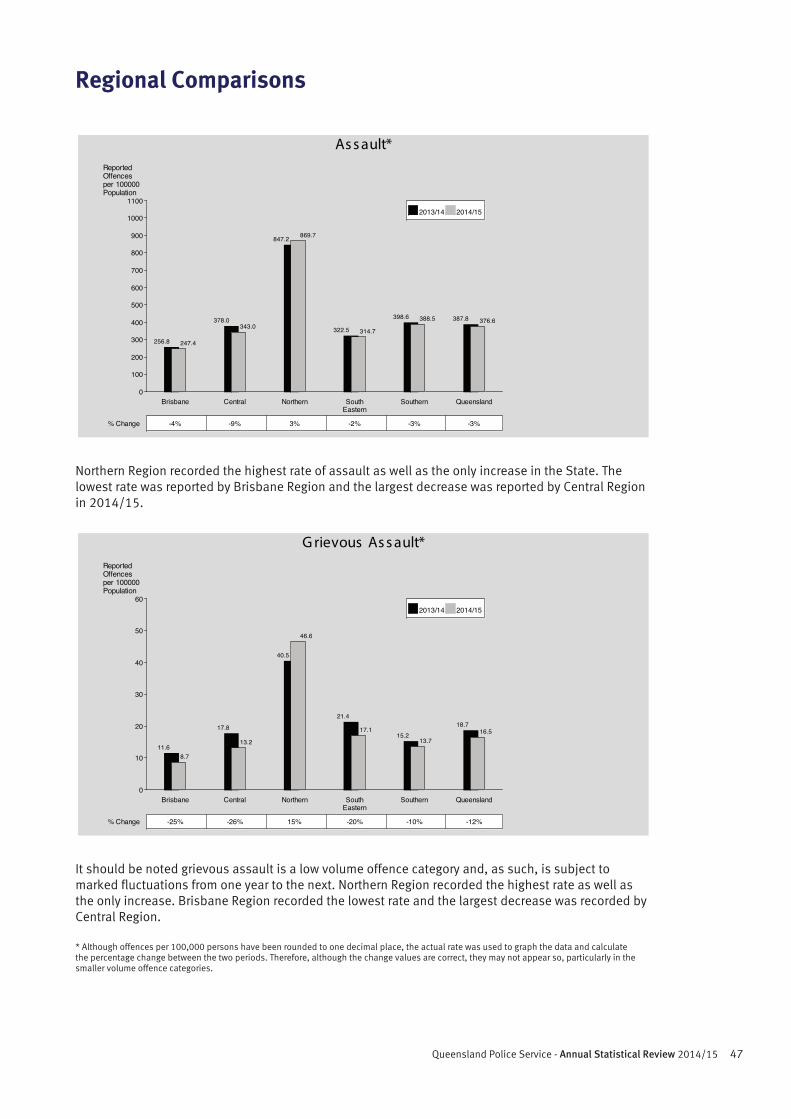
47Queensland Police Service - Annual Statistical Review 2014/15
Regional Comparisons
Northern Region recorded the highest rate of assault as well as the only increase in the State. The lowest rate was reported by Brisbane Region and the largest decrease was reported by Central Region in 2014/15.
It should be noted grievous assault is a low volume offence category and, as such, is subject to marked fluctuations from one year to the next. Northern Region recorded the highest rate as well as the only increase. Brisbane Region recorded the lowest rate and the largest decrease was recorded by Central Region.
* Although offences per 100,000 persons have been rounded to one decimal place, the actual rate was used to graph the data and calculate the percentage change between the two periods. Therefore, although the change values are correct, they may not appear so, particularly in the smaller volume offence categories.
As s ault*ReportedOffencesper 100000Population
0
100
200
300
400
500
600
700
800
900
1000
1100
Brisbane Central Northern SouthEastern
Southern Queensland
% Change
2013/14 2014/15
256.8 247.4
-4%
378.0343.0
-9%
847.2 869.7
3%
322.5 314.7
-2%
398.6 388.5
-3%
387.8 376.6
-3%
G rievous As s ault*ReportedOffencesper 100000Population
0
10
20
30
40
50
60
Brisbane Central Northern SouthEastern
Southern Queensland
% Change
2013/14 2014/15
11.68.7
-25%
17.8
13.2
-26%
40.5
46.6
15%
21.4
17.1
-20%
15.213.7
-10%
18.716.5
-12%

48 With Honour We Serve
Regional Comparisons
Northern Region had the highest rate of serious assaults in the State as well as the largest increase along with Brisbane Region. Despite recording an increase, Brisbane Region reported the lowest rate in the State and Central Region reported the only decrease.
Northern Region recorded the highest rate of serious assault (other) offences, while Brisbane Region recorded the lowest rate and the largest decrease this year. Southern Region recorded the only increase for the current review period.
* Although offences per 100,000 persons have been rounded to one decimal place, the actual rate was used to graph the data and calculate the percentage change between the two periods. Therefore, although the change values are correct, they may not appear so, particularly in the smaller volume offence categories.
S erious As s ault*ReportedOffencesper 100000Population
0
100
200
300
400
500
Brisbane Central Northern SouthEastern
Southern Queensland
% Change
2013/14 2014/15
111.3 115.5
4%
171.5 161.8
-6%
382.5399.5
4%
155.2 159.1
3%
178.8 183.1
2%
175.4 178.0
2%
S erious As s ault (Other)*ReportedOffencesper 100000Population
0102030405060708090
100110120130140150160170
Brisbane Central Northern SouthEastern
Southern Queensland
% Change
2013/14 2014/15
44.135.6
-19%
53.847.9
-11%
136.5 135.8
-1%
50.7 48.0
-5%
51.4 52.1
1%
59.455.0
-7%
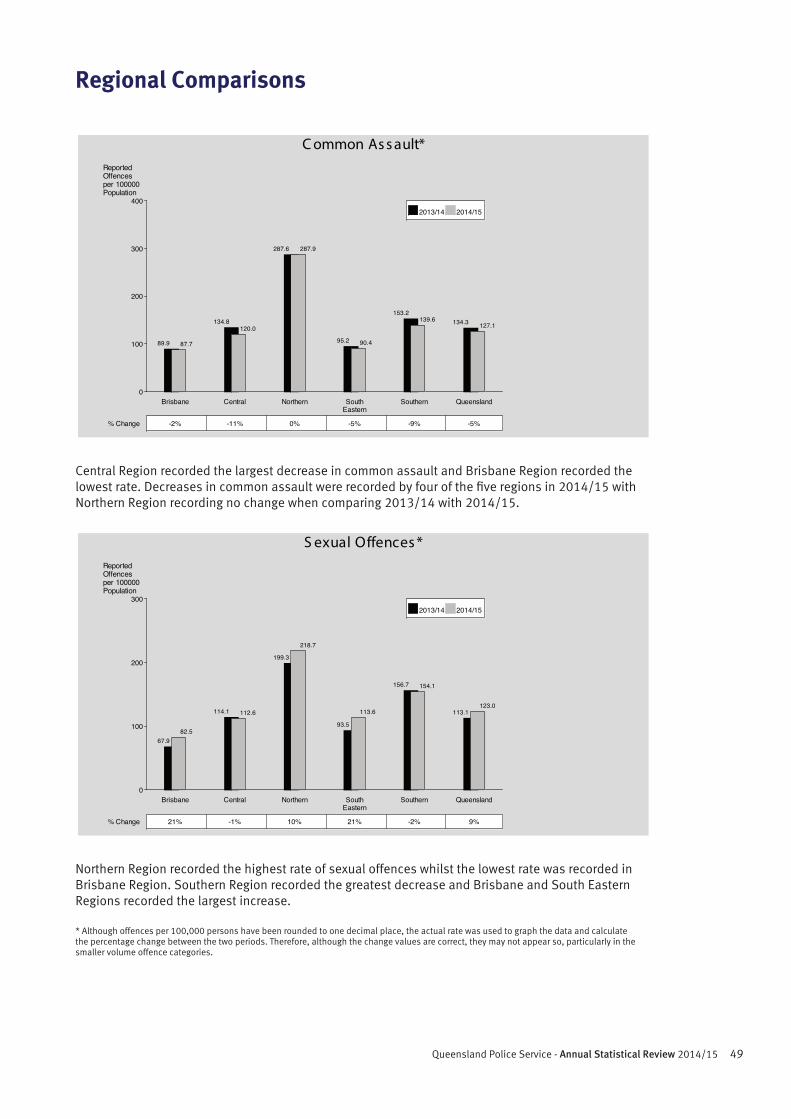
49Queensland Police Service - Annual Statistical Review 2014/15
Regional Comparisons
Central Region recorded the largest decrease in common assault and Brisbane Region recorded the lowest rate. Decreases in common assault were recorded by four of the five regions in 2014/15 with Northern Region recording no change when comparing 2013/14 with 2014/15.
Northern Region recorded the highest rate of sexual offences whilst the lowest rate was recorded in Brisbane Region. Southern Region recorded the greatest decrease and Brisbane and South Eastern Regions recorded the largest increase.
* Although offences per 100,000 persons have been rounded to one decimal place, the actual rate was used to graph the data and calculate the percentage change between the two periods. Therefore, although the change values are correct, they may not appear so, particularly in the smaller volume offence categories.
C ommon As s ault*ReportedOffencesper 100000Population
0
100
200
300
400
Brisbane Central Northern SouthEastern
Southern Queensland
% Change
2013/14 2014/15
89.9 87.7
-2%
134.8120.0
-11%
287.6 287.9
0%
95.2 90.4
-5%
153.2139.6
-9%
134.3 127.1
-5%
S exual Offences *ReportedOffencesper 100000Population
0
100
200
300
Brisbane Central Northern SouthEastern
Southern Queensland
% Change
2013/14 2014/15
67.982.5
21%
114.1 112.6
-1%
199.3
218.7
10%
93.5
113.6
21%
156.7 154.1
-2%
113.1123.0
9%

50 With Honour We Serve
Regional Comparisons
Increases in rape and attempted rape offences were recorded by four of the five regions with Queensland recording a 14% increase in the period under review. The highest rate was recorded by Northern Region while the lowest rate of rape and attempted rape was recorded by Brisbane Region.
The highest rate was recorded by Northern Region whilst the lowest rate was recorded by Brisbane Region where the largest increase was also recorded. Central Region recorded the largest decrease in the period under review.
* Although offences per 100,000 persons have been rounded to one decimal place, the actual rate was used to graph the data and calculate the percentage change between the two periods. Therefore, although the change values are correct, they may not appear so, particularly in the smaller volume offence categories.
R ape and Attempted R ape*ReportedOffencesper 100000Population
0
10
20
30
40
50
60
70
Brisbane Central Northern SouthEastern
Southern Queensland
% Change
2013/14 2014/15
21.2 21.3
1%
33.4 34.1
2%
43.3
58.2
34%
26.1
39.4
51%
42.6 42.1
-1%
31.0
35.4
14%
Other S exual Offences *ReportedOffencesper 100000Population
0102030405060708090
100110120130140150160170180190200
Brisbane Central Northern SouthEastern
Southern Queensland
% Change
2013/14 2014/15
46.7
61.1
31%
80.7 78.5
-3%
156.0 160.5
3%
67.574.2
10%
114.0 112.0
-2%
82.287.6
7%
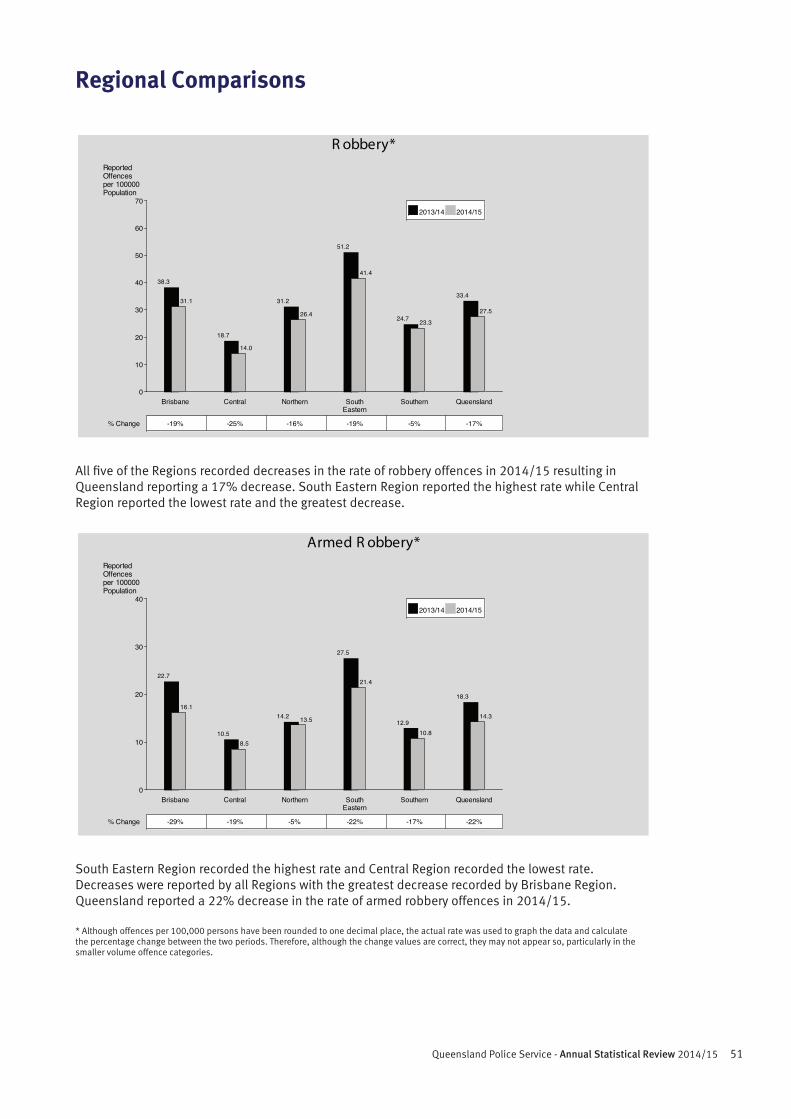
51Queensland Police Service - Annual Statistical Review 2014/15
Regional Comparisons
All five of the Regions recorded decreases in the rate of robbery offences in 2014/15 resulting in Queensland reporting a 17% decrease. South Eastern Region reported the highest rate while Central Region reported the lowest rate and the greatest decrease.
South Eastern Region recorded the highest rate and Central Region recorded the lowest rate. Decreases were reported by all Regions with the greatest decrease recorded by Brisbane Region. Queensland reported a 22% decrease in the rate of armed robbery offences in 2014/15.
* Although offences per 100,000 persons have been rounded to one decimal place, the actual rate was used to graph the data and calculate the percentage change between the two periods. Therefore, although the change values are correct, they may not appear so, particularly in the smaller volume offence categories.
R obbery*ReportedOffencesper 100000Population
0
10
20
30
40
50
60
70
Brisbane Central Northern SouthEastern
Southern Queensland
% Change
2013/14 2014/15
38.3
31.1
-19%
18.7
14.0
-25%
31.2
26.4
-16%
51.2
41.4
-19%
24.7 23.3
-5%
33.4
27.5
-17%
Armed R obbery*ReportedOffencesper 100000Population
0
10
20
30
40
Brisbane Central Northern SouthEastern
Southern Queensland
% Change
2013/14 2014/15
22.7
16.1
-29%
10.58.5
-19%
14.2 13.5
-5%
27.5
21.4
-22%
12.910.8
-17%
18.3
14.3
-22%
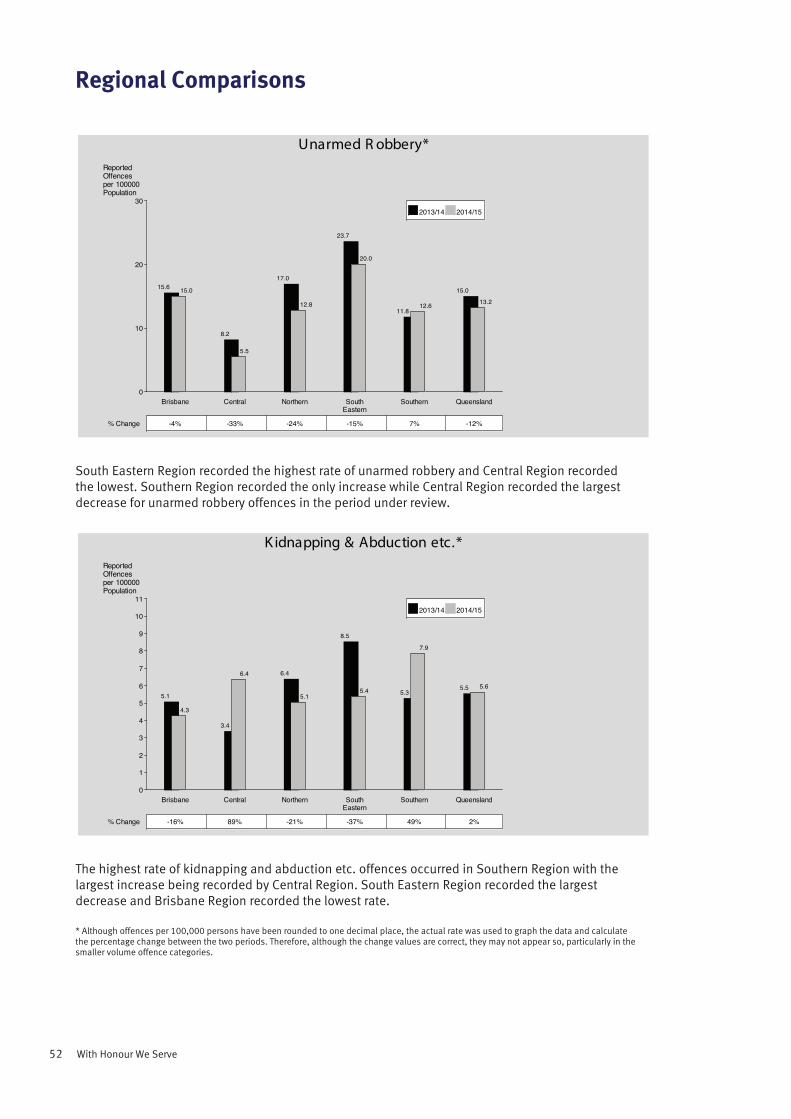
52 With Honour We Serve
Regional Comparisons
South Eastern Region recorded the highest rate of unarmed robbery and Central Region recorded the lowest. Southern Region recorded the only increase while Central Region recorded the largest decrease for unarmed robbery offences in the period under review.
The highest rate of kidnapping and abduction etc. offences occurred in Southern Region with the largest increase being recorded by Central Region. South Eastern Region recorded the largest decrease and Brisbane Region recorded the lowest rate.
* Although offences per 100,000 persons have been rounded to one decimal place, the actual rate was used to graph the data and calculate the percentage change between the two periods. Therefore, although the change values are correct, they may not appear so, particularly in the smaller volume offence categories.
Unarmed R obbery*ReportedOffencesper 100000Population
0
10
20
30
Brisbane Central Northern SouthEastern
Southern Queensland
% Change
2013/14 2014/15
15.6 15.0
-4%
8.2
5.5
-33%
17.0
12.8
-24%
23.7
20.0
-15%
11.812.6
7%
15.0
13.2
-12%
K idnapping & Abduction etc.*ReportedOffencesper 100000Population
0
1
2
3
4
5
6
7
8
9
10
11
Brisbane Central Northern SouthEastern
Southern Queensland
% Change
2013/14 2014/15
5.1
4.3
-16%
3.4
6.4
89%
6.4
5.1
-21%
8.5
5.4
-37%
5.3
7.9
49%
5.5 5.6
2%
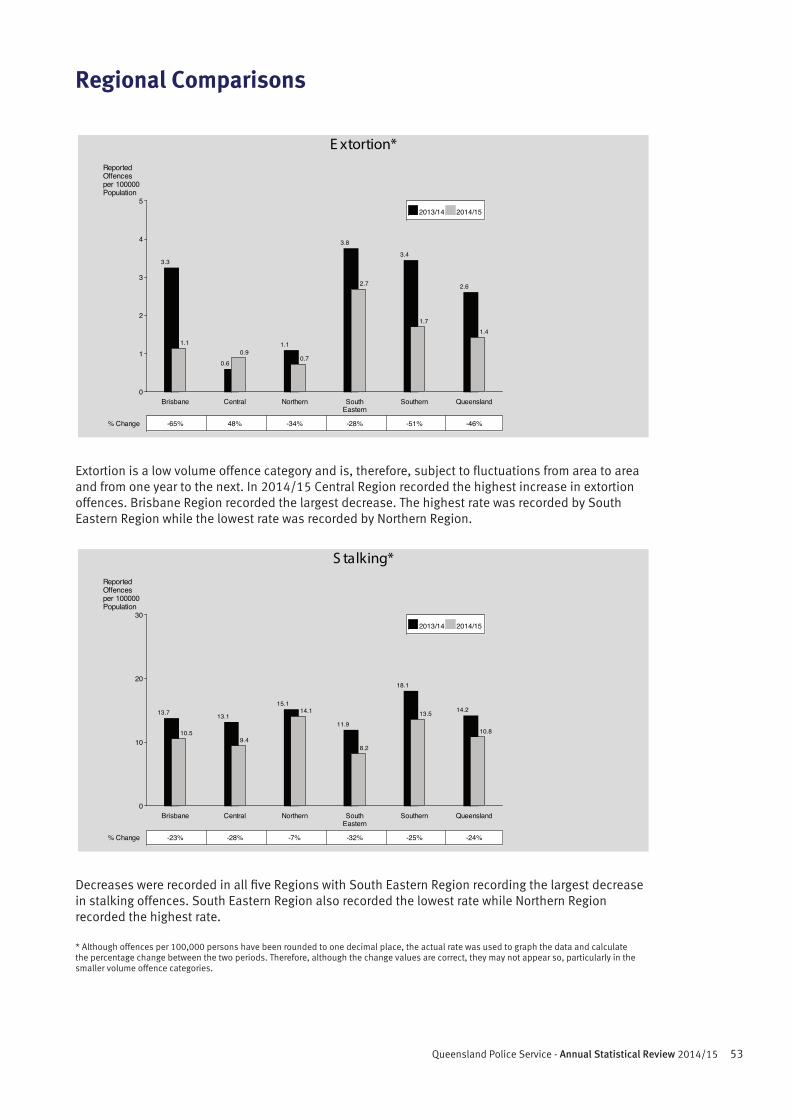
53Queensland Police Service - Annual Statistical Review 2014/15
Regional Comparisons
Extortion is a low volume offence category and is, therefore, subject to fluctuations from area to area and from one year to the next. In 2014/15 Central Region recorded the highest increase in extortion offences. Brisbane Region recorded the largest decrease. The highest rate was recorded by South Eastern Region while the lowest rate was recorded by Northern Region.
Decreases were recorded in all five Regions with South Eastern Region recording the largest decrease in stalking offences. South Eastern Region also recorded the lowest rate while Northern Region recorded the highest rate.
* Although offences per 100,000 persons have been rounded to one decimal place, the actual rate was used to graph the data and calculate the percentage change between the two periods. Therefore, although the change values are correct, they may not appear so, particularly in the smaller volume offence categories.
E xtortion*ReportedOffencesper 100000Population
0
1
2
3
4
5
Brisbane Central Northern SouthEastern
Southern Queensland
% Change
2013/14 2014/15
3.3
1.1
-65%
0.60.9
48%
1.1
0.7
-34%
3.8
2.7
-28%
3.4
1.7
-51%
2.6
1.4
-46%
S talking*ReportedOffencesper 100000Population
0
10
20
30
Brisbane Central Northern SouthEastern
Southern Queensland
% Change
2013/14 2014/15
13.7
10.5
-23%
13.1
9.4
-28%
15.114.1
-7%
11.9
8.2
-32%
18.1
13.5
-25%
14.2
10.8
-24%
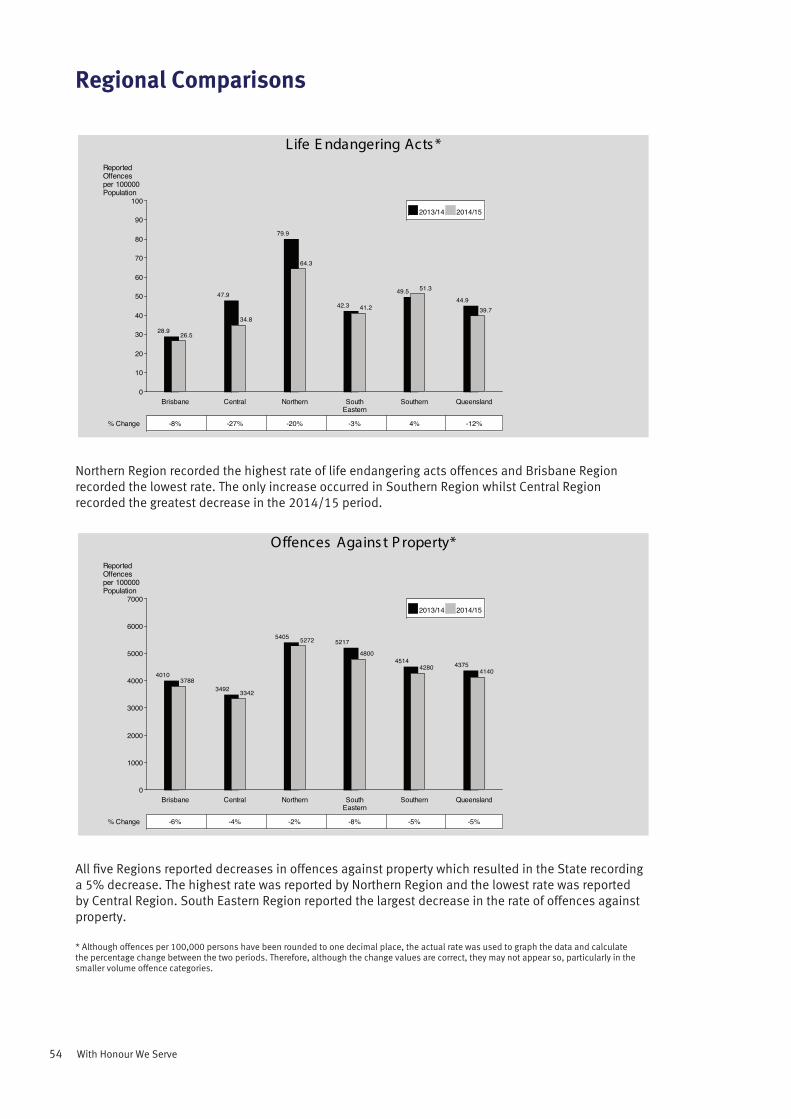
54 With Honour We Serve
Regional Comparisons
Northern Region recorded the highest rate of life endangering acts offences and Brisbane Region recorded the lowest rate. The only increase occurred in Southern Region whilst Central Region recorded the greatest decrease in the 2014/15 period.
All five Regions reported decreases in offences against property which resulted in the State recording a 5% decrease. The highest rate was reported by Northern Region and the lowest rate was reported by Central Region. South Eastern Region reported the largest decrease in the rate of offences against property.
* Although offences per 100,000 persons have been rounded to one decimal place, the actual rate was used to graph the data and calculate the percentage change between the two periods. Therefore, although the change values are correct, they may not appear so, particularly in the smaller volume offence categories.
Life E ndangering Acts *ReportedOffencesper 100000Population
0
10
20
30
40
50
60
70
80
90
100
Brisbane Central Northern SouthEastern
Southern Queensland
% Change
2013/14 2014/15
28.9 26.5
-8%
47.9
34.8
-27%
79.9
64.3
-20%
42.3 41.2
-3%
49.5 51.3
4%
44.939.7
-12%
Offences Agains t P roperty*ReportedOffencesper 100000Population
0
1000
2000
3000
4000
5000
6000
7000
Brisbane Central Northern SouthEastern
Southern Queensland
% Change
2013/14 2014/15
40103788
-6%
3492 3342
-4%
5405 5272
-2%
5217
4800
-8%
45144280
-5%
43754140
-5%
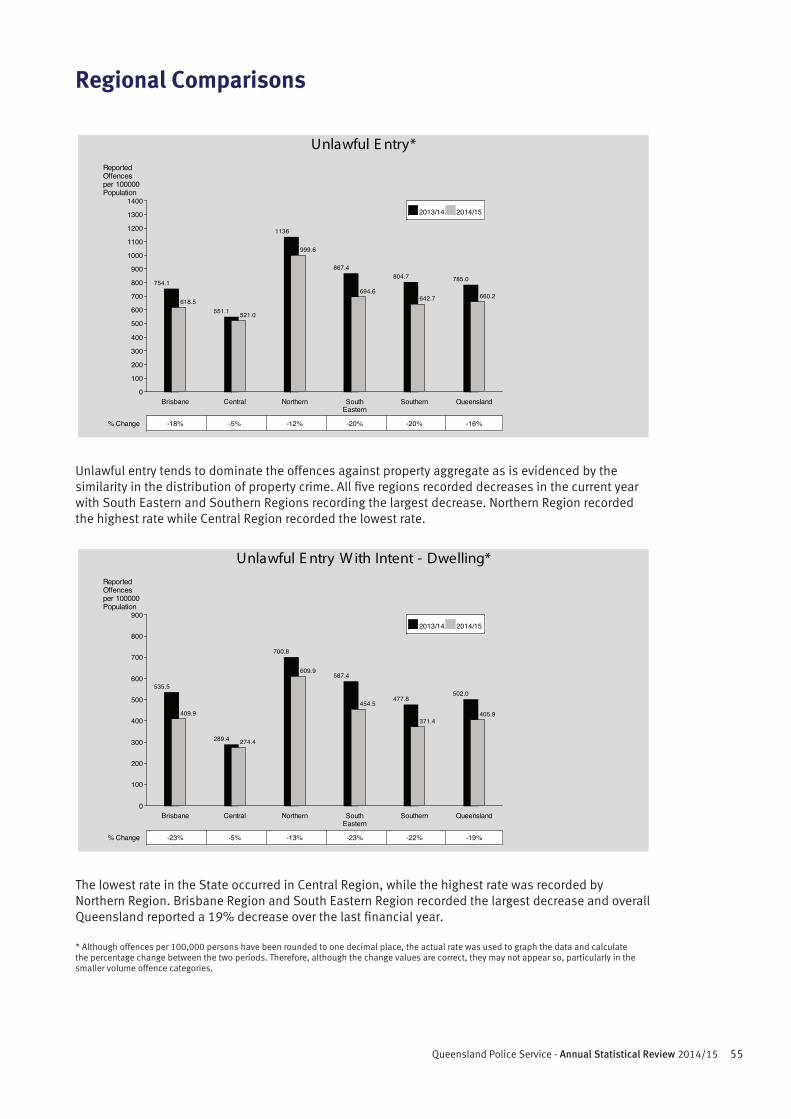
55Queensland Police Service - Annual Statistical Review 2014/15
Regional Comparisons
Unlawful entry tends to dominate the offences against property aggregate as is evidenced by the similarity in the distribution of property crime. All five regions recorded decreases in the current year with South Eastern and Southern Regions recording the largest decrease. Northern Region recorded the highest rate while Central Region recorded the lowest rate.
The lowest rate in the State occurred in Central Region, while the highest rate was recorded by Northern Region. Brisbane Region and South Eastern Region recorded the largest decrease and overall Queensland reported a 19% decrease over the last financial year.
* Although offences per 100,000 persons have been rounded to one decimal place, the actual rate was used to graph the data and calculate the percentage change between the two periods. Therefore, although the change values are correct, they may not appear so, particularly in the smaller volume offence categories.
Unlawful E ntry*ReportedOffencesper 100000Population
0
100
200
300
400
500
600
700
800
900
1000
1100
1200
1300
1400
Brisbane Central Northern SouthEastern
Southern Queensland
% Change
2013/14 2014/15
754.1
618.5
-18%
551.1 521.0
-5%
1136
999.6
-12%
867.4
694.6
-20%
804.7
642.7
-20%
785.0
660.2
-16%
Unlawful E ntry W ith Intent - Dwelling*ReportedOffencesper 100000Population
0
100
200
300
400
500
600
700
800
900
Brisbane Central Northern SouthEastern
Southern Queensland
% Change
2013/14 2014/15
535.5
409.9
-23%
289.4 274.4
-5%
700.8
609.9
-13%
587.4
454.5
-23%
477.8
371.4
-22%
502.0
405.9
-19%
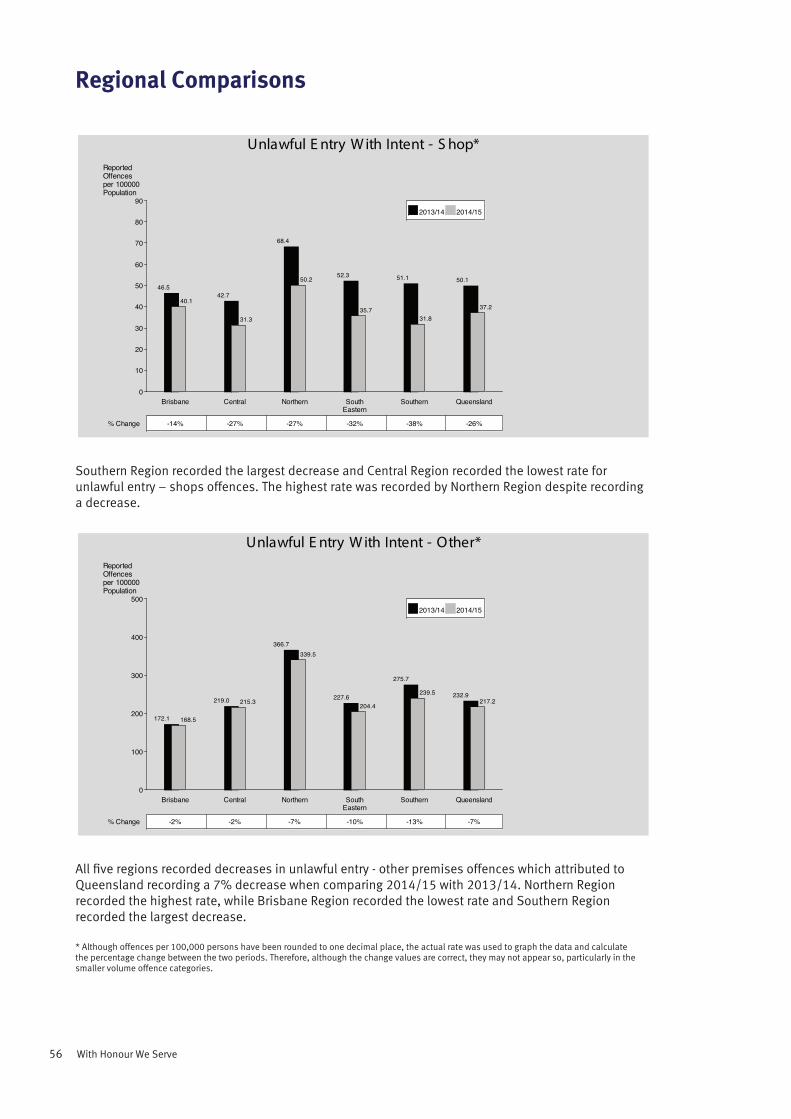
56 With Honour We Serve
Regional Comparisons
Southern Region recorded the largest decrease and Central Region recorded the lowest rate for unlawful entry – shops offences. The highest rate was recorded by Northern Region despite recording a decrease.
All five regions recorded decreases in unlawful entry - other premises offences which attributed to Queensland recording a 7% decrease when comparing 2014/15 with 2013/14. Northern Region recorded the highest rate, while Brisbane Region recorded the lowest rate and Southern Region recorded the largest decrease.
* Although offences per 100,000 persons have been rounded to one decimal place, the actual rate was used to graph the data and calculate the percentage change between the two periods. Therefore, although the change values are correct, they may not appear so, particularly in the smaller volume offence categories.
Unlawful E ntry W ith Intent - S hop*ReportedOffencesper 100000Population
0
10
20
30
40
50
60
70
80
90
Brisbane Central Northern SouthEastern
Southern Queensland
% Change
2013/14 2014/15
46.5
40.1
-14%
42.7
31.3
-27%
68.4
50.2
-27%
52.3
35.7
-32%
51.1
31.8
-38%
50.1
37.2
-26%
Unlawful E ntry W ith Intent - Other*ReportedOffencesper 100000Population
0
100
200
300
400
500
Brisbane Central Northern SouthEastern
Southern Queensland
% Change
2013/14 2014/15
172.1 168.5
-2%
219.0 215.3
-2%
366.7339.5
-7%
227.6204.4
-10%
275.7
239.5
-13%
232.9217.2
-7%
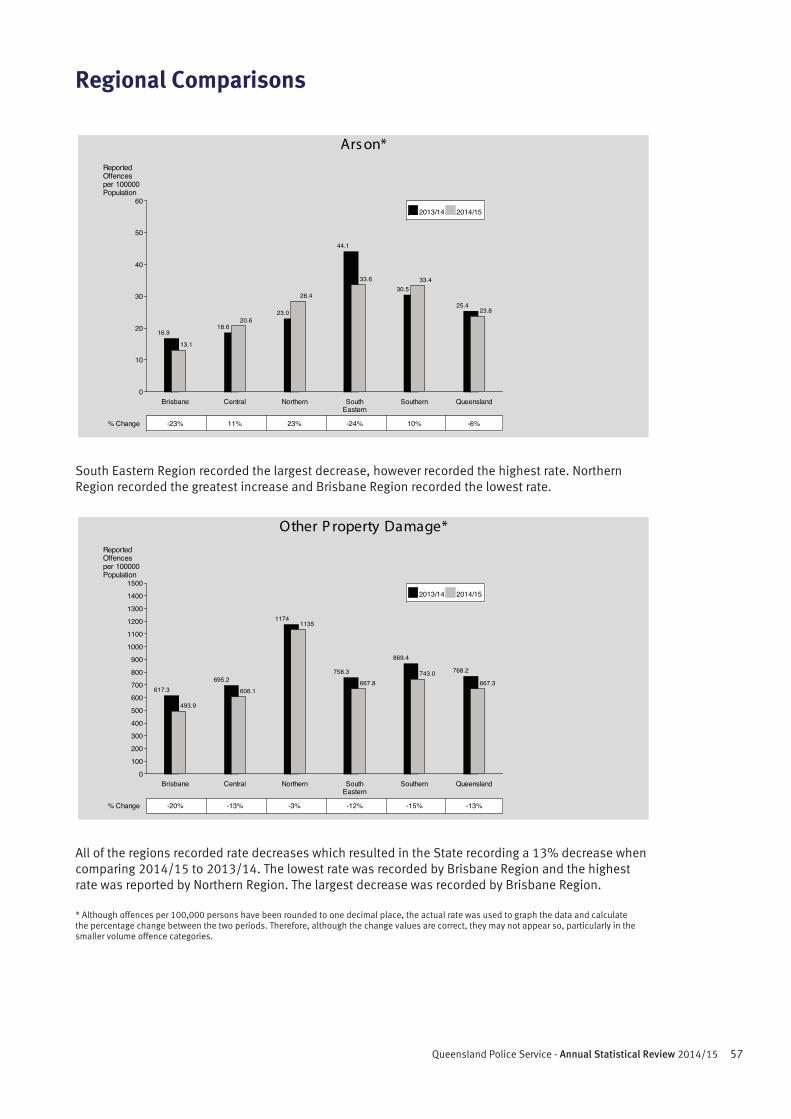
57Queensland Police Service - Annual Statistical Review 2014/15
Regional Comparisons
South Eastern Region recorded the largest decrease, however recorded the highest rate. Northern Region recorded the greatest increase and Brisbane Region recorded the lowest rate.
All of the regions recorded rate decreases which resulted in the State recording a 13% decrease when comparing 2014/15 to 2013/14. The lowest rate was recorded by Brisbane Region and the highest rate was reported by Northern Region. The largest decrease was recorded by Brisbane Region.
* Although offences per 100,000 persons have been rounded to one decimal place, the actual rate was used to graph the data and calculate the percentage change between the two periods. Therefore, although the change values are correct, they may not appear so, particularly in the smaller volume offence categories.
Ars on*ReportedOffencesper 100000Population
0
10
20
30
40
50
60
Brisbane Central Northern SouthEastern
Southern Queensland
% Change
2013/14 2014/15
16.9
13.1
-23%
18.620.6
11%
23.0
28.4
23%
44.1
33.6
-24%
30.533.4
10%
25.423.8
-6%
Other P roperty Damage*ReportedOffencesper 100000Population
0
100
200
300
400
500
600
700
800
900
1000
1100
1200
1300
1400
1500
Brisbane Central Northern SouthEastern
Southern Queensland
% Change
2013/14 2014/15
617.3
493.9
-20%
695.2
606.1
-13%
11741135
-3%
758.3
667.8
-12%
869.4
743.0
-15%
768.2
667.3
-13%
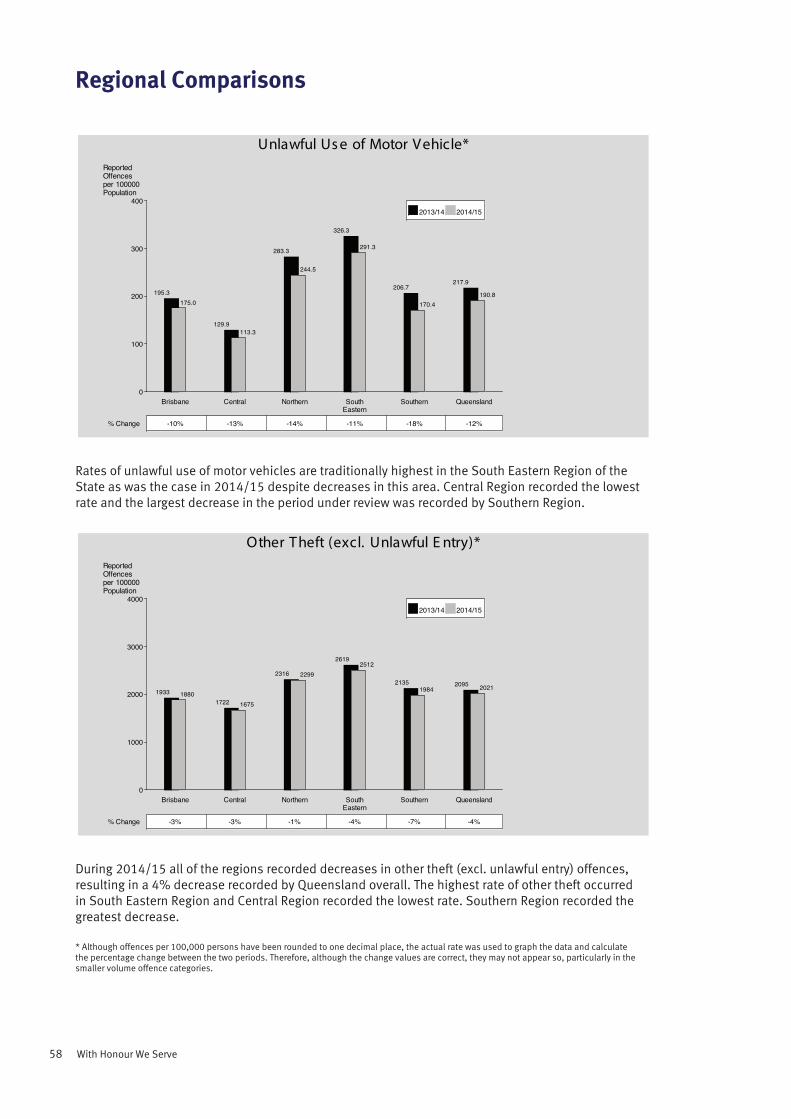
58 With Honour We Serve
Regional Comparisons
Rates of unlawful use of motor vehicles are traditionally highest in the South Eastern Region of the State as was the case in 2014/15 despite decreases in this area. Central Region recorded the lowest rate and the largest decrease in the period under review was recorded by Southern Region.
During 2014/15 all of the regions recorded decreases in other theft (excl. unlawful entry) offences, resulting in a 4% decrease recorded by Queensland overall. The highest rate of other theft occurred in South Eastern Region and Central Region recorded the lowest rate. Southern Region recorded the greatest decrease.
* Although offences per 100,000 persons have been rounded to one decimal place, the actual rate was used to graph the data and calculate the percentage change between the two periods. Therefore, although the change values are correct, they may not appear so, particularly in the smaller volume offence categories.
Unlawful Us e of Motor Vehicle*ReportedOffencesper 100000Population
0
100
200
300
400
Brisbane Central Northern SouthEastern
Southern Queensland
% Change
2013/14 2014/15
195.3175.0
-10%
129.9113.3
-13%
283.3
244.5
-14%
326.3
291.3
-11%
206.7
170.4
-18%
217.9
190.8
-12%
Other Theft (excl. Unlawful E ntry)*ReportedOffencesper 100000Population
0
1000
2000
3000
4000
Brisbane Central Northern SouthEastern
Southern Queensland
% Change
2013/14 2014/15
1933 1880
-3%
1722 1675
-3%
2316 2299
-1%
26192512
-4%
21351984
-7%
2095 2021
-4%
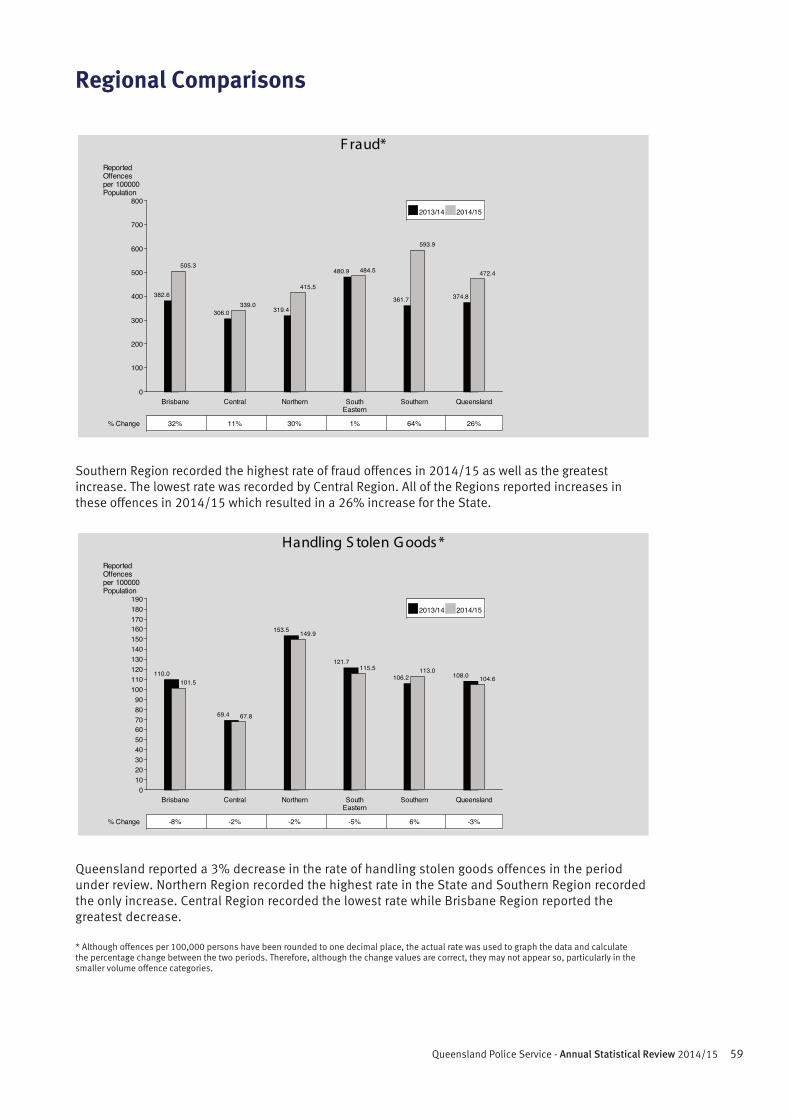
59Queensland Police Service - Annual Statistical Review 2014/15
Regional Comparisons
Southern Region recorded the highest rate of fraud offences in 2014/15 as well as the greatest increase. The lowest rate was recorded by Central Region. All of the Regions reported increases in these offences in 2014/15 which resulted in a 26% increase for the State.
Queensland reported a 3% decrease in the rate of handling stolen goods offences in the period under review. Northern Region recorded the highest rate in the State and Southern Region recorded the only increase. Central Region recorded the lowest rate while Brisbane Region reported the greatest decrease.
* Although offences per 100,000 persons have been rounded to one decimal place, the actual rate was used to graph the data and calculate the percentage change between the two periods. Therefore, although the change values are correct, they may not appear so, particularly in the smaller volume offence categories.
F raud*ReportedOffencesper 100000Population
0
100
200
300
400
500
600
700
800
Brisbane Central Northern SouthEastern
Southern Queensland
% Change
2013/14 2014/15
382.6
505.3
32%
306.0339.0
11%
319.4
415.5
30%
480.9 484.5
1%
361.7
593.9
64%
374.8
472.4
26%
Handling S tolen G oods *ReportedOffencesper 100000Population
0102030405060708090
100110120130140150160170180190
Brisbane Central Northern SouthEastern
Southern Queensland
% Change
2013/14 2014/15
110.0101.5
-8%
69.4 67.8
-2%
153.5 149.9
-2%
121.7115.5
-5%
106.2113.0
6%
108.0 104.6
-3%
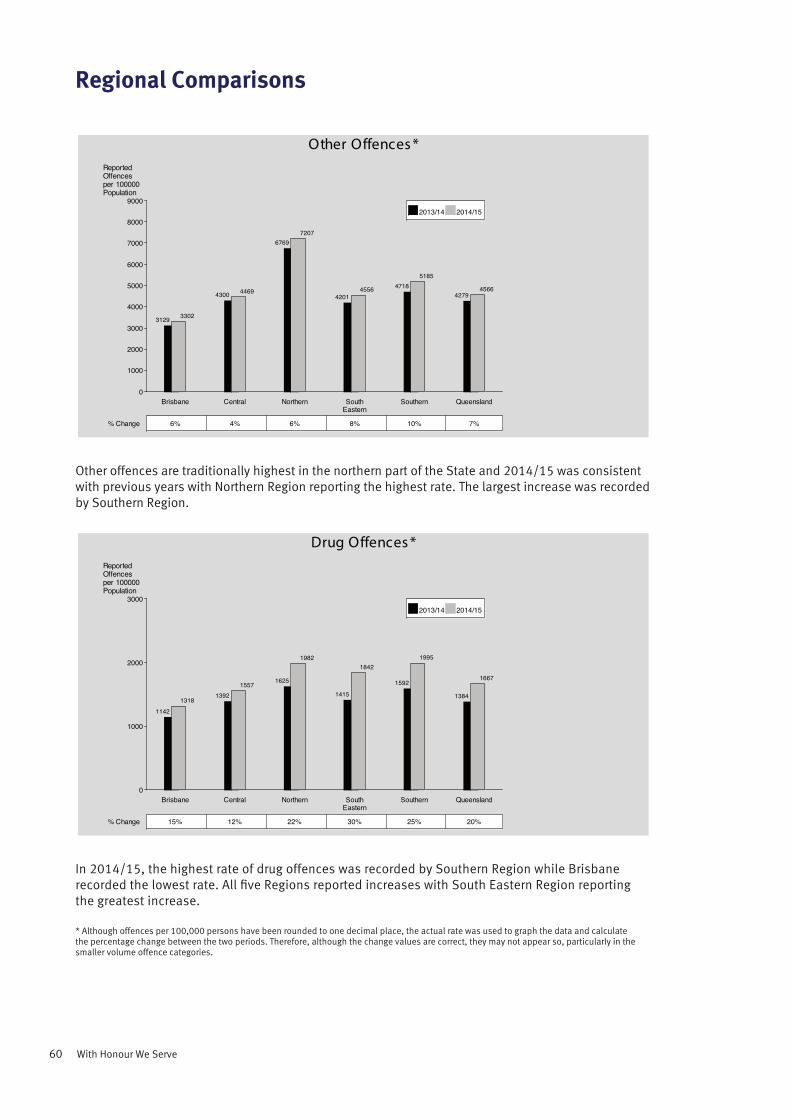
60 With Honour We Serve
Regional Comparisons
Other offences are traditionally highest in the northern part of the State and 2014/15 was consistent with previous years with Northern Region reporting the highest rate. The largest increase was recorded by Southern Region.
In 2014/15, the highest rate of drug offences was recorded by Southern Region while Brisbane recorded the lowest rate. All five Regions reported increases with South Eastern Region reporting the greatest increase.
* Although offences per 100,000 persons have been rounded to one decimal place, the actual rate was used to graph the data and calculate the percentage change between the two periods. Therefore, although the change values are correct, they may not appear so, particularly in the smaller volume offence categories.
Other Offences *ReportedOffencesper 100000Population
0
1000
2000
3000
4000
5000
6000
7000
8000
9000
Brisbane Central Northern SouthEastern
Southern Queensland
% Change
2013/14 2014/15
3129 3302
6%
4300 4469
4%
67697207
6%
42014556
8%
47185185
10%
42794566
7%
Drug Offences *ReportedOffencesper 100000Population
0
1000
2000
3000
Brisbane Central Northern SouthEastern
Southern Queensland
% Change
2013/14 2014/15
11421318
15%
13921557
12%
1625
1982
22%
1415
1842
30%
1592
1995
25%
1384
1667
20%
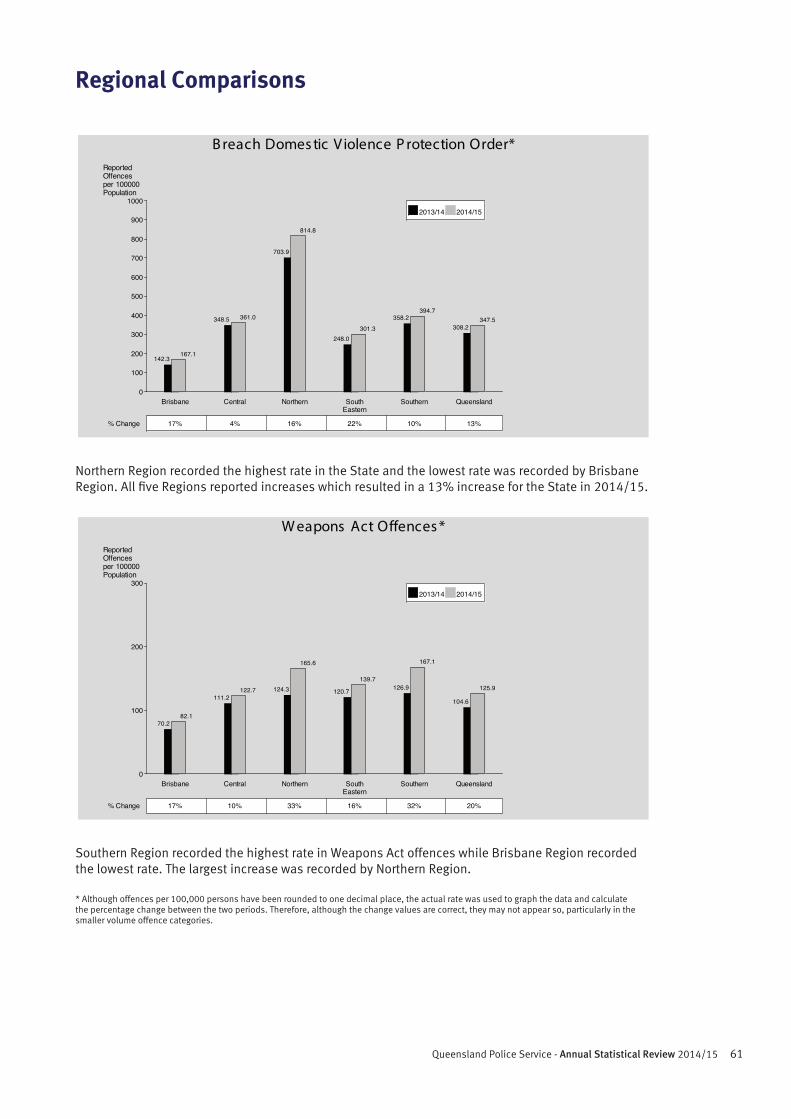
61Queensland Police Service - Annual Statistical Review 2014/15
Regional Comparisons
Northern Region recorded the highest rate in the State and the lowest rate was recorded by Brisbane Region. All five Regions reported increases which resulted in a 13% increase for the State in 2014/15.
Southern Region recorded the highest rate in Weapons Act offences while Brisbane Region recorded the lowest rate. The largest increase was recorded by Northern Region.
* Although offences per 100,000 persons have been rounded to one decimal place, the actual rate was used to graph the data and calculate the percentage change between the two periods. Therefore, although the change values are correct, they may not appear so, particularly in the smaller volume offence categories.
B reach Domes tic Violence P rotection Order*ReportedOffencesper 100000Population
0
100
200
300
400
500
600
700
800
900
1000
Brisbane Central Northern SouthEastern
Southern Queensland
% Change
2013/14 2014/15
142.3167.1
17%
348.5 361.0
4%
703.9
814.8
16%
248.0301.3
22%
358.2394.7
10%
308.2347.5
13%
W eapons Act Offences *ReportedOffencesper 100000Population
0
100
200
300
Brisbane Central Northern SouthEastern
Southern Queensland
% Change
2013/14 2014/15
70.282.1
17%
111.2122.7
10%
124.3
165.6
33%
120.7
139.7
16%
126.9
167.1
32%
104.6
125.9
20%
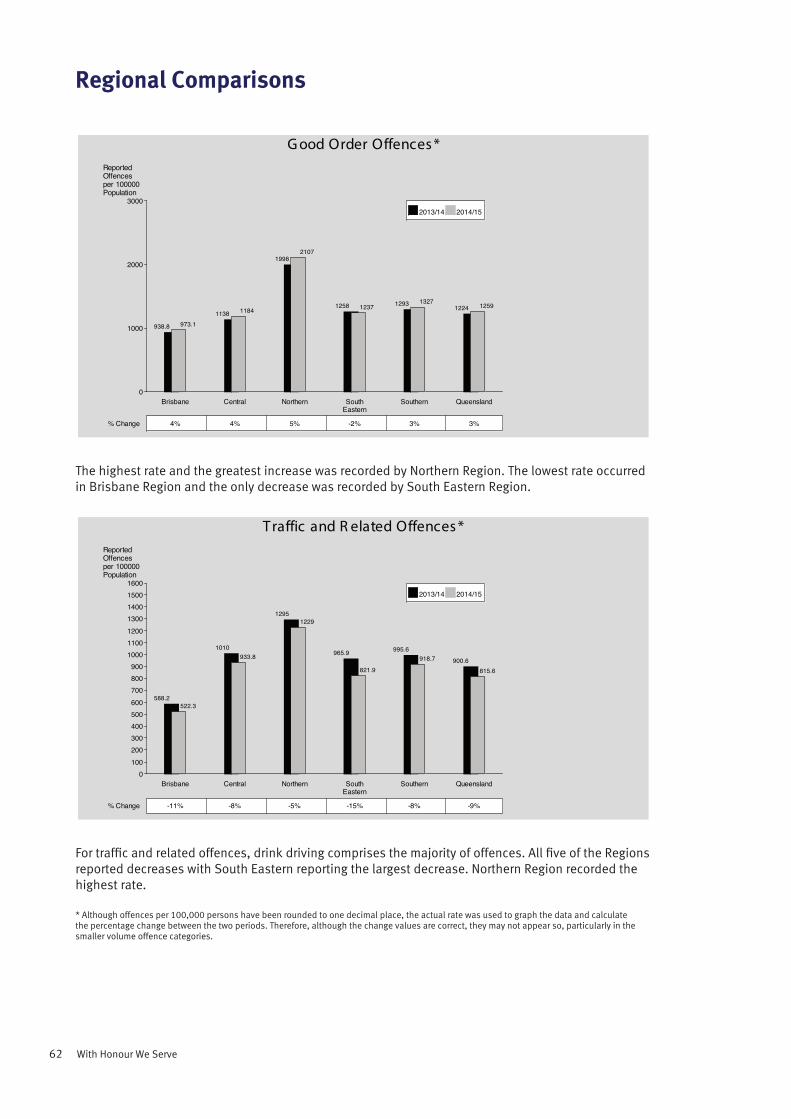
62 With Honour We Serve
Regional Comparisons
The highest rate and the greatest increase was recorded by Northern Region. The lowest rate occurred in Brisbane Region and the only decrease was recorded by South Eastern Region.
For traffic and related offences, drink driving comprises the majority of offences. All five of the Regions reported decreases with South Eastern reporting the largest decrease. Northern Region recorded the highest rate.
* Although offences per 100,000 persons have been rounded to one decimal place, the actual rate was used to graph the data and calculate the percentage change between the two periods. Therefore, although the change values are correct, they may not appear so, particularly in the smaller volume offence categories.
G ood Order Offences *ReportedOffencesper 100000Population
0
1000
2000
3000
Brisbane Central Northern SouthEastern
Southern Queensland
% Change
2013/14 2014/15
938.8 973.1
4%
1138 1184
4%
19982107
5%
1258 1237
-2%
1293 1327
3%
1224 1259
3%
Traffic and R elated Offences *ReportedOffencesper 100000Population
0100200300400500600700800900
1000110012001300140015001600
Brisbane Central Northern SouthEastern
Southern Queensland
% Change
2013/14 2014/15
588.2522.3
-11%
1010933.8
-8%
12951229
-5%
965.9
821.9
-15%
995.6918.7
-8%
900.6815.6
-9%
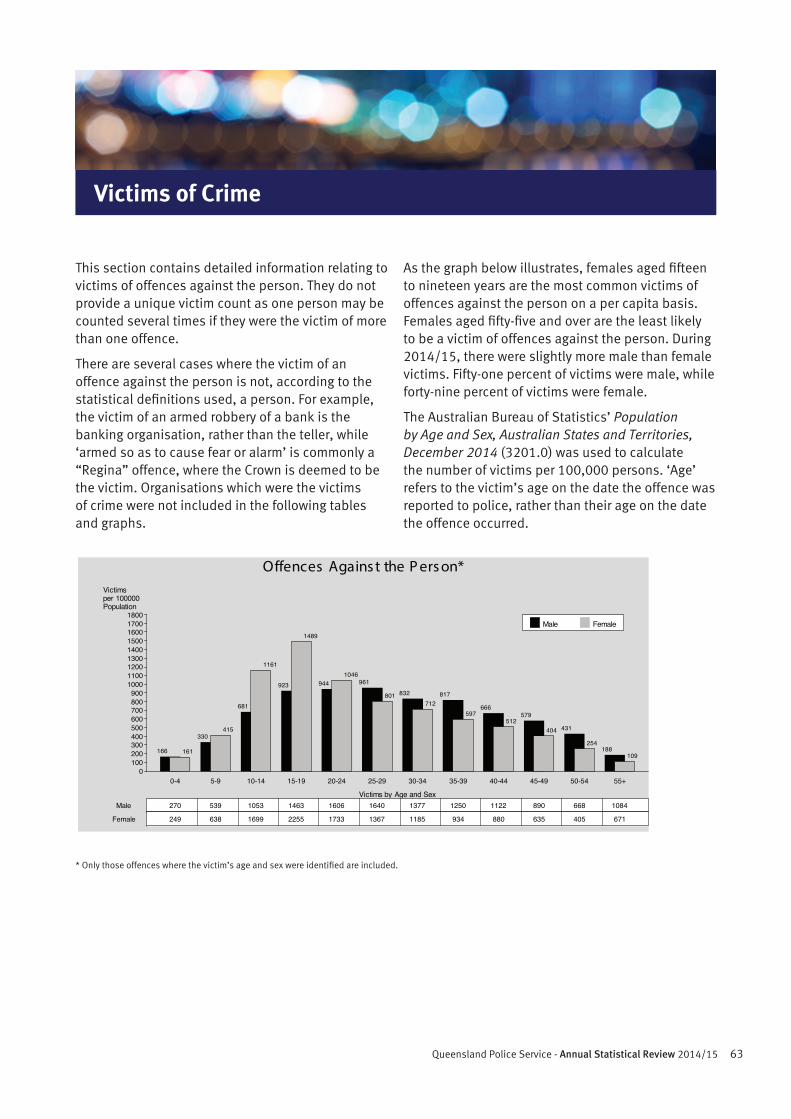
63Queensland Police Service - Annual Statistical Review 2014/15
Victims of Crime
This section contains detailed information relating to victims of offences against the person. They do not provide a unique victim count as one person may be counted several times if they were the victim of more than one offence.
There are several cases where the victim of an offence against the person is not, according to the statistical definitions used, a person. For example, the victim of an armed robbery of a bank is the banking organisation, rather than the teller, while ‘armed so as to cause fear or alarm’ is commonly a “Regina” offence, where the Crown is deemed to be the victim. Organisations which were the victims of crime were not included in the following tables and graphs.
As the graph below illustrates, females aged fifteen to nineteen years are the most common victims of offences against the person on a per capita basis. Females aged fifty-five and over are the least likely to be a victim of offences against the person. During 2014/15, there were slightly more male than female victims. Fifty-one percent of victims were male, while forty-nine percent of victims were female.
The Australian Bureau of Statistics’ Population by Age and Sex, Australian States and Territories, December 2014 (3201.0) was used to calculate the number of victims per 100,000 persons. ‘Age’ refers to the victim’s age on the date the offence was reported to police, rather than their age on the date the offence occurred.
* Only those offences where the victim’s age and sex were identified are included.
Offences Agains t the P ers on*Victimsper 100000Population
0100200300400500600700800900
100011001200130014001500160017001800
Victims by Age and Sex
0-4 5-9 10-14 15-19 20-24 25-29 30-34 35-39 40-44 45-49 50-54 55+
Male
Female
Male Female
166 161
270
249
330415
539
638
681
1161
1053
1699
923
1489
1463
2255
9441046
1606
1733
961
801
1640
1367
832712
1377
1185
817
597
1250
934
666
512
1122
880
579
404
890
635
431
254
668
405
188109
1084
671
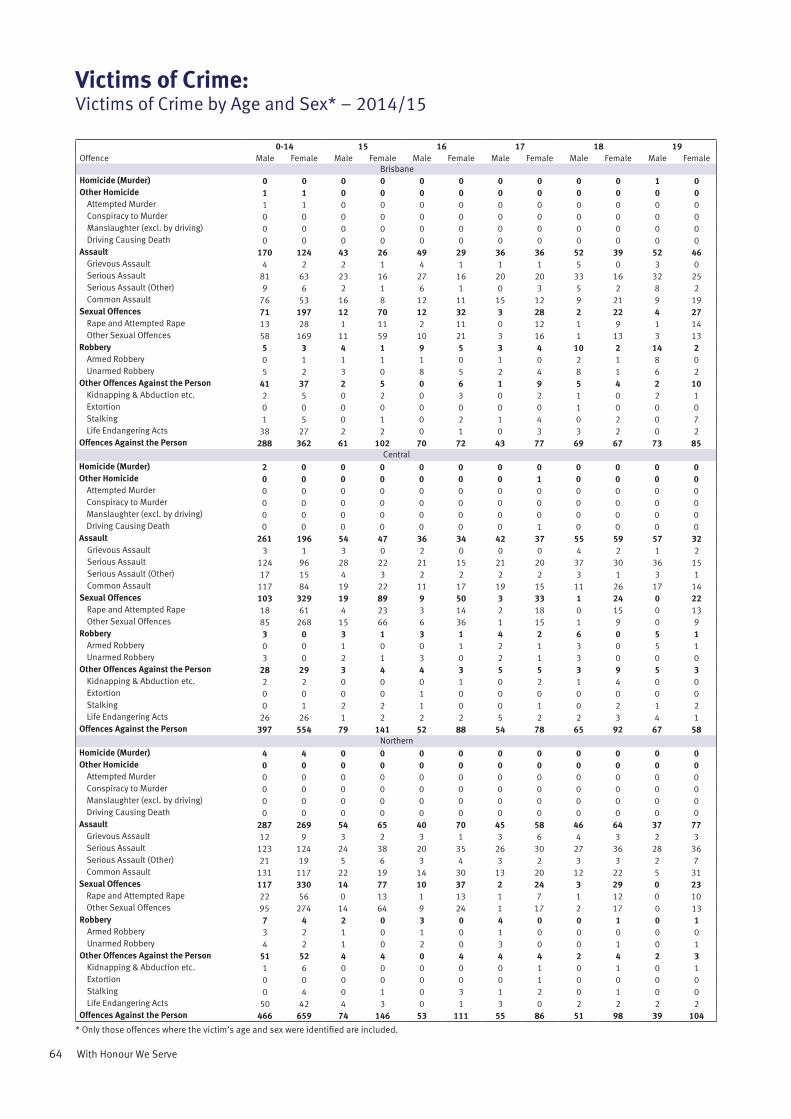
64 With Honour We Serve
0-14 15 16 17 18 19Offence Male Female Male Female Male Female Male Female Male Female Male Female
BrisbaneHomicide (Murder) 0 0 0 0 0 0 0 0 0 0 1 0Other Homicide 1 1 0 0 0 0 0 0 0 0 0 0
Attempted Murder 1 1 0 0 0 0 0 0 0 0 0 0Conspiracy to Murder 0 0 0 0 0 0 0 0 0 0 0 0Manslaughter (excl. by driving) 0 0 0 0 0 0 0 0 0 0 0 0Driving Causing Death 0 0 0 0 0 0 0 0 0 0 0 0
Assault 170 124 43 26 49 29 36 36 52 39 52 46Grievous Assault 4 2 2 1 4 1 1 1 5 0 3 0Serious Assault 81 63 23 16 27 16 20 20 33 16 32 25Serious Assault (Other) 9 6 2 1 6 1 0 3 5 2 8 2Common Assault 76 53 16 8 12 11 15 12 9 21 9 19
Sexual Offences 71 197 12 70 12 32 3 28 2 22 4 27Rape and Attempted Rape 13 28 1 11 2 11 0 12 1 9 1 14Other Sexual Offences 58 169 11 59 10 21 3 16 1 13 3 13
Robbery 5 3 4 1 9 5 3 4 10 2 14 2Armed Robbery 0 1 1 1 1 0 1 0 2 1 8 0Unarmed Robbery 5 2 3 0 8 5 2 4 8 1 6 2
Other Offences Against the Person 41 37 2 5 0 6 1 9 5 4 2 10Kidnapping & Abduction etc. 2 5 0 2 0 3 0 2 1 0 2 1Extortion 0 0 0 0 0 0 0 0 1 0 0 0Stalking 1 5 0 1 0 2 1 4 0 2 0 7Life Endangering Acts 38 27 2 2 0 1 0 3 3 2 0 2
Offences Against the Person 288 362 61 102 70 72 43 77 69 67 73 85Central
Homicide (Murder) 2 0 0 0 0 0 0 0 0 0 0 0Other Homicide 0 0 0 0 0 0 0 1 0 0 0 0
Attempted Murder 0 0 0 0 0 0 0 0 0 0 0 0Conspiracy to Murder 0 0 0 0 0 0 0 0 0 0 0 0Manslaughter (excl. by driving) 0 0 0 0 0 0 0 0 0 0 0 0Driving Causing Death 0 0 0 0 0 0 0 1 0 0 0 0
Assault 261 196 54 47 36 34 42 37 55 59 57 32Grievous Assault 3 1 3 0 2 0 0 0 4 2 1 2Serious Assault 124 96 28 22 21 15 21 20 37 30 36 15Serious Assault (Other) 17 15 4 3 2 2 2 2 3 1 3 1Common Assault 117 84 19 22 11 17 19 15 11 26 17 14
Sexual Offences 103 329 19 89 9 50 3 33 1 24 0 22Rape and Attempted Rape 18 61 4 23 3 14 2 18 0 15 0 13Other Sexual Offences 85 268 15 66 6 36 1 15 1 9 0 9
Robbery 3 0 3 1 3 1 4 2 6 0 5 1Armed Robbery 0 0 1 0 0 1 2 1 3 0 5 1Unarmed Robbery 3 0 2 1 3 0 2 1 3 0 0 0
Other Offences Against the Person 28 29 3 4 4 3 5 5 3 9 5 3Kidnapping & Abduction etc. 2 2 0 0 0 1 0 2 1 4 0 0Extortion 0 0 0 0 1 0 0 0 0 0 0 0Stalking 0 1 2 2 1 0 0 1 0 2 1 2Life Endangering Acts 26 26 1 2 2 2 5 2 2 3 4 1
Offences Against the Person 397 554 79 141 52 88 54 78 65 92 67 58Northern
Homicide (Murder) 4 4 0 0 0 0 0 0 0 0 0 0Other Homicide 0 0 0 0 0 0 0 0 0 0 0 0
Attempted Murder 0 0 0 0 0 0 0 0 0 0 0 0Conspiracy to Murder 0 0 0 0 0 0 0 0 0 0 0 0Manslaughter (excl. by driving) 0 0 0 0 0 0 0 0 0 0 0 0Driving Causing Death 0 0 0 0 0 0 0 0 0 0 0 0
Assault 287 269 54 65 40 70 45 58 46 64 37 77Grievous Assault 12 9 3 2 3 1 3 6 4 3 2 3Serious Assault 123 124 24 38 20 35 26 30 27 36 28 36Serious Assault (Other) 21 19 5 6 3 4 3 2 3 3 2 7Common Assault 131 117 22 19 14 30 13 20 12 22 5 31
Sexual Offences 117 330 14 77 10 37 2 24 3 29 0 23Rape and Attempted Rape 22 56 0 13 1 13 1 7 1 12 0 10Other Sexual Offences 95 274 14 64 9 24 1 17 2 17 0 13
Robbery 7 4 2 0 3 0 4 0 0 1 0 1Armed Robbery 3 2 1 0 1 0 1 0 0 0 0 0Unarmed Robbery 4 2 1 0 2 0 3 0 0 1 0 1
Other Offences Against the Person 51 52 4 4 0 4 4 4 2 4 2 3Kidnapping & Abduction etc. 1 6 0 0 0 0 0 1 0 1 0 1Extortion 0 0 0 0 0 0 0 1 0 0 0 0Stalking 0 4 0 1 0 3 1 2 0 1 0 0Life Endangering Acts 50 42 4 3 0 1 3 0 2 2 2 2
Offences Against the Person 466 659 74 146 53 111 55 86 51 98 39 104
Victims of Crime:Victims of Crime by Age and Sex* – 2014/15
* Only those offences where the victim’s age and sex were identified are included.
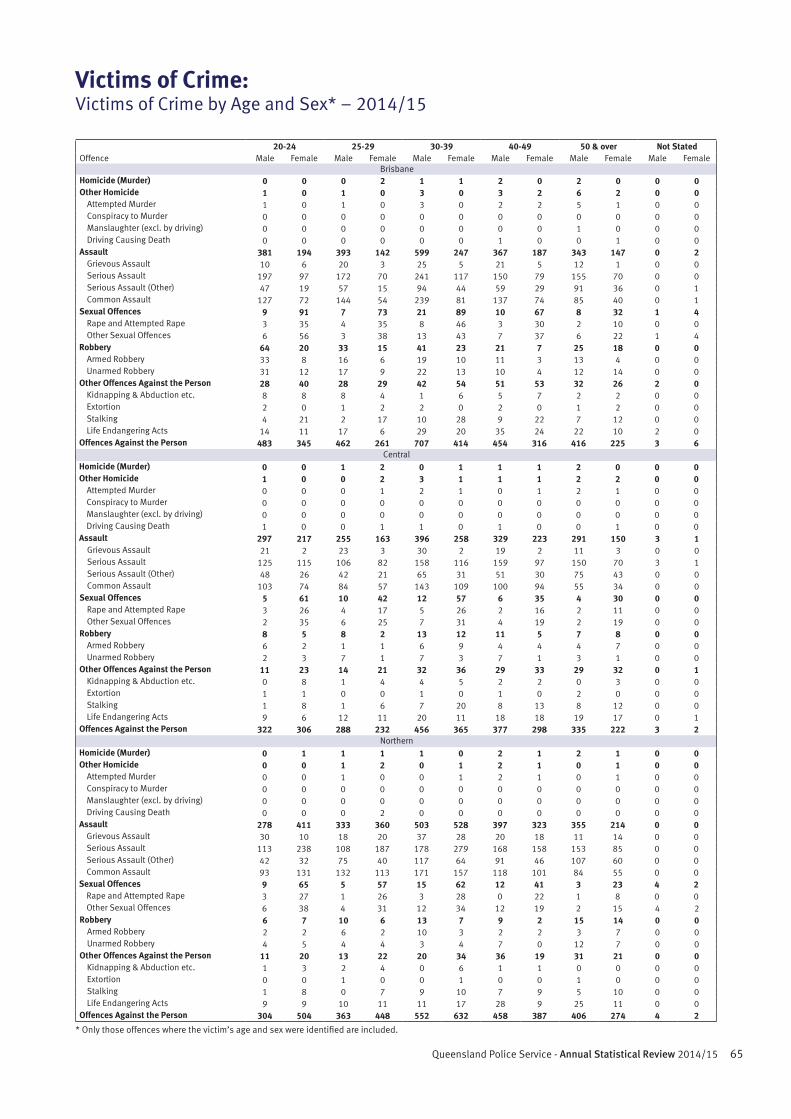
65Queensland Police Service - Annual Statistical Review 2014/15
20-24 25-29 30-39 40-49 50 & over Not StatedOffence Male Female Male Female Male Female Male Female Male Female Male Female
BrisbaneHomicide (Murder) 0 0 0 2 1 1 2 0 2 0 0 0Other Homicide 1 0 1 0 3 0 3 2 6 2 0 0
Attempted Murder 1 0 1 0 3 0 2 2 5 1 0 0Conspiracy to Murder 0 0 0 0 0 0 0 0 0 0 0 0Manslaughter (excl. by driving) 0 0 0 0 0 0 0 0 1 0 0 0Driving Causing Death 0 0 0 0 0 0 1 0 0 1 0 0
Assault 381 194 393 142 599 247 367 187 343 147 0 2Grievous Assault 10 6 20 3 25 5 21 5 12 1 0 0Serious Assault 197 97 172 70 241 117 150 79 155 70 0 0Serious Assault (Other) 47 19 57 15 94 44 59 29 91 36 0 1Common Assault 127 72 144 54 239 81 137 74 85 40 0 1
Sexual Offences 9 91 7 73 21 89 10 67 8 32 1 4Rape and Attempted Rape 3 35 4 35 8 46 3 30 2 10 0 0Other Sexual Offences 6 56 3 38 13 43 7 37 6 22 1 4
Robbery 64 20 33 15 41 23 21 7 25 18 0 0Armed Robbery 33 8 16 6 19 10 11 3 13 4 0 0Unarmed Robbery 31 12 17 9 22 13 10 4 12 14 0 0
Other Offences Against the Person 28 40 28 29 42 54 51 53 32 26 2 0Kidnapping & Abduction etc. 8 8 8 4 1 6 5 7 2 2 0 0Extortion 2 0 1 2 2 0 2 0 1 2 0 0Stalking 4 21 2 17 10 28 9 22 7 12 0 0Life Endangering Acts 14 11 17 6 29 20 35 24 22 10 2 0
Offences Against the Person 483 345 462 261 707 414 454 316 416 225 3 6Central
Homicide (Murder) 0 0 1 2 0 1 1 1 2 0 0 0Other Homicide 1 0 0 2 3 1 1 1 2 2 0 0
Attempted Murder 0 0 0 1 2 1 0 1 2 1 0 0Conspiracy to Murder 0 0 0 0 0 0 0 0 0 0 0 0Manslaughter (excl. by driving) 0 0 0 0 0 0 0 0 0 0 0 0Driving Causing Death 1 0 0 1 1 0 1 0 0 1 0 0
Assault 297 217 255 163 396 258 329 223 291 150 3 1Grievous Assault 21 2 23 3 30 2 19 2 11 3 0 0Serious Assault 125 115 106 82 158 116 159 97 150 70 3 1Serious Assault (Other) 48 26 42 21 65 31 51 30 75 43 0 0Common Assault 103 74 84 57 143 109 100 94 55 34 0 0
Sexual Offences 5 61 10 42 12 57 6 35 4 30 0 0Rape and Attempted Rape 3 26 4 17 5 26 2 16 2 11 0 0Other Sexual Offences 2 35 6 25 7 31 4 19 2 19 0 0
Robbery 8 5 8 2 13 12 11 5 7 8 0 0Armed Robbery 6 2 1 1 6 9 4 4 4 7 0 0Unarmed Robbery 2 3 7 1 7 3 7 1 3 1 0 0
Other Offences Against the Person 11 23 14 21 32 36 29 33 29 32 0 1Kidnapping & Abduction etc. 0 8 1 4 4 5 2 2 0 3 0 0Extortion 1 1 0 0 1 0 1 0 2 0 0 0Stalking 1 8 1 6 7 20 8 13 8 12 0 0Life Endangering Acts 9 6 12 11 20 11 18 18 19 17 0 1
Offences Against the Person 322 306 288 232 456 365 377 298 335 222 3 2Northern
Homicide (Murder) 0 1 1 1 1 0 2 1 2 1 0 0Other Homicide 0 0 1 2 0 1 2 1 0 1 0 0
Attempted Murder 0 0 1 0 0 1 2 1 0 1 0 0Conspiracy to Murder 0 0 0 0 0 0 0 0 0 0 0 0Manslaughter (excl. by driving) 0 0 0 0 0 0 0 0 0 0 0 0Driving Causing Death 0 0 0 2 0 0 0 0 0 0 0 0
Assault 278 411 333 360 503 528 397 323 355 214 0 0Grievous Assault 30 10 18 20 37 28 20 18 11 14 0 0Serious Assault 113 238 108 187 178 279 168 158 153 85 0 0Serious Assault (Other) 42 32 75 40 117 64 91 46 107 60 0 0Common Assault 93 131 132 113 171 157 118 101 84 55 0 0
Sexual Offences 9 65 5 57 15 62 12 41 3 23 4 2Rape and Attempted Rape 3 27 1 26 3 28 0 22 1 8 0 0Other Sexual Offences 6 38 4 31 12 34 12 19 2 15 4 2
Robbery 6 7 10 6 13 7 9 2 15 14 0 0Armed Robbery 2 2 6 2 10 3 2 2 3 7 0 0Unarmed Robbery 4 5 4 4 3 4 7 0 12 7 0 0
Other Offences Against the Person 11 20 13 22 20 34 36 19 31 21 0 0Kidnapping & Abduction etc. 1 3 2 4 0 6 1 1 0 0 0 0Extortion 0 0 1 0 0 1 0 0 1 0 0 0Stalking 1 8 0 7 9 10 7 9 5 10 0 0Life Endangering Acts 9 9 10 11 11 17 28 9 25 11 0 0
Offences Against the Person 304 504 363 448 552 632 458 387 406 274 4 2
Victims of Crime:Victims of Crime by Age and Sex* – 2014/15
* Only those offences where the victim’s age and sex were identified are included.
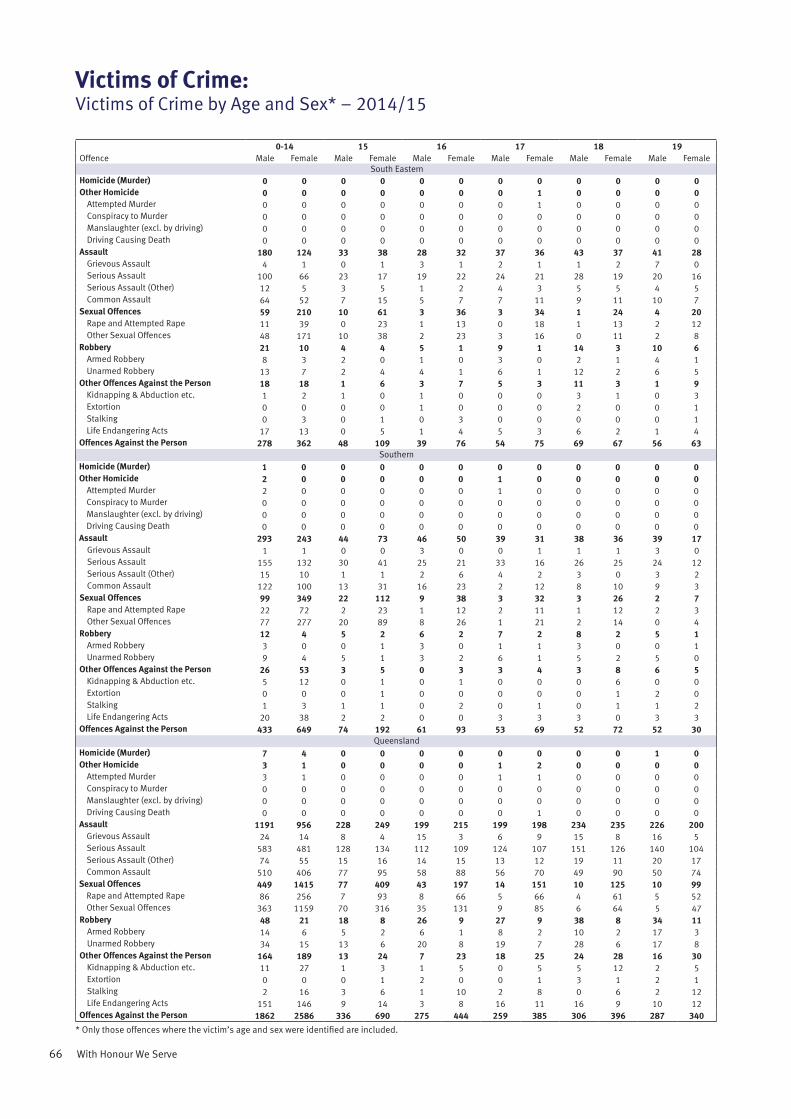
66 With Honour We Serve
0-14 15 16 17 18 19Offence Male Female Male Female Male Female Male Female Male Female Male Female
South EasternHomicide (Murder) 0 0 0 0 0 0 0 0 0 0 0 0Other Homicide 0 0 0 0 0 0 0 1 0 0 0 0
Attempted Murder 0 0 0 0 0 0 0 1 0 0 0 0Conspiracy to Murder 0 0 0 0 0 0 0 0 0 0 0 0Manslaughter (excl. by driving) 0 0 0 0 0 0 0 0 0 0 0 0Driving Causing Death 0 0 0 0 0 0 0 0 0 0 0 0
Assault 180 124 33 38 28 32 37 36 43 37 41 28Grievous Assault 4 1 0 1 3 1 2 1 1 2 7 0Serious Assault 100 66 23 17 19 22 24 21 28 19 20 16Serious Assault (Other) 12 5 3 5 1 2 4 3 5 5 4 5Common Assault 64 52 7 15 5 7 7 11 9 11 10 7
Sexual Offences 59 210 10 61 3 36 3 34 1 24 4 20Rape and Attempted Rape 11 39 0 23 1 13 0 18 1 13 2 12Other Sexual Offences 48 171 10 38 2 23 3 16 0 11 2 8
Robbery 21 10 4 4 5 1 9 1 14 3 10 6Armed Robbery 8 3 2 0 1 0 3 0 2 1 4 1Unarmed Robbery 13 7 2 4 4 1 6 1 12 2 6 5
Other Offences Against the Person 18 18 1 6 3 7 5 3 11 3 1 9Kidnapping & Abduction etc. 1 2 1 0 1 0 0 0 3 1 0 3Extortion 0 0 0 0 1 0 0 0 2 0 0 1Stalking 0 3 0 1 0 3 0 0 0 0 0 1Life Endangering Acts 17 13 0 5 1 4 5 3 6 2 1 4
Offences Against the Person 278 362 48 109 39 76 54 75 69 67 56 63Southern
Homicide (Murder) 1 0 0 0 0 0 0 0 0 0 0 0Other Homicide 2 0 0 0 0 0 1 0 0 0 0 0
Attempted Murder 2 0 0 0 0 0 1 0 0 0 0 0Conspiracy to Murder 0 0 0 0 0 0 0 0 0 0 0 0Manslaughter (excl. by driving) 0 0 0 0 0 0 0 0 0 0 0 0Driving Causing Death 0 0 0 0 0 0 0 0 0 0 0 0
Assault 293 243 44 73 46 50 39 31 38 36 39 17Grievous Assault 1 1 0 0 3 0 0 1 1 1 3 0Serious Assault 155 132 30 41 25 21 33 16 26 25 24 12Serious Assault (Other) 15 10 1 1 2 6 4 2 3 0 3 2Common Assault 122 100 13 31 16 23 2 12 8 10 9 3
Sexual Offences 99 349 22 112 9 38 3 32 3 26 2 7Rape and Attempted Rape 22 72 2 23 1 12 2 11 1 12 2 3Other Sexual Offences 77 277 20 89 8 26 1 21 2 14 0 4
Robbery 12 4 5 2 6 2 7 2 8 2 5 1Armed Robbery 3 0 0 1 3 0 1 1 3 0 0 1Unarmed Robbery 9 4 5 1 3 2 6 1 5 2 5 0
Other Offences Against the Person 26 53 3 5 0 3 3 4 3 8 6 5Kidnapping & Abduction etc. 5 12 0 1 0 1 0 0 0 6 0 0Extortion 0 0 0 1 0 0 0 0 0 1 2 0Stalking 1 3 1 1 0 2 0 1 0 1 1 2Life Endangering Acts 20 38 2 2 0 0 3 3 3 0 3 3
Offences Against the Person 433 649 74 192 61 93 53 69 52 72 52 30Queensland
Homicide (Murder) 7 4 0 0 0 0 0 0 0 0 1 0Other Homicide 3 1 0 0 0 0 1 2 0 0 0 0
Attempted Murder 3 1 0 0 0 0 1 1 0 0 0 0Conspiracy to Murder 0 0 0 0 0 0 0 0 0 0 0 0Manslaughter (excl. by driving) 0 0 0 0 0 0 0 0 0 0 0 0Driving Causing Death 0 0 0 0 0 0 0 1 0 0 0 0
Assault 1191 956 228 249 199 215 199 198 234 235 226 200Grievous Assault 24 14 8 4 15 3 6 9 15 8 16 5Serious Assault 583 481 128 134 112 109 124 107 151 126 140 104Serious Assault (Other) 74 55 15 16 14 15 13 12 19 11 20 17Common Assault 510 406 77 95 58 88 56 70 49 90 50 74
Sexual Offences 449 1415 77 409 43 197 14 151 10 125 10 99Rape and Attempted Rape 86 256 7 93 8 66 5 66 4 61 5 52Other Sexual Offences 363 1159 70 316 35 131 9 85 6 64 5 47
Robbery 48 21 18 8 26 9 27 9 38 8 34 11Armed Robbery 14 6 5 2 6 1 8 2 10 2 17 3Unarmed Robbery 34 15 13 6 20 8 19 7 28 6 17 8
Other Offences Against the Person 164 189 13 24 7 23 18 25 24 28 16 30Kidnapping & Abduction etc. 11 27 1 3 1 5 0 5 5 12 2 5Extortion 0 0 0 1 2 0 0 1 3 1 2 1Stalking 2 16 3 6 1 10 2 8 0 6 2 12Life Endangering Acts 151 146 9 14 3 8 16 11 16 9 10 12
Offences Against the Person 1862 2586 336 690 275 444 259 385 306 396 287 340
Victims of Crime:Victims of Crime by Age and Sex* – 2014/15
* Only those offences where the victim’s age and sex were identified are included.
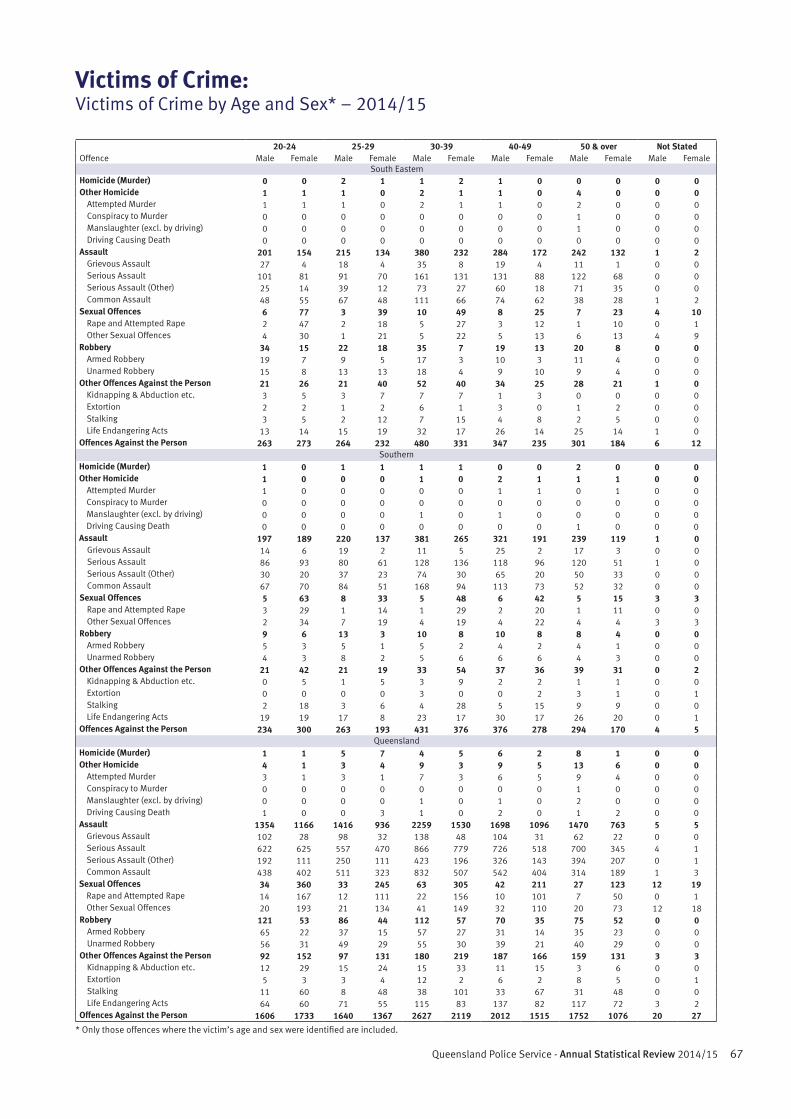
67Queensland Police Service - Annual Statistical Review 2014/15
20-24 25-29 30-39 40-49 50 & over Not StatedOffence Male Female Male Female Male Female Male Female Male Female Male Female
South EasternHomicide (Murder) 0 0 2 1 1 2 1 0 0 0 0 0Other Homicide 1 1 1 0 2 1 1 0 4 0 0 0
Attempted Murder 1 1 1 0 2 1 1 0 2 0 0 0Conspiracy to Murder 0 0 0 0 0 0 0 0 1 0 0 0Manslaughter (excl. by driving) 0 0 0 0 0 0 0 0 1 0 0 0Driving Causing Death 0 0 0 0 0 0 0 0 0 0 0 0
Assault 201 154 215 134 380 232 284 172 242 132 1 2Grievous Assault 27 4 18 4 35 8 19 4 11 1 0 0Serious Assault 101 81 91 70 161 131 131 88 122 68 0 0Serious Assault (Other) 25 14 39 12 73 27 60 18 71 35 0 0Common Assault 48 55 67 48 111 66 74 62 38 28 1 2
Sexual Offences 6 77 3 39 10 49 8 25 7 23 4 10Rape and Attempted Rape 2 47 2 18 5 27 3 12 1 10 0 1Other Sexual Offences 4 30 1 21 5 22 5 13 6 13 4 9
Robbery 34 15 22 18 35 7 19 13 20 8 0 0Armed Robbery 19 7 9 5 17 3 10 3 11 4 0 0Unarmed Robbery 15 8 13 13 18 4 9 10 9 4 0 0
Other Offences Against the Person 21 26 21 40 52 40 34 25 28 21 1 0Kidnapping & Abduction etc. 3 5 3 7 7 7 1 3 0 0 0 0Extortion 2 2 1 2 6 1 3 0 1 2 0 0Stalking 3 5 2 12 7 15 4 8 2 5 0 0Life Endangering Acts 13 14 15 19 32 17 26 14 25 14 1 0
Offences Against the Person 263 273 264 232 480 331 347 235 301 184 6 12Southern
Homicide (Murder) 1 0 1 1 1 1 0 0 2 0 0 0Other Homicide 1 0 0 0 1 0 2 1 1 1 0 0
Attempted Murder 1 0 0 0 0 0 1 1 0 1 0 0Conspiracy to Murder 0 0 0 0 0 0 0 0 0 0 0 0Manslaughter (excl. by driving) 0 0 0 0 1 0 1 0 0 0 0 0Driving Causing Death 0 0 0 0 0 0 0 0 1 0 0 0
Assault 197 189 220 137 381 265 321 191 239 119 1 0Grievous Assault 14 6 19 2 11 5 25 2 17 3 0 0Serious Assault 86 93 80 61 128 136 118 96 120 51 1 0Serious Assault (Other) 30 20 37 23 74 30 65 20 50 33 0 0Common Assault 67 70 84 51 168 94 113 73 52 32 0 0
Sexual Offences 5 63 8 33 5 48 6 42 5 15 3 3Rape and Attempted Rape 3 29 1 14 1 29 2 20 1 11 0 0Other Sexual Offences 2 34 7 19 4 19 4 22 4 4 3 3
Robbery 9 6 13 3 10 8 10 8 8 4 0 0Armed Robbery 5 3 5 1 5 2 4 2 4 1 0 0Unarmed Robbery 4 3 8 2 5 6 6 6 4 3 0 0
Other Offences Against the Person 21 42 21 19 33 54 37 36 39 31 0 2Kidnapping & Abduction etc. 0 5 1 5 3 9 2 2 1 1 0 0Extortion 0 0 0 0 3 0 0 2 3 1 0 1Stalking 2 18 3 6 4 28 5 15 9 9 0 0Life Endangering Acts 19 19 17 8 23 17 30 17 26 20 0 1
Offences Against the Person 234 300 263 193 431 376 376 278 294 170 4 5Queensland
Homicide (Murder) 1 1 5 7 4 5 6 2 8 1 0 0Other Homicide 4 1 3 4 9 3 9 5 13 6 0 0
Attempted Murder 3 1 3 1 7 3 6 5 9 4 0 0Conspiracy to Murder 0 0 0 0 0 0 0 0 1 0 0 0Manslaughter (excl. by driving) 0 0 0 0 1 0 1 0 2 0 0 0Driving Causing Death 1 0 0 3 1 0 2 0 1 2 0 0
Assault 1354 1166 1416 936 2259 1530 1698 1096 1470 763 5 5Grievous Assault 102 28 98 32 138 48 104 31 62 22 0 0Serious Assault 622 625 557 470 866 779 726 518 700 345 4 1Serious Assault (Other) 192 111 250 111 423 196 326 143 394 207 0 1Common Assault 438 402 511 323 832 507 542 404 314 189 1 3
Sexual Offences 34 360 33 245 63 305 42 211 27 123 12 19Rape and Attempted Rape 14 167 12 111 22 156 10 101 7 50 0 1Other Sexual Offences 20 193 21 134 41 149 32 110 20 73 12 18
Robbery 121 53 86 44 112 57 70 35 75 52 0 0Armed Robbery 65 22 37 15 57 27 31 14 35 23 0 0Unarmed Robbery 56 31 49 29 55 30 39 21 40 29 0 0
Other Offences Against the Person 92 152 97 131 180 219 187 166 159 131 3 3Kidnapping & Abduction etc. 12 29 15 24 15 33 11 15 3 6 0 0Extortion 5 3 3 4 12 2 6 2 8 5 0 1Stalking 11 60 8 48 38 101 33 67 31 48 0 0Life Endangering Acts 64 60 71 55 115 83 137 82 117 72 3 2
Offences Against the Person 1606 1733 1640 1367 2627 2119 2012 1515 1752 1076 20 27
Victims of Crime:Victims of Crime by Age and Sex* – 2014/15
* Only those offences where the victim’s age and sex were identified are included.
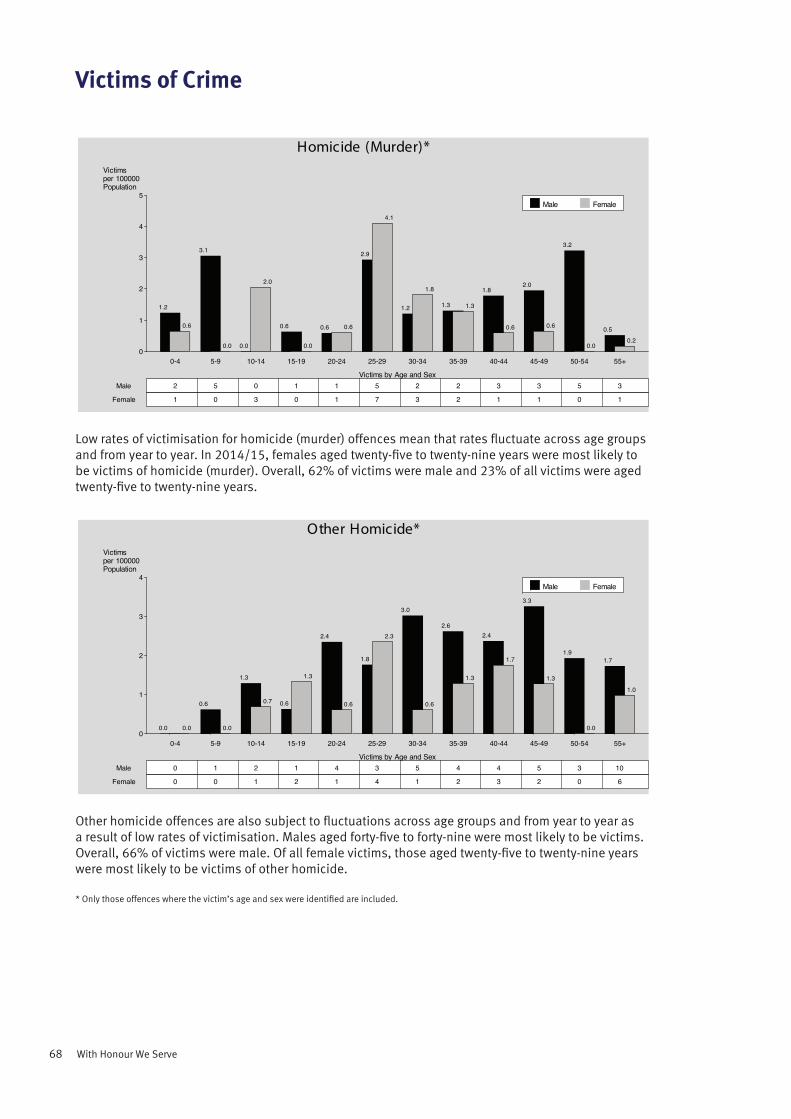
68 With Honour We Serve
Victims of Crime
Low rates of victimisation for homicide (murder) offences mean that rates fluctuate across age groups and from year to year. In 2014/15, females aged twenty-five to twenty-nine years were most likely to be victims of homicide (murder). Overall, 62% of victims were male and 23% of all victims were aged twenty-five to twenty-nine years.
Other homicide offences are also subject to fluctuations across age groups and from year to year as a result of low rates of victimisation. Males aged forty-five to forty-nine were most likely to be victims. Overall, 66% of victims were male. Of all female victims, those aged twenty-five to twenty-nine years were most likely to be victims of other homicide.
* Only those offences where the victim’s age and sex were identified are included.
Homicide (Murder)*Victimsper 100000Population
0
1
2
3
4
5
Victims by Age and Sex
0-4 5-9 10-14 15-19 20-24 25-29 30-34 35-39 40-44 45-49 50-54 55+
Male
Female
Male Female
1.2
0.6
2
1
3.1
0.0
5
0
0.0
2.0
0
3
0.6
0.0
1
0
0.6 0.6
1
1
2.9
4.1
5
7
1.2
1.8
2
3
1.3 1.3
2
2
1.8
0.6
3
1
2.0
0.6
3
1
3.2
0.0
5
0
0.50.2
3
1
Other Homicide*Victimsper 100000Population
0
1
2
3
4
Victims by Age and Sex
0-4 5-9 10-14 15-19 20-24 25-29 30-34 35-39 40-44 45-49 50-54 55+
Male
Female
Male Female
0.0 0.0
0
0
0.6
0.0
1
0
1.3
0.7
2
1
0.6
1.3
1
2
2.4
0.6
4
1
1.8
2.3
3
4
3.0
0.6
5
1
2.6
1.3
4
2
2.4
1.7
4
3
3.3
1.3
5
2
1.9
0.0
3
0
1.7
1.0
10
6

69Queensland Police Service - Annual Statistical Review 2014/15
Victims of Crime
For every age cohort except fifteen to nineteen years, males were more likely to be victims of assault than females (58% of victims were male). Males aged twenty-five to twenty-nine years were most likely to be victims. The rate of females assaulted aged fifteen to nineteen years was higher than any other age group. The likelihood of being a victim of assault decreased with increasing age after nineteen years for females and twenty-nine for males.
The offence category of sexual offences is unique in that the number of female victims far outweighs the number of male victims (82% of victims were female). At every age, females were significantly more likely to be victims than males with females in the ten to nineteen years age range, the most likely. In fact, at this age females were almost six times more likely to be victims of sexual offences than males.
* Only those offences where the victim’s age and sex were identified are included.
As s ault*Victimsper 100000Population
0
100
200
300
400
500
600
700
800
900
1000
Victims by Age and Sex
0-4 5-9 10-14 15-19 20-24 25-29 30-34 35-39 40-44 45-49 50-54 55+
Male
Female
Male Female
92.9 69.9
151
108
170.3134.7
278
207
492.9437.9
762
641
685.3724.4
1086
1097
795.6
703.8
1354
1166
829.5
548.4
1416
936
716.2
512.3
1185
852
702.1
433.5
1074
678
561.7
372.3
947
640
488.4
290.1
751
456
364.8
186.6
566
297
156.6
75.6
904
466
S exual Offences *Victimsper 100000Population
0
100
200
300
400
500
600
700
800
Victims by Age and Sex
0-4 5-9 10-14 15-19 20-24 25-29 30-34 35-39 40-44 45-49 50-54 55+
Male
Female
Male Female
31.455.7
51
86
125.0
233.6
204
359
125.5
662.7
194
970
97.2
647.8
154
981
20.0
217.3
34
360
19.3
143.6
33
245
13.3
112.4
22
187
26.875.4
41
118
14.8
73.3
25
126
11.154.1
17
85
10.3 28.3
16
45
1.9 12.7
11
78
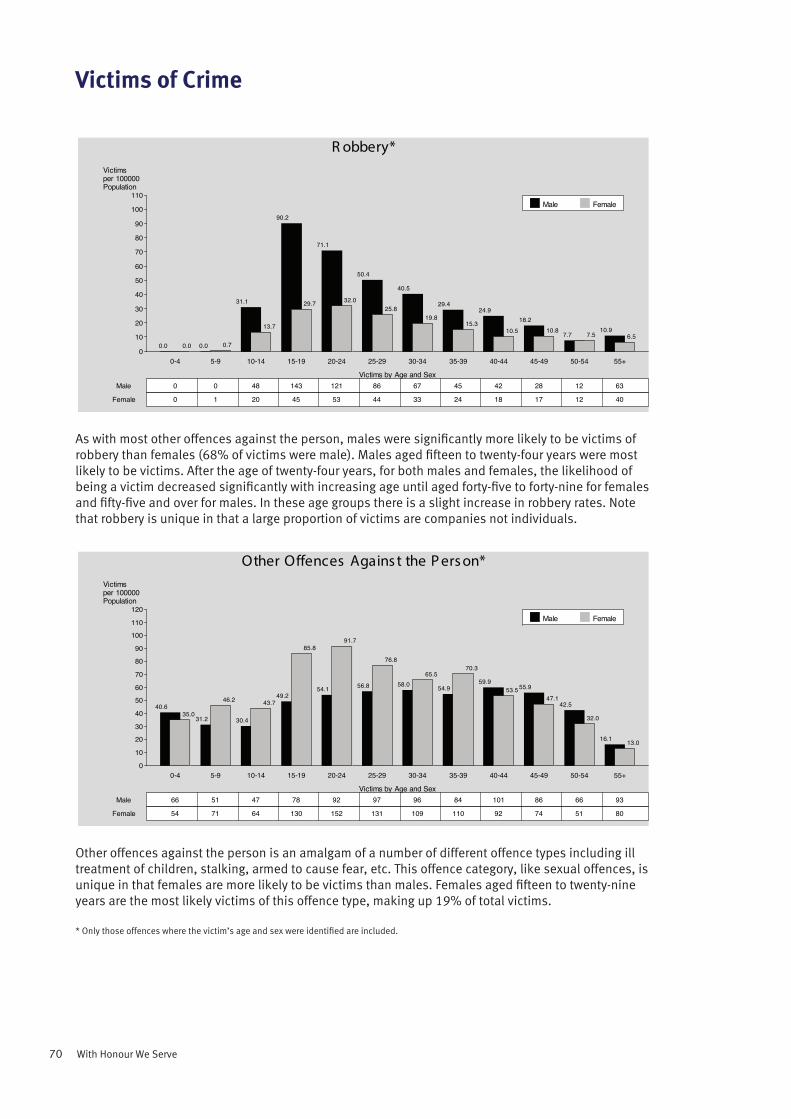
70 With Honour We Serve
Victims of Crime
As with most other offences against the person, males were significantly more likely to be victims of robbery than females (68% of victims were male). Males aged fifteen to twenty-four years were most likely to be victims. After the age of twenty-four years, for both males and females, the likelihood of being a victim decreased significantly with increasing age until aged forty-five to forty-nine for females and fifty-five and over for males. In these age groups there is a slight increase in robbery rates. Note that robbery is unique in that a large proportion of victims are companies not individuals.
Other offences against the person is an amalgam of a number of different offence types including ill treatment of children, stalking, armed to cause fear, etc. This offence category, like sexual offences, is unique in that females are more likely to be victims than males. Females aged fifteen to twenty-nine years are the most likely victims of this offence type, making up 19% of total victims.
* Only those offences where the victim’s age and sex were identified are included.
R obbery*Victimsper 100000Population
0
10
20
30
40
50
60
70
80
90
100
110
Victims by Age and Sex
0-4 5-9 10-14 15-19 20-24 25-29 30-34 35-39 40-44 45-49 50-54 55+
Male
Female
Male Female
0.0 0.0
0
0
0.0 0.7
0
1
31.1
13.7
48
20
90.2
29.7
143
45
71.1
32.0
121
53
50.4
25.8
86
44
40.5
19.8
67
33
29.4
15.3
45
24
24.9
10.5
42
18
18.210.8
28
17
7.7 7.5
12
12
10.96.5
63
40
Other Offences Agains t the P ers on*Victimsper 100000Population
0
10
20
30
40
50
60
70
80
90
100
110
120
Victims by Age and Sex
0-4 5-9 10-14 15-19 20-24 25-29 30-34 35-39 40-44 45-49 50-54 55+
Male
Female
Male Female
40.635.0
66
54
31.2
46.2
51
71
30.4
43.7
47
64
49.2
85.8
78
130
54.1
91.7
92
152
56.8
76.8
97
131
58.065.5
96
109
54.9
70.3
84
110
59.953.5
101
92
55.9
47.1
86
74
42.5
32.0
66
51
16.1 13.0
93
80
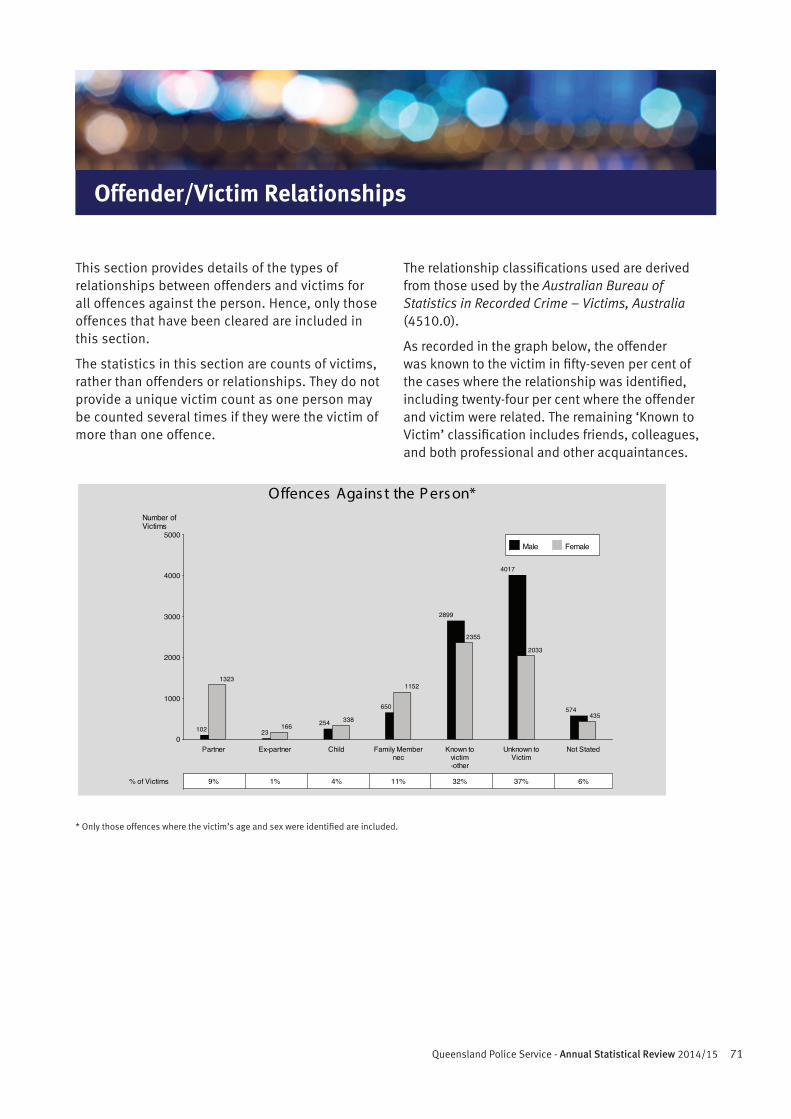
71Queensland Police Service - Annual Statistical Review 2014/15
Offender/Victim Relationships
Offences Agains t the P ers on*Number ofVictims
0
1000
2000
3000
4000
5000
Partner Ex-partner Child Family Membernec
Known tovictim-other
Unknown toVictim
Not Stated
% of Victims
Male Female
102
1323
9%
23166
1%
254 338
4%
650
1152
11%
2899
2355
32%
4017
2033
37%
574435
6%
This section provides details of the types of relationships between offenders and victims for all offences against the person. Hence, only those offences that have been cleared are included in this section.
The statistics in this section are counts of victims, rather than offenders or relationships. They do not provide a unique victim count as one person may be counted several times if they were the victim of more than one offence.
The relationship classifications used are derived from those used by the Australian Bureau of Statistics in Recorded Crime – Victims, Australia (4510.0).
As recorded in the graph below, the offender was known to the victim in fifty-seven per cent of the cases where the relationship was identified, including twenty-four per cent where the offender and victim were related. The remaining ‘Known to Victim’ classification includes friends, colleagues, and both professional and other acquaintances.
* Only those offences where the victim’s age and sex were identified are included.
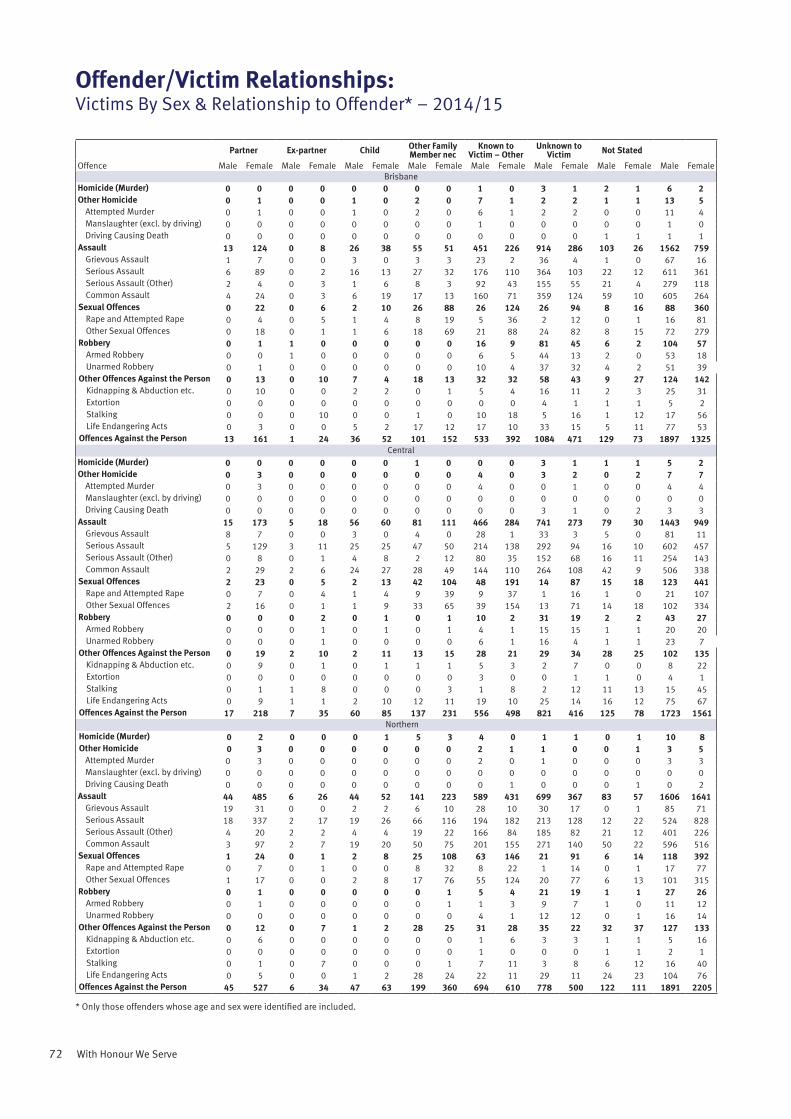
72 With Honour We Serve
Offender/Victim Relationships:Victims By Sex & Relationship to Offender* – 2014/15
Partner Ex-partner Child Other Family Member nec
Known to Victim – Other
Unknown to Victim Not Stated
Offence Male Female Male Female Male Female Male Female Male Female Male Female Male Female Male FemaleBrisbane
Homicide (Murder) 0 0 0 0 0 0 0 0 1 0 3 1 2 1 6 2Other Homicide 0 1 0 0 1 0 2 0 7 1 2 2 1 1 13 5
Attempted Murder 0 1 0 0 1 0 2 0 6 1 2 2 0 0 11 4Manslaughter (excl. by driving) 0 0 0 0 0 0 0 0 1 0 0 0 0 0 1 0Driving Causing Death 0 0 0 0 0 0 0 0 0 0 0 0 1 1 1 1
Assault 13 124 0 8 26 38 55 51 451 226 914 286 103 26 1562 759Grievous Assault 1 7 0 0 3 0 3 3 23 2 36 4 1 0 67 16Serious Assault 6 89 0 2 16 13 27 32 176 110 364 103 22 12 611 361Serious Assault (Other) 2 4 0 3 1 6 8 3 92 43 155 55 21 4 279 118Common Assault 4 24 0 3 6 19 17 13 160 71 359 124 59 10 605 264
Sexual Offences 0 22 0 6 2 10 26 88 26 124 26 94 8 16 88 360Rape and Attempted Rape 0 4 0 5 1 4 8 19 5 36 2 12 0 1 16 81Other Sexual Offences 0 18 0 1 1 6 18 69 21 88 24 82 8 15 72 279
Robbery 0 1 1 0 0 0 0 0 16 9 81 45 6 2 104 57Armed Robbery 0 0 1 0 0 0 0 0 6 5 44 13 2 0 53 18Unarmed Robbery 0 1 0 0 0 0 0 0 10 4 37 32 4 2 51 39
Other Offences Against the Person 0 13 0 10 7 4 18 13 32 32 58 43 9 27 124 142Kidnapping & Abduction etc. 0 10 0 0 2 2 0 1 5 4 16 11 2 3 25 31Extortion 0 0 0 0 0 0 0 0 0 0 4 1 1 1 5 2Stalking 0 0 0 10 0 0 1 0 10 18 5 16 1 12 17 56Life Endangering Acts 0 3 0 0 5 2 17 12 17 10 33 15 5 11 77 53
Offences Against the Person 13 161 1 24 36 52 101 152 533 392 1084 471 129 73 1897 1325Central
Homicide (Murder) 0 0 0 0 0 0 1 0 0 0 3 1 1 1 5 2Other Homicide 0 3 0 0 0 0 0 0 4 0 3 2 0 2 7 7
Attempted Murder 0 3 0 0 0 0 0 0 4 0 0 1 0 0 4 4Manslaughter (excl. by driving) 0 0 0 0 0 0 0 0 0 0 0 0 0 0 0 0Driving Causing Death 0 0 0 0 0 0 0 0 0 0 3 1 0 2 3 3
Assault 15 173 5 18 56 60 81 111 466 284 741 273 79 30 1443 949Grievous Assault 8 7 0 0 3 0 4 0 28 1 33 3 5 0 81 11Serious Assault 5 129 3 11 25 25 47 50 214 138 292 94 16 10 602 457Serious Assault (Other) 0 8 0 1 4 8 2 12 80 35 152 68 16 11 254 143Common Assault 2 29 2 6 24 27 28 49 144 110 264 108 42 9 506 338
Sexual Offences 2 23 0 5 2 13 42 104 48 191 14 87 15 18 123 441Rape and Attempted Rape 0 7 0 4 1 4 9 39 9 37 1 16 1 0 21 107Other Sexual Offences 2 16 0 1 1 9 33 65 39 154 13 71 14 18 102 334
Robbery 0 0 0 2 0 1 0 1 10 2 31 19 2 2 43 27Armed Robbery 0 0 0 1 0 1 0 1 4 1 15 15 1 1 20 20Unarmed Robbery 0 0 0 1 0 0 0 0 6 1 16 4 1 1 23 7
Other Offences Against the Person 0 19 2 10 2 11 13 15 28 21 29 34 28 25 102 135Kidnapping & Abduction etc. 0 9 0 1 0 1 1 1 5 3 2 7 0 0 8 22Extortion 0 0 0 0 0 0 0 0 3 0 0 1 1 0 4 1Stalking 0 1 1 8 0 0 0 3 1 8 2 12 11 13 15 45Life Endangering Acts 0 9 1 1 2 10 12 11 19 10 25 14 16 12 75 67
Offences Against the Person 17 218 7 35 60 85 137 231 556 498 821 416 125 78 1723 1561Northern
Homicide (Murder) 0 2 0 0 0 1 5 3 4 0 1 1 0 1 10 8Other Homicide 0 3 0 0 0 0 0 0 2 1 1 0 0 1 3 5
Attempted Murder 0 3 0 0 0 0 0 0 2 0 1 0 0 0 3 3Manslaughter (excl. by driving) 0 0 0 0 0 0 0 0 0 0 0 0 0 0 0 0Driving Causing Death 0 0 0 0 0 0 0 0 0 1 0 0 0 1 0 2
Assault 44 485 6 26 44 52 141 223 589 431 699 367 83 57 1606 1641Grievous Assault 19 31 0 0 2 2 6 10 28 10 30 17 0 1 85 71Serious Assault 18 337 2 17 19 26 66 116 194 182 213 128 12 22 524 828Serious Assault (Other) 4 20 2 2 4 4 19 22 166 84 185 82 21 12 401 226Common Assault 3 97 2 7 19 20 50 75 201 155 271 140 50 22 596 516
Sexual Offences 1 24 0 1 2 8 25 108 63 146 21 91 6 14 118 392Rape and Attempted Rape 0 7 0 1 0 0 8 32 8 22 1 14 0 1 17 77Other Sexual Offences 1 17 0 0 2 8 17 76 55 124 20 77 6 13 101 315
Robbery 0 1 0 0 0 0 0 1 5 4 21 19 1 1 27 26Armed Robbery 0 1 0 0 0 0 0 1 1 3 9 7 1 0 11 12Unarmed Robbery 0 0 0 0 0 0 0 0 4 1 12 12 0 1 16 14
Other Offences Against the Person 0 12 0 7 1 2 28 25 31 28 35 22 32 37 127 133Kidnapping & Abduction etc. 0 6 0 0 0 0 0 0 1 6 3 3 1 1 5 16Extortion 0 0 0 0 0 0 0 0 1 0 0 0 1 1 2 1Stalking 0 1 0 7 0 0 0 1 7 11 3 8 6 12 16 40Life Endangering Acts 0 5 0 0 1 2 28 24 22 11 29 11 24 23 104 76
Offences Against the Person 45 527 6 34 47 63 199 360 694 610 778 500 122 111 1891 2205
* Only those offenders whose age and sex were identified are included.

73Queensland Police Service - Annual Statistical Review 2014/15
Offender/Victim Relationships:Victims By Sex & Relationship to Offender* – 2014/15
Partner Ex-partner Child Other Family Member nec
Known to Victim – Other
Unknown to Victim Not Stated
Offence Male Female Male Female Male Female Male Female Male Female Male Female Male Female Male FemaleSouth Eastern
Homicide (Murder) 0 1 0 0 0 0 0 0 2 1 1 0 1 1 4 3Other Homicide 0 1 0 0 0 0 2 0 3 0 2 2 0 0 7 3
Attempted Murder 0 1 0 0 0 0 2 0 3 0 1 2 0 0 6 3Manslaughter (excl. by driving) 0 0 0 0 0 0 0 0 0 0 1 0 0 0 1 0Driving Causing Death 0 0 0 0 0 0 0 0 0 0 0 0 0 0 0 0
Assault 10 159 5 31 20 27 66 56 345 170 536 198 54 25 1036 666Grievous Assault 5 7 2 0 2 0 2 3 21 4 33 5 2 0 67 19Serious Assault 3 114 3 20 12 13 38 29 149 86 228 79 14 14 447 355Serious Assault (Other) 0 3 0 4 2 4 9 5 76 24 113 39 14 7 214 86Common Assault 2 35 0 7 4 10 17 19 99 56 162 75 24 4 308 206
Sexual Offences 0 15 0 3 4 17 14 81 40 89 2 53 6 14 66 272Rape and Attempted Rape 0 6 0 1 1 7 4 26 8 21 1 12 2 0 16 73Other Sexual Offences 0 9 0 2 3 10 10 55 32 68 1 41 4 14 50 199
Robbery 0 1 0 0 0 0 0 0 24 7 61 42 4 6 89 56Armed Robbery 0 0 0 0 0 0 0 0 9 3 32 13 2 0 43 16Unarmed Robbery 0 1 0 0 0 0 0 0 15 4 29 29 2 6 46 40
Other Offences Against the Person 0 11 0 11 3 2 9 8 42 27 35 20 19 23 108 102Kidnapping & Abduction etc. 0 2 0 3 0 0 0 0 9 6 4 2 0 2 13 15Extortion 0 0 0 0 0 0 0 0 2 0 0 0 2 2 4 2Stalking 0 3 0 5 0 0 0 0 4 7 2 7 5 6 11 28Life Endangering Acts 0 6 0 3 3 2 9 8 27 14 29 11 12 13 80 57
Offences Against the Person 10 188 5 45 27 46 91 145 456 294 637 315 84 69 1310 1102Southern
Homicide (Murder) 1 0 0 0 0 1 2 0 1 0 1 0 1 1 6 2Other Homicide 0 1 0 0 0 0 2 0 3 1 2 0 0 0 7 2
Attempted Murder 0 1 0 0 0 0 2 0 2 1 1 0 0 0 5 2Manslaughter (excl. by driving) 0 0 0 0 0 0 0 0 1 0 0 0 0 0 1 0Driving Causing Death 0 0 0 0 0 0 0 0 0 0 1 0 0 0 1 0
Assault 13 180 4 19 78 73 76 114 520 313 608 225 79 27 1378 951Grievous Assault 9 6 1 1 3 2 5 2 26 1 24 5 3 0 71 17Serious Assault 3 124 2 11 32 38 50 69 190 136 231 78 24 8 532 464Serious Assault (Other) 0 9 0 1 5 2 5 9 110 46 106 42 21 5 247 114Common Assault 1 41 1 6 38 31 16 34 194 130 247 100 31 14 528 356
Sexual Offences 2 28 0 2 3 13 29 127 58 190 11 57 7 40 110 457Rape and Attempted Rape 0 7 0 2 1 4 3 40 14 43 1 11 2 4 21 111Other Sexual Offences 2 21 0 0 2 9 26 87 44 147 10 46 5 36 89 346
Robbery 0 2 0 0 0 0 1 0 25 9 30 16 6 4 62 31Armed Robbery 0 0 0 0 0 0 0 0 6 1 18 8 1 2 25 11Unarmed Robbery 0 2 0 0 0 0 1 0 19 8 12 8 5 2 37 20
Other Offences Against the Person 1 18 0 7 3 5 12 23 53 48 45 33 21 32 135 166Kidnapping & Abduction etc. 0 9 0 1 0 1 1 6 5 11 2 3 0 2 8 33Extortion 0 0 0 0 0 0 0 0 3 0 1 0 0 1 4 1Stalking 0 3 0 4 0 0 0 0 5 15 7 16 6 15 18 53Life Endangering Acts 1 6 0 2 3 4 11 17 40 22 35 14 15 14 105 79
Offences Against the Person 17 229 4 28 84 92 122 264 660 561 697 331 114 104 1698 1609Queensland
Homicide (Murder) 1 3 0 0 0 2 8 3 8 1 9 3 5 5 31 17Other Homicide 0 9 0 0 1 0 6 0 19 3 10 6 1 4 37 22
Attempted Murder 0 9 0 0 1 0 6 0 17 2 5 5 0 0 29 16Manslaughter (excl. by driving) 0 0 0 0 0 0 0 0 2 0 1 0 0 0 3 0Driving Causing Death 0 0 0 0 0 0 0 0 0 1 4 1 1 4 5 6
Assault 95 1121 20 102 224 250 419 555 2371 1424 3498 1349 398 165 7025 4966Grievous Assault 42 58 3 1 13 4 20 18 126 18 156 34 11 1 371 134Serious Assault 35 793 10 61 104 115 228 296 923 652 1328 482 88 66 2716 2465Serious Assault (Other) 6 44 2 11 16 24 43 51 524 232 711 286 93 39 1395 687Common Assault 12 226 5 29 91 107 128 190 798 522 1303 547 206 59 2543 1680
Sexual Offences 5 112 0 17 13 61 136 509 235 740 74 382 42 102 505 1923Rape and Attempted Rape 0 31 0 13 4 19 32 157 44 159 6 65 5 6 91 450Other Sexual Offences 5 81 0 4 9 42 104 352 191 581 68 317 37 96 414 1473
Robbery 0 5 1 2 0 1 1 2 80 31 224 141 19 15 325 197Armed Robbery 0 1 1 1 0 1 0 2 26 13 118 56 7 3 152 77Unarmed Robbery 0 4 0 1 0 0 1 0 54 18 106 85 12 12 173 120
Other Offences Against the Person 1 73 2 45 16 24 80 84 187 156 202 152 109 144 597 678Kidnapping & Abduction etc. 0 36 0 5 2 4 2 8 25 30 27 26 3 8 59 117Extortion 0 0 0 0 0 0 0 0 9 0 5 2 5 5 19 7Stalking 0 8 1 34 0 0 1 4 28 59 19 59 29 58 78 222Life Endangering Acts 1 29 1 6 14 20 77 72 125 67 151 65 72 73 441 332
Offences Against the Person 102 1323 23 166 254 338 650 1153 2900 2355 4017 2033 574 435 8520 7803
* Only those offenders whose age and sex were identified are included.
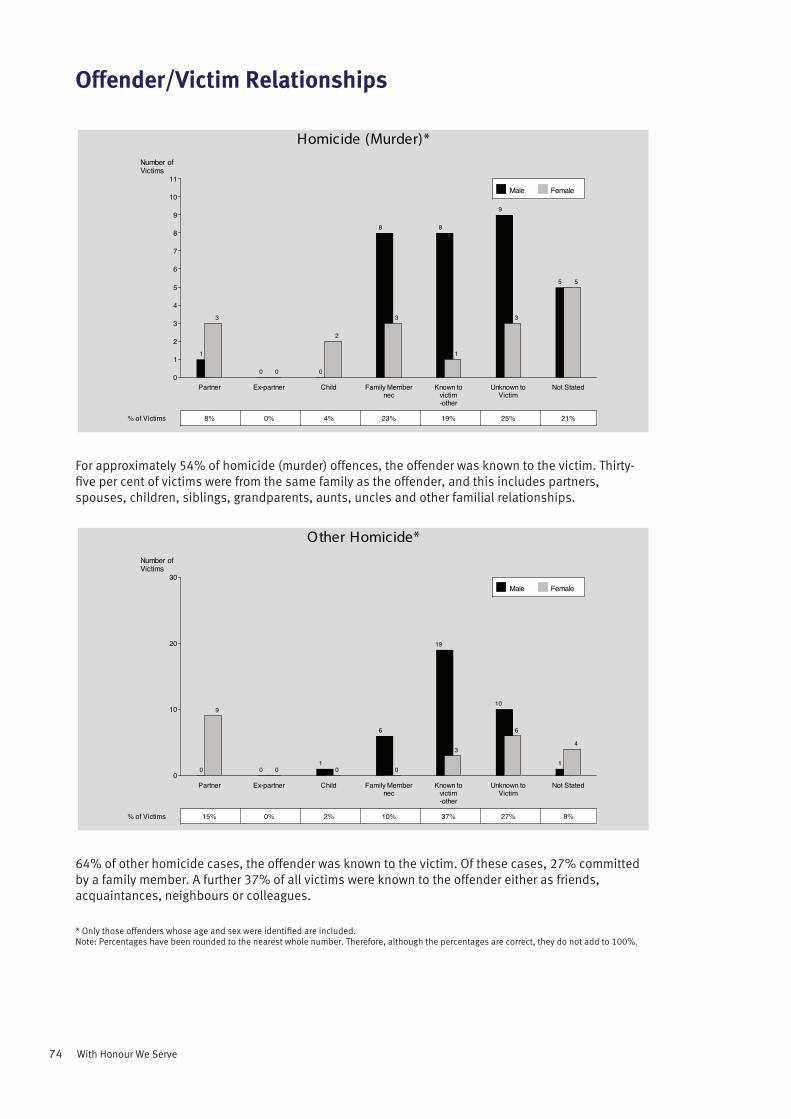
74 With Honour We Serve
Offender/Victim Relationships
For approximately 54% of homicide (murder) offences, the offender was known to the victim. Thirty-five per cent of victims were from the same family as the offender, and this includes partners, spouses, children, siblings, grandparents, aunts, uncles and other familial relationships.
64% of other homicide cases, the offender was known to the victim. Of these cases, 27% committed by a family member. A further 37% of all victims were known to the offender either as friends, acquaintances, neighbours or colleagues.
* Only those offenders whose age and sex were identified are included.Note: Percentages have been rounded to the nearest whole number. Therefore, although the percentages are correct, they do not add to 100%.
Homicide (Murder)*Number ofVictims
0
1
2
3
4
5
6
7
8
9
10
11
Partner Ex-partner Child Family Membernec
Known tovictim-other
Unknown toVictim
Not Stated
% of Victims
Male Female
1
3
8%
0 0
0%
0
2
4%
8
3
23%
8
1
19%
9
3
25%
5 5
21%
Other Homicide*Number ofVictims
0
10
20
30
Partner Ex-partner Child Family Membernec
Known tovictim-other
Unknown toVictim
Not Stated
% of Victims
Male Female
0
9
15%
0 0
0%
10
2%
6
0
10%
19
3
37%
10
6
27%
1
4
8%
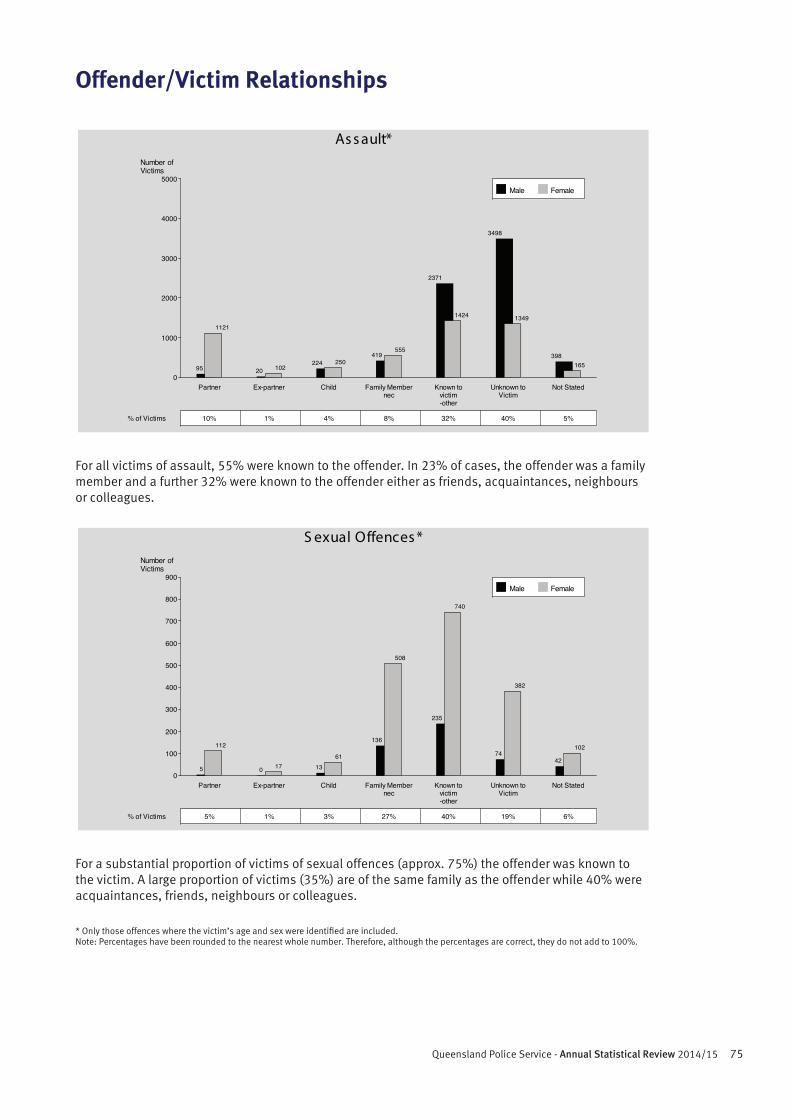
75Queensland Police Service - Annual Statistical Review 2014/15
Offender/Victim Relationships
For all victims of assault, 55% were known to the offender. In 23% of cases, the offender was a family member and a further 32% were known to the offender either as friends, acquaintances, neighbours or colleagues.
For a substantial proportion of victims of sexual offences (approx. 75%) the offender was known to the victim. A large proportion of victims (35%) are of the same family as the offender while 40% were acquaintances, friends, neighbours or colleagues.
* Only those offences where the victim’s age and sex were identified are included. Note: Percentages have been rounded to the nearest whole number. Therefore, although the percentages are correct, they do not add to 100%.
As s ault*Number ofVictims
0
1000
2000
3000
4000
5000
Partner Ex-partner Child Family Membernec
Known tovictim-other
Unknown toVictim
Not Stated
% of Victims
Male Female
95
1121
10%
20 102
1%
224 250
4%
419555
8%
2371
1424
32%
3498
1349
40%
398165
5%
S exual Offences *Number ofVictims
0
100
200
300
400
500
600
700
800
900
Partner Ex-partner Child Family Membernec
Known tovictim-other
Unknown toVictim
Not Stated
% of Victims
Male Female
5
112
5%
0 17
1%
1361
3%
136
508
27%
235
740
40%
74
382
19%
42
102
6%
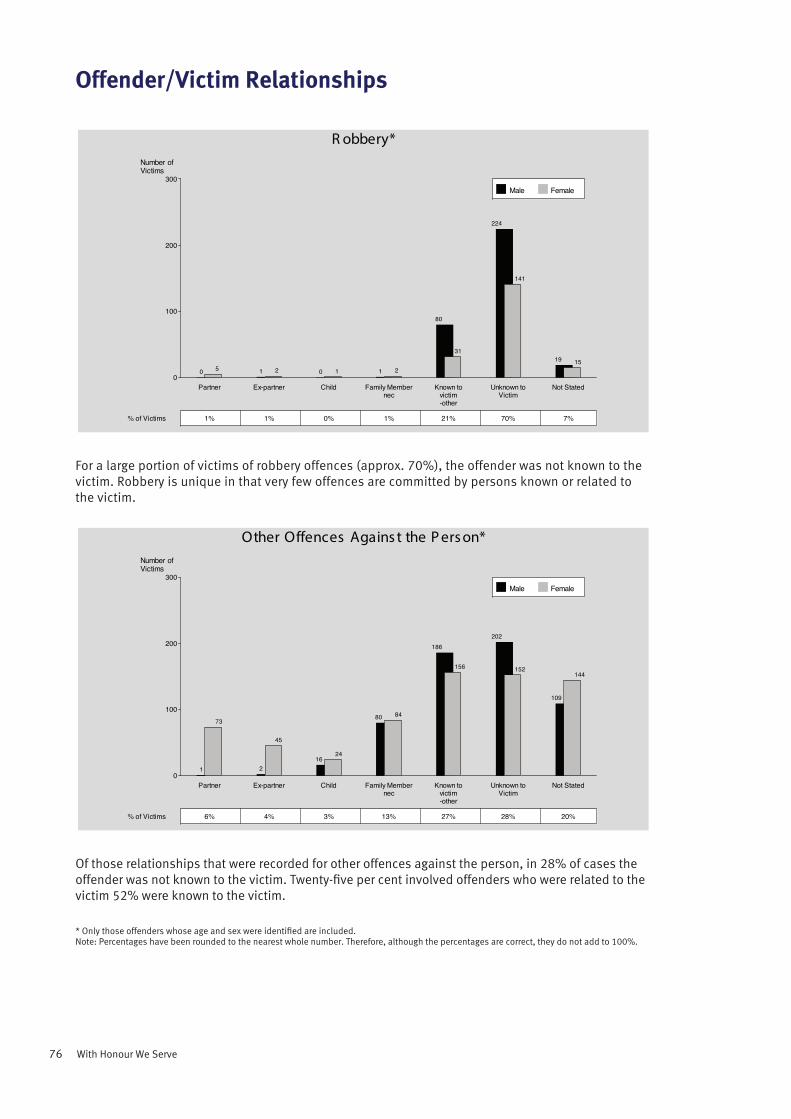
76 With Honour We Serve
Offender/Victim Relationships
For a large portion of victims of robbery offences (approx. 70%), the offender was not known to the victim. Robbery is unique in that very few offences are committed by persons known or related to the victim.
Of those relationships that were recorded for other offences against the person, in 28% of cases the offender was not known to the victim. Twenty-five per cent involved offenders who were related to the victim 52% were known to the victim.
* Only those offenders whose age and sex were identified are included.Note: Percentages have been rounded to the nearest whole number. Therefore, although the percentages are correct, they do not add to 100%.
R obbery*Number ofVictims
0
100
200
300
Partner Ex-partner Child Family Membernec
Known tovictim-other
Unknown toVictim
Not Stated
% of Victims
Male Female
0 5
1%
1 2
1%
0 1
0%
1 2
1%
80
31
21%
224
141
70%
19 15
7%
Other Offences Agains t the P ers on*Number ofVictims
0
100
200
300
Partner Ex-partner Child Family Membernec
Known tovictim-other
Unknown toVictim
Not Stated
% of Victims
Male Female
1
73
6%
2
45
4%
1624
3%
80 84
13%
186
156
27%
202
152
28%
109
144
20%
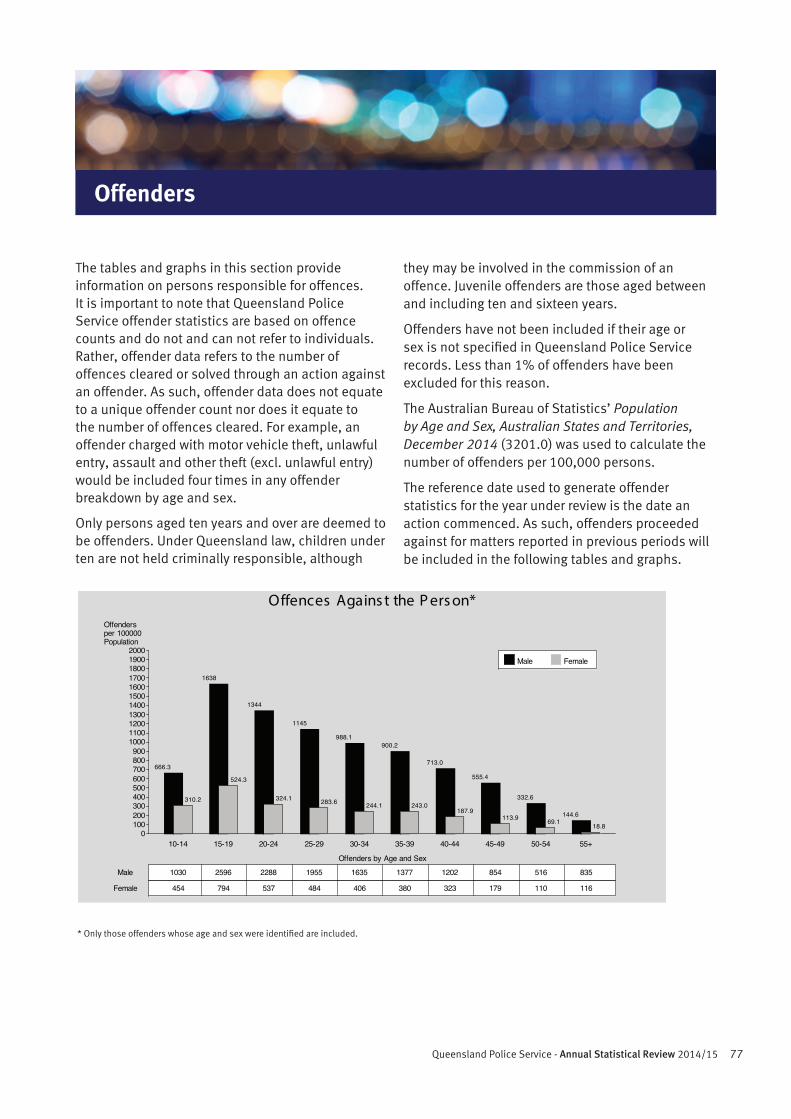
77Queensland Police Service - Annual Statistical Review 2014/15
Offenders
Offences Agains t the P ers on*Offendersper 100000Population
0100200300400500600700800900
10001100120013001400150016001700180019002000
Offenders by Age and Sex
10-14 15-19 20-24 25-29 30-34 35-39 40-44 45-49 50-54 55+
Male
Female
Male Female
666.3
310.2
1030
454
1638
524.3
2596
794
1344
324.1
2288
537
1145
283.6
1955
484
988.1
244.1
1635
406
900.2
243.0
1377
380
713.0
187.9
1202
323
555.4
113.9
854
179
332.6
69.1
516
110
144.6
18.8
835
116
The tables and graphs in this section provide information on persons responsible for offences. It is important to note that Queensland Police Service offender statistics are based on offence counts and do not and can not refer to individuals. Rather, offender data refers to the number of offences cleared or solved through an action against an offender. As such, offender data does not equate to a unique offender count nor does it equate to the number of offences cleared. For example, an offender charged with motor vehicle theft, unlawful entry, assault and other theft (excl. unlawful entry) would be included four times in any offender breakdown by age and sex.
Only persons aged ten years and over are deemed to be offenders. Under Queensland law, children under ten are not held criminally responsible, although
they may be involved in the commission of an offence. Juvenile offenders are those aged between and including ten and sixteen years.
Offenders have not been included if their age or sex is not specified in Queensland Police Service records. Less than 1% of offenders have been excluded for this reason.
The Australian Bureau of Statistics’ Population by Age and Sex, Australian States and Territories, December 2014 (3201.0) was used to calculate the number of offenders per 100,000 persons.
The reference date used to generate offender statistics for the year under review is the date an action commenced. As such, offenders proceeded against for matters reported in previous periods will be included in the following tables and graphs.
* Only those offenders whose age and sex were identified are included.
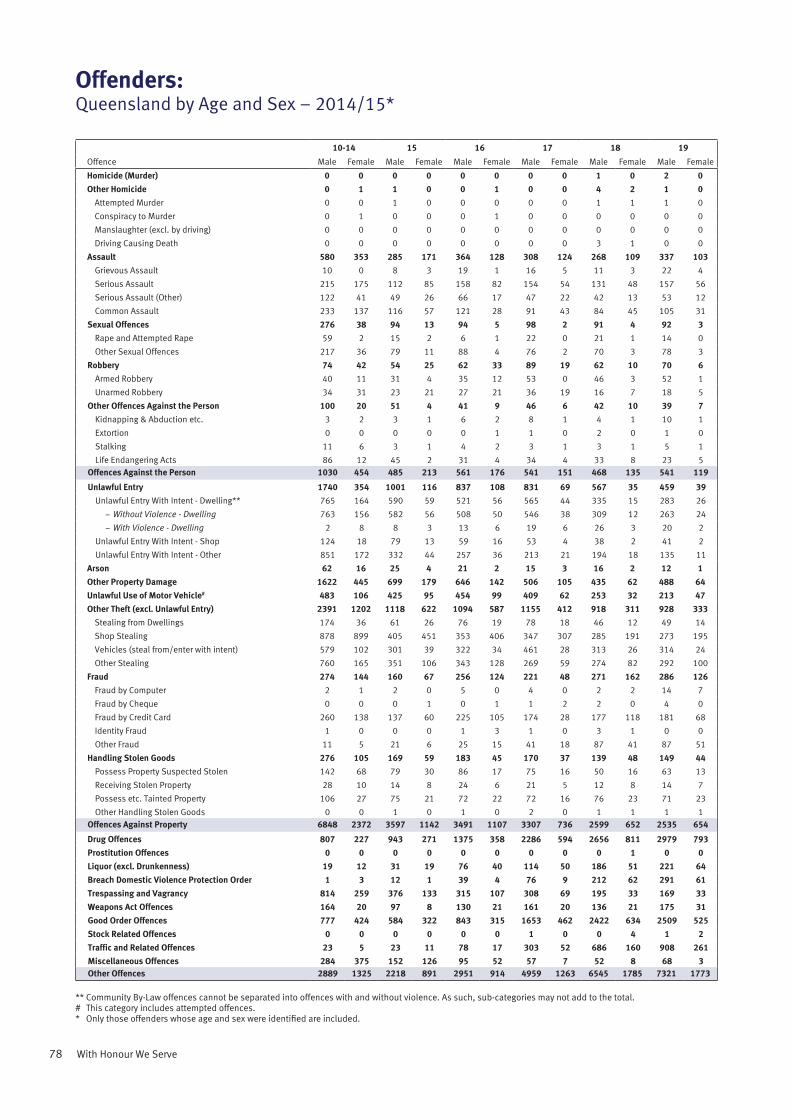
78 With Honour We Serve
Offenders:Queensland by Age and Sex – 2014/15*
10-14 15 16 17 18 19Offence Male Female Male Female Male Female Male Female Male Female Male Female
Homicide (Murder) 0 0 0 0 0 0 0 0 1 0 2 0Other Homicide 0 1 1 0 0 1 0 0 4 2 1 0
Attempted Murder 0 0 1 0 0 0 0 0 1 1 1 0
Conspiracy to Murder 0 1 0 0 0 1 0 0 0 0 0 0
Manslaughter (excl. by driving) 0 0 0 0 0 0 0 0 0 0 0 0
Driving Causing Death 0 0 0 0 0 0 0 0 3 1 0 0
Assault 580 353 285 171 364 128 308 124 268 109 337 103Grievous Assault 10 0 8 3 19 1 16 5 11 3 22 4
Serious Assault 215 175 112 85 158 82 154 54 131 48 157 56
Serious Assault (Other) 122 41 49 26 66 17 47 22 42 13 53 12
Common Assault 233 137 116 57 121 28 91 43 84 45 105 31
Sexual Offences 276 38 94 13 94 5 98 2 91 4 92 3Rape and Attempted Rape 59 2 15 2 6 1 22 0 21 1 14 0
Other Sexual Offences 217 36 79 11 88 4 76 2 70 3 78 3
Robbery 74 42 54 25 62 33 89 19 62 10 70 6Armed Robbery 40 11 31 4 35 12 53 0 46 3 52 1
Unarmed Robbery 34 31 23 21 27 21 36 19 16 7 18 5
Other Offences Against the Person 100 20 51 4 41 9 46 6 42 10 39 7Kidnapping & Abduction etc. 3 2 3 1 6 2 8 1 4 1 10 1
Extortion 0 0 0 0 0 1 1 0 2 0 1 0
Stalking 11 6 3 1 4 2 3 1 3 1 5 1
Life Endangering Acts 86 12 45 2 31 4 34 4 33 8 23 5Offences Against the Person 1030 454 485 213 561 176 541 151 468 135 541 119
Unlawful Entry 1740 354 1001 116 837 108 831 69 567 35 459 39Unlawful Entry With Intent - Dwelling** 765 164 590 59 521 56 565 44 335 15 283 26
− Without Violence - Dwelling 763 156 582 56 508 50 546 38 309 12 263 24
− With Violence - Dwelling 2 8 8 3 13 6 19 6 26 3 20 2
Unlawful Entry With Intent - Shop 124 18 79 13 59 16 53 4 38 2 41 2
Unlawful Entry With Intent - Other 851 172 332 44 257 36 213 21 194 18 135 11
Arson 62 16 25 4 21 2 15 3 16 2 12 1Other Property Damage 1622 445 699 179 646 142 506 105 435 62 488 64Unlawful Use of Motor Vehicle# 483 106 425 95 454 99 409 62 253 32 213 47Other Theft (excl. Unlawful Entry) 2391 1202 1118 622 1094 587 1155 412 918 311 928 333
Stealing from Dwellings 174 36 61 26 76 19 78 18 46 12 49 14
Shop Stealing 878 899 405 451 353 406 347 307 285 191 273 195
Vehicles (steal from/enter with intent) 579 102 301 39 322 34 461 28 313 26 314 24
Other Stealing 760 165 351 106 343 128 269 59 274 82 292 100
Fraud 274 144 160 67 256 124 221 48 271 162 286 126Fraud by Computer 2 1 2 0 5 0 4 0 2 2 14 7
Fraud by Cheque 0 0 0 1 0 1 1 2 2 0 4 0
Fraud by Credit Card 260 138 137 60 225 105 174 28 177 118 181 68
Identity Fraud 1 0 0 0 1 3 1 0 3 1 0 0
Other Fraud 11 5 21 6 25 15 41 18 87 41 87 51
Handling Stolen Goods 276 105 169 59 183 45 170 37 139 48 149 44Possess Property Suspected Stolen 142 68 79 30 86 17 75 16 50 16 63 13
Receiving Stolen Property 28 10 14 8 24 6 21 5 12 8 14 7
Possess etc. Tainted Property 106 27 75 21 72 22 72 16 76 23 71 23
Other Handling Stolen Goods 0 0 1 0 1 0 2 0 1 1 1 1Offences Against Property 6848 2372 3597 1142 3491 1107 3307 736 2599 652 2535 654
Drug Offences 807 227 943 271 1375 358 2286 594 2656 811 2979 793Prostitution Offences 0 0 0 0 0 0 0 0 0 1 0 0Liquor (excl. Drunkenness) 19 12 31 19 76 40 114 50 186 51 221 64Breach Domestic Violence Protection Order 1 3 12 1 39 4 76 9 212 62 291 61Trespassing and Vagrancy 814 259 376 133 315 107 308 69 195 33 169 33Weapons Act Offences 164 20 97 8 130 21 161 20 136 21 175 31Good Order Offences 777 424 584 322 843 315 1653 462 2422 634 2509 525Stock Related Offences 0 0 0 0 0 0 1 0 0 4 1 2Traffic and Related Offences 23 5 23 11 78 17 303 52 686 160 908 261Miscellaneous Offences 284 375 152 126 95 52 57 7 52 8 68 3Other Offences 2889 1325 2218 891 2951 914 4959 1263 6545 1785 7321 1773
** Community By-Law offences cannot be separated into offences with and without violence. As such, sub-categories may not add to the total.# This category includes attempted offences.* Only those offenders whose age and sex were identified are included.
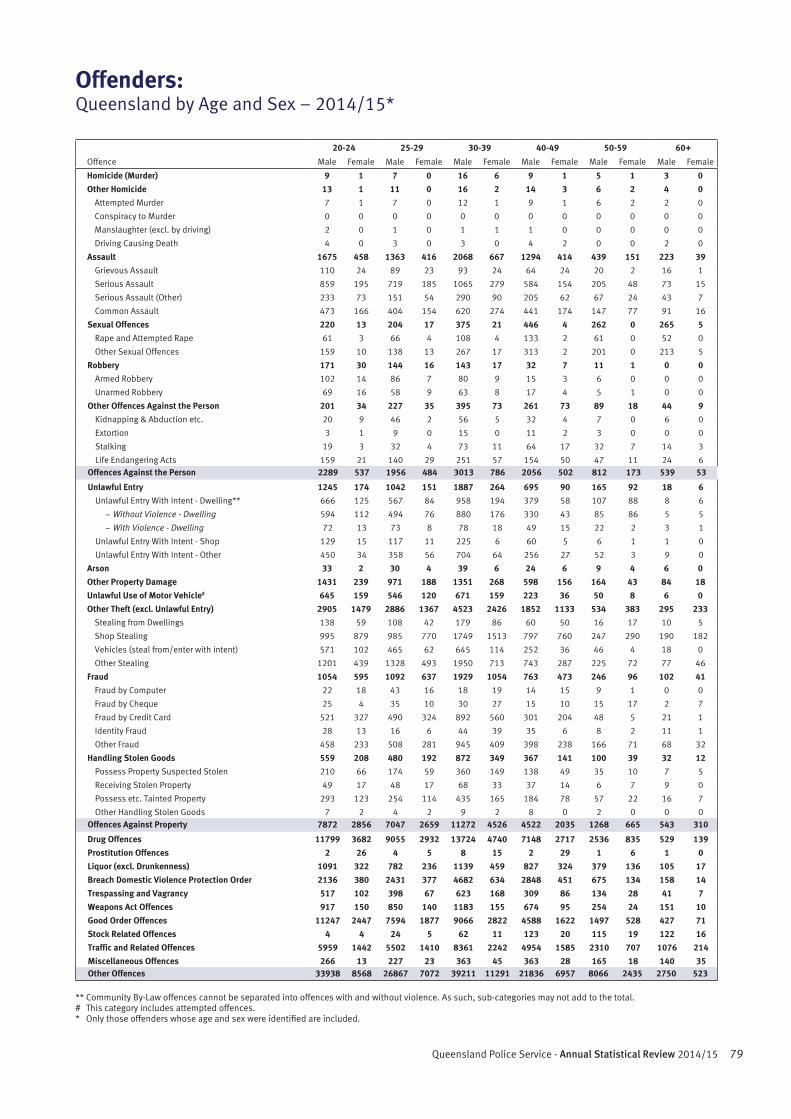
79Queensland Police Service - Annual Statistical Review 2014/15
Offenders:Queensland by Age and Sex – 2014/15*
20-24 25-29 30-39 40-49 50-59 60+Offence Male Female Male Female Male Female Male Female Male Female Male Female
Homicide (Murder) 9 1 7 0 16 6 9 1 5 1 3 0Other Homicide 13 1 11 0 16 2 14 3 6 2 4 0
Attempted Murder 7 1 7 0 12 1 9 1 6 2 2 0
Conspiracy to Murder 0 0 0 0 0 0 0 0 0 0 0 0
Manslaughter (excl. by driving) 2 0 1 0 1 1 1 0 0 0 0 0
Driving Causing Death 4 0 3 0 3 0 4 2 0 0 2 0
Assault 1675 458 1363 416 2068 667 1294 414 439 151 223 39Grievous Assault 110 24 89 23 93 24 64 24 20 2 16 1
Serious Assault 859 195 719 185 1065 279 584 154 205 48 73 15
Serious Assault (Other) 233 73 151 54 290 90 205 62 67 24 43 7
Common Assault 473 166 404 154 620 274 441 174 147 77 91 16
Sexual Offences 220 13 204 17 375 21 446 4 262 0 265 5Rape and Attempted Rape 61 3 66 4 108 4 133 2 61 0 52 0
Other Sexual Offences 159 10 138 13 267 17 313 2 201 0 213 5
Robbery 171 30 144 16 143 17 32 7 11 1 0 0Armed Robbery 102 14 86 7 80 9 15 3 6 0 0 0
Unarmed Robbery 69 16 58 9 63 8 17 4 5 1 0 0
Other Offences Against the Person 201 34 227 35 395 73 261 73 89 18 44 9Kidnapping & Abduction etc. 20 9 46 2 56 5 32 4 7 0 6 0
Extortion 3 1 9 0 15 0 11 2 3 0 0 0
Stalking 19 3 32 4 73 11 64 17 32 7 14 3
Life Endangering Acts 159 21 140 29 251 57 154 50 47 11 24 6Offences Against the Person 2289 537 1956 484 3013 786 2056 502 812 173 539 53
Unlawful Entry 1245 174 1042 151 1887 264 695 90 165 92 18 6Unlawful Entry With Intent - Dwelling** 666 125 567 84 958 194 379 58 107 88 8 6
− Without Violence - Dwelling 594 112 494 76 880 176 330 43 85 86 5 5
− With Violence - Dwelling 72 13 73 8 78 18 49 15 22 2 3 1
Unlawful Entry With Intent - Shop 129 15 117 11 225 6 60 5 6 1 1 0
Unlawful Entry With Intent - Other 450 34 358 56 704 64 256 27 52 3 9 0
Arson 33 2 30 4 39 6 24 6 9 4 6 0Other Property Damage 1431 239 971 188 1351 268 598 156 164 43 84 18Unlawful Use of Motor Vehicle# 645 159 546 120 671 159 223 36 50 8 6 0Other Theft (excl. Unlawful Entry) 2905 1479 2886 1367 4523 2426 1852 1133 534 383 295 233
Stealing from Dwellings 138 59 108 42 179 86 60 50 16 17 10 5
Shop Stealing 995 879 985 770 1749 1513 797 760 247 290 190 182
Vehicles (steal from/enter with intent) 571 102 465 62 645 114 252 36 46 4 18 0
Other Stealing 1201 439 1328 493 1950 713 743 287 225 72 77 46
Fraud 1054 595 1092 637 1929 1054 763 473 246 96 102 41Fraud by Computer 22 18 43 16 18 19 14 15 9 1 0 0
Fraud by Cheque 25 4 35 10 30 27 15 10 15 17 2 7
Fraud by Credit Card 521 327 490 324 892 560 301 204 48 5 21 1
Identity Fraud 28 13 16 6 44 39 35 6 8 2 11 1
Other Fraud 458 233 508 281 945 409 398 238 166 71 68 32
Handling Stolen Goods 559 208 480 192 872 349 367 141 100 39 32 12Possess Property Suspected Stolen 210 66 174 59 360 149 138 49 35 10 7 5
Receiving Stolen Property 49 17 48 17 68 33 37 14 6 7 9 0
Possess etc. Tainted Property 293 123 254 114 435 165 184 78 57 22 16 7
Other Handling Stolen Goods 7 2 4 2 9 2 8 0 2 0 0 0Offences Against Property 7872 2856 7047 2659 11272 4526 4522 2035 1268 665 543 310
Drug Offences 11799 3682 9055 2932 13724 4740 7148 2717 2536 835 529 139Prostitution Offences 2 26 4 5 8 15 2 29 1 6 1 0Liquor (excl. Drunkenness) 1091 322 782 236 1139 459 827 324 379 136 105 17Breach Domestic Violence Protection Order 2136 380 2431 377 4682 634 2848 451 675 134 158 14Trespassing and Vagrancy 517 102 398 67 623 168 309 86 134 28 41 7Weapons Act Offences 917 150 850 140 1183 155 674 95 254 24 151 10Good Order Offences 11247 2447 7594 1877 9066 2822 4588 1622 1497 528 427 71Stock Related Offences 4 4 24 5 62 11 123 20 115 19 122 16Traffic and Related Offences 5959 1442 5502 1410 8361 2242 4954 1585 2310 707 1076 214Miscellaneous Offences 266 13 227 23 363 45 363 28 165 18 140 35Other Offences 33938 8568 26867 7072 39211 11291 21836 6957 8066 2435 2750 523
** Community By-Law offences cannot be separated into offences with and without violence. As such, sub-categories may not add to the total.# This category includes attempted offences.* Only those offenders whose age and sex were identified are included.

80 With Honour We Serve
Offenders:Indigenous Queensland by Type of Action^ by Age – 2014/15*
Arrest Caution Community Conference
Notice to Appear Summons Warrant Other
Offence Juvenile Adult Juvenile Adult Juvenile Adult Juvenile Adult Juvenile Adult Juvenile Adult Juvenile Adult
Homicide (Murder) 0 10 0 0 0 0 0 0 0 0 0 0 0 0Other Homicide 0 8 0 0 0 0 0 2 0 0 0 0 0 0
Attempted Murder 0 6 0 0 0 0 0 1 0 0 0 0 0 0
Conspiracy to Murder 0 0 0 0 0 0 0 0 0 0 0 0 0 0
Manslaughter (excl. by driving) 0 1 0 0 0 0 0 0 0 0 0 0 0 0
Driving Causing Death 0 1 0 0 0 0 0 1 0 0 0 0 0 0
Assault 327 1924 205 6 24 1 164 805 0 2 8 48 29 246Grievous Assault 11 132 3 0 1 0 1 23 0 1 0 4 3 20
Serious Assault 121 876 106 3 13 1 64 416 0 1 5 27 8 115
Serious Assault (Other) 99 373 18 0 4 0 23 83 0 0 0 4 8 16
Common Assault 96 543 78 3 6 0 76 283 0 0 3 13 10 95
Sexual Offences 31 206 46 5 6 1 4 39 0 0 1 10 37 62Rape and Attempted Rape 12 59 8 0 1 0 0 11 0 0 1 5 3 7
Other Sexual Offences 19 147 38 5 5 1 4 28 0 0 0 5 34 55
Robbery 88 167 6 1 3 0 11 20 0 0 3 16 2 2Armed Robbery 45 92 1 0 1 0 5 9 0 0 0 11 1 1
Unarmed Robbery 43 75 5 1 2 0 6 11 0 0 3 5 1 1
Other Offences Against the Person 19 208 25 1 0 0 14 50 0 1 0 7 1 22Kidnapping & Abduction etc. 2 25 3 0 0 0 0 7 0 0 0 3 0 0
Extortion 0 2 0 0 0 0 0 0 0 0 0 0 0 0
Stalking 1 26 2 0 0 0 0 0 0 0 0 0 0 3
Life Endangering Acts 16 155 20 1 0 0 14 43 0 1 0 4 1 19
Offences Against the Person 465 2523 282 13 33 2 193 916 0 3 12 81 69 332Unlawful Entry 1474 1662 438 7 105 1 366 584 0 0 17 119 40 85
Unlawful Entry With Intent - Dwelling** 788 1062 127 3 24 1 188 345 0 0 15 66 32 60
− Without Violence - Dwelling 768 982 127 3 23 1 187 328 0 0 15 59 32 60
− With Violence - Dwelling 20 80 0 0 1 0 1 17 0 0 0 7 0 0
Unlawful Entry With Intent - Shop 126 143 41 0 10 0 30 69 0 0 1 13 2 3
Unlawful Entry With Intent - Other 560 457 270 4 71 0 148 170 0 0 1 40 6 22
Arson 12 21 16 0 9 0 10 8 0 0 0 2 2 0Other Property Damage 669 987 439 8 88 1 399 715 3 0 3 35 22 96Unlawful Use of Motor Vehicle# 739 730 102 4 22 0 129 248 0 0 12 40 6 19Other Theft (excl. Unlawful Entry) 1251 1743 656 15 107 0 712 1897 1 3 19 133 56 127
Stealing from Dwellings 69 112 37 0 11 0 29 61 0 0 1 6 2 26
Shop Stealing 340 611 271 2 28 0 414 1024 0 0 5 37 15 20
Vehicles (steal from/enter with intent) 422 494 177 2 19 0 95 219 1 0 10 40 23 34
Other Stealing 420 526 171 11 49 0 174 593 0 3 3 50 16 47
Fraud 102 510 69 3 53 0 95 648 0 0 9 101 0 38Fraud by Computer 0 2 2 0 0 0 0 10 0 0 0 0 0 0
Fraud by Cheque 0 4 0 0 0 0 2 6 0 0 0 5 0 2
Fraud by Credit Card 98 396 60 3 52 0 90 398 0 0 9 77 0 29
Identity Fraud 0 3 0 0 0 0 0 0 0 0 0 0 0 0
Other Fraud 4 105 7 0 1 0 3 234 0 0 0 19 0 7
Handling Stolen Goods 194 304 68 3 9 0 172 378 0 0 0 8 3 12Possess Property Suspected Stolen 119 130 30 1 3 0 99 156 0 0 0 1 2 8
Receiving Stolen Property 13 37 11 2 2 0 15 50 0 0 0 2 1 0
Possess etc. Tainted Property 61 132 27 0 4 0 58 169 0 0 0 5 0 3
Other Handling Stolen Goods 1 5 0 0 0 0 0 3 0 0 0 0 0 1
Offences Against Property 4441 5957 1788 40 393 2 1883 4478 4 3 60 438 129 377Drug Offences 174 1987 170 21 14 1 147 4433 0 0 1 16 195 1148Prostitution Offences 0 2 0 0 0 0 0 1 0 0 0 0 0 0Liquor (excl. Drunkenness) 20 612 5 3 1 0 35 2707 0 13 0 3 2 63Breach Domestic Violence Protection Order 17 2652 4 4 0 0 6 1070 0 4 0 36 4 1140Trespassing and Vagrancy 370 435 197 8 27 0 322 352 0 0 0 3 8 21Weapons Act Offences 39 281 30 3 0 0 37 307 0 0 0 2 3 6Good Order Offences 643 6330 160 4 24 1 451 3800 2 8 5 62 26 2148Stock Related Offences 0 0 0 2 0 0 0 1 0 0 0 0 0 1Traffic and Related Offences 33 855 3 0 2 0 21 2948 0 0 0 17 0 26Miscellaneous Offences 37 138 44 5 5 0 15 132 0 0 0 10 6 25Other Offences 1333 13292 613 50 73 2 1034 15751 2 25 6 149 244 4578
** Community By-Law offences cannot be separated into offences with and without violence. As such, sub-categories may not add to the total.# This category includes attempted offences.^ See Glossary for definitions and inclusions (page 165).* Only those offenders whose age and sex were identified are included.
81Queensland Police Service - Annual Statistical Review 2014/15
Offenders:Non-Indigenous Queensland by Type of Action^ by Age – 2014/15*
** Community By-Law offences cannot be separated into offences with and without violence. As such, sub-categories may not add to the total.# This category includes attempted offences.^ See Glossary for definitions and inclusions (page 165).* Only those offenders whose age and sex were identified are included.
Arrest Caution Community Conference
Notice to Appear Summons Warrant Other
Offence Juvenile Adult Juvenile Adult Juvenile Adult Juvenile Adult Juvenile Adult Juvenile Adult Juvenile Adult
Homicide (Murder) 0 46 0 0 0 0 0 0 0 2 0 0 0 1Other Homicide 3 55 0 0 0 0 0 10 0 0 0 1 0 0
Attempted Murder 1 40 0 0 0 0 0 2 0 0 0 1 0 0
Conspiracy to Murder 2 0 0 0 0 0 0 0 0 0 0 0 0 0
Manslaughter (excl. by driving) 0 5 0 0 0 0 0 0 0 0 0 0 0 0
Driving Causing Death 0 10 0 0 0 0 0 8 0 0 0 0 0 0
Assault 364 4121 375 25 90 5 210 2227 2 7 6 166 48 760Grievous Assault 13 286 3 0 4 0 1 31 0 0 0 17 1 27
Serious Assault 134 1798 208 10 48 3 81 1194 1 4 4 103 19 368
Serious Assault (Other) 74 701 37 3 11 0 35 243 1 1 0 15 8 41
Common Assault 143 1336 127 12 27 2 93 759 0 2 2 31 20 324
Sexual Offences 48 1216 148 12 66 3 14 177 0 0 0 54 99 275Rape and Attempted Rape 13 352 5 0 19 1 4 26 0 0 0 15 13 57
Other Sexual Offences 35 864 143 12 47 2 10 151 0 0 0 39 86 218
Robbery 127 513 4 0 10 0 13 42 1 0 11 46 5 14Armed Robbery 61 299 3 0 5 0 2 22 1 0 1 30 4 9
Unarmed Robbery 66 214 1 0 5 0 11 20 0 0 10 16 1 5
Other Offences Against the Person 51 830 81 5 18 1 12 332 0 2 2 42 1 96Kidnapping & Abduction etc. 7 149 2 0 1 1 0 12 0 0 2 8 0 5
Extortion 1 34 0 0 0 0 0 8 0 0 0 3 0 1
Stalking 9 205 14 1 1 0 0 26 0 1 0 12 0 17
Life Endangering Acts 34 442 65 4 16 0 12 286 0 1 0 19 1 73
Offences Against the Person 593 6781 608 42 184 9 249 2788 3 11 19 309 153 1146Unlawful Entry 818 3311 468 63 101 3 243 1424 0 0 28 322 29 204
Unlawful Entry With Intent - Dwelling** 540 1818 192 44 33 2 170 787 0 0 28 184 14 118
− Without Violence - Dwelling 527 1560 190 44 33 2 170 747 0 0 25 168 14 115
− With Violence - Dwelling 13 258 2 0 0 0 0 40 0 0 3 16 0 3
Unlawful Entry With Intent - Shop 52 357 25 3 6 0 11 93 0 0 0 18 0 9
Unlawful Entry With Intent - Other 226 1136 251 16 62 1 62 544 0 0 0 120 15 77
Arson 16 137 33 1 23 0 3 27 0 0 0 5 2 9Other Property Damage 541 2592 821 47 223 2 428 2315 0 1 11 109 36 209Unlawful Use of Motor Vehicle# 389 1538 94 15 24 2 121 726 0 0 16 214 5 79Other Theft (excl. Unlawful Entry) 975 6490 1791 139 216 6 1082 12057 1 7 26 771 44 451
Stealing from Dwellings 76 307 110 3 18 2 27 328 0 1 0 56 7 78
Shop Stealing 306 2127 1149 36 81 3 722 6742 0 2 4 162 6 80
Vehicles (steal from/enter with intent) 280 1491 182 74 44 1 91 915 0 0 13 125 15 72
Other Stealing 313 2565 350 26 73 0 242 4072 1 4 9 428 16 221
Fraud 205 3215 243 7 71 7 169 3838 0 7 3 498 0 212Fraud by Computer 2 58 4 0 1 0 0 94 0 0 0 23 0 13
Fraud by Cheque 0 59 0 0 0 0 0 86 0 0 0 26 0 16
Fraud by Credit Card 185 1758 203 5 62 6 162 1476 0 0 3 206 0 68
Identity Fraud 1 97 4 1 0 0 0 98 0 0 0 4 0 8
Other Fraud 17 1243 32 1 8 1 7 2084 0 7 0 239 0 107
Handling Stolen Goods 120 1304 129 5 11 0 122 1805 0 1 1 57 4 34Possess Property Suspected Stolen 53 450 47 4 5 0 59 706 0 1 1 12 3 12
Receiving Stolen Property 15 111 18 0 1 0 14 164 0 0 0 5 0 0
Possess etc. Tainted Property 51 729 64 1 5 0 49 922 0 0 0 36 1 19
Other Handling Stolen Goods 1 14 0 0 0 0 0 13 0 0 0 4 0 3
Offences Against Property 3064 18587 3579 277 669 20 2168 22192 1 16 85 1976 120 1198Drug Offences 311 14310 1415 79 104 2 563 35791 0 7 0 265 823 10974Prostitution Offences 0 16 0 0 0 0 0 54 0 0 0 1 0 9Liquor (excl. Drunkenness) 9 2064 77 22 5 1 30 746 1 39 0 6 10 158Breach Domestic Violence Protection Order 11 5141 3 23 0 1 11 3065 0 10 1 220 3 2244Trespassing and Vagrancy 237 1096 434 53 41 0 318 1187 0 3 2 18 13 78Weapons Act Offences 58 1557 160 21 12 0 96 2827 0 0 0 37 4 67Good Order Offences 654 16248 366 42 34 3 807 12590 0 18 4 475 64 9769Stock Related Offences 0 3 0 386 0 0 0 66 0 0 0 0 0 1Traffic and Related Offences 36 4690 13 11 3 1 46 28341 0 50 0 135 0 391Miscellaneous Offences 28 662 767 69 51 0 16 687 0 1 1 34 19 80Other Offences 1344 45787 3235 706 250 8 1887 85354 1 128 8 1191 936 23771
82 With Honour We Serve
Offenders: Regions by Age and Sex – 2014/15*
10-14 15 16 17 18 19Offence Male Female Male Female Male Female Male Female Male Female Male Female
BrisbaneHomicide (Murder) 0 0 0 0 0 0 0 0 0 0 0 0Other Homicide 0 0 0 0 0 0 0 0 0 0 0 0Assault 88 53 48 29 65 21 65 32 41 24 78 18Sexual Offences 42 3 10 1 14 1 14 0 20 2 20 0Robbery 22 11 12 6 21 12 25 11 24 2 30 1Other Offences Against the Person 10 4 7 1 14 2 13 0 8 1 12 0Offences Against the Person 162 71 77 37 114 36 117 43 93 29 140 19Unlawful Entry 159 52 197 25 154 11 177 23 112 6 99 7Arson 11 7 1 1 5 0 4 0 4 0 6 0Other Property Damage 172 39 75 24 121 20 112 24 102 8 101 11Unlawful Use of Motor Vehicle# 65 16 128 14 114 10 102 11 59 9 45 10Other Theft (excl. Unlawful Entry) 427 319 323 188 297 180 344 142 299 106 206 127Fraud 61 31 59 13 129 58 74 22 129 33 79 44Handling Stolen Goods 47 9 35 14 44 14 35 14 38 15 41 12Offences Against Property 942 473 818 279 864 293 848 236 743 177 577 211
CentralHomicide (Murder) 0 0 0 0 0 0 0 0 1 0 0 0Other Homicide 0 0 0 0 0 0 0 0 2 1 0 0Assault 95 68 48 27 76 23 60 27 73 26 55 28Sexual Offences 65 7 21 5 18 0 20 0 18 1 28 0Robbery 3 0 7 2 4 3 11 0 8 1 4 1Other Offences Against the Person 11 1 14 1 7 1 5 1 13 5 10 3Offences Against the Person 174 76 90 35 105 27 96 28 115 34 97 32Unlawful Entry 302 63 166 27 153 20 151 12 75 6 73 6Arson 9 2 2 0 6 0 6 1 1 1 0 0Other Property Damage 251 70 151 34 117 23 74 23 76 17 53 11Unlawful Use of Motor Vehicle# 48 10 38 15 75 9 52 7 25 1 25 7Other Theft (excl. Unlawful Entry) 486 154 194 136 215 96 256 46 141 41 179 38Fraud 52 33 23 21 44 16 32 14 27 16 80 17Handling Stolen Goods 46 7 32 7 23 0 28 2 20 7 31 3Offences Against Property 1194 339 606 240 633 164 599 105 365 89 441 82
NorthernHomicide (Murder) 0 0 0 0 0 0 0 0 0 0 1 0Other Homicide 0 0 1 0 0 0 0 0 1 0 0 0Assault 148 109 90 44 90 42 89 30 59 25 91 21Sexual Offences 76 18 21 2 30 2 25 0 25 0 10 1Robbery 11 14 12 3 7 4 16 0 10 0 8 1Other Offences Against the Person 25 2 15 0 7 0 8 4 8 1 5 1Offences Against the Person 260 143 139 49 134 48 138 34 103 26 115 24Unlawful Entry 820 163 382 42 304 33 333 18 194 13 120 7Arson 16 3 2 0 1 0 1 0 4 0 4 0Other Property Damage 488 225 204 67 145 45 110 29 79 15 176 22Unlawful Use of Motor Vehicle# 246 51 149 51 151 51 155 26 87 11 54 9Other Theft (excl. Unlawful Entry) 777 361 257 132 205 111 216 85 140 44 129 32Fraud 50 36 20 6 6 10 35 1 6 9 31 4Handling Stolen Goods 122 68 50 21 66 7 49 4 22 3 23 3Offences Against Property 2519 907 1064 319 878 257 899 163 532 95 537 77
South EasternHomicide (Murder) 0 0 0 0 0 0 0 0 0 0 0 0Other Homicide 0 1 0 0 0 1 0 0 0 0 1 0Assault 94 54 30 25 59 15 35 15 51 16 51 14Sexual Offences 39 2 13 2 14 1 11 0 9 1 6 0Robbery 21 12 14 10 18 12 15 6 10 5 14 3Other Offences Against the Person 25 5 2 1 4 5 6 0 6 3 4 1Offences Against the Person 179 74 59 38 95 34 67 21 76 25 76 18Unlawful Entry 180 48 96 13 108 15 97 11 98 4 81 10Arson 11 0 4 0 4 0 3 0 1 0 1 0Other Property Damage 364 61 89 31 92 29 100 12 79 10 85 3Unlawful Use of Motor Vehicle# 63 14 39 11 67 23 68 16 52 10 57 14Other Theft (excl. Unlawful Entry) 307 212 136 99 166 113 161 90 174 67 167 75Fraud 45 16 31 22 29 33 46 6 72 54 47 50Handling Stolen Goods 29 12 20 8 22 21 29 13 35 14 27 15Offences Against Property 999 363 415 184 488 234 504 148 511 159 465 167
SouthernHomicide (Murder) 0 0 0 0 0 0 0 0 0 0 1 0Other Homicide 0 0 0 0 0 0 0 0 1 1 0 0Assault 155 69 69 46 74 27 59 20 44 18 62 22Sexual Offences 54 8 29 3 18 1 28 2 18 0 28 2Robbery 17 5 9 4 12 2 22 2 10 2 14 0Other Offences Against the Person 29 8 13 1 9 1 14 1 7 0 8 2Offences Against the Person 255 90 120 54 113 31 123 25 80 21 113 26Unlawful Entry 279 28 160 9 118 29 73 5 88 6 86 9Arson 15 4 16 3 5 2 1 2 6 1 1 1Other Property Damage 347 50 180 23 171 25 110 17 99 12 73 17Unlawful Use of Motor Vehicle# 61 15 71 4 47 6 32 2 30 1 32 7Other Theft (excl. Unlawful Entry) 394 156 208 67 211 87 178 49 164 53 247 61Fraud 66 28 26 5 48 7 34 5 34 50 49 11Handling Stolen Goods 32 9 32 9 28 3 29 4 24 9 27 11Offences Against Property 1194 290 693 120 628 159 457 84 445 132 515 117
# This category includes attempted offences.* Only those offenders whose age and sex were identified are included.
83Queensland Police Service - Annual Statistical Review 2014/15
Offenders: Regions by Age and Sex – 2014/15*
20-24 25-29 30-39 40-49 50-59 60+Offence Male Female Male Female Male Female Male Female Male Female Male Female
BrisbaneHomicide (Murder) 3 0 0 0 3 1 2 1 2 0 3 0Other Homicide 1 0 7 0 3 0 4 0 2 0 1 0Assault 346 83 300 83 407 95 251 69 80 19 41 9Sexual Offences 42 5 45 1 80 2 94 1 43 0 58 5Robbery 51 12 51 2 53 4 13 1 7 0 0 0Other Offences Against the Person 36 6 42 2 93 15 66 16 21 4 9 0Offences Against the Person 479 106 445 88 639 117 430 88 155 23 112 14Unlawful Entry 297 53 325 39 674 107 224 25 66 66 6 0Arson 10 0 6 0 6 0 3 3 4 1 1 0Other Property Damage 318 43 192 23 313 42 148 28 53 10 20 3Unlawful Use of Motor Vehicle# 186 60 192 37 233 61 83 11 15 2 1 0Other Theft (excl. Unlawful Entry) 861 550 995 493 1515 885 592 444 172 116 91 105Fraud 317 133 325 205 635 311 246 139 78 27 30 7Handling Stolen Goods 158 83 161 58 292 142 124 66 28 16 8 3Offences Against Property 2147 922 2196 855 3668 1548 1420 716 416 238 157 118
CentralHomicide (Murder) 3 0 2 0 6 0 1 0 1 1 0 0Other Homicide 6 0 2 0 4 1 3 2 1 0 1 0Assault 319 89 261 79 386 134 274 80 90 29 43 7Sexual Offences 46 3 53 3 76 7 107 1 67 0 59 0Robbery 22 4 22 2 21 4 8 0 3 0 0 0Other Offences Against the Person 40 6 43 9 80 12 59 20 21 1 12 1Offences Against the Person 436 102 383 93 573 158 452 103 183 31 115 8Unlawful Entry 290 18 171 20 300 45 128 21 53 5 3 0Arson 2 1 13 1 13 1 3 0 2 0 2 0Other Property Damage 286 47 213 27 261 48 115 39 35 8 20 0Unlawful Use of Motor Vehicle# 76 12 62 10 98 21 46 4 21 1 2 0Other Theft (excl. Unlawful Entry) 445 203 441 178 684 336 276 171 92 68 49 32Fraud 183 83 137 101 271 240 104 82 49 20 14 10Handling Stolen Goods 73 18 73 21 127 23 57 12 25 7 0 1Offences Against Property 1355 382 1110 358 1754 714 729 329 277 109 90 43
NorthernHomicide (Murder) 0 0 1 0 3 2 4 0 0 0 0 0Other Homicide 1 0 1 0 2 0 4 0 2 0 2 0Assault 468 137 352 129 563 194 355 119 110 53 56 4Sexual Offences 53 4 27 2 66 8 86 0 43 0 43 0Robbery 12 2 7 3 14 0 2 2 0 0 0 0Other Offences Against the Person 45 6 29 14 66 13 38 15 23 6 6 3Offences Against the Person 579 149 417 148 714 217 489 136 178 59 107 7Unlawful Entry 197 34 141 30 267 23 102 6 17 3 5 0Arson 6 1 3 1 6 1 7 2 2 1 0 0Other Property Damage 279 69 191 67 273 66 113 38 33 7 13 3Unlawful Use of Motor Vehicle# 110 23 38 16 57 8 15 1 2 1 0 0Other Theft (excl. Unlawful Entry) 392 156 268 121 440 228 201 73 86 47 24 25Fraud 121 102 132 87 141 85 131 37 20 14 5 4Handling Stolen Goods 81 20 51 19 93 28 44 11 22 2 1 2Offences Against Property 1186 405 824 341 1277 439 613 168 182 75 48 34
South EasternHomicide (Murder) 2 0 3 0 3 2 0 0 0 0 0 0Other Homicide 4 0 1 0 5 1 1 1 0 0 0 0Assault 255 60 218 54 307 89 195 60 63 25 33 9Sexual Offences 40 1 46 0 54 2 56 1 44 0 52 0Robbery 48 8 36 5 30 4 7 2 1 1 0 0Other Offences Against the Person 35 8 55 3 65 8 42 10 13 1 7 0Offences Against the Person 384 77 359 62 464 106 301 74 121 27 92 9Unlawful Entry 169 40 214 25 240 46 108 16 13 11 3 0Arson 11 0 4 1 7 1 6 0 0 0 1 0Other Property Damage 240 35 189 27 246 53 103 22 15 10 17 9Unlawful Use of Motor Vehicle# 168 42 178 39 158 42 46 15 8 1 0 0Other Theft (excl. Unlawful Entry) 618 303 702 317 1019 505 449 265 75 83 88 37Fraud 228 157 317 129 578 221 165 116 54 24 42 15Handling Stolen Goods 124 42 114 54 198 85 79 26 7 5 10 2Offences Against Property 1558 619 1718 592 2446 953 956 460 172 134 161 63
SouthernHomicide (Murder) 1 1 1 0 1 1 2 0 2 0 0 0Other Homicide 1 1 0 0 2 0 2 0 1 2 0 0Assault 287 89 232 71 405 155 219 86 96 25 50 10Sexual Offences 39 0 33 11 96 2 102 1 65 0 53 0Robbery 38 4 28 4 25 5 2 2 0 0 0 0Other Offences Against the Person 45 8 58 7 90 25 56 12 11 6 10 5Offences Against the Person 411 103 352 93 619 188 383 101 175 33 113 15Unlawful Entry 292 29 191 37 406 43 133 22 16 7 1 6Arson 4 0 4 1 7 3 5 1 1 2 2 0Other Property Damage 308 45 186 44 258 59 119 29 28 8 14 3Unlawful Use of Motor Vehicle# 105 22 75 18 125 27 33 5 4 3 3 0Other Theft (excl. Unlawful Entry) 589 267 480 258 865 472 334 180 109 69 43 34Fraud 203 118 180 115 303 195 116 97 45 11 11 5Handling Stolen Goods 121 45 80 40 162 71 63 26 18 9 13 4Offences Against Property 1622 526 1196 513 2126 870 803 360 221 109 87 52
# This category includes attempted offences.* Only those offenders whose age and sex were identified are included.
84 With Honour We Serve
Offenders
For all age groups, males were more likely than females to commit homicide (murder) with males aged twenty to thirty-nine years representing 52% of all offenders. Of those proceeded against for Homicide, 85% were male. Of the total 60 offenders responsible for homicide (murder) offences, only 9 were female.
Males aged twenty to twenty-nine years were most likely to commit other homicide offences. At every age, except ten to fourteen years, males committed more offences than females. In total, only 15% of those proceeded against for other homicide offences were female. Males aged twenty to forty-four years accounted for 61% of all offenders in this offence type.
* Only those offenders whose age and sex were identified are included.
Homicide (Murder)*Offendersper 100000Population
0
1
2
3
4
5
6
7
Offenders by Age and Sex
10-14 15-19 20-24 25-29 30-34 35-39 40-44 45-49 50-54 55+
Male
Female
Male Female
0.0 0.0
0
0
1.9
0.0
3
0
5.3
0.6
9
1
4.1
0.0
7
0
4.8
1.2
8
2
5.2
2.6
8
4
1.2
0.6
2
1
4.6
0.0
7
0
3.2
0.0
5
0
0.50.2
3
1
Other Homicide*Offendersper 100000Population
0
1
2
3
4
5
6
7
8
9
10
Offenders by Age and Sex
10-14 15-19 20-24 25-29 30-34 35-39 40-44 45-49 50-54 55+
Male
Female
Male Female
0.0
0.7
0
1
3.8
2.0
6
3
7.6
0.6
13
1
6.4
0.0
11
0
4.2
0.6
7
1
5.9
0.6
9
1
5.9
1.7
10
3
2.6
0.0
4
0
1.9
0.0
3
0
1.2
0.3
7
2
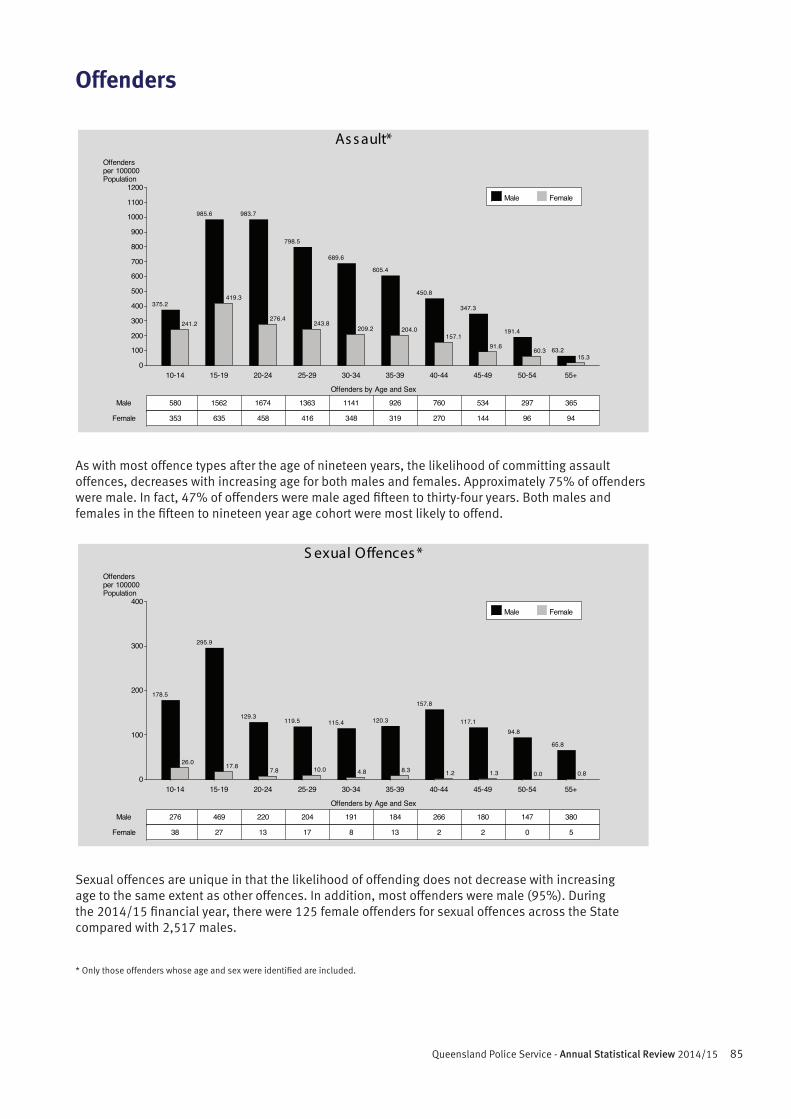
85Queensland Police Service - Annual Statistical Review 2014/15
Offenders
As with most offence types after the age of nineteen years, the likelihood of committing assault offences, decreases with increasing age for both males and females. Approximately 75% of offenders were male. In fact, 47% of offenders were male aged fifteen to thirty-four years. Both males and females in the fifteen to nineteen year age cohort were most likely to offend.
Sexual offences are unique in that the likelihood of offending does not decrease with increasing age to the same extent as other offences. In addition, most offenders were male (95%). During the 2014/15 financial year, there were 125 female offenders for sexual offences across the State compared with 2,517 males.
* Only those offenders whose age and sex were identified are included.
As s ault*Offendersper 100000Population
0
100
200
300
400
500
600
700
800
900
1000
1100
1200
Offenders by Age and Sex
10-14 15-19 20-24 25-29 30-34 35-39 40-44 45-49 50-54 55+
Male
Female
Male Female
375.2
241.2
580
353
985.6
419.3
1562
635
983.7
276.4
1674
458
798.5
243.8
1363
416
689.6
209.2
1141
348
605.4
204.0
926
319
450.8
157.1
760
270
347.3
91.6
534
144
191.4
60.3
297
96
63.215.3
365
94
S exual Offences *Offendersper 100000Population
0
100
200
300
400
Offenders by Age and Sex
10-14 15-19 20-24 25-29 30-34 35-39 40-44 45-49 50-54 55+
Male
Female
Male Female
178.5
26.0
276
38
295.9
17.8
469
27
129.3
7.8
220
13
119.5
10.0
204
17
115.4
4.8
191
8
120.3
8.3
184
13
157.8
1.2
266
2
117.1
1.3
180
2
94.8
0.0
147
0
65.8
0.8
380
5
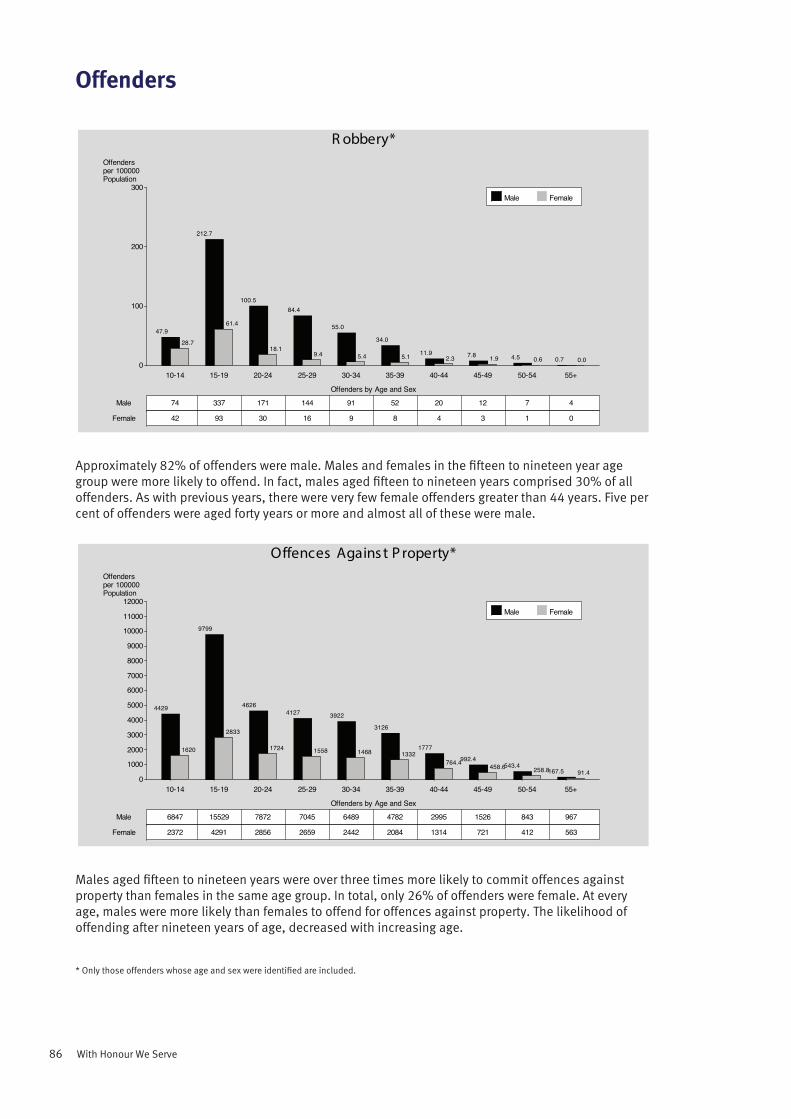
86 With Honour We Serve
Offenders
Approximately 82% of offenders were male. Males and females in the fifteen to nineteen year age group were more likely to offend. In fact, males aged fifteen to nineteen years comprised 30% of all offenders. As with previous years, there were very few female offenders greater than 44 years. Five per cent of offenders were aged forty years or more and almost all of these were male.
Males aged fifteen to nineteen years were over three times more likely to commit offences against property than females in the same age group. In total, only 26% of offenders were female. At every age, males were more likely than females to offend for offences against property. The likelihood of offending after nineteen years of age, decreased with increasing age.
* Only those offenders whose age and sex were identified are included.
R obbery*Offendersper 100000Population
0
100
200
300
Offenders by Age and Sex
10-14 15-19 20-24 25-29 30-34 35-39 40-44 45-49 50-54 55+
Male
Female
Male Female
47.9
28.7
74
42
212.7
61.4
337
93
100.5
18.1
171
30
84.4
9.4
144
16
55.0
5.4
91
9
34.0
5.1
52
8
11.92.3
20
4
7.8 1.9
12
3
4.5 0.6
7
1
0.7 0.0
4
0
Offences Agains t P roperty*Offendersper 100000Population
0
1000
2000
3000
4000
5000
6000
7000
8000
9000
10000
11000
12000
Offenders by Age and Sex
10-14 15-19 20-24 25-29 30-34 35-39 40-44 45-49 50-54 55+
Male
Female
Male Female
4429
1620
6847
2372
9799
2833
15529
4291
4626
1724
7872
2856
4127
1558
7045
2659
3922
1468
6489
2442
3126
1332
4782
2084
1777
764.4
2995
1314
992.4458.6
1526
721
543.4 258.8
843
412
167.5 91.4
967
563
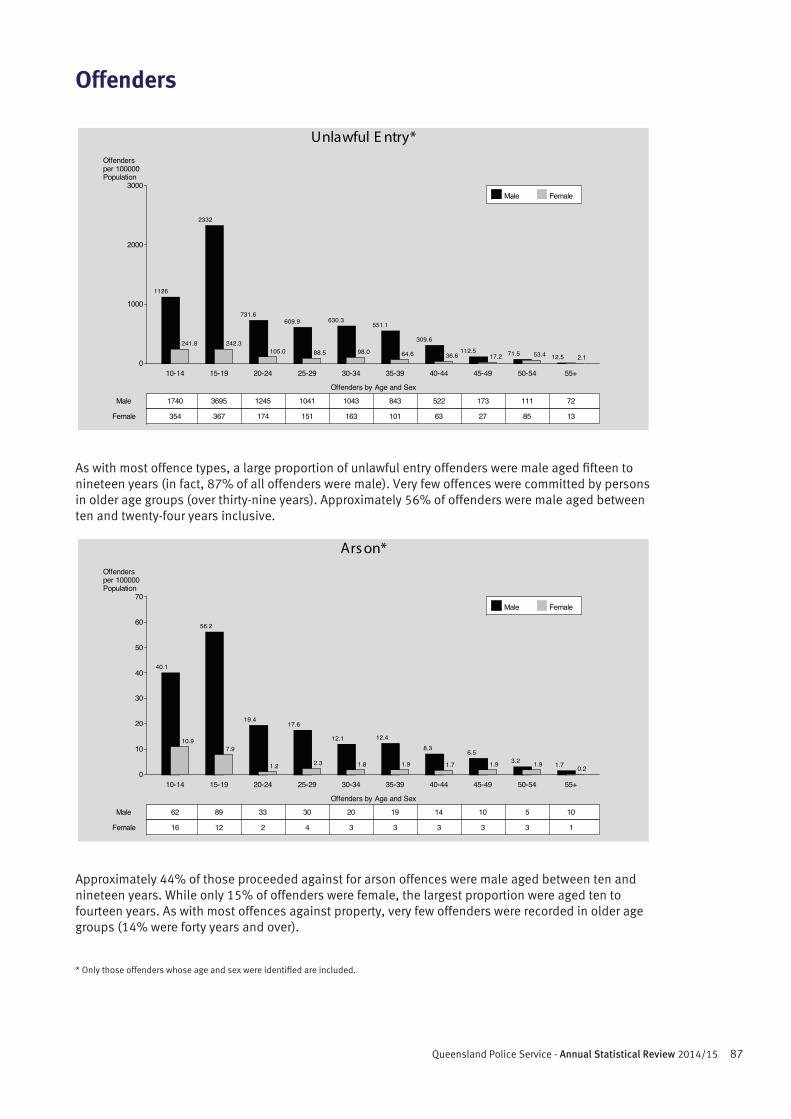
87Queensland Police Service - Annual Statistical Review 2014/15
Offenders
Unlawful E ntry*Offendersper 100000Population
0
1000
2000
3000
Offenders by Age and Sex
10-14 15-19 20-24 25-29 30-34 35-39 40-44 45-49 50-54 55+
Male
Female
Male Female
1126
241.8
1740
354
2332
242.3
3695
367
731.6
105.0
1245
174
609.9
88.5
1041
151
630.3
98.0
1043
163
551.1
64.6
843
101
309.6
36.6
522
63
112.517.2
173
27
71.5 53.4
111
85
12.5 2.1
72
13
As with most offence types, a large proportion of unlawful entry offenders were male aged fifteen to nineteen years (in fact, 87% of all offenders were male). Very few offences were committed by persons in older age groups (over thirty-nine years). Approximately 56% of offenders were male aged between ten and twenty-four years inclusive.
Ars on*Offendersper 100000Population
0
10
20
30
40
50
60
70
Offenders by Age and Sex
10-14 15-19 20-24 25-29 30-34 35-39 40-44 45-49 50-54 55+
Male
Female
Male Female
40.1
10.9
62
16
56.2
7.9
89
12
19.4
1.2
33
2
17.6
2.3
30
4
12.1
1.8
20
3
12.4
1.9
19
3
8.3
1.7
14
3
6.5
1.9
10
3
3.2 1.9
5
3
1.7 0.2
10
1
Approximately 44% of those proceeded against for arson offences were male aged between ten and nineteen years. While only 15% of offenders were female, the largest proportion were aged ten to fourteen years. As with most offences against property, very few offenders were recorded in older age groups (14% were forty years and over).
* Only those offenders whose age and sex were identified are included.
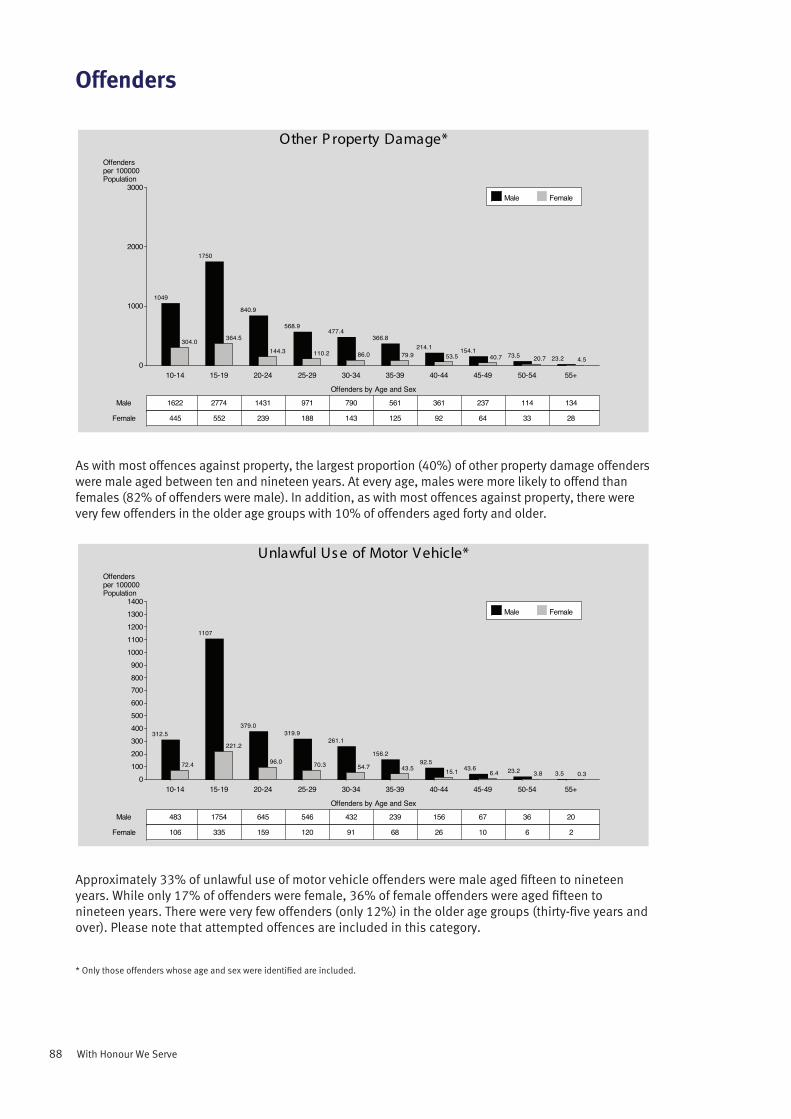
88 With Honour We Serve
Offenders
As with most offences against property, the largest proportion (40%) of other property damage offenders were male aged between ten and nineteen years. At every age, males were more likely to offend than females (82% of offenders were male). In addition, as with most offences against property, there were very few offenders in the older age groups with 10% of offenders aged forty and older.
Approximately 33% of unlawful use of motor vehicle offenders were male aged fifteen to nineteen years. While only 17% of offenders were female, 36% of female offenders were aged fifteen to nineteen years. There were very few offenders (only 12%) in the older age groups (thirty-five years and over). Please note that attempted offences are included in this category.
* Only those offenders whose age and sex were identified are included.
Other P roperty Damage*Offendersper 100000Population
0
1000
2000
3000
Offenders by Age and Sex
10-14 15-19 20-24 25-29 30-34 35-39 40-44 45-49 50-54 55+
Male
Female
Male Female
1049
304.0
1622
445
1750
364.5
2774
552
840.9
144.3
1431
239
568.9
110.2
971
188
477.4
86.0
790
143
366.8
79.9
561
125
214.153.5
361
92
154.140.7
237
64
73.5 20.7
114
33
23.2 4.5
134
28
Unlawful Us e of Motor Vehicle*Offendersper 100000Population
0100200300400500600700800900
10001100120013001400
Offenders by Age and Sex
10-14 15-19 20-24 25-29 30-34 35-39 40-44 45-49 50-54 55+
Male
Female
Male Female
312.5
72.4
483
106
1107
221.2
1754
335
379.0
96.0
645
159
319.9
70.3
546
120
261.1
54.7
432
91
156.2
43.5
239
68
92.515.1
156
26
43.66.4
67
10
23.2 3.8
36
6
3.5 0.3
20
2
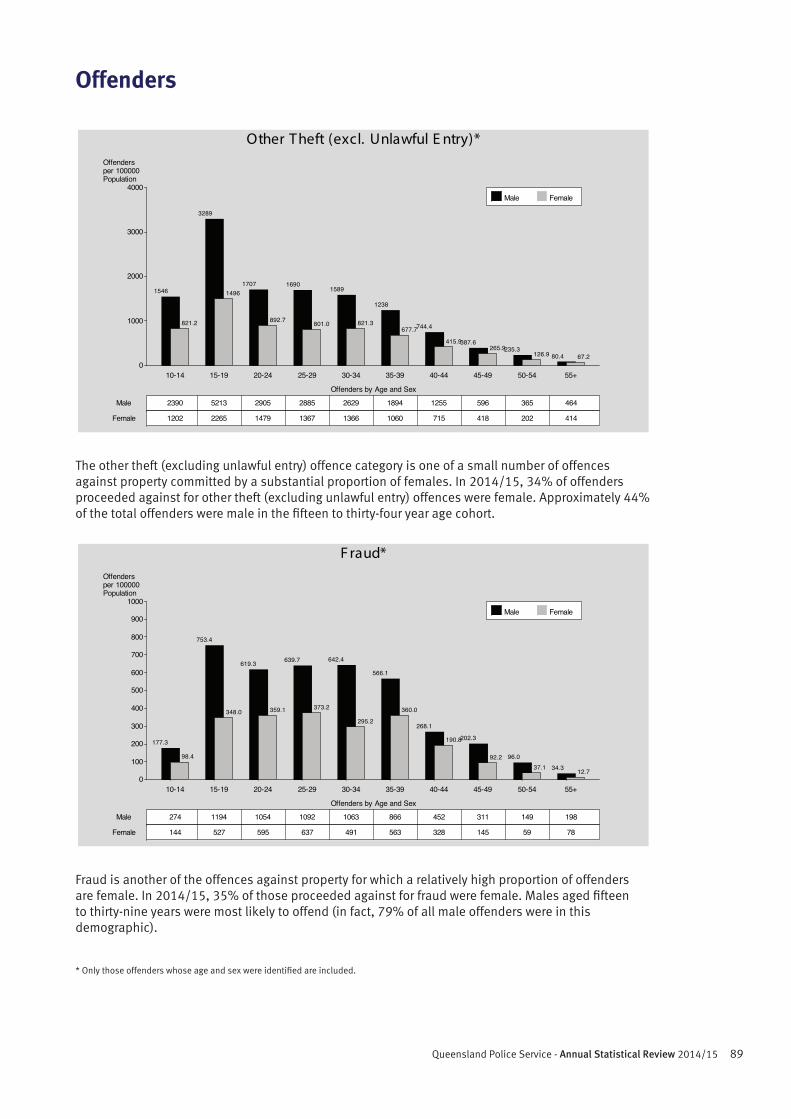
89Queensland Police Service - Annual Statistical Review 2014/15
Offenders
The other theft (excluding unlawful entry) offence category is one of a small number of offences against property committed by a substantial proportion of females. In 2014/15, 34% of offenders proceeded against for other theft (excluding unlawful entry) offences were female. Approximately 44% of the total offenders were male in the fifteen to thirty-four year age cohort.
Fraud is another of the offences against property for which a relatively high proportion of offenders are female. In 2014/15, 35% of those proceeded against for fraud were female. Males aged fifteen to thirty-nine years were most likely to offend (in fact, 79% of all male offenders were in this demographic).
* Only those offenders whose age and sex were identified are included.
Other Theft (excl. Unlawful E ntry)*Offendersper 100000Population
0
1000
2000
3000
4000
Offenders by Age and Sex
10-14 15-19 20-24 25-29 30-34 35-39 40-44 45-49 50-54 55+
Male
Female
Male Female
1546
821.2
2390
1202
3289
1496
5213
2265
1707
892.7
2905
1479
1690
801.0
2885
1367
1589
821.3
2629
1366
1238
677.7
1894
1060
744.4
415.9
1255
715
387.6265.9
596
418
235.3126.9
365
202
80.4 67.2
464
414
F raud*Offendersper 100000Population
0
100
200
300
400
500
600
700
800
900
1000
Offenders by Age and Sex
10-14 15-19 20-24 25-29 30-34 35-39 40-44 45-49 50-54 55+
Male
Female
Male Female
177.3
98.4
274
144
753.4
348.0
1194
527
619.3
359.1
1054
595
639.7
373.2
1092
637
642.4
295.2
1063
491
566.1
360.0
866
563
268.1
190.8
452
328
202.3
92.2
311
145
96.037.1
149
59
34.3 12.7
198
78
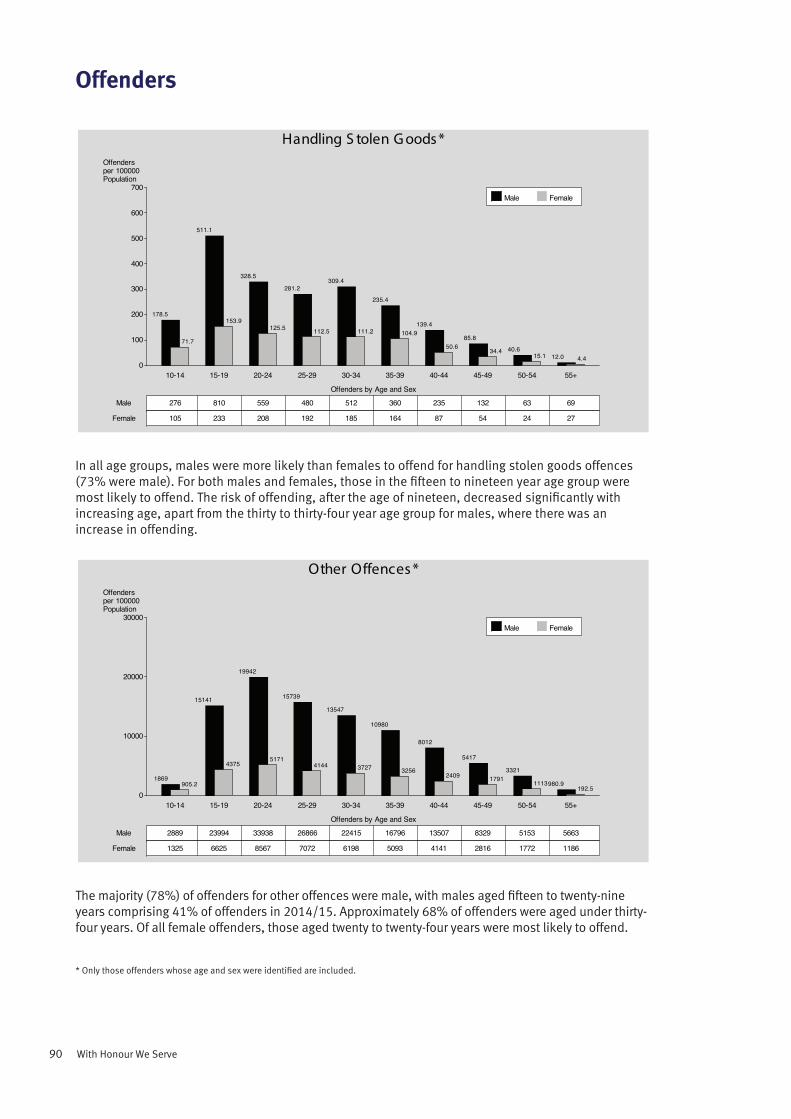
90 With Honour We Serve
Offenders
In all age groups, males were more likely than females to offend for handling stolen goods offences (73% were male). For both males and females, those in the fifteen to nineteen year age group were most likely to offend. The risk of offending, after the age of nineteen, decreased significantly with increasing age, apart from the thirty to thirty-four year age group for males, where there was an increase in offending.
The majority (78%) of offenders for other offences were male, with males aged fifteen to twenty-nine years comprising 41% of offenders in 2014/15. Approximately 68% of offenders were aged under thirty-four years. Of all female offenders, those aged twenty to twenty-four years were most likely to offend.
* Only those offenders whose age and sex were identified are included.
Handling S tolen G oods *Offendersper 100000Population
0
100
200
300
400
500
600
700
Offenders by Age and Sex
10-14 15-19 20-24 25-29 30-34 35-39 40-44 45-49 50-54 55+
Male
Female
Male Female
178.5
71.7
276
105
511.1
153.9
810
233
328.5
125.5
559
208
281.2
112.5
480
192
309.4
111.2
512
185
235.4
104.9
360
164
139.4
50.6
235
87
85.8
34.4
132
54
40.615.1
63
24
12.0 4.4
69
27
Other Offences *Offendersper 100000Population
0
10000
20000
30000
Offenders by Age and Sex
10-14 15-19 20-24 25-29 30-34 35-39 40-44 45-49 50-54 55+
Male
Female
Male Female
1869905.2
2889
1325
15141
4375
23994
6625
19942
5171
33938
8567
15739
4144
26866
7072
13547
3727
22415
6198
10980
3256
16796
5093
8012
2409
13507
4141
5417
1791
8329
2816
3321
1113
5153
1772
980.9192.5
5663
1186
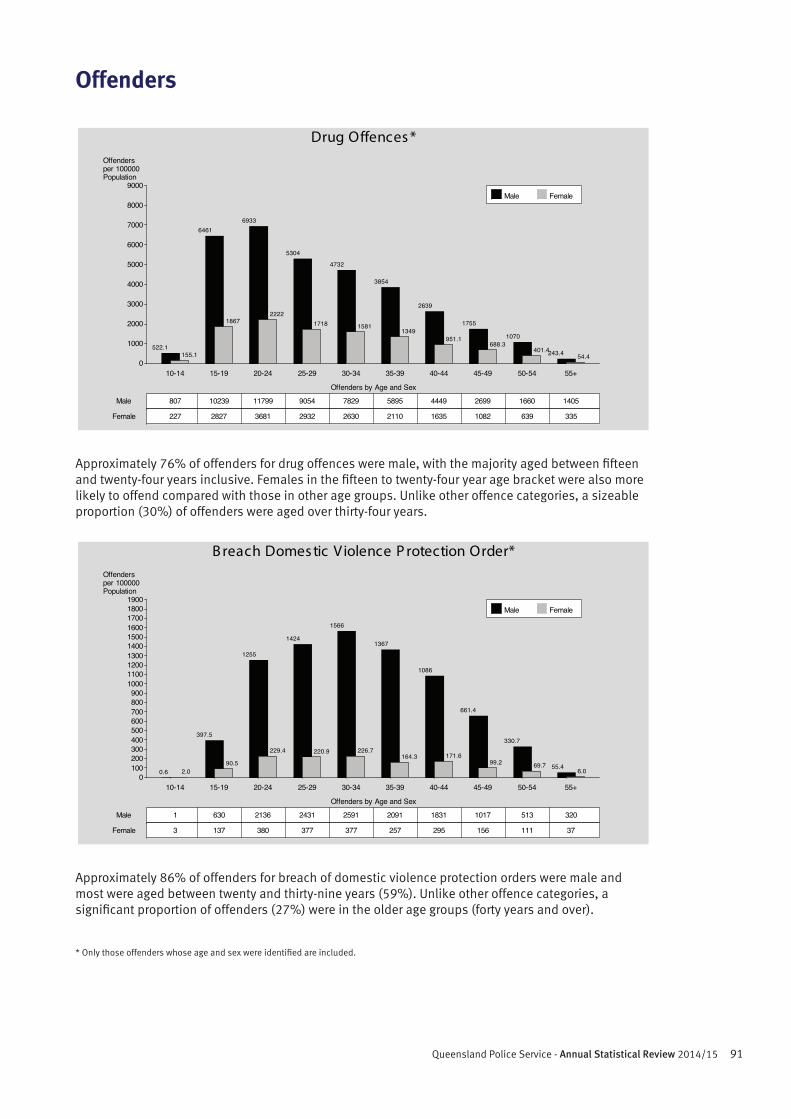
91Queensland Police Service - Annual Statistical Review 2014/15
Offenders
Approximately 76% of offenders for drug offences were male, with the majority aged between fifteen and twenty-four years inclusive. Females in the fifteen to twenty-four year age bracket were also more likely to offend compared with those in other age groups. Unlike other offence categories, a sizeable proportion (30%) of offenders were aged over thirty-four years.
Approximately 86% of offenders for breach of domestic violence protection orders were male and most were aged between twenty and thirty-nine years (59%). Unlike other offence categories, a significant proportion of offenders (27%) were in the older age groups (forty years and over).
* Only those offenders whose age and sex were identified are included.
Drug Offences *Offendersper 100000Population
0
1000
2000
3000
4000
5000
6000
7000
8000
9000
Offenders by Age and Sex
10-14 15-19 20-24 25-29 30-34 35-39 40-44 45-49 50-54 55+
Male
Female
Male Female
522.1155.1
807
227
6461
1867
10239
2827
6933
2222
11799
3681
5304
1718
9054
2932
4732
1581
7829
2630
3854
1349
5895
2110
2639
951.1
4449
1635
1755
688.3
2699
1082
1070
401.4
1660
639
243.4 54.4
1405
335
B reach Domes tic Violence P rotection Order*Offendersper 100000Population
0100200300400500600700800900
1000110012001300140015001600170018001900
Offenders by Age and Sex
10-14 15-19 20-24 25-29 30-34 35-39 40-44 45-49 50-54 55+
Male
Female
Male Female
0.6 2.0
1
3
397.5
90.5
630
137
1255
229.4
2136
380
1424
220.9
2431
377
1566
226.7
2591
377
1367
164.3
2091
257
1086
171.6
1831
295
661.4
99.2
1017
156
330.7
69.7
513
111
55.4 6.0
320
37
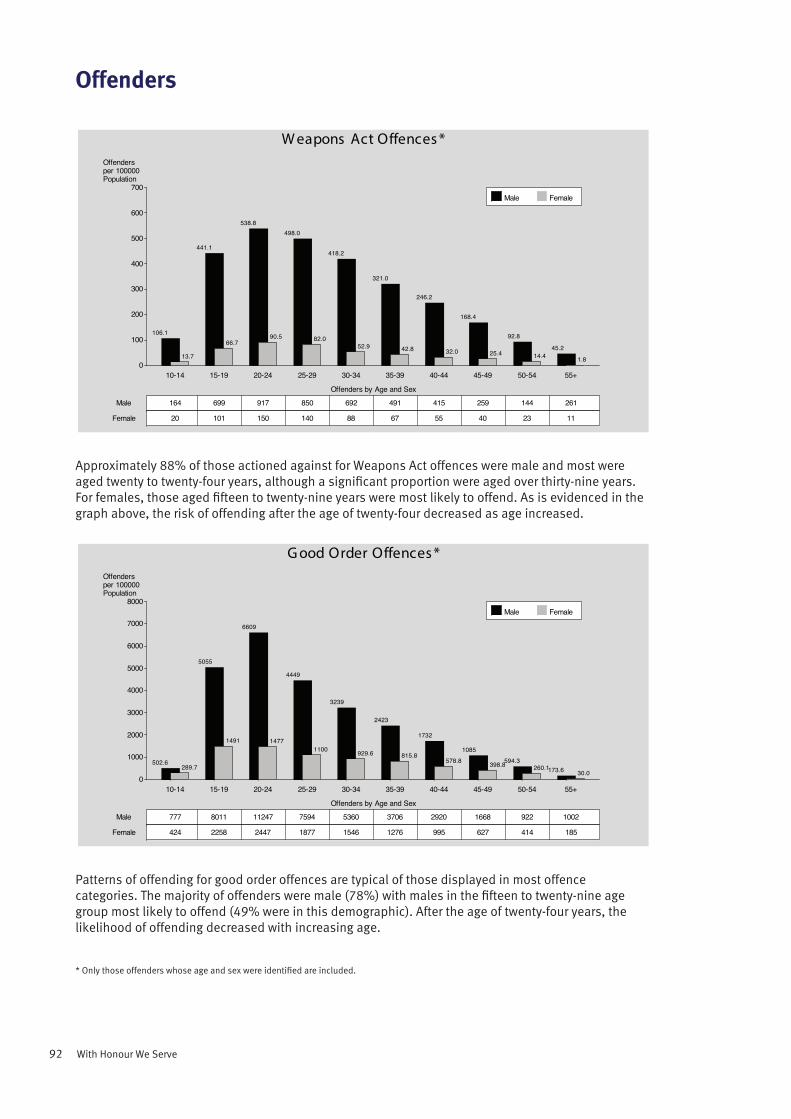
92 With Honour We Serve
Offenders
Approximately 88% of those actioned against for Weapons Act offences were male and most were aged twenty to twenty-four years, although a significant proportion were aged over thirty-nine years. For females, those aged fifteen to twenty-nine years were most likely to offend. As is evidenced in the graph above, the risk of offending after the age of twenty-four decreased as age increased.
Patterns of offending for good order offences are typical of those displayed in most offence categories. The majority of offenders were male (78%) with males in the fifteen to twenty-nine age group most likely to offend (49% were in this demographic). After the age of twenty-four years, the likelihood of offending decreased with increasing age.
* Only those offenders whose age and sex were identified are included.
W eapons Act Offences *Offendersper 100000Population
0
100
200
300
400
500
600
700
Offenders by Age and Sex
10-14 15-19 20-24 25-29 30-34 35-39 40-44 45-49 50-54 55+
Male
Female
Male Female
106.1
13.7
164
20
441.1
66.7
699
101
538.8
90.5
917
150
498.0
82.0
850
140
418.2
52.9
692
88
321.0
42.8
491
67
246.2
32.0
415
55
168.4
25.4
259
40
92.8
14.4
144
23
45.2
1.8
261
11
G ood Order Offences *Offendersper 100000Population
0
1000
2000
3000
4000
5000
6000
7000
8000
Offenders by Age and Sex
10-14 15-19 20-24 25-29 30-34 35-39 40-44 45-49 50-54 55+
Male
Female
Male Female
502.6289.7
777
424
5055
1491
8011
2258
6609
1477
11247
2447
4449
1100
7594
1877
3239
929.6
5360
1546
2423
815.8
3706
1276
1732
578.8
2920
995
1085
398.8
1668
627
594.3260.1
922
414
173.6 30.0
1002
185
93Queensland Police Service - Annual Statistical Review 2014/15
Crime Locations
This section provides a breakdown of crime by the type of location in which the offence occurred. The location classifications are based on those used by the Australian Bureau of Statistics in compiling the Recorded Crime – Victims, Australia (4510.0). A crime location is defined as the initial site where a criminal incident occurred, classified by the primary function of that site where the site has more than one function. This definition may encompass any surrounding land, yard, car parking area, together with any other structures existing at the location.
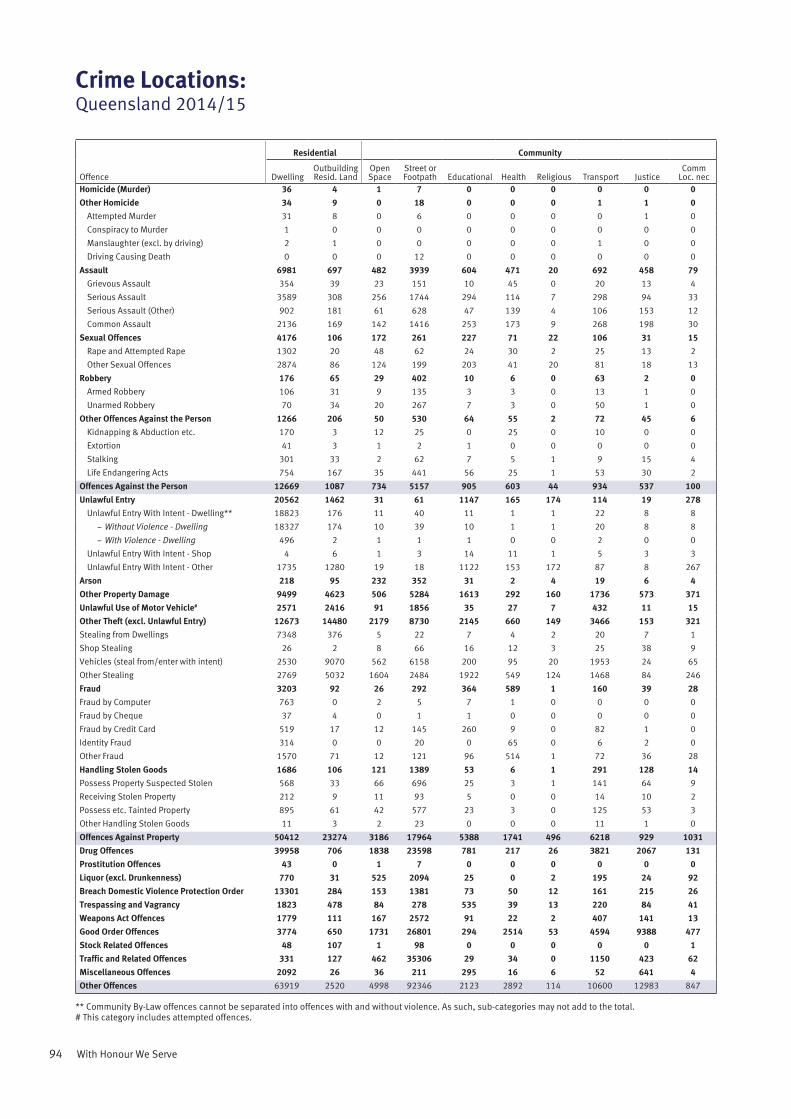
94 With Honour We Serve
Offence
Residential Community
DwellingOutbuilding Resid. Land
Open Space
Street or Footpath Educational Health Religious Transport Justice
Comm Loc. nec
Homicide (Murder) 36 4 1 7 0 0 0 0 0 0Other Homicide 34 9 0 18 0 0 0 1 1 0
Attempted Murder 31 8 0 6 0 0 0 0 1 0
Conspiracy to Murder 1 0 0 0 0 0 0 0 0 0
Manslaughter (excl. by driving) 2 1 0 0 0 0 0 1 0 0
Driving Causing Death 0 0 0 12 0 0 0 0 0 0
Assault 6981 697 482 3939 604 471 20 692 458 79Grievous Assault 354 39 23 151 10 45 0 20 13 4
Serious Assault 3589 308 256 1744 294 114 7 298 94 33
Serious Assault (Other) 902 181 61 628 47 139 4 106 153 12
Common Assault 2136 169 142 1416 253 173 9 268 198 30
Sexual Offences 4176 106 172 261 227 71 22 106 31 15Rape and Attempted Rape 1302 20 48 62 24 30 2 25 13 2
Other Sexual Offences 2874 86 124 199 203 41 20 81 18 13
Robbery 176 65 29 402 10 6 0 63 2 0Armed Robbery 106 31 9 135 3 3 0 13 1 0
Unarmed Robbery 70 34 20 267 7 3 0 50 1 0
Other Offences Against the Person 1266 206 50 530 64 55 2 72 45 6Kidnapping & Abduction etc. 170 3 12 25 0 25 0 10 0 0
Extortion 41 3 1 2 1 0 0 0 0 0
Stalking 301 33 2 62 7 5 1 9 15 4
Life Endangering Acts 754 167 35 441 56 25 1 53 30 2
Offences Against the Person 12669 1087 734 5157 905 603 44 934 537 100Unlawful Entry 20562 1462 31 61 1147 165 174 114 19 278
Unlawful Entry With Intent - Dwelling** 18823 176 11 40 11 1 1 22 8 8
− Without Violence - Dwelling 18327 174 10 39 10 1 1 20 8 8
− With Violence - Dwelling 496 2 1 1 1 0 0 2 0 0
Unlawful Entry With Intent - Shop 4 6 1 3 14 11 1 5 3 3
Unlawful Entry With Intent - Other 1735 1280 19 18 1122 153 172 87 8 267
Arson 218 95 232 352 31 2 4 19 6 4Other Property Damage 9499 4623 506 5284 1613 292 160 1736 573 371Unlawful Use of Motor Vehicle# 2571 2416 91 1856 35 27 7 432 11 15Other Theft (excl. Unlawful Entry) 12673 14480 2179 8730 2145 660 149 3466 153 321Stealing from Dwellings 7348 376 5 22 7 4 2 20 7 1
Shop Stealing 26 2 8 66 16 12 3 25 38 9
Vehicles (steal from/enter with intent) 2530 9070 562 6158 200 95 20 1953 24 65
Other Stealing 2769 5032 1604 2484 1922 549 124 1468 84 246
Fraud 3203 92 26 292 364 589 1 160 39 28Fraud by Computer 763 0 2 5 7 1 0 0 0 0
Fraud by Cheque 37 4 0 1 1 0 0 0 0 0
Fraud by Credit Card 519 17 12 145 260 9 0 82 1 0
Identity Fraud 314 0 0 20 0 65 0 6 2 0
Other Fraud 1570 71 12 121 96 514 1 72 36 28
Handling Stolen Goods 1686 106 121 1389 53 6 1 291 128 14Possess Property Suspected Stolen 568 33 66 696 25 3 1 141 64 9
Receiving Stolen Property 212 9 11 93 5 0 0 14 10 2
Possess etc. Tainted Property 895 61 42 577 23 3 0 125 53 3
Other Handling Stolen Goods 11 3 2 23 0 0 0 11 1 0
Offences Against Property 50412 23274 3186 17964 5388 1741 496 6218 929 1031Drug Offences 39958 706 1838 23598 781 217 26 3821 2067 131Prostitution Offences 43 0 1 7 0 0 0 0 0 0Liquor (excl. Drunkenness) 770 31 525 2094 25 0 2 195 24 92Breach Domestic Violence Protection Order 13301 284 153 1381 73 50 12 161 215 26Trespassing and Vagrancy 1823 478 84 278 535 39 13 220 84 41Weapons Act Offences 1779 111 167 2572 91 22 2 407 141 13Good Order Offences 3774 650 1731 26801 294 2514 53 4594 9388 477Stock Related Offences 48 107 1 98 0 0 0 0 0 1Traffic and Related Offences 331 127 462 35306 29 34 0 1150 423 62Miscellaneous Offences 2092 26 36 211 295 16 6 52 641 4Other Offences 63919 2520 4998 92346 2123 2892 114 10600 12983 847
Crime Locations:Queensland 2014/15
** Community By-Law offences cannot be separated into offences with and without violence. As such, sub-categories may not add to the total.# This category includes attempted offences.
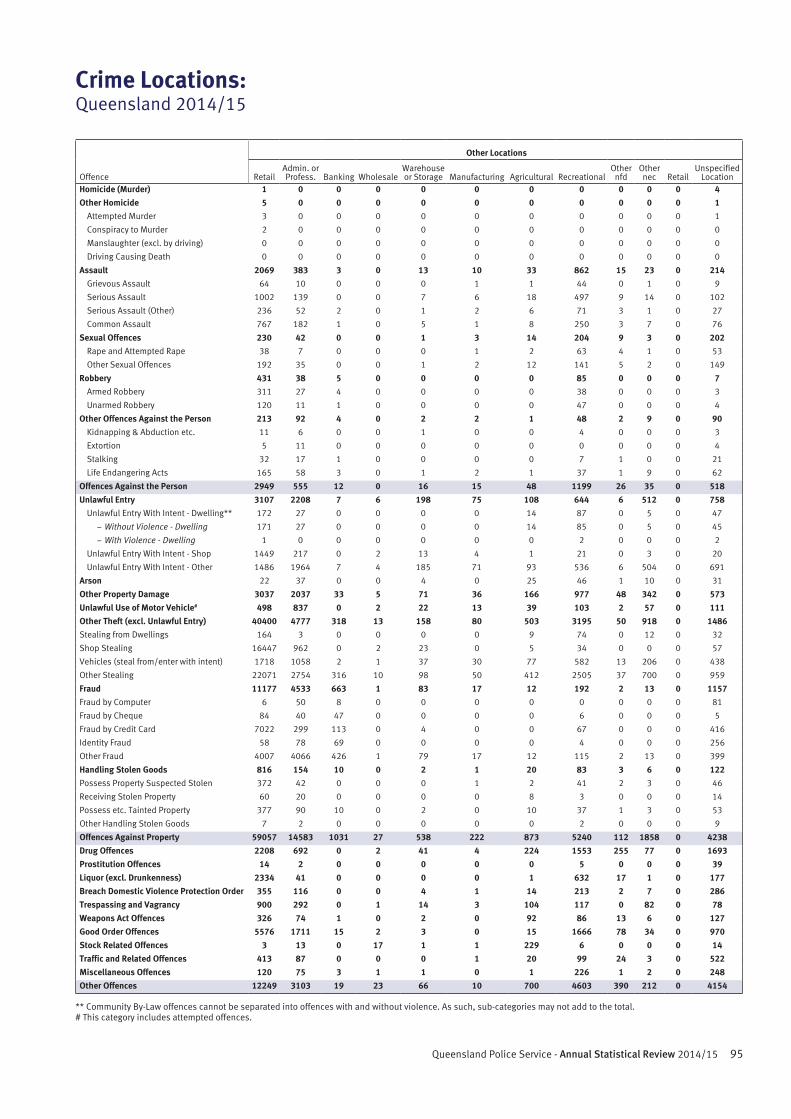
95Queensland Police Service - Annual Statistical Review 2014/15
Offence
Other Locations
RetailAdmin. or Profess. Banking Wholesale
Warehouse or Storage Manufacturing Agricultural Recreational
Other nfd
Other nec Retail
Unspecified Location
Homicide (Murder) 1 0 0 0 0 0 0 0 0 0 0 4Other Homicide 5 0 0 0 0 0 0 0 0 0 0 1
Attempted Murder 3 0 0 0 0 0 0 0 0 0 0 1
Conspiracy to Murder 2 0 0 0 0 0 0 0 0 0 0 0
Manslaughter (excl. by driving) 0 0 0 0 0 0 0 0 0 0 0 0
Driving Causing Death 0 0 0 0 0 0 0 0 0 0 0 0
Assault 2069 383 3 0 13 10 33 862 15 23 0 214Grievous Assault 64 10 0 0 0 1 1 44 0 1 0 9
Serious Assault 1002 139 0 0 7 6 18 497 9 14 0 102
Serious Assault (Other) 236 52 2 0 1 2 6 71 3 1 0 27
Common Assault 767 182 1 0 5 1 8 250 3 7 0 76
Sexual Offences 230 42 0 0 1 3 14 204 9 3 0 202Rape and Attempted Rape 38 7 0 0 0 1 2 63 4 1 0 53
Other Sexual Offences 192 35 0 0 1 2 12 141 5 2 0 149
Robbery 431 38 5 0 0 0 0 85 0 0 0 7Armed Robbery 311 27 4 0 0 0 0 38 0 0 0 3
Unarmed Robbery 120 11 1 0 0 0 0 47 0 0 0 4
Other Offences Against the Person 213 92 4 0 2 2 1 48 2 9 0 90Kidnapping & Abduction etc. 11 6 0 0 1 0 0 4 0 0 0 3
Extortion 5 11 0 0 0 0 0 0 0 0 0 4
Stalking 32 17 1 0 0 0 0 7 1 0 0 21
Life Endangering Acts 165 58 3 0 1 2 1 37 1 9 0 62
Offences Against the Person 2949 555 12 0 16 15 48 1199 26 35 0 518Unlawful Entry 3107 2208 7 6 198 75 108 644 6 512 0 758
Unlawful Entry With Intent - Dwelling** 172 27 0 0 0 0 14 87 0 5 0 47
− Without Violence - Dwelling 171 27 0 0 0 0 14 85 0 5 0 45
− With Violence - Dwelling 1 0 0 0 0 0 0 2 0 0 0 2
Unlawful Entry With Intent - Shop 1449 217 0 2 13 4 1 21 0 3 0 20
Unlawful Entry With Intent - Other 1486 1964 7 4 185 71 93 536 6 504 0 691
Arson 22 37 0 0 4 0 25 46 1 10 0 31
Other Property Damage 3037 2037 33 5 71 36 166 977 48 342 0 573Unlawful Use of Motor Vehicle# 498 837 0 2 22 13 39 103 2 57 0 111Other Theft (excl. Unlawful Entry) 40400 4777 318 13 158 80 503 3195 50 918 0 1486Stealing from Dwellings 164 3 0 0 0 0 9 74 0 12 0 32
Shop Stealing 16447 962 0 2 23 0 5 34 0 0 0 57
Vehicles (steal from/enter with intent) 1718 1058 2 1 37 30 77 582 13 206 0 438
Other Stealing 22071 2754 316 10 98 50 412 2505 37 700 0 959
Fraud 11177 4533 663 1 83 17 12 192 2 13 0 1157Fraud by Computer 6 50 8 0 0 0 0 0 0 0 0 81
Fraud by Cheque 84 40 47 0 0 0 0 6 0 0 0 5
Fraud by Credit Card 7022 299 113 0 4 0 0 67 0 0 0 416
Identity Fraud 58 78 69 0 0 0 0 4 0 0 0 256
Other Fraud 4007 4066 426 1 79 17 12 115 2 13 0 399
Handling Stolen Goods 816 154 10 0 2 1 20 83 3 6 0 122Possess Property Suspected Stolen 372 42 0 0 0 1 2 41 2 3 0 46
Receiving Stolen Property 60 20 0 0 0 0 8 3 0 0 0 14
Possess etc. Tainted Property 377 90 10 0 2 0 10 37 1 3 0 53
Other Handling Stolen Goods 7 2 0 0 0 0 0 2 0 0 0 9
Offences Against Property 59057 14583 1031 27 538 222 873 5240 112 1858 0 4238Drug Offences 2208 692 0 2 41 4 224 1553 255 77 0 1693Prostitution Offences 14 2 0 0 0 0 0 5 0 0 0 39Liquor (excl. Drunkenness) 2334 41 0 0 0 0 1 632 17 1 0 177Breach Domestic Violence Protection Order 355 116 0 0 4 1 14 213 2 7 0 286Trespassing and Vagrancy 900 292 0 1 14 3 104 117 0 82 0 78Weapons Act Offences 326 74 1 0 2 0 92 86 13 6 0 127Good Order Offences 5576 1711 15 2 3 0 15 1666 78 34 0 970Stock Related Offences 3 13 0 17 1 1 229 6 0 0 0 14Traffic and Related Offences 413 87 0 0 0 1 20 99 24 3 0 522Miscellaneous Offences 120 75 3 1 1 0 1 226 1 2 0 248Other Offences 12249 3103 19 23 66 10 700 4603 390 212 0 4154
Crime Locations:Queensland 2014/15
** Community By-Law offences cannot be separated into offences with and without violence. As such, sub-categories may not add to the total.# This category includes attempted offences.

96 With Honour We Serve
97Queensland Police Service - Annual Statistical Review 2014/15
District Crime
In this section, a detailed examination of reported and cleared crime is provided for the Queensland Police Service’s statistical regions and districts during the 2014/15 financial year.
The tables include some offences where the Police District in which the offence occurred cannot be identified according to current police boundaries. There are two instances where this may occur:
• The offence was detected as part of a covert operation, and the location of the offence has not currently been recorded to maintain security; and
• The accuracy of the address has not been determined at the time that the data was extracted for inclusion in this publication. That is, the address was not verified.
In these cases, the offences have been included in the highest hierarchical geographical level available. Therefore, police district statistics may not always sum to regional totals, or regional statistics to Queensland totals.
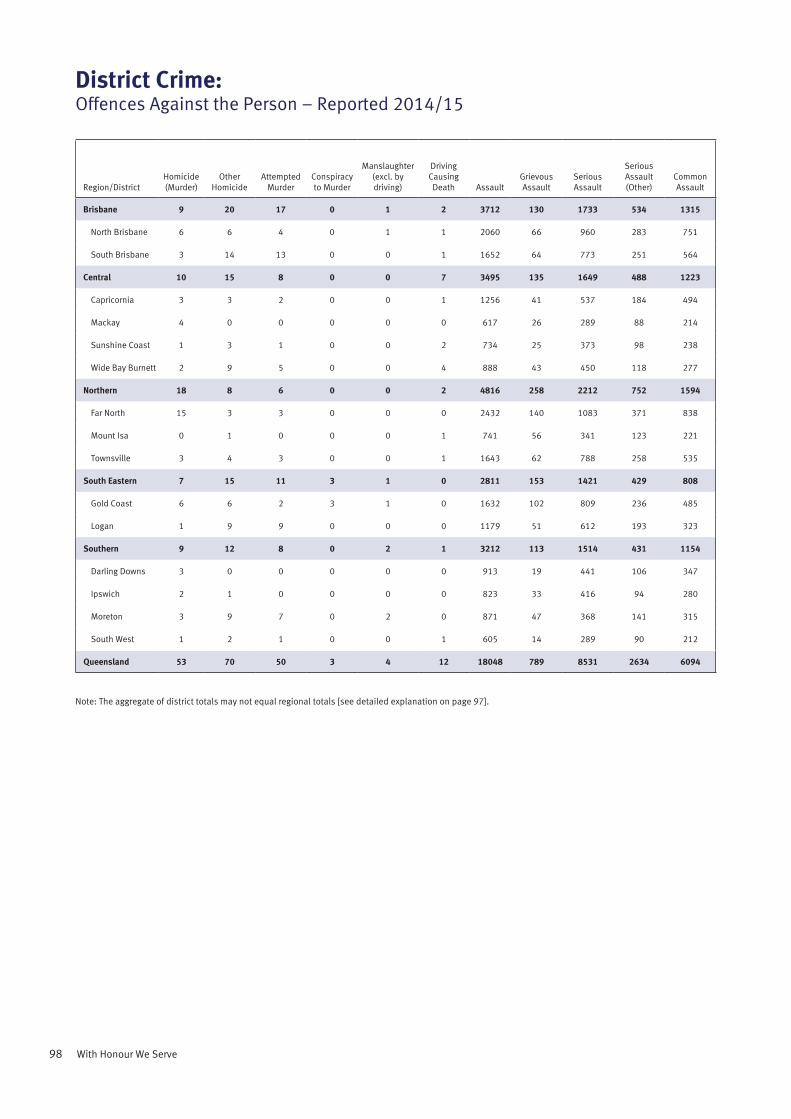
98 With Honour We Serve
Region/DistrictHomicide (Murder)
Other Homicide
Attempted Murder
Conspiracy to Murder
Manslaughter (excl. by driving)
Driving Causing Death Assault
Grievous Assault
Serious Assault
Serious Assault (Other)
Common Assault
Brisbane 9 20 17 0 1 2 3712 130 1733 534 1315
North Brisbane 6 6 4 0 1 1 2060 66 960 283 751
South Brisbane 3 14 13 0 0 1 1652 64 773 251 564
Central 10 15 8 0 0 7 3495 135 1649 488 1223
Capricornia 3 3 2 0 0 1 1256 41 537 184 494
Mackay 4 0 0 0 0 0 617 26 289 88 214
Sunshine Coast 1 3 1 0 0 2 734 25 373 98 238
Wide Bay Burnett 2 9 5 0 0 4 888 43 450 118 277
Northern 18 8 6 0 0 2 4816 258 2212 752 1594
Far North 15 3 3 0 0 0 2432 140 1083 371 838
Mount Isa 0 1 0 0 0 1 741 56 341 123 221
Townsville 3 4 3 0 0 1 1643 62 788 258 535
South Eastern 7 15 11 3 1 0 2811 153 1421 429 808
Gold Coast 6 6 2 3 1 0 1632 102 809 236 485
Logan 1 9 9 0 0 0 1179 51 612 193 323
Southern 9 12 8 0 2 1 3212 113 1514 431 1154
Darling Downs 3 0 0 0 0 0 913 19 441 106 347
Ipswich 2 1 0 0 0 0 823 33 416 94 280
Moreton 3 9 7 0 2 0 871 47 368 141 315
South West 1 2 1 0 0 1 605 14 289 90 212
Queensland 53 70 50 3 4 12 18048 789 8531 2634 6094
District Crime:Offences Against the Person – Reported 2014/15
Note: The aggregate of district totals may not equal regional totals [see detailed explanation on page 97].
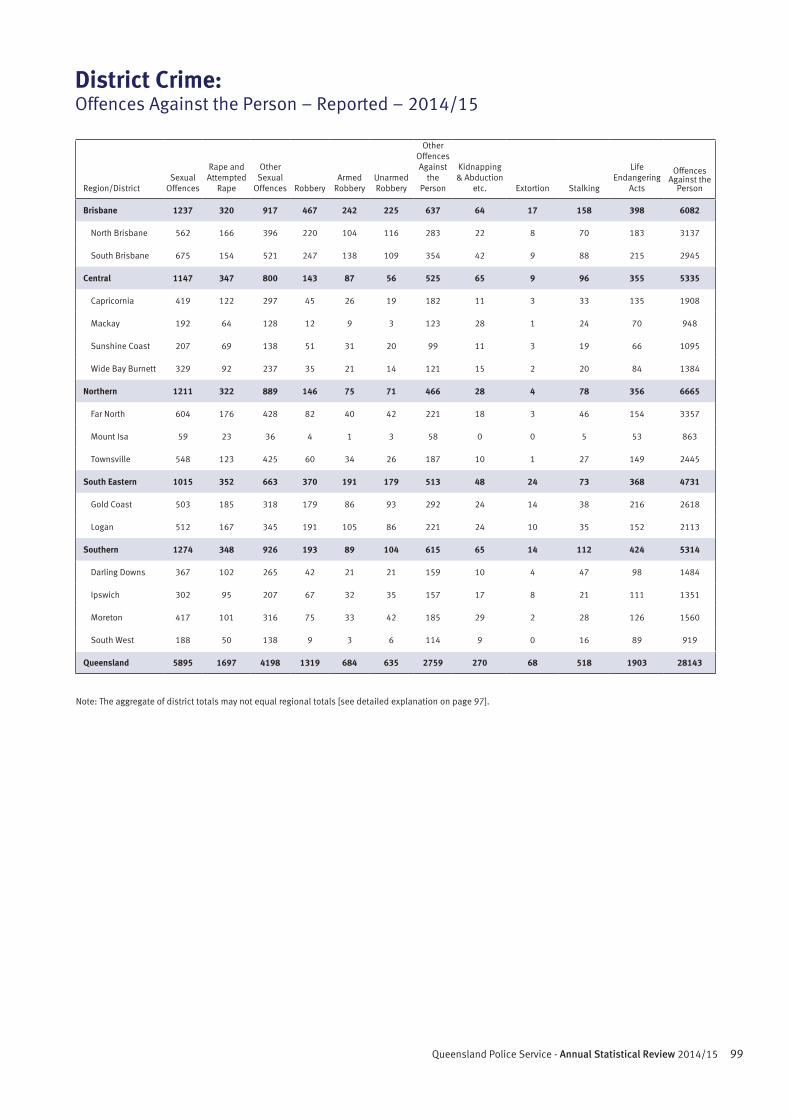
99Queensland Police Service - Annual Statistical Review 2014/15
Region/DistrictSexual
Offences
Rape and Attempted
Rape
Other Sexual
Offences RobberyArmed
RobberyUnarmed Robbery
Other Offences Against
the Person
Kidnapping & Abduction
etc. Extortion Stalking
Life Endangering
Acts
Offences Against the
Person
Brisbane 1237 320 917 467 242 225 637 64 17 158 398 6082
North Brisbane 562 166 396 220 104 116 283 22 8 70 183 3137
South Brisbane 675 154 521 247 138 109 354 42 9 88 215 2945
Central 1147 347 800 143 87 56 525 65 9 96 355 5335
Capricornia 419 122 297 45 26 19 182 11 3 33 135 1908
Mackay 192 64 128 12 9 3 123 28 1 24 70 948
Sunshine Coast 207 69 138 51 31 20 99 11 3 19 66 1095
Wide Bay Burnett 329 92 237 35 21 14 121 15 2 20 84 1384
Northern 1211 322 889 146 75 71 466 28 4 78 356 6665
Far North 604 176 428 82 40 42 221 18 3 46 154 3357
Mount Isa 59 23 36 4 1 3 58 0 0 5 53 863
Townsville 548 123 425 60 34 26 187 10 1 27 149 2445
South Eastern 1015 352 663 370 191 179 513 48 24 73 368 4731
Gold Coast 503 185 318 179 86 93 292 24 14 38 216 2618
Logan 512 167 345 191 105 86 221 24 10 35 152 2113
Southern 1274 348 926 193 89 104 615 65 14 112 424 5314
Darling Downs 367 102 265 42 21 21 159 10 4 47 98 1484
Ipswich 302 95 207 67 32 35 157 17 8 21 111 1351
Moreton 417 101 316 75 33 42 185 29 2 28 126 1560
South West 188 50 138 9 3 6 114 9 0 16 89 919
Queensland 5895 1697 4198 1319 684 635 2759 270 68 518 1903 28143
District Crime:Offences Against the Person – Reported – 2014/15
Note: The aggregate of district totals may not equal regional totals [see detailed explanation on page 97].
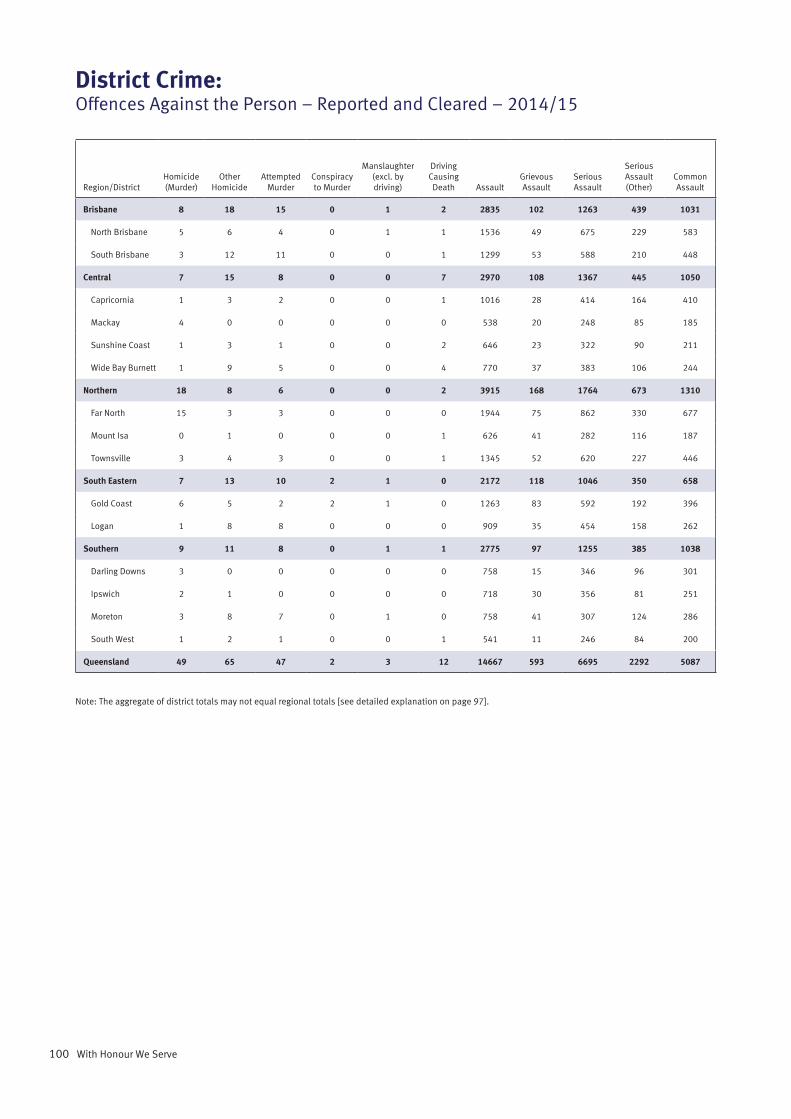
100 With Honour We Serve
Region/DistrictHomicide (Murder)
Other Homicide
Attempted Murder
Conspiracy to Murder
Manslaughter (excl. by driving)
Driving Causing Death Assault
Grievous Assault
Serious Assault
Serious Assault (Other)
Common Assault
Brisbane 8 18 15 0 1 2 2835 102 1263 439 1031
North Brisbane 5 6 4 0 1 1 1536 49 675 229 583
South Brisbane 3 12 11 0 0 1 1299 53 588 210 448
Central 7 15 8 0 0 7 2970 108 1367 445 1050
Capricornia 1 3 2 0 0 1 1016 28 414 164 410
Mackay 4 0 0 0 0 0 538 20 248 85 185
Sunshine Coast 1 3 1 0 0 2 646 23 322 90 211
Wide Bay Burnett 1 9 5 0 0 4 770 37 383 106 244
Northern 18 8 6 0 0 2 3915 168 1764 673 1310
Far North 15 3 3 0 0 0 1944 75 862 330 677
Mount Isa 0 1 0 0 0 1 626 41 282 116 187
Townsville 3 4 3 0 0 1 1345 52 620 227 446
South Eastern 7 13 10 2 1 0 2172 118 1046 350 658
Gold Coast 6 5 2 2 1 0 1263 83 592 192 396
Logan 1 8 8 0 0 0 909 35 454 158 262
Southern 9 11 8 0 1 1 2775 97 1255 385 1038
Darling Downs 3 0 0 0 0 0 758 15 346 96 301
Ipswich 2 1 0 0 0 0 718 30 356 81 251
Moreton 3 8 7 0 1 0 758 41 307 124 286
South West 1 2 1 0 0 1 541 11 246 84 200
Queensland 49 65 47 2 3 12 14667 593 6695 2292 5087
District Crime:Offences Against the Person – Reported and Cleared – 2014/15
Note: The aggregate of district totals may not equal regional totals [see detailed explanation on page 97].
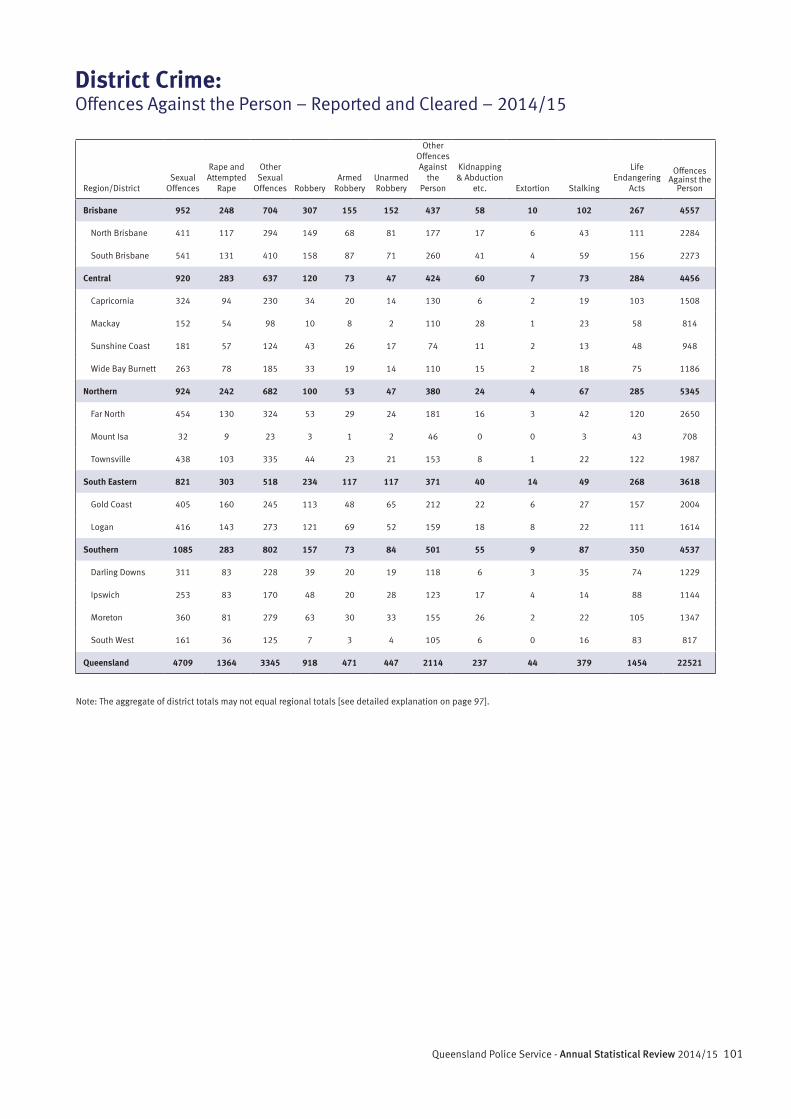
101Queensland Police Service - Annual Statistical Review 2014/15
Region/DistrictSexual
Offences
Rape and Attempted
Rape
Other Sexual
Offences RobberyArmed
RobberyUnarmed Robbery
Other Offences Against
the Person
Kidnapping & Abduction
etc. Extortion Stalking
Life Endangering
Acts
Offences Against the
Person
Brisbane 952 248 704 307 155 152 437 58 10 102 267 4557
North Brisbane 411 117 294 149 68 81 177 17 6 43 111 2284
South Brisbane 541 131 410 158 87 71 260 41 4 59 156 2273
Central 920 283 637 120 73 47 424 60 7 73 284 4456
Capricornia 324 94 230 34 20 14 130 6 2 19 103 1508
Mackay 152 54 98 10 8 2 110 28 1 23 58 814
Sunshine Coast 181 57 124 43 26 17 74 11 2 13 48 948
Wide Bay Burnett 263 78 185 33 19 14 110 15 2 18 75 1186
Northern 924 242 682 100 53 47 380 24 4 67 285 5345
Far North 454 130 324 53 29 24 181 16 3 42 120 2650
Mount Isa 32 9 23 3 1 2 46 0 0 3 43 708
Townsville 438 103 335 44 23 21 153 8 1 22 122 1987
South Eastern 821 303 518 234 117 117 371 40 14 49 268 3618
Gold Coast 405 160 245 113 48 65 212 22 6 27 157 2004
Logan 416 143 273 121 69 52 159 18 8 22 111 1614
Southern 1085 283 802 157 73 84 501 55 9 87 350 4537
Darling Downs 311 83 228 39 20 19 118 6 3 35 74 1229
Ipswich 253 83 170 48 20 28 123 17 4 14 88 1144
Moreton 360 81 279 63 30 33 155 26 2 22 105 1347
South West 161 36 125 7 3 4 105 6 0 16 83 817
Queensland 4709 1364 3345 918 471 447 2114 237 44 379 1454 22521
District Crime:Offences Against the Person – Reported and Cleared – 2014/15
Note: The aggregate of district totals may not equal regional totals [see detailed explanation on page 97].
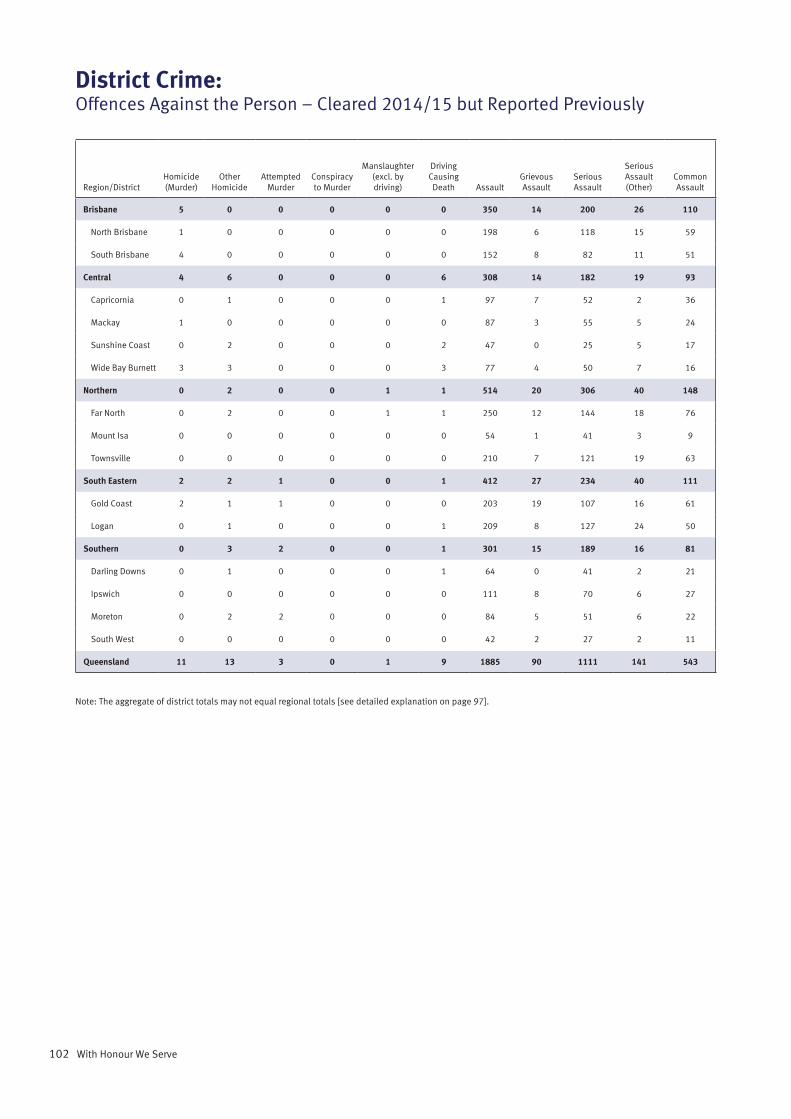
102 With Honour We Serve
District Crime:Offences Against the Person – Cleared 2014/15 but Reported Previously
Region/DistrictHomicide (Murder)
Other Homicide
Attempted Murder
Conspiracy to Murder
Manslaughter (excl. by driving)
Driving Causing Death Assault
Grievous Assault
Serious Assault
Serious Assault (Other)
Common Assault
Brisbane 5 0 0 0 0 0 350 14 200 26 110
North Brisbane 1 0 0 0 0 0 198 6 118 15 59
South Brisbane 4 0 0 0 0 0 152 8 82 11 51
Central 4 6 0 0 0 6 308 14 182 19 93
Capricornia 0 1 0 0 0 1 97 7 52 2 36
Mackay 1 0 0 0 0 0 87 3 55 5 24
Sunshine Coast 0 2 0 0 0 2 47 0 25 5 17
Wide Bay Burnett 3 3 0 0 0 3 77 4 50 7 16
Northern 0 2 0 0 1 1 514 20 306 40 148
Far North 0 2 0 0 1 1 250 12 144 18 76
Mount Isa 0 0 0 0 0 0 54 1 41 3 9
Townsville 0 0 0 0 0 0 210 7 121 19 63
South Eastern 2 2 1 0 0 1 412 27 234 40 111
Gold Coast 2 1 1 0 0 0 203 19 107 16 61
Logan 0 1 0 0 0 1 209 8 127 24 50
Southern 0 3 2 0 0 1 301 15 189 16 81
Darling Downs 0 1 0 0 0 1 64 0 41 2 21
Ipswich 0 0 0 0 0 0 111 8 70 6 27
Moreton 0 2 2 0 0 0 84 5 51 6 22
South West 0 0 0 0 0 0 42 2 27 2 11
Queensland 11 13 3 0 1 9 1885 90 1111 141 543
Note: The aggregate of district totals may not equal regional totals [see detailed explanation on page 97].

103Queensland Police Service - Annual Statistical Review 2014/15
Region/DistrictSexual
Offences
Rape and Attempted
Rape
Other Sexual
Offences RobberyArmed
RobberyUnarmed Robbery
Other Offences Against
the Person
Kidnapping & Abduction
etc. Extortion Stalking
Life Endangering
Acts
Offences Against the
Person
Brisbane 176 61 115 35 21 14 87 4 10 33 40 653
North Brisbane 105 42 63 21 11 10 49 1 2 21 25 374
South Brisbane 71 19 52 14 10 4 38 3 8 12 15 279
Central 176 44 132 11 5 6 72 7 1 17 47 577
Capricornia 42 10 32 6 3 3 22 3 1 5 13 168
Mackay 42 13 29 2 1 1 16 2 0 5 9 148
Sunshine Coast 35 4 31 1 0 1 12 1 0 3 8 97
Wide Bay Burnett 57 17 40 2 1 1 22 1 0 4 17 164
Northern 223 50 173 14 4 10 57 8 0 16 33 810
Far North 71 10 61 7 4 3 29 3 0 11 15 359
Mount Isa 11 5 6 0 0 0 5 0 0 2 3 70
Townsville 141 35 106 7 0 7 23 5 0 3 15 381
South Eastern 206 34 172 33 15 18 74 5 4 21 44 729
Gold Coast 72 10 62 10 5 5 47 3 4 12 28 335
Logan 134 24 110 23 10 13 27 2 0 9 16 394
Southern 300 56 244 16 9 7 60 6 3 17 34 680
Darling Downs 135 11 124 1 1 0 13 2 0 4 7 214
Ipswich 78 12 66 11 6 5 24 1 1 8 14 224
Moreton 50 25 25 3 2 1 17 3 1 3 10 156
South West 37 8 29 1 0 1 6 0 1 2 3 86
Queensland 1086 245 841 109 54 55 350 30 18 104 198 3454
District Crime:Offences Against the Person – Cleared 2014/15 but Reported Previously
Note: The aggregate of district totals may not equal regional totals [see detailed explanation on page 97].
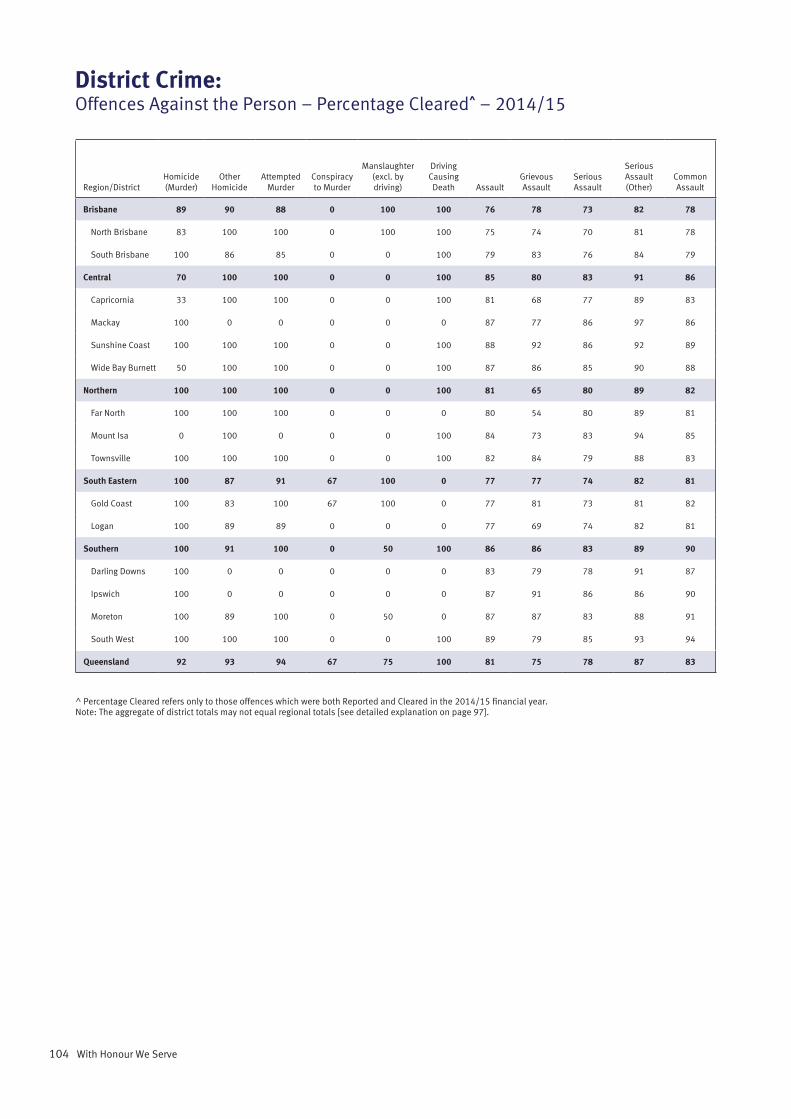
104 With Honour We Serve
District Crime:Offences Against the Person – Percentage Cleared^ – 2014/15
Region/DistrictHomicide (Murder)
Other Homicide
Attempted Murder
Conspiracy to Murder
Manslaughter (excl. by driving)
Driving Causing Death Assault
Grievous Assault
Serious Assault
Serious Assault (Other)
Common Assault
Brisbane 89 90 88 0 100 100 76 78 73 82 78
North Brisbane 83 100 100 0 100 100 75 74 70 81 78
South Brisbane 100 86 85 0 0 100 79 83 76 84 79
Central 70 100 100 0 0 100 85 80 83 91 86
Capricornia 33 100 100 0 0 100 81 68 77 89 83
Mackay 100 0 0 0 0 0 87 77 86 97 86
Sunshine Coast 100 100 100 0 0 100 88 92 86 92 89
Wide Bay Burnett 50 100 100 0 0 100 87 86 85 90 88
Northern 100 100 100 0 0 100 81 65 80 89 82
Far North 100 100 100 0 0 0 80 54 80 89 81
Mount Isa 0 100 0 0 0 100 84 73 83 94 85
Townsville 100 100 100 0 0 100 82 84 79 88 83
South Eastern 100 87 91 67 100 0 77 77 74 82 81
Gold Coast 100 83 100 67 100 0 77 81 73 81 82
Logan 100 89 89 0 0 0 77 69 74 82 81
Southern 100 91 100 0 50 100 86 86 83 89 90
Darling Downs 100 0 0 0 0 0 83 79 78 91 87
Ipswich 100 0 0 0 0 0 87 91 86 86 90
Moreton 100 89 100 0 50 0 87 87 83 88 91
South West 100 100 100 0 0 100 89 79 85 93 94
Queensland 92 93 94 67 75 100 81 75 78 87 83
^ Percentage Cleared refers only to those offences which were both Reported and Cleared in the 2014/15 financial year.Note: The aggregate of district totals may not equal regional totals [see detailed explanation on page 97].
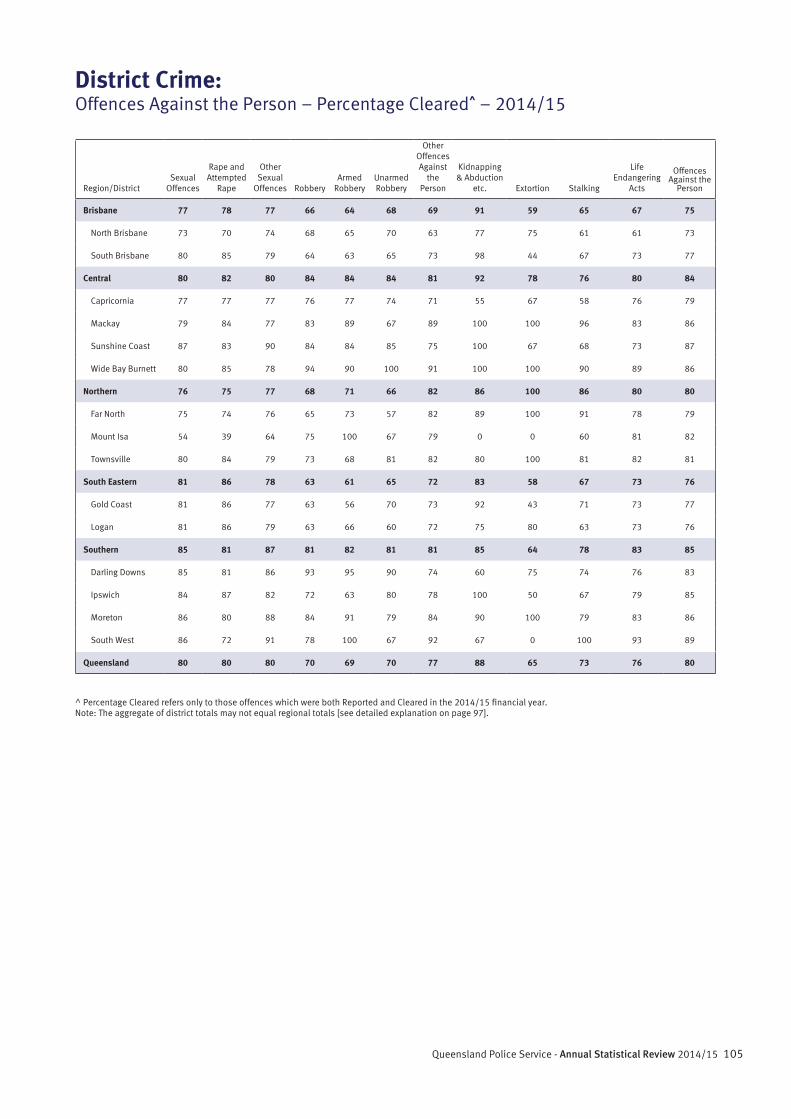
105Queensland Police Service - Annual Statistical Review 2014/15
Region/DistrictSexual
Offences
Rape and Attempted
Rape
Other Sexual
Offences RobberyArmed
RobberyUnarmed Robbery
Other Offences Against
the Person
Kidnapping & Abduction
etc. Extortion Stalking
Life Endangering
Acts
Offences Against the
Person
Brisbane 77 78 77 66 64 68 69 91 59 65 67 75
North Brisbane 73 70 74 68 65 70 63 77 75 61 61 73
South Brisbane 80 85 79 64 63 65 73 98 44 67 73 77
Central 80 82 80 84 84 84 81 92 78 76 80 84
Capricornia 77 77 77 76 77 74 71 55 67 58 76 79
Mackay 79 84 77 83 89 67 89 100 100 96 83 86
Sunshine Coast 87 83 90 84 84 85 75 100 67 68 73 87
Wide Bay Burnett 80 85 78 94 90 100 91 100 100 90 89 86
Northern 76 75 77 68 71 66 82 86 100 86 80 80
Far North 75 74 76 65 73 57 82 89 100 91 78 79
Mount Isa 54 39 64 75 100 67 79 0 0 60 81 82
Townsville 80 84 79 73 68 81 82 80 100 81 82 81
South Eastern 81 86 78 63 61 65 72 83 58 67 73 76
Gold Coast 81 86 77 63 56 70 73 92 43 71 73 77
Logan 81 86 79 63 66 60 72 75 80 63 73 76
Southern 85 81 87 81 82 81 81 85 64 78 83 85
Darling Downs 85 81 86 93 95 90 74 60 75 74 76 83
Ipswich 84 87 82 72 63 80 78 100 50 67 79 85
Moreton 86 80 88 84 91 79 84 90 100 79 83 86
South West 86 72 91 78 100 67 92 67 0 100 93 89
Queensland 80 80 80 70 69 70 77 88 65 73 76 80
District Crime:Offences Against the Person – Percentage Cleared^ – 2014/15
^ Percentage Cleared refers only to those offences which were both Reported and Cleared in the 2014/15 financial year.Note: The aggregate of district totals may not equal regional totals [see detailed explanation on page 97].
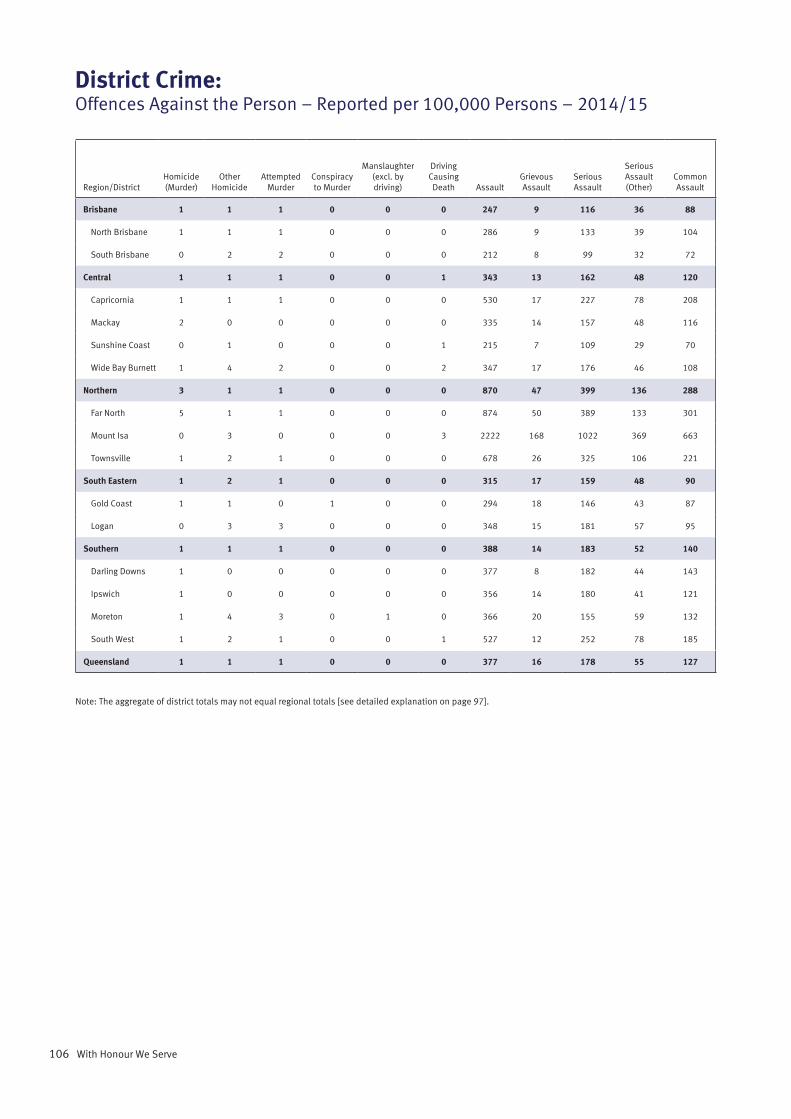
106 With Honour We Serve
District Crime:Offences Against the Person – Reported per 100,000 Persons – 2014/15
Region/DistrictHomicide (Murder)
Other Homicide
Attempted Murder
Conspiracy to Murder
Manslaughter (excl. by driving)
Driving Causing Death Assault
Grievous Assault
Serious Assault
Serious Assault (Other)
Common Assault
Brisbane 1 1 1 0 0 0 247 9 116 36 88
North Brisbane 1 1 1 0 0 0 286 9 133 39 104
South Brisbane 0 2 2 0 0 0 212 8 99 32 72
Central 1 1 1 0 0 1 343 13 162 48 120
Capricornia 1 1 1 0 0 0 530 17 227 78 208
Mackay 2 0 0 0 0 0 335 14 157 48 116
Sunshine Coast 0 1 0 0 0 1 215 7 109 29 70
Wide Bay Burnett 1 4 2 0 0 2 347 17 176 46 108
Northern 3 1 1 0 0 0 870 47 399 136 288
Far North 5 1 1 0 0 0 874 50 389 133 301
Mount Isa 0 3 0 0 0 3 2222 168 1022 369 663
Townsville 1 2 1 0 0 0 678 26 325 106 221
South Eastern 1 2 1 0 0 0 315 17 159 48 90
Gold Coast 1 1 0 1 0 0 294 18 146 43 87
Logan 0 3 3 0 0 0 348 15 181 57 95
Southern 1 1 1 0 0 0 388 14 183 52 140
Darling Downs 1 0 0 0 0 0 377 8 182 44 143
Ipswich 1 0 0 0 0 0 356 14 180 41 121
Moreton 1 4 3 0 1 0 366 20 155 59 132
South West 1 2 1 0 0 1 527 12 252 78 185
Queensland 1 1 1 0 0 0 377 16 178 55 127
Note: The aggregate of district totals may not equal regional totals [see detailed explanation on page 97].
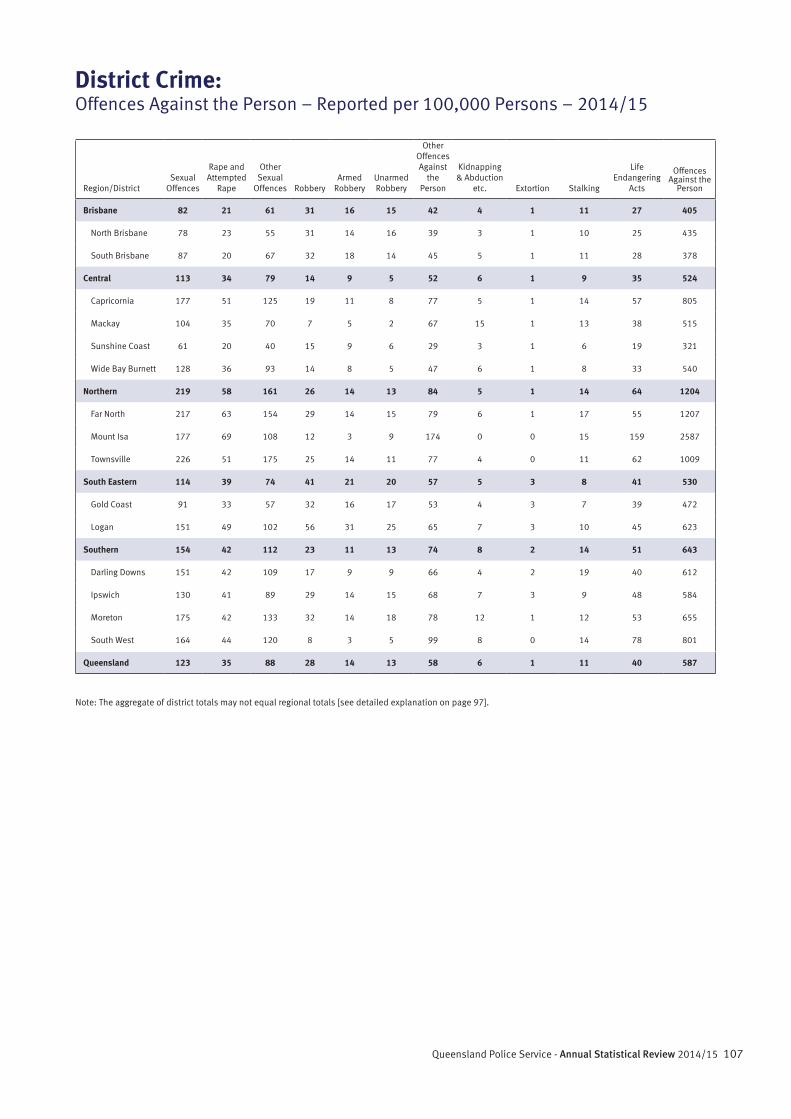
107Queensland Police Service - Annual Statistical Review 2014/15
Region/DistrictSexual
Offences
Rape and Attempted
Rape
Other Sexual
Offences RobberyArmed
RobberyUnarmed Robbery
Other Offences Against
the Person
Kidnapping & Abduction
etc. Extortion Stalking
Life Endangering
Acts
Offences Against the
Person
Brisbane 82 21 61 31 16 15 42 4 1 11 27 405
North Brisbane 78 23 55 31 14 16 39 3 1 10 25 435
South Brisbane 87 20 67 32 18 14 45 5 1 11 28 378
Central 113 34 79 14 9 5 52 6 1 9 35 524
Capricornia 177 51 125 19 11 8 77 5 1 14 57 805
Mackay 104 35 70 7 5 2 67 15 1 13 38 515
Sunshine Coast 61 20 40 15 9 6 29 3 1 6 19 321
Wide Bay Burnett 128 36 93 14 8 5 47 6 1 8 33 540
Northern 219 58 161 26 14 13 84 5 1 14 64 1204
Far North 217 63 154 29 14 15 79 6 1 17 55 1207
Mount Isa 177 69 108 12 3 9 174 0 0 15 159 2587
Townsville 226 51 175 25 14 11 77 4 0 11 62 1009
South Eastern 114 39 74 41 21 20 57 5 3 8 41 530
Gold Coast 91 33 57 32 16 17 53 4 3 7 39 472
Logan 151 49 102 56 31 25 65 7 3 10 45 623
Southern 154 42 112 23 11 13 74 8 2 14 51 643
Darling Downs 151 42 109 17 9 9 66 4 2 19 40 612
Ipswich 130 41 89 29 14 15 68 7 3 9 48 584
Moreton 175 42 133 32 14 18 78 12 1 12 53 655
South West 164 44 120 8 3 5 99 8 0 14 78 801
Queensland 123 35 88 28 14 13 58 6 1 11 40 587
District Crime:Offences Against the Person – Reported per 100,000 Persons – 2014/15
Note: The aggregate of district totals may not equal regional totals [see detailed explanation on page 97].
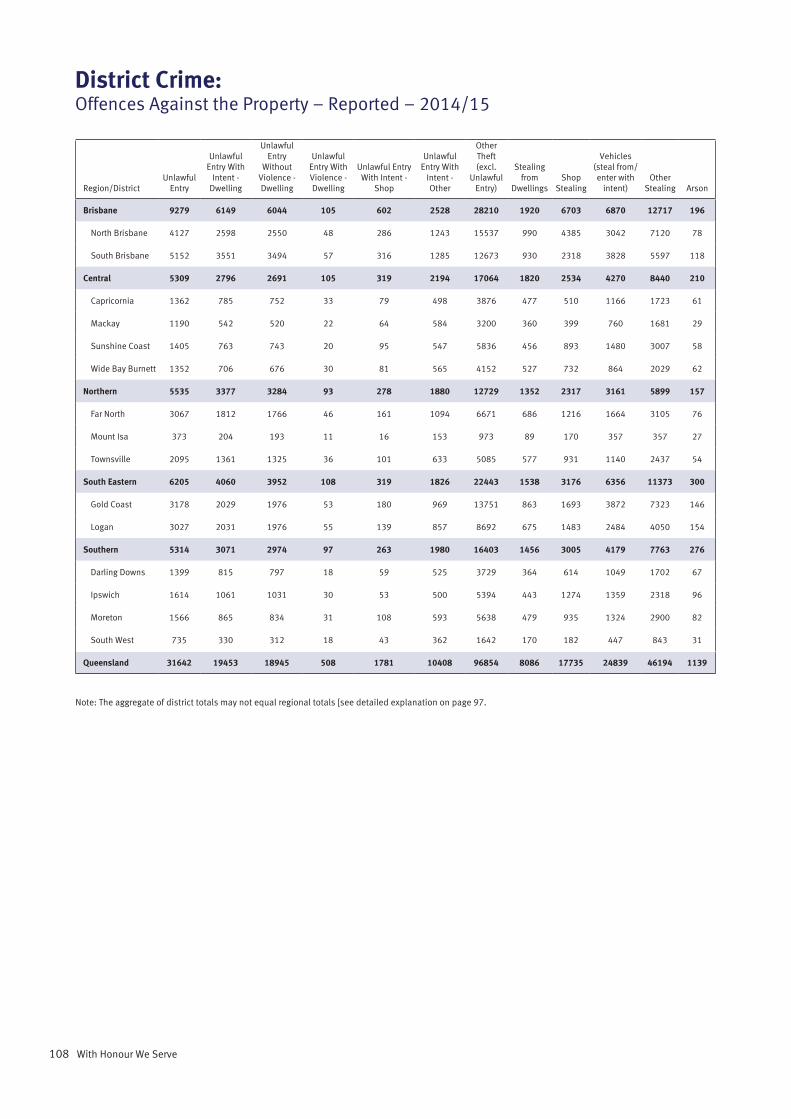
108 With Honour We Serve
District Crime:Offences Against the Property – Reported – 2014/15
Region/DistrictUnlawful
Entry
Unlawful Entry With
Intent - Dwelling
Unlawful Entry
Without Violence - Dwelling
Unlawful Entry With Violence - Dwelling
Unlawful Entry With Intent -
Shop
Unlawful Entry With
Intent - Other
Other Theft (excl.
Unlawful Entry)
Stealing from
DwellingsShop
Stealing
Vehicles (steal from/enter with
intent)Other
Stealing Arson
Brisbane 9279 6149 6044 105 602 2528 28210 1920 6703 6870 12717 196
North Brisbane 4127 2598 2550 48 286 1243 15537 990 4385 3042 7120 78
South Brisbane 5152 3551 3494 57 316 1285 12673 930 2318 3828 5597 118
Central 5309 2796 2691 105 319 2194 17064 1820 2534 4270 8440 210
Capricornia 1362 785 752 33 79 498 3876 477 510 1166 1723 61
Mackay 1190 542 520 22 64 584 3200 360 399 760 1681 29
Sunshine Coast 1405 763 743 20 95 547 5836 456 893 1480 3007 58
Wide Bay Burnett 1352 706 676 30 81 565 4152 527 732 864 2029 62
Northern 5535 3377 3284 93 278 1880 12729 1352 2317 3161 5899 157
Far North 3067 1812 1766 46 161 1094 6671 686 1216 1664 3105 76
Mount Isa 373 204 193 11 16 153 973 89 170 357 357 27
Townsville 2095 1361 1325 36 101 633 5085 577 931 1140 2437 54
South Eastern 6205 4060 3952 108 319 1826 22443 1538 3176 6356 11373 300
Gold Coast 3178 2029 1976 53 180 969 13751 863 1693 3872 7323 146
Logan 3027 2031 1976 55 139 857 8692 675 1483 2484 4050 154
Southern 5314 3071 2974 97 263 1980 16403 1456 3005 4179 7763 276
Darling Downs 1399 815 797 18 59 525 3729 364 614 1049 1702 67
Ipswich 1614 1061 1031 30 53 500 5394 443 1274 1359 2318 96
Moreton 1566 865 834 31 108 593 5638 479 935 1324 2900 82
South West 735 330 312 18 43 362 1642 170 182 447 843 31
Queensland 31642 19453 18945 508 1781 10408 96854 8086 17735 24839 46194 1139
Note: The aggregate of district totals may not equal regional totals [see detailed explanation on page 97.
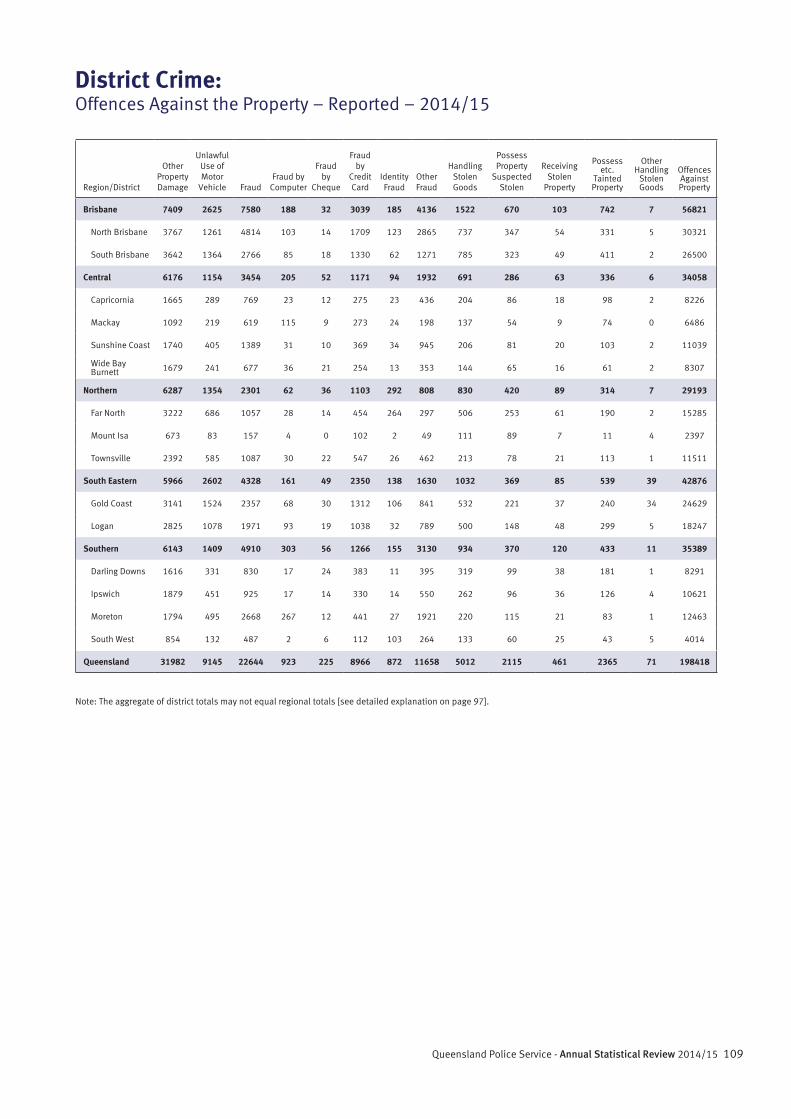
109Queensland Police Service - Annual Statistical Review 2014/15
Region/District
Other Property Damage
Unlawful Use of Motor
Vehicle FraudFraud by
Computer
Fraud by
Cheque
Fraud by
Credit Card
Identity Fraud
Other Fraud
Handling Stolen Goods
Possess Property
Suspected Stolen
Receiving Stolen
Property
Possess etc.
Tainted Property
Other Handling
Stolen Goods
Offences Against Property
Brisbane 7409 2625 7580 188 32 3039 185 4136 1522 670 103 742 7 56821
North Brisbane 3767 1261 4814 103 14 1709 123 2865 737 347 54 331 5 30321
South Brisbane 3642 1364 2766 85 18 1330 62 1271 785 323 49 411 2 26500
Central 6176 1154 3454 205 52 1171 94 1932 691 286 63 336 6 34058
Capricornia 1665 289 769 23 12 275 23 436 204 86 18 98 2 8226
Mackay 1092 219 619 115 9 273 24 198 137 54 9 74 0 6486
Sunshine Coast 1740 405 1389 31 10 369 34 945 206 81 20 103 2 11039
Wide Bay Burnett 1679 241 677 36 21 254 13 353 144 65 16 61 2 8307
Northern 6287 1354 2301 62 36 1103 292 808 830 420 89 314 7 29193
Far North 3222 686 1057 28 14 454 264 297 506 253 61 190 2 15285
Mount Isa 673 83 157 4 0 102 2 49 111 89 7 11 4 2397
Townsville 2392 585 1087 30 22 547 26 462 213 78 21 113 1 11511
South Eastern 5966 2602 4328 161 49 2350 138 1630 1032 369 85 539 39 42876
Gold Coast 3141 1524 2357 68 30 1312 106 841 532 221 37 240 34 24629
Logan 2825 1078 1971 93 19 1038 32 789 500 148 48 299 5 18247
Southern 6143 1409 4910 303 56 1266 155 3130 934 370 120 433 11 35389
Darling Downs 1616 331 830 17 24 383 11 395 319 99 38 181 1 8291
Ipswich 1879 451 925 17 14 330 14 550 262 96 36 126 4 10621
Moreton 1794 495 2668 267 12 441 27 1921 220 115 21 83 1 12463
South West 854 132 487 2 6 112 103 264 133 60 25 43 5 4014
Queensland 31982 9145 22644 923 225 8966 872 11658 5012 2115 461 2365 71 198418
District Crime:Offences Against the Property – Reported – 2014/15
Note: The aggregate of district totals may not equal regional totals [see detailed explanation on page 97].
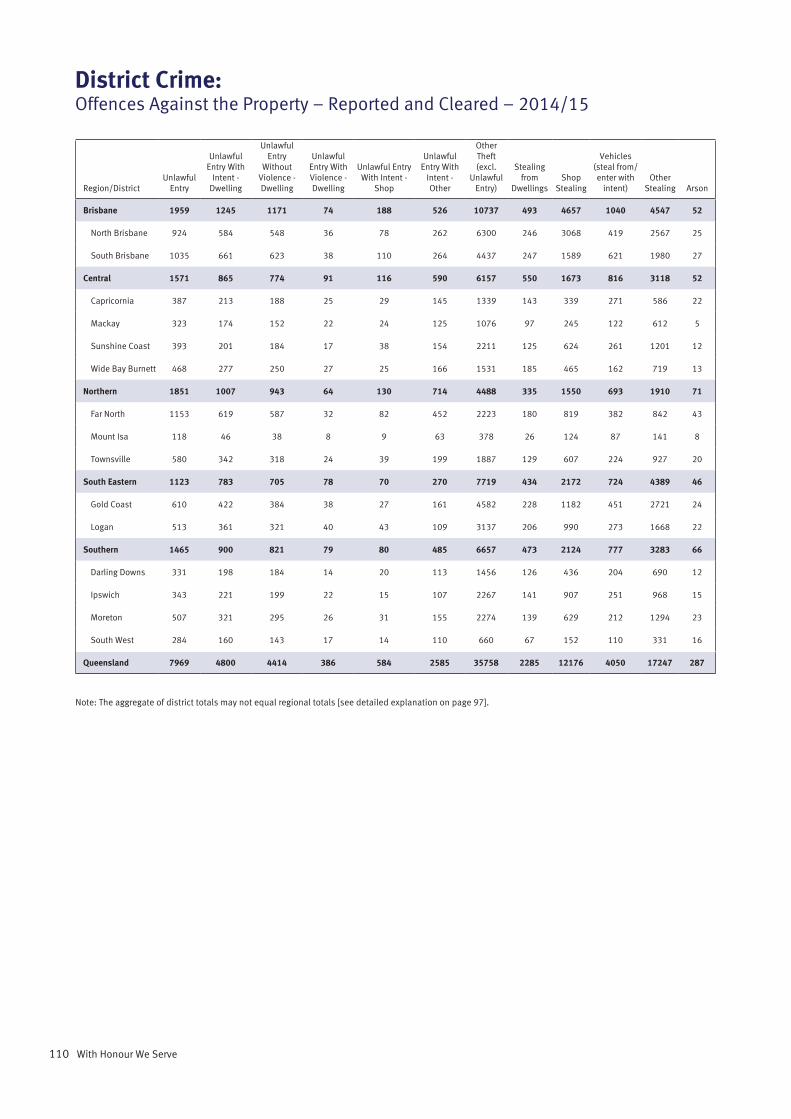
110 With Honour We Serve
District Crime:Offences Against the Property – Reported and Cleared – 2014/15
Region/DistrictUnlawful
Entry
Unlawful Entry With
Intent - Dwelling
Unlawful Entry
Without Violence - Dwelling
Unlawful Entry With Violence - Dwelling
Unlawful Entry With Intent -
Shop
Unlawful Entry With
Intent - Other
Other Theft (excl.
Unlawful Entry)
Stealing from
DwellingsShop
Stealing
Vehicles (steal from/enter with
intent)Other
Stealing Arson
Brisbane 1959 1245 1171 74 188 526 10737 493 4657 1040 4547 52
North Brisbane 924 584 548 36 78 262 6300 246 3068 419 2567 25
South Brisbane 1035 661 623 38 110 264 4437 247 1589 621 1980 27
Central 1571 865 774 91 116 590 6157 550 1673 816 3118 52
Capricornia 387 213 188 25 29 145 1339 143 339 271 586 22
Mackay 323 174 152 22 24 125 1076 97 245 122 612 5
Sunshine Coast 393 201 184 17 38 154 2211 125 624 261 1201 12
Wide Bay Burnett 468 277 250 27 25 166 1531 185 465 162 719 13
Northern 1851 1007 943 64 130 714 4488 335 1550 693 1910 71
Far North 1153 619 587 32 82 452 2223 180 819 382 842 43
Mount Isa 118 46 38 8 9 63 378 26 124 87 141 8
Townsville 580 342 318 24 39 199 1887 129 607 224 927 20
South Eastern 1123 783 705 78 70 270 7719 434 2172 724 4389 46
Gold Coast 610 422 384 38 27 161 4582 228 1182 451 2721 24
Logan 513 361 321 40 43 109 3137 206 990 273 1668 22
Southern 1465 900 821 79 80 485 6657 473 2124 777 3283 66
Darling Downs 331 198 184 14 20 113 1456 126 436 204 690 12
Ipswich 343 221 199 22 15 107 2267 141 907 251 968 15
Moreton 507 321 295 26 31 155 2274 139 629 212 1294 23
South West 284 160 143 17 14 110 660 67 152 110 331 16
Queensland 7969 4800 4414 386 584 2585 35758 2285 12176 4050 17247 287
Note: The aggregate of district totals may not equal regional totals [see detailed explanation on page 97].
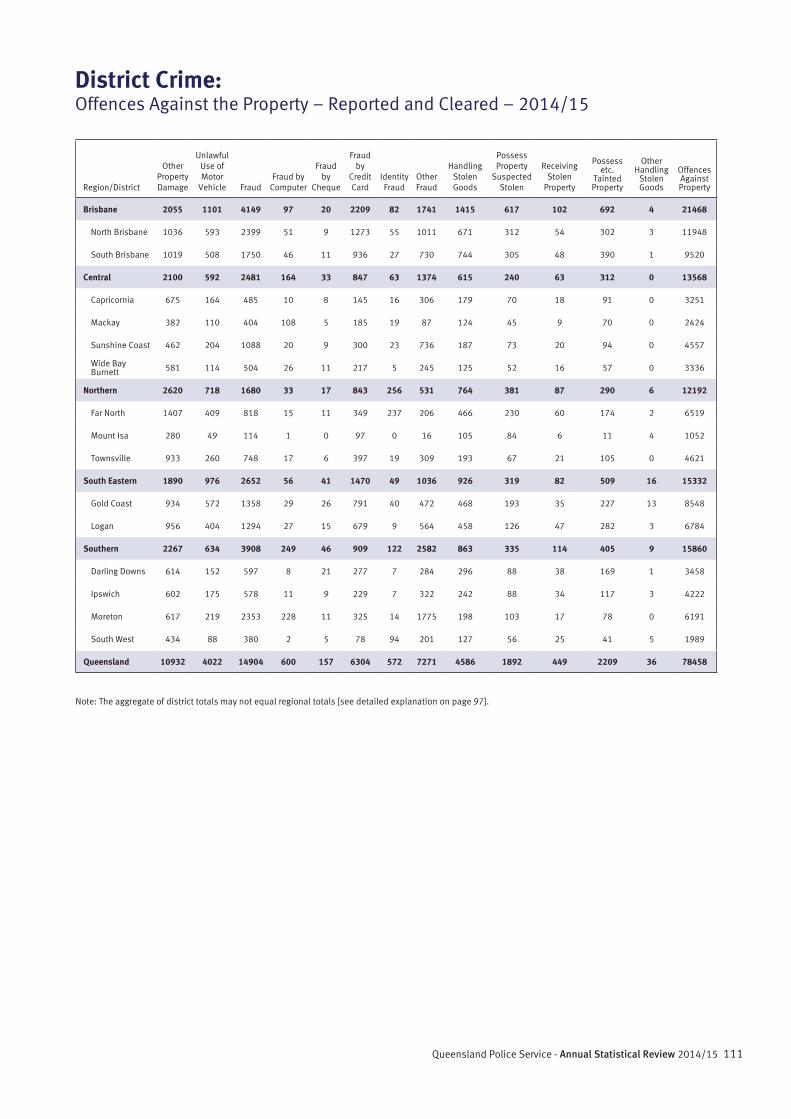
111Queensland Police Service - Annual Statistical Review 2014/15
Region/District
Other Property Damage
Unlawful Use of Motor
Vehicle FraudFraud by
Computer
Fraud by
Cheque
Fraud by
Credit Card
Identity Fraud
Other Fraud
Handling Stolen Goods
Possess Property
Suspected Stolen
Receiving Stolen
Property
Possess etc.
Tainted Property
Other Handling
Stolen Goods
Offences Against Property
Brisbane 2055 1101 4149 97 20 2209 82 1741 1415 617 102 692 4 21468
North Brisbane 1036 593 2399 51 9 1273 55 1011 671 312 54 302 3 11948
South Brisbane 1019 508 1750 46 11 936 27 730 744 305 48 390 1 9520
Central 2100 592 2481 164 33 847 63 1374 615 240 63 312 0 13568
Capricornia 675 164 485 10 8 145 16 306 179 70 18 91 0 3251
Mackay 382 110 404 108 5 185 19 87 124 45 9 70 0 2424
Sunshine Coast 462 204 1088 20 9 300 23 736 187 73 20 94 0 4557
Wide Bay Burnett 581 114 504 26 11 217 5 245 125 52 16 57 0 3336
Northern 2620 718 1680 33 17 843 256 531 764 381 87 290 6 12192
Far North 1407 409 818 15 11 349 237 206 466 230 60 174 2 6519
Mount Isa 280 49 114 1 0 97 0 16 105 84 6 11 4 1052
Townsville 933 260 748 17 6 397 19 309 193 67 21 105 0 4621
South Eastern 1890 976 2652 56 41 1470 49 1036 926 319 82 509 16 15332
Gold Coast 934 572 1358 29 26 791 40 472 468 193 35 227 13 8548
Logan 956 404 1294 27 15 679 9 564 458 126 47 282 3 6784
Southern 2267 634 3908 249 46 909 122 2582 863 335 114 405 9 15860
Darling Downs 614 152 597 8 21 277 7 284 296 88 38 169 1 3458
Ipswich 602 175 578 11 9 229 7 322 242 88 34 117 3 4222
Moreton 617 219 2353 228 11 325 14 1775 198 103 17 78 0 6191
South West 434 88 380 2 5 78 94 201 127 56 25 41 5 1989
Queensland 10932 4022 14904 600 157 6304 572 7271 4586 1892 449 2209 36 78458
District Crime:Offences Against the Property – Reported and Cleared – 2014/15
Note: The aggregate of district totals may not equal regional totals [see detailed explanation on page 97].
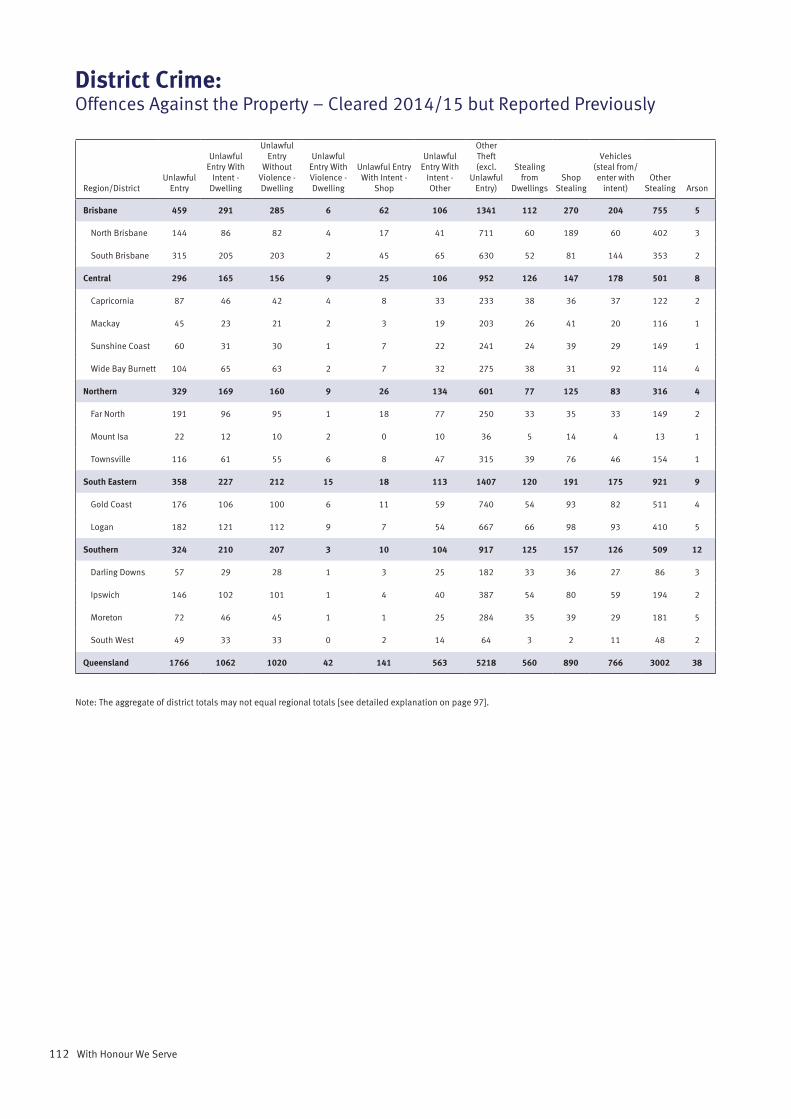
112 With Honour We Serve
District Crime:Offences Against the Property – Cleared 2014/15 but Reported Previously
Region/DistrictUnlawful
Entry
Unlawful Entry With
Intent - Dwelling
Unlawful Entry
Without Violence - Dwelling
Unlawful Entry With Violence - Dwelling
Unlawful Entry With Intent -
Shop
Unlawful Entry With
Intent - Other
Other Theft (excl.
Unlawful Entry)
Stealing from
DwellingsShop
Stealing
Vehicles (steal from/enter with
intent)Other
Stealing Arson
Brisbane 459 291 285 6 62 106 1341 112 270 204 755 5
North Brisbane 144 86 82 4 17 41 711 60 189 60 402 3
South Brisbane 315 205 203 2 45 65 630 52 81 144 353 2
Central 296 165 156 9 25 106 952 126 147 178 501 8
Capricornia 87 46 42 4 8 33 233 38 36 37 122 2
Mackay 45 23 21 2 3 19 203 26 41 20 116 1
Sunshine Coast 60 31 30 1 7 22 241 24 39 29 149 1
Wide Bay Burnett 104 65 63 2 7 32 275 38 31 92 114 4
Northern 329 169 160 9 26 134 601 77 125 83 316 4
Far North 191 96 95 1 18 77 250 33 35 33 149 2
Mount Isa 22 12 10 2 0 10 36 5 14 4 13 1
Townsville 116 61 55 6 8 47 315 39 76 46 154 1
South Eastern 358 227 212 15 18 113 1407 120 191 175 921 9
Gold Coast 176 106 100 6 11 59 740 54 93 82 511 4
Logan 182 121 112 9 7 54 667 66 98 93 410 5
Southern 324 210 207 3 10 104 917 125 157 126 509 12
Darling Downs 57 29 28 1 3 25 182 33 36 27 86 3
Ipswich 146 102 101 1 4 40 387 54 80 59 194 2
Moreton 72 46 45 1 1 25 284 35 39 29 181 5
South West 49 33 33 0 2 14 64 3 2 11 48 2
Queensland 1766 1062 1020 42 141 563 5218 560 890 766 3002 38
Note: The aggregate of district totals may not equal regional totals [see detailed explanation on page 97].
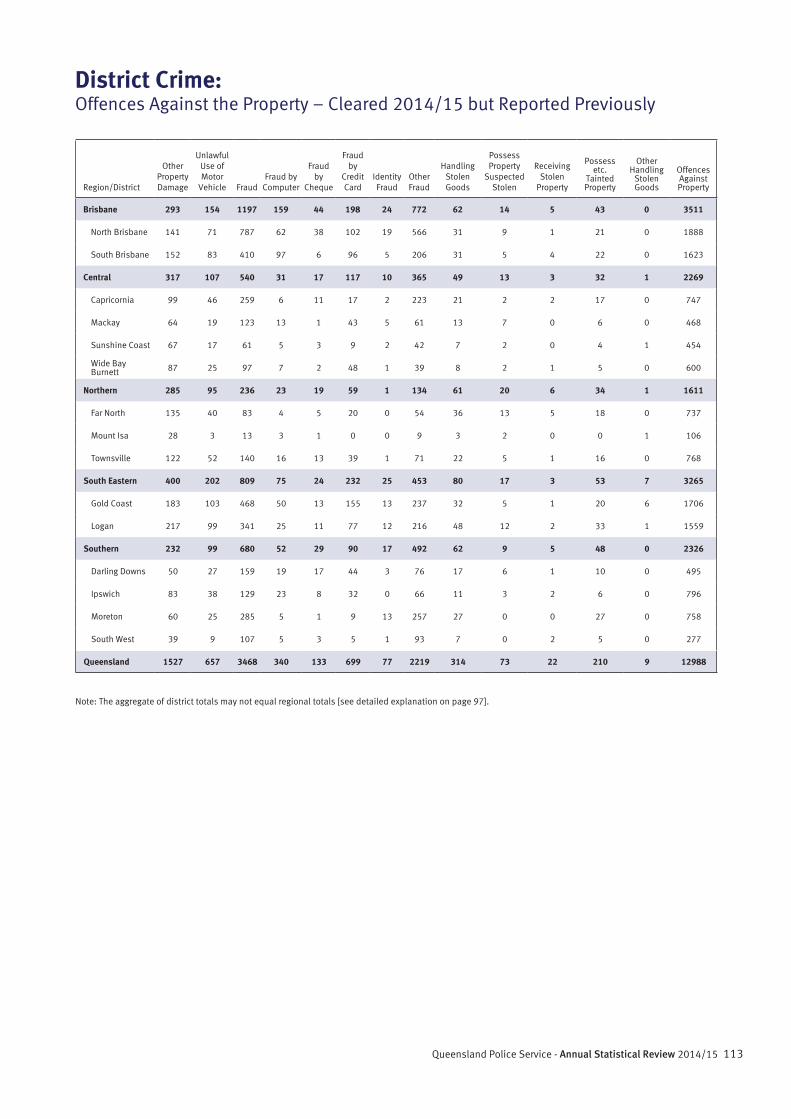
113Queensland Police Service - Annual Statistical Review 2014/15
Region/District
Other Property Damage
Unlawful Use of Motor
Vehicle FraudFraud by
Computer
Fraud by
Cheque
Fraud by
Credit Card
Identity Fraud
Other Fraud
Handling Stolen Goods
Possess Property
Suspected Stolen
Receiving Stolen
Property
Possess etc.
Tainted Property
Other Handling
Stolen Goods
Offences Against Property
Brisbane 293 154 1197 159 44 198 24 772 62 14 5 43 0 3511
North Brisbane 141 71 787 62 38 102 19 566 31 9 1 21 0 1888
South Brisbane 152 83 410 97 6 96 5 206 31 5 4 22 0 1623
Central 317 107 540 31 17 117 10 365 49 13 3 32 1 2269
Capricornia 99 46 259 6 11 17 2 223 21 2 2 17 0 747
Mackay 64 19 123 13 1 43 5 61 13 7 0 6 0 468
Sunshine Coast 67 17 61 5 3 9 2 42 7 2 0 4 1 454
Wide Bay Burnett 87 25 97 7 2 48 1 39 8 2 1 5 0 600
Northern 285 95 236 23 19 59 1 134 61 20 6 34 1 1611
Far North 135 40 83 4 5 20 0 54 36 13 5 18 0 737
Mount Isa 28 3 13 3 1 0 0 9 3 2 0 0 1 106
Townsville 122 52 140 16 13 39 1 71 22 5 1 16 0 768
South Eastern 400 202 809 75 24 232 25 453 80 17 3 53 7 3265
Gold Coast 183 103 468 50 13 155 13 237 32 5 1 20 6 1706
Logan 217 99 341 25 11 77 12 216 48 12 2 33 1 1559
Southern 232 99 680 52 29 90 17 492 62 9 5 48 0 2326
Darling Downs 50 27 159 19 17 44 3 76 17 6 1 10 0 495
Ipswich 83 38 129 23 8 32 0 66 11 3 2 6 0 796
Moreton 60 25 285 5 1 9 13 257 27 0 0 27 0 758
South West 39 9 107 5 3 5 1 93 7 0 2 5 0 277
Queensland 1527 657 3468 340 133 699 77 2219 314 73 22 210 9 12988
District Crime:Offences Against the Property – Cleared 2014/15 but Reported Previously
Note: The aggregate of district totals may not equal regional totals [see detailed explanation on page 97].
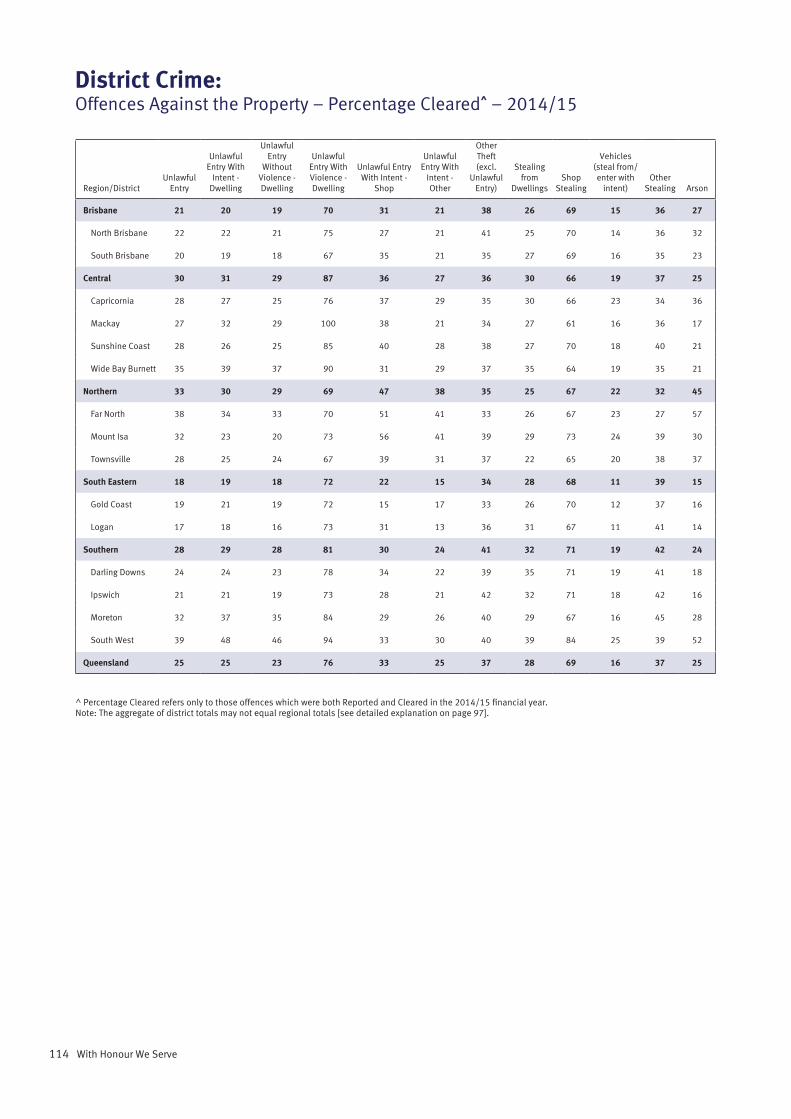
114 With Honour We Serve
District Crime:Offences Against the Property – Percentage Cleared^ – 2014/15
Region/DistrictUnlawful
Entry
Unlawful Entry With
Intent - Dwelling
Unlawful Entry
Without Violence - Dwelling
Unlawful Entry With Violence - Dwelling
Unlawful Entry With Intent -
Shop
Unlawful Entry With
Intent - Other
Other Theft (excl.
Unlawful Entry)
Stealing from
DwellingsShop
Stealing
Vehicles (steal from/enter with
intent)Other
Stealing Arson
Brisbane 21 20 19 70 31 21 38 26 69 15 36 27
North Brisbane 22 22 21 75 27 21 41 25 70 14 36 32
South Brisbane 20 19 18 67 35 21 35 27 69 16 35 23
Central 30 31 29 87 36 27 36 30 66 19 37 25
Capricornia 28 27 25 76 37 29 35 30 66 23 34 36
Mackay 27 32 29 100 38 21 34 27 61 16 36 17
Sunshine Coast 28 26 25 85 40 28 38 27 70 18 40 21
Wide Bay Burnett 35 39 37 90 31 29 37 35 64 19 35 21
Northern 33 30 29 69 47 38 35 25 67 22 32 45
Far North 38 34 33 70 51 41 33 26 67 23 27 57
Mount Isa 32 23 20 73 56 41 39 29 73 24 39 30
Townsville 28 25 24 67 39 31 37 22 65 20 38 37
South Eastern 18 19 18 72 22 15 34 28 68 11 39 15
Gold Coast 19 21 19 72 15 17 33 26 70 12 37 16
Logan 17 18 16 73 31 13 36 31 67 11 41 14
Southern 28 29 28 81 30 24 41 32 71 19 42 24
Darling Downs 24 24 23 78 34 22 39 35 71 19 41 18
Ipswich 21 21 19 73 28 21 42 32 71 18 42 16
Moreton 32 37 35 84 29 26 40 29 67 16 45 28
South West 39 48 46 94 33 30 40 39 84 25 39 52
Queensland 25 25 23 76 33 25 37 28 69 16 37 25
^ Percentage Cleared refers only to those offences which were both Reported and Cleared in the 2014/15 financial year.Note: The aggregate of district totals may not equal regional totals [see detailed explanation on page 97].
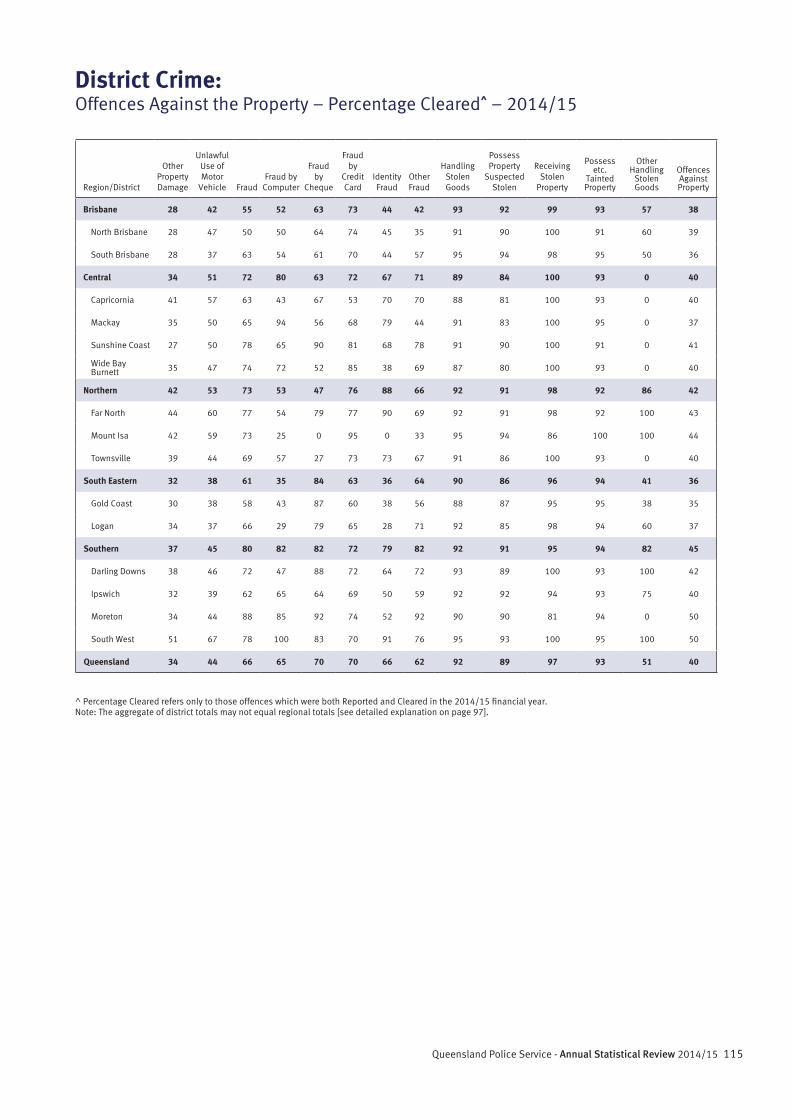
115Queensland Police Service - Annual Statistical Review 2014/15
Region/District
Other Property Damage
Unlawful Use of Motor
Vehicle FraudFraud by
Computer
Fraud by
Cheque
Fraud by
Credit Card
Identity Fraud
Other Fraud
Handling Stolen Goods
Possess Property
Suspected Stolen
Receiving Stolen
Property
Possess etc.
Tainted Property
Other Handling
Stolen Goods
Offences Against Property
Brisbane 28 42 55 52 63 73 44 42 93 92 99 93 57 38
North Brisbane 28 47 50 50 64 74 45 35 91 90 100 91 60 39
South Brisbane 28 37 63 54 61 70 44 57 95 94 98 95 50 36
Central 34 51 72 80 63 72 67 71 89 84 100 93 0 40
Capricornia 41 57 63 43 67 53 70 70 88 81 100 93 0 40
Mackay 35 50 65 94 56 68 79 44 91 83 100 95 0 37
Sunshine Coast 27 50 78 65 90 81 68 78 91 90 100 91 0 41
Wide Bay Burnett 35 47 74 72 52 85 38 69 87 80 100 93 0 40
Northern 42 53 73 53 47 76 88 66 92 91 98 92 86 42
Far North 44 60 77 54 79 77 90 69 92 91 98 92 100 43
Mount Isa 42 59 73 25 0 95 0 33 95 94 86 100 100 44
Townsville 39 44 69 57 27 73 73 67 91 86 100 93 0 40
South Eastern 32 38 61 35 84 63 36 64 90 86 96 94 41 36
Gold Coast 30 38 58 43 87 60 38 56 88 87 95 95 38 35
Logan 34 37 66 29 79 65 28 71 92 85 98 94 60 37
Southern 37 45 80 82 82 72 79 82 92 91 95 94 82 45
Darling Downs 38 46 72 47 88 72 64 72 93 89 100 93 100 42
Ipswich 32 39 62 65 64 69 50 59 92 92 94 93 75 40
Moreton 34 44 88 85 92 74 52 92 90 90 81 94 0 50
South West 51 67 78 100 83 70 91 76 95 93 100 95 100 50
Queensland 34 44 66 65 70 70 66 62 92 89 97 93 51 40
District Crime:Offences Against the Property – Percentage Cleared^ – 2014/15
^ Percentage Cleared refers only to those offences which were both Reported and Cleared in the 2014/15 financial year.Note: The aggregate of district totals may not equal regional totals [see detailed explanation on page 97].
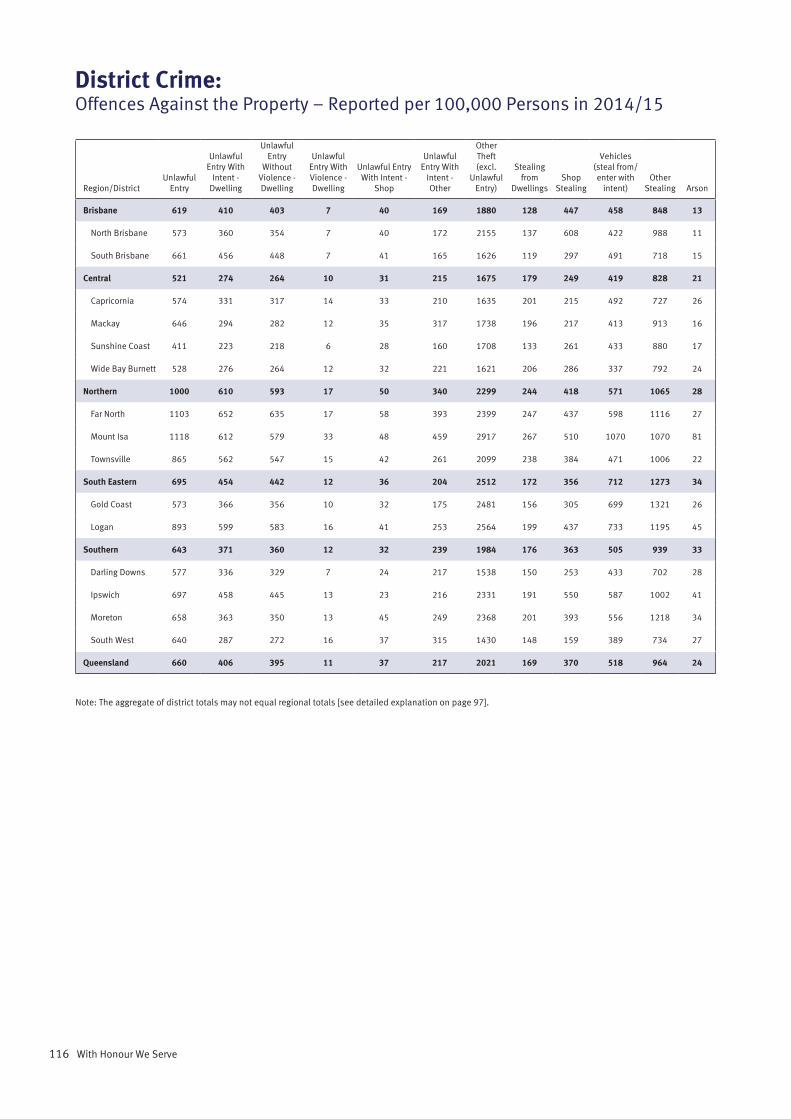
116 With Honour We Serve
District Crime:Offences Against the Property – Reported per 100,000 Persons in 2014/15
Region/DistrictUnlawful
Entry
Unlawful Entry With
Intent - Dwelling
Unlawful Entry
Without Violence - Dwelling
Unlawful Entry With Violence - Dwelling
Unlawful Entry With Intent -
Shop
Unlawful Entry With
Intent - Other
Other Theft (excl.
Unlawful Entry)
Stealing from
DwellingsShop
Stealing
Vehicles (steal from/enter with
intent)Other
Stealing Arson
Brisbane 619 410 403 7 40 169 1880 128 447 458 848 13
North Brisbane 573 360 354 7 40 172 2155 137 608 422 988 11
South Brisbane 661 456 448 7 41 165 1626 119 297 491 718 15
Central 521 274 264 10 31 215 1675 179 249 419 828 21
Capricornia 574 331 317 14 33 210 1635 201 215 492 727 26
Mackay 646 294 282 12 35 317 1738 196 217 413 913 16
Sunshine Coast 411 223 218 6 28 160 1708 133 261 433 880 17
Wide Bay Burnett 528 276 264 12 32 221 1621 206 286 337 792 24
Northern 1000 610 593 17 50 340 2299 244 418 571 1065 28
Far North 1103 652 635 17 58 393 2399 247 437 598 1116 27
Mount Isa 1118 612 579 33 48 459 2917 267 510 1070 1070 81
Townsville 865 562 547 15 42 261 2099 238 384 471 1006 22
South Eastern 695 454 442 12 36 204 2512 172 356 712 1273 34
Gold Coast 573 366 356 10 32 175 2481 156 305 699 1321 26
Logan 893 599 583 16 41 253 2564 199 437 733 1195 45
Southern 643 371 360 12 32 239 1984 176 363 505 939 33
Darling Downs 577 336 329 7 24 217 1538 150 253 433 702 28
Ipswich 697 458 445 13 23 216 2331 191 550 587 1002 41
Moreton 658 363 350 13 45 249 2368 201 393 556 1218 34
South West 640 287 272 16 37 315 1430 148 159 389 734 27
Queensland 660 406 395 11 37 217 2021 169 370 518 964 24
Note: The aggregate of district totals may not equal regional totals [see detailed explanation on page 97].
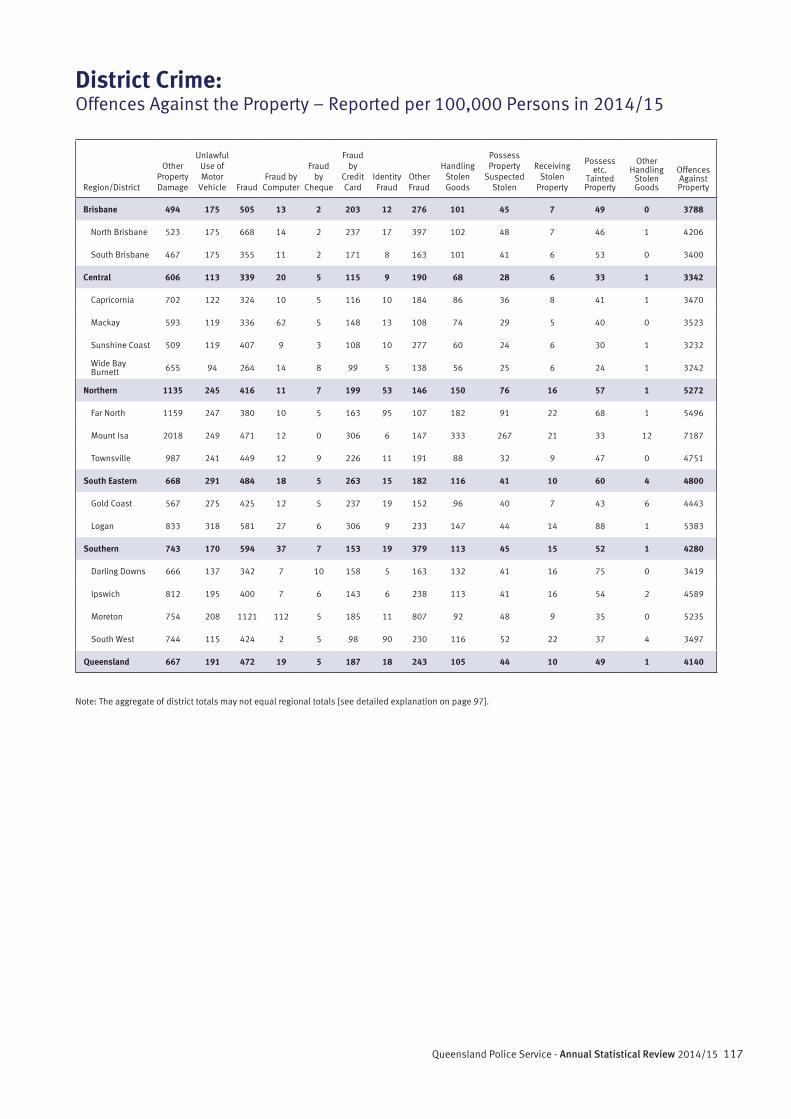
117Queensland Police Service - Annual Statistical Review 2014/15
Region/District
Other Property Damage
Unlawful Use of Motor
Vehicle FraudFraud by
Computer
Fraud by
Cheque
Fraud by
Credit Card
Identity Fraud
Other Fraud
Handling Stolen Goods
Possess Property
Suspected Stolen
Receiving Stolen
Property
Possess etc.
Tainted Property
Other Handling
Stolen Goods
Offences Against Property
Brisbane 494 175 505 13 2 203 12 276 101 45 7 49 0 3788
North Brisbane 523 175 668 14 2 237 17 397 102 48 7 46 1 4206
South Brisbane 467 175 355 11 2 171 8 163 101 41 6 53 0 3400
Central 606 113 339 20 5 115 9 190 68 28 6 33 1 3342
Capricornia 702 122 324 10 5 116 10 184 86 36 8 41 1 3470
Mackay 593 119 336 62 5 148 13 108 74 29 5 40 0 3523
Sunshine Coast 509 119 407 9 3 108 10 277 60 24 6 30 1 3232
Wide Bay Burnett 655 94 264 14 8 99 5 138 56 25 6 24 1 3242
Northern 1135 245 416 11 7 199 53 146 150 76 16 57 1 5272
Far North 1159 247 380 10 5 163 95 107 182 91 22 68 1 5496
Mount Isa 2018 249 471 12 0 306 6 147 333 267 21 33 12 7187
Townsville 987 241 449 12 9 226 11 191 88 32 9 47 0 4751
South Eastern 668 291 484 18 5 263 15 182 116 41 10 60 4 4800
Gold Coast 567 275 425 12 5 237 19 152 96 40 7 43 6 4443
Logan 833 318 581 27 6 306 9 233 147 44 14 88 1 5383
Southern 743 170 594 37 7 153 19 379 113 45 15 52 1 4280
Darling Downs 666 137 342 7 10 158 5 163 132 41 16 75 0 3419
Ipswich 812 195 400 7 6 143 6 238 113 41 16 54 2 4589
Moreton 754 208 1121 112 5 185 11 807 92 48 9 35 0 5235
South West 744 115 424 2 5 98 90 230 116 52 22 37 4 3497
Queensland 667 191 472 19 5 187 18 243 105 44 10 49 1 4140
District Crime:Offences Against the Property – Reported per 100,000 Persons in 2014/15
Note: The aggregate of district totals may not equal regional totals [see detailed explanation on page 97].
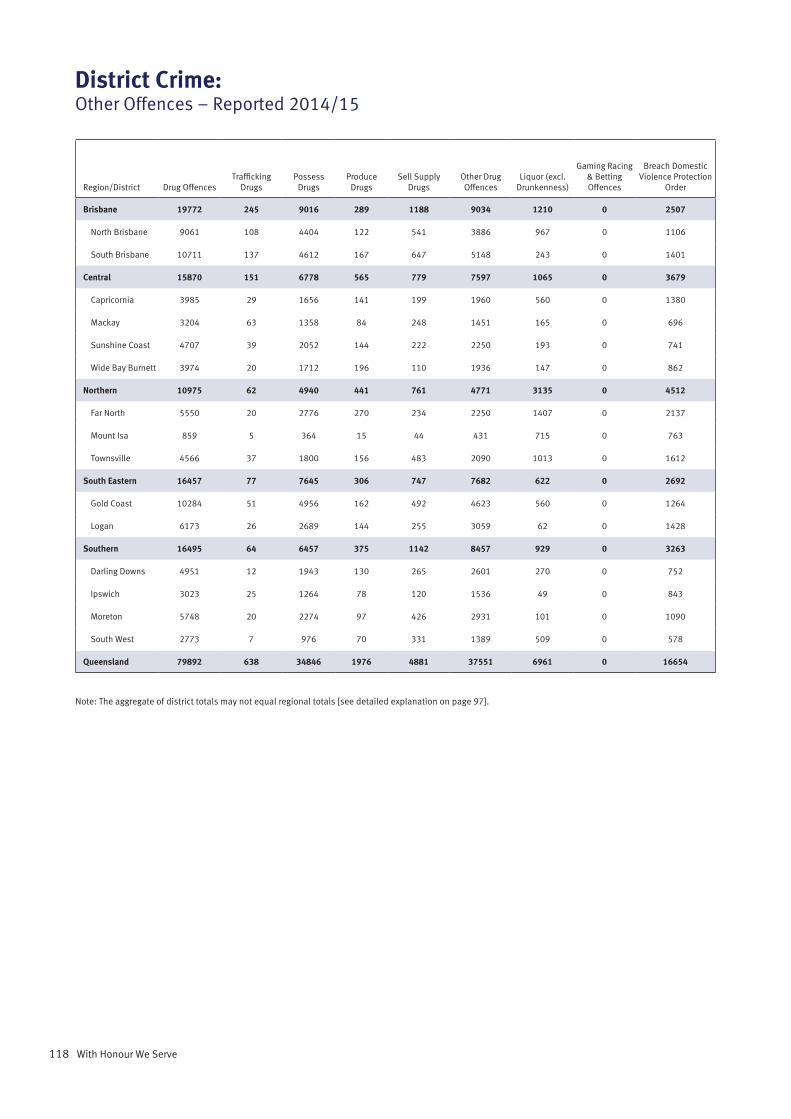
118 With Honour We Serve
District Crime:Other Offences – Reported 2014/15
Region/District Drug OffencesTrafficking
DrugsPossess
DrugsProduce
DrugsSell Supply
DrugsOther Drug Offences
Liquor (excl. Drunkenness)
Gaming Racing & Betting Offences
Breach Domestic Violence Protection
Order
Brisbane 19772 245 9016 289 1188 9034 1210 0 2507
North Brisbane 9061 108 4404 122 541 3886 967 0 1106
South Brisbane 10711 137 4612 167 647 5148 243 0 1401
Central 15870 151 6778 565 779 7597 1065 0 3679
Capricornia 3985 29 1656 141 199 1960 560 0 1380
Mackay 3204 63 1358 84 248 1451 165 0 696
Sunshine Coast 4707 39 2052 144 222 2250 193 0 741
Wide Bay Burnett 3974 20 1712 196 110 1936 147 0 862
Northern 10975 62 4940 441 761 4771 3135 0 4512
Far North 5550 20 2776 270 234 2250 1407 0 2137
Mount Isa 859 5 364 15 44 431 715 0 763
Townsville 4566 37 1800 156 483 2090 1013 0 1612
South Eastern 16457 77 7645 306 747 7682 622 0 2692
Gold Coast 10284 51 4956 162 492 4623 560 0 1264
Logan 6173 26 2689 144 255 3059 62 0 1428
Southern 16495 64 6457 375 1142 8457 929 0 3263
Darling Downs 4951 12 1943 130 265 2601 270 0 752
Ipswich 3023 25 1264 78 120 1536 49 0 843
Moreton 5748 20 2274 97 426 2931 101 0 1090
South West 2773 7 976 70 331 1389 509 0 578
Queensland 79892 638 34846 1976 4881 37551 6961 0 16654
Note: The aggregate of district totals may not equal regional totals [see detailed explanation on page 97].
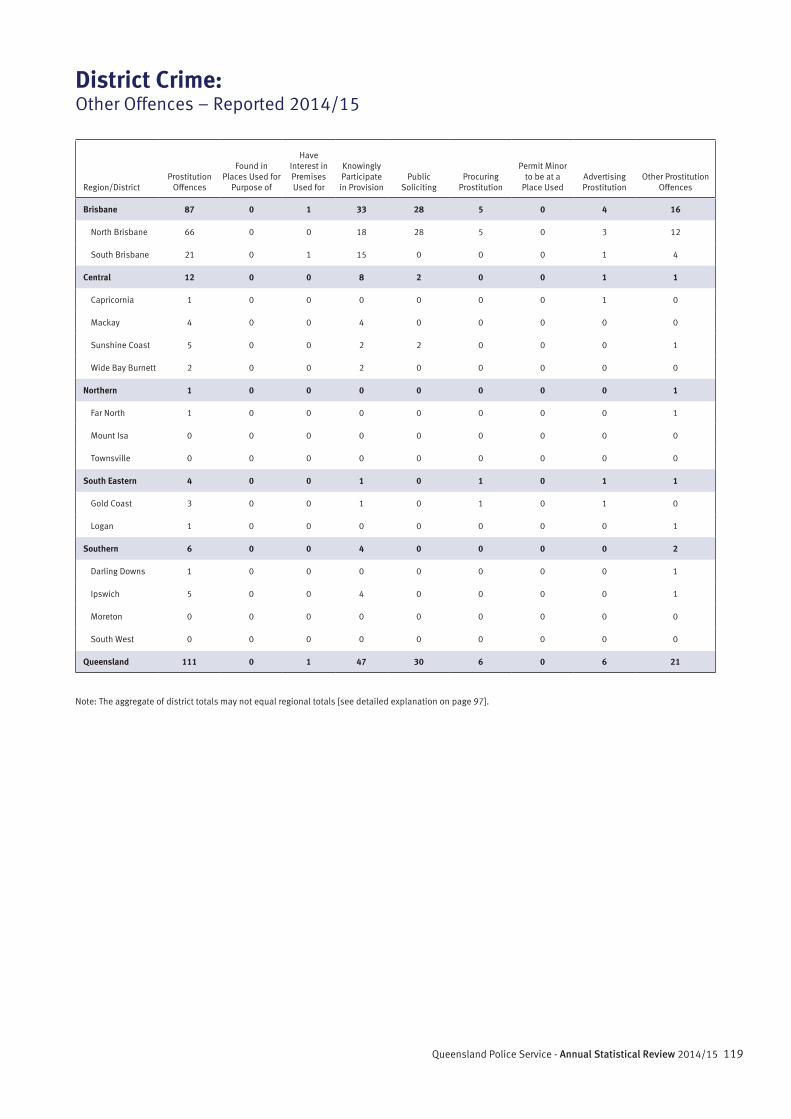
119Queensland Police Service - Annual Statistical Review 2014/15
District Crime:Other Offences – Reported 2014/15
Region/DistrictProstitution
Offences
Found in Places Used for
Purpose of
Have Interest in Premises Used for
Knowingly Participate in Provision
Public Soliciting
Procuring Prostitution
Permit Minor to be at a
Place UsedAdvertising Prostitution
Other Prostitution Offences
Brisbane 87 0 1 33 28 5 0 4 16
North Brisbane 66 0 0 18 28 5 0 3 12
South Brisbane 21 0 1 15 0 0 0 1 4
Central 12 0 0 8 2 0 0 1 1
Capricornia 1 0 0 0 0 0 0 1 0
Mackay 4 0 0 4 0 0 0 0 0
Sunshine Coast 5 0 0 2 2 0 0 0 1
Wide Bay Burnett 2 0 0 2 0 0 0 0 0
Northern 1 0 0 0 0 0 0 0 1
Far North 1 0 0 0 0 0 0 0 1
Mount Isa 0 0 0 0 0 0 0 0 0
Townsville 0 0 0 0 0 0 0 0 0
South Eastern 4 0 0 1 0 1 0 1 1
Gold Coast 3 0 0 1 0 1 0 1 0
Logan 1 0 0 0 0 0 0 0 1
Southern 6 0 0 4 0 0 0 0 2
Darling Downs 1 0 0 0 0 0 0 0 1
Ipswich 5 0 0 4 0 0 0 0 1
Moreton 0 0 0 0 0 0 0 0 0
South West 0 0 0 0 0 0 0 0 0
Queensland 111 0 1 47 30 6 0 6 21
Note: The aggregate of district totals may not equal regional totals [see detailed explanation on page 97].
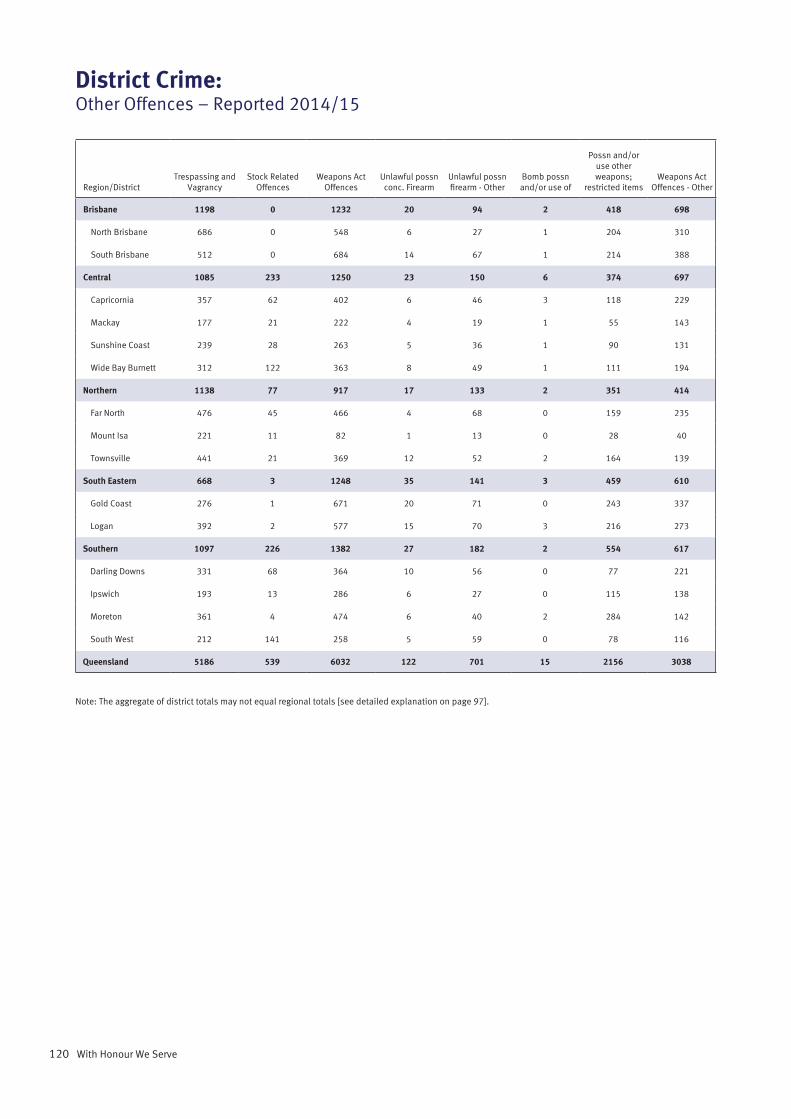
120 With Honour We Serve
District Crime:Other Offences – Reported 2014/15
Region/DistrictTrespassing and
VagrancyStock Related
OffencesWeapons Act
OffencesUnlawful possn conc. Firearm
Unlawful possn firearm - Other
Bomb possn and/or use of
Possn and/or use other weapons;
restricted itemsWeapons Act
Offences - Other
Brisbane 1198 0 1232 20 94 2 418 698
North Brisbane 686 0 548 6 27 1 204 310
South Brisbane 512 0 684 14 67 1 214 388
Central 1085 233 1250 23 150 6 374 697
Capricornia 357 62 402 6 46 3 118 229
Mackay 177 21 222 4 19 1 55 143
Sunshine Coast 239 28 263 5 36 1 90 131
Wide Bay Burnett 312 122 363 8 49 1 111 194
Northern 1138 77 917 17 133 2 351 414
Far North 476 45 466 4 68 0 159 235
Mount Isa 221 11 82 1 13 0 28 40
Townsville 441 21 369 12 52 2 164 139
South Eastern 668 3 1248 35 141 3 459 610
Gold Coast 276 1 671 20 71 0 243 337
Logan 392 2 577 15 70 3 216 273
Southern 1097 226 1382 27 182 2 554 617
Darling Downs 331 68 364 10 56 0 77 221
Ipswich 193 13 286 6 27 0 115 138
Moreton 361 4 474 6 40 2 284 142
South West 212 141 258 5 59 0 78 116
Queensland 5186 539 6032 122 701 15 2156 3038
Note: The aggregate of district totals may not equal regional totals [see detailed explanation on page 97].
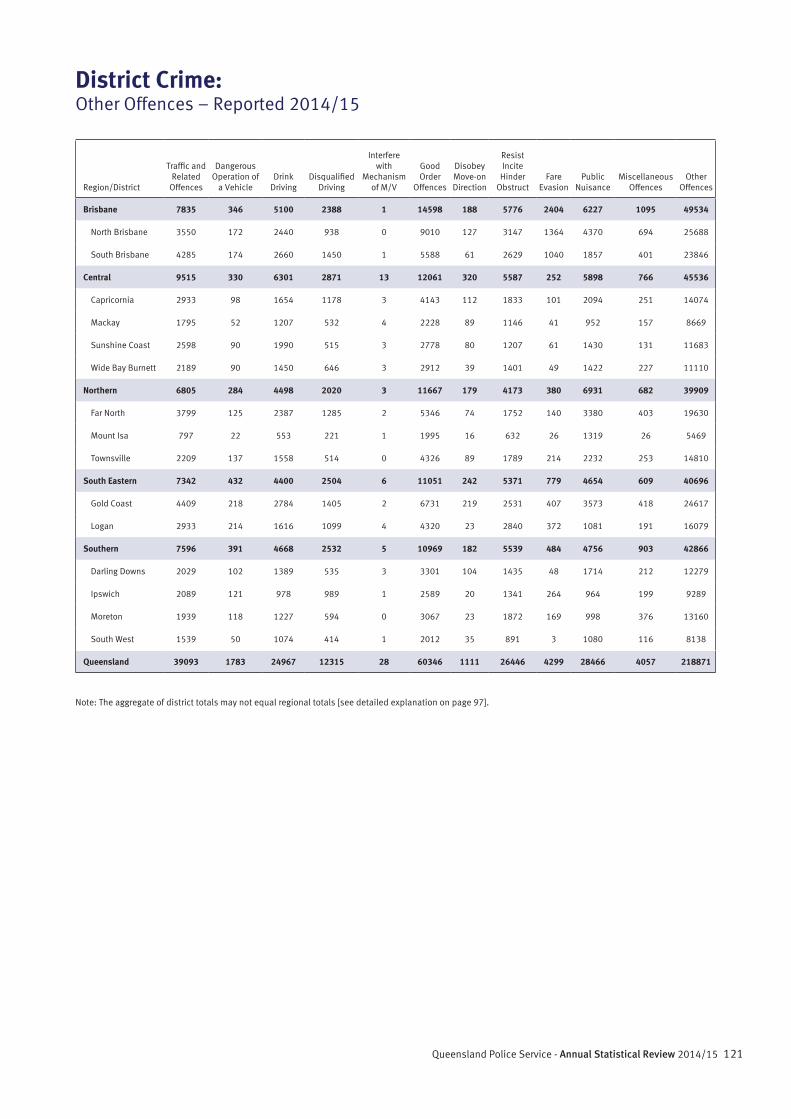
121Queensland Police Service - Annual Statistical Review 2014/15
Region/District
Traffic and Related
Offences
Dangerous Operation of
a VehicleDrink
DrivingDisqualified
Driving
Interfere with
Mechanism of M/V
Good Order
Offences
Disobey Move-on Direction
Resist Incite
Hinder Obstruct
Fare Evasion
Public Nuisance
Miscellaneous Offences
Other Offences
Brisbane 7835 346 5100 2388 1 14598 188 5776 2404 6227 1095 49534
North Brisbane 3550 172 2440 938 0 9010 127 3147 1364 4370 694 25688
South Brisbane 4285 174 2660 1450 1 5588 61 2629 1040 1857 401 23846
Central 9515 330 6301 2871 13 12061 320 5587 252 5898 766 45536
Capricornia 2933 98 1654 1178 3 4143 112 1833 101 2094 251 14074
Mackay 1795 52 1207 532 4 2228 89 1146 41 952 157 8669
Sunshine Coast 2598 90 1990 515 3 2778 80 1207 61 1430 131 11683
Wide Bay Burnett 2189 90 1450 646 3 2912 39 1401 49 1422 227 11110
Northern 6805 284 4498 2020 3 11667 179 4173 380 6931 682 39909
Far North 3799 125 2387 1285 2 5346 74 1752 140 3380 403 19630
Mount Isa 797 22 553 221 1 1995 16 632 26 1319 26 5469
Townsville 2209 137 1558 514 0 4326 89 1789 214 2232 253 14810
South Eastern 7342 432 4400 2504 6 11051 242 5371 779 4654 609 40696
Gold Coast 4409 218 2784 1405 2 6731 219 2531 407 3573 418 24617
Logan 2933 214 1616 1099 4 4320 23 2840 372 1081 191 16079
Southern 7596 391 4668 2532 5 10969 182 5539 484 4756 903 42866
Darling Downs 2029 102 1389 535 3 3301 104 1435 48 1714 212 12279
Ipswich 2089 121 978 989 1 2589 20 1341 264 964 199 9289
Moreton 1939 118 1227 594 0 3067 23 1872 169 998 376 13160
South West 1539 50 1074 414 1 2012 35 891 3 1080 116 8138
Queensland 39093 1783 24967 12315 28 60346 1111 26446 4299 28466 4057 218871
District Crime:Other Offences – Reported 2014/15
Note: The aggregate of district totals may not equal regional totals [see detailed explanation on page 97].
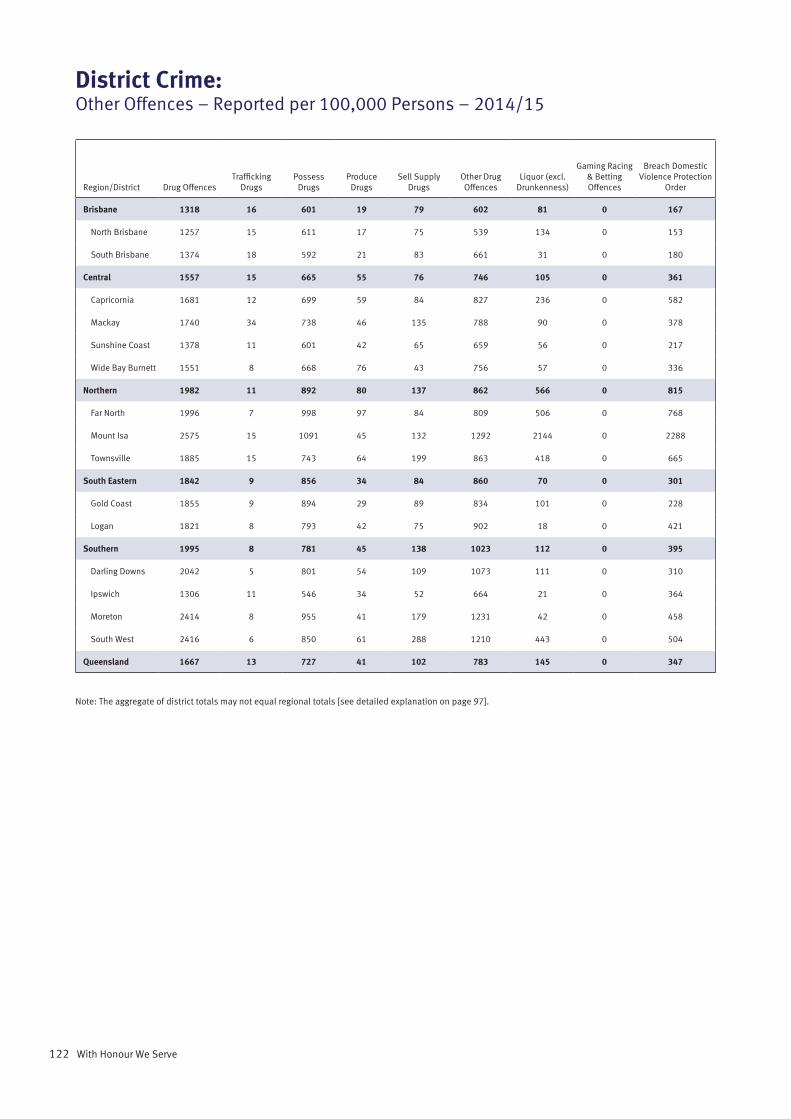
122 With Honour We Serve
District Crime:Other Offences – Reported per 100,000 Persons – 2014/15
Region/District Drug OffencesTrafficking
DrugsPossess
DrugsProduce
DrugsSell Supply
DrugsOther Drug Offences
Liquor (excl. Drunkenness)
Gaming Racing & Betting Offences
Breach Domestic Violence Protection
Order
Brisbane 1318 16 601 19 79 602 81 0 167
North Brisbane 1257 15 611 17 75 539 134 0 153
South Brisbane 1374 18 592 21 83 661 31 0 180
Central 1557 15 665 55 76 746 105 0 361
Capricornia 1681 12 699 59 84 827 236 0 582
Mackay 1740 34 738 46 135 788 90 0 378
Sunshine Coast 1378 11 601 42 65 659 56 0 217
Wide Bay Burnett 1551 8 668 76 43 756 57 0 336
Northern 1982 11 892 80 137 862 566 0 815
Far North 1996 7 998 97 84 809 506 0 768
Mount Isa 2575 15 1091 45 132 1292 2144 0 2288
Townsville 1885 15 743 64 199 863 418 0 665
South Eastern 1842 9 856 34 84 860 70 0 301
Gold Coast 1855 9 894 29 89 834 101 0 228
Logan 1821 8 793 42 75 902 18 0 421
Southern 1995 8 781 45 138 1023 112 0 395
Darling Downs 2042 5 801 54 109 1073 111 0 310
Ipswich 1306 11 546 34 52 664 21 0 364
Moreton 2414 8 955 41 179 1231 42 0 458
South West 2416 6 850 61 288 1210 443 0 504
Queensland 1667 13 727 41 102 783 145 0 347
Note: The aggregate of district totals may not equal regional totals [see detailed explanation on page 97].
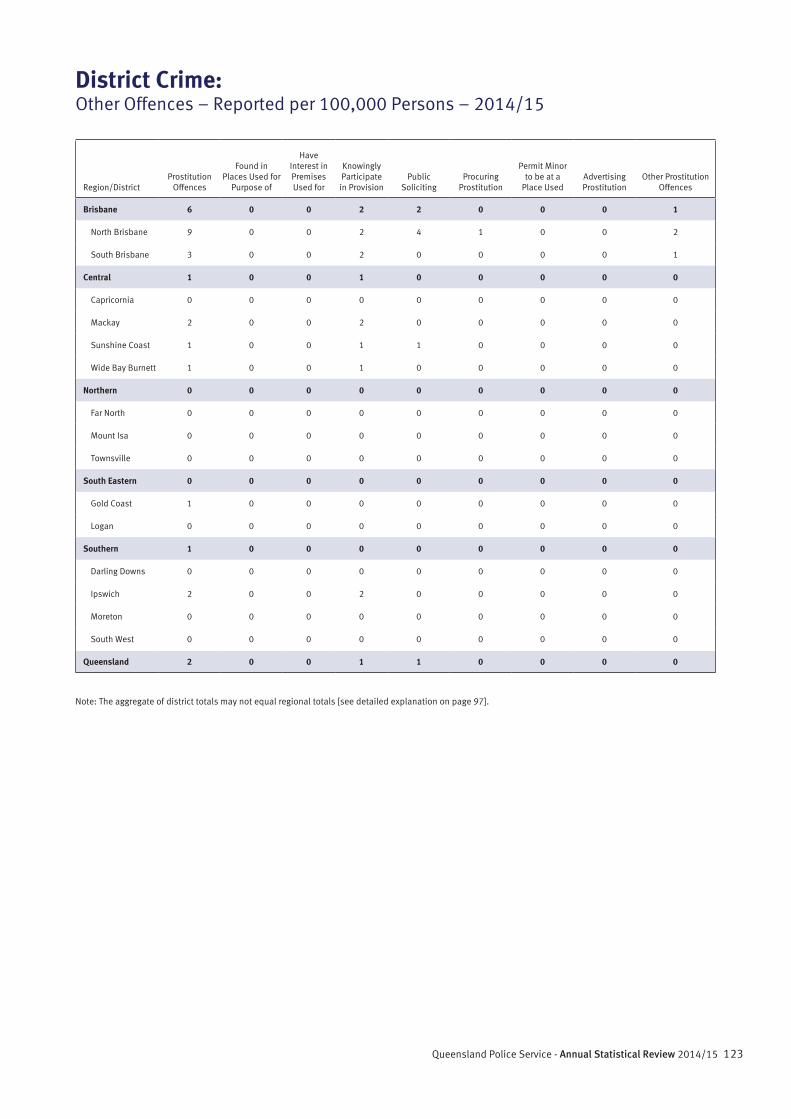
123Queensland Police Service - Annual Statistical Review 2014/15
Region/DistrictProstitution
Offences
Found in Places Used for
Purpose of
Have Interest in Premises Used for
Knowingly Participate in Provision
Public Soliciting
Procuring Prostitution
Permit Minor to be at a
Place UsedAdvertising Prostitution
Other Prostitution Offences
Brisbane 6 0 0 2 2 0 0 0 1
North Brisbane 9 0 0 2 4 1 0 0 2
South Brisbane 3 0 0 2 0 0 0 0 1
Central 1 0 0 1 0 0 0 0 0
Capricornia 0 0 0 0 0 0 0 0 0
Mackay 2 0 0 2 0 0 0 0 0
Sunshine Coast 1 0 0 1 1 0 0 0 0
Wide Bay Burnett 1 0 0 1 0 0 0 0 0
Northern 0 0 0 0 0 0 0 0 0
Far North 0 0 0 0 0 0 0 0 0
Mount Isa 0 0 0 0 0 0 0 0 0
Townsville 0 0 0 0 0 0 0 0 0
South Eastern 0 0 0 0 0 0 0 0 0
Gold Coast 1 0 0 0 0 0 0 0 0
Logan 0 0 0 0 0 0 0 0 0
Southern 1 0 0 0 0 0 0 0 0
Darling Downs 0 0 0 0 0 0 0 0 0
Ipswich 2 0 0 2 0 0 0 0 0
Moreton 0 0 0 0 0 0 0 0 0
South West 0 0 0 0 0 0 0 0 0
Queensland 2 0 0 1 1 0 0 0 0
District Crime:Other Offences – Reported per 100,000 Persons – 2014/15
Note: The aggregate of district totals may not equal regional totals [see detailed explanation on page 97].
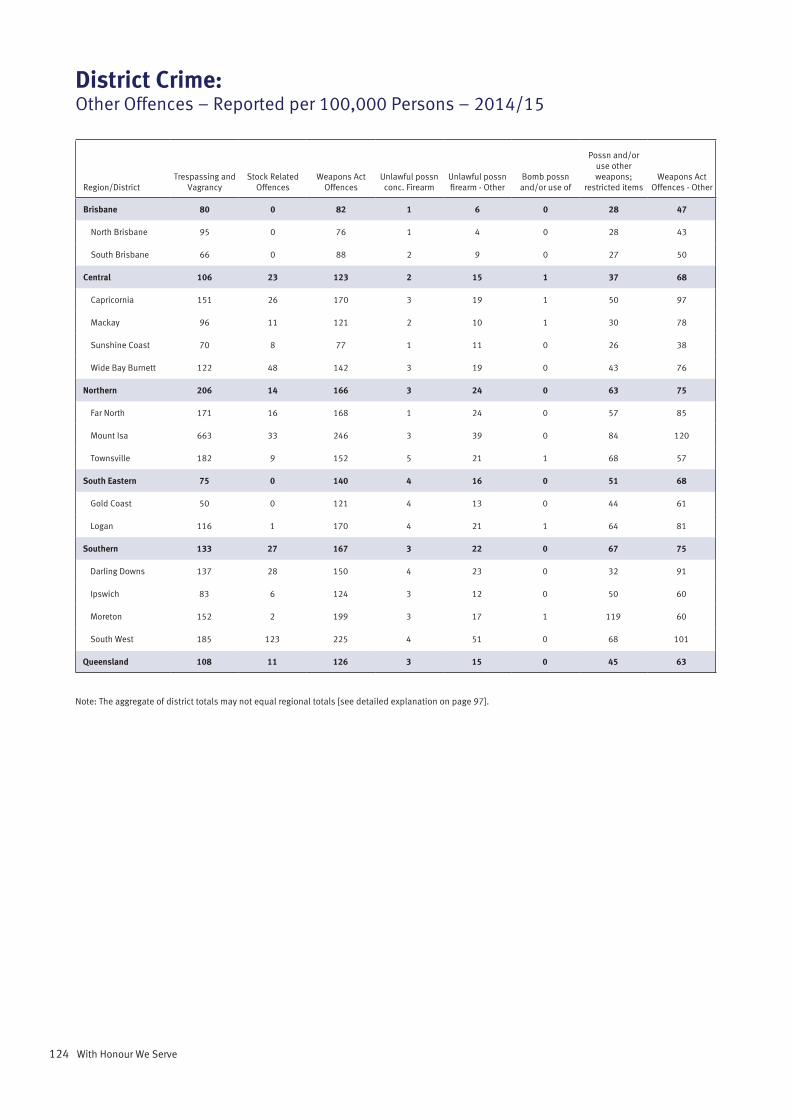
124 With Honour We Serve
Region/DistrictTrespassing and
VagrancyStock Related
OffencesWeapons Act
OffencesUnlawful possn conc. Firearm
Unlawful possn firearm - Other
Bomb possn and/or use of
Possn and/or use other weapons;
restricted itemsWeapons Act
Offences - Other
Brisbane 80 0 82 1 6 0 28 47
North Brisbane 95 0 76 1 4 0 28 43
South Brisbane 66 0 88 2 9 0 27 50
Central 106 23 123 2 15 1 37 68
Capricornia 151 26 170 3 19 1 50 97
Mackay 96 11 121 2 10 1 30 78
Sunshine Coast 70 8 77 1 11 0 26 38
Wide Bay Burnett 122 48 142 3 19 0 43 76
Northern 206 14 166 3 24 0 63 75
Far North 171 16 168 1 24 0 57 85
Mount Isa 663 33 246 3 39 0 84 120
Townsville 182 9 152 5 21 1 68 57
South Eastern 75 0 140 4 16 0 51 68
Gold Coast 50 0 121 4 13 0 44 61
Logan 116 1 170 4 21 1 64 81
Southern 133 27 167 3 22 0 67 75
Darling Downs 137 28 150 4 23 0 32 91
Ipswich 83 6 124 3 12 0 50 60
Moreton 152 2 199 3 17 1 119 60
South West 185 123 225 4 51 0 68 101
Queensland 108 11 126 3 15 0 45 63
District Crime:Other Offences – Reported per 100,000 Persons – 2014/15
Note: The aggregate of district totals may not equal regional totals [see detailed explanation on page 97].
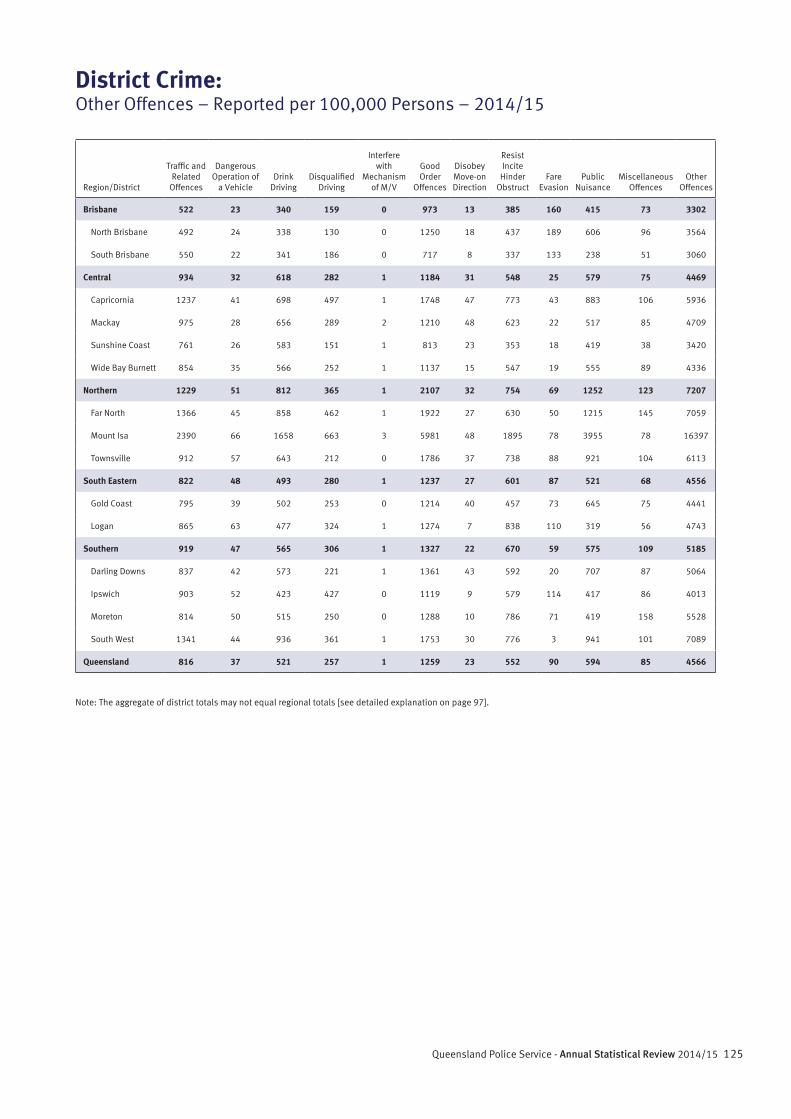
125Queensland Police Service - Annual Statistical Review 2014/15
Region/District
Traffic and Related
Offences
Dangerous Operation of
a VehicleDrink
DrivingDisqualified
Driving
Interfere with
Mechanism of M/V
Good Order
Offences
Disobey Move-on Direction
Resist Incite
Hinder Obstruct
Fare Evasion
Public Nuisance
Miscellaneous Offences
Other Offences
Brisbane 522 23 340 159 0 973 13 385 160 415 73 3302
North Brisbane 492 24 338 130 0 1250 18 437 189 606 96 3564
South Brisbane 550 22 341 186 0 717 8 337 133 238 51 3060
Central 934 32 618 282 1 1184 31 548 25 579 75 4469
Capricornia 1237 41 698 497 1 1748 47 773 43 883 106 5936
Mackay 975 28 656 289 2 1210 48 623 22 517 85 4709
Sunshine Coast 761 26 583 151 1 813 23 353 18 419 38 3420
Wide Bay Burnett 854 35 566 252 1 1137 15 547 19 555 89 4336
Northern 1229 51 812 365 1 2107 32 754 69 1252 123 7207
Far North 1366 45 858 462 1 1922 27 630 50 1215 145 7059
Mount Isa 2390 66 1658 663 3 5981 48 1895 78 3955 78 16397
Townsville 912 57 643 212 0 1786 37 738 88 921 104 6113
South Eastern 822 48 493 280 1 1237 27 601 87 521 68 4556
Gold Coast 795 39 502 253 0 1214 40 457 73 645 75 4441
Logan 865 63 477 324 1 1274 7 838 110 319 56 4743
Southern 919 47 565 306 1 1327 22 670 59 575 109 5185
Darling Downs 837 42 573 221 1 1361 43 592 20 707 87 5064
Ipswich 903 52 423 427 0 1119 9 579 114 417 86 4013
Moreton 814 50 515 250 0 1288 10 786 71 419 158 5528
South West 1341 44 936 361 1 1753 30 776 3 941 101 7089
Queensland 816 37 521 257 1 1259 23 552 90 594 85 4566
District Crime:Other Offences – Reported per 100,000 Persons – 2014/15
Note: The aggregate of district totals may not equal regional totals [see detailed explanation on page 97].

126 With Honour We Serve
127Queensland Police Service - Annual Statistical Review 2014/15
Missing Persons
This section contains information relating to missing and located missing persons within Queensland.
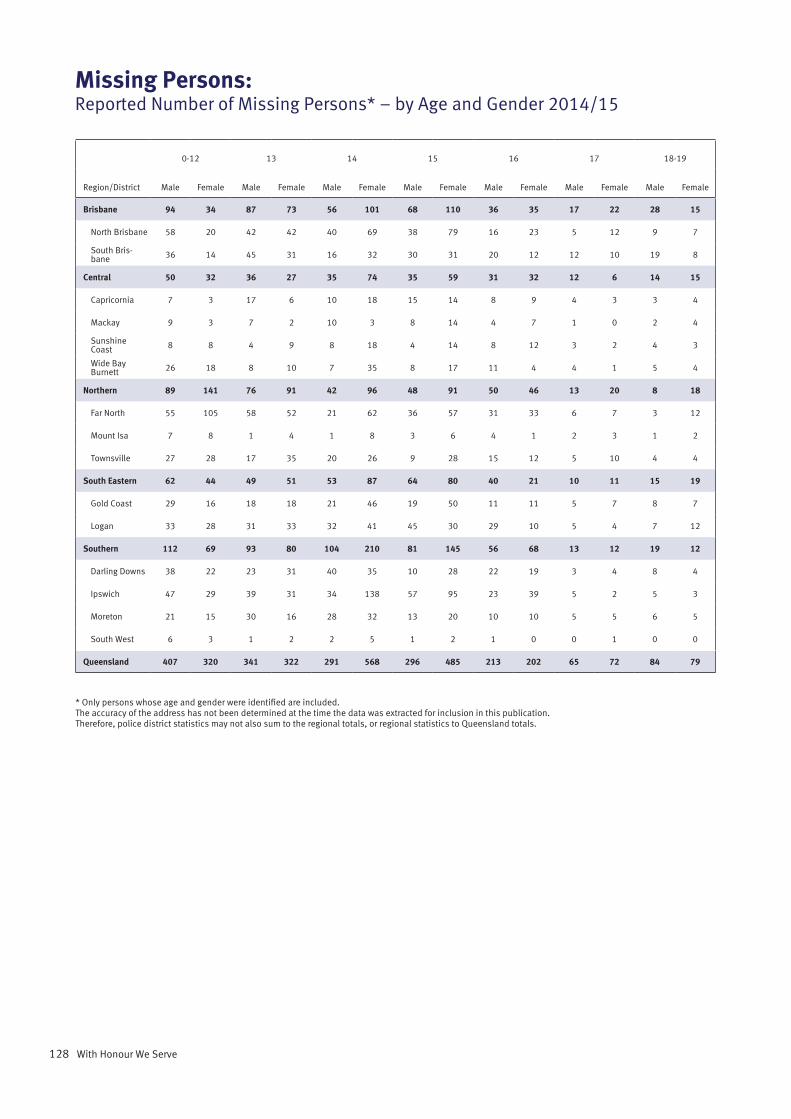
128 With Honour We Serve
Region/District
0-12 13 14 15 16 17 18-19
Male Female Male Female Male Female Male Female Male Female Male Female Male Female
Brisbane 94 34 87 73 56 101 68 110 36 35 17 22 28 15
North Brisbane 58 20 42 42 40 69 38 79 16 23 5 12 9 7
South Bris-bane 36 14 45 31 16 32 30 31 20 12 12 10 19 8
Central 50 32 36 27 35 74 35 59 31 32 12 6 14 15
Capricornia 7 3 17 6 10 18 15 14 8 9 4 3 3 4
Mackay 9 3 7 2 10 3 8 14 4 7 1 0 2 4
Sunshine Coast 8 8 4 9 8 18 4 14 8 12 3 2 4 3
Wide Bay Burnett 26 18 8 10 7 35 8 17 11 4 4 1 5 4
Northern 89 141 76 91 42 96 48 91 50 46 13 20 8 18
Far North 55 105 58 52 21 62 36 57 31 33 6 7 3 12
Mount Isa 7 8 1 4 1 8 3 6 4 1 2 3 1 2
Townsville 27 28 17 35 20 26 9 28 15 12 5 10 4 4
South Eastern 62 44 49 51 53 87 64 80 40 21 10 11 15 19
Gold Coast 29 16 18 18 21 46 19 50 11 11 5 7 8 7
Logan 33 28 31 33 32 41 45 30 29 10 5 4 7 12
Southern 112 69 93 80 104 210 81 145 56 68 13 12 19 12
Darling Downs 38 22 23 31 40 35 10 28 22 19 3 4 8 4
Ipswich 47 29 39 31 34 138 57 95 23 39 5 2 5 3
Moreton 21 15 30 16 28 32 13 20 10 10 5 5 6 5
South West 6 3 1 2 2 5 1 2 1 0 0 1 0 0
Queensland 407 320 341 322 291 568 296 485 213 202 65 72 84 79
Missing Persons:Reported Number of Missing Persons* – by Age and Gender 2014/15
* Only persons whose age and gender were identified are included. The accuracy of the address has not been determined at the time the data was extracted for inclusion in this publication. Therefore, police district statistics may not also sum to the regional totals, or regional statistics to Queensland totals.

129Queensland Police Service - Annual Statistical Review 2014/15
Region/District
20-24 25-29 30-39 40-49 50-59 60+ Total
Male Female Male Female Male Female Male Female Male Female Male Female Male Female
Brisbane 72 35 44 35 97 53 71 47 41 33 72 34 783 627
North Brisbane 33 23 26 22 49 30 41 26 23 20 48 21 428 394
South Bris-bane 39 12 18 13 48 23 30 21 18 13 24 13 355 233
Central 22 16 40 22 46 28 42 27 32 14 32 17 427 369
Capricornia 9 4 11 3 10 4 11 9 14 4 3 5 122 86
Mackay 6 4 10 4 10 5 9 1 3 4 8 0 87 51
Sunshine Coast 1 6 8 9 14 8 17 9 8 3 10 8 97 109
Wide Bay Burnett 6 2 11 6 12 11 5 8 7 3 11 4 121 123
Northern 35 25 30 22 53 31 52 20 29 9 32 15 557 625
Far North 20 13 16 13 29 20 25 8 22 6 21 9 343 397
Mount Isa 4 3 2 3 4 2 6 5 3 1 3 1 41 47
Townsville 11 9 12 6 20 9 21 7 4 2 8 5 173 181
South Eastern 26 18 25 23 56 40 38 34 26 8 39 15 503 451
Gold Coast 13 9 12 13 34 28 26 17 15 5 24 8 235 235
Logan 13 9 13 10 22 12 12 17 11 3 15 7 268 216
Southern 39 28 29 35 53 54 56 31 46 19 36 19 737 782
Darling Downs 9 9 9 11 7 15 17 6 11 8 12 5 209 197
Ipswich 19 12 12 15 23 20 16 15 14 3 10 3 304 405
Moreton 11 7 6 8 18 17 17 10 16 7 12 6 193 158
South West 0 0 2 1 5 2 6 0 5 1 2 5 31 22
Queensland 195 122 169 137 309 208 261 161 174 83 213 100 3018 2859
Missing Persons:Reported Number of Missing Persons* – by Age and Gender 2014/15
* Only persons whose age and gender were identified are included. The accuracy of the address has not been determined at the time the data was extracted for inclusion in this publication. Therefore, police district statistics may not also sum to the regional totals, or regional statistics to Queensland totals.

130 With Honour We Serve
Region/District
0-12 13 14 15 16 17 18-19
Male Female Male Female Male Female Male Female Male Female Male Female Male Female
Brisbane 93 33 87 73 56 101 68 110 36 35 17 22 28 15
North Brisbane 58 20 42 42 40 69 38 79 16 23 5 12 9 7
South Bris-bane 35 13 45 31 16 32 30 31 20 12 12 10 19 8
Central 50 32 36 27 35 74 35 59 31 32 12 6 14 15
Capricornia 7 3 17 6 10 18 15 14 8 9 4 3 3 4
Mackay 9 3 7 2 10 3 8 14 4 7 1 0 2 4
Sunshine Coast 8 8 4 9 8 18 4 14 8 12 3 2 4 3
Wide Bay Burnett 26 18 8 10 7 35 8 17 11 4 4 1 5 4
Northern 88 141 76 91 42 96 48 91 50 46 13 20 8 18
Far North 54 105 58 52 21 62 36 57 31 33 6 7 3 12
Mount Isa 7 8 1 4 1 8 3 6 4 1 2 3 1 2
Townsville 27 28 17 35 20 26 9 28 15 12 5 10 4 4
South Eastern 62 44 49 51 53 87 64 80 40 21 10 11 15 19
Gold Coast 29 16 18 18 21 46 19 50 11 11 5 7 8 7
Logan 33 28 31 33 32 41 45 30 29 10 5 4 7 12
Southern 112 69 93 80 104 210 81 145 56 68 13 12 18 12
Darling Downs 38 22 23 31 40 35 10 28 22 19 3 4 7 4
Ipswich 47 29 39 31 34 138 57 95 23 39 5 2 5 3
Moreton 21 15 30 16 28 32 13 20 10 10 5 5 6 5
South West 6 3 1 2 2 5 1 2 1 0 0 1 0 0
Queensland 406 319 341 322 291 568 296 485 213 202 65 72 83 79
Missing Persons:Number of Located Missing Persons* – by Age and Gender 2014/15
* Only persons whose age and gender were identified are included. The accuracy of the address has not been determined at the time the data was extracted for inclusion in this publication. Therefore, police district statistics may not also sum to the regional totals, or regional statistics to Queensland totals.
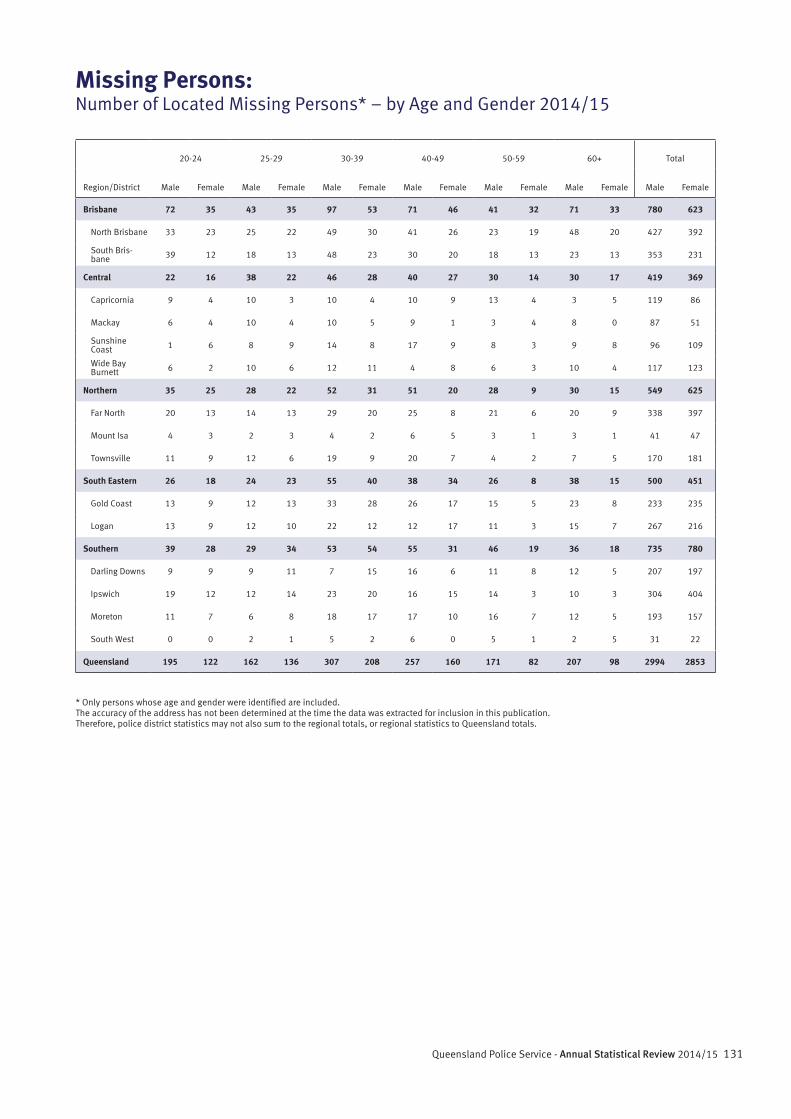
131Queensland Police Service - Annual Statistical Review 2014/15
Region/District
20-24 25-29 30-39 40-49 50-59 60+ Total
Male Female Male Female Male Female Male Female Male Female Male Female Male Female
Brisbane 72 35 43 35 97 53 71 46 41 32 71 33 780 623
North Brisbane 33 23 25 22 49 30 41 26 23 19 48 20 427 392
South Bris-bane 39 12 18 13 48 23 30 20 18 13 23 13 353 231
Central 22 16 38 22 46 28 40 27 30 14 30 17 419 369
Capricornia 9 4 10 3 10 4 10 9 13 4 3 5 119 86
Mackay 6 4 10 4 10 5 9 1 3 4 8 0 87 51
Sunshine Coast 1 6 8 9 14 8 17 9 8 3 9 8 96 109
Wide Bay Burnett 6 2 10 6 12 11 4 8 6 3 10 4 117 123
Northern 35 25 28 22 52 31 51 20 28 9 30 15 549 625
Far North 20 13 14 13 29 20 25 8 21 6 20 9 338 397
Mount Isa 4 3 2 3 4 2 6 5 3 1 3 1 41 47
Townsville 11 9 12 6 19 9 20 7 4 2 7 5 170 181
South Eastern 26 18 24 23 55 40 38 34 26 8 38 15 500 451
Gold Coast 13 9 12 13 33 28 26 17 15 5 23 8 233 235
Logan 13 9 12 10 22 12 12 17 11 3 15 7 267 216
Southern 39 28 29 34 53 54 55 31 46 19 36 18 735 780
Darling Downs 9 9 9 11 7 15 16 6 11 8 12 5 207 197
Ipswich 19 12 12 14 23 20 16 15 14 3 10 3 304 404
Moreton 11 7 6 8 18 17 17 10 16 7 12 5 193 157
South West 0 0 2 1 5 2 6 0 5 1 2 5 31 22
Queensland 195 122 162 136 307 208 257 160 171 82 207 98 2994 2853
Missing Persons:Number of Located Missing Persons* – by Age and Gender 2014/15
* Only persons whose age and gender were identified are included. The accuracy of the address has not been determined at the time the data was extracted for inclusion in this publication. Therefore, police district statistics may not also sum to the regional totals, or regional statistics to Queensland totals.

132 With Honour We Serve
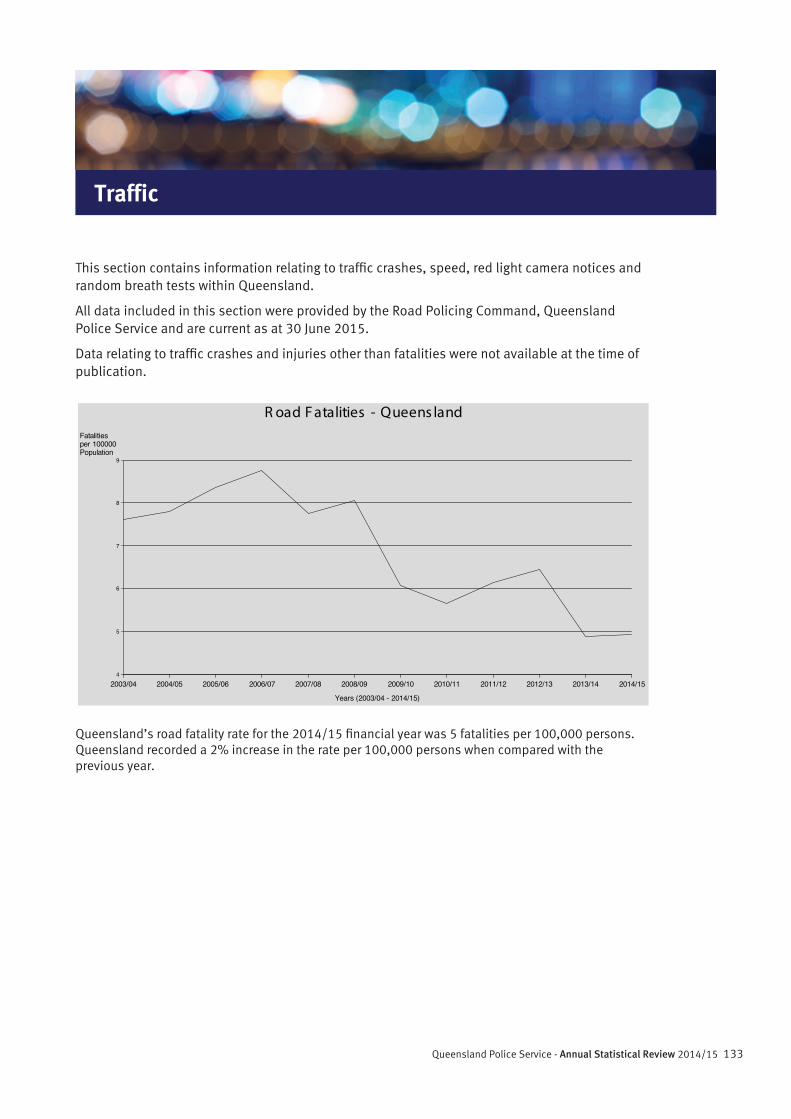
133Queensland Police Service - Annual Statistical Review 2014/15
Traffic
This section contains information relating to traffic crashes, speed, red light camera notices and random breath tests within Queensland.
All data included in this section were provided by the Road Policing Command, Queensland Police Service and are current as at 30 June 2015.
Data relating to traffic crashes and injuries other than fatalities were not available at the time of publication.
Fatalitiesper 100000Population
4
5
6
7
8
9
Years (2003/04 - 2014/15)
2003/04 2004/05 2005/06 2006/07 2007/08 2008/09 2009/10 2010/11 2011/12 2012/13 2013/14 2014/15
R oad F atalities - Queens land
Queensland’s road fatality rate for the 2014/15 financial year was 5 fatalities per 100,000 persons. Queensland recorded a 2% increase in the rate per 100,000 persons when compared with the previous year.
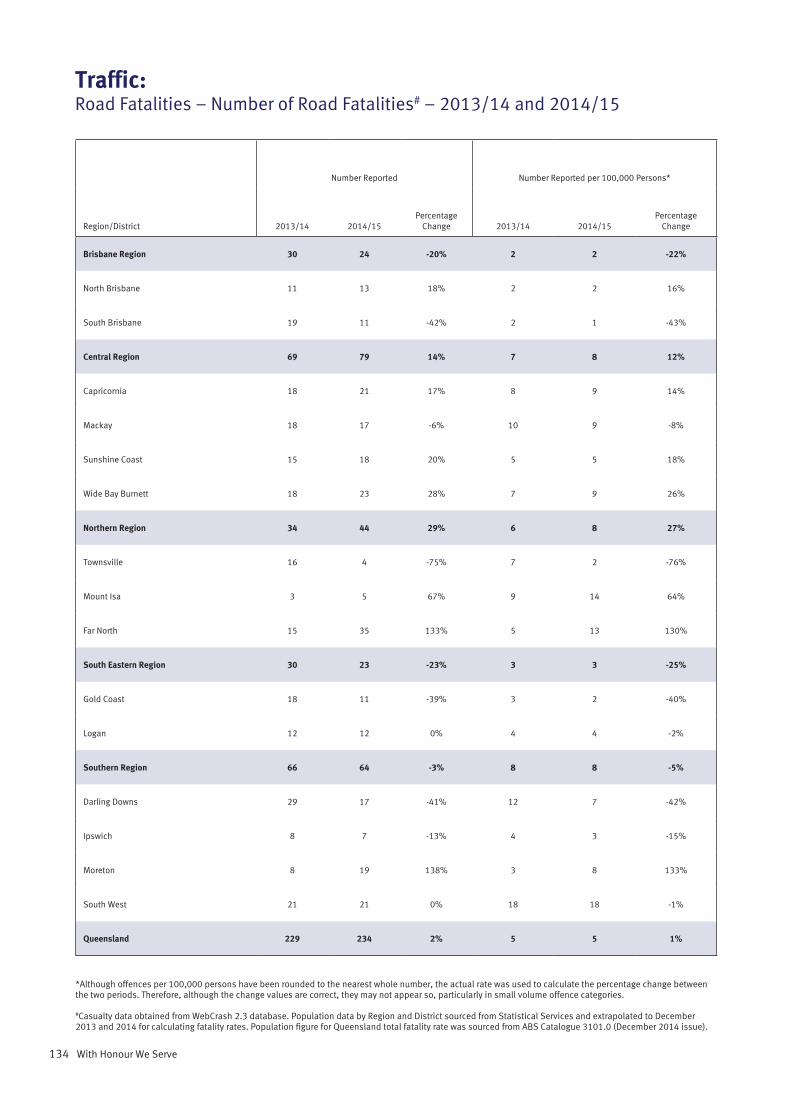
134 With Honour We Serve
Traffic:Road Fatalities – Number of Road Fatalities# – 2013/14 and 2014/15
Number Reported Number Reported per 100,000 Persons*
Region/District 2013/14 2014/15Percentage
Change 2013/14 2014/15Percentage
Change
Brisbane Region 30 24 -20% 2 2 -22%
North Brisbane 11 13 18% 2 2 16%
South Brisbane 19 11 -42% 2 1 -43%
Central Region 69 79 14% 7 8 12%
Capricornia 18 21 17% 8 9 14%
Mackay 18 17 -6% 10 9 -8%
Sunshine Coast 15 18 20% 5 5 18%
Wide Bay Burnett 18 23 28% 7 9 26%
Northern Region 34 44 29% 6 8 27%
Townsville 16 4 -75% 7 2 -76%
Mount Isa 3 5 67% 9 14 64%
Far North 15 35 133% 5 13 130%
South Eastern Region 30 23 -23% 3 3 -25%
Gold Coast 18 11 -39% 3 2 -40%
Logan 12 12 0% 4 4 -2%
Southern Region 66 64 -3% 8 8 -5%
Darling Downs 29 17 -41% 12 7 -42%
Ipswich 8 7 -13% 4 3 -15%
Moreton 8 19 138% 3 8 133%
South West 21 21 0% 18 18 -1%
Queensland 229 234 2% 5 5 1%
*Although offences per 100,000 persons have been rounded to the nearest whole number, the actual rate was used to calculate the percentage change between the two periods. Therefore, although the change values are correct, they may not appear so, particularly in small volume offence categories.
#Casualty data obtained from WebCrash 2.3 database. Population data by Region and District sourced from Statistical Services and extrapolated to December 2013 and 2014 for calculating fatality rates. Population figure for Queensland total fatality rate was sourced from ABS Catalogue 3101.0 (December 2014 issue).
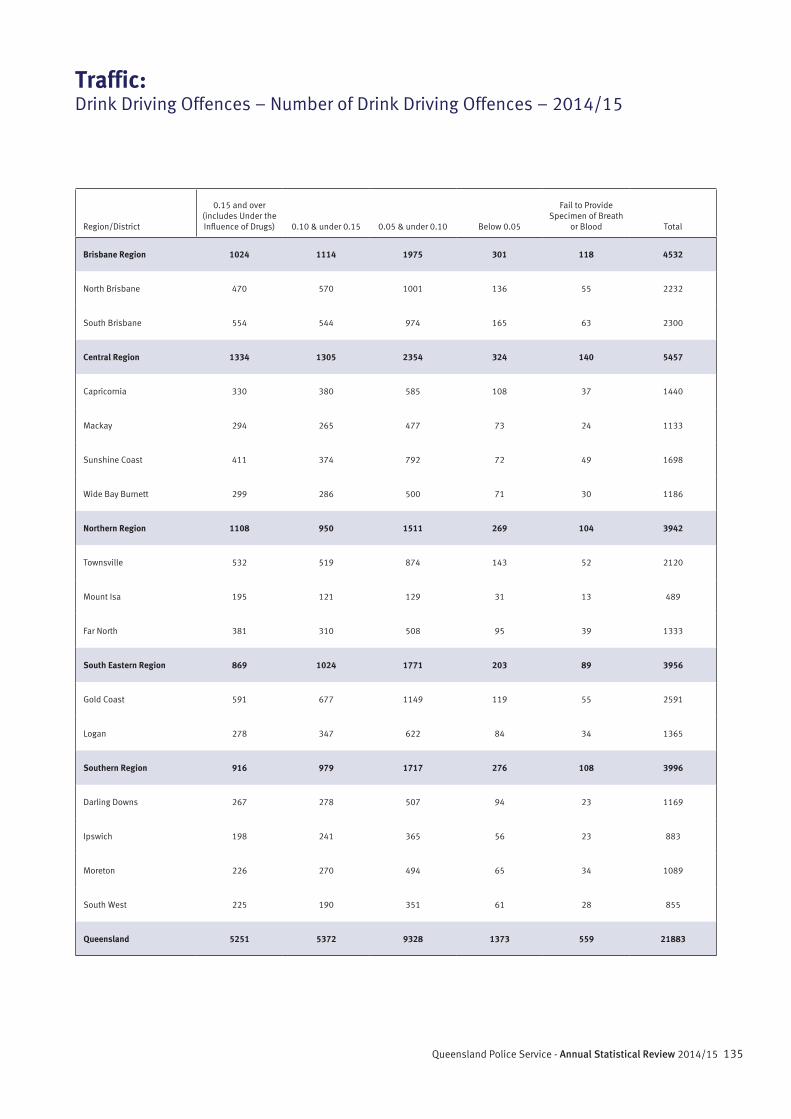
135Queensland Police Service - Annual Statistical Review 2014/15
Traffic:Drink Driving Offences – Number of Drink Driving Offences – 2014/15
Region/District
0.15 and over (includes Under the Influence of Drugs) 0.10 & under 0.15 0.05 & under 0.10 Below 0.05
Fail to Provide Specimen of Breath
or Blood Total
Brisbane Region 1024 1114 1975 301 118 4532
North Brisbane 470 570 1001 136 55 2232
South Brisbane 554 544 974 165 63 2300
Central Region 1334 1305 2354 324 140 5457
Capricornia 330 380 585 108 37 1440
Mackay 294 265 477 73 24 1133
Sunshine Coast 411 374 792 72 49 1698
Wide Bay Burnett 299 286 500 71 30 1186
Northern Region 1108 950 1511 269 104 3942
Townsville 532 519 874 143 52 2120
Mount Isa 195 121 129 31 13 489
Far North 381 310 508 95 39 1333
South Eastern Region 869 1024 1771 203 89 3956
Gold Coast 591 677 1149 119 55 2591
Logan 278 347 622 84 34 1365
Southern Region 916 979 1717 276 108 3996
Darling Downs 267 278 507 94 23 1169
Ipswich 198 241 365 56 23 883
Moreton 226 270 494 65 34 1089
South West 225 190 351 61 28 855
Queensland 5251 5372 9328 1373 559 21883
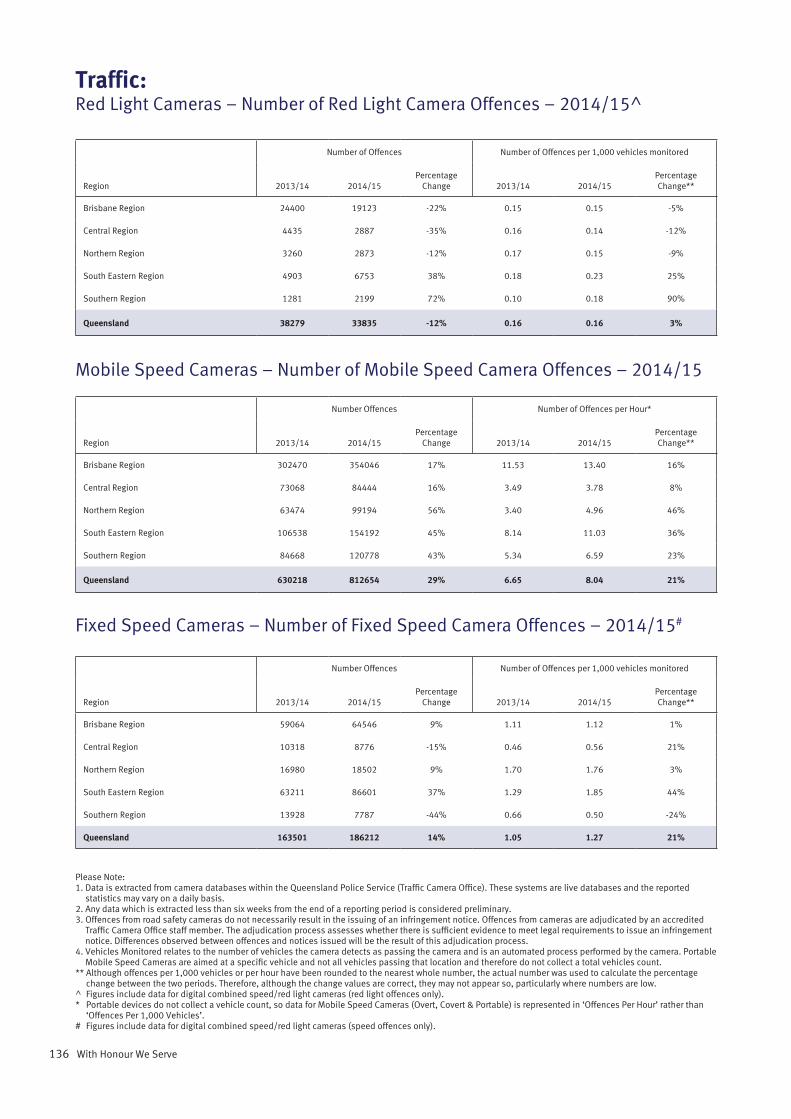
136 With Honour We Serve
Number of Offences Number of Offences per 1,000 vehicles monitored
Region 2013/14 2014/15Percentage
Change 2013/14 2014/15Percentage Change**
Brisbane Region 24400 19123 -22% 0.15 0.15 -5%
Central Region 4435 2887 -35% 0.16 0.14 -12%
Northern Region 3260 2873 -12% 0.17 0.15 -9%
South Eastern Region 4903 6753 38% 0.18 0.23 25%
Southern Region 1281 2199 72% 0.10 0.18 90%
Queensland 38279 33835 -12% 0.16 0.16 3%
Number Offences Number of Offences per Hour*
Region 2013/14 2014/15Percentage
Change 2013/14 2014/15Percentage Change**
Brisbane Region 302470 354046 17% 11.53 13.40 16%
Central Region 73068 84444 16% 3.49 3.78 8%
Northern Region 63474 99194 56% 3.40 4.96 46%
South Eastern Region 106538 154192 45% 8.14 11.03 36%
Southern Region 84668 120778 43% 5.34 6.59 23%
Queensland 630218 812654 29% 6.65 8.04 21%
Number Offences Number of Offences per 1,000 vehicles monitored
Region 2013/14 2014/15Percentage
Change 2013/14 2014/15Percentage Change**
Brisbane Region 59064 64546 9% 1.11 1.12 1%
Central Region 10318 8776 -15% 0.46 0.56 21%
Northern Region 16980 18502 9% 1.70 1.76 3%
South Eastern Region 63211 86601 37% 1.29 1.85 44%
Southern Region 13928 7787 -44% 0.66 0.50 -24%
Queensland 163501 186212 14% 1.05 1.27 21%
Traffic:Red Light Cameras – Number of Red Light Camera Offences – 2014/15^
Mobile Speed Cameras – Number of Mobile Speed Camera Offences – 2014/15
Fixed Speed Cameras – Number of Fixed Speed Camera Offences – 2014/15#
Please Note:1. Data is extracted from camera databases within the Queensland Police Service (Traffic Camera Office). These systems are live databases and the reported
statistics may vary on a daily basis.2. Any data which is extracted less than six weeks from the end of a reporting period is considered preliminary.3. Offences from road safety cameras do not necessarily result in the issuing of an infringement notice. Offences from cameras are adjudicated by an accredited
Traffic Camera Office staff member. The adjudication process assesses whether there is sufficient evidence to meet legal requirements to issue an infringement notice. Differences observed between offences and notices issued will be the result of this adjudication process.
4. Vehicles Monitored relates to the number of vehicles the camera detects as passing the camera and is an automated process performed by the camera. Portable Mobile Speed Cameras are aimed at a specific vehicle and not all vehicles passing that location and therefore do not collect a total vehicles count.
** Although offences per 1,000 vehicles or per hour have been rounded to the nearest whole number, the actual number was used to calculate the percentage change between the two periods. Therefore, although the change values are correct, they may not appear so, particularly where numbers are low.
^ Figures include data for digital combined speed/red light cameras (red light offences only).* Portable devices do not collect a vehicle count, so data for Mobile Speed Cameras (Overt, Covert & Portable) is represented in ‘Offences Per Hour’ rather than
‘Offences Per 1,000 Vehicles’.# Figures include data for digital combined speed/red light cameras (speed offences only).
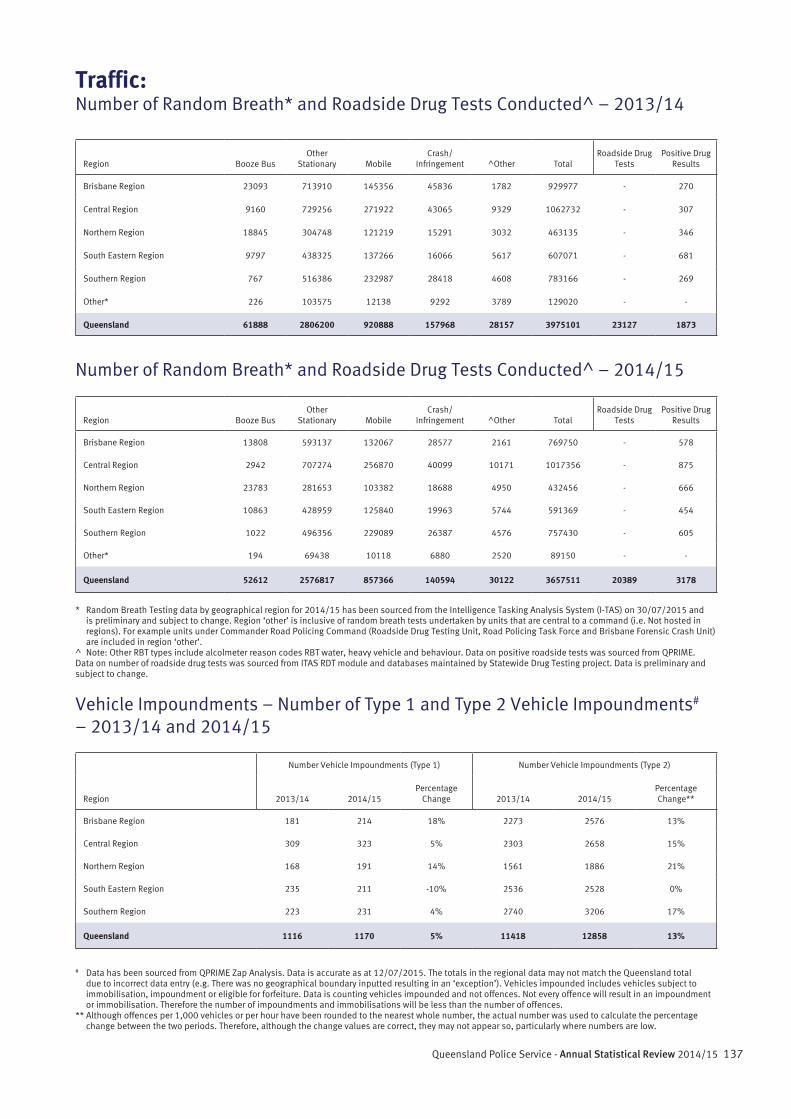
137Queensland Police Service - Annual Statistical Review 2014/15
Number Vehicle Impoundments (Type 1) Number Vehicle Impoundments (Type 2)
Region 2013/14 2014/15Percentage
Change 2013/14 2014/15Percentage Change**
Brisbane Region 181 214 18% 2273 2576 13%
Central Region 309 323 5% 2303 2658 15%
Northern Region 168 191 14% 1561 1886 21%
South Eastern Region 235 211 -10% 2536 2528 0%
Southern Region 223 231 4% 2740 3206 17%
Queensland 1116 1170 5% 11418 12858 13%
Region Booze BusOther
Stationary MobileCrash/
Infringement ^Other TotalRoadside Drug
TestsPositive Drug
Results
Brisbane Region 23093 713910 145356 45836 1782 929977 - 270
Central Region 9160 729256 271922 43065 9329 1062732 - 307
Northern Region 18845 304748 121219 15291 3032 463135 - 346
South Eastern Region 9797 438325 137266 16066 5617 607071 - 681
Southern Region 767 516386 232987 28418 4608 783166 - 269
Other* 226 103575 12138 9292 3789 129020 - -
Queensland 61888 2806200 920888 157968 28157 3975101 23127 1873
Region Booze BusOther
Stationary MobileCrash/
Infringement ^Other TotalRoadside Drug
TestsPositive Drug
Results
Brisbane Region 13808 593137 132067 28577 2161 769750 - 578
Central Region 2942 707274 256870 40099 10171 1017356 - 875
Northern Region 23783 281653 103382 18688 4950 432456 - 666
South Eastern Region 10863 428959 125840 19963 5744 591369 - 454
Southern Region 1022 496356 229089 26387 4576 757430 - 605
Other* 194 69438 10118 6880 2520 89150 - -
Queensland 52612 2576817 857366 140594 30122 3657511 20389 3178
Traffic:Number of Random Breath* and Roadside Drug Tests Conducted^ – 2013/14
Number of Random Breath* and Roadside Drug Tests Conducted^ – 2014/15
* Random Breath Testing data by geographical region for 2014/15 has been sourced from the Intelligence Tasking Analysis System (I-TAS) on 30/07/2015 and is preliminary and subject to change. Region ‘other’ is inclusive of random breath tests undertaken by units that are central to a command (i.e. Not hosted in regions). For example units under Commander Road Policing Command (Roadside Drug Testing Unit, Road Policing Task Force and Brisbane Forensic Crash Unit) are included in region ‘other’.
^ Note: Other RBT types include alcolmeter reason codes RBT water, heavy vehicle and behaviour. Data on positive roadside tests was sourced from QPRIME.Data on number of roadside drug tests was sourced from ITAS RDT module and databases maintained by Statewide Drug Testing project. Data is preliminary and subject to change.
# Data has been sourced from QPRIME Zap Analysis. Data is accurate as at 12/07/2015. The totals in the regional data may not match the Queensland total due to incorrect data entry (e.g. There was no geographical boundary inputted resulting in an ‘exception’). Vehicles impounded includes vehicles subject to immobilisation, impoundment or eligible for forfeiture. Data is counting vehicles impounded and not offences. Not every offence will result in an impoundment or immobilisation. Therefore the number of impoundments and immobilisations will be less than the number of offences.
** Although offences per 1,000 vehicles or per hour have been rounded to the nearest whole number, the actual number was used to calculate the percentage change between the two periods. Therefore, although the change values are correct, they may not appear so, particularly where numbers are low.
Vehicle Impoundments – Number of Type 1 and Type 2 Vehicle Impoundments# – 2013/14 and 2014/15
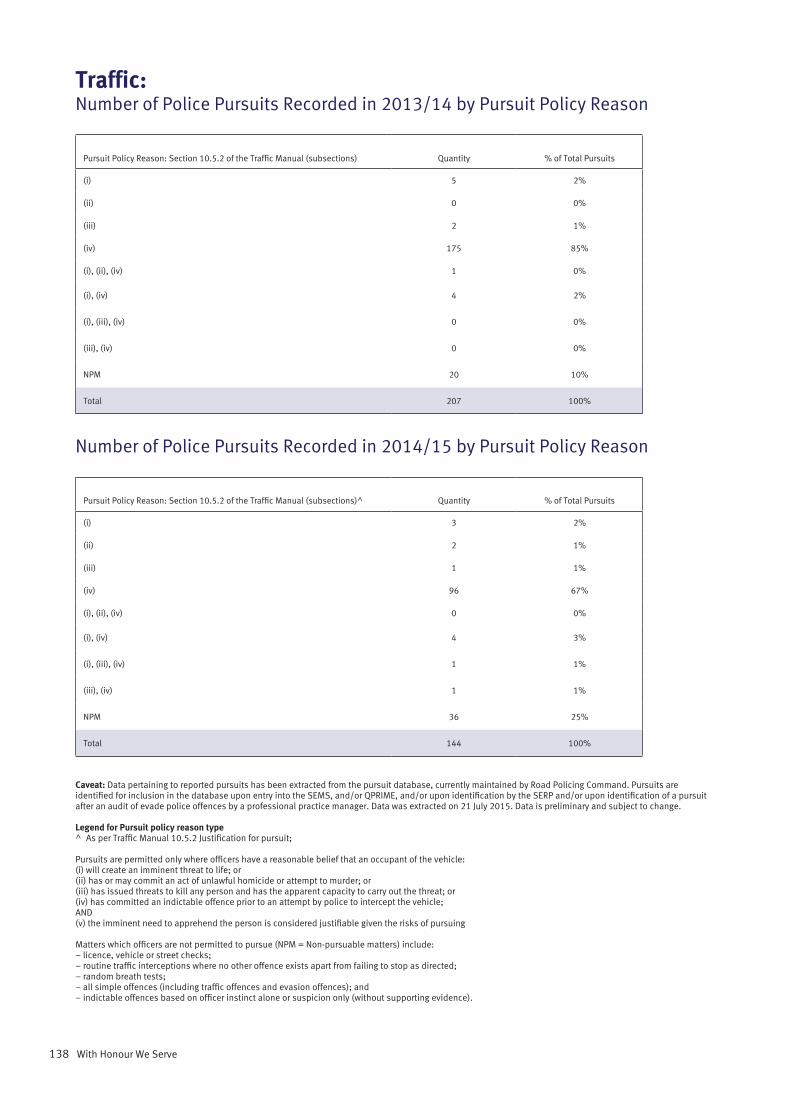
138 With Honour We Serve
Pursuit Policy Reason: Section 10.5.2 of the Traffic Manual (subsections) Quantity % of Total Pursuits
(i) 5 2%
(ii) 0 0%
(iii) 2 1%
(iv) 175 85%
(i), (ii), (iv) 1 0%
(i), (iv) 4 2%
(i), (iii), (iv) 0 0%
(iii), (iv) 0 0%
NPM 20 10%
Total 207 100%
Pursuit Policy Reason: Section 10.5.2 of the Traffic Manual (subsections)^ Quantity % of Total Pursuits
(i) 3 2%
(ii) 2 1%
(iii) 1 1%
(iv) 96 67%
(i), (ii), (iv) 0 0%
(i), (iv) 4 3%
(i), (iii), (iv) 1 1%
(iii), (iv) 1 1%
NPM 36 25%
Total 144 100%
Traffic:Number of Police Pursuits Recorded in 2013/14 by Pursuit Policy Reason
Number of Police Pursuits Recorded in 2014/15 by Pursuit Policy Reason
Caveat: Data pertaining to reported pursuits has been extracted from the pursuit database, currently maintained by Road Policing Command. Pursuits are identified for inclusion in the database upon entry into the SEMS, and/or QPRIME, and/or upon identification by the SERP and/or upon identification of a pursuit after an audit of evade police offences by a professional practice manager. Data was extracted on 21 July 2015. Data is preliminary and subject to change.
Legend for Pursuit policy reason type^ As per Traffic Manual 10.5.2 Justification for pursuit;
Pursuits are permitted only where officers have a reasonable belief that an occupant of the vehicle:(i) will create an imminent threat to life; or(ii) has or may commit an act of unlawful homicide or attempt to murder; or(iii) has issued threats to kill any person and has the apparent capacity to carry out the threat; or(iv) has committed an indictable offence prior to an attempt by police to intercept the vehicle;AND(v) the imminent need to apprehend the person is considered justifiable given the risks of pursuing
Matters which officers are not permitted to pursue (NPM = Non-pursuable matters) include:– licence, vehicle or street checks;– routine traffic interceptions where no other offence exists apart from failing to stop as directed;– random breath tests; – all simple offences (including traffic offences and evasion offences); and– indictable offences based on officer instinct alone or suspicion only (without supporting evidence).
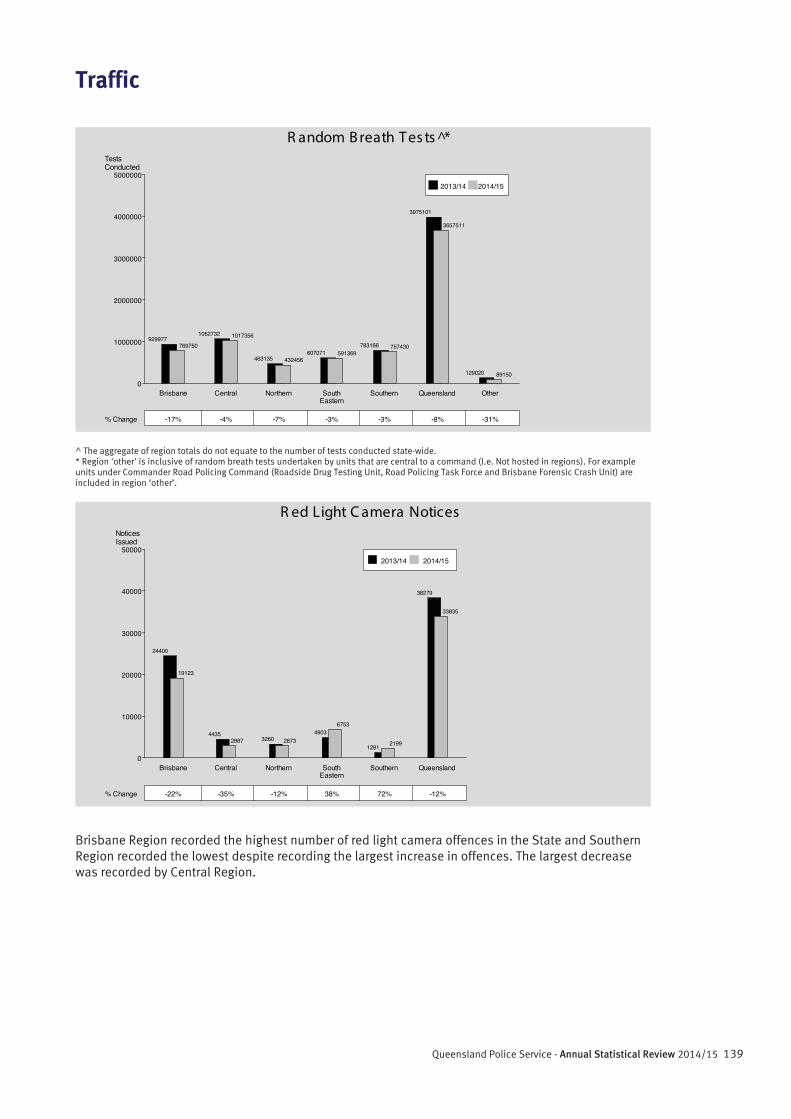
139Queensland Police Service - Annual Statistical Review 2014/15
Traffic
^ The aggregate of region totals do not equate to the number of tests conducted state-wide.* Region 'other' is inclusive of random breath tests undertaken by units that are central to a command (I.e. Not hosted in regions). For example units under Commander Road Policing Command (Roadside Drug Testing Unit, Road Policing Task Force and Brisbane Forensic Crash Unit) are included in region ‘other’.
Brisbane Region recorded the highest number of red light camera offences in the State and Southern Region recorded the lowest despite recording the largest increase in offences. The largest decrease was recorded by Central Region.
R andom B reath Tes ts *̂TestsConducted
0
1000000
2000000
3000000
4000000
5000000
Brisbane Central Northern SouthEastern
Southern Queensland Other
% Change
2013/14 2014/15
929977769750
-17%
1062732 1017356
-4%
463135 432456
-7%
607071 591369
-3%
783166 757430
-3%
3975101
3657511
-8%
129020 89150
-31%
R ed Light C amera NoticesNoticesIssued
0
10000
20000
30000
40000
50000
Brisbane Central Northern SouthEastern
Southern Queensland
% Change
2013/14 2014/15
24400
19123
-22%
44352887
-35%
3260 2873
-12%
49036753
38%
1281 2199
72%
38279
33835
-12%
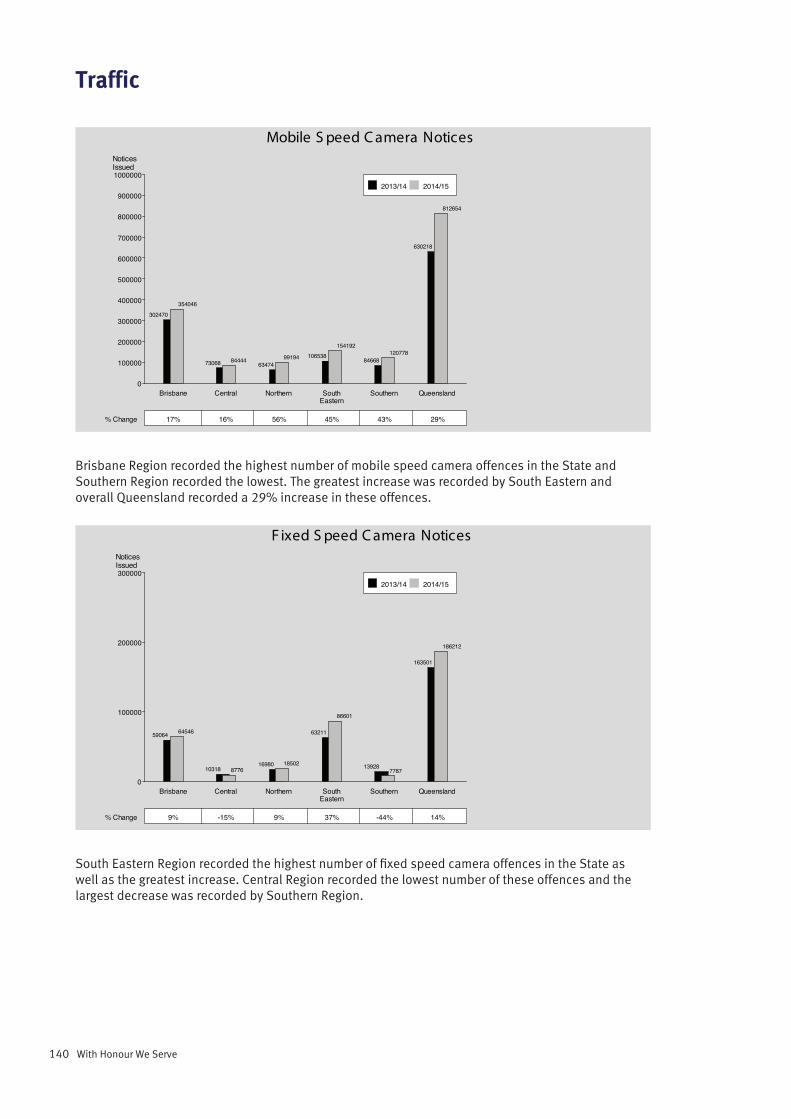
140 With Honour We Serve
Traffic
Brisbane Region recorded the highest number of mobile speed camera offences in the State and Southern Region recorded the lowest. The greatest increase was recorded by South Eastern and overall Queensland recorded a 29% increase in these offences.
South Eastern Region recorded the highest number of fixed speed camera offences in the State as well as the greatest increase. Central Region recorded the lowest number of these offences and the largest decrease was recorded by Southern Region.
Mobile S peed C amera NoticesNoticesIssued
0
100000
200000
300000
400000
500000
600000
700000
800000
900000
1000000
Brisbane Central Northern SouthEastern
Southern Queensland
% Change
2013/14 2014/15
302470
354046
17%
73068 84444
16%
6347499194
56%
106538154192
45%
84668120778
43%
630218
812654
29%
F ixed S peed C amera NoticesNoticesIssued
0
100000
200000
300000
Brisbane Central Northern SouthEastern
Southern Queensland
% Change
2013/14 2014/15
59064 64546
9%
10318 8776
-15%
16980 18502
9%
63211
86601
37%
139287787
-44%
163501
186212
14%
141Queensland Police Service - Annual Statistical Review 2014/15
Crime Statistics in Focus
This chapter has been introduced to provide a detailed examination for selected topics of public interest.
The tables offer information on the reported number and rate per 100,000 persons for public nuisance offences, Move-on Directions and assaults on Police. The number of Domestic Violence Protection Orders and the number and rate per 100,000 persons for Breach of Domestic Violence Protection Orders are also provided.
These statistics have been provided for the Queensland Police Service’s statistical regions and districts.
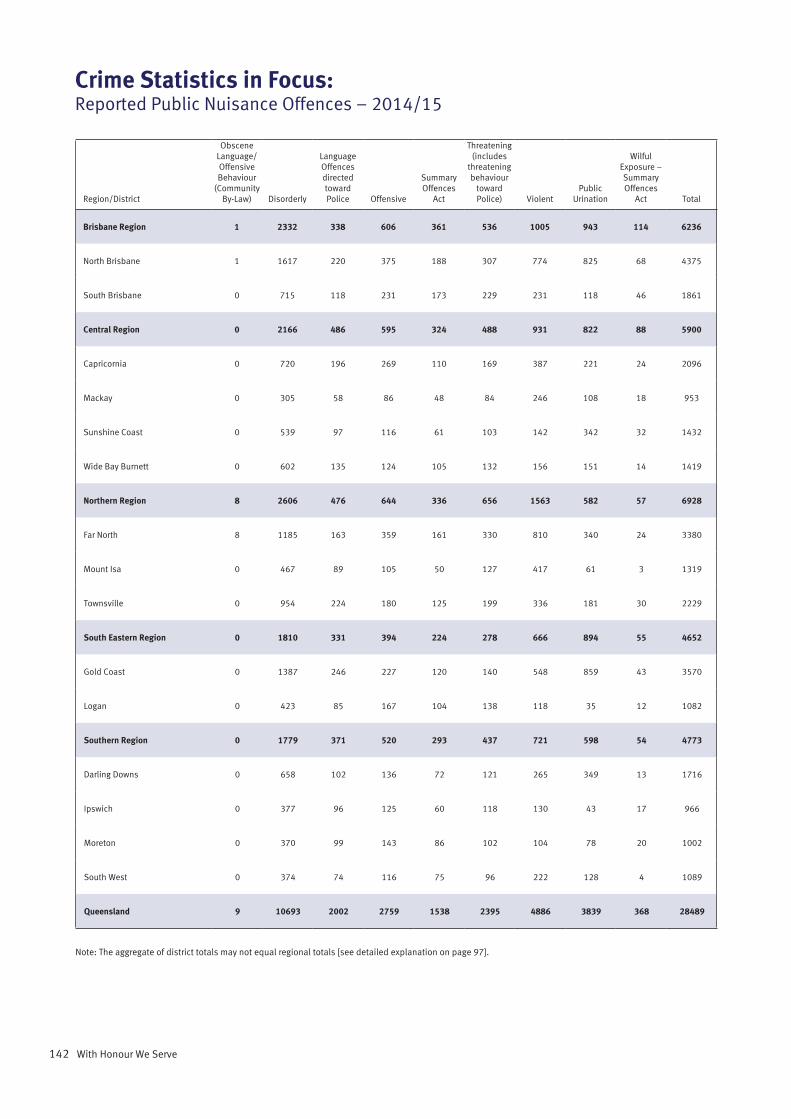
142 With Honour We Serve
Crime Statistics in Focus:Reported Public Nuisance Offences – 2014/15
Region/District
Obscene Language/Offensive Behaviour
(Community By-Law) Disorderly
Language Offences directed toward Police Offensive
Summary Offences
Act
Threatening (includes
threatening behaviour
toward Police) Violent
Public Urination
Wilful Exposure – Summary Offences
Act Total
Brisbane Region 1 2332 338 606 361 536 1005 943 114 6236
North Brisbane 1 1617 220 375 188 307 774 825 68 4375
South Brisbane 0 715 118 231 173 229 231 118 46 1861
Central Region 0 2166 486 595 324 488 931 822 88 5900
Capricornia 0 720 196 269 110 169 387 221 24 2096
Mackay 0 305 58 86 48 84 246 108 18 953
Sunshine Coast 0 539 97 116 61 103 142 342 32 1432
Wide Bay Burnett 0 602 135 124 105 132 156 151 14 1419
Northern Region 8 2606 476 644 336 656 1563 582 57 6928
Far North 8 1185 163 359 161 330 810 340 24 3380
Mount Isa 0 467 89 105 50 127 417 61 3 1319
Townsville 0 954 224 180 125 199 336 181 30 2229
South Eastern Region 0 1810 331 394 224 278 666 894 55 4652
Gold Coast 0 1387 246 227 120 140 548 859 43 3570
Logan 0 423 85 167 104 138 118 35 12 1082
Southern Region 0 1779 371 520 293 437 721 598 54 4773
Darling Downs 0 658 102 136 72 121 265 349 13 1716
Ipswich 0 377 96 125 60 118 130 43 17 966
Moreton 0 370 99 143 86 102 104 78 20 1002
South West 0 374 74 116 75 96 222 128 4 1089
Queensland 9 10693 2002 2759 1538 2395 4886 3839 368 28489
Note: The aggregate of district totals may not equal regional totals [see detailed explanation on page 97].
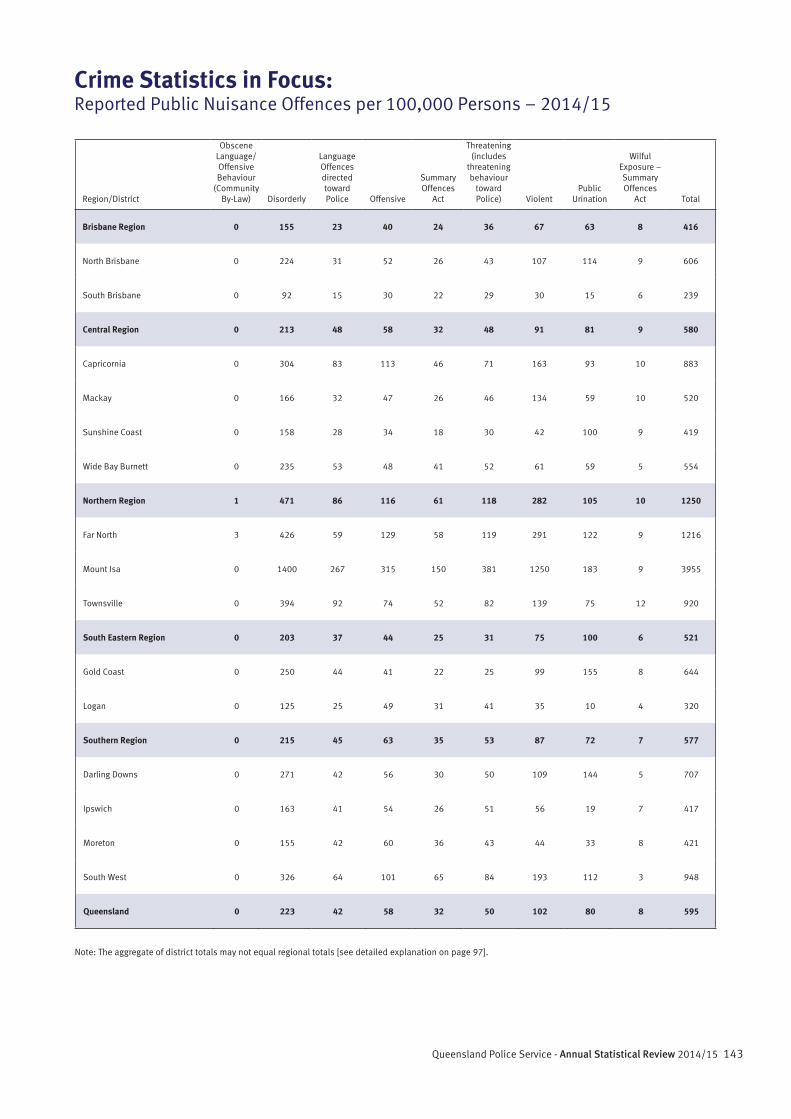
143Queensland Police Service - Annual Statistical Review 2014/15
Crime Statistics in Focus:Reported Public Nuisance Offences per 100,000 Persons – 2014/15
Region/District
Obscene Language/Offensive Behaviour
(Community By-Law) Disorderly
Language Offences directed toward Police Offensive
Summary Offences
Act
Threatening (includes
threatening behaviour
toward Police) Violent
Public Urination
Wilful Exposure – Summary Offences
Act Total
Brisbane Region 0 155 23 40 24 36 67 63 8 416
North Brisbane 0 224 31 52 26 43 107 114 9 606
South Brisbane 0 92 15 30 22 29 30 15 6 239
Central Region 0 213 48 58 32 48 91 81 9 580
Capricornia 0 304 83 113 46 71 163 93 10 883
Mackay 0 166 32 47 26 46 134 59 10 520
Sunshine Coast 0 158 28 34 18 30 42 100 9 419
Wide Bay Burnett 0 235 53 48 41 52 61 59 5 554
Northern Region 1 471 86 116 61 118 282 105 10 1250
Far North 3 426 59 129 58 119 291 122 9 1216
Mount Isa 0 1400 267 315 150 381 1250 183 9 3955
Townsville 0 394 92 74 52 82 139 75 12 920
South Eastern Region 0 203 37 44 25 31 75 100 6 521
Gold Coast 0 250 44 41 22 25 99 155 8 644
Logan 0 125 25 49 31 41 35 10 4 320
Southern Region 0 215 45 63 35 53 87 72 7 577
Darling Downs 0 271 42 56 30 50 109 144 5 707
Ipswich 0 163 41 54 26 51 56 19 7 417
Moreton 0 155 42 60 36 43 44 33 8 421
South West 0 326 64 101 65 84 193 112 3 948
Queensland 0 223 42 58 32 50 102 80 8 595
Note: The aggregate of district totals may not equal regional totals [see detailed explanation on page 97].
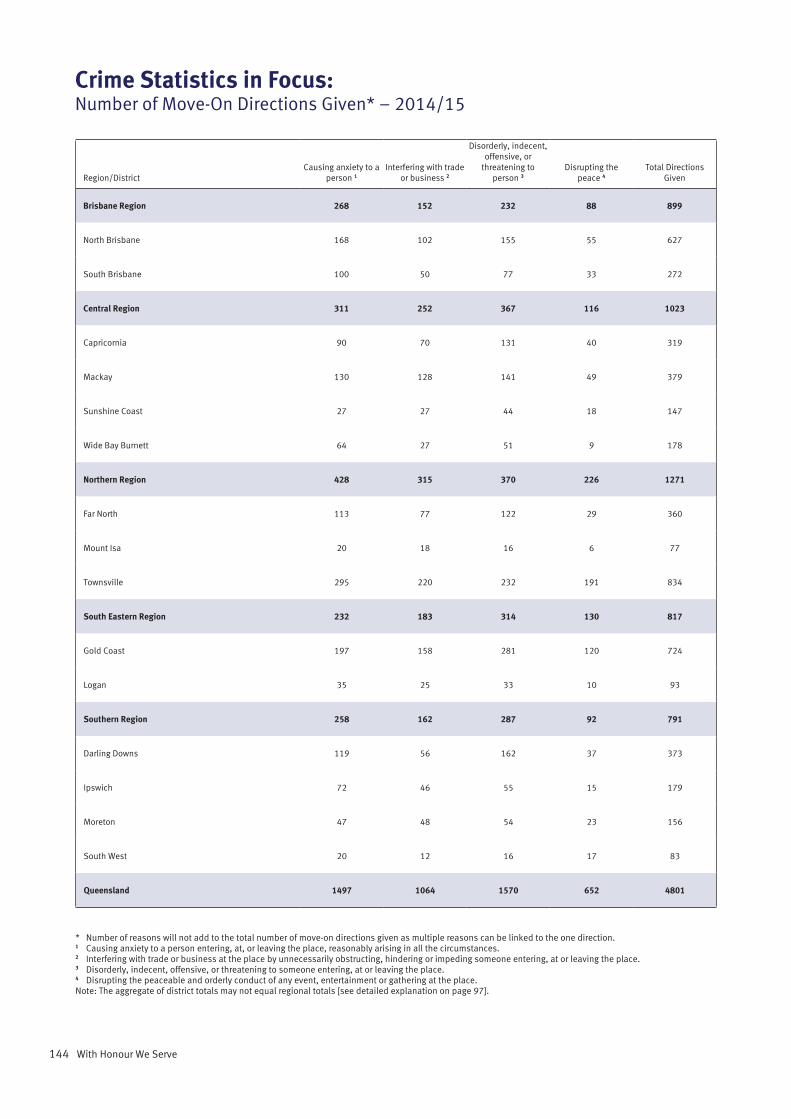
144 With Honour We Serve
Crime Statistics in Focus:Number of Move-On Directions Given* – 2014/15
Region/DistrictCausing anxiety to a
person 1Interfering with trade
or business 2
Disorderly, indecent, offensive, or
threatening to person 3
Disrupting the peace 4
Total Directions Given
Brisbane Region 268 152 232 88 899
North Brisbane 168 102 155 55 627
South Brisbane 100 50 77 33 272
Central Region 311 252 367 116 1023
Capricornia 90 70 131 40 319
Mackay 130 128 141 49 379
Sunshine Coast 27 27 44 18 147
Wide Bay Burnett 64 27 51 9 178
Northern Region 428 315 370 226 1271
Far North 113 77 122 29 360
Mount Isa 20 18 16 6 77
Townsville 295 220 232 191 834
South Eastern Region 232 183 314 130 817
Gold Coast 197 158 281 120 724
Logan 35 25 33 10 93
Southern Region 258 162 287 92 791
Darling Downs 119 56 162 37 373
Ipswich 72 46 55 15 179
Moreton 47 48 54 23 156
South West 20 12 16 17 83
Queensland 1497 1064 1570 652 4801
* Number of reasons will not add to the total number of move-on directions given as multiple reasons can be linked to the one direction.1 Causing anxiety to a person entering, at, or leaving the place, reasonably arising in all the circumstances.2 Interfering with trade or business at the place by unnecessarily obstructing, hindering or impeding someone entering, at or leaving the place.3 Disorderly, indecent, offensive, or threatening to someone entering, at or leaving the place.4 Disrupting the peaceable and orderly conduct of any event, entertainment or gathering at the place.Note: The aggregate of district totals may not equal regional totals [see detailed explanation on page 97].
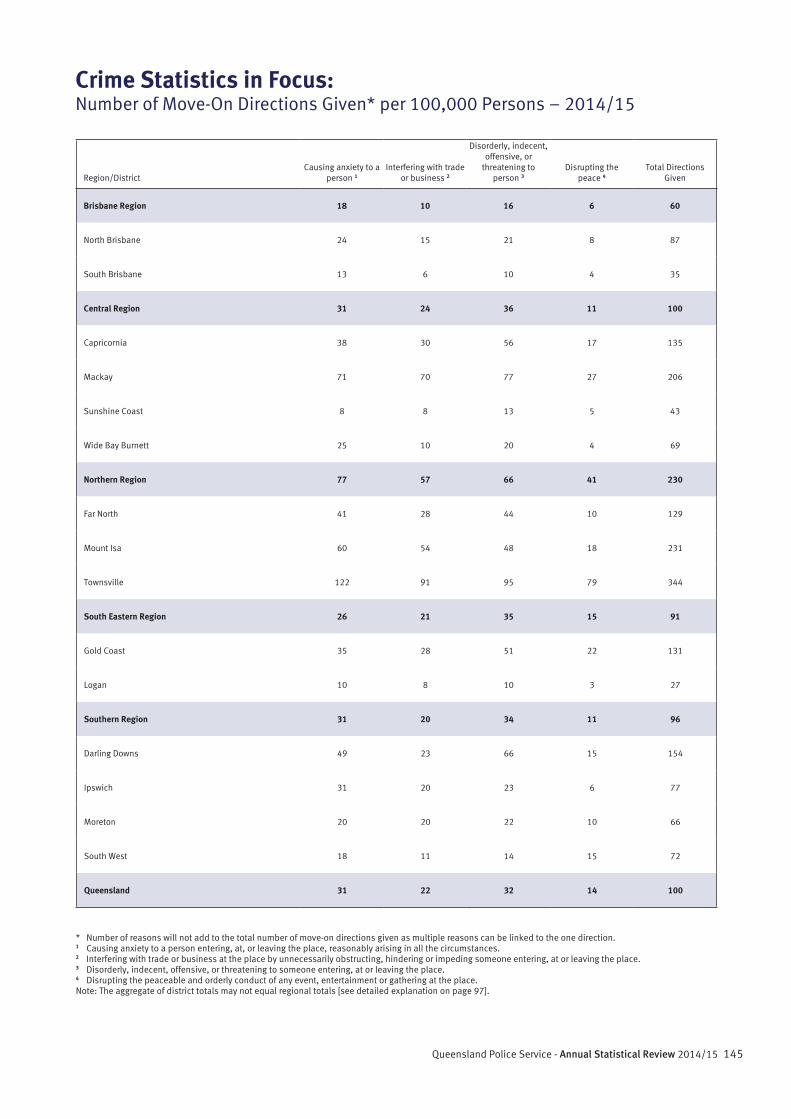
145Queensland Police Service - Annual Statistical Review 2014/15
Crime Statistics in Focus:Number of Move-On Directions Given* per 100,000 Persons – 2014/15
Region/DistrictCausing anxiety to a
person 1Interfering with trade
or business 2
Disorderly, indecent, offensive, or
threatening to person 3
Disrupting the peace 4
Total Directions Given
Brisbane Region 18 10 16 6 60
North Brisbane 24 15 21 8 87
South Brisbane 13 6 10 4 35
Central Region 31 24 36 11 100
Capricornia 38 30 56 17 135
Mackay 71 70 77 27 206
Sunshine Coast 8 8 13 5 43
Wide Bay Burnett 25 10 20 4 69
Northern Region 77 57 66 41 230
Far North 41 28 44 10 129
Mount Isa 60 54 48 18 231
Townsville 122 91 95 79 344
South Eastern Region 26 21 35 15 91
Gold Coast 35 28 51 22 131
Logan 10 8 10 3 27
Southern Region 31 20 34 11 96
Darling Downs 49 23 66 15 154
Ipswich 31 20 23 6 77
Moreton 20 20 22 10 66
South West 18 11 14 15 72
Queensland 31 22 32 14 100
* Number of reasons will not add to the total number of move-on directions given as multiple reasons can be linked to the one direction.1 Causing anxiety to a person entering, at, or leaving the place, reasonably arising in all the circumstances.2 Interfering with trade or business at the place by unnecessarily obstructing, hindering or impeding someone entering, at or leaving the place.3 Disorderly, indecent, offensive, or threatening to someone entering, at or leaving the place.4 Disrupting the peaceable and orderly conduct of any event, entertainment or gathering at the place.Note: The aggregate of district totals may not equal regional totals [see detailed explanation on page 97].
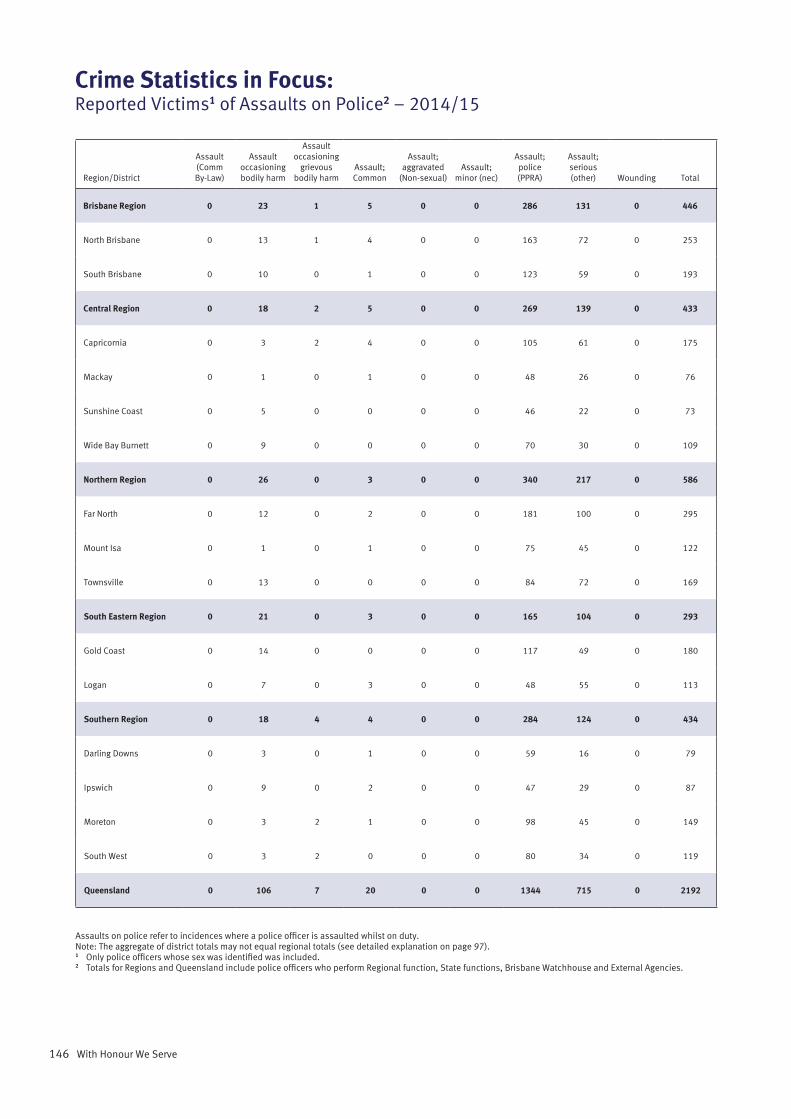
146 With Honour We Serve
Crime Statistics in Focus:Reported Victims1 of Assaults on Police2 – 2014/15
Region/District
Assault (Comm By-Law)
Assault occasioning bodily harm
Assault occasioning
grievous bodily harm
Assault; Common
Assault; aggravated
(Non-sexual)Assault;
minor (nec)
Assault; police (PPRA)
Assault; serious (other) Wounding Total
Brisbane Region 0 23 1 5 0 0 286 131 0 446
North Brisbane 0 13 1 4 0 0 163 72 0 253
South Brisbane 0 10 0 1 0 0 123 59 0 193
Central Region 0 18 2 5 0 0 269 139 0 433
Capricornia 0 3 2 4 0 0 105 61 0 175
Mackay 0 1 0 1 0 0 48 26 0 76
Sunshine Coast 0 5 0 0 0 0 46 22 0 73
Wide Bay Burnett 0 9 0 0 0 0 70 30 0 109
Northern Region 0 26 0 3 0 0 340 217 0 586
Far North 0 12 0 2 0 0 181 100 0 295
Mount Isa 0 1 0 1 0 0 75 45 0 122
Townsville 0 13 0 0 0 0 84 72 0 169
South Eastern Region 0 21 0 3 0 0 165 104 0 293
Gold Coast 0 14 0 0 0 0 117 49 0 180
Logan 0 7 0 3 0 0 48 55 0 113
Southern Region 0 18 4 4 0 0 284 124 0 434
Darling Downs 0 3 0 1 0 0 59 16 0 79
Ipswich 0 9 0 2 0 0 47 29 0 87
Moreton 0 3 2 1 0 0 98 45 0 149
South West 0 3 2 0 0 0 80 34 0 119
Queensland 0 106 7 20 0 0 1344 715 0 2192
Assaults on police refer to incidences where a police officer is assaulted whilst on duty.Note: The aggregate of district totals may not equal regional totals (see detailed explanation on page 97).1 Only police officers whose sex was identified was included.2 Totals for Regions and Queensland include police officers who perform Regional function, State functions, Brisbane Watchhouse and External Agencies.
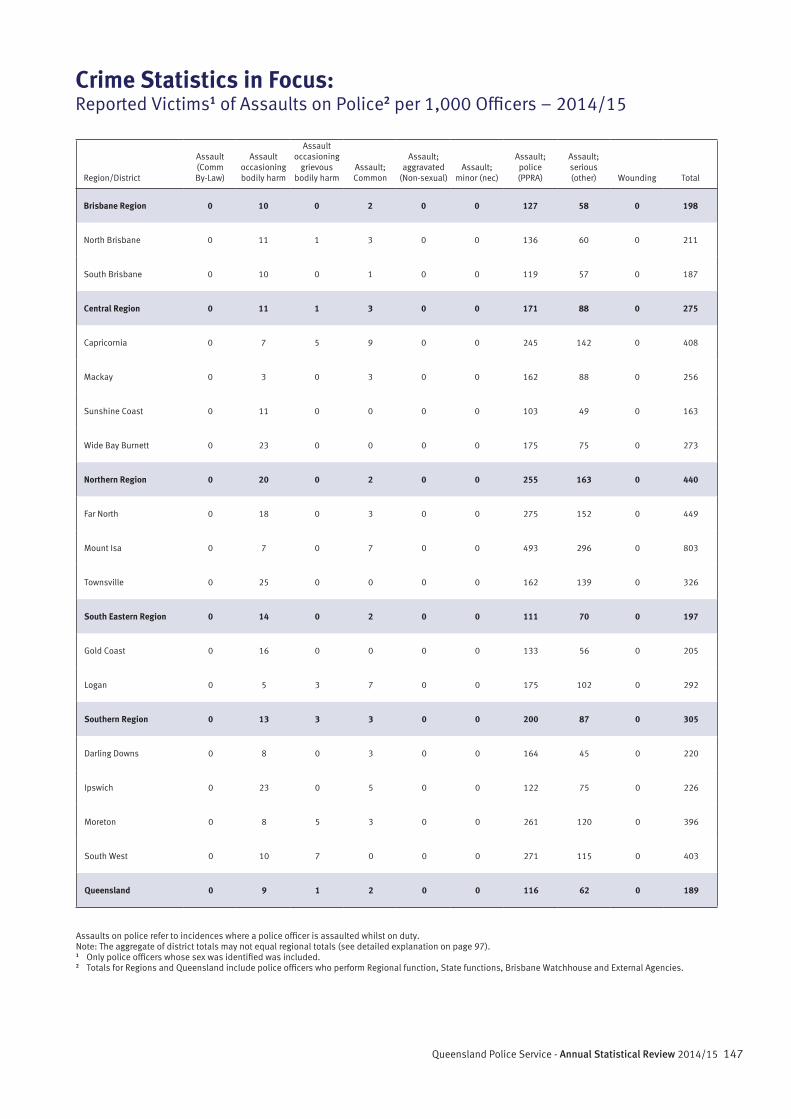
147Queensland Police Service - Annual Statistical Review 2014/15
Crime Statistics in Focus:Reported Victims1 of Assaults on Police2 per 1,000 Officers – 2014/15
Region/District
Assault (Comm By-Law)
Assault occasioning bodily harm
Assault occasioning
grievous bodily harm
Assault; Common
Assault; aggravated
(Non-sexual)Assault;
minor (nec)
Assault; police (PPRA)
Assault; serious (other) Wounding Total
Brisbane Region 0 10 0 2 0 0 127 58 0 198
North Brisbane 0 11 1 3 0 0 136 60 0 211
South Brisbane 0 10 0 1 0 0 119 57 0 187
Central Region 0 11 1 3 0 0 171 88 0 275
Capricornia 0 7 5 9 0 0 245 142 0 408
Mackay 0 3 0 3 0 0 162 88 0 256
Sunshine Coast 0 11 0 0 0 0 103 49 0 163
Wide Bay Burnett 0 23 0 0 0 0 175 75 0 273
Northern Region 0 20 0 2 0 0 255 163 0 440
Far North 0 18 0 3 0 0 275 152 0 449
Mount Isa 0 7 0 7 0 0 493 296 0 803
Townsville 0 25 0 0 0 0 162 139 0 326
South Eastern Region 0 14 0 2 0 0 111 70 0 197
Gold Coast 0 16 0 0 0 0 133 56 0 205
Logan 0 5 3 7 0 0 175 102 0 292
Southern Region 0 13 3 3 0 0 200 87 0 305
Darling Downs 0 8 0 3 0 0 164 45 0 220
Ipswich 0 23 0 5 0 0 122 75 0 226
Moreton 0 8 5 3 0 0 261 120 0 396
South West 0 10 7 0 0 0 271 115 0 403
Queensland 0 9 1 2 0 0 116 62 0 189
Assaults on police refer to incidences where a police officer is assaulted whilst on duty.Note: The aggregate of district totals may not equal regional totals (see detailed explanation on page 97).1 Only police officers whose sex was identified was included.2 Totals for Regions and Queensland include police officers who perform Regional function, State functions, Brisbane Watchhouse and External Agencies.
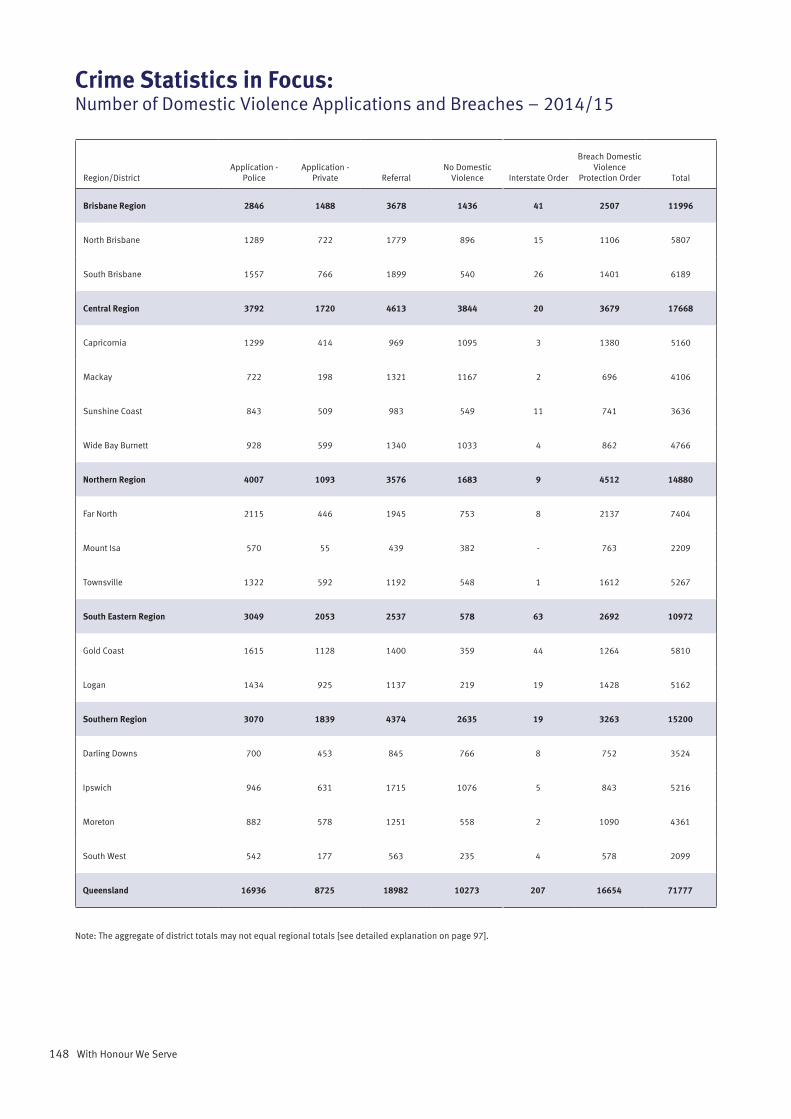
148 With Honour We Serve
Note: The aggregate of district totals may not equal regional totals [see detailed explanation on page 97].
Crime Statistics in Focus:Number of Domestic Violence Applications and Breaches – 2014/15
Region/DistrictApplication -
PoliceApplication -
Private ReferralNo Domestic
Violence Interstate Order
Breach Domestic Violence
Protection Order Total
Brisbane Region 2846 1488 3678 1436 41 2507 11996
North Brisbane 1289 722 1779 896 15 1106 5807
South Brisbane 1557 766 1899 540 26 1401 6189
Central Region 3792 1720 4613 3844 20 3679 17668
Capricornia 1299 414 969 1095 3 1380 5160
Mackay 722 198 1321 1167 2 696 4106
Sunshine Coast 843 509 983 549 11 741 3636
Wide Bay Burnett 928 599 1340 1033 4 862 4766
Northern Region 4007 1093 3576 1683 9 4512 14880
Far North 2115 446 1945 753 8 2137 7404
Mount Isa 570 55 439 382 - 763 2209
Townsville 1322 592 1192 548 1 1612 5267
South Eastern Region 3049 2053 2537 578 63 2692 10972
Gold Coast 1615 1128 1400 359 44 1264 5810
Logan 1434 925 1137 219 19 1428 5162
Southern Region 3070 1839 4374 2635 19 3263 15200
Darling Downs 700 453 845 766 8 752 3524
Ipswich 946 631 1715 1076 5 843 5216
Moreton 882 578 1251 558 2 1090 4361
South West 542 177 563 235 4 578 2099
Queensland 16936 8725 18982 10273 207 16654 71777
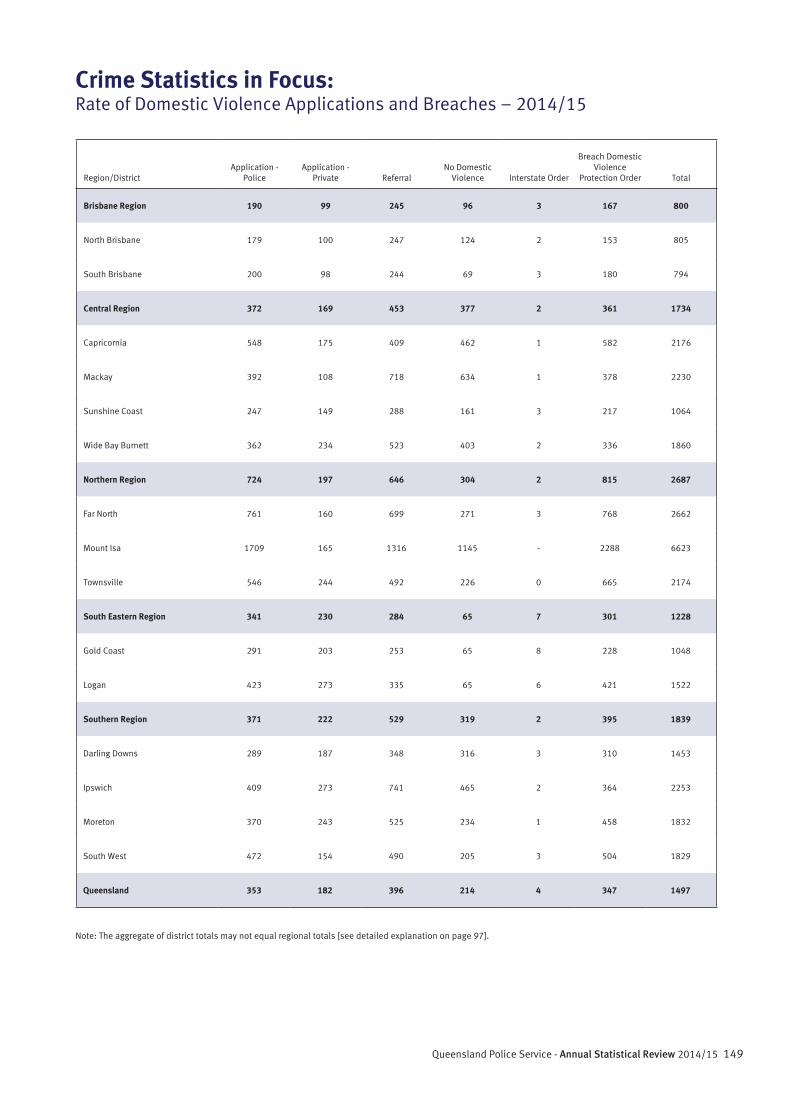
149Queensland Police Service - Annual Statistical Review 2014/15
Note: The aggregate of district totals may not equal regional totals [see detailed explanation on page 97].
Crime Statistics in Focus:Rate of Domestic Violence Applications and Breaches – 2014/15
Region/DistrictApplication -
PoliceApplication -
Private ReferralNo Domestic
Violence Interstate Order
Breach Domestic Violence
Protection Order Total
Brisbane Region 190 99 245 96 3 167 800
North Brisbane 179 100 247 124 2 153 805
South Brisbane 200 98 244 69 3 180 794
Central Region 372 169 453 377 2 361 1734
Capricornia 548 175 409 462 1 582 2176
Mackay 392 108 718 634 1 378 2230
Sunshine Coast 247 149 288 161 3 217 1064
Wide Bay Burnett 362 234 523 403 2 336 1860
Northern Region 724 197 646 304 2 815 2687
Far North 761 160 699 271 3 768 2662
Mount Isa 1709 165 1316 1145 - 2288 6623
Townsville 546 244 492 226 0 665 2174
South Eastern Region 341 230 284 65 7 301 1228
Gold Coast 291 203 253 65 8 228 1048
Logan 423 273 335 65 6 421 1522
Southern Region 371 222 529 319 2 395 1839
Darling Downs 289 187 348 316 3 310 1453
Ipswich 409 273 741 465 2 364 2253
Moreton 370 243 525 234 1 458 1832
South West 472 154 490 205 3 504 1829
Queensland 353 182 396 214 4 347 1497

150 With Honour We Serve
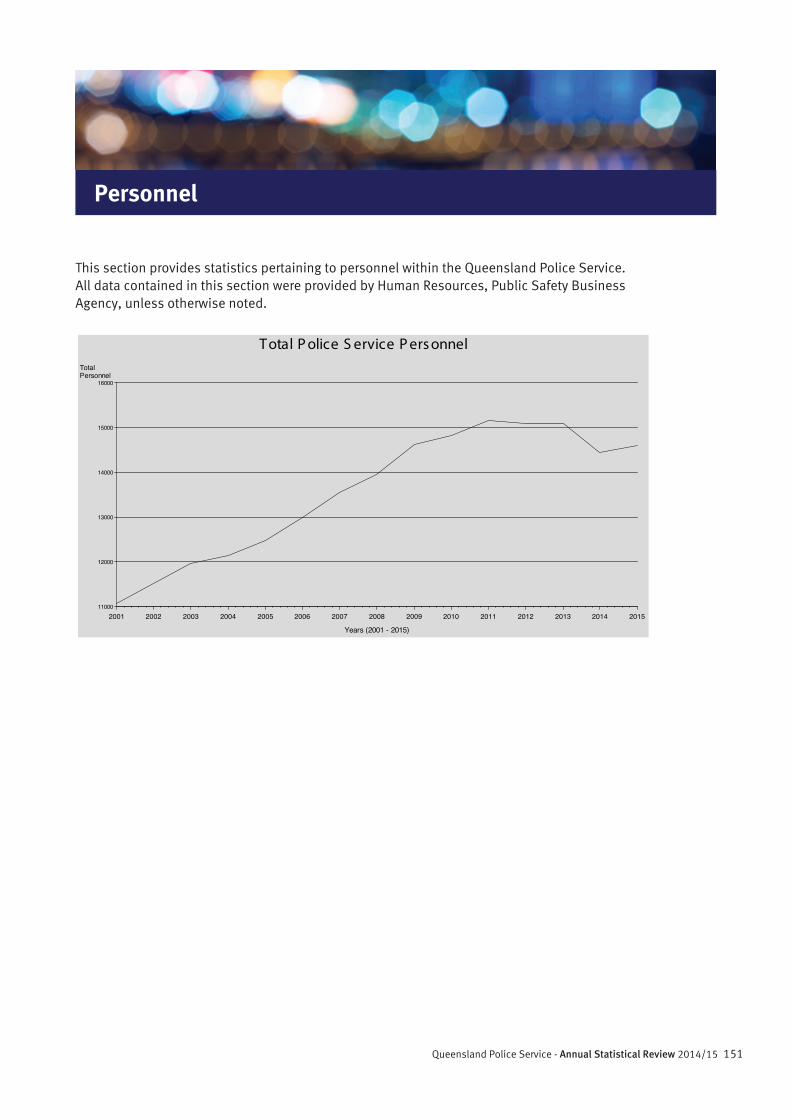
151Queensland Police Service - Annual Statistical Review 2014/15
Personnel
This section provides statistics pertaining to personnel within the Queensland Police Service. All data contained in this section were provided by Human Resources, Public Safety Business Agency, unless otherwise noted.
TotalPersonnel
11000
12000
13000
14000
15000
16000
Years (2001 - 2015)
2001 2002 2003 2004 2005 2006 2007 2008 2009 2010 2011 2012 2013 2014 2015
Total P olice S ervice P ers onnel
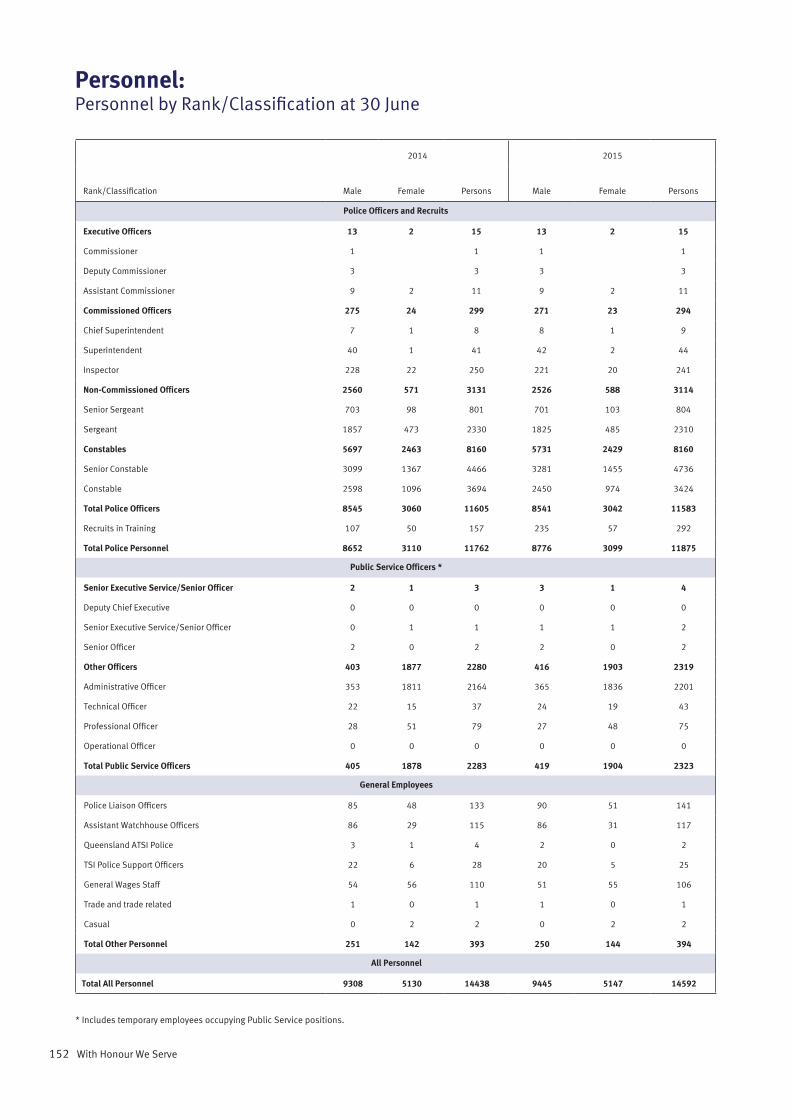
152 With Honour We Serve
Personnel:Personnel by Rank/Classification at 30 June
Rank/Classification
2014 2015
Male Female Persons Male Female Persons
Police Officers and Recruits
Executive Officers 13 2 15 13 2 15
Commissioner 1 1 1 1
Deputy Commissioner 3 3 3 3
Assistant Commissioner 9 2 11 9 2 11
Commissioned Officers 275 24 299 271 23 294
Chief Superintendent 7 1 8 8 1 9
Superintendent 40 1 41 42 2 44
Inspector 228 22 250 221 20 241
Non-Commissioned Officers 2560 571 3131 2526 588 3114
Senior Sergeant 703 98 801 701 103 804
Sergeant 1857 473 2330 1825 485 2310
Constables 5697 2463 8160 5731 2429 8160
Senior Constable 3099 1367 4466 3281 1455 4736
Constable 2598 1096 3694 2450 974 3424
Total Police Officers 8545 3060 11605 8541 3042 11583
Recruits in Training 107 50 157 235 57 292
Total Police Personnel 8652 3110 11762 8776 3099 11875
Public Service Officers *
Senior Executive Service/Senior Officer 2 1 3 3 1 4
Deputy Chief Executive 0 0 0 0 0 0
Senior Executive Service/Senior Officer 0 1 1 1 1 2
Senior Officer 2 0 2 2 0 2
Other Officers 403 1877 2280 416 1903 2319
Administrative Officer 353 1811 2164 365 1836 2201
Technical Officer 22 15 37 24 19 43
Professional Officer 28 51 79 27 48 75
Operational Officer 0 0 0 0 0 0
Total Public Service Officers 405 1878 2283 419 1904 2323
General Employees
Police Liaison Officers 85 48 133 90 51 141
Assistant Watchhouse Officers 86 29 115 86 31 117
Queensland ATSI Police 3 1 4 2 0 2
TSI Police Support Officers 22 6 28 20 5 25
General Wages Staff 54 56 110 51 55 106
Trade and trade related 1 0 1 1 0 1
Casual 0 2 2 0 2 2
Total Other Personnel 251 142 393 250 144 394
All Personnel
Total All Personnel 9308 5130 14438 9445 5147 14592
* Includes temporary employees occupying Public Service positions.
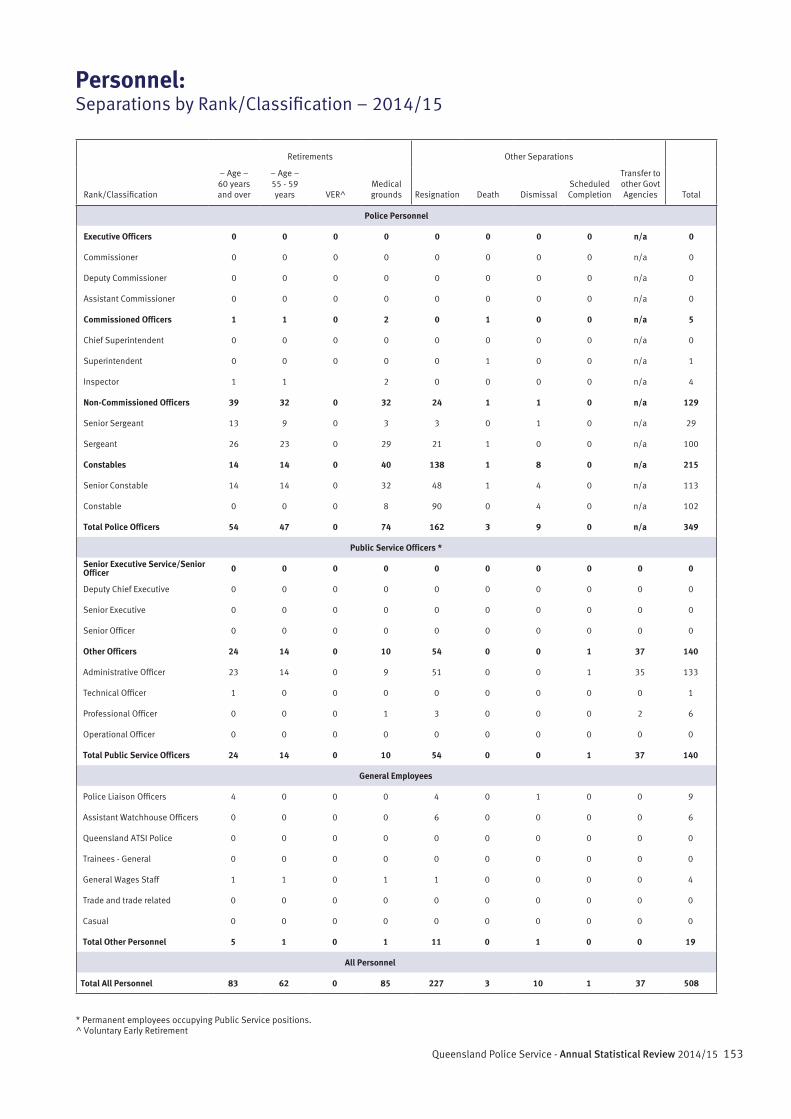
153Queensland Police Service - Annual Statistical Review 2014/15
Personnel:Separations by Rank/Classification – 2014/15
Rank/Classification
Retirements Other Separations
– Age – 60 years and over
– Age – 55 - 59 years VER^
Medical grounds Resignation Death Dismissal
Scheduled Completion
Transfer to other Govt Agencies Total
Police Personnel
Executive Officers 0 0 0 0 0 0 0 0 n/a 0
Commissioner 0 0 0 0 0 0 0 0 n/a 0
Deputy Commissioner 0 0 0 0 0 0 0 0 n/a 0
Assistant Commissioner 0 0 0 0 0 0 0 0 n/a 0
Commissioned Officers 1 1 0 2 0 1 0 0 n/a 5
Chief Superintendent 0 0 0 0 0 0 0 0 n/a 0
Superintendent 0 0 0 0 0 1 0 0 n/a 1
Inspector 1 1 2 0 0 0 0 n/a 4
Non-Commissioned Officers 39 32 0 32 24 1 1 0 n/a 129
Senior Sergeant 13 9 0 3 3 0 1 0 n/a 29
Sergeant 26 23 0 29 21 1 0 0 n/a 100
Constables 14 14 0 40 138 1 8 0 n/a 215
Senior Constable 14 14 0 32 48 1 4 0 n/a 113
Constable 0 0 0 8 90 0 4 0 n/a 102
Total Police Officers 54 47 0 74 162 3 9 0 n/a 349
Public Service Officers *
Senior Executive Service/Senior Officer 0 0 0 0 0 0 0 0 0 0
Deputy Chief Executive 0 0 0 0 0 0 0 0 0 0
Senior Executive 0 0 0 0 0 0 0 0 0 0
Senior Officer 0 0 0 0 0 0 0 0 0 0
Other Officers 24 14 0 10 54 0 0 1 37 140
Administrative Officer 23 14 0 9 51 0 0 1 35 133
Technical Officer 1 0 0 0 0 0 0 0 0 1
Professional Officer 0 0 0 1 3 0 0 0 2 6
Operational Officer 0 0 0 0 0 0 0 0 0 0
Total Public Service Officers 24 14 0 10 54 0 0 1 37 140
General Employees
Police Liaison Officers 4 0 0 0 4 0 1 0 0 9
Assistant Watchhouse Officers 0 0 0 0 6 0 0 0 0 6
Queensland ATSI Police 0 0 0 0 0 0 0 0 0 0
Trainees - General 0 0 0 0 0 0 0 0 0 0
General Wages Staff 1 1 0 1 1 0 0 0 0 4
Trade and trade related 0 0 0 0 0 0 0 0 0 0
Casual 0 0 0 0 0 0 0 0 0 0
Total Other Personnel 5 1 0 1 11 0 1 0 0 19
All Personnel
Total All Personnel 83 62 0 85 227 3 10 1 37 508
* Permanent employees occupying Public Service positions.^ Voluntary Early Retirement
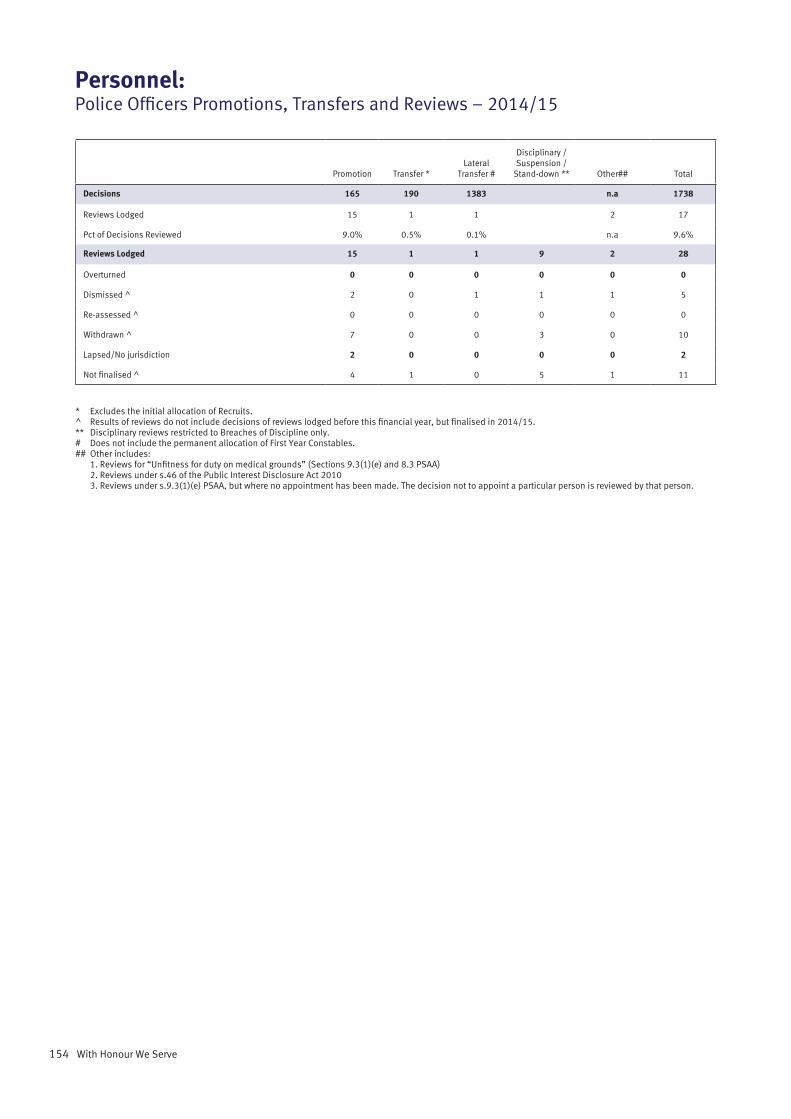
154 With Honour We Serve
Personnel:Police Officers Promotions, Transfers and Reviews – 2014/15
Promotion Transfer *Lateral
Transfer #
Disciplinary / Suspension /
Stand-down ** Other## Total
Decisions 165 190 1383 n.a 1738
Reviews Lodged 15 1 1 2 17
Pct of Decisions Reviewed 9.0% 0.5% 0.1% n.a 9.6%
Reviews Lodged 15 1 1 9 2 28
Overturned 0 0 0 0 0 0
Dismissed ^ 2 0 1 1 1 5
Re-assessed ^ 0 0 0 0 0 0
Withdrawn ^ 7 0 0 3 0 10
Lapsed/No jurisdiction 2 0 0 0 0 2
Not finalised ^ 4 1 0 5 1 11
* Excludes the initial allocation of Recruits.^ Results of reviews do not include decisions of reviews lodged before this financial year, but finalised in 2014/15.** Disciplinary reviews restricted to Breaches of Discipline only.# Does not include the permanent allocation of First Year Constables.## Other includes: 1. Reviews for “Unfitness for duty on medical grounds” (Sections 9.3(1)(e) and 8.3 PSAA) 2. Reviews under s.46 of the Public Interest Disclosure Act 2010 3. Reviews under s.9.3(1)(e) PSAA, but where no appointment has been made. The decision not to appoint a particular person is reviewed by that person.
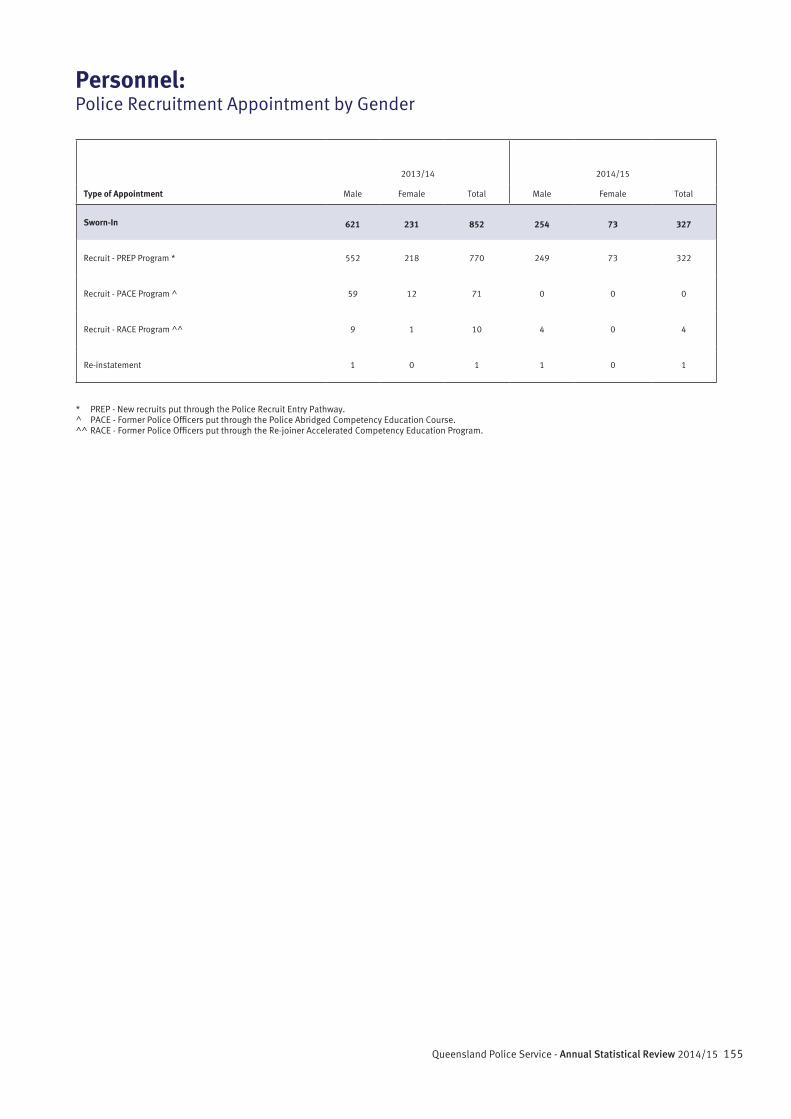
155Queensland Police Service - Annual Statistical Review 2014/15
Personnel:Police Recruitment Appointment by Gender
2013/14 2014/15
Type of Appointment Male Female Total Male Female Total
Sworn-In 621 231 852 254 73 327
Recruit - PREP Program * 552 218 770 249 73 322
Recruit - PACE Program ^ 59 12 71 0 0 0
Recruit - RACE Program ^^ 9 1 10 4 0 4
Re-instatement 1 0 1 1 0 1
* PREP - New recruits put through the Police Recruit Entry Pathway.^ PACE - Former Police Officers put through the Police Abridged Competency Education Course.^^ RACE - Former Police Officers put through the Re-joiner Accelerated Competency Education Program.
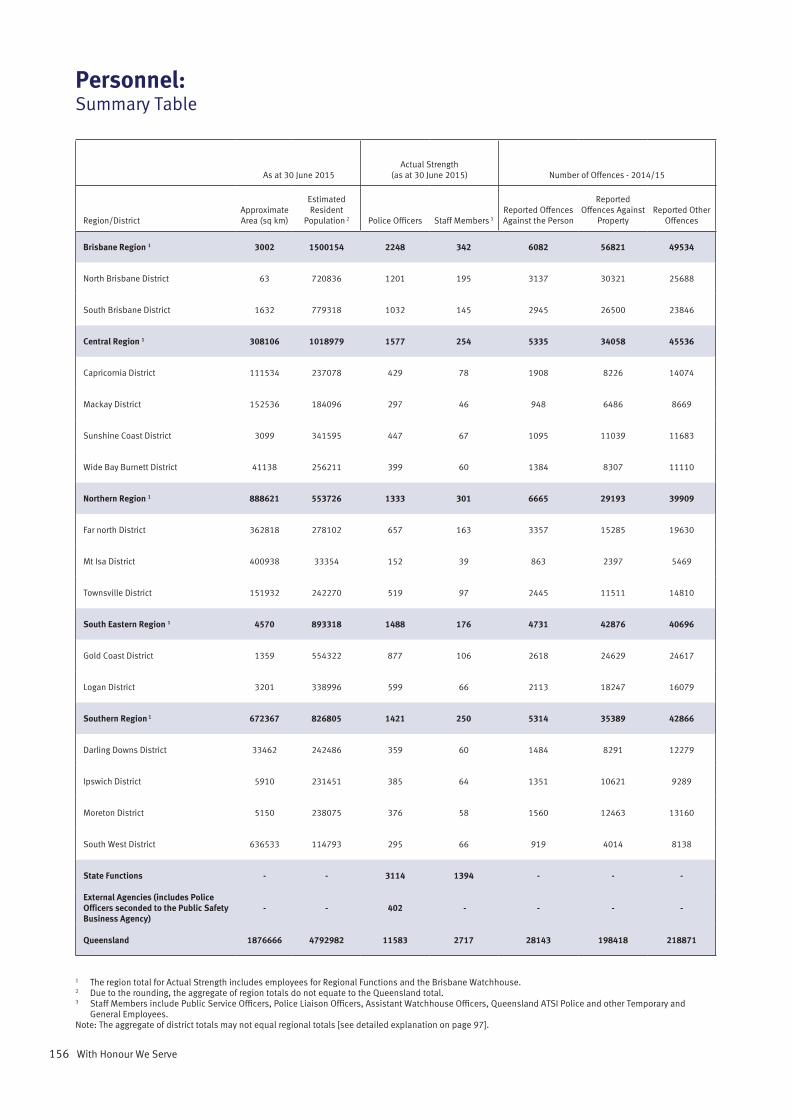
156 With Honour We Serve
Personnel:Summary Table
As at 30 June 2015Actual Strength
(as at 30 June 2015) Number of Offences - 2014/15
Region/DistrictApproximate Area (sq km)
Estimated Resident
Population 2 Police Officers Staff Members 3
Reported Offences Against the Person
Reported Offences Against
PropertyReported Other
Offences
Brisbane Region 1 3002 1500154 2248 342 6082 56821 49534
North Brisbane District 63 720836 1201 195 3137 30321 25688
South Brisbane District 1632 779318 1032 145 2945 26500 23846
Central Region 1 308106 1018979 1577 254 5335 34058 45536
Capricornia District 111534 237078 429 78 1908 8226 14074
Mackay District 152536 184096 297 46 948 6486 8669
Sunshine Coast District 3099 341595 447 67 1095 11039 11683
Wide Bay Burnett District 41138 256211 399 60 1384 8307 11110
Northern Region 1 888621 553726 1333 301 6665 29193 39909
Far north District 362818 278102 657 163 3357 15285 19630
Mt Isa District 400938 33354 152 39 863 2397 5469
Townsville District 151932 242270 519 97 2445 11511 14810
South Eastern Region 1 4570 893318 1488 176 4731 42876 40696
Gold Coast District 1359 554322 877 106 2618 24629 24617
Logan District 3201 338996 599 66 2113 18247 16079
Southern Region 1 672367 826805 1421 250 5314 35389 42866
Darling Downs District 33462 242486 359 60 1484 8291 12279
Ipswich District 5910 231451 385 64 1351 10621 9289
Moreton District 5150 238075 376 58 1560 12463 13160
South West District 636533 114793 295 66 919 4014 8138
State Functions - - 3114 1394 - - -
External Agencies (includes Police Officers seconded to the Public Safety Business Agency)
- - 402 - - - -
Queensland 1876666 4792982 11583 2717 28143 198418 218871
1 The region total for Actual Strength includes employees for Regional Functions and the Brisbane Watchhouse. 2 Due to the rounding, the aggregate of region totals do not equate to the Queensland total.3 Staff Members include Public Service Officers, Police Liaison Officers, Assistant Watchhouse Officers, Queensland ATSI Police and other Temporary and
General Employees. Note: The aggregate of district totals may not equal regional totals [see detailed explanation on page 97].
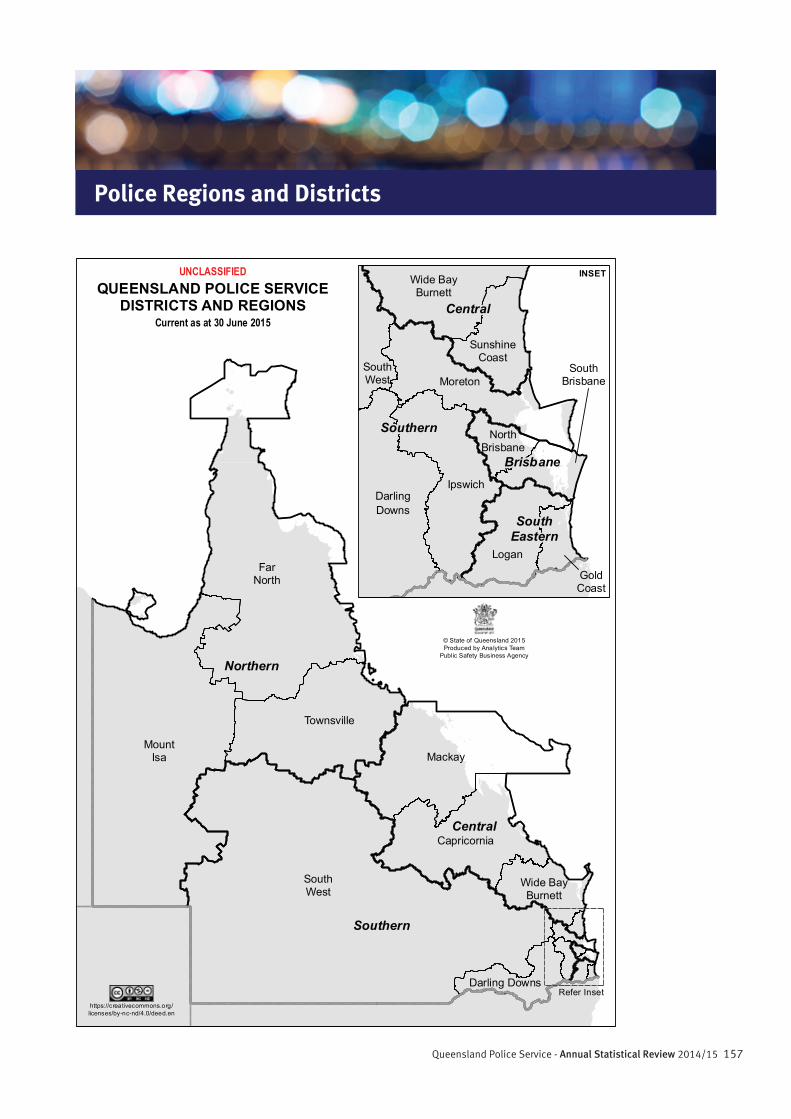
157Queensland Police Service - Annual Statistical Review 2014/15
Central
Northern
Southern
Capricornia
Darling Downs
FarNorth
MackayMount
Isa
SouthWest
Townsville
Wide BayBurnett
aneBrisb
Central
SouthEastern
Southern
DarlingDowns
GoldCoast
Ipswich
Logan
Moreton
NorthBrisbane
SouthBrisbane
SouthWest
SunshineCoast
Wide BayBurnettQUEENSLAND POLICE SERVICE
DISTRICTS AND REGIONSCurrent as at 30 June 2015
UNCLASSIFIED INSET
Refer Insethttps://creativecommons.org/licenses/by-nc-nd/4.0/deed.en
© State of Queensland 2015Produced by Analytics Team
Public Safety Business Agency
Police Regions and Districts

158 With Honour We Serve
159Queensland Police Service - Annual Statistical Review 2014/15
Explanatory Notes
Explanatory NotesThe interpretation of police crime statistics is not a simple task. Before an appreciation for the value and utility of crime statistics is possible, it is necessary to understand the conventions and bounds of police crime statistics as well as the various external variables which may affect them. These include the procedures used by the Queensland Police Service (QPS) in the compilation and collation of crime statistics, the definitions and rules QPS follows in producing crime statistics, and the social and environmental factors that may have an impact on the statistics.
Once an understanding of the scope of police crime statistics is achieved, the value of the information they provide and its worth as a research and planning tool becomes evident. QPS strives to maintain absolute integrity and accuracy in the production of these statistics and publishes the Annual Statistical Review as its official public record of statistics pertaining to police, crime and related matters. To assist in using the information contained in this publication, a detailed summary of the above-mentioned definitions and conventions is provided over the following pages.
Reporting and Detection RatesA major environmental factor that impacts on the use of police crime statistics as an indicator of total crime levels in Queensland is the level of reporting by the community.
The rate of crime reporting may vary according to many factors. This includes the perception by members of the community as to whether an offence has actually occurred, and whether the offence is reported by the victim or a community member to the QPS.
According to both Office of the Government Statistician (OGS) and Australian Bureau of Statistics (ABS) Surveys, the most common reason for not reporting crime was that the offence was considered too trivial. The second most common reason was that the victim doubted the police could or would take action.
Another factor which has a major impact on crime statistics is the priorities and activities of the QPS.
An expansion of the Drug Squad, for example, may result in an enhanced ability to detect drug offences within Queensland. An increase in the number of drug offences recorded in police crime statistics may, therefore, be directly related to the effectiveness of the Squad rather than an actual increase in drug offences in Queensland.
In order to gain a more comprehensive picture of the nature and extent of crime, QPS crime statistics should be examined in conjunction with information from other sources such as Victims of Crime surveys and criminological research.
Recording OffencesThe crime statistics presented in this Review were derived from the Queensland Police Records and Information Management Exchange (QPRIME, 2007) database.
After becoming aware of an offence the reporting officer contacts PoliceLink by telephone as soon as practicable. A twenty-four hour data entry service exists to facilitate this process. The offence is recorded, classified and counted by the data entry staff. This process provides the benefits of reducing police officers’ administrative workloads as well as providing an accurate and immediate computerised record of crimes.
Crime Statistics CollectionReference Period
For the purposes of this Annual Statistical Review, the reference period is the financial year, 2013/14 to 2014/15.
Reference Date
The reference date for reported offences is the date an offence is reported to or detected by police. For cleared offences, the reference date is the date the offence was cleared by police. For offender statistics the reference date is the date an action is commenced.
160 With Honour We Serve
Data SourceCrime
All Queensland Police Service crime statistics are derived from the data contained in official crime reports.
Since June 2007, official crime reports have been recorded in the Queensland Police Records and Information Management Exchange (QPRIME). Crime reports recorded between December 1994 and June 2007 have been converted from Crime Recording Information System for Police (CRISP) to QPRIME.
Prior to December 1994 crime reports were derived from data entered into the crime statistics database maintained by the Statistics Section of the former Information Management Bureau (and its precursors).
“Cancelled” and “Not substantiated” or “unfounded” reports are excluded from QPS published crime statistics information.
Population
The population data used to calculate the number of victims and offenders by age and sex per 100,000 population was taken from Australian Demographic Statistics December 2014 (ABS Catalogue No. 3101.0).
All other rate calculations throughout the publication are based on a projection of the Estimated Residential Population as at June 2014 (for 2013/14) and June 2015 (for 2014/15) as provided by the ABS and the Office of Economic and Statistical Research, Queensland.
Rates and NumbersMethodology
Numbers of offences are simply the number of offences occurring (recorded by police) within a specific area and for a specified period of time. These are presented as simple counts. The problem with using crime numbers to gauge the true level of crime is that areas with larger populations will presumably have higher numbers of crime than areas with smaller populations.
Rates displayed in this publication are always presented per 100,000 persons. Calculation of rates allows direct comparisons of crime to be made across different geographical areas (State, regions and districts) and across time since the size of the population is taken into account in the calculation.
Rates are calculated as:
No. of Reported offences x 100,000Estimated Residential Population
Interpreting Rates and Numbers
It is important to note that transient population groups such as tourists are not factored into the estimated population. This would have particular impact on high tourism areas where crime rates would be overestimated.
Caution should be exercised when using either numbers or rates alone to measure crime in specific and different areas. Rates, for example, are sensitive to small populations. Both numbers and rates of reported offences have particular uses and should be presented together to give a clear and balanced picture of the level of crime.
Percentage changes are another type of rate which requires caution when interpreting. Small numbers of offences can result in large percentage changes.
Comparisons of crime rates over different areas should be interpreted with great caution due to the many factors which differ from community to community. The level of crime in any community is affected by the number and composition of its population, with particular reference to age, sex, ethnicity and employment. The climate and geographical features of the community are important as is the economic structure including the local industry and the level and distribution of income. The attitude of the public toward crime can also impact upon local crime levels.
Crime statistics for low volume offence categories tend to fluctuate randomly and dramatically from one year to the next. This can cause difficulties in the identification of trends and patterns in the levels of offences. It is, therefore, important to approach these low volume offence categories with caution when looking at trends and even when making comparisons across geographical areas.
Unreported CrimeQPS crime data can only relate to the offences which have been reported to police. Obviously, there is a large proportion of crime that is never reported. Various surveys, for example, Crime Victimisation, Australia and Crime and Safety Surveys, are conducted by the ABS to determine the level of unreported crime. The reporting rate can vary dramatically across offence types. For example, approximately 88 per cent of all motor vehicle theft is reported to police whilst only 38 per cent of sexual offences are reported. It is important to keep this in mind when using crime data. Relying on reported offences only can lead to an underestimation of the true rate of victimisation.
161Queensland Police Service - Annual Statistical Review 2014/15
Offence ClassificationThe offence categories used by the QPS for crime statistics are based on the Australian National Classification of Offences (ANCO), prepared by the ABS. ANCO was designed to provide a national framework for classifying offences for statistical purposes. The Australian Standard Offence Classification (ASOC) has been implemented in some jurisdictions by the National Centre for Crime and Justice Statistics of the ABS, and will eventually supersede ANCO. However, the QPS crime statistics collection will continue to be based on ANCO.
Crime statistics are presented under three broad offence divisions: offences against the person; offences against property; and other offences. These three primary divisions have been developed to facilitate the understanding of crime statistics by grouping similar offence categories together. Following are the offence sub-divisions located within each of these primary categories.
Offences Against the PersonThe offence division of offences against the person includes the following offence sub-divisions: homicide (murder), other homicide; assault; sexual offences; robbery; and other offences against the person.
Offences Against PropertyThe offence division of offences against property includes the following offence sub-divisions: unlawful entry with Intent; arson; other property damage; unlawful use of motor vehicle; other theft (excluding unlawful entry); fraud; and handling stolen goods.
Other OffencesThe offence division of other offences includes the following offence sub-divisions: drug offences; prostitution offences; liquor (excluding drunkenness); gaming, racing and betting offences; breach of domestic violence protection orders; trespassing and vagrancy; Weapons Act offences; good order offences; stock related offences; traffic and related offences; and miscellaneous offences.
Many offence sub-divisions are divided into offence groups and then offence sub-groups. Reported and cleared offence statistics in this publication are presented to a group level in most sections.
Geographical ClassificationQueensland crime statistics are compiled to four hierarchical geographical levels. Firstly, statistics are compiled for the State as a whole. Below this, QPS
divides the state into five statistical regions. The next geographical level is that of statistical districts, of which there are 15 throughout the State. Finally, these districts are divided into 335 statistical divisions. Reported and cleared offence statistics are presented at State, Regional and District levels in this Review.
Counting MethodologyThe counting rules used by the QPS in the collection and collation of crime statistics are based on the guidelines published in the National Crime Statistics Manual (ABS) and as amended from time to time by the National Crime Statistics Advisory Group.
The national counting rule is that for each victim within a distinct criminal incident, the Most Serious Offence (MSO) per ANCO subdivision is counted. The national data set does not include ‘victimless’ offences such as those detailed in the QPS division of other offences. The QPS counting rule for offences of this type is to count each distinct criminal act per criminal incident.
Where the victim based rule applies, the description of a victim varies according to the type of offence. A victim may be an individual person, an organisation, a place/premise, or a motor vehicle (refer to Glossary for definition of victim).
The application of the MSO rule has major implications for the recording of crime statistics. By applying the MSO rule a single criminal incident may result in a number of offences being recorded. For incidents where the same victim is subjected to multiple offences belonging to different subdivisions, one offence, the most serious, is counted within each subdivision. For example, if a person is kidnapped and then raped by two offenders, one kidnapping/abduction/deprivation of liberty and one rape would be counted.
Exceptions to Counting RulesThe offence subdivision of sexual offences (which includes rape and attempted rape and other sexual offences) is an exception to the national counting rule. The counting rule applied by the QPS in respect of this group of offences is that for each victim the MSO per ANCO subdivision is counted on the basis of time and place.
The effect of using this rule is that if a victim is subjected to numerous sexual offences over a long period of time by one offender and these actions come to the attention of police at one point in time, the MSO per separate incident based on time and place is counted. Therefore, it is only possible to identify the number of offences, not victims, of sexual offences. A count of ten sexual offences may mean that there were ten victims or that one victim was subjected to
162 With Honour We Serve
ten offences over an unspecified time period by one or more offenders.
Fluctuations in the number of reported offences for this offence category must therefore be considered with caution, due to the effects of the current counting rule.
Victims of CrimeThe Victims of Crime statistics presented in this Review are compiled on the basis of one victim per counted offence. The statistics do not provide a unique victim count. For example, where the same victim is subjected to multiple offences belonging to different offence sub-divisions within an incident, then in accordance with the MSO rule, that victim would be recorded for each most serious offence per sub-division.
It is important to remember that these statistics are derived using a system whose primary function is to service operational policing. Consequently, there may be slight variations between offence and victim counts.
Statistics relating to victims of offences against property are not included. This is due to the statistical definition of ‘victim’ used by the QPS, that is, a victim may be an individual person, an organisation, a place or premise, or a motor vehicle (refer to Glossary).
Offences included in the other offences division are also excluded, as these offences are usually deemed to be ‘victimless’ offences.
There are several offence groups in offences against the person where the victim may be an organisation rather than an individual person. Examples include robbery committed upon a banking institution or business, and extortion committed upon organisations. It should be noted that these offences are not included in the victim count.
Offender CountingOffender statistics are based on offence counts and do not and can not refer to individuals. The data refers to the number of offences cleared or solved through an action against an offender. As such, offender data does not equate to a unique offender count and nor does it equate to the number of offences cleared. For example, an offender charged with motor vehicle theft, unlawful entry, assault and other theft would be included four times in any offender breakdown by age and sex.
Only persons aged ten years and over are deemed to be offenders. Under Queensland law, children under ten years of age are not held criminally responsible, although they may be involved in the commission of an offence. Juvenile offenders are those aged between and including ten and sixteen years.
Offenders have not been included if their age and sex is not specified in QPS records. Less than 1% of offenders have been excluded for this reason.
Drink Driving OffencesExamples of significant events affecting the drink driving time series include:
• 04/05/1985 – Legal blood/alcohol limit for persons under 18 years lowered to 0.02%;
• 1986/87 – Reduce Impaired Driving (RID) campaign introduced;
• 01/01/1989 – Random Breath Test (RBT) formally commenced;
• 04/10/1991 – First two Mobile Breath Stations (Booze Buses) introduced.
• 01/07/2012 – Introduction of Drink Driving 0.05 and under 0.10 which replaces Drink Driving 0.05 and under 0.08;
• 01/07/2012 – Introduction of Drink Driving 0.10 and under 0.15 which replaces Drink Driving 0.08 and under 0.15.
Drug Enforcement RegionOffences detected or under investigation involving covert drug operations or sensitive issues such as sexual child abuse are not geographically classified until after the completion of all inquiries in the interest of strict confidentiality. For this reason, a temporary holding geographical classification, the Drug Enforcement Region, has been created. Offences classified to this area are included only in Queensland offence counts in this Review.
Other property damage – Change in PolicyIn December 2001, the Service implemented a change in policy in regard to the reporting of other property damage offences. Prior to this change, the offence of wilful damage was automatically recorded in conjunction with some unlawful entry and unlawful use of motor vehicle offences. As damage to property is an intrinsic part of break and enter offences, the Service altered the policy so that the offence of wilful damage is no longer recorded with these offences.
163Queensland Police Service - Annual Statistical Review 2014/15
Symbols and Abbreviationsn/a not available
- not defined
0 nil
nec not elsewhere classified
nfd not further defined
ATSI Aboriginal and Torres Strait Islander
OffenceFor statistical purposes an offence is any act reported to or becoming known by the police, which they consider, prima facie, to be in breach of the criminal law. With the exception of murder, each offence count represents an actual offence, an attempted offence, a conspiracy, or the aiding or abetting of an offence. In the case of murder, these categories are distinguished.
Reported OffencesReported offences refer to all established offences reported to or becoming known to the police within the relevant reference period.
Not SubstantiatedAn offence is “not substantiated” or “unfounded” when investigation has established that the alleged offence was not in fact committed. This includes a false report, a mistake in the facts as reported by the informant, or no breach of the law involved in the alleged offence.
Inability to prove an ingredient of an offence does not make an offence “not substantiated” nor does a decision by a complainant not to proceed after the offence has been reported.
Glossary
Cleared OffencesAn offence is deemed to be cleared under, but not restricted to, the following circumstances:
• At least one offender has been arrested or summonsed or issued with a notice to appear, or information has been laid to compel an offender’s appearance before a court;
• Action has been taken against at least one offender under the provisions of the Youth Justice Act, 1992 (Qld) (e.g. administration of an official caution, summons or reference to a community conference);
• At least one offender has been dealt with in accordance with Queensland Police Service policy (e.g. informal counselling of children and elderly persons);
• The offender has admitted the offence but there is an obstacle to proceedings (e.g. diplomatic immunity);
• The offender is known and sufficient evidence has been obtained, but the complainant refuses to prosecute;
• The offender is in another jurisdiction and extradition is not desired or not available;
• The offender is serving a sentence and no useful purpose would be served by prosecution;
• The offender has died before proceedings can be commenced;
• The offender has been admitted to a mental institution before charges are laid and release is unlikely;
• The offender is being offered drug diversion for a minor drug offence;
• There is some other bar to prosecution;
• The offender is dealt with by ex-officio indictment;
• The offender is being dealt with by another agency apart from QPS;
• The complainant or essential witness has died and proceedings would be abortive;
164 With Honour We Serve
• Following a complaint the complainant has requested that police take no further action;
The recovery of stolen or otherwise unlawfully obtained property, e.g. a motor vehicle, does not in itself clear or solve an offence.
Number of Offences ClearedCleared offences are presented in this publication in two groups, i.e., those that were both reported and cleared in the reference period, and those that were cleared in the reference period but reported previously.
Percentage ClearedPercentage Cleared is the percentage of offences that were reported within a specified period that were also cleared within that period.
OffenderAn offender is any person who, through the clearance of an offence, is deemed to be responsible for committing that offence.
Action TypeThe following definitions apply to the action types presented in the tables appearing on pages 80 and 81, Offenders, Indigenous/Non Indigenous – Queensland by Type of Action by Age:
• Arrest: The taking into custody of an offender to compel that person’s appearance before a court;
• Summons: A direction or command issued by a magistrate or justice to an offender to appear before a court with reference to a matter described therein, at a given time and place;
• Notice to appear: A notice issued and personally served by a police officer upon an offender whom he/she reasonably suspects has committed or is committing an offence, to appear before a court, with reference to a matter described therein, at a stated time and place;
• Warrant: For the purposes of this application, a warrant is an authority under the hand of a judge or justice to arrest an offender in order that the person may be dealt with according to the law;
• Caution: An official caution administered to a child under the provisions of the Youth Justice Act, 1992 and includes the cautioning of persons over 65 years of age and intellectually disabled persons for minor criminal offences in accordance with official Service policy. The term does not apply to any informal process where a child is spoken to by an officer where the officer is exercising discretion in relation to the child’s particular behaviour or actions;
• Community Conference: The referral of a child under the provisions of the Youth Justice Act, 1992 to community conference by a police officer before the start of a proceeding for an offence, or by court after a finding of guilty is made against a child for the offence;
• Other: The offender is known and sufficient evidence has been obtained but there is a bar to prosecution or other official process (see also definition of cleared offences on the previous page).
VictimThe description of a victim varies according to offence type:
• for homicide, assault, sexual offences and other offences against the person subdivisions, the victim is an individual person;
• for robbery, extortion, arson, other property damage, stealing (excluding motor vehicles), and fraud, the victim may be either an individual person or an organisation;
• for motor vehicle theft, the victim is the motor vehicle;
• for offences of unlawful entry, the victim is the place/premise as defined on the basis of occupation/ownership.
Crime LocationThe crime location is the initial site where a criminal incident occurred, classified by the primary function of that site where the site has more than one function.
Indigenous IdentificationIn January 2003 it became mandatory for Queensland police officers to ask all offenders the question: Are you of Aboriginal or Torres Strait Islander origin? It is the choice of the person being asked this question to identify their origins as either of the following four: Not Aboriginal or Torres Strait Islander, Identifies as Aboriginal, Identifies as Torres Strait Islander, Identifies as Aboriginal and Torres Strait Islander. If identification has not been made, a reason is recorded within the occurrence.
Since the implementation of QPRIME in June 2007, the indigenous status indicator has not been captured in 10% of cases for the 2014/15 financial year. For these instances, the indigenous indicator has been applied by extracting the indicator from previous identifications. Instances where the indicator was not captured using this method have not been included in the current publication. This was the case in approximately 3% for the period under review.