Annual Statistical Report 2010/2011 - APSCN
385
January 30, 2012 The Honorable Mike Beebe Governor of Arkansas Little Rock, Arkansas and Members of the Arkansas General Assembly Dear Governor Beebe and Members of the Arkansas General Assembly: In compliance with the provisions of A.C.A. §§6-20-2201 et seq., the Annual Statistical Report of the Public Schools of Arkansas, Public Charter Schools, and Education Service Cooperatives, 2010-2011 Actual and 2011-2012 Budgeted,(ASR) is hereby submitted. The Rankings of Selected Items of the Public Schools of Arkansas, 2010-2011 Actual, (Rankings) are also included. The appendix in the ASR includes Arkansas Public School Computer Network (APSCN) coding specifications for each line item in the report. The information contained in the report was obtained from the Annual Financial Report (2010-2011 actual) submitted in Cycle 9, due on August 31, 2011, and Budget (2011-2012 budgeted) submitted in Cycle 1, due on September 30, 2011. The information in this report has not been audited. The school districts are listed according to Local Education Agency (LEA) number in the Rankings report, and are ranked from highest to lowest on the following data: 1. Per-Pupil Expenditures Net current expenditures divided by the four-quarter Average Daily Attendance (ADA). Arkansas uses the three-quarter Average Daily Membership (ADM) for funding and other analytical purposes. Users of this information should be aware of this difference. 2. Average Daily Attendance The annual average of the total days of attendance divided by the number of days taught. It includes students who attend school outside the district on a tuition agreement between the respective districts. This report uses the four-quarter average ADA for FY 2010-2011. 3. Average Daily Membership The annual average (four-quarter) of the total days of attendance and absence divided by the number of days taught in 2010-2011. It includes students who attend school outside the district on a tuition agreement between the respective districts. The prior year’s average for the first three (3) quarters is used for State funding purposes.
Transcript of Annual Statistical Report 2010/2011 - APSCN
January 30, 2012 The Honorable Mike Beebe Governor of Arkansas Little Rock, Arkansas and Members of the Arkansas General Assembly Dear Governor Beebe and Members of the Arkansas General Assembly: In compliance with the provisions of A.C.A. §§6-20-2201 et seq., the Annual Statistical Report of the Public Schools of Arkansas, Public Charter Schools, and Education Service Cooperatives, 2010-2011 Actual and 2011-2012 Budgeted,(ASR) is hereby submitted. The Rankings of Selected Items of the Public Schools of Arkansas, 2010-2011 Actual, (Rankings) are also included. The appendix in the ASR includes Arkansas Public School Computer Network (APSCN) coding specifications for each line item in the report. The information contained in the report was obtained from the Annual Financial Report (2010-2011 actual) submitted in Cycle 9, due on August 31, 2011, and Budget (2011-2012 budgeted) submitted in Cycle 1, due on September 30, 2011. The information in this report has not been audited. The school districts are listed according to Local Education Agency (LEA) number in the Rankings report, and are ranked from highest to lowest on the following data: 1. Per-Pupil Expenditures
Net current expenditures divided by the four-quarter Average Daily Attendance (ADA). Arkansas uses the three-quarter Average Daily Membership (ADM) for funding and other analytical purposes. Users of this information should be aware of this difference.
2. Average Daily Attendance
The annual average of the total days of attendance divided by the number of days taught. It includes students who attend school outside the district on a tuition agreement between the respective districts. This report uses the four-quarter average ADA for FY 2010-2011.
3. Average Daily Membership The annual average (four-quarter) of the total days of attendance and absence divided by the number of days taught in 2010-2011. It includes students who attend school outside the district on a tuition agreement between the respective districts. The prior year’s average for the first three (3) quarters is used for State funding purposes.
Governor Mike Beebe Members of the General Assembly January 30, 2012 Page 2 4. K-12 Certified Full-Time Equivalent (FTE)
The FTE of K-12 certified personnel employed by the district as K-12 classroom teachers, librarians, counselors, psychologists, and other K-12 certified, non-administrative employees who are paid from the Teacher Salary Fund. Certified employees paid from federal funds are not included.
5. Average Salary of K-12 Certified FTEs
The total salaries of all K-12 Certified FTEs, divided by the number of K-12 Certified FTEs. Benefits paid by the districts such as teacher retirement, FICA/Med, and state mandated insurance payments are not included.
6. Certified FTEs
The number of all certified personnel including administrative FTEs, K-12 Classroom FTEs, and other non-administrative personnel employed by the district who are paid from the Teacher Salary Fund. Adult Education employees and certified employees paid form federal funds are not included.
7. Average Salary of Certified FTEs
The total salaries of all Certified FTEs divided by the number of Certified FTEs. Benefits paid by the districts such as teacher retirement, FICA/Med, and state mandated insurance payments are not included.
For additional information, please call or write the Office of Accountability and Reporting, Department of Education, Four Capitol Mall, Room 105C, Little Rock, AR 72201. The phone number is (501)682-5059. Respectfully Submitted,
Tom W. Kimbrell, Ed.D. Commissioner of Education
Corrections to FTEs Reported by School Districts in Cycle 8, July 2011
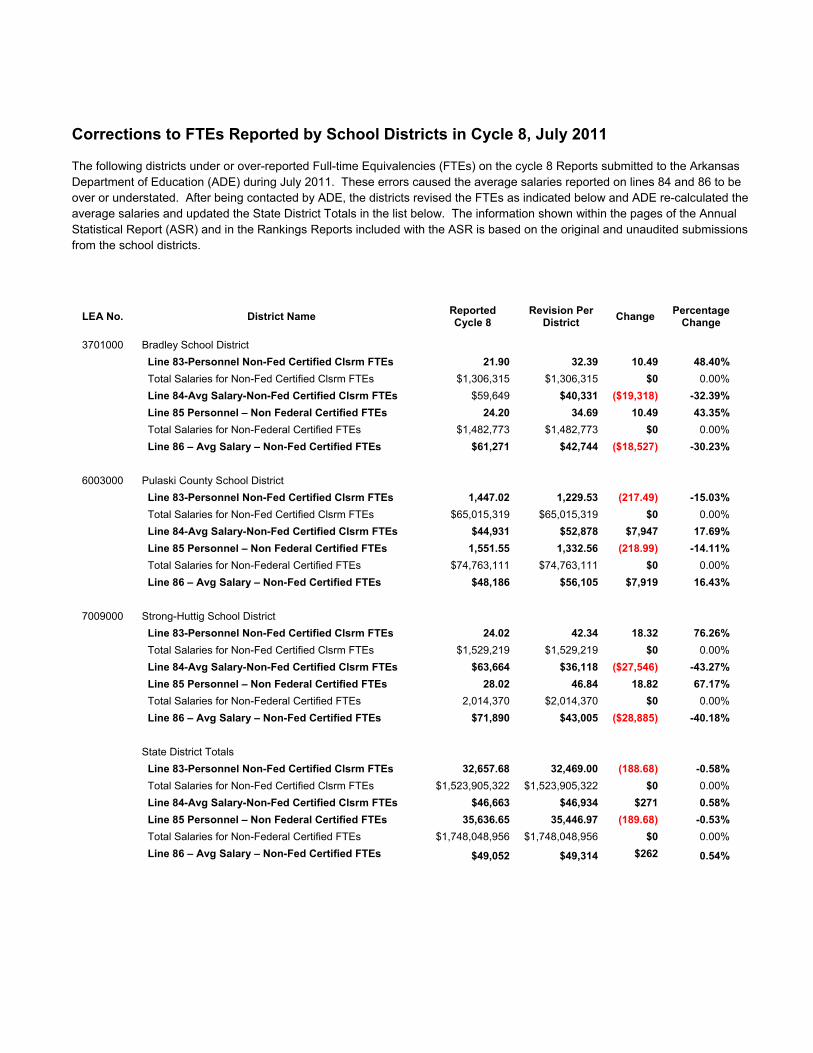
The following districts under or over-reported Full-time Equivalencies (FTEs) on the cycle 8 reports submitted to the Arkansas Department of Education (ADE) during July 2011. These errors caused the average salaries reported on lines 84 and 86 to be over or understated. After being contacted by ADE, the districts revised the FTEs as indicated below and ADE re-calculated the average salaries and updated the State District Totals in the list below. The information shown within the pages of the Annual Statistical Report (ASR) and in the Rankings Reports included with the ASR is based on the original and unaudited submissions from the school districts.
LEA No. District Name Reported Cycle 8
Revision Per District Change Percentage
Change
3701000 Bradley School District Line 83-Personnel Non-Fed Certified Clsrm FTEs 21.90 32.39 10.49 48.40% Total Salaries for Non-Fed Certified Clsrm FTEs $1,306,315 $1,306,315 $0 0.00% Line 84-Avg Salary-Non-Fed Certified Clsrm FTEs $59,649 $40,331 ($19,318) -32.39% Line 85 Personnel – Non Federal Certified FTEs 24.20 34.69 10.49 43.35% Total Salaries for Non-Federal Certified FTEs $1,482,773 $1,482,773 $0 0.00% Line 86 – Avg Salary – Non-Fed Certified FTEs $61,271 $42,744 ($18,527) -30.23%
6003000 Pulaski County School District Line 83-Personnel Non-Fed Certified Clsrm FTEs 1,447.02 1,229.53 (217.49) -15.03% Total Salaries for Non-Fed Certified Clsrm FTEs $65,015,319 $65,015,319 $0 0.00% Line 84-Avg Salary-Non-Fed Certified Clsrm FTEs $44,931 $52,878 $7,947 17.69% Line 85 Personnel – Non Federal Certified FTEs 1,551.55 1,332.56 (218.99) -14.11% Total Salaries for Non-Federal Certified FTEs $74,763,111 $74,763,111 $0 0.00% Line 86 – Avg Salary – Non-Fed Certified FTEs $48,186 $56,105 $7,919 16.43%
7009000 Strong-Huttig School District Line 83-Personnel Non-Fed Certified Clsrm FTEs 24.02 42.34 18.32 76.26% Total Salaries for Non-Fed Certified Clsrm FTEs $1,529,219 $1,529,219 $0 0.00% Line 84-Avg Salary-Non-Fed Certified Clsrm FTEs $63,664 $36,118 ($27,546) -43.27% Line 85 Personnel – Non Federal Certified FTEs 28.02 46.84 18.82 67.17% Total Salaries for Non-Federal Certified FTEs 2,014,370 $2,014,370 $0 0.00% Line 86 – Avg Salary – Non-Fed Certified FTEs $71,890 $43,005 ($28,885) -40.18%
State District Totals Line 83-Personnel Non-Fed Certified Clsrm FTEs 32,657.68 32,469.00 (188.68) -0.58% Total Salaries for Non-Fed Certified Clsrm FTEs $1,523,905,322 $1,523,905,322 $0 0.00% Line 84-Avg Salary-Non-Fed Certified Clsrm FTEs $46,663 $46,934 $271 0.58% Line 85 Personnel – Non Federal Certified FTEs 35,636.65 35,446.97 (189.68) -0.53% Total Salaries for Non-Federal Certified FTEs $1,748,048,956 $1,748,048,956 $0 0.00%
Line 86 – Avg Salary – Non-Fed Certified FTEs $49,052 $49,314 $262 0.54%
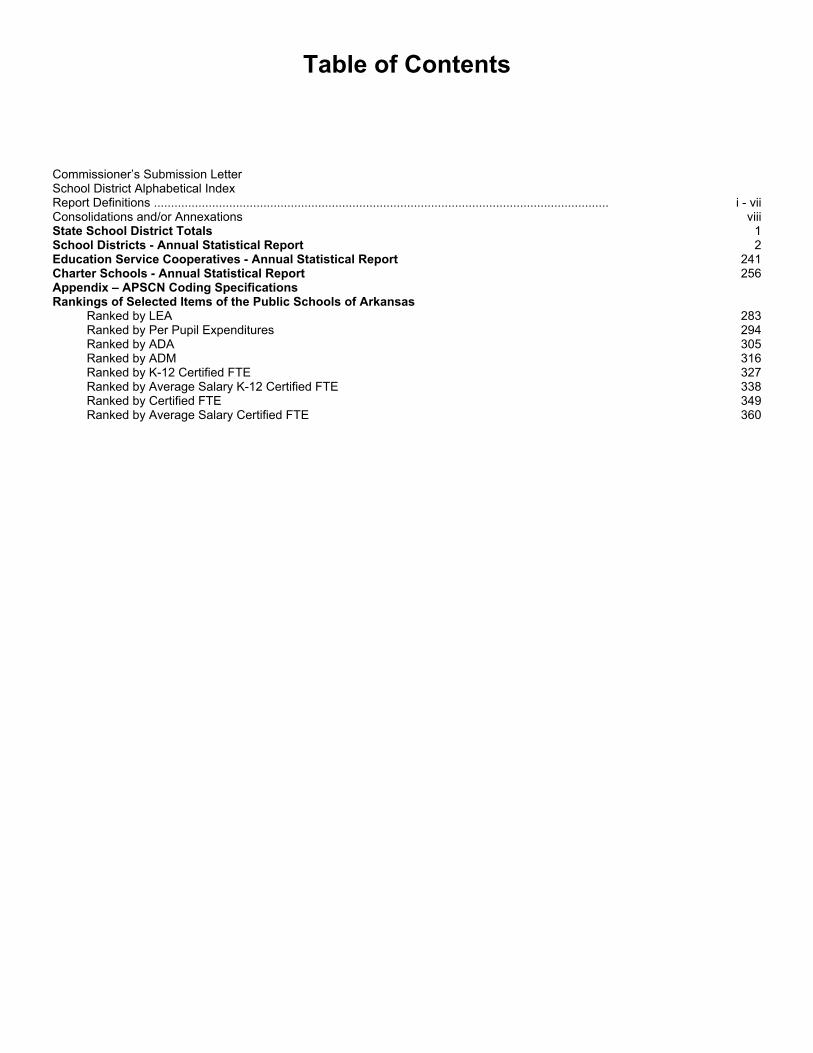
Table of Contents
Commissioner’s Submission Letter School District Alphabetical Index Report Definitions ..................................................................................................................................... i - vii Consolidations and/or Annexations viii State School District Totals 1 School Districts - Annual Statistical Report 2 Education Service Cooperatives - Annual Statistical Report 241 Charter Schools - Annual Statistical Report 256 Appendix – APSCN Coding Specifications Rankings of Selected Items of the Public Schools of Arkansas Ranked by LEA 283 Ranked by Per Pupil Expenditures 294 Ranked by ADA 305 Ranked by ADM 316 Ranked by K-12 Certified FTE 327 Ranked by Average Salary K-12 Certified FTE 338 Ranked by Certified FTE 349 Ranked by Average Salary Certified FTE 360
dhyrkas
Typewritten Text
275
dhyrkas
Typewritten Text
dhyrkas
Typewritten Text
dhyrkas
Typewritten Text
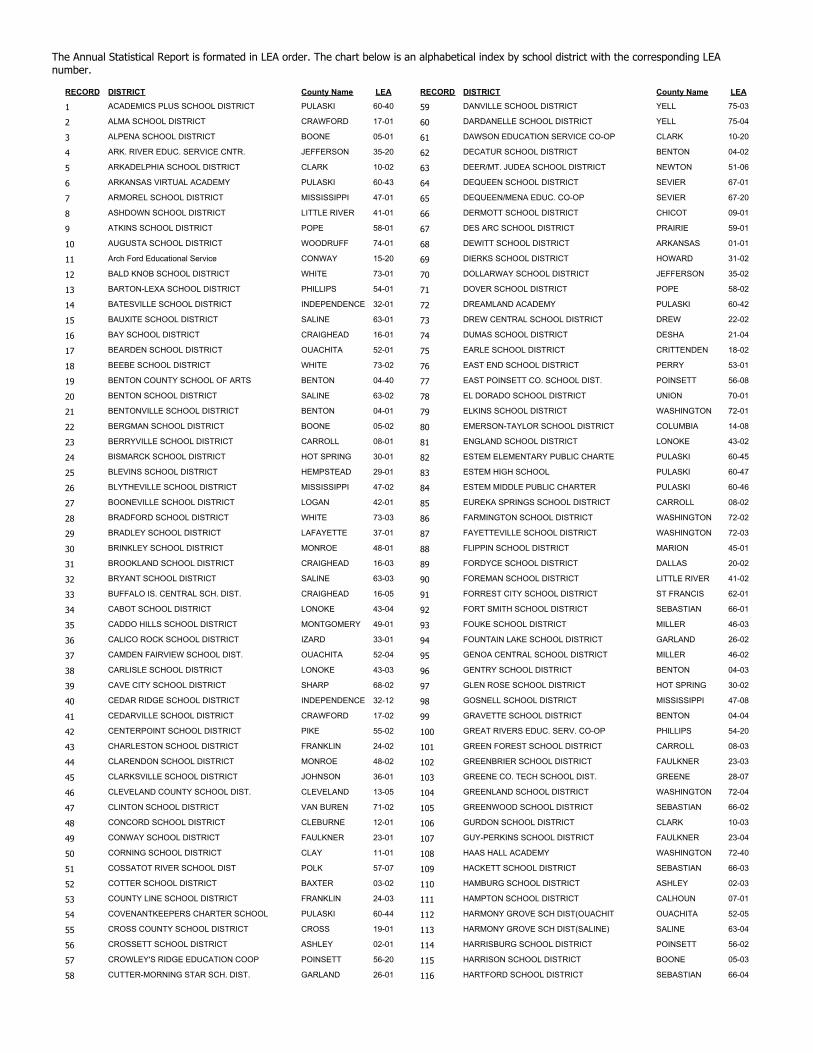
The Annual Statistical Report is formated in LEA order. The chart below is an alphabetical index by school district with the corresponding LEA number.
RECORD DISTRICT County Name LEA
1 ACADEMICS PLUS SCHOOL DISTRICT PULASKI 60-40
2 ALMA SCHOOL DISTRICT CRAWFORD 17-01
3 ALPENA SCHOOL DISTRICT BOONE 05-01
4 ARK. RIVER EDUC. SERVICE CNTR. JEFFERSON 35-20
5 ARKADELPHIA SCHOOL DISTRICT CLARK 10-02
6 ARKANSAS VIRTUAL ACADEMY PULASKI 60-43
7 ARMOREL SCHOOL DISTRICT MISSISSIPPI 47-01
8 ASHDOWN SCHOOL DISTRICT LITTLE RIVER 41-01
9 ATKINS SCHOOL DISTRICT POPE 58-01
10 AUGUSTA SCHOOL DISTRICT WOODRUFF 74-01
11 Arch Ford Educational Service CONWAY 15-20
12 BALD KNOB SCHOOL DISTRICT WHITE 73-01
13 BARTON-LEXA SCHOOL DISTRICT PHILLIPS 54-01
14 BATESVILLE SCHOOL DISTRICT INDEPENDENCE 32-01
15 BAUXITE SCHOOL DISTRICT SALINE 63-01
16 BAY SCHOOL DISTRICT CRAIGHEAD 16-01
17 BEARDEN SCHOOL DISTRICT OUACHITA 52-01
18 BEEBE SCHOOL DISTRICT WHITE 73-02
19 BENTON COUNTY SCHOOL OF ARTS BENTON 04-40
20 BENTON SCHOOL DISTRICT SALINE 63-02
21 BENTONVILLE SCHOOL DISTRICT BENTON 04-01
22 BERGMAN SCHOOL DISTRICT BOONE 05-02
23 BERRYVILLE SCHOOL DISTRICT CARROLL 08-01
24 BISMARCK SCHOOL DISTRICT HOT SPRING 30-01
25 BLEVINS SCHOOL DISTRICT HEMPSTEAD 29-01
26 BLYTHEVILLE SCHOOL DISTRICT MISSISSIPPI 47-02
27 BOONEVILLE SCHOOL DISTRICT LOGAN 42-01
28 BRADFORD SCHOOL DISTRICT WHITE 73-03
29 BRADLEY SCHOOL DISTRICT LAFAYETTE 37-01
30 BRINKLEY SCHOOL DISTRICT MONROE 48-01
31 BROOKLAND SCHOOL DISTRICT CRAIGHEAD 16-03
32 BRYANT SCHOOL DISTRICT SALINE 63-03
33 BUFFALO IS. CENTRAL SCH. DIST. CRAIGHEAD 16-05
34 CABOT SCHOOL DISTRICT LONOKE 43-04
35 CADDO HILLS SCHOOL DISTRICT MONTGOMERY 49-01
36 CALICO ROCK SCHOOL DISTRICT IZARD 33-01
37 CAMDEN FAIRVIEW SCHOOL DIST. OUACHITA 52-04
38 CARLISLE SCHOOL DISTRICT LONOKE 43-03
39 CAVE CITY SCHOOL DISTRICT SHARP 68-02
40 CEDAR RIDGE SCHOOL DISTRICT INDEPENDENCE 32-12
41 CEDARVILLE SCHOOL DISTRICT CRAWFORD 17-02
42 CENTERPOINT SCHOOL DISTRICT PIKE 55-02
43 CHARLESTON SCHOOL DISTRICT FRANKLIN 24-02
44 CLARENDON SCHOOL DISTRICT MONROE 48-02
45 CLARKSVILLE SCHOOL DISTRICT JOHNSON 36-01
46 CLEVELAND COUNTY SCHOOL DIST. CLEVELAND 13-05
47 CLINTON SCHOOL DISTRICT VAN BUREN 71-02
48 CONCORD SCHOOL DISTRICT CLEBURNE 12-01
49 CONWAY SCHOOL DISTRICT FAULKNER 23-01
50 CORNING SCHOOL DISTRICT CLAY 11-01
51 COSSATOT RIVER SCHOOL DIST POLK 57-07
52 COTTER SCHOOL DISTRICT BAXTER 03-02
53 COUNTY LINE SCHOOL DISTRICT FRANKLIN 24-03
54 COVENANTKEEPERS CHARTER SCHOOL PULASKI 60-44
55 CROSS COUNTY SCHOOL DISTRICT CROSS 19-01
56 CROSSETT SCHOOL DISTRICT ASHLEY 02-01
57 CROWLEY'S RIDGE EDUCATION COOP POINSETT 56-20
58 CUTTER-MORNING STAR SCH. DIST. GARLAND 26-01
RECORD DISTRICT County Name LEA
59 DANVILLE SCHOOL DISTRICT YELL 75-03
60 DARDANELLE SCHOOL DISTRICT YELL 75-04
61 DAWSON EDUCATION SERVICE CO-OP CLARK 10-20
62 DECATUR SCHOOL DISTRICT BENTON 04-02
63 DEER/MT. JUDEA SCHOOL DISTRICT NEWTON 51-06
64 DEQUEEN SCHOOL DISTRICT SEVIER 67-01
65 DEQUEEN/MENA EDUC. CO-OP SEVIER 67-20
66 DERMOTT SCHOOL DISTRICT CHICOT 09-01
67 DES ARC SCHOOL DISTRICT PRAIRIE 59-01
68 DEWITT SCHOOL DISTRICT ARKANSAS 01-01
69 DIERKS SCHOOL DISTRICT HOWARD 31-02
70 DOLLARWAY SCHOOL DISTRICT JEFFERSON 35-02
71 DOVER SCHOOL DISTRICT POPE 58-02
72 DREAMLAND ACADEMY PULASKI 60-42
73 DREW CENTRAL SCHOOL DISTRICT DREW 22-02
74 DUMAS SCHOOL DISTRICT DESHA 21-04
75 EARLE SCHOOL DISTRICT CRITTENDEN 18-02
76 EAST END SCHOOL DISTRICT PERRY 53-01
77 EAST POINSETT CO. SCHOOL DIST. POINSETT 56-08
78 EL DORADO SCHOOL DISTRICT UNION 70-01
79 ELKINS SCHOOL DISTRICT WASHINGTON 72-01
80 EMERSON-TAYLOR SCHOOL DISTRICT COLUMBIA 14-08
81 ENGLAND SCHOOL DISTRICT LONOKE 43-02
82 ESTEM ELEMENTARY PUBLIC CHARTE PULASKI 60-45
83 ESTEM HIGH SCHOOL PULASKI 60-47
84 ESTEM MIDDLE PUBLIC CHARTER PULASKI 60-46
85 EUREKA SPRINGS SCHOOL DISTRICT CARROLL 08-02
86 FARMINGTON SCHOOL DISTRICT WASHINGTON 72-02
87 FAYETTEVILLE SCHOOL DISTRICT WASHINGTON 72-03
88 FLIPPIN SCHOOL DISTRICT MARION 45-01
89 FORDYCE SCHOOL DISTRICT DALLAS 20-02
90 FOREMAN SCHOOL DISTRICT LITTLE RIVER 41-02
91 FORREST CITY SCHOOL DISTRICT ST FRANCIS 62-01
92 FORT SMITH SCHOOL DISTRICT SEBASTIAN 66-01
93 FOUKE SCHOOL DISTRICT MILLER 46-03
94 FOUNTAIN LAKE SCHOOL DISTRICT GARLAND 26-02
95 GENOA CENTRAL SCHOOL DISTRICT MILLER 46-02
96 GENTRY SCHOOL DISTRICT BENTON 04-03
97 GLEN ROSE SCHOOL DISTRICT HOT SPRING 30-02
98 GOSNELL SCHOOL DISTRICT MISSISSIPPI 47-08
99 GRAVETTE SCHOOL DISTRICT BENTON 04-04
100 GREAT RIVERS EDUC. SERV. CO-OP PHILLIPS 54-20
101 GREEN FOREST SCHOOL DISTRICT CARROLL 08-03
102 GREENBRIER SCHOOL DISTRICT FAULKNER 23-03
103 GREENE CO. TECH SCHOOL DIST. GREENE 28-07
104 GREENLAND SCHOOL DISTRICT WASHINGTON 72-04
105 GREENWOOD SCHOOL DISTRICT SEBASTIAN 66-02
106 GURDON SCHOOL DISTRICT CLARK 10-03
107 GUY-PERKINS SCHOOL DISTRICT FAULKNER 23-04
108 HAAS HALL ACADEMY WASHINGTON 72-40
109 HACKETT SCHOOL DISTRICT SEBASTIAN 66-03
110 HAMBURG SCHOOL DISTRICT ASHLEY 02-03
111 HAMPTON SCHOOL DISTRICT CALHOUN 07-01
112 HARMONY GROVE SCH DIST(OUACHIT OUACHITA 52-05
113 HARMONY GROVE SCH DIST(SALINE) SALINE 63-04
114 HARRISBURG SCHOOL DISTRICT POINSETT 56-02
115 HARRISON SCHOOL DISTRICT BOONE 05-03
116 HARTFORD SCHOOL DISTRICT SEBASTIAN 66-04
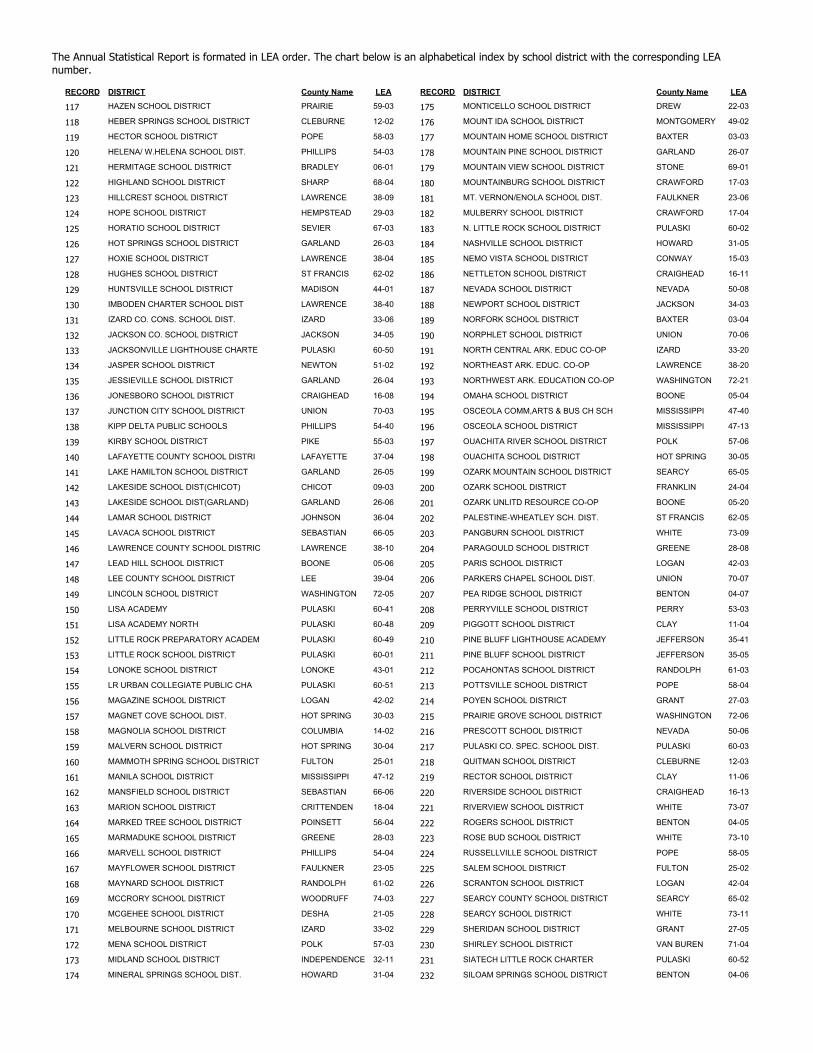
The Annual Statistical Report is formated in LEA order. The chart below is an alphabetical index by school district with the corresponding LEA number.
RECORD DISTRICT County Name LEA
117 HAZEN SCHOOL DISTRICT PRAIRIE 59-03
118 HEBER SPRINGS SCHOOL DISTRICT CLEBURNE 12-02
119 HECTOR SCHOOL DISTRICT POPE 58-03
120 HELENA/ W.HELENA SCHOOL DIST. PHILLIPS 54-03
121 HERMITAGE SCHOOL DISTRICT BRADLEY 06-01
122 HIGHLAND SCHOOL DISTRICT SHARP 68-04
123 HILLCREST SCHOOL DISTRICT LAWRENCE 38-09
124 HOPE SCHOOL DISTRICT HEMPSTEAD 29-03
125 HORATIO SCHOOL DISTRICT SEVIER 67-03
126 HOT SPRINGS SCHOOL DISTRICT GARLAND 26-03
127 HOXIE SCHOOL DISTRICT LAWRENCE 38-04
128 HUGHES SCHOOL DISTRICT ST FRANCIS 62-02
129 HUNTSVILLE SCHOOL DISTRICT MADISON 44-01
130 IMBODEN CHARTER SCHOOL DIST LAWRENCE 38-40
131 IZARD CO. CONS. SCHOOL DIST. IZARD 33-06
132 JACKSON CO. SCHOOL DISTRICT JACKSON 34-05
133 JACKSONVILLE LIGHTHOUSE CHARTE PULASKI 60-50
134 JASPER SCHOOL DISTRICT NEWTON 51-02
135 JESSIEVILLE SCHOOL DISTRICT GARLAND 26-04
136 JONESBORO SCHOOL DISTRICT CRAIGHEAD 16-08
137 JUNCTION CITY SCHOOL DISTRICT UNION 70-03
138 KIPP DELTA PUBLIC SCHOOLS PHILLIPS 54-40
139 KIRBY SCHOOL DISTRICT PIKE 55-03
140 LAFAYETTE COUNTY SCHOOL DISTRI LAFAYETTE 37-04
141 LAKE HAMILTON SCHOOL DISTRICT GARLAND 26-05
142 LAKESIDE SCHOOL DIST(CHICOT) CHICOT 09-03
143 LAKESIDE SCHOOL DIST(GARLAND) GARLAND 26-06
144 LAMAR SCHOOL DISTRICT JOHNSON 36-04
145 LAVACA SCHOOL DISTRICT SEBASTIAN 66-05
146 LAWRENCE COUNTY SCHOOL DISTRIC LAWRENCE 38-10
147 LEAD HILL SCHOOL DISTRICT BOONE 05-06
148 LEE COUNTY SCHOOL DISTRICT LEE 39-04
149 LINCOLN SCHOOL DISTRICT WASHINGTON 72-05
150 LISA ACADEMY PULASKI 60-41
151 LISA ACADEMY NORTH PULASKI 60-48
152 LITTLE ROCK PREPARATORY ACADEM PULASKI 60-49
153 LITTLE ROCK SCHOOL DISTRICT PULASKI 60-01
154 LONOKE SCHOOL DISTRICT LONOKE 43-01
155 LR URBAN COLLEGIATE PUBLIC CHA PULASKI 60-51
156 MAGAZINE SCHOOL DISTRICT LOGAN 42-02
157 MAGNET COVE SCHOOL DIST. HOT SPRING 30-03
158 MAGNOLIA SCHOOL DISTRICT COLUMBIA 14-02
159 MALVERN SCHOOL DISTRICT HOT SPRING 30-04
160 MAMMOTH SPRING SCHOOL DISTRICT FULTON 25-01
161 MANILA SCHOOL DISTRICT MISSISSIPPI 47-12
162 MANSFIELD SCHOOL DISTRICT SEBASTIAN 66-06
163 MARION SCHOOL DISTRICT CRITTENDEN 18-04
164 MARKED TREE SCHOOL DISTRICT POINSETT 56-04
165 MARMADUKE SCHOOL DISTRICT GREENE 28-03
166 MARVELL SCHOOL DISTRICT PHILLIPS 54-04
167 MAYFLOWER SCHOOL DISTRICT FAULKNER 23-05
168 MAYNARD SCHOOL DISTRICT RANDOLPH 61-02
169 MCCRORY SCHOOL DISTRICT WOODRUFF 74-03
170 MCGEHEE SCHOOL DISTRICT DESHA 21-05
171 MELBOURNE SCHOOL DISTRICT IZARD 33-02
172 MENA SCHOOL DISTRICT POLK 57-03
173 MIDLAND SCHOOL DISTRICT INDEPENDENCE 32-11
174 MINERAL SPRINGS SCHOOL DIST. HOWARD 31-04
RECORD DISTRICT County Name LEA
175 MONTICELLO SCHOOL DISTRICT DREW 22-03
176 MOUNT IDA SCHOOL DISTRICT MONTGOMERY 49-02
177 MOUNTAIN HOME SCHOOL DISTRICT BAXTER 03-03
178 MOUNTAIN PINE SCHOOL DISTRICT GARLAND 26-07
179 MOUNTAIN VIEW SCHOOL DISTRICT STONE 69-01
180 MOUNTAINBURG SCHOOL DISTRICT CRAWFORD 17-03
181 MT. VERNON/ENOLA SCHOOL DIST. FAULKNER 23-06
182 MULBERRY SCHOOL DISTRICT CRAWFORD 17-04
183 N. LITTLE ROCK SCHOOL DISTRICT PULASKI 60-02
184 NASHVILLE SCHOOL DISTRICT HOWARD 31-05
185 NEMO VISTA SCHOOL DISTRICT CONWAY 15-03
186 NETTLETON SCHOOL DISTRICT CRAIGHEAD 16-11
187 NEVADA SCHOOL DISTRICT NEVADA 50-08
188 NEWPORT SCHOOL DISTRICT JACKSON 34-03
189 NORFORK SCHOOL DISTRICT BAXTER 03-04
190 NORPHLET SCHOOL DISTRICT UNION 70-06
191 NORTH CENTRAL ARK. EDUC CO-OP IZARD 33-20
192 NORTHEAST ARK. EDUC. CO-OP LAWRENCE 38-20
193 NORTHWEST ARK. EDUCATION CO-OP WASHINGTON 72-21
194 OMAHA SCHOOL DISTRICT BOONE 05-04
195 OSCEOLA COMM,ARTS & BUS CH SCH MISSISSIPPI 47-40
196 OSCEOLA SCHOOL DISTRICT MISSISSIPPI 47-13
197 OUACHITA RIVER SCHOOL DISTRICT POLK 57-06
198 OUACHITA SCHOOL DISTRICT HOT SPRING 30-05
199 OZARK MOUNTAIN SCHOOL DISTRICT SEARCY 65-05
200 OZARK SCHOOL DISTRICT FRANKLIN 24-04
201 OZARK UNLITD RESOURCE CO-OP BOONE 05-20
202 PALESTINE-WHEATLEY SCH. DIST. ST FRANCIS 62-05
203 PANGBURN SCHOOL DISTRICT WHITE 73-09
204 PARAGOULD SCHOOL DISTRICT GREENE 28-08
205 PARIS SCHOOL DISTRICT LOGAN 42-03
206 PARKERS CHAPEL SCHOOL DIST. UNION 70-07
207 PEA RIDGE SCHOOL DISTRICT BENTON 04-07
208 PERRYVILLE SCHOOL DISTRICT PERRY 53-03
209 PIGGOTT SCHOOL DISTRICT CLAY 11-04
210 PINE BLUFF LIGHTHOUSE ACADEMY JEFFERSON 35-41
211 PINE BLUFF SCHOOL DISTRICT JEFFERSON 35-05
212 POCAHONTAS SCHOOL DISTRICT RANDOLPH 61-03
213 POTTSVILLE SCHOOL DISTRICT POPE 58-04
214 POYEN SCHOOL DISTRICT GRANT 27-03
215 PRAIRIE GROVE SCHOOL DISTRICT WASHINGTON 72-06
216 PRESCOTT SCHOOL DISTRICT NEVADA 50-06
217 PULASKI CO. SPEC. SCHOOL DIST. PULASKI 60-03
218 QUITMAN SCHOOL DISTRICT CLEBURNE 12-03
219 RECTOR SCHOOL DISTRICT CLAY 11-06
220 RIVERSIDE SCHOOL DISTRICT CRAIGHEAD 16-13
221 RIVERVIEW SCHOOL DISTRICT WHITE 73-07
222 ROGERS SCHOOL DISTRICT BENTON 04-05
223 ROSE BUD SCHOOL DISTRICT WHITE 73-10
224 RUSSELLVILLE SCHOOL DISTRICT POPE 58-05
225 SALEM SCHOOL DISTRICT FULTON 25-02
226 SCRANTON SCHOOL DISTRICT LOGAN 42-04
227 SEARCY COUNTY SCHOOL DISTRICT SEARCY 65-02
228 SEARCY SCHOOL DISTRICT WHITE 73-11
229 SHERIDAN SCHOOL DISTRICT GRANT 27-05
230 SHIRLEY SCHOOL DISTRICT VAN BUREN 71-04
231 SIATECH LITTLE ROCK CHARTER PULASKI 60-52
232 SILOAM SPRINGS SCHOOL DISTRICT BENTON 04-06
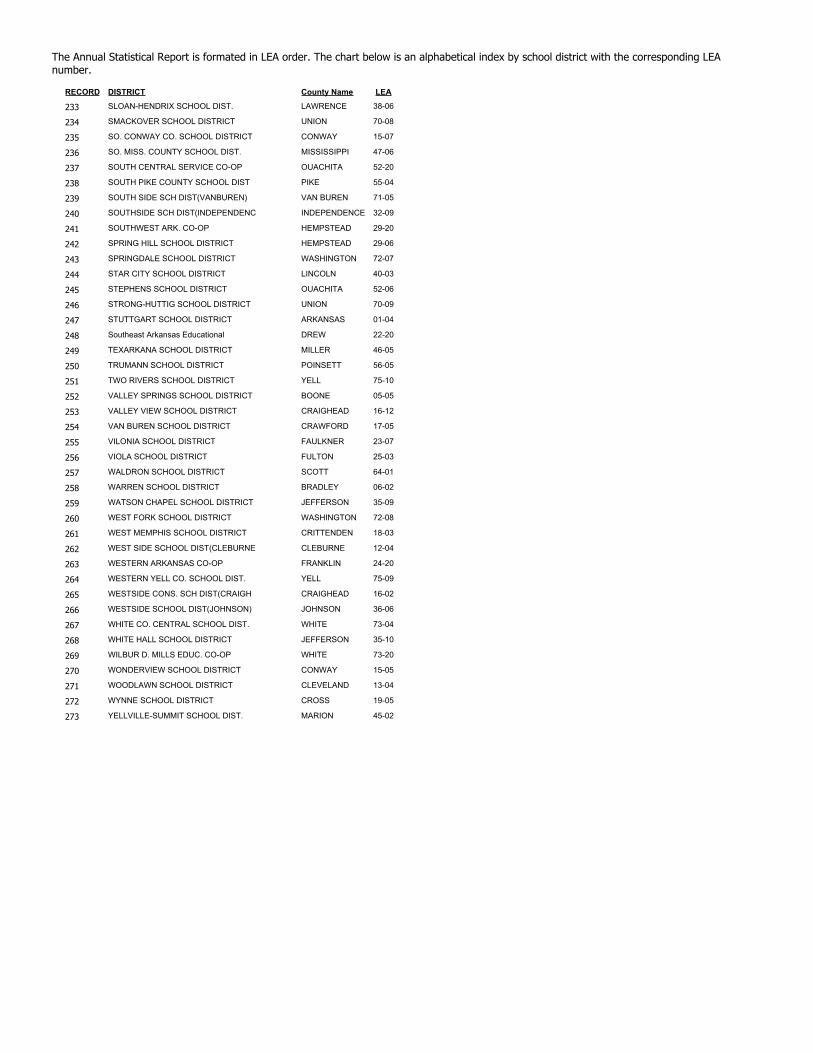
The Annual Statistical Report is formated in LEA order. The chart below is an alphabetical index by school district with the corresponding LEA number.
RECORD DISTRICT County Name LEA
233 SLOAN-HENDRIX SCHOOL DIST. LAWRENCE 38-06
234 SMACKOVER SCHOOL DISTRICT UNION 70-08
235 SO. CONWAY CO. SCHOOL DISTRICT CONWAY 15-07
236 SO. MISS. COUNTY SCHOOL DIST. MISSISSIPPI 47-06
237 SOUTH CENTRAL SERVICE CO-OP OUACHITA 52-20
238 SOUTH PIKE COUNTY SCHOOL DIST PIKE 55-04
239 SOUTH SIDE SCH DIST(VANBUREN) VAN BUREN 71-05
240 SOUTHSIDE SCH DIST(INDEPENDENC INDEPENDENCE 32-09
241 SOUTHWEST ARK. CO-OP HEMPSTEAD 29-20
242 SPRING HILL SCHOOL DISTRICT HEMPSTEAD 29-06
243 SPRINGDALE SCHOOL DISTRICT WASHINGTON 72-07
244 STAR CITY SCHOOL DISTRICT LINCOLN 40-03
245 STEPHENS SCHOOL DISTRICT OUACHITA 52-06
246 STRONG-HUTTIG SCHOOL DISTRICT UNION 70-09
247 STUTTGART SCHOOL DISTRICT ARKANSAS 01-04
248 Southeast Arkansas Educational DREW 22-20
249 TEXARKANA SCHOOL DISTRICT MILLER 46-05
250 TRUMANN SCHOOL DISTRICT POINSETT 56-05
251 TWO RIVERS SCHOOL DISTRICT YELL 75-10
252 VALLEY SPRINGS SCHOOL DISTRICT BOONE 05-05
253 VALLEY VIEW SCHOOL DISTRICT CRAIGHEAD 16-12
254 VAN BUREN SCHOOL DISTRICT CRAWFORD 17-05
255 VILONIA SCHOOL DISTRICT FAULKNER 23-07
256 VIOLA SCHOOL DISTRICT FULTON 25-03
257 WALDRON SCHOOL DISTRICT SCOTT 64-01
258 WARREN SCHOOL DISTRICT BRADLEY 06-02
259 WATSON CHAPEL SCHOOL DISTRICT JEFFERSON 35-09
260 WEST FORK SCHOOL DISTRICT WASHINGTON 72-08
261 WEST MEMPHIS SCHOOL DISTRICT CRITTENDEN 18-03
262 WEST SIDE SCHOOL DIST(CLEBURNE CLEBURNE 12-04
263 WESTERN ARKANSAS CO-OP FRANKLIN 24-20
264 WESTERN YELL CO. SCHOOL DIST. YELL 75-09
265 WESTSIDE CONS. SCH DIST(CRAIGH CRAIGHEAD 16-02
266 WESTSIDE SCHOOL DIST(JOHNSON) JOHNSON 36-06
267 WHITE CO. CENTRAL SCHOOL DIST. WHITE 73-04
268 WHITE HALL SCHOOL DISTRICT JEFFERSON 35-10
269 WILBUR D. MILLS EDUC. CO-OP WHITE 73-20
270 WONDERVIEW SCHOOL DISTRICT CONWAY 15-05
271 WOODLAWN SCHOOL DISTRICT CLEVELAND 13-04
272 WYNNE SCHOOL DISTRICT CROSS 19-05
273 YELLVILLE-SUMMIT SCHOOL DIST. MARION 45-02
Annual Statistical Report2010-2011
Report Definitions
1. Area in Square Miles. The number of square miles within the boundaries of the school district, to the nearest full square mile. The 2010-2011 area in square miles was calculated using the Calculate Geometry tool in ArcGIS (ArcInfo) v10 software. The original district boundary shape-files were obtained from the UALR GIS laboratory.
2. ADA (Average Daily Attendance K-12). The aggregate number of days of attendance of all students during a school year divided by the number of days taught during that year. It includes students who attend school outside the resident district on a tuition agreement between the respective resident and receiving districts. This report uses the four-quarter ADA for FY 2010-2011.
3. ADA Percent Change Over 5 Yrs. The percentage change in the ADA in the district from FY 2005-2006 through 2010-2011 in grades K-12. A negative (-) sign indicates a loss in ADA.
4. Four-Quarter Average Daily Membership (ADM). The number of days of attendance and absence for students in kindergarten through grade twelve (K12) during a school year divided by the total number of days taught in 2010-2011. It includes students who attend school outside the district on a tuition agreement between the respective resident and receiving districts. This number is not used in funding calculations.
5. Prior-Year Three-Quarter ADM. The ADM for the first three (3) quarters of the 2009-2010 school year. This is used for 2010-2011 State Foundation Funding purposes.
6. Assessment. The total of the assessed value of real, personal and utility property in the school district, assessed in calendar year 2010 for taxes collectable in calendar year 2011 and used for Foundation Funding estimate in FY 2012.
7. M & O Mills. The millage levied by the electors of a local school district for the maintenance and operation of the school district.
8. URT Mills. The Uniform Rate of Tax (URT) is a constitutionally imposed property tax of 25-mills on the assessed valuation of all real, personal, and utility property. The net revenues from this tax must be used solely for the maintenance and operation of schools.
9. M&O Mills in Excess of URT. Line 7 minus line 8.
10. Dedicated M & O Mills. The millage levied by the electors of a school district for maintenance and operation purposes specifically stated on the ballot of the school district and limited to three mills.
11. Debt Service Mills. The millage voted by the electors of a school district to be pledged as security for the retirement of bonded indebtedness of the school district.
12. Total Mills. The sum of lines 7, 10, and 11.
13. Total Debt Bond/Non-Bond. As of June 30, 2011, the district total of outstanding commercial bonds, revolving loans, post-dated warrants, lease purchases, and installment loans.
REVENUES14. Property Tax Receipts (Including URT). Revenue from local sources comprised of property taxes, property tax relief, tax accruals, delinquent taxes, excess commissions, land redemptions, income tax penalties and interest on delinquent taxes and other local taxes.
15. Other Local Receipts. Revenue from local sources other than property taxes, including but not limited to revenue in lieu of taxes, interest on investments, rental income, donations, food service revenues, vending machine revenues, miscellaneous local revenue, and revenue from the county.
16. Revenue from Intermediate Sources. Unrestricted revenue from the county including county general apportionment, severance tax, and other revenue from the county.
i
17. Foundation Funding.
17.1 State Foundation Funding (Excluding URT). State financial aid provided to school districts. For 2010-2011, state foundation funding is computed as the difference between the foundation funding amount ($ 6,023) multiplied by the prior-year three-quarter ADM for the district and the sum of 98% of the uniform rate of tax multiplied by the property assessment of the school district, plus calculated miscellaneous funds. For the 2011-2012 fiscal year, state foundation funding is computed using $6,144 instead of $6,023 in the preceding calculation.
17.2 Tax Rate Guarantee (98% URT X Assessment less Net Revenues). State financial aid adjustment based on the difference between 98% of the 25 mills uniform rate of tax (URT) multiplied by the assessment and actual net revenues. To school districts that received state foundation funding in FY11, ADE will disburse aid to school districts with actual net revenues of less than 98% of the URT multiplied by the assessment and will recoup aid from school districts with actual net revenues of more than 98% of the URT multiplied by the assessment.
18. Student Growth Funding. For 2010-2011 student growth funding is calculated based on the increase in current year average daily membership of each quarter compared with the previous year three-quarter average daily membership. This increase for each quarter is multiplied by one-quarter (1/4) of the per student foundation funding amount. Any increase resulting solely from consolidation or annexation with another school district is excluded for purposes of calculating student growth funding.
19. Declining Enrollment Funding. For 2010-2011, state funding for school districts that have experienced a decline in average daily membership over the two (2) immediately preceding school years.
20. Consolidation Incentive/Assistance. Funds to provide a monetary incentive for school district consolidations and annexations.
21. Isolated Funding. State financial aid provided to isolated school districts, small school districts, or districts with isolated school areas as set forth in A.C.A. §§6-20-601 et seq. and restricted for the use of those isolated school districts, small school districts, or districts with isolated school areas.
22. Supplemental Millage Incentive Funds. State funding that is being phased out over a 10 year period and is paid to a school district that had levied ad valorem taxes in excess of the twenty-five (25) mills and formerly qualified for supplemental millage incentive funding under the Supplemental School District Funding Act of 2003, §§6-20-2401 et seq. [repealed], in fiscal year 2005. Fiscal year 2010-2011 is the fifth year of the phase-out.
23. Other Unrestricted State Funding. Other unrestricted revenue from State sources.
24. Total Unrestricted Revenue from State and Local Sources. The sum of lines 14 through 23.
25. Adult Education. Restricted funds provided for adult education including adult basic education, adult general education, workplace adult education, and other adult education.
26. Professional Development Funding. Restricted funds provided to school districts for purposes promulgated in Rules by the State Board of Education and equal to an amount of up to fifty dollars ($50) multiplied by the school district's previous school year three-quarter average ADM.
ii
27. Other Regular Education. Other restricted funds including, but not limited to, Reading Program In-service (McRAT, ELLA, Reading Recovery), Career Education, College Prep Enrichment Program and Distance Learning.
28. Gifted and Talented. Restricted funds for specific programs for the education of gifted and talented children, and also for Advance Placement reimbursements.
29. Alternative Learning Environments (ALE). Restricted funds provided for a student intervention program in compliance with A.C.A. §§ 6-18-508, 6-18-509, and 6-20-2305(b)(2) that seeks to eliminate traditional barriers to student learning. For the 2010-2011 school year ALE funding was $4,063 for each identified ALE student enrolled in the prior year.
30. English Language Learners (ELL). Restricted funds provided to assist in the education of students identified as not proficient in the English language. For the 2010-2011 school year ELL funding was $293 for each identified ELL student.
31. National School Lunch Act Funds (NSLA). Restricted funds provided to school districts based on the number of National School Lunch students for the immediately preceding school year as determined under A.C.A. §6-20-2303(12)(A)
32. Other Special Education. Other restricted funds provided to school districts for special education, including Children with Disabilities, and Early Childhood Special Education.
33. Workforce Education. Restricted funds provided by the State for vocational programs, excluding federal funds, including Tech. Prep., and Secondary Workforce Centers.
34. School Food Service. Restricted funds provided by the State for school food lunch activities.
35. Education Service Cooperatives. For the Education Service Cooperatives these are funds provided by the State for the basic operational costs of the Education Service Cooperatives as established by A.C.A. §6-13-1001 through §6-13-1026. For school districts these are funds provided in a grant to the district from the Education Service Cooperative
36. Early Childhood Programs. Restricted funds provided by the State for Early Childhood Programs, including Arkansas Better Chance, K3 programs, Parental Involvement, and Smart Start programs.
37. Magnet School Programs. Funds provided by the State to the three Pulaski County school districts for the operation of Magnet Schools, Majority-to-Minority (M-to-M) programs, M-to-M transportation expenditures, and for court ordered teacher retirement and insurance benefits.
38. Other Non-Instructional Program Aid. Restricted funds provided by non-instructional programs not otherwise identified, such as Worker’s Comp Funding, Game and Fish Habitat Grant, Department of Health, and Academic Facilities programs.
39. Total Restricted Revenue from State Sources. The sum of lines 25 through 38.
40. Total Restricted Revenue from Federal Sources. Restricted funds provided by the federal government through the state as agents to the school districts, which must be used for specific categorical purposes, such as: revenue in lieu of taxes, Elementary / Secondary Education Programs, ROTC, Carl Perkins Vocational Aid, Adult Education, School Food Services, IDEA Title VI, and Safe & Drug Free Schools.
41. Financing Sources. Non-revenue financing sources including, but not limited to proceeds from the sale of bonds, revolving loans, postdated warrants, current loans, lease purchases, and the debt service savings resulting from refunding outstanding bonds.
iii
42. Balances from Consolidated/Annexed District. Balances transferred from individual districts into the combined database of the resulting Consolidated/Annexed district.
43. Indirect Cost Reimbursement. Funds provided for those costs that are not readily identified with the activities funded by the associated federal grant or contract, but are incurred for the joint benefit of those activities and other activities and programs of the organization.
44. Gains and Losses from Sale of Fixed Assets. Non-revenue funds from the sale of equipment, buildings, and land.
45. Compensation for Loss of Fixed Assets. Compensation from insurance for the loss of school property that is not being replaced.
46. Other. Other inter-fund transfers.
47. Total Other Sources of Revenues. The sum of lines 41 through 46.
48. Total Revenue from All Sources. The sum of lines 24, 39, 40 and 47.
EXPENDITURES
49. Regular Instruction. Expenditures for activities dealing directly with teaching students or interaction between teacher and pupils. Teaching may be provided for pupils in a school classroom, in a home or hospital, and in other learning situations such as co-curricular activities
50. Special Education. Expenditures for activities that are designed to deal with special needs of children who are handicapped and in need of special education and related services, including teachers, teacher aides, physical and occupational therapists, speech/language therapists, and counselors.
51. Workforce Education. Expenditures for programs that provide individuals with the opportunity for employment in an occupational area, including agricultural operations, business occupations, health careers, or trade and industrial occupations.
52. Adult Education. Expenditures to develop knowledge and skills to meet education objectives for adults and to prepare for a new or different career.
53. Compensatory Education. Expenditures for instructional activities designed primarily to meet the educational needs of pupils who are judged to be underachievers or educationally deprived. All compensatory education must be supplemental to regular instruction.
54. Other. Expenditures for other instructional activities not otherwise identified, such as: Gifted and Talented programs, band, choir, English Language Learners, Alternative Learning Environments, Fine Arts, and ROTC.
55. Total Instruction. The sum of lines 49 through 54.
56. General Administration. Expenditures for activities that are concerned with establishing and administering district policy, including the activities of the district board of education, elections, reappraisal of property, the overall general administration of the district, and the office of the Superintendent.
57. Central Services. Expenditures for activities concerned with paying, transporting, exchanging, and maintaining goods and services for the district
iv
58. Maintenance and Operation of Plant Services. Expenditures that are concerned with operating and maintaining the plant, grounds, buildings, equipment, maintaining general purpose vehicles such as trucks, tractors, graders and staff vehicles, and maintaining order and safety in school buildings and on school grounds
59. Student Transportation. Expenditures for activities concerned with the transporting of students to and from school, including managing transportation services such as operating, repairing, cleaning, painting, fueling, and inspecting vehicles for safety.
60. Other District Level Support Services. Expenditures for all other district level support services not otherwise identified.
61. Total District Level Support. The sum of lines 56 through 60.
62. Student Support Services. Expenditures for services that are designed to assess and improve the welfare of students and supplement the teaching process, including social work services, guidance services, physical and mental health services, speech pathology, audiology services, and parental involvement programs.
63. Instructional Staff Support Services. Expenditures that are associated with assisting the instructional staff in planning, developing and evaluating the process of providing learning experiences for children.
64. School Administrative Services. Expenditures for activities concerned with overall administrative responsibility of a school, including the office of the principal.
65. Total School Level Support Services. The sum of lines 62 through 64.
66. Food Service Operations. Expenditures for activities concerned with providing food to students and staff in a school or school district. This service area includes preparing and serving regular meals, lunches, or snacks in connection with school activities and food delivery.
67. Other Enterprise Operations. Expenditures for activities where the stated intent is for the activity to finance or recover the costs primarily through user charges. Food services are not included.
68. Community Operations. Expenditures for activities concerned with providing community services to students, staff, or other community participants. Examples of this function would be offering parental training or operating a community swimming pool, a recreation program for the elderly, or a childcare center for working mothers.
69. Other Non-Instructional Services. Expenditures for other non-instructional programs not otherwise identified.
70. Total Non-Instructional Services. The sum of lines 66 through 69.
71. Facilities Acquisition and Construction. Expenditures for activities concerned with acquiring land and buildings; remodeling buildings; constructing buildings and additions to buildings; initially installing or extending service systems; and site improvements.
72. Debt Service. Expenditures for paying the district’s debt, including principal, interest and fiscal fees.
73. Payments to Other LEAs Within the State. Invalid
74. Payments to Other LEAs Outside State. Invalid
75. Other Non-Programmed Costs. Other non-programmed costs not otherwise identified.
v
76. Total Expenditures. The sum of lines 55, 61, 65, 70 through 75.
77. Less: Capital Expenditures. Expenditures for acquiring capital assets, including land, existing buildings, existing infrastructure assets, and equipment. (Includes amounts shown on line 71.)
78. Less: Debt Service. The amount in line 72.
79. Total Current Expenditures. Line 76 minus (line 77 plus line 78).
80. Exclusions from Current Expenditures. The following accounts are excluded from Current Expenditures to arrive at Net Current Expenditures. The exclusions are Tuition paid by Individuals, Tuition paid by Other LEAs within the State, Transportation Fees paid by Individuals, Transportation Fees paid by Other LEAs within the State, Services provided to other LEAs (Other than tuition and Transportation), Food Service Revenues, Student Activities Revenues, Textbook Revenues, Community Operations (line 68) and Other Non-Programmed Costs (line 75). Students of Adult Education and Pre-School Programs are not included in Average Daily Attendance (line 2); therefore, those expenditures are not included in Net Current Expenditures. Prior to 2009-2010, in an effort to match the definition of “per pupil expenditures” used by the National Center for Education Statistics (NCES), Title 1 and Title V expenditures, less transfers into those funds, were also excluded. However, NCES also includes costs paid directly by the state on behalf of Local Educational Entities (LEAs). In Arkansas, examples of on-behalf-of payments include funds paid directly by ADE to the Employment Benefits Division pertaining to health insurance and the costs of operating the Arkansas Public School Computer Network (APSCN). The ASR utilizes data recorded on the books of LEAs and does not include any costs paid by the state on behalf of LEAs. Therefore, the exclusions shown on line 80 are for the purpose of calculating per pupil expenditures from all funding sources received by LEAs.
81. Net Current Expenditures. Line 79 minus line 80.
82. Per Pupil Expenditures. Line 81 divided by line 2. The Per Pupil Expenditure (PPE) is calculated using the four-quarter average ADA. Arkansas uses the three-quarter Average Daily Membership for funding and other analytical purposes.
83. Personnel – Non-Federal Certified Classroom FTEs. The number of K-12 certified personnel employed by the district as K-12 classroom teachers, librarians, counselors, psychologists, and other K-12 certified, non-administrative employees and paid from the Teacher Salary Fund. Certified employees paid from federal funds are not included
84. Average Salary – Non-Federal Certified Classroom FTEs. The average salary of personnel defined in line 83.
85. Personnel – Non-Federal Certified FTEs. The number of all certified personnel including administrative FTEs, K-12 Classroom FTEs, and other non-administrative personnel employed by the district and paid from the Teacher Salary Fund. Adult Education employees and certified employees paid from federal funds are not included.
86.Average Salary – Non-Federal Certified FTEs. The average salary of personnel defined in line 83.
vi
87. Legal Balance87.1 Legal Balance (Funds 1, 2 and 4). Combined balances as of June 30, 2011, for Teacher Salary Fund, Operating Fund, and Debt Service Fund87.2 Total Categorical Fund Balances. Combined balances as of June 30, 2011, for the National School Lunch Act Fund (NSLA), Alternative Learning Environment Fund (ALE), English Language Learner Fund (ELL), and the Professional Development Fund.87.3 Deposits with Paying Agents (QZAB). Escrow balance as of June 30, 2011, restricted for the retirement of Qualified Zone Academy Bonds.87.4 Net Legal Balance (Excluding Categorical and QZAB). Line 87.1 minus (line 87.2 plus line 87.3).
88. Building Fund Balance (Fund 3). Building Fund Balance as of June 30, 2011. The Building Fund is used to record revenues and expenditures of specific building projects.
89. Capital Outlay Fund Balance (Fund 5). Capital Outlay Fund Balance as of June 30, 2011. The Capital Outlay Fund is comprised of a set of accounts used to record the receipts and expenditures of building projects funded by mills voted and passed specifically for capital outlay and dedicated M&O purposes.
Note: FTE - Full Time Equivalent .LEA - Local Education Agency.
vii
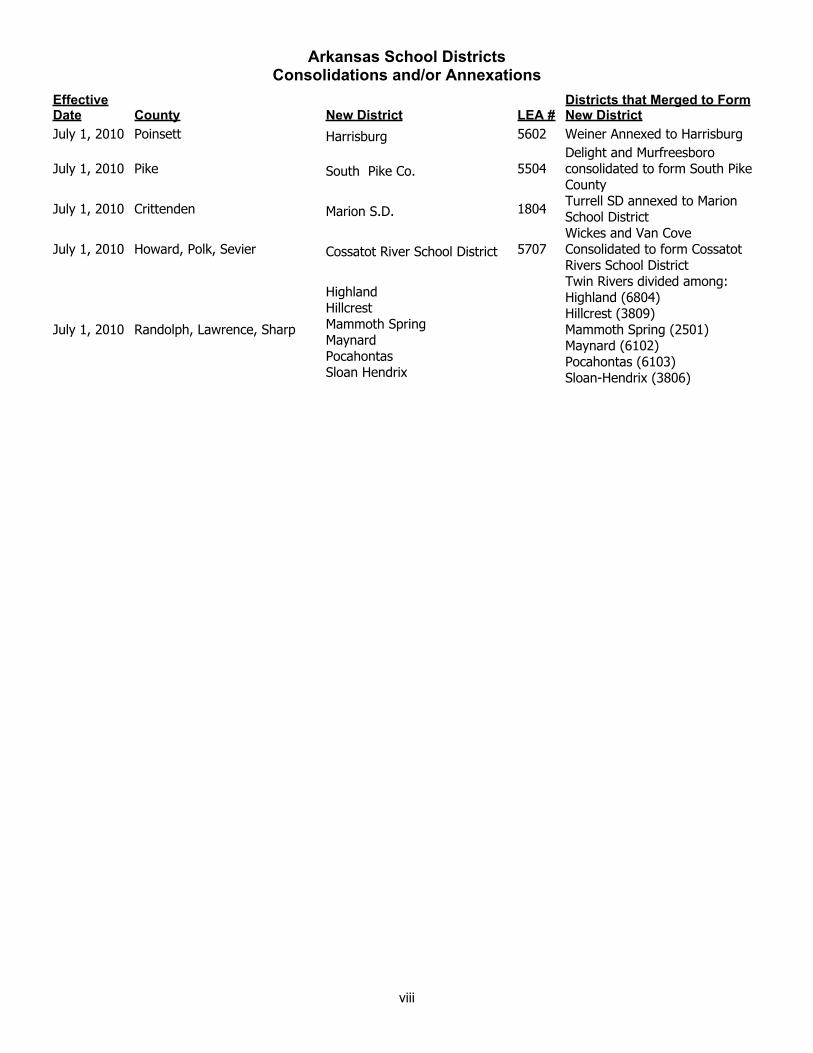
Arkansas School DistrictsConsolidations and/or Annexations
Effective Date County New District LEA #
Districts that Merged to Form New District
July 1, 2010 Poinsett Harrisburg 5602 Weiner Annexed to Harrisburg
July 1, 2010 Pike South Pike Co. 5504Delight and Murfreesboro consolidated to form South Pike County
July 1, 2010 Crittenden Marion S.D. 1804 Turrell SD annexed to Marion School District
July 1, 2010 Howard, Polk, Sevier Cossatot River School District 5707Wickes and Van Cove Consolidated to form Cossatot Rivers School District
July 1, 2010 Randolph, Lawrence, Sharp
HighlandHillcrestMammoth SpringMaynardPocahontasSloan Hendrix
Twin Rivers divided among:Highland (6804)Hillcrest (3809)Mammoth Spring (2501)Maynard (6102)Pocahontas (6103)Sloan-Hendrix (3806)
viii
Annual Statistical Report
Public Schools of ArkansasAnd
Education Cooperatives
ArkansasDepartment of Education
2010-2011 Actual2011-2012 Budgeted
In Compliance with A.C.A. §6-20-2201 et seq.
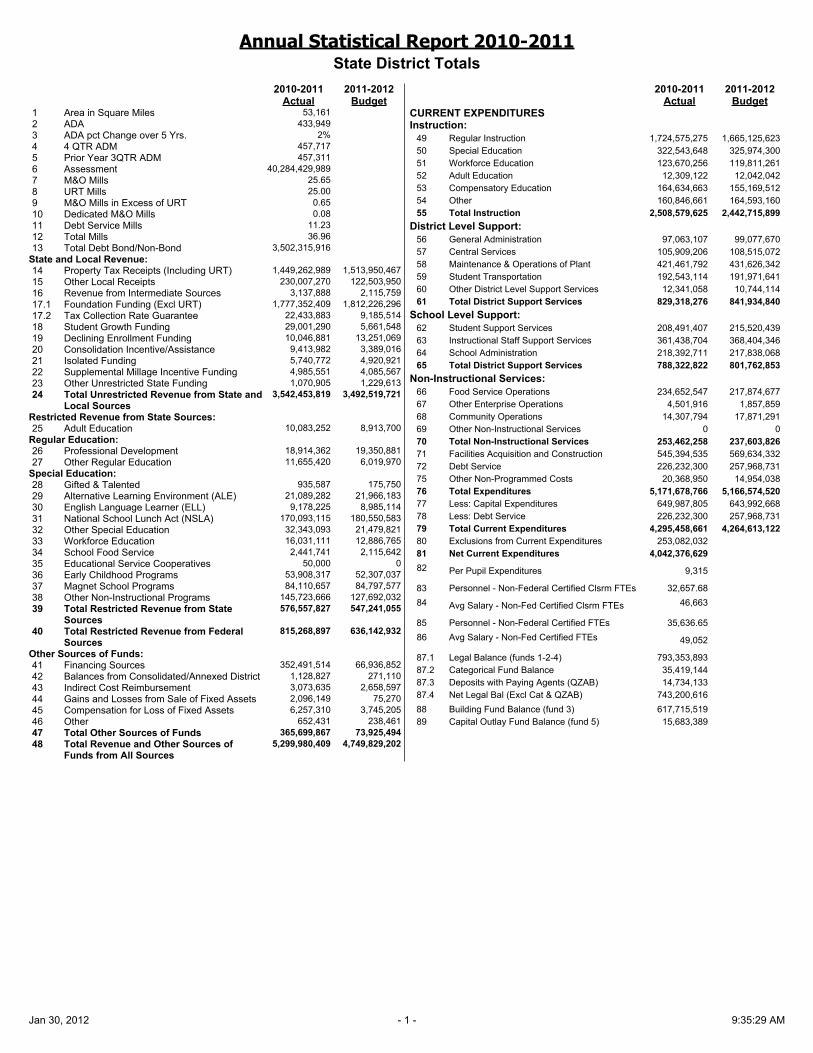
Annual Statistical Report 2010-2011State District Totals
2010-2011 2011-2012Actual Budget
1 Area in Square Miles 53,1612 ADA 433,9493 ADA pct Change over 5 Yrs. 2%4 4 QTR ADM 457,7175 Prior Year 3QTR ADM 457,3116 Assessment 40,284,429,9897 M&O Mills 25.658 URT Mills 25.009 M&O Mills in Excess of URT 0.6510 Dedicated M&O Mills 0.0811 Debt Service Mills 11.2312 Total Mills 36.9613 Total Debt Bond/Non-Bond 3,502,315,916
State and Local Revenue:14 Property Tax Receipts (Including URT) 1,449,262,989 1,513,950,46715 Other Local Receipts 230,007,270 122,503,95016 Revenue from Intermediate Sources 3,137,888 2,115,75917.1 Foundation Funding (Excl URT) 1,777,352,409 1,812,226,29617.2 Tax Collection Rate Guarantee 22,433,883 9,185,51418 Student Growth Funding 29,001,290 5,661,54819 Declining Enrollment Funding 10,046,881 13,251,06920 Consolidation Incentive/Assistance 9,413,982 3,389,01621 Isolated Funding 5,740,772 4,920,92122 Supplemental Millage Incentive Funding 4,985,551 4,085,56723 Other Unrestricted State Funding 1,070,905 1,229,61324 Total Unrestricted Revenue from State and
Local Sources 3,542,453,819 3,492,519,721
Restricted Revenue from State Sources:25 Adult Education 10,083,252 8,913,700
Regular Education:26 Professional Development 18,914,362 19,350,88127 Other Regular Education 11,655,420 6,019,970
Special Education:28 Gifted & Talented 935,587 175,75029 Alternative Learning Environment (ALE) 21,089,282 21,966,18330 English Language Learner (ELL) 9,178,225 8,985,11431 National School Lunch Act (NSLA) 170,093,115 180,550,58332 Other Special Education 32,343,093 21,479,82133 Workforce Education 16,031,111 12,886,76534 School Food Service 2,441,741 2,115,64235 Educational Service Cooperatives 50,000 036 Early Childhood Programs 53,908,317 52,307,03737 Magnet School Programs 84,110,657 84,797,57738 Other Non-Instructional Programs 145,723,666 127,692,03239 Total Restricted Revenue from State
Sources 576,557,827 547,241,055
40 Total Restricted Revenue from Federal Sources
815,268,897 636,142,932
Other Sources of Funds:41 Financing Sources 352,491,514 66,936,85242 Balances from Consolidated/Annexed District 1,128,827 271,11043 Indirect Cost Reimbursement 3,073,635 2,658,59744 Gains and Losses from Sale of Fixed Assets 2,096,149 75,27045 Compensation for Loss of Fixed Assets 6,257,310 3,745,20546 Other 652,431 238,46147 Total Other Sources of Funds 365,699,867 73,925,49448 Total Revenue and Other Sources of
Funds from All Sources 5,299,980,409 4,749,829,202
2010-2011 2011-2012Actual Budget
CURRENT EXPENDITURESInstruction:
49 Regular Instruction 1,724,575,275 1,665,125,62350 Special Education 322,543,648 325,974,30051 Workforce Education 123,670,256 119,811,26152 Adult Education 12,309,122 12,042,04253 Compensatory Education 164,634,663 155,169,51254 Other 160,846,661 164,593,16055 Total Instruction 2,508,579,625 2,442,715,899
District Level Support:56 General Administration 97,063,107 99,077,67057 Central Services 105,909,206 108,515,07258 Maintenance & Operations of Plant 421,461,792 431,626,34259 Student Transportation 192,543,114 191,971,64160 Other District Level Support Services 12,341,058 10,744,11461 Total District Support Services 829,318,276 841,934,840
School Level Support:62 Student Support Services 208,491,407 215,520,43963 Instructional Staff Support Services 361,438,704 368,404,34664 School Administration 218,392,711 217,838,06865 Total District Support Services 788,322,822 801,762,853
Non-Instructional Services:66 Food Service Operations 234,652,547 217,874,67767 Other Enterprise Operations 4,501,916 1,857,85968 Community Operations 14,307,794 17,871,29169 Other Non-Instructional Services 0 070 Total Non-Instructional Services 253,462,258 237,603,82671 Facilities Acquisition and Construction 545,394,535 569,634,33272 Debt Service 226,232,300 257,968,73175 Other Non-Programmed Costs 20,368,950 14,954,03876 Total Expenditures 5,171,678,766 5,166,574,52077 Less: Capital Expenditures 649,987,805 643,992,66878 Less: Debt Service 226,232,300 257,968,73179 Total Current Expenditures 4,295,458,661 4,264,613,12280 Exclusions from Current Expenditures 253,082,03281 Net Current Expenditures 4,042,376,62982 Per Pupil Expenditures 9,315
83 Personnel - Non-Federal Certified Clsrm FTEs 32,657.6884 Avg Salary - Non-Fed Certified Clsrm FTEs 46,663
85 Personnel - Non-Federal Certified FTEs 35,636.6586 Avg Salary - Non-Fed Certified FTEs 49,052
87.1 Legal Balance (funds 1-2-4) 793,353,89387.2 Categorical Fund Balance 35,419,14487.3 Deposits with Paying Agents (QZAB) 14,734,13387.4 Net Legal Bal (Excl Cat & QZAB) 743,200,61688 Building Fund Balance (fund 3) 617,715,51989 Capital Outlay Fund Balance (fund 5) 15,683,389
Jan 30, 2012 - 1 - 9:35:29 AM

Annual Statistical Report 2010-2011
County: ARKANSAS DEWITT SCHOOL DISTRICT LEA:0101000
2010-2011 2011-2012Actual Budget
1 Area in Square Miles 9222 ADA 1,2913 ADA pct Change over 5 Yrs. (12%)4 4 QTR ADM 1,3275 Prior Year 3QTR ADM 1,3596 Assessment 125,817,9377 M&O Mills 25.008 URT Mills 25.009 M&O Mills in Excess of URT 0.0010 Dedicated M&O Mills 0.0011 Debt Service Mills 9.5012 Total Mills 34.5013 Total Debt Bond/Non-Bond 7,708,149
State and Local Revenue:14 Property Tax Receipts (Including URT) 4,088,692 3,623,57315 Other Local Receipts 440,094 166,64516 Revenue from Intermediate Sources 0 017.1 Foundation Funding (Excl URT) 5,114,208 5,004,02917.2 Tax Collection Rate Guarantee 24,076 20,00018 Student Growth Funding 0 019 Declining Enrollment Funding 217,009 75,66320 Consolidation Incentive/Assistance 0 021 Isolated Funding 63,300 76,00022 Supplemental Millage Incentive Funding 0 023 Other Unrestricted State Funding 0 024 Total Unrestricted Revenue from State and
Local Sources 9,947,380 8,965,910
Restricted Revenue from State Sources:25 Adult Education 0 0
Regular Education:26 Professional Development 56,214 56,55727 Other Regular Education 15,686 7,000
Special Education:28 Gifted & Talented 450 029 Alternative Learning Environment (ALE) 59,807 43,48130 English Language Learner (ELL) 3,516 3,58831 National School Lunch Act (NSLA) 410,688 411,37832 Other Special Education 150,120 144,00033 Workforce Education 115,105 121,06234 School Food Service 4,824 4,50035 Educational Service Cooperatives 0 036 Early Childhood Programs 67,068 65,00037 Magnet School Programs 0 038 Other Non-Instructional Programs 60,716 51,21039 Total Restricted Revenue from State Sources 944,193 907,77640 Total Restricted Revenue from Federal
Sources 2,300,964 1,279,096
Other Sources of Funds:41 Financing Sources 15,311 102,62842 Balances from Consolidated/Annexed District 0 043 Indirect Cost Reimbursement 5,597 5,00044 Gains and Losses from Sale of Fixed Assets 117,684 2,50045 Compensation for Loss of Fixed Assets 83,834 1,00046 Other 0 047 Total Other Sources of Funds 222,426 111,12848 Total Revenue and Other Sources of Funds
from All Sources 13,414,964 11,263,910
2010-2011 2011-2012Actual Budget
CURRENT EXPENDITURESInstruction:
49 Regular Instruction 5,097,859 4,200,74650 Special Education 968,687 943,25551 Workforce Education 545,958 561,28452 Adult Education 0 053 Compensatory Education 295,324 260,90554 Other 135,541 159,97455 Total Instruction 7,043,369 6,126,164
District Level Support:56 General Administration 500,100 437,26057 Central Services 134,420 191,67658 Maintenance & Operations of Plant 993,016 846,04059 Student Transportation 466,544 488,78760 Other District Level Support Services 20,603 7,00061 Total District Support Services 2,114,683 1,970,763
School Level Support:62 Student Support Services 419,368 415,62363 Instructional Staff Support Services 1,104,457 709,01064 School Administration 768,543 670,15965 Total District Support Services 2,292,368 1,794,792
Non-Instructional Services:66 Food Service Operations 654,688 556,72167 Other Enterprise Operations 0 068 Community Operations 0 069 Other Non-Instructional Services 0 070 Total Non-Instructional Services 654,688 556,72171 Facilities Acquisition and Construction 601,319 072 Debt Service 622,864 560,39675 Other Non-Programmed Costs 0 076 Total Expenditures 13,329,291 11,008,83677 Less: Capital Expenditures 621,837 128,50078 Less: Debt Service 622,864 560,39679 Total Current Expenditures 12,084,590 10,319,94080 Exclusions from Current Expenditures 506,37781 Net Current Expenditures 11,578,213
82 Per Pupil Expenditures 8,967
83 Personnel - Non-Federal Certified Clsrm FTEs 100.7984 Avg Salary - Non-Fed Certified Clsrm FTEs 44,45185 Personnel - Non-Federal Certified FTEs 112.1586 Avg Salary - Non-Fed Certified FTEs 46,88287.1 Legal Balance (funds 1-2-4) 1,489,19887.2 Categorical Fund Balance 57,76087.3 Deposits with Paying Agents (QZAB) 087.4 Net Legal Bal (Excl Cat & QZAB) 1,431,43788 Building Fund Balance (fund 3) 34,62989 Capital Outlay Fund Balance (fund 5) 0
Jan 30, 2012 - 2 - 9:35:29 AM

Annual Statistical Report 2010-2011
County: ARKANSAS STUTTGART SCHOOL DISTRICT LEA:0104000
2010-2011 2011-2012Actual Budget
1 Area in Square Miles 2122 ADA 1,6733 ADA pct Change over 5 Yrs. (8%)4 4 QTR ADM 1,7865 Prior Year 3QTR ADM 1,8446 Assessment 177,909,0157 M&O Mills 25.008 URT Mills 25.009 M&O Mills in Excess of URT 0.0010 Dedicated M&O Mills 0.0011 Debt Service Mills 6.9012 Total Mills 31.9013 Total Debt Bond/Non-Bond 12,091,422
State and Local Revenue:14 Property Tax Receipts (Including URT) 5,322,715 5,004,00015 Other Local Receipts 648,657 273,65016 Revenue from Intermediate Sources 0 017.1 Foundation Funding (Excl URT) 6,890,765 6,655,24217.2 Tax Collection Rate Guarantee 0 018 Student Growth Funding 0 019 Declining Enrollment Funding 0 020 Consolidation Incentive/Assistance 0 021 Isolated Funding 0 022 Supplemental Millage Incentive Funding 0 023 Other Unrestricted State Funding 0 024 Total Unrestricted Revenue from State and
Local Sources 12,862,137 11,932,892
Restricted Revenue from State Sources:25 Adult Education 228,153 192,159
Regular Education:26 Professional Development 76,250 75,98027 Other Regular Education 25,807 19,300
Special Education:28 Gifted & Talented 4,605 029 Alternative Learning Environment (ALE) 89,345 135,08630 English Language Learner (ELL) 10,255 031 National School Lunch Act (NSLA) 574,368 562,16632 Other Special Education 50,968 23,20033 Workforce Education 76,266 91,50034 School Food Service 7,658 7,80035 Educational Service Cooperatives 0 036 Early Childhood Programs 167,224 170,10037 Magnet School Programs 0 038 Other Non-Instructional Programs 74,015 61,29439 Total Restricted Revenue from State Sources 1,384,914 1,338,58540 Total Restricted Revenue from Federal
Sources 3,459,816 2,715,080
Other Sources of Funds:41 Financing Sources 26,024 042 Balances from Consolidated/Annexed District 0 043 Indirect Cost Reimbursement 11,349 044 Gains and Losses from Sale of Fixed Assets 0 045 Compensation for Loss of Fixed Assets 1,703 046 Other 0 047 Total Other Sources of Funds 39,076 048 Total Revenue and Other Sources of Funds
from All Sources 17,745,944 15,986,557
2010-2011 2011-2012Actual Budget
CURRENT EXPENDITURESInstruction:
49 Regular Instruction 6,313,753 5,901,25850 Special Education 674,708 791,86451 Workforce Education 264,230 287,25052 Adult Education 251,022 225,29653 Compensatory Education 507,878 600,68954 Other 562,739 610,01755 Total Instruction 8,574,330 8,416,374
District Level Support:56 General Administration 437,098 492,10157 Central Services 633,581 440,01958 Maintenance & Operations of Plant 1,504,065 1,374,47559 Student Transportation 363,814 448,71560 Other District Level Support Services 33,987 28,39761 Total District Support Services 2,972,545 2,783,707
School Level Support:62 Student Support Services 742,645 692,52163 Instructional Staff Support Services 1,493,737 1,368,42864 School Administration 863,467 786,35865 Total District Support Services 3,099,849 2,847,307
Non-Instructional Services:66 Food Service Operations 901,819 787,09867 Other Enterprise Operations 426 068 Community Operations 39,088 40,16569 Other Non-Instructional Services 0 070 Total Non-Instructional Services 941,332 827,26371 Facilities Acquisition and Construction 351,420 318,50972 Debt Service 305,966 893,78675 Other Non-Programmed Costs 481 076 Total Expenditures 16,245,924 16,086,94777 Less: Capital Expenditures 935,500 720,59178 Less: Debt Service 305,966 893,78679 Total Current Expenditures 15,004,457 14,472,56980 Exclusions from Current Expenditures 948,47981 Net Current Expenditures 14,055,979
82 Per Pupil Expenditures 8,401
83 Personnel - Non-Federal Certified Clsrm FTEs 120.0584 Avg Salary - Non-Fed Certified Clsrm FTEs 42,46885 Personnel - Non-Federal Certified FTEs 133.7186 Avg Salary - Non-Fed Certified FTEs 45,73987.1 Legal Balance (funds 1-2-4) 4,640,65987.2 Categorical Fund Balance 247,51187.3 Deposits with Paying Agents (QZAB) 087.4 Net Legal Bal (Excl Cat & QZAB) 4,393,14788 Building Fund Balance (fund 3) 54,73489 Capital Outlay Fund Balance (fund 5) 0
Jan 30, 2012 - 3 - 9:35:29 AM

Annual Statistical Report 2010-2011
County: ASHLEY CROSSETT SCHOOL DISTRICT LEA:0201000
2010-2011 2011-2012Actual Budget
1 Area in Square Miles 2152 ADA 1,7663 ADA pct Change over 5 Yrs. (17%)4 4 QTR ADM 1,8665 Prior Year 3QTR ADM 1,9056 Assessment 228,029,7487 M&O Mills 25.008 URT Mills 25.009 M&O Mills in Excess of URT 0.0010 Dedicated M&O Mills 1.2711 Debt Service Mills 9.7012 Total Mills 35.9713 Total Debt Bond/Non-Bond 12,390,678
State and Local Revenue:14 Property Tax Receipts (Including URT) 7,898,687 6,611,80015 Other Local Receipts 931,364 523,00016 Revenue from Intermediate Sources 12,052 12,00017.1 Foundation Funding (Excl URT) 5,958,505 5,843,14617.2 Tax Collection Rate Guarantee 43,858 45,00018 Student Growth Funding 0 019 Declining Enrollment Funding 47,762 117,96520 Consolidation Incentive/Assistance 0 021 Isolated Funding 0 022 Supplemental Millage Incentive Funding 0 023 Other Unrestricted State Funding 0 024 Total Unrestricted Revenue from State and
Local Sources 14,892,228 13,152,911
Restricted Revenue from State Sources:25 Adult Education 0 0
Regular Education:26 Professional Development 78,797 79,11327 Other Regular Education 25,156 5,000
Special Education:28 Gifted & Talented 2,562 029 Alternative Learning Environment (ALE) 124,937 107,64630 English Language Learner (ELL) 8,204 8,00031 National School Lunch Act (NSLA) 540,640 547,99832 Other Special Education 49,447 42,07533 Workforce Education 0 034 School Food Service 6,580 6,00035 Educational Service Cooperatives 0 036 Early Childhood Programs 391,300 389,80037 Magnet School Programs 0 038 Other Non-Instructional Programs 23,643 16,37039 Total Restricted Revenue from State Sources 1,251,266 1,202,00240 Total Restricted Revenue from Federal
Sources 3,399,486 2,596,688
Other Sources of Funds:41 Financing Sources 0 042 Balances from Consolidated/Annexed District 0 043 Indirect Cost Reimbursement 0 044 Gains and Losses from Sale of Fixed Assets 0 045 Compensation for Loss of Fixed Assets 10,986 046 Other 0 047 Total Other Sources of Funds 10,986 048 Total Revenue and Other Sources of Funds
from All Sources 19,553,965 16,951,601
2010-2011 2011-2012Actual Budget
CURRENT EXPENDITURESInstruction:
49 Regular Instruction 7,920,678 7,268,12050 Special Education 823,300 896,80851 Workforce Education 545,972 549,40952 Adult Education 0 053 Compensatory Education 686,796 629,47754 Other 701,856 774,15555 Total Instruction 10,678,602 10,117,968
District Level Support:56 General Administration 538,819 474,90357 Central Services 378,318 324,02358 Maintenance & Operations of Plant 1,978,872 2,076,54459 Student Transportation 637,717 825,38360 Other District Level Support Services 16,697 17,00061 Total District Support Services 3,550,423 3,717,853
School Level Support:62 Student Support Services 907,616 985,68263 Instructional Staff Support Services 1,787,962 1,462,86164 School Administration 952,548 982,88765 Total District Support Services 3,648,126 3,431,430
Non-Instructional Services:66 Food Service Operations 990,048 1,006,34367 Other Enterprise Operations 0 068 Community Operations 2,528 1,20069 Other Non-Instructional Services 0 070 Total Non-Instructional Services 992,575 1,007,54371 Facilities Acquisition and Construction 1,692,090 229,36872 Debt Service 559,316 700,00075 Other Non-Programmed Costs 0 076 Total Expenditures 21,121,134 19,204,16377 Less: Capital Expenditures 1,948,138 463,94178 Less: Debt Service 559,316 700,00079 Total Current Expenditures 18,613,679 18,040,22280 Exclusions from Current Expenditures 1,039,04981 Net Current Expenditures 17,574,631
82 Per Pupil Expenditures 9,953
83 Personnel - Non-Federal Certified Clsrm FTEs 103.7484 Avg Salary - Non-Fed Certified Clsrm FTEs 54,72885 Personnel - Non-Federal Certified FTEs 114.4586 Avg Salary - Non-Fed Certified FTEs 57,19987.1 Legal Balance (funds 1-2-4) 5,063,04987.2 Categorical Fund Balance 4,75787.3 Deposits with Paying Agents (QZAB) 087.4 Net Legal Bal (Excl Cat & QZAB) 5,058,29288 Building Fund Balance (fund 3) 129,26789 Capital Outlay Fund Balance (fund 5) 588,063
Jan 30, 2012 - 4 - 9:35:29 AM

Annual Statistical Report 2010-2011
County: ASHLEY HAMBURG SCHOOL DISTRICT LEA:0203000
2010-2011 2011-2012Actual Budget
1 Area in Square Miles 7322 ADA 1,8033 ADA pct Change over 5 Yrs. 4%4 4 QTR ADM 1,8875 Prior Year 3QTR ADM 1,9406 Assessment 96,021,9157 M&O Mills 25.008 URT Mills 25.009 M&O Mills in Excess of URT 0.0010 Dedicated M&O Mills 0.0011 Debt Service Mills 10.5012 Total Mills 35.5013 Total Debt Bond/Non-Bond 11,507,750
State and Local Revenue:14 Property Tax Receipts (Including URT) 3,232,787 3,320,21915 Other Local Receipts 1,102,660 558,00016 Revenue from Intermediate Sources 0 017.1 Foundation Funding (Excl URT) 9,370,050 9,285,31017.2 Tax Collection Rate Guarantee 19,738 25,00018 Student Growth Funding 0 019 Declining Enrollment Funding 0 133,69320 Consolidation Incentive/Assistance 0 021 Isolated Funding 11,357 8,00022 Supplemental Millage Incentive Funding 6,886 5,50923 Other Unrestricted State Funding 20,032 024 Total Unrestricted Revenue from State and
Local Sources 13,763,510 13,335,731
Restricted Revenue from State Sources:25 Adult Education 0 0
Regular Education:26 Professional Development 80,227 80,36127 Other Regular Education 31,671 0
Special Education:28 Gifted & Talented 5,353 029 Alternative Learning Environment (ALE) 109,417 72,86930 English Language Learner (ELL) 47,466 40,00031 National School Lunch Act (NSLA) 1,454,272 1,447,16032 Other Special Education 275,594 033 Workforce Education 0 034 School Food Service 9,732 10,50035 Educational Service Cooperatives 0 036 Early Childhood Programs 685,400 680,40037 Magnet School Programs 0 038 Other Non-Instructional Programs 1,442,953 1,463,90239 Total Restricted Revenue from State Sources 4,142,085 3,795,19240 Total Restricted Revenue from Federal
Sources 4,298,344 3,412,333
Other Sources of Funds:41 Financing Sources 606,626 042 Balances from Consolidated/Annexed District 0 043 Indirect Cost Reimbursement 75,489 70,36344 Gains and Losses from Sale of Fixed Assets 0 045 Compensation for Loss of Fixed Assets 0 046 Other 7,439 047 Total Other Sources of Funds 689,554 70,36348 Total Revenue and Other Sources of Funds
from All Sources 22,893,493 20,613,620
2010-2011 2011-2012Actual Budget
CURRENT EXPENDITURESInstruction:
49 Regular Instruction 7,249,033 6,776,24750 Special Education 1,092,117 799,65351 Workforce Education 681,786 659,32352 Adult Education 0 053 Compensatory Education 619,354 762,66954 Other 1,109,334 1,086,59355 Total Instruction 10,751,624 10,084,485
District Level Support:56 General Administration 455,152 417,49257 Central Services 356,404 442,84558 Maintenance & Operations of Plant 1,535,914 1,524,07759 Student Transportation 717,522 799,31060 Other District Level Support Services 84,973 80,36361 Total District Support Services 3,149,965 3,264,087
School Level Support:62 Student Support Services 922,415 833,42663 Instructional Staff Support Services 1,985,280 1,569,17764 School Administration 935,825 1,003,07865 Total District Support Services 3,843,520 3,405,681
Non-Instructional Services:66 Food Service Operations 1,416,024 1,426,90067 Other Enterprise Operations 18,211 068 Community Operations 12,370 29,00069 Other Non-Instructional Services 0 070 Total Non-Instructional Services 1,446,605 1,455,90071 Facilities Acquisition and Construction 3,575,953 2,730,88672 Debt Service 1,105,608 875,32475 Other Non-Programmed Costs 7,079 076 Total Expenditures 23,880,355 21,816,36277 Less: Capital Expenditures 3,861,654 2,873,68678 Less: Debt Service 1,105,608 875,32479 Total Current Expenditures 18,913,093 18,067,35380 Exclusions from Current Expenditures 1,622,29181 Net Current Expenditures 17,290,801
82 Per Pupil Expenditures 9,589
83 Personnel - Non-Federal Certified Clsrm FTEs 145.4284 Avg Salary - Non-Fed Certified Clsrm FTEs 40,47285 Personnel - Non-Federal Certified FTEs 162.1886 Avg Salary - Non-Fed Certified FTEs 42,53187.1 Legal Balance (funds 1-2-4) 2,042,72787.2 Categorical Fund Balance 40,09787.3 Deposits with Paying Agents (QZAB) 087.4 Net Legal Bal (Excl Cat & QZAB) 2,002,63088 Building Fund Balance (fund 3) 1,325,53389 Capital Outlay Fund Balance (fund 5) 0
Jan 30, 2012 - 5 - 9:35:29 AM

Annual Statistical Report 2010-2011
County: BAXTER COTTER SCHOOL DISTRICT LEA:0302000
2010-2011 2011-2012Actual Budget
1 Area in Square Miles 342 ADA 6283 ADA pct Change over 5 Yrs. 6%4 4 QTR ADM 6615 Prior Year 3QTR ADM 6516 Assessment 51,056,7557 M&O Mills 25.008 URT Mills 25.009 M&O Mills in Excess of URT 0.0010 Dedicated M&O Mills 0.0011 Debt Service Mills 7.6712 Total Mills 32.6713 Total Debt Bond/Non-Bond 3,067,840
State and Local Revenue:14 Property Tax Receipts (Including URT) 1,441,718 1,612,31815 Other Local Receipts 299,602 96,00016 Revenue from Intermediate Sources 0 017.1 Foundation Funding (Excl URT) 2,714,869 2,812,87417.2 Tax Collection Rate Guarantee 43,847 018 Student Growth Funding 56,511 019 Declining Enrollment Funding 0 020 Consolidation Incentive/Assistance 0 021 Isolated Funding 0 022 Supplemental Millage Incentive Funding 0 023 Other Unrestricted State Funding 11,873 11,87324 Total Unrestricted Revenue from State and
Local Sources 4,568,420 4,533,065
Restricted Revenue from State Sources:25 Adult Education 0 0
Regular Education:26 Professional Development 26,936 28,03127 Other Regular Education 820 1,800
Special Education:28 Gifted & Talented 1,300 029 Alternative Learning Environment (ALE) 11,214 16,70430 English Language Learner (ELL) 0 031 National School Lunch Act (NSLA) 211,792 231,74832 Other Special Education 59,190 3,50033 Workforce Education 3,250 034 School Food Service 2,298 2,30035 Educational Service Cooperatives 0 036 Early Childhood Programs 0 037 Magnet School Programs 0 038 Other Non-Instructional Programs 34,401 28,04139 Total Restricted Revenue from State Sources 351,201 312,12440 Total Restricted Revenue from Federal
Sources 1,460,515 960,956
Other Sources of Funds:41 Financing Sources 431,400 042 Balances from Consolidated/Annexed District 0 043 Indirect Cost Reimbursement 7,400 7,40044 Gains and Losses from Sale of Fixed Assets 0 045 Compensation for Loss of Fixed Assets 0 046 Other 0 047 Total Other Sources of Funds 438,800 7,40048 Total Revenue and Other Sources of Funds
from All Sources 6,818,936 5,813,545
2010-2011 2011-2012Actual Budget
CURRENT EXPENDITURESInstruction:
49 Regular Instruction 2,482,125 2,100,52450 Special Education 431,129 374,62051 Workforce Education 163,461 217,67952 Adult Education 0 053 Compensatory Education 382,512 573,73254 Other 284,037 260,26555 Total Instruction 3,743,264 3,526,819
District Level Support:56 General Administration 201,934 195,11257 Central Services 149,677 118,73258 Maintenance & Operations of Plant 593,663 519,28959 Student Transportation 193,721 124,89660 Other District Level Support Services 11,442 12,25861 Total District Support Services 1,150,436 970,287
School Level Support:62 Student Support Services 201,283 264,16563 Instructional Staff Support Services 234,039 214,19264 School Administration 292,362 275,92365 Total District Support Services 727,684 754,279
Non-Instructional Services:66 Food Service Operations 337,487 295,92067 Other Enterprise Operations 0 068 Community Operations 0 6,90069 Other Non-Instructional Services 0 070 Total Non-Instructional Services 337,487 302,82071 Facilities Acquisition and Construction 765,773 14,25272 Debt Service 296,646 294,54675 Other Non-Programmed Costs 29,285 076 Total Expenditures 7,050,576 5,863,00377 Less: Capital Expenditures 991,053 80,15278 Less: Debt Service 296,646 294,54679 Total Current Expenditures 5,762,877 5,488,30580 Exclusions from Current Expenditures 297,55781 Net Current Expenditures 5,465,319
82 Per Pupil Expenditures 8,710
83 Personnel - Non-Federal Certified Clsrm FTEs 51.7984 Avg Salary - Non-Fed Certified Clsrm FTEs 39,89185 Personnel - Non-Federal Certified FTEs 55.4486 Avg Salary - Non-Fed Certified FTEs 42,34487.1 Legal Balance (funds 1-2-4) 782,94287.2 Categorical Fund Balance 36,37387.3 Deposits with Paying Agents (QZAB) 087.4 Net Legal Bal (Excl Cat & QZAB) 746,56988 Building Fund Balance (fund 3) 124,01389 Capital Outlay Fund Balance (fund 5) 0
Jan 30, 2012 - 6 - 9:35:29 AM

Annual Statistical Report 2010-2011
County: BAXTER MOUNTAIN HOME SCHOOL DISTRICT LEA:0303000
2010-2011 2011-2012Actual Budget
1 Area in Square Miles 3502 ADA 3,7623 ADA pct Change over 5 Yrs. 1%4 4 QTR ADM 3,9775 Prior Year 3QTR ADM 3,9726 Assessment 552,953,8637 M&O Mills 25.298 URT Mills 25.009 M&O Mills in Excess of URT 0.2910 Dedicated M&O Mills 0.0011 Debt Service Mills 6.8712 Total Mills 32.1613 Total Debt Bond/Non-Bond 41,458,550
State and Local Revenue:14 Property Tax Receipts (Including URT) 16,775,786 17,227,25815 Other Local Receipts 1,228,819 755,65016 Revenue from Intermediate Sources 0 017.1 Foundation Funding (Excl URT) 10,621,218 10,879,36017.2 Tax Collection Rate Guarantee 333,404 018 Student Growth Funding 65,334 019 Declining Enrollment Funding 0 020 Consolidation Incentive/Assistance 0 021 Isolated Funding 0 022 Supplemental Millage Incentive Funding 0 023 Other Unrestricted State Funding 66,599 024 Total Unrestricted Revenue from State and
Local Sources 29,091,160 28,862,268
Restricted Revenue from State Sources:25 Adult Education 4,738 0
Regular Education:26 Professional Development 164,273 168,88627 Other Regular Education 44,248 0
Special Education:28 Gifted & Talented 2,950 029 Alternative Learning Environment (ALE) 328,169 431,74330 English Language Learner (ELL) 7,032 7,00031 National School Lunch Act (NSLA) 1,056,480 1,086,38232 Other Special Education 59,126 033 Workforce Education 2,099 034 School Food Service 13,309 14,00035 Educational Service Cooperatives 0 036 Early Childhood Programs 0 037 Magnet School Programs 0 038 Other Non-Instructional Programs 337,559 6,98139 Total Restricted Revenue from State Sources 2,019,983 1,714,99240 Total Restricted Revenue from Federal
Sources 5,439,441 5,874,474
Other Sources of Funds:41 Financing Sources 18,500 1,091,95642 Balances from Consolidated/Annexed District 0 043 Indirect Cost Reimbursement 19,380 044 Gains and Losses from Sale of Fixed Assets 2,513 4,20045 Compensation for Loss of Fixed Assets 103,972 046 Other 0 047 Total Other Sources of Funds 144,364 1,096,15648 Total Revenue and Other Sources of Funds
from All Sources 36,694,949 37,547,890
2010-2011 2011-2012Actual Budget
CURRENT EXPENDITURESInstruction:
49 Regular Instruction 13,034,092 12,491,18950 Special Education 1,937,395 2,113,46451 Workforce Education 1,238,963 1,230,75452 Adult Education 4,738 053 Compensatory Education 1,069,518 1,080,65854 Other 2,317,612 2,496,76155 Total Instruction 19,602,318 19,412,825
District Level Support:56 General Administration 587,071 599,95457 Central Services 437,490 452,52358 Maintenance & Operations of Plant 3,434,949 4,560,17159 Student Transportation 1,604,167 1,699,89360 Other District Level Support Services 55,714 35,00061 Total District Support Services 6,119,390 7,347,541
School Level Support:62 Student Support Services 1,471,626 1,667,67763 Instructional Staff Support Services 2,302,080 2,378,10564 School Administration 1,747,983 1,819,15365 Total District Support Services 5,521,690 5,864,935
Non-Instructional Services:66 Food Service Operations 1,665,327 1,578,72167 Other Enterprise Operations 0 068 Community Operations 383 5,00069 Other Non-Instructional Services 0 070 Total Non-Instructional Services 1,665,710 1,583,72171 Facilities Acquisition and Construction 10,432,541 4,006,11672 Debt Service 2,731,898 2,901,04575 Other Non-Programmed Costs 78,891 076 Total Expenditures 46,152,438 41,116,18377 Less: Capital Expenditures 10,872,727 4,443,24578 Less: Debt Service 2,731,898 2,901,04579 Total Current Expenditures 32,547,813 33,771,89480 Exclusions from Current Expenditures 1,105,45381 Net Current Expenditures 31,442,360
82 Per Pupil Expenditures 8,358
83 Personnel - Non-Federal Certified Clsrm FTEs 264.3584 Avg Salary - Non-Fed Certified Clsrm FTEs 45,04485 Personnel - Non-Federal Certified FTEs 283.8386 Avg Salary - Non-Fed Certified FTEs 47,04087.1 Legal Balance (funds 1-2-4) 2,981,42487.2 Categorical Fund Balance 132,96587.3 Deposits with Paying Agents (QZAB) 114,23387.4 Net Legal Bal (Excl Cat & QZAB) 2,734,22688 Building Fund Balance (fund 3) 5,043,77189 Capital Outlay Fund Balance (fund 5) 104,828
Jan 30, 2012 - 7 - 9:35:29 AM

Annual Statistical Report 2010-2011
County: BAXTER NORFORK SCHOOL DISTRICT LEA:0304000
2010-2011 2011-2012Actual Budget
1 Area in Square Miles 1692 ADA 4393 ADA pct Change over 5 Yrs. 2%4 4 QTR ADM 4655 Prior Year 3QTR ADM 4676 Assessment 58,942,7227 M&O Mills 27.008 URT Mills 25.009 M&O Mills in Excess of URT 2.0010 Dedicated M&O Mills 0.0011 Debt Service Mills 7.3912 Total Mills 34.3913 Total Debt Bond/Non-Bond 2,640,500
State and Local Revenue:14 Property Tax Receipts (Including URT) 1,779,575 1,957,63615 Other Local Receipts 341,495 111,90816 Revenue from Intermediate Sources 0 017.1 Foundation Funding (Excl URT) 1,339,381 1,330,01517.2 Tax Collection Rate Guarantee 47,015 018 Student Growth Funding 24,865 019 Declining Enrollment Funding 0 1,78220 Consolidation Incentive/Assistance 0 021 Isolated Funding 0 022 Supplemental Millage Incentive Funding 0 023 Other Unrestricted State Funding 0 024 Total Unrestricted Revenue from State and
Local Sources 3,532,330 3,401,341
Restricted Revenue from State Sources:25 Adult Education 0 0
Regular Education:26 Professional Development 19,325 19,77727 Other Regular Education 104,639 108,900
Special Education:28 Gifted & Talented 250 25029 Alternative Learning Environment (ALE) 5,566 16,08330 English Language Learner (ELL) 0 031 National School Lunch Act (NSLA) 371,008 382,53632 Other Special Education 56,432 56,40033 Workforce Education 0 034 School Food Service 2,077 2,00035 Educational Service Cooperatives 0 036 Early Childhood Programs 0 037 Magnet School Programs 0 038 Other Non-Instructional Programs 5,684 2,22439 Total Restricted Revenue from State Sources 564,982 588,17040 Total Restricted Revenue from Federal
Sources 778,605 975,509
Other Sources of Funds:41 Financing Sources 50,500 042 Balances from Consolidated/Annexed District 0 043 Indirect Cost Reimbursement 0 044 Gains and Losses from Sale of Fixed Assets 0 045 Compensation for Loss of Fixed Assets 4,717 046 Other 0 047 Total Other Sources of Funds 55,217 048 Total Revenue and Other Sources of Funds
from All Sources 4,931,134 4,965,020
2010-2011 2011-2012Actual Budget
CURRENT EXPENDITURESInstruction:
49 Regular Instruction 1,851,327 1,727,51650 Special Education 324,421 346,76851 Workforce Education 161,334 157,62652 Adult Education 0 053 Compensatory Education 163,411 170,95254 Other 219,026 225,24255 Total Instruction 2,719,519 2,628,104
District Level Support:56 General Administration 138,740 138,11457 Central Services 95,378 96,67958 Maintenance & Operations of Plant 442,262 443,90759 Student Transportation 268,380 304,37360 Other District Level Support Services 13,752 061 Total District Support Services 958,513 983,073
School Level Support:62 Student Support Services 173,602 153,92063 Instructional Staff Support Services 306,700 327,89864 School Administration 206,476 200,70665 Total District Support Services 686,779 682,524
Non-Instructional Services:66 Food Service Operations 339,627 330,79567 Other Enterprise Operations 0 068 Community Operations 694 1,50069 Other Non-Instructional Services 0 070 Total Non-Instructional Services 340,321 332,29571 Facilities Acquisition and Construction 6,806 122,91872 Debt Service 236,396 255,30075 Other Non-Programmed Costs 0 076 Total Expenditures 4,948,334 5,004,21477 Less: Capital Expenditures 96,280 225,91878 Less: Debt Service 236,396 255,30079 Total Current Expenditures 4,615,658 4,522,99680 Exclusions from Current Expenditures 298,27581 Net Current Expenditures 4,317,382
82 Per Pupil Expenditures 9,834
83 Personnel - Non-Federal Certified Clsrm FTEs 37.9884 Avg Salary - Non-Fed Certified Clsrm FTEs 41,98685 Personnel - Non-Federal Certified FTEs 42.0686 Avg Salary - Non-Fed Certified FTEs 44,87487.1 Legal Balance (funds 1-2-4) 609,65687.2 Categorical Fund Balance 93,55587.3 Deposits with Paying Agents (QZAB) 087.4 Net Legal Bal (Excl Cat & QZAB) 516,10088 Building Fund Balance (fund 3) 60,31489 Capital Outlay Fund Balance (fund 5) 0
Jan 30, 2012 - 8 - 9:35:29 AM

Annual Statistical Report 2010-2011
County: BENTON BENTONVILLE SCHOOL DISTRICT LEA:0401000
2010-2011 2011-2012Actual Budget
1 Area in Square Miles 1432 ADA 12,7933 ADA pct Change over 5 Yrs. 33%4 4 QTR ADM 13,5365 Prior Year 3QTR ADM 13,0366 Assessment 1,612,132,5107 M&O Mills 25.008 URT Mills 25.009 M&O Mills in Excess of URT 0.0010 Dedicated M&O Mills 2.0011 Debt Service Mills 16.7012 Total Mills 43.7013 Total Debt Bond/Non-Bond 173,660,000
State and Local Revenue:14 Property Tax Receipts (Including URT) 63,482,497 67,275,28215 Other Local Receipts 8,365,633 6,390,98116 Revenue from Intermediate Sources 95,939 017.1 Foundation Funding (Excl URT) 38,640,267 43,683,01717.2 Tax Collection Rate Guarantee 355,772 018 Student Growth Funding 3,008,398 552,96019 Declining Enrollment Funding 0 020 Consolidation Incentive/Assistance 0 021 Isolated Funding 0 022 Supplemental Millage Incentive Funding 0 023 Other Unrestricted State Funding 0 024 Total Unrestricted Revenue from State and
Local Sources 113,948,505 117,902,240
Restricted Revenue from State Sources:25 Adult Education 0 0
Regular Education:26 Professional Development 539,188 573,87727 Other Regular Education 45,027 0
Special Education:28 Gifted & Talented 40,050 40,05029 Alternative Learning Environment (ALE) 301,475 301,47530 English Language Learner (ELL) 202,756 202,75631 National School Lunch Act (NSLA) 1,871,534 1,960,05532 Other Special Education 617,992 551,06433 Workforce Education 145,603 282,28434 School Food Service 33,853 33,85335 Educational Service Cooperatives 0 036 Early Childhood Programs 1,208,987 1,264,86837 Magnet School Programs 0 038 Other Non-Instructional Programs 36,278 25,58239 Total Restricted Revenue from State Sources 5,042,743 5,235,86440 Total Restricted Revenue from Federal
Sources 10,734,538 7,081,253
Other Sources of Funds:41 Financing Sources 33,471,410 27,000,00042 Balances from Consolidated/Annexed District 0 043 Indirect Cost Reimbursement 0 044 Gains and Losses from Sale of Fixed Assets 9,032 045 Compensation for Loss of Fixed Assets 0 046 Other 0 047 Total Other Sources of Funds 33,480,442 27,000,00048 Total Revenue and Other Sources of Funds
from All Sources 163,206,229 157,219,356
2010-2011 2011-2012Actual Budget
CURRENT EXPENDITURESInstruction:
49 Regular Instruction 50,863,496 51,294,11950 Special Education 8,660,225 7,904,18551 Workforce Education 1,912,212 1,833,34252 Adult Education 0 053 Compensatory Education 2,861,359 2,560,90154 Other 4,978,868 4,602,34055 Total Instruction 69,276,160 68,194,887
District Level Support:56 General Administration 1,857,290 1,404,84457 Central Services 4,546,387 5,554,97958 Maintenance & Operations of Plant 9,918,873 9,715,59759 Student Transportation 5,634,125 5,829,36260 Other District Level Support Services 0 061 Total District Support Services 21,956,676 22,504,781
School Level Support:62 Student Support Services 7,430,980 7,485,23563 Instructional Staff Support Services 4,958,819 5,039,62264 School Administration 6,464,571 6,360,40265 Total District Support Services 18,854,371 18,885,259
Non-Instructional Services:66 Food Service Operations 5,014,513 5,415,09067 Other Enterprise Operations 0 068 Community Operations 2,308,656 2,539,03069 Other Non-Instructional Services 0 070 Total Non-Instructional Services 7,323,169 7,954,12071 Facilities Acquisition and Construction 4,690,160 27,492,76172 Debt Service 9,818,498 14,637,11175 Other Non-Programmed Costs 39,978 076 Total Expenditures 131,959,012 159,668,92077 Less: Capital Expenditures 5,990,653 28,294,90078 Less: Debt Service 9,818,498 14,637,11179 Total Current Expenditures 116,149,861 116,736,90980 Exclusions from Current Expenditures 8,342,09281 Net Current Expenditures 107,807,770
82 Per Pupil Expenditures 8,427
83 Personnel - Non-Federal Certified Clsrm FTEs 894.3384 Avg Salary - Non-Fed Certified Clsrm FTEs 53,59485 Personnel - Non-Federal Certified FTEs 944.0286 Avg Salary - Non-Fed Certified FTEs 55,49987.1 Legal Balance (funds 1-2-4) 17,567,99787.2 Categorical Fund Balance 914,47887.3 Deposits with Paying Agents (QZAB) 087.4 Net Legal Bal (Excl Cat & QZAB) 16,653,51988 Building Fund Balance (fund 3) 35,614,73189 Capital Outlay Fund Balance (fund 5) 886,461
Jan 30, 2012 - 9 - 9:35:29 AM

Annual Statistical Report 2010-2011
County: BENTON DECATUR SCHOOL DISTRICT LEA:0402000
2010-2011 2011-2012Actual Budget
1 Area in Square Miles 502 ADA 4723 ADA pct Change over 5 Yrs. (12%)4 4 QTR ADM 4865 Prior Year 3QTR ADM 4846 Assessment 46,396,3707 M&O Mills 25.008 URT Mills 25.009 M&O Mills in Excess of URT 0.0010 Dedicated M&O Mills 0.0011 Debt Service Mills 14.9012 Total Mills 39.9013 Total Debt Bond/Non-Bond 5,580,663
State and Local Revenue:14 Property Tax Receipts (Including URT) 1,722,893 1,783,38215 Other Local Receipts 249,298 207,78016 Revenue from Intermediate Sources 0 017.1 Foundation Funding (Excl URT) 1,840,963 1,872,68217.2 Tax Collection Rate Guarantee 0 018 Student Growth Funding 0 019 Declining Enrollment Funding 81,551 020 Consolidation Incentive/Assistance 0 021 Isolated Funding 0 022 Supplemental Millage Incentive Funding 0 023 Other Unrestricted State Funding 0 024 Total Unrestricted Revenue from State and
Local Sources 3,894,705 3,863,844
Restricted Revenue from State Sources:25 Adult Education 0 0
Regular Education:26 Professional Development 20,013 20,75827 Other Regular Education 1,635 10,800
Special Education:28 Gifted & Talented 50 029 Alternative Learning Environment (ALE) 22,712 41,45030 English Language Learner (ELL) 44,243 45,14931 National School Lunch Act (NSLA) 371,008 392,65632 Other Special Education 70,152 86,68733 Workforce Education 3,792 034 School Food Service 2,080 2,08035 Educational Service Cooperatives 0 036 Early Childhood Programs 158,342 154,47837 Magnet School Programs 0 038 Other Non-Instructional Programs 10,825 9,51639 Total Restricted Revenue from State Sources 704,851 763,57440 Total Restricted Revenue from Federal
Sources 810,365 686,730
Other Sources of Funds:41 Financing Sources 15,353 042 Balances from Consolidated/Annexed District 0 043 Indirect Cost Reimbursement 0 044 Gains and Losses from Sale of Fixed Assets 0 045 Compensation for Loss of Fixed Assets 0 046 Other 0 047 Total Other Sources of Funds 15,353 048 Total Revenue and Other Sources of Funds
from All Sources 5,425,273 5,314,148
2010-2011 2011-2012Actual Budget
CURRENT EXPENDITURESInstruction:
49 Regular Instruction 1,744,171 1,843,57950 Special Education 268,975 310,08851 Workforce Education 166,402 169,57252 Adult Education 0 053 Compensatory Education 105,986 86,68654 Other 307,637 305,30955 Total Instruction 2,593,171 2,715,233
District Level Support:56 General Administration 176,021 193,53157 Central Services 127,924 100,08558 Maintenance & Operations of Plant 569,899 499,48659 Student Transportation 197,037 184,80860 Other District Level Support Services 5,047 2,60061 Total District Support Services 1,075,927 980,511
School Level Support:62 Student Support Services 256,633 271,19263 Instructional Staff Support Services 384,904 459,01264 School Administration 238,976 237,24165 Total District Support Services 880,513 967,445
Non-Instructional Services:66 Food Service Operations 334,385 294,47067 Other Enterprise Operations 0 068 Community Operations 57 069 Other Non-Instructional Services 0 070 Total Non-Instructional Services 334,442 294,47071 Facilities Acquisition and Construction 0 072 Debt Service 445,384 488,35275 Other Non-Programmed Costs 0 076 Total Expenditures 5,329,436 5,446,01177 Less: Capital Expenditures 34,070 20,88778 Less: Debt Service 445,384 488,35279 Total Current Expenditures 4,849,982 4,936,77380 Exclusions from Current Expenditures 282,74381 Net Current Expenditures 4,567,240
82 Per Pupil Expenditures 9,682
83 Personnel - Non-Federal Certified Clsrm FTEs 39.2584 Avg Salary - Non-Fed Certified Clsrm FTEs 38,74685 Personnel - Non-Federal Certified FTEs 43.3686 Avg Salary - Non-Fed Certified FTEs 40,90087.1 Legal Balance (funds 1-2-4) 846,55487.2 Categorical Fund Balance 96,77787.3 Deposits with Paying Agents (QZAB) 087.4 Net Legal Bal (Excl Cat & QZAB) 749,77788 Building Fund Balance (fund 3) 111,02889 Capital Outlay Fund Balance (fund 5) 0
Jan 30, 2012 - 10 - 9:35:29 AM

Annual Statistical Report 2010-2011
County: BENTON GENTRY SCHOOL DISTRICT LEA:0403000
2010-2011 2011-2012Actual Budget
1 Area in Square Miles 872 ADA 1,3443 ADA pct Change over 5 Yrs. (3%)4 4 QTR ADM 1,4185 Prior Year 3QTR ADM 1,4376 Assessment 146,063,9507 M&O Mills 28.008 URT Mills 25.009 M&O Mills in Excess of URT 3.0010 Dedicated M&O Mills 0.0011 Debt Service Mills 14.9012 Total Mills 42.9013 Total Debt Bond/Non-Bond 11,895,000
State and Local Revenue:14 Property Tax Receipts (Including URT) 6,035,565 6,012,91615 Other Local Receipts 919,418 866,21116 Revenue from Intermediate Sources 0 017.1 Foundation Funding (Excl URT) 5,129,371 5,161,58017.2 Tax Collection Rate Guarantee 62,387 018 Student Growth Funding 72,011 019 Declining Enrollment Funding 0 020 Consolidation Incentive/Assistance 0 021 Isolated Funding 0 022 Supplemental Millage Incentive Funding 0 023 Other Unrestricted State Funding 0 024 Total Unrestricted Revenue from State and
Local Sources 12,218,752 12,040,707
Restricted Revenue from State Sources:25 Adult Education 4,408 0
Regular Education:26 Professional Development 59,441 94,23327 Other Regular Education 6,447 0
Special Education:28 Gifted & Talented 1,050 029 Alternative Learning Environment (ALE) 52,982 63,57230 English Language Learner (ELL) 45,415 45,41531 National School Lunch Act (NSLA) 434,992 494,04332 Other Special Education 107,311 50,85433 Workforce Education 0 034 School Food Service 4,696 5,00035 Educational Service Cooperatives 0 036 Early Childhood Programs 0 037 Magnet School Programs 0 038 Other Non-Instructional Programs 155,245 62,72639 Total Restricted Revenue from State Sources 871,987 815,84340 Total Restricted Revenue from Federal
Sources 1,922,785 1,428,325
Other Sources of Funds:41 Financing Sources 1,470,000 042 Balances from Consolidated/Annexed District 0 043 Indirect Cost Reimbursement 0 044 Gains and Losses from Sale of Fixed Assets 0 045 Compensation for Loss of Fixed Assets 0 046 Other 0 047 Total Other Sources of Funds 1,470,000 048 Total Revenue and Other Sources of Funds
from All Sources 16,483,523 14,284,875
2010-2011 2011-2012Actual Budget
CURRENT EXPENDITURESInstruction:
49 Regular Instruction 5,396,538 5,459,32950 Special Education 1,080,445 1,068,09251 Workforce Education 400,029 389,75152 Adult Education 0 053 Compensatory Education 258,526 249,84654 Other 241,894 245,21055 Total Instruction 7,377,432 7,412,228
District Level Support:56 General Administration 159,522 199,13857 Central Services 514,171 530,20558 Maintenance & Operations of Plant 1,328,820 1,434,12559 Student Transportation 821,006 684,38460 Other District Level Support Services 50,807 15,00061 Total District Support Services 2,874,325 2,862,851
School Level Support:62 Student Support Services 611,473 637,43863 Instructional Staff Support Services 743,978 851,39064 School Administration 633,534 655,79065 Total District Support Services 1,988,985 2,144,618
Non-Instructional Services:66 Food Service Operations 680,531 690,49367 Other Enterprise Operations 0 068 Community Operations 644 3,00069 Other Non-Instructional Services 0 070 Total Non-Instructional Services 681,175 693,49371 Facilities Acquisition and Construction 486,841 1,049,76672 Debt Service 884,770 980,00075 Other Non-Programmed Costs 54,916 076 Total Expenditures 14,348,444 15,142,95777 Less: Capital Expenditures 822,593 1,192,63778 Less: Debt Service 884,770 980,00079 Total Current Expenditures 12,641,081 12,970,31980 Exclusions from Current Expenditures 806,88081 Net Current Expenditures 11,834,202
82 Per Pupil Expenditures 8,803
83 Personnel - Non-Federal Certified Clsrm FTEs 103.6384 Avg Salary - Non-Fed Certified Clsrm FTEs 46,28085 Personnel - Non-Federal Certified FTEs 113.1486 Avg Salary - Non-Fed Certified FTEs 48,85687.1 Legal Balance (funds 1-2-4) 1,609,27987.2 Categorical Fund Balance 77,61287.3 Deposits with Paying Agents (QZAB) 087.4 Net Legal Bal (Excl Cat & QZAB) 1,531,66788 Building Fund Balance (fund 3) 3,612,28289 Capital Outlay Fund Balance (fund 5) 0
Jan 30, 2012 - 11 - 9:35:29 AM

Annual Statistical Report 2010-2011
County: BENTON GRAVETTE SCHOOL DISTRICT LEA:0404000
2010-2011 2011-2012Actual Budget
1 Area in Square Miles 1512 ADA 1,6753 ADA pct Change over 5 Yrs. 9%4 4 QTR ADM 1,7625 Prior Year 3QTR ADM 1,7506 Assessment 267,875,8107 M&O Mills 25.808 URT Mills 25.009 M&O Mills in Excess of URT 0.8010 Dedicated M&O Mills 0.0011 Debt Service Mills 11.4012 Total Mills 37.2013 Total Debt Bond/Non-Bond 30,415,000
State and Local Revenue:14 Property Tax Receipts (Including URT) 9,458,983 9,688,36515 Other Local Receipts 862,183 178,86516 Revenue from Intermediate Sources 12,788 017.1 Foundation Funding (Excl URT) 4,128,306 4,313,27417.2 Tax Collection Rate Guarantee 8,638 018 Student Growth Funding 95,361 019 Declining Enrollment Funding 0 020 Consolidation Incentive/Assistance 0 021 Isolated Funding 0 022 Supplemental Millage Incentive Funding 0 023 Other Unrestricted State Funding 15,150 5,00024 Total Unrestricted Revenue from State and
Local Sources 14,581,408 14,185,504
Restricted Revenue from State Sources:25 Adult Education 0 0
Regular Education:26 Professional Development 72,372 75,02227 Other Regular Education 9,800 7,200
Special Education:28 Gifted & Talented 1,400 1,20029 Alternative Learning Environment (ALE) 61,879 90,61930 English Language Learner (ELL) 15,236 15,00031 National School Lunch Act (NSLA) 414,656 449,32832 Other Special Education 49,978 40,00033 Workforce Education 416 034 School Food Service 6,339 035 Educational Service Cooperatives 0 036 Early Childhood Programs 194,400 194,40037 Magnet School Programs 0 038 Other Non-Instructional Programs 2,527 2,02139 Total Restricted Revenue from State Sources 829,002 874,79040 Total Restricted Revenue from Federal
Sources 2,133,235 1,068,114
Other Sources of Funds:41 Financing Sources 0 042 Balances from Consolidated/Annexed District 0 043 Indirect Cost Reimbursement 0 044 Gains and Losses from Sale of Fixed Assets 0 045 Compensation for Loss of Fixed Assets 0 046 Other 0 047 Total Other Sources of Funds 0 048 Total Revenue and Other Sources of Funds
from All Sources 17,543,646 16,128,408
2010-2011 2011-2012Actual Budget
CURRENT EXPENDITURESInstruction:
49 Regular Instruction 5,813,138 5,494,34250 Special Education 959,706 1,030,90751 Workforce Education 658,297 645,42552 Adult Education 0 053 Compensatory Education 504,622 295,94354 Other 847,784 858,78955 Total Instruction 8,783,548 8,325,406
District Level Support:56 General Administration 287,333 297,76557 Central Services 494,864 536,38158 Maintenance & Operations of Plant 1,465,994 1,575,20559 Student Transportation 731,621 1,040,33560 Other District Level Support Services 23,091 22,00061 Total District Support Services 3,002,904 3,471,686
School Level Support:62 Student Support Services 542,822 525,64963 Instructional Staff Support Services 1,004,971 1,258,90764 School Administration 651,565 706,02365 Total District Support Services 2,199,357 2,490,579
Non-Instructional Services:66 Food Service Operations 814,151 2,70067 Other Enterprise Operations 0 068 Community Operations 955 8,00069 Other Non-Instructional Services 0 070 Total Non-Instructional Services 815,106 10,70071 Facilities Acquisition and Construction 1,899,177 072 Debt Service 1,983,115 1,983,76575 Other Non-Programmed Costs 0 076 Total Expenditures 18,683,208 16,282,13677 Less: Capital Expenditures 2,138,786 344,13778 Less: Debt Service 1,983,115 1,983,76579 Total Current Expenditures 14,561,307 13,954,23480 Exclusions from Current Expenditures 875,23881 Net Current Expenditures 13,686,069
82 Per Pupil Expenditures 8,171
83 Personnel - Non-Federal Certified Clsrm FTEs 117.6584 Avg Salary - Non-Fed Certified Clsrm FTEs 48,57285 Personnel - Non-Federal Certified FTEs 125.6286 Avg Salary - Non-Fed Certified FTEs 50,15387.1 Legal Balance (funds 1-2-4) 2,315,61887.2 Categorical Fund Balance 270,55187.3 Deposits with Paying Agents (QZAB) 087.4 Net Legal Bal (Excl Cat & QZAB) 2,045,06788 Building Fund Balance (fund 3) 1,704,98989 Capital Outlay Fund Balance (fund 5) 0
Jan 30, 2012 - 12 - 9:35:29 AM

Annual Statistical Report 2010-2011
County: BENTON ROGERS SCHOOL DISTRICT LEA:0405000
2010-2011 2011-2012Actual Budget
1 Area in Square Miles 2602 ADA 13,2363 ADA pct Change over 5 Yrs. 8%4 4 QTR ADM 13,8615 Prior Year 3QTR ADM 13,6966 Assessment 1,732,144,9907 M&O Mills 25.008 URT Mills 25.009 M&O Mills in Excess of URT 0.0010 Dedicated M&O Mills 2.5011 Debt Service Mills 10.9012 Total Mills 38.4013 Total Debt Bond/Non-Bond 158,025,000
State and Local Revenue:14 Property Tax Receipts (Including URT) 64,959,961 64,065,74615 Other Local Receipts 5,665,849 5,365,50016 Revenue from Intermediate Sources 100,157 017.1 Foundation Funding (Excl URT) 40,430,117 42,854,12217.2 Tax Collection Rate Guarantee 688,995 018 Student Growth Funding 1,173,580 307,20019 Declining Enrollment Funding 0 020 Consolidation Incentive/Assistance 0 021 Isolated Funding 0 022 Supplemental Millage Incentive Funding 0 023 Other Unrestricted State Funding 0 488,00024 Total Unrestricted Revenue from State and
Local Sources 113,018,659 113,080,568
Restricted Revenue from State Sources:25 Adult Education 0 0
Regular Education:26 Professional Development 566,467 588,85627 Other Regular Education 30,922 0
Special Education:28 Gifted & Talented 39,850 029 Alternative Learning Environment (ALE) 593,645 744,19330 English Language Learner (ELL) 1,368,896 1,384,57031 National School Lunch Act (NSLA) 3,943,696 4,154,76632 Other Special Education 775,181 300,00033 Workforce Education 205,081 034 School Food Service 52,256 40,00035 Educational Service Cooperatives 0 036 Early Childhood Programs 1,507,625 1,507,80037 Magnet School Programs 0 038 Other Non-Instructional Programs 86,411 69,12939 Total Restricted Revenue from State Sources 9,170,030 8,789,31440 Total Restricted Revenue from Federal
Sources 17,341,362 17,677,174
Other Sources of Funds:41 Financing Sources 10,385,167 042 Balances from Consolidated/Annexed District 0 043 Indirect Cost Reimbursement 0 044 Gains and Losses from Sale of Fixed Assets 10,288 045 Compensation for Loss of Fixed Assets 1,287 046 Other 0 047 Total Other Sources of Funds 10,396,741 048 Total Revenue and Other Sources of Funds
from All Sources 149,926,793 139,547,056
2010-2011 2011-2012Actual Budget
CURRENT EXPENDITURESInstruction:
49 Regular Instruction 51,200,698 52,107,44050 Special Education 9,492,964 10,012,11251 Workforce Education 2,574,130 2,243,40352 Adult Education 0 053 Compensatory Education 3,145,385 2,874,59754 Other 7,370,690 7,704,40255 Total Instruction 73,783,866 74,941,954
District Level Support:56 General Administration 912,932 1,074,47057 Central Services 1,893,494 3,976,27458 Maintenance & Operations of Plant 10,147,491 12,956,01259 Student Transportation 3,318,188 3,546,79660 Other District Level Support Services 16,120 20,00061 Total District Support Services 16,288,225 21,573,552
School Level Support:62 Student Support Services 5,971,190 6,357,46663 Instructional Staff Support Services 9,354,027 10,522,47364 School Administration 6,634,528 6,554,98665 Total District Support Services 21,959,745 23,434,925
Non-Instructional Services:66 Food Service Operations 6,852,195 7,605,00067 Other Enterprise Operations 0 068 Community Operations 976,502 4,220,61669 Other Non-Instructional Services 0 070 Total Non-Instructional Services 7,828,697 11,825,61671 Facilities Acquisition and Construction 2,669,366 5,600,00072 Debt Service 11,697,509 11,443,23975 Other Non-Programmed Costs 116,527 076 Total Expenditures 134,343,934 148,819,28677 Less: Capital Expenditures 4,444,545 7,357,27078 Less: Debt Service 11,697,509 11,443,23979 Total Current Expenditures 118,201,880 130,018,77780 Exclusions from Current Expenditures 8,606,94081 Net Current Expenditures 109,594,940
82 Per Pupil Expenditures 8,280
83 Personnel - Non-Federal Certified Clsrm FTEs 879.2684 Avg Salary - Non-Fed Certified Clsrm FTEs 55,83685 Personnel - Non-Federal Certified FTEs 950.9286 Avg Salary - Non-Fed Certified FTEs 58,04987.1 Legal Balance (funds 1-2-4) 9,513,76587.2 Categorical Fund Balance 152,97987.3 Deposits with Paying Agents (QZAB) 087.4 Net Legal Bal (Excl Cat & QZAB) 9,360,78688 Building Fund Balance (fund 3) 18,329,42389 Capital Outlay Fund Balance (fund 5) 2,761,164
Jan 30, 2012 - 13 - 9:35:29 AM

Annual Statistical Report 2010-2011
County: BENTON SILOAM SPRINGS SCHOOL DISTRICT LEA:0406000
2010-2011 2011-2012Actual Budget
1 Area in Square Miles 1442 ADA 3,6003 ADA pct Change over 5 Yrs. 11%4 4 QTR ADM 3,8355 Prior Year 3QTR ADM 3,8106 Assessment 306,811,0317 M&O Mills 25.008 URT Mills 25.009 M&O Mills in Excess of URT 0.0010 Dedicated M&O Mills 0.0011 Debt Service Mills 20.0012 Total Mills 45.0013 Total Debt Bond/Non-Bond 54,840,000
State and Local Revenue:14 Property Tax Receipts (Including URT) 13,574,929 13,957,40115 Other Local Receipts 2,672,254 1,088,15516 Revenue from Intermediate Sources 27,862 20,00017.1 Foundation Funding (Excl URT) 15,324,489 16,117,38717.2 Tax Collection Rate Guarantee 66,308 018 Student Growth Funding 226,254 019 Declining Enrollment Funding 0 020 Consolidation Incentive/Assistance 0 021 Isolated Funding 0 022 Supplemental Millage Incentive Funding 0 023 Other Unrestricted State Funding 685 024 Total Unrestricted Revenue from State and
Local Sources 31,892,780 31,182,943
Restricted Revenue from State Sources:25 Adult Education 0 0
Regular Education:26 Professional Development 157,569 163,53827 Other Regular Education 24,306 21,600
Special Education:28 Gifted & Talented 3,650 029 Alternative Learning Environment (ALE) 261,901 298,31630 English Language Learner (ELL) 200,119 200,11931 National School Lunch Act (NSLA) 1,023,856 1,082,72932 Other Special Education 213,591 133,99833 Workforce Education 103,589 56,87534 School Food Service 12,236 12,20035 Educational Service Cooperatives 0 036 Early Childhood Programs 580,770 756,52137 Magnet School Programs 0 038 Other Non-Instructional Programs 6,667,247 3,242,47539 Total Restricted Revenue from State Sources 9,248,834 5,968,37140 Total Restricted Revenue from Federal
Sources 4,650,240 3,237,540
Other Sources of Funds:41 Financing Sources 0 042 Balances from Consolidated/Annexed District 0 043 Indirect Cost Reimbursement 0 044 Gains and Losses from Sale of Fixed Assets 0 045 Compensation for Loss of Fixed Assets 0 046 Other 0 047 Total Other Sources of Funds 0 048 Total Revenue and Other Sources of Funds
from All Sources 45,791,854 40,388,853
2010-2011 2011-2012Actual Budget
CURRENT EXPENDITURESInstruction:
49 Regular Instruction 12,744,648 11,869,39550 Special Education 2,078,017 2,159,04251 Workforce Education 1,091,919 1,073,17652 Adult Education 0 053 Compensatory Education 874,275 989,59354 Other 2,671,320 2,507,39155 Total Instruction 19,460,178 18,598,597
District Level Support:56 General Administration 489,887 558,61557 Central Services 302,491 364,39258 Maintenance & Operations of Plant 2,880,237 3,550,36559 Student Transportation 1,353,483 1,315,54760 Other District Level Support Services 59,103 58,04261 Total District Support Services 5,085,202 5,846,961
School Level Support:62 Student Support Services 1,472,888 1,573,97363 Instructional Staff Support Services 3,408,818 3,569,88564 School Administration 1,901,454 1,910,77665 Total District Support Services 6,783,161 7,054,634
Non-Instructional Services:66 Food Service Operations 1,883,334 1,789,23367 Other Enterprise Operations 0 068 Community Operations 1,078 10,00069 Other Non-Instructional Services 0 070 Total Non-Instructional Services 1,884,412 1,799,23371 Facilities Acquisition and Construction 16,233,175 19,781,10072 Debt Service 3,333,704 3,495,94475 Other Non-Programmed Costs 0 3476 Total Expenditures 52,779,831 56,576,50377 Less: Capital Expenditures 16,710,682 20,234,98778 Less: Debt Service 3,333,704 3,495,94479 Total Current Expenditures 32,735,445 32,845,57280 Exclusions from Current Expenditures 2,148,42281 Net Current Expenditures 30,587,023
82 Per Pupil Expenditures 8,496
83 Personnel - Non-Federal Certified Clsrm FTEs 249.2184 Avg Salary - Non-Fed Certified Clsrm FTEs 46,55385 Personnel - Non-Federal Certified FTEs 274.4686 Avg Salary - Non-Fed Certified FTEs 49,20387.1 Legal Balance (funds 1-2-4) 7,404,11287.2 Categorical Fund Balance 123,07487.3 Deposits with Paying Agents (QZAB) 087.4 Net Legal Bal (Excl Cat & QZAB) 7,281,03888 Building Fund Balance (fund 3) 17,421,05489 Capital Outlay Fund Balance (fund 5) 0
Jan 30, 2012 - 14 - 9:35:29 AM

Annual Statistical Report 2010-2011
County: BENTON PEA RIDGE SCHOOL DISTRICT LEA:0407000
2010-2011 2011-2012Actual Budget
1 Area in Square Miles 532 ADA 1,5553 ADA pct Change over 5 Yrs. 25%4 4 QTR ADM 1,6395 Prior Year 3QTR ADM 1,6086 Assessment 92,498,1107 M&O Mills 25.008 URT Mills 25.009 M&O Mills in Excess of URT 0.0010 Dedicated M&O Mills 0.0011 Debt Service Mills 19.8012 Total Mills 44.8013 Total Debt Bond/Non-Bond 18,292,857
State and Local Revenue:14 Property Tax Receipts (Including URT) 3,875,328 4,614,34315 Other Local Receipts 610,782 598,65516 Revenue from Intermediate Sources 0 017.1 Foundation Funding (Excl URT) 7,462,155 7,816,89917.2 Tax Collection Rate Guarantee 30,585 20,00018 Student Growth Funding 387,265 200,00019 Declining Enrollment Funding 0 020 Consolidation Incentive/Assistance 0 021 Isolated Funding 0 022 Supplemental Millage Incentive Funding 55,333 44,26623 Other Unrestricted State Funding 0 024 Total Unrestricted Revenue from State and
Local Sources 12,421,448 13,294,163
Restricted Revenue from State Sources:25 Adult Education 0 0
Regular Education:26 Professional Development 66,511 69,55127 Other Regular Education 11,400 9,600
Special Education:28 Gifted & Talented 5,500 029 Alternative Learning Environment (ALE) 44,734 51,06630 English Language Learner (ELL) 12,306 12,30031 National School Lunch Act (NSLA) 371,405 388,19032 Other Special Education 86,746 109,34333 Workforce Education 0 4,87534 School Food Service 4,788 2,35035 Educational Service Cooperatives 0 036 Early Childhood Programs 0 037 Magnet School Programs 0 038 Other Non-Instructional Programs 183,724 155,52039 Total Restricted Revenue from State Sources 787,113 802,79540 Total Restricted Revenue from Federal
Sources 2,339,793 1,233,273
Other Sources of Funds:41 Financing Sources 3,541,724 042 Balances from Consolidated/Annexed District 0 043 Indirect Cost Reimbursement 5,000 5,00044 Gains and Losses from Sale of Fixed Assets 994 045 Compensation for Loss of Fixed Assets 8,132 046 Other 0 047 Total Other Sources of Funds 3,555,850 5,00048 Total Revenue and Other Sources of Funds
from All Sources 19,104,204 15,335,231
2010-2011 2011-2012Actual Budget
CURRENT EXPENDITURESInstruction:
49 Regular Instruction 4,959,741 5,225,42950 Special Education 577,379 700,60651 Workforce Education 416,632 362,48652 Adult Education 0 053 Compensatory Education 256,828 305,56454 Other 718,424 764,42655 Total Instruction 6,929,004 7,358,511
District Level Support:56 General Administration 249,854 346,91257 Central Services 409,243 356,98358 Maintenance & Operations of Plant 1,263,752 1,248,39459 Student Transportation 593,760 764,36260 Other District Level Support Services 43,631 44,82261 Total District Support Services 2,560,241 2,761,473
School Level Support:62 Student Support Services 510,206 581,60463 Instructional Staff Support Services 703,880 811,68664 School Administration 789,587 914,07965 Total District Support Services 2,003,673 2,307,368
Non-Instructional Services:66 Food Service Operations 805,803 807,58167 Other Enterprise Operations 0 068 Community Operations 222 50069 Other Non-Instructional Services 0 070 Total Non-Instructional Services 806,025 808,08171 Facilities Acquisition and Construction 1,914,847 6,745,87672 Debt Service 1,168,577 1,203,02275 Other Non-Programmed Costs 0 076 Total Expenditures 15,382,368 21,184,33177 Less: Capital Expenditures 2,066,363 6,975,15178 Less: Debt Service 1,168,577 1,203,02279 Total Current Expenditures 12,147,427 13,006,15880 Exclusions from Current Expenditures 476,68981 Net Current Expenditures 11,670,738
82 Per Pupil Expenditures 7,507
83 Personnel - Non-Federal Certified Clsrm FTEs 100.0684 Avg Salary - Non-Fed Certified Clsrm FTEs 46,29985 Personnel - Non-Federal Certified FTEs 104.5886 Avg Salary - Non-Fed Certified FTEs 48,05087.1 Legal Balance (funds 1-2-4) 1,662,83387.2 Categorical Fund Balance 20,46787.3 Deposits with Paying Agents (QZAB) 087.4 Net Legal Bal (Excl Cat & QZAB) 1,642,36688 Building Fund Balance (fund 3) 8,909,57689 Capital Outlay Fund Balance (fund 5) 0
Jan 30, 2012 - 15 - 9:35:29 AM

Annual Statistical Report 2010-2011
County: BOONE ALPENA SCHOOL DISTRICT LEA:0501000
2010-2011 2011-2012Actual Budget
1 Area in Square Miles 1252 ADA 5183 ADA pct Change over 5 Yrs. (2%)4 4 QTR ADM 5545 Prior Year 3QTR ADM 5796 Assessment 26,852,3107 M&O Mills 25.608 URT Mills 25.009 M&O Mills in Excess of URT 0.6010 Dedicated M&O Mills 0.0011 Debt Service Mills 8.0012 Total Mills 33.6013 Total Debt Bond/Non-Bond 1,458,904
State and Local Revenue:14 Property Tax Receipts (Including URT) 800,130 793,00015 Other Local Receipts 185,052 88,37516 Revenue from Intermediate Sources 7,312 017.1 Foundation Funding (Excl URT) 2,843,527 2,747,73817.2 Tax Collection Rate Guarantee 30,934 20,00018 Student Growth Funding 0 019 Declining Enrollment Funding 994 76,09320 Consolidation Incentive/Assistance 0 021 Isolated Funding 0 022 Supplemental Millage Incentive Funding 18,424 14,73923 Other Unrestricted State Funding 0 024 Total Unrestricted Revenue from State and
Local Sources 3,886,373 3,739,945
Restricted Revenue from State Sources:25 Adult Education 0 0
Regular Education:26 Professional Development 23,950 23,49127 Other Regular Education 0 0
Special Education:28 Gifted & Talented 400 40029 Alternative Learning Environment (ALE) 19,299 27,68930 English Language Learner (ELL) 0 031 National School Lunch Act (NSLA) 160,704 198,85332 Other Special Education 18,663 45,00033 Workforce Education 4,875 11,37534 School Food Service 2,238 2,20035 Educational Service Cooperatives 0 036 Early Childhood Programs 0 037 Magnet School Programs 0 038 Other Non-Instructional Programs 23,053 20,04739 Total Restricted Revenue from State Sources 253,182 329,05540 Total Restricted Revenue from Federal
Sources 726,790 633,538
Other Sources of Funds:41 Financing Sources 0 128,12542 Balances from Consolidated/Annexed District 0 043 Indirect Cost Reimbursement 0 044 Gains and Losses from Sale of Fixed Assets 0 045 Compensation for Loss of Fixed Assets 0 046 Other 0 047 Total Other Sources of Funds 0 128,12548 Total Revenue and Other Sources of Funds
from All Sources 4,866,345 4,830,662
2010-2011 2011-2012Actual Budget
CURRENT EXPENDITURESInstruction:
49 Regular Instruction 2,110,902 1,837,08650 Special Education 410,177 438,89351 Workforce Education 186,498 183,52252 Adult Education 0 053 Compensatory Education 155,778 171,01154 Other 95,202 73,52455 Total Instruction 2,958,557 2,704,035
District Level Support:56 General Administration 134,107 142,91057 Central Services 78,357 69,74258 Maintenance & Operations of Plant 405,372 421,92459 Student Transportation 233,760 216,12160 Other District Level Support Services 18,307 2,55461 Total District Support Services 869,903 853,251
School Level Support:62 Student Support Services 155,358 153,41963 Instructional Staff Support Services 290,331 282,16364 School Administration 283,145 283,02965 Total District Support Services 728,835 718,610
Non-Instructional Services:66 Food Service Operations 250,244 211,96367 Other Enterprise Operations 9,577 068 Community Operations 2,297 3,00069 Other Non-Instructional Services 0 070 Total Non-Instructional Services 262,118 214,96371 Facilities Acquisition and Construction 3,324 151,38272 Debt Service 126,307 139,75675 Other Non-Programmed Costs 44,268 076 Total Expenditures 4,993,313 4,781,99777 Less: Capital Expenditures 60,304 200,36878 Less: Debt Service 126,307 139,75679 Total Current Expenditures 4,806,702 4,441,87380 Exclusions from Current Expenditures 202,17081 Net Current Expenditures 4,604,532
82 Per Pupil Expenditures 8,893
83 Personnel - Non-Federal Certified Clsrm FTEs 56.3784 Avg Salary - Non-Fed Certified Clsrm FTEs 33,64985 Personnel - Non-Federal Certified FTEs 59.3786 Avg Salary - Non-Fed Certified FTEs 35,75587.1 Legal Balance (funds 1-2-4) 412,32987.2 Categorical Fund Balance 32,20787.3 Deposits with Paying Agents (QZAB) 087.4 Net Legal Bal (Excl Cat & QZAB) 380,12288 Building Fund Balance (fund 3) 172,43289 Capital Outlay Fund Balance (fund 5) 0
Jan 30, 2012 - 16 - 9:35:29 AM

Annual Statistical Report 2010-2011
County: BOONE BERGMAN SCHOOL DISTRICT LEA:0502000
2010-2011 2011-2012Actual Budget
1 Area in Square Miles 1152 ADA 1,0063 ADA pct Change over 5 Yrs. 10%4 4 QTR ADM 1,0675 Prior Year 3QTR ADM 1,0856 Assessment 47,818,1317 M&O Mills 25.008 URT Mills 25.009 M&O Mills in Excess of URT 0.0010 Dedicated M&O Mills 0.0011 Debt Service Mills 7.0012 Total Mills 32.0013 Total Debt Bond/Non-Bond 2,604,113
State and Local Revenue:14 Property Tax Receipts (Including URT) 1,425,404 1,292,80015 Other Local Receipts 424,384 199,78116 Revenue from Intermediate Sources 2,625 2,00017.1 Foundation Funding (Excl URT) 5,394,553 5,373,78217.2 Tax Collection Rate Guarantee 76,409 018 Student Growth Funding 55,908 019 Declining Enrollment Funding 0 59,01320 Consolidation Incentive/Assistance 0 021 Isolated Funding 0 022 Supplemental Millage Incentive Funding 28,316 11,32623 Other Unrestricted State Funding 0 024 Total Unrestricted Revenue from State and
Local Sources 7,407,599 6,938,702
Restricted Revenue from State Sources:25 Adult Education 0 0
Regular Education:26 Professional Development 44,856 45,14827 Other Regular Education 5,150 4,800
Special Education:28 Gifted & Talented 650 029 Alternative Learning Environment (ALE) 104,947 110,13330 English Language Learner (ELL) 0 031 National School Lunch Act (NSLA) 274,784 248,56532 Other Special Education 4,443 033 Workforce Education 10,563 3,25034 School Food Service 4,369 4,31335 Educational Service Cooperatives 0 036 Early Childhood Programs 0 037 Magnet School Programs 0 038 Other Non-Instructional Programs 66,455 60,23539 Total Restricted Revenue from State Sources 516,217 476,44440 Total Restricted Revenue from Federal
Sources 1,259,018 885,240
Other Sources of Funds:41 Financing Sources 6,356 042 Balances from Consolidated/Annexed District 0 043 Indirect Cost Reimbursement 0 044 Gains and Losses from Sale of Fixed Assets 1,990 045 Compensation for Loss of Fixed Assets 0 046 Other 0 047 Total Other Sources of Funds 8,346 048 Total Revenue and Other Sources of Funds
from All Sources 9,191,179 8,300,387
2010-2011 2011-2012Actual Budget
CURRENT EXPENDITURESInstruction:
49 Regular Instruction 3,798,102 3,497,76950 Special Education 634,153 560,51351 Workforce Education 326,362 329,47652 Adult Education 0 053 Compensatory Education 542,127 391,79854 Other 184,922 186,36655 Total Instruction 5,485,666 4,965,922
District Level Support:56 General Administration 164,322 171,73457 Central Services 50,479 145,90158 Maintenance & Operations of Plant 727,503 839,29859 Student Transportation 385,240 367,19660 Other District Level Support Services 35,538 35,32261 Total District Support Services 1,363,081 1,559,451
School Level Support:62 Student Support Services 330,420 314,60763 Instructional Staff Support Services 420,160 444,59364 School Administration 350,598 352,16965 Total District Support Services 1,101,178 1,111,368
Non-Instructional Services:66 Food Service Operations 515,136 511,81567 Other Enterprise Operations 0 068 Community Operations 286 6,00069 Other Non-Instructional Services 0 070 Total Non-Instructional Services 515,422 517,81571 Facilities Acquisition and Construction 35,450 479,69872 Debt Service 46,614 135,66175 Other Non-Programmed Costs 21 076 Total Expenditures 8,547,432 8,769,91577 Less: Capital Expenditures 160,256 591,04578 Less: Debt Service 46,614 135,66179 Total Current Expenditures 8,340,562 8,043,20980 Exclusions from Current Expenditures 313,82581 Net Current Expenditures 8,026,737
82 Per Pupil Expenditures 7,983
83 Personnel - Non-Federal Certified Clsrm FTEs 81.7184 Avg Salary - Non-Fed Certified Clsrm FTEs 41,02785 Personnel - Non-Federal Certified FTEs 86.7786 Avg Salary - Non-Fed Certified FTEs 42,53987.1 Legal Balance (funds 1-2-4) 2,209,07487.2 Categorical Fund Balance 7,53887.3 Deposits with Paying Agents (QZAB) 087.4 Net Legal Bal (Excl Cat & QZAB) 2,201,53688 Building Fund Balance (fund 3) 512,70889 Capital Outlay Fund Balance (fund 5) 0
Jan 30, 2012 - 17 - 9:35:29 AM

Annual Statistical Report 2010-2011
County: BOONE HARRISON SCHOOL DISTRICT LEA:0503000
2010-2011 2011-2012Actual Budget
1 Area in Square Miles 2092 ADA 2,5803 ADA pct Change over 5 Yrs. (2%)4 4 QTR ADM 2,7435 Prior Year 3QTR ADM 2,7666 Assessment 324,769,0587 M&O Mills 25.008 URT Mills 25.009 M&O Mills in Excess of URT 0.0010 Dedicated M&O Mills 0.0011 Debt Service Mills 9.3012 Total Mills 34.3013 Total Debt Bond/Non-Bond 18,220,000
State and Local Revenue:14 Property Tax Receipts (Including URT) 10,588,976 10,861,17715 Other Local Receipts 1,334,043 154,03416 Revenue from Intermediate Sources 0 017.1 Foundation Funding (Excl URT) 8,857,707 8,999,67517.2 Tax Collection Rate Guarantee 384,097 018 Student Growth Funding 0 019 Declining Enrollment Funding 136,210 19,04620 Consolidation Incentive/Assistance 0 021 Isolated Funding 0 022 Supplemental Millage Incentive Funding 0 023 Other Unrestricted State Funding 0 8,00024 Total Unrestricted Revenue from State and
Local Sources 21,301,033 20,041,932
Restricted Revenue from State Sources:25 Adult Education 0 0
Regular Education:26 Professional Development 114,405 116,96327 Other Regular Education 2,800 4,600
Special Education:28 Gifted & Talented 1,900 2,00029 Alternative Learning Environment (ALE) 132,169 123,60430 English Language Learner (ELL) 3,223 3,20031 National School Lunch Act (NSLA) 652,736 724,08632 Other Special Education 211,923 198,20033 Workforce Education 28,438 22,75034 School Food Service 9,881 035 Educational Service Cooperatives 0 036 Early Childhood Programs 97,200 97,20037 Magnet School Programs 0 038 Other Non-Instructional Programs 1,020,688 283,67539 Total Restricted Revenue from State Sources 2,275,362 1,576,27840 Total Restricted Revenue from Federal
Sources 4,248,218 1,899,362
Other Sources of Funds:41 Financing Sources 5,608 042 Balances from Consolidated/Annexed District 0 043 Indirect Cost Reimbursement 23,755 13,00044 Gains and Losses from Sale of Fixed Assets 1,698 50045 Compensation for Loss of Fixed Assets 11,420 50,00046 Other 0 047 Total Other Sources of Funds 42,482 63,50048 Total Revenue and Other Sources of Funds
from All Sources 27,867,095 23,581,072
2010-2011 2011-2012Actual Budget
CURRENT EXPENDITURESInstruction:
49 Regular Instruction 9,281,873 8,594,31350 Special Education 1,973,613 2,465,14551 Workforce Education 796,483 628,61152 Adult Education 0 053 Compensatory Education 788,445 678,41454 Other 1,251,200 1,175,20455 Total Instruction 14,091,613 13,541,687
District Level Support:56 General Administration 508,826 585,25457 Central Services 860,430 897,00258 Maintenance & Operations of Plant 2,486,081 2,169,72159 Student Transportation 1,059,851 1,077,70060 Other District Level Support Services 188,982 45,00061 Total District Support Services 5,104,170 4,774,677
School Level Support:62 Student Support Services 1,488,405 1,661,59163 Instructional Staff Support Services 2,285,866 1,576,21764 School Administration 1,371,396 1,330,40765 Total District Support Services 5,145,667 4,568,215
Non-Instructional Services:66 Food Service Operations 1,405,127 61067 Other Enterprise Operations 0 068 Community Operations 9,066 069 Other Non-Instructional Services 0 070 Total Non-Instructional Services 1,414,193 61071 Facilities Acquisition and Construction 3,137,747 504,00072 Debt Service 1,042,852 1,130,58675 Other Non-Programmed Costs 515 076 Total Expenditures 29,936,756 24,519,77577 Less: Capital Expenditures 4,580,674 961,90078 Less: Debt Service 1,042,852 1,130,58679 Total Current Expenditures 24,313,231 22,427,28980 Exclusions from Current Expenditures 1,470,53581 Net Current Expenditures 22,842,696
82 Per Pupil Expenditures 8,853
83 Personnel - Non-Federal Certified Clsrm FTEs 187.3384 Avg Salary - Non-Fed Certified Clsrm FTEs 48,25585 Personnel - Non-Federal Certified FTEs 205.9886 Avg Salary - Non-Fed Certified FTEs 50,98087.1 Legal Balance (funds 1-2-4) 1,705,32187.2 Categorical Fund Balance 087.3 Deposits with Paying Agents (QZAB) 087.4 Net Legal Bal (Excl Cat & QZAB) 1,705,32188 Building Fund Balance (fund 3) 1,059,82389 Capital Outlay Fund Balance (fund 5) 0
Jan 30, 2012 - 18 - 9:35:29 AM

Annual Statistical Report 2010-2011
County: BOONE OMAHA SCHOOL DISTRICT LEA:0504000
2010-2011 2011-2012Actual Budget
1 Area in Square Miles 952 ADA 3933 ADA pct Change over 5 Yrs. (5%)4 4 QTR ADM 4175 Prior Year 3QTR ADM 4236 Assessment 28,893,0807 M&O Mills 25.008 URT Mills 25.009 M&O Mills in Excess of URT 0.0010 Dedicated M&O Mills 0.0011 Debt Service Mills 13.1012 Total Mills 38.1013 Total Debt Bond/Non-Bond 2,947,735
State and Local Revenue:14 Property Tax Receipts (Including URT) 1,009,586 1,032,71715 Other Local Receipts 246,946 52,60016 Revenue from Intermediate Sources 0 017.1 Foundation Funding (Excl URT) 1,854,104 1,863,00017.2 Tax Collection Rate Guarantee 31,705 018 Student Growth Funding 0 019 Declining Enrollment Funding 6,535 12,87220 Consolidation Incentive/Assistance 0 021 Isolated Funding 0 022 Supplemental Millage Incentive Funding 16,776 13,42123 Other Unrestricted State Funding 0 024 Total Unrestricted Revenue from State and
Local Sources 3,165,651 2,974,610
Restricted Revenue from State Sources:25 Adult Education 0 0
Regular Education:26 Professional Development 17,481 17,73527 Other Regular Education 4,166 0
Special Education:28 Gifted & Talented 3,150 029 Alternative Learning Environment (ALE) 21,087 26,65230 English Language Learner (ELL) 0 031 National School Lunch Act (NSLA) 311,488 301,57632 Other Special Education 51,588 45,00033 Workforce Education 7,313 034 School Food Service 1,813 035 Educational Service Cooperatives 0 036 Early Childhood Programs 190,998 194,40037 Magnet School Programs 0 038 Other Non-Instructional Programs 43,312 40,53439 Total Restricted Revenue from State Sources 652,395 625,89740 Total Restricted Revenue from Federal
Sources 1,176,665 580,922
Other Sources of Funds:41 Financing Sources 0 925,00042 Balances from Consolidated/Annexed District 0 043 Indirect Cost Reimbursement 0 044 Gains and Losses from Sale of Fixed Assets 0 045 Compensation for Loss of Fixed Assets 0 046 Other 0 047 Total Other Sources of Funds 0 925,00048 Total Revenue and Other Sources of Funds
from All Sources 4,994,712 5,106,429
2010-2011 2011-2012Actual Budget
CURRENT EXPENDITURESInstruction:
49 Regular Instruction 1,886,740 2,005,57850 Special Education 157,550 156,11051 Workforce Education 106,724 108,40352 Adult Education 0 053 Compensatory Education 140,735 142,11654 Other 179,823 180,50455 Total Instruction 2,471,572 2,592,711
District Level Support:56 General Administration 137,284 156,01957 Central Services 58,776 56,55358 Maintenance & Operations of Plant 332,488 350,23659 Student Transportation 174,774 173,46960 Other District Level Support Services 1,472 1,30061 Total District Support Services 704,793 737,577
School Level Support:62 Student Support Services 160,859 150,81763 Instructional Staff Support Services 427,472 187,24664 School Administration 158,001 160,66065 Total District Support Services 746,331 498,723
Non-Instructional Services:66 Food Service Operations 278,168 245,08367 Other Enterprise Operations 0 068 Community Operations 60,222 64,75469 Other Non-Instructional Services 0 070 Total Non-Instructional Services 338,390 309,83771 Facilities Acquisition and Construction 375,585 965,97772 Debt Service 307,962 332,18875 Other Non-Programmed Costs 0 076 Total Expenditures 4,944,633 5,437,01377 Less: Capital Expenditures 488,557 978,92778 Less: Debt Service 307,962 332,18879 Total Current Expenditures 4,148,114 4,125,89880 Exclusions from Current Expenditures 366,48281 Net Current Expenditures 3,781,632
82 Per Pupil Expenditures 9,613
83 Personnel - Non-Federal Certified Clsrm FTEs 35.2884 Avg Salary - Non-Fed Certified Clsrm FTEs 39,48785 Personnel - Non-Federal Certified FTEs 38.5186 Avg Salary - Non-Fed Certified FTEs 41,09987.1 Legal Balance (funds 1-2-4) 816,83987.2 Categorical Fund Balance 138,91587.3 Deposits with Paying Agents (QZAB) 087.4 Net Legal Bal (Excl Cat & QZAB) 677,92488 Building Fund Balance (fund 3) 239,89989 Capital Outlay Fund Balance (fund 5) 0
Jan 30, 2012 - 19 - 9:35:29 AM

Annual Statistical Report 2010-2011
County: BOONE VALLEY SPRINGS SCHOOL DISTRICT LEA:0505000
2010-2011 2011-2012Actual Budget
1 Area in Square Miles 722 ADA 9093 ADA pct Change over 5 Yrs. 0%4 4 QTR ADM 9485 Prior Year 3QTR ADM 9646 Assessment 48,788,9087 M&O Mills 25.008 URT Mills 25.009 M&O Mills in Excess of URT 0.0010 Dedicated M&O Mills 0.0011 Debt Service Mills 7.8012 Total Mills 32.8013 Total Debt Bond/Non-Bond 2,742,868
State and Local Revenue:14 Property Tax Receipts (Including URT) 1,502,368 1,456,00015 Other Local Receipts 458,155 158,15016 Revenue from Intermediate Sources 0 017.1 Foundation Funding (Excl URT) 4,639,396 4,663,65217.2 Tax Collection Rate Guarantee 75,372 018 Student Growth Funding 1,717 019 Declining Enrollment Funding 0 32,53220 Consolidation Incentive/Assistance 0 021 Isolated Funding 0 022 Supplemental Millage Incentive Funding 24,918 19,93423 Other Unrestricted State Funding 175 024 Total Unrestricted Revenue from State and
Local Sources 6,702,101 6,330,268
Restricted Revenue from State Sources:25 Adult Education 0 0
Regular Education:26 Professional Development 39,879 40,41427 Other Regular Education 0 0
Special Education:28 Gifted & Talented 2,480 029 Alternative Learning Environment (ALE) 20,965 25,17530 English Language Learner (ELL) 1,758 031 National School Lunch Act (NSLA) 219,232 236,80832 Other Special Education 75,470 033 Workforce Education 23,563 22,75034 School Food Service 3,433 035 Educational Service Cooperatives 0 036 Early Childhood Programs 0 037 Magnet School Programs 0 038 Other Non-Instructional Programs 78,081 71,93939 Total Restricted Revenue from State Sources 464,860 397,08640 Total Restricted Revenue from Federal
Sources 1,162,169 803,064
Other Sources of Funds:41 Financing Sources 4,864 042 Balances from Consolidated/Annexed District 0 043 Indirect Cost Reimbursement 0 044 Gains and Losses from Sale of Fixed Assets 0 045 Compensation for Loss of Fixed Assets 0 046 Other 0 047 Total Other Sources of Funds 4,864 048 Total Revenue and Other Sources of Funds
from All Sources 8,333,995 7,530,418
2010-2011 2011-2012Actual Budget
CURRENT EXPENDITURESInstruction:
49 Regular Instruction 3,447,908 3,036,78550 Special Education 551,513 576,91851 Workforce Education 211,241 215,35052 Adult Education 0 053 Compensatory Education 280,687 253,40454 Other 53,478 53,43955 Total Instruction 4,544,827 4,135,894
District Level Support:56 General Administration 193,950 199,15757 Central Services 107,868 116,37358 Maintenance & Operations of Plant 630,375 731,28859 Student Transportation 317,717 395,34460 Other District Level Support Services 31,652 19,98261 Total District Support Services 1,281,561 1,462,143
School Level Support:62 Student Support Services 406,719 412,63963 Instructional Staff Support Services 626,388 603,65064 School Administration 427,480 392,25765 Total District Support Services 1,460,586 1,408,546
Non-Instructional Services:66 Food Service Operations 349,561 314,53367 Other Enterprise Operations 32,468 068 Community Operations 1,447 1,60069 Other Non-Instructional Services 0 070 Total Non-Instructional Services 383,476 316,13371 Facilities Acquisition and Construction 80,558 4,50072 Debt Service 230,446 228,29175 Other Non-Programmed Costs 18,593 076 Total Expenditures 8,000,048 7,555,50877 Less: Capital Expenditures 103,339 120,75078 Less: Debt Service 230,446 228,29179 Total Current Expenditures 7,666,264 7,206,46780 Exclusions from Current Expenditures 413,85981 Net Current Expenditures 7,252,405
82 Per Pupil Expenditures 7,979
83 Personnel - Non-Federal Certified Clsrm FTEs 73.9484 Avg Salary - Non-Fed Certified Clsrm FTEs 41,29285 Personnel - Non-Federal Certified FTEs 80.0786 Avg Salary - Non-Fed Certified FTEs 44,50387.1 Legal Balance (funds 1-2-4) 1,205,72187.2 Categorical Fund Balance 9,51187.3 Deposits with Paying Agents (QZAB) 087.4 Net Legal Bal (Excl Cat & QZAB) 1,196,21088 Building Fund Balance (fund 3) 160,63589 Capital Outlay Fund Balance (fund 5) 0
Jan 30, 2012 - 20 - 9:35:29 AM

Annual Statistical Report 2010-2011
County: BOONE LEAD HILL SCHOOL DISTRICT LEA:0506000
2010-2011 2011-2012Actual Budget
1 Area in Square Miles 1162 ADA 3363 ADA pct Change over 5 Yrs. (8%)4 4 QTR ADM 3585 Prior Year 3QTR ADM 3746 Assessment 31,722,8947 M&O Mills 25.908 URT Mills 25.009 M&O Mills in Excess of URT 0.9010 Dedicated M&O Mills 0.0011 Debt Service Mills 13.1012 Total Mills 39.0013 Total Debt Bond/Non-Bond 1,993,767
State and Local Revenue:14 Property Tax Receipts (Including URT) 1,243,348 1,258,64915 Other Local Receipts 116,907 50,75016 Revenue from Intermediate Sources 0 017.1 Foundation Funding (Excl URT) 1,480,875 1,456,32617.2 Tax Collection Rate Guarantee 35,344 018 Student Growth Funding 84,648 019 Declining Enrollment Funding 0 30,07520 Consolidation Incentive/Assistance 0 021 Isolated Funding 0 022 Supplemental Millage Incentive Funding 0 023 Other Unrestricted State Funding 41 024 Total Unrestricted Revenue from State and
Local Sources 2,961,163 2,795,800
Restricted Revenue from State Sources:25 Adult Education 0 0
Regular Education:26 Professional Development 15,464 21,94527 Other Regular Education 5,600 8,600
Special Education:28 Gifted & Talented 1,000 029 Alternative Learning Environment (ALE) 0 3,52330 English Language Learner (ELL) 0 031 National School Lunch Act (NSLA) 280,736 281,33632 Other Special Education 19,344 17,81233 Workforce Education 63,386 11,37534 School Food Service 1,663 1,60035 Educational Service Cooperatives 0 036 Early Childhood Programs 167,670 194,40037 Magnet School Programs 0 038 Other Non-Instructional Programs 22,555 37,41239 Total Restricted Revenue from State Sources 577,418 578,00340 Total Restricted Revenue from Federal
Sources 574,559 623,082
Other Sources of Funds:41 Financing Sources 0 042 Balances from Consolidated/Annexed District 0 043 Indirect Cost Reimbursement 0 044 Gains and Losses from Sale of Fixed Assets 0 045 Compensation for Loss of Fixed Assets 0 046 Other 0 047 Total Other Sources of Funds 0 048 Total Revenue and Other Sources of Funds
from All Sources 4,113,141 3,996,884
2010-2011 2011-2012Actual Budget
CURRENT EXPENDITURESInstruction:
49 Regular Instruction 1,684,473 1,382,33850 Special Education 291,797 276,97551 Workforce Education 106,380 117,71152 Adult Education 0 053 Compensatory Education 122,056 104,89454 Other 104,933 135,92855 Total Instruction 2,309,638 2,017,846
District Level Support:56 General Administration 218,468 212,98857 Central Services 44,552 53,50058 Maintenance & Operations of Plant 351,766 386,02359 Student Transportation 221,787 222,20960 Other District Level Support Services 590 061 Total District Support Services 837,163 874,721
School Level Support:62 Student Support Services 143,190 199,62663 Instructional Staff Support Services 143,946 196,08164 School Administration 192,794 201,24365 Total District Support Services 479,930 596,950
Non-Instructional Services:66 Food Service Operations 234,226 186,00067 Other Enterprise Operations 0 068 Community Operations 0 8,00069 Other Non-Instructional Services 0 070 Total Non-Instructional Services 234,226 194,00071 Facilities Acquisition and Construction 91,959 120,00072 Debt Service 203,004 210,86875 Other Non-Programmed Costs 53,499 076 Total Expenditures 4,209,419 4,014,38577 Less: Capital Expenditures 120,729 139,41578 Less: Debt Service 203,004 210,86879 Total Current Expenditures 3,885,687 3,664,10280 Exclusions from Current Expenditures 344,48481 Net Current Expenditures 3,541,203
82 Per Pupil Expenditures 10,549
83 Personnel - Non-Federal Certified Clsrm FTEs 31.5884 Avg Salary - Non-Fed Certified Clsrm FTEs 40,91085 Personnel - Non-Federal Certified FTEs 34.5486 Avg Salary - Non-Fed Certified FTEs 43,16287.1 Legal Balance (funds 1-2-4) 754,28187.2 Categorical Fund Balance 10,43987.3 Deposits with Paying Agents (QZAB) 087.4 Net Legal Bal (Excl Cat & QZAB) 743,84288 Building Fund Balance (fund 3) 089 Capital Outlay Fund Balance (fund 5) 0
Jan 30, 2012 - 21 - 9:35:29 AM

Annual Statistical Report 2010-2011
County: BRADLEY HERMITAGE SCHOOL DISTRICT LEA:0601000
2010-2011 2011-2012Actual Budget
1 Area in Square Miles 4022 ADA 4483 ADA pct Change over 5 Yrs. (6%)4 4 QTR ADM 4705 Prior Year 3QTR ADM 4636 Assessment 31,013,7127 M&O Mills 25.008 URT Mills 25.009 M&O Mills in Excess of URT 0.0010 Dedicated M&O Mills 0.0011 Debt Service Mills 16.5012 Total Mills 41.5013 Total Debt Bond/Non-Bond 5,286,175
State and Local Revenue:14 Property Tax Receipts (Including URT) 1,221,577 1,188,47715 Other Local Receipts 249,593 226,78416 Revenue from Intermediate Sources 1,706 1,50017.1 Foundation Funding (Excl URT) 2,034,843 2,114,92917.2 Tax Collection Rate Guarantee 14,708 759,83618 Student Growth Funding 46,151 019 Declining Enrollment Funding 0 020 Consolidation Incentive/Assistance 0 021 Isolated Funding 0 022 Supplemental Millage Incentive Funding 5,729 4,58323 Other Unrestricted State Funding 0 024 Total Unrestricted Revenue from State and
Local Sources 3,574,307 4,296,109
Restricted Revenue from State Sources:25 Adult Education 0 0
Regular Education:26 Professional Development 19,136 19,88527 Other Regular Education 148,133 2,400
Special Education:28 Gifted & Talented 100 029 Alternative Learning Environment (ALE) 4,347 8,58030 English Language Learner (ELL) 31,644 31,64431 National School Lunch Act (NSLA) 350,176 355,21232 Other Special Education 1,895 033 Workforce Education 43,334 37,37534 School Food Service 1,690 1,50035 Educational Service Cooperatives 0 036 Early Childhood Programs 175,775 179,82037 Magnet School Programs 0 038 Other Non-Instructional Programs 141,183 46,77339 Total Restricted Revenue from State Sources 917,413 683,18940 Total Restricted Revenue from Federal
Sources 1,410,167 879,399
Other Sources of Funds:41 Financing Sources 0 042 Balances from Consolidated/Annexed District 0 043 Indirect Cost Reimbursement 0 044 Gains and Losses from Sale of Fixed Assets 11,580 045 Compensation for Loss of Fixed Assets 0 046 Other 0 047 Total Other Sources of Funds 11,580 048 Total Revenue and Other Sources of Funds
from All Sources 5,913,467 5,858,697
2010-2011 2011-2012Actual Budget
CURRENT EXPENDITURESInstruction:
49 Regular Instruction 2,288,932 2,377,83950 Special Education 189,701 213,98251 Workforce Education 153,867 148,64652 Adult Education 0 053 Compensatory Education 415,344 225,89354 Other 148,250 164,64255 Total Instruction 3,196,094 3,131,002
District Level Support:56 General Administration 183,641 184,29957 Central Services 120,178 59,61758 Maintenance & Operations of Plant 604,789 540,19859 Student Transportation 342,047 197,89660 Other District Level Support Services 2,649 9,84961 Total District Support Services 1,253,304 991,858
School Level Support:62 Student Support Services 229,714 198,52663 Instructional Staff Support Services 630,914 613,74064 School Administration 210,002 235,14465 Total District Support Services 1,070,630 1,047,411
Non-Instructional Services:66 Food Service Operations 306,710 292,83967 Other Enterprise Operations 0 068 Community Operations 0 1,60269 Other Non-Instructional Services 0 070 Total Non-Instructional Services 306,710 294,44171 Facilities Acquisition and Construction 362,705 23,14672 Debt Service 237,417 228,13875 Other Non-Programmed Costs 0 076 Total Expenditures 6,426,860 5,715,99677 Less: Capital Expenditures 510,952 112,13878 Less: Debt Service 237,417 228,13879 Total Current Expenditures 5,678,491 5,375,72180 Exclusions from Current Expenditures 369,50881 Net Current Expenditures 5,308,983
82 Per Pupil Expenditures 11,843
83 Personnel - Non-Federal Certified Clsrm FTEs 31.9384 Avg Salary - Non-Fed Certified Clsrm FTEs 48,01485 Personnel - Non-Federal Certified FTEs 37.4586 Avg Salary - Non-Fed Certified FTEs 50,00987.1 Legal Balance (funds 1-2-4) 418,15887.2 Categorical Fund Balance 42,13387.3 Deposits with Paying Agents (QZAB) 087.4 Net Legal Bal (Excl Cat & QZAB) 376,02588 Building Fund Balance (fund 3) 139,85889 Capital Outlay Fund Balance (fund 5) 0
Jan 30, 2012 - 22 - 9:35:29 AM

Annual Statistical Report 2010-2011
County: BRADLEY WARREN SCHOOL DISTRICT LEA:0602000
2010-2011 2011-2012Actual Budget
1 Area in Square Miles 2402 ADA 1,4543 ADA pct Change over 5 Yrs. (4%)4 4 QTR ADM 1,5185 Prior Year 3QTR ADM 1,4986 Assessment 78,804,1067 M&O Mills 25.008 URT Mills 25.009 M&O Mills in Excess of URT 0.0010 Dedicated M&O Mills 0.0011 Debt Service Mills 11.5012 Total Mills 36.5013 Total Debt Bond/Non-Bond 8,102,401
State and Local Revenue:14 Property Tax Receipts (Including URT) 2,739,338 2,711,54115 Other Local Receipts 731,941 347,17416 Revenue from Intermediate Sources 12,819 13,00017.1 Foundation Funding (Excl URT) 7,079,915 7,393,55217.2 Tax Collection Rate Guarantee 49,038 50,00018 Student Growth Funding 120,867 019 Declining Enrollment Funding 0 020 Consolidation Incentive/Assistance 0 021 Isolated Funding 0 022 Supplemental Millage Incentive Funding 18,615 14,89223 Other Unrestricted State Funding 3,140 3,00024 Total Unrestricted Revenue from State and
Local Sources 10,755,674 10,533,159
Restricted Revenue from State Sources:25 Adult Education 231,295 193,311
Regular Education:26 Professional Development 61,968 64,37727 Other Regular Education 10,843 5,800
Special Education:28 Gifted & Talented 350 029 Alternative Learning Environment (ALE) 56,232 52,18630 English Language Learner (ELL) 14,943 14,94331 National School Lunch Act (NSLA) 881,220 1,134,45232 Other Special Education 6,138 033 Workforce Education 968,621 889,14634 School Food Service 5,546 4,00035 Educational Service Cooperatives 0 036 Early Childhood Programs 585,845 585,70037 Magnet School Programs 0 038 Other Non-Instructional Programs 380,735 293,52739 Total Restricted Revenue from State Sources 3,203,736 3,237,44240 Total Restricted Revenue from Federal
Sources 3,324,176 2,581,333
Other Sources of Funds:41 Financing Sources 0 042 Balances from Consolidated/Annexed District 0 043 Indirect Cost Reimbursement 12,331 2,79244 Gains and Losses from Sale of Fixed Assets 0 045 Compensation for Loss of Fixed Assets 2,845 046 Other 0 047 Total Other Sources of Funds 15,176 2,79248 Total Revenue and Other Sources of Funds
from All Sources 17,298,761 16,354,726
2010-2011 2011-2012Actual Budget
CURRENT EXPENDITURESInstruction:
49 Regular Instruction 6,045,836 5,803,12350 Special Education 733,000 799,16751 Workforce Education 807,439 767,94352 Adult Education 250,153 313,63853 Compensatory Education 602,256 643,88054 Other 490,061 557,38355 Total Instruction 8,928,746 8,885,134
District Level Support:56 General Administration 367,821 359,37457 Central Services 434,020 396,75458 Maintenance & Operations of Plant 1,391,058 1,536,74859 Student Transportation 556,661 446,49860 Other District Level Support Services 42,622 31,10861 Total District Support Services 2,792,182 2,770,482
School Level Support:62 Student Support Services 713,065 877,70963 Instructional Staff Support Services 1,478,488 1,597,57064 School Administration 1,020,706 1,060,10765 Total District Support Services 3,212,259 3,535,386
Non-Instructional Services:66 Food Service Operations 974,265 968,75967 Other Enterprise Operations 0 068 Community Operations 95,382 5,33969 Other Non-Instructional Services 0 070 Total Non-Instructional Services 1,069,648 974,09871 Facilities Acquisition and Construction 496,472 139,17672 Debt Service 465,226 556,74475 Other Non-Programmed Costs 23,734 076 Total Expenditures 16,988,266 16,861,01977 Less: Capital Expenditures 845,589 256,88578 Less: Debt Service 465,226 556,74479 Total Current Expenditures 15,677,451 16,047,39180 Exclusions from Current Expenditures 1,545,58381 Net Current Expenditures 14,131,868
82 Per Pupil Expenditures 9,716
83 Personnel - Non-Federal Certified Clsrm FTEs 117.2084 Avg Salary - Non-Fed Certified Clsrm FTEs 41,51885 Personnel - Non-Federal Certified FTEs 132.9686 Avg Salary - Non-Fed Certified FTEs 44,11487.1 Legal Balance (funds 1-2-4) 1,713,81987.2 Categorical Fund Balance 90,23887.3 Deposits with Paying Agents (QZAB) 087.4 Net Legal Bal (Excl Cat & QZAB) 1,623,58188 Building Fund Balance (fund 3) 630,93189 Capital Outlay Fund Balance (fund 5) 0
Jan 30, 2012 - 23 - 9:35:29 AM

Annual Statistical Report 2010-2011
County: CALHOUN HAMPTON SCHOOL DISTRICT LEA:0701000
2010-2011 2011-2012Actual Budget
1 Area in Square Miles 4822 ADA 5233 ADA pct Change over 5 Yrs. (24%)4 4 QTR ADM 5545 Prior Year 3QTR ADM 5986 Assessment 75,341,6217 M&O Mills 30.008 URT Mills 25.009 M&O Mills in Excess of URT 5.0010 Dedicated M&O Mills 0.0011 Debt Service Mills 6.7012 Total Mills 36.7013 Total Debt Bond/Non-Bond 6,526,640
State and Local Revenue:14 Property Tax Receipts (Including URT) 2,443,783 2,791,77815 Other Local Receipts 413,418 137,96916 Revenue from Intermediate Sources 9,536 017.1 Foundation Funding (Excl URT) 1,831,564 1,707,94917.2 Tax Collection Rate Guarantee 142,886 018 Student Growth Funding 0 019 Declining Enrollment Funding 93,808 020 Consolidation Incentive/Assistance 0 021 Isolated Funding 0 022 Supplemental Millage Incentive Funding 0 023 Other Unrestricted State Funding 0 024 Total Unrestricted Revenue from State and
Local Sources 4,934,995 4,637,696
Restricted Revenue from State Sources:25 Adult Education 0 0
Regular Education:26 Professional Development 24,730 23,45727 Other Regular Education 4,578 1,400
Special Education:28 Gifted & Talented 2,000 029 Alternative Learning Environment (ALE) 36,933 30,92230 English Language Learner (ELL) 3,516 3,58831 National School Lunch Act (NSLA) 185,504 181,14832 Other Special Education 21,294 033 Workforce Education 24,375 034 School Food Service 2,398 2,39835 Educational Service Cooperatives 0 036 Early Childhood Programs 96,131 97,20037 Magnet School Programs 0 038 Other Non-Instructional Programs 932,149 903,77439 Total Restricted Revenue from State Sources 1,333,608 1,243,88740 Total Restricted Revenue from Federal
Sources 1,412,315 845,972
Other Sources of Funds:41 Financing Sources 0 042 Balances from Consolidated/Annexed District 0 043 Indirect Cost Reimbursement 0 044 Gains and Losses from Sale of Fixed Assets 0 045 Compensation for Loss of Fixed Assets 158,164 1,781,43746 Other 0 047 Total Other Sources of Funds 158,164 1,781,43748 Total Revenue and Other Sources of Funds
from All Sources 7,839,082 8,508,991
2010-2011 2011-2012Actual Budget
CURRENT EXPENDITURESInstruction:
49 Regular Instruction 1,931,622 1,799,11850 Special Education 304,048 315,51351 Workforce Education 185,788 148,84552 Adult Education 0 053 Compensatory Education 225,146 243,57154 Other 196,426 188,48455 Total Instruction 2,843,031 2,695,530
District Level Support:56 General Administration 326,420 316,45757 Central Services 120,038 125,18558 Maintenance & Operations of Plant 545,784 490,16459 Student Transportation 279,548 392,03260 Other District Level Support Services 10,246 9,70061 Total District Support Services 1,282,036 1,333,538
School Level Support:62 Student Support Services 274,038 275,47263 Instructional Staff Support Services 744,655 737,95464 School Administration 285,981 301,13565 Total District Support Services 1,304,675 1,314,561
Non-Instructional Services:66 Food Service Operations 359,947 336,54367 Other Enterprise Operations 8,541 068 Community Operations 0 30069 Other Non-Instructional Services 0 070 Total Non-Instructional Services 368,487 336,84371 Facilities Acquisition and Construction 5,556,829 6,185,89472 Debt Service 367,504 370,88275 Other Non-Programmed Costs 0 076 Total Expenditures 11,722,563 12,237,24877 Less: Capital Expenditures 5,622,832 6,382,44878 Less: Debt Service 367,504 370,88279 Total Current Expenditures 5,732,227 5,483,91880 Exclusions from Current Expenditures 303,91781 Net Current Expenditures 5,428,309
82 Per Pupil Expenditures 10,384
83 Personnel - Non-Federal Certified Clsrm FTEs 40.5084 Avg Salary - Non-Fed Certified Clsrm FTEs 37,54685 Personnel - Non-Federal Certified FTEs 51.4686 Avg Salary - Non-Fed Certified FTEs 39,15587.1 Legal Balance (funds 1-2-4) 4,703,71587.2 Categorical Fund Balance 31,23387.3 Deposits with Paying Agents (QZAB) 087.4 Net Legal Bal (Excl Cat & QZAB) 4,672,48288 Building Fund Balance (fund 3) 1,006,59289 Capital Outlay Fund Balance (fund 5) 0
Jan 30, 2012 - 24 - 9:35:29 AM

Annual Statistical Report 2010-2011
County: CARROLL BERRYVILLE SCHOOL DISTRICT LEA:0801000
2010-2011 2011-2012Actual Budget
1 Area in Square Miles 2192 ADA 1,7463 ADA pct Change over 5 Yrs. 2%4 4 QTR ADM 1,8565 Prior Year 3QTR ADM 1,8656 Assessment 128,099,2947 M&O Mills 25.008 URT Mills 25.009 M&O Mills in Excess of URT 0.0010 Dedicated M&O Mills 0.0011 Debt Service Mills 13.0512 Total Mills 38.0513 Total Debt Bond/Non-Bond 15,445,942
State and Local Revenue:14 Property Tax Receipts (Including URT) 4,435,748 4,480,55115 Other Local Receipts 714,115 32,50016 Revenue from Intermediate Sources 0 017.1 Foundation Funding (Excl URT) 8,169,716 8,307,27217.2 Tax Collection Rate Guarantee 110,641 018 Student Growth Funding 48,583 (8,071)19 Declining Enrollment Funding 0 3,93220 Consolidation Incentive/Assistance 0 021 Isolated Funding 0 022 Supplemental Millage Incentive Funding 0 023 Other Unrestricted State Funding 0 024 Total Unrestricted Revenue from State and
Local Sources 13,478,803 12,816,184
Restricted Revenue from State Sources:25 Adult Education 0 0
Regular Education:26 Professional Development 77,135 78,98327 Other Regular Education 14,933 0
Special Education:28 Gifted & Talented 2,726 1,00029 Alternative Learning Environment (ALE) 68,258 53,84430 English Language Learner (ELL) 89,072 80,00031 National School Lunch Act (NSLA) 528,240 535,85432 Other Special Education 158,017 173,99333 Workforce Education 29,250 12,59434 School Food Service 6,125 035 Educational Service Cooperatives 0 036 Early Childhood Programs 0 037 Magnet School Programs 0 038 Other Non-Instructional Programs 436,219 89,48639 Total Restricted Revenue from State Sources 1,409,975 1,025,75440 Total Restricted Revenue from Federal
Sources 2,680,583 1,505,459
Other Sources of Funds:41 Financing Sources 1,500,000 042 Balances from Consolidated/Annexed District 0 043 Indirect Cost Reimbursement 0 044 Gains and Losses from Sale of Fixed Assets 0 045 Compensation for Loss of Fixed Assets 84,562 046 Other 0 047 Total Other Sources of Funds 1,584,562 048 Total Revenue and Other Sources of Funds
from All Sources 19,153,923 15,347,397
2010-2011 2011-2012Actual Budget
CURRENT EXPENDITURESInstruction:
49 Regular Instruction 6,066,179 5,957,35550 Special Education 1,107,627 1,007,09551 Workforce Education 447,795 413,93452 Adult Education 0 053 Compensatory Education 648,198 509,84754 Other 1,105,465 930,98355 Total Instruction 9,375,264 8,819,213
District Level Support:56 General Administration 1,936,010 380,18657 Central Services 363,710 212,89958 Maintenance & Operations of Plant 1,483,195 1,271,99759 Student Transportation 675,956 484,43460 Other District Level Support Services 32,721 16,50061 Total District Support Services 4,491,592 2,366,016
School Level Support:62 Student Support Services 882,762 808,59163 Instructional Staff Support Services 1,027,843 1,505,37664 School Administration 571,859 530,24365 Total District Support Services 2,482,464 2,844,210
Non-Instructional Services:66 Food Service Operations 993,642 292,07967 Other Enterprise Operations 0 068 Community Operations 69 1,30069 Other Non-Instructional Services 0 070 Total Non-Instructional Services 993,712 293,37971 Facilities Acquisition and Construction 1,673,672 443,83072 Debt Service 1,081,125 1,081,80675 Other Non-Programmed Costs 0 076 Total Expenditures 20,097,828 15,848,45577 Less: Capital Expenditures 1,796,443 450,73078 Less: Debt Service 1,081,125 1,081,80679 Total Current Expenditures 17,220,261 14,315,91980 Exclusions from Current Expenditures 631,96981 Net Current Expenditures 16,588,291
82 Per Pupil Expenditures 9,499
83 Personnel - Non-Federal Certified Clsrm FTEs 140.8584 Avg Salary - Non-Fed Certified Clsrm FTEs 39,78485 Personnel - Non-Federal Certified FTEs 150.2986 Avg Salary - Non-Fed Certified FTEs 41,56687.1 Legal Balance (funds 1-2-4) 2,290,07387.2 Categorical Fund Balance 177,79187.3 Deposits with Paying Agents (QZAB) 087.4 Net Legal Bal (Excl Cat & QZAB) 2,112,28388 Building Fund Balance (fund 3) 555,95789 Capital Outlay Fund Balance (fund 5) 0
Jan 30, 2012 - 25 - 9:35:29 AM

Annual Statistical Report 2010-2011
County: CARROLL EUREKA SPRINGS SCHOOL DISTRICT LEA:0802000
2010-2011 2011-2012Actual Budget
1 Area in Square Miles 1582 ADA 6073 ADA pct Change over 5 Yrs. (3%)4 4 QTR ADM 6435 Prior Year 3QTR ADM 6516 Assessment 200,052,6167 M&O Mills 25.008 URT Mills 25.009 M&O Mills in Excess of URT 0.0010 Dedicated M&O Mills 0.0011 Debt Service Mills 11.1312 Total Mills 36.1313 Total Debt Bond/Non-Bond 13,946,946
State and Local Revenue:14 Property Tax Receipts (Including URT) 6,490,220 6,938,78415 Other Local Receipts 423,918 279,50016 Revenue from Intermediate Sources 0 017.1 Foundation Funding (Excl URT) 0 017.2 Tax Collection Rate Guarantee 0 018 Student Growth Funding 0 019 Declining Enrollment Funding 8,944 16,15920 Consolidation Incentive/Assistance 0 021 Isolated Funding 0 022 Supplemental Millage Incentive Funding 0 023 Other Unrestricted State Funding 0 024 Total Unrestricted Revenue from State and
Local Sources 6,923,081 7,234,443
Restricted Revenue from State Sources:25 Adult Education 0 0
Regular Education:26 Professional Development 26,918 27,35927 Other Regular Education 2,674 4,500
Special Education:28 Gifted & Talented 950 029 Alternative Learning Environment (ALE) 62,245 49,24330 English Language Learner (ELL) 7,911 031 National School Lunch Act (NSLA) 169,008 200,37632 Other Special Education 222,321 182,17933 Workforce Education 0 19,50834 School Food Service 2,448 2,50035 Educational Service Cooperatives 0 036 Early Childhood Programs 190,998 194,40037 Magnet School Programs 0 038 Other Non-Instructional Programs 0 039 Total Restricted Revenue from State Sources 685,473 680,06540 Total Restricted Revenue from Federal
Sources 2,001,702 1,048,721
Other Sources of Funds:41 Financing Sources 0 042 Balances from Consolidated/Annexed District 0 043 Indirect Cost Reimbursement 0 044 Gains and Losses from Sale of Fixed Assets 2,726 045 Compensation for Loss of Fixed Assets 0 046 Other 0 047 Total Other Sources of Funds 2,726 048 Total Revenue and Other Sources of Funds
from All Sources 9,612,983 8,963,229
2010-2011 2011-2012Actual Budget
CURRENT EXPENDITURESInstruction:
49 Regular Instruction 2,901,271 2,571,50150 Special Education 798,567 645,81951 Workforce Education 142,435 131,81152 Adult Education 0 053 Compensatory Education 427,691 288,09554 Other 300,782 263,19055 Total Instruction 4,570,746 3,900,415
District Level Support:56 General Administration 191,108 261,99357 Central Services 95,634 104,58858 Maintenance & Operations of Plant 558,125 582,96559 Student Transportation 337,755 333,50360 Other District Level Support Services 25,727 18,25861 Total District Support Services 1,208,348 1,301,305
School Level Support:62 Student Support Services 374,933 357,07563 Instructional Staff Support Services 370,160 457,79064 School Administration 435,029 438,29765 Total District Support Services 1,180,121 1,253,162
Non-Instructional Services:66 Food Service Operations 467,323 511,66667 Other Enterprise Operations 0 068 Community Operations 0 2,00069 Other Non-Instructional Services 0 070 Total Non-Instructional Services 467,323 513,66671 Facilities Acquisition and Construction 869,825 7,000,00072 Debt Service 629,336 899,56775 Other Non-Programmed Costs 0 076 Total Expenditures 8,925,700 14,868,11577 Less: Capital Expenditures 987,168 7,004,00078 Less: Debt Service 629,336 899,56779 Total Current Expenditures 7,309,196 6,964,54880 Exclusions from Current Expenditures 368,53781 Net Current Expenditures 6,940,659
82 Per Pupil Expenditures 11,437
83 Personnel - Non-Federal Certified Clsrm FTEs 44.9884 Avg Salary - Non-Fed Certified Clsrm FTEs 47,53585 Personnel - Non-Federal Certified FTEs 49.0286 Avg Salary - Non-Fed Certified FTEs 50,71687.1 Legal Balance (funds 1-2-4) 1,729,05887.2 Categorical Fund Balance 087.3 Deposits with Paying Agents (QZAB) 087.4 Net Legal Bal (Excl Cat & QZAB) 1,729,05888 Building Fund Balance (fund 3) 11,484,79689 Capital Outlay Fund Balance (fund 5) 0
Jan 30, 2012 - 26 - 9:35:29 AM

Annual Statistical Report 2010-2011
County: CARROLL GREEN FOREST SCHOOL DISTRICT LEA:0803000
2010-2011 2011-2012Actual Budget
1 Area in Square Miles 1832 ADA 1,1553 ADA pct Change over 5 Yrs. (2%)4 4 QTR ADM 1,2205 Prior Year 3QTR ADM 1,2286 Assessment 73,828,4267 M&O Mills 25.008 URT Mills 25.009 M&O Mills in Excess of URT 0.0010 Dedicated M&O Mills 0.0011 Debt Service Mills 11.0012 Total Mills 36.0013 Total Debt Bond/Non-Bond 8,155,000
State and Local Revenue:14 Property Tax Receipts (Including URT) 2,463,150 2,432,64815 Other Local Receipts 472,866 151,50016 Revenue from Intermediate Sources 0 017.1 Foundation Funding (Excl URT) 5,670,099 5,680,24817.2 Tax Collection Rate Guarantee 34,819 018 Student Growth Funding 110,320 019 Declining Enrollment Funding 0 28,53920 Consolidation Incentive/Assistance 0 021 Isolated Funding 0 022 Supplemental Millage Incentive Funding 0 023 Other Unrestricted State Funding 0 024 Total Unrestricted Revenue from State and
Local Sources 8,751,254 8,292,935
Restricted Revenue from State Sources:25 Adult Education 0 0
Regular Education:26 Professional Development 50,799 51,65827 Other Regular Education 10,196 9,800
Special Education:28 Gifted & Talented 1,455 029 Alternative Learning Environment (ALE) 75,612 31,91730 English Language Learner (ELL) 95,225 97,17531 National School Lunch Act (NSLA) 927,520 978,60432 Other Special Education 147,975 033 Workforce Education 27,625 38,18834 School Food Service 4,755 4,00035 Educational Service Cooperatives 0 036 Early Childhood Programs 0 037 Magnet School Programs 0 038 Other Non-Instructional Programs 437,933 84,39539 Total Restricted Revenue from State Sources 1,779,096 1,295,73640 Total Restricted Revenue from Federal
Sources 2,146,815 1,569,064
Other Sources of Funds:41 Financing Sources 1,053,513 888,00042 Balances from Consolidated/Annexed District 0 043 Indirect Cost Reimbursement 0 044 Gains and Losses from Sale of Fixed Assets 0 045 Compensation for Loss of Fixed Assets 62,612 046 Other 0 047 Total Other Sources of Funds 1,116,125 888,00048 Total Revenue and Other Sources of Funds
from All Sources 13,793,290 12,045,736
2010-2011 2011-2012Actual Budget
CURRENT EXPENDITURESInstruction:
49 Regular Instruction 4,323,436 4,212,89250 Special Education 594,120 691,41351 Workforce Education 285,707 276,76052 Adult Education 0 053 Compensatory Education 185,249 263,53254 Other 244,614 254,13955 Total Instruction 5,633,127 5,698,735
District Level Support:56 General Administration 270,409 296,44057 Central Services 225,669 237,03058 Maintenance & Operations of Plant 929,967 1,204,06459 Student Transportation 549,266 690,17360 Other District Level Support Services 24,727 12,79961 Total District Support Services 2,000,039 2,440,506
School Level Support:62 Student Support Services 577,502 639,86463 Instructional Staff Support Services 1,094,756 1,229,82164 School Administration 363,745 386,31765 Total District Support Services 2,036,003 2,256,002
Non-Instructional Services:66 Food Service Operations 762,473 798,99267 Other Enterprise Operations 79,911 068 Community Operations 0 10,00069 Other Non-Instructional Services 0 070 Total Non-Instructional Services 842,384 808,99271 Facilities Acquisition and Construction 1,137,322 1,665,66672 Debt Service 655,714 547,40775 Other Non-Programmed Costs 94,539 076 Total Expenditures 12,399,127 13,417,30877 Less: Capital Expenditures 1,476,509 1,951,52578 Less: Debt Service 655,714 547,40779 Total Current Expenditures 10,266,903 10,918,37680 Exclusions from Current Expenditures 482,10981 Net Current Expenditures 9,784,794
82 Per Pupil Expenditures 8,469
83 Personnel - Non-Federal Certified Clsrm FTEs 83.0484 Avg Salary - Non-Fed Certified Clsrm FTEs 39,71885 Personnel - Non-Federal Certified FTEs 91.1886 Avg Salary - Non-Fed Certified FTEs 41,79087.1 Legal Balance (funds 1-2-4) 2,763,11487.2 Categorical Fund Balance 158,52187.3 Deposits with Paying Agents (QZAB) 087.4 Net Legal Bal (Excl Cat & QZAB) 2,604,59388 Building Fund Balance (fund 3) 1,150,07789 Capital Outlay Fund Balance (fund 5) 0
Jan 30, 2012 - 27 - 9:35:29 AM

Annual Statistical Report 2010-2011
County: CHICOT DERMOTT SCHOOL DISTRICT LEA:0901000
2010-2011 2011-2012Actual Budget
1 Area in Square Miles 2432 ADA 4123 ADA pct Change over 5 Yrs. (27%)4 4 QTR ADM 4245 Prior Year 3QTR ADM 4386 Assessment 30,211,1937 M&O Mills 25.008 URT Mills 25.009 M&O Mills in Excess of URT 0.0010 Dedicated M&O Mills 0.0011 Debt Service Mills 16.8112 Total Mills 41.8113 Total Debt Bond/Non-Bond 3,109,818
State and Local Revenue:14 Property Tax Receipts (Including URT) 1,169,818 1,110,00015 Other Local Receipts 196,368 85,00016 Revenue from Intermediate Sources 0 017.1 Foundation Funding (Excl URT) 1,888,703 1,864,08317.2 Tax Collection Rate Guarantee 5,248 6,00018 Student Growth Funding 0 019 Declining Enrollment Funding 0 020 Consolidation Incentive/Assistance 0 021 Isolated Funding 0 022 Supplemental Millage Incentive Funding 8,247 6,58923 Other Unrestricted State Funding 2,518 1,00024 Total Unrestricted Revenue from State and
Local Sources 3,270,903 3,072,672
Restricted Revenue from State Sources:25 Adult Education 282,036 271,822
Regular Education:26 Professional Development 18,122 17,96427 Other Regular Education 239,452 125,000
Special Education:28 Gifted & Talented 0 029 Alternative Learning Environment (ALE) 11,295 21,55430 English Language Learner (ELL) 1,465 1,49531 National School Lunch Act (NSLA) 619,008 598,09232 Other Special Education 1,795 033 Workforce Education 7,042 5,00034 School Food Service 2,352 2,00035 Educational Service Cooperatives 0 036 Early Childhood Programs 48,600 48,60037 Magnet School Programs 0 038 Other Non-Instructional Programs 36,651 34,94339 Total Restricted Revenue from State Sources 1,267,818 1,126,47040 Total Restricted Revenue from Federal
Sources 2,148,394 1,304,873
Other Sources of Funds:41 Financing Sources 0 042 Balances from Consolidated/Annexed District 0 043 Indirect Cost Reimbursement 8,324 6,00044 Gains and Losses from Sale of Fixed Assets 0 045 Compensation for Loss of Fixed Assets 1,597 046 Other 0 047 Total Other Sources of Funds 9,921 6,00048 Total Revenue and Other Sources of Funds
from All Sources 6,697,035 5,510,016
2010-2011 2011-2012Actual Budget
CURRENT EXPENDITURESInstruction:
49 Regular Instruction 1,792,971 1,542,76550 Special Education 396,830 293,77951 Workforce Education 36,217 75052 Adult Education 263,780 283,25353 Compensatory Education 539,706 431,75554 Other 65,028 39,34155 Total Instruction 3,094,531 2,591,643
District Level Support:56 General Administration 213,484 221,87157 Central Services 108,034 89,42758 Maintenance & Operations of Plant 636,247 722,56659 Student Transportation 222,385 181,04260 Other District Level Support Services 18,604 19,40061 Total District Support Services 1,198,754 1,234,305
School Level Support:62 Student Support Services 161,348 154,24563 Instructional Staff Support Services 899,002 961,53564 School Administration 309,384 213,98565 Total District Support Services 1,369,734 1,329,765
Non-Instructional Services:66 Food Service Operations 386,803 321,30167 Other Enterprise Operations 0 068 Community Operations 1,042 1,19469 Other Non-Instructional Services 0 070 Total Non-Instructional Services 387,845 322,49571 Facilities Acquisition and Construction 191,458 072 Debt Service 245,342 245,60075 Other Non-Programmed Costs 4 076 Total Expenditures 6,487,668 5,723,80977 Less: Capital Expenditures 203,955 16,50078 Less: Debt Service 245,342 245,60079 Total Current Expenditures 6,038,372 5,461,70980 Exclusions from Current Expenditures 446,76081 Net Current Expenditures 5,591,611
82 Per Pupil Expenditures 13,556
83 Personnel - Non-Federal Certified Clsrm FTEs 26.6284 Avg Salary - Non-Fed Certified Clsrm FTEs 41,50485 Personnel - Non-Federal Certified FTEs 35.1286 Avg Salary - Non-Fed Certified FTEs 45,20287.1 Legal Balance (funds 1-2-4) 765,50687.2 Categorical Fund Balance 48,90487.3 Deposits with Paying Agents (QZAB) 087.4 Net Legal Bal (Excl Cat & QZAB) 716,60388 Building Fund Balance (fund 3) 869,76989 Capital Outlay Fund Balance (fund 5) 0
Jan 30, 2012 - 28 - 9:35:29 AM

Annual Statistical Report 2010-2011
County: CHICOT LAKESIDE SCHOOL DIST(CHICOT) LEA:0903000
2010-2011 2011-2012Actual Budget
1 Area in Square Miles 5872 ADA 1,1153 ADA pct Change over 5 Yrs. (24%)4 4 QTR ADM 1,1625 Prior Year 3QTR ADM 1,1896 Assessment 07 M&O Mills 25.008 URT Mills 25.009 M&O Mills in Excess of URT 0.0010 Dedicated M&O Mills 0.0011 Debt Service Mills 14.8012 Total Mills 39.8013 Total Debt Bond/Non-Bond 2,890,000
State and Local Revenue:14 Property Tax Receipts (Including URT) 4,041,005 4,041,00515 Other Local Receipts 430,400 176,43416 Revenue from Intermediate Sources 0 017.1 Foundation Funding (Excl URT) 4,574,431 4,492,32717.2 Tax Collection Rate Guarantee 30,862 30,86218 Student Growth Funding 0 019 Declining Enrollment Funding 186,020 86,44620 Consolidation Incentive/Assistance 0 021 Isolated Funding 0 022 Supplemental Millage Incentive Funding 0 023 Other Unrestricted State Funding 57,156 57,15624 Total Unrestricted Revenue from State and
Local Sources 9,319,875 8,884,230
Restricted Revenue from State Sources:25 Adult Education 0 0
Regular Education:26 Professional Development 49,172 49,19327 Other Regular Education 38,058 38,058
Special Education:28 Gifted & Talented 50 029 Alternative Learning Environment (ALE) 29,294 518,95630 English Language Learner (ELL) 26,370 031 National School Lunch Act (NSLA) 981,088 973,54432 Other Special Education 4,870 4,87033 Workforce Education 12,221 2,47134 School Food Service 5,744 035 Educational Service Cooperatives 0 036 Early Childhood Programs 476,280 476,28037 Magnet School Programs 0 038 Other Non-Instructional Programs 405,753 439,10039 Total Restricted Revenue from State Sources 2,028,901 2,502,47340 Total Restricted Revenue from Federal
Sources 4,164,603 1,917,536
Other Sources of Funds:41 Financing Sources (535,936) 042 Balances from Consolidated/Annexed District 0 043 Indirect Cost Reimbursement 0 044 Gains and Losses from Sale of Fixed Assets 0 045 Compensation for Loss of Fixed Assets 19,899 046 Other 0 047 Total Other Sources of Funds (516,037) 048 Total Revenue and Other Sources of Funds
from All Sources 14,997,342 13,304,238
2010-2011 2011-2012Actual Budget
CURRENT EXPENDITURESInstruction:
49 Regular Instruction 4,567,237 5,235,84050 Special Education 459,790 473,88351 Workforce Education 197,786 226,79652 Adult Education 0 053 Compensatory Education 1,208,232 1,434,75154 Other 237,160 318,26455 Total Instruction 6,670,205 7,689,534
District Level Support:56 General Administration 392,561 392,18557 Central Services 186,783 220,08558 Maintenance & Operations of Plant 1,136,356 1,070,09559 Student Transportation 601,586 638,08460 Other District Level Support Services 0 061 Total District Support Services 2,317,287 2,320,449
School Level Support:62 Student Support Services 540,992 542,89063 Instructional Staff Support Services 2,596,653 2,318,07264 School Administration 574,055 621,80165 Total District Support Services 3,711,701 3,482,763
Non-Instructional Services:66 Food Service Operations 952,733 540,56067 Other Enterprise Operations 0 068 Community Operations 11,224 11,22469 Other Non-Instructional Services 0 070 Total Non-Instructional Services 963,957 551,78471 Facilities Acquisition and Construction 1,989,812 072 Debt Service 549,846 075 Other Non-Programmed Costs 13,869 076 Total Expenditures 16,216,676 14,044,53077 Less: Capital Expenditures 2,284,302 254,49478 Less: Debt Service 549,846 079 Total Current Expenditures 13,382,528 13,790,03680 Exclusions from Current Expenditures 335,38681 Net Current Expenditures 13,047,141
82 Per Pupil Expenditures 11,701
83 Personnel - Non-Federal Certified Clsrm FTEs 99.7384 Avg Salary - Non-Fed Certified Clsrm FTEs 37,92885 Personnel - Non-Federal Certified FTEs 113.2486 Avg Salary - Non-Fed Certified FTEs 40,69487.1 Legal Balance (funds 1-2-4) 10,060,26787.2 Categorical Fund Balance 1,040,14887.3 Deposits with Paying Agents (QZAB) 087.4 Net Legal Bal (Excl Cat & QZAB) 9,020,11988 Building Fund Balance (fund 3) 089 Capital Outlay Fund Balance (fund 5) 170,907
Jan 30, 2012 - 29 - 9:35:29 AM

Annual Statistical Report 2010-2011
County: CLARK ARKADELPHIA SCHOOL DISTRICT LEA:1002000
2010-2011 2011-2012Actual Budget
1 Area in Square Miles 3302 ADA 1,8753 ADA pct Change over 5 Yrs. (11%)4 4 QTR ADM 1,9425 Prior Year 3QTR ADM 1,9206 Assessment 186,657,3587 M&O Mills 25.008 URT Mills 25.009 M&O Mills in Excess of URT 0.0010 Dedicated M&O Mills 0.0011 Debt Service Mills 13.9012 Total Mills 38.9013 Total Debt Bond/Non-Bond 9,320,000
State and Local Revenue:14 Property Tax Receipts (Including URT) 6,678,629 6,931,81215 Other Local Receipts 862,183 581,09116 Revenue from Intermediate Sources 18,401 15,00017.1 Foundation Funding (Excl URT) 7,201,754 7,392,08917.2 Tax Collection Rate Guarantee 59,119 018 Student Growth Funding 0 019 Declining Enrollment Funding 217,340 020 Consolidation Incentive/Assistance 0 021 Isolated Funding 0 022 Supplemental Millage Incentive Funding 0 023 Other Unrestricted State Funding 0 024 Total Unrestricted Revenue from State and
Local Sources 15,037,426 14,919,992
Restricted Revenue from State Sources:25 Adult Education 128,805 127,527
Regular Education:26 Professional Development 79,418 82,53327 Other Regular Education 10,149 10,000
Special Education:28 Gifted & Talented 5,350 029 Alternative Learning Environment (ALE) 58,182 21,01530 English Language Learner (ELL) 3,809 031 National School Lunch Act (NSLA) 514,352 528,77032 Other Special Education 21,441 17,53733 Workforce Education 47,066 48,23734 School Food Service 7,149 8,00035 Educational Service Cooperatives 0 036 Early Childhood Programs 220,173 291,60037 Magnet School Programs 0 038 Other Non-Instructional Programs 90,471 76,63039 Total Restricted Revenue from State Sources 1,186,364 1,211,84940 Total Restricted Revenue from Federal
Sources 3,741,408 3,018,417
Other Sources of Funds:41 Financing Sources 0 042 Balances from Consolidated/Annexed District 0 043 Indirect Cost Reimbursement 27,000 22,00044 Gains and Losses from Sale of Fixed Assets 0 045 Compensation for Loss of Fixed Assets 621,409 046 Other 0 047 Total Other Sources of Funds 648,409 22,00048 Total Revenue and Other Sources of Funds
from All Sources 20,613,608 19,172,258
2010-2011 2011-2012Actual Budget
CURRENT EXPENDITURESInstruction:
49 Regular Instruction 7,083,918 6,667,66450 Special Education 1,417,307 1,382,61051 Workforce Education 624,744 597,68752 Adult Education 168,635 148,20653 Compensatory Education 637,274 564,07054 Other 616,506 583,38455 Total Instruction 10,548,382 9,943,621
District Level Support:56 General Administration 516,267 520,21557 Central Services 599,926 537,04858 Maintenance & Operations of Plant 2,267,236 1,779,11659 Student Transportation 763,275 800,84860 Other District Level Support Services 40,911 42,00061 Total District Support Services 4,187,615 3,679,227
School Level Support:62 Student Support Services 831,795 996,71063 Instructional Staff Support Services 1,635,795 1,451,19364 School Administration 915,552 883,56065 Total District Support Services 3,383,142 3,331,464
Non-Instructional Services:66 Food Service Operations 945,845 957,48067 Other Enterprise Operations 0 068 Community Operations 398,558 627,38869 Other Non-Instructional Services 0 070 Total Non-Instructional Services 1,344,403 1,584,86871 Facilities Acquisition and Construction 536,330 518,44172 Debt Service 939,946 937,90875 Other Non-Programmed Costs 0 076 Total Expenditures 20,939,818 19,995,52877 Less: Capital Expenditures 861,263 703,47578 Less: Debt Service 939,946 937,90879 Total Current Expenditures 19,138,610 18,354,14480 Exclusions from Current Expenditures 1,428,55181 Net Current Expenditures 17,710,059
82 Per Pupil Expenditures 9,445
83 Personnel - Non-Federal Certified Clsrm FTEs 150.0184 Avg Salary - Non-Fed Certified Clsrm FTEs 41,72785 Personnel - Non-Federal Certified FTEs 161.9086 Avg Salary - Non-Fed Certified FTEs 43,64987.1 Legal Balance (funds 1-2-4) 2,889,99887.2 Categorical Fund Balance 98,96687.3 Deposits with Paying Agents (QZAB) 087.4 Net Legal Bal (Excl Cat & QZAB) 2,791,03288 Building Fund Balance (fund 3) 126,32189 Capital Outlay Fund Balance (fund 5) 0
Jan 30, 2012 - 30 - 9:35:29 AM

Annual Statistical Report 2010-2011
County: CLARK GURDON SCHOOL DISTRICT LEA:1003000
2010-2011 2011-2012Actual Budget
1 Area in Square Miles 3402 ADA 7073 ADA pct Change over 5 Yrs. (12%)4 4 QTR ADM 7505 Prior Year 3QTR ADM 7716 Assessment 58,642,2457 M&O Mills 25.008 URT Mills 25.009 M&O Mills in Excess of URT 0.0010 Dedicated M&O Mills 0.0011 Debt Service Mills 11.0012 Total Mills 36.0013 Total Debt Bond/Non-Bond 5,802,400
State and Local Revenue:14 Property Tax Receipts (Including URT) 2,048,565 2,017,29315 Other Local Receipts 358,622 138,30016 Revenue from Intermediate Sources 7,385 017.1 Foundation Funding (Excl URT) 3,235,662 3,179,92817.2 Tax Collection Rate Guarantee 10,821 018 Student Growth Funding 0 019 Declining Enrollment Funding 21,803 59,04420 Consolidation Incentive/Assistance 0 021 Isolated Funding 0 022 Supplemental Millage Incentive Funding 0 023 Other Unrestricted State Funding 0 024 Total Unrestricted Revenue from State and
Local Sources 5,682,859 5,394,565
Restricted Revenue from State Sources:25 Adult Education 0 0
Regular Education:26 Professional Development 31,873 31,84527 Other Regular Education 37,876 3,000
Special Education:28 Gifted & Talented 150 029 Alternative Learning Environment (ALE) 42,905 60,55830 English Language Learner (ELL) 11,134 1,00031 National School Lunch Act (NSLA) 550,560 543,44432 Other Special Education 98,882 033 Workforce Education 27,834 8,66734 School Food Service 3,148 3,50035 Educational Service Cooperatives 0 036 Early Childhood Programs 194,400 194,40037 Magnet School Programs 0 038 Other Non-Instructional Programs 210,972 230,76339 Total Restricted Revenue from State Sources 1,209,735 1,077,17740 Total Restricted Revenue from Federal
Sources 1,512,779 1,208,759
Other Sources of Funds:41 Financing Sources 0 042 Balances from Consolidated/Annexed District 0 043 Indirect Cost Reimbursement 4,625 044 Gains and Losses from Sale of Fixed Assets 0 045 Compensation for Loss of Fixed Assets 0 046 Other 0 047 Total Other Sources of Funds 4,625 048 Total Revenue and Other Sources of Funds
from All Sources 8,409,998 7,680,501
2010-2011 2011-2012Actual Budget
CURRENT EXPENDITURESInstruction:
49 Regular Instruction 2,778,061 2,723,37150 Special Education 451,520 476,95951 Workforce Education 253,742 212,86652 Adult Education 0 053 Compensatory Education 320,383 429,04354 Other 153,240 151,35555 Total Instruction 3,956,947 3,993,594
District Level Support:56 General Administration 235,985 237,26057 Central Services 80,355 81,80658 Maintenance & Operations of Plant 716,089 663,15659 Student Transportation 433,942 349,87560 Other District Level Support Services 13,400 10,12561 Total District Support Services 1,479,771 1,342,223
School Level Support:62 Student Support Services 426,042 446,27763 Instructional Staff Support Services 993,106 884,57764 School Administration 269,411 273,59665 Total District Support Services 1,688,558 1,604,449
Non-Instructional Services:66 Food Service Operations 488,746 428,32567 Other Enterprise Operations 0 068 Community Operations 163 24669 Other Non-Instructional Services 0 070 Total Non-Instructional Services 488,909 428,57171 Facilities Acquisition and Construction 1,592 072 Debt Service 456,908 458,60875 Other Non-Programmed Costs 0 076 Total Expenditures 8,072,685 7,827,44577 Less: Capital Expenditures 227,738 129,78278 Less: Debt Service 456,908 458,60879 Total Current Expenditures 7,388,038 7,239,05680 Exclusions from Current Expenditures 371,52781 Net Current Expenditures 7,016,512
82 Per Pupil Expenditures 9,926
83 Personnel - Non-Federal Certified Clsrm FTEs 54.7084 Avg Salary - Non-Fed Certified Clsrm FTEs 44,55585 Personnel - Non-Federal Certified FTEs 61.8186 Avg Salary - Non-Fed Certified FTEs 46,97787.1 Legal Balance (funds 1-2-4) 1,026,90487.2 Categorical Fund Balance 83,33987.3 Deposits with Paying Agents (QZAB) 087.4 Net Legal Bal (Excl Cat & QZAB) 943,56688 Building Fund Balance (fund 3) 200,00089 Capital Outlay Fund Balance (fund 5) 0
Jan 30, 2012 - 31 - 9:35:29 AM

Annual Statistical Report 2010-2011
County: CLAY CORNING SCHOOL DISTRICT LEA:1101000
2010-2011 2011-2012Actual Budget
1 Area in Square Miles 3672 ADA 9663 ADA pct Change over 5 Yrs. (13%)4 4 QTR ADM 1,0245 Prior Year 3QTR ADM 1,0566 Assessment 88,968,8227 M&O Mills 25.008 URT Mills 25.009 M&O Mills in Excess of URT 0.0010 Dedicated M&O Mills 0.0011 Debt Service Mills 6.5012 Total Mills 31.5013 Total Debt Bond/Non-Bond 4,380,000
State and Local Revenue:14 Property Tax Receipts (Including URT) 2,588,320 2,599,00015 Other Local Receipts 312,981 121,80016 Revenue from Intermediate Sources 0 017.1 Foundation Funding (Excl URT) 4,248,117 4,117,18817.2 Tax Collection Rate Guarantee 82,506 018 Student Growth Funding 0 019 Declining Enrollment Funding 46,437 96,36920 Consolidation Incentive/Assistance 0 021 Isolated Funding 0 022 Supplemental Millage Incentive Funding 0 023 Other Unrestricted State Funding 0 024 Total Unrestricted Revenue from State and
Local Sources 7,278,361 6,934,357
Restricted Revenue from State Sources:25 Adult Education 0 0
Regular Education:26 Professional Development 43,687 43,43527 Other Regular Education 1,803 6,400
Special Education:28 Gifted & Talented 50 50029 Alternative Learning Environment (ALE) 30,838 35,19130 English Language Learner (ELL) 0 031 National School Lunch Act (NSLA) 494,014 614,79532 Other Special Education 66,409 20,00033 Workforce Education 0 034 School Food Service 4,025 4,00035 Educational Service Cooperatives 0 036 Early Childhood Programs 0 037 Magnet School Programs 0 038 Other Non-Instructional Programs 24,317 20,63239 Total Restricted Revenue from State Sources 665,143 744,95340 Total Restricted Revenue from Federal
Sources 1,782,302 1,533,274
Other Sources of Funds:41 Financing Sources 0 042 Balances from Consolidated/Annexed District 0 043 Indirect Cost Reimbursement 5,500 044 Gains and Losses from Sale of Fixed Assets 0 045 Compensation for Loss of Fixed Assets 0 046 Other 0 047 Total Other Sources of Funds 5,500 048 Total Revenue and Other Sources of Funds
from All Sources 9,731,305 9,212,584
2010-2011 2011-2012Actual Budget
CURRENT EXPENDITURESInstruction:
49 Regular Instruction 3,680,044 3,514,29550 Special Education 877,384 918,66451 Workforce Education 369,466 259,66752 Adult Education 0 053 Compensatory Education 585,030 508,32954 Other 189,592 207,60255 Total Instruction 5,701,516 5,408,557
District Level Support:56 General Administration 293,491 312,75257 Central Services 96,322 91,84958 Maintenance & Operations of Plant 1,184,382 2,710,68859 Student Transportation 310,823 435,66260 Other District Level Support Services 22,227 9,64261 Total District Support Services 1,907,244 3,560,593
School Level Support:62 Student Support Services 364,761 428,98363 Instructional Staff Support Services 557,126 957,62364 School Administration 396,076 423,77565 Total District Support Services 1,317,963 1,810,381
Non-Instructional Services:66 Food Service Operations 546,292 503,52167 Other Enterprise Operations 0 068 Community Operations 489 15,64969 Other Non-Instructional Services 0 070 Total Non-Instructional Services 546,781 519,17071 Facilities Acquisition and Construction 270,706 5,20072 Debt Service 379,711 382,73675 Other Non-Programmed Costs 0 076 Total Expenditures 10,123,922 11,686,63877 Less: Capital Expenditures 475,161 351,10278 Less: Debt Service 379,711 382,73679 Total Current Expenditures 9,269,049 10,952,79980 Exclusions from Current Expenditures 223,06981 Net Current Expenditures 9,045,981
82 Per Pupil Expenditures 9,361
83 Personnel - Non-Federal Certified Clsrm FTEs 80.9884 Avg Salary - Non-Fed Certified Clsrm FTEs 43,29285 Personnel - Non-Federal Certified FTEs 87.4886 Avg Salary - Non-Fed Certified FTEs 45,44587.1 Legal Balance (funds 1-2-4) 1,999,12587.2 Categorical Fund Balance 176,76087.3 Deposits with Paying Agents (QZAB) 087.4 Net Legal Bal (Excl Cat & QZAB) 1,822,36488 Building Fund Balance (fund 3) 1,934,17789 Capital Outlay Fund Balance (fund 5) 0
Jan 30, 2012 - 32 - 9:35:29 AM

Annual Statistical Report 2010-2011
County: CLAY PIGGOTT SCHOOL DISTRICT LEA:1104000
2010-2011 2011-2012Actual Budget
1 Area in Square Miles 1472 ADA 9213 ADA pct Change over 5 Yrs. (7%)4 4 QTR ADM 9565 Prior Year 3QTR ADM 9836 Assessment 60,040,0527 M&O Mills 25.008 URT Mills 25.009 M&O Mills in Excess of URT 0.0010 Dedicated M&O Mills 0.0011 Debt Service Mills 10.4412 Total Mills 35.4413 Total Debt Bond/Non-Bond 4,392,621
State and Local Revenue:14 Property Tax Receipts (Including URT) 1,980,258 1,980,40015 Other Local Receipts 388,217 188,78016 Revenue from Intermediate Sources 3,900 017.1 Foundation Funding (Excl URT) 4,463,835 4,422,89617.2 Tax Collection Rate Guarantee 57,118 50,00018 Student Growth Funding 0 019 Declining Enrollment Funding 38,607 72,19220 Consolidation Incentive/Assistance 0 021 Isolated Funding 0 022 Supplemental Millage Incentive Funding 0 023 Other Unrestricted State Funding 0 024 Total Unrestricted Revenue from State and
Local Sources 6,931,935 6,714,268
Restricted Revenue from State Sources:25 Adult Education 0 0
Regular Education:26 Professional Development 40,648 40,65527 Other Regular Education 5,573 7,400
Special Education:28 Gifted & Talented 100 5029 Alternative Learning Environment (ALE) 49,650 19,60630 English Language Learner (ELL) 0 031 National School Lunch Act (NSLA) 277,760 274,75832 Other Special Education 23,244 19,20033 Workforce Education 0 034 School Food Service 3,376 3,40035 Educational Service Cooperatives 0 036 Early Childhood Programs 0 037 Magnet School Programs 0 038 Other Non-Instructional Programs 90,152 80,00139 Total Restricted Revenue from State Sources 490,503 445,07040 Total Restricted Revenue from Federal
Sources 1,197,562 1,410,032
Other Sources of Funds:41 Financing Sources 0 042 Balances from Consolidated/Annexed District 0 043 Indirect Cost Reimbursement 0 044 Gains and Losses from Sale of Fixed Assets 1,530 1,00045 Compensation for Loss of Fixed Assets 0 046 Other 0 047 Total Other Sources of Funds 1,530 1,00048 Total Revenue and Other Sources of Funds
from All Sources 8,621,530 8,570,370
2010-2011 2011-2012Actual Budget
CURRENT EXPENDITURESInstruction:
49 Regular Instruction 3,552,788 3,515,53750 Special Education 754,558 854,02151 Workforce Education 273,542 287,84852 Adult Education 0 053 Compensatory Education 205,654 290,99854 Other 232,202 253,98355 Total Instruction 5,018,745 5,202,387
District Level Support:56 General Administration 178,218 202,13557 Central Services 112,423 183,35858 Maintenance & Operations of Plant 849,826 884,38759 Student Transportation 283,695 323,00960 Other District Level Support Services 31,538 25,00061 Total District Support Services 1,455,700 1,617,889
School Level Support:62 Student Support Services 318,818 331,99463 Instructional Staff Support Services 426,349 523,83564 School Administration 363,626 369,90165 Total District Support Services 1,108,794 1,225,730
Non-Instructional Services:66 Food Service Operations 538,697 526,42867 Other Enterprise Operations 0 068 Community Operations 736 2,15069 Other Non-Instructional Services 0 070 Total Non-Instructional Services 539,434 528,57871 Facilities Acquisition and Construction 248,140 274,36872 Debt Service 495,872 495,60275 Other Non-Programmed Costs 0 076 Total Expenditures 8,866,684 9,344,55477 Less: Capital Expenditures 389,881 431,96878 Less: Debt Service 495,872 495,60279 Total Current Expenditures 7,980,931 8,416,98480 Exclusions from Current Expenditures 370,17081 Net Current Expenditures 7,610,761
82 Per Pupil Expenditures 8,265
83 Personnel - Non-Federal Certified Clsrm FTEs 76.2184 Avg Salary - Non-Fed Certified Clsrm FTEs 42,52085 Personnel - Non-Federal Certified FTEs 81.8786 Avg Salary - Non-Fed Certified FTEs 43,79687.1 Legal Balance (funds 1-2-4) 1,055,44687.2 Categorical Fund Balance 196,66187.3 Deposits with Paying Agents (QZAB) 087.4 Net Legal Bal (Excl Cat & QZAB) 858,78588 Building Fund Balance (fund 3) 192,77289 Capital Outlay Fund Balance (fund 5) 0
Jan 30, 2012 - 33 - 9:35:29 AM

Annual Statistical Report 2010-2011
County: CLAY RECTOR SCHOOL DISTRICT LEA:1106000
2010-2011 2011-2012Actual Budget
1 Area in Square Miles 1792 ADA 5653 ADA pct Change over 5 Yrs. (8%)4 4 QTR ADM 5895 Prior Year 3QTR ADM 6026 Assessment 39,406,1537 M&O Mills 25.008 URT Mills 25.009 M&O Mills in Excess of URT 0.0010 Dedicated M&O Mills 0.0011 Debt Service Mills 13.4912 Total Mills 38.4913 Total Debt Bond/Non-Bond 3,585,000
State and Local Revenue:14 Property Tax Receipts (Including URT) 1,399,844 1,401,90015 Other Local Receipts 351,913 111,99916 Revenue from Intermediate Sources 0 017.1 Foundation Funding (Excl URT) 2,679,169 2,661,64717.2 Tax Collection Rate Guarantee 23,380 018 Student Growth Funding 0 019 Declining Enrollment Funding 0 34,77520 Consolidation Incentive/Assistance 0 021 Isolated Funding 0 022 Supplemental Millage Incentive Funding 0 023 Other Unrestricted State Funding 0 024 Total Unrestricted Revenue from State and
Local Sources 4,454,305 4,210,321
Restricted Revenue from State Sources:25 Adult Education 0 0
Regular Education:26 Professional Development 24,911 25,04527 Other Regular Education 2,400 0
Special Education:28 Gifted & Talented 50 029 Alternative Learning Environment (ALE) 0 030 English Language Learner (ELL) 0 031 National School Lunch Act (NSLA) 181,536 171,53432 Other Special Education 20,374 24,93133 Workforce Education 0 034 School Food Service 2,411 2,30035 Educational Service Cooperatives 0 036 Early Childhood Programs 87,077 85,00037 Magnet School Programs 0 038 Other Non-Instructional Programs 33,001 30,15839 Total Restricted Revenue from State Sources 351,760 338,96840 Total Restricted Revenue from Federal
Sources 783,053 1,203,582
Other Sources of Funds:41 Financing Sources 0 042 Balances from Consolidated/Annexed District 0 043 Indirect Cost Reimbursement 0 044 Gains and Losses from Sale of Fixed Assets 1,537 045 Compensation for Loss of Fixed Assets 0 046 Other 0 047 Total Other Sources of Funds 1,537 048 Total Revenue and Other Sources of Funds
from All Sources 5,590,655 5,752,871
2010-2011 2011-2012Actual Budget
CURRENT EXPENDITURESInstruction:
49 Regular Instruction 2,392,164 1,984,80250 Special Education 452,224 499,82951 Workforce Education 297,240 245,42052 Adult Education 0 053 Compensatory Education 309,693 409,45954 Other 86,614 57,46055 Total Instruction 3,537,933 3,196,970
District Level Support:56 General Administration 155,450 132,03757 Central Services 51,480 50,41058 Maintenance & Operations of Plant 484,766 454,40359 Student Transportation 170,535 183,15460 Other District Level Support Services 13,766 13,76661 Total District Support Services 875,997 833,769
School Level Support:62 Student Support Services 172,737 200,96063 Instructional Staff Support Services 155,846 230,26964 School Administration 207,767 205,33065 Total District Support Services 536,350 636,559
Non-Instructional Services:66 Food Service Operations 325,703 325,15167 Other Enterprise Operations 0 068 Community Operations 0 20069 Other Non-Instructional Services 0 070 Total Non-Instructional Services 325,703 325,35171 Facilities Acquisition and Construction 5,279 072 Debt Service 347,656 378,54975 Other Non-Programmed Costs 0 076 Total Expenditures 5,628,919 5,371,19877 Less: Capital Expenditures 112,635 116,94278 Less: Debt Service 347,656 378,54979 Total Current Expenditures 5,168,627 4,875,70780 Exclusions from Current Expenditures 461,30481 Net Current Expenditures 4,707,323
82 Per Pupil Expenditures 8,334
83 Personnel - Non-Federal Certified Clsrm FTEs 50.7784 Avg Salary - Non-Fed Certified Clsrm FTEs 41,43485 Personnel - Non-Federal Certified FTEs 53.7786 Avg Salary - Non-Fed Certified FTEs 43,40487.1 Legal Balance (funds 1-2-4) 637,07887.2 Categorical Fund Balance 20,82187.3 Deposits with Paying Agents (QZAB) 087.4 Net Legal Bal (Excl Cat & QZAB) 616,25788 Building Fund Balance (fund 3) 089 Capital Outlay Fund Balance (fund 5) 0
Jan 30, 2012 - 34 - 9:35:29 AM

Annual Statistical Report 2010-2011
County: CLEBURNE CONCORD SCHOOL DISTRICT LEA:1201000
2010-2011 2011-2012Actual Budget
1 Area in Square Miles 2032 ADA 4313 ADA pct Change over 5 Yrs. (15%)4 4 QTR ADM 4615 Prior Year 3QTR ADM 4456 Assessment 51,362,3657 M&O Mills 25.008 URT Mills 25.009 M&O Mills in Excess of URT 0.0010 Dedicated M&O Mills 0.0011 Debt Service Mills 11.6012 Total Mills 36.6013 Total Debt Bond/Non-Bond 2,758,000
State and Local Revenue:14 Property Tax Receipts (Including URT) 1,588,114 1,819,47115 Other Local Receipts 288,408 163,40016 Revenue from Intermediate Sources 420 017.1 Foundation Funding (Excl URT) 1,653,430 1,552,44117.2 Tax Collection Rate Guarantee 23,867 018 Student Growth Funding 0 019 Declining Enrollment Funding 114,046 020 Consolidation Incentive/Assistance 0 021 Isolated Funding 0 022 Supplemental Millage Incentive Funding 1,701 1,36123 Other Unrestricted State Funding 0 024 Total Unrestricted Revenue from State and
Local Sources 3,669,986 3,536,673
Restricted Revenue from State Sources:25 Adult Education 0 0
Regular Education:26 Professional Development 18,409 19,39527 Other Regular Education 0 5,000
Special Education:28 Gifted & Talented 830 029 Alternative Learning Environment (ALE) 0 030 English Language Learner (ELL) 0 031 National School Lunch Act (NSLA) 138,384 135,10232 Other Special Education 1,823 033 Workforce Education 0 3,25034 School Food Service 2,022 2,10035 Educational Service Cooperatives 0 036 Early Childhood Programs 451,994 452,48037 Magnet School Programs 0 038 Other Non-Instructional Programs 11,336 7,17239 Total Restricted Revenue from State Sources 624,798 624,49940 Total Restricted Revenue from Federal
Sources 1,349,712 728,621
Other Sources of Funds:41 Financing Sources 602,700 042 Balances from Consolidated/Annexed District 0 043 Indirect Cost Reimbursement 0 044 Gains and Losses from Sale of Fixed Assets 27,001 045 Compensation for Loss of Fixed Assets 0 046 Other 0 047 Total Other Sources of Funds 629,701 048 Total Revenue and Other Sources of Funds
from All Sources 6,274,197 4,889,793
2010-2011 2011-2012Actual Budget
CURRENT EXPENDITURESInstruction:
49 Regular Instruction 1,925,365 1,870,31350 Special Education 216,826 236,44851 Workforce Education 185,381 168,68752 Adult Education 0 053 Compensatory Education 242,147 167,15454 Other 40,834 41,27855 Total Instruction 2,610,554 2,483,880
District Level Support:56 General Administration 188,075 186,55057 Central Services 90,482 100,32158 Maintenance & Operations of Plant 587,452 545,84259 Student Transportation 246,313 219,99360 Other District Level Support Services 18,704 8,50061 Total District Support Services 1,131,026 1,061,206
School Level Support:62 Student Support Services 308,400 231,18663 Instructional Staff Support Services 334,031 365,37464 School Administration 170,161 145,14465 Total District Support Services 812,592 741,704
Non-Instructional Services:66 Food Service Operations 276,366 257,54867 Other Enterprise Operations 2,944 068 Community Operations 126,399 93,66169 Other Non-Instructional Services 0 070 Total Non-Instructional Services 405,710 351,20871 Facilities Acquisition and Construction 467,088 5,00072 Debt Service 192,010 246,27575 Other Non-Programmed Costs 0 076 Total Expenditures 5,618,980 4,889,27477 Less: Capital Expenditures 658,633 130,30578 Less: Debt Service 192,010 246,27579 Total Current Expenditures 4,768,337 4,512,69480 Exclusions from Current Expenditures 700,34581 Net Current Expenditures 4,067,992
82 Per Pupil Expenditures 9,428
83 Personnel - Non-Federal Certified Clsrm FTEs 34.1884 Avg Salary - Non-Fed Certified Clsrm FTEs 38,83285 Personnel - Non-Federal Certified FTEs 38.2286 Avg Salary - Non-Fed Certified FTEs 41,47787.1 Legal Balance (funds 1-2-4) 1,220,79387.2 Categorical Fund Balance 5,47187.3 Deposits with Paying Agents (QZAB) 087.4 Net Legal Bal (Excl Cat & QZAB) 1,215,32288 Building Fund Balance (fund 3) 1,101,15889 Capital Outlay Fund Balance (fund 5) 0
Jan 30, 2012 - 35 - 9:35:29 AM

Annual Statistical Report 2010-2011
County: CLEBURNE HEBER SPRINGS SCHOOL DISTRICT LEA:1202000
2010-2011 2011-2012Actual Budget
1 Area in Square Miles 752 ADA 1,6343 ADA pct Change over 5 Yrs. 2%4 4 QTR ADM 1,7385 Prior Year 3QTR ADM 1,7136 Assessment 235,471,9677 M&O Mills 25.008 URT Mills 25.009 M&O Mills in Excess of URT 0.0010 Dedicated M&O Mills 0.0011 Debt Service Mills 4.4012 Total Mills 29.4013 Total Debt Bond/Non-Bond 10,410,590
State and Local Revenue:14 Property Tax Receipts (Including URT) 6,387,188 6,320,51915 Other Local Receipts 822,434 438,86216 Revenue from Intermediate Sources 1,619 1,47017.1 Foundation Funding (Excl URT) 4,761,625 4,951,15217.2 Tax Collection Rate Guarantee 191,760 018 Student Growth Funding 155,484 019 Declining Enrollment Funding 0 020 Consolidation Incentive/Assistance 0 021 Isolated Funding 0 022 Supplemental Millage Incentive Funding 0 023 Other Unrestricted State Funding 0 024 Total Unrestricted Revenue from State and
Local Sources 12,320,110 11,712,003
Restricted Revenue from State Sources:25 Adult Education 0 0
Regular Education:26 Professional Development 70,864 74,05327 Other Regular Education 14,288 6,200
Special Education:28 Gifted & Talented 1,000 50029 Alternative Learning Environment (ALE) 75,450 73,49130 English Language Learner (ELL) 7,911 031 National School Lunch Act (NSLA) 424,576 468,55632 Other Special Education 132,894 114,14033 Workforce Education 28,438 27,62534 School Food Service 5,260 5,34035 Educational Service Cooperatives 0 036 Early Childhood Programs 105,000 105,00037 Magnet School Programs 0 038 Other Non-Instructional Programs 3,010 70,67339 Total Restricted Revenue from State Sources 868,691 945,57840 Total Restricted Revenue from Federal
Sources 2,116,139 1,874,904
Other Sources of Funds:41 Financing Sources 10,275 042 Balances from Consolidated/Annexed District 0 043 Indirect Cost Reimbursement 2,000 044 Gains and Losses from Sale of Fixed Assets 7,226 045 Compensation for Loss of Fixed Assets 0 046 Other 0 047 Total Other Sources of Funds 19,501 048 Total Revenue and Other Sources of Funds
from All Sources 15,324,441 14,532,485
2010-2011 2011-2012Actual Budget
CURRENT EXPENDITURESInstruction:
49 Regular Instruction 5,902,035 5,474,85750 Special Education 1,439,328 1,397,51651 Workforce Education 490,294 501,11652 Adult Education 0 053 Compensatory Education 359,502 427,39754 Other 539,317 388,51655 Total Instruction 8,730,477 8,189,402
District Level Support:56 General Administration 208,826 201,75057 Central Services 261,520 293,07558 Maintenance & Operations of Plant 1,522,436 1,581,36259 Student Transportation 447,165 419,90560 Other District Level Support Services 42,886 26,82561 Total District Support Services 2,482,833 2,522,916
School Level Support:62 Student Support Services 717,774 740,14663 Instructional Staff Support Services 797,269 780,21164 School Administration 709,526 623,94065 Total District Support Services 2,224,570 2,144,297
Non-Instructional Services:66 Food Service Operations 892,288 833,67967 Other Enterprise Operations 32,594 068 Community Operations 3,485 069 Other Non-Instructional Services 0 070 Total Non-Instructional Services 928,367 833,67971 Facilities Acquisition and Construction 306,220 990,69272 Debt Service 552,127 906,30575 Other Non-Programmed Costs 10,572 076 Total Expenditures 15,235,165 15,587,29177 Less: Capital Expenditures 498,168 1,061,24278 Less: Debt Service 552,127 906,30579 Total Current Expenditures 14,184,871 13,619,74580 Exclusions from Current Expenditures 798,82781 Net Current Expenditures 13,386,043
82 Per Pupil Expenditures 8,193
83 Personnel - Non-Federal Certified Clsrm FTEs 123.8684 Avg Salary - Non-Fed Certified Clsrm FTEs 42,83685 Personnel - Non-Federal Certified FTEs 131.8186 Avg Salary - Non-Fed Certified FTEs 44,48987.1 Legal Balance (funds 1-2-4) 920,77687.2 Categorical Fund Balance 31,52887.3 Deposits with Paying Agents (QZAB) 087.4 Net Legal Bal (Excl Cat & QZAB) 889,24988 Building Fund Balance (fund 3) 522,09489 Capital Outlay Fund Balance (fund 5) 0
Jan 30, 2012 - 36 - 9:35:29 AM

Annual Statistical Report 2010-2011
County: CLEBURNE QUITMAN SCHOOL DISTRICT LEA:1203000
2010-2011 2011-2012Actual Budget
1 Area in Square Miles 1592 ADA 5683 ADA pct Change over 5 Yrs. 3%4 4 QTR ADM 6045 Prior Year 3QTR ADM 6146 Assessment 134,227,8497 M&O Mills 26.248 URT Mills 25.009 M&O Mills in Excess of URT 1.2410 Dedicated M&O Mills 0.0011 Debt Service Mills 7.2612 Total Mills 33.5013 Total Debt Bond/Non-Bond 3,889,281
State and Local Revenue:14 Property Tax Receipts (Including URT) 3,298,234 4,489,61515 Other Local Receipts 423,848 290,61116 Revenue from Intermediate Sources 577 55017.1 Foundation Funding (Excl URT) 1,578,708 435,57617.2 Tax Collection Rate Guarantee 11,156 018 Student Growth Funding 11,308 019 Declining Enrollment Funding 0 21,71920 Consolidation Incentive/Assistance 0 021 Isolated Funding 0 022 Supplemental Millage Incentive Funding 0 023 Other Unrestricted State Funding 0 024 Total Unrestricted Revenue from State and
Local Sources 5,323,831 5,238,071
Restricted Revenue from State Sources:25 Adult Education 0 0
Regular Education:26 Professional Development 25,385 25,71127 Other Regular Education 2,490 0
Special Education:28 Gifted & Talented 300 029 Alternative Learning Environment (ALE) 50,544 23,33630 English Language Learner (ELL) 0 031 National School Lunch Act (NSLA) 158,224 166,98032 Other Special Education 2,514 033 Workforce Education 45,230 034 School Food Service 2,825 3,00035 Educational Service Cooperatives 0 036 Early Childhood Programs 0 037 Magnet School Programs 0 038 Other Non-Instructional Programs 469,384 4,09639 Total Restricted Revenue from State Sources 756,895 223,12340 Total Restricted Revenue from Federal
Sources 1,049,298 894,800
Other Sources of Funds:41 Financing Sources 0 042 Balances from Consolidated/Annexed District 0 043 Indirect Cost Reimbursement 0 044 Gains and Losses from Sale of Fixed Assets 15,388 045 Compensation for Loss of Fixed Assets 0 046 Other 0 047 Total Other Sources of Funds 15,388 048 Total Revenue and Other Sources of Funds
from All Sources 7,145,413 6,355,994
2010-2011 2011-2012Actual Budget
CURRENT EXPENDITURESInstruction:
49 Regular Instruction 2,385,173 2,104,50650 Special Education 299,793 282,38751 Workforce Education 229,303 189,72852 Adult Education 0 053 Compensatory Education 277,920 124,45254 Other 289,125 192,74755 Total Instruction 3,481,314 2,893,821
District Level Support:56 General Administration 195,177 202,18857 Central Services 192,509 186,11558 Maintenance & Operations of Plant 587,949 665,11459 Student Transportation 378,442 345,39460 Other District Level Support Services 3,126 3,50061 Total District Support Services 1,357,203 1,402,312
School Level Support:62 Student Support Services 235,655 242,97063 Instructional Staff Support Services 499,316 441,29064 School Administration 233,950 239,92665 Total District Support Services 968,920 924,186
Non-Instructional Services:66 Food Service Operations 343,488 404,37267 Other Enterprise Operations 0 068 Community Operations 34 1,50069 Other Non-Instructional Services 0 070 Total Non-Instructional Services 343,522 405,87271 Facilities Acquisition and Construction 1,503,919 331,65572 Debt Service 150,627 337,55675 Other Non-Programmed Costs 0 076 Total Expenditures 7,805,505 6,295,40077 Less: Capital Expenditures 1,636,919 470,44278 Less: Debt Service 150,627 337,55679 Total Current Expenditures 6,017,959 5,487,40380 Exclusions from Current Expenditures 287,09781 Net Current Expenditures 5,730,863
82 Per Pupil Expenditures 10,093
83 Personnel - Non-Federal Certified Clsrm FTEs 48.4584 Avg Salary - Non-Fed Certified Clsrm FTEs 38,88085 Personnel - Non-Federal Certified FTEs 53.4586 Avg Salary - Non-Fed Certified FTEs 41,23787.1 Legal Balance (funds 1-2-4) 2,321,99987.2 Categorical Fund Balance 18,13487.3 Deposits with Paying Agents (QZAB) 087.4 Net Legal Bal (Excl Cat & QZAB) 2,303,86588 Building Fund Balance (fund 3) 627,73289 Capital Outlay Fund Balance (fund 5) 0
Jan 30, 2012 - 37 - 9:35:29 AM

Annual Statistical Report 2010-2011
County: CLEBURNE WEST SIDE SCHOOL DIST(CLEBURNE LEA:1204000
2010-2011 2011-2012Actual Budget
1 Area in Square Miles 1812 ADA 4683 ADA pct Change over 5 Yrs. (3%)4 4 QTR ADM 4875 Prior Year 3QTR ADM 5136 Assessment 133,683,2587 M&O Mills 25.048 URT Mills 25.009 M&O Mills in Excess of URT 0.0410 Dedicated M&O Mills 0.0011 Debt Service Mills 3.6612 Total Mills 28.7013 Total Debt Bond/Non-Bond 4,452,377
State and Local Revenue:14 Property Tax Receipts (Including URT) 3,514,424 3,169,04815 Other Local Receipts 309,591 145,44816 Revenue from Intermediate Sources 483 017.1 Foundation Funding (Excl URT) 0 017.2 Tax Collection Rate Guarantee 0 018 Student Growth Funding 0 019 Declining Enrollment Funding 0 68,35220 Consolidation Incentive/Assistance 0 021 Isolated Funding 0 022 Supplemental Millage Incentive Funding 0 023 Other Unrestricted State Funding 0 024 Total Unrestricted Revenue from State and
Local Sources 3,824,498 3,382,848
Restricted Revenue from State Sources:25 Adult Education 0 0
Regular Education:26 Professional Development 21,229 20,81027 Other Regular Education 16,494 2,400
Special Education:28 Gifted & Talented 1,780 029 Alternative Learning Environment (ALE) 21,534 7,87630 English Language Learner (ELL) 0 031 National School Lunch Act (NSLA) 144,336 149,77632 Other Special Education 2,103 033 Workforce Education 52,430 9,20934 School Food Service 1,937 1,93735 Educational Service Cooperatives 0 036 Early Childhood Programs 46,725 47,25037 Magnet School Programs 0 038 Other Non-Instructional Programs 0 039 Total Restricted Revenue from State Sources 308,569 239,25840 Total Restricted Revenue from Federal
Sources 1,687,421 875,088
Other Sources of Funds:41 Financing Sources 808,900 042 Balances from Consolidated/Annexed District 0 043 Indirect Cost Reimbursement 0 044 Gains and Losses from Sale of Fixed Assets 0 045 Compensation for Loss of Fixed Assets 0 046 Other 0 047 Total Other Sources of Funds 808,900 048 Total Revenue and Other Sources of Funds
from All Sources 6,629,388 4,497,194
2010-2011 2011-2012Actual Budget
CURRENT EXPENDITURESInstruction:
49 Regular Instruction 2,355,648 1,514,45750 Special Education 327,281 282,32151 Workforce Education 223,389 164,91552 Adult Education 0 053 Compensatory Education 142,589 215,26754 Other 151,738 73,47655 Total Instruction 3,200,646 2,250,437
District Level Support:56 General Administration 237,564 215,41957 Central Services 89,746 64,98658 Maintenance & Operations of Plant 406,435 356,07059 Student Transportation 192,630 172,48960 Other District Level Support Services 13,250 8,10661 Total District Support Services 939,625 817,071
School Level Support:62 Student Support Services 224,303 176,70263 Instructional Staff Support Services 225,789 273,20464 School Administration 269,640 171,76665 Total District Support Services 719,732 621,672
Non-Instructional Services:66 Food Service Operations 271,241 237,22767 Other Enterprise Operations 0 068 Community Operations 0 1,00069 Other Non-Instructional Services 0 070 Total Non-Instructional Services 271,241 238,22771 Facilities Acquisition and Construction 1,060,714 172 Debt Service 280,595 370,30675 Other Non-Programmed Costs 52,460 076 Total Expenditures 6,525,012 4,297,71477 Less: Capital Expenditures 1,183,160 9,93578 Less: Debt Service 280,595 370,30679 Total Current Expenditures 5,061,257 3,917,47380 Exclusions from Current Expenditures 380,01881 Net Current Expenditures 4,681,239
82 Per Pupil Expenditures 10,006
83 Personnel - Non-Federal Certified Clsrm FTEs 37.5884 Avg Salary - Non-Fed Certified Clsrm FTEs 50,93985 Personnel - Non-Federal Certified FTEs 40.6886 Avg Salary - Non-Fed Certified FTEs 53,69987.1 Legal Balance (funds 1-2-4) 1,034,79187.2 Categorical Fund Balance 19,42787.3 Deposits with Paying Agents (QZAB) 087.4 Net Legal Bal (Excl Cat & QZAB) 1,015,36488 Building Fund Balance (fund 3) 089 Capital Outlay Fund Balance (fund 5) 0
Jan 30, 2012 - 38 - 9:35:29 AM

Annual Statistical Report 2010-2011
County: CLEVELAND WOODLAWN SCHOOL DISTRICT LEA:1304000
2010-2011 2011-2012Actual Budget
1 Area in Square Miles 1032 ADA 5213 ADA pct Change over 5 Yrs. (6%)4 4 QTR ADM 5505 Prior Year 3QTR ADM 5526 Assessment 25,654,9547 M&O Mills 25.008 URT Mills 25.009 M&O Mills in Excess of URT 0.0010 Dedicated M&O Mills 0.0011 Debt Service Mills 10.0012 Total Mills 35.0013 Total Debt Bond/Non-Bond 2,540,493
State and Local Revenue:14 Property Tax Receipts (Including URT) 821,193 850,00015 Other Local Receipts 370,045 121,58516 Revenue from Intermediate Sources 0 017.1 Foundation Funding (Excl URT) 2,720,420 2,750,28517.2 Tax Collection Rate Guarantee 23,846 20,00018 Student Growth Funding 0 019 Declining Enrollment Funding 31,982 6,17520 Consolidation Incentive/Assistance 0 021 Isolated Funding 0 022 Supplemental Millage Incentive Funding 38,344 30,67523 Other Unrestricted State Funding 0 024 Total Unrestricted Revenue from State and
Local Sources 4,005,830 3,778,720
Restricted Revenue from State Sources:25 Adult Education 0 0
Regular Education:26 Professional Development 22,829 23,30627 Other Regular Education 7,045 2,000
Special Education:28 Gifted & Talented 250 25029 Alternative Learning Environment (ALE) 51,113 16,20730 English Language Learner (ELL) 0 031 National School Lunch Act (NSLA) 96,720 105,75432 Other Special Education 2,261 033 Workforce Education 39,813 55,79234 School Food Service 0 035 Educational Service Cooperatives 0 036 Early Childhood Programs 0 037 Magnet School Programs 0 038 Other Non-Instructional Programs 135,038 1,282,36539 Total Restricted Revenue from State Sources 355,068 1,485,67440 Total Restricted Revenue from Federal
Sources 567,483 597,041
Other Sources of Funds:41 Financing Sources 714,127 042 Balances from Consolidated/Annexed District 0 043 Indirect Cost Reimbursement 0 044 Gains and Losses from Sale of Fixed Assets 0 045 Compensation for Loss of Fixed Assets 0 046 Other 0 047 Total Other Sources of Funds 714,127 048 Total Revenue and Other Sources of Funds
from All Sources 5,642,508 5,861,435
2010-2011 2011-2012Actual Budget
CURRENT EXPENDITURESInstruction:
49 Regular Instruction 2,211,765 2,058,18850 Special Education 218,224 331,48451 Workforce Education 95,160 100,81552 Adult Education 0 053 Compensatory Education 65,949 162,23354 Other 66,286 40,07555 Total Instruction 2,657,383 2,692,795
District Level Support:56 General Administration 247,139 218,87957 Central Services 29,480 43,18658 Maintenance & Operations of Plant 419,120 482,99759 Student Transportation 254,348 164,92160 Other District Level Support Services 4,013 11,95561 Total District Support Services 954,100 921,937
School Level Support:62 Student Support Services 167,767 225,35063 Instructional Staff Support Services 212,202 252,87964 School Administration 231,608 223,74565 Total District Support Services 611,577 701,973
Non-Instructional Services:66 Food Service Operations 232,631 112,66667 Other Enterprise Operations 0 068 Community Operations 39 50069 Other Non-Instructional Services 0 070 Total Non-Instructional Services 232,670 113,16671 Facilities Acquisition and Construction 154,857 1,857,51972 Debt Service 64,839 123,02275 Other Non-Programmed Costs 0 076 Total Expenditures 4,675,427 6,410,41377 Less: Capital Expenditures 286,148 1,952,44978 Less: Debt Service 64,839 123,02279 Total Current Expenditures 4,324,440 4,334,94180 Exclusions from Current Expenditures 303,60281 Net Current Expenditures 4,020,838
82 Per Pupil Expenditures 7,712
83 Personnel - Non-Federal Certified Clsrm FTEs 34.6084 Avg Salary - Non-Fed Certified Clsrm FTEs 44,35185 Personnel - Non-Federal Certified FTEs 38.6786 Avg Salary - Non-Fed Certified FTEs 46,72487.1 Legal Balance (funds 1-2-4) 932,38387.2 Categorical Fund Balance 11,61987.3 Deposits with Paying Agents (QZAB) 087.4 Net Legal Bal (Excl Cat & QZAB) 920,76488 Building Fund Balance (fund 3) 924,62489 Capital Outlay Fund Balance (fund 5) 0
Jan 30, 2012 - 39 - 9:35:29 AM

Annual Statistical Report 2010-2011
County: CLEVELAND CLEVELAND COUNTY SCHOOL DIST. LEA:1305000
2010-2011 2011-2012Actual Budget
1 Area in Square Miles 4682 ADA 8113 ADA pct Change over 5 Yrs. (2%)4 4 QTR ADM 8475 Prior Year 3QTR ADM 8946 Assessment 53,565,1727 M&O Mills 28.008 URT Mills 25.009 M&O Mills in Excess of URT 3.0010 Dedicated M&O Mills 0.0011 Debt Service Mills 10.1012 Total Mills 38.1013 Total Debt Bond/Non-Bond 4,632,000
State and Local Revenue:14 Property Tax Receipts (Including URT) 1,799,810 2,083,32215 Other Local Receipts 467,376 137,15416 Revenue from Intermediate Sources 0 017.1 Foundation Funding (Excl URT) 4,137,037 3,876,69117.2 Tax Collection Rate Guarantee 54,026 018 Student Growth Funding 46,133 019 Declining Enrollment Funding 0 152,61720 Consolidation Incentive/Assistance 0 021 Isolated Funding 60,975 022 Supplemental Millage Incentive Funding 11,100 8,88023 Other Unrestricted State Funding 0 024 Total Unrestricted Revenue from State and
Local Sources 6,576,457 6,258,664
Restricted Revenue from State Sources:25 Adult Education 0 0
Regular Education:26 Professional Development 36,986 35,79327 Other Regular Education 30,814 7,800
Special Education:28 Gifted & Talented 2,500 029 Alternative Learning Environment (ALE) 26,206 26,40430 English Language Learner (ELL) 1,172 031 National School Lunch Act (NSLA) 247,504 240,35032 Other Special Education 7,135 033 Workforce Education 22,750 22,00034 School Food Service 3,042 035 Educational Service Cooperatives 0 036 Early Childhood Programs 136,080 136,08037 Magnet School Programs 0 038 Other Non-Instructional Programs 78,351 63,65739 Total Restricted Revenue from State Sources 592,540 532,08440 Total Restricted Revenue from Federal
Sources 2,479,055 1,928,624
Other Sources of Funds:41 Financing Sources 3,831 32,61842 Balances from Consolidated/Annexed District 0 043 Indirect Cost Reimbursement 0 044 Gains and Losses from Sale of Fixed Assets 0 045 Compensation for Loss of Fixed Assets 0 046 Other 0 047 Total Other Sources of Funds 3,831 32,61848 Total Revenue and Other Sources of Funds
from All Sources 9,651,883 8,751,990
2010-2011 2011-2012Actual Budget
CURRENT EXPENDITURESInstruction:
49 Regular Instruction 3,210,569 3,569,27050 Special Education 409,674 440,96251 Workforce Education 230,232 217,09452 Adult Education 0 053 Compensatory Education 274,787 275,59054 Other 118,337 055 Total Instruction 4,243,599 4,502,915
District Level Support:56 General Administration 292,838 227,05057 Central Services 242,785 296,21758 Maintenance & Operations of Plant 923,273 591,89359 Student Transportation 482,482 330,05760 Other District Level Support Services 7,279 3,25061 Total District Support Services 1,948,658 1,448,468
School Level Support:62 Student Support Services 599,653 577,64163 Instructional Staff Support Services 541,177 506,23964 School Administration 389,167 431,38565 Total District Support Services 1,529,997 1,515,266
Non-Instructional Services:66 Food Service Operations 499,413 455,60867 Other Enterprise Operations 0 068 Community Operations 545,022 597,16869 Other Non-Instructional Services 0 070 Total Non-Instructional Services 1,044,435 1,052,77571 Facilities Acquisition and Construction 498,849 141,69572 Debt Service 139,422 156,73975 Other Non-Programmed Costs 0 076 Total Expenditures 9,404,961 8,817,85777 Less: Capital Expenditures 860,319 238,14978 Less: Debt Service 139,422 156,73979 Total Current Expenditures 8,405,220 8,422,97080 Exclusions from Current Expenditures 877,60481 Net Current Expenditures 7,527,617
82 Per Pupil Expenditures 9,284
83 Personnel - Non-Federal Certified Clsrm FTEs 65.4784 Avg Salary - Non-Fed Certified Clsrm FTEs 40,82085 Personnel - Non-Federal Certified FTEs 70.2686 Avg Salary - Non-Fed Certified FTEs 43,81887.1 Legal Balance (funds 1-2-4) 1,804,44787.2 Categorical Fund Balance 51,83987.3 Deposits with Paying Agents (QZAB) 087.4 Net Legal Bal (Excl Cat & QZAB) 1,752,60888 Building Fund Balance (fund 3) 089 Capital Outlay Fund Balance (fund 5) 0
Jan 30, 2012 - 40 - 9:35:29 AM

Annual Statistical Report 2010-2011
County: COLUMBIA MAGNOLIA SCHOOL DISTRICT LEA:1402000
2010-2011 2011-2012Actual Budget
1 Area in Square Miles 3802 ADA 2,6003 ADA pct Change over 5 Yrs. (13%)4 4 QTR ADM 2,7585 Prior Year 3QTR ADM 2,8586 Assessment 245,726,8817 M&O Mills 25.008 URT Mills 25.009 M&O Mills in Excess of URT 0.0010 Dedicated M&O Mills 0.0011 Debt Service Mills 4.6012 Total Mills 29.6013 Total Debt Bond/Non-Bond 9,805,000
State and Local Revenue:14 Property Tax Receipts (Including URT) 6,805,220 6,195,30915 Other Local Receipts 866,415 558,23516 Revenue from Intermediate Sources 538,261 350,00017.1 Foundation Funding (Excl URT) 11,041,299 10,622,15717.2 Tax Collection Rate Guarantee 170,916 018 Student Growth Funding 0 019 Declining Enrollment Funding 172,619 246,71220 Consolidation Incentive/Assistance 0 021 Isolated Funding 8,804 8,80422 Supplemental Millage Incentive Funding 0 023 Other Unrestricted State Funding 0 024 Total Unrestricted Revenue from State and
Local Sources 19,603,534 17,981,217
Restricted Revenue from State Sources:25 Adult Education 233,624 0
Regular Education:26 Professional Development 118,199 117,71027 Other Regular Education 7,400 18,200
Special Education:28 Gifted & Talented 3,400 029 Alternative Learning Environment (ALE) 158,538 136,70230 English Language Learner (ELL) 10,255 9,00031 National School Lunch Act (NSLA) 948,848 961,40032 Other Special Education 54,023 033 Workforce Education 101,293 100,00034 School Food Service 10,446 7,50035 Educational Service Cooperatives 0 036 Early Childhood Programs 583,577 583,20037 Magnet School Programs 0 038 Other Non-Instructional Programs 751,603 1,178,80739 Total Restricted Revenue from State Sources 2,981,206 3,112,51940 Total Restricted Revenue from Federal
Sources 6,218,936 4,447,053
Other Sources of Funds:41 Financing Sources 1,021,419 042 Balances from Consolidated/Annexed District 0 043 Indirect Cost Reimbursement 145,652 044 Gains and Losses from Sale of Fixed Assets 30,667 13,95045 Compensation for Loss of Fixed Assets 9,674 046 Other 0 047 Total Other Sources of Funds 1,207,412 13,95048 Total Revenue and Other Sources of Funds
from All Sources 30,011,088 25,554,740
2010-2011 2011-2012Actual Budget
CURRENT EXPENDITURESInstruction:
49 Regular Instruction 10,038,374 9,604,90850 Special Education 1,503,346 1,537,32551 Workforce Education 839,888 895,56852 Adult Education 294,153 053 Compensatory Education 1,887,631 1,773,15254 Other 511,600 547,51655 Total Instruction 15,074,994 14,358,468
District Level Support:56 General Administration 445,195 471,81157 Central Services 595,121 653,63158 Maintenance & Operations of Plant 2,325,507 3,654,91859 Student Transportation 1,073,199 1,327,61360 Other District Level Support Services 177,872 146,32061 Total District Support Services 4,616,894 6,254,293
School Level Support:62 Student Support Services 1,001,298 949,13163 Instructional Staff Support Services 1,300,600 1,848,15064 School Administration 1,534,420 1,486,91165 Total District Support Services 3,836,318 4,284,192
Non-Instructional Services:66 Food Service Operations 1,454,091 1,501,06867 Other Enterprise Operations 0 068 Community Operations 0 1,50069 Other Non-Instructional Services 0 070 Total Non-Instructional Services 1,454,091 1,502,56871 Facilities Acquisition and Construction 3,265,349 1,446,57572 Debt Service 229,810 425,01975 Other Non-Programmed Costs 0 29,88576 Total Expenditures 28,477,455 28,301,00077 Less: Capital Expenditures 3,667,810 2,102,66578 Less: Debt Service 229,810 425,01979 Total Current Expenditures 24,579,835 25,773,31680 Exclusions from Current Expenditures 1,486,04481 Net Current Expenditures 23,093,791
82 Per Pupil Expenditures 8,882
83 Personnel - Non-Federal Certified Clsrm FTEs 198.7784 Avg Salary - Non-Fed Certified Clsrm FTEs 44,13085 Personnel - Non-Federal Certified FTEs 219.0086 Avg Salary - Non-Fed Certified FTEs 46,83087.1 Legal Balance (funds 1-2-4) 3,684,47587.2 Categorical Fund Balance 104,84287.3 Deposits with Paying Agents (QZAB) 087.4 Net Legal Bal (Excl Cat & QZAB) 3,579,63388 Building Fund Balance (fund 3) 4,506,61189 Capital Outlay Fund Balance (fund 5) 0
Jan 30, 2012 - 41 - 9:35:29 AM

Annual Statistical Report 2010-2011
County: COLUMBIA EMERSON-TAYLOR SCHOOL DISTRICT LEA:1408000
2010-2011 2011-2012Actual Budget
1 Area in Square Miles 2922 ADA 5763 ADA pct Change over 5 Yrs. (10%)4 4 QTR ADM 6135 Prior Year 3QTR ADM 6226 Assessment 69,247,5147 M&O Mills 29.908 URT Mills 25.009 M&O Mills in Excess of URT 4.9010 Dedicated M&O Mills 0.0011 Debt Service Mills 7.5012 Total Mills 37.4013 Total Debt Bond/Non-Bond 6,160,596
State and Local Revenue:14 Property Tax Receipts (Including URT) 2,328,122 2,121,00015 Other Local Receipts 386,477 329,98716 Revenue from Intermediate Sources 116,868 110,00017.1 Foundation Funding (Excl URT) 2,158,864 2,004,97017.2 Tax Collection Rate Guarantee 44,176 018 Student Growth Funding 0 70,00019 Declining Enrollment Funding 0 020 Consolidation Incentive/Assistance 0 021 Isolated Funding 294,309 295,00022 Supplemental Millage Incentive Funding 6,320 023 Other Unrestricted State Funding 0 024 Total Unrestricted Revenue from State and
Local Sources 5,335,135 4,930,957
Restricted Revenue from State Sources:25 Adult Education 0 0
Regular Education:26 Professional Development 25,740 26,01627 Other Regular Education 387,595 393,200
Special Education:28 Gifted & Talented 200 029 Alternative Learning Environment (ALE) 9,711 5,30630 English Language Learner (ELL) 0 031 National School Lunch Act (NSLA) 137,888 135,10232 Other Special Education 2,549 18,55133 Workforce Education 9,244 30,06834 School Food Service 2,216 2,00035 Educational Service Cooperatives 0 036 Early Childhood Programs 0 037 Magnet School Programs 0 038 Other Non-Instructional Programs 493,815 5,01339 Total Restricted Revenue from State Sources 1,068,959 615,25740 Total Restricted Revenue from Federal
Sources 788,018 755,340
Other Sources of Funds:41 Financing Sources 983,677 042 Balances from Consolidated/Annexed District 0 043 Indirect Cost Reimbursement 0 044 Gains and Losses from Sale of Fixed Assets 0 045 Compensation for Loss of Fixed Assets 0 046 Other 0 047 Total Other Sources of Funds 983,677 048 Total Revenue and Other Sources of Funds
from All Sources 8,175,790 6,301,554
2010-2011 2011-2012Actual Budget
CURRENT EXPENDITURESInstruction:
49 Regular Instruction 2,308,739 2,284,59050 Special Education 348,522 395,15151 Workforce Education 380,309 395,62052 Adult Education 0 053 Compensatory Education 151,104 123,11354 Other 230,856 222,63055 Total Instruction 3,419,530 3,421,104
District Level Support:56 General Administration 130,990 141,35957 Central Services 125,870 148,55158 Maintenance & Operations of Plant 543,501 949,95659 Student Transportation 225,877 502,00660 Other District Level Support Services 26,208 46,79161 Total District Support Services 1,052,446 1,788,664
School Level Support:62 Student Support Services 217,461 239,03163 Instructional Staff Support Services 436,628 462,24664 School Administration 436,732 442,10765 Total District Support Services 1,090,822 1,143,384
Non-Instructional Services:66 Food Service Operations 310,120 317,29567 Other Enterprise Operations 0 068 Community Operations 4,044 1,50069 Other Non-Instructional Services 0 070 Total Non-Instructional Services 314,164 318,79571 Facilities Acquisition and Construction 1,841,511 746,98972 Debt Service 357,543 614,47475 Other Non-Programmed Costs 0 076 Total Expenditures 8,076,016 8,033,41077 Less: Capital Expenditures 1,885,222 1,053,80878 Less: Debt Service 357,543 614,47479 Total Current Expenditures 5,833,251 6,365,12880 Exclusions from Current Expenditures 305,67581 Net Current Expenditures 5,527,576
82 Per Pupil Expenditures 9,597
83 Personnel - Non-Federal Certified Clsrm FTEs 55.8484 Avg Salary - Non-Fed Certified Clsrm FTEs 40,75685 Personnel - Non-Federal Certified FTEs 61.5086 Avg Salary - Non-Fed Certified FTEs 43,54087.1 Legal Balance (funds 1-2-4) 3,547,19687.2 Categorical Fund Balance 46,03587.3 Deposits with Paying Agents (QZAB) 225,43887.4 Net Legal Bal (Excl Cat & QZAB) 3,275,72388 Building Fund Balance (fund 3) 949,26689 Capital Outlay Fund Balance (fund 5) 0
Jan 30, 2012 - 42 - 9:35:29 AM

Annual Statistical Report 2010-2011
County: CONWAY NEMO VISTA SCHOOL DISTRICT LEA:1503000
2010-2011 2011-2012Actual Budget
1 Area in Square Miles 1072 ADA 4633 ADA pct Change over 5 Yrs. 8%4 4 QTR ADM 4905 Prior Year 3QTR ADM 4966 Assessment 139,456,5687 M&O Mills 26.608 URT Mills 25.009 M&O Mills in Excess of URT 1.6010 Dedicated M&O Mills 0.0011 Debt Service Mills 11.7012 Total Mills 38.3013 Total Debt Bond/Non-Bond 2,103,897
State and Local Revenue:14 Property Tax Receipts (Including URT) 4,565,125 4,119,03515 Other Local Receipts 212,749 99,05016 Revenue from Intermediate Sources 52,914 70017.1 Foundation Funding (Excl URT) 236,256 017.2 Tax Collection Rate Guarantee 62,488 018 Student Growth Funding 0 019 Declining Enrollment Funding 22,104 14,96120 Consolidation Incentive/Assistance 0 021 Isolated Funding 0 022 Supplemental Millage Incentive Funding 31,398 25,11823 Other Unrestricted State Funding 0 024 Total Unrestricted Revenue from State and
Local Sources 5,183,034 4,258,864
Restricted Revenue from State Sources:25 Adult Education 0 0
Regular Education:26 Professional Development 20,499 20,79827 Other Regular Education 3,800 2,600
Special Education:28 Gifted & Talented 100 029 Alternative Learning Environment (ALE) 27,628 30,13430 English Language Learner (ELL) 586 59831 National School Lunch Act (NSLA) 160,704 154,33032 Other Special Education 2,030 033 Workforce Education 2,979 2,97934 School Food Service 1,924 2,00035 Educational Service Cooperatives 0 036 Early Childhood Programs 97,200 98,00037 Magnet School Programs 0 038 Other Non-Instructional Programs 5,595 14,06439 Total Restricted Revenue from State Sources 323,045 325,50340 Total Restricted Revenue from Federal
Sources 784,643 716,348
Other Sources of Funds:41 Financing Sources 0 042 Balances from Consolidated/Annexed District 0 043 Indirect Cost Reimbursement 0 044 Gains and Losses from Sale of Fixed Assets 0 045 Compensation for Loss of Fixed Assets 0 046 Other 0 047 Total Other Sources of Funds 0 048 Total Revenue and Other Sources of Funds
from All Sources 6,290,722 5,300,715
2010-2011 2011-2012Actual Budget
CURRENT EXPENDITURESInstruction:
49 Regular Instruction 1,885,874 1,875,64350 Special Education 294,993 264,70651 Workforce Education 180,434 186,48752 Adult Education 0 053 Compensatory Education 181,696 156,27254 Other 97,716 90,96155 Total Instruction 2,640,714 2,574,069
District Level Support:56 General Administration 209,588 230,53857 Central Services 54,449 76,81658 Maintenance & Operations of Plant 514,044 695,07659 Student Transportation 255,800 274,30560 Other District Level Support Services 28,466 20,00061 Total District Support Services 1,062,347 1,296,735
School Level Support:62 Student Support Services 358,464 417,48663 Instructional Staff Support Services 235,822 307,24264 School Administration 251,657 277,82065 Total District Support Services 845,943 1,002,548
Non-Instructional Services:66 Food Service Operations 294,489 296,23267 Other Enterprise Operations 18,306 068 Community Operations 535 5,07669 Other Non-Instructional Services 0 070 Total Non-Instructional Services 313,330 301,30871 Facilities Acquisition and Construction 222,321 763,65172 Debt Service 215,101 210,52775 Other Non-Programmed Costs 0 076 Total Expenditures 5,299,755 6,148,83877 Less: Capital Expenditures 379,752 823,74778 Less: Debt Service 215,101 210,52779 Total Current Expenditures 4,704,903 5,114,56480 Exclusions from Current Expenditures 278,24181 Net Current Expenditures 4,426,661
82 Per Pupil Expenditures 9,561
83 Personnel - Non-Federal Certified Clsrm FTEs 40.0984 Avg Salary - Non-Fed Certified Clsrm FTEs 38,70685 Personnel - Non-Federal Certified FTEs 43.5786 Avg Salary - Non-Fed Certified FTEs 41,68087.1 Legal Balance (funds 1-2-4) 3,751,51287.2 Categorical Fund Balance 11,68887.3 Deposits with Paying Agents (QZAB) 087.4 Net Legal Bal (Excl Cat & QZAB) 3,739,82388 Building Fund Balance (fund 3) 231,18989 Capital Outlay Fund Balance (fund 5) 0
Jan 30, 2012 - 43 - 9:35:29 AM

Annual Statistical Report 2010-2011
County: CONWAY WONDERVIEW SCHOOL DISTRICT LEA:1505000
2010-2011 2011-2012Actual Budget
1 Area in Square Miles 1612 ADA 3923 ADA pct Change over 5 Yrs. 0%4 4 QTR ADM 4115 Prior Year 3QTR ADM 4126 Assessment 70,606,4167 M&O Mills 25.008 URT Mills 25.009 M&O Mills in Excess of URT 0.0010 Dedicated M&O Mills 0.0011 Debt Service Mills 11.2012 Total Mills 36.2013 Total Debt Bond/Non-Bond 4,675,000
State and Local Revenue:14 Property Tax Receipts (Including URT) 2,225,620 2,430,00015 Other Local Receipts 225,217 50,00016 Revenue from Intermediate Sources 475 017.1 Foundation Funding (Excl URT) 1,027,823 679,70617.2 Tax Collection Rate Guarantee 24,991 018 Student Growth Funding 9,622 019 Declining Enrollment Funding 0 020 Consolidation Incentive/Assistance 0 021 Isolated Funding 0 022 Supplemental Millage Incentive Funding 16,258 13,00723 Other Unrestricted State Funding 0 024 Total Unrestricted Revenue from State and
Local Sources 3,530,007 3,172,713
Restricted Revenue from State Sources:25 Adult Education 0 0
Regular Education:26 Professional Development 17,042 17,50127 Other Regular Education 6,400 0
Special Education:28 Gifted & Talented 0 029 Alternative Learning Environment (ALE) 32,585 37,47130 English Language Learner (ELL) 0 031 National School Lunch Act (NSLA) 102,672 106,26032 Other Special Education 30,348 29,00033 Workforce Education 0 034 School Food Service 1,642 035 Educational Service Cooperatives 0 036 Early Childhood Programs 97,200 97,20037 Magnet School Programs 0 038 Other Non-Instructional Programs 378,995 4,36739 Total Restricted Revenue from State Sources 666,884 291,79940 Total Restricted Revenue from Federal
Sources 1,162,004 411,203
Other Sources of Funds:41 Financing Sources 1,820,179 250,00042 Balances from Consolidated/Annexed District 0 043 Indirect Cost Reimbursement 0 044 Gains and Losses from Sale of Fixed Assets 0 045 Compensation for Loss of Fixed Assets 0 046 Other 0 047 Total Other Sources of Funds 1,820,179 250,00048 Total Revenue and Other Sources of Funds
from All Sources 7,179,074 4,125,715
2010-2011 2011-2012Actual Budget
CURRENT EXPENDITURESInstruction:
49 Regular Instruction 1,751,799 1,444,73650 Special Education 250,759 264,91651 Workforce Education 178,107 153,26052 Adult Education 0 053 Compensatory Education 124,972 96,36254 Other 136,919 135,83855 Total Instruction 2,442,557 2,095,113
District Level Support:56 General Administration 197,063 186,19857 Central Services 189,538 95,50158 Maintenance & Operations of Plant 411,146 316,45759 Student Transportation 167,163 153,28460 Other District Level Support Services 10,410 061 Total District Support Services 975,320 751,439
School Level Support:62 Student Support Services 136,981 129,10863 Instructional Staff Support Services 146,700 122,09364 School Administration 217,511 196,71865 Total District Support Services 501,192 447,920
Non-Instructional Services:66 Food Service Operations 237,834 190,29767 Other Enterprise Operations 0 068 Community Operations 1,001 069 Other Non-Instructional Services 0 070 Total Non-Instructional Services 238,834 190,29771 Facilities Acquisition and Construction 3,092,460 200,00072 Debt Service 219,869 302,00075 Other Non-Programmed Costs 38,900 076 Total Expenditures 7,509,132 3,986,76977 Less: Capital Expenditures 3,183,608 235,00078 Less: Debt Service 219,869 302,00079 Total Current Expenditures 4,105,655 3,449,76980 Exclusions from Current Expenditures 315,89081 Net Current Expenditures 3,789,765
82 Per Pupil Expenditures 9,676
83 Personnel - Non-Federal Certified Clsrm FTEs 37.9784 Avg Salary - Non-Fed Certified Clsrm FTEs 36,16185 Personnel - Non-Federal Certified FTEs 40.8086 Avg Salary - Non-Fed Certified FTEs 38,19487.1 Legal Balance (funds 1-2-4) 987,80987.2 Categorical Fund Balance 18,50687.3 Deposits with Paying Agents (QZAB) 087.4 Net Legal Bal (Excl Cat & QZAB) 969,30288 Building Fund Balance (fund 3) 1,550,65389 Capital Outlay Fund Balance (fund 5) 0
Jan 30, 2012 - 44 - 9:35:29 AM

Annual Statistical Report 2010-2011
County: CONWAY SO. CONWAY CO. SCHOOL DISTRICT LEA:1507000
2010-2011 2011-2012Actual Budget
1 Area in Square Miles 2742 ADA 2,1063 ADA pct Change over 5 Yrs. (4%)4 4 QTR ADM 2,2275 Prior Year 3QTR ADM 2,2826 Assessment 197,354,7047 M&O Mills 25.008 URT Mills 25.009 M&O Mills in Excess of URT 0.0010 Dedicated M&O Mills 0.0011 Debt Service Mills 10.4012 Total Mills 35.4013 Total Debt Bond/Non-Bond 18,415,176
State and Local Revenue:14 Property Tax Receipts (Including URT) 6,590,488 6,606,67515 Other Local Receipts 1,160,744 627,88816 Revenue from Intermediate Sources 6,297 6,50017.1 Foundation Funding (Excl URT) 8,923,664 8,829,81717.2 Tax Collection Rate Guarantee 228,356 018 Student Growth Funding 0 019 Declining Enrollment Funding 61,615 161,86420 Consolidation Incentive/Assistance 0 021 Isolated Funding 0 022 Supplemental Millage Incentive Funding 0 023 Other Unrestricted State Funding 0 60024 Total Unrestricted Revenue from State and
Local Sources 16,971,164 16,233,344
Restricted Revenue from State Sources:25 Adult Education 0 0
Regular Education:26 Professional Development 94,379 94,47327 Other Regular Education 6,071 12,000
Special Education:28 Gifted & Talented 1,950 2,00029 Alternative Learning Environment (ALE) 48,756 58,85930 English Language Learner (ELL) 16,408 031 National School Lunch Act (NSLA) 707,296 705,36432 Other Special Education 20,842 033 Workforce Education 638,730 501,05934 School Food Service 800,142 805,00035 Educational Service Cooperatives 0 036 Early Childhood Programs 388,800 388,80037 Magnet School Programs 0 038 Other Non-Instructional Programs 130,260 360,77639 Total Restricted Revenue from State Sources 2,853,634 2,928,33140 Total Restricted Revenue from Federal
Sources 4,241,649 2,964,688
Other Sources of Funds:41 Financing Sources 1,274,573 042 Balances from Consolidated/Annexed District 0 043 Indirect Cost Reimbursement 20,546 18,50044 Gains and Losses from Sale of Fixed Assets 0 045 Compensation for Loss of Fixed Assets 6,069 046 Other 87,448 85,00047 Total Other Sources of Funds 1,388,636 103,50048 Total Revenue and Other Sources of Funds
from All Sources 25,455,083 22,229,863
2010-2011 2011-2012Actual Budget
CURRENT EXPENDITURESInstruction:
49 Regular Instruction 7,677,577 7,352,39950 Special Education 1,220,880 1,108,17251 Workforce Education 1,045,348 990,95852 Adult Education 0 053 Compensatory Education 519,392 678,87854 Other 1,020,914 1,114,09455 Total Instruction 11,484,112 11,244,499
District Level Support:56 General Administration 484,534 403,11257 Central Services 412,846 536,67258 Maintenance & Operations of Plant 2,134,233 1,982,61559 Student Transportation 1,349,361 1,320,59960 Other District Level Support Services 106,750 91,48261 Total District Support Services 4,487,724 4,334,480
School Level Support:62 Student Support Services 1,102,236 1,238,38263 Instructional Staff Support Services 1,543,818 1,690,96964 School Administration 1,049,554 1,023,57465 Total District Support Services 3,695,608 3,952,925
Non-Instructional Services:66 Food Service Operations 1,067,112 1,081,59367 Other Enterprise Operations 0 068 Community Operations 5,622 10,00069 Other Non-Instructional Services 0 070 Total Non-Instructional Services 1,072,734 1,091,59371 Facilities Acquisition and Construction 3,342,790 1,851,83072 Debt Service 757,962 1,287,67875 Other Non-Programmed Costs 0 076 Total Expenditures 24,840,930 23,763,00677 Less: Capital Expenditures 4,075,886 2,589,12878 Less: Debt Service 757,962 1,287,67879 Total Current Expenditures 20,007,082 19,886,20080 Exclusions from Current Expenditures 1,260,45281 Net Current Expenditures 18,746,630
82 Per Pupil Expenditures 8,902
83 Personnel - Non-Federal Certified Clsrm FTEs 169.6784 Avg Salary - Non-Fed Certified Clsrm FTEs 42,99185 Personnel - Non-Federal Certified FTEs 182.3886 Avg Salary - Non-Fed Certified FTEs 45,25687.1 Legal Balance (funds 1-2-4) 2,522,66387.2 Categorical Fund Balance 57,99787.3 Deposits with Paying Agents (QZAB) 087.4 Net Legal Bal (Excl Cat & QZAB) 2,464,66688 Building Fund Balance (fund 3) 961,90289 Capital Outlay Fund Balance (fund 5) 0
Jan 30, 2012 - 45 - 9:35:29 AM

Annual Statistical Report 2010-2011
County: CRAIGHEAD BAY SCHOOL DISTRICT LEA:1601000
2010-2011 2011-2012Actual Budget
1 Area in Square Miles 652 ADA 5323 ADA pct Change over 5 Yrs. (3%)4 4 QTR ADM 5665 Prior Year 3QTR ADM 5336 Assessment 29,732,0907 M&O Mills 25.008 URT Mills 25.009 M&O Mills in Excess of URT 0.0010 Dedicated M&O Mills 0.0011 Debt Service Mills 12.7012 Total Mills 37.7013 Total Debt Bond/Non-Bond 2,802,600
State and Local Revenue:14 Property Tax Receipts (Including URT) 1,037,657 1,032,43915 Other Local Receipts 395,548 118,73116 Revenue from Intermediate Sources 0 017.1 Foundation Funding (Excl URT) 2,477,120 2,744,21417.2 Tax Collection Rate Guarantee 36,525 018 Student Growth Funding 200,024 019 Declining Enrollment Funding 0 020 Consolidation Incentive/Assistance 0 021 Isolated Funding 0 022 Supplemental Millage Incentive Funding 23,555 9,42223 Other Unrestricted State Funding 0 024 Total Unrestricted Revenue from State and
Local Sources 4,170,430 3,904,806
Restricted Revenue from State Sources:25 Adult Education 0 0
Regular Education:26 Professional Development 22,044 23,95427 Other Regular Education 100 0
Special Education:28 Gifted & Talented 100 029 Alternative Learning Environment (ALE) 7,842 5,67930 English Language Learner (ELL) 0 031 National School Lunch Act (NSLA) 143,344 154,83632 Other Special Education 24,960 18,25633 Workforce Education 8,938 1,62534 School Food Service 1,903 1,60035 Educational Service Cooperatives 0 036 Early Childhood Programs 0 037 Magnet School Programs 0 038 Other Non-Instructional Programs 27,623 14,55739 Total Restricted Revenue from State Sources 236,854 220,50740 Total Restricted Revenue from Federal
Sources 810,725 739,197
Other Sources of Funds:41 Financing Sources 0 042 Balances from Consolidated/Annexed District 0 043 Indirect Cost Reimbursement 0 044 Gains and Losses from Sale of Fixed Assets 2,450 045 Compensation for Loss of Fixed Assets 0 046 Other 0 047 Total Other Sources of Funds 2,450 048 Total Revenue and Other Sources of Funds
from All Sources 5,220,458 4,864,510
2010-2011 2011-2012Actual Budget
CURRENT EXPENDITURESInstruction:
49 Regular Instruction 1,892,758 1,740,81050 Special Education 433,772 420,06951 Workforce Education 199,358 284,73852 Adult Education 0 053 Compensatory Education 259,964 168,22954 Other 213,907 240,30055 Total Instruction 2,999,758 2,854,146
District Level Support:56 General Administration 204,407 223,84057 Central Services 102,587 106,22958 Maintenance & Operations of Plant 513,710 522,64359 Student Transportation 126,267 209,74260 Other District Level Support Services 22,144 7,70061 Total District Support Services 969,115 1,070,154
School Level Support:62 Student Support Services 156,554 191,16463 Instructional Staff Support Services 367,089 402,43964 School Administration 324,166 247,20665 Total District Support Services 847,809 840,809
Non-Instructional Services:66 Food Service Operations 302,971 311,58567 Other Enterprise Operations 0 068 Community Operations 0 1,00069 Other Non-Instructional Services 0 070 Total Non-Instructional Services 302,971 312,58571 Facilities Acquisition and Construction 6,212 26,96872 Debt Service 209,560 205,13175 Other Non-Programmed Costs 0 076 Total Expenditures 5,335,425 5,309,79377 Less: Capital Expenditures 68,085 144,88978 Less: Debt Service 209,560 205,13179 Total Current Expenditures 5,057,781 4,959,77380 Exclusions from Current Expenditures 298,23481 Net Current Expenditures 4,759,547
82 Per Pupil Expenditures 8,951
83 Personnel - Non-Federal Certified Clsrm FTEs 45.4084 Avg Salary - Non-Fed Certified Clsrm FTEs 38,55885 Personnel - Non-Federal Certified FTEs 51.4586 Avg Salary - Non-Fed Certified FTEs 40,60287.1 Legal Balance (funds 1-2-4) 1,762,00287.2 Categorical Fund Balance 45,20487.3 Deposits with Paying Agents (QZAB) 087.4 Net Legal Bal (Excl Cat & QZAB) 1,716,79988 Building Fund Balance (fund 3) 56,94289 Capital Outlay Fund Balance (fund 5) 0
Jan 30, 2012 - 46 - 9:35:29 AM

Annual Statistical Report 2010-2011
County: CRAIGHEAD WESTSIDE CONS. SCH DIST(CRAIGH LEA:1602000
2010-2011 2011-2012Actual Budget
1 Area in Square Miles 2092 ADA 1,5353 ADA pct Change over 5 Yrs. (3%)4 4 QTR ADM 1,6205 Prior Year 3QTR ADM 1,5986 Assessment 97,151,8837 M&O Mills 25.008 URT Mills 25.009 M&O Mills in Excess of URT 0.0010 Dedicated M&O Mills 0.0011 Debt Service Mills 7.1712 Total Mills 32.1713 Total Debt Bond/Non-Bond 6,342,417
State and Local Revenue:14 Property Tax Receipts (Including URT) 2,732,964 3,404,62415 Other Local Receipts 878,724 648,69716 Revenue from Intermediate Sources 0 017.1 Foundation Funding (Excl URT) 7,347,520 7,580,80017.2 Tax Collection Rate Guarantee 37,124 018 Student Growth Funding 129,796 019 Declining Enrollment Funding 0 020 Consolidation Incentive/Assistance 0 021 Isolated Funding 0 022 Supplemental Millage Incentive Funding 12,477 9,98123 Other Unrestricted State Funding 31,422 024 Total Unrestricted Revenue from State and
Local Sources 11,170,027 11,644,102
Restricted Revenue from State Sources:25 Adult Education 0 0
Regular Education:26 Professional Development 66,096 68,70927 Other Regular Education 1,940 0
Special Education:28 Gifted & Talented 900 029 Alternative Learning Environment (ALE) 22,753 18,57030 English Language Learner (ELL) 0 031 National School Lunch Act (NSLA) 428,544 446,29232 Other Special Education 343,238 033 Workforce Education 68,792 50,37534 School Food Service 6,520 6,50035 Educational Service Cooperatives 0 036 Early Childhood Programs 169,846 170,00037 Magnet School Programs 0 038 Other Non-Instructional Programs 109,821 102,54439 Total Restricted Revenue from State Sources 1,218,450 862,99040 Total Restricted Revenue from Federal
Sources 2,391,889 2,033,554
Other Sources of Funds:41 Financing Sources 178,520 042 Balances from Consolidated/Annexed District 0 043 Indirect Cost Reimbursement 0 044 Gains and Losses from Sale of Fixed Assets 0 045 Compensation for Loss of Fixed Assets 53,075 046 Other 0 047 Total Other Sources of Funds 231,595 048 Total Revenue and Other Sources of Funds
from All Sources 15,011,961 14,540,646
2010-2011 2011-2012Actual Budget
CURRENT EXPENDITURESInstruction:
49 Regular Instruction 5,645,401 5,228,84350 Special Education 1,287,068 1,059,47751 Workforce Education 333,807 350,28952 Adult Education 0 053 Compensatory Education 464,369 467,44654 Other 538,408 584,19055 Total Instruction 8,269,053 7,690,245
District Level Support:56 General Administration 188,159 193,03457 Central Services 410,148 390,44758 Maintenance & Operations of Plant 1,370,866 1,446,53359 Student Transportation 672,238 727,14760 Other District Level Support Services 41,244 26,30061 Total District Support Services 2,682,655 2,783,461
School Level Support:62 Student Support Services 635,269 703,60163 Instructional Staff Support Services 703,765 754,61664 School Administration 555,144 551,40565 Total District Support Services 1,894,178 2,009,622
Non-Instructional Services:66 Food Service Operations 796,851 656,92467 Other Enterprise Operations 0 068 Community Operations 73,017 80,35069 Other Non-Instructional Services 0 070 Total Non-Instructional Services 869,869 737,27471 Facilities Acquisition and Construction 456,241 116,54472 Debt Service 647,733 572,73375 Other Non-Programmed Costs 0 076 Total Expenditures 14,819,727 13,909,87977 Less: Capital Expenditures 753,121 176,23478 Less: Debt Service 647,733 572,73379 Total Current Expenditures 13,418,874 13,160,91180 Exclusions from Current Expenditures 1,080,61281 Net Current Expenditures 12,338,262
82 Per Pupil Expenditures 8,037
83 Personnel - Non-Federal Certified Clsrm FTEs 114.4684 Avg Salary - Non-Fed Certified Clsrm FTEs 40,65385 Personnel - Non-Federal Certified FTEs 123.5286 Avg Salary - Non-Fed Certified FTEs 42,47887.1 Legal Balance (funds 1-2-4) 1,678,62387.2 Categorical Fund Balance 49,66887.3 Deposits with Paying Agents (QZAB) 148,62187.4 Net Legal Bal (Excl Cat & QZAB) 1,480,33588 Building Fund Balance (fund 3) 223,30489 Capital Outlay Fund Balance (fund 5) 0
Jan 30, 2012 - 47 - 9:35:29 AM

Annual Statistical Report 2010-2011
County: CRAIGHEAD BROOKLAND SCHOOL DISTRICT LEA:1603000
2010-2011 2011-2012Actual Budget
1 Area in Square Miles 1132 ADA 1,5673 ADA pct Change over 5 Yrs. 24%4 4 QTR ADM 1,6255 Prior Year 3QTR ADM 1,5746 Assessment 97,971,8327 M&O Mills 25.008 URT Mills 25.009 M&O Mills in Excess of URT 0.0010 Dedicated M&O Mills 0.0011 Debt Service Mills 12.0112 Total Mills 37.0113 Total Debt Bond/Non-Bond 10,690,489
State and Local Revenue:14 Property Tax Receipts (Including URT) 3,342,596 3,807,45415 Other Local Receipts 1,007,765 588,21416 Revenue from Intermediate Sources 0 017.1 Foundation Funding (Excl URT) 7,220,250 7,533,24817.2 Tax Collection Rate Guarantee 43,611 018 Student Growth Funding 323,931 200,00019 Declining Enrollment Funding 0 020 Consolidation Incentive/Assistance 0 021 Isolated Funding 0 022 Supplemental Millage Incentive Funding 0 023 Other Unrestricted State Funding 18,007 18,00724 Total Unrestricted Revenue from State and
Local Sources 11,956,161 12,146,923
Restricted Revenue from State Sources:25 Adult Education 0 360
Regular Education:26 Professional Development 65,101 68,52027 Other Regular Education 6,691 7,200
Special Education:28 Gifted & Talented 1,000 029 Alternative Learning Environment (ALE) 28,360 33,40930 English Language Learner (ELL) 4,102 031 National School Lunch Act (NSLA) 313,328 314,22632 Other Special Education 57,430 35,61133 Workforce Education 52,679 24,37534 School Food Service 5,919 6,20035 Educational Service Cooperatives 0 036 Early Childhood Programs 296,460 296,46037 Magnet School Programs 0 038 Other Non-Instructional Programs 365,777 616,32539 Total Restricted Revenue from State Sources 1,196,847 1,402,68640 Total Restricted Revenue from Federal
Sources 1,839,146 1,458,383
Other Sources of Funds:41 Financing Sources 510,761 188,40942 Balances from Consolidated/Annexed District 0 043 Indirect Cost Reimbursement 0 044 Gains and Losses from Sale of Fixed Assets 0 045 Compensation for Loss of Fixed Assets 0 046 Other 0 047 Total Other Sources of Funds 510,761 188,40948 Total Revenue and Other Sources of Funds
from All Sources 15,502,914 15,196,401
2010-2011 2011-2012Actual Budget
CURRENT EXPENDITURESInstruction:
49 Regular Instruction 5,782,409 5,936,53950 Special Education 1,064,274 1,157,60151 Workforce Education 339,343 356,29452 Adult Education 0 36053 Compensatory Education 324,872 298,50654 Other 330,180 302,24655 Total Instruction 7,841,077 8,051,546
District Level Support:56 General Administration 308,028 348,49357 Central Services 159,241 147,27558 Maintenance & Operations of Plant 1,150,617 1,324,39159 Student Transportation 471,105 583,15260 Other District Level Support Services 13,303 20,83861 Total District Support Services 2,102,294 2,424,149
School Level Support:62 Student Support Services 503,146 563,78263 Instructional Staff Support Services 890,588 810,62264 School Administration 621,774 695,95765 Total District Support Services 2,015,508 2,070,361
Non-Instructional Services:66 Food Service Operations 649,676 654,91367 Other Enterprise Operations 642 068 Community Operations 143,233 146,55469 Other Non-Instructional Services 0 070 Total Non-Instructional Services 793,551 801,46771 Facilities Acquisition and Construction 727,763 1,049,47272 Debt Service 1,075,416 887,03475 Other Non-Programmed Costs 0 1,14476 Total Expenditures 14,555,609 15,285,17277 Less: Capital Expenditures 826,276 1,257,92278 Less: Debt Service 1,075,416 887,03479 Total Current Expenditures 12,653,917 13,140,21780 Exclusions from Current Expenditures 1,163,51281 Net Current Expenditures 11,490,404
82 Per Pupil Expenditures 7,331
83 Personnel - Non-Federal Certified Clsrm FTEs 113.3984 Avg Salary - Non-Fed Certified Clsrm FTEs 42,00285 Personnel - Non-Federal Certified FTEs 124.5086 Avg Salary - Non-Fed Certified FTEs 43,31187.1 Legal Balance (funds 1-2-4) 2,054,43987.2 Categorical Fund Balance 19,62387.3 Deposits with Paying Agents (QZAB) 087.4 Net Legal Bal (Excl Cat & QZAB) 2,034,81688 Building Fund Balance (fund 3) 886,27289 Capital Outlay Fund Balance (fund 5) 0
Jan 30, 2012 - 48 - 9:35:29 AM

Annual Statistical Report 2010-2011
County: CRAIGHEAD BUFFALO IS. CENTRAL SCH. DIST. LEA:1605000
2010-2011 2011-2012Actual Budget
1 Area in Square Miles 1382 ADA 7743 ADA pct Change over 5 Yrs. (1%)4 4 QTR ADM 8225 Prior Year 3QTR ADM 8076 Assessment 51,082,0967 M&O Mills 25.008 URT Mills 25.009 M&O Mills in Excess of URT 0.0010 Dedicated M&O Mills 0.0011 Debt Service Mills 8.0012 Total Mills 33.0013 Total Debt Bond/Non-Bond 3,515,000
State and Local Revenue:14 Property Tax Receipts (Including URT) 1,357,399 1,578,81015 Other Local Receipts 742,672 163,35016 Revenue from Intermediate Sources 0 017.1 Foundation Funding (Excl URT) 3,678,213 3,791,60317.2 Tax Collection Rate Guarantee 23,318 018 Student Growth Funding 0 019 Declining Enrollment Funding 93,688 020 Consolidation Incentive/Assistance 0 021 Isolated Funding 0 022 Supplemental Millage Incentive Funding 173 023 Other Unrestricted State Funding 0 024 Total Unrestricted Revenue from State and
Local Sources 5,895,463 5,533,763
Restricted Revenue from State Sources:25 Adult Education 0 0
Regular Education:26 Professional Development 33,374 34,83127 Other Regular Education 0 2,400
Special Education:28 Gifted & Talented 100 029 Alternative Learning Environment (ALE) 0 030 English Language Learner (ELL) 15,236 7,50031 National School Lunch Act (NSLA) 257,920 280,32432 Other Special Education 3,306 033 Workforce Education 0 034 School Food Service 2,940 2,75035 Educational Service Cooperatives 0 036 Early Childhood Programs 145,320 145,00037 Magnet School Programs 0 038 Other Non-Instructional Programs 67,937 47,93439 Total Restricted Revenue from State Sources 526,132 520,73940 Total Restricted Revenue from Federal
Sources 1,639,760 876,736
Other Sources of Funds:41 Financing Sources 0 042 Balances from Consolidated/Annexed District 0 043 Indirect Cost Reimbursement 0 044 Gains and Losses from Sale of Fixed Assets 0 045 Compensation for Loss of Fixed Assets 0 046 Other 0 047 Total Other Sources of Funds 0 048 Total Revenue and Other Sources of Funds
from All Sources 8,061,355 6,931,238
2010-2011 2011-2012Actual Budget
CURRENT EXPENDITURESInstruction:
49 Regular Instruction 4,052,630 3,451,80450 Special Education 576,636 548,31951 Workforce Education 255,098 264,78052 Adult Education 0 053 Compensatory Education 399,394 290,41854 Other 66,207 69,15555 Total Instruction 5,349,965 4,624,476
District Level Support:56 General Administration 226,194 229,11057 Central Services 38,460 39,15058 Maintenance & Operations of Plant 710,085 769,94659 Student Transportation 266,847 232,73060 Other District Level Support Services 5,017 5,00061 Total District Support Services 1,246,604 1,275,936
School Level Support:62 Student Support Services 217,092 229,71063 Instructional Staff Support Services 258,480 287,31564 School Administration 424,034 416,24565 Total District Support Services 899,606 933,270
Non-Instructional Services:66 Food Service Operations 368,403 377,20067 Other Enterprise Operations 0 068 Community Operations 718 069 Other Non-Instructional Services 0 070 Total Non-Instructional Services 369,121 377,20071 Facilities Acquisition and Construction 64,434 072 Debt Service 117,557 232,15675 Other Non-Programmed Costs 0 076 Total Expenditures 8,047,285 7,443,03877 Less: Capital Expenditures 319,174 106,00078 Less: Debt Service 117,557 232,15679 Total Current Expenditures 7,610,554 7,104,88280 Exclusions from Current Expenditures 695,25081 Net Current Expenditures 6,915,304
82 Per Pupil Expenditures 8,935
83 Personnel - Non-Federal Certified Clsrm FTEs 71.0084 Avg Salary - Non-Fed Certified Clsrm FTEs 40,58085 Personnel - Non-Federal Certified FTEs 76.0086 Avg Salary - Non-Fed Certified FTEs 42,53487.1 Legal Balance (funds 1-2-4) 1,168,52087.2 Categorical Fund Balance 134,61087.3 Deposits with Paying Agents (QZAB) 087.4 Net Legal Bal (Excl Cat & QZAB) 1,033,91088 Building Fund Balance (fund 3) 134,33389 Capital Outlay Fund Balance (fund 5) 0
Jan 30, 2012 - 49 - 9:35:29 AM

Annual Statistical Report 2010-2011
County: CRAIGHEAD JONESBORO SCHOOL DISTRICT LEA:1608000
2010-2011 2011-2012Actual Budget
1 Area in Square Miles 362 ADA 4,9123 ADA pct Change over 5 Yrs. 12%4 4 QTR ADM 5,3155 Prior Year 3QTR ADM 5,2156 Assessment 505,829,5137 M&O Mills 25.408 URT Mills 25.009 M&O Mills in Excess of URT 0.4010 Dedicated M&O Mills 0.0011 Debt Service Mills 7.7012 Total Mills 33.1013 Total Debt Bond/Non-Bond 43,182,475
State and Local Revenue:14 Property Tax Receipts (Including URT) 14,164,338 15,386,98815 Other Local Receipts 2,142,166 1,640,14216 Revenue from Intermediate Sources 0 017.1 Foundation Funding (Excl URT) 19,439,646 20,294,84717.2 Tax Collection Rate Guarantee 291,130 389,49218 Student Growth Funding 714,051 019 Declining Enrollment Funding 0 020 Consolidation Incentive/Assistance 0 021 Isolated Funding 0 022 Supplemental Millage Incentive Funding 0 023 Other Unrestricted State Funding 0 024 Total Unrestricted Revenue from State and
Local Sources 36,751,330 37,711,469
Restricted Revenue from State Sources:25 Adult Education 0 0
Regular Education:26 Professional Development 215,684 225,59227 Other Regular Education 27,794 24,000
Special Education:28 Gifted & Talented 14,150 029 Alternative Learning Environment (ALE) 427,265 445,71230 English Language Learner (ELL) 70,320 70,32031 National School Lunch Act (NSLA) 1,797,411 2,704,72532 Other Special Education 272,779 033 Workforce Education 273,766 323,08034 School Food Service 20,089 20,00035 Educational Service Cooperatives 0 036 Early Childhood Programs 398,505 397,80037 Magnet School Programs 0 038 Other Non-Instructional Programs 140,395 333,76639 Total Restricted Revenue from State Sources 3,658,159 4,544,99640 Total Restricted Revenue from Federal
Sources 11,966,386 7,361,157
Other Sources of Funds:41 Financing Sources 18,625,038 042 Balances from Consolidated/Annexed District 0 043 Indirect Cost Reimbursement 82,565 57,41044 Gains and Losses from Sale of Fixed Assets 2,830 045 Compensation for Loss of Fixed Assets 0 046 Other 0 047 Total Other Sources of Funds 18,710,433 57,41048 Total Revenue and Other Sources of Funds
from All Sources 71,086,308 49,675,032
2010-2011 2011-2012Actual Budget
CURRENT EXPENDITURESInstruction:
49 Regular Instruction 16,559,993 16,267,09450 Special Education 3,595,203 3,194,92651 Workforce Education 1,237,109 1,196,04352 Adult Education 0 053 Compensatory Education 2,146,138 2,260,93254 Other 3,483,484 3,316,71255 Total Instruction 27,021,928 26,235,707
District Level Support:56 General Administration 917,453 866,02657 Central Services 578,770 571,63058 Maintenance & Operations of Plant 4,524,984 4,663,68959 Student Transportation 1,582,847 1,744,73860 Other District Level Support Services 206,138 163,65461 Total District Support Services 7,810,191 8,009,737
School Level Support:62 Student Support Services 1,568,678 1,608,01763 Instructional Staff Support Services 4,659,670 4,679,59964 School Administration 2,543,583 2,469,40165 Total District Support Services 8,771,930 8,757,017
Non-Instructional Services:66 Food Service Operations 2,882,964 3,631,31867 Other Enterprise Operations 0 068 Community Operations 11,498 12,48069 Other Non-Instructional Services 0 070 Total Non-Instructional Services 2,894,462 3,643,79871 Facilities Acquisition and Construction 5,632,971 14,920,54172 Debt Service 2,045,918 3,122,71275 Other Non-Programmed Costs 48,869 076 Total Expenditures 54,226,270 64,689,51377 Less: Capital Expenditures 7,021,350 16,152,77578 Less: Debt Service 2,045,918 3,122,71279 Total Current Expenditures 45,159,001 45,414,02680 Exclusions from Current Expenditures 2,181,81781 Net Current Expenditures 42,977,184
82 Per Pupil Expenditures 8,750
83 Personnel - Non-Federal Certified Clsrm FTEs 315.3384 Avg Salary - Non-Fed Certified Clsrm FTEs 45,53985 Personnel - Non-Federal Certified FTEs 341.0686 Avg Salary - Non-Fed Certified FTEs 48,13287.1 Legal Balance (funds 1-2-4) 10,005,21887.2 Categorical Fund Balance 966,44987.3 Deposits with Paying Agents (QZAB) 300,31787.4 Net Legal Bal (Excl Cat & QZAB) 8,738,45188 Building Fund Balance (fund 3) 20,138,74789 Capital Outlay Fund Balance (fund 5) 0
Jan 30, 2012 - 50 - 9:35:29 AM

Annual Statistical Report 2010-2011
County: CRAIGHEAD NETTLETON SCHOOL DISTRICT LEA:1611000
2010-2011 2011-2012Actual Budget
1 Area in Square Miles 422 ADA 3,0103 ADA pct Change over 5 Yrs. 9%4 4 QTR ADM 3,1495 Prior Year 3QTR ADM 3,1156 Assessment 375,717,3597 M&O Mills 26.008 URT Mills 25.009 M&O Mills in Excess of URT 1.0010 Dedicated M&O Mills 0.0011 Debt Service Mills 9.0012 Total Mills 35.0013 Total Debt Bond/Non-Bond 25,795,117
State and Local Revenue:14 Property Tax Receipts (Including URT) 12,359,186 12,857,29715 Other Local Receipts 1,576,576 466,73516 Revenue from Intermediate Sources 12,106 017.1 Foundation Funding (Excl URT) 9,856,446 10,147,98217.2 Tax Collection Rate Guarantee 121,568 018 Student Growth Funding 210,905 019 Declining Enrollment Funding 0 020 Consolidation Incentive/Assistance 0 021 Isolated Funding 0 022 Supplemental Millage Incentive Funding 0 023 Other Unrestricted State Funding 0 024 Total Unrestricted Revenue from State and
Local Sources 24,136,787 23,472,014
Restricted Revenue from State Sources:25 Adult Education 0 0
Regular Education:26 Professional Development 128,833 133,61627 Other Regular Education 17,010 0
Special Education:28 Gifted & Talented 1,550 029 Alternative Learning Environment (ALE) 165,649 165,64930 English Language Learner (ELL) 39,262 39,26131 National School Lunch Act (NSLA) 898,752 925,98032 Other Special Education 225,043 033 Workforce Education 130,031 034 School Food Service 11,587 11,70035 Educational Service Cooperatives 0 036 Early Childhood Programs 437,303 437,40037 Magnet School Programs 0 038 Other Non-Instructional Programs 83,852 30,95339 Total Restricted Revenue from State Sources 2,138,873 1,744,55940 Total Restricted Revenue from Federal
Sources 4,548,959 2,958,154
Other Sources of Funds:41 Financing Sources 587,681 042 Balances from Consolidated/Annexed District 0 043 Indirect Cost Reimbursement 11,116 044 Gains and Losses from Sale of Fixed Assets 0 045 Compensation for Loss of Fixed Assets 15,538 046 Other 0 047 Total Other Sources of Funds 614,335 048 Total Revenue and Other Sources of Funds
from All Sources 31,438,954 28,174,728
2010-2011 2011-2012Actual Budget
CURRENT EXPENDITURESInstruction:
49 Regular Instruction 10,755,279 10,470,57350 Special Education 2,381,542 2,255,60151 Workforce Education 746,908 560,04552 Adult Education 0 053 Compensatory Education 914,842 766,10854 Other 1,440,820 1,305,47055 Total Instruction 16,239,391 15,357,796
District Level Support:56 General Administration 449,911 415,65757 Central Services 288,715 300,03158 Maintenance & Operations of Plant 2,755,714 2,675,77459 Student Transportation 1,326,268 941,00160 Other District Level Support Services 95,026 84,29761 Total District Support Services 4,915,634 4,416,760
School Level Support:62 Student Support Services 1,403,101 1,453,39463 Instructional Staff Support Services 2,265,287 1,874,00564 School Administration 1,684,994 1,665,15765 Total District Support Services 5,353,382 4,992,556
Non-Instructional Services:66 Food Service Operations 1,520,235 1,396,00367 Other Enterprise Operations 0 068 Community Operations 444,190 130,87869 Other Non-Instructional Services 0 070 Total Non-Instructional Services 1,964,425 1,526,88071 Facilities Acquisition and Construction 718,779 072 Debt Service 2,351,131 2,442,13975 Other Non-Programmed Costs 0 076 Total Expenditures 31,542,743 28,736,13277 Less: Capital Expenditures 1,488,551 174,44678 Less: Debt Service 2,351,131 2,442,13979 Total Current Expenditures 27,703,060 26,119,54680 Exclusions from Current Expenditures 1,778,41781 Net Current Expenditures 25,924,643
82 Per Pupil Expenditures 8,612
83 Personnel - Non-Federal Certified Clsrm FTEs 216.8084 Avg Salary - Non-Fed Certified Clsrm FTEs 45,14485 Personnel - Non-Federal Certified FTEs 234.8786 Avg Salary - Non-Fed Certified FTEs 47,29687.1 Legal Balance (funds 1-2-4) 1,737,39187.2 Categorical Fund Balance 61887.3 Deposits with Paying Agents (QZAB) 087.4 Net Legal Bal (Excl Cat & QZAB) 1,736,77388 Building Fund Balance (fund 3) 592,41889 Capital Outlay Fund Balance (fund 5) 0
Jan 30, 2012 - 51 - 9:35:29 AM

Annual Statistical Report 2010-2011
County: CRAIGHEAD VALLEY VIEW SCHOOL DISTRICT LEA:1612000
2010-2011 2011-2012Actual Budget
1 Area in Square Miles 1062 ADA 2,2653 ADA pct Change over 5 Yrs. 29%4 4 QTR ADM 2,3495 Prior Year 3QTR ADM 2,2796 Assessment 159,845,6707 M&O Mills 25.008 URT Mills 25.009 M&O Mills in Excess of URT 0.0010 Dedicated M&O Mills 0.0011 Debt Service Mills 12.6012 Total Mills 37.6013 Total Debt Bond/Non-Bond 37,204,839
State and Local Revenue:14 Property Tax Receipts (Including URT) 5,538,221 5,869,87115 Other Local Receipts 1,432,245 900,15016 Revenue from Intermediate Sources 0 017.1 Foundation Funding (Excl URT) 10,040,060 10,496,56117.2 Tax Collection Rate Guarantee 60,272 018 Student Growth Funding 441,084 500,00019 Declining Enrollment Funding 0 020 Consolidation Incentive/Assistance 0 021 Isolated Funding 0 022 Supplemental Millage Incentive Funding 0 023 Other Unrestricted State Funding 22,190 024 Total Unrestricted Revenue from State and
Local Sources 17,534,072 17,766,582
Restricted Revenue from State Sources:25 Adult Education 538,258 534,812
Regular Education:26 Professional Development 94,254 99,41627 Other Regular Education 41,030 4,600
Special Education:28 Gifted & Talented 4,533 029 Alternative Learning Environment (ALE) 12,392 10,19730 English Language Learner (ELL) 12,599 031 National School Lunch Act (NSLA) 279,903 285,46732 Other Special Education 159,867 110,29733 Workforce Education 47,938 37,37534 School Food Service 8,790 8,70035 Educational Service Cooperatives 0 036 Early Childhood Programs 288,198 291,60037 Magnet School Programs 0 038 Other Non-Instructional Programs 319,268 5,917,84339 Total Restricted Revenue from State Sources 1,807,030 7,300,30740 Total Restricted Revenue from Federal
Sources 1,658,538 1,571,578
Other Sources of Funds:41 Financing Sources 16,426,858 112,00042 Balances from Consolidated/Annexed District 0 043 Indirect Cost Reimbursement 761 1,00344 Gains and Losses from Sale of Fixed Assets 0 045 Compensation for Loss of Fixed Assets 14,695 046 Other 0 047 Total Other Sources of Funds 16,442,313 113,00348 Total Revenue and Other Sources of Funds
from All Sources 37,441,952 26,751,470
2010-2011 2011-2012Actual Budget
CURRENT EXPENDITURESInstruction:
49 Regular Instruction 8,360,194 8,386,85950 Special Education 1,099,227 1,049,86651 Workforce Education 611,460 572,29752 Adult Education 649,446 571,82853 Compensatory Education 153,696 141,13854 Other 1,019,955 991,89355 Total Instruction 11,893,978 11,713,880
District Level Support:56 General Administration 379,409 429,58557 Central Services 198,544 548,50958 Maintenance & Operations of Plant 1,865,284 1,850,28259 Student Transportation 615,675 723,02660 Other District Level Support Services 52,619 52,04661 Total District Support Services 3,111,531 3,603,449
School Level Support:62 Student Support Services 736,632 736,70863 Instructional Staff Support Services 860,110 808,12064 School Administration 857,153 880,02365 Total District Support Services 2,453,895 2,424,851
Non-Instructional Services:66 Food Service Operations 1,146,035 1,078,38967 Other Enterprise Operations 0 068 Community Operations 0 1,34069 Other Non-Instructional Services 0 070 Total Non-Instructional Services 1,146,035 1,079,72971 Facilities Acquisition and Construction 2,737,089 22,307,06972 Debt Service 1,562,610 2,194,92675 Other Non-Programmed Costs 2,632 076 Total Expenditures 22,907,771 43,323,90477 Less: Capital Expenditures 2,956,814 22,722,09678 Less: Debt Service 1,562,610 2,194,92679 Total Current Expenditures 18,388,347 18,406,88280 Exclusions from Current Expenditures 2,287,92381 Net Current Expenditures 16,100,424
82 Per Pupil Expenditures 7,109
83 Personnel - Non-Federal Certified Clsrm FTEs 158.6084 Avg Salary - Non-Fed Certified Clsrm FTEs 44,17085 Personnel - Non-Federal Certified FTEs 168.1786 Avg Salary - Non-Fed Certified FTEs 46,26087.1 Legal Balance (funds 1-2-4) 2,675,54187.2 Categorical Fund Balance 26,92987.3 Deposits with Paying Agents (QZAB) 087.4 Net Legal Bal (Excl Cat & QZAB) 2,648,61288 Building Fund Balance (fund 3) 16,863,27089 Capital Outlay Fund Balance (fund 5) 0
Jan 30, 2012 - 52 - 9:35:29 AM

Annual Statistical Report 2010-2011
County: CRAIGHEAD RIVERSIDE SCHOOL DISTRICT LEA:1613000
2010-2011 2011-2012Actual Budget
1 Area in Square Miles 1002 ADA 7633 ADA pct Change over 5 Yrs. 4%4 4 QTR ADM 8125 Prior Year 3QTR ADM 8046 Assessment 37,673,3947 M&O Mills 25.008 URT Mills 25.009 M&O Mills in Excess of URT 0.0010 Dedicated M&O Mills 0.0011 Debt Service Mills 16.0612 Total Mills 41.0613 Total Debt Bond/Non-Bond 5,425,185
State and Local Revenue:14 Property Tax Receipts (Including URT) 1,472,367 1,480,00015 Other Local Receipts 421,158 142,57216 Revenue from Intermediate Sources 0 017.1 Foundation Funding (Excl URT) 3,937,362 4,048,68217.2 Tax Collection Rate Guarantee 3,697 4,00018 Student Growth Funding 46,076 40,68519 Declining Enrollment Funding 0 020 Consolidation Incentive/Assistance 0 021 Isolated Funding 0 022 Supplemental Millage Incentive Funding 23,622 18,89823 Other Unrestricted State Funding 0 024 Total Unrestricted Revenue from State and
Local Sources 5,904,282 5,734,837
Restricted Revenue from State Sources:25 Adult Education 0 0
Regular Education:26 Professional Development 33,234 34,32427 Other Regular Education 5,768 0
Special Education:28 Gifted & Talented 300 029 Alternative Learning Environment (ALE) 0 030 English Language Learner (ELL) 0 031 National School Lunch Act (NSLA) 252,960 259,57832 Other Special Education 60,069 3,00033 Workforce Education 38,925 43,87534 School Food Service 3,250 2,00035 Educational Service Cooperatives 0 036 Early Childhood Programs 0 037 Magnet School Programs 0 038 Other Non-Instructional Programs 5,764,701 23,49539 Total Restricted Revenue from State Sources 6,159,208 366,27240 Total Restricted Revenue from Federal
Sources 1,409,228 1,798,147
Other Sources of Funds:41 Financing Sources 0 042 Balances from Consolidated/Annexed District 0 043 Indirect Cost Reimbursement 0 044 Gains and Losses from Sale of Fixed Assets 0 045 Compensation for Loss of Fixed Assets 0 046 Other 0 047 Total Other Sources of Funds 0 048 Total Revenue and Other Sources of Funds
from All Sources 13,472,718 7,899,256
2010-2011 2011-2012Actual Budget
CURRENT EXPENDITURESInstruction:
49 Regular Instruction 3,166,915 2,716,35850 Special Education 580,622 744,19951 Workforce Education 245,992 294,70052 Adult Education 0 053 Compensatory Education 385,237 440,20754 Other 94,285 106,13555 Total Instruction 4,473,051 4,301,599
District Level Support:56 General Administration 240,084 217,97257 Central Services 52,339 88,51158 Maintenance & Operations of Plant 546,665 741,86459 Student Transportation 253,376 408,69160 Other District Level Support Services 28,394 10,00061 Total District Support Services 1,120,859 1,467,038
School Level Support:62 Student Support Services 185,799 247,26063 Instructional Staff Support Services 728,437 706,40564 School Administration 395,149 378,97365 Total District Support Services 1,309,385 1,332,638
Non-Instructional Services:66 Food Service Operations 373,814 425,54467 Other Enterprise Operations 0 068 Community Operations 0 069 Other Non-Instructional Services 0 070 Total Non-Instructional Services 373,814 425,54471 Facilities Acquisition and Construction 8,143,042 805,00072 Debt Service 403,779 418,77775 Other Non-Programmed Costs 59,632 076 Total Expenditures 15,883,563 8,750,59677 Less: Capital Expenditures 8,342,807 1,143,08078 Less: Debt Service 403,779 418,77779 Total Current Expenditures 7,136,977 7,188,73980 Exclusions from Current Expenditures 403,31781 Net Current Expenditures 6,733,659
82 Per Pupil Expenditures 8,826
83 Personnel - Non-Federal Certified Clsrm FTEs 64.5584 Avg Salary - Non-Fed Certified Clsrm FTEs 40,58985 Personnel - Non-Federal Certified FTEs 69.5886 Avg Salary - Non-Fed Certified FTEs 42,40187.1 Legal Balance (funds 1-2-4) 920,00487.2 Categorical Fund Balance 119,16287.3 Deposits with Paying Agents (QZAB) 087.4 Net Legal Bal (Excl Cat & QZAB) 800,84288 Building Fund Balance (fund 3) 1,188,89689 Capital Outlay Fund Balance (fund 5) 0
Jan 30, 2012 - 53 - 9:35:29 AM

Annual Statistical Report 2010-2011
County: CRAWFORD ALMA SCHOOL DISTRICT LEA:1701000
2010-2011 2011-2012Actual Budget
1 Area in Square Miles 1022 ADA 3,2623 ADA pct Change over 5 Yrs. 7%4 4 QTR ADM 3,4065 Prior Year 3QTR ADM 3,4326 Assessment 164,383,4187 M&O Mills 25.008 URT Mills 25.009 M&O Mills in Excess of URT 0.0010 Dedicated M&O Mills 0.0011 Debt Service Mills 18.4012 Total Mills 43.4013 Total Debt Bond/Non-Bond 53,585,000
State and Local Revenue:14 Property Tax Receipts (Including URT) 6,588,614 7,041,18315 Other Local Receipts 1,802,327 88,84316 Revenue from Intermediate Sources 2,264 2,00017.1 Foundation Funding (Excl URT) 16,753,036 16,921,99817.2 Tax Collection Rate Guarantee 67,487 018 Student Growth Funding 0 019 Declining Enrollment Funding 0 62,82220 Consolidation Incentive/Assistance 0 021 Isolated Funding 0 022 Supplemental Millage Incentive Funding 0 023 Other Unrestricted State Funding 23,775 024 Total Unrestricted Revenue from State and
Local Sources 25,237,504 24,116,846
Restricted Revenue from State Sources:25 Adult Education 0 0
Regular Education:26 Professional Development 141,939 144,57327 Other Regular Education 19,750 11,600
Special Education:28 Gifted & Talented 5,350 5,00029 Alternative Learning Environment (ALE) 93,571 191,25030 English Language Learner (ELL) 1,172 1,00031 National School Lunch Act (NSLA) 860,064 882,46432 Other Special Education 33,067 19,50033 Workforce Education 174,407 173,59434 School Food Service 12,209 035 Educational Service Cooperatives 0 036 Early Childhood Programs 0 037 Magnet School Programs 0 038 Other Non-Instructional Programs 2,320,376 1,975,61339 Total Restricted Revenue from State Sources 3,661,905 3,404,59440 Total Restricted Revenue from Federal
Sources 3,825,119 1,833,638
Other Sources of Funds:41 Financing Sources 2,895,013 042 Balances from Consolidated/Annexed District 0 043 Indirect Cost Reimbursement 0 044 Gains and Losses from Sale of Fixed Assets 0 045 Compensation for Loss of Fixed Assets 0 046 Other 0 047 Total Other Sources of Funds 2,895,013 048 Total Revenue and Other Sources of Funds
from All Sources 35,619,539 29,355,078
2010-2011 2011-2012Actual Budget
CURRENT EXPENDITURESInstruction:
49 Regular Instruction 12,150,843 10,881,29050 Special Education 2,334,872 2,335,19751 Workforce Education 603,475 653,55352 Adult Education 0 053 Compensatory Education 1,487,324 1,451,97454 Other 870,836 932,07855 Total Instruction 17,447,350 16,254,091
District Level Support:56 General Administration 891,030 934,19257 Central Services 595,716 632,13458 Maintenance & Operations of Plant 2,804,662 2,527,08559 Student Transportation 1,316,114 1,377,26060 Other District Level Support Services 46,441 50,79961 Total District Support Services 5,653,963 5,521,470
School Level Support:62 Student Support Services 1,033,241 1,026,64263 Instructional Staff Support Services 1,259,746 1,109,56164 School Administration 1,295,708 1,290,17365 Total District Support Services 3,588,696 3,426,377
Non-Instructional Services:66 Food Service Operations 1,672,170 13,86867 Other Enterprise Operations 0 068 Community Operations 0 2,20069 Other Non-Instructional Services 0 070 Total Non-Instructional Services 1,672,170 16,06871 Facilities Acquisition and Construction 4,288,536 1,890,00072 Debt Service 2,301,210 2,766,85475 Other Non-Programmed Costs 57,943 076 Total Expenditures 35,009,868 29,874,86077 Less: Capital Expenditures 4,517,164 2,023,91178 Less: Debt Service 2,301,210 2,766,85479 Total Current Expenditures 28,191,494 25,084,09680 Exclusions from Current Expenditures 1,827,19381 Net Current Expenditures 26,364,301
82 Per Pupil Expenditures 8,083
83 Personnel - Non-Federal Certified Clsrm FTEs 230.1184 Avg Salary - Non-Fed Certified Clsrm FTEs 45,38385 Personnel - Non-Federal Certified FTEs 249.3986 Avg Salary - Non-Fed Certified FTEs 48,71587.1 Legal Balance (funds 1-2-4) 298,07687.2 Categorical Fund Balance 087.3 Deposits with Paying Agents (QZAB) 087.4 Net Legal Bal (Excl Cat & QZAB) 298,07688 Building Fund Balance (fund 3) 617,97589 Capital Outlay Fund Balance (fund 5) 0
Jan 30, 2012 - 54 - 9:35:29 AM

Annual Statistical Report 2010-2011
County: CRAWFORD CEDARVILLE SCHOOL DISTRICT LEA:1702000
2010-2011 2011-2012Actual Budget
1 Area in Square Miles 1522 ADA 8563 ADA pct Change over 5 Yrs. (2%)4 4 QTR ADM 9255 Prior Year 3QTR ADM 9356 Assessment 38,831,6317 M&O Mills 25.008 URT Mills 25.009 M&O Mills in Excess of URT 0.0010 Dedicated M&O Mills 0.0011 Debt Service Mills 11.0012 Total Mills 36.0013 Total Debt Bond/Non-Bond 6,392,403
State and Local Revenue:14 Property Tax Receipts (Including URT) 1,401,521 1,360,00015 Other Local Receipts 410,046 325,31616 Revenue from Intermediate Sources 603 017.1 Foundation Funding (Excl URT) 4,642,375 4,217,59917.2 Tax Collection Rate Guarantee 10,923 018 Student Growth Funding 0 019 Declining Enrollment Funding 4,758 22,73320 Consolidation Incentive/Assistance 0 021 Isolated Funding 0 022 Supplemental Millage Incentive Funding 14,335 11,46823 Other Unrestricted State Funding 0 024 Total Unrestricted Revenue from State and
Local Sources 6,484,561 5,937,116
Restricted Revenue from State Sources:25 Adult Education 0 0
Regular Education:26 Professional Development 38,677 40,23327 Other Regular Education 699 0
Special Education:28 Gifted & Talented 150 029 Alternative Learning Environment (ALE) 51,194 100,39230 English Language Learner (ELL) 0 031 National School Lunch Act (NSLA) 557,169 684,11232 Other Special Education 4,191 033 Workforce Education 17,875 22,00034 School Food Service 3,512 3,50035 Educational Service Cooperatives 0 036 Early Childhood Programs 0 037 Magnet School Programs 0 038 Other Non-Instructional Programs 4,334,489 1,544,20339 Total Restricted Revenue from State Sources 5,007,957 2,394,44040 Total Restricted Revenue from Federal
Sources 3,710,188 1,935,176
Other Sources of Funds:41 Financing Sources 5,113,783 897,09042 Balances from Consolidated/Annexed District 0 043 Indirect Cost Reimbursement 4,778 044 Gains and Losses from Sale of Fixed Assets 7,976 045 Compensation for Loss of Fixed Assets 158,641 046 Other 0 047 Total Other Sources of Funds 5,285,178 897,09048 Total Revenue and Other Sources of Funds
from All Sources 20,487,884 11,163,822
2010-2011 2011-2012Actual Budget
CURRENT EXPENDITURESInstruction:
49 Regular Instruction 2,939,684 3,206,35450 Special Education 249,700 306,28951 Workforce Education 180,197 183,17352 Adult Education 0 053 Compensatory Education 311,374 250,63854 Other 192,712 175,60355 Total Instruction 3,873,668 4,122,057
District Level Support:56 General Administration 246,208 262,51557 Central Services 126,909 125,53258 Maintenance & Operations of Plant 827,560 869,09459 Student Transportation 406,580 463,30660 Other District Level Support Services 15,529 16,00061 Total District Support Services 1,622,787 1,736,447
School Level Support:62 Student Support Services 395,149 436,37363 Instructional Staff Support Services 839,852 892,74964 School Administration 442,103 436,90265 Total District Support Services 1,677,104 1,766,024
Non-Instructional Services:66 Food Service Operations 569,493 605,83267 Other Enterprise Operations 0 068 Community Operations 554 6,00069 Other Non-Instructional Services 0 070 Total Non-Instructional Services 570,047 611,83271 Facilities Acquisition and Construction 7,194,044 7,060,33472 Debt Service 368,040 406,94275 Other Non-Programmed Costs 24,413 8,19876 Total Expenditures 15,330,103 15,711,83477 Less: Capital Expenditures 7,493,433 7,280,96378 Less: Debt Service 368,040 406,94279 Total Current Expenditures 7,468,629 8,023,92980 Exclusions from Current Expenditures 363,62081 Net Current Expenditures 7,105,009
82 Per Pupil Expenditures 8,299
83 Personnel - Non-Federal Certified Clsrm FTEs 56.8984 Avg Salary - Non-Fed Certified Clsrm FTEs 44,59785 Personnel - Non-Federal Certified FTEs 63.2186 Avg Salary - Non-Fed Certified FTEs 48,17287.1 Legal Balance (funds 1-2-4) 3,236,90387.2 Categorical Fund Balance 65,36687.3 Deposits with Paying Agents (QZAB) 087.4 Net Legal Bal (Excl Cat & QZAB) 3,171,53688 Building Fund Balance (fund 3) 4,486,32689 Capital Outlay Fund Balance (fund 5) 0
Jan 30, 2012 - 55 - 9:35:29 AM

Annual Statistical Report 2010-2011
County: CRAWFORD MOUNTAINBURG SCHOOL DISTRICT LEA:1703000
2010-2011 2011-2012Actual Budget
1 Area in Square Miles 1962 ADA 6483 ADA pct Change over 5 Yrs. (7%)4 4 QTR ADM 6925 Prior Year 3QTR ADM 6806 Assessment 34,401,8817 M&O Mills 25.008 URT Mills 25.009 M&O Mills in Excess of URT 0.0010 Dedicated M&O Mills 0.0011 Debt Service Mills 14.1012 Total Mills 39.1013 Total Debt Bond/Non-Bond 2,678,705
State and Local Revenue:14 Property Tax Receipts (Including URT) 1,262,599 1,259,16715 Other Local Receipts 323,001 136,59616 Revenue from Intermediate Sources 448 44017.1 Foundation Funding (Excl URT) 3,215,394 3,347,40717.2 Tax Collection Rate Guarantee 680 018 Student Growth Funding 0 019 Declining Enrollment Funding 79,684 020 Consolidation Incentive/Assistance 0 021 Isolated Funding 0 022 Supplemental Millage Incentive Funding 31,274 25,01923 Other Unrestricted State Funding 0 024 Total Unrestricted Revenue from State and
Local Sources 4,913,081 4,768,629
Restricted Revenue from State Sources:25 Adult Education 0 0
Regular Education:26 Professional Development 28,134 29,45027 Other Regular Education 5,263 7,850
Special Education:28 Gifted & Talented 982 029 Alternative Learning Environment (ALE) 0 3,56530 English Language Learner (ELL) 0 031 National School Lunch Act (NSLA) 322,068 433,47732 Other Special Education 4,563 5,55033 Workforce Education 14,625 13,81234 School Food Service 6,738 6,59935 Educational Service Cooperatives 0 036 Early Childhood Programs 84,901 97,20037 Magnet School Programs 0 038 Other Non-Instructional Programs 78,775 77,79539 Total Restricted Revenue from State Sources 546,049 675,29840 Total Restricted Revenue from Federal
Sources 1,334,284 1,059,099
Other Sources of Funds:41 Financing Sources 5,170 042 Balances from Consolidated/Annexed District 0 043 Indirect Cost Reimbursement 5,692 5,50044 Gains and Losses from Sale of Fixed Assets 0 045 Compensation for Loss of Fixed Assets 6,785 046 Other 0 047 Total Other Sources of Funds 17,647 5,50048 Total Revenue and Other Sources of Funds
from All Sources 6,811,060 6,508,527
2010-2011 2011-2012Actual Budget
CURRENT EXPENDITURESInstruction:
49 Regular Instruction 2,333,516 2,350,96650 Special Education 398,878 387,25951 Workforce Education 216,259 181,40252 Adult Education 0 053 Compensatory Education 236,347 243,61554 Other 56,546 167,82355 Total Instruction 3,241,545 3,331,065
District Level Support:56 General Administration 204,184 191,32757 Central Services 133,660 107,65458 Maintenance & Operations of Plant 659,979 687,24859 Student Transportation 386,285 412,11960 Other District Level Support Services 57,649 27,76261 Total District Support Services 1,441,757 1,426,109
School Level Support:62 Student Support Services 375,301 382,26863 Instructional Staff Support Services 370,579 424,32864 School Administration 311,644 266,76065 Total District Support Services 1,057,524 1,073,355
Non-Instructional Services:66 Food Service Operations 355,245 352,63167 Other Enterprise Operations 34,565 068 Community Operations 1,782 2,20069 Other Non-Instructional Services 0 070 Total Non-Instructional Services 391,592 354,83171 Facilities Acquisition and Construction 397,715 15,64872 Debt Service 255,979 334,63575 Other Non-Programmed Costs 71 076 Total Expenditures 6,786,183 6,535,64477 Less: Capital Expenditures 449,119 115,33078 Less: Debt Service 255,979 334,63579 Total Current Expenditures 6,081,086 6,085,67980 Exclusions from Current Expenditures 291,70481 Net Current Expenditures 5,789,382
82 Per Pupil Expenditures 8,935
83 Personnel - Non-Federal Certified Clsrm FTEs 52.6884 Avg Salary - Non-Fed Certified Clsrm FTEs 39,48285 Personnel - Non-Federal Certified FTEs 57.0986 Avg Salary - Non-Fed Certified FTEs 42,41187.1 Legal Balance (funds 1-2-4) 655,07487.2 Categorical Fund Balance 57,30687.3 Deposits with Paying Agents (QZAB) 087.4 Net Legal Bal (Excl Cat & QZAB) 597,76888 Building Fund Balance (fund 3) 137,03089 Capital Outlay Fund Balance (fund 5) 0
Jan 30, 2012 - 56 - 9:35:29 AM

Annual Statistical Report 2010-2011
County: CRAWFORD MULBERRY SCHOOL DISTRICT LEA:1704000
2010-2011 2011-2012Actual Budget
1 Area in Square Miles 1252 ADA 3663 ADA pct Change over 5 Yrs. (33%)4 4 QTR ADM 3935 Prior Year 3QTR ADM 4026 Assessment 43,246,1287 M&O Mills 25.008 URT Mills 25.009 M&O Mills in Excess of URT 0.0010 Dedicated M&O Mills 0.0011 Debt Service Mills 11.4012 Total Mills 36.4013 Total Debt Bond/Non-Bond 1,417,710
State and Local Revenue:14 Property Tax Receipts (Including URT) 1,513,276 1,511,50015 Other Local Receipts 288,503 73,18016 Revenue from Intermediate Sources 262 25017.1 Foundation Funding (Excl URT) 1,297,472 1,310,69417.2 Tax Collection Rate Guarantee 11,860 10,00018 Student Growth Funding 0 019 Declining Enrollment Funding 37,885 33,88420 Consolidation Incentive/Assistance 0 021 Isolated Funding 116,944 101,00022 Supplemental Millage Incentive Funding 0 023 Other Unrestricted State Funding 0 024 Total Unrestricted Revenue from State and
Local Sources 3,266,203 3,040,508
Restricted Revenue from State Sources:25 Adult Education 0 0
Regular Education:26 Professional Development 16,646 16,58927 Other Regular Education 4,380 9,200
Special Education:28 Gifted & Talented 962 029 Alternative Learning Environment (ALE) 28,644 22,50730 English Language Learner (ELL) 0 031 National School Lunch Act (NSLA) 237,251 314,73232 Other Special Education 11,009 033 Workforce Education 5,688 1,26534 School Food Service 1,585 1,60035 Educational Service Cooperatives 0 036 Early Childhood Programs 0 037 Magnet School Programs 0 038 Other Non-Instructional Programs 99,722 9,40339 Total Restricted Revenue from State Sources 405,886 375,29640 Total Restricted Revenue from Federal
Sources 1,298,886 765,172
Other Sources of Funds:41 Financing Sources 0 042 Balances from Consolidated/Annexed District 0 043 Indirect Cost Reimbursement 2,183 044 Gains and Losses from Sale of Fixed Assets 711 045 Compensation for Loss of Fixed Assets 8,396 046 Other 0 047 Total Other Sources of Funds 11,289 048 Total Revenue and Other Sources of Funds
from All Sources 4,982,265 4,180,976
2010-2011 2011-2012Actual Budget
CURRENT EXPENDITURESInstruction:
49 Regular Instruction 1,499,879 1,286,04450 Special Education 256,377 198,01051 Workforce Education 143,607 154,80152 Adult Education 0 053 Compensatory Education 240,688 154,70354 Other 62,443 73,43055 Total Instruction 2,202,993 1,866,988
District Level Support:56 General Administration 127,872 119,40257 Central Services 70,921 92,47858 Maintenance & Operations of Plant 324,462 337,10159 Student Transportation 134,595 147,21660 Other District Level Support Services 23,685 6,39961 Total District Support Services 681,535 702,595
School Level Support:62 Student Support Services 174,568 189,99863 Instructional Staff Support Services 506,319 537,18864 School Administration 278,278 261,63465 Total District Support Services 959,166 988,820
Non-Instructional Services:66 Food Service Operations 233,094 217,49867 Other Enterprise Operations 19,968 068 Community Operations 0 45069 Other Non-Instructional Services 0 070 Total Non-Instructional Services 253,062 217,94871 Facilities Acquisition and Construction 778,985 96,46472 Debt Service 278,471 280,69175 Other Non-Programmed Costs 0 076 Total Expenditures 5,154,212 4,153,50577 Less: Capital Expenditures 822,630 121,89478 Less: Debt Service 278,471 280,69179 Total Current Expenditures 4,053,111 3,750,92080 Exclusions from Current Expenditures 104,25981 Net Current Expenditures 3,948,852
82 Per Pupil Expenditures 10,798
83 Personnel - Non-Federal Certified Clsrm FTEs 35.1484 Avg Salary - Non-Fed Certified Clsrm FTEs 41,06085 Personnel - Non-Federal Certified FTEs 39.6986 Avg Salary - Non-Fed Certified FTEs 43,77187.1 Legal Balance (funds 1-2-4) 596,33487.2 Categorical Fund Balance 5,78087.3 Deposits with Paying Agents (QZAB) 80,53387.4 Net Legal Bal (Excl Cat & QZAB) 510,02188 Building Fund Balance (fund 3) 089 Capital Outlay Fund Balance (fund 5) 0
Jan 30, 2012 - 57 - 9:35:29 AM
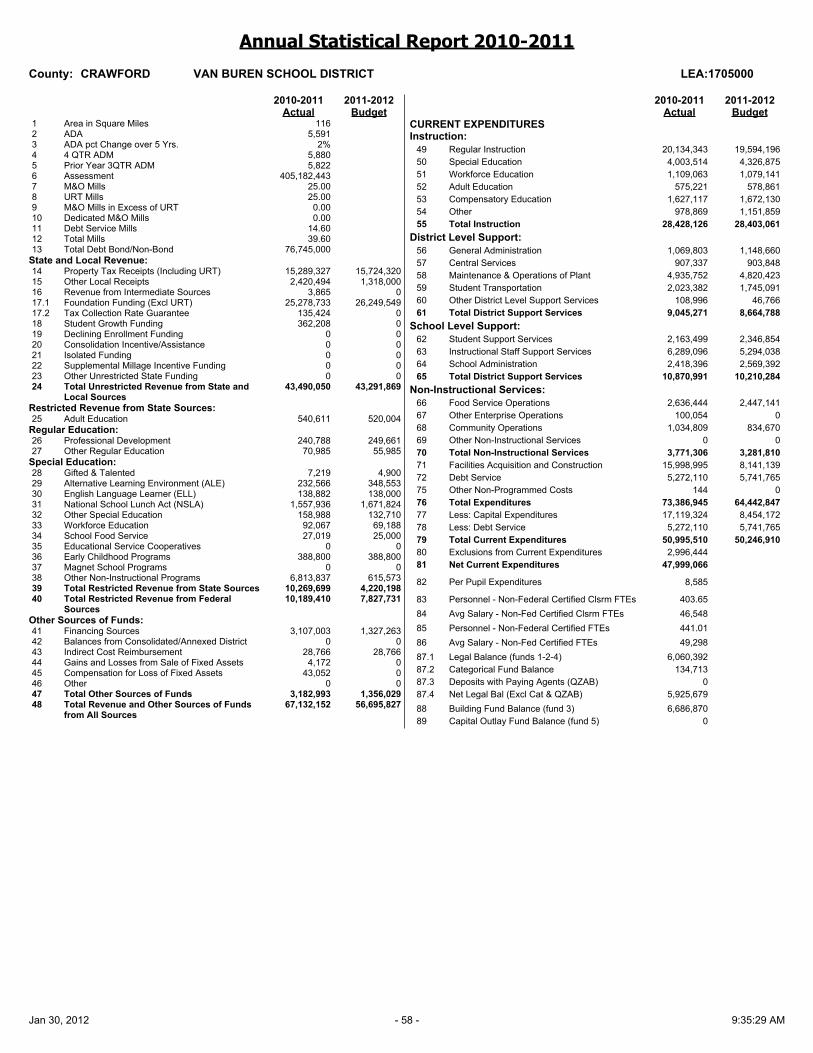
Annual Statistical Report 2010-2011
County: CRAWFORD VAN BUREN SCHOOL DISTRICT LEA:1705000
2010-2011 2011-2012Actual Budget
1 Area in Square Miles 1162 ADA 5,5913 ADA pct Change over 5 Yrs. 2%4 4 QTR ADM 5,8805 Prior Year 3QTR ADM 5,8226 Assessment 405,182,4437 M&O Mills 25.008 URT Mills 25.009 M&O Mills in Excess of URT 0.0010 Dedicated M&O Mills 0.0011 Debt Service Mills 14.6012 Total Mills 39.6013 Total Debt Bond/Non-Bond 76,745,000
State and Local Revenue:14 Property Tax Receipts (Including URT) 15,289,327 15,724,32015 Other Local Receipts 2,420,494 1,318,00016 Revenue from Intermediate Sources 3,865 017.1 Foundation Funding (Excl URT) 25,278,733 26,249,54917.2 Tax Collection Rate Guarantee 135,424 018 Student Growth Funding 362,208 019 Declining Enrollment Funding 0 020 Consolidation Incentive/Assistance 0 021 Isolated Funding 0 022 Supplemental Millage Incentive Funding 0 023 Other Unrestricted State Funding 0 024 Total Unrestricted Revenue from State and
Local Sources 43,490,050 43,291,869
Restricted Revenue from State Sources:25 Adult Education 540,611 520,004
Regular Education:26 Professional Development 240,788 249,66127 Other Regular Education 70,985 55,985
Special Education:28 Gifted & Talented 7,219 4,90029 Alternative Learning Environment (ALE) 232,566 348,55330 English Language Learner (ELL) 138,882 138,00031 National School Lunch Act (NSLA) 1,557,936 1,671,82432 Other Special Education 158,988 132,71033 Workforce Education 92,067 69,18834 School Food Service 27,019 25,00035 Educational Service Cooperatives 0 036 Early Childhood Programs 388,800 388,80037 Magnet School Programs 0 038 Other Non-Instructional Programs 6,813,837 615,57339 Total Restricted Revenue from State Sources 10,269,699 4,220,19840 Total Restricted Revenue from Federal
Sources 10,189,410 7,827,731
Other Sources of Funds:41 Financing Sources 3,107,003 1,327,26342 Balances from Consolidated/Annexed District 0 043 Indirect Cost Reimbursement 28,766 28,76644 Gains and Losses from Sale of Fixed Assets 4,172 045 Compensation for Loss of Fixed Assets 43,052 046 Other 0 047 Total Other Sources of Funds 3,182,993 1,356,02948 Total Revenue and Other Sources of Funds
from All Sources 67,132,152 56,695,827
2010-2011 2011-2012Actual Budget
CURRENT EXPENDITURESInstruction:
49 Regular Instruction 20,134,343 19,594,19650 Special Education 4,003,514 4,326,87551 Workforce Education 1,109,063 1,079,14152 Adult Education 575,221 578,86153 Compensatory Education 1,627,117 1,672,13054 Other 978,869 1,151,85955 Total Instruction 28,428,126 28,403,061
District Level Support:56 General Administration 1,069,803 1,148,66057 Central Services 907,337 903,84858 Maintenance & Operations of Plant 4,935,752 4,820,42359 Student Transportation 2,023,382 1,745,09160 Other District Level Support Services 108,996 46,76661 Total District Support Services 9,045,271 8,664,788
School Level Support:62 Student Support Services 2,163,499 2,346,85463 Instructional Staff Support Services 6,289,096 5,294,03864 School Administration 2,418,396 2,569,39265 Total District Support Services 10,870,991 10,210,284
Non-Instructional Services:66 Food Service Operations 2,636,444 2,447,14167 Other Enterprise Operations 100,054 068 Community Operations 1,034,809 834,67069 Other Non-Instructional Services 0 070 Total Non-Instructional Services 3,771,306 3,281,81071 Facilities Acquisition and Construction 15,998,995 8,141,13972 Debt Service 5,272,110 5,741,76575 Other Non-Programmed Costs 144 076 Total Expenditures 73,386,945 64,442,84777 Less: Capital Expenditures 17,119,324 8,454,17278 Less: Debt Service 5,272,110 5,741,76579 Total Current Expenditures 50,995,510 50,246,91080 Exclusions from Current Expenditures 2,996,44481 Net Current Expenditures 47,999,066
82 Per Pupil Expenditures 8,585
83 Personnel - Non-Federal Certified Clsrm FTEs 403.6584 Avg Salary - Non-Fed Certified Clsrm FTEs 46,54885 Personnel - Non-Federal Certified FTEs 441.0186 Avg Salary - Non-Fed Certified FTEs 49,29887.1 Legal Balance (funds 1-2-4) 6,060,39287.2 Categorical Fund Balance 134,71387.3 Deposits with Paying Agents (QZAB) 087.4 Net Legal Bal (Excl Cat & QZAB) 5,925,67988 Building Fund Balance (fund 3) 6,686,87089 Capital Outlay Fund Balance (fund 5) 0
Jan 30, 2012 - 58 - 9:35:29 AM

Annual Statistical Report 2010-2011
County: CRITTENDEN EARLE SCHOOL DISTRICT LEA:1802000
2010-2011 2011-2012Actual Budget
1 Area in Square Miles 1362 ADA 6713 ADA pct Change over 5 Yrs. (17%)4 4 QTR ADM 6945 Prior Year 3QTR ADM 7556 Assessment 24,330,4767 M&O Mills 25.008 URT Mills 25.009 M&O Mills in Excess of URT 0.0010 Dedicated M&O Mills 0.0011 Debt Service Mills 19.8012 Total Mills 44.8013 Total Debt Bond/Non-Bond 7,956,455
State and Local Revenue:14 Property Tax Receipts (Including URT) 1,059,801 964,31615 Other Local Receipts 2,172,685 89,97216 Revenue from Intermediate Sources 0 017.1 Foundation Funding (Excl URT) 3,949,343 3,679,84517.2 Tax Collection Rate Guarantee 34,582 018 Student Growth Funding 0 019 Declining Enrollment Funding 69,867 180,32620 Consolidation Incentive/Assistance 0 021 Isolated Funding 0 022 Supplemental Millage Incentive Funding 29,961 23,96823 Other Unrestricted State Funding 0 024 Total Unrestricted Revenue from State and
Local Sources 7,316,240 4,938,427
Restricted Revenue from State Sources:25 Adult Education 0 0
Regular Education:26 Professional Development 31,235 29,51827 Other Regular Education 153,639 0
Special Education:28 Gifted & Talented 0 029 Alternative Learning Environment (ALE) 0 030 English Language Learner (ELL) 0 031 National School Lunch Act (NSLA) 1,078,800 1,012,50632 Other Special Education 17,672 033 Workforce Education 79,917 34,12534 School Food Service 3,359 035 Educational Service Cooperatives 0 036 Early Childhood Programs 237,307 260,52037 Magnet School Programs 0 038 Other Non-Instructional Programs 239,747 183,74139 Total Restricted Revenue from State Sources 1,841,676 1,520,41040 Total Restricted Revenue from Federal
Sources 3,405,176 1,938,012
Other Sources of Funds:41 Financing Sources 688,215 042 Balances from Consolidated/Annexed District 0 043 Indirect Cost Reimbursement 0 044 Gains and Losses from Sale of Fixed Assets 0 045 Compensation for Loss of Fixed Assets 0 046 Other 0 047 Total Other Sources of Funds 688,215 048 Total Revenue and Other Sources of Funds
from All Sources 13,251,307 8,396,849
2010-2011 2011-2012Actual Budget
CURRENT EXPENDITURESInstruction:
49 Regular Instruction 3,566,575 2,760,34750 Special Education 453,306 414,63551 Workforce Education 422,734 401,05252 Adult Education 0 053 Compensatory Education 777,897 546,71854 Other 150,947 199,91255 Total Instruction 5,371,459 4,322,665
District Level Support:56 General Administration 238,265 235,95557 Central Services 242,279 267,59758 Maintenance & Operations of Plant 1,232,518 946,07959 Student Transportation 299,094 229,39960 Other District Level Support Services 4,301 061 Total District Support Services 2,016,457 1,679,030
School Level Support:62 Student Support Services 471,733 289,16163 Instructional Staff Support Services 853,611 489,56764 School Administration 197,721 252,53865 Total District Support Services 1,523,064 1,031,265
Non-Instructional Services:66 Food Service Operations 628,626 598,44567 Other Enterprise Operations 0 068 Community Operations 0 2,00069 Other Non-Instructional Services 0 070 Total Non-Instructional Services 628,626 600,44571 Facilities Acquisition and Construction 1,034,781 163,91172 Debt Service 1,557,360 514,17875 Other Non-Programmed Costs 115,787 076 Total Expenditures 12,247,534 8,311,49477 Less: Capital Expenditures 1,094,272 175,91178 Less: Debt Service 1,557,360 514,17879 Total Current Expenditures 9,595,902 7,621,40580 Exclusions from Current Expenditures 509,71681 Net Current Expenditures 9,086,186
82 Per Pupil Expenditures 13,543
83 Personnel - Non-Federal Certified Clsrm FTEs 51.0484 Avg Salary - Non-Fed Certified Clsrm FTEs 44,74085 Personnel - Non-Federal Certified FTEs 55.0486 Avg Salary - Non-Fed Certified FTEs 48,97187.1 Legal Balance (funds 1-2-4) 1,857,17087.2 Categorical Fund Balance 4,99687.3 Deposits with Paying Agents (QZAB) 087.4 Net Legal Bal (Excl Cat & QZAB) 1,852,17488 Building Fund Balance (fund 3) 183,93189 Capital Outlay Fund Balance (fund 5) 0
Jan 30, 2012 - 59 - 9:35:29 AM

Annual Statistical Report 2010-2011
County: CRITTENDEN WEST MEMPHIS SCHOOL DISTRICT LEA:1803000
2010-2011 2011-2012Actual Budget
1 Area in Square Miles 1082 ADA 5,3163 ADA pct Change over 5 Yrs. (4%)4 4 QTR ADM 5,6605 Prior Year 3QTR ADM 5,8876 Assessment 283,741,0817 M&O Mills 27.008 URT Mills 25.009 M&O Mills in Excess of URT 2.0010 Dedicated M&O Mills 0.0011 Debt Service Mills 2.0012 Total Mills 29.0013 Total Debt Bond/Non-Bond 3,285,000
State and Local Revenue:14 Property Tax Receipts (Including URT) 8,051,800 7,869,21815 Other Local Receipts 1,185,087 763,32516 Revenue from Intermediate Sources 0 017.1 Foundation Funding (Excl URT) 28,404,507 27,855,08617.2 Tax Collection Rate Guarantee 308,617 310,00018 Student Growth Funding 0 019 Declining Enrollment Funding 55,622 664,87320 Consolidation Incentive/Assistance 0 021 Isolated Funding 0 022 Supplemental Millage Incentive Funding 146,136 116,90923 Other Unrestricted State Funding 0 024 Total Unrestricted Revenue from State and
Local Sources 38,151,769 37,579,411
Restricted Revenue from State Sources:25 Adult Education 0 0
Regular Education:26 Professional Development 243,472 240,30427 Other Regular Education 15,010 11,800
Special Education:28 Gifted & Talented 1,250 029 Alternative Learning Environment (ALE) 73,012 92,47530 English Language Learner (ELL) 1,758 031 National School Lunch Act (NSLA) 4,679,264 4,570,19232 Other Special Education 32,108 033 Workforce Education 115,375 139,75034 School Food Service 25,068 035 Educational Service Cooperatives 0 036 Early Childhood Programs 677,452 699,90037 Magnet School Programs 0 038 Other Non-Instructional Programs 314,445 214,60939 Total Restricted Revenue from State Sources 6,178,214 5,969,03040 Total Restricted Revenue from Federal
Sources 14,724,807 11,619,341
Other Sources of Funds:41 Financing Sources 0 042 Balances from Consolidated/Annexed District 0 043 Indirect Cost Reimbursement 5,678 150,00044 Gains and Losses from Sale of Fixed Assets 0 045 Compensation for Loss of Fixed Assets 200,137 167,00046 Other 0 047 Total Other Sources of Funds 205,814 317,00048 Total Revenue and Other Sources of Funds
from All Sources 59,260,604 55,484,782
2010-2011 2011-2012Actual Budget
CURRENT EXPENDITURESInstruction:
49 Regular Instruction 21,356,388 21,239,75250 Special Education 3,739,425 4,058,70751 Workforce Education 1,353,844 1,428,05752 Adult Education 0 053 Compensatory Education 3,215,056 2,807,56754 Other 1,522,083 1,714,93955 Total Instruction 31,186,797 31,249,022
District Level Support:56 General Administration 1,078,379 1,154,13257 Central Services 759,843 606,16458 Maintenance & Operations of Plant 5,036,223 5,142,88659 Student Transportation 1,002,277 700,19960 Other District Level Support Services 73,750 208,03361 Total District Support Services 7,950,472 7,811,414
School Level Support:62 Student Support Services 2,206,808 2,475,12563 Instructional Staff Support Services 5,992,701 7,012,99864 School Administration 2,666,463 2,699,52065 Total District Support Services 10,865,972 12,187,643
Non-Instructional Services:66 Food Service Operations 2,997,642 3,038,61167 Other Enterprise Operations 16,640 068 Community Operations 5,666 58,45069 Other Non-Instructional Services 0 070 Total Non-Instructional Services 3,019,948 3,097,06171 Facilities Acquisition and Construction 3,663,292 1,121,55572 Debt Service 283,421 177,66475 Other Non-Programmed Costs 8 076 Total Expenditures 56,969,911 55,644,35977 Less: Capital Expenditures 5,210,449 1,497,17678 Less: Debt Service 283,421 177,66479 Total Current Expenditures 51,476,041 53,969,51980 Exclusions from Current Expenditures 1,629,70081 Net Current Expenditures 49,846,341
82 Per Pupil Expenditures 9,377
83 Personnel - Non-Federal Certified Clsrm FTEs 378.3784 Avg Salary - Non-Fed Certified Clsrm FTEs 50,43585 Personnel - Non-Federal Certified FTEs 436.9986 Avg Salary - Non-Fed Certified FTEs 53,04487.1 Legal Balance (funds 1-2-4) 25,042,72887.2 Categorical Fund Balance 1,058,34187.3 Deposits with Paying Agents (QZAB) 087.4 Net Legal Bal (Excl Cat & QZAB) 23,984,38788 Building Fund Balance (fund 3) 10,872,35189 Capital Outlay Fund Balance (fund 5) 0
Jan 30, 2012 - 60 - 9:35:29 AM

Annual Statistical Report 2010-2011
County: CRITTENDEN MARION SCHOOL DISTRICT LEA:1804000
2010-2011 2011-2012Actual Budget
1 Area in Square Miles 3112 ADA 3,9983 ADA pct Change over 5 Yrs. 1%4 4 QTR ADM 4,2305 Prior Year 3QTR ADM 4,0066 Assessment 315,196,5067 M&O Mills 25.008 URT Mills 25.009 M&O Mills in Excess of URT 0.0010 Dedicated M&O Mills 0.0011 Debt Service Mills 15.7012 Total Mills 40.7013 Total Debt Bond/Non-Bond 35,695,467
State and Local Revenue:14 Property Tax Receipts (Including URT) 12,021,648 11,806,72115 Other Local Receipts 3,597,611 799,23516 Revenue from Intermediate Sources 0 017.1 Foundation Funding (Excl URT) 18,010,532 18,245,47417.2 Tax Collection Rate Guarantee 388,994 380,00018 Student Growth Funding 321,673 019 Declining Enrollment Funding 0 020 Consolidation Incentive/Assistance 1,535,443 021 Isolated Funding 9,502 022 Supplemental Millage Incentive Funding 68,918 55,13423 Other Unrestricted State Funding 0 024 Total Unrestricted Revenue from State and
Local Sources 35,954,321 31,286,564
Restricted Revenue from State Sources:25 Adult Education 0 0
Regular Education:26 Professional Development 176,226 180,09827 Other Regular Education 194,900 213,644
Special Education:28 Gifted & Talented 0 029 Alternative Learning Environment (ALE) 66,877 80,70330 English Language Learner (ELL) 10,548 38,90031 National School Lunch Act (NSLA) 1,160,144 1,262,97632 Other Special Education 53,297 10,00033 Workforce Education 80,881 92,62534 School Food Service 0 035 Educational Service Cooperatives 0 036 Early Childhood Programs 289,566 291,60037 Magnet School Programs 0 038 Other Non-Instructional Programs 498,006 2,846,04039 Total Restricted Revenue from State Sources 2,530,445 5,016,58640 Total Restricted Revenue from Federal
Sources 4,802,398 2,681,756
Other Sources of Funds:41 Financing Sources 2,302,669 4,061,77542 Balances from Consolidated/Annexed District 323,268 043 Indirect Cost Reimbursement 0 044 Gains and Losses from Sale of Fixed Assets 155,025 045 Compensation for Loss of Fixed Assets 0 046 Other 0 047 Total Other Sources of Funds 2,780,962 4,061,77548 Total Revenue and Other Sources of Funds
from All Sources 46,068,126 43,046,680
2010-2011 2011-2012Actual Budget
CURRENT EXPENDITURESInstruction:
49 Regular Instruction 15,024,073 14,044,83050 Special Education 3,602,571 3,409,79651 Workforce Education 894,049 836,29952 Adult Education 0 053 Compensatory Education 1,177,560 1,068,75054 Other 694,513 616,14755 Total Instruction 21,392,766 19,975,822
District Level Support:56 General Administration 1,180,831 1,304,16957 Central Services 370,355 329,11858 Maintenance & Operations of Plant 2,626,206 2,881,23059 Student Transportation 2,733,843 1,672,69860 Other District Level Support Services 100,207 61,40861 Total District Support Services 7,011,441 6,248,622
School Level Support:62 Student Support Services 1,750,210 1,623,43363 Instructional Staff Support Services 2,087,889 2,484,78464 School Administration 1,885,168 1,913,03465 Total District Support Services 5,723,267 6,021,251
Non-Instructional Services:66 Food Service Operations 1,957,376 067 Other Enterprise Operations 0 068 Community Operations 2,361 40,00069 Other Non-Instructional Services 0 070 Total Non-Instructional Services 1,959,737 40,00071 Facilities Acquisition and Construction 3,173,508 12,609,37972 Debt Service 3,631,183 4,028,02975 Other Non-Programmed Costs 31,721 076 Total Expenditures 42,923,623 48,923,10377 Less: Capital Expenditures 4,940,939 12,884,15978 Less: Debt Service 3,631,183 4,028,02979 Total Current Expenditures 34,351,501 32,010,91580 Exclusions from Current Expenditures 1,265,82281 Net Current Expenditures 33,085,679
82 Per Pupil Expenditures 8,277
83 Personnel - Non-Federal Certified Clsrm FTEs 278.0084 Avg Salary - Non-Fed Certified Clsrm FTEs 48,08385 Personnel - Non-Federal Certified FTEs 298.3486 Avg Salary - Non-Fed Certified FTEs 50,85087.1 Legal Balance (funds 1-2-4) 5,308,63587.2 Categorical Fund Balance 269,77487.3 Deposits with Paying Agents (QZAB) 087.4 Net Legal Bal (Excl Cat & QZAB) 5,038,86188 Building Fund Balance (fund 3) 6,151,58389 Capital Outlay Fund Balance (fund 5) 0
Jan 30, 2012 - 61 - 9:35:29 AM

Annual Statistical Report 2010-2011
County: CROSS CROSS COUNTY SCHOOL DISTRICT LEA:1901000
2010-2011 2011-2012Actual Budget
1 Area in Square Miles 2932 ADA 5633 ADA pct Change over 5 Yrs. (13%)4 4 QTR ADM 6035 Prior Year 3QTR ADM 6066 Assessment 45,146,7637 M&O Mills 26.308 URT Mills 25.009 M&O Mills in Excess of URT 1.3010 Dedicated M&O Mills 0.0011 Debt Service Mills 13.6012 Total Mills 39.9013 Total Debt Bond/Non-Bond 6,195,000
State and Local Revenue:14 Property Tax Receipts (Including URT) 1,684,505 1,648,92115 Other Local Receipts 355,767 77,50016 Revenue from Intermediate Sources 212 017.1 Foundation Funding (Excl URT) 2,504,420 2,638,62117.2 Tax Collection Rate Guarantee 32,842 32,50018 Student Growth Funding 39,184 40,00019 Declining Enrollment Funding 0 020 Consolidation Incentive/Assistance 0 021 Isolated Funding 0 022 Supplemental Millage Incentive Funding 0 023 Other Unrestricted State Funding 0 024 Total Unrestricted Revenue from State and
Local Sources 4,616,931 4,437,542
Restricted Revenue from State Sources:25 Adult Education 0 0
Regular Education:26 Professional Development 25,081 25,83427 Other Regular Education 327,140 13,615
Special Education:28 Gifted & Talented 860 029 Alternative Learning Environment (ALE) 0 030 English Language Learner (ELL) 0 031 National School Lunch Act (NSLA) 431,520 464,50832 Other Special Education 18,751 033 Workforce Education 0 50,00034 School Food Service 2,783 035 Educational Service Cooperatives 0 036 Early Childhood Programs 0 037 Magnet School Programs 0 038 Other Non-Instructional Programs 198,017 145,98539 Total Restricted Revenue from State Sources 1,004,151 699,94240 Total Restricted Revenue from Federal
Sources 1,502,845 1,985,113
Other Sources of Funds:41 Financing Sources 0 042 Balances from Consolidated/Annexed District 0 043 Indirect Cost Reimbursement 7,443 044 Gains and Losses from Sale of Fixed Assets 144,807 20,00045 Compensation for Loss of Fixed Assets 0 046 Other 17,118 047 Total Other Sources of Funds 169,369 20,00048 Total Revenue and Other Sources of Funds
from All Sources 7,293,296 7,142,597
2010-2011 2011-2012Actual Budget
CURRENT EXPENDITURESInstruction:
49 Regular Instruction 1,961,770 2,132,72250 Special Education 381,319 360,46351 Workforce Education 165,330 146,86752 Adult Education 0 053 Compensatory Education 256,110 297,37554 Other 70,658 74,67455 Total Instruction 2,835,187 3,012,101
District Level Support:56 General Administration 375,358 308,41457 Central Services 122,409 258,62658 Maintenance & Operations of Plant 513,490 470,51859 Student Transportation 316,179 292,56260 Other District Level Support Services 21,163 16,10061 Total District Support Services 1,348,598 1,346,220
School Level Support:62 Student Support Services 220,692 245,85663 Instructional Staff Support Services 1,129,200 1,591,46564 School Administration 298,851 239,81265 Total District Support Services 1,648,743 2,077,133
Non-Instructional Services:66 Food Service Operations 294,756 328,28867 Other Enterprise Operations 0 068 Community Operations 0 3,37569 Other Non-Instructional Services 0 070 Total Non-Instructional Services 294,756 331,66371 Facilities Acquisition and Construction 15,945 249,87472 Debt Service 513,236 513,36875 Other Non-Programmed Costs 0 076 Total Expenditures 6,656,466 7,530,35977 Less: Capital Expenditures 108,649 455,81578 Less: Debt Service 513,236 513,36879 Total Current Expenditures 6,034,581 6,561,17680 Exclusions from Current Expenditures 224,18681 Net Current Expenditures 5,810,394
82 Per Pupil Expenditures 10,321
83 Personnel - Non-Federal Certified Clsrm FTEs 45.6584 Avg Salary - Non-Fed Certified Clsrm FTEs 37,77485 Personnel - Non-Federal Certified FTEs 51.7186 Avg Salary - Non-Fed Certified FTEs 41,62687.1 Legal Balance (funds 1-2-4) 2,292,78687.2 Categorical Fund Balance 12,35687.3 Deposits with Paying Agents (QZAB) 087.4 Net Legal Bal (Excl Cat & QZAB) 2,280,43088 Building Fund Balance (fund 3) 089 Capital Outlay Fund Balance (fund 5) 0
Jan 30, 2012 - 62 - 9:35:29 AM

Annual Statistical Report 2010-2011
County: CROSS WYNNE SCHOOL DISTRICT LEA:1905000
2010-2011 2011-2012Actual Budget
1 Area in Square Miles 3382 ADA 2,7193 ADA pct Change over 5 Yrs. (6%)4 4 QTR ADM 2,8525 Prior Year 3QTR ADM 2,8386 Assessment 160,861,0507 M&O Mills 25.008 URT Mills 25.009 M&O Mills in Excess of URT 0.0010 Dedicated M&O Mills 0.0011 Debt Service Mills 10.0012 Total Mills 35.0013 Total Debt Bond/Non-Bond 4,440,869
State and Local Revenue:14 Property Tax Receipts (Including URT) 5,160,254 4,900,00015 Other Local Receipts 937,507 555,80016 Revenue from Intermediate Sources 1,087 1,00017.1 Foundation Funding (Excl URT) 13,130,137 13,621,73217.2 Tax Collection Rate Guarantee 59,552 018 Student Growth Funding 0 019 Declining Enrollment Funding 212,190 020 Consolidation Incentive/Assistance 0 021 Isolated Funding 0 022 Supplemental Millage Incentive Funding 117,515 94,01223 Other Unrestricted State Funding 0 024 Total Unrestricted Revenue from State and
Local Sources 19,618,242 19,172,544
Restricted Revenue from State Sources:25 Adult Education 0 0
Regular Education:26 Professional Development 117,361 121,17427 Other Regular Education 3,968 9,300
Special Education:28 Gifted & Talented 2,382 1,00029 Alternative Learning Environment (ALE) 76,181 80,00030 English Language Learner (ELL) 879 3,00031 National School Lunch Act (NSLA) 806,992 852,61032 Other Special Education 23,258 8,43633 Workforce Education 15,167 15,16734 School Food Service 11,142 035 Educational Service Cooperatives 0 036 Early Childhood Programs 0 037 Magnet School Programs 0 038 Other Non-Instructional Programs 211,568 420,73939 Total Restricted Revenue from State Sources 1,268,899 1,511,42640 Total Restricted Revenue from Federal
Sources 4,701,621 4,053,609
Other Sources of Funds:41 Financing Sources 0 042 Balances from Consolidated/Annexed District 0 043 Indirect Cost Reimbursement 0 044 Gains and Losses from Sale of Fixed Assets 0 045 Compensation for Loss of Fixed Assets 0 046 Other 0 047 Total Other Sources of Funds 0 048 Total Revenue and Other Sources of Funds
from All Sources 25,588,762 24,737,580
2010-2011 2011-2012Actual Budget
CURRENT EXPENDITURESInstruction:
49 Regular Instruction 10,098,108 9,362,79350 Special Education 2,273,048 2,392,88451 Workforce Education 870,169 854,57552 Adult Education 0 053 Compensatory Education 899,322 714,10354 Other 888,659 942,09955 Total Instruction 15,029,306 14,266,453
District Level Support:56 General Administration 697,883 471,42257 Central Services 473,986 444,97458 Maintenance & Operations of Plant 1,973,007 2,084,43559 Student Transportation 1,166,901 1,226,25460 Other District Level Support Services 67,649 50,00061 Total District Support Services 4,379,426 4,277,085
School Level Support:62 Student Support Services 1,206,350 1,273,59963 Instructional Staff Support Services 2,019,273 1,999,08464 School Administration 1,161,401 1,150,67365 Total District Support Services 4,387,024 4,423,357
Non-Instructional Services:66 Food Service Operations 1,489,862 1,462,36567 Other Enterprise Operations 8,988 068 Community Operations 63 1,00069 Other Non-Instructional Services 0 070 Total Non-Instructional Services 1,498,913 1,463,36571 Facilities Acquisition and Construction 945,488 1,477,83272 Debt Service 836,516 842,89575 Other Non-Programmed Costs 3,637 076 Total Expenditures 27,080,311 26,750,98777 Less: Capital Expenditures 1,461,787 2,187,42478 Less: Debt Service 836,516 842,89579 Total Current Expenditures 24,782,008 23,720,66880 Exclusions from Current Expenditures 853,10781 Net Current Expenditures 23,928,901
82 Per Pupil Expenditures 8,799
83 Personnel - Non-Federal Certified Clsrm FTEs 193.6084 Avg Salary - Non-Fed Certified Clsrm FTEs 50,80185 Personnel - Non-Federal Certified FTEs 213.6986 Avg Salary - Non-Fed Certified FTEs 53,37587.1 Legal Balance (funds 1-2-4) 3,015,96587.2 Categorical Fund Balance 226,47287.3 Deposits with Paying Agents (QZAB) 087.4 Net Legal Bal (Excl Cat & QZAB) 2,789,49388 Building Fund Balance (fund 3) 724,79389 Capital Outlay Fund Balance (fund 5) 0
Jan 30, 2012 - 63 - 9:35:29 AM

Annual Statistical Report 2010-2011
County: DALLAS FORDYCE SCHOOL DISTRICT LEA:2002000
2010-2011 2011-2012Actual Budget
1 Area in Square Miles 2212 ADA 8893 ADA pct Change over 5 Yrs. (17%)4 4 QTR ADM 9365 Prior Year 3QTR ADM 9826 Assessment 52,278,7107 M&O Mills 25.008 URT Mills 25.009 M&O Mills in Excess of URT 0.0010 Dedicated M&O Mills 0.0011 Debt Service Mills 8.5012 Total Mills 33.5013 Total Debt Bond/Non-Bond 7,464,491
State and Local Revenue:14 Property Tax Receipts (Including URT) 1,565,994 1,579,70715 Other Local Receipts 307,289 111,61116 Revenue from Intermediate Sources 0 017.1 Foundation Funding (Excl URT) 4,651,907 4,480,80517.2 Tax Collection Rate Guarantee 95,797 95,00018 Student Growth Funding 0 019 Declining Enrollment Funding 82,033 134,15420 Consolidation Incentive/Assistance 0 021 Isolated Funding 0 022 Supplemental Millage Incentive Funding 21,387 17,10923 Other Unrestricted State Funding 0 024 Total Unrestricted Revenue from State and
Local Sources 6,724,407 6,418,386
Restricted Revenue from State Sources:25 Adult Education 0 0
Regular Education:26 Professional Development 40,600 39,75127 Other Regular Education 19,938 0
Special Education:28 Gifted & Talented 1,300 029 Alternative Learning Environment (ALE) 10,401 38,46630 English Language Learner (ELL) 2,930 2,93031 National School Lunch Act (NSLA) 314,960 321,31032 Other Special Education 1,880,025 033 Workforce Education 129,898 034 School Food Service 2,996 3,00035 Educational Service Cooperatives 0 036 Early Childhood Programs 0 037 Magnet School Programs 0 038 Other Non-Instructional Programs 130,589 118,01439 Total Restricted Revenue from State Sources 2,533,637 523,47140 Total Restricted Revenue from Federal
Sources 1,917,114 1,478,771
Other Sources of Funds:41 Financing Sources 0 042 Balances from Consolidated/Annexed District 0 043 Indirect Cost Reimbursement 0 044 Gains and Losses from Sale of Fixed Assets 4,095 045 Compensation for Loss of Fixed Assets 0 046 Other 0 047 Total Other Sources of Funds 4,095 048 Total Revenue and Other Sources of Funds
from All Sources 11,179,253 8,420,628
2010-2011 2011-2012Actual Budget
CURRENT EXPENDITURESInstruction:
49 Regular Instruction 3,447,839 3,386,33450 Special Education 2,312,321 443,10351 Workforce Education 215,567 94,46952 Adult Education 0 053 Compensatory Education 324,200 334,09754 Other 139,330 124,79855 Total Instruction 6,439,258 4,382,802
District Level Support:56 General Administration 203,232 216,07557 Central Services 242,500 234,75458 Maintenance & Operations of Plant 712,109 672,94159 Student Transportation 357,569 386,06360 Other District Level Support Services 29,983 16,20061 Total District Support Services 1,545,393 1,526,033
School Level Support:62 Student Support Services 396,010 394,02863 Instructional Staff Support Services 718,291 654,98964 School Administration 454,187 476,62465 Total District Support Services 1,568,488 1,525,642
Non-Instructional Services:66 Food Service Operations 416,610 434,51267 Other Enterprise Operations 0 068 Community Operations 0 069 Other Non-Instructional Services 0 070 Total Non-Instructional Services 416,610 434,51271 Facilities Acquisition and Construction 158,498 170,55472 Debt Service 565,607 563,16475 Other Non-Programmed Costs 0 076 Total Expenditures 10,693,854 8,602,70777 Less: Capital Expenditures 408,281 446,88078 Less: Debt Service 565,607 563,16479 Total Current Expenditures 9,719,966 7,592,66380 Exclusions from Current Expenditures 316,94181 Net Current Expenditures 9,403,025
82 Per Pupil Expenditures 10,575
83 Personnel - Non-Federal Certified Clsrm FTEs 66.3984 Avg Salary - Non-Fed Certified Clsrm FTEs 39,45585 Personnel - Non-Federal Certified FTEs 72.5986 Avg Salary - Non-Fed Certified FTEs 42,21587.1 Legal Balance (funds 1-2-4) 1,420,60387.2 Categorical Fund Balance 44,18787.3 Deposits with Paying Agents (QZAB) 087.4 Net Legal Bal (Excl Cat & QZAB) 1,376,41688 Building Fund Balance (fund 3) 089 Capital Outlay Fund Balance (fund 5) 747
Jan 30, 2012 - 64 - 9:35:29 AM

Annual Statistical Report 2010-2011
County: DESHA DUMAS SCHOOL DISTRICT LEA:2104000
2010-2011 2011-2012Actual Budget
1 Area in Square Miles 3662 ADA 1,3833 ADA pct Change over 5 Yrs. (15%)4 4 QTR ADM 1,4595 Prior Year 3QTR ADM 1,4966 Assessment 86,360,1127 M&O Mills 25.008 URT Mills 25.009 M&O Mills in Excess of URT 0.0010 Dedicated M&O Mills 0.0011 Debt Service Mills 14.0012 Total Mills 39.0013 Total Debt Bond/Non-Bond 12,974,574
State and Local Revenue:14 Property Tax Receipts (Including URT) 3,079,271 2,889,30015 Other Local Receipts 629,562 585,77416 Revenue from Intermediate Sources 2,500 017.1 Foundation Funding (Excl URT) 6,787,964 6,861,94317.2 Tax Collection Rate Guarantee 175,849 150,00018 Student Growth Funding 0 019 Declining Enrollment Funding 255,466 99,25620 Consolidation Incentive/Assistance 0 021 Isolated Funding 0 022 Supplemental Millage Incentive Funding 37,857 30,28623 Other Unrestricted State Funding 0 024 Total Unrestricted Revenue from State and
Local Sources 10,968,470 10,616,559
Restricted Revenue from State Sources:25 Adult Education 190,077 195,320
Regular Education:26 Professional Development 61,880 62,03727 Other Regular Education 29,225 10,600
Special Education:28 Gifted & Talented 900 50029 Alternative Learning Environment (ALE) 108,035 114,11230 English Language Learner (ELL) 20,510 20,93031 National School Lunch Act (NSLA) 1,185,440 1,176,95632 Other Special Education 65,854 10,00033 Workforce Education 3,924 034 School Food Service 5,650 5,65035 Educational Service Cooperatives 0 036 Early Childhood Programs 72,900 72,90037 Magnet School Programs 0 038 Other Non-Instructional Programs 877,822 268,01239 Total Restricted Revenue from State Sources 2,622,216 1,937,01640 Total Restricted Revenue from Federal
Sources 4,589,476 2,671,541
Other Sources of Funds:41 Financing Sources 0 042 Balances from Consolidated/Annexed District 0 043 Indirect Cost Reimbursement 14,336 44,26344 Gains and Losses from Sale of Fixed Assets 0 045 Compensation for Loss of Fixed Assets 13,650 046 Other 0 047 Total Other Sources of Funds 27,986 44,26348 Total Revenue and Other Sources of Funds
from All Sources 18,208,147 15,269,379
2010-2011 2011-2012Actual Budget
CURRENT EXPENDITURESInstruction:
49 Regular Instruction 5,323,908 4,477,77050 Special Education 866,890 944,80151 Workforce Education 587,490 560,39252 Adult Education 153,643 139,36253 Compensatory Education 1,124,914 1,224,92354 Other 778,120 821,86855 Total Instruction 8,834,965 8,169,116
District Level Support:56 General Administration 522,997 554,47657 Central Services 583,301 404,85658 Maintenance & Operations of Plant 1,683,543 1,505,46559 Student Transportation 583,088 506,86260 Other District Level Support Services 49,325 78,73561 Total District Support Services 3,422,254 3,050,392
School Level Support:62 Student Support Services 609,760 616,39263 Instructional Staff Support Services 1,250,605 1,258,87464 School Administration 678,753 742,76865 Total District Support Services 2,539,118 2,618,034
Non-Instructional Services:66 Food Service Operations 925,493 846,93267 Other Enterprise Operations 0 068 Community Operations 9,863 30,18769 Other Non-Instructional Services 0 070 Total Non-Instructional Services 935,356 877,11971 Facilities Acquisition and Construction 3,877,103 687,41772 Debt Service 1,027,343 1,018,83975 Other Non-Programmed Costs 0 3,09976 Total Expenditures 20,636,138 16,424,01677 Less: Capital Expenditures 4,523,326 815,60378 Less: Debt Service 1,027,343 1,018,83979 Total Current Expenditures 15,085,470 14,589,57480 Exclusions from Current Expenditures 702,49081 Net Current Expenditures 14,382,980
82 Per Pupil Expenditures 10,397
83 Personnel - Non-Federal Certified Clsrm FTEs 116.9084 Avg Salary - Non-Fed Certified Clsrm FTEs 40,98385 Personnel - Non-Federal Certified FTEs 128.5386 Avg Salary - Non-Fed Certified FTEs 42,93687.1 Legal Balance (funds 1-2-4) 2,258,59387.2 Categorical Fund Balance 137,24987.3 Deposits with Paying Agents (QZAB) 087.4 Net Legal Bal (Excl Cat & QZAB) 2,121,34588 Building Fund Balance (fund 3) 708,07289 Capital Outlay Fund Balance (fund 5) 0
Jan 30, 2012 - 65 - 9:35:29 AM

Annual Statistical Report 2010-2011
County: DESHA MCGEHEE SCHOOL DISTRICT LEA:2105000
2010-2011 2011-2012Actual Budget
1 Area in Square Miles 5262 ADA 1,0783 ADA pct Change over 5 Yrs. (14%)4 4 QTR ADM 1,1215 Prior Year 3QTR ADM 1,1576 Assessment 117,733,3247 M&O Mills 31.008 URT Mills 25.009 M&O Mills in Excess of URT 6.0010 Dedicated M&O Mills 0.0011 Debt Service Mills 9.4612 Total Mills 40.4613 Total Debt Bond/Non-Bond 6,439,539
State and Local Revenue:14 Property Tax Receipts (Including URT) 4,182,122 4,230,00015 Other Local Receipts 473,222 170,34616 Revenue from Intermediate Sources 0 017.1 Foundation Funding (Excl URT) 4,058,571 4,028,08717.2 Tax Collection Rate Guarantee 70,889 75,00018 Student Growth Funding 0 019 Declining Enrollment Funding 22,737 97,65920 Consolidation Incentive/Assistance 0 021 Isolated Funding 0 022 Supplemental Millage Incentive Funding 73,624 58,89923 Other Unrestricted State Funding 0 024 Total Unrestricted Revenue from State and
Local Sources 8,881,164 8,659,991
Restricted Revenue from State Sources:25 Adult Education 0 0
Regular Education:26 Professional Development 47,849 47,68127 Other Regular Education 27,900 5,000
Special Education:28 Gifted & Talented 1,257 029 Alternative Learning Environment (ALE) 19,096 17,65830 English Language Learner (ELL) 4,102 031 National School Lunch Act (NSLA) 882,880 871,33232 Other Special Education 45,217 36,00033 Workforce Education 10,834 10,50034 School Food Service 4,906 4,80035 Educational Service Cooperatives 0 036 Early Childhood Programs 290,136 291,60037 Magnet School Programs 0 038 Other Non-Instructional Programs 30,447 27,95439 Total Restricted Revenue from State Sources 1,364,623 1,312,52540 Total Restricted Revenue from Federal
Sources 3,859,437 2,298,631
Other Sources of Funds:41 Financing Sources 0 042 Balances from Consolidated/Annexed District 0 043 Indirect Cost Reimbursement 0 044 Gains and Losses from Sale of Fixed Assets 0 045 Compensation for Loss of Fixed Assets 0 046 Other 0 047 Total Other Sources of Funds 0 048 Total Revenue and Other Sources of Funds
from All Sources 14,105,224 12,271,148
2010-2011 2011-2012Actual Budget
CURRENT EXPENDITURESInstruction:
49 Regular Instruction 4,310,985 4,325,18750 Special Education 727,050 1,066,83851 Workforce Education 335,923 356,29852 Adult Education 0 053 Compensatory Education 581,229 743,96454 Other 18,249 21,00655 Total Instruction 5,973,435 6,513,293
District Level Support:56 General Administration 300,511 363,67057 Central Services 406,458 336,11258 Maintenance & Operations of Plant 886,961 1,026,77159 Student Transportation 414,893 768,32160 Other District Level Support Services 19,719 10,00061 Total District Support Services 2,028,542 2,504,874
School Level Support:62 Student Support Services 607,274 648,70463 Instructional Staff Support Services 1,360,806 1,610,10464 School Administration 457,224 479,13265 Total District Support Services 2,425,304 2,737,940
Non-Instructional Services:66 Food Service Operations 638,082 675,27767 Other Enterprise Operations 0 068 Community Operations 9,394 7,75969 Other Non-Instructional Services 0 070 Total Non-Instructional Services 647,476 683,03671 Facilities Acquisition and Construction 1,781,229 072 Debt Service 685,766 674,87275 Other Non-Programmed Costs 2,866 076 Total Expenditures 13,544,618 13,114,01477 Less: Capital Expenditures 2,074,382 255,34378 Less: Debt Service 685,766 674,87279 Total Current Expenditures 10,784,470 12,183,80080 Exclusions from Current Expenditures 643,78781 Net Current Expenditures 10,140,683
82 Per Pupil Expenditures 9,404
83 Personnel - Non-Federal Certified Clsrm FTEs 84.0984 Avg Salary - Non-Fed Certified Clsrm FTEs 41,86985 Personnel - Non-Federal Certified FTEs 93.7386 Avg Salary - Non-Fed Certified FTEs 44,14787.1 Legal Balance (funds 1-2-4) 2,888,58687.2 Categorical Fund Balance 666,08387.3 Deposits with Paying Agents (QZAB) 087.4 Net Legal Bal (Excl Cat & QZAB) 2,222,50288 Building Fund Balance (fund 3) 119,35089 Capital Outlay Fund Balance (fund 5) 0
Jan 30, 2012 - 66 - 9:35:29 AM

Annual Statistical Report 2010-2011
County: DREW DREW CENTRAL SCHOOL DISTRICT LEA:2202000
2010-2011 2011-2012Actual Budget
1 Area in Square Miles 5642 ADA 9133 ADA pct Change over 5 Yrs. (7%)4 4 QTR ADM 9705 Prior Year 3QTR ADM 9826 Assessment 61,014,5567 M&O Mills 25.008 URT Mills 25.009 M&O Mills in Excess of URT 0.0010 Dedicated M&O Mills 0.0011 Debt Service Mills 10.6012 Total Mills 35.6013 Total Debt Bond/Non-Bond 7,190,000
State and Local Revenue:14 Property Tax Receipts (Including URT) 1,979,716 1,805,10115 Other Local Receipts 438,455 103,50016 Revenue from Intermediate Sources 4,514 4,00017.1 Foundation Funding (Excl URT) 4,470,911 4,478,34017.2 Tax Collection Rate Guarantee 56,981 50,00018 Student Growth Funding 0 019 Declining Enrollment Funding 0 020 Consolidation Incentive/Assistance 0 021 Isolated Funding 0 022 Supplemental Millage Incentive Funding 0 023 Other Unrestricted State Funding 0 024 Total Unrestricted Revenue from State and
Local Sources 6,950,577 6,440,941
Restricted Revenue from State Sources:25 Adult Education 0 0
Regular Education:26 Professional Development 40,609 41,20227 Other Regular Education 11,688 3,000
Special Education:28 Gifted & Talented 200 029 Alternative Learning Environment (ALE) 39,208 50,90130 English Language Learner (ELL) 13,478 10,00031 National School Lunch Act (NSLA) 704,320 710,42432 Other Special Education 4,022 033 Workforce Education 45,771 40,00034 School Food Service 3,413 2,00035 Educational Service Cooperatives 0 036 Early Childhood Programs 291,600 291,60037 Magnet School Programs 0 038 Other Non-Instructional Programs 517,441 140,34139 Total Restricted Revenue from State Sources 1,671,750 1,289,46840 Total Restricted Revenue from Federal
Sources 2,286,173 1,402,350
Other Sources of Funds:41 Financing Sources 1,840,946 042 Balances from Consolidated/Annexed District 0 043 Indirect Cost Reimbursement 0 044 Gains and Losses from Sale of Fixed Assets 300 045 Compensation for Loss of Fixed Assets 0 046 Other 0 047 Total Other Sources of Funds 1,841,246 048 Total Revenue and Other Sources of Funds
from All Sources 12,749,746 9,132,759
2010-2011 2011-2012Actual Budget
CURRENT EXPENDITURESInstruction:
49 Regular Instruction 3,506,060 3,033,35350 Special Education 426,708 480,48151 Workforce Education 266,166 223,04352 Adult Education 0 053 Compensatory Education 708,011 784,05854 Other 476,846 443,49455 Total Instruction 5,383,790 4,964,430
District Level Support:56 General Administration 260,091 171,25857 Central Services 266,772 232,54858 Maintenance & Operations of Plant 756,094 697,37459 Student Transportation 672,251 559,27760 Other District Level Support Services 14,197 061 Total District Support Services 1,969,406 1,660,457
School Level Support:62 Student Support Services 540,662 502,56663 Instructional Staff Support Services 1,010,587 733,75164 School Administration 501,970 521,32165 Total District Support Services 2,053,220 1,757,637
Non-Instructional Services:66 Food Service Operations 530,140 511,68367 Other Enterprise Operations 0 068 Community Operations 174 30069 Other Non-Instructional Services 0 070 Total Non-Instructional Services 530,314 511,98371 Facilities Acquisition and Construction 725,580 450,00072 Debt Service 429,678 451,09975 Other Non-Programmed Costs 0 076 Total Expenditures 11,091,988 9,795,60677 Less: Capital Expenditures 893,410 469,50078 Less: Debt Service 429,678 451,09979 Total Current Expenditures 9,768,900 8,875,00780 Exclusions from Current Expenditures 389,76481 Net Current Expenditures 9,379,136
82 Per Pupil Expenditures 10,268
83 Personnel - Non-Federal Certified Clsrm FTEs 83.3784 Avg Salary - Non-Fed Certified Clsrm FTEs 34,51485 Personnel - Non-Federal Certified FTEs 89.5186 Avg Salary - Non-Fed Certified FTEs 37,25387.1 Legal Balance (funds 1-2-4) 520,29987.2 Categorical Fund Balance 53,69087.3 Deposits with Paying Agents (QZAB) 087.4 Net Legal Bal (Excl Cat & QZAB) 466,60988 Building Fund Balance (fund 3) 1,835,61789 Capital Outlay Fund Balance (fund 5) 0
Jan 30, 2012 - 67 - 9:35:29 AM

Annual Statistical Report 2010-2011
County: DREW MONTICELLO SCHOOL DISTRICT LEA:2203000
2010-2011 2011-2012Actual Budget
1 Area in Square Miles 952 ADA 2,0023 ADA pct Change over 5 Yrs. (4%)4 4 QTR ADM 2,0805 Prior Year 3QTR ADM 2,0786 Assessment 116,492,2437 M&O Mills 25.008 URT Mills 25.009 M&O Mills in Excess of URT 0.0010 Dedicated M&O Mills 0.0011 Debt Service Mills 14.9012 Total Mills 39.9013 Total Debt Bond/Non-Bond 9,960,000
State and Local Revenue:14 Property Tax Receipts (Including URT) 4,300,396 4,195,00015 Other Local Receipts 1,336,199 766,42016 Revenue from Intermediate Sources 9,264 6,00017.1 Foundation Funding (Excl URT) 9,743,002 9,969,88117.2 Tax Collection Rate Guarantee 80,599 80,00018 Student Growth Funding 0 019 Declining Enrollment Funding 94,501 020 Consolidation Incentive/Assistance 0 021 Isolated Funding 0 022 Supplemental Millage Incentive Funding 5,192 4,15423 Other Unrestricted State Funding 0 024 Total Unrestricted Revenue from State and
Local Sources 15,569,153 15,021,455
Restricted Revenue from State Sources:25 Adult Education 208,505 212,357
Regular Education:26 Professional Development 85,940 88,45727 Other Regular Education 23,973 5,000
Special Education:28 Gifted & Talented 850 50029 Alternative Learning Environment (ALE) 156,547 155,56230 English Language Learner (ELL) 3,223 031 National School Lunch Act (NSLA) 531,216 584,93632 Other Special Education 282,527 254,00033 Workforce Education 559,364 470,00034 School Food Service 6,777 8,50035 Educational Service Cooperatives 0 036 Early Childhood Programs 196,075 192,73337 Magnet School Programs 0 038 Other Non-Instructional Programs 334,476 466,15339 Total Restricted Revenue from State Sources 2,389,473 2,438,19840 Total Restricted Revenue from Federal
Sources 4,204,529 2,634,551
Other Sources of Funds:41 Financing Sources (451,505) 042 Balances from Consolidated/Annexed District 0 043 Indirect Cost Reimbursement 18,248 044 Gains and Losses from Sale of Fixed Assets 0 045 Compensation for Loss of Fixed Assets 0 046 Other 0 047 Total Other Sources of Funds (433,257) 048 Total Revenue and Other Sources of Funds
from All Sources 21,729,899 20,094,204
2010-2011 2011-2012Actual Budget
CURRENT EXPENDITURESInstruction:
49 Regular Instruction 7,465,878 7,298,70550 Special Education 1,065,853 1,156,57551 Workforce Education 805,619 786,68252 Adult Education 361,844 379,82853 Compensatory Education 1,033,732 1,111,19754 Other 695,536 664,03555 Total Instruction 11,428,461 11,397,023
District Level Support:56 General Administration 460,492 444,44557 Central Services 740,050 407,30158 Maintenance & Operations of Plant 1,962,488 2,072,57059 Student Transportation 696,985 734,29560 Other District Level Support Services 48,716 24,00061 Total District Support Services 3,908,731 3,682,611
School Level Support:62 Student Support Services 856,146 905,23263 Instructional Staff Support Services 1,744,637 1,338,33064 School Administration 975,368 1,045,52765 Total District Support Services 3,576,151 3,289,089
Non-Instructional Services:66 Food Service Operations 1,095,324 1,012,73667 Other Enterprise Operations 30,461 40,81568 Community Operations 417,872 98,74469 Other Non-Instructional Services 0 070 Total Non-Instructional Services 1,543,656 1,152,29671 Facilities Acquisition and Construction 603,452 072 Debt Service 938,369 291,96975 Other Non-Programmed Costs 2,168 6,08876 Total Expenditures 22,000,987 19,819,07677 Less: Capital Expenditures 964,151 219,44278 Less: Debt Service 938,369 291,96979 Total Current Expenditures 20,098,467 19,307,66480 Exclusions from Current Expenditures 1,847,33481 Net Current Expenditures 18,251,133
82 Per Pupil Expenditures 9,116
83 Personnel - Non-Federal Certified Clsrm FTEs 154.3584 Avg Salary - Non-Fed Certified Clsrm FTEs 41,39185 Personnel - Non-Federal Certified FTEs 168.3586 Avg Salary - Non-Fed Certified FTEs 43,59887.1 Legal Balance (funds 1-2-4) 4,022,44987.2 Categorical Fund Balance 65,76487.3 Deposits with Paying Agents (QZAB) 087.4 Net Legal Bal (Excl Cat & QZAB) 3,956,68588 Building Fund Balance (fund 3) 858,33889 Capital Outlay Fund Balance (fund 5) 298,913
Jan 30, 2012 - 68 - 9:35:29 AM

Annual Statistical Report 2010-2011
County: FAULKNER CONWAY SCHOOL DISTRICT LEA:2301000
2010-2011 2011-2012Actual Budget
1 Area in Square Miles 1252 ADA 8,8093 ADA pct Change over 5 Yrs. 9%4 4 QTR ADM 9,2075 Prior Year 3QTR ADM 9,0546 Assessment 995,462,4727 M&O Mills 25.008 URT Mills 25.009 M&O Mills in Excess of URT 0.0010 Dedicated M&O Mills 0.0011 Debt Service Mills 13.1012 Total Mills 38.1013 Total Debt Bond/Non-Bond 126,294,365
State and Local Revenue:14 Property Tax Receipts (Including URT) 33,412,126 37,430,94215 Other Local Receipts 4,901,840 2,515,71616 Revenue from Intermediate Sources 49,650 017.1 Foundation Funding (Excl URT) 30,826,448 32,182,24317.2 Tax Collection Rate Guarantee 294,236 294,23618 Student Growth Funding 954,615 921,60019 Declining Enrollment Funding 0 020 Consolidation Incentive/Assistance 0 021 Isolated Funding 0 022 Supplemental Millage Incentive Funding 0 023 Other Unrestricted State Funding 0 024 Total Unrestricted Revenue from State and
Local Sources 70,438,914 73,344,738
Restricted Revenue from State Sources:25 Adult Education 702,312 689,152
Regular Education:26 Professional Development 374,468 391,41727 Other Regular Education 23,310 89,803
Special Education:28 Gifted & Talented 20,323 029 Alternative Learning Environment (ALE) 264,745 262,62730 English Language Learner (ELL) 98,741 98,74131 National School Lunch Act (NSLA) 1,895,712 2,060,93832 Other Special Education 559,060 378,83933 Workforce Education 1,790,279 1,760,00034 School Food Service 27,606 27,00035 Educational Service Cooperatives 0 036 Early Childhood Programs 874,800 877,24037 Magnet School Programs 0 038 Other Non-Instructional Programs 257,068 4,020,97539 Total Restricted Revenue from State Sources 6,888,425 10,656,73140 Total Restricted Revenue from Federal
Sources 11,439,931 9,539,935
Other Sources of Funds:41 Financing Sources 38,702,405 10,800,00042 Balances from Consolidated/Annexed District 0 043 Indirect Cost Reimbursement 102,297 75,00044 Gains and Losses from Sale of Fixed Assets 827,092 045 Compensation for Loss of Fixed Assets 7,394 046 Other 0 047 Total Other Sources of Funds 39,639,188 10,875,00048 Total Revenue and Other Sources of Funds
from All Sources 128,406,459 104,416,404
2010-2011 2011-2012Actual Budget
CURRENT EXPENDITURESInstruction:
49 Regular Instruction 30,127,254 32,715,96050 Special Education 6,996,573 6,994,30651 Workforce Education 4,076,260 3,410,38752 Adult Education 961,912 895,13353 Compensatory Education 2,256,702 2,261,81054 Other 4,313,165 4,429,97255 Total Instruction 48,731,865 50,707,568
District Level Support:56 General Administration 753,586 709,88657 Central Services 1,854,955 1,776,11058 Maintenance & Operations of Plant 8,408,887 8,527,18459 Student Transportation 2,737,718 2,299,55660 Other District Level Support Services 216,444 141,81461 Total District Support Services 13,971,590 13,454,550
School Level Support:62 Student Support Services 4,295,540 4,311,36863 Instructional Staff Support Services 5,991,138 6,545,54264 School Administration 4,408,926 4,666,89665 Total District Support Services 14,695,604 15,523,807
Non-Instructional Services:66 Food Service Operations 4,183,577 4,141,51467 Other Enterprise Operations 11,544 068 Community Operations 71,495 65,88269 Other Non-Instructional Services 0 070 Total Non-Instructional Services 4,266,616 4,207,39671 Facilities Acquisition and Construction 5,851,239 48,666,40572 Debt Service 6,361,683 8,590,13275 Other Non-Programmed Costs 36,405 076 Total Expenditures 93,915,002 141,149,85777 Less: Capital Expenditures 7,249,779 49,335,81078 Less: Debt Service 6,361,683 8,590,13279 Total Current Expenditures 80,303,540 83,223,91580 Exclusions from Current Expenditures 5,686,92181 Net Current Expenditures 74,616,619
82 Per Pupil Expenditures 8,470
83 Personnel - Non-Federal Certified Clsrm FTEs 608.5584 Avg Salary - Non-Fed Certified Clsrm FTEs 52,39085 Personnel - Non-Federal Certified FTEs 651.9586 Avg Salary - Non-Fed Certified FTEs 54,81187.1 Legal Balance (funds 1-2-4) 6,000,00087.2 Categorical Fund Balance 696,88987.3 Deposits with Paying Agents (QZAB) 087.4 Net Legal Bal (Excl Cat & QZAB) 5,303,11188 Building Fund Balance (fund 3) 38,038,44189 Capital Outlay Fund Balance (fund 5) 0
Jan 30, 2012 - 69 - 9:35:29 AM

Annual Statistical Report 2010-2011
County: FAULKNER GREENBRIER SCHOOL DISTRICT LEA:2303000
2010-2011 2011-2012Actual Budget
1 Area in Square Miles 1412 ADA 2,9113 ADA pct Change over 5 Yrs. 19%4 4 QTR ADM 3,0765 Prior Year 3QTR ADM 3,0446 Assessment 194,955,6877 M&O Mills 25.008 URT Mills 25.009 M&O Mills in Excess of URT 0.0010 Dedicated M&O Mills 0.0011 Debt Service Mills 13.0012 Total Mills 38.0013 Total Debt Bond/Non-Bond 28,968,721
State and Local Revenue:14 Property Tax Receipts (Including URT) 6,648,823 7,939,13215 Other Local Receipts 1,361,332 706,44616 Revenue from Intermediate Sources 16,709 017.1 Foundation Funding (Excl URT) 13,984,742 14,133,55017.2 Tax Collection Rate Guarantee 45,785 018 Student Growth Funding 192,450 307,20019 Declining Enrollment Funding 0 020 Consolidation Incentive/Assistance 0 021 Isolated Funding 0 022 Supplemental Millage Incentive Funding 56,023 44,81823 Other Unrestricted State Funding 0 024 Total Unrestricted Revenue from State and
Local Sources 22,305,865 23,131,145
Restricted Revenue from State Sources:25 Adult Education 0 0
Regular Education:26 Professional Development 125,907 130,43727 Other Regular Education 6,727 20,600
Special Education:28 Gifted & Talented 8,672 029 Alternative Learning Environment (ALE) 63,180 18,52830 English Language Learner (ELL) 11,134 11,13431 National School Lunch Act (NSLA) 597,290 589,49032 Other Special Education 405,050 033 Workforce Education 20,042 44,41734 School Food Service 9,927 3,00035 Educational Service Cooperatives 0 036 Early Childhood Programs 622,350 622,35037 Magnet School Programs 0 038 Other Non-Instructional Programs 1,482,835 2,749,29639 Total Restricted Revenue from State Sources 3,353,114 4,189,25240 Total Restricted Revenue from Federal
Sources 2,935,281 1,832,209
Other Sources of Funds:41 Financing Sources 3,037,201 2,715,71442 Balances from Consolidated/Annexed District 0 043 Indirect Cost Reimbursement 0 044 Gains and Losses from Sale of Fixed Assets 0 045 Compensation for Loss of Fixed Assets 0 046 Other 0 047 Total Other Sources of Funds 3,037,201 2,715,71448 Total Revenue and Other Sources of Funds
from All Sources 31,631,461 31,868,320
2010-2011 2011-2012Actual Budget
CURRENT EXPENDITURESInstruction:
49 Regular Instruction 11,611,302 10,946,00750 Special Education 2,091,409 2,076,99951 Workforce Education 636,908 620,00152 Adult Education 0 053 Compensatory Education 175,483 246,61954 Other 507,796 497,03255 Total Instruction 15,022,898 14,386,657
District Level Support:56 General Administration 530,306 542,42357 Central Services 503,411 829,55958 Maintenance & Operations of Plant 1,789,540 2,088,33159 Student Transportation 879,674 1,049,40260 Other District Level Support Services 68,311 27,50061 Total District Support Services 3,771,241 4,537,214
School Level Support:62 Student Support Services 1,362,919 1,510,55263 Instructional Staff Support Services 1,669,674 1,495,38664 School Administration 1,213,755 1,290,67365 Total District Support Services 4,246,347 4,296,611
Non-Instructional Services:66 Food Service Operations 1,148,357 1,133,26967 Other Enterprise Operations 0 068 Community Operations 2,790 3,75069 Other Non-Instructional Services 0 070 Total Non-Instructional Services 1,151,147 1,137,01971 Facilities Acquisition and Construction 4,324,599 8,187,39172 Debt Service 2,010,771 1,932,15975 Other Non-Programmed Costs 115,173 076 Total Expenditures 30,642,176 34,477,05177 Less: Capital Expenditures 4,698,295 8,782,34978 Less: Debt Service 2,010,771 1,932,15979 Total Current Expenditures 23,933,110 23,762,54480 Exclusions from Current Expenditures 1,843,39381 Net Current Expenditures 22,089,717
82 Per Pupil Expenditures 7,589
83 Personnel - Non-Federal Certified Clsrm FTEs 200.8584 Avg Salary - Non-Fed Certified Clsrm FTEs 49,64085 Personnel - Non-Federal Certified FTEs 217.6386 Avg Salary - Non-Fed Certified FTEs 51,83087.1 Legal Balance (funds 1-2-4) 2,844,31987.2 Categorical Fund Balance 14,97087.3 Deposits with Paying Agents (QZAB) 087.4 Net Legal Bal (Excl Cat & QZAB) 2,829,34988 Building Fund Balance (fund 3) 2,706,37289 Capital Outlay Fund Balance (fund 5) 0
Jan 30, 2012 - 70 - 9:35:29 AM

Annual Statistical Report 2010-2011
County: FAULKNER GUY-PERKINS SCHOOL DISTRICT LEA:2304000
2010-2011 2011-2012Actual Budget
1 Area in Square Miles 472 ADA 4033 ADA pct Change over 5 Yrs. 1%4 4 QTR ADM 4335 Prior Year 3QTR ADM 4586 Assessment 40,710,7697 M&O Mills 25.008 URT Mills 25.009 M&O Mills in Excess of URT 0.0010 Dedicated M&O Mills 0.0011 Debt Service Mills 14.6012 Total Mills 39.6013 Total Debt Bond/Non-Bond 2,810,000
State and Local Revenue:14 Property Tax Receipts (Including URT) 1,346,169 1,531,83015 Other Local Receipts 224,992 125,72816 Revenue from Intermediate Sources 0 017.1 Foundation Funding (Excl URT) 1,961,429 1,682,15517.2 Tax Collection Rate Guarantee 4,119 018 Student Growth Funding 0 019 Declining Enrollment Funding 0 62,97620 Consolidation Incentive/Assistance 0 021 Isolated Funding 0 022 Supplemental Millage Incentive Funding 19,205 15,36423 Other Unrestricted State Funding 0 024 Total Unrestricted Revenue from State and
Local Sources 3,555,914 3,418,053
Restricted Revenue from State Sources:25 Adult Education 0 0
Regular Education:26 Professional Development 18,945 18,54327 Other Regular Education 1,127 0
Special Education:28 Gifted & Talented 150 029 Alternative Learning Environment (ALE) 35,592 25,16030 English Language Learner (ELL) 0 031 National School Lunch Act (NSLA) 147,808 140,66832 Other Special Education 1,876 033 Workforce Education 9,209 17,06334 School Food Service 1,591 035 Educational Service Cooperatives 0 036 Early Childhood Programs 72,318 72,90037 Magnet School Programs 0 038 Other Non-Instructional Programs 45,865 23,26339 Total Restricted Revenue from State Sources 334,480 297,59740 Total Restricted Revenue from Federal
Sources 687,819 487,633
Other Sources of Funds:41 Financing Sources 8,298 042 Balances from Consolidated/Annexed District 0 043 Indirect Cost Reimbursement 0 044 Gains and Losses from Sale of Fixed Assets 2,000 045 Compensation for Loss of Fixed Assets 6,749 046 Other 0 24,00047 Total Other Sources of Funds 17,047 24,00048 Total Revenue and Other Sources of Funds
from All Sources 4,595,261 4,227,284
2010-2011 2011-2012Actual Budget
CURRENT EXPENDITURESInstruction:
49 Regular Instruction 1,920,053 1,712,36050 Special Education 266,791 258,37551 Workforce Education 183,087 186,09052 Adult Education 0 053 Compensatory Education 34,466 81,53354 Other 38,638 62,71755 Total Instruction 2,443,034 2,301,076
District Level Support:56 General Administration 161,667 155,69557 Central Services 81,981 78,26558 Maintenance & Operations of Plant 451,399 447,24359 Student Transportation 182,567 173,65560 Other District Level Support Services 13,384 4,00061 Total District Support Services 890,999 858,859
School Level Support:62 Student Support Services 201,320 194,44963 Instructional Staff Support Services 399,804 296,86864 School Administration 217,303 151,41365 Total District Support Services 818,426 642,730
Non-Instructional Services:66 Food Service Operations 226,045 216,59667 Other Enterprise Operations 0 068 Community Operations 0 50069 Other Non-Instructional Services 0 070 Total Non-Instructional Services 226,045 217,09671 Facilities Acquisition and Construction 58,049 14,57772 Debt Service 91,989 102,47575 Other Non-Programmed Costs 76,545 076 Total Expenditures 4,605,087 4,136,81277 Less: Capital Expenditures 110,917 45,11278 Less: Debt Service 91,989 102,47579 Total Current Expenditures 4,402,181 3,989,22580 Exclusions from Current Expenditures 409,25781 Net Current Expenditures 3,992,924
82 Per Pupil Expenditures 9,900
83 Personnel - Non-Federal Certified Clsrm FTEs 37.3984 Avg Salary - Non-Fed Certified Clsrm FTEs 40,47785 Personnel - Non-Federal Certified FTEs 39.8886 Avg Salary - Non-Fed Certified FTEs 44,08087.1 Legal Balance (funds 1-2-4) 659,73987.2 Categorical Fund Balance 087.3 Deposits with Paying Agents (QZAB) 087.4 Net Legal Bal (Excl Cat & QZAB) 659,73988 Building Fund Balance (fund 3) 19,32889 Capital Outlay Fund Balance (fund 5) 0
Jan 30, 2012 - 71 - 9:35:29 AM

Annual Statistical Report 2010-2011
County: FAULKNER MAYFLOWER SCHOOL DISTRICT LEA:2305000
2010-2011 2011-2012Actual Budget
1 Area in Square Miles 842 ADA 9843 ADA pct Change over 5 Yrs. 10%4 4 QTR ADM 1,0585 Prior Year 3QTR ADM 1,0216 Assessment 66,306,9667 M&O Mills 25.008 URT Mills 25.009 M&O Mills in Excess of URT 0.0010 Dedicated M&O Mills 0.0011 Debt Service Mills 15.5012 Total Mills 40.5013 Total Debt Bond/Non-Bond 10,445,281
State and Local Revenue:14 Property Tax Receipts (Including URT) 2,509,644 2,349,00015 Other Local Receipts 606,391 269,26016 Revenue from Intermediate Sources 5,769 3,00017.1 Foundation Funding (Excl URT) 4,602,791 4,883,75717.2 Tax Collection Rate Guarantee 0 018 Student Growth Funding 222,008 019 Declining Enrollment Funding 0 020 Consolidation Incentive/Assistance 0 021 Isolated Funding 0 022 Supplemental Millage Incentive Funding 2,069 1,65523 Other Unrestricted State Funding 0 024 Total Unrestricted Revenue from State and
Local Sources 7,948,672 7,506,672
Restricted Revenue from State Sources:25 Adult Education 0 0
Regular Education:26 Professional Development 42,237 44,89327 Other Regular Education 9,175 5,000
Special Education:28 Gifted & Talented 785 15029 Alternative Learning Environment (ALE) 37,664 29,26430 English Language Learner (ELL) 0 031 National School Lunch Act (NSLA) 269,328 287,91432 Other Special Education 89,498 84,41933 Workforce Education 7,042 11,37534 School Food Service 3,158 2,50035 Educational Service Cooperatives 0 036 Early Childhood Programs 145,800 145,80037 Magnet School Programs 0 038 Other Non-Instructional Programs 713,287 1,322,24439 Total Restricted Revenue from State Sources 1,317,974 1,933,56040 Total Restricted Revenue from Federal
Sources 1,221,331 1,232,716
Other Sources of Funds:41 Financing Sources 3,538,552 042 Balances from Consolidated/Annexed District 0 043 Indirect Cost Reimbursement 478 50044 Gains and Losses from Sale of Fixed Assets 0 045 Compensation for Loss of Fixed Assets 0 046 Other 0 047 Total Other Sources of Funds 3,539,030 50048 Total Revenue and Other Sources of Funds
from All Sources 14,027,007 10,673,447
2010-2011 2011-2012Actual Budget
CURRENT EXPENDITURESInstruction:
49 Regular Instruction 3,648,197 3,885,77850 Special Education 569,874 551,19551 Workforce Education 105,131 113,50052 Adult Education 0 053 Compensatory Education 257,019 195,74854 Other 188,565 203,24455 Total Instruction 4,768,787 4,949,465
District Level Support:56 General Administration 225,314 339,82457 Central Services 288,728 305,77058 Maintenance & Operations of Plant 795,963 914,90759 Student Transportation 465,418 575,01960 Other District Level Support Services 33,408 16,58361 Total District Support Services 1,808,831 2,152,102
School Level Support:62 Student Support Services 393,126 492,42863 Instructional Staff Support Services 536,982 577,30964 School Administration 404,865 707,04065 Total District Support Services 1,334,973 1,776,778
Non-Instructional Services:66 Food Service Operations 505,673 547,63467 Other Enterprise Operations 0 068 Community Operations 125 60069 Other Non-Instructional Services 0 070 Total Non-Instructional Services 505,798 548,23471 Facilities Acquisition and Construction 2,841,350 3,684,56872 Debt Service 374,302 515,97375 Other Non-Programmed Costs 1,805 076 Total Expenditures 11,635,846 13,627,12077 Less: Capital Expenditures 2,985,759 4,170,83478 Less: Debt Service 374,302 515,97379 Total Current Expenditures 8,275,785 8,940,31480 Exclusions from Current Expenditures 638,05481 Net Current Expenditures 7,637,731
82 Per Pupil Expenditures 7,759
83 Personnel - Non-Federal Certified Clsrm FTEs 76.4184 Avg Salary - Non-Fed Certified Clsrm FTEs 40,99185 Personnel - Non-Federal Certified FTEs 81.4486 Avg Salary - Non-Fed Certified FTEs 42,77687.1 Legal Balance (funds 1-2-4) 2,248,68187.2 Categorical Fund Balance 46,78087.3 Deposits with Paying Agents (QZAB) 087.4 Net Legal Bal (Excl Cat & QZAB) 2,201,90188 Building Fund Balance (fund 3) 1,945,28989 Capital Outlay Fund Balance (fund 5) 0
Jan 30, 2012 - 72 - 9:35:29 AM

Annual Statistical Report 2010-2011
County: FAULKNER MT. VERNON/ENOLA SCHOOL DIST. LEA:2306000
2010-2011 2011-2012Actual Budget
1 Area in Square Miles 1072 ADA 4593 ADA pct Change over 5 Yrs. 2%4 4 QTR ADM 4785 Prior Year 3QTR ADM 4996 Assessment 32,880,3607 M&O Mills 25.498 URT Mills 25.009 M&O Mills in Excess of URT 0.4910 Dedicated M&O Mills 0.0011 Debt Service Mills 16.0112 Total Mills 41.5013 Total Debt Bond/Non-Bond 3,795,000
State and Local Revenue:14 Property Tax Receipts (Including URT) 1,024,510 1,024,30015 Other Local Receipts 298,334 275,11116 Revenue from Intermediate Sources 2,602 2,60017.1 Foundation Funding (Excl URT) 2,374,762 2,138,81617.2 Tax Collection Rate Guarantee 20,349 20,00018 Student Growth Funding 0 019 Declining Enrollment Funding 6,987 120,60620 Consolidation Incentive/Assistance 0 021 Isolated Funding 0 022 Supplemental Millage Incentive Funding 28,416 45,46623 Other Unrestricted State Funding 0 024 Total Unrestricted Revenue from State and
Local Sources 3,755,960 3,626,899
Restricted Revenue from State Sources:25 Adult Education 0 0
Regular Education:26 Professional Development 20,633 20,31027 Other Regular Education 4,727 2,350
Special Education:28 Gifted & Talented 300 30029 Alternative Learning Environment (ALE) 46,318 27,64730 English Language Learner (ELL) 0 031 National School Lunch Act (NSLA) 147,808 144,71632 Other Special Education 2,044 033 Workforce Education 5,417 1,08434 School Food Service 1,926 2,00035 Educational Service Cooperatives 0 036 Early Childhood Programs 97,200 97,20037 Magnet School Programs 0 038 Other Non-Instructional Programs 24,236 34,02239 Total Restricted Revenue from State Sources 350,609 329,62940 Total Restricted Revenue from Federal
Sources 637,506 558,879
Other Sources of Funds:41 Financing Sources 100 042 Balances from Consolidated/Annexed District 0 043 Indirect Cost Reimbursement 0 044 Gains and Losses from Sale of Fixed Assets 0 2,70045 Compensation for Loss of Fixed Assets 8,742 3,00046 Other 0 15,00047 Total Other Sources of Funds 8,842 20,70048 Total Revenue and Other Sources of Funds
from All Sources 4,752,918 4,536,107
2010-2011 2011-2012Actual Budget
CURRENT EXPENDITURESInstruction:
49 Regular Instruction 1,659,428 1,757,26350 Special Education 199,031 194,56151 Workforce Education 203,687 211,82252 Adult Education 0 053 Compensatory Education 88,644 128,84954 Other 227,082 195,99555 Total Instruction 2,377,872 2,488,490
District Level Support:56 General Administration 149,165 153,64557 Central Services 56,011 68,53958 Maintenance & Operations of Plant 504,684 571,72459 Student Transportation 254,612 185,52060 Other District Level Support Services 17,055 19,01361 Total District Support Services 981,526 998,441
School Level Support:62 Student Support Services 134,802 167,47863 Instructional Staff Support Services 226,368 232,96264 School Administration 237,345 242,23465 Total District Support Services 598,514 642,674
Non-Instructional Services:66 Food Service Operations 270,583 280,36467 Other Enterprise Operations 63,278 60,45068 Community Operations 0 50069 Other Non-Instructional Services 0 070 Total Non-Instructional Services 333,861 341,31471 Facilities Acquisition and Construction 1,178,140 25,66372 Debt Service 244,260 242,66675 Other Non-Programmed Costs 0 076 Total Expenditures 5,714,174 4,739,24777 Less: Capital Expenditures 1,305,994 76,16378 Less: Debt Service 244,260 242,66679 Total Current Expenditures 4,163,919 4,420,41880 Exclusions from Current Expenditures 331,20681 Net Current Expenditures 3,832,714
82 Per Pupil Expenditures 8,354
83 Personnel - Non-Federal Certified Clsrm FTEs 35.6084 Avg Salary - Non-Fed Certified Clsrm FTEs 41,82285 Personnel - Non-Federal Certified FTEs 38.7486 Avg Salary - Non-Fed Certified FTEs 44,77787.1 Legal Balance (funds 1-2-4) 989,26387.2 Categorical Fund Balance 6,54687.3 Deposits with Paying Agents (QZAB) 087.4 Net Legal Bal (Excl Cat & QZAB) 982,71688 Building Fund Balance (fund 3) 202,19389 Capital Outlay Fund Balance (fund 5) 0
Jan 30, 2012 - 73 - 9:35:29 AM

Annual Statistical Report 2010-2011
County: FAULKNER VILONIA SCHOOL DISTRICT LEA:2307000
2010-2011 2011-2012Actual Budget
1 Area in Square Miles 1092 ADA 2,9043 ADA pct Change over 5 Yrs. 10%4 4 QTR ADM 3,0625 Prior Year 3QTR ADM 2,9766 Assessment 148,521,4537 M&O Mills 25.008 URT Mills 25.009 M&O Mills in Excess of URT 0.0010 Dedicated M&O Mills 0.0011 Debt Service Mills 13.9012 Total Mills 38.9013 Total Debt Bond/Non-Bond 15,710,845
State and Local Revenue:14 Property Tax Receipts (Including URT) 5,181,811 5,431,27615 Other Local Receipts 1,933,452 1,554,05016 Revenue from Intermediate Sources 18,968 17,00017.1 Foundation Funding (Excl URT) 14,616,371 15,164,81417.2 Tax Collection Rate Guarantee 38,602 018 Student Growth Funding 593,961 400,00019 Declining Enrollment Funding 0 020 Consolidation Incentive/Assistance 0 021 Isolated Funding 0 022 Supplemental Millage Incentive Funding 173,014 138,41123 Other Unrestricted State Funding 0 024 Total Unrestricted Revenue from State and
Local Sources 22,556,180 22,705,551
Restricted Revenue from State Sources:25 Adult Education 37,425 37,000
Regular Education:26 Professional Development 123,072 129,70327 Other Regular Education 18,130 9,200
Special Education:28 Gifted & Talented 2,903 029 Alternative Learning Environment (ALE) 89,061 106,23630 English Language Learner (ELL) 9,083 9,00031 National School Lunch Act (NSLA) 577,840 579,37032 Other Special Education 169,583 107,10033 Workforce Education 107,251 122,41734 School Food Service 11,581 11,60035 Educational Service Cooperatives 0 036 Early Childhood Programs 438,600 437,40037 Magnet School Programs 0 038 Other Non-Instructional Programs 310,940 280,88739 Total Restricted Revenue from State Sources 1,895,469 1,829,91340 Total Restricted Revenue from Federal
Sources 3,408,341 2,880,919
Other Sources of Funds:41 Financing Sources 113,000 12,11142 Balances from Consolidated/Annexed District 0 043 Indirect Cost Reimbursement 0 044 Gains and Losses from Sale of Fixed Assets 0 045 Compensation for Loss of Fixed Assets 31,767 046 Other 0 047 Total Other Sources of Funds 144,767 12,11148 Total Revenue and Other Sources of Funds
from All Sources 28,004,756 27,428,494
2010-2011 2011-2012Actual Budget
CURRENT EXPENDITURESInstruction:
49 Regular Instruction 10,084,642 9,959,00850 Special Education 1,914,205 1,960,19051 Workforce Education 887,490 911,70752 Adult Education 0 053 Compensatory Education 366,827 447,16254 Other 991,605 1,004,35555 Total Instruction 14,244,769 14,282,422
District Level Support:56 General Administration 496,641 705,15257 Central Services 503,380 591,58758 Maintenance & Operations of Plant 2,207,126 2,266,84659 Student Transportation 1,098,039 1,114,84560 Other District Level Support Services 179,152 208,30061 Total District Support Services 4,484,338 4,886,730
School Level Support:62 Student Support Services 1,455,788 1,374,77863 Instructional Staff Support Services 1,594,464 1,730,62264 School Administration 1,295,524 1,336,09265 Total District Support Services 4,345,776 4,441,492
Non-Instructional Services:66 Food Service Operations 1,572,429 1,621,86067 Other Enterprise Operations 38,678 65,00068 Community Operations 484,278 514,03669 Other Non-Instructional Services 0 070 Total Non-Instructional Services 2,095,385 2,200,89671 Facilities Acquisition and Construction 148,559 261,43572 Debt Service 770,654 794,77775 Other Non-Programmed Costs 4,760 16,23476 Total Expenditures 26,094,240 26,883,98677 Less: Capital Expenditures 790,650 652,24178 Less: Debt Service 770,654 794,77779 Total Current Expenditures 24,532,936 25,436,96980 Exclusions from Current Expenditures 2,276,52581 Net Current Expenditures 22,256,411
82 Per Pupil Expenditures 7,665
83 Personnel - Non-Federal Certified Clsrm FTEs 197.3484 Avg Salary - Non-Fed Certified Clsrm FTEs 48,64485 Personnel - Non-Federal Certified FTEs 213.8186 Avg Salary - Non-Fed Certified FTEs 50,66887.1 Legal Balance (funds 1-2-4) 4,275,92887.2 Categorical Fund Balance 18,28487.3 Deposits with Paying Agents (QZAB) 087.4 Net Legal Bal (Excl Cat & QZAB) 4,257,64488 Building Fund Balance (fund 3) 747,80189 Capital Outlay Fund Balance (fund 5) 0
Jan 30, 2012 - 74 - 9:35:29 AM

Annual Statistical Report 2010-2011
County: FRANKLIN CHARLESTON SCHOOL DISTRICT LEA:2402000
2010-2011 2011-2012Actual Budget
1 Area in Square Miles 1102 ADA 8463 ADA pct Change over 5 Yrs. (2%)4 4 QTR ADM 8725 Prior Year 3QTR ADM 8666 Assessment 49,795,2847 M&O Mills 25.008 URT Mills 25.009 M&O Mills in Excess of URT 0.0010 Dedicated M&O Mills 0.0011 Debt Service Mills 12.5012 Total Mills 37.5013 Total Debt Bond/Non-Bond 7,605,000
State and Local Revenue:14 Property Tax Receipts (Including URT) 1,748,001 1,760,24415 Other Local Receipts 347,108 310,73416 Revenue from Intermediate Sources 0 017.1 Foundation Funding (Excl URT) 3,968,584 4,113,61917.2 Tax Collection Rate Guarantee 40,603 40,00018 Student Growth Funding 0 019 Declining Enrollment Funding 89,743 020 Consolidation Incentive/Assistance 0 021 Isolated Funding 0 022 Supplemental Millage Incentive Funding 0 023 Other Unrestricted State Funding 0 024 Total Unrestricted Revenue from State and
Local Sources 6,194,039 6,224,597
Restricted Revenue from State Sources:25 Adult Education 0 0
Regular Education:26 Professional Development 35,826 37,03727 Other Regular Education 1,377 1,400
Special Education:28 Gifted & Talented 250 25029 Alternative Learning Environment (ALE) 8,857 53930 English Language Learner (ELL) 0 031 National School Lunch Act (NSLA) 166,656 181,65432 Other Special Education 3,549 033 Workforce Education 142,425 8,12534 School Food Service 2,928 035 Educational Service Cooperatives 0 036 Early Childhood Programs 97,200 97,20037 Magnet School Programs 0 038 Other Non-Instructional Programs 515,607 425,12839 Total Restricted Revenue from State Sources 974,674 751,33340 Total Restricted Revenue from Federal
Sources 927,967 627,834
Other Sources of Funds:41 Financing Sources 4,118 042 Balances from Consolidated/Annexed District 0 043 Indirect Cost Reimbursement 0 044 Gains and Losses from Sale of Fixed Assets 0 045 Compensation for Loss of Fixed Assets 0 046 Other 191,237 1,62847 Total Other Sources of Funds 195,356 1,62848 Total Revenue and Other Sources of Funds
from All Sources 8,292,036 7,605,392
2010-2011 2011-2012Actual Budget
CURRENT EXPENDITURESInstruction:
49 Regular Instruction 3,457,398 3,284,14850 Special Education 301,758 358,52651 Workforce Education 370,108 240,32752 Adult Education 0 053 Compensatory Education 164,506 137,57954 Other 78,580 92,21055 Total Instruction 4,372,350 4,112,790
District Level Support:56 General Administration 199,580 205,46657 Central Services 99,417 98,83858 Maintenance & Operations of Plant 775,490 670,88159 Student Transportation 236,844 257,78160 Other District Level Support Services 23,718 31,00261 Total District Support Services 1,335,049 1,263,968
School Level Support:62 Student Support Services 393,464 451,26363 Instructional Staff Support Services 420,794 397,75364 School Administration 402,058 396,13065 Total District Support Services 1,216,316 1,245,146
Non-Instructional Services:66 Food Service Operations 302,372 301,68567 Other Enterprise Operations 17,648 13,65068 Community Operations 231 1,50069 Other Non-Instructional Services 0 070 Total Non-Instructional Services 320,251 316,83571 Facilities Acquisition and Construction 945,601 632,56372 Debt Service 222,773 327,98675 Other Non-Programmed Costs 0 076 Total Expenditures 8,412,340 7,899,28977 Less: Capital Expenditures 1,182,956 754,23378 Less: Debt Service 222,773 327,98679 Total Current Expenditures 7,006,610 6,817,07080 Exclusions from Current Expenditures 385,17781 Net Current Expenditures 6,621,434
82 Per Pupil Expenditures 7,829
83 Personnel - Non-Federal Certified Clsrm FTEs 57.0984 Avg Salary - Non-Fed Certified Clsrm FTEs 50,00785 Personnel - Non-Federal Certified FTEs 61.8986 Avg Salary - Non-Fed Certified FTEs 52,48887.1 Legal Balance (funds 1-2-4) 1,501,92387.2 Categorical Fund Balance 7,17487.3 Deposits with Paying Agents (QZAB) 087.4 Net Legal Bal (Excl Cat & QZAB) 1,494,74988 Building Fund Balance (fund 3) 941,52189 Capital Outlay Fund Balance (fund 5) 0
Jan 30, 2012 - 75 - 9:35:29 AM

Annual Statistical Report 2010-2011
County: FRANKLIN COUNTY LINE SCHOOL DISTRICT LEA:2403000
2010-2011 2011-2012Actual Budget
1 Area in Square Miles 1442 ADA 4453 ADA pct Change over 5 Yrs. (14%)4 4 QTR ADM 4735 Prior Year 3QTR ADM 4996 Assessment 45,808,8447 M&O Mills 25.008 URT Mills 25.009 M&O Mills in Excess of URT 0.0010 Dedicated M&O Mills 0.0011 Debt Service Mills 11.1012 Total Mills 36.1013 Total Debt Bond/Non-Bond 4,685,000
State and Local Revenue:14 Property Tax Receipts (Including URT) 1,719,387 1,570,98515 Other Local Receipts 168,789 124,59216 Revenue from Intermediate Sources 0 017.1 Foundation Funding (Excl URT) 1,737,225 1,783,35417.2 Tax Collection Rate Guarantee 44,393 018 Student Growth Funding 0 019 Declining Enrollment Funding 97,512 79,28820 Consolidation Incentive/Assistance 0 021 Isolated Funding 0 022 Supplemental Millage Incentive Funding 0 023 Other Unrestricted State Funding 0 024 Total Unrestricted Revenue from State and
Local Sources 3,767,306 3,558,219
Restricted Revenue from State Sources:25 Adult Education 0 0
Regular Education:26 Professional Development 20,648 20,06327 Other Regular Education 3,956 2,800
Special Education:28 Gifted & Talented 1,350 50029 Alternative Learning Environment (ALE) 10,117 6,79830 English Language Learner (ELL) 2,344 2,39231 National School Lunch Act (NSLA) 134,416 138,64432 Other Special Education 7,472 7,00033 Workforce Education 6,500 13,00034 School Food Service 1,990 1,90035 Educational Service Cooperatives 0 036 Early Childhood Programs 94,867 97,20037 Magnet School Programs 0 038 Other Non-Instructional Programs 23,124 226,23739 Total Restricted Revenue from State Sources 306,784 516,53440 Total Restricted Revenue from Federal
Sources 1,188,999 628,695
Other Sources of Funds:41 Financing Sources 516,030 042 Balances from Consolidated/Annexed District 0 043 Indirect Cost Reimbursement 0 2,52344 Gains and Losses from Sale of Fixed Assets 0 40045 Compensation for Loss of Fixed Assets 0 046 Other 0 047 Total Other Sources of Funds 516,030 2,92348 Total Revenue and Other Sources of Funds
from All Sources 5,779,120 4,706,371
2010-2011 2011-2012Actual Budget
CURRENT EXPENDITURESInstruction:
49 Regular Instruction 1,892,059 1,919,68750 Special Education 203,489 190,89451 Workforce Education 157,139 138,68252 Adult Education 0 053 Compensatory Education 222,908 215,14754 Other 48,402 55,45255 Total Instruction 2,523,997 2,519,862
District Level Support:56 General Administration 176,896 258,93757 Central Services 57,600 59,24258 Maintenance & Operations of Plant 355,890 356,40359 Student Transportation 263,756 221,80860 Other District Level Support Services 8,726 12,52361 Total District Support Services 862,868 908,912
School Level Support:62 Student Support Services 230,584 236,93463 Instructional Staff Support Services 235,791 231,73964 School Administration 229,747 230,18765 Total District Support Services 696,122 698,860
Non-Instructional Services:66 Food Service Operations 252,970 242,49767 Other Enterprise Operations 0 068 Community Operations 0 50069 Other Non-Instructional Services 0 070 Total Non-Instructional Services 252,970 242,99771 Facilities Acquisition and Construction 498,308 522,03772 Debt Service 381,985 249,50875 Other Non-Programmed Costs 44,449 5,54876 Total Expenditures 5,260,699 5,147,72477 Less: Capital Expenditures 602,269 538,03778 Less: Debt Service 381,985 249,50879 Total Current Expenditures 4,276,446 4,360,17980 Exclusions from Current Expenditures 255,10181 Net Current Expenditures 4,021,345
82 Per Pupil Expenditures 9,028
83 Personnel - Non-Federal Certified Clsrm FTEs 36.3684 Avg Salary - Non-Fed Certified Clsrm FTEs 42,16885 Personnel - Non-Federal Certified FTEs 39.7986 Avg Salary - Non-Fed Certified FTEs 44,90087.1 Legal Balance (funds 1-2-4) 1,265,25487.2 Categorical Fund Balance 8,49787.3 Deposits with Paying Agents (QZAB) 087.4 Net Legal Bal (Excl Cat & QZAB) 1,256,75788 Building Fund Balance (fund 3) 879,57889 Capital Outlay Fund Balance (fund 5) 0
Jan 30, 2012 - 76 - 9:35:29 AM

Annual Statistical Report 2010-2011
County: FRANKLIN OZARK SCHOOL DISTRICT LEA:2404000
2010-2011 2011-2012Actual Budget
1 Area in Square Miles 3302 ADA 1,6993 ADA pct Change over 5 Yrs. (2%)4 4 QTR ADM 1,8105 Prior Year 3QTR ADM 1,8446 Assessment 146,498,1937 M&O Mills 25.008 URT Mills 25.009 M&O Mills in Excess of URT 0.0010 Dedicated M&O Mills 0.0011 Debt Service Mills 8.0012 Total Mills 33.0013 Total Debt Bond/Non-Bond 5,924,276
State and Local Revenue:14 Property Tax Receipts (Including URT) 4,666,294 4,852,44715 Other Local Receipts 670,217 332,18516 Revenue from Intermediate Sources 0 017.1 Foundation Funding (Excl URT) 7,289,667 7,403,07917.2 Tax Collection Rate Guarantee 121,016 64,00018 Student Growth Funding 0 019 Declining Enrollment Funding 8,854 92,46720 Consolidation Incentive/Assistance 0 021 Isolated Funding 0 022 Supplemental Millage Incentive Funding 0 023 Other Unrestricted State Funding 174,693 175,00024 Total Unrestricted Revenue from State and
Local Sources 12,930,740 12,919,178
Restricted Revenue from State Sources:25 Adult Education 0 0
Regular Education:26 Professional Development 76,265 76,87027 Other Regular Education 6,363 2,000
Special Education:28 Gifted & Talented 400 20029 Alternative Learning Environment (ALE) 195,837 187,39530 English Language Learner (ELL) 0 1,00031 National School Lunch Act (NSLA) 485,584 503,47032 Other Special Education 7,554 033 Workforce Education 16,250 15,43834 School Food Service 6,299 6,50035 Educational Service Cooperatives 0 036 Early Childhood Programs 0 037 Magnet School Programs 0 038 Other Non-Instructional Programs 217,196 1,124,85139 Total Restricted Revenue from State Sources 1,011,748 1,917,72440 Total Restricted Revenue from Federal
Sources 3,370,145 2,174,035
Other Sources of Funds:41 Financing Sources 461 50042 Balances from Consolidated/Annexed District 0 043 Indirect Cost Reimbursement 69,421 67,83644 Gains and Losses from Sale of Fixed Assets 2,664 5,00045 Compensation for Loss of Fixed Assets 6,244 046 Other 0 5,00047 Total Other Sources of Funds 78,790 78,33648 Total Revenue and Other Sources of Funds
from All Sources 17,391,424 17,089,273
2010-2011 2011-2012Actual Budget
CURRENT EXPENDITURESInstruction:
49 Regular Instruction 6,487,562 6,134,47150 Special Education 836,387 805,63751 Workforce Education 435,546 364,04752 Adult Education 0 053 Compensatory Education 779,188 836,49554 Other 344,330 311,81055 Total Instruction 8,883,012 8,452,461
District Level Support:56 General Administration 316,941 355,03357 Central Services 191,491 161,05758 Maintenance & Operations of Plant 1,566,322 1,621,28159 Student Transportation 860,293 817,46760 Other District Level Support Services 93,065 92,83661 Total District Support Services 3,028,111 3,047,674
School Level Support:62 Student Support Services 852,936 809,46663 Instructional Staff Support Services 1,996,309 1,370,93064 School Administration 804,707 726,20465 Total District Support Services 3,653,952 2,906,600
Non-Instructional Services:66 Food Service Operations 779,213 762,24167 Other Enterprise Operations 182 068 Community Operations 65 4,00069 Other Non-Instructional Services 0 070 Total Non-Instructional Services 779,460 766,24171 Facilities Acquisition and Construction 287,333 1,043,95472 Debt Service 823,342 927,19075 Other Non-Programmed Costs 9,640 076 Total Expenditures 17,464,849 17,144,12077 Less: Capital Expenditures 904,253 1,326,77978 Less: Debt Service 823,342 927,19079 Total Current Expenditures 15,737,255 14,890,15180 Exclusions from Current Expenditures 516,09381 Net Current Expenditures 15,221,161
82 Per Pupil Expenditures 8,959
83 Personnel - Non-Federal Certified Clsrm FTEs 131.2684 Avg Salary - Non-Fed Certified Clsrm FTEs 46,24785 Personnel - Non-Federal Certified FTEs 140.8686 Avg Salary - Non-Fed Certified FTEs 48,24187.1 Legal Balance (funds 1-2-4) 2,786,95287.2 Categorical Fund Balance 107,08687.3 Deposits with Paying Agents (QZAB) 087.4 Net Legal Bal (Excl Cat & QZAB) 2,679,86688 Building Fund Balance (fund 3) 089 Capital Outlay Fund Balance (fund 5) 0
Jan 30, 2012 - 77 - 9:35:29 AM

Annual Statistical Report 2010-2011
County: FULTON MAMMOTH SPRING SCHOOL DISTRICT LEA:2501000
2010-2011 2011-2012Actual Budget
1 Area in Square Miles 2272 ADA 4443 ADA pct Change over 5 Yrs. 2%4 4 QTR ADM 4705 Prior Year 3QTR ADM 3966 Assessment 34,275,5707 M&O Mills 30.008 URT Mills 25.009 M&O Mills in Excess of URT 5.0010 Dedicated M&O Mills 0.0011 Debt Service Mills 5.0012 Total Mills 35.0013 Total Debt Bond/Non-Bond 997,517
State and Local Revenue:14 Property Tax Receipts (Including URT) 964,931 1,176,68015 Other Local Receipts 231,959 79,70016 Revenue from Intermediate Sources 12 017.1 Foundation Funding (Excl URT) 2,078,225 2,040,56717.2 Tax Collection Rate Guarantee 41,278 018 Student Growth Funding 74,618 019 Declining Enrollment Funding 0 020 Consolidation Incentive/Assistance 341,846 021 Isolated Funding 28,050 022 Supplemental Millage Incentive Funding 0 023 Other Unrestricted State Funding 4,876 024 Total Unrestricted Revenue from State and
Local Sources 3,765,795 3,296,947
Restricted Revenue from State Sources:25 Adult Education 0 0
Regular Education:26 Professional Development 18,912 19,87427 Other Regular Education 0 0
Special Education:28 Gifted & Talented 200 029 Alternative Learning Environment (ALE) 27,296 26,98430 English Language Learner (ELL) 0 031 National School Lunch Act (NSLA) 147,875 151,29432 Other Special Education 76,971 033 Workforce Education 0 034 School Food Service 1,733 1,50035 Educational Service Cooperatives 0 036 Early Childhood Programs 127,736 126,36037 Magnet School Programs 0 038 Other Non-Instructional Programs 32,300 10,32239 Total Restricted Revenue from State Sources 433,024 336,33440 Total Restricted Revenue from Federal
Sources 839,383 718,204
Other Sources of Funds:41 Financing Sources 0 042 Balances from Consolidated/Annexed District 0 043 Indirect Cost Reimbursement 0 044 Gains and Losses from Sale of Fixed Assets 0 045 Compensation for Loss of Fixed Assets 0 046 Other 0 047 Total Other Sources of Funds 0 048 Total Revenue and Other Sources of Funds
from All Sources 5,038,201 4,351,485
2010-2011 2011-2012Actual Budget
CURRENT EXPENDITURESInstruction:
49 Regular Instruction 1,860,037 1,750,32450 Special Education 324,610 298,18151 Workforce Education 186,055 172,75652 Adult Education 0 053 Compensatory Education 232,512 301,63254 Other 79,617 130,57255 Total Instruction 2,682,832 2,653,465
District Level Support:56 General Administration 176,272 179,74857 Central Services 6,119 1,20058 Maintenance & Operations of Plant 318,348 311,93859 Student Transportation 275,301 382,09260 Other District Level Support Services 14,534 5,00061 Total District Support Services 790,573 879,978
School Level Support:62 Student Support Services 150,207 151,94363 Instructional Staff Support Services 132,185 129,82764 School Administration 204,830 196,61565 Total District Support Services 487,222 478,385
Non-Instructional Services:66 Food Service Operations 250,046 206,45367 Other Enterprise Operations 0 068 Community Operations 288 069 Other Non-Instructional Services 0 070 Total Non-Instructional Services 250,334 206,45371 Facilities Acquisition and Construction 0 072 Debt Service 96,407 73,72975 Other Non-Programmed Costs 0 076 Total Expenditures 4,307,367 4,292,00977 Less: Capital Expenditures 104,276 141,90078 Less: Debt Service 96,407 73,72979 Total Current Expenditures 4,106,684 4,076,38080 Exclusions from Current Expenditures 458,32781 Net Current Expenditures 3,648,356
82 Per Pupil Expenditures 8,208
83 Personnel - Non-Federal Certified Clsrm FTEs 43.7784 Avg Salary - Non-Fed Certified Clsrm FTEs 29,75785 Personnel - Non-Federal Certified FTEs 46.7786 Avg Salary - Non-Fed Certified FTEs 32,10787.1 Legal Balance (funds 1-2-4) 569,31187.2 Categorical Fund Balance 54,67887.3 Deposits with Paying Agents (QZAB) 087.4 Net Legal Bal (Excl Cat & QZAB) 514,63288 Building Fund Balance (fund 3) 794,68989 Capital Outlay Fund Balance (fund 5) 0
Jan 30, 2012 - 78 - 9:35:29 AM

Annual Statistical Report 2010-2011
County: FULTON SALEM SCHOOL DISTRICT LEA:2502000
2010-2011 2011-2012Actual Budget
1 Area in Square Miles 2272 ADA 6953 ADA pct Change over 5 Yrs. (1%)4 4 QTR ADM 7285 Prior Year 3QTR ADM 7376 Assessment 41,747,3037 M&O Mills 25.008 URT Mills 25.009 M&O Mills in Excess of URT 0.0010 Dedicated M&O Mills 0.0011 Debt Service Mills 6.5012 Total Mills 31.5013 Total Debt Bond/Non-Bond 630,000
State and Local Revenue:14 Property Tax Receipts (Including URT) 1,216,904 1,262,00015 Other Local Receipts 362,919 125,50016 Revenue from Intermediate Sources 16 3,00017.1 Foundation Funding (Excl URT) 3,436,983 3,444,10417.2 Tax Collection Rate Guarantee 42,721 45,00018 Student Growth Funding 0 019 Declining Enrollment Funding 0 29,18420 Consolidation Incentive/Assistance 0 021 Isolated Funding 0 022 Supplemental Millage Incentive Funding 1,670 1,33623 Other Unrestricted State Funding 0 024 Total Unrestricted Revenue from State and
Local Sources 5,061,213 4,910,124
Restricted Revenue from State Sources:25 Adult Education 0 0
Regular Education:26 Professional Development 30,491 30,84127 Other Regular Education 7,134 2,500
Special Education:28 Gifted & Talented 150 10029 Alternative Learning Environment (ALE) 17,471 28,64230 English Language Learner (ELL) 0 031 National School Lunch Act (NSLA) 227,664 229,72432 Other Special Education 31,370 28,50033 Workforce Education 0 034 School Food Service 3,145 3,00035 Educational Service Cooperatives 0 036 Early Childhood Programs 0 037 Magnet School Programs 0 038 Other Non-Instructional Programs 45,962 146,96539 Total Restricted Revenue from State Sources 363,387 470,27240 Total Restricted Revenue from Federal
Sources 1,049,726 917,504
Other Sources of Funds:41 Financing Sources 1,618 042 Balances from Consolidated/Annexed District 0 043 Indirect Cost Reimbursement 0 044 Gains and Losses from Sale of Fixed Assets 2,482 045 Compensation for Loss of Fixed Assets 2,191 046 Other 0 047 Total Other Sources of Funds 6,291 048 Total Revenue and Other Sources of Funds
from All Sources 6,480,617 6,297,900
2010-2011 2011-2012Actual Budget
CURRENT EXPENDITURESInstruction:
49 Regular Instruction 2,644,321 2,604,36550 Special Education 454,069 429,85451 Workforce Education 219,978 222,08352 Adult Education 0 053 Compensatory Education 208,128 215,43954 Other 245,788 266,91155 Total Instruction 3,772,283 3,738,652
District Level Support:56 General Administration 207,979 192,66957 Central Services 77,815 81,39358 Maintenance & Operations of Plant 540,967 488,88059 Student Transportation 372,123 391,50560 Other District Level Support Services 12,344 6,00061 Total District Support Services 1,211,227 1,160,447
School Level Support:62 Student Support Services 219,738 241,03863 Instructional Staff Support Services 305,675 267,13164 School Administration 215,118 216,83765 Total District Support Services 740,531 725,006
Non-Instructional Services:66 Food Service Operations 408,574 425,82567 Other Enterprise Operations 53,167 068 Community Operations 361 3,00269 Other Non-Instructional Services 0 070 Total Non-Instructional Services 462,102 428,82771 Facilities Acquisition and Construction 386,843 172,41472 Debt Service 175,128 181,57075 Other Non-Programmed Costs 0 076 Total Expenditures 6,748,114 6,406,91677 Less: Capital Expenditures 636,776 309,13478 Less: Debt Service 175,128 181,57079 Total Current Expenditures 5,936,211 5,916,21280 Exclusions from Current Expenditures 271,66881 Net Current Expenditures 5,664,542
82 Per Pupil Expenditures 8,153
83 Personnel - Non-Federal Certified Clsrm FTEs 54.9684 Avg Salary - Non-Fed Certified Clsrm FTEs 43,71385 Personnel - Non-Federal Certified FTEs 57.8086 Avg Salary - Non-Fed Certified FTEs 45,29387.1 Legal Balance (funds 1-2-4) 1,448,32287.2 Categorical Fund Balance 17,43287.3 Deposits with Paying Agents (QZAB) 087.4 Net Legal Bal (Excl Cat & QZAB) 1,430,89088 Building Fund Balance (fund 3) 1,347,46489 Capital Outlay Fund Balance (fund 5) 0
Jan 30, 2012 - 79 - 9:35:29 AM

Annual Statistical Report 2010-2011
County: FULTON VIOLA SCHOOL DISTRICT LEA:2503000
2010-2011 2011-2012Actual Budget
1 Area in Square Miles 2362 ADA 3923 ADA pct Change over 5 Yrs. 1%4 4 QTR ADM 4105 Prior Year 3QTR ADM 4156 Assessment 34,590,1297 M&O Mills 25.008 URT Mills 25.009 M&O Mills in Excess of URT 0.0010 Dedicated M&O Mills 0.0011 Debt Service Mills 15.6212 Total Mills 40.6213 Total Debt Bond/Non-Bond 4,045,000
State and Local Revenue:14 Property Tax Receipts (Including URT) 1,269,364 1,301,72215 Other Local Receipts 219,954 100,00016 Revenue from Intermediate Sources 12 017.1 Foundation Funding (Excl URT) 1,678,355 1,668,32317.2 Tax Collection Rate Guarantee 45,507 018 Student Growth Funding 68,306 019 Declining Enrollment Funding 0 12,59520 Consolidation Incentive/Assistance 0 021 Isolated Funding 0 125,00022 Supplemental Millage Incentive Funding 0 023 Other Unrestricted State Funding 11,198 024 Total Unrestricted Revenue from State and
Local Sources 3,292,697 3,207,640
Restricted Revenue from State Sources:25 Adult Education 0 0
Regular Education:26 Professional Development 17,145 17,39427 Other Regular Education 129,974 6,400
Special Education:28 Gifted & Talented 150 029 Alternative Learning Environment (ALE) 15,521 15,08830 English Language Learner (ELL) 879 031 National School Lunch Act (NSLA) 115,568 128,01832 Other Special Education 1,920 033 Workforce Education 0 034 School Food Service 1,669 1,50035 Educational Service Cooperatives 0 036 Early Childhood Programs 0 037 Magnet School Programs 0 038 Other Non-Instructional Programs 729,389 591,64539 Total Restricted Revenue from State Sources 1,012,215 760,04540 Total Restricted Revenue from Federal
Sources 640,147 1,090,330
Other Sources of Funds:41 Financing Sources 1,148 042 Balances from Consolidated/Annexed District 0 043 Indirect Cost Reimbursement 0 044 Gains and Losses from Sale of Fixed Assets 2,195 045 Compensation for Loss of Fixed Assets 1,394 046 Other 0 047 Total Other Sources of Funds 4,738 048 Total Revenue and Other Sources of Funds
from All Sources 4,949,796 5,058,015
2010-2011 2011-2012Actual Budget
CURRENT EXPENDITURESInstruction:
49 Regular Instruction 1,585,367 1,477,55950 Special Education 191,302 213,66051 Workforce Education 192,464 185,31352 Adult Education 0 053 Compensatory Education 105,249 132,34154 Other 135,917 129,15955 Total Instruction 2,210,299 2,138,033
District Level Support:56 General Administration 146,256 139,37657 Central Services 46,785 48,60558 Maintenance & Operations of Plant 438,943 386,04059 Student Transportation 245,942 240,81560 Other District Level Support Services 12,951 5,00061 Total District Support Services 890,876 819,836
School Level Support:62 Student Support Services 147,769 166,65563 Instructional Staff Support Services 106,775 121,18964 School Administration 185,525 204,17965 Total District Support Services 440,069 492,023
Non-Instructional Services:66 Food Service Operations 252,862 241,84467 Other Enterprise Operations 0 068 Community Operations 0 2,00069 Other Non-Instructional Services 0 070 Total Non-Instructional Services 252,862 243,84471 Facilities Acquisition and Construction 2,181,180 1,285,16172 Debt Service 287,147 268,18075 Other Non-Programmed Costs 0 076 Total Expenditures 6,262,433 5,247,07777 Less: Capital Expenditures 2,212,017 1,301,16178 Less: Debt Service 287,147 268,18079 Total Current Expenditures 3,763,269 3,677,73680 Exclusions from Current Expenditures 185,69481 Net Current Expenditures 3,577,575
82 Per Pupil Expenditures 9,132
83 Personnel - Non-Federal Certified Clsrm FTEs 27.9984 Avg Salary - Non-Fed Certified Clsrm FTEs 42,34585 Personnel - Non-Federal Certified FTEs 30.6086 Avg Salary - Non-Fed Certified FTEs 44,83187.1 Legal Balance (funds 1-2-4) 733,10587.2 Categorical Fund Balance 53,27787.3 Deposits with Paying Agents (QZAB) 087.4 Net Legal Bal (Excl Cat & QZAB) 679,82888 Building Fund Balance (fund 3) 328,30289 Capital Outlay Fund Balance (fund 5) 0
Jan 30, 2012 - 80 - 9:35:29 AM

Annual Statistical Report 2010-2011
County: GARLAND CUTTER-MORNING STAR SCH. DIST. LEA:2601000
2010-2011 2011-2012Actual Budget
1 Area in Square Miles 322 ADA 6013 ADA pct Change over 5 Yrs. (8%)4 4 QTR ADM 6225 Prior Year 3QTR ADM 6766 Assessment 38,902,3787 M&O Mills 25.008 URT Mills 25.009 M&O Mills in Excess of URT 0.0010 Dedicated M&O Mills 0.0011 Debt Service Mills 14.5012 Total Mills 39.5013 Total Debt Bond/Non-Bond 5,522,257
State and Local Revenue:14 Property Tax Receipts (Including URT) 1,364,581 1,215,00015 Other Local Receipts 304,774 68,10016 Revenue from Intermediate Sources 72 017.1 Foundation Funding (Excl URT) 3,127,513 2,890,82117.2 Tax Collection Rate Guarantee 66,139 018 Student Growth Funding 0 019 Declining Enrollment Funding 0 154,79820 Consolidation Incentive/Assistance 0 021 Isolated Funding 0 022 Supplemental Millage Incentive Funding 21,238 16,99123 Other Unrestricted State Funding 1,147 024 Total Unrestricted Revenue from State and
Local Sources 4,885,464 4,345,710
Restricted Revenue from State Sources:25 Adult Education 0 0
Regular Education:26 Professional Development 27,961 34,96527 Other Regular Education 7,560 0
Special Education:28 Gifted & Talented 982 029 Alternative Learning Environment (ALE) 0 030 English Language Learner (ELL) 1,465 031 National School Lunch Act (NSLA) 213,280 204,40032 Other Special Education 2,770 033 Workforce Education 24,557 24,37534 School Food Service 2,528 2,50035 Educational Service Cooperatives 0 036 Early Childhood Programs 0 037 Magnet School Programs 0 038 Other Non-Instructional Programs 163,063 46,51839 Total Restricted Revenue from State Sources 444,165 312,75840 Total Restricted Revenue from Federal
Sources 1,037,290 701,355
Other Sources of Funds:41 Financing Sources 200,900 042 Balances from Consolidated/Annexed District 0 043 Indirect Cost Reimbursement 0 044 Gains and Losses from Sale of Fixed Assets 0 045 Compensation for Loss of Fixed Assets 0 046 Other 517 047 Total Other Sources of Funds 201,417 048 Total Revenue and Other Sources of Funds
from All Sources 6,568,337 5,359,824
2010-2011 2011-2012Actual Budget
CURRENT EXPENDITURESInstruction:
49 Regular Instruction 2,492,789 2,156,44050 Special Education 425,014 317,53951 Workforce Education 167,092 161,75852 Adult Education 0 053 Compensatory Education 157,784 178,35854 Other 210,371 165,95155 Total Instruction 3,453,051 2,980,046
District Level Support:56 General Administration 316,910 238,01457 Central Services 154,324 144,72358 Maintenance & Operations of Plant 503,796 397,00259 Student Transportation 140,165 137,39460 Other District Level Support Services 11,024 12,00061 Total District Support Services 1,126,219 929,133
School Level Support:62 Student Support Services 334,204 322,01263 Instructional Staff Support Services 446,515 388,01464 School Administration 269,440 291,78665 Total District Support Services 1,050,159 1,001,812
Non-Instructional Services:66 Food Service Operations 280,069 254,63667 Other Enterprise Operations 0 068 Community Operations 0 60069 Other Non-Instructional Services 0 070 Total Non-Instructional Services 280,069 255,23671 Facilities Acquisition and Construction 626,651 32,99772 Debt Service 417,118 413,40075 Other Non-Programmed Costs 0 076 Total Expenditures 6,953,266 5,612,62377 Less: Capital Expenditures 720,066 54,23178 Less: Debt Service 417,118 413,40079 Total Current Expenditures 5,816,082 5,144,99280 Exclusions from Current Expenditures 338,76181 Net Current Expenditures 5,477,321
82 Per Pupil Expenditures 9,115
83 Personnel - Non-Federal Certified Clsrm FTEs 59.8184 Avg Salary - Non-Fed Certified Clsrm FTEs 39,20585 Personnel - Non-Federal Certified FTEs 64.8886 Avg Salary - Non-Fed Certified FTEs 41,55787.1 Legal Balance (funds 1-2-4) 248,39687.2 Categorical Fund Balance 21,07887.3 Deposits with Paying Agents (QZAB) 087.4 Net Legal Bal (Excl Cat & QZAB) 227,31788 Building Fund Balance (fund 3) 089 Capital Outlay Fund Balance (fund 5) 0
Jan 30, 2012 - 81 - 9:35:29 AM

Annual Statistical Report 2010-2011
County: GARLAND FOUNTAIN LAKE SCHOOL DISTRICT LEA:2602000
2010-2011 2011-2012Actual Budget
1 Area in Square Miles 1852 ADA 1,1343 ADA pct Change over 5 Yrs. 8%4 4 QTR ADM 1,2125 Prior Year 3QTR ADM 1,2206 Assessment 366,418,7787 M&O Mills 27.058 URT Mills 25.009 M&O Mills in Excess of URT 2.0510 Dedicated M&O Mills 0.0011 Debt Service Mills 7.7512 Total Mills 34.8013 Total Debt Bond/Non-Bond 13,495,000
State and Local Revenue:14 Property Tax Receipts (Including URT) 11,493,588 13,096,33815 Other Local Receipts 478,940 967,50016 Revenue from Intermediate Sources 130 20017.1 Foundation Funding (Excl URT) 0 017.2 Tax Collection Rate Guarantee 0 018 Student Growth Funding 19,260 019 Declining Enrollment Funding 0 020 Consolidation Incentive/Assistance 0 021 Isolated Funding 0 022 Supplemental Millage Incentive Funding 0 023 Other Unrestricted State Funding 0 024 Total Unrestricted Revenue from State and
Local Sources 11,991,918 14,064,038
Restricted Revenue from State Sources:25 Adult Education 0 0
Regular Education:26 Professional Development 50,453 51,61727 Other Regular Education 4,788 1,000
Special Education:28 Gifted & Talented 300 029 Alternative Learning Environment (ALE) 76,831 51,31530 English Language Learner (ELL) 11,134 031 National School Lunch Act (NSLA) 287,556 329,57732 Other Special Education 79,317 51,73333 Workforce Education 29,792 16,79234 School Food Service 3,659 3,70035 Educational Service Cooperatives 0 036 Early Childhood Programs 0 037 Magnet School Programs 0 038 Other Non-Instructional Programs 0 039 Total Restricted Revenue from State Sources 543,829 505,73340 Total Restricted Revenue from Federal
Sources 2,634,924 2,348,649
Other Sources of Funds:41 Financing Sources 1,765,922 042 Balances from Consolidated/Annexed District 0 043 Indirect Cost Reimbursement 0 044 Gains and Losses from Sale of Fixed Assets 0 045 Compensation for Loss of Fixed Assets 0 046 Other 0 047 Total Other Sources of Funds 1,765,922 048 Total Revenue and Other Sources of Funds
from All Sources 16,936,592 16,918,420
2010-2011 2011-2012Actual Budget
CURRENT EXPENDITURESInstruction:
49 Regular Instruction 4,729,482 5,182,17250 Special Education 735,528 753,76251 Workforce Education 268,841 139,18152 Adult Education 0 053 Compensatory Education 595,296 572,51254 Other 505,843 556,02955 Total Instruction 6,834,991 7,203,656
District Level Support:56 General Administration 330,060 456,19257 Central Services 192,833 153,37358 Maintenance & Operations of Plant 1,524,286 2,895,02459 Student Transportation 612,578 662,87960 Other District Level Support Services 38,559 27,43361 Total District Support Services 2,698,316 4,194,901
School Level Support:62 Student Support Services 730,743 780,57063 Instructional Staff Support Services 1,889,752 1,722,41764 School Administration 679,251 772,86965 Total District Support Services 3,299,745 3,275,856
Non-Instructional Services:66 Food Service Operations 504,275 612,96367 Other Enterprise Operations 0 068 Community Operations 2,101 1,50069 Other Non-Instructional Services 0 070 Total Non-Instructional Services 506,376 614,46371 Facilities Acquisition and Construction 4,136,523 4,778,94672 Debt Service 843,894 877,07075 Other Non-Programmed Costs 0 076 Total Expenditures 18,319,846 20,944,89177 Less: Capital Expenditures 4,757,483 5,334,39678 Less: Debt Service 843,894 877,07079 Total Current Expenditures 12,718,469 14,733,42580 Exclusions from Current Expenditures 331,26381 Net Current Expenditures 12,387,206
82 Per Pupil Expenditures 10,919
83 Personnel - Non-Federal Certified Clsrm FTEs 91.5184 Avg Salary - Non-Fed Certified Clsrm FTEs 48,31285 Personnel - Non-Federal Certified FTEs 101.5186 Avg Salary - Non-Fed Certified FTEs 50,38587.1 Legal Balance (funds 1-2-4) 1,942,55687.2 Categorical Fund Balance 51,88387.3 Deposits with Paying Agents (QZAB) 087.4 Net Legal Bal (Excl Cat & QZAB) 1,890,67388 Building Fund Balance (fund 3) 4,625,54089 Capital Outlay Fund Balance (fund 5) 39,422
Jan 30, 2012 - 82 - 9:35:29 AM

Annual Statistical Report 2010-2011
County: GARLAND HOT SPRINGS SCHOOL DISTRICT LEA:2603000
2010-2011 2011-2012Actual Budget
1 Area in Square Miles 352 ADA 3,4383 ADA pct Change over 5 Yrs. 0%4 4 QTR ADM 3,6335 Prior Year 3QTR ADM 3,5366 Assessment 538,380,8207 M&O Mills 25.008 URT Mills 25.009 M&O Mills in Excess of URT 0.0010 Dedicated M&O Mills 1.9011 Debt Service Mills 10.8012 Total Mills 37.7013 Total Debt Bond/Non-Bond 23,360,000
State and Local Revenue:14 Property Tax Receipts (Including URT) 18,670,573 18,200,00415 Other Local Receipts 2,239,994 1,378,00016 Revenue from Intermediate Sources 495 017.1 Foundation Funding (Excl URT) 8,866,636 9,151,31117.2 Tax Collection Rate Guarantee 392,763 018 Student Growth Funding 589,908 019 Declining Enrollment Funding 0 020 Consolidation Incentive/Assistance 0 021 Isolated Funding 0 022 Supplemental Millage Incentive Funding 0 023 Other Unrestricted State Funding 0 024 Total Unrestricted Revenue from State and
Local Sources 30,760,370 28,729,315
Restricted Revenue from State Sources:25 Adult Education 0 0
Regular Education:26 Professional Development 146,231 027 Other Regular Education 56,809 0
Special Education:28 Gifted & Talented 2,262 029 Alternative Learning Environment (ALE) 697,211 030 English Language Learner (ELL) 79,989 031 National School Lunch Act (NSLA) 2,760,736 2,872,05632 Other Special Education 278,445 100,00033 Workforce Education 142,464 034 School Food Service 14,062 035 Educational Service Cooperatives 0 036 Early Childhood Programs 290,890 037 Magnet School Programs 0 038 Other Non-Instructional Programs 61,783 50,00039 Total Restricted Revenue from State Sources 4,530,881 3,022,05640 Total Restricted Revenue from Federal
Sources 11,783,704 5,688,900
Other Sources of Funds:41 Financing Sources 0 042 Balances from Consolidated/Annexed District 0 043 Indirect Cost Reimbursement 0 50,00044 Gains and Losses from Sale of Fixed Assets 0 045 Compensation for Loss of Fixed Assets 232,940 046 Other 0 047 Total Other Sources of Funds 232,940 50,00048 Total Revenue and Other Sources of Funds
from All Sources 47,307,895 37,490,271
2010-2011 2011-2012Actual Budget
CURRENT EXPENDITURESInstruction:
49 Regular Instruction 16,435,337 13,398,41050 Special Education 2,946,278 2,823,96451 Workforce Education 500,682 334,84152 Adult Education 0 053 Compensatory Education 3,522,811 1,405,45654 Other 1,878,996 1,753,63855 Total Instruction 25,284,104 19,716,309
District Level Support:56 General Administration 1,377,051 1,418,56757 Central Services 1,368,894 1,178,72858 Maintenance & Operations of Plant 7,048,482 3,615,28059 Student Transportation 984,582 798,57760 Other District Level Support Services 43,980 46,00061 Total District Support Services 10,822,989 7,057,152
School Level Support:62 Student Support Services 1,916,975 1,869,90163 Instructional Staff Support Services 3,732,796 2,595,99264 School Administration 2,077,057 2,016,97865 Total District Support Services 7,726,828 6,482,871
Non-Instructional Services:66 Food Service Operations 2,237,331 867,57167 Other Enterprise Operations 0 068 Community Operations 895,210 1,144,28269 Other Non-Instructional Services 0 070 Total Non-Instructional Services 3,132,542 2,011,85371 Facilities Acquisition and Construction 62,563 072 Debt Service 1,828,068 1,775,50075 Other Non-Programmed Costs 19,016 076 Total Expenditures 48,876,111 37,043,68477 Less: Capital Expenditures 1,039,546 078 Less: Debt Service 1,828,068 1,775,50079 Total Current Expenditures 46,008,496 35,268,18480 Exclusions from Current Expenditures 1,875,91181 Net Current Expenditures 44,132,585
82 Per Pupil Expenditures 12,838
83 Personnel - Non-Federal Certified Clsrm FTEs 286.2284 Avg Salary - Non-Fed Certified Clsrm FTEs 45,86085 Personnel - Non-Federal Certified FTEs 328.5986 Avg Salary - Non-Fed Certified FTEs 48,52487.1 Legal Balance (funds 1-2-4) 6,099,22887.2 Categorical Fund Balance 46,14487.3 Deposits with Paying Agents (QZAB) 087.4 Net Legal Bal (Excl Cat & QZAB) 6,053,08588 Building Fund Balance (fund 3) 4,65889 Capital Outlay Fund Balance (fund 5) 712,767
Jan 30, 2012 - 83 - 9:35:29 AM

Annual Statistical Report 2010-2011
County: GARLAND JESSIEVILLE SCHOOL DISTRICT LEA:2604000
2010-2011 2011-2012Actual Budget
1 Area in Square Miles 2022 ADA 8613 ADA pct Change over 5 Yrs. 5%4 4 QTR ADM 8845 Prior Year 3QTR ADM 9186 Assessment 127,860,9477 M&O Mills 29.708 URT Mills 25.009 M&O Mills in Excess of URT 4.7010 Dedicated M&O Mills 0.0011 Debt Service Mills 9.0012 Total Mills 38.7013 Total Debt Bond/Non-Bond 15,189,328
State and Local Revenue:14 Property Tax Receipts (Including URT) 4,326,652 4,651,58115 Other Local Receipts 428,576 229,00016 Revenue from Intermediate Sources 95 017.1 Foundation Funding (Excl URT) 2,330,330 2,237,68317.2 Tax Collection Rate Guarantee 107,590 018 Student Growth Funding 0 019 Declining Enrollment Funding 0 79,10420 Consolidation Incentive/Assistance 0 021 Isolated Funding 0 022 Supplemental Millage Incentive Funding 0 023 Other Unrestricted State Funding 0 024 Total Unrestricted Revenue from State and
Local Sources 7,193,243 7,197,368
Restricted Revenue from State Sources:25 Adult Education 0 0
Regular Education:26 Professional Development 37,967 37,81227 Other Regular Education 4,459 2,500
Special Education:28 Gifted & Talented 400 029 Alternative Learning Environment (ALE) 70,737 56,12330 English Language Learner (ELL) 0 031 National School Lunch Act (NSLA) 276,272 268,68632 Other Special Education 3,761 033 Workforce Education 21,125 14,62534 School Food Service 3,248 3,00035 Educational Service Cooperatives 0 036 Early Childhood Programs 0 037 Magnet School Programs 0 038 Other Non-Instructional Programs 0 039 Total Restricted Revenue from State Sources 417,969 382,74640 Total Restricted Revenue from Federal
Sources 1,614,761 1,275,858
Other Sources of Funds:41 Financing Sources 5,096,000 042 Balances from Consolidated/Annexed District 0 043 Indirect Cost Reimbursement 0 044 Gains and Losses from Sale of Fixed Assets 0 045 Compensation for Loss of Fixed Assets 15,386 046 Other 0 047 Total Other Sources of Funds 5,111,386 048 Total Revenue and Other Sources of Funds
from All Sources 14,337,359 8,855,972
2010-2011 2011-2012Actual Budget
CURRENT EXPENDITURESInstruction:
49 Regular Instruction 3,855,127 3,471,38250 Special Education 474,300 448,59151 Workforce Education 71,051 106,43252 Adult Education 0 053 Compensatory Education 136,092 67,25854 Other 170,655 250,93055 Total Instruction 4,707,225 4,344,593
District Level Support:56 General Administration 253,006 140,13557 Central Services 263,418 213,01158 Maintenance & Operations of Plant 1,006,677 761,79959 Student Transportation 431,238 587,74060 Other District Level Support Services 37,532 14,51061 Total District Support Services 1,991,871 1,717,196
School Level Support:62 Student Support Services 396,628 385,40063 Instructional Staff Support Services 516,535 570,90164 School Administration 318,036 309,32765 Total District Support Services 1,231,199 1,265,629
Non-Instructional Services:66 Food Service Operations 432,795 414,72267 Other Enterprise Operations 0 068 Community Operations 0 1,31969 Other Non-Instructional Services 0 070 Total Non-Instructional Services 432,795 416,04171 Facilities Acquisition and Construction 129,151 325,00072 Debt Service 679,500 1,068,51075 Other Non-Programmed Costs 109,275 076 Total Expenditures 9,281,017 9,136,96977 Less: Capital Expenditures 292,846 538,80278 Less: Debt Service 679,500 1,068,51079 Total Current Expenditures 8,308,671 7,529,65780 Exclusions from Current Expenditures 514,76281 Net Current Expenditures 7,793,909
82 Per Pupil Expenditures 9,050
83 Personnel - Non-Federal Certified Clsrm FTEs 64.2284 Avg Salary - Non-Fed Certified Clsrm FTEs 44,01285 Personnel - Non-Federal Certified FTEs 69.2286 Avg Salary - Non-Fed Certified FTEs 45,50587.1 Legal Balance (funds 1-2-4) 753,21887.2 Categorical Fund Balance 37,44787.3 Deposits with Paying Agents (QZAB) (196,000)87.4 Net Legal Bal (Excl Cat & QZAB) 911,77188 Building Fund Balance (fund 3) 5,477,18289 Capital Outlay Fund Balance (fund 5) 0
Jan 30, 2012 - 84 - 9:35:29 AM
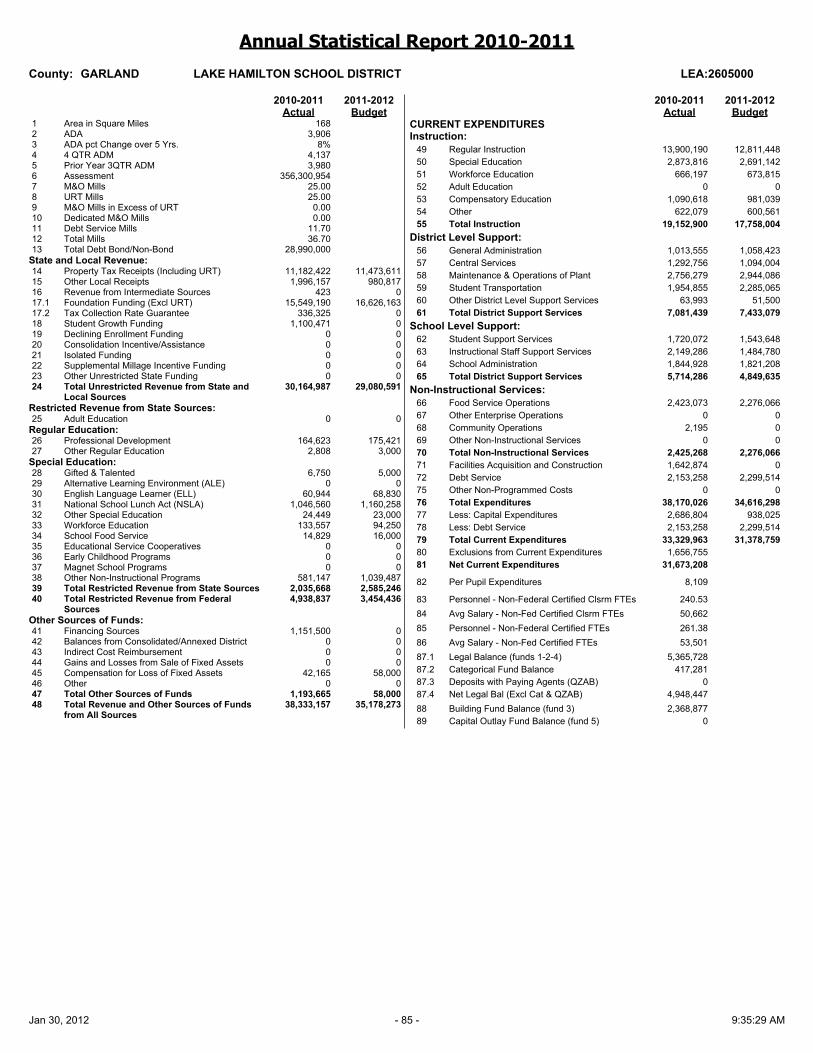
Annual Statistical Report 2010-2011
County: GARLAND LAKE HAMILTON SCHOOL DISTRICT LEA:2605000
2010-2011 2011-2012Actual Budget
1 Area in Square Miles 1682 ADA 3,9063 ADA pct Change over 5 Yrs. 8%4 4 QTR ADM 4,1375 Prior Year 3QTR ADM 3,9806 Assessment 356,300,9547 M&O Mills 25.008 URT Mills 25.009 M&O Mills in Excess of URT 0.0010 Dedicated M&O Mills 0.0011 Debt Service Mills 11.7012 Total Mills 36.7013 Total Debt Bond/Non-Bond 28,990,000
State and Local Revenue:14 Property Tax Receipts (Including URT) 11,182,422 11,473,61115 Other Local Receipts 1,996,157 980,81716 Revenue from Intermediate Sources 423 017.1 Foundation Funding (Excl URT) 15,549,190 16,626,16317.2 Tax Collection Rate Guarantee 336,325 018 Student Growth Funding 1,100,471 019 Declining Enrollment Funding 0 020 Consolidation Incentive/Assistance 0 021 Isolated Funding 0 022 Supplemental Millage Incentive Funding 0 023 Other Unrestricted State Funding 0 024 Total Unrestricted Revenue from State and
Local Sources 30,164,987 29,080,591
Restricted Revenue from State Sources:25 Adult Education 0 0
Regular Education:26 Professional Development 164,623 175,42127 Other Regular Education 2,808 3,000
Special Education:28 Gifted & Talented 6,750 5,00029 Alternative Learning Environment (ALE) 0 030 English Language Learner (ELL) 60,944 68,83031 National School Lunch Act (NSLA) 1,046,560 1,160,25832 Other Special Education 24,449 23,00033 Workforce Education 133,557 94,25034 School Food Service 14,829 16,00035 Educational Service Cooperatives 0 036 Early Childhood Programs 0 037 Magnet School Programs 0 038 Other Non-Instructional Programs 581,147 1,039,48739 Total Restricted Revenue from State Sources 2,035,668 2,585,24640 Total Restricted Revenue from Federal
Sources 4,938,837 3,454,436
Other Sources of Funds:41 Financing Sources 1,151,500 042 Balances from Consolidated/Annexed District 0 043 Indirect Cost Reimbursement 0 044 Gains and Losses from Sale of Fixed Assets 0 045 Compensation for Loss of Fixed Assets 42,165 58,00046 Other 0 047 Total Other Sources of Funds 1,193,665 58,00048 Total Revenue and Other Sources of Funds
from All Sources 38,333,157 35,178,273
2010-2011 2011-2012Actual Budget
CURRENT EXPENDITURESInstruction:
49 Regular Instruction 13,900,190 12,811,44850 Special Education 2,873,816 2,691,14251 Workforce Education 666,197 673,81552 Adult Education 0 053 Compensatory Education 1,090,618 981,03954 Other 622,079 600,56155 Total Instruction 19,152,900 17,758,004
District Level Support:56 General Administration 1,013,555 1,058,42357 Central Services 1,292,756 1,094,00458 Maintenance & Operations of Plant 2,756,279 2,944,08659 Student Transportation 1,954,855 2,285,06560 Other District Level Support Services 63,993 51,50061 Total District Support Services 7,081,439 7,433,079
School Level Support:62 Student Support Services 1,720,072 1,543,64863 Instructional Staff Support Services 2,149,286 1,484,78064 School Administration 1,844,928 1,821,20865 Total District Support Services 5,714,286 4,849,635
Non-Instructional Services:66 Food Service Operations 2,423,073 2,276,06667 Other Enterprise Operations 0 068 Community Operations 2,195 069 Other Non-Instructional Services 0 070 Total Non-Instructional Services 2,425,268 2,276,06671 Facilities Acquisition and Construction 1,642,874 072 Debt Service 2,153,258 2,299,51475 Other Non-Programmed Costs 0 076 Total Expenditures 38,170,026 34,616,29877 Less: Capital Expenditures 2,686,804 938,02578 Less: Debt Service 2,153,258 2,299,51479 Total Current Expenditures 33,329,963 31,378,75980 Exclusions from Current Expenditures 1,656,75581 Net Current Expenditures 31,673,208
82 Per Pupil Expenditures 8,109
83 Personnel - Non-Federal Certified Clsrm FTEs 240.5384 Avg Salary - Non-Fed Certified Clsrm FTEs 50,66285 Personnel - Non-Federal Certified FTEs 261.3886 Avg Salary - Non-Fed Certified FTEs 53,50187.1 Legal Balance (funds 1-2-4) 5,365,72887.2 Categorical Fund Balance 417,28187.3 Deposits with Paying Agents (QZAB) 087.4 Net Legal Bal (Excl Cat & QZAB) 4,948,44788 Building Fund Balance (fund 3) 2,368,87789 Capital Outlay Fund Balance (fund 5) 0
Jan 30, 2012 - 85 - 9:35:29 AM

Annual Statistical Report 2010-2011
County: GARLAND LAKESIDE SCHOOL DIST(GARLAND) LEA:2606000
2010-2011 2011-2012Actual Budget
1 Area in Square Miles 622 ADA 2,8403 ADA pct Change over 5 Yrs. 13%4 4 QTR ADM 2,9975 Prior Year 3QTR ADM 3,0056 Assessment 389,554,6407 M&O Mills 25.008 URT Mills 25.009 M&O Mills in Excess of URT 0.0010 Dedicated M&O Mills 0.0011 Debt Service Mills 12.7012 Total Mills 37.7013 Total Debt Bond/Non-Bond 26,040,000
State and Local Revenue:14 Property Tax Receipts (Including URT) 13,020,745 13,996,69915 Other Local Receipts 1,428,293 1,497,88916 Revenue from Intermediate Sources 315 017.1 Foundation Funding (Excl URT) 8,935,168 8,980,01617.2 Tax Collection Rate Guarantee 284,494 018 Student Growth Funding 89,426 019 Declining Enrollment Funding 0 020 Consolidation Incentive/Assistance 0 021 Isolated Funding 0 022 Supplemental Millage Incentive Funding 0 023 Other Unrestricted State Funding 0 024 Total Unrestricted Revenue from State and
Local Sources 23,758,441 24,474,604
Restricted Revenue from State Sources:25 Adult Education 0 0
Regular Education:26 Professional Development 124,278 127,77727 Other Regular Education 1,941 0
Special Education:28 Gifted & Talented 2,000 029 Alternative Learning Environment (ALE) 140,783 123,89430 English Language Learner (ELL) 31,644 31,64431 National School Lunch Act (NSLA) 582,529 604,16432 Other Special Education 12,654 033 Workforce Education 211,412 034 School Food Service 8,149 035 Educational Service Cooperatives 0 036 Early Childhood Programs 310,846 354,00037 Magnet School Programs 0 038 Other Non-Instructional Programs 17,370 13,89639 Total Restricted Revenue from State Sources 1,443,606 1,255,37540 Total Restricted Revenue from Federal
Sources 3,007,555 1,130,113
Other Sources of Funds:41 Financing Sources 11,532,288 042 Balances from Consolidated/Annexed District 0 043 Indirect Cost Reimbursement 0 044 Gains and Losses from Sale of Fixed Assets 0 045 Compensation for Loss of Fixed Assets 0 046 Other 0 047 Total Other Sources of Funds 11,532,288 048 Total Revenue and Other Sources of Funds
from All Sources 39,741,890 26,860,092
2010-2011 2011-2012Actual Budget
CURRENT EXPENDITURESInstruction:
49 Regular Instruction 12,024,119 11,122,55250 Special Education 2,005,039 1,476,15251 Workforce Education 523,833 528,66152 Adult Education 0 053 Compensatory Education 391,866 309,88454 Other 428,276 474,34155 Total Instruction 15,373,134 13,911,589
District Level Support:56 General Administration 781,148 780,13557 Central Services 938,122 819,93558 Maintenance & Operations of Plant 2,457,957 2,451,44059 Student Transportation 1,139,756 1,193,52460 Other District Level Support Services 43,504 061 Total District Support Services 5,360,487 5,245,034
School Level Support:62 Student Support Services 1,184,463 1,187,88263 Instructional Staff Support Services 1,580,426 1,311,58564 School Administration 1,337,029 1,379,58665 Total District Support Services 4,101,919 3,879,053
Non-Instructional Services:66 Food Service Operations 1,080,891 1,000,00067 Other Enterprise Operations 0 068 Community Operations 22,452 80169 Other Non-Instructional Services 0 070 Total Non-Instructional Services 1,103,344 1,000,80171 Facilities Acquisition and Construction 1,247,780 11,900,00072 Debt Service 967,115 1,104,00075 Other Non-Programmed Costs 48,563 076 Total Expenditures 28,202,341 37,040,47777 Less: Capital Expenditures 1,922,912 12,415,00078 Less: Debt Service 967,115 1,104,00079 Total Current Expenditures 25,312,314 23,521,47780 Exclusions from Current Expenditures 1,305,31781 Net Current Expenditures 24,006,996
82 Per Pupil Expenditures 8,454
83 Personnel - Non-Federal Certified Clsrm FTEs 190.4484 Avg Salary - Non-Fed Certified Clsrm FTEs 50,23085 Personnel - Non-Federal Certified FTEs 206.6686 Avg Salary - Non-Fed Certified FTEs 53,04187.1 Legal Balance (funds 1-2-4) 3,099,90087.2 Categorical Fund Balance 78,01187.3 Deposits with Paying Agents (QZAB) 087.4 Net Legal Bal (Excl Cat & QZAB) 3,021,88988 Building Fund Balance (fund 3) 11,469,17689 Capital Outlay Fund Balance (fund 5) 0
Jan 30, 2012 - 86 - 9:35:29 AM

Annual Statistical Report 2010-2011
County: GARLAND MOUNTAIN PINE SCHOOL DISTRICT LEA:2607000
2010-2011 2011-2012Actual Budget
1 Area in Square Miles 1042 ADA 5593 ADA pct Change over 5 Yrs. (5%)4 4 QTR ADM 5975 Prior Year 3QTR ADM 6096 Assessment 47,456,5377 M&O Mills 25.008 URT Mills 25.009 M&O Mills in Excess of URT 0.0010 Dedicated M&O Mills 0.0011 Debt Service Mills 12.9012 Total Mills 37.9013 Total Debt Bond/Non-Bond 3,997,316
State and Local Revenue:14 Property Tax Receipts (Including URT) 1,606,148 1,716,04615 Other Local Receipts 183,198 62,70016 Revenue from Intermediate Sources 64 017.1 Foundation Funding (Excl URT) 2,549,717 2,484,96117.2 Tax Collection Rate Guarantee 37,323 018 Student Growth Funding 23,206 019 Declining Enrollment Funding 0 25,89720 Consolidation Incentive/Assistance 0 021 Isolated Funding 0 022 Supplemental Millage Incentive Funding 0 023 Other Unrestricted State Funding 0 024 Total Unrestricted Revenue from State and
Local Sources 4,399,656 4,289,604
Restricted Revenue from State Sources:25 Adult Education 0 0
Regular Education:26 Professional Development 25,192 25,45627 Other Regular Education 1,384 800
Special Education:28 Gifted & Talented 0 029 Alternative Learning Environment (ALE) 0 030 English Language Learner (ELL) 0 031 National School Lunch Act (NSLA) 466,240 466,53232 Other Special Education 2,495 033 Workforce Education 18,959 034 School Food Service 2,354 035 Educational Service Cooperatives 0 036 Early Childhood Programs 0 037 Magnet School Programs 0 038 Other Non-Instructional Programs 73,415 26,10239 Total Restricted Revenue from State Sources 590,040 518,89040 Total Restricted Revenue from Federal
Sources 988,415 792,198
Other Sources of Funds:41 Financing Sources 14,800 042 Balances from Consolidated/Annexed District 0 043 Indirect Cost Reimbursement 0 044 Gains and Losses from Sale of Fixed Assets 0 045 Compensation for Loss of Fixed Assets 25,500 046 Other 0 047 Total Other Sources of Funds 40,300 048 Total Revenue and Other Sources of Funds
from All Sources 6,018,411 5,600,692
2010-2011 2011-2012Actual Budget
CURRENT EXPENDITURESInstruction:
49 Regular Instruction 2,217,845 2,175,14250 Special Education 272,608 279,28051 Workforce Education 105,363 108,30252 Adult Education 0 053 Compensatory Education 110,346 191,15254 Other 99,993 119,42855 Total Instruction 2,806,155 2,873,304
District Level Support:56 General Administration 216,855 183,36257 Central Services 124,934 127,37358 Maintenance & Operations of Plant 617,466 526,87459 Student Transportation 425,039 184,28260 Other District Level Support Services 6,315 50061 Total District Support Services 1,390,608 1,022,391
School Level Support:62 Student Support Services 272,859 294,38463 Instructional Staff Support Services 609,389 661,85964 School Administration 261,539 248,84565 Total District Support Services 1,143,786 1,205,088
Non-Instructional Services:66 Food Service Operations 304,273 300,18267 Other Enterprise Operations 0 068 Community Operations 0 069 Other Non-Instructional Services 0 070 Total Non-Instructional Services 304,273 300,18271 Facilities Acquisition and Construction 105,219 072 Debt Service 279,167 340,53475 Other Non-Programmed Costs 201 076 Total Expenditures 6,029,410 5,741,49877 Less: Capital Expenditures 430,008 47,35278 Less: Debt Service 279,167 340,53479 Total Current Expenditures 5,320,235 5,353,61280 Exclusions from Current Expenditures 182,21781 Net Current Expenditures 5,138,018
82 Per Pupil Expenditures 9,199
83 Personnel - Non-Federal Certified Clsrm FTEs 50.1584 Avg Salary - Non-Fed Certified Clsrm FTEs 38,17285 Personnel - Non-Federal Certified FTEs 56.3586 Avg Salary - Non-Fed Certified FTEs 40,23787.1 Legal Balance (funds 1-2-4) 671,82987.2 Categorical Fund Balance 71,71387.3 Deposits with Paying Agents (QZAB) 087.4 Net Legal Bal (Excl Cat & QZAB) 600,11688 Building Fund Balance (fund 3) 14,80089 Capital Outlay Fund Balance (fund 5) 0
Jan 30, 2012 - 87 - 9:35:29 AM

Annual Statistical Report 2010-2011
County: GRANT POYEN SCHOOL DISTRICT LEA:2703000
2010-2011 2011-2012Actual Budget
1 Area in Square Miles 562 ADA 5043 ADA pct Change over 5 Yrs. 0%4 4 QTR ADM 5325 Prior Year 3QTR ADM 5386 Assessment 11,391,0007 M&O Mills 25.008 URT Mills 25.009 M&O Mills in Excess of URT 0.0010 Dedicated M&O Mills 0.0011 Debt Service Mills 21.7012 Total Mills 46.7013 Total Debt Bond/Non-Bond 2,758,320
State and Local Revenue:14 Property Tax Receipts (Including URT) 490,116 530,00015 Other Local Receipts 387,071 154,75016 Revenue from Intermediate Sources 40 017.1 Foundation Funding (Excl URT) 2,971,805 2,997,68917.2 Tax Collection Rate Guarantee 5,508 018 Student Growth Funding 0 019 Declining Enrollment Funding 77,125 15,72920 Consolidation Incentive/Assistance 0 021 Isolated Funding 0 022 Supplemental Millage Incentive Funding 0 023 Other Unrestricted State Funding 0 024 Total Unrestricted Revenue from State and
Local Sources 3,931,666 3,698,168
Restricted Revenue from State Sources:25 Adult Education 0 0
Regular Education:26 Professional Development 22,270 22,60327 Other Regular Education 1,600 1,600
Special Education:28 Gifted & Talented 1,000 029 Alternative Learning Environment (ALE) 2,560 12,22830 English Language Learner (ELL) 0 031 National School Lunch Act (NSLA) 160,704 158,37832 Other Special Education 2,206 2,00033 Workforce Education 22,985 76,49434 School Food Service 1,873 1,00035 Educational Service Cooperatives 0 036 Early Childhood Programs 0 037 Magnet School Programs 0 038 Other Non-Instructional Programs 173,618 90,32839 Total Restricted Revenue from State Sources 388,816 364,63140 Total Restricted Revenue from Federal
Sources 447,875 363,822
Other Sources of Funds:41 Financing Sources 7,076 042 Balances from Consolidated/Annexed District 0 043 Indirect Cost Reimbursement 0 044 Gains and Losses from Sale of Fixed Assets 0 045 Compensation for Loss of Fixed Assets 0 046 Other 0 047 Total Other Sources of Funds 7,076 048 Total Revenue and Other Sources of Funds
from All Sources 4,775,433 4,426,620
2010-2011 2011-2012Actual Budget
CURRENT EXPENDITURESInstruction:
49 Regular Instruction 1,985,028 2,040,91450 Special Education 317,249 294,58051 Workforce Education 16,250 26,00152 Adult Education 0 053 Compensatory Education 98,999 103,83954 Other 85,906 99,92455 Total Instruction 2,503,433 2,565,258
District Level Support:56 General Administration 179,804 205,90457 Central Services 102,760 140,44758 Maintenance & Operations of Plant 349,247 557,31059 Student Transportation 139,180 192,23360 Other District Level Support Services 19,377 10,00061 Total District Support Services 790,368 1,105,894
School Level Support:62 Student Support Services 130,896 152,13263 Instructional Staff Support Services 325,369 389,62664 School Administration 295,205 292,31265 Total District Support Services 751,470 834,070
Non-Instructional Services:66 Food Service Operations 268,349 274,24167 Other Enterprise Operations 33,614 068 Community Operations 0 25069 Other Non-Instructional Services 0 070 Total Non-Instructional Services 301,963 274,49171 Facilities Acquisition and Construction 119,879 22,91972 Debt Service 118,299 182,06175 Other Non-Programmed Costs 0 076 Total Expenditures 4,585,412 4,984,69377 Less: Capital Expenditures 183,952 187,63978 Less: Debt Service 118,299 182,06179 Total Current Expenditures 4,283,161 4,614,99380 Exclusions from Current Expenditures 237,40681 Net Current Expenditures 4,045,754
82 Per Pupil Expenditures 8,030
83 Personnel - Non-Federal Certified Clsrm FTEs 35.9084 Avg Salary - Non-Fed Certified Clsrm FTEs 46,69385 Personnel - Non-Federal Certified FTEs 40.9786 Avg Salary - Non-Fed Certified FTEs 49,63187.1 Legal Balance (funds 1-2-4) 2,190,71287.2 Categorical Fund Balance 14,58987.3 Deposits with Paying Agents (QZAB) 087.4 Net Legal Bal (Excl Cat & QZAB) 2,176,12388 Building Fund Balance (fund 3) 361,52289 Capital Outlay Fund Balance (fund 5) 0
Jan 30, 2012 - 88 - 9:35:29 AM

Annual Statistical Report 2010-2011
County: GRANT SHERIDAN SCHOOL DISTRICT LEA:2705000
2010-2011 2011-2012Actual Budget
1 Area in Square Miles 6262 ADA 3,9003 ADA pct Change over 5 Yrs. (4%)4 4 QTR ADM 4,1355 Prior Year 3QTR ADM 4,1066 Assessment 266,192,6037 M&O Mills 25.008 URT Mills 25.009 M&O Mills in Excess of URT 0.0010 Dedicated M&O Mills 0.0011 Debt Service Mills 7.2012 Total Mills 32.2013 Total Debt Bond/Non-Bond 21,873,671
State and Local Revenue:14 Property Tax Receipts (Including URT) 8,449,159 8,057,11715 Other Local Receipts 1,524,799 714,00016 Revenue from Intermediate Sources 0 017.1 Foundation Funding (Excl URT) 18,453,726 18,949,40117.2 Tax Collection Rate Guarantee 179,037 018 Student Growth Funding 177,754 019 Declining Enrollment Funding 0 020 Consolidation Incentive/Assistance 0 021 Isolated Funding 0 022 Supplemental Millage Incentive Funding 1,626 1,30123 Other Unrestricted State Funding 0 024 Total Unrestricted Revenue from State and
Local Sources 28,786,101 27,721,819
Restricted Revenue from State Sources:25 Adult Education 0 0
Regular Education:26 Professional Development 169,838 175,69427 Other Regular Education 16,139 27,076
Special Education:28 Gifted & Talented 5,094 5,00029 Alternative Learning Environment (ALE) 219,118 202,89830 English Language Learner (ELL) 29,593 32,29231 National School Lunch Act (NSLA) 891,808 953,30432 Other Special Education 35,450 25,00033 Workforce Education 33,123 30,00034 School Food Service 14,268 14,00035 Educational Service Cooperatives 0 036 Early Childhood Programs 389,600 389,60037 Magnet School Programs 0 038 Other Non-Instructional Programs 2,054,681 241,98139 Total Restricted Revenue from State Sources 3,858,712 2,096,84540 Total Restricted Revenue from Federal
Sources 5,133,556 3,650,396
Other Sources of Funds:41 Financing Sources 5,000,000 042 Balances from Consolidated/Annexed District 0 043 Indirect Cost Reimbursement 18,899 15,00044 Gains and Losses from Sale of Fixed Assets 0 045 Compensation for Loss of Fixed Assets 16,584 24,00046 Other 0 047 Total Other Sources of Funds 5,035,482 39,00048 Total Revenue and Other Sources of Funds
from All Sources 42,813,851 33,508,060
2010-2011 2011-2012Actual Budget
CURRENT EXPENDITURESInstruction:
49 Regular Instruction 13,546,152 13,397,29550 Special Education 2,174,524 2,201,90851 Workforce Education 806,651 805,09352 Adult Education 0 72453 Compensatory Education 720,719 828,35554 Other 1,061,193 1,179,49255 Total Instruction 18,309,239 18,412,867
District Level Support:56 General Administration 664,493 627,59457 Central Services 1,298,197 1,397,10358 Maintenance & Operations of Plant 3,222,886 4,042,34459 Student Transportation 1,435,652 1,762,84760 Other District Level Support Services 72,405 23,90561 Total District Support Services 6,693,634 7,853,793
School Level Support:62 Student Support Services 1,308,238 1,333,10263 Instructional Staff Support Services 1,886,724 2,000,81164 School Administration 1,634,185 1,639,48965 Total District Support Services 4,829,147 4,973,402
Non-Instructional Services:66 Food Service Operations 1,998,455 1,978,12567 Other Enterprise Operations 0 068 Community Operations 4,358 3,00069 Other Non-Instructional Services 0 070 Total Non-Instructional Services 2,002,814 1,981,12571 Facilities Acquisition and Construction 4,182,080 2,319,92872 Debt Service 1,386,363 1,329,93675 Other Non-Programmed Costs 11,176 076 Total Expenditures 37,414,453 36,871,05277 Less: Capital Expenditures 4,342,353 3,119,53078 Less: Debt Service 1,386,363 1,329,93679 Total Current Expenditures 31,685,737 32,421,58680 Exclusions from Current Expenditures 1,689,17281 Net Current Expenditures 29,996,565
82 Per Pupil Expenditures 7,691
83 Personnel - Non-Federal Certified Clsrm FTEs 263.5584 Avg Salary - Non-Fed Certified Clsrm FTEs 44,73985 Personnel - Non-Federal Certified FTEs 288.1586 Avg Salary - Non-Fed Certified FTEs 46,64587.1 Legal Balance (funds 1-2-4) 2,968,30387.2 Categorical Fund Balance 96,17687.3 Deposits with Paying Agents (QZAB) 087.4 Net Legal Bal (Excl Cat & QZAB) 2,872,12788 Building Fund Balance (fund 3) 10,027,46489 Capital Outlay Fund Balance (fund 5) 0
Jan 30, 2012 - 89 - 9:35:29 AM

Annual Statistical Report 2010-2011
County: GREENE MARMADUKE SCHOOL DISTRICT LEA:2803000
2010-2011 2011-2012Actual Budget
1 Area in Square Miles 1222 ADA 6803 ADA pct Change over 5 Yrs. (5%)4 4 QTR ADM 7255 Prior Year 3QTR ADM 7246 Assessment 41,628,3857 M&O Mills 25.008 URT Mills 25.009 M&O Mills in Excess of URT 0.0010 Dedicated M&O Mills 0.0011 Debt Service Mills 4.1012 Total Mills 29.1013 Total Debt Bond/Non-Bond 1,438,070
State and Local Revenue:14 Property Tax Receipts (Including URT) 1,200,823 1,094,89515 Other Local Receipts 513,371 208,60016 Revenue from Intermediate Sources 101 017.1 Foundation Funding (Excl URT) 3,302,255 3,423,88617.2 Tax Collection Rate Guarantee 22,816 018 Student Growth Funding 13,657 019 Declining Enrollment Funding 0 020 Consolidation Incentive/Assistance 0 021 Isolated Funding 0 022 Supplemental Millage Incentive Funding 3,899 3,11923 Other Unrestricted State Funding 0 024 Total Unrestricted Revenue from State and
Local Sources 5,056,922 4,730,500
Restricted Revenue from State Sources:25 Adult Education 0 0
Regular Education:26 Professional Development 29,943 30,73427 Other Regular Education 4,000 5,200
Special Education:28 Gifted & Talented 300 30029 Alternative Learning Environment (ALE) 15,521 27,81330 English Language Learner (ELL) 0 031 National School Lunch Act (NSLA) 233,120 230,73632 Other Special Education 2,966 033 Workforce Education 0 034 School Food Service 3,160 3,10035 Educational Service Cooperatives 0 036 Early Childhood Programs 139,580 139,58037 Magnet School Programs 0 038 Other Non-Instructional Programs 16,301 10,44239 Total Restricted Revenue from State Sources 444,891 447,90540 Total Restricted Revenue from Federal
Sources 1,995,836 1,002,739
Other Sources of Funds:41 Financing Sources 0 042 Balances from Consolidated/Annexed District 0 043 Indirect Cost Reimbursement 0 044 Gains and Losses from Sale of Fixed Assets 1,788 045 Compensation for Loss of Fixed Assets 0 046 Other 0 047 Total Other Sources of Funds 1,788 048 Total Revenue and Other Sources of Funds
from All Sources 7,499,437 6,181,144
2010-2011 2011-2012Actual Budget
CURRENT EXPENDITURESInstruction:
49 Regular Instruction 2,720,293 2,347,32650 Special Education 354,802 356,21751 Workforce Education 185,975 203,89252 Adult Education 0 053 Compensatory Education 78,092 76,71454 Other 311,230 328,01355 Total Instruction 3,650,392 3,312,162
District Level Support:56 General Administration 216,789 224,71757 Central Services 93,195 96,65158 Maintenance & Operations of Plant 563,455 573,57759 Student Transportation 323,338 324,97460 Other District Level Support Services 19,689 7,50661 Total District Support Services 1,216,465 1,227,426
School Level Support:62 Student Support Services 305,853 320,44263 Instructional Staff Support Services 1,035,266 552,00264 School Administration 224,437 215,08465 Total District Support Services 1,565,556 1,087,528
Non-Instructional Services:66 Food Service Operations 524,633 401,35767 Other Enterprise Operations 0 068 Community Operations 79,735 83,47469 Other Non-Instructional Services 0 070 Total Non-Instructional Services 604,368 484,83171 Facilities Acquisition and Construction 269,134 97,58672 Debt Service 94,992 93,74475 Other Non-Programmed Costs 55,904 076 Total Expenditures 7,456,811 6,303,27677 Less: Capital Expenditures 590,556 133,58678 Less: Debt Service 94,992 93,74479 Total Current Expenditures 6,771,262 6,075,94680 Exclusions from Current Expenditures 776,57481 Net Current Expenditures 5,994,688
82 Per Pupil Expenditures 8,817
83 Personnel - Non-Federal Certified Clsrm FTEs 53.4584 Avg Salary - Non-Fed Certified Clsrm FTEs 42,47885 Personnel - Non-Federal Certified FTEs 57.6186 Avg Salary - Non-Fed Certified FTEs 44,43687.1 Legal Balance (funds 1-2-4) 2,178,51087.2 Categorical Fund Balance 29,84087.3 Deposits with Paying Agents (QZAB) 087.4 Net Legal Bal (Excl Cat & QZAB) 2,148,66988 Building Fund Balance (fund 3) 089 Capital Outlay Fund Balance (fund 5) 0
Jan 30, 2012 - 90 - 9:35:29 AM

Annual Statistical Report 2010-2011
County: GREENE GREENE CO. TECH SCHOOL DIST. LEA:2807000
2010-2011 2011-2012Actual Budget
1 Area in Square Miles 3462 ADA 3,2293 ADA pct Change over 5 Yrs. 0%4 4 QTR ADM 3,4165 Prior Year 3QTR ADM 3,3446 Assessment 234,706,6237 M&O Mills 25.008 URT Mills 25.009 M&O Mills in Excess of URT 0.0010 Dedicated M&O Mills 0.0011 Debt Service Mills 12.4912 Total Mills 37.4913 Total Debt Bond/Non-Bond 34,091,600
State and Local Revenue:14 Property Tax Receipts (Including URT) 7,763,870 8,697,11215 Other Local Receipts 1,651,839 1,064,94616 Revenue from Intermediate Sources 473 017.1 Foundation Funding (Excl URT) 14,863,154 15,255,49017.2 Tax Collection Rate Guarantee 196,213 152,80018 Student Growth Funding 562,217 019 Declining Enrollment Funding 0 020 Consolidation Incentive/Assistance 0 021 Isolated Funding 0 022 Supplemental Millage Incentive Funding 15,945 12,75623 Other Unrestricted State Funding 40,908 024 Total Unrestricted Revenue from State and
Local Sources 25,094,620 25,183,104
Restricted Revenue from State Sources:25 Adult Education 0 0
Regular Education:26 Professional Development 138,305 144,89527 Other Regular Education 12,572 13,900
Special Education:28 Gifted & Talented 6,300 2,50029 Alternative Learning Environment (ALE) 99,340 110,34030 English Language Learner (ELL) 11,427 031 National School Lunch Act (NSLA) 857,088 913,33032 Other Special Education 246,764 184,03633 Workforce Education 30,875 39,81234 School Food Service 12,280 12,00035 Educational Service Cooperatives 0 036 Early Childhood Programs 680,400 680,40037 Magnet School Programs 0 038 Other Non-Instructional Programs 6,102,754 3,220,34339 Total Restricted Revenue from State Sources 8,198,104 5,321,55740 Total Restricted Revenue from Federal
Sources 4,611,203 4,228,631
Other Sources of Funds:41 Financing Sources 5,273,987 9642 Balances from Consolidated/Annexed District 0 043 Indirect Cost Reimbursement 0 044 Gains and Losses from Sale of Fixed Assets 128,080 045 Compensation for Loss of Fixed Assets 254,537 146,81646 Other 0 047 Total Other Sources of Funds 5,656,604 146,91248 Total Revenue and Other Sources of Funds
from All Sources 43,560,531 34,880,204
2010-2011 2011-2012Actual Budget
CURRENT EXPENDITURESInstruction:
49 Regular Instruction 11,694,885 12,713,91650 Special Education 2,640,711 2,667,60351 Workforce Education 686,977 757,72552 Adult Education 0 053 Compensatory Education 572,152 644,19354 Other 896,554 987,18655 Total Instruction 16,491,280 17,770,623
District Level Support:56 General Administration 601,472 669,26857 Central Services 1,082,698 940,12458 Maintenance & Operations of Plant 3,147,225 2,922,98859 Student Transportation 1,466,236 1,679,69460 Other District Level Support Services 100,548 106,28561 Total District Support Services 6,398,180 6,318,360
School Level Support:62 Student Support Services 1,591,350 1,662,63963 Instructional Staff Support Services 1,593,245 1,910,86064 School Administration 1,574,863 1,574,46265 Total District Support Services 4,759,458 5,147,960
Non-Instructional Services:66 Food Service Operations 1,646,668 1,595,78267 Other Enterprise Operations 0 29,79268 Community Operations 118,246 154,41969 Other Non-Instructional Services 0 070 Total Non-Instructional Services 1,764,914 1,779,99371 Facilities Acquisition and Construction 17,364,090 11,909,53172 Debt Service 1,999,957 2,247,27975 Other Non-Programmed Costs 2,152 076 Total Expenditures 48,780,031 45,173,74777 Less: Capital Expenditures 18,008,635 12,707,55478 Less: Debt Service 1,999,957 2,247,27979 Total Current Expenditures 28,771,440 30,218,91380 Exclusions from Current Expenditures 2,338,59381 Net Current Expenditures 26,432,847
82 Per Pupil Expenditures 8,187
83 Personnel - Non-Federal Certified Clsrm FTEs 226.8684 Avg Salary - Non-Fed Certified Clsrm FTEs 43,23685 Personnel - Non-Federal Certified FTEs 245.4086 Avg Salary - Non-Fed Certified FTEs 45,58887.1 Legal Balance (funds 1-2-4) 6,700,78087.2 Categorical Fund Balance 113,98487.3 Deposits with Paying Agents (QZAB) 087.4 Net Legal Bal (Excl Cat & QZAB) 6,586,79688 Building Fund Balance (fund 3) 7,367,56089 Capital Outlay Fund Balance (fund 5) 0
Jan 30, 2012 - 91 - 9:35:29 AM

Annual Statistical Report 2010-2011
County: GREENE PARAGOULD SCHOOL DISTRICT LEA:2808000
2010-2011 2011-2012Actual Budget
1 Area in Square Miles 1202 ADA 2,6983 ADA pct Change over 5 Yrs. 4%4 4 QTR ADM 2,8835 Prior Year 3QTR ADM 2,8296 Assessment 213,350,5907 M&O Mills 25.008 URT Mills 25.009 M&O Mills in Excess of URT 0.0010 Dedicated M&O Mills 0.0011 Debt Service Mills 7.6712 Total Mills 32.6713 Total Debt Bond/Non-Bond 29,591,500
State and Local Revenue:14 Property Tax Receipts (Including URT) 6,504,850 6,830,76115 Other Local Receipts 1,031,946 704,81616 Revenue from Intermediate Sources 400 017.1 Foundation Funding (Excl URT) 12,003,146 12,536,69017.2 Tax Collection Rate Guarantee 151,143 018 Student Growth Funding 330,874 019 Declining Enrollment Funding 0 020 Consolidation Incentive/Assistance 0 021 Isolated Funding 0 022 Supplemental Millage Incentive Funding 0 023 Other Unrestricted State Funding 58,141 024 Total Unrestricted Revenue from State and
Local Sources 20,080,500 20,072,267
Restricted Revenue from State Sources:25 Adult Education 0 0
Regular Education:26 Professional Development 117,028 122,61927 Other Regular Education 35,816 0
Special Education:28 Gifted & Talented 1,450 029 Alternative Learning Environment (ALE) 13,286 41,94730 English Language Learner (ELL) 16,408 3,33131 National School Lunch Act (NSLA) 893,296 941,16032 Other Special Education 96,048 71,41133 Workforce Education 70,608 40,62534 School Food Service 11,427 035 Educational Service Cooperatives 0 036 Early Childhood Programs 679,528 660,66037 Magnet School Programs 0 038 Other Non-Instructional Programs 304,622 299,80139 Total Restricted Revenue from State Sources 2,239,518 2,181,55440 Total Restricted Revenue from Federal
Sources 5,958,189 3,353,625
Other Sources of Funds:41 Financing Sources 13,931,505 220,56542 Balances from Consolidated/Annexed District 0 043 Indirect Cost Reimbursement 37,432 044 Gains and Losses from Sale of Fixed Assets 7,189 045 Compensation for Loss of Fixed Assets 0 046 Other 0 047 Total Other Sources of Funds 13,976,126 220,56548 Total Revenue and Other Sources of Funds
from All Sources 42,254,334 25,828,011
2010-2011 2011-2012Actual Budget
CURRENT EXPENDITURESInstruction:
49 Regular Instruction 10,828,957 9,723,44450 Special Education 1,997,887 1,986,84151 Workforce Education 562,444 476,50752 Adult Education 0 053 Compensatory Education 698,142 684,83254 Other 1,056,925 1,005,69255 Total Instruction 15,144,355 13,877,315
District Level Support:56 General Administration 595,143 616,15157 Central Services 324,327 235,27458 Maintenance & Operations of Plant 2,321,981 2,147,20159 Student Transportation 921,390 648,44560 Other District Level Support Services 104,553 11,06961 Total District Support Services 4,267,394 3,658,140
School Level Support:62 Student Support Services 1,228,125 1,401,69763 Instructional Staff Support Services 2,125,435 2,766,56064 School Administration 1,316,969 1,252,68465 Total District Support Services 4,670,529 5,420,941
Non-Instructional Services:66 Food Service Operations 1,367,760 1,254,37167 Other Enterprise Operations 73,614 068 Community Operations 66,913 46,22969 Other Non-Instructional Services 0 070 Total Non-Instructional Services 1,508,288 1,300,60071 Facilities Acquisition and Construction 2,079,165 6,900,30072 Debt Service 1,248,574 1,386,10675 Other Non-Programmed Costs 96,429 076 Total Expenditures 29,014,734 32,543,40277 Less: Capital Expenditures 2,614,429 7,457,99778 Less: Debt Service 1,248,574 1,386,10679 Total Current Expenditures 25,151,731 23,699,29980 Exclusions from Current Expenditures 2,295,29781 Net Current Expenditures 22,856,433
82 Per Pupil Expenditures 8,473
83 Personnel - Non-Federal Certified Clsrm FTEs 198.7084 Avg Salary - Non-Fed Certified Clsrm FTEs 43,18885 Personnel - Non-Federal Certified FTEs 218.0786 Avg Salary - Non-Fed Certified FTEs 46,15987.1 Legal Balance (funds 1-2-4) 1,702,14887.2 Categorical Fund Balance 742,11487.3 Deposits with Paying Agents (QZAB) 087.4 Net Legal Bal (Excl Cat & QZAB) 960,03388 Building Fund Balance (fund 3) 13,446,99289 Capital Outlay Fund Balance (fund 5) 0
Jan 30, 2012 - 92 - 9:35:29 AM

Annual Statistical Report 2010-2011
County: HEMPSTEAD BLEVINS SCHOOL DISTRICT LEA:2901000
2010-2011 2011-2012Actual Budget
1 Area in Square Miles 2322 ADA 5163 ADA pct Change over 5 Yrs. (26%)4 4 QTR ADM 5535 Prior Year 3QTR ADM 6236 Assessment 28,632,3757 M&O Mills 25.008 URT Mills 25.009 M&O Mills in Excess of URT 0.0010 Dedicated M&O Mills 0.0011 Debt Service Mills 6.3012 Total Mills 31.3013 Total Debt Bond/Non-Bond 1,183,807
State and Local Revenue:14 Property Tax Receipts (Including URT) 841,898 828,00015 Other Local Receipts 284,999 100,12516 Revenue from Intermediate Sources 0 017.1 Foundation Funding (Excl URT) 3,072,955 2,713,03517.2 Tax Collection Rate Guarantee 11,943 018 Student Growth Funding 0 019 Declining Enrollment Funding 53,273 207,51420 Consolidation Incentive/Assistance 0 021 Isolated Funding 64,320 022 Supplemental Millage Incentive Funding 4,181 3,34523 Other Unrestricted State Funding 0 024 Total Unrestricted Revenue from State and
Local Sources 4,333,568 3,852,019
Restricted Revenue from State Sources:25 Adult Education 0 0
Regular Education:26 Professional Development 25,780 23,55327 Other Regular Education 116,103 0
Special Education:28 Gifted & Talented 0 029 Alternative Learning Environment (ALE) 0 030 English Language Learner (ELL) 16,701 11,28731 National School Lunch Act (NSLA) 506,912 476,65232 Other Special Education 18,399 033 Workforce Education 0 034 School Food Service 2,162 1,50035 Educational Service Cooperatives 0 036 Early Childhood Programs 70,178 72,90037 Magnet School Programs 0 038 Other Non-Instructional Programs 49,001 29,66039 Total Restricted Revenue from State Sources 805,235 615,55240 Total Restricted Revenue from Federal
Sources 913,616 764,186
Other Sources of Funds:41 Financing Sources 0 042 Balances from Consolidated/Annexed District 0 043 Indirect Cost Reimbursement 0 044 Gains and Losses from Sale of Fixed Assets 0 045 Compensation for Loss of Fixed Assets 0 046 Other 0 047 Total Other Sources of Funds 0 048 Total Revenue and Other Sources of Funds
from All Sources 6,052,419 5,231,757
2010-2011 2011-2012Actual Budget
CURRENT EXPENDITURESInstruction:
49 Regular Instruction 2,088,557 1,840,66650 Special Education 380,901 368,91651 Workforce Education 185,262 188,28552 Adult Education 0 053 Compensatory Education 253,340 151,58054 Other 96,328 72,06455 Total Instruction 3,004,388 2,621,511
District Level Support:56 General Administration 163,645 156,88657 Central Services 58,267 54,71858 Maintenance & Operations of Plant 559,180 610,68959 Student Transportation 361,790 282,07860 Other District Level Support Services 4,388 061 Total District Support Services 1,147,270 1,104,371
School Level Support:62 Student Support Services 254,135 293,14563 Instructional Staff Support Services 615,580 680,82364 School Administration 156,459 173,63065 Total District Support Services 1,026,174 1,147,598
Non-Instructional Services:66 Food Service Operations 300,447 267,92767 Other Enterprise Operations 0 068 Community Operations 250 50069 Other Non-Instructional Services 0 070 Total Non-Instructional Services 300,697 268,42771 Facilities Acquisition and Construction 310,080 120,00072 Debt Service 125,519 120,40075 Other Non-Programmed Costs 0 076 Total Expenditures 5,914,128 5,382,30877 Less: Capital Expenditures 416,461 120,00078 Less: Debt Service 125,519 120,40079 Total Current Expenditures 5,372,148 5,141,90880 Exclusions from Current Expenditures 258,32281 Net Current Expenditures 5,113,826
82 Per Pupil Expenditures 9,918
83 Personnel - Non-Federal Certified Clsrm FTEs 41.0884 Avg Salary - Non-Fed Certified Clsrm FTEs 42,89185 Personnel - Non-Federal Certified FTEs 50.5286 Avg Salary - Non-Fed Certified FTEs 44,64687.1 Legal Balance (funds 1-2-4) 1,220,28887.2 Categorical Fund Balance 39,80287.3 Deposits with Paying Agents (QZAB) 087.4 Net Legal Bal (Excl Cat & QZAB) 1,180,48688 Building Fund Balance (fund 3) 295,93689 Capital Outlay Fund Balance (fund 5) 0
Jan 30, 2012 - 93 - 9:35:29 AM

Annual Statistical Report 2010-2011
County: HEMPSTEAD HOPE SCHOOL DISTRICT LEA:2903000
2010-2011 2011-2012Actual Budget
1 Area in Square Miles 2852 ADA 2,4663 ADA pct Change over 5 Yrs. (4%)4 4 QTR ADM 2,4865 Prior Year 3QTR ADM 2,5406 Assessment 171,840,8217 M&O Mills 25.008 URT Mills 25.009 M&O Mills in Excess of URT 0.0010 Dedicated M&O Mills 0.0011 Debt Service Mills 9.7012 Total Mills 34.7013 Total Debt Bond/Non-Bond 11,330,000
State and Local Revenue:14 Property Tax Receipts (Including URT) 5,651,390 5,396,00015 Other Local Receipts 1,121,748 570,15016 Revenue from Intermediate Sources 0 017.1 Foundation Funding (Excl URT) 10,867,748 10,918,91517.2 Tax Collection Rate Guarantee 135,923 018 Student Growth Funding 0 019 Declining Enrollment Funding 0 141,12820 Consolidation Incentive/Assistance 0 021 Isolated Funding 0 022 Supplemental Millage Incentive Funding 0 023 Other Unrestricted State Funding 0 024 Total Unrestricted Revenue from State and
Local Sources 17,776,809 17,026,193
Restricted Revenue from State Sources:25 Adult Education 183,763 181,200
Regular Education:26 Professional Development 105,070 105,71427 Other Regular Education 18,967 0
Special Education:28 Gifted & Talented 300 029 Alternative Learning Environment (ALE) 83,901 93,63630 English Language Learner (ELL) 111,926 031 National School Lunch Act (NSLA) 1,966,144 2,015,90432 Other Special Education 63,365 033 Workforce Education 0 034 School Food Service 9,739 035 Educational Service Cooperatives 0 036 Early Childhood Programs 680,400 680,40037 Magnet School Programs 0 038 Other Non-Instructional Programs 202,029 177,57139 Total Restricted Revenue from State Sources 3,425,604 3,254,42540 Total Restricted Revenue from Federal
Sources 5,525,231 3,278,473
Other Sources of Funds:41 Financing Sources 0 415,80142 Balances from Consolidated/Annexed District 0 043 Indirect Cost Reimbursement 51,647 044 Gains and Losses from Sale of Fixed Assets 956 045 Compensation for Loss of Fixed Assets 55,730 046 Other 0 047 Total Other Sources of Funds 108,334 415,80148 Total Revenue and Other Sources of Funds
from All Sources 26,835,977 23,974,892
2010-2011 2011-2012Actual Budget
CURRENT EXPENDITURESInstruction:
49 Regular Instruction 9,460,077 9,132,77650 Special Education 1,009,684 1,090,17451 Workforce Education 935,756 758,14952 Adult Education 278,646 275,32453 Compensatory Education 2,210,913 1,972,72054 Other 828,200 788,06655 Total Instruction 14,723,276 14,017,209
District Level Support:56 General Administration 514,426 479,49857 Central Services 480,024 486,63058 Maintenance & Operations of Plant 2,409,254 2,277,80859 Student Transportation 1,066,120 802,02560 Other District Level Support Services 57,644 6,00061 Total District Support Services 4,527,468 4,051,961
School Level Support:62 Student Support Services 915,931 924,59563 Instructional Staff Support Services 2,462,062 2,431,94264 School Administration 1,024,403 1,091,91865 Total District Support Services 4,402,395 4,448,455
Non-Instructional Services:66 Food Service Operations 1,544,755 300,71367 Other Enterprise Operations 27,586 068 Community Operations 114,206 88,33169 Other Non-Instructional Services 0 070 Total Non-Instructional Services 1,686,547 389,04471 Facilities Acquisition and Construction 720,339 072 Debt Service 1,270,776 883,44675 Other Non-Programmed Costs 30,596 076 Total Expenditures 27,361,397 23,790,11577 Less: Capital Expenditures 1,190,859 32,02078 Less: Debt Service 1,270,776 883,44679 Total Current Expenditures 24,899,763 22,874,64980 Exclusions from Current Expenditures 1,734,98281 Net Current Expenditures 23,164,781
82 Per Pupil Expenditures 9,394
83 Personnel - Non-Federal Certified Clsrm FTEs 198.9484 Avg Salary - Non-Fed Certified Clsrm FTEs 40,99285 Personnel - Non-Federal Certified FTEs 224.0486 Avg Salary - Non-Fed Certified FTEs 42,59187.1 Legal Balance (funds 1-2-4) 3,276,06287.2 Categorical Fund Balance 60,04887.3 Deposits with Paying Agents (QZAB) 087.4 Net Legal Bal (Excl Cat & QZAB) 3,216,01488 Building Fund Balance (fund 3) 089 Capital Outlay Fund Balance (fund 5) 0
Jan 30, 2012 - 94 - 9:35:29 AM

Annual Statistical Report 2010-2011
County: HEMPSTEAD SPRING HILL SCHOOL DISTRICT LEA:2906000
2010-2011 2011-2012Actual Budget
1 Area in Square Miles 722 ADA 4923 ADA pct Change over 5 Yrs. (2%)4 4 QTR ADM 5075 Prior Year 3QTR ADM 4696 Assessment 12,581,3857 M&O Mills 25.008 URT Mills 25.009 M&O Mills in Excess of URT 0.0010 Dedicated M&O Mills 0.0011 Debt Service Mills 16.8012 Total Mills 41.8013 Total Debt Bond/Non-Bond 3,529,367
State and Local Revenue:14 Property Tax Receipts (Including URT) 543,975 480,24415 Other Local Receipts 287,867 64,00016 Revenue from Intermediate Sources 0 017.1 Foundation Funding (Excl URT) 2,523,647 2,798,47017.2 Tax Collection Rate Guarantee 8,451 018 Student Growth Funding 226,465 019 Declining Enrollment Funding 0 020 Consolidation Incentive/Assistance 0 021 Isolated Funding 0 022 Supplemental Millage Incentive Funding 26,736 21,38923 Other Unrestricted State Funding 0 024 Total Unrestricted Revenue from State and
Local Sources 3,617,142 3,364,103
Restricted Revenue from State Sources:25 Adult Education 0 0
Regular Education:26 Professional Development 19,412 21,42927 Other Regular Education 8,292 0
Special Education:28 Gifted & Talented 100 029 Alternative Learning Environment (ALE) 0 030 English Language Learner (ELL) 2,051 031 National School Lunch Act (NSLA) 119,040 125,99432 Other Special Education 1,923 033 Workforce Education 0 034 School Food Service 1,720 035 Educational Service Cooperatives 0 036 Early Childhood Programs 0 037 Magnet School Programs 0 038 Other Non-Instructional Programs 754,908 242,31239 Total Restricted Revenue from State Sources 907,446 389,73540 Total Restricted Revenue from Federal
Sources 572,166 411,862
Other Sources of Funds:41 Financing Sources 9,802 042 Balances from Consolidated/Annexed District 0 043 Indirect Cost Reimbursement 0 044 Gains and Losses from Sale of Fixed Assets 0 045 Compensation for Loss of Fixed Assets 0 046 Other 0 047 Total Other Sources of Funds 9,802 048 Total Revenue and Other Sources of Funds
from All Sources 5,106,556 4,165,700
2010-2011 2011-2012Actual Budget
CURRENT EXPENDITURESInstruction:
49 Regular Instruction 2,040,569 1,797,38850 Special Education 175,326 181,51851 Workforce Education 221,473 226,63352 Adult Education 0 053 Compensatory Education 43,168 34,16054 Other 82,813 92,45455 Total Instruction 2,563,349 2,332,153
District Level Support:56 General Administration 159,638 166,66657 Central Services 121,668 124,02858 Maintenance & Operations of Plant 300,048 322,90459 Student Transportation 93,959 109,83260 Other District Level Support Services 0 061 Total District Support Services 675,313 723,430
School Level Support:62 Student Support Services 145,668 173,36263 Instructional Staff Support Services 258,757 279,92564 School Administration 179,474 179,13465 Total District Support Services 583,899 632,421
Non-Instructional Services:66 Food Service Operations 194,237 181,78067 Other Enterprise Operations 0 068 Community Operations 0 2,00069 Other Non-Instructional Services 0 070 Total Non-Instructional Services 194,237 183,78071 Facilities Acquisition and Construction 871,303 175,00072 Debt Service 179,592 266,56375 Other Non-Programmed Costs 0 076 Total Expenditures 5,067,694 4,313,34877 Less: Capital Expenditures 953,833 207,37978 Less: Debt Service 179,592 266,56379 Total Current Expenditures 3,934,269 3,839,40680 Exclusions from Current Expenditures 267,36081 Net Current Expenditures 3,666,910
82 Per Pupil Expenditures 7,459
83 Personnel - Non-Federal Certified Clsrm FTEs 34.3484 Avg Salary - Non-Fed Certified Clsrm FTEs 46,24885 Personnel - Non-Federal Certified FTEs 38.3486 Avg Salary - Non-Fed Certified FTEs 48,15487.1 Legal Balance (funds 1-2-4) 507,96987.2 Categorical Fund Balance 25,78487.3 Deposits with Paying Agents (QZAB) 087.4 Net Legal Bal (Excl Cat & QZAB) 482,18588 Building Fund Balance (fund 3) 128,48389 Capital Outlay Fund Balance (fund 5) 0
Jan 30, 2012 - 95 - 9:35:29 AM

Annual Statistical Report 2010-2011
County: HOT SPRING BISMARCK SCHOOL DISTRICT LEA:3001000
2010-2011 2011-2012Actual Budget
1 Area in Square Miles 1792 ADA 9253 ADA pct Change over 5 Yrs. (5%)4 4 QTR ADM 9785 Prior Year 3QTR ADM 9786 Assessment 55,487,7917 M&O Mills 25.008 URT Mills 25.009 M&O Mills in Excess of URT 0.0010 Dedicated M&O Mills 0.0011 Debt Service Mills 16.0012 Total Mills 41.0013 Total Debt Bond/Non-Bond 8,010,000
State and Local Revenue:14 Property Tax Receipts (Including URT) 2,143,321 2,644,42215 Other Local Receipts 460,417 200,53016 Revenue from Intermediate Sources 4,067 3,00017.1 Foundation Funding (Excl URT) 4,590,846 4,624,42717.2 Tax Collection Rate Guarantee 17,164 759,45118 Student Growth Funding 21,014 019 Declining Enrollment Funding 0 12,53420 Consolidation Incentive/Assistance 0 021 Isolated Funding 0 022 Supplemental Millage Incentive Funding 8,793 7,03423 Other Unrestricted State Funding 0 024 Total Unrestricted Revenue from State and
Local Sources 7,245,621 8,251,398
Restricted Revenue from State Sources:25 Adult Education 0 0
Regular Education:26 Professional Development 40,463 41,28827 Other Regular Education 1,437 2,800
Special Education:28 Gifted & Talented 400 029 Alternative Learning Environment (ALE) 38,273 36,10330 English Language Learner (ELL) 10,255 031 National School Lunch Act (NSLA) 293,632 292,97432 Other Special Education 28,968 033 Workforce Education 17,334 24,91734 School Food Service 3,823 2,48535 Educational Service Cooperatives 0 036 Early Childhood Programs 0 037 Magnet School Programs 0 038 Other Non-Instructional Programs 590,597 60,43939 Total Restricted Revenue from State Sources 1,025,182 461,00540 Total Restricted Revenue from Federal
Sources 1,595,973 1,182,219
Other Sources of Funds:41 Financing Sources 4,492 042 Balances from Consolidated/Annexed District 0 043 Indirect Cost Reimbursement 0 044 Gains and Losses from Sale of Fixed Assets 0 045 Compensation for Loss of Fixed Assets 0 046 Other 0 047 Total Other Sources of Funds 4,492 048 Total Revenue and Other Sources of Funds
from All Sources 9,871,268 9,894,622
2010-2011 2011-2012Actual Budget
CURRENT EXPENDITURESInstruction:
49 Regular Instruction 3,999,069 3,591,45450 Special Education 647,754 568,34751 Workforce Education 245,390 245,10152 Adult Education 0 053 Compensatory Education 146,458 137,07954 Other 124,450 100,21855 Total Instruction 5,163,120 4,642,198
District Level Support:56 General Administration 363,128 355,66957 Central Services 350,057 131,05858 Maintenance & Operations of Plant 1,057,110 743,39059 Student Transportation 465,117 483,79960 Other District Level Support Services 27,502 061 Total District Support Services 2,262,915 1,713,917
School Level Support:62 Student Support Services 347,552 327,39963 Instructional Staff Support Services 530,990 788,77564 School Administration 301,983 290,97165 Total District Support Services 1,180,526 1,407,145
Non-Instructional Services:66 Food Service Operations 525,609 559,95167 Other Enterprise Operations 0 068 Community Operations 604 1,50069 Other Non-Instructional Services 0 070 Total Non-Instructional Services 526,213 561,45171 Facilities Acquisition and Construction 981,591 89,07672 Debt Service 407,738 652,95375 Other Non-Programmed Costs 0 076 Total Expenditures 10,522,102 9,066,73977 Less: Capital Expenditures 1,071,676 189,68778 Less: Debt Service 407,738 652,95379 Total Current Expenditures 9,042,688 8,224,10080 Exclusions from Current Expenditures 439,59481 Net Current Expenditures 8,603,094
82 Per Pupil Expenditures 9,297
83 Personnel - Non-Federal Certified Clsrm FTEs 78.0084 Avg Salary - Non-Fed Certified Clsrm FTEs 42,47485 Personnel - Non-Federal Certified FTEs 82.0086 Avg Salary - Non-Fed Certified FTEs 44,09987.1 Legal Balance (funds 1-2-4) 992,58687.2 Categorical Fund Balance 91,66987.3 Deposits with Paying Agents (QZAB) 087.4 Net Legal Bal (Excl Cat & QZAB) 900,91788 Building Fund Balance (fund 3) 106,34289 Capital Outlay Fund Balance (fund 5) 0
Jan 30, 2012 - 96 - 9:35:29 AM

Annual Statistical Report 2010-2011
County: HOT SPRING GLEN ROSE SCHOOL DISTRICT LEA:3002000
2010-2011 2011-2012Actual Budget
1 Area in Square Miles 752 ADA 8683 ADA pct Change over 5 Yrs. (10%)4 4 QTR ADM 9335 Prior Year 3QTR ADM 9796 Assessment 45,674,8857 M&O Mills 25.008 URT Mills 25.009 M&O Mills in Excess of URT 0.0010 Dedicated M&O Mills 0.0011 Debt Service Mills 13.2012 Total Mills 38.2013 Total Debt Bond/Non-Bond 5,434,048
State and Local Revenue:14 Property Tax Receipts (Including URT) 1,675,105 1,858,18515 Other Local Receipts 687,444 281,10016 Revenue from Intermediate Sources 3,982 3,90017.1 Foundation Funding (Excl URT) 4,800,303 4,648,03917.2 Tax Collection Rate Guarantee 12,536 018 Student Growth Funding 0 019 Declining Enrollment Funding 30,115 122,11220 Consolidation Incentive/Assistance 0 021 Isolated Funding 0 022 Supplemental Millage Incentive Funding 35,064 118,42423 Other Unrestricted State Funding 0 024 Total Unrestricted Revenue from State and
Local Sources 7,244,548 7,031,760
Restricted Revenue from State Sources:25 Adult Education 0 0
Regular Education:26 Professional Development 40,480 39,79427 Other Regular Education 0 2,982
Special Education:28 Gifted & Talented 1,052 029 Alternative Learning Environment (ALE) 23,078 16,16630 English Language Learner (ELL) 586 031 National School Lunch Act (NSLA) 256,928 247,43432 Other Special Education 26,513 033 Workforce Education 75,834 69,87534 School Food Service 3,100 3,10035 Educational Service Cooperatives 0 036 Early Childhood Programs 122,375 126,36037 Magnet School Programs 0 038 Other Non-Instructional Programs 112,646 10,36639 Total Restricted Revenue from State Sources 662,591 516,07740 Total Restricted Revenue from Federal
Sources 1,469,121 922,129
Other Sources of Funds:41 Financing Sources 450,800 042 Balances from Consolidated/Annexed District 0 043 Indirect Cost Reimbursement 0 044 Gains and Losses from Sale of Fixed Assets 0 045 Compensation for Loss of Fixed Assets 0 046 Other 0 047 Total Other Sources of Funds 450,800 048 Total Revenue and Other Sources of Funds
from All Sources 9,827,060 8,469,967
2010-2011 2011-2012Actual Budget
CURRENT EXPENDITURESInstruction:
49 Regular Instruction 3,952,109 3,701,63750 Special Education 614,012 535,09651 Workforce Education 262,551 270,61352 Adult Education 0 053 Compensatory Education 232,261 206,21254 Other 73,285 74,57455 Total Instruction 5,134,217 4,788,131
District Level Support:56 General Administration 290,096 266,93357 Central Services 44,113 46,15458 Maintenance & Operations of Plant 1,035,109 886,46259 Student Transportation 373,883 275,69960 Other District Level Support Services 24,366 15,92561 Total District Support Services 1,767,568 1,491,173
School Level Support:62 Student Support Services 406,382 415,14863 Instructional Staff Support Services 573,091 633,00664 School Administration 376,849 297,43765 Total District Support Services 1,356,322 1,345,591
Non-Instructional Services:66 Food Service Operations 462,442 504,85967 Other Enterprise Operations 12,441 068 Community Operations 0 3,00069 Other Non-Instructional Services 0 070 Total Non-Instructional Services 474,883 507,85971 Facilities Acquisition and Construction 64,479 497,07372 Debt Service 374,953 425,24175 Other Non-Programmed Costs 0 076 Total Expenditures 9,172,422 9,055,06977 Less: Capital Expenditures 261,601 548,90978 Less: Debt Service 374,953 425,24179 Total Current Expenditures 8,535,868 8,080,91980 Exclusions from Current Expenditures 691,90481 Net Current Expenditures 7,843,965
82 Per Pupil Expenditures 9,041
83 Personnel - Non-Federal Certified Clsrm FTEs 64.1484 Avg Salary - Non-Fed Certified Clsrm FTEs 46,26785 Personnel - Non-Federal Certified FTEs 71.3986 Avg Salary - Non-Fed Certified FTEs 48,34287.1 Legal Balance (funds 1-2-4) 876,74287.2 Categorical Fund Balance 25,63287.3 Deposits with Paying Agents (QZAB) 087.4 Net Legal Bal (Excl Cat & QZAB) 851,10988 Building Fund Balance (fund 3) 561,61489 Capital Outlay Fund Balance (fund 5) 0
Jan 30, 2012 - 97 - 9:35:29 AM

Annual Statistical Report 2010-2011
County: HOT SPRING MAGNET COVE SCHOOL DIST. LEA:3003000
2010-2011 2011-2012Actual Budget
1 Area in Square Miles 492 ADA 6223 ADA pct Change over 5 Yrs. (15%)4 4 QTR ADM 6555 Prior Year 3QTR ADM 6876 Assessment 62,716,3677 M&O Mills 25.008 URT Mills 25.009 M&O Mills in Excess of URT 0.0010 Dedicated M&O Mills 0.0011 Debt Service Mills 14.1812 Total Mills 39.1813 Total Debt Bond/Non-Bond 5,795,000
State and Local Revenue:14 Property Tax Receipts (Including URT) 2,314,817 2,408,08315 Other Local Receipts 727,083 443,80316 Revenue from Intermediate Sources 2,788 017.1 Foundation Funding (Excl URT) 2,596,137 2,411,88417.2 Tax Collection Rate Guarantee 31,479 31,47918 Student Growth Funding 0 019 Declining Enrollment Funding 150,786 94,46420 Consolidation Incentive/Assistance 0 021 Isolated Funding 0 022 Supplemental Millage Incentive Funding 0 023 Other Unrestricted State Funding 40,554 40,55424 Total Unrestricted Revenue from State and
Local Sources 5,863,644 5,430,267
Restricted Revenue from State Sources:25 Adult Education 0 0
Regular Education:26 Professional Development 28,407 27,80527 Other Regular Education 2,789 0
Special Education:28 Gifted & Talented 0 029 Alternative Learning Environment (ALE) 0 030 English Language Learner (ELL) 0 031 National School Lunch Act (NSLA) 163,680 318,86632 Other Special Education 2,814 033 Workforce Education 29,250 52,14834 School Food Service 2,344 2,34435 Educational Service Cooperatives 0 036 Early Childhood Programs 0 037 Magnet School Programs 0 038 Other Non-Instructional Programs 25,260 19,30139 Total Restricted Revenue from State Sources 254,545 420,46440 Total Restricted Revenue from Federal
Sources 1,028,732 638,887
Other Sources of Funds:41 Financing Sources 0 042 Balances from Consolidated/Annexed District 0 043 Indirect Cost Reimbursement 0 044 Gains and Losses from Sale of Fixed Assets 2,106 045 Compensation for Loss of Fixed Assets 27,717 046 Other 0 047 Total Other Sources of Funds 29,822 048 Total Revenue and Other Sources of Funds
from All Sources 7,176,743 6,489,618
2010-2011 2011-2012Actual Budget
CURRENT EXPENDITURESInstruction:
49 Regular Instruction 2,389,577 2,194,57950 Special Education 242,371 232,48251 Workforce Education 232,806 304,73452 Adult Education 0 053 Compensatory Education 85,616 55,71254 Other 179,641 197,89155 Total Instruction 3,130,010 2,985,398
District Level Support:56 General Administration 153,911 153,28357 Central Services 209,923 193,52758 Maintenance & Operations of Plant 795,980 818,42659 Student Transportation 215,356 393,75260 Other District Level Support Services 12,883 2,50061 Total District Support Services 1,388,053 1,561,488
School Level Support:62 Student Support Services 339,817 412,33163 Instructional Staff Support Services 695,176 695,07064 School Administration 399,936 327,97865 Total District Support Services 1,434,929 1,435,379
Non-Instructional Services:66 Food Service Operations 343,253 348,07867 Other Enterprise Operations 0 068 Community Operations 0 50069 Other Non-Instructional Services 0 070 Total Non-Instructional Services 343,253 348,57871 Facilities Acquisition and Construction 382,184 1,128,19672 Debt Service 312,604 456,40075 Other Non-Programmed Costs 0 076 Total Expenditures 6,991,032 7,915,43977 Less: Capital Expenditures 441,254 1,266,35078 Less: Debt Service 312,604 456,40079 Total Current Expenditures 6,237,175 6,192,68980 Exclusions from Current Expenditures 266,05581 Net Current Expenditures 5,971,119
82 Per Pupil Expenditures 9,599
83 Personnel - Non-Federal Certified Clsrm FTEs 51.0284 Avg Salary - Non-Fed Certified Clsrm FTEs 41,84785 Personnel - Non-Federal Certified FTEs 57.5286 Avg Salary - Non-Fed Certified FTEs 44,21887.1 Legal Balance (funds 1-2-4) 2,830,97987.2 Categorical Fund Balance 66,94287.3 Deposits with Paying Agents (QZAB) 087.4 Net Legal Bal (Excl Cat & QZAB) 2,764,03788 Building Fund Balance (fund 3) 562,64389 Capital Outlay Fund Balance (fund 5) 0
Jan 30, 2012 - 98 - 9:35:29 AM

Annual Statistical Report 2010-2011
County: HOT SPRING MALVERN SCHOOL DISTRICT LEA:3004000
2010-2011 2011-2012Actual Budget
1 Area in Square Miles 4572 ADA 2,0203 ADA pct Change over 5 Yrs. (3%)4 4 QTR ADM 2,1085 Prior Year 3QTR ADM 2,1356 Assessment 182,909,1617 M&O Mills 25.008 URT Mills 25.009 M&O Mills in Excess of URT 0.0010 Dedicated M&O Mills 0.0011 Debt Service Mills 12.6512 Total Mills 37.6513 Total Debt Bond/Non-Bond 12,623,549
State and Local Revenue:14 Property Tax Receipts (Including URT) 6,504,312 6,332,31515 Other Local Receipts 1,021,909 421,25816 Revenue from Intermediate Sources 8,987 6,00017.1 Foundation Funding (Excl URT) 8,460,179 8,465,03117.2 Tax Collection Rate Guarantee 83,485 018 Student Growth Funding 24,211 019 Declining Enrollment Funding 0 73,63620 Consolidation Incentive/Assistance 0 021 Isolated Funding 0 022 Supplemental Millage Incentive Funding 0 023 Other Unrestricted State Funding 0 1,00024 Total Unrestricted Revenue from State and
Local Sources 16,103,084 15,299,240
Restricted Revenue from State Sources:25 Adult Education 0 0
Regular Education:26 Professional Development 88,300 89,46227 Other Regular Education 6,164 8,000
Special Education:28 Gifted & Talented 1,250 60029 Alternative Learning Environment (ALE) 184,095 129,78030 English Language Learner (ELL) 12,599 12,00031 National School Lunch Act (NSLA) 719,200 1,020,10132 Other Special Education 101,672 106,00033 Workforce Education 133,427 115,91734 School Food Service 7,336 7,00035 Educational Service Cooperatives 50,000 036 Early Childhood Programs 0 037 Magnet School Programs 0 038 Other Non-Instructional Programs 109,653 3,099,23239 Total Restricted Revenue from State Sources 1,413,695 4,588,09240 Total Restricted Revenue from Federal
Sources 3,140,043 3,123,201
Other Sources of Funds:41 Financing Sources 3,407,057 181,74742 Balances from Consolidated/Annexed District 0 043 Indirect Cost Reimbursement 0 044 Gains and Losses from Sale of Fixed Assets 0 045 Compensation for Loss of Fixed Assets 0 046 Other 0 047 Total Other Sources of Funds 3,407,057 181,74748 Total Revenue and Other Sources of Funds
from All Sources 24,063,879 23,192,280
2010-2011 2011-2012Actual Budget
CURRENT EXPENDITURESInstruction:
49 Regular Instruction 7,098,576 7,438,86650 Special Education 1,246,432 1,221,57751 Workforce Education 414,283 356,64552 Adult Education 0 053 Compensatory Education 897,111 801,43354 Other 1,165,068 1,362,65255 Total Instruction 10,821,469 11,181,173
District Level Support:56 General Administration 413,977 433,09757 Central Services 379,182 397,05658 Maintenance & Operations of Plant 1,549,390 1,605,60659 Student Transportation 844,359 921,81460 Other District Level Support Services 53,093 40,91461 Total District Support Services 3,240,001 3,398,487
School Level Support:62 Student Support Services 1,196,801 1,186,01463 Instructional Staff Support Services 1,548,098 1,498,07664 School Administration 946,609 1,003,05565 Total District Support Services 3,691,509 3,687,145
Non-Instructional Services:66 Food Service Operations 981,693 1,032,47267 Other Enterprise Operations 0 068 Community Operations 7,825 30069 Other Non-Instructional Services 0 070 Total Non-Instructional Services 989,517 1,032,77271 Facilities Acquisition and Construction 620,650 7,794,88272 Debt Service 708,803 963,52375 Other Non-Programmed Costs 165 076 Total Expenditures 20,072,114 28,057,98277 Less: Capital Expenditures 678,032 7,931,85878 Less: Debt Service 708,803 963,52379 Total Current Expenditures 18,685,280 19,162,60280 Exclusions from Current Expenditures 585,01481 Net Current Expenditures 18,100,266
82 Per Pupil Expenditures 8,962
83 Personnel - Non-Federal Certified Clsrm FTEs 146.2784 Avg Salary - Non-Fed Certified Clsrm FTEs 45,97885 Personnel - Non-Federal Certified FTEs 158.1386 Avg Salary - Non-Fed Certified FTEs 48,41087.1 Legal Balance (funds 1-2-4) 2,520,47187.2 Categorical Fund Balance 152,67987.3 Deposits with Paying Agents (QZAB) 087.4 Net Legal Bal (Excl Cat & QZAB) 2,367,79288 Building Fund Balance (fund 3) 4,690,92289 Capital Outlay Fund Balance (fund 5) 0
Jan 30, 2012 - 99 - 9:35:29 AM

Annual Statistical Report 2010-2011
County: HOT SPRING OUACHITA SCHOOL DISTRICT LEA:3005000
2010-2011 2011-2012Actual Budget
1 Area in Square Miles 732 ADA 4393 ADA pct Change over 5 Yrs. 12%4 4 QTR ADM 4555 Prior Year 3QTR ADM 4746 Assessment 21,556,8237 M&O Mills 25.008 URT Mills 25.009 M&O Mills in Excess of URT 0.0010 Dedicated M&O Mills 0.0011 Debt Service Mills 15.8012 Total Mills 40.8013 Total Debt Bond/Non-Bond 3,940,000
State and Local Revenue:14 Property Tax Receipts (Including URT) 758,358 864,92015 Other Local Receipts 343,241 214,22516 Revenue from Intermediate Sources 2,009 017.1 Foundation Funding (Excl URT) 2,343,687 2,260,18717.2 Tax Collection Rate Guarantee 3,406 018 Student Growth Funding 0 019 Declining Enrollment Funding 29,814 61,77820 Consolidation Incentive/Assistance 0 021 Isolated Funding 0 022 Supplemental Millage Incentive Funding 0 023 Other Unrestricted State Funding 1,190 024 Total Unrestricted Revenue from State and
Local Sources 3,481,705 3,401,110
Restricted Revenue from State Sources:25 Adult Education 0 0
Regular Education:26 Professional Development 19,606 19,23727 Other Regular Education 0 0
Special Education:28 Gifted & Talented 2,100 029 Alternative Learning Environment (ALE) 0 030 English Language Learner (ELL) 0 031 National School Lunch Act (NSLA) 105,152 111,82632 Other Special Education 1,942 033 Workforce Education 9,750 10,83334 School Food Service 1,678 16,00035 Educational Service Cooperatives 0 036 Early Childhood Programs 97,200 97,20037 Magnet School Programs 0 038 Other Non-Instructional Programs 620,952 289,08039 Total Restricted Revenue from State Sources 858,380 544,17640 Total Restricted Revenue from Federal
Sources 559,383 383,360
Other Sources of Funds:41 Financing Sources 21,380 042 Balances from Consolidated/Annexed District 0 043 Indirect Cost Reimbursement 0 044 Gains and Losses from Sale of Fixed Assets 0 045 Compensation for Loss of Fixed Assets 5,876 046 Other 0 047 Total Other Sources of Funds 27,256 048 Total Revenue and Other Sources of Funds
from All Sources 4,926,723 4,328,646
2010-2011 2011-2012Actual Budget
CURRENT EXPENDITURESInstruction:
49 Regular Instruction 1,939,584 1,773,92850 Special Education 224,144 207,89851 Workforce Education 170,546 167,94352 Adult Education 0 053 Compensatory Education 70,325 77,40354 Other 46,541 45,60455 Total Instruction 2,451,141 2,272,775
District Level Support:56 General Administration 148,417 137,55857 Central Services 97,943 102,39358 Maintenance & Operations of Plant 418,850 673,70059 Student Transportation 226,528 133,63660 Other District Level Support Services 3,094 6,30061 Total District Support Services 894,832 1,053,588
School Level Support:62 Student Support Services 221,289 257,11463 Instructional Staff Support Services 200,123 202,58064 School Administration 183,879 134,81265 Total District Support Services 605,292 594,506
Non-Instructional Services:66 Food Service Operations 208,204 208,60967 Other Enterprise Operations 0 068 Community Operations 357 1,00069 Other Non-Instructional Services 0 070 Total Non-Instructional Services 208,561 209,60971 Facilities Acquisition and Construction 794,936 072 Debt Service 290,161 295,46775 Other Non-Programmed Costs 0 076 Total Expenditures 5,244,923 4,425,94577 Less: Capital Expenditures 923,262 19,14678 Less: Debt Service 290,161 295,46779 Total Current Expenditures 4,031,500 4,111,33180 Exclusions from Current Expenditures 392,81981 Net Current Expenditures 3,638,680
82 Per Pupil Expenditures 8,293
83 Personnel - Non-Federal Certified Clsrm FTEs 32.0584 Avg Salary - Non-Fed Certified Clsrm FTEs 39,45485 Personnel - Non-Federal Certified FTEs 35.5586 Avg Salary - Non-Fed Certified FTEs 41,66287.1 Legal Balance (funds 1-2-4) 208,26587.2 Categorical Fund Balance 41687.3 Deposits with Paying Agents (QZAB) 087.4 Net Legal Bal (Excl Cat & QZAB) 207,84888 Building Fund Balance (fund 3) 862,62089 Capital Outlay Fund Balance (fund 5) 0
Jan 30, 2012 - 100 - 9:35:29 AM

Annual Statistical Report 2010-2011
County: HOWARD DIERKS SCHOOL DISTRICT LEA:3102000
2010-2011 2011-2012Actual Budget
1 Area in Square Miles 2282 ADA 5143 ADA pct Change over 5 Yrs. (1%)4 4 QTR ADM 5435 Prior Year 3QTR ADM 5146 Assessment 36,102,6167 M&O Mills 32.008 URT Mills 25.009 M&O Mills in Excess of URT 7.0010 Dedicated M&O Mills 0.0011 Debt Service Mills 11.0012 Total Mills 43.0013 Total Debt Bond/Non-Bond 3,223,920
State and Local Revenue:14 Property Tax Receipts (Including URT) 1,432,206 1,514,66315 Other Local Receipts 372,336 285,70016 Revenue from Intermediate Sources 0 017.1 Foundation Funding (Excl URT) 2,225,096 2,461,17217.2 Tax Collection Rate Guarantee 32,188 018 Student Growth Funding 180,344 019 Declining Enrollment Funding 0 020 Consolidation Incentive/Assistance 0 021 Isolated Funding 0 022 Supplemental Millage Incentive Funding 0 023 Other Unrestricted State Funding 0 024 Total Unrestricted Revenue from State and
Local Sources 4,242,170 4,261,535
Restricted Revenue from State Sources:25 Adult Education 0 0
Regular Education:26 Professional Development 21,238 23,10027 Other Regular Education 0 0
Special Education:28 Gifted & Talented 200 029 Alternative Learning Environment (ALE) 813 30,13430 English Language Learner (ELL) 5,567 5,00031 National School Lunch Act (NSLA) 150,288 151,80032 Other Special Education 25,567 033 Workforce Education 3,250 034 School Food Service 2,285 2,40035 Educational Service Cooperatives 0 036 Early Childhood Programs 0 037 Magnet School Programs 0 038 Other Non-Instructional Programs 163,634 52,15939 Total Restricted Revenue from State Sources 372,843 264,59340 Total Restricted Revenue from Federal
Sources 883,266 642,716
Other Sources of Funds:41 Financing Sources 0 042 Balances from Consolidated/Annexed District 0 043 Indirect Cost Reimbursement 0 044 Gains and Losses from Sale of Fixed Assets 500 045 Compensation for Loss of Fixed Assets 0 046 Other 0 047 Total Other Sources of Funds 500 048 Total Revenue and Other Sources of Funds
from All Sources 5,498,778 5,168,844
2010-2011 2011-2012Actual Budget
CURRENT EXPENDITURESInstruction:
49 Regular Instruction 2,250,415 2,045,29750 Special Education 314,901 324,36751 Workforce Education 217,107 216,02952 Adult Education 0 053 Compensatory Education 212,468 185,23254 Other 195,410 187,61755 Total Instruction 3,190,301 2,958,541
District Level Support:56 General Administration 165,486 159,90157 Central Services 66,707 54,00558 Maintenance & Operations of Plant 415,546 408,81459 Student Transportation 270,302 282,24960 Other District Level Support Services 0 061 Total District Support Services 918,041 904,970
School Level Support:62 Student Support Services 215,976 208,88863 Instructional Staff Support Services 171,878 204,34664 School Administration 124,389 127,61165 Total District Support Services 512,244 540,845
Non-Instructional Services:66 Food Service Operations 338,419 359,05267 Other Enterprise Operations 0 068 Community Operations 0 5,18869 Other Non-Instructional Services 0 070 Total Non-Instructional Services 338,419 364,24071 Facilities Acquisition and Construction 485,264 072 Debt Service 401,982 267,01575 Other Non-Programmed Costs 0 076 Total Expenditures 5,846,250 5,035,60977 Less: Capital Expenditures 584,862 109,16278 Less: Debt Service 401,982 267,01579 Total Current Expenditures 4,859,406 4,659,43380 Exclusions from Current Expenditures 291,17081 Net Current Expenditures 4,568,236
82 Per Pupil Expenditures 8,884
83 Personnel - Non-Federal Certified Clsrm FTEs 48.3284 Avg Salary - Non-Fed Certified Clsrm FTEs 40,53085 Personnel - Non-Federal Certified FTEs 50.5886 Avg Salary - Non-Fed Certified FTEs 41,77187.1 Legal Balance (funds 1-2-4) 837,66487.2 Categorical Fund Balance 4,24187.3 Deposits with Paying Agents (QZAB) 087.4 Net Legal Bal (Excl Cat & QZAB) 833,42388 Building Fund Balance (fund 3) 089 Capital Outlay Fund Balance (fund 5) 0
Jan 30, 2012 - 101 - 9:35:29 AM

Annual Statistical Report 2010-2011
County: HOWARD MINERAL SPRINGS SCHOOL DIST. LEA:3104000
2010-2011 2011-2012Actual Budget
1 Area in Square Miles 2642 ADA 4683 ADA pct Change over 5 Yrs. (21%)4 4 QTR ADM 4795 Prior Year 3QTR ADM 4996 Assessment 57,839,6737 M&O Mills 25.008 URT Mills 25.009 M&O Mills in Excess of URT 0.0010 Dedicated M&O Mills 0.0011 Debt Service Mills 9.0012 Total Mills 34.0013 Total Debt Bond/Non-Bond 3,489,443
State and Local Revenue:14 Property Tax Receipts (Including URT) 1,634,618 2,423,96015 Other Local Receipts 297,957 137,95916 Revenue from Intermediate Sources 0 017.1 Foundation Funding (Excl URT) 1,825,580 1,520,36317.2 Tax Collection Rate Guarantee 51,269 018 Student Growth Funding 0 019 Declining Enrollment Funding 0 55,51120 Consolidation Incentive/Assistance 0 021 Isolated Funding 205,014 022 Supplemental Millage Incentive Funding 26,875 21,50023 Other Unrestricted State Funding 0 024 Total Unrestricted Revenue from State and
Local Sources 4,041,313 4,159,293
Restricted Revenue from State Sources:25 Adult Education 0 0
Regular Education:26 Professional Development 20,630 20,37227 Other Regular Education 297,205 125,000
Special Education:28 Gifted & Talented 50 029 Alternative Learning Environment (ALE) 0 030 English Language Learner (ELL) 1,465 031 National School Lunch Act (NSLA) 436,480 663,36632 Other Special Education 5,891 033 Workforce Education 0 034 School Food Service 2,331 2,33135 Educational Service Cooperatives 0 036 Early Childhood Programs 230,633 230,63337 Magnet School Programs 0 038 Other Non-Instructional Programs 18,569 7,28939 Total Restricted Revenue from State Sources 1,013,254 1,048,99140 Total Restricted Revenue from Federal
Sources 1,257,645 1,058,810
Other Sources of Funds:41 Financing Sources 1,002,426 042 Balances from Consolidated/Annexed District 0 043 Indirect Cost Reimbursement 0 044 Gains and Losses from Sale of Fixed Assets 500 045 Compensation for Loss of Fixed Assets 10,291 046 Other 0 047 Total Other Sources of Funds 1,013,216 048 Total Revenue and Other Sources of Funds
from All Sources 7,325,429 6,267,094
2010-2011 2011-2012Actual Budget
CURRENT EXPENDITURESInstruction:
49 Regular Instruction 2,426,116 2,157,70650 Special Education 287,231 259,20051 Workforce Education 210,794 218,24652 Adult Education 0 053 Compensatory Education 281,548 235,88854 Other 127,709 173,35055 Total Instruction 3,333,399 3,044,390
District Level Support:56 General Administration 163,332 172,82457 Central Services 150,736 275,63858 Maintenance & Operations of Plant 572,514 574,89859 Student Transportation 340,790 232,18560 Other District Level Support Services 8,408 50061 Total District Support Services 1,235,779 1,256,045
School Level Support:62 Student Support Services 172,086 188,81663 Instructional Staff Support Services 547,586 680,56064 School Administration 247,064 217,15665 Total District Support Services 966,735 1,086,532
Non-Instructional Services:66 Food Service Operations 282,493 141,79867 Other Enterprise Operations 0 068 Community Operations 0 5,06569 Other Non-Instructional Services 0 070 Total Non-Instructional Services 282,493 146,86371 Facilities Acquisition and Construction 543,383 072 Debt Service 193,607 335,62375 Other Non-Programmed Costs 0 076 Total Expenditures 6,555,396 5,869,45477 Less: Capital Expenditures 804,236 87,47078 Less: Debt Service 193,607 335,62379 Total Current Expenditures 5,557,553 5,446,36180 Exclusions from Current Expenditures 366,14981 Net Current Expenditures 5,191,404
82 Per Pupil Expenditures 11,098
83 Personnel - Non-Federal Certified Clsrm FTEs 42.3384 Avg Salary - Non-Fed Certified Clsrm FTEs 45,20285 Personnel - Non-Federal Certified FTEs 49.9186 Avg Salary - Non-Fed Certified FTEs 48,70387.1 Legal Balance (funds 1-2-4) 997,63787.2 Categorical Fund Balance 48,68487.3 Deposits with Paying Agents (QZAB) 087.4 Net Legal Bal (Excl Cat & QZAB) 948,95388 Building Fund Balance (fund 3) 785,16689 Capital Outlay Fund Balance (fund 5) 0
Jan 30, 2012 - 102 - 9:35:29 AM

Annual Statistical Report 2010-2011
County: HOWARD NASHVILLE SCHOOL DISTRICT LEA:3105000
2010-2011 2011-2012Actual Budget
1 Area in Square Miles 2372 ADA 1,8653 ADA pct Change over 5 Yrs. 6%4 4 QTR ADM 1,9395 Prior Year 3QTR ADM 1,9026 Assessment 126,391,5137 M&O Mills 25.008 URT Mills 25.009 M&O Mills in Excess of URT 0.0010 Dedicated M&O Mills 0.0011 Debt Service Mills 6.7012 Total Mills 31.7013 Total Debt Bond/Non-Bond 3,122,789
State and Local Revenue:14 Property Tax Receipts (Including URT) 3,897,846 3,901,07415 Other Local Receipts 836,141 353,34016 Revenue from Intermediate Sources 0 017.1 Foundation Funding (Excl URT) 8,396,051 8,836,90317.2 Tax Collection Rate Guarantee 99,508 018 Student Growth Funding 264,362 019 Declining Enrollment Funding 0 020 Consolidation Incentive/Assistance 0 021 Isolated Funding 0 022 Supplemental Millage Incentive Funding 0 023 Other Unrestricted State Funding 0 024 Total Unrestricted Revenue from State and
Local Sources 13,493,908 13,091,317
Restricted Revenue from State Sources:25 Adult Education 0 0
Regular Education:26 Professional Development 78,673 82,36427 Other Regular Education 2,338 0
Special Education:28 Gifted & Talented 50 029 Alternative Learning Environment (ALE) 137,329 148,97130 English Language Learner (ELL) 64,460 65,78031 National School Lunch Act (NSLA) 615,536 630,98232 Other Special Education 103,302 85,00033 Workforce Education 51,459 48,75034 School Food Service 8,272 8,30035 Educational Service Cooperatives 0 036 Early Childhood Programs 0 037 Magnet School Programs 0 038 Other Non-Instructional Programs 108,296 106,65139 Total Restricted Revenue from State Sources 1,169,715 1,176,79840 Total Restricted Revenue from Federal
Sources 2,920,225 2,461,842
Other Sources of Funds:41 Financing Sources 258,600 042 Balances from Consolidated/Annexed District 0 043 Indirect Cost Reimbursement 6,664 044 Gains and Losses from Sale of Fixed Assets 0 045 Compensation for Loss of Fixed Assets 0 046 Other 0 047 Total Other Sources of Funds 265,264 048 Total Revenue and Other Sources of Funds
from All Sources 17,849,112 16,729,957
2010-2011 2011-2012Actual Budget
CURRENT EXPENDITURESInstruction:
49 Regular Instruction 7,032,633 7,008,82650 Special Education 1,191,916 1,144,03751 Workforce Education 853,462 808,79652 Adult Education 0 053 Compensatory Education 493,191 418,16154 Other 438,757 464,75555 Total Instruction 10,009,959 9,844,575
District Level Support:56 General Administration 339,224 375,69457 Central Services 258,382 195,01258 Maintenance & Operations of Plant 1,103,650 1,147,26459 Student Transportation 734,773 537,77560 Other District Level Support Services 29,813 12,50061 Total District Support Services 2,465,842 2,268,244
School Level Support:62 Student Support Services 630,314 668,02863 Instructional Staff Support Services 1,152,177 721,27764 School Administration 920,588 917,42065 Total District Support Services 2,703,080 2,306,726
Non-Instructional Services:66 Food Service Operations 1,096,853 1,131,73667 Other Enterprise Operations 13,766 068 Community Operations 35 1,00069 Other Non-Instructional Services 0 070 Total Non-Instructional Services 1,110,654 1,132,73671 Facilities Acquisition and Construction 25,463 35,00072 Debt Service 903,911 744,75375 Other Non-Programmed Costs 0 133,00076 Total Expenditures 17,218,909 16,465,03477 Less: Capital Expenditures 289,052 314,50078 Less: Debt Service 903,911 744,75379 Total Current Expenditures 16,025,946 15,405,78180 Exclusions from Current Expenditures 607,89181 Net Current Expenditures 15,418,055
82 Per Pupil Expenditures 8,269
83 Personnel - Non-Federal Certified Clsrm FTEs 127.2984 Avg Salary - Non-Fed Certified Clsrm FTEs 52,39085 Personnel - Non-Federal Certified FTEs 139.1386 Avg Salary - Non-Fed Certified FTEs 54,11187.1 Legal Balance (funds 1-2-4) 4,227,70987.2 Categorical Fund Balance 28,53587.3 Deposits with Paying Agents (QZAB) 087.4 Net Legal Bal (Excl Cat & QZAB) 4,199,17488 Building Fund Balance (fund 3) 258,60089 Capital Outlay Fund Balance (fund 5) 0
Jan 30, 2012 - 103 - 9:35:29 AM

Annual Statistical Report 2010-2011
County: INDEPENDENCE BATESVILLE SCHOOL DISTRICT LEA:3201000
2010-2011 2011-2012Actual Budget
1 Area in Square Miles 2192 ADA 2,7873 ADA pct Change over 5 Yrs. 2%4 4 QTR ADM 2,9435 Prior Year 3QTR ADM 2,8706 Assessment 240,921,1037 M&O Mills 28.908 URT Mills 25.009 M&O Mills in Excess of URT 3.9010 Dedicated M&O Mills 0.0011 Debt Service Mills 9.8512 Total Mills 38.7513 Total Debt Bond/Non-Bond 24,995,000
State and Local Revenue:14 Property Tax Receipts (Including URT) 8,768,383 9,136,30815 Other Local Receipts 2,063,287 1,113,10016 Revenue from Intermediate Sources 3,332 017.1 Foundation Funding (Excl URT) 11,667,007 12,220,30817.2 Tax Collection Rate Guarantee 49,463 018 Student Growth Funding 449,120 019 Declining Enrollment Funding 0 020 Consolidation Incentive/Assistance 697,617 021 Isolated Funding 0 022 Supplemental Millage Incentive Funding 18,008 14,40623 Other Unrestricted State Funding 0 024 Total Unrestricted Revenue from State and
Local Sources 23,716,217 22,484,122
Restricted Revenue from State Sources:25 Adult Education 0 0
Regular Education:26 Professional Development 118,683 125,04127 Other Regular Education 22,139 31,400
Special Education:28 Gifted & Talented 2,450 029 Alternative Learning Environment (ALE) 172,231 147,56230 English Language Learner (ELL) 87,607 97,17531 National School Lunch Act (NSLA) 799,056 829,33432 Other Special Education 962,376 947,63033 Workforce Education 4,550 034 School Food Service 11,136 12,00035 Educational Service Cooperatives 0 036 Early Childhood Programs 840,362 827,00037 Magnet School Programs 0 038 Other Non-Instructional Programs 161,837 105,64539 Total Restricted Revenue from State Sources 3,182,427 3,122,78740 Total Restricted Revenue from Federal
Sources 5,495,958 3,557,747
Other Sources of Funds:41 Financing Sources 4,914,577 042 Balances from Consolidated/Annexed District 0 043 Indirect Cost Reimbursement 0 044 Gains and Losses from Sale of Fixed Assets 0 045 Compensation for Loss of Fixed Assets 3,885 046 Other 0 047 Total Other Sources of Funds 4,918,462 048 Total Revenue and Other Sources of Funds
from All Sources 37,313,064 29,164,656
2010-2011 2011-2012Actual Budget
CURRENT EXPENDITURESInstruction:
49 Regular Instruction 10,340,308 9,595,11750 Special Education 2,650,139 2,739,85151 Workforce Education 883,322 755,70952 Adult Education 0 053 Compensatory Education 517,024 484,90954 Other 925,342 884,68755 Total Instruction 15,316,136 14,460,274
District Level Support:56 General Administration 437,555 407,07157 Central Services 823,565 883,22858 Maintenance & Operations of Plant 3,786,143 3,695,38959 Student Transportation 1,312,738 1,340,58260 Other District Level Support Services 56,611 35,00061 Total District Support Services 6,416,612 6,361,270
School Level Support:62 Student Support Services 1,008,563 979,14963 Instructional Staff Support Services 1,819,523 2,311,24664 School Administration 1,230,681 1,238,71165 Total District Support Services 4,058,767 4,529,107
Non-Instructional Services:66 Food Service Operations 1,840,499 1,738,08767 Other Enterprise Operations 167,837 068 Community Operations 1,623,848 1,484,85669 Other Non-Instructional Services 0 070 Total Non-Instructional Services 3,632,185 3,222,94371 Facilities Acquisition and Construction 1,599,092 4,214,58272 Debt Service 662,131 1,102,50075 Other Non-Programmed Costs 0 076 Total Expenditures 31,684,923 33,890,67777 Less: Capital Expenditures 1,943,864 4,560,73278 Less: Debt Service 662,131 1,102,50079 Total Current Expenditures 29,078,928 28,227,44580 Exclusions from Current Expenditures 3,871,63781 Net Current Expenditures 25,207,291
82 Per Pupil Expenditures 9,043
83 Personnel - Non-Federal Certified Clsrm FTEs 188.6084 Avg Salary - Non-Fed Certified Clsrm FTEs 37,46885 Personnel - Non-Federal Certified FTEs 206.4886 Avg Salary - Non-Fed Certified FTEs 40,26487.1 Legal Balance (funds 1-2-4) 4,443,97387.2 Categorical Fund Balance 24,44787.3 Deposits with Paying Agents (QZAB) 087.4 Net Legal Bal (Excl Cat & QZAB) 4,419,52588 Building Fund Balance (fund 3) 4,249,10589 Capital Outlay Fund Balance (fund 5) 0
Jan 30, 2012 - 104 - 9:35:29 AM

Annual Statistical Report 2010-2011
County: INDEPENDENCE SOUTHSIDE SCH DIST(INDEPENDENC LEA:3209000
2010-2011 2011-2012Actual Budget
1 Area in Square Miles 522 ADA 1,4463 ADA pct Change over 5 Yrs. 9%4 4 QTR ADM 1,5145 Prior Year 3QTR ADM 1,5086 Assessment 52,712,6277 M&O Mills 25.008 URT Mills 25.009 M&O Mills in Excess of URT 0.0010 Dedicated M&O Mills 0.0011 Debt Service Mills 15.2012 Total Mills 40.2013 Total Debt Bond/Non-Bond 8,283,512
State and Local Revenue:14 Property Tax Receipts (Including URT) 1,944,085 2,114,90515 Other Local Receipts 898,487 438,80016 Revenue from Intermediate Sources 1,647 1,00017.1 Foundation Funding (Excl URT) 7,871,450 8,033,29217.2 Tax Collection Rate Guarantee 0 018 Student Growth Funding 45,955 019 Declining Enrollment Funding 0 020 Consolidation Incentive/Assistance 0 021 Isolated Funding 0 022 Supplemental Millage Incentive Funding 99,156 89,32523 Other Unrestricted State Funding 0 024 Total Unrestricted Revenue from State and
Local Sources 10,860,780 10,677,322
Restricted Revenue from State Sources:25 Adult Education 4,732 0
Regular Education:26 Professional Development 62,355 64,32327 Other Regular Education 7,449 0
Special Education:28 Gifted & Talented 2,204 029 Alternative Learning Environment (ALE) 22,997 18,69430 English Language Learner (ELL) 8,497 031 National School Lunch Act (NSLA) 461,280 459,95432 Other Special Education 248,007 110,20033 Workforce Education 3,612 034 School Food Service 5,873 5,90035 Educational Service Cooperatives 0 036 Early Childhood Programs 513,250 576,43037 Magnet School Programs 0 038 Other Non-Instructional Programs 565,906 155,74039 Total Restricted Revenue from State Sources 1,906,162 1,391,24140 Total Restricted Revenue from Federal
Sources 2,705,823 1,732,653
Other Sources of Funds:41 Financing Sources 2,009,340 042 Balances from Consolidated/Annexed District 0 043 Indirect Cost Reimbursement 3,617 044 Gains and Losses from Sale of Fixed Assets 3,212 045 Compensation for Loss of Fixed Assets 0 046 Other 0 047 Total Other Sources of Funds 2,016,169 048 Total Revenue and Other Sources of Funds
from All Sources 17,488,934 13,801,216
2010-2011 2011-2012Actual Budget
CURRENT EXPENDITURESInstruction:
49 Regular Instruction 5,497,228 5,622,86350 Special Education 1,020,044 1,064,56851 Workforce Education 444,221 434,76452 Adult Education 0 053 Compensatory Education 694,722 440,77954 Other 102,498 109,09555 Total Instruction 7,758,714 7,672,069
District Level Support:56 General Administration 216,463 286,83557 Central Services 129,605 121,49958 Maintenance & Operations of Plant 1,671,337 2,177,39159 Student Transportation 650,865 627,37760 Other District Level Support Services 55,775 32,61761 Total District Support Services 2,724,046 3,245,720
School Level Support:62 Student Support Services 654,814 646,52163 Instructional Staff Support Services 779,633 825,74164 School Administration 643,357 627,35265 Total District Support Services 2,077,804 2,099,613
Non-Instructional Services:66 Food Service Operations 821,644 762,24567 Other Enterprise Operations 168,054 068 Community Operations 189,110 395,67869 Other Non-Instructional Services 0 070 Total Non-Instructional Services 1,178,809 1,157,92271 Facilities Acquisition and Construction 546,402 2,003,90072 Debt Service 460,170 583,28475 Other Non-Programmed Costs 69,813 076 Total Expenditures 14,815,757 16,762,50977 Less: Capital Expenditures 847,361 2,381,00978 Less: Debt Service 460,170 583,28479 Total Current Expenditures 13,508,226 13,798,21680 Exclusions from Current Expenditures 1,357,75181 Net Current Expenditures 12,150,475
82 Per Pupil Expenditures 8,404
83 Personnel - Non-Federal Certified Clsrm FTEs 97.3284 Avg Salary - Non-Fed Certified Clsrm FTEs 41,50985 Personnel - Non-Federal Certified FTEs 105.6286 Avg Salary - Non-Fed Certified FTEs 43,71987.1 Legal Balance (funds 1-2-4) 1,019,93287.2 Categorical Fund Balance 26,55187.3 Deposits with Paying Agents (QZAB) 087.4 Net Legal Bal (Excl Cat & QZAB) 993,38088 Building Fund Balance (fund 3) 3,304,26989 Capital Outlay Fund Balance (fund 5) 0
Jan 30, 2012 - 105 - 9:35:29 AM

Annual Statistical Report 2010-2011
County: INDEPENDENCE MIDLAND SCHOOL DISTRICT LEA:3211000
2010-2011 2011-2012Actual Budget
1 Area in Square Miles 1662 ADA 5003 ADA pct Change over 5 Yrs. (7%)4 4 QTR ADM 5215 Prior Year 3QTR ADM 5156 Assessment 49,693,6447 M&O Mills 33.398 URT Mills 25.009 M&O Mills in Excess of URT 8.3910 Dedicated M&O Mills 0.0011 Debt Service Mills 5.4112 Total Mills 38.8013 Total Debt Bond/Non-Bond 1,123,786
State and Local Revenue:14 Property Tax Receipts (Including URT) 1,592,051 1,435,00015 Other Local Receipts 259,281 101,00016 Revenue from Intermediate Sources 619 017.1 Foundation Funding (Excl URT) 2,161,700 1,995,86517.2 Tax Collection Rate Guarantee 39,475 018 Student Growth Funding 38,291 019 Declining Enrollment Funding 0 020 Consolidation Incentive/Assistance 0 021 Isolated Funding 0 022 Supplemental Millage Incentive Funding 13,361 10,68923 Other Unrestricted State Funding 0 024 Total Unrestricted Revenue from State and
Local Sources 4,104,777 3,542,554
Restricted Revenue from State Sources:25 Adult Education 0 0
Regular Education:26 Professional Development 21,290 22,16627 Other Regular Education 3,600 0
Special Education:28 Gifted & Talented 0 029 Alternative Learning Environment (ALE) 37,623 25,00030 English Language Learner (ELL) 0 031 National School Lunch Act (NSLA) 164,672 175,58232 Other Special Education 82,470 52,20033 Workforce Education 7,854 034 School Food Service 8,576 2,00035 Educational Service Cooperatives 0 036 Early Childhood Programs 303,000 303,00037 Magnet School Programs 0 038 Other Non-Instructional Programs 18,789 11,64139 Total Restricted Revenue from State Sources 647,875 591,58940 Total Restricted Revenue from Federal
Sources 852,349 605,617
Other Sources of Funds:41 Financing Sources 0 042 Balances from Consolidated/Annexed District 0 043 Indirect Cost Reimbursement 0 044 Gains and Losses from Sale of Fixed Assets 0 045 Compensation for Loss of Fixed Assets 0 046 Other 0 047 Total Other Sources of Funds 0 048 Total Revenue and Other Sources of Funds
from All Sources 5,605,001 4,739,760
2010-2011 2011-2012Actual Budget
CURRENT EXPENDITURESInstruction:
49 Regular Instruction 2,228,364 2,109,75550 Special Education 390,989 394,98151 Workforce Education 125,236 154,59052 Adult Education 0 053 Compensatory Education 55,885 92,12154 Other 92,491 136,01555 Total Instruction 2,892,965 2,887,462
District Level Support:56 General Administration 178,449 187,96257 Central Services 46,069 46,16458 Maintenance & Operations of Plant 576,123 442,30259 Student Transportation 214,328 332,25060 Other District Level Support Services 16,672 6,03961 Total District Support Services 1,031,641 1,014,717
School Level Support:62 Student Support Services 153,567 199,59663 Instructional Staff Support Services 263,500 268,14864 School Administration 151,131 156,61665 Total District Support Services 568,198 624,360
Non-Instructional Services:66 Food Service Operations 319,982 309,55067 Other Enterprise Operations 0 068 Community Operations 102 069 Other Non-Instructional Services 0 070 Total Non-Instructional Services 320,084 309,55071 Facilities Acquisition and Construction 75,508 44,56172 Debt Service 293,781 119,37975 Other Non-Programmed Costs 4,046 076 Total Expenditures 5,186,223 5,000,02977 Less: Capital Expenditures 152,152 184,56178 Less: Debt Service 293,781 119,37979 Total Current Expenditures 4,740,289 4,696,08980 Exclusions from Current Expenditures 555,90681 Net Current Expenditures 4,184,383
82 Per Pupil Expenditures 8,374
83 Personnel - Non-Federal Certified Clsrm FTEs 38.4784 Avg Salary - Non-Fed Certified Clsrm FTEs 38,35785 Personnel - Non-Federal Certified FTEs 41.3886 Avg Salary - Non-Fed Certified FTEs 40,56187.1 Legal Balance (funds 1-2-4) 2,885,89487.2 Categorical Fund Balance 7,82487.3 Deposits with Paying Agents (QZAB) 087.4 Net Legal Bal (Excl Cat & QZAB) 2,878,07088 Building Fund Balance (fund 3) 405,09489 Capital Outlay Fund Balance (fund 5) 0
Jan 30, 2012 - 106 - 9:35:29 AM

Annual Statistical Report 2010-2011
County: INDEPENDENCE CEDAR RIDGE SCHOOL DISTRICT LEA:3212000
2010-2011 2011-2012Actual Budget
1 Area in Square Miles 2712 ADA 7843 ADA pct Change over 5 Yrs. 7%4 4 QTR ADM 8295 Prior Year 3QTR ADM 8326 Assessment 141,616,7997 M&O Mills 34.908 URT Mills 25.009 M&O Mills in Excess of URT 9.9010 Dedicated M&O Mills 0.0011 Debt Service Mills 3.3012 Total Mills 38.2013 Total Debt Bond/Non-Bond 3,327,487
State and Local Revenue:14 Property Tax Receipts (Including URT) 5,275,597 4,965,74715 Other Local Receipts 681,759 478,96916 Revenue from Intermediate Sources 923 1,00017.1 Foundation Funding (Excl URT) 1,602,132 1,597,53917.2 Tax Collection Rate Guarantee 36,155 35,00018 Student Growth Funding 72,848 019 Declining Enrollment Funding 0 6,82020 Consolidation Incentive/Assistance 0 021 Isolated Funding 32,848 32,00022 Supplemental Millage Incentive Funding 17,965 14,37223 Other Unrestricted State Funding 0 024 Total Unrestricted Revenue from State and
Local Sources 7,720,227 7,131,447
Restricted Revenue from State Sources:25 Adult Education 0 0
Regular Education:26 Professional Development 34,397 35,15127 Other Regular Education 28,564 22,400
Special Education:28 Gifted & Talented 150 029 Alternative Learning Environment (ALE) 9,832 28,51830 English Language Learner (ELL) 0 031 National School Lunch Act (NSLA) 240,064 270,71032 Other Special Education 182,499 108,62833 Workforce Education 0 034 School Food Service 3,236 3,20035 Educational Service Cooperatives 0 036 Early Childhood Programs 391,040 388,80037 Magnet School Programs 0 038 Other Non-Instructional Programs 36,450 49,50039 Total Restricted Revenue from State Sources 926,232 906,90740 Total Restricted Revenue from Federal
Sources 1,361,221 1,390,744
Other Sources of Funds:41 Financing Sources 478,700 042 Balances from Consolidated/Annexed District 0 043 Indirect Cost Reimbursement 0 044 Gains and Losses from Sale of Fixed Assets 1,000 045 Compensation for Loss of Fixed Assets 14,620 046 Other 0 047 Total Other Sources of Funds 494,320 048 Total Revenue and Other Sources of Funds
from All Sources 10,502,000 9,429,098
2010-2011 2011-2012Actual Budget
CURRENT EXPENDITURESInstruction:
49 Regular Instruction 3,719,338 3,312,74450 Special Education 712,705 771,27451 Workforce Education 341,730 353,54352 Adult Education 0 053 Compensatory Education 276,815 349,20254 Other 344,599 451,36255 Total Instruction 5,395,187 5,238,125
District Level Support:56 General Administration 294,060 262,88957 Central Services 185,504 123,97058 Maintenance & Operations of Plant 1,249,871 1,224,09959 Student Transportation 500,844 541,99960 Other District Level Support Services 46,184 13,50061 Total District Support Services 2,276,462 2,166,458
School Level Support:62 Student Support Services 339,121 430,03163 Instructional Staff Support Services 579,405 541,42964 School Administration 316,248 329,76065 Total District Support Services 1,234,775 1,301,219
Non-Instructional Services:66 Food Service Operations 526,598 504,34967 Other Enterprise Operations 22,194 068 Community Operations 73,882 45,67069 Other Non-Instructional Services 0 070 Total Non-Instructional Services 622,674 550,01871 Facilities Acquisition and Construction 634,578 1,269,89872 Debt Service 312,494 303,48375 Other Non-Programmed Costs 0 50076 Total Expenditures 10,476,170 10,829,70177 Less: Capital Expenditures 1,007,987 1,708,45878 Less: Debt Service 312,494 303,48379 Total Current Expenditures 9,155,689 8,817,76080 Exclusions from Current Expenditures 981,70281 Net Current Expenditures 8,173,986
82 Per Pupil Expenditures 10,424
83 Personnel - Non-Federal Certified Clsrm FTEs 70.6384 Avg Salary - Non-Fed Certified Clsrm FTEs 39,80285 Personnel - Non-Federal Certified FTEs 77.1886 Avg Salary - Non-Fed Certified FTEs 41,31987.1 Legal Balance (funds 1-2-4) 5,696,04787.2 Categorical Fund Balance 63,34287.3 Deposits with Paying Agents (QZAB) 087.4 Net Legal Bal (Excl Cat & QZAB) 5,632,70588 Building Fund Balance (fund 3) 1,211,89489 Capital Outlay Fund Balance (fund 5) 0
Jan 30, 2012 - 107 - 9:35:29 AM

Annual Statistical Report 2010-2011
County: IZARD CALICO ROCK SCHOOL DISTRICT LEA:3301000
2010-2011 2011-2012Actual Budget
1 Area in Square Miles 1932 ADA 3953 ADA pct Change over 5 Yrs. (13%)4 4 QTR ADM 4195 Prior Year 3QTR ADM 4086 Assessment 30,336,5007 M&O Mills 25.008 URT Mills 25.009 M&O Mills in Excess of URT 0.0010 Dedicated M&O Mills 0.0011 Debt Service Mills 17.3012 Total Mills 42.3013 Total Debt Bond/Non-Bond 3,914,044
State and Local Revenue:14 Property Tax Receipts (Including URT) 1,151,685 1,156,46615 Other Local Receipts 317,119 85,50016 Revenue from Intermediate Sources 1,212 1,00017.1 Foundation Funding (Excl URT) 1,710,510 1,780,04217.2 Tax Collection Rate Guarantee 33,779 018 Student Growth Funding 70,906 019 Declining Enrollment Funding 0 020 Consolidation Incentive/Assistance 0 021 Isolated Funding 0 022 Supplemental Millage Incentive Funding 0 023 Other Unrestricted State Funding 0 024 Total Unrestricted Revenue from State and
Local Sources 3,285,211 3,023,008
Restricted Revenue from State Sources:25 Adult Education 0 0
Regular Education:26 Professional Development 16,858 17,74127 Other Regular Education 5,200 0
Special Education:28 Gifted & Talented 500 029 Alternative Learning Environment (ALE) 4,510 030 English Language Learner (ELL) 0 031 National School Lunch Act (NSLA) 118,048 124,47632 Other Special Education 1,670 033 Workforce Education 0 034 School Food Service 1,605 1,60035 Educational Service Cooperatives 0 036 Early Childhood Programs 0 037 Magnet School Programs 0 038 Other Non-Instructional Programs 41,597 38,79539 Total Restricted Revenue from State Sources 189,988 182,61240 Total Restricted Revenue from Federal
Sources 1,202,673 769,217
Other Sources of Funds:41 Financing Sources 0 042 Balances from Consolidated/Annexed District 0 043 Indirect Cost Reimbursement 0 044 Gains and Losses from Sale of Fixed Assets 0 045 Compensation for Loss of Fixed Assets 8,360 046 Other 0 047 Total Other Sources of Funds 8,360 048 Total Revenue and Other Sources of Funds
from All Sources 4,686,232 3,974,837
2010-2011 2011-2012Actual Budget
CURRENT EXPENDITURESInstruction:
49 Regular Instruction 1,555,458 1,370,43350 Special Education 271,868 249,63151 Workforce Education 146,610 139,80752 Adult Education 0 053 Compensatory Education 23,929 26,84854 Other 157,397 147,55555 Total Instruction 2,155,262 1,934,275
District Level Support:56 General Administration 147,642 134,48957 Central Services 84,734 70,80058 Maintenance & Operations of Plant 442,967 409,00559 Student Transportation 170,932 202,19360 Other District Level Support Services 16,363 061 Total District Support Services 862,638 816,488
School Level Support:62 Student Support Services 143,181 146,36863 Instructional Staff Support Services 534,716 379,33064 School Administration 190,315 238,03065 Total District Support Services 868,212 763,728
Non-Instructional Services:66 Food Service Operations 346,679 341,19767 Other Enterprise Operations 760 068 Community Operations 26 1,00069 Other Non-Instructional Services 0 070 Total Non-Instructional Services 347,466 342,19771 Facilities Acquisition and Construction 158,838 49,78972 Debt Service 273,813 280,57075 Other Non-Programmed Costs 0 076 Total Expenditures 4,666,227 4,187,04677 Less: Capital Expenditures 221,608 66,12578 Less: Debt Service 273,813 280,57079 Total Current Expenditures 4,170,807 3,840,35180 Exclusions from Current Expenditures 314,55581 Net Current Expenditures 3,856,252
82 Per Pupil Expenditures 9,767
83 Personnel - Non-Federal Certified Clsrm FTEs 36.2184 Avg Salary - Non-Fed Certified Clsrm FTEs 36,78685 Personnel - Non-Federal Certified FTEs 39.3186 Avg Salary - Non-Fed Certified FTEs 38,54987.1 Legal Balance (funds 1-2-4) 808,98787.2 Categorical Fund Balance 16,02587.3 Deposits with Paying Agents (QZAB) 087.4 Net Legal Bal (Excl Cat & QZAB) 792,96288 Building Fund Balance (fund 3) 176,84889 Capital Outlay Fund Balance (fund 5) 0
Jan 30, 2012 - 108 - 9:35:29 AM

Annual Statistical Report 2010-2011
County: IZARD MELBOURNE SCHOOL DISTRICT LEA:3302000
2010-2011 2011-2012Actual Budget
1 Area in Square Miles 2582 ADA 8693 ADA pct Change over 5 Yrs. 5%4 4 QTR ADM 9075 Prior Year 3QTR ADM 9066 Assessment 64,308,0027 M&O Mills 25.128 URT Mills 25.009 M&O Mills in Excess of URT 0.1210 Dedicated M&O Mills 0.0011 Debt Service Mills 13.1012 Total Mills 38.2213 Total Debt Bond/Non-Bond 6,985,000
State and Local Revenue:14 Property Tax Receipts (Including URT) 2,196,386 1,855,66715 Other Local Receipts 405,664 203,10016 Revenue from Intermediate Sources 0 017.1 Foundation Funding (Excl URT) 3,932,899 4,018,90917.2 Tax Collection Rate Guarantee 92,855 018 Student Growth Funding 56,923 019 Declining Enrollment Funding 0 020 Consolidation Incentive/Assistance 0 021 Isolated Funding 134,362 022 Supplemental Millage Incentive Funding 0 023 Other Unrestricted State Funding 44,819 024 Total Unrestricted Revenue from State and
Local Sources 6,863,908 6,077,676
Restricted Revenue from State Sources:25 Adult Education 0 0
Regular Education:26 Professional Development 37,455 38,59027 Other Regular Education 387,456 0
Special Education:28 Gifted & Talented 2,600 029 Alternative Learning Environment (ALE) 17,552 25,24330 English Language Learner (ELL) 0 031 National School Lunch Act (NSLA) 263,872 259,07232 Other Special Education 73,304 033 Workforce Education 29,859 034 School Food Service 3,548 3,50035 Educational Service Cooperatives 0 036 Early Childhood Programs 97,700 97,20037 Magnet School Programs 0 038 Other Non-Instructional Programs 31,074 28,53039 Total Restricted Revenue from State Sources 944,421 452,13540 Total Restricted Revenue from Federal
Sources 1,412,197 1,116,917
Other Sources of Funds:41 Financing Sources 123,189 042 Balances from Consolidated/Annexed District 0 043 Indirect Cost Reimbursement 0 044 Gains and Losses from Sale of Fixed Assets 0 045 Compensation for Loss of Fixed Assets 0 046 Other 0 047 Total Other Sources of Funds 123,189 048 Total Revenue and Other Sources of Funds
from All Sources 9,343,715 7,646,728
2010-2011 2011-2012Actual Budget
CURRENT EXPENDITURESInstruction:
49 Regular Instruction 3,200,474 2,792,10450 Special Education 560,784 662,33251 Workforce Education 263,253 221,13052 Adult Education 0 053 Compensatory Education 270,755 239,90254 Other 174,266 284,44055 Total Instruction 4,469,533 4,199,908
District Level Support:56 General Administration 171,245 175,11857 Central Services 138,673 122,43858 Maintenance & Operations of Plant 877,779 865,87059 Student Transportation 663,449 380,07760 Other District Level Support Services 3,578 12,00061 Total District Support Services 1,854,725 1,555,503
School Level Support:62 Student Support Services 285,012 319,97563 Instructional Staff Support Services 300,012 352,31564 School Administration 361,089 358,97065 Total District Support Services 946,113 1,031,260
Non-Instructional Services:66 Food Service Operations 562,487 506,06167 Other Enterprise Operations 0 068 Community Operations 102 35069 Other Non-Instructional Services 0 070 Total Non-Instructional Services 562,589 506,41171 Facilities Acquisition and Construction 240,900 65,10672 Debt Service 377,045 435,30975 Other Non-Programmed Costs 0 076 Total Expenditures 8,450,905 7,793,49777 Less: Capital Expenditures 706,501 141,96378 Less: Debt Service 377,045 435,30979 Total Current Expenditures 7,367,358 7,216,22580 Exclusions from Current Expenditures 496,57881 Net Current Expenditures 6,870,780
82 Per Pupil Expenditures 7,911
83 Personnel - Non-Federal Certified Clsrm FTEs 67.6184 Avg Salary - Non-Fed Certified Clsrm FTEs 40,37785 Personnel - Non-Federal Certified FTEs 72.6086 Avg Salary - Non-Fed Certified FTEs 42,21087.1 Legal Balance (funds 1-2-4) 1,774,27287.2 Categorical Fund Balance 88,26587.3 Deposits with Paying Agents (QZAB) 087.4 Net Legal Bal (Excl Cat & QZAB) 1,686,00788 Building Fund Balance (fund 3) 1,727,92989 Capital Outlay Fund Balance (fund 5) 0
Jan 30, 2012 - 109 - 9:35:29 AM

Annual Statistical Report 2010-2011
County: IZARD IZARD CO. CONS. SCHOOL DIST. LEA:3306000
2010-2011 2011-2012Actual Budget
1 Area in Square Miles 1802 ADA 4793 ADA pct Change over 5 Yrs. (5%)4 4 QTR ADM 5125 Prior Year 3QTR ADM 5176 Assessment 51,230,5617 M&O Mills 25.008 URT Mills 25.009 M&O Mills in Excess of URT 0.0010 Dedicated M&O Mills 0.0011 Debt Service Mills 11.0012 Total Mills 36.0013 Total Debt Bond/Non-Bond 3,887,296
State and Local Revenue:14 Property Tax Receipts (Including URT) 1,655,807 1,682,00015 Other Local Receipts 331,885 334,80016 Revenue from Intermediate Sources 0 017.1 Foundation Funding (Excl URT) 1,900,034 1,889,27317.2 Tax Collection Rate Guarantee 78,148 78,00018 Student Growth Funding 60,725 019 Declining Enrollment Funding 0 34,71420 Consolidation Incentive/Assistance 0 021 Isolated Funding 0 022 Supplemental Millage Incentive Funding 0 023 Other Unrestricted State Funding 0 024 Total Unrestricted Revenue from State and
Local Sources 4,026,598 4,018,787
Restricted Revenue from State Sources:25 Adult Education 0 0
Regular Education:26 Professional Development 21,401 21,69027 Other Regular Education 3,524 6,000
Special Education:28 Gifted & Talented 100 029 Alternative Learning Environment (ALE) 62,448 61,63630 English Language Learner (ELL) 0 031 National School Lunch Act (NSLA) 387,872 369,38032 Other Special Education 95,568 114,09333 Workforce Education 0 10,65634 School Food Service 2,361 2,40035 Educational Service Cooperatives 0 036 Early Childhood Programs 145,800 145,80037 Magnet School Programs 0 038 Other Non-Instructional Programs 37,596 13,09239 Total Restricted Revenue from State Sources 756,670 744,74740 Total Restricted Revenue from Federal
Sources 1,152,954 961,447
Other Sources of Funds:41 Financing Sources 760,070 400,00042 Balances from Consolidated/Annexed District 0 043 Indirect Cost Reimbursement 3,238 044 Gains and Losses from Sale of Fixed Assets 0 045 Compensation for Loss of Fixed Assets 0 046 Other 0 047 Total Other Sources of Funds 763,308 400,00048 Total Revenue and Other Sources of Funds
from All Sources 6,699,531 6,124,981
2010-2011 2011-2012Actual Budget
CURRENT EXPENDITURESInstruction:
49 Regular Instruction 1,825,865 1,854,87850 Special Education 327,608 447,09951 Workforce Education 204,066 229,90752 Adult Education 0 053 Compensatory Education 342,930 364,99854 Other 241,589 224,74755 Total Instruction 2,942,057 3,121,629
District Level Support:56 General Administration 179,789 183,52557 Central Services 89,180 65,02458 Maintenance & Operations of Plant 499,401 454,05559 Student Transportation 394,646 315,46760 Other District Level Support Services 23,615 20,15061 Total District Support Services 1,186,631 1,038,221
School Level Support:62 Student Support Services 161,702 147,83463 Instructional Staff Support Services 437,560 430,67364 School Administration 235,729 271,20465 Total District Support Services 834,991 849,711
Non-Instructional Services:66 Food Service Operations 390,815 377,16367 Other Enterprise Operations 0 068 Community Operations 0 069 Other Non-Instructional Services 0 070 Total Non-Instructional Services 390,815 377,16371 Facilities Acquisition and Construction 306,929 1,208,26372 Debt Service 237,239 316,65675 Other Non-Programmed Costs 38,796 076 Total Expenditures 5,937,459 6,911,64477 Less: Capital Expenditures 431,732 1,272,96078 Less: Debt Service 237,239 316,65679 Total Current Expenditures 5,268,488 5,322,02880 Exclusions from Current Expenditures 486,80881 Net Current Expenditures 4,781,680
82 Per Pupil Expenditures 9,982
83 Personnel - Non-Federal Certified Clsrm FTEs 41.3184 Avg Salary - Non-Fed Certified Clsrm FTEs 39,60685 Personnel - Non-Federal Certified FTEs 45.9286 Avg Salary - Non-Fed Certified FTEs 43,72587.1 Legal Balance (funds 1-2-4) 1,492,13487.2 Categorical Fund Balance 14,23787.3 Deposits with Paying Agents (QZAB) 087.4 Net Legal Bal (Excl Cat & QZAB) 1,477,89788 Building Fund Balance (fund 3) 52,88089 Capital Outlay Fund Balance (fund 5) 0
Jan 30, 2012 - 110 - 9:35:29 AM

Annual Statistical Report 2010-2011
County: JACKSON NEWPORT SCHOOL DISTRICT LEA:3403000
2010-2011 2011-2012Actual Budget
1 Area in Square Miles 3392 ADA 1,3263 ADA pct Change over 5 Yrs. (11%)4 4 QTR ADM 1,4195 Prior Year 3QTR ADM 1,4156 Assessment 125,817,2997 M&O Mills 25.008 URT Mills 25.009 M&O Mills in Excess of URT 0.0010 Dedicated M&O Mills 0.0011 Debt Service Mills 12.0012 Total Mills 37.0013 Total Debt Bond/Non-Bond 9,291,550
State and Local Revenue:14 Property Tax Receipts (Including URT) 4,338,949 4,412,04915 Other Local Receipts 570,397 246,11216 Revenue from Intermediate Sources 0 017.1 Foundation Funding (Excl URT) 5,539,600 5,680,83017.2 Tax Collection Rate Guarantee 86,930 018 Student Growth Funding 0 019 Declining Enrollment Funding 168,554 171,90920 Consolidation Incentive/Assistance 0 021 Isolated Funding 0 022 Supplemental Millage Incentive Funding 0 023 Other Unrestricted State Funding 750 024 Total Unrestricted Revenue from State and
Local Sources 10,705,181 10,510,900
Restricted Revenue from State Sources:25 Adult Education 0 0
Regular Education:26 Professional Development 58,533 60,47927 Other Regular Education 36,461 12,800
Special Education:28 Gifted & Talented 1,100 029 Alternative Learning Environment (ALE) 51,803 64,20630 English Language Learner (ELL) 10,841 031 National School Lunch Act (NSLA) 1,039,616 1,060,57632 Other Special Education 128,047 187,00633 Workforce Education 3,800 034 School Food Service 6,311 6,30035 Educational Service Cooperatives 0 036 Early Childhood Programs 495,720 495,72037 Magnet School Programs 0 038 Other Non-Instructional Programs 71,223 20,42839 Total Restricted Revenue from State Sources 1,903,454 1,907,51540 Total Restricted Revenue from Federal
Sources 3,883,591 3,563,178
Other Sources of Funds:41 Financing Sources 0 042 Balances from Consolidated/Annexed District 0 043 Indirect Cost Reimbursement 23,951 29,50044 Gains and Losses from Sale of Fixed Assets 0 045 Compensation for Loss of Fixed Assets 0 046 Other 0 047 Total Other Sources of Funds 23,951 29,50048 Total Revenue and Other Sources of Funds
from All Sources 16,516,178 16,011,094
2010-2011 2011-2012Actual Budget
CURRENT EXPENDITURESInstruction:
49 Regular Instruction 5,075,540 5,462,44050 Special Education 1,109,807 1,269,95651 Workforce Education 399,457 451,36252 Adult Education 0 053 Compensatory Education 933,699 1,037,83754 Other 783,520 772,74255 Total Instruction 8,302,023 8,994,337
District Level Support:56 General Administration 325,856 310,86957 Central Services 302,632 204,06458 Maintenance & Operations of Plant 1,443,661 1,257,05159 Student Transportation 579,930 624,00660 Other District Level Support Services 70,951 74,37061 Total District Support Services 2,723,030 2,470,360
School Level Support:62 Student Support Services 565,911 556,92363 Instructional Staff Support Services 1,045,193 1,322,98164 School Administration 604,664 622,93765 Total District Support Services 2,215,768 2,502,841
Non-Instructional Services:66 Food Service Operations 954,699 865,70067 Other Enterprise Operations 474 068 Community Operations 7,686 16,00969 Other Non-Instructional Services 0 070 Total Non-Instructional Services 962,859 881,70971 Facilities Acquisition and Construction 642,994 673,74872 Debt Service 932,780 935,64275 Other Non-Programmed Costs 0 5,09176 Total Expenditures 15,779,454 16,463,72877 Less: Capital Expenditures 799,015 932,36178 Less: Debt Service 932,780 935,64279 Total Current Expenditures 14,047,660 14,595,72680 Exclusions from Current Expenditures 942,26781 Net Current Expenditures 13,105,393
82 Per Pupil Expenditures 9,881
83 Personnel - Non-Federal Certified Clsrm FTEs 111.0584 Avg Salary - Non-Fed Certified Clsrm FTEs 37,77385 Personnel - Non-Federal Certified FTEs 121.9586 Avg Salary - Non-Fed Certified FTEs 40,12787.1 Legal Balance (funds 1-2-4) 2,832,68087.2 Categorical Fund Balance 668,63287.3 Deposits with Paying Agents (QZAB) 087.4 Net Legal Bal (Excl Cat & QZAB) 2,164,04988 Building Fund Balance (fund 3) 1,071,44889 Capital Outlay Fund Balance (fund 5) 0
Jan 30, 2012 - 111 - 9:35:29 AM

Annual Statistical Report 2010-2011
County: JACKSON JACKSON CO. SCHOOL DISTRICT LEA:3405000
2010-2011 2011-2012Actual Budget
1 Area in Square Miles 2552 ADA 7703 ADA pct Change over 5 Yrs. (5%)4 4 QTR ADM 8135 Prior Year 3QTR ADM 8046 Assessment 50,619,4337 M&O Mills 25.008 URT Mills 25.009 M&O Mills in Excess of URT 0.0010 Dedicated M&O Mills 0.0011 Debt Service Mills 8.0012 Total Mills 33.0013 Total Debt Bond/Non-Bond 5,070,000
State and Local Revenue:14 Property Tax Receipts (Including URT) 1,531,062 1,679,50015 Other Local Receipts 411,303 255,20016 Revenue from Intermediate Sources 0 017.1 Foundation Funding (Excl URT) 3,630,267 3,767,55317.2 Tax Collection Rate Guarantee 58,311 50,11318 Student Growth Funding 60,396 7,97919 Declining Enrollment Funding 0 020 Consolidation Incentive/Assistance 0 021 Isolated Funding 77,274 79,00022 Supplemental Millage Incentive Funding 0 023 Other Unrestricted State Funding 0 024 Total Unrestricted Revenue from State and
Local Sources 5,768,613 5,839,345
Restricted Revenue from State Sources:25 Adult Education 0 0
Regular Education:26 Professional Development 33,248 34,54227 Other Regular Education 4,825 2,800
Special Education:28 Gifted & Talented 0 029 Alternative Learning Environment (ALE) 47,862 10,23830 English Language Learner (ELL) 586 031 National School Lunch Act (NSLA) 269,824 267,67432 Other Special Education 3,293 033 Workforce Education 50,386 034 School Food Service 3,424 035 Educational Service Cooperatives 0 036 Early Childhood Programs 291,114 291,60037 Magnet School Programs 0 038 Other Non-Instructional Programs 66,902 60,75039 Total Restricted Revenue from State Sources 771,465 667,60440 Total Restricted Revenue from Federal
Sources 1,561,575 839,562
Other Sources of Funds:41 Financing Sources 0 042 Balances from Consolidated/Annexed District 0 043 Indirect Cost Reimbursement 0 044 Gains and Losses from Sale of Fixed Assets 100,221 045 Compensation for Loss of Fixed Assets 0 046 Other 0 047 Total Other Sources of Funds 100,221 048 Total Revenue and Other Sources of Funds
from All Sources 8,201,874 7,346,511
2010-2011 2011-2012Actual Budget
CURRENT EXPENDITURESInstruction:
49 Regular Instruction 3,209,621 3,131,80450 Special Education 362,588 360,41951 Workforce Education 265,943 272,52152 Adult Education 0 053 Compensatory Education 239,955 156,79054 Other 113,251 111,49855 Total Instruction 4,191,358 4,033,032
District Level Support:56 General Administration 236,061 218,23257 Central Services 82,488 82,75458 Maintenance & Operations of Plant 990,831 811,13059 Student Transportation 263,730 263,23660 Other District Level Support Services 29,331 21,31261 Total District Support Services 1,602,442 1,396,664
School Level Support:62 Student Support Services 177,346 200,15963 Instructional Staff Support Services 603,184 647,69564 School Administration 365,281 381,79965 Total District Support Services 1,145,811 1,229,654
Non-Instructional Services:66 Food Service Operations 443,760 477,23067 Other Enterprise Operations 32,415 5,66668 Community Operations 12,448 1,00069 Other Non-Instructional Services 0 070 Total Non-Instructional Services 488,622 483,89671 Facilities Acquisition and Construction 548,923 25,00072 Debt Service 373,114 373,65475 Other Non-Programmed Costs 0 076 Total Expenditures 8,350,271 7,541,90077 Less: Capital Expenditures 869,121 156,06478 Less: Debt Service 373,114 373,65479 Total Current Expenditures 7,108,036 7,012,18280 Exclusions from Current Expenditures 668,57681 Net Current Expenditures 6,439,461
82 Per Pupil Expenditures 8,364
83 Personnel - Non-Federal Certified Clsrm FTEs 63.5384 Avg Salary - Non-Fed Certified Clsrm FTEs 38,14985 Personnel - Non-Federal Certified FTEs 71.5086 Avg Salary - Non-Fed Certified FTEs 40,81287.1 Legal Balance (funds 1-2-4) 1,967,31587.2 Categorical Fund Balance 79,04387.3 Deposits with Paying Agents (QZAB) 087.4 Net Legal Bal (Excl Cat & QZAB) 1,888,27288 Building Fund Balance (fund 3) 089 Capital Outlay Fund Balance (fund 5) 0
Jan 30, 2012 - 112 - 9:35:29 AM

Annual Statistical Report 2010-2011
County: JEFFERSON DOLLARWAY SCHOOL DISTRICT LEA:3502000
2010-2011 2011-2012Actual Budget
1 Area in Square Miles 4142 ADA 1,4263 ADA pct Change over 5 Yrs. (21%)4 4 QTR ADM 1,5235 Prior Year 3QTR ADM 1,5996 Assessment 95,080,9897 M&O Mills 25.008 URT Mills 25.009 M&O Mills in Excess of URT 0.0010 Dedicated M&O Mills 0.0011 Debt Service Mills 15.8012 Total Mills 40.8013 Total Debt Bond/Non-Bond 14,563,708
State and Local Revenue:14 Property Tax Receipts (Including URT) 3,714,784 3,879,30415 Other Local Receipts 248,122 47,45016 Revenue from Intermediate Sources 93 017.1 Foundation Funding (Excl URT) 7,304,918 7,045,92517.2 Tax Collection Rate Guarantee 45,043 58,23718 Student Growth Funding 0 019 Declining Enrollment Funding 413,328 222,99620 Consolidation Incentive/Assistance 0 021 Isolated Funding 0 022 Supplemental Millage Incentive Funding 53,137 42,51023 Other Unrestricted State Funding 0 024 Total Unrestricted Revenue from State and
Local Sources 11,779,426 11,296,422
Restricted Revenue from State Sources:25 Adult Education 0 0
Regular Education:26 Professional Development 66,134 64,68827 Other Regular Education 8,493 0
Special Education:28 Gifted & Talented 50 029 Alternative Learning Environment (ALE) 0 030 English Language Learner (ELL) 0 031 National School Lunch Act (NSLA) 2,202,240 2,132,79032 Other Special Education 6,550 033 Workforce Education 78,813 034 School Food Service 6,212 6,30035 Educational Service Cooperatives 0 036 Early Childhood Programs 607,544 037 Magnet School Programs 0 038 Other Non-Instructional Programs 1,302,108 1,131,81539 Total Restricted Revenue from State Sources 4,278,144 3,335,59340 Total Restricted Revenue from Federal
Sources 4,047,143 4,349,282
Other Sources of Funds:41 Financing Sources 0 042 Balances from Consolidated/Annexed District 0 043 Indirect Cost Reimbursement 0 044 Gains and Losses from Sale of Fixed Assets 0 045 Compensation for Loss of Fixed Assets 0 046 Other 0 047 Total Other Sources of Funds 0 048 Total Revenue and Other Sources of Funds
from All Sources 20,104,713 18,981,298
2010-2011 2011-2012Actual Budget
CURRENT EXPENDITURESInstruction:
49 Regular Instruction 6,553,608 6,064,86750 Special Education 1,292,741 1,340,57451 Workforce Education 550,144 464,77852 Adult Education 0 053 Compensatory Education 1,324,333 1,307,97754 Other 278,650 311,57255 Total Instruction 9,999,476 9,489,769
District Level Support:56 General Administration 368,855 388,04457 Central Services 187,052 214,81758 Maintenance & Operations of Plant 2,158,895 2,170,20459 Student Transportation 846,824 542,43160 Other District Level Support Services 22,764 6,56361 Total District Support Services 3,584,390 3,322,059
School Level Support:62 Student Support Services 1,109,213 1,033,79763 Instructional Staff Support Services 2,192,179 2,203,98964 School Administration 559,333 527,93865 Total District Support Services 3,860,725 3,765,724
Non-Instructional Services:66 Food Service Operations 1,058,256 986,21267 Other Enterprise Operations 0 068 Community Operations 0 069 Other Non-Instructional Services 0 070 Total Non-Instructional Services 1,058,256 986,21271 Facilities Acquisition and Construction 1,949,226 1,794,38272 Debt Service 1,030,721 1,030,72175 Other Non-Programmed Costs 11,350 11,35076 Total Expenditures 21,494,144 20,400,21777 Less: Capital Expenditures 2,261,452 2,107,88778 Less: Debt Service 1,030,721 1,030,72179 Total Current Expenditures 18,201,971 17,261,60880 Exclusions from Current Expenditures 894,43581 Net Current Expenditures 17,307,536
82 Per Pupil Expenditures 12,141
83 Personnel - Non-Federal Certified Clsrm FTEs 115.2384 Avg Salary - Non-Fed Certified Clsrm FTEs 47,51085 Personnel - Non-Federal Certified FTEs 124.2986 Avg Salary - Non-Fed Certified FTEs 49,11087.1 Legal Balance (funds 1-2-4) 6,138,35687.2 Categorical Fund Balance 1,926,92587.3 Deposits with Paying Agents (QZAB) 087.4 Net Legal Bal (Excl Cat & QZAB) 4,211,43188 Building Fund Balance (fund 3) 089 Capital Outlay Fund Balance (fund 5) 0
Jan 30, 2012 - 113 - 9:35:29 AM

Annual Statistical Report 2010-2011
County: JEFFERSON PINE BLUFF SCHOOL DISTRICT LEA:3505000
2010-2011 2011-2012Actual Budget
1 Area in Square Miles 1832 ADA 4,4143 ADA pct Change over 5 Yrs. (13%)4 4 QTR ADM 4,7275 Prior Year 3QTR ADM 4,8106 Assessment 352,463,7817 M&O Mills 25.008 URT Mills 25.009 M&O Mills in Excess of URT 0.0010 Dedicated M&O Mills 2.0011 Debt Service Mills 14.7012 Total Mills 41.7013 Total Debt Bond/Non-Bond 36,915,000
State and Local Revenue:14 Property Tax Receipts (Including URT) 13,606,890 12,685,73015 Other Local Receipts 1,006,188 628,50816 Revenue from Intermediate Sources 284 28417.1 Foundation Funding (Excl URT) 20,673,040 20,447,50017.2 Tax Collection Rate Guarantee 268,558 235,10018 Student Growth Funding 0 019 Declining Enrollment Funding 301,180 230,95320 Consolidation Incentive/Assistance 0 021 Isolated Funding 0 022 Supplemental Millage Incentive Funding 0 023 Other Unrestricted State Funding 8,082 024 Total Unrestricted Revenue from State and
Local Sources 35,864,222 34,228,075
Restricted Revenue from State Sources:25 Adult Education 0 0
Regular Education:26 Professional Development 198,924 200,64327 Other Regular Education 128,260 54,357
Special Education:28 Gifted & Talented 600 029 Alternative Learning Environment (ALE) 145,008 206,13130 English Language Learner (ELL) 7,032 031 National School Lunch Act (NSLA) 3,732,896 3,809,16832 Other Special Education 543,707 033 Workforce Education 95,688 102,37534 School Food Service 17,169 17,20135 Educational Service Cooperatives 0 036 Early Childhood Programs 388,800 388,80037 Magnet School Programs 0 038 Other Non-Instructional Programs 233,550 419,48339 Total Restricted Revenue from State Sources 5,491,634 5,198,15840 Total Restricted Revenue from Federal
Sources 13,527,686 8,803,451
Other Sources of Funds:41 Financing Sources 23,629 042 Balances from Consolidated/Annexed District 0 043 Indirect Cost Reimbursement 118,000 85,00044 Gains and Losses from Sale of Fixed Assets 0 045 Compensation for Loss of Fixed Assets 31,080 046 Other 0 047 Total Other Sources of Funds 172,709 85,00048 Total Revenue and Other Sources of Funds
from All Sources 55,056,251 48,314,683
2010-2011 2011-2012Actual Budget
CURRENT EXPENDITURESInstruction:
49 Regular Instruction 21,671,756 17,415,42850 Special Education 3,460,997 3,046,00051 Workforce Education 1,514,826 1,381,03852 Adult Education 0 053 Compensatory Education 4,914,228 2,512,62154 Other 1,245,253 1,515,80855 Total Instruction 32,807,059 25,870,895
District Level Support:56 General Administration 935,539 578,13057 Central Services 2,736,081 1,548,23658 Maintenance & Operations of Plant 6,676,841 6,713,65859 Student Transportation 1,718,797 1,404,81460 Other District Level Support Services 123,849 204,67161 Total District Support Services 12,191,107 10,449,510
School Level Support:62 Student Support Services 1,896,161 2,174,10763 Instructional Staff Support Services 4,760,124 3,563,89864 School Administration 2,098,948 2,024,14765 Total District Support Services 8,755,234 7,762,152
Non-Instructional Services:66 Food Service Operations 2,664,361 2,199,27067 Other Enterprise Operations 21 068 Community Operations 30,169 30,16969 Other Non-Instructional Services 0 070 Total Non-Instructional Services 2,694,551 2,229,43971 Facilities Acquisition and Construction (580,252) 232,55872 Debt Service 1,550,052 2,154,01975 Other Non-Programmed Costs 410,893 34876 Total Expenditures 57,828,643 48,698,92077 Less: Capital Expenditures 2,717,110 394,67078 Less: Debt Service 1,550,052 2,154,01979 Total Current Expenditures 53,561,482 46,150,23180 Exclusions from Current Expenditures 1,997,31081 Net Current Expenditures 51,564,172
82 Per Pupil Expenditures 11,683
83 Personnel - Non-Federal Certified Clsrm FTEs 337.9684 Avg Salary - Non-Fed Certified Clsrm FTEs 51,93385 Personnel - Non-Federal Certified FTEs 360.2186 Avg Salary - Non-Fed Certified FTEs 51,90687.1 Legal Balance (funds 1-2-4) 13,360,39487.2 Categorical Fund Balance 22,65687.3 Deposits with Paying Agents (QZAB) 087.4 Net Legal Bal (Excl Cat & QZAB) 13,337,73888 Building Fund Balance (fund 3) 3,862,65889 Capital Outlay Fund Balance (fund 5) 1,358,357
Jan 30, 2012 - 114 - 9:35:29 AM

Annual Statistical Report 2010-2011
County: JEFFERSON WATSON CHAPEL SCHOOL DISTRICT LEA:3509000
2010-2011 2011-2012Actual Budget
1 Area in Square Miles 1162 ADA 2,9163 ADA pct Change over 5 Yrs. (8%)4 4 QTR ADM 3,0925 Prior Year 3QTR ADM 3,0576 Assessment 107,371,9127 M&O Mills 26.108 URT Mills 25.009 M&O Mills in Excess of URT 1.1010 Dedicated M&O Mills 0.0011 Debt Service Mills 5.7012 Total Mills 31.8013 Total Debt Bond/Non-Bond 2,280,000
State and Local Revenue:14 Property Tax Receipts (Including URT) 3,183,005 3,183,00515 Other Local Receipts 506,801 225,37916 Revenue from Intermediate Sources 156 15617.1 Foundation Funding (Excl URT) 15,870,797 16,421,22117.2 Tax Collection Rate Guarantee 76,461 76,46118 Student Growth Funding 221,390 019 Declining Enrollment Funding 0 020 Consolidation Incentive/Assistance 0 021 Isolated Funding 0 022 Supplemental Millage Incentive Funding 235,434 188,34723 Other Unrestricted State Funding 0 024 Total Unrestricted Revenue from State and
Local Sources 20,094,044 20,094,569
Restricted Revenue from State Sources:25 Adult Education 913,877 847,358
Regular Education:26 Professional Development 126,423 131,45727 Other Regular Education 19,000 34,800
Special Education:28 Gifted & Talented 900 029 Alternative Learning Environment (ALE) 26,328 030 English Language Learner (ELL) 0 031 National School Lunch Act (NSLA) 998,944 1,091,94832 Other Special Education 12,522 033 Workforce Education 187,688 127,56234 School Food Service 10,211 10,21135 Educational Service Cooperatives 0 036 Early Childhood Programs 0 037 Magnet School Programs 0 038 Other Non-Instructional Programs 1,528,632 171,43439 Total Restricted Revenue from State Sources 3,824,525 2,414,77140 Total Restricted Revenue from Federal
Sources 4,934,402 4,724,865
Other Sources of Funds:41 Financing Sources 0 042 Balances from Consolidated/Annexed District 0 043 Indirect Cost Reimbursement 4,710 4,71044 Gains and Losses from Sale of Fixed Assets 2,400 045 Compensation for Loss of Fixed Assets 0 046 Other 0 047 Total Other Sources of Funds 7,110 4,71048 Total Revenue and Other Sources of Funds
from All Sources 28,860,081 27,238,915
2010-2011 2011-2012Actual Budget
CURRENT EXPENDITURESInstruction:
49 Regular Instruction 10,276,313 9,806,20650 Special Education 1,952,313 1,731,93351 Workforce Education 744,380 911,03752 Adult Education 1,007,953 899,52953 Compensatory Education 658,674 977,53454 Other 855,204 977,10555 Total Instruction 15,494,836 15,303,343
District Level Support:56 General Administration 369,679 337,49857 Central Services 343,419 320,64158 Maintenance & Operations of Plant 2,739,308 2,919,15359 Student Transportation 1,563,016 1,422,32260 Other District Level Support Services 22,960 8,80461 Total District Support Services 5,038,382 5,008,417
School Level Support:62 Student Support Services 972,706 958,63463 Instructional Staff Support Services 2,324,667 3,076,79164 School Administration 1,473,323 1,453,21565 Total District Support Services 4,770,696 5,488,639
Non-Instructional Services:66 Food Service Operations 1,400,960 1,336,49367 Other Enterprise Operations 0 068 Community Operations 1,728 1,72869 Other Non-Instructional Services 0 070 Total Non-Instructional Services 1,402,688 1,338,22071 Facilities Acquisition and Construction 2,083,053 1,856,21872 Debt Service 144,490 99,49075 Other Non-Programmed Costs 1,752 076 Total Expenditures 28,935,897 29,094,32877 Less: Capital Expenditures 2,839,435 2,679,72878 Less: Debt Service 144,490 99,49079 Total Current Expenditures 25,951,973 26,315,11180 Exclusions from Current Expenditures 1,583,17581 Net Current Expenditures 24,368,797
82 Per Pupil Expenditures 8,358
83 Personnel - Non-Federal Certified Clsrm FTEs 190.3484 Avg Salary - Non-Fed Certified Clsrm FTEs 48,62185 Personnel - Non-Federal Certified FTEs 205.8186 Avg Salary - Non-Fed Certified FTEs 51,11787.1 Legal Balance (funds 1-2-4) 7,394,02187.2 Categorical Fund Balance 566,14687.3 Deposits with Paying Agents (QZAB) 087.4 Net Legal Bal (Excl Cat & QZAB) 6,827,87588 Building Fund Balance (fund 3) 089 Capital Outlay Fund Balance (fund 5) 0
Jan 30, 2012 - 115 - 9:35:29 AM

Annual Statistical Report 2010-2011
County: JEFFERSON WHITE HALL SCHOOL DISTRICT LEA:3510000
2010-2011 2011-2012Actual Budget
1 Area in Square Miles 1052 ADA 2,8943 ADA pct Change over 5 Yrs. (2%)4 4 QTR ADM 3,0005 Prior Year 3QTR ADM 3,0106 Assessment 252,552,2747 M&O Mills 25.008 URT Mills 25.009 M&O Mills in Excess of URT 0.0010 Dedicated M&O Mills 0.0011 Debt Service Mills 14.2012 Total Mills 39.2013 Total Debt Bond/Non-Bond 24,165,000
State and Local Revenue:14 Property Tax Receipts (Including URT) 9,114,896 9,700,16115 Other Local Receipts 890,939 487,00016 Revenue from Intermediate Sources 153 017.1 Foundation Funding (Excl URT) 12,128,068 12,342,54517.2 Tax Collection Rate Guarantee 210,989 018 Student Growth Funding 0 019 Declining Enrollment Funding 220,382 020 Consolidation Incentive/Assistance 0 021 Isolated Funding 0 022 Supplemental Millage Incentive Funding 0 023 Other Unrestricted State Funding 0 024 Total Unrestricted Revenue from State and
Local Sources 22,565,427 22,529,706
Restricted Revenue from State Sources:25 Adult Education 0 0
Regular Education:26 Professional Development 124,497 127,81827 Other Regular Education 9,944 7,600
Special Education:28 Gifted & Talented 1,000 029 Alternative Learning Environment (ALE) 14,017 44,68330 English Language Learner (ELL) 6,446 6,57831 National School Lunch Act (NSLA) 537,168 580,88832 Other Special Education 21,137 033 Workforce Education 24,375 36,56334 School Food Service 9,784 9,80035 Educational Service Cooperatives 0 036 Early Childhood Programs 0 037 Magnet School Programs 0 038 Other Non-Instructional Programs 1,359,796 159,53139 Total Restricted Revenue from State Sources 2,108,163 973,46140 Total Restricted Revenue from Federal
Sources 3,546,727 1,874,780
Other Sources of Funds:41 Financing Sources 0 042 Balances from Consolidated/Annexed District 0 043 Indirect Cost Reimbursement 0 044 Gains and Losses from Sale of Fixed Assets 1,500 045 Compensation for Loss of Fixed Assets 35,376 046 Other 194,648 047 Total Other Sources of Funds 231,524 048 Total Revenue and Other Sources of Funds
from All Sources 28,451,841 25,377,947
2010-2011 2011-2012Actual Budget
CURRENT EXPENDITURESInstruction:
49 Regular Instruction 11,072,587 10,806,16650 Special Education 1,558,158 1,557,31051 Workforce Education 490,966 488,28952 Adult Education 0 053 Compensatory Education 698,084 684,01654 Other 375,834 362,80655 Total Instruction 14,195,630 13,898,587
District Level Support:56 General Administration 455,459 545,91557 Central Services 498,123 315,80858 Maintenance & Operations of Plant 2,911,034 3,087,65859 Student Transportation 920,098 766,24760 Other District Level Support Services 37,354 15,60061 Total District Support Services 4,822,067 4,731,228
School Level Support:62 Student Support Services 1,091,361 1,226,25463 Instructional Staff Support Services 2,045,120 1,491,59464 School Administration 1,280,221 1,317,74965 Total District Support Services 4,416,701 4,035,596
Non-Instructional Services:66 Food Service Operations 1,353,371 1,320,73067 Other Enterprise Operations 0 068 Community Operations 2,646 11,32769 Other Non-Instructional Services 0 070 Total Non-Instructional Services 1,356,017 1,332,05771 Facilities Acquisition and Construction 6,133,543 10,50072 Debt Service 1,672,903 1,677,73375 Other Non-Programmed Costs 11,690 076 Total Expenditures 32,608,552 25,685,70177 Less: Capital Expenditures 6,801,277 208,10078 Less: Debt Service 1,672,903 1,677,73379 Total Current Expenditures 24,134,373 23,799,86880 Exclusions from Current Expenditures 809,03181 Net Current Expenditures 23,325,342
82 Per Pupil Expenditures 8,059
83 Personnel - Non-Federal Certified Clsrm FTEs 185.1484 Avg Salary - Non-Fed Certified Clsrm FTEs 51,95485 Personnel - Non-Federal Certified FTEs 199.2786 Avg Salary - Non-Fed Certified FTEs 54,26287.1 Legal Balance (funds 1-2-4) 2,793,63487.2 Categorical Fund Balance 37,20487.3 Deposits with Paying Agents (QZAB) 087.4 Net Legal Bal (Excl Cat & QZAB) 2,756,43088 Building Fund Balance (fund 3) 4,087,56589 Capital Outlay Fund Balance (fund 5) 0
Jan 30, 2012 - 116 - 9:35:29 AM

Annual Statistical Report 2010-2011
County: JOHNSON CLARKSVILLE SCHOOL DISTRICT LEA:3601000
2010-2011 2011-2012Actual Budget
1 Area in Square Miles 1162 ADA 2,3643 ADA pct Change over 5 Yrs. 6%4 4 QTR ADM 2,4845 Prior Year 3QTR ADM 2,5176 Assessment 147,781,4287 M&O Mills 25.008 URT Mills 25.009 M&O Mills in Excess of URT 0.0010 Dedicated M&O Mills 0.0011 Debt Service Mills 9.5012 Total Mills 34.5013 Total Debt Bond/Non-Bond 13,020,000
State and Local Revenue:14 Property Tax Receipts (Including URT) 5,324,708 5,096,49015 Other Local Receipts 820,467 381,23516 Revenue from Intermediate Sources 0 017.1 Foundation Funding (Excl URT) 11,456,350 11,683,44017.2 Tax Collection Rate Guarantee 108,341 018 Student Growth Funding 0 019 Declining Enrollment Funding 106,637 61,22520 Consolidation Incentive/Assistance 0 021 Isolated Funding 0 022 Supplemental Millage Incentive Funding 0 023 Other Unrestricted State Funding 0 024 Total Unrestricted Revenue from State and
Local Sources 17,816,503 17,222,390
Restricted Revenue from State Sources:25 Adult Education 142,844 139,725
Regular Education:26 Professional Development 104,095 105,81827 Other Regular Education 6,179 0
Special Education:28 Gifted & Talented 1,700 029 Alternative Learning Environment (ALE) 203,841 208,57630 English Language Learner (ELL) 96,690 98,00031 National School Lunch Act (NSLA) 833,776 854,12832 Other Special Education 44,760 12,00033 Workforce Education 51,953 15,00034 School Food Service 9,469 10,00035 Educational Service Cooperatives 0 036 Early Childhood Programs 0 037 Magnet School Programs 0 038 Other Non-Instructional Programs 492,542 595,74639 Total Restricted Revenue from State Sources 1,987,848 2,038,99240 Total Restricted Revenue from Federal
Sources 4,573,385 2,797,892
Other Sources of Funds:41 Financing Sources 987,690 042 Balances from Consolidated/Annexed District 0 043 Indirect Cost Reimbursement 21,249 14,04644 Gains and Losses from Sale of Fixed Assets 0 045 Compensation for Loss of Fixed Assets 0 046 Other 0 047 Total Other Sources of Funds 1,008,939 14,04648 Total Revenue and Other Sources of Funds
from All Sources 25,386,675 22,073,320
2010-2011 2011-2012Actual Budget
CURRENT EXPENDITURESInstruction:
49 Regular Instruction 7,983,810 7,871,98050 Special Education 1,707,883 1,738,07351 Workforce Education 478,871 451,68152 Adult Education 161,285 160,59453 Compensatory Education 700,957 635,66954 Other 1,711,342 1,717,00555 Total Instruction 12,744,149 12,575,003
District Level Support:56 General Administration 530,376 660,33257 Central Services 1,195,860 722,13458 Maintenance & Operations of Plant 2,060,507 1,818,80659 Student Transportation 854,408 971,29660 Other District Level Support Services 88,029 49,04661 Total District Support Services 4,729,179 4,221,614
School Level Support:62 Student Support Services 750,980 783,99763 Instructional Staff Support Services 1,262,181 1,080,86464 School Administration 1,178,726 1,199,11465 Total District Support Services 3,191,887 3,063,975
Non-Instructional Services:66 Food Service Operations 1,256,036 1,196,67367 Other Enterprise Operations 11,772 068 Community Operations 521 069 Other Non-Instructional Services 0 070 Total Non-Instructional Services 1,268,329 1,196,67371 Facilities Acquisition and Construction 1,894,726 911,48072 Debt Service 932,361 1,030,16275 Other Non-Programmed Costs 15,999 076 Total Expenditures 24,776,630 22,998,90877 Less: Capital Expenditures 2,191,667 1,174,28078 Less: Debt Service 932,361 1,030,16279 Total Current Expenditures 21,652,602 20,794,46680 Exclusions from Current Expenditures 967,16781 Net Current Expenditures 20,685,435
82 Per Pupil Expenditures 8,751
83 Personnel - Non-Federal Certified Clsrm FTEs 174.1284 Avg Salary - Non-Fed Certified Clsrm FTEs 45,24985 Personnel - Non-Federal Certified FTEs 188.2886 Avg Salary - Non-Fed Certified FTEs 47,74587.1 Legal Balance (funds 1-2-4) 4,212,55087.2 Categorical Fund Balance 21,75687.3 Deposits with Paying Agents (QZAB) 087.4 Net Legal Bal (Excl Cat & QZAB) 4,190,79388 Building Fund Balance (fund 3) 2,224,67589 Capital Outlay Fund Balance (fund 5) 0
Jan 30, 2012 - 117 - 9:35:29 AM

Annual Statistical Report 2010-2011
County: JOHNSON LAMAR SCHOOL DISTRICT LEA:3604000
2010-2011 2011-2012Actual Budget
1 Area in Square Miles 3092 ADA 1,0043 ADA pct Change over 5 Yrs. (4%)4 4 QTR ADM 1,0675 Prior Year 3QTR ADM 1,0846 Assessment 60,983,9827 M&O Mills 25.008 URT Mills 25.009 M&O Mills in Excess of URT 0.0010 Dedicated M&O Mills 0.0011 Debt Service Mills 10.3312 Total Mills 35.3313 Total Debt Bond/Non-Bond 5,029,649
State and Local Revenue:14 Property Tax Receipts (Including URT) 2,049,465 1,953,77515 Other Local Receipts 417,889 130,60016 Revenue from Intermediate Sources 0 017.1 Foundation Funding (Excl URT) 4,796,875 4,844,92017.2 Tax Collection Rate Guarantee 85,876 82,00018 Student Growth Funding 0 019 Declining Enrollment Funding 89,231 51,33320 Consolidation Incentive/Assistance 0 021 Isolated Funding 0 022 Supplemental Millage Incentive Funding 37,528 30,02223 Other Unrestricted State Funding 0 024 Total Unrestricted Revenue from State and
Local Sources 7,476,864 7,092,650
Restricted Revenue from State Sources:25 Adult Education 0 0
Regular Education:26 Professional Development 44,823 45,22127 Other Regular Education 3,800 4,800
Special Education:28 Gifted & Talented 600 029 Alternative Learning Environment (ALE) 37,664 50,48630 English Language Learner (ELL) 1,758 031 National School Lunch Act (NSLA) 327,856 326,87632 Other Special Education 4,440 033 Workforce Education 5,417 8,12534 School Food Service 4,267 4,50035 Educational Service Cooperatives 0 036 Early Childhood Programs 160,520 194,40037 Magnet School Programs 0 038 Other Non-Instructional Programs 82,058 148,27439 Total Restricted Revenue from State Sources 673,203 782,68240 Total Restricted Revenue from Federal
Sources 1,942,862 2,399,076
Other Sources of Funds:41 Financing Sources 377,300 042 Balances from Consolidated/Annexed District 0 043 Indirect Cost Reimbursement 0 044 Gains and Losses from Sale of Fixed Assets 0 045 Compensation for Loss of Fixed Assets 0 046 Other 0 047 Total Other Sources of Funds 377,300 048 Total Revenue and Other Sources of Funds
from All Sources 10,470,230 10,274,408
2010-2011 2011-2012Actual Budget
CURRENT EXPENDITURESInstruction:
49 Regular Instruction 4,008,230 3,782,85350 Special Education 685,828 666,92551 Workforce Education 343,717 456,13552 Adult Education 0 053 Compensatory Education 318,383 369,71254 Other 298,602 307,61655 Total Instruction 5,654,760 5,583,241
District Level Support:56 General Administration 178,414 170,94657 Central Services 227,426 266,20758 Maintenance & Operations of Plant 958,025 751,19559 Student Transportation 554,798 445,54260 Other District Level Support Services 11,893 11,00061 Total District Support Services 1,930,556 1,644,890
School Level Support:62 Student Support Services 389,637 415,33463 Instructional Staff Support Services 502,867 520,73464 School Administration 360,369 379,33065 Total District Support Services 1,252,872 1,315,398
Non-Instructional Services:66 Food Service Operations 470,938 486,11067 Other Enterprise Operations 0 068 Community Operations 99 50069 Other Non-Instructional Services 0 070 Total Non-Instructional Services 471,037 486,61071 Facilities Acquisition and Construction 459,388 1,157,80472 Debt Service 369,618 343,43075 Other Non-Programmed Costs 0 076 Total Expenditures 10,138,232 10,531,37277 Less: Capital Expenditures 759,949 1,222,84178 Less: Debt Service 369,618 343,43079 Total Current Expenditures 9,008,665 8,965,10180 Exclusions from Current Expenditures 454,02881 Net Current Expenditures 8,554,637
82 Per Pupil Expenditures 8,523
83 Personnel - Non-Federal Certified Clsrm FTEs 76.9684 Avg Salary - Non-Fed Certified Clsrm FTEs 48,12385 Personnel - Non-Federal Certified FTEs 82.3786 Avg Salary - Non-Fed Certified FTEs 49,86687.1 Legal Balance (funds 1-2-4) 1,656,43987.2 Categorical Fund Balance 36,71887.3 Deposits with Paying Agents (QZAB) 087.4 Net Legal Bal (Excl Cat & QZAB) 1,619,72188 Building Fund Balance (fund 3) 1,394,21089 Capital Outlay Fund Balance (fund 5) 0
Jan 30, 2012 - 118 - 9:35:29 AM

Annual Statistical Report 2010-2011
County: JOHNSON WESTSIDE SCHOOL DIST(JOHNSON) LEA:3606000
2010-2011 2011-2012Actual Budget
1 Area in Square Miles 882 ADA 5703 ADA pct Change over 5 Yrs. 1%4 4 QTR ADM 6085 Prior Year 3QTR ADM 6166 Assessment 27,491,0687 M&O Mills 25.008 URT Mills 25.009 M&O Mills in Excess of URT 0.0010 Dedicated M&O Mills 0.0011 Debt Service Mills 12.0012 Total Mills 37.0013 Total Debt Bond/Non-Bond 4,646,419
State and Local Revenue:14 Property Tax Receipts (Including URT) 988,889 847,00015 Other Local Receipts 283,222 192,30016 Revenue from Intermediate Sources 0 017.1 Foundation Funding (Excl URT) 3,007,510 3,405,72617.2 Tax Collection Rate Guarantee 50,990 50,00018 Student Growth Funding 59,478 019 Declining Enrollment Funding 0 21,87320 Consolidation Incentive/Assistance 0 021 Isolated Funding 0 022 Supplemental Millage Incentive Funding 21,870 17,49623 Other Unrestricted State Funding 0 024 Total Unrestricted Revenue from State and
Local Sources 4,411,959 4,534,395
Restricted Revenue from State Sources:25 Adult Education 0 0
Regular Education:26 Professional Development 25,480 25,80727 Other Regular Education 1,393 3,200
Special Education:28 Gifted & Talented 0 029 Alternative Learning Environment (ALE) 75,816 85,55330 English Language Learner (ELL) 3,516 031 National School Lunch Act (NSLA) 461,280 466,53232 Other Special Education 2,524 033 Workforce Education 0 034 School Food Service 2,715 2,80035 Educational Service Cooperatives 0 036 Early Childhood Programs 0 037 Magnet School Programs 0 038 Other Non-Instructional Programs 908,760 312,50039 Total Restricted Revenue from State Sources 1,481,483 896,39240 Total Restricted Revenue from Federal
Sources 1,894,934 1,110,178
Other Sources of Funds:41 Financing Sources 0 042 Balances from Consolidated/Annexed District 0 043 Indirect Cost Reimbursement 385 044 Gains and Losses from Sale of Fixed Assets 0 045 Compensation for Loss of Fixed Assets 0 046 Other 0 047 Total Other Sources of Funds 385 048 Total Revenue and Other Sources of Funds
from All Sources 7,788,762 6,540,965
2010-2011 2011-2012Actual Budget
CURRENT EXPENDITURESInstruction:
49 Regular Instruction 2,373,314 2,407,57350 Special Education 395,104 410,27251 Workforce Education 189,399 194,47852 Adult Education 0 053 Compensatory Education 245,527 231,26154 Other 144,789 145,08555 Total Instruction 3,348,133 3,388,669
District Level Support:56 General Administration 115,839 107,75757 Central Services 74,981 89,60958 Maintenance & Operations of Plant 413,658 428,15459 Student Transportation 320,624 307,04560 Other District Level Support Services 15,613 10,00061 Total District Support Services 940,716 942,565
School Level Support:62 Student Support Services 264,336 281,86163 Instructional Staff Support Services 503,017 467,69664 School Administration 222,475 213,54465 Total District Support Services 989,829 963,101
Non-Instructional Services:66 Food Service Operations 433,677 492,83667 Other Enterprise Operations 9,682 068 Community Operations 864 069 Other Non-Instructional Services 0 070 Total Non-Instructional Services 444,223 492,83671 Facilities Acquisition and Construction 1,872,564 75,77772 Debt Service 341,413 255,90575 Other Non-Programmed Costs 55,300 076 Total Expenditures 7,992,177 6,118,85377 Less: Capital Expenditures 2,011,156 108,53778 Less: Debt Service 341,413 255,90579 Total Current Expenditures 5,639,608 5,754,41180 Exclusions from Current Expenditures 225,14481 Net Current Expenditures 5,414,464
82 Per Pupil Expenditures 9,492
83 Personnel - Non-Federal Certified Clsrm FTEs 51.9384 Avg Salary - Non-Fed Certified Clsrm FTEs 39,24785 Personnel - Non-Federal Certified FTEs 53.9386 Avg Salary - Non-Fed Certified FTEs 43,45387.1 Legal Balance (funds 1-2-4) 1,300,26887.2 Categorical Fund Balance 11,64287.3 Deposits with Paying Agents (QZAB) 087.4 Net Legal Bal (Excl Cat & QZAB) 1,288,62688 Building Fund Balance (fund 3) 1,727,81689 Capital Outlay Fund Balance (fund 5) 0
Jan 30, 2012 - 119 - 9:35:29 AM

Annual Statistical Report 2010-2011
County: LAFAYETTE BRADLEY SCHOOL DISTRICT LEA:3701000
2010-2011 2011-2012Actual Budget
1 Area in Square Miles 2562 ADA 3593 ADA pct Change over 5 Yrs. (2%)4 4 QTR ADM 3795 Prior Year 3QTR ADM 4126 Assessment 29,885,6827 M&O Mills 29.008 URT Mills 25.009 M&O Mills in Excess of URT 4.0010 Dedicated M&O Mills 0.0011 Debt Service Mills 3.0012 Total Mills 32.0013 Total Debt Bond/Non-Bond 1,971,624
State and Local Revenue:14 Property Tax Receipts (Including URT) 866,793 866,79615 Other Local Receipts 222,687 233,72016 Revenue from Intermediate Sources 78,535 017.1 Foundation Funding (Excl URT) 1,633,324 1,574,37317.2 Tax Collection Rate Guarantee 101,131 6,92818 Student Growth Funding 0 019 Declining Enrollment Funding 0 020 Consolidation Incentive/Assistance 0 021 Isolated Funding 0 110,00022 Supplemental Millage Incentive Funding 0 023 Other Unrestricted State Funding 0 024 Total Unrestricted Revenue from State and
Local Sources 2,902,470 2,791,817
Restricted Revenue from State Sources:25 Adult Education 0 0
Regular Education:26 Professional Development 17,040 15,67727 Other Regular Education 197,122 0
Special Education:28 Gifted & Talented 200 029 Alternative Learning Environment (ALE) 9,223 2,57030 English Language Learner (ELL) 0 031 National School Lunch Act (NSLA) 313,472 106,21832 Other Special Education 2,724 033 Workforce Education 0 034 School Food Service 1,742 035 Educational Service Cooperatives 0 036 Early Childhood Programs 0 037 Magnet School Programs 0 038 Other Non-Instructional Programs 13,502 9,95339 Total Restricted Revenue from State Sources 555,024 134,41840 Total Restricted Revenue from Federal
Sources 860,902 537,578
Other Sources of Funds:41 Financing Sources 918,240 3,30042 Balances from Consolidated/Annexed District 0 043 Indirect Cost Reimbursement 2,737 044 Gains and Losses from Sale of Fixed Assets 0 045 Compensation for Loss of Fixed Assets 0 046 Other 0 047 Total Other Sources of Funds 920,977 3,30048 Total Revenue and Other Sources of Funds
from All Sources 5,239,372 3,467,113
2010-2011 2011-2012Actual Budget
CURRENT EXPENDITURESInstruction:
49 Regular Instruction 1,467,349 1,194,98450 Special Education 220,233 241,94751 Workforce Education 133,666 135,95152 Adult Education 0 053 Compensatory Education 315,005 428,08854 Other 29,066 33,00655 Total Instruction 2,165,319 2,033,976
District Level Support:56 General Administration 184,856 175,22157 Central Services 43,213 47,87558 Maintenance & Operations of Plant 255,899 248,48459 Student Transportation 208,573 122,11760 Other District Level Support Services 4,881 4,84461 Total District Support Services 697,422 598,541
School Level Support:62 Student Support Services 68,215 75,22063 Instructional Staff Support Services 279,918 184,70664 School Administration 137,659 146,40365 Total District Support Services 485,792 406,328
Non-Instructional Services:66 Food Service Operations 248,405 242,08667 Other Enterprise Operations 0 068 Community Operations 0 069 Other Non-Instructional Services 0 070 Total Non-Instructional Services 248,405 242,08671 Facilities Acquisition and Construction 394,383 2,214,43072 Debt Service 59,831 36,42775 Other Non-Programmed Costs 36,172 076 Total Expenditures 4,087,323 5,531,78977 Less: Capital Expenditures 503,724 2,247,93078 Less: Debt Service 59,831 36,42779 Total Current Expenditures 3,523,768 3,247,43280 Exclusions from Current Expenditures 219,09581 Net Current Expenditures 3,304,673
82 Per Pupil Expenditures 9,214
83 Personnel - Non-Federal Certified Clsrm FTEs 21.9084 Avg Salary - Non-Fed Certified Clsrm FTEs 59,64985 Personnel - Non-Federal Certified FTEs 24.2086 Avg Salary - Non-Fed Certified FTEs 61,27187.1 Legal Balance (funds 1-2-4) 3,643,65087.2 Categorical Fund Balance 114,41387.3 Deposits with Paying Agents (QZAB) 087.4 Net Legal Bal (Excl Cat & QZAB) 3,529,23788 Building Fund Balance (fund 3) 850,87989 Capital Outlay Fund Balance (fund 5) 0
Jan 30, 2012 - 120 - 9:35:29 AM

Annual Statistical Report 2010-2011
County: LAFAYETTE LAFAYETTE COUNTY SCHOOL DISTRI LEA:3704000
2010-2011 2011-2012Actual Budget
1 Area in Square Miles 3892 ADA 7023 ADA pct Change over 5 Yrs. (20%)4 4 QTR ADM 7475 Prior Year 3QTR ADM 7936 Assessment 66,377,3417 M&O Mills 26.708 URT Mills 25.009 M&O Mills in Excess of URT 1.7010 Dedicated M&O Mills 0.0011 Debt Service Mills 6.1012 Total Mills 32.8013 Total Debt Bond/Non-Bond 3,460,200
State and Local Revenue:14 Property Tax Receipts (Including URT) 2,009,352 1,991,00015 Other Local Receipts 340,528 117,97516 Revenue from Intermediate Sources 156,931 135,00017.1 Foundation Funding (Excl URT) 3,040,017 2,873,13417.2 Tax Collection Rate Guarantee 100,233 82,00018 Student Growth Funding 0 019 Declining Enrollment Funding 0 128,31720 Consolidation Incentive/Assistance 0 021 Isolated Funding 0 022 Supplemental Millage Incentive Funding 0 023 Other Unrestricted State Funding 0 024 Total Unrestricted Revenue from State and
Local Sources 5,647,061 5,327,426
Restricted Revenue from State Sources:25 Adult Education 0 0
Regular Education:26 Professional Development 32,792 31,83127 Other Regular Education 175,641 9,200
Special Education:28 Gifted & Talented 0 029 Alternative Learning Environment (ALE) 30,635 23,00030 English Language Learner (ELL) 0 031 National School Lunch Act (NSLA) 649,760 649,70432 Other Special Education 27,385 033 Workforce Education 0 034 School Food Service 3,034 3,00035 Educational Service Cooperatives 0 036 Early Childhood Programs 0 037 Magnet School Programs 0 038 Other Non-Instructional Programs 28,665 367,71239 Total Restricted Revenue from State Sources 947,912 1,084,44740 Total Restricted Revenue from Federal
Sources 2,183,421 1,469,394
Other Sources of Funds:41 Financing Sources 2,295,876 042 Balances from Consolidated/Annexed District 0 043 Indirect Cost Reimbursement 32,363 10,00044 Gains and Losses from Sale of Fixed Assets 4,386 045 Compensation for Loss of Fixed Assets 0 046 Other 0 25,00047 Total Other Sources of Funds 2,332,625 35,00048 Total Revenue and Other Sources of Funds
from All Sources 11,111,018 7,916,267
2010-2011 2011-2012Actual Budget
CURRENT EXPENDITURESInstruction:
49 Regular Instruction 2,808,930 2,586,38450 Special Education 498,850 489,22451 Workforce Education 316,268 308,02252 Adult Education 0 053 Compensatory Education 328,332 348,82354 Other 195,787 164,41955 Total Instruction 4,148,167 3,896,873
District Level Support:56 General Administration 274,647 243,17957 Central Services 266,963 267,64558 Maintenance & Operations of Plant 913,100 1,962,78559 Student Transportation 311,174 421,40260 Other District Level Support Services 59,463 37,29961 Total District Support Services 1,825,347 2,932,310
School Level Support:62 Student Support Services 389,796 364,65263 Instructional Staff Support Services 999,453 743,59164 School Administration 280,913 377,64665 Total District Support Services 1,670,162 1,485,889
Non-Instructional Services:66 Food Service Operations 461,393 456,76467 Other Enterprise Operations 49,165 068 Community Operations 6,297 17,11869 Other Non-Instructional Services 0 070 Total Non-Instructional Services 516,855 473,88271 Facilities Acquisition and Construction 292,500 1,187,59372 Debt Service 207,768 208,23375 Other Non-Programmed Costs 4,768 076 Total Expenditures 8,665,567 10,184,78077 Less: Capital Expenditures 404,599 1,296,31878 Less: Debt Service 207,768 208,23379 Total Current Expenditures 8,053,201 8,680,22980 Exclusions from Current Expenditures 296,11081 Net Current Expenditures 7,757,090
82 Per Pupil Expenditures 11,054
83 Personnel - Non-Federal Certified Clsrm FTEs 61.8684 Avg Salary - Non-Fed Certified Clsrm FTEs 40,40485 Personnel - Non-Federal Certified FTEs 70.7986 Avg Salary - Non-Fed Certified FTEs 42,79587.1 Legal Balance (funds 1-2-4) 2,429,04287.2 Categorical Fund Balance 231,09887.3 Deposits with Paying Agents (QZAB) 087.4 Net Legal Bal (Excl Cat & QZAB) 2,197,94488 Building Fund Balance (fund 3) 3,397,83389 Capital Outlay Fund Balance (fund 5) 0
Jan 30, 2012 - 121 - 9:35:29 AM

Annual Statistical Report 2010-2011
County: LAWRENCE HOXIE SCHOOL DISTRICT LEA:3804000
2010-2011 2011-2012Actual Budget
1 Area in Square Miles 1252 ADA 9003 ADA pct Change over 5 Yrs. 1%4 4 QTR ADM 9465 Prior Year 3QTR ADM 9956 Assessment 38,032,9157 M&O Mills 25.008 URT Mills 25.009 M&O Mills in Excess of URT 0.0010 Dedicated M&O Mills 0.0011 Debt Service Mills 9.0012 Total Mills 34.0013 Total Debt Bond/Non-Bond 5,339,625
State and Local Revenue:14 Property Tax Receipts (Including URT) 1,109,401 1,135,00015 Other Local Receipts 532,816 165,50016 Revenue from Intermediate Sources 1,770 3,00017.1 Foundation Funding (Excl URT) 5,113,276 4,895,50117.2 Tax Collection Rate Guarantee 75,260 018 Student Growth Funding 0 019 Declining Enrollment Funding 0 142,41820 Consolidation Incentive/Assistance 0 021 Isolated Funding 0 022 Supplemental Millage Incentive Funding 64,479 51,58323 Other Unrestricted State Funding 0 024 Total Unrestricted Revenue from State and
Local Sources 6,897,001 6,393,002
Restricted Revenue from State Sources:25 Adult Education 0 0
Regular Education:26 Professional Development 41,172 40,22327 Other Regular Education 6,787 9,000
Special Education:28 Gifted & Talented 100 029 Alternative Learning Environment (ALE) 44,856 45,96830 English Language Learner (ELL) 0 031 National School Lunch Act (NSLA) 735,072 715,48432 Other Special Education 7,874 033 Workforce Education 6,500 034 School Food Service 4,186 8,00035 Educational Service Cooperatives 0 036 Early Childhood Programs 243,000 243,00037 Magnet School Programs 0 038 Other Non-Instructional Programs 55,051 896,81239 Total Restricted Revenue from State Sources 1,144,597 1,958,48740 Total Restricted Revenue from Federal
Sources 1,589,484 1,297,059
Other Sources of Funds:41 Financing Sources 3,682,507 042 Balances from Consolidated/Annexed District 0 043 Indirect Cost Reimbursement 3,192 044 Gains and Losses from Sale of Fixed Assets 0 045 Compensation for Loss of Fixed Assets 0 3,00046 Other 0 047 Total Other Sources of Funds 3,685,699 3,00048 Total Revenue and Other Sources of Funds
from All Sources 13,316,782 9,651,548
2010-2011 2011-2012Actual Budget
CURRENT EXPENDITURESInstruction:
49 Regular Instruction 3,550,549 3,573,76250 Special Education 553,171 540,23951 Workforce Education 424,744 403,45052 Adult Education 0 053 Compensatory Education 617,632 597,76854 Other 364,278 474,63055 Total Instruction 5,510,374 5,589,849
District Level Support:56 General Administration 226,758 260,51457 Central Services 75,757 85,01058 Maintenance & Operations of Plant 875,533 941,00059 Student Transportation 337,915 446,59060 Other District Level Support Services 37,068 23,00061 Total District Support Services 1,553,031 1,756,114
School Level Support:62 Student Support Services 298,192 289,23563 Instructional Staff Support Services 651,923 712,62664 School Administration 376,920 375,68465 Total District Support Services 1,327,035 1,377,545
Non-Instructional Services:66 Food Service Operations 576,486 582,47267 Other Enterprise Operations 70,122 068 Community Operations 1,161 1,50069 Other Non-Instructional Services 0 070 Total Non-Instructional Services 647,769 583,97271 Facilities Acquisition and Construction 183,292 3,713,00072 Debt Service 1,486,227 327,80975 Other Non-Programmed Costs 0 076 Total Expenditures 10,707,728 13,348,28977 Less: Capital Expenditures 319,113 3,876,31078 Less: Debt Service 1,486,227 327,80979 Total Current Expenditures 8,902,387 9,144,17080 Exclusions from Current Expenditures 613,75681 Net Current Expenditures 8,288,631
82 Per Pupil Expenditures 9,207
83 Personnel - Non-Federal Certified Clsrm FTEs 79.8984 Avg Salary - Non-Fed Certified Clsrm FTEs 37,22185 Personnel - Non-Federal Certified FTEs 87.1386 Avg Salary - Non-Fed Certified FTEs 39,26487.1 Legal Balance (funds 1-2-4) 3,956,87787.2 Categorical Fund Balance 55,97087.3 Deposits with Paying Agents (QZAB) 166,81287.4 Net Legal Bal (Excl Cat & QZAB) 3,734,09588 Building Fund Balance (fund 3) 3,593,25489 Capital Outlay Fund Balance (fund 5) 0
Jan 30, 2012 - 122 - 9:35:29 AM

Annual Statistical Report 2010-2011
County: LAWRENCE SLOAN-HENDRIX SCHOOL DIST. LEA:3806000
2010-2011 2011-2012Actual Budget
1 Area in Square Miles 2062 ADA 6113 ADA pct Change over 5 Yrs. 10%4 4 QTR ADM 6535 Prior Year 3QTR ADM 5076 Assessment 33,858,0817 M&O Mills 25.008 URT Mills 25.009 M&O Mills in Excess of URT 0.0010 Dedicated M&O Mills 0.0011 Debt Service Mills 11.9312 Total Mills 36.9313 Total Debt Bond/Non-Bond 1,860,000
State and Local Revenue:14 Property Tax Receipts (Including URT) 916,460 1,264,96415 Other Local Receipts 276,099 213,76316 Revenue from Intermediate Sources 871 5,50017.1 Foundation Funding (Excl URT) 3,590,969 3,194,85917.2 Tax Collection Rate Guarantee 42,766 37,51118 Student Growth Funding 0 019 Declining Enrollment Funding 95,678 109,20120 Consolidation Incentive/Assistance 1,031,642 515,82121 Isolated Funding 84,652 022 Supplemental Millage Incentive Funding 32,464 25,97123 Other Unrestricted State Funding 0 024 Total Unrestricted Revenue from State and
Local Sources 6,071,601 5,367,590
Restricted Revenue from State Sources:25 Adult Education 0 0
Regular Education:26 Professional Development 28,581 40,14827 Other Regular Education 3,343 5,100
Special Education:28 Gifted & Talented 150 15029 Alternative Learning Environment (ALE) 33,461 49,67730 English Language Learner (ELL) 0 031 National School Lunch Act (NSLA) 235,253 348,19532 Other Special Education 2,077 033 Workforce Education 0 034 School Food Service 0 035 Educational Service Cooperatives 0 036 Early Childhood Programs 0 037 Magnet School Programs 0 038 Other Non-Instructional Programs 56,718 1,043,82539 Total Restricted Revenue from State Sources 359,583 1,487,09640 Total Restricted Revenue from Federal
Sources 1,379,286 1,786,835
Other Sources of Funds:41 Financing Sources 5,316 042 Balances from Consolidated/Annexed District 0 043 Indirect Cost Reimbursement 0 044 Gains and Losses from Sale of Fixed Assets 0 045 Compensation for Loss of Fixed Assets 87,120 046 Other 0 047 Total Other Sources of Funds 92,436 048 Total Revenue and Other Sources of Funds
from All Sources 7,902,907 8,641,520
2010-2011 2011-2012Actual Budget
CURRENT EXPENDITURESInstruction:
49 Regular Instruction 1,987,505 2,100,11550 Special Education 364,798 493,88651 Workforce Education 268,045 279,45352 Adult Education 0 053 Compensatory Education 362,858 573,87254 Other 107,886 237,75755 Total Instruction 3,091,090 3,685,082
District Level Support:56 General Administration 233,463 279,78257 Central Services 187,122 201,66458 Maintenance & Operations of Plant 456,694 523,96159 Student Transportation 418,317 484,01660 Other District Level Support Services 3,712 18,61761 Total District Support Services 1,299,308 1,508,040
School Level Support:62 Student Support Services 194,142 267,48163 Instructional Staff Support Services 328,198 822,16764 School Administration 234,464 247,54665 Total District Support Services 756,803 1,337,194
Non-Instructional Services:66 Food Service Operations 340,027 342,10667 Other Enterprise Operations 18,101 22,35968 Community Operations 852 4,52969 Other Non-Instructional Services 0 070 Total Non-Instructional Services 358,979 368,99471 Facilities Acquisition and Construction 445,557 2,105,34972 Debt Service 61,819 122,30075 Other Non-Programmed Costs 0 076 Total Expenditures 6,013,556 9,126,95977 Less: Capital Expenditures 701,292 2,434,33778 Less: Debt Service 61,819 122,30079 Total Current Expenditures 5,250,446 6,570,32280 Exclusions from Current Expenditures 160,73181 Net Current Expenditures 5,089,715
82 Per Pupil Expenditures 8,326
83 Personnel - Non-Federal Certified Clsrm FTEs 47.5084 Avg Salary - Non-Fed Certified Clsrm FTEs 39,85585 Personnel - Non-Federal Certified FTEs 52.0086 Avg Salary - Non-Fed Certified FTEs 42,25087.1 Legal Balance (funds 1-2-4) 4,432,85287.2 Categorical Fund Balance 245,85387.3 Deposits with Paying Agents (QZAB) 087.4 Net Legal Bal (Excl Cat & QZAB) 4,186,99888 Building Fund Balance (fund 3) 089 Capital Outlay Fund Balance (fund 5) 64,212
Jan 30, 2012 - 123 - 9:35:29 AM

Annual Statistical Report 2010-2011
County: LAWRENCE HILLCREST SCHOOL DISTRICT LEA:3809000
2010-2011 2011-2012Actual Budget
1 Area in Square Miles 2962 ADA 3903 ADA pct Change over 5 Yrs. (16%)4 4 QTR ADM 4095 Prior Year 3QTR ADM 4346 Assessment 35,524,2637 M&O Mills 25.008 URT Mills 25.009 M&O Mills in Excess of URT 0.0010 Dedicated M&O Mills 0.0011 Debt Service Mills 10.9012 Total Mills 35.9013 Total Debt Bond/Non-Bond 2,250,000
State and Local Revenue:14 Property Tax Receipts (Including URT) 1,153,907 1,156,24315 Other Local Receipts 214,255 134,45016 Revenue from Intermediate Sources 772 017.1 Foundation Funding (Excl URT) 1,863,319 1,644,82017.2 Tax Collection Rate Guarantee 47,723 45,00018 Student Growth Funding 0 019 Declining Enrollment Funding 0 020 Consolidation Incentive/Assistance 54,940 021 Isolated Funding 196,706 183,38622 Supplemental Millage Incentive Funding 0 023 Other Unrestricted State Funding 0 024 Total Unrestricted Revenue from State and
Local Sources 3,531,622 3,163,899
Restricted Revenue from State Sources:25 Adult Education 0 0
Regular Education:26 Professional Development 18,364 17,35627 Other Regular Education 151,069 130,491
Special Education:28 Gifted & Talented 0 029 Alternative Learning Environment (ALE) 29,379 33,10130 English Language Learner (ELL) 0 031 National School Lunch Act (NSLA) 306,585 236,13232 Other Special Education 88,937 80,00033 Workforce Education 31,087 034 School Food Service 6,720 6,80035 Educational Service Cooperatives 0 036 Early Childhood Programs 0 037 Magnet School Programs 0 038 Other Non-Instructional Programs 30,795 22,84539 Total Restricted Revenue from State Sources 662,937 526,72540 Total Restricted Revenue from Federal
Sources 665,679 837,151
Other Sources of Funds:41 Financing Sources 4,366 042 Balances from Consolidated/Annexed District 0 043 Indirect Cost Reimbursement 0 044 Gains and Losses from Sale of Fixed Assets 0 045 Compensation for Loss of Fixed Assets 21,782 20,00046 Other 0 047 Total Other Sources of Funds 26,148 20,00048 Total Revenue and Other Sources of Funds
from All Sources 4,886,385 4,547,775
2010-2011 2011-2012Actual Budget
CURRENT EXPENDITURESInstruction:
49 Regular Instruction 1,466,831 1,360,52150 Special Education 310,285 277,31051 Workforce Education 215,275 295,35652 Adult Education 0 053 Compensatory Education 138,643 240,19654 Other 86,664 69,00455 Total Instruction 2,217,698 2,242,387
District Level Support:56 General Administration 193,843 194,86857 Central Services 92,069 81,59558 Maintenance & Operations of Plant 560,679 626,73059 Student Transportation 392,825 267,07360 Other District Level Support Services 23,265 6,00061 Total District Support Services 1,262,681 1,176,265
School Level Support:62 Student Support Services 218,095 175,64063 Instructional Staff Support Services 262,456 341,48964 School Administration 182,798 132,95465 Total District Support Services 663,350 650,083
Non-Instructional Services:66 Food Service Operations 311,049 293,00067 Other Enterprise Operations 16,567 068 Community Operations 7,311 2,00069 Other Non-Instructional Services 0 070 Total Non-Instructional Services 334,926 295,00071 Facilities Acquisition and Construction 7,890 260,26472 Debt Service 152,230 191,89775 Other Non-Programmed Costs 6,616 076 Total Expenditures 4,645,392 4,815,89777 Less: Capital Expenditures 155,974 295,26478 Less: Debt Service 152,230 191,89779 Total Current Expenditures 4,337,188 4,328,73680 Exclusions from Current Expenditures 203,25381 Net Current Expenditures 4,133,935
82 Per Pupil Expenditures 10,587
83 Personnel - Non-Federal Certified Clsrm FTEs 34.7684 Avg Salary - Non-Fed Certified Clsrm FTEs 38,02385 Personnel - Non-Federal Certified FTEs 38.1386 Avg Salary - Non-Fed Certified FTEs 40,56487.1 Legal Balance (funds 1-2-4) 1,747,93987.2 Categorical Fund Balance 180,15587.3 Deposits with Paying Agents (QZAB) 087.4 Net Legal Bal (Excl Cat & QZAB) 1,567,78388 Building Fund Balance (fund 3) 309,75789 Capital Outlay Fund Balance (fund 5) 0
Jan 30, 2012 - 124 - 9:35:29 AM

Annual Statistical Report 2010-2011
County: LAWRENCE LAWRENCE COUNTY SCHOOL DISTRIC LEA:3810000
2010-2011 2011-2012Actual Budget
1 Area in Square Miles 1912 ADA 1,0163 ADA pct Change over 5 Yrs. 0%4 4 QTR ADM 1,0825 Prior Year 3QTR ADM 1,0566 Assessment 78,320,1787 M&O Mills 27.508 URT Mills 25.009 M&O Mills in Excess of URT 2.5010 Dedicated M&O Mills 0.0011 Debt Service Mills 4.9012 Total Mills 32.4013 Total Debt Bond/Non-Bond 3,648,136
State and Local Revenue:14 Property Tax Receipts (Including URT) 2,320,442 2,243,70015 Other Local Receipts 516,456 196,83516 Revenue from Intermediate Sources 1,813 1,90017.1 Foundation Funding (Excl URT) 4,499,156 4,719,87617.2 Tax Collection Rate Guarantee 127,111 018 Student Growth Funding 157,637 019 Declining Enrollment Funding 0 020 Consolidation Incentive/Assistance 0 021 Isolated Funding 0 022 Supplemental Millage Incentive Funding 7,776 6,22123 Other Unrestricted State Funding 0 024 Total Unrestricted Revenue from State and
Local Sources 7,630,391 7,168,532
Restricted Revenue from State Sources:25 Adult Education 0 0
Regular Education:26 Professional Development 43,680 45,81327 Other Regular Education 2,327 6,400
Special Education:28 Gifted & Talented 350 10029 Alternative Learning Environment (ALE) 40,955 41,61630 English Language Learner (ELL) 0 031 National School Lunch Act (NSLA) 326,864 341,04432 Other Special Education 54,366 19,94033 Workforce Education 5,688 3,25034 School Food Service 3,461 3,45035 Educational Service Cooperatives 0 036 Early Childhood Programs 0 037 Magnet School Programs 0 038 Other Non-Instructional Programs 326,990 1,799,69839 Total Restricted Revenue from State Sources 804,681 2,261,31140 Total Restricted Revenue from Federal
Sources 2,078,141 1,800,794
Other Sources of Funds:41 Financing Sources 2,606,640 042 Balances from Consolidated/Annexed District 0 043 Indirect Cost Reimbursement 0 044 Gains and Losses from Sale of Fixed Assets 0 045 Compensation for Loss of Fixed Assets 53,041 046 Other 0 047 Total Other Sources of Funds 2,659,681 048 Total Revenue and Other Sources of Funds
from All Sources 13,172,893 11,230,637
2010-2011 2011-2012Actual Budget
CURRENT EXPENDITURESInstruction:
49 Regular Instruction 4,214,213 4,177,50450 Special Education 762,449 706,91451 Workforce Education 389,249 373,43752 Adult Education 0 053 Compensatory Education 601,288 544,08154 Other 137,018 144,62455 Total Instruction 6,104,218 5,946,561
District Level Support:56 General Administration 212,738 217,18157 Central Services 340,901 487,43558 Maintenance & Operations of Plant 893,206 1,057,84259 Student Transportation 355,681 306,22160 Other District Level Support Services 35,928 13,00061 Total District Support Services 1,838,456 2,081,677
School Level Support:62 Student Support Services 274,400 397,72663 Instructional Staff Support Services 445,639 665,69564 School Administration 521,679 530,06165 Total District Support Services 1,241,718 1,593,483
Non-Instructional Services:66 Food Service Operations 487,285 505,29867 Other Enterprise Operations 0 068 Community Operations 0 2,10069 Other Non-Instructional Services 0 070 Total Non-Instructional Services 487,285 507,39871 Facilities Acquisition and Construction 1,758,486 3,969,53372 Debt Service 72,958 239,78475 Other Non-Programmed Costs 0 076 Total Expenditures 11,503,121 14,338,43677 Less: Capital Expenditures 2,010,310 4,265,65178 Less: Debt Service 72,958 239,78479 Total Current Expenditures 9,419,853 9,833,00180 Exclusions from Current Expenditures 429,83881 Net Current Expenditures 8,990,015
82 Per Pupil Expenditures 8,849
83 Personnel - Non-Federal Certified Clsrm FTEs 91.2684 Avg Salary - Non-Fed Certified Clsrm FTEs 39,29785 Personnel - Non-Federal Certified FTEs 97.0086 Avg Salary - Non-Fed Certified FTEs 41,40787.1 Legal Balance (funds 1-2-4) 4,389,72587.2 Categorical Fund Balance 76,32587.3 Deposits with Paying Agents (QZAB) 087.4 Net Legal Bal (Excl Cat & QZAB) 4,313,40088 Building Fund Balance (fund 3) 2,858,63989 Capital Outlay Fund Balance (fund 5) 0
Jan 30, 2012 - 125 - 9:35:29 AM

Annual Statistical Report 2010-2011
County: LEE LEE COUNTY SCHOOL DISTRICT LEA:3904000
2010-2011 2011-2012Actual Budget
1 Area in Square Miles 6242 ADA 9113 ADA pct Change over 5 Yrs. (28%)4 4 QTR ADM 9805 Prior Year 3QTR ADM 1,0956 Assessment 95,361,5657 M&O Mills 25.008 URT Mills 25.009 M&O Mills in Excess of URT 0.0010 Dedicated M&O Mills 0.0011 Debt Service Mills 1.3012 Total Mills 26.3013 Total Debt Bond/Non-Bond 300,000
State and Local Revenue:14 Property Tax Receipts (Including URT) 2,247,551 2,148,61515 Other Local Receipts 325,647 246,86416 Revenue from Intermediate Sources 0 017.1 Foundation Funding (Excl URT) 4,287,558 3,641,40017.2 Tax Collection Rate Guarantee 134,999 135,00018 Student Growth Funding 0 019 Declining Enrollment Funding 119,737 332,23720 Consolidation Incentive/Assistance 0 021 Isolated Funding 0 022 Supplemental Millage Incentive Funding 0 023 Other Unrestricted State Funding 0 024 Total Unrestricted Revenue from State and
Local Sources 7,115,492 6,504,116
Restricted Revenue from State Sources:25 Adult Education 0 0
Regular Education:26 Professional Development 45,270 41,80327 Other Regular Education 254,018 600
Special Education:28 Gifted & Talented 50 029 Alternative Learning Environment (ALE) 77,603 83,23230 English Language Learner (ELL) 0 031 National School Lunch Act (NSLA) 1,553,472 1,363,16432 Other Special Education 4,484 4,00033 Workforce Education 38,542 034 School Food Service 5,071 2,00035 Educational Service Cooperatives 0 036 Early Childhood Programs 533,628 534,60037 Magnet School Programs 0 038 Other Non-Instructional Programs 24,425 18,11039 Total Restricted Revenue from State Sources 2,536,563 2,047,50940 Total Restricted Revenue from Federal
Sources 5,784,383 3,418,832
Other Sources of Funds:41 Financing Sources 0 042 Balances from Consolidated/Annexed District 0 043 Indirect Cost Reimbursement 10,070 044 Gains and Losses from Sale of Fixed Assets 0 045 Compensation for Loss of Fixed Assets 0 046 Other 0 047 Total Other Sources of Funds 10,070 048 Total Revenue and Other Sources of Funds
from All Sources 15,446,508 11,970,457
2010-2011 2011-2012Actual Budget
CURRENT EXPENDITURESInstruction:
49 Regular Instruction 4,856,901 4,004,09350 Special Education 546,990 541,23151 Workforce Education 406,008 354,72452 Adult Education 0 053 Compensatory Education 1,199,908 1,135,74254 Other 167,135 182,84255 Total Instruction 7,176,941 6,218,632
District Level Support:56 General Administration 521,716 607,14757 Central Services 278,945 368,03258 Maintenance & Operations of Plant 1,209,000 1,486,94059 Student Transportation 651,905 547,39460 Other District Level Support Services 32,462 34,31861 Total District Support Services 2,694,027 3,043,831
School Level Support:62 Student Support Services 487,120 518,69963 Instructional Staff Support Services 1,947,443 1,840,78764 School Administration 316,362 359,89165 Total District Support Services 2,750,925 2,719,376
Non-Instructional Services:66 Food Service Operations 822,971 746,50767 Other Enterprise Operations 0 068 Community Operations 11,680 36,54269 Other Non-Instructional Services 0 070 Total Non-Instructional Services 834,650 783,04971 Facilities Acquisition and Construction 2,473,201 55,00072 Debt Service 82,362 80,19275 Other Non-Programmed Costs 0 076 Total Expenditures 16,012,107 12,900,08177 Less: Capital Expenditures 2,665,132 149,78878 Less: Debt Service 82,362 80,19279 Total Current Expenditures 13,264,612 12,670,10180 Exclusions from Current Expenditures 800,01781 Net Current Expenditures 12,464,596
82 Per Pupil Expenditures 13,685
83 Personnel - Non-Federal Certified Clsrm FTEs 93.5984 Avg Salary - Non-Fed Certified Clsrm FTEs 42,03285 Personnel - Non-Federal Certified FTEs 102.8286 Avg Salary - Non-Fed Certified FTEs 44,00987.1 Legal Balance (funds 1-2-4) 1,777,24987.2 Categorical Fund Balance 15,35887.3 Deposits with Paying Agents (QZAB) 087.4 Net Legal Bal (Excl Cat & QZAB) 1,761,89188 Building Fund Balance (fund 3) 089 Capital Outlay Fund Balance (fund 5) 0
Jan 30, 2012 - 126 - 9:35:29 AM

Annual Statistical Report 2010-2011
County: LINCOLN STAR CITY SCHOOL DISTRICT LEA:4003000
2010-2011 2011-2012Actual Budget
1 Area in Square Miles 4072 ADA 1,5693 ADA pct Change over 5 Yrs. (4%)4 4 QTR ADM 1,6515 Prior Year 3QTR ADM 1,6726 Assessment 85,472,1867 M&O Mills 25.008 URT Mills 25.009 M&O Mills in Excess of URT 0.0010 Dedicated M&O Mills 0.0011 Debt Service Mills 12.0012 Total Mills 37.0013 Total Debt Bond/Non-Bond 8,900,000
State and Local Revenue:14 Property Tax Receipts (Including URT) 3,006,736 2,961,17515 Other Local Receipts 744,320 728,50016 Revenue from Intermediate Sources 0 017.1 Foundation Funding (Excl URT) 7,970,761 8,074,68217.2 Tax Collection Rate Guarantee 49,408 51,39518 Student Growth Funding 0 019 Declining Enrollment Funding 78,751 51,39520 Consolidation Incentive/Assistance 0 021 Isolated Funding 0 022 Supplemental Millage Incentive Funding 44,612 35,68923 Other Unrestricted State Funding 0 024 Total Unrestricted Revenue from State and
Local Sources 11,894,588 11,902,836
Restricted Revenue from State Sources:25 Adult Education 157,114 157,347
Regular Education:26 Professional Development 69,146 70,14227 Other Regular Education 13,561 0
Special Education:28 Gifted & Talented 350 029 Alternative Learning Environment (ALE) 41,483 25,03130 English Language Learner (ELL) 3,809 3,80931 National School Lunch Act (NSLA) 493,520 502,96432 Other Special Education 102,488 033 Workforce Education 0 034 School Food Service 6,662 6,50035 Educational Service Cooperatives 0 036 Early Childhood Programs 303,750 340,20037 Magnet School Programs 0 038 Other Non-Instructional Programs 1,077,201 183,77839 Total Restricted Revenue from State Sources 2,269,085 1,289,77140 Total Restricted Revenue from Federal
Sources 2,980,228 1,897,863
Other Sources of Funds:41 Financing Sources 0 042 Balances from Consolidated/Annexed District 0 043 Indirect Cost Reimbursement 22,081 044 Gains and Losses from Sale of Fixed Assets 0 045 Compensation for Loss of Fixed Assets 0 046 Other 0 047 Total Other Sources of Funds 22,081 048 Total Revenue and Other Sources of Funds
from All Sources 17,165,982 15,090,470
2010-2011 2011-2012Actual Budget
CURRENT EXPENDITURESInstruction:
49 Regular Instruction 5,871,212 6,128,52250 Special Education 839,785 988,35051 Workforce Education 326,340 367,23452 Adult Education 194,644 173,48053 Compensatory Education 653,490 676,57654 Other 174,817 169,59355 Total Instruction 8,060,288 8,503,756
District Level Support:56 General Administration 545,154 353,96757 Central Services 355,141 488,48658 Maintenance & Operations of Plant 1,194,717 1,663,48459 Student Transportation 825,220 898,49860 Other District Level Support Services 100,046 43,35261 Total District Support Services 3,020,279 3,447,787
School Level Support:62 Student Support Services 805,661 776,02863 Instructional Staff Support Services 839,562 710,48364 School Administration 906,514 968,50765 Total District Support Services 2,551,737 2,455,018
Non-Instructional Services:66 Food Service Operations 816,707 938,24967 Other Enterprise Operations 116,481 10,20068 Community Operations 175 50069 Other Non-Instructional Services 0 070 Total Non-Instructional Services 933,363 948,94971 Facilities Acquisition and Construction 1,170,551 501,10072 Debt Service 807,462 544,17475 Other Non-Programmed Costs 0 076 Total Expenditures 16,543,679 16,400,78477 Less: Capital Expenditures 1,512,473 1,051,76478 Less: Debt Service 807,462 544,17479 Total Current Expenditures 14,223,744 14,804,84680 Exclusions from Current Expenditures 1,037,82481 Net Current Expenditures 13,185,920
82 Per Pupil Expenditures 8,403
83 Personnel - Non-Federal Certified Clsrm FTEs 106.5584 Avg Salary - Non-Fed Certified Clsrm FTEs 44,24785 Personnel - Non-Federal Certified FTEs 116.8386 Avg Salary - Non-Fed Certified FTEs 48,92787.1 Legal Balance (funds 1-2-4) 7,549,44587.2 Categorical Fund Balance 100,57887.3 Deposits with Paying Agents (QZAB) 087.4 Net Legal Bal (Excl Cat & QZAB) 7,448,86788 Building Fund Balance (fund 3) 3,022,95489 Capital Outlay Fund Balance (fund 5) 68,369
Jan 30, 2012 - 127 - 9:35:29 AM

Annual Statistical Report 2010-2011
County: LITTLE RIVER ASHDOWN SCHOOL DISTRICT LEA:4101000
2010-2011 2011-2012Actual Budget
1 Area in Square Miles 3452 ADA 1,3973 ADA pct Change over 5 Yrs. (12%)4 4 QTR ADM 1,4835 Prior Year 3QTR ADM 1,5356 Assessment 199,253,6877 M&O Mills 25.008 URT Mills 25.009 M&O Mills in Excess of URT 0.0010 Dedicated M&O Mills 0.0011 Debt Service Mills 10.7012 Total Mills 35.7013 Total Debt Bond/Non-Bond 10,625,000
State and Local Revenue:14 Property Tax Receipts (Including URT) 7,535,403 6,430,29915 Other Local Receipts 682,992 366,00016 Revenue from Intermediate Sources 13,146 017.1 Foundation Funding (Excl URT) 3,432,331 4,580,89017.2 Tax Collection Rate Guarantee 97,474 80,00018 Student Growth Funding 0 019 Declining Enrollment Funding 9,878 144,00020 Consolidation Incentive/Assistance 0 021 Isolated Funding 0 022 Supplemental Millage Incentive Funding 0 023 Other Unrestricted State Funding 0 024 Total Unrestricted Revenue from State and
Local Sources 11,771,225 11,601,189
Restricted Revenue from State Sources:25 Adult Education 0 0
Regular Education:26 Professional Development 63,497 63,06727 Other Regular Education 10,426 4,000
Special Education:28 Gifted & Talented 1,250 029 Alternative Learning Environment (ALE) 108,116 105,24230 English Language Learner (ELL) 0 031 National School Lunch Act (NSLA) 418,128 449,32832 Other Special Education 16,567 9,20033 Workforce Education 81,250 65,00034 School Food Service 5,601 5,00035 Educational Service Cooperatives 0 036 Early Childhood Programs 0 037 Magnet School Programs 0 038 Other Non-Instructional Programs 0 039 Total Restricted Revenue from State Sources 704,835 700,83740 Total Restricted Revenue from Federal
Sources 1,815,020 2,269,075
Other Sources of Funds:41 Financing Sources 0 042 Balances from Consolidated/Annexed District 0 043 Indirect Cost Reimbursement 0 044 Gains and Losses from Sale of Fixed Assets 9,348 045 Compensation for Loss of Fixed Assets 8,337 046 Other 0 047 Total Other Sources of Funds 17,685 048 Total Revenue and Other Sources of Funds
from All Sources 14,308,765 14,571,101
2010-2011 2011-2012Actual Budget
CURRENT EXPENDITURESInstruction:
49 Regular Instruction 5,319,517 4,616,27650 Special Education 941,654 935,51351 Workforce Education 372,003 362,10752 Adult Education 0 053 Compensatory Education 310,025 356,10354 Other 661,710 630,60155 Total Instruction 7,604,908 6,900,600
District Level Support:56 General Administration 231,437 269,63357 Central Services 276,307 481,77458 Maintenance & Operations of Plant 1,678,373 1,504,74959 Student Transportation 734,886 429,52460 Other District Level Support Services 28,503 11,80061 Total District Support Services 2,949,505 2,697,481
School Level Support:62 Student Support Services 609,257 737,80863 Instructional Staff Support Services 1,456,342 1,313,98464 School Administration 841,941 838,32965 Total District Support Services 2,907,540 2,890,122
Non-Instructional Services:66 Food Service Operations 841,750 865,17267 Other Enterprise Operations 9,442 068 Community Operations 27,305 56,28369 Other Non-Instructional Services 0 070 Total Non-Instructional Services 878,497 921,45571 Facilities Acquisition and Construction 59,770 (3,000)72 Debt Service 736,790 737,61275 Other Non-Programmed Costs 14,421 076 Total Expenditures 15,151,432 14,144,27077 Less: Capital Expenditures 372,063 150,20778 Less: Debt Service 736,790 737,61279 Total Current Expenditures 14,042,579 13,256,45080 Exclusions from Current Expenditures 687,00581 Net Current Expenditures 13,355,574
82 Per Pupil Expenditures 9,563
83 Personnel - Non-Federal Certified Clsrm FTEs 124.1784 Avg Salary - Non-Fed Certified Clsrm FTEs 42,78785 Personnel - Non-Federal Certified FTEs 138.2686 Avg Salary - Non-Fed Certified FTEs 45,25887.1 Legal Balance (funds 1-2-4) 3,388,51387.2 Categorical Fund Balance 67,28087.3 Deposits with Paying Agents (QZAB) 087.4 Net Legal Bal (Excl Cat & QZAB) 3,321,23388 Building Fund Balance (fund 3) 49,04889 Capital Outlay Fund Balance (fund 5) 261,977
Jan 30, 2012 - 128 - 9:35:29 AM

Annual Statistical Report 2010-2011
County: LITTLE RIVER FOREMAN SCHOOL DISTRICT LEA:4102000
2010-2011 2011-2012Actual Budget
1 Area in Square Miles 1772 ADA 5213 ADA pct Change over 5 Yrs. 4%4 4 QTR ADM 5415 Prior Year 3QTR ADM 5536 Assessment 30,901,5007 M&O Mills 28.008 URT Mills 25.009 M&O Mills in Excess of URT 3.0010 Dedicated M&O Mills 0.0011 Debt Service Mills 7.5012 Total Mills 35.5013 Total Debt Bond/Non-Bond 4,071,565
State and Local Revenue:14 Property Tax Receipts (Including URT) 1,156,229 1,188,69415 Other Local Receipts 465,622 131,92916 Revenue from Intermediate Sources 5,514 017.1 Foundation Funding (Excl URT) 2,425,085 2,568,76617.2 Tax Collection Rate Guarantee 0 018 Student Growth Funding 0 019 Declining Enrollment Funding 0 35,54320 Consolidation Incentive/Assistance 0 021 Isolated Funding 0 022 Supplemental Millage Incentive Funding 0 023 Other Unrestricted State Funding 0 024 Total Unrestricted Revenue from State and
Local Sources 4,052,450 3,924,932
Restricted Revenue from State Sources:25 Adult Education 0 0
Regular Education:26 Professional Development 22,885 22,95927 Other Regular Education 6,229 5,000
Special Education:28 Gifted & Talented 150 029 Alternative Learning Environment (ALE) 7,963 3,73030 English Language Learner (ELL) 0 031 National School Lunch Act (NSLA) 185,008 187,72632 Other Special Education 29,672 033 Workforce Education 0 034 School Food Service 0 2,00035 Educational Service Cooperatives 0 036 Early Childhood Programs 0 037 Magnet School Programs 0 038 Other Non-Instructional Programs 83,977 41,77539 Total Restricted Revenue from State Sources 335,883 263,19040 Total Restricted Revenue from Federal
Sources 705,607 673,509
Other Sources of Funds:41 Financing Sources 549,185 042 Balances from Consolidated/Annexed District 0 043 Indirect Cost Reimbursement 0 044 Gains and Losses from Sale of Fixed Assets 0 045 Compensation for Loss of Fixed Assets 11,455 046 Other 0 047 Total Other Sources of Funds 560,640 048 Total Revenue and Other Sources of Funds
from All Sources 5,654,580 4,861,632
2010-2011 2011-2012Actual Budget
CURRENT EXPENDITURESInstruction:
49 Regular Instruction 1,918,222 1,756,00750 Special Education 257,083 271,56151 Workforce Education 139,055 146,69852 Adult Education 0 053 Compensatory Education 61,669 96,31954 Other 63,264 59,30155 Total Instruction 2,439,293 2,329,887
District Level Support:56 General Administration 233,386 218,65157 Central Services 44,651 51,05658 Maintenance & Operations of Plant 614,375 569,13459 Student Transportation 278,595 208,33960 Other District Level Support Services 0 061 Total District Support Services 1,171,007 1,047,180
School Level Support:62 Student Support Services 268,518 303,37463 Instructional Staff Support Services 480,940 355,16664 School Administration 232,756 233,51665 Total District Support Services 982,215 892,056
Non-Instructional Services:66 Food Service Operations 369,208 270,57267 Other Enterprise Operations 0 068 Community Operations 0 50069 Other Non-Instructional Services 0 070 Total Non-Instructional Services 369,208 271,07271 Facilities Acquisition and Construction 620,682 318,62472 Debt Service 255,680 298,58375 Other Non-Programmed Costs 20,040 076 Total Expenditures 5,858,126 5,157,40277 Less: Capital Expenditures 793,206 351,69378 Less: Debt Service 255,680 298,58379 Total Current Expenditures 4,809,239 4,507,12680 Exclusions from Current Expenditures 224,06481 Net Current Expenditures 4,585,175
82 Per Pupil Expenditures 8,803
83 Personnel - Non-Federal Certified Clsrm FTEs 39.1384 Avg Salary - Non-Fed Certified Clsrm FTEs 42,50885 Personnel - Non-Federal Certified FTEs 43.5086 Avg Salary - Non-Fed Certified FTEs 45,06687.1 Legal Balance (funds 1-2-4) 467,12687.2 Categorical Fund Balance 087.3 Deposits with Paying Agents (QZAB) 087.4 Net Legal Bal (Excl Cat & QZAB) 467,12688 Building Fund Balance (fund 3) 624,70389 Capital Outlay Fund Balance (fund 5) 0
Jan 30, 2012 - 129 - 9:35:29 AM

Annual Statistical Report 2010-2011
County: LOGAN BOONEVILLE SCHOOL DISTRICT LEA:4201000
2010-2011 2011-2012Actual Budget
1 Area in Square Miles 2032 ADA 1,2883 ADA pct Change over 5 Yrs. (8%)4 4 QTR ADM 1,3615 Prior Year 3QTR ADM 1,4046 Assessment 89,913,8937 M&O Mills 25.008 URT Mills 25.009 M&O Mills in Excess of URT 0.0010 Dedicated M&O Mills 0.0011 Debt Service Mills 15.2012 Total Mills 40.2013 Total Debt Bond/Non-Bond 13,798,386
State and Local Revenue:14 Property Tax Receipts (Including URT) 3,485,985 2,961,45815 Other Local Receipts 567,773 604,83016 Revenue from Intermediate Sources 4,314 4,31417.1 Foundation Funding (Excl URT) 6,095,439 6,110,16517.2 Tax Collection Rate Guarantee 95,212 95,21218 Student Growth Funding 0 019 Declining Enrollment Funding 114,166 119,56220 Consolidation Incentive/Assistance 0 021 Isolated Funding 0 022 Supplemental Millage Incentive Funding 0 023 Other Unrestricted State Funding 0 44,11524 Total Unrestricted Revenue from State and
Local Sources 10,362,890 9,939,656
Restricted Revenue from State Sources:25 Adult Education 0 0
Regular Education:26 Professional Development 58,051 57,83327 Other Regular Education 6,134 3,358
Special Education:28 Gifted & Talented 1,450 1,65029 Alternative Learning Environment (ALE) 70,412 70,41230 English Language Learner (ELL) 4,688 4,68831 National School Lunch Act (NSLA) 446,400 446,29232 Other Special Education 30,412 73,47333 Workforce Education 33,169 6,50034 School Food Service 0 035 Educational Service Cooperatives 0 036 Early Childhood Programs 0 037 Magnet School Programs 0 038 Other Non-Instructional Programs 145,248 146,80839 Total Restricted Revenue from State Sources 795,963 811,01440 Total Restricted Revenue from Federal
Sources 2,081,627 1,954,374
Other Sources of Funds:41 Financing Sources 0 28,40042 Balances from Consolidated/Annexed District 0 043 Indirect Cost Reimbursement 0 044 Gains and Losses from Sale of Fixed Assets 0 045 Compensation for Loss of Fixed Assets 0 046 Other 27,376 047 Total Other Sources of Funds 27,376 28,40048 Total Revenue and Other Sources of Funds
from All Sources 13,267,855 12,733,444
2010-2011 2011-2012Actual Budget
CURRENT EXPENDITURESInstruction:
49 Regular Instruction 4,926,443 5,051,46750 Special Education 789,298 995,95951 Workforce Education 400,975 382,75352 Adult Education 0 053 Compensatory Education 494,529 516,63554 Other 264,969 276,85355 Total Instruction 6,876,214 7,223,667
District Level Support:56 General Administration 388,953 277,68857 Central Services 295,004 339,39458 Maintenance & Operations of Plant 1,213,267 1,062,16259 Student Transportation 524,325 480,10160 Other District Level Support Services 35,518 14,00061 Total District Support Services 2,457,067 2,173,346
School Level Support:62 Student Support Services 470,024 485,83963 Instructional Staff Support Services 641,509 761,10964 School Administration 678,484 687,19665 Total District Support Services 1,790,017 1,934,144
Non-Instructional Services:66 Food Service Operations 833,343 812,86467 Other Enterprise Operations 90,856 068 Community Operations 8,513 1,65869 Other Non-Instructional Services 0 070 Total Non-Instructional Services 932,712 814,52271 Facilities Acquisition and Construction 41,119 457,23472 Debt Service 961,519 912,08675 Other Non-Programmed Costs 0 076 Total Expenditures 13,058,649 13,514,99977 Less: Capital Expenditures 337,548 705,90778 Less: Debt Service 961,519 912,08679 Total Current Expenditures 11,759,582 11,897,00680 Exclusions from Current Expenditures 464,39181 Net Current Expenditures 11,295,191
82 Per Pupil Expenditures 8,771
83 Personnel - Non-Federal Certified Clsrm FTEs 105.7584 Avg Salary - Non-Fed Certified Clsrm FTEs 41,48485 Personnel - Non-Federal Certified FTEs 113.3086 Avg Salary - Non-Fed Certified FTEs 43,41987.1 Legal Balance (funds 1-2-4) 2,646,91487.2 Categorical Fund Balance 147,89887.3 Deposits with Paying Agents (QZAB) 087.4 Net Legal Bal (Excl Cat & QZAB) 2,499,01788 Building Fund Balance (fund 3) 835,00989 Capital Outlay Fund Balance (fund 5) 0
Jan 30, 2012 - 130 - 9:35:29 AM

Annual Statistical Report 2010-2011
County: LOGAN MAGAZINE SCHOOL DISTRICT LEA:4202000
2010-2011 2011-2012Actual Budget
1 Area in Square Miles 1212 ADA 4863 ADA pct Change over 5 Yrs. 0%4 4 QTR ADM 5165 Prior Year 3QTR ADM 5436 Assessment 33,982,5157 M&O Mills 25.008 URT Mills 25.009 M&O Mills in Excess of URT 0.0010 Dedicated M&O Mills 0.0011 Debt Service Mills 14.0012 Total Mills 39.0013 Total Debt Bond/Non-Bond 6,488,663
State and Local Revenue:14 Property Tax Receipts (Including URT) 1,215,116 1,280,72815 Other Local Receipts 355,446 233,34516 Revenue from Intermediate Sources 677 017.1 Foundation Funding (Excl URT) 2,415,752 2,281,71717.2 Tax Collection Rate Guarantee 42,460 018 Student Growth Funding 0 019 Declining Enrollment Funding 25,538 77,41420 Consolidation Incentive/Assistance 0 021 Isolated Funding 0 022 Supplemental Millage Incentive Funding 33,943 27,15423 Other Unrestricted State Funding 0 024 Total Unrestricted Revenue from State and
Local Sources 4,088,932 3,900,358
Restricted Revenue from State Sources:25 Adult Education 0 0
Regular Education:26 Professional Development 22,461 21,94627 Other Regular Education 1,185 2,200
Special Education:28 Gifted & Talented 250 20029 Alternative Learning Environment (ALE) 54,729 87,54230 English Language Learner (ELL) 2,637 2,69131 National School Lunch Act (NSLA) 383,904 406,82432 Other Special Education 2,225 033 Workforce Education 4,063 1,60034 School Food Service 2,642 2,50035 Educational Service Cooperatives 0 036 Early Childhood Programs 221,616 243,00037 Magnet School Programs 0 038 Other Non-Instructional Programs 179,154 50,00139 Total Restricted Revenue from State Sources 874,866 818,50440 Total Restricted Revenue from Federal
Sources 870,913 815,055
Other Sources of Funds:41 Financing Sources 166,822 042 Balances from Consolidated/Annexed District 0 043 Indirect Cost Reimbursement 5,600 5,40044 Gains and Losses from Sale of Fixed Assets 0 045 Compensation for Loss of Fixed Assets 2,769 5,00046 Other 0 047 Total Other Sources of Funds 175,192 10,40048 Total Revenue and Other Sources of Funds
from All Sources 6,009,902 5,544,317
2010-2011 2011-2012Actual Budget
CURRENT EXPENDITURESInstruction:
49 Regular Instruction 2,249,799 2,156,77750 Special Education 237,440 223,31251 Workforce Education 136,230 139,31852 Adult Education 0 053 Compensatory Education 190,685 216,05754 Other 201,644 172,17055 Total Instruction 3,015,798 2,907,635
District Level Support:56 General Administration 128,715 125,45357 Central Services 145,249 130,30958 Maintenance & Operations of Plant 532,077 566,07159 Student Transportation 361,119 195,74560 Other District Level Support Services 15,415 13,50061 Total District Support Services 1,182,575 1,031,080
School Level Support:62 Student Support Services 297,055 364,80363 Instructional Staff Support Services 254,980 257,95864 School Administration 183,535 180,80965 Total District Support Services 735,571 803,570
Non-Instructional Services:66 Food Service Operations 374,455 352,63767 Other Enterprise Operations 13,502 14,00068 Community Operations 63,752 62,45369 Other Non-Instructional Services 0 070 Total Non-Instructional Services 451,709 429,09071 Facilities Acquisition and Construction 1,874,072 94,71772 Debt Service 398,117 405,79075 Other Non-Programmed Costs 0 076 Total Expenditures 7,657,842 5,671,88177 Less: Capital Expenditures 2,055,710 160,71778 Less: Debt Service 398,117 405,79079 Total Current Expenditures 5,204,015 5,105,37580 Exclusions from Current Expenditures 456,49181 Net Current Expenditures 4,747,524
82 Per Pupil Expenditures 9,771
83 Personnel - Non-Federal Certified Clsrm FTEs 44.2084 Avg Salary - Non-Fed Certified Clsrm FTEs 39,44385 Personnel - Non-Federal Certified FTEs 48.2486 Avg Salary - Non-Fed Certified FTEs 41,47587.1 Legal Balance (funds 1-2-4) 482,49187.2 Categorical Fund Balance 45,70187.3 Deposits with Paying Agents (QZAB) 087.4 Net Legal Bal (Excl Cat & QZAB) 436,79088 Building Fund Balance (fund 3) 1,074,92089 Capital Outlay Fund Balance (fund 5) 0
Jan 30, 2012 - 131 - 9:35:29 AM

Annual Statistical Report 2010-2011
County: LOGAN PARIS SCHOOL DISTRICT LEA:4203000
2010-2011 2011-2012Actual Budget
1 Area in Square Miles 2282 ADA 1,0603 ADA pct Change over 5 Yrs. (3%)4 4 QTR ADM 1,1125 Prior Year 3QTR ADM 1,1196 Assessment 75,110,9407 M&O Mills 25.008 URT Mills 25.009 M&O Mills in Excess of URT 0.0010 Dedicated M&O Mills 0.0011 Debt Service Mills 13.0012 Total Mills 38.0013 Total Debt Bond/Non-Bond 10,733,894
State and Local Revenue:14 Property Tax Receipts (Including URT) 2,651,247 2,688,50015 Other Local Receipts 703,284 700,34416 Revenue from Intermediate Sources 3,551 4,00017.1 Foundation Funding (Excl URT) 4,828,004 4,904,75317.2 Tax Collection Rate Guarantee 72,887 30,00018 Student Growth Funding 0 019 Declining Enrollment Funding 23,369 4,63920 Consolidation Incentive/Assistance 0 021 Isolated Funding 0 022 Supplemental Millage Incentive Funding 0 023 Other Unrestricted State Funding 0 024 Total Unrestricted Revenue from State and
Local Sources 8,282,342 8,332,236
Restricted Revenue from State Sources:25 Adult Education 0 0
Regular Education:26 Professional Development 46,279 47,35727 Other Regular Education 12,595 19,500
Special Education:28 Gifted & Talented 1,450 1,00029 Alternative Learning Environment (ALE) 82,885 60,00030 English Language Learner (ELL) 9,083 10,00031 National School Lunch Act (NSLA) 332,816 340,03232 Other Special Education 13,539 8,50033 Workforce Education 3,250 2,43734 School Food Service 5,048 5,00035 Educational Service Cooperatives 0 036 Early Childhood Programs 267,785 247,86037 Magnet School Programs 0 038 Other Non-Instructional Programs 344,648 218,00039 Total Restricted Revenue from State Sources 1,119,378 959,68640 Total Restricted Revenue from Federal
Sources 2,476,833 1,498,304
Other Sources of Funds:41 Financing Sources 0 042 Balances from Consolidated/Annexed District 0 043 Indirect Cost Reimbursement 2,571 2,50044 Gains and Losses from Sale of Fixed Assets 0 045 Compensation for Loss of Fixed Assets 0 13,70046 Other 0 047 Total Other Sources of Funds 2,571 16,20048 Total Revenue and Other Sources of Funds
from All Sources 11,881,124 10,806,426
2010-2011 2011-2012Actual Budget
CURRENT EXPENDITURESInstruction:
49 Regular Instruction 4,521,460 4,418,31850 Special Education 556,361 604,40851 Workforce Education 221,990 146,26752 Adult Education 0 053 Compensatory Education 254,274 220,77754 Other 172,358 161,99755 Total Instruction 5,726,443 5,551,766
District Level Support:56 General Administration 285,338 274,54057 Central Services 173,023 177,53658 Maintenance & Operations of Plant 1,133,279 1,169,09759 Student Transportation 399,269 403,92260 Other District Level Support Services 42,845 48,68561 Total District Support Services 2,033,755 2,073,781
School Level Support:62 Student Support Services 610,754 591,65463 Instructional Staff Support Services 876,713 926,64664 School Administration 469,583 476,19465 Total District Support Services 1,957,050 1,994,494
Non-Instructional Services:66 Food Service Operations 635,302 629,93167 Other Enterprise Operations 0 068 Community Operations 154,245 141,56869 Other Non-Instructional Services 0 070 Total Non-Instructional Services 789,547 771,49971 Facilities Acquisition and Construction 916,923 70,00072 Debt Service 564,314 551,88175 Other Non-Programmed Costs 2,773 076 Total Expenditures 11,990,805 11,013,42177 Less: Capital Expenditures 1,172,958 303,10878 Less: Debt Service 564,314 551,88179 Total Current Expenditures 10,253,532 10,158,43280 Exclusions from Current Expenditures 995,01481 Net Current Expenditures 9,258,519
82 Per Pupil Expenditures 8,730
83 Personnel - Non-Federal Certified Clsrm FTEs 82.4684 Avg Salary - Non-Fed Certified Clsrm FTEs 41,04185 Personnel - Non-Federal Certified FTEs 89.9286 Avg Salary - Non-Fed Certified FTEs 43,09787.1 Legal Balance (funds 1-2-4) 1,498,06587.2 Categorical Fund Balance 38,44787.3 Deposits with Paying Agents (QZAB) 087.4 Net Legal Bal (Excl Cat & QZAB) 1,459,61888 Building Fund Balance (fund 3) 373,96589 Capital Outlay Fund Balance (fund 5) 0
Jan 30, 2012 - 132 - 9:35:29 AM

Annual Statistical Report 2010-2011
County: LOGAN SCRANTON SCHOOL DISTRICT LEA:4204000
2010-2011 2011-2012Actual Budget
1 Area in Square Miles 792 ADA 3893 ADA pct Change over 5 Yrs. 3%4 4 QTR ADM 4055 Prior Year 3QTR ADM 4106 Assessment 33,804,8167 M&O Mills 25.008 URT Mills 25.009 M&O Mills in Excess of URT 0.0010 Dedicated M&O Mills 0.0011 Debt Service Mills 13.0012 Total Mills 38.0013 Total Debt Bond/Non-Bond 2,765,156
State and Local Revenue:14 Property Tax Receipts (Including URT) 1,182,690 1,175,61815 Other Local Receipts 407,029 332,93616 Revenue from Intermediate Sources 1,513 50017.1 Foundation Funding (Excl URT) 1,670,334 1,643,35817.2 Tax Collection Rate Guarantee 16,041 018 Student Growth Funding 28,492 019 Declining Enrollment Funding 0 18,12520 Consolidation Incentive/Assistance 0 021 Isolated Funding 0 022 Supplemental Millage Incentive Funding 0 023 Other Unrestricted State Funding 0 024 Total Unrestricted Revenue from State and
Local Sources 3,306,099 3,170,537
Restricted Revenue from State Sources:25 Adult Education 0 0
Regular Education:26 Professional Development 16,951 17,11927 Other Regular Education 17,363 3,600
Special Education:28 Gifted & Talented 1,802 029 Alternative Learning Environment (ALE) 42,743 41,61630 English Language Learner (ELL) 1,758 031 National School Lunch Act (NSLA) 98,704 104,23632 Other Special Education 0 033 Workforce Education 1,625 034 School Food Service 1,640 1,50035 Educational Service Cooperatives 0 036 Early Childhood Programs 0 037 Magnet School Programs 0 038 Other Non-Instructional Programs 13,112 11,55639 Total Restricted Revenue from State Sources 195,698 179,62740 Total Restricted Revenue from Federal
Sources 419,169 335,101
Other Sources of Funds:41 Financing Sources 0 042 Balances from Consolidated/Annexed District 0 043 Indirect Cost Reimbursement 0 044 Gains and Losses from Sale of Fixed Assets 0 045 Compensation for Loss of Fixed Assets 14,292 046 Other 0 047 Total Other Sources of Funds 14,292 048 Total Revenue and Other Sources of Funds
from All Sources 3,935,259 3,685,265
2010-2011 2011-2012Actual Budget
CURRENT EXPENDITURESInstruction:
49 Regular Instruction 1,483,306 1,555,70050 Special Education 150,835 149,84651 Workforce Education 159,261 163,41552 Adult Education 0 053 Compensatory Education 41,474 38,94854 Other 47,391 52,22855 Total Instruction 1,882,267 1,960,137
District Level Support:56 General Administration 99,361 123,65957 Central Services 98,698 86,95158 Maintenance & Operations of Plant 376,353 380,35259 Student Transportation 212,228 133,89160 Other District Level Support Services 11,640 12,25061 Total District Support Services 798,280 737,102
School Level Support:62 Student Support Services 170,505 180,01363 Instructional Staff Support Services 285,769 317,76364 School Administration 153,771 143,52565 Total District Support Services 610,045 641,301
Non-Instructional Services:66 Food Service Operations 167,872 170,48567 Other Enterprise Operations 0 068 Community Operations 79 10069 Other Non-Instructional Services 0 070 Total Non-Instructional Services 167,951 170,58571 Facilities Acquisition and Construction 37,111 60,00072 Debt Service 224,443 209,36275 Other Non-Programmed Costs 0 076 Total Expenditures 3,720,098 3,778,48777 Less: Capital Expenditures 135,086 60,00078 Less: Debt Service 224,443 209,36279 Total Current Expenditures 3,360,569 3,509,12580 Exclusions from Current Expenditures 334,46681 Net Current Expenditures 3,026,103
82 Per Pupil Expenditures 7,774
83 Personnel - Non-Federal Certified Clsrm FTEs 29.3984 Avg Salary - Non-Fed Certified Clsrm FTEs 40,18885 Personnel - Non-Federal Certified FTEs 33.3986 Avg Salary - Non-Fed Certified FTEs 42,41687.1 Legal Balance (funds 1-2-4) 727,21587.2 Categorical Fund Balance 9,72387.3 Deposits with Paying Agents (QZAB) 087.4 Net Legal Bal (Excl Cat & QZAB) 717,49288 Building Fund Balance (fund 3) 240,51489 Capital Outlay Fund Balance (fund 5) 0
Jan 30, 2012 - 133 - 9:35:29 AM

Annual Statistical Report 2010-2011
County: LONOKE LONOKE SCHOOL DISTRICT LEA:4301000
2010-2011 2011-2012Actual Budget
1 Area in Square Miles 2072 ADA 1,7443 ADA pct Change over 5 Yrs. (1%)4 4 QTR ADM 1,8235 Prior Year 3QTR ADM 1,8526 Assessment 113,538,9987 M&O Mills 25.168 URT Mills 25.009 M&O Mills in Excess of URT 0.1610 Dedicated M&O Mills 0.0011 Debt Service Mills 15.2412 Total Mills 40.4013 Total Debt Bond/Non-Bond 26,464,169
State and Local Revenue:14 Property Tax Receipts (Including URT) 3,735,923 4,388,01915 Other Local Receipts 6,663,282 357,30016 Revenue from Intermediate Sources 171 017.1 Foundation Funding (Excl URT) 8,445,502 8,475,94617.2 Tax Collection Rate Guarantee 57,724 018 Student Growth Funding 0 019 Declining Enrollment Funding 35,807 020 Consolidation Incentive/Assistance 0 021 Isolated Funding 0 022 Supplemental Millage Incentive Funding 25,687 20,54923 Other Unrestricted State Funding 823 024 Total Unrestricted Revenue from State and
Local Sources 18,964,919 13,241,814
Restricted Revenue from State Sources:25 Adult Education 299,702 300,510
Regular Education:26 Professional Development 76,606 77,65327 Other Regular Education 13,770 12,400
Special Education:28 Gifted & Talented 1,724 029 Alternative Learning Environment (ALE) 53,266 58,03030 English Language Learner (ELL) 18,752 18,75231 National School Lunch Act (NSLA) 502,448 521,68632 Other Special Education 14,322 033 Workforce Education 70,146 25,18834 School Food Service 6,693 6,50035 Educational Service Cooperatives 0 036 Early Childhood Programs 1,801 037 Magnet School Programs 0 038 Other Non-Instructional Programs 4,173,994 215,75839 Total Restricted Revenue from State Sources 5,233,226 1,236,47640 Total Restricted Revenue from Federal
Sources 2,956,478 1,966,230
Other Sources of Funds:41 Financing Sources 643,854 111,53142 Balances from Consolidated/Annexed District 0 043 Indirect Cost Reimbursement 0 044 Gains and Losses from Sale of Fixed Assets 0 045 Compensation for Loss of Fixed Assets 0 046 Other 0 047 Total Other Sources of Funds 643,854 111,53148 Total Revenue and Other Sources of Funds
from All Sources 27,798,475 16,556,052
2010-2011 2011-2012Actual Budget
CURRENT EXPENDITURESInstruction:
49 Regular Instruction 5,844,334 5,602,80450 Special Education 995,966 848,22751 Workforce Education 479,533 423,71952 Adult Education 373,734 389,04453 Compensatory Education 744,095 687,00454 Other 725,398 673,00655 Total Instruction 9,163,059 8,623,803
District Level Support:56 General Administration 358,224 308,09657 Central Services 460,569 318,15958 Maintenance & Operations of Plant 1,577,013 1,613,38959 Student Transportation 1,077,237 957,28860 Other District Level Support Services 24,609 25,00061 Total District Support Services 3,497,652 3,221,932
School Level Support:62 Student Support Services 731,905 631,00163 Instructional Staff Support Services 1,145,036 943,26164 School Administration 1,024,664 912,50065 Total District Support Services 2,901,605 2,486,762
Non-Instructional Services:66 Food Service Operations 892,334 887,00067 Other Enterprise Operations 0 068 Community Operations 0 5,00069 Other Non-Instructional Services 0 070 Total Non-Instructional Services 892,334 892,00071 Facilities Acquisition and Construction 6,554,907 072 Debt Service 789,025 1,406,79975 Other Non-Programmed Costs 48,326 076 Total Expenditures 23,846,908 16,631,29677 Less: Capital Expenditures 6,931,069 308,29678 Less: Debt Service 789,025 1,406,79979 Total Current Expenditures 16,126,814 14,916,20180 Exclusions from Current Expenditures 1,202,34581 Net Current Expenditures 14,924,469
82 Per Pupil Expenditures 8,557
83 Personnel - Non-Federal Certified Clsrm FTEs 133.0884 Avg Salary - Non-Fed Certified Clsrm FTEs 41,90485 Personnel - Non-Federal Certified FTEs 144.3986 Avg Salary - Non-Fed Certified FTEs 44,07287.1 Legal Balance (funds 1-2-4) 552,08387.2 Categorical Fund Balance 2,08387.3 Deposits with Paying Agents (QZAB) 087.4 Net Legal Bal (Excl Cat & QZAB) 550,00088 Building Fund Balance (fund 3) 9,956,52989 Capital Outlay Fund Balance (fund 5) 97,176
Jan 30, 2012 - 134 - 9:35:29 AM

Annual Statistical Report 2010-2011
County: LONOKE ENGLAND SCHOOL DISTRICT LEA:4302000
2010-2011 2011-2012Actual Budget
1 Area in Square Miles 1542 ADA 7233 ADA pct Change over 5 Yrs. (17%)4 4 QTR ADM 7545 Prior Year 3QTR ADM 7626 Assessment 48,347,6207 M&O Mills 27.008 URT Mills 25.009 M&O Mills in Excess of URT 2.0010 Dedicated M&O Mills 0.0011 Debt Service Mills 14.0012 Total Mills 41.0013 Total Debt Bond/Non-Bond 4,111,632
State and Local Revenue:14 Property Tax Receipts (Including URT) 1,861,338 1,896,00015 Other Local Receipts 247,820 91,30016 Revenue from Intermediate Sources 0 017.1 Foundation Funding (Excl URT) 3,454,820 3,438,96317.2 Tax Collection Rate Guarantee 0 018 Student Growth Funding 0 019 Declining Enrollment Funding 90,797 27,86320 Consolidation Incentive/Assistance 0 021 Isolated Funding 0 022 Supplemental Millage Incentive Funding 3,487 2,79023 Other Unrestricted State Funding 0 024 Total Unrestricted Revenue from State and
Local Sources 5,658,262 5,456,916
Restricted Revenue from State Sources:25 Adult Education 0 0
Regular Education:26 Professional Development 31,527 31,92027 Other Regular Education 10,356 9,600
Special Education:28 Gifted & Talented 0 029 Alternative Learning Environment (ALE) 3,779 1,57530 English Language Learner (ELL) 293 1,00031 National School Lunch Act (NSLA) 383,571 484,92132 Other Special Education 15,999 15,00033 Workforce Education 0 034 School Food Service 2,718 2,70035 Educational Service Cooperatives 0 036 Early Childhood Programs 52,600 53,00037 Magnet School Programs 0 038 Other Non-Instructional Programs 85,485 141,28939 Total Restricted Revenue from State Sources 586,328 741,00540 Total Restricted Revenue from Federal
Sources 1,287,292 1,203,678
Other Sources of Funds:41 Financing Sources 0 042 Balances from Consolidated/Annexed District 0 043 Indirect Cost Reimbursement 0 044 Gains and Losses from Sale of Fixed Assets 0 045 Compensation for Loss of Fixed Assets 0 046 Other 0 047 Total Other Sources of Funds 0 048 Total Revenue and Other Sources of Funds
from All Sources 7,531,882 7,401,599
2010-2011 2011-2012Actual Budget
CURRENT EXPENDITURESInstruction:
49 Regular Instruction 2,964,270 2,746,73350 Special Education 622,827 634,78651 Workforce Education 241,173 207,50952 Adult Education 0 053 Compensatory Education 237,035 206,57154 Other 71,786 81,00455 Total Instruction 4,137,091 3,876,603
District Level Support:56 General Administration 283,838 201,74657 Central Services 161,120 163,98458 Maintenance & Operations of Plant 658,468 781,95759 Student Transportation 331,440 313,39760 Other District Level Support Services 27,387 12,00061 Total District Support Services 1,462,253 1,473,084
School Level Support:62 Student Support Services 341,662 326,79463 Instructional Staff Support Services 727,057 848,76064 School Administration 345,656 356,13965 Total District Support Services 1,414,375 1,531,693
Non-Instructional Services:66 Food Service Operations 350,241 336,21867 Other Enterprise Operations 0 068 Community Operations 1,605 3,22869 Other Non-Instructional Services 0 070 Total Non-Instructional Services 351,846 339,44671 Facilities Acquisition and Construction 61,246 1,280,54472 Debt Service 261,113 263,47075 Other Non-Programmed Costs 0 076 Total Expenditures 7,687,926 8,764,84077 Less: Capital Expenditures 235,887 1,384,68578 Less: Debt Service 261,113 263,47079 Total Current Expenditures 7,190,925 7,116,68480 Exclusions from Current Expenditures 253,93181 Net Current Expenditures 6,936,994
82 Per Pupil Expenditures 9,599
83 Personnel - Non-Federal Certified Clsrm FTEs 65.9084 Avg Salary - Non-Fed Certified Clsrm FTEs 39,94285 Personnel - Non-Federal Certified FTEs 72.4086 Avg Salary - Non-Fed Certified FTEs 42,86287.1 Legal Balance (funds 1-2-4) 555,84987.2 Categorical Fund Balance 58,29287.3 Deposits with Paying Agents (QZAB) 087.4 Net Legal Bal (Excl Cat & QZAB) 497,55788 Building Fund Balance (fund 3) 1,281,50889 Capital Outlay Fund Balance (fund 5) 0
Jan 30, 2012 - 135 - 9:35:29 AM

Annual Statistical Report 2010-2011
County: LONOKE CARLISLE SCHOOL DISTRICT LEA:4303000
2010-2011 2011-2012Actual Budget
1 Area in Square Miles 2432 ADA 7103 ADA pct Change over 5 Yrs. 1%4 4 QTR ADM 7495 Prior Year 3QTR ADM 7216 Assessment 55,974,8937 M&O Mills 25.008 URT Mills 25.009 M&O Mills in Excess of URT 0.0010 Dedicated M&O Mills 0.0011 Debt Service Mills 17.0012 Total Mills 42.0013 Total Debt Bond/Non-Bond 12,385,571
State and Local Revenue:14 Property Tax Receipts (Including URT) 2,210,752 2,108,77415 Other Local Receipts 586,524 444,25316 Revenue from Intermediate Sources 0 017.1 Foundation Funding (Excl URT) 3,028,707 3,252,22117.2 Tax Collection Rate Guarantee 2,454 018 Student Growth Funding 165,121 019 Declining Enrollment Funding 0 020 Consolidation Incentive/Assistance 0 021 Isolated Funding 0 022 Supplemental Millage Incentive Funding 0 023 Other Unrestricted State Funding 267 024 Total Unrestricted Revenue from State and
Local Sources 5,993,826 5,805,248
Restricted Revenue from State Sources:25 Adult Education 0 0
Regular Education:26 Professional Development 29,830 31,89327 Other Regular Education 5,600 3,000
Special Education:28 Gifted & Talented 150 029 Alternative Learning Environment (ALE) 21,981 12,10330 English Language Learner (ELL) 0 031 National School Lunch Act (NSLA) 167,152 200,37632 Other Special Education 2,955 033 Workforce Education 0 034 School Food Service 2,738 2,50035 Educational Service Cooperatives 0 036 Early Childhood Programs 194,400 194,40037 Magnet School Programs 0 038 Other Non-Instructional Programs 45,209 44,84639 Total Restricted Revenue from State Sources 470,014 489,11840 Total Restricted Revenue from Federal
Sources 1,044,493 983,524
Other Sources of Funds:41 Financing Sources 4,995 042 Balances from Consolidated/Annexed District 0 043 Indirect Cost Reimbursement 0 044 Gains and Losses from Sale of Fixed Assets 0 045 Compensation for Loss of Fixed Assets 0 046 Other 0 047 Total Other Sources of Funds 4,995 048 Total Revenue and Other Sources of Funds
from All Sources 7,513,328 7,277,890
2010-2011 2011-2012Actual Budget
CURRENT EXPENDITURESInstruction:
49 Regular Instruction 2,583,952 2,783,41050 Special Education 277,304 273,55451 Workforce Education 224,952 177,83652 Adult Education 0 053 Compensatory Education 391,927 419,78954 Other 39,005 47,88355 Total Instruction 3,517,141 3,702,472
District Level Support:56 General Administration 220,005 268,14657 Central Services 92,173 94,57058 Maintenance & Operations of Plant 832,030 924,57059 Student Transportation 389,803 292,05360 Other District Level Support Services 14,229 18,26061 Total District Support Services 1,548,240 1,597,599
School Level Support:62 Student Support Services 287,476 287,73563 Instructional Staff Support Services 413,119 392,29664 School Administration 206,718 264,90465 Total District Support Services 907,314 944,934
Non-Instructional Services:66 Food Service Operations 359,260 339,46667 Other Enterprise Operations 0 068 Community Operations 691 2,00069 Other Non-Instructional Services 0 070 Total Non-Instructional Services 359,950 341,46671 Facilities Acquisition and Construction 236,228 417,85672 Debt Service 604,630 419,32875 Other Non-Programmed Costs 8,731 076 Total Expenditures 7,182,233 7,423,65577 Less: Capital Expenditures 518,471 503,98278 Less: Debt Service 604,630 419,32879 Total Current Expenditures 6,059,132 6,500,34480 Exclusions from Current Expenditures 477,29381 Net Current Expenditures 5,581,839
82 Per Pupil Expenditures 7,858
83 Personnel - Non-Federal Certified Clsrm FTEs 50.8384 Avg Salary - Non-Fed Certified Clsrm FTEs 40,56385 Personnel - Non-Federal Certified FTEs 56.7586 Avg Salary - Non-Fed Certified FTEs 42,24487.1 Legal Balance (funds 1-2-4) 3,222,57687.2 Categorical Fund Balance 64,00987.3 Deposits with Paying Agents (QZAB) 087.4 Net Legal Bal (Excl Cat & QZAB) 3,158,56788 Building Fund Balance (fund 3) 486,21089 Capital Outlay Fund Balance (fund 5) 3,824
Jan 30, 2012 - 136 - 9:35:29 AM

Annual Statistical Report 2010-2011
County: LONOKE CABOT SCHOOL DISTRICT LEA:4304000
2010-2011 2011-2012Actual Budget
1 Area in Square Miles 1832 ADA 9,3423 ADA pct Change over 5 Yrs. 19%4 4 QTR ADM 9,9765 Prior Year 3QTR ADM 9,8556 Assessment 587,509,1607 M&O Mills 25.008 URT Mills 25.009 M&O Mills in Excess of URT 0.0010 Dedicated M&O Mills 0.0011 Debt Service Mills 14.5012 Total Mills 39.5013 Total Debt Bond/Non-Bond 58,859,341
State and Local Revenue:14 Property Tax Receipts (Including URT) 21,506,591 28,553,00015 Other Local Receipts 4,346,049 1,671,04616 Revenue from Intermediate Sources 936 017.1 Foundation Funding (Excl URT) 45,516,036 46,956,83617.2 Tax Collection Rate Guarantee 202,022 018 Student Growth Funding 730,364 019 Declining Enrollment Funding 0 020 Consolidation Incentive/Assistance 0 021 Isolated Funding 0 022 Supplemental Millage Incentive Funding 306,981 245,58423 Other Unrestricted State Funding 0 024 Total Unrestricted Revenue from State and
Local Sources 72,608,978 77,426,466
Restricted Revenue from State Sources:25 Adult Education 0 0
Regular Education:26 Professional Development 407,597 424,05727 Other Regular Education 55,772 34,800
Special Education:28 Gifted & Talented 14,244 11,55029 Alternative Learning Environment (ALE) 523,802 786,34830 English Language Learner (ELL) 38,090 38,09031 National School Lunch Act (NSLA) 1,903,268 1,783,96032 Other Special Education 236,754 72,37233 Workforce Education 109,212 19,50034 School Food Service 27,600 27,00035 Educational Service Cooperatives 0 036 Early Childhood Programs 882,550 874,80037 Magnet School Programs 0 038 Other Non-Instructional Programs 4,643,998 11,167,30739 Total Restricted Revenue from State Sources 8,842,887 15,239,78440 Total Restricted Revenue from Federal
Sources 7,614,514 8,721,660
Other Sources of Funds:41 Financing Sources 6,054 042 Balances from Consolidated/Annexed District 0 043 Indirect Cost Reimbursement 0 044 Gains and Losses from Sale of Fixed Assets 128,458 045 Compensation for Loss of Fixed Assets 0 046 Other 0 047 Total Other Sources of Funds 134,512 048 Total Revenue and Other Sources of Funds
from All Sources 89,200,892 101,387,909
2010-2011 2011-2012Actual Budget
CURRENT EXPENDITURESInstruction:
49 Regular Instruction 32,839,150 32,510,87250 Special Education 8,091,047 9,008,82851 Workforce Education 2,362,325 2,313,19552 Adult Education 0 053 Compensatory Education 750,546 623,12554 Other 2,744,273 3,336,50655 Total Instruction 46,787,341 47,792,525
District Level Support:56 General Administration 1,034,710 1,159,37757 Central Services 1,711,134 2,048,93358 Maintenance & Operations of Plant 7,191,336 7,179,38459 Student Transportation 3,480,510 3,593,43060 Other District Level Support Services 86,054 50,00061 Total District Support Services 13,503,744 14,031,123
School Level Support:62 Student Support Services 3,984,224 4,236,00963 Instructional Staff Support Services 7,209,231 7,016,20064 School Administration 4,013,359 4,118,08065 Total District Support Services 15,206,813 15,370,289
Non-Instructional Services:66 Food Service Operations 3,497,950 3,606,15067 Other Enterprise Operations 468,233 068 Community Operations 11,118 15,00069 Other Non-Instructional Services 0 070 Total Non-Instructional Services 3,977,300 3,621,15071 Facilities Acquisition and Construction 10,473,482 20,021,55172 Debt Service 2,668,808 4,050,56475 Other Non-Programmed Costs 333,613 076 Total Expenditures 92,951,102 104,887,20277 Less: Capital Expenditures 11,864,608 21,196,14178 Less: Debt Service 2,668,808 4,050,56479 Total Current Expenditures 78,417,685 79,640,49780 Exclusions from Current Expenditures 5,280,61281 Net Current Expenditures 73,137,074
82 Per Pupil Expenditures 7,829
83 Personnel - Non-Federal Certified Clsrm FTEs 616.3484 Avg Salary - Non-Fed Certified Clsrm FTEs 49,44585 Personnel - Non-Federal Certified FTEs 682.1586 Avg Salary - Non-Fed Certified FTEs 51,70487.1 Legal Balance (funds 1-2-4) 6,148,74287.2 Categorical Fund Balance 234,38687.3 Deposits with Paying Agents (QZAB) 087.4 Net Legal Bal (Excl Cat & QZAB) 5,914,35688 Building Fund Balance (fund 3) 10,907,94389 Capital Outlay Fund Balance (fund 5) 0
Jan 30, 2012 - 137 - 9:35:29 AM

Annual Statistical Report 2010-2011
County: MADISON HUNTSVILLE SCHOOL DISTRICT LEA:4401000
2010-2011 2011-2012Actual Budget
1 Area in Square Miles 7402 ADA 2,2233 ADA pct Change over 5 Yrs. (5%)4 4 QTR ADM 2,3145 Prior Year 3QTR ADM 2,3426 Assessment 157,248,9447 M&O Mills 25.008 URT Mills 25.009 M&O Mills in Excess of URT 0.0010 Dedicated M&O Mills 0.0011 Debt Service Mills 7.1012 Total Mills 32.1013 Total Debt Bond/Non-Bond 7,855,000
State and Local Revenue:14 Property Tax Receipts (Including URT) 4,613,277 5,339,32015 Other Local Receipts 802,958 546,37516 Revenue from Intermediate Sources 150,000 75,00017.1 Foundation Funding (Excl URT) 10,321,564 10,275,42217.2 Tax Collection Rate Guarantee 148,052 018 Student Growth Funding 0 019 Declining Enrollment Funding 0 020 Consolidation Incentive/Assistance 0 021 Isolated Funding 189,739 190,00022 Supplemental Millage Incentive Funding 46,953 37,56223 Other Unrestricted State Funding 0 024 Total Unrestricted Revenue from State and
Local Sources 16,272,543 16,463,679
Restricted Revenue from State Sources:25 Adult Education 0 0
Regular Education:26 Professional Development 96,866 98,20227 Other Regular Education 392,511 200,000
Special Education:28 Gifted & Talented 1,900 029 Alternative Learning Environment (ALE) 79,594 79,59430 English Language Learner (ELL) 39,262 39,26231 National School Lunch Act (NSLA) 669,600 697,77432 Other Special Education 20,250 20,00033 Workforce Education 0 034 School Food Service 0 8,00035 Educational Service Cooperatives 0 036 Early Childhood Programs 101,228 97,50037 Magnet School Programs 0 038 Other Non-Instructional Programs 478,595 103,66139 Total Restricted Revenue from State Sources 1,879,807 1,343,99340 Total Restricted Revenue from Federal
Sources 3,823,097 2,732,840
Other Sources of Funds:41 Financing Sources 0 042 Balances from Consolidated/Annexed District 0 043 Indirect Cost Reimbursement 0 044 Gains and Losses from Sale of Fixed Assets 0 045 Compensation for Loss of Fixed Assets 0 046 Other 0 047 Total Other Sources of Funds 0 048 Total Revenue and Other Sources of Funds
from All Sources 21,975,447 20,540,512
2010-2011 2011-2012Actual Budget
CURRENT EXPENDITURESInstruction:
49 Regular Instruction 8,138,225 7,624,01650 Special Education 1,496,457 1,481,92551 Workforce Education 698,778 799,56752 Adult Education 0 053 Compensatory Education 948,379 851,59154 Other 692,059 779,34155 Total Instruction 11,973,898 11,536,441
District Level Support:56 General Administration 352,361 393,02057 Central Services 380,565 533,68758 Maintenance & Operations of Plant 2,092,258 2,151,07659 Student Transportation 1,516,266 1,416,41260 Other District Level Support Services 84,689 2,00061 Total District Support Services 4,426,139 4,496,195
School Level Support:62 Student Support Services 631,034 715,47463 Instructional Staff Support Services 1,763,767 1,378,52664 School Administration 963,748 962,42065 Total District Support Services 3,358,548 3,056,420
Non-Instructional Services:66 Food Service Operations 1,157,558 1,140,91967 Other Enterprise Operations 0 068 Community Operations 222,576 129,28869 Other Non-Instructional Services 0 070 Total Non-Instructional Services 1,380,134 1,270,20771 Facilities Acquisition and Construction 1,564,561 1,428,54572 Debt Service 498,092 497,07875 Other Non-Programmed Costs 0 076 Total Expenditures 23,201,372 22,284,88577 Less: Capital Expenditures 2,260,549 1,850,62878 Less: Debt Service 498,092 497,07879 Total Current Expenditures 20,442,730 19,937,17980 Exclusions from Current Expenditures 895,36081 Net Current Expenditures 19,547,370
82 Per Pupil Expenditures 8,792
83 Personnel - Non-Federal Certified Clsrm FTEs 159.5184 Avg Salary - Non-Fed Certified Clsrm FTEs 48,12985 Personnel - Non-Federal Certified FTEs 175.3386 Avg Salary - Non-Fed Certified FTEs 49,80187.1 Legal Balance (funds 1-2-4) 1,815,50787.2 Categorical Fund Balance 193,39587.3 Deposits with Paying Agents (QZAB) 087.4 Net Legal Bal (Excl Cat & QZAB) 1,622,11288 Building Fund Balance (fund 3) 5,323,50589 Capital Outlay Fund Balance (fund 5) 0
Jan 30, 2012 - 138 - 9:35:29 AM

Annual Statistical Report 2010-2011
County: MARION FLIPPIN SCHOOL DISTRICT LEA:4501000
2010-2011 2011-2012Actual Budget
1 Area in Square Miles 1422 ADA 7633 ADA pct Change over 5 Yrs. (10%)4 4 QTR ADM 8135 Prior Year 3QTR ADM 8466 Assessment 96,654,9947 M&O Mills 30.808 URT Mills 25.009 M&O Mills in Excess of URT 5.8010 Dedicated M&O Mills 0.0011 Debt Service Mills 3.1012 Total Mills 33.9013 Total Debt Bond/Non-Bond 2,562,919
State and Local Revenue:14 Property Tax Receipts (Including URT) 2,947,611 3,114,88715 Other Local Receipts 663,494 364,14116 Revenue from Intermediate Sources 81 17,00017.1 Foundation Funding (Excl URT) 2,774,753 2,621,06717.2 Tax Collection Rate Guarantee 18,109 018 Student Growth Funding 0 019 Declining Enrollment Funding 81,250 97,32120 Consolidation Incentive/Assistance 0 021 Isolated Funding 0 022 Supplemental Millage Incentive Funding 0 023 Other Unrestricted State Funding 0 024 Total Unrestricted Revenue from State and
Local Sources 6,485,297 6,214,416
Restricted Revenue from State Sources:25 Adult Education 0 0
Regular Education:26 Professional Development 34,981 34,50127 Other Regular Education 7,801 0
Special Education:28 Gifted & Talented 50 029 Alternative Learning Environment (ALE) 105,841 78,38230 English Language Learner (ELL) 0 031 National School Lunch Act (NSLA) 269,824 264,13232 Other Special Education 96,183 40,00033 Workforce Education 2,438 1,50034 School Food Service 3,396 3,20035 Educational Service Cooperatives 0 036 Early Childhood Programs 292,740 306,60037 Magnet School Programs 0 038 Other Non-Instructional Programs 11,030 7,81739 Total Restricted Revenue from State Sources 824,283 736,13240 Total Restricted Revenue from Federal
Sources 1,593,494 1,903,532
Other Sources of Funds:41 Financing Sources 0 042 Balances from Consolidated/Annexed District 0 043 Indirect Cost Reimbursement 0 044 Gains and Losses from Sale of Fixed Assets 0 045 Compensation for Loss of Fixed Assets 0 046 Other 0 047 Total Other Sources of Funds 0 048 Total Revenue and Other Sources of Funds
from All Sources 8,903,075 8,854,080
2010-2011 2011-2012Actual Budget
CURRENT EXPENDITURESInstruction:
49 Regular Instruction 3,211,281 3,029,55050 Special Education 610,409 655,12851 Workforce Education 175,136 215,91952 Adult Education 0 053 Compensatory Education 494,938 450,54954 Other 490,484 473,64955 Total Instruction 4,982,249 4,824,796
District Level Support:56 General Administration 208,286 245,43057 Central Services 189,040 152,83258 Maintenance & Operations of Plant 955,071 809,07359 Student Transportation 332,664 307,68660 Other District Level Support Services 34,040 33,66061 Total District Support Services 1,719,101 1,548,681
School Level Support:62 Student Support Services 255,328 266,91963 Instructional Staff Support Services 592,748 575,23164 School Administration 398,880 409,60865 Total District Support Services 1,246,955 1,251,758
Non-Instructional Services:66 Food Service Operations 433,005 409,47867 Other Enterprise Operations 0 068 Community Operations 25,385 6,30069 Other Non-Instructional Services 0 070 Total Non-Instructional Services 458,390 415,77871 Facilities Acquisition and Construction 459,736 1,207,86672 Debt Service 127,583 157,72275 Other Non-Programmed Costs 0 076 Total Expenditures 8,994,013 9,406,60177 Less: Capital Expenditures 557,000 1,278,78478 Less: Debt Service 127,583 157,72279 Total Current Expenditures 8,309,431 7,970,09480 Exclusions from Current Expenditures 609,99681 Net Current Expenditures 7,699,435
82 Per Pupil Expenditures 10,087
83 Personnel - Non-Federal Certified Clsrm FTEs 69.7784 Avg Salary - Non-Fed Certified Clsrm FTEs 41,07585 Personnel - Non-Federal Certified FTEs 75.2186 Avg Salary - Non-Fed Certified FTEs 43,48387.1 Legal Balance (funds 1-2-4) 730,12687.2 Categorical Fund Balance 9,23887.3 Deposits with Paying Agents (QZAB) 087.4 Net Legal Bal (Excl Cat & QZAB) 720,88888 Building Fund Balance (fund 3) 709,45089 Capital Outlay Fund Balance (fund 5) 0
Jan 30, 2012 - 139 - 9:35:29 AM

Annual Statistical Report 2010-2011
County: MARION YELLVILLE-SUMMIT SCHOOL DIST. LEA:4502000
2010-2011 2011-2012Actual Budget
1 Area in Square Miles 2642 ADA 7603 ADA pct Change over 5 Yrs. (14%)4 4 QTR ADM 8125 Prior Year 3QTR ADM 8296 Assessment 59,440,0837 M&O Mills 25.008 URT Mills 25.009 M&O Mills in Excess of URT 0.0010 Dedicated M&O Mills 0.0011 Debt Service Mills 11.9812 Total Mills 36.9813 Total Debt Bond/Non-Bond 7,790,000
State and Local Revenue:14 Property Tax Receipts (Including URT) 2,051,852 2,117,39615 Other Local Receipts 321,953 135,27716 Revenue from Intermediate Sources 91 10017.1 Foundation Funding (Excl URT) 3,573,025 3,529,82517.2 Tax Collection Rate Guarantee 74,355 018 Student Growth Funding 0 019 Declining Enrollment Funding 92,092 49,42820 Consolidation Incentive/Assistance 0 021 Isolated Funding 0 022 Supplemental Millage Incentive Funding 27,741 22,19323 Other Unrestricted State Funding 0 024 Total Unrestricted Revenue from State and
Local Sources 6,141,109 5,854,219
Restricted Revenue from State Sources:25 Adult Education 0 0
Regular Education:26 Professional Development 34,292 34,45527 Other Regular Education 22,336 0
Special Education:28 Gifted & Talented 450 029 Alternative Learning Environment (ALE) 42,540 58,40330 English Language Learner (ELL) 0 031 National School Lunch Act (NSLA) 275,776 275,26432 Other Special Education 70,621 033 Workforce Education 22,750 28,45434 School Food Service 2,938 2,93835 Educational Service Cooperatives 0 036 Early Childhood Programs 0 037 Magnet School Programs 0 038 Other Non-Instructional Programs 97,753 115,27939 Total Restricted Revenue from State Sources 569,455 514,79340 Total Restricted Revenue from Federal
Sources 1,973,928 1,243,349
Other Sources of Funds:41 Financing Sources 6,562 042 Balances from Consolidated/Annexed District 0 043 Indirect Cost Reimbursement 0 044 Gains and Losses from Sale of Fixed Assets 0 045 Compensation for Loss of Fixed Assets 0 046 Other 0 047 Total Other Sources of Funds 6,562 048 Total Revenue and Other Sources of Funds
from All Sources 8,691,054 7,612,361
2010-2011 2011-2012Actual Budget
CURRENT EXPENDITURESInstruction:
49 Regular Instruction 2,744,688 2,294,77550 Special Education 628,193 624,58351 Workforce Education 237,971 278,24352 Adult Education 0 053 Compensatory Education 440,751 437,87554 Other 362,075 396,38255 Total Instruction 4,413,678 4,031,858
District Level Support:56 General Administration 204,670 183,72257 Central Services 195,743 187,30058 Maintenance & Operations of Plant 877,033 841,86759 Student Transportation 476,705 356,42760 Other District Level Support Services 19,098 4,24261 Total District Support Services 1,773,249 1,573,558
School Level Support:62 Student Support Services 408,245 301,93163 Instructional Staff Support Services 409,298 336,38564 School Administration 348,397 349,46965 Total District Support Services 1,165,940 987,786
Non-Instructional Services:66 Food Service Operations 414,434 406,21767 Other Enterprise Operations 16,552 068 Community Operations 3,091 2,28269 Other Non-Instructional Services 0 070 Total Non-Instructional Services 434,077 408,49971 Facilities Acquisition and Construction 24,133 22,96472 Debt Service 491,843 575,27475 Other Non-Programmed Costs 435 076 Total Expenditures 8,303,355 7,599,93877 Less: Capital Expenditures 174,572 65,68278 Less: Debt Service 491,843 575,27479 Total Current Expenditures 7,636,941 6,958,98380 Exclusions from Current Expenditures 250,67581 Net Current Expenditures 7,386,266
82 Per Pupil Expenditures 9,724
83 Personnel - Non-Federal Certified Clsrm FTEs 54.1084 Avg Salary - Non-Fed Certified Clsrm FTEs 43,35585 Personnel - Non-Federal Certified FTEs 58.4786 Avg Salary - Non-Fed Certified FTEs 45,50387.1 Legal Balance (funds 1-2-4) 965,32787.2 Categorical Fund Balance 39,83487.3 Deposits with Paying Agents (QZAB) 087.4 Net Legal Bal (Excl Cat & QZAB) 925,49388 Building Fund Balance (fund 3) 452,34689 Capital Outlay Fund Balance (fund 5) 0
Jan 30, 2012 - 140 - 9:35:29 AM

Annual Statistical Report 2010-2011
County: MILLER GENOA CENTRAL SCHOOL DISTRICT LEA:4602000
2010-2011 2011-2012Actual Budget
1 Area in Square Miles 792 ADA 9063 ADA pct Change over 5 Yrs. (3%)4 4 QTR ADM 9395 Prior Year 3QTR ADM 9236 Assessment 35,884,7287 M&O Mills 25.008 URT Mills 25.009 M&O Mills in Excess of URT 0.0010 Dedicated M&O Mills 0.0011 Debt Service Mills 22.0012 Total Mills 47.0013 Total Debt Bond/Non-Bond 6,956,599
State and Local Revenue:14 Property Tax Receipts (Including URT) 1,519,403 1,761,00015 Other Local Receipts 746,638 196,90016 Revenue from Intermediate Sources 17,273 17,50017.1 Foundation Funding (Excl URT) 4,733,602 4,874,43917.2 Tax Collection Rate Guarantee 11,771 22,00018 Student Growth Funding 96,127 019 Declining Enrollment Funding 0 020 Consolidation Incentive/Assistance 0 021 Isolated Funding 0 022 Supplemental Millage Incentive Funding 99,074 79,25923 Other Unrestricted State Funding 0 024 Total Unrestricted Revenue from State and
Local Sources 7,223,888 6,951,098
Restricted Revenue from State Sources:25 Adult Education 0 0
Regular Education:26 Professional Development 38,161 39,74627 Other Regular Education 3,298 10,340
Special Education:28 Gifted & Talented 100 30029 Alternative Learning Environment (ALE) 46,156 48,08230 English Language Learner (ELL) 0 031 National School Lunch Act (NSLA) 213,776 214,03832 Other Special Education 56,607 033 Workforce Education 27,625 19,50034 School Food Service 2,672 3,30035 Educational Service Cooperatives 0 036 Early Childhood Programs 0 037 Magnet School Programs 0 038 Other Non-Instructional Programs 293,154 172,99339 Total Restricted Revenue from State Sources 681,550 508,29940 Total Restricted Revenue from Federal
Sources 1,144,853 846,888
Other Sources of Funds:41 Financing Sources 0 042 Balances from Consolidated/Annexed District 0 043 Indirect Cost Reimbursement 4,241 4,44344 Gains and Losses from Sale of Fixed Assets 0 045 Compensation for Loss of Fixed Assets 0 046 Other 0 047 Total Other Sources of Funds 4,241 4,44348 Total Revenue and Other Sources of Funds
from All Sources 9,054,531 8,310,727
2010-2011 2011-2012Actual Budget
CURRENT EXPENDITURESInstruction:
49 Regular Instruction 4,059,018 3,704,08350 Special Education 387,739 407,65951 Workforce Education 277,942 234,44652 Adult Education 0 053 Compensatory Education 201,872 128,84954 Other 142,926 127,51855 Total Instruction 5,069,497 4,602,555
District Level Support:56 General Administration 552,448 191,91557 Central Services 173,535 156,73258 Maintenance & Operations of Plant 693,885 690,69359 Student Transportation 510,524 459,77260 Other District Level Support Services 5,185 19,44361 Total District Support Services 1,935,577 1,518,554
School Level Support:62 Student Support Services 390,705 397,97563 Instructional Staff Support Services 541,380 601,70164 School Administration 358,480 327,73965 Total District Support Services 1,290,565 1,327,414
Non-Instructional Services:66 Food Service Operations 429,136 365,80067 Other Enterprise Operations 0 068 Community Operations 792 2,00069 Other Non-Instructional Services 0 070 Total Non-Instructional Services 429,928 367,80071 Facilities Acquisition and Construction 283,028 77,60072 Debt Service 441,561 441,74075 Other Non-Programmed Costs 0 076 Total Expenditures 9,450,156 8,335,66377 Less: Capital Expenditures 506,135 202,66778 Less: Debt Service 441,561 441,74079 Total Current Expenditures 8,502,460 7,691,25780 Exclusions from Current Expenditures 748,57681 Net Current Expenditures 7,753,884
82 Per Pupil Expenditures 8,557
83 Personnel - Non-Federal Certified Clsrm FTEs 69.2584 Avg Salary - Non-Fed Certified Clsrm FTEs 47,25285 Personnel - Non-Federal Certified FTEs 74.8286 Avg Salary - Non-Fed Certified FTEs 50,02487.1 Legal Balance (funds 1-2-4) 884,32487.2 Categorical Fund Balance 20,19687.3 Deposits with Paying Agents (QZAB) 087.4 Net Legal Bal (Excl Cat & QZAB) 864,12888 Building Fund Balance (fund 3) 231,89489 Capital Outlay Fund Balance (fund 5) 0
Jan 30, 2012 - 141 - 9:35:29 AM

Annual Statistical Report 2010-2011
County: MILLER FOUKE SCHOOL DISTRICT LEA:4603000
2010-2011 2011-2012Actual Budget
1 Area in Square Miles 2802 ADA 9713 ADA pct Change over 5 Yrs. 0%4 4 QTR ADM 1,0305 Prior Year 3QTR ADM 1,0236 Assessment 45,472,9067 M&O Mills 25.108 URT Mills 25.009 M&O Mills in Excess of URT 0.1010 Dedicated M&O Mills 0.0011 Debt Service Mills 23.9012 Total Mills 49.0013 Total Debt Bond/Non-Bond 7,015,394
State and Local Revenue:14 Property Tax Receipts (Including URT) 2,035,768 2,116,03515 Other Local Receipts 588,082 242,83816 Revenue from Intermediate Sources 20,899 20,89917.1 Foundation Funding (Excl URT) 5,089,152 5,240,21117.2 Tax Collection Rate Guarantee 34,693 018 Student Growth Funding 60,817 019 Declining Enrollment Funding 0 020 Consolidation Incentive/Assistance 0 021 Isolated Funding 0 022 Supplemental Millage Incentive Funding 32,742 26,19423 Other Unrestricted State Funding 0 024 Total Unrestricted Revenue from State and
Local Sources 7,862,153 7,646,177
Restricted Revenue from State Sources:25 Adult Education 0 0
Regular Education:26 Professional Development 42,308 43,90627 Other Regular Education 6,698 9,400
Special Education:28 Gifted & Talented 50 029 Alternative Learning Environment (ALE) 48,593 66,36130 English Language Learner (ELL) 0 031 National School Lunch Act (NSLA) 313,472 331,93632 Other Special Education 44,204 033 Workforce Education 39,813 33,31334 School Food Service 3,953 3,50035 Educational Service Cooperatives 0 036 Early Childhood Programs 287,054 286,74037 Magnet School Programs 0 038 Other Non-Instructional Programs 158,686 148,74739 Total Restricted Revenue from State Sources 944,831 923,90340 Total Restricted Revenue from Federal
Sources 1,447,666 938,152
Other Sources of Funds:41 Financing Sources 135,853 042 Balances from Consolidated/Annexed District 0 043 Indirect Cost Reimbursement 0 044 Gains and Losses from Sale of Fixed Assets 0 045 Compensation for Loss of Fixed Assets 0 046 Other 0 047 Total Other Sources of Funds 135,853 048 Total Revenue and Other Sources of Funds
from All Sources 10,390,503 9,508,232
2010-2011 2011-2012Actual Budget
CURRENT EXPENDITURESInstruction:
49 Regular Instruction 4,308,028 4,052,30650 Special Education 476,439 447,94051 Workforce Education 239,662 264,73552 Adult Education 0 053 Compensatory Education 277,129 284,06754 Other 198,433 240,89255 Total Instruction 5,499,692 5,289,940
District Level Support:56 General Administration 288,332 302,65357 Central Services 314,843 269,79758 Maintenance & Operations of Plant 900,312 961,87059 Student Transportation 522,857 578,01360 Other District Level Support Services 15,977 5,80561 Total District Support Services 2,042,321 2,118,138
School Level Support:62 Student Support Services 416,867 431,00263 Instructional Staff Support Services 479,479 691,37564 School Administration 415,693 411,62665 Total District Support Services 1,312,039 1,534,003
Non-Instructional Services:66 Food Service Operations 518,728 506,38167 Other Enterprise Operations 0 068 Community Operations 142 2,00069 Other Non-Instructional Services 0 070 Total Non-Instructional Services 518,869 508,38171 Facilities Acquisition and Construction 15,671 65472 Debt Service 503,244 514,16475 Other Non-Programmed Costs 0 076 Total Expenditures 9,891,837 9,965,28077 Less: Capital Expenditures 256,383 305,84578 Less: Debt Service 503,244 514,16479 Total Current Expenditures 9,132,210 9,145,27180 Exclusions from Current Expenditures 739,51381 Net Current Expenditures 8,392,696
82 Per Pupil Expenditures 8,648
83 Personnel - Non-Federal Certified Clsrm FTEs 59.9984 Avg Salary - Non-Fed Certified Clsrm FTEs 50,86185 Personnel - Non-Federal Certified FTEs 66.4386 Avg Salary - Non-Fed Certified FTEs 53,20087.1 Legal Balance (funds 1-2-4) 2,277,13687.2 Categorical Fund Balance 74,52487.3 Deposits with Paying Agents (QZAB) 087.4 Net Legal Bal (Excl Cat & QZAB) 2,202,61288 Building Fund Balance (fund 3) 998,67989 Capital Outlay Fund Balance (fund 5) 20,906
Jan 30, 2012 - 142 - 9:35:29 AM

Annual Statistical Report 2010-2011
County: MILLER TEXARKANA SCHOOL DISTRICT LEA:4605000
2010-2011 2011-2012Actual Budget
1 Area in Square Miles 1972 ADA 3,9363 ADA pct Change over 5 Yrs. (7%)4 4 QTR ADM 4,2305 Prior Year 3QTR ADM 4,3466 Assessment 337,982,9827 M&O Mills 25.008 URT Mills 25.009 M&O Mills in Excess of URT 0.0010 Dedicated M&O Mills 0.0011 Debt Service Mills 13.9012 Total Mills 38.9013 Total Debt Bond/Non-Bond 21,203,898
State and Local Revenue:14 Property Tax Receipts (Including URT) 12,068,413 12,948,96515 Other Local Receipts 2,045,923 2,045,28616 Revenue from Intermediate Sources 86,362 80,00017.1 Foundation Funding (Excl URT) 18,126,093 17,722,41717.2 Tax Collection Rate Guarantee 288,551 018 Student Growth Funding 0 019 Declining Enrollment Funding 0 301,42520 Consolidation Incentive/Assistance 0 021 Isolated Funding 0 022 Supplemental Millage Incentive Funding 0 023 Other Unrestricted State Funding 5,507 024 Total Unrestricted Revenue from State and
Local Sources 32,620,850 33,098,093
Restricted Revenue from State Sources:25 Adult Education 424,721 0
Regular Education:26 Professional Development 179,762 180,03727 Other Regular Education 41,775 0
Special Education:28 Gifted & Talented 1,250 029 Alternative Learning Environment (ALE) 310,616 324,87130 English Language Learner (ELL) 11,720 11,96031 National School Lunch Act (NSLA) 1,476,592 1,463,35232 Other Special Education 584,930 228,97833 Workforce Education 942,938 494,66634 School Food Service 15,867 15,90035 Educational Service Cooperatives 0 036 Early Childhood Programs 793,152 037 Magnet School Programs 0 038 Other Non-Instructional Programs 238,712 209,84139 Total Restricted Revenue from State Sources 5,022,035 2,929,60540 Total Restricted Revenue from Federal
Sources 13,695,776 6,506,223
Other Sources of Funds:41 Financing Sources 6,786 042 Balances from Consolidated/Annexed District 0 043 Indirect Cost Reimbursement 52,932 60,00044 Gains and Losses from Sale of Fixed Assets 0 045 Compensation for Loss of Fixed Assets 301,489 046 Other 0 047 Total Other Sources of Funds 361,207 60,00048 Total Revenue and Other Sources of Funds
from All Sources 51,699,867 42,593,921
2010-2011 2011-2012Actual Budget
CURRENT EXPENDITURESInstruction:
49 Regular Instruction 15,908,006 15,839,04450 Special Education 3,160,287 3,394,11451 Workforce Education 1,476,763 1,255,43552 Adult Education 584,113 1,044,12353 Compensatory Education 1,778,699 1,263,51054 Other 1,446,716 1,346,84655 Total Instruction 24,354,583 24,143,072
District Level Support:56 General Administration 1,561,328 629,86057 Central Services 1,509,262 1,438,91458 Maintenance & Operations of Plant 4,775,053 3,834,92559 Student Transportation 1,575,561 1,347,09260 Other District Level Support Services 113,046 110,52861 Total District Support Services 9,534,249 7,361,318
School Level Support:62 Student Support Services 2,286,765 1,894,09063 Instructional Staff Support Services 5,222,525 3,705,46564 School Administration 2,366,627 2,469,94365 Total District Support Services 9,875,916 8,069,498
Non-Instructional Services:66 Food Service Operations 2,732,768 2,348,28667 Other Enterprise Operations 0 068 Community Operations 3,250 1,00069 Other Non-Instructional Services 0 070 Total Non-Instructional Services 2,736,018 2,349,28671 Facilities Acquisition and Construction 4,250,704 398,73672 Debt Service 1,472,559 1,546,05475 Other Non-Programmed Costs 181,599 076 Total Expenditures 52,405,630 43,867,96577 Less: Capital Expenditures 5,077,970 576,30078 Less: Debt Service 1,472,559 1,546,05479 Total Current Expenditures 45,855,100 41,745,61180 Exclusions from Current Expenditures 2,757,03481 Net Current Expenditures 43,098,066
82 Per Pupil Expenditures 10,950
83 Personnel - Non-Federal Certified Clsrm FTEs 323.6084 Avg Salary - Non-Fed Certified Clsrm FTEs 44,25585 Personnel - Non-Federal Certified FTEs 352.8586 Avg Salary - Non-Fed Certified FTEs 47,28887.1 Legal Balance (funds 1-2-4) 8,760,34887.2 Categorical Fund Balance 127,98687.3 Deposits with Paying Agents (QZAB) 087.4 Net Legal Bal (Excl Cat & QZAB) 8,632,36188 Building Fund Balance (fund 3) 2,563,30789 Capital Outlay Fund Balance (fund 5) 0
Jan 30, 2012 - 143 - 9:35:29 AM

Annual Statistical Report 2010-2011
County: MISSISSIPPI ARMOREL SCHOOL DISTRICT LEA:4701000
2010-2011 2011-2012Actual Budget
1 Area in Square Miles 682 ADA 4283 ADA pct Change over 5 Yrs. 11%4 4 QTR ADM 4555 Prior Year 3QTR ADM 4486 Assessment 118,626,1317 M&O Mills 27.008 URT Mills 25.009 M&O Mills in Excess of URT 2.0010 Dedicated M&O Mills 0.0011 Debt Service Mills 12.0012 Total Mills 39.0013 Total Debt Bond/Non-Bond 4,810,000
State and Local Revenue:14 Property Tax Receipts (Including URT) 3,871,162 4,415,93715 Other Local Receipts 417,471 283,80716 Revenue from Intermediate Sources 0 017.1 Foundation Funding (Excl URT) 0 017.2 Tax Collection Rate Guarantee 0 018 Student Growth Funding 45,700 019 Declining Enrollment Funding 0 020 Consolidation Incentive/Assistance 0 021 Isolated Funding 0 022 Supplemental Millage Incentive Funding 0 023 Other Unrestricted State Funding 0 024 Total Unrestricted Revenue from State and
Local Sources 4,334,333 4,699,744
Restricted Revenue from State Sources:25 Adult Education 0 0
Regular Education:26 Professional Development 18,516 19,23327 Other Regular Education 13,895 0
Special Education:28 Gifted & Talented 100 029 Alternative Learning Environment (ALE) 0 030 English Language Learner (ELL) 0 031 National School Lunch Act (NSLA) 96,224 102,21232 Other Special Education 67,954 31,00033 Workforce Education 3,250 3,00034 School Food Service 1,532 035 Educational Service Cooperatives 0 036 Early Childhood Programs 0 037 Magnet School Programs 0 038 Other Non-Instructional Programs 0 039 Total Restricted Revenue from State Sources 201,471 155,44540 Total Restricted Revenue from Federal
Sources 218,347 248,906
Other Sources of Funds:41 Financing Sources 0 042 Balances from Consolidated/Annexed District 0 043 Indirect Cost Reimbursement 0 044 Gains and Losses from Sale of Fixed Assets 0 045 Compensation for Loss of Fixed Assets 0 046 Other 0 047 Total Other Sources of Funds 0 048 Total Revenue and Other Sources of Funds
from All Sources 4,754,151 5,104,095
2010-2011 2011-2012Actual Budget
CURRENT EXPENDITURESInstruction:
49 Regular Instruction 1,834,645 1,722,13350 Special Education 293,073 425,86851 Workforce Education 219,684 212,24052 Adult Education 0 053 Compensatory Education 27,317 20,28054 Other 79,074 96,43555 Total Instruction 2,453,793 2,476,955
District Level Support:56 General Administration 184,220 183,65557 Central Services 92,031 96,02458 Maintenance & Operations of Plant 434,169 447,02659 Student Transportation 85,285 80,26560 Other District Level Support Services 12,054 9,05061 Total District Support Services 807,758 816,020
School Level Support:62 Student Support Services 121,581 148,90963 Instructional Staff Support Services 260,607 261,49864 School Administration 204,209 219,02365 Total District Support Services 586,397 629,431
Non-Instructional Services:66 Food Service Operations 213,446 210,69167 Other Enterprise Operations 0 068 Community Operations 0 069 Other Non-Instructional Services 0 070 Total Non-Instructional Services 213,446 210,69171 Facilities Acquisition and Construction 768,083 55,00072 Debt Service 1,179,327 681,97475 Other Non-Programmed Costs 0 076 Total Expenditures 6,008,804 4,870,07177 Less: Capital Expenditures 927,036 151,08678 Less: Debt Service 1,179,327 681,97479 Total Current Expenditures 3,902,441 4,037,01180 Exclusions from Current Expenditures 188,10381 Net Current Expenditures 3,714,338
82 Per Pupil Expenditures 8,682
83 Personnel - Non-Federal Certified Clsrm FTEs 40.5284 Avg Salary - Non-Fed Certified Clsrm FTEs 39,44085 Personnel - Non-Federal Certified FTEs 43.4086 Avg Salary - Non-Fed Certified FTEs 41,53187.1 Legal Balance (funds 1-2-4) 1,200,88487.2 Categorical Fund Balance 34,22787.3 Deposits with Paying Agents (QZAB) 087.4 Net Legal Bal (Excl Cat & QZAB) 1,166,65788 Building Fund Balance (fund 3) 379,75389 Capital Outlay Fund Balance (fund 5) 0
Jan 30, 2012 - 144 - 9:35:29 AM

Annual Statistical Report 2010-2011
County: MISSISSIPPI BLYTHEVILLE SCHOOL DISTRICT LEA:4702000
2010-2011 2011-2012Actual Budget
1 Area in Square Miles 1172 ADA 2,7203 ADA pct Change over 5 Yrs. (5%)4 4 QTR ADM 2,9025 Prior Year 3QTR ADM 2,9986 Assessment 151,709,1497 M&O Mills 25.008 URT Mills 25.009 M&O Mills in Excess of URT 0.0010 Dedicated M&O Mills 0.0011 Debt Service Mills 8.3912 Total Mills 33.3913 Total Debt Bond/Non-Bond 15,045,000
State and Local Revenue:14 Property Tax Receipts (Including URT) 4,641,140 4,632,00015 Other Local Receipts 1,006,556 506,98816 Revenue from Intermediate Sources 0 017.1 Foundation Funding (Excl URT) 14,446,192 14,188,85817.2 Tax Collection Rate Guarantee 200,871 200,00018 Student Growth Funding 0 019 Declining Enrollment Funding 213,064 254,23920 Consolidation Incentive/Assistance 0 021 Isolated Funding 0 022 Supplemental Millage Incentive Funding 32,697 26,15723 Other Unrestricted State Funding 0 024 Total Unrestricted Revenue from State and
Local Sources 20,540,520 19,808,242
Restricted Revenue from State Sources:25 Adult Education 0 0
Regular Education:26 Professional Development 124,005 123,55527 Other Regular Education 27,599 46,600
Special Education:28 Gifted & Talented 300 30029 Alternative Learning Environment (ALE) 364,289 350,13530 English Language Learner (ELL) 22,561 19,18031 National School Lunch Act (NSLA) 2,452,224 2,424,75232 Other Special Education 12,282 033 Workforce Education 173,085 173,87534 School Food Service 13,073 035 Educational Service Cooperatives 0 036 Early Childhood Programs 179,560 194,40037 Magnet School Programs 0 038 Other Non-Instructional Programs 309,212 282,91839 Total Restricted Revenue from State Sources 3,678,191 3,615,71640 Total Restricted Revenue from Federal
Sources 9,206,677 6,015,696
Other Sources of Funds:41 Financing Sources 4,104 042 Balances from Consolidated/Annexed District 0 043 Indirect Cost Reimbursement 108,414 52,00044 Gains and Losses from Sale of Fixed Assets 294 045 Compensation for Loss of Fixed Assets 21,619 046 Other 0 047 Total Other Sources of Funds 134,431 52,00048 Total Revenue and Other Sources of Funds
from All Sources 33,559,819 29,491,654
2010-2011 2011-2012Actual Budget
CURRENT EXPENDITURESInstruction:
49 Regular Instruction 10,783,658 10,555,24950 Special Education 2,235,962 2,510,71051 Workforce Education 850,370 749,35452 Adult Education 0 053 Compensatory Education 3,854,927 3,109,75254 Other 1,364,500 1,478,93155 Total Instruction 19,089,417 18,403,997
District Level Support:56 General Administration 816,378 826,65757 Central Services 443,744 371,65658 Maintenance & Operations of Plant 3,904,166 4,569,53159 Student Transportation 944,549 1,128,04160 Other District Level Support Services 179,432 97,00061 Total District Support Services 6,288,269 6,992,885
School Level Support:62 Student Support Services 1,152,939 1,351,74563 Instructional Staff Support Services 2,396,633 3,133,28864 School Administration 1,533,785 1,564,45865 Total District Support Services 5,083,357 6,049,491
Non-Instructional Services:66 Food Service Operations 1,812,768 269,61067 Other Enterprise Operations 0 068 Community Operations 37,754 55,00069 Other Non-Instructional Services 0 070 Total Non-Instructional Services 1,850,522 324,61071 Facilities Acquisition and Construction 27,291 072 Debt Service 386,021 1,024,76975 Other Non-Programmed Costs 0 076 Total Expenditures 32,724,877 32,795,75277 Less: Capital Expenditures 687,446 242,59778 Less: Debt Service 386,021 1,024,76979 Total Current Expenditures 31,651,410 31,528,38680 Exclusions from Current Expenditures 677,23281 Net Current Expenditures 30,974,178
82 Per Pupil Expenditures 11,387
83 Personnel - Non-Federal Certified Clsrm FTEs 209.2884 Avg Salary - Non-Fed Certified Clsrm FTEs 43,14485 Personnel - Non-Federal Certified FTEs 232.4986 Avg Salary - Non-Fed Certified FTEs 46,60187.1 Legal Balance (funds 1-2-4) 5,109,78587.2 Categorical Fund Balance 593,56987.3 Deposits with Paying Agents (QZAB) 087.4 Net Legal Bal (Excl Cat & QZAB) 4,516,21688 Building Fund Balance (fund 3) 558,48689 Capital Outlay Fund Balance (fund 5) 0
Jan 30, 2012 - 145 - 9:35:29 AM

Annual Statistical Report 2010-2011
County: MISSISSIPPI SO. MISS. COUNTY SCHOOL DIST. LEA:4706000
2010-2011 2011-2012Actual Budget
1 Area in Square Miles 3712 ADA 1,2253 ADA pct Change over 5 Yrs. 1%4 4 QTR ADM 1,3015 Prior Year 3QTR ADM 1,2726 Assessment 65,355,4067 M&O Mills 26.608 URT Mills 25.009 M&O Mills in Excess of URT 1.6010 Dedicated M&O Mills 0.0011 Debt Service Mills 9.4012 Total Mills 36.0013 Total Debt Bond/Non-Bond 6,692,438
State and Local Revenue:14 Property Tax Receipts (Including URT) 1,717,645 1,806,77015 Other Local Receipts 1,052,568 980,35316 Revenue from Intermediate Sources 0 017.1 Foundation Funding (Excl URT) 6,095,970 6,374,05217.2 Tax Collection Rate Guarantee 0 018 Student Growth Funding 169,939 108,44419 Declining Enrollment Funding 0 020 Consolidation Incentive/Assistance 0 021 Isolated Funding 0 022 Supplemental Millage Incentive Funding 0 023 Other Unrestricted State Funding 0 024 Total Unrestricted Revenue from State and
Local Sources 9,036,122 9,269,619
Restricted Revenue from State Sources:25 Adult Education 0 0
Regular Education:26 Professional Development 52,628 55,05927 Other Regular Education 9,000 0
Special Education:28 Gifted & Talented 650 029 Alternative Learning Environment (ALE) 26,816 5,09830 English Language Learner (ELL) 4,981 031 National School Lunch Act (NSLA) 943,392 1,014,02432 Other Special Education 83,512 70,00033 Workforce Education 26,000 26,00034 School Food Service 5,580 5,00035 Educational Service Cooperatives 0 036 Early Childhood Programs 184,680 148,22037 Magnet School Programs 0 038 Other Non-Instructional Programs 218,058 102,82639 Total Restricted Revenue from State Sources 1,555,297 1,426,22740 Total Restricted Revenue from Federal
Sources 2,639,342 3,512,216
Other Sources of Funds:41 Financing Sources (196,923) 042 Balances from Consolidated/Annexed District 0 043 Indirect Cost Reimbursement 6,893 044 Gains and Losses from Sale of Fixed Assets 2,875 045 Compensation for Loss of Fixed Assets 2,050 046 Other 0 047 Total Other Sources of Funds (185,105) 048 Total Revenue and Other Sources of Funds
from All Sources 13,045,657 14,208,062
2010-2011 2011-2012Actual Budget
CURRENT EXPENDITURESInstruction:
49 Regular Instruction 4,663,339 5,732,14350 Special Education 527,106 613,51451 Workforce Education 225,357 182,57652 Adult Education 0 053 Compensatory Education 1,078,890 1,131,97054 Other 198,782 205,26655 Total Instruction 6,693,473 7,865,468
District Level Support:56 General Administration 239,332 346,84457 Central Services 223,180 490,80358 Maintenance & Operations of Plant 1,202,129 1,739,87059 Student Transportation 936,224 1,160,15860 Other District Level Support Services 25,401 27,88161 Total District Support Services 2,626,266 3,765,556
School Level Support:62 Student Support Services 582,278 687,84663 Instructional Staff Support Services 1,091,374 1,121,55364 School Administration 426,178 421,62265 Total District Support Services 2,099,829 2,231,020
Non-Instructional Services:66 Food Service Operations 780,607 728,02167 Other Enterprise Operations 0 068 Community Operations 4,798 10,62569 Other Non-Instructional Services 0 070 Total Non-Instructional Services 785,405 738,64671 Facilities Acquisition and Construction 215,870 116,64272 Debt Service 506,723 562,00075 Other Non-Programmed Costs 94,045 4,30076 Total Expenditures 13,021,612 15,283,63277 Less: Capital Expenditures 834,525 938,03078 Less: Debt Service 506,723 562,00079 Total Current Expenditures 11,680,364 13,783,60180 Exclusions from Current Expenditures 949,22681 Net Current Expenditures 10,731,138
82 Per Pupil Expenditures 8,760
83 Personnel - Non-Federal Certified Clsrm FTEs 80.2484 Avg Salary - Non-Fed Certified Clsrm FTEs 42,92385 Personnel - Non-Federal Certified FTEs 89.7386 Avg Salary - Non-Fed Certified FTEs 44,79287.1 Legal Balance (funds 1-2-4) 2,558,90687.2 Categorical Fund Balance 188,77687.3 Deposits with Paying Agents (QZAB) 087.4 Net Legal Bal (Excl Cat & QZAB) 2,370,13088 Building Fund Balance (fund 3) 193,04789 Capital Outlay Fund Balance (fund 5) 0
Jan 30, 2012 - 146 - 9:35:29 AM

Annual Statistical Report 2010-2011
County: MISSISSIPPI GOSNELL SCHOOL DISTRICT LEA:4708000
2010-2011 2011-2012Actual Budget
1 Area in Square Miles 1112 ADA 1,2963 ADA pct Change over 5 Yrs. (3%)4 4 QTR ADM 1,3955 Prior Year 3QTR ADM 1,4096 Assessment 40,959,4077 M&O Mills 30.008 URT Mills 25.009 M&O Mills in Excess of URT 5.0010 Dedicated M&O Mills 0.0011 Debt Service Mills 0.0012 Total Mills 30.0013 Total Debt Bond/Non-Bond 0
State and Local Revenue:14 Property Tax Receipts (Including URT) 1,039,990 1,031,39715 Other Local Receipts 681,933 267,08616 Revenue from Intermediate Sources 0 017.1 Foundation Funding (Excl URT) 7,154,115 7,677,29117.2 Tax Collection Rate Guarantee 17,244 38,13218 Student Growth Funding 0 019 Declining Enrollment Funding 47,281 020 Consolidation Incentive/Assistance 0 021 Isolated Funding 0 022 Supplemental Millage Incentive Funding 83,876 67,10023 Other Unrestricted State Funding 0 024 Total Unrestricted Revenue from State and
Local Sources 9,024,439 9,081,006
Restricted Revenue from State Sources:25 Adult Education 0 0
Regular Education:26 Professional Development 58,260 59,87827 Other Regular Education 3,399 3,800
Special Education:28 Gifted & Talented 250 029 Alternative Learning Environment (ALE) 18,649 26,69430 English Language Learner (ELL) 6,446 031 National School Lunch Act (NSLA) 466,240 477,15832 Other Special Education 14,558 033 Workforce Education 28,167 21,12534 School Food Service 5,447 035 Educational Service Cooperatives 0 036 Early Childhood Programs 0 037 Magnet School Programs 0 038 Other Non-Instructional Programs 201,751 13,69239 Total Restricted Revenue from State Sources 803,168 602,34740 Total Restricted Revenue from Federal
Sources 2,401,547 937,053
Other Sources of Funds:41 Financing Sources 0 042 Balances from Consolidated/Annexed District 0 043 Indirect Cost Reimbursement 0 044 Gains and Losses from Sale of Fixed Assets 500 045 Compensation for Loss of Fixed Assets 0 046 Other 0 047 Total Other Sources of Funds 500 048 Total Revenue and Other Sources of Funds
from All Sources 12,229,654 10,620,406
2010-2011 2011-2012Actual Budget
CURRENT EXPENDITURESInstruction:
49 Regular Instruction 4,758,442 4,675,92850 Special Education 961,728 806,61851 Workforce Education 326,983 328,89552 Adult Education 0 053 Compensatory Education 514,048 419,49954 Other 387,982 431,42055 Total Instruction 6,949,183 6,662,361
District Level Support:56 General Administration 339,074 357,27657 Central Services 341,699 312,34358 Maintenance & Operations of Plant 1,138,133 1,283,30159 Student Transportation 535,911 551,51060 Other District Level Support Services 10,831 10,00061 Total District Support Services 2,365,647 2,514,430
School Level Support:62 Student Support Services 451,455 468,64263 Instructional Staff Support Services 757,760 770,59264 School Administration 694,584 720,20865 Total District Support Services 1,903,799 1,959,442
Non-Instructional Services:66 Food Service Operations 659,867 38,35167 Other Enterprise Operations 29,915 068 Community Operations 0 6,59169 Other Non-Instructional Services 0 070 Total Non-Instructional Services 689,781 44,94271 Facilities Acquisition and Construction 822,752 072 Debt Service 0 075 Other Non-Programmed Costs 0 076 Total Expenditures 12,731,163 11,181,17577 Less: Capital Expenditures 1,293,214 300,39578 Less: Debt Service 0 079 Total Current Expenditures 11,437,949 10,880,78180 Exclusions from Current Expenditures 313,00681 Net Current Expenditures 11,124,943
82 Per Pupil Expenditures 8,583
83 Personnel - Non-Federal Certified Clsrm FTEs 95.3484 Avg Salary - Non-Fed Certified Clsrm FTEs 43,47685 Personnel - Non-Federal Certified FTEs 106.7886 Avg Salary - Non-Fed Certified FTEs 46,14987.1 Legal Balance (funds 1-2-4) 4,864,29487.2 Categorical Fund Balance 97,54487.3 Deposits with Paying Agents (QZAB) 087.4 Net Legal Bal (Excl Cat & QZAB) 4,766,75088 Building Fund Balance (fund 3) 1,279,04289 Capital Outlay Fund Balance (fund 5) 0
Jan 30, 2012 - 147 - 9:35:29 AM

Annual Statistical Report 2010-2011
County: MISSISSIPPI MANILA SCHOOL DISTRICT LEA:4712000
2010-2011 2011-2012Actual Budget
1 Area in Square Miles 1362 ADA 9283 ADA pct Change over 5 Yrs. (3%)4 4 QTR ADM 9845 Prior Year 3QTR ADM 1,0196 Assessment 41,118,8137 M&O Mills 25.008 URT Mills 25.009 M&O Mills in Excess of URT 0.0010 Dedicated M&O Mills 0.0011 Debt Service Mills 11.7012 Total Mills 36.7013 Total Debt Bond/Non-Bond 3,955,000
State and Local Revenue:14 Property Tax Receipts (Including URT) 1,353,414 1,300,06815 Other Local Receipts 617,828 583,13016 Revenue from Intermediate Sources 0 017.1 Foundation Funding (Excl URT) 5,185,582 5,038,16917.2 Tax Collection Rate Guarantee 26,950 018 Student Growth Funding 0 019 Declining Enrollment Funding 18,129 103,71120 Consolidation Incentive/Assistance 0 021 Isolated Funding 0 022 Supplemental Millage Incentive Funding 35,966 28,77323 Other Unrestricted State Funding 217 024 Total Unrestricted Revenue from State and
Local Sources 7,238,086 7,053,851
Restricted Revenue from State Sources:25 Adult Education 0 0
Regular Education:26 Professional Development 42,131 41,73927 Other Regular Education 3,600 0
Special Education:28 Gifted & Talented 250 029 Alternative Learning Environment (ALE) 18,893 20,47630 English Language Learner (ELL) 2,930 2,39231 National School Lunch Act (NSLA) 317,936 313,21432 Other Special Education 4,173 033 Workforce Education 21,124 034 School Food Service 3,469 3,40035 Educational Service Cooperatives 0 036 Early Childhood Programs 194,012 194,40037 Magnet School Programs 0 038 Other Non-Instructional Programs 1,187,518 84,92339 Total Restricted Revenue from State Sources 1,796,036 660,54440 Total Restricted Revenue from Federal
Sources 1,835,058 909,457
Other Sources of Funds:41 Financing Sources 25,013 042 Balances from Consolidated/Annexed District 0 043 Indirect Cost Reimbursement 0 044 Gains and Losses from Sale of Fixed Assets 0 045 Compensation for Loss of Fixed Assets 0 046 Other 0 047 Total Other Sources of Funds 25,013 048 Total Revenue and Other Sources of Funds
from All Sources 10,894,193 8,623,852
2010-2011 2011-2012Actual Budget
CURRENT EXPENDITURESInstruction:
49 Regular Instruction 4,102,925 3,860,95850 Special Education 629,614 541,81551 Workforce Education 346,940 301,13652 Adult Education 0 053 Compensatory Education 386,939 317,34354 Other 115,144 108,14455 Total Instruction 5,581,562 5,129,396
District Level Support:56 General Administration 292,663 304,78457 Central Services 152,263 155,99158 Maintenance & Operations of Plant 861,222 973,45859 Student Transportation 376,849 289,65760 Other District Level Support Services 19,033 17,90061 Total District Support Services 1,702,029 1,741,790
School Level Support:62 Student Support Services 371,307 358,77363 Instructional Staff Support Services 465,377 408,69564 School Administration 452,572 473,62865 Total District Support Services 1,289,256 1,241,096
Non-Instructional Services:66 Food Service Operations 473,571 417,44567 Other Enterprise Operations 0 16,50068 Community Operations 0 169 Other Non-Instructional Services 0 070 Total Non-Instructional Services 473,571 433,94671 Facilities Acquisition and Construction 4,238,068 4,50372 Debt Service 374,606 371,78975 Other Non-Programmed Costs 0 076 Total Expenditures 13,659,092 8,922,52077 Less: Capital Expenditures 4,569,127 70,99878 Less: Debt Service 374,606 371,78979 Total Current Expenditures 8,715,360 8,479,73380 Exclusions from Current Expenditures 477,59681 Net Current Expenditures 8,237,763
82 Per Pupil Expenditures 8,876
83 Personnel - Non-Federal Certified Clsrm FTEs 72.0384 Avg Salary - Non-Fed Certified Clsrm FTEs 43,54085 Personnel - Non-Federal Certified FTEs 76.8286 Avg Salary - Non-Fed Certified FTEs 45,33487.1 Legal Balance (funds 1-2-4) 3,249,15487.2 Categorical Fund Balance 118,96487.3 Deposits with Paying Agents (QZAB) 087.4 Net Legal Bal (Excl Cat & QZAB) 3,130,19088 Building Fund Balance (fund 3) 089 Capital Outlay Fund Balance (fund 5) 0
Jan 30, 2012 - 148 - 9:35:29 AM

Annual Statistical Report 2010-2011
County: MISSISSIPPI OSCEOLA SCHOOL DISTRICT LEA:4713000
2010-2011 2011-2012Actual Budget
1 Area in Square Miles 522 ADA 1,2993 ADA pct Change over 5 Yrs. (12%)4 4 QTR ADM 1,3705 Prior Year 3QTR ADM 1,4756 Assessment 74,512,9917 M&O Mills 25.008 URT Mills 25.009 M&O Mills in Excess of URT 0.0010 Dedicated M&O Mills 0.0011 Debt Service Mills 13.2012 Total Mills 38.2013 Total Debt Bond/Non-Bond 10,205,000
State and Local Revenue:14 Property Tax Receipts (Including URT) 2,512,322 2,537,00015 Other Local Receipts 449,183 368,69816 Revenue from Intermediate Sources 0 017.1 Foundation Funding (Excl URT) 7,141,888 6,682,44717.2 Tax Collection Rate Guarantee 110,942 018 Student Growth Funding 0 019 Declining Enrollment Funding 252,484 271,53420 Consolidation Incentive/Assistance 0 021 Isolated Funding 0 022 Supplemental Millage Incentive Funding 114,154 91,32323 Other Unrestricted State Funding 0 024 Total Unrestricted Revenue from State and
Local Sources 10,580,973 9,951,002
Restricted Revenue from State Sources:25 Adult Education 0 0
Regular Education:26 Professional Development 60,997 58,75527 Other Regular Education 46,951 20,600
Special Education:28 Gifted & Talented 50 029 Alternative Learning Environment (ALE) 41,808 36,35230 English Language Learner (ELL) 6,739 031 National School Lunch Act (NSLA) 1,221,152 2,083,16432 Other Special Education 340,467 033 Workforce Education 25,459 3,25034 School Food Service 6,159 10,00035 Educational Service Cooperatives 0 036 Early Childhood Programs 165,839 194,40037 Magnet School Programs 0 038 Other Non-Instructional Programs 808,800 5,303,86739 Total Restricted Revenue from State Sources 2,724,420 7,710,38840 Total Restricted Revenue from Federal
Sources 5,458,968 5,375,330
Other Sources of Funds:41 Financing Sources 0 042 Balances from Consolidated/Annexed District 0 043 Indirect Cost Reimbursement 15,000 34,60044 Gains and Losses from Sale of Fixed Assets 0 045 Compensation for Loss of Fixed Assets 16,900 046 Other 0 047 Total Other Sources of Funds 31,900 34,60048 Total Revenue and Other Sources of Funds
from All Sources 18,796,260 23,071,320
2010-2011 2011-2012Actual Budget
CURRENT EXPENDITURESInstruction:
49 Regular Instruction 4,824,235 4,896,03750 Special Education 1,258,377 844,20051 Workforce Education 372,253 337,16752 Adult Education 0 053 Compensatory Education 1,204,015 1,660,12054 Other 773,974 671,45055 Total Instruction 8,432,854 8,408,974
District Level Support:56 General Administration 627,419 652,89557 Central Services 126,389 104,21558 Maintenance & Operations of Plant 1,637,542 1,595,65459 Student Transportation 328,163 352,19760 Other District Level Support Services 49,535 60,94561 Total District Support Services 2,769,047 2,765,906
School Level Support:62 Student Support Services 903,777 985,98763 Instructional Staff Support Services 2,652,062 3,263,13464 School Administration 568,239 596,16765 Total District Support Services 4,124,078 4,845,288
Non-Instructional Services:66 Food Service Operations 1,062,026 1,114,47467 Other Enterprise Operations 0 068 Community Operations 333 5,00069 Other Non-Instructional Services 0 070 Total Non-Instructional Services 1,062,360 1,119,47471 Facilities Acquisition and Construction 1,530,941 8,241,61572 Debt Service 560,333 677,50075 Other Non-Programmed Costs 17,585 076 Total Expenditures 18,497,198 26,058,75777 Less: Capital Expenditures 1,668,331 8,297,11578 Less: Debt Service 560,333 677,50079 Total Current Expenditures 16,268,534 17,084,14280 Exclusions from Current Expenditures 391,19081 Net Current Expenditures 15,877,344
82 Per Pupil Expenditures 12,218
83 Personnel - Non-Federal Certified Clsrm FTEs 110.0484 Avg Salary - Non-Fed Certified Clsrm FTEs 41,88685 Personnel - Non-Federal Certified FTEs 119.9086 Avg Salary - Non-Fed Certified FTEs 43,69987.1 Legal Balance (funds 1-2-4) 3,083,67487.2 Categorical Fund Balance 980,54487.3 Deposits with Paying Agents (QZAB) 087.4 Net Legal Bal (Excl Cat & QZAB) 2,103,13088 Building Fund Balance (fund 3) 3,414,88989 Capital Outlay Fund Balance (fund 5) 0
Jan 30, 2012 - 149 - 9:35:29 AM

Annual Statistical Report 2010-2011
County: MONROE BRINKLEY SCHOOL DISTRICT LEA:4801000
2010-2011 2011-2012Actual Budget
1 Area in Square Miles 2322 ADA 5903 ADA pct Change over 5 Yrs. (32%)4 4 QTR ADM 6325 Prior Year 3QTR ADM 6886 Assessment 56,271,4937 M&O Mills 25.008 URT Mills 25.009 M&O Mills in Excess of URT 0.0010 Dedicated M&O Mills 0.0011 Debt Service Mills 10.9012 Total Mills 35.9013 Total Debt Bond/Non-Bond 1,670,000
State and Local Revenue:14 Property Tax Receipts (Including URT) 1,994,703 1,204,00015 Other Local Receipts 298,542 130,00016 Revenue from Intermediate Sources 0 017.1 Foundation Funding (Excl URT) 2,695,758 2,491,31017.2 Tax Collection Rate Guarantee 63,712 018 Student Growth Funding 0 019 Declining Enrollment Funding 140,637 170,86520 Consolidation Incentive/Assistance 0 021 Isolated Funding 0 022 Supplemental Millage Incentive Funding 32,873 26,29823 Other Unrestricted State Funding 0 024 Total Unrestricted Revenue from State and
Local Sources 5,226,224 4,022,473
Restricted Revenue from State Sources:25 Adult Education 0 0
Regular Education:26 Professional Development 28,457 26,80227 Other Regular Education 10,910 0
Special Education:28 Gifted & Talented 50 029 Alternative Learning Environment (ALE) 34,698 43,56430 English Language Learner (ELL) 0 031 National School Lunch Act (NSLA) 538,656 499,92832 Other Special Education 2,819 033 Workforce Education 6,500 034 School Food Service 3,103 035 Educational Service Cooperatives 0 036 Early Childhood Programs 153,879 155,52037 Magnet School Programs 0 038 Other Non-Instructional Programs 25,206 21,55239 Total Restricted Revenue from State Sources 804,277 747,36640 Total Restricted Revenue from Federal
Sources 1,250,787 1,721,356
Other Sources of Funds:41 Financing Sources 26,570 042 Balances from Consolidated/Annexed District 0 043 Indirect Cost Reimbursement 0 044 Gains and Losses from Sale of Fixed Assets 0 045 Compensation for Loss of Fixed Assets 0 046 Other 0 047 Total Other Sources of Funds 26,570 048 Total Revenue and Other Sources of Funds
from All Sources 7,307,859 6,491,195
2010-2011 2011-2012Actual Budget
CURRENT EXPENDITURESInstruction:
49 Regular Instruction 2,857,049 1,967,64050 Special Education 308,826 324,68851 Workforce Education 219,461 163,13652 Adult Education 0 053 Compensatory Education 330,403 463,33354 Other 383,521 380,06355 Total Instruction 4,099,260 3,298,860
District Level Support:56 General Administration 299,798 286,79457 Central Services 265,272 158,83858 Maintenance & Operations of Plant 853,775 488,18359 Student Transportation 193,593 177,83960 Other District Level Support Services 16,761 061 Total District Support Services 1,629,199 1,111,654
School Level Support:62 Student Support Services 446,063 382,61063 Instructional Staff Support Services 710,512 716,02364 School Administration 308,243 267,63065 Total District Support Services 1,464,818 1,366,262
Non-Instructional Services:66 Food Service Operations 557,448 560,52467 Other Enterprise Operations 0 068 Community Operations 349 10,00069 Other Non-Instructional Services 0 070 Total Non-Instructional Services 557,797 570,52471 Facilities Acquisition and Construction 31,898 072 Debt Service 140,862 143,24375 Other Non-Programmed Costs 35,628 076 Total Expenditures 7,959,463 6,490,54277 Less: Capital Expenditures 53,299 078 Less: Debt Service 140,862 143,24379 Total Current Expenditures 7,765,301 6,347,29980 Exclusions from Current Expenditures 364,71281 Net Current Expenditures 7,400,589
82 Per Pupil Expenditures 12,552
83 Personnel - Non-Federal Certified Clsrm FTEs 62.5284 Avg Salary - Non-Fed Certified Clsrm FTEs 42,31285 Personnel - Non-Federal Certified FTEs 69.0986 Avg Salary - Non-Fed Certified FTEs 44,13187.1 Legal Balance (funds 1-2-4) 465,95587.2 Categorical Fund Balance 34,32987.3 Deposits with Paying Agents (QZAB) 087.4 Net Legal Bal (Excl Cat & QZAB) 431,62688 Building Fund Balance (fund 3) 12,90789 Capital Outlay Fund Balance (fund 5) 0
Jan 30, 2012 - 150 - 9:35:29 AM
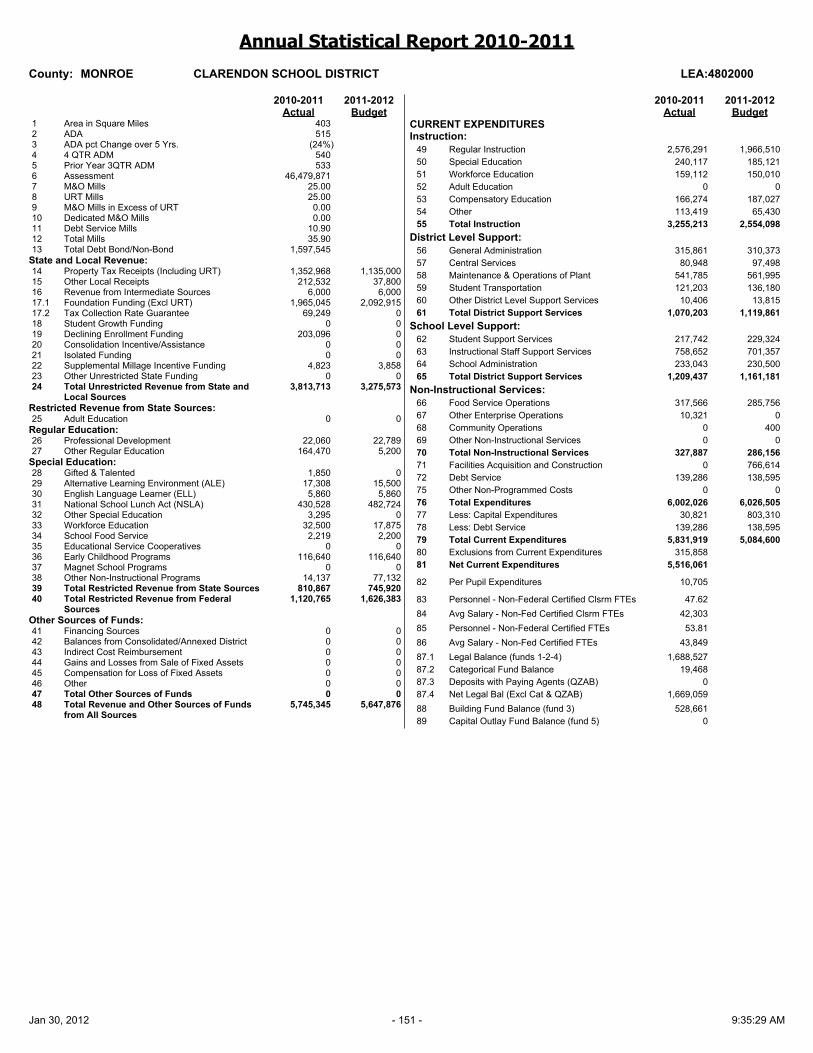
Annual Statistical Report 2010-2011
County: MONROE CLARENDON SCHOOL DISTRICT LEA:4802000
2010-2011 2011-2012Actual Budget
1 Area in Square Miles 4032 ADA 5153 ADA pct Change over 5 Yrs. (24%)4 4 QTR ADM 5405 Prior Year 3QTR ADM 5336 Assessment 46,479,8717 M&O Mills 25.008 URT Mills 25.009 M&O Mills in Excess of URT 0.0010 Dedicated M&O Mills 0.0011 Debt Service Mills 10.9012 Total Mills 35.9013 Total Debt Bond/Non-Bond 1,597,545
State and Local Revenue:14 Property Tax Receipts (Including URT) 1,352,968 1,135,00015 Other Local Receipts 212,532 37,80016 Revenue from Intermediate Sources 6,000 6,00017.1 Foundation Funding (Excl URT) 1,965,045 2,092,91517.2 Tax Collection Rate Guarantee 69,249 018 Student Growth Funding 0 019 Declining Enrollment Funding 203,096 020 Consolidation Incentive/Assistance 0 021 Isolated Funding 0 022 Supplemental Millage Incentive Funding 4,823 3,85823 Other Unrestricted State Funding 0 024 Total Unrestricted Revenue from State and
Local Sources 3,813,713 3,275,573
Restricted Revenue from State Sources:25 Adult Education 0 0
Regular Education:26 Professional Development 22,060 22,78927 Other Regular Education 164,470 5,200
Special Education:28 Gifted & Talented 1,850 029 Alternative Learning Environment (ALE) 17,308 15,50030 English Language Learner (ELL) 5,860 5,86031 National School Lunch Act (NSLA) 430,528 482,72432 Other Special Education 3,295 033 Workforce Education 32,500 17,87534 School Food Service 2,219 2,20035 Educational Service Cooperatives 0 036 Early Childhood Programs 116,640 116,64037 Magnet School Programs 0 038 Other Non-Instructional Programs 14,137 77,13239 Total Restricted Revenue from State Sources 810,867 745,92040 Total Restricted Revenue from Federal
Sources 1,120,765 1,626,383
Other Sources of Funds:41 Financing Sources 0 042 Balances from Consolidated/Annexed District 0 043 Indirect Cost Reimbursement 0 044 Gains and Losses from Sale of Fixed Assets 0 045 Compensation for Loss of Fixed Assets 0 046 Other 0 047 Total Other Sources of Funds 0 048 Total Revenue and Other Sources of Funds
from All Sources 5,745,345 5,647,876
2010-2011 2011-2012Actual Budget
CURRENT EXPENDITURESInstruction:
49 Regular Instruction 2,576,291 1,966,51050 Special Education 240,117 185,12151 Workforce Education 159,112 150,01052 Adult Education 0 053 Compensatory Education 166,274 187,02754 Other 113,419 65,43055 Total Instruction 3,255,213 2,554,098
District Level Support:56 General Administration 315,861 310,37357 Central Services 80,948 97,49858 Maintenance & Operations of Plant 541,785 561,99559 Student Transportation 121,203 136,18060 Other District Level Support Services 10,406 13,81561 Total District Support Services 1,070,203 1,119,861
School Level Support:62 Student Support Services 217,742 229,32463 Instructional Staff Support Services 758,652 701,35764 School Administration 233,043 230,50065 Total District Support Services 1,209,437 1,161,181
Non-Instructional Services:66 Food Service Operations 317,566 285,75667 Other Enterprise Operations 10,321 068 Community Operations 0 40069 Other Non-Instructional Services 0 070 Total Non-Instructional Services 327,887 286,15671 Facilities Acquisition and Construction 0 766,61472 Debt Service 139,286 138,59575 Other Non-Programmed Costs 0 076 Total Expenditures 6,002,026 6,026,50577 Less: Capital Expenditures 30,821 803,31078 Less: Debt Service 139,286 138,59579 Total Current Expenditures 5,831,919 5,084,60080 Exclusions from Current Expenditures 315,85881 Net Current Expenditures 5,516,061
82 Per Pupil Expenditures 10,705
83 Personnel - Non-Federal Certified Clsrm FTEs 47.6284 Avg Salary - Non-Fed Certified Clsrm FTEs 42,30385 Personnel - Non-Federal Certified FTEs 53.8186 Avg Salary - Non-Fed Certified FTEs 43,84987.1 Legal Balance (funds 1-2-4) 1,688,52787.2 Categorical Fund Balance 19,46887.3 Deposits with Paying Agents (QZAB) 087.4 Net Legal Bal (Excl Cat & QZAB) 1,669,05988 Building Fund Balance (fund 3) 528,66189 Capital Outlay Fund Balance (fund 5) 0
Jan 30, 2012 - 151 - 9:35:29 AM

Annual Statistical Report 2010-2011
County: MONTGOMERY CADDO HILLS SCHOOL DISTRICT LEA:4901000
2010-2011 2011-2012Actual Budget
1 Area in Square Miles 3212 ADA 5363 ADA pct Change over 5 Yrs. (2%)4 4 QTR ADM 5725 Prior Year 3QTR ADM 5506 Assessment 30,651,0697 M&O Mills 25.008 URT Mills 25.009 M&O Mills in Excess of URT 0.0010 Dedicated M&O Mills 0.0011 Debt Service Mills 8.7012 Total Mills 33.7013 Total Debt Bond/Non-Bond 2,432,779
State and Local Revenue:14 Property Tax Receipts (Including URT) 951,092 775,00015 Other Local Receipts 182,834 87,50016 Revenue from Intermediate Sources 267 017.1 Foundation Funding (Excl URT) 2,294,538 2,462,31417.2 Tax Collection Rate Guarantee 31,844 018 Student Growth Funding 132,401 019 Declining Enrollment Funding 0 020 Consolidation Incentive/Assistance 0 021 Isolated Funding 0 022 Supplemental Millage Incentive Funding 43,193 34,55523 Other Unrestricted State Funding 0 024 Total Unrestricted Revenue from State and
Local Sources 3,636,169 3,359,369
Restricted Revenue from State Sources:25 Adult Education 0 0
Regular Education:26 Professional Development 22,746 24,11127 Other Regular Education 112,671 183,400
Special Education:28 Gifted & Talented 50 029 Alternative Learning Environment (ALE) 32,707 61,47030 English Language Learner (ELL) 586 59831 National School Lunch Act (NSLA) 423,584 462,48432 Other Special Education 3,289 033 Workforce Education 0 034 School Food Service 2,419 3,50035 Educational Service Cooperatives 0 036 Early Childhood Programs 0 037 Magnet School Programs 0 038 Other Non-Instructional Programs 20,582 20,00439 Total Restricted Revenue from State Sources 618,634 755,56740 Total Restricted Revenue from Federal
Sources 1,706,382 1,281,834
Other Sources of Funds:41 Financing Sources 0 042 Balances from Consolidated/Annexed District 0 043 Indirect Cost Reimbursement 0 044 Gains and Losses from Sale of Fixed Assets 13,400 045 Compensation for Loss of Fixed Assets 25,219 046 Other 0 047 Total Other Sources of Funds 38,619 048 Total Revenue and Other Sources of Funds
from All Sources 5,999,805 5,396,770
2010-2011 2011-2012Actual Budget
CURRENT EXPENDITURESInstruction:
49 Regular Instruction 1,968,986 1,867,09550 Special Education 399,167 397,86751 Workforce Education 140,172 156,63352 Adult Education 0 053 Compensatory Education 397,157 359,22154 Other 88,710 100,14255 Total Instruction 2,994,191 2,880,958
District Level Support:56 General Administration 163,994 148,89357 Central Services 79,104 92,86758 Maintenance & Operations of Plant 560,549 609,65859 Student Transportation 348,896 312,21460 Other District Level Support Services 14,556 8,65061 Total District Support Services 1,167,099 1,172,282
School Level Support:62 Student Support Services 246,006 254,86163 Instructional Staff Support Services 451,930 414,87164 School Administration 185,100 206,48565 Total District Support Services 883,036 876,217
Non-Instructional Services:66 Food Service Operations 348,293 380,26767 Other Enterprise Operations 7,286 068 Community Operations 845 3,56169 Other Non-Instructional Services 0 070 Total Non-Instructional Services 356,424 383,82871 Facilities Acquisition and Construction 133,200 072 Debt Service 309,593 251,02675 Other Non-Programmed Costs 13,777 076 Total Expenditures 5,857,319 5,564,31177 Less: Capital Expenditures 192,608 17,00078 Less: Debt Service 309,593 251,02679 Total Current Expenditures 5,355,119 5,296,28580 Exclusions from Current Expenditures 153,57881 Net Current Expenditures 5,201,541
82 Per Pupil Expenditures 9,696
83 Personnel - Non-Federal Certified Clsrm FTEs 45.9284 Avg Salary - Non-Fed Certified Clsrm FTEs 38,77785 Personnel - Non-Federal Certified FTEs 49.0886 Avg Salary - Non-Fed Certified FTEs 40,82087.1 Legal Balance (funds 1-2-4) 1,454,72687.2 Categorical Fund Balance 12,50187.3 Deposits with Paying Agents (QZAB) 087.4 Net Legal Bal (Excl Cat & QZAB) 1,442,22588 Building Fund Balance (fund 3) 089 Capital Outlay Fund Balance (fund 5) 0
Jan 30, 2012 - 152 - 9:35:29 AM

Annual Statistical Report 2010-2011
County: MONTGOMERY MOUNT IDA SCHOOL DISTRICT LEA:4902000
2010-2011 2011-2012Actual Budget
1 Area in Square Miles 3162 ADA 4733 ADA pct Change over 5 Yrs. (16%)4 4 QTR ADM 5025 Prior Year 3QTR ADM 5356 Assessment 64,148,8277 M&O Mills 25.008 URT Mills 25.009 M&O Mills in Excess of URT 0.0010 Dedicated M&O Mills 0.0011 Debt Service Mills 9.0012 Total Mills 34.0013 Total Debt Bond/Non-Bond 4,157,776
State and Local Revenue:14 Property Tax Receipts (Including URT) 1,961,518 1,909,02815 Other Local Receipts 301,205 131,80016 Revenue from Intermediate Sources 275 30017.1 Foundation Funding (Excl URT) 1,362,118 1,141,99617.2 Tax Collection Rate Guarantee 62,478 60,00018 Student Growth Funding 0 019 Declining Enrollment Funding 88,026 94,55620 Consolidation Incentive/Assistance 0 021 Isolated Funding 0 022 Supplemental Millage Incentive Funding 0 023 Other Unrestricted State Funding 0 024 Total Unrestricted Revenue from State and
Local Sources 3,775,619 3,337,680
Restricted Revenue from State Sources:25 Adult Education 0 0
Regular Education:26 Professional Development 22,118 21,35927 Other Regular Education 3,729 0
Special Education:28 Gifted & Talented 0 029 Alternative Learning Environment (ALE) 17,877 10,90130 English Language Learner (ELL) 0 031 National School Lunch Act (NSLA) 167,152 156,35432 Other Special Education 124,030 033 Workforce Education 0 034 School Food Service 1,999 2,10035 Educational Service Cooperatives 0 036 Early Childhood Programs 0 037 Magnet School Programs 0 038 Other Non-Instructional Programs 2,303 1,84239 Total Restricted Revenue from State Sources 339,208 192,55640 Total Restricted Revenue from Federal
Sources 1,332,533 1,264,554
Other Sources of Funds:41 Financing Sources 0 042 Balances from Consolidated/Annexed District 0 043 Indirect Cost Reimbursement 0 044 Gains and Losses from Sale of Fixed Assets 0 045 Compensation for Loss of Fixed Assets 0 046 Other 0 047 Total Other Sources of Funds 0 048 Total Revenue and Other Sources of Funds
from All Sources 5,447,360 4,794,791
2010-2011 2011-2012Actual Budget
CURRENT EXPENDITURESInstruction:
49 Regular Instruction 1,850,334 1,634,97850 Special Education 437,091 214,53351 Workforce Education 203,463 198,93452 Adult Education 0 053 Compensatory Education 102,045 149,59854 Other 263,379 253,30155 Total Instruction 2,856,313 2,451,343
District Level Support:56 General Administration 138,775 140,85957 Central Services 53,507 54,03158 Maintenance & Operations of Plant 439,633 528,54659 Student Transportation 277,140 239,27960 Other District Level Support Services 13,538 14,59261 Total District Support Services 922,593 977,307
School Level Support:62 Student Support Services 190,390 189,95163 Instructional Staff Support Services 427,001 372,93164 School Administration 266,519 226,86365 Total District Support Services 883,910 789,746
Non-Instructional Services:66 Food Service Operations 335,433 298,11967 Other Enterprise Operations 12,900 068 Community Operations 0 50069 Other Non-Instructional Services 0 070 Total Non-Instructional Services 348,333 298,61971 Facilities Acquisition and Construction 14,500 177,59872 Debt Service 274,764 279,64075 Other Non-Programmed Costs 0 076 Total Expenditures 5,300,414 4,974,25377 Less: Capital Expenditures 139,137 204,09878 Less: Debt Service 274,764 279,64079 Total Current Expenditures 4,886,513 4,490,51580 Exclusions from Current Expenditures 207,81681 Net Current Expenditures 4,678,697
82 Per Pupil Expenditures 9,889
83 Personnel - Non-Federal Certified Clsrm FTEs 42.6084 Avg Salary - Non-Fed Certified Clsrm FTEs 42,44385 Personnel - Non-Federal Certified FTEs 46.7586 Avg Salary - Non-Fed Certified FTEs 45,53687.1 Legal Balance (funds 1-2-4) 1,735,85887.2 Categorical Fund Balance 8,31987.3 Deposits with Paying Agents (QZAB) 087.4 Net Legal Bal (Excl Cat & QZAB) 1,727,53988 Building Fund Balance (fund 3) 1,854,28189 Capital Outlay Fund Balance (fund 5) 0
Jan 30, 2012 - 153 - 9:35:29 AM
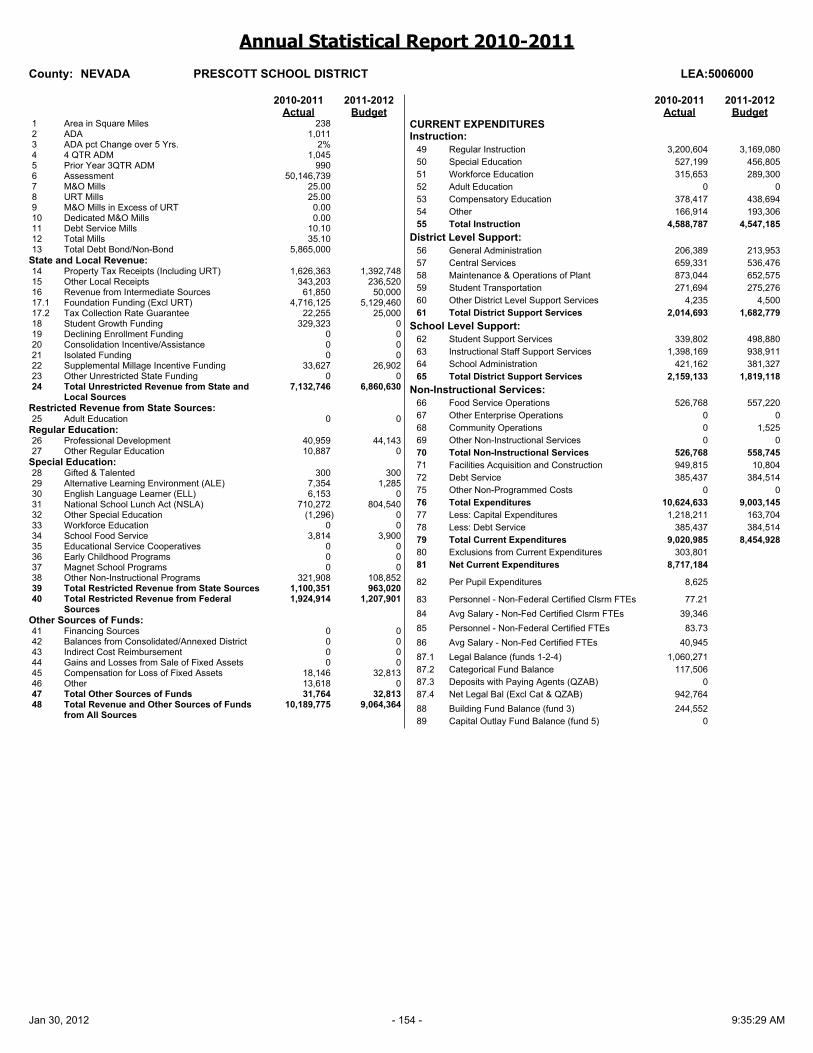
Annual Statistical Report 2010-2011
County: NEVADA PRESCOTT SCHOOL DISTRICT LEA:5006000
2010-2011 2011-2012Actual Budget
1 Area in Square Miles 2382 ADA 1,0113 ADA pct Change over 5 Yrs. 2%4 4 QTR ADM 1,0455 Prior Year 3QTR ADM 9906 Assessment 50,146,7397 M&O Mills 25.008 URT Mills 25.009 M&O Mills in Excess of URT 0.0010 Dedicated M&O Mills 0.0011 Debt Service Mills 10.1012 Total Mills 35.1013 Total Debt Bond/Non-Bond 5,865,000
State and Local Revenue:14 Property Tax Receipts (Including URT) 1,626,363 1,392,74815 Other Local Receipts 343,203 236,52016 Revenue from Intermediate Sources 61,850 50,00017.1 Foundation Funding (Excl URT) 4,716,125 5,129,46017.2 Tax Collection Rate Guarantee 22,255 25,00018 Student Growth Funding 329,323 019 Declining Enrollment Funding 0 020 Consolidation Incentive/Assistance 0 021 Isolated Funding 0 022 Supplemental Millage Incentive Funding 33,627 26,90223 Other Unrestricted State Funding 0 024 Total Unrestricted Revenue from State and
Local Sources 7,132,746 6,860,630
Restricted Revenue from State Sources:25 Adult Education 0 0
Regular Education:26 Professional Development 40,959 44,14327 Other Regular Education 10,887 0
Special Education:28 Gifted & Talented 300 30029 Alternative Learning Environment (ALE) 7,354 1,28530 English Language Learner (ELL) 6,153 031 National School Lunch Act (NSLA) 710,272 804,54032 Other Special Education (1,296) 033 Workforce Education 0 034 School Food Service 3,814 3,90035 Educational Service Cooperatives 0 036 Early Childhood Programs 0 037 Magnet School Programs 0 038 Other Non-Instructional Programs 321,908 108,85239 Total Restricted Revenue from State Sources 1,100,351 963,02040 Total Restricted Revenue from Federal
Sources 1,924,914 1,207,901
Other Sources of Funds:41 Financing Sources 0 042 Balances from Consolidated/Annexed District 0 043 Indirect Cost Reimbursement 0 044 Gains and Losses from Sale of Fixed Assets 0 045 Compensation for Loss of Fixed Assets 18,146 32,81346 Other 13,618 047 Total Other Sources of Funds 31,764 32,81348 Total Revenue and Other Sources of Funds
from All Sources 10,189,775 9,064,364
2010-2011 2011-2012Actual Budget
CURRENT EXPENDITURESInstruction:
49 Regular Instruction 3,200,604 3,169,08050 Special Education 527,199 456,80551 Workforce Education 315,653 289,30052 Adult Education 0 053 Compensatory Education 378,417 438,69454 Other 166,914 193,30655 Total Instruction 4,588,787 4,547,185
District Level Support:56 General Administration 206,389 213,95357 Central Services 659,331 536,47658 Maintenance & Operations of Plant 873,044 652,57559 Student Transportation 271,694 275,27660 Other District Level Support Services 4,235 4,50061 Total District Support Services 2,014,693 1,682,779
School Level Support:62 Student Support Services 339,802 498,88063 Instructional Staff Support Services 1,398,169 938,91164 School Administration 421,162 381,32765 Total District Support Services 2,159,133 1,819,118
Non-Instructional Services:66 Food Service Operations 526,768 557,22067 Other Enterprise Operations 0 068 Community Operations 0 1,52569 Other Non-Instructional Services 0 070 Total Non-Instructional Services 526,768 558,74571 Facilities Acquisition and Construction 949,815 10,80472 Debt Service 385,437 384,51475 Other Non-Programmed Costs 0 076 Total Expenditures 10,624,633 9,003,14577 Less: Capital Expenditures 1,218,211 163,70478 Less: Debt Service 385,437 384,51479 Total Current Expenditures 9,020,985 8,454,92880 Exclusions from Current Expenditures 303,80181 Net Current Expenditures 8,717,184
82 Per Pupil Expenditures 8,625
83 Personnel - Non-Federal Certified Clsrm FTEs 77.2184 Avg Salary - Non-Fed Certified Clsrm FTEs 39,34685 Personnel - Non-Federal Certified FTEs 83.7386 Avg Salary - Non-Fed Certified FTEs 40,94587.1 Legal Balance (funds 1-2-4) 1,060,27187.2 Categorical Fund Balance 117,50687.3 Deposits with Paying Agents (QZAB) 087.4 Net Legal Bal (Excl Cat & QZAB) 942,76488 Building Fund Balance (fund 3) 244,55289 Capital Outlay Fund Balance (fund 5) 0
Jan 30, 2012 - 154 - 9:35:29 AM

Annual Statistical Report 2010-2011
County: NEVADA NEVADA SCHOOL DISTRICT LEA:5008000
2010-2011 2011-2012Actual Budget
1 Area in Square Miles 3462 ADA 3813 ADA pct Change over 5 Yrs. (4%)4 4 QTR ADM 4025 Prior Year 3QTR ADM 3946 Assessment 32,319,8727 M&O Mills 25.008 URT Mills 25.009 M&O Mills in Excess of URT 0.0010 Dedicated M&O Mills 0.0011 Debt Service Mills 9.8012 Total Mills 34.8013 Total Debt Bond/Non-Bond 815,201
State and Local Revenue:14 Property Tax Receipts (Including URT) 1,047,203 981,50015 Other Local Receipts 290,170 273,65416 Revenue from Intermediate Sources 23,490 23,00017.1 Foundation Funding (Excl URT) 1,597,458 1,597,45817.2 Tax Collection Rate Guarantee 1,727 1,72718 Student Growth Funding 46,046 46,04619 Declining Enrollment Funding 0 020 Consolidation Incentive/Assistance 0 021 Isolated Funding 0 022 Supplemental Millage Incentive Funding 0 023 Other Unrestricted State Funding 0 024 Total Unrestricted Revenue from State and
Local Sources 3,006,094 2,923,385
Restricted Revenue from State Sources:25 Adult Education 0 0
Regular Education:26 Professional Development 16,313 16,31327 Other Regular Education 118,777 119,977
Special Education:28 Gifted & Talented 50 029 Alternative Learning Environment (ALE) 0 030 English Language Learner (ELL) 0 031 National School Lunch Act (NSLA) 287,680 287,68032 Other Special Education 3,836 033 Workforce Education 0 034 School Food Service 1,050 1,30035 Educational Service Cooperatives 0 036 Early Childhood Programs 0 037 Magnet School Programs 0 038 Other Non-Instructional Programs 11,279 11,27939 Total Restricted Revenue from State Sources 438,984 436,54940 Total Restricted Revenue from Federal
Sources 674,576 462,840
Other Sources of Funds:41 Financing Sources 67,625 042 Balances from Consolidated/Annexed District 0 043 Indirect Cost Reimbursement 0 044 Gains and Losses from Sale of Fixed Assets 0 045 Compensation for Loss of Fixed Assets 5,427 046 Other 0 047 Total Other Sources of Funds 73,052 048 Total Revenue and Other Sources of Funds
from All Sources 4,192,707 3,822,774
2010-2011 2011-2012Actual Budget
CURRENT EXPENDITURESInstruction:
49 Regular Instruction 1,551,527 1,520,73250 Special Education 184,084 171,07651 Workforce Education 165,645 166,08852 Adult Education 0 053 Compensatory Education 116,563 126,11354 Other 32,793 69,06255 Total Instruction 2,050,613 2,053,072
District Level Support:56 General Administration 146,527 146,30957 Central Services 146,557 141,53758 Maintenance & Operations of Plant 336,994 281,19759 Student Transportation 271,262 235,01160 Other District Level Support Services 1,787 1,80061 Total District Support Services 903,128 805,854
School Level Support:62 Student Support Services 221,181 210,77863 Instructional Staff Support Services 374,928 174,89364 School Administration 144,369 145,23765 Total District Support Services 740,477 530,909
Non-Instructional Services:66 Food Service Operations 338,391 304,29867 Other Enterprise Operations 0 068 Community Operations 0 34269 Other Non-Instructional Services 0 070 Total Non-Instructional Services 338,391 304,63971 Facilities Acquisition and Construction 0 072 Debt Service 140,593 109,14675 Other Non-Programmed Costs 0 076 Total Expenditures 4,173,202 3,803,62077 Less: Capital Expenditures 94,389 10,40078 Less: Debt Service 140,593 109,14679 Total Current Expenditures 3,938,220 3,684,07480 Exclusions from Current Expenditures 239,84581 Net Current Expenditures 3,698,374
82 Per Pupil Expenditures 9,712
83 Personnel - Non-Federal Certified Clsrm FTEs 39.8184 Avg Salary - Non-Fed Certified Clsrm FTEs 37,36085 Personnel - Non-Federal Certified FTEs 44.1186 Avg Salary - Non-Fed Certified FTEs 39,43187.1 Legal Balance (funds 1-2-4) 387,81787.2 Categorical Fund Balance 11,36287.3 Deposits with Paying Agents (QZAB) 087.4 Net Legal Bal (Excl Cat & QZAB) 376,45588 Building Fund Balance (fund 3) 089 Capital Outlay Fund Balance (fund 5) 0
Jan 30, 2012 - 155 - 9:35:29 AM

Annual Statistical Report 2010-2011
County: NEWTON JASPER SCHOOL DISTRICT LEA:5102000
2010-2011 2011-2012Actual Budget
1 Area in Square Miles 6142 ADA 8653 ADA pct Change over 5 Yrs. 1%4 4 QTR ADM 8915 Prior Year 3QTR ADM 8976 Assessment 55,972,6407 M&O Mills 25.008 URT Mills 25.009 M&O Mills in Excess of URT 0.0010 Dedicated M&O Mills 0.0011 Debt Service Mills 10.9012 Total Mills 35.9013 Total Debt Bond/Non-Bond 5,224,065
State and Local Revenue:14 Property Tax Receipts (Including URT) 1,913,500 2,116,00015 Other Local Receipts 436,954 159,20016 Revenue from Intermediate Sources 0 017.1 Foundation Funding (Excl URT) 3,722,271 3,817,55417.2 Tax Collection Rate Guarantee 62,633 018 Student Growth Funding 2,183 019 Declining Enrollment Funding 0 020 Consolidation Incentive/Assistance 0 021 Isolated Funding 1,206,299 1,206,30022 Supplemental Millage Incentive Funding 0 023 Other Unrestricted State Funding 422 024 Total Unrestricted Revenue from State and
Local Sources 7,344,262 7,299,054
Restricted Revenue from State Sources:25 Adult Education 0 0
Regular Education:26 Professional Development 37,103 37,90627 Other Regular Education 397,317 389,800
Special Education:28 Gifted & Talented 0 029 Alternative Learning Environment (ALE) 12,961 24,91130 English Language Learner (ELL) 0 031 National School Lunch Act (NSLA) 297,104 431,11432 Other Special Education 107,877 103,00033 Workforce Education 19,352 10,56234 School Food Service 3,482 3,40035 Educational Service Cooperatives 0 036 Early Childhood Programs 0 037 Magnet School Programs 0 038 Other Non-Instructional Programs 403,581 212,41039 Total Restricted Revenue from State Sources 1,278,777 1,213,10440 Total Restricted Revenue from Federal
Sources 2,290,904 1,746,550
Other Sources of Funds:41 Financing Sources (21,687) 906,50042 Balances from Consolidated/Annexed District 0 043 Indirect Cost Reimbursement 0 044 Gains and Losses from Sale of Fixed Assets 0 045 Compensation for Loss of Fixed Assets 0 046 Other 0 047 Total Other Sources of Funds (21,687) 906,50048 Total Revenue and Other Sources of Funds
from All Sources 10,892,257 11,165,208
2010-2011 2011-2012Actual Budget
CURRENT EXPENDITURESInstruction:
49 Regular Instruction 3,667,140 3,621,10050 Special Education 675,996 742,68351 Workforce Education 393,690 432,28752 Adult Education 0 053 Compensatory Education 304,181 267,65854 Other 67,552 71,52755 Total Instruction 5,108,560 5,135,255
District Level Support:56 General Administration 261,047 328,02457 Central Services 72,337 73,25658 Maintenance & Operations of Plant 1,032,519 1,022,94959 Student Transportation 867,780 764,33860 Other District Level Support Services 40,025 42,78861 Total District Support Services 2,273,708 2,231,355
School Level Support:62 Student Support Services 445,403 483,25063 Instructional Staff Support Services 573,048 522,21564 School Administration 545,633 616,86265 Total District Support Services 1,564,084 1,622,326
Non-Instructional Services:66 Food Service Operations 514,742 479,99067 Other Enterprise Operations 14,913 14,91368 Community Operations 624 6,53069 Other Non-Instructional Services 0 070 Total Non-Instructional Services 530,279 501,43371 Facilities Acquisition and Construction 575,788 994,99772 Debt Service 571,032 573,41075 Other Non-Programmed Costs 27,196 076 Total Expenditures 10,650,647 11,058,77677 Less: Capital Expenditures 1,057,015 1,424,19478 Less: Debt Service 571,032 573,41079 Total Current Expenditures 9,022,601 9,061,17280 Exclusions from Current Expenditures 376,90281 Net Current Expenditures 8,645,699
82 Per Pupil Expenditures 9,994
83 Personnel - Non-Federal Certified Clsrm FTEs 75.1984 Avg Salary - Non-Fed Certified Clsrm FTEs 41,92585 Personnel - Non-Federal Certified FTEs 81.9586 Avg Salary - Non-Fed Certified FTEs 44,60487.1 Legal Balance (funds 1-2-4) 1,758,24587.2 Categorical Fund Balance 32,43987.3 Deposits with Paying Agents (QZAB) 141,24287.4 Net Legal Bal (Excl Cat & QZAB) 1,584,56488 Building Fund Balance (fund 3) 737,76889 Capital Outlay Fund Balance (fund 5) 0
Jan 30, 2012 - 156 - 9:35:29 AM

Annual Statistical Report 2010-2011
County: NEWTON DEER/MT. JUDEA SCHOOL DISTRICT LEA:5106000
2010-2011 2011-2012Actual Budget
1 Area in Square Miles 3982 ADA 3373 ADA pct Change over 5 Yrs. (17%)4 4 QTR ADM 3605 Prior Year 3QTR ADM 3726 Assessment 22,489,5897 M&O Mills 25.008 URT Mills 25.009 M&O Mills in Excess of URT 0.0010 Dedicated M&O Mills 0.0011 Debt Service Mills 8.0012 Total Mills 33.0013 Total Debt Bond/Non-Bond 1,774,958
State and Local Revenue:14 Property Tax Receipts (Including URT) 683,926 684,00015 Other Local Receipts 331,975 73,10016 Revenue from Intermediate Sources 0 017.1 Foundation Funding (Excl URT) 1,385,461 1,384,92017.2 Tax Collection Rate Guarantee 39,677 39,00018 Student Growth Funding 0 019 Declining Enrollment Funding 0 020 Consolidation Incentive/Assistance 0 021 Isolated Funding 729,859 730,00022 Supplemental Millage Incentive Funding 8,469 6,77623 Other Unrestricted State Funding 0 024 Total Unrestricted Revenue from State and
Local Sources 3,179,367 2,917,796
Restricted Revenue from State Sources:25 Adult Education 0 0
Regular Education:26 Professional Development 15,402 15,32527 Other Regular Education 390,877 385,000
Special Education:28 Gifted & Talented 3,100 029 Alternative Learning Environment (ALE) 0 030 English Language Learner (ELL) 0 031 National School Lunch Act (NSLA) 284,704 283,36032 Other Special Education 51,963 033 Workforce Education 2,438 2,00034 School Food Service 1,749 1,00035 Educational Service Cooperatives 0 036 Early Childhood Programs 0 037 Magnet School Programs 0 038 Other Non-Instructional Programs 61,047 49,72239 Total Restricted Revenue from State Sources 811,279 736,40740 Total Restricted Revenue from Federal
Sources 1,486,373 1,029,264
Other Sources of Funds:41 Financing Sources 115,690 2,033,65342 Balances from Consolidated/Annexed District 0 043 Indirect Cost Reimbursement 4,000 4,00044 Gains and Losses from Sale of Fixed Assets 0 045 Compensation for Loss of Fixed Assets 66,977 046 Other 0 047 Total Other Sources of Funds 186,667 2,037,65348 Total Revenue and Other Sources of Funds
from All Sources 5,663,685 6,721,121
2010-2011 2011-2012Actual Budget
CURRENT EXPENDITURESInstruction:
49 Regular Instruction 1,860,107 1,751,83650 Special Education 263,016 259,44651 Workforce Education 282,020 228,30052 Adult Education 0 053 Compensatory Education 227,103 207,45454 Other 183,758 188,15555 Total Instruction 2,816,004 2,635,190
District Level Support:56 General Administration 268,945 300,31757 Central Services 79,000 102,93758 Maintenance & Operations of Plant 426,383 462,72359 Student Transportation 578,265 346,25760 Other District Level Support Services 4,825 95061 Total District Support Services 1,357,418 1,213,184
School Level Support:62 Student Support Services 64,519 69,79663 Instructional Staff Support Services 322,525 245,58164 School Administration 169,895 165,26565 Total District Support Services 556,939 480,642
Non-Instructional Services:66 Food Service Operations 267,095 252,98667 Other Enterprise Operations 0 068 Community Operations 0 3,62469 Other Non-Instructional Services 0 070 Total Non-Instructional Services 267,095 256,61071 Facilities Acquisition and Construction 647,850 3,426,00072 Debt Service 228,105 322,45075 Other Non-Programmed Costs 0 076 Total Expenditures 5,873,410 8,334,07677 Less: Capital Expenditures 978,508 3,429,62178 Less: Debt Service 228,105 322,45079 Total Current Expenditures 4,666,798 4,582,00480 Exclusions from Current Expenditures 133,67081 Net Current Expenditures 4,533,127
82 Per Pupil Expenditures 13,464
83 Personnel - Non-Federal Certified Clsrm FTEs 42.8284 Avg Salary - Non-Fed Certified Clsrm FTEs 35,97685 Personnel - Non-Federal Certified FTEs 46.8986 Avg Salary - Non-Fed Certified FTEs 39,42387.1 Legal Balance (funds 1-2-4) 2,266,30087.2 Categorical Fund Balance 28,71187.3 Deposits with Paying Agents (QZAB) 087.4 Net Legal Bal (Excl Cat & QZAB) 2,237,58988 Building Fund Balance (fund 3) 24,20589 Capital Outlay Fund Balance (fund 5) 0
Jan 30, 2012 - 157 - 9:35:29 AM

Annual Statistical Report 2010-2011
County: OUACHITA BEARDEN SCHOOL DISTRICT LEA:5201000
2010-2011 2011-2012Actual Budget
1 Area in Square Miles 2512 ADA 5403 ADA pct Change over 5 Yrs. (13%)4 4 QTR ADM 5665 Prior Year 3QTR ADM 5796 Assessment 31,660,7017 M&O Mills 25.008 URT Mills 25.009 M&O Mills in Excess of URT 0.0010 Dedicated M&O Mills 0.0011 Debt Service Mills 9.9012 Total Mills 34.9013 Total Debt Bond/Non-Bond 2,750,254
State and Local Revenue:14 Property Tax Receipts (Including URT) 1,007,199 885,00015 Other Local Receipts 353,489 130,15016 Revenue from Intermediate Sources 54,170 40,00017.1 Foundation Funding (Excl URT) 2,698,716 2,658,75717.2 Tax Collection Rate Guarantee 26,115 10,00018 Student Growth Funding 0 019 Declining Enrollment Funding 86,641 45,03620 Consolidation Incentive/Assistance 0 021 Isolated Funding 0 022 Supplemental Millage Incentive Funding 13,662 10,93023 Other Unrestricted State Funding 0 024 Total Unrestricted Revenue from State and
Local Sources 4,239,992 3,779,873
Restricted Revenue from State Sources:25 Adult Education 0 0
Regular Education:26 Professional Development 23,962 23,93227 Other Regular Education 1,322 2,400
Special Education:28 Gifted & Talented 50 029 Alternative Learning Environment (ALE) 10,401 24,00030 English Language Learner (ELL) 0 031 National School Lunch Act (NSLA) 404,736 395,69232 Other Special Education 4,445 033 Workforce Education 34,938 47,93834 School Food Service 2,138 2,00035 Educational Service Cooperatives 0 036 Early Childhood Programs 0 037 Magnet School Programs 0 038 Other Non-Instructional Programs 58,932 54,28939 Total Restricted Revenue from State Sources 540,925 550,25040 Total Restricted Revenue from Federal
Sources 1,195,220 1,098,439
Other Sources of Funds:41 Financing Sources 6,309 042 Balances from Consolidated/Annexed District 0 043 Indirect Cost Reimbursement 0 044 Gains and Losses from Sale of Fixed Assets 0 045 Compensation for Loss of Fixed Assets 0 046 Other 0 047 Total Other Sources of Funds 6,309 048 Total Revenue and Other Sources of Funds
from All Sources 5,982,445 5,428,563
2010-2011 2011-2012Actual Budget
CURRENT EXPENDITURESInstruction:
49 Regular Instruction 2,271,928 2,378,01450 Special Education 260,464 219,24351 Workforce Education 114,632 117,95752 Adult Education 0 053 Compensatory Education 267,480 320,25954 Other 66,733 105,38255 Total Instruction 2,981,237 3,140,854
District Level Support:56 General Administration 157,804 173,56257 Central Services 111,338 105,87158 Maintenance & Operations of Plant 512,741 595,87259 Student Transportation 335,038 403,52060 Other District Level Support Services 4,564 17,60061 Total District Support Services 1,121,486 1,296,425
School Level Support:62 Student Support Services 269,630 308,96663 Instructional Staff Support Services 450,222 462,67364 School Administration 246,335 249,39465 Total District Support Services 966,187 1,021,033
Non-Instructional Services:66 Food Service Operations 303,490 324,64567 Other Enterprise Operations 31,178 7,91768 Community Operations 94 2,90169 Other Non-Instructional Services 0 070 Total Non-Instructional Services 334,762 335,46371 Facilities Acquisition and Construction 194,233 44,33472 Debt Service 112,244 157,48575 Other Non-Programmed Costs 0 076 Total Expenditures 5,710,147 5,995,59477 Less: Capital Expenditures 326,565 223,20878 Less: Debt Service 112,244 157,48579 Total Current Expenditures 5,271,339 5,614,90180 Exclusions from Current Expenditures 295,71181 Net Current Expenditures 4,975,628
82 Per Pupil Expenditures 9,217
83 Personnel - Non-Federal Certified Clsrm FTEs 48.4384 Avg Salary - Non-Fed Certified Clsrm FTEs 36,86085 Personnel - Non-Federal Certified FTEs 53.6086 Avg Salary - Non-Fed Certified FTEs 39,48187.1 Legal Balance (funds 1-2-4) 1,782,45087.2 Categorical Fund Balance 211,60387.3 Deposits with Paying Agents (QZAB) 087.4 Net Legal Bal (Excl Cat & QZAB) 1,570,84788 Building Fund Balance (fund 3) 150,39789 Capital Outlay Fund Balance (fund 5) 0
Jan 30, 2012 - 158 - 9:35:29 AM

Annual Statistical Report 2010-2011
County: OUACHITA CAMDEN FAIRVIEW SCHOOL DIST. LEA:5204000
2010-2011 2011-2012Actual Budget
1 Area in Square Miles 3362 ADA 2,3003 ADA pct Change over 5 Yrs. (12%)4 4 QTR ADM 2,4285 Prior Year 3QTR ADM 2,4416 Assessment 146,046,5977 M&O Mills 25.008 URT Mills 25.009 M&O Mills in Excess of URT 0.0010 Dedicated M&O Mills 0.0011 Debt Service Mills 9.0012 Total Mills 34.0013 Total Debt Bond/Non-Bond 13,965,000
State and Local Revenue:14 Property Tax Receipts (Including URT) 4,512,625 4,680,46615 Other Local Receipts 1,134,712 973,91916 Revenue from Intermediate Sources 227,428 225,00017.1 Foundation Funding (Excl URT) 11,079,773 11,203,17817.2 Tax Collection Rate Guarantee 152,198 018 Student Growth Funding 0 019 Declining Enrollment Funding 114,949 20,42920 Consolidation Incentive/Assistance 0 021 Isolated Funding 0 022 Supplemental Millage Incentive Funding 48,297 38,63723 Other Unrestricted State Funding 0 024 Total Unrestricted Revenue from State and
Local Sources 17,269,982 17,141,629
Restricted Revenue from State Sources:25 Adult Education 0 0
Regular Education:26 Professional Development 100,947 103,15527 Other Regular Education 22,385 15,600
Special Education:28 Gifted & Talented 600 029 Alternative Learning Environment (ALE) 217,411 167,16830 English Language Learner (ELL) 1,465 031 National School Lunch Act (NSLA) 1,777,664 1,837,79232 Other Special Education 15,836 33,11133 Workforce Education 163,186 138,93734 School Food Service 16,180 13,27535 Educational Service Cooperatives 0 036 Early Childhood Programs 528,226 513,38237 Magnet School Programs 0 038 Other Non-Instructional Programs 660,188 213,12339 Total Restricted Revenue from State Sources 3,504,087 3,035,54340 Total Restricted Revenue from Federal
Sources 5,748,307 4,243,823
Other Sources of Funds:41 Financing Sources 0 042 Balances from Consolidated/Annexed District 0 043 Indirect Cost Reimbursement 34,338 44,00044 Gains and Losses from Sale of Fixed Assets 32,161 045 Compensation for Loss of Fixed Assets 13,163 046 Other 0 047 Total Other Sources of Funds 79,662 44,00048 Total Revenue and Other Sources of Funds
from All Sources 26,602,038 24,464,995
2010-2011 2011-2012Actual Budget
CURRENT EXPENDITURESInstruction:
49 Regular Instruction 8,284,830 7,833,92950 Special Education 1,323,218 1,430,47251 Workforce Education 859,901 709,92952 Adult Education 0 053 Compensatory Education 1,521,550 1,673,69354 Other 1,305,050 1,274,80055 Total Instruction 13,294,548 12,922,823
District Level Support:56 General Administration 499,485 384,36057 Central Services 596,580 487,29058 Maintenance & Operations of Plant 2,928,061 2,497,20659 Student Transportation 1,358,015 1,259,10960 Other District Level Support Services 67,365 77,02861 Total District Support Services 5,449,505 4,704,994
School Level Support:62 Student Support Services 1,722,308 1,812,46563 Instructional Staff Support Services 2,429,310 2,514,64964 School Administration 1,206,669 1,204,21765 Total District Support Services 5,358,288 5,531,331
Non-Instructional Services:66 Food Service Operations 1,572,303 1,489,99167 Other Enterprise Operations 0 068 Community Operations 2,901 12,73569 Other Non-Instructional Services 0 070 Total Non-Instructional Services 1,575,204 1,502,72671 Facilities Acquisition and Construction 685,584 168,97372 Debt Service 936,044 940,09475 Other Non-Programmed Costs 0 076 Total Expenditures 27,299,173 25,770,94177 Less: Capital Expenditures 1,940,242 444,55078 Less: Debt Service 936,044 940,09479 Total Current Expenditures 24,422,887 24,386,29780 Exclusions from Current Expenditures 1,020,55881 Net Current Expenditures 23,402,329
82 Per Pupil Expenditures 10,177
83 Personnel - Non-Federal Certified Clsrm FTEs 170.5184 Avg Salary - Non-Fed Certified Clsrm FTEs 44,10985 Personnel - Non-Federal Certified FTEs 196.7086 Avg Salary - Non-Fed Certified FTEs 47,31387.1 Legal Balance (funds 1-2-4) 3,091,95687.2 Categorical Fund Balance 328,47387.3 Deposits with Paying Agents (QZAB) 087.4 Net Legal Bal (Excl Cat & QZAB) 2,763,48288 Building Fund Balance (fund 3) 868,15689 Capital Outlay Fund Balance (fund 5) 0
Jan 30, 2012 - 159 - 9:35:29 AM

Annual Statistical Report 2010-2011
County: OUACHITA HARMONY GROVE SCH DIST(OUACHIT LEA:5205000
2010-2011 2011-2012Actual Budget
1 Area in Square Miles 3612 ADA 9623 ADA pct Change over 5 Yrs. (2%)4 4 QTR ADM 1,0075 Prior Year 3QTR ADM 1,0196 Assessment 43,274,3867 M&O Mills 25.008 URT Mills 25.009 M&O Mills in Excess of URT 0.0010 Dedicated M&O Mills 0.0011 Debt Service Mills 15.2012 Total Mills 40.2013 Total Debt Bond/Non-Bond 5,665,000
State and Local Revenue:14 Property Tax Receipts (Including URT) 1,572,284 1,572,96615 Other Local Receipts 566,272 256,74316 Revenue from Intermediate Sources 91,585 50,00017.1 Foundation Funding (Excl URT) 5,066,207 5,068,66017.2 Tax Collection Rate Guarantee 64,152 018 Student Growth Funding 10,390 019 Declining Enrollment Funding 0 39,66020 Consolidation Incentive/Assistance 0 021 Isolated Funding 212,718 022 Supplemental Millage Incentive Funding 53,343 42,67423 Other Unrestricted State Funding 0 024 Total Unrestricted Revenue from State and
Local Sources 7,636,952 7,030,703
Restricted Revenue from State Sources:25 Adult Education 0 0
Regular Education:26 Professional Development 42,126 42,61827 Other Regular Education 389,019 0
Special Education:28 Gifted & Talented 1,500 029 Alternative Learning Environment (ALE) 21,615 22,67330 English Language Learner (ELL) 586 031 National School Lunch Act (NSLA) 252,960 265,14432 Other Special Education 4,173 033 Workforce Education 35,750 95,06234 School Food Service 4,158 035 Educational Service Cooperatives 0 036 Early Childhood Programs 0 037 Magnet School Programs 0 038 Other Non-Instructional Programs 1,569,919 98,47039 Total Restricted Revenue from State Sources 2,321,806 523,96740 Total Restricted Revenue from Federal
Sources 1,302,405 1,001,959
Other Sources of Funds:41 Financing Sources 0 042 Balances from Consolidated/Annexed District 0 043 Indirect Cost Reimbursement 2,238 044 Gains and Losses from Sale of Fixed Assets 1,600 045 Compensation for Loss of Fixed Assets 0 046 Other 0 047 Total Other Sources of Funds 3,838 048 Total Revenue and Other Sources of Funds
from All Sources 11,265,000 8,556,629
2010-2011 2011-2012Actual Budget
CURRENT EXPENDITURESInstruction:
49 Regular Instruction 4,239,477 3,812,61250 Special Education 449,164 370,01451 Workforce Education 307,256 297,02952 Adult Education 0 053 Compensatory Education 210,214 229,25854 Other 200,008 181,41955 Total Instruction 5,406,118 4,890,332
District Level Support:56 General Administration 303,077 302,36757 Central Services 63,492 63,01758 Maintenance & Operations of Plant 865,134 803,64859 Student Transportation 537,366 612,53360 Other District Level Support Services 11,375 3,00061 Total District Support Services 1,780,444 1,784,565
School Level Support:62 Student Support Services 441,493 426,17363 Instructional Staff Support Services 919,926 1,181,15764 School Administration 446,121 441,53465 Total District Support Services 1,807,540 2,048,864
Non-Instructional Services:66 Food Service Operations 518,737 243,74367 Other Enterprise Operations 0 068 Community Operations 0 2,50069 Other Non-Instructional Services 0 070 Total Non-Instructional Services 518,737 246,24371 Facilities Acquisition and Construction 2,274,034 072 Debt Service 347,499 344,35575 Other Non-Programmed Costs 0 076 Total Expenditures 12,134,372 9,314,35977 Less: Capital Expenditures 2,436,624 279,51278 Less: Debt Service 347,499 344,35579 Total Current Expenditures 9,350,249 8,690,49280 Exclusions from Current Expenditures 513,64981 Net Current Expenditures 8,836,600
82 Per Pupil Expenditures 9,185
83 Personnel - Non-Federal Certified Clsrm FTEs 84.3084 Avg Salary - Non-Fed Certified Clsrm FTEs 38,82285 Personnel - Non-Federal Certified FTEs 91.9986 Avg Salary - Non-Fed Certified FTEs 41,72987.1 Legal Balance (funds 1-2-4) 1,445,55187.2 Categorical Fund Balance 35,09387.3 Deposits with Paying Agents (QZAB) 087.4 Net Legal Bal (Excl Cat & QZAB) 1,410,45888 Building Fund Balance (fund 3) 633,81689 Capital Outlay Fund Balance (fund 5) 0
Jan 30, 2012 - 160 - 9:35:29 AM

Annual Statistical Report 2010-2011
County: OUACHITA STEPHENS SCHOOL DISTRICT LEA:5206000
2010-2011 2011-2012Actual Budget
1 Area in Square Miles 2242 ADA 3433 ADA pct Change over 5 Yrs. (27%)4 4 QTR ADM 3555 Prior Year 3QTR ADM 3536 Assessment 35,099,3447 M&O Mills 25.008 URT Mills 25.009 M&O Mills in Excess of URT 0.0010 Dedicated M&O Mills 0.0011 Debt Service Mills 9.0012 Total Mills 34.0013 Total Debt Bond/Non-Bond 870,000
State and Local Revenue:14 Property Tax Receipts (Including URT) 1,090,553 1,091,35815 Other Local Receipts 114,738 35,96016 Revenue from Intermediate Sources 38,345 38,00017.1 Foundation Funding (Excl URT) 1,247,136 1,298,40917.2 Tax Collection Rate Guarantee 34,126 018 Student Growth Funding 13,928 019 Declining Enrollment Funding 0 020 Consolidation Incentive/Assistance 0 021 Isolated Funding 0 022 Supplemental Millage Incentive Funding 7,724 6,17923 Other Unrestricted State Funding 20,702 024 Total Unrestricted Revenue from State and
Local Sources 2,567,252 2,469,906
Restricted Revenue from State Sources:25 Adult Education 0 0
Regular Education:26 Professional Development 14,590 15,04727 Other Regular Education 197,545 111,468
Special Education:28 Gifted & Talented 0 029 Alternative Learning Environment (ALE) 12,595 5,55430 English Language Learner (ELL) 0 031 National School Lunch Act (NSLA) 299,584 380,17632 Other Special Education 1,445 30,00033 Workforce Education 41,438 20,00034 School Food Service 1,655 1,60035 Educational Service Cooperatives 0 036 Early Childhood Programs 0 037 Magnet School Programs 0 038 Other Non-Instructional Programs 8,687 7,47639 Total Restricted Revenue from State Sources 577,539 571,32140 Total Restricted Revenue from Federal
Sources 1,781,070 1,024,178
Other Sources of Funds:41 Financing Sources 0 042 Balances from Consolidated/Annexed District 0 043 Indirect Cost Reimbursement 0 044 Gains and Losses from Sale of Fixed Assets 0 045 Compensation for Loss of Fixed Assets 800 046 Other 0 047 Total Other Sources of Funds 800 048 Total Revenue and Other Sources of Funds
from All Sources 4,926,661 4,065,405
2010-2011 2011-2012Actual Budget
CURRENT EXPENDITURESInstruction:
49 Regular Instruction 1,393,498 1,254,58250 Special Education 255,711 265,28051 Workforce Education 23,963 25,55052 Adult Education 0 053 Compensatory Education 522,016 269,95754 Other 125,128 167,51455 Total Instruction 2,320,316 1,982,884
District Level Support:56 General Administration 206,797 228,45357 Central Services 165,833 150,58858 Maintenance & Operations of Plant 345,102 285,07359 Student Transportation 296,994 229,36660 Other District Level Support Services 2,261 2,50061 Total District Support Services 1,016,987 895,981
School Level Support:62 Student Support Services 184,913 164,40963 Instructional Staff Support Services 360,317 462,39164 School Administration 201,790 146,73465 Total District Support Services 747,021 773,534
Non-Instructional Services:66 Food Service Operations 261,797 244,50067 Other Enterprise Operations 0 068 Community Operations 0 2,00069 Other Non-Instructional Services 0 070 Total Non-Instructional Services 261,797 246,50071 Facilities Acquisition and Construction 523,455 142,02772 Debt Service 78,760 58,02575 Other Non-Programmed Costs 14 076 Total Expenditures 4,948,348 4,098,95077 Less: Capital Expenditures 831,594 222,46478 Less: Debt Service 78,760 58,02579 Total Current Expenditures 4,037,994 3,818,46180 Exclusions from Current Expenditures 83,27581 Net Current Expenditures 3,954,720
82 Per Pupil Expenditures 11,519
83 Personnel - Non-Federal Certified Clsrm FTEs 30.9584 Avg Salary - Non-Fed Certified Clsrm FTEs 40,84085 Personnel - Non-Federal Certified FTEs 34.3686 Avg Salary - Non-Fed Certified FTEs 43,24887.1 Legal Balance (funds 1-2-4) 893,53187.2 Categorical Fund Balance 112,95387.3 Deposits with Paying Agents (QZAB) 087.4 Net Legal Bal (Excl Cat & QZAB) 780,57888 Building Fund Balance (fund 3) 089 Capital Outlay Fund Balance (fund 5) 0
Jan 30, 2012 - 161 - 9:35:29 AM

Annual Statistical Report 2010-2011
County: PERRY EAST END SCHOOL DISTRICT LEA:5301000
2010-2011 2011-2012Actual Budget
1 Area in Square Miles 1062 ADA 5863 ADA pct Change over 5 Yrs. (11%)4 4 QTR ADM 6315 Prior Year 3QTR ADM 6316 Assessment 34,514,5977 M&O Mills 25.008 URT Mills 25.009 M&O Mills in Excess of URT 0.0010 Dedicated M&O Mills 0.0011 Debt Service Mills 11.8712 Total Mills 36.8713 Total Debt Bond/Non-Bond 3,803,381
State and Local Revenue:14 Property Tax Receipts (Including URT) 1,160,511 1,050,00015 Other Local Receipts 367,365 110,00016 Revenue from Intermediate Sources 0 017.1 Foundation Funding (Excl URT) 2,958,497 3,036,21517.2 Tax Collection Rate Guarantee 58,970 30,00018 Student Growth Funding 0 019 Declining Enrollment Funding 58,995 020 Consolidation Incentive/Assistance 0 021 Isolated Funding 0 022 Supplemental Millage Incentive Funding 41,074 32,85923 Other Unrestricted State Funding 0 024 Total Unrestricted Revenue from State and
Local Sources 4,645,411 4,259,074
Restricted Revenue from State Sources:25 Adult Education 0 0
Regular Education:26 Professional Development 26,089 26,80627 Other Regular Education 12,916 0
Special Education:28 Gifted & Talented 2,294 029 Alternative Learning Environment (ALE) 5,201 030 English Language Learner (ELL) 0 031 National School Lunch Act (NSLA) 179,552 187,22032 Other Special Education 18,165 10,53633 Workforce Education 8,125 034 School Food Service 2,521 035 Educational Service Cooperatives 0 036 Early Childhood Programs 94,347 97,20037 Magnet School Programs 0 038 Other Non-Instructional Programs 145,731 58,78539 Total Restricted Revenue from State Sources 494,941 380,54740 Total Restricted Revenue from Federal
Sources 1,325,422 675,062
Other Sources of Funds:41 Financing Sources 341,382 042 Balances from Consolidated/Annexed District 0 043 Indirect Cost Reimbursement 0 044 Gains and Losses from Sale of Fixed Assets 0 045 Compensation for Loss of Fixed Assets 0 046 Other 0 047 Total Other Sources of Funds 341,382 048 Total Revenue and Other Sources of Funds
from All Sources 6,807,157 5,314,683
2010-2011 2011-2012Actual Budget
CURRENT EXPENDITURESInstruction:
49 Regular Instruction 1,801,955 1,654,22350 Special Education 412,400 405,88951 Workforce Education 164,226 162,22252 Adult Education 0 053 Compensatory Education 135,395 154,42054 Other 166,838 199,60755 Total Instruction 2,680,814 2,576,362
District Level Support:56 General Administration 252,237 285,55757 Central Services 77,980 66,97158 Maintenance & Operations of Plant 561,263 585,10259 Student Transportation 388,511 356,91760 Other District Level Support Services 133,569 12,00061 Total District Support Services 1,413,560 1,306,547
School Level Support:62 Student Support Services 209,659 220,34063 Instructional Staff Support Services 603,332 399,27964 School Administration 265,598 247,37665 Total District Support Services 1,078,589 866,995
Non-Instructional Services:66 Food Service Operations 385,451 374,76467 Other Enterprise Operations 0 068 Community Operations 28 50069 Other Non-Instructional Services 0 070 Total Non-Instructional Services 385,479 375,26471 Facilities Acquisition and Construction 602,045 072 Debt Service 123,338 166,87575 Other Non-Programmed Costs 0 076 Total Expenditures 6,283,824 5,292,04377 Less: Capital Expenditures 859,050 122,87378 Less: Debt Service 123,338 166,87579 Total Current Expenditures 5,301,437 5,002,29580 Exclusions from Current Expenditures 362,42381 Net Current Expenditures 4,939,014
82 Per Pupil Expenditures 8,434
83 Personnel - Non-Federal Certified Clsrm FTEs 39.8884 Avg Salary - Non-Fed Certified Clsrm FTEs 44,61385 Personnel - Non-Federal Certified FTEs 40.9686 Avg Salary - Non-Fed Certified FTEs 47,22487.1 Legal Balance (funds 1-2-4) 1,029,05087.2 Categorical Fund Balance 18,18387.3 Deposits with Paying Agents (QZAB) 087.4 Net Legal Bal (Excl Cat & QZAB) 1,010,86788 Building Fund Balance (fund 3) 1,015,03789 Capital Outlay Fund Balance (fund 5) 0
Jan 30, 2012 - 162 - 9:35:29 AM

Annual Statistical Report 2010-2011
County: PERRY PERRYVILLE SCHOOL DISTRICT LEA:5303000
2010-2011 2011-2012Actual Budget
1 Area in Square Miles 4012 ADA 9483 ADA pct Change over 5 Yrs. 2%4 4 QTR ADM 1,0145 Prior Year 3QTR ADM 1,0546 Assessment 48,549,2287 M&O Mills 25.008 URT Mills 25.009 M&O Mills in Excess of URT 0.0010 Dedicated M&O Mills 0.0011 Debt Service Mills 9.9812 Total Mills 34.9813 Total Debt Bond/Non-Bond 4,877,666
State and Local Revenue:14 Property Tax Receipts (Including URT) 1,556,561 1,955,45615 Other Local Receipts 402,419 166,47516 Revenue from Intermediate Sources 0 017.1 Foundation Funding (Excl URT) 5,015,369 4,881,83417.2 Tax Collection Rate Guarantee 92,643 018 Student Growth Funding 0 019 Declining Enrollment Funding 40,567 100,76220 Consolidation Incentive/Assistance 0 021 Isolated Funding 0 022 Supplemental Millage Incentive Funding 38,884 31,10723 Other Unrestricted State Funding 0 024 Total Unrestricted Revenue from State and
Local Sources 7,146,443 7,135,634
Restricted Revenue from State Sources:25 Adult Education 0 0
Regular Education:26 Professional Development 43,593 43,27827 Other Regular Education 7,500 8,800
Special Education:28 Gifted & Talented 350 029 Alternative Learning Environment (ALE) 66,511 56,78730 English Language Learner (ELL) 0 031 National School Lunch Act (NSLA) 224,688 253,50632 Other Special Education 7,959 033 Workforce Education 18,688 21,12534 School Food Service 3,190 3,00035 Educational Service Cooperatives 0 036 Early Childhood Programs 0 037 Magnet School Programs 0 038 Other Non-Instructional Programs 352,557 85,11539 Total Restricted Revenue from State Sources 725,036 471,61140 Total Restricted Revenue from Federal
Sources 1,459,153 1,246,308
Other Sources of Funds:41 Financing Sources 0 042 Balances from Consolidated/Annexed District 0 043 Indirect Cost Reimbursement 0 044 Gains and Losses from Sale of Fixed Assets 0 045 Compensation for Loss of Fixed Assets 0 046 Other 0 047 Total Other Sources of Funds 0 048 Total Revenue and Other Sources of Funds
from All Sources 9,330,632 8,853,553
2010-2011 2011-2012Actual Budget
CURRENT EXPENDITURESInstruction:
49 Regular Instruction 3,384,452 3,058,67550 Special Education 551,061 638,33951 Workforce Education 303,306 319,79352 Adult Education 0 053 Compensatory Education 164,950 194,43554 Other 389,806 401,61355 Total Instruction 4,793,576 4,612,855
District Level Support:56 General Administration 295,168 316,38957 Central Services 155,831 167,23458 Maintenance & Operations of Plant 833,924 858,06559 Student Transportation 532,219 557,31860 Other District Level Support Services 26,117 13,75061 Total District Support Services 1,843,259 1,912,756
School Level Support:62 Student Support Services 393,217 459,26563 Instructional Staff Support Services 373,789 460,74464 School Administration 397,776 354,01465 Total District Support Services 1,164,782 1,274,023
Non-Instructional Services:66 Food Service Operations 487,647 477,56567 Other Enterprise Operations 0 068 Community Operations 0 58969 Other Non-Instructional Services 0 070 Total Non-Instructional Services 487,647 478,15471 Facilities Acquisition and Construction 2,497 072 Debt Service 156,840 306,75575 Other Non-Programmed Costs 44,601 076 Total Expenditures 8,493,203 8,584,54377 Less: Capital Expenditures 217,369 191,15878 Less: Debt Service 156,840 306,75579 Total Current Expenditures 8,118,993 8,086,63080 Exclusions from Current Expenditures 386,01381 Net Current Expenditures 7,732,980
82 Per Pupil Expenditures 8,153
83 Personnel - Non-Federal Certified Clsrm FTEs 76.0084 Avg Salary - Non-Fed Certified Clsrm FTEs 41,64185 Personnel - Non-Federal Certified FTEs 81.5086 Avg Salary - Non-Fed Certified FTEs 43,86587.1 Legal Balance (funds 1-2-4) 3,173,05187.2 Categorical Fund Balance 146,90087.3 Deposits with Paying Agents (QZAB) 087.4 Net Legal Bal (Excl Cat & QZAB) 3,026,15188 Building Fund Balance (fund 3) 254,07289 Capital Outlay Fund Balance (fund 5) 0
Jan 30, 2012 - 163 - 9:35:29 AM

Annual Statistical Report 2010-2011
County: PHILLIPS BARTON-LEXA SCHOOL DISTRICT LEA:5401000
2010-2011 2011-2012Actual Budget
1 Area in Square Miles 1542 ADA 7173 ADA pct Change over 5 Yrs. (6%)4 4 QTR ADM 7665 Prior Year 3QTR ADM 7516 Assessment 33,076,9857 M&O Mills 25.008 URT Mills 25.009 M&O Mills in Excess of URT 0.0010 Dedicated M&O Mills 0.0011 Debt Service Mills 3.6012 Total Mills 28.6013 Total Debt Bond/Non-Bond 1,335,130
State and Local Revenue:14 Property Tax Receipts (Including URT) 873,703 741,25015 Other Local Receipts 296,272 98,88016 Revenue from Intermediate Sources 0 017.1 Foundation Funding (Excl URT) 3,747,557 3,927,86717.2 Tax Collection Rate Guarantee 35,549 35,00018 Student Growth Funding 101,141 019 Declining Enrollment Funding 0 020 Consolidation Incentive/Assistance 0 021 Isolated Funding 0 022 Supplemental Millage Incentive Funding 26,743 21,39523 Other Unrestricted State Funding 26,317 23,00024 Total Unrestricted Revenue from State and
Local Sources 5,107,281 4,847,392
Restricted Revenue from State Sources:25 Adult Education 0 0
Regular Education:26 Professional Development 31,052 32,66827 Other Regular Education 8,285 3,000
Special Education:28 Gifted & Talented 300 029 Alternative Learning Environment (ALE) 1,585 4,10430 English Language Learner (ELL) 0 031 National School Lunch Act (NSLA) 241,056 369,71932 Other Special Education 3,372 3,07633 Workforce Education 0 034 School Food Service 2,871 2,85035 Educational Service Cooperatives 0 036 Early Childhood Programs 96,228 97,20037 Magnet School Programs 0 038 Other Non-Instructional Programs 455,165 656,77439 Total Restricted Revenue from State Sources 839,914 1,169,39140 Total Restricted Revenue from Federal
Sources 1,075,806 796,303
Other Sources of Funds:41 Financing Sources 597,800 042 Balances from Consolidated/Annexed District 0 043 Indirect Cost Reimbursement 0 044 Gains and Losses from Sale of Fixed Assets 0 045 Compensation for Loss of Fixed Assets 3,959 046 Other 0 047 Total Other Sources of Funds 601,759 048 Total Revenue and Other Sources of Funds
from All Sources 7,624,759 6,813,086
2010-2011 2011-2012Actual Budget
CURRENT EXPENDITURESInstruction:
49 Regular Instruction 3,230,164 2,509,99550 Special Education 389,147 349,18951 Workforce Education 188,676 182,34652 Adult Education 0 053 Compensatory Education 354,167 532,68854 Other 127,450 299,26355 Total Instruction 4,289,603 3,873,481
District Level Support:56 General Administration 318,348 252,25657 Central Services 188,808 100,91758 Maintenance & Operations of Plant 613,877 579,08859 Student Transportation 282,380 213,94760 Other District Level Support Services 8,788 3,16961 Total District Support Services 1,412,201 1,149,377
School Level Support:62 Student Support Services 304,759 276,76763 Instructional Staff Support Services 341,077 346,01964 School Administration 318,756 287,05465 Total District Support Services 964,592 909,840
Non-Instructional Services:66 Food Service Operations 396,656 353,74167 Other Enterprise Operations 0 068 Community Operations 0 12,29669 Other Non-Instructional Services 0 070 Total Non-Instructional Services 396,656 366,03771 Facilities Acquisition and Construction 672,469 1,322,96072 Debt Service 121,681 148,81675 Other Non-Programmed Costs 9,064 076 Total Expenditures 7,866,267 7,770,51177 Less: Capital Expenditures 876,554 1,332,70078 Less: Debt Service 121,681 148,81679 Total Current Expenditures 6,868,032 6,288,99580 Exclusions from Current Expenditures 344,35381 Net Current Expenditures 6,523,680
82 Per Pupil Expenditures 9,096
83 Personnel - Non-Federal Certified Clsrm FTEs 53.1784 Avg Salary - Non-Fed Certified Clsrm FTEs 47,46085 Personnel - Non-Federal Certified FTEs 56.2886 Avg Salary - Non-Fed Certified FTEs 50,46887.1 Legal Balance (funds 1-2-4) 2,520,04787.2 Categorical Fund Balance 174,72687.3 Deposits with Paying Agents (QZAB) 087.4 Net Legal Bal (Excl Cat & QZAB) 2,345,32188 Building Fund Balance (fund 3) 597,88589 Capital Outlay Fund Balance (fund 5) 0
Jan 30, 2012 - 164 - 9:35:29 AM

Annual Statistical Report 2010-2011
County: PHILLIPS HELENA/ W.HELENA SCHOOL DIST. LEA:5403000
2010-2011 2011-2012Actual Budget
1 Area in Square Miles 1382 ADA 2,1153 ADA pct Change over 5 Yrs. (24%)4 4 QTR ADM 2,2335 Prior Year 3QTR ADM 2,3156 Assessment 113,701,9997 M&O Mills 25.008 URT Mills 25.009 M&O Mills in Excess of URT 0.0010 Dedicated M&O Mills 0.0011 Debt Service Mills 9.1012 Total Mills 34.1013 Total Debt Bond/Non-Bond 7,300,000
State and Local Revenue:14 Property Tax Receipts (Including URT) 3,682,599 3,674,70015 Other Local Receipts 587,602 312,78616 Revenue from Intermediate Sources 0 017.1 Foundation Funding (Excl URT) 11,102,332 10,914,16617.2 Tax Collection Rate Guarantee 217,874 018 Student Growth Funding 0 019 Declining Enrollment Funding 796,391 224,22520 Consolidation Incentive/Assistance 0 021 Isolated Funding 0 022 Supplemental Millage Incentive Funding 177,851 142,28123 Other Unrestricted State Funding 0 024 Total Unrestricted Revenue from State and
Local Sources 16,564,649 15,268,158
Restricted Revenue from State Sources:25 Adult Education 0 0
Regular Education:26 Professional Development 95,746 95,01427 Other Regular Education 43,675 0
Special Education:28 Gifted & Talented 150 029 Alternative Learning Environment (ALE) 203,028 246,91830 English Language Learner (ELL) 0 031 National School Lunch Act (NSLA) 3,136,704 3,146,81432 Other Special Education 9,484 033 Workforce Education 39,813 034 School Food Service 10,790 035 Educational Service Cooperatives 0 036 Early Childhood Programs 350,000 350,00037 Magnet School Programs 0 038 Other Non-Instructional Programs 255,660 211,99739 Total Restricted Revenue from State Sources 4,145,049 4,050,74340 Total Restricted Revenue from Federal
Sources 8,604,680 5,811,336
Other Sources of Funds:41 Financing Sources 0 042 Balances from Consolidated/Annexed District 0 043 Indirect Cost Reimbursement 0 044 Gains and Losses from Sale of Fixed Assets 0 045 Compensation for Loss of Fixed Assets 0 046 Other 0 047 Total Other Sources of Funds 0 048 Total Revenue and Other Sources of Funds
from All Sources 29,314,378 25,130,237
2010-2011 2011-2012Actual Budget
CURRENT EXPENDITURESInstruction:
49 Regular Instruction 8,802,742 8,908,36350 Special Education 1,444,730 1,289,80351 Workforce Education 511,177 410,26852 Adult Education 0 053 Compensatory Education 1,033,077 1,654,01254 Other 953,007 654,88355 Total Instruction 12,744,733 12,917,328
District Level Support:56 General Administration 736,973 986,99457 Central Services 611,775 475,64558 Maintenance & Operations of Plant 2,972,328 2,030,38159 Student Transportation 1,058,947 1,237,68760 Other District Level Support Services 21,345 54,51161 Total District Support Services 5,401,369 4,785,218
School Level Support:62 Student Support Services 1,198,394 686,37463 Instructional Staff Support Services 2,804,200 3,739,72664 School Administration 1,705,760 916,57565 Total District Support Services 5,708,354 5,342,675
Non-Instructional Services:66 Food Service Operations 2,014,175 873,53567 Other Enterprise Operations 0 068 Community Operations 0 069 Other Non-Instructional Services 0 070 Total Non-Instructional Services 2,014,175 873,53571 Facilities Acquisition and Construction 61,469 072 Debt Service 759,398 759,45375 Other Non-Programmed Costs 253 076 Total Expenditures 26,689,749 24,678,20977 Less: Capital Expenditures 759,251 295,88678 Less: Debt Service 759,398 759,45379 Total Current Expenditures 25,171,100 23,622,87080 Exclusions from Current Expenditures 559,30481 Net Current Expenditures 24,611,796
82 Per Pupil Expenditures 11,638
83 Personnel - Non-Federal Certified Clsrm FTEs 101.8984 Avg Salary - Non-Fed Certified Clsrm FTEs 50,56185 Personnel - Non-Federal Certified FTEs 132.6286 Avg Salary - Non-Fed Certified FTEs 54,17087.1 Legal Balance (funds 1-2-4) 4,564,30487.2 Categorical Fund Balance 963,70787.3 Deposits with Paying Agents (QZAB) 087.4 Net Legal Bal (Excl Cat & QZAB) 3,600,59788 Building Fund Balance (fund 3) 089 Capital Outlay Fund Balance (fund 5) 0
Jan 30, 2012 - 165 - 9:35:29 AM

Annual Statistical Report 2010-2011
County: PHILLIPS MARVELL SCHOOL DISTRICT LEA:5404000
2010-2011 2011-2012Actual Budget
1 Area in Square Miles 6052 ADA 4133 ADA pct Change over 5 Yrs. (46%)4 4 QTR ADM 4535 Prior Year 3QTR ADM 5366 Assessment 54,520,7747 M&O Mills 25.008 URT Mills 25.009 M&O Mills in Excess of URT 0.0010 Dedicated M&O Mills 0.0011 Debt Service Mills 8.0012 Total Mills 33.0013 Total Debt Bond/Non-Bond 2,250,000
State and Local Revenue:14 Property Tax Receipts (Including URT) 1,607,121 1,763,55015 Other Local Receipts 314,009 237,24016 Revenue from Intermediate Sources 0 017.1 Foundation Funding (Excl URT) 1,901,614 1,403,24817.2 Tax Collection Rate Guarantee 51,299 50,00018 Student Growth Funding 0 019 Declining Enrollment Funding 258,778 268,02520 Consolidation Incentive/Assistance 0 021 Isolated Funding 0 022 Supplemental Millage Incentive Funding 0 023 Other Unrestricted State Funding 34,882 34,90024 Total Unrestricted Revenue from State and
Local Sources 4,167,703 3,756,963
Restricted Revenue from State Sources:25 Adult Education 0 0
Regular Education:26 Professional Development 22,176 19,25627 Other Regular Education 179,193 180,355
Special Education:28 Gifted & Talented 1,083 1,00029 Alternative Learning Environment (ALE) 13,977 42,62530 English Language Learner (ELL) 0 031 National School Lunch Act (NSLA) 787,152 853,56232 Other Special Education 2,197 2,20033 Workforce Education 7,584 7,00034 School Food Service 2,204 2,00035 Educational Service Cooperatives 0 036 Early Childhood Programs 122,201 218,70037 Magnet School Programs 0 038 Other Non-Instructional Programs 26,109 49,09539 Total Restricted Revenue from State Sources 1,163,875 1,375,79340 Total Restricted Revenue from Federal
Sources 3,224,880 3,432,191
Other Sources of Funds:41 Financing Sources 0 042 Balances from Consolidated/Annexed District 0 043 Indirect Cost Reimbursement 0 044 Gains and Losses from Sale of Fixed Assets 123 045 Compensation for Loss of Fixed Assets 2,115 046 Other 0 047 Total Other Sources of Funds 2,238 048 Total Revenue and Other Sources of Funds
from All Sources 8,558,696 8,564,947
2010-2011 2011-2012Actual Budget
CURRENT EXPENDITURESInstruction:
49 Regular Instruction 3,103,950 2,609,88350 Special Education 774,508 701,76851 Workforce Education 252,849 274,93652 Adult Education 0 053 Compensatory Education 973,253 655,34654 Other 207,794 265,53655 Total Instruction 5,312,355 4,507,469
District Level Support:56 General Administration 332,097 296,27457 Central Services 115,735 62,79958 Maintenance & Operations of Plant 529,267 578,37359 Student Transportation 267,605 182,12060 Other District Level Support Services 0 061 Total District Support Services 1,244,704 1,119,566
School Level Support:62 Student Support Services 372,698 318,58563 Instructional Staff Support Services 972,394 411,16864 School Administration 83,285 43,72565 Total District Support Services 1,428,377 773,478
Non-Instructional Services:66 Food Service Operations 302,299 279,43367 Other Enterprise Operations 0 068 Community Operations 23,589 069 Other Non-Instructional Services 0 070 Total Non-Instructional Services 325,888 279,43371 Facilities Acquisition and Construction 736,413 36,00072 Debt Service 14,081 270,00075 Other Non-Programmed Costs 0 076 Total Expenditures 9,061,818 6,985,94677 Less: Capital Expenditures 939,831 310,40578 Less: Debt Service 14,081 270,00079 Total Current Expenditures 8,107,905 6,405,54180 Exclusions from Current Expenditures 439,82081 Net Current Expenditures 7,668,085
82 Per Pupil Expenditures 18,579
83 Personnel - Non-Federal Certified Clsrm FTEs 51.7084 Avg Salary - Non-Fed Certified Clsrm FTEs 49,84985 Personnel - Non-Federal Certified FTEs 54.9886 Avg Salary - Non-Fed Certified FTEs 52,60987.1 Legal Balance (funds 1-2-4) 4,203,27387.2 Categorical Fund Balance 264,68587.3 Deposits with Paying Agents (QZAB) 087.4 Net Legal Bal (Excl Cat & QZAB) 3,938,58988 Building Fund Balance (fund 3) 242,17089 Capital Outlay Fund Balance (fund 5) 0
Jan 30, 2012 - 166 - 9:35:29 AM

Annual Statistical Report 2010-2011
County: PIKE CENTERPOINT SCHOOL DISTRICT LEA:5502000
2010-2011 2011-2012Actual Budget
1 Area in Square Miles 2172 ADA 9263 ADA pct Change over 5 Yrs. (5%)4 4 QTR ADM 1,0065 Prior Year 3QTR ADM 1,0416 Assessment 56,839,0217 M&O Mills 25.008 URT Mills 25.009 M&O Mills in Excess of URT 0.0010 Dedicated M&O Mills 0.0011 Debt Service Mills 13.6012 Total Mills 38.6013 Total Debt Bond/Non-Bond 4,905,000
State and Local Revenue:14 Property Tax Receipts (Including URT) 1,860,937 1,904,83015 Other Local Receipts 451,760 284,84016 Revenue from Intermediate Sources 8,019 13,00017.1 Foundation Funding (Excl URT) 4,924,518 4,830,46817.2 Tax Collection Rate Guarantee 147,189 150,00018 Student Growth Funding 0 019 Declining Enrollment Funding 7,740 83,80420 Consolidation Incentive/Assistance 0 021 Isolated Funding 0 022 Supplemental Millage Incentive Funding 0 023 Other Unrestricted State Funding 0 024 Total Unrestricted Revenue from State and
Local Sources 7,400,163 7,266,942
Restricted Revenue from State Sources:25 Adult Education 0 0
Regular Education:26 Professional Development 43,038 42,94427 Other Regular Education 4,485 4,500
Special Education:28 Gifted & Talented 100 029 Alternative Learning Environment (ALE) 0 4,14530 English Language Learner (ELL) 55,377 86,74431 National School Lunch Act (NSLA) 311,488 358,75432 Other Special Education 4,263 033 Workforce Education 0 034 School Food Service 4,165 4,21235 Educational Service Cooperatives 0 036 Early Childhood Programs 87,480 037 Magnet School Programs 0 038 Other Non-Instructional Programs 703,826 234,15839 Total Restricted Revenue from State Sources 1,214,222 735,45740 Total Restricted Revenue from Federal
Sources 1,931,322 1,844,922
Other Sources of Funds:41 Financing Sources 0 042 Balances from Consolidated/Annexed District 0 043 Indirect Cost Reimbursement 0 044 Gains and Losses from Sale of Fixed Assets 0 045 Compensation for Loss of Fixed Assets 0 046 Other 0 047 Total Other Sources of Funds 0 048 Total Revenue and Other Sources of Funds
from All Sources 10,545,708 9,847,321
2010-2011 2011-2012Actual Budget
CURRENT EXPENDITURESInstruction:
49 Regular Instruction 3,802,052 3,215,49850 Special Education 643,440 693,70151 Workforce Education 335,291 366,13652 Adult Education 0 053 Compensatory Education 438,148 244,58454 Other 144,069 188,13655 Total Instruction 5,363,000 4,708,055
District Level Support:56 General Administration 262,559 236,05057 Central Services 218,267 275,18058 Maintenance & Operations of Plant 918,408 849,03959 Student Transportation 397,602 310,06560 Other District Level Support Services 17,059 4,59361 Total District Support Services 1,813,896 1,674,927
School Level Support:62 Student Support Services 308,686 313,81963 Instructional Staff Support Services 712,327 810,83264 School Administration 566,006 551,66965 Total District Support Services 1,587,020 1,676,320
Non-Instructional Services:66 Food Service Operations 588,962 600,06567 Other Enterprise Operations 0 068 Community Operations 243 3,40069 Other Non-Instructional Services 0 070 Total Non-Instructional Services 589,205 603,46571 Facilities Acquisition and Construction 1,125,018 899,39672 Debt Service 223,436 454,29575 Other Non-Programmed Costs 0 076 Total Expenditures 10,701,574 10,016,45877 Less: Capital Expenditures 1,304,149 1,025,93478 Less: Debt Service 223,436 454,29579 Total Current Expenditures 9,173,989 8,536,22980 Exclusions from Current Expenditures 469,59981 Net Current Expenditures 8,704,390
82 Per Pupil Expenditures 9,397
83 Personnel - Non-Federal Certified Clsrm FTEs 77.6984 Avg Salary - Non-Fed Certified Clsrm FTEs 39,20085 Personnel - Non-Federal Certified FTEs 85.6986 Avg Salary - Non-Fed Certified FTEs 42,70587.1 Legal Balance (funds 1-2-4) 1,268,69087.2 Categorical Fund Balance 32,01087.3 Deposits with Paying Agents (QZAB) 087.4 Net Legal Bal (Excl Cat & QZAB) 1,236,67988 Building Fund Balance (fund 3) 137,07589 Capital Outlay Fund Balance (fund 5) 0
Jan 30, 2012 - 167 - 9:35:29 AM
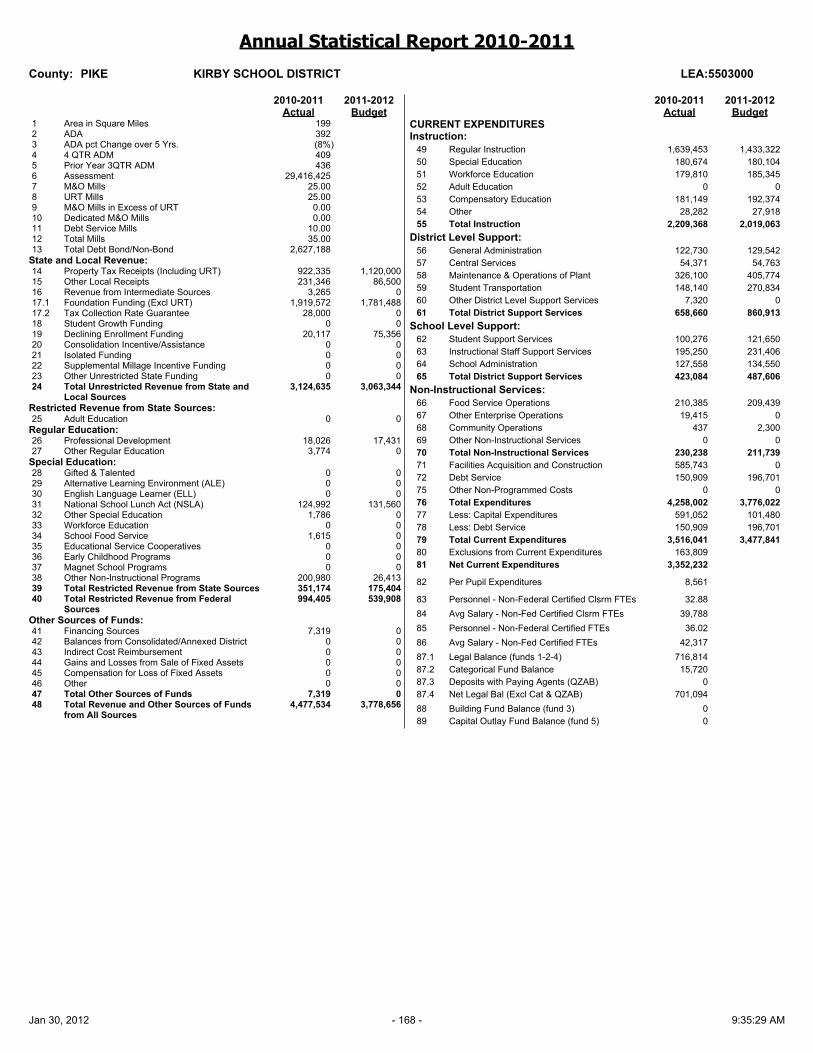
Annual Statistical Report 2010-2011
County: PIKE KIRBY SCHOOL DISTRICT LEA:5503000
2010-2011 2011-2012Actual Budget
1 Area in Square Miles 1992 ADA 3923 ADA pct Change over 5 Yrs. (8%)4 4 QTR ADM 4095 Prior Year 3QTR ADM 4366 Assessment 29,416,4257 M&O Mills 25.008 URT Mills 25.009 M&O Mills in Excess of URT 0.0010 Dedicated M&O Mills 0.0011 Debt Service Mills 10.0012 Total Mills 35.0013 Total Debt Bond/Non-Bond 2,627,188
State and Local Revenue:14 Property Tax Receipts (Including URT) 922,335 1,120,00015 Other Local Receipts 231,346 86,50016 Revenue from Intermediate Sources 3,265 017.1 Foundation Funding (Excl URT) 1,919,572 1,781,48817.2 Tax Collection Rate Guarantee 28,000 018 Student Growth Funding 0 019 Declining Enrollment Funding 20,117 75,35620 Consolidation Incentive/Assistance 0 021 Isolated Funding 0 022 Supplemental Millage Incentive Funding 0 023 Other Unrestricted State Funding 0 024 Total Unrestricted Revenue from State and
Local Sources 3,124,635 3,063,344
Restricted Revenue from State Sources:25 Adult Education 0 0
Regular Education:26 Professional Development 18,026 17,43127 Other Regular Education 3,774 0
Special Education:28 Gifted & Talented 0 029 Alternative Learning Environment (ALE) 0 030 English Language Learner (ELL) 0 031 National School Lunch Act (NSLA) 124,992 131,56032 Other Special Education 1,786 033 Workforce Education 0 034 School Food Service 1,615 035 Educational Service Cooperatives 0 036 Early Childhood Programs 0 037 Magnet School Programs 0 038 Other Non-Instructional Programs 200,980 26,41339 Total Restricted Revenue from State Sources 351,174 175,40440 Total Restricted Revenue from Federal
Sources 994,405 539,908
Other Sources of Funds:41 Financing Sources 7,319 042 Balances from Consolidated/Annexed District 0 043 Indirect Cost Reimbursement 0 044 Gains and Losses from Sale of Fixed Assets 0 045 Compensation for Loss of Fixed Assets 0 046 Other 0 047 Total Other Sources of Funds 7,319 048 Total Revenue and Other Sources of Funds
from All Sources 4,477,534 3,778,656
2010-2011 2011-2012Actual Budget
CURRENT EXPENDITURESInstruction:
49 Regular Instruction 1,639,453 1,433,32250 Special Education 180,674 180,10451 Workforce Education 179,810 185,34552 Adult Education 0 053 Compensatory Education 181,149 192,37454 Other 28,282 27,91855 Total Instruction 2,209,368 2,019,063
District Level Support:56 General Administration 122,730 129,54257 Central Services 54,371 54,76358 Maintenance & Operations of Plant 326,100 405,77459 Student Transportation 148,140 270,83460 Other District Level Support Services 7,320 061 Total District Support Services 658,660 860,913
School Level Support:62 Student Support Services 100,276 121,65063 Instructional Staff Support Services 195,250 231,40664 School Administration 127,558 134,55065 Total District Support Services 423,084 487,606
Non-Instructional Services:66 Food Service Operations 210,385 209,43967 Other Enterprise Operations 19,415 068 Community Operations 437 2,30069 Other Non-Instructional Services 0 070 Total Non-Instructional Services 230,238 211,73971 Facilities Acquisition and Construction 585,743 072 Debt Service 150,909 196,70175 Other Non-Programmed Costs 0 076 Total Expenditures 4,258,002 3,776,02277 Less: Capital Expenditures 591,052 101,48078 Less: Debt Service 150,909 196,70179 Total Current Expenditures 3,516,041 3,477,84180 Exclusions from Current Expenditures 163,80981 Net Current Expenditures 3,352,232
82 Per Pupil Expenditures 8,561
83 Personnel - Non-Federal Certified Clsrm FTEs 32.8884 Avg Salary - Non-Fed Certified Clsrm FTEs 39,78885 Personnel - Non-Federal Certified FTEs 36.0286 Avg Salary - Non-Fed Certified FTEs 42,31787.1 Legal Balance (funds 1-2-4) 716,81487.2 Categorical Fund Balance 15,72087.3 Deposits with Paying Agents (QZAB) 087.4 Net Legal Bal (Excl Cat & QZAB) 701,09488 Building Fund Balance (fund 3) 089 Capital Outlay Fund Balance (fund 5) 0
Jan 30, 2012 - 168 - 9:35:29 AM

Annual Statistical Report 2010-2011
County: PIKE SOUTH PIKE COUNTY SCHOOL DIST LEA:5504000
2010-2011 2011-2012Actual Budget
1 Area in Square Miles 3792 ADA 7093 ADA pct Change over 5 Yrs. (16%)4 4 QTR ADM 7495 Prior Year 3QTR ADM 5266 Assessment 19,531,9947 M&O Mills 32.108 URT Mills 25.009 M&O Mills in Excess of URT 7.1010 Dedicated M&O Mills 0.0011 Debt Service Mills 7.9012 Total Mills 40.0013 Total Debt Bond/Non-Bond 3,826,933
State and Local Revenue:14 Property Tax Receipts (Including URT) 2,332,284 2,056,00015 Other Local Receipts 483,969 167,88116 Revenue from Intermediate Sources 0 017.1 Foundation Funding (Excl URT) 3,553,386 3,176,97017.2 Tax Collection Rate Guarantee 56,798 018 Student Growth Funding 0 019 Declining Enrollment Funding 52,189 205,54820 Consolidation Incentive/Assistance 1,760,222 880,11121 Isolated Funding 0 022 Supplemental Millage Incentive Funding 15,074 12,05923 Other Unrestricted State Funding 0 024 Total Unrestricted Revenue from State and
Local Sources 8,253,922 6,498,569
Restricted Revenue from State Sources:25 Adult Education 0 0
Regular Education:26 Professional Development 33,825 31,82427 Other Regular Education 21,478 9,400
Special Education:28 Gifted & Talented 1,065 029 Alternative Learning Environment (ALE) 35,104 22,54930 English Language Learner (ELL) 2,344 2,39231 National School Lunch Act (NSLA) 238,576 244,90432 Other Special Education 3,350 033 Workforce Education 28,651 10,29234 School Food Service 2,982 3,50035 Educational Service Cooperatives 0 036 Early Childhood Programs 0 037 Magnet School Programs 0 038 Other Non-Instructional Programs 51,736 644,94439 Total Restricted Revenue from State Sources 419,111 969,80540 Total Restricted Revenue from Federal
Sources 1,141,136 790,480
Other Sources of Funds:41 Financing Sources 0 4,75442 Balances from Consolidated/Annexed District 119,852 043 Indirect Cost Reimbursement 0 044 Gains and Losses from Sale of Fixed Assets 0 045 Compensation for Loss of Fixed Assets 0 046 Other 0 047 Total Other Sources of Funds 119,852 4,75448 Total Revenue and Other Sources of Funds
from All Sources 9,934,021 8,263,608
2010-2011 2011-2012Actual Budget
CURRENT EXPENDITURESInstruction:
49 Regular Instruction 3,401,752 2,759,96050 Special Education 399,055 407,67751 Workforce Education 388,795 224,04252 Adult Education 0 053 Compensatory Education 197,112 135,89354 Other 262,258 224,04455 Total Instruction 4,648,973 3,751,615
District Level Support:56 General Administration 179,522 170,13757 Central Services 232,151 463,31558 Maintenance & Operations of Plant 948,082 725,28659 Student Transportation 253,583 359,15860 Other District Level Support Services 13,162 6,00061 Total District Support Services 1,626,500 1,723,896
School Level Support:62 Student Support Services 389,236 329,68163 Instructional Staff Support Services 434,261 301,34864 School Administration 407,871 285,91765 Total District Support Services 1,231,369 916,946
Non-Instructional Services:66 Food Service Operations 433,480 413,73667 Other Enterprise Operations 0 068 Community Operations 366 069 Other Non-Instructional Services 0 070 Total Non-Instructional Services 433,845 413,73671 Facilities Acquisition and Construction 82,898 1,057,19772 Debt Service 277,101 177,37575 Other Non-Programmed Costs 330 076 Total Expenditures 8,301,015 8,040,76577 Less: Capital Expenditures 308,949 1,482,80278 Less: Debt Service 277,101 177,37579 Total Current Expenditures 7,714,965 6,380,58980 Exclusions from Current Expenditures 435,15381 Net Current Expenditures 7,279,812
82 Per Pupil Expenditures 10,275
83 Personnel - Non-Federal Certified Clsrm FTEs 60.7684 Avg Salary - Non-Fed Certified Clsrm FTEs 51,56185 Personnel - Non-Federal Certified FTEs 62.7886 Avg Salary - Non-Fed Certified FTEs 55,78887.1 Legal Balance (funds 1-2-4) 2,205,54987.2 Categorical Fund Balance 25,28087.3 Deposits with Paying Agents (QZAB) 087.4 Net Legal Bal (Excl Cat & QZAB) 2,180,26888 Building Fund Balance (fund 3) 089 Capital Outlay Fund Balance (fund 5) 0
Jan 30, 2012 - 169 - 9:35:29 AM

Annual Statistical Report 2010-2011
County: POINSETT HARRISBURG SCHOOL DISTRICT LEA:5602000
2010-2011 2011-2012Actual Budget
1 Area in Square Miles 3732 ADA 1,2613 ADA pct Change over 5 Yrs. (4%)4 4 QTR ADM 1,3705 Prior Year 3QTR ADM 1,1246 Assessment 38,479,5657 M&O Mills 36.408 URT Mills 25.009 M&O Mills in Excess of URT 11.4010 Dedicated M&O Mills 0.0011 Debt Service Mills 3.5012 Total Mills 39.9013 Total Debt Bond/Non-Bond 7,644,536
State and Local Revenue:14 Property Tax Receipts (Including URT) 3,222,861 3,519,94415 Other Local Receipts 570,425 73,00016 Revenue from Intermediate Sources 0 017.1 Foundation Funding (Excl URT) 6,542,492 6,238,56917.2 Tax Collection Rate Guarantee 59,933 018 Student Growth Funding 0 019 Declining Enrollment Funding 129,374 217,86620 Consolidation Incentive/Assistance 1,806,900 903,45021 Isolated Funding 0 022 Supplemental Millage Incentive Funding 7,695 6,15623 Other Unrestricted State Funding 0 024 Total Unrestricted Revenue from State and
Local Sources 12,339,680 10,958,985
Restricted Revenue from State Sources:25 Adult Education 0 0
Regular Education:26 Professional Development 59,720 58,18727 Other Regular Education 91,016 16,100
Special Education:28 Gifted & Talented 300 029 Alternative Learning Environment (ALE) 17,755 24,82930 English Language Learner (ELL) 4,981 031 National School Lunch Act (NSLA) 1,030,688 1,009,97632 Other Special Education 63,593 195,00033 Workforce Education 93,368 034 School Food Service 5,404 5,50035 Educational Service Cooperatives 0 036 Early Childhood Programs 0 037 Magnet School Programs 0 038 Other Non-Instructional Programs 96,358 85,74939 Total Restricted Revenue from State Sources 1,463,184 1,395,34140 Total Restricted Revenue from Federal
Sources 2,163,200 2,361,412
Other Sources of Funds:41 Financing Sources 15,463 042 Balances from Consolidated/Annexed District 685,487 043 Indirect Cost Reimbursement 0 044 Gains and Losses from Sale of Fixed Assets 0 045 Compensation for Loss of Fixed Assets 14,432 046 Other 0 047 Total Other Sources of Funds 715,383 048 Total Revenue and Other Sources of Funds
from All Sources 16,681,447 14,715,738
2010-2011 2011-2012Actual Budget
CURRENT EXPENDITURESInstruction:
49 Regular Instruction 5,741,838 5,833,34750 Special Education 960,805 1,122,70451 Workforce Education 454,026 492,96152 Adult Education 0 053 Compensatory Education 197,230 360,43054 Other 412,667 501,82955 Total Instruction 7,766,567 8,311,270
District Level Support:56 General Administration 448,610 386,84257 Central Services 370,394 364,03258 Maintenance & Operations of Plant 1,322,615 1,366,54759 Student Transportation 626,645 709,41660 Other District Level Support Services 17,224 15,00061 Total District Support Services 2,785,489 2,841,837
School Level Support:62 Student Support Services 633,722 841,31463 Instructional Staff Support Services 1,360,790 1,485,48364 School Administration 639,843 680,23165 Total District Support Services 2,634,355 3,007,028
Non-Instructional Services:66 Food Service Operations 616,526 790,40067 Other Enterprise Operations 0 068 Community Operations 988 2,67669 Other Non-Instructional Services 0 070 Total Non-Instructional Services 617,514 793,07671 Facilities Acquisition and Construction 241,116 235,60072 Debt Service 491,972 460,26975 Other Non-Programmed Costs 31,776 076 Total Expenditures 14,568,789 15,649,08177 Less: Capital Expenditures 813,362 456,53378 Less: Debt Service 491,972 460,26979 Total Current Expenditures 13,263,454 14,732,27980 Exclusions from Current Expenditures 414,75781 Net Current Expenditures 12,848,698
82 Per Pupil Expenditures 10,186
83 Personnel - Non-Federal Certified Clsrm FTEs 118.4584 Avg Salary - Non-Fed Certified Clsrm FTEs 43,45185 Personnel - Non-Federal Certified FTEs 130.0586 Avg Salary - Non-Fed Certified FTEs 45,93487.1 Legal Balance (funds 1-2-4) 3,159,68387.2 Categorical Fund Balance 255,55587.3 Deposits with Paying Agents (QZAB) 087.4 Net Legal Bal (Excl Cat & QZAB) 2,904,12888 Building Fund Balance (fund 3) 15,41289 Capital Outlay Fund Balance (fund 5) 0
Jan 30, 2012 - 170 - 9:35:29 AM

Annual Statistical Report 2010-2011
County: POINSETT MARKED TREE SCHOOL DISTRICT LEA:5604000
2010-2011 2011-2012Actual Budget
1 Area in Square Miles 1022 ADA 5623 ADA pct Change over 5 Yrs. (6%)4 4 QTR ADM 5965 Prior Year 3QTR ADM 6026 Assessment 34,382,7257 M&O Mills 25.008 URT Mills 25.009 M&O Mills in Excess of URT 0.0010 Dedicated M&O Mills 0.0011 Debt Service Mills 8.5012 Total Mills 33.5013 Total Debt Bond/Non-Bond 1,734,676
State and Local Revenue:14 Property Tax Receipts (Including URT) 1,106,461 1,094,23015 Other Local Receipts 188,332 53,00016 Revenue from Intermediate Sources 0 017.1 Foundation Funding (Excl URT) 2,779,603 2,837,55217.2 Tax Collection Rate Guarantee 18,628 18,00018 Student Growth Funding 0 019 Declining Enrollment Funding 27,435 6,29820 Consolidation Incentive/Assistance 0 021 Isolated Funding 0 022 Supplemental Millage Incentive Funding 13,225 10,58023 Other Unrestricted State Funding 334 024 Total Unrestricted Revenue from State and
Local Sources 4,134,018 4,019,660
Restricted Revenue from State Sources:25 Adult Education 0 0
Regular Education:26 Professional Development 24,915 40,31427 Other Regular Education 17,095 1,800
Special Education:28 Gifted & Talented 150 029 Alternative Learning Environment (ALE) 25,475 13,15330 English Language Learner (ELL) 0 031 National School Lunch Act (NSLA) 448,384 582,92732 Other Special Education 2,468 2,40033 Workforce Education 0 034 School Food Service 1,978 2,00035 Educational Service Cooperatives 0 036 Early Childhood Programs 0 037 Magnet School Programs 0 038 Other Non-Instructional Programs 38,830 37,63439 Total Restricted Revenue from State Sources 559,295 680,22740 Total Restricted Revenue from Federal
Sources 1,368,506 1,442,094
Other Sources of Funds:41 Financing Sources 5,917 042 Balances from Consolidated/Annexed District 0 043 Indirect Cost Reimbursement 17,672 044 Gains and Losses from Sale of Fixed Assets 0 045 Compensation for Loss of Fixed Assets 14,844 046 Other 0 047 Total Other Sources of Funds 38,433 048 Total Revenue and Other Sources of Funds
from All Sources 6,100,252 6,141,982
2010-2011 2011-2012Actual Budget
CURRENT EXPENDITURESInstruction:
49 Regular Instruction 2,042,444 1,984,48650 Special Education 491,981 431,64451 Workforce Education 263,369 157,84052 Adult Education 0 053 Compensatory Education 315,809 493,77154 Other 94,520 62,23455 Total Instruction 3,208,123 3,129,975
District Level Support:56 General Administration 261,364 241,81957 Central Services 84,865 86,92858 Maintenance & Operations of Plant 456,847 549,63859 Student Transportation 240,804 248,04760 Other District Level Support Services 56,849 21,07661 Total District Support Services 1,100,729 1,147,508
School Level Support:62 Student Support Services 234,335 240,53763 Instructional Staff Support Services 717,380 773,86364 School Administration 244,829 217,78965 Total District Support Services 1,196,544 1,232,189
Non-Instructional Services:66 Food Service Operations 295,871 312,02867 Other Enterprise Operations 0 068 Community Operations 1,578 3,00069 Other Non-Instructional Services 0 070 Total Non-Instructional Services 297,449 315,02871 Facilities Acquisition and Construction 18,464 119,71272 Debt Service 152,779 103,65975 Other Non-Programmed Costs 7 076 Total Expenditures 5,974,095 6,048,07277 Less: Capital Expenditures 148,307 215,76278 Less: Debt Service 152,779 103,65979 Total Current Expenditures 5,673,009 5,728,65080 Exclusions from Current Expenditures 145,79381 Net Current Expenditures 5,527,216
82 Per Pupil Expenditures 9,831
83 Personnel - Non-Federal Certified Clsrm FTEs 49.5684 Avg Salary - Non-Fed Certified Clsrm FTEs 40,55785 Personnel - Non-Federal Certified FTEs 54.2886 Avg Salary - Non-Fed Certified FTEs 42,57887.1 Legal Balance (funds 1-2-4) 995,52687.2 Categorical Fund Balance 119,21787.3 Deposits with Paying Agents (QZAB) 142,90587.4 Net Legal Bal (Excl Cat & QZAB) 733,40488 Building Fund Balance (fund 3) 105,91789 Capital Outlay Fund Balance (fund 5) 0
Jan 30, 2012 - 171 - 9:35:29 AM

Annual Statistical Report 2010-2011
County: POINSETT TRUMANN SCHOOL DISTRICT LEA:5605000
2010-2011 2011-2012Actual Budget
1 Area in Square Miles 1202 ADA 1,4003 ADA pct Change over 5 Yrs. (11%)4 4 QTR ADM 1,5065 Prior Year 3QTR ADM 1,5746 Assessment 84,939,0377 M&O Mills 25.008 URT Mills 25.009 M&O Mills in Excess of URT 0.0010 Dedicated M&O Mills 0.0011 Debt Service Mills 10.8012 Total Mills 35.8013 Total Debt Bond/Non-Bond 7,350,300
State and Local Revenue:14 Property Tax Receipts (Including URT) 2,835,930 2,759,86315 Other Local Receipts 509,596 217,86116 Revenue from Intermediate Sources 0 017.1 Foundation Funding (Excl URT) 7,500,823 7,216,85017.2 Tax Collection Rate Guarantee 31,983 1,50018 Student Growth Funding 0 019 Declining Enrollment Funding 56,134 173,23020 Consolidation Incentive/Assistance 0 021 Isolated Funding 0 022 Supplemental Millage Incentive Funding 39,178 31,34323 Other Unrestricted State Funding 0 024 Total Unrestricted Revenue from State and
Local Sources 10,973,644 10,400,647
Restricted Revenue from State Sources:25 Adult Education 0 0
Regular Education:26 Professional Development 65,112 64,32827 Other Regular Education 4,443 2,400
Special Education:28 Gifted & Talented 250 029 Alternative Learning Environment (ALE) 60,945 71,54330 English Language Learner (ELL) 4,395 4,48531 National School Lunch Act (NSLA) 735,399 920,92732 Other Special Education 8,373 6,00033 Workforce Education 0 034 School Food Service 6,375 6,37535 Educational Service Cooperatives 0 036 Early Childhood Programs 388,800 388,80037 Magnet School Programs 0 038 Other Non-Instructional Programs 704,690 71,13739 Total Restricted Revenue from State Sources 1,978,782 1,535,99540 Total Restricted Revenue from Federal
Sources 4,617,503 2,885,843
Other Sources of Funds:41 Financing Sources 0 042 Balances from Consolidated/Annexed District 0 043 Indirect Cost Reimbursement 0 9,50044 Gains and Losses from Sale of Fixed Assets 0 045 Compensation for Loss of Fixed Assets 0 046 Other 0 047 Total Other Sources of Funds 0 9,50048 Total Revenue and Other Sources of Funds
from All Sources 17,569,929 14,831,985
2010-2011 2011-2012Actual Budget
CURRENT EXPENDITURESInstruction:
49 Regular Instruction 5,458,244 5,550,05150 Special Education 1,194,623 1,298,72551 Workforce Education 445,575 364,02452 Adult Education 0 053 Compensatory Education 707,770 804,91754 Other 419,763 389,60255 Total Instruction 8,225,974 8,407,319
District Level Support:56 General Administration 304,123 240,66357 Central Services 219,798 130,75358 Maintenance & Operations of Plant 1,506,733 1,764,32159 Student Transportation 432,610 520,02160 Other District Level Support Services 47,864 24,50061 Total District Support Services 2,511,128 2,680,258
School Level Support:62 Student Support Services 696,486 747,36663 Instructional Staff Support Services 1,346,395 1,183,26864 School Administration 678,138 668,68465 Total District Support Services 2,721,020 2,599,317
Non-Instructional Services:66 Food Service Operations 816,128 755,20767 Other Enterprise Operations 0 068 Community Operations 1,983 2,00069 Other Non-Instructional Services 0 070 Total Non-Instructional Services 818,111 757,20771 Facilities Acquisition and Construction 2,178,560 78,02972 Debt Service 569,725 571,32675 Other Non-Programmed Costs 0 076 Total Expenditures 17,024,518 15,093,45677 Less: Capital Expenditures 2,580,433 387,95078 Less: Debt Service 569,725 571,32679 Total Current Expenditures 13,874,360 14,134,18080 Exclusions from Current Expenditures 706,26581 Net Current Expenditures 13,168,095
82 Per Pupil Expenditures 9,404
83 Personnel - Non-Federal Certified Clsrm FTEs 114.9884 Avg Salary - Non-Fed Certified Clsrm FTEs 41,29085 Personnel - Non-Federal Certified FTEs 124.7486 Avg Salary - Non-Fed Certified FTEs 43,45987.1 Legal Balance (funds 1-2-4) 2,132,91287.2 Categorical Fund Balance 111,81887.3 Deposits with Paying Agents (QZAB) 087.4 Net Legal Bal (Excl Cat & QZAB) 2,021,09488 Building Fund Balance (fund 3) 75,11389 Capital Outlay Fund Balance (fund 5) 0
Jan 30, 2012 - 172 - 9:35:29 AM

Annual Statistical Report 2010-2011
County: POINSETT EAST POINSETT CO. SCHOOL DIST. LEA:5608000
2010-2011 2011-2012Actual Budget
1 Area in Square Miles 1502 ADA 6853 ADA pct Change over 5 Yrs. (11%)4 4 QTR ADM 7245 Prior Year 3QTR ADM 7436 Assessment 31,314,9017 M&O Mills 25.008 URT Mills 25.009 M&O Mills in Excess of URT 0.0010 Dedicated M&O Mills 0.0011 Debt Service Mills 6.2012 Total Mills 31.2013 Total Debt Bond/Non-Bond 836,727
State and Local Revenue:14 Property Tax Receipts (Including URT) 885,170 519,67215 Other Local Receipts 294,290 134,89116 Revenue from Intermediate Sources 0 017.1 Foundation Funding (Excl URT) 3,721,974 3,693,95217.2 Tax Collection Rate Guarantee 10,471 018 Student Growth Funding 0 019 Declining Enrollment Funding 55,141 49,79720 Consolidation Incentive/Assistance 0 021 Isolated Funding 0 022 Supplemental Millage Incentive Funding 39,389 31,51123 Other Unrestricted State Funding 0 024 Total Unrestricted Revenue from State and
Local Sources 5,006,435 4,429,823
Restricted Revenue from State Sources:25 Adult Education 0 0
Regular Education:26 Professional Development 30,723 30,79427 Other Regular Education 15,319 6,727
Special Education:28 Gifted & Talented 1,954 029 Alternative Learning Environment (ALE) 6,095 10,52830 English Language Learner (ELL) 5,274 031 National School Lunch Act (NSLA) 558,496 537,37232 Other Special Education 19,937 033 Workforce Education 0 034 School Food Service 2,714 3,00035 Educational Service Cooperatives 0 036 Early Childhood Programs 284,796 291,60037 Magnet School Programs 0 038 Other Non-Instructional Programs 56,760 54,11939 Total Restricted Revenue from State Sources 982,069 934,14040 Total Restricted Revenue from Federal
Sources 1,042,587 975,825
Other Sources of Funds:41 Financing Sources 0 042 Balances from Consolidated/Annexed District 0 043 Indirect Cost Reimbursement 0 044 Gains and Losses from Sale of Fixed Assets 0 045 Compensation for Loss of Fixed Assets 0 046 Other 0 047 Total Other Sources of Funds 0 048 Total Revenue and Other Sources of Funds
from All Sources 7,031,091 6,339,788
2010-2011 2011-2012Actual Budget
CURRENT EXPENDITURESInstruction:
49 Regular Instruction 3,098,833 2,898,71450 Special Education 570,545 608,87551 Workforce Education 226,247 213,37952 Adult Education 0 053 Compensatory Education 141,109 140,60754 Other 54,107 70,05455 Total Instruction 4,090,841 3,931,630
District Level Support:56 General Administration 220,692 210,06957 Central Services 89,057 67,82158 Maintenance & Operations of Plant 711,517 636,90359 Student Transportation 303,278 140,07660 Other District Level Support Services 14,768 14,42661 Total District Support Services 1,339,313 1,069,295
School Level Support:62 Student Support Services 218,585 220,83263 Instructional Staff Support Services 653,257 668,51464 School Administration 311,200 296,81065 Total District Support Services 1,183,042 1,186,156
Non-Instructional Services:66 Food Service Operations 415,552 374,65367 Other Enterprise Operations 26,310 068 Community Operations 50 30069 Other Non-Instructional Services 0 070 Total Non-Instructional Services 441,911 374,95371 Facilities Acquisition and Construction 45,295 072 Debt Service 81,950 81,46375 Other Non-Programmed Costs 6,585 076 Total Expenditures 7,188,935 6,643,49777 Less: Capital Expenditures 299,522 37,63178 Less: Debt Service 81,950 81,46379 Total Current Expenditures 6,807,464 6,524,40280 Exclusions from Current Expenditures 457,98781 Net Current Expenditures 6,349,476
82 Per Pupil Expenditures 9,274
83 Personnel - Non-Federal Certified Clsrm FTEs 58.9484 Avg Salary - Non-Fed Certified Clsrm FTEs 40,54185 Personnel - Non-Federal Certified FTEs 64.5786 Avg Salary - Non-Fed Certified FTEs 42,52087.1 Legal Balance (funds 1-2-4) 2,347,30887.2 Categorical Fund Balance 18,10687.3 Deposits with Paying Agents (QZAB) 087.4 Net Legal Bal (Excl Cat & QZAB) 2,329,20288 Building Fund Balance (fund 3) 089 Capital Outlay Fund Balance (fund 5) 0
Jan 30, 2012 - 173 - 9:35:29 AM

Annual Statistical Report 2010-2011
County: POLK MENA SCHOOL DISTRICT LEA:5703000
2010-2011 2011-2012Actual Budget
1 Area in Square Miles 4342 ADA 1,8323 ADA pct Change over 5 Yrs. (5%)4 4 QTR ADM 1,8835 Prior Year 3QTR ADM 1,9456 Assessment 133,614,1917 M&O Mills 25.008 URT Mills 25.009 M&O Mills in Excess of URT 0.0010 Dedicated M&O Mills 0.0011 Debt Service Mills 10.9012 Total Mills 35.9013 Total Debt Bond/Non-Bond 18,910,817
State and Local Revenue:14 Property Tax Receipts (Including URT) 4,216,514 4,215,80715 Other Local Receipts 1,105,512 374,52616 Revenue from Intermediate Sources 7,381 7,38117.1 Foundation Funding (Excl URT) 8,356,377 8,060,58017.2 Tax Collection Rate Guarantee 170,848 170,00018 Student Growth Funding 0 019 Declining Enrollment Funding 32,795 192,27620 Consolidation Incentive/Assistance 0 021 Isolated Funding 13,113 022 Supplemental Millage Incentive Funding 7,759 6,20723 Other Unrestricted State Funding 371 024 Total Unrestricted Revenue from State and
Local Sources 13,910,670 13,026,777
Restricted Revenue from State Sources:25 Adult Education 0 0
Regular Education:26 Professional Development 80,464 79,79627 Other Regular Education 6,735 2,500
Special Education:28 Gifted & Talented 450 029 Alternative Learning Environment (ALE) 122,906 126,71330 English Language Learner (ELL) 5,567 5,56731 National School Lunch Act (NSLA) 595,200 623,39232 Other Special Education 82,184 55,00033 Workforce Education 40,342 47,97134 School Food Service 7,260 7,20035 Educational Service Cooperatives 0 036 Early Childhood Programs 0 037 Magnet School Programs 0 038 Other Non-Instructional Programs 3,993,655 2,390,02339 Total Restricted Revenue from State Sources 4,934,762 3,338,16240 Total Restricted Revenue from Federal
Sources 4,139,602 4,881,825
Other Sources of Funds:41 Financing Sources 1,004,500 042 Balances from Consolidated/Annexed District 0 043 Indirect Cost Reimbursement 10,246 044 Gains and Losses from Sale of Fixed Assets 36,135 045 Compensation for Loss of Fixed Assets 1,000,000 046 Other 0 047 Total Other Sources of Funds 2,050,881 048 Total Revenue and Other Sources of Funds
from All Sources 25,035,916 21,246,764
2010-2011 2011-2012Actual Budget
CURRENT EXPENDITURESInstruction:
49 Regular Instruction 7,124,046 6,307,19150 Special Education 1,010,820 1,133,50251 Workforce Education 671,777 692,00952 Adult Education 0 053 Compensatory Education 662,855 635,36054 Other 428,249 424,20355 Total Instruction 9,897,748 9,192,265
District Level Support:56 General Administration 340,115 309,27157 Central Services 206,685 205,39258 Maintenance & Operations of Plant 1,641,779 1,279,37759 Student Transportation 1,020,636 1,009,09260 Other District Level Support Services 51,859 29,00061 Total District Support Services 3,261,073 2,832,131
School Level Support:62 Student Support Services 780,995 810,15163 Instructional Staff Support Services 1,551,108 1,436,12264 School Administration 700,587 708,02865 Total District Support Services 3,032,690 2,954,302
Non-Instructional Services:66 Food Service Operations 1,007,915 1,005,15067 Other Enterprise Operations 0 068 Community Operations 126,891 145,10969 Other Non-Instructional Services 0 070 Total Non-Instructional Services 1,134,806 1,150,25971 Facilities Acquisition and Construction 11,785,679 7,460,23872 Debt Service 1,266,243 1,354,12775 Other Non-Programmed Costs 22,020 076 Total Expenditures 30,400,259 24,943,32177 Less: Capital Expenditures 12,515,048 7,770,99978 Less: Debt Service 1,266,243 1,354,12779 Total Current Expenditures 16,618,969 15,818,19480 Exclusions from Current Expenditures 886,53781 Net Current Expenditures 15,732,432
82 Per Pupil Expenditures 8,589
83 Personnel - Non-Federal Certified Clsrm FTEs 134.7584 Avg Salary - Non-Fed Certified Clsrm FTEs 43,47985 Personnel - Non-Federal Certified FTEs 144.9586 Avg Salary - Non-Fed Certified FTEs 45,17987.1 Legal Balance (funds 1-2-4) 2,696,78487.2 Categorical Fund Balance 112,11087.3 Deposits with Paying Agents (QZAB) 087.4 Net Legal Bal (Excl Cat & QZAB) 2,584,67488 Building Fund Balance (fund 3) 10,453,68189 Capital Outlay Fund Balance (fund 5) 0
Jan 30, 2012 - 174 - 9:35:29 AM

Annual Statistical Report 2010-2011
County: POLK OUACHITA RIVER SCHOOL DISTRICT LEA:5706000
2010-2011 2011-2012Actual Budget
1 Area in Square Miles 3532 ADA 6613 ADA pct Change over 5 Yrs. (3%)4 4 QTR ADM 7025 Prior Year 3QTR ADM 6766 Assessment 42,370,3927 M&O Mills 25.008 URT Mills 25.009 M&O Mills in Excess of URT 0.0010 Dedicated M&O Mills 0.0011 Debt Service Mills 6.3012 Total Mills 31.3013 Total Debt Bond/Non-Bond 1,975,000
State and Local Revenue:14 Property Tax Receipts (Including URT) 1,181,741 1,173,61515 Other Local Receipts 340,519 313,72616 Revenue from Intermediate Sources 2,078 2,07817.1 Foundation Funding (Excl URT) 2,729,982 2,933,41817.2 Tax Collection Rate Guarantee 60,221 52,17418 Student Growth Funding 164,654 019 Declining Enrollment Funding 0 020 Consolidation Incentive/Assistance 0 021 Isolated Funding 285,639 275,03322 Supplemental Millage Incentive Funding 19,439 15,55123 Other Unrestricted State Funding 0 024 Total Unrestricted Revenue from State and
Local Sources 4,784,273 4,765,595
Restricted Revenue from State Sources:25 Adult Education 0 0
Regular Education:26 Professional Development 27,972 29,95827 Other Regular Education 417,413 385,056
Special Education:28 Gifted & Talented 300 029 Alternative Learning Environment (ALE) 1,585 030 English Language Learner (ELL) 0 031 National School Lunch Act (NSLA) 507,904 526,24032 Other Special Education 29,331 033 Workforce Education 7,042 4,00034 School Food Service 2,932 3,00035 Educational Service Cooperatives 0 036 Early Childhood Programs 0 037 Magnet School Programs 0 038 Other Non-Instructional Programs 221,277 226,93039 Total Restricted Revenue from State Sources 1,215,756 1,175,18440 Total Restricted Revenue from Federal
Sources 1,529,608 1,150,405
Other Sources of Funds:41 Financing Sources 0 042 Balances from Consolidated/Annexed District 0 043 Indirect Cost Reimbursement 0 044 Gains and Losses from Sale of Fixed Assets 0 045 Compensation for Loss of Fixed Assets 1,167 046 Other 0 047 Total Other Sources of Funds 1,167 048 Total Revenue and Other Sources of Funds
from All Sources 7,530,804 7,091,184
2010-2011 2011-2012Actual Budget
CURRENT EXPENDITURESInstruction:
49 Regular Instruction 2,981,458 2,805,24150 Special Education 341,389 338,33451 Workforce Education 388,186 377,21752 Adult Education 0 053 Compensatory Education 46,394 34,25154 Other 45,486 54,11055 Total Instruction 3,802,912 3,609,153
District Level Support:56 General Administration 128,185 128,73657 Central Services 151,833 129,17058 Maintenance & Operations of Plant 642,019 822,53659 Student Transportation 449,054 613,26060 Other District Level Support Services 12,756 12,76061 Total District Support Services 1,383,847 1,706,462
School Level Support:62 Student Support Services 299,547 295,39763 Instructional Staff Support Services 736,762 779,55064 School Administration 252,663 241,62465 Total District Support Services 1,288,972 1,316,571
Non-Instructional Services:66 Food Service Operations 428,584 452,73267 Other Enterprise Operations 60,432 60,43268 Community Operations 608 1,92569 Other Non-Instructional Services 0 070 Total Non-Instructional Services 489,624 515,09071 Facilities Acquisition and Construction 282,397 35,24472 Debt Service 120,858 120,29575 Other Non-Programmed Costs 0 076 Total Expenditures 7,368,610 7,302,81577 Less: Capital Expenditures 535,620 386,06778 Less: Debt Service 120,858 120,29579 Total Current Expenditures 6,712,132 6,796,45380 Exclusions from Current Expenditures 280,42281 Net Current Expenditures 6,431,710
82 Per Pupil Expenditures 9,736
83 Personnel - Non-Federal Certified Clsrm FTEs 57.7284 Avg Salary - Non-Fed Certified Clsrm FTEs 41,67085 Personnel - Non-Federal Certified FTEs 62.4886 Avg Salary - Non-Fed Certified FTEs 43,19787.1 Legal Balance (funds 1-2-4) 1,924,32287.2 Categorical Fund Balance 15,71787.3 Deposits with Paying Agents (QZAB) 087.4 Net Legal Bal (Excl Cat & QZAB) 1,908,60588 Building Fund Balance (fund 3) 585,98689 Capital Outlay Fund Balance (fund 5) 0
Jan 30, 2012 - 175 - 9:35:29 AM

Annual Statistical Report 2010-2011
County: POLK COSSATOT RIVER SCHOOL DIST LEA:5707000
2010-2011 2011-2012Actual Budget
1 Area in Square Miles 02 ADA 1,0633 ADA pct Change over 5 Yrs. (2%)4 4 QTR ADM 1,1335 Prior Year 3QTR ADM 06 Assessment 56,450,8607 M&O Mills 25.008 URT Mills 25.009 M&O Mills in Excess of URT 0.0010 Dedicated M&O Mills 0.0011 Debt Service Mills 19.0012 Total Mills 44.0013 Total Debt Bond/Non-Bond 9,699,775
State and Local Revenue:14 Property Tax Receipts (Including URT) 1,977,374 1,834,50015 Other Local Receipts 564,700 293,00016 Revenue from Intermediate Sources 2,319 2,00017.1 Foundation Funding (Excl URT) 5,541,487 5,518,83417.2 Tax Collection Rate Guarantee 60,882 018 Student Growth Funding 0 019 Declining Enrollment Funding 0 37,69320 Consolidation Incentive/Assistance 1,806,900 903,45021 Isolated Funding 419,012 327,10422 Supplemental Millage Incentive Funding 55,773 44,61823 Other Unrestricted State Funding 50 024 Total Unrestricted Revenue from State and
Local Sources 10,428,498 8,961,199
Restricted Revenue from State Sources:25 Adult Education 0 0
Regular Education:26 Professional Development 47,525 48,17727 Other Regular Education 388,829 306,400
Special Education:28 Gifted & Talented 0 029 Alternative Learning Environment (ALE) 35,267 22,88030 English Language Learner (ELL) 58,600 55,00031 National School Lunch Act (NSLA) 832,288 841,98432 Other Special Education 24,286 18,06733 Workforce Education 5,417 034 School Food Service 5,125 5,00035 Educational Service Cooperatives 0 036 Early Childhood Programs 0 037 Magnet School Programs 0 038 Other Non-Instructional Programs 118,909 3,394,22839 Total Restricted Revenue from State Sources 1,516,246 4,691,73640 Total Restricted Revenue from Federal
Sources 2,082,210 1,958,182
Other Sources of Funds:41 Financing Sources 3,512,077 042 Balances from Consolidated/Annexed District 220 043 Indirect Cost Reimbursement 14,847 044 Gains and Losses from Sale of Fixed Assets 0 045 Compensation for Loss of Fixed Assets 19,338 046 Other 0 047 Total Other Sources of Funds 3,546,482 048 Total Revenue and Other Sources of Funds
from All Sources 17,573,436 15,611,117
2010-2011 2011-2012Actual Budget
CURRENT EXPENDITURESInstruction:
49 Regular Instruction 3,959,385 3,928,46350 Special Education 518,835 519,76251 Workforce Education 365,007 448,94552 Adult Education 0 053 Compensatory Education 474,832 449,45054 Other 379,157 411,21455 Total Instruction 5,697,217 5,757,833
District Level Support:56 General Administration 312,778 319,17057 Central Services 234,376 249,41758 Maintenance & Operations of Plant 727,640 897,82659 Student Transportation 707,662 776,27060 Other District Level Support Services 40,542 9,50061 Total District Support Services 2,022,998 2,252,183
School Level Support:62 Student Support Services 470,750 498,39263 Instructional Staff Support Services 862,529 1,160,15764 School Administration 388,626 450,38165 Total District Support Services 1,721,905 2,108,930
Non-Instructional Services:66 Food Service Operations 809,307 973,18767 Other Enterprise Operations 29,674 068 Community Operations 0 5,00069 Other Non-Instructional Services 0 070 Total Non-Instructional Services 838,981 978,18771 Facilities Acquisition and Construction 95,907 5,575,80072 Debt Service 1,025,222 749,46975 Other Non-Programmed Costs 75,974 076 Total Expenditures 11,478,204 17,422,40177 Less: Capital Expenditures 489,140 6,020,48578 Less: Debt Service 1,025,222 749,46979 Total Current Expenditures 9,963,841 10,652,44780 Exclusions from Current Expenditures 550,51981 Net Current Expenditures 9,413,322
82 Per Pupil Expenditures 8,852
83 Personnel - Non-Federal Certified Clsrm FTEs 95.8584 Avg Salary - Non-Fed Certified Clsrm FTEs 37,06085 Personnel - Non-Federal Certified FTEs 105.7486 Avg Salary - Non-Fed Certified FTEs 38,56087.1 Legal Balance (funds 1-2-4) 4,050,33487.2 Categorical Fund Balance 325,26787.3 Deposits with Paying Agents (QZAB) 087.4 Net Legal Bal (Excl Cat & QZAB) 3,725,06788 Building Fund Balance (fund 3) 5,136,26489 Capital Outlay Fund Balance (fund 5) 0
Jan 30, 2012 - 176 - 9:35:29 AM

Annual Statistical Report 2010-2011
County: POPE ATKINS SCHOOL DISTRICT LEA:5801000
2010-2011 2011-2012Actual Budget
1 Area in Square Miles 1002 ADA 9223 ADA pct Change over 5 Yrs. (11%)4 4 QTR ADM 9725 Prior Year 3QTR ADM 9906 Assessment 55,624,7357 M&O Mills 25.008 URT Mills 25.009 M&O Mills in Excess of URT 0.0010 Dedicated M&O Mills 0.0011 Debt Service Mills 18.4012 Total Mills 43.4013 Total Debt Bond/Non-Bond 11,017,149
State and Local Revenue:14 Property Tax Receipts (Including URT) 2,272,682 2,542,00015 Other Local Receipts 400,971 158,17816 Revenue from Intermediate Sources 407 017.1 Foundation Funding (Excl URT) 4,639,519 4,605,08117.2 Tax Collection Rate Guarantee 24,026 018 Student Growth Funding 0 019 Declining Enrollment Funding 67,427 57,44620 Consolidation Incentive/Assistance 0 021 Isolated Funding 0 022 Supplemental Millage Incentive Funding 63,687 50,95023 Other Unrestricted State Funding 0 024 Total Unrestricted Revenue from State and
Local Sources 7,468,720 7,413,655
Restricted Revenue from State Sources:25 Adult Education 0 0
Regular Education:26 Professional Development 40,966 41,18427 Other Regular Education 2,443 1,400
Special Education:28 Gifted & Talented 200 029 Alternative Learning Environment (ALE) 55,257 58,10030 English Language Learner (ELL) 2,051 2,00031 National School Lunch Act (NSLA) 298,592 294,49232 Other Special Education 70,481 033 Workforce Education 42,792 54,16634 School Food Service 4,080 4,00035 Educational Service Cooperatives 0 036 Early Childhood Programs 193,914 194,40037 Magnet School Programs 0 038 Other Non-Instructional Programs 2,172,844 387,32339 Total Restricted Revenue from State Sources 2,883,619 1,037,06540 Total Restricted Revenue from Federal
Sources 2,403,952 1,812,165
Other Sources of Funds:41 Financing Sources 0 042 Balances from Consolidated/Annexed District 0 043 Indirect Cost Reimbursement 0 044 Gains and Losses from Sale of Fixed Assets 16,510 045 Compensation for Loss of Fixed Assets 6,780 046 Other 0 047 Total Other Sources of Funds 23,290 048 Total Revenue and Other Sources of Funds
from All Sources 12,779,580 10,262,885
2010-2011 2011-2012Actual Budget
CURRENT EXPENDITURESInstruction:
49 Regular Instruction 4,516,161 3,840,69950 Special Education 729,546 627,19351 Workforce Education 247,465 246,70052 Adult Education 0 053 Compensatory Education 292,448 278,28954 Other 273,478 278,97955 Total Instruction 6,059,096 5,271,861
District Level Support:56 General Administration 230,103 251,36857 Central Services 150,966 183,35058 Maintenance & Operations of Plant 1,050,181 943,15259 Student Transportation 428,263 320,43660 Other District Level Support Services 59,543 25,00061 Total District Support Services 1,919,056 1,723,306
School Level Support:62 Student Support Services 344,626 484,16363 Instructional Staff Support Services 801,440 616,74464 School Administration 345,014 361,98165 Total District Support Services 1,491,080 1,462,888
Non-Instructional Services:66 Food Service Operations 621,748 503,19867 Other Enterprise Operations 0 068 Community Operations 0 1,49769 Other Non-Instructional Services 0 070 Total Non-Instructional Services 621,748 504,69571 Facilities Acquisition and Construction 3,950,229 1,620,93772 Debt Service 701,430 741,80075 Other Non-Programmed Costs 3,350 076 Total Expenditures 14,745,988 11,325,48877 Less: Capital Expenditures 4,555,543 1,726,27478 Less: Debt Service 701,430 741,80079 Total Current Expenditures 9,489,015 8,857,41480 Exclusions from Current Expenditures 402,44781 Net Current Expenditures 9,086,568
82 Per Pupil Expenditures 9,857
83 Personnel - Non-Federal Certified Clsrm FTEs 78.9184 Avg Salary - Non-Fed Certified Clsrm FTEs 41,01385 Personnel - Non-Federal Certified FTEs 84.8086 Avg Salary - Non-Fed Certified FTEs 42,94887.1 Legal Balance (funds 1-2-4) 3,210,70887.2 Categorical Fund Balance 44,16487.3 Deposits with Paying Agents (QZAB) 087.4 Net Legal Bal (Excl Cat & QZAB) 3,166,54488 Building Fund Balance (fund 3) 2,259,99489 Capital Outlay Fund Balance (fund 5) 0
Jan 30, 2012 - 177 - 9:35:29 AM

Annual Statistical Report 2010-2011
County: POPE DOVER SCHOOL DISTRICT LEA:5802000
2010-2011 2011-2012Actual Budget
1 Area in Square Miles 2352 ADA 1,2693 ADA pct Change over 5 Yrs. (5%)4 4 QTR ADM 1,3575 Prior Year 3QTR ADM 1,3576 Assessment 73,600,1417 M&O Mills 25.008 URT Mills 25.009 M&O Mills in Excess of URT 0.0010 Dedicated M&O Mills 0.0011 Debt Service Mills 15.3012 Total Mills 40.3013 Total Debt Bond/Non-Bond 10,610,000
State and Local Revenue:14 Property Tax Receipts (Including URT) 2,818,473 3,067,29215 Other Local Receipts 473,163 423,04816 Revenue from Intermediate Sources 875 1,15017.1 Foundation Funding (Excl URT) 6,292,300 6,423,44717.2 Tax Collection Rate Guarantee 9,043 018 Student Growth Funding 0 019 Declining Enrollment Funding 49,118 020 Consolidation Incentive/Assistance 0 021 Isolated Funding 0 022 Supplemental Millage Incentive Funding 68,069 54,45523 Other Unrestricted State Funding 0 024 Total Unrestricted Revenue from State and
Local Sources 9,711,040 9,969,392
Restricted Revenue from State Sources:25 Adult Education 0 0
Regular Education:26 Professional Development 56,120 57,77827 Other Regular Education 5,208 8,000
Special Education:28 Gifted & Talented 1,150 1,10029 Alternative Learning Environment (ALE) 53,347 45,55430 English Language Learner (ELL) 5,567 031 National School Lunch Act (NSLA) 352,656 403,78832 Other Special Education 38,230 5,00033 Workforce Education 76,646 52,81234 School Food Service 5,039 5,00035 Educational Service Cooperatives 0 036 Early Childhood Programs 0 037 Magnet School Programs 0 038 Other Non-Instructional Programs 150,319 1,250,80939 Total Restricted Revenue from State Sources 744,282 1,829,84240 Total Restricted Revenue from Federal
Sources 2,020,164 2,360,968
Other Sources of Funds:41 Financing Sources 3,878 656,60042 Balances from Consolidated/Annexed District 0 043 Indirect Cost Reimbursement 6,587 044 Gains and Losses from Sale of Fixed Assets 15,562 045 Compensation for Loss of Fixed Assets 0 046 Other 0 2,00147 Total Other Sources of Funds 26,027 658,60148 Total Revenue and Other Sources of Funds
from All Sources 12,501,514 14,818,803
2010-2011 2011-2012Actual Budget
CURRENT EXPENDITURESInstruction:
49 Regular Instruction 4,340,864 4,440,93850 Special Education 697,644 824,08551 Workforce Education 348,351 387,87052 Adult Education 0 053 Compensatory Education 353,478 332,02454 Other 486,411 498,99255 Total Instruction 6,226,748 6,483,911
District Level Support:56 General Administration 276,193 272,74357 Central Services 370,462 337,82558 Maintenance & Operations of Plant 1,205,503 1,245,09759 Student Transportation 808,185 509,84460 Other District Level Support Services 71,324 58,98561 Total District Support Services 2,731,667 2,424,495
School Level Support:62 Student Support Services 449,890 536,12863 Instructional Staff Support Services 611,018 792,53964 School Administration 491,812 511,92365 Total District Support Services 1,552,720 1,840,590
Non-Instructional Services:66 Food Service Operations 735,394 741,14367 Other Enterprise Operations 0 068 Community Operations 0 2,81869 Other Non-Instructional Services 0 070 Total Non-Instructional Services 735,394 743,96171 Facilities Acquisition and Construction 562,060 2,789,68072 Debt Service 771,484 747,46875 Other Non-Programmed Costs 14,759 076 Total Expenditures 12,594,833 15,030,10577 Less: Capital Expenditures 1,029,053 2,891,34778 Less: Debt Service 771,484 747,46879 Total Current Expenditures 10,794,296 11,391,28980 Exclusions from Current Expenditures 367,17581 Net Current Expenditures 10,427,121
82 Per Pupil Expenditures 8,215
83 Personnel - Non-Federal Certified Clsrm FTEs 94.8684 Avg Salary - Non-Fed Certified Clsrm FTEs 44,46485 Personnel - Non-Federal Certified FTEs 102.1186 Avg Salary - Non-Fed Certified FTEs 46,17687.1 Legal Balance (funds 1-2-4) 1,568,39587.2 Categorical Fund Balance 93,75587.3 Deposits with Paying Agents (QZAB) 087.4 Net Legal Bal (Excl Cat & QZAB) 1,474,64088 Building Fund Balance (fund 3) 443,11089 Capital Outlay Fund Balance (fund 5) 0
Jan 30, 2012 - 178 - 9:35:29 AM
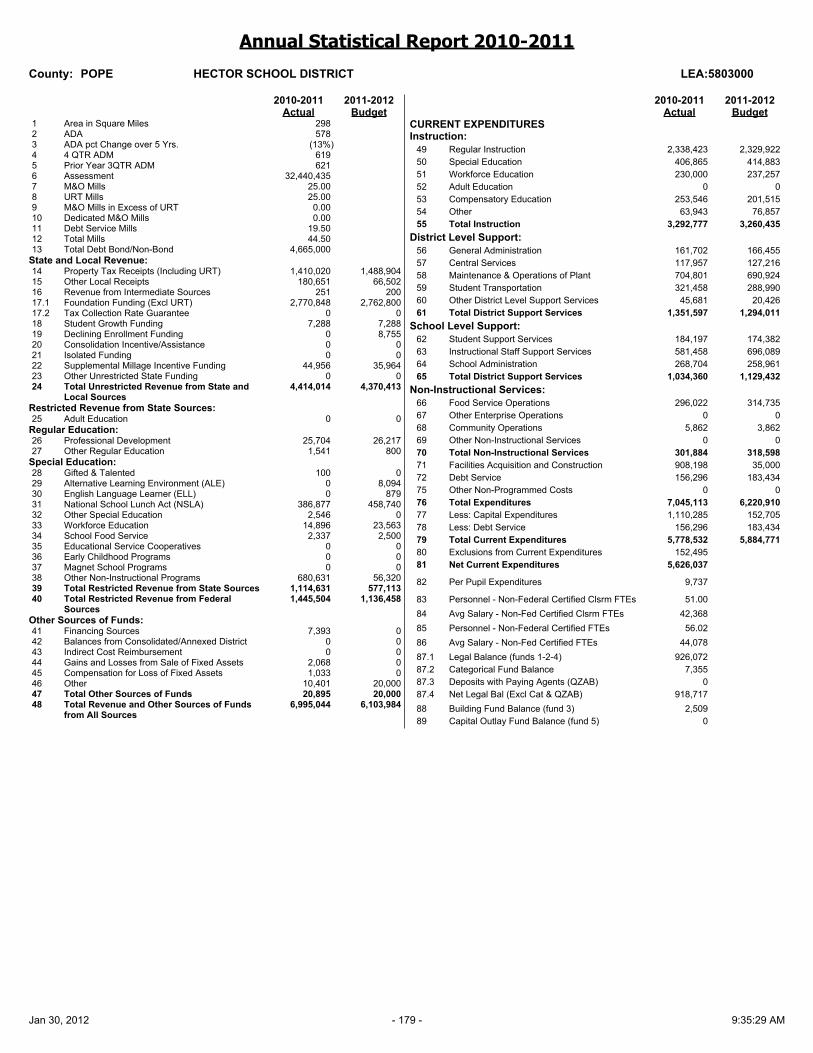
Annual Statistical Report 2010-2011
County: POPE HECTOR SCHOOL DISTRICT LEA:5803000
2010-2011 2011-2012Actual Budget
1 Area in Square Miles 2982 ADA 5783 ADA pct Change over 5 Yrs. (13%)4 4 QTR ADM 6195 Prior Year 3QTR ADM 6216 Assessment 32,440,4357 M&O Mills 25.008 URT Mills 25.009 M&O Mills in Excess of URT 0.0010 Dedicated M&O Mills 0.0011 Debt Service Mills 19.5012 Total Mills 44.5013 Total Debt Bond/Non-Bond 4,665,000
State and Local Revenue:14 Property Tax Receipts (Including URT) 1,410,020 1,488,90415 Other Local Receipts 180,651 66,50216 Revenue from Intermediate Sources 251 20017.1 Foundation Funding (Excl URT) 2,770,848 2,762,80017.2 Tax Collection Rate Guarantee 0 018 Student Growth Funding 7,288 7,28819 Declining Enrollment Funding 0 8,75520 Consolidation Incentive/Assistance 0 021 Isolated Funding 0 022 Supplemental Millage Incentive Funding 44,956 35,96423 Other Unrestricted State Funding 0 024 Total Unrestricted Revenue from State and
Local Sources 4,414,014 4,370,413
Restricted Revenue from State Sources:25 Adult Education 0 0
Regular Education:26 Professional Development 25,704 26,21727 Other Regular Education 1,541 800
Special Education:28 Gifted & Talented 100 029 Alternative Learning Environment (ALE) 0 8,09430 English Language Learner (ELL) 0 87931 National School Lunch Act (NSLA) 386,877 458,74032 Other Special Education 2,546 033 Workforce Education 14,896 23,56334 School Food Service 2,337 2,50035 Educational Service Cooperatives 0 036 Early Childhood Programs 0 037 Magnet School Programs 0 038 Other Non-Instructional Programs 680,631 56,32039 Total Restricted Revenue from State Sources 1,114,631 577,11340 Total Restricted Revenue from Federal
Sources 1,445,504 1,136,458
Other Sources of Funds:41 Financing Sources 7,393 042 Balances from Consolidated/Annexed District 0 043 Indirect Cost Reimbursement 0 044 Gains and Losses from Sale of Fixed Assets 2,068 045 Compensation for Loss of Fixed Assets 1,033 046 Other 10,401 20,00047 Total Other Sources of Funds 20,895 20,00048 Total Revenue and Other Sources of Funds
from All Sources 6,995,044 6,103,984
2010-2011 2011-2012Actual Budget
CURRENT EXPENDITURESInstruction:
49 Regular Instruction 2,338,423 2,329,92250 Special Education 406,865 414,88351 Workforce Education 230,000 237,25752 Adult Education 0 053 Compensatory Education 253,546 201,51554 Other 63,943 76,85755 Total Instruction 3,292,777 3,260,435
District Level Support:56 General Administration 161,702 166,45557 Central Services 117,957 127,21658 Maintenance & Operations of Plant 704,801 690,92459 Student Transportation 321,458 288,99060 Other District Level Support Services 45,681 20,42661 Total District Support Services 1,351,597 1,294,011
School Level Support:62 Student Support Services 184,197 174,38263 Instructional Staff Support Services 581,458 696,08964 School Administration 268,704 258,96165 Total District Support Services 1,034,360 1,129,432
Non-Instructional Services:66 Food Service Operations 296,022 314,73567 Other Enterprise Operations 0 068 Community Operations 5,862 3,86269 Other Non-Instructional Services 0 070 Total Non-Instructional Services 301,884 318,59871 Facilities Acquisition and Construction 908,198 35,00072 Debt Service 156,296 183,43475 Other Non-Programmed Costs 0 076 Total Expenditures 7,045,113 6,220,91077 Less: Capital Expenditures 1,110,285 152,70578 Less: Debt Service 156,296 183,43479 Total Current Expenditures 5,778,532 5,884,77180 Exclusions from Current Expenditures 152,49581 Net Current Expenditures 5,626,037
82 Per Pupil Expenditures 9,737
83 Personnel - Non-Federal Certified Clsrm FTEs 51.0084 Avg Salary - Non-Fed Certified Clsrm FTEs 42,36885 Personnel - Non-Federal Certified FTEs 56.0286 Avg Salary - Non-Fed Certified FTEs 44,07887.1 Legal Balance (funds 1-2-4) 926,07287.2 Categorical Fund Balance 7,35587.3 Deposits with Paying Agents (QZAB) 087.4 Net Legal Bal (Excl Cat & QZAB) 918,71788 Building Fund Balance (fund 3) 2,50989 Capital Outlay Fund Balance (fund 5) 0
Jan 30, 2012 - 179 - 9:35:29 AM

Annual Statistical Report 2010-2011
County: POPE POTTSVILLE SCHOOL DISTRICT LEA:5804000
2010-2011 2011-2012Actual Budget
1 Area in Square Miles 702 ADA 1,5613 ADA pct Change over 5 Yrs. 15%4 4 QTR ADM 1,6185 Prior Year 3QTR ADM 1,6156 Assessment 71,124,7577 M&O Mills 25.008 URT Mills 25.009 M&O Mills in Excess of URT 0.0010 Dedicated M&O Mills 0.0011 Debt Service Mills 20.2012 Total Mills 45.2013 Total Debt Bond/Non-Bond 13,656,909
State and Local Revenue:14 Property Tax Receipts (Including URT) 2,999,156 3,375,35615 Other Local Receipts 720,028 278,50016 Revenue from Intermediate Sources 825 017.1 Foundation Funding (Excl URT) 8,049,119 8,185,78417.2 Tax Collection Rate Guarantee 13,897 018 Student Growth Funding 25,340 019 Declining Enrollment Funding 0 020 Consolidation Incentive/Assistance 0 021 Isolated Funding 0 022 Supplemental Millage Incentive Funding 56,518 45,21423 Other Unrestricted State Funding 0 024 Total Unrestricted Revenue from State and
Local Sources 11,864,884 11,884,854
Restricted Revenue from State Sources:25 Adult Education 0 0
Regular Education:26 Professional Development 66,810 68,52527 Other Regular Education 17,873 7,600
Special Education:28 Gifted & Talented 900 029 Alternative Learning Environment (ALE) 42,255 40,20730 English Language Learner (ELL) 10,841 10,84131 National School Lunch Act (NSLA) 342,240 339,49032 Other Special Education 6,617 16,64133 Workforce Education 28,167 88,83334 School Food Service 5,133 5,00035 Educational Service Cooperatives 0 036 Early Childhood Programs 0 037 Magnet School Programs 0 038 Other Non-Instructional Programs 258,832 251,84639 Total Restricted Revenue from State Sources 779,669 828,98340 Total Restricted Revenue from Federal
Sources 1,744,556 2,427,902
Other Sources of Funds:41 Financing Sources 1,523,766 042 Balances from Consolidated/Annexed District 0 043 Indirect Cost Reimbursement 0 044 Gains and Losses from Sale of Fixed Assets 3,500 045 Compensation for Loss of Fixed Assets 0 046 Other 0 047 Total Other Sources of Funds 1,527,266 048 Total Revenue and Other Sources of Funds
from All Sources 15,916,374 15,141,738
2010-2011 2011-2012Actual Budget
CURRENT EXPENDITURESInstruction:
49 Regular Instruction 5,427,683 5,639,30750 Special Education 787,831 874,67851 Workforce Education 397,188 467,32252 Adult Education 0 053 Compensatory Education 431,035 486,04254 Other 906,302 898,58155 Total Instruction 7,950,039 8,365,930
District Level Support:56 General Administration 269,787 264,46157 Central Services 134,358 132,62858 Maintenance & Operations of Plant 1,156,187 1,177,55059 Student Transportation 401,733 484,65060 Other District Level Support Services 12,293 20,00061 Total District Support Services 1,974,359 2,079,290
School Level Support:62 Student Support Services 538,245 508,03663 Instructional Staff Support Services 811,665 962,04264 School Administration 595,007 611,55065 Total District Support Services 1,944,917 2,081,628
Non-Instructional Services:66 Food Service Operations 624,512 648,07067 Other Enterprise Operations 0 068 Community Operations 0 1,30369 Other Non-Instructional Services 0 070 Total Non-Instructional Services 624,512 649,37371 Facilities Acquisition and Construction 735,774 2,890,58472 Debt Service 539,581 790,55975 Other Non-Programmed Costs 0 076 Total Expenditures 13,769,182 16,857,36477 Less: Capital Expenditures 831,676 3,061,36178 Less: Debt Service 539,581 790,55979 Total Current Expenditures 12,397,925 13,005,44580 Exclusions from Current Expenditures 602,10081 Net Current Expenditures 11,795,826
82 Per Pupil Expenditures 7,556
83 Personnel - Non-Federal Certified Clsrm FTEs 120.2184 Avg Salary - Non-Fed Certified Clsrm FTEs 43,74285 Personnel - Non-Federal Certified FTEs 127.3986 Avg Salary - Non-Fed Certified FTEs 45,44187.1 Legal Balance (funds 1-2-4) 2,565,90387.2 Categorical Fund Balance 53,47287.3 Deposits with Paying Agents (QZAB) 087.4 Net Legal Bal (Excl Cat & QZAB) 2,512,43188 Building Fund Balance (fund 3) 2,452,39089 Capital Outlay Fund Balance (fund 5) 0
Jan 30, 2012 - 180 - 9:35:29 AM

Annual Statistical Report 2010-2011
County: POPE RUSSELLVILLE SCHOOL DISTRICT LEA:5805000
2010-2011 2011-2012Actual Budget
1 Area in Square Miles 1002 ADA 4,9613 ADA pct Change over 5 Yrs. 3%4 4 QTR ADM 5,1225 Prior Year 3QTR ADM 5,1396 Assessment 764,348,3827 M&O Mills 26.808 URT Mills 25.009 M&O Mills in Excess of URT 1.8010 Dedicated M&O Mills 1.4011 Debt Service Mills 12.6012 Total Mills 40.8013 Total Debt Bond/Non-Bond 52,528,775
State and Local Revenue:14 Property Tax Receipts (Including URT) 29,913,377 33,284,17715 Other Local Receipts 3,416,003 1,879,52816 Revenue from Intermediate Sources 3,231 2,65217.1 Foundation Funding (Excl URT) 12,648,080 12,810,80917.2 Tax Collection Rate Guarantee 57,909 018 Student Growth Funding 157,269 019 Declining Enrollment Funding 0 020 Consolidation Incentive/Assistance 0 021 Isolated Funding 0 022 Supplemental Millage Incentive Funding 0 023 Other Unrestricted State Funding 0 024 Total Unrestricted Revenue from State and
Local Sources 46,195,870 47,977,166
Restricted Revenue from State Sources:25 Adult Education 526,152 513,754
Regular Education:26 Professional Development 212,562 217,69627 Other Regular Education 29,413 2,600
Special Education:28 Gifted & Talented 15,150 029 Alternative Learning Environment (ALE) 274,456 265,61230 English Language Learner (ELL) 150,309 153,38731 National School Lunch Act (NSLA) 1,407,648 1,467,90632 Other Special Education 336,075 312,94933 Workforce Education 795,888 203,93834 School Food Service 18,263 18,25035 Educational Service Cooperatives 0 036 Early Childhood Programs 0 037 Magnet School Programs 0 038 Other Non-Instructional Programs 31,823 039 Total Restricted Revenue from State Sources 3,797,739 3,156,09240 Total Restricted Revenue from Federal
Sources 9,498,128 5,702,623
Other Sources of Funds:41 Financing Sources 916,300 042 Balances from Consolidated/Annexed District 0 043 Indirect Cost Reimbursement 44,000 044 Gains and Losses from Sale of Fixed Assets 11,588 045 Compensation for Loss of Fixed Assets 19,333 046 Other 0 047 Total Other Sources of Funds 991,221 048 Total Revenue and Other Sources of Funds
from All Sources 60,482,958 56,835,881
2010-2011 2011-2012Actual Budget
CURRENT EXPENDITURESInstruction:
49 Regular Instruction 19,128,059 18,417,26050 Special Education 3,084,399 3,512,08151 Workforce Education 1,800,316 1,148,45852 Adult Education 691,918 693,29353 Compensatory Education 1,480,891 1,781,76454 Other 2,903,245 2,836,74455 Total Instruction 29,088,828 28,389,599
District Level Support:56 General Administration 562,635 721,04757 Central Services 1,547,980 2,229,40458 Maintenance & Operations of Plant 7,310,994 7,130,74159 Student Transportation 1,590,222 1,976,13260 Other District Level Support Services 184,788 192,56361 Total District Support Services 11,196,618 12,249,887
School Level Support:62 Student Support Services 2,220,707 2,690,19563 Instructional Staff Support Services 4,365,815 4,214,92464 School Administration 2,396,344 2,599,21665 Total District Support Services 8,982,867 9,504,335
Non-Instructional Services:66 Food Service Operations 2,923,190 2,825,68967 Other Enterprise Operations 17,105 068 Community Operations 97,425 87,45069 Other Non-Instructional Services 0 070 Total Non-Instructional Services 3,037,720 2,913,13971 Facilities Acquisition and Construction 10,224,311 4,834,13372 Debt Service 4,890,085 4,856,35275 Other Non-Programmed Costs 28,439 076 Total Expenditures 67,448,869 62,747,44577 Less: Capital Expenditures 11,436,149 6,566,62778 Less: Debt Service 4,890,085 4,856,35279 Total Current Expenditures 51,122,635 51,324,46680 Exclusions from Current Expenditures 2,283,08881 Net Current Expenditures 48,839,547
82 Per Pupil Expenditures 9,844
83 Personnel - Non-Federal Certified Clsrm FTEs 389.7784 Avg Salary - Non-Fed Certified Clsrm FTEs 45,28985 Personnel - Non-Federal Certified FTEs 426.5386 Avg Salary - Non-Fed Certified FTEs 47,61687.1 Legal Balance (funds 1-2-4) 8,733,62187.2 Categorical Fund Balance 98,40987.3 Deposits with Paying Agents (QZAB) 087.4 Net Legal Bal (Excl Cat & QZAB) 8,635,21288 Building Fund Balance (fund 3) 6,500,27889 Capital Outlay Fund Balance (fund 5) 365,262
Jan 30, 2012 - 181 - 9:35:29 AM

Annual Statistical Report 2010-2011
County: PRAIRIE DES ARC SCHOOL DISTRICT LEA:5901000
2010-2011 2011-2012Actual Budget
1 Area in Square Miles 2752 ADA 5583 ADA pct Change over 5 Yrs. (7%)4 4 QTR ADM 5915 Prior Year 3QTR ADM 6036 Assessment 41,408,5817 M&O Mills 25.008 URT Mills 25.009 M&O Mills in Excess of URT 0.0010 Dedicated M&O Mills 0.0011 Debt Service Mills 5.0012 Total Mills 30.0013 Total Debt Bond/Non-Bond 1,165,000
State and Local Revenue:14 Property Tax Receipts (Including URT) 1,165,940 1,265,84815 Other Local Receipts 344,516 126,77516 Revenue from Intermediate Sources 3,812 3,00017.1 Foundation Funding (Excl URT) 2,592,229 2,595,07217.2 Tax Collection Rate Guarantee 59,629 018 Student Growth Funding 0 019 Declining Enrollment Funding 29,995 33,63820 Consolidation Incentive/Assistance 0 021 Isolated Funding 0 022 Supplemental Millage Incentive Funding 0 023 Other Unrestricted State Funding 0 024 Total Unrestricted Revenue from State and
Local Sources 4,196,122 4,024,333
Restricted Revenue from State Sources:25 Adult Education 240,000 150,000
Regular Education:26 Professional Development 24,931 25,08127 Other Regular Education 3,019 1,200
Special Education:28 Gifted & Talented 50 5029 Alternative Learning Environment (ALE) 8,654 9,94830 English Language Learner (ELL) 0 031 National School Lunch Act (NSLA) 189,472 190,25632 Other Special Education 2,469 033 Workforce Education 1,625 1,62534 School Food Service 2,264 2,30035 Educational Service Cooperatives 0 036 Early Childhood Programs 97,200 124,40037 Magnet School Programs 0 038 Other Non-Instructional Programs 19,141 18,05539 Total Restricted Revenue from State Sources 588,825 522,91540 Total Restricted Revenue from Federal
Sources 821,387 656,477
Other Sources of Funds:41 Financing Sources 37,377 042 Balances from Consolidated/Annexed District 0 043 Indirect Cost Reimbursement 4,823 044 Gains and Losses from Sale of Fixed Assets 0 045 Compensation for Loss of Fixed Assets 23,180 046 Other 0 047 Total Other Sources of Funds 65,380 048 Total Revenue and Other Sources of Funds
from All Sources 5,671,714 5,203,725
2010-2011 2011-2012Actual Budget
CURRENT EXPENDITURESInstruction:
49 Regular Instruction 1,998,013 1,767,24250 Special Education 312,837 357,00651 Workforce Education 219,414 251,29652 Adult Education 226,486 150,00053 Compensatory Education 199,436 259,41654 Other 264,992 215,81055 Total Instruction 3,221,179 3,000,771
District Level Support:56 General Administration 152,248 133,89157 Central Services 115,228 113,46058 Maintenance & Operations of Plant 615,868 540,92059 Student Transportation 233,227 220,11560 Other District Level Support Services 18,398 7,56761 Total District Support Services 1,134,969 1,015,953
School Level Support:62 Student Support Services 199,240 211,38063 Instructional Staff Support Services 245,168 310,13464 School Administration 240,825 218,61865 Total District Support Services 685,233 740,132
Non-Instructional Services:66 Food Service Operations 364,886 338,77567 Other Enterprise Operations 34,146 068 Community Operations 0 22,92969 Other Non-Instructional Services 0 070 Total Non-Instructional Services 399,032 361,70471 Facilities Acquisition and Construction 126,945 072 Debt Service 44,790 88,47375 Other Non-Programmed Costs 0 076 Total Expenditures 5,612,147 5,207,03377 Less: Capital Expenditures 194,098 4,50078 Less: Debt Service 44,790 88,47379 Total Current Expenditures 5,373,259 5,114,06080 Exclusions from Current Expenditures 614,92681 Net Current Expenditures 4,758,333
82 Per Pupil Expenditures 8,523
83 Personnel - Non-Federal Certified Clsrm FTEs 45.6784 Avg Salary - Non-Fed Certified Clsrm FTEs 39,78885 Personnel - Non-Federal Certified FTEs 48.8786 Avg Salary - Non-Fed Certified FTEs 41,92987.1 Legal Balance (funds 1-2-4) 2,356,18887.2 Categorical Fund Balance 146,60287.3 Deposits with Paying Agents (QZAB) 087.4 Net Legal Bal (Excl Cat & QZAB) 2,209,58688 Building Fund Balance (fund 3) 22,17589 Capital Outlay Fund Balance (fund 5) 0
Jan 30, 2012 - 182 - 9:35:29 AM

Annual Statistical Report 2010-2011
County: PRAIRIE HAZEN SCHOOL DISTRICT LEA:5903000
2010-2011 2011-2012Actual Budget
1 Area in Square Miles 3752 ADA 6203 ADA pct Change over 5 Yrs. (3%)4 4 QTR ADM 6445 Prior Year 3QTR ADM 6426 Assessment 63,948,8167 M&O Mills 26.438 URT Mills 25.009 M&O Mills in Excess of URT 1.4310 Dedicated M&O Mills 0.0011 Debt Service Mills 3.6012 Total Mills 30.0313 Total Debt Bond/Non-Bond 730,864
State and Local Revenue:14 Property Tax Receipts (Including URT) 1,791,091 1,474,51315 Other Local Receipts 355,226 194,90516 Revenue from Intermediate Sources 4,064 017.1 Foundation Funding (Excl URT) 2,251,603 2,384,20717.2 Tax Collection Rate Guarantee 112,532 107,67218 Student Growth Funding 20,553 019 Declining Enrollment Funding 15,117 020 Consolidation Incentive/Assistance 0 021 Isolated Funding 0 022 Supplemental Millage Incentive Funding 0 023 Other Unrestricted State Funding 2,964 024 Total Unrestricted Revenue from State and
Local Sources 4,553,150 4,161,297
Restricted Revenue from State Sources:25 Adult Education 0 0
Regular Education:26 Professional Development 26,535 27,27927 Other Regular Education 7,449 7,400
Special Education:28 Gifted & Talented 924 029 Alternative Learning Environment (ALE) 10,401 3,19230 English Language Learner (ELL) 0 031 National School Lunch Act (NSLA) 213,280 310,34832 Other Special Education 59,668 50,00033 Workforce Education 0 034 School Food Service 2,554 2,50035 Educational Service Cooperatives 0 036 Early Childhood Programs 118,940 116,64037 Magnet School Programs 0 038 Other Non-Instructional Programs 13,599 8,52439 Total Restricted Revenue from State Sources 453,350 525,88340 Total Restricted Revenue from Federal
Sources 908,802 772,305
Other Sources of Funds:41 Financing Sources 215,885 042 Balances from Consolidated/Annexed District 0 043 Indirect Cost Reimbursement 0 044 Gains and Losses from Sale of Fixed Assets 26,686 045 Compensation for Loss of Fixed Assets 20,346 046 Other 0 047 Total Other Sources of Funds 262,916 048 Total Revenue and Other Sources of Funds
from All Sources 6,178,218 5,459,485
2010-2011 2011-2012Actual Budget
CURRENT EXPENDITURESInstruction:
49 Regular Instruction 2,594,099 2,436,44250 Special Education 376,957 386,71851 Workforce Education 147,275 178,76752 Adult Education 0 053 Compensatory Education 289,412 281,34654 Other 73,352 77,27855 Total Instruction 3,481,095 3,360,551
District Level Support:56 General Administration 143,468 143,28757 Central Services 159,392 161,87158 Maintenance & Operations of Plant 535,705 438,82359 Student Transportation 232,774 207,51060 Other District Level Support Services 10,530 10,00061 Total District Support Services 1,081,868 961,491
School Level Support:62 Student Support Services 344,759 290,05563 Instructional Staff Support Services 300,253 299,85864 School Administration 279,930 272,24365 Total District Support Services 924,941 862,156
Non-Instructional Services:66 Food Service Operations 368,934 331,18867 Other Enterprise Operations 58,919 60068 Community Operations 6,342 7,00069 Other Non-Instructional Services 0 070 Total Non-Instructional Services 434,196 338,78871 Facilities Acquisition and Construction 65,654 43,10072 Debt Service 155,409 91,65575 Other Non-Programmed Costs 25,316 076 Total Expenditures 6,168,479 5,657,74177 Less: Capital Expenditures 121,763 137,75478 Less: Debt Service 155,409 91,65579 Total Current Expenditures 5,891,307 5,428,33280 Exclusions from Current Expenditures 463,59581 Net Current Expenditures 5,427,711
82 Per Pupil Expenditures 8,754
83 Personnel - Non-Federal Certified Clsrm FTEs 52.5084 Avg Salary - Non-Fed Certified Clsrm FTEs 39,29085 Personnel - Non-Federal Certified FTEs 55.8086 Avg Salary - Non-Fed Certified FTEs 41,14487.1 Legal Balance (funds 1-2-4) 1,889,99787.2 Categorical Fund Balance 14,66787.3 Deposits with Paying Agents (QZAB) 087.4 Net Legal Bal (Excl Cat & QZAB) 1,875,33188 Building Fund Balance (fund 3) 089 Capital Outlay Fund Balance (fund 5) 0
Jan 30, 2012 - 183 - 9:35:29 AM

Annual Statistical Report 2010-2011
County: PULASKI LITTLE ROCK SCHOOL DISTRICT LEA:6001000
2010-2011 2011-2012Actual Budget
1 Area in Square Miles 972 ADA 22,9953 ADA pct Change over 5 Yrs. (4%)4 4 QTR ADM 23,7885 Prior Year 3QTR ADM 22,7756 Assessment 3,176,216,5107 M&O Mills 32.008 URT Mills 25.009 M&O Mills in Excess of URT 7.0010 Dedicated M&O Mills 2.0011 Debt Service Mills 12.4012 Total Mills 46.4013 Total Debt Bond/Non-Bond 203,182,402
State and Local Revenue:14 Property Tax Receipts (Including URT) 139,616,052 146,639,80815 Other Local Receipts 15,071,922 10,003,05716 Revenue from Intermediate Sources 21,614 15,00017.1 Foundation Funding (Excl URT) 58,441,252 61,907,28617.2 Tax Collection Rate Guarantee 2,765,444 500,00018 Student Growth Funding 89,426 019 Declining Enrollment Funding 0 35,26720 Consolidation Incentive/Assistance 0 021 Isolated Funding 0 022 Supplemental Millage Incentive Funding 0 023 Other Unrestricted State Funding 0 024 Total Unrestricted Revenue from State and
Local Sources 216,005,710 219,100,418
Restricted Revenue from State Sources:25 Adult Education 976,294 902,683
Regular Education:26 Professional Development 941,957 964,70127 Other Regular Education 0 0
Special Education:28 Gifted & Talented 4,620 029 Alternative Learning Environment (ALE) 2,634,287 2,564,22130 English Language Learner (ELL) 572,815 598,00031 National School Lunch Act (NSLA) 11,243,933 14,315,69732 Other Special Education 3,487,081 3,490,00033 Workforce Education 1,571,238 1,598,00034 School Food Service 75,215 72,20735 Educational Service Cooperatives 0 036 Early Childhood Programs 5,260,561 5,321,70037 Magnet School Programs 54,336,505 52,341,57738 Other Non-Instructional Programs 37,976 30,38139 Total Restricted Revenue from State Sources 81,142,482 82,199,16840 Total Restricted Revenue from Federal
Sources 56,665,217 54,316,952
Other Sources of Funds:41 Financing Sources 0 042 Balances from Consolidated/Annexed District 0 043 Indirect Cost Reimbursement 777,113 916,43044 Gains and Losses from Sale of Fixed Assets 0 045 Compensation for Loss of Fixed Assets 0 046 Other 0 047 Total Other Sources of Funds 777,113 916,43048 Total Revenue and Other Sources of Funds
from All Sources 354,590,522 356,532,968
2010-2011 2011-2012Actual Budget
CURRENT EXPENDITURESInstruction:
49 Regular Instruction 120,133,854 119,687,59150 Special Education 25,073,471 25,751,89051 Workforce Education 7,270,421 6,877,88052 Adult Education 1,263,239 1,259,63353 Compensatory Education 13,630,897 9,199,68754 Other 12,433,393 13,837,88255 Total Instruction 179,805,275 176,614,564
District Level Support:56 General Administration 4,730,477 4,141,58157 Central Services 9,937,873 8,338,34358 Maintenance & Operations of Plant 28,733,713 26,149,08659 Student Transportation 17,984,657 17,873,78860 Other District Level Support Services 1,238,360 2,355,69061 Total District Support Services 62,625,080 58,858,487
School Level Support:62 Student Support Services 14,674,462 15,189,55863 Instructional Staff Support Services 34,871,708 37,779,82964 School Administration 16,574,702 15,606,82765 Total District Support Services 66,120,872 68,576,214
Non-Instructional Services:66 Food Service Operations 11,742,948 12,696,64567 Other Enterprise Operations 1,267,449 1,460,20068 Community Operations 271,809 308,01169 Other Non-Instructional Services 0 070 Total Non-Instructional Services 13,282,206 14,464,85671 Facilities Acquisition and Construction 21,212,184 21,313,04772 Debt Service 13,356,632 12,361,62975 Other Non-Programmed Costs 10,330,357 9,996,93676 Total Expenditures 366,732,607 362,185,73377 Less: Capital Expenditures 32,117,768 26,219,06678 Less: Debt Service 13,356,632 12,361,62979 Total Current Expenditures 321,258,206 323,605,03880 Exclusions from Current Expenditures 25,744,50281 Net Current Expenditures 295,513,704
82 Per Pupil Expenditures 12,851
83 Personnel - Non-Federal Certified Clsrm FTEs 1,936.3984 Avg Salary - Non-Fed Certified Clsrm FTEs 53,06985 Personnel - Non-Federal Certified FTEs 2,136.5986 Avg Salary - Non-Fed Certified FTEs 55,65087.1 Legal Balance (funds 1-2-4) 20,598,99987.2 Categorical Fund Balance 087.3 Deposits with Paying Agents (QZAB) 087.4 Net Legal Bal (Excl Cat & QZAB) 20,598,99988 Building Fund Balance (fund 3) 9,146,50789 Capital Outlay Fund Balance (fund 5) 487,732
LRSD figures include the four-quarter average M-to-M received for ADA and ADM and related revenues and expenditures as well as Magnet School four-quarter average for ADA, ADM and related expenditures. LRSD received the following desegregation revenues: M to M Incentive funding $4,486,566.00; Magnet School funding $15,280.423.32; and Magnet & M to-M Transportation $3,977,759.00. LSRD also received $15,742,154.50 for Health Insurance and Teacher Retirement.
Jan 30, 2012 - 184 - 9:35:29 AM
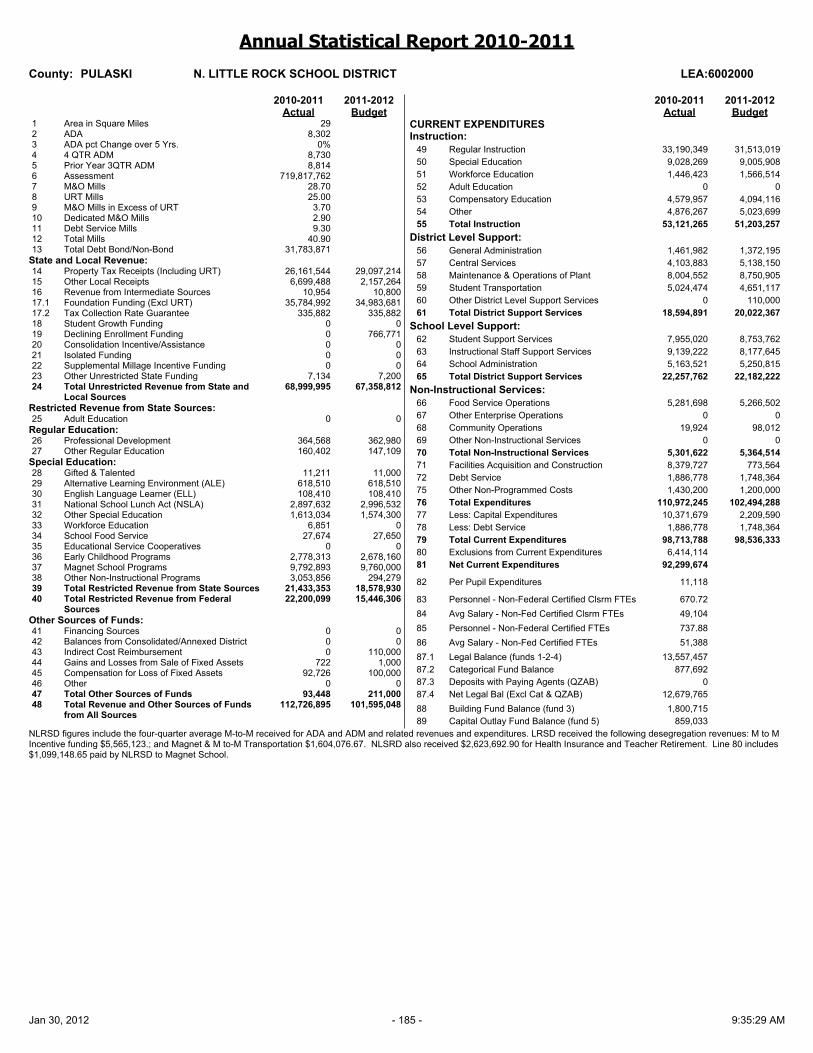
Annual Statistical Report 2010-2011
County: PULASKI N. LITTLE ROCK SCHOOL DISTRICT LEA:6002000
2010-2011 2011-2012Actual Budget
1 Area in Square Miles 292 ADA 8,3023 ADA pct Change over 5 Yrs. 0%4 4 QTR ADM 8,7305 Prior Year 3QTR ADM 8,8146 Assessment 719,817,7627 M&O Mills 28.708 URT Mills 25.009 M&O Mills in Excess of URT 3.7010 Dedicated M&O Mills 2.9011 Debt Service Mills 9.3012 Total Mills 40.9013 Total Debt Bond/Non-Bond 31,783,871
State and Local Revenue:14 Property Tax Receipts (Including URT) 26,161,544 29,097,21415 Other Local Receipts 6,699,488 2,157,26416 Revenue from Intermediate Sources 10,954 10,80017.1 Foundation Funding (Excl URT) 35,784,992 34,983,68117.2 Tax Collection Rate Guarantee 335,882 335,88218 Student Growth Funding 0 019 Declining Enrollment Funding 0 766,77120 Consolidation Incentive/Assistance 0 021 Isolated Funding 0 022 Supplemental Millage Incentive Funding 0 023 Other Unrestricted State Funding 7,134 7,20024 Total Unrestricted Revenue from State and
Local Sources 68,999,995 67,358,812
Restricted Revenue from State Sources:25 Adult Education 0 0
Regular Education:26 Professional Development 364,568 362,98027 Other Regular Education 160,402 147,109
Special Education:28 Gifted & Talented 11,211 11,00029 Alternative Learning Environment (ALE) 618,510 618,51030 English Language Learner (ELL) 108,410 108,41031 National School Lunch Act (NSLA) 2,897,632 2,996,53232 Other Special Education 1,613,034 1,574,30033 Workforce Education 6,851 034 School Food Service 27,674 27,65035 Educational Service Cooperatives 0 036 Early Childhood Programs 2,778,313 2,678,16037 Magnet School Programs 9,792,893 9,760,00038 Other Non-Instructional Programs 3,053,856 294,27939 Total Restricted Revenue from State Sources 21,433,353 18,578,93040 Total Restricted Revenue from Federal
Sources 22,200,099 15,446,306
Other Sources of Funds:41 Financing Sources 0 042 Balances from Consolidated/Annexed District 0 043 Indirect Cost Reimbursement 0 110,00044 Gains and Losses from Sale of Fixed Assets 722 1,00045 Compensation for Loss of Fixed Assets 92,726 100,00046 Other 0 047 Total Other Sources of Funds 93,448 211,00048 Total Revenue and Other Sources of Funds
from All Sources 112,726,895 101,595,048
2010-2011 2011-2012Actual Budget
CURRENT EXPENDITURESInstruction:
49 Regular Instruction 33,190,349 31,513,01950 Special Education 9,028,269 9,005,90851 Workforce Education 1,446,423 1,566,51452 Adult Education 0 053 Compensatory Education 4,579,957 4,094,11654 Other 4,876,267 5,023,69955 Total Instruction 53,121,265 51,203,257
District Level Support:56 General Administration 1,461,982 1,372,19557 Central Services 4,103,883 5,138,15058 Maintenance & Operations of Plant 8,004,552 8,750,90559 Student Transportation 5,024,474 4,651,11760 Other District Level Support Services 0 110,00061 Total District Support Services 18,594,891 20,022,367
School Level Support:62 Student Support Services 7,955,020 8,753,76263 Instructional Staff Support Services 9,139,222 8,177,64564 School Administration 5,163,521 5,250,81565 Total District Support Services 22,257,762 22,182,222
Non-Instructional Services:66 Food Service Operations 5,281,698 5,266,50267 Other Enterprise Operations 0 068 Community Operations 19,924 98,01269 Other Non-Instructional Services 0 070 Total Non-Instructional Services 5,301,622 5,364,51471 Facilities Acquisition and Construction 8,379,727 773,56472 Debt Service 1,886,778 1,748,36475 Other Non-Programmed Costs 1,430,200 1,200,00076 Total Expenditures 110,972,245 102,494,28877 Less: Capital Expenditures 10,371,679 2,209,59078 Less: Debt Service 1,886,778 1,748,36479 Total Current Expenditures 98,713,788 98,536,33380 Exclusions from Current Expenditures 6,414,11481 Net Current Expenditures 92,299,674
82 Per Pupil Expenditures 11,118
83 Personnel - Non-Federal Certified Clsrm FTEs 670.7284 Avg Salary - Non-Fed Certified Clsrm FTEs 49,10485 Personnel - Non-Federal Certified FTEs 737.8886 Avg Salary - Non-Fed Certified FTEs 51,38887.1 Legal Balance (funds 1-2-4) 13,557,45787.2 Categorical Fund Balance 877,69287.3 Deposits with Paying Agents (QZAB) 087.4 Net Legal Bal (Excl Cat & QZAB) 12,679,76588 Building Fund Balance (fund 3) 1,800,71589 Capital Outlay Fund Balance (fund 5) 859,033
NLRSD figures include the four-quarter average M-to-M received for ADA and ADM and related revenues and expenditures. LRSD received the following desegregation revenues: M to M Incentive funding $5,565,123.; and Magnet & M to-M Transportation $1,604,076.67. NLSRD also received $2,623,692.90 for Health Insurance and Teacher Retirement. Line 80 includes $1,099,148.65 paid by NLRSD to Magnet School.
Jan 30, 2012 - 185 - 9:35:29 AM
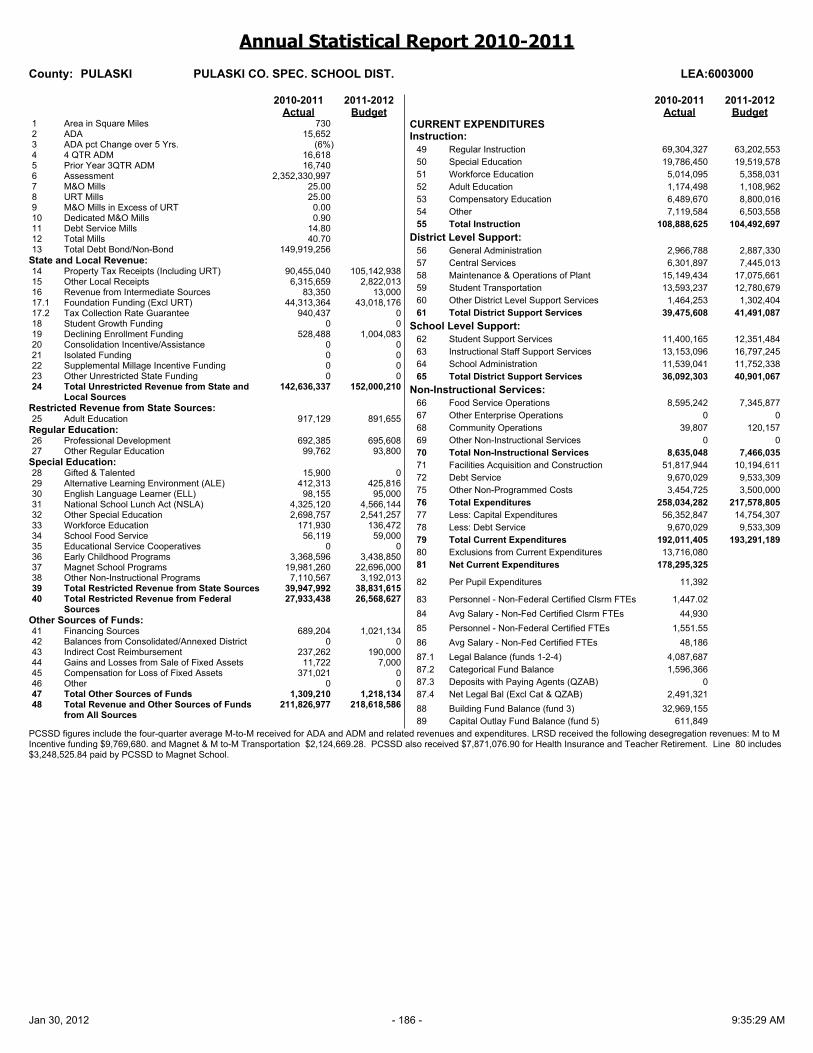
Annual Statistical Report 2010-2011
County: PULASKI PULASKI CO. SPEC. SCHOOL DIST. LEA:6003000
2010-2011 2011-2012Actual Budget
1 Area in Square Miles 7302 ADA 15,6523 ADA pct Change over 5 Yrs. (6%)4 4 QTR ADM 16,6185 Prior Year 3QTR ADM 16,7406 Assessment 2,352,330,9977 M&O Mills 25.008 URT Mills 25.009 M&O Mills in Excess of URT 0.0010 Dedicated M&O Mills 0.9011 Debt Service Mills 14.8012 Total Mills 40.7013 Total Debt Bond/Non-Bond 149,919,256
State and Local Revenue:14 Property Tax Receipts (Including URT) 90,455,040 105,142,93815 Other Local Receipts 6,315,659 2,822,01316 Revenue from Intermediate Sources 83,350 13,00017.1 Foundation Funding (Excl URT) 44,313,364 43,018,17617.2 Tax Collection Rate Guarantee 940,437 018 Student Growth Funding 0 019 Declining Enrollment Funding 528,488 1,004,08320 Consolidation Incentive/Assistance 0 021 Isolated Funding 0 022 Supplemental Millage Incentive Funding 0 023 Other Unrestricted State Funding 0 024 Total Unrestricted Revenue from State and
Local Sources 142,636,337 152,000,210
Restricted Revenue from State Sources:25 Adult Education 917,129 891,655
Regular Education:26 Professional Development 692,385 695,60827 Other Regular Education 99,762 93,800
Special Education:28 Gifted & Talented 15,900 029 Alternative Learning Environment (ALE) 412,313 425,81630 English Language Learner (ELL) 98,155 95,00031 National School Lunch Act (NSLA) 4,325,120 4,566,14432 Other Special Education 2,698,757 2,541,25733 Workforce Education 171,930 136,47234 School Food Service 56,119 59,00035 Educational Service Cooperatives 0 036 Early Childhood Programs 3,368,596 3,438,85037 Magnet School Programs 19,981,260 22,696,00038 Other Non-Instructional Programs 7,110,567 3,192,01339 Total Restricted Revenue from State Sources 39,947,992 38,831,61540 Total Restricted Revenue from Federal
Sources 27,933,438 26,568,627
Other Sources of Funds:41 Financing Sources 689,204 1,021,13442 Balances from Consolidated/Annexed District 0 043 Indirect Cost Reimbursement 237,262 190,00044 Gains and Losses from Sale of Fixed Assets 11,722 7,00045 Compensation for Loss of Fixed Assets 371,021 046 Other 0 047 Total Other Sources of Funds 1,309,210 1,218,13448 Total Revenue and Other Sources of Funds
from All Sources 211,826,977 218,618,586
2010-2011 2011-2012Actual Budget
CURRENT EXPENDITURESInstruction:
49 Regular Instruction 69,304,327 63,202,55350 Special Education 19,786,450 19,519,57851 Workforce Education 5,014,095 5,358,03152 Adult Education 1,174,498 1,108,96253 Compensatory Education 6,489,670 8,800,01654 Other 7,119,584 6,503,55855 Total Instruction 108,888,625 104,492,697
District Level Support:56 General Administration 2,966,788 2,887,33057 Central Services 6,301,897 7,445,01358 Maintenance & Operations of Plant 15,149,434 17,075,66159 Student Transportation 13,593,237 12,780,67960 Other District Level Support Services 1,464,253 1,302,40461 Total District Support Services 39,475,608 41,491,087
School Level Support:62 Student Support Services 11,400,165 12,351,48463 Instructional Staff Support Services 13,153,096 16,797,24564 School Administration 11,539,041 11,752,33865 Total District Support Services 36,092,303 40,901,067
Non-Instructional Services:66 Food Service Operations 8,595,242 7,345,87767 Other Enterprise Operations 0 068 Community Operations 39,807 120,15769 Other Non-Instructional Services 0 070 Total Non-Instructional Services 8,635,048 7,466,03571 Facilities Acquisition and Construction 51,817,944 10,194,61172 Debt Service 9,670,029 9,533,30975 Other Non-Programmed Costs 3,454,725 3,500,00076 Total Expenditures 258,034,282 217,578,80577 Less: Capital Expenditures 56,352,847 14,754,30778 Less: Debt Service 9,670,029 9,533,30979 Total Current Expenditures 192,011,405 193,291,18980 Exclusions from Current Expenditures 13,716,08081 Net Current Expenditures 178,295,325
82 Per Pupil Expenditures 11,392
83 Personnel - Non-Federal Certified Clsrm FTEs 1,447.0284 Avg Salary - Non-Fed Certified Clsrm FTEs 44,93085 Personnel - Non-Federal Certified FTEs 1,551.5586 Avg Salary - Non-Fed Certified FTEs 48,18687.1 Legal Balance (funds 1-2-4) 4,087,68787.2 Categorical Fund Balance 1,596,36687.3 Deposits with Paying Agents (QZAB) 087.4 Net Legal Bal (Excl Cat & QZAB) 2,491,32188 Building Fund Balance (fund 3) 32,969,15589 Capital Outlay Fund Balance (fund 5) 611,849
PCSSD figures include the four-quarter average M-to-M received for ADA and ADM and related revenues and expenditures. LRSD received the following desegregation revenues: M to M Incentive funding $9,769,680. and Magnet & M to-M Transportation $2,124,669.28. PCSSD also received $7,871,076.90 for Health Insurance and Teacher Retirement. Line 80 includes $3,248,525.84 paid by PCSSD to Magnet School.
Jan 30, 2012 - 186 - 9:35:29 AM

Annual Statistical Report 2010-2011
County: RANDOLPH MAYNARD SCHOOL DISTRICT LEA:6102000
2010-2011 2011-2012Actual Budget
1 Area in Square Miles 2022 ADA 4983 ADA pct Change over 5 Yrs. 3%4 4 QTR ADM 5215 Prior Year 3QTR ADM 4706 Assessment 25,409,5647 M&O Mills 25.208 URT Mills 25.009 M&O Mills in Excess of URT 0.2010 Dedicated M&O Mills 3.0011 Debt Service Mills 2.5012 Total Mills 30.7013 Total Debt Bond/Non-Bond 236,378
State and Local Revenue:14 Property Tax Receipts (Including URT) 653,626 556,00015 Other Local Receipts 208,245 127,75016 Revenue from Intermediate Sources 0 017.1 Foundation Funding (Excl URT) 2,473,056 2,573,94317.2 Tax Collection Rate Guarantee 26,321 20,00018 Student Growth Funding 144,818 75,00019 Declining Enrollment Funding 0 020 Consolidation Incentive/Assistance 146,505 73,25321 Isolated Funding 12,022 022 Supplemental Millage Incentive Funding 20,789 16,63123 Other Unrestricted State Funding 0 024 Total Unrestricted Revenue from State and
Local Sources 3,685,382 3,442,577
Restricted Revenue from State Sources:25 Adult Education 0 0
Regular Education:26 Professional Development 20,538 22,04927 Other Regular Education 2,469 4,600
Special Education:28 Gifted & Talented 150 029 Alternative Learning Environment (ALE) 1,947 1,50030 English Language Learner (ELL) 0 031 National School Lunch Act (NSLA) 358,595 383,54832 Other Special Education 1,927 1,40433 Workforce Education 0 034 School Food Service 2,096 2,00035 Educational Service Cooperatives 0 036 Early Childhood Programs 0 037 Magnet School Programs 0 038 Other Non-Instructional Programs 165,058 13,12139 Total Restricted Revenue from State Sources 552,780 428,22240 Total Restricted Revenue from Federal
Sources 1,079,913 696,103
Other Sources of Funds:41 Financing Sources 76,378 042 Balances from Consolidated/Annexed District 0 67,05843 Indirect Cost Reimbursement 0 044 Gains and Losses from Sale of Fixed Assets 125 045 Compensation for Loss of Fixed Assets 0 046 Other 0 047 Total Other Sources of Funds 76,503 67,05848 Total Revenue and Other Sources of Funds
from All Sources 5,394,578 4,633,960
2010-2011 2011-2012Actual Budget
CURRENT EXPENDITURESInstruction:
49 Regular Instruction 1,710,631 1,635,99950 Special Education 351,060 351,01551 Workforce Education 194,754 194,33952 Adult Education 0 053 Compensatory Education 237,925 177,68154 Other 207,448 219,08955 Total Instruction 2,701,819 2,578,122
District Level Support:56 General Administration 153,890 172,02657 Central Services 140,231 130,00358 Maintenance & Operations of Plant 478,151 356,42359 Student Transportation 233,458 353,29660 Other District Level Support Services 16,948 6,00061 Total District Support Services 1,022,679 1,017,748
School Level Support:62 Student Support Services 235,685 262,92363 Instructional Staff Support Services 150,248 264,93464 School Administration 181,466 214,94065 Total District Support Services 567,400 742,797
Non-Instructional Services:66 Food Service Operations 334,160 336,70267 Other Enterprise Operations 0 068 Community Operations 1,294 5,00069 Other Non-Instructional Services 0 070 Total Non-Instructional Services 335,454 341,70271 Facilities Acquisition and Construction 321,340 2,50072 Debt Service 29,298 28,33875 Other Non-Programmed Costs 0 19076 Total Expenditures 4,977,989 4,711,39777 Less: Capital Expenditures 452,232 169,98478 Less: Debt Service 29,298 28,33879 Total Current Expenditures 4,496,460 4,513,07580 Exclusions from Current Expenditures 186,62381 Net Current Expenditures 4,309,837
82 Per Pupil Expenditures 8,655
83 Personnel - Non-Federal Certified Clsrm FTEs 39.2084 Avg Salary - Non-Fed Certified Clsrm FTEs 41,16085 Personnel - Non-Federal Certified FTEs 41.7786 Avg Salary - Non-Fed Certified FTEs 42,97587.1 Legal Balance (funds 1-2-4) 823,96787.2 Categorical Fund Balance 169,88887.3 Deposits with Paying Agents (QZAB) 087.4 Net Legal Bal (Excl Cat & QZAB) 654,07988 Building Fund Balance (fund 3) 150,00089 Capital Outlay Fund Balance (fund 5) 150,937
Jan 30, 2012 - 187 - 9:35:29 AM

Annual Statistical Report 2010-2011
County: RANDOLPH POCAHONTAS SCHOOL DISTRICT LEA:6103000
2010-2011 2011-2012Actual Budget
1 Area in Square Miles 1992 ADA 1,7343 ADA pct Change over 5 Yrs. (3%)4 4 QTR ADM 1,8195 Prior Year 3QTR ADM 1,8316 Assessment 118,666,4247 M&O Mills 25.008 URT Mills 25.009 M&O Mills in Excess of URT 0.0010 Dedicated M&O Mills 0.0011 Debt Service Mills 4.3712 Total Mills 29.3713 Total Debt Bond/Non-Bond 3,530,000
State and Local Revenue:14 Property Tax Receipts (Including URT) 3,039,788 2,940,00015 Other Local Receipts 887,644 391,75016 Revenue from Intermediate Sources 0 017.1 Foundation Funding (Excl URT) 8,351,773 8,269,53017.2 Tax Collection Rate Guarantee 162,448 207,66618 Student Growth Funding 0 019 Declining Enrollment Funding 0 40,17820 Consolidation Incentive/Assistance 6,104 021 Isolated Funding 501 022 Supplemental Millage Incentive Funding 0 023 Other Unrestricted State Funding 0 024 Total Unrestricted Revenue from State and
Local Sources 12,448,257 11,849,124
Restricted Revenue from State Sources:25 Adult Education 0 0
Regular Education:26 Professional Development 75,781 77,09627 Other Regular Education 17,088 2,000
Special Education:28 Gifted & Talented 900 029 Alternative Learning Environment (ALE) 33,484 21,59530 English Language Learner (ELL) 0 031 National School Lunch Act (NSLA) 548,028 571,78032 Other Special Education 320,828 185,50033 Workforce Education 0 034 School Food Service 7,190 7,19035 Educational Service Cooperatives 0 036 Early Childhood Programs 194,400 194,40037 Magnet School Programs 0 038 Other Non-Instructional Programs 74,171 63,22739 Total Restricted Revenue from State Sources 1,271,870 1,122,78840 Total Restricted Revenue from Federal
Sources 3,921,618 2,408,121
Other Sources of Funds:41 Financing Sources 0 042 Balances from Consolidated/Annexed District 0 043 Indirect Cost Reimbursement 6,614 044 Gains and Losses from Sale of Fixed Assets 0 045 Compensation for Loss of Fixed Assets 440,047 046 Other 0 047 Total Other Sources of Funds 446,661 048 Total Revenue and Other Sources of Funds
from All Sources 18,088,407 15,380,033
2010-2011 2011-2012Actual Budget
CURRENT EXPENDITURESInstruction:
49 Regular Instruction 6,193,811 6,225,46350 Special Education 1,676,126 1,886,06551 Workforce Education 509,656 489,34552 Adult Education 0 053 Compensatory Education 558,772 627,19954 Other 290,991 327,16955 Total Instruction 9,229,356 9,555,241
District Level Support:56 General Administration 237,530 252,83257 Central Services 119,449 135,94258 Maintenance & Operations of Plant 1,203,925 1,316,05559 Student Transportation 651,825 619,90160 Other District Level Support Services 47,834 38,46461 Total District Support Services 2,260,563 2,363,194
School Level Support:62 Student Support Services 622,746 560,78563 Instructional Staff Support Services 1,167,400 1,115,26264 School Administration 760,717 770,06465 Total District Support Services 2,550,862 2,446,111
Non-Instructional Services:66 Food Service Operations 962,976 1,003,61467 Other Enterprise Operations 98,126 068 Community Operations 18,677 26,21969 Other Non-Instructional Services 0 070 Total Non-Instructional Services 1,079,779 1,029,83371 Facilities Acquisition and Construction 2,598,232 981,89672 Debt Service 230,548 296,33875 Other Non-Programmed Costs 14,531 12,14876 Total Expenditures 17,963,870 16,684,76177 Less: Capital Expenditures 3,102,057 1,223,04778 Less: Debt Service 230,548 296,33879 Total Current Expenditures 14,631,265 15,165,37680 Exclusions from Current Expenditures 1,080,99881 Net Current Expenditures 13,550,267
82 Per Pupil Expenditures 7,813
83 Personnel - Non-Federal Certified Clsrm FTEs 123.9084 Avg Salary - Non-Fed Certified Clsrm FTEs 44,01785 Personnel - Non-Federal Certified FTEs 132.9086 Avg Salary - Non-Fed Certified FTEs 45,73687.1 Legal Balance (funds 1-2-4) 3,606,62487.2 Categorical Fund Balance 125,99787.3 Deposits with Paying Agents (QZAB) 087.4 Net Legal Bal (Excl Cat & QZAB) 3,480,62788 Building Fund Balance (fund 3) 3,991,34089 Capital Outlay Fund Balance (fund 5) 0
Jan 30, 2012 - 188 - 9:35:29 AM

Annual Statistical Report 2010-2011
County: ST FRANCIS FORREST CITY SCHOOL DISTRICT LEA:6201000
2010-2011 2011-2012Actual Budget
1 Area in Square Miles 3452 ADA 2,9373 ADA pct Change over 5 Yrs. (17%)4 4 QTR ADM 3,1385 Prior Year 3QTR ADM 3,2716 Assessment 164,698,9657 M&O Mills 25.008 URT Mills 25.009 M&O Mills in Excess of URT 0.0010 Dedicated M&O Mills 0.0011 Debt Service Mills 7.6012 Total Mills 32.6013 Total Debt Bond/Non-Bond 15,255,000
State and Local Revenue:14 Property Tax Receipts (Including URT) 5,147,203 5,202,86715 Other Local Receipts 1,090,230 811,28716 Revenue from Intermediate Sources 0 017.1 Foundation Funding (Excl URT) 15,699,208 15,286,19017.2 Tax Collection Rate Guarantee 140,345 018 Student Growth Funding 0 019 Declining Enrollment Funding 449,105 383,69320 Consolidation Incentive/Assistance 0 021 Isolated Funding 0 022 Supplemental Millage Incentive Funding 71,890 57,51223 Other Unrestricted State Funding 56,571 56,57124 Total Unrestricted Revenue from State and
Local Sources 22,654,552 21,798,120
Restricted Revenue from State Sources:25 Adult Education 99,576 0
Regular Education:26 Professional Development 135,305 133,34927 Other Regular Education 38,074 14,400
Special Education:28 Gifted & Talented 1,200 1,20029 Alternative Learning Environment (ALE) 160,204 232,20330 English Language Learner (ELL) 5,274 031 National School Lunch Act (NSLA) 2,639,712 2,609,94832 Other Special Education 374,107 483,04033 Workforce Education 71,235 034 School Food Service 15,506 035 Educational Service Cooperatives 0 036 Early Childhood Programs 1,119,499 1,130,34937 Magnet School Programs 0 038 Other Non-Instructional Programs 3,173,103 560,92239 Total Restricted Revenue from State Sources 7,832,796 5,165,41140 Total Restricted Revenue from Federal
Sources 9,561,397 8,700,972
Other Sources of Funds:41 Financing Sources 0 042 Balances from Consolidated/Annexed District 0 043 Indirect Cost Reimbursement 91,609 54,93244 Gains and Losses from Sale of Fixed Assets 50 045 Compensation for Loss of Fixed Assets 5,350 2,00046 Other 0 047 Total Other Sources of Funds 97,009 56,93248 Total Revenue and Other Sources of Funds
from All Sources 40,145,755 35,721,435
2010-2011 2011-2012Actual Budget
CURRENT EXPENDITURESInstruction:
49 Regular Instruction 12,362,947 11,981,89850 Special Education 3,056,628 3,382,25751 Workforce Education 804,940 830,66352 Adult Education 94,277 053 Compensatory Education 2,388,293 1,926,10654 Other 1,824,378 1,634,37855 Total Instruction 20,531,463 19,755,302
District Level Support:56 General Administration 809,216 830,11157 Central Services 692,356 586,39658 Maintenance & Operations of Plant 2,784,430 2,560,05359 Student Transportation 1,291,000 1,180,94860 Other District Level Support Services 129,253 73,77661 Total District Support Services 5,706,255 5,231,284
School Level Support:62 Student Support Services 1,891,698 1,726,90263 Instructional Staff Support Services 3,506,376 3,572,61664 School Administration 1,930,596 1,758,79265 Total District Support Services 7,328,670 7,058,310
Non-Instructional Services:66 Food Service Operations 2,416,857 2,090,48467 Other Enterprise Operations 20,116 068 Community Operations 8,077 15,60069 Other Non-Instructional Services 0 070 Total Non-Instructional Services 2,445,051 2,106,08471 Facilities Acquisition and Construction 5,491,044 1,681,62772 Debt Service 1,114,114 1,112,39575 Other Non-Programmed Costs 0 076 Total Expenditures 42,616,596 36,945,00277 Less: Capital Expenditures 6,005,468 2,062,23378 Less: Debt Service 1,114,114 1,112,39579 Total Current Expenditures 35,497,014 33,770,37480 Exclusions from Current Expenditures 2,063,07181 Net Current Expenditures 33,433,944
82 Per Pupil Expenditures 11,383
83 Personnel - Non-Federal Certified Clsrm FTEs 221.6184 Avg Salary - Non-Fed Certified Clsrm FTEs 50,84585 Personnel - Non-Federal Certified FTEs 249.5086 Avg Salary - Non-Fed Certified FTEs 53,48887.1 Legal Balance (funds 1-2-4) 2,572,35187.2 Categorical Fund Balance 146,16087.3 Deposits with Paying Agents (QZAB) 087.4 Net Legal Bal (Excl Cat & QZAB) 2,426,19288 Building Fund Balance (fund 3) 2,300,22189 Capital Outlay Fund Balance (fund 5) 0
Jan 30, 2012 - 189 - 9:35:29 AM

Annual Statistical Report 2010-2011
County: ST FRANCIS HUGHES SCHOOL DISTRICT LEA:6202000
2010-2011 2011-2012Actual Budget
1 Area in Square Miles 2422 ADA 3813 ADA pct Change over 5 Yrs. (30%)4 4 QTR ADM 4155 Prior Year 3QTR ADM 4256 Assessment 50,397,5897 M&O Mills 37.008 URT Mills 25.009 M&O Mills in Excess of URT 12.0010 Dedicated M&O Mills 0.0011 Debt Service Mills 2.4012 Total Mills 39.4013 Total Debt Bond/Non-Bond 662,584
State and Local Revenue:14 Property Tax Receipts (Including URT) 2,192,885 1,792,23915 Other Local Receipts 1,027,013 43,00016 Revenue from Intermediate Sources 0 017.1 Foundation Funding (Excl URT) 1,359,874 1,306,47317.2 Tax Collection Rate Guarantee 41,745 42,00018 Student Growth Funding 316 019 Declining Enrollment Funding 0 33,45420 Consolidation Incentive/Assistance 0 021 Isolated Funding 0 022 Supplemental Millage Incentive Funding 0 023 Other Unrestricted State Funding 0 024 Total Unrestricted Revenue from State and
Local Sources 4,621,833 3,217,166
Restricted Revenue from State Sources:25 Adult Education 0 0
Regular Education:26 Professional Development 17,568 20,93027 Other Regular Education 118,341 0
Special Education:28 Gifted & Talented 384,717 029 Alternative Learning Environment (ALE) 27,344 84,51130 English Language Learner (ELL) 0 031 National School Lunch Act (NSLA) 346,208 444,11432 Other Special Education 1,439 033 Workforce Education 9,750 034 School Food Service 1,940 035 Educational Service Cooperatives 0 036 Early Childhood Programs 0 037 Magnet School Programs 0 038 Other Non-Instructional Programs 9,297 6,84939 Total Restricted Revenue from State Sources 916,604 556,40440 Total Restricted Revenue from Federal
Sources 1,492,251 1,081,907
Other Sources of Funds:41 Financing Sources 0 042 Balances from Consolidated/Annexed District 0 043 Indirect Cost Reimbursement 0 044 Gains and Losses from Sale of Fixed Assets 0 045 Compensation for Loss of Fixed Assets 0 046 Other 0 047 Total Other Sources of Funds 0 048 Total Revenue and Other Sources of Funds
from All Sources 7,030,688 4,855,477
2010-2011 2011-2012Actual Budget
CURRENT EXPENDITURESInstruction:
49 Regular Instruction 2,350,927 2,030,43650 Special Education 225,284 343,35651 Workforce Education 60,644 112,52052 Adult Education 0 053 Compensatory Education 427,580 408,65354 Other 87,283 101,13255 Total Instruction 3,151,718 2,996,097
District Level Support:56 General Administration 704,092 452,89657 Central Services 2,060 44,90158 Maintenance & Operations of Plant 665,843 818,02859 Student Transportation 137,408 103,03760 Other District Level Support Services 6,310 8,50061 Total District Support Services 1,515,713 1,427,362
School Level Support:62 Student Support Services 186,461 226,45963 Instructional Staff Support Services 801,368 559,27864 School Administration 87,179 87,92565 Total District Support Services 1,075,008 873,662
Non-Instructional Services:66 Food Service Operations 316,573 316,51567 Other Enterprise Operations 0 068 Community Operations 347 3,00069 Other Non-Instructional Services 0 070 Total Non-Instructional Services 316,921 319,51571 Facilities Acquisition and Construction 119,220 072 Debt Service 126,128 160,75075 Other Non-Programmed Costs 0 076 Total Expenditures 6,304,707 5,777,38677 Less: Capital Expenditures 131,693 40,10078 Less: Debt Service 126,128 160,75079 Total Current Expenditures 6,046,886 5,576,53680 Exclusions from Current Expenditures 120,55881 Net Current Expenditures 5,926,328
82 Per Pupil Expenditures 15,559
83 Personnel - Non-Federal Certified Clsrm FTEs 32.0784 Avg Salary - Non-Fed Certified Clsrm FTEs 50,03185 Personnel - Non-Federal Certified FTEs 35.1286 Avg Salary - Non-Fed Certified FTEs 57,59387.1 Legal Balance (funds 1-2-4) 2,228,46787.2 Categorical Fund Balance 2,88487.3 Deposits with Paying Agents (QZAB) 087.4 Net Legal Bal (Excl Cat & QZAB) 2,225,58388 Building Fund Balance (fund 3) 089 Capital Outlay Fund Balance (fund 5) 179
Jan 30, 2012 - 190 - 9:35:29 AM

Annual Statistical Report 2010-2011
County: ST FRANCIS PALESTINE-WHEATLEY SCH. DIST. LEA:6205000
2010-2011 2011-2012Actual Budget
1 Area in Square Miles 1552 ADA 6243 ADA pct Change over 5 Yrs. 18%4 4 QTR ADM 6685 Prior Year 3QTR ADM 6486 Assessment 32,545,5817 M&O Mills 25.008 URT Mills 25.009 M&O Mills in Excess of URT 0.0010 Dedicated M&O Mills 0.0011 Debt Service Mills 11.8012 Total Mills 36.8013 Total Debt Bond/Non-Bond 5,116,175
State and Local Revenue:14 Property Tax Receipts (Including URT) 871,125 772,00015 Other Local Receipts 277,420 242,83516 Revenue from Intermediate Sources 34,094 72,00717.1 Foundation Funding (Excl URT) 3,136,050 3,326,17917.2 Tax Collection Rate Guarantee 16,787 018 Student Growth Funding 134,261 105,00019 Declining Enrollment Funding 0 020 Consolidation Incentive/Assistance 0 021 Isolated Funding 0 022 Supplemental Millage Incentive Funding 3,674 2,93923 Other Unrestricted State Funding 8,510 85,95924 Total Unrestricted Revenue from State and
Local Sources 4,481,921 4,606,919
Restricted Revenue from State Sources:25 Adult Education 0 0
Regular Education:26 Professional Development 26,782 28,44327 Other Regular Education 152,714 35,341
Special Education:28 Gifted & Talented 0 029 Alternative Learning Environment (ALE) 0 030 English Language Learner (ELL) 0 031 National School Lunch Act (NSLA) 572,186 608,87332 Other Special Education 2,653 2,40033 Workforce Education 0 52534 School Food Service 2,813 2,50035 Educational Service Cooperatives 0 036 Early Childhood Programs 142,792 145,80037 Magnet School Programs 0 038 Other Non-Instructional Programs 57,747 46,20239 Total Restricted Revenue from State Sources 957,687 870,08440 Total Restricted Revenue from Federal
Sources 834,009 1,060,310
Other Sources of Funds:41 Financing Sources 4,243,942 042 Balances from Consolidated/Annexed District 0 043 Indirect Cost Reimbursement 0 044 Gains and Losses from Sale of Fixed Assets 0 045 Compensation for Loss of Fixed Assets 0 046 Other 0 047 Total Other Sources of Funds 4,243,942 048 Total Revenue and Other Sources of Funds
from All Sources 10,517,559 6,537,313
2010-2011 2011-2012Actual Budget
CURRENT EXPENDITURESInstruction:
49 Regular Instruction 2,529,508 2,636,14850 Special Education 301,820 153,81151 Workforce Education 181,029 181,35352 Adult Education 0 053 Compensatory Education 169,711 176,32254 Other 170,119 282,95355 Total Instruction 3,352,187 3,430,587
District Level Support:56 General Administration 511,186 179,70757 Central Services 126,844 157,16958 Maintenance & Operations of Plant 627,761 612,88559 Student Transportation 296,176 237,71260 Other District Level Support Services 6,763 8,40061 Total District Support Services 1,568,730 1,195,873
School Level Support:62 Student Support Services 317,974 225,37863 Instructional Staff Support Services 398,729 416,83964 School Administration 324,512 346,41165 Total District Support Services 1,041,215 988,628
Non-Instructional Services:66 Food Service Operations 558,792 526,25267 Other Enterprise Operations 0 068 Community Operations 3,097 3,46169 Other Non-Instructional Services 0 070 Total Non-Instructional Services 561,889 529,71371 Facilities Acquisition and Construction 83,077 4,064,75072 Debt Service 47,150 130,00075 Other Non-Programmed Costs 10,663 076 Total Expenditures 6,664,911 10,339,55277 Less: Capital Expenditures 122,294 4,116,16578 Less: Debt Service 47,150 130,00079 Total Current Expenditures 6,495,467 6,093,38780 Exclusions from Current Expenditures 451,98481 Net Current Expenditures 6,043,483
82 Per Pupil Expenditures 9,682
83 Personnel - Non-Federal Certified Clsrm FTEs 52.2384 Avg Salary - Non-Fed Certified Clsrm FTEs 38,43485 Personnel - Non-Federal Certified FTEs 60.9186 Avg Salary - Non-Fed Certified FTEs 39,76587.1 Legal Balance (funds 1-2-4) 2,738,84587.2 Categorical Fund Balance 693,39087.3 Deposits with Paying Agents (QZAB) 67,06287.4 Net Legal Bal (Excl Cat & QZAB) 1,978,39388 Building Fund Balance (fund 3) 4,154,14589 Capital Outlay Fund Balance (fund 5) 0
Jan 30, 2012 - 191 - 9:35:29 AM

Annual Statistical Report 2010-2011
County: SALINE BAUXITE SCHOOL DISTRICT LEA:6301000
2010-2011 2011-2012Actual Budget
1 Area in Square Miles 872 ADA 1,4063 ADA pct Change over 5 Yrs. 29%4 4 QTR ADM 1,4855 Prior Year 3QTR ADM 1,4206 Assessment 65,210,4307 M&O Mills 25.008 URT Mills 25.009 M&O Mills in Excess of URT 0.0010 Dedicated M&O Mills 0.0011 Debt Service Mills 13.6012 Total Mills 38.6013 Total Debt Bond/Non-Bond 11,409,733
State and Local Revenue:14 Property Tax Receipts (Including URT) 2,139,052 2,205,00015 Other Local Receipts 610,590 611,54816 Revenue from Intermediate Sources 7,511 017.1 Foundation Funding (Excl URT) 7,021,443 7,556,16717.2 Tax Collection Rate Guarantee 39,940 018 Student Growth Funding 473,501 153,60019 Declining Enrollment Funding 0 020 Consolidation Incentive/Assistance 0 021 Isolated Funding 0 022 Supplemental Millage Incentive Funding 24,372 19,49823 Other Unrestricted State Funding 159,178 159,17824 Total Unrestricted Revenue from State and
Local Sources 10,475,586 10,704,991
Restricted Revenue from State Sources:25 Adult Education 0 0
Regular Education:26 Professional Development 58,731 63,14127 Other Regular Education 4,296 3,800
Special Education:28 Gifted & Talented 1,450 029 Alternative Learning Environment (ALE) 12,839 11,82330 English Language Learner (ELL) 4,395 16,35331 National School Lunch Act (NSLA) 251,568 344,60232 Other Special Education 5,817 033 Workforce Education 123,500 99,12534 School Food Service 4,148 4,25035 Educational Service Cooperatives 0 036 Early Childhood Programs 0 037 Magnet School Programs 0 038 Other Non-Instructional Programs 705,534 141,02239 Total Restricted Revenue from State Sources 1,172,279 684,11640 Total Restricted Revenue from Federal
Sources 1,589,763 1,114,213
Other Sources of Funds:41 Financing Sources 602,670 042 Balances from Consolidated/Annexed District 0 043 Indirect Cost Reimbursement 0 044 Gains and Losses from Sale of Fixed Assets 0 045 Compensation for Loss of Fixed Assets 11,037 046 Other 0 047 Total Other Sources of Funds 613,707 048 Total Revenue and Other Sources of Funds
from All Sources 13,851,335 12,503,320
2010-2011 2011-2012Actual Budget
CURRENT EXPENDITURESInstruction:
49 Regular Instruction 4,927,477 5,207,22450 Special Education 670,998 788,68851 Workforce Education 246,733 264,44852 Adult Education 0 053 Compensatory Education 223,409 206,94854 Other 311,324 304,80255 Total Instruction 6,379,942 6,772,111
District Level Support:56 General Administration 476,108 280,85957 Central Services 126,418 131,74258 Maintenance & Operations of Plant 1,200,603 1,287,63559 Student Transportation 445,592 425,85660 Other District Level Support Services 14,346 26,27561 Total District Support Services 2,263,066 2,152,367
School Level Support:62 Student Support Services 595,909 669,78563 Instructional Staff Support Services 1,053,273 831,12664 School Administration 569,127 567,96365 Total District Support Services 2,218,309 2,068,874
Non-Instructional Services:66 Food Service Operations 649,301 486,01567 Other Enterprise Operations 26,076 15,92468 Community Operations 0 50169 Other Non-Instructional Services 0 070 Total Non-Instructional Services 675,377 502,44071 Facilities Acquisition and Construction 506,961 25,52972 Debt Service 662,029 607,22475 Other Non-Programmed Costs 41 1,15076 Total Expenditures 12,705,725 12,129,69577 Less: Capital Expenditures 1,054,538 242,65178 Less: Debt Service 662,029 607,22479 Total Current Expenditures 10,989,158 11,279,82080 Exclusions from Current Expenditures 431,81081 Net Current Expenditures 10,557,347
82 Per Pupil Expenditures 7,507
83 Personnel - Non-Federal Certified Clsrm FTEs 87.6084 Avg Salary - Non-Fed Certified Clsrm FTEs 45,15085 Personnel - Non-Federal Certified FTEs 96.1886 Avg Salary - Non-Fed Certified FTEs 47,52287.1 Legal Balance (funds 1-2-4) 1,698,20687.2 Categorical Fund Balance 85,87887.3 Deposits with Paying Agents (QZAB) 087.4 Net Legal Bal (Excl Cat & QZAB) 1,612,32888 Building Fund Balance (fund 3) 521,65189 Capital Outlay Fund Balance (fund 5) 0
Jan 30, 2012 - 192 - 9:35:29 AM

Annual Statistical Report 2010-2011
County: SALINE BENTON SCHOOL DISTRICT LEA:6302000
2010-2011 2011-2012Actual Budget
1 Area in Square Miles 1052 ADA 4,3983 ADA pct Change over 5 Yrs. 5%4 4 QTR ADM 4,6295 Prior Year 3QTR ADM 4,5776 Assessment 367,117,7777 M&O Mills 25.008 URT Mills 25.009 M&O Mills in Excess of URT 0.0010 Dedicated M&O Mills 0.0011 Debt Service Mills 16.9012 Total Mills 41.9013 Total Debt Bond/Non-Bond 62,630,000
State and Local Revenue:14 Property Tax Receipts (Including URT) 14,444,682 14,878,18815 Other Local Receipts 3,311,433 1,190,57316 Revenue from Intermediate Sources 0 017.1 Foundation Funding (Excl URT) 18,854,290 19,577,24217.2 Tax Collection Rate Guarantee 172,834 179,13218 Student Growth Funding 475,992 019 Declining Enrollment Funding 0 020 Consolidation Incentive/Assistance 0 021 Isolated Funding 0 022 Supplemental Millage Incentive Funding 0 023 Other Unrestricted State Funding 0 024 Total Unrestricted Revenue from State and
Local Sources 37,259,230 35,825,135
Restricted Revenue from State Sources:25 Adult Education 0 0
Regular Education:26 Professional Development 189,296 197,08127 Other Regular Education 7,118 5,179
Special Education:28 Gifted & Talented 7,300 7,30029 Alternative Learning Environment (ALE) 152,159 155,23030 English Language Learner (ELL) 52,740 53,82031 National School Lunch Act (NSLA) 847,664 898,65632 Other Special Education 354,318 155,00033 Workforce Education 111,520 142,51734 School Food Service 14,814 9,81435 Educational Service Cooperatives 0 036 Early Childhood Programs 85,925 79,72837 Magnet School Programs 0 038 Other Non-Instructional Programs 4,321,946 267,84139 Total Restricted Revenue from State Sources 6,144,801 1,972,16640 Total Restricted Revenue from Federal
Sources 4,514,297 4,253,426
Other Sources of Funds:41 Financing Sources 8,295,946 042 Balances from Consolidated/Annexed District 0 043 Indirect Cost Reimbursement 26,333 25,04244 Gains and Losses from Sale of Fixed Assets 17,000 045 Compensation for Loss of Fixed Assets 24,927 046 Other 0 047 Total Other Sources of Funds 8,364,206 25,04248 Total Revenue and Other Sources of Funds
from All Sources 56,282,535 42,075,769
2010-2011 2011-2012Actual Budget
CURRENT EXPENDITURESInstruction:
49 Regular Instruction 16,314,741 15,728,64650 Special Education 2,845,405 2,871,99851 Workforce Education 1,131,731 1,188,11052 Adult Education 0 053 Compensatory Education 303,525 254,19354 Other 1,110,074 1,116,95355 Total Instruction 21,705,477 21,159,901
District Level Support:56 General Administration 758,674 1,012,32557 Central Services 1,338,543 1,277,27358 Maintenance & Operations of Plant 4,077,207 4,005,30959 Student Transportation 1,068,784 1,169,25060 Other District Level Support Services 91,010 77,03761 Total District Support Services 7,334,218 7,541,194
School Level Support:62 Student Support Services 1,799,234 1,772,18463 Instructional Staff Support Services 2,466,059 2,550,64364 School Administration 2,082,730 2,062,30965 Total District Support Services 6,348,023 6,385,135
Non-Instructional Services:66 Food Service Operations 1,804,559 1,856,09967 Other Enterprise Operations 633 068 Community Operations 114,749 101,01069 Other Non-Instructional Services 0 070 Total Non-Instructional Services 1,919,941 1,957,10871 Facilities Acquisition and Construction 14,448,432 8,032,63372 Debt Service 4,007,790 4,609,10275 Other Non-Programmed Costs 23,825 076 Total Expenditures 55,787,707 49,685,07477 Less: Capital Expenditures 15,990,494 9,349,50378 Less: Debt Service 4,007,790 4,609,10279 Total Current Expenditures 35,789,422 35,726,46880 Exclusions from Current Expenditures 1,748,00281 Net Current Expenditures 34,041,420
82 Per Pupil Expenditures 7,739
83 Personnel - Non-Federal Certified Clsrm FTEs 275.5884 Avg Salary - Non-Fed Certified Clsrm FTEs 50,41385 Personnel - Non-Federal Certified FTEs 300.2486 Avg Salary - Non-Fed Certified FTEs 53,47287.1 Legal Balance (funds 1-2-4) 2,874,76087.2 Categorical Fund Balance 67,63687.3 Deposits with Paying Agents (QZAB) 087.4 Net Legal Bal (Excl Cat & QZAB) 2,807,12488 Building Fund Balance (fund 3) 7,747,56689 Capital Outlay Fund Balance (fund 5) 0
Jan 30, 2012 - 193 - 9:35:29 AM

Annual Statistical Report 2010-2011
County: SALINE BRYANT SCHOOL DISTRICT LEA:6303000
2010-2011 2011-2012Actual Budget
1 Area in Square Miles 3452 ADA 7,5543 ADA pct Change over 5 Yrs. 20%4 4 QTR ADM 7,8795 Prior Year 3QTR ADM 7,6266 Assessment 617,572,4337 M&O Mills 25.008 URT Mills 25.009 M&O Mills in Excess of URT 0.0010 Dedicated M&O Mills 0.0011 Debt Service Mills 12.2012 Total Mills 37.2013 Total Debt Bond/Non-Bond 55,012,305
State and Local Revenue:14 Property Tax Receipts (Including URT) 21,325,283 25,894,10115 Other Local Receipts 2,791,441 2,619,60016 Revenue from Intermediate Sources 0 017.1 Foundation Funding (Excl URT) 31,396,828 33,502,05717.2 Tax Collection Rate Guarantee 342,657 325,00018 Student Growth Funding 1,552,534 1,000,00019 Declining Enrollment Funding 0 020 Consolidation Incentive/Assistance 0 021 Isolated Funding 73,256 60,67022 Supplemental Millage Incentive Funding 0 023 Other Unrestricted State Funding 0 024 Total Unrestricted Revenue from State and
Local Sources 57,481,999 63,401,428
Restricted Revenue from State Sources:25 Adult Education 0 0
Regular Education:26 Professional Development 315,425 336,01027 Other Regular Education 14,649 26,800
Special Education:28 Gifted & Talented 9,800 8,00029 Alternative Learning Environment (ALE) 307,122 329,73530 English Language Learner (ELL) 75,301 73,25031 National School Lunch Act (NSLA) 1,293,950 1,458,64632 Other Special Education 1,076,644 1,009,00233 Workforce Education 159,828 295,03234 School Food Service 18,319 18,00035 Educational Service Cooperatives 0 036 Early Childhood Programs 0 037 Magnet School Programs 0 038 Other Non-Instructional Programs 1,506,960 10,180,39739 Total Restricted Revenue from State Sources 4,777,998 13,734,87240 Total Restricted Revenue from Federal
Sources 6,918,713 4,740,657
Other Sources of Funds:41 Financing Sources 13,838,070 199,22042 Balances from Consolidated/Annexed District 0 043 Indirect Cost Reimbursement 19,242 22,56044 Gains and Losses from Sale of Fixed Assets 10,363 045 Compensation for Loss of Fixed Assets 28,394 046 Other 0 047 Total Other Sources of Funds 13,896,070 221,78048 Total Revenue and Other Sources of Funds
from All Sources 83,074,779 82,098,736
2010-2011 2011-2012Actual Budget
CURRENT EXPENDITURESInstruction:
49 Regular Instruction 26,495,847 28,663,40950 Special Education 6,964,601 6,939,00651 Workforce Education 1,793,676 2,068,04952 Adult Education 0 053 Compensatory Education 315,190 291,68854 Other 1,258,277 1,337,37755 Total Instruction 36,827,590 39,299,529
District Level Support:56 General Administration 932,660 974,71757 Central Services 1,168,832 1,145,54358 Maintenance & Operations of Plant 6,205,029 5,665,84259 Student Transportation 2,155,989 2,595,42460 Other District Level Support Services 76,902 22,56061 Total District Support Services 10,539,412 10,404,086
School Level Support:62 Student Support Services 3,286,265 3,410,57963 Instructional Staff Support Services 4,229,345 5,849,93164 School Administration 2,735,607 2,788,47165 Total District Support Services 10,251,217 12,048,981
Non-Instructional Services:66 Food Service Operations 2,305,987 2,520,17067 Other Enterprise Operations 47 068 Community Operations 15,986 12,12569 Other Non-Instructional Services 0 070 Total Non-Instructional Services 2,322,020 2,532,29571 Facilities Acquisition and Construction 12,337,555 38,503,02272 Debt Service 2,264,158 3,671,00975 Other Non-Programmed Costs 97,423 076 Total Expenditures 74,639,374 106,458,92177 Less: Capital Expenditures 14,314,148 41,378,53178 Less: Debt Service 2,264,158 3,671,00979 Total Current Expenditures 58,061,069 61,409,38180 Exclusions from Current Expenditures 2,146,64481 Net Current Expenditures 55,914,425
82 Per Pupil Expenditures 7,402
83 Personnel - Non-Federal Certified Clsrm FTEs 476.0684 Avg Salary - Non-Fed Certified Clsrm FTEs 52,09785 Personnel - Non-Federal Certified FTEs 508.6786 Avg Salary - Non-Fed Certified FTEs 53,91687.1 Legal Balance (funds 1-2-4) 4,427,77587.2 Categorical Fund Balance 268,99687.3 Deposits with Paying Agents (QZAB) 087.4 Net Legal Bal (Excl Cat & QZAB) 4,158,77988 Building Fund Balance (fund 3) 26,338,57589 Capital Outlay Fund Balance (fund 5) 913,394
Jan 30, 2012 - 194 - 9:35:29 AM

Annual Statistical Report 2010-2011
County: SALINE HARMONY GROVE SCH DIST(SALINE) LEA:6304000
2010-2011 2011-2012Actual Budget
1 Area in Square Miles 222 ADA 1,0563 ADA pct Change over 5 Yrs. 31%4 4 QTR ADM 1,0975 Prior Year 3QTR ADM 1,0426 Assessment 52,662,4567 M&O Mills 25.008 URT Mills 25.009 M&O Mills in Excess of URT 0.0010 Dedicated M&O Mills 0.0011 Debt Service Mills 14.4012 Total Mills 39.4013 Total Debt Bond/Non-Bond 8,035,000
State and Local Revenue:14 Property Tax Receipts (Including URT) 1,959,719 2,232,00015 Other Local Receipts 576,529 240,47816 Revenue from Intermediate Sources 5,605 5,00017.1 Foundation Funding (Excl URT) 5,048,263 5,486,90917.2 Tax Collection Rate Guarantee 34,286 25,00018 Student Growth Funding 330,422 019 Declining Enrollment Funding 0 020 Consolidation Incentive/Assistance 0 021 Isolated Funding 0 022 Supplemental Millage Incentive Funding 9,852 7,88123 Other Unrestricted State Funding 0 024 Total Unrestricted Revenue from State and
Local Sources 7,964,676 7,997,268
Restricted Revenue from State Sources:25 Adult Education 0 0
Regular Education:26 Professional Development 43,114 46,74727 Other Regular Education 1,935 0
Special Education:28 Gifted & Talented 200 029 Alternative Learning Environment (ALE) 11,173 030 English Language Learner (ELL) 0 031 National School Lunch Act (NSLA) 249,711 253,00032 Other Special Education 4,270 033 Workforce Education 8,125 034 School Food Service 3,401 3,50035 Educational Service Cooperatives 0 036 Early Childhood Programs 0 037 Magnet School Programs 0 038 Other Non-Instructional Programs 551,397 88,79939 Total Restricted Revenue from State Sources 873,326 392,04640 Total Restricted Revenue from Federal
Sources 851,231 809,498
Other Sources of Funds:41 Financing Sources 1,508,331 042 Balances from Consolidated/Annexed District 0 043 Indirect Cost Reimbursement 0 044 Gains and Losses from Sale of Fixed Assets 0 045 Compensation for Loss of Fixed Assets 0 046 Other 0 047 Total Other Sources of Funds 1,508,331 048 Total Revenue and Other Sources of Funds
from All Sources 11,197,564 9,198,811
2010-2011 2011-2012Actual Budget
CURRENT EXPENDITURESInstruction:
49 Regular Instruction 3,747,825 3,515,82550 Special Education 646,161 660,41951 Workforce Education 288,844 274,82352 Adult Education 0 053 Compensatory Education 171,238 177,98054 Other 404,866 413,82555 Total Instruction 5,258,935 5,042,873
District Level Support:56 General Administration 237,559 236,16357 Central Services 122,936 114,85458 Maintenance & Operations of Plant 1,054,490 991,11159 Student Transportation 141,435 213,44160 Other District Level Support Services 19,869 4,00061 Total District Support Services 1,576,287 1,559,569
School Level Support:62 Student Support Services 352,971 467,45963 Instructional Staff Support Services 571,050 563,37164 School Administration 440,298 559,31965 Total District Support Services 1,364,319 1,590,149
Non-Instructional Services:66 Food Service Operations 445,056 419,76467 Other Enterprise Operations 67,170 068 Community Operations 0 50069 Other Non-Instructional Services 0 070 Total Non-Instructional Services 512,226 420,26471 Facilities Acquisition and Construction 1,070,741 13,70172 Debt Service 406,994 462,37975 Other Non-Programmed Costs 44,225 076 Total Expenditures 10,233,726 9,088,93477 Less: Capital Expenditures 1,142,802 105,37678 Less: Debt Service 406,994 462,37979 Total Current Expenditures 8,683,930 8,521,17980 Exclusions from Current Expenditures 558,08581 Net Current Expenditures 8,125,846
82 Per Pupil Expenditures 7,698
83 Personnel - Non-Federal Certified Clsrm FTEs 76.2284 Avg Salary - Non-Fed Certified Clsrm FTEs 47,14585 Personnel - Non-Federal Certified FTEs 82.4886 Avg Salary - Non-Fed Certified FTEs 49,42987.1 Legal Balance (funds 1-2-4) 797,80787.2 Categorical Fund Balance 45,33887.3 Deposits with Paying Agents (QZAB) 087.4 Net Legal Bal (Excl Cat & QZAB) 752,46888 Building Fund Balance (fund 3) 1,485,86289 Capital Outlay Fund Balance (fund 5) 0
Jan 30, 2012 - 195 - 9:35:29 AM

Annual Statistical Report 2010-2011
County: SCOTT WALDRON SCHOOL DISTRICT LEA:6401000
2010-2011 2011-2012Actual Budget
1 Area in Square Miles 7642 ADA 1,4883 ADA pct Change over 5 Yrs. (10%)4 4 QTR ADM 1,6215 Prior Year 3QTR ADM 1,6606 Assessment 74,220,6777 M&O Mills 25.008 URT Mills 25.009 M&O Mills in Excess of URT 0.0010 Dedicated M&O Mills 0.0011 Debt Service Mills 10.6012 Total Mills 35.6013 Total Debt Bond/Non-Bond 11,115,000
State and Local Revenue:14 Property Tax Receipts (Including URT) 2,248,429 2,358,09915 Other Local Receipts 657,177 604,06816 Revenue from Intermediate Sources 0 017.1 Foundation Funding (Excl URT) 7,494,880 7,433,53217.2 Tax Collection Rate Guarantee 136,649 018 Student Growth Funding 0 019 Declining Enrollment Funding 0 111,54420 Consolidation Incentive/Assistance 0 021 Isolated Funding 0 022 Supplemental Millage Incentive Funding 102,285 81,82823 Other Unrestricted State Funding 0 024 Total Unrestricted Revenue from State and
Local Sources 10,639,420 10,589,071
Restricted Revenue from State Sources:25 Adult Education 0 0
Regular Education:26 Professional Development 68,670 68,82527 Other Regular Education 18,135 16,800
Special Education:28 Gifted & Talented 1,800 029 Alternative Learning Environment (ALE) 281,647 188,88830 English Language Learner (ELL) 44,536 44,54031 National School Lunch Act (NSLA) 562,960 767,10032 Other Special Education 11,802 033 Workforce Education 47,667 35,47934 School Food Service 32,476 32,47035 Educational Service Cooperatives 0 036 Early Childhood Programs 491,948 498,50037 Magnet School Programs 0 038 Other Non-Instructional Programs 897,030 1,124,38739 Total Restricted Revenue from State Sources 2,458,670 2,776,98940 Total Restricted Revenue from Federal
Sources 4,337,646 3,603,537
Other Sources of Funds:41 Financing Sources 1,602,300 042 Balances from Consolidated/Annexed District 0 043 Indirect Cost Reimbursement 15,490 15,18044 Gains and Losses from Sale of Fixed Assets 0 045 Compensation for Loss of Fixed Assets 0 046 Other 0 047 Total Other Sources of Funds 1,617,790 15,18048 Total Revenue and Other Sources of Funds
from All Sources 19,053,526 16,984,777
2010-2011 2011-2012Actual Budget
CURRENT EXPENDITURESInstruction:
49 Regular Instruction 5,915,330 6,071,38750 Special Education 984,217 1,012,65951 Workforce Education 545,685 526,66952 Adult Education 0 053 Compensatory Education 590,913 821,73854 Other 563,149 562,11955 Total Instruction 8,599,294 8,994,572
District Level Support:56 General Administration 391,882 389,41457 Central Services 347,044 326,73158 Maintenance & Operations of Plant 1,452,412 1,654,85859 Student Transportation 672,288 712,06160 Other District Level Support Services 50,436 46,08061 Total District Support Services 2,914,062 3,129,143
School Level Support:62 Student Support Services 530,343 672,55363 Instructional Staff Support Services 755,996 1,074,70164 School Administration 625,168 624,21365 Total District Support Services 1,911,507 2,371,467
Non-Instructional Services:66 Food Service Operations 883,449 880,73767 Other Enterprise Operations 16,806 2,74068 Community Operations 134,632 144,31069 Other Non-Instructional Services 0 070 Total Non-Instructional Services 1,034,887 1,027,78771 Facilities Acquisition and Construction 4,966,717 4,174,61672 Debt Service 672,422 640,56175 Other Non-Programmed Costs 2,733 076 Total Expenditures 20,101,623 20,338,14677 Less: Capital Expenditures 5,267,355 4,420,02778 Less: Debt Service 672,422 640,56179 Total Current Expenditures 14,161,846 15,277,55880 Exclusions from Current Expenditures 828,94081 Net Current Expenditures 13,332,906
82 Per Pupil Expenditures 8,962
83 Personnel - Non-Federal Certified Clsrm FTEs 122.1384 Avg Salary - Non-Fed Certified Clsrm FTEs 42,15085 Personnel - Non-Federal Certified FTEs 131.4286 Avg Salary - Non-Fed Certified FTEs 43,78787.1 Legal Balance (funds 1-2-4) 3,305,30187.2 Categorical Fund Balance 120,99987.3 Deposits with Paying Agents (QZAB) 087.4 Net Legal Bal (Excl Cat & QZAB) 3,184,30288 Building Fund Balance (fund 3) 8,240,54789 Capital Outlay Fund Balance (fund 5) 0
Jan 30, 2012 - 196 - 9:35:29 AM

Annual Statistical Report 2010-2011
County: SEARCY SEARCY COUNTY SCHOOL DISTRICT LEA:6502000
2010-2011 2011-2012Actual Budget
1 Area in Square Miles 5472 ADA 8783 ADA pct Change over 5 Yrs. (5%)4 4 QTR ADM 9295 Prior Year 3QTR ADM 9216 Assessment 47,905,8027 M&O Mills 25.008 URT Mills 25.009 M&O Mills in Excess of URT 0.0010 Dedicated M&O Mills 0.0011 Debt Service Mills 7.7512 Total Mills 32.7513 Total Debt Bond/Non-Bond 3,414,573
State and Local Revenue:14 Property Tax Receipts (Including URT) 1,698,619 1,687,04815 Other Local Receipts 616,112 353,88016 Revenue from Intermediate Sources 0 017.1 Foundation Funding (Excl URT) 3,978,762 4,471,03717.2 Tax Collection Rate Guarantee 103,966 103,96618 Student Growth Funding 53,981 50,00019 Declining Enrollment Funding 0 020 Consolidation Incentive/Assistance 0 021 Isolated Funding 68,207 022 Supplemental Millage Incentive Funding 24,245 19,39623 Other Unrestricted State Funding 14,667 024 Total Unrestricted Revenue from State and
Local Sources 6,558,558 6,685,327
Restricted Revenue from State Sources:25 Adult Education 155,843 182,858
Regular Education:26 Professional Development 38,086 39,45427 Other Regular Education 11,088 4,000
Special Education:28 Gifted & Talented 100 029 Alternative Learning Environment (ALE) 91,133 122,98230 English Language Learner (ELL) 1,465 031 National School Lunch Act (NSLA) 658,688 681,07632 Other Special Education 53,389 033 Workforce Education 185,625 241,07634 School Food Service 3,371 3,40035 Educational Service Cooperatives 0 036 Early Childhood Programs 169,950 194,40037 Magnet School Programs 0 038 Other Non-Instructional Programs 39,599 48,57639 Total Restricted Revenue from State Sources 1,408,339 1,517,82240 Total Restricted Revenue from Federal
Sources 2,003,405 2,069,073
Other Sources of Funds:41 Financing Sources 0 042 Balances from Consolidated/Annexed District 0 043 Indirect Cost Reimbursement 12,191 044 Gains and Losses from Sale of Fixed Assets 39,422 045 Compensation for Loss of Fixed Assets 7,120 046 Other 0 047 Total Other Sources of Funds 58,734 048 Total Revenue and Other Sources of Funds
from All Sources 10,029,035 10,272,222
2010-2011 2011-2012Actual Budget
CURRENT EXPENDITURESInstruction:
49 Regular Instruction 3,501,808 3,365,89750 Special Education 724,995 1,011,63651 Workforce Education 532,601 510,10852 Adult Education 204,757 171,95253 Compensatory Education 651,940 911,43354 Other 363,155 232,31955 Total Instruction 5,979,257 6,203,345
District Level Support:56 General Administration 219,398 218,67957 Central Services 188,728 204,16258 Maintenance & Operations of Plant 904,809 812,62859 Student Transportation 572,015 551,37360 Other District Level Support Services 44,361 23,40261 Total District Support Services 1,929,311 1,810,244
School Level Support:62 Student Support Services 441,620 487,31863 Instructional Staff Support Services 814,930 1,012,83964 School Administration 388,245 369,49665 Total District Support Services 1,644,794 1,869,654
Non-Instructional Services:66 Food Service Operations 557,170 505,29967 Other Enterprise Operations 29,175 068 Community Operations 3,229 6,00069 Other Non-Instructional Services 0 070 Total Non-Instructional Services 589,575 511,29971 Facilities Acquisition and Construction 143,375 19,68072 Debt Service 211,903 211,94575 Other Non-Programmed Costs 0 076 Total Expenditures 10,498,215 10,626,16777 Less: Capital Expenditures 287,032 227,70878 Less: Debt Service 211,903 211,94579 Total Current Expenditures 9,999,280 10,186,51480 Exclusions from Current Expenditures 866,22081 Net Current Expenditures 9,133,059
82 Per Pupil Expenditures 10,405
83 Personnel - Non-Federal Certified Clsrm FTEs 89.3184 Avg Salary - Non-Fed Certified Clsrm FTEs 38,08885 Personnel - Non-Federal Certified FTEs 99.6286 Avg Salary - Non-Fed Certified FTEs 40,13187.1 Legal Balance (funds 1-2-4) 1,076,52687.2 Categorical Fund Balance 257,54487.3 Deposits with Paying Agents (QZAB) 087.4 Net Legal Bal (Excl Cat & QZAB) 818,98288 Building Fund Balance (fund 3) 723,09889 Capital Outlay Fund Balance (fund 5) 0
Jan 30, 2012 - 197 - 9:35:29 AM

Annual Statistical Report 2010-2011
County: SEARCY OZARK MOUNTAIN SCHOOL DISTRICT LEA:6505000
2010-2011 2011-2012Actual Budget
1 Area in Square Miles 3852 ADA 6133 ADA pct Change over 5 Yrs. (11%)4 4 QTR ADM 6495 Prior Year 3QTR ADM 6806 Assessment 46,574,7777 M&O Mills 25.008 URT Mills 25.009 M&O Mills in Excess of URT 0.0010 Dedicated M&O Mills 0.0011 Debt Service Mills 11.5012 Total Mills 36.5013 Total Debt Bond/Non-Bond 2,700,322
State and Local Revenue:14 Property Tax Receipts (Including URT) 1,588,147 1,589,00015 Other Local Receipts 291,150 123,00516 Revenue from Intermediate Sources 793 80017.1 Foundation Funding (Excl URT) 3,003,894 2,889,20117.2 Tax Collection Rate Guarantee 55,939 55,00018 Student Growth Funding 0 019 Declining Enrollment Funding 0 020 Consolidation Incentive/Assistance 0 021 Isolated Funding 576,856 581,40122 Supplemental Millage Incentive Funding 14,732 11,78623 Other Unrestricted State Funding 5,548 5,50024 Total Unrestricted Revenue from State and
Local Sources 5,537,060 5,255,693
Restricted Revenue from State Sources:25 Adult Education 0 0
Regular Education:26 Professional Development 28,120 27,52327 Other Regular Education 392,101 369,900
Special Education:28 Gifted & Talented 150 15029 Alternative Learning Environment (ALE) 46,359 54,92130 English Language Learner (ELL) 0 031 National School Lunch Act (NSLA) 530,720 523,20432 Other Special Education 107,986 84,50033 Workforce Education 24,375 20,31234 School Food Service 2,712 2,70035 Educational Service Cooperatives 0 036 Early Childhood Programs 0 037 Magnet School Programs 0 038 Other Non-Instructional Programs 360,242 257,49839 Total Restricted Revenue from State Sources 1,492,764 1,340,70840 Total Restricted Revenue from Federal
Sources 1,463,133 1,913,046
Other Sources of Funds:41 Financing Sources 1,778 1,50042 Balances from Consolidated/Annexed District 0 043 Indirect Cost Reimbursement 0 044 Gains and Losses from Sale of Fixed Assets 11,120 1,50045 Compensation for Loss of Fixed Assets 5,309 046 Other 0 047 Total Other Sources of Funds 18,208 3,00048 Total Revenue and Other Sources of Funds
from All Sources 8,511,164 8,512,447
2010-2011 2011-2012Actual Budget
CURRENT EXPENDITURESInstruction:
49 Regular Instruction 2,888,660 2,993,25050 Special Education 434,667 469,26451 Workforce Education 314,960 306,97652 Adult Education 0 053 Compensatory Education 371,522 608,56254 Other 143,390 117,78755 Total Instruction 4,153,199 4,495,839
District Level Support:56 General Administration 192,300 190,37357 Central Services 188,793 178,39258 Maintenance & Operations of Plant 846,498 1,024,70159 Student Transportation 441,748 489,02760 Other District Level Support Services 22,317 2,00061 Total District Support Services 1,691,657 1,884,494
School Level Support:62 Student Support Services 323,288 357,93363 Instructional Staff Support Services 747,665 645,34964 School Administration 435,059 392,05765 Total District Support Services 1,506,012 1,395,339
Non-Instructional Services:66 Food Service Operations 498,192 420,45867 Other Enterprise Operations 30,000 068 Community Operations 2,619 3,00069 Other Non-Instructional Services 0 070 Total Non-Instructional Services 530,811 423,45871 Facilities Acquisition and Construction 671,367 542,33872 Debt Service 210,238 202,34375 Other Non-Programmed Costs 450 076 Total Expenditures 8,763,734 8,943,81077 Less: Capital Expenditures 867,037 1,095,26478 Less: Debt Service 210,238 202,34379 Total Current Expenditures 7,686,459 7,646,20480 Exclusions from Current Expenditures 265,52681 Net Current Expenditures 7,420,934
82 Per Pupil Expenditures 12,114
83 Personnel - Non-Federal Certified Clsrm FTEs 65.4784 Avg Salary - Non-Fed Certified Clsrm FTEs 36,69885 Personnel - Non-Federal Certified FTEs 72.4986 Avg Salary - Non-Fed Certified FTEs 40,31287.1 Legal Balance (funds 1-2-4) 1,444,63087.2 Categorical Fund Balance 66,87887.3 Deposits with Paying Agents (QZAB) 087.4 Net Legal Bal (Excl Cat & QZAB) 1,377,75188 Building Fund Balance (fund 3) 1,173,95889 Capital Outlay Fund Balance (fund 5) 0
Jan 30, 2012 - 198 - 9:35:29 AM

Annual Statistical Report 2010-2011
County: SEBASTIAN FORT SMITH SCHOOL DISTRICT LEA:6601000
2010-2011 2011-2012Actual Budget
1 Area in Square Miles 692 ADA 12,9413 ADA pct Change over 5 Yrs. 4%4 4 QTR ADM 13,6925 Prior Year 3QTR ADM 13,7116 Assessment 1,372,844,8027 M&O Mills 25.008 URT Mills 25.009 M&O Mills in Excess of URT 0.0010 Dedicated M&O Mills 0.0011 Debt Service Mills 11.5012 Total Mills 36.5013 Total Debt Bond/Non-Bond 64,613,384
State and Local Revenue:14 Property Tax Receipts (Including URT) 47,494,789 48,124,78415 Other Local Receipts 4,148,847 1,842,83216 Revenue from Intermediate Sources 2,013 5,00017.1 Foundation Funding (Excl URT) 49,838,972 50,779,99917.2 Tax Collection Rate Guarantee 240,910 248,45018 Student Growth Funding 293,049 019 Declining Enrollment Funding 0 020 Consolidation Incentive/Assistance 0 021 Isolated Funding 0 022 Supplemental Millage Incentive Funding 0 023 Other Unrestricted State Funding 0 024 Total Unrestricted Revenue from State and
Local Sources 102,018,580 101,001,065
Restricted Revenue from State Sources:25 Adult Education 1,250,566 1,212,936
Regular Education:26 Professional Development 567,099 582,25627 Other Regular Education 48,409 70,000
Special Education:28 Gifted & Talented 38,102 32,15029 Alternative Learning Environment (ALE) 349,093 341,29930 English Language Learner (ELL) 963,677 981,31831 National School Lunch Act (NSLA) 4,670,336 4,837,36032 Other Special Education 1,582,805 1,429,45833 Workforce Education 275,438 372,43734 School Food Service 45,324 45,50035 Educational Service Cooperatives 0 036 Early Childhood Programs 1,237,480 1,247,20037 Magnet School Programs 0 038 Other Non-Instructional Programs 1,090,158 2,766,29839 Total Restricted Revenue from State Sources 12,118,486 13,918,21240 Total Restricted Revenue from Federal
Sources 28,261,982 21,886,579
Other Sources of Funds:41 Financing Sources 16,270,000 042 Balances from Consolidated/Annexed District 0 043 Indirect Cost Reimbursement 192,200 163,23944 Gains and Losses from Sale of Fixed Assets 0 045 Compensation for Loss of Fixed Assets 148,919 046 Other 0 047 Total Other Sources of Funds 16,611,119 163,23948 Total Revenue and Other Sources of Funds
from All Sources 159,010,167 136,969,095
2010-2011 2011-2012Actual Budget
CURRENT EXPENDITURESInstruction:
49 Regular Instruction 49,389,671 48,531,04350 Special Education 9,995,910 10,605,89051 Workforce Education 3,031,522 2,970,50652 Adult Education 1,481,299 1,444,92953 Compensatory Education 6,305,369 5,378,89654 Other 4,314,713 4,909,82655 Total Instruction 74,518,483 73,841,090
District Level Support:56 General Administration 768,770 1,140,78857 Central Services 2,787,520 2,919,85558 Maintenance & Operations of Plant 15,174,575 14,097,52859 Student Transportation 2,489,521 2,923,01060 Other District Level Support Services 356,594 264,61461 Total District Support Services 21,576,979 21,345,795
School Level Support:62 Student Support Services 9,135,335 9,267,83163 Instructional Staff Support Services 14,530,283 13,786,59364 School Administration 7,266,485 7,371,61065 Total District Support Services 30,932,102 30,426,034
Non-Instructional Services:66 Food Service Operations 6,851,480 6,918,54267 Other Enterprise Operations 0 068 Community Operations 672,359 729,17769 Other Non-Instructional Services 0 070 Total Non-Instructional Services 7,523,840 7,647,71971 Facilities Acquisition and Construction 13,578,534 19,167,84972 Debt Service 3,521,680 13,227,81275 Other Non-Programmed Costs 49,615 076 Total Expenditures 151,701,234 165,656,29877 Less: Capital Expenditures 17,157,243 21,294,26378 Less: Debt Service 3,521,680 13,227,81279 Total Current Expenditures 131,022,310 131,134,22380 Exclusions from Current Expenditures 6,214,80281 Net Current Expenditures 124,807,509
82 Per Pupil Expenditures 9,644
83 Personnel - Non-Federal Certified Clsrm FTEs 895.1584 Avg Salary - Non-Fed Certified Clsrm FTEs 53,40685 Personnel - Non-Federal Certified FTEs 968.9686 Avg Salary - Non-Fed Certified FTEs 55,92487.1 Legal Balance (funds 1-2-4) 22,671,03187.2 Categorical Fund Balance 2,191,77087.3 Deposits with Paying Agents (QZAB) 10,003,34487.4 Net Legal Bal (Excl Cat & QZAB) 10,475,91788 Building Fund Balance (fund 3) 16,376,59489 Capital Outlay Fund Balance (fund 5) 0
Jan 30, 2012 - 199 - 9:35:29 AM

Annual Statistical Report 2010-2011
County: SEBASTIAN GREENWOOD SCHOOL DISTRICT LEA:6602000
2010-2011 2011-2012Actual Budget
1 Area in Square Miles 1802 ADA 3,3793 ADA pct Change over 5 Yrs. 9%4 4 QTR ADM 3,5625 Prior Year 3QTR ADM 3,5406 Assessment 284,500,2657 M&O Mills 25.008 URT Mills 25.009 M&O Mills in Excess of URT 0.0010 Dedicated M&O Mills 0.0011 Debt Service Mills 13.7012 Total Mills 38.7013 Total Debt Bond/Non-Bond 37,359,647
State and Local Revenue:14 Property Tax Receipts (Including URT) 11,361,794 11,061,85415 Other Local Receipts 1,469,428 1,031,65016 Revenue from Intermediate Sources 520 017.1 Foundation Funding (Excl URT) 13,977,750 14,697,85817.2 Tax Collection Rate Guarantee 112,243 018 Student Growth Funding 167,651 019 Declining Enrollment Funding 0 020 Consolidation Incentive/Assistance 0 021 Isolated Funding 0 022 Supplemental Millage Incentive Funding 0 023 Other Unrestricted State Funding 63,950 024 Total Unrestricted Revenue from State and
Local Sources 27,153,337 26,791,362
Restricted Revenue from State Sources:25 Adult Education 0 0
Regular Education:26 Professional Development 146,404 151,41027 Other Regular Education 7,800 11,800
Special Education:28 Gifted & Talented 4,150 3,00029 Alternative Learning Environment (ALE) 108,523 84,39230 English Language Learner (ELL) 10,255 10,00031 National School Lunch Act (NSLA) 528,240 594,55032 Other Special Education 148,613 120,00033 Workforce Education 66,563 60,00034 School Food Service 10,833 10,00035 Educational Service Cooperatives 0 036 Early Childhood Programs 271,188 280,00037 Magnet School Programs 0 038 Other Non-Instructional Programs 312,993 271,93439 Total Restricted Revenue from State Sources 1,615,561 1,597,08640 Total Restricted Revenue from Federal
Sources 3,008,570 2,171,372
Other Sources of Funds:41 Financing Sources 960,000 980,00042 Balances from Consolidated/Annexed District 0 043 Indirect Cost Reimbursement 0 044 Gains and Losses from Sale of Fixed Assets 0 045 Compensation for Loss of Fixed Assets 2,501 046 Other 0 047 Total Other Sources of Funds 962,501 980,00048 Total Revenue and Other Sources of Funds
from All Sources 32,739,969 31,539,820
2010-2011 2011-2012Actual Budget
CURRENT EXPENDITURESInstruction:
49 Regular Instruction 12,759,441 11,919,93250 Special Education 2,813,659 3,410,98351 Workforce Education 717,223 680,72152 Adult Education 0 053 Compensatory Education 499,260 477,43454 Other 719,899 698,47755 Total Instruction 17,509,482 17,187,547
District Level Support:56 General Administration 445,201 566,73757 Central Services 1,277,878 1,443,32158 Maintenance & Operations of Plant 2,662,532 2,673,42359 Student Transportation 1,213,291 1,398,41160 Other District Level Support Services 44,880 16,00061 Total District Support Services 5,643,782 6,097,892
School Level Support:62 Student Support Services 1,364,542 1,415,87763 Instructional Staff Support Services 1,797,395 1,757,65764 School Administration 1,518,162 1,520,57665 Total District Support Services 4,680,098 4,694,110
Non-Instructional Services:66 Food Service Operations 1,242,719 1,063,81067 Other Enterprise Operations 24,132 068 Community Operations 119,606 110,77869 Other Non-Instructional Services 0 070 Total Non-Instructional Services 1,386,457 1,174,58971 Facilities Acquisition and Construction 1,505,256 1,900,00072 Debt Service 1,822,188 2,170,06875 Other Non-Programmed Costs 1,672 076 Total Expenditures 32,548,936 33,224,20677 Less: Capital Expenditures 2,044,395 2,275,51578 Less: Debt Service 1,822,188 2,170,06879 Total Current Expenditures 28,682,353 28,778,62380 Exclusions from Current Expenditures 1,210,29281 Net Current Expenditures 27,472,061
82 Per Pupil Expenditures 8,129
83 Personnel - Non-Federal Certified Clsrm FTEs 227.1984 Avg Salary - Non-Fed Certified Clsrm FTEs 49,20885 Personnel - Non-Federal Certified FTEs 247.3786 Avg Salary - Non-Fed Certified FTEs 51,95587.1 Legal Balance (funds 1-2-4) 3,352,26387.2 Categorical Fund Balance 20,58387.3 Deposits with Paying Agents (QZAB) 087.4 Net Legal Bal (Excl Cat & QZAB) 3,331,68088 Building Fund Balance (fund 3) 1,359,04889 Capital Outlay Fund Balance (fund 5) 0
Jan 30, 2012 - 200 - 9:35:29 AM

Annual Statistical Report 2010-2011
County: SEBASTIAN HACKETT SCHOOL DISTRICT LEA:6603000
2010-2011 2011-2012Actual Budget
1 Area in Square Miles 302 ADA 5873 ADA pct Change over 5 Yrs. 2%4 4 QTR ADM 6215 Prior Year 3QTR ADM 6366 Assessment 29,385,4077 M&O Mills 25.008 URT Mills 25.009 M&O Mills in Excess of URT 0.0010 Dedicated M&O Mills 0.0011 Debt Service Mills 13.0012 Total Mills 38.0013 Total Debt Bond/Non-Bond 3,265,000
State and Local Revenue:14 Property Tax Receipts (Including URT) 1,022,780 1,023,00015 Other Local Receipts 188,516 85,77516 Revenue from Intermediate Sources 93 10017.1 Foundation Funding (Excl URT) 3,156,736 3,082,24617.2 Tax Collection Rate Guarantee 11,906 018 Student Growth Funding 0 019 Declining Enrollment Funding 0 51,24120 Consolidation Incentive/Assistance 0 021 Isolated Funding 0 022 Supplemental Millage Incentive Funding 37,124 29,69923 Other Unrestricted State Funding 0 024 Total Unrestricted Revenue from State and
Local Sources 4,417,154 4,272,061
Restricted Revenue from State Sources:25 Adult Education 0 0
Regular Education:26 Professional Development 26,313 26,25527 Other Regular Education 3,900 2,400
Special Education:28 Gifted & Talented 927 029 Alternative Learning Environment (ALE) 52,819 57,40830 English Language Learner (ELL) 0 031 National School Lunch Act (NSLA) 164,176 166,98032 Other Special Education 2,606 033 Workforce Education 9,750 79,74434 School Food Service 2,013 035 Educational Service Cooperatives 0 036 Early Childhood Programs 0 037 Magnet School Programs 0 038 Other Non-Instructional Programs 298,534 120,84839 Total Restricted Revenue from State Sources 561,038 453,63540 Total Restricted Revenue from Federal
Sources 895,374 551,093
Other Sources of Funds:41 Financing Sources 3,468 042 Balances from Consolidated/Annexed District 0 043 Indirect Cost Reimbursement 0 044 Gains and Losses from Sale of Fixed Assets 0 045 Compensation for Loss of Fixed Assets 33,954 15,00046 Other 0 047 Total Other Sources of Funds 37,423 15,00048 Total Revenue and Other Sources of Funds
from All Sources 5,910,989 5,291,789
2010-2011 2011-2012Actual Budget
CURRENT EXPENDITURESInstruction:
49 Regular Instruction 2,234,700 2,192,76350 Special Education 222,659 230,48651 Workforce Education 219,714 255,61852 Adult Education 0 053 Compensatory Education 98,208 96,52054 Other 119,329 132,10355 Total Instruction 2,894,610 2,907,489
District Level Support:56 General Administration 158,899 161,04857 Central Services 135,311 126,63358 Maintenance & Operations of Plant 552,128 638,89259 Student Transportation 138,447 131,05760 Other District Level Support Services 11,566 1,55061 Total District Support Services 996,351 1,059,180
School Level Support:62 Student Support Services 259,768 244,27363 Instructional Staff Support Services 388,443 366,30764 School Administration 245,880 246,00965 Total District Support Services 894,091 856,590
Non-Instructional Services:66 Food Service Operations 250,534 241,74367 Other Enterprise Operations 44,768 068 Community Operations 0 22369 Other Non-Instructional Services 0 070 Total Non-Instructional Services 295,302 241,96671 Facilities Acquisition and Construction 683,745 184,08572 Debt Service 194,377 251,71575 Other Non-Programmed Costs 69,273 076 Total Expenditures 6,027,749 5,501,02677 Less: Capital Expenditures 698,340 213,98978 Less: Debt Service 194,377 251,71579 Total Current Expenditures 5,135,032 5,035,32180 Exclusions from Current Expenditures 226,25781 Net Current Expenditures 4,908,775
82 Per Pupil Expenditures 8,365
83 Personnel - Non-Federal Certified Clsrm FTEs 46.3284 Avg Salary - Non-Fed Certified Clsrm FTEs 43,19785 Personnel - Non-Federal Certified FTEs 51.3886 Avg Salary - Non-Fed Certified FTEs 45,36987.1 Legal Balance (funds 1-2-4) 1,152,85887.2 Categorical Fund Balance 5,43587.3 Deposits with Paying Agents (QZAB) 087.4 Net Legal Bal (Excl Cat & QZAB) 1,147,42388 Building Fund Balance (fund 3) 481,52689 Capital Outlay Fund Balance (fund 5) 0
Jan 30, 2012 - 201 - 9:35:29 AM

Annual Statistical Report 2010-2011
County: SEBASTIAN HARTFORD SCHOOL DISTRICT LEA:6604000
2010-2011 2011-2012Actual Budget
1 Area in Square Miles 922 ADA 3143 ADA pct Change over 5 Yrs. (22%)4 4 QTR ADM 3405 Prior Year 3QTR ADM 3566 Assessment 27,920,0367 M&O Mills 25.008 URT Mills 25.009 M&O Mills in Excess of URT 0.0010 Dedicated M&O Mills 0.0011 Debt Service Mills 14.3012 Total Mills 39.3013 Total Debt Bond/Non-Bond 1,288,104
State and Local Revenue:14 Property Tax Receipts (Including URT) 886,127 885,70015 Other Local Receipts 169,541 129,60116 Revenue from Intermediate Sources 52 5017.1 Foundation Funding (Excl URT) 1,431,817 1,382,40717.2 Tax Collection Rate Guarantee 119,582 120,00018 Student Growth Funding 0 100,00019 Declining Enrollment Funding 64,476 54,58920 Consolidation Incentive/Assistance 0 021 Isolated Funding 0 022 Supplemental Millage Incentive Funding 25,433 20,34623 Other Unrestricted State Funding 0 024 Total Unrestricted Revenue from State and
Local Sources 2,697,028 2,692,693
Restricted Revenue from State Sources:25 Adult Education 0 0
Regular Education:26 Professional Development 14,744 14,35427 Other Regular Education 2,400 9,600
Special Education:28 Gifted & Talented 0 029 Alternative Learning Environment (ALE) 47,943 39,08730 English Language Learner (ELL) 0 031 National School Lunch Act (NSLA) 183,188 116,88632 Other Special Education 1,460 033 Workforce Education 5,417 4,06234 School Food Service 4,013 4,00035 Educational Service Cooperatives 0 036 Early Childhood Programs 92,437 97,20037 Magnet School Programs 0 038 Other Non-Instructional Programs 9,439 8,60339 Total Restricted Revenue from State Sources 361,041 293,79240 Total Restricted Revenue from Federal
Sources 654,771 843,472
Other Sources of Funds:41 Financing Sources 316 042 Balances from Consolidated/Annexed District 0 043 Indirect Cost Reimbursement 0 044 Gains and Losses from Sale of Fixed Assets 550 045 Compensation for Loss of Fixed Assets 0 046 Other 0 047 Total Other Sources of Funds 866 048 Total Revenue and Other Sources of Funds
from All Sources 3,713,706 3,829,957
2010-2011 2011-2012Actual Budget
CURRENT EXPENDITURESInstruction:
49 Regular Instruction 1,289,663 1,287,02050 Special Education 231,703 208,72051 Workforce Education 181,161 174,44852 Adult Education 0 053 Compensatory Education 84,707 81,50554 Other 177,583 184,03555 Total Instruction 1,964,817 1,935,728
District Level Support:56 General Administration 149,634 153,71657 Central Services 102,694 99,83258 Maintenance & Operations of Plant 366,922 364,29659 Student Transportation 164,345 184,35760 Other District Level Support Services 13,204 6,85061 Total District Support Services 796,799 809,051
School Level Support:62 Student Support Services 189,796 142,95763 Instructional Staff Support Services 352,323 363,88364 School Administration 169,999 185,17965 Total District Support Services 712,117 692,019
Non-Instructional Services:66 Food Service Operations 254,243 248,19567 Other Enterprise Operations 0 068 Community Operations 0 2,17769 Other Non-Instructional Services 0 070 Total Non-Instructional Services 254,243 250,37271 Facilities Acquisition and Construction 84,775 1,075,61772 Debt Service 55,994 71,80175 Other Non-Programmed Costs 0 076 Total Expenditures 3,868,745 4,834,58877 Less: Capital Expenditures 97,099 1,077,11778 Less: Debt Service 55,994 71,80179 Total Current Expenditures 3,715,652 3,685,66980 Exclusions from Current Expenditures 238,84081 Net Current Expenditures 3,476,812
82 Per Pupil Expenditures 11,079
83 Personnel - Non-Federal Certified Clsrm FTEs 24.5184 Avg Salary - Non-Fed Certified Clsrm FTEs 50,88285 Personnel - Non-Federal Certified FTEs 25.5286 Avg Salary - Non-Fed Certified FTEs 56,96187.1 Legal Balance (funds 1-2-4) 366,90987.2 Categorical Fund Balance 20,16387.3 Deposits with Paying Agents (QZAB) 087.4 Net Legal Bal (Excl Cat & QZAB) 346,74588 Building Fund Balance (fund 3) 797,05889 Capital Outlay Fund Balance (fund 5) 0
Jan 30, 2012 - 202 - 9:35:29 AM

Annual Statistical Report 2010-2011
County: SEBASTIAN LAVACA SCHOOL DISTRICT LEA:6605000
2010-2011 2011-2012Actual Budget
1 Area in Square Miles 632 ADA 8033 ADA pct Change over 5 Yrs. (5%)4 4 QTR ADM 8475 Prior Year 3QTR ADM 8336 Assessment 54,346,8307 M&O Mills 25.008 URT Mills 25.009 M&O Mills in Excess of URT 0.0010 Dedicated M&O Mills 0.0011 Debt Service Mills 16.9012 Total Mills 41.9013 Total Debt Bond/Non-Bond 12,815,467
State and Local Revenue:14 Property Tax Receipts (Including URT) 2,269,237 1,951,49715 Other Local Receipts 633,297 454,91816 Revenue from Intermediate Sources 123 10017.1 Foundation Funding (Excl URT) 3,642,677 3,838,38417.2 Tax Collection Rate Guarantee 42,648 018 Student Growth Funding 0 019 Declining Enrollment Funding 138,198 020 Consolidation Incentive/Assistance 0 021 Isolated Funding 0 022 Supplemental Millage Incentive Funding 11,291 9,03323 Other Unrestricted State Funding 0 024 Total Unrestricted Revenue from State and
Local Sources 6,737,471 6,253,932
Restricted Revenue from State Sources:25 Adult Education 0 0
Regular Education:26 Professional Development 34,439 35,94127 Other Regular Education 4,630 8,400
Special Education:28 Gifted & Talented 867 029 Alternative Learning Environment (ALE) 12,920 45,22230 English Language Learner (ELL) 879 89731 National School Lunch Act (NSLA) 194,432 210,49632 Other Special Education 6,779 033 Workforce Education 45,973 8,12534 School Food Service 3,294 3,40035 Educational Service Cooperatives 0 036 Early Childhood Programs 267,300 267,30037 Magnet School Programs 0 038 Other Non-Instructional Programs 442,098 514,99239 Total Restricted Revenue from State Sources 1,013,610 1,094,77340 Total Restricted Revenue from Federal
Sources 1,491,813 1,188,902
Other Sources of Funds:41 Financing Sources 1,140,631 149,00042 Balances from Consolidated/Annexed District 0 043 Indirect Cost Reimbursement 14,389 13,01444 Gains and Losses from Sale of Fixed Assets 0 11,50045 Compensation for Loss of Fixed Assets 6,677 15,21646 Other 0 047 Total Other Sources of Funds 1,161,696 188,73048 Total Revenue and Other Sources of Funds
from All Sources 10,404,591 8,726,337
2010-2011 2011-2012Actual Budget
CURRENT EXPENDITURESInstruction:
49 Regular Instruction 3,187,521 2,998,16650 Special Education 405,403 380,03051 Workforce Education 233,356 239,09652 Adult Education 0 053 Compensatory Education 422,320 307,36154 Other 113,232 112,64055 Total Instruction 4,361,831 4,037,293
District Level Support:56 General Administration 430,903 353,56857 Central Services 227,577 171,10158 Maintenance & Operations of Plant 894,196 841,40259 Student Transportation 446,919 298,41760 Other District Level Support Services 41,243 20,31461 Total District Support Services 2,040,839 1,684,802
School Level Support:62 Student Support Services 496,992 556,59863 Instructional Staff Support Services 573,376 396,30164 School Administration 368,057 355,04365 Total District Support Services 1,438,424 1,307,941
Non-Instructional Services:66 Food Service Operations 408,533 427,92967 Other Enterprise Operations 17,246 068 Community Operations 3,765 95669 Other Non-Instructional Services 0 070 Total Non-Instructional Services 429,544 428,88571 Facilities Acquisition and Construction 1,153,163 571,52672 Debt Service 828,698 949,40775 Other Non-Programmed Costs 132,302 17,35676 Total Expenditures 10,384,801 8,997,21177 Less: Capital Expenditures 1,511,302 765,37478 Less: Debt Service 828,698 949,40779 Total Current Expenditures 8,044,801 7,282,43180 Exclusions from Current Expenditures 887,45281 Net Current Expenditures 7,157,349
82 Per Pupil Expenditures 8,908
83 Personnel - Non-Federal Certified Clsrm FTEs 66.6984 Avg Salary - Non-Fed Certified Clsrm FTEs 40,11285 Personnel - Non-Federal Certified FTEs 71.0286 Avg Salary - Non-Fed Certified FTEs 42,55087.1 Legal Balance (funds 1-2-4) 1,316,82087.2 Categorical Fund Balance 1,85187.3 Deposits with Paying Agents (QZAB) 087.4 Net Legal Bal (Excl Cat & QZAB) 1,314,97088 Building Fund Balance (fund 3) 2,357,50189 Capital Outlay Fund Balance (fund 5) 0
Jan 30, 2012 - 203 - 9:35:29 AM

Annual Statistical Report 2010-2011
County: SEBASTIAN MANSFIELD SCHOOL DISTRICT LEA:6606000
2010-2011 2011-2012Actual Budget
1 Area in Square Miles 1542 ADA 8873 ADA pct Change over 5 Yrs. (12%)4 4 QTR ADM 9555 Prior Year 3QTR ADM 9516 Assessment 57,421,4457 M&O Mills 25.008 URT Mills 25.009 M&O Mills in Excess of URT 0.0010 Dedicated M&O Mills 0.0011 Debt Service Mills 15.0112 Total Mills 40.0113 Total Debt Bond/Non-Bond 9,540,870
State and Local Revenue:14 Property Tax Receipts (Including URT) 2,222,301 2,151,03915 Other Local Receipts 400,745 351,27516 Revenue from Intermediate Sources 139 15017.1 Foundation Funding (Excl URT) 4,298,159 4,449,64817.2 Tax Collection Rate Guarantee 53,902 018 Student Growth Funding 0 019 Declining Enrollment Funding 109,709 020 Consolidation Incentive/Assistance 0 021 Isolated Funding 0 022 Supplemental Millage Incentive Funding 15,871 12,69623 Other Unrestricted State Funding 0 024 Total Unrestricted Revenue from State and
Local Sources 7,100,826 6,964,808
Restricted Revenue from State Sources:25 Adult Education 0 0
Regular Education:26 Professional Development 39,340 40,62127 Other Regular Education 1,126 3,600
Special Education:28 Gifted & Talented 250 029 Alternative Learning Environment (ALE) 37,014 38,67330 English Language Learner (ELL) 586 031 National School Lunch Act (NSLA) 248,496 280,32432 Other Special Education 3,897 033 Workforce Education 13,000 13,00034 School Food Service 2,146 2,14535 Educational Service Cooperatives 0 036 Early Childhood Programs 0 037 Magnet School Programs 0 038 Other Non-Instructional Programs 125,667 124,57239 Total Restricted Revenue from State Sources 471,522 502,93540 Total Restricted Revenue from Federal
Sources 1,279,654 996,187
Other Sources of Funds:41 Financing Sources 0 042 Balances from Consolidated/Annexed District 0 043 Indirect Cost Reimbursement 0 044 Gains and Losses from Sale of Fixed Assets 0 045 Compensation for Loss of Fixed Assets 0 046 Other 0 047 Total Other Sources of Funds 0 048 Total Revenue and Other Sources of Funds
from All Sources 8,852,001 8,463,930
2010-2011 2011-2012Actual Budget
CURRENT EXPENDITURESInstruction:
49 Regular Instruction 2,858,931 3,243,07950 Special Education 614,010 525,58351 Workforce Education 245,060 254,62152 Adult Education 0 053 Compensatory Education 349,655 368,94454 Other 268,131 321,12455 Total Instruction 4,335,787 4,713,350
District Level Support:56 General Administration 286,249 243,47357 Central Services 168,780 205,23658 Maintenance & Operations of Plant 601,468 696,74859 Student Transportation 420,187 474,35560 Other District Level Support Services 31,818 28,00061 Total District Support Services 1,508,502 1,647,811
School Level Support:62 Student Support Services 268,238 332,74063 Instructional Staff Support Services 504,620 352,75064 School Administration 376,859 395,86465 Total District Support Services 1,149,717 1,081,354
Non-Instructional Services:66 Food Service Operations 414,890 371,44767 Other Enterprise Operations 0 068 Community Operations 0 069 Other Non-Instructional Services 0 070 Total Non-Instructional Services 414,890 371,44771 Facilities Acquisition and Construction 0 072 Debt Service 765,216 646,03275 Other Non-Programmed Costs 7,611 076 Total Expenditures 8,181,723 8,459,99577 Less: Capital Expenditures 240,268 235,53478 Less: Debt Service 765,216 646,03279 Total Current Expenditures 7,176,239 7,578,42980 Exclusions from Current Expenditures 359,66881 Net Current Expenditures 6,816,570
82 Per Pupil Expenditures 7,684
83 Personnel - Non-Federal Certified Clsrm FTEs 69.7584 Avg Salary - Non-Fed Certified Clsrm FTEs 42,35585 Personnel - Non-Federal Certified FTEs 75.2686 Avg Salary - Non-Fed Certified FTEs 44,19887.1 Legal Balance (funds 1-2-4) 1,036,66587.2 Categorical Fund Balance 61,55687.3 Deposits with Paying Agents (QZAB) 087.4 Net Legal Bal (Excl Cat & QZAB) 975,10988 Building Fund Balance (fund 3) 196,53989 Capital Outlay Fund Balance (fund 5) 0
Jan 30, 2012 - 204 - 9:35:29 AM

Annual Statistical Report 2010-2011
County: SEVIER DEQUEEN SCHOOL DISTRICT LEA:6701000
2010-2011 2011-2012Actual Budget
1 Area in Square Miles 3812 ADA 2,2693 ADA pct Change over 5 Yrs. (1%)4 4 QTR ADM 2,3805 Prior Year 3QTR ADM 2,4966 Assessment 112,572,1397 M&O Mills 25.008 URT Mills 25.009 M&O Mills in Excess of URT 0.0010 Dedicated M&O Mills 0.0011 Debt Service Mills 2.3012 Total Mills 27.3013 Total Debt Bond/Non-Bond 4,715,000
State and Local Revenue:14 Property Tax Receipts (Including URT) 2,748,641 2,254,50015 Other Local Receipts 1,093,322 2,315,18216 Revenue from Intermediate Sources 0 017.1 Foundation Funding (Excl URT) 12,422,470 11,880,84117.2 Tax Collection Rate Guarantee 128,796 128,00018 Student Growth Funding 12,089 019 Declining Enrollment Funding 0 020 Consolidation Incentive/Assistance 0 021 Isolated Funding 0 022 Supplemental Millage Incentive Funding 14,220 11,37623 Other Unrestricted State Funding 0 024 Total Unrestricted Revenue from State and
Local Sources 16,419,537 16,589,899
Restricted Revenue from State Sources:25 Adult Education 0 0
Regular Education:26 Professional Development 103,221 101,02527 Other Regular Education 7,500 67,500
Special Education:28 Gifted & Talented 850 029 Alternative Learning Environment (ALE) 56,598 59,23230 English Language Learner (ELL) 268,095 540,56031 National School Lunch Act (NSLA) 1,839,168 032 Other Special Education 27,759 24,00033 Workforce Education 47,126 46,04134 School Food Service 9,665 10,10035 Educational Service Cooperatives 0 036 Early Childhood Programs 0 037 Magnet School Programs 0 038 Other Non-Instructional Programs 1,996,404 1,316,34839 Total Restricted Revenue from State Sources 4,356,385 2,164,80640 Total Restricted Revenue from Federal
Sources 3,970,048 3,763,347
Other Sources of Funds:41 Financing Sources 1,776,077 10,00042 Balances from Consolidated/Annexed District 0 043 Indirect Cost Reimbursement 0 044 Gains and Losses from Sale of Fixed Assets 0 045 Compensation for Loss of Fixed Assets 0 046 Other 0 047 Total Other Sources of Funds 1,776,077 10,00048 Total Revenue and Other Sources of Funds
from All Sources 26,522,047 22,528,052
2010-2011 2011-2012Actual Budget
CURRENT EXPENDITURESInstruction:
49 Regular Instruction 10,248,145 10,425,86550 Special Education 1,161,095 1,319,42151 Workforce Education 657,724 668,10052 Adult Education 0 053 Compensatory Education 688,895 969,91454 Other 539,540 831,93055 Total Instruction 13,295,399 14,215,230
District Level Support:56 General Administration 598,227 619,80257 Central Services 126,989 115,74158 Maintenance & Operations of Plant 1,880,557 2,186,44659 Student Transportation 828,151 967,35960 Other District Level Support Services 22,045 5,60061 Total District Support Services 3,455,969 3,894,948
School Level Support:62 Student Support Services 931,510 1,113,71563 Instructional Staff Support Services 1,583,192 1,846,51964 School Administration 1,285,905 1,313,43565 Total District Support Services 3,800,606 4,273,669
Non-Instructional Services:66 Food Service Operations 1,467,114 1,532,45767 Other Enterprise Operations 0 068 Community Operations 5,858 6,00069 Other Non-Instructional Services 0 070 Total Non-Instructional Services 1,472,972 1,538,45771 Facilities Acquisition and Construction 3,540,523 3,716,06172 Debt Service 254,452 304,54075 Other Non-Programmed Costs 0 076 Total Expenditures 25,819,920 27,942,90577 Less: Capital Expenditures 3,864,670 4,351,59578 Less: Debt Service 254,452 304,54079 Total Current Expenditures 21,700,799 23,286,77080 Exclusions from Current Expenditures 814,64081 Net Current Expenditures 20,886,158
82 Per Pupil Expenditures 9,206
83 Personnel - Non-Federal Certified Clsrm FTEs 169.7684 Avg Salary - Non-Fed Certified Clsrm FTEs 47,68385 Personnel - Non-Federal Certified FTEs 196.1686 Avg Salary - Non-Fed Certified FTEs 49,90687.1 Legal Balance (funds 1-2-4) 7,647,97887.2 Categorical Fund Balance 932,83087.3 Deposits with Paying Agents (QZAB) 087.4 Net Legal Bal (Excl Cat & QZAB) 6,715,14888 Building Fund Balance (fund 3) 1,591,72389 Capital Outlay Fund Balance (fund 5) 0
Jan 30, 2012 - 205 - 9:35:29 AM

Annual Statistical Report 2010-2011
County: SEVIER HORATIO SCHOOL DISTRICT LEA:6703000
2010-2011 2011-2012Actual Budget
1 Area in Square Miles 1532 ADA 7993 ADA pct Change over 5 Yrs. 4%4 4 QTR ADM 8555 Prior Year 3QTR ADM 8276 Assessment 27,679,4787 M&O Mills 25.008 URT Mills 25.009 M&O Mills in Excess of URT 0.0010 Dedicated M&O Mills 0.0011 Debt Service Mills 19.0012 Total Mills 44.0013 Total Debt Bond/Non-Bond 6,796,316
State and Local Revenue:14 Property Tax Receipts (Including URT) 1,141,764 1,236,32215 Other Local Receipts 369,598 132,60016 Revenue from Intermediate Sources 144 017.1 Foundation Funding (Excl URT) 4,304,431 4,604,03517.2 Tax Collection Rate Guarantee 890 018 Student Growth Funding 176,865 019 Declining Enrollment Funding 0 020 Consolidation Incentive/Assistance 0 021 Isolated Funding 0 022 Supplemental Millage Incentive Funding 45,758 36,60723 Other Unrestricted State Funding 0 024 Total Unrestricted Revenue from State and
Local Sources 6,039,450 6,009,564
Restricted Revenue from State Sources:25 Adult Education 0 0
Regular Education:26 Professional Development 34,196 36,44327 Other Regular Education 6,299 11,200
Special Education:28 Gifted & Talented 50 029 Alternative Learning Environment (ALE) 0 57,03530 English Language Learner (ELL) 20,217 031 National School Lunch Act (NSLA) 253,456 308,76632 Other Special Education 4,497 033 Workforce Education 44,959 35,00034 School Food Service 0 035 Educational Service Cooperatives 0 036 Early Childhood Programs 0 037 Magnet School Programs 0 038 Other Non-Instructional Programs 2,310,817 6,979,46539 Total Restricted Revenue from State Sources 2,674,490 7,427,90940 Total Restricted Revenue from Federal
Sources 1,359,391 1,418,702
Other Sources of Funds:41 Financing Sources 4,922,556 042 Balances from Consolidated/Annexed District 0 043 Indirect Cost Reimbursement 0 044 Gains and Losses from Sale of Fixed Assets 0 045 Compensation for Loss of Fixed Assets 0 046 Other 0 047 Total Other Sources of Funds 4,922,556 048 Total Revenue and Other Sources of Funds
from All Sources 14,995,887 14,856,175
2010-2011 2011-2012Actual Budget
CURRENT EXPENDITURESInstruction:
49 Regular Instruction 3,298,999 3,221,25650 Special Education 320,179 292,69151 Workforce Education 186,214 235,06552 Adult Education 0 053 Compensatory Education 120,474 147,83054 Other 170,733 208,31255 Total Instruction 4,096,599 4,105,154
District Level Support:56 General Administration 251,265 230,46857 Central Services 85,823 96,71258 Maintenance & Operations of Plant 719,500 584,01559 Student Transportation 265,274 484,19860 Other District Level Support Services 59 6,00061 Total District Support Services 1,321,921 1,401,392
School Level Support:62 Student Support Services 371,017 365,13263 Instructional Staff Support Services 664,616 783,38664 School Administration 232,196 319,20765 Total District Support Services 1,267,829 1,467,726
Non-Instructional Services:66 Food Service Operations 389,341 359,32767 Other Enterprise Operations 0 068 Community Operations 0 1,00069 Other Non-Instructional Services 0 070 Total Non-Instructional Services 389,341 360,32771 Facilities Acquisition and Construction 4,082,843 8,783,39172 Debt Service 388,711 572,29575 Other Non-Programmed Costs 0 076 Total Expenditures 11,547,243 16,690,28577 Less: Capital Expenditures 4,162,842 9,107,43678 Less: Debt Service 388,711 572,29579 Total Current Expenditures 6,995,690 7,010,55480 Exclusions from Current Expenditures 275,54181 Net Current Expenditures 6,720,149
82 Per Pupil Expenditures 8,411
83 Personnel - Non-Federal Certified Clsrm FTEs 68.9784 Avg Salary - Non-Fed Certified Clsrm FTEs 41,04885 Personnel - Non-Federal Certified FTEs 74.3586 Avg Salary - Non-Fed Certified FTEs 42,36587.1 Legal Balance (funds 1-2-4) 1,669,90687.2 Categorical Fund Balance 19,26987.3 Deposits with Paying Agents (QZAB) 087.4 Net Legal Bal (Excl Cat & QZAB) 1,650,63788 Building Fund Balance (fund 3) 3,324,27289 Capital Outlay Fund Balance (fund 5) 0
Jan 30, 2012 - 206 - 9:35:29 AM

Annual Statistical Report 2010-2011
County: SHARP CAVE CITY SCHOOL DISTRICT LEA:6802000
2010-2011 2011-2012Actual Budget
1 Area in Square Miles 2852 ADA 1,2563 ADA pct Change over 5 Yrs. 2%4 4 QTR ADM 1,3395 Prior Year 3QTR ADM 1,3426 Assessment 60,211,4587 M&O Mills 25.008 URT Mills 25.009 M&O Mills in Excess of URT 0.0010 Dedicated M&O Mills 0.0011 Debt Service Mills 14.0012 Total Mills 39.0013 Total Debt Bond/Non-Bond 8,363,350
State and Local Revenue:14 Property Tax Receipts (Including URT) 2,283,146 2,087,00015 Other Local Receipts 658,463 276,65016 Revenue from Intermediate Sources 0 017.1 Foundation Funding (Excl URT) 6,649,120 6,813,38217.2 Tax Collection Rate Guarantee 71,269 018 Student Growth Funding 35,310 019 Declining Enrollment Funding 0 020 Consolidation Incentive/Assistance 0 021 Isolated Funding 11,944 10,00022 Supplemental Millage Incentive Funding 37,115 29,69223 Other Unrestricted State Funding 0 024 Total Unrestricted Revenue from State and
Local Sources 9,746,366 9,216,724
Restricted Revenue from State Sources:25 Adult Education 0 0
Regular Education:26 Professional Development 55,522 57,17327 Other Regular Education 2,600 3,600
Special Education:28 Gifted & Talented 150 029 Alternative Learning Environment (ALE) 36,851 63,17030 English Language Learner (ELL) 879 031 National School Lunch Act (NSLA) 459,296 470,58032 Other Special Education 78,207 033 Workforce Education 18,092 034 School Food Service 5,306 5,00035 Educational Service Cooperatives 0 036 Early Childhood Programs 291,600 291,60037 Magnet School Programs 0 038 Other Non-Instructional Programs 179,718 366,92539 Total Restricted Revenue from State Sources 1,128,220 1,258,04840 Total Restricted Revenue from Federal
Sources 1,893,839 1,697,720
Other Sources of Funds:41 Financing Sources 683,500 042 Balances from Consolidated/Annexed District 0 043 Indirect Cost Reimbursement 0 044 Gains and Losses from Sale of Fixed Assets 7,466 045 Compensation for Loss of Fixed Assets 13,671 046 Other 0 047 Total Other Sources of Funds 704,637 048 Total Revenue and Other Sources of Funds
from All Sources 13,473,062 12,172,492
2010-2011 2011-2012Actual Budget
CURRENT EXPENDITURESInstruction:
49 Regular Instruction 4,851,400 4,613,86150 Special Education 964,444 949,84451 Workforce Education 482,308 435,60052 Adult Education 0 053 Compensatory Education 421,220 431,98354 Other 177,479 176,37455 Total Instruction 6,896,851 6,607,663
District Level Support:56 General Administration 302,912 222,07857 Central Services 179,913 181,87058 Maintenance & Operations of Plant 1,092,996 1,134,36359 Student Transportation 629,591 621,99560 Other District Level Support Services 36,602 20,00061 Total District Support Services 2,242,014 2,180,306
School Level Support:62 Student Support Services 394,048 391,78063 Instructional Staff Support Services 554,004 654,26064 School Administration 552,809 536,10165 Total District Support Services 1,500,861 1,582,142
Non-Instructional Services:66 Food Service Operations 918,360 937,43667 Other Enterprise Operations 26,703 068 Community Operations 52,162 58,54369 Other Non-Instructional Services 0 070 Total Non-Instructional Services 997,225 995,97971 Facilities Acquisition and Construction 1,181,434 404,95072 Debt Service 516,054 714,87475 Other Non-Programmed Costs 457 076 Total Expenditures 13,334,896 12,485,91477 Less: Capital Expenditures 1,597,133 669,52378 Less: Debt Service 516,054 714,87479 Total Current Expenditures 11,221,709 11,101,51780 Exclusions from Current Expenditures 913,86081 Net Current Expenditures 10,307,849
82 Per Pupil Expenditures 8,205
83 Personnel - Non-Federal Certified Clsrm FTEs 98.5884 Avg Salary - Non-Fed Certified Clsrm FTEs 40,19985 Personnel - Non-Federal Certified FTEs 107.7286 Avg Salary - Non-Fed Certified FTEs 42,39187.1 Legal Balance (funds 1-2-4) 2,024,25687.2 Categorical Fund Balance 83,35687.3 Deposits with Paying Agents (QZAB) 087.4 Net Legal Bal (Excl Cat & QZAB) 1,940,89988 Building Fund Balance (fund 3) 513,80689 Capital Outlay Fund Balance (fund 5) 153,500
Jan 30, 2012 - 207 - 9:35:29 AM

Annual Statistical Report 2010-2011
County: SHARP HIGHLAND SCHOOL DISTRICT LEA:6804000
2010-2011 2011-2012Actual Budget
1 Area in Square Miles 3262 ADA 1,5033 ADA pct Change over 5 Yrs. 2%4 4 QTR ADM 1,5925 Prior Year 3QTR ADM 1,5586 Assessment 149,377,2317 M&O Mills 25.008 URT Mills 25.009 M&O Mills in Excess of URT 0.0010 Dedicated M&O Mills 0.0011 Debt Service Mills 5.0012 Total Mills 30.0013 Total Debt Bond/Non-Bond 4,990,000
State and Local Revenue:14 Property Tax Receipts (Including URT) 3,928,867 3,836,75515 Other Local Receipts 712,595 346,00016 Revenue from Intermediate Sources 0 017.1 Foundation Funding (Excl URT) 6,257,137 6,177,78517.2 Tax Collection Rate Guarantee 200,215 018 Student Growth Funding 0 019 Declining Enrollment Funding 50,593 020 Consolidation Incentive/Assistance 225,863 112,93121 Isolated Funding 18,533 022 Supplemental Millage Incentive Funding 0 023 Other Unrestricted State Funding 0 024 Total Unrestricted Revenue from State and
Local Sources 11,393,803 10,473,471
Restricted Revenue from State Sources:25 Adult Education 0 0
Regular Education:26 Professional Development 66,095 99,59927 Other Regular Education 35,327 0
Special Education:28 Gifted & Talented 2,918 029 Alternative Learning Environment (ALE) 59,218 91,09130 English Language Learner (ELL) 0 031 National School Lunch Act (NSLA) 504,990 647,30932 Other Special Education 14,298 033 Workforce Education 8,000 034 School Food Service 6,345 035 Educational Service Cooperatives 0 036 Early Childhood Programs 0 037 Magnet School Programs 0 038 Other Non-Instructional Programs 44,989 31,74239 Total Restricted Revenue from State Sources 742,179 869,74140 Total Restricted Revenue from Federal
Sources 3,446,108 3,296,893
Other Sources of Funds:41 Financing Sources 906,500 042 Balances from Consolidated/Annexed District 0 204,05243 Indirect Cost Reimbursement 8,500 044 Gains and Losses from Sale of Fixed Assets 530 045 Compensation for Loss of Fixed Assets 0 046 Other 0 047 Total Other Sources of Funds 915,530 204,05248 Total Revenue and Other Sources of Funds
from All Sources 16,497,619 14,844,157
2010-2011 2011-2012Actual Budget
CURRENT EXPENDITURESInstruction:
49 Regular Instruction 5,183,006 5,322,27050 Special Education 769,217 821,12651 Workforce Education 387,712 365,30552 Adult Education 0 053 Compensatory Education 689,231 554,71954 Other 418,168 297,45855 Total Instruction 7,447,333 7,360,878
District Level Support:56 General Administration 279,942 285,64957 Central Services 126,750 138,71158 Maintenance & Operations of Plant 1,425,872 1,320,78459 Student Transportation 1,031,023 878,99060 Other District Level Support Services 36,774 25,00061 Total District Support Services 2,900,362 2,649,134
School Level Support:62 Student Support Services 450,731 506,24463 Instructional Staff Support Services 1,257,207 1,535,22664 School Administration 593,453 488,72265 Total District Support Services 2,301,391 2,530,193
Non-Instructional Services:66 Food Service Operations 830,235 763,50067 Other Enterprise Operations 0 068 Community Operations 0 4,00069 Other Non-Instructional Services 0 070 Total Non-Instructional Services 830,235 767,50071 Facilities Acquisition and Construction 832,563 1,888,99272 Debt Service 438,196 576,00875 Other Non-Programmed Costs 8,623 076 Total Expenditures 14,758,704 15,772,70577 Less: Capital Expenditures 1,280,089 2,347,43378 Less: Debt Service 438,196 576,00879 Total Current Expenditures 13,040,418 12,849,26480 Exclusions from Current Expenditures 567,97081 Net Current Expenditures 12,472,449
82 Per Pupil Expenditures 8,297
83 Personnel - Non-Federal Certified Clsrm FTEs 109.1384 Avg Salary - Non-Fed Certified Clsrm FTEs 39,85085 Personnel - Non-Federal Certified FTEs 117.9286 Avg Salary - Non-Fed Certified FTEs 41,90987.1 Legal Balance (funds 1-2-4) 4,008,79787.2 Categorical Fund Balance 172,18387.3 Deposits with Paying Agents (QZAB) 087.4 Net Legal Bal (Excl Cat & QZAB) 3,836,61488 Building Fund Balance (fund 3) 2,146,85589 Capital Outlay Fund Balance (fund 5) 0
Jan 30, 2012 - 208 - 9:35:29 AM

Annual Statistical Report 2010-2011
County: STONE MOUNTAIN VIEW SCHOOL DISTRICT LEA:6901000
2010-2011 2011-2012Actual Budget
1 Area in Square Miles 5692 ADA 1,6173 ADA pct Change over 5 Yrs. 2%4 4 QTR ADM 1,7115 Prior Year 3QTR ADM 1,6856 Assessment 133,473,8167 M&O Mills 25.008 URT Mills 25.009 M&O Mills in Excess of URT 0.0010 Dedicated M&O Mills 0.0011 Debt Service Mills 3.9112 Total Mills 28.9113 Total Debt Bond/Non-Bond 2,381,316
State and Local Revenue:14 Property Tax Receipts (Including URT) 3,489,702 3,250,60015 Other Local Receipts 704,841 236,30016 Revenue from Intermediate Sources 783 017.1 Foundation Funding (Excl URT) 6,915,718 7,128,19317.2 Tax Collection Rate Guarantee 244,900 244,00018 Student Growth Funding 219,853 155,89019 Declining Enrollment Funding 0 020 Consolidation Incentive/Assistance 0 021 Isolated Funding 461,237 461,23722 Supplemental Millage Incentive Funding 0 023 Other Unrestricted State Funding 0 024 Total Unrestricted Revenue from State and
Local Sources 12,037,034 11,476,220
Restricted Revenue from State Sources:25 Adult Education 0 0
Regular Education:26 Professional Development 69,687 72,55227 Other Regular Education 390,648 387,856
Special Education:28 Gifted & Talented 350 029 Alternative Learning Environment (ALE) 3,860 1,78230 English Language Learner (ELL) 2,637 2,00031 National School Lunch Act (NSLA) 513,856 524,21632 Other Special Education 80,886 34,16033 Workforce Education 0 034 School Food Service 5,621 5,00035 Educational Service Cooperatives 0 036 Early Childhood Programs 257,580 256,35737 Magnet School Programs 0 038 Other Non-Instructional Programs 53,279 38,52139 Total Restricted Revenue from State Sources 1,378,404 1,322,44440 Total Restricted Revenue from Federal
Sources 3,369,773 2,488,324
Other Sources of Funds:41 Financing Sources 0 042 Balances from Consolidated/Annexed District 0 043 Indirect Cost Reimbursement 0 044 Gains and Losses from Sale of Fixed Assets 0 045 Compensation for Loss of Fixed Assets 16,334 046 Other 0 047 Total Other Sources of Funds 16,334 048 Total Revenue and Other Sources of Funds
from All Sources 16,801,545 15,286,988
2010-2011 2011-2012Actual Budget
CURRENT EXPENDITURESInstruction:
49 Regular Instruction 6,836,653 6,653,32650 Special Education 988,896 1,027,77751 Workforce Education 640,658 647,20452 Adult Education 0 053 Compensatory Education 769,633 719,25654 Other 148,673 152,96255 Total Instruction 9,384,514 9,200,524
District Level Support:56 General Administration 343,709 558,91457 Central Services 87,857 86,42758 Maintenance & Operations of Plant 1,146,153 1,119,81059 Student Transportation 1,010,522 1,039,32560 Other District Level Support Services 52,705 23,13861 Total District Support Services 2,640,946 2,827,614
School Level Support:62 Student Support Services 516,474 622,43963 Instructional Staff Support Services 695,118 713,61164 School Administration 820,794 893,74465 Total District Support Services 2,032,387 2,229,794
Non-Instructional Services:66 Food Service Operations 770,163 737,71767 Other Enterprise Operations 0 068 Community Operations 541 3,00069 Other Non-Instructional Services 0 070 Total Non-Instructional Services 770,705 740,71771 Facilities Acquisition and Construction 812,477 27,64172 Debt Service 394,084 373,06675 Other Non-Programmed Costs 0 076 Total Expenditures 16,035,113 15,399,35777 Less: Capital Expenditures 1,401,591 473,51678 Less: Debt Service 394,084 373,06679 Total Current Expenditures 14,239,437 14,552,77580 Exclusions from Current Expenditures 808,01181 Net Current Expenditures 13,431,426
82 Per Pupil Expenditures 8,308
83 Personnel - Non-Federal Certified Clsrm FTEs 128.6784 Avg Salary - Non-Fed Certified Clsrm FTEs 43,71285 Personnel - Non-Federal Certified FTEs 137.7486 Avg Salary - Non-Fed Certified FTEs 45,70987.1 Legal Balance (funds 1-2-4) 5,911,71587.2 Categorical Fund Balance 154,54787.3 Deposits with Paying Agents (QZAB) 087.4 Net Legal Bal (Excl Cat & QZAB) 5,757,16888 Building Fund Balance (fund 3) 25,05289 Capital Outlay Fund Balance (fund 5) 0
Jan 30, 2012 - 209 - 9:35:29 AM

Annual Statistical Report 2010-2011
County: UNION EL DORADO SCHOOL DISTRICT LEA:7001000
2010-2011 2011-2012Actual Budget
1 Area in Square Miles 2742 ADA 4,2893 ADA pct Change over 5 Yrs. 1%4 4 QTR ADM 4,5985 Prior Year 3QTR ADM 4,5806 Assessment 387,032,6967 M&O Mills 26.908 URT Mills 25.009 M&O Mills in Excess of URT 1.9010 Dedicated M&O Mills 0.0011 Debt Service Mills 6.6012 Total Mills 33.5013 Total Debt Bond/Non-Bond 29,618,346
State and Local Revenue:14 Property Tax Receipts (Including URT) 12,281,055 12,360,74415 Other Local Receipts 2,402,477 641,00016 Revenue from Intermediate Sources 380,568 350,00017.1 Foundation Funding (Excl URT) 18,069,325 18,611,78917.2 Tax Collection Rate Guarantee 116,939 50,00018 Student Growth Funding 156,854 019 Declining Enrollment Funding 0 020 Consolidation Incentive/Assistance 0 021 Isolated Funding 6,147 022 Supplemental Millage Incentive Funding 0 023 Other Unrestricted State Funding 0 4,00024 Total Unrestricted Revenue from State and
Local Sources 33,413,365 32,017,533
Restricted Revenue from State Sources:25 Adult Education 27,406 0
Regular Education:26 Professional Development 189,429 195,54027 Other Regular Education 26,526 0
Special Education:28 Gifted & Talented 6,250 4,00029 Alternative Learning Environment (ALE) 149,884 159,79030 English Language Learner (ELL) 42,192 42,15931 National School Lunch Act (NSLA) 1,417,568 1,426,92032 Other Special Education 92,299 033 Workforce Education 86,125 034 School Food Service 13,770 13,00035 Educational Service Cooperatives 0 036 Early Childhood Programs 0 037 Magnet School Programs 0 038 Other Non-Instructional Programs 6,518,396 2,192,01039 Total Restricted Revenue from State Sources 8,569,845 4,033,41940 Total Restricted Revenue from Federal
Sources 6,546,941 7,167,316
Other Sources of Funds:41 Financing Sources 0 042 Balances from Consolidated/Annexed District 0 043 Indirect Cost Reimbursement 41,305 41,30544 Gains and Losses from Sale of Fixed Assets 1,986 045 Compensation for Loss of Fixed Assets 0 046 Other 55,375 047 Total Other Sources of Funds 98,666 41,30548 Total Revenue and Other Sources of Funds
from All Sources 48,628,816 43,259,573
2010-2011 2011-2012Actual Budget
CURRENT EXPENDITURESInstruction:
49 Regular Instruction 16,253,523 16,537,34650 Special Education 2,353,995 2,301,12651 Workforce Education 766,483 790,04752 Adult Education 0 053 Compensatory Education 2,035,405 1,744,05654 Other 1,303,399 1,190,47655 Total Instruction 22,712,806 22,563,050
District Level Support:56 General Administration 595,212 594,74357 Central Services 1,301,378 1,129,95558 Maintenance & Operations of Plant 3,247,214 4,149,83459 Student Transportation 1,406,727 1,649,02860 Other District Level Support Services 89,041 89,28161 Total District Support Services 6,639,572 7,612,841
School Level Support:62 Student Support Services 2,409,331 2,530,14463 Instructional Staff Support Services 3,440,301 3,530,19864 School Administration 1,684,347 1,772,65165 Total District Support Services 7,533,980 7,832,993
Non-Instructional Services:66 Food Service Operations 1,949,156 1,828,31667 Other Enterprise Operations 0 068 Community Operations 4,266 2,50069 Other Non-Instructional Services 0 070 Total Non-Instructional Services 1,953,421 1,830,81671 Facilities Acquisition and Construction 17,943,482 5,048,80472 Debt Service 2,080,267 2,080,24975 Other Non-Programmed Costs 258,932 1,43876 Total Expenditures 59,122,460 46,970,19177 Less: Capital Expenditures 19,081,942 7,104,72778 Less: Debt Service 2,080,267 2,080,24979 Total Current Expenditures 37,960,251 37,785,21480 Exclusions from Current Expenditures 1,625,12981 Net Current Expenditures 36,335,122
82 Per Pupil Expenditures 8,472
83 Personnel - Non-Federal Certified Clsrm FTEs 354.4184 Avg Salary - Non-Fed Certified Clsrm FTEs 40,88985 Personnel - Non-Federal Certified FTEs 389.4586 Avg Salary - Non-Fed Certified FTEs 43,30987.1 Legal Balance (funds 1-2-4) 4,250,88787.2 Categorical Fund Balance 29,87187.3 Deposits with Paying Agents (QZAB) 087.4 Net Legal Bal (Excl Cat & QZAB) 4,221,01788 Building Fund Balance (fund 3) 2,374,62789 Capital Outlay Fund Balance (fund 5) 409,844
Jan 30, 2012 - 210 - 9:35:29 AM

Annual Statistical Report 2010-2011
County: UNION JUNCTION CITY SCHOOL DISTRICT LEA:7003000
2010-2011 2011-2012Actual Budget
1 Area in Square Miles 2042 ADA 4413 ADA pct Change over 5 Yrs. (31%)4 4 QTR ADM 4685 Prior Year 3QTR ADM 5536 Assessment 56,772,3007 M&O Mills 25.008 URT Mills 25.009 M&O Mills in Excess of URT 0.0010 Dedicated M&O Mills 0.0011 Debt Service Mills 10.0012 Total Mills 35.0013 Total Debt Bond/Non-Bond 2,815,168
State and Local Revenue:14 Property Tax Receipts (Including URT) 1,851,282 1,677,27315 Other Local Receipts 413,771 205,44716 Revenue from Intermediate Sources 45,981 46,00017.1 Foundation Funding (Excl URT) 1,956,985 1,901,68117.2 Tax Collection Rate Guarantee 33,008 30,00018 Student Growth Funding 0 019 Declining Enrollment Funding 93,387 36,55720 Consolidation Incentive/Assistance 0 021 Isolated Funding 0 022 Supplemental Millage Incentive Funding 0 023 Other Unrestricted State Funding 0 024 Total Unrestricted Revenue from State and
Local Sources 4,394,414 3,896,958
Restricted Revenue from State Sources:25 Adult Education 0 0
Regular Education:26 Professional Development 22,887 22,94727 Other Regular Education 3,886 0
Special Education:28 Gifted & Talented 250 029 Alternative Learning Environment (ALE) 0 030 English Language Learner (ELL) 0 031 National School Lunch Act (NSLA) 143,840 168,49832 Other Special Education 39,334 033 Workforce Education 17,875 034 School Food Service 2,843 2,84435 Educational Service Cooperatives 0 036 Early Childhood Programs 0 037 Magnet School Programs 0 038 Other Non-Instructional Programs 12,279 9,91939 Total Restricted Revenue from State Sources 243,195 204,20840 Total Restricted Revenue from Federal
Sources 929,831 541,763
Other Sources of Funds:41 Financing Sources 0 042 Balances from Consolidated/Annexed District 0 043 Indirect Cost Reimbursement 0 044 Gains and Losses from Sale of Fixed Assets 0 045 Compensation for Loss of Fixed Assets 0 046 Other 0 047 Total Other Sources of Funds 0 048 Total Revenue and Other Sources of Funds
from All Sources 5,567,439 4,642,929
2010-2011 2011-2012Actual Budget
CURRENT EXPENDITURESInstruction:
49 Regular Instruction 2,177,651 1,833,95750 Special Education 447,035 403,27651 Workforce Education 146,485 129,27252 Adult Education 0 053 Compensatory Education 265,581 84,78554 Other 6,500 6,50055 Total Instruction 3,043,252 2,457,791
District Level Support:56 General Administration 184,456 187,43957 Central Services 137,193 131,63958 Maintenance & Operations of Plant 516,202 578,76059 Student Transportation 284,789 330,22860 Other District Level Support Services 11,785 18,00061 Total District Support Services 1,134,425 1,246,066
School Level Support:62 Student Support Services 137,414 118,45163 Instructional Staff Support Services 460,429 518,88564 School Administration 285,522 279,96865 Total District Support Services 883,365 917,303
Non-Instructional Services:66 Food Service Operations 377,264 366,52667 Other Enterprise Operations 0 068 Community Operations 0 20069 Other Non-Instructional Services 0 070 Total Non-Instructional Services 377,264 366,72671 Facilities Acquisition and Construction 66,437 3,50072 Debt Service 209,622 206,64275 Other Non-Programmed Costs 0 076 Total Expenditures 5,714,364 5,198,02777 Less: Capital Expenditures 117,050 65,56478 Less: Debt Service 209,622 206,64279 Total Current Expenditures 5,387,693 4,925,82180 Exclusions from Current Expenditures 371,08481 Net Current Expenditures 5,016,609
82 Per Pupil Expenditures 11,369
83 Personnel - Non-Federal Certified Clsrm FTEs 38.1784 Avg Salary - Non-Fed Certified Clsrm FTEs 43,39385 Personnel - Non-Federal Certified FTEs 44.6886 Avg Salary - Non-Fed Certified FTEs 46,84287.1 Legal Balance (funds 1-2-4) 1,288,06887.2 Categorical Fund Balance 56687.3 Deposits with Paying Agents (QZAB) 087.4 Net Legal Bal (Excl Cat & QZAB) 1,287,50288 Building Fund Balance (fund 3) 101,97889 Capital Outlay Fund Balance (fund 5) 0
Jan 30, 2012 - 211 - 9:35:29 AM
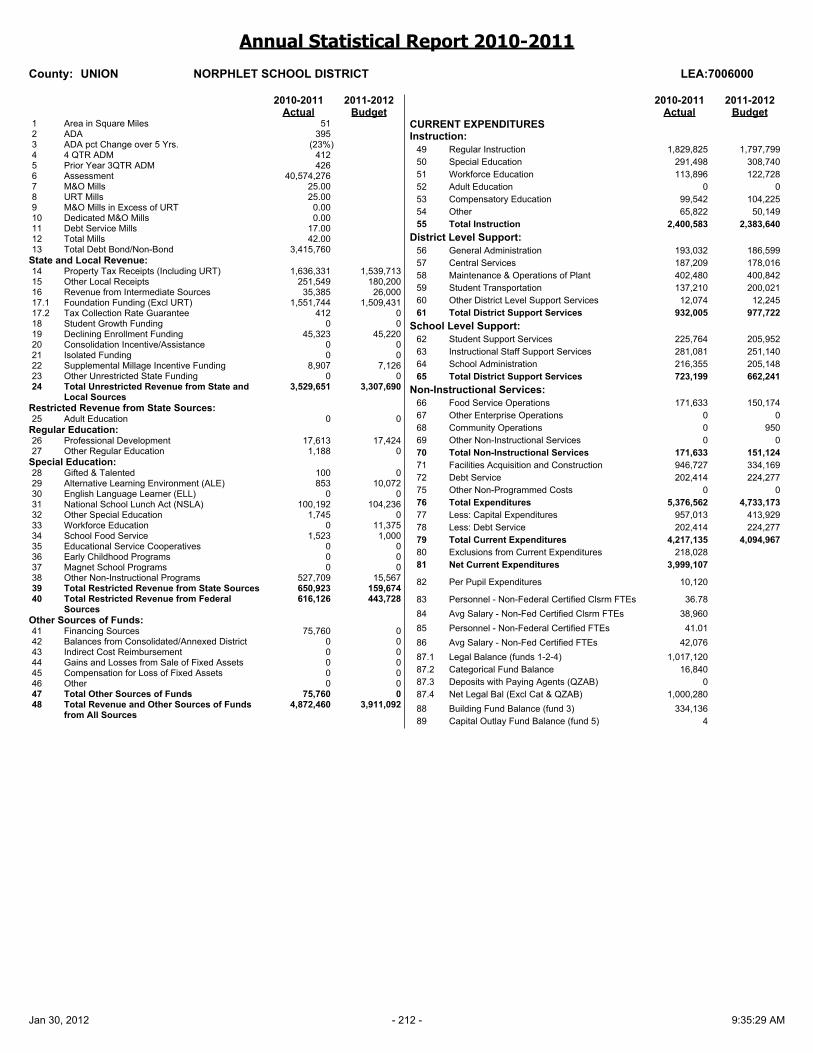
Annual Statistical Report 2010-2011
County: UNION NORPHLET SCHOOL DISTRICT LEA:7006000
2010-2011 2011-2012Actual Budget
1 Area in Square Miles 512 ADA 3953 ADA pct Change over 5 Yrs. (23%)4 4 QTR ADM 4125 Prior Year 3QTR ADM 4266 Assessment 40,574,2767 M&O Mills 25.008 URT Mills 25.009 M&O Mills in Excess of URT 0.0010 Dedicated M&O Mills 0.0011 Debt Service Mills 17.0012 Total Mills 42.0013 Total Debt Bond/Non-Bond 3,415,760
State and Local Revenue:14 Property Tax Receipts (Including URT) 1,636,331 1,539,71315 Other Local Receipts 251,549 180,20016 Revenue from Intermediate Sources 35,385 26,00017.1 Foundation Funding (Excl URT) 1,551,744 1,509,43117.2 Tax Collection Rate Guarantee 412 018 Student Growth Funding 0 019 Declining Enrollment Funding 45,323 45,22020 Consolidation Incentive/Assistance 0 021 Isolated Funding 0 022 Supplemental Millage Incentive Funding 8,907 7,12623 Other Unrestricted State Funding 0 024 Total Unrestricted Revenue from State and
Local Sources 3,529,651 3,307,690
Restricted Revenue from State Sources:25 Adult Education 0 0
Regular Education:26 Professional Development 17,613 17,42427 Other Regular Education 1,188 0
Special Education:28 Gifted & Talented 100 029 Alternative Learning Environment (ALE) 853 10,07230 English Language Learner (ELL) 0 031 National School Lunch Act (NSLA) 100,192 104,23632 Other Special Education 1,745 033 Workforce Education 0 11,37534 School Food Service 1,523 1,00035 Educational Service Cooperatives 0 036 Early Childhood Programs 0 037 Magnet School Programs 0 038 Other Non-Instructional Programs 527,709 15,56739 Total Restricted Revenue from State Sources 650,923 159,67440 Total Restricted Revenue from Federal
Sources 616,126 443,728
Other Sources of Funds:41 Financing Sources 75,760 042 Balances from Consolidated/Annexed District 0 043 Indirect Cost Reimbursement 0 044 Gains and Losses from Sale of Fixed Assets 0 045 Compensation for Loss of Fixed Assets 0 046 Other 0 047 Total Other Sources of Funds 75,760 048 Total Revenue and Other Sources of Funds
from All Sources 4,872,460 3,911,092
2010-2011 2011-2012Actual Budget
CURRENT EXPENDITURESInstruction:
49 Regular Instruction 1,829,825 1,797,79950 Special Education 291,498 308,74051 Workforce Education 113,896 122,72852 Adult Education 0 053 Compensatory Education 99,542 104,22554 Other 65,822 50,14955 Total Instruction 2,400,583 2,383,640
District Level Support:56 General Administration 193,032 186,59957 Central Services 187,209 178,01658 Maintenance & Operations of Plant 402,480 400,84259 Student Transportation 137,210 200,02160 Other District Level Support Services 12,074 12,24561 Total District Support Services 932,005 977,722
School Level Support:62 Student Support Services 225,764 205,95263 Instructional Staff Support Services 281,081 251,14064 School Administration 216,355 205,14865 Total District Support Services 723,199 662,241
Non-Instructional Services:66 Food Service Operations 171,633 150,17467 Other Enterprise Operations 0 068 Community Operations 0 95069 Other Non-Instructional Services 0 070 Total Non-Instructional Services 171,633 151,12471 Facilities Acquisition and Construction 946,727 334,16972 Debt Service 202,414 224,27775 Other Non-Programmed Costs 0 076 Total Expenditures 5,376,562 4,733,17377 Less: Capital Expenditures 957,013 413,92978 Less: Debt Service 202,414 224,27779 Total Current Expenditures 4,217,135 4,094,96780 Exclusions from Current Expenditures 218,02881 Net Current Expenditures 3,999,107
82 Per Pupil Expenditures 10,120
83 Personnel - Non-Federal Certified Clsrm FTEs 36.7884 Avg Salary - Non-Fed Certified Clsrm FTEs 38,96085 Personnel - Non-Federal Certified FTEs 41.0186 Avg Salary - Non-Fed Certified FTEs 42,07687.1 Legal Balance (funds 1-2-4) 1,017,12087.2 Categorical Fund Balance 16,84087.3 Deposits with Paying Agents (QZAB) 087.4 Net Legal Bal (Excl Cat & QZAB) 1,000,28088 Building Fund Balance (fund 3) 334,13689 Capital Outlay Fund Balance (fund 5) 4
Jan 30, 2012 - 212 - 9:35:29 AM

Annual Statistical Report 2010-2011
County: UNION PARKERS CHAPEL SCHOOL DIST. LEA:7007000
2010-2011 2011-2012Actual Budget
1 Area in Square Miles 452 ADA 6293 ADA pct Change over 5 Yrs. (11%)4 4 QTR ADM 6585 Prior Year 3QTR ADM 7136 Assessment 52,270,3847 M&O Mills 25.008 URT Mills 25.009 M&O Mills in Excess of URT 0.0010 Dedicated M&O Mills 0.0011 Debt Service Mills 7.8012 Total Mills 32.8013 Total Debt Bond/Non-Bond 3,550,000
State and Local Revenue:14 Property Tax Receipts (Including URT) 1,565,654 1,533,07215 Other Local Receipts 521,556 569,35016 Revenue from Intermediate Sources 59,265 40,00017.1 Foundation Funding (Excl URT) 3,041,561 2,720,18317.2 Tax Collection Rate Guarantee 18,104 018 Student Growth Funding 0 16,30319 Declining Enrollment Funding 0 170,12720 Consolidation Incentive/Assistance 0 021 Isolated Funding 0 022 Supplemental Millage Incentive Funding 0 023 Other Unrestricted State Funding 0 024 Total Unrestricted Revenue from State and
Local Sources 5,206,140 5,049,035
Restricted Revenue from State Sources:25 Adult Education 0 0
Regular Education:26 Professional Development 29,499 27,88027 Other Regular Education 1,990 2,000
Special Education:28 Gifted & Talented 1,450 029 Alternative Learning Environment (ALE) 0 030 English Language Learner (ELL) 879 031 National School Lunch Act (NSLA) 109,120 98,44732 Other Special Education 120,642 033 Workforce Education 26,000 17,06234 School Food Service 2,338 2,33835 Educational Service Cooperatives 0 036 Early Childhood Programs 0 037 Magnet School Programs 0 038 Other Non-Instructional Programs 433,607 70,29739 Total Restricted Revenue from State Sources 725,524 218,02440 Total Restricted Revenue from Federal
Sources 687,197 347,478
Other Sources of Funds:41 Financing Sources 0 906,50042 Balances from Consolidated/Annexed District 0 043 Indirect Cost Reimbursement 0 044 Gains and Losses from Sale of Fixed Assets 0 045 Compensation for Loss of Fixed Assets 0 046 Other 0 047 Total Other Sources of Funds 0 906,50048 Total Revenue and Other Sources of Funds
from All Sources 6,618,861 6,521,037
2010-2011 2011-2012Actual Budget
CURRENT EXPENDITURESInstruction:
49 Regular Instruction 2,987,326 2,978,17550 Special Education 393,873 386,68851 Workforce Education 112,693 113,06952 Adult Education 0 053 Compensatory Education 105,897 101,84254 Other 42,952 43,77555 Total Instruction 3,642,742 3,623,550
District Level Support:56 General Administration 220,002 200,20157 Central Services 172,001 156,62558 Maintenance & Operations of Plant 462,607 517,83059 Student Transportation 263,929 185,11460 Other District Level Support Services 11,563 11,56361 Total District Support Services 1,130,103 1,071,335
School Level Support:62 Student Support Services 324,346 261,47163 Instructional Staff Support Services 152,277 161,41564 School Administration 233,358 281,82965 Total District Support Services 709,981 704,715
Non-Instructional Services:66 Food Service Operations 293,781 260,81567 Other Enterprise Operations 0 068 Community Operations 719 4,00269 Other Non-Instructional Services 0 070 Total Non-Instructional Services 294,499 264,81771 Facilities Acquisition and Construction 1,938,094 379,98072 Debt Service 224,390 223,19075 Other Non-Programmed Costs 138,693 076 Total Expenditures 8,078,501 6,267,58677 Less: Capital Expenditures 2,062,424 428,76078 Less: Debt Service 224,390 223,19079 Total Current Expenditures 5,791,687 5,615,63680 Exclusions from Current Expenditures 538,72881 Net Current Expenditures 5,252,959
82 Per Pupil Expenditures 8,355
83 Personnel - Non-Federal Certified Clsrm FTEs 51.8484 Avg Salary - Non-Fed Certified Clsrm FTEs 42,98485 Personnel - Non-Federal Certified FTEs 55.5086 Avg Salary - Non-Fed Certified FTEs 45,61087.1 Legal Balance (funds 1-2-4) 1,552,52187.2 Categorical Fund Balance 4,68887.3 Deposits with Paying Agents (QZAB) 087.4 Net Legal Bal (Excl Cat & QZAB) 1,547,83388 Building Fund Balance (fund 3) 719,35089 Capital Outlay Fund Balance (fund 5) 85,778
Jan 30, 2012 - 213 - 9:35:29 AM

Annual Statistical Report 2010-2011
County: UNION SMACKOVER SCHOOL DISTRICT LEA:7008000
2010-2011 2011-2012Actual Budget
1 Area in Square Miles 2422 ADA 8083 ADA pct Change over 5 Yrs. 3%4 4 QTR ADM 8505 Prior Year 3QTR ADM 8976 Assessment 76,580,4657 M&O Mills 25.008 URT Mills 25.009 M&O Mills in Excess of URT 0.0010 Dedicated M&O Mills 0.0011 Debt Service Mills 16.0012 Total Mills 41.0013 Total Debt Bond/Non-Bond 5,325,000
State and Local Revenue:14 Property Tax Receipts (Including URT) 2,917,553 2,485,00015 Other Local Receipts 519,296 287,81016 Revenue from Intermediate Sources 74,566 65,00017.1 Foundation Funding (Excl URT) 3,588,474 3,317,78117.2 Tax Collection Rate Guarantee 26,612 15,00018 Student Growth Funding 0 019 Declining Enrollment Funding 0 141,68120 Consolidation Incentive/Assistance 0 021 Isolated Funding 0 022 Supplemental Millage Incentive Funding 22,348 17,87923 Other Unrestricted State Funding 0 024 Total Unrestricted Revenue from State and
Local Sources 7,148,849 6,330,151
Restricted Revenue from State Sources:25 Adult Education 0 0
Regular Education:26 Professional Development 37,116 36,07627 Other Regular Education 17,720 1,400
Special Education:28 Gifted & Talented 1,900 029 Alternative Learning Environment (ALE) 3,819 9,90730 English Language Learner (ELL) 5,274 031 National School Lunch Act (NSLA) 217,744 217,58032 Other Special Education 77,906 81,87533 Workforce Education 36,563 34,93834 School Food Service 2,700 035 Educational Service Cooperatives 0 036 Early Childhood Programs 287,780 270,61737 Magnet School Programs 0 038 Other Non-Instructional Programs 33,701 26,64539 Total Restricted Revenue from State Sources 722,222 679,03740 Total Restricted Revenue from Federal
Sources 969,881 908,038
Other Sources of Funds:41 Financing Sources 0 042 Balances from Consolidated/Annexed District 0 043 Indirect Cost Reimbursement 0 044 Gains and Losses from Sale of Fixed Assets 505 045 Compensation for Loss of Fixed Assets 0 046 Other 0 047 Total Other Sources of Funds 505 048 Total Revenue and Other Sources of Funds
from All Sources 8,841,458 7,917,226
2010-2011 2011-2012Actual Budget
CURRENT EXPENDITURESInstruction:
49 Regular Instruction 3,205,068 3,132,60850 Special Education 540,069 491,49351 Workforce Education 287,978 334,65652 Adult Education 0 053 Compensatory Education 213,796 170,74954 Other 348,249 346,47455 Total Instruction 4,595,159 4,475,979
District Level Support:56 General Administration 357,890 368,38757 Central Services 150,716 194,92258 Maintenance & Operations of Plant 761,881 794,84659 Student Transportation 252,578 333,46360 Other District Level Support Services 23,920 11,00061 Total District Support Services 1,546,985 1,702,618
School Level Support:62 Student Support Services 383,497 356,27863 Instructional Staff Support Services 864,849 905,67764 School Administration 231,985 233,72665 Total District Support Services 1,480,331 1,495,681
Non-Instructional Services:66 Food Service Operations 344,324 335,36067 Other Enterprise Operations 0 068 Community Operations 100 1,00169 Other Non-Instructional Services 0 070 Total Non-Instructional Services 344,424 336,36271 Facilities Acquisition and Construction 107,316 4,70572 Debt Service 364,794 360,45175 Other Non-Programmed Costs 53,011 076 Total Expenditures 8,492,020 8,375,79577 Less: Capital Expenditures 212,179 106,48078 Less: Debt Service 364,794 360,45179 Total Current Expenditures 7,915,047 7,908,86480 Exclusions from Current Expenditures 826,00881 Net Current Expenditures 7,089,039
82 Per Pupil Expenditures 8,774
83 Personnel - Non-Federal Certified Clsrm FTEs 64.1384 Avg Salary - Non-Fed Certified Clsrm FTEs 40,72685 Personnel - Non-Federal Certified FTEs 72.3586 Avg Salary - Non-Fed Certified FTEs 43,19587.1 Legal Balance (funds 1-2-4) 2,305,67287.2 Categorical Fund Balance 30,52087.3 Deposits with Paying Agents (QZAB) 087.4 Net Legal Bal (Excl Cat & QZAB) 2,275,15288 Building Fund Balance (fund 3) 845,61589 Capital Outlay Fund Balance (fund 5) 0
Jan 30, 2012 - 214 - 9:35:29 AM

Annual Statistical Report 2010-2011
County: UNION STRONG-HUTTIG SCHOOL DISTRICT LEA:7009000
2010-2011 2011-2012Actual Budget
1 Area in Square Miles 3032 ADA 4223 ADA pct Change over 5 Yrs. (33%)4 4 QTR ADM 4465 Prior Year 3QTR ADM 4726 Assessment 39,603,2627 M&O Mills 25.708 URT Mills 25.009 M&O Mills in Excess of URT 0.7010 Dedicated M&O Mills 0.0011 Debt Service Mills 13.3012 Total Mills 39.0013 Total Debt Bond/Non-Bond 1,590,130
State and Local Revenue:14 Property Tax Receipts (Including URT) 1,571,912 1,455,00015 Other Local Receipts 274,012 177,05016 Revenue from Intermediate Sources 39,183 35,00017.1 Foundation Funding (Excl URT) 1,762,364 1,705,01317.2 Tax Collection Rate Guarantee 10,603 10,00018 Student Growth Funding 0 019 Declining Enrollment Funding 253,147 72,06920 Consolidation Incentive/Assistance 0 021 Isolated Funding 0 022 Supplemental Millage Incentive Funding 11,649 9,31923 Other Unrestricted State Funding 0 024 Total Unrestricted Revenue from State and
Local Sources 3,922,870 3,463,451
Restricted Revenue from State Sources:25 Adult Education 0 0
Regular Education:26 Professional Development 19,503 18,99027 Other Regular Education 152,344 2,119
Special Education:28 Gifted & Talented 0 029 Alternative Learning Environment (ALE) 126,928 23,12930 English Language Learner (ELL) 0 031 National School Lunch Act (NSLA) 391,840 374,44032 Other Special Education 41,255 35,00033 Workforce Education 20,313 10,00034 School Food Service 2,091 2,00035 Educational Service Cooperatives 0 036 Early Childhood Programs 0 037 Magnet School Programs 0 038 Other Non-Instructional Programs 14,831 13,32739 Total Restricted Revenue from State Sources 769,105 479,00540 Total Restricted Revenue from Federal
Sources 1,490,341 725,365
Other Sources of Funds:41 Financing Sources 0 042 Balances from Consolidated/Annexed District 0 043 Indirect Cost Reimbursement 0 044 Gains and Losses from Sale of Fixed Assets 0 045 Compensation for Loss of Fixed Assets 0 046 Other 0 047 Total Other Sources of Funds 0 048 Total Revenue and Other Sources of Funds
from All Sources 6,182,316 4,667,820
2010-2011 2011-2012Actual Budget
CURRENT EXPENDITURESInstruction:
49 Regular Instruction 1,865,099 1,529,00050 Special Education 296,804 324,53751 Workforce Education 217,668 3,97552 Adult Education 0 053 Compensatory Education 304,657 152,58654 Other 186,391 135,54855 Total Instruction 2,870,618 2,145,646
District Level Support:56 General Administration 515,715 283,74357 Central Services 128,537 118,12558 Maintenance & Operations of Plant 556,169 484,01259 Student Transportation 240,125 220,91560 Other District Level Support Services 0 061 Total District Support Services 1,440,545 1,106,795
School Level Support:62 Student Support Services 331,689 231,67863 Instructional Staff Support Services 495,698 428,79864 School Administration 258,054 190,91665 Total District Support Services 1,085,442 851,392
Non-Instructional Services:66 Food Service Operations 327,164 330,79667 Other Enterprise Operations 0 068 Community Operations 0 2,00069 Other Non-Instructional Services 0 070 Total Non-Instructional Services 327,164 332,79671 Facilities Acquisition and Construction 157,608 072 Debt Service 181,895 183,40075 Other Non-Programmed Costs 10,000 076 Total Expenditures 6,073,271 4,620,02977 Less: Capital Expenditures 169,315 5,00078 Less: Debt Service 181,895 183,40079 Total Current Expenditures 5,722,061 4,431,62980 Exclusions from Current Expenditures 185,22781 Net Current Expenditures 5,536,835
82 Per Pupil Expenditures 13,135
83 Personnel - Non-Federal Certified Clsrm FTEs 24.0284 Avg Salary - Non-Fed Certified Clsrm FTEs 63,66485 Personnel - Non-Federal Certified FTEs 28.0286 Avg Salary - Non-Fed Certified FTEs 71,89087.1 Legal Balance (funds 1-2-4) 919,98987.2 Categorical Fund Balance 111,83987.3 Deposits with Paying Agents (QZAB) 087.4 Net Legal Bal (Excl Cat & QZAB) 808,15088 Building Fund Balance (fund 3) 089 Capital Outlay Fund Balance (fund 5) 0
Jan 30, 2012 - 215 - 9:35:29 AM

Annual Statistical Report 2010-2011
County: VAN BUREN CLINTON SCHOOL DISTRICT LEA:7102000
2010-2011 2011-2012Actual Budget
1 Area in Square Miles 4882 ADA 1,2523 ADA pct Change over 5 Yrs. 2%4 4 QTR ADM 1,3325 Prior Year 3QTR ADM 1,3226 Assessment 199,480,5327 M&O Mills 25.008 URT Mills 25.009 M&O Mills in Excess of URT 0.0010 Dedicated M&O Mills 0.0011 Debt Service Mills 7.8012 Total Mills 32.8013 Total Debt Bond/Non-Bond 7,145,787
State and Local Revenue:14 Property Tax Receipts (Including URT) 4,806,763 6,134,32215 Other Local Receipts 688,023 413,37116 Revenue from Intermediate Sources 0 017.1 Foundation Funding (Excl URT) 3,514,825 3,058,60217.2 Tax Collection Rate Guarantee 191,347 018 Student Growth Funding 104,184 184,32019 Declining Enrollment Funding 0 020 Consolidation Incentive/Assistance 0 021 Isolated Funding 0 022 Supplemental Millage Incentive Funding 0 023 Other Unrestricted State Funding 0 024 Total Unrestricted Revenue from State and
Local Sources 9,305,143 9,790,615
Restricted Revenue from State Sources:25 Adult Education 0 0
Regular Education:26 Professional Development 54,681 56,65127 Other Regular Education 22,671 0
Special Education:28 Gifted & Talented 800 029 Alternative Learning Environment (ALE) 115,105 123,14830 English Language Learner (ELL) 4,981 14,56831 National School Lunch Act (NSLA) 609,085 798,28032 Other Special Education 185,600 234,78533 Workforce Education 33,313 31,68834 School Food Service 5,450 3,54335 Educational Service Cooperatives 0 036 Early Childhood Programs 193,914 194,40037 Magnet School Programs 0 038 Other Non-Instructional Programs 18,077 14,77639 Total Restricted Revenue from State Sources 1,243,676 1,471,83940 Total Restricted Revenue from Federal
Sources 2,288,369 2,505,436
Other Sources of Funds:41 Financing Sources 0 1,084,19842 Balances from Consolidated/Annexed District 0 043 Indirect Cost Reimbursement 28,688 044 Gains and Losses from Sale of Fixed Assets 0 045 Compensation for Loss of Fixed Assets 59,802 046 Other 0 047 Total Other Sources of Funds 88,490 1,084,19848 Total Revenue and Other Sources of Funds
from All Sources 12,925,677 14,852,087
2010-2011 2011-2012Actual Budget
CURRENT EXPENDITURESInstruction:
49 Regular Instruction 4,558,230 4,605,96450 Special Education 1,304,686 1,265,48851 Workforce Education 338,977 318,36152 Adult Education 0 053 Compensatory Education 495,117 951,78054 Other 453,053 399,13055 Total Instruction 7,150,062 7,540,723
District Level Support:56 General Administration 255,829 235,27457 Central Services 730,251 688,12058 Maintenance & Operations of Plant 1,047,684 1,208,63559 Student Transportation 714,721 552,48860 Other District Level Support Services 63,975 23,20061 Total District Support Services 2,812,460 2,707,717
School Level Support:62 Student Support Services 743,317 666,14163 Instructional Staff Support Services 747,443 884,87764 School Administration 661,260 641,27565 Total District Support Services 2,152,020 2,192,293
Non-Instructional Services:66 Food Service Operations 807,828 789,23867 Other Enterprise Operations 0 068 Community Operations 348 6,63869 Other Non-Instructional Services 0 070 Total Non-Instructional Services 808,176 795,87771 Facilities Acquisition and Construction 0 21,65272 Debt Service 600,338 624,22575 Other Non-Programmed Costs 10,721 076 Total Expenditures 13,533,777 13,882,48777 Less: Capital Expenditures 307,695 315,38778 Less: Debt Service 600,338 624,22579 Total Current Expenditures 12,625,744 12,942,87580 Exclusions from Current Expenditures 701,21581 Net Current Expenditures 11,924,529
82 Per Pupil Expenditures 9,527
83 Personnel - Non-Federal Certified Clsrm FTEs 108.2484 Avg Salary - Non-Fed Certified Clsrm FTEs 40,03985 Personnel - Non-Federal Certified FTEs 115.0386 Avg Salary - Non-Fed Certified FTEs 41,89787.1 Legal Balance (funds 1-2-4) 4,217,44487.2 Categorical Fund Balance 145,01987.3 Deposits with Paying Agents (QZAB) 087.4 Net Legal Bal (Excl Cat & QZAB) 4,072,42588 Building Fund Balance (fund 3) 089 Capital Outlay Fund Balance (fund 5) 0
Jan 30, 2012 - 216 - 9:35:29 AM

Annual Statistical Report 2010-2011
County: VAN BUREN SHIRLEY SCHOOL DISTRICT LEA:7104000
2010-2011 2011-2012Actual Budget
1 Area in Square Miles 932 ADA 4143 ADA pct Change over 5 Yrs. (21%)4 4 QTR ADM 4415 Prior Year 3QTR ADM 4676 Assessment 78,488,9597 M&O Mills 25.008 URT Mills 25.009 M&O Mills in Excess of URT 0.0010 Dedicated M&O Mills 0.0011 Debt Service Mills 10.7012 Total Mills 35.7013 Total Debt Bond/Non-Bond 2,889,832
State and Local Revenue:14 Property Tax Receipts (Including URT) 2,564,147 1,994,24715 Other Local Receipts 234,819 110,03316 Revenue from Intermediate Sources 0 017.1 Foundation Funding (Excl URT) 995,950 776,43117.2 Tax Collection Rate Guarantee 78,445 018 Student Growth Funding 0 019 Declining Enrollment Funding 117,840 71,36320 Consolidation Incentive/Assistance 0 021 Isolated Funding 0 022 Supplemental Millage Incentive Funding 0 023 Other Unrestricted State Funding 0 024 Total Unrestricted Revenue from State and
Local Sources 3,991,201 2,952,074
Restricted Revenue from State Sources:25 Adult Education 0 0
Regular Education:26 Professional Development 19,304 18,79627 Other Regular Education 21,902 0
Special Education:28 Gifted & Talented 1,050 029 Alternative Learning Environment (ALE) 73,947 78,46530 English Language Learner (ELL) 0 031 National School Lunch Act (NSLA) 362,080 359,26032 Other Special Education 29,826 35,71033 Workforce Education 0 034 School Food Service 1,715 035 Educational Service Cooperatives 0 036 Early Childhood Programs 0 037 Magnet School Programs 0 038 Other Non-Instructional Programs 2,206 1,76439 Total Restricted Revenue from State Sources 512,030 493,99540 Total Restricted Revenue from Federal
Sources 702,863 663,259
Other Sources of Funds:41 Financing Sources 0 042 Balances from Consolidated/Annexed District 0 043 Indirect Cost Reimbursement 0 044 Gains and Losses from Sale of Fixed Assets 1,337 045 Compensation for Loss of Fixed Assets 0 046 Other 0 047 Total Other Sources of Funds 1,337 048 Total Revenue and Other Sources of Funds
from All Sources 5,207,431 4,109,328
2010-2011 2011-2012Actual Budget
CURRENT EXPENDITURESInstruction:
49 Regular Instruction 1,847,900 1,690,76650 Special Education 342,701 362,92151 Workforce Education 157,297 160,63152 Adult Education 0 053 Compensatory Education 151,253 208,43354 Other 151,295 144,25055 Total Instruction 2,650,446 2,567,002
District Level Support:56 General Administration 192,474 193,15857 Central Services 102,699 98,70458 Maintenance & Operations of Plant 457,051 603,92459 Student Transportation 226,951 239,09360 Other District Level Support Services 10,094 061 Total District Support Services 989,269 1,134,880
School Level Support:62 Student Support Services 201,911 182,75963 Instructional Staff Support Services 178,327 139,12064 School Administration 175,454 116,57365 Total District Support Services 555,692 438,451
Non-Instructional Services:66 Food Service Operations 264,520 280,06067 Other Enterprise Operations 0 068 Community Operations 0 1,00069 Other Non-Instructional Services 0 070 Total Non-Instructional Services 264,520 281,06071 Facilities Acquisition and Construction 308,248 072 Debt Service 200,052 204,07075 Other Non-Programmed Costs 0 076 Total Expenditures 4,968,228 4,625,46277 Less: Capital Expenditures 417,080 51,38078 Less: Debt Service 200,052 204,07079 Total Current Expenditures 4,351,095 4,370,01280 Exclusions from Current Expenditures 121,05781 Net Current Expenditures 4,230,038
82 Per Pupil Expenditures 10,221
83 Personnel - Non-Federal Certified Clsrm FTEs 42.6584 Avg Salary - Non-Fed Certified Clsrm FTEs 39,81885 Personnel - Non-Federal Certified FTEs 45.1786 Avg Salary - Non-Fed Certified FTEs 40,49287.1 Legal Balance (funds 1-2-4) 2,884,02587.2 Categorical Fund Balance 39,20787.3 Deposits with Paying Agents (QZAB) 087.4 Net Legal Bal (Excl Cat & QZAB) 2,844,81888 Building Fund Balance (fund 3) 089 Capital Outlay Fund Balance (fund 5) 0
Jan 30, 2012 - 217 - 9:35:29 AM

Annual Statistical Report 2010-2011
County: VAN BUREN SOUTH SIDE SCH DIST(VANBUREN) LEA:7105000
2010-2011 2011-2012Actual Budget
1 Area in Square Miles 1112 ADA 4803 ADA pct Change over 5 Yrs. 1%4 4 QTR ADM 5115 Prior Year 3QTR ADM 5256 Assessment 178,275,5387 M&O Mills 26.708 URT Mills 25.009 M&O Mills in Excess of URT 1.7010 Dedicated M&O Mills 0.0011 Debt Service Mills 14.0012 Total Mills 40.7013 Total Debt Bond/Non-Bond 2,531,763
State and Local Revenue:14 Property Tax Receipts (Including URT) 5,164,624 2,928,00015 Other Local Receipts 360,409 189,44416 Revenue from Intermediate Sources 0 017.1 Foundation Funding (Excl URT) 212,771 017.2 Tax Collection Rate Guarantee 84,944 018 Student Growth Funding 0 019 Declining Enrollment Funding 0 38,64620 Consolidation Incentive/Assistance 0 021 Isolated Funding 0 022 Supplemental Millage Incentive Funding 26,681 21,32523 Other Unrestricted State Funding 0 024 Total Unrestricted Revenue from State and
Local Sources 5,849,429 3,177,415
Restricted Revenue from State Sources:25 Adult Education 0 0
Regular Education:26 Professional Development 21,709 21,71127 Other Regular Education 39,137 12,466
Special Education:28 Gifted & Talented 200 029 Alternative Learning Environment (ALE) 38,355 12,31130 English Language Learner (ELL) 0 031 National School Lunch Act (NSLA) 146,320 138,64432 Other Special Education 50,034 53,07633 Workforce Education 0 034 School Food Service 1,988 2,00035 Educational Service Cooperatives 0 036 Early Childhood Programs 97,200 97,20037 Magnet School Programs 0 038 Other Non-Instructional Programs 1,066,053 4,86639 Total Restricted Revenue from State Sources 1,460,995 342,27440 Total Restricted Revenue from Federal
Sources 943,788 619,310
Other Sources of Funds:41 Financing Sources 0 042 Balances from Consolidated/Annexed District 0 043 Indirect Cost Reimbursement 0 044 Gains and Losses from Sale of Fixed Assets 0 045 Compensation for Loss of Fixed Assets 0 046 Other 0 047 Total Other Sources of Funds 0 048 Total Revenue and Other Sources of Funds
from All Sources 8,254,212 4,138,999
2010-2011 2011-2012Actual Budget
CURRENT EXPENDITURESInstruction:
49 Regular Instruction 2,200,639 2,098,31450 Special Education 502,932 533,01351 Workforce Education 182,716 192,18352 Adult Education 0 053 Compensatory Education 120,811 135,07254 Other 106,650 200,17255 Total Instruction 3,113,748 3,158,755
District Level Support:56 General Administration 234,716 202,00257 Central Services 103,155 123,24758 Maintenance & Operations of Plant 576,864 743,84359 Student Transportation 210,406 466,91760 Other District Level Support Services 17,043 7,00061 Total District Support Services 1,142,185 1,543,009
School Level Support:62 Student Support Services 298,489 358,80363 Instructional Staff Support Services 234,970 293,06464 School Administration 269,704 295,12965 Total District Support Services 803,164 946,997
Non-Instructional Services:66 Food Service Operations 239,730 341,89067 Other Enterprise Operations 20,887 068 Community Operations 44,495 34,48169 Other Non-Instructional Services 0 070 Total Non-Instructional Services 305,111 376,37171 Facilities Acquisition and Construction 2,687,401 127,25072 Debt Service 166,452 151,65675 Other Non-Programmed Costs 97,791 076 Total Expenditures 8,315,851 6,304,03877 Less: Capital Expenditures 2,730,252 427,47578 Less: Debt Service 166,452 151,65679 Total Current Expenditures 5,419,147 5,724,90780 Exclusions from Current Expenditures 437,13081 Net Current Expenditures 4,982,018
82 Per Pupil Expenditures 10,377
83 Personnel - Non-Federal Certified Clsrm FTEs 46.6884 Avg Salary - Non-Fed Certified Clsrm FTEs 39,57485 Personnel - Non-Federal Certified FTEs 48.9586 Avg Salary - Non-Fed Certified FTEs 41,37687.1 Legal Balance (funds 1-2-4) 4,450,52387.2 Categorical Fund Balance 22,88287.3 Deposits with Paying Agents (QZAB) 087.4 Net Legal Bal (Excl Cat & QZAB) 4,427,64288 Building Fund Balance (fund 3) 162,69389 Capital Outlay Fund Balance (fund 5) 0
Jan 30, 2012 - 218 - 9:35:29 AM

Annual Statistical Report 2010-2011
County: WASHINGTON ELKINS SCHOOL DISTRICT LEA:7201000
2010-2011 2011-2012Actual Budget
1 Area in Square Miles 1012 ADA 1,1043 ADA pct Change over 5 Yrs. 3%4 4 QTR ADM 1,1515 Prior Year 3QTR ADM 1,1646 Assessment 55,493,6407 M&O Mills 25.008 URT Mills 25.009 M&O Mills in Excess of URT 0.0010 Dedicated M&O Mills 0.0011 Debt Service Mills 14.6012 Total Mills 39.6013 Total Debt Bond/Non-Bond 6,676,727
State and Local Revenue:14 Property Tax Receipts (Including URT) 2,042,560 2,419,50515 Other Local Receipts 459,304 193,44516 Revenue from Intermediate Sources 0 017.1 Foundation Funding (Excl URT) 5,673,347 5,721,73417.2 Tax Collection Rate Guarantee 45,419 25,00018 Student Growth Funding 0 019 Declining Enrollment Funding 0 34,52920 Consolidation Incentive/Assistance 0 021 Isolated Funding 0 022 Supplemental Millage Incentive Funding 27,221 21,77723 Other Unrestricted State Funding 370 024 Total Unrestricted Revenue from State and
Local Sources 8,248,221 8,415,990
Restricted Revenue from State Sources:25 Adult Education 0 0
Regular Education:26 Professional Development 48,135 48,84527 Other Regular Education 4,000 5,600
Special Education:28 Gifted & Talented 2,838 60029 Alternative Learning Environment (ALE) 44,002 39,04630 English Language Learner (ELL) 13,771 031 National School Lunch Act (NSLA) 256,432 278,80632 Other Special Education 5,730 5,65033 Workforce Education 0 034 School Food Service 3,429 2,00035 Educational Service Cooperatives 0 036 Early Childhood Programs 0 037 Magnet School Programs 0 038 Other Non-Instructional Programs 131,427 123,55539 Total Restricted Revenue from State Sources 509,764 504,10240 Total Restricted Revenue from Federal
Sources 1,050,002 956,487
Other Sources of Funds:41 Financing Sources 0 930,00042 Balances from Consolidated/Annexed District 0 043 Indirect Cost Reimbursement 0 044 Gains and Losses from Sale of Fixed Assets 0 045 Compensation for Loss of Fixed Assets 0 046 Other 0 047 Total Other Sources of Funds 0 930,00048 Total Revenue and Other Sources of Funds
from All Sources 9,807,987 10,806,579
2010-2011 2011-2012Actual Budget
CURRENT EXPENDITURESInstruction:
49 Regular Instruction 3,463,012 3,324,82050 Special Education 731,813 856,89251 Workforce Education 319,329 303,74052 Adult Education 0 053 Compensatory Education 150,926 87,32854 Other 388,520 335,21255 Total Instruction 5,053,600 4,907,991
District Level Support:56 General Administration 148,801 268,83157 Central Services 300,554 301,92958 Maintenance & Operations of Plant 750,498 802,13159 Student Transportation 586,375 504,15760 Other District Level Support Services 50,121 36,94861 Total District Support Services 1,836,348 1,913,996
School Level Support:62 Student Support Services 336,150 340,28163 Instructional Staff Support Services 592,318 1,599,57064 School Administration 492,777 528,84865 Total District Support Services 1,421,245 2,468,699
Non-Instructional Services:66 Food Service Operations 502,938 519,51767 Other Enterprise Operations 0 068 Community Operations 48 1,10069 Other Non-Instructional Services 0 070 Total Non-Instructional Services 502,986 520,61771 Facilities Acquisition and Construction 4,804 5,00072 Debt Service 494,135 493,71675 Other Non-Programmed Costs 0 076 Total Expenditures 9,313,117 10,310,01977 Less: Capital Expenditures 121,442 70,50078 Less: Debt Service 494,135 493,71679 Total Current Expenditures 8,697,540 9,745,80380 Exclusions from Current Expenditures 450,52981 Net Current Expenditures 8,247,010
82 Per Pupil Expenditures 7,470
83 Personnel - Non-Federal Certified Clsrm FTEs 82.7084 Avg Salary - Non-Fed Certified Clsrm FTEs 41,97785 Personnel - Non-Federal Certified FTEs 88.9786 Avg Salary - Non-Fed Certified FTEs 43,76987.1 Legal Balance (funds 1-2-4) 424,34487.2 Categorical Fund Balance 8,53087.3 Deposits with Paying Agents (QZAB) 087.4 Net Legal Bal (Excl Cat & QZAB) 415,81588 Building Fund Balance (fund 3) 793,75589 Capital Outlay Fund Balance (fund 5) 0
Jan 30, 2012 - 219 - 9:35:29 AM

Annual Statistical Report 2010-2011
County: WASHINGTON FARMINGTON SCHOOL DISTRICT LEA:7202000
2010-2011 2011-2012Actual Budget
1 Area in Square Miles 332 ADA 2,0583 ADA pct Change over 5 Yrs. 5%4 4 QTR ADM 2,1785 Prior Year 3QTR ADM 2,1336 Assessment 139,951,3267 M&O Mills 25.008 URT Mills 25.009 M&O Mills in Excess of URT 0.0010 Dedicated M&O Mills 0.0011 Debt Service Mills 17.6012 Total Mills 42.6013 Total Debt Bond/Non-Bond 20,349,255
State and Local Revenue:14 Property Tax Receipts (Including URT) 6,190,552 6,903,52215 Other Local Receipts 881,390 481,21016 Revenue from Intermediate Sources 0 017.1 Foundation Funding (Excl URT) 9,186,232 9,956,01917.2 Tax Collection Rate Guarantee 13,983 018 Student Growth Funding 273,083 019 Declining Enrollment Funding 0 020 Consolidation Incentive/Assistance 0 021 Isolated Funding 0 022 Supplemental Millage Incentive Funding 0 023 Other Unrestricted State Funding 0 024 Total Unrestricted Revenue from State and
Local Sources 16,545,240 17,340,751
Restricted Revenue from State Sources:25 Adult Education 0 0
Regular Education:26 Professional Development 88,222 92,32627 Other Regular Education 2,983 13,231
Special Education:28 Gifted & Talented 2,760 1,40029 Alternative Learning Environment (ALE) 105,719 75,68830 English Language Learner (ELL) 16,408 16,45031 National School Lunch Act (NSLA) 416,144 417,95632 Other Special Education 12,518 033 Workforce Education 11,105 17,60434 School Food Service 7,142 8,00035 Educational Service Cooperatives 0 036 Early Childhood Programs 0 037 Magnet School Programs 0 038 Other Non-Instructional Programs 193,154 221,81439 Total Restricted Revenue from State Sources 856,156 864,46940 Total Restricted Revenue from Federal
Sources 1,956,680 1,334,042
Other Sources of Funds:41 Financing Sources 717,676 042 Balances from Consolidated/Annexed District 0 043 Indirect Cost Reimbursement 0 044 Gains and Losses from Sale of Fixed Assets 2,331 045 Compensation for Loss of Fixed Assets 0 046 Other 0 047 Total Other Sources of Funds 720,007 048 Total Revenue and Other Sources of Funds
from All Sources 20,078,082 19,539,262
2010-2011 2011-2012Actual Budget
CURRENT EXPENDITURESInstruction:
49 Regular Instruction 6,994,458 6,412,71550 Special Education 1,290,475 1,261,04251 Workforce Education 523,419 615,21752 Adult Education 0 053 Compensatory Education 229,850 248,80154 Other 1,183,715 1,197,38055 Total Instruction 10,221,916 9,735,154
District Level Support:56 General Administration 552,591 535,13557 Central Services 291,566 328,69458 Maintenance & Operations of Plant 1,643,490 1,678,50059 Student Transportation 720,130 601,05160 Other District Level Support Services 106,658 91,14261 Total District Support Services 3,314,436 3,234,524
School Level Support:62 Student Support Services 703,346 660,16963 Instructional Staff Support Services 1,112,647 1,138,83864 School Administration 972,693 953,15965 Total District Support Services 2,788,686 2,752,166
Non-Instructional Services:66 Food Service Operations 955,463 908,31967 Other Enterprise Operations 3,490 068 Community Operations 0 1,50069 Other Non-Instructional Services 0 070 Total Non-Instructional Services 958,953 909,81971 Facilities Acquisition and Construction 419,369 409,17872 Debt Service 1,454,615 1,322,35575 Other Non-Programmed Costs 95,938 076 Total Expenditures 19,253,912 18,363,19677 Less: Capital Expenditures 571,714 432,87878 Less: Debt Service 1,454,615 1,322,35579 Total Current Expenditures 17,227,583 16,607,96380 Exclusions from Current Expenditures 897,12781 Net Current Expenditures 16,330,456
82 Per Pupil Expenditures 7,935
83 Personnel - Non-Federal Certified Clsrm FTEs 153.7484 Avg Salary - Non-Fed Certified Clsrm FTEs 45,90185 Personnel - Non-Federal Certified FTEs 166.5686 Avg Salary - Non-Fed Certified FTEs 48,41387.1 Legal Balance (funds 1-2-4) 718,67987.2 Categorical Fund Balance 39,31787.3 Deposits with Paying Agents (QZAB) 087.4 Net Legal Bal (Excl Cat & QZAB) 679,36288 Building Fund Balance (fund 3) 2,198,41189 Capital Outlay Fund Balance (fund 5) 0
Jan 30, 2012 - 220 - 9:35:29 AM

Annual Statistical Report 2010-2011
County: WASHINGTON FAYETTEVILLE SCHOOL DISTRICT LEA:7203000
2010-2011 2011-2012Actual Budget
1 Area in Square Miles 1132 ADA 8,3883 ADA pct Change over 5 Yrs. 7%4 4 QTR ADM 8,8395 Prior Year 3QTR ADM 8,5416 Assessment 1,284,990,3947 M&O Mills 25.008 URT Mills 25.009 M&O Mills in Excess of URT 0.0010 Dedicated M&O Mills 0.0011 Debt Service Mills 20.6512 Total Mills 45.6513 Total Debt Bond/Non-Bond 157,509,702
State and Local Revenue:14 Property Tax Receipts (Including URT) 55,376,322 58,232,70115 Other Local Receipts 3,005,692 448,00016 Revenue from Intermediate Sources 0 017.1 Foundation Funding (Excl URT) 18,935,683 22,856,68417.2 Tax Collection Rate Guarantee 0 018 Student Growth Funding 1,978,334 019 Declining Enrollment Funding 0 020 Consolidation Incentive/Assistance 0 021 Isolated Funding 0 022 Supplemental Millage Incentive Funding 0 023 Other Unrestricted State Funding 0 024 Total Unrestricted Revenue from State and
Local Sources 79,296,030 81,537,385
Restricted Revenue from State Sources:25 Adult Education 433,287 458,851
Regular Education:26 Professional Development 353,252 374,81827 Other Regular Education 82,223 0
Special Education:28 Gifted & Talented 42,150 029 Alternative Learning Environment (ALE) 463,466 485,46230 English Language Learner (ELL) 197,189 85,62731 National School Lunch Act (NSLA) 1,616,960 1,784,15632 Other Special Education 777,833 033 Workforce Education 164,671 034 School Food Service 25,092 25,00035 Educational Service Cooperatives 0 036 Early Childhood Programs 577,368 037 Magnet School Programs 0 038 Other Non-Instructional Programs 388,976 198,18039 Total Restricted Revenue from State Sources 5,122,467 3,412,09440 Total Restricted Revenue from Federal
Sources 16,635,895 11,925,427
Other Sources of Funds:41 Financing Sources 31,843,216 042 Balances from Consolidated/Annexed District 0 043 Indirect Cost Reimbursement 0 044 Gains and Losses from Sale of Fixed Assets 0 045 Compensation for Loss of Fixed Assets 0 046 Other 0 047 Total Other Sources of Funds 31,843,216 048 Total Revenue and Other Sources of Funds
from All Sources 132,897,608 96,874,905
2010-2011 2011-2012Actual Budget
CURRENT EXPENDITURESInstruction:
49 Regular Instruction 39,777,677 34,646,88650 Special Education 7,885,442 7,807,23751 Workforce Education 1,024,212 966,13652 Adult Education 637,728 733,69053 Compensatory Education 2,047,245 1,581,25754 Other 1,972,779 1,900,92455 Total Instruction 53,345,084 47,636,130
District Level Support:56 General Administration 1,460,490 6,594,20957 Central Services 2,772,733 3,373,85958 Maintenance & Operations of Plant 7,540,271 6,694,60459 Student Transportation 2,688,809 3,190,32960 Other District Level Support Services 20,171 35,00061 Total District Support Services 14,482,474 19,888,001
School Level Support:62 Student Support Services 4,111,810 3,483,40663 Instructional Staff Support Services 9,166,807 10,147,10564 School Administration 4,286,937 4,313,27665 Total District Support Services 17,565,554 17,943,786
Non-Instructional Services:66 Food Service Operations 3,581,094 3,603,15867 Other Enterprise Operations 0 068 Community Operations 132,387 166,90969 Other Non-Instructional Services 0 070 Total Non-Instructional Services 3,713,481 3,770,06771 Facilities Acquisition and Construction 18,777,727 23,129,75972 Debt Service 7,765,633 13,467,84075 Other Non-Programmed Costs 0 076 Total Expenditures 115,649,954 125,835,58377 Less: Capital Expenditures 19,895,805 24,406,56978 Less: Debt Service 7,765,633 13,467,84079 Total Current Expenditures 87,988,516 87,961,17480 Exclusions from Current Expenditures 1,309,00781 Net Current Expenditures 86,679,509
82 Per Pupil Expenditures 10,333
83 Personnel - Non-Federal Certified Clsrm FTEs 582.4484 Avg Salary - Non-Fed Certified Clsrm FTEs 57,27985 Personnel - Non-Federal Certified FTEs 631.7386 Avg Salary - Non-Fed Certified FTEs 59,38487.1 Legal Balance (funds 1-2-4) 85,833,05887.2 Categorical Fund Balance 430,79787.3 Deposits with Paying Agents (QZAB) 3,253,09487.4 Net Legal Bal (Excl Cat & QZAB) 82,149,16788 Building Fund Balance (fund 3) 55,68389 Capital Outlay Fund Balance (fund 5) 2,497,991
Jan 30, 2012 - 221 - 9:35:29 AM

Annual Statistical Report 2010-2011
County: WASHINGTON GREENLAND SCHOOL DISTRICT LEA:7204000
2010-2011 2011-2012Actual Budget
1 Area in Square Miles 1362 ADA 7603 ADA pct Change over 5 Yrs. (15%)4 4 QTR ADM 7945 Prior Year 3QTR ADM 8226 Assessment 79,663,1157 M&O Mills 25.008 URT Mills 25.009 M&O Mills in Excess of URT 0.0010 Dedicated M&O Mills 0.0011 Debt Service Mills 14.5012 Total Mills 39.5013 Total Debt Bond/Non-Bond 6,923,361
State and Local Revenue:14 Property Tax Receipts (Including URT) 3,191,777 3,011,27015 Other Local Receipts 466,973 401,32316 Revenue from Intermediate Sources 10,180 10317.1 Foundation Funding (Excl URT) 2,933,493 2,884,29017.2 Tax Collection Rate Guarantee 0 018 Student Growth Funding 0 019 Declining Enrollment Funding 0 96,64520 Consolidation Incentive/Assistance 0 021 Isolated Funding 0 022 Supplemental Millage Incentive Funding 29,394 23,51523 Other Unrestricted State Funding 0 024 Total Unrestricted Revenue from State and
Local Sources 6,631,816 6,417,146
Restricted Revenue from State Sources:25 Adult Education 0 0
Regular Education:26 Professional Development 33,983 33,48727 Other Regular Education 8,894 4,975
Special Education:28 Gifted & Talented 200 20029 Alternative Learning Environment (ALE) 31,204 23,54430 English Language Learner (ELL) 5,567 6,74631 National School Lunch Act (NSLA) 213,776 238,83232 Other Special Education 3,366 3,36633 Workforce Education 0 1,08334 School Food Service 2,735 3,00035 Educational Service Cooperatives 0 036 Early Childhood Programs 0 037 Magnet School Programs 0 038 Other Non-Instructional Programs 293,430 31,09239 Total Restricted Revenue from State Sources 593,155 346,32540 Total Restricted Revenue from Federal
Sources 1,466,358 1,100,168
Other Sources of Funds:41 Financing Sources 0 042 Balances from Consolidated/Annexed District 0 043 Indirect Cost Reimbursement 0 044 Gains and Losses from Sale of Fixed Assets 6,314 045 Compensation for Loss of Fixed Assets 0 046 Other 0 047 Total Other Sources of Funds 6,314 048 Total Revenue and Other Sources of Funds
from All Sources 8,697,643 7,863,639
2010-2011 2011-2012Actual Budget
CURRENT EXPENDITURESInstruction:
49 Regular Instruction 2,684,678 2,825,98650 Special Education 587,647 516,30351 Workforce Education 351,588 325,06752 Adult Education 0 053 Compensatory Education 171,519 191,34954 Other 333,119 347,67355 Total Instruction 4,128,550 4,206,379
District Level Support:56 General Administration 250,215 279,90957 Central Services 210,956 200,05358 Maintenance & Operations of Plant 649,042 850,60359 Student Transportation 366,861 328,79560 Other District Level Support Services 37,621 34,48161 Total District Support Services 1,514,696 1,693,841
School Level Support:62 Student Support Services 372,336 374,78163 Instructional Staff Support Services 548,801 555,46664 School Administration 376,477 381,29565 Total District Support Services 1,297,614 1,311,543
Non-Instructional Services:66 Food Service Operations 380,347 396,07467 Other Enterprise Operations 0 068 Community Operations 2,571 19,14669 Other Non-Instructional Services 0 070 Total Non-Instructional Services 382,918 415,22171 Facilities Acquisition and Construction 865,544 16,69472 Debt Service 409,140 433,81475 Other Non-Programmed Costs 0 076 Total Expenditures 8,598,461 8,077,49177 Less: Capital Expenditures 1,074,838 97,25678 Less: Debt Service 409,140 433,81479 Total Current Expenditures 7,114,484 7,546,42180 Exclusions from Current Expenditures 277,29681 Net Current Expenditures 6,837,188
82 Per Pupil Expenditures 8,996
83 Personnel - Non-Federal Certified Clsrm FTEs 63.8484 Avg Salary - Non-Fed Certified Clsrm FTEs 40,42485 Personnel - Non-Federal Certified FTEs 69.3786 Avg Salary - Non-Fed Certified FTEs 43,33087.1 Legal Balance (funds 1-2-4) 2,637,69887.2 Categorical Fund Balance 18,83887.3 Deposits with Paying Agents (QZAB) 286,53387.4 Net Legal Bal (Excl Cat & QZAB) 2,332,32788 Building Fund Balance (fund 3) 272,65389 Capital Outlay Fund Balance (fund 5) 0
Jan 30, 2012 - 222 - 9:35:29 AM

Annual Statistical Report 2010-2011
County: WASHINGTON LINCOLN SCHOOL DISTRICT LEA:7205000
2010-2011 2011-2012Actual Budget
1 Area in Square Miles 1462 ADA 1,1883 ADA pct Change over 5 Yrs. 1%4 4 QTR ADM 1,2725 Prior Year 3QTR ADM 1,3036 Assessment 66,959,9037 M&O Mills 25.008 URT Mills 25.009 M&O Mills in Excess of URT 0.0010 Dedicated M&O Mills 0.0011 Debt Service Mills 17.7012 Total Mills 42.7013 Total Debt Bond/Non-Bond 16,475,000
State and Local Revenue:14 Property Tax Receipts (Including URT) 2,660,776 2,978,63215 Other Local Receipts 1,167,246 808,00216 Revenue from Intermediate Sources 286 017.1 Foundation Funding (Excl URT) 6,155,435 6,278,06717.2 Tax Collection Rate Guarantee 37,227 018 Student Growth Funding 12,724 019 Declining Enrollment Funding 0 44,91320 Consolidation Incentive/Assistance 0 021 Isolated Funding 0 022 Supplemental Millage Incentive Funding 42,818 34,25423 Other Unrestricted State Funding 3,000 024 Total Unrestricted Revenue from State and
Local Sources 10,079,512 10,143,868
Restricted Revenue from State Sources:25 Adult Education 0 1,000
Regular Education:26 Professional Development 53,912 54,62227 Other Regular Education 520,531 1,200
Special Education:28 Gifted & Talented 200 029 Alternative Learning Environment (ALE) 136,842 139,89430 English Language Learner (ELL) 31,644 31,64431 National School Lunch Act (NSLA) 613,714 775,87332 Other Special Education 5,340 033 Workforce Education 29,334 109,30034 School Food Service 4,446 4,50035 Educational Service Cooperatives 0 036 Early Childhood Programs 206,522 194,40037 Magnet School Programs 0 038 Other Non-Instructional Programs 1,230,415 5,426,78539 Total Restricted Revenue from State Sources 2,832,900 6,739,21840 Total Restricted Revenue from Federal
Sources 2,538,702 1,912,588
Other Sources of Funds:41 Financing Sources 9,307,169 925,00042 Balances from Consolidated/Annexed District 0 043 Indirect Cost Reimbursement 2,892 044 Gains and Losses from Sale of Fixed Assets 0 045 Compensation for Loss of Fixed Assets 0 046 Other 0 047 Total Other Sources of Funds 9,310,061 925,00048 Total Revenue and Other Sources of Funds
from All Sources 24,761,176 19,720,675
2010-2011 2011-2012Actual Budget
CURRENT EXPENDITURESInstruction:
49 Regular Instruction 5,063,932 4,695,97550 Special Education 828,515 872,22751 Workforce Education 354,133 434,31552 Adult Education 0 1,00053 Compensatory Education 426,371 452,29954 Other 433,850 456,17555 Total Instruction 7,106,801 6,911,991
District Level Support:56 General Administration 419,417 459,03757 Central Services 295,014 337,43758 Maintenance & Operations of Plant 1,182,421 1,034,61959 Student Transportation 497,371 470,71260 Other District Level Support Services 80,586 48,37061 Total District Support Services 2,474,809 2,350,174
School Level Support:62 Student Support Services 809,802 777,60163 Instructional Staff Support Services 1,946,567 1,909,03664 School Administration 676,996 647,52665 Total District Support Services 3,433,364 3,334,163
Non-Instructional Services:66 Food Service Operations 752,512 701,96767 Other Enterprise Operations 113 068 Community Operations 94,708 101,33269 Other Non-Instructional Services 0 070 Total Non-Instructional Services 847,333 803,29871 Facilities Acquisition and Construction 2,264,751 13,638,42672 Debt Service 754,515 919,67575 Other Non-Programmed Costs 215,178 076 Total Expenditures 17,096,751 27,957,72777 Less: Capital Expenditures 2,543,082 13,719,72178 Less: Debt Service 754,515 919,67579 Total Current Expenditures 13,799,154 13,318,33180 Exclusions from Current Expenditures 905,47181 Net Current Expenditures 12,893,684
82 Per Pupil Expenditures 10,857
83 Personnel - Non-Federal Certified Clsrm FTEs 83.4684 Avg Salary - Non-Fed Certified Clsrm FTEs 50,43785 Personnel - Non-Federal Certified FTEs 95.8486 Avg Salary - Non-Fed Certified FTEs 53,47887.1 Legal Balance (funds 1-2-4) 1,796,33387.2 Categorical Fund Balance 22,36787.3 Deposits with Paying Agents (QZAB) 087.4 Net Legal Bal (Excl Cat & QZAB) 1,773,96788 Building Fund Balance (fund 3) 9,212,60589 Capital Outlay Fund Balance (fund 5) 0
Jan 30, 2012 - 223 - 9:35:29 AM

Annual Statistical Report 2010-2011
County: WASHINGTON PRAIRIE GROVE SCHOOL DISTRICT LEA:7206000
2010-2011 2011-2012Actual Budget
1 Area in Square Miles 1062 ADA 1,6843 ADA pct Change over 5 Yrs. 12%4 4 QTR ADM 1,7475 Prior Year 3QTR ADM 1,6986 Assessment 114,808,4887 M&O Mills 25.008 URT Mills 25.009 M&O Mills in Excess of URT 0.0010 Dedicated M&O Mills 0.0011 Debt Service Mills 11.9012 Total Mills 36.9013 Total Debt Bond/Non-Bond 11,625,000
State and Local Revenue:14 Property Tax Receipts (Including URT) 4,271,373 4,650,00015 Other Local Receipts 631,296 333,00016 Revenue from Intermediate Sources 372 22817.1 Foundation Funding (Excl URT) 7,316,368 7,913,31717.2 Tax Collection Rate Guarantee 0 018 Student Growth Funding 336,271 61,44019 Declining Enrollment Funding 0 020 Consolidation Incentive/Assistance 0 021 Isolated Funding 0 022 Supplemental Millage Incentive Funding 0 023 Other Unrestricted State Funding 0 024 Total Unrestricted Revenue from State and
Local Sources 12,555,680 12,957,985
Restricted Revenue from State Sources:25 Adult Education 0 0
Regular Education:26 Professional Development 70,221 74,01527 Other Regular Education 41,877 8,500
Special Education:28 Gifted & Talented 750 029 Alternative Learning Environment (ALE) 83,413 72,08230 English Language Learner (ELL) 14,357 14,94531 National School Lunch Act (NSLA) 368,528 404,80032 Other Special Education 22,549 033 Workforce Education 7,313 034 School Food Service 5,725 5,60035 Educational Service Cooperatives 0 036 Early Childhood Programs 0 037 Magnet School Programs 0 038 Other Non-Instructional Programs 126,012 138,70339 Total Restricted Revenue from State Sources 740,744 718,64540 Total Restricted Revenue from Federal
Sources 1,778,123 1,268,114
Other Sources of Funds:41 Financing Sources 5,111 042 Balances from Consolidated/Annexed District 0 043 Indirect Cost Reimbursement 0 044 Gains and Losses from Sale of Fixed Assets 0 045 Compensation for Loss of Fixed Assets 0 046 Other 0 047 Total Other Sources of Funds 5,111 048 Total Revenue and Other Sources of Funds
from All Sources 15,079,659 14,944,744
2010-2011 2011-2012Actual Budget
CURRENT EXPENDITURESInstruction:
49 Regular Instruction 5,572,532 5,495,97750 Special Education 913,037 955,06451 Workforce Education 527,125 513,50652 Adult Education 0 053 Compensatory Education 194,905 233,53554 Other 840,674 941,06955 Total Instruction 8,048,273 8,139,150
District Level Support:56 General Administration 415,058 422,48657 Central Services 457,650 550,68158 Maintenance & Operations of Plant 1,167,648 1,251,78759 Student Transportation 657,536 562,30060 Other District Level Support Services 84,049 107,11961 Total District Support Services 2,781,942 2,894,373
School Level Support:62 Student Support Services 550,077 559,02063 Instructional Staff Support Services 936,501 802,22464 School Administration 770,620 791,43465 Total District Support Services 2,257,199 2,152,678
Non-Instructional Services:66 Food Service Operations 726,145 683,60067 Other Enterprise Operations 0 068 Community Operations 26,900 21,34269 Other Non-Instructional Services 0 070 Total Non-Instructional Services 753,045 704,94271 Facilities Acquisition and Construction 355,115 072 Debt Service 524,235 789,56775 Other Non-Programmed Costs 15,333 076 Total Expenditures 14,735,142 14,680,71077 Less: Capital Expenditures 601,939 287,75578 Less: Debt Service 524,235 789,56779 Total Current Expenditures 13,608,968 13,603,38880 Exclusions from Current Expenditures 507,49581 Net Current Expenditures 13,101,473
82 Per Pupil Expenditures 7,778
83 Personnel - Non-Federal Certified Clsrm FTEs 115.9984 Avg Salary - Non-Fed Certified Clsrm FTEs 44,70385 Personnel - Non-Federal Certified FTEs 125.9886 Avg Salary - Non-Fed Certified FTEs 47,31687.1 Legal Balance (funds 1-2-4) 1,650,00087.2 Categorical Fund Balance 31,92487.3 Deposits with Paying Agents (QZAB) 087.4 Net Legal Bal (Excl Cat & QZAB) 1,618,07688 Building Fund Balance (fund 3) 571,84389 Capital Outlay Fund Balance (fund 5) 0
Jan 30, 2012 - 224 - 9:35:29 AM

Annual Statistical Report 2010-2011
County: WASHINGTON SPRINGDALE SCHOOL DISTRICT LEA:7207000
2010-2011 2011-2012Actual Budget
1 Area in Square Miles 1842 ADA 17,5923 ADA pct Change over 5 Yrs. 19%4 4 QTR ADM 18,6785 Prior Year 3QTR ADM 18,0886 Assessment 1,415,539,2437 M&O Mills 25.008 URT Mills 25.009 M&O Mills in Excess of URT 0.0010 Dedicated M&O Mills 0.0011 Debt Service Mills 13.6012 Total Mills 38.6013 Total Debt Bond/Non-Bond 150,285,000
State and Local Revenue:14 Property Tax Receipts (Including URT) 56,516,021 58,882,00015 Other Local Receipts 7,827,078 2,193,00016 Revenue from Intermediate Sources 6,420 017.1 Foundation Funding (Excl URT) 71,882,262 80,301,37317.2 Tax Collection Rate Guarantee 0 018 Student Growth Funding 3,584,694 019 Declining Enrollment Funding 0 020 Consolidation Incentive/Assistance 0 021 Isolated Funding 0 022 Supplemental Millage Incentive Funding 0 023 Other Unrestricted State Funding 0 024 Total Unrestricted Revenue from State and
Local Sources 139,816,475 141,376,373
Restricted Revenue from State Sources:25 Adult Education 0 0
Regular Education:26 Professional Development 748,114 793,21927 Other Regular Education 235,747 93,200
Special Education:28 Gifted & Talented 29,653 029 Alternative Learning Environment (ALE) 1,076,532 1,474,08630 English Language Learner (ELL) 2,332,280 2,380,04031 National School Lunch Act (NSLA) 5,659,909 6,309,57032 Other Special Education 2,331,226 2,174,73633 Workforce Education 83,092 203,95634 School Food Service 66,936 035 Educational Service Cooperatives 0 036 Early Childhood Programs 2,631,315 2,624,40037 Magnet School Programs 0 038 Other Non-Instructional Programs 5,101,225 1,127,51239 Total Restricted Revenue from State Sources 20,296,029 17,180,71940 Total Restricted Revenue from Federal
Sources 24,318,021 19,438,380
Other Sources of Funds:41 Financing Sources 12,629,312 042 Balances from Consolidated/Annexed District 0 043 Indirect Cost Reimbursement 96,401 044 Gains and Losses from Sale of Fixed Assets 526 045 Compensation for Loss of Fixed Assets 0 1,290,00046 Other 0 047 Total Other Sources of Funds 12,726,239 1,290,00048 Total Revenue and Other Sources of Funds
from All Sources 197,156,764 179,285,472
2010-2011 2011-2012Actual Budget
CURRENT EXPENDITURESInstruction:
49 Regular Instruction 66,545,165 66,601,46650 Special Education 10,913,923 11,100,04251 Workforce Education 4,847,324 4,923,51752 Adult Education 0 053 Compensatory Education 2,399,765 3,192,09654 Other 11,717,606 11,928,26755 Total Instruction 96,423,782 97,745,388
District Level Support:56 General Administration 1,910,784 1,873,68157 Central Services 2,722,025 2,533,25358 Maintenance & Operations of Plant 16,462,243 18,930,42559 Student Transportation 4,991,649 5,413,31260 Other District Level Support Services 228,431 111,28161 Total District Support Services 26,315,132 28,861,951
School Level Support:62 Student Support Services 6,888,341 6,851,41563 Instructional Staff Support Services 14,317,745 13,892,24464 School Administration 8,450,605 8,408,44165 Total District Support Services 29,656,691 29,152,100
Non-Instructional Services:66 Food Service Operations 8,599,990 7,911,96067 Other Enterprise Operations 69,001 068 Community Operations 40,674 38,31269 Other Non-Instructional Services 0 070 Total Non-Instructional Services 8,709,665 7,950,27271 Facilities Acquisition and Construction 19,977,036 959,98172 Debt Service 11,819,328 10,223,35375 Other Non-Programmed Costs 144,898 076 Total Expenditures 193,046,531 174,893,04477 Less: Capital Expenditures 22,365,500 2,226,27778 Less: Debt Service 11,819,328 10,223,35379 Total Current Expenditures 158,861,704 162,443,41480 Exclusions from Current Expenditures 7,967,21681 Net Current Expenditures 150,894,488
82 Per Pupil Expenditures 8,577
83 Personnel - Non-Federal Certified Clsrm FTEs 1,129.9184 Avg Salary - Non-Fed Certified Clsrm FTEs 56,35985 Personnel - Non-Federal Certified FTEs 1,229.5786 Avg Salary - Non-Fed Certified FTEs 58,67987.1 Legal Balance (funds 1-2-4) 14,057,42287.2 Categorical Fund Balance 353,00587.3 Deposits with Paying Agents (QZAB) 087.4 Net Legal Bal (Excl Cat & QZAB) 13,704,41788 Building Fund Balance (fund 3) 26,198,59789 Capital Outlay Fund Balance (fund 5) 0
Jan 30, 2012 - 225 - 9:35:29 AM

Annual Statistical Report 2010-2011
County: WASHINGTON WEST FORK SCHOOL DISTRICT LEA:7208000
2010-2011 2011-2012Actual Budget
1 Area in Square Miles 1312 ADA 1,1583 ADA pct Change over 5 Yrs. (1%)4 4 QTR ADM 1,2225 Prior Year 3QTR ADM 1,2466 Assessment 53,802,4637 M&O Mills 25.008 URT Mills 25.009 M&O Mills in Excess of URT 0.0010 Dedicated M&O Mills 0.0011 Debt Service Mills 13.6012 Total Mills 38.6013 Total Debt Bond/Non-Bond 6,070,000
State and Local Revenue:14 Property Tax Receipts (Including URT) 2,078,089 2,046,23215 Other Local Receipts 464,377 175,55016 Revenue from Intermediate Sources 273 017.1 Foundation Funding (Excl URT) 6,122,419 6,202,87817.2 Tax Collection Rate Guarantee 16,783 018 Student Growth Funding 0 019 Declining Enrollment Funding 36,499 59,41220 Consolidation Incentive/Assistance 0 021 Isolated Funding 0 022 Supplemental Millage Incentive Funding 45,014 36,01223 Other Unrestricted State Funding 0 024 Total Unrestricted Revenue from State and
Local Sources 8,763,453 8,520,084
Restricted Revenue from State Sources:25 Adult Education 0 0
Regular Education:26 Professional Development 51,523 59,27127 Other Regular Education 2,400 0
Special Education:28 Gifted & Talented 750 029 Alternative Learning Environment (ALE) 44,571 48,57930 English Language Learner (ELL) 0 031 National School Lunch Act (NSLA) 310,496 328,96032 Other Special Education 6,435 033 Workforce Education 1,625 034 School Food Service 4,675 5,00035 Educational Service Cooperatives 0 036 Early Childhood Programs 0 037 Magnet School Programs 0 038 Other Non-Instructional Programs 141,534 142,01839 Total Restricted Revenue from State Sources 564,009 583,82740 Total Restricted Revenue from Federal
Sources 1,688,094 1,095,178
Other Sources of Funds:41 Financing Sources 202,566 042 Balances from Consolidated/Annexed District 0 043 Indirect Cost Reimbursement 0 044 Gains and Losses from Sale of Fixed Assets 4,000 045 Compensation for Loss of Fixed Assets 0 046 Other 0 047 Total Other Sources of Funds 206,566 048 Total Revenue and Other Sources of Funds
from All Sources 11,222,123 10,199,089
2010-2011 2011-2012Actual Budget
CURRENT EXPENDITURESInstruction:
49 Regular Instruction 4,032,959 3,788,80450 Special Education 652,800 717,75851 Workforce Education 405,755 398,15552 Adult Education 0 053 Compensatory Education 362,974 314,80854 Other 387,725 392,34055 Total Instruction 5,842,214 5,611,865
District Level Support:56 General Administration 193,251 183,70457 Central Services 463,686 284,84658 Maintenance & Operations of Plant 863,568 891,13359 Student Transportation 665,127 535,64560 Other District Level Support Services 45,366 25,91761 Total District Support Services 2,230,999 1,921,245
School Level Support:62 Student Support Services 566,742 588,99963 Instructional Staff Support Services 443,182 565,87364 School Administration 451,385 426,32965 Total District Support Services 1,461,309 1,581,202
Non-Instructional Services:66 Food Service Operations 598,578 579,43267 Other Enterprise Operations 0 068 Community Operations 14,779 3,79869 Other Non-Instructional Services 0 070 Total Non-Instructional Services 613,357 583,22971 Facilities Acquisition and Construction 156,985 753,34072 Debt Service 317,452 452,36375 Other Non-Programmed Costs 0 076 Total Expenditures 10,622,316 10,903,24577 Less: Capital Expenditures 416,552 813,70478 Less: Debt Service 317,452 452,36379 Total Current Expenditures 9,888,312 9,637,17780 Exclusions from Current Expenditures 402,64381 Net Current Expenditures 9,485,669
82 Per Pupil Expenditures 8,189
83 Personnel - Non-Federal Certified Clsrm FTEs 86.6384 Avg Salary - Non-Fed Certified Clsrm FTEs 45,34285 Personnel - Non-Federal Certified FTEs 90.9186 Avg Salary - Non-Fed Certified FTEs 47,02487.1 Legal Balance (funds 1-2-4) 1,069,39787.2 Categorical Fund Balance 15,02387.3 Deposits with Paying Agents (QZAB) 087.4 Net Legal Bal (Excl Cat & QZAB) 1,054,37388 Building Fund Balance (fund 3) 843,91589 Capital Outlay Fund Balance (fund 5) 0
Jan 30, 2012 - 226 - 9:35:29 AM

Annual Statistical Report 2010-2011
County: WHITE BALD KNOB SCHOOL DISTRICT LEA:7301000
2010-2011 2011-2012Actual Budget
1 Area in Square Miles 1872 ADA 1,2203 ADA pct Change over 5 Yrs. (1%)4 4 QTR ADM 1,2915 Prior Year 3QTR ADM 1,3226 Assessment 81,849,2437 M&O Mills 25.008 URT Mills 25.009 M&O Mills in Excess of URT 0.0010 Dedicated M&O Mills 0.0011 Debt Service Mills 13.5012 Total Mills 38.5013 Total Debt Bond/Non-Bond 8,044,251
State and Local Revenue:14 Property Tax Receipts (Including URT) 2,679,780 2,827,57515 Other Local Receipts 798,988 820,60816 Revenue from Intermediate Sources 5,959 5,89717.1 Foundation Funding (Excl URT) 6,176,175 5,818,02017.2 Tax Collection Rate Guarantee 36,148 018 Student Growth Funding 0 019 Declining Enrollment Funding 0 80,11820 Consolidation Incentive/Assistance 0 021 Isolated Funding 0 022 Supplemental Millage Incentive Funding 27,886 22,30923 Other Unrestricted State Funding 0 024 Total Unrestricted Revenue from State and
Local Sources 9,724,936 9,574,527
Restricted Revenue from State Sources:25 Adult Education 0 0
Regular Education:26 Professional Development 54,664 54,90727 Other Regular Education 8,881 800
Special Education:28 Gifted & Talented 300 029 Alternative Learning Environment (ALE) 43,962 30,21730 English Language Learner (ELL) 4,981 031 National School Lunch Act (NSLA) 407,712 413,40232 Other Special Education 5,414 033 Workforce Education 153,230 159,79234 School Food Service 6,646 5,15035 Educational Service Cooperatives 0 036 Early Childhood Programs 0 037 Magnet School Programs 0 038 Other Non-Instructional Programs 166,733 1,372,43739 Total Restricted Revenue from State Sources 852,523 2,036,70540 Total Restricted Revenue from Federal
Sources 2,740,804 1,551,664
Other Sources of Funds:41 Financing Sources (650,788) 906,50042 Balances from Consolidated/Annexed District 0 043 Indirect Cost Reimbursement 19,000 7,00044 Gains and Losses from Sale of Fixed Assets 1,440 045 Compensation for Loss of Fixed Assets 0 046 Other 0 047 Total Other Sources of Funds (630,348) 913,50048 Total Revenue and Other Sources of Funds
from All Sources 12,687,915 14,076,397
2010-2011 2011-2012Actual Budget
CURRENT EXPENDITURESInstruction:
49 Regular Instruction 4,253,864 4,272,98150 Special Education 918,000 840,17551 Workforce Education 404,156 355,30652 Adult Education 0 053 Compensatory Education 1,007,277 494,78554 Other 456,526 452,02355 Total Instruction 7,039,823 6,415,269
District Level Support:56 General Administration 255,237 254,89457 Central Services 299,805 341,64758 Maintenance & Operations of Plant 1,107,117 1,198,85959 Student Transportation 382,923 343,43960 Other District Level Support Services 69,596 59,80061 Total District Support Services 2,114,677 2,198,639
School Level Support:62 Student Support Services 483,818 466,74663 Instructional Staff Support Services 878,587 519,97764 School Administration 628,562 611,35165 Total District Support Services 1,990,967 1,598,074
Non-Instructional Services:66 Food Service Operations 669,355 657,65567 Other Enterprise Operations 68,204 4,70068 Community Operations 189,502 207,01669 Other Non-Instructional Services 0 070 Total Non-Instructional Services 927,062 869,37271 Facilities Acquisition and Construction 561,479 2,007,00072 Debt Service 711,630 381,14875 Other Non-Programmed Costs 0 076 Total Expenditures 13,345,638 13,469,50177 Less: Capital Expenditures 1,236,443 2,115,85078 Less: Debt Service 711,630 381,14879 Total Current Expenditures 11,397,565 10,972,50480 Exclusions from Current Expenditures 673,58381 Net Current Expenditures 10,723,982
82 Per Pupil Expenditures 8,788
83 Personnel - Non-Federal Certified Clsrm FTEs 95.1384 Avg Salary - Non-Fed Certified Clsrm FTEs 42,02185 Personnel - Non-Federal Certified FTEs 102.5086 Avg Salary - Non-Fed Certified FTEs 44,84287.1 Legal Balance (funds 1-2-4) 3,091,30687.2 Categorical Fund Balance 36,59687.3 Deposits with Paying Agents (QZAB) 087.4 Net Legal Bal (Excl Cat & QZAB) 3,054,71188 Building Fund Balance (fund 3) 71,40389 Capital Outlay Fund Balance (fund 5) 0
Jan 30, 2012 - 227 - 9:35:29 AM

Annual Statistical Report 2010-2011
County: WHITE BEEBE SCHOOL DISTRICT LEA:7302000
2010-2011 2011-2012Actual Budget
1 Area in Square Miles 2362 ADA 3,0723 ADA pct Change over 5 Yrs. 12%4 4 QTR ADM 3,1935 Prior Year 3QTR ADM 3,2006 Assessment 175,867,0127 M&O Mills 25.008 URT Mills 25.009 M&O Mills in Excess of URT 0.0010 Dedicated M&O Mills 0.0011 Debt Service Mills 11.6012 Total Mills 36.6013 Total Debt Bond/Non-Bond 17,830,000
State and Local Revenue:14 Property Tax Receipts (Including URT) 5,932,795 6,547,98215 Other Local Receipts 2,567,975 1,639,17916 Revenue from Intermediate Sources 0 017.1 Foundation Funding (Excl URT) 15,202,777 15,339,76317.2 Tax Collection Rate Guarantee 92,567 90,00018 Student Growth Funding 21,261 019 Declining Enrollment Funding 0 020 Consolidation Incentive/Assistance 0 021 Isolated Funding 0 022 Supplemental Millage Incentive Funding 111,910 89,52823 Other Unrestricted State Funding 0 024 Total Unrestricted Revenue from State and
Local Sources 23,929,285 23,706,452
Restricted Revenue from State Sources:25 Adult Education 0 0
Regular Education:26 Professional Development 132,362 135,56627 Other Regular Education 16,200 10,200
Special Education:28 Gifted & Talented 2,750 10,00029 Alternative Learning Environment (ALE) 98,081 110,17430 English Language Learner (ELL) 9,376 031 National School Lunch Act (NSLA) 763,840 789,86632 Other Special Education 40,870 033 Workforce Education 67,960 37,37534 School Food Service 10,166 10,50035 Educational Service Cooperatives 0 036 Early Childhood Programs 388,314 388,80037 Magnet School Programs 0 038 Other Non-Instructional Programs 1,850,119 918,57839 Total Restricted Revenue from State Sources 3,380,037 2,411,05940 Total Restricted Revenue from Federal
Sources 4,360,838 2,903,227
Other Sources of Funds:41 Financing Sources 3,549,844 3,549,84442 Balances from Consolidated/Annexed District 0 043 Indirect Cost Reimbursement 0 044 Gains and Losses from Sale of Fixed Assets 0 045 Compensation for Loss of Fixed Assets 0 046 Other 0 047 Total Other Sources of Funds 3,549,844 3,549,84448 Total Revenue and Other Sources of Funds
from All Sources 35,220,003 32,570,581
2010-2011 2011-2012Actual Budget
CURRENT EXPENDITURESInstruction:
49 Regular Instruction 11,017,369 11,313,92050 Special Education 2,045,688 2,142,18151 Workforce Education 743,748 746,43652 Adult Education 0 053 Compensatory Education 595,103 607,32154 Other 1,114,314 1,226,18855 Total Instruction 15,516,221 16,036,045
District Level Support:56 General Administration 688,709 670,12557 Central Services 297,480 300,52158 Maintenance & Operations of Plant 2,763,428 3,037,90759 Student Transportation 1,155,021 1,121,66660 Other District Level Support Services 60,444 15,00061 Total District Support Services 4,965,082 5,145,219
School Level Support:62 Student Support Services 1,096,098 1,115,43863 Instructional Staff Support Services 1,531,326 1,689,25564 School Administration 1,611,735 1,627,85465 Total District Support Services 4,239,159 4,432,546
Non-Instructional Services:66 Food Service Operations 1,733,667 1,706,10667 Other Enterprise Operations 58,398 068 Community Operations 426,685 225,82369 Other Non-Instructional Services 0 070 Total Non-Instructional Services 2,218,750 1,931,93071 Facilities Acquisition and Construction 6,360,587 5,879,33672 Debt Service 1,187,970 1,680,95275 Other Non-Programmed Costs 82,194 076 Total Expenditures 34,569,963 35,106,02877 Less: Capital Expenditures 7,284,450 6,530,49578 Less: Debt Service 1,187,970 1,680,95279 Total Current Expenditures 26,097,543 26,894,58180 Exclusions from Current Expenditures 2,220,55081 Net Current Expenditures 23,876,993
82 Per Pupil Expenditures 7,772
83 Personnel - Non-Federal Certified Clsrm FTEs 213.5784 Avg Salary - Non-Fed Certified Clsrm FTEs 44,37885 Personnel - Non-Federal Certified FTEs 234.5786 Avg Salary - Non-Fed Certified FTEs 47,62587.1 Legal Balance (funds 1-2-4) 3,098,15487.2 Categorical Fund Balance 52,94187.3 Deposits with Paying Agents (QZAB) 087.4 Net Legal Bal (Excl Cat & QZAB) 3,045,21388 Building Fund Balance (fund 3) 2,887,44689 Capital Outlay Fund Balance (fund 5) 0
Jan 30, 2012 - 228 - 9:35:29 AM

Annual Statistical Report 2010-2011
County: WHITE BRADFORD SCHOOL DISTRICT LEA:7303000
2010-2011 2011-2012Actual Budget
1 Area in Square Miles 932 ADA 4563 ADA pct Change over 5 Yrs. (9%)4 4 QTR ADM 4915 Prior Year 3QTR ADM 4926 Assessment 23,038,2367 M&O Mills 25.008 URT Mills 25.009 M&O Mills in Excess of URT 0.0010 Dedicated M&O Mills 0.0011 Debt Service Mills 12.0012 Total Mills 37.0013 Total Debt Bond/Non-Bond 3,220,000
State and Local Revenue:14 Property Tax Receipts (Including URT) 767,205 754,00015 Other Local Receipts 218,275 202,42016 Revenue from Intermediate Sources 2,276 2,50017.1 Foundation Funding (Excl URT) 2,427,430 2,450,29517.2 Tax Collection Rate Guarantee 43,860 45,00018 Student Growth Funding 0 019 Declining Enrollment Funding 27,164 3,99420 Consolidation Incentive/Assistance 0 021 Isolated Funding 0 022 Supplemental Millage Incentive Funding 31,731 25,38423 Other Unrestricted State Funding 0 024 Total Unrestricted Revenue from State and
Local Sources 3,517,942 3,483,593
Restricted Revenue from State Sources:25 Adult Education 0 0
Regular Education:26 Professional Development 20,348 20,79527 Other Regular Education 1,682 4,800
Special Education:28 Gifted & Talented 1,000 029 Alternative Learning Environment (ALE) 18,568 030 English Language Learner (ELL) 0 031 National School Lunch Act (NSLA) 161,200 239,50832 Other Special Education 2,015 033 Workforce Education 0 034 School Food Service 0 035 Educational Service Cooperatives 0 036 Early Childhood Programs 97,200 97,20037 Magnet School Programs 0 038 Other Non-Instructional Programs 2,286,035 473,54739 Total Restricted Revenue from State Sources 2,588,048 835,85040 Total Restricted Revenue from Federal
Sources 1,035,024 1,048,168
Other Sources of Funds:41 Financing Sources 0 042 Balances from Consolidated/Annexed District 0 043 Indirect Cost Reimbursement 0 044 Gains and Losses from Sale of Fixed Assets 0 045 Compensation for Loss of Fixed Assets 0 046 Other 0 047 Total Other Sources of Funds 0 048 Total Revenue and Other Sources of Funds
from All Sources 7,141,014 5,367,611
2010-2011 2011-2012Actual Budget
CURRENT EXPENDITURESInstruction:
49 Regular Instruction 1,701,227 1,882,54050 Special Education 206,517 296,08951 Workforce Education 151,829 158,82652 Adult Education 0 053 Compensatory Education 726,301 377,44754 Other 50,813 89,83455 Total Instruction 2,836,686 2,804,735
District Level Support:56 General Administration 166,633 178,91857 Central Services 146,775 157,65158 Maintenance & Operations of Plant 376,536 413,14059 Student Transportation 149,930 223,57560 Other District Level Support Services 10,062 19,00061 Total District Support Services 849,937 992,284
School Level Support:62 Student Support Services 183,087 199,60363 Instructional Staff Support Services 243,781 294,16464 School Administration 204,625 207,96865 Total District Support Services 631,493 701,735
Non-Instructional Services:66 Food Service Operations 273,042 276,00667 Other Enterprise Operations 0 068 Community Operations 320 1,00069 Other Non-Instructional Services 0 070 Total Non-Instructional Services 273,362 277,00671 Facilities Acquisition and Construction 4,272,512 1,126,05372 Debt Service 206,715 204,88075 Other Non-Programmed Costs 0 076 Total Expenditures 9,070,706 6,106,69377 Less: Capital Expenditures 4,336,894 1,258,32678 Less: Debt Service 206,715 204,88079 Total Current Expenditures 4,527,096 4,643,48780 Exclusions from Current Expenditures 222,29181 Net Current Expenditures 4,304,806
82 Per Pupil Expenditures 9,447
83 Personnel - Non-Federal Certified Clsrm FTEs 36.7584 Avg Salary - Non-Fed Certified Clsrm FTEs 37,40285 Personnel - Non-Federal Certified FTEs 41.2586 Avg Salary - Non-Fed Certified FTEs 39,72087.1 Legal Balance (funds 1-2-4) 1,448,90987.2 Categorical Fund Balance 103,45587.3 Deposits with Paying Agents (QZAB) 087.4 Net Legal Bal (Excl Cat & QZAB) 1,345,45588 Building Fund Balance (fund 3) 689,17989 Capital Outlay Fund Balance (fund 5) 0
Jan 30, 2012 - 229 - 9:35:29 AM

Annual Statistical Report 2010-2011
County: WHITE WHITE CO. CENTRAL SCHOOL DIST. LEA:7304000
2010-2011 2011-2012Actual Budget
1 Area in Square Miles 592 ADA 6303 ADA pct Change over 5 Yrs. (1%)4 4 QTR ADM 6695 Prior Year 3QTR ADM 6936 Assessment 66,874,2217 M&O Mills 25.008 URT Mills 25.009 M&O Mills in Excess of URT 0.0010 Dedicated M&O Mills 0.0011 Debt Service Mills 13.1012 Total Mills 38.1013 Total Debt Bond/Non-Bond 2,645,000
State and Local Revenue:14 Property Tax Receipts (Including URT) 1,934,530 2,307,00015 Other Local Receipts 359,415 112,97516 Revenue from Intermediate Sources 3,069 017.1 Foundation Funding (Excl URT) 3,038,890 2,493,91317.2 Tax Collection Rate Guarantee 25,268 018 Student Growth Funding 0 019 Declining Enrollment Funding 0 63,99020 Consolidation Incentive/Assistance 0 021 Isolated Funding 0 022 Supplemental Millage Incentive Funding 43,659 34,92723 Other Unrestricted State Funding 0 024 Total Unrestricted Revenue from State and
Local Sources 5,404,830 5,012,805
Restricted Revenue from State Sources:25 Adult Education 0 0
Regular Education:26 Professional Development 28,679 28,50427 Other Regular Education 4,544 2,400
Special Education:28 Gifted & Talented 1,966 1,80029 Alternative Learning Environment (ALE) 34,698 45,84430 English Language Learner (ELL) 0 031 National School Lunch Act (NSLA) 208,816 216,56832 Other Special Education 41,626 2,50033 Workforce Education 29,521 2,70834 School Food Service 2,652 1,75035 Educational Service Cooperatives 0 036 Early Childhood Programs 187,596 194,40037 Magnet School Programs 0 038 Other Non-Instructional Programs 239,989 405,57539 Total Restricted Revenue from State Sources 780,087 902,05040 Total Restricted Revenue from Federal
Sources 1,179,585 872,506
Other Sources of Funds:41 Financing Sources 6,072 042 Balances from Consolidated/Annexed District 0 043 Indirect Cost Reimbursement 0 044 Gains and Losses from Sale of Fixed Assets 1,202 045 Compensation for Loss of Fixed Assets 8,377 046 Other 47,255 40,00047 Total Other Sources of Funds 62,906 40,00048 Total Revenue and Other Sources of Funds
from All Sources 7,427,409 6,827,361
2010-2011 2011-2012Actual Budget
CURRENT EXPENDITURESInstruction:
49 Regular Instruction 2,480,027 2,598,54450 Special Education 412,151 458,89251 Workforce Education 195,445 207,43652 Adult Education 0 053 Compensatory Education 122,874 103,88454 Other 292,539 286,88955 Total Instruction 3,503,036 3,655,645
District Level Support:56 General Administration 210,163 250,14757 Central Services 154,779 184,80758 Maintenance & Operations of Plant 583,712 764,28159 Student Transportation 177,613 494,38160 Other District Level Support Services 14,940 5,50061 Total District Support Services 1,141,207 1,699,116
School Level Support:62 Student Support Services 304,653 291,33063 Instructional Staff Support Services 471,214 533,68764 School Administration 278,844 278,15365 Total District Support Services 1,054,711 1,103,169
Non-Instructional Services:66 Food Service Operations 321,411 443,81967 Other Enterprise Operations 15,663 068 Community Operations 394 1,20069 Other Non-Instructional Services 0 070 Total Non-Instructional Services 337,468 445,01971 Facilities Acquisition and Construction 534,336 787,62072 Debt Service 207,776 73,77075 Other Non-Programmed Costs 0 076 Total Expenditures 6,778,534 7,764,33877 Less: Capital Expenditures 632,793 1,243,41978 Less: Debt Service 207,776 73,77079 Total Current Expenditures 5,937,965 6,447,14980 Exclusions from Current Expenditures 504,17681 Net Current Expenditures 5,433,789
82 Per Pupil Expenditures 8,628
83 Personnel - Non-Federal Certified Clsrm FTEs 54.3884 Avg Salary - Non-Fed Certified Clsrm FTEs 40,68785 Personnel - Non-Federal Certified FTEs 59.9186 Avg Salary - Non-Fed Certified FTEs 42,70187.1 Legal Balance (funds 1-2-4) 1,203,67187.2 Categorical Fund Balance 6,40687.3 Deposits with Paying Agents (QZAB) 087.4 Net Legal Bal (Excl Cat & QZAB) 1,197,26588 Building Fund Balance (fund 3) 724,13689 Capital Outlay Fund Balance (fund 5) 0
Jan 30, 2012 - 230 - 9:35:29 AM

Annual Statistical Report 2010-2011
County: WHITE RIVERVIEW SCHOOL DISTRICT LEA:7307000
2010-2011 2011-2012Actual Budget
1 Area in Square Miles 1862 ADA 1,2183 ADA pct Change over 5 Yrs. 4%4 4 QTR ADM 1,2945 Prior Year 3QTR ADM 1,3106 Assessment 89,592,8537 M&O Mills 27.228 URT Mills 25.009 M&O Mills in Excess of URT 2.2210 Dedicated M&O Mills 0.0011 Debt Service Mills 8.7812 Total Mills 36.0013 Total Debt Bond/Non-Bond 2,775,000
State and Local Revenue:14 Property Tax Receipts (Including URT) 2,984,108 2,609,94015 Other Local Receipts 912,588 692,02516 Revenue from Intermediate Sources 5,915 6,00017.1 Foundation Funding (Excl URT) 5,784,326 5,767,75517.2 Tax Collection Rate Guarantee 43,324 40,00018 Student Growth Funding 10,851 019 Declining Enrollment Funding 0 35,57420 Consolidation Incentive/Assistance 0 021 Isolated Funding 0 022 Supplemental Millage Incentive Funding 63,981 51,18523 Other Unrestricted State Funding 0 024 Total Unrestricted Revenue from State and
Local Sources 9,805,093 9,202,479
Restricted Revenue from State Sources:25 Adult Education 0 0
Regular Education:26 Professional Development 54,195 55,04127 Other Regular Education 2,400 4,800
Special Education:28 Gifted & Talented 600 60029 Alternative Learning Environment (ALE) 79,188 79,00030 English Language Learner (ELL) 14,357 14,00031 National School Lunch Act (NSLA) 901,728 933,06432 Other Special Education 5,368 2,00033 Workforce Education 44,813 27,89734 School Food Service 5,459 3,50035 Educational Service Cooperatives 0 036 Early Childhood Programs 194,400 194,40037 Magnet School Programs 0 038 Other Non-Instructional Programs 381,950 216,15539 Total Restricted Revenue from State Sources 1,684,458 1,530,45740 Total Restricted Revenue from Federal
Sources 2,432,499 1,977,693
Other Sources of Funds:41 Financing Sources 0 042 Balances from Consolidated/Annexed District 0 043 Indirect Cost Reimbursement 0 044 Gains and Losses from Sale of Fixed Assets 0 045 Compensation for Loss of Fixed Assets 0 046 Other 0 047 Total Other Sources of Funds 0 048 Total Revenue and Other Sources of Funds
from All Sources 13,922,050 12,710,629
2010-2011 2011-2012Actual Budget
CURRENT EXPENDITURESInstruction:
49 Regular Instruction 4,937,337 5,062,20450 Special Education 606,688 707,85251 Workforce Education 386,540 395,74552 Adult Education 0 053 Compensatory Education 599,354 456,37654 Other 504,317 486,19955 Total Instruction 7,034,236 7,108,376
District Level Support:56 General Administration 304,577 335,31657 Central Services 327,718 480,35058 Maintenance & Operations of Plant 1,247,601 1,314,54359 Student Transportation 395,141 444,20760 Other District Level Support Services 27,618 14,97761 Total District Support Services 2,302,655 2,589,393
School Level Support:62 Student Support Services 592,843 679,17463 Instructional Staff Support Services 516,223 628,73664 School Administration 528,236 568,04165 Total District Support Services 1,637,302 1,875,951
Non-Instructional Services:66 Food Service Operations 1,074,120 1,135,71367 Other Enterprise Operations 0 068 Community Operations 152,013 156,55169 Other Non-Instructional Services 0 070 Total Non-Instructional Services 1,226,133 1,292,26471 Facilities Acquisition and Construction 1,006,988 1,782,44172 Debt Service 447,332 447,85475 Other Non-Programmed Costs 0 076 Total Expenditures 13,654,647 15,096,27977 Less: Capital Expenditures 1,338,378 2,194,25378 Less: Debt Service 447,332 447,85479 Total Current Expenditures 11,868,936 12,454,17280 Exclusions from Current Expenditures 775,52581 Net Current Expenditures 11,093,412
82 Per Pupil Expenditures 9,107
83 Personnel - Non-Federal Certified Clsrm FTEs 84.5084 Avg Salary - Non-Fed Certified Clsrm FTEs 49,86985 Personnel - Non-Federal Certified FTEs 90.3586 Avg Salary - Non-Fed Certified FTEs 52,02287.1 Legal Balance (funds 1-2-4) 8,521,95787.2 Categorical Fund Balance 69,25587.3 Deposits with Paying Agents (QZAB) 087.4 Net Legal Bal (Excl Cat & QZAB) 8,452,70288 Building Fund Balance (fund 3) 274,75289 Capital Outlay Fund Balance (fund 5) 4,071
Jan 30, 2012 - 231 - 9:35:29 AM

Annual Statistical Report 2010-2011
County: WHITE PANGBURN SCHOOL DISTRICT LEA:7309000
2010-2011 2011-2012Actual Budget
1 Area in Square Miles 1062 ADA 7103 ADA pct Change over 5 Yrs. 4%4 4 QTR ADM 7455 Prior Year 3QTR ADM 7376 Assessment 78,716,6607 M&O Mills 25.008 URT Mills 25.009 M&O Mills in Excess of URT 0.0010 Dedicated M&O Mills 0.0011 Debt Service Mills 16.4012 Total Mills 41.4013 Total Debt Bond/Non-Bond 11,016,131
State and Local Revenue:14 Property Tax Receipts (Including URT) 2,180,382 3,223,25015 Other Local Receipts 669,761 388,32716 Revenue from Intermediate Sources 3,308 017.1 Foundation Funding (Excl URT) 3,174,721 2,650,36717.2 Tax Collection Rate Guarantee 37,919 018 Student Growth Funding 52,867 019 Declining Enrollment Funding 0 020 Consolidation Incentive/Assistance 0 021 Isolated Funding 0 022 Supplemental Millage Incentive Funding 60,613 48,49023 Other Unrestricted State Funding 0 024 Total Unrestricted Revenue from State and
Local Sources 6,179,571 6,310,434
Restricted Revenue from State Sources:25 Adult Education 0 0
Regular Education:26 Professional Development 30,468 31,58927 Other Regular Education 0 0
Special Education:28 Gifted & Talented 100 1,00029 Alternative Learning Environment (ALE) 60,579 28,47630 English Language Learner (ELL) 0 031 National School Lunch Act (NSLA) 210,304 219,09832 Other Special Education 3,018 033 Workforce Education 81,153 32,00034 School Food Service 2,771 3,50035 Educational Service Cooperatives 0 036 Early Childhood Programs 131,220 131,22037 Magnet School Programs 0 038 Other Non-Instructional Programs 1,204,407 14,09339 Total Restricted Revenue from State Sources 1,724,020 460,97640 Total Restricted Revenue from Federal
Sources 1,143,877 963,583
Other Sources of Funds:41 Financing Sources 2,171,372 042 Balances from Consolidated/Annexed District 0 043 Indirect Cost Reimbursement 4,002 044 Gains and Losses from Sale of Fixed Assets 14,988 4,02045 Compensation for Loss of Fixed Assets 18,736 5,67146 Other 0 20,83247 Total Other Sources of Funds 2,209,097 30,52348 Total Revenue and Other Sources of Funds
from All Sources 11,256,566 7,765,516
2010-2011 2011-2012Actual Budget
CURRENT EXPENDITURESInstruction:
49 Regular Instruction 3,014,047 2,916,34350 Special Education 344,018 485,48851 Workforce Education 324,184 323,28152 Adult Education 0 053 Compensatory Education 155,713 194,65154 Other 170,442 143,38855 Total Instruction 4,008,404 4,063,151
District Level Support:56 General Administration 181,624 217,37457 Central Services 141,467 184,84458 Maintenance & Operations of Plant 586,463 815,97159 Student Transportation 306,608 268,81160 Other District Level Support Services 4,002 061 Total District Support Services 1,220,163 1,487,000
School Level Support:62 Student Support Services 309,305 349,79263 Instructional Staff Support Services 539,519 544,76964 School Administration 331,377 358,44065 Total District Support Services 1,180,202 1,253,001
Non-Instructional Services:66 Food Service Operations 410,948 491,17667 Other Enterprise Operations 169 068 Community Operations 199,146 224,87069 Other Non-Instructional Services 0 070 Total Non-Instructional Services 610,263 716,04671 Facilities Acquisition and Construction 5,087,829 2,140,33572 Debt Service 623,301 754,80375 Other Non-Programmed Costs 0 076 Total Expenditures 12,730,162 10,414,33677 Less: Capital Expenditures 5,262,303 2,252,43378 Less: Debt Service 623,301 754,80379 Total Current Expenditures 6,844,558 7,407,10080 Exclusions from Current Expenditures 744,60181 Net Current Expenditures 6,099,958
82 Per Pupil Expenditures 8,594
83 Personnel - Non-Federal Certified Clsrm FTEs 58.9184 Avg Salary - Non-Fed Certified Clsrm FTEs 43,35985 Personnel - Non-Federal Certified FTEs 64.5486 Avg Salary - Non-Fed Certified FTEs 46,14887.1 Legal Balance (funds 1-2-4) 946,98087.2 Categorical Fund Balance 25,81587.3 Deposits with Paying Agents (QZAB) 087.4 Net Legal Bal (Excl Cat & QZAB) 921,16688 Building Fund Balance (fund 3) 2,212,65289 Capital Outlay Fund Balance (fund 5) 0
Jan 30, 2012 - 232 - 9:35:29 AM

Annual Statistical Report 2010-2011
County: WHITE ROSE BUD SCHOOL DISTRICT LEA:7310000
2010-2011 2011-2012Actual Budget
1 Area in Square Miles 1172 ADA 7793 ADA pct Change over 5 Yrs. 2%4 4 QTR ADM 8155 Prior Year 3QTR ADM 8166 Assessment 64,501,0967 M&O Mills 25.008 URT Mills 25.009 M&O Mills in Excess of URT 0.0010 Dedicated M&O Mills 0.0011 Debt Service Mills 14.3012 Total Mills 39.3013 Total Debt Bond/Non-Bond 5,205,000
State and Local Revenue:14 Property Tax Receipts (Including URT) 1,918,675 2,281,40315 Other Local Receipts 485,356 134,44816 Revenue from Intermediate Sources 0 017.1 Foundation Funding (Excl URT) 3,802,080 3,439,28817.2 Tax Collection Rate Guarantee 0 018 Student Growth Funding 22,511 019 Declining Enrollment Funding 0 020 Consolidation Incentive/Assistance 0 021 Isolated Funding 0 022 Supplemental Millage Incentive Funding 32,840 26,27223 Other Unrestricted State Funding 0 024 Total Unrestricted Revenue from State and
Local Sources 6,261,462 5,881,411
Restricted Revenue from State Sources:25 Adult Education 0 0
Regular Education:26 Professional Development 33,732 34,62827 Other Regular Education 4,692 1,200
Special Education:28 Gifted & Talented 50 029 Alternative Learning Environment (ALE) 32,220 13,92730 English Language Learner (ELL) 8,497 7,00031 National School Lunch Act (NSLA) 212,784 222,13432 Other Special Education 3,341 033 Workforce Education 15,709 13,00034 School Food Service 2,983 035 Educational Service Cooperatives 0 036 Early Childhood Programs 105,494 104,48037 Magnet School Programs 0 038 Other Non-Instructional Programs 346,190 39,37839 Total Restricted Revenue from State Sources 765,691 435,74740 Total Restricted Revenue from Federal
Sources 1,455,922 1,265,631
Other Sources of Funds:41 Financing Sources 0 042 Balances from Consolidated/Annexed District 0 043 Indirect Cost Reimbursement 0 044 Gains and Losses from Sale of Fixed Assets 200 045 Compensation for Loss of Fixed Assets 0 046 Other 0 047 Total Other Sources of Funds 200 048 Total Revenue and Other Sources of Funds
from All Sources 8,483,276 7,582,789
2010-2011 2011-2012Actual Budget
CURRENT EXPENDITURESInstruction:
49 Regular Instruction 2,750,105 2,680,05950 Special Education 406,552 528,36251 Workforce Education 334,220 338,31552 Adult Education 0 053 Compensatory Education 203,841 263,64354 Other 350,238 387,77555 Total Instruction 4,044,957 4,198,155
District Level Support:56 General Administration 161,590 170,57157 Central Services 150,281 147,40958 Maintenance & Operations of Plant 681,447 985,32259 Student Transportation 379,979 508,08360 Other District Level Support Services 90,263 16,21361 Total District Support Services 1,463,560 1,827,598
School Level Support:62 Student Support Services 225,592 298,12763 Instructional Staff Support Services 769,071 535,44764 School Administration 257,688 251,74265 Total District Support Services 1,252,351 1,085,316
Non-Instructional Services:66 Food Service Operations 398,153 397,74267 Other Enterprise Operations 468 068 Community Operations 37,009 3,00069 Other Non-Instructional Services 0 070 Total Non-Instructional Services 435,631 400,74271 Facilities Acquisition and Construction 451,942 167,32472 Debt Service 330,208 218,83475 Other Non-Programmed Costs 74,194 076 Total Expenditures 8,052,843 7,897,96877 Less: Capital Expenditures 603,250 437,49478 Less: Debt Service 330,208 218,83479 Total Current Expenditures 7,119,385 7,241,64080 Exclusions from Current Expenditures 593,20481 Net Current Expenditures 6,526,181
82 Per Pupil Expenditures 8,373
83 Personnel - Non-Federal Certified Clsrm FTEs 58.8884 Avg Salary - Non-Fed Certified Clsrm FTEs 43,02185 Personnel - Non-Federal Certified FTEs 61.0586 Avg Salary - Non-Fed Certified FTEs 44,32287.1 Legal Balance (funds 1-2-4) 1,848,72387.2 Categorical Fund Balance 125,72687.3 Deposits with Paying Agents (QZAB) 087.4 Net Legal Bal (Excl Cat & QZAB) 1,722,99788 Building Fund Balance (fund 3) 1,333,24889 Capital Outlay Fund Balance (fund 5) 0
Jan 30, 2012 - 233 - 9:35:29 AM

Annual Statistical Report 2010-2011
County: WHITE SEARCY SCHOOL DISTRICT LEA:7311000
2010-2011 2011-2012Actual Budget
1 Area in Square Miles 1622 ADA 3,7673 ADA pct Change over 5 Yrs. 3%4 4 QTR ADM 3,9985 Prior Year 3QTR ADM 3,9516 Assessment 518,047,8837 M&O Mills 25.008 URT Mills 25.009 M&O Mills in Excess of URT 0.0010 Dedicated M&O Mills 0.0011 Debt Service Mills 10.7012 Total Mills 35.7013 Total Debt Bond/Non-Bond 25,925,000
State and Local Revenue:14 Property Tax Receipts (Including URT) 16,657,380 16,841,77215 Other Local Receipts 1,777,786 984,30016 Revenue from Intermediate Sources 17,816 017.1 Foundation Funding (Excl URT) 12,256,647 11,852,24317.2 Tax Collection Rate Guarantee 221,899 018 Student Growth Funding 223,739 58,66419 Declining Enrollment Funding 0 020 Consolidation Incentive/Assistance 0 021 Isolated Funding 0 022 Supplemental Millage Incentive Funding 0 023 Other Unrestricted State Funding 0 024 Total Unrestricted Revenue from State and
Local Sources 31,155,267 29,736,979
Restricted Revenue from State Sources:25 Adult Education 0 0
Regular Education:26 Professional Development 163,425 169,72127 Other Regular Education 10,906 17,200
Special Education:28 Gifted & Talented 5,900 029 Alternative Learning Environment (ALE) 49,244 45,00030 English Language Learner (ELL) 24,612 20,00031 National School Lunch Act (NSLA) 875,440 902,70432 Other Special Education 40,339 033 Workforce Education 119,709 034 School Food Service 13,190 8,50035 Educational Service Cooperatives 0 036 Early Childhood Programs 0 037 Magnet School Programs 0 038 Other Non-Instructional Programs 37,839 19,79039 Total Restricted Revenue from State Sources 1,340,604 1,182,91540 Total Restricted Revenue from Federal
Sources 5,899,472 3,291,943
Other Sources of Funds:41 Financing Sources 3,224 042 Balances from Consolidated/Annexed District 0 043 Indirect Cost Reimbursement 10,880 18,11544 Gains and Losses from Sale of Fixed Assets 0 045 Compensation for Loss of Fixed Assets 594,335 046 Other 0 047 Total Other Sources of Funds 608,439 18,11548 Total Revenue and Other Sources of Funds
from All Sources 39,003,782 34,229,952
2010-2011 2011-2012Actual Budget
CURRENT EXPENDITURESInstruction:
49 Regular Instruction 13,279,769 13,443,64150 Special Education 2,184,525 2,495,38651 Workforce Education 762,769 834,84652 Adult Education 0 053 Compensatory Education 1,268,337 1,417,54154 Other 532,447 501,09355 Total Instruction 18,027,848 18,692,507
District Level Support:56 General Administration 807,387 892,96057 Central Services 213,616 293,44058 Maintenance & Operations of Plant 2,665,432 3,920,65159 Student Transportation 1,182,898 1,459,29360 Other District Level Support Services 158,936 169,60061 Total District Support Services 5,028,269 6,735,945
School Level Support:62 Student Support Services 1,137,784 1,268,66263 Instructional Staff Support Services 2,100,745 2,387,51964 School Administration 1,819,694 1,816,64565 Total District Support Services 5,058,223 5,472,826
Non-Instructional Services:66 Food Service Operations 1,974,555 1,954,45067 Other Enterprise Operations 152,874 068 Community Operations 2,180 16,00069 Other Non-Instructional Services 0 070 Total Non-Instructional Services 2,129,609 1,970,45071 Facilities Acquisition and Construction 6,667,848 1,505,35772 Debt Service 1,885,528 2,541,47275 Other Non-Programmed Costs 53,451 076 Total Expenditures 38,850,776 36,918,55777 Less: Capital Expenditures 7,097,637 2,089,37178 Less: Debt Service 1,885,528 2,541,47279 Total Current Expenditures 29,867,611 32,287,71480 Exclusions from Current Expenditures 1,290,21881 Net Current Expenditures 28,577,393
82 Per Pupil Expenditures 7,585
83 Personnel - Non-Federal Certified Clsrm FTEs 236.1684 Avg Salary - Non-Fed Certified Clsrm FTEs 49,59485 Personnel - Non-Federal Certified FTEs 262.2986 Avg Salary - Non-Fed Certified FTEs 51,86587.1 Legal Balance (funds 1-2-4) 13,045,60887.2 Categorical Fund Balance 430,81987.3 Deposits with Paying Agents (QZAB) 087.4 Net Legal Bal (Excl Cat & QZAB) 12,614,78988 Building Fund Balance (fund 3) 6,963,44789 Capital Outlay Fund Balance (fund 5) 1,705,724
Jan 30, 2012 - 234 - 9:35:29 AM

Annual Statistical Report 2010-2011
County: WOODRUFF AUGUSTA SCHOOL DISTRICT LEA:7401000
2010-2011 2011-2012Actual Budget
1 Area in Square Miles 3642 ADA 4463 ADA pct Change over 5 Yrs. (28%)4 4 QTR ADM 4775 Prior Year 3QTR ADM 4906 Assessment 46,502,3307 M&O Mills 25.008 URT Mills 25.009 M&O Mills in Excess of URT 0.0010 Dedicated M&O Mills 0.0011 Debt Service Mills 7.5012 Total Mills 32.5013 Total Debt Bond/Non-Bond 2,226,900
State and Local Revenue:14 Property Tax Receipts (Including URT) 1,426,833 1,471,02315 Other Local Receipts 319,968 206,59616 Revenue from Intermediate Sources 0 017.1 Foundation Funding (Excl URT) 1,761,131 1,765,41217.2 Tax Collection Rate Guarantee 23,515 018 Student Growth Funding 0 019 Declining Enrollment Funding 0 43,50020 Consolidation Incentive/Assistance 0 021 Isolated Funding 19,857 20,00022 Supplemental Millage Incentive Funding 0 023 Other Unrestricted State Funding 0 024 Total Unrestricted Revenue from State and
Local Sources 3,551,304 3,506,531
Restricted Revenue from State Sources:25 Adult Education 0 0
Regular Education:26 Professional Development 20,273 20,17227 Other Regular Education 293,085 8,700
Special Education:28 Gifted & Talented 1,000 029 Alternative Learning Environment (ALE) 0 17,98930 English Language Learner (ELL) 293 031 National School Lunch Act (NSLA) 417,632 420,99232 Other Special Education 2,008 033 Workforce Education 0 034 School Food Service 2,475 2,00035 Educational Service Cooperatives 0 036 Early Childhood Programs 291,114 287,89437 Magnet School Programs 0 038 Other Non-Instructional Programs 39,829 17,02239 Total Restricted Revenue from State Sources 1,067,708 774,76940 Total Restricted Revenue from Federal
Sources 2,647,817 1,757,953
Other Sources of Funds:41 Financing Sources (2,766) 042 Balances from Consolidated/Annexed District 0 043 Indirect Cost Reimbursement 16,128 46,00044 Gains and Losses from Sale of Fixed Assets 6,951 045 Compensation for Loss of Fixed Assets 0 046 Other 0 047 Total Other Sources of Funds 20,313 46,00048 Total Revenue and Other Sources of Funds
from All Sources 7,287,143 6,085,254
2010-2011 2011-2012Actual Budget
CURRENT EXPENDITURESInstruction:
49 Regular Instruction 2,459,396 2,041,77750 Special Education 322,134 319,20251 Workforce Education 155,547 159,84752 Adult Education 0 053 Compensatory Education 464,842 479,83354 Other 59,260 49,73455 Total Instruction 3,461,180 3,050,392
District Level Support:56 General Administration 378,376 341,94257 Central Services 359,134 111,43458 Maintenance & Operations of Plant 725,281 642,58959 Student Transportation 239,029 213,22060 Other District Level Support Services 17,782 46,00061 Total District Support Services 1,719,601 1,355,185
School Level Support:62 Student Support Services 183,819 200,57563 Instructional Staff Support Services 1,021,607 664,62164 School Administration 246,714 225,20265 Total District Support Services 1,452,140 1,090,397
Non-Instructional Services:66 Food Service Operations 360,769 345,33767 Other Enterprise Operations 0 068 Community Operations 0 5,24269 Other Non-Instructional Services 0 070 Total Non-Instructional Services 360,769 350,57971 Facilities Acquisition and Construction 0 072 Debt Service 240,958 215,99475 Other Non-Programmed Costs 0 076 Total Expenditures 7,234,649 6,062,54877 Less: Capital Expenditures 26,344 10,76878 Less: Debt Service 240,958 215,99479 Total Current Expenditures 6,967,346 5,835,78680 Exclusions from Current Expenditures 449,29481 Net Current Expenditures 6,518,053
82 Per Pupil Expenditures 14,621
83 Personnel - Non-Federal Certified Clsrm FTEs 36.8484 Avg Salary - Non-Fed Certified Clsrm FTEs 38,29585 Personnel - Non-Federal Certified FTEs 39.9586 Avg Salary - Non-Fed Certified FTEs 42,27487.1 Legal Balance (funds 1-2-4) 579,37387.2 Categorical Fund Balance 54,94387.3 Deposits with Paying Agents (QZAB) 087.4 Net Legal Bal (Excl Cat & QZAB) 524,43088 Building Fund Balance (fund 3) 089 Capital Outlay Fund Balance (fund 5) 0
Jan 30, 2012 - 235 - 9:35:29 AM

Annual Statistical Report 2010-2011
County: WOODRUFF MCCRORY SCHOOL DISTRICT LEA:7403000
2010-2011 2011-2012Actual Budget
1 Area in Square Miles 1812 ADA 6363 ADA pct Change over 5 Yrs. 7%4 4 QTR ADM 6715 Prior Year 3QTR ADM 6556 Assessment 43,318,5607 M&O Mills 25.008 URT Mills 25.009 M&O Mills in Excess of URT 0.0010 Dedicated M&O Mills 0.0011 Debt Service Mills 10.7012 Total Mills 35.7013 Total Debt Bond/Non-Bond 2,360,000
State and Local Revenue:14 Property Tax Receipts (Including URT) 1,480,161 1,060,30515 Other Local Receipts 345,966 115,60016 Revenue from Intermediate Sources 0 017.1 Foundation Funding (Excl URT) 2,889,052 3,063,13717.2 Tax Collection Rate Guarantee 35,877 018 Student Growth Funding 121,224 019 Declining Enrollment Funding 0 020 Consolidation Incentive/Assistance 0 021 Isolated Funding 0 022 Supplemental Millage Incentive Funding 0 023 Other Unrestricted State Funding 0 024 Total Unrestricted Revenue from State and
Local Sources 4,872,280 4,239,042
Restricted Revenue from State Sources:25 Adult Education 0 0
Regular Education:26 Professional Development 27,101 28,56027 Other Regular Education 3,757 2,000
Special Education:28 Gifted & Talented 300 029 Alternative Learning Environment (ALE) 54,282 34,69430 English Language Learner (ELL) 0 031 National School Lunch Act (NSLA) 208,320 224,15832 Other Special Education 22,163 033 Workforce Education 0 034 School Food Service 2,812 2,80035 Educational Service Cooperatives 0 036 Early Childhood Programs 91,368 97,20037 Magnet School Programs 0 038 Other Non-Instructional Programs 46,458 661,98339 Total Restricted Revenue from State Sources 456,561 1,051,39540 Total Restricted Revenue from Federal
Sources 1,061,952 829,077
Other Sources of Funds:41 Financing Sources 0 603,82042 Balances from Consolidated/Annexed District 0 043 Indirect Cost Reimbursement 0 044 Gains and Losses from Sale of Fixed Assets 0 045 Compensation for Loss of Fixed Assets 9,092 11,55246 Other 0 047 Total Other Sources of Funds 9,092 615,37148 Total Revenue and Other Sources of Funds
from All Sources 6,399,884 6,734,886
2010-2011 2011-2012Actual Budget
CURRENT EXPENDITURESInstruction:
49 Regular Instruction 2,747,834 2,469,15950 Special Education 389,088 388,50651 Workforce Education 195,729 192,95052 Adult Education 0 053 Compensatory Education 186,928 147,58454 Other 123,059 137,42555 Total Instruction 3,642,638 3,335,625
District Level Support:56 General Administration 224,063 203,47457 Central Services 80,907 66,92258 Maintenance & Operations of Plant 457,666 443,58159 Student Transportation 267,133 155,95060 Other District Level Support Services 24,500 6,00061 Total District Support Services 1,054,267 875,928
School Level Support:62 Student Support Services 195,383 209,48763 Instructional Staff Support Services 333,960 331,81564 School Administration 239,435 232,63665 Total District Support Services 768,777 773,938
Non-Instructional Services:66 Food Service Operations 362,989 355,67267 Other Enterprise Operations 0 068 Community Operations 3,018 1,00069 Other Non-Instructional Services 0 070 Total Non-Instructional Services 366,008 356,67271 Facilities Acquisition and Construction 7,422 1,624,19672 Debt Service 233,120 139,38175 Other Non-Programmed Costs 3,453 076 Total Expenditures 6,075,685 7,105,74077 Less: Capital Expenditures 268,944 1,646,79678 Less: Debt Service 233,120 139,38179 Total Current Expenditures 5,573,621 5,319,56280 Exclusions from Current Expenditures 399,52781 Net Current Expenditures 5,174,094
82 Per Pupil Expenditures 8,132
83 Personnel - Non-Federal Certified Clsrm FTEs 49.9884 Avg Salary - Non-Fed Certified Clsrm FTEs 42,80585 Personnel - Non-Federal Certified FTEs 53.4286 Avg Salary - Non-Fed Certified FTEs 45,10487.1 Legal Balance (funds 1-2-4) 2,526,80987.2 Categorical Fund Balance 104,66087.3 Deposits with Paying Agents (QZAB) 087.4 Net Legal Bal (Excl Cat & QZAB) 2,422,14988 Building Fund Balance (fund 3) 089 Capital Outlay Fund Balance (fund 5) 0
Jan 30, 2012 - 236 - 9:35:29 AM

Annual Statistical Report 2010-2011
County: YELL DANVILLE SCHOOL DISTRICT LEA:7503000
2010-2011 2011-2012Actual Budget
1 Area in Square Miles 1482 ADA 8403 ADA pct Change over 5 Yrs. (1%)4 4 QTR ADM 8775 Prior Year 3QTR ADM 9026 Assessment 42,706,7717 M&O Mills 25.008 URT Mills 25.009 M&O Mills in Excess of URT 0.0010 Dedicated M&O Mills 0.0011 Debt Service Mills 6.0012 Total Mills 31.0013 Total Debt Bond/Non-Bond 1,635,375
State and Local Revenue:14 Property Tax Receipts (Including URT) 1,151,466 1,040,98915 Other Local Receipts 308,628 248,15016 Revenue from Intermediate Sources 0 017.1 Foundation Funding (Excl URT) 4,401,309 4,225,59717.2 Tax Collection Rate Guarantee 36,327 10,00018 Student Growth Funding 0 019 Declining Enrollment Funding 0 81,43920 Consolidation Incentive/Assistance 0 021 Isolated Funding 0 022 Supplemental Millage Incentive Funding 30,373 24,29823 Other Unrestricted State Funding 0 024 Total Unrestricted Revenue from State and
Local Sources 5,928,103 5,630,473
Restricted Revenue from State Sources:25 Adult Education 0 0
Regular Education:26 Professional Development 37,311 37,10827 Other Regular Education 10,776 3,800
Special Education:28 Gifted & Talented 50 029 Alternative Learning Environment (ALE) 11,336 11,56530 English Language Learner (ELL) 87,021 88,80331 National School Lunch Act (NSLA) 669,600 673,99232 Other Special Education 163,951 180,23933 Workforce Education 36,563 40,62534 School Food Service 3,455 3,40035 Educational Service Cooperatives 0 036 Early Childhood Programs 189,552 194,40037 Magnet School Programs 0 038 Other Non-Instructional Programs 42,284 35,05939 Total Restricted Revenue from State Sources 1,251,898 1,268,99140 Total Restricted Revenue from Federal
Sources 1,337,351 1,232,628
Other Sources of Funds:41 Financing Sources 1,048 042 Balances from Consolidated/Annexed District 0 043 Indirect Cost Reimbursement 0 044 Gains and Losses from Sale of Fixed Assets 0 045 Compensation for Loss of Fixed Assets 0 046 Other 0 047 Total Other Sources of Funds 1,048 048 Total Revenue and Other Sources of Funds
from All Sources 8,518,400 8,132,092
2010-2011 2011-2012Actual Budget
CURRENT EXPENDITURESInstruction:
49 Regular Instruction 3,002,831 2,784,68250 Special Education 685,069 720,87451 Workforce Education 374,755 346,88852 Adult Education 0 053 Compensatory Education 229,173 342,96454 Other 693,074 691,56055 Total Instruction 4,984,901 4,886,968
District Level Support:56 General Administration 203,297 183,15057 Central Services 310,567 269,74858 Maintenance & Operations of Plant 761,243 586,90959 Student Transportation 335,149 255,32960 Other District Level Support Services 46,106 38,56061 Total District Support Services 1,656,362 1,333,696
School Level Support:62 Student Support Services 327,159 369,20863 Instructional Staff Support Services 556,886 646,38264 School Administration 324,524 274,58965 Total District Support Services 1,208,569 1,290,180
Non-Instructional Services:66 Food Service Operations 499,128 518,06967 Other Enterprise Operations 14,415 12,00068 Community Operations 0 3,36569 Other Non-Instructional Services 0 070 Total Non-Instructional Services 513,543 533,43471 Facilities Acquisition and Construction 116,316 30,00072 Debt Service 240,177 213,04375 Other Non-Programmed Costs 3,645 076 Total Expenditures 8,723,513 8,287,32177 Less: Capital Expenditures 280,846 66,64878 Less: Debt Service 240,177 213,04379 Total Current Expenditures 8,202,490 8,007,63080 Exclusions from Current Expenditures 389,64381 Net Current Expenditures 7,812,848
82 Per Pupil Expenditures 9,302
83 Personnel - Non-Federal Certified Clsrm FTEs 72.8284 Avg Salary - Non-Fed Certified Clsrm FTEs 39,15785 Personnel - Non-Federal Certified FTEs 78.0586 Avg Salary - Non-Fed Certified FTEs 41,48587.1 Legal Balance (funds 1-2-4) 1,031,40187.2 Categorical Fund Balance 208,07887.3 Deposits with Paying Agents (QZAB) 087.4 Net Legal Bal (Excl Cat & QZAB) 823,32388 Building Fund Balance (fund 3) 153,07589 Capital Outlay Fund Balance (fund 5) 0
Jan 30, 2012 - 237 - 9:35:29 AM

Annual Statistical Report 2010-2011
County: YELL DARDANELLE SCHOOL DISTRICT LEA:7504000
2010-2011 2011-2012Actual Budget
1 Area in Square Miles 1872 ADA 1,8723 ADA pct Change over 5 Yrs. 12%4 4 QTR ADM 1,9345 Prior Year 3QTR ADM 1,9526 Assessment 94,087,6927 M&O Mills 25.008 URT Mills 25.009 M&O Mills in Excess of URT 0.0010 Dedicated M&O Mills 0.0011 Debt Service Mills 8.7012 Total Mills 33.7013 Total Debt Bond/Non-Bond 3,785,000
State and Local Revenue:14 Property Tax Receipts (Including URT) 2,919,934 3,057,00015 Other Local Receipts 417,840 320,68016 Revenue from Intermediate Sources 0 017.1 Foundation Funding (Excl URT) 9,539,796 9,565,48817.2 Tax Collection Rate Guarantee 66,084 65,00018 Student Growth Funding 9,592 019 Declining Enrollment Funding 0 35,97320 Consolidation Incentive/Assistance 0 021 Isolated Funding 0 022 Supplemental Millage Incentive Funding 80,375 64,30023 Other Unrestricted State Funding 0 024 Total Unrestricted Revenue from State and
Local Sources 13,033,621 13,108,441
Restricted Revenue from State Sources:25 Adult Education 0 0
Regular Education:26 Professional Development 80,719 82,21427 Other Regular Education 18,600 10,000
Special Education:28 Gifted & Talented 4,555 65029 Alternative Learning Environment (ALE) 81,463 83,01730 English Language Learner (ELL) 142,105 145,01531 National School Lunch Act (NSLA) 634,384 669,43832 Other Special Education 82,740 75,00033 Workforce Education 78,542 82,06334 School Food Service 7,571 7,50035 Educational Service Cooperatives 0 036 Early Childhood Programs 0 037 Magnet School Programs 0 038 Other Non-Instructional Programs 202,758 121,61139 Total Restricted Revenue from State Sources 1,333,437 1,276,50840 Total Restricted Revenue from Federal
Sources 2,591,604 2,201,333
Other Sources of Funds:41 Financing Sources 0 042 Balances from Consolidated/Annexed District 0 043 Indirect Cost Reimbursement 7,471 044 Gains and Losses from Sale of Fixed Assets 0 045 Compensation for Loss of Fixed Assets 0 046 Other 0 047 Total Other Sources of Funds 7,471 048 Total Revenue and Other Sources of Funds
from All Sources 16,966,133 16,586,282
2010-2011 2011-2012Actual Budget
CURRENT EXPENDITURESInstruction:
49 Regular Instruction 7,140,740 7,506,52250 Special Education 1,309,698 1,172,33951 Workforce Education 425,987 445,97852 Adult Education 0 053 Compensatory Education 408,055 507,78654 Other 942,666 896,50355 Total Instruction 10,227,147 10,529,128
District Level Support:56 General Administration 279,369 238,88657 Central Services 336,712 358,34658 Maintenance & Operations of Plant 1,382,200 1,419,21659 Student Transportation 491,444 537,49660 Other District Level Support Services 88,107 76,50061 Total District Support Services 2,577,833 2,630,444
School Level Support:62 Student Support Services 632,612 495,45463 Instructional Staff Support Services 701,825 604,79664 School Administration 1,013,231 1,033,76365 Total District Support Services 2,347,668 2,134,013
Non-Instructional Services:66 Food Service Operations 958,742 894,74567 Other Enterprise Operations 0 068 Community Operations 0 069 Other Non-Instructional Services 0 070 Total Non-Instructional Services 958,742 894,74571 Facilities Acquisition and Construction 217,044 072 Debt Service 404,786 406,80075 Other Non-Programmed Costs 13,929 076 Total Expenditures 16,747,150 16,595,12977 Less: Capital Expenditures 448,060 183,82278 Less: Debt Service 404,786 406,80079 Total Current Expenditures 15,894,303 16,004,50780 Exclusions from Current Expenditures 369,73281 Net Current Expenditures 15,524,570
82 Per Pupil Expenditures 8,294
83 Personnel - Non-Federal Certified Clsrm FTEs 138.2784 Avg Salary - Non-Fed Certified Clsrm FTEs 46,29585 Personnel - Non-Federal Certified FTEs 149.8186 Avg Salary - Non-Fed Certified FTEs 48,52787.1 Legal Balance (funds 1-2-4) 5,272,67987.2 Categorical Fund Balance 19,83887.3 Deposits with Paying Agents (QZAB) 087.4 Net Legal Bal (Excl Cat & QZAB) 5,252,84188 Building Fund Balance (fund 3) 089 Capital Outlay Fund Balance (fund 5) 0
Jan 30, 2012 - 238 - 9:35:29 AM

Annual Statistical Report 2010-2011
County: YELL WESTERN YELL CO. SCHOOL DIST. LEA:7509000
2010-2011 2011-2012Actual Budget
1 Area in Square Miles 1592 ADA 4513 ADA pct Change over 5 Yrs. 8%4 4 QTR ADM 4755 Prior Year 3QTR ADM 5006 Assessment 37,177,2367 M&O Mills 25.008 URT Mills 25.009 M&O Mills in Excess of URT 0.0010 Dedicated M&O Mills 0.0011 Debt Service Mills 13.8012 Total Mills 38.8013 Total Debt Bond/Non-Bond 2,765,638
State and Local Revenue:14 Property Tax Receipts (Including URT) 1,559,926 1,559,93215 Other Local Receipts 247,194 46,66016 Revenue from Intermediate Sources 0 017.1 Foundation Funding (Excl URT) 1,745,644 1,774,46817.2 Tax Collection Rate Guarantee 3,608 3,60018 Student Growth Funding 13,909 019 Declining Enrollment Funding 0 73,42120 Consolidation Incentive/Assistance 0 021 Isolated Funding 0 022 Supplemental Millage Incentive Funding 19,013 15,21023 Other Unrestricted State Funding 0 024 Total Unrestricted Revenue from State and
Local Sources 3,589,294 3,473,291
Restricted Revenue from State Sources:25 Adult Education 0 0
Regular Education:26 Professional Development 20,674 20,17127 Other Regular Education 5,393 5,200
Special Education:28 Gifted & Talented 1,300 029 Alternative Learning Environment (ALE) 20,193 18,52830 English Language Learner (ELL) 32,816 031 National School Lunch Act (NSLA) 387,872 374,44032 Other Special Education 43,230 033 Workforce Education 6,500 034 School Food Service 2,343 035 Educational Service Cooperatives 0 036 Early Childhood Programs 126,872 145,80037 Magnet School Programs 0 038 Other Non-Instructional Programs 575,624 8,22839 Total Restricted Revenue from State Sources 1,222,817 572,36740 Total Restricted Revenue from Federal
Sources 1,063,598 720,794
Other Sources of Funds:41 Financing Sources 0 174,00042 Balances from Consolidated/Annexed District 0 043 Indirect Cost Reimbursement 0 044 Gains and Losses from Sale of Fixed Assets 0 045 Compensation for Loss of Fixed Assets 0 046 Other 0 047 Total Other Sources of Funds 0 174,00048 Total Revenue and Other Sources of Funds
from All Sources 5,875,709 4,940,452
2010-2011 2011-2012Actual Budget
CURRENT EXPENDITURESInstruction:
49 Regular Instruction 1,988,766 1,503,20750 Special Education 380,992 355,48951 Workforce Education 127,682 129,30152 Adult Education 0 053 Compensatory Education 215,568 498,93254 Other 104,055 91,79055 Total Instruction 2,817,063 2,578,720
District Level Support:56 General Administration 187,206 192,17057 Central Services 166,652 152,24358 Maintenance & Operations of Plant 438,142 377,08359 Student Transportation 291,782 202,28860 Other District Level Support Services 10,898 11,00061 Total District Support Services 1,094,680 934,784
School Level Support:62 Student Support Services 214,557 189,86463 Instructional Staff Support Services 515,957 313,65364 School Administration 231,308 225,59665 Total District Support Services 961,822 729,113
Non-Instructional Services:66 Food Service Operations 313,880 120,37467 Other Enterprise Operations 0 068 Community Operations 0 069 Other Non-Instructional Services 0 070 Total Non-Instructional Services 313,880 120,37471 Facilities Acquisition and Construction 735,710 68,92572 Debt Service 230,401 210,73975 Other Non-Programmed Costs 0 076 Total Expenditures 6,153,556 4,642,65577 Less: Capital Expenditures 1,025,783 395,57278 Less: Debt Service 230,401 210,73979 Total Current Expenditures 4,897,373 4,036,34480 Exclusions from Current Expenditures 316,05881 Net Current Expenditures 4,581,315
82 Per Pupil Expenditures 10,162
83 Personnel - Non-Federal Certified Clsrm FTEs 46.6384 Avg Salary - Non-Fed Certified Clsrm FTEs 35,69785 Personnel - Non-Federal Certified FTEs 49.6386 Avg Salary - Non-Fed Certified FTEs 38,17287.1 Legal Balance (funds 1-2-4) 706,78287.2 Categorical Fund Balance 100,01387.3 Deposits with Paying Agents (QZAB) 087.4 Net Legal Bal (Excl Cat & QZAB) 606,76988 Building Fund Balance (fund 3) 089 Capital Outlay Fund Balance (fund 5) 0
Jan 30, 2012 - 239 - 9:35:29 AM

Annual Statistical Report 2010-2011
County: YELL TWO RIVERS SCHOOL DISTRICT LEA:7510000
2010-2011 2011-2012Actual Budget
1 Area in Square Miles 6152 ADA 8213 ADA pct Change over 5 Yrs. (14%)4 4 QTR ADM 8875 Prior Year 3QTR ADM 8916 Assessment 64,347,5167 M&O Mills 25.008 URT Mills 25.009 M&O Mills in Excess of URT 0.0010 Dedicated M&O Mills 0.0011 Debt Service Mills 10.6012 Total Mills 35.6013 Total Debt Bond/Non-Bond 6,451,196
State and Local Revenue:14 Property Tax Receipts (Including URT) 1,936,717 2,315,18015 Other Local Receipts 400,260 138,56816 Revenue from Intermediate Sources 0 017.1 Foundation Funding (Excl URT) 2,967,775 2,939,47817.2 Tax Collection Rate Guarantee 55,568 018 Student Growth Funding 0 019 Declining Enrollment Funding 146,931 020 Consolidation Incentive/Assistance 0 021 Isolated Funding 47,416 40,98622 Supplemental Millage Incentive Funding 40,926 32,74123 Other Unrestricted State Funding 0 024 Total Unrestricted Revenue from State and
Local Sources 5,595,593 5,466,953
Restricted Revenue from State Sources:25 Adult Education 0 0
Regular Education:26 Professional Development 36,853 37,84027 Other Regular Education 3,910 3,400
Special Education:28 Gifted & Talented 0 029 Alternative Learning Environment (ALE) 91,905 83,89530 English Language Learner (ELL) 21,389 21,82731 National School Lunch Act (NSLA) 710,272 694,23232 Other Special Education 76,271 65,73033 Workforce Education 15,167 84,89034 School Food Service 3,876 035 Educational Service Cooperatives 0 036 Early Childhood Programs 388,913 381,45737 Magnet School Programs 0 038 Other Non-Instructional Programs 330,844 85,92439 Total Restricted Revenue from State Sources 1,679,399 1,459,19540 Total Restricted Revenue from Federal
Sources 3,082,099 2,486,398
Other Sources of Funds:41 Financing Sources 0 042 Balances from Consolidated/Annexed District 0 043 Indirect Cost Reimbursement 23,579 28,22644 Gains and Losses from Sale of Fixed Assets 0 045 Compensation for Loss of Fixed Assets 10,485 046 Other 0 047 Total Other Sources of Funds 34,065 28,22648 Total Revenue and Other Sources of Funds
from All Sources 10,391,156 9,440,772
2010-2011 2011-2012Actual Budget
CURRENT EXPENDITURESInstruction:
49 Regular Instruction 3,236,824 2,838,06350 Special Education 585,819 579,57851 Workforce Education 315,543 304,35552 Adult Education 0 053 Compensatory Education 792,559 810,56754 Other 490,863 483,62855 Total Instruction 5,421,608 5,016,191
District Level Support:56 General Administration 190,912 172,81557 Central Services 170,043 170,56058 Maintenance & Operations of Plant 975,117 832,52059 Student Transportation 426,018 475,13360 Other District Level Support Services 41,919 56,19361 Total District Support Services 1,804,009 1,707,220
School Level Support:62 Student Support Services 616,265 647,59463 Instructional Staff Support Services 940,934 867,36264 School Administration 496,120 469,97465 Total District Support Services 2,053,318 1,984,930
Non-Instructional Services:66 Food Service Operations 722,712 699,58367 Other Enterprise Operations 35,231 068 Community Operations 0 5,00069 Other Non-Instructional Services 0 070 Total Non-Instructional Services 757,942 704,58371 Facilities Acquisition and Construction 1,556,523 112,50072 Debt Service 533,999 393,43975 Other Non-Programmed Costs 733 076 Total Expenditures 12,128,133 9,918,86377 Less: Capital Expenditures 1,982,379 292,83978 Less: Debt Service 533,999 393,43979 Total Current Expenditures 9,611,755 9,232,58580 Exclusions from Current Expenditures 659,10081 Net Current Expenditures 8,952,655
82 Per Pupil Expenditures 10,904
83 Personnel - Non-Federal Certified Clsrm FTEs 65.1784 Avg Salary - Non-Fed Certified Clsrm FTEs 42,71285 Personnel - Non-Federal Certified FTEs 70.6486 Avg Salary - Non-Fed Certified FTEs 46,23587.1 Legal Balance (funds 1-2-4) 1,166,04287.2 Categorical Fund Balance 311,39587.3 Deposits with Paying Agents (QZAB) 087.4 Net Legal Bal (Excl Cat & QZAB) 854,64788 Building Fund Balance (fund 3) 1,867,92789 Capital Outlay Fund Balance (fund 5) 0
Jan 30, 2012 - 240 - 9:35:29 AM
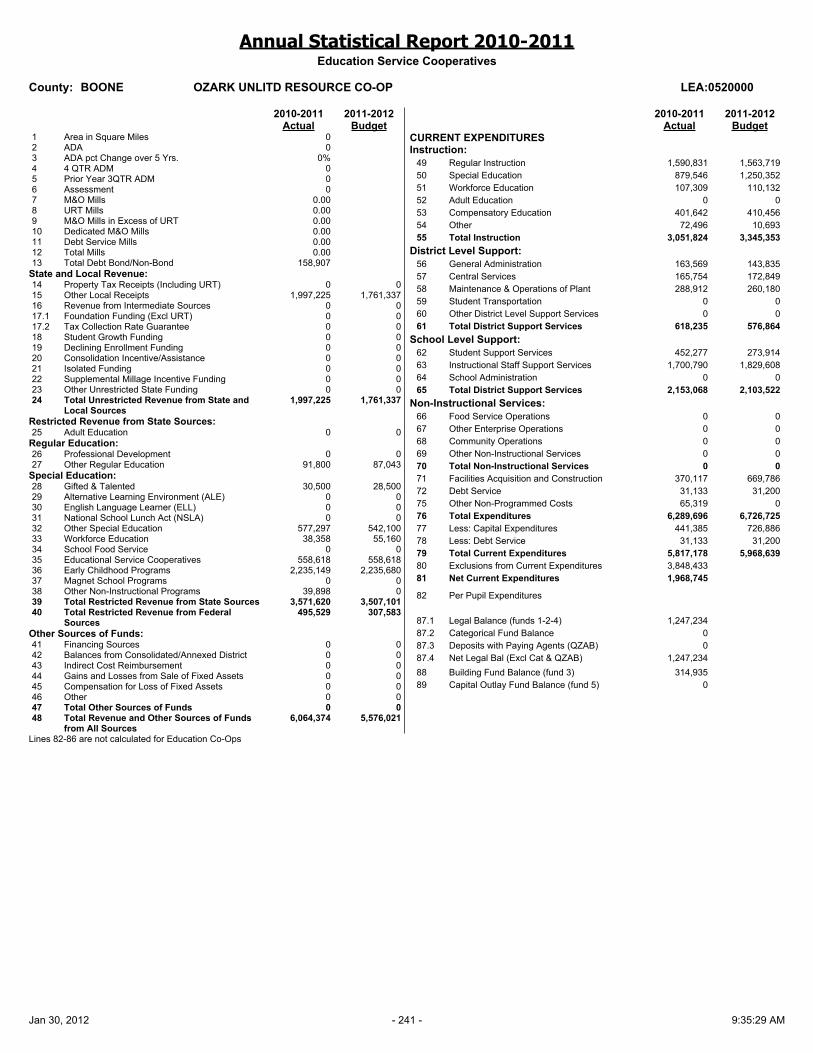
Annual Statistical Report 2010-2011Education Service Cooperatives
County: BOONE OZARK UNLITD RESOURCE CO-OP LEA:0520000
2010-2011 2011-2012Actual Budget
1 Area in Square Miles 02 ADA 03 ADA pct Change over 5 Yrs. 0%4 4 QTR ADM 05 Prior Year 3QTR ADM 06 Assessment 07 M&O Mills 0.008 URT Mills 0.009 M&O Mills in Excess of URT 0.0010 Dedicated M&O Mills 0.0011 Debt Service Mills 0.0012 Total Mills 0.0013 Total Debt Bond/Non-Bond 158,907
State and Local Revenue:14 Property Tax Receipts (Including URT) 0 015 Other Local Receipts 1,997,225 1,761,33716 Revenue from Intermediate Sources 0 017.1 Foundation Funding (Excl URT) 0 017.2 Tax Collection Rate Guarantee 0 018 Student Growth Funding 0 019 Declining Enrollment Funding 0 020 Consolidation Incentive/Assistance 0 021 Isolated Funding 0 022 Supplemental Millage Incentive Funding 0 023 Other Unrestricted State Funding 0 024 Total Unrestricted Revenue from State and
Local Sources 1,997,225 1,761,337
Restricted Revenue from State Sources:25 Adult Education 0 0
Regular Education:26 Professional Development 0 027 Other Regular Education 91,800 87,043
Special Education:28 Gifted & Talented 30,500 28,50029 Alternative Learning Environment (ALE) 0 030 English Language Learner (ELL) 0 031 National School Lunch Act (NSLA) 0 032 Other Special Education 577,297 542,10033 Workforce Education 38,358 55,16034 School Food Service 0 035 Educational Service Cooperatives 558,618 558,61836 Early Childhood Programs 2,235,149 2,235,68037 Magnet School Programs 0 038 Other Non-Instructional Programs 39,898 039 Total Restricted Revenue from State Sources 3,571,620 3,507,10140 Total Restricted Revenue from Federal
Sources 495,529 307,583
Other Sources of Funds:41 Financing Sources 0 042 Balances from Consolidated/Annexed District 0 043 Indirect Cost Reimbursement 0 044 Gains and Losses from Sale of Fixed Assets 0 045 Compensation for Loss of Fixed Assets 0 046 Other 0 047 Total Other Sources of Funds 0 048 Total Revenue and Other Sources of Funds
from All Sources 6,064,374 5,576,021
2010-2011 2011-2012Actual Budget
CURRENT EXPENDITURESInstruction:
49 Regular Instruction 1,590,831 1,563,71950 Special Education 879,546 1,250,35251 Workforce Education 107,309 110,13252 Adult Education 0 053 Compensatory Education 401,642 410,45654 Other 72,496 10,69355 Total Instruction 3,051,824 3,345,353
District Level Support:56 General Administration 163,569 143,83557 Central Services 165,754 172,84958 Maintenance & Operations of Plant 288,912 260,18059 Student Transportation 0 060 Other District Level Support Services 0 061 Total District Support Services 618,235 576,864
School Level Support:62 Student Support Services 452,277 273,91463 Instructional Staff Support Services 1,700,790 1,829,60864 School Administration 0 065 Total District Support Services 2,153,068 2,103,522
Non-Instructional Services:66 Food Service Operations 0 067 Other Enterprise Operations 0 068 Community Operations 0 069 Other Non-Instructional Services 0 070 Total Non-Instructional Services 0 071 Facilities Acquisition and Construction 370,117 669,78672 Debt Service 31,133 31,20075 Other Non-Programmed Costs 65,319 076 Total Expenditures 6,289,696 6,726,72577 Less: Capital Expenditures 441,385 726,88678 Less: Debt Service 31,133 31,20079 Total Current Expenditures 5,817,178 5,968,63980 Exclusions from Current Expenditures 3,848,43381 Net Current Expenditures 1,968,745
82 Per Pupil Expenditures
87.1 Legal Balance (funds 1-2-4) 1,247,23487.2 Categorical Fund Balance 087.3 Deposits with Paying Agents (QZAB) 087.4 Net Legal Bal (Excl Cat & QZAB) 1,247,23488 Building Fund Balance (fund 3) 314,93589 Capital Outlay Fund Balance (fund 5) 0
Lines 82-86 are not calculated for Education Co-Ops
Jan 30, 2012 - 241 - 9:35:29 AM
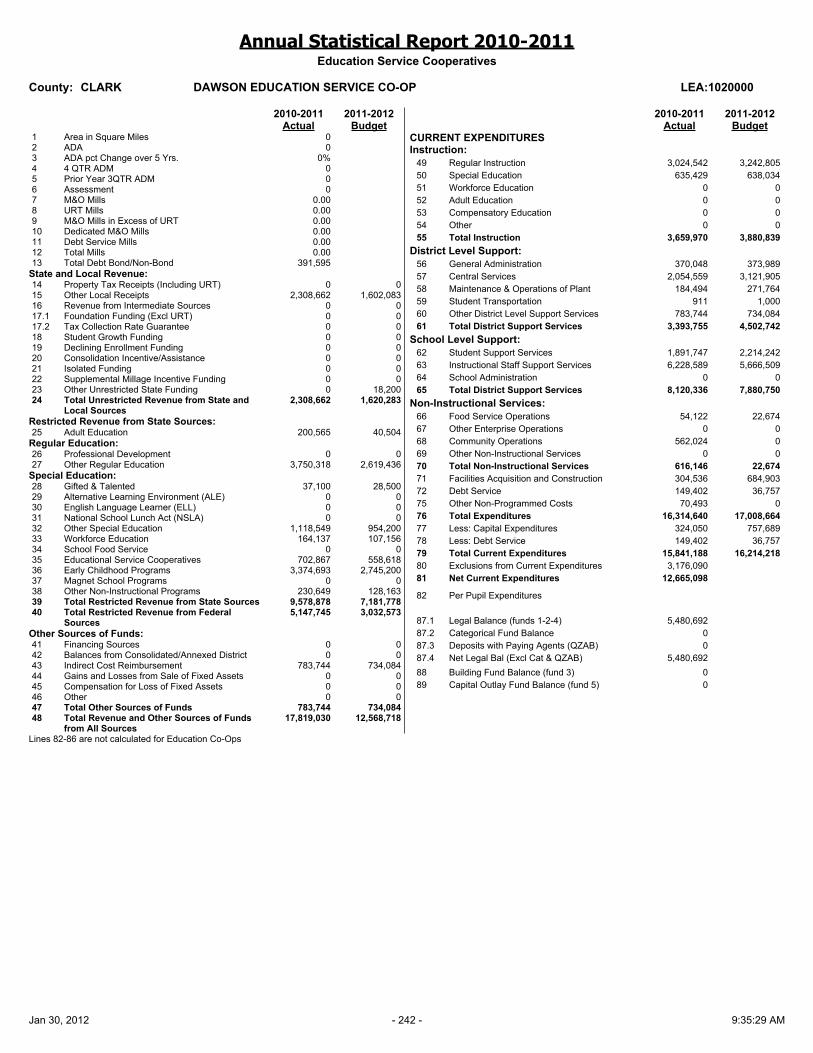
Annual Statistical Report 2010-2011Education Service Cooperatives
County: CLARK DAWSON EDUCATION SERVICE CO-OP LEA:1020000
2010-2011 2011-2012Actual Budget
1 Area in Square Miles 02 ADA 03 ADA pct Change over 5 Yrs. 0%4 4 QTR ADM 05 Prior Year 3QTR ADM 06 Assessment 07 M&O Mills 0.008 URT Mills 0.009 M&O Mills in Excess of URT 0.0010 Dedicated M&O Mills 0.0011 Debt Service Mills 0.0012 Total Mills 0.0013 Total Debt Bond/Non-Bond 391,595
State and Local Revenue:14 Property Tax Receipts (Including URT) 0 015 Other Local Receipts 2,308,662 1,602,08316 Revenue from Intermediate Sources 0 017.1 Foundation Funding (Excl URT) 0 017.2 Tax Collection Rate Guarantee 0 018 Student Growth Funding 0 019 Declining Enrollment Funding 0 020 Consolidation Incentive/Assistance 0 021 Isolated Funding 0 022 Supplemental Millage Incentive Funding 0 023 Other Unrestricted State Funding 0 18,20024 Total Unrestricted Revenue from State and
Local Sources 2,308,662 1,620,283
Restricted Revenue from State Sources:25 Adult Education 200,565 40,504
Regular Education:26 Professional Development 0 027 Other Regular Education 3,750,318 2,619,436
Special Education:28 Gifted & Talented 37,100 28,50029 Alternative Learning Environment (ALE) 0 030 English Language Learner (ELL) 0 031 National School Lunch Act (NSLA) 0 032 Other Special Education 1,118,549 954,20033 Workforce Education 164,137 107,15634 School Food Service 0 035 Educational Service Cooperatives 702,867 558,61836 Early Childhood Programs 3,374,693 2,745,20037 Magnet School Programs 0 038 Other Non-Instructional Programs 230,649 128,16339 Total Restricted Revenue from State Sources 9,578,878 7,181,77840 Total Restricted Revenue from Federal
Sources 5,147,745 3,032,573
Other Sources of Funds:41 Financing Sources 0 042 Balances from Consolidated/Annexed District 0 043 Indirect Cost Reimbursement 783,744 734,08444 Gains and Losses from Sale of Fixed Assets 0 045 Compensation for Loss of Fixed Assets 0 046 Other 0 047 Total Other Sources of Funds 783,744 734,08448 Total Revenue and Other Sources of Funds
from All Sources 17,819,030 12,568,718
2010-2011 2011-2012Actual Budget
CURRENT EXPENDITURESInstruction:
49 Regular Instruction 3,024,542 3,242,80550 Special Education 635,429 638,03451 Workforce Education 0 052 Adult Education 0 053 Compensatory Education 0 054 Other 0 055 Total Instruction 3,659,970 3,880,839
District Level Support:56 General Administration 370,048 373,98957 Central Services 2,054,559 3,121,90558 Maintenance & Operations of Plant 184,494 271,76459 Student Transportation 911 1,00060 Other District Level Support Services 783,744 734,08461 Total District Support Services 3,393,755 4,502,742
School Level Support:62 Student Support Services 1,891,747 2,214,24263 Instructional Staff Support Services 6,228,589 5,666,50964 School Administration 0 065 Total District Support Services 8,120,336 7,880,750
Non-Instructional Services:66 Food Service Operations 54,122 22,67467 Other Enterprise Operations 0 068 Community Operations 562,024 069 Other Non-Instructional Services 0 070 Total Non-Instructional Services 616,146 22,67471 Facilities Acquisition and Construction 304,536 684,90372 Debt Service 149,402 36,75775 Other Non-Programmed Costs 70,493 076 Total Expenditures 16,314,640 17,008,66477 Less: Capital Expenditures 324,050 757,68978 Less: Debt Service 149,402 36,75779 Total Current Expenditures 15,841,188 16,214,21880 Exclusions from Current Expenditures 3,176,09081 Net Current Expenditures 12,665,098
82 Per Pupil Expenditures
87.1 Legal Balance (funds 1-2-4) 5,480,69287.2 Categorical Fund Balance 087.3 Deposits with Paying Agents (QZAB) 087.4 Net Legal Bal (Excl Cat & QZAB) 5,480,69288 Building Fund Balance (fund 3) 089 Capital Outlay Fund Balance (fund 5) 0
Lines 82-86 are not calculated for Education Co-Ops
Jan 30, 2012 - 242 - 9:35:29 AM

Annual Statistical Report 2010-2011Education Service Cooperatives
County: CONWAY Arch Ford Educational Service LEA:1520000
2010-2011 2011-2012Actual Budget
1 Area in Square Miles 02 ADA 03 ADA pct Change over 5 Yrs. 0%4 4 QTR ADM 05 Prior Year 3QTR ADM 06 Assessment 07 M&O Mills 0.008 URT Mills 0.009 M&O Mills in Excess of URT 0.0010 Dedicated M&O Mills 0.0011 Debt Service Mills 0.0012 Total Mills 0.0013 Total Debt Bond/Non-Bond 0
State and Local Revenue:14 Property Tax Receipts (Including URT) 0 015 Other Local Receipts 4,849,268 4,444,70316 Revenue from Intermediate Sources 0 017.1 Foundation Funding (Excl URT) 0 017.2 Tax Collection Rate Guarantee 0 018 Student Growth Funding 0 019 Declining Enrollment Funding 0 020 Consolidation Incentive/Assistance 0 021 Isolated Funding 0 022 Supplemental Millage Incentive Funding 0 023 Other Unrestricted State Funding 0 024 Total Unrestricted Revenue from State and
Local Sources 4,849,268 4,444,703
Restricted Revenue from State Sources:25 Adult Education 0 0
Regular Education:26 Professional Development 0 027 Other Regular Education 702,927 736,500
Special Education:28 Gifted & Talented 91,381 59,77229 Alternative Learning Environment (ALE) 0 030 English Language Learner (ELL) 0 031 National School Lunch Act (NSLA) 0 032 Other Special Education 2,443,454 2,393,10233 Workforce Education 50,000 75,00034 School Food Service 0 035 Educational Service Cooperatives 225,016 658,61836 Early Childhood Programs 1,391,590 703,40037 Magnet School Programs 0 038 Other Non-Instructional Programs 262,000 261,00039 Total Restricted Revenue from State Sources 5,166,368 4,887,39240 Total Restricted Revenue from Federal
Sources 1,064,132 967,911
Other Sources of Funds:41 Financing Sources (75,895) 042 Balances from Consolidated/Annexed District 0 043 Indirect Cost Reimbursement 0 044 Gains and Losses from Sale of Fixed Assets 0 045 Compensation for Loss of Fixed Assets 0 046 Other 0 047 Total Other Sources of Funds (75,895) 048 Total Revenue and Other Sources of Funds
from All Sources 11,003,873 10,300,006
2010-2011 2011-2012Actual Budget
CURRENT EXPENDITURESInstruction:
49 Regular Instruction 97,200 97,20050 Special Education 861,563 1,361,41551 Workforce Education 0 052 Adult Education 0 053 Compensatory Education 0 054 Other 776,022 631,20055 Total Instruction 1,734,784 2,089,815
District Level Support:56 General Administration 420,454 403,47557 Central Services 853,132 1,232,19658 Maintenance & Operations of Plant 217,647 289,96059 Student Transportation 0 5,00060 Other District Level Support Services 84,108 129,69161 Total District Support Services 1,575,340 2,060,321
School Level Support:62 Student Support Services 1,656,243 2,079,45663 Instructional Staff Support Services 4,254,512 5,358,03664 School Administration 0 065 Total District Support Services 5,910,755 7,437,493
Non-Instructional Services:66 Food Service Operations 0 067 Other Enterprise Operations 915,262 1,185,00068 Community Operations 0 069 Other Non-Instructional Services 0 070 Total Non-Instructional Services 915,262 1,185,00071 Facilities Acquisition and Construction 448,744 326,36972 Debt Service 0 075 Other Non-Programmed Costs 0 076 Total Expenditures 10,584,886 13,098,99877 Less: Capital Expenditures 532,165 553,62078 Less: Debt Service 0 079 Total Current Expenditures 10,052,721 12,545,37880 Exclusions from Current Expenditures 1,990,58781 Net Current Expenditures 8,062,134
82 Per Pupil Expenditures
87.1 Legal Balance (funds 1-2-4) 5,376,21787.2 Categorical Fund Balance 087.3 Deposits with Paying Agents (QZAB) 087.4 Net Legal Bal (Excl Cat & QZAB) 5,376,21788 Building Fund Balance (fund 3) 089 Capital Outlay Fund Balance (fund 5) 0
Lines 82-86 are not calculated for Education Co-Ops
Jan 30, 2012 - 243 - 9:35:29 AM
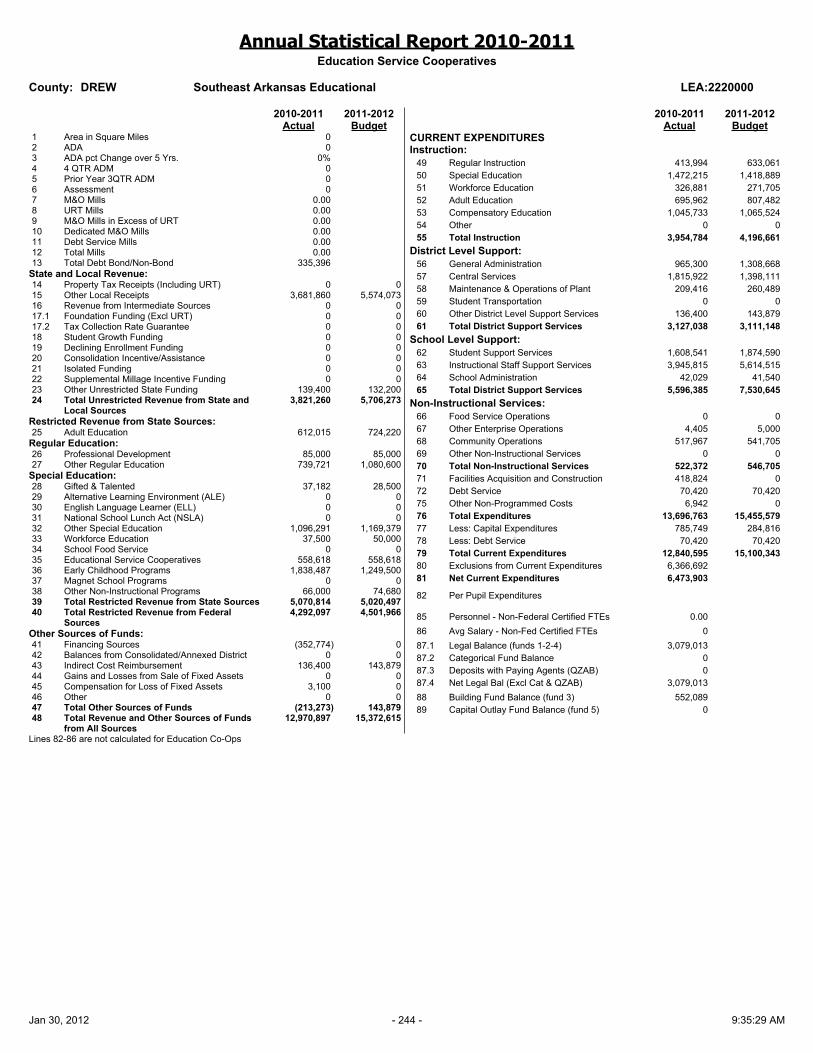
Annual Statistical Report 2010-2011Education Service Cooperatives
County: DREW Southeast Arkansas Educational LEA:2220000
2010-2011 2011-2012Actual Budget
1 Area in Square Miles 02 ADA 03 ADA pct Change over 5 Yrs. 0%4 4 QTR ADM 05 Prior Year 3QTR ADM 06 Assessment 07 M&O Mills 0.008 URT Mills 0.009 M&O Mills in Excess of URT 0.0010 Dedicated M&O Mills 0.0011 Debt Service Mills 0.0012 Total Mills 0.0013 Total Debt Bond/Non-Bond 335,396
State and Local Revenue:14 Property Tax Receipts (Including URT) 0 015 Other Local Receipts 3,681,860 5,574,07316 Revenue from Intermediate Sources 0 017.1 Foundation Funding (Excl URT) 0 017.2 Tax Collection Rate Guarantee 0 018 Student Growth Funding 0 019 Declining Enrollment Funding 0 020 Consolidation Incentive/Assistance 0 021 Isolated Funding 0 022 Supplemental Millage Incentive Funding 0 023 Other Unrestricted State Funding 139,400 132,20024 Total Unrestricted Revenue from State and
Local Sources 3,821,260 5,706,273
Restricted Revenue from State Sources:25 Adult Education 612,015 724,220
Regular Education:26 Professional Development 85,000 85,00027 Other Regular Education 739,721 1,080,600
Special Education:28 Gifted & Talented 37,182 28,50029 Alternative Learning Environment (ALE) 0 030 English Language Learner (ELL) 0 031 National School Lunch Act (NSLA) 0 032 Other Special Education 1,096,291 1,169,37933 Workforce Education 37,500 50,00034 School Food Service 0 035 Educational Service Cooperatives 558,618 558,61836 Early Childhood Programs 1,838,487 1,249,50037 Magnet School Programs 0 038 Other Non-Instructional Programs 66,000 74,68039 Total Restricted Revenue from State Sources 5,070,814 5,020,49740 Total Restricted Revenue from Federal
Sources 4,292,097 4,501,966
Other Sources of Funds:41 Financing Sources (352,774) 042 Balances from Consolidated/Annexed District 0 043 Indirect Cost Reimbursement 136,400 143,87944 Gains and Losses from Sale of Fixed Assets 0 045 Compensation for Loss of Fixed Assets 3,100 046 Other 0 047 Total Other Sources of Funds (213,273) 143,87948 Total Revenue and Other Sources of Funds
from All Sources 12,970,897 15,372,615
2010-2011 2011-2012Actual Budget
CURRENT EXPENDITURESInstruction:
49 Regular Instruction 413,994 633,06150 Special Education 1,472,215 1,418,88951 Workforce Education 326,881 271,70552 Adult Education 695,962 807,48253 Compensatory Education 1,045,733 1,065,52454 Other 0 055 Total Instruction 3,954,784 4,196,661
District Level Support:56 General Administration 965,300 1,308,66857 Central Services 1,815,922 1,398,11158 Maintenance & Operations of Plant 209,416 260,48959 Student Transportation 0 060 Other District Level Support Services 136,400 143,87961 Total District Support Services 3,127,038 3,111,148
School Level Support:62 Student Support Services 1,608,541 1,874,59063 Instructional Staff Support Services 3,945,815 5,614,51564 School Administration 42,029 41,54065 Total District Support Services 5,596,385 7,530,645
Non-Instructional Services:66 Food Service Operations 0 067 Other Enterprise Operations 4,405 5,00068 Community Operations 517,967 541,70569 Other Non-Instructional Services 0 070 Total Non-Instructional Services 522,372 546,70571 Facilities Acquisition and Construction 418,824 072 Debt Service 70,420 70,42075 Other Non-Programmed Costs 6,942 076 Total Expenditures 13,696,763 15,455,57977 Less: Capital Expenditures 785,749 284,81678 Less: Debt Service 70,420 70,42079 Total Current Expenditures 12,840,595 15,100,34380 Exclusions from Current Expenditures 6,366,69281 Net Current Expenditures 6,473,903
82 Per Pupil Expenditures
85 Personnel - Non-Federal Certified FTEs 0.0086 Avg Salary - Non-Fed Certified FTEs 087.1 Legal Balance (funds 1-2-4) 3,079,01387.2 Categorical Fund Balance 087.3 Deposits with Paying Agents (QZAB) 087.4 Net Legal Bal (Excl Cat & QZAB) 3,079,01388 Building Fund Balance (fund 3) 552,08989 Capital Outlay Fund Balance (fund 5) 0
Lines 82-86 are not calculated for Education Co-Ops
Jan 30, 2012 - 244 - 9:35:29 AM
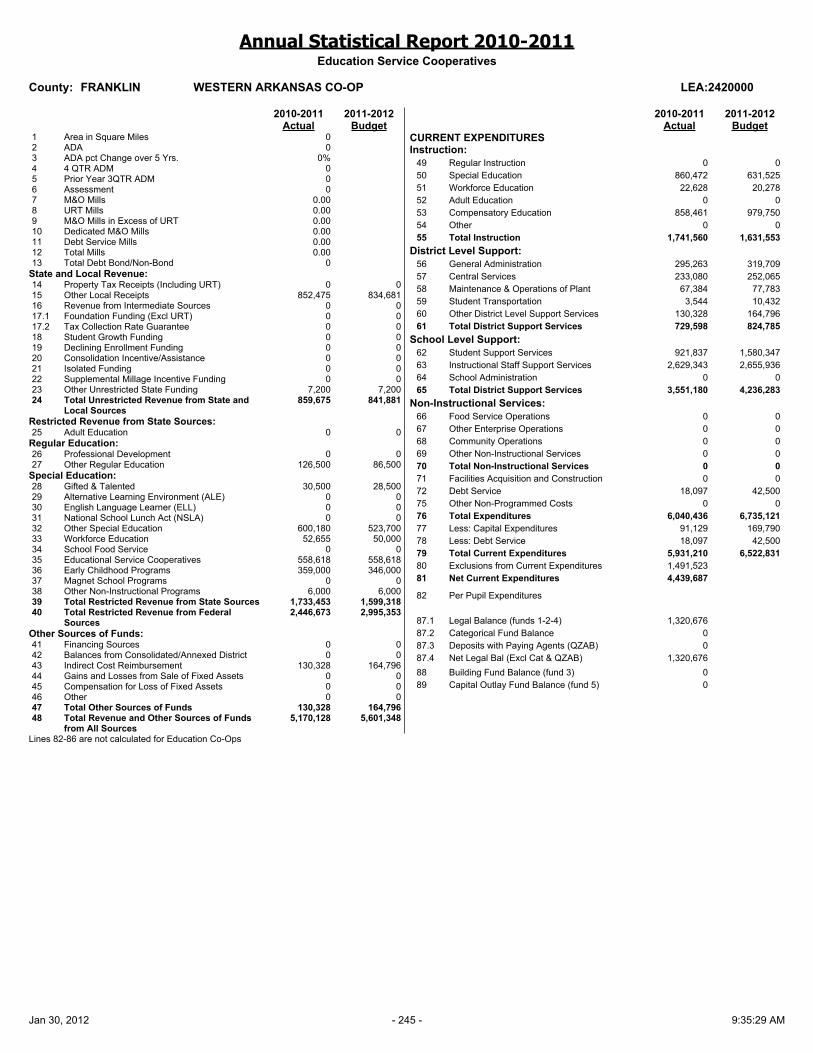
Annual Statistical Report 2010-2011Education Service Cooperatives
County: FRANKLIN WESTERN ARKANSAS CO-OP LEA:2420000
2010-2011 2011-2012Actual Budget
1 Area in Square Miles 02 ADA 03 ADA pct Change over 5 Yrs. 0%4 4 QTR ADM 05 Prior Year 3QTR ADM 06 Assessment 07 M&O Mills 0.008 URT Mills 0.009 M&O Mills in Excess of URT 0.0010 Dedicated M&O Mills 0.0011 Debt Service Mills 0.0012 Total Mills 0.0013 Total Debt Bond/Non-Bond 0
State and Local Revenue:14 Property Tax Receipts (Including URT) 0 015 Other Local Receipts 852,475 834,68116 Revenue from Intermediate Sources 0 017.1 Foundation Funding (Excl URT) 0 017.2 Tax Collection Rate Guarantee 0 018 Student Growth Funding 0 019 Declining Enrollment Funding 0 020 Consolidation Incentive/Assistance 0 021 Isolated Funding 0 022 Supplemental Millage Incentive Funding 0 023 Other Unrestricted State Funding 7,200 7,20024 Total Unrestricted Revenue from State and
Local Sources 859,675 841,881
Restricted Revenue from State Sources:25 Adult Education 0 0
Regular Education:26 Professional Development 0 027 Other Regular Education 126,500 86,500
Special Education:28 Gifted & Talented 30,500 28,50029 Alternative Learning Environment (ALE) 0 030 English Language Learner (ELL) 0 031 National School Lunch Act (NSLA) 0 032 Other Special Education 600,180 523,70033 Workforce Education 52,655 50,00034 School Food Service 0 035 Educational Service Cooperatives 558,618 558,61836 Early Childhood Programs 359,000 346,00037 Magnet School Programs 0 038 Other Non-Instructional Programs 6,000 6,00039 Total Restricted Revenue from State Sources 1,733,453 1,599,31840 Total Restricted Revenue from Federal
Sources 2,446,673 2,995,353
Other Sources of Funds:41 Financing Sources 0 042 Balances from Consolidated/Annexed District 0 043 Indirect Cost Reimbursement 130,328 164,79644 Gains and Losses from Sale of Fixed Assets 0 045 Compensation for Loss of Fixed Assets 0 046 Other 0 047 Total Other Sources of Funds 130,328 164,79648 Total Revenue and Other Sources of Funds
from All Sources 5,170,128 5,601,348
2010-2011 2011-2012Actual Budget
CURRENT EXPENDITURESInstruction:
49 Regular Instruction 0 050 Special Education 860,472 631,52551 Workforce Education 22,628 20,27852 Adult Education 0 053 Compensatory Education 858,461 979,75054 Other 0 055 Total Instruction 1,741,560 1,631,553
District Level Support:56 General Administration 295,263 319,70957 Central Services 233,080 252,06558 Maintenance & Operations of Plant 67,384 77,78359 Student Transportation 3,544 10,43260 Other District Level Support Services 130,328 164,79661 Total District Support Services 729,598 824,785
School Level Support:62 Student Support Services 921,837 1,580,34763 Instructional Staff Support Services 2,629,343 2,655,93664 School Administration 0 065 Total District Support Services 3,551,180 4,236,283
Non-Instructional Services:66 Food Service Operations 0 067 Other Enterprise Operations 0 068 Community Operations 0 069 Other Non-Instructional Services 0 070 Total Non-Instructional Services 0 071 Facilities Acquisition and Construction 0 072 Debt Service 18,097 42,50075 Other Non-Programmed Costs 0 076 Total Expenditures 6,040,436 6,735,12177 Less: Capital Expenditures 91,129 169,79078 Less: Debt Service 18,097 42,50079 Total Current Expenditures 5,931,210 6,522,83180 Exclusions from Current Expenditures 1,491,52381 Net Current Expenditures 4,439,687
82 Per Pupil Expenditures
87.1 Legal Balance (funds 1-2-4) 1,320,67687.2 Categorical Fund Balance 087.3 Deposits with Paying Agents (QZAB) 087.4 Net Legal Bal (Excl Cat & QZAB) 1,320,67688 Building Fund Balance (fund 3) 089 Capital Outlay Fund Balance (fund 5) 0
Lines 82-86 are not calculated for Education Co-Ops
Jan 30, 2012 - 245 - 9:35:29 AM

Annual Statistical Report 2010-2011Education Service Cooperatives
County: HEMPSTEAD SOUTHWEST ARK. CO-OP LEA:2920000
2010-2011 2011-2012Actual Budget
1 Area in Square Miles 02 ADA 03 ADA pct Change over 5 Yrs. 0%4 4 QTR ADM 05 Prior Year 3QTR ADM 06 Assessment 07 M&O Mills 0.008 URT Mills 0.009 M&O Mills in Excess of URT 0.0010 Dedicated M&O Mills 0.0011 Debt Service Mills 0.0012 Total Mills 0.0013 Total Debt Bond/Non-Bond 0
State and Local Revenue:14 Property Tax Receipts (Including URT) 0 015 Other Local Receipts 990,171 674,15416 Revenue from Intermediate Sources 0 017.1 Foundation Funding (Excl URT) 0 017.2 Tax Collection Rate Guarantee 0 018 Student Growth Funding 0 019 Declining Enrollment Funding 0 020 Consolidation Incentive/Assistance 0 021 Isolated Funding 0 022 Supplemental Millage Incentive Funding 0 023 Other Unrestricted State Funding 678 024 Total Unrestricted Revenue from State and
Local Sources 990,849 674,154
Restricted Revenue from State Sources:25 Adult Education 0 0
Regular Education:26 Professional Development 0 027 Other Regular Education 266,428 53,650
Special Education:28 Gifted & Talented 34,900 28,50029 Alternative Learning Environment (ALE) 0 030 English Language Learner (ELL) 0 031 National School Lunch Act (NSLA) 0 032 Other Special Education 648,971 569,40033 Workforce Education 50,000 37,50034 School Food Service 0 035 Educational Service Cooperatives 558,618 558,61836 Early Childhood Programs 377,500 461,00037 Magnet School Programs 0 038 Other Non-Instructional Programs 6,000 6,00039 Total Restricted Revenue from State Sources 1,942,417 1,714,66840 Total Restricted Revenue from Federal
Sources 489,883 442,966
Other Sources of Funds:41 Financing Sources 0 042 Balances from Consolidated/Annexed District 0 043 Indirect Cost Reimbursement 47,969 74,52544 Gains and Losses from Sale of Fixed Assets 0 045 Compensation for Loss of Fixed Assets 0 046 Other 0 047 Total Other Sources of Funds 47,969 74,52548 Total Revenue and Other Sources of Funds
from All Sources 3,471,118 2,906,313
2010-2011 2011-2012Actual Budget
CURRENT EXPENDITURESInstruction:
49 Regular Instruction 0 050 Special Education 940,815 1,103,80651 Workforce Education 0 052 Adult Education 0 053 Compensatory Education 0 054 Other 0 055 Total Instruction 940,815 1,103,806
District Level Support:56 General Administration 110,957 114,88157 Central Services 306,386 285,79758 Maintenance & Operations of Plant 357,190 184,59659 Student Transportation 0 1,50060 Other District Level Support Services 52,133 74,52561 Total District Support Services 826,665 661,299
School Level Support:62 Student Support Services 158,648 223,25563 Instructional Staff Support Services 1,714,677 1,457,28064 School Administration 0 065 Total District Support Services 1,873,325 1,680,534
Non-Instructional Services:66 Food Service Operations 0 067 Other Enterprise Operations 0 068 Community Operations 0 069 Other Non-Instructional Services 0 070 Total Non-Instructional Services 0 071 Facilities Acquisition and Construction 0 072 Debt Service 0 075 Other Non-Programmed Costs 0 076 Total Expenditures 3,640,805 3,445,64077 Less: Capital Expenditures 51,096 48,96578 Less: Debt Service 0 079 Total Current Expenditures 3,589,710 3,396,67580 Exclusions from Current Expenditures 1,347,16481 Net Current Expenditures 2,242,546
82 Per Pupil Expenditures
87.1 Legal Balance (funds 1-2-4) 1,649,26787.2 Categorical Fund Balance 087.3 Deposits with Paying Agents (QZAB) 087.4 Net Legal Bal (Excl Cat & QZAB) 1,649,26788 Building Fund Balance (fund 3) 089 Capital Outlay Fund Balance (fund 5) 0
Lines 82-86 are not calculated for Education Co-Ops
Jan 30, 2012 - 246 - 9:35:29 AM
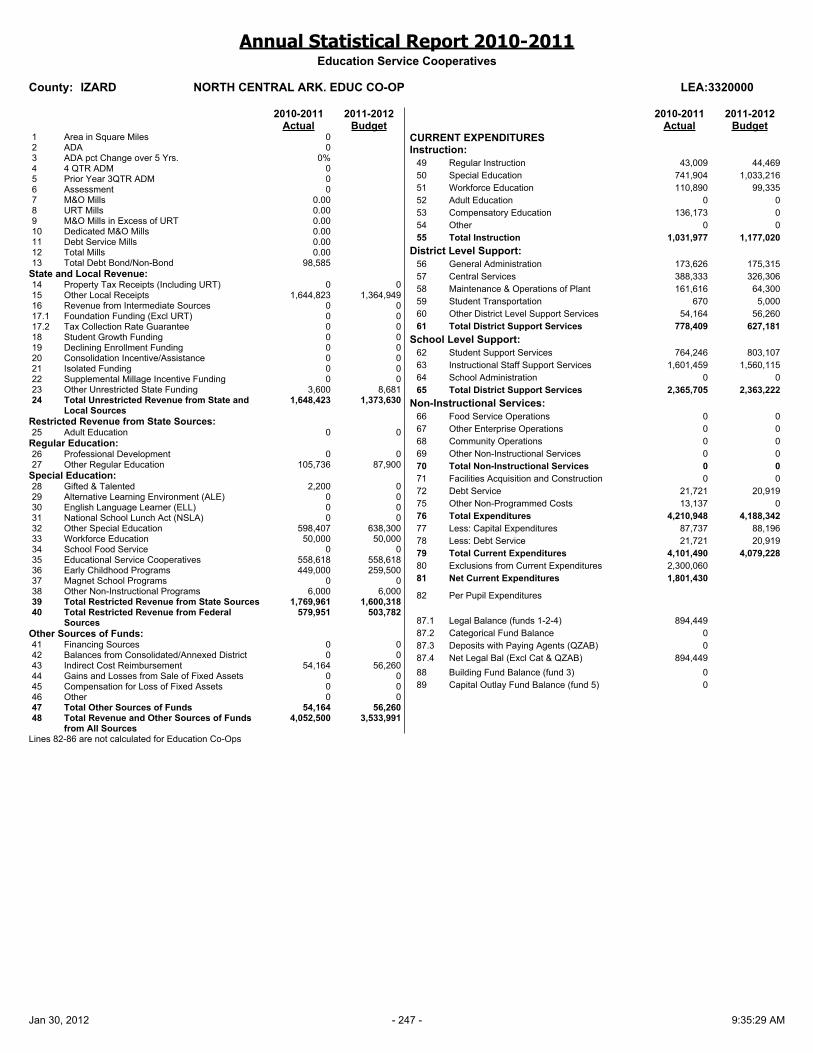
Annual Statistical Report 2010-2011Education Service Cooperatives
County: IZARD NORTH CENTRAL ARK. EDUC CO-OP LEA:3320000
2010-2011 2011-2012Actual Budget
1 Area in Square Miles 02 ADA 03 ADA pct Change over 5 Yrs. 0%4 4 QTR ADM 05 Prior Year 3QTR ADM 06 Assessment 07 M&O Mills 0.008 URT Mills 0.009 M&O Mills in Excess of URT 0.0010 Dedicated M&O Mills 0.0011 Debt Service Mills 0.0012 Total Mills 0.0013 Total Debt Bond/Non-Bond 98,585
State and Local Revenue:14 Property Tax Receipts (Including URT) 0 015 Other Local Receipts 1,644,823 1,364,94916 Revenue from Intermediate Sources 0 017.1 Foundation Funding (Excl URT) 0 017.2 Tax Collection Rate Guarantee 0 018 Student Growth Funding 0 019 Declining Enrollment Funding 0 020 Consolidation Incentive/Assistance 0 021 Isolated Funding 0 022 Supplemental Millage Incentive Funding 0 023 Other Unrestricted State Funding 3,600 8,68124 Total Unrestricted Revenue from State and
Local Sources 1,648,423 1,373,630
Restricted Revenue from State Sources:25 Adult Education 0 0
Regular Education:26 Professional Development 0 027 Other Regular Education 105,736 87,900
Special Education:28 Gifted & Talented 2,200 029 Alternative Learning Environment (ALE) 0 030 English Language Learner (ELL) 0 031 National School Lunch Act (NSLA) 0 032 Other Special Education 598,407 638,30033 Workforce Education 50,000 50,00034 School Food Service 0 035 Educational Service Cooperatives 558,618 558,61836 Early Childhood Programs 449,000 259,50037 Magnet School Programs 0 038 Other Non-Instructional Programs 6,000 6,00039 Total Restricted Revenue from State Sources 1,769,961 1,600,31840 Total Restricted Revenue from Federal
Sources 579,951 503,782
Other Sources of Funds:41 Financing Sources 0 042 Balances from Consolidated/Annexed District 0 043 Indirect Cost Reimbursement 54,164 56,26044 Gains and Losses from Sale of Fixed Assets 0 045 Compensation for Loss of Fixed Assets 0 046 Other 0 047 Total Other Sources of Funds 54,164 56,26048 Total Revenue and Other Sources of Funds
from All Sources 4,052,500 3,533,991
2010-2011 2011-2012Actual Budget
CURRENT EXPENDITURESInstruction:
49 Regular Instruction 43,009 44,46950 Special Education 741,904 1,033,21651 Workforce Education 110,890 99,33552 Adult Education 0 053 Compensatory Education 136,173 054 Other 0 055 Total Instruction 1,031,977 1,177,020
District Level Support:56 General Administration 173,626 175,31557 Central Services 388,333 326,30658 Maintenance & Operations of Plant 161,616 64,30059 Student Transportation 670 5,00060 Other District Level Support Services 54,164 56,26061 Total District Support Services 778,409 627,181
School Level Support:62 Student Support Services 764,246 803,10763 Instructional Staff Support Services 1,601,459 1,560,11564 School Administration 0 065 Total District Support Services 2,365,705 2,363,222
Non-Instructional Services:66 Food Service Operations 0 067 Other Enterprise Operations 0 068 Community Operations 0 069 Other Non-Instructional Services 0 070 Total Non-Instructional Services 0 071 Facilities Acquisition and Construction 0 072 Debt Service 21,721 20,91975 Other Non-Programmed Costs 13,137 076 Total Expenditures 4,210,948 4,188,34277 Less: Capital Expenditures 87,737 88,19678 Less: Debt Service 21,721 20,91979 Total Current Expenditures 4,101,490 4,079,22880 Exclusions from Current Expenditures 2,300,06081 Net Current Expenditures 1,801,430
82 Per Pupil Expenditures
87.1 Legal Balance (funds 1-2-4) 894,44987.2 Categorical Fund Balance 087.3 Deposits with Paying Agents (QZAB) 087.4 Net Legal Bal (Excl Cat & QZAB) 894,44988 Building Fund Balance (fund 3) 089 Capital Outlay Fund Balance (fund 5) 0
Lines 82-86 are not calculated for Education Co-Ops
Jan 30, 2012 - 247 - 9:35:29 AM

Annual Statistical Report 2010-2011Education Service Cooperatives
County: JEFFERSON ARK. RIVER EDUC. SERVICE CNTR. LEA:3520000
2010-2011 2011-2012Actual Budget
1 Area in Square Miles 02 ADA 03 ADA pct Change over 5 Yrs. 0%4 4 QTR ADM 05 Prior Year 3QTR ADM 06 Assessment 07 M&O Mills 0.008 URT Mills 0.009 M&O Mills in Excess of URT 0.0010 Dedicated M&O Mills 0.0011 Debt Service Mills 0.0012 Total Mills 0.0013 Total Debt Bond/Non-Bond 0
State and Local Revenue:14 Property Tax Receipts (Including URT) 0 015 Other Local Receipts 1,615,770 1,373,99416 Revenue from Intermediate Sources 0 017.1 Foundation Funding (Excl URT) 0 017.2 Tax Collection Rate Guarantee 0 018 Student Growth Funding 0 019 Declining Enrollment Funding 0 020 Consolidation Incentive/Assistance 0 021 Isolated Funding 0 022 Supplemental Millage Incentive Funding 0 023 Other Unrestricted State Funding 0 024 Total Unrestricted Revenue from State and
Local Sources 1,615,770 1,373,994
Restricted Revenue from State Sources:25 Adult Education 11,470 11,000
Regular Education:26 Professional Development 0 027 Other Regular Education 180,113 266,500
Special Education:28 Gifted & Talented 32,700 28,50029 Alternative Learning Environment (ALE) 0 030 English Language Learner (ELL) 0 031 National School Lunch Act (NSLA) 0 032 Other Special Education 805,565 613,57933 Workforce Education 418,125 430,62534 School Food Service 0 035 Educational Service Cooperatives 483,618 483,61836 Early Childhood Programs 1,498,965 1,309,50037 Magnet School Programs 0 038 Other Non-Instructional Programs 12,000 12,00039 Total Restricted Revenue from State Sources 3,442,556 3,155,32240 Total Restricted Revenue from Federal
Sources 333,043 264,026
Other Sources of Funds:41 Financing Sources 0 042 Balances from Consolidated/Annexed District 0 043 Indirect Cost Reimbursement 0 044 Gains and Losses from Sale of Fixed Assets 0 045 Compensation for Loss of Fixed Assets 0 046 Other 0 047 Total Other Sources of Funds 0 048 Total Revenue and Other Sources of Funds
from All Sources 5,391,369 4,793,342
2010-2011 2011-2012Actual Budget
CURRENT EXPENDITURESInstruction:
49 Regular Instruction 340,809 410,39750 Special Education 1,087,609 1,580,01851 Workforce Education 748,078 671,81252 Adult Education 0 053 Compensatory Education 193,636 221,71554 Other 0 055 Total Instruction 2,370,133 2,883,942
District Level Support:56 General Administration 422,769 427,15957 Central Services 245,303 239,86358 Maintenance & Operations of Plant 167,452 202,01959 Student Transportation 0 060 Other District Level Support Services 0 061 Total District Support Services 835,525 869,041
School Level Support:62 Student Support Services 53,535 51,50063 Instructional Staff Support Services 426,128 347,19964 School Administration 0 065 Total District Support Services 479,663 398,699
Non-Instructional Services:66 Food Service Operations 0 067 Other Enterprise Operations 0 068 Community Operations 1,048,620 1,050,00069 Other Non-Instructional Services 0 070 Total Non-Instructional Services 1,048,620 1,050,00071 Facilities Acquisition and Construction 0 072 Debt Service 18,553 075 Other Non-Programmed Costs 0 076 Total Expenditures 4,752,494 5,201,68177 Less: Capital Expenditures 34,167 30,51978 Less: Debt Service 18,553 079 Total Current Expenditures 4,699,773 5,171,16380 Exclusions from Current Expenditures 3,697,08781 Net Current Expenditures 1,002,687
82 Per Pupil Expenditures
87.1 Legal Balance (funds 1-2-4) 1,847,62287.2 Categorical Fund Balance 087.3 Deposits with Paying Agents (QZAB) 087.4 Net Legal Bal (Excl Cat & QZAB) 1,847,62288 Building Fund Balance (fund 3) 089 Capital Outlay Fund Balance (fund 5) 0
Lines 82-86 are not calculated for Education Co-Ops
Jan 30, 2012 - 248 - 9:35:29 AM
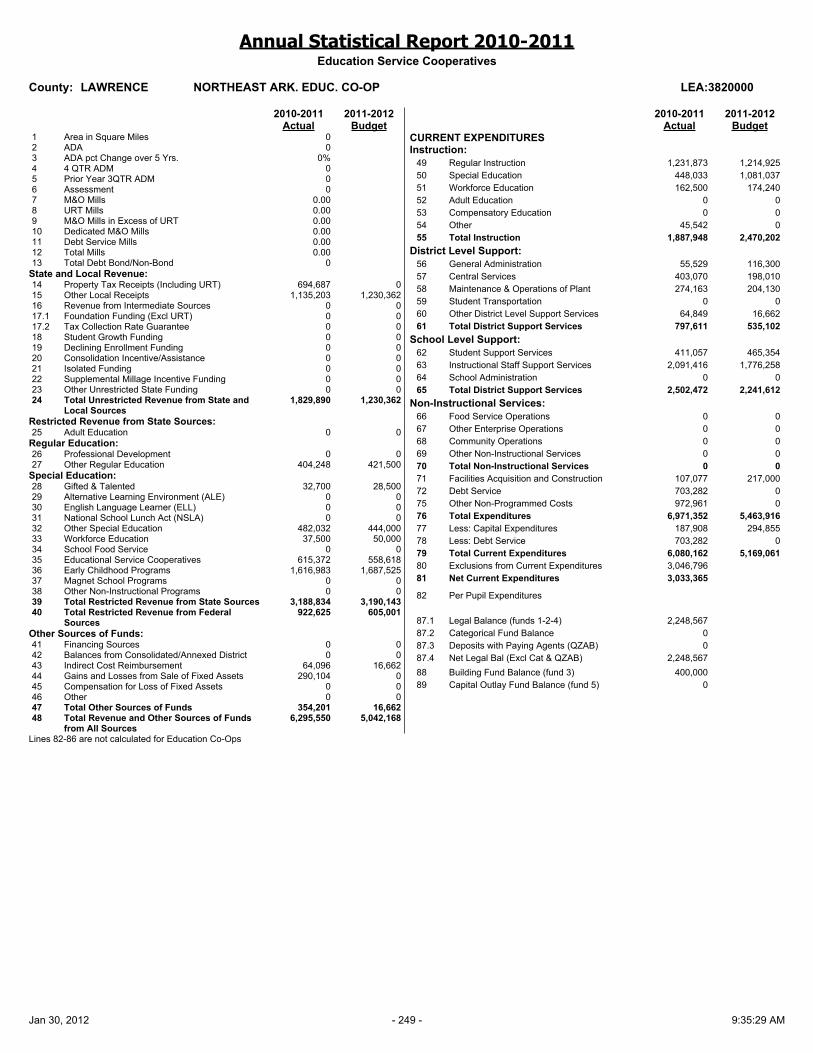
Annual Statistical Report 2010-2011Education Service Cooperatives
County: LAWRENCE NORTHEAST ARK. EDUC. CO-OP LEA:3820000
2010-2011 2011-2012Actual Budget
1 Area in Square Miles 02 ADA 03 ADA pct Change over 5 Yrs. 0%4 4 QTR ADM 05 Prior Year 3QTR ADM 06 Assessment 07 M&O Mills 0.008 URT Mills 0.009 M&O Mills in Excess of URT 0.0010 Dedicated M&O Mills 0.0011 Debt Service Mills 0.0012 Total Mills 0.0013 Total Debt Bond/Non-Bond 0
State and Local Revenue:14 Property Tax Receipts (Including URT) 694,687 015 Other Local Receipts 1,135,203 1,230,36216 Revenue from Intermediate Sources 0 017.1 Foundation Funding (Excl URT) 0 017.2 Tax Collection Rate Guarantee 0 018 Student Growth Funding 0 019 Declining Enrollment Funding 0 020 Consolidation Incentive/Assistance 0 021 Isolated Funding 0 022 Supplemental Millage Incentive Funding 0 023 Other Unrestricted State Funding 0 024 Total Unrestricted Revenue from State and
Local Sources 1,829,890 1,230,362
Restricted Revenue from State Sources:25 Adult Education 0 0
Regular Education:26 Professional Development 0 027 Other Regular Education 404,248 421,500
Special Education:28 Gifted & Talented 32,700 28,50029 Alternative Learning Environment (ALE) 0 030 English Language Learner (ELL) 0 031 National School Lunch Act (NSLA) 0 032 Other Special Education 482,032 444,00033 Workforce Education 37,500 50,00034 School Food Service 0 035 Educational Service Cooperatives 615,372 558,61836 Early Childhood Programs 1,616,983 1,687,52537 Magnet School Programs 0 038 Other Non-Instructional Programs 0 039 Total Restricted Revenue from State Sources 3,188,834 3,190,14340 Total Restricted Revenue from Federal
Sources 922,625 605,001
Other Sources of Funds:41 Financing Sources 0 042 Balances from Consolidated/Annexed District 0 043 Indirect Cost Reimbursement 64,096 16,66244 Gains and Losses from Sale of Fixed Assets 290,104 045 Compensation for Loss of Fixed Assets 0 046 Other 0 047 Total Other Sources of Funds 354,201 16,66248 Total Revenue and Other Sources of Funds
from All Sources 6,295,550 5,042,168
2010-2011 2011-2012Actual Budget
CURRENT EXPENDITURESInstruction:
49 Regular Instruction 1,231,873 1,214,92550 Special Education 448,033 1,081,03751 Workforce Education 162,500 174,24052 Adult Education 0 053 Compensatory Education 0 054 Other 45,542 055 Total Instruction 1,887,948 2,470,202
District Level Support:56 General Administration 55,529 116,30057 Central Services 403,070 198,01058 Maintenance & Operations of Plant 274,163 204,13059 Student Transportation 0 060 Other District Level Support Services 64,849 16,66261 Total District Support Services 797,611 535,102
School Level Support:62 Student Support Services 411,057 465,35463 Instructional Staff Support Services 2,091,416 1,776,25864 School Administration 0 065 Total District Support Services 2,502,472 2,241,612
Non-Instructional Services:66 Food Service Operations 0 067 Other Enterprise Operations 0 068 Community Operations 0 069 Other Non-Instructional Services 0 070 Total Non-Instructional Services 0 071 Facilities Acquisition and Construction 107,077 217,00072 Debt Service 703,282 075 Other Non-Programmed Costs 972,961 076 Total Expenditures 6,971,352 5,463,91677 Less: Capital Expenditures 187,908 294,85578 Less: Debt Service 703,282 079 Total Current Expenditures 6,080,162 5,169,06180 Exclusions from Current Expenditures 3,046,79681 Net Current Expenditures 3,033,365
82 Per Pupil Expenditures
87.1 Legal Balance (funds 1-2-4) 2,248,56787.2 Categorical Fund Balance 087.3 Deposits with Paying Agents (QZAB) 087.4 Net Legal Bal (Excl Cat & QZAB) 2,248,56788 Building Fund Balance (fund 3) 400,00089 Capital Outlay Fund Balance (fund 5) 0
Lines 82-86 are not calculated for Education Co-Ops
Jan 30, 2012 - 249 - 9:35:29 AM
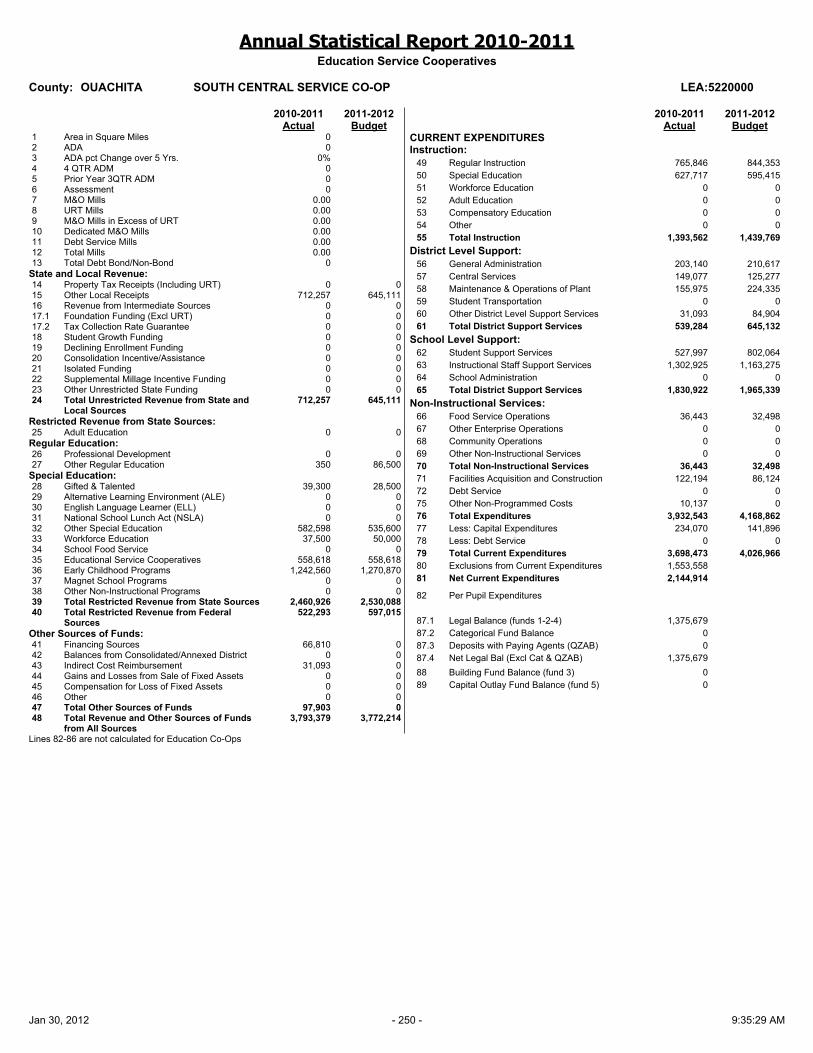
Annual Statistical Report 2010-2011Education Service Cooperatives
County: OUACHITA SOUTH CENTRAL SERVICE CO-OP LEA:5220000
2010-2011 2011-2012Actual Budget
1 Area in Square Miles 02 ADA 03 ADA pct Change over 5 Yrs. 0%4 4 QTR ADM 05 Prior Year 3QTR ADM 06 Assessment 07 M&O Mills 0.008 URT Mills 0.009 M&O Mills in Excess of URT 0.0010 Dedicated M&O Mills 0.0011 Debt Service Mills 0.0012 Total Mills 0.0013 Total Debt Bond/Non-Bond 0
State and Local Revenue:14 Property Tax Receipts (Including URT) 0 015 Other Local Receipts 712,257 645,11116 Revenue from Intermediate Sources 0 017.1 Foundation Funding (Excl URT) 0 017.2 Tax Collection Rate Guarantee 0 018 Student Growth Funding 0 019 Declining Enrollment Funding 0 020 Consolidation Incentive/Assistance 0 021 Isolated Funding 0 022 Supplemental Millage Incentive Funding 0 023 Other Unrestricted State Funding 0 024 Total Unrestricted Revenue from State and
Local Sources 712,257 645,111
Restricted Revenue from State Sources:25 Adult Education 0 0
Regular Education:26 Professional Development 0 027 Other Regular Education 350 86,500
Special Education:28 Gifted & Talented 39,300 28,50029 Alternative Learning Environment (ALE) 0 030 English Language Learner (ELL) 0 031 National School Lunch Act (NSLA) 0 032 Other Special Education 582,598 535,60033 Workforce Education 37,500 50,00034 School Food Service 0 035 Educational Service Cooperatives 558,618 558,61836 Early Childhood Programs 1,242,560 1,270,87037 Magnet School Programs 0 038 Other Non-Instructional Programs 0 039 Total Restricted Revenue from State Sources 2,460,926 2,530,08840 Total Restricted Revenue from Federal
Sources 522,293 597,015
Other Sources of Funds:41 Financing Sources 66,810 042 Balances from Consolidated/Annexed District 0 043 Indirect Cost Reimbursement 31,093 044 Gains and Losses from Sale of Fixed Assets 0 045 Compensation for Loss of Fixed Assets 0 046 Other 0 047 Total Other Sources of Funds 97,903 048 Total Revenue and Other Sources of Funds
from All Sources 3,793,379 3,772,214
2010-2011 2011-2012Actual Budget
CURRENT EXPENDITURESInstruction:
49 Regular Instruction 765,846 844,35350 Special Education 627,717 595,41551 Workforce Education 0 052 Adult Education 0 053 Compensatory Education 0 054 Other 0 055 Total Instruction 1,393,562 1,439,769
District Level Support:56 General Administration 203,140 210,61757 Central Services 149,077 125,27758 Maintenance & Operations of Plant 155,975 224,33559 Student Transportation 0 060 Other District Level Support Services 31,093 84,90461 Total District Support Services 539,284 645,132
School Level Support:62 Student Support Services 527,997 802,06463 Instructional Staff Support Services 1,302,925 1,163,27564 School Administration 0 065 Total District Support Services 1,830,922 1,965,339
Non-Instructional Services:66 Food Service Operations 36,443 32,49867 Other Enterprise Operations 0 068 Community Operations 0 069 Other Non-Instructional Services 0 070 Total Non-Instructional Services 36,443 32,49871 Facilities Acquisition and Construction 122,194 86,12472 Debt Service 0 075 Other Non-Programmed Costs 10,137 076 Total Expenditures 3,932,543 4,168,86277 Less: Capital Expenditures 234,070 141,89678 Less: Debt Service 0 079 Total Current Expenditures 3,698,473 4,026,96680 Exclusions from Current Expenditures 1,553,55881 Net Current Expenditures 2,144,914
82 Per Pupil Expenditures
87.1 Legal Balance (funds 1-2-4) 1,375,67987.2 Categorical Fund Balance 087.3 Deposits with Paying Agents (QZAB) 087.4 Net Legal Bal (Excl Cat & QZAB) 1,375,67988 Building Fund Balance (fund 3) 089 Capital Outlay Fund Balance (fund 5) 0
Lines 82-86 are not calculated for Education Co-Ops
Jan 30, 2012 - 250 - 9:35:29 AM
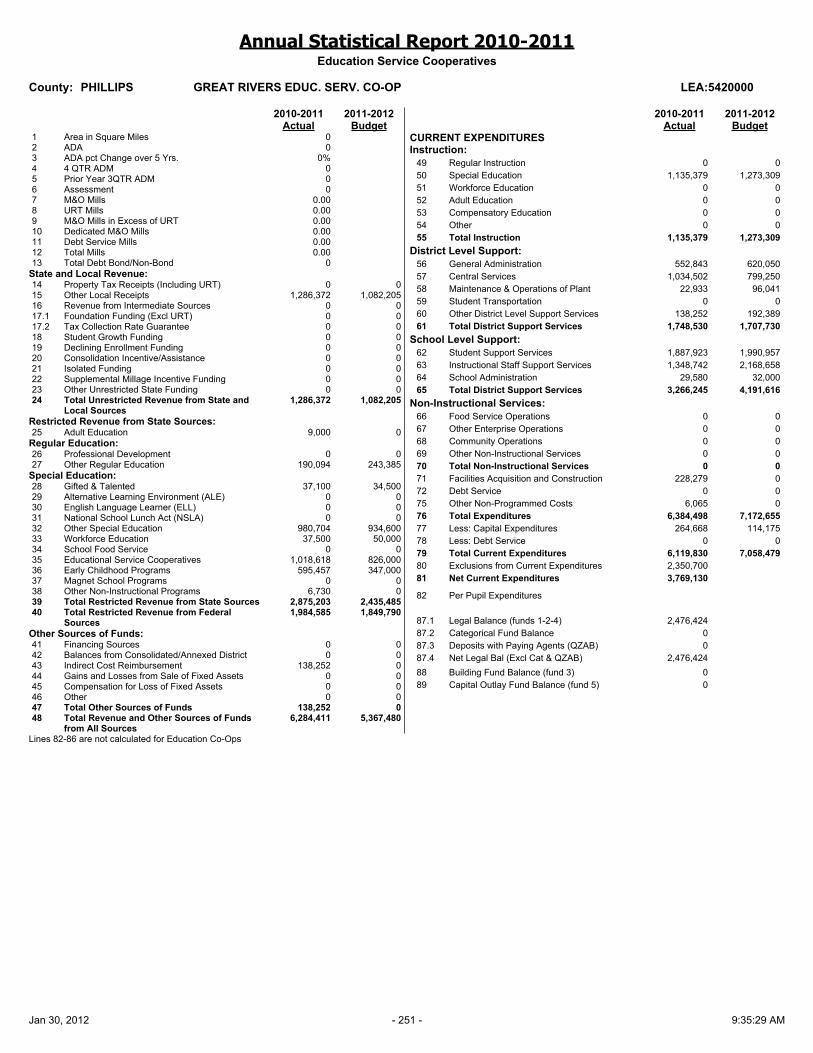
Annual Statistical Report 2010-2011Education Service Cooperatives
County: PHILLIPS GREAT RIVERS EDUC. SERV. CO-OP LEA:5420000
2010-2011 2011-2012Actual Budget
1 Area in Square Miles 02 ADA 03 ADA pct Change over 5 Yrs. 0%4 4 QTR ADM 05 Prior Year 3QTR ADM 06 Assessment 07 M&O Mills 0.008 URT Mills 0.009 M&O Mills in Excess of URT 0.0010 Dedicated M&O Mills 0.0011 Debt Service Mills 0.0012 Total Mills 0.0013 Total Debt Bond/Non-Bond 0
State and Local Revenue:14 Property Tax Receipts (Including URT) 0 015 Other Local Receipts 1,286,372 1,082,20516 Revenue from Intermediate Sources 0 017.1 Foundation Funding (Excl URT) 0 017.2 Tax Collection Rate Guarantee 0 018 Student Growth Funding 0 019 Declining Enrollment Funding 0 020 Consolidation Incentive/Assistance 0 021 Isolated Funding 0 022 Supplemental Millage Incentive Funding 0 023 Other Unrestricted State Funding 0 024 Total Unrestricted Revenue from State and
Local Sources 1,286,372 1,082,205
Restricted Revenue from State Sources:25 Adult Education 9,000 0
Regular Education:26 Professional Development 0 027 Other Regular Education 190,094 243,385
Special Education:28 Gifted & Talented 37,100 34,50029 Alternative Learning Environment (ALE) 0 030 English Language Learner (ELL) 0 031 National School Lunch Act (NSLA) 0 032 Other Special Education 980,704 934,60033 Workforce Education 37,500 50,00034 School Food Service 0 035 Educational Service Cooperatives 1,018,618 826,00036 Early Childhood Programs 595,457 347,00037 Magnet School Programs 0 038 Other Non-Instructional Programs 6,730 039 Total Restricted Revenue from State Sources 2,875,203 2,435,48540 Total Restricted Revenue from Federal
Sources 1,984,585 1,849,790
Other Sources of Funds:41 Financing Sources 0 042 Balances from Consolidated/Annexed District 0 043 Indirect Cost Reimbursement 138,252 044 Gains and Losses from Sale of Fixed Assets 0 045 Compensation for Loss of Fixed Assets 0 046 Other 0 047 Total Other Sources of Funds 138,252 048 Total Revenue and Other Sources of Funds
from All Sources 6,284,411 5,367,480
2010-2011 2011-2012Actual Budget
CURRENT EXPENDITURESInstruction:
49 Regular Instruction 0 050 Special Education 1,135,379 1,273,30951 Workforce Education 0 052 Adult Education 0 053 Compensatory Education 0 054 Other 0 055 Total Instruction 1,135,379 1,273,309
District Level Support:56 General Administration 552,843 620,05057 Central Services 1,034,502 799,25058 Maintenance & Operations of Plant 22,933 96,04159 Student Transportation 0 060 Other District Level Support Services 138,252 192,38961 Total District Support Services 1,748,530 1,707,730
School Level Support:62 Student Support Services 1,887,923 1,990,95763 Instructional Staff Support Services 1,348,742 2,168,65864 School Administration 29,580 32,00065 Total District Support Services 3,266,245 4,191,616
Non-Instructional Services:66 Food Service Operations 0 067 Other Enterprise Operations 0 068 Community Operations 0 069 Other Non-Instructional Services 0 070 Total Non-Instructional Services 0 071 Facilities Acquisition and Construction 228,279 072 Debt Service 0 075 Other Non-Programmed Costs 6,065 076 Total Expenditures 6,384,498 7,172,65577 Less: Capital Expenditures 264,668 114,17578 Less: Debt Service 0 079 Total Current Expenditures 6,119,830 7,058,47980 Exclusions from Current Expenditures 2,350,70081 Net Current Expenditures 3,769,130
82 Per Pupil Expenditures
87.1 Legal Balance (funds 1-2-4) 2,476,42487.2 Categorical Fund Balance 087.3 Deposits with Paying Agents (QZAB) 087.4 Net Legal Bal (Excl Cat & QZAB) 2,476,42488 Building Fund Balance (fund 3) 089 Capital Outlay Fund Balance (fund 5) 0
Lines 82-86 are not calculated for Education Co-Ops
Jan 30, 2012 - 251 - 9:35:29 AM

Annual Statistical Report 2010-2011Education Service Cooperatives
County: POINSETT CROWLEY'S RIDGE EDUCATION COOP LEA:5620000
2010-2011 2011-2012Actual Budget
1 Area in Square Miles 02 ADA 03 ADA pct Change over 5 Yrs. 0%4 4 QTR ADM 05 Prior Year 3QTR ADM 06 Assessment 07 M&O Mills 0.008 URT Mills 0.009 M&O Mills in Excess of URT 0.0010 Dedicated M&O Mills 0.0011 Debt Service Mills 0.0012 Total Mills 0.0013 Total Debt Bond/Non-Bond 11,709
State and Local Revenue:14 Property Tax Receipts (Including URT) 0 015 Other Local Receipts 1,374,469 1,384,20016 Revenue from Intermediate Sources 0 017.1 Foundation Funding (Excl URT) 0 017.2 Tax Collection Rate Guarantee 0 018 Student Growth Funding 0 019 Declining Enrollment Funding 0 020 Consolidation Incentive/Assistance 0 021 Isolated Funding 0 022 Supplemental Millage Incentive Funding 0 023 Other Unrestricted State Funding 0 024 Total Unrestricted Revenue from State and
Local Sources 1,374,469 1,384,200
Restricted Revenue from State Sources:25 Adult Education 0 0
Regular Education:26 Professional Development 0 027 Other Regular Education 98,254 96,500
Special Education:28 Gifted & Talented 37,100 30,00029 Alternative Learning Environment (ALE) 0 030 English Language Learner (ELL) 0 031 National School Lunch Act (NSLA) 0 032 Other Special Education 724,593 646,10033 Workforce Education 50,000 50,00034 School Food Service 0 035 Educational Service Cooperatives 558,618 558,61836 Early Childhood Programs 1,107,506 1,209,40037 Magnet School Programs 0 038 Other Non-Instructional Programs 6,000 039 Total Restricted Revenue from State Sources 2,582,071 2,590,61840 Total Restricted Revenue from Federal
Sources 1,480,548 1,090,913
Other Sources of Funds:41 Financing Sources 0 042 Balances from Consolidated/Annexed District 0 043 Indirect Cost Reimbursement 74,064 97,43744 Gains and Losses from Sale of Fixed Assets 0 045 Compensation for Loss of Fixed Assets 0 046 Other 0 047 Total Other Sources of Funds 74,064 97,43748 Total Revenue and Other Sources of Funds
from All Sources 5,511,152 5,163,168
2010-2011 2011-2012Actual Budget
CURRENT EXPENDITURESInstruction:
49 Regular Instruction 630,724 748,24850 Special Education 1,152,571 1,386,65151 Workforce Education 0 052 Adult Education 0 053 Compensatory Education 0 054 Other 0 055 Total Instruction 1,783,296 2,134,899
District Level Support:56 General Administration 122,022 124,27357 Central Services 117,018 110,48558 Maintenance & Operations of Plant 221,628 239,68759 Student Transportation 0 060 Other District Level Support Services 74,064 97,43761 Total District Support Services 534,732 571,882
School Level Support:62 Student Support Services 411,793 476,22063 Instructional Staff Support Services 2,411,758 2,356,45764 School Administration 0 065 Total District Support Services 2,823,551 2,832,677
Non-Instructional Services:66 Food Service Operations 0 067 Other Enterprise Operations 0 068 Community Operations 0 069 Other Non-Instructional Services 0 070 Total Non-Instructional Services 0 071 Facilities Acquisition and Construction 0 072 Debt Service 0 075 Other Non-Programmed Costs 0 076 Total Expenditures 5,141,578 5,539,45877 Less: Capital Expenditures 142,494 198,29978 Less: Debt Service 0 079 Total Current Expenditures 4,999,084 5,341,15980 Exclusions from Current Expenditures 1,957,90481 Net Current Expenditures 3,041,180
82 Per Pupil Expenditures
87.1 Legal Balance (funds 1-2-4) 2,281,30487.2 Categorical Fund Balance 2,45787.3 Deposits with Paying Agents (QZAB) 087.4 Net Legal Bal (Excl Cat & QZAB) 2,278,84788 Building Fund Balance (fund 3) 089 Capital Outlay Fund Balance (fund 5) 0
Lines 82-86 are not calculated for Education Co-Ops
Jan 30, 2012 - 252 - 9:35:29 AM
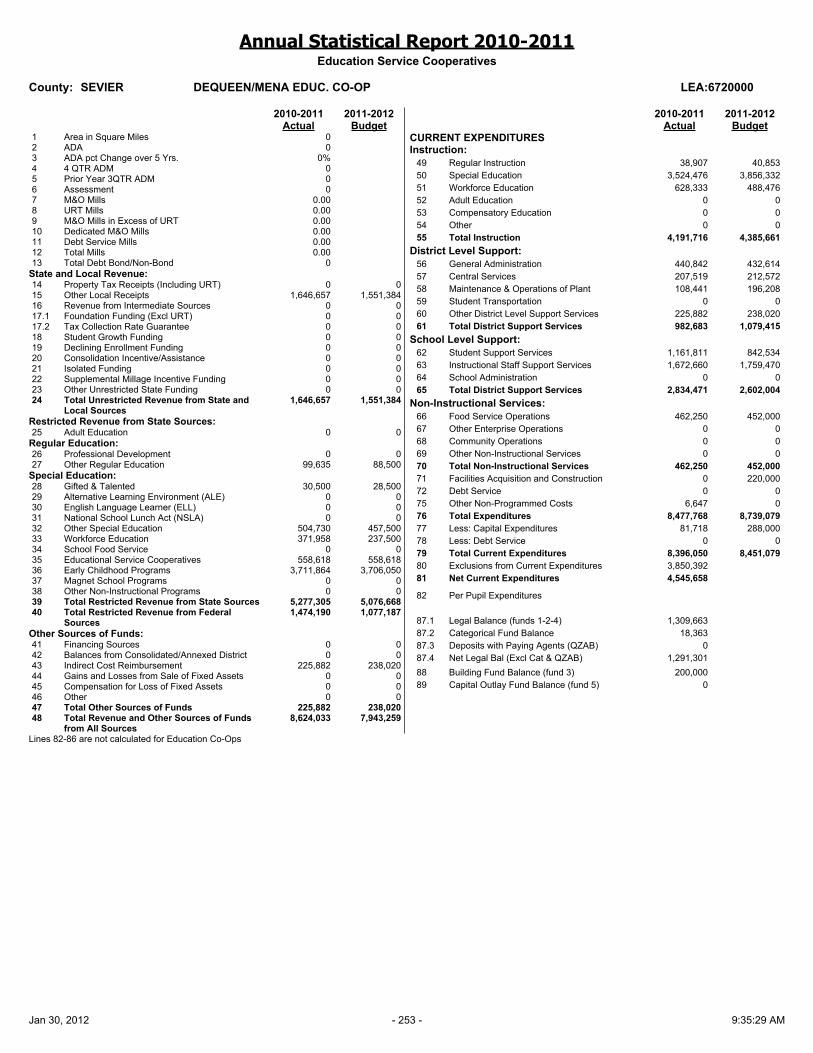
Annual Statistical Report 2010-2011Education Service Cooperatives
County: SEVIER DEQUEEN/MENA EDUC. CO-OP LEA:6720000
2010-2011 2011-2012Actual Budget
1 Area in Square Miles 02 ADA 03 ADA pct Change over 5 Yrs. 0%4 4 QTR ADM 05 Prior Year 3QTR ADM 06 Assessment 07 M&O Mills 0.008 URT Mills 0.009 M&O Mills in Excess of URT 0.0010 Dedicated M&O Mills 0.0011 Debt Service Mills 0.0012 Total Mills 0.0013 Total Debt Bond/Non-Bond 0
State and Local Revenue:14 Property Tax Receipts (Including URT) 0 015 Other Local Receipts 1,646,657 1,551,38416 Revenue from Intermediate Sources 0 017.1 Foundation Funding (Excl URT) 0 017.2 Tax Collection Rate Guarantee 0 018 Student Growth Funding 0 019 Declining Enrollment Funding 0 020 Consolidation Incentive/Assistance 0 021 Isolated Funding 0 022 Supplemental Millage Incentive Funding 0 023 Other Unrestricted State Funding 0 024 Total Unrestricted Revenue from State and
Local Sources 1,646,657 1,551,384
Restricted Revenue from State Sources:25 Adult Education 0 0
Regular Education:26 Professional Development 0 027 Other Regular Education 99,635 88,500
Special Education:28 Gifted & Talented 30,500 28,50029 Alternative Learning Environment (ALE) 0 030 English Language Learner (ELL) 0 031 National School Lunch Act (NSLA) 0 032 Other Special Education 504,730 457,50033 Workforce Education 371,958 237,50034 School Food Service 0 035 Educational Service Cooperatives 558,618 558,61836 Early Childhood Programs 3,711,864 3,706,05037 Magnet School Programs 0 038 Other Non-Instructional Programs 0 039 Total Restricted Revenue from State Sources 5,277,305 5,076,66840 Total Restricted Revenue from Federal
Sources 1,474,190 1,077,187
Other Sources of Funds:41 Financing Sources 0 042 Balances from Consolidated/Annexed District 0 043 Indirect Cost Reimbursement 225,882 238,02044 Gains and Losses from Sale of Fixed Assets 0 045 Compensation for Loss of Fixed Assets 0 046 Other 0 047 Total Other Sources of Funds 225,882 238,02048 Total Revenue and Other Sources of Funds
from All Sources 8,624,033 7,943,259
2010-2011 2011-2012Actual Budget
CURRENT EXPENDITURESInstruction:
49 Regular Instruction 38,907 40,85350 Special Education 3,524,476 3,856,33251 Workforce Education 628,333 488,47652 Adult Education 0 053 Compensatory Education 0 054 Other 0 055 Total Instruction 4,191,716 4,385,661
District Level Support:56 General Administration 440,842 432,61457 Central Services 207,519 212,57258 Maintenance & Operations of Plant 108,441 196,20859 Student Transportation 0 060 Other District Level Support Services 225,882 238,02061 Total District Support Services 982,683 1,079,415
School Level Support:62 Student Support Services 1,161,811 842,53463 Instructional Staff Support Services 1,672,660 1,759,47064 School Administration 0 065 Total District Support Services 2,834,471 2,602,004
Non-Instructional Services:66 Food Service Operations 462,250 452,00067 Other Enterprise Operations 0 068 Community Operations 0 069 Other Non-Instructional Services 0 070 Total Non-Instructional Services 462,250 452,00071 Facilities Acquisition and Construction 0 220,00072 Debt Service 0 075 Other Non-Programmed Costs 6,647 076 Total Expenditures 8,477,768 8,739,07977 Less: Capital Expenditures 81,718 288,00078 Less: Debt Service 0 079 Total Current Expenditures 8,396,050 8,451,07980 Exclusions from Current Expenditures 3,850,39281 Net Current Expenditures 4,545,658
82 Per Pupil Expenditures
87.1 Legal Balance (funds 1-2-4) 1,309,66387.2 Categorical Fund Balance 18,36387.3 Deposits with Paying Agents (QZAB) 087.4 Net Legal Bal (Excl Cat & QZAB) 1,291,30188 Building Fund Balance (fund 3) 200,00089 Capital Outlay Fund Balance (fund 5) 0
Lines 82-86 are not calculated for Education Co-Ops
Jan 30, 2012 - 253 - 9:35:29 AM
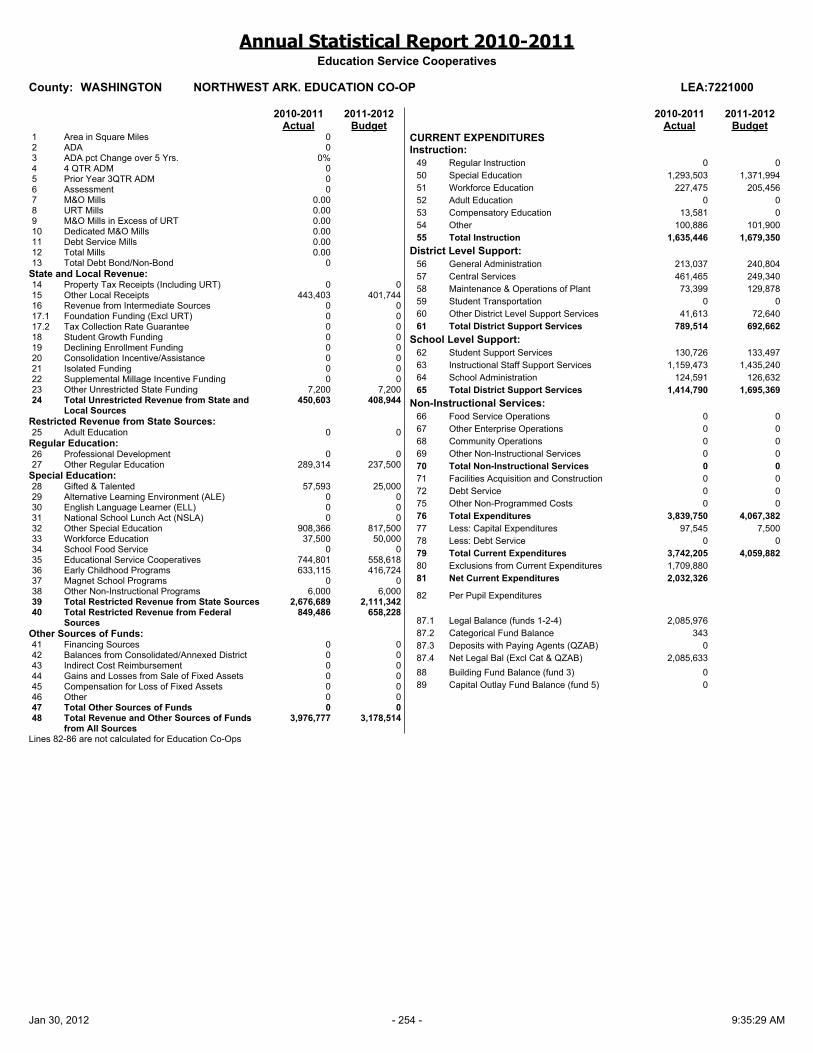
Annual Statistical Report 2010-2011Education Service Cooperatives
County: WASHINGTON NORTHWEST ARK. EDUCATION CO-OP LEA:7221000
2010-2011 2011-2012Actual Budget
1 Area in Square Miles 02 ADA 03 ADA pct Change over 5 Yrs. 0%4 4 QTR ADM 05 Prior Year 3QTR ADM 06 Assessment 07 M&O Mills 0.008 URT Mills 0.009 M&O Mills in Excess of URT 0.0010 Dedicated M&O Mills 0.0011 Debt Service Mills 0.0012 Total Mills 0.0013 Total Debt Bond/Non-Bond 0
State and Local Revenue:14 Property Tax Receipts (Including URT) 0 015 Other Local Receipts 443,403 401,74416 Revenue from Intermediate Sources 0 017.1 Foundation Funding (Excl URT) 0 017.2 Tax Collection Rate Guarantee 0 018 Student Growth Funding 0 019 Declining Enrollment Funding 0 020 Consolidation Incentive/Assistance 0 021 Isolated Funding 0 022 Supplemental Millage Incentive Funding 0 023 Other Unrestricted State Funding 7,200 7,20024 Total Unrestricted Revenue from State and
Local Sources 450,603 408,944
Restricted Revenue from State Sources:25 Adult Education 0 0
Regular Education:26 Professional Development 0 027 Other Regular Education 289,314 237,500
Special Education:28 Gifted & Talented 57,593 25,00029 Alternative Learning Environment (ALE) 0 030 English Language Learner (ELL) 0 031 National School Lunch Act (NSLA) 0 032 Other Special Education 908,366 817,50033 Workforce Education 37,500 50,00034 School Food Service 0 035 Educational Service Cooperatives 744,801 558,61836 Early Childhood Programs 633,115 416,72437 Magnet School Programs 0 038 Other Non-Instructional Programs 6,000 6,00039 Total Restricted Revenue from State Sources 2,676,689 2,111,34240 Total Restricted Revenue from Federal
Sources 849,486 658,228
Other Sources of Funds:41 Financing Sources 0 042 Balances from Consolidated/Annexed District 0 043 Indirect Cost Reimbursement 0 044 Gains and Losses from Sale of Fixed Assets 0 045 Compensation for Loss of Fixed Assets 0 046 Other 0 047 Total Other Sources of Funds 0 048 Total Revenue and Other Sources of Funds
from All Sources 3,976,777 3,178,514
2010-2011 2011-2012Actual Budget
CURRENT EXPENDITURESInstruction:
49 Regular Instruction 0 050 Special Education 1,293,503 1,371,99451 Workforce Education 227,475 205,45652 Adult Education 0 053 Compensatory Education 13,581 054 Other 100,886 101,90055 Total Instruction 1,635,446 1,679,350
District Level Support:56 General Administration 213,037 240,80457 Central Services 461,465 249,34058 Maintenance & Operations of Plant 73,399 129,87859 Student Transportation 0 060 Other District Level Support Services 41,613 72,64061 Total District Support Services 789,514 692,662
School Level Support:62 Student Support Services 130,726 133,49763 Instructional Staff Support Services 1,159,473 1,435,24064 School Administration 124,591 126,63265 Total District Support Services 1,414,790 1,695,369
Non-Instructional Services:66 Food Service Operations 0 067 Other Enterprise Operations 0 068 Community Operations 0 069 Other Non-Instructional Services 0 070 Total Non-Instructional Services 0 071 Facilities Acquisition and Construction 0 072 Debt Service 0 075 Other Non-Programmed Costs 0 076 Total Expenditures 3,839,750 4,067,38277 Less: Capital Expenditures 97,545 7,50078 Less: Debt Service 0 079 Total Current Expenditures 3,742,205 4,059,88280 Exclusions from Current Expenditures 1,709,88081 Net Current Expenditures 2,032,326
82 Per Pupil Expenditures
87.1 Legal Balance (funds 1-2-4) 2,085,97687.2 Categorical Fund Balance 34387.3 Deposits with Paying Agents (QZAB) 087.4 Net Legal Bal (Excl Cat & QZAB) 2,085,63388 Building Fund Balance (fund 3) 089 Capital Outlay Fund Balance (fund 5) 0
Lines 82-86 are not calculated for Education Co-Ops
Jan 30, 2012 - 254 - 9:35:29 AM

Annual Statistical Report 2010-2011Education Service Cooperatives
County: WHITE WILBUR D. MILLS EDUC. CO-OP LEA:7320000
2010-2011 2011-2012Actual Budget
1 Area in Square Miles 02 ADA 03 ADA pct Change over 5 Yrs. 0%4 4 QTR ADM 05 Prior Year 3QTR ADM 06 Assessment 07 M&O Mills 0.008 URT Mills 0.009 M&O Mills in Excess of URT 0.0010 Dedicated M&O Mills 0.0011 Debt Service Mills 0.0012 Total Mills 0.0013 Total Debt Bond/Non-Bond 0
State and Local Revenue:14 Property Tax Receipts (Including URT) 0 015 Other Local Receipts 1,246,351 1,197,29616 Revenue from Intermediate Sources 0 017.1 Foundation Funding (Excl URT) 0 017.2 Tax Collection Rate Guarantee 0 018 Student Growth Funding 0 019 Declining Enrollment Funding 0 020 Consolidation Incentive/Assistance 0 021 Isolated Funding 0 022 Supplemental Millage Incentive Funding 0 023 Other Unrestricted State Funding 0 024 Total Unrestricted Revenue from State and
Local Sources 1,246,351 1,197,296
Restricted Revenue from State Sources:25 Adult Education 0 0
Regular Education:26 Professional Development 0 027 Other Regular Education 113,500 86,500
Special Education:28 Gifted & Talented 34,900 28,50029 Alternative Learning Environment (ALE) 0 030 English Language Learner (ELL) 0 031 National School Lunch Act (NSLA) 0 032 Other Special Education 849,537 747,10033 Workforce Education 54,588 51,75934 School Food Service 0 035 Educational Service Cooperatives 558,618 558,00036 Early Childhood Programs 1,956,750 1,643,75037 Magnet School Programs 0 038 Other Non-Instructional Programs 6,000 6,00039 Total Restricted Revenue from State Sources 3,573,893 3,121,60940 Total Restricted Revenue from Federal
Sources 815,855 885,309
Other Sources of Funds:41 Financing Sources 0 042 Balances from Consolidated/Annexed District 0 043 Indirect Cost Reimbursement 68,150 77,21744 Gains and Losses from Sale of Fixed Assets 1,450 045 Compensation for Loss of Fixed Assets 0 046 Other 0 047 Total Other Sources of Funds 69,600 77,21748 Total Revenue and Other Sources of Funds
from All Sources 5,705,698 5,281,431
2010-2011 2011-2012Actual Budget
CURRENT EXPENDITURESInstruction:
49 Regular Instruction 1,225,848 1,213,53550 Special Education 558,994 590,23451 Workforce Education 16,375 16,73552 Adult Education 0 053 Compensatory Education 0 054 Other 500 2,00055 Total Instruction 1,801,717 1,822,504
District Level Support:56 General Administration 273,188 306,44557 Central Services 333,350 311,36358 Maintenance & Operations of Plant 213,462 173,94359 Student Transportation 503 060 Other District Level Support Services 80,132 89,81761 Total District Support Services 900,636 881,569
School Level Support:62 Student Support Services 1,206,007 1,169,79063 Instructional Staff Support Services 1,526,231 1,890,24764 School Administration 0 065 Total District Support Services 2,732,238 3,060,037
Non-Instructional Services:66 Food Service Operations 0 067 Other Enterprise Operations 3,382 4,00068 Community Operations 0 069 Other Non-Instructional Services 0 070 Total Non-Instructional Services 3,382 4,00071 Facilities Acquisition and Construction 3,586 250,00072 Debt Service 0 075 Other Non-Programmed Costs 0 076 Total Expenditures 5,441,559 6,018,11077 Less: Capital Expenditures 222,971 279,12978 Less: Debt Service 0 079 Total Current Expenditures 5,218,588 5,738,98180 Exclusions from Current Expenditures 2,870,37081 Net Current Expenditures 2,348,218
82 Per Pupil Expenditures
87.1 Legal Balance (funds 1-2-4) 2,576,17987.2 Categorical Fund Balance 087.3 Deposits with Paying Agents (QZAB) 087.4 Net Legal Bal (Excl Cat & QZAB) 2,576,17988 Building Fund Balance (fund 3) 089 Capital Outlay Fund Balance (fund 5) 0
Lines 82-86 are not calculated for Education Co-Ops
Jan 30, 2012 - 255 - 9:35:29 AM

Annual Statistical Report 2010-2011Charter Schools
County: BENTON BENTON COUNTY SCHOOL OF ARTS LEA:0440700
2010-2011 2011-2012Actual Budget
1 Area in Square Miles 02 ADA 6883 ADA pct Change over 5 Yrs. 82%4 4 QTR ADM 7235 Prior Year 3QTR ADM 06 Assessment 07 M&O Mills 0.008 URT Mills 0.009 M&O Mills in Excess of URT 0.0010 Dedicated M&O Mills 0.0011 Debt Service Mills 0.0012 Total Mills 0.0013 Total Debt Bond/Non-Bond 0
State and Local Revenue:14 Property Tax Receipts (Including URT) 0 015 Other Local Receipts 199,501 199,92116 Revenue from Intermediate Sources 0 017.1 Foundation Funding (Excl URT) 0 017.2 Tax Collection Rate Guarantee 0 018 Student Growth Funding 153,556 019 Declining Enrollment Funding 0 020 Consolidation Incentive/Assistance 0 021 Isolated Funding 0 022 Supplemental Millage Incentive Funding 0 023 Other Unrestricted State Funding 4,203,691 4,448,25624 Total Unrestricted Revenue from State and
Local Sources 4,556,748 4,648,177
Restricted Revenue from State Sources:25 Adult Education 0 0
Regular Education:26 Professional Development 28,866 30,40827 Other Regular Education 15,000 6,000
Special Education:28 Gifted & Talented 850 029 Alternative Learning Environment (ALE) 0 030 English Language Learner (ELL) 6,739 6,87731 National School Lunch Act (NSLA) 92,831 112,80332 Other Special Education 2,859 033 Workforce Education 0 034 School Food Service 608 035 Educational Service Cooperatives 0 036 Early Childhood Programs 0 037 Magnet School Programs 0 038 Other Non-Instructional Programs 0 039 Total Restricted Revenue from State Sources 147,753 156,08840 Total Restricted Revenue from Federal
Sources 451,883 294,201
Other Sources of Funds:41 Financing Sources 0 042 Balances from Consolidated/Annexed District 0 043 Indirect Cost Reimbursement 0 044 Gains and Losses from Sale of Fixed Assets 0 045 Compensation for Loss of Fixed Assets 0 046 Other 0 047 Total Other Sources of Funds 0 048 Total Revenue and Other Sources of Funds
from All Sources 5,156,384 5,098,466
2010-2011 2011-2012Actual Budget
CURRENT EXPENDITURESInstruction:
49 Regular Instruction 2,012,174 1,953,64850 Special Education 151,993 171,30151 Workforce Education 815 1,80052 Adult Education 0 053 Compensatory Education 104,013 62,56654 Other 645,828 679,65555 Total Instruction 2,914,823 2,868,970
District Level Support:56 General Administration 99,484 133,25757 Central Services 60,174 61,64958 Maintenance & Operations of Plant 475,695 535,44859 Student Transportation 3,848 6,00060 Other District Level Support Services 268 061 Total District Support Services 639,470 736,355
School Level Support:62 Student Support Services 91,117 128,98563 Instructional Staff Support Services 181,045 206,21364 School Administration 218,214 318,25565 Total District Support Services 490,376 653,454
Non-Instructional Services:66 Food Service Operations 322,983 197,79467 Other Enterprise Operations 0 068 Community Operations 8,000 8,00069 Other Non-Instructional Services 0 070 Total Non-Instructional Services 330,983 205,79471 Facilities Acquisition and Construction 0 072 Debt Service 510,226 518,40975 Other Non-Programmed Costs 0 076 Total Expenditures 4,885,879 4,982,98277 Less: Capital Expenditures 65,473 53,00078 Less: Debt Service 510,226 518,40979 Total Current Expenditures 4,310,180 4,411,57380 Exclusions from Current Expenditures 206,85181 Net Current Expenditures 4,103,329
82 Per Pupil Expenditures 5,967
83 Personnel - Non-Federal Certified Clsrm FTEs 55.6384 Avg Salary - Non-Fed Certified Clsrm FTEs 34,62685 Personnel - Non-Federal Certified FTEs 57.6386 Avg Salary - Non-Fed Certified FTEs 36,03887.1 Legal Balance (funds 1-2-4) 523,35487.2 Categorical Fund Balance 20,95387.3 Deposits with Paying Agents (QZAB) 087.4 Net Legal Bal (Excl Cat & QZAB) 502,40188 Building Fund Balance (fund 3) 089 Capital Outlay Fund Balance (fund 5) 0
Jan 30, 2012 - 256 - 9:35:29 AM

Annual Statistical Report 2010-2011Charter Schools
County: JEFFERSON PINE BLUFF LIGHTHOUSE ACADEMY LEA:3541700
2010-2011 2011-2012Actual Budget
1 Area in Square Miles 02 ADA 03 ADA pct Change over 5 Yrs. 0%4 4 QTR ADM 05 Prior Year 3QTR ADM 06 Assessment 07 M&O Mills 0.008 URT Mills 0.009 M&O Mills in Excess of URT 0.0010 Dedicated M&O Mills 0.0011 Debt Service Mills 0.0012 Total Mills 0.0013 Total Debt Bond/Non-Bond 0
State and Local Revenue:14 Property Tax Receipts (Including URT) 0 015 Other Local Receipts 0 26,95516 Revenue from Intermediate Sources 0 017.1 Foundation Funding (Excl URT) 0 017.2 Tax Collection Rate Guarantee 0 018 Student Growth Funding 0 019 Declining Enrollment Funding 0 020 Consolidation Incentive/Assistance 0 021 Isolated Funding 0 022 Supplemental Millage Incentive Funding 0 023 Other Unrestricted State Funding 0 1,290,24024 Total Unrestricted Revenue from State and
Local Sources 0 1,317,195
Restricted Revenue from State Sources:25 Adult Education 0 0
Regular Education:26 Professional Development 0 6,99327 Other Regular Education 0 0
Special Education:29 Alternative Learning Environment (ALE) 0 030 English Language Learner (ELL) 0 031 National School Lunch Act (NSLA) 0 142,69232 Other Special Education 0 033 Workforce Education 0 034 School Food Service 0 036 Early Childhood Programs 0 037 Magnet School Programs 0 038 Other Non-Instructional Programs 0 039 Total Restricted Revenue from State Sources 0 149,68540 Total Restricted Revenue from Federal
Sources 0 378,267
Other Sources of Funds:41 Financing Sources 0 043 Indirect Cost Reimbursement 0 044 Gains and Losses from Sale of Fixed Assets 0 047 Total Other Sources of Funds 0 048 Total Revenue and Other Sources of Funds
from All Sources 0 1,845,147
2010-2011 2011-2012Actual Budget
CURRENT EXPENDITURESInstruction:
49 Regular Instruction 0 459,76150 Special Education 0 121,86451 Workforce Education 0 052 Adult Education 0 053 Compensatory Education 0 123,89354 Other 0 055 Total Instruction 0 705,518
District Level Support:56 General Administration 0 173,00057 Central Services 0 61,96358 Maintenance & Operations of Plant 0 263,60059 Student Transportation 0 060 Other District Level Support Services 0 061 Total District Support Services 0 498,563
School Level Support:62 Student Support Services 0 136,72363 Instructional Staff Support Services 0 154,48764 School Administration 0 161,55465 Total District Support Services 0 452,764
Non-Instructional Services:66 Food Service Operations 0 144,25567 Other Enterprise Operations 0 068 Community Operations 0 069 Other Non-Instructional Services 0 070 Total Non-Instructional Services 0 144,25571 Facilities Acquisition and Construction 0 96,70072 Debt Service 0 55,00075 Other Non-Programmed Costs 0 076 Total Expenditures 0 1,952,80077 Less: Capital Expenditures 0 96,70078 Less: Debt Service 0 55,00079 Total Current Expenditures 0 1,801,10081 Net Current Expenditures 0
82 Per Pupil Expenditures
Jan 30, 2012 - 257 - 9:35:29 AM
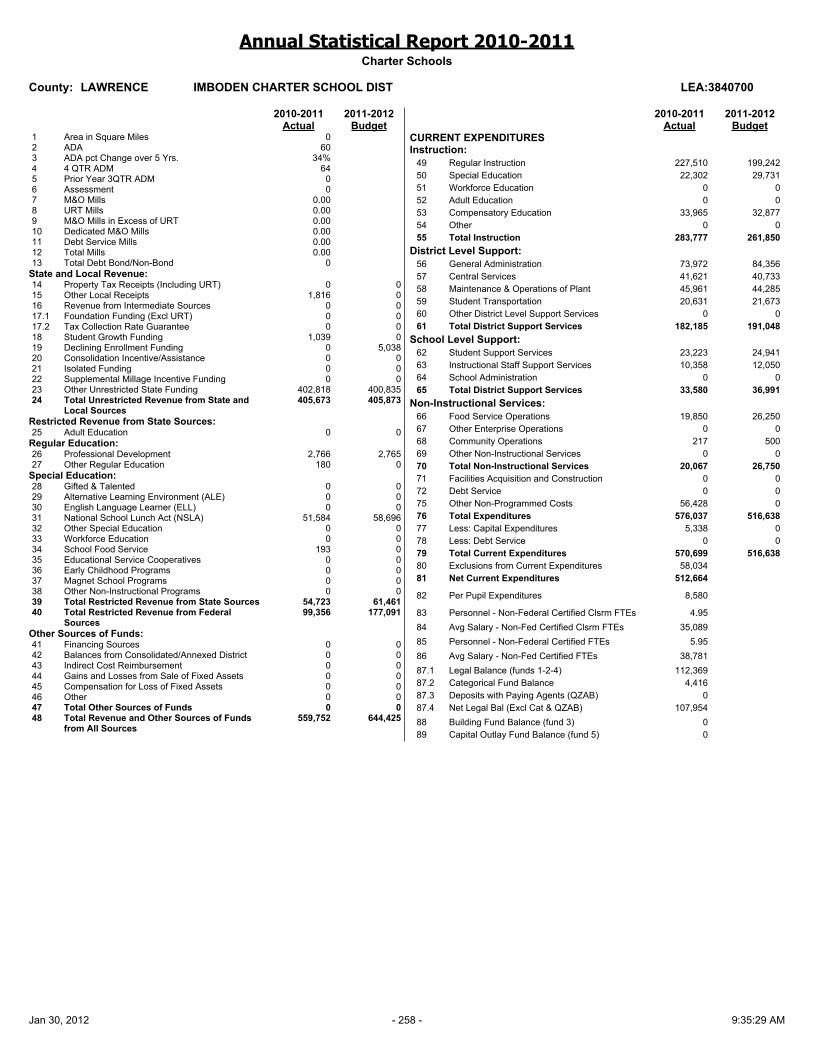
Annual Statistical Report 2010-2011Charter Schools
County: LAWRENCE IMBODEN CHARTER SCHOOL DIST LEA:3840700
2010-2011 2011-2012Actual Budget
1 Area in Square Miles 02 ADA 603 ADA pct Change over 5 Yrs. 34%4 4 QTR ADM 645 Prior Year 3QTR ADM 06 Assessment 07 M&O Mills 0.008 URT Mills 0.009 M&O Mills in Excess of URT 0.0010 Dedicated M&O Mills 0.0011 Debt Service Mills 0.0012 Total Mills 0.0013 Total Debt Bond/Non-Bond 0
State and Local Revenue:14 Property Tax Receipts (Including URT) 0 015 Other Local Receipts 1,816 016 Revenue from Intermediate Sources 0 017.1 Foundation Funding (Excl URT) 0 017.2 Tax Collection Rate Guarantee 0 018 Student Growth Funding 1,039 019 Declining Enrollment Funding 0 5,03820 Consolidation Incentive/Assistance 0 021 Isolated Funding 0 022 Supplemental Millage Incentive Funding 0 023 Other Unrestricted State Funding 402,818 400,83524 Total Unrestricted Revenue from State and
Local Sources 405,673 405,873
Restricted Revenue from State Sources:25 Adult Education 0 0
Regular Education:26 Professional Development 2,766 2,76527 Other Regular Education 180 0
Special Education:28 Gifted & Talented 0 029 Alternative Learning Environment (ALE) 0 030 English Language Learner (ELL) 0 031 National School Lunch Act (NSLA) 51,584 58,69632 Other Special Education 0 033 Workforce Education 0 034 School Food Service 193 035 Educational Service Cooperatives 0 036 Early Childhood Programs 0 037 Magnet School Programs 0 038 Other Non-Instructional Programs 0 039 Total Restricted Revenue from State Sources 54,723 61,46140 Total Restricted Revenue from Federal
Sources 99,356 177,091
Other Sources of Funds:41 Financing Sources 0 042 Balances from Consolidated/Annexed District 0 043 Indirect Cost Reimbursement 0 044 Gains and Losses from Sale of Fixed Assets 0 045 Compensation for Loss of Fixed Assets 0 046 Other 0 047 Total Other Sources of Funds 0 048 Total Revenue and Other Sources of Funds
from All Sources 559,752 644,425
2010-2011 2011-2012Actual Budget
CURRENT EXPENDITURESInstruction:
49 Regular Instruction 227,510 199,24250 Special Education 22,302 29,73151 Workforce Education 0 052 Adult Education 0 053 Compensatory Education 33,965 32,87754 Other 0 055 Total Instruction 283,777 261,850
District Level Support:56 General Administration 73,972 84,35657 Central Services 41,621 40,73358 Maintenance & Operations of Plant 45,961 44,28559 Student Transportation 20,631 21,67360 Other District Level Support Services 0 061 Total District Support Services 182,185 191,048
School Level Support:62 Student Support Services 23,223 24,94163 Instructional Staff Support Services 10,358 12,05064 School Administration 0 065 Total District Support Services 33,580 36,991
Non-Instructional Services:66 Food Service Operations 19,850 26,25067 Other Enterprise Operations 0 068 Community Operations 217 50069 Other Non-Instructional Services 0 070 Total Non-Instructional Services 20,067 26,75071 Facilities Acquisition and Construction 0 072 Debt Service 0 075 Other Non-Programmed Costs 56,428 076 Total Expenditures 576,037 516,63877 Less: Capital Expenditures 5,338 078 Less: Debt Service 0 079 Total Current Expenditures 570,699 516,63880 Exclusions from Current Expenditures 58,03481 Net Current Expenditures 512,664
82 Per Pupil Expenditures 8,580
83 Personnel - Non-Federal Certified Clsrm FTEs 4.9584 Avg Salary - Non-Fed Certified Clsrm FTEs 35,08985 Personnel - Non-Federal Certified FTEs 5.9586 Avg Salary - Non-Fed Certified FTEs 38,78187.1 Legal Balance (funds 1-2-4) 112,36987.2 Categorical Fund Balance 4,41687.3 Deposits with Paying Agents (QZAB) 087.4 Net Legal Bal (Excl Cat & QZAB) 107,95488 Building Fund Balance (fund 3) 089 Capital Outlay Fund Balance (fund 5) 0
Jan 30, 2012 - 258 - 9:35:29 AM

Annual Statistical Report 2010-2011Charter Schools
County: MISSISSIPPI OSCEOLA COMM,ARTS & BUS CH SCH LEA:4740700
2010-2011 2011-2012Actual Budget
1 Area in Square Miles 02 ADA 743 ADA pct Change over 5 Yrs. 0%4 4 QTR ADM 825 Prior Year 3QTR ADM 06 Assessment 07 M&O Mills 0.008 URT Mills 0.009 M&O Mills in Excess of URT 0.0010 Dedicated M&O Mills 0.0011 Debt Service Mills 0.0012 Total Mills 0.0013 Total Debt Bond/Non-Bond 0
State and Local Revenue:14 Property Tax Receipts (Including URT) 0 015 Other Local Receipts 63,335 016 Revenue from Intermediate Sources 0 017.1 Foundation Funding (Excl URT) 0 017.2 Tax Collection Rate Guarantee 0 018 Student Growth Funding 0 019 Declining Enrollment Funding 0 020 Consolidation Incentive/Assistance 0 021 Isolated Funding 0 022 Supplemental Millage Incentive Funding 0 023 Other Unrestricted State Funding 593,406 024 Total Unrestricted Revenue from State and
Local Sources 656,741 0
Restricted Revenue from State Sources:25 Adult Education 0 0
Regular Education:26 Professional Development 4,076 027 Other Regular Education 0 0
Special Education:28 Gifted & Talented 0 029 Alternative Learning Environment (ALE) 0 030 English Language Learner (ELL) 0 031 National School Lunch Act (NSLA) 0 032 Other Special Education 440 033 Workforce Education 22,209 034 School Food Service 0 035 Educational Service Cooperatives 0 036 Early Childhood Programs 0 037 Magnet School Programs 0 038 Other Non-Instructional Programs 0 039 Total Restricted Revenue from State Sources 26,725 040 Total Restricted Revenue from Federal
Sources 57,149 0
Other Sources of Funds:41 Financing Sources 0 042 Balances from Consolidated/Annexed District 0 043 Indirect Cost Reimbursement 0 044 Gains and Losses from Sale of Fixed Assets 0 045 Compensation for Loss of Fixed Assets 0 046 Other 0 047 Total Other Sources of Funds 0 048 Total Revenue and Other Sources of Funds
from All Sources 740,615 0
2010-2011 2011-2012Actual Budget
CURRENT EXPENDITURESInstruction:
49 Regular Instruction 440,824 050 Special Education 31,395 051 Workforce Education 0 052 Adult Education 0 053 Compensatory Education 37,563 054 Other 0 055 Total Instruction 509,782 0
District Level Support:56 General Administration 98,019 057 Central Services 66,000 058 Maintenance & Operations of Plant 17,384 059 Student Transportation 5,201 060 Other District Level Support Services 0 061 Total District Support Services 186,604 0
School Level Support:62 Student Support Services 36,626 063 Instructional Staff Support Services 15,766 064 School Administration 29,764 065 Total District Support Services 82,156 0
Non-Instructional Services:66 Food Service Operations 41,577 067 Other Enterprise Operations 2,188 068 Community Operations 0 069 Other Non-Instructional Services 0 070 Total Non-Instructional Services 43,765 071 Facilities Acquisition and Construction 0 072 Debt Service 0 075 Other Non-Programmed Costs 7,620 076 Total Expenditures 829,928 077 Less: Capital Expenditures 1,182 078 Less: Debt Service 0 079 Total Current Expenditures 828,745 080 Exclusions from Current Expenditures 30,51481 Net Current Expenditures 798,232
82 Per Pupil Expenditures 10,807
83 Personnel - Non-Federal Certified Clsrm FTEs 7.5784 Avg Salary - Non-Fed Certified Clsrm FTEs 33,16485 Personnel - Non-Federal Certified FTEs 8.5786 Avg Salary - Non-Fed Certified FTEs 33,34287.1 Legal Balance (funds 1-2-4) 087.2 Categorical Fund Balance 087.3 Deposits with Paying Agents (QZAB) 087.4 Net Legal Bal (Excl Cat & QZAB) 088 Building Fund Balance (fund 3) 089 Capital Outlay Fund Balance (fund 5) 0
The school’s charter was revoked by the Arkansas State Board on June 30, 2011; therefore, there is no budget for the 2011-2012 school year.
Jan 30, 2012 - 259 - 9:35:29 AM

Annual Statistical Report 2010-2011Charter Schools
County: PHILLIPS KIPP DELTA PUBLIC SCHOOLS LEA:5440700
2010-2011 2011-2012Actual Budget
1 Area in Square Miles 02 ADA 6083 ADA pct Change over 5 Yrs. 0%4 4 QTR ADM 6335 Prior Year 3QTR ADM 06 Assessment 07 M&O Mills 0.008 URT Mills 0.009 M&O Mills in Excess of URT 0.0010 Dedicated M&O Mills 0.0011 Debt Service Mills 0.0012 Total Mills 0.0013 Total Debt Bond/Non-Bond 0
State and Local Revenue:14 Property Tax Receipts (Including URT) 0 015 Other Local Receipts 1,403,484 2,651,59416 Revenue from Intermediate Sources 0 017.1 Foundation Funding (Excl URT) 0 017.2 Tax Collection Rate Guarantee 0 018 Student Growth Funding 0 019 Declining Enrollment Funding 0 020 Consolidation Incentive/Assistance 0 021 Isolated Funding 0 022 Supplemental Millage Incentive Funding 0 023 Other Unrestricted State Funding 3,829,845 5,222,40024 Total Unrestricted Revenue from State and
Local Sources 5,233,329 7,873,994
Restricted Revenue from State Sources:25 Adult Education 0 0
Regular Education:26 Professional Development 21,557 34,85027 Other Regular Education 17,377 36,000
Special Education:28 Gifted & Talented 350 029 Alternative Learning Environment (ALE) 0 030 English Language Learner (ELL) 0 031 National School Lunch Act (NSLA) 522,883 568,85532 Other Special Education 2,619 033 Workforce Education 15,166 034 School Food Service 2,284 035 Educational Service Cooperatives 0 036 Early Childhood Programs 0 037 Magnet School Programs 0 038 Other Non-Instructional Programs 0 039 Total Restricted Revenue from State Sources 582,236 639,70540 Total Restricted Revenue from Federal
Sources 2,053,023 1,644,566
Other Sources of Funds:41 Financing Sources 676,184 042 Balances from Consolidated/Annexed District 0 043 Indirect Cost Reimbursement 23,894 044 Gains and Losses from Sale of Fixed Assets 0 045 Compensation for Loss of Fixed Assets 0 046 Other 0 047 Total Other Sources of Funds 700,078 048 Total Revenue and Other Sources of Funds
from All Sources 8,568,666 10,158,265
2010-2011 2011-2012Actual Budget
CURRENT EXPENDITURESInstruction:
49 Regular Instruction 2,098,654 2,481,90550 Special Education 87,324 174,79051 Workforce Education 0 052 Adult Education 0 053 Compensatory Education 1,069,485 973,71754 Other 2,080 59,66055 Total Instruction 3,257,543 3,690,072
District Level Support:56 General Administration 344,850 477,68857 Central Services 133,292 171,20158 Maintenance & Operations of Plant 674,511 750,95859 Student Transportation 551,237 747,51060 Other District Level Support Services 211,003 185,97861 Total District Support Services 1,914,893 2,333,335
School Level Support:62 Student Support Services 115,260 220,43763 Instructional Staff Support Services 461,698 651,48864 School Administration 1,016,001 1,701,83665 Total District Support Services 1,592,959 2,573,761
Non-Instructional Services:66 Food Service Operations 489,115 719,20367 Other Enterprise Operations 0 068 Community Operations 0 069 Other Non-Instructional Services 0 070 Total Non-Instructional Services 489,115 719,20371 Facilities Acquisition and Construction 699,422 072 Debt Service 1,192,682 483,39275 Other Non-Programmed Costs 59 076 Total Expenditures 9,146,672 9,799,76377 Less: Capital Expenditures 972,230 351,61778 Less: Debt Service 1,192,682 483,39279 Total Current Expenditures 6,981,759 8,964,75480 Exclusions from Current Expenditures 86,24181 Net Current Expenditures 6,895,518
82 Per Pupil Expenditures 11,346
83 Personnel - Non-Federal Certified Clsrm FTEs 37.5084 Avg Salary - Non-Fed Certified Clsrm FTEs 34,03985 Personnel - Non-Federal Certified FTEs 37.5086 Avg Salary - Non-Fed Certified FTEs 34,03987.1 Legal Balance (funds 1-2-4) 1,713,44687.2 Categorical Fund Balance 231,06487.3 Deposits with Paying Agents (QZAB) 087.4 Net Legal Bal (Excl Cat & QZAB) 1,482,38188 Building Fund Balance (fund 3) 35,93589 Capital Outlay Fund Balance (fund 5) 0
Jan 30, 2012 - 260 - 9:35:29 AM

Annual Statistical Report 2010-2011Charter Schools
County: PULASKI ACADEMICS PLUS SCHOOL DISTRICT LEA:6040700
2010-2011 2011-2012Actual Budget
1 Area in Square Miles 02 ADA 5823 ADA pct Change over 5 Yrs. 45%4 4 QTR ADM 16,6195 Prior Year 3QTR ADM 06 Assessment 07 M&O Mills 0.008 URT Mills 0.009 M&O Mills in Excess of URT 0.0010 Dedicated M&O Mills 0.0011 Debt Service Mills 0.0012 Total Mills 0.0013 Total Debt Bond/Non-Bond 0
State and Local Revenue:14 Property Tax Receipts (Including URT) 0 015 Other Local Receipts 183,882 79,05816 Revenue from Intermediate Sources 0 017.1 Foundation Funding (Excl URT) 0 017.2 Tax Collection Rate Guarantee 0 018 Student Growth Funding 481,704 84,54119 Declining Enrollment Funding 0 020 Consolidation Incentive/Assistance 0 021 Isolated Funding 0 022 Supplemental Millage Incentive Funding 0 023 Other Unrestricted State Funding 3,192,190 3,724,73924 Total Unrestricted Revenue from State and
Local Sources 3,857,776 3,888,338
Restricted Revenue from State Sources:25 Adult Education 0 0
Regular Education:26 Professional Development 21,921 25,69227 Other Regular Education 16,400 0
Special Education:28 Gifted & Talented 0 029 Alternative Learning Environment (ALE) 0 030 English Language Learner (ELL) 0 031 National School Lunch Act (NSLA) 72,099 93,94732 Other Special Education 2,171 033 Workforce Education 0 034 School Food Service 886 88735 Educational Service Cooperatives 0 036 Early Childhood Programs 0 037 Magnet School Programs 0 038 Other Non-Instructional Programs 0 039 Total Restricted Revenue from State Sources 113,478 120,52640 Total Restricted Revenue from Federal
Sources 428,912 404,366
Other Sources of Funds:41 Financing Sources 26,544 042 Balances from Consolidated/Annexed District 0 043 Indirect Cost Reimbursement 0 044 Gains and Losses from Sale of Fixed Assets 0 77745 Compensation for Loss of Fixed Assets 0 046 Other 0 047 Total Other Sources of Funds 26,544 77748 Total Revenue and Other Sources of Funds
from All Sources 4,426,710 4,414,007
2010-2011 2011-2012Actual Budget
CURRENT EXPENDITURESInstruction:
49 Regular Instruction 1,974,872 2,291,99650 Special Education 83,530 88,40551 Workforce Education 43,450 45,02452 Adult Education 0 053 Compensatory Education 80,494 54,00054 Other 75,627 90,10555 Total Instruction 2,257,973 2,569,530
District Level Support:56 General Administration 194,704 241,99257 Central Services 214,731 245,89858 Maintenance & Operations of Plant 464,808 742,93759 Student Transportation 5,525 42,20060 Other District Level Support Services 0 061 Total District Support Services 879,768 1,273,027
School Level Support:62 Student Support Services 154,618 184,70563 Instructional Staff Support Services 134,219 188,92864 School Administration 258,051 230,55965 Total District Support Services 546,887 604,192
Non-Instructional Services:66 Food Service Operations 167,692 177,41867 Other Enterprise Operations 0 068 Community Operations 37 50069 Other Non-Instructional Services 0 070 Total Non-Instructional Services 167,729 177,91871 Facilities Acquisition and Construction 191,567 70,00072 Debt Service 0 075 Other Non-Programmed Costs 105,456 076 Total Expenditures 4,149,381 4,694,66777 Less: Capital Expenditures 207,390 239,89278 Less: Debt Service 0 079 Total Current Expenditures 3,941,991 4,454,77580 Exclusions from Current Expenditures 267,99781 Net Current Expenditures 3,673,994
82 Per Pupil Expenditures 6,316
83 Personnel - Non-Federal Certified Clsrm FTEs 45.8884 Avg Salary - Non-Fed Certified Clsrm FTEs 32,35185 Personnel - Non-Federal Certified FTEs 51.0186 Avg Salary - Non-Fed Certified FTEs 34,84087.1 Legal Balance (funds 1-2-4) 424,58787.2 Categorical Fund Balance 14,40087.3 Deposits with Paying Agents (QZAB) 087.4 Net Legal Bal (Excl Cat & QZAB) 410,18788 Building Fund Balance (fund 3) 796,07689 Capital Outlay Fund Balance (fund 5) 0
Jan 30, 2012 - 261 - 9:35:29 AM

Annual Statistical Report 2010-2011Charter Schools
County: PULASKI LISA ACADEMY LEA:6041700
2010-2011 2011-2012Actual Budget
1 Area in Square Miles 02 ADA 4573 ADA pct Change over 5 Yrs. 161%4 4 QTR ADM 4775 Prior Year 3QTR ADM 06 Assessment 07 M&O Mills 0.008 URT Mills 0.009 M&O Mills in Excess of URT 0.0010 Dedicated M&O Mills 0.0011 Debt Service Mills 0.0012 Total Mills 0.0013 Total Debt Bond/Non-Bond 0
State and Local Revenue:14 Property Tax Receipts (Including URT) 0 015 Other Local Receipts 212,703 50,00016 Revenue from Intermediate Sources 0 017.1 Foundation Funding (Excl URT) 0 017.2 Tax Collection Rate Guarantee 0 018 Student Growth Funding 110,070 019 Declining Enrollment Funding 0 020 Consolidation Incentive/Assistance 0 021 Isolated Funding 0 022 Supplemental Millage Incentive Funding 0 023 Other Unrestricted State Funding 2,759,870 3,686,40024 Total Unrestricted Revenue from State and
Local Sources 3,082,642 3,736,400
Restricted Revenue from State Sources:25 Adult Education 0 0
Regular Education:26 Professional Development 18,952 20,17327 Other Regular Education 1,437 0
Special Education:28 Gifted & Talented 2,100 029 Alternative Learning Environment (ALE) 0 030 English Language Learner (ELL) 0 031 National School Lunch Act (NSLA) 60,254 67,72832 Other Special Education 0 033 Workforce Education 0 034 School Food Service 1,270 035 Educational Service Cooperatives 0 036 Early Childhood Programs 0 037 Magnet School Programs 0 038 Other Non-Instructional Programs 1,406 039 Total Restricted Revenue from State Sources 85,420 87,90140 Total Restricted Revenue from Federal
Sources 422,058 209,338
Other Sources of Funds:41 Financing Sources (19,089) 042 Balances from Consolidated/Annexed District 0 043 Indirect Cost Reimbursement 0 044 Gains and Losses from Sale of Fixed Assets 0 045 Compensation for Loss of Fixed Assets 0 046 Other 0 047 Total Other Sources of Funds (19,089) 048 Total Revenue and Other Sources of Funds
from All Sources 3,571,032 4,033,639
2010-2011 2011-2012Actual Budget
CURRENT EXPENDITURESInstruction:
49 Regular Instruction 1,656,260 1,773,81250 Special Education 176,514 84,77151 Workforce Education 0 052 Adult Education 0 053 Compensatory Education 83,253 054 Other 55,920 055 Total Instruction 1,971,947 1,858,583
District Level Support:56 General Administration 189,240 213,15857 Central Services 153,997 231,29958 Maintenance & Operations of Plant 853,146 1,063,95559 Student Transportation 12,250 14,00060 Other District Level Support Services 173 061 Total District Support Services 1,208,806 1,522,412
School Level Support:62 Student Support Services 112,855 109,34963 Instructional Staff Support Services 145,584 171,91864 School Administration 161,494 435,74465 Total District Support Services 419,933 717,011
Non-Instructional Services:66 Food Service Operations 92,968 135,24767 Other Enterprise Operations 0 068 Community Operations 0 069 Other Non-Instructional Services 0 070 Total Non-Instructional Services 92,968 135,24771 Facilities Acquisition and Construction 19,495 58,80072 Debt Service 0 075 Other Non-Programmed Costs 34,095 076 Total Expenditures 3,747,245 4,292,05477 Less: Capital Expenditures 107,625 92,80078 Less: Debt Service 0 079 Total Current Expenditures 3,639,620 4,199,25480 Exclusions from Current Expenditures 218,59381 Net Current Expenditures 3,421,027
82 Per Pupil Expenditures 7,481
83 Personnel - Non-Federal Certified Clsrm FTEs 30.6184 Avg Salary - Non-Fed Certified Clsrm FTEs 38,01885 Personnel - Non-Federal Certified FTEs 32.7986 Avg Salary - Non-Fed Certified FTEs 39,28187.1 Legal Balance (funds 1-2-4) 341,60387.2 Categorical Fund Balance 087.3 Deposits with Paying Agents (QZAB) 087.4 Net Legal Bal (Excl Cat & QZAB) 341,60388 Building Fund Balance (fund 3) 089 Capital Outlay Fund Balance (fund 5) 0
Jan 30, 2012 - 262 - 9:35:29 AM

Annual Statistical Report 2010-2011Charter Schools
County: PULASKI DREAMLAND ACADEMY LEA:6042700
2010-2011 2011-2012Actual Budget
1 Area in Square Miles 02 ADA 2573 ADA pct Change over 5 Yrs. 0%4 4 QTR ADM 2655 Prior Year 3QTR ADM 06 Assessment 07 M&O Mills 0.008 URT Mills 0.009 M&O Mills in Excess of URT 0.0010 Dedicated M&O Mills 0.0011 Debt Service Mills 0.0012 Total Mills 0.0013 Total Debt Bond/Non-Bond 0
State and Local Revenue:14 Property Tax Receipts (Including URT) 0 015 Other Local Receipts 12,741 016 Revenue from Intermediate Sources 0 017.1 Foundation Funding (Excl URT) 0 017.2 Tax Collection Rate Guarantee 0 018 Student Growth Funding 0 019 Declining Enrollment Funding 88,689 020 Consolidation Incentive/Assistance 0 021 Isolated Funding 0 022 Supplemental Millage Incentive Funding 0 023 Other Unrestricted State Funding 1,629,523 1,607,32824 Total Unrestricted Revenue from State and
Local Sources 1,730,953 1,607,328
Restricted Revenue from State Sources:25 Adult Education 0 0
Regular Education:26 Professional Development 11,190 11,08727 Other Regular Education 3,943 0
Special Education:28 Gifted & Talented 0 029 Alternative Learning Environment (ALE) 0 030 English Language Learner (ELL) 0 031 National School Lunch Act (NSLA) 326,697 391,64432 Other Special Education 1,108 033 Workforce Education 0 034 School Food Service 1,210 035 Educational Service Cooperatives 0 036 Early Childhood Programs 0 037 Magnet School Programs 0 038 Other Non-Instructional Programs 0 039 Total Restricted Revenue from State Sources 344,148 402,73140 Total Restricted Revenue from Federal
Sources 804,657 563,508
Other Sources of Funds:41 Financing Sources 0 042 Balances from Consolidated/Annexed District 0 043 Indirect Cost Reimbursement 0 044 Gains and Losses from Sale of Fixed Assets 0 045 Compensation for Loss of Fixed Assets 0 046 Other 0 047 Total Other Sources of Funds 0 048 Total Revenue and Other Sources of Funds
from All Sources 2,879,758 2,573,567
2010-2011 2011-2012Actual Budget
CURRENT EXPENDITURESInstruction:
49 Regular Instruction 909,922 916,34650 Special Education 62,166 23,22351 Workforce Education 0 052 Adult Education 0 053 Compensatory Education 302,328 191,88054 Other 36,070 055 Total Instruction 1,310,487 1,131,449
District Level Support:56 General Administration 180,169 164,50957 Central Services 176,185 113,18858 Maintenance & Operations of Plant 356,903 330,08059 Student Transportation 21,368 3,00060 Other District Level Support Services 0 061 Total District Support Services 734,625 610,777
School Level Support:62 Student Support Services 185,404 88,82663 Instructional Staff Support Services 330,856 308,89864 School Administration 128,428 93,47165 Total District Support Services 644,689 491,195
Non-Instructional Services:66 Food Service Operations 230,639 23,49067 Other Enterprise Operations 0 068 Community Operations 481 069 Other Non-Instructional Services 0 070 Total Non-Instructional Services 231,121 23,49071 Facilities Acquisition and Construction 1,885 072 Debt Service 0 075 Other Non-Programmed Costs 0 076 Total Expenditures 2,922,807 2,256,91177 Less: Capital Expenditures 48,393 1,50078 Less: Debt Service 0 079 Total Current Expenditures 2,874,414 2,255,41180 Exclusions from Current Expenditures 3,74081 Net Current Expenditures 2,870,674
82 Per Pupil Expenditures 11,175
83 Personnel - Non-Federal Certified Clsrm FTEs 15.4784 Avg Salary - Non-Fed Certified Clsrm FTEs 35,96785 Personnel - Non-Federal Certified FTEs 17.5686 Avg Salary - Non-Fed Certified FTEs 36,98887.1 Legal Balance (funds 1-2-4) 45,19987.2 Categorical Fund Balance 14,73887.3 Deposits with Paying Agents (QZAB) 087.4 Net Legal Bal (Excl Cat & QZAB) 30,46188 Building Fund Balance (fund 3) 089 Capital Outlay Fund Balance (fund 5) 0
Jan 30, 2012 - 263 - 9:35:29 AM

Annual Statistical Report 2010-2011Charter Schools
County: PULASKI ARKANSAS VIRTUAL ACADEMY LEA:6043700
2010-2011 2011-2012Actual Budget
1 Area in Square Miles 02 ADA 4843 ADA pct Change over 5 Yrs. 0%4 4 QTR ADM 4905 Prior Year 3QTR ADM 06 Assessment 07 M&O Mills 0.008 URT Mills 0.009 M&O Mills in Excess of URT 0.0010 Dedicated M&O Mills 0.0011 Debt Service Mills 0.0012 Total Mills 0.0013 Total Debt Bond/Non-Bond 0
State and Local Revenue:14 Property Tax Receipts (Including URT) 0 015 Other Local Receipts 915 24,24716 Revenue from Intermediate Sources 0 017.1 Foundation Funding (Excl URT) 0 017.2 Tax Collection Rate Guarantee 0 018 Student Growth Funding 8,553 019 Declining Enrollment Funding 10,747 020 Consolidation Incentive/Assistance 0 021 Isolated Funding 0 022 Supplemental Millage Incentive Funding 0 023 Other Unrestricted State Funding 2,972,591 3,019,65324 Total Unrestricted Revenue from State and
Local Sources 2,992,806 3,043,900
Restricted Revenue from State Sources:25 Adult Education 0 0
Regular Education:26 Professional Development 20,413 20,41327 Other Regular Education 0 0
Special Education:28 Gifted & Talented 0 029 Alternative Learning Environment (ALE) 0 030 English Language Learner (ELL) 0 031 National School Lunch Act (NSLA) 0 032 Other Special Education 2,022 2,02233 Workforce Education 0 034 School Food Service 0 035 Educational Service Cooperatives 0 036 Early Childhood Programs 0 037 Magnet School Programs 0 038 Other Non-Instructional Programs 0 039 Total Restricted Revenue from State Sources 22,435 22,43540 Total Restricted Revenue from Federal
Sources 377,804 500,362
Other Sources of Funds:41 Financing Sources 0 042 Balances from Consolidated/Annexed District 0 043 Indirect Cost Reimbursement 0 044 Gains and Losses from Sale of Fixed Assets 0 045 Compensation for Loss of Fixed Assets 0 046 Other 0 047 Total Other Sources of Funds 0 048 Total Revenue and Other Sources of Funds
from All Sources 3,393,044 3,566,697
2010-2011 2011-2012Actual Budget
CURRENT EXPENDITURESInstruction:
49 Regular Instruction 2,351,506 2,049,16150 Special Education 84,752 90,40451 Workforce Education 0 052 Adult Education 0 053 Compensatory Education 12,389 51,88154 Other 0 055 Total Instruction 2,448,648 2,191,447
District Level Support:56 General Administration 692,278 676,55457 Central Services 3,908 236,00058 Maintenance & Operations of Plant 1,096 059 Student Transportation 0 060 Other District Level Support Services 0 5,00061 Total District Support Services 697,282 917,554
School Level Support:62 Student Support Services 113,890 179,65363 Instructional Staff Support Services 106,434 315,04364 School Administration 0 065 Total District Support Services 220,324 494,695
Non-Instructional Services:66 Food Service Operations 0 067 Other Enterprise Operations 0 068 Community Operations 0 2,00069 Other Non-Instructional Services 0 070 Total Non-Instructional Services 0 2,00071 Facilities Acquisition and Construction 0 072 Debt Service 0 075 Other Non-Programmed Costs 14,083 076 Total Expenditures 3,380,336 3,605,69677 Less: Capital Expenditures 1,090 3,00078 Less: Debt Service 0 079 Total Current Expenditures 3,379,246 3,602,69680 Exclusions from Current Expenditures 14,08381 Net Current Expenditures 3,365,163
82 Per Pupil Expenditures 6,946
83 Personnel - Non-Federal Certified Clsrm FTEs 8.5084 Avg Salary - Non-Fed Certified Clsrm FTEs 39,33285 Personnel - Non-Federal Certified FTEs 8.5086 Avg Salary - Non-Fed Certified FTEs 39,33287.1 Legal Balance (funds 1-2-4) 289,86787.2 Categorical Fund Balance 21,58587.3 Deposits with Paying Agents (QZAB) 087.4 Net Legal Bal (Excl Cat & QZAB) 268,28388 Building Fund Balance (fund 3) 089 Capital Outlay Fund Balance (fund 5) 0
Jan 30, 2012 - 264 - 9:35:29 AM
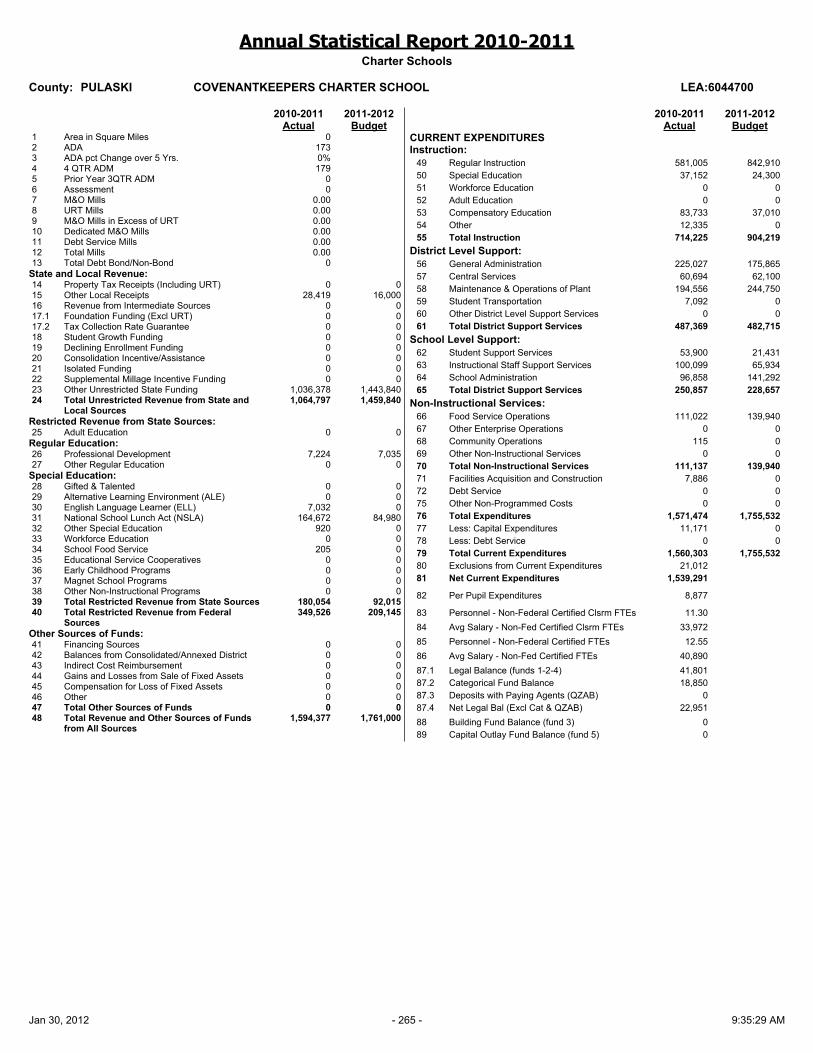
Annual Statistical Report 2010-2011Charter Schools
County: PULASKI COVENANTKEEPERS CHARTER SCHOOL LEA:6044700
2010-2011 2011-2012Actual Budget
1 Area in Square Miles 02 ADA 1733 ADA pct Change over 5 Yrs. 0%4 4 QTR ADM 1795 Prior Year 3QTR ADM 06 Assessment 07 M&O Mills 0.008 URT Mills 0.009 M&O Mills in Excess of URT 0.0010 Dedicated M&O Mills 0.0011 Debt Service Mills 0.0012 Total Mills 0.0013 Total Debt Bond/Non-Bond 0
State and Local Revenue:14 Property Tax Receipts (Including URT) 0 015 Other Local Receipts 28,419 16,00016 Revenue from Intermediate Sources 0 017.1 Foundation Funding (Excl URT) 0 017.2 Tax Collection Rate Guarantee 0 018 Student Growth Funding 0 019 Declining Enrollment Funding 0 020 Consolidation Incentive/Assistance 0 021 Isolated Funding 0 022 Supplemental Millage Incentive Funding 0 023 Other Unrestricted State Funding 1,036,378 1,443,84024 Total Unrestricted Revenue from State and
Local Sources 1,064,797 1,459,840
Restricted Revenue from State Sources:25 Adult Education 0 0
Regular Education:26 Professional Development 7,224 7,03527 Other Regular Education 0 0
Special Education:28 Gifted & Talented 0 029 Alternative Learning Environment (ALE) 0 030 English Language Learner (ELL) 7,032 031 National School Lunch Act (NSLA) 164,672 84,98032 Other Special Education 920 033 Workforce Education 0 034 School Food Service 205 035 Educational Service Cooperatives 0 036 Early Childhood Programs 0 037 Magnet School Programs 0 038 Other Non-Instructional Programs 0 039 Total Restricted Revenue from State Sources 180,054 92,01540 Total Restricted Revenue from Federal
Sources 349,526 209,145
Other Sources of Funds:41 Financing Sources 0 042 Balances from Consolidated/Annexed District 0 043 Indirect Cost Reimbursement 0 044 Gains and Losses from Sale of Fixed Assets 0 045 Compensation for Loss of Fixed Assets 0 046 Other 0 047 Total Other Sources of Funds 0 048 Total Revenue and Other Sources of Funds
from All Sources 1,594,377 1,761,000
2010-2011 2011-2012Actual Budget
CURRENT EXPENDITURESInstruction:
49 Regular Instruction 581,005 842,91050 Special Education 37,152 24,30051 Workforce Education 0 052 Adult Education 0 053 Compensatory Education 83,733 37,01054 Other 12,335 055 Total Instruction 714,225 904,219
District Level Support:56 General Administration 225,027 175,86557 Central Services 60,694 62,10058 Maintenance & Operations of Plant 194,556 244,75059 Student Transportation 7,092 060 Other District Level Support Services 0 061 Total District Support Services 487,369 482,715
School Level Support:62 Student Support Services 53,900 21,43163 Instructional Staff Support Services 100,099 65,93464 School Administration 96,858 141,29265 Total District Support Services 250,857 228,657
Non-Instructional Services:66 Food Service Operations 111,022 139,94067 Other Enterprise Operations 0 068 Community Operations 115 069 Other Non-Instructional Services 0 070 Total Non-Instructional Services 111,137 139,94071 Facilities Acquisition and Construction 7,886 072 Debt Service 0 075 Other Non-Programmed Costs 0 076 Total Expenditures 1,571,474 1,755,53277 Less: Capital Expenditures 11,171 078 Less: Debt Service 0 079 Total Current Expenditures 1,560,303 1,755,53280 Exclusions from Current Expenditures 21,01281 Net Current Expenditures 1,539,291
82 Per Pupil Expenditures 8,877
83 Personnel - Non-Federal Certified Clsrm FTEs 11.3084 Avg Salary - Non-Fed Certified Clsrm FTEs 33,97285 Personnel - Non-Federal Certified FTEs 12.5586 Avg Salary - Non-Fed Certified FTEs 40,89087.1 Legal Balance (funds 1-2-4) 41,80187.2 Categorical Fund Balance 18,85087.3 Deposits with Paying Agents (QZAB) 087.4 Net Legal Bal (Excl Cat & QZAB) 22,95188 Building Fund Balance (fund 3) 089 Capital Outlay Fund Balance (fund 5) 0
Jan 30, 2012 - 265 - 9:35:29 AM

Annual Statistical Report 2010-2011Charter Schools
County: PULASKI ESTEM ELEMENTARY PUBLIC CHARTE LEA:6045700
2010-2011 2011-2012Actual Budget
1 Area in Square Miles 02 ADA 3553 ADA pct Change over 5 Yrs. 0%4 4 QTR ADM 3605 Prior Year 3QTR ADM 06 Assessment 07 M&O Mills 0.008 URT Mills 0.009 M&O Mills in Excess of URT 0.0010 Dedicated M&O Mills 0.0011 Debt Service Mills 0.0012 Total Mills 0.0013 Total Debt Bond/Non-Bond 0
State and Local Revenue:14 Property Tax Receipts (Including URT) 0 015 Other Local Receipts 570,329 754,74516 Revenue from Intermediate Sources 0 017.1 Foundation Funding (Excl URT) 0 017.2 Tax Collection Rate Guarantee 0 018 Student Growth Funding 0 626,68819 Declining Enrollment Funding 0 020 Consolidation Incentive/Assistance 0 021 Isolated Funding 0 022 Supplemental Millage Incentive Funding 0 023 Other Unrestricted State Funding 2,168,280 2,211,84024 Total Unrestricted Revenue from State and
Local Sources 2,738,609 3,593,273
Restricted Revenue from State Sources:25 Adult Education 0 0
Regular Education:26 Professional Development 14,890 19,86627 Other Regular Education 10,000 0
Special Education:28 Gifted & Talented 0 029 Alternative Learning Environment (ALE) 0 030 English Language Learner (ELL) 0 3,88731 National School Lunch Act (NSLA) 63,984 78,43032 Other Special Education 1,478 1,47633 Workforce Education 0 034 School Food Service 909 1,00035 Educational Service Cooperatives 0 036 Early Childhood Programs 0 037 Magnet School Programs 0 038 Other Non-Instructional Programs 0 039 Total Restricted Revenue from State Sources 91,261 104,65940 Total Restricted Revenue from Federal
Sources 363,164 302,136
Other Sources of Funds:41 Financing Sources 57,038 042 Balances from Consolidated/Annexed District 0 043 Indirect Cost Reimbursement 0 044 Gains and Losses from Sale of Fixed Assets 0 045 Compensation for Loss of Fixed Assets 0 046 Other 0 047 Total Other Sources of Funds 57,038 048 Total Revenue and Other Sources of Funds
from All Sources 3,250,073 4,000,068
2010-2011 2011-2012Actual Budget
CURRENT EXPENDITURESInstruction:
49 Regular Instruction 1,699,824 2,130,33350 Special Education 88,908 73,51751 Workforce Education 0 052 Adult Education 0 053 Compensatory Education 111,141 69,18254 Other 0 055 Total Instruction 1,899,873 2,273,032
District Level Support:56 General Administration 26,493 49,86357 Central Services 212,040 254,63558 Maintenance & Operations of Plant 431,275 520,33459 Student Transportation 3,904 6,40060 Other District Level Support Services 278 061 Total District Support Services 673,990 831,232
School Level Support:62 Student Support Services 92,691 125,77463 Instructional Staff Support Services 129,548 230,58864 School Administration 337,755 318,08065 Total District Support Services 559,994 674,441
Non-Instructional Services:66 Food Service Operations 116,194 124,00067 Other Enterprise Operations 0 068 Community Operations 0 069 Other Non-Instructional Services 0 070 Total Non-Instructional Services 116,194 124,00071 Facilities Acquisition and Construction 0 072 Debt Service 0 075 Other Non-Programmed Costs 0 076 Total Expenditures 3,250,051 3,902,70577 Less: Capital Expenditures 0 20,52078 Less: Debt Service 0 079 Total Current Expenditures 3,250,051 3,882,18580 Exclusions from Current Expenditures 556,30081 Net Current Expenditures 2,693,751
82 Per Pupil Expenditures 7,593
83 Personnel - Non-Federal Certified Clsrm FTEs 26.9284 Avg Salary - Non-Fed Certified Clsrm FTEs 37,12285 Personnel - Non-Federal Certified FTEs 28.3886 Avg Salary - Non-Fed Certified FTEs 39,10687.1 Legal Balance (funds 1-2-4) 2,04887.2 Categorical Fund Balance 087.3 Deposits with Paying Agents (QZAB) 087.4 Net Legal Bal (Excl Cat & QZAB) 2,04888 Building Fund Balance (fund 3) 089 Capital Outlay Fund Balance (fund 5) 0
Jan 30, 2012 - 266 - 9:35:29 AM

Annual Statistical Report 2010-2011Charter Schools
County: PULASKI ESTEM MIDDLE PUBLIC CHARTER LEA:6046700
2010-2011 2011-2012Actual Budget
1 Area in Square Miles 02 ADA 4853 ADA pct Change over 5 Yrs. 0%4 4 QTR ADM 5015 Prior Year 3QTR ADM 06 Assessment 07 M&O Mills 0.008 URT Mills 0.009 M&O Mills in Excess of URT 0.0010 Dedicated M&O Mills 0.0011 Debt Service Mills 0.0012 Total Mills 0.0013 Total Debt Bond/Non-Bond 0
State and Local Revenue:14 Property Tax Receipts (Including URT) 0 015 Other Local Receipts 214,232 181,17916 Revenue from Intermediate Sources 0 017.1 Foundation Funding (Excl URT) 0 017.2 Tax Collection Rate Guarantee 0 018 Student Growth Funding 634,587 019 Declining Enrollment Funding 0 020 Consolidation Incentive/Assistance 0 021 Isolated Funding 0 022 Supplemental Millage Incentive Funding 0 023 Other Unrestricted State Funding 2,379,808 3,072,00024 Total Unrestricted Revenue from State and
Local Sources 3,228,627 3,253,179
Restricted Revenue from State Sources:25 Adult Education 0 0
Regular Education:26 Professional Development 16,342 25,50027 Other Regular Education 10,600 0
Special Education:28 Gifted & Talented 0 029 Alternative Learning Environment (ALE) 0 030 English Language Learner (ELL) 0 1,79431 National School Lunch Act (NSLA) 56,048 80,96032 Other Special Education 2,045 2,05033 Workforce Education 0 034 School Food Service 929 90035 Educational Service Cooperatives 0 036 Early Childhood Programs 0 037 Magnet School Programs 0 038 Other Non-Instructional Programs 0 039 Total Restricted Revenue from State Sources 85,963 111,20440 Total Restricted Revenue from Federal
Sources 539,204 244,000
Other Sources of Funds:41 Financing Sources 17,405 042 Balances from Consolidated/Annexed District 0 043 Indirect Cost Reimbursement 0 044 Gains and Losses from Sale of Fixed Assets 0 045 Compensation for Loss of Fixed Assets 0 046 Other 0 047 Total Other Sources of Funds 17,405 048 Total Revenue and Other Sources of Funds
from All Sources 3,871,199 3,608,383
2010-2011 2011-2012Actual Budget
CURRENT EXPENDITURESInstruction:
49 Regular Instruction 2,093,907 1,988,27050 Special Education 140,769 84,85551 Workforce Education 0 052 Adult Education 0 053 Compensatory Education 83,754 96,78354 Other 0 055 Total Instruction 2,318,430 2,169,908
District Level Support:56 General Administration 27,644 52,98057 Central Services 160,753 189,21958 Maintenance & Operations of Plant 555,939 610,80059 Student Transportation 11,503 6,80060 Other District Level Support Services 205 061 Total District Support Services 756,044 859,799
School Level Support:62 Student Support Services 123,609 063 Instructional Staff Support Services 71,541 129,00564 School Administration 357,514 238,12565 Total District Support Services 552,664 367,130
Non-Instructional Services:66 Food Service Operations 133,108 135,75867 Other Enterprise Operations 0 068 Community Operations 0 069 Other Non-Instructional Services 0 070 Total Non-Instructional Services 133,108 135,75871 Facilities Acquisition and Construction 128,572 072 Debt Service 0 075 Other Non-Programmed Costs 0 076 Total Expenditures 3,888,818 3,532,59677 Less: Capital Expenditures 128,572 21,74078 Less: Debt Service 0 079 Total Current Expenditures 3,760,246 3,510,85680 Exclusions from Current Expenditures 182,98581 Net Current Expenditures 3,577,261
82 Per Pupil Expenditures 7,379
83 Personnel - Non-Federal Certified Clsrm FTEs 28.8884 Avg Salary - Non-Fed Certified Clsrm FTEs 38,92985 Personnel - Non-Federal Certified FTEs 28.8886 Avg Salary - Non-Fed Certified FTEs 38,92987.1 Legal Balance (funds 1-2-4) 5,55187.2 Categorical Fund Balance 087.3 Deposits with Paying Agents (QZAB) 087.4 Net Legal Bal (Excl Cat & QZAB) 5,55188 Building Fund Balance (fund 3) 089 Capital Outlay Fund Balance (fund 5) 0
Jan 30, 2012 - 267 - 9:35:29 AM

Annual Statistical Report 2010-2011Charter Schools
County: PULASKI ESTEM HIGH SCHOOL LEA:6047700
2010-2011 2011-2012Actual Budget
1 Area in Square Miles 02 ADA 3283 ADA pct Change over 5 Yrs. 0%4 4 QTR ADM 3595 Prior Year 3QTR ADM 06 Assessment 07 M&O Mills 0.008 URT Mills 0.009 M&O Mills in Excess of URT 0.0010 Dedicated M&O Mills 0.0011 Debt Service Mills 0.0012 Total Mills 0.0013 Total Debt Bond/Non-Bond 0
State and Local Revenue:14 Property Tax Receipts (Including URT) 0 015 Other Local Receipts 463,796 366,77716 Revenue from Intermediate Sources 0 017.1 Foundation Funding (Excl URT) 0 017.2 Tax Collection Rate Guarantee 0 018 Student Growth Funding 0 019 Declining Enrollment Funding 0 020 Consolidation Incentive/Assistance 0 021 Isolated Funding 0 022 Supplemental Millage Incentive Funding 0 023 Other Unrestricted State Funding 2,181,290 3,010,56024 Total Unrestricted Revenue from State and
Local Sources 2,645,086 3,377,337
Restricted Revenue from State Sources:25 Adult Education 0 0
Regular Education:26 Professional Development 7,623 24,99027 Other Regular Education 4,400 0
Special Education:28 Gifted & Talented 150 029 Alternative Learning Environment (ALE) 0 030 English Language Learner (ELL) 0 3,28931 National School Lunch Act (NSLA) 28,272 88,55032 Other Special Education 1,062 1,98933 Workforce Education 0 034 School Food Service 291 30035 Educational Service Cooperatives 0 036 Early Childhood Programs 0 037 Magnet School Programs 0 038 Other Non-Instructional Programs 600 039 Total Restricted Revenue from State Sources 42,398 119,11840 Total Restricted Revenue from Federal
Sources 284,761 109,074
Other Sources of Funds:41 Financing Sources 2,278 042 Balances from Consolidated/Annexed District 0 043 Indirect Cost Reimbursement 0 044 Gains and Losses from Sale of Fixed Assets 0 045 Compensation for Loss of Fixed Assets 0 046 Other 0 047 Total Other Sources of Funds 2,278 048 Total Revenue and Other Sources of Funds
from All Sources 2,974,522 3,605,529
2010-2011 2011-2012Actual Budget
CURRENT EXPENDITURESInstruction:
49 Regular Instruction 1,597,039 1,833,61150 Special Education 48,603 99,57551 Workforce Education 0 052 Adult Education 0 053 Compensatory Education 95,920 30,05454 Other 150 055 Total Instruction 1,741,712 1,963,240
District Level Support:56 General Administration 23,093 155,68757 Central Services 102,343 91,90958 Maintenance & Operations of Plant 511,594 718,32659 Student Transportation 3,904 6,80060 Other District Level Support Services 0 061 Total District Support Services 640,934 972,723
School Level Support:62 Student Support Services 21,812 134,30163 Instructional Staff Support Services 48,316 133,67064 School Administration 402,023 284,14865 Total District Support Services 472,151 552,119
Non-Instructional Services:66 Food Service Operations 106,770 112,17567 Other Enterprise Operations 0 068 Community Operations 0 069 Other Non-Instructional Services 0 070 Total Non-Instructional Services 106,770 112,17571 Facilities Acquisition and Construction 0 072 Debt Service 0 075 Other Non-Programmed Costs 0 076 Total Expenditures 2,961,567 3,600,25677 Less: Capital Expenditures 0 35,34078 Less: Debt Service 0 079 Total Current Expenditures 2,961,567 3,564,91680 Exclusions from Current Expenditures 449,70981 Net Current Expenditures 2,511,858
82 Per Pupil Expenditures 7,661
83 Personnel - Non-Federal Certified Clsrm FTEs 23.7384 Avg Salary - Non-Fed Certified Clsrm FTEs 38,86285 Personnel - Non-Federal Certified FTEs 25.1086 Avg Salary - Non-Fed Certified FTEs 43,02087.1 Legal Balance (funds 1-2-4) 5,45187.2 Categorical Fund Balance 087.3 Deposits with Paying Agents (QZAB) 087.4 Net Legal Bal (Excl Cat & QZAB) 5,45188 Building Fund Balance (fund 3) 089 Capital Outlay Fund Balance (fund 5) 0
Jan 30, 2012 - 268 - 9:35:29 AM

Annual Statistical Report 2010-2011Charter Schools
County: PULASKI LISA ACADEMY NORTH LEA:6048700
2010-2011 2011-2012Actual Budget
1 Area in Square Miles 02 ADA 4043 ADA pct Change over 5 Yrs. 0%4 4 QTR ADM 4115 Prior Year 3QTR ADM 06 Assessment 07 M&O Mills 0.008 URT Mills 0.009 M&O Mills in Excess of URT 0.0010 Dedicated M&O Mills 0.0011 Debt Service Mills 0.0012 Total Mills 0.0013 Total Debt Bond/Non-Bond 0
State and Local Revenue:14 Property Tax Receipts (Including URT) 0 015 Other Local Receipts 104,058 34,00016 Revenue from Intermediate Sources 0 017.1 Foundation Funding (Excl URT) 0 017.2 Tax Collection Rate Guarantee 0 018 Student Growth Funding 0 019 Declining Enrollment Funding 0 020 Consolidation Incentive/Assistance 0 021 Isolated Funding 0 022 Supplemental Millage Incentive Funding 0 023 Other Unrestricted State Funding 2,501,171 2,764,80024 Total Unrestricted Revenue from State and
Local Sources 2,605,229 2,798,800
Restricted Revenue from State Sources:25 Adult Education 0 0
Regular Education:26 Professional Development 15,620 19,07127 Other Regular Education 2,400 0
Special Education:28 Gifted & Talented 0 029 Alternative Learning Environment (ALE) 0 030 English Language Learner (ELL) 0 031 National School Lunch Act (NSLA) 50,096 55,66032 Other Special Education 1,760 033 Workforce Education 0 034 School Food Service 0 035 Educational Service Cooperatives 0 036 Early Childhood Programs 0 037 Magnet School Programs 0 038 Other Non-Instructional Programs 0 039 Total Restricted Revenue from State Sources 69,876 74,73140 Total Restricted Revenue from Federal
Sources 327,430 117,464
Other Sources of Funds:41 Financing Sources 1,639 042 Balances from Consolidated/Annexed District 0 043 Indirect Cost Reimbursement 0 044 Gains and Losses from Sale of Fixed Assets 0 045 Compensation for Loss of Fixed Assets 0 046 Other 0 047 Total Other Sources of Funds 1,639 048 Total Revenue and Other Sources of Funds
from All Sources 3,004,174 2,990,995
2010-2011 2011-2012Actual Budget
CURRENT EXPENDITURESInstruction:
49 Regular Instruction 1,306,186 1,228,31550 Special Education 33,745 92,44251 Workforce Education 0 052 Adult Education 0 053 Compensatory Education 102,556 054 Other 0 055 Total Instruction 1,442,488 1,320,756
District Level Support:56 General Administration 134,202 160,89257 Central Services 26,325 140,15658 Maintenance & Operations of Plant 522,174 520,64859 Student Transportation 850 8,00060 Other District Level Support Services 0 061 Total District Support Services 683,551 829,696
School Level Support:62 Student Support Services 107,643 100,72763 Instructional Staff Support Services 55,230 123,02364 School Administration 280,482 355,17465 Total District Support Services 443,355 578,924
Non-Instructional Services:66 Food Service Operations 88,952 105,24767 Other Enterprise Operations 0 068 Community Operations 0 069 Other Non-Instructional Services 0 070 Total Non-Instructional Services 88,952 105,24771 Facilities Acquisition and Construction 192,580 15,00072 Debt Service 0 075 Other Non-Programmed Costs 258,251 076 Total Expenditures 3,109,175 2,849,62477 Less: Capital Expenditures 232,732 22,00078 Less: Debt Service 0 079 Total Current Expenditures 2,876,443 2,827,62480 Exclusions from Current Expenditures 354,06681 Net Current Expenditures 2,522,378
82 Per Pupil Expenditures 6,248
83 Personnel - Non-Federal Certified Clsrm FTEs 26.8184 Avg Salary - Non-Fed Certified Clsrm FTEs 35,55585 Personnel - Non-Federal Certified FTEs 29.8186 Avg Salary - Non-Fed Certified FTEs 38,72687.1 Legal Balance (funds 1-2-4) 82,55987.2 Categorical Fund Balance 5,94787.3 Deposits with Paying Agents (QZAB) 087.4 Net Legal Bal (Excl Cat & QZAB) 76,61388 Building Fund Balance (fund 3) 089 Capital Outlay Fund Balance (fund 5) 0
Jan 30, 2012 - 269 - 9:35:29 AM

Annual Statistical Report 2010-2011Charter Schools
County: PULASKI LITTLE ROCK PREPARATORY ACADEM LEA:6049700
2010-2011 2011-2012Actual Budget
1 Area in Square Miles 02 ADA 763 ADA pct Change over 5 Yrs. 0%4 4 QTR ADM 765 Prior Year 3QTR ADM 06 Assessment 07 M&O Mills 0.008 URT Mills 0.009 M&O Mills in Excess of URT 0.0010 Dedicated M&O Mills 0.0011 Debt Service Mills 0.0012 Total Mills 0.0013 Total Debt Bond/Non-Bond 0
State and Local Revenue:14 Property Tax Receipts (Including URT) 0 015 Other Local Receipts 296,188 016 Revenue from Intermediate Sources 0 017.1 Foundation Funding (Excl URT) 0 017.2 Tax Collection Rate Guarantee 0 018 Student Growth Funding 0 019 Declining Enrollment Funding 0 020 Consolidation Incentive/Assistance 0 021 Isolated Funding 0 022 Supplemental Millage Incentive Funding 0 023 Other Unrestricted State Funding 478,149 1,658,86024 Total Unrestricted Revenue from State and
Local Sources 774,337 1,658,860
Restricted Revenue from State Sources:25 Adult Education 0 0
Regular Education:26 Professional Development 2,413 11,44327 Other Regular Education 0 290,000
Special Education:28 Gifted & Talented 0 029 Alternative Learning Environment (ALE) 0 030 English Language Learner (ELL) 0 031 National School Lunch Act (NSLA) 45,632 191,26832 Other Special Education 220 033 Workforce Education 0 034 School Food Service 251 035 Educational Service Cooperatives 0 036 Early Childhood Programs 0 037 Magnet School Programs 0 038 Other Non-Instructional Programs 0 039 Total Restricted Revenue from State Sources 48,517 492,71140 Total Restricted Revenue from Federal
Sources 202,655 405,273
Other Sources of Funds:41 Financing Sources (61,131) 042 Balances from Consolidated/Annexed District 0 043 Indirect Cost Reimbursement 0 044 Gains and Losses from Sale of Fixed Assets 0 045 Compensation for Loss of Fixed Assets 0 046 Other 0 047 Total Other Sources of Funds (61,131) 048 Total Revenue and Other Sources of Funds
from All Sources 964,378 2,556,844
2010-2011 2011-2012Actual Budget
CURRENT EXPENDITURESInstruction:
49 Regular Instruction 390,031 1,267,85850 Special Education 6,352 20,80051 Workforce Education 0 052 Adult Education 0 053 Compensatory Education 26,000 054 Other 0 055 Total Instruction 422,382 1,288,658
District Level Support:56 General Administration 50,395 313,03157 Central Services 106,840 67,80058 Maintenance & Operations of Plant 40,083 101,57459 Student Transportation 0 72,90060 Other District Level Support Services 0 061 Total District Support Services 197,318 555,305
School Level Support:62 Student Support Services 0 6,70063 Instructional Staff Support Services 17,903 31,42564 School Administration 0 065 Total District Support Services 17,903 38,125
Non-Instructional Services:66 Food Service Operations 71,424 211,76667 Other Enterprise Operations 0 068 Community Operations 500 069 Other Non-Instructional Services 0 070 Total Non-Instructional Services 71,924 211,76671 Facilities Acquisition and Construction 0 190,00072 Debt Service 55,759 88,27175 Other Non-Programmed Costs 0 076 Total Expenditures 765,286 2,372,12577 Less: Capital Expenditures 5,162 201,00078 Less: Debt Service 55,759 88,27179 Total Current Expenditures 704,365 2,082,85480 Exclusions from Current Expenditures 50081 Net Current Expenditures 703,865
82 Per Pupil Expenditures 9,307
83 Personnel - Non-Federal Certified Clsrm FTEs 5.6784 Avg Salary - Non-Fed Certified Clsrm FTEs 40,25985 Personnel - Non-Federal Certified FTEs 5.6786 Avg Salary - Non-Fed Certified FTEs 40,25987.1 Legal Balance (funds 1-2-4) 351,61787.2 Categorical Fund Balance 74,52787.3 Deposits with Paying Agents (QZAB) 087.4 Net Legal Bal (Excl Cat & QZAB) 277,09088 Building Fund Balance (fund 3) 089 Capital Outlay Fund Balance (fund 5) 0
Jan 30, 2012 - 270 - 9:35:29 AM

Annual Statistical Report 2010-2011Charter Schools
County: PULASKI JACKSONVILLE LIGHTHOUSE CHARTE LEA:6050700
2010-2011 2011-2012Actual Budget
1 Area in Square Miles 02 ADA 3853 ADA pct Change over 5 Yrs. 0%4 4 QTR ADM 3915 Prior Year 3QTR ADM 06 Assessment 07 M&O Mills 0.008 URT Mills 0.009 M&O Mills in Excess of URT 0.0010 Dedicated M&O Mills 0.0011 Debt Service Mills 0.0012 Total Mills 0.0013 Total Debt Bond/Non-Bond 0
State and Local Revenue:14 Property Tax Receipts (Including URT) 0 015 Other Local Receipts 1,098,027 303,85016 Revenue from Intermediate Sources 0 017.1 Foundation Funding (Excl URT) 0 017.2 Tax Collection Rate Guarantee 0 018 Student Growth Funding 0 019 Declining Enrollment Funding 0 020 Consolidation Incentive/Assistance 0 021 Isolated Funding 0 022 Supplemental Millage Incentive Funding 0 023 Other Unrestricted State Funding 2,358,426 3,772,41624 Total Unrestricted Revenue from State and
Local Sources 3,456,453 4,076,266
Restricted Revenue from State Sources:25 Adult Education 0 0
Regular Education:26 Professional Development 14,086 26,02127 Other Regular Education 7,409 0
Special Education:28 Gifted & Talented 0 029 Alternative Learning Environment (ALE) 0 030 English Language Learner (ELL) 0 031 National School Lunch Act (NSLA) 83,824 149,72532 Other Special Education 1,395 033 Workforce Education 0 034 School Food Service 829 035 Educational Service Cooperatives 0 036 Early Childhood Programs 0 037 Magnet School Programs 0 038 Other Non-Instructional Programs 0 039 Total Restricted Revenue from State Sources 107,543 175,74640 Total Restricted Revenue from Federal
Sources 475,784 635,839
Other Sources of Funds:41 Financing Sources 100,000 150,00042 Balances from Consolidated/Annexed District 0 043 Indirect Cost Reimbursement 0 044 Gains and Losses from Sale of Fixed Assets 0 045 Compensation for Loss of Fixed Assets 0 046 Other 0 047 Total Other Sources of Funds 100,000 150,00048 Total Revenue and Other Sources of Funds
from All Sources 4,139,779 5,037,851
2010-2011 2011-2012Actual Budget
CURRENT EXPENDITURESInstruction:
49 Regular Instruction 981,485 1,825,96950 Special Education 75,470 150,03851 Workforce Education 0 052 Adult Education 0 053 Compensatory Education 137,932 159,35054 Other 107,792 48,31455 Total Instruction 1,302,678 2,183,670
District Level Support:56 General Administration 212,190 297,36057 Central Services 64,457 84,78558 Maintenance & Operations of Plant 320,951 787,64859 Student Transportation 6,339 5,50060 Other District Level Support Services 468 061 Total District Support Services 604,406 1,175,294
School Level Support:62 Student Support Services 109,128 130,62063 Instructional Staff Support Services 292,105 164,22764 School Administration 205,434 631,71665 Total District Support Services 606,667 926,563
Non-Instructional Services:66 Food Service Operations 148,939 240,06467 Other Enterprise Operations 26,844 068 Community Operations 0 50069 Other Non-Instructional Services 0 070 Total Non-Instructional Services 175,782 240,56471 Facilities Acquisition and Construction 255,991 997,45872 Debt Service 535,731 290,64575 Other Non-Programmed Costs 0 076 Total Expenditures 3,481,256 5,814,19477 Less: Capital Expenditures 285,040 1,035,45878 Less: Debt Service 535,731 290,64579 Total Current Expenditures 2,660,484 4,488,09180 Exclusions from Current Expenditures 66,75081 Net Current Expenditures 2,593,734
82 Per Pupil Expenditures 6,742
83 Personnel - Non-Federal Certified Clsrm FTEs 15.4984 Avg Salary - Non-Fed Certified Clsrm FTEs 42,77885 Personnel - Non-Federal Certified FTEs 18.8986 Avg Salary - Non-Fed Certified FTEs 46,27387.1 Legal Balance (funds 1-2-4) 83,09887.2 Categorical Fund Balance 12,98787.3 Deposits with Paying Agents (QZAB) 087.4 Net Legal Bal (Excl Cat & QZAB) 70,11188 Building Fund Balance (fund 3) 772,17389 Capital Outlay Fund Balance (fund 5) 0
Jan 30, 2012 - 271 - 9:35:29 AM

Annual Statistical Report 2010-2011Charter Schools
County: PULASKI LR URBAN COLLEGIATE PUBLIC CHA LEA:6051700
2010-2011 2011-2012Actual Budget
1 Area in Square Miles 02 ADA 3023 ADA pct Change over 5 Yrs. 0%4 4 QTR ADM 3025 Prior Year 3QTR ADM 06 Assessment 07 M&O Mills 0.008 URT Mills 0.009 M&O Mills in Excess of URT 0.0010 Dedicated M&O Mills 0.0011 Debt Service Mills 0.0012 Total Mills 0.0013 Total Debt Bond/Non-Bond 0
State and Local Revenue:14 Property Tax Receipts (Including URT) 0 015 Other Local Receipts 72,449 016 Revenue from Intermediate Sources 0 017.1 Foundation Funding (Excl URT) 0 017.2 Tax Collection Rate Guarantee 0 018 Student Growth Funding 0 019 Declining Enrollment Funding 0 020 Consolidation Incentive/Assistance 0 021 Isolated Funding 0 022 Supplemental Millage Incentive Funding 0 023 Other Unrestricted State Funding 1,414,836 024 Total Unrestricted Revenue from State and
Local Sources 1,487,285 0
Restricted Revenue from State Sources:25 Adult Education 0 0
Regular Education:26 Professional Development 8,652 027 Other Regular Education 0 0
Special Education:28 Gifted & Talented 0 029 Alternative Learning Environment (ALE) 0 030 English Language Learner (ELL) 0 031 National School Lunch Act (NSLA) 204,709 032 Other Special Education 0 033 Workforce Education 0 034 School Food Service 0 035 Educational Service Cooperatives 0 036 Early Childhood Programs 0 037 Magnet School Programs 0 038 Other Non-Instructional Programs 0 039 Total Restricted Revenue from State Sources 213,361 040 Total Restricted Revenue from Federal
Sources 402,739 0
Other Sources of Funds:41 Financing Sources 0 042 Balances from Consolidated/Annexed District 0 043 Indirect Cost Reimbursement 0 044 Gains and Losses from Sale of Fixed Assets 0 045 Compensation for Loss of Fixed Assets 0 046 Other 0 047 Total Other Sources of Funds 0 048 Total Revenue and Other Sources of Funds
from All Sources 2,103,384 0
2010-2011 2011-2012Actual Budget
CURRENT EXPENDITURESInstruction:
49 Regular Instruction 1,281,428 050 Special Education 62,125 051 Workforce Education 0 052 Adult Education 0 053 Compensatory Education 57,199 054 Other 0 055 Total Instruction 1,400,752 0
District Level Support:56 General Administration 50,548 057 Central Services 78,962 058 Maintenance & Operations of Plant 487,649 059 Student Transportation 30,923 060 Other District Level Support Services 0 061 Total District Support Services 648,082 0
School Level Support:62 Student Support Services 62,244 063 Instructional Staff Support Services 116,407 064 School Administration 118,438 065 Total District Support Services 297,089 0
Non-Instructional Services:66 Food Service Operations 136,726 067 Other Enterprise Operations 0 068 Community Operations 737 069 Other Non-Instructional Services 0 070 Total Non-Instructional Services 137,463 071 Facilities Acquisition and Construction 0 072 Debt Service 0 075 Other Non-Programmed Costs 0 076 Total Expenditures 2,483,386 077 Less: Capital Expenditures 133,363 078 Less: Debt Service 0 079 Total Current Expenditures 2,350,023 080 Exclusions from Current Expenditures 29,50481 Net Current Expenditures 2,320,519
82 Per Pupil Expenditures 7,681
83 Personnel - Non-Federal Certified Clsrm FTEs 22.0084 Avg Salary - Non-Fed Certified Clsrm FTEs 36,02385 Personnel - Non-Federal Certified FTEs 23.2186 Avg Salary - Non-Fed Certified FTEs 37,50787.1 Legal Balance (funds 1-2-4) 087.2 Categorical Fund Balance 087.3 Deposits with Paying Agents (QZAB) 087.4 Net Legal Bal (Excl Cat & QZAB) 088 Building Fund Balance (fund 3) 089 Capital Outlay Fund Balance (fund 5) 0
The school’s charter was revoked by the Arkansas State Board on March 14, 2011; therefore, there is no budget for the 2011-2012 school year.
Jan 30, 2012 - 272 - 9:35:29 AM
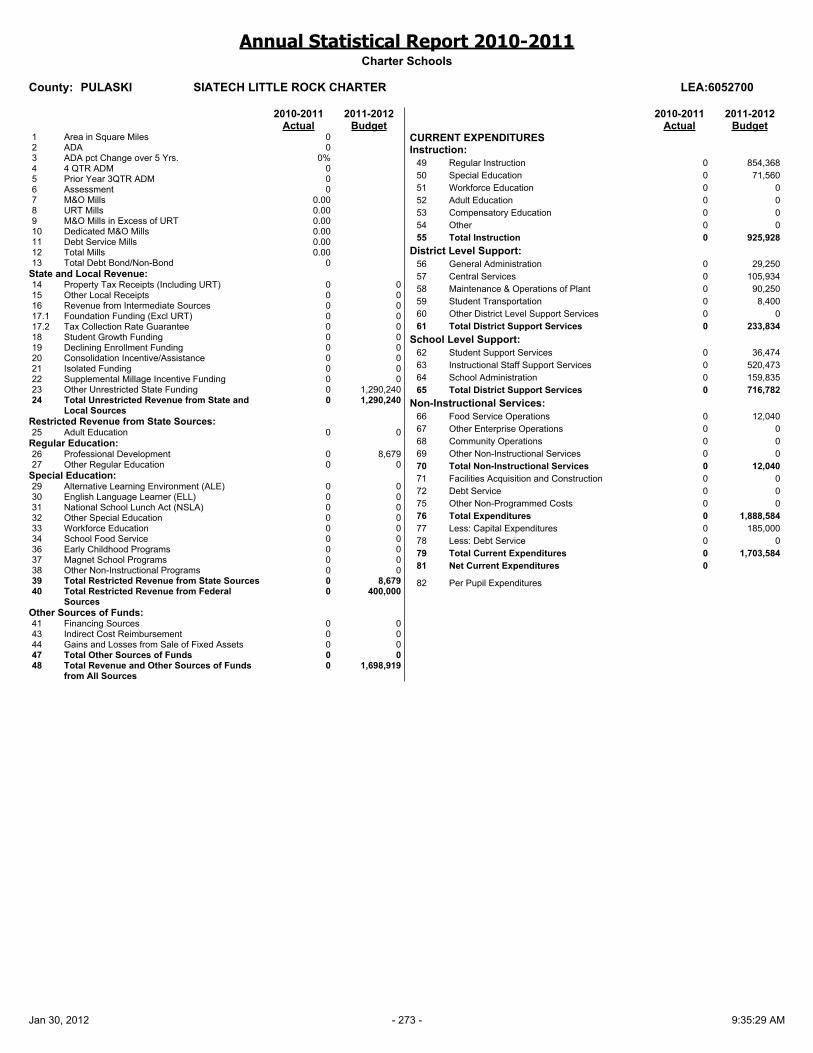
Annual Statistical Report 2010-2011Charter Schools
County: PULASKI SIATECH LITTLE ROCK CHARTER LEA:6052700
2010-2011 2011-2012Actual Budget
1 Area in Square Miles 02 ADA 03 ADA pct Change over 5 Yrs. 0%4 4 QTR ADM 05 Prior Year 3QTR ADM 06 Assessment 07 M&O Mills 0.008 URT Mills 0.009 M&O Mills in Excess of URT 0.0010 Dedicated M&O Mills 0.0011 Debt Service Mills 0.0012 Total Mills 0.0013 Total Debt Bond/Non-Bond 0
State and Local Revenue:14 Property Tax Receipts (Including URT) 0 015 Other Local Receipts 0 016 Revenue from Intermediate Sources 0 017.1 Foundation Funding (Excl URT) 0 017.2 Tax Collection Rate Guarantee 0 018 Student Growth Funding 0 019 Declining Enrollment Funding 0 020 Consolidation Incentive/Assistance 0 021 Isolated Funding 0 022 Supplemental Millage Incentive Funding 0 023 Other Unrestricted State Funding 0 1,290,24024 Total Unrestricted Revenue from State and
Local Sources 0 1,290,240
Restricted Revenue from State Sources:25 Adult Education 0 0
Regular Education:26 Professional Development 0 8,67927 Other Regular Education 0 0
Special Education:29 Alternative Learning Environment (ALE) 0 030 English Language Learner (ELL) 0 031 National School Lunch Act (NSLA) 0 032 Other Special Education 0 033 Workforce Education 0 034 School Food Service 0 036 Early Childhood Programs 0 037 Magnet School Programs 0 038 Other Non-Instructional Programs 0 039 Total Restricted Revenue from State Sources 0 8,67940 Total Restricted Revenue from Federal
Sources 0 400,000
Other Sources of Funds:41 Financing Sources 0 043 Indirect Cost Reimbursement 0 044 Gains and Losses from Sale of Fixed Assets 0 047 Total Other Sources of Funds 0 048 Total Revenue and Other Sources of Funds
from All Sources 0 1,698,919
2010-2011 2011-2012Actual Budget
CURRENT EXPENDITURESInstruction:
49 Regular Instruction 0 854,36850 Special Education 0 71,56051 Workforce Education 0 052 Adult Education 0 053 Compensatory Education 0 054 Other 0 055 Total Instruction 0 925,928
District Level Support:56 General Administration 0 29,25057 Central Services 0 105,93458 Maintenance & Operations of Plant 0 90,25059 Student Transportation 0 8,40060 Other District Level Support Services 0 061 Total District Support Services 0 233,834
School Level Support:62 Student Support Services 0 36,47463 Instructional Staff Support Services 0 520,47364 School Administration 0 159,83565 Total District Support Services 0 716,782
Non-Instructional Services:66 Food Service Operations 0 12,04067 Other Enterprise Operations 0 068 Community Operations 0 069 Other Non-Instructional Services 0 070 Total Non-Instructional Services 0 12,04071 Facilities Acquisition and Construction 0 072 Debt Service 0 075 Other Non-Programmed Costs 0 076 Total Expenditures 0 1,888,58477 Less: Capital Expenditures 0 185,00078 Less: Debt Service 0 079 Total Current Expenditures 0 1,703,58481 Net Current Expenditures 0
82 Per Pupil Expenditures
Jan 30, 2012 - 273 - 9:35:29 AM

Annual Statistical Report 2010-2011Charter Schools
County: WASHINGTON HAAS HALL ACADEMY LEA:7240700
2010-2011 2011-2012Actual Budget
1 Area in Square Miles 02 ADA 2813 ADA pct Change over 5 Yrs. 529%4 4 QTR ADM 2895 Prior Year 3QTR ADM 06 Assessment 07 M&O Mills 0.008 URT Mills 0.009 M&O Mills in Excess of URT 0.0010 Dedicated M&O Mills 0.0011 Debt Service Mills 0.0012 Total Mills 0.0013 Total Debt Bond/Non-Bond 0
State and Local Revenue:14 Property Tax Receipts (Including URT) 0 015 Other Local Receipts 9,817 52,61216 Revenue from Intermediate Sources 0 017.1 Foundation Funding (Excl URT) 0 017.2 Tax Collection Rate Guarantee 0 018 Student Growth Funding 618,291 184,32019 Declining Enrollment Funding 0 020 Consolidation Incentive/Assistance 0 021 Isolated Funding 0 022 Supplemental Millage Incentive Funding 0 023 Other Unrestricted State Funding 1,121,784 1,766,83024 Total Unrestricted Revenue from State and
Local Sources 1,749,892 2,003,762
Restricted Revenue from State Sources:25 Adult Education 0 0
Regular Education:26 Professional Development 7,703 13,47727 Other Regular Education 0 0
Special Education:28 Gifted & Talented 3,475 029 Alternative Learning Environment (ALE) 0 030 English Language Learner (ELL) 0 031 National School Lunch Act (NSLA) 0 032 Other Special Education 0 033 Workforce Education 0 034 School Food Service 0 035 Educational Service Cooperatives 0 036 Early Childhood Programs 0 037 Magnet School Programs 0 038 Other Non-Instructional Programs 0 039 Total Restricted Revenue from State Sources 11,178 13,47740 Total Restricted Revenue from Federal
Sources 37,686 0
Other Sources of Funds:41 Financing Sources 182,033 042 Balances from Consolidated/Annexed District 0 043 Indirect Cost Reimbursement 0 044 Gains and Losses from Sale of Fixed Assets 0 045 Compensation for Loss of Fixed Assets 0 046 Other 0 047 Total Other Sources of Funds 182,033 048 Total Revenue and Other Sources of Funds
from All Sources 1,980,789 2,017,239
2010-2011 2011-2012Actual Budget
CURRENT EXPENDITURESInstruction:
49 Regular Instruction 1,050,886 1,112,91250 Special Education 0 1,20051 Workforce Education 0 052 Adult Education 0 053 Compensatory Education 0 054 Other 0 055 Total Instruction 1,050,886 1,114,112
District Level Support:56 General Administration 126,134 182,94857 Central Services 26,442 151,31558 Maintenance & Operations of Plant 445,876 453,71459 Student Transportation 0 060 Other District Level Support Services 0 061 Total District Support Services 598,452 787,977
School Level Support:62 Student Support Services 32,764 33,45863 Instructional Staff Support Services 17,010 16,33464 School Administration 8,117 065 Total District Support Services 57,892 49,792
Non-Instructional Services:66 Food Service Operations 0 067 Other Enterprise Operations 0 068 Community Operations 0 069 Other Non-Instructional Services 0 070 Total Non-Instructional Services 0 071 Facilities Acquisition and Construction 0 072 Debt Service 173,118 075 Other Non-Programmed Costs 0 076 Total Expenditures 1,880,348 1,951,88177 Less: Capital Expenditures 119,432 96,00078 Less: Debt Service 173,118 079 Total Current Expenditures 1,587,798 1,855,88180 Exclusions from Current Expenditures 1,71781 Net Current Expenditures 1,586,081
82 Per Pupil Expenditures 5,648
83 Personnel - Non-Federal Certified Clsrm FTEs 15.3584 Avg Salary - Non-Fed Certified Clsrm FTEs 43,60185 Personnel - Non-Federal Certified FTEs 15.3586 Avg Salary - Non-Fed Certified FTEs 43,60187.1 Legal Balance (funds 1-2-4) 91,77887.2 Categorical Fund Balance 1,55687.3 Deposits with Paying Agents (QZAB) 087.4 Net Legal Bal (Excl Cat & QZAB) 90,22288 Building Fund Balance (fund 3) 33,00089 Capital Outlay Fund Balance (fund 5) 0
Jan 30, 2012 - 274 - 9:35:29 AM
Appendix
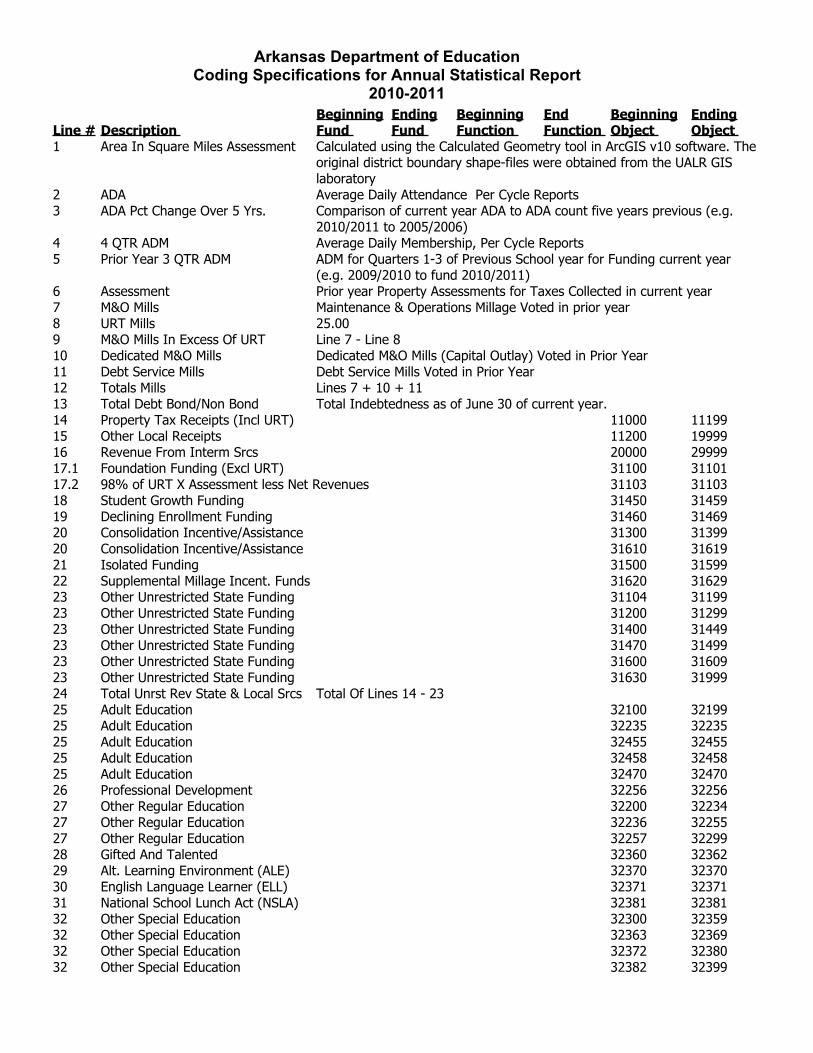
Arkansas Department of Education Coding Specifications for Annual Statistical Report
2010-2011
Line # Description Beginning Fund
Ending Fund
Beginning Function
End Function
Beginning Object
Ending Object
1 Area In Square Miles Assessment Calculated using the Calculated Geometry tool in ArcGIS v10 software. The original district boundary shape-files were obtained from the UALR GIS laboratory
2 ADA Average Daily Attendance Per Cycle Reports3 ADA Pct Change Over 5 Yrs. Comparison of current year ADA to ADA count five years previous (e.g.
2010/2011 to 2005/2006)4 4 QTR ADM Average Daily Membership, Per Cycle Reports5 Prior Year 3 QTR ADM ADM for Quarters 1-3 of Previous School year for Funding current year
(e.g. 2009/2010 to fund 2010/2011)6 Assessment Prior year Property Assessments for Taxes Collected in current year7 M&O Mills Maintenance & Operations Millage Voted in prior year8 URT Mills 25.00 9 M&O Mills In Excess Of URT Line 7 - Line 8 10 Dedicated M&O Mills Dedicated M&O Mills (Capital Outlay) Voted in Prior Year11 Debt Service Mills Debt Service Mills Voted in Prior Year12 Totals Mills Lines 7 + 10 + 11 13 Total Debt Bond/Non Bond Total Indebtedness as of June 30 of current year.14 Property Tax Receipts (Incl URT) 11000 11199 15 Other Local Receipts 11200 19999 16 Revenue From Interm Srcs 20000 29999 17.1 Foundation Funding (Excl URT) 31100 31101 17.2 98% of URT X Assessment less Net Revenues 31103 31103 18 Student Growth Funding 31450 31459 19 Declining Enrollment Funding 31460 31469 20 Consolidation Incentive/Assistance 31300 31399 20 Consolidation Incentive/Assistance 31610 31619 21 Isolated Funding 31500 31599 22 Supplemental Millage Incent. Funds 31620 31629 23 Other Unrestricted State Funding 31104 31199 23 Other Unrestricted State Funding 31200 31299 23 Other Unrestricted State Funding 31400 31449 23 Other Unrestricted State Funding 31470 31499 23 Other Unrestricted State Funding 31600 31609 23 Other Unrestricted State Funding 31630 31999 24 Total Unrst Rev State & Local Srcs Total Of Lines 14 - 23 25 Adult Education 32100 32199 25 Adult Education 32235 3223525 Adult Education 32455 3245525 Adult Education 32458 3245825 Adult Education 32470 3247026 Professional Development 32256 32256 27 Other Regular Education 32200 3223427 Other Regular Education 32236 3225527 Other Regular Education 32257 32299 28 Gifted And Talented 32360 32362 29 Alt. Learning Environment (ALE) 32370 32370 30 English Language Learner (ELL) 32371 32371 31 National School Lunch Act (NSLA) 32381 32381 32 Other Special Education 32300 32359 32 Other Special Education 32363 32369 32 Other Special Education 32372 32380 32 Other Special Education 32382 32399
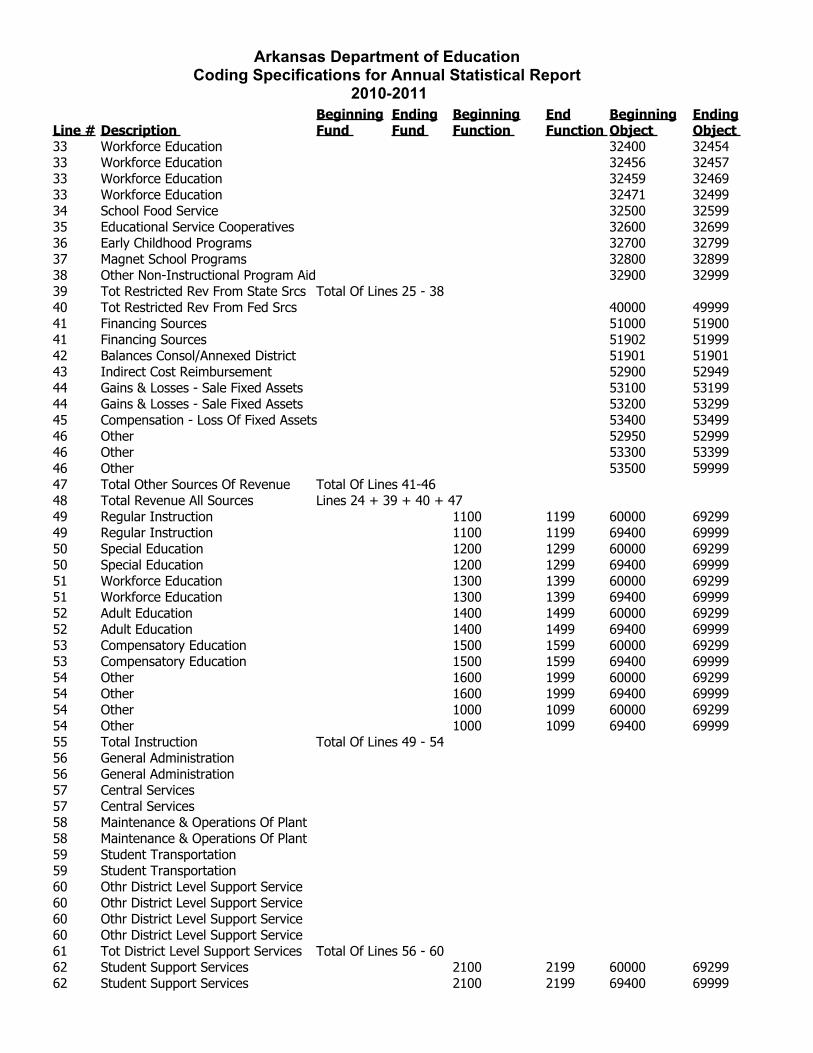
Arkansas Department of Education Coding Specifications for Annual Statistical Report
2010-2011
Line # Description Beginning Fund
Ending Fund
Beginning Function
End Function
Beginning Object
Ending Object
33 Workforce Education 32400 3245433 Workforce Education 32456 3245733 Workforce Education 32459 3246933 Workforce Education 32471 3249934 School Food Service 32500 32599 35 Educational Service Cooperatives 32600 32699 36 Early Childhood Programs 32700 32799 37 Magnet School Programs 32800 32899 38 Other Non-Instructional Program Aid 32900 32999 39 Tot Restricted Rev From State Srcs Total Of Lines 25 - 38 40 Tot Restricted Rev From Fed Srcs 40000 49999 41 Financing Sources 51000 51900 41 Financing Sources 51902 51999 42 Balances Consol/Annexed District 51901 51901 43 Indirect Cost Reimbursement 52900 52949 44 Gains & Losses - Sale Fixed Assets 53100 53199 44 Gains & Losses - Sale Fixed Assets 53200 53299 45 Compensation - Loss Of Fixed Assets 53400 53499 46 Other 52950 52999 46 Other 53300 53399 46 Other 53500 59999 47 Total Other Sources Of Revenue Total Of Lines 41-46 48 Total Revenue All Sources Lines 24 + 39 + 40 + 47 49 Regular Instruction 1100 1199 60000 69299 49 Regular Instruction 1100 1199 69400 69999 50 Special Education 1200 1299 60000 69299 50 Special Education 1200 1299 69400 69999 51 Workforce Education 1300 1399 60000 69299 51 Workforce Education 1300 1399 69400 69999 52 Adult Education 1400 1499 60000 69299 52 Adult Education 1400 1499 69400 69999 53 Compensatory Education 1500 1599 60000 69299 53 Compensatory Education 1500 1599 69400 69999 54 Other 1600 1999 60000 69299 54 Other 1600 1999 69400 69999 54 Other 1000 1099 60000 69299 54 Other 1000 1099 69400 69999 55 Total Instruction Total Of Lines 49 - 54 56 General Administration 56 General Administration 57 Central Services 57 Central Services 58 Maintenance & Operations Of Plant 58 Maintenance & Operations Of Plant 59 Student Transportation 59 Student Transportation 60 Othr District Level Support Service 60 Othr District Level Support Service 60 Othr District Level Support Service 60 Othr District Level Support Service 61 Tot District Level Support Services Total Of Lines 56 - 60 62 Student Support Services 2100 2199 60000 69299 62 Student Support Services 2100 2199 69400 69999
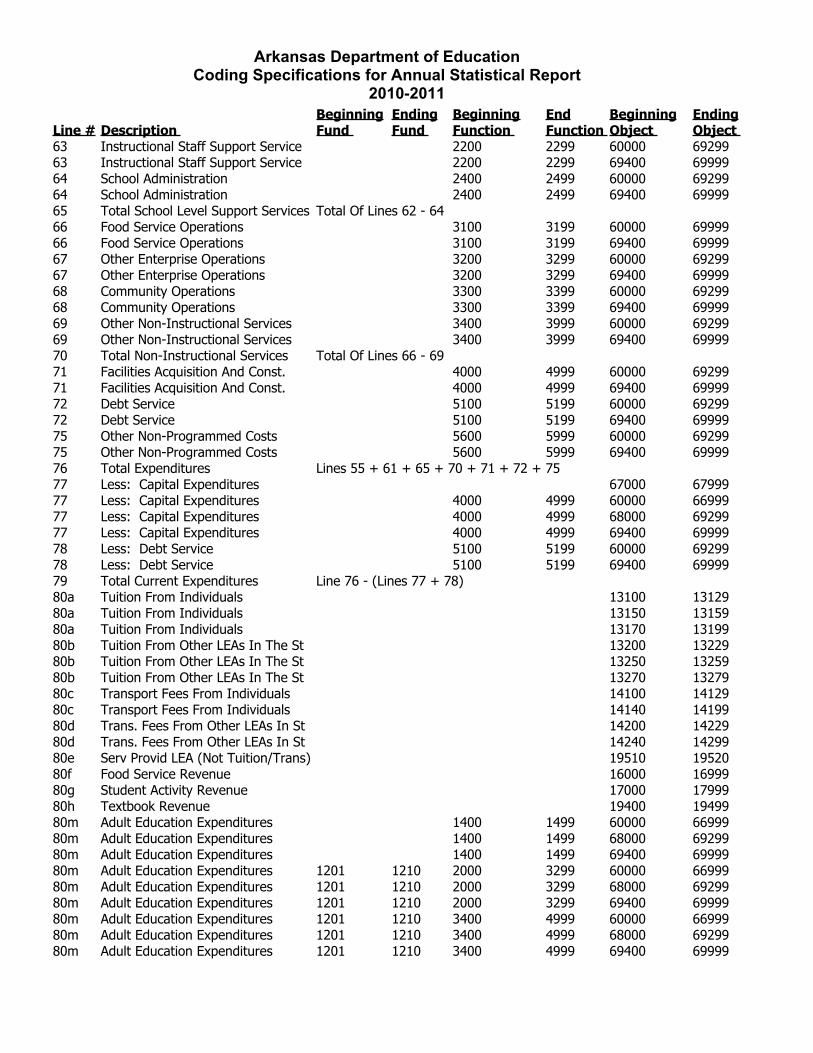
Arkansas Department of Education Coding Specifications for Annual Statistical Report
2010-2011
Line # Description Beginning Fund
Ending Fund
Beginning Function
End Function
Beginning Object
Ending Object
63 Instructional Staff Support Service 2200 2299 60000 69299 63 Instructional Staff Support Service 2200 2299 69400 69999 64 School Administration 2400 2499 60000 69299 64 School Administration 2400 2499 69400 69999 65 Total School Level Support Services Total Of Lines 62 - 64 66 Food Service Operations 3100 3199 60000 69999 66 Food Service Operations 3100 3199 69400 69999 67 Other Enterprise Operations 3200 3299 60000 69299 67 Other Enterprise Operations 3200 3299 69400 69999 68 Community Operations 3300 3399 60000 69299 68 Community Operations 3300 3399 69400 69999 69 Other Non-Instructional Services 3400 3999 60000 69299 69 Other Non-Instructional Services 3400 3999 69400 69999 70 Total Non-Instructional Services Total Of Lines 66 - 69 71 Facilities Acquisition And Const. 4000 4999 60000 69299 71 Facilities Acquisition And Const. 4000 4999 69400 69999 72 Debt Service 5100 5199 60000 69299 72 Debt Service 5100 5199 69400 69999 75 Other Non-Programmed Costs 5600 5999 60000 69299 75 Other Non-Programmed Costs 5600 5999 69400 69999 76 Total Expenditures Lines 55 + 61 + 65 + 70 + 71 + 72 + 7577 Less: Capital Expenditures 67000 6799977 Less: Capital Expenditures 4000 4999 60000 6699977 Less: Capital Expenditures 4000 4999 68000 6929977 Less: Capital Expenditures 4000 4999 69400 6999978 Less: Debt Service 5100 5199 60000 6929978 Less: Debt Service 5100 5199 69400 6999979 Total Current Expenditures Line 76 - (Lines 77 + 78)80a Tuition From Individuals 13100 1312980a Tuition From Individuals 13150 1315980a Tuition From Individuals 13170 1319980b Tuition From Other LEAs In The St 13200 1322980b Tuition From Other LEAs In The St 13250 1325980b Tuition From Other LEAs In The St 13270 1327980c Transport Fees From Individuals 14100 1412980c Transport Fees From Individuals 14140 1419980d Trans. Fees From Other LEAs In St 14200 1422980d Trans. Fees From Other LEAs In St 14240 1429980e Serv Provid LEA (Not Tuition/Trans) 19510 1952080f Food Service Revenue 16000 1699980g Student Activity Revenue 17000 1799980h Textbook Revenue 19400 1949980m Adult Education Expenditures 1400 1499 60000 66999 80m Adult Education Expenditures 1400 1499 68000 69299 80m Adult Education Expenditures 1400 1499 69400 69999 80m Adult Education Expenditures 1201 1210 2000 3299 60000 66999 80m Adult Education Expenditures 1201 1210 2000 3299 68000 69299 80m Adult Education Expenditures 1201 1210 2000 3299 69400 69999 80m Adult Education Expenditures 1201 1210 3400 4999 60000 66999 80m Adult Education Expenditures 1201 1210 3400 4999 68000 69299 80m Adult Education Expenditures 1201 1210 3400 4999 69400 69999
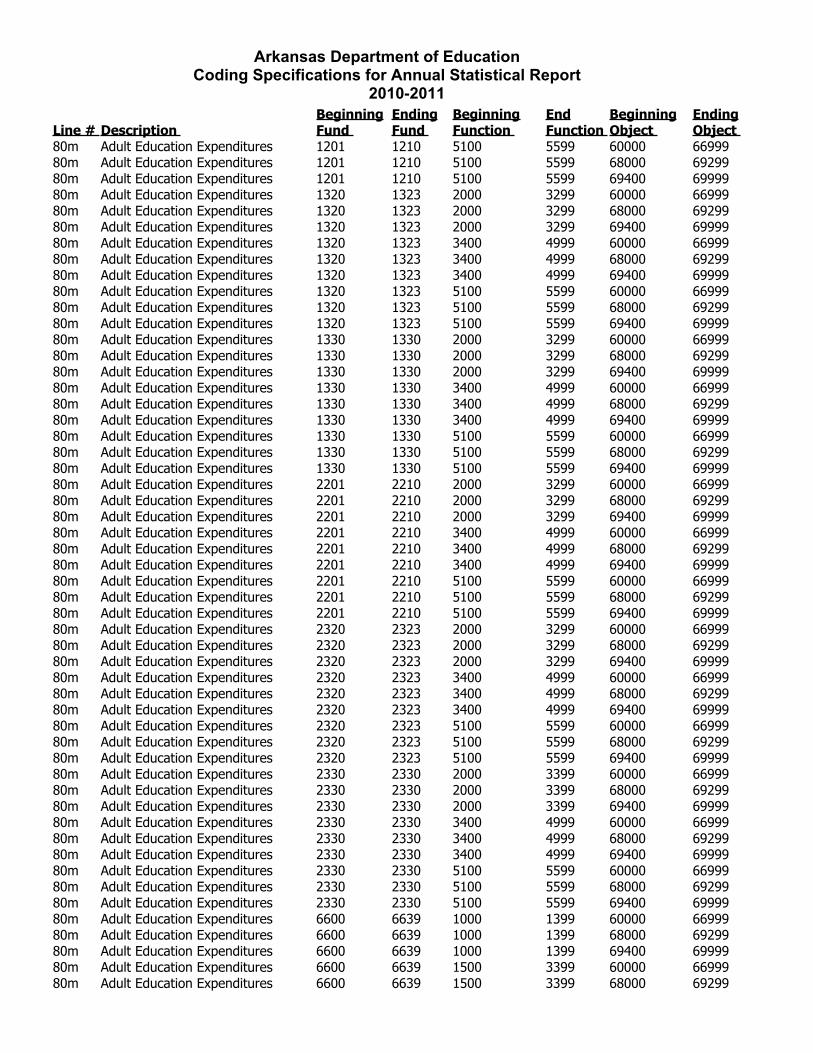
Arkansas Department of Education Coding Specifications for Annual Statistical Report
2010-2011
Line # Description Beginning Fund
Ending Fund
Beginning Function
End Function
Beginning Object
Ending Object
80m Adult Education Expenditures 1201 1210 5100 5599 60000 66999 80m Adult Education Expenditures 1201 1210 5100 5599 68000 69299 80m Adult Education Expenditures 1201 1210 5100 5599 69400 69999 80m Adult Education Expenditures 1320 1323 2000 3299 60000 66999 80m Adult Education Expenditures 1320 1323 2000 3299 68000 69299 80m Adult Education Expenditures 1320 1323 2000 3299 69400 69999 80m Adult Education Expenditures 1320 1323 3400 4999 60000 66999 80m Adult Education Expenditures 1320 1323 3400 4999 68000 69299 80m Adult Education Expenditures 1320 1323 3400 4999 69400 69999 80m Adult Education Expenditures 1320 1323 5100 5599 60000 66999 80m Adult Education Expenditures 1320 1323 5100 5599 68000 69299 80m Adult Education Expenditures 1320 1323 5100 5599 69400 69999 80m Adult Education Expenditures 1330 1330 2000 3299 60000 66999 80m Adult Education Expenditures 1330 1330 2000 3299 68000 69299 80m Adult Education Expenditures 1330 1330 2000 3299 69400 69999 80m Adult Education Expenditures 1330 1330 3400 4999 60000 66999 80m Adult Education Expenditures 1330 1330 3400 4999 68000 69299 80m Adult Education Expenditures 1330 1330 3400 4999 69400 69999 80m Adult Education Expenditures 1330 1330 5100 5599 60000 66999 80m Adult Education Expenditures 1330 1330 5100 5599 68000 69299 80m Adult Education Expenditures 1330 1330 5100 5599 69400 69999 80m Adult Education Expenditures 2201 2210 2000 3299 60000 66999 80m Adult Education Expenditures 2201 2210 2000 3299 68000 69299 80m Adult Education Expenditures 2201 2210 2000 3299 69400 69999 80m Adult Education Expenditures 2201 2210 3400 4999 60000 66999 80m Adult Education Expenditures 2201 2210 3400 4999 68000 69299 80m Adult Education Expenditures 2201 2210 3400 4999 69400 69999 80m Adult Education Expenditures 2201 2210 5100 5599 60000 66999 80m Adult Education Expenditures 2201 2210 5100 5599 68000 69299 80m Adult Education Expenditures 2201 2210 5100 5599 69400 69999 80m Adult Education Expenditures 2320 2323 2000 3299 60000 66999 80m Adult Education Expenditures 2320 2323 2000 3299 68000 69299 80m Adult Education Expenditures 2320 2323 2000 3299 69400 69999 80m Adult Education Expenditures 2320 2323 3400 4999 60000 66999 80m Adult Education Expenditures 2320 2323 3400 4999 68000 69299 80m Adult Education Expenditures 2320 2323 3400 4999 69400 69999 80m Adult Education Expenditures 2320 2323 5100 5599 60000 66999 80m Adult Education Expenditures 2320 2323 5100 5599 68000 69299 80m Adult Education Expenditures 2320 2323 5100 5599 69400 69999 80m Adult Education Expenditures 2330 2330 2000 3399 60000 66999 80m Adult Education Expenditures 2330 2330 2000 3399 68000 69299 80m Adult Education Expenditures 2330 2330 2000 3399 69400 69999 80m Adult Education Expenditures 2330 2330 3400 4999 60000 66999 80m Adult Education Expenditures 2330 2330 3400 4999 68000 69299 80m Adult Education Expenditures 2330 2330 3400 4999 69400 69999 80m Adult Education Expenditures 2330 2330 5100 5599 60000 66999 80m Adult Education Expenditures 2330 2330 5100 5599 68000 69299 80m Adult Education Expenditures 2330 2330 5100 5599 69400 69999 80m Adult Education Expenditures 6600 6639 1000 1399 60000 66999 80m Adult Education Expenditures 6600 6639 1000 1399 68000 69299 80m Adult Education Expenditures 6600 6639 1000 1399 69400 69999 80m Adult Education Expenditures 6600 6639 1500 3399 60000 66999 80m Adult Education Expenditures 6600 6639 1500 3399 68000 69299
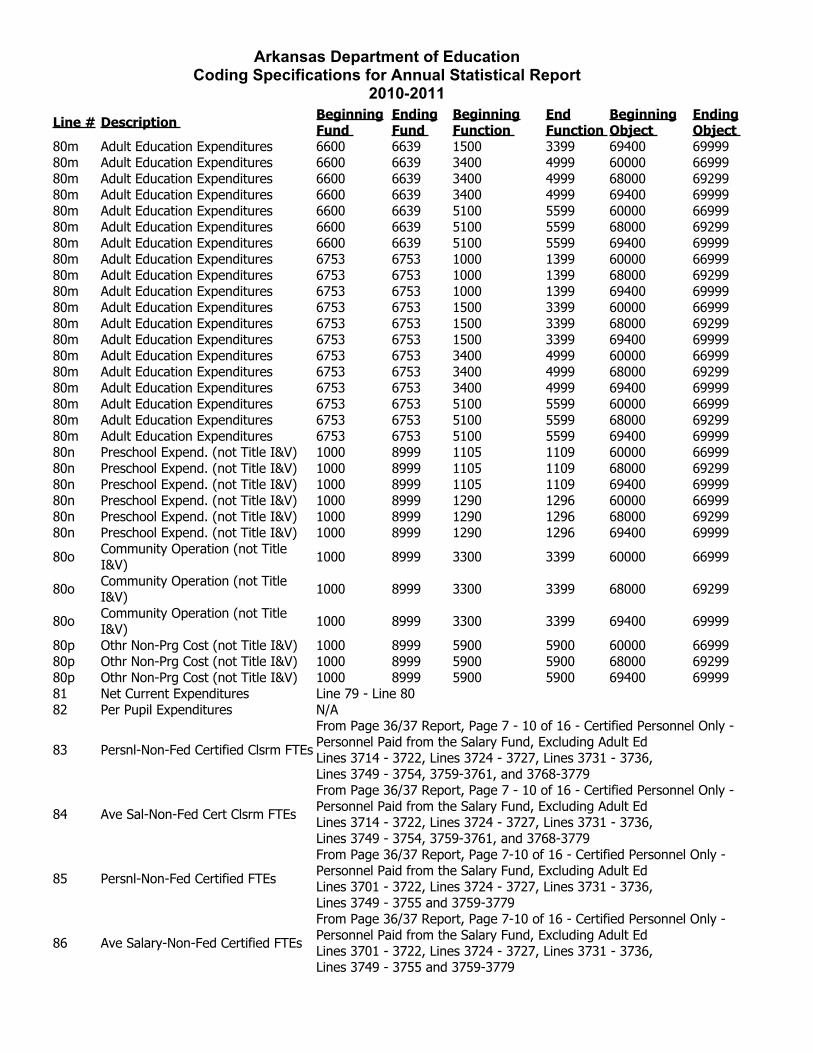
Arkansas Department of Education Coding Specifications for Annual Statistical Report
2010-2011
Line # Description Beginning Fund
Ending Fund
Beginning Function
End Function
Beginning Object
Ending Object
80m Adult Education Expenditures 6600 6639 1500 3399 69400 69999 80m Adult Education Expenditures 6600 6639 3400 4999 60000 66999 80m Adult Education Expenditures 6600 6639 3400 4999 68000 69299 80m Adult Education Expenditures 6600 6639 3400 4999 69400 69999 80m Adult Education Expenditures 6600 6639 5100 5599 60000 66999 80m Adult Education Expenditures 6600 6639 5100 5599 68000 69299 80m Adult Education Expenditures 6600 6639 5100 5599 69400 69999 80m Adult Education Expenditures 6753 6753 1000 1399 60000 66999 80m Adult Education Expenditures 6753 6753 1000 1399 68000 69299 80m Adult Education Expenditures 6753 6753 1000 1399 69400 69999 80m Adult Education Expenditures 6753 6753 1500 3399 60000 66999 80m Adult Education Expenditures 6753 6753 1500 3399 68000 69299 80m Adult Education Expenditures 6753 6753 1500 3399 69400 69999 80m Adult Education Expenditures 6753 6753 3400 4999 60000 66999 80m Adult Education Expenditures 6753 6753 3400 4999 68000 69299 80m Adult Education Expenditures 6753 6753 3400 4999 69400 69999 80m Adult Education Expenditures 6753 6753 5100 5599 60000 66999 80m Adult Education Expenditures 6753 6753 5100 5599 68000 69299 80m Adult Education Expenditures 6753 6753 5100 5599 69400 69999 80n Preschool Expend. (not Title I&V) 1000 8999 1105 1109 60000 66999 80n Preschool Expend. (not Title I&V) 1000 8999 1105 1109 68000 69299 80n Preschool Expend. (not Title I&V) 1000 8999 1105 1109 69400 69999 80n Preschool Expend. (not Title I&V) 1000 8999 1290 1296 60000 66999 80n Preschool Expend. (not Title I&V) 1000 8999 1290 1296 68000 69299 80n Preschool Expend. (not Title I&V) 1000 8999 1290 1296 69400 69999
80o Community Operation (not Title I&V) 1000 8999 3300 3399 60000 66999
80o Community Operation (not Title I&V) 1000 8999 3300 3399 68000 69299
80o Community Operation (not Title I&V) 1000 8999 3300 3399 69400 69999
80p Othr Non-Prg Cost (not Title I&V) 1000 8999 5900 5900 60000 66999 80p Othr Non-Prg Cost (not Title I&V) 1000 8999 5900 5900 68000 69299 80p Othr Non-Prg Cost (not Title I&V) 1000 8999 5900 5900 69400 69999 81 Net Current Expenditures Line 79 - Line 80 82 Per Pupil Expenditures N/A
83 Persnl-Non-Fed Certified Clsrm FTEs
From Page 36/37 Report, Page 7 - 10 of 16 - Certified Personnel Only - Personnel Paid from the Salary Fund, Excluding Adult EdLines 3714 - 3722, Lines 3724 - 3727, Lines 3731 - 3736,Lines 3749 - 3754, 3759-3761, and 3768-3779
84 Ave Sal-Non-Fed Cert Clsrm FTEs
From Page 36/37 Report, Page 7 - 10 of 16 - Certified Personnel Only - Personnel Paid from the Salary Fund, Excluding Adult EdLines 3714 - 3722, Lines 3724 - 3727, Lines 3731 - 3736,Lines 3749 - 3754, 3759-3761, and 3768-3779
85 Persnl-Non-Fed Certified FTEs
From Page 36/37 Report, Page 7-10 of 16 - Certified Personnel Only - Personnel Paid from the Salary Fund, Excluding Adult EdLines 3701 - 3722, Lines 3724 - 3727, Lines 3731 - 3736,Lines 3749 - 3755 and 3759-3779
86 Ave Salary-Non-Fed Certified FTEs
From Page 36/37 Report, Page 7-10 of 16 - Certified Personnel Only - Personnel Paid from the Salary Fund, Excluding Adult EdLines 3701 - 3722, Lines 3724 - 3727, Lines 3731 - 3736,Lines 3749 - 3755 and 3759-3779
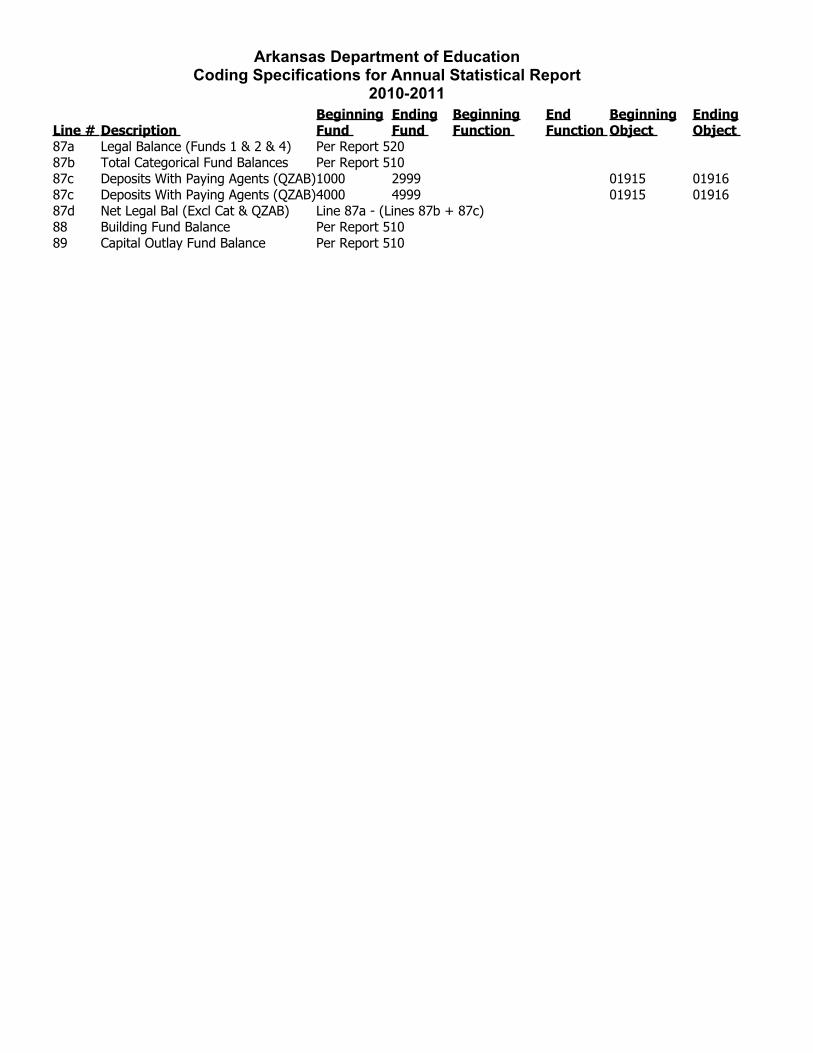
Arkansas Department of Education Coding Specifications for Annual Statistical Report
2010-2011
Line # Description Beginning Fund
Ending Fund
Beginning Function
End Function
Beginning Object
Ending Object
87a Legal Balance (Funds 1 & 2 & 4) Per Report 52087b Total Categorical Fund Balances Per Report 51087c Deposits With Paying Agents (QZAB) 1000 2999 01915 0191687c Deposits With Paying Agents (QZAB) 4000 4999 01915 0191687d Net Legal Bal (Excl Cat & QZAB) Line 87a - (Lines 87b + 87c)88 Building Fund Balance Per Report 51089 Capital Outlay Fund Balance Per Report 510
Rankings of Selected Itemsof the
Public Schools of ArkansasArkansas Department of
Education2010-2011 Actual

Annual Fiscal Report AnalysisLEA Order 2010-2011 Actual
LEA County District Rank Per Pupil Expend
(1)
ADA (2)
ADM (3)
K12 Cert FTE
(4)
Avg Salary K12 Cert (5)
Certified FTE (6)
Avg Salary Cert FTE (7)
0101000 ARKANSAS DEWITT SCHOOL DISTRICT
1 8,967 1,291 1,327 101 44,451 112 46,882
0104000 ARKANSAS STUTTGART SCHOOL DISTRICT
2 8,400 1,673 1,786 120 42,468 134 45,739
0201000 ASHLEY CROSSETT SCHOOL DISTRICT
3 9,952 1,766 1,866 104 54,728 114 57,199
0203000 ASHLEY HAMBURG SCHOOL DISTRICT
4 9,588 1,803 1,887 145 40,472 162 42,531
0302000 BAXTER COTTER SCHOOL DISTRICT
5 8,709 628 661 52 39,891 55 42,344
0303000 BAXTER MOUNTAIN HOME SCHOOL DISTRICT
6 8,357 3,762 3,977 264 45,044 284 47,040
0304000 BAXTER NORFORK SCHOOL DISTRICT
7 9,834 439 465 38 41,986 42 44,874
0401000 BENTON BENTONVILLE SCHOOL DISTRICT
8 8,427 12,793 13,536 894 53,594 944 55,499
0402000 BENTON DECATUR SCHOOL DISTRICT
9 9,682 472 486 39 38,746 43 40,900
0403000 BENTON GENTRY SCHOOL DISTRICT
10 8,802 1,344 1,418 104 46,280 113 48,856
0404000 BENTON GRAVETTE SCHOOL DISTRICT
11 8,170 1,675 1,762 95 53,718 105 54,392
0405000 BENTON ROGERS SCHOOL DISTRICT
12 8,279 13,236 13,861 879 55,836 951 58,049
0406000 BENTON SILOAM SPRINGS SCHOOL DISTRICT
13 8,496 3,600 3,835 249 46,553 274 49,203
0407000 BENTON PEA RIDGE SCHOOL DISTRICT
14 7,507 1,555 1,639 100 46,299 105 48,050
0501000 BOONE ALPENA SCHOOL DISTRICT
15 8,893 518 554 56 33,649 59 35,755
0502000 BOONE BERGMAN SCHOOL DISTRICT
16 7,982 1,006 1,067 82 41,027 87 42,539
0503000 BOONE HARRISON SCHOOL DISTRICT
17 8,853 2,580 2,743 187 48,255 206 50,980
0504000 BOONE OMAHA SCHOOL DISTRICT
18 9,612 393 417 35 39,487 39 41,099
0505000 BOONE VALLEY SPRINGS SCHOOL DISTRICT
19 7,979 909 948 74 41,292 80 44,503
0506000 BOONE LEAD HILL SCHOOL DISTRICT
20 10,548 336 358 32 40,910 35 43,162
0601000 BRADLEY HERMITAGE SCHOOL DISTRICT
21 11,843 448 470 33 42,039 37 44,408
0602000 BRADLEY WARREN SCHOOL DISTRICT
22 9,716 1,454 1,518 117 41,518 133 44,114
0701000 CALHOUN HAMPTON SCHOOL DISTRICT
23 10,384 523 554 40 37,546 51 39,155
0801000 CARROLL BERRYVILLE SCHOOL DISTRICT
24 9,498 1,746 1,856 141 39,784 150 41,566
0802000 CARROLL EUREKA SPRINGS SCHOOL DISTRICT
25 11,437 607 643 45 47,535 49 50,716
0803000 CARROLL GREEN FOREST SCHOOL DISTRICT
26 8,468 1,155 1,220 83 39,718 91 41,790
0901000 CHICOT DERMOTT SCHOOL 27 13,555 412 424 27 41,504 35 45,202
283
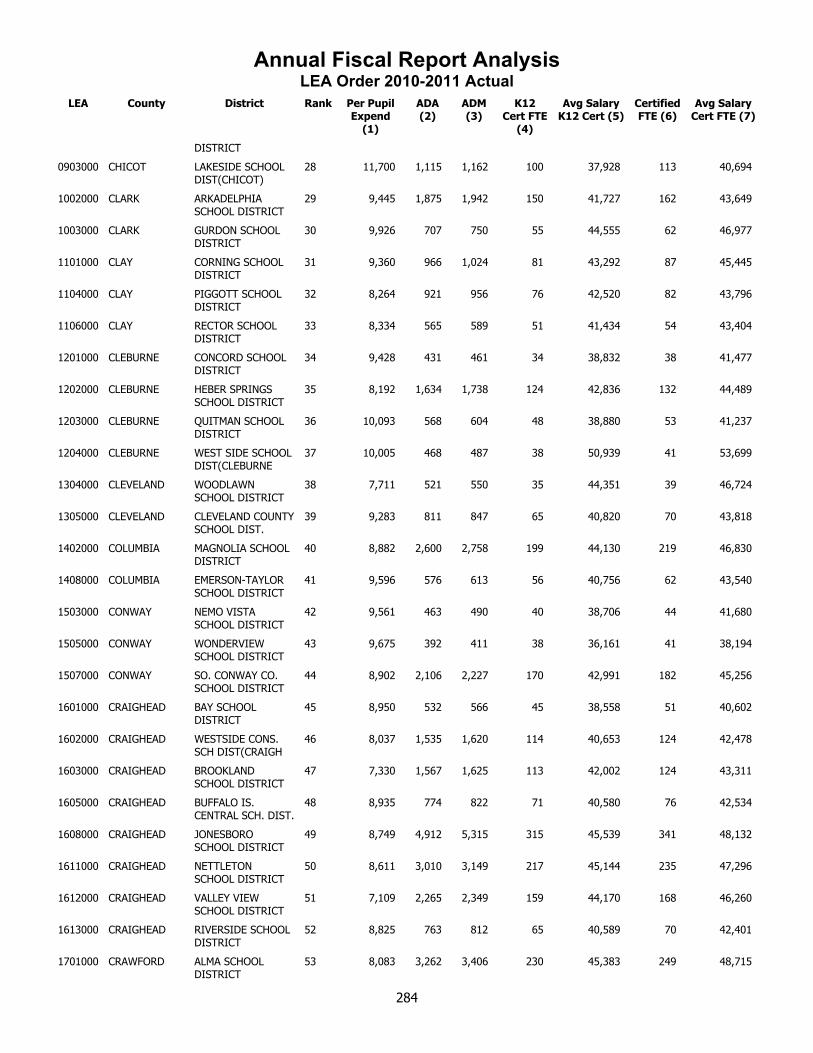
Annual Fiscal Report AnalysisLEA Order 2010-2011 Actual
LEA County District Rank Per Pupil Expend
(1)
ADA (2)
ADM (3)
K12 Cert FTE
(4)
Avg Salary K12 Cert (5)
Certified FTE (6)
Avg Salary Cert FTE (7)
DISTRICT
0903000 CHICOT LAKESIDE SCHOOL DIST(CHICOT)
28 11,700 1,115 1,162 100 37,928 113 40,694
1002000 CLARK ARKADELPHIA SCHOOL DISTRICT
29 9,445 1,875 1,942 150 41,727 162 43,649
1003000 CLARK GURDON SCHOOL DISTRICT
30 9,926 707 750 55 44,555 62 46,977
1101000 CLAY CORNING SCHOOL DISTRICT
31 9,360 966 1,024 81 43,292 87 45,445
1104000 CLAY PIGGOTT SCHOOL DISTRICT
32 8,264 921 956 76 42,520 82 43,796
1106000 CLAY RECTOR SCHOOL DISTRICT
33 8,334 565 589 51 41,434 54 43,404
1201000 CLEBURNE CONCORD SCHOOL DISTRICT
34 9,428 431 461 34 38,832 38 41,477
1202000 CLEBURNE HEBER SPRINGS SCHOOL DISTRICT
35 8,192 1,634 1,738 124 42,836 132 44,489
1203000 CLEBURNE QUITMAN SCHOOL DISTRICT
36 10,093 568 604 48 38,880 53 41,237
1204000 CLEBURNE WEST SIDE SCHOOL DIST(CLEBURNE
37 10,005 468 487 38 50,939 41 53,699
1304000 CLEVELAND WOODLAWN SCHOOL DISTRICT
38 7,711 521 550 35 44,351 39 46,724
1305000 CLEVELAND CLEVELAND COUNTY SCHOOL DIST.
39 9,283 811 847 65 40,820 70 43,818
1402000 COLUMBIA MAGNOLIA SCHOOL DISTRICT
40 8,882 2,600 2,758 199 44,130 219 46,830
1408000 COLUMBIA EMERSON-TAYLOR SCHOOL DISTRICT
41 9,596 576 613 56 40,756 62 43,540
1503000 CONWAY NEMO VISTA SCHOOL DISTRICT
42 9,561 463 490 40 38,706 44 41,680
1505000 CONWAY WONDERVIEW SCHOOL DISTRICT
43 9,675 392 411 38 36,161 41 38,194
1507000 CONWAY SO. CONWAY CO. SCHOOL DISTRICT
44 8,902 2,106 2,227 170 42,991 182 45,256
1601000 CRAIGHEAD BAY SCHOOL DISTRICT
45 8,950 532 566 45 38,558 51 40,602
1602000 CRAIGHEAD WESTSIDE CONS. SCH DIST(CRAIGH
46 8,037 1,535 1,620 114 40,653 124 42,478
1603000 CRAIGHEAD BROOKLAND SCHOOL DISTRICT
47 7,330 1,567 1,625 113 42,002 124 43,311
1605000 CRAIGHEAD BUFFALO IS. CENTRAL SCH. DIST.
48 8,935 774 822 71 40,580 76 42,534
1608000 CRAIGHEAD JONESBORO SCHOOL DISTRICT
49 8,749 4,912 5,315 315 45,539 341 48,132
1611000 CRAIGHEAD NETTLETON SCHOOL DISTRICT
50 8,611 3,010 3,149 217 45,144 235 47,296
1612000 CRAIGHEAD VALLEY VIEW SCHOOL DISTRICT
51 7,109 2,265 2,349 159 44,170 168 46,260
1613000 CRAIGHEAD RIVERSIDE SCHOOL DISTRICT
52 8,825 763 812 65 40,589 70 42,401
1701000 CRAWFORD ALMA SCHOOL DISTRICT
53 8,083 3,262 3,406 230 45,383 249 48,715
284
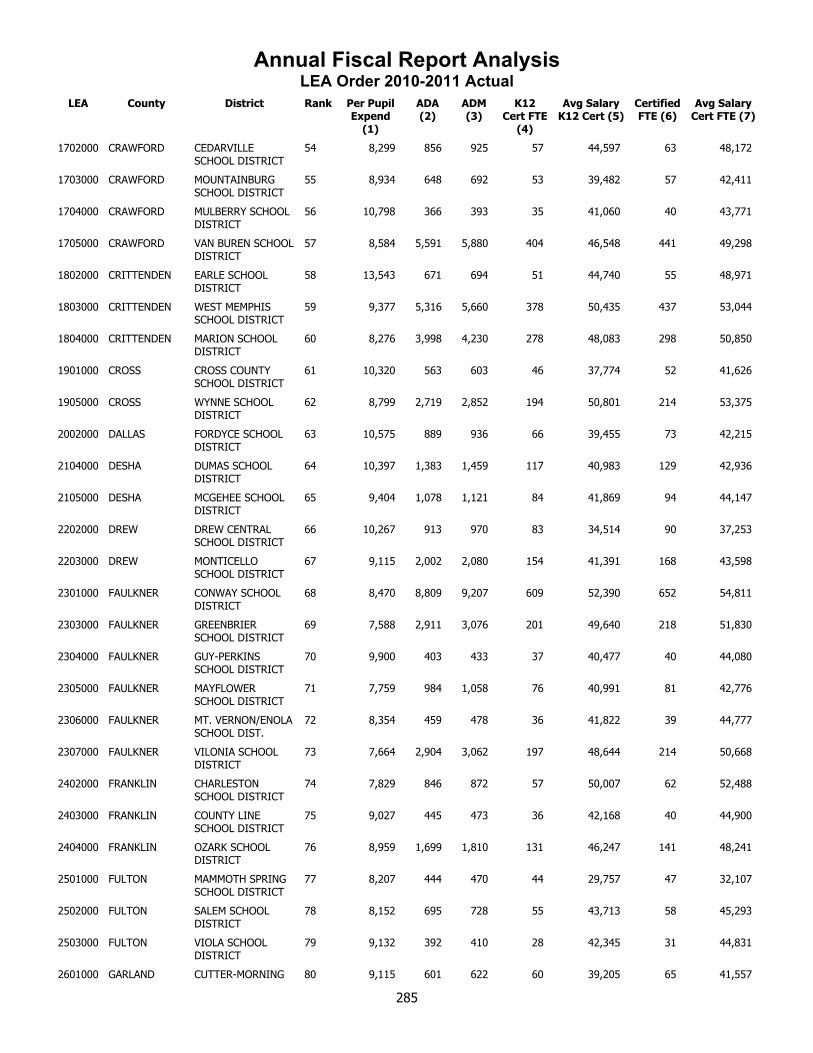
Annual Fiscal Report AnalysisLEA Order 2010-2011 Actual
LEA County District Rank Per Pupil Expend
(1)
ADA (2)
ADM (3)
K12 Cert FTE
(4)
Avg Salary K12 Cert (5)
Certified FTE (6)
Avg Salary Cert FTE (7)
1702000 CRAWFORD CEDARVILLE SCHOOL DISTRICT
54 8,299 856 925 57 44,597 63 48,172
1703000 CRAWFORD MOUNTAINBURG SCHOOL DISTRICT
55 8,934 648 692 53 39,482 57 42,411
1704000 CRAWFORD MULBERRY SCHOOL DISTRICT
56 10,798 366 393 35 41,060 40 43,771
1705000 CRAWFORD VAN BUREN SCHOOL DISTRICT
57 8,584 5,591 5,880 404 46,548 441 49,298
1802000 CRITTENDEN EARLE SCHOOL DISTRICT
58 13,543 671 694 51 44,740 55 48,971
1803000 CRITTENDEN WEST MEMPHIS SCHOOL DISTRICT
59 9,377 5,316 5,660 378 50,435 437 53,044
1804000 CRITTENDEN MARION SCHOOL DISTRICT
60 8,276 3,998 4,230 278 48,083 298 50,850
1901000 CROSS CROSS COUNTY SCHOOL DISTRICT
61 10,320 563 603 46 37,774 52 41,626
1905000 CROSS WYNNE SCHOOL DISTRICT
62 8,799 2,719 2,852 194 50,801 214 53,375
2002000 DALLAS FORDYCE SCHOOL DISTRICT
63 10,575 889 936 66 39,455 73 42,215
2104000 DESHA DUMAS SCHOOL DISTRICT
64 10,397 1,383 1,459 117 40,983 129 42,936
2105000 DESHA MCGEHEE SCHOOL DISTRICT
65 9,404 1,078 1,121 84 41,869 94 44,147
2202000 DREW DREW CENTRAL SCHOOL DISTRICT
66 10,267 913 970 83 34,514 90 37,253
2203000 DREW MONTICELLO SCHOOL DISTRICT
67 9,115 2,002 2,080 154 41,391 168 43,598
2301000 FAULKNER CONWAY SCHOOL DISTRICT
68 8,470 8,809 9,207 609 52,390 652 54,811
2303000 FAULKNER GREENBRIER SCHOOL DISTRICT
69 7,588 2,911 3,076 201 49,640 218 51,830
2304000 FAULKNER GUY-PERKINS SCHOOL DISTRICT
70 9,900 403 433 37 40,477 40 44,080
2305000 FAULKNER MAYFLOWER SCHOOL DISTRICT
71 7,759 984 1,058 76 40,991 81 42,776
2306000 FAULKNER MT. VERNON/ENOLA SCHOOL DIST.
72 8,354 459 478 36 41,822 39 44,777
2307000 FAULKNER VILONIA SCHOOL DISTRICT
73 7,664 2,904 3,062 197 48,644 214 50,668
2402000 FRANKLIN CHARLESTON SCHOOL DISTRICT
74 7,829 846 872 57 50,007 62 52,488
2403000 FRANKLIN COUNTY LINE SCHOOL DISTRICT
75 9,027 445 473 36 42,168 40 44,900
2404000 FRANKLIN OZARK SCHOOL DISTRICT
76 8,959 1,699 1,810 131 46,247 141 48,241
2501000 FULTON MAMMOTH SPRING SCHOOL DISTRICT
77 8,207 444 470 44 29,757 47 32,107
2502000 FULTON SALEM SCHOOL DISTRICT
78 8,152 695 728 55 43,713 58 45,293
2503000 FULTON VIOLA SCHOOL DISTRICT
79 9,132 392 410 28 42,345 31 44,831
2601000 GARLAND CUTTER-MORNING 80 9,115 601 622 60 39,205 65 41,557
285
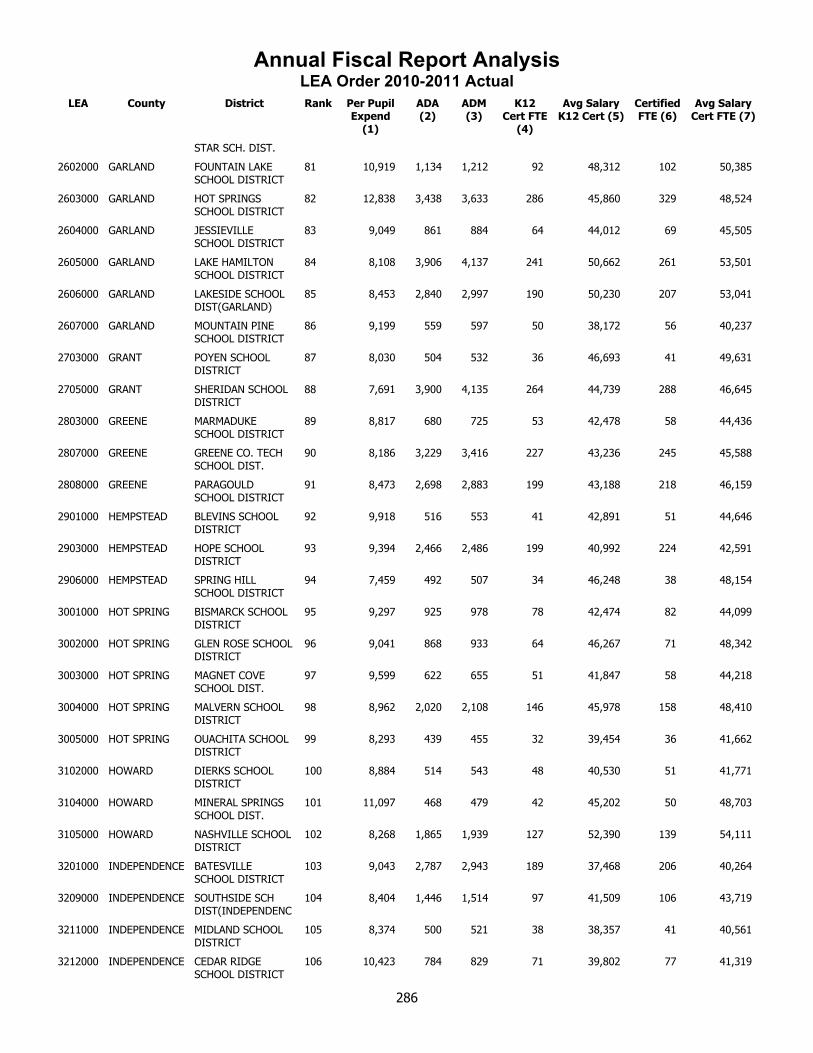
Annual Fiscal Report AnalysisLEA Order 2010-2011 Actual
LEA County District Rank Per Pupil Expend
(1)
ADA (2)
ADM (3)
K12 Cert FTE
(4)
Avg Salary K12 Cert (5)
Certified FTE (6)
Avg Salary Cert FTE (7)
STAR SCH. DIST.
2602000 GARLAND FOUNTAIN LAKE SCHOOL DISTRICT
81 10,919 1,134 1,212 92 48,312 102 50,385
2603000 GARLAND HOT SPRINGS SCHOOL DISTRICT
82 12,838 3,438 3,633 286 45,860 329 48,524
2604000 GARLAND JESSIEVILLE SCHOOL DISTRICT
83 9,049 861 884 64 44,012 69 45,505
2605000 GARLAND LAKE HAMILTON SCHOOL DISTRICT
84 8,108 3,906 4,137 241 50,662 261 53,501
2606000 GARLAND LAKESIDE SCHOOL DIST(GARLAND)
85 8,453 2,840 2,997 190 50,230 207 53,041
2607000 GARLAND MOUNTAIN PINE SCHOOL DISTRICT
86 9,199 559 597 50 38,172 56 40,237
2703000 GRANT POYEN SCHOOL DISTRICT
87 8,030 504 532 36 46,693 41 49,631
2705000 GRANT SHERIDAN SCHOOL DISTRICT
88 7,691 3,900 4,135 264 44,739 288 46,645
2803000 GREENE MARMADUKE SCHOOL DISTRICT
89 8,817 680 725 53 42,478 58 44,436
2807000 GREENE GREENE CO. TECH SCHOOL DIST.
90 8,186 3,229 3,416 227 43,236 245 45,588
2808000 GREENE PARAGOULD SCHOOL DISTRICT
91 8,473 2,698 2,883 199 43,188 218 46,159
2901000 HEMPSTEAD BLEVINS SCHOOL DISTRICT
92 9,918 516 553 41 42,891 51 44,646
2903000 HEMPSTEAD HOPE SCHOOL DISTRICT
93 9,394 2,466 2,486 199 40,992 224 42,591
2906000 HEMPSTEAD SPRING HILL SCHOOL DISTRICT
94 7,459 492 507 34 46,248 38 48,154
3001000 HOT SPRING BISMARCK SCHOOL DISTRICT
95 9,297 925 978 78 42,474 82 44,099
3002000 HOT SPRING GLEN ROSE SCHOOL DISTRICT
96 9,041 868 933 64 46,267 71 48,342
3003000 HOT SPRING MAGNET COVE SCHOOL DIST.
97 9,599 622 655 51 41,847 58 44,218
3004000 HOT SPRING MALVERN SCHOOL DISTRICT
98 8,962 2,020 2,108 146 45,978 158 48,410
3005000 HOT SPRING OUACHITA SCHOOL DISTRICT
99 8,293 439 455 32 39,454 36 41,662
3102000 HOWARD DIERKS SCHOOL DISTRICT
100 8,884 514 543 48 40,530 51 41,771
3104000 HOWARD MINERAL SPRINGS SCHOOL DIST.
101 11,097 468 479 42 45,202 50 48,703
3105000 HOWARD NASHVILLE SCHOOL DISTRICT
102 8,268 1,865 1,939 127 52,390 139 54,111
3201000 INDEPENDENCE BATESVILLE SCHOOL DISTRICT
103 9,043 2,787 2,943 189 37,468 206 40,264
3209000 INDEPENDENCE SOUTHSIDE SCH DIST(INDEPENDENC
104 8,404 1,446 1,514 97 41,509 106 43,719
3211000 INDEPENDENCE MIDLAND SCHOOL DISTRICT
105 8,374 500 521 38 38,357 41 40,561
3212000 INDEPENDENCE CEDAR RIDGE SCHOOL DISTRICT
106 10,423 784 829 71 39,802 77 41,319
286
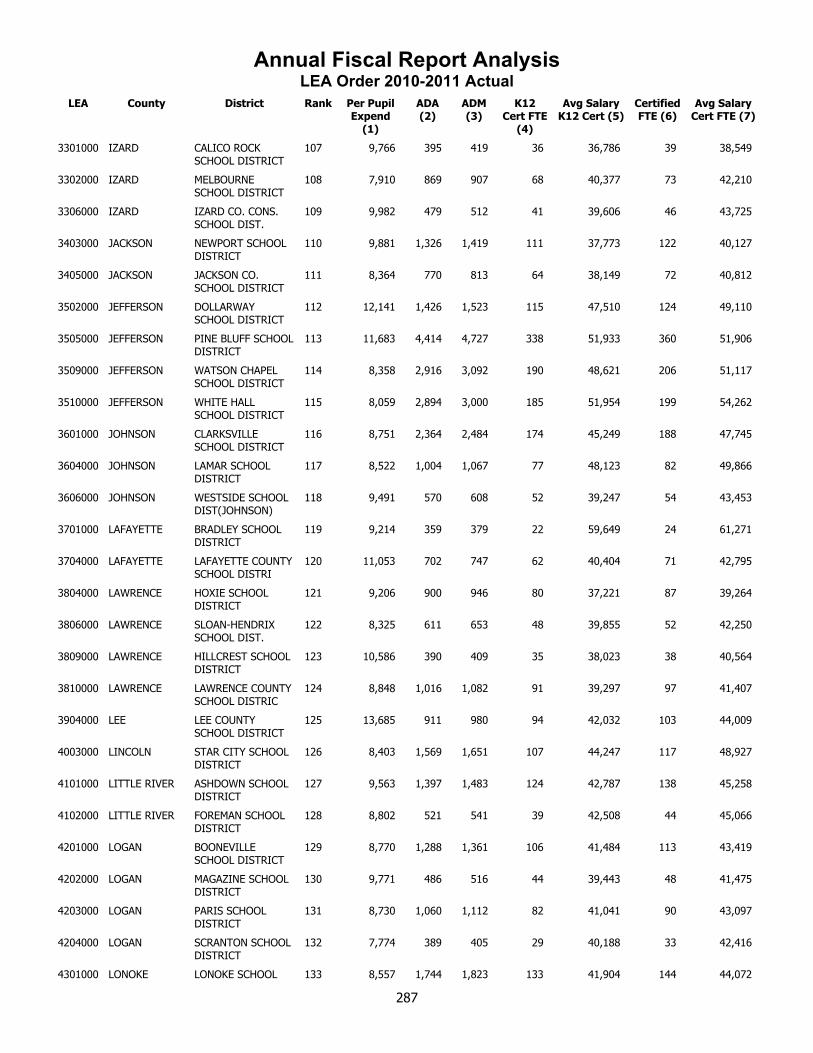
Annual Fiscal Report AnalysisLEA Order 2010-2011 Actual
LEA County District Rank Per Pupil Expend
(1)
ADA (2)
ADM (3)
K12 Cert FTE
(4)
Avg Salary K12 Cert (5)
Certified FTE (6)
Avg Salary Cert FTE (7)
3301000 IZARD CALICO ROCK SCHOOL DISTRICT
107 9,766 395 419 36 36,786 39 38,549
3302000 IZARD MELBOURNE SCHOOL DISTRICT
108 7,910 869 907 68 40,377 73 42,210
3306000 IZARD IZARD CO. CONS. SCHOOL DIST.
109 9,982 479 512 41 39,606 46 43,725
3403000 JACKSON NEWPORT SCHOOL DISTRICT
110 9,881 1,326 1,419 111 37,773 122 40,127
3405000 JACKSON JACKSON CO. SCHOOL DISTRICT
111 8,364 770 813 64 38,149 72 40,812
3502000 JEFFERSON DOLLARWAY SCHOOL DISTRICT
112 12,141 1,426 1,523 115 47,510 124 49,110
3505000 JEFFERSON PINE BLUFF SCHOOL DISTRICT
113 11,683 4,414 4,727 338 51,933 360 51,906
3509000 JEFFERSON WATSON CHAPEL SCHOOL DISTRICT
114 8,358 2,916 3,092 190 48,621 206 51,117
3510000 JEFFERSON WHITE HALL SCHOOL DISTRICT
115 8,059 2,894 3,000 185 51,954 199 54,262
3601000 JOHNSON CLARKSVILLE SCHOOL DISTRICT
116 8,751 2,364 2,484 174 45,249 188 47,745
3604000 JOHNSON LAMAR SCHOOL DISTRICT
117 8,522 1,004 1,067 77 48,123 82 49,866
3606000 JOHNSON WESTSIDE SCHOOL DIST(JOHNSON)
118 9,491 570 608 52 39,247 54 43,453
3701000 LAFAYETTE BRADLEY SCHOOL DISTRICT
119 9,214 359 379 22 59,649 24 61,271
3704000 LAFAYETTE LAFAYETTE COUNTY SCHOOL DISTRI
120 11,053 702 747 62 40,404 71 42,795
3804000 LAWRENCE HOXIE SCHOOL DISTRICT
121 9,206 900 946 80 37,221 87 39,264
3806000 LAWRENCE SLOAN-HENDRIX SCHOOL DIST.
122 8,325 611 653 48 39,855 52 42,250
3809000 LAWRENCE HILLCREST SCHOOL DISTRICT
123 10,586 390 409 35 38,023 38 40,564
3810000 LAWRENCE LAWRENCE COUNTY SCHOOL DISTRIC
124 8,848 1,016 1,082 91 39,297 97 41,407
3904000 LEE LEE COUNTY SCHOOL DISTRICT
125 13,685 911 980 94 42,032 103 44,009
4003000 LINCOLN STAR CITY SCHOOL DISTRICT
126 8,403 1,569 1,651 107 44,247 117 48,927
4101000 LITTLE RIVER ASHDOWN SCHOOL DISTRICT
127 9,563 1,397 1,483 124 42,787 138 45,258
4102000 LITTLE RIVER FOREMAN SCHOOL DISTRICT
128 8,802 521 541 39 42,508 44 45,066
4201000 LOGAN BOONEVILLE SCHOOL DISTRICT
129 8,770 1,288 1,361 106 41,484 113 43,419
4202000 LOGAN MAGAZINE SCHOOL DISTRICT
130 9,771 486 516 44 39,443 48 41,475
4203000 LOGAN PARIS SCHOOL DISTRICT
131 8,730 1,060 1,112 82 41,041 90 43,097
4204000 LOGAN SCRANTON SCHOOL DISTRICT
132 7,774 389 405 29 40,188 33 42,416
4301000 LONOKE LONOKE SCHOOL 133 8,557 1,744 1,823 133 41,904 144 44,072
287
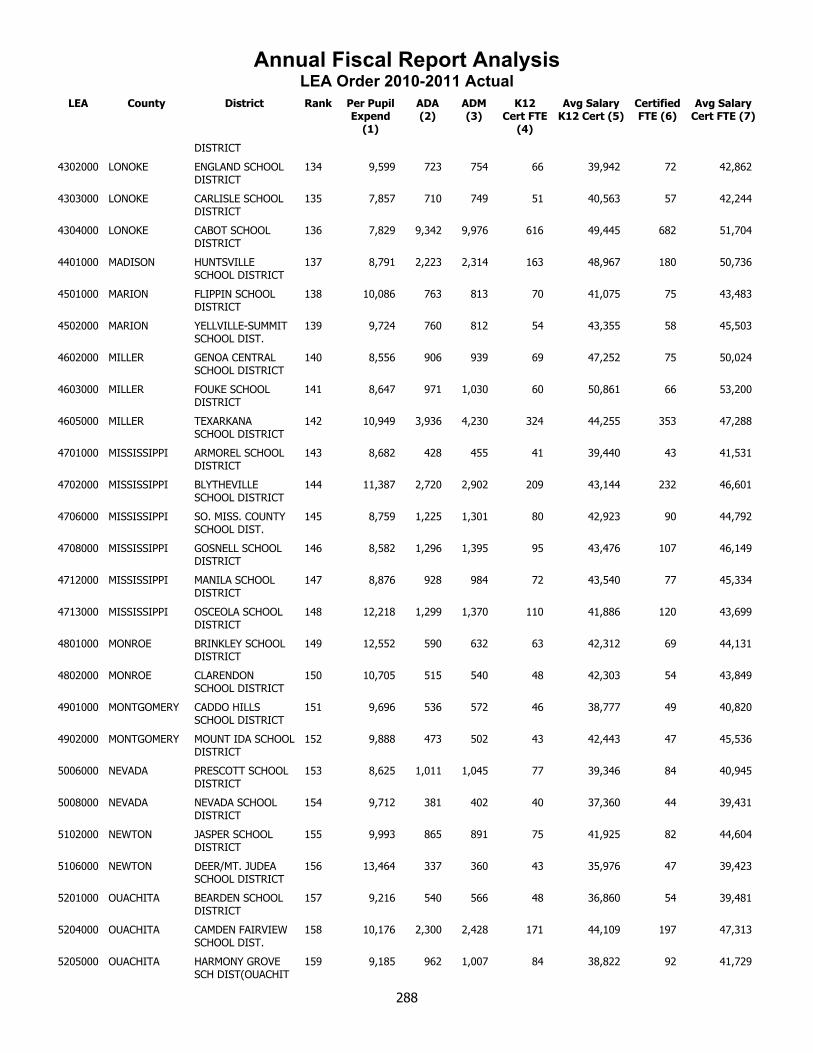
Annual Fiscal Report AnalysisLEA Order 2010-2011 Actual
LEA County District Rank Per Pupil Expend
(1)
ADA (2)
ADM (3)
K12 Cert FTE
(4)
Avg Salary K12 Cert (5)
Certified FTE (6)
Avg Salary Cert FTE (7)
DISTRICT
4302000 LONOKE ENGLAND SCHOOL DISTRICT
134 9,599 723 754 66 39,942 72 42,862
4303000 LONOKE CARLISLE SCHOOL DISTRICT
135 7,857 710 749 51 40,563 57 42,244
4304000 LONOKE CABOT SCHOOL DISTRICT
136 7,829 9,342 9,976 616 49,445 682 51,704
4401000 MADISON HUNTSVILLE SCHOOL DISTRICT
137 8,791 2,223 2,314 163 48,967 180 50,736
4501000 MARION FLIPPIN SCHOOL DISTRICT
138 10,086 763 813 70 41,075 75 43,483
4502000 MARION YELLVILLE-SUMMIT SCHOOL DIST.
139 9,724 760 812 54 43,355 58 45,503
4602000 MILLER GENOA CENTRAL SCHOOL DISTRICT
140 8,556 906 939 69 47,252 75 50,024
4603000 MILLER FOUKE SCHOOL DISTRICT
141 8,647 971 1,030 60 50,861 66 53,200
4605000 MILLER TEXARKANA SCHOOL DISTRICT
142 10,949 3,936 4,230 324 44,255 353 47,288
4701000 MISSISSIPPI ARMOREL SCHOOL DISTRICT
143 8,682 428 455 41 39,440 43 41,531
4702000 MISSISSIPPI BLYTHEVILLE SCHOOL DISTRICT
144 11,387 2,720 2,902 209 43,144 232 46,601
4706000 MISSISSIPPI SO. MISS. COUNTY SCHOOL DIST.
145 8,759 1,225 1,301 80 42,923 90 44,792
4708000 MISSISSIPPI GOSNELL SCHOOL DISTRICT
146 8,582 1,296 1,395 95 43,476 107 46,149
4712000 MISSISSIPPI MANILA SCHOOL DISTRICT
147 8,876 928 984 72 43,540 77 45,334
4713000 MISSISSIPPI OSCEOLA SCHOOL DISTRICT
148 12,218 1,299 1,370 110 41,886 120 43,699
4801000 MONROE BRINKLEY SCHOOL DISTRICT
149 12,552 590 632 63 42,312 69 44,131
4802000 MONROE CLARENDON SCHOOL DISTRICT
150 10,705 515 540 48 42,303 54 43,849
4901000 MONTGOMERY CADDO HILLS SCHOOL DISTRICT
151 9,696 536 572 46 38,777 49 40,820
4902000 MONTGOMERY MOUNT IDA SCHOOL DISTRICT
152 9,888 473 502 43 42,443 47 45,536
5006000 NEVADA PRESCOTT SCHOOL DISTRICT
153 8,625 1,011 1,045 77 39,346 84 40,945
5008000 NEVADA NEVADA SCHOOL DISTRICT
154 9,712 381 402 40 37,360 44 39,431
5102000 NEWTON JASPER SCHOOL DISTRICT
155 9,993 865 891 75 41,925 82 44,604
5106000 NEWTON DEER/MT. JUDEA SCHOOL DISTRICT
156 13,464 337 360 43 35,976 47 39,423
5201000 OUACHITA BEARDEN SCHOOL DISTRICT
157 9,216 540 566 48 36,860 54 39,481
5204000 OUACHITA CAMDEN FAIRVIEW SCHOOL DIST.
158 10,176 2,300 2,428 171 44,109 197 47,313
5205000 OUACHITA HARMONY GROVE SCH DIST(OUACHIT
159 9,185 962 1,007 84 38,822 92 41,729
288
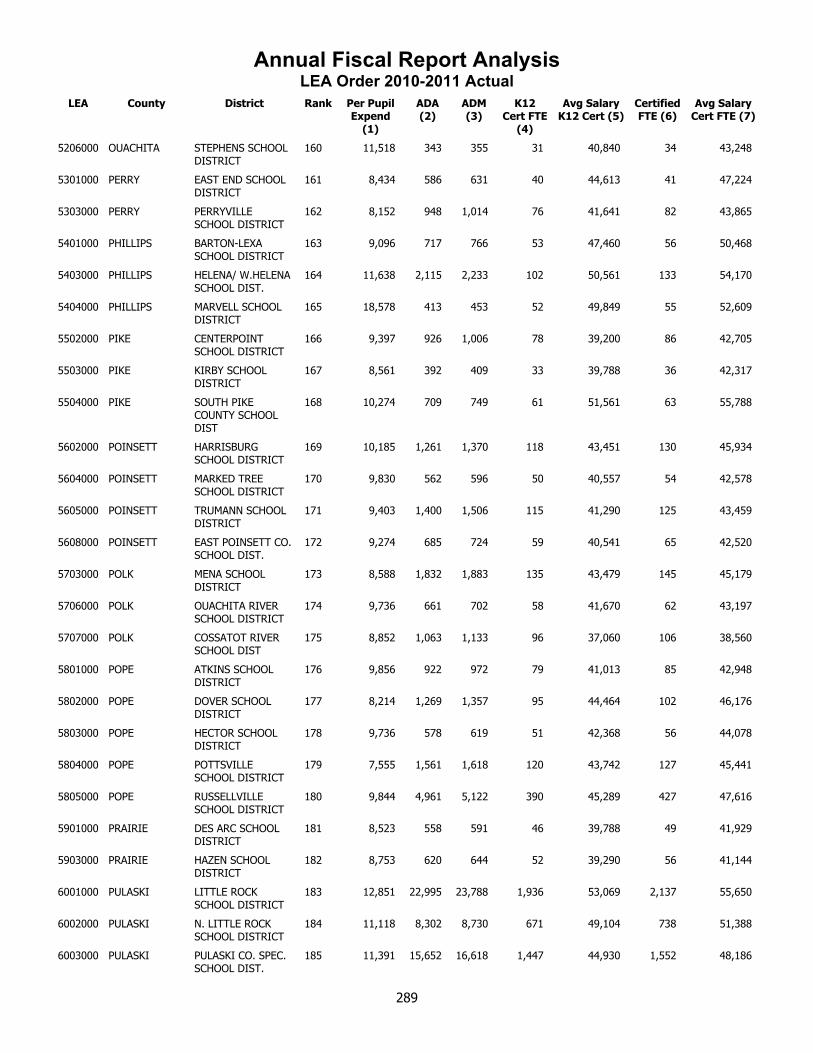
Annual Fiscal Report AnalysisLEA Order 2010-2011 Actual
LEA County District Rank Per Pupil Expend
(1)
ADA (2)
ADM (3)
K12 Cert FTE
(4)
Avg Salary K12 Cert (5)
Certified FTE (6)
Avg Salary Cert FTE (7)
5206000 OUACHITA STEPHENS SCHOOL DISTRICT
160 11,518 343 355 31 40,840 34 43,248
5301000 PERRY EAST END SCHOOL DISTRICT
161 8,434 586 631 40 44,613 41 47,224
5303000 PERRY PERRYVILLE SCHOOL DISTRICT
162 8,152 948 1,014 76 41,641 82 43,865
5401000 PHILLIPS BARTON-LEXA SCHOOL DISTRICT
163 9,096 717 766 53 47,460 56 50,468
5403000 PHILLIPS HELENA/ W.HELENA SCHOOL DIST.
164 11,638 2,115 2,233 102 50,561 133 54,170
5404000 PHILLIPS MARVELL SCHOOL DISTRICT
165 18,578 413 453 52 49,849 55 52,609
5502000 PIKE CENTERPOINT SCHOOL DISTRICT
166 9,397 926 1,006 78 39,200 86 42,705
5503000 PIKE KIRBY SCHOOL DISTRICT
167 8,561 392 409 33 39,788 36 42,317
5504000 PIKE SOUTH PIKE COUNTY SCHOOL DIST
168 10,274 709 749 61 51,561 63 55,788
5602000 POINSETT HARRISBURG SCHOOL DISTRICT
169 10,185 1,261 1,370 118 43,451 130 45,934
5604000 POINSETT MARKED TREE SCHOOL DISTRICT
170 9,830 562 596 50 40,557 54 42,578
5605000 POINSETT TRUMANN SCHOOL DISTRICT
171 9,403 1,400 1,506 115 41,290 125 43,459
5608000 POINSETT EAST POINSETT CO. SCHOOL DIST.
172 9,274 685 724 59 40,541 65 42,520
5703000 POLK MENA SCHOOL DISTRICT
173 8,588 1,832 1,883 135 43,479 145 45,179
5706000 POLK OUACHITA RIVER SCHOOL DISTRICT
174 9,736 661 702 58 41,670 62 43,197
5707000 POLK COSSATOT RIVER SCHOOL DIST
175 8,852 1,063 1,133 96 37,060 106 38,560
5801000 POPE ATKINS SCHOOL DISTRICT
176 9,856 922 972 79 41,013 85 42,948
5802000 POPE DOVER SCHOOL DISTRICT
177 8,214 1,269 1,357 95 44,464 102 46,176
5803000 POPE HECTOR SCHOOL DISTRICT
178 9,736 578 619 51 42,368 56 44,078
5804000 POPE POTTSVILLE SCHOOL DISTRICT
179 7,555 1,561 1,618 120 43,742 127 45,441
5805000 POPE RUSSELLVILLE SCHOOL DISTRICT
180 9,844 4,961 5,122 390 45,289 427 47,616
5901000 PRAIRIE DES ARC SCHOOL DISTRICT
181 8,523 558 591 46 39,788 49 41,929
5903000 PRAIRIE HAZEN SCHOOL DISTRICT
182 8,753 620 644 52 39,290 56 41,144
6001000 PULASKI LITTLE ROCK SCHOOL DISTRICT
183 12,851 22,995 23,788 1,936 53,069 2,137 55,650
6002000 PULASKI N. LITTLE ROCK SCHOOL DISTRICT
184 11,118 8,302 8,730 671 49,104 738 51,388
6003000 PULASKI PULASKI CO. SPEC. SCHOOL DIST.
185 11,391 15,652 16,618 1,447 44,930 1,552 48,186
289
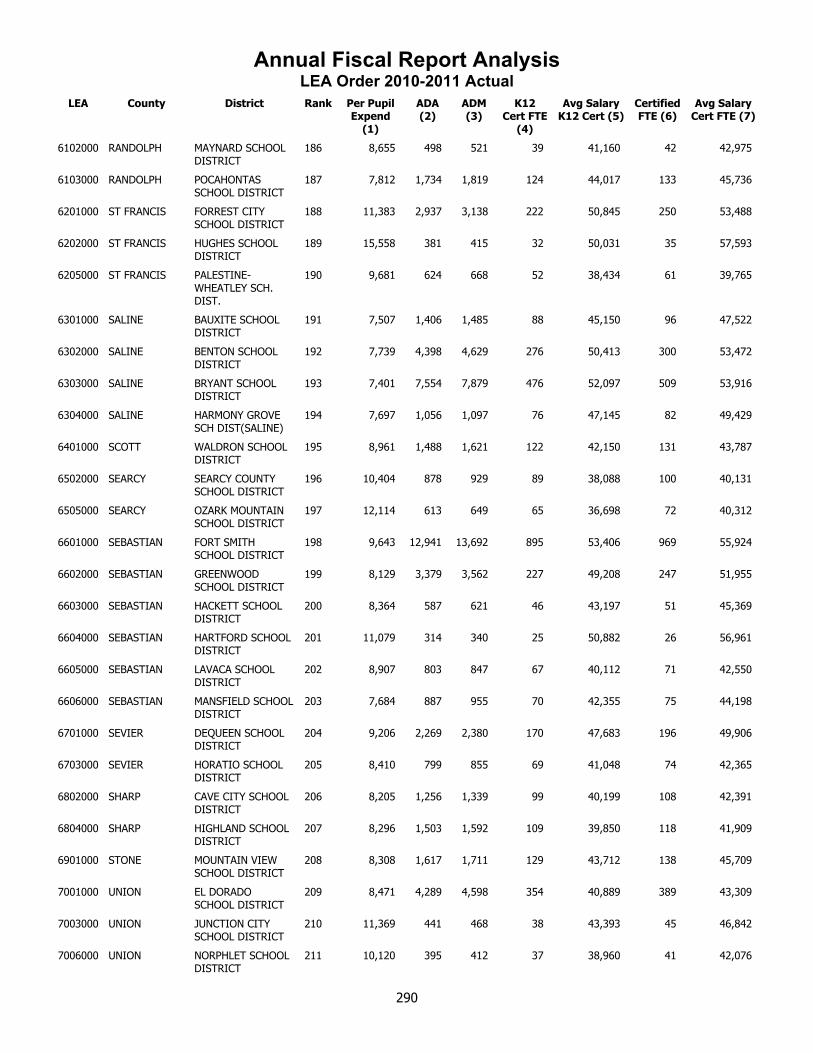
Annual Fiscal Report AnalysisLEA Order 2010-2011 Actual
LEA County District Rank Per Pupil Expend
(1)
ADA (2)
ADM (3)
K12 Cert FTE
(4)
Avg Salary K12 Cert (5)
Certified FTE (6)
Avg Salary Cert FTE (7)
6102000 RANDOLPH MAYNARD SCHOOL DISTRICT
186 8,655 498 521 39 41,160 42 42,975
6103000 RANDOLPH POCAHONTAS SCHOOL DISTRICT
187 7,812 1,734 1,819 124 44,017 133 45,736
6201000 ST FRANCIS FORREST CITY SCHOOL DISTRICT
188 11,383 2,937 3,138 222 50,845 250 53,488
6202000 ST FRANCIS HUGHES SCHOOL DISTRICT
189 15,558 381 415 32 50,031 35 57,593
6205000 ST FRANCIS PALESTINE-WHEATLEY SCH. DIST.
190 9,681 624 668 52 38,434 61 39,765
6301000 SALINE BAUXITE SCHOOL DISTRICT
191 7,507 1,406 1,485 88 45,150 96 47,522
6302000 SALINE BENTON SCHOOL DISTRICT
192 7,739 4,398 4,629 276 50,413 300 53,472
6303000 SALINE BRYANT SCHOOL DISTRICT
193 7,401 7,554 7,879 476 52,097 509 53,916
6304000 SALINE HARMONY GROVE SCH DIST(SALINE)
194 7,697 1,056 1,097 76 47,145 82 49,429
6401000 SCOTT WALDRON SCHOOL DISTRICT
195 8,961 1,488 1,621 122 42,150 131 43,787
6502000 SEARCY SEARCY COUNTY SCHOOL DISTRICT
196 10,404 878 929 89 38,088 100 40,131
6505000 SEARCY OZARK MOUNTAIN SCHOOL DISTRICT
197 12,114 613 649 65 36,698 72 40,312
6601000 SEBASTIAN FORT SMITH SCHOOL DISTRICT
198 9,643 12,941 13,692 895 53,406 969 55,924
6602000 SEBASTIAN GREENWOOD SCHOOL DISTRICT
199 8,129 3,379 3,562 227 49,208 247 51,955
6603000 SEBASTIAN HACKETT SCHOOL DISTRICT
200 8,364 587 621 46 43,197 51 45,369
6604000 SEBASTIAN HARTFORD SCHOOL DISTRICT
201 11,079 314 340 25 50,882 26 56,961
6605000 SEBASTIAN LAVACA SCHOOL DISTRICT
202 8,907 803 847 67 40,112 71 42,550
6606000 SEBASTIAN MANSFIELD SCHOOL DISTRICT
203 7,684 887 955 70 42,355 75 44,198
6701000 SEVIER DEQUEEN SCHOOL DISTRICT
204 9,206 2,269 2,380 170 47,683 196 49,906
6703000 SEVIER HORATIO SCHOOL DISTRICT
205 8,410 799 855 69 41,048 74 42,365
6802000 SHARP CAVE CITY SCHOOL DISTRICT
206 8,205 1,256 1,339 99 40,199 108 42,391
6804000 SHARP HIGHLAND SCHOOL DISTRICT
207 8,296 1,503 1,592 109 39,850 118 41,909
6901000 STONE MOUNTAIN VIEW SCHOOL DISTRICT
208 8,308 1,617 1,711 129 43,712 138 45,709
7001000 UNION EL DORADO SCHOOL DISTRICT
209 8,471 4,289 4,598 354 40,889 389 43,309
7003000 UNION JUNCTION CITY SCHOOL DISTRICT
210 11,369 441 468 38 43,393 45 46,842
7006000 UNION NORPHLET SCHOOL DISTRICT
211 10,120 395 412 37 38,960 41 42,076
290
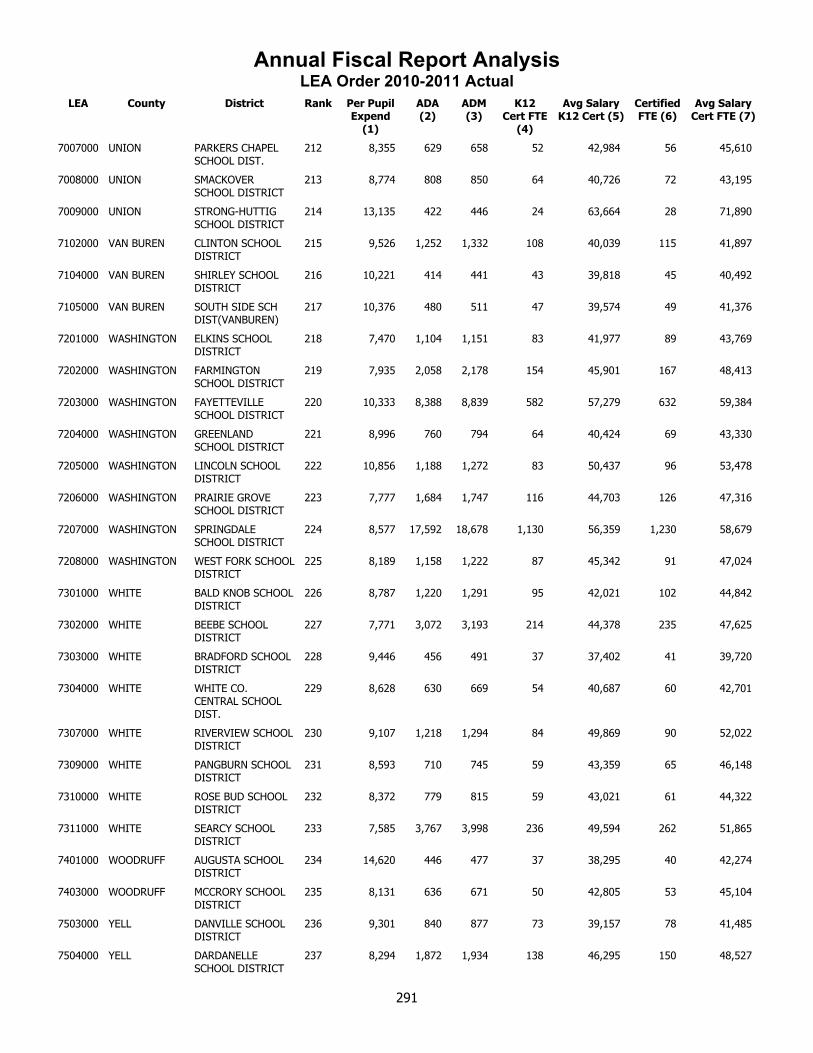
Annual Fiscal Report AnalysisLEA Order 2010-2011 Actual
LEA County District Rank Per Pupil Expend
(1)
ADA (2)
ADM (3)
K12 Cert FTE
(4)
Avg Salary K12 Cert (5)
Certified FTE (6)
Avg Salary Cert FTE (7)
7007000 UNION PARKERS CHAPEL SCHOOL DIST.
212 8,355 629 658 52 42,984 56 45,610
7008000 UNION SMACKOVER SCHOOL DISTRICT
213 8,774 808 850 64 40,726 72 43,195
7009000 UNION STRONG-HUTTIG SCHOOL DISTRICT
214 13,135 422 446 24 63,664 28 71,890
7102000 VAN BUREN CLINTON SCHOOL DISTRICT
215 9,526 1,252 1,332 108 40,039 115 41,897
7104000 VAN BUREN SHIRLEY SCHOOL DISTRICT
216 10,221 414 441 43 39,818 45 40,492
7105000 VAN BUREN SOUTH SIDE SCH DIST(VANBUREN)
217 10,376 480 511 47 39,574 49 41,376
7201000 WASHINGTON ELKINS SCHOOL DISTRICT
218 7,470 1,104 1,151 83 41,977 89 43,769
7202000 WASHINGTON FARMINGTON SCHOOL DISTRICT
219 7,935 2,058 2,178 154 45,901 167 48,413
7203000 WASHINGTON FAYETTEVILLE SCHOOL DISTRICT
220 10,333 8,388 8,839 582 57,279 632 59,384
7204000 WASHINGTON GREENLAND SCHOOL DISTRICT
221 8,996 760 794 64 40,424 69 43,330
7205000 WASHINGTON LINCOLN SCHOOL DISTRICT
222 10,856 1,188 1,272 83 50,437 96 53,478
7206000 WASHINGTON PRAIRIE GROVE SCHOOL DISTRICT
223 7,777 1,684 1,747 116 44,703 126 47,316
7207000 WASHINGTON SPRINGDALE SCHOOL DISTRICT
224 8,577 17,592 18,678 1,130 56,359 1,230 58,679
7208000 WASHINGTON WEST FORK SCHOOL DISTRICT
225 8,189 1,158 1,222 87 45,342 91 47,024
7301000 WHITE BALD KNOB SCHOOL DISTRICT
226 8,787 1,220 1,291 95 42,021 102 44,842
7302000 WHITE BEEBE SCHOOL DISTRICT
227 7,771 3,072 3,193 214 44,378 235 47,625
7303000 WHITE BRADFORD SCHOOL DISTRICT
228 9,446 456 491 37 37,402 41 39,720
7304000 WHITE WHITE CO. CENTRAL SCHOOL DIST.
229 8,628 630 669 54 40,687 60 42,701
7307000 WHITE RIVERVIEW SCHOOL DISTRICT
230 9,107 1,218 1,294 84 49,869 90 52,022
7309000 WHITE PANGBURN SCHOOL DISTRICT
231 8,593 710 745 59 43,359 65 46,148
7310000 WHITE ROSE BUD SCHOOL DISTRICT
232 8,372 779 815 59 43,021 61 44,322
7311000 WHITE SEARCY SCHOOL DISTRICT
233 7,585 3,767 3,998 236 49,594 262 51,865
7401000 WOODRUFF AUGUSTA SCHOOL DISTRICT
234 14,620 446 477 37 38,295 40 42,274
7403000 WOODRUFF MCCRORY SCHOOL DISTRICT
235 8,131 636 671 50 42,805 53 45,104
7503000 YELL DANVILLE SCHOOL DISTRICT
236 9,301 840 877 73 39,157 78 41,485
7504000 YELL DARDANELLE SCHOOL DISTRICT
237 8,294 1,872 1,934 138 46,295 150 48,527
291
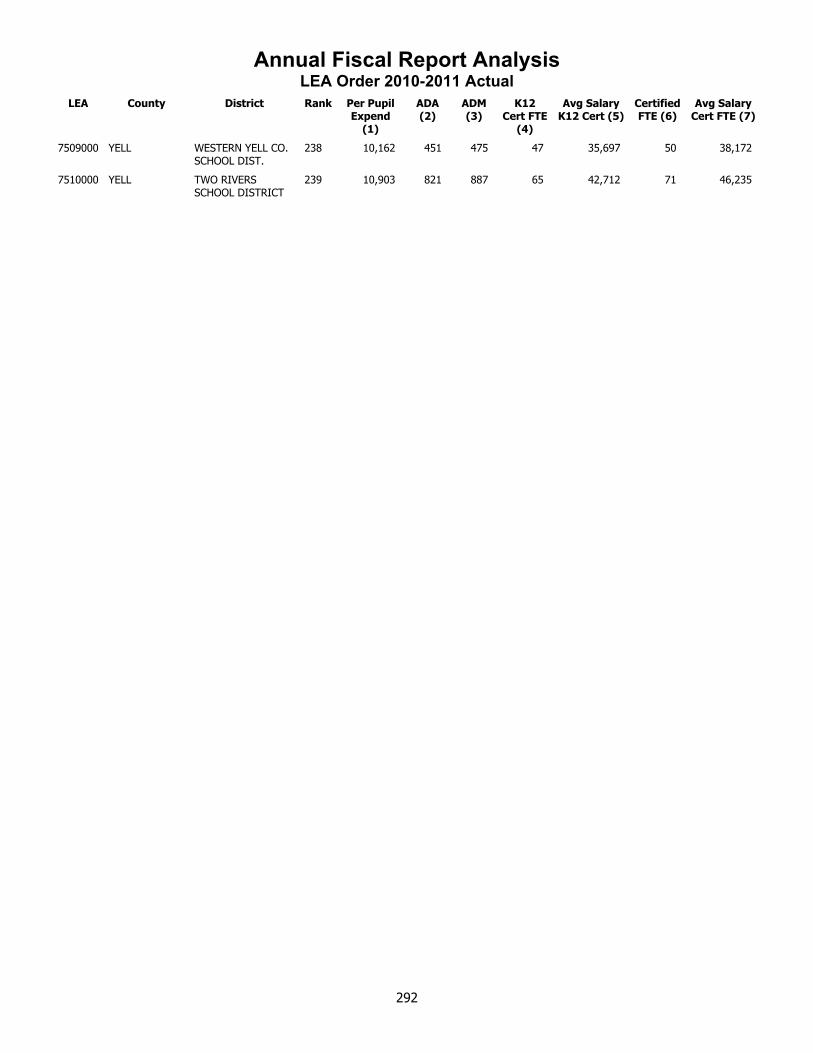
Annual Fiscal Report AnalysisLEA Order 2010-2011 Actual
LEA County District Rank Per Pupil Expend
(1)
ADA (2)
ADM (3)
K12 Cert FTE
(4)
Avg Salary K12 Cert (5)
Certified FTE (6)
Avg Salary Cert FTE (7)
7509000 YELL WESTERN YELL CO. SCHOOL DIST.
238 10,162 451 475 47 35,697 50 38,172
7510000 YELL TWO RIVERS SCHOOL DISTRICT
239 10,903 821 887 65 42,712 71 46,235
292
Ranked byPer Pupil Expenditures

Annual Fiscal Report AnalysisRank by Per Pupil Expenditures 2010-2011 Actual
LEA County District Rank Per Pupil Expend
(1)
ADA (2)
ADM (3)
K12 Cert FTE
(4)
Avg Salary K12 Cert (5)
Certified FTE (6)
Avg Salary Cert FTE (7)
5404000 PHILLIPS MARVELL SCHOOL DISTRICT
1 18,578 413 453 52 49,849 55 52,609
6202000 ST FRANCIS HUGHES SCHOOL DISTRICT
2 15,558 381 415 32 50,031 35 57,593
7401000 WOODRUFF AUGUSTA SCHOOL DISTRICT
3 14,620 446 477 37 38,295 40 42,274
3904000 LEE LEE COUNTY SCHOOL DISTRICT
4 13,685 911 980 94 42,032 103 44,009
0901000 CHICOT DERMOTT SCHOOL DISTRICT
5 13,555 412 424 27 41,504 35 45,202
1802000 CRITTENDEN EARLE SCHOOL DISTRICT
6 13,543 671 694 51 44,740 55 48,971
5106000 NEWTON DEER/MT. JUDEA SCHOOL DISTRICT
7 13,464 337 360 43 35,976 47 39,423
7009000 UNION STRONG-HUTTIG SCHOOL DISTRICT
8 13,135 422 446 24 63,664 28 71,890
6001000 PULASKI LITTLE ROCK SCHOOL DISTRICT
9 12,851 22,995 23,788 1,936 53,069 2,137 55,650
2603000 GARLAND HOT SPRINGS SCHOOL DISTRICT
10 12,838 3,438 3,633 286 45,860 329 48,524
4801000 MONROE BRINKLEY SCHOOL DISTRICT
11 12,552 590 632 63 42,312 69 44,131
4713000 MISSISSIPPI OSCEOLA SCHOOL DISTRICT
12 12,218 1,299 1,370 110 41,886 120 43,699
3502000 JEFFERSON DOLLARWAY SCHOOL DISTRICT
13 12,141 1,426 1,523 115 47,510 124 49,110
6505000 SEARCY OZARK MOUNTAIN SCHOOL DISTRICT
14 12,114 613 649 65 36,698 72 40,312
0601000 BRADLEY HERMITAGE SCHOOL DISTRICT
15 11,843 448 470 33 42,039 37 44,408
0903000 CHICOT LAKESIDE SCHOOL DIST(CHICOT)
16 11,700 1,115 1,162 100 37,928 113 40,694
3505000 JEFFERSON PINE BLUFF SCHOOL DISTRICT
17 11,683 4,414 4,727 338 51,933 360 51,906
5403000 PHILLIPS HELENA/ W.HELENA SCHOOL DIST.
18 11,638 2,115 2,233 102 50,561 133 54,170
5206000 OUACHITA STEPHENS SCHOOL DISTRICT
19 11,518 343 355 31 40,840 34 43,248
0802000 CARROLL EUREKA SPRINGS SCHOOL DISTRICT
20 11,437 607 643 45 47,535 49 50,716
6003000 PULASKI PULASKI CO. SPEC. SCHOOL DIST.
21 11,391 15,652 16,618 1,447 44,930 1,552 48,186
4702000 MISSISSIPPI BLYTHEVILLE SCHOOL DISTRICT
22 11,387 2,720 2,902 209 43,144 232 46,601
6201000 ST FRANCIS FORREST CITY SCHOOL DISTRICT
23 11,383 2,937 3,138 222 50,845 250 53,488
7003000 UNION JUNCTION CITY SCHOOL DISTRICT
24 11,369 441 468 38 43,393 45 46,842
6002000 PULASKI N. LITTLE ROCK SCHOOL DISTRICT
25 11,118 8,302 8,730 671 49,104 738 51,388
3104000 HOWARD MINERAL SPRINGS SCHOOL DIST.
26 11,097 468 479 42 45,202 50 48,703
6604000 SEBASTIAN HARTFORD SCHOOL 27 11,079 314 340 25 50,882 26 56,961
294
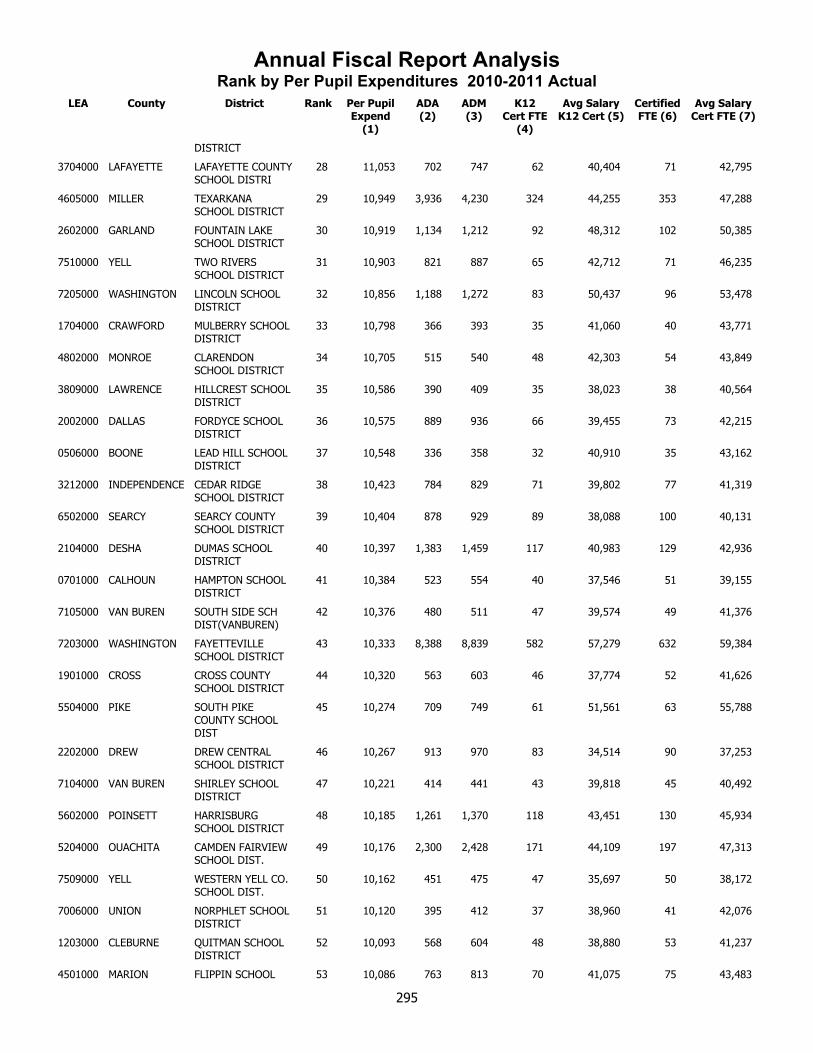
Annual Fiscal Report AnalysisRank by Per Pupil Expenditures 2010-2011 Actual
LEA County District Rank Per Pupil Expend
(1)
ADA (2)
ADM (3)
K12 Cert FTE
(4)
Avg Salary K12 Cert (5)
Certified FTE (6)
Avg Salary Cert FTE (7)
DISTRICT
3704000 LAFAYETTE LAFAYETTE COUNTY SCHOOL DISTRI
28 11,053 702 747 62 40,404 71 42,795
4605000 MILLER TEXARKANA SCHOOL DISTRICT
29 10,949 3,936 4,230 324 44,255 353 47,288
2602000 GARLAND FOUNTAIN LAKE SCHOOL DISTRICT
30 10,919 1,134 1,212 92 48,312 102 50,385
7510000 YELL TWO RIVERS SCHOOL DISTRICT
31 10,903 821 887 65 42,712 71 46,235
7205000 WASHINGTON LINCOLN SCHOOL DISTRICT
32 10,856 1,188 1,272 83 50,437 96 53,478
1704000 CRAWFORD MULBERRY SCHOOL DISTRICT
33 10,798 366 393 35 41,060 40 43,771
4802000 MONROE CLARENDON SCHOOL DISTRICT
34 10,705 515 540 48 42,303 54 43,849
3809000 LAWRENCE HILLCREST SCHOOL DISTRICT
35 10,586 390 409 35 38,023 38 40,564
2002000 DALLAS FORDYCE SCHOOL DISTRICT
36 10,575 889 936 66 39,455 73 42,215
0506000 BOONE LEAD HILL SCHOOL DISTRICT
37 10,548 336 358 32 40,910 35 43,162
3212000 INDEPENDENCE CEDAR RIDGE SCHOOL DISTRICT
38 10,423 784 829 71 39,802 77 41,319
6502000 SEARCY SEARCY COUNTY SCHOOL DISTRICT
39 10,404 878 929 89 38,088 100 40,131
2104000 DESHA DUMAS SCHOOL DISTRICT
40 10,397 1,383 1,459 117 40,983 129 42,936
0701000 CALHOUN HAMPTON SCHOOL DISTRICT
41 10,384 523 554 40 37,546 51 39,155
7105000 VAN BUREN SOUTH SIDE SCH DIST(VANBUREN)
42 10,376 480 511 47 39,574 49 41,376
7203000 WASHINGTON FAYETTEVILLE SCHOOL DISTRICT
43 10,333 8,388 8,839 582 57,279 632 59,384
1901000 CROSS CROSS COUNTY SCHOOL DISTRICT
44 10,320 563 603 46 37,774 52 41,626
5504000 PIKE SOUTH PIKE COUNTY SCHOOL DIST
45 10,274 709 749 61 51,561 63 55,788
2202000 DREW DREW CENTRAL SCHOOL DISTRICT
46 10,267 913 970 83 34,514 90 37,253
7104000 VAN BUREN SHIRLEY SCHOOL DISTRICT
47 10,221 414 441 43 39,818 45 40,492
5602000 POINSETT HARRISBURG SCHOOL DISTRICT
48 10,185 1,261 1,370 118 43,451 130 45,934
5204000 OUACHITA CAMDEN FAIRVIEW SCHOOL DIST.
49 10,176 2,300 2,428 171 44,109 197 47,313
7509000 YELL WESTERN YELL CO. SCHOOL DIST.
50 10,162 451 475 47 35,697 50 38,172
7006000 UNION NORPHLET SCHOOL DISTRICT
51 10,120 395 412 37 38,960 41 42,076
1203000 CLEBURNE QUITMAN SCHOOL DISTRICT
52 10,093 568 604 48 38,880 53 41,237
4501000 MARION FLIPPIN SCHOOL 53 10,086 763 813 70 41,075 75 43,483
295
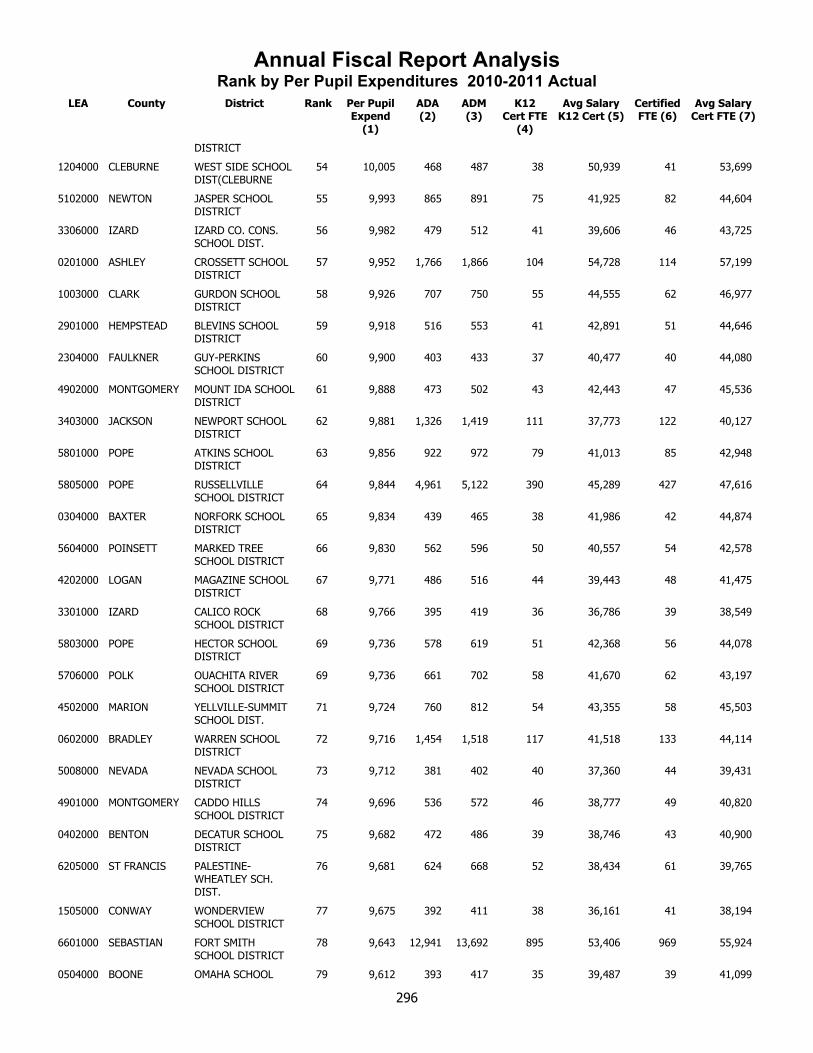
Annual Fiscal Report AnalysisRank by Per Pupil Expenditures 2010-2011 Actual
LEA County District Rank Per Pupil Expend
(1)
ADA (2)
ADM (3)
K12 Cert FTE
(4)
Avg Salary K12 Cert (5)
Certified FTE (6)
Avg Salary Cert FTE (7)
DISTRICT
1204000 CLEBURNE WEST SIDE SCHOOL DIST(CLEBURNE
54 10,005 468 487 38 50,939 41 53,699
5102000 NEWTON JASPER SCHOOL DISTRICT
55 9,993 865 891 75 41,925 82 44,604
3306000 IZARD IZARD CO. CONS. SCHOOL DIST.
56 9,982 479 512 41 39,606 46 43,725
0201000 ASHLEY CROSSETT SCHOOL DISTRICT
57 9,952 1,766 1,866 104 54,728 114 57,199
1003000 CLARK GURDON SCHOOL DISTRICT
58 9,926 707 750 55 44,555 62 46,977
2901000 HEMPSTEAD BLEVINS SCHOOL DISTRICT
59 9,918 516 553 41 42,891 51 44,646
2304000 FAULKNER GUY-PERKINS SCHOOL DISTRICT
60 9,900 403 433 37 40,477 40 44,080
4902000 MONTGOMERY MOUNT IDA SCHOOL DISTRICT
61 9,888 473 502 43 42,443 47 45,536
3403000 JACKSON NEWPORT SCHOOL DISTRICT
62 9,881 1,326 1,419 111 37,773 122 40,127
5801000 POPE ATKINS SCHOOL DISTRICT
63 9,856 922 972 79 41,013 85 42,948
5805000 POPE RUSSELLVILLE SCHOOL DISTRICT
64 9,844 4,961 5,122 390 45,289 427 47,616
0304000 BAXTER NORFORK SCHOOL DISTRICT
65 9,834 439 465 38 41,986 42 44,874
5604000 POINSETT MARKED TREE SCHOOL DISTRICT
66 9,830 562 596 50 40,557 54 42,578
4202000 LOGAN MAGAZINE SCHOOL DISTRICT
67 9,771 486 516 44 39,443 48 41,475
3301000 IZARD CALICO ROCK SCHOOL DISTRICT
68 9,766 395 419 36 36,786 39 38,549
5803000 POPE HECTOR SCHOOL DISTRICT
69 9,736 578 619 51 42,368 56 44,078
5706000 POLK OUACHITA RIVER SCHOOL DISTRICT
69 9,736 661 702 58 41,670 62 43,197
4502000 MARION YELLVILLE-SUMMIT SCHOOL DIST.
71 9,724 760 812 54 43,355 58 45,503
0602000 BRADLEY WARREN SCHOOL DISTRICT
72 9,716 1,454 1,518 117 41,518 133 44,114
5008000 NEVADA NEVADA SCHOOL DISTRICT
73 9,712 381 402 40 37,360 44 39,431
4901000 MONTGOMERY CADDO HILLS SCHOOL DISTRICT
74 9,696 536 572 46 38,777 49 40,820
0402000 BENTON DECATUR SCHOOL DISTRICT
75 9,682 472 486 39 38,746 43 40,900
6205000 ST FRANCIS PALESTINE-WHEATLEY SCH. DIST.
76 9,681 624 668 52 38,434 61 39,765
1505000 CONWAY WONDERVIEW SCHOOL DISTRICT
77 9,675 392 411 38 36,161 41 38,194
6601000 SEBASTIAN FORT SMITH SCHOOL DISTRICT
78 9,643 12,941 13,692 895 53,406 969 55,924
0504000 BOONE OMAHA SCHOOL 79 9,612 393 417 35 39,487 39 41,099
296
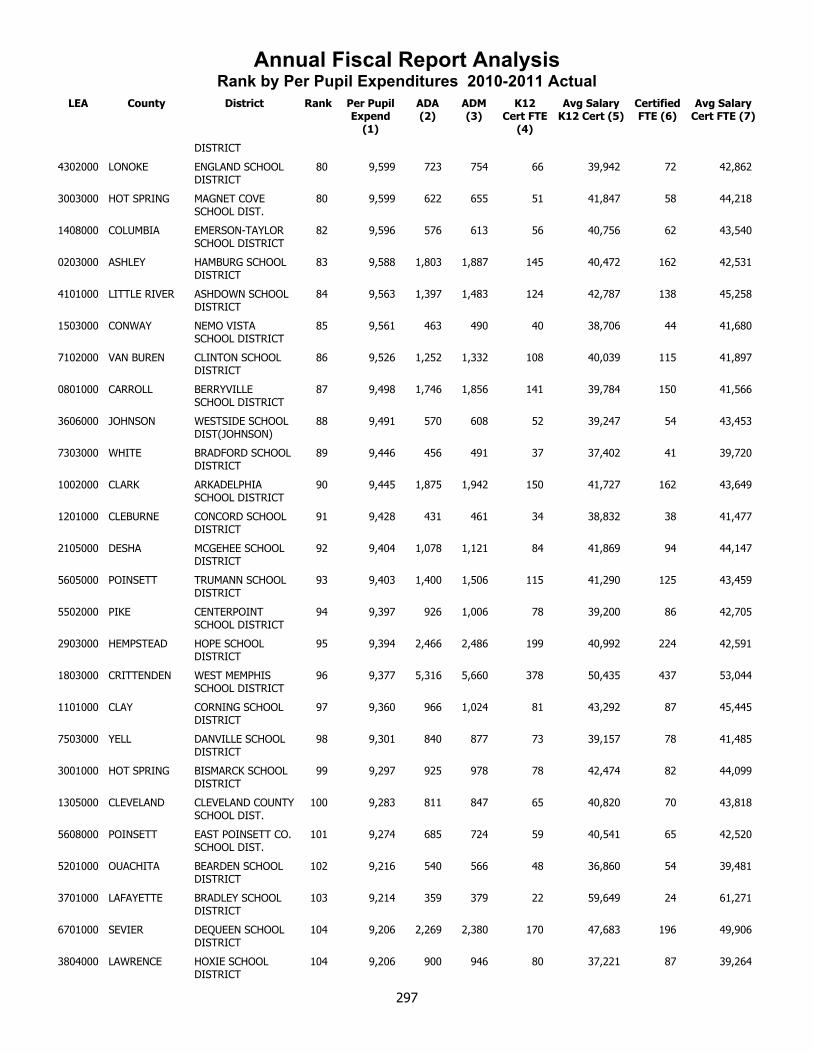
Annual Fiscal Report AnalysisRank by Per Pupil Expenditures 2010-2011 Actual
LEA County District Rank Per Pupil Expend
(1)
ADA (2)
ADM (3)
K12 Cert FTE
(4)
Avg Salary K12 Cert (5)
Certified FTE (6)
Avg Salary Cert FTE (7)
DISTRICT
4302000 LONOKE ENGLAND SCHOOL DISTRICT
80 9,599 723 754 66 39,942 72 42,862
3003000 HOT SPRING MAGNET COVE SCHOOL DIST.
80 9,599 622 655 51 41,847 58 44,218
1408000 COLUMBIA EMERSON-TAYLOR SCHOOL DISTRICT
82 9,596 576 613 56 40,756 62 43,540
0203000 ASHLEY HAMBURG SCHOOL DISTRICT
83 9,588 1,803 1,887 145 40,472 162 42,531
4101000 LITTLE RIVER ASHDOWN SCHOOL DISTRICT
84 9,563 1,397 1,483 124 42,787 138 45,258
1503000 CONWAY NEMO VISTA SCHOOL DISTRICT
85 9,561 463 490 40 38,706 44 41,680
7102000 VAN BUREN CLINTON SCHOOL DISTRICT
86 9,526 1,252 1,332 108 40,039 115 41,897
0801000 CARROLL BERRYVILLE SCHOOL DISTRICT
87 9,498 1,746 1,856 141 39,784 150 41,566
3606000 JOHNSON WESTSIDE SCHOOL DIST(JOHNSON)
88 9,491 570 608 52 39,247 54 43,453
7303000 WHITE BRADFORD SCHOOL DISTRICT
89 9,446 456 491 37 37,402 41 39,720
1002000 CLARK ARKADELPHIA SCHOOL DISTRICT
90 9,445 1,875 1,942 150 41,727 162 43,649
1201000 CLEBURNE CONCORD SCHOOL DISTRICT
91 9,428 431 461 34 38,832 38 41,477
2105000 DESHA MCGEHEE SCHOOL DISTRICT
92 9,404 1,078 1,121 84 41,869 94 44,147
5605000 POINSETT TRUMANN SCHOOL DISTRICT
93 9,403 1,400 1,506 115 41,290 125 43,459
5502000 PIKE CENTERPOINT SCHOOL DISTRICT
94 9,397 926 1,006 78 39,200 86 42,705
2903000 HEMPSTEAD HOPE SCHOOL DISTRICT
95 9,394 2,466 2,486 199 40,992 224 42,591
1803000 CRITTENDEN WEST MEMPHIS SCHOOL DISTRICT
96 9,377 5,316 5,660 378 50,435 437 53,044
1101000 CLAY CORNING SCHOOL DISTRICT
97 9,360 966 1,024 81 43,292 87 45,445
7503000 YELL DANVILLE SCHOOL DISTRICT
98 9,301 840 877 73 39,157 78 41,485
3001000 HOT SPRING BISMARCK SCHOOL DISTRICT
99 9,297 925 978 78 42,474 82 44,099
1305000 CLEVELAND CLEVELAND COUNTY SCHOOL DIST.
100 9,283 811 847 65 40,820 70 43,818
5608000 POINSETT EAST POINSETT CO. SCHOOL DIST.
101 9,274 685 724 59 40,541 65 42,520
5201000 OUACHITA BEARDEN SCHOOL DISTRICT
102 9,216 540 566 48 36,860 54 39,481
3701000 LAFAYETTE BRADLEY SCHOOL DISTRICT
103 9,214 359 379 22 59,649 24 61,271
6701000 SEVIER DEQUEEN SCHOOL DISTRICT
104 9,206 2,269 2,380 170 47,683 196 49,906
3804000 LAWRENCE HOXIE SCHOOL DISTRICT
104 9,206 900 946 80 37,221 87 39,264
297
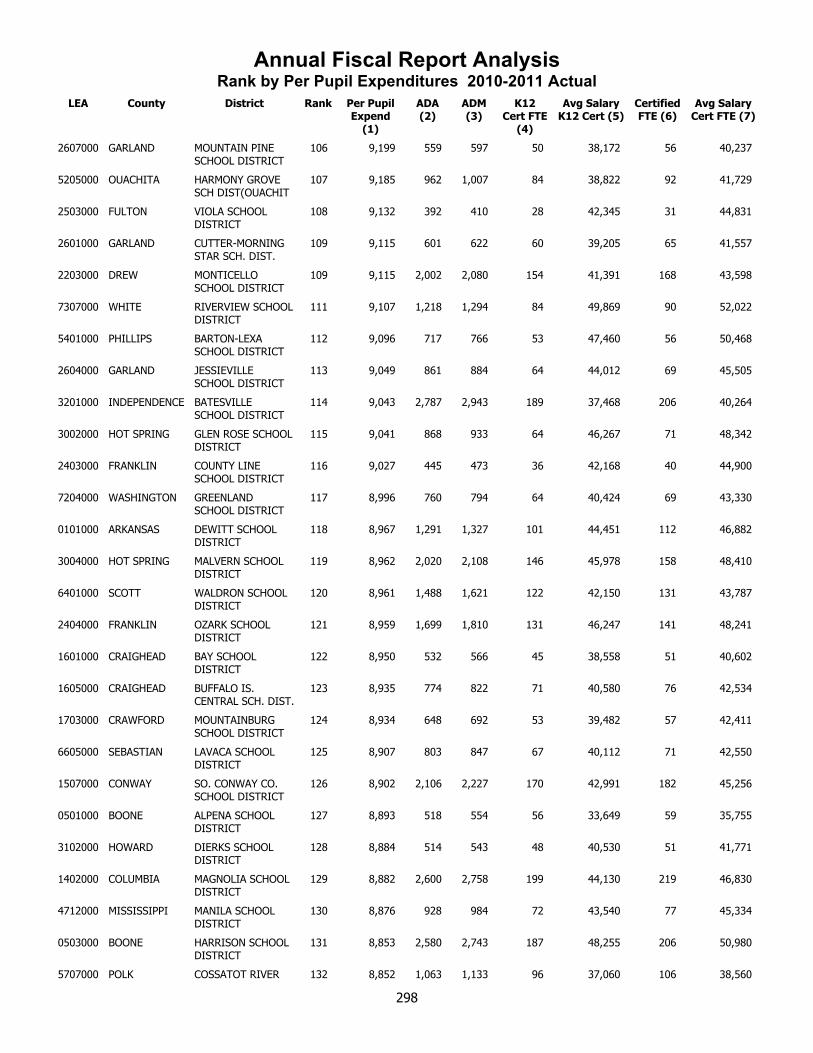
Annual Fiscal Report AnalysisRank by Per Pupil Expenditures 2010-2011 Actual
LEA County District Rank Per Pupil Expend
(1)
ADA (2)
ADM (3)
K12 Cert FTE
(4)
Avg Salary K12 Cert (5)
Certified FTE (6)
Avg Salary Cert FTE (7)
2607000 GARLAND MOUNTAIN PINE SCHOOL DISTRICT
106 9,199 559 597 50 38,172 56 40,237
5205000 OUACHITA HARMONY GROVE SCH DIST(OUACHIT
107 9,185 962 1,007 84 38,822 92 41,729
2503000 FULTON VIOLA SCHOOL DISTRICT
108 9,132 392 410 28 42,345 31 44,831
2601000 GARLAND CUTTER-MORNING STAR SCH. DIST.
109 9,115 601 622 60 39,205 65 41,557
2203000 DREW MONTICELLO SCHOOL DISTRICT
109 9,115 2,002 2,080 154 41,391 168 43,598
7307000 WHITE RIVERVIEW SCHOOL DISTRICT
111 9,107 1,218 1,294 84 49,869 90 52,022
5401000 PHILLIPS BARTON-LEXA SCHOOL DISTRICT
112 9,096 717 766 53 47,460 56 50,468
2604000 GARLAND JESSIEVILLE SCHOOL DISTRICT
113 9,049 861 884 64 44,012 69 45,505
3201000 INDEPENDENCE BATESVILLE SCHOOL DISTRICT
114 9,043 2,787 2,943 189 37,468 206 40,264
3002000 HOT SPRING GLEN ROSE SCHOOL DISTRICT
115 9,041 868 933 64 46,267 71 48,342
2403000 FRANKLIN COUNTY LINE SCHOOL DISTRICT
116 9,027 445 473 36 42,168 40 44,900
7204000 WASHINGTON GREENLAND SCHOOL DISTRICT
117 8,996 760 794 64 40,424 69 43,330
0101000 ARKANSAS DEWITT SCHOOL DISTRICT
118 8,967 1,291 1,327 101 44,451 112 46,882
3004000 HOT SPRING MALVERN SCHOOL DISTRICT
119 8,962 2,020 2,108 146 45,978 158 48,410
6401000 SCOTT WALDRON SCHOOL DISTRICT
120 8,961 1,488 1,621 122 42,150 131 43,787
2404000 FRANKLIN OZARK SCHOOL DISTRICT
121 8,959 1,699 1,810 131 46,247 141 48,241
1601000 CRAIGHEAD BAY SCHOOL DISTRICT
122 8,950 532 566 45 38,558 51 40,602
1605000 CRAIGHEAD BUFFALO IS. CENTRAL SCH. DIST.
123 8,935 774 822 71 40,580 76 42,534
1703000 CRAWFORD MOUNTAINBURG SCHOOL DISTRICT
124 8,934 648 692 53 39,482 57 42,411
6605000 SEBASTIAN LAVACA SCHOOL DISTRICT
125 8,907 803 847 67 40,112 71 42,550
1507000 CONWAY SO. CONWAY CO. SCHOOL DISTRICT
126 8,902 2,106 2,227 170 42,991 182 45,256
0501000 BOONE ALPENA SCHOOL DISTRICT
127 8,893 518 554 56 33,649 59 35,755
3102000 HOWARD DIERKS SCHOOL DISTRICT
128 8,884 514 543 48 40,530 51 41,771
1402000 COLUMBIA MAGNOLIA SCHOOL DISTRICT
129 8,882 2,600 2,758 199 44,130 219 46,830
4712000 MISSISSIPPI MANILA SCHOOL DISTRICT
130 8,876 928 984 72 43,540 77 45,334
0503000 BOONE HARRISON SCHOOL DISTRICT
131 8,853 2,580 2,743 187 48,255 206 50,980
5707000 POLK COSSATOT RIVER 132 8,852 1,063 1,133 96 37,060 106 38,560
298
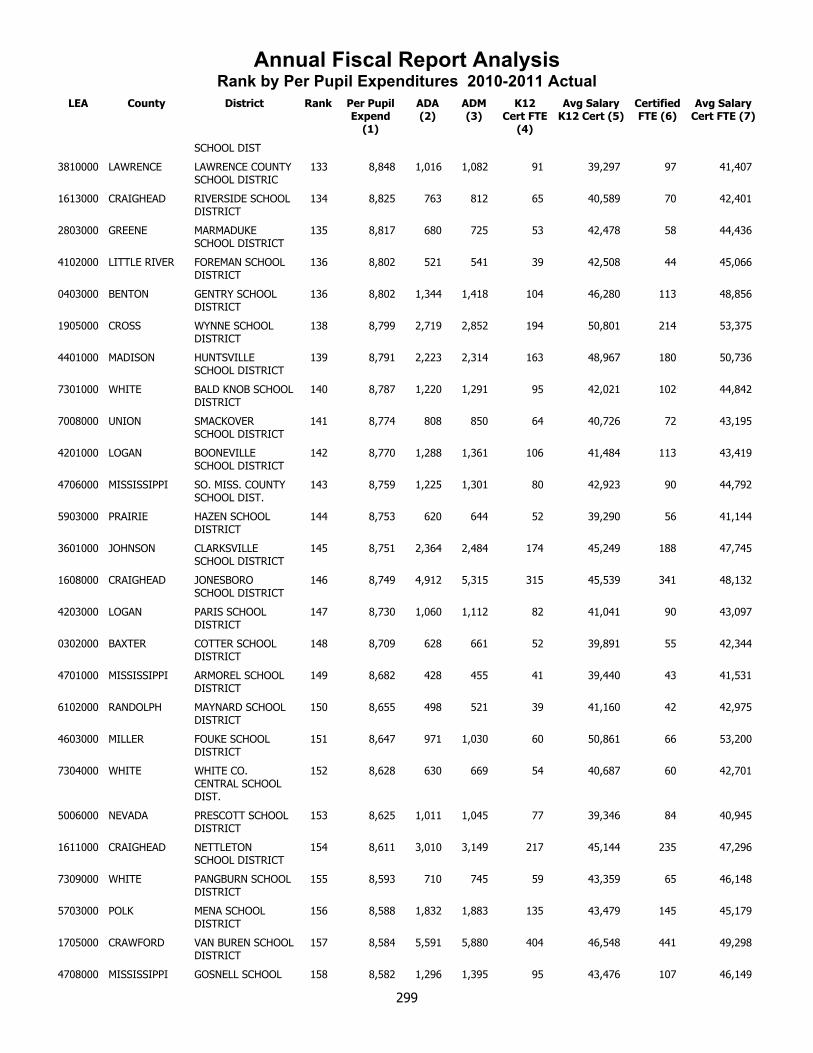
Annual Fiscal Report AnalysisRank by Per Pupil Expenditures 2010-2011 Actual
LEA County District Rank Per Pupil Expend
(1)
ADA (2)
ADM (3)
K12 Cert FTE
(4)
Avg Salary K12 Cert (5)
Certified FTE (6)
Avg Salary Cert FTE (7)
SCHOOL DIST
3810000 LAWRENCE LAWRENCE COUNTY SCHOOL DISTRIC
133 8,848 1,016 1,082 91 39,297 97 41,407
1613000 CRAIGHEAD RIVERSIDE SCHOOL DISTRICT
134 8,825 763 812 65 40,589 70 42,401
2803000 GREENE MARMADUKE SCHOOL DISTRICT
135 8,817 680 725 53 42,478 58 44,436
4102000 LITTLE RIVER FOREMAN SCHOOL DISTRICT
136 8,802 521 541 39 42,508 44 45,066
0403000 BENTON GENTRY SCHOOL DISTRICT
136 8,802 1,344 1,418 104 46,280 113 48,856
1905000 CROSS WYNNE SCHOOL DISTRICT
138 8,799 2,719 2,852 194 50,801 214 53,375
4401000 MADISON HUNTSVILLE SCHOOL DISTRICT
139 8,791 2,223 2,314 163 48,967 180 50,736
7301000 WHITE BALD KNOB SCHOOL DISTRICT
140 8,787 1,220 1,291 95 42,021 102 44,842
7008000 UNION SMACKOVER SCHOOL DISTRICT
141 8,774 808 850 64 40,726 72 43,195
4201000 LOGAN BOONEVILLE SCHOOL DISTRICT
142 8,770 1,288 1,361 106 41,484 113 43,419
4706000 MISSISSIPPI SO. MISS. COUNTY SCHOOL DIST.
143 8,759 1,225 1,301 80 42,923 90 44,792
5903000 PRAIRIE HAZEN SCHOOL DISTRICT
144 8,753 620 644 52 39,290 56 41,144
3601000 JOHNSON CLARKSVILLE SCHOOL DISTRICT
145 8,751 2,364 2,484 174 45,249 188 47,745
1608000 CRAIGHEAD JONESBORO SCHOOL DISTRICT
146 8,749 4,912 5,315 315 45,539 341 48,132
4203000 LOGAN PARIS SCHOOL DISTRICT
147 8,730 1,060 1,112 82 41,041 90 43,097
0302000 BAXTER COTTER SCHOOL DISTRICT
148 8,709 628 661 52 39,891 55 42,344
4701000 MISSISSIPPI ARMOREL SCHOOL DISTRICT
149 8,682 428 455 41 39,440 43 41,531
6102000 RANDOLPH MAYNARD SCHOOL DISTRICT
150 8,655 498 521 39 41,160 42 42,975
4603000 MILLER FOUKE SCHOOL DISTRICT
151 8,647 971 1,030 60 50,861 66 53,200
7304000 WHITE WHITE CO. CENTRAL SCHOOL DIST.
152 8,628 630 669 54 40,687 60 42,701
5006000 NEVADA PRESCOTT SCHOOL DISTRICT
153 8,625 1,011 1,045 77 39,346 84 40,945
1611000 CRAIGHEAD NETTLETON SCHOOL DISTRICT
154 8,611 3,010 3,149 217 45,144 235 47,296
7309000 WHITE PANGBURN SCHOOL DISTRICT
155 8,593 710 745 59 43,359 65 46,148
5703000 POLK MENA SCHOOL DISTRICT
156 8,588 1,832 1,883 135 43,479 145 45,179
1705000 CRAWFORD VAN BUREN SCHOOL DISTRICT
157 8,584 5,591 5,880 404 46,548 441 49,298
4708000 MISSISSIPPI GOSNELL SCHOOL 158 8,582 1,296 1,395 95 43,476 107 46,149
299

Annual Fiscal Report AnalysisRank by Per Pupil Expenditures 2010-2011 Actual
LEA County District Rank Per Pupil Expend
(1)
ADA (2)
ADM (3)
K12 Cert FTE
(4)
Avg Salary K12 Cert (5)
Certified FTE (6)
Avg Salary Cert FTE (7)
DISTRICT
7207000 WASHINGTON SPRINGDALE SCHOOL DISTRICT
159 8,577 17,592 18,678 1,130 56,359 1,230 58,679
5503000 PIKE KIRBY SCHOOL DISTRICT
160 8,561 392 409 33 39,788 36 42,317
4301000 LONOKE LONOKE SCHOOL DISTRICT
161 8,557 1,744 1,823 133 41,904 144 44,072
4602000 MILLER GENOA CENTRAL SCHOOL DISTRICT
162 8,556 906 939 69 47,252 75 50,024
5901000 PRAIRIE DES ARC SCHOOL DISTRICT
163 8,523 558 591 46 39,788 49 41,929
3604000 JOHNSON LAMAR SCHOOL DISTRICT
164 8,522 1,004 1,067 77 48,123 82 49,866
0406000 BENTON SILOAM SPRINGS SCHOOL DISTRICT
165 8,496 3,600 3,835 249 46,553 274 49,203
2808000 GREENE PARAGOULD SCHOOL DISTRICT
166 8,473 2,698 2,883 199 43,188 218 46,159
7001000 UNION EL DORADO SCHOOL DISTRICT
167 8,471 4,289 4,598 354 40,889 389 43,309
2301000 FAULKNER CONWAY SCHOOL DISTRICT
168 8,470 8,809 9,207 609 52,390 652 54,811
0803000 CARROLL GREEN FOREST SCHOOL DISTRICT
169 8,468 1,155 1,220 83 39,718 91 41,790
2606000 GARLAND LAKESIDE SCHOOL DIST(GARLAND)
170 8,453 2,840 2,997 190 50,230 207 53,041
5301000 PERRY EAST END SCHOOL DISTRICT
171 8,434 586 631 40 44,613 41 47,224
0401000 BENTON BENTONVILLE SCHOOL DISTRICT
172 8,427 12,793 13,536 894 53,594 944 55,499
6703000 SEVIER HORATIO SCHOOL DISTRICT
173 8,410 799 855 69 41,048 74 42,365
3209000 INDEPENDENCE SOUTHSIDE SCH DIST(INDEPENDENC
174 8,404 1,446 1,514 97 41,509 106 43,719
4003000 LINCOLN STAR CITY SCHOOL DISTRICT
175 8,403 1,569 1,651 107 44,247 117 48,927
0104000 ARKANSAS STUTTGART SCHOOL DISTRICT
176 8,400 1,673 1,786 120 42,468 134 45,739
3211000 INDEPENDENCE MIDLAND SCHOOL DISTRICT
177 8,374 500 521 38 38,357 41 40,561
7310000 WHITE ROSE BUD SCHOOL DISTRICT
178 8,372 779 815 59 43,021 61 44,322
6603000 SEBASTIAN HACKETT SCHOOL DISTRICT
179 8,364 587 621 46 43,197 51 45,369
3405000 JACKSON JACKSON CO. SCHOOL DISTRICT
179 8,364 770 813 64 38,149 72 40,812
3509000 JEFFERSON WATSON CHAPEL SCHOOL DISTRICT
181 8,358 2,916 3,092 190 48,621 206 51,117
0303000 BAXTER MOUNTAIN HOME SCHOOL DISTRICT
182 8,357 3,762 3,977 264 45,044 284 47,040
7007000 UNION PARKERS CHAPEL SCHOOL DIST.
183 8,355 629 658 52 42,984 56 45,610
2306000 FAULKNER MT. VERNON/ENOLA SCHOOL DIST.
184 8,354 459 478 36 41,822 39 44,777
300

Annual Fiscal Report AnalysisRank by Per Pupil Expenditures 2010-2011 Actual
LEA County District Rank Per Pupil Expend
(1)
ADA (2)
ADM (3)
K12 Cert FTE
(4)
Avg Salary K12 Cert (5)
Certified FTE (6)
Avg Salary Cert FTE (7)
1106000 CLAY RECTOR SCHOOL DISTRICT
185 8,334 565 589 51 41,434 54 43,404
3806000 LAWRENCE SLOAN-HENDRIX SCHOOL DIST.
186 8,325 611 653 48 39,855 52 42,250
6901000 STONE MOUNTAIN VIEW SCHOOL DISTRICT
187 8,308 1,617 1,711 129 43,712 138 45,709
1702000 CRAWFORD CEDARVILLE SCHOOL DISTRICT
188 8,299 856 925 57 44,597 63 48,172
6804000 SHARP HIGHLAND SCHOOL DISTRICT
189 8,296 1,503 1,592 109 39,850 118 41,909
7504000 YELL DARDANELLE SCHOOL DISTRICT
190 8,294 1,872 1,934 138 46,295 150 48,527
3005000 HOT SPRING OUACHITA SCHOOL DISTRICT
191 8,293 439 455 32 39,454 36 41,662
0405000 BENTON ROGERS SCHOOL DISTRICT
192 8,279 13,236 13,861 879 55,836 951 58,049
1804000 CRITTENDEN MARION SCHOOL DISTRICT
193 8,276 3,998 4,230 278 48,083 298 50,850
3105000 HOWARD NASHVILLE SCHOOL DISTRICT
194 8,268 1,865 1,939 127 52,390 139 54,111
1104000 CLAY PIGGOTT SCHOOL DISTRICT
195 8,264 921 956 76 42,520 82 43,796
5802000 POPE DOVER SCHOOL DISTRICT
196 8,214 1,269 1,357 95 44,464 102 46,176
2501000 FULTON MAMMOTH SPRING SCHOOL DISTRICT
197 8,207 444 470 44 29,757 47 32,107
6802000 SHARP CAVE CITY SCHOOL DISTRICT
198 8,205 1,256 1,339 99 40,199 108 42,391
1202000 CLEBURNE HEBER SPRINGS SCHOOL DISTRICT
199 8,192 1,634 1,738 124 42,836 132 44,489
7208000 WASHINGTON WEST FORK SCHOOL DISTRICT
200 8,189 1,158 1,222 87 45,342 91 47,024
2807000 GREENE GREENE CO. TECH SCHOOL DIST.
201 8,186 3,229 3,416 227 43,236 245 45,588
0404000 BENTON GRAVETTE SCHOOL DISTRICT
202 8,170 1,675 1,762 95 53,718 105 54,392
5303000 PERRY PERRYVILLE SCHOOL DISTRICT
203 8,152 948 1,014 76 41,641 82 43,865
2502000 FULTON SALEM SCHOOL DISTRICT
203 8,152 695 728 55 43,713 58 45,293
7403000 WOODRUFF MCCRORY SCHOOL DISTRICT
205 8,131 636 671 50 42,805 53 45,104
6602000 SEBASTIAN GREENWOOD SCHOOL DISTRICT
206 8,129 3,379 3,562 227 49,208 247 51,955
2605000 GARLAND LAKE HAMILTON SCHOOL DISTRICT
207 8,108 3,906 4,137 241 50,662 261 53,501
1701000 CRAWFORD ALMA SCHOOL DISTRICT
208 8,083 3,262 3,406 230 45,383 249 48,715
3510000 JEFFERSON WHITE HALL SCHOOL DISTRICT
209 8,059 2,894 3,000 185 51,954 199 54,262
1602000 CRAIGHEAD WESTSIDE CONS. SCH DIST(CRAIGH
210 8,037 1,535 1,620 114 40,653 124 42,478
2703000 GRANT POYEN SCHOOL 211 8,030 504 532 36 46,693 41 49,631
301

Annual Fiscal Report AnalysisRank by Per Pupil Expenditures 2010-2011 Actual
LEA County District Rank Per Pupil Expend
(1)
ADA (2)
ADM (3)
K12 Cert FTE
(4)
Avg Salary K12 Cert (5)
Certified FTE (6)
Avg Salary Cert FTE (7)
DISTRICT
0502000 BOONE BERGMAN SCHOOL DISTRICT
212 7,982 1,006 1,067 82 41,027 87 42,539
0505000 BOONE VALLEY SPRINGS SCHOOL DISTRICT
213 7,979 909 948 74 41,292 80 44,503
7202000 WASHINGTON FARMINGTON SCHOOL DISTRICT
214 7,935 2,058 2,178 154 45,901 167 48,413
3302000 IZARD MELBOURNE SCHOOL DISTRICT
215 7,910 869 907 68 40,377 73 42,210
4303000 LONOKE CARLISLE SCHOOL DISTRICT
216 7,857 710 749 51 40,563 57 42,244
4304000 LONOKE CABOT SCHOOL DISTRICT
217 7,829 9,342 9,976 616 49,445 682 51,704
2402000 FRANKLIN CHARLESTON SCHOOL DISTRICT
217 7,829 846 872 57 50,007 62 52,488
6103000 RANDOLPH POCAHONTAS SCHOOL DISTRICT
219 7,812 1,734 1,819 124 44,017 133 45,736
7206000 WASHINGTON PRAIRIE GROVE SCHOOL DISTRICT
220 7,777 1,684 1,747 116 44,703 126 47,316
4204000 LOGAN SCRANTON SCHOOL DISTRICT
221 7,774 389 405 29 40,188 33 42,416
7302000 WHITE BEEBE SCHOOL DISTRICT
222 7,771 3,072 3,193 214 44,378 235 47,625
2305000 FAULKNER MAYFLOWER SCHOOL DISTRICT
223 7,759 984 1,058 76 40,991 81 42,776
6302000 SALINE BENTON SCHOOL DISTRICT
224 7,739 4,398 4,629 276 50,413 300 53,472
1304000 CLEVELAND WOODLAWN SCHOOL DISTRICT
225 7,711 521 550 35 44,351 39 46,724
6304000 SALINE HARMONY GROVE SCH DIST(SALINE)
226 7,697 1,056 1,097 76 47,145 82 49,429
2705000 GRANT SHERIDAN SCHOOL DISTRICT
227 7,691 3,900 4,135 264 44,739 288 46,645
6606000 SEBASTIAN MANSFIELD SCHOOL DISTRICT
228 7,684 887 955 70 42,355 75 44,198
2307000 FAULKNER VILONIA SCHOOL DISTRICT
229 7,664 2,904 3,062 197 48,644 214 50,668
2303000 FAULKNER GREENBRIER SCHOOL DISTRICT
230 7,588 2,911 3,076 201 49,640 218 51,830
7311000 WHITE SEARCY SCHOOL DISTRICT
231 7,585 3,767 3,998 236 49,594 262 51,865
5804000 POPE POTTSVILLE SCHOOL DISTRICT
232 7,555 1,561 1,618 120 43,742 127 45,441
6301000 SALINE BAUXITE SCHOOL DISTRICT
233 7,507 1,406 1,485 88 45,150 96 47,522
0407000 BENTON PEA RIDGE SCHOOL DISTRICT
233 7,507 1,555 1,639 100 46,299 105 48,050
7201000 WASHINGTON ELKINS SCHOOL DISTRICT
235 7,470 1,104 1,151 83 41,977 89 43,769
2906000 HEMPSTEAD SPRING HILL SCHOOL DISTRICT
236 7,459 492 507 34 46,248 38 48,154
6303000 SALINE BRYANT SCHOOL DISTRICT
237 7,401 7,554 7,879 476 52,097 509 53,916
302
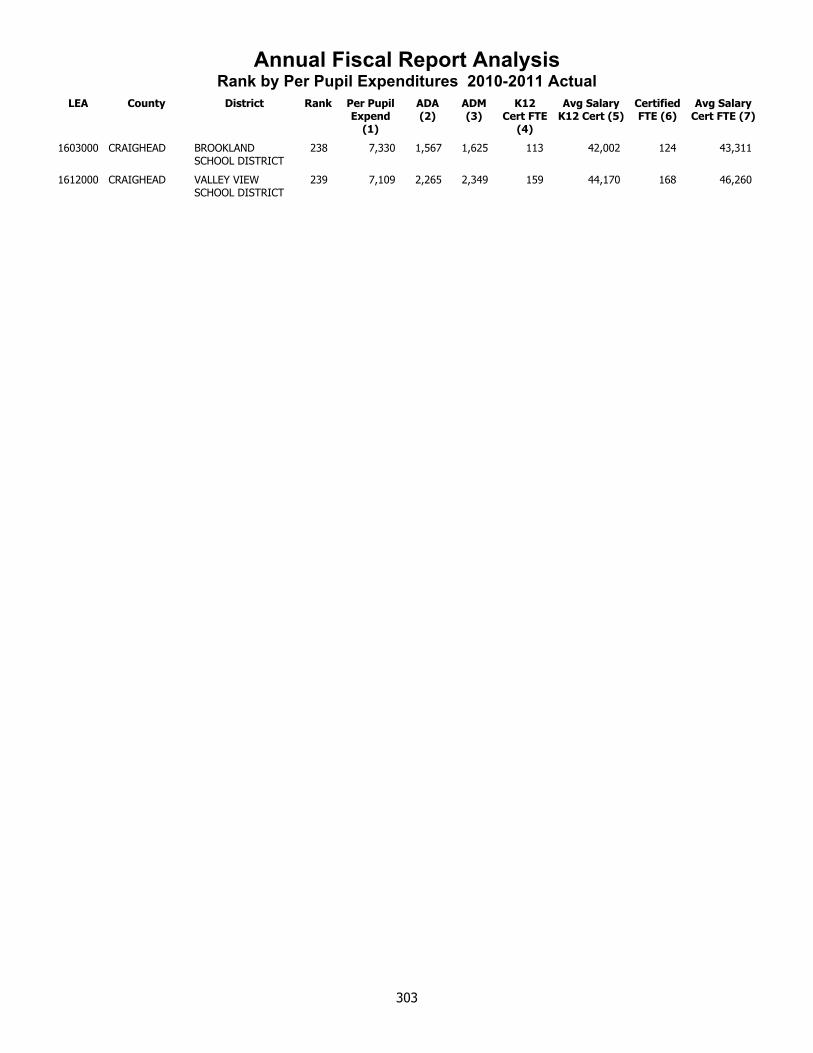
Annual Fiscal Report AnalysisRank by Per Pupil Expenditures 2010-2011 Actual
LEA County District Rank Per Pupil Expend
(1)
ADA (2)
ADM (3)
K12 Cert FTE
(4)
Avg Salary K12 Cert (5)
Certified FTE (6)
Avg Salary Cert FTE (7)
1603000 CRAIGHEAD BROOKLAND SCHOOL DISTRICT
238 7,330 1,567 1,625 113 42,002 124 43,311
1612000 CRAIGHEAD VALLEY VIEW SCHOOL DISTRICT
239 7,109 2,265 2,349 159 44,170 168 46,260
303

Ranked byAverage Daily Attendance
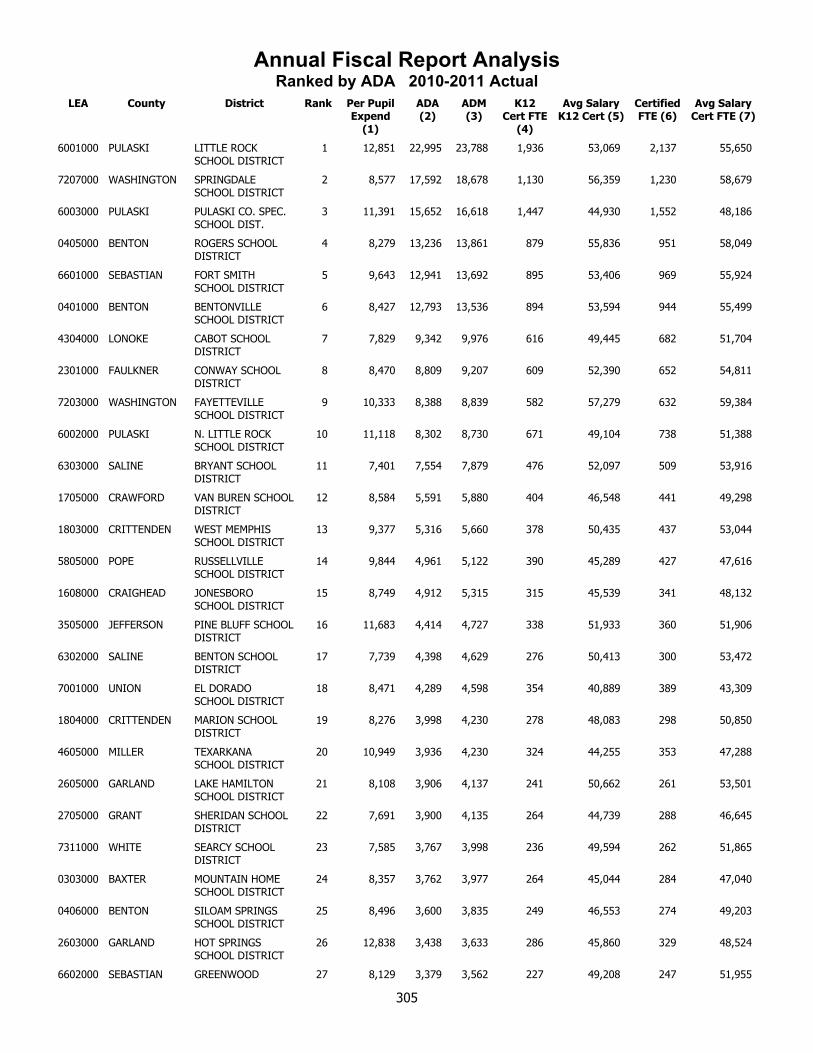
Annual Fiscal Report AnalysisRanked by ADA 2010-2011 Actual
LEA County District Rank Per Pupil Expend
(1)
ADA (2)
ADM (3)
K12 Cert FTE
(4)
Avg Salary K12 Cert (5)
Certified FTE (6)
Avg Salary Cert FTE (7)
6001000 PULASKI LITTLE ROCK SCHOOL DISTRICT
1 12,851 22,995 23,788 1,936 53,069 2,137 55,650
7207000 WASHINGTON SPRINGDALE SCHOOL DISTRICT
2 8,577 17,592 18,678 1,130 56,359 1,230 58,679
6003000 PULASKI PULASKI CO. SPEC. SCHOOL DIST.
3 11,391 15,652 16,618 1,447 44,930 1,552 48,186
0405000 BENTON ROGERS SCHOOL DISTRICT
4 8,279 13,236 13,861 879 55,836 951 58,049
6601000 SEBASTIAN FORT SMITH SCHOOL DISTRICT
5 9,643 12,941 13,692 895 53,406 969 55,924
0401000 BENTON BENTONVILLE SCHOOL DISTRICT
6 8,427 12,793 13,536 894 53,594 944 55,499
4304000 LONOKE CABOT SCHOOL DISTRICT
7 7,829 9,342 9,976 616 49,445 682 51,704
2301000 FAULKNER CONWAY SCHOOL DISTRICT
8 8,470 8,809 9,207 609 52,390 652 54,811
7203000 WASHINGTON FAYETTEVILLE SCHOOL DISTRICT
9 10,333 8,388 8,839 582 57,279 632 59,384
6002000 PULASKI N. LITTLE ROCK SCHOOL DISTRICT
10 11,118 8,302 8,730 671 49,104 738 51,388
6303000 SALINE BRYANT SCHOOL DISTRICT
11 7,401 7,554 7,879 476 52,097 509 53,916
1705000 CRAWFORD VAN BUREN SCHOOL DISTRICT
12 8,584 5,591 5,880 404 46,548 441 49,298
1803000 CRITTENDEN WEST MEMPHIS SCHOOL DISTRICT
13 9,377 5,316 5,660 378 50,435 437 53,044
5805000 POPE RUSSELLVILLE SCHOOL DISTRICT
14 9,844 4,961 5,122 390 45,289 427 47,616
1608000 CRAIGHEAD JONESBORO SCHOOL DISTRICT
15 8,749 4,912 5,315 315 45,539 341 48,132
3505000 JEFFERSON PINE BLUFF SCHOOL DISTRICT
16 11,683 4,414 4,727 338 51,933 360 51,906
6302000 SALINE BENTON SCHOOL DISTRICT
17 7,739 4,398 4,629 276 50,413 300 53,472
7001000 UNION EL DORADO SCHOOL DISTRICT
18 8,471 4,289 4,598 354 40,889 389 43,309
1804000 CRITTENDEN MARION SCHOOL DISTRICT
19 8,276 3,998 4,230 278 48,083 298 50,850
4605000 MILLER TEXARKANA SCHOOL DISTRICT
20 10,949 3,936 4,230 324 44,255 353 47,288
2605000 GARLAND LAKE HAMILTON SCHOOL DISTRICT
21 8,108 3,906 4,137 241 50,662 261 53,501
2705000 GRANT SHERIDAN SCHOOL DISTRICT
22 7,691 3,900 4,135 264 44,739 288 46,645
7311000 WHITE SEARCY SCHOOL DISTRICT
23 7,585 3,767 3,998 236 49,594 262 51,865
0303000 BAXTER MOUNTAIN HOME SCHOOL DISTRICT
24 8,357 3,762 3,977 264 45,044 284 47,040
0406000 BENTON SILOAM SPRINGS SCHOOL DISTRICT
25 8,496 3,600 3,835 249 46,553 274 49,203
2603000 GARLAND HOT SPRINGS SCHOOL DISTRICT
26 12,838 3,438 3,633 286 45,860 329 48,524
6602000 SEBASTIAN GREENWOOD 27 8,129 3,379 3,562 227 49,208 247 51,955
305

Annual Fiscal Report AnalysisRanked by ADA 2010-2011 Actual
LEA County District Rank Per Pupil Expend
(1)
ADA (2)
ADM (3)
K12 Cert FTE
(4)
Avg Salary K12 Cert (5)
Certified FTE (6)
Avg Salary Cert FTE (7)
SCHOOL DISTRICT
1701000 CRAWFORD ALMA SCHOOL DISTRICT
28 8,083 3,262 3,406 230 45,383 249 48,715
2807000 GREENE GREENE CO. TECH SCHOOL DIST.
29 8,186 3,229 3,416 227 43,236 245 45,588
7302000 WHITE BEEBE SCHOOL DISTRICT
30 7,771 3,072 3,193 214 44,378 235 47,625
1611000 CRAIGHEAD NETTLETON SCHOOL DISTRICT
31 8,611 3,010 3,149 217 45,144 235 47,296
6201000 ST FRANCIS FORREST CITY SCHOOL DISTRICT
32 11,383 2,937 3,138 222 50,845 250 53,488
3509000 JEFFERSON WATSON CHAPEL SCHOOL DISTRICT
33 8,358 2,916 3,092 190 48,621 206 51,117
2303000 FAULKNER GREENBRIER SCHOOL DISTRICT
34 7,588 2,911 3,076 201 49,640 218 51,830
2307000 FAULKNER VILONIA SCHOOL DISTRICT
35 7,664 2,904 3,062 197 48,644 214 50,668
3510000 JEFFERSON WHITE HALL SCHOOL DISTRICT
36 8,059 2,894 3,000 185 51,954 199 54,262
2606000 GARLAND LAKESIDE SCHOOL DIST(GARLAND)
37 8,453 2,840 2,997 190 50,230 207 53,041
3201000 INDEPENDENCE BATESVILLE SCHOOL DISTRICT
38 9,043 2,787 2,943 189 37,468 206 40,264
4702000 MISSISSIPPI BLYTHEVILLE SCHOOL DISTRICT
39 11,387 2,720 2,902 209 43,144 232 46,601
1905000 CROSS WYNNE SCHOOL DISTRICT
40 8,799 2,719 2,852 194 50,801 214 53,375
2808000 GREENE PARAGOULD SCHOOL DISTRICT
41 8,473 2,698 2,883 199 43,188 218 46,159
1402000 COLUMBIA MAGNOLIA SCHOOL DISTRICT
42 8,882 2,600 2,758 199 44,130 219 46,830
0503000 BOONE HARRISON SCHOOL DISTRICT
43 8,853 2,580 2,743 187 48,255 206 50,980
2903000 HEMPSTEAD HOPE SCHOOL DISTRICT
44 9,394 2,466 2,486 199 40,992 224 42,591
3601000 JOHNSON CLARKSVILLE SCHOOL DISTRICT
45 8,751 2,364 2,484 174 45,249 188 47,745
5204000 OUACHITA CAMDEN FAIRVIEW SCHOOL DIST.
46 10,176 2,300 2,428 171 44,109 197 47,313
6701000 SEVIER DEQUEEN SCHOOL DISTRICT
47 9,206 2,269 2,380 170 47,683 196 49,906
1612000 CRAIGHEAD VALLEY VIEW SCHOOL DISTRICT
48 7,109 2,265 2,349 159 44,170 168 46,260
4401000 MADISON HUNTSVILLE SCHOOL DISTRICT
49 8,791 2,223 2,314 163 48,967 180 50,736
5403000 PHILLIPS HELENA/ W.HELENA SCHOOL DIST.
50 11,638 2,115 2,233 102 50,561 133 54,170
1507000 CONWAY SO. CONWAY CO. SCHOOL DISTRICT
51 8,902 2,106 2,227 170 42,991 182 45,256
7202000 WASHINGTON FARMINGTON SCHOOL DISTRICT
52 7,935 2,058 2,178 154 45,901 167 48,413
3004000 HOT SPRING MALVERN SCHOOL DISTRICT
53 8,962 2,020 2,108 146 45,978 158 48,410
306
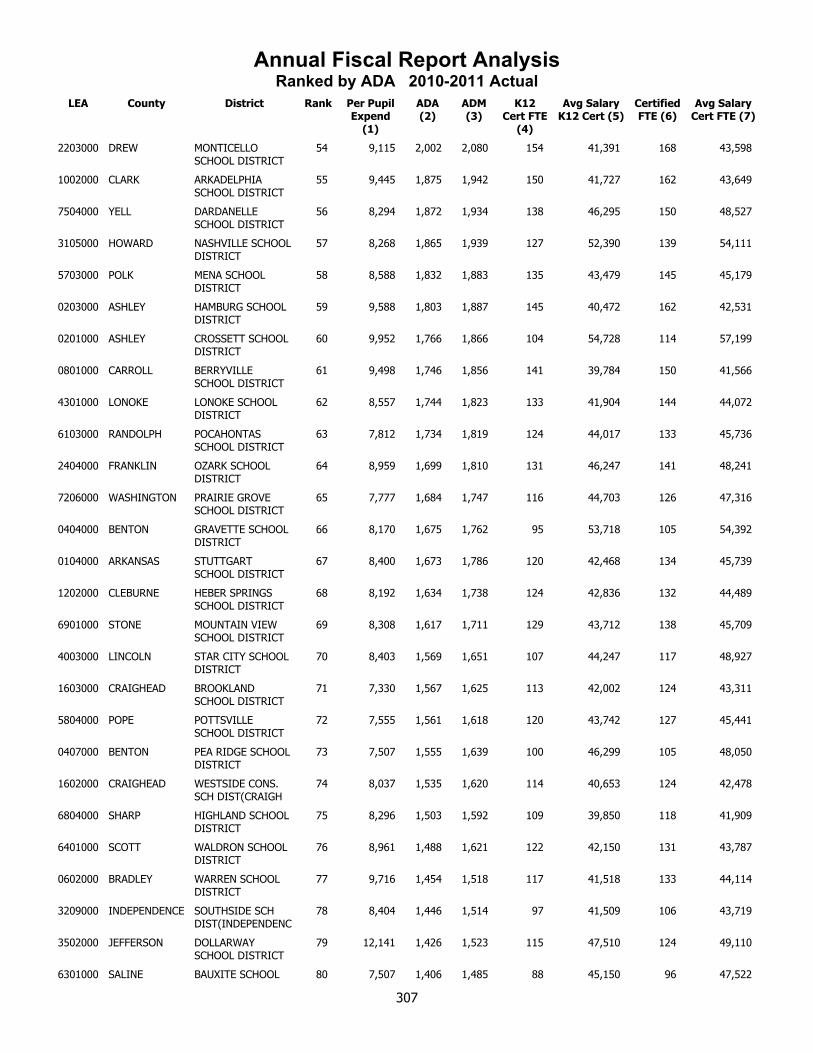
Annual Fiscal Report AnalysisRanked by ADA 2010-2011 Actual
LEA County District Rank Per Pupil Expend
(1)
ADA (2)
ADM (3)
K12 Cert FTE
(4)
Avg Salary K12 Cert (5)
Certified FTE (6)
Avg Salary Cert FTE (7)
2203000 DREW MONTICELLO SCHOOL DISTRICT
54 9,115 2,002 2,080 154 41,391 168 43,598
1002000 CLARK ARKADELPHIA SCHOOL DISTRICT
55 9,445 1,875 1,942 150 41,727 162 43,649
7504000 YELL DARDANELLE SCHOOL DISTRICT
56 8,294 1,872 1,934 138 46,295 150 48,527
3105000 HOWARD NASHVILLE SCHOOL DISTRICT
57 8,268 1,865 1,939 127 52,390 139 54,111
5703000 POLK MENA SCHOOL DISTRICT
58 8,588 1,832 1,883 135 43,479 145 45,179
0203000 ASHLEY HAMBURG SCHOOL DISTRICT
59 9,588 1,803 1,887 145 40,472 162 42,531
0201000 ASHLEY CROSSETT SCHOOL DISTRICT
60 9,952 1,766 1,866 104 54,728 114 57,199
0801000 CARROLL BERRYVILLE SCHOOL DISTRICT
61 9,498 1,746 1,856 141 39,784 150 41,566
4301000 LONOKE LONOKE SCHOOL DISTRICT
62 8,557 1,744 1,823 133 41,904 144 44,072
6103000 RANDOLPH POCAHONTAS SCHOOL DISTRICT
63 7,812 1,734 1,819 124 44,017 133 45,736
2404000 FRANKLIN OZARK SCHOOL DISTRICT
64 8,959 1,699 1,810 131 46,247 141 48,241
7206000 WASHINGTON PRAIRIE GROVE SCHOOL DISTRICT
65 7,777 1,684 1,747 116 44,703 126 47,316
0404000 BENTON GRAVETTE SCHOOL DISTRICT
66 8,170 1,675 1,762 95 53,718 105 54,392
0104000 ARKANSAS STUTTGART SCHOOL DISTRICT
67 8,400 1,673 1,786 120 42,468 134 45,739
1202000 CLEBURNE HEBER SPRINGS SCHOOL DISTRICT
68 8,192 1,634 1,738 124 42,836 132 44,489
6901000 STONE MOUNTAIN VIEW SCHOOL DISTRICT
69 8,308 1,617 1,711 129 43,712 138 45,709
4003000 LINCOLN STAR CITY SCHOOL DISTRICT
70 8,403 1,569 1,651 107 44,247 117 48,927
1603000 CRAIGHEAD BROOKLAND SCHOOL DISTRICT
71 7,330 1,567 1,625 113 42,002 124 43,311
5804000 POPE POTTSVILLE SCHOOL DISTRICT
72 7,555 1,561 1,618 120 43,742 127 45,441
0407000 BENTON PEA RIDGE SCHOOL DISTRICT
73 7,507 1,555 1,639 100 46,299 105 48,050
1602000 CRAIGHEAD WESTSIDE CONS. SCH DIST(CRAIGH
74 8,037 1,535 1,620 114 40,653 124 42,478
6804000 SHARP HIGHLAND SCHOOL DISTRICT
75 8,296 1,503 1,592 109 39,850 118 41,909
6401000 SCOTT WALDRON SCHOOL DISTRICT
76 8,961 1,488 1,621 122 42,150 131 43,787
0602000 BRADLEY WARREN SCHOOL DISTRICT
77 9,716 1,454 1,518 117 41,518 133 44,114
3209000 INDEPENDENCE SOUTHSIDE SCH DIST(INDEPENDENC
78 8,404 1,446 1,514 97 41,509 106 43,719
3502000 JEFFERSON DOLLARWAY SCHOOL DISTRICT
79 12,141 1,426 1,523 115 47,510 124 49,110
6301000 SALINE BAUXITE SCHOOL 80 7,507 1,406 1,485 88 45,150 96 47,522
307
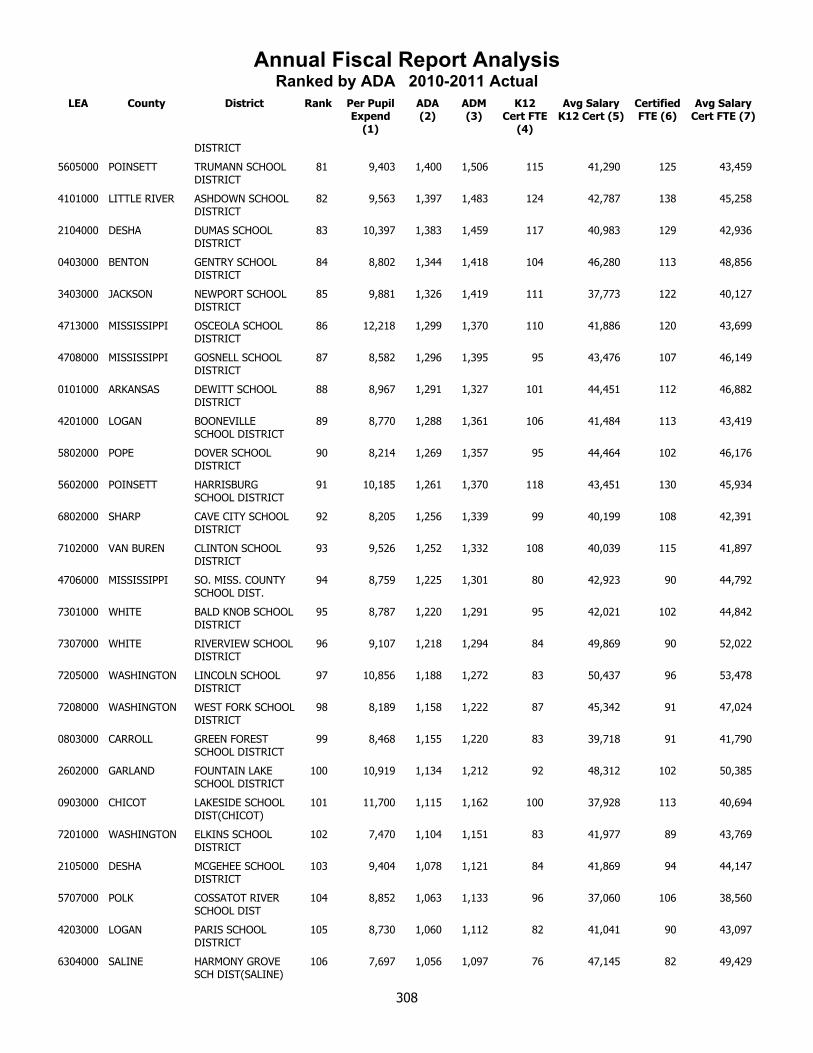
Annual Fiscal Report AnalysisRanked by ADA 2010-2011 Actual
LEA County District Rank Per Pupil Expend
(1)
ADA (2)
ADM (3)
K12 Cert FTE
(4)
Avg Salary K12 Cert (5)
Certified FTE (6)
Avg Salary Cert FTE (7)
DISTRICT
5605000 POINSETT TRUMANN SCHOOL DISTRICT
81 9,403 1,400 1,506 115 41,290 125 43,459
4101000 LITTLE RIVER ASHDOWN SCHOOL DISTRICT
82 9,563 1,397 1,483 124 42,787 138 45,258
2104000 DESHA DUMAS SCHOOL DISTRICT
83 10,397 1,383 1,459 117 40,983 129 42,936
0403000 BENTON GENTRY SCHOOL DISTRICT
84 8,802 1,344 1,418 104 46,280 113 48,856
3403000 JACKSON NEWPORT SCHOOL DISTRICT
85 9,881 1,326 1,419 111 37,773 122 40,127
4713000 MISSISSIPPI OSCEOLA SCHOOL DISTRICT
86 12,218 1,299 1,370 110 41,886 120 43,699
4708000 MISSISSIPPI GOSNELL SCHOOL DISTRICT
87 8,582 1,296 1,395 95 43,476 107 46,149
0101000 ARKANSAS DEWITT SCHOOL DISTRICT
88 8,967 1,291 1,327 101 44,451 112 46,882
4201000 LOGAN BOONEVILLE SCHOOL DISTRICT
89 8,770 1,288 1,361 106 41,484 113 43,419
5802000 POPE DOVER SCHOOL DISTRICT
90 8,214 1,269 1,357 95 44,464 102 46,176
5602000 POINSETT HARRISBURG SCHOOL DISTRICT
91 10,185 1,261 1,370 118 43,451 130 45,934
6802000 SHARP CAVE CITY SCHOOL DISTRICT
92 8,205 1,256 1,339 99 40,199 108 42,391
7102000 VAN BUREN CLINTON SCHOOL DISTRICT
93 9,526 1,252 1,332 108 40,039 115 41,897
4706000 MISSISSIPPI SO. MISS. COUNTY SCHOOL DIST.
94 8,759 1,225 1,301 80 42,923 90 44,792
7301000 WHITE BALD KNOB SCHOOL DISTRICT
95 8,787 1,220 1,291 95 42,021 102 44,842
7307000 WHITE RIVERVIEW SCHOOL DISTRICT
96 9,107 1,218 1,294 84 49,869 90 52,022
7205000 WASHINGTON LINCOLN SCHOOL DISTRICT
97 10,856 1,188 1,272 83 50,437 96 53,478
7208000 WASHINGTON WEST FORK SCHOOL DISTRICT
98 8,189 1,158 1,222 87 45,342 91 47,024
0803000 CARROLL GREEN FOREST SCHOOL DISTRICT
99 8,468 1,155 1,220 83 39,718 91 41,790
2602000 GARLAND FOUNTAIN LAKE SCHOOL DISTRICT
100 10,919 1,134 1,212 92 48,312 102 50,385
0903000 CHICOT LAKESIDE SCHOOL DIST(CHICOT)
101 11,700 1,115 1,162 100 37,928 113 40,694
7201000 WASHINGTON ELKINS SCHOOL DISTRICT
102 7,470 1,104 1,151 83 41,977 89 43,769
2105000 DESHA MCGEHEE SCHOOL DISTRICT
103 9,404 1,078 1,121 84 41,869 94 44,147
5707000 POLK COSSATOT RIVER SCHOOL DIST
104 8,852 1,063 1,133 96 37,060 106 38,560
4203000 LOGAN PARIS SCHOOL DISTRICT
105 8,730 1,060 1,112 82 41,041 90 43,097
6304000 SALINE HARMONY GROVE SCH DIST(SALINE)
106 7,697 1,056 1,097 76 47,145 82 49,429
308
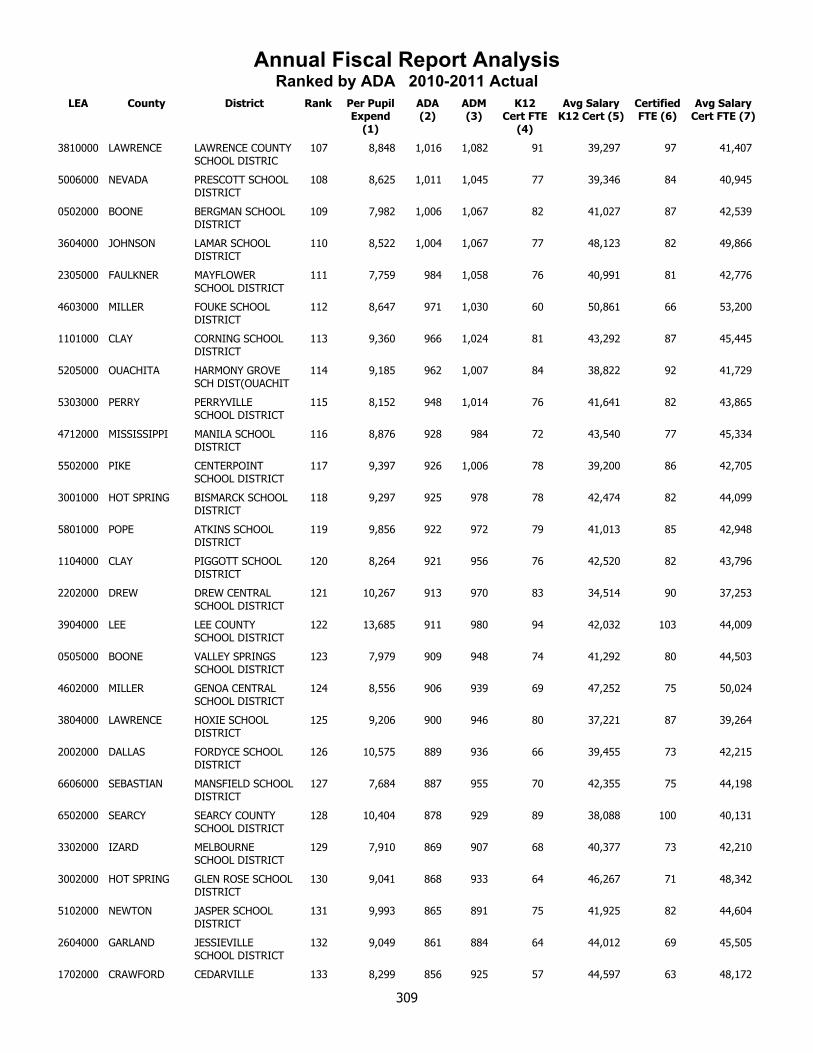
Annual Fiscal Report AnalysisRanked by ADA 2010-2011 Actual
LEA County District Rank Per Pupil Expend
(1)
ADA (2)
ADM (3)
K12 Cert FTE
(4)
Avg Salary K12 Cert (5)
Certified FTE (6)
Avg Salary Cert FTE (7)
3810000 LAWRENCE LAWRENCE COUNTY SCHOOL DISTRIC
107 8,848 1,016 1,082 91 39,297 97 41,407
5006000 NEVADA PRESCOTT SCHOOL DISTRICT
108 8,625 1,011 1,045 77 39,346 84 40,945
0502000 BOONE BERGMAN SCHOOL DISTRICT
109 7,982 1,006 1,067 82 41,027 87 42,539
3604000 JOHNSON LAMAR SCHOOL DISTRICT
110 8,522 1,004 1,067 77 48,123 82 49,866
2305000 FAULKNER MAYFLOWER SCHOOL DISTRICT
111 7,759 984 1,058 76 40,991 81 42,776
4603000 MILLER FOUKE SCHOOL DISTRICT
112 8,647 971 1,030 60 50,861 66 53,200
1101000 CLAY CORNING SCHOOL DISTRICT
113 9,360 966 1,024 81 43,292 87 45,445
5205000 OUACHITA HARMONY GROVE SCH DIST(OUACHIT
114 9,185 962 1,007 84 38,822 92 41,729
5303000 PERRY PERRYVILLE SCHOOL DISTRICT
115 8,152 948 1,014 76 41,641 82 43,865
4712000 MISSISSIPPI MANILA SCHOOL DISTRICT
116 8,876 928 984 72 43,540 77 45,334
5502000 PIKE CENTERPOINT SCHOOL DISTRICT
117 9,397 926 1,006 78 39,200 86 42,705
3001000 HOT SPRING BISMARCK SCHOOL DISTRICT
118 9,297 925 978 78 42,474 82 44,099
5801000 POPE ATKINS SCHOOL DISTRICT
119 9,856 922 972 79 41,013 85 42,948
1104000 CLAY PIGGOTT SCHOOL DISTRICT
120 8,264 921 956 76 42,520 82 43,796
2202000 DREW DREW CENTRAL SCHOOL DISTRICT
121 10,267 913 970 83 34,514 90 37,253
3904000 LEE LEE COUNTY SCHOOL DISTRICT
122 13,685 911 980 94 42,032 103 44,009
0505000 BOONE VALLEY SPRINGS SCHOOL DISTRICT
123 7,979 909 948 74 41,292 80 44,503
4602000 MILLER GENOA CENTRAL SCHOOL DISTRICT
124 8,556 906 939 69 47,252 75 50,024
3804000 LAWRENCE HOXIE SCHOOL DISTRICT
125 9,206 900 946 80 37,221 87 39,264
2002000 DALLAS FORDYCE SCHOOL DISTRICT
126 10,575 889 936 66 39,455 73 42,215
6606000 SEBASTIAN MANSFIELD SCHOOL DISTRICT
127 7,684 887 955 70 42,355 75 44,198
6502000 SEARCY SEARCY COUNTY SCHOOL DISTRICT
128 10,404 878 929 89 38,088 100 40,131
3302000 IZARD MELBOURNE SCHOOL DISTRICT
129 7,910 869 907 68 40,377 73 42,210
3002000 HOT SPRING GLEN ROSE SCHOOL DISTRICT
130 9,041 868 933 64 46,267 71 48,342
5102000 NEWTON JASPER SCHOOL DISTRICT
131 9,993 865 891 75 41,925 82 44,604
2604000 GARLAND JESSIEVILLE SCHOOL DISTRICT
132 9,049 861 884 64 44,012 69 45,505
1702000 CRAWFORD CEDARVILLE 133 8,299 856 925 57 44,597 63 48,172
309
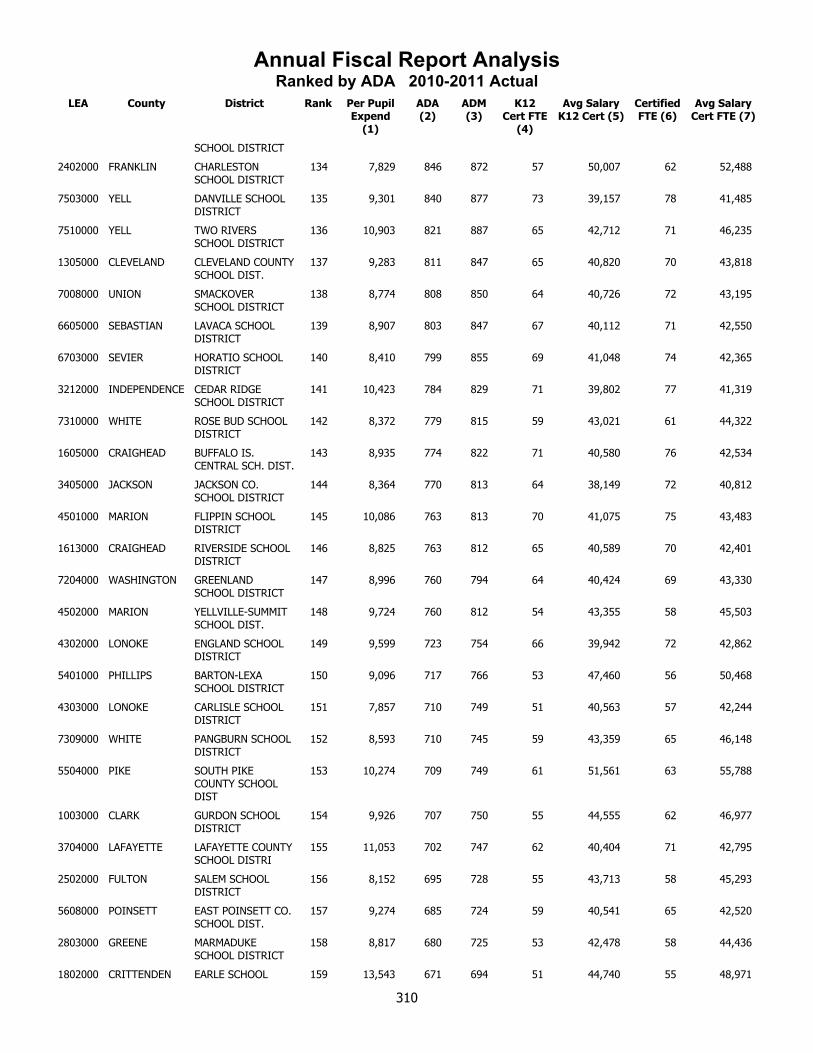
Annual Fiscal Report AnalysisRanked by ADA 2010-2011 Actual
LEA County District Rank Per Pupil Expend
(1)
ADA (2)
ADM (3)
K12 Cert FTE
(4)
Avg Salary K12 Cert (5)
Certified FTE (6)
Avg Salary Cert FTE (7)
SCHOOL DISTRICT
2402000 FRANKLIN CHARLESTON SCHOOL DISTRICT
134 7,829 846 872 57 50,007 62 52,488
7503000 YELL DANVILLE SCHOOL DISTRICT
135 9,301 840 877 73 39,157 78 41,485
7510000 YELL TWO RIVERS SCHOOL DISTRICT
136 10,903 821 887 65 42,712 71 46,235
1305000 CLEVELAND CLEVELAND COUNTY SCHOOL DIST.
137 9,283 811 847 65 40,820 70 43,818
7008000 UNION SMACKOVER SCHOOL DISTRICT
138 8,774 808 850 64 40,726 72 43,195
6605000 SEBASTIAN LAVACA SCHOOL DISTRICT
139 8,907 803 847 67 40,112 71 42,550
6703000 SEVIER HORATIO SCHOOL DISTRICT
140 8,410 799 855 69 41,048 74 42,365
3212000 INDEPENDENCE CEDAR RIDGE SCHOOL DISTRICT
141 10,423 784 829 71 39,802 77 41,319
7310000 WHITE ROSE BUD SCHOOL DISTRICT
142 8,372 779 815 59 43,021 61 44,322
1605000 CRAIGHEAD BUFFALO IS. CENTRAL SCH. DIST.
143 8,935 774 822 71 40,580 76 42,534
3405000 JACKSON JACKSON CO. SCHOOL DISTRICT
144 8,364 770 813 64 38,149 72 40,812
4501000 MARION FLIPPIN SCHOOL DISTRICT
145 10,086 763 813 70 41,075 75 43,483
1613000 CRAIGHEAD RIVERSIDE SCHOOL DISTRICT
146 8,825 763 812 65 40,589 70 42,401
7204000 WASHINGTON GREENLAND SCHOOL DISTRICT
147 8,996 760 794 64 40,424 69 43,330
4502000 MARION YELLVILLE-SUMMIT SCHOOL DIST.
148 9,724 760 812 54 43,355 58 45,503
4302000 LONOKE ENGLAND SCHOOL DISTRICT
149 9,599 723 754 66 39,942 72 42,862
5401000 PHILLIPS BARTON-LEXA SCHOOL DISTRICT
150 9,096 717 766 53 47,460 56 50,468
4303000 LONOKE CARLISLE SCHOOL DISTRICT
151 7,857 710 749 51 40,563 57 42,244
7309000 WHITE PANGBURN SCHOOL DISTRICT
152 8,593 710 745 59 43,359 65 46,148
5504000 PIKE SOUTH PIKE COUNTY SCHOOL DIST
153 10,274 709 749 61 51,561 63 55,788
1003000 CLARK GURDON SCHOOL DISTRICT
154 9,926 707 750 55 44,555 62 46,977
3704000 LAFAYETTE LAFAYETTE COUNTY SCHOOL DISTRI
155 11,053 702 747 62 40,404 71 42,795
2502000 FULTON SALEM SCHOOL DISTRICT
156 8,152 695 728 55 43,713 58 45,293
5608000 POINSETT EAST POINSETT CO. SCHOOL DIST.
157 9,274 685 724 59 40,541 65 42,520
2803000 GREENE MARMADUKE SCHOOL DISTRICT
158 8,817 680 725 53 42,478 58 44,436
1802000 CRITTENDEN EARLE SCHOOL 159 13,543 671 694 51 44,740 55 48,971
310
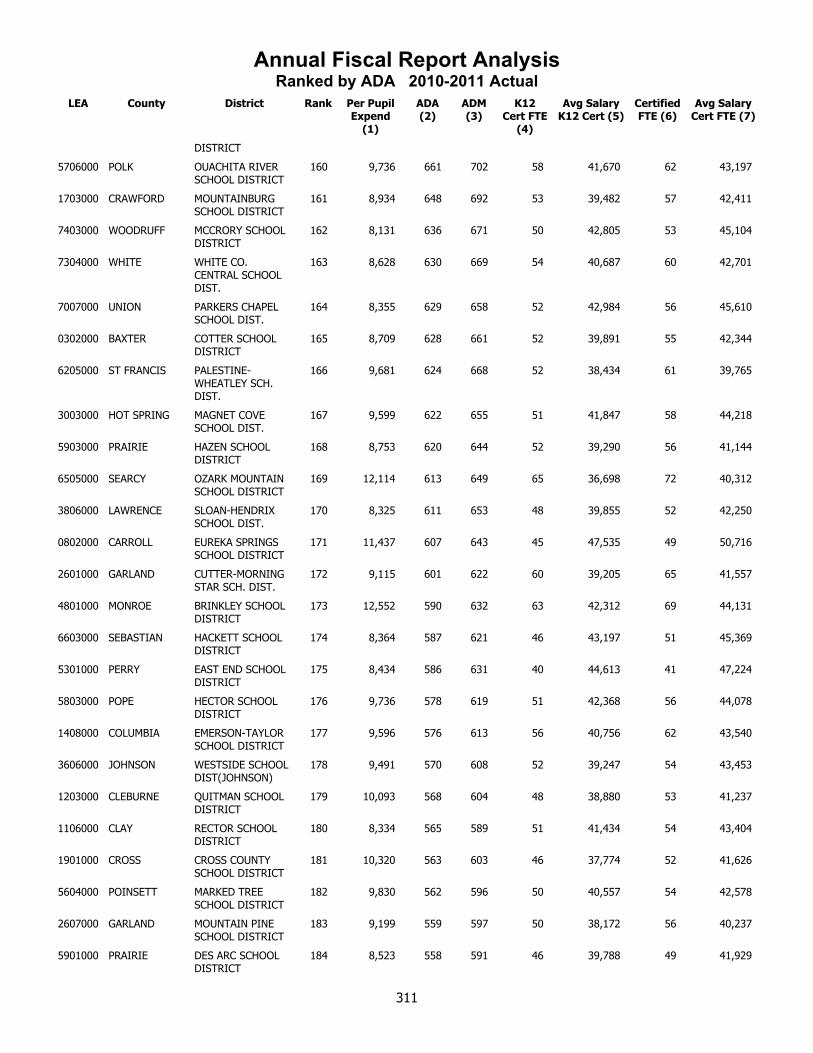
Annual Fiscal Report AnalysisRanked by ADA 2010-2011 Actual
LEA County District Rank Per Pupil Expend
(1)
ADA (2)
ADM (3)
K12 Cert FTE
(4)
Avg Salary K12 Cert (5)
Certified FTE (6)
Avg Salary Cert FTE (7)
DISTRICT
5706000 POLK OUACHITA RIVER SCHOOL DISTRICT
160 9,736 661 702 58 41,670 62 43,197
1703000 CRAWFORD MOUNTAINBURG SCHOOL DISTRICT
161 8,934 648 692 53 39,482 57 42,411
7403000 WOODRUFF MCCRORY SCHOOL DISTRICT
162 8,131 636 671 50 42,805 53 45,104
7304000 WHITE WHITE CO. CENTRAL SCHOOL DIST.
163 8,628 630 669 54 40,687 60 42,701
7007000 UNION PARKERS CHAPEL SCHOOL DIST.
164 8,355 629 658 52 42,984 56 45,610
0302000 BAXTER COTTER SCHOOL DISTRICT
165 8,709 628 661 52 39,891 55 42,344
6205000 ST FRANCIS PALESTINE-WHEATLEY SCH. DIST.
166 9,681 624 668 52 38,434 61 39,765
3003000 HOT SPRING MAGNET COVE SCHOOL DIST.
167 9,599 622 655 51 41,847 58 44,218
5903000 PRAIRIE HAZEN SCHOOL DISTRICT
168 8,753 620 644 52 39,290 56 41,144
6505000 SEARCY OZARK MOUNTAIN SCHOOL DISTRICT
169 12,114 613 649 65 36,698 72 40,312
3806000 LAWRENCE SLOAN-HENDRIX SCHOOL DIST.
170 8,325 611 653 48 39,855 52 42,250
0802000 CARROLL EUREKA SPRINGS SCHOOL DISTRICT
171 11,437 607 643 45 47,535 49 50,716
2601000 GARLAND CUTTER-MORNING STAR SCH. DIST.
172 9,115 601 622 60 39,205 65 41,557
4801000 MONROE BRINKLEY SCHOOL DISTRICT
173 12,552 590 632 63 42,312 69 44,131
6603000 SEBASTIAN HACKETT SCHOOL DISTRICT
174 8,364 587 621 46 43,197 51 45,369
5301000 PERRY EAST END SCHOOL DISTRICT
175 8,434 586 631 40 44,613 41 47,224
5803000 POPE HECTOR SCHOOL DISTRICT
176 9,736 578 619 51 42,368 56 44,078
1408000 COLUMBIA EMERSON-TAYLOR SCHOOL DISTRICT
177 9,596 576 613 56 40,756 62 43,540
3606000 JOHNSON WESTSIDE SCHOOL DIST(JOHNSON)
178 9,491 570 608 52 39,247 54 43,453
1203000 CLEBURNE QUITMAN SCHOOL DISTRICT
179 10,093 568 604 48 38,880 53 41,237
1106000 CLAY RECTOR SCHOOL DISTRICT
180 8,334 565 589 51 41,434 54 43,404
1901000 CROSS CROSS COUNTY SCHOOL DISTRICT
181 10,320 563 603 46 37,774 52 41,626
5604000 POINSETT MARKED TREE SCHOOL DISTRICT
182 9,830 562 596 50 40,557 54 42,578
2607000 GARLAND MOUNTAIN PINE SCHOOL DISTRICT
183 9,199 559 597 50 38,172 56 40,237
5901000 PRAIRIE DES ARC SCHOOL DISTRICT
184 8,523 558 591 46 39,788 49 41,929
311
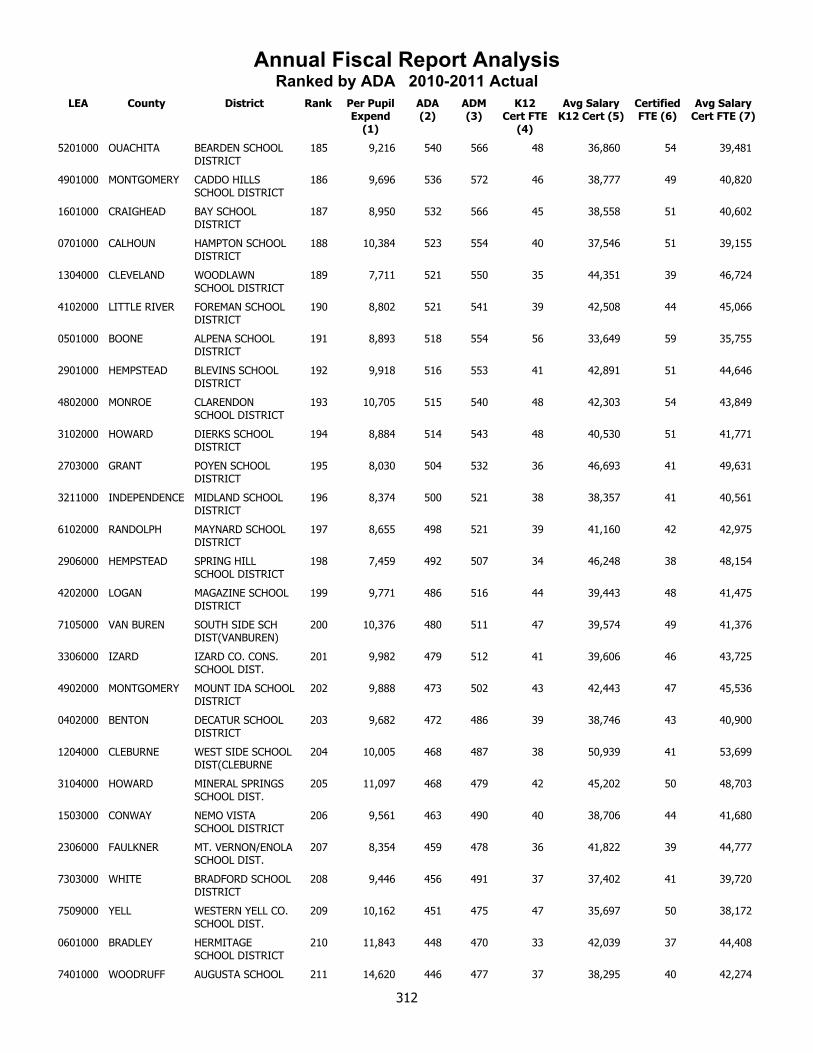
Annual Fiscal Report AnalysisRanked by ADA 2010-2011 Actual
LEA County District Rank Per Pupil Expend
(1)
ADA (2)
ADM (3)
K12 Cert FTE
(4)
Avg Salary K12 Cert (5)
Certified FTE (6)
Avg Salary Cert FTE (7)
5201000 OUACHITA BEARDEN SCHOOL DISTRICT
185 9,216 540 566 48 36,860 54 39,481
4901000 MONTGOMERY CADDO HILLS SCHOOL DISTRICT
186 9,696 536 572 46 38,777 49 40,820
1601000 CRAIGHEAD BAY SCHOOL DISTRICT
187 8,950 532 566 45 38,558 51 40,602
0701000 CALHOUN HAMPTON SCHOOL DISTRICT
188 10,384 523 554 40 37,546 51 39,155
1304000 CLEVELAND WOODLAWN SCHOOL DISTRICT
189 7,711 521 550 35 44,351 39 46,724
4102000 LITTLE RIVER FOREMAN SCHOOL DISTRICT
190 8,802 521 541 39 42,508 44 45,066
0501000 BOONE ALPENA SCHOOL DISTRICT
191 8,893 518 554 56 33,649 59 35,755
2901000 HEMPSTEAD BLEVINS SCHOOL DISTRICT
192 9,918 516 553 41 42,891 51 44,646
4802000 MONROE CLARENDON SCHOOL DISTRICT
193 10,705 515 540 48 42,303 54 43,849
3102000 HOWARD DIERKS SCHOOL DISTRICT
194 8,884 514 543 48 40,530 51 41,771
2703000 GRANT POYEN SCHOOL DISTRICT
195 8,030 504 532 36 46,693 41 49,631
3211000 INDEPENDENCE MIDLAND SCHOOL DISTRICT
196 8,374 500 521 38 38,357 41 40,561
6102000 RANDOLPH MAYNARD SCHOOL DISTRICT
197 8,655 498 521 39 41,160 42 42,975
2906000 HEMPSTEAD SPRING HILL SCHOOL DISTRICT
198 7,459 492 507 34 46,248 38 48,154
4202000 LOGAN MAGAZINE SCHOOL DISTRICT
199 9,771 486 516 44 39,443 48 41,475
7105000 VAN BUREN SOUTH SIDE SCH DIST(VANBUREN)
200 10,376 480 511 47 39,574 49 41,376
3306000 IZARD IZARD CO. CONS. SCHOOL DIST.
201 9,982 479 512 41 39,606 46 43,725
4902000 MONTGOMERY MOUNT IDA SCHOOL DISTRICT
202 9,888 473 502 43 42,443 47 45,536
0402000 BENTON DECATUR SCHOOL DISTRICT
203 9,682 472 486 39 38,746 43 40,900
1204000 CLEBURNE WEST SIDE SCHOOL DIST(CLEBURNE
204 10,005 468 487 38 50,939 41 53,699
3104000 HOWARD MINERAL SPRINGS SCHOOL DIST.
205 11,097 468 479 42 45,202 50 48,703
1503000 CONWAY NEMO VISTA SCHOOL DISTRICT
206 9,561 463 490 40 38,706 44 41,680
2306000 FAULKNER MT. VERNON/ENOLA SCHOOL DIST.
207 8,354 459 478 36 41,822 39 44,777
7303000 WHITE BRADFORD SCHOOL DISTRICT
208 9,446 456 491 37 37,402 41 39,720
7509000 YELL WESTERN YELL CO. SCHOOL DIST.
209 10,162 451 475 47 35,697 50 38,172
0601000 BRADLEY HERMITAGE SCHOOL DISTRICT
210 11,843 448 470 33 42,039 37 44,408
7401000 WOODRUFF AUGUSTA SCHOOL 211 14,620 446 477 37 38,295 40 42,274
312
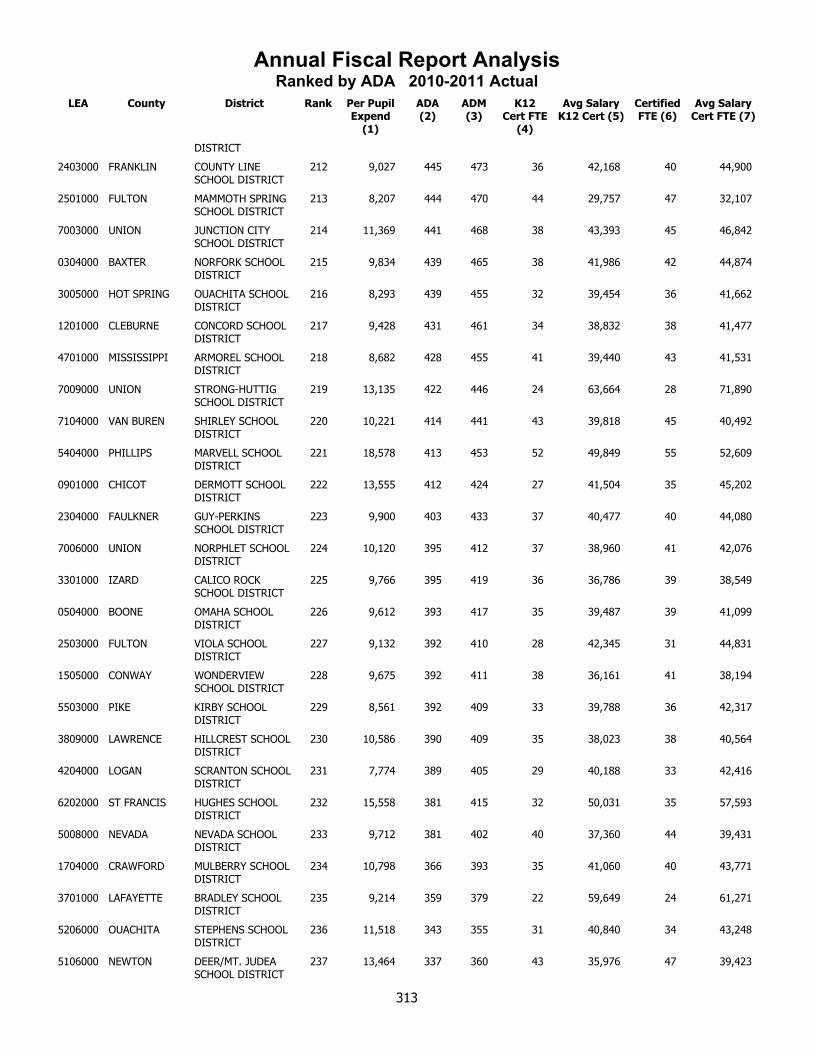
Annual Fiscal Report AnalysisRanked by ADA 2010-2011 Actual
LEA County District Rank Per Pupil Expend
(1)
ADA (2)
ADM (3)
K12 Cert FTE
(4)
Avg Salary K12 Cert (5)
Certified FTE (6)
Avg Salary Cert FTE (7)
DISTRICT
2403000 FRANKLIN COUNTY LINE SCHOOL DISTRICT
212 9,027 445 473 36 42,168 40 44,900
2501000 FULTON MAMMOTH SPRING SCHOOL DISTRICT
213 8,207 444 470 44 29,757 47 32,107
7003000 UNION JUNCTION CITY SCHOOL DISTRICT
214 11,369 441 468 38 43,393 45 46,842
0304000 BAXTER NORFORK SCHOOL DISTRICT
215 9,834 439 465 38 41,986 42 44,874
3005000 HOT SPRING OUACHITA SCHOOL DISTRICT
216 8,293 439 455 32 39,454 36 41,662
1201000 CLEBURNE CONCORD SCHOOL DISTRICT
217 9,428 431 461 34 38,832 38 41,477
4701000 MISSISSIPPI ARMOREL SCHOOL DISTRICT
218 8,682 428 455 41 39,440 43 41,531
7009000 UNION STRONG-HUTTIG SCHOOL DISTRICT
219 13,135 422 446 24 63,664 28 71,890
7104000 VAN BUREN SHIRLEY SCHOOL DISTRICT
220 10,221 414 441 43 39,818 45 40,492
5404000 PHILLIPS MARVELL SCHOOL DISTRICT
221 18,578 413 453 52 49,849 55 52,609
0901000 CHICOT DERMOTT SCHOOL DISTRICT
222 13,555 412 424 27 41,504 35 45,202
2304000 FAULKNER GUY-PERKINS SCHOOL DISTRICT
223 9,900 403 433 37 40,477 40 44,080
7006000 UNION NORPHLET SCHOOL DISTRICT
224 10,120 395 412 37 38,960 41 42,076
3301000 IZARD CALICO ROCK SCHOOL DISTRICT
225 9,766 395 419 36 36,786 39 38,549
0504000 BOONE OMAHA SCHOOL DISTRICT
226 9,612 393 417 35 39,487 39 41,099
2503000 FULTON VIOLA SCHOOL DISTRICT
227 9,132 392 410 28 42,345 31 44,831
1505000 CONWAY WONDERVIEW SCHOOL DISTRICT
228 9,675 392 411 38 36,161 41 38,194
5503000 PIKE KIRBY SCHOOL DISTRICT
229 8,561 392 409 33 39,788 36 42,317
3809000 LAWRENCE HILLCREST SCHOOL DISTRICT
230 10,586 390 409 35 38,023 38 40,564
4204000 LOGAN SCRANTON SCHOOL DISTRICT
231 7,774 389 405 29 40,188 33 42,416
6202000 ST FRANCIS HUGHES SCHOOL DISTRICT
232 15,558 381 415 32 50,031 35 57,593
5008000 NEVADA NEVADA SCHOOL DISTRICT
233 9,712 381 402 40 37,360 44 39,431
1704000 CRAWFORD MULBERRY SCHOOL DISTRICT
234 10,798 366 393 35 41,060 40 43,771
3701000 LAFAYETTE BRADLEY SCHOOL DISTRICT
235 9,214 359 379 22 59,649 24 61,271
5206000 OUACHITA STEPHENS SCHOOL DISTRICT
236 11,518 343 355 31 40,840 34 43,248
5106000 NEWTON DEER/MT. JUDEA SCHOOL DISTRICT
237 13,464 337 360 43 35,976 47 39,423
313
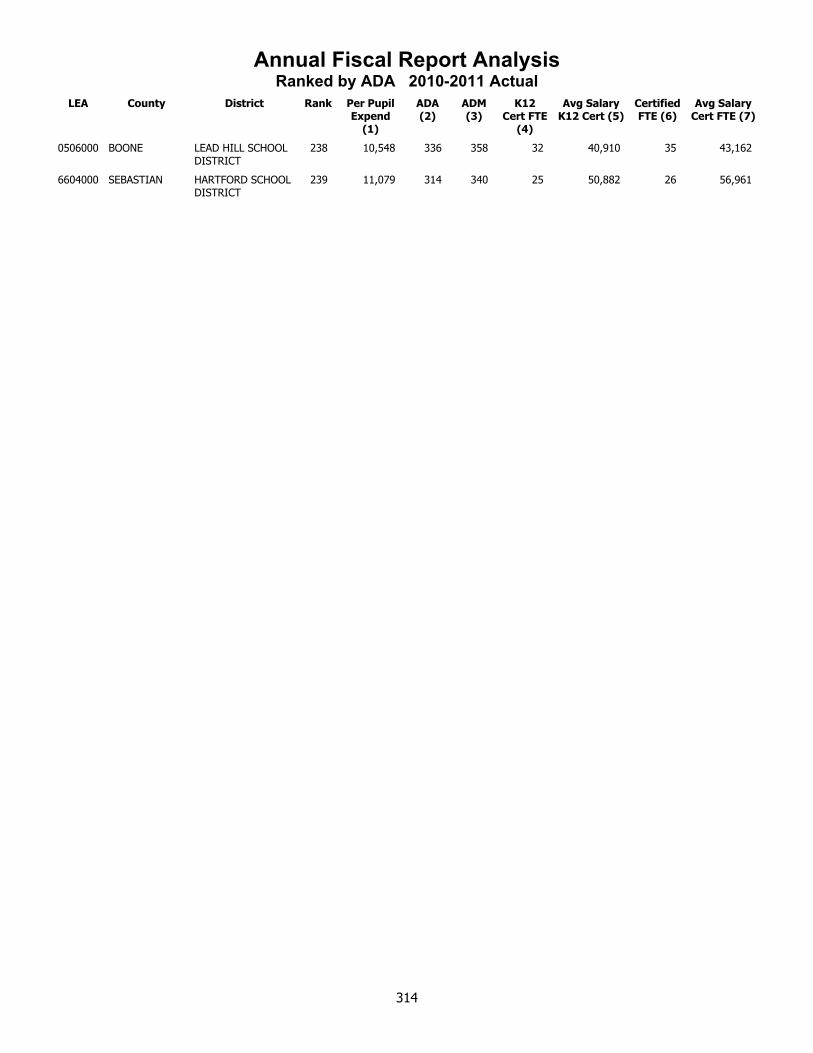
Annual Fiscal Report AnalysisRanked by ADA 2010-2011 Actual
LEA County District Rank Per Pupil Expend
(1)
ADA (2)
ADM (3)
K12 Cert FTE
(4)
Avg Salary K12 Cert (5)
Certified FTE (6)
Avg Salary Cert FTE (7)
0506000 BOONE LEAD HILL SCHOOL DISTRICT
238 10,548 336 358 32 40,910 35 43,162
6604000 SEBASTIAN HARTFORD SCHOOL DISTRICT
239 11,079 314 340 25 50,882 26 56,961
314

Ranked byAverage Daily Membership

Annual Fiscal Report AnalysisRanked by ADM 2010-2011 Actual
LEA County District Rank Per Pupil Expend
(1)
ADA (2)
ADM (3)
K12 Cert FTE
(4)
Avg Salary K12 Cert (5)
Certified FTE (6)
Avg Salary Cert FTE (7)
6001000 PULASKI LITTLE ROCK SCHOOL DISTRICT
1 12,851 22,995 23,788 1,936 53,069 2,137 55,650
7207000 WASHINGTON SPRINGDALE SCHOOL DISTRICT
2 8,577 17,592 18,678 1,130 56,359 1,230 58,679
6003000 PULASKI PULASKI CO. SPEC. SCHOOL DIST.
3 11,391 15,652 16,618 1,447 44,930 1,552 48,186
0405000 BENTON ROGERS SCHOOL DISTRICT
4 8,279 13,236 13,861 879 55,836 951 58,049
6601000 SEBASTIAN FORT SMITH SCHOOL DISTRICT
5 9,643 12,941 13,692 895 53,406 969 55,924
0401000 BENTON BENTONVILLE SCHOOL DISTRICT
6 8,427 12,793 13,536 894 53,594 944 55,499
4304000 LONOKE CABOT SCHOOL DISTRICT
7 7,829 9,342 9,976 616 49,445 682 51,704
2301000 FAULKNER CONWAY SCHOOL DISTRICT
8 8,470 8,809 9,207 609 52,390 652 54,811
7203000 WASHINGTON FAYETTEVILLE SCHOOL DISTRICT
9 10,333 8,388 8,839 582 57,279 632 59,384
6002000 PULASKI N. LITTLE ROCK SCHOOL DISTRICT
10 11,118 8,302 8,730 671 49,104 738 51,388
6303000 SALINE BRYANT SCHOOL DISTRICT
11 7,401 7,554 7,879 476 52,097 509 53,916
1705000 CRAWFORD VAN BUREN SCHOOL DISTRICT
12 8,584 5,591 5,880 404 46,548 441 49,298
1803000 CRITTENDEN WEST MEMPHIS SCHOOL DISTRICT
13 9,377 5,316 5,660 378 50,435 437 53,044
1608000 CRAIGHEAD JONESBORO SCHOOL DISTRICT
14 8,749 4,912 5,315 315 45,539 341 48,132
5805000 POPE RUSSELLVILLE SCHOOL DISTRICT
15 9,844 4,961 5,122 390 45,289 427 47,616
3505000 JEFFERSON PINE BLUFF SCHOOL DISTRICT
16 11,683 4,414 4,727 338 51,933 360 51,906
6302000 SALINE BENTON SCHOOL DISTRICT
17 7,739 4,398 4,629 276 50,413 300 53,472
7001000 UNION EL DORADO SCHOOL DISTRICT
18 8,471 4,289 4,598 354 40,889 389 43,309
1804000 CRITTENDEN MARION SCHOOL DISTRICT
19 8,276 3,998 4,230 278 48,083 298 50,850
4605000 MILLER TEXARKANA SCHOOL DISTRICT
20 10,949 3,936 4,230 324 44,255 353 47,288
2605000 GARLAND LAKE HAMILTON SCHOOL DISTRICT
21 8,108 3,906 4,137 241 50,662 261 53,501
2705000 GRANT SHERIDAN SCHOOL DISTRICT
22 7,691 3,900 4,135 264 44,739 288 46,645
7311000 WHITE SEARCY SCHOOL DISTRICT
23 7,585 3,767 3,998 236 49,594 262 51,865
0303000 BAXTER MOUNTAIN HOME SCHOOL DISTRICT
24 8,357 3,762 3,977 264 45,044 284 47,040
0406000 BENTON SILOAM SPRINGS SCHOOL DISTRICT
25 8,496 3,600 3,835 249 46,553 274 49,203
2603000 GARLAND HOT SPRINGS SCHOOL DISTRICT
26 12,838 3,438 3,633 286 45,860 329 48,524
6602000 SEBASTIAN GREENWOOD 27 8,129 3,379 3,562 227 49,208 247 51,955
316
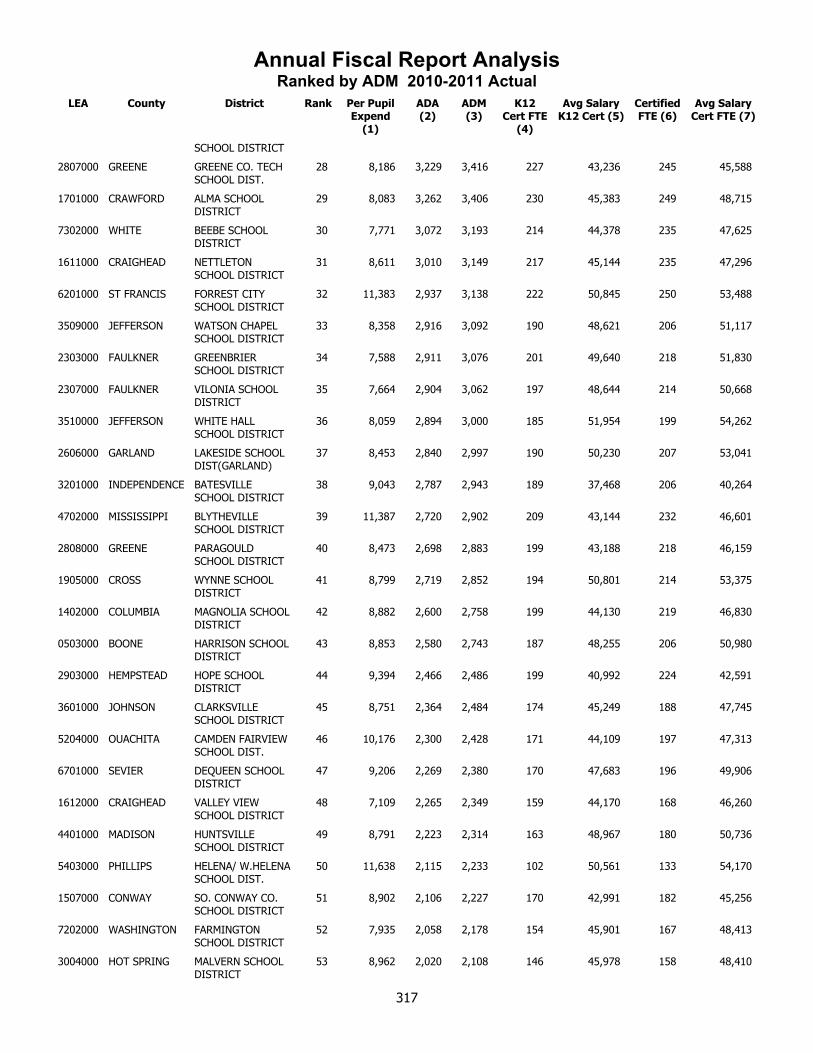
Annual Fiscal Report AnalysisRanked by ADM 2010-2011 Actual
LEA County District Rank Per Pupil Expend
(1)
ADA (2)
ADM (3)
K12 Cert FTE
(4)
Avg Salary K12 Cert (5)
Certified FTE (6)
Avg Salary Cert FTE (7)
SCHOOL DISTRICT
2807000 GREENE GREENE CO. TECH SCHOOL DIST.
28 8,186 3,229 3,416 227 43,236 245 45,588
1701000 CRAWFORD ALMA SCHOOL DISTRICT
29 8,083 3,262 3,406 230 45,383 249 48,715
7302000 WHITE BEEBE SCHOOL DISTRICT
30 7,771 3,072 3,193 214 44,378 235 47,625
1611000 CRAIGHEAD NETTLETON SCHOOL DISTRICT
31 8,611 3,010 3,149 217 45,144 235 47,296
6201000 ST FRANCIS FORREST CITY SCHOOL DISTRICT
32 11,383 2,937 3,138 222 50,845 250 53,488
3509000 JEFFERSON WATSON CHAPEL SCHOOL DISTRICT
33 8,358 2,916 3,092 190 48,621 206 51,117
2303000 FAULKNER GREENBRIER SCHOOL DISTRICT
34 7,588 2,911 3,076 201 49,640 218 51,830
2307000 FAULKNER VILONIA SCHOOL DISTRICT
35 7,664 2,904 3,062 197 48,644 214 50,668
3510000 JEFFERSON WHITE HALL SCHOOL DISTRICT
36 8,059 2,894 3,000 185 51,954 199 54,262
2606000 GARLAND LAKESIDE SCHOOL DIST(GARLAND)
37 8,453 2,840 2,997 190 50,230 207 53,041
3201000 INDEPENDENCE BATESVILLE SCHOOL DISTRICT
38 9,043 2,787 2,943 189 37,468 206 40,264
4702000 MISSISSIPPI BLYTHEVILLE SCHOOL DISTRICT
39 11,387 2,720 2,902 209 43,144 232 46,601
2808000 GREENE PARAGOULD SCHOOL DISTRICT
40 8,473 2,698 2,883 199 43,188 218 46,159
1905000 CROSS WYNNE SCHOOL DISTRICT
41 8,799 2,719 2,852 194 50,801 214 53,375
1402000 COLUMBIA MAGNOLIA SCHOOL DISTRICT
42 8,882 2,600 2,758 199 44,130 219 46,830
0503000 BOONE HARRISON SCHOOL DISTRICT
43 8,853 2,580 2,743 187 48,255 206 50,980
2903000 HEMPSTEAD HOPE SCHOOL DISTRICT
44 9,394 2,466 2,486 199 40,992 224 42,591
3601000 JOHNSON CLARKSVILLE SCHOOL DISTRICT
45 8,751 2,364 2,484 174 45,249 188 47,745
5204000 OUACHITA CAMDEN FAIRVIEW SCHOOL DIST.
46 10,176 2,300 2,428 171 44,109 197 47,313
6701000 SEVIER DEQUEEN SCHOOL DISTRICT
47 9,206 2,269 2,380 170 47,683 196 49,906
1612000 CRAIGHEAD VALLEY VIEW SCHOOL DISTRICT
48 7,109 2,265 2,349 159 44,170 168 46,260
4401000 MADISON HUNTSVILLE SCHOOL DISTRICT
49 8,791 2,223 2,314 163 48,967 180 50,736
5403000 PHILLIPS HELENA/ W.HELENA SCHOOL DIST.
50 11,638 2,115 2,233 102 50,561 133 54,170
1507000 CONWAY SO. CONWAY CO. SCHOOL DISTRICT
51 8,902 2,106 2,227 170 42,991 182 45,256
7202000 WASHINGTON FARMINGTON SCHOOL DISTRICT
52 7,935 2,058 2,178 154 45,901 167 48,413
3004000 HOT SPRING MALVERN SCHOOL DISTRICT
53 8,962 2,020 2,108 146 45,978 158 48,410
317
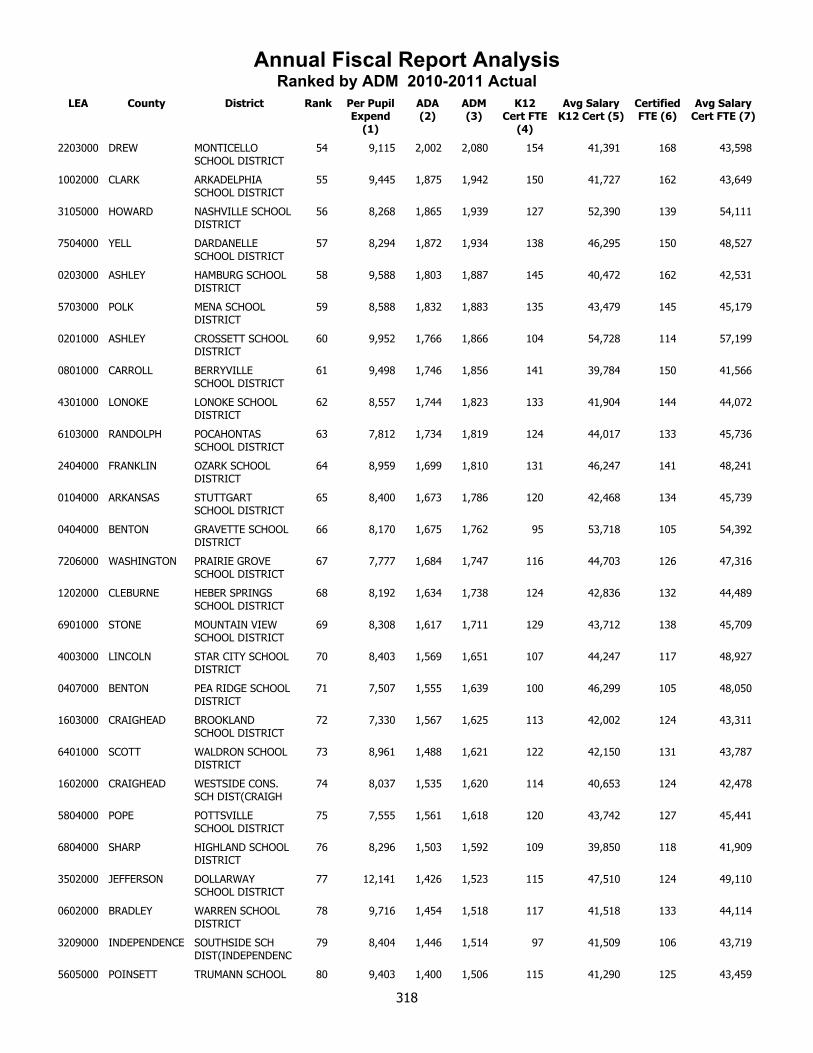
Annual Fiscal Report AnalysisRanked by ADM 2010-2011 Actual
LEA County District Rank Per Pupil Expend
(1)
ADA (2)
ADM (3)
K12 Cert FTE
(4)
Avg Salary K12 Cert (5)
Certified FTE (6)
Avg Salary Cert FTE (7)
2203000 DREW MONTICELLO SCHOOL DISTRICT
54 9,115 2,002 2,080 154 41,391 168 43,598
1002000 CLARK ARKADELPHIA SCHOOL DISTRICT
55 9,445 1,875 1,942 150 41,727 162 43,649
3105000 HOWARD NASHVILLE SCHOOL DISTRICT
56 8,268 1,865 1,939 127 52,390 139 54,111
7504000 YELL DARDANELLE SCHOOL DISTRICT
57 8,294 1,872 1,934 138 46,295 150 48,527
0203000 ASHLEY HAMBURG SCHOOL DISTRICT
58 9,588 1,803 1,887 145 40,472 162 42,531
5703000 POLK MENA SCHOOL DISTRICT
59 8,588 1,832 1,883 135 43,479 145 45,179
0201000 ASHLEY CROSSETT SCHOOL DISTRICT
60 9,952 1,766 1,866 104 54,728 114 57,199
0801000 CARROLL BERRYVILLE SCHOOL DISTRICT
61 9,498 1,746 1,856 141 39,784 150 41,566
4301000 LONOKE LONOKE SCHOOL DISTRICT
62 8,557 1,744 1,823 133 41,904 144 44,072
6103000 RANDOLPH POCAHONTAS SCHOOL DISTRICT
63 7,812 1,734 1,819 124 44,017 133 45,736
2404000 FRANKLIN OZARK SCHOOL DISTRICT
64 8,959 1,699 1,810 131 46,247 141 48,241
0104000 ARKANSAS STUTTGART SCHOOL DISTRICT
65 8,400 1,673 1,786 120 42,468 134 45,739
0404000 BENTON GRAVETTE SCHOOL DISTRICT
66 8,170 1,675 1,762 95 53,718 105 54,392
7206000 WASHINGTON PRAIRIE GROVE SCHOOL DISTRICT
67 7,777 1,684 1,747 116 44,703 126 47,316
1202000 CLEBURNE HEBER SPRINGS SCHOOL DISTRICT
68 8,192 1,634 1,738 124 42,836 132 44,489
6901000 STONE MOUNTAIN VIEW SCHOOL DISTRICT
69 8,308 1,617 1,711 129 43,712 138 45,709
4003000 LINCOLN STAR CITY SCHOOL DISTRICT
70 8,403 1,569 1,651 107 44,247 117 48,927
0407000 BENTON PEA RIDGE SCHOOL DISTRICT
71 7,507 1,555 1,639 100 46,299 105 48,050
1603000 CRAIGHEAD BROOKLAND SCHOOL DISTRICT
72 7,330 1,567 1,625 113 42,002 124 43,311
6401000 SCOTT WALDRON SCHOOL DISTRICT
73 8,961 1,488 1,621 122 42,150 131 43,787
1602000 CRAIGHEAD WESTSIDE CONS. SCH DIST(CRAIGH
74 8,037 1,535 1,620 114 40,653 124 42,478
5804000 POPE POTTSVILLE SCHOOL DISTRICT
75 7,555 1,561 1,618 120 43,742 127 45,441
6804000 SHARP HIGHLAND SCHOOL DISTRICT
76 8,296 1,503 1,592 109 39,850 118 41,909
3502000 JEFFERSON DOLLARWAY SCHOOL DISTRICT
77 12,141 1,426 1,523 115 47,510 124 49,110
0602000 BRADLEY WARREN SCHOOL DISTRICT
78 9,716 1,454 1,518 117 41,518 133 44,114
3209000 INDEPENDENCE SOUTHSIDE SCH DIST(INDEPENDENC
79 8,404 1,446 1,514 97 41,509 106 43,719
5605000 POINSETT TRUMANN SCHOOL 80 9,403 1,400 1,506 115 41,290 125 43,459
318
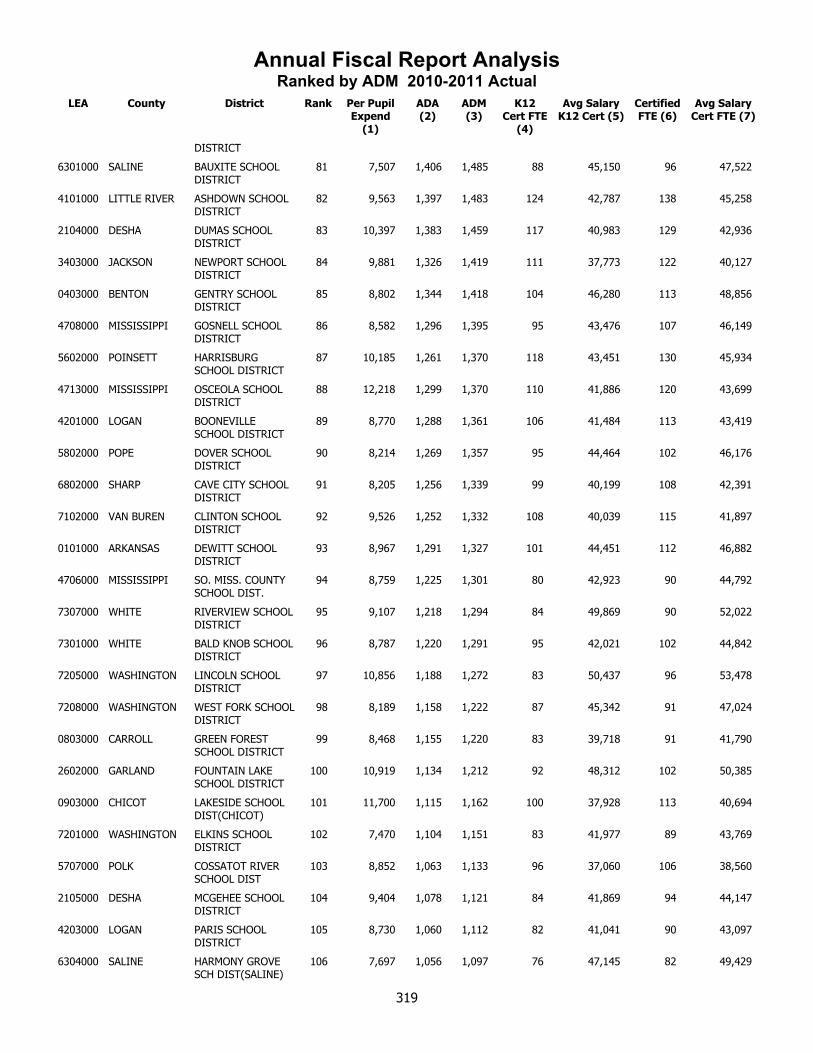
Annual Fiscal Report AnalysisRanked by ADM 2010-2011 Actual
LEA County District Rank Per Pupil Expend
(1)
ADA (2)
ADM (3)
K12 Cert FTE
(4)
Avg Salary K12 Cert (5)
Certified FTE (6)
Avg Salary Cert FTE (7)
DISTRICT
6301000 SALINE BAUXITE SCHOOL DISTRICT
81 7,507 1,406 1,485 88 45,150 96 47,522
4101000 LITTLE RIVER ASHDOWN SCHOOL DISTRICT
82 9,563 1,397 1,483 124 42,787 138 45,258
2104000 DESHA DUMAS SCHOOL DISTRICT
83 10,397 1,383 1,459 117 40,983 129 42,936
3403000 JACKSON NEWPORT SCHOOL DISTRICT
84 9,881 1,326 1,419 111 37,773 122 40,127
0403000 BENTON GENTRY SCHOOL DISTRICT
85 8,802 1,344 1,418 104 46,280 113 48,856
4708000 MISSISSIPPI GOSNELL SCHOOL DISTRICT
86 8,582 1,296 1,395 95 43,476 107 46,149
5602000 POINSETT HARRISBURG SCHOOL DISTRICT
87 10,185 1,261 1,370 118 43,451 130 45,934
4713000 MISSISSIPPI OSCEOLA SCHOOL DISTRICT
88 12,218 1,299 1,370 110 41,886 120 43,699
4201000 LOGAN BOONEVILLE SCHOOL DISTRICT
89 8,770 1,288 1,361 106 41,484 113 43,419
5802000 POPE DOVER SCHOOL DISTRICT
90 8,214 1,269 1,357 95 44,464 102 46,176
6802000 SHARP CAVE CITY SCHOOL DISTRICT
91 8,205 1,256 1,339 99 40,199 108 42,391
7102000 VAN BUREN CLINTON SCHOOL DISTRICT
92 9,526 1,252 1,332 108 40,039 115 41,897
0101000 ARKANSAS DEWITT SCHOOL DISTRICT
93 8,967 1,291 1,327 101 44,451 112 46,882
4706000 MISSISSIPPI SO. MISS. COUNTY SCHOOL DIST.
94 8,759 1,225 1,301 80 42,923 90 44,792
7307000 WHITE RIVERVIEW SCHOOL DISTRICT
95 9,107 1,218 1,294 84 49,869 90 52,022
7301000 WHITE BALD KNOB SCHOOL DISTRICT
96 8,787 1,220 1,291 95 42,021 102 44,842
7205000 WASHINGTON LINCOLN SCHOOL DISTRICT
97 10,856 1,188 1,272 83 50,437 96 53,478
7208000 WASHINGTON WEST FORK SCHOOL DISTRICT
98 8,189 1,158 1,222 87 45,342 91 47,024
0803000 CARROLL GREEN FOREST SCHOOL DISTRICT
99 8,468 1,155 1,220 83 39,718 91 41,790
2602000 GARLAND FOUNTAIN LAKE SCHOOL DISTRICT
100 10,919 1,134 1,212 92 48,312 102 50,385
0903000 CHICOT LAKESIDE SCHOOL DIST(CHICOT)
101 11,700 1,115 1,162 100 37,928 113 40,694
7201000 WASHINGTON ELKINS SCHOOL DISTRICT
102 7,470 1,104 1,151 83 41,977 89 43,769
5707000 POLK COSSATOT RIVER SCHOOL DIST
103 8,852 1,063 1,133 96 37,060 106 38,560
2105000 DESHA MCGEHEE SCHOOL DISTRICT
104 9,404 1,078 1,121 84 41,869 94 44,147
4203000 LOGAN PARIS SCHOOL DISTRICT
105 8,730 1,060 1,112 82 41,041 90 43,097
6304000 SALINE HARMONY GROVE SCH DIST(SALINE)
106 7,697 1,056 1,097 76 47,145 82 49,429
319

Annual Fiscal Report AnalysisRanked by ADM 2010-2011 Actual
LEA County District Rank Per Pupil Expend
(1)
ADA (2)
ADM (3)
K12 Cert FTE
(4)
Avg Salary K12 Cert (5)
Certified FTE (6)
Avg Salary Cert FTE (7)
3810000 LAWRENCE LAWRENCE COUNTY SCHOOL DISTRIC
107 8,848 1,016 1,082 91 39,297 97 41,407
3604000 JOHNSON LAMAR SCHOOL DISTRICT
108 8,522 1,004 1,067 77 48,123 82 49,866
0502000 BOONE BERGMAN SCHOOL DISTRICT
109 7,982 1,006 1,067 82 41,027 87 42,539
2305000 FAULKNER MAYFLOWER SCHOOL DISTRICT
110 7,759 984 1,058 76 40,991 81 42,776
5006000 NEVADA PRESCOTT SCHOOL DISTRICT
111 8,625 1,011 1,045 77 39,346 84 40,945
4603000 MILLER FOUKE SCHOOL DISTRICT
112 8,647 971 1,030 60 50,861 66 53,200
1101000 CLAY CORNING SCHOOL DISTRICT
113 9,360 966 1,024 81 43,292 87 45,445
5303000 PERRY PERRYVILLE SCHOOL DISTRICT
114 8,152 948 1,014 76 41,641 82 43,865
5205000 OUACHITA HARMONY GROVE SCH DIST(OUACHIT
115 9,185 962 1,007 84 38,822 92 41,729
5502000 PIKE CENTERPOINT SCHOOL DISTRICT
116 9,397 926 1,006 78 39,200 86 42,705
4712000 MISSISSIPPI MANILA SCHOOL DISTRICT
117 8,876 928 984 72 43,540 77 45,334
3904000 LEE LEE COUNTY SCHOOL DISTRICT
118 13,685 911 980 94 42,032 103 44,009
3001000 HOT SPRING BISMARCK SCHOOL DISTRICT
119 9,297 925 978 78 42,474 82 44,099
5801000 POPE ATKINS SCHOOL DISTRICT
120 9,856 922 972 79 41,013 85 42,948
2202000 DREW DREW CENTRAL SCHOOL DISTRICT
121 10,267 913 970 83 34,514 90 37,253
1104000 CLAY PIGGOTT SCHOOL DISTRICT
122 8,264 921 956 76 42,520 82 43,796
6606000 SEBASTIAN MANSFIELD SCHOOL DISTRICT
123 7,684 887 955 70 42,355 75 44,198
0505000 BOONE VALLEY SPRINGS SCHOOL DISTRICT
124 7,979 909 948 74 41,292 80 44,503
3804000 LAWRENCE HOXIE SCHOOL DISTRICT
125 9,206 900 946 80 37,221 87 39,264
4602000 MILLER GENOA CENTRAL SCHOOL DISTRICT
126 8,556 906 939 69 47,252 75 50,024
2002000 DALLAS FORDYCE SCHOOL DISTRICT
127 10,575 889 936 66 39,455 73 42,215
3002000 HOT SPRING GLEN ROSE SCHOOL DISTRICT
128 9,041 868 933 64 46,267 71 48,342
6502000 SEARCY SEARCY COUNTY SCHOOL DISTRICT
129 10,404 878 929 89 38,088 100 40,131
1702000 CRAWFORD CEDARVILLE SCHOOL DISTRICT
130 8,299 856 925 57 44,597 63 48,172
3302000 IZARD MELBOURNE SCHOOL DISTRICT
131 7,910 869 907 68 40,377 73 42,210
5102000 NEWTON JASPER SCHOOL DISTRICT
132 9,993 865 891 75 41,925 82 44,604
7510000 YELL TWO RIVERS 133 10,903 821 887 65 42,712 71 46,235
320
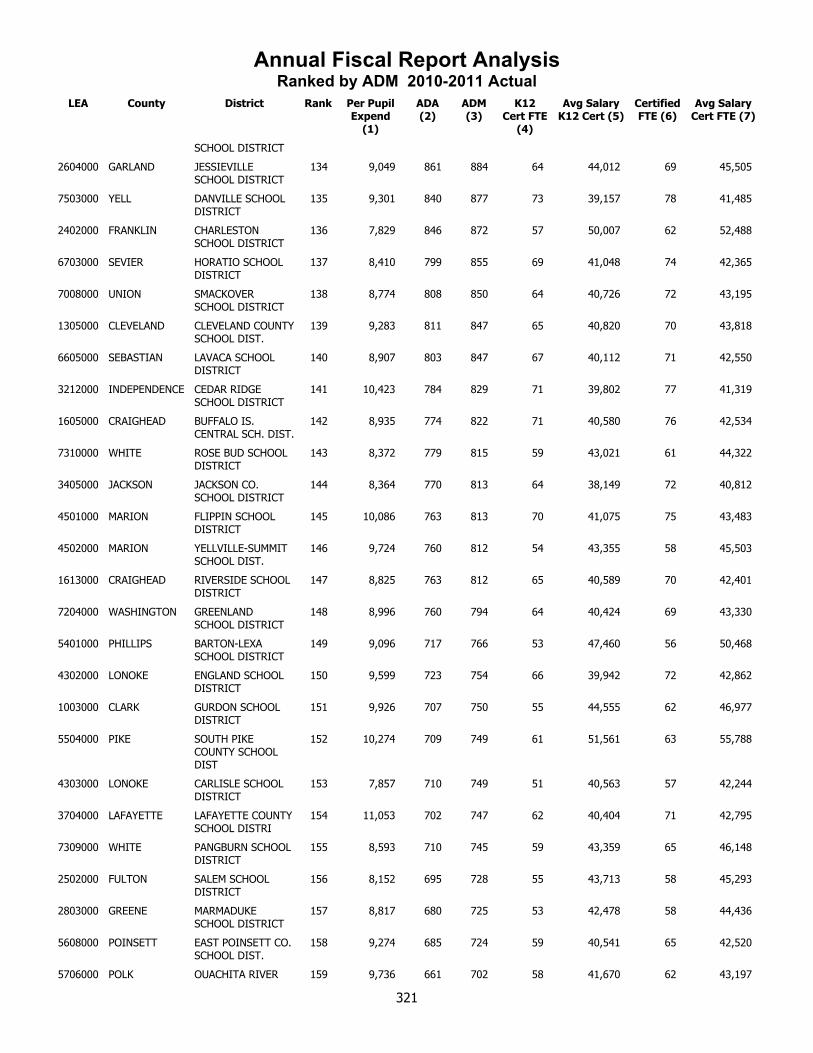
Annual Fiscal Report AnalysisRanked by ADM 2010-2011 Actual
LEA County District Rank Per Pupil Expend
(1)
ADA (2)
ADM (3)
K12 Cert FTE
(4)
Avg Salary K12 Cert (5)
Certified FTE (6)
Avg Salary Cert FTE (7)
SCHOOL DISTRICT
2604000 GARLAND JESSIEVILLE SCHOOL DISTRICT
134 9,049 861 884 64 44,012 69 45,505
7503000 YELL DANVILLE SCHOOL DISTRICT
135 9,301 840 877 73 39,157 78 41,485
2402000 FRANKLIN CHARLESTON SCHOOL DISTRICT
136 7,829 846 872 57 50,007 62 52,488
6703000 SEVIER HORATIO SCHOOL DISTRICT
137 8,410 799 855 69 41,048 74 42,365
7008000 UNION SMACKOVER SCHOOL DISTRICT
138 8,774 808 850 64 40,726 72 43,195
1305000 CLEVELAND CLEVELAND COUNTY SCHOOL DIST.
139 9,283 811 847 65 40,820 70 43,818
6605000 SEBASTIAN LAVACA SCHOOL DISTRICT
140 8,907 803 847 67 40,112 71 42,550
3212000 INDEPENDENCE CEDAR RIDGE SCHOOL DISTRICT
141 10,423 784 829 71 39,802 77 41,319
1605000 CRAIGHEAD BUFFALO IS. CENTRAL SCH. DIST.
142 8,935 774 822 71 40,580 76 42,534
7310000 WHITE ROSE BUD SCHOOL DISTRICT
143 8,372 779 815 59 43,021 61 44,322
3405000 JACKSON JACKSON CO. SCHOOL DISTRICT
144 8,364 770 813 64 38,149 72 40,812
4501000 MARION FLIPPIN SCHOOL DISTRICT
145 10,086 763 813 70 41,075 75 43,483
4502000 MARION YELLVILLE-SUMMIT SCHOOL DIST.
146 9,724 760 812 54 43,355 58 45,503
1613000 CRAIGHEAD RIVERSIDE SCHOOL DISTRICT
147 8,825 763 812 65 40,589 70 42,401
7204000 WASHINGTON GREENLAND SCHOOL DISTRICT
148 8,996 760 794 64 40,424 69 43,330
5401000 PHILLIPS BARTON-LEXA SCHOOL DISTRICT
149 9,096 717 766 53 47,460 56 50,468
4302000 LONOKE ENGLAND SCHOOL DISTRICT
150 9,599 723 754 66 39,942 72 42,862
1003000 CLARK GURDON SCHOOL DISTRICT
151 9,926 707 750 55 44,555 62 46,977
5504000 PIKE SOUTH PIKE COUNTY SCHOOL DIST
152 10,274 709 749 61 51,561 63 55,788
4303000 LONOKE CARLISLE SCHOOL DISTRICT
153 7,857 710 749 51 40,563 57 42,244
3704000 LAFAYETTE LAFAYETTE COUNTY SCHOOL DISTRI
154 11,053 702 747 62 40,404 71 42,795
7309000 WHITE PANGBURN SCHOOL DISTRICT
155 8,593 710 745 59 43,359 65 46,148
2502000 FULTON SALEM SCHOOL DISTRICT
156 8,152 695 728 55 43,713 58 45,293
2803000 GREENE MARMADUKE SCHOOL DISTRICT
157 8,817 680 725 53 42,478 58 44,436
5608000 POINSETT EAST POINSETT CO. SCHOOL DIST.
158 9,274 685 724 59 40,541 65 42,520
5706000 POLK OUACHITA RIVER 159 9,736 661 702 58 41,670 62 43,197
321
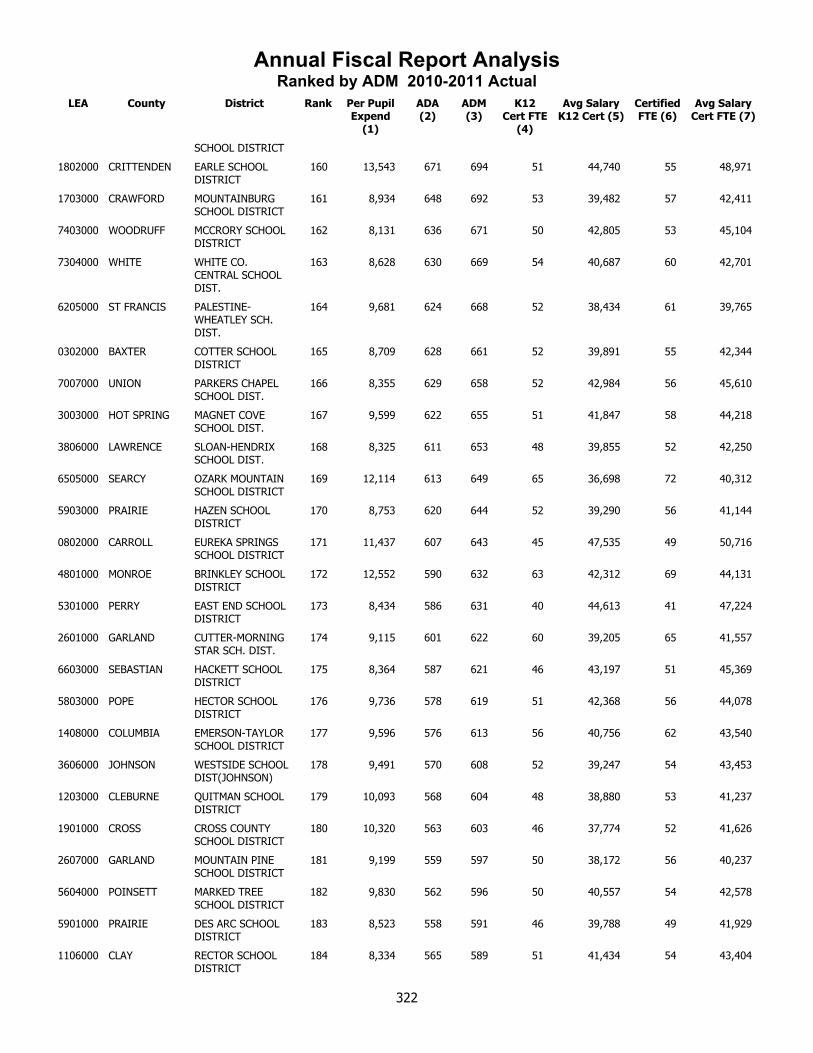
Annual Fiscal Report AnalysisRanked by ADM 2010-2011 Actual
LEA County District Rank Per Pupil Expend
(1)
ADA (2)
ADM (3)
K12 Cert FTE
(4)
Avg Salary K12 Cert (5)
Certified FTE (6)
Avg Salary Cert FTE (7)
SCHOOL DISTRICT
1802000 CRITTENDEN EARLE SCHOOL DISTRICT
160 13,543 671 694 51 44,740 55 48,971
1703000 CRAWFORD MOUNTAINBURG SCHOOL DISTRICT
161 8,934 648 692 53 39,482 57 42,411
7403000 WOODRUFF MCCRORY SCHOOL DISTRICT
162 8,131 636 671 50 42,805 53 45,104
7304000 WHITE WHITE CO. CENTRAL SCHOOL DIST.
163 8,628 630 669 54 40,687 60 42,701
6205000 ST FRANCIS PALESTINE-WHEATLEY SCH. DIST.
164 9,681 624 668 52 38,434 61 39,765
0302000 BAXTER COTTER SCHOOL DISTRICT
165 8,709 628 661 52 39,891 55 42,344
7007000 UNION PARKERS CHAPEL SCHOOL DIST.
166 8,355 629 658 52 42,984 56 45,610
3003000 HOT SPRING MAGNET COVE SCHOOL DIST.
167 9,599 622 655 51 41,847 58 44,218
3806000 LAWRENCE SLOAN-HENDRIX SCHOOL DIST.
168 8,325 611 653 48 39,855 52 42,250
6505000 SEARCY OZARK MOUNTAIN SCHOOL DISTRICT
169 12,114 613 649 65 36,698 72 40,312
5903000 PRAIRIE HAZEN SCHOOL DISTRICT
170 8,753 620 644 52 39,290 56 41,144
0802000 CARROLL EUREKA SPRINGS SCHOOL DISTRICT
171 11,437 607 643 45 47,535 49 50,716
4801000 MONROE BRINKLEY SCHOOL DISTRICT
172 12,552 590 632 63 42,312 69 44,131
5301000 PERRY EAST END SCHOOL DISTRICT
173 8,434 586 631 40 44,613 41 47,224
2601000 GARLAND CUTTER-MORNING STAR SCH. DIST.
174 9,115 601 622 60 39,205 65 41,557
6603000 SEBASTIAN HACKETT SCHOOL DISTRICT
175 8,364 587 621 46 43,197 51 45,369
5803000 POPE HECTOR SCHOOL DISTRICT
176 9,736 578 619 51 42,368 56 44,078
1408000 COLUMBIA EMERSON-TAYLOR SCHOOL DISTRICT
177 9,596 576 613 56 40,756 62 43,540
3606000 JOHNSON WESTSIDE SCHOOL DIST(JOHNSON)
178 9,491 570 608 52 39,247 54 43,453
1203000 CLEBURNE QUITMAN SCHOOL DISTRICT
179 10,093 568 604 48 38,880 53 41,237
1901000 CROSS CROSS COUNTY SCHOOL DISTRICT
180 10,320 563 603 46 37,774 52 41,626
2607000 GARLAND MOUNTAIN PINE SCHOOL DISTRICT
181 9,199 559 597 50 38,172 56 40,237
5604000 POINSETT MARKED TREE SCHOOL DISTRICT
182 9,830 562 596 50 40,557 54 42,578
5901000 PRAIRIE DES ARC SCHOOL DISTRICT
183 8,523 558 591 46 39,788 49 41,929
1106000 CLAY RECTOR SCHOOL DISTRICT
184 8,334 565 589 51 41,434 54 43,404
322

Annual Fiscal Report AnalysisRanked by ADM 2010-2011 Actual
LEA County District Rank Per Pupil Expend
(1)
ADA (2)
ADM (3)
K12 Cert FTE
(4)
Avg Salary K12 Cert (5)
Certified FTE (6)
Avg Salary Cert FTE (7)
4901000 MONTGOMERY CADDO HILLS SCHOOL DISTRICT
185 9,696 536 572 46 38,777 49 40,820
1601000 CRAIGHEAD BAY SCHOOL DISTRICT
186 8,950 532 566 45 38,558 51 40,602
5201000 OUACHITA BEARDEN SCHOOL DISTRICT
187 9,216 540 566 48 36,860 54 39,481
0501000 BOONE ALPENA SCHOOL DISTRICT
188 8,893 518 554 56 33,649 59 35,755
0701000 CALHOUN HAMPTON SCHOOL DISTRICT
189 10,384 523 554 40 37,546 51 39,155
2901000 HEMPSTEAD BLEVINS SCHOOL DISTRICT
190 9,918 516 553 41 42,891 51 44,646
1304000 CLEVELAND WOODLAWN SCHOOL DISTRICT
191 7,711 521 550 35 44,351 39 46,724
3102000 HOWARD DIERKS SCHOOL DISTRICT
192 8,884 514 543 48 40,530 51 41,771
4102000 LITTLE RIVER FOREMAN SCHOOL DISTRICT
193 8,802 521 541 39 42,508 44 45,066
4802000 MONROE CLARENDON SCHOOL DISTRICT
194 10,705 515 540 48 42,303 54 43,849
2703000 GRANT POYEN SCHOOL DISTRICT
195 8,030 504 532 36 46,693 41 49,631
6102000 RANDOLPH MAYNARD SCHOOL DISTRICT
196 8,655 498 521 39 41,160 42 42,975
3211000 INDEPENDENCE MIDLAND SCHOOL DISTRICT
197 8,374 500 521 38 38,357 41 40,561
4202000 LOGAN MAGAZINE SCHOOL DISTRICT
198 9,771 486 516 44 39,443 48 41,475
3306000 IZARD IZARD CO. CONS. SCHOOL DIST.
199 9,982 479 512 41 39,606 46 43,725
7105000 VAN BUREN SOUTH SIDE SCH DIST(VANBUREN)
200 10,376 480 511 47 39,574 49 41,376
2906000 HEMPSTEAD SPRING HILL SCHOOL DISTRICT
201 7,459 492 507 34 46,248 38 48,154
4902000 MONTGOMERY MOUNT IDA SCHOOL DISTRICT
202 9,888 473 502 43 42,443 47 45,536
7303000 WHITE BRADFORD SCHOOL DISTRICT
203 9,446 456 491 37 37,402 41 39,720
1503000 CONWAY NEMO VISTA SCHOOL DISTRICT
204 9,561 463 490 40 38,706 44 41,680
1204000 CLEBURNE WEST SIDE SCHOOL DIST(CLEBURNE
205 10,005 468 487 38 50,939 41 53,699
0402000 BENTON DECATUR SCHOOL DISTRICT
206 9,682 472 486 39 38,746 43 40,900
3104000 HOWARD MINERAL SPRINGS SCHOOL DIST.
207 11,097 468 479 42 45,202 50 48,703
2306000 FAULKNER MT. VERNON/ENOLA SCHOOL DIST.
208 8,354 459 478 36 41,822 39 44,777
7401000 WOODRUFF AUGUSTA SCHOOL DISTRICT
209 14,620 446 477 37 38,295 40 42,274
7509000 YELL WESTERN YELL CO. SCHOOL DIST.
210 10,162 451 475 47 35,697 50 38,172
2403000 FRANKLIN COUNTY LINE 211 9,027 445 473 36 42,168 40 44,900
323

Annual Fiscal Report AnalysisRanked by ADM 2010-2011 Actual
LEA County District Rank Per Pupil Expend
(1)
ADA (2)
ADM (3)
K12 Cert FTE
(4)
Avg Salary K12 Cert (5)
Certified FTE (6)
Avg Salary Cert FTE (7)
SCHOOL DISTRICT
0601000 BRADLEY HERMITAGE SCHOOL DISTRICT
212 11,843 448 470 33 42,039 37 44,408
2501000 FULTON MAMMOTH SPRING SCHOOL DISTRICT
213 8,207 444 470 44 29,757 47 32,107
7003000 UNION JUNCTION CITY SCHOOL DISTRICT
214 11,369 441 468 38 43,393 45 46,842
0304000 BAXTER NORFORK SCHOOL DISTRICT
215 9,834 439 465 38 41,986 42 44,874
1201000 CLEBURNE CONCORD SCHOOL DISTRICT
216 9,428 431 461 34 38,832 38 41,477
4701000 MISSISSIPPI ARMOREL SCHOOL DISTRICT
217 8,682 428 455 41 39,440 43 41,531
3005000 HOT SPRING OUACHITA SCHOOL DISTRICT
218 8,293 439 455 32 39,454 36 41,662
5404000 PHILLIPS MARVELL SCHOOL DISTRICT
219 18,578 413 453 52 49,849 55 52,609
7009000 UNION STRONG-HUTTIG SCHOOL DISTRICT
220 13,135 422 446 24 63,664 28 71,890
7104000 VAN BUREN SHIRLEY SCHOOL DISTRICT
221 10,221 414 441 43 39,818 45 40,492
2304000 FAULKNER GUY-PERKINS SCHOOL DISTRICT
222 9,900 403 433 37 40,477 40 44,080
0901000 CHICOT DERMOTT SCHOOL DISTRICT
223 13,555 412 424 27 41,504 35 45,202
3301000 IZARD CALICO ROCK SCHOOL DISTRICT
224 9,766 395 419 36 36,786 39 38,549
0504000 BOONE OMAHA SCHOOL DISTRICT
225 9,612 393 417 35 39,487 39 41,099
6202000 ST FRANCIS HUGHES SCHOOL DISTRICT
226 15,558 381 415 32 50,031 35 57,593
7006000 UNION NORPHLET SCHOOL DISTRICT
227 10,120 395 412 37 38,960 41 42,076
1505000 CONWAY WONDERVIEW SCHOOL DISTRICT
228 9,675 392 411 38 36,161 41 38,194
2503000 FULTON VIOLA SCHOOL DISTRICT
229 9,132 392 410 28 42,345 31 44,831
5503000 PIKE KIRBY SCHOOL DISTRICT
230 8,561 392 409 33 39,788 36 42,317
3809000 LAWRENCE HILLCREST SCHOOL DISTRICT
231 10,586 390 409 35 38,023 38 40,564
4204000 LOGAN SCRANTON SCHOOL DISTRICT
232 7,774 389 405 29 40,188 33 42,416
5008000 NEVADA NEVADA SCHOOL DISTRICT
233 9,712 381 402 40 37,360 44 39,431
1704000 CRAWFORD MULBERRY SCHOOL DISTRICT
234 10,798 366 393 35 41,060 40 43,771
3701000 LAFAYETTE BRADLEY SCHOOL DISTRICT
235 9,214 359 379 22 59,649 24 61,271
5106000 NEWTON DEER/MT. JUDEA SCHOOL DISTRICT
236 13,464 337 360 43 35,976 47 39,423
0506000 BOONE LEAD HILL SCHOOL DISTRICT
237 10,548 336 358 32 40,910 35 43,162
324
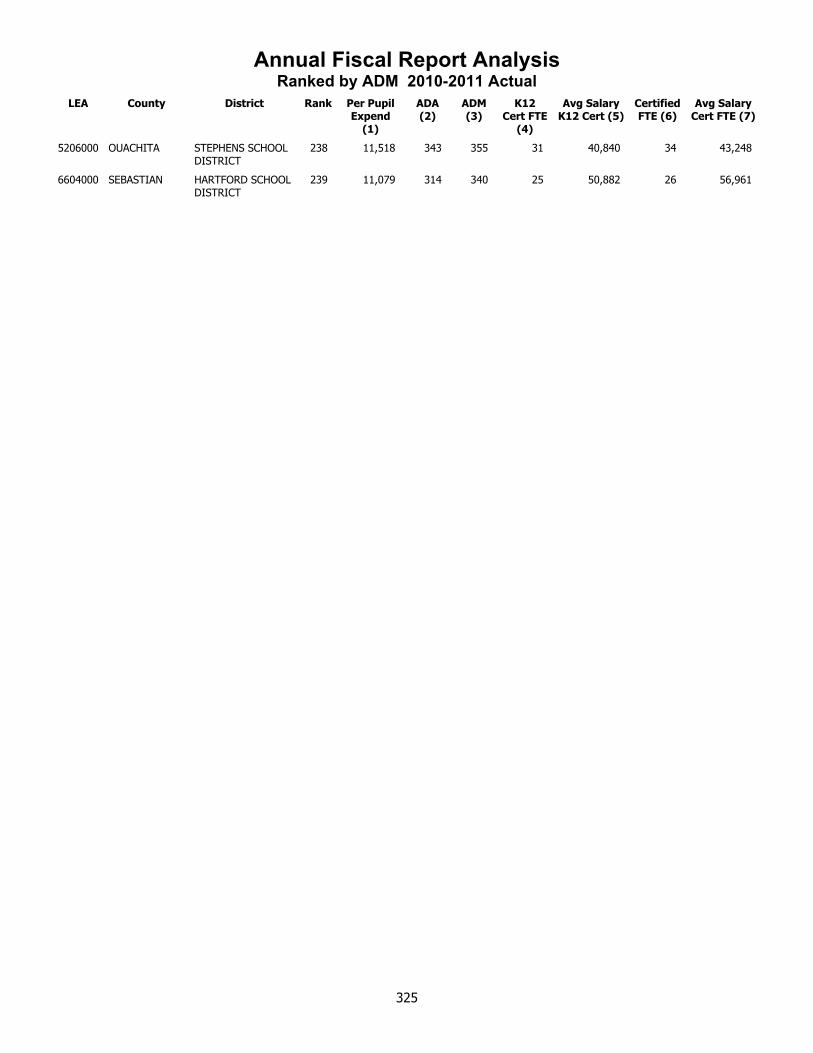
Annual Fiscal Report AnalysisRanked by ADM 2010-2011 Actual
LEA County District Rank Per Pupil Expend
(1)
ADA (2)
ADM (3)
K12 Cert FTE
(4)
Avg Salary K12 Cert (5)
Certified FTE (6)
Avg Salary Cert FTE (7)
5206000 OUACHITA STEPHENS SCHOOL DISTRICT
238 11,518 343 355 31 40,840 34 43,248
6604000 SEBASTIAN HARTFORD SCHOOL DISTRICT
239 11,079 314 340 25 50,882 26 56,961
325
Ranked byK-12 Certified Full Time
Equivalency
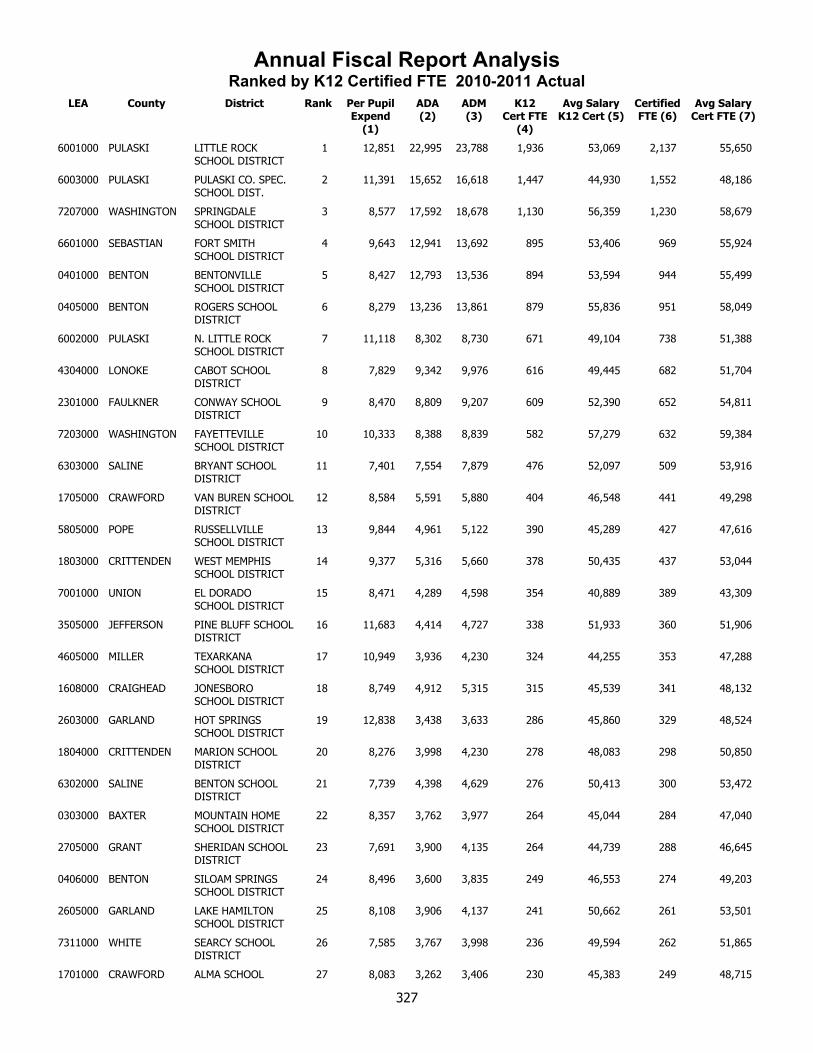
Annual Fiscal Report AnalysisRanked by K12 Certified FTE 2010-2011 Actual
LEA County District Rank Per Pupil Expend
(1)
ADA (2)
ADM (3)
K12 Cert FTE
(4)
Avg Salary K12 Cert (5)
Certified FTE (6)
Avg Salary Cert FTE (7)
6001000 PULASKI LITTLE ROCK SCHOOL DISTRICT
1 12,851 22,995 23,788 1,936 53,069 2,137 55,650
6003000 PULASKI PULASKI CO. SPEC. SCHOOL DIST.
2 11,391 15,652 16,618 1,447 44,930 1,552 48,186
7207000 WASHINGTON SPRINGDALE SCHOOL DISTRICT
3 8,577 17,592 18,678 1,130 56,359 1,230 58,679
6601000 SEBASTIAN FORT SMITH SCHOOL DISTRICT
4 9,643 12,941 13,692 895 53,406 969 55,924
0401000 BENTON BENTONVILLE SCHOOL DISTRICT
5 8,427 12,793 13,536 894 53,594 944 55,499
0405000 BENTON ROGERS SCHOOL DISTRICT
6 8,279 13,236 13,861 879 55,836 951 58,049
6002000 PULASKI N. LITTLE ROCK SCHOOL DISTRICT
7 11,118 8,302 8,730 671 49,104 738 51,388
4304000 LONOKE CABOT SCHOOL DISTRICT
8 7,829 9,342 9,976 616 49,445 682 51,704
2301000 FAULKNER CONWAY SCHOOL DISTRICT
9 8,470 8,809 9,207 609 52,390 652 54,811
7203000 WASHINGTON FAYETTEVILLE SCHOOL DISTRICT
10 10,333 8,388 8,839 582 57,279 632 59,384
6303000 SALINE BRYANT SCHOOL DISTRICT
11 7,401 7,554 7,879 476 52,097 509 53,916
1705000 CRAWFORD VAN BUREN SCHOOL DISTRICT
12 8,584 5,591 5,880 404 46,548 441 49,298
5805000 POPE RUSSELLVILLE SCHOOL DISTRICT
13 9,844 4,961 5,122 390 45,289 427 47,616
1803000 CRITTENDEN WEST MEMPHIS SCHOOL DISTRICT
14 9,377 5,316 5,660 378 50,435 437 53,044
7001000 UNION EL DORADO SCHOOL DISTRICT
15 8,471 4,289 4,598 354 40,889 389 43,309
3505000 JEFFERSON PINE BLUFF SCHOOL DISTRICT
16 11,683 4,414 4,727 338 51,933 360 51,906
4605000 MILLER TEXARKANA SCHOOL DISTRICT
17 10,949 3,936 4,230 324 44,255 353 47,288
1608000 CRAIGHEAD JONESBORO SCHOOL DISTRICT
18 8,749 4,912 5,315 315 45,539 341 48,132
2603000 GARLAND HOT SPRINGS SCHOOL DISTRICT
19 12,838 3,438 3,633 286 45,860 329 48,524
1804000 CRITTENDEN MARION SCHOOL DISTRICT
20 8,276 3,998 4,230 278 48,083 298 50,850
6302000 SALINE BENTON SCHOOL DISTRICT
21 7,739 4,398 4,629 276 50,413 300 53,472
0303000 BAXTER MOUNTAIN HOME SCHOOL DISTRICT
22 8,357 3,762 3,977 264 45,044 284 47,040
2705000 GRANT SHERIDAN SCHOOL DISTRICT
23 7,691 3,900 4,135 264 44,739 288 46,645
0406000 BENTON SILOAM SPRINGS SCHOOL DISTRICT
24 8,496 3,600 3,835 249 46,553 274 49,203
2605000 GARLAND LAKE HAMILTON SCHOOL DISTRICT
25 8,108 3,906 4,137 241 50,662 261 53,501
7311000 WHITE SEARCY SCHOOL DISTRICT
26 7,585 3,767 3,998 236 49,594 262 51,865
1701000 CRAWFORD ALMA SCHOOL 27 8,083 3,262 3,406 230 45,383 249 48,715
327

Annual Fiscal Report AnalysisRanked by K12 Certified FTE 2010-2011 Actual
LEA County District Rank Per Pupil Expend
(1)
ADA (2)
ADM (3)
K12 Cert FTE
(4)
Avg Salary K12 Cert (5)
Certified FTE (6)
Avg Salary Cert FTE (7)
DISTRICT
6602000 SEBASTIAN GREENWOOD SCHOOL DISTRICT
28 8,129 3,379 3,562 227 49,208 247 51,955
2807000 GREENE GREENE CO. TECH SCHOOL DIST.
29 8,186 3,229 3,416 227 43,236 245 45,588
6201000 ST FRANCIS FORREST CITY SCHOOL DISTRICT
30 11,383 2,937 3,138 222 50,845 250 53,488
1611000 CRAIGHEAD NETTLETON SCHOOL DISTRICT
31 8,611 3,010 3,149 217 45,144 235 47,296
7302000 WHITE BEEBE SCHOOL DISTRICT
32 7,771 3,072 3,193 214 44,378 235 47,625
4702000 MISSISSIPPI BLYTHEVILLE SCHOOL DISTRICT
33 11,387 2,720 2,902 209 43,144 232 46,601
2303000 FAULKNER GREENBRIER SCHOOL DISTRICT
34 7,588 2,911 3,076 201 49,640 218 51,830
2903000 HEMPSTEAD HOPE SCHOOL DISTRICT
35 9,394 2,466 2,486 199 40,992 224 42,591
1402000 COLUMBIA MAGNOLIA SCHOOL DISTRICT
36 8,882 2,600 2,758 199 44,130 219 46,830
2808000 GREENE PARAGOULD SCHOOL DISTRICT
37 8,473 2,698 2,883 199 43,188 218 46,159
2307000 FAULKNER VILONIA SCHOOL DISTRICT
38 7,664 2,904 3,062 197 48,644 214 50,668
1905000 CROSS WYNNE SCHOOL DISTRICT
39 8,799 2,719 2,852 194 50,801 214 53,375
2606000 GARLAND LAKESIDE SCHOOL DIST(GARLAND)
40 8,453 2,840 2,997 190 50,230 207 53,041
3509000 JEFFERSON WATSON CHAPEL SCHOOL DISTRICT
41 8,358 2,916 3,092 190 48,621 206 51,117
3201000 INDEPENDENCE BATESVILLE SCHOOL DISTRICT
42 9,043 2,787 2,943 189 37,468 206 40,264
0503000 BOONE HARRISON SCHOOL DISTRICT
43 8,853 2,580 2,743 187 48,255 206 50,980
3510000 JEFFERSON WHITE HALL SCHOOL DISTRICT
44 8,059 2,894 3,000 185 51,954 199 54,262
3601000 JOHNSON CLARKSVILLE SCHOOL DISTRICT
45 8,751 2,364 2,484 174 45,249 188 47,745
5204000 OUACHITA CAMDEN FAIRVIEW SCHOOL DIST.
46 10,176 2,300 2,428 171 44,109 197 47,313
6701000 SEVIER DEQUEEN SCHOOL DISTRICT
47 9,206 2,269 2,380 170 47,683 196 49,906
1507000 CONWAY SO. CONWAY CO. SCHOOL DISTRICT
48 8,902 2,106 2,227 170 42,991 182 45,256
4401000 MADISON HUNTSVILLE SCHOOL DISTRICT
49 8,791 2,223 2,314 163 48,967 180 50,736
1612000 CRAIGHEAD VALLEY VIEW SCHOOL DISTRICT
50 7,109 2,265 2,349 159 44,170 168 46,260
2203000 DREW MONTICELLO SCHOOL DISTRICT
51 9,115 2,002 2,080 154 41,391 168 43,598
7202000 WASHINGTON FARMINGTON SCHOOL DISTRICT
52 7,935 2,058 2,178 154 45,901 167 48,413
1002000 CLARK ARKADELPHIA SCHOOL DISTRICT
53 9,445 1,875 1,942 150 41,727 162 43,649
328

Annual Fiscal Report AnalysisRanked by K12 Certified FTE 2010-2011 Actual
LEA County District Rank Per Pupil Expend
(1)
ADA (2)
ADM (3)
K12 Cert FTE
(4)
Avg Salary K12 Cert (5)
Certified FTE (6)
Avg Salary Cert FTE (7)
3004000 HOT SPRING MALVERN SCHOOL DISTRICT
54 8,962 2,020 2,108 146 45,978 158 48,410
0203000 ASHLEY HAMBURG SCHOOL DISTRICT
55 9,588 1,803 1,887 145 40,472 162 42,531
0801000 CARROLL BERRYVILLE SCHOOL DISTRICT
56 9,498 1,746 1,856 141 39,784 150 41,566
7504000 YELL DARDANELLE SCHOOL DISTRICT
57 8,294 1,872 1,934 138 46,295 150 48,527
5703000 POLK MENA SCHOOL DISTRICT
58 8,588 1,832 1,883 135 43,479 145 45,179
4301000 LONOKE LONOKE SCHOOL DISTRICT
59 8,557 1,744 1,823 133 41,904 144 44,072
2404000 FRANKLIN OZARK SCHOOL DISTRICT
60 8,959 1,699 1,810 131 46,247 141 48,241
6901000 STONE MOUNTAIN VIEW SCHOOL DISTRICT
61 8,308 1,617 1,711 129 43,712 138 45,709
3105000 HOWARD NASHVILLE SCHOOL DISTRICT
62 8,268 1,865 1,939 127 52,390 139 54,111
4101000 LITTLE RIVER ASHDOWN SCHOOL DISTRICT
63 9,563 1,397 1,483 124 42,787 138 45,258
6103000 RANDOLPH POCAHONTAS SCHOOL DISTRICT
64 7,812 1,734 1,819 124 44,017 133 45,736
1202000 CLEBURNE HEBER SPRINGS SCHOOL DISTRICT
65 8,192 1,634 1,738 124 42,836 132 44,489
6401000 SCOTT WALDRON SCHOOL DISTRICT
66 8,961 1,488 1,621 122 42,150 131 43,787
5804000 POPE POTTSVILLE SCHOOL DISTRICT
67 7,555 1,561 1,618 120 43,742 127 45,441
0104000 ARKANSAS STUTTGART SCHOOL DISTRICT
68 8,400 1,673 1,786 120 42,468 134 45,739
5602000 POINSETT HARRISBURG SCHOOL DISTRICT
69 10,185 1,261 1,370 118 43,451 130 45,934
0602000 BRADLEY WARREN SCHOOL DISTRICT
70 9,716 1,454 1,518 117 41,518 133 44,114
2104000 DESHA DUMAS SCHOOL DISTRICT
71 10,397 1,383 1,459 117 40,983 129 42,936
7206000 WASHINGTON PRAIRIE GROVE SCHOOL DISTRICT
72 7,777 1,684 1,747 116 44,703 126 47,316
3502000 JEFFERSON DOLLARWAY SCHOOL DISTRICT
73 12,141 1,426 1,523 115 47,510 124 49,110
5605000 POINSETT TRUMANN SCHOOL DISTRICT
74 9,403 1,400 1,506 115 41,290 125 43,459
1602000 CRAIGHEAD WESTSIDE CONS. SCH DIST(CRAIGH
75 8,037 1,535 1,620 114 40,653 124 42,478
1603000 CRAIGHEAD BROOKLAND SCHOOL DISTRICT
76 7,330 1,567 1,625 113 42,002 124 43,311
3403000 JACKSON NEWPORT SCHOOL DISTRICT
77 9,881 1,326 1,419 111 37,773 122 40,127
4713000 MISSISSIPPI OSCEOLA SCHOOL DISTRICT
78 12,218 1,299 1,370 110 41,886 120 43,699
6804000 SHARP HIGHLAND SCHOOL DISTRICT
79 8,296 1,503 1,592 109 39,850 118 41,909
7102000 VAN BUREN CLINTON SCHOOL 80 9,526 1,252 1,332 108 40,039 115 41,897
329
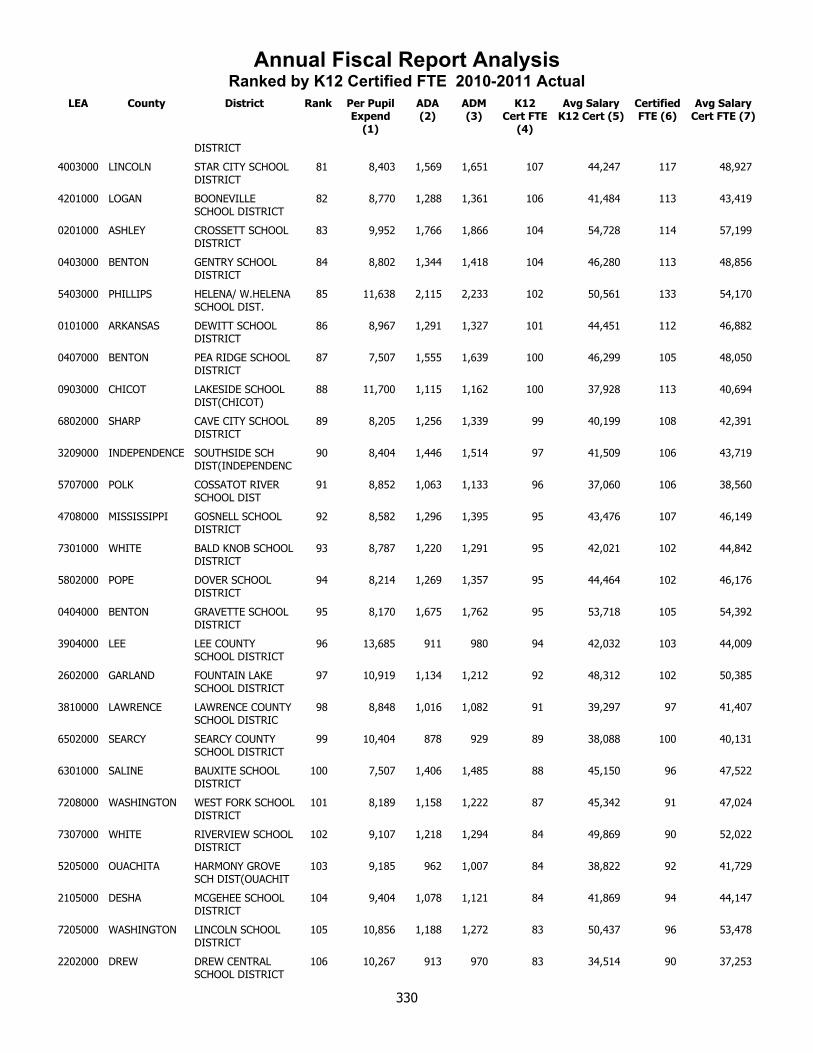
Annual Fiscal Report AnalysisRanked by K12 Certified FTE 2010-2011 Actual
LEA County District Rank Per Pupil Expend
(1)
ADA (2)
ADM (3)
K12 Cert FTE
(4)
Avg Salary K12 Cert (5)
Certified FTE (6)
Avg Salary Cert FTE (7)
DISTRICT
4003000 LINCOLN STAR CITY SCHOOL DISTRICT
81 8,403 1,569 1,651 107 44,247 117 48,927
4201000 LOGAN BOONEVILLE SCHOOL DISTRICT
82 8,770 1,288 1,361 106 41,484 113 43,419
0201000 ASHLEY CROSSETT SCHOOL DISTRICT
83 9,952 1,766 1,866 104 54,728 114 57,199
0403000 BENTON GENTRY SCHOOL DISTRICT
84 8,802 1,344 1,418 104 46,280 113 48,856
5403000 PHILLIPS HELENA/ W.HELENA SCHOOL DIST.
85 11,638 2,115 2,233 102 50,561 133 54,170
0101000 ARKANSAS DEWITT SCHOOL DISTRICT
86 8,967 1,291 1,327 101 44,451 112 46,882
0407000 BENTON PEA RIDGE SCHOOL DISTRICT
87 7,507 1,555 1,639 100 46,299 105 48,050
0903000 CHICOT LAKESIDE SCHOOL DIST(CHICOT)
88 11,700 1,115 1,162 100 37,928 113 40,694
6802000 SHARP CAVE CITY SCHOOL DISTRICT
89 8,205 1,256 1,339 99 40,199 108 42,391
3209000 INDEPENDENCE SOUTHSIDE SCH DIST(INDEPENDENC
90 8,404 1,446 1,514 97 41,509 106 43,719
5707000 POLK COSSATOT RIVER SCHOOL DIST
91 8,852 1,063 1,133 96 37,060 106 38,560
4708000 MISSISSIPPI GOSNELL SCHOOL DISTRICT
92 8,582 1,296 1,395 95 43,476 107 46,149
7301000 WHITE BALD KNOB SCHOOL DISTRICT
93 8,787 1,220 1,291 95 42,021 102 44,842
5802000 POPE DOVER SCHOOL DISTRICT
94 8,214 1,269 1,357 95 44,464 102 46,176
0404000 BENTON GRAVETTE SCHOOL DISTRICT
95 8,170 1,675 1,762 95 53,718 105 54,392
3904000 LEE LEE COUNTY SCHOOL DISTRICT
96 13,685 911 980 94 42,032 103 44,009
2602000 GARLAND FOUNTAIN LAKE SCHOOL DISTRICT
97 10,919 1,134 1,212 92 48,312 102 50,385
3810000 LAWRENCE LAWRENCE COUNTY SCHOOL DISTRIC
98 8,848 1,016 1,082 91 39,297 97 41,407
6502000 SEARCY SEARCY COUNTY SCHOOL DISTRICT
99 10,404 878 929 89 38,088 100 40,131
6301000 SALINE BAUXITE SCHOOL DISTRICT
100 7,507 1,406 1,485 88 45,150 96 47,522
7208000 WASHINGTON WEST FORK SCHOOL DISTRICT
101 8,189 1,158 1,222 87 45,342 91 47,024
7307000 WHITE RIVERVIEW SCHOOL DISTRICT
102 9,107 1,218 1,294 84 49,869 90 52,022
5205000 OUACHITA HARMONY GROVE SCH DIST(OUACHIT
103 9,185 962 1,007 84 38,822 92 41,729
2105000 DESHA MCGEHEE SCHOOL DISTRICT
104 9,404 1,078 1,121 84 41,869 94 44,147
7205000 WASHINGTON LINCOLN SCHOOL DISTRICT
105 10,856 1,188 1,272 83 50,437 96 53,478
2202000 DREW DREW CENTRAL SCHOOL DISTRICT
106 10,267 913 970 83 34,514 90 37,253
330

Annual Fiscal Report AnalysisRanked by K12 Certified FTE 2010-2011 Actual
LEA County District Rank Per Pupil Expend
(1)
ADA (2)
ADM (3)
K12 Cert FTE
(4)
Avg Salary K12 Cert (5)
Certified FTE (6)
Avg Salary Cert FTE (7)
0803000 CARROLL GREEN FOREST SCHOOL DISTRICT
107 8,468 1,155 1,220 83 39,718 91 41,790
7201000 WASHINGTON ELKINS SCHOOL DISTRICT
108 7,470 1,104 1,151 83 41,977 89 43,769
4203000 LOGAN PARIS SCHOOL DISTRICT
109 8,730 1,060 1,112 82 41,041 90 43,097
0502000 BOONE BERGMAN SCHOOL DISTRICT
110 7,982 1,006 1,067 82 41,027 87 42,539
1101000 CLAY CORNING SCHOOL DISTRICT
111 9,360 966 1,024 81 43,292 87 45,445
4706000 MISSISSIPPI SO. MISS. COUNTY SCHOOL DIST.
112 8,759 1,225 1,301 80 42,923 90 44,792
3804000 LAWRENCE HOXIE SCHOOL DISTRICT
113 9,206 900 946 80 37,221 87 39,264
5801000 POPE ATKINS SCHOOL DISTRICT
114 9,856 922 972 79 41,013 85 42,948
3001000 HOT SPRING BISMARCK SCHOOL DISTRICT
115 9,297 925 978 78 42,474 82 44,099
5502000 PIKE CENTERPOINT SCHOOL DISTRICT
116 9,397 926 1,006 78 39,200 86 42,705
5006000 NEVADA PRESCOTT SCHOOL DISTRICT
117 8,625 1,011 1,045 77 39,346 84 40,945
3604000 JOHNSON LAMAR SCHOOL DISTRICT
118 8,522 1,004 1,067 77 48,123 82 49,866
2305000 FAULKNER MAYFLOWER SCHOOL DISTRICT
119 7,759 984 1,058 76 40,991 81 42,776
6304000 SALINE HARMONY GROVE SCH DIST(SALINE)
120 7,697 1,056 1,097 76 47,145 82 49,429
1104000 CLAY PIGGOTT SCHOOL DISTRICT
121 8,264 921 956 76 42,520 82 43,796
5303000 PERRY PERRYVILLE SCHOOL DISTRICT
122 8,152 948 1,014 76 41,641 82 43,865
5102000 NEWTON JASPER SCHOOL DISTRICT
123 9,993 865 891 75 41,925 82 44,604
0505000 BOONE VALLEY SPRINGS SCHOOL DISTRICT
124 7,979 909 948 74 41,292 80 44,503
7503000 YELL DANVILLE SCHOOL DISTRICT
125 9,301 840 877 73 39,157 78 41,485
4712000 MISSISSIPPI MANILA SCHOOL DISTRICT
126 8,876 928 984 72 43,540 77 45,334
1605000 CRAIGHEAD BUFFALO IS. CENTRAL SCH. DIST.
127 8,935 774 822 71 40,580 76 42,534
3212000 INDEPENDENCE CEDAR RIDGE SCHOOL DISTRICT
128 10,423 784 829 71 39,802 77 41,319
4501000 MARION FLIPPIN SCHOOL DISTRICT
129 10,086 763 813 70 41,075 75 43,483
6606000 SEBASTIAN MANSFIELD SCHOOL DISTRICT
130 7,684 887 955 70 42,355 75 44,198
4602000 MILLER GENOA CENTRAL SCHOOL DISTRICT
131 8,556 906 939 69 47,252 75 50,024
6703000 SEVIER HORATIO SCHOOL DISTRICT
132 8,410 799 855 69 41,048 74 42,365
3302000 IZARD MELBOURNE 133 7,910 869 907 68 40,377 73 42,210
331
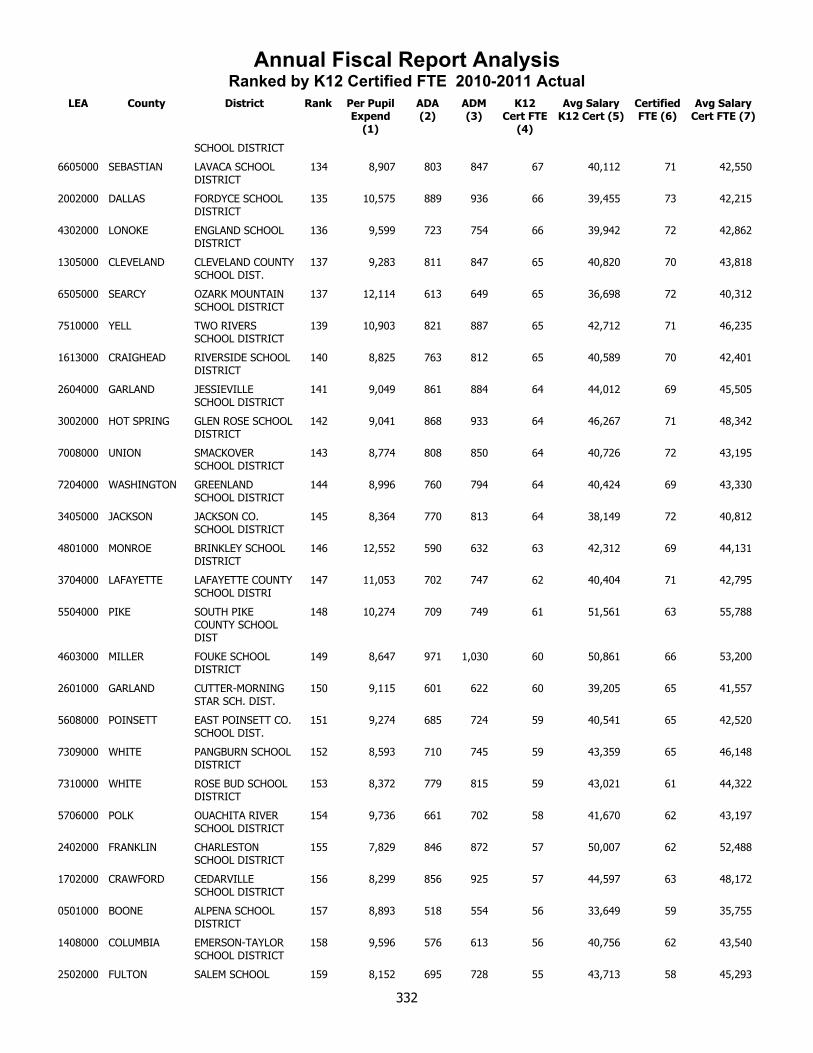
Annual Fiscal Report AnalysisRanked by K12 Certified FTE 2010-2011 Actual
LEA County District Rank Per Pupil Expend
(1)
ADA (2)
ADM (3)
K12 Cert FTE
(4)
Avg Salary K12 Cert (5)
Certified FTE (6)
Avg Salary Cert FTE (7)
SCHOOL DISTRICT
6605000 SEBASTIAN LAVACA SCHOOL DISTRICT
134 8,907 803 847 67 40,112 71 42,550
2002000 DALLAS FORDYCE SCHOOL DISTRICT
135 10,575 889 936 66 39,455 73 42,215
4302000 LONOKE ENGLAND SCHOOL DISTRICT
136 9,599 723 754 66 39,942 72 42,862
1305000 CLEVELAND CLEVELAND COUNTY SCHOOL DIST.
137 9,283 811 847 65 40,820 70 43,818
6505000 SEARCY OZARK MOUNTAIN SCHOOL DISTRICT
137 12,114 613 649 65 36,698 72 40,312
7510000 YELL TWO RIVERS SCHOOL DISTRICT
139 10,903 821 887 65 42,712 71 46,235
1613000 CRAIGHEAD RIVERSIDE SCHOOL DISTRICT
140 8,825 763 812 65 40,589 70 42,401
2604000 GARLAND JESSIEVILLE SCHOOL DISTRICT
141 9,049 861 884 64 44,012 69 45,505
3002000 HOT SPRING GLEN ROSE SCHOOL DISTRICT
142 9,041 868 933 64 46,267 71 48,342
7008000 UNION SMACKOVER SCHOOL DISTRICT
143 8,774 808 850 64 40,726 72 43,195
7204000 WASHINGTON GREENLAND SCHOOL DISTRICT
144 8,996 760 794 64 40,424 69 43,330
3405000 JACKSON JACKSON CO. SCHOOL DISTRICT
145 8,364 770 813 64 38,149 72 40,812
4801000 MONROE BRINKLEY SCHOOL DISTRICT
146 12,552 590 632 63 42,312 69 44,131
3704000 LAFAYETTE LAFAYETTE COUNTY SCHOOL DISTRI
147 11,053 702 747 62 40,404 71 42,795
5504000 PIKE SOUTH PIKE COUNTY SCHOOL DIST
148 10,274 709 749 61 51,561 63 55,788
4603000 MILLER FOUKE SCHOOL DISTRICT
149 8,647 971 1,030 60 50,861 66 53,200
2601000 GARLAND CUTTER-MORNING STAR SCH. DIST.
150 9,115 601 622 60 39,205 65 41,557
5608000 POINSETT EAST POINSETT CO. SCHOOL DIST.
151 9,274 685 724 59 40,541 65 42,520
7309000 WHITE PANGBURN SCHOOL DISTRICT
152 8,593 710 745 59 43,359 65 46,148
7310000 WHITE ROSE BUD SCHOOL DISTRICT
153 8,372 779 815 59 43,021 61 44,322
5706000 POLK OUACHITA RIVER SCHOOL DISTRICT
154 9,736 661 702 58 41,670 62 43,197
2402000 FRANKLIN CHARLESTON SCHOOL DISTRICT
155 7,829 846 872 57 50,007 62 52,488
1702000 CRAWFORD CEDARVILLE SCHOOL DISTRICT
156 8,299 856 925 57 44,597 63 48,172
0501000 BOONE ALPENA SCHOOL DISTRICT
157 8,893 518 554 56 33,649 59 35,755
1408000 COLUMBIA EMERSON-TAYLOR SCHOOL DISTRICT
158 9,596 576 613 56 40,756 62 43,540
2502000 FULTON SALEM SCHOOL 159 8,152 695 728 55 43,713 58 45,293
332
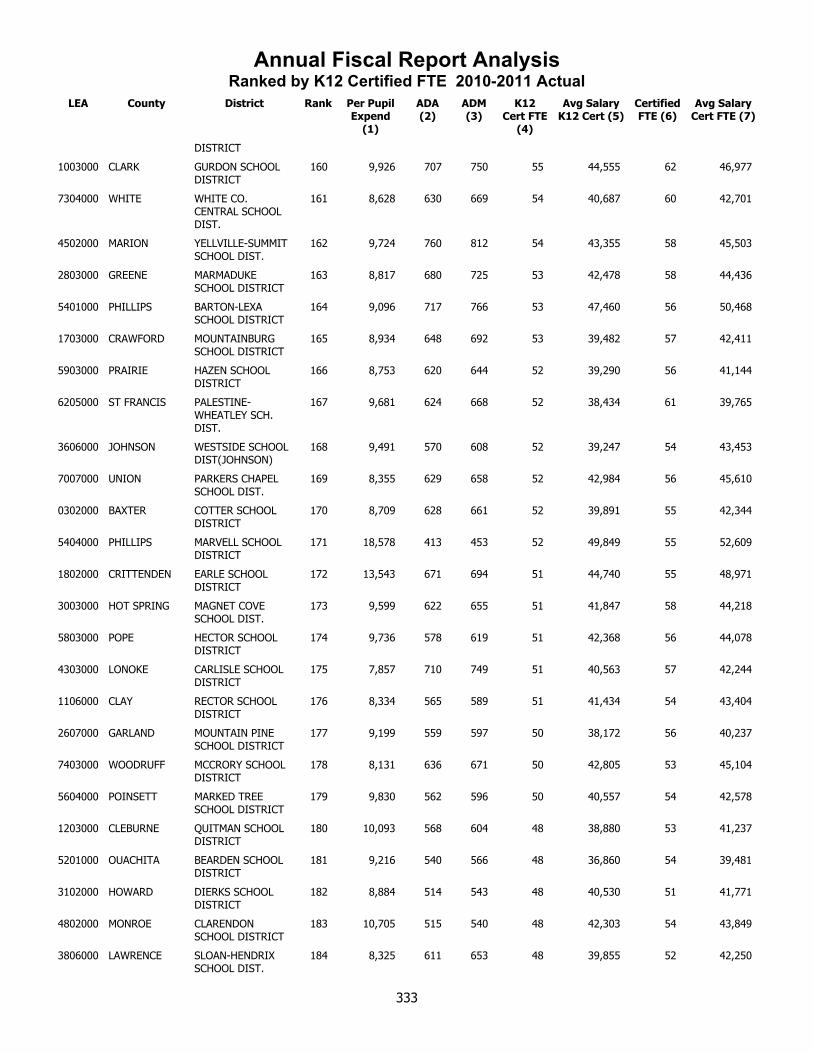
Annual Fiscal Report AnalysisRanked by K12 Certified FTE 2010-2011 Actual
LEA County District Rank Per Pupil Expend
(1)
ADA (2)
ADM (3)
K12 Cert FTE
(4)
Avg Salary K12 Cert (5)
Certified FTE (6)
Avg Salary Cert FTE (7)
DISTRICT
1003000 CLARK GURDON SCHOOL DISTRICT
160 9,926 707 750 55 44,555 62 46,977
7304000 WHITE WHITE CO. CENTRAL SCHOOL DIST.
161 8,628 630 669 54 40,687 60 42,701
4502000 MARION YELLVILLE-SUMMIT SCHOOL DIST.
162 9,724 760 812 54 43,355 58 45,503
2803000 GREENE MARMADUKE SCHOOL DISTRICT
163 8,817 680 725 53 42,478 58 44,436
5401000 PHILLIPS BARTON-LEXA SCHOOL DISTRICT
164 9,096 717 766 53 47,460 56 50,468
1703000 CRAWFORD MOUNTAINBURG SCHOOL DISTRICT
165 8,934 648 692 53 39,482 57 42,411
5903000 PRAIRIE HAZEN SCHOOL DISTRICT
166 8,753 620 644 52 39,290 56 41,144
6205000 ST FRANCIS PALESTINE-WHEATLEY SCH. DIST.
167 9,681 624 668 52 38,434 61 39,765
3606000 JOHNSON WESTSIDE SCHOOL DIST(JOHNSON)
168 9,491 570 608 52 39,247 54 43,453
7007000 UNION PARKERS CHAPEL SCHOOL DIST.
169 8,355 629 658 52 42,984 56 45,610
0302000 BAXTER COTTER SCHOOL DISTRICT
170 8,709 628 661 52 39,891 55 42,344
5404000 PHILLIPS MARVELL SCHOOL DISTRICT
171 18,578 413 453 52 49,849 55 52,609
1802000 CRITTENDEN EARLE SCHOOL DISTRICT
172 13,543 671 694 51 44,740 55 48,971
3003000 HOT SPRING MAGNET COVE SCHOOL DIST.
173 9,599 622 655 51 41,847 58 44,218
5803000 POPE HECTOR SCHOOL DISTRICT
174 9,736 578 619 51 42,368 56 44,078
4303000 LONOKE CARLISLE SCHOOL DISTRICT
175 7,857 710 749 51 40,563 57 42,244
1106000 CLAY RECTOR SCHOOL DISTRICT
176 8,334 565 589 51 41,434 54 43,404
2607000 GARLAND MOUNTAIN PINE SCHOOL DISTRICT
177 9,199 559 597 50 38,172 56 40,237
7403000 WOODRUFF MCCRORY SCHOOL DISTRICT
178 8,131 636 671 50 42,805 53 45,104
5604000 POINSETT MARKED TREE SCHOOL DISTRICT
179 9,830 562 596 50 40,557 54 42,578
1203000 CLEBURNE QUITMAN SCHOOL DISTRICT
180 10,093 568 604 48 38,880 53 41,237
5201000 OUACHITA BEARDEN SCHOOL DISTRICT
181 9,216 540 566 48 36,860 54 39,481
3102000 HOWARD DIERKS SCHOOL DISTRICT
182 8,884 514 543 48 40,530 51 41,771
4802000 MONROE CLARENDON SCHOOL DISTRICT
183 10,705 515 540 48 42,303 54 43,849
3806000 LAWRENCE SLOAN-HENDRIX SCHOOL DIST.
184 8,325 611 653 48 39,855 52 42,250
333
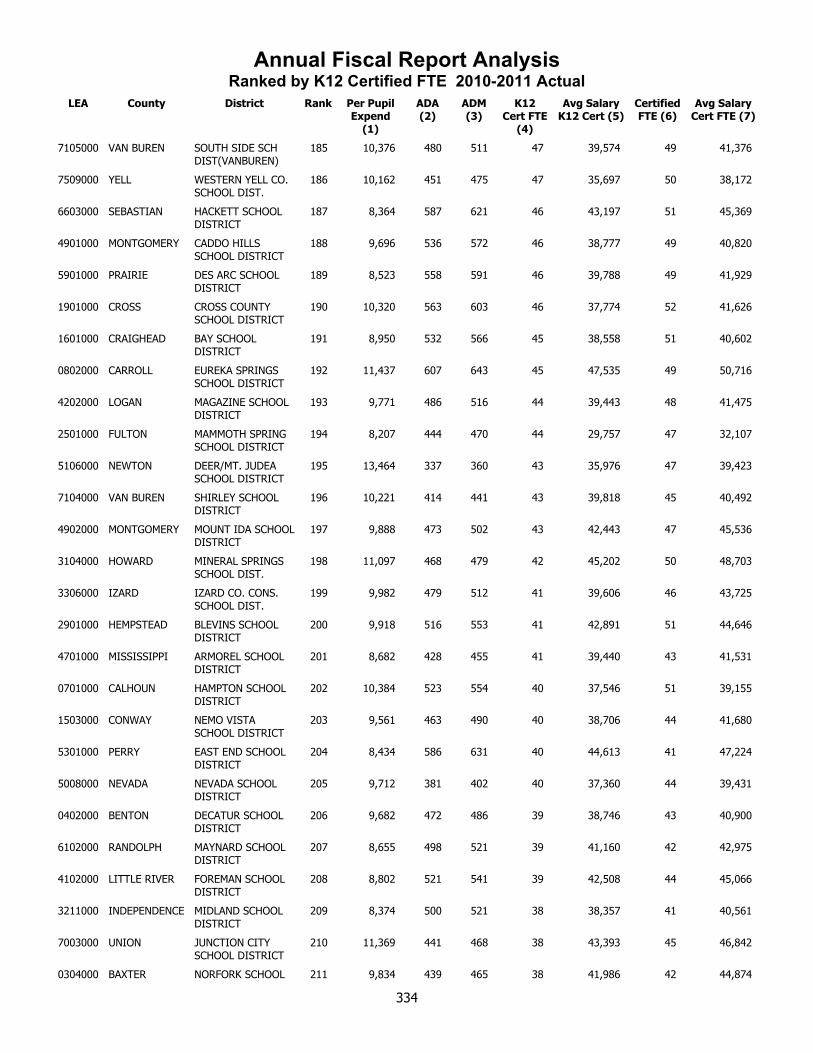
Annual Fiscal Report AnalysisRanked by K12 Certified FTE 2010-2011 Actual
LEA County District Rank Per Pupil Expend
(1)
ADA (2)
ADM (3)
K12 Cert FTE
(4)
Avg Salary K12 Cert (5)
Certified FTE (6)
Avg Salary Cert FTE (7)
7105000 VAN BUREN SOUTH SIDE SCH DIST(VANBUREN)
185 10,376 480 511 47 39,574 49 41,376
7509000 YELL WESTERN YELL CO. SCHOOL DIST.
186 10,162 451 475 47 35,697 50 38,172
6603000 SEBASTIAN HACKETT SCHOOL DISTRICT
187 8,364 587 621 46 43,197 51 45,369
4901000 MONTGOMERY CADDO HILLS SCHOOL DISTRICT
188 9,696 536 572 46 38,777 49 40,820
5901000 PRAIRIE DES ARC SCHOOL DISTRICT
189 8,523 558 591 46 39,788 49 41,929
1901000 CROSS CROSS COUNTY SCHOOL DISTRICT
190 10,320 563 603 46 37,774 52 41,626
1601000 CRAIGHEAD BAY SCHOOL DISTRICT
191 8,950 532 566 45 38,558 51 40,602
0802000 CARROLL EUREKA SPRINGS SCHOOL DISTRICT
192 11,437 607 643 45 47,535 49 50,716
4202000 LOGAN MAGAZINE SCHOOL DISTRICT
193 9,771 486 516 44 39,443 48 41,475
2501000 FULTON MAMMOTH SPRING SCHOOL DISTRICT
194 8,207 444 470 44 29,757 47 32,107
5106000 NEWTON DEER/MT. JUDEA SCHOOL DISTRICT
195 13,464 337 360 43 35,976 47 39,423
7104000 VAN BUREN SHIRLEY SCHOOL DISTRICT
196 10,221 414 441 43 39,818 45 40,492
4902000 MONTGOMERY MOUNT IDA SCHOOL DISTRICT
197 9,888 473 502 43 42,443 47 45,536
3104000 HOWARD MINERAL SPRINGS SCHOOL DIST.
198 11,097 468 479 42 45,202 50 48,703
3306000 IZARD IZARD CO. CONS. SCHOOL DIST.
199 9,982 479 512 41 39,606 46 43,725
2901000 HEMPSTEAD BLEVINS SCHOOL DISTRICT
200 9,918 516 553 41 42,891 51 44,646
4701000 MISSISSIPPI ARMOREL SCHOOL DISTRICT
201 8,682 428 455 41 39,440 43 41,531
0701000 CALHOUN HAMPTON SCHOOL DISTRICT
202 10,384 523 554 40 37,546 51 39,155
1503000 CONWAY NEMO VISTA SCHOOL DISTRICT
203 9,561 463 490 40 38,706 44 41,680
5301000 PERRY EAST END SCHOOL DISTRICT
204 8,434 586 631 40 44,613 41 47,224
5008000 NEVADA NEVADA SCHOOL DISTRICT
205 9,712 381 402 40 37,360 44 39,431
0402000 BENTON DECATUR SCHOOL DISTRICT
206 9,682 472 486 39 38,746 43 40,900
6102000 RANDOLPH MAYNARD SCHOOL DISTRICT
207 8,655 498 521 39 41,160 42 42,975
4102000 LITTLE RIVER FOREMAN SCHOOL DISTRICT
208 8,802 521 541 39 42,508 44 45,066
3211000 INDEPENDENCE MIDLAND SCHOOL DISTRICT
209 8,374 500 521 38 38,357 41 40,561
7003000 UNION JUNCTION CITY SCHOOL DISTRICT
210 11,369 441 468 38 43,393 45 46,842
0304000 BAXTER NORFORK SCHOOL 211 9,834 439 465 38 41,986 42 44,874
334
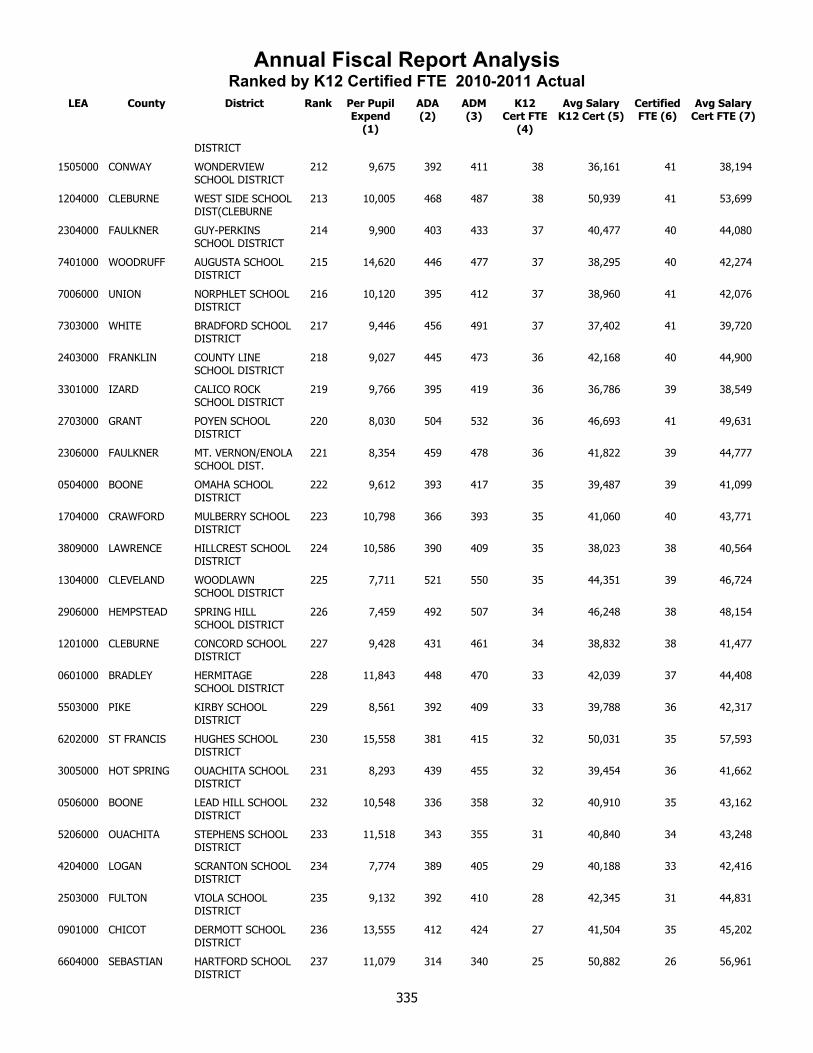
Annual Fiscal Report AnalysisRanked by K12 Certified FTE 2010-2011 Actual
LEA County District Rank Per Pupil Expend
(1)
ADA (2)
ADM (3)
K12 Cert FTE
(4)
Avg Salary K12 Cert (5)
Certified FTE (6)
Avg Salary Cert FTE (7)
DISTRICT
1505000 CONWAY WONDERVIEW SCHOOL DISTRICT
212 9,675 392 411 38 36,161 41 38,194
1204000 CLEBURNE WEST SIDE SCHOOL DIST(CLEBURNE
213 10,005 468 487 38 50,939 41 53,699
2304000 FAULKNER GUY-PERKINS SCHOOL DISTRICT
214 9,900 403 433 37 40,477 40 44,080
7401000 WOODRUFF AUGUSTA SCHOOL DISTRICT
215 14,620 446 477 37 38,295 40 42,274
7006000 UNION NORPHLET SCHOOL DISTRICT
216 10,120 395 412 37 38,960 41 42,076
7303000 WHITE BRADFORD SCHOOL DISTRICT
217 9,446 456 491 37 37,402 41 39,720
2403000 FRANKLIN COUNTY LINE SCHOOL DISTRICT
218 9,027 445 473 36 42,168 40 44,900
3301000 IZARD CALICO ROCK SCHOOL DISTRICT
219 9,766 395 419 36 36,786 39 38,549
2703000 GRANT POYEN SCHOOL DISTRICT
220 8,030 504 532 36 46,693 41 49,631
2306000 FAULKNER MT. VERNON/ENOLA SCHOOL DIST.
221 8,354 459 478 36 41,822 39 44,777
0504000 BOONE OMAHA SCHOOL DISTRICT
222 9,612 393 417 35 39,487 39 41,099
1704000 CRAWFORD MULBERRY SCHOOL DISTRICT
223 10,798 366 393 35 41,060 40 43,771
3809000 LAWRENCE HILLCREST SCHOOL DISTRICT
224 10,586 390 409 35 38,023 38 40,564
1304000 CLEVELAND WOODLAWN SCHOOL DISTRICT
225 7,711 521 550 35 44,351 39 46,724
2906000 HEMPSTEAD SPRING HILL SCHOOL DISTRICT
226 7,459 492 507 34 46,248 38 48,154
1201000 CLEBURNE CONCORD SCHOOL DISTRICT
227 9,428 431 461 34 38,832 38 41,477
0601000 BRADLEY HERMITAGE SCHOOL DISTRICT
228 11,843 448 470 33 42,039 37 44,408
5503000 PIKE KIRBY SCHOOL DISTRICT
229 8,561 392 409 33 39,788 36 42,317
6202000 ST FRANCIS HUGHES SCHOOL DISTRICT
230 15,558 381 415 32 50,031 35 57,593
3005000 HOT SPRING OUACHITA SCHOOL DISTRICT
231 8,293 439 455 32 39,454 36 41,662
0506000 BOONE LEAD HILL SCHOOL DISTRICT
232 10,548 336 358 32 40,910 35 43,162
5206000 OUACHITA STEPHENS SCHOOL DISTRICT
233 11,518 343 355 31 40,840 34 43,248
4204000 LOGAN SCRANTON SCHOOL DISTRICT
234 7,774 389 405 29 40,188 33 42,416
2503000 FULTON VIOLA SCHOOL DISTRICT
235 9,132 392 410 28 42,345 31 44,831
0901000 CHICOT DERMOTT SCHOOL DISTRICT
236 13,555 412 424 27 41,504 35 45,202
6604000 SEBASTIAN HARTFORD SCHOOL DISTRICT
237 11,079 314 340 25 50,882 26 56,961
335
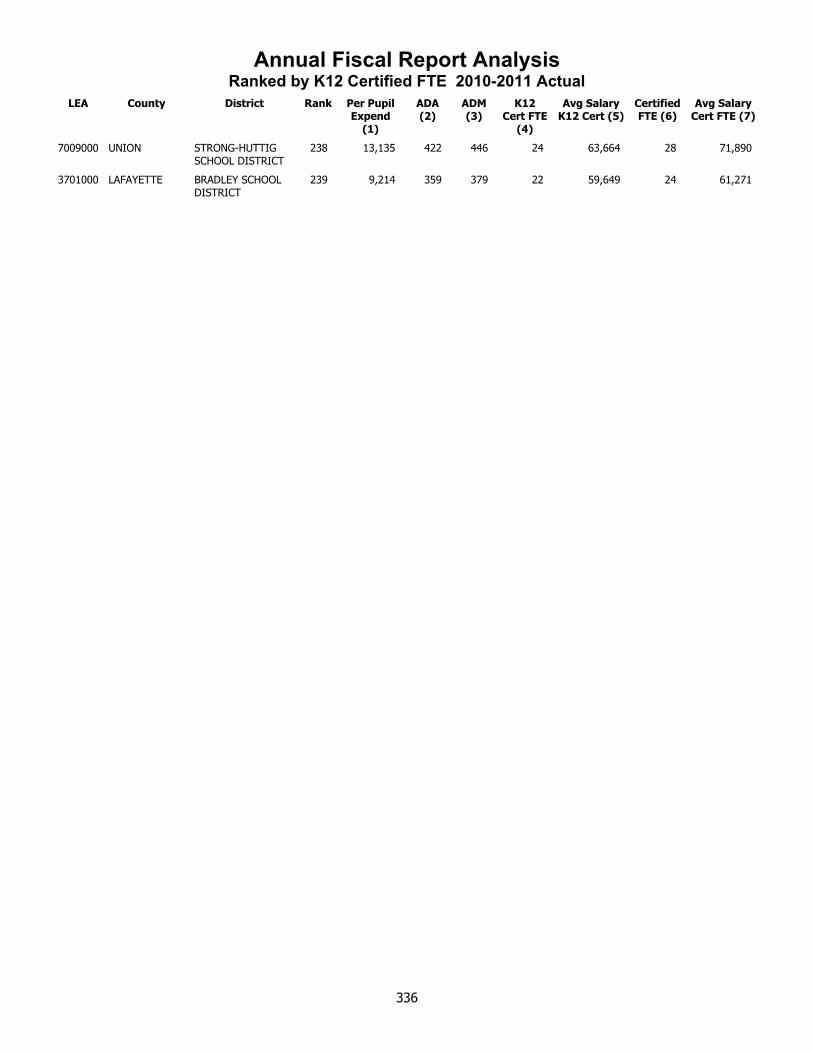
Annual Fiscal Report AnalysisRanked by K12 Certified FTE 2010-2011 Actual
LEA County District Rank Per Pupil Expend
(1)
ADA (2)
ADM (3)
K12 Cert FTE
(4)
Avg Salary K12 Cert (5)
Certified FTE (6)
Avg Salary Cert FTE (7)
7009000 UNION STRONG-HUTTIG SCHOOL DISTRICT
238 13,135 422 446 24 63,664 28 71,890
3701000 LAFAYETTE BRADLEY SCHOOL DISTRICT
239 9,214 359 379 22 59,649 24 61,271
336
Ranked byAverage Salary of K-12
CertifiedFull Time Equivalency

Annual Fiscal Report AnalysisRanked By K12 Certified Avg Salary 2010-2011 Actual
LEA County District Rank Per Pupil Expend
(1)
ADA (2)
ADM (3)
K12 Cert FTE
(4)
Avg Salary K12 Cert (5)
Certified FTE (6)
Avg Salary Cert FTE (7)
7009000 UNION STRONG-HUTTIG SCHOOL DISTRICT
1 13,135 422 446 24 63,664 28 71,890
3701000 LAFAYETTE BRADLEY SCHOOL DISTRICT
2 9,214 359 379 22 59,649 24 61,271
7203000 WASHINGTON FAYETTEVILLE SCHOOL DISTRICT
3 10,333 8,388 8,839 582 57,279 632 59,384
7207000 WASHINGTON SPRINGDALE SCHOOL DISTRICT
4 8,577 17,592 18,678 1,130 56,359 1,230 58,679
0405000 BENTON ROGERS SCHOOL DISTRICT
5 8,279 13,236 13,861 879 55,836 951 58,049
0201000 ASHLEY CROSSETT SCHOOL DISTRICT
6 9,952 1,766 1,866 104 54,728 114 57,199
0404000 BENTON GRAVETTE SCHOOL DISTRICT
7 8,170 1,675 1,762 95 53,718 105 54,392
0401000 BENTON BENTONVILLE SCHOOL DISTRICT
8 8,427 12,793 13,536 894 53,594 944 55,499
6601000 SEBASTIAN FORT SMITH SCHOOL DISTRICT
9 9,643 12,941 13,692 895 53,406 969 55,924
6001000 PULASKI LITTLE ROCK SCHOOL DISTRICT
10 12,851 22,995 23,788 1,936 53,069 2,137 55,650
2301000 FAULKNER CONWAY SCHOOL DISTRICT
11 8,470 8,809 9,207 609 52,390 652 54,811
3105000 HOWARD NASHVILLE SCHOOL DISTRICT
11 8,268 1,865 1,939 127 52,390 139 54,111
6303000 SALINE BRYANT SCHOOL DISTRICT
13 7,401 7,554 7,879 476 52,097 509 53,916
3510000 JEFFERSON WHITE HALL SCHOOL DISTRICT
14 8,059 2,894 3,000 185 51,954 199 54,262
3505000 JEFFERSON PINE BLUFF SCHOOL DISTRICT
15 11,683 4,414 4,727 338 51,933 360 51,906
5504000 PIKE SOUTH PIKE COUNTY SCHOOL DIST
16 10,274 709 749 61 51,561 63 55,788
1204000 CLEBURNE WEST SIDE SCHOOL DIST(CLEBURNE
17 10,005 468 487 38 50,939 41 53,699
6604000 SEBASTIAN HARTFORD SCHOOL DISTRICT
18 11,079 314 340 25 50,882 26 56,961
4603000 MILLER FOUKE SCHOOL DISTRICT
19 8,647 971 1,030 60 50,861 66 53,200
6201000 ST FRANCIS FORREST CITY SCHOOL DISTRICT
20 11,383 2,937 3,138 222 50,845 250 53,488
1905000 CROSS WYNNE SCHOOL DISTRICT
21 8,799 2,719 2,852 194 50,801 214 53,375
2605000 GARLAND LAKE HAMILTON SCHOOL DISTRICT
22 8,108 3,906 4,137 241 50,662 261 53,501
5403000 PHILLIPS HELENA/ W.HELENA SCHOOL DIST.
23 11,638 2,115 2,233 102 50,561 133 54,170
7205000 WASHINGTON LINCOLN SCHOOL DISTRICT
24 10,856 1,188 1,272 83 50,437 96 53,478
1803000 CRITTENDEN WEST MEMPHIS SCHOOL DISTRICT
25 9,377 5,316 5,660 378 50,435 437 53,044
6302000 SALINE BENTON SCHOOL DISTRICT
26 7,739 4,398 4,629 276 50,413 300 53,472
338
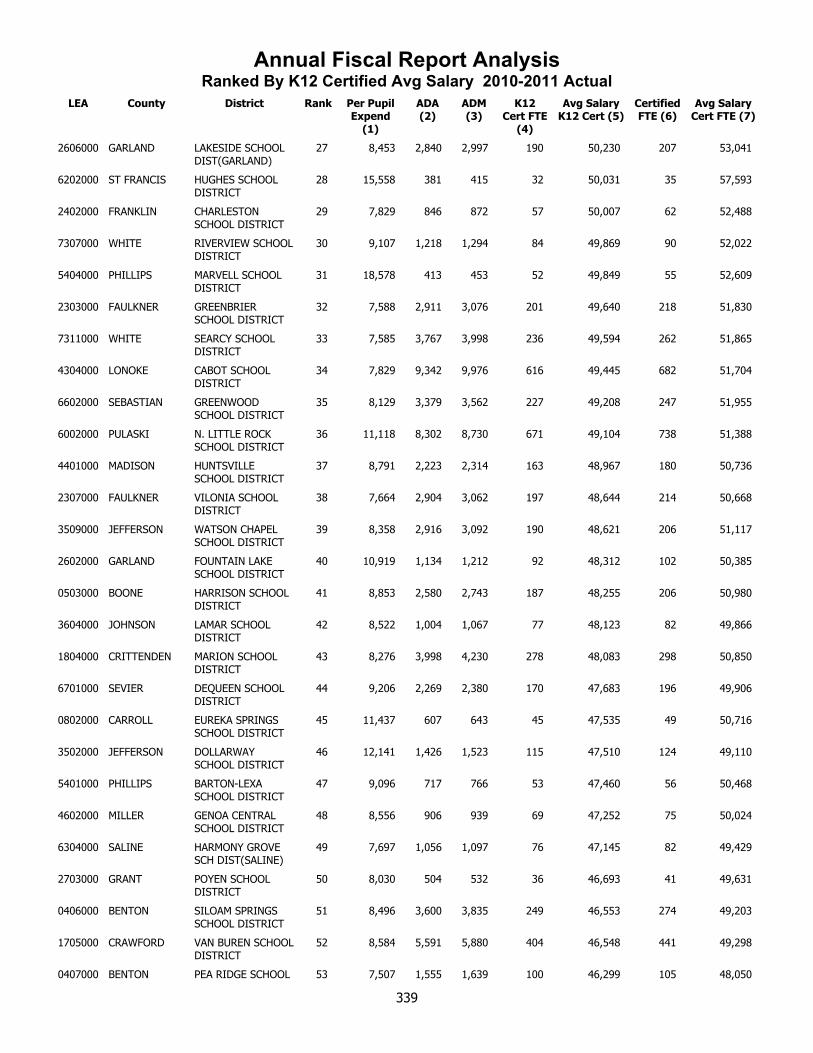
Annual Fiscal Report AnalysisRanked By K12 Certified Avg Salary 2010-2011 Actual
LEA County District Rank Per Pupil Expend
(1)
ADA (2)
ADM (3)
K12 Cert FTE
(4)
Avg Salary K12 Cert (5)
Certified FTE (6)
Avg Salary Cert FTE (7)
2606000 GARLAND LAKESIDE SCHOOL DIST(GARLAND)
27 8,453 2,840 2,997 190 50,230 207 53,041
6202000 ST FRANCIS HUGHES SCHOOL DISTRICT
28 15,558 381 415 32 50,031 35 57,593
2402000 FRANKLIN CHARLESTON SCHOOL DISTRICT
29 7,829 846 872 57 50,007 62 52,488
7307000 WHITE RIVERVIEW SCHOOL DISTRICT
30 9,107 1,218 1,294 84 49,869 90 52,022
5404000 PHILLIPS MARVELL SCHOOL DISTRICT
31 18,578 413 453 52 49,849 55 52,609
2303000 FAULKNER GREENBRIER SCHOOL DISTRICT
32 7,588 2,911 3,076 201 49,640 218 51,830
7311000 WHITE SEARCY SCHOOL DISTRICT
33 7,585 3,767 3,998 236 49,594 262 51,865
4304000 LONOKE CABOT SCHOOL DISTRICT
34 7,829 9,342 9,976 616 49,445 682 51,704
6602000 SEBASTIAN GREENWOOD SCHOOL DISTRICT
35 8,129 3,379 3,562 227 49,208 247 51,955
6002000 PULASKI N. LITTLE ROCK SCHOOL DISTRICT
36 11,118 8,302 8,730 671 49,104 738 51,388
4401000 MADISON HUNTSVILLE SCHOOL DISTRICT
37 8,791 2,223 2,314 163 48,967 180 50,736
2307000 FAULKNER VILONIA SCHOOL DISTRICT
38 7,664 2,904 3,062 197 48,644 214 50,668
3509000 JEFFERSON WATSON CHAPEL SCHOOL DISTRICT
39 8,358 2,916 3,092 190 48,621 206 51,117
2602000 GARLAND FOUNTAIN LAKE SCHOOL DISTRICT
40 10,919 1,134 1,212 92 48,312 102 50,385
0503000 BOONE HARRISON SCHOOL DISTRICT
41 8,853 2,580 2,743 187 48,255 206 50,980
3604000 JOHNSON LAMAR SCHOOL DISTRICT
42 8,522 1,004 1,067 77 48,123 82 49,866
1804000 CRITTENDEN MARION SCHOOL DISTRICT
43 8,276 3,998 4,230 278 48,083 298 50,850
6701000 SEVIER DEQUEEN SCHOOL DISTRICT
44 9,206 2,269 2,380 170 47,683 196 49,906
0802000 CARROLL EUREKA SPRINGS SCHOOL DISTRICT
45 11,437 607 643 45 47,535 49 50,716
3502000 JEFFERSON DOLLARWAY SCHOOL DISTRICT
46 12,141 1,426 1,523 115 47,510 124 49,110
5401000 PHILLIPS BARTON-LEXA SCHOOL DISTRICT
47 9,096 717 766 53 47,460 56 50,468
4602000 MILLER GENOA CENTRAL SCHOOL DISTRICT
48 8,556 906 939 69 47,252 75 50,024
6304000 SALINE HARMONY GROVE SCH DIST(SALINE)
49 7,697 1,056 1,097 76 47,145 82 49,429
2703000 GRANT POYEN SCHOOL DISTRICT
50 8,030 504 532 36 46,693 41 49,631
0406000 BENTON SILOAM SPRINGS SCHOOL DISTRICT
51 8,496 3,600 3,835 249 46,553 274 49,203
1705000 CRAWFORD VAN BUREN SCHOOL DISTRICT
52 8,584 5,591 5,880 404 46,548 441 49,298
0407000 BENTON PEA RIDGE SCHOOL 53 7,507 1,555 1,639 100 46,299 105 48,050
339
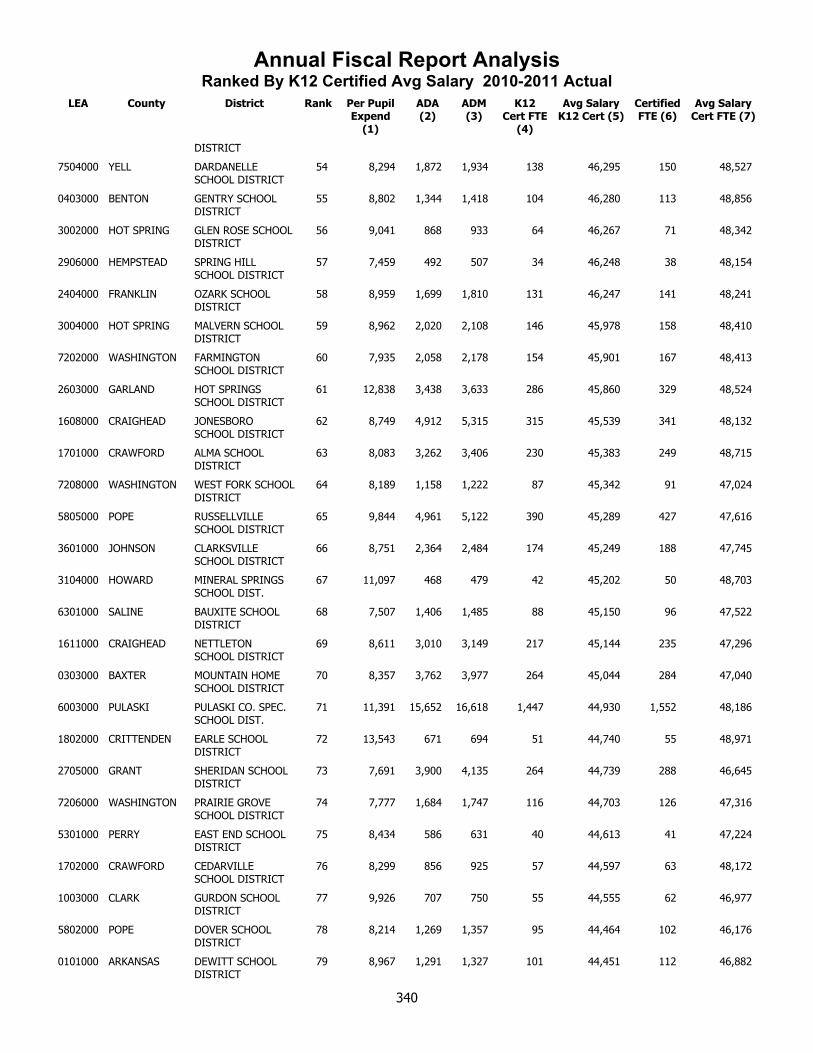
Annual Fiscal Report AnalysisRanked By K12 Certified Avg Salary 2010-2011 Actual
LEA County District Rank Per Pupil Expend
(1)
ADA (2)
ADM (3)
K12 Cert FTE
(4)
Avg Salary K12 Cert (5)
Certified FTE (6)
Avg Salary Cert FTE (7)
DISTRICT
7504000 YELL DARDANELLE SCHOOL DISTRICT
54 8,294 1,872 1,934 138 46,295 150 48,527
0403000 BENTON GENTRY SCHOOL DISTRICT
55 8,802 1,344 1,418 104 46,280 113 48,856
3002000 HOT SPRING GLEN ROSE SCHOOL DISTRICT
56 9,041 868 933 64 46,267 71 48,342
2906000 HEMPSTEAD SPRING HILL SCHOOL DISTRICT
57 7,459 492 507 34 46,248 38 48,154
2404000 FRANKLIN OZARK SCHOOL DISTRICT
58 8,959 1,699 1,810 131 46,247 141 48,241
3004000 HOT SPRING MALVERN SCHOOL DISTRICT
59 8,962 2,020 2,108 146 45,978 158 48,410
7202000 WASHINGTON FARMINGTON SCHOOL DISTRICT
60 7,935 2,058 2,178 154 45,901 167 48,413
2603000 GARLAND HOT SPRINGS SCHOOL DISTRICT
61 12,838 3,438 3,633 286 45,860 329 48,524
1608000 CRAIGHEAD JONESBORO SCHOOL DISTRICT
62 8,749 4,912 5,315 315 45,539 341 48,132
1701000 CRAWFORD ALMA SCHOOL DISTRICT
63 8,083 3,262 3,406 230 45,383 249 48,715
7208000 WASHINGTON WEST FORK SCHOOL DISTRICT
64 8,189 1,158 1,222 87 45,342 91 47,024
5805000 POPE RUSSELLVILLE SCHOOL DISTRICT
65 9,844 4,961 5,122 390 45,289 427 47,616
3601000 JOHNSON CLARKSVILLE SCHOOL DISTRICT
66 8,751 2,364 2,484 174 45,249 188 47,745
3104000 HOWARD MINERAL SPRINGS SCHOOL DIST.
67 11,097 468 479 42 45,202 50 48,703
6301000 SALINE BAUXITE SCHOOL DISTRICT
68 7,507 1,406 1,485 88 45,150 96 47,522
1611000 CRAIGHEAD NETTLETON SCHOOL DISTRICT
69 8,611 3,010 3,149 217 45,144 235 47,296
0303000 BAXTER MOUNTAIN HOME SCHOOL DISTRICT
70 8,357 3,762 3,977 264 45,044 284 47,040
6003000 PULASKI PULASKI CO. SPEC. SCHOOL DIST.
71 11,391 15,652 16,618 1,447 44,930 1,552 48,186
1802000 CRITTENDEN EARLE SCHOOL DISTRICT
72 13,543 671 694 51 44,740 55 48,971
2705000 GRANT SHERIDAN SCHOOL DISTRICT
73 7,691 3,900 4,135 264 44,739 288 46,645
7206000 WASHINGTON PRAIRIE GROVE SCHOOL DISTRICT
74 7,777 1,684 1,747 116 44,703 126 47,316
5301000 PERRY EAST END SCHOOL DISTRICT
75 8,434 586 631 40 44,613 41 47,224
1702000 CRAWFORD CEDARVILLE SCHOOL DISTRICT
76 8,299 856 925 57 44,597 63 48,172
1003000 CLARK GURDON SCHOOL DISTRICT
77 9,926 707 750 55 44,555 62 46,977
5802000 POPE DOVER SCHOOL DISTRICT
78 8,214 1,269 1,357 95 44,464 102 46,176
0101000 ARKANSAS DEWITT SCHOOL DISTRICT
79 8,967 1,291 1,327 101 44,451 112 46,882
340
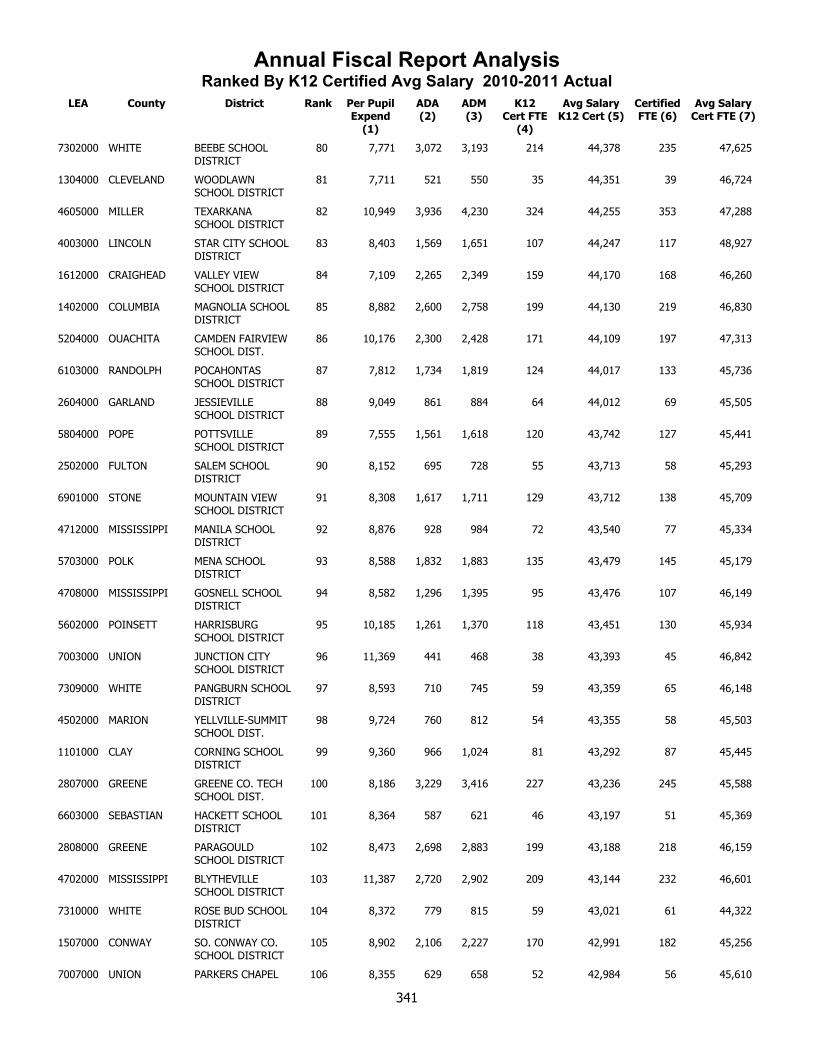
Annual Fiscal Report AnalysisRanked By K12 Certified Avg Salary 2010-2011 Actual
LEA County District Rank Per Pupil Expend
(1)
ADA (2)
ADM (3)
K12 Cert FTE
(4)
Avg Salary K12 Cert (5)
Certified FTE (6)
Avg Salary Cert FTE (7)
7302000 WHITE BEEBE SCHOOL DISTRICT
80 7,771 3,072 3,193 214 44,378 235 47,625
1304000 CLEVELAND WOODLAWN SCHOOL DISTRICT
81 7,711 521 550 35 44,351 39 46,724
4605000 MILLER TEXARKANA SCHOOL DISTRICT
82 10,949 3,936 4,230 324 44,255 353 47,288
4003000 LINCOLN STAR CITY SCHOOL DISTRICT
83 8,403 1,569 1,651 107 44,247 117 48,927
1612000 CRAIGHEAD VALLEY VIEW SCHOOL DISTRICT
84 7,109 2,265 2,349 159 44,170 168 46,260
1402000 COLUMBIA MAGNOLIA SCHOOL DISTRICT
85 8,882 2,600 2,758 199 44,130 219 46,830
5204000 OUACHITA CAMDEN FAIRVIEW SCHOOL DIST.
86 10,176 2,300 2,428 171 44,109 197 47,313
6103000 RANDOLPH POCAHONTAS SCHOOL DISTRICT
87 7,812 1,734 1,819 124 44,017 133 45,736
2604000 GARLAND JESSIEVILLE SCHOOL DISTRICT
88 9,049 861 884 64 44,012 69 45,505
5804000 POPE POTTSVILLE SCHOOL DISTRICT
89 7,555 1,561 1,618 120 43,742 127 45,441
2502000 FULTON SALEM SCHOOL DISTRICT
90 8,152 695 728 55 43,713 58 45,293
6901000 STONE MOUNTAIN VIEW SCHOOL DISTRICT
91 8,308 1,617 1,711 129 43,712 138 45,709
4712000 MISSISSIPPI MANILA SCHOOL DISTRICT
92 8,876 928 984 72 43,540 77 45,334
5703000 POLK MENA SCHOOL DISTRICT
93 8,588 1,832 1,883 135 43,479 145 45,179
4708000 MISSISSIPPI GOSNELL SCHOOL DISTRICT
94 8,582 1,296 1,395 95 43,476 107 46,149
5602000 POINSETT HARRISBURG SCHOOL DISTRICT
95 10,185 1,261 1,370 118 43,451 130 45,934
7003000 UNION JUNCTION CITY SCHOOL DISTRICT
96 11,369 441 468 38 43,393 45 46,842
7309000 WHITE PANGBURN SCHOOL DISTRICT
97 8,593 710 745 59 43,359 65 46,148
4502000 MARION YELLVILLE-SUMMIT SCHOOL DIST.
98 9,724 760 812 54 43,355 58 45,503
1101000 CLAY CORNING SCHOOL DISTRICT
99 9,360 966 1,024 81 43,292 87 45,445
2807000 GREENE GREENE CO. TECH SCHOOL DIST.
100 8,186 3,229 3,416 227 43,236 245 45,588
6603000 SEBASTIAN HACKETT SCHOOL DISTRICT
101 8,364 587 621 46 43,197 51 45,369
2808000 GREENE PARAGOULD SCHOOL DISTRICT
102 8,473 2,698 2,883 199 43,188 218 46,159
4702000 MISSISSIPPI BLYTHEVILLE SCHOOL DISTRICT
103 11,387 2,720 2,902 209 43,144 232 46,601
7310000 WHITE ROSE BUD SCHOOL DISTRICT
104 8,372 779 815 59 43,021 61 44,322
1507000 CONWAY SO. CONWAY CO. SCHOOL DISTRICT
105 8,902 2,106 2,227 170 42,991 182 45,256
7007000 UNION PARKERS CHAPEL 106 8,355 629 658 52 42,984 56 45,610
341

Annual Fiscal Report AnalysisRanked By K12 Certified Avg Salary 2010-2011 Actual
LEA County District Rank Per Pupil Expend
(1)
ADA (2)
ADM (3)
K12 Cert FTE
(4)
Avg Salary K12 Cert (5)
Certified FTE (6)
Avg Salary Cert FTE (7)
SCHOOL DIST.
4706000 MISSISSIPPI SO. MISS. COUNTY SCHOOL DIST.
107 8,759 1,225 1,301 80 42,923 90 44,792
2901000 HEMPSTEAD BLEVINS SCHOOL DISTRICT
108 9,918 516 553 41 42,891 51 44,646
1202000 CLEBURNE HEBER SPRINGS SCHOOL DISTRICT
109 8,192 1,634 1,738 124 42,836 132 44,489
7403000 WOODRUFF MCCRORY SCHOOL DISTRICT
110 8,131 636 671 50 42,805 53 45,104
4101000 LITTLE RIVER ASHDOWN SCHOOL DISTRICT
111 9,563 1,397 1,483 124 42,787 138 45,258
7510000 YELL TWO RIVERS SCHOOL DISTRICT
112 10,903 821 887 65 42,712 71 46,235
1104000 CLAY PIGGOTT SCHOOL DISTRICT
113 8,264 921 956 76 42,520 82 43,796
4102000 LITTLE RIVER FOREMAN SCHOOL DISTRICT
114 8,802 521 541 39 42,508 44 45,066
2803000 GREENE MARMADUKE SCHOOL DISTRICT
115 8,817 680 725 53 42,478 58 44,436
3001000 HOT SPRING BISMARCK SCHOOL DISTRICT
116 9,297 925 978 78 42,474 82 44,099
0104000 ARKANSAS STUTTGART SCHOOL DISTRICT
117 8,400 1,673 1,786 120 42,468 134 45,739
4902000 MONTGOMERY MOUNT IDA SCHOOL DISTRICT
118 9,888 473 502 43 42,443 47 45,536
5803000 POPE HECTOR SCHOOL DISTRICT
119 9,736 578 619 51 42,368 56 44,078
6606000 SEBASTIAN MANSFIELD SCHOOL DISTRICT
120 7,684 887 955 70 42,355 75 44,198
2503000 FULTON VIOLA SCHOOL DISTRICT
121 9,132 392 410 28 42,345 31 44,831
4801000 MONROE BRINKLEY SCHOOL DISTRICT
122 12,552 590 632 63 42,312 69 44,131
4802000 MONROE CLARENDON SCHOOL DISTRICT
123 10,705 515 540 48 42,303 54 43,849
2403000 FRANKLIN COUNTY LINE SCHOOL DISTRICT
124 9,027 445 473 36 42,168 40 44,900
6401000 SCOTT WALDRON SCHOOL DISTRICT
125 8,961 1,488 1,621 122 42,150 131 43,787
0601000 BRADLEY HERMITAGE SCHOOL DISTRICT
126 11,843 448 470 33 42,039 37 44,408
3904000 LEE LEE COUNTY SCHOOL DISTRICT
127 13,685 911 980 94 42,032 103 44,009
7301000 WHITE BALD KNOB SCHOOL DISTRICT
128 8,787 1,220 1,291 95 42,021 102 44,842
1603000 CRAIGHEAD BROOKLAND SCHOOL DISTRICT
129 7,330 1,567 1,625 113 42,002 124 43,311
0304000 BAXTER NORFORK SCHOOL DISTRICT
130 9,834 439 465 38 41,986 42 44,874
7201000 WASHINGTON ELKINS SCHOOL DISTRICT
131 7,470 1,104 1,151 83 41,977 89 43,769
5102000 NEWTON JASPER SCHOOL DISTRICT
132 9,993 865 891 75 41,925 82 44,604
342
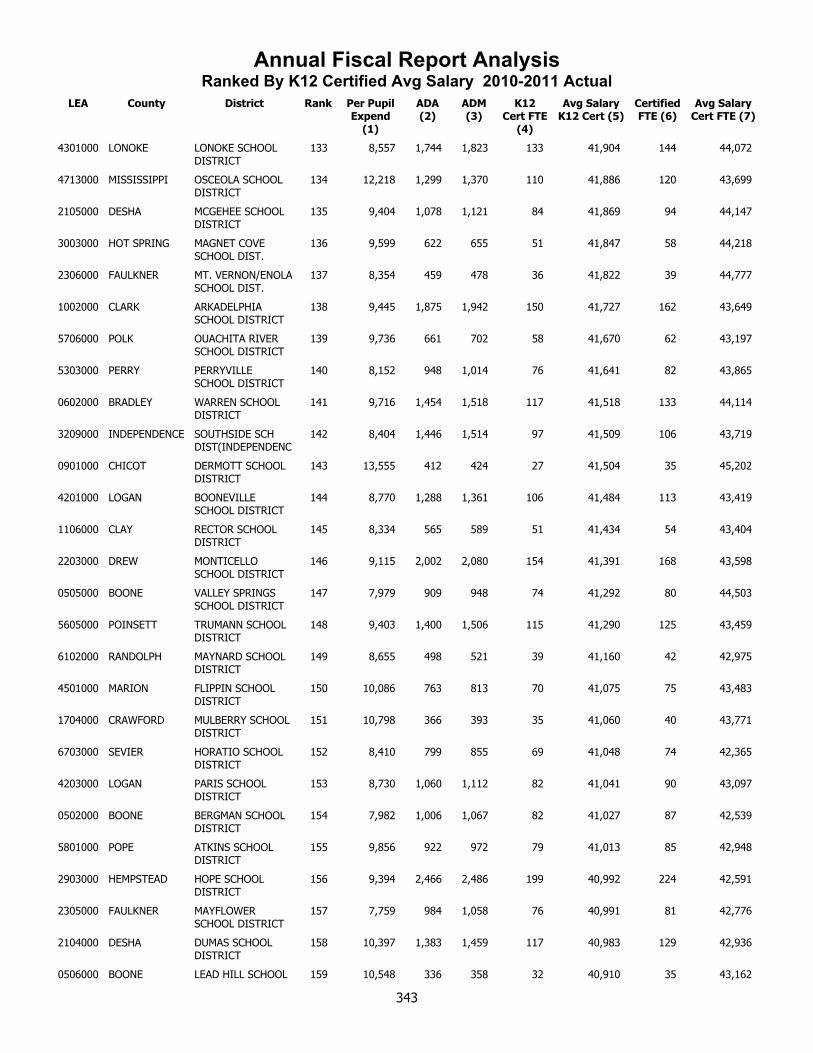
Annual Fiscal Report AnalysisRanked By K12 Certified Avg Salary 2010-2011 Actual
LEA County District Rank Per Pupil Expend
(1)
ADA (2)
ADM (3)
K12 Cert FTE
(4)
Avg Salary K12 Cert (5)
Certified FTE (6)
Avg Salary Cert FTE (7)
4301000 LONOKE LONOKE SCHOOL DISTRICT
133 8,557 1,744 1,823 133 41,904 144 44,072
4713000 MISSISSIPPI OSCEOLA SCHOOL DISTRICT
134 12,218 1,299 1,370 110 41,886 120 43,699
2105000 DESHA MCGEHEE SCHOOL DISTRICT
135 9,404 1,078 1,121 84 41,869 94 44,147
3003000 HOT SPRING MAGNET COVE SCHOOL DIST.
136 9,599 622 655 51 41,847 58 44,218
2306000 FAULKNER MT. VERNON/ENOLA SCHOOL DIST.
137 8,354 459 478 36 41,822 39 44,777
1002000 CLARK ARKADELPHIA SCHOOL DISTRICT
138 9,445 1,875 1,942 150 41,727 162 43,649
5706000 POLK OUACHITA RIVER SCHOOL DISTRICT
139 9,736 661 702 58 41,670 62 43,197
5303000 PERRY PERRYVILLE SCHOOL DISTRICT
140 8,152 948 1,014 76 41,641 82 43,865
0602000 BRADLEY WARREN SCHOOL DISTRICT
141 9,716 1,454 1,518 117 41,518 133 44,114
3209000 INDEPENDENCE SOUTHSIDE SCH DIST(INDEPENDENC
142 8,404 1,446 1,514 97 41,509 106 43,719
0901000 CHICOT DERMOTT SCHOOL DISTRICT
143 13,555 412 424 27 41,504 35 45,202
4201000 LOGAN BOONEVILLE SCHOOL DISTRICT
144 8,770 1,288 1,361 106 41,484 113 43,419
1106000 CLAY RECTOR SCHOOL DISTRICT
145 8,334 565 589 51 41,434 54 43,404
2203000 DREW MONTICELLO SCHOOL DISTRICT
146 9,115 2,002 2,080 154 41,391 168 43,598
0505000 BOONE VALLEY SPRINGS SCHOOL DISTRICT
147 7,979 909 948 74 41,292 80 44,503
5605000 POINSETT TRUMANN SCHOOL DISTRICT
148 9,403 1,400 1,506 115 41,290 125 43,459
6102000 RANDOLPH MAYNARD SCHOOL DISTRICT
149 8,655 498 521 39 41,160 42 42,975
4501000 MARION FLIPPIN SCHOOL DISTRICT
150 10,086 763 813 70 41,075 75 43,483
1704000 CRAWFORD MULBERRY SCHOOL DISTRICT
151 10,798 366 393 35 41,060 40 43,771
6703000 SEVIER HORATIO SCHOOL DISTRICT
152 8,410 799 855 69 41,048 74 42,365
4203000 LOGAN PARIS SCHOOL DISTRICT
153 8,730 1,060 1,112 82 41,041 90 43,097
0502000 BOONE BERGMAN SCHOOL DISTRICT
154 7,982 1,006 1,067 82 41,027 87 42,539
5801000 POPE ATKINS SCHOOL DISTRICT
155 9,856 922 972 79 41,013 85 42,948
2903000 HEMPSTEAD HOPE SCHOOL DISTRICT
156 9,394 2,466 2,486 199 40,992 224 42,591
2305000 FAULKNER MAYFLOWER SCHOOL DISTRICT
157 7,759 984 1,058 76 40,991 81 42,776
2104000 DESHA DUMAS SCHOOL DISTRICT
158 10,397 1,383 1,459 117 40,983 129 42,936
0506000 BOONE LEAD HILL SCHOOL 159 10,548 336 358 32 40,910 35 43,162
343
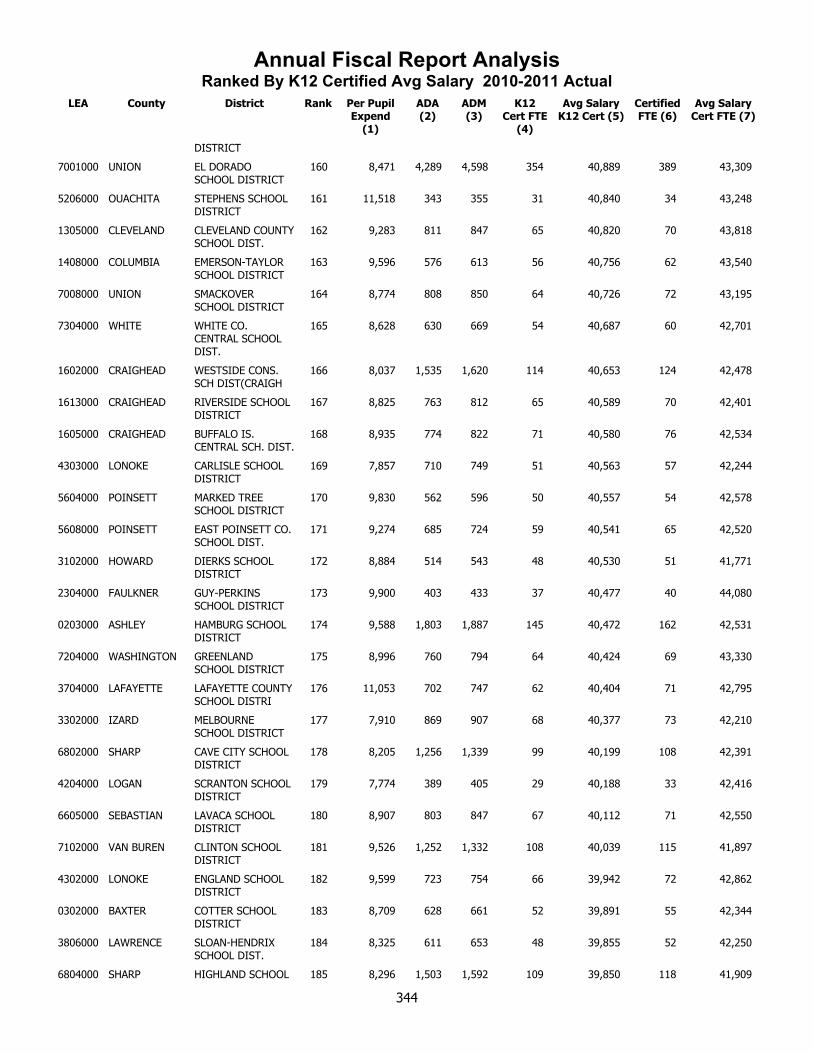
Annual Fiscal Report AnalysisRanked By K12 Certified Avg Salary 2010-2011 Actual
LEA County District Rank Per Pupil Expend
(1)
ADA (2)
ADM (3)
K12 Cert FTE
(4)
Avg Salary K12 Cert (5)
Certified FTE (6)
Avg Salary Cert FTE (7)
DISTRICT
7001000 UNION EL DORADO SCHOOL DISTRICT
160 8,471 4,289 4,598 354 40,889 389 43,309
5206000 OUACHITA STEPHENS SCHOOL DISTRICT
161 11,518 343 355 31 40,840 34 43,248
1305000 CLEVELAND CLEVELAND COUNTY SCHOOL DIST.
162 9,283 811 847 65 40,820 70 43,818
1408000 COLUMBIA EMERSON-TAYLOR SCHOOL DISTRICT
163 9,596 576 613 56 40,756 62 43,540
7008000 UNION SMACKOVER SCHOOL DISTRICT
164 8,774 808 850 64 40,726 72 43,195
7304000 WHITE WHITE CO. CENTRAL SCHOOL DIST.
165 8,628 630 669 54 40,687 60 42,701
1602000 CRAIGHEAD WESTSIDE CONS. SCH DIST(CRAIGH
166 8,037 1,535 1,620 114 40,653 124 42,478
1613000 CRAIGHEAD RIVERSIDE SCHOOL DISTRICT
167 8,825 763 812 65 40,589 70 42,401
1605000 CRAIGHEAD BUFFALO IS. CENTRAL SCH. DIST.
168 8,935 774 822 71 40,580 76 42,534
4303000 LONOKE CARLISLE SCHOOL DISTRICT
169 7,857 710 749 51 40,563 57 42,244
5604000 POINSETT MARKED TREE SCHOOL DISTRICT
170 9,830 562 596 50 40,557 54 42,578
5608000 POINSETT EAST POINSETT CO. SCHOOL DIST.
171 9,274 685 724 59 40,541 65 42,520
3102000 HOWARD DIERKS SCHOOL DISTRICT
172 8,884 514 543 48 40,530 51 41,771
2304000 FAULKNER GUY-PERKINS SCHOOL DISTRICT
173 9,900 403 433 37 40,477 40 44,080
0203000 ASHLEY HAMBURG SCHOOL DISTRICT
174 9,588 1,803 1,887 145 40,472 162 42,531
7204000 WASHINGTON GREENLAND SCHOOL DISTRICT
175 8,996 760 794 64 40,424 69 43,330
3704000 LAFAYETTE LAFAYETTE COUNTY SCHOOL DISTRI
176 11,053 702 747 62 40,404 71 42,795
3302000 IZARD MELBOURNE SCHOOL DISTRICT
177 7,910 869 907 68 40,377 73 42,210
6802000 SHARP CAVE CITY SCHOOL DISTRICT
178 8,205 1,256 1,339 99 40,199 108 42,391
4204000 LOGAN SCRANTON SCHOOL DISTRICT
179 7,774 389 405 29 40,188 33 42,416
6605000 SEBASTIAN LAVACA SCHOOL DISTRICT
180 8,907 803 847 67 40,112 71 42,550
7102000 VAN BUREN CLINTON SCHOOL DISTRICT
181 9,526 1,252 1,332 108 40,039 115 41,897
4302000 LONOKE ENGLAND SCHOOL DISTRICT
182 9,599 723 754 66 39,942 72 42,862
0302000 BAXTER COTTER SCHOOL DISTRICT
183 8,709 628 661 52 39,891 55 42,344
3806000 LAWRENCE SLOAN-HENDRIX SCHOOL DIST.
184 8,325 611 653 48 39,855 52 42,250
6804000 SHARP HIGHLAND SCHOOL 185 8,296 1,503 1,592 109 39,850 118 41,909
344
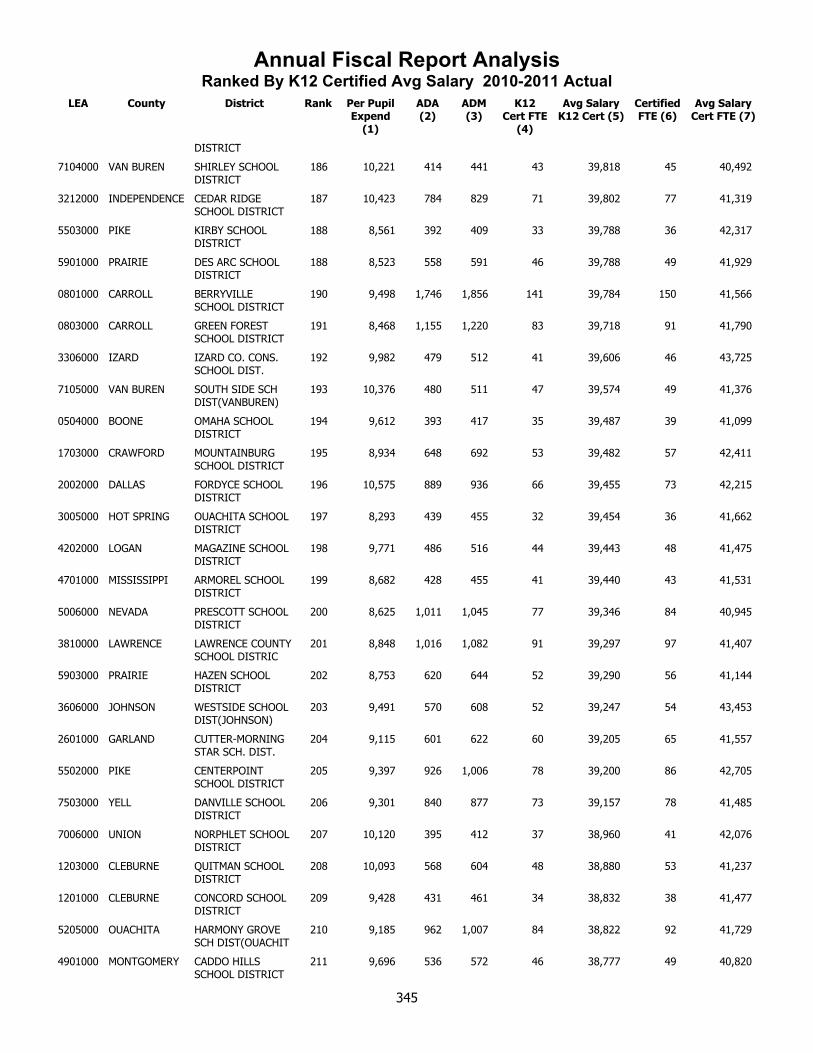
Annual Fiscal Report AnalysisRanked By K12 Certified Avg Salary 2010-2011 Actual
LEA County District Rank Per Pupil Expend
(1)
ADA (2)
ADM (3)
K12 Cert FTE
(4)
Avg Salary K12 Cert (5)
Certified FTE (6)
Avg Salary Cert FTE (7)
DISTRICT
7104000 VAN BUREN SHIRLEY SCHOOL DISTRICT
186 10,221 414 441 43 39,818 45 40,492
3212000 INDEPENDENCE CEDAR RIDGE SCHOOL DISTRICT
187 10,423 784 829 71 39,802 77 41,319
5503000 PIKE KIRBY SCHOOL DISTRICT
188 8,561 392 409 33 39,788 36 42,317
5901000 PRAIRIE DES ARC SCHOOL DISTRICT
188 8,523 558 591 46 39,788 49 41,929
0801000 CARROLL BERRYVILLE SCHOOL DISTRICT
190 9,498 1,746 1,856 141 39,784 150 41,566
0803000 CARROLL GREEN FOREST SCHOOL DISTRICT
191 8,468 1,155 1,220 83 39,718 91 41,790
3306000 IZARD IZARD CO. CONS. SCHOOL DIST.
192 9,982 479 512 41 39,606 46 43,725
7105000 VAN BUREN SOUTH SIDE SCH DIST(VANBUREN)
193 10,376 480 511 47 39,574 49 41,376
0504000 BOONE OMAHA SCHOOL DISTRICT
194 9,612 393 417 35 39,487 39 41,099
1703000 CRAWFORD MOUNTAINBURG SCHOOL DISTRICT
195 8,934 648 692 53 39,482 57 42,411
2002000 DALLAS FORDYCE SCHOOL DISTRICT
196 10,575 889 936 66 39,455 73 42,215
3005000 HOT SPRING OUACHITA SCHOOL DISTRICT
197 8,293 439 455 32 39,454 36 41,662
4202000 LOGAN MAGAZINE SCHOOL DISTRICT
198 9,771 486 516 44 39,443 48 41,475
4701000 MISSISSIPPI ARMOREL SCHOOL DISTRICT
199 8,682 428 455 41 39,440 43 41,531
5006000 NEVADA PRESCOTT SCHOOL DISTRICT
200 8,625 1,011 1,045 77 39,346 84 40,945
3810000 LAWRENCE LAWRENCE COUNTY SCHOOL DISTRIC
201 8,848 1,016 1,082 91 39,297 97 41,407
5903000 PRAIRIE HAZEN SCHOOL DISTRICT
202 8,753 620 644 52 39,290 56 41,144
3606000 JOHNSON WESTSIDE SCHOOL DIST(JOHNSON)
203 9,491 570 608 52 39,247 54 43,453
2601000 GARLAND CUTTER-MORNING STAR SCH. DIST.
204 9,115 601 622 60 39,205 65 41,557
5502000 PIKE CENTERPOINT SCHOOL DISTRICT
205 9,397 926 1,006 78 39,200 86 42,705
7503000 YELL DANVILLE SCHOOL DISTRICT
206 9,301 840 877 73 39,157 78 41,485
7006000 UNION NORPHLET SCHOOL DISTRICT
207 10,120 395 412 37 38,960 41 42,076
1203000 CLEBURNE QUITMAN SCHOOL DISTRICT
208 10,093 568 604 48 38,880 53 41,237
1201000 CLEBURNE CONCORD SCHOOL DISTRICT
209 9,428 431 461 34 38,832 38 41,477
5205000 OUACHITA HARMONY GROVE SCH DIST(OUACHIT
210 9,185 962 1,007 84 38,822 92 41,729
4901000 MONTGOMERY CADDO HILLS SCHOOL DISTRICT
211 9,696 536 572 46 38,777 49 40,820
345

Annual Fiscal Report AnalysisRanked By K12 Certified Avg Salary 2010-2011 Actual
LEA County District Rank Per Pupil Expend
(1)
ADA (2)
ADM (3)
K12 Cert FTE
(4)
Avg Salary K12 Cert (5)
Certified FTE (6)
Avg Salary Cert FTE (7)
0402000 BENTON DECATUR SCHOOL DISTRICT
212 9,682 472 486 39 38,746 43 40,900
1503000 CONWAY NEMO VISTA SCHOOL DISTRICT
213 9,561 463 490 40 38,706 44 41,680
1601000 CRAIGHEAD BAY SCHOOL DISTRICT
214 8,950 532 566 45 38,558 51 40,602
6205000 ST FRANCIS PALESTINE-WHEATLEY SCH. DIST.
215 9,681 624 668 52 38,434 61 39,765
3211000 INDEPENDENCE MIDLAND SCHOOL DISTRICT
216 8,374 500 521 38 38,357 41 40,561
7401000 WOODRUFF AUGUSTA SCHOOL DISTRICT
217 14,620 446 477 37 38,295 40 42,274
2607000 GARLAND MOUNTAIN PINE SCHOOL DISTRICT
218 9,199 559 597 50 38,172 56 40,237
3405000 JACKSON JACKSON CO. SCHOOL DISTRICT
219 8,364 770 813 64 38,149 72 40,812
6502000 SEARCY SEARCY COUNTY SCHOOL DISTRICT
220 10,404 878 929 89 38,088 100 40,131
3809000 LAWRENCE HILLCREST SCHOOL DISTRICT
221 10,586 390 409 35 38,023 38 40,564
0903000 CHICOT LAKESIDE SCHOOL DIST(CHICOT)
222 11,700 1,115 1,162 100 37,928 113 40,694
1901000 CROSS CROSS COUNTY SCHOOL DISTRICT
223 10,320 563 603 46 37,774 52 41,626
3403000 JACKSON NEWPORT SCHOOL DISTRICT
224 9,881 1,326 1,419 111 37,773 122 40,127
0701000 CALHOUN HAMPTON SCHOOL DISTRICT
225 10,384 523 554 40 37,546 51 39,155
3201000 INDEPENDENCE BATESVILLE SCHOOL DISTRICT
226 9,043 2,787 2,943 189 37,468 206 40,264
7303000 WHITE BRADFORD SCHOOL DISTRICT
227 9,446 456 491 37 37,402 41 39,720
5008000 NEVADA NEVADA SCHOOL DISTRICT
228 9,712 381 402 40 37,360 44 39,431
3804000 LAWRENCE HOXIE SCHOOL DISTRICT
229 9,206 900 946 80 37,221 87 39,264
5707000 POLK COSSATOT RIVER SCHOOL DIST
230 8,852 1,063 1,133 96 37,060 106 38,560
5201000 OUACHITA BEARDEN SCHOOL DISTRICT
231 9,216 540 566 48 36,860 54 39,481
3301000 IZARD CALICO ROCK SCHOOL DISTRICT
232 9,766 395 419 36 36,786 39 38,549
6505000 SEARCY OZARK MOUNTAIN SCHOOL DISTRICT
233 12,114 613 649 65 36,698 72 40,312
1505000 CONWAY WONDERVIEW SCHOOL DISTRICT
234 9,675 392 411 38 36,161 41 38,194
5106000 NEWTON DEER/MT. JUDEA SCHOOL DISTRICT
235 13,464 337 360 43 35,976 47 39,423
7509000 YELL WESTERN YELL CO. SCHOOL DIST.
236 10,162 451 475 47 35,697 50 38,172
2202000 DREW DREW CENTRAL SCHOOL DISTRICT
237 10,267 913 970 83 34,514 90 37,253
346

Annual Fiscal Report AnalysisRanked By K12 Certified Avg Salary 2010-2011 Actual
LEA County District Rank Per Pupil Expend
(1)
ADA (2)
ADM (3)
K12 Cert FTE
(4)
Avg Salary K12 Cert (5)
Certified FTE (6)
Avg Salary Cert FTE (7)
0501000 BOONE ALPENA SCHOOL DISTRICT
238 8,893 518 554 56 33,649 59 35,755
2501000 FULTON MAMMOTH SPRING SCHOOL DISTRICT
239 8,207 444 470 44 29,757 47 32,107
347
Ranked byCertified Full Time
Equivalency

Annual Fiscal Report AnalysisRanked by Certified FTE 2010-2011 Actual
LEA County District Rank Per Pupil Expend
(1)
ADA (2)
ADM (3)
K12 Cert FTE
(4)
Avg Salary K12 Cert (5)
Certified FTE (6)
Avg Salary Cert FTE (7)
6001000 PULASKI LITTLE ROCK SCHOOL DISTRICT
1 12,851 22,995 23,788 1,936 53,069 2,137 55,650
6003000 PULASKI PULASKI CO. SPEC. SCHOOL DIST.
2 11,391 15,652 16,618 1,447 44,930 1,552 48,186
7207000 WASHINGTON SPRINGDALE SCHOOL DISTRICT
3 8,577 17,592 18,678 1,130 56,359 1,230 58,679
6601000 SEBASTIAN FORT SMITH SCHOOL DISTRICT
4 9,643 12,941 13,692 895 53,406 969 55,924
0405000 BENTON ROGERS SCHOOL DISTRICT
5 8,279 13,236 13,861 879 55,836 951 58,049
0401000 BENTON BENTONVILLE SCHOOL DISTRICT
6 8,427 12,793 13,536 894 53,594 944 55,499
6002000 PULASKI N. LITTLE ROCK SCHOOL DISTRICT
7 11,118 8,302 8,730 671 49,104 738 51,388
4304000 LONOKE CABOT SCHOOL DISTRICT
8 7,829 9,342 9,976 616 49,445 682 51,704
2301000 FAULKNER CONWAY SCHOOL DISTRICT
9 8,470 8,809 9,207 609 52,390 652 54,811
7203000 WASHINGTON FAYETTEVILLE SCHOOL DISTRICT
10 10,333 8,388 8,839 582 57,279 632 59,384
6303000 SALINE BRYANT SCHOOL DISTRICT
11 7,401 7,554 7,879 476 52,097 509 53,916
1705000 CRAWFORD VAN BUREN SCHOOL DISTRICT
12 8,584 5,591 5,880 404 46,548 441 49,298
1803000 CRITTENDEN WEST MEMPHIS SCHOOL DISTRICT
13 9,377 5,316 5,660 378 50,435 437 53,044
5805000 POPE RUSSELLVILLE SCHOOL DISTRICT
14 9,844 4,961 5,122 390 45,289 427 47,616
7001000 UNION EL DORADO SCHOOL DISTRICT
15 8,471 4,289 4,598 354 40,889 389 43,309
3505000 JEFFERSON PINE BLUFF SCHOOL DISTRICT
16 11,683 4,414 4,727 338 51,933 360 51,906
4605000 MILLER TEXARKANA SCHOOL DISTRICT
17 10,949 3,936 4,230 324 44,255 353 47,288
1608000 CRAIGHEAD JONESBORO SCHOOL DISTRICT
18 8,749 4,912 5,315 315 45,539 341 48,132
2603000 GARLAND HOT SPRINGS SCHOOL DISTRICT
19 12,838 3,438 3,633 286 45,860 329 48,524
6302000 SALINE BENTON SCHOOL DISTRICT
20 7,739 4,398 4,629 276 50,413 300 53,472
1804000 CRITTENDEN MARION SCHOOL DISTRICT
21 8,276 3,998 4,230 278 48,083 298 50,850
2705000 GRANT SHERIDAN SCHOOL DISTRICT
22 7,691 3,900 4,135 264 44,739 288 46,645
0303000 BAXTER MOUNTAIN HOME SCHOOL DISTRICT
23 8,357 3,762 3,977 264 45,044 284 47,040
0406000 BENTON SILOAM SPRINGS SCHOOL DISTRICT
24 8,496 3,600 3,835 249 46,553 274 49,203
7311000 WHITE SEARCY SCHOOL DISTRICT
25 7,585 3,767 3,998 236 49,594 262 51,865
2605000 GARLAND LAKE HAMILTON SCHOOL DISTRICT
26 8,108 3,906 4,137 241 50,662 261 53,501
6201000 ST FRANCIS FORREST CITY 27 11,383 2,937 3,138 222 50,845 250 53,488
349

Annual Fiscal Report AnalysisRanked by Certified FTE 2010-2011 Actual
LEA County District Rank Per Pupil Expend
(1)
ADA (2)
ADM (3)
K12 Cert FTE
(4)
Avg Salary K12 Cert (5)
Certified FTE (6)
Avg Salary Cert FTE (7)
SCHOOL DISTRICT
1701000 CRAWFORD ALMA SCHOOL DISTRICT
28 8,083 3,262 3,406 230 45,383 249 48,715
6602000 SEBASTIAN GREENWOOD SCHOOL DISTRICT
29 8,129 3,379 3,562 227 49,208 247 51,955
2807000 GREENE GREENE CO. TECH SCHOOL DIST.
30 8,186 3,229 3,416 227 43,236 245 45,588
1611000 CRAIGHEAD NETTLETON SCHOOL DISTRICT
31 8,611 3,010 3,149 217 45,144 235 47,296
7302000 WHITE BEEBE SCHOOL DISTRICT
32 7,771 3,072 3,193 214 44,378 235 47,625
4702000 MISSISSIPPI BLYTHEVILLE SCHOOL DISTRICT
33 11,387 2,720 2,902 209 43,144 232 46,601
2903000 HEMPSTEAD HOPE SCHOOL DISTRICT
34 9,394 2,466 2,486 199 40,992 224 42,591
1402000 COLUMBIA MAGNOLIA SCHOOL DISTRICT
35 8,882 2,600 2,758 199 44,130 219 46,830
2808000 GREENE PARAGOULD SCHOOL DISTRICT
36 8,473 2,698 2,883 199 43,188 218 46,159
2303000 FAULKNER GREENBRIER SCHOOL DISTRICT
37 7,588 2,911 3,076 201 49,640 218 51,830
2307000 FAULKNER VILONIA SCHOOL DISTRICT
38 7,664 2,904 3,062 197 48,644 214 50,668
1905000 CROSS WYNNE SCHOOL DISTRICT
39 8,799 2,719 2,852 194 50,801 214 53,375
2606000 GARLAND LAKESIDE SCHOOL DIST(GARLAND)
40 8,453 2,840 2,997 190 50,230 207 53,041
3201000 INDEPENDENCE BATESVILLE SCHOOL DISTRICT
41 9,043 2,787 2,943 189 37,468 206 40,264
0503000 BOONE HARRISON SCHOOL DISTRICT
42 8,853 2,580 2,743 187 48,255 206 50,980
3509000 JEFFERSON WATSON CHAPEL SCHOOL DISTRICT
43 8,358 2,916 3,092 190 48,621 206 51,117
3510000 JEFFERSON WHITE HALL SCHOOL DISTRICT
44 8,059 2,894 3,000 185 51,954 199 54,262
5204000 OUACHITA CAMDEN FAIRVIEW SCHOOL DIST.
45 10,176 2,300 2,428 171 44,109 197 47,313
6701000 SEVIER DEQUEEN SCHOOL DISTRICT
46 9,206 2,269 2,380 170 47,683 196 49,906
3601000 JOHNSON CLARKSVILLE SCHOOL DISTRICT
47 8,751 2,364 2,484 174 45,249 188 47,745
1507000 CONWAY SO. CONWAY CO. SCHOOL DISTRICT
48 8,902 2,106 2,227 170 42,991 182 45,256
4401000 MADISON HUNTSVILLE SCHOOL DISTRICT
49 8,791 2,223 2,314 163 48,967 180 50,736
2203000 DREW MONTICELLO SCHOOL DISTRICT
50 9,115 2,002 2,080 154 41,391 168 43,598
1612000 CRAIGHEAD VALLEY VIEW SCHOOL DISTRICT
51 7,109 2,265 2,349 159 44,170 168 46,260
7202000 WASHINGTON FARMINGTON SCHOOL DISTRICT
52 7,935 2,058 2,178 154 45,901 167 48,413
0203000 ASHLEY HAMBURG SCHOOL DISTRICT
53 9,588 1,803 1,887 145 40,472 162 42,531
350

Annual Fiscal Report AnalysisRanked by Certified FTE 2010-2011 Actual
LEA County District Rank Per Pupil Expend
(1)
ADA (2)
ADM (3)
K12 Cert FTE
(4)
Avg Salary K12 Cert (5)
Certified FTE (6)
Avg Salary Cert FTE (7)
1002000 CLARK ARKADELPHIA SCHOOL DISTRICT
54 9,445 1,875 1,942 150 41,727 162 43,649
3004000 HOT SPRING MALVERN SCHOOL DISTRICT
55 8,962 2,020 2,108 146 45,978 158 48,410
0801000 CARROLL BERRYVILLE SCHOOL DISTRICT
56 9,498 1,746 1,856 141 39,784 150 41,566
7504000 YELL DARDANELLE SCHOOL DISTRICT
57 8,294 1,872 1,934 138 46,295 150 48,527
5703000 POLK MENA SCHOOL DISTRICT
58 8,588 1,832 1,883 135 43,479 145 45,179
4301000 LONOKE LONOKE SCHOOL DISTRICT
59 8,557 1,744 1,823 133 41,904 144 44,072
2404000 FRANKLIN OZARK SCHOOL DISTRICT
60 8,959 1,699 1,810 131 46,247 141 48,241
3105000 HOWARD NASHVILLE SCHOOL DISTRICT
61 8,268 1,865 1,939 127 52,390 139 54,111
4101000 LITTLE RIVER ASHDOWN SCHOOL DISTRICT
62 9,563 1,397 1,483 124 42,787 138 45,258
6901000 STONE MOUNTAIN VIEW SCHOOL DISTRICT
63 8,308 1,617 1,711 129 43,712 138 45,709
0104000 ARKANSAS STUTTGART SCHOOL DISTRICT
64 8,400 1,673 1,786 120 42,468 134 45,739
0602000 BRADLEY WARREN SCHOOL DISTRICT
65 9,716 1,454 1,518 117 41,518 133 44,114
6103000 RANDOLPH POCAHONTAS SCHOOL DISTRICT
66 7,812 1,734 1,819 124 44,017 133 45,736
5403000 PHILLIPS HELENA/ W.HELENA SCHOOL DIST.
67 11,638 2,115 2,233 102 50,561 133 54,170
1202000 CLEBURNE HEBER SPRINGS SCHOOL DISTRICT
68 8,192 1,634 1,738 124 42,836 132 44,489
6401000 SCOTT WALDRON SCHOOL DISTRICT
69 8,961 1,488 1,621 122 42,150 131 43,787
5602000 POINSETT HARRISBURG SCHOOL DISTRICT
70 10,185 1,261 1,370 118 43,451 130 45,934
2104000 DESHA DUMAS SCHOOL DISTRICT
71 10,397 1,383 1,459 117 40,983 129 42,936
5804000 POPE POTTSVILLE SCHOOL DISTRICT
72 7,555 1,561 1,618 120 43,742 127 45,441
7206000 WASHINGTON PRAIRIE GROVE SCHOOL DISTRICT
73 7,777 1,684 1,747 116 44,703 126 47,316
5605000 POINSETT TRUMANN SCHOOL DISTRICT
74 9,403 1,400 1,506 115 41,290 125 43,459
1603000 CRAIGHEAD BROOKLAND SCHOOL DISTRICT
75 7,330 1,567 1,625 113 42,002 124 43,311
3502000 JEFFERSON DOLLARWAY SCHOOL DISTRICT
76 12,141 1,426 1,523 115 47,510 124 49,110
1602000 CRAIGHEAD WESTSIDE CONS. SCH DIST(CRAIGH
77 8,037 1,535 1,620 114 40,653 124 42,478
3403000 JACKSON NEWPORT SCHOOL DISTRICT
78 9,881 1,326 1,419 111 37,773 122 40,127
4713000 MISSISSIPPI OSCEOLA SCHOOL DISTRICT
79 12,218 1,299 1,370 110 41,886 120 43,699
6804000 SHARP HIGHLAND SCHOOL 80 8,296 1,503 1,592 109 39,850 118 41,909
351
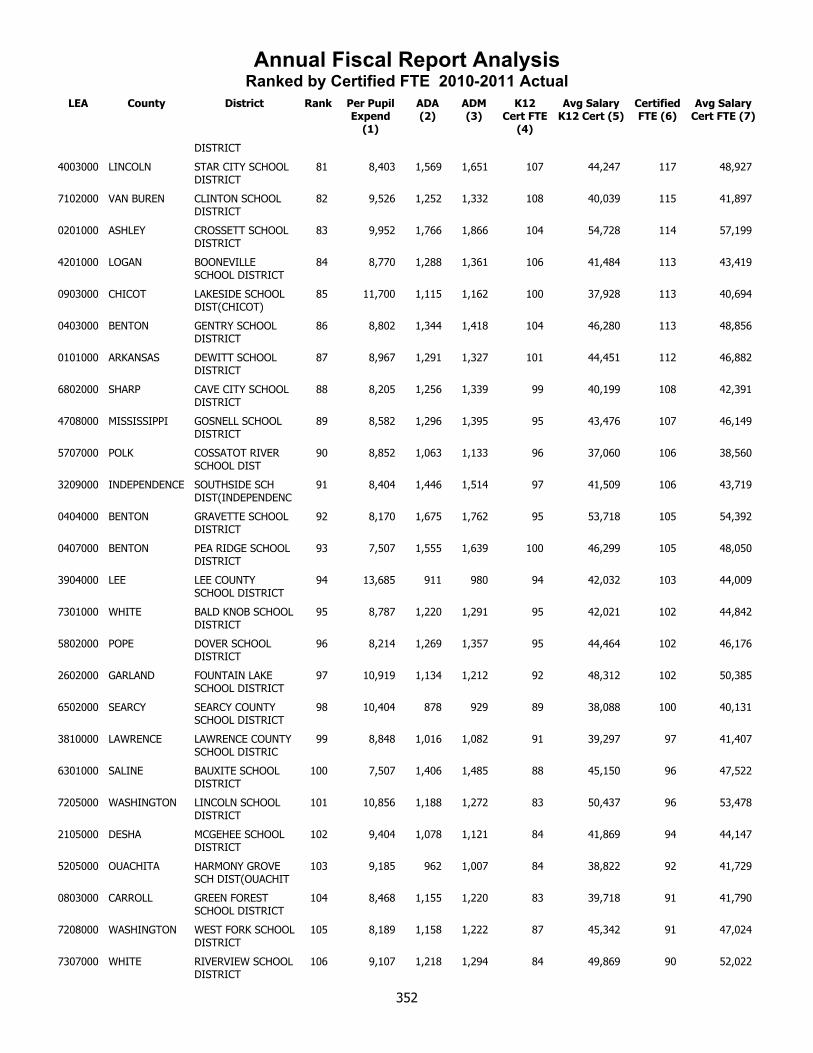
Annual Fiscal Report AnalysisRanked by Certified FTE 2010-2011 Actual
LEA County District Rank Per Pupil Expend
(1)
ADA (2)
ADM (3)
K12 Cert FTE
(4)
Avg Salary K12 Cert (5)
Certified FTE (6)
Avg Salary Cert FTE (7)
DISTRICT
4003000 LINCOLN STAR CITY SCHOOL DISTRICT
81 8,403 1,569 1,651 107 44,247 117 48,927
7102000 VAN BUREN CLINTON SCHOOL DISTRICT
82 9,526 1,252 1,332 108 40,039 115 41,897
0201000 ASHLEY CROSSETT SCHOOL DISTRICT
83 9,952 1,766 1,866 104 54,728 114 57,199
4201000 LOGAN BOONEVILLE SCHOOL DISTRICT
84 8,770 1,288 1,361 106 41,484 113 43,419
0903000 CHICOT LAKESIDE SCHOOL DIST(CHICOT)
85 11,700 1,115 1,162 100 37,928 113 40,694
0403000 BENTON GENTRY SCHOOL DISTRICT
86 8,802 1,344 1,418 104 46,280 113 48,856
0101000 ARKANSAS DEWITT SCHOOL DISTRICT
87 8,967 1,291 1,327 101 44,451 112 46,882
6802000 SHARP CAVE CITY SCHOOL DISTRICT
88 8,205 1,256 1,339 99 40,199 108 42,391
4708000 MISSISSIPPI GOSNELL SCHOOL DISTRICT
89 8,582 1,296 1,395 95 43,476 107 46,149
5707000 POLK COSSATOT RIVER SCHOOL DIST
90 8,852 1,063 1,133 96 37,060 106 38,560
3209000 INDEPENDENCE SOUTHSIDE SCH DIST(INDEPENDENC
91 8,404 1,446 1,514 97 41,509 106 43,719
0404000 BENTON GRAVETTE SCHOOL DISTRICT
92 8,170 1,675 1,762 95 53,718 105 54,392
0407000 BENTON PEA RIDGE SCHOOL DISTRICT
93 7,507 1,555 1,639 100 46,299 105 48,050
3904000 LEE LEE COUNTY SCHOOL DISTRICT
94 13,685 911 980 94 42,032 103 44,009
7301000 WHITE BALD KNOB SCHOOL DISTRICT
95 8,787 1,220 1,291 95 42,021 102 44,842
5802000 POPE DOVER SCHOOL DISTRICT
96 8,214 1,269 1,357 95 44,464 102 46,176
2602000 GARLAND FOUNTAIN LAKE SCHOOL DISTRICT
97 10,919 1,134 1,212 92 48,312 102 50,385
6502000 SEARCY SEARCY COUNTY SCHOOL DISTRICT
98 10,404 878 929 89 38,088 100 40,131
3810000 LAWRENCE LAWRENCE COUNTY SCHOOL DISTRIC
99 8,848 1,016 1,082 91 39,297 97 41,407
6301000 SALINE BAUXITE SCHOOL DISTRICT
100 7,507 1,406 1,485 88 45,150 96 47,522
7205000 WASHINGTON LINCOLN SCHOOL DISTRICT
101 10,856 1,188 1,272 83 50,437 96 53,478
2105000 DESHA MCGEHEE SCHOOL DISTRICT
102 9,404 1,078 1,121 84 41,869 94 44,147
5205000 OUACHITA HARMONY GROVE SCH DIST(OUACHIT
103 9,185 962 1,007 84 38,822 92 41,729
0803000 CARROLL GREEN FOREST SCHOOL DISTRICT
104 8,468 1,155 1,220 83 39,718 91 41,790
7208000 WASHINGTON WEST FORK SCHOOL DISTRICT
105 8,189 1,158 1,222 87 45,342 91 47,024
7307000 WHITE RIVERVIEW SCHOOL DISTRICT
106 9,107 1,218 1,294 84 49,869 90 52,022
352

Annual Fiscal Report AnalysisRanked by Certified FTE 2010-2011 Actual
LEA County District Rank Per Pupil Expend
(1)
ADA (2)
ADM (3)
K12 Cert FTE
(4)
Avg Salary K12 Cert (5)
Certified FTE (6)
Avg Salary Cert FTE (7)
4203000 LOGAN PARIS SCHOOL DISTRICT
107 8,730 1,060 1,112 82 41,041 90 43,097
4706000 MISSISSIPPI SO. MISS. COUNTY SCHOOL DIST.
108 8,759 1,225 1,301 80 42,923 90 44,792
2202000 DREW DREW CENTRAL SCHOOL DISTRICT
109 10,267 913 970 83 34,514 90 37,253
7201000 WASHINGTON ELKINS SCHOOL DISTRICT
110 7,470 1,104 1,151 83 41,977 89 43,769
1101000 CLAY CORNING SCHOOL DISTRICT
111 9,360 966 1,024 81 43,292 87 45,445
3804000 LAWRENCE HOXIE SCHOOL DISTRICT
112 9,206 900 946 80 37,221 87 39,264
0502000 BOONE BERGMAN SCHOOL DISTRICT
113 7,982 1,006 1,067 82 41,027 87 42,539
5502000 PIKE CENTERPOINT SCHOOL DISTRICT
114 9,397 926 1,006 78 39,200 86 42,705
5801000 POPE ATKINS SCHOOL DISTRICT
115 9,856 922 972 79 41,013 85 42,948
5006000 NEVADA PRESCOTT SCHOOL DISTRICT
116 8,625 1,011 1,045 77 39,346 84 40,945
6304000 SALINE HARMONY GROVE SCH DIST(SALINE)
117 7,697 1,056 1,097 76 47,145 82 49,429
3604000 JOHNSON LAMAR SCHOOL DISTRICT
118 8,522 1,004 1,067 77 48,123 82 49,866
3001000 HOT SPRING BISMARCK SCHOOL DISTRICT
119 9,297 925 978 78 42,474 82 44,099
5102000 NEWTON JASPER SCHOOL DISTRICT
120 9,993 865 891 75 41,925 82 44,604
1104000 CLAY PIGGOTT SCHOOL DISTRICT
121 8,264 921 956 76 42,520 82 43,796
5303000 PERRY PERRYVILLE SCHOOL DISTRICT
122 8,152 948 1,014 76 41,641 82 43,865
2305000 FAULKNER MAYFLOWER SCHOOL DISTRICT
123 7,759 984 1,058 76 40,991 81 42,776
0505000 BOONE VALLEY SPRINGS SCHOOL DISTRICT
124 7,979 909 948 74 41,292 80 44,503
7503000 YELL DANVILLE SCHOOL DISTRICT
125 9,301 840 877 73 39,157 78 41,485
3212000 INDEPENDENCE CEDAR RIDGE SCHOOL DISTRICT
126 10,423 784 829 71 39,802 77 41,319
4712000 MISSISSIPPI MANILA SCHOOL DISTRICT
127 8,876 928 984 72 43,540 77 45,334
1605000 CRAIGHEAD BUFFALO IS. CENTRAL SCH. DIST.
128 8,935 774 822 71 40,580 76 42,534
6606000 SEBASTIAN MANSFIELD SCHOOL DISTRICT
129 7,684 887 955 70 42,355 75 44,198
4501000 MARION FLIPPIN SCHOOL DISTRICT
130 10,086 763 813 70 41,075 75 43,483
4602000 MILLER GENOA CENTRAL SCHOOL DISTRICT
131 8,556 906 939 69 47,252 75 50,024
6703000 SEVIER HORATIO SCHOOL DISTRICT
132 8,410 799 855 69 41,048 74 42,365
3302000 IZARD MELBOURNE 133 7,910 869 907 68 40,377 73 42,210
353
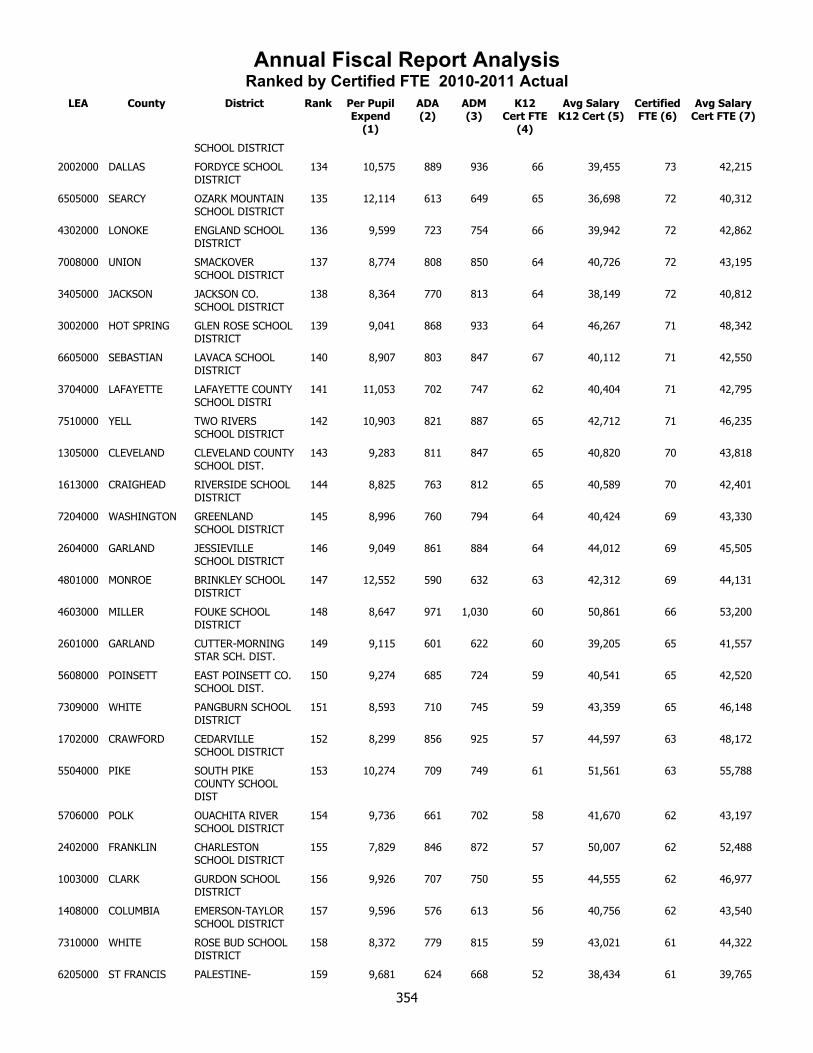
Annual Fiscal Report AnalysisRanked by Certified FTE 2010-2011 Actual
LEA County District Rank Per Pupil Expend
(1)
ADA (2)
ADM (3)
K12 Cert FTE
(4)
Avg Salary K12 Cert (5)
Certified FTE (6)
Avg Salary Cert FTE (7)
SCHOOL DISTRICT
2002000 DALLAS FORDYCE SCHOOL DISTRICT
134 10,575 889 936 66 39,455 73 42,215
6505000 SEARCY OZARK MOUNTAIN SCHOOL DISTRICT
135 12,114 613 649 65 36,698 72 40,312
4302000 LONOKE ENGLAND SCHOOL DISTRICT
136 9,599 723 754 66 39,942 72 42,862
7008000 UNION SMACKOVER SCHOOL DISTRICT
137 8,774 808 850 64 40,726 72 43,195
3405000 JACKSON JACKSON CO. SCHOOL DISTRICT
138 8,364 770 813 64 38,149 72 40,812
3002000 HOT SPRING GLEN ROSE SCHOOL DISTRICT
139 9,041 868 933 64 46,267 71 48,342
6605000 SEBASTIAN LAVACA SCHOOL DISTRICT
140 8,907 803 847 67 40,112 71 42,550
3704000 LAFAYETTE LAFAYETTE COUNTY SCHOOL DISTRI
141 11,053 702 747 62 40,404 71 42,795
7510000 YELL TWO RIVERS SCHOOL DISTRICT
142 10,903 821 887 65 42,712 71 46,235
1305000 CLEVELAND CLEVELAND COUNTY SCHOOL DIST.
143 9,283 811 847 65 40,820 70 43,818
1613000 CRAIGHEAD RIVERSIDE SCHOOL DISTRICT
144 8,825 763 812 65 40,589 70 42,401
7204000 WASHINGTON GREENLAND SCHOOL DISTRICT
145 8,996 760 794 64 40,424 69 43,330
2604000 GARLAND JESSIEVILLE SCHOOL DISTRICT
146 9,049 861 884 64 44,012 69 45,505
4801000 MONROE BRINKLEY SCHOOL DISTRICT
147 12,552 590 632 63 42,312 69 44,131
4603000 MILLER FOUKE SCHOOL DISTRICT
148 8,647 971 1,030 60 50,861 66 53,200
2601000 GARLAND CUTTER-MORNING STAR SCH. DIST.
149 9,115 601 622 60 39,205 65 41,557
5608000 POINSETT EAST POINSETT CO. SCHOOL DIST.
150 9,274 685 724 59 40,541 65 42,520
7309000 WHITE PANGBURN SCHOOL DISTRICT
151 8,593 710 745 59 43,359 65 46,148
1702000 CRAWFORD CEDARVILLE SCHOOL DISTRICT
152 8,299 856 925 57 44,597 63 48,172
5504000 PIKE SOUTH PIKE COUNTY SCHOOL DIST
153 10,274 709 749 61 51,561 63 55,788
5706000 POLK OUACHITA RIVER SCHOOL DISTRICT
154 9,736 661 702 58 41,670 62 43,197
2402000 FRANKLIN CHARLESTON SCHOOL DISTRICT
155 7,829 846 872 57 50,007 62 52,488
1003000 CLARK GURDON SCHOOL DISTRICT
156 9,926 707 750 55 44,555 62 46,977
1408000 COLUMBIA EMERSON-TAYLOR SCHOOL DISTRICT
157 9,596 576 613 56 40,756 62 43,540
7310000 WHITE ROSE BUD SCHOOL DISTRICT
158 8,372 779 815 59 43,021 61 44,322
6205000 ST FRANCIS PALESTINE- 159 9,681 624 668 52 38,434 61 39,765
354
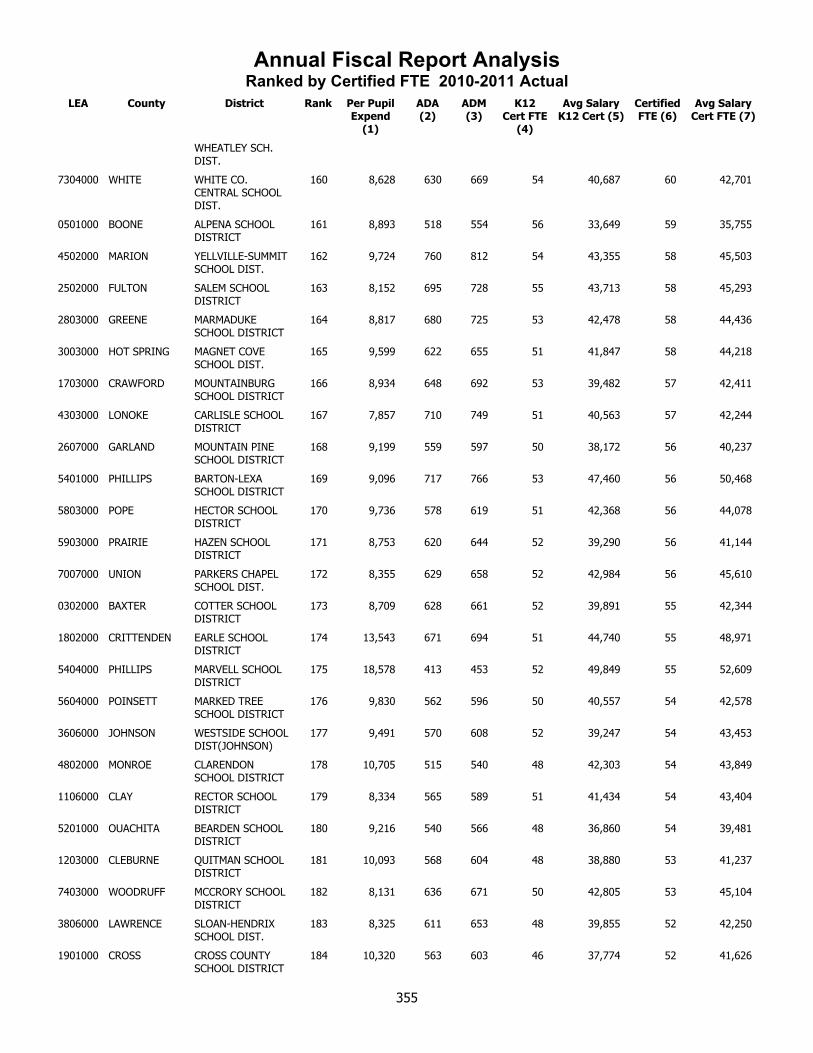
Annual Fiscal Report AnalysisRanked by Certified FTE 2010-2011 Actual
LEA County District Rank Per Pupil Expend
(1)
ADA (2)
ADM (3)
K12 Cert FTE
(4)
Avg Salary K12 Cert (5)
Certified FTE (6)
Avg Salary Cert FTE (7)
WHEATLEY SCH. DIST.
7304000 WHITE WHITE CO. CENTRAL SCHOOL DIST.
160 8,628 630 669 54 40,687 60 42,701
0501000 BOONE ALPENA SCHOOL DISTRICT
161 8,893 518 554 56 33,649 59 35,755
4502000 MARION YELLVILLE-SUMMIT SCHOOL DIST.
162 9,724 760 812 54 43,355 58 45,503
2502000 FULTON SALEM SCHOOL DISTRICT
163 8,152 695 728 55 43,713 58 45,293
2803000 GREENE MARMADUKE SCHOOL DISTRICT
164 8,817 680 725 53 42,478 58 44,436
3003000 HOT SPRING MAGNET COVE SCHOOL DIST.
165 9,599 622 655 51 41,847 58 44,218
1703000 CRAWFORD MOUNTAINBURG SCHOOL DISTRICT
166 8,934 648 692 53 39,482 57 42,411
4303000 LONOKE CARLISLE SCHOOL DISTRICT
167 7,857 710 749 51 40,563 57 42,244
2607000 GARLAND MOUNTAIN PINE SCHOOL DISTRICT
168 9,199 559 597 50 38,172 56 40,237
5401000 PHILLIPS BARTON-LEXA SCHOOL DISTRICT
169 9,096 717 766 53 47,460 56 50,468
5803000 POPE HECTOR SCHOOL DISTRICT
170 9,736 578 619 51 42,368 56 44,078
5903000 PRAIRIE HAZEN SCHOOL DISTRICT
171 8,753 620 644 52 39,290 56 41,144
7007000 UNION PARKERS CHAPEL SCHOOL DIST.
172 8,355 629 658 52 42,984 56 45,610
0302000 BAXTER COTTER SCHOOL DISTRICT
173 8,709 628 661 52 39,891 55 42,344
1802000 CRITTENDEN EARLE SCHOOL DISTRICT
174 13,543 671 694 51 44,740 55 48,971
5404000 PHILLIPS MARVELL SCHOOL DISTRICT
175 18,578 413 453 52 49,849 55 52,609
5604000 POINSETT MARKED TREE SCHOOL DISTRICT
176 9,830 562 596 50 40,557 54 42,578
3606000 JOHNSON WESTSIDE SCHOOL DIST(JOHNSON)
177 9,491 570 608 52 39,247 54 43,453
4802000 MONROE CLARENDON SCHOOL DISTRICT
178 10,705 515 540 48 42,303 54 43,849
1106000 CLAY RECTOR SCHOOL DISTRICT
179 8,334 565 589 51 41,434 54 43,404
5201000 OUACHITA BEARDEN SCHOOL DISTRICT
180 9,216 540 566 48 36,860 54 39,481
1203000 CLEBURNE QUITMAN SCHOOL DISTRICT
181 10,093 568 604 48 38,880 53 41,237
7403000 WOODRUFF MCCRORY SCHOOL DISTRICT
182 8,131 636 671 50 42,805 53 45,104
3806000 LAWRENCE SLOAN-HENDRIX SCHOOL DIST.
183 8,325 611 653 48 39,855 52 42,250
1901000 CROSS CROSS COUNTY SCHOOL DISTRICT
184 10,320 563 603 46 37,774 52 41,626
355
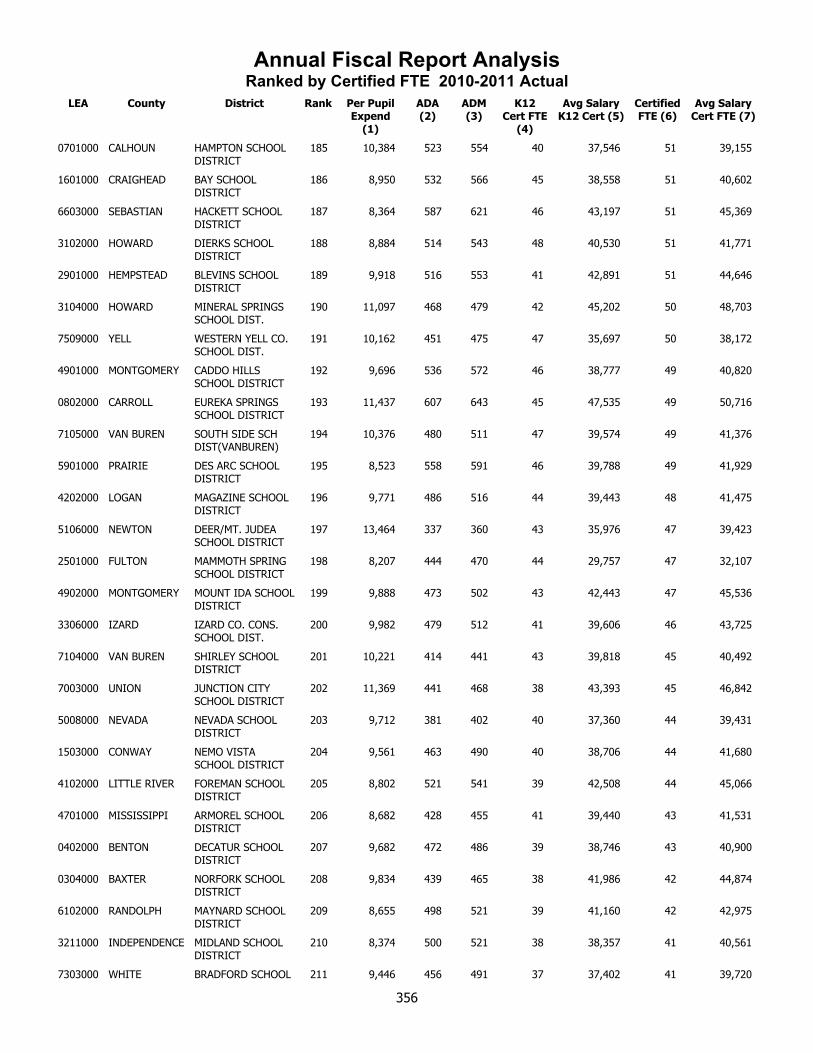
Annual Fiscal Report AnalysisRanked by Certified FTE 2010-2011 Actual
LEA County District Rank Per Pupil Expend
(1)
ADA (2)
ADM (3)
K12 Cert FTE
(4)
Avg Salary K12 Cert (5)
Certified FTE (6)
Avg Salary Cert FTE (7)
0701000 CALHOUN HAMPTON SCHOOL DISTRICT
185 10,384 523 554 40 37,546 51 39,155
1601000 CRAIGHEAD BAY SCHOOL DISTRICT
186 8,950 532 566 45 38,558 51 40,602
6603000 SEBASTIAN HACKETT SCHOOL DISTRICT
187 8,364 587 621 46 43,197 51 45,369
3102000 HOWARD DIERKS SCHOOL DISTRICT
188 8,884 514 543 48 40,530 51 41,771
2901000 HEMPSTEAD BLEVINS SCHOOL DISTRICT
189 9,918 516 553 41 42,891 51 44,646
3104000 HOWARD MINERAL SPRINGS SCHOOL DIST.
190 11,097 468 479 42 45,202 50 48,703
7509000 YELL WESTERN YELL CO. SCHOOL DIST.
191 10,162 451 475 47 35,697 50 38,172
4901000 MONTGOMERY CADDO HILLS SCHOOL DISTRICT
192 9,696 536 572 46 38,777 49 40,820
0802000 CARROLL EUREKA SPRINGS SCHOOL DISTRICT
193 11,437 607 643 45 47,535 49 50,716
7105000 VAN BUREN SOUTH SIDE SCH DIST(VANBUREN)
194 10,376 480 511 47 39,574 49 41,376
5901000 PRAIRIE DES ARC SCHOOL DISTRICT
195 8,523 558 591 46 39,788 49 41,929
4202000 LOGAN MAGAZINE SCHOOL DISTRICT
196 9,771 486 516 44 39,443 48 41,475
5106000 NEWTON DEER/MT. JUDEA SCHOOL DISTRICT
197 13,464 337 360 43 35,976 47 39,423
2501000 FULTON MAMMOTH SPRING SCHOOL DISTRICT
198 8,207 444 470 44 29,757 47 32,107
4902000 MONTGOMERY MOUNT IDA SCHOOL DISTRICT
199 9,888 473 502 43 42,443 47 45,536
3306000 IZARD IZARD CO. CONS. SCHOOL DIST.
200 9,982 479 512 41 39,606 46 43,725
7104000 VAN BUREN SHIRLEY SCHOOL DISTRICT
201 10,221 414 441 43 39,818 45 40,492
7003000 UNION JUNCTION CITY SCHOOL DISTRICT
202 11,369 441 468 38 43,393 45 46,842
5008000 NEVADA NEVADA SCHOOL DISTRICT
203 9,712 381 402 40 37,360 44 39,431
1503000 CONWAY NEMO VISTA SCHOOL DISTRICT
204 9,561 463 490 40 38,706 44 41,680
4102000 LITTLE RIVER FOREMAN SCHOOL DISTRICT
205 8,802 521 541 39 42,508 44 45,066
4701000 MISSISSIPPI ARMOREL SCHOOL DISTRICT
206 8,682 428 455 41 39,440 43 41,531
0402000 BENTON DECATUR SCHOOL DISTRICT
207 9,682 472 486 39 38,746 43 40,900
0304000 BAXTER NORFORK SCHOOL DISTRICT
208 9,834 439 465 38 41,986 42 44,874
6102000 RANDOLPH MAYNARD SCHOOL DISTRICT
209 8,655 498 521 39 41,160 42 42,975
3211000 INDEPENDENCE MIDLAND SCHOOL DISTRICT
210 8,374 500 521 38 38,357 41 40,561
7303000 WHITE BRADFORD SCHOOL 211 9,446 456 491 37 37,402 41 39,720
356
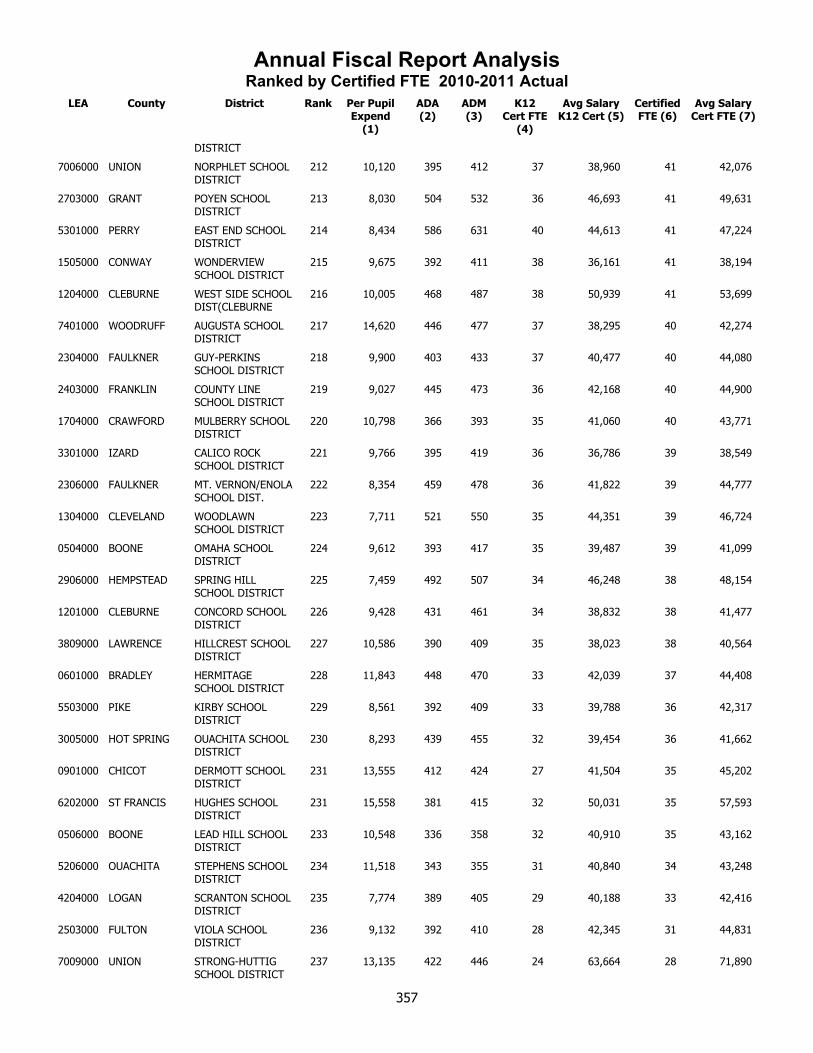
Annual Fiscal Report AnalysisRanked by Certified FTE 2010-2011 Actual
LEA County District Rank Per Pupil Expend
(1)
ADA (2)
ADM (3)
K12 Cert FTE
(4)
Avg Salary K12 Cert (5)
Certified FTE (6)
Avg Salary Cert FTE (7)
DISTRICT
7006000 UNION NORPHLET SCHOOL DISTRICT
212 10,120 395 412 37 38,960 41 42,076
2703000 GRANT POYEN SCHOOL DISTRICT
213 8,030 504 532 36 46,693 41 49,631
5301000 PERRY EAST END SCHOOL DISTRICT
214 8,434 586 631 40 44,613 41 47,224
1505000 CONWAY WONDERVIEW SCHOOL DISTRICT
215 9,675 392 411 38 36,161 41 38,194
1204000 CLEBURNE WEST SIDE SCHOOL DIST(CLEBURNE
216 10,005 468 487 38 50,939 41 53,699
7401000 WOODRUFF AUGUSTA SCHOOL DISTRICT
217 14,620 446 477 37 38,295 40 42,274
2304000 FAULKNER GUY-PERKINS SCHOOL DISTRICT
218 9,900 403 433 37 40,477 40 44,080
2403000 FRANKLIN COUNTY LINE SCHOOL DISTRICT
219 9,027 445 473 36 42,168 40 44,900
1704000 CRAWFORD MULBERRY SCHOOL DISTRICT
220 10,798 366 393 35 41,060 40 43,771
3301000 IZARD CALICO ROCK SCHOOL DISTRICT
221 9,766 395 419 36 36,786 39 38,549
2306000 FAULKNER MT. VERNON/ENOLA SCHOOL DIST.
222 8,354 459 478 36 41,822 39 44,777
1304000 CLEVELAND WOODLAWN SCHOOL DISTRICT
223 7,711 521 550 35 44,351 39 46,724
0504000 BOONE OMAHA SCHOOL DISTRICT
224 9,612 393 417 35 39,487 39 41,099
2906000 HEMPSTEAD SPRING HILL SCHOOL DISTRICT
225 7,459 492 507 34 46,248 38 48,154
1201000 CLEBURNE CONCORD SCHOOL DISTRICT
226 9,428 431 461 34 38,832 38 41,477
3809000 LAWRENCE HILLCREST SCHOOL DISTRICT
227 10,586 390 409 35 38,023 38 40,564
0601000 BRADLEY HERMITAGE SCHOOL DISTRICT
228 11,843 448 470 33 42,039 37 44,408
5503000 PIKE KIRBY SCHOOL DISTRICT
229 8,561 392 409 33 39,788 36 42,317
3005000 HOT SPRING OUACHITA SCHOOL DISTRICT
230 8,293 439 455 32 39,454 36 41,662
0901000 CHICOT DERMOTT SCHOOL DISTRICT
231 13,555 412 424 27 41,504 35 45,202
6202000 ST FRANCIS HUGHES SCHOOL DISTRICT
231 15,558 381 415 32 50,031 35 57,593
0506000 BOONE LEAD HILL SCHOOL DISTRICT
233 10,548 336 358 32 40,910 35 43,162
5206000 OUACHITA STEPHENS SCHOOL DISTRICT
234 11,518 343 355 31 40,840 34 43,248
4204000 LOGAN SCRANTON SCHOOL DISTRICT
235 7,774 389 405 29 40,188 33 42,416
2503000 FULTON VIOLA SCHOOL DISTRICT
236 9,132 392 410 28 42,345 31 44,831
7009000 UNION STRONG-HUTTIG SCHOOL DISTRICT
237 13,135 422 446 24 63,664 28 71,890
357
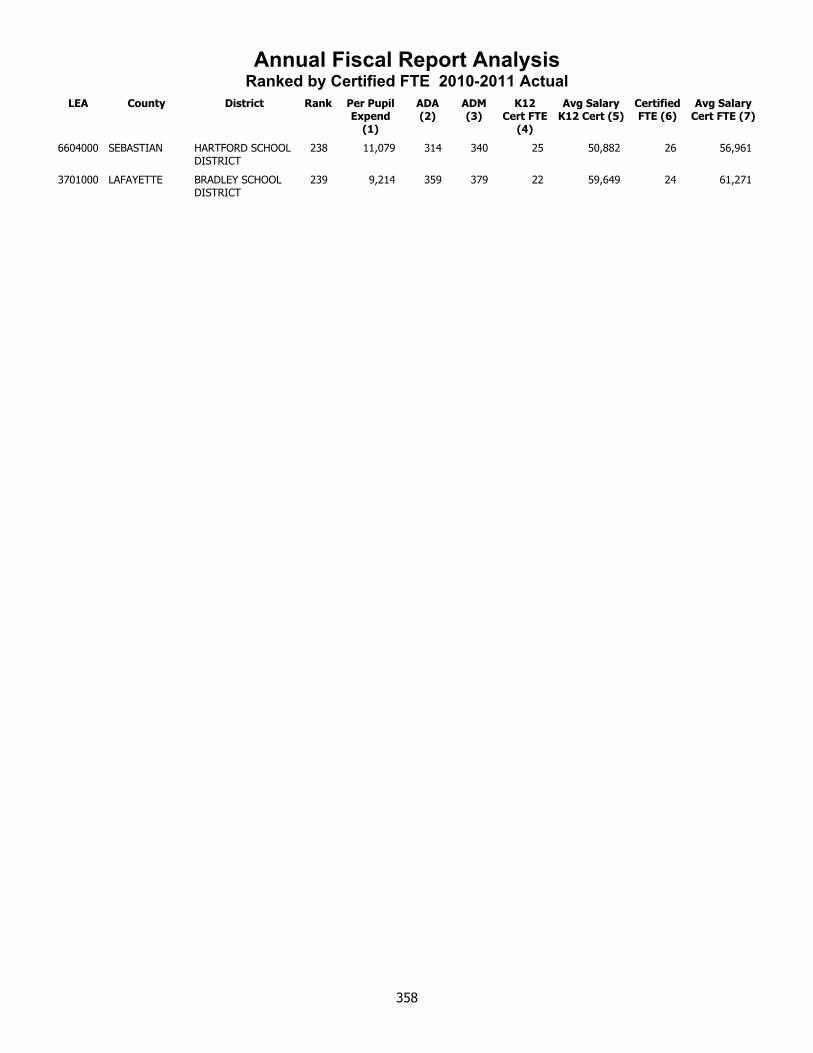
Annual Fiscal Report AnalysisRanked by Certified FTE 2010-2011 Actual
LEA County District Rank Per Pupil Expend
(1)
ADA (2)
ADM (3)
K12 Cert FTE
(4)
Avg Salary K12 Cert (5)
Certified FTE (6)
Avg Salary Cert FTE (7)
6604000 SEBASTIAN HARTFORD SCHOOL DISTRICT
238 11,079 314 340 25 50,882 26 56,961
3701000 LAFAYETTE BRADLEY SCHOOL DISTRICT
239 9,214 359 379 22 59,649 24 61,271
358

Ranked byAverage Salary of Certified
Full Time Equivalency
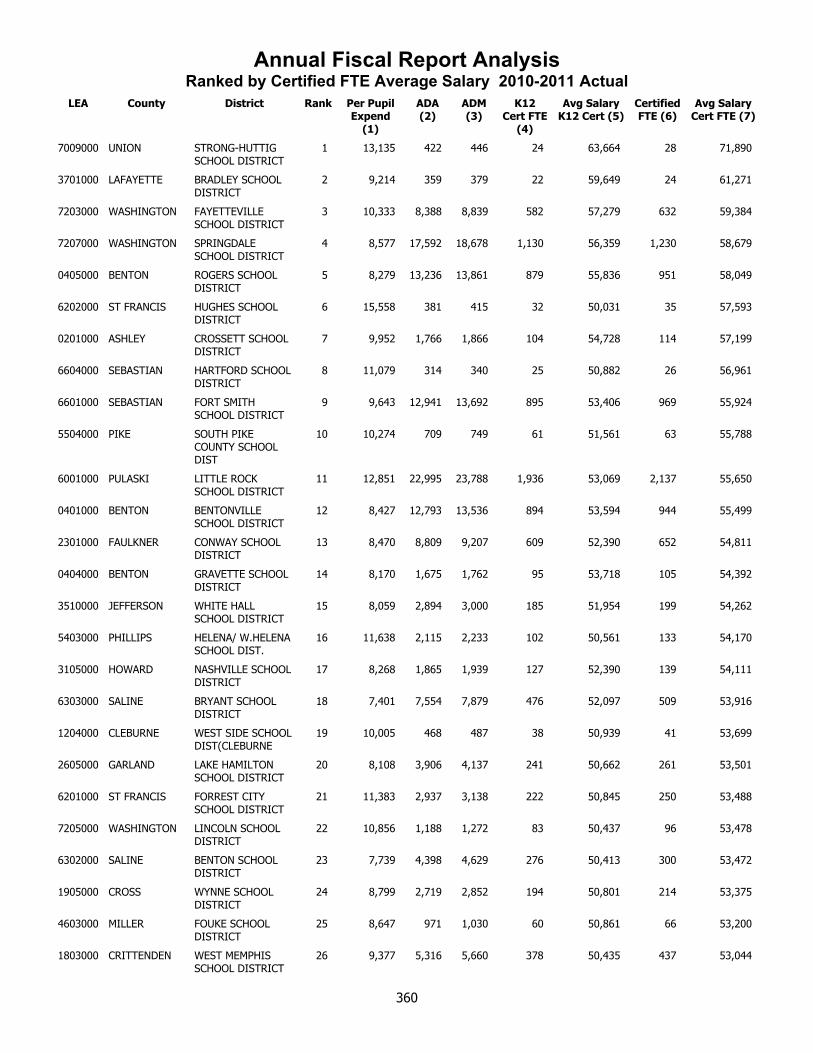
Annual Fiscal Report AnalysisRanked by Certified FTE Average Salary 2010-2011 Actual
LEA County District Rank Per Pupil Expend
(1)
ADA (2)
ADM (3)
K12 Cert FTE
(4)
Avg Salary K12 Cert (5)
Certified FTE (6)
Avg Salary Cert FTE (7)
7009000 UNION STRONG-HUTTIG SCHOOL DISTRICT
1 13,135 422 446 24 63,664 28 71,890
3701000 LAFAYETTE BRADLEY SCHOOL DISTRICT
2 9,214 359 379 22 59,649 24 61,271
7203000 WASHINGTON FAYETTEVILLE SCHOOL DISTRICT
3 10,333 8,388 8,839 582 57,279 632 59,384
7207000 WASHINGTON SPRINGDALE SCHOOL DISTRICT
4 8,577 17,592 18,678 1,130 56,359 1,230 58,679
0405000 BENTON ROGERS SCHOOL DISTRICT
5 8,279 13,236 13,861 879 55,836 951 58,049
6202000 ST FRANCIS HUGHES SCHOOL DISTRICT
6 15,558 381 415 32 50,031 35 57,593
0201000 ASHLEY CROSSETT SCHOOL DISTRICT
7 9,952 1,766 1,866 104 54,728 114 57,199
6604000 SEBASTIAN HARTFORD SCHOOL DISTRICT
8 11,079 314 340 25 50,882 26 56,961
6601000 SEBASTIAN FORT SMITH SCHOOL DISTRICT
9 9,643 12,941 13,692 895 53,406 969 55,924
5504000 PIKE SOUTH PIKE COUNTY SCHOOL DIST
10 10,274 709 749 61 51,561 63 55,788
6001000 PULASKI LITTLE ROCK SCHOOL DISTRICT
11 12,851 22,995 23,788 1,936 53,069 2,137 55,650
0401000 BENTON BENTONVILLE SCHOOL DISTRICT
12 8,427 12,793 13,536 894 53,594 944 55,499
2301000 FAULKNER CONWAY SCHOOL DISTRICT
13 8,470 8,809 9,207 609 52,390 652 54,811
0404000 BENTON GRAVETTE SCHOOL DISTRICT
14 8,170 1,675 1,762 95 53,718 105 54,392
3510000 JEFFERSON WHITE HALL SCHOOL DISTRICT
15 8,059 2,894 3,000 185 51,954 199 54,262
5403000 PHILLIPS HELENA/ W.HELENA SCHOOL DIST.
16 11,638 2,115 2,233 102 50,561 133 54,170
3105000 HOWARD NASHVILLE SCHOOL DISTRICT
17 8,268 1,865 1,939 127 52,390 139 54,111
6303000 SALINE BRYANT SCHOOL DISTRICT
18 7,401 7,554 7,879 476 52,097 509 53,916
1204000 CLEBURNE WEST SIDE SCHOOL DIST(CLEBURNE
19 10,005 468 487 38 50,939 41 53,699
2605000 GARLAND LAKE HAMILTON SCHOOL DISTRICT
20 8,108 3,906 4,137 241 50,662 261 53,501
6201000 ST FRANCIS FORREST CITY SCHOOL DISTRICT
21 11,383 2,937 3,138 222 50,845 250 53,488
7205000 WASHINGTON LINCOLN SCHOOL DISTRICT
22 10,856 1,188 1,272 83 50,437 96 53,478
6302000 SALINE BENTON SCHOOL DISTRICT
23 7,739 4,398 4,629 276 50,413 300 53,472
1905000 CROSS WYNNE SCHOOL DISTRICT
24 8,799 2,719 2,852 194 50,801 214 53,375
4603000 MILLER FOUKE SCHOOL DISTRICT
25 8,647 971 1,030 60 50,861 66 53,200
1803000 CRITTENDEN WEST MEMPHIS SCHOOL DISTRICT
26 9,377 5,316 5,660 378 50,435 437 53,044
360
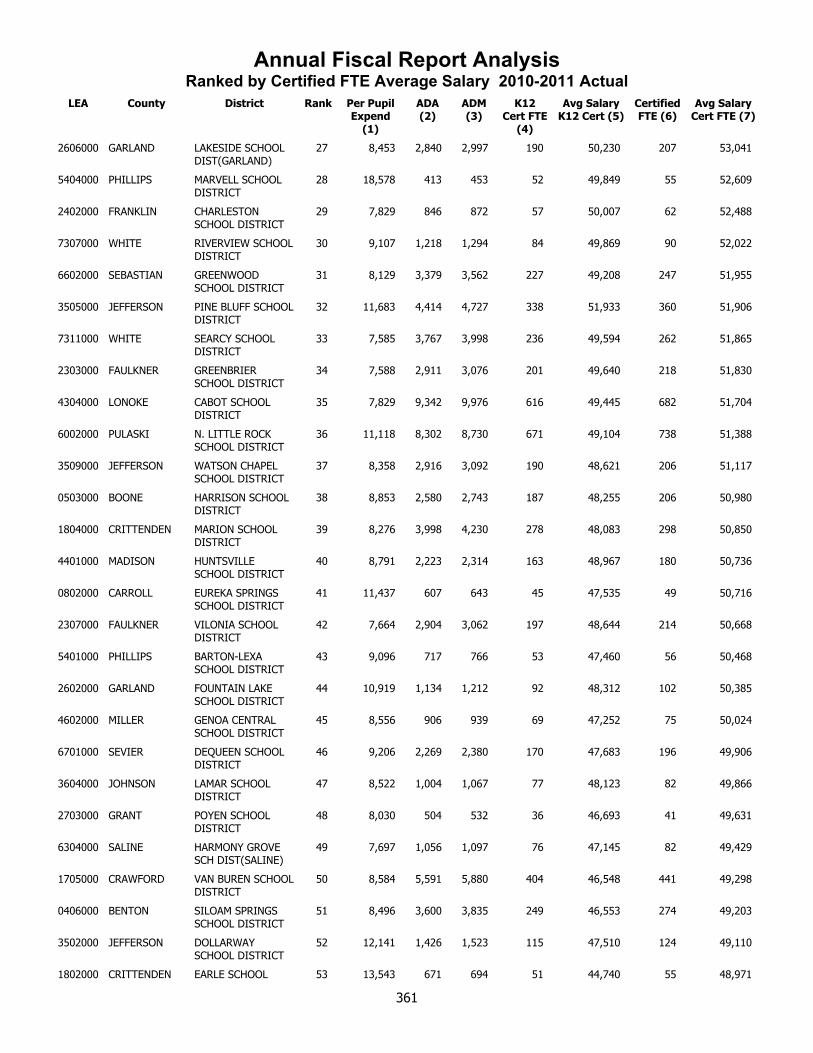
Annual Fiscal Report AnalysisRanked by Certified FTE Average Salary 2010-2011 Actual
LEA County District Rank Per Pupil Expend
(1)
ADA (2)
ADM (3)
K12 Cert FTE
(4)
Avg Salary K12 Cert (5)
Certified FTE (6)
Avg Salary Cert FTE (7)
2606000 GARLAND LAKESIDE SCHOOL DIST(GARLAND)
27 8,453 2,840 2,997 190 50,230 207 53,041
5404000 PHILLIPS MARVELL SCHOOL DISTRICT
28 18,578 413 453 52 49,849 55 52,609
2402000 FRANKLIN CHARLESTON SCHOOL DISTRICT
29 7,829 846 872 57 50,007 62 52,488
7307000 WHITE RIVERVIEW SCHOOL DISTRICT
30 9,107 1,218 1,294 84 49,869 90 52,022
6602000 SEBASTIAN GREENWOOD SCHOOL DISTRICT
31 8,129 3,379 3,562 227 49,208 247 51,955
3505000 JEFFERSON PINE BLUFF SCHOOL DISTRICT
32 11,683 4,414 4,727 338 51,933 360 51,906
7311000 WHITE SEARCY SCHOOL DISTRICT
33 7,585 3,767 3,998 236 49,594 262 51,865
2303000 FAULKNER GREENBRIER SCHOOL DISTRICT
34 7,588 2,911 3,076 201 49,640 218 51,830
4304000 LONOKE CABOT SCHOOL DISTRICT
35 7,829 9,342 9,976 616 49,445 682 51,704
6002000 PULASKI N. LITTLE ROCK SCHOOL DISTRICT
36 11,118 8,302 8,730 671 49,104 738 51,388
3509000 JEFFERSON WATSON CHAPEL SCHOOL DISTRICT
37 8,358 2,916 3,092 190 48,621 206 51,117
0503000 BOONE HARRISON SCHOOL DISTRICT
38 8,853 2,580 2,743 187 48,255 206 50,980
1804000 CRITTENDEN MARION SCHOOL DISTRICT
39 8,276 3,998 4,230 278 48,083 298 50,850
4401000 MADISON HUNTSVILLE SCHOOL DISTRICT
40 8,791 2,223 2,314 163 48,967 180 50,736
0802000 CARROLL EUREKA SPRINGS SCHOOL DISTRICT
41 11,437 607 643 45 47,535 49 50,716
2307000 FAULKNER VILONIA SCHOOL DISTRICT
42 7,664 2,904 3,062 197 48,644 214 50,668
5401000 PHILLIPS BARTON-LEXA SCHOOL DISTRICT
43 9,096 717 766 53 47,460 56 50,468
2602000 GARLAND FOUNTAIN LAKE SCHOOL DISTRICT
44 10,919 1,134 1,212 92 48,312 102 50,385
4602000 MILLER GENOA CENTRAL SCHOOL DISTRICT
45 8,556 906 939 69 47,252 75 50,024
6701000 SEVIER DEQUEEN SCHOOL DISTRICT
46 9,206 2,269 2,380 170 47,683 196 49,906
3604000 JOHNSON LAMAR SCHOOL DISTRICT
47 8,522 1,004 1,067 77 48,123 82 49,866
2703000 GRANT POYEN SCHOOL DISTRICT
48 8,030 504 532 36 46,693 41 49,631
6304000 SALINE HARMONY GROVE SCH DIST(SALINE)
49 7,697 1,056 1,097 76 47,145 82 49,429
1705000 CRAWFORD VAN BUREN SCHOOL DISTRICT
50 8,584 5,591 5,880 404 46,548 441 49,298
0406000 BENTON SILOAM SPRINGS SCHOOL DISTRICT
51 8,496 3,600 3,835 249 46,553 274 49,203
3502000 JEFFERSON DOLLARWAY SCHOOL DISTRICT
52 12,141 1,426 1,523 115 47,510 124 49,110
1802000 CRITTENDEN EARLE SCHOOL 53 13,543 671 694 51 44,740 55 48,971
361

Annual Fiscal Report AnalysisRanked by Certified FTE Average Salary 2010-2011 Actual
LEA County District Rank Per Pupil Expend
(1)
ADA (2)
ADM (3)
K12 Cert FTE
(4)
Avg Salary K12 Cert (5)
Certified FTE (6)
Avg Salary Cert FTE (7)
DISTRICT
4003000 LINCOLN STAR CITY SCHOOL DISTRICT
54 8,403 1,569 1,651 107 44,247 117 48,927
0403000 BENTON GENTRY SCHOOL DISTRICT
55 8,802 1,344 1,418 104 46,280 113 48,856
1701000 CRAWFORD ALMA SCHOOL DISTRICT
56 8,083 3,262 3,406 230 45,383 249 48,715
3104000 HOWARD MINERAL SPRINGS SCHOOL DIST.
57 11,097 468 479 42 45,202 50 48,703
7504000 YELL DARDANELLE SCHOOL DISTRICT
58 8,294 1,872 1,934 138 46,295 150 48,527
2603000 GARLAND HOT SPRINGS SCHOOL DISTRICT
59 12,838 3,438 3,633 286 45,860 329 48,524
7202000 WASHINGTON FARMINGTON SCHOOL DISTRICT
60 7,935 2,058 2,178 154 45,901 167 48,413
3004000 HOT SPRING MALVERN SCHOOL DISTRICT
61 8,962 2,020 2,108 146 45,978 158 48,410
3002000 HOT SPRING GLEN ROSE SCHOOL DISTRICT
62 9,041 868 933 64 46,267 71 48,342
2404000 FRANKLIN OZARK SCHOOL DISTRICT
63 8,959 1,699 1,810 131 46,247 141 48,241
6003000 PULASKI PULASKI CO. SPEC. SCHOOL DIST.
64 11,391 15,652 16,618 1,447 44,930 1,552 48,186
1702000 CRAWFORD CEDARVILLE SCHOOL DISTRICT
65 8,299 856 925 57 44,597 63 48,172
2906000 HEMPSTEAD SPRING HILL SCHOOL DISTRICT
66 7,459 492 507 34 46,248 38 48,154
1608000 CRAIGHEAD JONESBORO SCHOOL DISTRICT
67 8,749 4,912 5,315 315 45,539 341 48,132
0407000 BENTON PEA RIDGE SCHOOL DISTRICT
68 7,507 1,555 1,639 100 46,299 105 48,050
3601000 JOHNSON CLARKSVILLE SCHOOL DISTRICT
69 8,751 2,364 2,484 174 45,249 188 47,745
7302000 WHITE BEEBE SCHOOL DISTRICT
70 7,771 3,072 3,193 214 44,378 235 47,625
5805000 POPE RUSSELLVILLE SCHOOL DISTRICT
71 9,844 4,961 5,122 390 45,289 427 47,616
6301000 SALINE BAUXITE SCHOOL DISTRICT
72 7,507 1,406 1,485 88 45,150 96 47,522
7206000 WASHINGTON PRAIRIE GROVE SCHOOL DISTRICT
73 7,777 1,684 1,747 116 44,703 126 47,316
5204000 OUACHITA CAMDEN FAIRVIEW SCHOOL DIST.
74 10,176 2,300 2,428 171 44,109 197 47,313
1611000 CRAIGHEAD NETTLETON SCHOOL DISTRICT
75 8,611 3,010 3,149 217 45,144 235 47,296
4605000 MILLER TEXARKANA SCHOOL DISTRICT
76 10,949 3,936 4,230 324 44,255 353 47,288
5301000 PERRY EAST END SCHOOL DISTRICT
77 8,434 586 631 40 44,613 41 47,224
0303000 BAXTER MOUNTAIN HOME SCHOOL DISTRICT
78 8,357 3,762 3,977 264 45,044 284 47,040
7208000 WASHINGTON WEST FORK SCHOOL DISTRICT
79 8,189 1,158 1,222 87 45,342 91 47,024
362

Annual Fiscal Report AnalysisRanked by Certified FTE Average Salary 2010-2011 Actual
LEA County District Rank Per Pupil Expend
(1)
ADA (2)
ADM (3)
K12 Cert FTE
(4)
Avg Salary K12 Cert (5)
Certified FTE (6)
Avg Salary Cert FTE (7)
1003000 CLARK GURDON SCHOOL DISTRICT
80 9,926 707 750 55 44,555 62 46,977
0101000 ARKANSAS DEWITT SCHOOL DISTRICT
81 8,967 1,291 1,327 101 44,451 112 46,882
7003000 UNION JUNCTION CITY SCHOOL DISTRICT
82 11,369 441 468 38 43,393 45 46,842
1402000 COLUMBIA MAGNOLIA SCHOOL DISTRICT
83 8,882 2,600 2,758 199 44,130 219 46,830
1304000 CLEVELAND WOODLAWN SCHOOL DISTRICT
84 7,711 521 550 35 44,351 39 46,724
2705000 GRANT SHERIDAN SCHOOL DISTRICT
85 7,691 3,900 4,135 264 44,739 288 46,645
4702000 MISSISSIPPI BLYTHEVILLE SCHOOL DISTRICT
86 11,387 2,720 2,902 209 43,144 232 46,601
1612000 CRAIGHEAD VALLEY VIEW SCHOOL DISTRICT
87 7,109 2,265 2,349 159 44,170 168 46,260
7510000 YELL TWO RIVERS SCHOOL DISTRICT
88 10,903 821 887 65 42,712 71 46,235
5802000 POPE DOVER SCHOOL DISTRICT
89 8,214 1,269 1,357 95 44,464 102 46,176
2808000 GREENE PARAGOULD SCHOOL DISTRICT
90 8,473 2,698 2,883 199 43,188 218 46,159
4708000 MISSISSIPPI GOSNELL SCHOOL DISTRICT
91 8,582 1,296 1,395 95 43,476 107 46,149
7309000 WHITE PANGBURN SCHOOL DISTRICT
92 8,593 710 745 59 43,359 65 46,148
5602000 POINSETT HARRISBURG SCHOOL DISTRICT
93 10,185 1,261 1,370 118 43,451 130 45,934
0104000 ARKANSAS STUTTGART SCHOOL DISTRICT
94 8,400 1,673 1,786 120 42,468 134 45,739
6103000 RANDOLPH POCAHONTAS SCHOOL DISTRICT
95 7,812 1,734 1,819 124 44,017 133 45,736
6901000 STONE MOUNTAIN VIEW SCHOOL DISTRICT
96 8,308 1,617 1,711 129 43,712 138 45,709
7007000 UNION PARKERS CHAPEL SCHOOL DIST.
97 8,355 629 658 52 42,984 56 45,610
2807000 GREENE GREENE CO. TECH SCHOOL DIST.
98 8,186 3,229 3,416 227 43,236 245 45,588
4902000 MONTGOMERY MOUNT IDA SCHOOL DISTRICT
99 9,888 473 502 43 42,443 47 45,536
2604000 GARLAND JESSIEVILLE SCHOOL DISTRICT
100 9,049 861 884 64 44,012 69 45,505
4502000 MARION YELLVILLE-SUMMIT SCHOOL DIST.
101 9,724 760 812 54 43,355 58 45,503
1101000 CLAY CORNING SCHOOL DISTRICT
102 9,360 966 1,024 81 43,292 87 45,445
5804000 POPE POTTSVILLE SCHOOL DISTRICT
103 7,555 1,561 1,618 120 43,742 127 45,441
6603000 SEBASTIAN HACKETT SCHOOL DISTRICT
104 8,364 587 621 46 43,197 51 45,369
4712000 MISSISSIPPI MANILA SCHOOL DISTRICT
105 8,876 928 984 72 43,540 77 45,334
2502000 FULTON SALEM SCHOOL 106 8,152 695 728 55 43,713 58 45,293
363
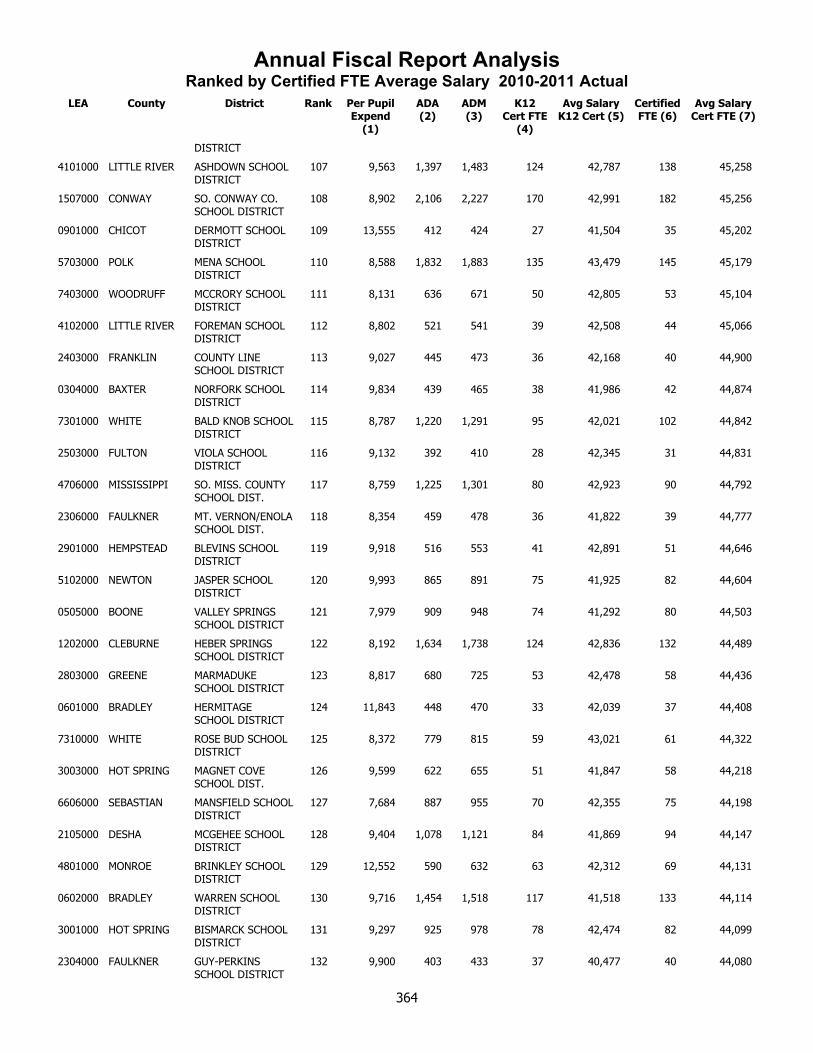
Annual Fiscal Report AnalysisRanked by Certified FTE Average Salary 2010-2011 Actual
LEA County District Rank Per Pupil Expend
(1)
ADA (2)
ADM (3)
K12 Cert FTE
(4)
Avg Salary K12 Cert (5)
Certified FTE (6)
Avg Salary Cert FTE (7)
DISTRICT
4101000 LITTLE RIVER ASHDOWN SCHOOL DISTRICT
107 9,563 1,397 1,483 124 42,787 138 45,258
1507000 CONWAY SO. CONWAY CO. SCHOOL DISTRICT
108 8,902 2,106 2,227 170 42,991 182 45,256
0901000 CHICOT DERMOTT SCHOOL DISTRICT
109 13,555 412 424 27 41,504 35 45,202
5703000 POLK MENA SCHOOL DISTRICT
110 8,588 1,832 1,883 135 43,479 145 45,179
7403000 WOODRUFF MCCRORY SCHOOL DISTRICT
111 8,131 636 671 50 42,805 53 45,104
4102000 LITTLE RIVER FOREMAN SCHOOL DISTRICT
112 8,802 521 541 39 42,508 44 45,066
2403000 FRANKLIN COUNTY LINE SCHOOL DISTRICT
113 9,027 445 473 36 42,168 40 44,900
0304000 BAXTER NORFORK SCHOOL DISTRICT
114 9,834 439 465 38 41,986 42 44,874
7301000 WHITE BALD KNOB SCHOOL DISTRICT
115 8,787 1,220 1,291 95 42,021 102 44,842
2503000 FULTON VIOLA SCHOOL DISTRICT
116 9,132 392 410 28 42,345 31 44,831
4706000 MISSISSIPPI SO. MISS. COUNTY SCHOOL DIST.
117 8,759 1,225 1,301 80 42,923 90 44,792
2306000 FAULKNER MT. VERNON/ENOLA SCHOOL DIST.
118 8,354 459 478 36 41,822 39 44,777
2901000 HEMPSTEAD BLEVINS SCHOOL DISTRICT
119 9,918 516 553 41 42,891 51 44,646
5102000 NEWTON JASPER SCHOOL DISTRICT
120 9,993 865 891 75 41,925 82 44,604
0505000 BOONE VALLEY SPRINGS SCHOOL DISTRICT
121 7,979 909 948 74 41,292 80 44,503
1202000 CLEBURNE HEBER SPRINGS SCHOOL DISTRICT
122 8,192 1,634 1,738 124 42,836 132 44,489
2803000 GREENE MARMADUKE SCHOOL DISTRICT
123 8,817 680 725 53 42,478 58 44,436
0601000 BRADLEY HERMITAGE SCHOOL DISTRICT
124 11,843 448 470 33 42,039 37 44,408
7310000 WHITE ROSE BUD SCHOOL DISTRICT
125 8,372 779 815 59 43,021 61 44,322
3003000 HOT SPRING MAGNET COVE SCHOOL DIST.
126 9,599 622 655 51 41,847 58 44,218
6606000 SEBASTIAN MANSFIELD SCHOOL DISTRICT
127 7,684 887 955 70 42,355 75 44,198
2105000 DESHA MCGEHEE SCHOOL DISTRICT
128 9,404 1,078 1,121 84 41,869 94 44,147
4801000 MONROE BRINKLEY SCHOOL DISTRICT
129 12,552 590 632 63 42,312 69 44,131
0602000 BRADLEY WARREN SCHOOL DISTRICT
130 9,716 1,454 1,518 117 41,518 133 44,114
3001000 HOT SPRING BISMARCK SCHOOL DISTRICT
131 9,297 925 978 78 42,474 82 44,099
2304000 FAULKNER GUY-PERKINS SCHOOL DISTRICT
132 9,900 403 433 37 40,477 40 44,080
364

Annual Fiscal Report AnalysisRanked by Certified FTE Average Salary 2010-2011 Actual
LEA County District Rank Per Pupil Expend
(1)
ADA (2)
ADM (3)
K12 Cert FTE
(4)
Avg Salary K12 Cert (5)
Certified FTE (6)
Avg Salary Cert FTE (7)
5803000 POPE HECTOR SCHOOL DISTRICT
133 9,736 578 619 51 42,368 56 44,078
4301000 LONOKE LONOKE SCHOOL DISTRICT
134 8,557 1,744 1,823 133 41,904 144 44,072
3904000 LEE LEE COUNTY SCHOOL DISTRICT
135 13,685 911 980 94 42,032 103 44,009
5303000 PERRY PERRYVILLE SCHOOL DISTRICT
136 8,152 948 1,014 76 41,641 82 43,865
4802000 MONROE CLARENDON SCHOOL DISTRICT
137 10,705 515 540 48 42,303 54 43,849
1305000 CLEVELAND CLEVELAND COUNTY SCHOOL DIST.
138 9,283 811 847 65 40,820 70 43,818
1104000 CLAY PIGGOTT SCHOOL DISTRICT
139 8,264 921 956 76 42,520 82 43,796
6401000 SCOTT WALDRON SCHOOL DISTRICT
140 8,961 1,488 1,621 122 42,150 131 43,787
1704000 CRAWFORD MULBERRY SCHOOL DISTRICT
141 10,798 366 393 35 41,060 40 43,771
7201000 WASHINGTON ELKINS SCHOOL DISTRICT
142 7,470 1,104 1,151 83 41,977 89 43,769
3306000 IZARD IZARD CO. CONS. SCHOOL DIST.
143 9,982 479 512 41 39,606 46 43,725
3209000 INDEPENDENCE SOUTHSIDE SCH DIST(INDEPENDENC
144 8,404 1,446 1,514 97 41,509 106 43,719
4713000 MISSISSIPPI OSCEOLA SCHOOL DISTRICT
145 12,218 1,299 1,370 110 41,886 120 43,699
1002000 CLARK ARKADELPHIA SCHOOL DISTRICT
146 9,445 1,875 1,942 150 41,727 162 43,649
2203000 DREW MONTICELLO SCHOOL DISTRICT
147 9,115 2,002 2,080 154 41,391 168 43,598
1408000 COLUMBIA EMERSON-TAYLOR SCHOOL DISTRICT
148 9,596 576 613 56 40,756 62 43,540
4501000 MARION FLIPPIN SCHOOL DISTRICT
149 10,086 763 813 70 41,075 75 43,483
5605000 POINSETT TRUMANN SCHOOL DISTRICT
150 9,403 1,400 1,506 115 41,290 125 43,459
3606000 JOHNSON WESTSIDE SCHOOL DIST(JOHNSON)
151 9,491 570 608 52 39,247 54 43,453
4201000 LOGAN BOONEVILLE SCHOOL DISTRICT
152 8,770 1,288 1,361 106 41,484 113 43,419
1106000 CLAY RECTOR SCHOOL DISTRICT
153 8,334 565 589 51 41,434 54 43,404
7204000 WASHINGTON GREENLAND SCHOOL DISTRICT
154 8,996 760 794 64 40,424 69 43,330
1603000 CRAIGHEAD BROOKLAND SCHOOL DISTRICT
155 7,330 1,567 1,625 113 42,002 124 43,311
7001000 UNION EL DORADO SCHOOL DISTRICT
156 8,471 4,289 4,598 354 40,889 389 43,309
5206000 OUACHITA STEPHENS SCHOOL DISTRICT
157 11,518 343 355 31 40,840 34 43,248
5706000 POLK OUACHITA RIVER SCHOOL DISTRICT
158 9,736 661 702 58 41,670 62 43,197
7008000 UNION SMACKOVER 159 8,774 808 850 64 40,726 72 43,195
365
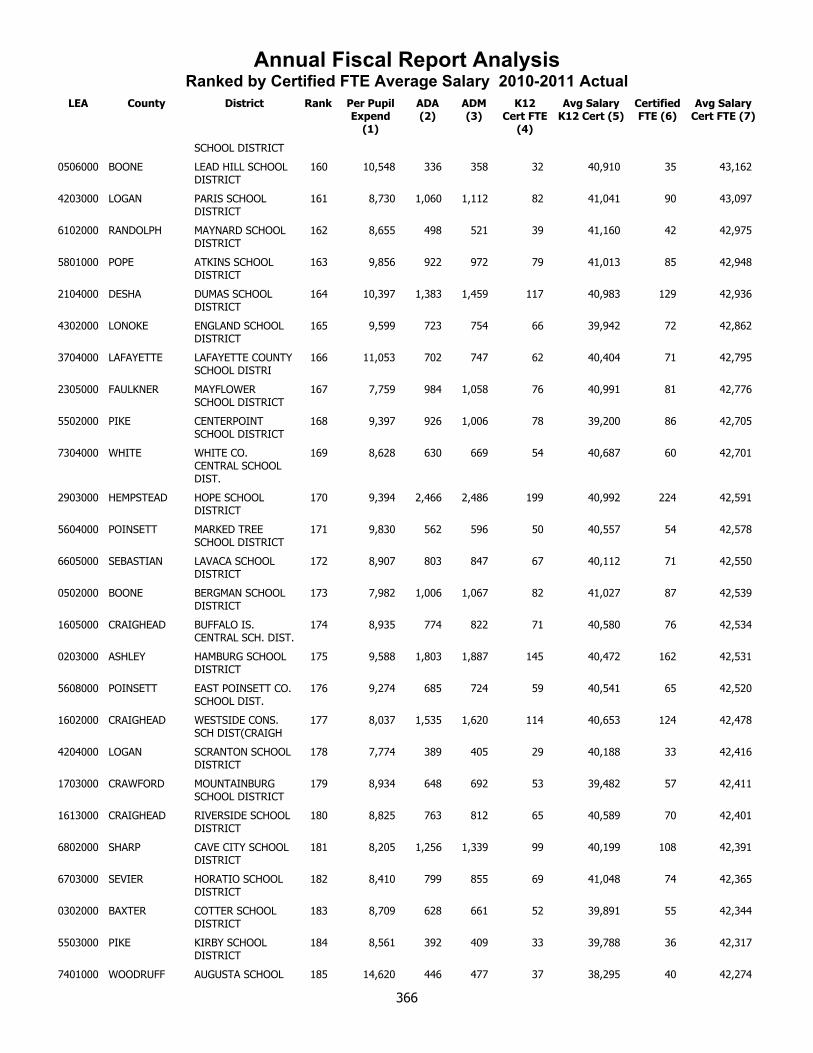
Annual Fiscal Report AnalysisRanked by Certified FTE Average Salary 2010-2011 Actual
LEA County District Rank Per Pupil Expend
(1)
ADA (2)
ADM (3)
K12 Cert FTE
(4)
Avg Salary K12 Cert (5)
Certified FTE (6)
Avg Salary Cert FTE (7)
SCHOOL DISTRICT
0506000 BOONE LEAD HILL SCHOOL DISTRICT
160 10,548 336 358 32 40,910 35 43,162
4203000 LOGAN PARIS SCHOOL DISTRICT
161 8,730 1,060 1,112 82 41,041 90 43,097
6102000 RANDOLPH MAYNARD SCHOOL DISTRICT
162 8,655 498 521 39 41,160 42 42,975
5801000 POPE ATKINS SCHOOL DISTRICT
163 9,856 922 972 79 41,013 85 42,948
2104000 DESHA DUMAS SCHOOL DISTRICT
164 10,397 1,383 1,459 117 40,983 129 42,936
4302000 LONOKE ENGLAND SCHOOL DISTRICT
165 9,599 723 754 66 39,942 72 42,862
3704000 LAFAYETTE LAFAYETTE COUNTY SCHOOL DISTRI
166 11,053 702 747 62 40,404 71 42,795
2305000 FAULKNER MAYFLOWER SCHOOL DISTRICT
167 7,759 984 1,058 76 40,991 81 42,776
5502000 PIKE CENTERPOINT SCHOOL DISTRICT
168 9,397 926 1,006 78 39,200 86 42,705
7304000 WHITE WHITE CO. CENTRAL SCHOOL DIST.
169 8,628 630 669 54 40,687 60 42,701
2903000 HEMPSTEAD HOPE SCHOOL DISTRICT
170 9,394 2,466 2,486 199 40,992 224 42,591
5604000 POINSETT MARKED TREE SCHOOL DISTRICT
171 9,830 562 596 50 40,557 54 42,578
6605000 SEBASTIAN LAVACA SCHOOL DISTRICT
172 8,907 803 847 67 40,112 71 42,550
0502000 BOONE BERGMAN SCHOOL DISTRICT
173 7,982 1,006 1,067 82 41,027 87 42,539
1605000 CRAIGHEAD BUFFALO IS. CENTRAL SCH. DIST.
174 8,935 774 822 71 40,580 76 42,534
0203000 ASHLEY HAMBURG SCHOOL DISTRICT
175 9,588 1,803 1,887 145 40,472 162 42,531
5608000 POINSETT EAST POINSETT CO. SCHOOL DIST.
176 9,274 685 724 59 40,541 65 42,520
1602000 CRAIGHEAD WESTSIDE CONS. SCH DIST(CRAIGH
177 8,037 1,535 1,620 114 40,653 124 42,478
4204000 LOGAN SCRANTON SCHOOL DISTRICT
178 7,774 389 405 29 40,188 33 42,416
1703000 CRAWFORD MOUNTAINBURG SCHOOL DISTRICT
179 8,934 648 692 53 39,482 57 42,411
1613000 CRAIGHEAD RIVERSIDE SCHOOL DISTRICT
180 8,825 763 812 65 40,589 70 42,401
6802000 SHARP CAVE CITY SCHOOL DISTRICT
181 8,205 1,256 1,339 99 40,199 108 42,391
6703000 SEVIER HORATIO SCHOOL DISTRICT
182 8,410 799 855 69 41,048 74 42,365
0302000 BAXTER COTTER SCHOOL DISTRICT
183 8,709 628 661 52 39,891 55 42,344
5503000 PIKE KIRBY SCHOOL DISTRICT
184 8,561 392 409 33 39,788 36 42,317
7401000 WOODRUFF AUGUSTA SCHOOL 185 14,620 446 477 37 38,295 40 42,274
366

Annual Fiscal Report AnalysisRanked by Certified FTE Average Salary 2010-2011 Actual
LEA County District Rank Per Pupil Expend
(1)
ADA (2)
ADM (3)
K12 Cert FTE
(4)
Avg Salary K12 Cert (5)
Certified FTE (6)
Avg Salary Cert FTE (7)
DISTRICT
3806000 LAWRENCE SLOAN-HENDRIX SCHOOL DIST.
186 8,325 611 653 48 39,855 52 42,250
4303000 LONOKE CARLISLE SCHOOL DISTRICT
187 7,857 710 749 51 40,563 57 42,244
2002000 DALLAS FORDYCE SCHOOL DISTRICT
188 10,575 889 936 66 39,455 73 42,215
3302000 IZARD MELBOURNE SCHOOL DISTRICT
189 7,910 869 907 68 40,377 73 42,210
7006000 UNION NORPHLET SCHOOL DISTRICT
190 10,120 395 412 37 38,960 41 42,076
5901000 PRAIRIE DES ARC SCHOOL DISTRICT
191 8,523 558 591 46 39,788 49 41,929
6804000 SHARP HIGHLAND SCHOOL DISTRICT
192 8,296 1,503 1,592 109 39,850 118 41,909
7102000 VAN BUREN CLINTON SCHOOL DISTRICT
193 9,526 1,252 1,332 108 40,039 115 41,897
0803000 CARROLL GREEN FOREST SCHOOL DISTRICT
194 8,468 1,155 1,220 83 39,718 91 41,790
3102000 HOWARD DIERKS SCHOOL DISTRICT
195 8,884 514 543 48 40,530 51 41,771
5205000 OUACHITA HARMONY GROVE SCH DIST(OUACHIT
196 9,185 962 1,007 84 38,822 92 41,729
1503000 CONWAY NEMO VISTA SCHOOL DISTRICT
197 9,561 463 490 40 38,706 44 41,680
3005000 HOT SPRING OUACHITA SCHOOL DISTRICT
198 8,293 439 455 32 39,454 36 41,662
1901000 CROSS CROSS COUNTY SCHOOL DISTRICT
199 10,320 563 603 46 37,774 52 41,626
0801000 CARROLL BERRYVILLE SCHOOL DISTRICT
200 9,498 1,746 1,856 141 39,784 150 41,566
2601000 GARLAND CUTTER-MORNING STAR SCH. DIST.
201 9,115 601 622 60 39,205 65 41,557
4701000 MISSISSIPPI ARMOREL SCHOOL DISTRICT
202 8,682 428 455 41 39,440 43 41,531
7503000 YELL DANVILLE SCHOOL DISTRICT
203 9,301 840 877 73 39,157 78 41,485
1201000 CLEBURNE CONCORD SCHOOL DISTRICT
204 9,428 431 461 34 38,832 38 41,477
4202000 LOGAN MAGAZINE SCHOOL DISTRICT
205 9,771 486 516 44 39,443 48 41,475
3810000 LAWRENCE LAWRENCE COUNTY SCHOOL DISTRIC
206 8,848 1,016 1,082 91 39,297 97 41,407
7105000 VAN BUREN SOUTH SIDE SCH DIST(VANBUREN)
207 10,376 480 511 47 39,574 49 41,376
3212000 INDEPENDENCE CEDAR RIDGE SCHOOL DISTRICT
208 10,423 784 829 71 39,802 77 41,319
1203000 CLEBURNE QUITMAN SCHOOL DISTRICT
209 10,093 568 604 48 38,880 53 41,237
5903000 PRAIRIE HAZEN SCHOOL DISTRICT
210 8,753 620 644 52 39,290 56 41,144
0504000 BOONE OMAHA SCHOOL DISTRICT
211 9,612 393 417 35 39,487 39 41,099
367
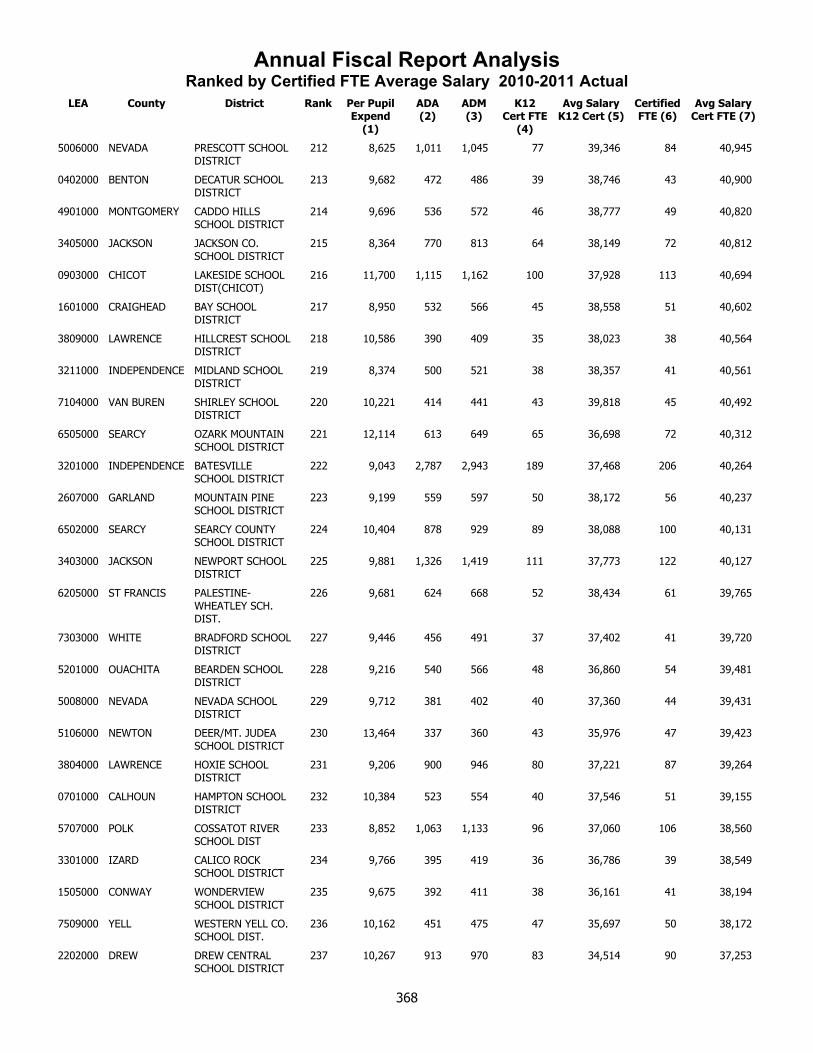
Annual Fiscal Report AnalysisRanked by Certified FTE Average Salary 2010-2011 Actual
LEA County District Rank Per Pupil Expend
(1)
ADA (2)
ADM (3)
K12 Cert FTE
(4)
Avg Salary K12 Cert (5)
Certified FTE (6)
Avg Salary Cert FTE (7)
5006000 NEVADA PRESCOTT SCHOOL DISTRICT
212 8,625 1,011 1,045 77 39,346 84 40,945
0402000 BENTON DECATUR SCHOOL DISTRICT
213 9,682 472 486 39 38,746 43 40,900
4901000 MONTGOMERY CADDO HILLS SCHOOL DISTRICT
214 9,696 536 572 46 38,777 49 40,820
3405000 JACKSON JACKSON CO. SCHOOL DISTRICT
215 8,364 770 813 64 38,149 72 40,812
0903000 CHICOT LAKESIDE SCHOOL DIST(CHICOT)
216 11,700 1,115 1,162 100 37,928 113 40,694
1601000 CRAIGHEAD BAY SCHOOL DISTRICT
217 8,950 532 566 45 38,558 51 40,602
3809000 LAWRENCE HILLCREST SCHOOL DISTRICT
218 10,586 390 409 35 38,023 38 40,564
3211000 INDEPENDENCE MIDLAND SCHOOL DISTRICT
219 8,374 500 521 38 38,357 41 40,561
7104000 VAN BUREN SHIRLEY SCHOOL DISTRICT
220 10,221 414 441 43 39,818 45 40,492
6505000 SEARCY OZARK MOUNTAIN SCHOOL DISTRICT
221 12,114 613 649 65 36,698 72 40,312
3201000 INDEPENDENCE BATESVILLE SCHOOL DISTRICT
222 9,043 2,787 2,943 189 37,468 206 40,264
2607000 GARLAND MOUNTAIN PINE SCHOOL DISTRICT
223 9,199 559 597 50 38,172 56 40,237
6502000 SEARCY SEARCY COUNTY SCHOOL DISTRICT
224 10,404 878 929 89 38,088 100 40,131
3403000 JACKSON NEWPORT SCHOOL DISTRICT
225 9,881 1,326 1,419 111 37,773 122 40,127
6205000 ST FRANCIS PALESTINE-WHEATLEY SCH. DIST.
226 9,681 624 668 52 38,434 61 39,765
7303000 WHITE BRADFORD SCHOOL DISTRICT
227 9,446 456 491 37 37,402 41 39,720
5201000 OUACHITA BEARDEN SCHOOL DISTRICT
228 9,216 540 566 48 36,860 54 39,481
5008000 NEVADA NEVADA SCHOOL DISTRICT
229 9,712 381 402 40 37,360 44 39,431
5106000 NEWTON DEER/MT. JUDEA SCHOOL DISTRICT
230 13,464 337 360 43 35,976 47 39,423
3804000 LAWRENCE HOXIE SCHOOL DISTRICT
231 9,206 900 946 80 37,221 87 39,264
0701000 CALHOUN HAMPTON SCHOOL DISTRICT
232 10,384 523 554 40 37,546 51 39,155
5707000 POLK COSSATOT RIVER SCHOOL DIST
233 8,852 1,063 1,133 96 37,060 106 38,560
3301000 IZARD CALICO ROCK SCHOOL DISTRICT
234 9,766 395 419 36 36,786 39 38,549
1505000 CONWAY WONDERVIEW SCHOOL DISTRICT
235 9,675 392 411 38 36,161 41 38,194
7509000 YELL WESTERN YELL CO. SCHOOL DIST.
236 10,162 451 475 47 35,697 50 38,172
2202000 DREW DREW CENTRAL SCHOOL DISTRICT
237 10,267 913 970 83 34,514 90 37,253
368
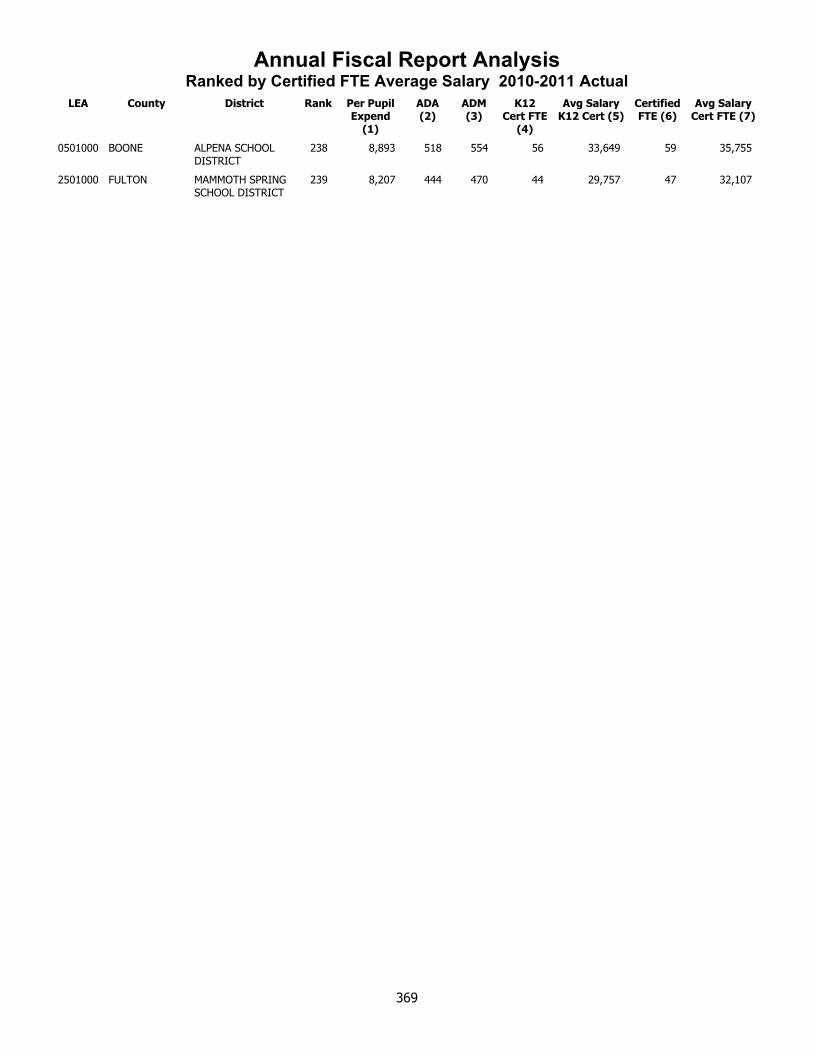
Annual Fiscal Report AnalysisRanked by Certified FTE Average Salary 2010-2011 Actual
LEA County District Rank Per Pupil Expend
(1)
ADA (2)
ADM (3)
K12 Cert FTE
(4)
Avg Salary K12 Cert (5)
Certified FTE (6)
Avg Salary Cert FTE (7)
0501000 BOONE ALPENA SCHOOL DISTRICT
238 8,893 518 554 56 33,649 59 35,755
2501000 FULTON MAMMOTH SPRING SCHOOL DISTRICT
239 8,207 444 470 44 29,757 47 32,107
369