Annual Statistical Digest - FRASER · 2018-11-06 · The ANNUAL STATISTICAL DIGEST is designed as a...
268
Board of Governors of the Federal Reserve System, Washington, D.C. ANNUAL STATISTICAL DIGEST 1983 Digitized for FRASER http://fraser.stlouisfed.org/ Federal Reserve Bank of St. Louis
Transcript of Annual Statistical Digest - FRASER · 2018-11-06 · The ANNUAL STATISTICAL DIGEST is designed as a...

Board of Governors of the Federal Reserve System, Washington, D.C.
ANNUAL STATISTICAL DIGEST
1983
Digitized for FRASER http://fraser.stlouisfed.org/ Federal Reserve Bank of St. Louis

October 1984
Copies of this publication may be obtained from Publications Services, Boardof Governors of the Federal Reserve System, Washington, D.C. 20551. Theprice is $11.50 per copy. Remittances should be made payable to the orderof the Board of Governors of the Federal Reserve System in a form collectibleat par in U.S. currency. Stamps and coupons are not acceptable.
Digitized for FRASER http://fraser.stlouisfed.org/ Federal Reserve Bank of St. Louis

Preface
The ANNUAL STATISTICAL DIGEST is designed as a com-pact source of economic—and, especially, financial-data.The object is to lighten the burden of assembling time seriesby providing a single source of historical continuations ofthe statistics carried regularly in the Federal Reserve Bul-letin.
The DIGEST also offers a continuation of series that for-merly appeared regularly in the Bulletin, as well as certainspecial, irregular tables, which the Bulletin also once car-ried. The domestic nonfinancial series included are thosefor which the Board of Governors is the primary source.Sources of data other than the Federal Reserve are listed inPart 3—Notes to Tables.
This issue of the DIGEST, like those for 1980 through1982, covers data for only a single year—in this case, 1983unless data were revised for earlier years; exceptions arenoted in the Table of Contents. The DIGEST serves to main-tain the historical series published in Banking and MonetaryStatistics, 1949-1970, and the DIGEST, 1970-1979. In 1985,a DIGEST containing data for 1980-84 will appear; and there-
after, every fifth year, the DIGEST will cover either ten orfive years. In the intervening years, the DIGEST will containdata only for the previous year (again, except when datafor earlier years have been revised). In this issue, seriesinclude revisions to all the data available through July 1984.The current coverage of the series, any changes in the cov-erage, and other pertinent details are given in Part 3—Notesto Tables.
The numbering system for the tables contained in thisissue differs slightly from those in previous issues of theDIGEST and in the Bulletin. As a guide to tables that coverthe same material in these publications, the Board's staffhas prepared a concordance, which accompanies this DI-GEST. A glossary of Federal Reserve terms is available freeof charge from Publications Services, Board of Governorsof the Federal Reserve System, Washington, D,C. 20551,Suggestions for making the DIGEST more useful may be sentto the Economic Editing Unit, Stop 96, at the same address.
Please note that the index refers to table numbers, notpage numbers.
Digitized for FRASER http://fraser.stlouisfed.org/ Federal Reserve Bank of St. Louis

Symbols and Abbreviations
CD Certificate of depositFHA Federal Housing AdministrationIPCs Individuals, partnerships, and corporationsn.e.c. Not elsewhere classifiedNOW Negotiable order of withdrawalREIT Real estate investment trustRP Repurchase agreementSDR Special drawing right
SMSA Standard metropolitan statistical areaVA Veterans Administration* Amount is less than one-half the smallest unit
in the table (for example, less than 50,000when the data are shown in millions to onedecimal place).
. . . Not applicablen.a. Not available
"U.S. government securities" may include issues of U.S. government agencies.*'State and local government" also includes municipalities, special districts, and other political subdivisions.
In some of the tables details do not add to totals because of rounding.
Digitized for FRASER http://fraser.stlouisfed.org/ Federal Reserve Bank of St. Louis

Contents
The data shown in this issue of the DIGEST are in general for 1983. The exceptions are indicated inparentheses after the table titles. A list of tables that were in the 1982 DIGEST that have been discontinuedappears at the end of this table of contents.
Part 1—Regular Tables
1. Reserves, money stock, liquid assets, and debt measuresA. Quarterly changes (1980-83) 3B. Monthly changes (1980-83) 4
2. Reserves of depository institutions and Reserve Bank creditA. Monthly averages 6B. Weekly averages of daily figures 7C. Wednesday figures 10D. End-of-month figures 13
3. Reserves and borrowings of depository institutionsA. Monthly averages 14B. Weekly averages of daily figures ..: 15
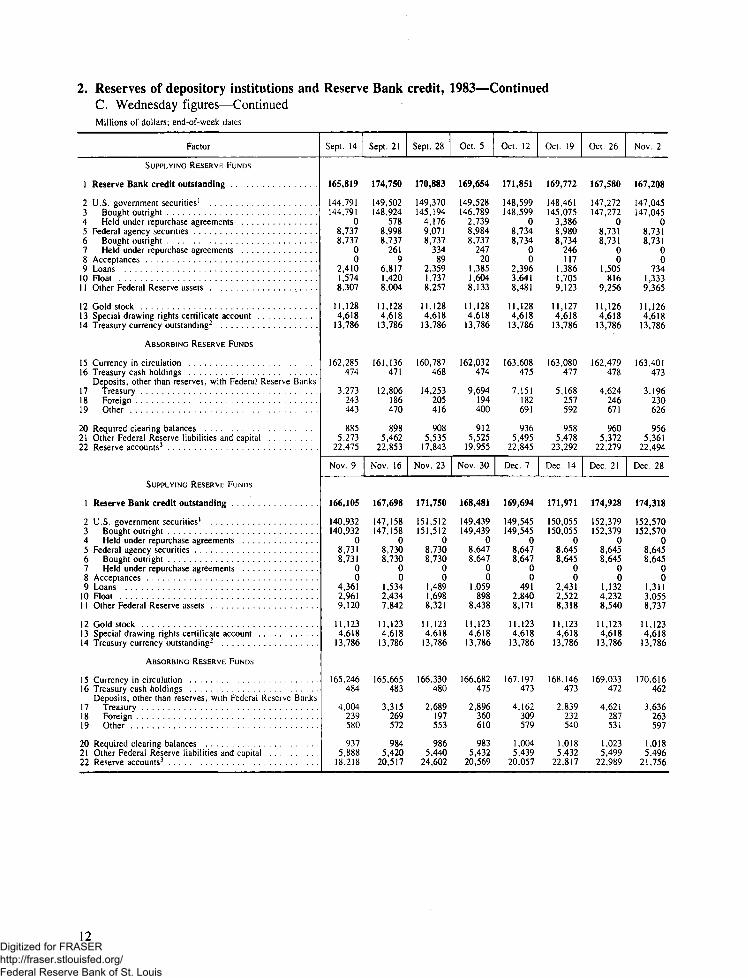
4. Federal funds and repurchase agreements of large member banks 175. Federal Reserve Bank interest rates
A. Short-term adjustment credit to depository institutions 19B. Extended credit to depository institutions 19
6. Reserve requirements of depository institutions, December 31, 1983 207. Margin requirements (1968-83) 208. Maximum interest rates payable on time and savings deposits at federally insured institutions 209. Federal Reserve open market transactions 21
10. Federal Reserve BanksA. Consolidated condition statement 22B. Federal Reserve note statement 23C. Maturity distribution of loans and securities held 23
11. Debits and deposit turnover at commercial banks (1971-83)A, Seasonally adjusted 24B. Not seasonally adjusted 28
12. Measures and components of the money stock and debt (1980-83)A. Seasonally adjusted 32B. Not seasonally adjusted 34
13. Aggregate reserves of depository institutions and monetary base (1980-83)A. Adjusted for changes in reserve requirements 36B. Not adjusted for changes in reserve requirements 37
14. Loans and securities of all commercial banksA. Seasonally adjusted 38B. Not seasonally adjusted 39
Digitized for FRASER http://fraser.stlouisfed.org/ Federal Reserve Bank of St. Louis

Contents—continued
15. Major nondeposit funds of commercial banks 4016. Commercial bank assets and liabilities—Last-Wednesday-of-month series
A. Domestically chartered commercial banks 46B. All commercial banking institutions , 47
17. Insured commercial banks with assets of $100 million or over—Domestic and foreign officesA. March 31, 1983 48B. June 30, 1983 50C. September 30, 1983 52D. December 31, 1983 54
18. Insured commercial banks with assets of $100 million or over—Domestic officesA. March 31, 1983 56B. June 30, 1983 58C. September 30, 1983 60D. December 31, 1983 , 62
19. Insured commercial bank assets and liabilities—Domestic officesA. March 31, 1983 64B. June 30, 1983 66C. September 30, 1983 68D. December 31, 1983 70
20. All large weekly reporting commercial banksA. Assets and liabilities 72B. Balance sheet memoranda , , 78
21. Gross demand deposits of individuals, partnerships, and corporations 8022. Commercial paper and bankers dollar acceptances outstanding
A. Commercial paper, seasonally adjusted (1981-83) 81B. Bankers dollar acceptances, not seasonally adjusted 81
23. Prime rate charged by banks on short-term business loans 8224. Terms of lending at commercial banks—Based on surveys of loans made 8225. Interest rates in money and capital markets
A. Annual and monthly averages 84B. Weekly averages 85
26. Stock market—Selected statisticsA. Stock prices and trading 90B. Customer financing 90C. Margin-account debt at brokers 90D. Special miscellaneous-account balances at brokers 90
27. Selected assets and liabilities of savings institutionsA. Savings and loan associations (1981-83) 91B. Mutual savings banks 92C. Life insurance companies (1982-83) 92D. Credit unions (1982-83) 93E. FSLIC-insured federal savings banks 93
28. Federal fiscal and financing operations 9429. U.S. budget
A. Receipts 95B. Outlays 96
Digitized for FRASER http://fraser.stlouisfed.org/ Federal Reserve Bank of St. Louis

30. Federal debt subject to statutory limit—Types and ownership 9731. Gross public debt of the U.S. Treasury—Types and ownership 9732. U.S. government securities dealers
A. Transactions 98B. Positions 101C. Financing 104
33. Debt of federal and federally sponsored credit agencies 10534. New security issues of state and local governments 10635. New security issues of corporations 10736. Open-end investment companies 10837. Corporate profits and their distribution (1981-83) 10838. Current assets and liabilities of nonfinancial corporations (1981-83) 10839. Total nonfarm business expenditures on new plant and equipment 10940. Domestic finance companies—Assets and liabilities 10941. Business credit of domestic finance companies
A. Accounts receivable 110B. Extensions and repayments 110
42. Mortgage markets I l l43. Mortgage debt outstanding, by type of holder and type of property (1980-83) 11244. Installment credit—Total outstanding, and net change (1982-83) 11445. Flow of funds accounts—Financial assets and liabilities, December 31, 1983
A. All sectors 116B. Private nonbank financial institutions 118
46. Flow of funds accounts, 1972-83A. Summary of credit market debt outstanding, by sector 120B. Direct and indirect claims on credit market debt 122C. Sector statements of financial assets and liabilities 124
47. Selected measures of nonfinancial business activity 12648. Output, capacity, and capacity utilization
A. Output 127B. Capacity 127C. Capacity utilization 127
49. Labor force, employment, and unemployment 12850. Industrial production 12951. Housing and construction 13152. Consumer and producer prices 13253. Gross national product and income 13354. Personal income and saving 13455. Summary of U.S. international transactions (1982-83) 13556. U.S. foreign trade 13657. U.S. reserve assets 13658. Selected U.S. liabilities to foreign official institutions (1982-83)
A. By type 137B. By area 138
Digitized for FRASER http://fraser.stlouisfed.org/ Federal Reserve Bank of St. Louis

Contents—continued
59. Liabilities to foreigners, payable in U.S. dollars, reported by banks in the United StatesA. By holder and type of liability 139B. By area and country 142
60. Banks' own claims on foreigners, payable in U.S. dollars, reported by banksin the United States (1982-83) 145
61. Banks' own and domestic customers' claims on foreigners, payable in U.S. dollars,reported by banks in the United States (1982-83) 148
62. Banks1 own claims on unaffiliated foreigners, payable in U.S. dollars, reported by banksin the United States (December 1981-83) 149
63. Liabilities to and claims on foreigners, payable in foreign currencies, reported by banksin the United States (December 1981-83) 149
64. Marketable U.S. Treasury bonds and notes—Foreign holdings and transactions (1982-83) 15065. Foreign official assets held at Federal Reserve Banks 15166. Foreign transactions in securities (1982-83) 15267. Liabilities to unaffiliated foreigners, reported by nonbanking business enterprises
in the United States (December 1980-83) 15468. Claims on unaffiliated foreigners, reported by nonbanking business enterprises
in the United States (December 1980-83) 15669. Assets and liabilities of foreign branches of U.S. banks 15870. Assets and liabilities of U.S. branches and agencies of foreign banks
A. March 31, 1983 162B. June 30, 1983 167C. September 30, 1983 172D. December 31, 1983 177
71. Claims on foreign countries held by U.S. offices and foreign branches of U.S.-chartered banks(1982-83) 182
72. Discount rates of foreign central banks 18373. Foreign short-term interest rates 18374. Index of weighted-average value of U.S. dollar 18375. Foreign exchange rates 184
Part 2—Special Tables
76. Statement of condition of Federal Reserve Banks, December 31, 1983 18777. Income and expenses of Federal Reserve Banks 19078. Banks and branches—Number in operation, December 31, 1983, by state 19279. Number of par banking offices, December 31, 1983 19480. Banking offices in the United States—Number, and changes in number, December 31, 1983
A. Banks (head offices), by type 194B. Branches, additional offices, and facilities, by type of bank 195
Digitized for FRASER http://fraser.stlouisfed.org/ Federal Reserve Bank of St. Louis

81. Changes in offices of commercial banks and nondeposit trust companies during 1983—Summary,by state 196
82. Percentage of total assets and total deposits held by 10 largest banking organizations(all commercial banks and trust companies), by state 197
83. Banking offices, assets, and deposits of banks in holding company groupsA. Summary totals and comparisons 208B. Multibank and one-bank classifications—Summary 208C. Details, by state 209D. Multibank, one-bank, and all commercial bank comparisons, by state 216
84. Consolidated report of incomeA. All insured commercial banks 223B. Insured commercial banks with foreign offices 226
85. Income, expenses, and dividends of member banks, by Federal Reserve DistrictA. All member banks 228B. Large banks 230C. Other than large banks 232
86. Selected assets and liabilities of minority-owned banks, by size of bank, December 31, 1983 23487. Denominations of U.S. currency in circulation 23588. Assets of pension funds (1972-83)
A. Totals for private and public funds 235B. Types held by private noninsured funds 235C. Types held by state and local government retirement funds 235
89. Terms of consumer installment credit 23690. Security credit reported by nonbank lenders subject to margin regulations, June 30, 1983 23691. Detailed debit and credit balances at brokers carrying margin accounts, June 30, 1983 23792. Commitments of life insurance companies for income-property mortgages (1981-83) 238
Part 3—Notes to Tables
Notes to regular tables 241Notes to special tables 255
Part 4—Index to Tables
Index to tables 261
Digitized for FRASER http://fraser.stlouisfed.org/ Federal Reserve Bank of St. Louis

Contents—continued
Discontinued Tables
Monetary and credit aggregates and interest ratesLarge weekly reporting commercial banks—Total commercial and industrial loans classified by industryU.S. government marketable securities—Ownership, by maturityInstallment credit—Extensions and liquidations
Digitized for FRASER http://fraser.stlouisfed.org/ Federal Reserve Bank of St. Louis

Part 1—Regular Tables
Digitized for FRASER http://fraser.stlouisfed.org/ Federal Reserve Bank of St. Louis

1. Reserves, money stock, liquid assets, and debt measuresA. Quarterly changesAnnual rate of change, seasonally adjusted, in percent1
Item
Reserves of depository institutions2
\ Total3
2 Required . .3 Nonborrowed . . .4 Monetary base4
Concepts of money, liquid assets, and debts5
5 Ml6 M27 M3 . .8 L9 Debt
Nontransaction components10 M26
1 1 M3 only7 . . . . .
Time and savings deposits at commercial banks12 Savings^13 Small-denomination time9
14 Large-denomination tiime1^1* . . . . . . . . .
Thrift institutions15 Savings8 . . . . . .16 Small-denomination time9
17 Large-denomination time ^'^ . . . . .
Debt components18 Federal . . .19 Nonfederal
20 Total loans and securities at commercial banks'^ . . . .
Reserves of depository institutions2
1 Total3
2 Required . . . . .3 Nonborrowed .4 Monetary base4
Concepts of money, liquid assets, and debts5
5 Ml6 M27 M38 L9 Debt
Nontransaction components10 M26
11 M3 only7
Time and savings deposits at commercial banks12 Savings8 . . . . . . . , . .13 Small-denomination time9
14 Large-denomination time10-11 . . . .
Thrift institutions15 Savings8
16 Small-denomination time9
17 Large-denomination time10-11
Debt components18 Federal19 Nonfederal
20 Total loans and securities at commercial banks'-
Qi
5 4644.18 6
7.27 38.18.3
109
7 412.0
-15 84 69.3
-16.59.72.9
8 511.5
9 2
Qi
4.640
-5.77 5
10.39 6
10 410.78 I
9 413.8
1 38 7
10.3
9 1-*I 6
3.6
13 56 8
2 6
19
Q2
2.5
9.57 2
-4.44 46.07.08 2
7 513.7
-21 911 215 1
-23.716.03 8
13.07.2
2.1
19
Q2
1.01.65.464
2.27 399
10.58 1
9 020.4
-2 016 1169
-3 04 53.3
12.17 2
8.4
80
Q3
7 96.8
15.57 5
15.913 611.69.38.0
12 92.3
22 3-12 1
-4.8
21.62.49.7
11.87.1
6.9
82
Q3
3.83.6
11.67 2
6.19 4
10 210.98 6
10 413.6
010 516.9
-.97 25.3
19.160
6.3
Q4
12 711.0
.59 1
10.595
11.411.097
9 220.2
2 326928.7
.111.08.6
11.89.2
13.1
Q4
14.012.916.08 5
15.410 61009.29 1
907.7
16 4-3 7-3.1
21 0-6 6
6.1
22 55 8
5.7
Ql
2 43.48.83 8
4.67 1
12.212.09 7
7 936.1
-32 440 238 9
-28.118.24.1
13.58.9
11.1
Ql
5.55.14.99 3
12,820510 810 78 7
23 0-27.1
-47 4-48 8-52.3
-28.7-51 5
14.3
21.05 5
9.7
19
Q2
7 58 6-.86 2
8.010 411.79.99 8
11 317.3
-12 410 3206
-10.04.51 3
10 79.6
84
19
Q2
11.81205.2
10 2
11.610 69 3
10 310 7
10 23.8
-14 8-14 6-24 1
-1 2- 17 0
15.3
23 27 3
99
81
Q3
3 12 08.15 2
3.18 0
11 511.99 1
9 726 5
- 15 827 527 9
-18 88.41 6
669.6
8 7
83
Q3
6.05 92.98 1
9.56 97 49 6
11 5
6 19 7
-6 3-4 6
-10 0
-2 212 312 3
21 28 8
9 7
Q4
- 13
9.13 7
4.610511 811.99 1
12 517 1
-9 18
7 4
-1197.22 8
14 17.9
3 6
Q4
.5- 18.17 8
4 88 59 98 9
10 1
9 616 4
-6 4— 4
-5 1
-4 518 812 4
12 49 5
104
Digitized for FRASER http://fraser.stlouisfed.org/ Federal Reserve Bank of St. Louis

1. Reserves, money stock, liquid assets, and debt measures —ContinuedB. Monthly changesAnnual rate of change, seasonally adjusted, in percent1
Item
Reserves of depository institutions2
1 Total3 . .' "2 Required3 Nonborrowed4 Monetary base4 . . . .
Concepts of money, liquid assets,and debts*
5 Ml6 M27 M38 L9 Debt
Nontransaction components10 M26
11 M 3 only7 . . .
Time and savings deposits atcommercial banks
12 Savings8
13 Small-denomination time9
14 Large-denomination time10-11
Thrift institutions15 Savings8
16 Small-denomination time9
17 Large-denomination time'^1"
Debt components18 Federal19 Nonfederal .
20 Total loans and securities atcommercial banks'^
Reserves of depository institutions2
1 Total3
2 Required . . . . .3 Nonborrowed4 Monetary base4 .
Concepts of money, liquid assets,and debts5
5 Ml6 M27 M38 L9 Debt
Nontransaction components10 M26
1 1 M3 only7
Time and savings deposits atcommercial banks
12 Savings8
13 Small-denomination time9
14 Large-denomination time1*''''
Thrift institutions15 Savings8
16 Small-denomination time9
17 Large-denomination time'^11
Debt components18 Federal19 Nonfederal
20 Total loans and securities atcommercial banks12
Jan.
4.17 5
14610.3
10 5809.9
10 012 1
7 119.2
-9.317 3
.6
-12.15 11.5
9.312 7
9 2
-10 7-5 3
.9-2 7
906.1
14 414.08 8
5.152.4
-51 035.151 1
-44 022.2
2 7
10 98.3
11.4
Feb.
2.44 1
-15.57.3
10 110.312.711 810 3
10423.9
-18.027 015.2
-17.510 22.5
3.711 8
13 9
7 18 1
11.27 5
698.9
10 711.010 7
9,518.7
-26 319.923 1
-20 89.81 4
19 38.6
3.3
Mar.
4.25 2
-47,18.6
-3 34.05.27 29.6
6.611.0
-30.341.120.0
-27.514 82.0
9.09 8
8 8
12 715.625.77.5
10 912.11006.98 8
12.51.3
- 10 314.0
-3 2
-6 55.82 7
11 28.3
5.1
Apr.
-.5-1 0
16 38.9
-21 9-3 1
.84 89 5
3 4199
-46.654 022.1
-41.922 6
2 2
20.97 0
-1 7
2 97 2
-10.65 6
16 714.915 19.79 3
14.315.8
-5 68.3
-6 9
2 4-3.4- 5
8 19.6
6.6
May
-6.65 9
57 83.9
3 7808.47 65 7
9510.0
-5.415 93.6
-22.316 45 2
16.03 4
-3 3
13 710 4
-21.66 8
-3 45.09 8
11.410 3
7.830.9
-16 116.531 9
-22 48.11 2
9 610.5
16.2
June
19
6.15 1
34,05.3
15 714.911.77 24.2
14 6-3.3
30.4-2 7
-27.6
26.82 0
10.8
-.35 2
- 1
IS
-1 2-4,3
6.42.9
- 65.789
11.6105
7.922.5
-15 622.833.2
-19 212.83.7
10 110.6
9.7
July
80
9.25.88.67.1
14.915.713.590
10.0
16.02.9
29.7.9
-24.6
29.0-1 7
9.4
17.384
8 2
81
1 51.5
16.37.5
6.48.0
13.011.98.5
8.634.1
-11517.431.8
-9 81.6
-.5
5.19.3
6.7
Aug.
11.911 3
1 1 . 1
22 012.711.411 99.4
9.55.1
21.9.0.6
29.4.6
10.8
14.28.3
16 5
3 55.4
14.24.2
5.911.612.111.97.5
13.514.0
-23.231.020.7
-30.814.22.5
2.08.7
8.6
Sept.
14.116 2
= 12.89.2
17.111.08.99 88.4
8.9-1.5
9.58.5
15.7
14.15 19.5
9.88 1
7.7
5 3.7
4.03.2
1.47.9
11.812.29.4
10.127.9
-17.724.8
7.3
-19 68.71.9
10.29.2
5.2
Oct.
-1 28
-1 28 1
11 494
11 69 59 8
8 722 2
6.314 220.4
.08 27 5
11.19 5
10 5
-7 8-2 7
2.83
69.6
11 413.099
12.519.1
-12 728.6-5 3
-17 412.44.7
19.87.6
5.6
Nov.
42.329 812 712 0
5 89 8
13 713 510 4
11 232 2
2.526 443.2
-11.318 290
13.09 8
17 4
1 0-1.521.75 3
8 611.911 210.78 9
13.08.3
6 113.9
-4 3
1 3-.5
.7
16.17.3
3.3
Dec.
-7 3-7 1
7 63 9
= 8 02 7
10011 1100
6 345 0
-42.436656.4
-33.526 0
7 2
12.29 5
18 2
6 17 17.2
11 5
13 713.812 79.47 3
13.88.5
3 84.8
-2 4
12 4-3.0
3.2
11.86.3
-10.1
Digitized for FRASER http://fraser.stlouisfed.org/ Federal Reserve Bank of St. Louis

1. Reserves, money stock, liquid assets, and debt measures—ContinuedB. Monthly changes—ContinuedAnnual rate of change, seasonally adjusted, in percent1
Item
Reserves of depository institutions-} Total3
2 Required3 Nonborrowed4 Monetary base1* . .
Concepts of money, liquid assets,and debts5
5 Ml6 M27 M38 L9 Debt
Non transact ion components10 M26
1 1 M3 only7
Time and savings deposits atcommercial banks
12 Savings** . . . .13 Small-denomination time9
14 Large-denomination time1^'"
Thrift institutions15 Savings8
16 Small-denomination time9 . .17 Large-denomination time10-11
Debt components18 Federal19 Nonfederal
20 Total loans and securities atcommercial banks12
Reserves of depository institutions2
1 Total3
2 Required3 Nonborrowed . .4 Monetary base4
Concepts of money, liquid assets,and debts5
5 Ml6 M27 M3 .8 L9 Debt . . . .
Nontransaction components10 M26
1 1 M3 only7
Time and savings deposits atcommercial banks
12 Savings8
13 Small-denomination time9
14 Large-denomination ttrne1^'11
Thrift institutions15 Savings8
16 Small-denomination time9
11 Large-denomination time10-11
Debt components1 8 Federal19 Nonfederal . . . .
20 Total loans and securitiesat commercial banks8
Jan.
9.55.8
-24.59.0
22 811.812.512 89 2
8.215 5
4.5.3
8 3
24 5-8 5
3.5
16.87.4
3.9
-11.9-13 8
-8.35.9
11 531.914 416.07.7
38.5-54 8
-98.2-82.6-84 3
-66.3-89 2
16.1
10.56 9
12.9
Feb.
-.34.1
-11.14.2
-5 92.64.98 97 5
5.414 5
-6.715.821 7
-5 76.15.2
12.86.3
10.3
13.718 112.012.3
14 821.713 110.06 9
23 9-23 6
-57.9-62.0-51 3
-30.9-63 1
19.9
20.13 3
7.5
Mar. | Apr.
-.2 -2.4-2.4 1.0
9.3 -3.03.1 5 9
- 5 5 15.9 8 19.0 12.69 8 10 75.9 94
8.1 9.12 1 3 30 6
-15 -2320.7 20.6189 20 5
-64 -266 0 2 84.2 1.7
4.7 17 16.2 7.6
8.2 8.8
18.8 10.819 1 9 41 1 5 3 212.7 8.2
130 367 8 8 47 3 878.4 11.5
1 1 4 9 3
6 2 994 7 10 1
- 20 8 - 8 5-37.0 -14.3-19 6 -42
-6.0 4.7- 29 4 - 5 6
15.6 16.3
26.7 14.67 2 7 9
11.3 8.8
May
7.34.0
25.510 4
4 59 79.1
10 68 6
11.37 1
- 818.73 2
-1 34 02.5
10 88.1
8.2
3.14 25 38.8
21 011 89 69.4
11 3
8 9o
-1 7-7.4
-20 5
8.6-8 312.5
25.97 3
10.7
June July
1982
2.4 -4.04.3 -4.2
-.9 15.98.1 4.9
2.1 2.17.6 8.09.7 9,0
11.8 1 1 . 17.7 7.6
9.3 9.918.0 12.7
.0 -7.615.5 25.515.1 21 7
1.3 -906.0 12.45.8 6.2
13.2 20.66.4 4.4
5.7 6.3
1983
15.8 4.914.9 4.0
-8.2 11.711.1 6.8
102 9 48.5 5.4
10 3 5 111.9 10.515.3 10.7
79 4 218 4 35
-3.4 -10.34.1 21.2
12 8 -14 8
1.3 -5.93 3 19 4
10.9 13.7
35.8 14.29.5 9 7
9.9 9.7
Aug.
9.59.7
16.57.0
12 212.112.9979.7
12.115 8
5.313.4
9
3 25.25.1
22.16.6
6.2
.82 9
-2.55.5
5 84.96 16.09 3
4 611 3
-6 919.8- 5
-4.019 411.5
17,27 0
11.2
Sept.
15.412.8-.39.3
15 210.610.010 010 3
9.17 8
12.98.6
-5 3
11 61 25.0
26.16.3
5.4
3.01 369
11.0
3 57 18 78.8
10 1
8 216 4
-5 217.3- 1 1
-5.314 711.6
13.59 2
4.9
Oct.
10.610.028.38.2
17 49 3
11.711 86 7
6.720 8
24 7-4.910 2
37 6-9 3
5.5
11 25.6
7.0
.3I
21 57.1
6 210 89 46 59 8
12 23 2
-3 523.4
- 1 1 3
-2.021 414.6
14.68 4
10.2
Nov.
21.621.916.57 9
15 810 57 75 4
10 8
8.8-2 9
30 1-4.0-9 3
29 6-6 4
7.4
31 45.5
10.3
-2.5-3 3-4 6
7.3
3 28 3
14 412 79 6
9 841 7
-7 918.113 5
-6.720 511.0
7.010 3
13.4
Dec.
8.95.48.6
10.2
10 312 15.76 79 4
12.7- 18 9
-19 3-21.9-36 0
-12 1-265
7.8
28.24.5
11.6
1.2]
5 86.7
5 37 78 0
10712 3
8 59 2
-13210.67 0
-6.712 410.4
8.513 4
12.9
Digitized for FRASER http://fraser.stlouisfed.org/ Federal Reserve Bank of St. Louis

2. Reserves of depository institutions and Reserve Bank credit, 1983A. Monthly averagesMillions of dollars
Factor
SUPPLYING RESERVE FUNDS
v 1 Reserve Bank credit outstanding
2 U S government securities' .3 Bought outright . .4 Held under repurchase agreements5 Federal agency securities6 Bought outright7 Held under repurchase agreements . .8 Acceptances . . . .9 Loans . .
V*10 Float1 1 Other Federal Reserve assets
12 Gold stock . . . . . . .13 Special drawing rights certificate account
^ 14 Treasury currency outstanding2
ABSORBING RESERVE FUNDS
^15 Currency in circulation16 Treasury cash holdings
Deposits, other than reserves, with Federal Reserve Banksv 17 Treasury . . . .
1 8 Foreign1 9 Other
20 Required clearing balances21 Other Federal Reserve liabilities and capital2 2 Reserve accounts** . . . . . . .
SUPPLYING RESERVE FUNDS
1 Reserve Bank credit outstanding
2 U S. government securities'3 Bought outright4 Held under repurchase agreements5 Federal agency securities6 Bought outright7 Held under repurchase agreements8 Acceptances9 Loans . . . .
10 Float1 1 Other Federal Reserve assets
12 Gold stock . . . . .13 Special drawing rights certificate account14 Treasury currency outstanding" . .
ABSORBING RESERVE FUNDS
15 Currency in circulation . . . . . .16 Treasury cash holdings
Deposits, other than reserves, with Federal Reserve Banks17 Treasury . . . . .18 Foreign19 Other . . . . .
20 Required clearing balances21 Other Federal Reserve liabilities and capital22 Reserve accounts*1
Jan.
157,519
135 318134 862
4568,9878 934
53126500
2,6529 936
11 1464,618
13,786
152 672438
3 250259691
4604 868
24 431
July
164,799
143,971143 122
8498 9508 883
6755
1 3821,8128 629
11 1314,618
13 786
160,683520
4,017252623
9025,197
22 139
Feb.
155,365
134 379133 961
4188,9458924
2117
5572,0839384
11 1424,618
13,786
151 650457
3,200236551
5114 776
23 530
Aug.
163,698
144,901144578
3238 7698 742
2730
1 712763
7 524
11 1284,618
13 786
160,453490
3,300237431
1,0665,289
21 965
Mar.
155,883
135,201135,087
1148,9298,917
129
8501,9488946
11,1384,618
13,786
153,186482
3,361244547
5784,858
22,168
Sept.
168,182
148,550145,487
3,0638 9958,739
256139
1,4461,1997,853
11,1284,618
13,786
161,684471
7,584212491
1,1175,569
20,585
Apr.
159,250
137,877137,453
4248,9318 910
2172
9951,9969 379
11,1374,618
13,786
155 354514
3,841254642
6254,995
22,565
Oct.
169,202
149,300147,045
2,25589368,734
202131837
1,3138,685
11,1274,618
13,786
162,578475
6,916216614
1,1855,689
21,059
May
160,130
139 481139,362
1198,9168 908
822
9072,0968 708
11,1334,618
13,786
157 143532
3,521244565
6934959
22,010
Nov.
167,773
148,005147,775
2308 7628,714
4854
9121,5928 448
11,1234,618
13,786
165,317481
2,905238596
1,2375,584
20,943
June
162 133
141 484141 177
3078 9228 895
2738
1 7161 6708 303
11 1314618
13,786
159 177536
3 525219541
7545 107
21 808
Dec.
171,695
151,679151 517
1628 6738 646
2734
7452,2948 270
11 1234,618
13 786
168,284471
3,591220594
1,4775,598
20,986
Digitized for FRASER http://fraser.stlouisfed.org/ Federal Reserve Bank of St. Louis

2. Reserves of depository institutions and Reserve Bank credit, 1983—ContinuedB. Weekly averages of daily figuresMillions of dollars; end-of-week dates
Factor
SUPPLYING RESERVE FUNDS
1 Reserve Bank credit outstanding
2 U S government securities'3 Bought outright . . . .4 Held under repurchase agreements5 Federal agency securities6 Bought outright7 Held under repurchase agreements8 Acceptances9 Loans . . . .
10 Float . . . .1 1 Other Federal Reserve assets
12 Gold stock13 Special drawing rights certificate account14 Treasury currency outstanding2
ABSORBING RESERVE FUNDS
15 Currency in circulation16 Treasury cash holdings
Deposits, other than reserves, withFederal Reserve Banks
17 Treasury18 Foreign19 Other
20 Required clearing balances '. . .21 Other Federal Reserve liabilities and capital . . . .22 Reserve accounts^ . . . . . .
SUPPLYING RESERVE FUNDS
1 Reserve Bank credit outstanding . . .
2 U S government securities'3 Bought outright . .4 Held under repurchase agreements5 Federal agency securities6 Bought outright7 Held under repurchase agreements8 Acceptances .9 Loans
10 Float1 1 Other Federal Reserve assets
12 Gold stock1 3 Special drawing rights certificate account14 Treasury currency outstanding2
ABSORBING RESERVE FUNDS
13 Currency in circulation16 Treasury cash holdings
Deposits, other than reserves, withFederal Reserve Banks
17 Treasury18 Foreign . . . . . .19 Other
20 Required clearing balances . . .21 Other Federal Reserve liabilities and capital . . . .22 Reserve accounts^
Jan. 5
162,503
138,453136,335
2,1189 3338937
396792
1,1982,9649 763
11,1484,618
13,786
155,079430
4,188275
1,017
4344,895
25,737
Mar. 9
154,836
134 321134,321
08,9238 923
00
6262 2878,680
11,1384,618
13,786
152 693473
3,709260520
5504,845
21,328
Jan. 12
157,958
135,843135,464
3798 9768,937
3958
4252,9189 738
11,1484,618
13,786
154,167433
2,915257657
4514,881
23,748
Mar. 16
155,642
135 149135,149
08,9158 915
00
8901 8388,851
11 1384,618
13,786
153 369481
3,690229565
5794,843
21,427
Jan. 19
158,163
136,497136,210
2878 9448,937
755
4651,943
10 259
11,1464,618
13,786
152,614437
3,115273589
4594,927
25,298
Mar. 23
157,044
136,337136,337
08,9158 915
00
64120989,054
11,1384,618
13,786
153 367485
3,387219584
5974,809
23,138
Jan. 26
155,985
134,037133,739
2988,9468,928
1821
3252,594
10061
11,1444,618
13,786
151,188443
3,909221602
4744,865
23,830
Mar. 30
155,475
134,460134,460
08,9158 915
00
8931,9579,250
11,1384,618
13,786
153,356493
2,534231521
5984,911
22,373
Feb. 2
153,780
132,579132,579
08,9278,927
00
3832,1449,747
11,1444,618
13,786
150,581446
2,431267596
4794,818
23,710
Apr. 6
157,764
136,396136,396o
8,9158 915
00
1,7571,5669,129
11,1384,618
13,786
154,670505
3,861300616
6104,964
21,780
Feb. 9
154,097
133,081133,081
08,9248,924
00
3701,9259797
11,1444,618
13,786
151,321449
3,456231585
5004,701
22,400
Apr. 13
157,557
136,576136,576
08,9128 912
00
5822,2439,244
11,1384,618
13,786
155,812513
3,009239622
6164,883
21,404
Feb. 16
155,725
133,833133,833
08,9248,924
00
8682,4369665
11,1434,618
13,786
151,846456
3,271246545
5074,792
23,609
Apr. 20
160,426
138,847138,847o
8,9088 908
o0
6662,5749,431
11,1374,618
13,786
155 643515
3,267236636
6325,018
24,020
Feb. 23
156,384
136 442134,771
1,67190098 924
8568
4751,5328 858
11 1394,618
13,786
151,881462
3 221210506
5214,770
24 354
Apr. 27
159,600
138 223137 690
5338,9208 908
1241
1,1711 7249,521
11 1354,618
13,786
155 098519
4 165253636
6295,015
22 822
Mar. 2
155,789
134751134 247
5048 9778923
5439
7102 3688 944
11 1394,618
13,786
151,963465
2 896267531
5344,897
23 778
May 4
162,224
139 990138 178
1 8129,0228 908
114366925
2 2689,653
11 1354,618
13,786
155 756526
5 853258700
6455,173
22 851
Digitized for FRASER http://fraser.stlouisfed.org/ Federal Reserve Bank of St. Louis

2. Reserves of depository institutions and Reserve Bank credit, 1983—ContinuedB. Weekly averages of daily figures—ContinuedMillions of dollars; end-of-week dates
Factor
SUPPLYING RESERVE FUNDS
1 Reserve Bank credit outstanding
2 U S government securities'3 Bought outright . . .4 Held under repurchase agreements5 Federal agency securities . . . .6 Bought outright7 Held under repurchase agreements8 Acceptances9 Loans
10 Float1 1 Other Federal Reserve assets
12 Gold stock13 Special drawing rights certificate account14 Treasury currency outstanding"
ABSORBING RESERVE FUNDS
15 Currency in circulation16 Treasury cash holdings . . .
Deposits, other than reserves, withFederal Reserve Banks
17 Treasury18 Foreign . . .19 Other
20 Required clearing balances21 Other Federal Reserve liabilities and capital . . . .22 Reserve accounts^
SUPPLYING RESERVE FUNDS
1 Reserve Bank credit outstanding
2 U S government securities' . . .3 Bought outright4 Held under repurchase agreements5 Federal agency securities6 Bought outright7 Held under repurchase agreements8 Acceptances9 Loans . . . . . .
10 Float1 1 Other Federal Reserve assets
12 Gold stock13 Special drawing rights certificate account14 Treasury currency outstanding" .
ABSORBING RESERVE FUNDS
15 Currency in circulation16 Treasury cash holdings
Deposits, other than reserves, withFederal Reserve Banks
1 7 Treasury . . .18 Foreign19 Other
20 Required clearing balances21 Other Federal Reserve liabilities and capital . . . .22 Reserve accounts*1 . . . .
May 11
159,554
138,058138,058
08,9088,908
00
7072,2159,667
11,1344,618
13,786
156,991532
3,812223554
6874,894
21,398
July 13
164,505
143,163143,163
08,8868,886
00
1,1472,6738,637
11,1314,618
13,786
161,665528
4,498209645
8215,088
20,586
May 18
159,993
139,806139,806
08,9088,908
00
1,0731,5228,684
11,1324,618
13,786
157,365533
3,131272560
6974,867
22,105
July 20
166,199
145,461142,841
2,6209,0368,880
156129
1,2361,5738,764
11,1314,618
13,786
160,709524
3,309262690
8845,313
24,042
May 25
159,716
140,400140,400
08,9088,908
00
9511,6267,831
11,1324,618
13,786
157.004533
2,966214535
7024,985
22,312
July 27
164,397
143,896143,896
08,8808,880
00
1,3871,5428,691
11,1314,618
13,786
159.916512
4,517231620
9795,260
21,897
June 1
160,326
140,446139,770
6768,9488,908
4050
1,1181,7178,047
11,1324,618
13,786
158,151533
2,883273562
7164,978
21,764
Aug. 3
164,237
143,975143,975
08,8808,880
00
1,3111,5968,475
11,1314,618
13,786
160.240494
4,024292604
9825,158
21,976
June 8
160,424
140,540140,540
08,9088,908
00
9072,0588,012
11,1324,618
13,786
159,246538
2,648202527
7354,994
21,069
Aug. 10
164,132
143,967143,967
08,8808,880
00
1,5201,1378,629
11,1304,618
13,786
161,294515
3,815228504
1,1675,116
21,029
June 15
161,349
140,921140,921
08,8938,893
00
1,8111,4868,238
11,1314,618
13,786
159,391540
3,131221543
7505,046
21,261
Aug. 17
165,081
145,456145,456
08,8808,880
00
1,4741,0868,186
11,1284,618
13,786
161,443515
3,310233446
1,0655,332
22,269
June 22
163,213
142,427141,953
4748,9378,890
4783
1,7121,5668,488
11,1314,618
13,786
159,068535
3,838213516
7635,206
22,607
Aug. 24
164,934
145,584145,584
08,8808,880
00
1,5791,3577,534
11,1284,618
13,786
160,893494
3,559204449
9775,299
22,592
June 29
162,708
141,615141,615
08,8908,890
00
2,1021,5938,509
11,1314,618
13,786
158,833533
3,858221575
7725,197
22,254
Aug. 31
163,699
144,901144,578
3238,7698,742
2730
1,712764
7,524
11,1284,618
13,786
160,453490
3,300237431
1,0665,289
21,966
July 6
165,099
143,095141,789
1,3069,0608,890
170144
2,2342,1028,464
11,1314,618
13,786
160,785533
4,454267546
7925,133
22,124
Sept. 7
163,830
145,379144,751
6288,7568,742
1441
1,246943
7,466
11,1284,618
13,786
162,024469
3,414224498
1,0935,191
20,449
Digitized for FRASER http://fraser.stlouisfed.org/ Federal Reserve Bank of St. Louis

2. Reserves of depository institutions and Reserve Bank credit, 1983—ContinuedB. Weekly averages of daily figures—ContinuedMillions of dollars; end-of-week dates
Factor
SUPPLYING RESERVE FUNDS
1 Reserve Bank credit outstanding
2 U S government securities' , . .3 Bought outright . . . .4 Held under repurchase agreements5 Federal agency securities6 Bought outright . . .7 Held under repurchase agreements8 Acceptances9 Loans
10 Float1 1 Other Federal Reserve assets
1 2 Gold stock13 Special drawing rights certificate account14 Treasury currency outstanding^ . . .
ABSORBING RESERVE FUNDS
15 Currency in circulation16 Treasury cash holdings . . .
Deposits, other than reserves, with Federal Reserve Banks17 Treasury18 Foreign . . .19 Other
20 Required clearing balances . .21 Other Federal Reserve liabilities and capital22 Reserve accounts**
SUPPLYING RESERVE FUNDS
1 Reserve Bank credit outstanding
2 U S government securities'3 Bought outright . . .4 Held under repurchase agreements5 Federal agency securities . . .6 Bought outright7 Held under repurchase agreements . . .8 Acceptances9 Loans
10 Float1 1 Other Federal Reserve assets
12 Gold stock13 Special drawing rights certificate account14 Treasury currency outstanding^
ABSORBING RESERVE FUNDS
15 Currency in circulation . . .16 Treasury cash holdings
Deposits, other than reserves, with Federal Reserve Banks17 Treasury1 8 Foreign19 Other
20" Required clearing balances21 Other Federal Reserve liabilities and capital . . .22 Reserve accounts*'
Sept. 14
163,970
144,732144,732
o8 7408,740
00
1 1501,6037,745
11,1284,618
13,786
162 678474
3,438200461
1,0705,649
19 533
Nov. 9
165,744
144 797144,797
o8,7318 731
00
1,0422,0639 111
1 1 , 1 234 618
13,786
164,141479
2 907216615
1 1765,656
20081
Sept. 21
169,105
149,095145,805
3 2908 9858,737
24861
2097966
7,901
11,1284,618
13,786
161 542474
7,175207605
1 1125,617
21 907
Nov. 16
168,222
147 910147,910
08 7298 729
00
1 0212,0128 551
11 1234 618
13,786
165 634484
3 207235592
1 3475 550
20 700
Sept. 28
173,608
153,334146,463
6 8719,4148,737
677289
1,2781,1128,181
11,1284,618
13,786
160 656471
14,157200417
1,0475,770
20 424
Nov. 23
168,623
149 723148,737
9868,9358 730
205233813
1,0957,824
1 1 , 1 234 618
13,786
165,646483
2 441239551
1 2525,604
21 935
Oct. 5
172,854
152,688146,396
62929,1758,737
438558
1 413838
8,182
11,1284,618
13,786
161 329470
12,326256474
1,1185,738
20 674
Nov. 30
169,040
149 688149,688
08,6598 659
00
8771,7368 081
11 1234 618
13,786
166 430479
2 881258612
1 2375 542
21 127
Oct. 12
170,076
150,359148,270
2 08990168,736
28011
1 2711,2718,148
11,1284,618
13,786
162 853475
8,628188646
1 1265,797
19 897
Dec. 7
168,837
150 402150 402
o8 6478 647
00
4381 3438 008
11 1234 618
13 786
166 612474
3 143221589
1 2545 464
20 605
Oct. 19
168,840
148,668146,412
2 2568,9088,734
174106577
1,7308,851
11,1284,618
13,786
163 260477
5,258216628
1 0955,645
21 793
Dec. 14
169,687
150 671150,671o
8 6468 646
o0
6291,5838 159
11 1234 618
13,786
1 67 7 1 3473
3 266197581
1 4845 617
19 883
Oct. 26
169,040
149 166147,479
1 6878 8928 731
161110565
1 1979,109
11,1274,618
13 786
162 527475
5,829208647
1 2595,597
22 028
Dec. 21
173,426
153 770153 770
o8 6458 645
o0
1 0541 6558 301
11 1234 618
13 786
168 295473
4 108237620
1 5015 682
22 036
Nov. 2
166,148
146,597146,597
o8 7318,731
00
4401,2129,169
11,1264,618
13,786
162 703477
3,923235633
1 3795,638
20 689
Dec. 28
172,966
151 498151 498o
8 6458 645
o0
7533,5928 479
11 1234 618
13 786
169 685471
3 729224528
1 3485 654
20 854
Digitized for FRASER http://fraser.stlouisfed.org/ Federal Reserve Bank of St. Louis

2. Reserves of depository institutions and Reserve Bank credit, 1983—ContinuedC. Wednesday figuresMillions of dollars; end of week dates
Factor
SUPPLYING RESERVE FUNDS
1 Reserve Bank credit outstanding
2 U S government securities1
3 Bought outright .4 Held under repurchase agreements5 Federal agency securities6 Bought outright7 Held under repurchase agreements8 Acceptances9 Loans
10 Float1 1 Other Federal Reserve assets
12 Gold stock13 Special drawing rights certificate account14 Treasury currency outstanding^
ABSORBING RESERVE FUNDS
1 5 Currency in circulation16 Treasury cash holdings
Deposits, other than reserves, withFederal Reserve Banks
17 Treasury18 Foreign19 Other
20 Required clearing balances21 Other Federal Reserve liabilities and capital . . .22 Reserve accounts**
SUPPLYING RESERVE FUNDS
1 Reserve Bank credit outstanding
2 U S government securities'3 Bought outright4 Held under repurchase agreements5 Federal agency securities6 Bought outright7 Held under repurchase agreements8 Acceptances9 Loans
10 Float1 1 Other Federal Reserve assets .
12 Gold stock13 Special drawing rights certificate account . . . .14 Treasury currency outstanding"
ABSORBING RESERVE FUNDS
15 Currency in circulation . . . .16 Treasury cash holdings
Deposits, other than reserves, withFederal Reserve Banks
17 Treasury18 Foreign19 Other
20 Required clearing balances . .21 Other Federal Reserve liabilities and capital . .22 Reserve accounts^ . .
Jan. 5
159,538
137,641137,641
08 9378,937
00
4082 6859,867
11,1484 618
13,786
155,032432
3028238662
4364,719
24 543
Mar. 16
158,633
136,293136 293
08,9158,915
0o
3,730177
9,518
11,1384,618
13,786
153,760481
3,935237670
5754,828
23,688
Jan. 12
162,160
138,227135,574
2,6539 2128,937
275406
1,8232 459
10033
11,1464 618
13 786
153,924435
2 753271581
4494,858
28 438
Mar. 23
157,499
136,811136 811
08,9158 915
00
8251 5909358
11 1384,618
13 786
153,675485
3,118199478
5954,683
23,807
Jan. 19
161,260
137 519135,510
2,0098 9858937
48385
2,1861 956
10 229
11,1464 618
13 786
152,188437
3468270545
4604,857
28 584
Mar. 30
156,688
134,660134 660
08,9158 915
0o
1 9851 7439385
11 1384,618
13 786
154 250495
2,116250575
5984,757
23,188
Jan. 26
157,105
135,206133,121
2,08590578,928
129148489
2 2169,989
11,1444 618
13 786
151,092444
2 140217609
4774,728
26944
Apr. 6
158,967
136,791136 791
08,9158,915
00
8873 0949,280
11,1384,618
13 786
155,715513
4,393194523
6084,763
21,799
Feb. 2
156,459
134,529134,529
08,9248,924
00
5332,6399,834
11,1444,618
13,786
151,131446
3,322226635
4784,601
25,168
Apr. 13
156,759
135,419136419
08,9088,908
00
5192,5599,354
11,1374,618
13,786
156,224513
3,523212554
6154,764
19,895
Feb. 9
155,366
133,976133,976
08,9248,924
00
5411,896
10,029
11,1444618
13,786
152,027450
2,699201580
5004,649
23,807
Apr. 20
161,279
138,899138 899
08,9088,908
00
1,2632,7179,492
11,1374,618
13,786
155,729515
4,596220620
6334,818
23,689
Feb. 16
158,051
134,138134,138
08,9248,924
00
3,5182,6908,781
11,1424,618
13,786
152,210458
4,057197524
5044,652
24,994
Apr. 27
165,501
141,108137,376
3,7328,9958,908
87285
4,0731,2749,766
11,1354,618
13,786
155,661521
6,803194668
6344,994
25,564
Feb. 23
159,752
138,130133,965
4,1659 0638,924
139245467
2 6589,189
11,1394 618
13 786
152,513463
2,643210504
5224,706
27,733
May 4
160,042
138,331138 331
08,9088,908
00
7982,3989,607
11,1354,618
13 786
156,639530
4,043217559
6464,772
22,174
Mar. 2
160,402
136 343132 817
3 5269 3028 923
379275
1,7773 7488 957
11,1394 618
13 786
152,609467
3 525226521
5354,766
27 296
May 11
159,100
136 869136 869
08,9088 908
00
1,1702 3059 848
11 1324,618
13 786
157,718532
3,552222556
6894,860
20,687
Mar. 9
155,576
134 883134 883
o8 9238 923
oo
3672 5428 861
11 1384 618
13 786
153,469481
3 407197498
5524,677
21 836
May 18
161,986
141,297141 297
o8,9088 908
0o
2,0281 9517,802
11,1324,618
13 786
157,546534
2,673250517
6974,696
24,609
10Digitized for FRASER http://fraser.stlouisfed.org/ Federal Reserve Bank of St. Louis
2. Reserves of depository institutions and Reserve Bank credit, 1983—ContinuedC. Wednesday figures—ContinuedMillions of dollars; end of week dates
Factor
SUPPLYING RESERVE FUNDS
1 Reserve Bank credit outstanding
2 U S government securities' . . . . .3 Bought outright4 Held under repurchase agreements5 Federal agency securities . . . . .6 Bought outright . . . .7 Held under repurchase agreements8 Acceptances9 Loans . . . . . , , , . . .
10 Float1 1 Other Federal Reserve assets
12 Gold stock . . . . .13 Special drawing rights certificate account i14 Treasury currency outstanding^
ABSORBING RESERVE FUNDS
15 Currency in circulation . . . . . . . . .16 Treasury cash holdings
Deposits, other than reserves, with Federal Reserve Banks1 7 Treasury . . . . . . . . . .1 8 Foreign19 Other
20 Required clearing balances21 Other Federal Reserve liabilities and capital . . . . . . .22 Reserve accounts3
SUPPLYING RESERVE FUNDS
1 Reserve Bank credit outstanding
? U S government securities1
3 Bought outright4 Held under repurchase agreements . . . . .5 Federal agency securities6 Bought outright7 Held under repurchase agreements , .8 Acceptances9 Loans . . . . . . .
10 Float1 1 Other Federal Reserve assets . . . . . .
12 Gold stock13 Special drawing rights certificate account . . .14 Treasury currency outstanding^
ABSORBING RESERVE FUNDS
15 Currency in circulation16 Treasury cash holdings . . . . . .
Deposits, other than reserves, with Federal Reserve Banks17 Treasury . . . , . . . .1 g Foreign19 Other
20 Required clearing balances21 Other Federal Reserve liabilities and capital22 Reserve accounts*'
May 25
161,531
140,750140 750
08,9088,908
00
1,5482,2258 100
11,1324 618
13,786
157,627532
2,809240684
7054,798
23,672
July 20
170,356
147,911144,125
3,7869 0208,880
14074
2,4841,8259,042
11 1314,618
13,786
160,383520
3,998268672
8235,179
28 047
June 1
166,123
144,3241 39 594
4,7309,1868,908
278351
2,1241,9668,172
11,1324 618
13,786
159,091535
2,670278633
7115,014
26,727
July 27
163,698
143,500143,500
08 8808,880
00
1,3491,4978,472
11 1314,618
13,786
160,002505
3,315242589
8275,022
22,730
June 8
161,304
141,063141 063
08,9088,908
00
8032,2418 289
11,1314 618
13,786
159,748539
3,067177514
7374,899
21,157
Aug. 3
166,134
144,322144,322
08 8808,880
00
2,4781,8068,648
11 1314,618
13,786
160,814488
3,586214518
8324,987
24 230
June 15
163,582
139,998139 998
08,8908,890
00
4,4121,4448 838
11,1314 618
13,786
159,600538
3,170271620
7484,900
23,269
Aug. 10
166,137
145,249145,249
08 8808,880
00
1,1632,0338,812
11 1284,618
13,786
161,662515
2,804282500
8365,036
24,034
June 22
165,347
143,456142 137
1 3199,0328,890
142272
1,9002,0478 640
11,1314 618
13,786
159,086533
3,379180453
7605,053
25,438
Aug. 17
164,608
144,972144,972
08 8808,880
00
1,7221 4217,613
11 1284,618
13,786
161,307515
3,991223452
8435,173
21 636
June 29
162,170
140,729140 729
o8 8908,890
o0
2,0801,6388 833
11,1314 618
13 786
159,945531
4,026241443
7725,038
20,708
Aug. 24
163,571
144,696144 696
08 8808,880
00
1,612872
7,511
11 1284,618
13 786
160,647490
3,025208540
8455,144
22 204
July 6
165,589
143 848141 448
2 40090558 890
16563
1 6262,1658 832
11 1314 618
13 786
161 682533
3 621279492
7785 017
22,721
Aug. 31
167,778
146,489144 226
2 2638 9328 742
190209
3 633979
7 536
11 1284 618
13 786
161,122490
4 189248465
8455 112
24 839
July 13
167,590
144,276144 276
08 8808,880o
03,0052,6228 807
11,1314618
13 786
161,660527
3,526196656
8134,984
24,762
Sept. 7
168,925
148,668144 277
4,3918 8408,742
98288
1,5351 7827,812
11 1284,618
13 786
162,798474
3,355259450
8635,250
25 008
11Digitized for FRASER http://fraser.stlouisfed.org/ Federal Reserve Bank of St. Louis
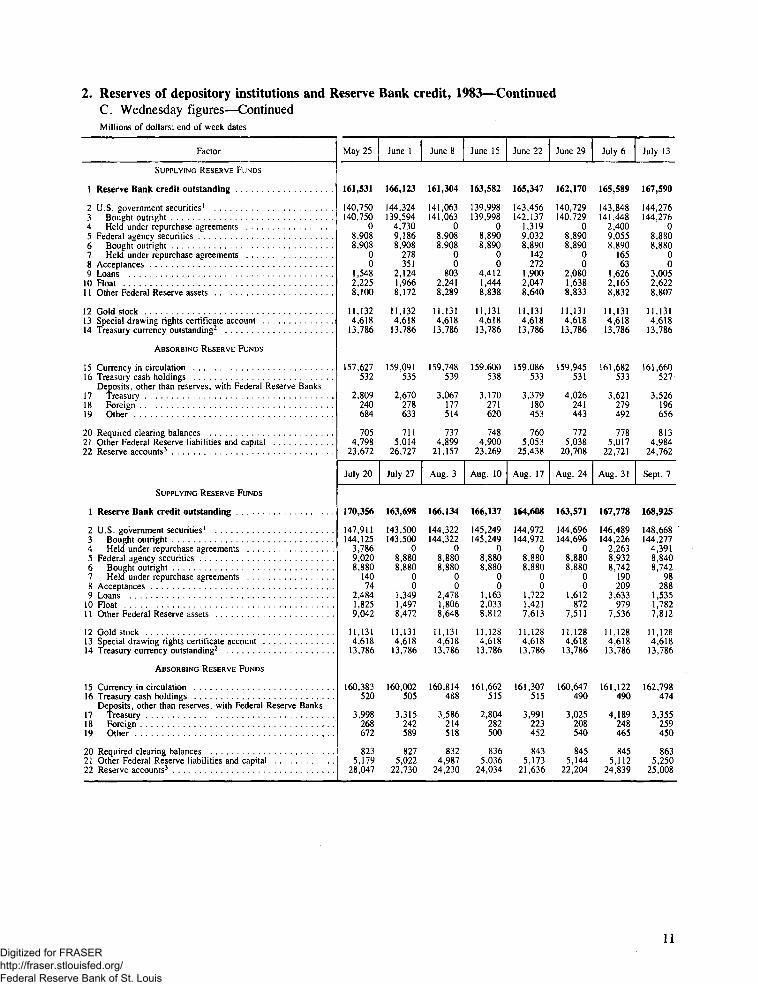
2. Reserves of depository institutions and Reserve Bank credit, 1983—ContinuedC. Wednesday figures—ContinuedMillions of dollars; end-of-week dates
Factor
SUPPLYING RESERVE FUNDS
1 Reserve Bank credit outstanding
2 U.S. government securities1
3 Bought outright4 Held under repurchase agreements5 Federal agency securities6 Bought outright7 Held under repurchase agreements8 Acceptances9 Loans
10 Float1 1 Other Federal Reserve assets
12 Gold stock13 Special drawing rights certificate account14 Treasury currency outstanding"
ABSORBING RESERVE FUNDS
15 Currency in circulation . . . .16 Treasury cash holdings
Deposits, other than reserves, with Federal Reserve Banks17 Treasury . .18 Foreign19 Other
20 Required clearing balances21 Other Federal Reserve liabilities and capital22 Reserve accounts-*
SUPPLYING RESERVE FUNDS
1 Reserve Bank credit outstanding
2 U S government securities'3 Bought outright4 Held under repurchase agreements5 Federal agency securities6 Bought outright7 Held under repurchase agreements8 Acceptances9 Loans . .
10 Float1 1 Other Federal Reserve assets
12 Gold stock13 Special drawing rights certificate account14 Treasury currency outstanding2 .
ABSORBING RESERVE FUNDS
1 5 Currency in circulation16 Treasury cash holdings
Deposits, other than reserves, with Federal Reserve Banks17 Treasury18 Foreign19 Other
20 Required clearing balances21 Other Federal Reserve liabilities and capital22 Reserve accounts-1
Sept. 14
165,819
144,791144 791
08 7378,737
00
2,4101,5748 307
11,1284,618
13,786
162,285474
3 273243443
8855,273
22 475
Nov. 9
166,105
140 932140,932
08,7318,731
00
4 3612,9619 120
11,1234 618
13,786
165 246484
4 004239580
9375 888
18.218
Sept. 21
174,750
149,502148 924
5788,9988,737
2619
6,8171,4208,004
11,1284,618
13,786
161,136471
12,806186470
8985,462
22,853
Nov. 16
167,698
147,158147,158
08,7308,730
00
1,5342,4347 842
11,1234 618
13,786
165 665483
3 315269572
9845,420
20,517
Sept. 28
170,883
149,370145,194
4,1769,0718,737
33489
2,3591,7378,257
11,1284,618
13,786
160,787468
14,253205416
9085,535
17,843
Nov. 23
171,750
151,512151,512
08,7308,730
00
1,4891,6988,321
11,1234,618
13,786
166.330480
2,689197553
9865,440
24,602
Oct. 5
169,654
149,528146,789
2,7398,9848,737
24720
1,3851,6048,133
11,1284,618
13,786
162,032474
9,694194400
9125,525
19,955
Nov. 30
168,481
149,439149,439
08,6478,647
00
1,059898
8,438
11,1234,618
13,786
166,682475
2,896360610
9835,432
20,569
Oct. 12
171,851
148,599148 599
08 7348,734
00
2,3963,6418 481
11,1284,618
13,786
163 608475
7 151182691
9365,495
22 845
Dec. 7
169,694
149 545149,545
08,6478,647
00
4912,8408 171
11,1234 618
13,786
167 197473
4 162309579
1,0045,439
20,057
Oct. 19
169,772
148,461145 075
3 38689808,734
246117
1 3861,7059 123
11,1274,618
13 786
163 080477
5 168257592
9585,478
23 292
Dec. 14
171,971
150 055150,055
08,6458,645
00
2 4312,5228 318
11,1234 618
13,786
168 146473
2 839232540
1,0185432
22,817
Oct. 26
167,580
147,272147 272
o8 7318 731
o0
1 505816
9 256
11 1264,618
13 786
162 479478
4 624246671
9605,372
22 279
Dec. 21
174,928
152 379152,379o
8,6458,645
00
1 1324,2328 540
11,1234 618
13,786
1 69 033472
4 621287531
1,0235,499
22,989
Nov. 2
167,208
147,045147 045o
8 7318 731o
o734
1 3339 365
11 1264618
13 786
163 401473
3 196230626
9565,361
22 494
Dec. 28
174,318
152 570152 570o
8 6458,645
o0
1 3113 0558 737
11,1234 61$
13 786
170 616462
3 636263597
1,0185 496
21,756
12Digitized for FRASER http://fraser.stlouisfed.org/ Federal Reserve Bank of St. Louis

2. Reserves of depository institutions and Reserve Bank credit, 1983—ContinuedD. End-of-month figuresMillions of dollars
Factor
SUPPLYING RESERVE FUNDS
1 Reserve bank creditoutstanding
2 U.S. government securities' . . .3 Bought outright4 Held under repurchase
agreements5 Federal agency securities6 Bought outright7 Held under repurchase
agreements8 Acceptances9 Loans . . .
10 Float. . . .1 1 Other Federal Reserve assets . . .
12 Gold stock13 Special drawing rights
certificate account14 Treasury currency
outstanding-
ABSORBING RESERVE FUNDS
15 Currency in circulation16 Treasury cash holdings
Deposits, other thanreserves, with FederalReserve Banks
17 Treasury . .18 Foreign1 9 Other
20 Required clearing balances . . . .21 Other Federal Reserve
liabilities and capital22 Reserve accounts3
Jan.
152,537
132,368132,368
08 9288 928
00
3541 ,0069,881
11,144
4,618
13,786
150,511448
2 627366603
478
4,85022,201
Feb.
153,936
135,561135,561
08 9238923
00
1 155-2,66410,961
11,139
4,618
13,786
151,872465
2,856352486
535
4,98821,924
Mar.
158,047
136,651136,651
08,9158,915
00
2,808486
9,187
11,138
4,618
13,786
154,307498
3,572425535
601
4,83422,816
Apr.
161,866
141,550137,864
3,6869,1568,908
248704848
-1,12410,732
11,135
4,618
13,786
155,307524
6,015322796
641
5,25322,547
May
160,828
141,180141,180
08,9088,908
00
1,260850
8,630
11,132
4,618
13,786
158,634532
4,372445679
711
5,14419,847
June
164,037
141,673140,511
1,1629,1058,890
215203
3,6101,0208,426
11,131
4,618
13,786
160,419533
8,764279470
775
5,11117,220
July
163,893
144,255144,255
08,8808,880
0o1,1131,0668,579
11,131
4,618
13,786
159,973495
3,815369566
830
5,17822,201
Aug.
167,778
146,489144,226
2,2638,9328,742
190209
3,633979
7,536
11,128
4,618
13,786
161,122490
4,189248465
845
5,11224,839
Sept.
175,755
155,423146,171
9,25292888,737
5511 1221,625-60
8,357
11,128
4,618
13,786
161,046468
16,557297438
911
5,80019,769
Oct.
165,267
146,096146,096
08 7318 731
00
387750
9,303
11,126
4,618
13,786
162,515478
4,841339749
956
5,69119,227
Nov.
168,481
149,439149,439
08 6478 647
00
1 057898
8,438
11 123
4,618
13,786
166,682475
2 896360610
983
5,43220,569
Dec.
172,460
151,942150,558
1,3848 8538 645
208418918
1 5638,766
11 121
4,618
13,786
170,005463
3 661191845
1,013
5,39420,413
13Digitized for FRASER http://fraser.stlouisfed.org/ Federal Reserve Bank of St. Louis

3. Reserves and borrowings of depository institutions, 1983A. Monthly averagesMillions of dollars
Reserve classification
1 Reserve balances with Reserve Banks' . . . .
2 Total vault cash3 Vault cash at institutions with required reserve balances . . . .4 Vault cash equal to required reserves at other institutions . . . . . . .5 Surplus vault cash at other institutions* .
6 Reserve balances + total vault cash3 .7 Reserve balances + total vault cash used to satisfy reserve requirements3' 4 . . . . .8 Required reserves
9 Excess reserve balances at Reserve Banks3' ^ . . . . . .10 Total borrowings at Reserve Banks . . . .1 1 Seasonal borrowings at Reserve Banks .12 Extended credit at Reserve Banks
1 Reserve balances with Reserve Banks'
2 Total vault cash . . .3 Vault cash at institutions with required reserve balances . . . . . . .4 Vault cash equal to required reserves at other institutions5 Surplus vault cash at other institutions^
6 Reserve balances + total vault cash3
7 Reserve balances + total vault cash used to satisfy reserve requirements3- 4
8 Required reserves . . . .
9 Excess reserve balances at Reserve Banks10 Total borrowings at Reserve Banks . . .1 1 Seasonal borrowings at Reserve Banks . . . . . . .12 Extended credit at Reserve Banks
Jan.
24,431
21,45414 6022,8294,023
45 88541 86241 316
546500
33156
July
22,139
20 41313,6473,1613 605
42,55238,94738,440
5071 382
172572
Feb.
23,530
20,03513,7052,5623,768
43,56539 79739 362
435557
39277
Aug.
21,965
20,03513,6563,0393,340
42,00038,66038,214
4461,573
198490
Mar.
22,168
19,48413,0272,8443,613
41,65238 03937 602
43785253
318
Sept.
20,585
20,79813,9273,4043,467
41,38337,91637,418
4981,441
191515
Apr.
22,565
19,56913,2462,8393,484
42,13438 65038 174
476993
82407
Oct.
21,059
2047113,8663,2123,393
41,53038,13737,632
505837142255
May
22,010
19,71013,3392,9333,438
41,72038 28237 833
44990298
514
Nov.
20,943
20,55814,0143,1873 357
41,50138,14437,615
529912119
6
June
21,808
20,09813 5933,0143,491
41,90638 415
37 93S3)
4801 714
121964
Dec.
20,986
20 75514,5973,3112 847
41,74138,89438,333
56174596
2
14Digitized for FRASER http://fraser.stlouisfed.org/ Federal Reserve Bank of St. Louis

3. Reserves and borrowings of depository institutions, 1983—ContinuedB. Weekly averages of daily figuresMillions of dollars; end-of-week dates
Reserve classification
1 Reserve balances with Reserve Banks'
2 Total vault cash . . . . . . . . . . . . .3 Vault cash at institutions with required
reserve balances4 Vault cash equal to required reserves
at other institutions . . .5 Surplus vault cash at other institutions2 .
6 Reserve balances 4- total vault cash''7 Reserve balances 4- total vault cash used
to satisfy reserve requirements3' 4
8 Required reserves
9 Excess reserve balances at Reserve Banks3' ^10 Total borrowings at Reserve Banks1 1 Seasonal borrowings at Reserve Banks12 Extended credit at Reserve Banks
I Reserve balances with Reserve Banks1
2 Total vault cash . . .3 Vault cash at institutions with required
reserve balances4 Vault cash equal to required reserves
at other institutions .5 Surplus vault cash at other institutions2
6 Reserve balances 4- total vault cash3
7 Reserve balances 4- total vault cash usedto satisfy reserve requirements''' 4
8 Required reserves
9 Excess reserve balances at Reserve Banks3' 5
10 Total borrowings at Reserve Banks1 1 Seasonal borrowings at Reserve Banks12 Extended credit at Reserve Banks
1 Reserve balances with Reserve Banks' . .
2 Total vault cash3 Vault cash at institutions with required
reserve balances4 Vault cash equal to required reserves
at other institutions . . .5 Surplus vault cash at other institutions2
6 Reserve balances + total vault cash3
7 Reserve balances + total vault cash usedto satisfy reserve requirements3' 4 . .
8 Required reserves
9 Excess reserve balances at Reserve Banks3- 5
10 Total borrowings at Reserve Banks1 1 Seasonal borrowings at Reserve Banks12 Extended credit at Reserve Banks
Jan. 5
25,737
20,105
14 126
2,4903,489
45 842
42,35341,360
9931,198
37143
Mar. 16
21,427
20 307
13 116
3,2373,954
41,734
37,78037 369
41189044
326
May 25
22 312
18 877
13 123
2 6353 119
41 189
38 07037 620
450951104511
Jan. 12
23,748
21,463
14,516
3,0173,930
45,211
41,28140,990
291425
31133
Mar. 23
23,138
18,297
12,652
2,4383,207
41,435
38,22837,896
33264159
346
June 1
21,764
19 856
13 445
3,0103,401
41 620
38,21937 743
4761,118
108530
Jan. 19
25,298
22,187
14,801
3,0194,367
47,485
43,11842,497
621465
30113
Mar. 30
22,373
19,392
13,137
2,7793,476
41,765
38,28937,825
46489362
305
June 8
21,069
20,136
13 427
3,1483,561
41,205
37,64437 020
624907107453
Jan. 26
23,830
21,836
14,892
2,8014,143
45,666
41,52341,022
50132534
197
Apr. 6
21,780
19,692
13,285
2,8633,544
41,472
37,92837,296
6321,757
80328
June 15
21,261
20,477
13,324
3,3433,810
41,738
37,92837 578
3501,811
1101,096
Feb. 2
23,710
21,228
14,513
2,6774,038
44,938
40,90040,484
416383
37211
Apr. 13
21,404
20,059
13,198
3,1263,735
41,463
37,72837,165
56357572
353
June 22
22,607
19,636
13,751
2,6423,243
42,243
39,00038 591
4091,712
1251,061
Feb.- 9
22,400
20,952
14,074
2,8534,025
43,352
39,32739,018
30937035
234
Apr. 20
24,020
18,625
12,891
2,4783,256
42,645
39,38939,170
21966677
405
June 29
22,254
20,150
13,869
2,9193,362
42 404
39,04238 557
4852,102
1431,262
Feb. 16
23,609
20,396
13 679
2,7313,986
44,005
40,01939,410
609868
39274
Apr. 27
22,822
19,630
13,417
2,8323,381
42,452
39,07138,612
4591,171
90484
July 6
22,124
20,484
13,749
3,0503,485
42 408
38,92338 069
8542,234
1431,103
Feb. 23
24,354
18,684
13 156
2,1613,367
43 038
39,67139,377
294475
45335
May 4
22,851
20,244
13,709
2,9773,558
43,095
39,53738 935
602925101493
July 13
20,586
21,027
13 625
3,5313 871
41 613
37,74237 246
4961,147
144434
Mar. 2
23,778
19,663
13 616
2,4333,614
43 441
39,82739,308
51971043
295
May 11
21,398
20 307
13 512
3,1233,672
41,705
38,03337 572
46170791
506
July 20
24,042
19 182
12 926
2,8613 395
43 224
39 82939 503
3261,236
179460
Mar. 9
21,328
19 859
12 974
3,0393,846
41 187
37 34136,873
46862644
297
May 18
22,105
19 516
13 081
2,9473,488
41,621
38 13337 755
3781,073
91519
July 27
21 897
20984
14 162
3,1953 627
42 881
39 25438 882
3721,387
203464*
15Digitized for FRASER http://fraser.stlouisfed.org/ Federal Reserve Bank of St. Louis

3. Reserves and borrowings of depository institutions, 1983—ContinuedB. Weekly averages of daily figures—ContinuedMillions of dollars; end-of-week dates
Reserve classification
1 Reserve balances with Reserve Banks'
2 Total vault cash3 Vault cash at institutions with required reserve balances4 Vault cash equal to required reserves at other institutions5 Surplus vault cash at other institutions2 . .
6 Reserve balances + total vault cash^7 Reserve balances + total vault cash used
to satisfy reserve requirements^' ^8 Required reserves
9 Excess reserve balances at Reserve Banks^' ^10 Total borrowings at Reserve Banks . .1 1 Seasonal borrowings at Reserve Banks . . . .12 Extended credit at Reserve Banks
1 Reserve balances with Reserve Banks' . . .
2 Total vault cash3 Vault cash at institutions with required reserve balances4 Vault cash equal to required reserves at other institutions5 Surplus vault cash at other institutions2
6 Reserve balances + total vault cash^7 Reserve balances + total vault cash used
to satisfy reserve requirements^1 4
8 Required reserves . .
9 Excess reserve balances at Reserve Banks^* ^10 Total borrowings at Reserve Banks . . . . .1 1 Seasonal borrowings at Reserve Banks12 Extended credit at Reserve Banks
1 Reserve balances with Reserve Banks'
2 Total vault cash . .3 Vault cash at institutions with required reserve balances4 Vault cash equal to required reserves at other institutions5 Surplus vault cash at other institutions2 . . . .
6 Reserve balances + total vault cash^ . .7 Reserve balances + total vault cash used
to satisfy reserve requirements^' 4
8 Required reserves . . . . .
9 Excess reserve balances at Reserve Banks^1 ^10 Total borrowings at Reserve Banks1 1 Seasonal borrowings at Reserve Banks . .12 Extended credit at Reserve Banks
Aug. 3
21,976
20,68413,8963 1443 644
42 660
39 01638 454
5621 311
192445
Aug. 10
21,029
20,80413,7333 3253 746
41 833
38 08737 693
3941 520
178457
Sept. 28
20,424
21,36414,5393,4123,413
41,788
38 37537,926
4491,278
204542
Nov. 16
20,700
20,95613,9363 3973,623
41,656
38 03337,388
6451 021
1124
Aug. 17
22,269
20,28413,3933 1443 747
42 553
38 80638 358
4481 474
194502
Oct. 5
20,674
2096314,1763,3063,481
41,637
38 15637,534
6221,413
161539
Nov. 23
21,935
19 19013,6502 6722,868
41 125
38 25737,958
299813123
4
Aug. 24
22,592
19,41413,5032 6563 255
42 006
38 75138 350
4011 579
207524
Oct. 12
19,897
21,01713,9263,4523,639
40,914
37,27536,546
7291,271
139645
Nov. 30
21,127
21,03614,4093,2983,329
42,163
38,83438,198
636877123
13
Aug. 31
21,966
19,36113,8942 9862 481
41 327
38 84638 353
4931 712
216499
Oct. 19
21,793
20,05713,4943, 1603,403
41,850
38,44738,106
34157713896
Dec. 7
20,605
20,92914,3553,2163,358
41,534
38 17637,671
505438
892
Sept. 7
20 449
20,73513,7523 4703 513
41 184
37 67136 914
7571 246
192489
Oct. 26
22,028
1967613,7372,8673,072
41,704
38 63238,178
454565144
5
Dec. 14
19,883
20 34814,7153 8431 ,790
40 231
38 44137,954
487629
891
Sept. 14
19 533
21 36413 8283 7573 779
40 897
37 11836 714
4041 150
185501
Nov. 2
20689
20 91014 1753,3373,398
41 599
38 20137 827
374440128
5
Dec. 21
22036
20 38314,4222 9632998
42 419
39 42138 776
6451 054
1001
Sept. 21
21 907
19,86213 5187 nnfi3 158
41 SRQ
38 43138 086
-14*:2 097
186520
Nov. 9
20 081
20 94914 0143,3413,594
41 030
37 43636,856
5801,042
1233
Dec. 28
20,854
21 29214,8793 2703,143
42 146
39 00338 567
436753115
3
16Digitized for FRASER http://fraser.stlouisfed.org/ Federal Reserve Bank of St. Louis

4. Federal funds and repurchase agreements of large member banks, 19831
Averages of daily figures, in millions of dollars
Maturity and source
One day and continuing contract1 Commercial banks in United States2 Other depository institutions, foreign
banks and foreign official institutions,and U S government agencies
3 Nonbank securities dealers4 All other
All other maturities5 Commercial banks in United States6 Other depository institutions, foreign
banks and foreign official institutions,and U S government agencies . . .
7 Nonbank securities dealers8 All other
MEMO: Federal funds and resale agreementloans in maturities of one day orcontinuing contract
9 Commercial banks in United States10 Nonbank securities dealers
One day and continuing contract1 Commercial banks in United States2 Other depository institutions, foreign
banks and foreign official institutions,and U.S. government agencies
3 Nonbank securities dealers . . .4 All other
All other maturities5 Commercial banks in United States6 Other depository institutions, foreign
banks and foreign official institutions,and U.S. government agencies
7 Nonbank securities dealers8 All other
MEMO: Federal funds and resale agreementloans in maturities of one day orcontinuing contract
9 Commercial banks in United States10 Nonbank securities dealers
One day and continuing contract1 Commercial banks in United States2 Other depository institutions, foreign
banks and foreign official institutions,and U.S. government agencies
3 Nonbank securities dealers4 All other
All other maturities5 Commercial banks in United States6 Other depository institutions, foreign
banks and foreign official institutions,and U.S. government agencies
7 Nonbank securities dealers8 All other
MEMO: Federal funds and resale agreementloans in maturities of one day orcontinuing contract
9 Commercial banks in United States10 Nonbank securities dealers
Jan. 5
62 958
22,0444,056
21 846
5,780
10,3524,102
13 007
23,7974 875
Mar. 9
68,175
29,5654 471
24,934
4,094
9,4844 9978,918
25,7005 121
May 11
63 386
29,1574,387
27 162
4,401
9,3376,2279 352
24,5443 932
Jan. 12
69 088
25,6114,512
25 481
4,392
8,8013,4398,606
27,3255,328
Mar. 16
64,608
29,2964,259
25,052
4,200
9,8064,6878,954
23,2084,467
May 18
61 792
29,1475,046
26 418
4,476
9,3516,4229 616
24,3153 858
Jan. 19
66 116
28,8044,434
24,765
4,266
8,6524,2709,024
27,9364,641
Mar. 23
60,985
28,8764,649
24,475
4,457
10,0884,8018,820
22,1444,312
May 25
58 724
29,1206,496
26,906
4,763
9,5346,4429,558
22,9094 234
\
Jan. 26
60 135
29,0514,342
25 232
4,175
8,5804,8098,938
24,7713 968
Mar. 30
58,326
24,5714,250
23,790
4,950
11,0055,5189,714
20,4134,356
June 1
59 750
28,0427,282
25 604
4,819
9,9086,3019 175
25,3644 395
Veek endin
Feb. 2
59 398
26,9805,022
26054
4,182
8,8024,9148,808
23,5754,749
Apr. 6
67,280
25,2744,137
22,428
5,608
1 1 ,4605,992
10,996
25,8884,481
June 8
64 366
26,8785,958
25 710
4,810
10,4045,4028 711
22,7704 560
g
Feb. 9
63 541
27,9284,273
24 697
4,444
9,2994,9868,544
23,5744,638
Apr. 13
69,189
26,7034,322
25,794
4,549
10,5095,3237,904
27,4964,532
June 15
62 554
26,4225,925
26 898
5,134
10,3165,8918,734
22,7664097
Feb. 16
60 970
290145,110
24 468
4,576
9,5344,8989441
24,1764 137
Apr. 20
63,218
28,2524 164
24,030
4,896
10,5605 5669,707
24,8264 252
June 22
59 083
25,7156,110
26 961
5,284
10,1046,4568 708
24,7314 231
Feb. 23
61 055
306124,654
24 727
4,232
9,4875,0109 581
25,2203 897
Apr. 27
56,409
28,8805 281
25,933
4,486
9,6815 9448,926
22,5564 315
June 29
55 808
24,1645 614
27 408
5,178
10,4636,0719 563
23,7264 186
Mar. 2
61 536
29,0804,408
26048
4,196
9,2215,2139 194
24,4154 636
May 4
59,065
30,1204 954
26,896
4,520
9,7816 2638,584
25,6864,332
July 6
67 385
22,3635 307
26 284
4,837
10,4655,0828 624
30,7924 620
17Digitized for FRASER http://fraser.stlouisfed.org/ Federal Reserve Bank of St. Louis

4. Federal funds and repurchase agreements of large member banks, 19831—ContinuedAverages of daily figures, in millions of dollars
Maturity and source
One day and continuing contract\ Commercial banks in United States2 Other depository institutions, foreign
banks and foreign official institutions,and U.S. government agencies
3 Nonbank securities dealers4 All other
All other maturities5 Commercial banks in United States6 Other depository institutions, foreign
banks and foreign official institutions,and U S. government agencies
7 Nonbank securities dealers8 All other
MEMO: Federal funds and resale agreementloans in maturities of one day orcontinuing contract
9 Commercial banks in United States10 Nonbank securities dealers
One day and continuing contract1 Commercial banks in United States2 Other depository institutions, foreign
banks and foreign official institutions,and U.S. government agencies
3 Nonbank securities dealers4 AH other
All other maturities5 Commercial banks in United States6 Other depository institutions, foreign
banks and foreign official institutions,and U S government agencies
7 Nonbank securities dealers8 All other
MEMO: Federal funds and resale agreementloans in maturities of one day orcontinuing contract
9 Commercial banks in United States10 Nonbank securities dealers
One day and continuing contract1 Commercial banks in United States2 Other depository institutions, foreign banks and for
official institutions, and U.S. government agei3 Nonbank securities dealers
Week ending
July 13
66,505
23,1414,715
24,863
4,612
10,3685,0397,851
29,5344,439
Sept. 14
62,353
23,2484,054
25,675
5,462
9,1105,5809,721
24,3534,778
July 20 July 27
60,129 57,396
23,965 24,1604,928 4,764
25,045 25,374
4,996 5,138
10,833 9,6685,938 5,8348,043 8,418
27,359 26,3204,828 4,042
Sept. 21 Sept. 28
56,891 52,838
25,292 24,2323,925 4,071
25,611 25,121
5,534 6,344
8,652 9,0365,674 6,3069,278 9,183
22,932 22,0804,036 4,487
eignicies . . .
4 All other
All other maturities5 Commercial banks in United States6 Other depository institutions, foreign banks and for
official institutions, and U.S. government agei7 Nonbank securities dealers
eignicies
8 A l l other . . . . . .
MEMO: Federal funds and resale agreement loansin maturities of one day or continuing contract
9 Commercial banks in United States10 Nonbank securities dealers
Nov. 16
61,281
25,8205,668
26,210
6,687
9,1947,4469,901
24,6145,022
Aug. 3
60,496
23,9924,295
24,222
5,396
9,2406,2138,524
28,4244,631
Oct. 5
58,355
23,2944,846
25,842
6,140
8,7885,4268,797
25,8104,395
Nov. 23
58,388
25,9385,294
25,907
6,460
9,5097,427
10,934
23,9485,428
Aug. 10
63,321
24,4404,581
24,340
5,334
9,1856,2148,254
24,8014,675
Oct. 12
66,583
22,9144,550
25,719
6,077
8,6145,2708,939
30,8744,882
Nov. 30
56,721
24,7904,792
23,464
7,057
10,0407,564
13,546
23,5044,286
Aug. 17
59,316
23,8224,571
25,482
5,456
9,3886,0828,821
23,0955,289
Oct. 19
61,496
24,7675,444
25,775
5,436
8,6085,1529,127
27,4484,742
Dec. 7
63,010
25,2605,174
26,838
6,164
9,8896,724
10,359
25,1434,514
Aug. 24
54,085
24,2994,761
25,886
5,557
9,2846,1789,186
22,4155,354
Oct. 26
56,760
25,7635,743
26,158
5,524
8,5375,9799,397
25,3044,808
Dec. 14
60,265
24,6555,479
26,580
6,442
10,2426,740
10,073
23,3814,715
Aug. 31
53,310
23,8033,877
25,195
5,825
9,1056,5129,606
23,0654,710
Nov. 2
57,560
24,7715,476
26,346
5,800
8,4846,4339,453
24,8254,933
Dec. 21
57,132
23,8005,577
26,514
6,483
9,8466,8268,805
22,4434,634
Sept. 7
59,984
23,6874,210
24,940
5,396
8,9946,0269,713
25,3224,736
Nov. 9
62,824
25,9335,573
25,643
6,883
9,5057,3539,932
25,3854,857
Dec. 28
55,311
21,4195,385
23,751
6,592
10,1106,799
12,862
22,8584,246
18Digitized for FRASER http://fraser.stlouisfed.org/ Federal Reserve Bank of St. Louis
5. Federal Reserve Bank interest ratesA. Short-term adjustment credit to depository institutions1
Percent per annum.
Year and month
1982In effect
December 3 1 ...
1983In effect
December 31 . . .
D . New Phila-Boston York delphia
8.5 8.5 8.5
8.5 8.5 8.5
Cleve-land
8.5
8.5
£S *•-
8.5 8.5
8.5 8.5
rhi aff St. Minne- Kansas n „ PSan
umcago Loujs apolis City uaiias rran-
8.5 8.5 8.5 8.5 8.5 8.5
8.5 8.5 8.5 8.5 8.5 8.5
B. Extended credit to depository institutionsPercent per annum.
Year and month
1982In effect
December 31 . . .
1983In effect
December 3 1 ...
1982In effect
December 31 ...
1983In effect
December 3 1 ...
*~ SX de^iaCleve-
land rd A**, rh- fl St. Minne- Kansas n „ PSan
ChlcaS° Louis apolis City Dallas j™'
Seasonal credit2
8.5 8.5 8.5
8.5 8.5 8.5
8.5
8.5
8.5 8.5
8.5 8.5
8.5 8.5 8.5 8.5 8.5 8.5
8.5 8,5 8.5 8.5 8.5 8.5
Exceptional circumstances and other extended credit3
8.5 8.5 8.5
8.5 8.5 8.5
8.5
8.5
8.5 8.5
8.5 8.5
8.5 8.5 8.5 8.5 8.5 8.5
8.5 8.5 8.5 8.5 8.5 8.5
19Digitized for FRASER http://fraser.stlouisfed.org/ Federal Reserve Bank of St. Louis

6* Reserve requirements of depository institutions, December 31, 19831
Percent of deposits
Type of deposit, anddeposit interval
Net demand-$0 million— $2 million$2 million-SlO million$10 miHion-SKX) million$100 million-$400 millionOver $400 million
Time and savings2-*Savings . . . .
Time4
$0 million-$5 million, by maturity30-179 days180 days to 4 years4 years or more
Over $5 million, by maturity30-179 days . . . .180 days to 4 years4 years or more
Member bank requirementsbefore implementation of the
Monetary Control Act
Percent
79>/>
IP/412V416'/4
3
32'/>1
62'/^1
Effective date
12/30/7612/30/7612/30/7612/30/7612/30/76
3/16/67
3/16/671/8/76
10/30/75
12/12/741/8/76
10/30/75
Type of deposit, anddeposit interval-5
Net transaction accounts1-*$0-$28 9 millionOver $28.9 million
Nonpersonal time deposits9
By original maturityLess than 1 !/*> yearsI '/» years or more
Eurocurrency liabilitiesA l l types . . . .
Depository institution require-ments after implementation of
the Monetary Control Act6
Percent
312
30
3
Effective date
12/29/8312/29/83
10/6/8310/6/83
11/13/80
7. Margin requirements1
Percent of market value; effective dates shown
Type of security or sale
1 Margin stocks . . . .2 Convertible bonds3 Short sales4 Writing options2
Mar. 11, 1968
705070
June 8, 1968
806080
May 6, 1970
655065
Dec. 6, 1971
555055
Nov. 24, 1972
655065
Jan. 3, 1974
505050
Jan. 1, 1977
50505030
8. Maximum interest rates payable on time and savings deposits at federally insured institutions1
Percent per annum
Type of deposit
1 Savings2 Negotiable order of withdrawal accounts3 Negotiable order of withdrawal accounts of $2,500 or more2
4 Money market deposit account2 . . .
Time accounts by maturity5 7-31 days of less than $2,5004
6 7 - 3 1 days of $2 500 or more2
7 More than 31 days
Commercial banks
In effect Dec. 31, 1983
Percent
5'/45i/4
3
5 "/4
Effectivedate
7/1/7912/31/80
1/5/8312/14/82
9/1/821/5/83
10/1/83
Savings and loan associationsand mutual
savings banks (thrift institutions)'
In effect Dec. 31, 1983
Percent
5'/>5!/4
3
5'/>
Effectivedate
7/1/7912/31/80
1/5/8312/14/82
9/1/821/5/83
10/1/83
20Digitized for FRASER http://fraser.stlouisfed.org/ Federal Reserve Bank of St. Louis

9. Federal Reserve open market transactions, 1983Millions of dollars
Type of transaction1
U.S. GOVERNMENTSECURITIES
Outright transactions(excluding matchedtransactions)
Treasury billsI Gross purchases . . . .2 Gross sales3 Exchange4 Redemptions
Others within I year5 Gross purchases . . . .6 Gross sales7 Maturity shift8 Exchange9 Redemptions
I to 5 years10 Gross purchases1 1 Gross sales12 Maturity shift13 Exchange
5 to 10 years14 Gross purchases15 Gross sales16 Maturity shift . .17 Exchange
Over 10 years18 Gross purchases19 Gross sales20 Maturity shift21 Exchange
All maturities22 Gross purchases23 Gross sales24 Redemptions .
Matched transactions25 Gross sales26 Gross purchases . . .
Repurchase agreements27 Gross purchases . . .28 Gross sales
Year Jan. Feb. Mar.
18,888 0 1,456 1,2593,420 1,983 934 0
O O O O2,400 900 300 0
484 0 0 0O O O O
18,887 558 4,564 1,198-16,553 -544 -2,688 -900
87 0 0 0
1,896 0 0 0O O O O
-15,533 -553 4,564 -1,19811,641 544 1,599 900
890 0 0 0O O O O
-2,450 -5 229 02,950 0 650 0
383 0 0 0O O O O
-904 0 - 2 2 9 01,962 0 439 0
22,540 0 1,456 1,2593,420 1,983 934 02,487 900 300 0
578,591 59,398 35,234 47,892576,908 59,043 38,204 47,724
105,971 6,747 6,697 3,526108,291 10,451 6,697 3,526
Apr. May June
2,880 516 1,7210 0 00 0 00 0 0
0 173 00 0 0
826 1,795 1,3980 -1,842 -9160 0 87
0 595 00 0 0
-684 -41 -1,3980 1,367 916
0 326 00 0 0
-142 -1,754 00 300 0
0 108 00 0 00 0 00 175 0
2,880 1,719 1,7210 0 00 0 87
37,873 43,404 50,08636,205 45,001 47,783
7,671 0 7,8913,984 3,687 6,730
July Aug. Sept.
666 1,768 3,1840 289 2140 0 00 0 500
156 0 00 0 0
1,162 2,212 9020 -5,344 -7530 0 0
481 0 00 0 0
-1,121 -2,212 -9020 3,130 753
215 0 00 0 0
-41 516 / 00 1,300 J 0
1f
124 0 00 0 00 -516 00 914 0
1,642 1,768 3,1840 289 2140 0 500
40,934 45,989 48,19343,037 44,480 47,667
7,816 2,263 37,2118,978 0 30,223
Oct. Nov.
309 1,4350 00 00 700
0 1550 0
529 2,828-636 -2,930
0 0
0 8200 0
-256 -1,689636 1,796
0 3490 0
-273 -9800 700
0 1510 00 -1590 434
309 2,9090 00 700
53,751 56,85853,367 57,991
19,247 3,25728,499 3,257
Dec.
3,695000
00
91500
00
-9150
0000
0000
3,69500
58,97956,404
3,6442,260
29 Net change in govern-ment securities
FEDERAL AGENCYOBLIGATIONS
Outright transactions30 Gross purchases31 Gross sales32 Redemptions
Repurchase agreements33 Gross purchases . . .34 Gross sales
35 Net change in agencyobligations
BANKERS ACCEPTANCES
36 Repurchase agreements,net
37 Total net change inSystem OpenMarket Account
12,631 -6,943 3,192 1,090 4,899 -371 493 2,583 2,234 -9,326 3,342 2,504
00
292
8,8339,213
009
4521,040
005
276276
008
379379
007
34092
00*
0248
0017
678463
0010
558773
00
138
1890
0 00 06 84
1,960 497 6342,510 2,510 497 426
-672 -596
- i ,062 - 1,480
241 -248
704 - 704
198 -225
203 - 203
51
209
356 -557 -84 206
913 -1,122 0 418
10,897 -9,019 3,187 1,082 5,844 -1,322 893 2,155 2,493 10,203 -11,005 3,258 3,128
21Digitized for FRASER http://fraser.stlouisfed.org/ Federal Reserve Bank of St. Louis
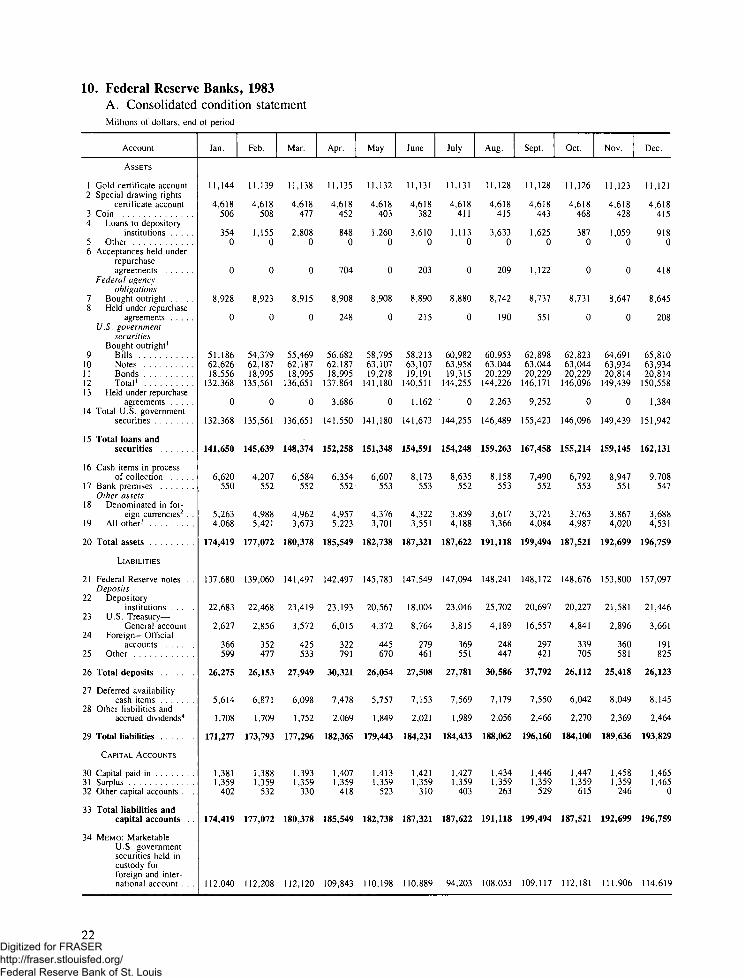
10. Federal Reserve Banks, 1983A. Consolidated condition statementMillions of dollars, end of period
Account
ASSETS
1 Gold certificate account2 Special drawing rights
certificate account3 Coin4 Loans to depository
institutions5 Other6 Acceptances held under
repurchaseagreements
Federal agencyobligations
1 Bought outright8 Held under repurchase
agreementsU.S. government
securitiesBought outright1
9 Bills10 Notes1 1 Bonds12 Total1
1 3 Held under repurchaseagreements
14 Total U.S. governmentsecurities
1 5 Total loans andsecurities
16 Cash items in processof collection
17 Bank premisesOther assets
18 Denominated in for-eign currencies2 . .
19 All other3
20 Total assets
LIABILITIES
21 Federal Reserve notes . .Deposits
22 Depositoryinstitutions
23 U.S. Treasury-General account
24 Foreign— Officialaccounts
25 Other
26 Total deposits
27 Deferred availabilitycash items
28 Other liabilities andaccrued dividends4
29 Total liabilities
CAPITAL ACCOUNTS
30 Capital paid in31 Surplus32 Other capital accounts . . .
33 Total liabilities andcapital accounts . .
34 MEMO: MarketableU.S. governmentsecurities held incustody forforeign and inter-national account . . .
Jan.
11,144
4,618506
3540
0
8,928
0
51,18662,62618,556
132,368
0
132,368
141,650
6,620550
5,2634,068
174,419
137,680
22,683
2,627
366599
26,275
5,614
1,708
171,277
1,3811,359
402
174,419
112,040
Feb.
11,139
4,618508
1,1550
0
8,923
0
54,37962,18718,995
135,561
0
135,561
145,639
4,207552
4,9885,421
177,072
139,060
22,468
2,856
352477
26,153
6,871
1,709
173,793
1,3881,359
532
177,072
112,208
Mar.
11,138
4,618477
2,8080
0
8,915
0
55,46962,18718,995
136,651
0
136,651
148,374
6,584552
4,9623,673
180,378
141,497
23,419
3,572
425533
27,949
6,098
1,752
177,2%
1,3931,359
330
180,378
112,120
Apr.
11,135
4,618452
8480
704
8,908
248
56,68262,18718,995
137,864
3,686
141,550
152,258
6,354552
4,9575,223
185,549
142,497
23,193
6,015
322791
30,321
7,478
2,069
182,365
1,4071,359
418
185,549
109,843
May
11,132
4,618403
1,2600
0
8,908
0
58,79563,10719,278
141,180
0
141,180
151,348
6,607553
4,3763,701
182,738
145,783
20,567
4,372
445670
26,054
5,757
1,849
179,443
1,4131,359
523
182,738
110,198
June
11,131
4,618382
3,6100
203
8,890
215
58,21363,10719,191
140,511
1,162
141,673
154,591
8,173553
4,3223,551
187,321
147,549
18,004
8,764
279461
27,508
7,153
2,021
184,231
1,4211,359
310
187,321
110,889
July
11,131
4,618411
1,1130
0
8,880
0
60,98263,95819,315
144,255
0
144,255
154,248
8,635552
3,8394,188
187,622
147,094
23,046
3,815
369551
27,781
7,569
1,989
184,433
1,4271,359
403
187,622
94,203
Aug.
11,128
4,618415
3,6330
209
8,742
190
60,95363,04420,229
144,226
2,263
146,489
159,263
8,158553
3,6173,366
191,118
148,241
25,702
4,189
248447
30,586
7,179
2,056
188,062
1,4341,359
263
191,118
108,053
Sept.
11,128
4,618443
1,6250
1,122
8,737
551
62,89863,04420,229
146,171
9,252
155,423
167,458
7,490552
3,7214,084
199,494
148,172
20,697
16,557
297421
37,792
7,550
2,466
196,160
1,4461,359
529
199,494
109,117
Oct.
11,126
4,618468
3870
0
8,731
0
62,82363,04420,229
146,096
0
146,096
155,214
6,792553
3,7634,987
187,521
148,676
20,227
4,841
339705
26,112
6,042
2,270
184,100
1,4471,359
615
187,521
112,181
Nov.
11,123
4,618428
1,0590
0
8,647
0
64,69163,93420,814
149,439
0
149,439
159,145
8,947551
3,8674,020
192,699
153,800
21,581
2,896
360581
25,418
8,049
2,369
189,636
1,4581,359
246
192,699
1 1 1 ,906
Dec.
11 ,121
4,618415
9180
418
8,645
208
65,81063,93420,814
150,558
1,384
151,942
162,131
9,708547
3,6884,531
196,759
157,097
21,446
3,661
191825
26,123
8,145
2,464
193,829
1,4651,465
0
196,759
114,619
22Digitized for FRASER http://fraser.stlouisfed.org/ Federal Reserve Bank of St. Louis

10. Federal Reserve Banks, 1983—ContinuedB. Federal Reserve note statementMillions of dollars, end of period
Account
I Federal Reserve notesoutstanding(issued to Bank) . .
2 LESS: Notes held byReserve Bank' . .
3 Federal Reservenotes, net
Collateral held againstnotes outstanding
4 Gold certificateaccount
5 Special drawing rightscertificateaccount
6 Other eligible assets . . .7 U.S. government
and agencysecurities
8 Total collateral
Jan.
159,546
21,866
137,680
11,144
4,6180
121,918
137,680
Feb.
159,741
20,681
139,060
11,139
4,6180
123,303
139,060
Mar.
159,568
18,130
141,438
11,138
4,6180
125,682
141,438
Apr.
161,327
18,830
142,497
11,135
4,6180
126,744
142,497
May
163,394
17,611
145,783
11,132
4,6180
130,033
145,783
June
166,397
18,810
147,587
11,131
4,6180
131,838
145,587
July
169,213
22,119
147,094
11,131
4,6180
131,345
147,094
Aug.
171,346
23,105
148,241
11,128
4,6180
132,495
148,241
Sept.
173,093
24,921
148,172
11,128
4,6180
132,426
148,172
Oct.
175,946
26,270
149,676
11,126
4,6180
133,932
149,676
Nov.
178,700
24,900
153,800
11,123
4,6180
138,059
153,800
Dec.
178,875
21,778
157,097
11,121
4,6180
141,358
157,097
C. Maturity distribution of loans and securities heldMillions of dollars, end of period
Type and maturitygrouping
1 Loans2 Within 15 days3 16 days to 90 days . . .4 91 days to 1 year . . .
5 Acceptances6 Within 15 days7 16 days to 90 days . . .8 91 days to 1 year . . .9 U.S. government
securities10 Within 15 days1 . . . .11 16 days to 90 days . . .12 91 days to 1 year . . .1 3 Over 1 year to
5 years14 Over5 years to
10 years15 Over 10 years
16 Federal agencyobligations
17 Within 15 days1 . . . .18 16 days to 90 days . .19 91 days to 1 year . . .20 Over 1 year to
5 years21 Over 5 years to
10 years . . . . . . .22 Over 10 years
Jan.
354338
160
0000
132,3683,755
25,79639,060
35,092
12.09116,574
8,92899
6901,957
4,715
949518
Feb.
1,1551,141
140
0000
135,5613,916
28,24940,865
32,778
12,97016,783
8,923225602
1,963
4,543
1,072518
Mar.
2,8082,782
260
0000
136,6513,525
26,66444,879
31,830
12,97016,783
8,915309508
1,862
4,614
1,104518
Apr.
848805430
704704
00
141,5504,947
30,72444,296
31,972
12,82816,783
9,156484499
2,026
4,499
1,130518
May
1,2601,220
400
0000
141,1804,011
32,65442,680
33,067
1 1 ,70017,068
8,908188585
1,977
4,450
1,190518
June
3,6103,561
490
203203
00
141,6733,767
30,11146,442
32,586
11,70017,067
9,105406583
2,012
4,421
1,165518
July
1,1131,045
680
0000
144,2554,116
34,74843,218
33,108
11,87417,191
8,88082
8141,914
4,418
1,134518
Aug.
3,6333,583
500
209209
00
146,4899,715
28,65743,975
32,863
13,69017,589
8,932336713
1,832
4,370
1,163518
Sept.
1,6251,553
720
1,1221,122
00
155,42313,00733,49944,925
32,713
13,69017,589
9,288725648
1,897
4,331
1,169518
Oct.
3873173436
0000
146,0965,528
30,96545,505
33,093
13,41617,589
8,731133638
1,859
4,353
1,230518
Nov.
1,0591,018
410
0000
149,4397,873
32,49343,553
34,021
13,48518,014
8,645120671
1,799
4,331
1,323403
Dec.
918881
370
418418
00
151,9422,700
38,24745,475
34,021
13,48518,014
8,853386598
1,937
4,196
1,333403
23Digitized for FRASER http://fraser.stlouisfed.org/ Federal Reserve Bank of St. Louis

11. Debits and deposit turnover at commercial banksA. Seasonally adjusted
Year and month
1971JanuaryFebruaryMarchAprilMayJuneJulyAugustSeptemberOctober . .NovemberDecember
1972JanuaryFebruaryMarchAprilMayJuneJulyAugustSeptemberOctoberNovemberDecember
1973JanuaryFebruaryMarchAprilMayJuneJulyAugustSeptemberOctoberNovemberDecember
Debits during the month(annual rate, billions of dollars)
To demand deposits1
Allbanks
12,102.612,487.812,695.712,837.812,842.413,164.813,313.513,426.913,561.113,682.113,905.713,914.9
14,130.714,269.713,978.014,535.814,753.514,837.714,698.715,089.515,500.015,493.916,089.116,403.7
17,063.517,147.617,438.217,752.917,967.718,609.919,272.119,458.019,616.720,245.120,387.220,847.9
MajorN.Y.C banks
4,458.24,713.74,772.84,802,34,672.74,861.04,900.64,938.35,010.75,200.25,101.95,030.9
5,184.25,269.24,994.55,123.05,466.35,383.05,297.05,537.75,646.45,592.55,930.86,024.7
6,234.66,093.25,988.86,269,56,466.06,670.46,872.57,050.37,149.47,243.57,351.17,573,3
Otherbanks
7,644.47,774.07,922.88,035.58,169.78,303.88,412.98,488.78,550.48,481.98,803.78,884.0
8,946.59,000.48,983.59,412.89,287.19,454.79,401.79,551.89,853.69,901.3
10,158.310,379.0
10,829.011,054.411,449.411,483.511,501.611,939.412,399.612,407.812,467.313,001.513,036.113,274.6
Average deposits outstanding(billions of dollars)
Demand deposits
Allbanks
184.2186.2187.3189.0190.7191.4193,5193.1193.8195.3196.3196.6
197.2198.5199.4200.6201.1202.0204.0 .206.5207.7210.2210.6211.3
216.7217.7218.8218.9220.3221.9223.0223.2223.2225.0225.7227.2
MajorN.Y.C. banks
24.024.323.924.224.524.124.523.923.924.423.923.8
23.623.523.523.423.522.923.223.123.323.923.423.4
24.424.324.224.223.924.424.524.924.524.524.925.1
i
Otherbanks
160.2161.9163.3164.8166.2167.3168.9169.2169.9170.9172.4172.8
173.6175.0175.9177.1177.6179.1180.8183.4184.3186.3187.2187.9
192.3193.4194.6194.7196.4197.4198.5198.2198.7200.5200.8202.1
Annual rate of deposit turnover
Demand deposits
Allbanks
65.767.167.867.967.468.868.869.570.070.170.870.8
71.771.970,172.573.473.472.073.174.673.776.477.6
78.778.879.781.181.683.986.487.287.990.090.391.8
MajorN.Y.C. banks
185.7194.0199.4198.3190.9201.9199.8206.4209.5213.5213.6211.7
220.1224.4212.7218.7232.4235.1227.9240.1241.9233.6253.2257.2
255.6250.4247.4259.2270.8272.9280.4282.9291.5295.7295.0301.5
Otherbanks
47.748.048.548.849.249.649.850.250.349.651.151.4
51.551.451.153.152.352.852.052.153.553.254.355.2
56.357.258.859.058.660.562.562.662.764.864.965.7
24Digitized for FRASER http://fraser.stlouisfed.org/ Federal Reserve Bank of St. Louis

11. Debits and deposit turnover at commercial banks—ContinuedA. Seasonally adjusted—Continued
Year and month
1974JanuaryFebruaryMarchAprilMayJuneJulyAugustSeptemberOctoberNovemberDecember . .
1975January . .FebruaryMarchAprilMayJuneJulyAugust . .SeptemberOctober . .NovemberDecember
1976JanuaryFebruaryMarchApril .MayJuneJulyAugust . . .SeptemberOctoberNovemberDecember
Debits during the month(annual rate, billions of dollars)
To demand deposits'
Allbanks
20,785.821,318.721,966.722,078.922,552.322,573.823,088.423,313.224,246.624,055.824,536.324,653.0
24,243.624,579.424,289.824,505.924,904.624,975.324,765.125,144.025,347.826,279.225,929.326,167.5
26,551.827,997.728,420.028,120.928,039.328,632.829,563.729,817.629,526.329,937.230,150.732,450.8
MajorN.Y.C. banks
7,277.47,648.38,013.77,946.18,247.88,351.28,541.28,581.79,171.99,028.69,117.79,203.1
9,192.09,443.89,296.79,571.99,814.89,745.99,535.09,412.89,577.3
10,365.99,932.1
10,133.8
10,471.510,682.811,455.211,170.010,933.611,231.111,973.711,857.511,317.011,873.211,797.312,845.4
Otherbanks
13,508.413,670.413,953.014,132.914,304.514,222.514,547.214,731.615,074.715,027.215,418.615,449.9
15,051.515,135.614,993.014,934.015,089.815,229.415,230.015,731.215,770.515,913.315,997.216,033.7
16,080.317,314.916,964.816,950.917,105.717,401.717,589.917,960.118,209.318,064.118,353.419,605.4
Average deposits outstanding(billions of dollars)
Demand deposits1
Allbanks
228.0228,7230.6233,3232.5232.3231.7232.6233.4233.1234.0233.9
232.3234.3235.2235.6238.9239.8240.2241.4242.4241.2242.9243.1
244.7246.0245.6246.3246.4246.7248.2248.6249.1250.5253.5259.0
MajorN.Y.C, banks
25.125.025.726.026.426.526.226.426.927.027.327.4
27.027.427.127.428.227.227.627.927.527.727.527.5
28.028.128.027.527.227.327.727.527.727.127.427.3
Otherbanks
202.9203.7204.9207.3206.1205.8205.5206.2206.5206.1206.8206.5
205.4206.9208.1208.2210.7212.6212.5213.5214.9213.6215.4215.7
216.8217.9217.5218.8219.2219.3220.5221.0221.4223.5226.0231.7
Annual rate of deposit turnover
Demand deposits
Allbanks
91.293.295.394.697.097.299.7
100.2103.9103.2104.8105.4
104.3104.9103.3104.0104.3104.1103.1104.2104.6108.9106.8107.6
108.5113.8115.7114.2113.8116.1119.1119.9118.6119.5119.0125.3
MajorN.Y.C. banks
290.1305.6312.1306.1312.5314.7326.3325.2340.8334.8334.5336.0
340.6344.7343.1349.5348.4358.2344.9337.2348.8374.6361.7369.1
374.2380.4408.7406.1402.3411.0432.5430.5409.0438.4430.1471.1
t
Otherbanks
66.667.168.168.269.469.170.871.573.072.974.674.8
73.373.272.171.771.671.671.773.773.474.574.374,3
74.279.578.077.578.079.379.881.382.380,881.284.6
25Digitized for FRASER http://fraser.stlouisfed.org/ Federal Reserve Bank of St. Louis

11. Debits and deposit turnover at commercial banks—ContinuedA. Seasonally adjusted—Continued
Year andmonth
1977January . . . .February. . . .MarchAprilMayJuneJulyAugustSeptember . .October . . . .November . .December. . .
1978January . . . .February. . . .MarchAprilMayJuneJulyAugustSeptember . .October . . . .November . .December. . .
1979January . . . .February. . . .MarchAprilMayJuneJulyAugustSeptember . .October . . . .November . .December. . .
Debits during the month(annual rate, billions of dollars)
To demand deposits '
Allbanks
32,470.631,895.432,629.133,602.134,442.934,055.334,194.534,240.334,922.335,275.336,438.736,970.2
36,496.436,898.237,488.739,249.239,678.140,963.740,285.141,686.541,711.442,912.143,251.242,552.9
44,484.544,929.845,998.247,685.247,590.749,810.351,541.551,854.253,731.853,777.152,664.154,768.2
MajorN.Y.C.banks
13,115.113,107.113,147.513,406.814,039.913,511.913,445.913,892.414,401.614,794.714,277.514,903.9
14,190.114,053.914,355.715,290.514,816.115,441.314,877.315,562.815,296.315,599.615,608.215,135.9
16,030.516,150.916,298.417,479.217,103.018,971.919,496.819,442.620,377.720,033.319,571.120,821.4
Otherbanks
19,355.618,788.219,481.620,195.420,403.020,543.420,748.620,347.920,520.720,480.522,161.222,066.3
22,306.322,844.223,133.023,958.724,862.025,522.425,407.826,123.726,415.127,312.427,643.127,417.0
28,454.028,778.929,699.930,206.030,487.730,838.432,044.732,411.633,354.133,743.833,093.033,946.8
ATSand
NOWac-
counts2
10.29.1
11.610.79.9
11.9
13.710.814.414.616.017.215.513.416.716.115.434.2
48.854.571.081.286.192.085.177.496.8
106.594.2
102.9
Savingsde-
posits3
3 38". 6340.2361.8319.9342.9344.2
303.9327.3372.6396.0398.3419.9415.5414.6414.6435.6457.2431.0
488.8441.6502.8562.7661.8579.3638.0654.4586.4695.5697.3635.3
Average deposits outstanding(billions of dollars)
Demand deposits1
Allbanks
254.6255.3258.0259.4260.0261.0267.7268.6270.4273.0274.0277.4
280.1281.3281.9285.2286.6289.5290.8293.1294.1297.1296.9298.3
298.8298.6299.2303.1304.0305.9307.3307.4311.2312.7313.0312.6
MajorN.Y.C.banks
27.727.327.227.527.626.828.227.227.227.127.027.1
27.527.327.127.327.127.128.028.428.128.628.628.5
27.528.028.228.128.428.729.229.329.630.530.930.5
Otherbanks
226.9228.0230.8231.9232.4234.2239.4241.4243.1245.9247.0250.2
252.7254.1254.7257.9259.5262.4262.8264.7266.0268.5268.4269.8
271.2270.6271.0275.0275.6277.3278.1278.2281.5282.2282.2282.1
ATSand
NOWac-
counts2
' i.'s1.61.71.71.81.8
1.91.92.02.02.02.02.12.22.22.32.35.1
6.57.99.19.9
10.510.711.211.912.112.112.412.7
Savingsde-
posits3
2lV.6212.6212.8213.3214.3215.1
217.1218.2219.2220.0221.3221.0218.7218.2218.2217.8217.7215.5
212.5210.3209.5208.4206.8206.9205.8204.5202.2198.7193.7192.5
Annual rate of deposit turnover
Demand deposits1
Allbanks
127.5124.9126.5129.6132.5130.5127.7127.5129.2129.2133.0133.3
130.3131.2133.0137.6138.4141.5138.5142.2141.8144.4145.7142.6
148.9150.5153.7157.3156.6162.8167.7168.7172.7172.0168.2175.2
MajorN.Y.C.banks
473.5479.9482.7487.6509.0503.8476.2510.4529.1545.3528.7549.4
516.8515.3529.3559.9547.0570.2530.8548.6544.4545.8546.3530.6
581.9577.6577.9621.5601.8662.1666.6663.8687.9657.9634.3683.2
Otherbanks
85.382.484.487.187.887.786.784.384.483.389.788.2
88.389.990.892.995.897.296.798.799.3
101.7103.0101.6
104.9106.3109.6109.9110.6111.2115.2116.5118.5119.6117.3120.3
ATSand
NOWac-
counts2
' 6.8'5.76.86.35.56.6
7.25.77.27.38.08.67.46.17.67.06.76.7
7.56.97.88.28.28.67.66.58.08.87.68.1
Savingsde-
posits3
".6".6
1.7.5.6.6
1.41.51.71.81.81.91.91.91.92.02.12.0
2.32.12.42.73.22.83.13.22.93.53.63.3
26Digitized for FRASER http://fraser.stlouisfed.org/ Federal Reserve Bank of St. Louis

11. Debits and deposit turnover at commercial banks—ContinuedA. Seasonally adjusted—Continued
Year andmonth
1980January . . . .February. . . .MarchAprilMayJuneJulyAugustSeptember . .October . . . .November . .December. . .
198!January . . . .February. . . .MarchAprilMayJuneJulyAugustSeptember . .OctoberNovember . .December. . .
1982January . . . .February. . . .MarchAprilMayJuneJulyAugustSeptember . .October . . . .November . .December. . .
1983January . . . .February. . . .MarchAprilMayJuneJulyAugustSeptember . .October . . . .November . .December. . .
Debits during the month(annual rate, billions of dollars)
To demand deposits'
Allbanks
58,128.260,466.359,581.658,698.061,337.260,515.861,827.163,574.663,918.765,853.367,982.570,491.4
72,319.973,995.376,781.876,801.678,223.077 833.983,058.787,495.585,724.883,692.787,450.486,927.1
85,831.586,456.785,467.986,781.388,573.887,602.390 280.795,177.994,480.097,097.095,475.997,748.5
103,333.1102,743.5102,206.1103,022.3107 273.3106,799.4107,884.4111,538.1110,700.7118,407.2114,466.6127,335.8
MajorN.Y.C.banks
23,199.724,240.823,803.124,611.225,443.623,829.224,491.325,441.025,097.926,757.527,013.327,924.8
29,259.230,524.631,808.531,545.032,388.832 918.836,253.339,292.837,841.735,544.635,188.936,731.8
35,142.636,731.735,758.037,038.437,248.235,729.536 880 839,525.337,986.342,077.938,971.642,104.4
46,353.045,133.244,327.446,025.646,891.246,445.446,978.048,373.346,903.752,639.949,715.853,446.6
Otherbanks
34,928.636,225.535,778.434.086.835.893.636,686.637,335.938,133.738,820.739,095.840,969.242,566.6
43,060.743,470.844,973.345.256.745,834.244 915.246,805.448,202.847,883.148,148.152.261.552,786.0
50,688.849.724.949,709.949,742.951.325.751,872.853 399 955,652.656,493.755.019.156,504.455,644.1
56,980.157,610.357,878.756,996.760 382.160,354. 160,906.463,164.963,796.965.767.364,750.873,889.2
ATS
NOWac-
counts2
131.0126.0146.3179.4142.4171.6165.0121.8181.2176.7153.0213.2
522.5542.5777.6872.1709.9895.4734.2674.4864.9813.3828.1897.2
749.1854.1893.7915.7900.5977.6,049.9,146.2,165.4,109.4,224.6,448.1
,262.3,286.4,369.4,202.2.371.5.342.1.390.1,679.5.495.9.392,8.447.4.626. 1
de-posits-1
671.3699.7684.9681.7659.3617.1648.6660.5756.8738.7834.2846.4
725.3694.0674.7656.3664.6717.7620.2795.0651.3635.5631.1689.3
625.0724.7733.7686.4698.9698.9773 8770.7707.8637.0697.1889.3
904.3827.9803.2714.9743 1776.2659.4706.3712.7643.7674.9730.0
Average deposits outstanding(billions of dollars)
Demand deposits'
Allbanks
313.8315.1315.2315.3315.8316.13163316.3316.0317.7313.3311.7
293.1287.8286.4284.3283.7279.4281.4279.5278.0278.4282.0284.6
288.1280.3277,9278.8277.4274.9277.8278.6277.1283,1286.0285.3
286.1284,4287.0286.4289.6290.6290.4289.2287.8289.1287.4289.1
MajorN.Y.C.banks
31.431.930.631.331.530.932.131.031.331.530.731.4
30.231.631.529.630.229.329.630.530.630.530.330,5
30.629.228.628.628.927.629.127.829.632.430.830.5
31.730.930.830.631.932,132.831.731.130.930.230.8
Otherbanks
282.4283.2284.5284.0284.3285.2284.2285.4284.7286.2282.6280.3
262.9256.1254.9254.6253.5250.1251.7249.0247.4247.9251.7254.1
257.5251.0249.3250.3248.5247.3248.6250.9247.4250.7255.2254.9
254.4253.5256.2255.8257.7258.6257.6257.5256.7258.2257.2258.3
ATSand
NOWac-
counts2
13.113.714.213.814.115.616.517.418.318.820.420.7
34.643.448.353.552.253.355.256.257.557.660.062.1
65.767.468.670.368.869.168.871.073.175.478.578.8
79.885.287.686.390 391.692.693.993.993.493.794.2
Savingsde-
posits3
191.8189.1185.1179.4178.2181.5185.3188.7189.2189.4189.6184.0
176.9173.5173.0172,7170.4166.9163.2159.0155.2153.5155.4157.1
159.1158.3159.4159.4159.3158.3155.5154.7154.6157.9163.2187.6
149.8143.1140.6139.3138.6137.9136.4134.8133.9132.3133.4132.3
Annual rate of deposit turnover
Demand deposits'
Allbanks
185.2191.9189.0186.2194.2191.4195.5201.0202.3207.3217.0226.2
246.7257.1268.1270.2275.7278.6295.2313.0308.4300.6310.1305.4
297.9308.5307.5311.2319.3318.7325.0341.6341.0343.0333.8342.6
361.1361.3356.1359.7370.4367.5371.5385.7384.7409.6398.3440.4
MajorN.Y.C.banks
737.7760.2776.9785.5807.4771.2763.0821.4800.9848.2879.6888.7
968.9964.7,009.5,065.1,071.8,123.4,223.3,291.0,237.3,165.8,161.1, 1 1 9 . 1
,148.1,256.5,250.4,296.6,287.8,295.9,265.7,424.2,282.5,298.7,263.7,381.2
,462.3,462.5,437.4,502.8,471.5,449. 1,432.2,526.7,508.8,703.8
1,645.61,733.1
Otherbanks
123.7127.9125.7120.0126.3128.6131.4133.6136.4136.6145.0151.9
163.8169.7176.5177.7180.8179,6185.9193.6193.5194.2207.6207.7
196.9198.1199.4198.8206.6209.8214 8221.8228.3219.5221.4218.3
223.9227.2225.9222.9234 3233.4236.5245.3248.6254.7251.8286.1
ATS
NOWac-
counts2
10.09.2
10.313.010.111.010.07.09.99.47.5
10.3
15.112.516.116.313.616 813.312.015.014.113.814.4
11.412.713.013.013.114.215.316.215.914.715.618.4
15.815.115.613.915.214.715.017.915.914.915.517.3
de-posits3
3.53.73.73.83.73 43.53.54.03.94.44.6
4.14.03.93.83.94 33.85.04.24.14.14.4
3.94.64.64.34.54.45.05.04.64.04.34.7
6.05.85.75.15.45.64.85.25.34.95.15.5
27Digitized for FRASER http://fraser.stlouisfed.org/ Federal Reserve Bank of St. Louis

11. Debits and deposit turnover at commercial banksB. Not seasonally adjusted
Year and month
1971January • •FebruaryMarchAprilMay . .JuneJu lyAugustSeptemberOctober . .NovemberDecember
1972January . .FebruaryMarchApril . .MayJuneJu lyAuuust . .September . .OctoberNovember . .December . .
1973January . .FebruaryMarchApril . .May .JuneJulyAugustSeptemberOctoberNovemberDecember . .
Debits during the month(annual rate, bi l l ions of dollars)
To demand depo
Allbanks
12.034.811.336.413.578.013.423 212,001.2H 684 813.136.412.928.813.384.8H. 206.013.738.815,364.8
13.942.813.165.215,103.214.156.414.955.615.523.214,019.615,332.414,768.415,624.016,114.816,887.6
18.181.215.654.018,139.217,763.618,328.818,693.619.062.019,674.018,055.221.182.420,220.021.381.6
MajorN.Y.C,banks
4.479.14.410.55,260.65,031.74.280.04 942 64.615.04,613.35,055.94.942.95.073.35,877.6
5,194,94,961.35,596.94,940.35,372.25.554.24,788.15,467.35,330.65,529.66,059.16,401,7
6,650.55,712.86.439.16,249.16,481.06,554.86,454.16,921.36,582.87,504,87,350.88,083.1
sits1
Otherbanks
7.555.76,925.98.317.48.391.57.721.28 742 28,521.48,315.58,328.98.263.18,665.59,487.2
8,747.98,203.99,506.39,216.19.583.49.969.09,231.59,865.19,437.8
10,094.410,055.710,485.9
11,530.79,941.2
11,700.111,514.511,847.812,138.812.607.912,752.711,472.413,677.612,869.213.298.5
Average deposits outstanding(b i l l ions ot" dollars)
Demand deposits1
Allbanks
190.0182.7183.6188.6186.6189.9192.2188.1191.2194.8196.1201.6
201,8195.5197.6204.3198.3202.3206.1203.1208.62 1 1 . 4212.9221.3
223.3215.2216.1220.8216.1222.6223. B218.8223.9224.7227.5236.4
MajorN.Y.C.banks
24.824.023.723.723.824.024.122.623.223.923.524.3
24.023.523.624.323.323.223.922.323.524.223.625.4
25.524.524.224.523.624.824.623.724.624.224.826.6
Otherbanks
165,2158.7159.9164.9162.8165.9168.1165.5168.0170.9172.6177.3
177.8172.0174.0180.0175.0179.1182.2180.8185.1187.2189.3195.9
197.8190.7191.9196.3192.5197.8199.2195.1199.3200.5202.7209.8
Annual rate of deposit turnover
Demand deposits'
Allbanks
63.362.074.071.264.372.168.368.770.067.870.176.2
69.167.376.469.375.476.768,075.570.873.975.776.3
81.472.783.980.584.884.085.289.980.694.388.990.4
MajorN.Y.C.banks
180.6183.8222.0212.3179.8205.9191.5204.1217.9206.8215.9241.9
216.52 1 1 . 1237.2203.3230.6239.4200.3245.2226.8228.5256.7252.0
260.8233.2266.1255.1274.6264.3262.4292.0267.6310.1296.4303.9
Otherbanks
45.743.652.050.947.452.750.750.249.648.450.253.5
49.247.754.651.254.855.750.754.651.053.953.153.5
58.352.161.058.761.561.463.365.457.668.263.563.4
28Digitized for FRASER http://fraser.stlouisfed.org/ Federal Reserve Bank of St. Louis

11. Debits and deposit turnover at commercial banks—ContinuedB. Not seasonally adjusted—Continued
Year and month
1974January . . . .FebruaryMarchAprilMay . . . .JuneJulyAugust . . . . . .SeptemberOctoberNovemberDecember
1975January . . . .FebruaryMarchApril . . . .MayJuneJuly .AugustSeptember . . . . .October .NovemberDecember . . . . .
1976JanuaryFebruaryMarchAprilMayJuneJuryAugustSeptemberOctoberNovemberDecember . . . . . . .
Debits during the month(annual rate, billions of dollars)
To demand deposits1
Allbanks
22,209.619,387.221,883.222,880.422,881.621,937.223,707.222,730.423,007.625,352.423,223.626,142.0
25,678.822,195.224,042.025,461.624,381.625,105.225,636.823,605.224,960.027,506.423,546.428,656.0
27,069.624,523.230,423.629,389.226,556.030,496.829,676.029,319.629,505.629,188.829,529.635,679.6
MajorN.Y.C.banks
7,896.17,119.48,167.48,137.08,266.78,081.68,429.78,072.58,725.89,596.48,574.4
10,089.6
9,907.88,664.09,452.39,897.49,494.09,816.49,681.88,500.19,355.1
10,994.89,046.5
11,483.9
10,830.19,436.7
12,396.811,667.010,148.211,901.311,729.011,246.411,398.311,478.811,486.414,594.0
Otherbanks
14,313.512,267.813,715.814,743.414,614.913,855.615,277.514,657.914,281.815,756.014,649.216,052.4
15,771.013,531.214,589.715,564.214,887.615,288.815,955.015,105.115,604.916,511.614,499.917,172.1
16,239.515,086.518,026.817,722.216,407.818,595.517,947.018,073.218,107,317,710.018,043.221,085.6
Average deposits outstanding(billions of dollars)
Demand deposits'
Allbanks
233.4224.9227.9233.8227.0232.6231.4228.0232.2231.7236.7241.8
237.1229.1230.5235.6232.4238.0238.9237.1240.1239.1245.4249.8
249.3241.5241.8248.6243.2247.8250.9246.0249.8254.0257.5268.8
MajorN.Y.C.banks
26.025.125.626.125.426.925.925.426.326.527.228.5
27.627.126.627.227.227.027.226.826.726.427.428.1
28.727.928.127.727.228.228.127.127.427.528.028.3
Otherbanks
207.4199.8202.3207.7201.6205.7205.5202.6205.9205.2209.5213.3
209.5202.0203.9208.4205.2211.0211.7210.3213.4212.7218.0221.7
220.6213.6213.7220.9216.0219.6222.8218.9222.4226.5229.5240.5
Annual rate of deposit turnover
Demand deposits'
Allbanks
95.286.296.097.9
100.894.3
102.599.799.1
109.498.1
108.1
108.396.9
104.3108.1104.9105.5107.399.6
104.0115.096.0
114.7
108.6101.5125.8118.2109.2123.1118.3119.2118.1114.9114.7132.7
MajorN.Y.C.banks
303.7283.6319.0311.8325.5300,4325.5317.8331,8362.1315.2354.0
359.0319.7355.3363.9349.0363.6355.9317.2350.4416.5330.2408.7
377,4338,2441,2421.2373.1422.0417.4415.0416.0417.4410.2515.7
Otherbanks
69.061.467.871.072.567.474.372.369.476.869.975.3
75.367.071.674.772.672.575.471.873.177.666.577.5
73.670.684.480.276.084.780.682.681.478.278.687.7
29Digitized for FRASER http://fraser.stlouisfed.org/ Federal Reserve Bank of St. Louis

11. Debits and deposit turnover at commercial banks—ContinuedB. Not seasonally adjusted—Continued
Year andmonth
1977January . . . .February. . . .MarchAprilMay .JuneJuly . ' . ' . ' . ' . ' . ' .AugustSeptember . .October . . . .November . .December. . .
1978January . . . .February. . . .MarchAprilMayJuneJulyAugustSeptember . .October . . . .November . .December. . .
1979January . . . .February. . . .MarchAprilMayJuneJulyAugustSeptember . .October . . . .November . ,December. . .
Debits during the month(annual rate, billions of dollars)
To demand deposits'
Allbanks
32,068.028,686.735,050.233,605.533,822.936,435.832,956.735,068.934,702.334,188.835,673.538,940.7
37,511.033,012.839,944.237,722.440,320.943,663.238,830.843,133.039,846.942,942.142,213.242,893.3
47,442.740,090.947,139.046,912.748,590.150,831.451,510.653,503.249,648.255,616.350,994.655,047.5
MajorN.Y.C.banks
13,076.311,784.814,358.813,210.213,505.614,707.012^604.413,876.614,325.214,298.113,988.816,119.7
14,767.312,537.415,511,114,587.914,787.616,701.314,144.615,969.614,557.115,362.015,617.815,627.1
17,309.914,382.816,797.717,008.817,413.519,487.319,280.020,077.119,072.520,316.919,169.021,538.6
Otherbanks
18,991.716,901.920,691.420,395.320,317.321,728.820,352.321,192.320,377.119,890.721,684.722,821.0
22,783.720,475.324,433,123,134.525,533.326,961.924,686.227,163.425,289.827,580.126,595.427,266.2
30,132.825,708.230,341.429,903.931,176.731,344.132,230.633,426.130,575.735,299.431,825.533,508.9
ATSand
NOWac-
counts2
9.810.711.111.111.212.1
14.610.512.713.815.815.514.815.915.916.917.234.9
53.250.760.776.484.183.882.391.893.4
113.1106.0103.9
Savingsde-
posits3
338.7346.9335,4344.1314.9341.9
323.8307.9369.1412.3383.6430.9421.3419.3405.1450.5434.1426.8
528.5387.7526.9610.6642.5570.6634.8630.1570.0720.3659.0629.5
Average deposits outstanding(billions of dollars)
Demand deposits1
Allbanks
263.6250.8252.2262.5254.6260 3271.1264.4270.5275.4277.8287.3
288.1274.8274,1288.3278.9287.5292.9287.1295.2298.1298.7308.9
305.5290.3290.3303.7294.5304.3307.3300.0311.9312.1313.4321.5
MajorN.Y.C.banks
29.927.427.227.927.127.128.426.426.627.227.328.3
29.427.226.427.626.127.128.121 A27.828.328.229.4
29.227.427.527.326.929.128.927.329.329.930.131.2
Otherbanks
233.7223.4225.0234.6227.5233.2242.6238.0243.9248.2250.5259.0
258.7247.6247.7260.7252.8260.4264.8260.0267.4269.8270.5279.5
276.3262.9262.8276.4267.6275.3278.5272.7282.6282.3283.3290.3
ATSand
NOWac-
counts2
' Y.51.61.71.71.81.8
1.91.92.02.02.02.02.12.22.22.32.35.1
6.67.68.79.9
10.410.711.412.112.312.412.512.7
Savingsde-
posits3
2 13*. 2213.6213.3214.3214.0214.0
215.8216.4218.2220.1220.6221.0220.5219.7219.7219.6217.8214.6
211.2208.3207.8207.8205.6206.4207.7206.3204.3200.9194.1191.9
Annual rate of deposit turnover
Demand deposits1
Allbanks
121.7114.4139.0128.0132.8140.0121.6132.6128.3124.1128.4135.5
130.2120.1145.7130.8144.6151.9132.6150.2135.0144.1141,3138.9
155.3138.1162.4154.5165.0167.0167.6178.3159.2178.2162.7171.2
MajorN.Y.C.banks
437.3430.1527.9473.5498.4542.7443.2525.6538.5525.7512.4569.6
502.1460.4587.5528.5566.6616.3503.4589.3523.6542.8553.8531.5
592.0524.9610.7623.0647.3670.7667.8731.1651.4680.5636.7689.4
Otherbanks
81.375.792.086.989.393 283.989.083.580.186.688.1
88.182.798.688.7
101.0103.5
93.2104.594.6
102.298.397.6
109.497.8
115.4108.2116.5113.9115.7122.6108.2125.0112.3115.4
ATSand
NOWac-
counts2
6.56.76.56.56.26.7
7.75.56.46.97.97.87.07.27.27.37.56.8
8.16.77.07.78.17.87.27.67.69.18.58.2
Savinssde-
posits3
1.61.61.61.61.51.6
.5
.4
.7
.9
.7
.9
.9
.9
.82.12.02.0
2.51.92.52.93.12.83 13.12.83.63.43.3
30Digitized for FRASER http://fraser.stlouisfed.org/ Federal Reserve Bank of St. Louis
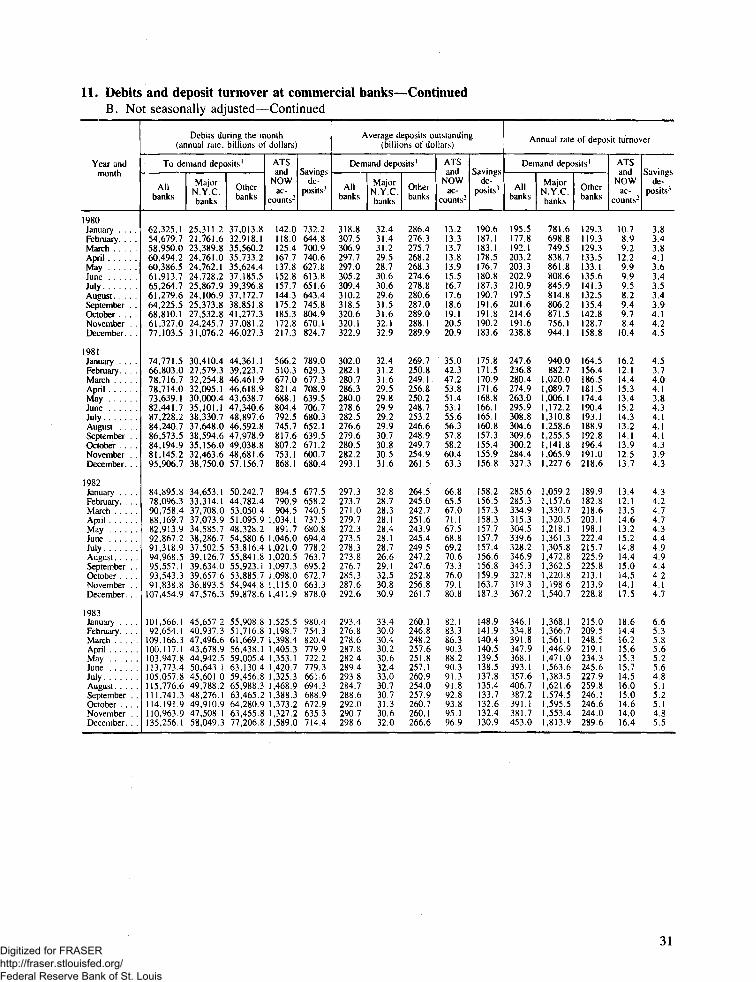
11. Debits and deposit turnover at commercial banks-B. Not seasonally adjusted—Continued
-Continued
Year andmonth
1980January . . . .February. . . .MarchAprilMayJuneJulyAugustSeptember . .October . . . .November . .December. . ,
1981January . . . .February. . . .MarchAprilMayJuneJulyAugustSeptember . .October . . . .November . .December. . .
1982January . . . .February. . , .MarchAprilMayJuneJulyAugustSeptember . .October . . . .November . .December. . .
1983January . . . .February. . . .March . . . . .AprilMayJune , .JulyAugustSeptember . .October . . . .November . .December. . .
Debits during the IT(annual rate, billions o
To demand deposits1
Allbanks
62,325.154,679.758,950.060,494.260,386.561,913.765,264.761,279.664,225.568,810.161,327.077,103.5
74,771.566,803.078,716.778,714.073,639.182,441.787,228.284,240.786,573.584,194.981,145.295,906.7
84,895.878,096.390,758:488,169.782,913.992,867.291,318.994,968.595,557.193,543.391,838.8
107,454.9
101,566.192,654.1
109,166.3100,117.1103,947.8113,773.4105,057.8115,776.6111,741.3114,191.9110,963.9135,256.1
MajorN.Y.C.banks
25,311.221,761.623,389.824,761.024,762.124,728.225,867.924,106.925,373.827,532.824,245.731,076.2
30,410.427,579.332,254.832,095.130,000.435,101.138,330.737,648.038,594.635,156.032,463.638,750.0
34,653.133,314.137,708.037,073.934,585.738,286.737,502.539,126.739,634.039,657.636,893.547,576.3
45,657.240,937.347,496.643,678.944,942.550,643.145,601.049,788.248,276.149,910.947,508.158,049.3
Otherbanks
37,013.832.918.135,560.235.733.235,624.437,185.539,396.837,172.738,851.841.277.337,081.246,027.3
44,361.139,223.746,461.946,618.943,638.747,340.648,897.646,592.847,978.949,038.848,681.657,156.7
50,242.744,782.453,050.451,095.948,328.254,580.653,816.455,841.855,923.153,885.754,944.859,878.6
55,908.851,716.861,669.756 438.159,005.463,130.459,456.865,988.363,465.264,280.963,455.877,206.8
onthdollars]
ATSand
NOWac-
counts2
142.0118.0125.4167.7137.8152.8157.7144.3175.2185.3172.8217.3
566.2510.3677.0821.4688.1804.4792.5745.7817.6807.2753.868.1
894.5790.9904.5
1,034.1891.7
,046.0,021.0,020.5,097.3,098.0,115.0,411.9
.525.5,198.7,398.4,405 3,353.1,420.7,325.3,468.9,388.3
1,373.21,327.21,589.0
de-posits^
732.2644.8700.9740.6627.8613.8651.6643.4745.8804.9670.1824.7
789.0629.3677.3708.9639.5706.7680.3652.1639.5671.2600.7680.4
677.5658.2740.5737.5680.8694.4778.2763.7695.2672.7663.3878.0
980.4754.3820.4779.9722.2779.3661,6694.3688.9672.9635.3714.4
Average deposits outstanding(billions of dollars)
Demand deposits'
Allbanks
318.8307.5306.9297.7297.0305.2309.4310.2318.5320.6320.1322.9
302.0282.1280.7286.3280.0278.6282.5276.6279.6280.5282.2293.1
297.3273.7271.0279.7272.3273.5278.3273.8276.7285.3287.6292.6
293.4276.8278,6287.8282.4289.4293.8284.7288.6292.0290.7298.6
MajorN.Y.C.banks
32.431.431.229.528.730.630.629.631.531.632.132.9
32.431.231.629.529.829.929.229.930.730.830.531.6
32.828.728.328.128.428.128.726.629.132.530.830.9
33.430.030.430.230.632.433.030.730,731.330.632.0
Otherbanks
286.4276.3275.7268.2268.3274.6278.8280.6287.0289.0288.1289.9
269.7250.8249.1256.8250.2248.7253.2246.6248.9249.7254.9261.5
264.5245.0242.7251.6243.9245.4249.5247.2247.6252.8256.8261.7
260.1246.8248.2257.6251.8257.1260.9254.0257.9260.7260.1266.6
ATS
NOWac-
count s-
13.213.313.713.813.915.516.717.618.619.120.520.9
35.042.347.253.851.453.155.656.357.858.260.463.3
66.865.567.071.167.568.869.270.673.376.079.180.8
82.183.386.390.388.290.391.391.892.893.895.196.9
de-posits3
190.6187.1183,1178.5176.7180.8187,3190.7191.6191.8190.2183.6
175.8171.5170.9171.6168.8166.1165.1160.8157.3155.4155.9156.8
158.2156.5157.3158.3157.7157.7157,4156.6156.8159.9163.7187.3
148.9141.9140.4140.5139.5138.5137.8135.4133.7132.6132.4130.9
Annual rate of deposit turnover
Demand deposits'
Allbanks
195.5177.8192.1203.2203.3202.9210.9197.5201.6214.6191.6238.8
247.6236.8280.4274.9263.0295.9308.8304.6309.6300.2284.4327.3
285.6285.3334.9315.3304.5339.6328.2346.9345,3327.8319.3367.2
346.1334.8391.8347.9368.1393.1357.6406.7387.2391.1381.7453.0
MajorN.Y.C.banks
781.6698.8749.5838.7861.8808.6845,9814.8806.2871.5756.1944.1
940.0882.7
,020.0,089.7,006. 1,172.2,310.8,258.6,255.5,141.8,065.9,227.6
,059.2,157.6,330.7,320.5,218.1,361.3,305.8,472.8,362.5,220.8,198.6,540.7
,368.1,366.7,561.1,446.9,471.0,563.6,383.5,621.6,574.5,595.5,553.4,813.9
Otherbanks
129.3119.3129.3133.5133.1135.6141.3132.5135.4142.8128.7158.8
164.5156.4186.5181.5174.4190.4193.1188.9192.8196.4191.0218.6
189.9182.8218.6203.1198.1222.4215.7225.9225.8213.1213.9228.8
215.0209.5248.5219.1234.3245.6227.9259.8246.1246.6244.0289.6
ATS
NOWac-
counts2
10.78.99.2
12.29.99.99.58.29.49.78.4
10.4
16.212.114.415.313.415.214.313,214.113.912.513.7
13.412.113.514.613.215.214.814.415.014.514.117.5
18,614.416.215.615.315.714.516.015.014.614.016.4
de-posits1
3.83.43.84.13.63.43.53.43.94.14.24.5
4.53.74.04.13.84.34.14.14.14.33.94.3
4.34.24.74.74.34.44.94.94.44.24.14.7
6.65.35.85.65.25.64.85.15.25.14.85.5
31Digitized for FRASER http://fraser.stlouisfed.org/ Federal Reserve Bank of St. Louis

12. Measures and components of the money stock and debt1
A. Seasonally adjustedBillions of dollars
Year and month
Measures
Ml M2 M3 Debt
1980JanuaryFebruaryMarchAprilMayJuneJulyAugustSeptemberOctoberNovemberDecember
1981JanuaryFebruaryMarchAprilMayJuneJulyAugustSeptemberOctoberNovemberDecember
1982JanuaryFebruaryMarchAprilMayJuneJulyAugustSeptemberOctoberNovemberDecember
1983JanuaryFebruaryMarchAprilMayJuneJulyAugustSeptemberOctoberNovemberDecember
392.5395.8394.7387.5388.7393.8398.7406.0411.8415.7417.7414.9
418.0420.4424.2430.1428.9428.7431.0433.1433.6433.8436.9441.9
450.3448.1447.9449.8451.5452.3453.1457.7463.5470.2476.4480.5
485.1491.1496.4497.9506.6510.9514.9517.4518.9521.6523.0525.3
,508.5,521.5,526.6,522.6,532.8,551.8,572.1,588.7,603.3,615.8,629.0,632.6
,640.9,653,0,669.6,690.3,697.3,705.4,716.8,733.4,744.8,758.7,776.2,796.6
,814.2,818.1,827.1,839.4,854.2,865.9,878.3,897.3,914.0,928.8,945.7,965.3
2,017.52,054.02,067.42,081.82,102.22,117.02,126.62,135.32,147.92,167.22,182.12,196.1
1,819.71,838.91,846.91,848.21.861.11,879.21,900.31,918.31,932.51,951.11,973.31,989.8
2,013.72,031.62,048.62,074.32,091.22,106.72,129.52,150.92,172.02,192.72,213.22,236.7
2,260.02,269.32,286.32,310.32,327.92,346.72,364.22,389.62,409.52,432.92,448.62,460.3
2,489.92,517.12,532.32,550.62,571.02,593.02,604.02,617.22,636.42,657.12,689.02,707.5
2,134.72,155.72,168.62,177.22,191.02,204.22,220.72,242.72,261.12,279.02,304.62,326.0
2,353.22,374.82,388.52,407.72,430.52,454.02,478.32,502.82,528.22,555.52,578.22,598.4
2,626.22,645.72,667.22,690.92,714.72,741.42,766.82,789.12,812.42,840.02,852.72,868.7
2,907.02,931.12,951.72,980.03,003.33,033.13,059.73,075.13,097.73,114.43,147.53,173.2
3,640.63,671.63,701.23,730.53,748.23,761.23,792.63,822.43,849.23,880.63,914.13,946.9
3,975.74,011.04,040.54,071.94,107.04,142.84,172.24,198.14,230.84,265.84,297.54,323.8
4,357.14,384.44,406.14,440.74,472.74,501.64,530.14,566.54,605.84,631.64,673.34,710.1
4,740.34,767.44,812.54,849.94,895.84,958.15,002.25,041.15,083.75,125.15,166.15,219.0
32Digitized for FRASER http://fraser.stlouisfed.org/ Federal Reserve Bank of St. Louis

Components
Cur-rency2
107.8108.3108.9109.4110.1111.1112.2113.2114.1115.1116.0116.7
117.0117.6118.3119.3119.6120.2121.0121.3121.7122.0122.7124.0
125.0125.5126.0127.1128.2129.1129.8130.7131.7132.5133.1134.1
135.7136,8138.1139.1140,5141.6142.4143.5144.8146.0147.2148.0
Travel-ers
checks3
3.83.83.83.83.83.83.94.04.04.04.14.2
4.24.24.24.24.24.24.24.34.34.34.34.3
4.34.44.44.44.44.54.44.44.44.44.44.3
4.14.34.54.64.64.64.64.74.74.84.94.8
De-mandde-
posits
263.3265.3263.2256.9255.5258.5260.6265.3268.9270.8270.6266.5
253.5245.1242.6243.1239.7237.5237.0236.9235.3235.1235.0236.2
239.3234.7232.8233.2232.2231.2230.7231.4233.2235.9237.8239.7
239.6237.9238.8239.5241.5243.0244.5243.7243.0243.6242.8243.7
Othercheck-
able de-posits5
17.718.418.717.419.220.421.923.424.825.827.127.6
43.353.459.163.565.466.868.870.772.372.574.977.4
81.683.584.785.286.887.688.291.294.297.4
101.1102.4
105.7112.1115.0114.7120.0121.7123.4125.6126.4127.2128.2128.8
Nontransactioncomponents
M26
,116.0,125.6,131.9,135.1,144.2,158.0,173.5,182.7,191.5,200.1,211.3,217.7
1,222.91,232.61,245.41,260.11,268.41,276.71,285.81,300.21,311.21 ,324.91,339.41,354.6
1,363.91,370.01,379.21,389.61,402.71,413.51,425.21,439.61,450.41,458.61,469.31,484.8
1,532.41,562.91,571.01,583.9,595.6,606.1,611.6,617.9,629.0,645.6,659.2,670.8
M37
311.2317.5320.4325.6328.3327.3328.2329.6329.2335.3344.3357.2
372.8378.6379.0384.0393.9401.3412.7417.5427.2434.0437.0440.2
445.8451.2459.2470.9473.7480.8485.9492.3495.6504.1502.9495.0
472.4463.1464.9468.8468.8476.0477.5482.0488.6489.9506.9511.4
Savingsdeposits3
419.3413.1403.2388.4383.7392.8402.4411.2415.2416.2414.5401.4
385.7378.2375.6375.3369.2363.8360.5352.4346.7342.4343.4345.7
350.2348.4347.2346.6346.2346.5344.0345.2348.7357.9366.8362.1
337.7325.6322.2321.9323.1322.8320.7319.3317.9317.1315.4312.9
Smalltimede-
posits4
640.8649.6663.0682.1691.2691.5691.0"391.2594.9701.0713.5731.4
748.0756.6762.2763.0770.5781.2786.4800.2810.4823.3827.1827.3
823.9831.0839.6846.8854.1861.3874.3880.7884.0878.6874.7856.9
795.2753.7733.2727.4722.6724.8737.0749.0759.0773.0785.5793.1
Largetimede-
posits5
223.6227.5231.8236.6238.2234.3231.0231.8235.3240.0247.9258.5
269.0274.0273.8273.1280.5287.4294.4299.6301.9301.3300.9301.6
305.1311.1316.2320.8321.7325.9331.0331.7331.3334.8335.0327.9
307.4297.1295.4298.3298.0303.0304.2308.6313.2315.6320.7325.9
Federaldebt
668.7670.8675.8687.5696.7696.5706.5714.9720.7727.4735.3742.8
749.5761.5768.7773.9780.1786.7790.0792.3798.0811.2822.0830.1
841.7850.7854.0866.2874.0883.6898.8915.3935.2943.9968.6991.4
,000.1,016.9,039.5,052.1,074.9,106.9,120.1,136.1,148.9,162.9,169.7,177.9
Non federaldebt
2,971.93,001.03,025.53,043.03,051.63,064.73,086.13,107.53,128.53,153.23,178.83,204.1
3,226.23,249.53,271.93,298.13,326.93,356.23,382.23,406.83,432.83,454.63,475.53,493.7
3,515.33,533.73,552.13,574.53,598.73,618.03,631.23,651.23,670.53,687.73,704.73,718.7
3,740.23,750.63,773.03,797.83,820.93,851.23,882.23,904.93,934.83,962.43,996.94,041.0
1980Jan.Feb.Mar.Apr.MayJuneJulyAug.Sept.Oct.Nov.Dec.
1981Jan.Feb.Mar.Apr.MayJuneJulyAug.Sept.Oct.Nov.Dec.
1982Jan.Feb.Mar.Apr.MayJuneJulyAug.Sept.Oct.Nov.Dec.
1983Jan.Feb.Mar.Apr.MayJuneJulyAug.Sept,Oct.,Nov.Dec.
33Digitized for FRASER http://fraser.stlouisfed.org/ Federal Reserve Bank of St. Louis

12. Measures and components of the money stock and debt1-B. Not seasonally adjustedBillions of dollars
-Continued
Year and month
Measures
Ml M2 M3 Debt
1980JanuaryFebruaryMarchAprilMayJuneJulyAugustSeptemberOctoberNovemberDecember
1981JanuaryFebruaryMarchAprilMayJuneJulyAugustSeptemberOctoberNovemberDecember
1982JanuaryFebruaryMarchAprilMayJuneJulyAugustSeptemberOctoberNovemberDecember
1983JanuaryFebruaryMarchAprilMayJuneJulyAugustSeptemberOctoberNovemberDecember
396.1386.3387.8392.6383.3393.1400.5404.3411.1417.3421.3424.8
421.7410.6417.2436.2423.4427.7432.8430.9432.3435.2440.5452.3
454.4438.0441.0456.3446.1451.3454.8454.9461.5471.3480.0491.9
489.6480.6489.2505.2500.7509.8516.6513.5516.3522.3526.7537.8
1,509.61,509.71,522.01,529.41,526.61,552.21,577.61,590.01,603.61,619.11,630.01,635.4
1,642.51,641.31,665.71,697.91,691.01,705.71,722.31,734.21,743.5,761.2,777.0,798.7
,816.4,806.8,824.7,848.3,848.5,866.6,883.7,897.1,910.4,930.1,945.7,967.4
2,020.42,043.22,066.62,092.42,096.72,118,12,131,92,133.32,142.22,167.12,181.22,197,9
1,822.51,831.61,844.71,853.21,854.91,876.31,901.51,918.91,931.41,952.51,975.81,996.1
2,017.32,024.92,046.72,080.02,085.02,103.52,129.62,151.02,169.52,193.32,215.82,242.7
2,264.52,263.12,285.42,316.42,322.32,343.92,363.72,389.12,405.72,432.52,450.42,466.6
2,495.02,510.22,532.22,558.42,565.92,591.22,604.02,615.62,631.02,655.72,690.12,713.6
2,139.72,152.32,169.72,185.82,187.72,200.22,218.02,238.12,256.12,277.82,306.42,332.8
2,359.92,373.52,390.62,416.72,426.52,449.32,473.62,497.02,521.12,553.32,580.22,605.6
2,634.72,646.22,670.82,700.32,710.72,736.52,760.42,786.32,802.92,836.92,854.32,876.5
2,917.12,932.32,956.72,991.22,999.33,028.63,052.53,070.63,085.53,110.43,148.83,181.1
3,632.73,654.33,686.43,711.53,729.43,742.13,772.33,805.33,837.53,867.73,901.93,946.9
3,967.63,995.54,028.74,053.54,086.54,121.64,150.64,181.64,222.64,256.44,287.74,323.8
4,348.94,369.14,395.04,422.14,451.64,479.24,505.94,546.54,594.64,619.14,661.94,710.1
4,730.44,748.24,797.34,826.94,871.24,933.24,975.65,019.35,071.65,111.55,153.85,219.0
34Digitized for FRASER http://fraser.stlouisfed.org/ Federal Reserve Bank of St. Louis

Components
Cur-rency2
106.7107.0108.1108.8110.1111.3112.9113.9113.9115.0117.1118.8
116.1116.2117.2118.7119.7120.3121.9121.9121.5121.9123.6126.1
124.1123.9124.7126.6128.2129.3130.8131.1131.3132.4133.9136.4
134.4135.0136.7138.7140.4141.9143.6143.8144.3145.7147.9150.5
Travel-ers
checks3
3.63.63.63.63.74.04.44.44.24.03.93.9
4.04.04.04.04.14.44.74.74.54.34.14.1
4.14.14.24.24,34.74.94.94.74.44.24.0
3.94.14.34.44.54.95.25.15.04.84.64.6
De-mandde-
posits4
268.2257.8257.7260.7250.6257,4261.4262.8268.3272.5273.4274.7
258.1238.4237.7246.4235.4236.5237.5234.6234.5236.5237.5243.6
243.7228.5228.4236.0228.3230.1231.2229.1232.3237.2240.2247.3
244.3231.9234.3242.1237.5241.8244.9241.1242.0244.8245.2251:6
Othercheck-
ablede-
posits5
17.617.918.419.418.920.421.923.124.625.626.927.4
43.652.058.267.064.366.668.769.771.872.575.278.5
82.581.583.789.585.487.388.089.893.297.3
101.6104.1
107.0109.5113.9120.0118.2121.2122.9123.5124.9127.0128.9131.2
Nontransactioncomponents
M26
1,113.51,123.51,134.21,136.81,143.31,159.11,177.11,185.71,192.51,201.81,208.61,210.6
1,220.81,230.71,248.51,261.81,267.51,278.01,289.61,303.41,311.21,326.01,336.51,346.3
1,362.01,368.81,383.71,391.91,402.41,415.31,428.81,442.21,448.91,458.81,465.71,475.5
1,530.81,562.71,577.41,587.21,596.11,608.31,615.21,619.81,626.01,644.81,654.51,660.1
M37
312.9321.8322.7323.8328.3324.1323.9328.9327.8333.4345.9360.7
374.8383.7381.1382.1394.1397.8407.3416.8426.0432.0438.8444.1
448.1456.4460.7468.1473.8477.3480.0491.9495.3502.4504.8499.2
474.5466.9465.5466.0469.1473.1472.1482.3488.8488.6508.9515.6
Over-night
RPs andEuro-
dollars8
21.621.923.119.920.923.026.827.528.428.528.628.3
30.028.630.430.432.535.335.137.534.732.633.935.9
40.537.939.337.340.340.642.342.941.944.745.944.1
47.848.548.750.855.456.153.152.453.557.055.356.1
Money marketmutual fundsGen-eral
purposeand broker/
dealer
37.845.348.347.950.755.959.461.561.261.462.161.6
63.772.982.994.398.1
101.3110.8120.4128.9135.7143.0150.6
153.8155.9158.8161.8163.8169.7171.8180.9185.1186.8190.8185.2
168.2160.6154.8148.2141.4140.2138.7139.1137.8137.5138.8138.2
Insti-tutiononly
10.611.912.011.914.017.319.920.318.216.815.915.0
15.618.021.122.921.321.523.224.928.031.133.436.2
35.433.734.734.435.236.739.246.448.348.949.948.4
46.045.444.041.340.539.538.638.438.839.840.640.3
Moneymarketdeposit
accounts
.0
.0
.0
.0
.0
.0
.0
.0
.0
.0
.0
.0
.0
.0
.0
.0
.0
.0
.0
.0
.0
.0
.0
.0
.0
.0
.0
.0
.0
.0
.0
.0
.0
.0
.043.0
189.9279.6321.0341,4357.4368.6370.5368.6369.5370.5372.9376.0
Savingsdeposits9
415.1407.5400.3388.3383.1393.0407.1415.2418.7420.0413.0398.2
382.0373.6373.5376.0369.6364.8365.1355.1348.2344.2341.4342.2
346.8344.9346.6348.6347.9348.6348.5346.9348.3357.9363.6357.6
334.8323.4323.0324.7325.5325.8324.8319.8316.2316.0312.0308.5
Smalltimede-
posits10
644.1653.9667.6686.0693.8692.4689.2686.9689.7697.6711.1728.3
751.4761.4767.4766.9773.1782.2784.5796.1805.3819.8824.3823.4
827.3836.1844.9850.2856.2862.0872.4877.4879.7876.0872.0852.5
797.7758.0737.4729.7723.8725.1735.8747.0756.3771.4783.1788.6
Largetimede-
posits ' '
227.1231.2234.2235.0237.0230,6226.5229.7234.1239.6249.8262.8
272.7278.0276.0271.0278.9283.1288.9297.4301.1301.5303.3306.3
308.7314.7317.6317.7319.5321.8325.5330.5331.7335.9337.7332.5
310.1299.2295.6295.0295.9299.8300.1308.5314.8317.9323.7329.8
Federaldebt
668.8670.8682.6687.3692.6688.0697.7708.8715.1719.9729.1742.8
749.5763.5778.6774.9775.4776.0779.4785.9794.4804.8815.8830.1
840.1850.8866.8865.3868.5871.8886.1907.2929.4935.6961.5991.4
997.81,015.7
,047.0,049.7,068,2,093.9,105.8,126.3,141.8,153.5,162.4,177.9
Non-federal
debt
2,963.92,983.43,003.83,024.23,036.83,054.13,074.53,096.53,122.43,147.83,172.93,204.1
3,218.03,232.03,250.13,278.63,311.13,345.63,371.23,395.73,428.13,451.63,471.93,493.7
3,508.83,518.43,532.23,556.83,583.13,607.43,619.83,639.23,665.13,683.53,700.43,718.7
3,732.63,732.53,750.23,777.23,803.03,839.33,869.73,893.03,929.33,958.03,991.34,041.0
1980Jan.Feb.Mar.Apr.MayJuneJulyAug.Sept.Oct.Nov.Dec.
1981Jan.Feb.Mar.Apr.MayJuneJulyAug.Sept.Oct.Nov.Dec.
1982Jan.Feb.Mar.Apr.MayJuneJulyAug.Sept.Oct.Nov.Dec.
1983Jan.Feb.Mar.Apr.MayJuneJulyAug.Sept.Oct.Nov.Dec.
35Digitized for FRASER http://fraser.stlouisfed.org/ Federal Reserve Bank of St. Louis
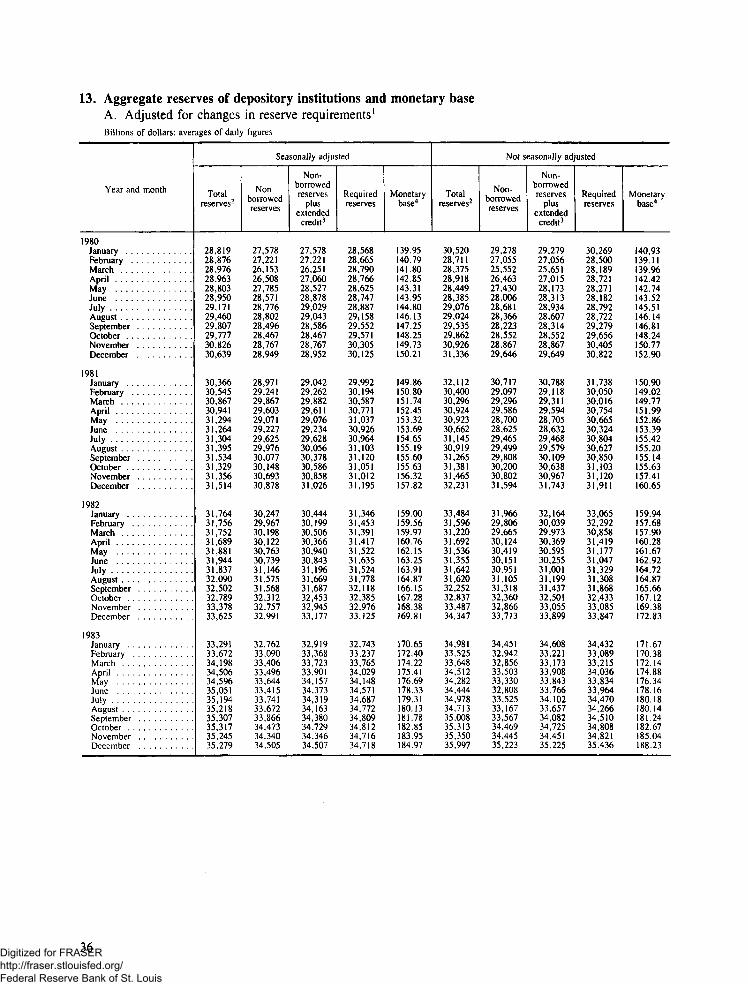
13. Aggregate reserves of depository institutions and monetary baseA. Adjusted for changes in reserve requirements1
Billions of dollars; averages of daily figures
Year and month
1980JanuaryFebruaryMarchAprilMayJuneJulyAugustSeptemberOctoberNovemberDecember
1981JanuaryFebruary . . .MarchAprilMayJuneJulyAugustSeptemberOctoberNovemberDecember
1982JanuaryFebruaryMarchAprilMayJuneJulyAugustSeptemberOctoberNovember . . . .December
1983JanuaryFebruaryMarch .AprilMayJuneJulvAugustSeptemberOctoberNovemberDecember
Seasonally adjusted
Totalreserves2
28,81928,87628,97628,96328,80328,95029,17129,46029,80729,77730,82630,639
30,36630,54530,86730,94131,29431,26431,30431,39531,53431,32931,35631,514
31,76431,75631,75231,68931,88131,94431,83732,09032,50232,78933,37833,625
33,29133,67234,19834,50634,59635,05135,19435,21835,30735,31735,24535,279
Non-borrowedreserves
27,57827,22126,15326,50827,78528,57128,77628,80228,49628,46728,76728,949
28,97129,24129,86729,60329,07129,22729,62529,97630,07730,14830,69330,878
30,24729,96730,19830,12230,76330,73931,14631,57531,56832,31232,75732,991
32,76233,09033,40633,49633,64433,41533,74133.67233,86634,47334,34034.505
Non-borrowedreserves
plusextended
credit3
27,57827,22126,25127,06028,52728,87829,02929,04328,58628,46728,76728,952
29,04229,26229,88229,61129,07629,23429,62830,05630,37830,58630,85831,026
30,44430, 19930,50630,36630,94030,84331,19631,66931,68732,45332,94533,177
32,91933,36833,72333,90134,15734,37334,31934,16334,38034,72934,34634.507
Requiredreserves
28,56828,66528,79028,76628,62528,74728,88729,15829,55229,57130,30530,125
29,99230,19430,58730,77131,03730,92630,96431,10331,12031,05131,01231,195
31,34631,45331,39131,41731,52231,63531,52431,77832,11832,38532,97633,125
32,74333,23733,76534,02934,14834,57134,68734,77234,80934,81234,71634,718
Monetarybase4
139.95140.79141.80142.85143.31143.95144.80146.13147.25148.25149.73150.21
149.86150.80151.74152.45153.32153.69154.65155.19155.60155.63156.32157.82
159.00J59.56159.97160.76162.15163.25163.91164.87166.15167.28168.38169.81
170.65172.40174.22175.41176.69178.33179.31180.13181.78182.85183.95184.97
Not seasonally adjusted
Totalreserves2
30,52028,71128,37528,91828,44928,38529,07629,02429,53529,86230,92631,336
32,11230,40030,29630,92430,92330,66231,14530,91931,26531,38131,46532,231
33,48431,59631,22031,69231,53631,35531,64231,62032,25232,83733,48734,347
34,98133,52533,64834,51234,28234,44434,97834,71335,00835,31335,35035,997
Non-borrowedreserves
29,27827,05525,55226,46327.43028,00628,68128,36628,22328,55228,86729,646
30,71729,09729,29629,58628,70028,62529,46529,49929,80830,20030,80231,594
31,96629,80629,66530,12430,41930,15130,95131,10531,31832,36032,86633,713
34,45132,94232,85633,50333,33032,80833,52533,16733,56734,46934,44535,223
Non-borrowedreserves
plusextended
credit3
29,27927,05625,65127,01528,17328,31328,93428,60728,31428,55228,86729,649
30,78829,11829,31129,59428,70528,63229,46829,57930,10930,63830,96731,743
32,16430,03929,97330,36930,59530,25531,00131,19931,43732,50133,05533,899
34,60833,22133,17333,90833,84333,76634,10233,65734,08234,72534,45135,225
Requiredreserves
30,26928,50028,18928,72128,27128,18228,79228,72229,27929,65630,40530,822
31,73830,05030,01630,75430,66530,32430,80430,62730,85031,10331,12031,911
33,06532,29230,85831,41931,17731,04731,32931,30831,86832,43333,08533,847
34,43233,08933,21534,03633,83433,96434,47034,26634,51034,80834,82135.436
Monetarybase4
140,93139.11139.96142.42142.74143.52145.51146.14146.81148.24150.77152.90
150.90149.02149.77151.99152.86153.39155.42155.20155.14155.63157.41160.65
159.94157.68157.90160.28161.67162.92164.72164.87165.66167.12169.38172.83
171.67170.38172.14174.88176.34178.16180.18180.14181.24182.67185.04188.23
36Digitized for FRASER http://fraser.stlouisfed.org/ Federal Reserve Bank of St. Louis

13. Aggregate reserves of depository institutions and monetary baseB. Not adjusted for changes in reserve requirements5
Billions of dollars; averages of daily figures
-Continued
Year and month
1980JanuaryFebruaryMarchAprilMayJuneJulyAugustSeptemberOctoberNovemberDecember
1981JanuaryFebruaryMarchAprilMayJuneJulyAugustSeptemberOctoberNovemberDecember
1982JanuaryFebruaryMarchApril . , .MayJuneJulyAugustSeptemberOctoberNovemberDecember
1983JanuaryFebruaryMarchAprilMayJune .JulyAugustSeptemberOctoberNovemberDecember
Totalreserves2
45,17943 17743,09644,88043,96343 47242,85940,37341 16441 70441,24440,660
41,62139 87239,68740,33840 52240,44641 00641 00740,59140,71040 94941,925
43 20241,28539 22739,55739 55039,56639,96440,17939,96040,58741 20041,854
41 86439,79938,03538 65038,28238,41538 94838,66137 91638,13738,14438,894
Non-borrowedreserves
43,93841 52240 27342,42542,94543 09242 46439,71539 85240 39439 18538,970
40,22638 56838 68839,00038 29938,40939 32739 58839 1353953040 28641 289
41 68539,49637 67237 98938 43238 36139 27339,66339 02740,11040 58041 221
41 33439,21737 24237 64137,33036 77937 49537,11436 47537.29437 23938.120
Non-borrowedreserves
plusextended
credit3
43,93841 55240,37242.97743,68743 40042,71739,95639 94340 39439,18538,973
40,29738 59038,70239,00838 30438,41639 33039 66839 43539,96740 45141 437
41 88239,72837 98138 23438 60938 46539,32339,75739 14540,25140 76841,406
41 49139,49537 56038 04637,84337 73738 07237,60536 99037,55037 24538,122
Requiredreserves
44,92842^96642,91044.68343,78543 26842i 57540,07140 90841 49840 72340,146
41,24739 52 139 40740,16940 26540 10840 66640 71540 17740,43340 60541 606
42 78440,98138 86639 28439 1913<> 25839 65139,86639 57640,18340 79941 354
41 31539,36437 60138 17437 83337 93438 44038,2143:7 41837,63337 61538,333
Monetarybase4
156.18154 13155 05157 68157.99158 79159 91158 29159 29160 93161 86163.00
161.28159 19159 83162 11163 12163 83165 99165 95164 55165 04166 98170 47
169 95167.64166 24168 50170 03171 45173 37173.81173 37174.88177 15180 52
179 10177 26177 28179 86181 28183 14185 30185.40185 11186.60188 97192 36
Excess6
251211186197178203284302256206521514
374350280169257338340292414278344319
418304361273359308314312384404402500
548435433476449480507446498505529561
Borrowings
1 2411 6552 8232 4551,018
379395658
1 3111 3102 0601,690
1,3951 3041 0001 3382 223
'2 0371 6791 4201 4561 181
663636
518,790555568117205691525933477621634
529582792
1 009952
1 6361 4531,5461 441
844906774
37Digitized for FRASER http://fraser.stlouisfed.org/ Federal Reserve Bank of St. Louis

14. Loans and securities of all commercial banks, 19831
A. Seasonally adjustedBillions of dollars; averages of Wednesday figures
Category
1 Total loans and securities2
2 U S Treasury securities3 Other securities4 Total loans and leases2
5 Commercial andindustrial loans
6 Real estate loans7 Loans to individuals8 Security loans9 Loans to nonbank financial
institutions10 Agricultural loans1 1 Lease financing receivables . .12 All other loans
Jan.
1,428.2
139.8243. 33
1.045.03
395. 23
305. 33
192.73
22.7
31.736.513.347.6
Feb.
1,436.3
144.5243.1
1,048.7
394.94
307.54
192,922.2
31.636.913.349.3
Mar.
1,450.1
151.0242.8
1,056.3
396.2309.5194.822.6
32.037.313.150.8
Apr.
1,460.6
157.8243.4
1,059.5
392.9311.4196.022.9
31.637.613.154.0
May
1,474.4
166.1245.0
1,063.3
392.9313.6197.923.4
31.137.813.153.5
June
1,488.0
171.2246.2
1,070.6
395.0317.0199.822.3
31.138.213.054.2
July
1,499.9
172.9246.1
1,080.9
399.2319.4203.1
23.7
31.238.412.953.0
Aug.
1,513.2
174.4247.8
1,091.0
402.5322.5205.523.0
30.938.612.955.1
Sept. Oct.
1,520.3 1,532.95
176.9 182.3247.1 246.5
1,096.3 1,104.1s
402.6 404.95
326.2 329.2207.7 212.023.7 25.2
30.8 30.438.9 39.112.9 13.053.5 50.55
Nov.
1,548.9
186.2247.1
1,115.7
408.0332.1215.426.2
29.839.313.051.8
Dec.
1,566.5
188.0247.5
1,131.0
413.8334.6219.227.3
29.739.613.153.7
MEMO13 Total loans and securities
plus loans sold2* 6
14 Total loans plus loans sold6
15 Total loans soldto affiliates6
16 Commercial and industrialloans plus loans sold6
17 Commercial and industrialloans sold
18 Acceptances held19 Other commercial and
industrial loans20 To U.S. addressees21 To non-U.S. addressees7 . .22 Loans to foreign banks
1,431.1 1,439.3
1.048.03 1,051.6
30 30
397. 53 397.24
2 3 2 38.8 8.2
386.4 386.6374.0 374.4
12.3 12.213.7 14.3
1,453.1
1,059.3
30
398.5
2 48.9
387.3374.9
12.314.9
1,463.6
1,062.4
3 0
395.3
2 48.9
384.0372.1
11.915.2
1,477.2
1,066.1
2 8
395.1
2 28.2
384.8371.8
13.015.1
1,490.7
1,073.3
2 7
397.2
2 18.0
387.1373.8
13.315.0
1,502.6
1,083.5
2 7
401.3
2 18.4
390.8378.3
12.514.4
1,515.7
1,093.5
2 6
404.5
2 08.5
394.1381.5
12.514.5
1,522.8
1,098.9
2 6
404.6
2 08.3
394.3381.8
12.514.0
1,535.55
1,106.75
2 6
406.85
2 08.9
396.0383.2
12.814.4
1,551.4
1,118.2
2 5
410.0
1 98.6
399.4387.0
12.414,3
1,568.9
1,133.4
2 4
415.6
1 88.3
405.5395.3
10.312.7
38Digitized for FRASER http://fraser.stlouisfed.org/ Federal Reserve Bank of St. Louis

14. Loans and investments of all commercial banks, 19831—ContinuedB. Not seasonally adjustedBillions of dollars; averages of Wednesday figures
Category
1 Total loans and securities2
2 U.S. Treasury securities3 Other securities4 Total loans and leases2 , .5 Commercial and
industrial loans6 Real estate loans7 Loans to individuals8 Security loans9 Loans to nonbank financial
institutions10 Agricultural loans1 1 Lease financing receivables . .12 All other loans
Jan.
1,430.5
139.3243. 53
1,047.73
394. 13
305. 93
193 23
22 9
31 936 313.350.2
Feb.
1,432.0
145.1242.6
1,044.3
393. 44
307. 24
192.321.5
31 736.413.348.6
Mar.
1,445.0
153.2242.3
1,049.5
395.1308.6193 022.0
31 636.513.149.6
Apr.
1,460.0
160.6243.4
1,056.0
395.2310.4194 722.9
31 337 013.151.5
May
1,468.1
165.3245.2
1,057.6
393 1312.4196 722 5
30 737 713.151.5
June
1,485.6
171.6245.9
1,068.0
394.4315.4199023.5
30738 413.053.7
July
1,493.6
171.6244.8
1,077.2
397.9318.4202 1
23.1
30638.812.953.4
Aug.
1,507.0
172.4247.0
1,087.5
400.1322.2205 7
23.6
30 739 112.953.1
Sept.
1,521.6
176.3247.1
1,098.3
402.2326.9209 123.4
30939.412.953.4
Oct.
1,538.0
180.9246.8
1,110.3s
405. 55330.5213 7
25 0
30 639 613.052.55
Nov.
1,556.1
185.0247.6
1,123.5
4099333 4216 7
26 7
30 239 613.053.9
Dec.
1,577.8
188.82490
1,140.0
416 2335 6220 7
28 2
30 639 613.156.0
MEMO13 Total loans and securities
plus loans sold2
14 Total loans plus loans sold2 . . . .15 Total loans sold
to affiliates16 Commercial and industrial
loans plus loans sold17 Commercial and industrial
loans sold8
18 Acceptances held . .19 Other commercial and
industrial loans20 To U.S. addressees21 To non-U.S. addressees . . .22 Loans to foreign banks
1,433.5
1,050.73
3 0
396 43
2.39.2
384.9372.6
12.214.3
1,434.9
1,047.3
30
395 74
2.38.4
385.0372.7
12.314.1
1,448.0
1,052.5
3 0
397 4
2.48.5
386.5374.4
12.214.6
1,462.9
1,059.0
3 0
397 5
2.48.2
386.9375.1
11.814.6
1,470.9
1,060.4
2 8
395 3
2 27.7
385.4373.4
12.014.5
1,488.3
1,070.8
2 7
3965
2.18.0
386.3374.3
12.114.5
1,496,3
1,079.9
2 7
400 0
2.18.3
389.6377.5
12.114.0
1,509.6
1,090.1
2 6
402 1
2.08.2
391.9379.7
12.214.0
1,524.2
1,100.8
2.6
404 2
2.08.3
393.9381.6
12.414.4
1,540.55
1,112.9s
2 6
407 55
2.08.8
396.8383.9
12.814.8
1,558.6
1,126.0
2 5
411 8
L98.9
401.0388.2
12.914.5
1,580.2
1,142.4
2 4
418 0
1 89.1
407.1394.5
12.613.6
39Digitized for FRASER http://fraser.stlouisfed.org/ Federal Reserve Bank of St. Louis

15. Major nondeposit funds of commercial banks1
Monthly averages, billions of dollars
Source
Total nondeposit funds1 Seasonally adjusted"2 Not seasonally adjusted . .
Federal funds, RPs, and otherborrowings from nonbanks3
3 Seasonally adjusted4 Not seasonally adjusted5 Net balances due to foreign -related
institutions, not seasonally adjusted . .6 Loans sold to affiliates, not seasonally
adjusted**
MEMO7 Domestically chartered banks' net
positions with own foreign branches,not seasonally adjusted5
8 Gross due from balances9 Gross due to balances
10 Foreign- related institutions1 net positionswith directly related institutions,not seasonally adjusted6
1 1 Gross due from balances12 Gross due to balances
Security RP borrowings13 Seasonally adjusted14 Not seasonally adjusted
U.S. Treasury demand balances8
15 Seasonally adjusted16 Not seasonally adjusted
Time deposits, $100,000 or more9
17 Seasonally adjusted18 Not seasonally adjusted
1972
Dec.
28 728 3
17 216.8
8.9
2.6
1.96
2.5
702.79 7
6.46.1
7.27.4
86.786.8
Jan.
28 528 7
16 917.2
8.9
2.7
1.87
2.5
7 12.89 8
7 36.5
7.58.1
87.988.6
Feb.
28 829 3
18 118.5
7.8
2.8
1.75
2.2
6 23.09 2
797.8
8 79.9
93 693.1
Mar.
30 730 3
20 8205
6.7
3 1
1.61 l2 7
5 13.38 4
7 87.7
9510.4
101 8100.9
Apr.
31 330.6
20.619.9
7.1
3.6
1.6.8
2.4
5.52.88 3
7.47.4
8.18.3
106.1105.0
May
35.134.6
23.623.2
7.8
3.6
1.7.9
2.6
6.12.88 9
7.37.6
7.08.7
108.6108.6
19
June
35.836.0
24.224.4
8.0
3.6
1.8.8
2.6
6.23.395
8.58,7
7.07.1
110.1108.6
73
July
39039.7
27.027.8
8.1
3.9
2.0] 13.1
6.13.59 6
10.010.3
6.76.5
114.4112.8
Aug.
42 341.6
29 729.0
8.1
4.5
2.11 13.2
603.29 2
10.310.7
5.24,1
120.5122.0
Sept.
43 943 2
31 931 3
7.4
4 6
1.61 i2 7
5 83.39 1
11 411.6
5 45.3
125.8128.1
Oct.
44 644.0
33 032.4
7.0
4.6
1.21 42.6
5 84.09 8
12.712.7
6.86.0
127.4129.2
Nov.
45 547 7
33 635 7
7.6
4 3
1.41 32 7
6 239
10 1
12 012.8
5 64.3
127 4126.7
Dec.
44 944 5
33 332 9
7.2
4 4
1 31 42 7
5 9409 9
12 311 6
6 06 3
127 7128 1
40Digitized for FRASER http://fraser.stlouisfed.org/ Federal Reserve Bank of St. Louis

15. Major nondeposit funds of commercial banks1-Monthly averages, billions of dollars
-Continued
Source
Total nondeposit funds1 Seasonally adjusted2
2 Not seasonally adjustedFederal funds, RPs, and other borrowings from
nonbanks3
3 Seasonally adjusted . .4 Not seasonally adjusted5 Net balances due to foreign-related institutions,
not seasonally adjusted6 Loans sold to affiliates, not seasonally
adjusted4
MEMO7 Domestically chartered banks' net positions with
own foreign branches, not seasonallyadjusted*5
8 Gross due from balances9 Gross due to balances . . . .
10 Foreign-related institutions' net positions withdirectly related institutions, not seasonallyadjusted6
1 1 Gross due from balances12 Gross due to balances
Security RP borrowings13 Seasonally adjusted . . . .14 Not seasonally adjusted
U.S. Treasury demand balances8
15 Seasonally adjusted16 Not seasonally adjusted
Time deposits, $100,000 or more9
17 Seasonally adjusted18 Not seasonally adjusted
Total nondeposit funds1 Seasonally adjusted2
2 Not seasonally adjusted . . .Federal funds, RPs, and other borrowings from
nonbanks3
3 Seasonally adjusted4 Not seasonally adjusted5 Net balances due to foreign-related institutions,
not seasonally adjusted6 Loans sold to affiliates, not seasonally
adjusted4
Mt- MO7 Domestically chartered banks' net positions with
own foreign branches, not seasonallyadjusted5
8 Gross due from balances9 Gross due to balances
10 Foreign-related institutions' net positions withdirectly related institutions, not seasonallyadjusted6
1 1 Gross due from balances12 Gross due to balances
Security RP borrowings13 Seasonally adjusted'14 Not seasonally adjusted
U.S. Treasury demand balances8
15 Seasonally adjusted16 Not seasonally adjusted
Time deposits, $100,000 or more9
17 Seasonally adjusted18 Not seasonally adjusted
Jan.
44.1446
32 533 0
7.2
4 4
1 21 83 0
604 4
10 4
12 811 4
7.58 0
131 3132 I
Jan,
44 344 7
32 633.0
7.2
4 5
03 63 5
7 36 1
13 4
12 711.4
3.740
172.9174 3
Feb.
45.746 3
32 733.4
8.1
4.8
1 61.63.2
6.54 5
11.0
13.213.1
6.06 6
134.6133 8
Feb.
41.942 3
31.732.1
5.8
4.4
-1 24 33.0
7.15 4
12.5
13 112.8
3.13 3
171.9171 1
Mar.
50.149 4
36 335.6
8.9
4.9
1 82.03.8
7.14 3
11.3
14 113.9
5.96 4
135.4134 4
Mar.
39.538 7
29.829.0
5.2
4.6
-1 94 72.7
7 25 6
12.8
12 912.7
3.53 8
169.7168 7
Apr.
48.948 0
34 333.4
9.4
5.2
2 12.44.5
7.34 3
11.6
13 613.3
5.760
143.2142 0
Apr.
41.240 7
30 830.3
5.9
4.5
-1 34 53 1
7 16 3
13.6
13 413.1
3.84 0
166.2165 0
May
53.753 2
38 337.8
9.9
5.6
2 72.95.6
7.24 2
11.5
13 914.3
6.57 6
149.7149 5
May
42.542 2
32.832.5
5.2
4.5
- 1 75 94.1
7 064
13.3
13 213.7
3.84 1
164.4164 0
19
June
52.7529
38 138.3
9.1
5.5
2 22.24.4
6.95 2
12.1
14 915.1
5.86 1
154.3152 7
19
June
40.4405
31 932.1
3.9
4.5
-2 96 53 5
696 3
13.2
13 013.1
3.84 2
161.6160 2
74
July
55.956 8
40 541.4
9.9
5,5
3 31.64.9
6.66 2
12 8
14414.9
5.75 4
159.0157 2
75
July
41.041 8
32 633.4
4.0
4.4
-3 97 83 8
8 06 5
14 4
13 413.7
3.73 4
158.6157 2
Aug.
57.156.3
41.140.3
10.7
5.31C
3.02.25.2
7.75.5
13.2
14.915.5
5.34 0
162.3163.7
Aug.
41.541.1
31.230.8
6.0
4.4
-2 2644.1
8 37 I
15.4
12 913.5
3.62.7
156.7157 3
Sept.
56.455 7
40 539.8
10.7
5.2
2 62.45.0
8.15 3
13.4
14 815.4
5.45 5
163.6165 8
Sept.
41.040.6
31.531.1
5.1
4.4
-2 86 83.9
8 07 2
15.2
14 415.1
3.73 9
157.6158 6
Oct.
54.253 6
39 638.9
9.6
5.1
1 22.84.0
8.45 2
13.6
14 114.2
4.23 7
164.8166 6
Oct.
41.941 5
31 731.3
5/6
4.6
-1 46 24 7
7 17 1
14 2
14 314.3
3.83 4
159.6160 3
Nov.
50.552 6
35 737 8
9.8
5.0
1 32 43.7
8.54 8
13 3
14 114.9
4.13 4
165.0164 4
Nov.
41.442 9
31 332.9
5.5
4 6
— 1 46 34 8
7 07 6
14 6
14 114.7
4.03 5
160.1159 8
Dec.
48.047 6
34 434 1
8.8
4 7
93 74.6
7.95 6
13 5
13 212 5
4.54 9
169.0170 2
Dec.
42041 7
32 432.1
5.3
4 3
— 2 07 55 4
7 48 0
15 4
13 613.0
3.74 1
158.5160 4
41Digitized for FRASER http://fraser.stlouisfed.org/ Federal Reserve Bank of St. Louis

15. Major nondeposit funds of commercial banks1—ContinuedMonthly averages, billions of dollars
Source
Total nondeposit funds1 Seasonally adjusted"2 Not seasonally adjusted
Federal funds, RPs, and other borrowings fromnonbanks3
3 Seasonally adjusted4 Not seasonally adjusted5 Net balances due to foreign -related institutions,
not seasonally adjusted6 Loans sold to affiliates, not seasonally
adjusted4
MEMO7 Domestically chartered banks' net positions with
own foreign branches, not seasonallyadjusted^
8 Gross due from balances . .9 Gross due to balances
10 Foreign-related institutions' net positions withdirectly related institutions, not seasonallyadjusted6
1 1 Gross due from balances12 Gross due to balances
Security RP borrowings13 Seasonally adjusted'14 Not seasonally adjusted
U.S. Treasury demand balances8
15 Seasonally adjusted16 Not seasonally adjusted
Time deposits, $100,000 or more9
17 Seasonally adjusted18 Not seasonally adjusted . .
Total nondeposit funds1 Seasonally adjusted2
2 Not seasonally adjustedFederal funds, RPs, and other borrowings from
nonbanks3
3 Seasonally adjusted4 Not seasonally adjusted5 Net balances due to foreign-related institutions,
not seasonally adjusted6 Loans sold to affiliates, not seasonally adjusted4. .
MEMO7 Domestically chartered banks' net positions with
own foreign branches, not seasonallyadjusted^
8 Gross due from balances9 Gross due to balances
10 Foreign-related institutions' net positions withdirectly related institutions, not seasonallyadjusted6
1 1 Gross due from balances12 Gross due to balances
Security RP borrowings13 Seasonally adjusted"14 Not seasonally adjusted
U.S. Treasury demand balances8
15 Seasonally adjusted16 Not seasonally adjusted
Time deposits, $100,000 or more9
17 Seasonally adjusted18 Not seasonally adjusted
Jan.
40 841 0
33 233 4
3 3
4 2
-3 27 84.5
6.67.9
14 5
14.813 5
3.53 8
155 2157 1
Jan.
52 052.0
44.944 9
3 33.8
-5 311 15 7
8 79 2
17 8
23 021.3
3 63.9
136 7138.8
Feb.
41 441.7
33.433.6
3 7
4.3
-3 48,65.1
7.27.4
146
15.314 8
4.44 5
151 4151.3
Feb.
55 855.9
47.847 9
4 33.8
-4.09 75.6
8.48.2
16 6
22.822.0
404.2
136 9137.7
Mar.
40 039 1
31 831.0
3 9
4.2
-3 69.35.6
7.67.5
15 1
15.715 4
3.83 9
150 9151.0
Mar.
55 454.2
49.748 4
1 93.9
-7.613 35 6
9.67 4
17 0
23 823.4
4 44.3
136 8137.6
Apr.
43 843.7
35 635.4
4 3
4.0
-3 18 14.9
7.57.5
15 0
16.916 5
3.63 9
149 6148 7
Apr.
53 153.2
49.049 1
23.9
-8 814 45 5
9.17 1
16 2
23 923.3
5 25.4
136 6135.9
May
47.547.2
39.238.9
4.0
4.2
~3 89.25.3
7.97.6
15.5
19.020.0
3.83.8
145 9145.1
May
57.957.7
54.854.6
- 73.8
-9.215 36.0
8.56.9
15 5
25.427.0
3.83.6
138.0137.1
19
June
44.944.8
35,835.8
4.7
4.4
-3 29.05.7
8.08.4
164
18.418 5
4.24.8
149 1147.7
19
June
55 555.1
51.751 4
- 13.9
-10.11696.7
10.07.7
17 7
26.025.8
4.35.0
141.7140.2
76
July
45 946.4
37.037.6
4 4
4.5
-3 39.46.0
7.88.1
15 9
18.4184
3.83 5
149 3147.7
77
July
56 857.1
53.253 4
- 24.0
-10.117 169
9.98.5
18 3
26.426.2
3 93.6
144 0142.1
Aug.
48 047.8
41 541.3
2 5
4.1
-5 211 96.6
7.87.4
15 2
21.6224
4.83 7
145 0144 5
Aug.
58 758.9
54.654 9
o4.1
-9216 37 0
9.38 7
17 9
26927.9
4 33.4
147 0145.6
Sept.
47.947.6
40.640.3
3 5
3.8
-5 111.36.1
8.77.7
164
20.221.2
4.65.0
142 3142.0
Sept.
59959.8
54.053 9
1 84.1
-8.416 37.8
10.39.2
195
27.328.4
4 45.0
148 9147.6
Oct.
51 251.1
43 543.4
40
3.7
-4 81207.1
8.98.1
16 9
20.019 9
4.540
139 8139.7
Oct.
61 261.5
54.254 5
2 84.1
-8 417 38 8
11.394
20 8
28 127.8
4 13.7
153 2152.4
Nov.
53 355 1
44 646.3
5 1
3 7
-3 610 669
8 88 1
16 9
21.322 0
4.64 1
137 6137 8
Nov.
60 462.1
55 957 5
o4.5
-10 619 48 7
1079 3
20 0
29 930.5
4 03.5
157 8158.5
Dec.
54 754.4
47 447.1
3 6
3.7
-5 912 86.8
9.68.6
18 2
23.923 4
3.94 4
137 6140.0
Dec.
60 560.1
57.457 0
-1 54.7
-12 421 1
8.6
10.910 721 7
30 530.5
4 55.1
161 8165.3
42Digitized for FRASER http://fraser.stlouisfed.org/ Federal Reserve Bank of St. Louis

15. Major nondeposit funds of commercial banks1—ContinuedMonthly averages, billions of dollars
Source
Total nondeposit funds1 Seasonally adjusted2 . .2 Not seasonally adjusted
Federal funds, RPs, and other borrowings fromnonbanks3
3 Seasonally adjusted4 Not seasonally adjusted5 Net balances due to foreign- related institutions,
not seasonally adjusted . . .6 Loans sold to affiliates, not seasonally
adjusted4
MEMO7 Domestically chartered banks' net positions with
own foreign branches, not seasonallyadjusted^
8 Gross due from balances9 Gross due to balances
10 Foreign -related institutions' net positions withdirectly related institutions, not seasonallyadjusted6
1 1 Gross due from balances12 Gross due to balances
Security RP borrowings13 Seasonally adjusted14 Not seasonally adjusted
U.S. Treasury demand balances8
15 Seasonally adjusted16 Not seasonally adjusted
Time deposits, $100,000 or more9
17 Seasonally adjusted . . . .18 Not seasonally adjusted
Total nondeposit fundsI Seasonally adjusted2 .2 Not seasonally adjusted
Federal funds, RPs, and other borrowings fromnonbanks3
3 Seasonally adjusted4 Not seasonally adjusted . . .5 Net balances due to foreign-related institutions,
not seasonally adjusted6 Loans sold to affiliates, not seasonally
adjusted4
MEMO7 Domestically chartered banks' net positions with
own foreign branches, not seasonallyadjusted5 . , .
8 Gross due from balances9 Gross due to balances
10 Foreign- related institutions1 net positions withdirectly related institutions, not seasonallyadjusted6 , . .
1 1 Gross due from balances1 2 Gross due to balances
Security RP borrowings1 3 Seasonally adjusted14 Not seasonally adjusted .
U.S. Treasury demand balances8
15 Seasonally adjusted16 Not seasonally adjusted
Time deposits, $100,000 or more9
17 Seasonally adjusted ; . .18 Not seasonally adjusted
1978
Jan.
59.959.7
57.557.3
-2.2
4 7
- 13.522.38.7
11.311.623.0
30.929.3
3.84.3
164.8167.9
Feb.
62.161,8
59.959.6
-2.3
4 6
-13.122.79.5
10.811. 121.9
31.230.3
4.24.3
169.0170.9
Mar.
62.861.2
62.360.8
-3.8
4 3
-14.823.1
8.2
11.012.223.2
32.231.8
5.04.8
174.9176.9
Apr.
65.766.0
61.962.2
... 4
4 3
-11.019.07.9
10.612.523.1
32.331.4
4.95.0
180.2179.4
May
73.973.7
69.469.2
.1
4.3
-11.619.67.9
11.81,1.823.6
31.232.8
4.44.0
186.0184.8
June
73.172.4
67.466.7
1.3
4.4
-11.720.6
8.8
13.112.225.3
29.929.8
5.46.2
189.9187.2
July
75.675.6
68,268.1
3.0
4.5
-9.418.48.9
12.512.124.5
31.231.0
4.64.4
194.3190.6
Aug.
78.078.6
71.171.7
2.2
4.6
-10.419.69.1
12.711.524.2
32.633.5
4.43.5
198.4195.6
Sept.
77.777.9
68.969.1
4.3
4 5
-10.220.09.7
14.612.927.5
32.333.2
5.46.2
200.8198.6
Oct.
84.585.4
73.774.5
7.0
3 8
-9.821.311.4
16.914.331.2
35.034.9
4.44.3
202.4201.1
Nov.
85.787.1
74.075.4
8.1
3 6
-9.722.813.0
17.913.831.7
37.738.2
9.98.3
210.2211.7
Dec.
86.886.7
76.376.2
6.8
3 7
-10.124.914.7
17.014.331.3
40.540.8
9.410.3
213.2218.3
1979
Jan.
81.281.3
71.371 4
6.3
3.6
-10.024.614.5
16.415.431.8
42.040.7
10.712.0
216.1220.5
Feb.
94.793.6
79.078.0
12.0
3.6
-6.223.317.0
18.415.033.3
43.342.2
7.98.4
218.0221.5
Mar.
100.999.1
80.178 3
17.3
3.5
-3.422.519.0
20.815.336.0
44.544.1
7.06.5
218.5221.4
Apr.
103.0103.4
79.680.0
19.8
3.6
-.921.920.8
20.815.736.5
47.145.7
5.45.3
217.5216.3
May
114.0113.7
86.986.7
23.4
3.7
2.719.522.2
20.615.936.6
47.949.6
9.08.4
215.1213.8
June
116.8115.8
86.085.0
27.1
3.8
5.320.125.4
21.817.639.3
50.650.3
9.610.8
212.6208.9
July
122.6122.1
90.389.9
28.5
3.7
5.620.325.9
22.917.640.5
49.048.7
13.713.2
214.5209.7
Aug.
129.2130.5
92.493.6
33.1
3.7
8.219.427.7
24.916.241.1
47.849.2
12.29.8
217.4214.1
Sept.
132.4133.0
93.293.8
35.5
3.7
10.521.732.2
25.023.448.3
51.151.9
10.812.5
222.9220.6
Oct.
130.2131.8
92.293.7
34.5
3.6
9.122.031.1
25.425.751.1
50.250.1
11.211.7
227.9226.6
Nov.
127.2128.4
88.990 1
34.7
3.6
11.421.633.0
23.326.549.7
44.745.0
7.15.6
228.8230.6
Dec.
120.1120.1
88.788 7
28.4
3.0'
6.922.929.7
21.628.950.5
43.744.1
9.29.7
228.6234.1
43Digitized for FRASER http://fraser.stlouisfed.org/ Federal Reserve Bank of St. Louis

15. Major nondeposit funds of commercial banks1—ContinuedMonthly averages, billions of dollars
Source
Total nondeposit funds1 Seasonally adjusted"2 Not seasonally adjusted . . .
Federal funds, RPs, and other borrowings fromnonbanks-1
3 Seasonally adjusted4 Not seasonally adjusted . . . .5 Net balances due to foreign-related institutions,
not seasonally adjusted6 Loans sold to affiliates, not seasonally
adjusted4
MEMO7 Domestically chartered banks' net positions with
own foreign branches, not seasonallyadjusted"* . . .
8 Gross due from balances9 Gross due to balances
10 Foreign-related institutions' net positions withdirectly related institutions, not seasonallyadjusted6
1 1 Gross due from balances12 Gross due to balances
Security RP borrowings13 Seasonally adjusted'14 Not seasonally adjusted
U.S. Treasury demand balances8
15 Seasonally adjusted16 Not seasonally adjusted
Time deposits, $100,000 or more9
17 Seasonally adjusted18 Not seasonally adjusted
Total nondeposit funds1 Seasonally adjusted"2 Not seasonally adjusted . . . . . . .
Federal funds, RPs, and other borrowings fromnonbanks3
3 Seasonally adjusted4 Not seasonally adjusted5 Net balances due to foreign-related institutions,
not seasonally adjusted6 Loans sold to affiliates, not seasonally
adjusted4
MEMO7 Domestically chartered banks' net positions with
own foreign branches, not seasonallyadjusted5 . .
8 Gross due from balances9 Gross due to balances
10 Foreign- related institutions' net positions withdirectly related institutions, not seasonallyadjusted ^
1 1 Gross due from balances . . . . . . .12 Gross due to balances
Security RP borrowings13 Seasonally adjusted14 Not seasonally adjusted
U.S. Treasury demand balances8
15 Seasonally adjusted16 Not seasonally adjusted
Time deposits, $100,000 or more9
17 Seasonally adjusted . . . .18 Not seasonally adjusted
IBF ADJUSTMENTS FOR SELECTED ITEMS12
19 Items 1 and 2 . .20 Items 3 and 421 Item 5 . . . .22 Item 723 Item 10
Jan.
123 6123.6
92 892.9
28.1
2.7
6.022.928 9
22.129 751.7
42.341.5
11.112.7
229.5234 1
Jan.
120 2121.5
109.2110 5
8.3
2.8
-16.137 421.2
24 531.556 0
55.154 5
6.87.9
278.0283 0
Feb.
129 6128.0
97.696.1
29.4
2.6
6.623.3299
22.830553.2
42.641.8
11.111.7
233.7238.0
Feb.
119.1120.3
108.0109.2
8.3
2.8
-14.636.321.6
23 031.854.8
54.653.9
7.68.2
283.3288.1
Mar.
133 8132 0
98 5'96 6
32.8
2 6
9 323.633 0
23.532 055 4
42.041 6
8.27 8
238.0240 9
Mar.
114 3115.7
108.0109 4
3.5
2.8
-16.938 821.8
20 531 952 4
54 554 0
10.710.3
284.2286 8
Apr.
122 0122 7
92 593 2
26.9
2 6
5.924.5304
20.928 4494
39,638 5
9.190
241.8240 1
Apr.
107 9108.5
105.9106 5
-.6
2.7
-21.243 021.7
20 634.054 6
55.153 8
12.212.1
287.3284 8
May
1262125.5
100599.8
23.0
2.7
2.627.4300
20.528 448.8
38.539.2
8.78.5
244.0242.3
May
117.9120.8
106.5109.3
8.7
2.8
-13.543 429.8
22 335.757.9
54.655,5
12.312.3
297.1294,5
19
June
118.9117.5
101.5100.1
14.6
2.8
-5.330.124.7
19.928.548.4
42.142.1
9.210.0
241.6237.0
19
June
119.4121.5
110.6112.7
6.0
2.9
-14.542.527.8
20.636.957.4
58.258.5
12.012.4
304.4298.6
80
July
120 61199
106 9106.2
10.9
2 8
-8.332.724 3
19.330 850.1
46.846.6
9.19.1
237.8232 2
81
July
118 8120.4
109.9111 5
6.2
2.7
-14.545 030.4
20 937.358.2
57.357.0
10.610.5
311.8305.0
Aug.
1 1 1 6113 4
98 4100 2
10.3
2 9
= 10.235.825 5
20.630951.6
48.849.9
11.29.0
238.4235.3
Aug.
120.1123.2
107.1110.1
10.4
2.6
-10.143.733.5
20637.958.5
55.957.0
9.07.3
318.1315.3
Sept.
114 5115 1
102 7103 4
8.8
2 9
- 14.438.223 7
23.330 353.6
49.049.6
12.213.8
242.7241.1
Sept.
119.6121.7
107.6109.6
9.3
2.7
-12.244.532.2
21.640.061.6
55.956.1
9.610.7
321.1320.6
Oct.
120 0122 1
106 0108 0
11.3
2 8
= 12.938.325 3
24.330855.2
50.050.1
11.012.6
247.5247.0
Oct.
114.5116.56
106.9108.8
4.9
2.7
-15.345.530.1
20.438.158.5
55.355.4
10.713.2
322.6323.1
Nov.
1 19 1121 3
107 9110 2
8 5
2 6
- 14 537.623 1
23.131 054 1
50.6509
9.36 7
256.0258 3
Nov.
117 5119.9
111.0113 4
3.8
2.7
-14.847 932.9
18 739.057 8
57 457 9
14.39.6
322.2325.0
Dec.
118 3120 4
107 3109 4
8 3
2 7
- 14 537.623 0
22 932 555 4
51.752 0
9.39 1
266.9272 9
Dec.
96 198 1
111.5113 5
-18.1
2.8
-22.454 932.4
4 348.152 4
59 159 2
12.311.1
323.9330.6
22 41 7
20.73 1
17 6
44Digitized for FRASER http://fraser.stlouisfed.org/ Federal Reserve Bank of St. Louis

15. Major nondeposit funds of commercial banks1—ContinuedMonthly averages, billions of dollars
Source
Total nondeposit funds1 Seasonally adjusted"2 Not seasonally adjusted . . .
Federal funds, RPs, and other borrowings fromnonbanks3
3 Seasonally adjusted4 Not seasonally adjusted5 Net balances due to foreign-related institutions,
not seasonally adjusted6 Loans sold to affiliates, not seasonally adjusted4 , ,
MEMO7 Domestically chartered banks' net positions with
own foreign branches, not seasonallyadjusted^
8 Gross due from balances9 Gross due to balances
10 Foreign-related institutions' net positions withdirectly related institutions, not seasonallyadjusted6 . .
1 1 Gross due from balances . . . .12 Gross due to balances
Security RP borrowings13 Seasonally adjusted'14 Not seasonally adjusted
U.S. Treasury demand balances8
15 Seasonally adjusted16 Not seasonally adjusted . . . .
Time deposits, $100,000 or more9
17 Seasonally adjusted18 Not seasonally adjusted
IBF ADJUSTMENTS FOR SELECTED ITEMS12
19 Total nondeposit funds . .20 Federal funds, RPs and other borrowings from
nonbanks21 Net balances due to related foreign institutions. . .22 Domestic chartered banks net positions with own
foreign banks23 Foreign- related institutions net positions with
directly -related foreign institutions
Total nondeposit funds1 Seasonally adjusted2
2 Not seasonally adjustedFederal funds, RPs, and other borrowings from
nonbanks3
3 Seasonally adjusted4 Not seasonally adjusted5 Net balances due to foreign-related institutions,
not seasonally adjusted6 Ix>ans sold to affiliates, not seasonally adjusted4 . .
MEMO7 Domestically chartered banks' net positions with
own foreign branches, not seasonallyadjusted5
8 Gross due from balances9 Gross due to balances
10 Foreign-related institutions' net positions withdirectly related institutions, not seasonallyadjusted6
1 1 Gross due from balances . .12 Gross due to balances
Security RP borrowings13 Seasonally adjusted"14 Not seasonally adjusted
U.S. Treasury demand balances8
15 Seasonally adjusted16 Not seasonally adjusted . .
Time deposits, $100,000 or more9
17 Seasonally adjusted , .18 Not seasonally adjusted
Jan.
85 2866
111 7113.1
-29 22.8
-27.055 128 0
-2 150.147 8
60.359 8
12 314 4
3260331 0
29 6
2.427.2
4 8
22 5
Jan.
74 075.3
132 7134.0
-61.63.0
-49.979 229 2
-11657 045 3
72 972 2
13 916 3
321 8325 7
Feb.
85 887 1
1 1 1 4112 7
-28 32.8
--25.855 029 1
-2 450.548 1
60.059 4
18 719 9
331 4335 7
304
2.428.0
4 9
23 1
Feb.
76 377.7
134 9136.3
-61.53.0
-50.478 928 4
-11055 5444
74 373 7
9 410 2
308 3310 8
Mar.
84 185.5
113.9115.2
-32 52.8
-28.756 727.9
-3.650.046 3
61.560 9
15 415.4
336 2337.8
31.2
2.428.4
4.9
23 6
Mar.
75.476.9
134 8136.3
-62.33.0
-52.779 726 8
-9 456.146 6
74.473 9
12.813 2
300 8301 0
Apr.
85 085.7
114 6115.3
-32 32.8
-29.757 427.6
-2 549.2465
62.961 7
13 413 7
3399336.1
31.4
2.429.0
5 0
24 0
Apr.
78 279.1
137 8138,7
-62.43.0
-52.680 327 6
-9 755 946 1
77 376 3
13 714 2
296 9293 3
May
86 1892
117 1120.2
-33 72.8
-29.858 128.3
-3 849.545 6
60.862 0
15 015 3
344 2340.4
31 7
2.429.3
5 0
24 3
May
86 890.7
141 9145.8
-57.82.8
-48.676 327 6
-9 155 846 6
80 782 7
12012 5
289 2285 5
19
June
89 391.8
118.6121.1
-32.23.0
-29.157.728.5
-3.050.347 2
61.161.7
10 810.7
351.4345.1
32.0
2,429.6
5.0
24 6
19
[" June
87.490.1
140 0142.8
-55.42.7
-49.275 826 6
-6 254.047 8
80.781 5
13.613 2
288.8284 0
82
July
86 387.6
120 5121.7
-3692.8
-32.960.627.6
-3.952.748 7
62.862 2
8 18.2
357 7351.1
32.2
2.429.8
5.1
24 7
83
July
77 978.7
134 4135.1
-59.22.7
-50.977 426 5
-8 255 347 1
77 376 2
21 721 8
285 9281 5
Aug.
83 5864
121 8124.6
-40 92.8
-34.365 130 6
-6 553.546 9
66.567 5
10 08 1
361 0359.7
32 5
2.430.1
5 3
24 9
Aug.
83 486.2
132 7135.5
-51.92.6
-45.373 628 3
-6 653 647 0
76 177 0
20 316 4
284 1284 4
Sept.
80 382.0
123.0124.7
-45 52.8
-38.668 529.8
-6.854.147 2
66.266.0
11 212.3
360.8362.1
32.8
2.430.4
5.3
25 0
Sept.
85 486.5
134 2135.3
-51.42.6
-46.374 728 3
-5 053.648 5
78 177 3
16.717 9
282.8284 7
Oct.
82 584 0
127 6129.1
-47 82.8
-40.369 8294
-7 453.946 4
70.169 8
12 7164
363 7365.6
33 1
2.430.7
5 4
25 3
Oct.
82 083.0
135 2136.2
-55.72.6
-48.576 427 9
-7 255 548 3
79 979 1
18 924 7
278 3280 3
Nov.
87 290 0
129 2131 9
-44 82.9
-38.369 931 5
-6 453 647 1
71 272 1
12 47 8
359 4362 4
33 3
2.430.9
5 5
25 4
Nov.
96 399.6
140 8144.1
-47.02.5
-43.076 533 6
-4053 549 5
83 384 6
12 07 5
280 7283 0
Dec.
82 985 0
127 7129 7
-47 62.9
-39 572 232 6
-8 054 746 6
71 071 2
12 810 8
347 9354 6
33 9
2.431.5
5 8
25 7
Dec.
100 3102.5
140 7142.8
-42.72.4
-39.875 335 5
- 2 954 151 1
84 885 1
13 110 8
283 1288 1
45Digitized for FRASER http://fraser.stlouisfed.org/ Federal Reserve Bank of St. Louis

16. Commercial bank assets and liabilities—Last-Wednesday-of-month series, 1983A. Domestically chartered commercial banks1
Billions of dollars
Account
1 Loans and securities,excludinginterbank
2 Loans, excludinginterbank
3 Commercial andindustrial
4 Other5 U.S. Treasury
securities6 Other securities
7 Cash assets, total8 Currency and coin . . .9 Reserves with
Reserve Banks . . .10 Balances with deposi-
tory institutions . .1 1 Cash items in
process ofcollection
12 Other assets
13 Total assets/total liabil-ities and capital . . .
14 Deposits15 Demand16 Savings1 7 Time18 Borrowings19 Other liabilities20 Residual (assets less
liabilities)21 U.S. Treasury note
balances includedin borrowings . . . .
Jan.
1,370.8
993.3
355.1638 2
136.0241 6
167.820.4
23.9
67.7
55 9
260 1
1,798.7
1,340.6324.0361.5655 1221.6106 4
130.1
17.1
Feb.
1,373.7
991.4
355.7635 8
141.4240 8
184.720.3
25.3
71.6
67 5
263.6
1,822.0
1,368.3337.9395.2635.2218.01060
129.6
7.0
Mar.
1,392.2
1,001.7
358.0643 7
150.6239 9
168.919.9
20.5
67.1
61 5
257.9
1,818.9
1,374.2333.4419.2621.6211.3103 5
130.0
9.6
Apr.
1,403.8
1,005.1
357.9647.2
155.5243.3
170.120.4
23.9
66.1
596
252.4
1,826.3
1,368.0329.2426.9611.9224.0102.3
132.0
17.8
May
1,411.9
1,007.5
356.7650.8
160.9243.5
164.520.3
22.4
65.6
56 3
248.3
1,824.8
1,370.8324.5440.2606.1214.1104 7
135.1
2.7
June
1,435.1
1,025.6
360.1665 6
166.0243 5
176.921-.3
18.8
69.7
67 1
253.2
1,865.2
1,402.7344.4445.3613.1221.21043
137.0
19.3
July
1,437.4
1,029.1
361.1668.0
165.1243.3
168.720.7
20.6
67.1
60.3
254.5
1,860.6
1,396.5334.2447.5614.8217.5105.5
141.0
19.3
Aug.
1,457.0
1,043.4
363.06804
167.5246 1
176.921.0
22.5
69.0
64 4
257.2
1,891.0
1,420.1344.7449.0626.4217.2107.6
146.1
14.8
Sept.
1,466.1
1,049.7
364.0685.7
171.2245.2
160.020.8
15.4
66.7
569
252.3
1,878.4
1,408.1328.1448.8631.2217.8107.1
145.4
20.8
Oct.
1,482.7
1,060.6
366.6694 1
176.8245 2
164.020.5
19.7
67.1
56 6
253.0
1,899.7
1,419.5331.3451.5636.8226.8106.5
146.9
22.5
Nov.
1,502.8
1,076.3
372.4703 9
180.6245 8
179.522.3
17.6
71.1
68 5
261.7
1,944.0
1,460.5358.1458.9643 6219.8112 6
151.0
2.8
Dec.
1,526.7
1,097.2
381.9715 4
181.4248 1
190,523.4
18.6
75.6
73 0
253.4
1,970.6
1,482.5371.0460.7650.8216.3117 9
153.9
8.8
46Digitized for FRASER http://fraser.stlouisfed.org/ Federal Reserve Bank of St. Louis

16, Commercial bank assets and liabilities—Last-Wednesday-of-month series, 1983—ContinuedB. All commercial banking institutions2
Billions of dollars
Account
1 Loans and securities,excludinginterbank
2 Loans, excludinginterbank
3 Commercial andindustrial
4 Other5 U.S. Treasury
securities6 Other securities
7 Cash assets total8 Currency and coin . . .9 Reserves with
Reserve Banks . . .10 Balances with deposi-
tory institutions . .1 1 Cash items in
process ofcollection
12 Other assets
13 Total assets/total liabil-ities and capital , . .
14 Deposits15 Demand16 Savings17 Time
18 Borrowings19 Other liabilities20 Residual (assets less
liabilities)21 U.S. Treasury note
balances includedin borrowings . . . .
Jan.
1 427 5
1,044.8
392.4652.4
139.5243.2
183.720.4
25.3
81.1
56 9
333.2
1,944.4
1,385.4335.9361 9687.7
283 5143.5
132.0
17.1
Feb.
1 429 8
1,042.3
392.3650.0
145 1242.4
200 520.3
26.7
84.9
68 6
330.2
1,960.4
1,412 6350.2395 6666.8
276 8140.4
131,5
7.0
Mar.
1 451.3
1,054.5
395.9658.6
155.3241.5
185.519.9
22.0
81.0
62 6
325.4
1,962.2
1 419.5345.7419.7654.1
269.9141.1
131.9
9.6
Apr.
1 ,460 8
1,055.7
393.5662.2
160,2244.9
186 320.4
25.4
79.8
60 7
317.8
1,964.9
1,411.0341.1427 3642.6
281 3138.6
133.9
17.8
May
1 467 6
1,056.4
391.7664.7
166 1245.2
180 320.3
23.8
78.9
57 3
309.5
1,957.4
1,413 1336.4440 76360
269 5137.9
137.0
2.7
June July
1,491,5 1,494.1
1,075.2 1,078.8
395.3 397.7679.9 681.2
171.3 170.3245.1 245.0
193 5 185.221.3 20.7
20.0 21.9
84.0 81.2
68 2 61 4
318.1 318.7
2,003.2 1,998.0
1,443 8 1,438.1356.4 346.4445 7 448.0641.6 643.8
2782 277.9142.3 139.1
138.9 142.9
19.3 19.3
Aug.
1,515.4
1,094.9
400.6694.3
172.7247.8
193 321.1
24.0
82.8
65 4
324.6
2,033.3
1,461 4356.6449 5655.3
280 5143.4
148.0
14.8
Sept.
1 525.4
1,102.5
402.7699.8
176.1246.9
174,720.9
16.6
79.3
58 0
320.9
2,021.0
1 448.9340.0449.3659.5
282.6142.3
147.3
20.8
Oct.
1,541 5
1,112.6
404.9707.6
182 0247.0
178 420.5
20.8
79.5
57 6
318.8
2,038.8
1 ,459 0343.2452 0663 8
289 6141.5
148.8
22.5
Nov.
1 563.7
1,130.1
411,6718.4
186.1247.6
194 822.3
19.1
83.8
69 5
329.6
2,088.1
1 500 8369.9459 4671.4
282 6151.9
152.8
2.8
Dec.
1 588 3
1,151.4
421.2730.2
186 9249.9
205 Q23.4
19.7
87.9
74 0
320.9
2,114.1
1 524 7383.2461 2680 3
275 1158.5
155.8
8.8
47Digitized for FRASER http://fraser.stlouisfed.org/ Federal Reserve Bank of St. Louis

17. Insured commercial banks with assets of $100 million or over—Domestic and foreign offices1
A. March 31, 1983Millions of dollars, except for number of banks
Item
1 Total assets
2 Cash and due from depository institutions3 Currency and coin (U.S. and foreign) .4 Balances with Federal Reserve Banks5 Balances with other central banks6 Demand balances with commercial banks in United States7 All other balances with depository institutions in United States and
with banks in foreign countries .8 Time and savings balances with commercial banks in United States9 Balances with other depository institutions in United States
10 Balances with banks in foreign countries1 1 Foreign branches of other U S banks12 Other banks in foreign countries13 Cash items in process of collection
14 Total securities, loans, and lease financing receivables .
15 Total securities, book value16 U S Treasury17 Obligations of other U.S. government agencies and corporations18 Obligations of states and political subdivisions in United States19 All other securities20 Other bonds notes and debentures . . . . . .21 Federal Reserve and corporate stock .22 Trading account securities
23 Federal funds sold and securities purchased under agreements to resell24 Total loans gross25 LESS: Unearned income on loans26 Allowance for possible loan loss27 EQUALS: Loans, net
Total loans, gross, by category28 Real estate loans2 9 Construction a n d land development . . . . . . . . . .30 Secured by farmland31 Secured by residential properties32 1- to 4-family . . . . . . .33 FHA-insured or VA-guaranteed34 Conventional35 Multifamily36 FHA-insured37 Conventional38 Secured by nonfarm nonresidential properties
39 Loans to financial institutions40 REITs and mortgage companies in United States41 Commercial banks in United States42 U.S. branches and agencies of foreign banks43 Other commercial banks44 Banks in foreign countries45 Foreign branches of other U.S. banks46 Other47 Finance companies of other U S banks48 Other financial institutions
49 Loans for purchasing or carrying securities50 Brokers and dealers in securities51 Other52 Loans to finance agricultural production and other loans to farmers53 Commercial and industrial loans54 U S addressees (domicile)55 Non-U S addressees (domicile)
56 Loans to individuals for household, family, and other personal expenditures57 Installment loans58 Passenger automobiles59 Credit cards and related plans .60 Retail (charge account) credit card61 Check and revolving credit62 Mobile homes63 Other installment loans64 Other retail consumer goods65 Residential property repair and modernization66 Other for household, family, and other personal expenditures67 Single-payment loans68 All other loans69 Loans to foreign governments and official institutions70 Other71 Lease financing receivables
Insured
1,770,638
290,94013,71521,4903,468
18,905
166,02223,088
779142,155
(4)(4)
67,340
1,348,103
274,25589,79042,378
108,55433,53414,051
1,98017,503
70,5181,012,752
13,74811,492
987,511
235,680(4)0(4)(4)(4)(4)(4)(4)(4)(4)
102,4615,243
16,019(4)(4)
48,809(4)(4)
11,28121,110
14,5719,5155,057
12,948450,294
(4)(4)
144,249(4)
. (4)(4)(4)(4)(4)(4)(4)(4)(4)(4)
52,548C4)(4)
15,818
Banks with foreign offices2
Total
1,270,783
231,9817,923
16,2423,4687,419
142,41413,163
593128,65820,485
108,17354,514
929,711
143,46841,10516,35057,41528,59810,461
1,43316,705
38,212749,489
6,9378,321
734,231
142,300(4)0(4)(4)(4)(4)(4)(4)o(4)
94,6404,578
1 1 ,0425,6975,346
48,165715
47,45010,85120,004
12,5039,0813,4227,249
366,150231,675134,475
78,215(4)(4)(4)(4)(4)(4)(4)(4)(4)(4)(4)
48,43334,14114,29213,800
Foreignoffices3
383,859
124,122238179
3,175238
119,0348,538
465110,031
14,99695,035
1,258
211,053
11,369211
23605
10,5318,138
1482,245
599198,442
1,733361
196,348
8,376(4)(4)(4)(4)(4)(4)(4)(4)(4)(4)
33,01645
791555236
24,278311
23,967356
7,546
2,0771,492
585752
124,92117,622
107,299
6,496(4)(4)(4)(4)(4)(4)(4)0(4)(4)(4)
22,80420,854
1,9502,737
Domesticoffices
953,966
107,8597,685
16,063293
7,181
23,3804,625
12818,6285,489
13,13953,256
718,659
132,09840,89416,32856,81018,0672,3231,284
14,460
37,613551,048
5,2047,960
537,883
133,92435,553
87269,87165,970
4,29161,679
3,901243
3,65827,627
61,6244,533
10,2525,1425,110
23,887404
23,48310,49512,458
10,4267,5892,8376,496
241,229214,053
27,176
71,71959,07016,55622,91519,0453,8703,079
16,5194,0453,2269,248
12,64925,62913,28712,3421 1 ,063
Bankswithoutforeignoffices
499,855
58,9595,7925,248(4)
11,486
23,6089,925
18713,497(4)(4)
12,826
418,391
130,78848,68626,02751,1394,9353,590
547798
32,306263,263
6,8113,171
253,280
93,38112,303
1,57051,34448,7712,425
46,3462,573
1082,465
28,164
7,821665
4,976(4)(4)
644(4)(4)
4301,106
2,068434
1,6345,699
84,144(4)(4)
66,03453,88822,46611,0519,5111,5413,532
16,8383,2574,0039,577
12,1474,115(4)(4)2,018
48Digitized for FRASER http://fraser.stlouisfed.org/ Federal Reserve Bank of St. Louis

17-A. Continued
Item
72 Bank premises, furniture and fixtures, and other assets representing bank premises . . . .73 Real estate owned other than bank premises .74 Intangible assets75 All other assets76 Investment in unconsolidated subsidiaries and associated companies77 Customers' liability on acceptances outstanding78 U S addressees (domicile)79 Non-U S addressees (domicile) .80 Net due from foreign branches and foreign, Edge, and Agreement subsidiaries8 1 Other
82 Total liabilities and equity capital4
83 Total liabilities excluding subordinated debt
84 Total deposits85 Individuals partnerships and corporations86 U S government .87 States and political subdivisions in United States . .88 All other89 Foreign governments and official institutions90 Commercial banks in United States91 U.S branches and agencies of foreign banks92 Other commercial banks in United States93 Banks in foreign countries .94 Foreign branches of other U S banks95 Other banks in foreign countries . . .96 Certified and officers' checks, travelers checks, and letters of credit sold for cash . . .97 Federal funds purchased and securities sold under agreements to repurchase
in domestic offices and Edge and Agreement subsidiaries98 Interest-bearing demand notes issued to U.S. Treasury
and other liabilities for borrowed money99 Interest-bearing demand notes (note balances) issued to U.S. Treasury
100 Other liabilities for borrowed money101 Mortgage indebtedness and liability for capitalized leases102 All other liabilities . . . .103 Acceptances executed and outstanding104 Net due to foreign branches, foreign, and Edge, and Agreement subsidiaries105 Other106 Subordinated notes and debentures107 Total equity capital5
108 Preferred stock109 Common stock1 10 Surplus1 1 1 Undivided profits and reserve for contingencies and other capital reserves112 Undivided profits113 Reserve for contingencies and other capital reserves
MEMODeposits in domestic offices
\ 14 Total demand115 Total savings . . . .1 1 6 Total time117 Time deposits of $100 000 or more . . . .1 18 Certificates of deposit in denominations of $100 000 or more1 19 Other120 Super NOW accounts121 Other NOW accounts and ATS accounts (savings deposits authorized for
automatic transfer)122 All other savings deposits that are subject to a federal regulatory interest rate ceiling . ,123 Money market time deposits (a) in minimum denominations of $2,500 but less than
$100,000 with original maturities of 26 weeks, and (b) in minimum denomina-tions of $2,500 but less than $100,000 with original maturities of 91 days . . . .
124 All savers certificates125 Total Individual Retirement Accounts (IRA) and Keogh plan accounts1 26 Demand deposits adjusted
127 Standby letters of credit total . . . .128 U S addressees (domicile)129 Non-U S addressees (domicile) . . . .130 Standby letters of credit conveyed to others through participations (included
in total standby letters of credit)131 Holdings of commercial paper included in total gross loans
Averages for 30 calendar days (or calendar month) ending with report date132 Total assets ". .1 33 Cash and due from depository institutions134 Federal funds sold and securities purchased under agreements to resell135 Total loans . . . .136 Total deposits137 Time CDs in denominations of $100,000 or more in domestic offices138 Federal funds purchased and securities sold under agreements to repurchase139 Other liabilities for borrowed money
140 Number of banks . . . . . . . .
Insured
26,1853,5221,075
100,8121,982
58,285(4)(4)(4)
40,545
1,770,638
1,667,772
1,339,7711,059,069
2,85557,313
207,32625,10977,813(4)(4)
104,404
<?(4)13,208
172,179
54,68011,85442,825
2,35698,78658,398(4)
40,3887,032
95,834540
17,92331,58445,78844,958
830
278,733304,086458,943246,991206,23140,76012,000
45,99899,678
114,1254,223
16,350183,963
101,872(4)(4)
8,447(4)
1,751,582276,548
74,338993,630
1,315,912209,274177,01138,133
1,879
Banks with foreign offices2
Total
16,0002.152
60790,332
1,84357,90516,55341,352
(4)30,585
1,270,783
1,204,545
922,461687,257
1,84426,357
197,51424,81468,660
5,79862,862
104,04017,81086,2309,489
139,334
49,7749,523
40,2511,523
91,45458,017(4)
33,4375,388
60,849444
11,53418,55530,31629,985
331
183,831164,768275,853180,163144,21535,949
5,482
23,07949,767
49,8152,2608,244
109,303
95,70169,98925,712
8,154(4)
1,257,129221,58340,645
738,351904,396
(4)143,52135,686
194
Foreignoffices3
1,60684
(4)46,995
1,21214,845(4)(4)
20,48510,453
(4)
383,391
298,009156,900
225847
139,32817,73234,464
3,79030,67487,13215,45371,679
709
456
17,224(4)
17,22411
67,69111,19346,557
9,941469
(4)(4)(4)(4)(4)(4)C4)
0000000
00
0000
20,684(4)(4)
654(4)
329,526119,105
736197,013289,777
(4)616
16,244
194
Domesticoffices
14,3942,068(4)
110,986631
43,060(4)(4)
46,55720,739
(4)
888,197
624,452530,358
1,61925,51058,186
7,08234,196
2,00832,18816,9082,357
14,5518,780
138,877
32,5509,523
23,0281,512
90,80546,82420,48523,4964,919(4)(4)(4)(4)C4)(4)C4)
183,831164,768275,853180,863144,21535,9495,482
23,07949,767
49,8152,2608,244
109,303
75,016(4)(4)
7,499493
927,603102,47939,908
541,338614,619147,280142,905
19,442
194
Bankswithoutforeignoffices
10,1851,371
46810,480
139381
(4)(4)(4)9,960
499,855
463,227
417,310371,812
1,01230,956
9,812295
9,153(4)(4)
364(4)(4)3,719
32,845
4,9062,3322,574
8327,332
381(4)6,9511,644
34,98596
6,38913,02815,47114,972
499
94,902139,318183,09066,82862,016
4,8126,517
22,91949,911
64,3101,9628,106
74,661
6,172(4)(4)
2941,294
494,45354,96533,694
255,280411,516
61,99433,489
2,446
1,685
49Digitized for FRASER http://fraser.stlouisfed.org/ Federal Reserve Bank of St. Louis

17. Insured commercial banks with assets of $100 million or over—Domestic and foreign offices1—ContinuedB. June 30, 1983Millions of dollars, except for number of banks
Item
1 Total assets
2 Cash and due from depository institutions3 Currency and coin (U S and foreign)4 Balances with Federal Reserve Banks . . . .5 Balances with other central banks . . . .6 Demand balances with commercial banks in United States7 All other balances with depository institutions in United States and
with banks i n foreign countries . . . . . . . . .8 Time and savings balances with commercial banks in United States9 Balances with other depository institutions in United States
10 Balances with banks in foreign countries . . . .1 1 Foreign branches of other U S banks12 Other banks in foreign countries13 Cash items in process of collection . . . .
14 Total securities, loans, and lease financing receivables . . . .
15 Total securities book value . . . .16 U S Treasury . . . .17 Obligations of other U.S. government agencies and corporations18 Obligations of states and political subdivisions in United States19 All other securities . . . .20 Other bonds notes and debentures21 Federal Reserve and corporate stock22 Trading account securities
23 Federal funds sold and securities purchased under agreements to resell24 Total loans, gross25 LESS' Unearned income on loans . . . .26 Allowance for possible loan loss . . . .27 EQUALS: Loans, net
Total loans, gross, by category28 Real estate loans29 Construction and land development . . . .30 Secured by farmland31 Secured by residential properties . . . .32 1- to 4-family . .33 FHA-insured or VA-guaranteed . . .34 Conventional35 Multifamily36 FHA-insured . . . .37 Conventional38 Secured by nonfarm nonresidential properties . . . .
39 Loans to financial institutions . . . .40 REITs and mortgage companies in United States41 Commercial banks in United States . . . .42 U S branches and agencies of foreign banks43 Other commercial banks . . . .44 Banks in foreign countries45 Foreign branches of other U.S. banks46 Other . . . .47 Finance companies of other U S banks48 Other financial institutions
49 Loans for purchasing or carrying securities50 Brokers and dealers in securities . . . . . . .51 Other . . . .52 Loans to finance agricultural production and other loans to farmers53 Commercial and industrial loans . . . . .54 U S addressees (domicile) . . . .55 Non-U S addressees (domicile)
56 Loans to individuals for household, family, and other personal expenditures57 Installment loans58 Passenger automobiles . . . .59 Credit cards and related plans60 Retail (charge account) credit card .61 Check and revolving credit . . . .62 Mobile homes63 Other installment loans . . . .64 Other retail consumer goods65 Residential property repair and modernization . . .66 Other for household family and other personal expenditures . . . .67 Single-payment loans . .68 All other loans69 Loans to foreign governments and official institutions . . . .70 Other71 Lease financing receivables . . . .
Insured
1,808,316
295,64415,36415,9424,007
20,605
165,96823,978
1,311140,678
(4)(4)
73,757
1,377,046
285,89597,64542,067
109,11437,06914,6942,038
20,337
74,3801,026,495
13,55711,871
1,001,066
240,001
0(4)(4)<4)(4)(4)(4)(4)C4)C4)
101,7095,482
15,202(4)(4)
48,719(?(4)
10,35321,952
18,73713,1965,540
13,680448,695
(4)(4)
149,139(4)(4)(4)<4>(4)(4)(4)(4)(?(4)(4)
54,535(4)(4)
15,704
Banks with foreign offices2
Total
1,297,732
234,6438,850
10,1644,0078,349
143,22615,212
777127,23821,346
105,89260,047
950,077
150,61644,28616,65557,99131,68410,601
1,47019,613
46,040755,210
6,8508,610
739,749
144,096(4)C )0(4)(4)( )t4)(4)oc4)
93,7594,798
10,3655,2975,068
47,991689
47,3029,894
20,711
16,49312,6233,8707,524
362,555229,495133,060
80,593(4)<4>(4)C4)( )
(4)(4)(4)(4)<4>(4)
50,19034,97115,21813,671
Foreignoffices3
384,379
124,157256172
3,709235
118,7499,699
663108,386
16,16892,218
1,036
211,041
11,68615930
58010,9178,203
1472,567
631198,026
1,694348
195,984
8,880(4)(4)(4)(4)(4)(4)(4)(4)(4)(4)
33,50741
863595267
23,687334
23,353365
8,551
2,2861,664
623710
122,93218,854
104,077
6,567(4)(4)(4)(4)(4)(4)(4)(4)(4)(4)(4)
23,14420,979
2,1662,740
Domesticoffices
980,748
110,4878,5959,991
2988,114
24,4775,513
11318,8525,178
13,67459,011
739,036
138,93044,12716,62557,41220,767
2,3981,323
17,046
45,410557,184
5,1578,262
543,765
135,21636,276
98970,16365,9684,359
61,6094,194
2793,915
27,789
60,2524,7579,5024,7024,800
24,304355
23,9499,529
12,160
14,20710,9593,2476,814
239,623210,64028,983
74,02760,88317,13523,64119,7463,8953,079
17,0274,0693,1989,761
13,14427,04513,99313,05310,931
Bankswithoutforeignoffices
510,584
61,0006,5135,779(4)
12,256
22,7428,766
53513,441(4)(4)
13,710
426,969
135,28053,36025,41251,1235,3854,092
569724
28,340271,285
6,7073,261
261,317
95,90513,034
1,65152,45449,7582,440
47,3182,696
962,600
28,765
7,950684
4,837(4)(4)
728(4)(4)
4591,241
2,244574
1,6706,156
86,140(4)(4)
68,54556,05423,6721 1 ,4979,9251,5723,498
17,3873,3553,985
10,04612,4924,345<4)(4)2,033
50Digitized for FRASER http://fraser.stlouisfed.org/ Federal Reserve Bank of St. Louis

17-B. Continued
Item
72 Bank premises, furniture and fixtures, and other assets representing bank premises . . .73 Real estate owned other than bank premises7 4 Intangible assets . . . .75 All other assets . . . . . . . .76 Investment in unconsolidated subsidiaries and associated companies77 Customers' liability on acceptances outstanding78 U S addressees (domicile) . . . . .79 Non-U S addressees (domicile) . .80 Net due from foreign branches and foreign, Edge, and Agreement subsidiaries . . . .8 1 Other
82 Total liabilities and equity capital4
83 Total liabilities excluding subordinated debt
84 Total deposits85 Individuals partnerships and corporations86 U S government - . . . . . . . . . . .87 States and political subdivisions in United States88 All other89 Foreign governments and official institutions90 Commercial banks in United States91 U.S. branches and agencies of foreign banks92 Other commercial banks in United States93 Banks in foreign countries . . . . . . . . .94 Foreign branches of other U S banks95 Other banks in foreign countries96 Certified and officers' checks, travelers checks, and letters of credit sold for cash. . .97 Federal funds purchased and securities sold under agreements to repurchase
in domestic offices and Edge and Agreement subsidiaries98 Interest-bearing demand notes issued to U.S. Treasury
and other liabilities for borrowed money99 Interest-bearing demand notes (note balances) issued to U S Treasury
100 Other liabilities for borrowed money . . . . . . . . . . . . . .101 Mortgage indebtedness and liability for capitalized leases102 All other liabilities103 Acceptances executed and outstanding104 Net due to foreign branches foreign and Edge and Agreement subsidiaries1 0 5 Other . . . . . . . . . .106 Subordinated notes and debentures107 Total equity capital5
108 Preferred stock109 Common stock1 10 Surplus , . . . .1 1 1 Undivided profits and reserve for contingencies and other capital reserves112 Undivided profits113 Reserve for contingencies and other capital reserves
MEMODeposits in domestic offices
114 Total demand1 15 Total savings1 16 Total time117 Time deposits of $100,000 or more118 Certificates of deposit in denominations of $100 000 or more119 Other120 Super NOW accounts . . .121 Other NOW accounts and ATS accounts (savings deposits authorized for
automatic transfer)122 All other savings deposits that are subject to a federal regulatory interest rate ceiling . .123 Money market time deposits (a) in minimum denominations of $2,500 but less than
$100,000 with original maturities of 26 weeks, and (b) in minimum denomina-tions of $2,500 but less than $100,000 with original maturities of 91 days . . .
124 All savers certificates125 Total Individual Retirement Accounts (IRA) and Keogh plan accounts126 Demand deposits adjusted
127 Standby letters of credit total128 U.S addressees (domicile)129 Non-U S addressees (domicile) . . . . . .130 Standby letters of credit conveyed to others through participations (included
in total standby letters of credit)131 Holdings of commercial paper included in total gross loans
Averages for 30 calendar days (or calendar month) ending with report date1 32 Total assets . . . . . . . . . . . . . .133 Cash and due from depository institutions134 Federal funds sold and securities purchased under agreements to resell135 Total loans . . . . . . . .136 Total deposits137 Time CDs in denominations of $100,000 or more in domestic offices138 Federal funds purchased and securities sold under agreements to repurchase139 Other liabilities for borrowed money
140 Number of banks . . . . , . . .
Insured
26,6683,9341,166
103,8601,885
60,726(4)(4)(4)
41,249
1,808,316
1,703,873
1,367,9821,084,744
2,86755,703
209,72128,65177,409(4)(4)
103,660(4)(4)
14,946
168,568
60,21118,41641,795
2,314104,79860,883
(4)43,915
6,81897,625
55918,02532,08446,95646,151
806
295,011321,374449,893237,976194,45343,52314,121
44,96597,759
110,6213,048
19,227190,443
105,889(4)(4)
9,228(4)
1,771,605277,19069,967
1,004,3791,437,093
194,214173,02639,203
1,868
Banks with foreign offices2
Total
16,4442,451
63993,476
1,73060,34715,80544,542(4)
31,399
1,297,732
1,230,455
941,559702,863
1,91225,724
200,16228,31768,6605,630
63,030103,186
18,80484,38210,897
136,969
53,21714,42238,795
1,47397,23860,505(4)
36,7335,218
62,058453
11,61618,89831,09230,768
324
196,838174,510268,509172,970134,11238,8586,283
22,62448,393
48,0511,6889,693
113,414
99,49872,95526,543
8,930(4)
1 ,266,767221,23339,970
742,0751,016,104
(4)140,61836,208
195
Foreignoffices3
1,67683
(4)47,423
1,17613,822(4)(4)
22,5889,837
(4)383,913
301,704160,346
407830
139,50818,45933,816
3,14530,67187,23216,73370,499
612
339
16,278(4)
16,27810
65,58211,45944,8089,315
466(4)(4)(4)(4)(4)(4)(4)
0000000
00
0000
25,325(4)(4)
785(4)
309,019115,517
539197,156388,654
(4)455
15,318
195
Domesticoffices
14,7682,368(4)
1 14,089554
46,526(4)(4)
44,80822,202
(4)913,938
639,856542,518
1,50424,89460,6559,857
34,8442,485
32,35915,9542,070
13,88310,285
136,629
36,93914,42222,517
1,46399,05249,04622,58827,4184,752(4)(4)(4)(4)(4)(4)(4)
196,838174,510268,509172,970134,11238,8586,283
22,62448,393
48,0511,6889,693
113,414
74,173(4)(4)
8,145537
957,748105,71739,431
544,919627,450133,960140,61220,890
195
Bankswithoutforeignoffices
10,2231,482
52610,383
155378
(4)( )(4)9,850
510,584
473,417
426,423381,881
95629,9789,559
3358,749(4)(4)
475(4)(4)4,049
31,599
6,9943,9943,000
8427,560
378(4)7,1811,600
35,567106
6,40913,18615,86515,383
482
98,173146,865181,38565,00760,3414,6657,838
22,34149,365
62,5701,3609,534
77,030
6,391(4)(4)
2981,306
504,83955,95729,997
262,304420,99060,25432,4092,994
1,673
51Digitized for FRASER http://fraser.stlouisfed.org/ Federal Reserve Bank of St. Louis

17. Insured commercial banks with assets of $100 million or over—Domestic and foreign offices1—ContinuedC, September 30, 1983Millions of dollars, except for number of banks
Item
1 Total assets . . . . . . . . .2 Cash and due from depository institutions . . . . .3 Currency and coin (U S and foreign)4 Balances with Federal Reserve Banks5 Balances with other centra] banks6 Demand balances with commercial banks in United States7 All other balances with depository institutions in United States and
with banks in foreign countries8 Time and savings balances with commercial banks in United States9 Balances with other depository institutions in United States
10 Balances with banks in foreign countries1 1 Foreign branches of other U S banks12 Other banks in foreign countries .13 Cash items in process of collection14 Total securities, loans and lease financing receivables15 Total securities book value16 U S Treasury17 Obligations of other U S government agencies and corporations .18 Obligations of states and political subdivisions in United States19 All other securities20 Other bonds notes and debentures . . . . . . . .21 Federal Reserve and corporate stock22 Trading account securities23 Federal funds sold and securities purchased under agreements to resell24 Total loans gross . . .25 LESS* Unearned income on loans26 Allowance for possible loan loss27 EQUALS" Loans net . .
Total loans, gross, by category28 Real estate loans29 Construction and land development .30 Secured by farmland31 Secured by residential properties32 1- to 4-family . . .33 FHA-insured or VA-guaranteed34 Conventional . . . . . . . . .35 Multifamily . .36 FHA-insured37 Conventional . . . . . . .38 Secured by nonfarm nonresidential properties39 Loans to financial institutions40 RETTs and mortgage companies in United States . . . .41 Commercial banks in United States42 U S branches and agencies of foreign banks43 Other commercial banks . .44 Banks in foreign countries45 Foreign branches of other U S banks . .46 Other47 Finance companies of other U S banks . .48 Other financial institutions , , . . . .49 Loans for purchasing or carrying securities .50 Brokers and dealers in securities51 Other . .52 Loans to finance agricultural production and other loans to farmers53 Commercial and industrial loans54 U S addressees (domicile) . .55 Non-U S addressees (domicile) . . . .56 Loans to individuals for household family, and other personal expenditures57 Installment loans .58 Passenger automobiles59 Credit cards and related plans . . .60 Retail (charge account) credit card . . . .61 Check and revolving credit62 Mobile homes . . .63 Other installment loans64 Other retail consumer goods . . .65 Residential property repair and moderni/ation66 Other for household family and other personal expenditures67 Single-payment loans . •68 All other loans69 Loans to foreign governments and official institutions70 Other .71 Lease financing receivables72 Bank premises, furniture and fixtures, and other assets representing bank premises . . . .
Insured
1,815,091285,893
13,08218,9383,983
19,459
157,63224,726
1,278131,628
(4>(4)
72,7981,390,588
291,384102,95241,274
110,93836,21915,661
2,27118,28868,983
1,040,20013,54912,280
1,014,371
246,485o(4)(4)(?(?(4)(4)(4)(4)<4>101,614
5,02315,566(4)(4)
48,966C4)(4)10,30221,75715,7519,8295,921
14,066448,823
(4)(4)
156,908(4)(4)(4)(4)(4)(4)(4)(4)(4)(4)(4)
56,552(4)(4)15,85127,135
Banks with foreign offices2
Total
1,293,822225,797
7,73912,9773,9837,041
135,91616,117
936118,863
18,807100,05758,140
952,517152,67946,94816,37658,93730,41811,105
1,54117,77240,783
760,9576,7988,886
745,273
147,212(4)(4)C4)(4)(4)(4)(4)(4)(4)(4)
93,8454,442
10,6924,9115,781
48,346958
47,3889,822
20,54213,5569,3964,1597,768
361,876230,356131,51984,632(4)(4)(4)(4)(4)(4)(4>(4)(4)0(4)
52,06937,27114,79813,78216.835
Foreignoffices3
374,058117,311
246182
3,627203
1 1 1 ,7669,917
769101,080
14,26186,819
1,286207,390
12,51912021
57911,7988,575
1843,039
643193,475
1,670334
191,471
8,413(4)(4)(4)(4)(4)(4)(4)(4)(4)(4)
32,39162
829608222
23,000284
22,716408
8,0921,8471,200
647820
120,76618,726
102,0416,602(4)(4)(4)(4)(4)(4)(4)(4)(4)<4)(4)
22.63620,5822,0542,7571,748
Domesticoffices
980,256108,486
7,49212,795
3566,839
24,1506,199
16717,7834,546
13,23756,854
745,127140,16046,82816,35558,35818,6192,5291,357
14,73340,139
567,4825,1288,552
553,802
138,79937,565
1,00071,55967,147
4,21062,938
4,412235
4,17728,67561,454
4,3819,8634,3045,559
25,346675
24,6729,414
12,45011,7098,1963,5136,948
241,110211,631
29,47978,03064,10418.42925,26620,9934,2733,112
17,2974,1353.160
10.00213,92629,43316,68912,744[ 1 .02515.087
Bankswithoutforeignoffices
520,43659,964
5,3275,945
(4)12,416
21,6578,609
34112,706(4)(4)14,618
437,413138,43055,88624,85551,905
5,7854,540
729516
28,075278,960
6,7313,391
268,839
99,16513,972
1,73153,82650,9542,542
48,4112,873
1052,768
29,6367,768
5784,874(4)(4)
620(4)(4)
4811,2152,195
4331,7626,298
86,906(4)(4)
72,15059,17525,27312,40210,652
1,7513,526
17,9733,4214,088
10,46312,9764,478(4)(4>2,069
10,270
52Digitized for FRASER http://fraser.stlouisfed.org/ Federal Reserve Bank of St. Louis
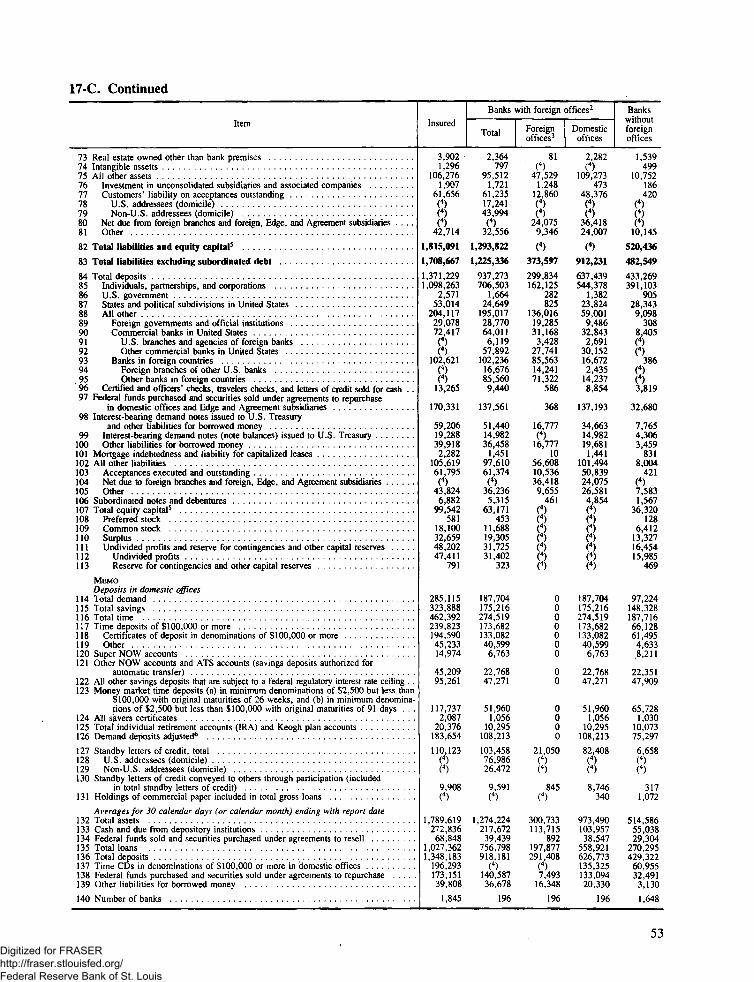
17-C. Continued
Item
73 Real estate owned other than bank premises74 Intangible assetts . . . . . .75 All other assets76 Investment in unconsolidated subsidiaries and associated companies77 Customers' liability on acceptances outstanding78 U S addressees (domicile) . .79 Non-U S addressees (domicile) . . .80 Net due from foreign branches and foreign, Edge, and Agreement subsidiaries . . . .81 Other
82 Total liabilities and equity capital5
83 Total liabilities excluding subordinated debt
84 Total deposits . . . . . . ,85 Individuals partnerships and corporations . . . .86 U S government . . .87 States and political subdivisions in United States88 All other89 Foreign governments and official institutions . . . .90 Commercial banks in United States91 U S branches and agencies of foreign banks92 Other commercial banks in United States . . . .93 Banks in foreign countries . . .94 Foreign branches of other U S banks95 Other banks in foreign countries .96 Certified and officers' checks, travelers checks, and letters of credit sold for cash . .97 Federal funds purchased and securities sold under agreements to repurchase
in domestic offices and Edge and Agreement subsidiaries98 Interest-bearing demand notes issued to U.S. Treasury
and other liabilities for borrowed money . . .99 Interest- bearing demand notes (note balances) issued to U.S. Treasury
100 Other liabilities for borrowed money101 Mortgage indebtedness and liability for capitalized leases102 All other liabilities103 Acceptances executed and outstanding . . .104 Net due to foreign branches and foreign, Edge, and Agreement subsidiaries105 Other106 Subordinated notes and debentures . .107 Total equity capital5
108 Preferred stock . .109 Common stock . . . . .110 Surplus111 Undivided profits and reserve for contingencies and other capital reserves1 12 Undivided profits . . . .113 Reserve for contingencies and other capital reserves . . .
MEMODeposits in domestic offices
114 Total demand . . . . . .115 Total savings116 Total time . . . .117 Time deposits of $100 000 or more . . . .118 Certificates of deposit in denominations of $100 000 or more1 19 Other120 Super NOW accounts . . . . . . .121 Other NOW accounts and ATS accounts (savings deposits authorized for
automatic transfer) . . . . . . . .122 All other savings deposits that are subject to a federal regulatory interest rate ceiling . .123 Money market time deposits (a) in minimum denominations of $2,500 but less than
$100,000 with original maturities of 26 weeks, and (b) in minimum denomina-tions of $2,500 but less than $100,000 with original maturities of 91 days . . .
124 All savers certificates125 Total individual retirement accounts (IRA) and Keogh plan accounts126 Demand deposits adjusted**
127 Standby letters of credit total . . . . . .128 U S addressees (domicile)129 Non-U. S addressees (domicile) . .130 Standby letters of credit conveyed to others through participation (included
in total standby letters of credit)131 Holdings of commercial paper included in total gross loans
Averages for 30 calendar days (or calendar month) ending with report date132 Total assets . . . . ,133 Cash and due from depository institutions . . . . . . .134 Federal funds sold and securities purchased under agreements to resell135 Total loans136 Total deposits . . . . .137 Time CDs in denominations of $100,000 or more in 'domestic offices138 Federal funds purchased and securities sold under agreements to repurchase139 Other liabilities for borrowed money . . . .
140 Number of banks
Insured
3,9021,296
106,2761,907
61,656(4)(4)(4)
42,714
1,815,091
1,708,667
1,371,2291,098,263
2,57153,014
204,11729,07872,417(4)(4)
102,621(4)(4)
13,265
170,331
59,20619,28839,9182,282
105,61961,795(4)
43,8246,882
99,542581
18,10032,65948,20247,411
791
285,115323,888462,392239,823194,59045,23314,974
45,20995,261
117,7372,087
20,376183,654
110,123(4)(4)
9,908(4)
1,789,619272,83668,848
1,027,3621,348,183
196,293173,15139,808
1,845
Banks with foreign offices2
Total
2,364797
95,5121,721
61,23517,24143,994(4)
32,556
1,293,822
1,225,336
937,273706,503
1,66424,649
195,01728,77064,011
6,11957,892
102,23616,67685,5609,440
137,561
51,44014,98236,458
1,45197,61061,374(4)
36,2365,315
63,171453
11,68819,30531,72531,402
323
187,704175,216274,519173,682133,08240,5996,763
22,76847,271
51,9601,056
10,295108,213
103,45876,98626,472
9,591(4)
1,274,224217,67239,439
756,798918,181
(4)140,58736,678
196
Foreignoffices3
81(4)
47,5291,248
12,860(4)(4)
24,0759,346
(4)
373,597
299,834162,125
282825
136,01619,28531,168
3,42827,74185,56314,24171,322
586
368
16,777(4)
16,77710
56,60810,53636,4189,655
461(4)(4)(4)(4)(4)(4)(4)
0000000
00
0000
21,050(4)(4)
845(4)
300,733113,715
892197,877291,408
(4)7,493
16,348
196
Domesticoffices
2,282(4)
109,273473
48,376(4)(4)
36,41824,007
(4)
912,231
637,439544,378
1,38223,82459,0019,486
32,8432,691
30,15216,6722,435
14,2378,854
137,193
34,66314,98219,681
1,441101,49450,83924,07526,5814,854(4)(4)(4)(4)(4)(4)(4)
187,704175,216274,519173,682133,08240,5996,763
22,76847,271
51,9601,056
10,295108,213
82,408(4)(4)
8,746340
973,490103,95738,547
558,921626,773135,325133,09420,330
196
Bankswithoutforeignoffices
1,539499
10,752186420
(4)(4)(4)
10,145
520,436
482,549
433,269391,103
90528,3439,098
3088,405(4)(4)
386(*)(4)3,819
32,680
7,7654,3063,459
8318,004
421(4)7,5831,567
36,320128
6,41213,32716,45415,985
469
97,224148,328187,71666,12861,4954,6338,211
22,35147,909
65,7281,030
10,07375,297
6,658(4)(4)
3171,072
514,58655,03829,304
270,295429,32260,95532,491
3,130
1,648
53Digitized for FRASER http://fraser.stlouisfed.org/ Federal Reserve Bank of St. Louis

17. Insured commercial banks with assets of $100 million or over—Domestic and foreign offices1—ContinuedD. December 31, 1983Millions of dollars, except for number of banks
Item
1 Total assets2 Cash and due from depository institutions . . . .3 Currency and coin (U.S. and foreign)4 Balances with Federal Reserve Banks5 Balances with other central banks6 Demand balances with commercial banks in United States7 All other balances with depository institutions in United States and
with banks in foreign countries8 Time and savings balances with commercial banks in United States9 Balances with other depository institutions in United States
10 Balances with banks in foreign countries1 ] Foreign branches of other U.S. banks . . . .12 Other banks in foreign countries13 Cash items in process of collection14 Total securities, loans, and lease financing receivables15 Total securities book value16 U S Treasury17 Obligations of other U.S. government agencies and corporations18 Obligations of states and political subdivisions in United States19 All other securities20 Other bonds, notes, and debentures21 Federal Reserve and corporate stock22 Trading account securities . . . .23 Federal funds sold and securities purchased under agreements to resell24 Total loans gross25 LESS* Unearned income on loans26 Allowance for possible loan loss27 Allocated transfer risk reserves28 EQUALS' Loans net . . . . . .
Total loans, gross, by category29 Real estate loans30 Construction and land development3 1 Secured by farmland32 Secured by residential properties33 1- to 4-family34 FHA-insured or VA-guaranteed35 Conventional36 Multifamily . . . .37 FHA-insured38 Conventional39 Secured by nonfarm nonresidential properties40 Loans to financial institutions . . . .•41 REITs and mortgage companies in United States42 Commercial banks in United States43 U S branches and agencies of foreign banks44 Other commercial banks45 Banks in foreign countries46 Foreign branches of other U.S. banks47 Other .48 Finance companies in United States49 Other financial institutions50 Loans for purchasing or carrying securities5 1 Brokers and dealers in securities52 Other53 Loans to finance agricultural production and other loans to farmers54 Commercial and industrial loans55 U S addressees (domicile) . . . .56 Non-U S addressees (domicile)57 Loans to individuals for household, family, and other personal expenditures58 Installment loans59 Passenger automobiles60 Credit cards and related plans61 Retail (charge account) credit card62 Check and revolving credit63 Mobile homes64 Other installment loans65 Other retail consumer goods . . . .66 Residential property repair and modernization67 Other for household, family, and other personal expenditures68 Single-payment loans69 All other loans70 Loans to foreign governments and official institutions71 Other72 Lease financing receivables
Insured
1,882,878298,664
16,12920,8284,097
20,468
154,62626,725
2,499125,402
(4)(4)
82,5151,440,315
299,956108,11240,561
115,47235,81216,5062,276
17,03068,331
1,081,90813,41112,957
61,055,534
252,044(4)<4)C4)C4)(4)C4)(4)(4)(4)(4)
105,5464,981
18,149(4)(4)
48,618<4)(4)
10,79823,00018,49612,3916,106
14,231464,071
C4)(4)
166,961(4)(4)(4)(4)(4)(4)0(4)(4)(4)(4)
60,543(4)(4)
16,494
Banks with foreign offices2
Total
1,340,730234,045
9,57314,3074,0977,635
132,55618,1482,028
112,38018,85093,53065,878
986,408158,06249,25416,49562,48229,83111,828
1,51316,49040,382
789,9216,7199,489
6773,706
150,199(4)(4)C4)C4)C4)C4)C4)(4)(4)(4)
97,2284,348
12,7595,9086,851
48,066782
47,28410,27321,78315,78711,5154,2727,997
372,690239,482133,20890,212
(4)(4)C4)(4)(4)(4)(4)(4)(4)(4)(4)
55,80740,49715,31014,257
Foreignoffices3
382,117113,554
302189
3,727233
107,98911,080
1,78295,12714,11481,013
1,114208,481
13,70914423
64612,8978,890
1483,859
622193,210
1,614360
(4)191,235
8,780(4)(4)C4)C4)(4)(4)(4)(4)(4)(4)
31,80958
779604175
22,341371
21,970391
8,2402,1761,558
618856
120,41217,970
102,4426,528(4)(4)(4)
0(4)(4)(4)(4)(4)(4)(4)
22,65020,519
2,1322,916
Domesticoffices
1,026,215120,491
9,27114,118
3707,402
24,5677,069
24617,2534,736
12,51864,763
777,927144,35249,11116,47261,83616,9342,9381,364
12,63139,761
596,7105,1059,129
6582,472
141,42038,210
1,08772,20267,537
4,10063,4384,665
2614,404
29,92165,4194,290
11,9805,3046,676
25,724411
25,3149,882
13,54313,6119,9583,6537,141
252,278221,51230,76683,68468,42019,37028,12123,5984,5233,105
17,8234,1423,113
10,56815,26433,15719,97913,17811,342
Bankswithoutforeignoffices
542,14864,6196,5566,522C4)
12,834
22,0708,576
47213,022
C4)C4)
16,637453,908141,89558,85824,06652,990
5,9814,678
764540
27,949291,988
6,6923,468(4)
281,827
101,84414,908
1,77454,56951,6362,270
49,3672,933
932,840
30,5928,319
6345,390(4)(4)
552(4)(4)
5261,2172,709
8751,8346,233
91,395(4)(4)
76,75063,06826,73314,51112,3592,1523,510
18,3153,4364,110
10,76813,6814,737(4)(4)2,237
54Digitized for FRASER http://fraser.stlouisfed.org/ Federal Reserve Bank of St. Louis

17-D. Continued
Item
73 Bank premises, furniture and fixtures, and other assets representing bank premises . . . .74 Intangible assets .75 Real estate owned other than bank premises76 All other assets77 Investment in unconsolidated subsidiaries and associated companies78 Customers* liability on acceptances outstanding79 U S addressees (domicile)80 Non-U S addressees (domicile)81 Net due from foreign branches and foreign Edge and Agreement subsidiaries82 Other
83 Total liabilities and equity capital5
84 Total liabilities excluding subordinated debt
85 Total deposits86 Individuals partnerships and corporations87 U S government88 States and political subdivisions in United States .89 All other9 0 Foreign governments a n d official institutions . . .91 Commercial banks in United States92 U S branches and agencies of foreign banks93 Other commercial banks in United States94 Banks in foreign countries . . . . '95 Foreign branches of other U S banks96 Other banks in foreign countries97 Certified and officers' checks, travelers checks, and letters of credit sold for cash . . .
98 Federal funds purchased and securities sold under agreements to repurchasein domestic offices and Edge and Agreement subsidiaries
99 Interest-bearing demand notes issued to U.S. Treasury and other liabilitiesfor borrowed money
100 Interest-bearing demand notes (note balances) issued to U.S. Treasury101 Other liabilities for borrowed money •102 Mortgage indebtedness and'I lability for capitalized leases103 All other liabilities104 Acceptances executed and outstanding105 Net due to foreign branches and foreign, Edge, and Agreement subsidiaries106 Other
107 Subordinated notes and debentures
108 Total equity capital5
109 Preferred stock1 10 Common stockI l l Surplus112 Undivided profits and reserve for contingencies and other capital reserves113 Undivided profits1 14 Reserve for contingencies and other capital reserves
MEMODeposits in domestic offices
115 Total demand .116 Total savings1 17 Total time1 18 Time deposits of $100,000 or more119 Certificates of deposit in denominations of $100 000 or more120 Other121 Super NOW accounts .122 Other "NOW" accounts and ATS accounts (savings deposits authorized for
automatic transfers)123 All other savings deposits that are subject to a federal regulatory interest rate ceiling . .124 Total individual retirement accounts (IRA) and Keogh plan accounts125 Demand deposits adjusted6
126 Standby letters of credit total127 U S. addressees (domicile)128 Non-U S addressees (domicile) . , . .129 Standby letters of credit conveyed to others through participations
(included in total standby letters of credit)130 Holdings of commercial paper included in total gross loans .
Average for 30 calendar days (or calendar month) ending with report date131 Total assets . . . .132 Cash and due from depository institutions133 Federal funds sold and securities purchased under agreements to resell134 Total loans .135 Total deposits136 Time CDs in denominations of $100,000 or more in domestic offices
137 Federal funds purchased and securities sold under agreements to repurchase138 Other liabilities for borrowed money
139 Number of banks
Insured
27,7473,6981,506
110,9482,018
66,414(4)(4)(4)
42,517
1,882,878
1,774,348
1,438,4921,154,787
2,85153,729
212,69029,79973,605(4)(4)
109,285(4)(4)
14,436
171,232
52,9198,309
44,6102,357
109,34966,748(4)
42,601
6,443
102,087585
18,22434,44448,83448,065
770
312,010331,980486,108249,756202,415
47,34116,752
47,72792,63922,001
200,296
117,403(4)C4)
9,845(4)
1,846,892277,028
72,8201,055,8921,392,501
197,549
181,14344,696
1,829
Banks with foreign offices2
Total
17,3312,176
92199,849
1,81065,98618,45047,536(4)
32,053
1,340,730
1,270,678
985,257746,000
1,83224,763
202,47529,51464,2385,576
58,662108,72317,26491,45910,187
135,100
47,6936,531
41,1621,523
101,10466,320(4)
34,784
4,937
65,116453
11,74520,67332,24431,935
309
205,815178,002293,045181,173138,28242,891
7,631
24,02945,85911,306
118,792
109,89283,49126,401
9,460(4)
1,317,840221,41743,324
774,631950,867
(4)146,33541,527
195
Foreignoffices3
1,85997
(4)58,125
1,33914,190(4)C4)
33,4029,195
(4)381,658
308,395168,496
246767
138,34118,16030,1353,258
26,87690,04614,80375,243
544
629
18,103(4)
18,10311
54,52111,69234,2008,628
459
(4)(4)(4)(4)(4)(4)(4)
0000000
0000
21,158(4)(4)
583(4)
309,171110,897
664193,110299,341
(4)665
17,000
195
Domesticoffices
15,4722,079(4)
110,247471
51,796(4)(4)
34,20023,780
(4)956,622
676,862577,504
1,58623,99664,13411,35434,103
2,31731,78618,6772,461
16,2169,643
134,472
29,5906,531
23,0591,512
114,18554,62833,40226,155
4,478
(4)( )(4)(4)0( )(4)
205,815178,002293,045181,173138,28242,891
7,631
24,02945,85911,306
118,792
88,734(4)(4)
8,877635
1,008,670110,52042,660
581,520651,526135,332
145,67024,526
195
Bankswithoutforeignoffices
10,4151,522
58511,099
208428
(4)(4)(4)
10,463
542,148
503,671
453,235408,787
1,02028,96510,214
2859,368(4)(4)
562C4)(4)4,248
36,131
5,2261,7783,448
8348,244
427(4)7,817
1,507
36,971132
6,47913,77016,59016,130
460
106,195153,978193,06268,58264,1334,4509,121
23,69946,78010,69581,504
7,511(4)(4)
3851,126
529,05255,61129,496
281,261441,634
62,216
34,8083,169
1,634
55Digitized for FRASER http://fraser.stlouisfed.org/ Federal Reserve Bank of St. Louis
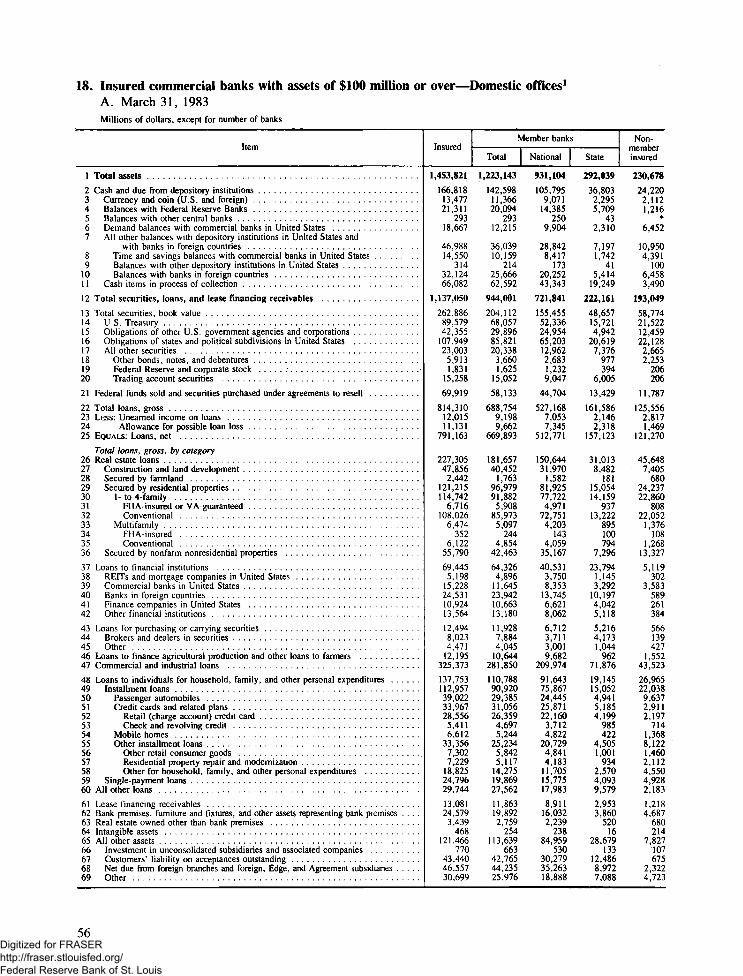
18. Insured commercial banks with assets of $100 million or over—Domestic offices1
A. March 31, 1983Millions of dollars, except for number of banks
Item
1 Total assets
2 Cash and due from depository institutions .3 Currency and coin (U S and foreign)4 Balances with Federal Reserve Banks5 Balances with other central banks6 Demand balances with commercial banks in United States7 All other balances with depository institutions in United States and
with banks in foreign countries8 Time and savings balances with commercial banks in United States9 Balances with other depository institutions in United States
10 Balances with banks in foreign countries1 1 Cash items in process of collection
12 Total securities, loans, and lease financing receivables
1 3 Total securities book value14 U S Treasury15 Obligations of other U.S. government agencies and corporations16 Obligations of states and political subdivisions in United States17 All other securities18 Other bonds, notes, and debentures19 Federal Reserve and corporate stock20 Trading account securities
21 Federal funds sold and securities purchased under agreements to resell
22 Total loans gross23 LESS* Unearned income on loans24 Allowance for possible loan loss25 EQUALS: Loans, net
Total loans, gross, by category26 Real estate loans27 Construction and land development28 Secured by farmland29 Secured by residential properties30 1- to 4-family31 FHA-insured or VA-guaranteed32 Conventional33 Multifamily34 FHA-insured35 Conventional36 Secured by nonfarm nonresidential properties
37 Loans to financial institutions38 REITs and mortgage companies in United States39 Commercial banks in United States .40 Banks in foreign countries41 Finance companies in United States42 Other financial institutions
43 Loans for purchasing or carrying securities44 Brokers and dealers in securities45 Other46 Loans to finance agricultural production and other loans to farmers47 Commercial and industrial loans
48 Loans to individuals for household, family, and other personal expenditures49 Installment loans50 Passenger automobiles51 Credit cards and related plans52 Retail (charge account) credit card53 Check and revolving credit54 Mobile homes55 Other installment loans56 Other retail consumer goods57 Residential property repair and modernization58 Other for household family, and other personal expenditures59 Single-payment loans60 All other loans .
61 Lease financing receivables62 Bank premises, furniture and fixtures, and other assets representing bank premises . . . .63 Real estate owned other than bank premises .64 Intangible assets65 All other assets .66 Investment in unconsolidated subsidiaries and associated companies67 Customers' liability on acceptances outstanding68 Net due from foreign branches and foreign, Edge, and Agreement subsidiaries69 Other
1,453,821
166 81813,47721 311
29318,667
46,98814,550
31432,12466 082
1,137,050
262 88689,57942,355
107 94923,003
5,9131 831
15,258
69,919
814,31012 01511,131
791,163
227 30547,8562442
121,2151 14 742
6,716108 026
6474352
6 12255,790
69 4455 198
15,22824 53110,92413 564
12 4948 0234 471
12,195325 373
137,753112,95739 02233 96728,5565 4116 612
33,3567 3027,229
18,82524 79629,744
13 08124,5793 439
468121,466
77043,44046,55730 699
»
Total
1,223,143
142 5981 1 ,36620 094
29312,215
3603910,159
21425,66662 592
944,001
204 1126805729,89685 82120 3383,6601 625
15 052
58 133
688 7549 1989662
669,893
181 65740,452
1 76396,97991 8825,908
85 9735097
2444 854
42,463
64 3264896
1 1 ,64523 9421066313 180
11 9287 8844 045
10,644281,850
110,78890,92029,38531 05626,35946975 244
25,2345 8425,117
14,27519 86927,562
11 86319,8922 759
254113,639
66342,76544,23525 976
Member bank
National
931,104
105 7959,071
14 385250
9,904
28,8428,417
17320,25243 343
721,841
155 45552,33624,95465 20312,9622,6831 2329,047
44,704
527,1687 0537,345
512,771
150,64431,970
1 58281,92577 722
4,97172 7514203
1434 059
35,167
40 5313,7508,353
13 7456,6218 062
6,7123 7113,0019,682
209,974
91,64375,86724,44525,87122,160
3,7124 822
20,7294,8414,183
11,70515 77517,983
8 91116,0322,239
23884,959
53030,27935,26318,888
s
State
292,039
36 80322955 709
432,310
7 1971,742
415 414
19 249
222,161
48 65715 7214,942
20 6197 376
977394
6005
13,429
161,5862 1462 318
157,123
31 0138,482
18115,05414 159
93713 222
895100794
7,296
23 7941 1453,292
10 1974,0425 118
5 2164 1731 044
96271,876
19,14515,0524,9415 1854,199
985422
4,5051 001
9342,57040939,579
2 9533,860
52016
28,679133
12,4868,9727 088
Non-
insured
230,678
24 2202 1121 216
*6452
10 9504 391
10064583 490
193,049
58 77421 52212 45922 128
2 6652253
206206
11 787
125 5562 8171 469
121,270
45 648• 7405
68024 23722 860
80822 052
1 376108
1 26813 327
5 119302
3,583589261384
566139427
1,55243,523
26,96522,0389 6372 9112,197
7141 3688,1221 4602,1124,5504 9282,183
I 2184,687
680214
7,827107675
2,3224 723
56Digitized for FRASER http://fraser.stlouisfed.org/ Federal Reserve Bank of St. Louis

18-A. Continued
Item
70 Total liabilities and equity capital2
71 Total liabilities excluding subordinated debt72 Total deposits .73 Individuals partnerships and corporations74 U S government75 States and political subdivisions in United States76 All other77 Foreign governments and official institutions . . .78 Commercial banks in United States . . . .79 Banks in foreign countries80 Certified and officers' checks, travelers checks, and letters of credit sold for cash . . .81 Demand deposits82 Mutual savings banks83 Other individuals partnerships and corporations84 U S government .85 States and political subdivisions in United States86 All other . . .87 Foreign governments and official institutions88 Commercial banks in United States89 Banks in foreign countries90 Certified and officers' checks, travelers checks, and letters of credit sold for cash . . .91 Time deposits . . .92 Mutual savings banks93 Other individuals94 U S government95 States and political subdivisions in United States . . .96 All other97 Foreign governments and official institutions98 Commercial banks in United States99 Banks in foreign countries
100 Savings deposits101 Mutual savings banks102 Other individuals partnerships and corporations . .103 Individuals and nonprofit organizations104 Corporations and other profit organizations105 U S government . . . . . . .106 States and political subdivisions107 All other . . . .108 Foreign governments and official institutions109 Commercial banks in United States . . . .1 10 Banks in foreign countries111 Federal funds purchased and securities sold under agreement to repurchase112 Interest-bearing demand notes issued to U.S. Treasury and other liabilities for
borrowed money113 Interest-bearing demand notes (note balances) issued to U S Treasury1 14 Other liabilities for borrowed money1 15 Mortgage indebtedness and liability for capitalized leases1 16 All other liabilities117 Acceptances executed and outstanding . . . .118 Net due to foreign branches and foreign, Edge and Agreement subsidiaries1 19 Other120 Subordinated notes and debentures121 Total equity capital
MEMO122 Time deposits of $100 000 or more123 Certificates of deposit in denominations of $100,000 or more124 Other .125 Super NOW accounts126 Other NOW accounts and ATS accounts (savings deposits authorized for
(automatic transfer) .127 All other savings deposits that are subject to a federal regulatory interest rate ceiling . .128 Money market time deposits (a) in minimum denominations of $2,500 but less than
$100,000 with original maturities of 26 weeks, and (b) in minimum denomina-tions of $2,500 but less than $100,000 with original maturities of 91 days . . . .
129 All savers certificates .130 Total individual retirement accounts (IRA) and Keogh plan accounts131 Demand deposits adjusted3
132 Total standby letters of credit133 Conveyed to others through participations (included in standby letters of credit) . .134 Holdings of commercial paper included in total gross loans
Average for 30 calendar days (or calendar month) ending with report date135 Total assets . . . . . . . .136 Cash and due from depository institutions137 Federal funds sold and securities purchased under agreements to resell138 Total loans . . .139 Total deposits140 Time CDs in denominations of $100,000 or more in domestic offices141 Federal funds purchased and securities sold under agreements to repurchase142 Other liabilities for borrowed money143 Number of banks . . .
Insured
1,453,8211,351,4231,041,762
902,1702,631
56,46667,998
7,37743,34917,27112,498
278,7331,092
219,0111,7959,646
34,6921,291
26,8936,508
12,498458,943
173381,606
71143,27933,1745,999
16,41110,763
304,0861
300,286272,314
27,972125
3,5411338745
*
171,723
37,45611,85425,6022,345
98,13747,20520,48530,4476,563
95,834
246,991206,23140,76012,000
45,99899,678
114,1254,223
16,350183,963
81,1887,7931,786
1,422,056157,44373,602
796,6181,026,136
209,274176,39421,888
1,879
Member banks
Total 1
1,223,1431,137,513
845,471726,709
2,21441,80964,0687,040
40,35016,67810,671
236,854953
182,6941,5127,860
33,1641,218
25,6086,339
10,671369,614
148306,757
58731,33030,7935,736
14,71710,340
239,0031
236,156215,377
20,779114
2,6201128626*
161,452
35,49210,94924,543
1,92093,17946,52919,50027,1495,482
80,148
207,571169,73537,8369,090
35,93177,502
87,2643,321
12,768147,142
77,9927,7011,224
1,194,670135,01861,427
674,043832,366172,667166,12820,732
1,140
National
931,104866,549660,541575,772
1,79134,49041,7053,683
28,7649,2576,785
175,407540
138,0871,1656,231
22,599600
19,2642,7356,785
289,80988
244,042550
26,13418,9962,9989,4776,522
195,3251
193,014175,81017,204
762,125
1108624*
115,606
22,0748,138
13,9361,610
66,71834,01513,94718,7563,445
61,110
154,601129,41425,1877,768
29,75362,776
73,0832,785
10,492111,635
48,8195,094
803
910,910100,20247,323
515,348649,755131,181120,747
11,678964
State
292,039270,964184,930150,938
4237,319
22,3643,357
11,5867,4213,887
61,447413
44,606347
1,62910,565
6186,3443,6033,887
79,80561
62,71537
5,19611,7972,7385,2403,818
43,678*
43,14239,5673,575
38495
212*
45,846
13,4182,811
10,607310
26,46012,5145,5538,3932,037
19,038
52,97140,32112,650
1,322
6,17914,726
14,181536
2,27535,507
29,1732,607
421
283,76034,81614,104
158,695182,61141,48545,3819,055
176
Non-memberinsured
230,678213,910196,291175,460
41714,6573,930
3382,999
5931,827
41,879139
36,317283
1,7861,528
731,286
1691,827
89,32825
74,849123
1 1 ,9492,381
2631,694
42465,084
*64,13056,937
7,19311
92221
119*
10,271
1,964905
1,059425
4,959676985
3,2981,081
15,686
39,42036,496
2,9242,910
10,06722,176
26,861902
3,58236,821
3,19692
563
227,38722,42512,175
122,575193,77036,60810,266
1,156739
57Digitized for FRASER http://fraser.stlouisfed.org/ Federal Reserve Bank of St. Louis

18. Insured commercial banks with assets of $100 million or over—Domestic offices1—ContinuedB. June 30, 1983Millions of dollars, except for number of banks
Item
1 Total assets
2 Cash and due from depository institutions3 Currency and coin (U S and foreign)4 Balances with Federal Reserve Banks .5 Balances with other central banks6 Demand balances with commercial banks in United States7 All other balances with depository institutions in United States and
with banks in foreign countries8 Time and savings balances with commercial banks in United States9 Balances with other depository institutions in United States
10 Balances with banks in foreign countries1 1 Cash items in process of collection
12 Total securities, loans, and lease financing receivables
13 Total securities book value14 U S Treasury15 Obligations of other U S government agencies and corporations16 Obligations of states and political subdivisions in United States . .17 All other securities1 8 Other bonds notes and debentures19 Federal Reserve and corporate stock20 Trading account securities
21 Federal funds sold and securities purchased under agreements to resell
22 Total loans gross23 LESS: Unearned income on loans24 Allowance for possible loan loss25 EQUALS' Loans net
Total loans, gross, by category26 Real estate loans27 Construction and land development28 Secured by farmland29 Secured by residential properties30 1- to 4-family31 FHA-insured or VA-guaranteed32 Conventional33 Multifamily34 FHA-insured35 Conventional .36 Secured by nonfarm nonresidential properties
37 Loans to financial institutions38 REITs and mortgage companies in United States39 Commercial banks in United States40 Banks in foreign countries41 Finance companies in United States ,42 Other financial institutions .
43 Loans for purchasing or carrying securities44 Brokers and dealers in securities45 Other . . .46 Loans to finance agricultural production and other loans to farmers47 Commercial and industrial loans
48 Loans to individuals for household family and other personal expenditures49 Installment loans50 Passenger automobiles . . . .51 Credit cards and related plans52 Retail (charge account) credit card53 Check and revolving credit54 Mobile homes . . .55 Other installment loans56 Other retail consumer goods57 Residential property repair and modernization58 Other for household, family, and other personal expenditures59 Single-payment loans60 All other loans
61 Lease financing receivables62 Bank premises, furniture and fixtures, and other assets representing bank premises . . . .63 Real estate owned other than bank premises64 Intangible assets65 All other assets66 Investment in unconsolidated subsidiaries and associated companies67 Customers' liability on acceptances outstanding68 Net due from foreign branches and foreign, Edge, and Agreement subsidiaries69 Other
1,491,333
171,48715,10815,770
29820,370
47 21914 279
64832 29272,722
1,166,005
274,21097 48642 037
108,53426 1526 4911 892
17,770
73,750
828,46911,86411 523
805,082
231,12149 310
2,640122 616115,726
6 799108 927
6,890375
6,51556 554
68 2025,442
14 34025,0329,988
13,401
16,45011,5334,918
12,970325,763
142,5721 16 93640,80835 13729 6715,4666,577
34 4147,4247 183
19,80725,63631 391
12,96424,991
3,851526
124,472709
46 90444,80832 051
>
Total
1,254,895
146,80812,65114,285
27813,742
36 71110,122
27126 31869,141
968,312
213,686740133009786,30023 2774 1081 655
17,514
63,427
698,6649,165
10 048679,451
184,29441,607
1,92497 80992,3656 006
86,3595,444
2875,158
42 955
62 7005,138
10 41224,479
9,71712,954
15,7451 1 ,2604,485
11,311280,616
114,71494 14930,70932,15027 4074,7435,227
26 0625,9315 109
15,02220,56529 084
11,74920,252
3,108291
116,124591
46 20342,18627,144
Member bank
National
955,193
108,06510,06510,893
23811,142
29 1828,342
23320 60846,543
741,832
161,68756 38825 08365,21015 0063 0881,221
10,697
49,032
536,9556,9687,659
522,329
153,27533,084
1,73882 75078,2695 045
73,2244,480
1454,335
35 703
396293,8767 547
13,8516,2408,115
8,4474,9403,507
10,292210,943
95,00178 76125,61626,86323 1153,7484,825
21,4564,9214,204
12,33116,24019 368
8,78416,2522,514
27486,257
45833 66833,16418,967
s
State
299,702
38,7432 5863 392
392 600
7 5281 780
385 710
22 598
226,480
51 99917 6245 014
21 0908 2711 020
4346 816
14 395
161 7092,1982 389
157 122
31,0208 523
18615 05914 095
96113 134
964141822
7 252
23 0711,2622 865
106283,4774 839
7 2986,320
9781,018
69,873
19 71315 3885,0935 2874 292
995402
4 6061,010
9052,6914 3259 716
29644,000
59418
29,868133
12 5359,0238 178
Non-
insured
236,437
24,6792 4571 485
206 629
10 5084 157
3775 9743 580
197,693
60 52423 47311 94122 235
2 8752 382
236256
10 323
129 8052,6991 475
125 631
46,8267 703
71624 80823 362
79322 569
1 44689
1,35713 599
5 502303
3 928553271447
706273433
1,65944,947
27 85822 78810,0982 9872 264
7231 3508 3521,4932 0744,7865 0702 307
1 2154,740
743235
8,348118701
2,6224 907
58Digitized for FRASER http://fraser.stlouisfed.org/ Federal Reserve Bank of St. Louis

18-B. Continued
Item
70 Total liabilities and equity capital2 . .71 Total liabilities excluding subordinated debt
72 Total deposits . . .73 Individuals partnerships and corporations74 U.S. government . . . .75 States and political subdivisions in United States76 All other77 Foreign governments and official institutions78 Commercial banks in United States79 Banks in foreign countries80 Certified and officers' checks, travelers checks, and letters of credit sold for cash . . .81 Demand deposits82 Mutual savings banks83 Other individuals partnerships and corporations84 U S government85 States and political subdivisions in United States86 All other87 Foreign governments and official institutions88 Commercial banks in United States89 Banks in foreign countries90 Certified and officers' checks, travelers checks, and letters of credit sold for cash . . .91 Time deposits92 Mutual savings banks . .93 Other individuals94 U.S. government . .95 States and political subdivisions in United States96 All other97 Foreign governments and official institutions98 Commercial banks in United States99 Banks in foreign countries
100 Savings deposits101 Mutual savings banks . . . .102 Other individuals, partnerships, and corporations103 Individuals and nonprofit organizations .104 Corporations and other profit organizations105 U.S. government106 States and political subdivisions . . .107 All other108 Foreign governments and official institutions109 Commercial banks in United States1 10 Banks in foreign countries11 1 Federal funds purchased and securities sold under agreement to repurchase112 Interest-bearing demand notes issued to U.S. Treasury and other liabilities
for borrowed money1 13 Interest-bearing demand notes (note balances) issued to U.S. Treasury1 14 Other liabilities for borrowed money115 Mortgage indebtedness and liability for capitalized leases1 16 All other liabilities117 Acceptances executed and outstanding118 Net due to foreign branches and foreign, Edge, and Agreement subsidiaries119 Other . . . .120 Subordinated notes and debentures121 Total equity capital . . . .
MEMO122 Time deposits of $100,000 or more123 Certificates of deposit in denominations of $100,000 or more1 24 Other125 Super NOW accounts126 Other NOW accounts and ATS accounts (savings deposits authorized for
(automatic transfer)127 All other savings deposits that are subject to a federal regulatory interest rate ceiling . .128 Money market time deposits (a) in minimum denominations of $2,500 but less than
$100,000 with original maturities of 26 weeks, and (b) in minimum denomina-tions of $2,500 but less than $100,000 with original maturities of 91 days . . . .
129 All savers certificates130 Total individual retirement accounts (IRA) and Keogh plan accounts . . . .131 Demand deposits adjusted^132 Total standby letters of credit133 Conveyed to others through participations (included in standby letters of credit) . .134 Holdings of commercial paper included in total gross loans
Average for 30 calendar days (or calendar month) ending with report dale135 Total assets136 Cash and due from depository institutions . . . .137 Federal funds sold and securities purchased under agreements to resell138 Total loans139 Total deposits . . . . .140 Time CDs in denominations of $100,000 or more in domestic offices141 Federal funds purchased and securities sold under agreements to repurchase142 Other liabilities for borrowed money . . . .143 Number of banks
1,491,3331,387,356
1 066 279924,399
2,46054 87270 21310,19243,59316 42814,334
295,0111 126
228 2531,880
11,41238,005
1 53629,9666,504
14,334449 893
132378 588
45638,58832 129
8 60713,5979 924
321 3741
316,299283 831
32,468124
4 872794930
*168 228
43,93318,41625 517
2,304106 61249,42422,58834 6006 352
97,625
237 976194 45343 52314 121
44 96597,759
110,6213,048
19 227190 44380 5648,4431,844
1,462,586161 67469,428
807,2231 048 439
194,214172,57123 885
1 868
^Total
1,254,8951,167,989
864 969743 529
2,04841 05766 0869 768
40,65615 66212,230
251 389957
190 6201 5809,513
36,4891 460
28 7196,310
12,230360 887
118302 968
37327 90229 5268 260
11 9149 351
252 6931
248,865224 531
24 334114
3 642714823
*158 432
41 13516,88224 252
1,884101 56948 72321,61631 2295 326
81,580
198 930158 53640 39510639
34 93775,726
84,3642 380
14 992151 94977 1468,3591,251
1 229 328139 05258,215
681 476849 831158,365162,34322 680
1 137
Member bank
National
955,193889,726
674 6 1 2588,678
1,56034 15643 090
5 58528,798
8 7077,128
185,047539
143 6741 1407,712
24,855839
21 0942,9227,128
284 89673
242 818349
23,48918 1674 7007,6835 785
204 6691
201,574181 854
19,72072
2 955684622
*113 793
26,44213,05513 386
1,58173 29936,14916,19120 959
3 30462,162
149 284122 71526 5699 078
29 04061,286
70,8892,027
12 382116 27051 803
5,314928
932,224103 72943,980
523,593663 469122,627119,111
12 087962
s
State
299,702278,263
190 357154 850
5076 901
22 9964 183
11 8586 9555,102
66 342418
46 946441
1,80111,634
6217 6253 3885,102
75 99145
60 15024
4 41311 3593 5614 2313 567
48 024*
47 29142 6774 614
43687
312*
44 640
14 6933,827
10 866303
28 27012 5745,426
10 2702 022
19,417
49 64635 82113 826
1 560
5 89714,440
13,475353
2 61035 67925 343
3,046322
297 10535 32314,235
157 883186 36235,73743,23210 592
175
Non-
insured
236,437219,366
201 309180,870
39213 8154 128
4242,937
7672,104
43,622169
37 633299
1,8991,516
761 247
1932,104
89 00714
75 62083
10,6862 603
3471 684
57368 681
H:
67,43459 300
8,1349
1 230826#
9 796
2,7981,5331 265
4205 043
701972
3 3701 026
16,045
39 04635 917
3 1293 482
10 02722,033
26,257668
4 23538 495
3 41784
593
233 25822 62111,213
125 748198 60835,84910,228
1 205731
59Digitized for FRASER http://fraser.stlouisfed.org/ Federal Reserve Bank of St. Louis
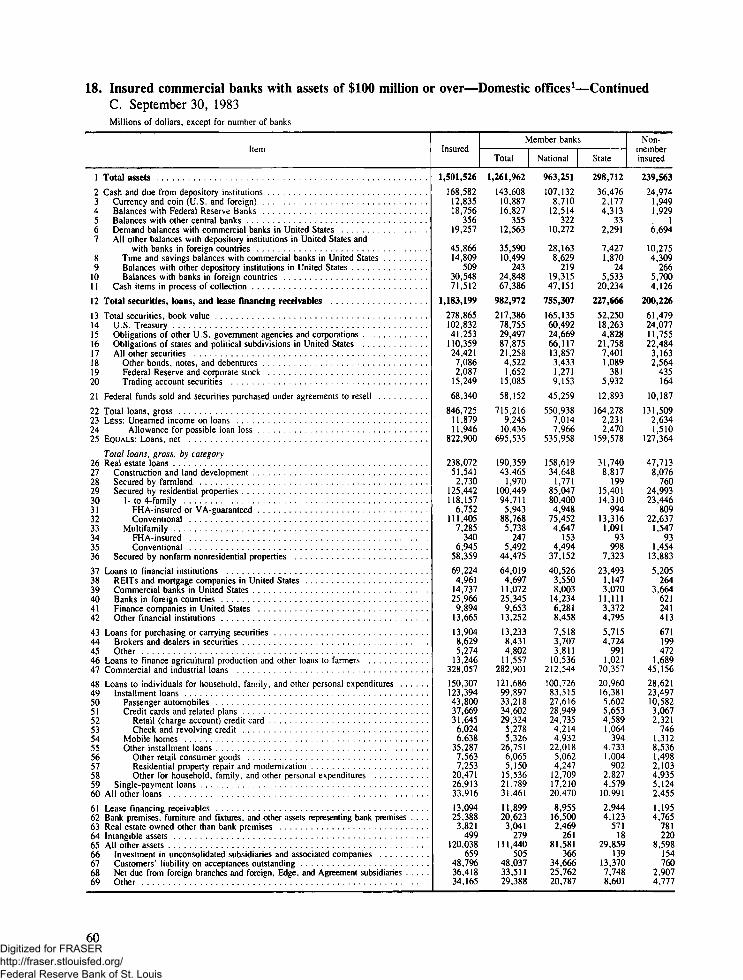
18. Insured commercial banks with assets of $100 million or over—Domestic offices1—ContinuedC. September 30, 1983Millions of dollars, except for number of banks
1 Total assets
2 Cash and due from depository institutions3 Currency and coin (U S and foreign)4 Balances with Federal Reserve Banks . . . . .5 Balances with other central banks6 Demand balances with commercial banks in United States7 All other balances with depository institutions in United States and
with banks in foreign countries .8 Time and savings balances with commercial banks in United States9 Balances with other depository institutions in United States
10 Balances with banks in foreign countries1 1 Cash items in process of collection .
12 Total securities, loans, and lease financing receivables . .
13 Total securities book value14 U S Treasury15 Obligations of other U.S. government agencies and corporations16 Obligations of states and political subdivisions in United States17 All other securities18 Other bonds notes, and debentures19 Federal Reserve and corporate stock20 Trading account securities
21 Federal funds sold and securities purchased under agreements to resell
22 Total loans gross23 LESS* Unearned income on loans24 Allowance for possible loan loss25 EQUALS' Loans net
Total loans, gross, by category26 Real estate loans . . . . . .27 Construction and land development28 Secured by farmland29 Secured by residential properties30 1- to 4-family31 FHA-insured or VA-guaranteed32 Conventional33 Multifamily . . .34 FHA-insured .35 Conventional36 Secured by nonfarm nonresidential properties
37 Loans to financial institutions38 REITs and mortgage companies in United States39 Commercial banks in United States40 Banks in foreign countries41 Finance companies in United States42 Other financial institutions
43 Loans for purchasing or carrying securities44 Brokers and dealers in securities45 Other46 Loans to finance agricultural production and other loans to farmers47 Commercial and industrial loans
48 Loans to individuals for household family and other personal expenditures49 Installment loans50 Passenger automobiles5 1 Credit cards and related plans52 Retail (charge account) credit card53 Check and revolving credit . . . . .54 Mobile homes . . . .55 Other installment loans56 Other retail consumer goods57 Residential property repair and modernization58 Other for household family and other personal expenditures59 Single-payment loans . .60 All other loans .
61 Lease financing receivables .62 Bank premises, furniture and fixtures, and other assets representing bank premises . . . .63 Real estate owned other than bank premises . . •64 Intangible assets .65 All other assets66 Investment in unconsolidated subsidiaries and associated companies67 Customers' liability on acceptances outstanding68 Net due from foreign branches and foreign, Edge, and Agreement subsidiaries69 Other .
1,501,526
168,58212,83518,756
35619,257
45,86614,809
50930,54871,512
1,183,199
278,865102,83241,253
110,35924,4217,0862,087
15,249
68,340
846,72511,8791 1 ,946
822,900
238,07251,5412,730
125,442118,157
6,7521 1 1 ,405
7,285340
6,94558,359
69,2244,961
14,73725,9669,894
13,665
13,9048,6295,274
13,246328,057
150 307123,39443,80037,66931,6456,0246,638
35,2877,5637,253
20,47126,91333,916
13,09425,388
3,821499
120,038659
48,79636,41834,165
h
Total
1,261,962
143,60810 88716 827
35512,563
35,59010,499
24324 84867,386
982,972
217,38678,75529,49787 87521,2584,5221 652
15,085
58,152
715 2169,245
10436695,535
190,35943 465
1,970100,44994 7115,943
88,7685,738
2475,492
44,475
64,0194,697
11,07225,3459,653
13,252
13,2338,4314802
11,557282,901
121 68699,89733,21834 60229,324
5,2785,326
26,7516,0655,150
15,53621,78931,461
11,89920,623
3,041279
1 1 1 ,440505
48,03733,51129,388
Member bank
National
963,251
107,1328 710
12,514322
10,272
28,1638,629
21919,31547,151
755,307
165,13560,49224,66966 11713,8573,4331 2719,153
45,259
550 9387,0147 966
535,958
158,61934 648
1,77185,04780,4004,948
75,4524,647
1534,494
37,152
40,5263,5508,003
14,2346,2818,458
7,5183,7073,811
10,536212,544
100 72683,51527,61628 94924,7354,2144,932
22,0185,0624,247
12,70917,21020,470
8,95516,5002,469
26181,581
36634,66625,76220,787
s
State
298,712
36,4762 1774 313
332,291
7,4271,870
245 533
20,234
227,666
52,25018,2634,828
21 7587,4011,089
3815,932
12,893
164,2782,2312,470
159,578
31,7408 817
19915,40114 310
99413,316
1,09193
9987,323
23,4931,1473,070
11,1113,3724,795
5,7154,724
9911,021
70,357
20 96016,3815,6025,6534,5891,064
3944,7331 ,004
9022,8274,579
10,991
2,9444,123
57118
29,859139
13,3707,7488,601
Non-
insured
239,563
24,9741 9491 929
16,694
102754,309
2665 7004,126
200,226
61,47924,07711,75522 484
3,1632,564
435164
10,187
131,5092,6341 510
127,364
47,7138076
76024,99323,446
80922,637
1,54793
1,45413,883
5,205264
3,664621241413
671199472
1,68945,156
28,62123,49710,5823,0672,321
7461,3128,5361,4982,1034,9355,1242,455
1,1954,765
781220
8,598154760
2,9074,777
60Digitized for FRASER http://fraser.stlouisfed.org/ Federal Reserve Bank of St. Louis

18-C. Continued
70 Total liabilities and equity capital2
71 Total liabilities excluding subordinated debt72 Total deposits73 Individuals partnerships and corporations74 U S government .75 States and political subdivisions in United States76 All other77 Foreisn governments and official institutions78 Commercial banks in United States . . .79 Banks in foreign countries80 Certified and officers1 checks, travelers checks, and letters of credit sold for cash . . .81 Demand deposits . .82 Mutual savings banks . .83 Other individuals partnerships and corporations84 U S government85 States and political subdivisions in United States86 All other87 Foreign governments and official institutions88 Commercial banks in United States89 Banks in foreign countries . . .90 Certified and officers' checks, travelers checks, and letters of credit sold for cash . . .91 Time deposits . . . ,92 Mutual savings banks93 Other individuals partnerships and corporations94 U S government95 States and political subdivisions in United States96 All other97 Foreign governments and official institutions98 Commercial banks in United States99 Banks in foreign countries
100 Savings deposits101 Mutual savings banks . . . . .102 Other individuals, partnerships, and corporations103 Individuals and nonprofit organizations104 Corporations and other profit organizations105 U S government106 States and political subdivisions in United States . .107 All other108 Foreign governments and official institutions .109 Commercial banks in United States1 10 Banks in foreign countries1 1 1 Federal funds purchased and securities sold under agreements to repurchase1 12 Interest-bearing demand notes issued to U.S. Treasury and other liabilities
for borrowed money113 Interest-bearing demand notes (note balances) issued to U S Treasury1 14 Other liabilities for borrowed money . . . .1 15 Mortgage indebtedness and liability for capitalized leases1 16 All other liabilities117 Acceptances executed and outstanding118 Net due to foreign branches and foreign Edge and Agreement subsidiaries119 Other120 Subordinated notes and debentures121 Total equity capital2 . . . . .
MEMO122 Time deposits of $100 000 or more123 Certificates of deposit in denominations of $100 000 or more1 24 Other1 25 Super NOW accounts126 Other NOW accounts and ATS accounts (savings deposits authorized for
automatic transfer)127 All other savings deposits that are subject to a federal regulatory interest rate ceiling . .128 Money market time deposits (a) in minimum denominations of $2,500 butless than
$100,000 with original maturities of 26 weeks, and (b) in minimum denomina-tions of $2,500 but less than $100,000 with original maturities of 91 days . . . .
129 All savers certificates130 Total individual retirement accounts (IRA) and Keogh plan accounts131 Demand deposits adjusted*'132 Total standby letters of credit133 Conveyed to others through participations (included in standby letters of credit) . . . .134 Holdings of commercial paper included in total gross loans
Average for 30 calendar days (or calendar month) ending with report date135 Total assets . .136 Cash and due from depository institutions1 37 Federal funds sold and securities purchased under agreements to resell138 Total loans139 Total deposits140 Time CDs in denominations of $100,000 or more in domestic offices141 Federal funds purchased and securities sold under agreements to repurchase142 Other liabilities for borrowed money143 Number of banks
1,501,5261,395,5631 071 395
936,1382,289
52 18968,1019 793
41,24917,05812,679
285 1151,047
2240141,6749,707
35,9941 028
28,2756,691
12,679462,392
147391,535
53938 13032,041
8,72312 95210,366
323 8881
319,394285,161
34,23277
4,351664222
2169,963
42,42919 28823,141
2 272109,50451 26024,07534 169
6,42199,542
239,823194,59045 23314,974
45,20995,261
117,7372 087
20,376183 65489,0739,0631 412
1 488 886159 12167,957
829 4851 056 774
196,293165 65923,460
1,845
^Total
1,261,9621,173,275
868 497752,710
1,93138 94264,185
9 42738,48616,27310,729
242,217895
186 6271,3978,022
34,548986
27,0416,520
10,729370,671
118312,865
46927 64329,5768,400
11,4269,751
255,6081
252,204226,424
25,78065
3,2776141182
159,024
39,44517,61021,835
1 844104,46650 50023,25230 714
5,41983,268
200,161158,40541 75511,531
35,25874,598
90,0801 616
15,944146 39385,515
8,954960
1,252 593136 19457,144
701 136855 748160,045154,98822,206
1,125
Member bank
National
963,251896,379680 009598 611
1 58232 01941 212
4 59028 0328 5906,585
180 157557
141 9481 0946 161
23,811623
20 5022,6876,585
292 05367
250 957425
23 26117 3423,9277 5145,901
207 799
205,082183 79321,289
622,597
5840162
115,843
25,34012 87512,465
1 54673 64137 08714 98221 572
3 39863,474
150,i 64123 36126 8039,878
29,36859,955
75,7171 307
13,145111 40953,5395,486
677
952 790102 70244,490
537 625672 6361 24 909109 616
12,701950
s
State
298,712276,896188 488154 099
3506 922
22 9744 837
104547 6834,144
62 060338
44 680303
1 86010,736
3636 5403,8344,144
78 61851
61 90843
4 38212 2344,4723 9123,849
47 809*
47,12242 631
4,4913
680312*
43,181
14,1054 7359 370
29830 82513 4138 2699 1422 021
19,794
49 99735 04414 953
1 653
5,89014,643
14,363308
2,79934 98431 9763,468
283
299 80233 49212,654
163 511183 11135 13545 3719 506
175
Non-
insured
239,563222,287202 898183 428
35813 2473 915
3672 763
7861,950
42 898153
37 386277
1 6861,446
421 234
1701,950
91 72129
78 67070
10 4872 464
3231 526
61568 280
*67,19058 738
8,45211
1,074413*
10,939
2,9841 6791,306
4285 038
760823
3 4551 002
16,274
39 66236 1853 4783 442
9,95120,662
27,656471
4,43237 2613 558
109452
236 29422 928*10,813
128 348201 027
36 24810 671
1,254720
61Digitized for FRASER http://fraser.stlouisfed.org/ Federal Reserve Bank of St. Louis

18. Insured commercial banks with assets of $100 million or over—Domestic offices1—ContinuedD. December 31, 1983Millions of dollars, except for number of banks J
Item
1 Total assets
2 Cash and due from depository institutions3 Currency and coin (U S. and foreign)4 Balances with Federal Reserve Banks5 Balances with other central banks6 Demand balances with commercial banks in United States7 All other balances with depository institutions in United States and
with banks in foreign countries8 Time and savings balances with commercial banks in United States9 Balances with other depository institutions in United States
10 Balances with banks in foreign countries1 1 Cash items in process of collection
12 Total securities, loans, and lease financing receivables
13 Total securities book value14 U S Treasury15 Obligations of other U.S. government agencies and corporations16 Obligations of states and political subdivisions in United States17 All other securities18 Other bonds, notes, and debentures19 Federal Reserve and corporate stock20 Trading account securities
21 Federal funds sold and securities purchased under agreements to resell . .
22 Total loans gross23 LESS: Unearned income on loans24 Allowance for possible loan loss . .25 Allocated transfer risk reserves . . . . .26 EQUALS* Loans net
Total loans, gross, by category27 Real estate loans . .28 Construction and land development29 Secured by farmland30 Secured by residential properties31 1- to 4-family . . . .32 FHA insured or VA-guaranteed33 Conventional34 Multifamily35 FHA-insured36 Conventional37 Secured by nonfarm nonresidential properties
38 Loans to financial institutions39 REITs and mortgage companies in United States40 Commercial banks in United States41 Banks in foreign countries42 Finance companies in United States43 Other financial institutions .
44 Loans for purchasing or carrying securities45 Brokers and dealers in securities46 Other47 Loans to finance agricultural production and other loans to farmers48 Commercial and industrial loans
49 Loans to individuals for household, family, and other personal expenditures50 Installment loans51 Passenger automobiles52 Credit cards and related plans53 Retail (charge account) credit card54 Check and revolving credit55 Mobile homes56 Other installment loans57 Other retail consumer goods58 Residential property repair and modernization59 Other for household, family, and other personal expenditures60 Single-payment loans .61 All other loans
62 Lease financing receivables63 Bank premises, furniture and fixtures, and other assets representing bank premises . . . .64 Real estate owned other than bank premises . . .65 Intangible assets66 All other assets67 Investment in unconsolidated subsidiaries and associated companies68 Customers' liability on acceptances outstanding69 Net due from foreign branches and foreign, Edge, and Agreement subsidiaries70 Other
Insured
1,568,363
185,11015,82720,639
37020,236
46,63715,645
71730,27581,401
1,231,834
286,247107,96840,538
114,82622,9157,6162,128
13,171
67,709
888,69811,79712,597
6864,299
243,26453,118
2,862126,771119,174
6,369112,804
7,598354
7,24460,513
73,7384,923
17,37026,27710,40714,760
16,32010,8335,487
13,375343,674
160,433131,48846,10342,63235,9586,6756,615
36,1387,5787,223
21,33728,94537,894
13,57825,887
3,601585
121,346679
52,22434,20034,243
Member banks
TotaJ
1,318,708
158,26613,40318,319
36913,344
35,97511,344
35924,27276,857
1,023,816
223,38382,31829,14592,26119,6584,9011,721
13,036
57,882
750,4459,197
11,0186
730,225
194,11744,451
2,074101,45195,4155,600
89,8156,037
2675,770
46,141
67,8624,672
13,06525,67310,14614,306
15,35710,3734,984
1 1 ,754295,592
130,588106,99034,93739,20933,3345,8755,320
27,5256,1025,177
16,24623,59835,176
12,32621,039
2,831374
112,381505
51,39631,31629,163
National
1,014,410
120,17910,78114,030
33610,990
28,6549,488
33818,82855,388
790,596
171,32564,59624,30969,14013,2783,8261,3428,111
44,458
580,7736,9798,477
6565,312
163,36735,941
1,88086,52981,5044,622
76,8825,025
1454,880
39,017
42,9043,6349,265
14,4806,4819,044
9,2735,4023,871
10,425223,217
108,43989,76929,04933,07228,3164,7564,928
22,7195,1114,309
13,29918,67023,149
9,50216,8182,334
35484,129
32437,67124,96821,166
State
304,298
38,0872,6224,289
332,354
7,3211,856
215,444
21,469
233,220
52,05817,7224,836
23,1216,3801,075
3794,926
13,425
169,6722,2192,541
0164,913
30,7508,509
19514,92213,911
97812,933
1,011122890
7,124
24,9581,0393,800
11,1933,6655,262
6,0844,9711,1131,329
72,375
22,14917,2215,8876,1365,0181,119
3914,806
991868
2,9464,928
12,027
2,8254,221
49720
28,252182
13,7256,3487,997
Non-memberinsured
249,655
26,8442,4242,320
16,892
10,6624,301
3586,0034,544
208,018
62,86525,65011,39222,565
3,2572,716
407134
9,827
138,2532,6001,579
*134,074
49,1478,667
78725,32023,759
76922,990
1,56187
1,47414,372
5,875251
4,305603262454
963460503
1,62148,082
29,84624,49811,1663,4232,623
8001,2958,6131,4762,0475,0915,3472,718
1,2524,848
770211
8,965173828
2,8845,080
62Digitized for FRASER http://fraser.stlouisfed.org/ Federal Reserve Bank of St. Louis

18-D. Continued
71 Total liabilities and equity capital2
72 Total liabilities excluding subordinated debt
73 Total deposits . . .74 Individuals, partnerships, and corporations75 U S government76 States and political subdivisions in United States77 All other78 Foreign governments and official institutions79 Commercial banks in United States80 Banks in foreign countries81 Certified and officers' checks, travelers checks, and letters of credit sold for cash . .82 Demand deposits83 Mutual savings banks84 Other individuals partnerships and corporations85 U S government . .86 States and political subdivisions in United States87 All other88 Foreign governments and official institutions . .89 Commercial banks in United States90 Banks in foreign countries91 Certified and officers' checks, travelers checks, and letters of credit sold for cash . .
92 Time deposits93 Mutual savings banks94 Other individuals partnerships and corporations95 U S government96 States and political subdivisions in United States97 All other98 Foreign governments and official institutions99 Commercial banks in United States
100 Banks in foreign countries101 Savings deposits102 Mutual savings banks103 Other individuals, partnerships, and corporations104 Individuals and nonprofit organizations105 Corporations and other profit organizations106 U S . government107 States and political subdivisions in United States108 All other . .109 Foreign governments and official institutions1 10 Commercial banks in United StatesI l l Banks in foreign countries
112 Federal funds purchased and securities sold under agreements to repurchase113 Interest-bearing demand notes issued to U.S. Treasury and other liabilities
for borrowed money114 Interest-bearing demand notes (note balances) issued to U.S. Treasury115 Other liabilities for borrowed money116 Mortgage indebtedness and liability for capitalized leases117 AH other liabilities .118 Acceptances executed and outstanding119 Net due to foreign branches and foreign, Edge, and Agreement subsidiaries120 Other121 Subordinated notes and debentures ,
122 Total equity capital2
MEMO123 Time deposits of $100 000 or more124 Certificates of deposit (CDs) in denominations of $100,000 or more125 Other126 Super NOW accounts127 Other NOW accounts and ATS accounts (savings deposits authorized for
automatic transfer)128 All other savings deposits that are subject to a federal regulatory interest
rate ceiling . . . . . . . . .129 Total individual retirement accounts (IRA) and Keogh plan accounts130 Demand deposits adjusted3
131 Total standby letters of credit132 Conveyed to others through participations (included in standby letters of credit). . . .133 Holdings of commercial paper included in total gross loans
Average for 30 calendar days (or calendar month) ending with report date134 Total assets135 Cash and due from depository institutions1 36 Federal funds sold and securities purchased under agreements to resell137 Total loans138 Total deposits139 Time CDs in denominations of $100,000 or more in domestic offices140 Federal funds purchased and securities sold under agreements to repurchase141 Other liabilities for borrowed money
142 Number of banks
1,568,363
1,460,292
1,130,097986,291
2 60552,96174 34811 63943,47019,23913,891
312,0101 126
247 4412,094
10,97336 484
1,00428,2197 260
13,891
486,108134
410 608425
37,21637,72410,55415 1911 1 ,979
331,9801
326,980288 90038,080
864772
1418061*
170,603
34,8178,309
26 5072,346
122,43055,05533,40233 9735,984
102,086
249 756202,41547 34116,752
47 727
92,63922 001
200,296
96,2459,2621 761
1 537,721166,13172,156
862 7821 093 160
197,549180,47827,695
1 829
J
Total
1,318,708
1,228,162
917,800794,529
2 18239,45369 9111 1 ,24240,33418,33511,725
265,381978
207 0281,7739,090
34 788947
26,7977 043
11,725
391,223104
328 941334
26,83935,00410,21613 49711,291
261,1961
257,477228 55028,927
753,523
1197940
*
158,773
32 6497,561
25 0881,913
117,02754,22732,51530 2854,995
85,551
208 307164,44543,86212,917
37 203
72,15617 281
159,954
92,3459,1171 250
1,294065142,97661,452
728 926886 558160,565168,81126,211
1,116
Member bank
National
1,014,410
945,878
723 720636,347
1 76532,70745 6076 198
29,07810,3327,295
198,043604
157 8061,3927,223
23 723600
20,0573 0657,295
311,14681
266 383303
22,61021 769
5,5208 9837,266
214,5311
211,471187 27024,201
712 874
1157738
*
116,226
19,3545,494
13 8611,607
84,97040,44222,98521 5433,000
65,532
159 245128,99530 25011,164
31 067
58,62914 259
121,206
57,5275,379
783
993 724107,64748,527
562 865699 801126,270123,818
13,469
944
s
State
304,298
282,284
194 079158,183
4176,746
24 3045 044
11,2568,0034,430
67 338374
49 221381
1,86711 065
3476,7403 9784,430
80 07723
62 55831
4,23013 2354,6964 5144,025
46,6640
46,00641 2794,726
5650
413*
42,547
13 2952,067
11 228306
32,05713,7869,5308 7421,995
20,019
49 06235,45013 612
1,753
6 136
13 5263 022
38,748
34,8183,738
468
300 34235,32912,925
166 061186 75734,29544,99412,742
172
Non-
insured
249,655
232,130
212 298191 762
42313,5094 437
3963,136
9042,166
46 629148
40 413322
1,8831 696
571,422
2172,166
94 88530
81 66791
10,3772 720
3381 694
68770,784
*69,50460 351
9,15310
1 24821
120
*
11,830
2 168749
1 419433
5,402828887
3 688990
16,535
41 44837,969
3 4793,836
10 524
20 4834 720
40,342
3,900145511
243 65623,15510,704
133 856206 602
36,9841 1 ,667
1,484
713
63Digitized for FRASER http://fraser.stlouisfed.org/ Federal Reserve Bank of St. Louis

19. Insured commercial bank assets and liabilities—Domestic offices1
A. March 31, 1983Millions of dollars, except for number of banks
Item
1 Total assets :
2 Cash and due from depository institutions3 Currency and coin (U S and foreign)4 Balances with Federal Reserve Banks5 Balances with other central banks6 Demand balances with commercial banks in United States7 All other balances with depository institutions in United States and
with banks in foreign countries8 Cash items in process of collection
9 Total securities, loans, and lease financing receivables
10 Total securities, book value11 U S Treasury .12 Obligations of other U S. government agencies and corporations13 Obligations of states and political subdivisions in United States14 All other securities
15 Federal funds sold and securities purchased under agreements to resell
16 Total loans gross17 LESS: Unearned income on loans18 Allowance for possible loan loss19 EQUALS* Loans, net
Total loans, gross, by category20 Real estate loans21 Construction and land development22 Secured by farmland . . . .23 Secured by residential properties ,24 1- to 4-family25 Multifamily26 Secured by nonfarm nonresidential properties
Total loans, gross, by category27 Loans to financial institutions . . .28 Loans for purchasing or carrying securities29 Loans to finance agricultural production and other loans to farmers3 0 Commercial a n d industrial loans . . . . . .
31 Loans to individuals for household, family, and other personal expenditures32 Installment loans33 Passenger automobiles34 Credit cards and related plans35 Mobile homes36 All other installment loans for household, family, and other personal
expenditures37 Single-payment loans38 All other loans .
39 Lease financing receivables40 Bank premises, furniture and fixtures, and other assets representing
bank premises41 Real estate owned other than bank premises42 Intangible assets ,43 All other assets
1,866,754
201,74818 28723 271
29332 586
58,77268 539
1,496,758
389 857136 04978,857
149 85125 099
98 711
1 025 78117 72213,330
994 728
301 23753 2128451
165,557157 775
7 78274,017
73 50713 07536,441
379 974
188 515150 06358 04335,4909 585
4694538 45233 032
13,461
32 8424697
553130,156
1
Total
1,395,337
158 73713 50721 666
29317 114
4207364084
1,092,554
256 35687 03044 587
103 43621 303
70 740
775 65211 62610 608
753 418
211 68242 3903 747
115 834110 234
5 59949,711
66 20312 15419 703
304 698
132 303106 83337 45331 9556 568
30 85825 47028 910
12 041
23 3603 224
304117 157
Member bank
National
1,073,998
1 19 40310 84815 694
25014 107
33,95244 551
844,900
198 73767 72637 09980 14313 768
55 323
598 9489 0378 139
581 771
175 15533 668
3 14297 15392 547
4 60641,193
42 1496 912
17,111229 177
109 3538891731 09926,5385 913
25 3662043719 091
9 069
18 9312 609
26987,887
s
State
321,339
39 3352 6595 972
433 007
8 12119 533
247 654
57 61819 3037 488
23 2937 535
15 417
176 7042 5882 469
171 647
36 5278 723
60518 68117 687
9938 518
24 0535 2422 592
75 521
22 95017 9166 3535 417
655
5 4915 0349 gi9
2 972
4 42961536
29 270
Non-
insured
471 417
43 0104 7gQ1 604
*15 472
16 6984 455
404 204
133 50249 01934 27146 4153 797
27 972
250 12960962 722
241 311
89 55510 8224 704
49 72347 540
2 18324 306
7 304921
16 73875 276
56 21243 23120 5913 5353 018
16 08712 9824 122
1 420
94821 473
24912 999
64Digitized for FRASER http://fraser.stlouisfed.org/ Federal Reserve Bank of St. Louis
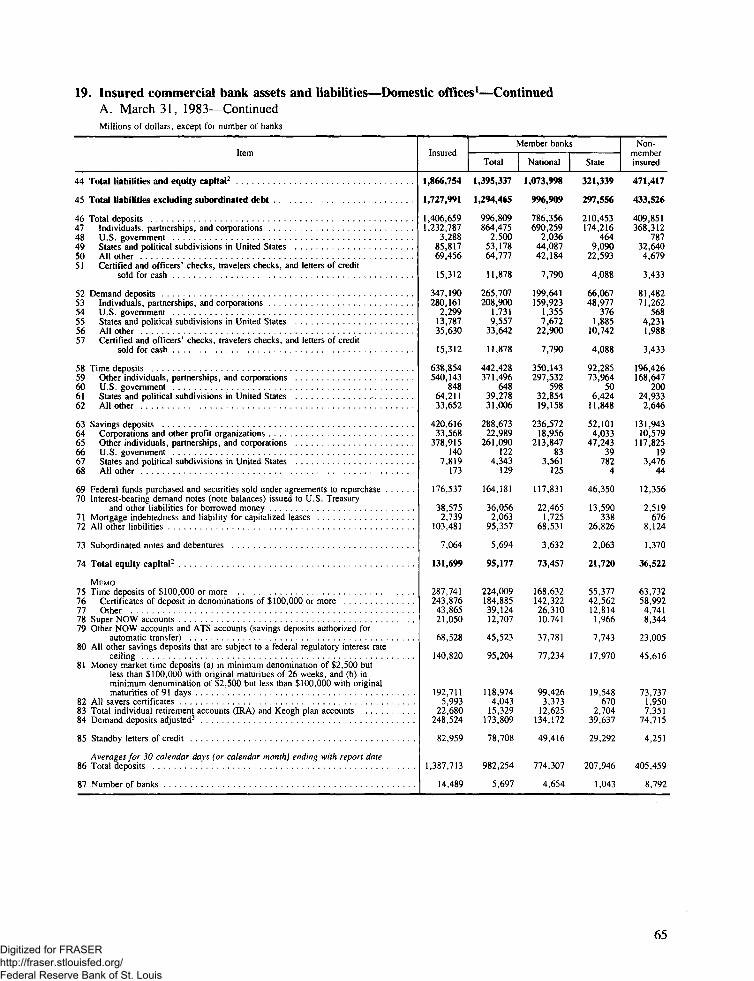
19. Insured commercial bank assets and liabilities—Domestic offices1—ContinuedA. March 31, 1983—ContinuedMillions of dollars, except for number of banks
Item
44 Total liabilities and equity capital2
45 Total liabilities excluding subordinated debt
46 Total deposits . . .47 Individuals partnerships and corporations48 U S government49 States and political subdivisions in United States50 All other51 Certified and officers' checks, travelers checks, and letters of credit
sold for cash . . . . .
52 Demand deposits . . .53 Individuals partnerships, and corporations54 U S government55 States and political subdivisions in United States . . . . .56 All other . . . .57 Certified and officers' checks, travelers checks, and letters of credit
sold for cash . , . . .
58 Time deposits59 Other individuals partnerships and corporations60 U S . government61 States and political subdivisions in United States . . .• . .62 All other
63 Savings deposits . . . . . . . . . . . .64 Corporations and other profit organizations65 Other individuals partnerships and corporations . . . . . .66 U S. government67 States and political subdivisions in United States68 All other . . . . . . . . . . . . .
69 Federal funds purchased and securities sold under agreements to repurchase70 Interest-bearing demand notes (note balances) issued to U.S. Treasury
and other liabilities for borrowed money71 Mortgage indebtedness and liability for capitalized leases72 All other liabilities
73 Subordinated notes and debentures
74 Total equity capital2
MEMO75 Time deposits of $100 000 or more76 Certificates of deposit in denominations of $100,000 or more77 Other78 Super NOW accounts79 Other NOW accounts and ATS accounts (savings deposits authorized for
automatic transfer) . . .80 All other savings deposits that are subject to a federal regulatory interest rate
ceiling81 Money market time deposits (a) in minimum denomination of $2,500 but
less than $100,000 with original maturities of 26 weeks, and (b) inminimum denomination of $2,500 but less than $100,000 with originalmaturities of 91 days
82 All savers certificates83 Total individual retirement accounts (IRA) and Keogh plan accounts . . . .84 Demand deposits adjusted^
85 Standby letters of credit . . . . . .
Averages for 30 calendar days (or calendar month) ending with report date86 Total deposits
87 Number of banks . . . . . . . . . .
Insured
1,866,754
1,727,991
1,406,6591,232,787
3,28885,81769,456
15,312
347,190280,161
2,29913,78735,630
15,312
638,854540,143
84864,21133,652
420,61633,568
378,915140
7,819173
176,537
38,5752,739
103,481
7,064
131,699
287,741243,87643,86521,050
68,528
140,820
192,7115,993
22,680248,524
82,959
1,387,713
14,489
Member banks
Total
1,395,337
1,294,465
996,809864,475
2,50053,17864,777
11,878
265,707208,900
1,7319,557
33,642
11,878
442,428371,496
64839,27831,006
288,67322,989
261,090122
4,343129
164,181
36,0562,063
95,357
5,694
95,177
224,009184,88539,12412,707
45,523
95,204
118,9744,043
15,329173,809
78,708
982,254
5,697
National
1,073,998
996,909
786,356690,259
2,03644,08742,184
7,790
199,641159,923
1,3557,672
22,900
7,790
350,143297,532
59832,85419,158
236,57218,956
213,84783
3,561125
117,831
22,4651,725
68,531
3,632
73,457
168,632142,32226,31010,741
37,781
77,234
99,4263,373
12,625134,172
49,416
774,307
4,654
State
321,339
297,556
210,453174,216
4649,090
22,593
4,088
66,06748,977
3761,885
10,742
4,088
92,28573,964
506,424
11,848
52,1014,033
47,24339
7824
46,350
13,590338
26,826
2,063
21,720
55,37742,56212,8141,966
7,743
17,970
19,548670
2,70439,637
29,292
207,946
1,043
Non-memberinsured
471,417
433,526
409,851368,312
78732,6404,679
3,433
81,48271,262
5684,2311,988
3,433
196,426168,647
20024,933
2,646
131,94310,579
117,82519
3,47644
12,356
2,519676
8,124
1,370
36,522
63,73258,9924,7418,344
23,005
45,616
73,7371,9507,351
74,715
4,251
405,459
8,792
65Digitized for FRASER http://fraser.stlouisfed.org/ Federal Reserve Bank of St. Louis

19. Insured commercial bank assets and liabilities—Domestic offices1—ContinuedB. June 30, 1983Millions of dollars, except for number of banks
1 Total assets
2 Cash and due from depository institutions3 Currency and coin (U S and foreign)4 Balances with Federal Reserve Banks5 Balances with other central banks6 Demand balances with commercial banks in United States7 All other balances with depository institutions in United States and
with banks in foreign countries8 Cash items in process of collection
9 Total securities, loans, and lease financing receivables
10 Total securities, book value11 U S Treasury12 Obligations of other U.S. government agencies and corporations13 Obligations of states and political subdivisions in United States14 All other securities
15 Federal funds sold and securities purchased under agreements to resell
16 Total loans, gross17 LESS' Unearned income on loans18 Allowance for possible loan loss19 EQUALS: Loans, net
Total loans, gross, by category20 Real estate loans21 Construction and land development22 Secured by farmland23 Secured by residential properties . .24 1- to 4-family25 Multifamily26 Secured by nonfarm nonresidential properties
Total loans, gross, by category27 Loans to financial institutions28 Loans for purchasing or carrying securities . . .29 Loans to finance agricultural production and other loans to farmers30 Commercial and industrial loans
31 Loans to individuals for household, family, and other personal expenditures32 Installment loans33 Passenger automobiles34 Credit cards and related plans35 Mobile homes36 All other installment loans for household, family, and other personal
expenditures37 Single-payment loans38 All other loans
39 Lease financing receivables .40 Bank premises, furniture and fixtures, and other assets representing
bank premises . . .4 1 Real estate owned other than bank premises , .42 Intangible assets43 All other assets
1,915,916
207 34920,46017,912
29834,783
58,36575,441
1,536,043
407,333149,34278,668
150,84928,474
98,590
1.048,06817 54313,785
1,016,739
308 09455,311
8 839168,372160,096
8 27775,571
71,89017,06038,513
382,320
195,411155,61960,48337,044
9,561
48 53139,79234,779
13,381
33,4165,167
623133,319
P
Total
1,433,982
163 52915 03315,945
27818 968
42,48670 819
1,122,959
268,88895 37544,914
104,23824 361
74,620
790,16511 6101 1 ,045
767,511
215 86843,9083 983
117,370111,388
5 98250,607
64,55115,98820,859
304,823
137,590111,15639 13033,4486 556
32 02226 43430,488
11,940
23,8253,599
344119,726
Member bank
National
1,103,997
122 0121204512,259
23815 653
33,91347 904
870,260
207,49873 78937,37780,41215 920
58,558
612,7158 9618,502
595,252
179 16235,130
3 36898 58793,6594 928
42,077
41,2288 660
18,105231,108
113,91292,76232 57027,881
5 915
26 39621 15020,539
8,953
19,2502,905
30789,263
s
State
329,984
41 5172 9883 686
393 315
8,57322 915
252,699
61,39121 5867,538
23,8268 441
16,062
177,4512 6492542
172,260
36 7058,777
61518 78317,729
1 0548,530
23,3237 3282,754
73,715
23,67818,3946 5605,567
641
5 6265 2849,948
2,987
4575694
3730,463
Non-
insured
481,934
43 8205 4271 967
2015 905
15,8794 622
413,084
138,44553 96733,75446,611
4 1 13
23,970
257,9025 9342 741
249,228
92 2261 1 ,4044 856
51 00348,708
2 29524 964
7,3391 072
17,65477,498
57,82144,46321 3533,5963 005
16 50913 3584,292
1,441
9,5911,567
27913,593
66Digitized for FRASER http://fraser.stlouisfed.org/ Federal Reserve Bank of St. Louis

19. Insured commercial bank assets and liabilities—Domestic offices1—ContinuedB. June 30, 1983—ContinuedMillions of dollars, except for number of banks
44 Total liabilities and equity capital2
45 Total liabilities excluding subordinated debt
46 Total deposits .47 Individuals partnerships and corporations48 U S government . . . . . .49 States and political subdivisions in United States50 All other51 Certified and officers' checks, travelers checks, and letters of credit
sold for cash . . . . . . . .
52 Demand deposits53 Individuals partnerships and corporations54 U S government . . . . . . .55 States and political subdivisions in United States56 All other . .57 Certified and officers' checks, travelers checks, and letters of credit
sold for cash
58 Time deposits . . . . . . . . .59 Other individuals partnerships and corporations60 U S government . . .61 States and political subdivisions in United States .62 All other
63 Savings deposits . . . . . . . .64 Corporations and other profit organizations65 Other individuals partnerships and corporations66 U S government . . . . . . . . .67 States and political subdivisions in United States68 All other . .
69 Federal funds purchased and securities sold under agreements to repurchase .70 Interest-bearing demand notes (note balances) issued to U.S. Treasury
and other liabilities for borrowed money71 Mortgage indebtedness and liability for capitalized leases .72 All other liabilities
73 Subordinated notes and debentures . . . . . . . . .
74 Total equity capital2 . . . .
MEMO75 Time deposits of $100 000 or more76 Certificates of deposit in denominations of $100 000 or more7 7 Other . . . . . . .78 Super NOW accounts . .79 Other NOW accounts and ATS accounts (savings deposits authorized for
automatic transfer) . . . . . . . . . . . .80 All other savings deposits that are subject to a federal regulatory interest rate
ceiling81 Money market time deposits (a) in minimum denomination of $2,500 but
less than $100,000 with original maturities of 26 weeks, and (b) inminimum denomination of $2,500 but less than $100,000 with originalmaturities of 91 days . . . . . . . .
82 All savers certificates83 Total individual retirement accounts (IRA) and Keogh plan accounts84 Demand deposits adjusted^ . . . . . . .
85 Standby letters of credit
Averages for 30 calendar days (or calendar month) ending with report date86 Total deposits .
87 Number of banks
1,915,916
1,774,532
1,439,9551 263 728
3 25084 08671 444
17,448
365 290290 952
2,50215 74538 643
17 448
629 528537 834
6005842732,667
445 13838,692
396 250148
9,914134
173 363
46 3042703
112,207
6,828
134,556
279,018232 43946 57924 689
66755
139011
186 9124 363
26,640256 746
82,486
1,420,757
14 500
1
Total
1,433,982
1,331,252
1,021,683886 292
242052 55866 830
13,584
281 447217 748
1,85911 30436952
13 584
434,385368 603
43335,56429,784
305 85226,866
273 075128
5,69093
161 188
42 4712032
103,877
5,533
97,197
215,952174 24541,70714 871
44 291
93 528
115 3562 919
18,038179 587
77,969
1,005,730
5 758
Member bank
National
1,103,997
1,025,494
805,010707 ,409
1,86243 89243,580
8,266
210,321166,326
1,3849216
25,129
8 266
345,808297 050
39330,00018,364
248,88121,769
222,26584
4,67687
116,050
27 5091,701
75,224
3,486
75,017
163,701135 99327,70812 568
36,913
75 843
96,6192 475
14,918139,665
52,475
793,180
4 713
s
State
329,984
305,758
216,674178,883
5598 665
23 249
5,318
71 12651,422
4752 087
11,823
5 318
88,57771 553
405,564
1 1 ,420
56,9715,097
50 81043
1,0146
45 138
14 962331
28,653
2,047
22,179
52,25138 25213,9992 303
7,378
17 684
18,737444
3,12039,922
25,494
212,550
1 045
Non-
insured
481 934
443,280
418,272377 436
83031 5294614
3 864
83 84373 204
6434 4421 690
3 864
195 143169 231
16722 8622,883
139 28611,826
123 17420
4,22441
12 175
3 832671
8,330
1 295
37,359
63,06658 1944 8719 gig
22 464
45 484
71 5571 4448 602
77 159
4 517
415 027
8 742
67Digitized for FRASER http://fraser.stlouisfed.org/ Federal Reserve Bank of St. Louis
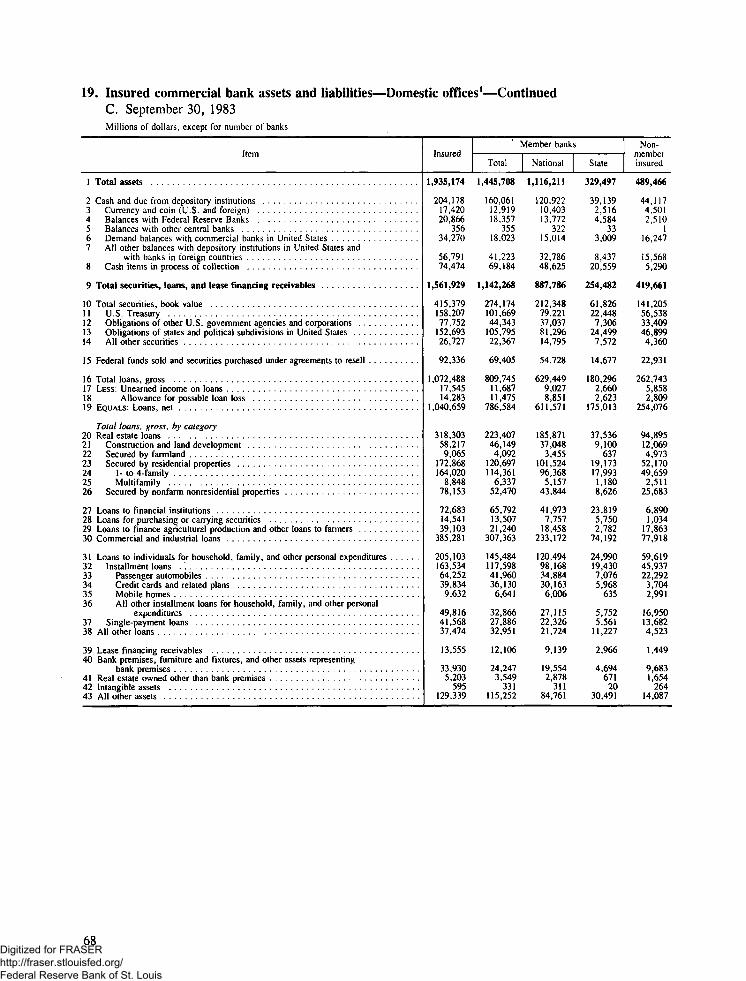
19. Insured commercial bank assets and liabilities—Domestic offices1—ContinuedC. September 30, 1983Millions of dollars, except for number of banks
1 Total assets
2 Cash and due from depository institutions3 Currency and coin (U S and foreign)4 Balances with Federal Reserve Banks . .5 Balances with other central banks . .6 Demand balances with commercial banks in United States7 All other balances with depository institutions in United States and
with banks in foreign countries . . . . .8 Cash items in process of collection
9 Total securities, loans, and lease financing receivables
10 Total securities book value11 U S Treasury12 Obligations of other U S government agencies and corporations . . . . . .13 Obligations of states and political subdivisions in United States14 All other securities
15 Federal funds sold and securities purchased under agreements to resell
16 Total loans gross17 LESS* Unearned income on loans . .18 Allowance for possible loan loss19 EQUALS* Loans net
Total loans, gross, by category20 Real estate loans21 Construction and land development . .22 Secured by farmland23 Secured by residential properties24 1- to 4-family . .25 Multifamily26 Secured by nonfamn nonresidential properties
27 Loans to financial institutions28 Loans for purchasing or carrying securities . . . .29 Loans to finance agricultural production and other loans to farmers30 Commercial and industrial loans
31 Loans to individuals for household family and other personal expenditures32 Installment loans . . . .33 Passenger automobiles . . . .34 Credit cards and related plans35 Mobile homes . .36 All other installment loans for household, family, and other personal
expenditures37 Single-payment loans . .38 All other loans
39 Lease financing receivables . . . .40 Bank premises, furniture and fixtures, and other assets representing
bank premises . .41 Real estate owned other than bank premises . .42 Intangible assets - . . .43 All other assets
1,935,174
204,17817,42020,866
35634 270
56,79174,474
1,561,929
415 379158,20777,752
152,69326 727
92,336
1,072,48817,54514,283
1,040,659
318,30358,2179,065
172,868164,020
8,84878,153
72,68314,54139,103
385,281
205 103163,53464,25239,8349,632
49,81641,56837,474
13,555
33,9305,203
595129,339
' ?
Total
1,445,708
160,06112 91918,357
35518 023
41,22369,184
1,142,268
274 174101,66944,343
105,79522 367
69,405
809,74511,6871 1 ,475
786,584
223,40746,1494,092
120 697114,361
6,33752,470
65 79213,50721,240
307 363
145 484117,59841 ,96036 130
6,641
32,86627,88632951
12,106
24,2473,549
331115,252
Member bank
National
1,116,211
120,92210,40313,772
32215 014
32,78648,625
887,786
212 34879,22137,03781,29614 795
54,728
629,4499,0278,851
611,571
185,87137,048
3,455101,52496,368
5,15743,844
41,9737,757
18,458233,172
120,49498,16834,88430,1636,006
27,11522,32621,724
9,139
19,5542,878
31184,761
s
State
329,497
39,1392 5164 584
333 009
8 43720,559
254,482
61 82622 4487,306
24,4997 572
14,677
180 2962,6602,623
175 013
37 5369,100
63719 17317,9931,1808626
23 8195,7502,782
74 192
24 990194307,0765 968
635
5 7525,561
11 227
2,966
4,69467120
30,491
Non-
insured
489,466
44 1174 5012 510
116 247
15 5685 290
419,661
141 20556 53833 40946 8994 360
22 931
262 7435,8582,809
254 076
94 895120694,973
52 17049 659
2,51125 683
6 8901 034
17,86377 918
59 61945 93722,2923 7042991
16 95013,6824 523
1,449
9,6831,654
26414,087
68Digitized for FRASER http://fraser.stlouisfed.org/ Federal Reserve Bank of St. Louis

19. Insured commercial bank assets and liabilities—Domestic offices1—ContinuedC. September 30, 1983—ContinuedMillions of dollars, except for number of banks
44 Total liabilities and equity capital2 . . . . .
45 Total liabilities excluding subordinated debt . . . .
46 Total deposits47 Individuals partnerships and corporations . . . . . . . . .48 U S government . . .49 States and political subdivisions in United States50 All other . .51 Certified and officers' checks, travelers checks, and letters of credit
sold for cash
52 Demand deposits . . . . . . . .53 Individuals partnerships and corporations54 U S government . .55 States and political subdivisions in United States56 All other . . .57 Certified and officers' checks, travelers checks, and letters of credit
sold for cash
58 Time deposits59 Other individuals partnerships and corporations . . . .60 U.S government61 States and political subdivisions in United States62 All other
63 Savings deposits . . . . . , .64 Corporations and other profit organizations65 Other individuals, partnerships and corporations . . . . . . . . . .66 U S government67 States and political subdivisions in United States68 All other
69 Federal funds purchased and securities sold under agreements to repurchase . . .70 Interest-bearing demand notes (note balances) issued to U.S. Treasury
a n d other liabilities f o r borrowed money . . . . . .7 1 Mortgage indebtedness and liability for capitalized leases72 All other liabilities . . .
73 Subordinated notes and debentures . . . .
74 Total equity capital2 . . . . . .
MEMO75 Time deposits of $100 000 or more76 Certificates of deposit in denominations of $100 000 or more77 Other78 Super NOW accounts .79 Other NOW accounts and ATS accounts (savings deposits authorized for
automatic transfer)80 All other savings deposits that are subject to a federal regulatory interest rate
ceiling . . .81 Money market time deposits (a) in minimum denomination of $2,500 but
less than $100,000 with original maturities of 26 weeks, and (b) inminimum denomination of $2,500 but less than $100,000 with originalmaturities of 91 days >
8 2 A l l savers certificates . . . . .83 Total individual retirement accounts (IRA) and Keogh plan accounts84 Demand deposits adjusted''
85 Standby letters of credit
Averages for 30 calendar days (or calendar month) ending with report date86 Total deposits
87 Number of banks . . . . . . . . .
1,935,174
1,790,890
1 452 5471,283,872
3,04980 62269335
15 669
355,100286 916
2,26513 61936 631
15 669
648 303557 417
67457 63132,580
449 14441 030
398 508109
9 371125
175 231
45 0412,670
115 401
6 888
137,397
283 033235 039
47,99426 526
66 699
135 489
196 2553 012
28 230249 455
91 134
1 436 685
14464
I
Total
1,445,708
1,340,760
1 ,028 927899,518
2,2595020864,899
12 043
272,293213,963
1,6539 638
34,996
12 043
446 997381 450
52335 20629,819
309,63628 569
275 53683
5 36584
161 935
40 9791,991
106,928
5,618
99,330
218 417175 50442,91316 252
44 467
92 046
121,9922001
19 152173 967
86 414
1 015 358
5 777
Member bank
National
1,116,211
1,035,903
813 863721,116
1,85841 49841,694
7 697
205,580164,956
1,3177 531
24,080
7,697
355 486307,837
46329,65017,537
252,79723 574
224,74878
4 31878
118,142
26 5351,665
75,698
3,574
76,734
165 676137 85927,81713 780
37 129
74 218
102,2701 627
15 818134,871
54 283
805 730
4 732
s
State
329,497
304,856
215 064178 402
4018 710
23 205
4 346
66,71249007
3362 107
10 917
4 346
91 51173 613
605 556
12,282
56 8404 994
50 7884
1 0476
43 793
14 444326
31 230
2044
22,596
52 74037 64515,0952 472
7 338
17 828
19 723373
3 33439097
32 131
209 628
1 045
Non-
insured
489,466
450,130
423 621384,354
79030 4144436
3 626
82,80872 953
6123 9821 635
3 626
201 306175 967
15122 426
2,761
139,50712 462
122 97226
400740
13 296
4061679
8 473
1 269
38,067
64 61659 535
5,08110 275
22 232
43 443
74 2631 0129 078
75 488
4 720
421 328
8 687
69Digitized for FRASER http://fraser.stlouisfed.org/ Federal Reserve Bank of St. Louis

19. Insured commercial bank assets and liabilities—Domestic offices1—ContinuedD. December 31, 1983Millions of dollars, except for number of banks
1 Total assets . . . .
2 Cash and due from depository institutions3 Currency and coin (U S and foreign) . . . .4 Balances with Federal Reserve Banks ,5 Balances with other central banks6 Demand balances with commercial banks in United States . .7 All other balances with depository institutions in United States and
with banks in foreign countries8 Cash items in process of collection . . . . . .
9 Total securities, loans and lease financing receivables
10 Total securities book value . . . . .11 U S Treasury12 Obligations of other U S government agencies and corporations . .13 Obligations of states and political subdivisions in United States14 All other securities
15 Federal funds sold and securities purchased under agreements to resell
16 Total loans gross . . . . .17 LESS; Unearned income on loans18 Allowance for possible loan loss . .19 Allocated transfer risk reserves .20 EQUALS* Loans net
Total loans, gross, by category21 Real estate loans22 Construction and land development . . . . .23 Secured by farmland24 Secured by residential properties . . . . .25 1- to 4-family .26 Multifamily27 Secured by nonfarm nonresidential properties . .
28 Loans to financial institutions . . . . . . .29 Loans for purchasing or carrying securities30 Loans to finance agricultural production and other loans to farmers31 Commercial and industrial loans . . . . . . . . . .
32 Loans to individuals for households, family, and other personal expenditures33 Installment loans . .34 Passenger automobiles35 Credit cards and related plans . . •36 Mobile homes .37 All other installment loans for households, family, and other personal
expenditures . . . .38 Single-payment loans3 9 A l l other loans . . . . . . .
40 Lease financing receivables41 Bank premises, furniture and fixtures, and other assets representing
bank premises42 Real estate owned other than bank premises43 Intangible assets44 All other assets , ,
2,018,499
225,15121,00423,221
37036,916
58,83584,805
1,622,168
425,668166 79076,380
157,18125,318
92,368
1,122,38517,36315,041
61 089 977
327 04260,4709 291
175 968166,687
9 28181,313
77 23417,03939024
403,314
217,110172 88967,21445 1759,603
50,89644 22141,622
14,157
34,6255,044
700130,810
J
Total
1,510,830
1 76 62515 73220,115
36919 263
42 19878 949
1,189,275
281,809106 97143 736
110,28820 814
69,136
849 4891 1 ,60812 100
6825 776
229 02647,5614 245
122 514115,821
669354,707
69,55515,66721 428
321,473
155,569125 51444,00741 085
6,625
33,7973005536,770
12 554
24,7973,365
448116,320
Member bank
National
1,175,411
135 66712 72915,527
33616,035
33 92457 116
929,132
220 05184 9063649584,39614 253
53,903
663,8478,9699 399
6645 474
192 22538,737
3 603103,67998,0965 583
46,206
44,4129,547
18 351245,297
129,518105 40036,598348695,992
27,94024 11824,496
9,704
19,9902,763
42587,434
s
State
335,419
40 9583,0034,588
333 228
8 27421,833
260,143
61,75722 065
7 24125,8926 560
15,233
185,6422,6392701
0180 302
36 8018,824
64218,83417,724
1,1108,501
25,1436,1203 077
76,176
26,05220 1147,4096,216
633
5,8565 937
12,273
2,851
4,807602
2328,886
Non-
insured
507,668
48 5275 2723,106
117 653
16 6385 856
432,894
143 85959 81932 64446,8934 504
23,232
272 8965,7552 941
*264 200
98 01612,9105 046
53 45450,866
2 58826,606
7 6791,371
17 5968 1 ,840
61,54147 37523,20740912,978
17,09914 1664,853
1,602
9,8271,679
25214,490
70Digitized for FRASER http://fraser.stlouisfed.org/ Federal Reserve Bank of St. Louis

19. Insured commercial bank assets and liabilities—Domestic offices1—ContinuedD. December 31, 1983—ContinuedMillions of dollars, except for number of banks
Item
45 Total liabilities and equity capital2
46 Total liabilities excluding subordinated debt . . . .
47 Total deposits48 Individuals partnerships and corporations . . .49 U S government . .50 States and political subdivisions in United States51 All other52 Certified and officers' checks, travelers checks, and letters of credit
sold for cash . . . . .
53 Demand deposits54 Individuals partnerships and corporations . . .55 U S government56 States and political subdivisions in United States . . . . . . .57 All other . .58 Certified and officers' checks, travelers checks, and letters of credit
sold for cash . . . .
59 Time deposits60 Other individuals, partnerships and corporations .61 U S government62 States and political subdivisions in United States . . . . .63 All other . . . .
64 Savings deposits . .65 Corporations and other profit organizations66 ' Other individuals partnerships and corporations . . . .67 U S. government68 States and political subdivisions in United States . .69 All other . . . . . . . . .70 Federal funds purchased and securities sold under agreement to repurchase71 Interest-bearing demand notes (note balances) issued to U.S. Treasury and
other liabilities for borrowed money72 Mortgage indebtedness and liability for capitalized leases . . .73 AH other liabilities
74 Subordinated notes and debentures . . . . . . .
75 Total equity capital2
MEMO76 Time deposits of $100 000 or more77 Certificates of deposit in denominations of $100 000 or more . . .78 Other79 Super NOW . . . .80 Other NOW accounts and ATS accounts (savings deposits authorized for
automatic transfer)81 All other savings deposits that are subject to a federal regulatory interest
rate ceiling . . . . . .82 Total individual retirement accounts (IRA) and Keogh plan accounts83 Demand deposits adjusted** . . . . . . .
84 Standby letters of credit
Average for 30 calendar days (or calendar month) ending with report date85 Total deposits
86 Number of banks
2,018,499
1,871,894
1,526,8961 347,621
3,37682,78875,589
17,521
388,144315,481
2 70O15,35537,088
17,521
677 597581,618
56157,11538,302
461,15445,844
404,677115
10,318200
176,830
36,8552,763
128,550
6,565
140,040
295 470245,354
50 11629,548
70,171
131,86030,378
271,819
98,434
1,483,666
14,451
Total
1,510,830
1,403,827
1,085,875948,080
2,50651,36470 606
13,320
298 255236,838
2 02410,88735,186
13,320
470 379400,026
39134,68335,280
317,24132,195
279,02191
5 795140
162,377
33,8902 074
119,611
5,307
101,696
227 901182,86545 03618,208
46,877
89,19920,717
190,087
93,317
1,051,752
5,804
Member bank
National
1,175,411
1,093,088
864,399764 810
2,03142,77146 162
8,626
225 852182,850
1 6058 737
24,033
8 626
377 286325,679
34129 27121,995
261,26226,959
229 32185
4 763134
119,281
20,5131 741
87,154
3,289
79,035
176 203144 928
31 27515 528
39 209
72 59817,130
146,763
58,354
838,061
4 752
s
State
335,419
310,739
221,476183 270
4758,593
24 4<M
4694
72 40453 989
4192 150
11 153
4 694
93 09474 347
505 412
13 285
55 9795,235
49 6996
1 0326
43,096
13,377334
32,456
2018
22,661
51 69937 93713 7622 679
7 669
16 6013,587
43 324
34,963
213,691
1 052
Non-
insured
507,668
468,067
441,021399 542
87131 4244 983
4201
89 88978 642
67644681 901
4 201
207 218181 592
17022 433
3 022
143 91413 650
125 65724
4 52360
14 454
2,965689
8 939
1 257
38,344
67 56962 489
5 08011 340
23 294
42 6629 661
81 731
5 117
431 914
8 647
71Digitized for FRASER http://fraser.stlouisfed.org/ Federal Reserve Bank of St. Louis
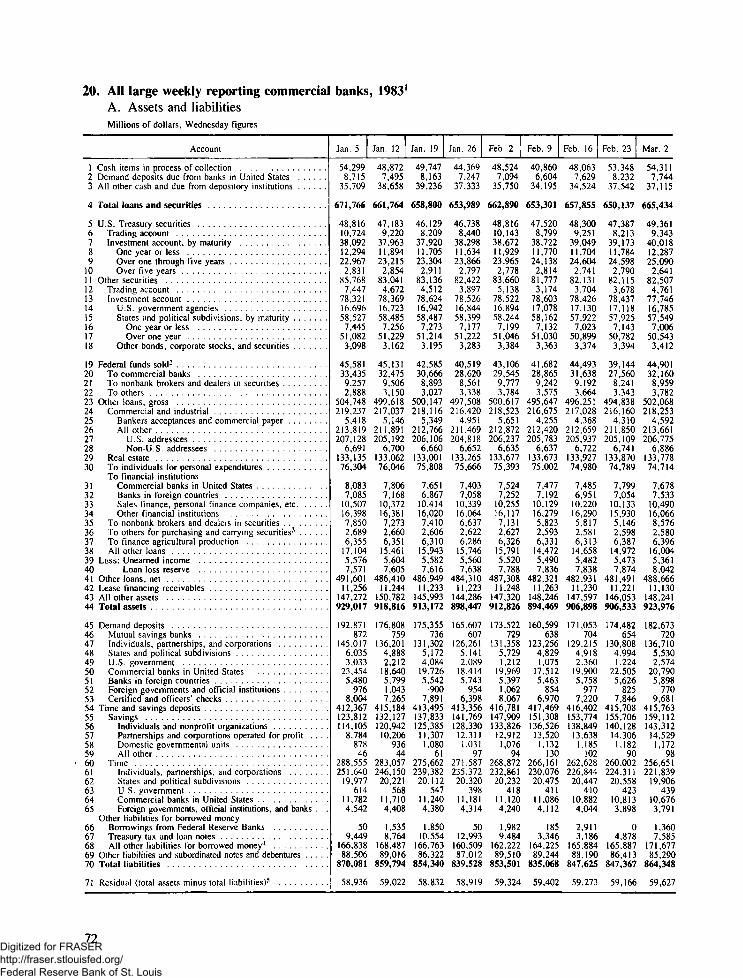
20. All large weekly reporting commercial banks, 19831
A. Assets and liabilitiesMillions of dollars, Wednesday figures
Account
1 Cash items in process of collection2 Demand deposits due from banks in United States3 All other cash and due from depository institutions
4 Total loans and securities
5 U S, Treasury securities6 Trading account7 Investment account, by maturity8 One year or less9 Over one through five years
10 Over five years1 1 Other securities12 Trading account13 Investment account . .14 U.S government agencies .15 States and political subdivisions by maturity16 One year or less . . . .17 Over one year . . . .18 Other bonds, corporate stocks, and securities
19 Federal funds sold2
20 To commercial banks21 To nonbank brokers and dealers in securities . . . .22 To others23 Other loans gross24 Commercial and industrial25 Bankers acceptances and commercial paper26 All other27 U S. addressees . . .28 Non-U S addressees29 Real estate30 To individuals for personal expenditures
To financial institutions31 Commercial banks in United States32 Banks in foreign countries33 Sales finance, personal finance companies, etc34 Other financial institutions35 To nonbank brokers and dealers in securities36 To others for purchasing and carrying securities^37 To finance agricultural production38 All other loans .39 LESS* Unearned income40 Loan loss reserve . . .41 Other loans net42 Lease financing receivables43 All other assets44 Total assets . . .
45 Demand deposits46 Mutual savings banks . .47 Individuals partnerships and corporations . .48 States and political subdivisions49 U S government50 Commercial banks in United States51 Banks in foreign countries52 Foreign governments and official institutions53 Certified and officers' checks54 Time and savings deposits55 Savings . .56 Individuals and nonprofit organizations57 Partnerships and corporations operated for profit . . . .58 Domestic governmental units59 All other60 Time61 Individuals partnerships and corporations62 States and political subdivisions63 U S government64 Commercial banks in United States65 Foreign governments, official institutions, and banks . . .
Other liabilities for borrowed money66 Borrowings from Federal Reserve Banks67 Treasury tax and loan notes68 All other l iabil i t ies for borrowed money1*69 Other liabilities and subordinated notes and debentures70 Total liabilities
71 Residual (total assets minus total liabilities)^
Jan. 5
54 2998,715
35,709
671,766
48,81610 7243809212,29422 967
2 83185,7687 447
78 3211669658 527
7 44551 0823,098
45 58133,4359 2572,888
504 748219 237
5,418213 819207,128
6 691133,13576,304
8,0837 085
10,50716 3987,8502 6896 355
17,1045 5767,571
491 6011 1 ,256
147,272929,017
192 871872
145 0176,0353 033
23,4545,480
9768 004
412,367123,812114 105
8,78487846
288,555251 640
19 977614
11 7824,542
509.449
166 83888.506
870,081
58,936
Jan. 12
48 8727,495
38,658
661,764
47,1839220
37,9631 1 ,89423 2152,854
83,0414 672
78,36916,72358 4857 256
51,2293,162
45,13132,4759,5063,150
499 618217,037
5,146211 891205,192
6 700133,06276,046
7,8067 168
10,37216 3817,2732 6606 351
15,4615 6047,605
48641011,244
150,782918,816
176 808759
1 36 20 14,8882 212
18,6405,7991,0437 265
415,184132,127120 94210,206
93644
283,057246,150
20 221568
11 7104,408
1,5358,764
168 48789,016
859,794
59,022
Jan. 19
49,7478,163
39,236
658,800
46,1298,209
37,92011,70523,304
2,91183,136
451278,62416,94258 4877,273
51,2143,195
42,58530,6668,8933,027
500 147218,116
5,349212,766206,106
6,660133,00175,808
7,6516,867
10,41416,0207,4102 6066,310
15,9435 5827,616
486 94911,233
145,993913,172
175,355736
131,3025,1724 084
19,7265,542
9007 891
413,495137,833125,385
11,3071,080
61275,662239,382
20 112547
11 2404,380
1,85010.554
166 76386.322
854,340
58.832
Jan. 26
44 3697,247
37,333
653,989
46,7388 440
38,2981 1 ,63423 866
2,79782,4223 897
78,52616,84458 399
7,17751,2223,283
40,51928,620
8,5613,338
497 508216,420
4,951211 469204,818
6 652133,26575,666
7,4037 058
10,33916 0646,6372 6226 286
15,7465 5607,638
484 31011,223
144,286898,447
165 607607
1 26 26 15,1412 089
18,4145,743
9546 398
413,356141,769128 330
12,3111,031
97271,587235,372
20 320398
11 1814,314
5012,993
160 50987,012
839,528
58,919
Feb. 2
48,5247,094
35,750
662,890
48,81610,14338,67211,92923,965
2,77883,660
5 13878,52216,89458 2447,199
5 1 ,0463,384
43,10629,5459,7773,784
500617218,523
5,651212,872206,237
6,635133,67775,393
7,5247,252
10,25516 1177,1312 6276,326
15,7915 5207,788
487 3081 1 ,248
147,320912,826
173 522729
131 3585,7291 212
19,9695,3971,0628 067
416,781147,909133,826
12,9121 076
94268,872232,861
20 232418
11 1204,240
1,9829 484
162 22289,510
853,501
59,324
Feb. 9
40,8606,604
34,195
653,301
47,5208,799
38,72211,77024,138
2,81481,777
3 17478,60317,07858,1627,132
51,0303,363
41,68228,8659,2423,575
495,647216,675
4,255212,420205,783
6,637133,67375,002
7,4777,192
10,12916,2795,8232 5936,331
14,47254907,836
482 32111,263
148,246894,469
160,599638
123,2564,8291,075
17,5125,463
8546,970
417,469151,308136,52613,520
1,132130
266,161230,07620 475
41111 0864,112
1853,346
164 22589,244
835,068
59,402
Feb. 16
48 0637,629
34,524
657,855
48,3009 251
390491 1 ,70424 604
2 74182 131
3 70478 42617 13057 922
7 02350 899
3,374
44,49331,6389 1923,664
496 251217 028
4,368212 659205,937
6 722133,92774,980
7,4856 951
10,22016 2905 8172 5816 313
14,6585 4827,838
482 93111,230
147,597906,898
171 053704
129 2154,9182 360
19,9005,758
9777 220
416,402153 774138 84913.638
1 185102
262,628226 84420447
41010 8824,044
2,9113 186
165 88488.190
847,625
59 273
Feb. 23
53 3488,232
37,542
650,137
47,3878 213
39 1731 1 ,78424 598
2 79082 115
3 67878 43717 11857 925
7 14350 782
3,394
39,14427,5608 2413,343
494 838216 160
4,310211 850205,109
6 741133,87074,789
7,7997 054
10,13315 9305 1462 5986 387
14,9725 4737 874
481 49111 221
146,053906,533
1 74 482654
1 30 8084,9941 224
22,5055,626
8257 846
415,708155 706140 12814,306
1 18290
260.002224 3 1 1
20 558423
10 8133,898
04 878
165 88786,413
847,367
59 166
Mar. 2
54 3117,744
37,115
665,434
49,3619 343
4001812,28725 090
2 64182 5074 761
77 74616 78557 5497 006
505433,412
44,90132,1608,9593,782
502 068218,253
4,592213 661206,775
6 886133,77874,714
7,6787 533
10,49016 0668,5762 5806 396
16,0045 3618 042
488 66611 130
148,241923,976
182 673720
136 7105,5302,574
20,7905,898
7709 681
415,763159,112143 31214,529
1 17298
256,651221 839
19 906439
10 6763,791
1,3607 585
171 67785,290
864,348
59 627
72Digitized for FRASER http://fraser.stlouisfed.org/ Federal Reserve Bank of St. Louis

20. AH large weekly reporting commercial banks, 19831—ContinuedA. Assets and liabilities—ContinuedMillions of dollars, Wednesday figures
Account
1 Cash items in process of collection2 Demand deposits due from banks in United States3 AH other cash and due from depository institutions . . .
4 Total loans and securities
5 U S Treasury securities6 Trading account7 Investment account by maturity8 One year or less ,9 Over one through five years
10 Over five years1 1 Other securities .12 Trading account13 Investment account14 U S government agencies15 States and political subdivisions, by maturity16 One year or less17 Over one year . . .18 Other bonds, corporate stocks, and securities
19 Federal funds sold2 . . . . .20 To commercial banks21 To nonbank brokers and dealers in securities22 To others . . . .23 Other loans, gross24 Commercial and industrial25 Bankers acceptances and commercial paper26 All other27 U S addressees28 Non-U S addressees . . .29 Real estate30 To individuals for personal expenditures
To financial institutions31 Commercial banks in United States32 Banks in foreign countries33 Sales finance, personal finance companies, etc34 Other financial institutions35 To nonbank brokers and dealers in securities36 To others for purchasing and carrying securities3
37 To finance agricultural production38 All other loans39 LESS; Unearned income40 Loan loss reserve41 Other loans net .42 Lease financing receivables43 All other assets . .44 Total assets . . .
45 Demand deposits46 Mutual savings banks47 Individuals, partnerships, and corporations48 States and political subdivisions49 U.S. government50 Commercial banks in United States51 Banks in foreign countries52 Foreign governments and official institutions53 Certified and officers' checks54 Time and savings deposits55 Savings . .56 Individuals and nonprofit organizations57 Partnerships and corporations operated for profit . . . .58 Domestic governmental units . . . .59 All other60 Time61 Individuals partnerships, and corporations62 States and political subdivisions63 U.S. government .64 Commercial banks in United States . . .65 Foreign governments, official institutions, and banks . . .
Other liabilities for borrowed money66 Borrowings from Federal Reserve Banks67 Treasury tax and loan notes68 All other liabilities for borrowed money4
69 Other liabilities and subordinated notes and debentures . . . .70 Total liabilities .
71 Residual (total assets minus total liabilities}5
Mar. 9
45,0906,687
32,276
660,486
51,11810,63240 48612,58425 2122,690
82,3574,734
77 62316,71757,462
7 07550,388
3,443
44,41830,5629,9353,920
496,016216,413
4,444211,968205 205
6,763133 78274,604
7 4627,277
10,10615,9586,9282,5636,388
14,5355,3648 059
482,59311 128
148,426904,093
169 155630
129,1784,4981,073
18 9955,886
9397,955
414,213161 155145 038
14,8771,144
96253,058218,713
19 766437
10,2923,850
7,381170,45483,107
844,310
59,783
Mar. 16
50,9677,150
34,197
658,624
49,8799,156
4072312,83125 244
2 64781,5694,699
76 87016 28057,0416750
50,2913,549
4203630,2418,3063,489
498,562217 336
4,749212,587205 801
6,786133 94774,613
7 9787,701
10,17515,7947,1812,5676,481
147895,3568 065
485,14111 119
147,982910,038
1 74 497822
132,4475,0742,536
19 0855,862
7887,883
413,438162 798146 678
14,8441,176
100250,640216 762
19 732417
9,9473,782
3 2687,041
168 88583,405
850,534
59,505
Mar. 23
43,5876,373
33,903
653,773
49,9379,629
40,30812,74124 9732,594
81,4754,676
76,79916,28156,9846738
50,2463,535
37,22126,6847,2503,286
498,542216,600
4,357212,243205.464
6,779134 00174,558
8,1647,596
10,41315,8906,8992,6696,542
15,2105,3318,071
485,14011 070
143,540892,247
164 904569
125,2505,3562,015
18 1186,038
9656,592
415,064163,434147 234
15,0151,090
95251,6302 1 7 470
19 919531
9,9983,712
2648,437
160,80383,461
832,934
59,313
Mar. 30
49,3256,788
33,978
652,514
49,0988,514
40 58313,09224 913
2 57981,5234,679
76 84416,22057,0836 727
50,3563,542
35,75225,1357,1803,437
499,460216 528
4,847211,681204 878
6,803134 10374,662
7,5607,589
10,49916,0818,1382,6886,638
14,9735,3277 991
486,14111 058
142,486896,149
173 384541
130,3014,4392,095
18 6685,596
95910,785
415,250164 270147 774
15,2841 103
109250,980217 173
19 786519
9 8153,686
1 1967,583
156 39183,213
832,017
59,132
Apr. 6
52,1657,090
32,364
668,799
51,3899,471
41,91813,88925 3812,647
81,7755,286
76,48916,20956,7356,560
50,1753,544
47,79336,4857,8603,448
501,063217,348
4,883212,465205,753
6,712134 17674,674
7,5767,843
10,62615,8387,5322,7316,679
16,0395,3207,901
487,8411 1 ,076
147,481918,974
180 354704
135,6364,9421,817
20,5365,863
79710,058
415,461168,757152 228
15,3671,076
86246,704214 171
19 085502
9,3573,588
14C3,548
177,60481,97C
859,077
59,897
Apr. 13
49,4576,668
31,066
662,144
5 1 ,96410,20041,76413,73925 3762,650
8 1 ,6034,931
76,67216,23156,850
6,64450,206
3,592
43,76831,438
8,8973,433
498,066215,494
4,262211,232204,477
6,755134,27874,763
7,5827,717
10,35115,9097,8452,6596,768
14,6985,3257,932
484,80911,081
145,219905,634
176 615668
136,2924,3751,586
19,1575,800
9127,825
416,571169,282152 57315,560
1,06090
247,288214,243
19 282623
9,4933,647
.3,674
165,57183,115
845,545
60,089
Apr. 20
50,7487,304
33,596
662,080
51,80510,49541 31013,33025 3702 610
83,9436,624
77 31916,55357,182
7 10550,0773,584
39 62427,8238,7983,004
499,969215 849
4,227211,621204 865
6,756134 37675,141
7 7007,487
10,16015,9468,1602,9316,834
15,3845,3077 954
486,70711 095
144,738909,560
1 79 049707
135,2785,0204,234
19 4645,364
8778,104
414,040169 020152 250
15,5891 086
94245,020212 542
19 190595
9 1873,506
57C12,897
161 42581,736
849,717
59,843
Apr. 27
47,5726,599
35,833
657,064
50,9969,882
41 11413,211
' 25 2572,645
84,1516,602
77 54916,75757,314
7 06150,253
3,478
38,90627,369
8,2753,262
496,296214 580
4,261210,320203 784
6,535134 19575,264
7 9997,0249,485
15,8117,2172,8976,808
15,0165,2828 003
483,01111 074
141,158899,301
170 795640
129,4584,8633,477
17 5875,571
9468,252
410,116166 629149 66115,837
1 03595
243 487211 286
19 259579
8 8283,535
3 07513,915
159 72782,065
839,701
59,60C
May 4
52,6387,287
31 989
666,367
52,44110,22542 21613 414260752 727
84 5767,365
77 21116 76656,988
7 04749 941
3,457
42 88031,1238,5693 188
499,816216 168
4 730211,438204 48 1
6,957134 17075 343
8 2427,4699,393
16 2418,2152,8816,857
14 8365,2158 131
486,47011 082
144 951914,313
179 995730
132,2315,9243 472
20 7185 749
85610,316
409,848169 183152 01615,982
1 08798
240 665209 53 1
18 655526
8 4323,520
14511,513
1 70 02482,503
854,029
60,284
73Digitized for FRASER http://fraser.stlouisfed.org/ Federal Reserve Bank of St. Louis
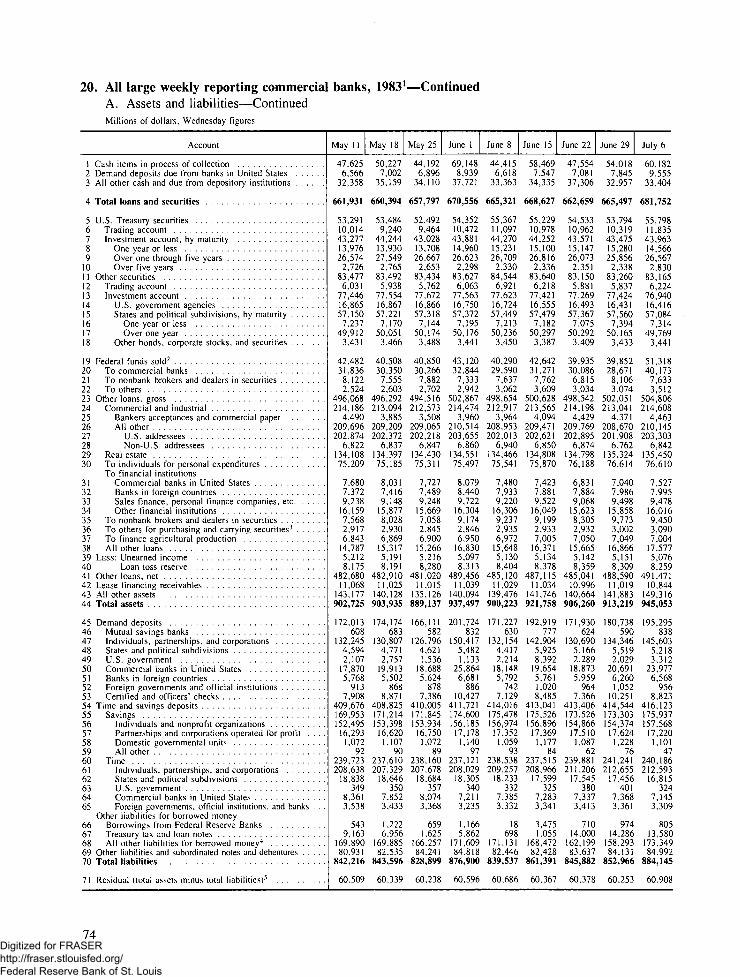
20. All large weekly reporting commercial banks, 19831—ContinuedA. Assets and liabilities—ContinuedMillions of dollars, Wednesday figures
Account
1 Cash items in process of collection2 Demand deposits due from banks in United States3 All other cash and due from depository institutions
4 Total loans and securities
5 U S Treasury securities6 Trading account7 Investment account, by maturity8 One year or less9 Over one through five years
10 Over five years1 1 Other securities12 Trading account13 Investment account14 U.S. government agencies15 States and political subdivisions, by maturity16 One year or less1 7 Over one year18 Other bonds, corporate stocks, and securities
19 Federal funds sold~20 To commercial banks21 To nonbank brokers and dealers in securities22 To others23 Other loans, gross24 Commercial and industrial25 Bankers acceptances and commercial paper26 All other27 U S addressees28 Non-U.S. addressees29 Real estate30 To individuals for personal expenditures
To financial institutions31 Commercial banks in United States32 Banks in foreign countries33 Sales finance, personal finance companies, etc34 Other financial institutions35 To nonbank brokers and dealers in securities36 To others for purchasing and carrying securities3
37 To finance agricultural production38 All other loans39 LESS: Unearned income40 Loan loss reserve41 Other loans net42 Lease financing receivables43 All other assets44 Total assets
45 Demand deposits46 Mutual savings banks47 Individuals, partnerships, and corporations48 States and political subdivisions49 U.S. government50 Commercial banks in United States51 Banks in foreign countries52 Foreign governments and official institutions53 Certified and officers' checks54 Time and savings deposits55 Savings56 Individuals and nonprofit organizations57 Partnerships and corporations operated for profit . . . .58 Domestic governmental units , . .59 All other60 Time61 Individuals, partnerships, and corporations62 States and political subdivisions63 U.S. government64 Commercial banks in United States65 Foreign governments, official institutions, and banks . . .
Other l iabi l i t ies for borrowed money66 Borrowings from Federal Reserve Banks67 Treasury tax and loan notes68 All other l iabi l i t ies for borrowed money4
69 Other liabilities and subordinated notes and debentures70 Total liabilities
71 Residual (total assets minus total l iabil i t ies)^
May 1 1
47,6256,566
32 358
661,931
53 29110 01443,27713,97626 574
2,72683,477
6,03177 44616,86557,1507 237
49,9123,431
42,48231,836
8,1222,524
496,068214,186
4,490209,696202 874
6,822134,10875 209
7 6807,3729,238
16 1597,5682.9176,843
14,7875,2128,175
482 6801 1 ,068
143,177902,725
172 013608
132,2454,5942,107
17 8705 768
9137,908
409,676169,953152 495
16,2931,072
92239,723208,638
18,838349
8,3613,538
5439,163
169,89080,931
842,216
60.509
May 18
50,2277,002
35 159
660,394
53 4849,240
44,24413,93027 5492,765
83,4925,938
77 55416,86757,221
7 17050,0513,466
40 50830,350
7,5552,603
496,292213,094
3,885209,209202 372
6,837134,39775 185
8 0317,4169,148
15 8778,0282,9306,869
15,3175,1918,191
482 9101 1 ,025
140,128903,935
174 174683
130,8074,7712,757
19,9135,502
8688,871
408,825171,214153,398
16,6201,107
90237,610207,329
18,646350
7,8523,433
1,2226,956
169,88582,535
843,596
60.339
May 25
44,1926,896
34 110
657,797
52 4929,464
43,02813,70826667
2,65383,434
5,76277 67216,86657,3187,144
50,1743,488
40,85030,266
7,8822,702
494,516212,573
3,508209,065202 218
6,847134,43075 311
7 7277,4899,248
15 6697,0582,8456,900
15,2665,2168,280
481 02011,015
135,126889,137
166 111582
126.7964,6211,536
18,6885,624
8787,386
410,005171.845153 934
16,7501,072
89238,160207,678
18,684357
8,0743,368
6591,625
166.25784,241
828,899
60,238
June 1
69,1488,939
37 721
670,556
54 35210,47243,88114,96026,623
2,29883,6276,063
77,56316,75057,372
7,19550,176
3,441
43,12032,8447,3332,942
502,867214,474
3,960210,514203 655
6,860134,55175,497
8 0798,4409,722
16 3049,1742,8466,950
16,8305,0978,313
489 4561 1 ,039
140,094937,497
201 724832
150,4175,4821,133
25,8646,681
88610,427
411,721174,600156,185
17,1781,140
97237,121208,029
18,305340
7,2113,235
1,1665,862
171,60984.818
876,900
60,596
June 8
44,4156,618
33 363
665,321
55 3671 1 ,09744,27015,23126,709
2,33084,544
6,92177,62316,72457,449
7,21350,2363,450
40,29029,590
7,6373,062
498,654212,917
3,964208,953202,013
6,940134,46675,541
74807,9339,220
16,3069,2372,9356,972
15,6485,1308,404
485 12011,029
139,476900,223
171,227630
132,1544,4172,214
18,1485,792
7427,129
414,016175,478156,974
17,3521,059
93238,538209,257
18,233332
7,3853,332
18698
171,13182,446
839,537
60,686
June 15
58,4697,547
34 335
668,627
55 22910,97844,25215,10026,8162,336
83,6406,218
77,42116,55557,479
7 18250,2973,387
42,64231,2717,7623,609
500,628213,565
4,094209,471202,621
6,850134,80875,870
7 4237,8819,522
16 0499,1992,9337,005
16,3715,1348,378
487 1151 1 ,034
141,746921,758
192 919111
142,9045,9258,392
19,6545,7611,0208,485
413,041175,526156,89617,369
1,17784
237,515208,966
17,599325
7,2833,341
3,4751,055
168,47282,428
861,391
60,367
June 22
47,5547,081
37 306
662,659
54 53310,96243,57115,14726073
2,35183,150
5,88177 26916,49357,367
7 07550,2923,409
39 93530,0866,8153,034
498,542214,198
4,429209,769202 895
6,874134,79876,188
6 8317,8849,068
15 6238,3052,9327,050
15,6655,1428,359
485 04110,996
140,664906,260
171 930624
130,6905,1662,289
18,8735,959
9647,366
413,406173,526154,866
17,5101,087
62239,881211,206
17,545380
7,3373,413
71014,000
162,19983,637
845,882
60.378
June 29
54,0187,845
32 957
665,497
53 79410 31943,47515,28025 856
2 33883,2605,837
77 42416,43157,560
7 39450,1653,433
39 85228,6718,1063074
502,051213,041
4,371208,670201 908
6,762135,32476 614
7 0407,9869,498
15 8589,7733,0027,049
16,8665,1518,309
488 59011,019
141,883913,219
180 738590
134,3465,5192,029
20,6916 2601,052
10,251414,544173,303154,374
17,6241,228
76241,241212,655
17,456401
7,3683,361
97414,286
158,29384.131
852,966
60,253
July 6
60,1829,555
33 404
681,752
55 79811 83543,96314,56626 567
2 83083,1656,224
76 94016,41657,084
7 31449,769
3,441
51 31840,1737,6333 512
504,806214,608
4,463210,145203 303
6,842135,45076 610
7 5277,9959,478
160169,4503,0907,004
17,5775,0768,259
491 47110,844
149,316945,053
195 295838
145,6035,2183,312
23,9776 568
9568 823
416,123175,937157 568
17,2201,101
47240,186212,593
16,815324
7,1453,309
80513,580
173,34984,992
884,145
60.908
74Digitized for FRASER http://fraser.stlouisfed.org/ Federal Reserve Bank of St. Louis

20. All large weekly reporting commercial banks, 19831—ContinuedA. Assets and liabilities—ContinuedMillions of dollars. Wednesday figures
Account
1 Cash items in process of collection2 Demand deposits due from banks in United States3 All other cash and due from depository institutions
4 Total loans and securities
5 U S Treasury securities . . . .6 Trading account7 Investment account by maturity8 One year or less9 Over one through five years
10 Over five years1 1 Other securities12 Trading account13 Investment account14 U.S. government agencies15 States and political subdivisions, by maturity16 One year or less17 Over one year18 Other bonds, corporate stocks, and securities
19 Federal funds sold2
20 To commercial banks . . . . . .21 To nonbank brokers and dealers in securities22 To others23 Other loans gross24 Commercial and industrial25 Bankers acceptances and commercial paper26 All other . . . .27 U S addressees28 Non-U S addressees .29 Real estate30 To individuals for personal expenditures
To financial institutions31 Commercial banks in United States32 Banks in foreign countries33 Sales finance, personal finance companies, etc34 Other financial institutions35 To nonbank brokers and dealers in securities36 To others for purchasing and carrying securities3
37 To finance agricultural production38 All other loans39 LESS: Unearned income40 Loan loss reserve41 Other loans net . . . . .42 Lease financing receivables43 All other assets . . . . .44 Total assets . . . . . .
45 Demand deposits46 Mutual savings banks47 Individuals partnerships and corporations .48 States and political subdivisions49 U.S. government50 Commercial banks in United States5 1 Banks in foreign countries52 Foreign governments and official institutions53 Certified and officers' checks . . .54 Time and savings deposits55 Savings . . . . . .56 Individuals and nonprofit organizations . .57 Partnerships and corporations operated for profit . . . .58 Domestic governmental units59 All other60 Time61 Individuals, partnerships, and corporations62 States and political subdivisions63 U S government64 Commercial banks in United States . .65 Foreign governments, official institutions, and banks . . .
Other liabilities for borrowed money66 Borrowings from Federal Reserve Banks67 Treasury tax and loan notes68 All other liabilities for borrowed money4
69 Other liabilities and subordinated notes and debentures70 Total liabilities . . . . . . .
71 Residual (total assets minus total liabilities)3
July 13
49,5266,913
36,671
667,376
51,5699,248
42 32214 03725,596
2,68981 9474,942
77,00516,31257,206
6,80050,407
3,486
45 70635,461
7,0023 242
501,474213 846
4,388209,458202 476
6,982135,72776 682
7,3287,6779,529
1 6 0058,5953,0956,995
15 9955,0868 235
488,15410 912
144,415915,813
177 066643
136,7724 654
98718,7116,218
9058 176
414,990174,638156 147
17,3251,113
52240 352212,755
16 852330
7 1043,310
2 14014,274
161 91084,420
854,799
61,014
July 20
47,3647,381
37,562
667,262
52 O i l10,10841 90413 65225,6842,567
82 6545 490
77,16316,23057,359
7,02050,3393,574
44 48933 870
7,1983 421
501,444213 951
3 953209,998203 169
6 829135,99976 940
7,0807,9759,006
15 8948,5243,1067,045
15 9245,0648 271
488,10810 843
141 972912,385
174 122743
132 0024 6972,769
19 6355,853
7527 669
414,876174 119155 672
17,3431,048
55240 757213 413
16 784328
69353,298
I 51413,202
162 43385,407
851,555
60,830
July 27
48,0726,721
33,829
664,552
50,2309,095
41 13613,76424,7672,605
83,2845,450
77,83416,30258,008
7,70150,307
3,524
43 78532,764
7,7353 286
500,627212 984
3,645209,339202 432
6,907135,99177,306
6,9197,8839,091
15,7388,6523,0747,058
15,9305,0588 316
487,25210 848
140,108904,130
172 998616
132,5714 9322,037
17,9875,809
7198 328
414,301173,218154 658
17,4451,045
71241 083214,009
16 671331
6 8143,258
31214.024
156 13485.731
843,499
60.631
Aug. 3
50,2687,424
34,492
672,218
51,5649,837
41,72714,46024,5972,670
84,3666,416
77,95116,44557,9887,826
50,1623,518
44,04933,2767,5263,246
505,624215,193
4,268210,925203,997
6,928135,86777,532
7,4918,2729,420
16,2838,8423,0987,092
16,5335,0358,350
492,23910,878
143,882919,162
179 163796
134,3445,3093,221
20,1465,919
9088,520
416,182174,835156,194
17,4831,100
57241 347214,542
16,597327
6,6943,187
1 41210.753
162,94987,601
858,060
61,102
Aug. 10
43,0906,645
35,051
666,306
50,3378,240
42 09714,38225,1162,599
84,0676,045
78,02116,39358,094
7,86150,2333,534
41 54330,8697,5843,090
503,761214 466
3,762210,703203 829
6,874136,27877,785
7,1787,9729,194
16,3758,1433,1067,138
16,1265,0628,340
490,35810 871
144,134906,097
169 241705
129,5284 3501,878
18,3616,080
8337 506
416,206174,086155 322
17,5841,125
54242 119214,777
16 955314
6,8443,230
1468,797
162 69687,729
844,816
61,281
Aug. 17
47,9457,347
32,649
668,026
52,0759,736
42,33813,64126,2382,460
85,0387,059
77,97916,46858,0077,900
50,1083,503
39,75628,356
8,6182,782
504,564213,640
3,656209,984203,089
6,895136,57978,108
7,3027,7599,079
16,2839,2343,0967,122
16,3635,0428,365
491,15710,939
143,691910,597
174 475742
134,4264,8441,091
19,4095,623
8177,522
417,620173,254154,429
17,6491,120
56244 366216,871
17 033314
6,8333,314
3929,996
157,00890,014
849,505
61,092
Aug. 24
43,8976,749
32,718
666,159
51,6159,229
42 38613,73426,1852,466
84,1116,322
77,78816,55157,6447,569
50,0753,593
40,40629,611
8,0482,747
503,440213,763
3,977209,786202,908
6,877136,73778,464
7,5517,3889,094
15,9567,9903,0747,085
16,3355,0598,353
490,02810,944
140,878901,346
166 410614
127,0264 5412,078
18,0495,690
9177,495
418,146172,276153,331
17,7711,115
58245 870218,112
17 270318
6,8223,346
36311,012
155,61588,678
840,224
61,122
Aug. 31
50,3817,820
35,447
670,579
51 4018,384
43 01714 07326,4802,464
84 4216,652
77,76916,38957,7567,640
50,1163,624
41 21630 5417,7302 946
507,011214 064
3,955210,109203 199
6,909137,07879 033
7,4998,0289,287
15 9549,4213,1827,124
16 3425,0348 436
493,54010 948
141,284916,459
177 314711
134 7424 931
99520 0516,1651,1668 552
419,0191 72 60 1153 681
17,7511 124
45246 4 1 8218 862
17 065320
6 8153,355
2 4091 1 162
156 94388,235
855,082
61,377
Sept. 7
52 2227,780
36,560
671,102
52 7019,238
43 46314 35226,5752,536
84 7056,935
77,77016,43857,678
7,70749,970
3,654
4006529,1737,6833 208
507,192214 100
4 048210,052203 179
6,873137,22479 093
7,3958,3669,391
16 1998,9113,1357,116
16,2625,0408 521
493,63110 957
141,648920,270
181 310766
137 9124 7971,380
21 2316,7081,1367 380
420,2181 74 484155 317
17,9681,156
42245 734218,150
17 058310
6 9513,264
4466,730
1 64 07885,983
858,764
61,505
75Digitized for FRASER http://fraser.stlouisfed.org/ Federal Reserve Bank of St. Louis

20. All large weekly reporting commercial banks, 19831—ContinuedA. Assets and liabilities—ContinuedMillions of dollars, Wednesday figures
Account
1 Cash items in process of collection2 Demand deposits due from banks in United States3 All other cash and due from depository institutions
4 Total loans and securities
5 U S. Treasury securities6 Trading account7 Investment account by maturity8 One year o r less . . .9 Over one through five years
10 Over five years1 1 Other securities . . . . , . ,12 Trading account13 Investment account14 U S government agencies15 States and political subdivisions, by maturity16 One year or less17 Over one year18 Other bonds, corporate stocks, and securities
19 Federal funds sold2 .20 To commercial banks . .21 To nonbank brokers and dealers in securities22 To others . .23 Other loans gross24 Commercial and industrial25 Bankers acceptances and commercial paper26 All other27 U S addressees28 Non-U.S addressees . .29 Real estate30 To individuals for personal expenditures
To financial institutions31 Commercial banks in United States32 Banks in foreign countries . .33 Sales finance, personal finance companies, etc34 Other financial institutions35 To nonbank brokers and dealers in securities36 To others for purchasing and carrying securities3
37 To finance agricultural production . .38 All other loans39 LESS' Unearned income40 Loan loss reserve41 Other loans net42 Lease financing receivables43 All other assets44 Total assets
45 Demand deposits . . . . .46 Mutual savings banks47 Individuals, partnerships and corporations48 States and political subdivisions49 U S government50 Commercial banks in United States51 Banks in foreign countries52 Foreign governments and official institutions53 Certified and officers' checks54 Time and savings deposits55 Savings56 Individuals and nonprofit organizations57 Partnerships and corporations operated for profit . . . .58 Domestic governmental units59 All other60 Time deposits61 Individuals, partnerships, and corporations62 States and political subdivisions63 U S government64 Commercial banks in United States65 Foreign governments, official institutions, and banks . . .
Other liabilities for borrowed money66 Borrowings from Federal Reserve Banks67 Treasury tax and loan notes68 All other liabilities for borrowed money4
69 Other liabilities and subordinated notes and debentures70 Total liabilities
7 1 Residual (total assets minus total liabilities)^
Sept. 14
48 9097,509
34,810
667,970
53,5499,992
43 55714,12426,710
2 72484,0146,356
77 65916,27157,731
7,660500713,656
38,36328,266
7,3762,721
505,609213 532
4,218209 3 1 4202 465
6,849137 59279,458
6 7328,1589,155
16,3407,7883,1407,125
16,5895 0548,512
492 04310,916
145 543915,656
179,118553
137 8744,7352 600
18 7126,752
7957,098
418 706173,884154,760
17,9061,176
43244 822217,203
17,062307
6,9453,304
1,4607 806
160.69186.314
854,096
61.561
Sept. 21
46 3227 727
33 842
667,321
52,1458,630
43 51513 94526,8632 708
84 3856,537
77 84816 31757,8897,667
50 2223,641
36 10626 214
7,0272 866
508 268214 630
3 916210 714203 796
6 9181 37 92979 842
7 1517 9639,275
16 2459,2313,1907 186
15,6275 0718,512
494 68410 919
143 512909,643
170 580633
130 8205 0981 847
18 5695 552
7397 321
4 1 7 299172,469153 322
17,9451,160
42244 830217,272
17 199302
6,7823,275
5,63815 312
153,28186.241
848,350
61 293
Sept. 28
44 5767 360
29,462
669,109
52,1988,391
43 80714 48926,544
2 77584 1026,359
77 74316 13257,9687,650
50 3173,643
39 12828,789
7,6722 666
507,190213 345
3 653209 693202 766
6927138 08680 277
7 2468 2089,352
16 1958,2903,2117 161
15,8195 0488,461
493 68110,927
142 755904,188
167 689557
128 7224,6931 610
17 9605 755
6367,755
417 907172,306153 000
18,1011,166
38245 601218,206
17 183270
6,8023,140
1,10515 225
154,18886,861
842,974
61 214
Oct. 5
50 7827,634
30,608
685,223
55,5139,506
46 00714,29628,825
2 88683,8226,206
77 61616,06557,9517,731
502203,600
47 64236,3958,3932,855
511,690214 945
3,728211 217204 059
7,158138 23980527
7 4068,6459,396
16 2429,6803,2587 151
16,1995 0068,437
498 24610,962
147 455932,664
181,676735
136 9964,9173 314
20,4955,799
9798,440
419 273174,859155,152
18,3611,302
44244 414217,911
16,490266
6,6823,065
46615 533
168,74685,159
870,854
61,810
Oct. 12
564028,153
34,001
685,182
54,1517,903
46 24814,50628,676
3 06682,8385,297
77 54016,02057,8977,685
50,2123,624
49,05638,231
7,7973,028
512,626215 825
4,573211 252204 050
7,201138 58080,931
7 3628,7089,322
16,2309,1773,2927,106
16,0945,0248,465
499 13810,944
142 769937,452
188,660770
143 9954,5401 560
21,3266,776
9418,752
419,677173,528153,365
18,8481,278
37246,149219,657
16,545268
6,5663,113
!,39315,163
166,80583,937
875,636
61,816
Oct. 19
48,3237,327
33,923
683,192
55,1958,712
46 48314,86728,550
3 06684,1126,326
77 78516,05458,0597,803
50,2563,672
45,40534,558
7,7403,107
511,970215,381
4,556210 825203,675
7,151139 0928 1 ,062
7 7908,3729,511
15,8308,5513,2717083
16,0275 0088,482
498 48010,957
141 545925,266
174,875808
133 5974,7352 759
18,7125,726
8097,728
419,856172,329152,084
18,9621,245
38247,527221,015
16,638269
6,5373,067
1,02115,916
165,99485,994
863,657
61,609
Oct. 26
44 0857,099
32,297
679,728
56,0299,296
46 73314,73428,778
3 22183,889
6,12377 76615 95258,1567,809
50 3473,658
41 43229,3609,0623 010
511,926215 088
4,397210 690203 468
7,222139 33581,515
7 5108,2719,126
15,2209,3843,2257 306
15,9455 0088,540
498 37710,968
140 830915,006
168,996616
129 8024 4431 796
18,5435,780
8327,183
420,288171,623151,220
19,1741,191
39248,665221,933
16,785236
6,6673,042
1,09915,833
160,88886,368
853,471
61,535
Nov. 2
49 8797 144
33,431
689,192
56,3049,114
47 19014 73029,246
3 21384 HO6,346
77 79415 98258,1467,833
50 3123,667
45 75133,2029,3943 156
516,655216 762
4,854211 909204 653
7,256139 44181 642
7 8918,6069,655
15 5819,8403,3327 284
16,62049798,680
502 99710,987
143 740934,374
178 265707
136 4565 5221 154
19,7406,316
7117,659
422 723173,711153,120
19,3441,200
45249 012222,530
16,572224
6,5583,128
37915,032
168,66487,328
872,390
6 1 ,984
Nov. 9
496367 372
29 250
689 240
57 0649,383
47 68215 13929 318
3 22583 673
5 79977 87415 88558,3567,942
50 4153,633
44 08332 2888 3913 404
518 139218 599
5 324213 274205 928
7 346139 26181 756
8 2028 6049,322
15 8889,2133,3787 221
16 6965 0188 703
504 4 1 810 992
146 918933,408
178 267713
1 36 2684 3401 496
18 6215 978
75110 100
424 004174,186153 311
19,6711,164
40249 818223,408
16 609211
6,4603,129
3,7252 742
171,94090,601
871,279
62 129
76Digitized for FRASER http://fraser.stlouisfed.org/ Federal Reserve Bank of St. Louis

20. All large weekly reporting commercial banks, 19831—ContinuedA. Assets and liabilities—ContinuedMillions ot" dollars, Wednesday figures
Account
1 Cash items in process ot collection2 Demand deposits due from banks in United States3 All other cash and due from depository institutions
4 Total loans and securities
5 U S Treasury securities .6 Trading account7 Investment account by maturity8 One year or less9 Over one through five years
10 Over five years1 1 Other securities12 Trading account13 Investment account14 U S government agencies15 States and political subdivisions, by maturity16 One year or less17 Over one year18 Other bonds corporate stocks, and securities , . .
19 Federal funds sold2
20 To commercial banks . . .21 To nonbank brokers and dealers in securities22 To others23 Other loans, gross . . .24 Commercial and industrial25 Bankers acceptances and commercial paper26 All other27 U S addressees28 Non-U S addressees29 Real estate , . . .30 To individuals for personal expenditures
To financial institutions3 1 Commercial banks in United States32 Banks in foreign countries . .33 Sales finance, personal finance companies, etc34 Other financial institutions35 To nonbank brokers and dealers in securities36 To others for purchasing and carrying securities3
37 To finance agricultural production38 All other loans39 LESS: Unearned income . . . .40 Loan loss reserve41 Other loans net42 Lease financing receivables . . .43 All other assets44 Total assets
45 Demand deposits . . . .46 Mutual savings banks47 Individuals, partnerships and corporations48 States and political subdivisions . . .49 U S government50 Commercial banks in United States51 Banks in foreign countries . .52 Foreign governments and official institutions53 Certified and officers' checks54 Time and savings deposits . . . . . .55 Savings56 Individuals and nonprofit organizations . , .57 Partnerships and corporations operated for profit58 Domestic governmental units59 All other . . . . .60 Time61 Individuals, partnerships, and corporations62 States and political subdivisions63 U.S. government64 Commercial banks in United States .65 Foreign governments, official institutions, and banks .
Other liabilities for borrowed money66 Borrowings from Federal Reserve Banks67 Treasury tax and loan notes68 All other liabilities for borrowed money1* . .69 Other liabilities and subordinated notes and debentures . . .70 Total liabilities
71 Residual (total assets minus total liabilities)^
Nov. 16
53 6398.013
31.786
688,578
58,4789,678
48 80015,27430,734
2 79283,614
5,71977 89415,88158,3487,863
504853,665
42,52330,2769,1813,067
517,696216,679
4,353212,326205 055
7,271139,63481 980
7 9978,5879,297
15,43810,3873,1867,208
17 3004,9978 737
503,96210,989
142 374935,378
182,710734
138,3974,8442 314
20,1556,921
8998,448
423,360174,195153,138
19,7801,232
45249 166222,521
16 648218
6 5983,180
9101,662
1 72 65092,010
873,302
62 076
Nov. 23
49,0966,403
34,748
685,388
57,3738,178
49,19415,44230,932
2,82084,536
6,22778,30916,02158,618
7,99250,6263,670
40,57427,9989,4063,170
516,646216,287
3,900212,387205,124
7,263139,68682,425
8,1318,0879,178
15,02310,5903,1957,161
16,8834,9798,763
502,90411,015
140,825927,476
172,648563
133,3774,6912 026
18,2896,000
9366,766
425,988173,928152,78819,926
1,17143
252 060225,008
16,960214
6,7283,150
6051,340
170,29094,716
865,587
61 888
Nov. 30
53 4548,071
32,089
693,385
58,5009,045
49,45515,46931,244
2 74383,9465,675
78 27115,90558,6767,984
506923,690
44,81533,5878,3692,860
519,862217,406
4,857212,548205,251
7,298139,90382,898
7 8798,4119,224
15,24611,2323,1807,153
17 3294,9738 765
506,1231 1 ,044
142,087940,130
185,419677
141,3385,1201 938
20,1246 4981 2768,448
426 856174,763153,39820,109
1,21640
252 093225,114
16 617214
7,0593,089
5151,484
171 27792,176
877,727
62 402
Dec. 7
47,8117,914
32,072
695,036
60,0189,850
50,16815,95231,353
2,86284,723
6,49178,23115,89358,641
8,13350,5073,697
43,76130,628
9,6123,522
520,334218,375
4,875213,500206,230
7,270139,91183,448
7,8148,2089,299
15,50510,6853,2007,068
16,8174,9738,826
506,5341 1 ,063
144,470938,367
177,670623
136,6164,7961 820
19,2346,058
8217,702
427,672176,017154,44020,265
1,25557
251,655224,902
16,368232
7,1193,034
1492,651
173,74893,781
875,671
62 696
Dec. 14
52,0767,626
35,366
694,899
59,1438,538
50,60615,67731,824
3,10584,3385,787
78,55116,15058,7027,996
50,7063,699
44,77731,12210,0653,590
520,432218,338
4,730213,608206,536
7,071140,28884,171
7,6477,3359,322
15,65310,5443,1157,157
16,8624,9768,816
506,6411 1 ,058
142,728943,753
182,850674
141,5634,8632,237
18,7855,995
7607,973
427,187175,169153,67320,222
1,22252
252,018224,907
16,530217
7,3053,059
1,9382,219
169,10397,849
881,147
62,606
Dec. 21
53 4848,258
34,714
695,178
58,1768,337
49 83915.39831,248
3 19285,155
6,16978 98616,20559,105
7,9645 1 , 1 403,676
39,56826,686
9,2023,680
526,058219,870
4,390215,480208,277
7,203140,30385,083
9,1107,7009,139
15,36511,5503,1397,207
17 5924,9658 813
512,28011,104
143,854946,593
184,936587
141,6205 2661 188
20,0055 929
9549,386
428,095174,814153,48420,048
1,20280
253 280225,765
16 752215
7,3703,180
4209,382
163 41498,233
884,479
62 114
Dec. 28
57 6439 170
35,582
697,623
56,6607,682
48 97914 94130,838
3 20085 741
5,91779 82416 15260,0107,953
52 0573 662
40 22027 565
9,2103 446
528,797221,859
4668217,191209 949
7 241139,96685 971
9 0957 8559,358
16 13510,5543,1997 137
17 66849708 826
515^00211,136
140 517951 672
193 574633
147 5685 7542 059
21,6206461
8978,582
429 545174,788153 25420,242
1,20884
254 757227,175
16 624211
7 6683,080
7066 104
162 03497,320
889,283
62 389
Adjust-mentbank6
126367162
3,811
6211
620291318
11680
1679277397217180
5
409392
17
2,220619
17602578
24830638
2
110
• • ' y
29849228
2 1012
2374,705
1 175
1 008361722
912 9651,2521 095
1082027
1 7141,460
226
27
19315
4,349
356
77Digitized for FRASER http://fraser.stlouisfed.org/ Federal Reserve Bank of St. Louis

20. All large weekly reporting commercial banks, 19831—ContinuedB. Balance sheet memorandaMillions of dollars
Account
1 Total loans (gross) and investments adjusted2
2 Total loans (gross) adjusted2
3 Demand deposits adjusted'1
4 Total time deposits in accounts of $100,000 or more5 Negotiable CDs6 Other time deposits
7 Total loans sold outright to affiliates4
8 Commercial and industrial .9 Other .
1 Total loans (gross) and investments adjusted2
2 Total loans (gross) adjusted2
3 Demand deposits adjusted-*
4 Total time deposits in accounts of $100,000 or more5 Negotiable CDs6 Other time deposits
7 Total loans sold outright to affiliates4
8 Commercial and industrial9 Other
1 Total loans (gross) and investments adjusted2
2 Total loans (gross) adjusted"3 Demand deposits adjusted*^
4 Total time deposits in accounts of $100,000 or more5 Negotiable CDs6 Other time deposits
7 Total loans sold outright to affiliates4
8 Commercial and industrial9 Other
Jan. 5
643,395508 8 1 1112,086
180,336125,98954,347
2,9172 261
656
Mar. 9
635,884502,409103,996
156,218108,12448 094
2,9972 357
640
May 1 1
635,803499 034104,410
144,47396,54547 928
2,8082 189
619
Jan. 12
634,692504,468107,084
177,122124,10553,017
2,9742,308
666
Mar. 16
633,826502,378101,908
154,163106,06048 103
2,9332 322
611
May 18
635,394498 418101 276
142,56494,60147 963
2,8082 189
619
Jan, 19
633,681504,416101,798
171,306119.69251,614
2,9982 336
661
Mar. 23
632,327500,915101,184
155,381107,02648 354
2,9842 366
617
May 25
633,299497 373101 694
143,19795,13448 063
2,7572 145
611
Jan. 26
631,163502,003100,735
169,294118,50450,790
2,9652,311
654
Mar. 30
633,137502,517103,295
154,918106,73048 187
3,0172 390
626
June 1
643,043505 064105,578
141,87094,27047 600
2,7352 130
606
Feb. 2
639,130506,654103,817
167,844117,88249,963
2,9722,318
654
Apr. 6
637,959504,795105,836
151,100103,22547 875
3,0362 412
624
June 8
641,784501 874106,450
143,00994,94248,067
2,7772,173
604
Feb. 9
630,285500,987101,152
166,286116,63149,655
2,9692,326
643
Apr. 13
636,381502,814106,415
151,702103,77247,930
3,0512,426
625
June 15
643,445504,576106,403
141,77393,84047,933
2,7922,161
631
Feb. 16
632,052501,621100,729
163,600114,35849,243
3,0012,357
644
Apr. 20
639,818504,070104,602
149,291101,27048,021
3,0472,427
619
June 22
639,243501,560103,215
143,89595,70048 196
2,7212 149
572
Feb. 23
628,124498,62297,404
162,024112 94749,077
2,9682 327
641
Apr. 27
634,982499,834102,158
147,91399,73248 181
2,8682 243
624
June 29
643,246506 191104,000
144,46196,69247 769
2,6932 120
573
Mar. 2
638,999507 131104,998
159,2321 10 96948,263
2,8642 282
581
May 4
640,349503,332103,168
145,04397,20347 839
2,7902 172
617
July 6
647,387508 424107,824
143,35095,73947 611
2,6342 066
568
78Digitized for FRASER http://fraser.stlouisfed.org/ Federal Reserve Bank of St. Louis

20. All large weekly reporting commercial banks, 19831—ContinuedB. Balance sheet memoranda—ContinuedMillions of dollars
Account July 13 July 20 July 27 Aug. 3 Aug. 10 Aug. 17 Aug. 24 Aug. 31 Sept. 7
1 Total loans (gross) and investments adjusted2 . .2 Total loans (gross) adjusted2
3 Demand deposits adjusted3
4 Total time deposits in accounts of $100,000 or more ,5 Negotiable CDs6 Other time deposits
7 Total loans sold outright to affiliates4 . .8 Commercial and industrial9 Other
1 Total loans (gross) and investments adjusted2
2 Total loans (gross) adjusted2
3 Demand deposits adjusted3
4 Total time deposits in accounts of $100,000 or more .5 Negotiable CDs6 Other time deposits
7 Total loans sold outright to affiliates4 . .8 Commercial and industrial9 Other
1 Total loans (gross) and investments adjusted2
2 Total loans (gross) adjusted2
3 Demand deposits adjusted3
4 Total time deposits in accounts of $ 100,000 or more ,5 Negotiable CDs6 Other time deposits
7 Total loans sold outright to affiliates4 .8 Commercial and industrial9 Other
637,907 639,648 638,244504,390 504,983 504,730107,841 104,353 104,902
142,918 142,834 142,70894,537 93,977 93,78148,381 48,856 48,927
2,666 2,682 2,6362,080 2,098 2,033586 584 602
644,835 641,660 645,775 642,409 646,010508,905 507,256 508,662 506,683 510,188105,527 105,912 106,030 102,386 105,886
142,375 142,637 144,303 145,418 145,49293,172 93,199 94,528 95,185 95,12749,204 49,438 49,775 50,233 50,366
2,623 2,6112,024 2,010599 601
2,533 2,579 2,5291,934 2,022 1,993598 558 536
648,095510,689106,477
144,55094,19050,359
2,5882,020568
Sept. 14 Sept. 21 | Sept. 281 Oct. 5 [ Oct. 12 Oct. 19 Oct. 26 I Nov. 2 I Nov. 9
646,539 647,540 646,582508,975 511,010 510,282108,898 103,842 103,543
143,316 143,018 143,73292,752 92,451 93,386
" 50,564 50,567 50,345
2,617 2,492 2,5352,019 1,896 1,940598 596 595
654,866 653,078 654,334 656,406 661,758 662,470515,531 516,090 515,028 516,488 521,313 521,732107,084 109,371 105,081 104,572 107,492 108,514
140,509 139,984 139,949 140,253 140,573 140,75989,981 88,863 87,936 87,967 88,424 88,32250,529 51,120 52,013 52,286 52,150 52,437
2,506 2,553 2,530 2,576 2,594 2,5361,915 1,982 1,968 1,981 2,001 1,945591 571 562 596 592 591
Nov. 16 Nov. 23 Nov. 30 Dec. 7 Dec. 14 Dec. 21 Dec. 28Adjust-mentbank5
664,039521,946106,603
140,10787,42752,680
2,5591,963596
663,000521,091103,238
142,77789,54253,235
2,4901,904586
665,657523,211109,903
142,51689,42453,092
2,3851,839546
670,393525,653108,805
142,02088,93153,089
2,4321,850583
669,922526,440109,752
142,34689,37852,969
2,4011,831570
673,160529,830110,258
143,37689,92253,454
2,3861,837549
674,759532,358112,252
144,84291,71453,128
2,3641,810
555
3,5362,2351,009
457263193
79Digitized for FRASER http://fraser.stlouisfed.org/ Federal Reserve Bank of St. Louis
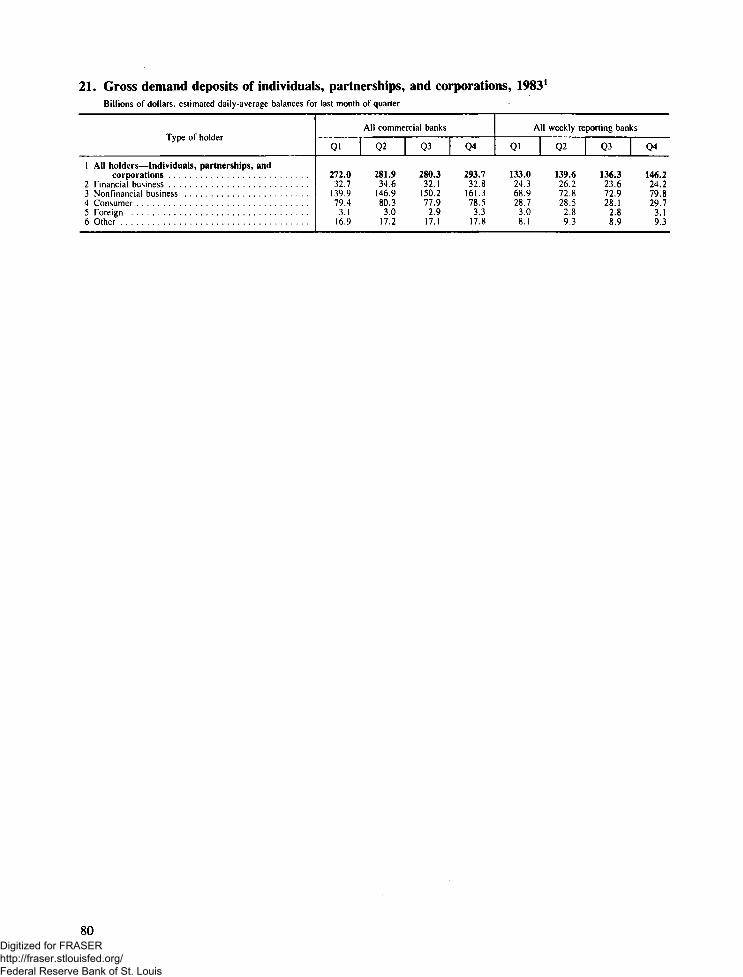
21. Gross demand deposits of individuals, partnerships, and corporations, 19831
Billions of dollars, estimated daily-average balances for last month of quarter
Type of holder
1 All holders — Individuals, partnerships, andcorporations
2 Financial business3 Nonfinancial business4 Consumer5 Foreign6 Other
All commercial banks
Ql
272.032.7
139.979.4
3.116.9
Q2 | Q3
281.9 280.334.6 32.1
146.9 150.280.3 77.93.0 2.9
17.2 17.1
Q4
293.732.8
161.378.53.3
17.8
All weekly reporting banks
Ql
133.024.368.928.7
3.08.1
Q2
139,626.272.828.5
2.89.3
Q3
136.323.672.928.12.88.9
Q4
146.224.279.829.7
3.19.3
80Digitized for FRASER http://fraser.stlouisfed.org/ Federal Reserve Bank of St. Louis

22. Commercial paper and bankers dollar acceptances outstandingA. Commercial paper, seasonally adjustedMillions of dollars, end of period
Instrument
1 AH issuers
Financial companies1
Dealer-placed paper2
2 Total3 Bank-related
Directly placed paper*4 Total5 Bank-related
6 Nonfinancial companies4 . . .
1 AH issuers . .
Financial companies'Dealer-placed paper1
2 Total3 Bank-related
Directly placed paper*4 Total5 Bank-related
6 Nonfinancial companies4 . . .
1 AH issuers
Financial companies'Dealer-placed paper2
2 Total3 Bank-related
Directly placed paper3
4 Total5 Bank-related
6 Nonfinancial companies4 . . .
Jan. Feb. Mar. Apr. May June July Aug. Sept. Oct. Nov. Dec.3
1981
127,457
20,2603,670
69,18522,570
38,012
129,408
20,8363,742
69,64422,331
38,928
131,504
22,2294,163
70,44621,604
38,829
133,821
23,0944,437
70,96222,858
39,765
139,300
24,4674,800
72,89423,880
41,939
144,547
26,0124,750
75,10224,107
43,433
150,175
27,4735,267
78,57526,104
44,127
155,108
28,8986,037
79,81725,153
46,393
161,808
31,4776,182
81,30926,427
49,022
162,593
30,3945,640
81,63625,397
50,563
164,580
30,3105,735
81,52226,225
52,748
165,829
30,3336,045
81,66026,914
53,836
1982
167,002
29,7936,210
81,38028,946
55,829
167,134
30,2636,556
81,79627,591
56,075
168,476
31,3347,055
79,79527,579
57,347
173,011
32,6737,905
82,22329,434
58,115
176,102
33,9218,003
83,68830,576
58,493
178,292
35,9647,188
84,72130,828
57,607
179,518
37,9286,427
84,56631,141
57,024
175,702
38,1676,038
80,70028,901
56,835
171,198
36,8525,924
79,68427,761
54,662
168,634
35,5075,791
78,61927,712
54,508
165,327
35,6476,232
78,38927,769
51,291
166,670
34,6342,516
84,13032,034
47,906
1983
166,598
35,5382,660
83,76731,691
47,293
168,609
37,3212,604
84,93231,661
46,356
168,469
35,8192,030
86,59732,951
46,053
170,430
36,9141,950
87,94432,495
45,572
169,133
37,6341,954
87,62032,943
43,879
170,336
39,3132,192
87,69633,420
43,327
171,538
39,0272,367
89,09533,613
43,416
174,246
40,9502,353
90,35035,085
42,946
176,127
40,8262,303
90,92134,856
44,380
175,150
38,6602,195
91,73734,622
44,753
180,606
41,4592,341
93,87835,001
45,269
185,852
41,6882,441
96,54835,566
47,616
B. Bankers dollar acceptances, not seasonally adjustedMillions of dollars, end of period
Instrument
1 Total
Holder2 Accepting banks3 Own bills4 Bills bought
Federal Reserve Banks5 Own account6 Foreign correspondents . . .7 Others
Basis8 Imports into United States . . .9 Exports from United States. . .
10 All other
1983
Jan.
77,529
10,2499,0671,182
0965
66,315
15,80317,93143,794
Feb.
73,705
9,5678,2581,308
01,003
63,136
14,97617,63341,097
Mar.
70,843
10,5189,0831,435
0758
59,568
14,21716,82639,800
Apr.
70,389
9,4947,9511,543
0778
60,118
14,41817,12438,848
May
68,797
8,2237,497
726
0788
59,786
13,85816,07438,865
June
70,910
9,1477,9981,148
203792
60,698
14,32416,35640,226
July
72,210
9,0078,231
777
0670
63,032
15,12216,28641,301
Aug.
73,977
8,4987,4661,033
209717
65,961
14,48716,47643,514
Sept.
73,569
9,2057,9861,219
1,122622
64,942
14,65316,21543,201
Oct.
72,902
9,5018,2121,289
0483
62,917
14,82916,03642,037
Nov.
77,919
10,8949,5581,337
0573
66,452
14,90617,20945,805
Dec.
78,309
9,3558,1251,230
418729
68,225
15,64916,88045,781
81Digitized for FRASER http://fraser.stlouisfed.org/ Federal Reserve Bank of St. Louis

23. Prime rate charged by banks on short-term business loans, 19831
Percent per annum
Date of change in effective rate
Effective date Rate Effective date Rate Effective date Rate
January 1 1 . . . 11.00 February 28 . . . 10.50 August 8 . . . 11.00
Averages of daily effective rates
Year Jan. Feb. Mar. Apr. May June July Aug. Sept. Oct. Nov. Dec.
10.79 11.16 10.98 10.50 10.50 10.50 10.50 10.50 10.89 1.00 11.00 11.00 11.00
24. Terms of lending at commercial banks—Based on surveys of loans made, 19831
Item Feb. 7-11 May 2-6 Aug. 1-5 Nov. 7-11
SHORT-TERM COMMERCIAL AND INDUSTRIAL LOANS
1 Amount of loans (millions of dollars) 41,1722 Number of loans (thousands) 1693 Weighted-average maturity (months)2 1.04 Weighted-average interest rate (percent per annum)3 10.20
By size of bank5 Large banks4 9.856 Small banks 11.83
By size of loan (thousands of dollars)1 1=99 13.918 100-999 12.379 1,000 and over 9.81
Percentage of amount of loans10 With floating rate 20.611 Made under commitment 57.312 With no stated maturity 7.613 With one-day maturity 46.6
LONG-TERM COMMERCIAL AND INDUSTRIAL LOANS
14 Amount of loans (millions of dollars) 3,51215 Number of loans (thousands) 2516 Weighted-average maturity (months)2 52.517 Weighted-average interest rate (percent per annum)3 11.81
By size of bank18 Large banks4 10.8619 Small banks 13.55
By size of loan (thousands of dollars)20 1-99 14.5621 100-999 13.5222 1,000 and over 10.88
Percentage of amount of loans23 With floating rate 69.324 Made under commitment 69.0
38,0482001.4
10.31
9.9311.42
13.3511.709.87
41.065.013.237.1
4,20538
56.611.41
10.3713.07
14.5212.5810.31
67.472.3
36,8201711.2
11.09
10.8511.84
13.3811.8610.81
36.264.311.338.0
4,49126
55.311.83
11.4312.65
14.5311.9511.39
79.866.0
26,9061311.3
10.95
10.6211.79
13.6512.2010.59
36.768.412.517.4
2,83419
50.812.94
11.5814.35
14.0316.2311.68
73.659.1
82Digitized for FRASER http://fraser.stlouisfed.org/ Federal Reserve Bank of St. Louis

24. Terms of lending at commercial banks—Based on surveys of loans made, 19831—Continued
Item Feb. 7-11 May 2-6 Aug. 1-5 Nov. 7-11
CONSTRUCTION AND LAND DEVELOPMENT LOANS
25 Amount of loans (millions of dollars)26 Number of loans (thousands)27 Weighted-average maturity (months)2
28 Weighted-average interest rate (percent per annum)3
Bv size of bank29 Large banks4
30 Small banks
Bv size of loan (thousands of dollars)31 1-99 .'32 100-49933 500 and over
Percentage of amount of loans34 With floating rate35 Secured by real estate36 Made under commitment37 With no stated maturity
Bv type of construction38 1- to 4-family39 Multifamily40 Nonresidential
LOANS TO FARMERS
41 Amount of loans (millions of dollars)42 Number of loans (thousands)43 Weighted-average maturity (months)3
44" Weighted-average interest rate (percent per annum)3
By size of bank45 Large banks4
46 Small banks
Bv size of loan (thousands of dollars)47 1=24 .'48 25-9949 100 and over
By purpose of loan50 Feeder livestock51 Other livestock52 Other current operating expenses53 Farm machinery and equipment54 Other
1,85927
6.212.56
11.1013.98
14.5213.8911.35
55.561.145.13.8
20.45.7
73.9
1,24566
9.613.85
12.4714.17
14.4614.1213.30
13.7614.2314.1014.1513.14
1,91726
8.311.72
10.7912.84
14.1212.0810.91
47.756.748.36.9
7.35.5
87.2
1,69980
10.613.26
12.0113.94
13.9013.9812.61
13.3513.0013.2514.7812.62
1,34024
15.512.99
12.4813.27
14.1512.9712.40
64.180.875.410.1
23.310.566.2
94262
7.113.72
12.2014.21
14.1713.9813.11
13.0514.1413.9314.2613.17
99023
8.513.25
12.6513.53
14.3013.0212.57
65.192.464.44.0
33.915.950.3
1,46757
6.813.64
11.8214.24
14.2714.1613.25
14.0013.8713.3713.9112.93
83Digitized for FRASER http://fraser.stlouisfed.org/ Federal Reserve Bank of St. Louis

25. Interest rates in money and capital markets, 1983A. Annual and monthly averagesPercent per annum
hem
MONEY MARKET INSTRUMENTS
1 Federal funds2 Discount window borrowing
Commercial paper1' -3 1 -month4 3-month5 6-month
Finance paper, directly placed1-2
6 1 -month7 3-month8 6-month
Bankers acceptances2- 3
9 3-month ,10 6-month
Certificates of deposit,secondary market4
1 1 1 -month12 3-month1 3 6-month14 Eurodollar deposits, 3-month3
U.S. Treasury bil ls2-6
Secondary market15 3-month . . .16 6-month17 1-year
Auction average*18 3-month19 6-month20 1-year
U.S. TREASURY NOTES AND BONDS
Constant maturities7
2 1 1 -year22 2-year23 2 !/>-yearK
24 3-year . .25 5-year26 7-year27 10-year28 20-vear29 30-year
Composite9
30 Over 10 years (long-term) . .
STATE AND LOCAL NOTES AND BONDS
Moody's series10
3 1 Aaa32 Baa33 Bond Bu\er series"
CORPORATE BONDS
34 Seasoned issues, all industries12 . . . .Rating group
35 Aaa . . . .36 Aa37 A38 Baa . . . .
39 A-rated recently-offered utilitybonds13
MEMO: Dividend/price ratio14
40 Preferred stocks4 1 Common stocks
Year
9.098.50
8.878.888.89
8.808.708 69
8.908.91
8.969.079 279.56
8.618.738 80
8 638 758.86
9.5710.21
10.4510.8011 0211 .1011.3411 18
10.84
8 8010.179 51
12.78
12.0412 4213 1013.55
12.73
11.024 40
Jan.
8.688.50
8.198.178.15
8 037.967 97
8 198.19
8 298.368 468.97
7 867.938 01
7 817 908.01
8 629.33
9 6410.0310 3610.4610.7810 63
10 37
90010.989 50
12.90
11.7912 3513 5313.94
12 74
11 234 79
Feb.
8.518.50
8.308.348.39
8.258.248 26
8.368.41
8.408,548 779,14
8,118.238 28
8 138 238.31
8.929.64
9.9110.2610 5610.7211.0310 88
10.60
8.8010.599 58
13.02
12.0112.5813 5213.95
12.90
11 .134 74
Mar.
8.778.50
8.568.528.48
8.488.358 35
8.548.52
8.628.698 809.25
8.358.378.36
8.308.338.43
9.049.66
9.8410.0810.3110.5110.8010.63
10.34
8.4210.059.20
12.71
11.7312.3213.1513.61
12.47
10,864.59
Apr.
8.808.50
8.588.538.48
8 528.418 41
8.498.43
8.608.638 769.23
8.218.308 29
8 258 348.28
8.989.57
9.7610.02102910.4010.6310 48
10.19
8.289.759.05
12.44
11.5112.0612 8613.29
12.04
10.804.44
May
8.638.50
8.368.338.31
8.288.198 I S
8.368.33
8.448.498 628.96
8.198.22
- 8.23
8.198.208.05
8.909.49
9.6610.0310.3010.3810.6710.53
10.21
8.399.749.11
12.30
11.4611.9512.6813.09
11.92
10.654.27
June July
8.98 9.378.50 8.50
8.97 9.159.00 9.259.03 9.36
8.86 9.138.81 9 .118.80 9 10
9.04 9.339.06 9.47
9.06 9,309.20 9.509.45 9.919.67 10.00
8.79 9.088.89 9.268.87 9.34
8.82 9.128.89 9.298.80 9.36
9.66 10.2010.18 10.69
10.32 10.9010.63 1 1 . 2 110.83 11.3510.85 11.3811 .12 11.5910.93 11.40
10.64 11.10
8.73 8.7010.18 10.069.52 9.53
12.54 12.73
11.74 12.1512.15 12.3912.88 12.9913.37 13.39
12.40 12.79
10.81 11.064.26 4.21
Aug.
9.568.50
9.419.549.68
9.359.419.42
9.599.71
9.529.77
10.1710.27
9.349.519.60
9.399.539.77
10.5311.07
11.3011.6311.7711.8511.9611.82
11.42
9.0410.259.72
13.01
12.5112.7213.1713.64
13.16
11.074.35
Sept.
9.458.50
9.199.249.28
9.159.099 09
9.239,26
9.289.399 649.82
9.009.159.27
9.059.199.64
10.1610.79
11.0711.4311.6111.6511.8211.63
11.26
8,9710.109.58
12.91
12.3712.6213.1113.55
12.98
11.064.24
Oct.
9.488.50
9.038.998.98
8.998.828 79
9.018.97
9.119.189.319.54
8.648.838.98
8.718.909.13
9.8110.57
10.8711.2811.4711.5411.7711.58
11.21
8.9310.049.66
12.79
12.2512.4912.9713.46
12.89
10.974.25
Nov.
9 348.50
9.109.109.09
9 068.878 84
9.169.13
9229.369 519.79
8.768.93908
8 718.899.03
9.9410.66
10.9611.4111.6111.6911.9211.75
11.32
9.0110.019.75
12.93
12.41P. 6113.0913.61
13.14
1 1 . 1 24.31
Dec.
9478.50
9.569.539.50
9 519.169 11
9 529.45
9679.699 85
10.08
9.009.179 24
8 969.149.16
10.1110.84
1 1 . 1 311.5411.7811.8312.0211.88
11.44
9.3410.299.89
13.07
12.5712.7613.2113.75
13.29
11.494.32
84Digitized for FRASER http://fraser.stlouisfed.org/ Federal Reserve Bank of St. Louis

25. Interest rates in money and capital markets, 1983—ContinuedB. Weekly averagesPercent per annum
MONEY MARKET INSTRUMENTS
I Federal funds15
2 Discount window borrowingCommercial paper1- 2
3 1 -month4 3-month .5 6-month
Finance paper, directly placed1 ' 2
6 1 -month7 3-month8 6-month
Bankers acceptances2- 3
9 3-month10 6-month
Certificates of deposit,secondary market4
1 1 1 -month12 3-month1 3 6-month14 Eurodollar deposits, 3-month16
U.S. Treasury bi l ls2-6
Secondary market15 3-month16 6-month17 1-year
Auction average18 3-month19 6-month . .20 1-year
U.S. TREASURY NOTES AND BONDS
Constant maturities7
21 1-year22 2-year23 2'/>-year8
24 3-year25 5-year26 7-year27 10-year *.28 20-year29 30-year
Composite9
30 Over 10 years (long-term)
STATE AND LOCAL NOTES AND BONDS
Moody's series10
,3 1 Aaa32 Baa33 Bond Buyer series"
CORPORATE BONDS
34 Seasoned issues all industries12
Rating group35 Aaa36 Aa37 A .38 Baa
39 A-rated recently-offered ut i l i tybonds1-1
MEMO: Dividend/price ratio14
40 Preferred stocks41 Common stocks
Week ending
Jan. 7
10.218.50
8.438.358.23
8.228.098.08
8.328.16
8.538.518.479.08
7.927.958,02
i
7.907.95
8.629.35
9.6510.0410.2910.3610.6310.46
10.24
9.401 1 . 009.48
12.94
11.7712.3513 6114.04
12.72
1 1 . 4 14.84
Jan. 14
8.428.50
8.048.038.00
7.887.927.98
7.997.98
8.168.188.298.75
7.667.737.82
7.677.77
8.419.179.309.459.88
10.2210.3210.6510.48
10.23
9.4011.009.37
12.85
11. ZO12.2813.5113.92
12.59
1 1 . 1 64.69
Jan. 21
8.498.50
8.038.028.01
7.837.797.80
8.058.07
8.128.188.298.76
7.757.857.96
7.627.73
8.569.25
9.559.92
10.2810.4110.7610.63
10.34
8.5010.809.48
12.81
1 1 .7.012.2513.4413.84
12.73
1 1 . 1 84.74
Jan. 28
8.448.50
8.238.268.32
8.158.038.01
8.328.46
8.328.518.749.19
8.058.138.19
8.068.148 01
8.839.499.709.87
10,2210.5810.6811.0110.87
10.61
8.7011.109.66
12.97
11.9412.4513.5313.96
12.94
1 1 . 1 54.87
Feb. 4
8.538.50
8.398.438.49
S.338.238.21
8.528.60
8.468.688.969.35
8.168.298.34
8.128.23
8.989.68
lo'.oo10.3810.7410.8811 .1611.01
10.74
9.0011.009.74
13.07
12.0612.6013.5814.01
13.06
1 1 . 1 74.81
Feb. 11
8.508.50
8.37&.458.54
8.368.348.35
8.458.52
8.458.638.919.30
8.228:348.41
8.258.35
9.069.799.90
10.0610.4510.7810.9211.2111.05
10.77
8.9010.759,72
13.10
12.1112.6913.5814.02
12.96
11 .194.74
Feb. 18
8.628.50
8.328.348.37
8.278.318.36
8.348.39
8.428.548.779.11
8.168.288.33
/
8.268.39
8.989.69
V.9510.2810:5910.7511.0610.91
10.62
8.7510.409.53
13.05
12.0812.6113.5413.97
12.86
11.094.67
Feb. 25
8.478.50
8.148*. 168.19
8.098.078.08
8.168.18
8.278.348^509.01
7.918.008.06
7.897.978.31
8.679.389.509.669.95
10.1710.4010.7110.59
10.30
8.5510.209.34
12.87
11.8212.4313.4013.81
12.64
11.064.73
Mar. 4
8.448.50
8.168-. 108.07
8.078.018.02
8.108.10
8.208.248.328.88
7.977.977.98
7.947.95
-8.599.27
9.489.769r97
10.2510.6010.47
10.16
8.309.909.04
12.70
11.6312.3013.2213.67
12.42
11.054.57
Mar. 11
8.598.50
8.448.388'.33
8.348.208.21
8.438.39
8.528.558.638.91
8.258.258.27
8.218.17
8.939.619.709.78
10.0310.2410.5110.8410.66
10.36
8.4510.159.22
12.75
11.7212.3713.2313.65
12.58
10.834.56
85Digitized for FRASER http://fraser.stlouisfed.org/ Federal Reserve Bank of St. Louis

25. Interest rates in money and capital markets, 1983—ContinuedB. Weekly averages—ContinuedPercent per annum
MONEY MARKET INSTRUMENTS
1 Federal funds'5
2 Discount window borrowingCommercial paper1-2
3 1 -month4 3-month5 6-month
Finance paper, directly placed1- -6 1 -month7 3-month8 6-month
Bankers acceptances2' -1
9 3-month10 6-month
Certificates of deposit,secondary market4
1 1 1- month12 3-month13 6-month14 Eurodollar deposits 3-month l f >
U.S. Treasury bi l l s 2 - 6
Secondary market15 3-month16 6-month17 1-year
Auction average18 3-month19 6-month20 1-year
U.S. TREASURY NOTES AND BONDS
Constant maturities7
21 1-year22 2-year23 2i/>-year*24 3-year25 5-year26 7-year27 10-year28 20-year29 30-year
Composite9
30 Over 10 years (long-term)
STATE AND LOCAL NOTES AND BONDS
Moody's series10
31 Aaa32 Baa33 Bond Buyer series11
CORPORATE BONDS
34 Seasoned issues, all industries12
Rating group35 Aaa36 Aa37 A38 Baa . . . .
39 A-rated recently-offered utilitybonds13
MEMO: Dividend/price ratio14
40 Preferred stocks41 Common stocks
Week ending
Mar. 18
8.578.50
8.518.488.45
8.478.348.33
8.528.48
8.618.678.799.16
8.318.358.37
8.268.26
9.059.66
9.8310.0810.3010.5210.8510.67
10.39
8.4010.059.19
12.74
11,7912.3513.2113.61
12.46
10.714.66
Mar. 25
8.758.50
8.688.688.67
8.608.528.51
8.778.76
8.798.919.089.48
8.558.578.55
8.438.548.43
9.289.839.95
10.0310.2610.5110.6010.8410.67
10.39
8.4510.059,15
12.71
11.7612.3013.1913.58
12.41
10.954.58
Apr. 1
8.888.50
9.048.958.90
8.878.668.66
8.848.85
8.979.059.169.54
8.648.678.60
8.688.71
9.349.89
10.0610.2810.5310.6210.8410.68
10.40
8.5010.109.38
12.69
11.7512.3113.1413.56
12.41
10.784.56
Apr. 8
9.438.50
8.868.778.70
8,768.628.62
8.738.65
8.918.939.019.59
8.458.518.46
8.668.71
9.179.729.759.90
10.1310.4010.5210.7410.58
10.30
8.4010.009.23
12.57
11.6612.1912.9913.46
12.19
10.764.63
Apr. 15
8,768.50
8.538.498.44
8.468.378.37
8.488.42
8.578.618.759.30
8.168.258.26
8.178.25
8.949.54
9.7 1'9.98
10.2610.3710.5910.43
10.15
8.209.809.04
12.43
11.5112.0512.8613.31
11.84
10.884.46
Apr. 22
8.708.50
8.478.438.38
8.468.338.33
8.458.39
8.528.578.719.14
8.128.278.29
8,038.208.28
8.989.579.709.77
10.0210.2810.3810.6210.47
10.18
8.309.809.09
12.38
11.4611.9912.8113.25
11.99
10.824.35
Apr. 29
8.588.50
8.368.338.30
8.348.298.28
8.298.27
8.398.408.569.09
8.118.168.16
8.158.22
8.839.44
9.689.95
10.2010.3310.5710.43
10.13
8.209.408.82
12.35
11.4312.0112.8013.16
11.82
10.734.33
May 6
8.808.50
8.298.218.14
8.208.108.07
8.178.09
8.328.328.358.88
8.038.028.00
8.048.05
8.649.239.359.439.77
10.0710.1910.4510.32
10.00
8.109.408.78
12.19
11.2911 .8112.6512.99
11.64
10.594.30
May 13
8.488.50
8.228.168.11
8.138.047.99
8.188.10
8.298.308.388.71
8.038.058.04
8.148.13
8.709.27
9.459.84
10.1210.2110.4810.35
10.03
8.209.608,86
12.13
11.2911.8012.5312.92
11.69
10.624.26
May 20
8.598.50
8.398.358.33
8.288.198.16
8.418.37
8.488.528.668.89
8.148.218.24
8.108.148.05
8.939.549.659.69
10.1010.3810.4510.7810.62
10.29
8.509.859.29
12.33
11.5411.9812.7013.09
12.08
10.624.30
May 27
8.728.50
8.488.548.56
8.438.378.35
8.608.64
8.628.758.999.14
8.488.508.51
8.468.47
9.239.81
9'.9510.3210,5510.5910.9010.73
10.43
8.7510.109,5)
12.49
11.6712.1612.8213.28
12.29
10.784.23
86Digitized for FRASER http://fraser.stlouisfed.org/ Federal Reserve Bank of St. Louis
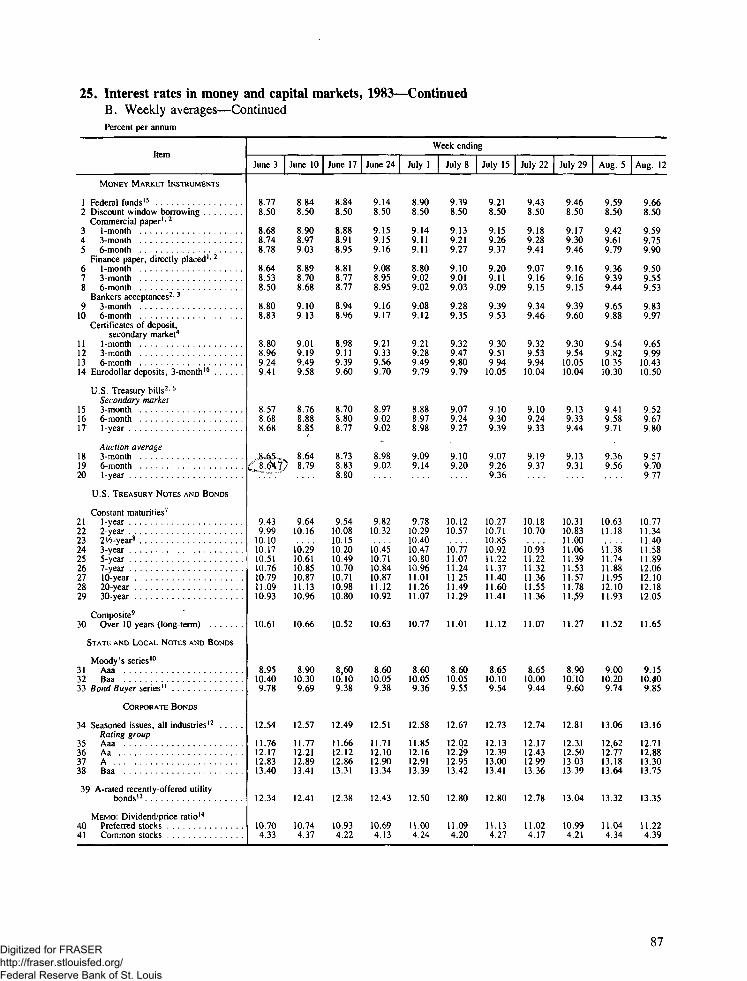
25. Interest rates in money and capital markets, 1983—ContinuedB. Weekly averages—ContinuedPercent per annum
Item
MONEY MARKET INSTRUMENTS
1 Federal funds15
2 Discount window borrowingCommercial paper1- 2
3 1 -month4 3-month5 6-month
Finance paper, directly placed1' 2
6 1-month7 3-month8 6-month . .
Bankers acceptances2- 3
9 3-month10 6-month
Certificates of deposit,secondary market4
11 1- month12 3-month .13 6-month14 Eurodollar deposits 3-month16
U.S. Treasury bills2 '6
Secondary market15 3-month16 6-month17 1-year
Auction average18 3-month19 6-month20 1-year . . . . .
U.S. TREASURY NOTES AND BONDS
Constant maturities7
21 1-year . . . . .22 2-year23 2'/>-year8
24 3-year25 5-year26 7-year . .27 10-year28 20-year29 30-year
Composite9
30 Over 10 years (long-term)
STATE AND LOCAL NOTES AND BONDS
Moody 's series10
31 Aaa32 Baa33 Bond Buyer series11
CORPORATE BONDS
34 Seasoned issues, all industries12
Rating group35 Aaa36 Aa37 A38 Baa . . .
39 A-rated recently- offered utilitybonds13
MEMO: Dividend/price ratio14
40 Preferred stocks41 Common stocks
Week ending
June 3
8.778.50
8.688.748.78
8.648.538.50
8.808.83
8.808.969.249.41
8.578.688.68
9.439.99
10.1010.1710.5110.7610.7911.0910.93
10.61
8.9510.409.78
12.54
11.7612.1712.8313.40
12.34
10.704.33
June 10
8.848.50
8.908.979.03
8.898.708.68
9.109.13
9.019.199.499.58
8.768.888.85
8.64) 8.79
9.6410.16
10'.2910.6110.8510.8711.1310.96
10.66
8.9010.309.69
12.57
11.7712.2112.8913.41
12.41
10.744.37
June 17
8.848.50
8.888.918.95
8.818.778.77
8.948.96
8.989.119.399.60
8.708.808.77
8.738.838 80
9.5410.0810.1510.2010.4910.7010.7110.9810.80
10.52
8.6010.109.38
12.49
11.6612.1212.8613.31
12.38
10.934.22
June 24
9.148.50
9.159,159.16
9.088.958.95
9.169.17
9.219,339.569.70
8.979.029.02
8.989,02
9.8210.32
10'.4510.7110.8410.8711.1210.92
10.63
8.6010.059.38
12.51
11.7112.1012.9013.34
12.43
10.694.13
July 1
8.908.50
9.149.119.11
8.809.029.02
9.089.12
9.219.289.499.79
8.888.978.98
9.099.14
9.7810.2910.4010.4710.8010.9611.0111.2611.07
10.77
8.6010.059.36
12.58
11.8512.1612.9113.39
12.50
n.oo4.24
Ju lyS
9.398.50
9.139.219.27
9.109.019.03
9.289.35
9.329.479.809.79
9.079.249.27
9.109.20
10.1210.57
10J711.0711.2411.2511.4911.29
11.01
8.6010.059.55
12.67
12.0212.2*912.9513.42
12.80
11.094.20
July 15
9.218.50
9.159.269.37
9.209.119.09
9.399.53
9.309.519.94
10.05
9.109.309.39
9.079.269 36
10.2710.7110.8510.9211.2211.3711.4011.6011.41
11.12
8.6510/109.54
12.73
12.1312.3913.0013.41
12.80
H.134.27
July 22
9.438.50
9.189.289.41
9.079.169.15
9.349.46
9.329.539.94
10.04
9.109.249.33
9.199.37
10.1810.70
10.9311.2211.3211.3611.5511.36
11.07
8.6510.009.44
12.74
12J712.4312.9913.36
12.78
11.024.17
July 29
9.468.50
9.179.309.46
9.169.169.15
9.399.60
9.309.54
10.0510.04
9.139.339.44
9.139.31
10.3110.8311.0011.0611.3911.5311.5711.7811.^9
11.27
8.90lO.'lO9.60
12.81
12.3,112.5013.0313.39
13.04
10.994.21
Aug. 5
9.598.50
9.429.619.79
9.369.399.44
9.659.88
9.549.82
10.3510.30
9.419.589.71
9.369.56
10.6311.18
1L7411.8811.9512.1011.93
11.52
9.0010.209.74
13.06
12,6212.7713.1813.64
13.32
11.044.34
Aug. 12
9.668.50
9.599.759,90
9.509.559.53
9.839.97
9.659.99
10.4310.50
9.529.679.80
9.579.709.77
10.7711.3411.40H.5811.8912.0612.1012.1812.05
11.65
9.1510.409.85
13.16
12.7112.8813.3013.75
13.35
11.224.39
87Digitized for FRASER http://fraser.stlouisfed.org/ Federal Reserve Bank of St. Louis

25. Interest rates in money and capital markets, 1983—ContinuedB. Weekly averages—ContinuedPercent per annum
Item
MONEY MARKET INSTRUMENTS
1 Federal funds15
2 Discount window borrowingCommercial paper1- 2
3 1 -month4 3-month5 6-month
Finance paper, directly placed1- 2
6 1 -month7 3-month8 6-month
Bankers acceptances2' 3
9 3-month10 6-month
Certificates of deposit,secondary market4
1 1 1 -month12 3-month13 6-month14 Eurodollar deposits 3 -month16 . .
U.S. Treasury bills2-6
Secondary market15 3-month .16 6-month17 1-year
Auction average18 3-month1 9 6-month20 1-year
U.S. TREASURY NOTES AND BONDS
Constant maturities7
21 1-year22 2-year23 2^-year8
24 3-year25 5-year26 7-year27 10-year28 20-year29 30-year
Composite9
30 Over 10 years (long-term)
STATE AND LOCAL NOTES AND BONDS
Moody's series10
31 Aaa32 Baa33 Bond Buyer series" . .
CORPORATE BONDS
34 Seasoned issues, all industries12
Rating group35 Aaa36 Aa37 A38 Baa
39 A-Rated recently-offered utilitybonds13
MEMO: Dividend/price ratio14
40 Preferred stocks41 Common stocks
Week ending
Aug. 19
9.678.50
9.469.559.67
9.399.489.48
9.579.62
9.599.78
10.1010.30
9.359.459.50
9.439.55
10.4310.93
11.1711.4911.6111.7111.8111.69
11.28
9.0010.209.70
12.97
12.4012.6813.1613.63
12.98
10.934.29
Aug. 26
9.418.50
9.209.309.39
9.169.259.30
9.369.41
9.349.499.82
10.04
9.159.329.37
9.189.29
10.2710.8011.0011.0311.3411.4711.5811.7111.55
11.18
9.0010.209.59
12.87
12.3212.5413.0713.55
13.01
11.094.40
Sept. 2
9.448.50
9.349.469.61
9.349.349.32
9.529.68
9.469.73
10.1410.13
9.269.529.64
9.289.53
10.5711.14
11.4111.7311.8811.9412.0911.92
11.52
9.1010.259.75
13.03
12.5412.7613.1613.65
13.28
11.054.32
Sept. 9
9.538.50
9.339.399.47
9.279.339.34
9.369.43
9.379.549.85
10.14
9.139.359.47
9.219.409.64
10.3810.9510.8511.2311.5611.7311.7611.9211.73
11.37
9.0510.209.67
12.98
12.4712.6813.1513,60
13.00
11.184.22
Sept. 16
9.548.50
9.289.309.35
9.209.089.09
9.309.33
9.329.439.689.91
9.089.219.33
9.049.14
10.2110.83
11.1411.4611.6411.6911.8511.67
11.28
9.0010.109.62
12.94
12.4012.6713.1513.55
13.00
11.074.29
Sept. 23 1 Sept. 30
9.48 9.048.50 8.50
9.16 8.979.18 9.019.20 9.02
9.10 8.979.06 8.839.06 8.81
9.15 9.039.13 9.01
9.28 9.089.34 9.179.52 9.369.85 9.50
8.94 8.759.02 8.899.15 9.04
8.99 8.739.06 8.84
10.01 9.8910.70 10.5610.80 . . . .10.99 10.8211.37 11.2211.54 11.4211.59 11.4611.78 11.6411.57 11.45
11.20 11.09
8.90 8.8010.00 9.959.42 9.46
12.88 12.81
12.31 12.2212.58 12.4913.10 13.0413.51 13.49
12.77 12.87
11.02 10.964.23 4.23
Oct. 7
10.008.50
9.018.958.96
8.958.838.82
8.968.93
9.089.139.309.48
8.628.818.93
8.728.929.13
9.7710.4910.6010.7411.1511.3411.3811.6011.41
11.04
8.9010.009.49
12.77
12.2012.4512.9913.44
12.73
11.074.24
Oct. 14
9.468.50
9.099.049.04
9.048.878.85
9.089.06
9.149.229.389.50
8.798.979.10
8.838.97
9.9210.67
10.9511.3611.5511.6011.8511.63
11.28
9.0010.159.67
12.77
12.2212.5112.9513.42
12.95
11.044.19
Oct. 21
9.368.50
8.988.958,93
8.958.808.78
8.968.87
9.079.139.249.56
8.538.728.89
8.638.79
9.6910.5110.7010.7911.2011.4011.4711.7111.51
11.16
8.9010.009,68
12.75
12.2112.46 '12.9313.42
12.89
10.874.27
Oct. 28
9.368.50
9.049.039.00
9.028.788.75
9.069.02
9.159.259.349.56
8.668.889.02
8.668.91
9.8610.63
10.9811.3911.5811.6811.9011.72
11.34
8.9010.009.81
12.85
12.3412.5413.0013.52
13.08
10.904.31
Digitized for FRASER http://fraser.stlouisfed.org/ Federal Reserve Bank of St. Louis
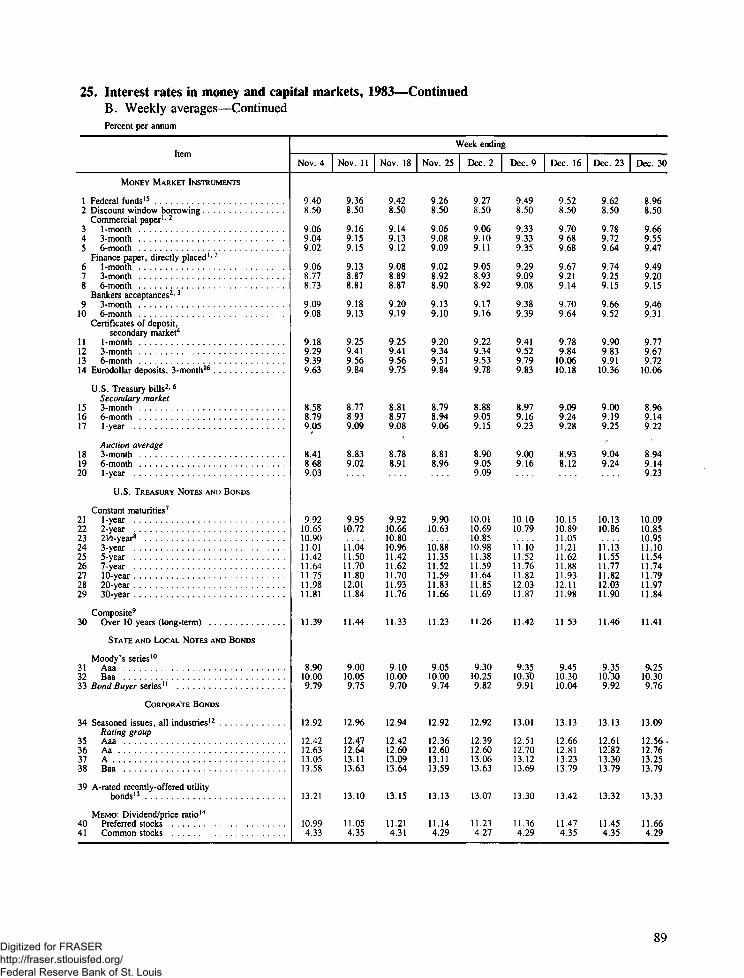
25. Interest rates in money and capital markets, 1983—ContinuedB. Weekly averages—ContinuedPercent per annum
MONEY MARKET INSTRUMENTS
1 Federal funds15
2 Discount window borrowingCommercial paper1' 2
3 1 -month4 3-month5 6-month
Finance paper, directly placed1- 2
6 1 -month7 3-month ,8 6-month
Bankers acceptances2' 3
9 3-month10 6-month
Certificates of deposit,secondary market4
1 1 1 -month12 3 -month1 3 6-month14 Eurodollar deposits, 3-month16
U.S. Treasury bills2' 6Secondary market
15 3 -month16 6-month17 1-year
Auction average18 3-month19 6-month20 1-year
U.S. TREASURY NOTES AND BONDS
Constant maturities7
21 1-year . . . . .22 2-year23 2V2-year8
24 3-year25 5-year26 7-year27 10-year28 20-year29 30-year
Composite9
30 Over 10 years (long-term)
STATE AND LOCAL NOTES AND BONDS
Moody's series10
31 Aaa32 Baa33 Bond Buyer series11
CORPORATE BONDS
34 Seasoned issues all industries'2Rating group
35 Aaa36 Aa37 A38 Baa
39 A-rated recently-offered utilitybonds13 .
MEMO: Dividend/price ratio14
40 Preferred stocks41 Common stocks
Nov. 4
9.408.50
9069.049 02
9068.778 73
9.099.08
9.189 299 39963
8 588 799.05
8.418 689 03
9 9210.6510 9011.0111 4211 6411.7511 9811.81
11 39
8.9010009 79
12 92
12.4212 6313 0513 58
13 21
10 994.33
Nov. 11
9.368.50
9.169.159 15
9.138.878.81
9.189.13
9.259 419.569.84
8778.939.09
8.83902
9.9510.72
11.0411 5011.7011.8012.0111.84
11.44
9.0010.05975
12.96
12.4712.6413 1113.63
13.10
11.054.35
Nov. 18
9.428.50
9.149.139 12
9.088.898.87
9.209.19
9.259419.569.75
8 818.979.08
8.78891
9.9210.6610.8010.9611 4211.6211.7011.9311.76
11.33
9.1010.009 70
12.94
12.4212.6013 0913.64
13.15
11.214.31
\
Nov. 25
9.268.50
9.069.08909
9.028.928.90
9.139.10
9.209 349.519.84
8 798.949.06
8.818 96
9.9010.63
10.8811 3511.5211.5911 8311.66
11.23
9.05lO.'OO9 74
12.92
12.3612.6013 1113.59
13 13
11 144.29
Veek endin
Dec. 2
9.278.50
9.069.109 11
9.058.93892
9.179.16
9.229 349.539.78
8 889.059.15
8.909059.09
10.0110.69108510.9811 3811.5911.6411 8511.69
11.26
9.3010.259 82
12.92
12.3912.6013 0613.63
13 07
11 234.27
g
Dec. 9
9.498.50
9.339.339 35
9.299.09908
9.389.39
9.419 529799.83
8 979.169.23
9.009 16
10 1010.79
11.1011 5211 7611.8212 0311.87
11.42
9.3510. 3u9 91
13.01
12.5112*7013 1213.69
13 30
11 364.29
Dec. 16
9.528.50
9.709.689 68
9679.219 14
9709.64
9.789 84
100610.18
9 099 249.28
8.938 12
10 1510.8911 0511.2111 6211 8811.9312 1111.98
11.53
9.4510 3010 04
13 13
12.6612 8113 2313 79
13 42
11 474.35
Dec. 23
9.628.50
9.789.729 64
9.749.259 15
9.669.52
9.909 83991
10.36
9009.199.25
9.049 24
10.1310.86
11.1311 5511.7711.8212 0311.90
11.46
9.3510f309 92
13.13
12.6112:8213 3013.79
13.32
11.454.35
Dec. 30
8.968.50
9669.559 47
9499.209 15
9469.31
9779 679 72
10.06
8 969 149.22
8.949 14923
100910.8510 9511.1011 5411 7411.7911 9711.84
11.41
9,2510.309 76
13.09
12.56 .12 7613 2513.79
13 33
11 664.29
89Digitized for FRASER http://fraser.stlouisfed.org/ Federal Reserve Bank of St. Louis

26. Stock market—Selected statistics, 1983A. Stock prices and tradingAverages of daily figures
Series
Common stock pricesNew York Stock Exchange
(Dec. 31, 1965 = 50)1 Total2 Industrial3 Transportation . . . .4 Utility5 Finance
Standard & Poor's Corporation(1941-43) = 10)
6 Total7 Industrial8 Public util i ty9 Transportation (1970 = 10) . . . .
10 Financial (1970 = 10)
1 1 American Stock Exchange(Aug. 31, 1973 = 50), total1 . .
Year
92 63107.4589.3647.0095.34
160.41180.4964.8728.8718.70
216.48
Jan.
83 2595 3775 6545.5985.66
144.27162 0261.8924.9316.51
182.76
Feb.
84 7497 26794445.9286.57
146.80165 1561 5225.5216.75
187.17
Mar.
87 501006183.2845.8993.22
151.88170 3362.1326.4818.60
191.88
Apr.
90 61104 4685.2646.2299.07
157.71176 7862.9527.3020.00
202.51
May
94 61109.4389.0747.62
102.45
164.10184.1064.8829.0320.56
223.97
June
9643112,5292.2246.76
101.22
166.39187.4264.1429.7320.15
237.51
July
96 74113 2192.9146.6199.60
166.96188 3265.0629.9619.56
244.03
Aug.
93 96109.5088.0646.9495.76
162.42183.1664.8528.6218.75
230.10
Sept.
96 70112 7694.5648.1697.00
167.16188 6166.0030.9918.91
234.36
Oct.
96 78112 8795 4148 7394.79
167,65188 99690931.0818.29
223.76
Nov.
95 36110 7797 6848 5094.48
165.23185 8668 9531,5218.10
218.42
Dec.
94 92110 6098 7947.0094.25
164.36185 1866.9531.3318.16
221.31
Volume of trading(thousands of shares)
12 New York Stock'Exchange13 American Stock Exchange .
85,418 88,463 85,026 82,694 89,627 93,016 89,729 79,508 74,191 82,866 85,445 86,405 88,0418,215 9,220 8,284 7,354 8,576 12,260 10,874 8,199 6,329 6,629 7,751 6,160 6,939
B. Customer financingEnd-of-period balances, millions of dollars
Series
1 Regulated margin credit atbroker-dealers"
2 Margin stocks*1
3 Convertible bonds4 Subscription issues , . .
MEMO: Free credit balancesat brokers4
5 Margin accounts6 Cash accounts . . . .
Jan.
13,370
13 070299
6 2578,225
Feb.
13,985
13 680304
6 1957,955
Mar.
14,483
14 170312
1
6 3707 965
Apr.
15,590
15 260329
1
60907,970
May
16,713
15 370342
1
6 0908,310
June
18,292
17 930361
1
6 1508,590
July
19,218
18 870347
1
6 2758,145
Aug.
19,437
19 090346
1
63508,035
Sept.
20,124
19 760363
6 5507,930
Oct.
21,030
20 690339
1
6 6307,695
Nov.
22,076
21 790285
6 5157,600
Dec.
23,000
22 720279
1
6 6208430
C. Margin-account debt at brokersPercentage distribution, end of period
Series
1 Total
By equity class5
2 Less than 40 percent3 40-494 50-595 60=696 70-797 80 percent or more
Jan.
100.0
18.023.025.016.09.09.0
Feb.
100.0
18.020.027.016.010.09.0
Mar.
100.0
17.021.025.018.010.09.0
Apr.
100.0
14.019.028.019.010.09.0
May
100.0
14.019.030.016.011.09.0
June
100.0
13.021.029.016.012.09.0
July
100.0
21.028.021.014.09.07.0
Aug.
100.0
23.028.020.013.09.07.0
Sept.
100.0
23.027.021.013.09.07.0
Oct.
100.0
35.024.017.010.07.07.0
Nov.
100.0
48.022.017.010.07.06.0
Dec.
100,0
41.022.016.09.06.06.0
D. Special miscellaneous-account balances at brokers6
End of period
Item Jan. Feb. Mar. Apr. May June July Aug. Sept. Oct. Nov. Dec.
I Total balances(millions of dollars) 35,654 43,006 43,472 44,999 45,465 47,100 50,580 50,267 51,211 54,029 57,490 58,329
Distribution by equity status(percent)
2 Net credit statusDebit status, by equity
3 60 percent or more4 Less than 60 percent
57.0
35.08.0
66.0
27.07.0
62.0
28.09.0
64.0
30.06.0
62.0
32.06.0
62.0
33.05.0
62.0
31.06.0
62.0
31.07.0
64.0
29.07.0
63.0
28.09.0
63.0
29.08.0
63.0
28.09.0
90Digitized for FRASER http://fraser.stlouisfed.org/ Federal Reserve Bank of St. Louis

27. Selected assets and liabilities of savings institutionsA. Savings and loan associationsMillions of dollars, end of period
Account
1 Assets
2 Mortgages
3 Cash and investmentsecurities^
4 Other .
5 Liabilities and net worth . . .
6 Savings capital7 Borrowed money8 FHLBB . .9 Other
10 Loans in process3
11 Other
12 Net worth4
13 MEMO: Mortgage loancommitmentsoutstanding5
1 Assets . . . . .
2 Mortgages
3 Cash and investmentsecurities-
4 Other
5 Liabilities and net worth . . .
6 Savings capital7 Borrowed money8 FHLBB9 Other
10 Loans in process3
1 1 Other
1 2 Net worth5
13 MEMO: Mortgage loancommitmentsoutstanding3
1 Assets
2 Mortgages
3 Cash and investmentsecurities2
4 Other
5 Liabilities and net worth . . .
6 Savings capital . . .7 Borrowed money8 FHLBB9 Other . .
10 Loans in process3
1 1 Other
12 Net worth4
13 MEMO: Mortgage loancommitmentsoutstanding5
Jan.
632,130
504,474
57,84669,810
632,130
513 74362,99846,62916,3698,101
14,160
33,128
15,977
661,776
511,537
64,50885,731
661,776
527,16088 78362,58126,202
6,26518,317
27,516
15,131
716,291
482,790
91,345142,156
716,219
584,77388,83160,41528,41610,45516,440
26,247
19,468
Feb.
635,361
505 736
58 82970 796
635,361
516 17962 29846,36015,9387,814
16 080
32,990
16 286
666,326
510,553
67,05188 722
666,326
529,96589 14662 69026,456
6,16120,137
27,078
15,397
724,005
482 418
94,784146,803
724,005
593 82486,47758,84127 6361 1 ,04417,259
26,445
22,077
Mar.
637,862
507,615
58 92071,327
637,862
520 13064,21747,31616,9017,737
13 126
32,652
17 387
672,468
510,032
68,27894 158
672,468
536,70890 68963,63627,053
6,41818,583
26,488
15,582
725,309
477,022
97,377150,910
725,309
599,09284,85056,85927,99112,25514,436
26,931
24,922
Apr.
639,866
510,033
57,36672,467
639,866
517 04467,71349,60718,1067,821
15,018
32,270
18 573
675,745
508,586
68,43198 728
675,745
533,92293 56065,34728,213
6,56822,238
26,025
16,375
730,211
477,593
99,973152,645
730,211
603,18783,62355,93327,69013,47815,853
27,548
27,968
May
645,739
512,304
59 57273,863
645,739
518 703700225 1 ,06418,9587,979
17 167
31,868
18 761
681,291
507,845
70,558102 988
681,291
535,61394 16265 26128,901
6,76626,142
25,419
16,622
729,920
473 481
104,245152,194
729,920
601,73182,73154,39224t33914,54817,936
27,522
30,148
June
19*
647,857
515,422
58,16574,270
647,857
518 73574 71853,83620,8827,993
14 857
31,554
18 037
19
686,585
506,559
71,131108 895
686,585
539,21896 85066,92529,925
7,11625,062
25,455
16,828
19
733,074
474,510
102,063156,501
733,074
605,28284,34254,23430,10815,99815,140
28,310
30,691
July
I 1
649,985
517,177
58,03274,776
649,985
515,00279,51957,18822,331
7,75016,712
3 1 ,002
17,235
82'
691,526
504,220
73,160114,146
691,526
540,43298,43367,01931,414
7,25027,859
24,802
15,924
83'
741,416
479,322
102,546159,548
741,416
610,82684,69453,57931,11517,09417,527
28,369
31,733
Aug.
653,236
518,373
59,17775,686
653,236
513,56683,24560,02523,220
7,36418,560
30,501
16,689
697,152
503,191
74,552119,409
697,152
543,38098,80366,37432,429
7,49130,477
24,492
16,943
746,998
483,178
99,812164,008
746,998
615,36984,38852,30332,08517,96718,615
28,626
32,415
Sept.
655,903
518,985
59 80677,112
655,903
515 88787,24061,85725,383
7,05115 537
30,188
16 012
692,199
494,918
75,155122 126
692,199
548,58099 77165,56734,204
8,08419,372
24,476
17,256
748,491
482,305
100,243165,943
748,491
618,00285,97652,17933,79718,81215,496
29,017
32,483
Oct.
659,351
519,458
61 82378,070
659,351
519 71285 84562,00023,845
6,76917 607
29,418
15 733
693,719
491,057
75,153127 509
693,719
548,047100 88165,01535,866
8,48420,253
24,538
18,407
756,953
485,366
101,553170,034
756,953
622,57787,36752,67834,68919,20917,458
29,551
32,798
Nov.
660,620
519,353
61 70679 561
660,220
520 22585 96661,92224,044
6,47119 212
28,746
15 758
698,510
489,871
78,715129 924
698,510
549,430102 88564,20238,683
8,96721,423
24,772
19,682
763,365
489,720
101,386172,259
763,365
625,01389,23551,73537,50019,72819,179
29,938
34,780
Dec.
664,167
518,547
63 12382,497
664,167
525 06188 78262,79425,988
6,38515 544
28,395
15 225
707,646
483,614
85,438138 594
707,646
567,86197 85063,86133,989
9,93415,602
26,233
18,504
771,705
493,432
103,395174,878
771,705
634,07691,44352,62638,81721,11715,275
30,911
32,996
91Digitized for FRASER http://fraser.stlouisfed.org/ Federal Reserve Bank of St. Louis

27. Selected assets and liabilities of savings institutions—ContinuedB. Mutual savings banks1
Millions of dollars, end of period
y Account
1 AssetsLoans
2 Mortgage3 Other
Securities4 U S government2
5 State and local govern-ment
6 Corporate and other3 . . . .7 Cash8 Other assets
9 Liabilities
10 Deposits1 1 Regular4
12 Ordinary savings13 Time and other14 Other15 Other liabilities16 General reserve accounts . . .
17 MEMO: Mortgage loancommitmentsoutstanding5
Jan.
174,726
93 94417,420
10 248
2,44636,4306 2757,963
174,726
157 113154 87641,85090,184
2 23777229,196
1,253
Feb.
176,378
93,60718,211
11,081
2,44036,9056,1048,031
176,378
159,162156,91541,16587,3772,2477,5429,197
1,295
Mar.
178,814
93,82317,837
12,187
2,40337,8276,5488,189
178,814
161,489159,08841,18386,272
2,4017,3959,342
1,639
Apr.
178,826
93,31118,353
12,364
2,31138,3426,0398,107
178,826
161,262158,76040,37984,5932,5027,6319,352
1,882
May
180,071
93,58717,893
13,110
2,26039,1425,9608,118
180,071
162,287159,84040,46783,5062,4473,1149,377
1,860
June
19
181,975
94,00017,438
13,572
2,25740,206
6,2248,276
181,975
163,990161,57340,45184,7052,4177,7549,575
1,884
July
83
182,822
93,99818,134
13,931
2,24840,667
5,3228,522
182,822
164,848162,27139,98385,4452,5777,5969,684
1,969
Aug.
183,612
93,94117,929
14,484
2,24741,045
5,1688,799
183,612
165,087162,60039,36086,4462,4877,8849,932
2,046
Sept.
186,041
94,83117,830
14 794
2,24441,8895 5608,893
186,041
165,887162,99839,76885,6032 8899,4759,879
2,023
Oct.
187,385
94,86319,589
14,634
2,19542,0924,9939,019
187,385
168,064165,57538,48591,795
2,4898,779
10,015
2,210
Nov.
189,149
95,60019,675
15 092
2,19542,629
4,9838,975
189,149
169,356167,00638,44893,0732 3509,185
10,210
2,418
Dec.
193,535
97 35619,129
15 360
2,17743,5806 2639,670
193,535
172,665170,13538,55495,129
2 53010,15410,368
2,387
C. Life insurance companiesMillions of dollars, end of period
Account
1 Assets . . .
Securities2 Government . .3 United States1
4 State and local5 Foreign2
6 Business7 Bonds8 Stocks
9 Mortgages10 Real estate1 1 Policy loans12 Other assets
1 Assets
Securities2 Government3 United States1
4 State and local5 Foreign2
6 Business7 Bonds8 Stocks
9 Mortgages10 Real estate1 1 Policy loans12 Other assets
Jan.
529,378
2743310,1777 3029,954
259 194211 81347,381
138,23518 30449,04437,168
589,490
35 58716,7318,225
10 631290 178233,380
56 798
142,27720 92253,23942,111
Feb.
531,539
27,99410,5707,423
10,001259,188213,11646,072
138,40518,56249,45837,932
595,959
36,94617,8778,333
10,736293 427235,376
58,051
142,68321,01453,38343,355
Mar.
535,939
28,76311,0717,501
10,191259,642214,00645,636
138,83119,01650,013
139,674
602,770
38,44919,2138,368
10,868296,233236,430
59,803
143,03121,17553,56050,322
Apr.
540,405
28,73810,8197,611
10,308262,186215,659
46,527
139,24619,35550,52540,355
609,298
39,21019,7468,524
10,940300 558238,68961,869
143,01121,35253,71551,452
May
544,118
29,25211,0627,741
10,449264,047218,06845,979
139,50219,49550,93340,889
620,572
42,52320,70610,05311,764
309 254245,83363,421
143,75821,34453,80448,889
June
19
548,076
29,45110,9527,876
10,623265,775220,32145,454
139,67219,65751,37042,151
19
628,224
43,34821,14110,35511,852
313 510248,248
65,262
144,72521,62953,91451,098
July
52
552,203
29,90511,2038,012
10,690268,224222,651
45,573
140,21319,85151,79142,219
83
633,569
44,75122,22810,50412,019
316 934252,39764,537
145,08621,69053,97251,136
Aug.
558,690
31,44212,5238,164
10,755271,262223,23348,029
140,40219,95952,15043,475
638,826
45,70022,81710,69512,188
318 584253,97764,607
146,40021,74954,06352,330
Sept.
565,591
31,85412,7058,241
10,908275,127225,755
49,372
140,47620,21652,42345,495
644,295
46,10923,12410,73912,236
321 568256,13165,437
147,35621,90354,16553,194
Oct.
574,579
33,18213,6578,459
11,066282,161228,80853,353
140,76220,16752,63645,651
647,149
47,76724,38010,79112,596
320964256,33264,632
148,25622,14154,25553,765
Nov.
581,355
34,12414,3058,661
11,158286,030231,58754,443
141,03820,23452,78647,113
652,904
47,17024,23210,68612,252
325 787260,43265,355
148,94722,27854,36254,360
Dec.
588,163
36,88216,5299,047
11,306287 126231,406
55,720
141,9892062452,96148,571
658,979
49,41726,36410,79612,257
325 015259,59165 424
151,59922 68354,51855,747
92Digitized for FRASER http://fraser.stlouisfed.org/ Federal Reserve Bank of St. Louis

27. Selected assets and liabilities of savings institutions—ContinuedD. Credit unionsMillions of dollars, end of period
Account
1 Total assets/liabilitiesand capital
2 Federal3 State
4 Loans outstanding . . . .5 Federal6 State7 Savings8 Federal (shares)9 State (shares and
deposits)
1 Total assets/liabilitiesand capital
2 Federal3 State
4 Loans outstanding5 Federal6 State7 Savings8 Federal (shares)9 State (shares and
deposits)
Jan. Feb. Mar. Apr. May June July Aug. Sept. Oct. Nov. Dec.
1982
60,847
39,30121,546
41,99626,90915,08754,57535,532
19,043
61,594
39,85821,736
41,75126,75814,99355,20335,962
19,241
63,176
40,92222,254
41,84826,82515,02356,78736,992
19,795
63,375
41,02222,353
41,76726,77114,99657,09037,235
19,855
64,396
41,67622,720
41,79926,78015,01957,85737,727
20,130
65,563
42,50423,059
42,14926,99815,15159,04638,489
20,557
65,802
42,73623,066
42,27727,06615,21159,35738,736
20,621
66,271
43,10723,164
42,78227,42015,36259,59338,943
20,650
67,330
48,83623,494
43,06327,67115,39260,62039,689
20,931
68,157
44.38823,769
42,97127,64815,32361,82940,535
21,294
68,876
44,98623,890
42,99527,72815,26762,67341,076
21,597
69,585
45,49324,092
43,23227,94815,28462,99041,352
21,636
1983
69,814
45,60924,205
42,94727,74015,20763,36541,556
21,809
E. FSLIC-insured federal
Account
1 Assets
2 Mortgages
3 Cash and investmentsecurities
4 Other
5 Liabilities and net worth . . .
6 Savings capital7 Borrowed money8 FHLBB9 Other
10 Loans in process^1 1 Other
12 Net worth4
13 MEMO: Mortgage loancommitmentsoutstanding^ . . . .
Jan.
71,379
46,67324,706
42,85227,64415,18164,87542,533
22,342
73,824
48,35025,474
43,07027,82315,24767,64144,336
23,305
74,827
48,98625,841
43,55328,13315,40068,86245,165
23,697
76,762
50,27526,487
44,05828,51215,54670,47546,192
24,283
78,362
51,43026,932
45,00629,17515,82171,61047,145
24,465
78,846
51,85926,987
45,64729,67215,97572,23247,713
24,519
79,241
52,26126,980
46,94030,58216,35872,21447,847
24,367
80,189
53,08627,103
47,82931,21216,61773,28048,709
24,571
80,419
53,29727,122
48,45431,69116,76373,66149,044
24,617
81,094
53,80127,293
49,24032,30416,93674,05149,400
24,651
81,961
54,48227,479
50,08332,93017,15374,73949,889
24,850
savings banks
Feb. Mar. Apr. May June July Aug. Sept. Oct. Nov. Dec.
1983
6,815
3,375
2,1161,324
6,815
5,92647014232810389
330
283
9,401
5,115
2,4531,833
9,401
8,050717396321121203
431
431
18,635
11,556
3,6833,396
18,635
15,3772,1601,550
610265305
793
592
22,713
14,345
4,3104,058
22,713
18,5982,7191,979
740335453
943
722
33,667
21,248
5,9016,518
33,667
27,4194,1462,7551,391
650759
1,343
1,113
39,660
25,236
6,6757,749
39,660
32,4464,8313,0941,737
791755
1,628
1,438
41,763
26,494
6,8908,379
41,763
34,1085,0083,1311,877
828919
1,728
1,743
46,191
28,086
7,51410,591
46,191
37,2845,4453,5721,873
9341,142
2,320
1,774
57,496
34,814
9,24513,437
57,496
47,0586,5984,1922,4061,1201,089
2,751
2,130
59,422
35,637
9,58714,198
59,422
48,5446,7754,3232,4521,1811,293
2,810
2,064
61,717
37,166
9,65314,898
61,717
50,3846,9814,3812,6001,2222,924
2,924
2,230
64,969
38,698
10,43815,835
64,969
53,2277,4774,6402,8371,2641,157
3,108
2,151
93Digitized for FRASER http://fraser.stlouisfed.org/ Federal Reserve Bank of St. Louis

28. Federal fiscal and financing operationsMillions of dollars
Type of account or operationFiscalyear1983
Calendar year 1983
Year HI H2 Jan. Feb. Mar. Apr.
U.S. budgetReceipts1
Outlays'Surplus, or deficit ( — )
Trust fundsFederal funds2
Off-budget entitiesSurplus, or deficit (-)
6 Federal Financing Bank outlays7 Other3
U.S. budget plus off-budget, including FederalFinancing Bank
8 Surplus, or deficit (-)Source of financing
9 Borrowing from the public10 Cash and monetary assets—Decrease, or
increase ( — ) *11 Other5
MEMO12 Treasury operating balance (level, end of period)13 Federal Reserve Banks14 Tax and loan accounts
600,562795,917
-195,35523,056
-218,410
-10,404-1,953
-207,711
212,425
-9,8895,176
37,05716,55720,500
612,915803,326
-190,41130,425
-220,827
-8,617-1,734
-200,764
186,558
7,0807,580
221,54564,165
157,380
306,331396,477
-90,14622,680
112,822
-5,418-528
-96,094
102,538
-9,6643,222
100,24328,20672,037
306,584406,849-100,265
7,745108,005
-3,199-1,206
-104,670
84,020
16,2944,358
121,30235,95985,343
57,50567,087
-9,582-3,623-5,959
-271= 63
38,81664,152
-25,336-4,830
-20,506
-5247
-9,916 -25,341
6,419 17,919
2,1791,318
17,5022,627
14,875
7,496-74
10,0062,8567,150
43,50469,540
-26,0362,085
-28,120
-1,244-16
-27,296
31,303
-6,7672,761
15,4523,572
11,880
66,23469,542
-3,308403
-3,711
-1,290151
-4,447
2,681
-8,1569,922
24,0536,015
18,038
U.S. budget1 Receipts1
2 Outlays1
3 Surplus, or deficit (-)4 Trust funds5 Federal funds2
Off-budget entitiesSurplus, or deficit ( — )
6 Federal Financing Bank outlays7 Other3
U.S. budget plus off-budget, including FederalFinancing Bank
8 Surplus, or deficit ( — )Source of financing
9 Borrowing from the public10 Cash and monetary assets—Decrease, or increase ( = )4.11 Other5
MEMO12 Treasury operating balance (level, end of period)13 Federal Reserve Banks14 Tax and loan accounts
Calendar year 1983
May June July Aug. Sept. Oct. Nov. Dec.
33,75563,040-29,28524,923-54,208
-1,433242
66,51763,1163,4013,722-318
-1,128-889
43,94865,360
-21,412-5,592-15,820
49,68367,160
-11,411289
-17,765
63,55661,6101,94614,006
-12,060
-1,326 -1,112 -1,27033 -155 -1,432
45,15670,225
-25,069= 1,471-23,598
1,347100
46,20067,792
-21,792-3,408-18,183
-526-152
58,04174,702
-16,6613,921
-20,579
-312400
-30,476 1,382 -22,705 -18,744 =756 -23,623 -22,270 -16,572
18,49719,189-7,209
5,2334,372861
25,719= 23,605-3,496
27,9978,76419,233
11,8776,3174,511
20,5224,328
-6,106
15,442-19,061
4,375
21,646 18,469 37,0573,815 4,189 16,55717,831 14,280 20,500
11,7329,5252,367
27,1004,84122,259
8,94621,277-7,953
5,2132,8962,316
15,501-6,0927,164
11,8173,6618,157
94Digitized for FRASER http://fraser.stlouisfed.org/ Federal Reserve Bank of St. Louis

29. U.S. budgetA. ReceiptsMillions of dollars
Source
1 AH sources'
2 Individual income taxes net . . .3 Withheld4 Presidential Election Campaign Fund5 Nonwithheld6 Refunds
Corporation income taxes7 Gross receipts8 Refunds
9 Social insurance taxes and contributions, net10 Payroll employment taxes and contributions"1 1 Self-employment taxes and contributions"1 . . . .12 Unemployment insurance13 Other net receipts4
14 Excise taxes . . . .15 Customs deposits16 Estate and gift taxes , . . . . . . . .17 Miscellaneous receipts-"
1 All sources' . . . .
Calendar year 1983
Year Jan.
612,915 57,505
292.212 34.151269.299 20,953
36 083,717 13,21760,839 18
64,586 2.39422,730 1,230
211,774 17,071180,762 15,479
6,825 41519,700 7894,487 387
36,489 2,7079,089 4855,933 553
15,562 1,374
2 Individual income taxes net .3 Withheld4 Presidential Election Campaign Fund . .5 Nonwithheld . . . . . , . . .6 Refunds
Corporation income taxes7 Gross receipts8 Refunds . . . . . . . . . . .
9 Social insurance taxes and contributions, net10 Payroll employment taxes and contributions"1 1 Self-employment taxes and contributions^ . . . . .12 Unemployment insurance13 Other net receipts4
14 Excise taxes15 Customs deposits . .16 Estate and gift taxes . . . .17 Miscellaneous receipts**
Feb.
38,816
20,54422,288
41,9703,717
2,1152,388
13,79711,845
431,553
356
2,795503349
1,101
Mar.
43,504
15,65824,808
93,604
12,764
6,9852,612
17,93916,975
418160387
2,755733500
1,545
Apr.
66,234
35,04021,636
831,96118,564
8,4453,650
21,48114,5674,2322,324
358
2,557762458
1,141
May
33,755
6,38422,205
61,131
16,958
1,9032,205
22,33015,680
4185,875
357
2,991670493
1,190
June
66,517
32,77323,641
311,1312,003
1 1 ,6801,724
17,90316,366
901285351
3,099857530
1,400
Calendar year 1983
July
43,948
21,93821,437
32,1601,662
2,5621,706
15,31714,108-6321,454
387
3,369772559
1,137
Aug.
49,683
23,25922,519
21,967K228
1,8161,433
20,08916,137
03,529
423
3,112967514
1,359
Sept.
63,556
30,96121,060
111,595
1,695
10,4771,430
17,24015,753
927176384
3,692815552
1,249
Oct.
45,156
23,22721,720
02,022
515
2,8242,356
15,70714,266
01,100
341
3,142766488
1,357
Nov.
46,200
22,70022,550
01,011
861
1,8271,360
16,78014,151
1032,166
360
3,259904453
1,637
Dec.
58,041
25,57724,482
01,948
854
11,558636
16,12015,435
0289396
3,011855484
1,072
95Digitized for FRASER http://fraser.stlouisfed.org/ Federal Reserve Bank of St. Louis

29. U.S. budget—ContinuedB. OutlaysMillions of dollars
Source
1 All types1
2 National defense3 International affairs4 General science space and technology5 Energy6 Natural resources and environment . . . .
7 Agriculture8 Commerce and housing credit9 Transportation
10 Community and regional development1 1 Education training employment and social services
12 Health1 3 Income security14 Veterans benefits and services15 Administration of justice16 General government
17 General-purpose fiscal assistance18 Net interest . . . .19 Undistributed offsetting receipts2
1 All types1
Calendar year 1983
Year Jan.
803,326 67,087
214,039 16,29710,822 8047,702 4873,606 296
12,825 1,007
15,432 3,2234,812 1,213
23,241 1,7187,451 504
26,047 2,259
83,356 6,612278,580 23,01024,955 8374,708 4484,913 337
6,414 1,26990,123 7,616
-16,147 -849
2 National defense3 International affairs4 General science space and technology5 Energy6 Natural resources and environment
7 Agriculture8 Commerce and housing credit9 Transportation
10 Community and regional development ,1 1 Education training employment and social services .
12 Health13 Income security14 Veterans benefits and services15 Administration of justice16 General government
17 General-purpose fiscal assistance18 Net interest19 Undistributed offsetting receipts2
Feb.
64,152
16,567108610330998
2,170-5591,557
4052,159
6,57522,812
2,063412345
898,416-905
Mar.
69,540
19,0381,601
526488913
1,003395
1,776562
2,114
6,91324,8402,292
473427
406,854-715
Apr.
69,542
17,524937607212
1,036
2,717434
1,581427
1,985
7,12024,6543,357
432163
1,1626,124-929
May
63,040
17,309438589375905
558136
1,531469
2,113
6,96622,304
882378
1,002
2878,066
-1,265
June
63,116
18,337817667372
1,033
483545
1,755757
2,171
7,02025,381
1,903379160
2775,282
-4,224
Calendar year 1983
July
65,360
17,3941,038
687243955
685665
1,875514
1,943
6,67222,5362,024
453-93
1,1787,522-963
Aug.
67,160
18,548209707258
1,188
-5-3322,101
6892,673
7,42022,4182,258
491,248
368,395
-1,144
Sept.
61,610
18,086822685
-971,344
662190
2,148671
2,046
5,91722,853
2,012398282
316,106
-2,544
Oct.
70,225
17,4161,083
880253
1,251
1,7181,8483,0511,0152,165
7,92820,922
1,940442143
1,6447,5361,010
Nov.
67,792
17,947318111342974
766-2882,118
6862,205
7,06422,8102,051
396535
3379,464-710
Dec.
74,702
19,5762,647
480534
1,221
1,452565
2,030752
2,214
7,14924,0403,336
448364
648,712-889
96Digitized for FRASER http://fraser.stlouisfed.org/ Federal Reserve Bank of St. Louis

30. Federal debt subject to statutory limit — Types and ownership, 1983Billions of dollars
Item
1 Federal debt outstanding
2 Public debt securities3 Held by public . . .4 Held by agencies . . .5 Agency securities6 Held by public7 Held by agencies
8 Debt subject to statutory limit
9 Public debt securities10 Other debt1
1 1 MEMO* Statutory debt limit . . . .
Mar. 31
1,249.3
1,24451,043.3
201.24 83 7I l
1,245.3
1 243 91 4
1 ,290 2
June 30
1,324.3
1,31961,090.3
229.34 73 61 1
1,320.4
1 319 01 4
1,3890
Sept. 30
1,381.9
1 377 21,138 2
239.04 73 61 i
1,378.0
1 376 61 3
1 389 0
Dec. 31
1,415.3
1 410 71 , 1 74 4
236 84 63 51 i
1,411.4
1 410 11 3
1 490 0
31. Gross public debt of the U.S. Treasury—Types and ownershipBillions of dollars, end of period
Type and holder
1 Total gross public debt
Type2 Interest-bearing debt3 Marketable4 Bills .5 Notes . . . .6 Bonds
7 Nonmarketable '8 State and local
government series9 Foreign issues2
10 Government . .11 Public12 Savings bonds and notes13 Government-account series3
14 Non-interest-bearing debt
Holder4
15 U.S. government agenciesand trust funds
16 Federal Reserve Banks
17 Private investors .18 Commercial banks . . . .19 Money market funds20 Insurance companies21 Other corporations . . . .22 State and local governments
Individuals23 Savings bonds24 Other securities , .25 Foreign and international^26 Other miscellaneous investors^
Qi1,061.3
1 059 875262562395.0101 4
307.2
23.219.615 64.1
674196.7
1 5
202.5126.6
733.3116 125 732.1169
1029
67 545.0
136.1191 0
19
Q2
1,079.6
1 078 476402560406.9101 1
314.4
23.417.513 83.6
674206.0
1 2
211.7127.0
740.9116.122432.517.6
107 3
67446.7
137.21927
82
Q3
1,142.0
1 14098244277.9442.9103 6
316.5
23.614.612.22.4
675210.5
1 2
216.4134,4
781.2117,838 634.821,6
112 1
67.648.0
140.6210 1
Q4
1,197.1
1 195 5881 5311.8465.01046
314.0
25.714.713.01.7
680205.4
1 6
209.4139.3
848.4131.442639.124.5
1134
68 348.2
149.5231 4
Ql1,244.5
1 243 0937 8331.9494.4111 4
305.2
27.112.411.1
1.3685
197.0
1 5
201.2136.7
906.6153.244.842.427.2n.a
68.847.9
156.2n.a.
19
Q2
1,319.6
1 318 1978 9334.3527.1117 5
339.2
33.111.41080.6
694225.0
1 5
229.3141.7
948.6171.628 344.832.8n.a
69.751.6
160.1n.a
83
Q3
1,377.2
1 375 81 0240
3407557.5125 7
351.8
35.111.511 5
.070 3
234.7
1 5
239.0155.4
982.7176.322 147.335.9n a
70658.4
160.2n a
Q4
1,410 7
1 40091 0509
343 85734133 7
350.0
36.710.4104
.0707
231.9
9 8
236.3151 9
1,022.6188922 848.9402n a
71 561.9
168.9n a
97Digitized for FRASER http://fraser.stlouisfed.org/ Federal Reserve Bank of St. Louis

32. U.S. government securities dealers, 1983A. Transactions1
Par value, averages of daily figures, in mill ions of dollars
Type and maturity Jan. Feb. Mar. Apr. May June July Aug. Sept. Oct. Nov. Dec.
IMMEDIATE DELIVERY
1 U.S. government securities 35,736 40,549 37,894 38,464 41,050 42,647 38,092 45,687 48,172 46,104 48,821 42,398
Maturitv1 Bills3 Other within 1 year4 1—5 years5 5=10 years6 Over 10 years
Type of customer1 U.S. government securities
dealers8 U.S. government securities
brokers9 All others2
10 Federal agency securities1 1 Certificates of deposit12 Bankers acceptances . . ,13 Commercial paper
FUTURES TRANSACTIONS3
14 Treasury bills15 Treasury coupons16 Federal agency securities
19 443821
6,9754,2634,234
2 219
17,60015 9175 1994 7402,8317,906
5,1731,664
192
20 308706
9,2435,2515,042
1,905
20,64218 0034,9744,4022,5937,806
6,3032,050
230
20 195520
7,8795.1934,106
1,757
19,07117 06545743,7022,2557,601
6,0372,117
262
22,141611
7,3854,1334,194
2,418
19,22516 8225,5994,5403,0278,636
6,1361,758
204
2 1 ,095571
9,0734,5195,791
2,240
20,71118,0995,5563,7552,4118,015
6,6952,322
308
22,735637
8,2186.1544,903
2,370
22,17818,0994,8274,1772,4698,480
7,7322,647
369
21,922575
7,1244,1874,284
2,134
19,07016,8895,0744,5042,6158,275
6,6842,566
442
23,909669
10,1894,8216,100
2,179
23,95119,5575,2794,4252,6567,128
7,4603,144
276
24,438674
10,3567,4065,298
2,426
24,54621,2006,2374,7733,0867,677
6,0112,555
200
24,203757
10,1845,8345,127
2,470
23,39220,2426,8854,2072,6498,629
7,9903,188
208
24 8001,019
10,5266,4546,022
2,542
23,01023 2696 7834,3462,7458,307
7,1893,445
293
23 526936
7,9415,1344,861
2 429
19,14420 826
5 9254 4312,3707,969
6,4492,552
194
FORWARD TRANSACTIONS4
17 U.S. government securities . .18 Federal agency securities
IMMEDIATE DELIVERY
1 U.S. government securities
1,0331,147
1,707 1,6351,181 1,441
1,363 1,537 1,396 1.489 1,792 2,1151,496 1,565 1,598 1,603 2,120 1,928
1,151 1,520 1,1751,800 2,020 1,857
Week ending
Jan. 5 Jan. 12 Jan. 19 Jan. 26 Feb. 2 Feb. 9 Feb. 16 Feb. 23 Mar. 2 Mar. 9
30,552 37,657 34,562 38,681 35,109 34,438 39,908 43,922 48,158 39,001
Maturity2 Bills .'3 Other within 1 year4 1—5 years5 5-10 years6 Over 10 years
Type of customer7 U.S. government securities
dealers8 U.S. government securities
brokers9 All others2
10 Federal agency securities1 1 Certificates of deposit12 Bankers acceptances13 Commercial paper
FUTURES TRANSACTIONS3
14 Treasury bills15 Treasury coupons16 Federal agency securities
FORWARD TRANSACTIONS'*
17 U S government securities18 Federal agency securities
16,546808
5,8413,8213,537
2,081
13,95514,5163,9843 3872,6047,729
3 6491 ,141
177
649940
20,7791,1626 6764,5614,479
2,313
18,48116,8936,0685 6053,2277,726
3 7661,539
153
3971,343
19,751715
6,2484,2633,585
2,285
16,66815,6106,0074,5082,5947,919
5 0411,536
164
1 3501,497
20,540676
8,9914,1624,312
2,554
19,37216,7554,9104,3542,5677,664
6,8371,982
186
1,535964
18,245655
8,0073,2694,933
1,544
17,91715,6493,9024,7822,5198,036
6,1691,608
159
1,885857
16,447643
7,2084,6195,521
1,922
17,81614,6993,4473,7532,0597,252
5 , 1 1 11,683
182
2,254993
21,678919
8,4404,3274,544
1,700
20,27417,9345,1243,8892,3557,265
7,2702,002
233
1,2201,405
21,147627
12,0605,1834,904
2,137
22,22019,5664,9554,8543,0488,235
6,4572,374
281
1,5431,184
23,734617
9,5258,7165,566
2,385
23,61922,154
7,2365 0932,9388,409
5 5392,537
293
1 2431,295
21,418471
7 2475,6384,227
1,585
20,26217,1545 0463 7342,2667 074
7 7162,330
257
9421 606
98Digitized for FRASER http://fraser.stlouisfed.org/ Federal Reserve Bank of St. Louis

32. U.S. government securities dealers, 1983—ContinuedA. Transactions1—ContinuedPar value, averages of daily figures, in millions of dollars
Type and maturity
IMMEDIATE DELIVERY
1 U.S. government securities ,
Maturity2 Bills3 Other within 1 year4 1—5 years5 5-10 years6 Over 10 years
Type of customer1 U.S. government securities
dealers8 U.S. government securities
brokers9 All others2
10 Federal agency securities .1 1 Certificates of deposit12 Bankers acceptances1 3 Commercial paper
FUTURES TRANSACTIONS3
14 Treasury bills1 5 Treasury coupons .16 Federal agency securities
FORWARD TRANSACTIONS4
17 U S government securities18 Federal agency securities .
IMMEDIATE DELIVERY
1 U.S. government securities
Maturity2 Bills "3 Other within 1 year4 1—5 years5 5-10 years6 Over 10 years
Type of customer1 U.S. government securities
dealers8 U.S. government securities
brokers9 All others2
10 Federal agency securities1 1 Certificates of deposit12 Bankers acceptances1 3 Commercial paper
FUTURES TRANS ACTIONS 3
14 Treasury bills15 Treasury coupons16 Federal agency securities
FORWARD TRANSACTIONS4
17 U.S. government securities18 Federal agency securities
Mar. 16
31,090
17,549455
6 1813,9862,919
1 551
15,78413,7554,8653,9892,3437,075
5,8952,018
383
1,7881,714
May 25
34,484
18,548493
7,5763,4344,433
1,851
17,61615,0165,6263,3261,8977,876
64612,371
361
7191,166
Mar. 23
40,768
21,123641
11 39442263,384
2011
21,06417,6933,9023,4742,3997,741
6,4462,172
198
2 4391,420
June 1
41,697
22,210518
11,0363,7494,184
2,122
19,74219,8334,1804 2912,1599,084
7 3182,190
520
1,0181,175
Mar. 30
37,321
19,236403
6 21962875 176
1 596
18 33517 3904,0433,47220427,916
5,2371,985
241
1 4931,091
June 8
41,755
22,168614
6,6438,0764,254
2,105
20 99518,6554,2754 5382,3187,979
8 9712,234
326
1,2322,058
Apr. 6
35,514
22,670650
4 8443,7183,631
1 747
17,86715,9004,6723,7102,5279,882
6,1171,403
165
1,1681,347
June 15
38,973
22,013762
6,5315,0494,619
2,030
20,63216,3125,8613,9892,3828,502
7,1002,551
388
1,0282,162
Weeke
Apr. 13
36,161
23,081587
5,7813,3743,339
3,319
16,81416,0285,0064,8593,0578,355
5,4871,407
144
1,5911,652
June 22
42,762
21,158467
11,3114,9434,884
2,256
22,91317,5924,1564,2712,1909,272
8,1613,166
295
2,3341,526
nding
Apr. 20
39,701
22,277673
70224,8694,860
1 842
20,60817,2515,8004,3073,1698,885
6,3962,058
193
1,2671,770
June 29
45,543
23,651655
8,2317,0355,971
3,196
23,42318,9235,0263,3422,5167,626
6,5082,848
373
1,001904
Apr. 27
39,186
20,777580
10,2173,7743,839
2,122
19,82817,2376,2154,8212,9027,746
6,2351,871
241
1,2451,131
July 6
36,661
23,007578
5,9153,4803,681
2,023
17,96616,6734,0405,1193,4949,854
5,4901,743
335
9971,209
May 4
42,543
20,752655
10 5515 1185468
2 714
21,37418,4555,7514,4793,1028,525
6,3592,033
198
2,1741,415
July 13
38,439
23,262607
6,4554,2893,826
2,077
20,32716,0364,7823,9912,6838,866
6 6152,151
483
6511,723
May 11
48,340
24 756544
8 0975 8989 044
2 716
24 956206675,6813,8952 9177,252
63102,307
291
2 4432,014
July 20
41,186
23,588611
7 3894,9184 680
2,160
20 65818,3686 3934 9792,6348 224
7 0582582
416
1,9292 272
May 18
39,972
21 072678
8 2584 6835 281
2 163
20 16517,6446,1193,6892 3878,259
7 2782,521
199
1 3451,727
July 27
35,455
18,511595
8,2353,9564 159
2,111
17 19216,1525,1434 6312,3657,157
6 4583,113
614
1,5611 150
99Digitized for FRASER http://fraser.stlouisfed.org/ Federal Reserve Bank of St. Louis

32. U.S. government securities dealers, 1983—ContinuedA. Transactions1—ContinuedPar value, averages of daily figures, in millions of dollars
Type and maturity
IMMEDIATE DELIVERY
1 U.S. government securities
Maiurit\2 Bills "3 Other within 1 year4 1=5 years5 5-10 years6 Over 10 years
Type of customer1 U.S. government securities
dealers8 U.S. government securities
brokers9 All others2
10 Federal agency securities1 1 Certificates of deposit12 Bankers acceptances13 Commercial paper . .
FUTURES TRANSACTIONS3
14 Treasury bills15 Treasury coupons16 Federal agency securities
FORWARD TRANSACTIONS4
17 U S . government securities18 Federal agency securities
IMMEDIATE DELIVERY
1 U.S. government securities
Maturity2 Bills3 Other within 1 year4 1—5 years5 5-10 years6 Over 10 years
Type of customer1 U.S. government securities
dealers .8 U.S. government securities
brokers9 All others2
10 Federal agency securities1 1 Certificates of deposit12 Bankers acceptances13 Commercial paper
FUTURES TRANSACTIONS3
14 Treasury bills15 Treasury coupons16 Federal agency securities
FORWARD TRANSACTIONS*
17 U.S. government securities18 Federal agency securities
Week ending
Aug. 3
44,955
24,358631
10,8563,6955,415
2,230
23,53619,1894,3653,9442,5247,203
9,3393,264
181
3,5221,876
Oct. 19
44,403
23,181749
9,7385,5565,179
2,248
22,87019,2848,4034,5393,0817,945
10,9523,907
227
1,0981,980
Aug. 10
43,108
21,699513
7,7685J467,984
2,119
22,23018,7604,2093,2802,4077,006
6,5052,957
339
1,9442,358
Oct. 26
44,751
21,494715
12,1265,8504,566
2,637
21,40920,7056,7354,1322,0918,401
6,1763,217
211
2,2391,521
Aug. 17
48,147
25,067712
10,1445,4896,734
2,400
25,38220,365
7,0325,0242,7317,614
7,6173,298
371
8042,762
Nov. 2
42,828
24,965949
7,7475,0214,146
2,607
21,03919,1835,8404,1152,5668,337
5,8962,481
169
7241,427
Aug. 24
41,962
21,404526
9,4824,6985,852
1,819
22,10418,0395,0985,0503,0256,903
6,2993,298
204
1,8941,842
Nov. 9
49,512
25,433888
11,5075,3276,357
3,037
24,25922,2167,7333,9352,7728,391
8,5562,941
389
1,4582,518
Aug. 31
48,026
25,915884
1 1 ,9664,8224,439
2,384
24,91120,7325,3264,4012,3697,068
8,0703,076
229
1,1301,416
Nov. 16
59,076
26,0361,169
12,6599,8109,401
2,940
27,24528,891
8,4364,4533,0368,671
8,2203,762
235
2,2253,023
Sept. 7
46,975
24,678698
7,12810,4494,022
2,529
23,03721,4114,5584,4063,0598,261
5,4321,920
139
1,0841,262
Nov. 23
44,345
22,883821
1 1 ,2674,2235,152
2,146
20,25621,9436,7294,7742,6828,565
7,8434,497
305
1,8141,828
Sept. 14
39,863
20,526820
7,8476,0044,667
1,903
19,62018,3416,2924,5863,0867,460
4,8782,206
164
1,7721,897
Nov. 30
45,112
23,1111,0868,4258,0184,473
2,157
21,18321,7724,3834,3742,5027,454
4,4062,782
217
8601,100
Sept. 21
49,087
25,095627
13,5565,2444,566
2,127
25,36121,5997,1495,6133,6107,661
7,1373,058
289
2,9572,609
Dec. 7
43,038
24,822979
6,4805,5615,195
2,743
20,50119,7946,1904,5362,7497,420
6,1483,264
173
5832,077
Sept. 28
56,649
26,493494
12,6359,0667,961
2,686
30,66823,295
6,9284,8552,8146,742
6,8332,880
191
3,2212,119
Dec. 14
38,736
21,878913
6,2784,8354,831
2,014
18,91117,8117,4234,6322,4687,340
7,7263,101
168
6292,759
Oct. 5
50,899
28,449826
10,0306,3555,239
2,766
26,27121,863
5,9393,8372,7229,594
6,7912,562
210
2771,426
Dec. 21
39,060
22,536985
6,4294,3064,803
1,895
18,13019,0354,7174,5392,2018,158
7,2692,427
231
1,6691,329
Oct. 12
48,619
26,498821
9,3895,9555,956
2,599
25,03720,9836,7594,0042,8069,251
8,4083,302
288
8272,302
Dec. 28
46,466
25,121812
12,5364,6793,320
2,862
18,88724,7174,7974,1872,0108,520
5,7941,399
142
2,0211,193
100Digitized for FRASER http://fraser.stlouisfed.org/ Federal Reserve Bank of St. Louis

32. U.S. government securities dealers, 1983—ContinuedB. Positions1
Averages of daily figures, in millions of dollars
Type and maturity
NET IMMEDIATE2
1 U.S. government securities . . . .2 Bills3 Other within 1 year . . .4 ]_5 years5 5-10 years6 Over 10 years7 Federal agency securities .8 Certificates of deposit9 Bankers acceptances
10 Commercial paper
FUTURE POSITIONS
1 1 Treasury bills . . .12 Treasury coupons .13 Federal aeencv securities
Jan.
14,6809 962-2323,094-1942 0505 1256,1803,5513,436
-7,078-2,123
-343
Feb.
14,16610.534= 4282,693-2031 5704,4555,6842,9012,893
-3,217-1,230
-137
Mar.
11,3999,544
31,263-7481,3374,8556,1052,8093,174
-526-1,787
-64
Apr.
9,0147 775-371
733-57934
5 2785,4723,0543,228
-7 341- 1 ,966
112
May
6,3864538
31571
-1271 3745 6944,8353,0503,029
-6,382-1,485
56
June
3,8773,657
63-183
550-2105,6314,4882,4052,894
- 1 ,023-2204
July
555416126329347
-6636,8594,7292,7642,782
-1,578-714
345
Aug.
3,252877
-1982,216
149208
7,9954,6892,9172,755
1,493-1,715
428
Sept.
7,5001,779-5584,4961,162
6219,1706,0983,7433,297
-6,942-1,526
187
Oct.
4,9952,144-4663,021
132164
10,1576,8034,0543,385
8,339-715
305
Nov.
1,6651 590-1421,559
- 1 ,203-13893647,5314,5623,209
-5,636-136
569
Dec,
-2,336-1 437
47712
-745-912
11 4807,4494,1783,822
-2,926U016
384
FORWARD POSITIONS
14 U.S. government securities15 Federal agency securities
-1,397-2,311
-1,061-1,962
-1,782- 1 ,926
-887-1,594
-2,057-1,722
-635-1,799
-1,631-2,180
-4,348-4,062
= 1,456-5,205
= 1,756-6,214
-3,246 -2,971-6,014 -7,738
101Digitized for FRASER http://fraser.stlouisfed.org/ Federal Reserve Bank of St. Louis

32. U.S. government securities dealers, 1983—ContinuedB. Positions1—ContinuedAverages of daily figures, in millions of dollars
Type and maturity
NET IMMEDIATE2
1 U.S. government securities2 Bills3 Other within 1 year4 1=5 years5 5=10 years6 Over 10 years7 Federal agency securities8 Certificates of deposit . . .9 Bankers acceptances
10 Commercial paper
FUTURE POSITIONS
1 1 Treasury bills12 Treasury coupons13 Federal agency securities
FORWARD POSITIONS
14 U.S. government securities15 Federal agency securities . .
NET IMMEDIATE2
1 U.S. government securities2 Bills3 Other within 1 year , .4 i_5 years5 5-10 years6 Over 10 years .1 Federal agency securities8 Certificates of deposit9 Bankers acceptances
10 Commercial paper . .
FUTURE POSITIONS
1 1 Treasury bills12 Treasury coupons13 Federal agency securities
FORWARD POSITIONS
14 U.S. government securities15 Federal agency securities
NET IMMEDIATE2
1 U.S. government securities . .2 Bills3 Other within 1 year4 1-5 years5 5-10 years6 Over 10 years7 Federal agency securities8 Certificates of deposit9 Bankers acceptances
10 Commercial paper . .
FUTURE POSITIONS
1 1 Treasury bills12 Treasury coupons1 3 Federal agency securities . .
FORWARD POSITIONS
14 U.S. government securities15 Federal agency securities . .
Week ending
Jan. 5
17,95910,378
4734,674
5611,8735,9487,8424,3423,474
= 9,481-2,579
= 566
-815-2,816
Mar. 16
8,5078,114
22222
- 1 ,4481,5985,3946,1782,9453,183
450-1,666
23
-2,689-2,748
May 25
3451,363= 90
1,856-98
1,0255,6974,3332,1012,405
= 1,774-786
1
-3,513-1,703
Jan, 12
15,5059,031-35
3,761362
2,3665,3526,2313,5903,391
-9,474= 2,667
-494
-1,309= 2,604
Mar. 23
10,2669,555= 30
1,575-1,584
7494,4755,7932,6673,047
1,086- 1 ,443
25
-2,790-1,927
June 1
-1861546
= 215-1,045
5825,1944,5851,8522,678
-1,206= 302
51
-2,913- 1 ,764
Jan. 19
13,8889,526-3252,292-73
2,4685,5735,7933,5473,539
-8,184-2,290
-326
-1,697-2,582
Mar, 30
8,8957,197-44955
-119906
4,7456,1392,4002,636,
749-1,960
-52
- 1 ,028-1,558
June 8
4,2734,420
146-778
513-28
5,5594,5342,2942,963
-569-114
178
- 1 ,245-1,877
Jan. 26
14,6801 1 ,044-4823,143-8741,8494,5135,6693,5023,362
= 4,803-1,632
= 233
-1,713-1,853
Apr. 6
7,4737,063-350
71-5231,2124,9375,7272,4003,035
-2,103-2,170
-108
= 813-1,724
June 15
4,2905,473
25-1,517
317= 7
6,1324,2282,2442,710
= 744= 208
55
= 561-2,281
Feb. 2
12,20210,660-6872,175-942
9954,2086,1303,1423,533
= 1,242- 1 ,032
-88
- 1 ,033= 1,573
Apr. 13
6,9246,650-491-53
-2701,0875,0225,3072,7403,345
-6,649-2,136
79
-1,002-1,771
June 22
3,2372,726
71,194-162-5275,4244,5652,4093,145
-1,441122181
-189-1,781
Feb. 9
13,24410,257-5842,204
91,3574,5145,9703,0143,267
-710-932-155
-1,041-2,039
Apr. 20
10,2719,413-404-131
3041,0895,6595,4923,1773,204
-8,830-2,025
227
-1,312-1,853
June 29
3,5561,897
48190
1,687-2655,5314,4352,6692,839
-1,202160392
-398- 1 ,407
Feb. 16
11,1828,972-4551,372-4621,7544,9355,1842,3722,410
-3,311-1,265
-153
-1,297-2,527
Apr. 27
10,6988,119-2982,337-53593
5,2215,3893,2862,944
-8,175= 1,592
177
-664-1,214
July 6
962528133
= 1721,067-5935,4804,8043,2012,469
- 1 ,960237296
-124- 1 ,203
Feb. 23
16,91911,896-2884,143= 6141,7834,2965,4433,0292,543
-5,384-1,367
-101
- 1 ,060-1,689
May 4
11,7928,325= 32
2,532153813
5,6235,7514,2473,899
- 10,542-2,059
79
-556-1,152
July 13
4371,554
167-1,031
671= 9246,3544,7952,9622,756
-1,356-18240
-503-1,746
Mar. 2
16,97410,789-1093,654
6491,9914,0136,0933,1803,229
-6,704-1,980
-177
-972-1,493
May 11
11,8576,891
972,564
2332,0725,5815,1043,8343,575
-10,687-2,246
51
= 863-1,650
July 20
4761,044
108-347
242= 5717,4454,9182,7382,832
- 1 ,039-455
525
= 1,914-2,633
Mar. 9
16,56613,273
1061,666-2911,8125,0816,2933,1393,722
-2,265-1,784
= 179
-970-1,715
May 18
7,4585,649
93180
= 1181,6556,0674,7603,0292,813
-6,976-1,699
85
-1,813-2,095
July 27
1,267-478
952,244-146= 4497,4404,5882,4532,962
-2,354-1,839
431
-2,603-2,535
102Digitized for FRASER http://fraser.stlouisfed.org/ Federal Reserve Bank of St. Louis

32. U.S. government securities dealers, 1983—ContinuedB. Positions1—ContinuedAverages of daily figures, in millions of dollars
Type and maturity
NET IMMEDIATE2
1 U.S. government securities2 Bills3 Other within 1 year4 1-5 years5 5-10 years6 Over 10 years . .7 Federal agency securities8 Certificates of deposit9 Bankers acceptances
10 Commercial paper
FUTURE POSITIONS
1 1 Treasury bills12 Treasury coupons1 3 Federal agency securities
FORWARD POSITIONS
14 U.S. government securities15 Federal agency securities
NET IMMEDIATE2
1 U.S. government securities . . .2 Bills3 Other within 1 year4 1—5 years5 5-10 years6 Over 10 years7 Federal agency securities8 Certificates of deposit9 Bankers acceptances
10 Commercial paper
FUTURE POSITIONS
1 1 Treasury bills12 Treasury coupons13 Federal agency securities
FORWARD POSITIONS
14 U.S. government securities15 Federal agency securities
Week ending
Aug. 3
1,109182125
1,78626
-1,0097,4624,4252,8172,899
1,960-1,999
96
-3,925-2,726
Oct. 19
3,3212,830-6421,003
357-227
11,0526,6104,3103,149
-7,567-524
307
-1,422-7,037
Aug. 10
3,811599202
2,250619142
8,4264,6862,8423,013
5,396-2,523
403
-4,269-3,243
Oct. 26
5,8512,657-5113,770-220
15510,2176,9804,3843,131
-8,044-562
387
-1,951-6,099
Aug. 17
2,9561,003-89
1,248382412
8,6414,5262,8902,643
3,413-2,015
628
-4,676-4,685
Nov. 2
3,6342,474-4722,826
-1,353160
9,8647,4944,3443,134
-6,787-23438
-2,592-5,309
Aug. 24
2,843859
-5531,818
168551
7,2874,4612,8752,462
-970-1,118
439
-4,652-4,375
Nov. 9
1,9683,247-3751,159
-1,494-569
11,3007,0944,5743,410
-4,779286625
-1,831-6,839
Aug. 31
4,270958
-5413,779-457
5307,9045,2382,9862,744
-3,208-952
435
-3,940-4,735
Nov. 16
1,4261,694,-96
708= 994
11410,7417,2544,3843,245
-6,078-87775
-2,467-6,908
Sept. 7
4,372139
-6213,1291,097
6288,5595,8673,3972,818
-3,606-893
425
-1,724-4,991
Nov. 23
-830-336-24865
-1,292-44
7,6247,4284,4113,055
-5,794-463
570
-4,144-5,322
Sept. 14
5,8841,879-4942,4661,059
9749,5576,1254,3203,417
-5,539-1,594
294
-2,412-5,074
Nov. 30
2,84250745
3,342-879-1737,8778,3744,9323,074
-5,499-495
374
-4,494-5,591
Sept. 21
7,3921,389-5275,391
540600
9,7856,3283,8983,127
-6,708-1,742
125
-1,156-6,305
Dec. 7
1,634443499
1,46319
-79010,0658,5064,7753,724
-2,857-163
397
-3,835-6,807
Sept. 28
11,4543,345-5916,4351,889
3768,6556,0393,4383,465
-9,527-1,668
-25
-643-4,469
Dec. 14
-1,662527
75-512-794-957
11,8627,7514,2573,630
-2,819901328
-4,004-8,329
Oct. 5
9,1782,847-3975,0241,151
5529,2166,3033,4233,908
-10,950-1,612
144
-1,452-5,373
Dec. 21
-6,840-3,461
-112-909
-1,527-831
12,0066,7824,0323,940
-211,423
384
-3,623-7,863
Oct. 12
4,296671
-3163,051
650241
9,9616,5863,6473,945
-8,801-808
207
-1,613= 6,398
Dec. 28
-2,693= 2,212
-1742,322
-1,481-1,14911,7876,6823,8754,011
-5,0001,822
414
-764-7,795
103Digitized for FRASER http://fraser.stlouisfed.org/ Federal Reserve Bank of St. Louis

32. U.S. government securities dealers, 1983—ContinuedC. Financing1
Millions of dollars
Source Jan. Feb. Mar. Apr. May June July Aug. Sept. Oct. Nov. Dec
REVERSE REPURCHASE AGREEMENTSZ
1 Overnight and continuing2 Term agreements
REPURCHASE AGREEMENTS3
3 Overnight and continuing4 Term agreements
27,038 24,136 19,668 22,351 23,679 29,613 34,936 32,232 30,255 33,623 34,944 36,71049,013 49,425 49,637 49,414 49,308 49,145 48,064 51,018 53,158 53,194 62,966 65,578
59,753 56,033 51,228 51,702 52,378 56,459 59,099 58,772 60,603 63,269 60,962 65,09543,846 42,891 43,450 41,890 42,350 39,423 36,772 41,110 44,998 47,319 55,306 53,560
REVERSE REPURCHASE AGREEMENTS2
1 Overnight and continuing2 Term agreements
REPURCHASE AGREEMENTS3
3 Overnight and continuing4 Term agreements
REVERSE REPURCHASE AGREEMENTS2
1 Overnight and continuing2 Term agreements
REPURCHASE AGREEMENTS3
3 Overnight and continuing4 Term agreements
REVERSE REPURCHASE AGREEMENTS2
1 Overnight and continuing2 Term agreements
REPURCHASE AGREEMENTS3
3 Overnight and continuing4 Term agreements ,
REVERSE REPURCHASE AGREEMENTS2
1 Overnight and continuing2 Term agreements
REPURCHASE AGREEMENTS3
3 Overnight and continuing4 Term agreements
REVERSE REPURCHASE AGREEMENTS,2
1 Overnight and continuing2 Term agreements
3 Overnight and continuing4 Term agreements
Jan. 5 Jan. 12 Jan. 19 Jan. 26 Feb. 2 Feb. 9 Feb. 16 Feb. 23 Mar. 2 Mar. 9 Mar. 16
28,190 29,157 25,803 25,001 25,818 24,808 25,253 24,205 20,862 19,175 20,77548,726 49,164 49,171 48,990 50,747 51,467 48,935 47,569 49,319 49,386 48,737
64,874 60,438 56,805 56,893 58,250 56,003 57,304 55,326 54,397 53,666 51,97642,007 44,157 44,198 45,023 43,761 42,939 42,571 42,338 43,700 42,924 42,104
Mar. 23|Mar. 3o| Apr. 6 JApr. 13 Apr. 20 Apr. 27JMay 4 JMay 11 JMay 18 May 25 June
18,304 19,225 23,163 22,216 19,978 24,087 20,823 20,420 25,853 27,618 31,35550,234 50,509 48,456 50,187 51,123 47,891 46,993 49,816 49,578 50,846 49,086
48,498 47,605 49,458 52,272 51,826 53,252 53,429 51,300 54,039 50,924 57,43844,364 44,157 40,054 41,769 43,816 41,922 40,313 44,435 41,613 43,039 39,433
REPURCHASE AGREEMENTS3
June 8 June 15 June 22 June 29 July 6 July 13 July 20 July 27 Aug. 3 Aug. 10
26,658 27,873 30,665 31,515 32,759 37,285 36,943 32,755 31,969 31,01949,294 51,191 48,363 47,792 44,700 47,280 49,717 50,560 49,325 50,484
53,590 55,663 59,173 56,431 59,400 58,868 59,574 58,553 58,369 57,93240,178 40,257 38,851 38,396 34,617 36,086 37,768 38,616 37,866 39,189
Aug. 17 Aug. 24 Aug. 31 Sept. 7 Sept. 14 Sept. 21 Sept. 28 Oct. 5 Oct. 12 Oct. 19
32,870 31,967 33,333 34,483 31,720 26,506 28,311 31,848 35,141 33,83250,725 53,484 51,073 50,961 53,183 52,931 55,558 51,443 52,473 53,250
60,765 56,115 60,677 64,824 63,467 56,302 57,817 61,406 64,385 65,38541,511 45,851 41,133 41,138 43,514 44,861 50,478 47,263 45,856 46,396
Oct. 261 Nov. 2 I Nov. 9 Nov. l^Nov. 23|Nov. 3o| Dec. 7 I Dec. 14 Dec. 21 Dec., 28
33,665 33,652 37,681 37,186 30,367 35,834 36,354 36,403 36,151 37,93155,610 59,693 60,394 61,048 69,976 63,721 64,347 66,134 66,290 65,542
61,899 63,148 66,652 68,019 41,600 65,390 65,924 66,359 65,393 62,70349,760 51,264 50,332 48,828 74,740 51,365 54,224 53,355 52,841 53,818
104Digitized for FRASER http://fraser.stlouisfed.org/ Federal Reserve Bank of St. Louis

33. Debt of federal and federally sponsored credit agencies, 1983Millions of dollars, end of period
Agency Jan. Feb. Mar. Apr. May June July Aug. Sept. Oct. Nov. Dec.
1 Federal and federallysponsored agencies
2 Federal agencies3 Defense Department1 . . . .4 Export-Import Bank2' 3 . . . .5 Federal Housing
Administration4 . . . .6 Government National
Mortgage Associationparticipationcertificates5
7 Postal Service6
8 Tennessee ValleyAuthority
9 United States RailwayAssociation6
10 Federally sponsoredagencies7
11 Federal Home LoanBanks
12 Federal Home LoanMortgageCorporation
13 Federal National MortgageAssociation
14 Farm Credit Banks15 Student Loan Marketing
Association8
MEMO16 Federal Financing Bank
debt9
Lending to federal andfederally sponsoredagencies
17 Export-Import Bank3
18 Postal Service6
19 Student Loan MarketingAssociation8
20 Tennessee ValleyAuthority
21 United States RailwayAssociation6
Other lending*0
22 Farmers HomeAdministration
23 Rural ElectrificationAdministration . . . .
24 Other
237,349 235,561 234,364 234,803 234,238 235,041 236,037 236,931 236,610 239,121 240,177 239,716
33,018 33,045 33,083346 336 335
14,267 14,255 14,304
33,120 33,065 33,353 33,436318 308 298 284
14,304 14,303 14,563 14,563
33,420 33,744 33,735 33,813 33,940274 264 258 253 243
14,564 14,740 14,740 14,740 14,853
282
2,1651,471
281
2,1651,471
271
2,1651,471
255
2,1651,471
243
2,1651,404
228
2,1651,404
220
2,1651,404
213
2,1651,404
206
2,1651,404
203
2,1651,404
197
2,1651,404
194
2,1651,404
14,365 14,415 14,415
122 122 122
204,331 202,516 201,281
54,489 53,071 51,899
14,485 14,520 14,570 14,675
122 122 125 125
201,683 201,173 201,688 202,601
50,297 49,756 48,871 49,065
14,675 14,840 14,840 14,945 14,970
125 125 125 109 111
203,511 202,866 205,386 206,364 205,776
49,081 49,283 49,956 49,285 48,930
3,911 3,980 4,427 5,111 5,726 6,500 6,146 5,875 6,134 6,950 7,024 6,793
72,247 72,221 71,36672,280 71,987 72,047
72,058 70,769 71,303 71,61272,227 72,548 72,652 73,306
72,163 71,258 71,965 73,531 74,59473,744 73,046 73,465 73,474 72,409
1,404 1,257 1,542 1,990 2,374 2,362 2,472 2,648 3,145 3,050 3,050 3,050
126,587 126,623 127,717 129,125 130,528 131,987 133,367 134,505 136,031 134,799 135,361 135,791
14,177 14,177 14,2321,221 1,221 1,221
5,000 5,000 5,000
12,640 12,690 12,675
122 122 122
14,232 14,232 14,493 14,4931,221 1,154 1,154 1,154
5,000 5,000 5,000 5,000
12,760 12,795 12,845 12,950
122 122 125 125
14,493 14,676 14,676 14,676 14,7891,154 1,154 1,154 1,154 1,154
5,000 5,000 5,000 5,000 5,000
12,950 13,115 13,175 13,220 13,245
125 125 125 109 111
53,056 52,431 52,686 53,541 54,586 54,946 55,776 56,386 55,691 55,916 55,916 55,266
17,330 17,502 17,81723,041 23,480 23,964
17,970 18,076 18,378 18,49724,279 24,563 25,046 25,372
18,638 18,936 19,093 19,216 19,76625,759 27,384 25,660 26,070 26,460
105Digitized for FRASER http://fraser.stlouisfed.org/ Federal Reserve Bank of St. Louis

34. New security issues of state and local governments, 1983Millions of dollars
Type of issue or issuer, or use Year Jan. Feb. Mar. Apr. May June July Aug. Sept. Oct. Nov. Dec.
1 All issues, new and refunding1
Type of issue2 General obligation3 U.S. government loans2 . . . .4 Revenue5 U.S. government loans2 . . . .
Type of issuer6 State7 Special district and statutory
authority8 Municipalities, counties,
townships, school districts.
9 Issues for new capital, total. .
Use of proceeds10 Education11 TransportationJ 2 Utilities and conservation13 Social welfare14 Industrial aid15 Other purposes.
85,092 3,810 6,205 8,809 11,073 9,583 7,555 4,370 6,194 6,160 6,650 5,829 8,854
21,470 877 1,259 2,256 3,46996 0 3 3 2
63,622 2,933 4,946 6,553 7,604253 0 2 5 9
7,135
50,632
27,325
71,120
8,1704,353] 3,54726,3787,08811,584
237
2,226
1,347
3,308
35550985932323663
252 726 1,745
4,277 5,486 5,845
1,676 2,597 3,483
5,099 7,589 9,120
1,089542
1,0501,536183699
831816
1,7382,818405981
688560
2,5953,174503
1,600
3,571'6
6,01214
830
4,478
4,275
6,989
828419
1,5132,069708
1,452
1,5507
6,00516
277
4,260
3,018
6,049
887229939
2,120669
1,205
860 1,614 1,266 1,935 1,679 1,1347 9 14 15 15 15
3,510 4,580 4,894 4,715 4,150 7,72026 29 35 39 39 39
484
3,009
877
3,884
535274268
1,920393494
673
3,357
2,164
4,612
714261285
2,139254959
452 856 405 198
4,199 4,387 3,318 5,790
1,509 1,407 2,106 2,866
5,512 5,187 5,333 8,438
527195
1,238
457250605
515 744336 421
1,101 1,2302,334 2,580 2,080 2,676494 323 516 2,317724 972 785 1,050
106Digitized for FRASER http://fraser.stlouisfed.org/ Federal Reserve Bank of St. Louis

35. New security issues of corporationsMillions of dollars
1 All issues'
2 Bonds
Type of offering3 Public4 Private placement
Industry group5 Manufacturing6 Commercial and miscellaneous , .7 Transportation8 Public utility9 Communication
10 Real estate and financial
1 1 Stocks
Type12 Preferred13 Common
Industry group14 Manufacturing15 Commercial and miscellaneous . .16 Transportation17 Public utility1 8 Communication19 Real estate and financial
1 All issues1
2 Bonds
Industry group3 Manufacturing4 Commercial and miscellaneous . .5 Transportation6 Public utility7 Communication8 Real estate and financial
9 Stocks
Type10 Preferred1 1 Common
Industry group12 Manufacturing13 Commercial and miscellaneous . .1 4 Transportation15 Public utility16 Communication17 Real estate and financial
Year
84,514
53 952
44,1549 798
13,1235,6811 474
12,1552,265
19,255
30,562
5 11325,449
5 6497,770
7097,5172 2276,690
99,003
47 424
8,1335,3741,0867 0663,380
22,385
51 579
7 21344 366
14 13513,1122 7295,0011,822
14,780
Jan.
3,130
1 316
643673
28323043
4938
259
1,814
1991,615
25072325
44958
309
7,709
4569
849562
32313
02,813
3 140
5942 546
888994355350187366
Feb.
3,913
2,062
1,523539
335733
365364922
1,851
1971,654
29162673
7432
117
8,503
3,851
655335250763
01,848
4 652
1,9622 690
1 038646283534
22,149
Mar.
7,304
5,140
3,5851,555
748699224
1,89484
1,491
2,164
1981,966
549673
31598
3310
11,728
5,317
962511
0950650
2,244
6 411
8935 518
1 6541,225
91674
1,1331,634
Apr.
4,954
2,710
2,124586
49814531
88716
1,133
2,244
1722,072
259770
15766
3431
10,488
6,035
1,4491,109
175755725
1,822
4,453
4404 013
1,4241,494
113639
37746
May
7,560
4 761
4,225536
625510
741,230
3222,000
2,799
8871,912
48157235
477141
1,093
11,504
7,032
2,1581,055
1501 115
5052,049
4472
4923 980
1 545922221264
81,512
June
1982
4,955
3,255
2,425830
462343
82761176
1,431
1,700
671,633
502317
52211
17534
1983
8,190
2,269
706425115363250410
5,921
6655 256
2 4491,358
109550138
1,317
July
6,264
3,976
2,9101,066
1,638493
58717
84986
2,288
6441,644
187615
533196
1,054
6,490
2,566
60228148322
1,100708
3,924
2903 634
1 0151,415
3377220
1,065
Aug.
9,439
6674
5,6671 007
1,6021,202
402934205
2,329
2,765
6222,143
71837562
759495357
5,981
2,587
200458
0355
01,574
3 394
2473 147
1 309743145263236698
Sept.
8,270
5,785
5,330454
1,730481
641,021
3112,178
2,485
5221,963
34574284
1,0034
307
6,598
2,895
282353
0590100
1,570
3,703
6443 059
962997165200
01,379
Oct.
10,009
7 141
6,446695
2,044417285
1,663208
2,524
2,868
6112,257
666640
80620
33829
6,897
3055
367114
0510
502,014
3 842
3003 542
744868305588
361,301
Nov.
8,887
5 497
5 012485
1 954523
oo
1 246115
1,571
3 390
5732 817
4811,024
225752
14894
8,103
4075
2223
111910
03,009
4 028
4333 595
4581,598
192622
131,145
Dec.
9,830
5 636
4 2641 372
1 204565120944372
2,431
4 194
4213 773
920693
22742
1 361455
6,812
3 173
423201105120
02,324
3 639
2533 386
649852413245
121,468
107Digitized for FRASER http://fraser.stlouisfed.org/ Federal Reserve Bank of St. Louis

36. Open-end investment companies, 19831
Millions of dollars
Item Year Jan. Feb. Mar. Apr. May June July Aug. Sept. Oct. Nov. Dec.
1 Sales of own shares2
2 Redemptions of own shares3
3 Net sales
4 Assets4
5 Cash position5
6 Other
84,793 8,095 6,115 7,871 8,418 7,577 8,107 6,944 6,032 5,91557,120 4,233 3,510 5,066 6,482 4,486 5,416 4,500 4,885 4,41227,673 3,862 2,605 2,805 1,936 3,091 2,691 2,444 1,147 1,503
6,532 6,341 6,8464,264 3,920 5,9462,268 2,421 900
113,59980,384 84,981 90,075 98,669101,423106,449104,279104,494109,455107,314113,052113,599
8,343105,256
6,94373,441
7,40477,577
7,90482,171
8,49690,173
8,77192,652
9,11097,339
8,81595,464
8,045 8,86893,449100,587
8,256 9,395 8,34399,058 103,657 105,256
37. Corporate profits and their distributionBillions of dollars; data are at seasonally adjusted annual rates.
Item
1 Corporate profits with inventory valuationand capital consumption adjustments
2 Profits before tax3 Profits tax liability4 Profits after tax5 Dividends . . .6 Undistributed profits7 Inventory valuation adjustment8 Capital consumption adjustment . . .
1 Corporate profits with inventory valuationand capital consumption adjustments . . .
2 Profits before tax3 Profits tax liability . . .4 Profits after tax5 Dividends6 Undistributed profits7 Inventory valuation adjustment8 Capital consumption adjustment
Qi
159.9167 662 9
104 769 235.5-6 3-1.4
1981
189 9221 2
81 1140066 573 5
-23 6-7 6
19
Q2
161.7169 862 9
106 968 638.2-8 9
0.8
1982
159 1165 560 7
104 869235 6-9 5
3 1
82
Q3
163.3168 961 9
107 069 038.1
-10 14.5
1983
225 2203 275 8
127472 954 5
-11 233 2
Q4
151.6155 855 0
100 870 230.6
-12 68.4
Ql
194 8239989 7
150 262 587 7
-35 8-94
Qi
179.1161 759 1
102 671 131.4-4 321.7
19
Q2
184 3214 879 4
135 465 669 8
-22 6-7 9
19
Q2
216.7198 274 8
123 471 751.7
-12 130.6
81
Q3
195 7222 3
82 9139 468 670 8
-19 6-7 0
83
Q3
245 0227 4
84 7142 673 369.3
-19 336.9
Q4
184 9207 672 6
135 069 365 7
= 16 5-6 3
Q4
2600225 5
84 5141 175 465.6-9 243.6
38. Current assets and liabilities of nonfinancial corporations1
Billions of dollars, except for ratio
1 Current assets
2 Cash3 U.S. government
securities4 Notes and accounts
receivable5 Inventories6 Other
7 Current liabilities
8 Notes and accountspayable
9 Other
10 Net working capital . . .
1 J Current ratio^
Qi1,367.7
126.2
18 5
523.8559 3139 9
921.4
517 5403.9
446.3
1 484
19
Q2
1,382.0
125.7
19.3
529.0564.2143 7
929.8
522.6407.2
452.2
1.486
81
Q3
1,403.7
124.8
17.4
537.2575.7148 6
965J
546.0419.1
438.7
1 455
Q4
1,419.3
131.8
17 4
530.3585 1154 6
976.3
558 8417.5
442.9
1 454
Qi1,418.0
121.8
16 5
533.4591.6154 7
987.0
552.9434.0
431.0
1.437
19
Q2
1,417.2
124.1
16.5
531.2587.6157 9
988.7
554.9433.8
428.5
1.433
82
Q3
1,441.8
126.9
18.9
534.2596.5165.3
1,007.6
562.7444.9
434.2
1.431
Q4
1,425.4
144.0
22.4
511.0575.2172.6
977.8
552.8425.0
447.6
1.458
Qi1,437.3
138.7
26.0
518.4573.4180.7
987.1
542.7444 .4
450.2
1.456
19
Q2
1,465.1
145.0
27.9
535.0571.0186.2
996.4
550.8445.6
468.6
1.470
83
Q3
1,522.5
148.1
26.6
563.4590.7193.7
1,037.1
577.3459.9
485.4
1.468
Q4
1,561.2
164.9
30.2
579.0591.9195.3
1,056.7
598.8457,9
504.6
J.477
108Digitized for FRASER http://fraser.stlouisfed.org/ Federal Reserve Bank of St. Louis

39. Total nonfarm business expenditures on new plant and equipment, 1983Billions of dollars; quarterly data are at seasonally adjusted annual rates.
Industry
1 Total nonfarm business
Manufacturing2 Durable goods industries3 Nondurable goods industries . . .
Nonmanufacturing4 Mining . .
Transportation5 Railroad6 Air7 Other
Public utilities8 Electric9 Gas and other
10 Trade and service . .1 1 Commercial and other1
Year
302.50
51 7859.75
11 83
3 923 773 50
34.997 00
87 9438.02
Ql
293.03
50 7459,12
12 03
3 354093 60
33.977 64
82 3836.11
Q2
293.46
48 4860 31
10 91
3 644 103 14
34.866 62
85 8535.54
Q3
304.70
53.0658.06
11 93
4 073 573 36
35.846 38
91 0637.38
Q4
318.83
54 8561 50
12 43
4 633 323 91
35 317 37
92 4443 05
40. Domestic finance companies—Assets and liabilities, 1983Billions of dollars, end of period
Asset account
Gross accounts receivable1 Consumer . . .2 Business3 Total4 LESS: Reserves for unearned income
and losses5 Net accounts receivable6 Cash and bank deposits, securities,
and all other
7 Total assets
Ql
89 9822
172 1
29.7142 4
42 8
185.2
Q2
91 384.9
176 2
30.4145 8
44 3
190.2
Q3
92 3868
179 0
30 1148 9
45 0
193.9
Q4
92 895.2
188 0
30.6157 4
45 3
202.7
Liability account
8 Bank loans9 Commercial paper
10 Short-term debt n e e1 1 Long-term debt, n.e.c12 Other debt
13 Capital, surplus, andundivided profits
14 Total liabilities and capital
Ql
16 645 29 8
64.722.8
26 0
185.2
Q2
16 34909 6
64.5240
26 7
190.2
Q3
17 049.7
8 766.224.4
27 9
193.9
Q4
19 153 611 365.427 1
26 2
202.7
109Digitized for FRASER http://fraser.stlouisfed.org/ Federal Reserve Bank of St. Louis

41. Business credit of domestic finance companies, 1983A. Accounts receivableMillions of dollars
Type Jan. Feb. Mar. Apr. May June July Aug. Sept. Oct. Nov. Dec.
Total outstanding, end of period\ Retail automotive (commercial
vehicles)2 Wholesale automotive3 Retail paper on business,
industrial, and farmequipment
4 Loans on commercial accountsreceivable and factoredcommercial accountsreceivable
5 All other business credit
Changes during period,seasonally adjusted
6 Retail automotive (commercialvehicles)
7 Wholesale automotive8 Retail paper on business,
industrial, and farmequipment
9 Loans on commercial accountsreceivable and factoredcommercial accounts
12,734 12,948 13,772 14,811 15,372 16,252 16,809 17,540 18,671 19,523 20,519 21,26712,066 12,568 12,525 12,425 12,796 12,758 11,747 10,287 11,521 12,562 13,654 15,038
27,852 27,771 27,627 27,654 27,619 27,713 27,818 27,764 27,862 28,177 28,282 28,797
8,993 9,161 9,320 9,400 8,981 9,247 9,333 9,562 9,795 9,927 9,912 10,33219,185 19,132 18,995 18,791 18,677 18,924 18,592 18,421 18,910 19,051 19,120 19,784
269 396 645182 115 -590
-41
830226
580239
599 503 1,052 1,44352 -239 1,039 397
680 1,320 485310 662 583
381 283 -116 -167 -98 -67 =320 256 -406 =198 602
receivable10 All other business credit
501119
-243-523
102-520
73-126
-137-87
= 8244
18910
279-233
255558
149253
17= 8
121930
B. Extensions and repaymentsMillions of dollars, seasonally adjusted
Type
Extensions1 Retail automotive (commercial
vehicles)2 Wholesale automotive3 Retail paper on business,
industrial, and farmequipment
4 Loans on commercial accountsreceivable and factoredcommercial accountsreceivable
5 All other business credit
Repayments6 Retail automotive (commercial
vehicles)7 Wholesale automotive8 Retail paper on business,
industrial, and farmequipment
9 Loans on commercial accountsreceivable and factoredcommercial accountsreceivable
10 All other business credit
Jan.
1 2306,458
1,308
12,2861,526
9616 276
1,349
1 1 ,7851,407
Feb.
1,3366,643
1,477
11,6341,368
9406 528
1,096
11,8771,891
Mar.
1 6046,058
1,252
13 3271,683
9596 648
969
13,2252,203
Apr.
1 8106,494
1,180
1 1 ,8971,546
9806 268
1,296
11,8241,672
May
1,6156,971
1,344
13,4571,935
1,0356 732
1,511
13,5942,022
June
1 ,6757,468
1,331
13,0711,796
1,0767,416
1 ,429
13,0791,552
July
1,6156,363
1,220
12,6161,573
1,1126 602
1,287
12,4271,563
Aug.
2,1848,285
1,385
15,7942,234
1,1327 246
1,705
15,5152,467
Sept.
2,6207,461
1,149
13,7822,197
1,1777,064
893
13,5271,639
Oct.
1,9257,124
1,049
13,8221,921
1,2456,814
1,455
13,6731,668
Nov.
2,5928,516
1,504
15,3442,032
1,2727 854
1 702
15,3272,040
Dec.
1 8367,690
1,610
13 4412,761
1,3517 107
1 008
13,3201,831
110Digitized for FRASER http://fraser.stlouisfed.org/ Federal Reserve Bank of St. Louis

42. Mortgage markets, 1983Millions of dollars, except as noted
Item
PRIMARY MARKETS
Conventional mortgages on new homes
Terms '1 Purchase price (thousands of dollars) . . .2 Amount of loan (thousands of dollars) . . .3 Loan— price ratio (percent)4 Maturity (years)5 Fees and charges
(percent of loan amount)^6 Contract rate (percent per annum)
Yield (percent per annum)7 FHLBB series-'8 HUD series4
SECONDARY MARKETS
Yield (percent per annum)9 FHA mortgages (HUD series)5
10 GNMA securities6
FEDERAL NATIONALMORTGAGE ASSOCIATION
Mortgage holdings (end of period)1 1 Total12 FHA/VA13 Conventional
Mortgage transactions (during period)14 Purchases15 Sales
Mortgage commitments1
16 Contracted (during period)17 Outstanding (end of period)
FEDERAL HOME LOANMORTGAGE CORPORATION
Mortgage holdings (end of period)*18 Total19 FHA/VA20 Conventional
Mortgage transactions (during period)21 Purchases22 Sales
Mortgage commitments9
23 Contracted (during period)24 Outstanding (end of period)
Jan. Feb. Mar. Apr. May June July Aug.
Terms and yields in primary and secondary
88.965.475.226.5
2.4613.00
13.4913.44
12.8712.06
88.466.677.927.2
2.7812.62
13.1613.18
12.6511.94
80.160.576.824.2
2.2112.97
13.4113.17
12.6811.87
89.666.574.226.9
2.0912.02
12.4213.02
12.5011.76
92.167.877.526.8
2.4412.21
12.6713.09
12.4111.72
93.069.276.927.3
2.4311.90
12.3613.37
12,9612.09
97.372.376.528.1
2.5412.02
12.5014.00
14.2312.54
94.467.373.325.7
1.9612.01
12.3813.90
13.7813.01
Sept.
markets
100.776.578.527.2
2.4512.08
12.5413.60
13.5512.73
Oct.
95.872.578.426.9
2.3311.80
12.2513.52
13.2312.42
Nov.
98.076.780.526.5
2.5411.82
12.3413.48
13.2312.51
Dec.
94.873.379.127.3
2.5611.94
12.4213.41
13.2512.49
Activity in secondary markets
73,10638,92434,182
2,0450
2,0067,487
4,5601,0043,556
1,4791,641
2,0598,086
73,55538,76834,788
1,5941
7856,475
4,4501,0003,450
1,7561,756
8687,238
73,66638,40935,257
1,432111
1,1846,187
4,795995
3,800
2,8492,469
1,4385,845
73,55437,90135,653
1,004586
1,0235,811
4,997990
4,008
1,8071,525
3,0797,143
74,11637,66936,446
1,579204
1,5345,726
6,026984
5,042
2,4391,408
2,3346,889
74,66937S37637,293
1,33283
2,5065,887
6,235982
5,253
1,4941,244
2,3587,719
74,63037,09237,538
1,357786
1,1985,099
6,182971
5,211
1,5231,491
4,67110,794
75,05736,89438,163
1,213121
1,2825,165
6,149964
5,185
1,6211,588
6,36715,519
75,17436,67038,505
1,203464
2,7396,684
6,857961
5,896
2,2631,556
3,28316,512
75,66536,45539,210
1,244257
1,8827,182
6,971955
6,016
2,8862,750
2,59816,198
76,71436,34940,365
1,3480
9976,493
7,093940
6,153
1,2871,143
2,09316,994
78,25636,21142,045
2,204250
1,4715,461
7,633941
6,691
1,6851,115
1,70416,964
111Digitized for FRASER http://fraser.stlouisfed.org/ Federal Reserve Bank of St. Louis

43. Mortgage debt outstanding, by type of holder and type of property1
Millions oi' dollars, end of period
1 All holders
2 1 - to 4-i'amily3 Mul t i fami ly4 Commercial5 Farm
6 Major financial institutions7 Commercial banks'8 1- to 4- family9 Mul t i f ami ly
10 Commercial1 1 Farm12 Mutual savings banks13 1- to4-family14 Mult i family1 5 Commercial16 Farm17 Savings and loan associations18 1- to 4-family19 Mult i family20 Commercial21 Life insurance companies22 1- to 4-family23 Mult i family24 Commercial25 Farm
26 Federal and related agencies27 Government National Mortgage Association28 1- to 4-family29 Multifamily30 Farmers Home Administration31 1- to 4-family32 Mult i family3 3 Commercial34 Farm . . .35 Federal Housing and Veterans Administrations36 1- to 4-family37 Multifamily38 Federal National Mortgage Association39 i. to 4-family40 Mult i family41 Federal Land Banks42 1- to 4-family . . . .43 Farm44 Federal Home Loan Mortgage Corporation45 1- to 4-family46 Mul t i fami ly
47 Mortgage pools or trusts3
48 Government National Mortgage Association49 1- to 4-family50 Multifamily5 1 Federal Home Loan Mortgage Corporation52 1- to 4-family53 Multifamily .54 Federal National Mortgage Association55 1- to 4-family56 Farmers Home Administration57 1- to 4-family5H Multifamily59 Commercial60 Farm
61 Individuals and others4* . . .62 1- to 4-family .63 Mult i family64 Commercial65 Farm
Qi1,371,149
914.265129.960240 90086 024
951,213250 686152.592
11,80777.688
8 59999.15166,45016.39016,271
40478,981398 033
37.21743,731
122,39517 14319,26573,55412 433
103,9213,919
7493,1702 8451.139
408409889
5,6212 0223,599
53,99048 394
5,59633 311
1.70831 6034,2353.2101 025
124.63280 84378,872
1 97115 45412,3593,095
28,33514 9262,1594,4956 755
191,38311 6 66824 25824,75225 705
19
Q2
1 ,398,069
931,600132.365245 061
89 043
958.805252 972153 816
12,26778,417
8 47299 17666,61616,18616 334
40481,093399 788
37 33343,972
125,56417 80419 29275,72512 743
108 5394,466
7363,7303 3751 383
636402954
5,6912 0853,606
55,41949 837
5,58235 574
1 89333 6814 0143,037
977
129,64784 28282,208
2 07416 12012,8863 234
29 24515 2242,1594,7637 099
201 078124 28725 28925 44826 054
80
03
1,435,537
960,733134,590249 60690,608
977,500258 003157,046
12,59179,775
8 59199,^0666,91216,08816,276
30492,129410 091
37,74644,292
128,06217 99019,33877,91612 818
110.5264,389
7193,6703 525
978774^70
1,4035,6001 9863,614
55,63250071
5,56136 837
1,98534 8524,5433,4591 084
136,58389,45287,276
2 17616 65913,3183 341
30,47216 2262,2355,0596,952
210,928132 67626 ^7225,91825 962
Q4
1,471,786
986.979137,134255 655
92 018
997.168263 030160,326
12.92481,081
8 69999.86567.48916,05816 278
40503,192419 763
38 14245,287
131,08117 94319 51480,66612 958
114,3004,642
7043,9383 492
916610411
1 5555,6402 0513,589
57,32751 775
5 55238 1312099
36 0325 0683,8731 195
142,25893 87491.602
2 27216 85413,4713 383
31.53016 6832,6125,2716 964
218,060138 28427 34526,66125 770
Ql
1 ,497,629
1.004.072138.082261 012
94 463
1 ,006,985266 734161,758
13,28283,133
8 56199,71967,61915,95516,105
40507,615423 656
38,22345,736
132,91717 79919,52782,61612 975
116,2434,826
6964,1302 8371,321
528479509
5,7992 1353,664
57,36251 842
5,52040 258
2,22838 030
5,1613,9531 208
147,24697 , 1 8494,810
2 37417 06713.6413,426
32,99516 6402,8535,3828 120
227,155145 97427 39227,56126 228
19
Q2
1,533,329
1,028,436139,287268 08297,524
1.023,299273 225164.873
13,80086.091
8,46199,99368,03515,90915 999
50515,422430 841
38,09046,491
134,65917 54919,49584,57113 044
119,1244,972
6984,2742 6621J51
464357690
5,8952 1723,723
57,65752 1815,476
42 6812,401
40 2805,2574,0251 232
152,308100,55898,057
2,50117 56514,1153,450
34,18517 1653,0975,7508 173
238,598155 17327 77628,82326 826
81
Q3
1,561,738
1,047.787140,233273 7121 00 006
1,034 032279 017167 550
14,48188,588
8 39899 99466,11615,93915 909
30518,985433 923
37 99047,072
136,03617 37619 44186,07013 149
121 7724,382
6963,6861 562
500242325495
6,0052 2403,765
59,68254 227
5 45544 708
2 60542 1035 4334,1661 267
158,140103 750101,068
2 68217 93614,4013 535
36 45418 4073,4886,0408 519
247 794162 51228 26229 70827 312
Q4
1 583 264
1.065.294136 354279 889101 727
1 040 827284 536170 Oil
15,13291 026
8 36599 99768,18715,96015 810
40518 547433 142
37 69947,706
137 74717 20119 28388 16313 100
1 26 0944 765
6934,0722 235
914473506342
5,9992 2893,710
61,41255 986
5 42646 446
2 78843 6585 2375,181
56
163 000105 790103 007
2 78319 85319,501
352717717
36 64018 3783 4266J618 675
253 343167 29727 98230 51727 547
112Digitized for FRASER http://fraser.stlouisfed.org/ Federal Reserve Bank of St. Louis

43. Mortgage debt outstanding, by type of holder and type of property1—ContinuedMillions of dollars, end of period
Type of holder, and type of property1982
Ql Q2 Q3 Q4
1983
Ql Q2 Q3 Q4
1 All holders
2 1- to 4-family3 Muitifamily .4 Commercial .5 Farm
6 Major financial institutions7 Commercial banks2
8 1- to 4-familyMuitifamilyCommercialFarm
Mutual savings banks1- to 4-i'ami!yMultifamilyCommercialFarm
Savings and loan associations1- to 4-familyMultifamiiyCommercial
Life insurance companies . . .1- to 4-familyMuitifamilyCommercialFarm
26 Federal and related agencies27 Government National Mortgage Association28293031323334353637383940414243444546
1- to 4-fami!yMuitifamily
Farmers Home Administration1- to 4-familyMuitifamilyCommercialFarm
Federal Housing and Veterans AdministrationsI- to 4-familyMuitifamily
Federal National Mortgage Association1- to 4-familyMuitifamily
Federal Land Banks1- to 4-familyFarm
Federal Home Loan Mortgage Corporation . . .1- to 4-familyMuitifamily
1- to 4-familyMultifamily
Federal Home Loan Mortgage Corporation .1- to 4-familyMultifamily ,
Federal National Mortgage Association1- to 4-family
Fanners Home Administration1- to 4-familyMultifamilyCommercial ,Farm
1,603,344 1,624,176 1,632,126 1,655,013 1,681,630 1,723,052 1,775,117 1,826,356
1,078,182 1,090,472 1,091,696 1,105,756 1,122.111 1,146,926 1,182,356 1,214,550138,062 138,787 138,180 140,542 141,500 144,731 147,052 150,950283,218 289,412 295,782 302,009 311,107 323,427 336,697 351,289103,882 105,505 106,468 106,706 106,912 107,968 109,012 109,567
61 Individuals and others4
62 1- to 4-family63 Muitifamily64 Commercial65 Farm
,042,191289,515172,31915,66393,1378,39697,46466,30515,53615,594
29516,450430,46138,01147,978138,76217,08619,19989,52912,948
128,6984,438689
3,7492,469715615499640
6,0032,2663,73762,54457,1425,40247,9472,87445,0735,2975,240
57
172,303108,592105,7012,89123,97023,610
3602,7862,78636,95518,7403,4476,3518,417
260,152172,24829,39530.13028,379
1,042,801293,241172,98315,83595,9198,50496,34665,38115,33815,598
29513,675426,45338,37248,850139,53916,45118,98291,11312,993
131,4564,669688
3,9811,335491179256409
5,9082,2183,69065,00859,6315,37749,2702,95446,3165,2665,209
57
183,657111,459108,4872,97228,70328,329
3744,5564,55638,93919,3574,0446,7628,776
266,262177,28429,58630,91428,478
1,026,992297,288173,02216,02499,6808,56294,38263,84915,02615,479
28494,918406,32838,20050,382140,40416,86518,96791,64012,932
134,4094,110682
3,42894730246164435
5,3622,1303,23268,84163,4955,34649,9833,02946,9545,1665,116
50
198,376114,776111,7283,04835,13234,739
3938,1338,13340,33520,0794,3447,0568,856
272,349182,19930,06831,38128,701
1.023,541300,203173,15716,421102,2198,40697,80566,77715,30515,694
29483,614393,32338,97951,312141,91916,74318,84793,50112,828
138,1354,227676
3,5511,786783218377408
5,2281,9803,248
71,81466,5005,31450,3503,06847,2824,7804,733
47
216,654118,940115,8313,10942,96442,560
40414,45014,45040,30020,0054,3447,0118,940
276,633185,17030,75531,89528,813
1,028,802303,371172,34616,230106,3018,494
105,37873,24015,58716,522
29477,022384,71839,25953,045143,03116,38818,82595,15812,660
140,0283,753665
3,0882,077707380337653
5,1381,8673,27173,66668,3705,29650,5443,05947,4854,8504,795
55
234,596127,939124,4823,45748,00847,575
43318,15718,15740,49220,2634,3447,1158,770
278,204185,47931,27532,62928,821
1,048,688310,217174,03216,876110,4378,872
119,23684,34916,66718,192
28474,510377,94739,95456,609144,72515,86018,77897,41612,671
142,0943,643651
2,9921,605381555248421
5,0841,9113,17374,66969,3965,27350,8583,03047,8286,2356,119
116
252,665139,276135,6283,64850,93450,446
48820,93320,93341,52220,7284,3437,3039,148
279,605185,51531,86833,22229,000
1,079,605320,299178,05417,424
115,6929,129
129,64592,46717,58819,562
28482,305381,74441,33459,227147,35615,33418,857100,20912,756
142,2243,475639
2,83660021132113244
5,0502,0612,98975,17469,9385,23651,0693,00848,0616,8566,799
57
272,611151,597147,7613,83654,15253,539
61323,81923,8)943,04321,0835,0427,5429,376
280,677185,69931,20834,35229,418
1,109,975328,878181,67218,023119,8439,340
136,06696,57717,78721,673
29493.432389,81142,43561,186151,59915,38519,189104,27912,746
147,3713,395630
2,7652,1411,159173409400
4,8941,8933,00178,25673,0455,21151,0523,00048,0527,6337,756
57
285,021159,850155,8014,04957,84357,206
63725,12125,12142,20720,4045,0907,3519,362
283,989185,27032,53336,54829,638
113Digitized for FRASER http://fraser.stlouisfed.org/ Federal Reserve Bank of St. Louis

44. Installment credit—Total outstanding, and net change1*Millions of dollars
Holder, and type of credit
1 Total
By major holder2 Commercial banks3 Finance companies4 Credit unions . .5 Retailers2
6 Savings and loans7 Gasoline companies8 Mutual savings banks
By major credit type9 Automobile . .
10 Commercial banks1 1 Indirect paper12 Direct loans13 Credit unions14 Finance companies
15 Revolving . . .16 Commercial banks17 Retailers18 Gasoline companies . .
19 Mobile home20 Commercial banks21 Finance companies22 Savings and loans23 Credit unions . . .
24 Other25 Commercial banks26 Finance companies27 Credit unions . . .28 Retailers29 Savings and loans30 Mutual savings banks . . .
31 Total
By major holder32 Commercial banks33 Finance companies34 Credit unions35 Retailers2
36 Savings and loans37 Gasoline companies38 Mutual savings banks
By major credit type39 Automobile40 Commercial banks41 Indirect paper42 Direct Joans43 Credit unions44 Finance companies
45 Revolving46 Commercial banks47 Retailers48 Gasoline companies
49 Mobile home50 Commercial banks .51 Finance companies52 Savings and loans53 Credit unions
54 Other55 Commercial banks56 Finance companies57 Credit unions58 Retailers59 Savings and loans60 Mutual savings banks . . .
1982
Jan. Feb. Mar. Apr. May June July Aug. Sept. Oct. Nov. Dec.
Amounts outstanding (end of period)
332,793
146,78288,92545,90730,03712,4484,5414,153
124,58057,90434,35623,54821,95344,723
63,10932,54226,0264,541
17,88210,1194,4812,794
488
127,22246,21739,72123,4664,0119,6544,153
330,571
145,78889,00945,58628,99212,6384,4334,125
124,49857,80834,28823,52021,79944,891
61,47231,94825,091
4,433
17,79510,0074,5062,797
485
126,80646,02539,61223,302
3,9019,8414,125
330,671
145,58889,59145,63228,57012,8834,2294,178
124,91757,86834,29423,57421,82145,228
60,67531,68724,7594,229
17,7999,9324,5482,834
486
127,27946,10139,81523,325
3,81110,0494,178
332,394
146,18690,67445,44928,63813,0254,2274,195
125,69357,95034,35823,59221,73346,010
61,06531,93724,9014,227
17,8569,9244,6082,840
484
127,78046,37540,05623,232
3,73710,1854,195
333,907
146,16791,95845,47228,69813,1454,2184,249
126,83857,71734,25023,46721,74447,377
61,33232,08325,0314,218
17,9669,9694,6662,847
484
127,77146,39839,91523,244
3,66710,2984,249
336,976
147,22793,00945,88128,86813,2674,3984,326
128,14357,86834,36523,50321,94048,335
62,26332,61825,2474,398
18,0579,9844,7312,854
488
128,51346,75739,94323,453
3,62110,4134,326
338,205
147,55993,35345,69728,99413,6324,6004,370
128,11057,88234,38923,49321,85248,376
62,96932,93725,4324,600
18,1359,9774,8012,871
486
128,99146,76340,17623,359
3,56210,7614,370
340,094
148,43893,20746,15429,09614,0294,7144,456
128,05157,99234,34523,64722,07147,988
63,80233,50925,5794,714
18,2909,9674,9162,916
491
129,95246,97040,30323,593
3,51711,1134,456
342,885
149,80193,35746,84729,23514,4354,6694,541
128,86558,54234,72823,81422,40247,921
64,45034,01725,7644,669
18,3719,9564,9532,964
498
131,19947,28640,48323,947
3,47111,4714,541
341,959
149,22092,54146,64529,51315,0954,3224,623
128,15558,33234,60423,72822,30647,518
64,53134,10426,1054,322
18,3479,8384,9713,042
496
130,92646,94640,05223,8443,408
12,0534,623
343,737
149,02193,46246,83230,16715,4004,1414,714
128,85458,25634,60023,65622,39548,203
65,14434,21826,7854,141
18,3189,7584,9703,092
498
131,42146,78940,28923,9393,382
12,3084,714
355,849
152,49098,69347,25332,73515,8234,0634,792
131,08659,55534,75523,47222,59648,935
69,99836,66629,2694,063
22,2549,6059,0033,143
503
132,51146,66440,75524,154
3,46612,6804,792
Net change (during period)3
417
105-204
308-261402767
66119219
-100176
-229
-108-126
-927
5-45
1928
3
454157
6129
-1711267
167
77102
-110-6013934
-15
-145-100-94-6
-6015
102127
-5934
-16-96
5824-2
22614629
-48-1115
-15
633
420204
-123121172
-158-3
-281-216-170-46-73
8
523546135
-158
33-61
5541
2
358151141
-48-14
131-3
1,623
68063111054
139-817
5462093
-7358
468
653576
85-8
68-26
59332
35611010450
-31106
17
1,844
4981,027-49187160
-1435
1,093-115-27-88-31
1,239
751540225
= 14
962
47470
-9671
-259-18-3811335
2,023
4461,067
79197198
1422
969-91-5
-8642
1,018
727532181
14
95-20
6252
1
23225
-133616
14622
839
, 287152
-47246190-718
37142201-59-19-86
558299266-7
108-16
6657
1
136-138
172-29-20133
18
256
-21-192
157-432634547
-380-91
-1435260
-349
199166
-1245
111-22108892
260-74
4995
-3117447
1,256
68810625569
200-88
26
349360238122110
-121
311311
88-88
75-61860
3
52123
209142
-1914026
-131
73-372
38-67274
-10831
-701371172016
-223
81223
-34-108
-35-105
-978
1
-107-182-140
21-3319631
2,015
4571,051
412-51
181-35
0
1,534336134202211987
39740
= 35
23-47
5614
4199459
197-51120
0
2,418
1,1111,024
197-91201-51
27
1,491527429
9889
875
501650-98-51
-37-74-15
493
4638
164105
715227
114Digitized for FRASER http://fraser.stlouisfed.org/ Federal Reserve Bank of St. Louis

44. Installment credit—Total outstanding, and net change1A—ContinuedMillions of dollars
Holder, and type of credit1983
Jan. Feb. Mar. Apr. May June July Aug. Sept. Oct. Nov. Dec.
Amounts outstanding (end of period)
1 Total
By major holder2 Commercial banks . .3 Finance companies . .4 Credit unions5 Retailers2
6 Savings and loans . . .7 Gasoline companies .8 Mutual savings banks
By major credit type9 Automobile
10 Commercial banks .11 Indirect paper . .12 Direct loans13 Credit unions14 Finance companies
15 Revolving16 Commercial banks .17 Retailers18 Gasoline companies ,
19 Mobile home20 Commercial banks .21 Finance companies22 Savings and loans .23 Credit unions
24 Other25 Commercial banks . . .26 Finance companies . ,
Credit unionsRetailers
272829 Savings and loans30 Mutual savings banks
31 Total
By major holder32 Commercial banks . .33 Finance companies . .34 Credit unions35 Retailers2
36 Savings and loans . . .37 Gasoline companies .38 Mutual savings banks
By major credit type39 Automobile40 Commercial banks .41 Indirect paper . .42 Direct loans43 Credit unions44 Finance companies
45 Revolving46 Commercial banks .47 Retailers48 Gasoline companies
49 Mobile home50 Commercial banks .51 Finance companies52 Savings and loans .53 Credit unions
54 Other55 Commercial banks . . .56 Finance companies . .57 Credit unions58 Retailers59 Savings and loans , . .60 Mutual savings banks
353,254 349,761 351,736 353,263 355,302 360,605 365,498 371,295 375,246 379,334 384,410 396,082
150,13199,62646,94631,30216,2284,1024,919
148,70998,44646,75730,04016,9793,7805,050
148,99799,44147,08129,82617,5923,6695,130
149,31199,35747,50529,87118,0223,9805,217
149,601100,11647,83830,04118,4843,9435,279
152,065101,05648,65230,34718,9454,1595,381
154,914102,08449,13930,40319,1354,3565,467
158,402102,54150,12130,64819,4614,4575,665
160,973102,17451,12330,92619,9854,3385,727
163,274102,33851,76731,33720,4724,2435,903
165,670102,56052,57832,37121,0234,1576,051
171,978102,86253,47135,91121,6154,1316,114
129,063 128,06357,135 56,758
129,392 129,842 130,938 132,91656,745 56,865 57,352 58,231
135,373 138,242 139,00259,695 62,178 63,448
140,101 141,107 142,44964,780 65,917 67,557
22,45849,470
68,32336,31327,9084,102
22,6379,8459,0773,217498
133,23146,83841,07923,9903,39413,0114,919
22,36048,945
66,03335,54126,7123,780
22,6689,8429,0673,263496
132,99746,56840,43423,9013,32813,7165,050
22,51850,129
65,82635,62526,5323,669
22,6539,7959,0803,279499
133,86546,83240,23224,0643,29414,3135,130
22,72150,256
66,35535,77326,6023,980
22,6369,6979,1063,330503
134,43046,97639,99524,2813,26914,6925,217
22,88050,706
23,269 23,50251,416 52,176
23,97252,092
24,451 24,759 25,147 25,57451,103 50,562 50,043 49,318
66,423 67,945 68,866 70,00635,687 36,697 37,358 38,16226,793 27,089 27,152 27,3873,943 4,159 4,356 4,457
22,6739,6729,1453,349507
135,26846,89040,26524,4513,24815,1355,279
22,7229,7609,0773,369516
137,02247,37740,56324,8673,25815,5765,381
22,8309,8269,0803,403521
138,42948,03540,82825,1163,25115,7325,467
22,9339,8519,1403,471531
140,05448,21141,30925,6183,26115,9905,727
71,03939,04127,6604,338
23,1899,8769,1963,575542
142,01648,60841,87526,1303,26616,4105,727
72,10539,77428,0884,243
23,3589,8779,2503,682549
143,77048,84342,52626,4593,24916,7905,903
74,03240,77429,1014,157
23,4929,8719,2703,793558
145,77949,10843,24726,8733,27017,2306,051
80,82344,18432,5084,131
23,6809,8429,3653,906567
149,13050,39544,17927,3303,40317,7096,114
Net change (during period)3
2,595
-2101,987
20196516-78164
280-854
201,114
309174213-78
250173
177-1
1,756297872
1-17439164
22
252-981
4322742
-200144
-514-94
15-435
517035
-200
-1855
-10937-1
549121
-43729
-13705144
2,937 2,041 2,272 3,861 3,706 4,093 2,553 5,093 4,819 5,782
841921143331609-35127
763-142
68837
1,047763319-35
174-61220123
953281
-1367212
597127
485-6770816736829981
44175
34125
971489183299
51-7597236
578-4
-189361-1634581
798 1,565 2,223 2,278 1,709 2,713 2,832 3,977372288255542-5168
706508
13761
584370265-51
100-60126304
882-20185147-1051268
80657329462377
-77
1,440587
275578
1,10474228577
1634865446
1,1541881632929
579-77
507662161475
101
1,8491,282
328239
6164401715
23736137577
1,004465131327-10-10101
63851016426565173
2,3722,063
23277
54131516165
222-11153755
958-894082733
190173
-385646225448
-16777
2951,014
309- 1 ,028
579511235
-167
25510
1371017
1,424174506330-1034777
470942215437131185
1,7091,483
451-225
1,238875232131
-3023
-1589510
2,176332853481-17342185
-4091231858458155
1,2681,257
436-425
1,4271,04032958
-64-4
-1649410
2,188539549466-11490155
-146731537589-31126
1,4681,568
349-449
1,6901,207515-31
139
-1661209
2,6231,16346937422469126
115Digitized for FRASER http://fraser.stlouisfed.org/ Federal Reserve Bank of St. Louis

45. Flow of funds accounts—Financial assets and liabilities, December 31, 1983A. All sectorsAmounts outstanding, billions of dollars
Line, and transaction category
1 Total financial assets
2 total liabilities
3 Gold2
4 Special drawing rights5 International Monetary
Fund position6 Official foreign Exchange7 Treasury currency
8 Checkable depositsand currency
9 Private domestic1 0 Foreign11 U S government
12 Small time andsavings deposits
13 Money market fund shares
14 Large time deposits15 Federal funds and
security RPs16 Deposits abroad
17 Life insurance reserves18 Pension fund reserves19 Interbank claims
20 Corporate equities3
21 Credit market instruments . . .22 U.S. Treasury
securities4
23 Federal agencysecurities^
24 State and local govern-ment securities5
25 Corporate andforeign bonds . . . . . .
26 Mortgages27 Consumer credit28 Bank loans n.e.c29 Open market paper30 Other loans
31 Security credit32 Trade credit6
33 Taxes payable34 Miscellaneous
Households
Assets Liabi
ties
6 042 4
Private domestic nonfinancial sectors
Business andtoUl T°ta
*' Assets Li^H- Assets L«jWK- Assets l
1 .lOd.l 2W.2 7.645.9
^P^work! government
tf AssetS "'lief Assets "
545.8 273.0
1,923.0 2,367.9 416.6 4,707.4 574.9 1,338.4
™ 1
338 7338 7
1,532.2 . . .162 6
141.5 . . .
262 61,105.6 ...
1,519.5 . . .
868.1 1,832
329.3 . . .
95 7
160.0 . . .
58 6
103 3 55 447 5103 3 55 447.5
12.3 1,544.5162 6
71.8 55.2 268.6
30 5 20 3 . . . . 50.815.4 15.4
. . 262.61,105.6
1 519 5
21.6 . . - 5.0
113 1146.3 2 6
16.9
17.5 10.9 . .
17.5109
.8
35.0
37.3
9.6112.0
-53.3
95.6
.2 125.7 1,813.3 193.8 395.5 1,187.6 4,041.0 249.9 245.6 213.2 1,177.9
118 93 3 434 3 166 1 1.174 4
18 40 3 137 9
4.2 83.8 8.4 384.7 172.6
471 0 58.6184.3 1,238.4 577.7 51.8 236.1 1
484 8 63 0 63 0. . . . 32 ^ 467 1
40.2 . . .It
19.3 412t
92.2 ie
44.9 56.7 85.1>.7 207.0 10.8
r 8 19 3> 5 545 9 438 9 21.0 545 9
5 2 12 1 12 1>.4 411.7 110.5 503.9
33
468.6
421.0 46.4 63.1816 1 50 9 2484 8499.4 35.356 7 37 4 80 9
294.4 66.2 162.3
47 8486.4 24.7 12.7 26.6 21.9
5 2 -98127.0 116.6 261.8 12.3 *
116Digitized for FRASER http://fraser.stlouisfed.org/ Federal Reserve Bank of St. Louis

Financial sectors
Sponsored agenciesTotal and mortgage pools
Assets
5,766.7
11.1
*3.7
18.4
55.555.5
10.2
49.5
53.321.9
44.6
535.6
4,589.6
573.9
317.5
296.0
484.21,531.5
421.8565.1137.4262.3
71.622.2
' 279.5*
Liabiii- Assets Liabili-ties ties
502.4
5,508.7 495.4
573.8 .8541.3 .8
17 515.0
1,555.5162 6
353.1
167.9 13.0
253.0993 6-6.9
129 4
775.7 480.6 457.0
2 9
452.0 .5 452.0
105 02.2 381.6
30 3122 3 864.0 94.8 5.0
43 1
2 2505.7 8.2 38.4
Monetary Commercialauthority banking
Assets Lifabili- Assetsties
201.9 1,756.5
201.9
11 1
*3 7
18.4
153.9 7 8149.3 7.8
54.1
2.5 42.1 42.1
161.2 1,566.8
151 9 183 2
89 80 6
159 6
130329.7218.9565 1
.4 16.7
29 1
5.1 5.9 110.5
Liabili-ties
1,656.9
385.5357.6
17.010.9
742.9
253.7
142.7
-49.1
68.6
30.6
" '38.0'
.3112.3
Privatenonbank finance
Assets
3,305.9
46.946.9
10.2
49.5
40.321.9
535.5
2,381.0
236.0
• 227.5
136.4
471.2820.1202.9
' 119.5"167.5
42.522.2
* 155/7
Liabili-ties
3,154.4
34.334.3
812.6162.6
99.4
25.2
253.0993.6
129.4
250.1
74.42.2
30.384.359.0
43.1
1.9349.1
FloatsAll and
sectors' discrep-ancies
Assets Lit^i»- Assets
14,231.4 -4.7
12,129 4
49 326.7
11.3 11.36.3 6.3
18.4 16.9 -1.5
531.4 573.8 42.4503.0 541.3 38.3
17.5 17 510.9 15.0 4.1
1,555.5 1,555.5162.6 162.6
353.1 353.1
104.0 167.9 63.837.3 37 3
262.6 262.61 105.6 1,105 6
-8.6 -6.9 1.7
2,150-8 129.4
6,240.3 6,240.3
1,174.4 1,174.4
455.3 455.3
468.6 468.6
589.2 589.21,818.4 1,818.4
484.8 484.8565.1 565.1259.9 259 9424.6 424.6
91.0 91 0619.4 520.9 -98.4
2.3 7.4 5.1912.3 894.5 -17.8
Line
1
2
34
567
89
1011
1213
14
1516
171819
20
21
22
23
24
252627282930
31323334
117Digitized for FRASER http://fraser.stlouisfed.org/ Federal Reserve Bank of St. Louis

45. Flow of funds accounts—Financial assets and liabilities, December 31, 1983—ContinuedB. Private nonbank financial institutionsAmounts outstanding, billions of dollars
Transaction category
1 Total assets
2 Total liabilities
3 Checkable deposits4 Small time and
savings deposits5 Money market fund shares . . .
6 Large time deposits
7 Federal funds andsecurity RPs
8 Deposits abroad
9 Life insurance reserves10 Pension fund reserves
1 1 Corporate equities3
1 2 Credit market instruments . . .13 U.S. Treasury
securities4
14 Federal agencysecurities^
15 State and local govern-ment securities .
16 Corporate and foreignbonds
17 Mortgages1 8 Consumer credit19 Bank loans n.e c.20 Open-market paper21 Other loans
22 Security credit23 Trade credit24 Taxes payable2 5 Miscellaneous . . . .
Savings Mutual Credit ^e PrivateTotal and loan savings unions insurance pension
associations banks companies funds
Assets L«*jH- Assets LaWli- Assets Liabili- Assets Liabili- Assets Liabili- Assgts Liabili-
3,305.9 821.7 191.5 103.1 636.5 409.3
3,154.4 794.7 . . . . 180.4 95.9 604.4 409.3
46 9 34 3 91 19 8 43 77 15 68 46 22
10 2 812 6 . . . . 570.4 . 153 1 10.2 89.2. . . 162 6
49 5 99 4 15.2 87 8 11 116 22 70
40 3 25 2 21 1 25 2 6 221 9
253 0 253 0993 6 . . 270 6 409 3
535.5 129.4 4.2 65.1 250.7
2,381.0 250.1 696.4 71.6 166.6 89.1 514.6 142.0
236 0 27 9 98 23 4 25.0 . . . 49 1
227 5 102 3 23 2 6 1 24 0 19 5
1364 .9 2.2 10.7
471 2 74 4 . . . . 3.5 21 7 221.0 . . . 68 2820 1 2 2 526.3 46.3 6.0 150.2 5.2 . . .202 9 26.6 60 53 5
30 3 9.2119 5 84 3 12 5 7 8 29 3167 5 59 0 . 59 0 . . . . . 54.5
4 2 5 4 3 1 . . . . .22 2
1 9 . 1 . . . . 6155 7 349 1 79.9 19.8 9.1 8.1 52.1 80.2 7.4
118Digitized for FRASER http://fraser.stlouisfed.org/ Federal Reserve Bank of St. Louis

State andlocal governmerretirement fund
Assets Liabil
ties
313.7
313.
6.0
. Other Finance Re
it insurance companies in
s companies r
'- Assets Liabili- Assets Liabili- Assetties ties
228.1 252.7 7.
7 155.2 256.2
86 50
313.7
88 1 4K 1
219.6
45.5
40.0
3.0
116.614.5
149.2 247.7 J72.0 2.
21 0
12 4
88 2
al estate Open-end Money Security/estment investment market brokerstrusts companies funds and dealers
s Liabili- Assets Liabili- Assets Liabi1'- Assets Liabi1'-ties ties ties ties
9 129.4 162.6 49.4
8.4 129.4 162.6 44.1
1 7 . -.3 4 1
162 6
24.0
13.021.9
75 1 1 29 4 4 1
1 6.5 52.6 102.4 -1.3
5 7 . 36.2 -77
30 1 1 4
25.7 70.3 .7 13.0 5.019 178 2 1 7 7
116.917.784 0
113.0
22.22 *
155 0 84 1 5
3.43 3 8 66 2
42 5 43 1
98 2.0 1.5.
Line
1
2
3
45
6
78
910
11
12
13
14
15
161718192021
22232425
119Digitized for FRASER http://fraser.stlouisfed.org/ Federal Reserve Bank of St. Louis

46. Flow of funds accounts, 1972-83A. Summary of credit market debt outstanding, by sectorAmounts outstanding at end of year, billions of dollars
Transaction category, or sector
1 Total credit market debt owed bydomestic non financialsectors
2 U S government3 Treasury issues4 Agency issues and mortgages . . .
5 Private domestic nonfinancialsectors
6 Debt capital instruments7 State and local obligations . . .8 Corporate bonds . . .9 Mortgages
10 Home mortgages1 1 Multifamily residential . . . .12 Commercial1 3 Farm
14 Other debt instruments15 Bank loans n.e.c16 Consumer credit1 7 Open market paper1 8 Other
19 By borrowing sector, total20 State and local governments . . . .21 Households
22 Nonfinancial business23 Farm24 Nonfarm noncorporate25 Corporate
26 Foreign credit market debt heldin United States
27 Bonds28 Bank loans n.e.c. .29 Open-market paper30 U.S. government loans31 Total nonfinancial domestic plus
foreign
1972 1973 1974 1975 1976 1977 1978 1979 1980 1981 1982 1983
Nonfinancial sectors
1,730.9
340.8331.5
9.3
1,390.1968.5176.5198.3593.7365.1
81.0111.835.8
421.6158.3177.6
10.675.0
1,390.1181.4591.0
617.857.2
148.0412.5
60.616.09.73.2
31.7
1,791.6
1,919.1
349.1339.4
9.6
1,570.11,072.8
191.2207.5674.1410.8
91.4130.741.3
497.3195.4203.7
13.185.1
1,570.1193.7670.5
705.966.9
177.7461.3
67.017.012.54.2
33.4
1,986.2
2,094.2
360.8351.5
9.4
1,733.41,173.1
207.7227.1738.3447.9
98.3145.846.3
560.3228.3213.6
19.898.6
1,733.4209.2724.2
800.074.7
197.8527.4
79.819.116.511.432.8
2,174.0
2,288.8
446.3437.3
8.9
1,842.61,275.8
223.8254.3797.7490.0
98.9157.950.9
566.7217.7223.2
17.2108.7
1,842.6222.9776.1
843.583.2
211.9548.5
91.225.318.511.735.7
2,380.0
2,532.6
515.8506.4
9.3
2,016.91,399.4
239.5277.2882.8553.8102.7169.656.6
617.4222.0248.6
21.2125.6
2,016.9238.2866.5
912.293.4
227.3591.5
110.633.924.113.639.0
2,643.2
2,854.1
572.5564.1
8.4
2,281.51,572.3
262.9300.0
1,009.4647.8109.8188.063.6
709.2248.9289.1
24.3146.9
2,281.5253.6
1,004.1
1,023.9105.6255.6662.6
123.938.927.116.141.8
2,978.0
3,218.1
626.2519.2
7.0
2,591.91,772.0
291.3321.2
1,159.6759.9119.1209.7
70.8
819.9284.5337.925.4
172.1
2,591.9272.7
1,171.8
1,147.3120.3286.0741.1
161.943.146.426.645.7
3,380.0
3,604.2
663.6658.0
5.6
2,940.71,985.0
321.6338.5
1,324.9881.5126.9233.9
82.7
955.6333.9383.436.5
201.8
2,940.7293.2
1,348.9
1,298.5141.6320.4836.5
182.547.048.737.849.0
3,786.7
3,946.9
742.8737.8
5.0
3,204.12,177.0
351.9365.1
1,460.0978.2135.8254.092.0
1,027.1370.5388.241.7
226,6
3,204.1313.6
1,468.8
1,421.7156.0353.7912.0
209.647.860.248.053.6
4,156.4
4,323.8
830.1825.6
4.5
3,493.72,335.4
373.7387.2
1,574.51,058.9
135.3278.6101.7
1,158.3425.0412.4
60.9260.0
3,493.7323.2
1,594.2
1,576.3172.3393.2
1,010.8
237.053.364.161.957.8
4,560.8
4,710.1
991.4987.7
3.7
3,718.72,479.2
424.3406.0
1,648.91,109.7
135.5296.9106.9
1,239.5478.8430.7
57.9272.2
3,718.7359.6
1,674.4
1,684.8181.3417.1
1,086.4
226.459.929.474.962.2
4,936.5
5,219.0
1,177.91,174.4
3.6
4,041.02,705.7
486.6421.0
1,816.11,213.5
148.0345.0109.6
1,335.3499.4484.8
56.7294.4
4,041.0395.5
1,832.2
1,813.3183.8486.2
1,143.3
245.663.135.380.966.2
5,464.5
120Digitized for FRASER http://fraser.stlouisfed.org/ Federal Reserve Bank of St. Louis

46. Flow of funds accounts, 1972-83—ContinuedA. Summary of credit market debt outstanding, by sector-Amounts outstanding at end of year, billions of dollars
-Continued
Transaction category, or sector
32 Total credit market debt owedby financial sectors
By type of instrument33 U S government-related34 Sponsored credit agency
securities35 Mortgage pool securities36 Loans from U S government
37 Private financial sectors38 Corporate bonds39 Mortgages40 Bank loans n.e c.41 Open-market paper42 Loans from Federal Home
Loan Banks
43 Total, by sector
44 Sponsored credit agencies45 Mortgage pools46 Private financial sectors47 Commercial banks . .48 Bank affiliates49 Savings and loan associations . . .50 Finance companies51 Real estate investment trusts . . . .
52 Total credit market debt
53 U.S. government securities54 State and local obligations55 Corporate and foreign bonds . . . .56 Mortgages57 Consumer credit .58 Bank loans n e e59 Open-market paper60 Other loans
Selected claims not included above61 Security credit62 Trade credit63 Investment company shares64 Other corporate equities
1972 1973 1974 1975 1976 1977 1978 1 1979 1980 1981 1982 1983
Financial sectors
148.2
57.9
43.514.4
90.333.0
1.220.427.8
8.0
148.2
43.514.490.34.16.89.5
61.18.8
194.0
77.9
59.818.0
116.237.4
1.529.532.7
15.1
194.0
59.818.0
116.24.1
10.017.170.714.4
232.6
98.6
76.421.5
.7
134.040.5
1.633.636.5
21.8
232.6
77.121.5
134.04.3
14.423.376.215.8
239.9
108.9
78.828.5
1.6
131.043.7
2.029.937.5
17.8
239.9
80.328.5
131.04.5
15.019.176.715.7
261.1
123.1
81.240.7
1.2
138.053.62.4
26.439.7
15.9
261.1
82.440.7
138.05.2
20.417.481.213.8
307.1
145.5
88.256.8
.5
161.563.72.4
26.049.2
20.2
307.1
88.756.8
161.55.7
22.424.397.911.3
381.6 465.3
182.6 231.8
111.3 135.570.4 94.8
.9 1.5
199.1 233.571.2 79.0
2.5 2.628.8 28.363.9 81.8
32.7 41.8
381.6 465.3
112.2 137.070.4 94.8
199.1 233.55.9 6.1
29.5 36.037.8 50.3
116.2 132.79.7 8.4
528.6
276.6
159.9114.0
2.7
252.086.12.4
27.986.6
49.0
528.6
162.6114.0252.0
6.342.957.8
138.96.2
614.0
324.0
190.4129.0
4.6
290.085.3
1.930.1
107.6
65.2
614.0
195.0129.0290.0
6.251.273.4
152.96.4
686.8
388.9
205.4178.5
5.0
298.087.52.0
33.3109.1
66.0
686.8
210.4178.5298.0
6.853.370.4
161.16.4
775.7
457.0
207.0245.0
5.0
318.7105.0
2.230.3
122.3
59.0
775.7
212.0245.0318.7
6.761.971.6
172.06.5
AH sectors
1,939.8
397.4176.5247.3596.2177.6188.541.6
114.7
37.4221.358.9
1,138.1
2,180.2
425.7191.2261.9676.9203.7237.3
50.0133.7
29.5264.246.6
901.4
2,406.7
457.6207.7286.7741.1213.6278.467.6
153.9
24.7211.3
35.2641.7
2,619.9
552.5223.8323.4800.8223.2266.1
66.4163.8
28.5223.643.0
849.5
2,904.3
636.7239.5364.6886.2248.6272.574.6
181.6
41.1243.046.5
1,005.5
3,285.0
716.7262.9402.6
1,012.7289.1302.1
89.5209.4
43.4271.145.4
950.0
3,761.6 4,252.0
807.1 893.2291.3 321.6435.4 464.4
1,162.9 1,328.2337.9 383.4359.7 410.9115.9 156.2251.3 294.1
44.6 46.7332.1 393.545.8 51.2
982.5 1,179.5
4,685.1
1,016.1351.9499.1
1,463.0388.2458.6176.3331.9
59.2441.8
63.51,572.1
5,174.8
1,149.1373.7525.7
1,576.9412.4519.2230.3387.6
60.1475.5
63.81,504.7
5,623.3
1375.0424.3553.4
1,651.3430.7541.5241.9405.4
66.6463.4
89.51,720.7
6,240.3
1,629.7468.6589.2
1,818.4484.8565.1259.9424.6
91.0520.9129.4
2021.4
121Digitized for FRASER http://fraser.stlouisfed.org/ Federal Reserve Bank of St. Louis
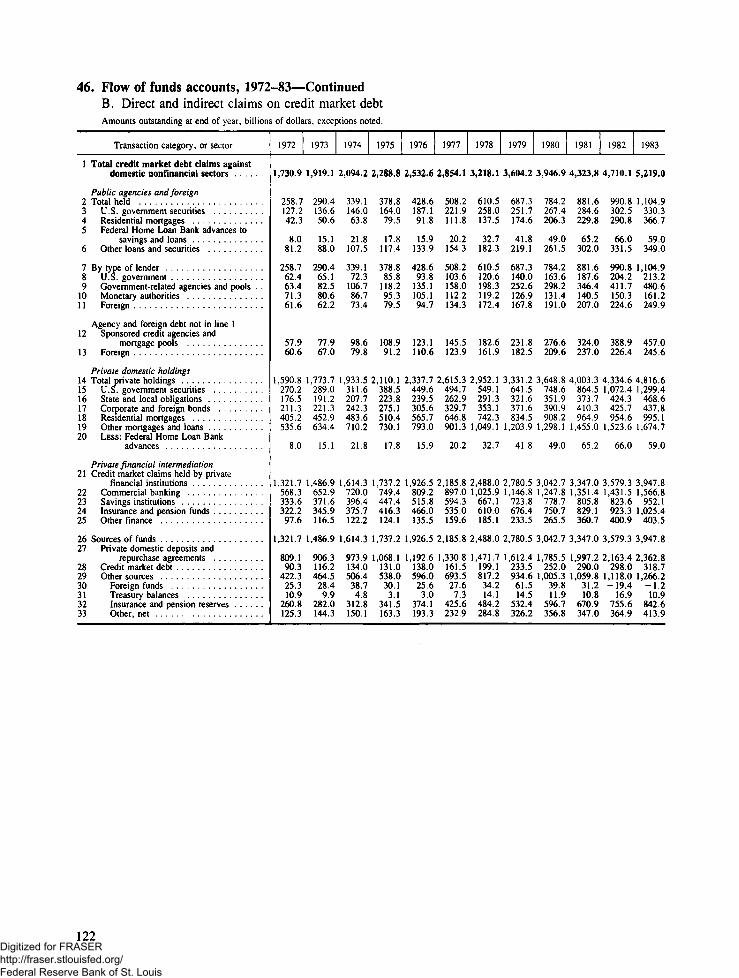
46. Flow of funds accounts, 1972-83—ContinuedB. Direct and indirect claims on credit market debtAmounts outstanding at end of year, billions of dollars, exceptions noted.
Transaction category, or sector
1 Total credit market debt claims againstdomestic nonfinancial sectors
Public agencies and foreign2 Total held3 U.S. government securities4 Residential mortgages5 Federal Home Loan Bank advances to
savings and loans . .6 Other loans and securities
7 By type of lender8 U.S. government .9 Government-related agencies and pools . .
10 Monetary authorities1 1 Foreign
Agency and foreign debt not in line 112 Sponsored credit agencies and
mortgage pools13 Foreign
Private domestic holdings14 Total private holdings15 U S government securities16 State and local obligations . .17 Corporate and foreign bonds18 Residential mortgages19 Other mortgages and loans . .20 LESS: Federal Home Loan Bank
advances
Private financial intermediation21 Credit market claims held by private
financial institutions22 Commercial banking23 Savings institutions . . . .24 Insurance and pension funds25 Other finance . .
26 Sources of funds27 Private domestic deposits and
repurchase agreements28 Credit market debt29 Other sources30 Foreign funds . . .31 Treasury balances . . .32 Insurance and pension reserves33 Other, net
1972
1,730.9
258.7127.242.3
8.081.2
258.762.463.471.361.6
57.960.6
1,590.8270 2176.5211.3405 2535.6
80
1,321.7568.3333.6322.297.6
1,321.7
809.190.3
422.325.310.9
260.8125.3
1973
1,919.1
290.4136.650.6
15.188.0
290.465.182.580.662.2
77.967.0
1,773.7289 0191.2221.3452 9634.4
15 1
1,486.9652.9371.6345.9116.5
1,486.9
906.3116.2464.5
28.49.9
282.0144.3
1974
2,094.2
339.1146.063.8
21.8107.5
339.172.3
106.786.773.4
98.679.8
1,933.5311 6207.7242.3483 6710.2
21 8
1,614.3720.0396.4375.7122.2
1,614.3
973.9134.0506.438.74.8
312.8150.1
1975
2,288.8
378.8164.079.5
17.8117.4
378.885.8
118.295.379.5
108.991.2
2,110.1388 5223.8275.15104730.1
17.8
1,737.2749.4447.4416.3124.1
1,737.2
1,068.1131.0538.0
30.13.1
341.5163.3
1976
2,532.6
428.6187.191.8
15.9133.9
428.693.8
135.1105.194.7
123.1110.6
2,337.7449.6239.5305.6565.7793.0
15.9
1,926.5809.2515.8466.0135.5
1,926.5
1,192.6138.0596.025.63.0
374.1193.3
1977 1978
2,854.1 3,218.1
508.2 610.5221.9 258.0111.8 137.5
20.2 32.7154.3 182.3
508.2 610.5103.6 120.6158.0 198.3112.2 119.2134.3 172.4
145.5 182.6123.9 161.9
2,615.3 2,952.1494.7 549. 1262.9329.7646.8901.3
20.2
2,185.8897.0594.3535.0159.6
2,185.8
1,330.8161.5693.527.6
7.3425.6232.9
291.3353.1742.3
1,049.1
32.7
2,488.01,025.9
667.1610.0185.1
2,488.0
1,471.7199.1817.234.214.1
484.2284.8
1979 1980
3,604.2 3,946.9
687.3 784.2251.7 267.4174.6 206.3
41.8 49.0219.1 261.5
687.3 784.2140.0 163.6252.6 298.2126.9 131.4167.8 191.0
231.8 276.6182.5 209.6
3,331.2 3,648.8641 5 748.6321.6371.68345
1,203.9
41 8
2,780.51,146.8
723.8676.4233.5
2,780.5
1,612.4233.5934.661.514.5
532.4326.2
351.9390.9908.2
1,298.1
49.0
3,042.71,247.8
778.7750.7265.5
3,042.7
1,785.5252.0
1,005.339.811.9
596.7356.8
1981
4,323.8
881.6284.6229.8
65.2302.0
881.6187.6346.4140.5207.0
324.0237.0
4,003.3864 5373.7410.39649
1,455.0
65 2
3,347.01,351.4
805.8829.1360.7
3,347.0
1,997.2290.0
1,059.831.210.8
670.9347.0
1982
4,710.1
990.8302.5290.8
66.0331.5
990.8204.2411.7150.3224.6
388.9226.4
4,334.61 072 4
424.3425.7954 6
1,523.6
66.0
3,579.31,431.5
823.6923.3400.9
3,579.3
2,163.4298.0
1,118.0-19.4
16.9755.6364.9
1983
5,219.0
1,104.9330.3366.7
59.0349.0
1,104.9213.2480.6161.2249.9
457.0245.6
4,816.61 299 4
468.6437.8995 1
1,674.7
590
3,947.81,566.8
952.11,025.4
403.5
3,947.8
2,362.8318.7
1,266.2-1.210.9
842.6413.9
122Digitized for FRASER http://fraser.stlouisfed.org/ Federal Reserve Bank of St. Louis
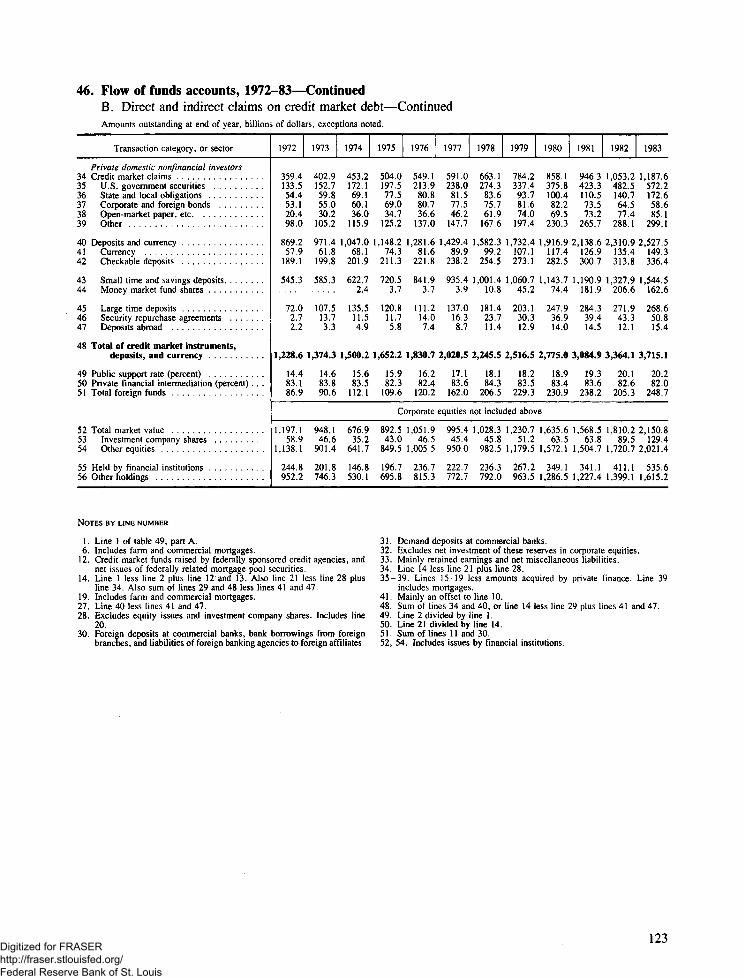
46. Flow of funds accounts, 1972-83—ContinuedB. Direct and indirect claims on credit market debt—ContinuedAmounts outstanding at end of year, billions of dollars, exceptions noted.
Transaction category, or sector
Private domestic nonfmancial investors34 Credit market claims35 U.S. government securities36 State and local obligations37 Corporate and foreign bonds38 Open-market paper, etc39 Other
40 Deposits and currency4 1 Currency42 Checkable deposits
43 Small time and savings deposits44 Money market fund shares
45 Large time deposits . . .46 Security repurchase agreements47 Deposits abroad
48 Total of credit market instruments,deposits, and currency
49 Public support rate (percent)50 Private financial intermediation (percent) . . .5 1 Total foreign funds
52 Total market value53 Investment company shares54 Other equities . .
55 Held by financial institutions56 Other holdings
1972
359.4133.554.453.120.498.0
869.257.9
189.1
545.3
72.02.72.2
1,228.6
14.483.186.9
1973
402.9152.759.855.030.2
105.2
971.461.8
199.8
585.3
107.513.73.3
1,374.3
14.683.890.6
1974
453.2172.169.160.136.0
115.9
1,047.068.1
201.9
622.72.4
135.511.54.9
1,500.2
15.683.5
112.1
1975
504.0197.577.569.034.7
125.2
1,148.274.3
211.3
720.53.7
120.811.75.8
1,652.2
15.982.3
109.6
1976
549.1213.9
80.880.736.6
137.0
1,281.681.6
221.8
841.93.7
111.214.07.4
1,830.7
16.282.4
120.2
1977
591.0238.0
81.577.546.2
147.7
1,429.489.9
238.2
935.43.9
137.016.38.7
2,020.5
17.183.6
162.0
Corporate equities
1,197.158.9
1,138.1
244.8952.2
948.146.6
901.4
201.8746.3
676.935.2
641.7
146.8530.1
892.543.0
849.5
196.7695.8
1,051.946.5
1,005.5
236.7815.3
995.445.4
950.0
222.7772.7
1978
663.1274.3
83.675.761.9
167.6
1,582.399.2
254.5
1,001.410.8
181.423.711.4
2,245.5
18.184.3
206.5
1979
784.2337.493.781.674.0
197.4
1,732.4107.1273.1
1,060.745.2
203.130.312.9
2,516.5
18.283.5
229.3
1980
858.1375.8100.482.269.5
230.3
1,916.9117.4282.5
1,143.774.4
247.936.914.0
2,775.0
18.983.4
230.9
1981
946.3423.3110.573.573.2
265.7
2,138.6126.9300.7
1,190.9181.9
284.339.414.5
3,084.9
19.383.6
238.2
1982
1,053.2482.5140.764.577.4
288.1
2,310.9135.4313.8
1,327.9206.6
271.943.312.1
3,364.1
20.182.6
205.3
1983
1,187.6572.2172.658.685.1
299.1
2,527.5149.3336.4
1,544.5162.6
268.650.815.4
3,715.1
20.282.0
248.7
not included above
1,028.345.8
982.5
236.3792.0
1,230.751.2
1,179.5
267.2963.5
1,635.663.5
1,572.1
349.11,286.5
1,568.563.8
1,504.7
341.11,227.4
1,810.289.5
1,720.7
411.11,399.1
2,150.8129.4
2,021.4
535.61,615.2
NOTES BY LINE NUMBER
1. Line 1 of table 49, part A.6. Includes farm and commercial mortgages.
12. Credit market funds raised by federally sponsored credit agencies, andnet issues of federally related mortgage pool securities.
14. Line 1 less line 2 plus line 12 and 13. Also line 21 less line 28 plusline 34. Also sum of lines 29 and 48 less lines 41 and 47.
19. Includes farm and commercial mortgages.27. Line 40 less lines 41 and 47.28. Excludes equity issues and investment company shares. Includes line
20.30. Foreign deposits at commercial banks, bank borrowings from foreign
branches, and liabilities of foreign banking agencies to foreign affiliates.
31. Demand deposits at commercial banks.32. Excludes net investment of these reserves in corporate equities.33. Mainly retained earnings and net miscellaneous liabilities.34. Line 14 less line 21 plus line 28.35-39. Lines 15-19 less amounts acquired by private finance. Line 39
includes mortgages.41. Mainly an offset to line 10.48. Sum of lines 34 and 40, or line 14 less line 29 plus lines 41 and 47.49. Line 2 divided by line 1.50. Line 21 divided by line 14.51. Sum of lines 11 and 30.52. 54. Includes issues by financial institutions.
123Digitized for FRASER http://fraser.stlouisfed.org/ Federal Reserve Bank of St. Louis

46. Flow of funds accounts, 1972-83—ContinuedC. Sector statements of financial assets and liabilitiesAmounts outstanding at end of year, billions of dollars
Category
1 Total financial assets
2 Deposits and credit marketinstruments'
3 Deposits4 Checkable deposits and
currency5 Small time and savings
deposits6 Money market fund shares7 Large time deposits
8 Credit market instruments9 U.S. government securities . . . .
10 Treasury issues1 1 Savings bonds12 Other Treasury13 Agency issues
14 State and local obligations . . . .15 Corporate and foreign bonds . . .16 Mortgages17 Open-market paper
18 Corporate equities19 Investment company shares20 Other corporate equities .
21 Life insurance reserves22 Pension fund reserves23 Security credit24 Miscellaneous assets
25 Total liabilities
26 Credit market instruments27 Home mortgages28 Other mortgages29 Installment consumer credit30 Other consumer credit31 Bank loans n e e32 Other loans
33 Security credit34 Trade credit35 Deferred and unpaid life insurance
premiums
1972 1973 1974 1975 1976 1977
Households, personal trusts,
2,388.4
972.9
710.8
142.6
545.3
22.9
262.093.979.657.721.914.3
48.453.160.56.2
913.258.9
854.2
143.7322.3
5.031.3
621.1
591.0358.0
21.5133.244.510.123.6
17.56.6
6.0
2,301.9
1,088.3
788.4
156,5
585.3
46.5
299.9112.896.660.436.316.2
53.755.063.115.3
712.846.6
666.1
151.3310.6
4.934.1
697.3
670.5404.5
22.6155.148.613.526.2
13.27.3
6.4
2,206.3
1,199.3
853.7
163.8
622.62.4
65,0
345.5134.1113.363.350.020.8
61.960.170.019.5
505.935.2
470.7
158.0302.5
3.936.8
750.9
724.2442.3
23.7164.649.015.229.4
11.48.3
7.1
2,564.3
1,326.5
945.3
170.7
719.63.7
51.3
381.2152.9133.267.465.819.7
68.169.076.215.1
660.543.0
617,5
166.6365.7
4.540.6
805.3
776.1482.9
24.8172.350.913.731.5
12.19.4
7.7
2,905.3
1,477.9
1,068.5
186.4
835.83.7
42.6
409.4163.0139.972.067.923.1
70.180.783.612.0
772.346.5
725.8
175.0427.7
6.346.0
902.7
866.5544.3
25.6193.854.814.633.4
17.210.5
8.4
3,081.7
1,638.8
1,195.6
205.7
930.93.9
55,1
443.3182.2153,376.876.628.9
70.177.591.721.7
732.945.4
687.5
186.5465.2
5.352.9
1,043.6
1,004.1635.1
26.7230.6
58.617.435.7
18.511.7
9.3
1978 1979 1980 1981 1982 1983
and nonprofit organizations
3,375.9
1,829.0
1,325.9
228.8
997.010.889.3
503.1211.7175.380.794.636.5
72.775.7
105.937.1
749.945.8
704.2
198.5531.1
7.859.5
1,215.1
1,171.8746.5
28.1273.6
64.319.939.5
19.713.2
10.3
3,861.2
2,060.1
1,459.3
250.4
1,056.945.2
106.8
600.8264.7206.3
79.9126.458.5
83.281.6
125.945.3
915.251.2
864.0
211.1598.6
9.666.7
1,396.2
1,348.9869.2
29.6312.0
71.320.845.9
20.714.9
11.7
4,540.5
2,281.7
1,622.3
258.6
1,140.374.4
148.9
659.4297.3227.8
72.5155.369.5
89.982.2
148.141.9
1,221.963.5
1,158.4
222.5727. 1
14.872.4
1,526.1
1,468.8967.5
31.5313.5
74.826.854.7
27.217.2
12.9
4,838.8
2,556.0
1,821.7
284.3
1,187.4181.9168.1
734.2346.2261.9
68.2193.784.3
99.973.5
171.243.6
1,162.763.8
1,098.9
232.7796.2
12.778.5
1,654.3
1,594.21,051.1
33.8331.7
80.731.265.8
25.619.8
14.7
5,384.4
2,781.3
1,982.7
307.3
1,322.9206.6145.9
798.6377.0291.8
68.3223.4
85.2
129.064.5
186.541.6
1,322.389.5
1,232.9
246.8932.6
16.085.3
1,740.9
1,674.41,101.0
36.4344.8
85.933.373.0
28.822.2
15.5
6,042.4
3,043.1
2,175.0
338.7
1,532.2162,6141.5
868.1425.0329.3
71.5257.895.7
160.058.6
184.340.2
1,519.5129.4
1,390.1
262.61,105.6
19.392.2
1,923.0
1,832.21,199.5
38.9387.9
96.932.376.7
47.826.5
16.4
124Digitized for FRASER http://fraser.stlouisfed.org/ Federal Reserve Bank of St. Louis
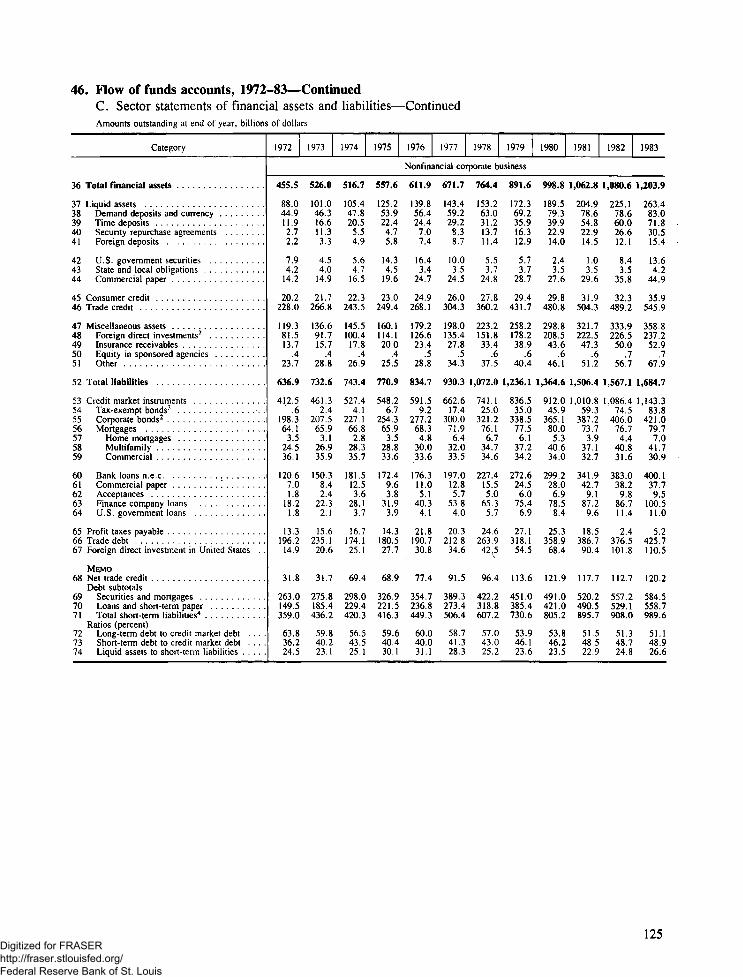
46. Flow of funds accounts, 1972-83—ContinuedC. Sector statements of financial assets and liabilities—ContinuedAmounts outstanding at end of year, billions of dollars
Category
36 Total financial assets
37 Liquid assets38 Demand deposits and currency39 Time deposits40 Security repurchase agreements41 Foreign deposits
42 U S government securities43 State and local obligations44 Commercial paper . .
45 Consumer credit46 Trade credit
47 Miscellaneous assets48 Foreign direct investments2
49 Insurance receivables50 Equity in sponsored agencies5 1 Other . . . . . .
52 Total liabilities
53 Credit market instruments54 Tax-exempt bonds"1
55 Corporate bonds2
56 Mortgages57 Home mortgages58 Multifamily59 Commercial
60 Bank loans n.e.c61 Commercial paper62 Acceptances63 Finance company loans .64 U S. government loans
65 Profit taxes payable66 Trade debt67 Foreign direct investment in United States . .
MEMO68 Net trade credit
Debt subtotals69 Securities and mortgages70 Loans and short-term paper71 Total short-term liabilities4
Ratios (percent)72 Long-term debt to credit market debt . . . .73 Short-term debt to credit market debt . . . .74 Liquid assets to short-term liabilities
1972 1973 1974 1975 1976 1977 1978 1979 1980 1981 1982 1983
Nonfinancial corporate business
455.5
88.044.911.92.72.2
7.94.2
14.2
20.2228.0
119.381.513.7
526.0
101.046.316.611.33.3
4.54.0
14.9
21.7266.8
136.691.715.7
23.7 28.8
636.9 732.6
412.5 461.3.6 2.4
198.3 207.564.1 65.9
3.5 3.124.5 26.936.1 35.9
120.6 150.37.0 8.41.8 2.4
18.2 22.31.8 2.1
13.3 15.6196.2 235.114.9 20.6
31.8 31.7
263.0 275.8149.5 185.4359.0 436.2
63.8 59.836.2 40.224.5 23.1
516.7
105.447.820.55.54.9
5.64.7
16.5
22.3243.5
145.5100.4
17.8
26.9
743.4
527.44.1
227.166.8
2.828.335.7
181.512.53.6
28.13.7
16.7174.125.1
69.4
298.0229.4420.3
56.543.525.1
557.6
125.253.922.44.75.8
14.34.5
19.6
23.0249.4
160.1114.120.0
25.5
770.9
548.26.7
254.365.9
3.528.833.6
172.49.63.8
31.93.9
14.3180.527.7
68.9
326.9221.5416.3
59.640.430.1
611.9
139.856.424.47.07.4
16.43.4
24.7
24.9268.1
179.2126.623.4
28.8
834.7
591.59.2
277.268.34.8
30.033.6
176.311.05.1
40.34.1
21.8190.730.8
77.4
354.7236.8449.3
60.040.031.1
671.7
143.459.229.28.38.7
10.03.5
24.5
26.0304.3
198.0135.427.8
.534.3
930.3
662.617.4
300.071.96.4
32.033.5
197.012.85.7
53.84.0
20.3212.8
34.6
91.5
389.3273.4506.4
58.741.328.3
764.4 891.6
153.2 172.363.0 69.231.2 35.913.7 16.311.4 12.9
5.5 5.73.7 3.7
24.8 28.7
27.8 29.4360.2 431.7
223.2 258.2151.8 178.233.4 38.9
.6 .637.5 40.4
1,072.0 1,236.1
741.1 836.525.0 35.0
321.2 338.576.1 77.5
6.7 6.134.7 37.234.6 34.2
227.4 272.615.5 24.55.0 6.0
65.3 75.45.7 6.9
24.6 27.1263.9 318.142.5 54.5
96.4 113.6
422.2 451.0318.8 385.4607.2 730.6
57.0 53.943.0 46.125.2 23.6
998.8
189.579.339.922.914.0
2.43.5
27.6
29.8480.8
298.8208.543.6
.646.1
1,364.6
912.045.9
365.180.05.3
40.634.0
299.228.06.9
78.58.4
25.3358.9
68.4
121.9
491.0421.0805.2
53.846.223.5
1,062.8 1,080.6
204.9 225.178.6 78.654.8 60.022.9 26.614.5 12.1
1.0 8.43.5 3.5
29.6 35.8
31.9 32.3504.3 489.2
321.7 333.9222.5 226.547.3 50.0
.6 .751.2 56.7
1,506.4 1,567.1
1,010.8 1,086.459.3 74.5
387.2 406.073.7 76.7
3.9 4.437.1 40.832.7 31.6
341.9 383.042.7 38.2
9.1 9.887.2 86.79.6 11.4
18.5 2.4386.7 376.590.4 101.8
117.7 112.7
520.2 557.2490.5 529.1895.7 908.0
51.5 51.348.5 48.722.9 24.8
1,203.9
263.483.071.830.515.4
13.64.2
44.9
35.9545.9
358.8237.2
52.9.7
67.9
1,684.7
1,143.383.8
421.079.7
7.041.730.9
400.137.79.5
100.511.0
5.2425.7110.5
120.2
584.5558.7989.6
51.148.926.6
125Digitized for FRASER http://fraser.stlouisfed.org/ Federal Reserve Bank of St. Louis

47. Selected measures of nonfinancial business activity, 19831
1967 = 100; monthly data are seasonally adjusted. Exceptions are noted.
Measure
1 Industrial production, total
Market groupings2 Products total3 Final, total4 Consumer goods5 Equipment6 Intermediate7 Materials
Industry groupings8 Manufacturing
Capacity utilization (percent)2
9 Manufacturing10 Industrial materials industries . . .11 Construction contracts (1977 = 100)3 . . . .12 Nonagricultural employment, total4
13 Goods-producing total14 Manufacturing, total15 Manufacturing, production worker . . .16 Service- producing .
17 Personal income total^18 Wage and salary disbursements19 Manufacturing20 Disposable personal income^21 Retail sales6
Prices7
22 Consumer23 Producer finished goods
Year
147.6
149 2147 1151.7140 81566145.2
148 2
75 275 2
137.0136.8101 596.088.7
156 1
435 3389 83004426 3373 0
298 4285 2
Jan.
137.4
140 9140 1143.6135 3143 7132.0
136 7
70068 7
127.0135.098 592.985.1
155 0
421 0376 82862293 1283 9
293 1283 9
Feb.
138.1
140 3138.9143.4132 7145 3134.9
138 2
70670.1
119.0134.897 992.885.1
155 1
420 7376 22869410 3352 3
293 2284.1
Mar.
140.0
141.6139.9144.3133 8147.8137.6
140.4
71.671.5
131.0135.298.093.085.3
155.6
423 8378 6289.3413 7358 4
293 4283.4
Apr.
142.6
144.5142.8147.7136 2150.8139.7
143.1
72.972.5
129.0135.698.593.586.1
156.0
426 8382.2293.4417 4363 5
295 5283.1
May
144.4
146.2144.5150.4136.5152.2141.7
145.1
73.873.5
148.0136.199.194.186.7
156.5
431 6386.9296 A420 5371.6
297.1284.2
June
146.4
148.1146.4152.4138.2154.5143.7
147.4
74.974.4
151.0136.799.794.687.3
156.9
433.7389.0299.24220376.9
298.1285.0
July
149.7
150.9149.0154.8141.0158.1147.8
150.6
76.476.5
137.0137.2100.595.288.1
157.3
436.1391.9302.6429.0377.6
299.3285.7
Aug.
151,8
153.2150.7156.3143.1162.2149.7
152.8
77.377.4
146.0136.6101.095.688.6
156.2
437.5393.6304.6430 1375.5
300.3286.1
Sept.
153.8
1549152.1157.3144 9165.4152.2
155 1
78 478.6
143.0138.3101.596.189.2
158.5
441 53962308.2434 1380 3
301 8285.1
Oct.
155.0
155 6152 7156.9147 0166 5154.0
156 2
78 979.5
139.0138.8102 597.190.4
158 7
4464400 6310.2438 8385 6
3026287 6
Nov.
155.3
155 8153 2156.1149 1165 5154.5
1564
78 8796
145.0139.3103 297.891.2
159 1
449 8401 7312 8303 1286 8
303 1286.8
Dec.
156.2
157 4155 2157.7151 8165 4154.5
156 8
78 979.6
134.0139.9103 898.491.9
159 6
453 9404 2314 4303 5287 2
303 5287.2
126Digitized for FRASER http://fraser.stlouisfed.org/ Federal Reserve Bank of St. Louis
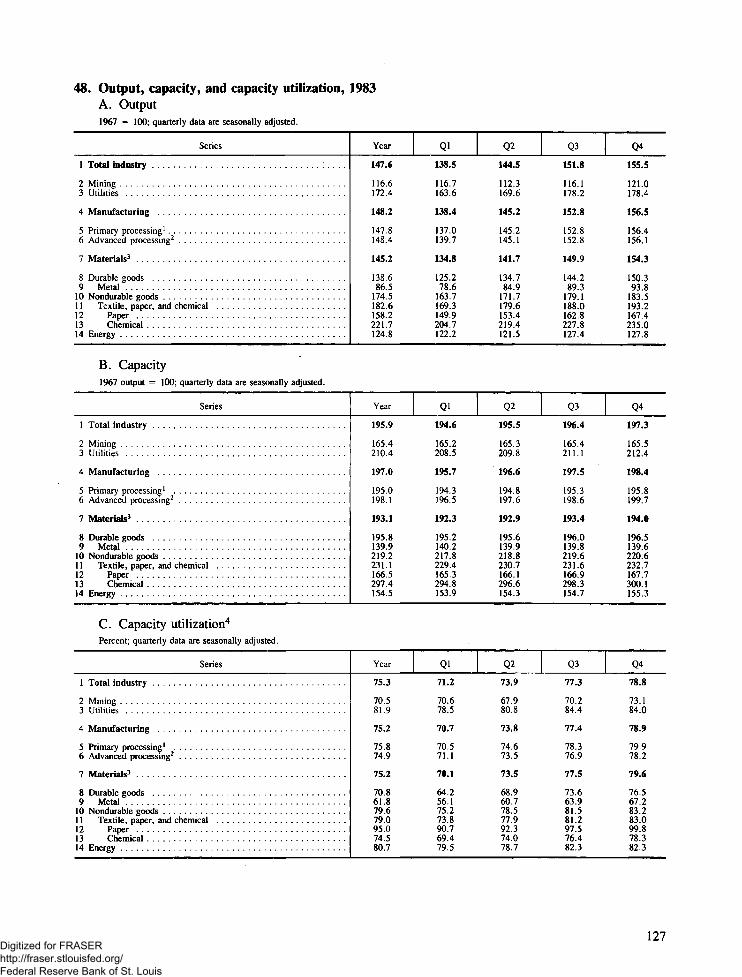
48. Output, capacity, and capacity utilization, 1983A. Output1967 = 100; quarterly data are seasonally adjusted.
Series
1 Total industry
2 Mining3 Utilities
4 Manufacturing ,
5 Primary processing'6 Advanced processing^
7 Materials3
8 Durable goods9 Metal
10 Nondurable goods1 1 Textile paper and chemical12 Paper13 Chemical14 Energy
B. Capacity1967 output = 100; quarterly data are seasonally adjusted.
Series
1 Total industry
2 Mining3 Utilities . . .
4 Manufacturing
5 Primary processing1
6 Advanced processing^
7 Materials3
8 Durable goods9 Metal
10 Nondurable goods1 1 Textile paper and chemical12 Paper . .13 Chemical14 Energy
C. Capacity utilization4
Percent; quarterly data are seasonally adjusted.
Series
1 Total industry . . . . . . .
2 Mining3 Utilities
4 Manufacturing
5 Primary processing1
6 Advanced processing^
7 Materials3
8 Durable goods9 Metal
10 Nondurable goods . .1 1 Textile paper and chemical12 Paper1 3 Chemical14 Energy
Year
147.6
116 6172 4
148.2
147 8148 4
145.2
138 686.5
174 5182 6158.2221.7124 8
Year
195.9
165 4210.4
197.0
195 0198 1
193.1
195.8139 9219.2231 1166 5297.4154 5
Year
75.3
70.581 9
75.2
75.8749
75.2
70 861.879679 095.074 580 7
Ql138.5
116 7163 6
138.4
137.0139.7
134.8
125.278.6
163 7169 3149.9204.71222
Ql194.6
165.2208.5
195.7
194 31965
192.3
195.2140 2217.8279 4165.3294.8153 9
Ql71.2
70.678.5
70.7
70.571.1
70.1
64 256.175.273 890.769.479 5
Q2
144.5
112 3169 6
145.2
145 2145.1
141.7
134 784.9
171 7179 6153 4219.4121 5
Q2
195.5
165 3209.8
196.6
194 8197 6
192.9
195.6139 9218.8230 7166.1296.6154 3
Q2
73.9
67.9808
73.8
74.673.5
73.5
68 960.778.577 992.374.078 7
Q3
151.8
116 1178 2
152.8
152 8152 8
149.9
144 289 3
179 1188 0162 8227 8127 4
Q3
196.4
165 4211 1
197.5
195 3198 6
193.4
196.0139 82196231 6166 9298.3154 7
Q3
77.3
70.284 4
77.4
78.376.9
77.5
73 663.981 581 297.576482 3
Q4
155.5
121 0178 4
156.5
1564156 1
1543
150 393 8
183 5193 2167 42350127 8
Q4
197.3
165 52124
198.4
195 8199 7
194.0
196.5139 62206232 7167 7300.1155 3
Q4
78.8
73.1840
78.9
79.978.2
79.6
76 567.283.283 099.878.382 3
127Digitized for FRASER http://fraser.stlouisfed.org/ Federal Reserve Bank of St. Louis

49. Labor force, employment, and unemployment, 1983Thousands of persons; monthly data are seasonally adjusted. Exceptions noted.
Category
HOUSEHOLD SURVEY DATA
1 Noninstitutional population1
2 Labor force (including Armed Forces)' .3 Civilian labor force .
Employment4 Nonagricultural industries2
5 AgricultureUnemployment
6 Number . . . .7 Rate (percent of civilian labor force)8 Not in labor force
ESTABLISHMENT SURVEY DATA
9 Nonagricultural payroll employment**
10 Manufacturing1 1 Mining12 Contract construction1 3 Transportation and public utilities14 Trade1 5 Finance . . . .16 Service17 Government
HOUSEHOLD SURVEY DATA
1 Noninstitutional population1
2 Labor force (including Armed Forces)1
3 Civilian labor forceEmployment
4 Nonagricultural industries2
5 AgricultureUnemployment
6 Number7 Rate (percent of civilian labor force)8 Not in labor force
ESTABLISHMENT SURVEY DATA
9 Nonagricultural payroll employment3
10 Manufacturing .1 1 Mining12 Contract construction13 Transportation and public utilities14 Trade15 Finance16 Service17 Government
Year
176,414
113,749111,550
97,4503,383
10,71796
62,665
89,986
18,6781,0213,9494,943
20 5085,456
19,68515 747
Jan.
175,543
112,866110,677
95,7343 420
1 1 ,52310 4
62,677
88,827
18,073993
3,8934,984
204575 363
19,21415 850
July
176,498
114,017111 825
97,7263 499
10,60095
62,481
90,274
18,521946
3 9475,001
20 8365,478
19 72315,822
Feb.
175,693
112,876110,688
95,7573 415
11,51610 4
62,817
88,728
18,056967
3,8044,969
20 4745,389
19,23015 839
Aug.
176,648
114,325112 117
98,0353 449
10,6339 5
62,323
89,918
18,597950
3,9854,369
20 9035,498
19 80815,808
Mar.
175,850
112,929110,735
95,9303 386
11,419103
62,921
88,945
18,085955
3,7924,975
20 5385 408
19,35615 836
Sept.
176,811
114,438112 229
98,5683 308
10,3539 2
62,373
91,018
18,698952
4 0195,046
209725,503
19 89315,935
Apr.
175,996
113 1771 10,975
96,2143 392
11,36910.2
62 819
89,259
18,189943
3,8174,993
20 5905 445
19,45615 826
Oct.
176,990
1 14,0771 1 1 866
98,7303 240
9,8968.8
62,913
91,345
18,886965
4,0445,053
21 0595,512
19 96215 864
May
176,151
113,148110,950
96,3883,374
11,18810 1
63,003
89,578
18,298940
3,8495,001
206535,460
19,52915 848
Nov.
177,151
114,235112,035
99,3493 257
9,4298 4
62,916
91,688
19,018967
4,0735,043
21 1495,530
2003415,874
June
176,320
114 100111,905
97,2643479
11,162100
62 220
89,927
18,391939
3,9115,005
20 7555 464
19,62615 836
Dec.
177,325
114,340112 136
99,5853 356
9,1958 2
62,985
92,026
19,143969
4,0865,055
21 2285,546
20 13015 869
128Digitized for FRASER http://fraser.stlouisfed.org/ Federal Reserve Bank of St. Louis

50. Industrial production1
Monthly data are seasonally adjusted
Grouping
MAJOR MARKET
1 Total index . . . .
2 Products3 Final products4 Consumer goods . . .5 Equipment6 Intermediate products7 Materials . . .
Consumer goods8 Durable consumer goods9 Automotive products
10 Autos and utility vehicles. . .1 1 Autos12 Auto parts and allied
goods13 Home goods14 Appliances, A/C, and TV15 Appliances and TV . . .16 Carpeting and furniture . .17 Miscellaneous home
goods18 Nondurable consumer goods . . .19 Clothing20 Consumer staples21 Consumer foods and
tobacco22 Nonfood staples23 Consumer chemical
products24 Consumer paper
products25 Consumer energy
products26 Residential utilities . . .
Equipment27 Business . .28 Industrial29 Building and mining . . . .30 Manufacturing3 1 Power32 Commercial, transit, and
farm33 Commercial34 Transit35 Farm36 Defense and space
Intermediate products37 Construction supplies38 Business supplies39 Commercial energy products . .
Materials40 Durable goods materials41 Durable consumer parts . . . .42 Equipment parts43 Durable materials n.e.c. . . .44 Basic metal materials . . . .45 Nondurable goods materials . . . .46 Textile, paper, and chemical
materials47 Textile materials48 Paper materials49 Chemical materials50 Containers, nondurable . . . .51 Nondurable materials n.e.c. . .52 Energy materials53 Primary energy54 Converted fuel materials . . . .
Supplementary groups55 Home goods and clothing . . . .56 Energy, total57 Products . .58 Materials . . .
1967pro-por-tion
100.00
60.7147.8227.6820.1412.8939.29
7.892.832.031.90
.805.061.401.331.07
2.5919.794.29
15.50
8.337.17
2.63
1.92
2.621.45
12.636.771.443.851.47
5.863.261.93.67
7.51
6.426.471.14
20.354.585.44
10.345.57
10.47
7.621.851.624.151.701.148.484.653.82
9.3512.233.768.48
1983avg.
147.6
149.2147.1151.7140.8156.6145.2
147.5158.2134.0117.4
219.6141.4116.4120.1178.1
139.9153 4
163.7
153.5175.4
231.0
132.7
150.9173.4
153 3120.4159.3107.1117.1
191.3273.295.269.5
119.9
142.5170.7184.3
138.6113.6176.4129.990.2
174.5
182.6116.2158.2221.7167.9130.5124.8114.7137.0
129.9135.9161.0124.8
1983
Jan. Feb. Mar. Apr. May June July Aug. Sept. Oct. Nov. Dec.
Index (1967 - 100)
137.4
140.9140.1143.6135.3143.7132.0
131.6136.2107.097.1
210.2129.1109.5112.9149.0
131.4148.3
158.6
150.9167.6
222.6
127.1
142.2164.1
146.6118.4173.897.6
118.3
179.2254.9
90.866.0
116.4
127.0160.3180.6
121.596.2
157.5113.878.1
159.7
163.7104.7150.1195.4162.1129!6123.0116.5130.8
120.8132.4153.8123.0
138.1
140.3138.9143.4132.7145.3134.9
134.4144.3120.8107.3
203.9128.8105.8108.8156.7
129.7147.0
157.4
149.5166.5
220.9
127.9
140.2162.9
1427113.7153.697.9
116.0
176.1251.2
88.263.4
116.1
129.7160.9178.6
125.3101.6158.8118.282.4
164.0
170.0106.4150.1206.2159.6130.5121.8115.4129.6
119.9131.0151.9121.8
140.0
141.6139.9144.3133.8147.8137.6
136.3142.6116.499.9
209.3132.8105.0108.5168.3
133.3147.5
158.1
148.4169.4
225.6
128.1
143.3166.1
143.7113.1145.399.7
116,2
179.2255.790.163.4
117.0
133.1162.3180.3
128.7104.0162.5121.986.0
167.5
174.3110.6149.5212.5163.8127.7121.9114.4131.1
122.0131.9154.5121.9
142.6
144.5142.8147.7136.2150.8139.7
140.5144.9117.8102.7
213.6138.1106.1109.7180.5
137.91505
161.1
150.9172.9
225.5
129.2
152.2175.5
1469113.5141.8101.7116.6
185.4264.392.070.2
118.2
136.4165.2183.3
132.4106.5167.2125.487.8
168.7
175.9110.6150.8214.9163.2129.1121.6113.9131.0
126.3133.9161.7121.6
144.4
146.2144.5150.4136.5152.2141.7
145.5152.2124.9107.4
221.5141.8112.8116.1181.9
140.9- 152.3
162.8
153.2174.0
227.8
128.6
153.4174.3
147.7114.5146.2102.5115.0
186.1265.092.671.3
117.6
138.4166.0183.1
134.7108.5170.6127.589.3
172.1
180.2114.6154.4219.6164.3129.7121.1113.8129.9
129.2133.8162.4121.1
146.4
148.1146.4152.4138.2154.5143.7
149.2160.0135.4118.3
222.6143.2114.4118.4185.6
141.3153.6
164.3
155.9174.1
229.0
130.1
151.2170.5
150.2116.3148.7105.0114.1
189.5270.993.270.4
118.0
142.1166.8181.4
137.0109.5175.8128.789.6
174.3
182.8116.0155.0223.6166.1129.9121.8112.6132.9
130.2133.6160.4121.8
149.7
150.9149.0154.8141.0158.1147.8
152.9167.0145.4129.8
221.9144.9116.2119.7187.3
143.0155.6
166.1
156.6177.2
233.8
132.6
153.2173.2
153.3119.9154.4108.9114.6
191.9276.092.070.8
120.4
145.8170.4185.2
141.1115.6180.8131.590.8
177.0
186.1119.0161.1225.9166.5131.3127.7115.4142.7
132.3138.5162.9127.7
151.8
153.2150.7156.3143.1162.2149.7
154.2168.1147.0132.0
221.8146.4121.2125.0187.5
143.2157 1
168.0
156.3181.6
239.7
137.4
155.7179.9
156.6124.3159.2113.3119.0
194.0277.495.970.8
120.2
149.0175.3186.9
144.2119.9183.6134.293.1
178.0
186.4121.5161.8225.1170.6133.0128.0113.9145.2
133.3139.4165.2128.0
153.8
154.9152.1157.3144.9165.4152.2
157.5172.9153.1135.0
223.1148.8125.2129.7186.3
146.1157 2
167.6
154.6182.7
240.0
138.2
157.7182.8
158 7125.6160.81150118.8
196.9281.797.670.6
121.8
151.4179.3190.2
147.4123.1186.0137.894.8
182.3
191.6123.1165.5232.4173.8132.7126.4112.9142.8
135.5139.1167.5126.4
155.0
155.6152.7156.9147.0166.5154.0
156.7171.3149.2129.6
227.4148.4129.2133.3185.5
143.6157 1
167.2
156.0180.3
238.7
137.6
153.0174.5
161 3126.6166.9114.6118.5
201.3288.1100.070.9
122.9
152.3180.6187.0
149.4124.9188.3139.898.0
185.3
195.4124.0166.3238.7175.9131.9126.3114.1141.2
135.5137.7163.3126.3
155.3
155.8153.2156.1149.1165.5154.5
155.9171.5149.2129.4
228.2147.2127.0131.3182.7
143.4156 1
165.4
154.5178.1
232.4
136.6
154.1175.8
164.1128.6175.8114.3119.4
205.1292.5103.273.5
124.0
151.6179.4187.6
150.3125.0192.5139.397.1
184.8
194.7121.9169.8237.0176.6130.6127.1115.5141.1
135.9138.5164.3127.1
156.2
157.4155.2157.7151.8165.4154,5
158.6178.4157.8137.4
230.7147.5126.3130.2184.0
143.9157 3
166.0
155.4178.3
229.9
137.2
156.5185.2
167 3130.8185.3115 1118.4
209.6298.9106.073.5
125.7
151.5179.3188.0
151.3127.9193.4139.596.9
180.3
189.6121.3166.0229.3173.0129.5130.0117.6145.1
137.6141.1166.0130.0
129Digitized for FRASER http://fraser.stlouisfed.org/ Federal Reserve Bank of St. Louis

50. Industrial production1—ContinuedMonthly data are seasonally adjusted
Grouping
MAJOR INDUSTRY
1 Mining and utilities2 Mining3 Utilities4 Electric5 Manufacturing6 Nondurable . . . .7 Durable
Mining8 Metal9 Coal
10 Oil and gas extraction1 1 Stone and earth minerals
Nondurable manufactures12 Foods13 Tobacco products14 Textile mill products15 Apparel products16 Paper and products
17 Printing and publishing18 Chemicals and products19 Petroleum products20 Rubber and plastic products . . . .21 Leather and products
Durable manufactures22 Ordnance, private and
government23 Lumber and products24 Furniture and fixtures ,. . . . .25 Clay, glass, and stone
products
26 Primary metals27 Iron and steel28 Fabricated metal
products29 Nonelectrical machinery30 Electrical machinery
3 1 Transportation equipment . . . .32 Motor vehicles and parts . . . .33 Aerospace and
miscellaneoustransportationequipment
34 Instruments35 Miscellaneous manufactures . . . .
MAJOR MARKET
36 Products, total
37 Final . .38 Consumer goods39 Equipment40 Intermediate
SICcode
0000000
1011,12
1314
2021222326
2728293031
19,912425
32
33331,2
343536
37371
372-93839
1967propor-
tion
12.056.365.693.88
87.9535.9751.98
.51
.694.40
.75
8.75.67
2.683.313.21
4.727.741.792.24
.86
3.641.641.37
2.74
6.574.21
5.939.158.05
9.274.50
4.772.111.51
1983
Jan. Feb. Mar. Apr. May June July Aug. Sept. Oct. Nov. Dec.
Index (1967 = 100)
141.3121.9163.1184.4136.7157.4122.5
81.7144.8124.6112.8
154.4104.7125.8
158.8
141.3197.6113.5256.2
59.5
93.5130.0150.0
128,0
73.159.0
107.6138.0169.5
106.3113.9
99.1154.5131.3
137.5115.6162.0183.0138.2159.0123.9
75.1136.5117.0115.7
153.0108.5130.7
155.6
144.0202.3111.7264.0
61.7
93.3130.2154.0
131.8
77.964.3
110.3136.2168.9
109.6123.0
97.0153.4133.9
137.7112.6165.8188.2140.4160.7126.3
75.2127.3114.4114.0
152.0113.4131.9
156.3
145.9205.7114.8272.0
59.4
91.9128.7161.0
135.6
81.266.9
113.9138.6173.8
110.1123.2
97.7154.0136.9
138.9111.6169.3192.7143.1163.3129.1
79.8125.3112.2117.7
153.7114.8136.6
157.0
145.7208.5120.6283.0
58.7
93.2132.1167.7
138.3
83.168.5
115.3143.1177.2
111.4125.5
98.1155.1145.0
139.7112.8169.7192.9145.1165.4131.0
84.4125.6112.5122.5
155.6112.9139.6
161.5
145.2211.0123.8288.0
59.6
92.6135.8169.6
139.2
84.969.5
115.5146.1180.1
113.8130.4
98.1156.0149.0
139.6112.6169.8192.0147.4167.8133.2
82.9124,6112.6121.7
157.7120.0141.8
163.0
147.4214.7123.0293.8
60.1
93.3137.4173.1
141.7
84.869.7
118.5149.5182.4
116.6136.2
98.1156.1151.0
143.8115,0176.0200.9150.6170.6136.8
82.5139.9113.9121.2
159.9112.9146.7
165.1
152.0218.3124.3296.1
62.3
95.2141.3175.2
145.8
85.571.8
122.7154.2188.3
119.7142.3
98.5159.3153.7
146.0116.1179.3205.4152.8172.9138.8
80.9141.2114.7125.0
159.3117.1147.4
168.6
157.8220.3123.2306.9
64.4
96.8141.6179.0
147.9
87.575.1
126.0157.3189.2
121.1144.3
99.2161.6153.1
146.5117.1179.3204.5155.1174.6141.6
78.7140.5116.3126.5
158.2112.7148.7
170.4
161.7224.1125.1310.9
64.2
98.0142.3180.7
151.7
90.678.2
127.4158.3195.8
124.7150.9
100.0163.6151.7
145.8118.3176.5200.7156.2175.6142.8
81.0142.7117.3127.4
157,6109.1148.7
171.5
162.7228.4123.6310.8
64.0
98.8141.7181.0
151.9
95.384.3
126.9159.2198.4
125.5150.9
101.6163.0149.1
147.2121.1176.3200.2156.4174.8143.6
84.6144.8119.8132.2
157.1109.5145.8
172.1
162.0225.6125.4309.1
63.2
99.3141.0177.5
152.7
92,279.2
128.5161.8200.1
127.3152.9
103.2163.0148.9
151.5123.7182.5208.0156.8173.9145.0
82.3145.2123.4133.9
157.7112.3145.0
170,1
161.7221.1114.4314.4
66,0
99.8143.8177.9
153.8
90.474.1
129.2164,3201.5
130.8158.9
104.3164.6149.3
Gross value (billions of 1972 dollars, annual rates)
0
0000
507.4
390.9277.5113.4116.6
578.1
448.3310.9137.4129.8
578.4
447.3312.0135.3131.1
584.1
451,3313.8137.5132.8
592.6
457.7318.8138.9134.9
601.8
465.6325.6140.0136.2
610.5
471.8330.4141.4138.7
620.5
478.2333.7144.5142.3
626.6
481.8336.7145.1144.8
637.0
489.9341.6148.4147.1
637.8
490.7340.2150.5147.1
638.4
490.8338.3152.5147.6
645.4
497.8341.9155.9147.6
130Digitized for FRASER http://fraser.stlouisfed.org/ Federal Reserve Bank of St. Louis

51. Housing and construction, 1983Monthly figures are at seasonally adjusted annual rates except as noted.
Item
NEW UNITS
1 Permits authorized2 1-family3 2-or- more-family
4 Started5 1 -family6 2-or- mo re- family
7 Under construction, endof period'
8 1-family9 2-or- more-family
10 Completed11 1-family1 2 2-or-more- family
13 Mobile homes shipped
Merchant builder activityin 1-family units
14 Number sold15 Number for sale, end
of period'
Price (thousands of dollars)2
Median16 Units sold
Average17 Units sold
EXISTING UNITS (1-family)
18 Number sold
Price of units sold(thousands of dollars)2
19 Median20 Average
CONSTRUCTION
21 Total put in place
22 Private23 Residential24 Nonrcsidential total
Buildings25 Industrial26 Commercial27 Other28 Public utilities and other . . .
29 Public30 Military3 1 Highway32 Conservation and development .33 Other
Jan. Feb. Mar. Apr. May June July 1 Aug. Sept. Oct. Nov. Dec.
Private residential real estate activity (thousands of units)
1,431862569
1,6321,087
545
758428330
1,191777414
289
592
257
73.5
87.2
2,600
68.180.0
1,456831625
1,7061,066
640
795454341
1,141720421
277
592
261
73.8
86.8
2,440
68.280.3
1,492859633
1,5921,016
576
824469355
1,159786373
275
611
262
72.5
86.2
2,670
68.981.1
1,556860696
1,5491,030
519
856487368
1,180806374
284
634
266
74.7
87.6
2,680
68.881.3
1,660943717
1,7791,150
629
898515383
1,313855458
289
654
273
74.5
88.8
2,840
69.281.7
Value of new
247,914
195,03289,701
105,331
15,18238,16711,98339,999
52,8822,341
13,9664,756
31,819
243,032
194,33193,568
100,763
14,31536,67511,66438,109
48,7012,421
12,5094,532
29,239
241,908
194,86596,12798,738
14,26335,46911,59837,408
47,0432,541
11,8664,894
27,742
247,360
199,462101,96197,501
13,22333,61910,77039,889
47,8972,784
12,9005,023
27,190
254,763
206,029107,49498,535
13,04733,29111,23740,960
48,7342,255
13,0444,548
28,887
1,7641,010
754
1,7431,124
619
929529401
1,368941427
299
655
283
75.8
90.9
2,820
71.484.7
1,752 1,671930 900822 771
1,793 1,8731,048 1,124
745 749
962 979538 544424 434
1,427 1,716983 1,029444 687
296 307
606 558
289 296
75.2 76.8
89.2 91.3
2,780 2,760
71.8 71.584.2 84.7
1,540864676
1,6791,038
641
991545446
1,5121,006
506
305
597
299
81.0
97.8
2,770
69.982.8
1,650905745
1,6721,017
655
994542452
1,5671,028
539
308
624
301
75.9
89.5
2,720
69.883.0
1,649919730
1,7301,074
656
1,011543468
1,445994451
313
636
304
75.9
91.4
2,700
70.483.4
1,602913689
1,6941,021
673
1,020542478
1,489986503
310
755
300
75.9
91.7
2,850
69.982.9
construction3 (millions of dollars)
264,321
214,729113,524101,205
13,13635,89810,97441,197
49,5921,894
12,9254,853
29,920
274,205 281,997
222,759 228,529122,297 127,136100,462 101,393
12,227 14,22735,871 36,27711,250 12,03841,114 38,851
51,446 53,4692,655 2,258
14,091 15,9065,608 5,210
29,092 30,095
285,384
232,561129,142103,419
13,16636,90112,56440,788
52,8232,705
15,8965,048
29,174
265,626
216,976116,478100,498
10,53236,11812,27941,569
48,6492,458
14,6444,253
27,294
265,780
214,920110,385104,535
12,28038,08112,00142,173
50,8603,192
14,3603,902
29,406
265,319
215,497107,973107,524
12,92138,95512,12143,527
49,8212,977
14,7804,896
27,168
131Digitized for FRASER http://fraser.stlouisfed.org/ Federal Reserve Bank of St. Louis

52. Consumer and producer prices, 1983Percentage changes based on seasonally adjusted data, except as noted
Item
CONSUMER PRices2
1 All items
2 Food .3 Energy items4 All items less food and energy5 Commodities6 Services
PRODUCER PRICES
7 Finished goods8 Consumer foods9 Consumer energy
10 Other consumer goods1 1 Capital equipment
12 Intermediate materials3
13 Excluding energy
Crude materials14 Foods15 Energy16 Other
CONSUMER PRicns2
1 All items
2 Food3 Energy items4 All items less food and energy5 Commodities6 Services .
PRODUCER PRICES
7 Finished goods8 Consumer foods9 Consumer energy
10 Other consumer goods1 1 Capital equipment
12 Intermediate materials3
1 3 Excluding energy
Crude materials14 Foods15 Energy16 Other
12 months to
1982 1983Dec. Dec.
3.9 3.8
3.1 2.61 3 - 54 5 495.8 503.4 48
3.7 .62.1 2.2- 1 -905.3 1.83.9 2.0
.3 1 5
.6 2.8
1.5 8 12.6 -4.6
-76 15 8
Jan. Feb. Mar. | Ap
.3 -.1 .1
.3 .1 .4-2.8 -2.4 -1.4 2- 5 3 2
.6 .4 .4
.7 .3 .1
-.7 1 - 1-.2 .8 .0
-35 -30 -30 -1-.7 .5 .5-.1 .3 .3
-.5 -.1 -.30 4 0
.6 2.1 .4 1-1.1 -1.5 2 = 1=30 10 1 7 2
Qi
1.2
3.2-23.3
4.25.74.3
-3.22.3
-32.31.02.1
-3.41.5
13.3-9.2-1.5
r. May
.7 .4
4 .2.4 1.75 23 .1.5 .3
0 .3.8 -.49 2.6.0 .1.0 .2
.5 .40 .3
.8 -1.70 -.34 3.6
3 months (at annual r
Q2 Q
5.4
1.719 14.23.24.8
2.6-.912.92.21.7
2.82.8
-5.8 1-5.149.1 1
1 month to
June July Aug.
.2 .4 .4
-.2 -.1 .2.3 .4 .3. 3 5 5.3 .6 .5.3 .4 .4
.4 .0 .4-.6 -.5 .32.4 -.3 .2
.4 .3 .5
.2 .2 .5
.8 .3 ;3
.4 .4 2
-1.5 -2.1 4.1.0 -.6 -.1
4.2 18 10
ate) to
3 Q4
4.5 4.0
1.1 4.33.4 -175.9 496.8 4 65.2 5.3
2.0 1.02.5 5.51.3 -9.52.7 1.22.1 2.1
4.0 2.73.6 3.3
5.6 12.41.7 -2.16.6 3.4
Sept. Oct. IS
.4 .4
.2 .4
.1 -.2
.5 4
.5 .4
.4 .5
.1 .2
.7 1.0
.1 -.5 --.1 -.1-.1 .0
.4 .3
.3 .3
1.7 .8.3 -1.0
1.1 .2
Indexlevel
" (1967 =100) l
303.5
293 9418 0293 6249 0345 5
287 1264.076942424290.5
32032980
2562783.6263 3
fov. 1 Dec.
.4 2
.2 4
.1 -.35 3.4 3.5 .3
-.1 1-.3 .6- 1 2 - 8
.4 0
.1 .3
.1 .23 2
5 1 62 30 6
132Digitized for FRASER http://fraser.stlouisfed.org/ Federal Reserve Bank of St. Louis

53. Gross national product and income, 1983Billions of current dollars except as noted; quarterly data are at seasonally adjusted annual rates.
Account Year Qi Q2 Q3 Q4
GROSS NATIONAL PRODUCT
1 Total 3,310.5
By source2 Personal consumption expenditures 2,158.03 Durable goods 279.44 Nondurable goods 804.15 Services , 1,074.5
6 Gross private domestic investment 471.97 Fixed investment 478.48 Nonresidential 348.49 Structures 131.1
10 Producers' durable equipment 217.211 Residential structures 130.012 Nonfarm 124.9
13 Change in business inventories -6.414 Nonfarm -2.8
15 Net exports of goods and services -9.016 Exports 335.417 Imports 344.4
18 Government purchases of goods and services 689.519 Federal 274.820 State and local 414.7
By major type of product21 Final sales, total 3,316.922 Goods 1,366.523 Durable 548.724 Nondurable 817.825 Services 1,635.626 Structures 308.4
27 Change in business inventories - 6.428 Durable goods - 3.929 Nondurable goods - 2.5
30 MEMO: Total GNP in 1972 dollars 1,535.3
NATIONAL INCOME
31 Total 2,650.2
32 Compensation of employees 1,990.233 Wages and salaries 1,664.134 Government and government enterprises 325.735 Other 1,338.436 Supplement to wages and salaries 326.137 Employer contributions for social insurance 152.738 Other labor income 173.4
39 Proprietors' income1 128.540 Business and professional1 107.641 Farm1 20.9
42 Rental income of persons2 54.8
43 Corporate profits1 229.144 Profits before tax3 207.545 Inventory valuation adjustment -9.246 Capital consumption adjustment 30.847 Net interest 247.5
3,171.5
2,073.0258.5777.1
1,037.4
404.1443.5332.1132.9199.3111.3106.7
-39.4-39.0
17.0326.9309.9
677.4273.5404.0
3,210.91,292.2
482.7809.5
1,588.4290.9
-39.4-38.2-1.2
1,490.1
2,528.5
1,923.71,610.6
319.21,291.5
313.1148.8164.3
120.698.422.2
54.1
181.8169.7-1.7
13.9248.3
3,272.0
2,147.0277.7799.6
1,069.7
450.1464.6336.3127.4208.8128.4123.3
-14.5-10.3
-8.5327.1335.6
683.4273.7409.7
3,286.61,346.8
536.8810.0
1,623.4301.9
-14.5-8.9-5.7
1,525.1
2,612.8
1,968.71,647.1
323.31,323.8
321.6151.5170.1
127.2106.221.0
54.8
218.2203.3
-10.625.6
243.8
3,362.2
2,181.1282.8814.8
1,083.5
501.1492.5351.0130.9220.2141.5136.3
8.518.4
-18.3341.1359.4
698.3278.1420.2
3,353.71,388.9
568.9820.0
1,651.0322.3
8.513.1
-4.5
1,553.4
2,686.9
2,011.81,681.5
328.41,353.1
330.3153.9176.4
126.7111.2
15.5
53.9
248.4229.1
-18.337.6
246.1
3,436.2
2,230.9298.6825.0
1,107.3
532.5512.8374.0133.3240.7138.8133.5
19.619.7
-26.1346.5372.6
699.0274.1424.9
3,416.61,438.2
606.4831.8
1,679.6318.5
19.618.31.4
1,572.5
2,772.4
2,056.61,717.3
332.11,385.2
339.4156.7182.7
139.4114.525.0
56.2
268.2228.2-6.346.2
251.9
133Digitized for FRASER http://fraser.stlouisfed.org/ Federal Reserve Bank of St. Louis

54. Personal income and saving, 1983Billions of current dollars; quarterly data are at seasonally adjusted annual rates. Exceptions noted.
Account Year Ql Q2 Q3 Q4
PERSONAL INCOME AND SAVING
1 Total personal income 2,742.1
2 Wage and salary disbursements 1,664.63 Commodity-producing industries 529.74 Manufacturing 402.85 Distributive industries 397.26 Service industries 411.57 Government and government enterprises 326.2
8 Other labor income 173.49 Proprietors' income1 128.5
10 Business and professional1 107.611 Farm1 20.912 Rental income of persons2 54.813 Dividends 70.514 Personal interest income 366.315 Transfer payments 403.616 Old-age survivors, disability, and health insurance benefits 222.8
17 LESS: Personal contributions for social insurance 119.5
18 EQUALS: Personal income 2,742.1
19 LESS: Personal tax and nontax payments 406.5
20 EQUALS: Disposable personal income 2,335.6
21 LESS: Personal outlays 2,222.0
22 EQUALS: Personal saving 113.6
MEMO: Per capita (1972 dollars)23 Gross national product 6,552.424 Personal consumption expenditures 4,316.525 Disposable personal income 4,671.826 Saving rate (percent) 4.9
GROSS SAVING
27 Gross saving 439.6
28 Gross private saving 569.929 Personal saving 113.630 Undistributed corporate profits1 78.931 Corporate inventory valuation adjustment —9.2
Capital consumption allowances32 Corporate 231.633 Noncorporate 145.734 Wage accruals less disbursements .0
35 Government surplus, or deficit ( — ) , national income andproduct accounts —130.2
36 Federal -181.637 State and local 51.4
38 Capital grants received by the United States, net .0
39 Gross investment 437.4
40 Gross private domestic 471.941 Net foreign -34.6
42 Statistical discrepancy —2.3
2,657.7
1,610.7508.6385.4386.4396.4319.2
164.3120.698.422.254.168.8
357.2398.5217.4
116.5
2,657.7
401.8
2,255.9
2,134.2
121.7
6,381.54,225.74,598.7
5.4
398.5
541.5121.748.9-1.7
228.3142.6
.0
-142.9-183.3
40.4
.0
397.4
404.1-6.7
-1.2
2,713.6
1,648.4522.2397.4394.3407.3324.6
170.1127.2106.221.054.869.3
357.1405.3221.1
118.6
2,713.6
412.6
2,301.0
2,209.5
91.5
6,517.94,319.14,628.9
4.0
420.6
535.091.570.1
-10.6
229.8143.5
.0
-114.4-166.1
51.7
.0
417.1
450.1-33.0
-3.5
2,761.9
1,681.9537.8409.2398.9416.4328.8
176.4126.7111.2
15.553.970.9
369.9402.6223.8
120.5
2,761.9
400.1
2,361,7
2,245.9
115.8
6,622.54,331.44,690.0
4.9
455.4
587.2115.889.7
-18.3
233.1148.6
.0
-131.8-187.3
55.5
.0
457.9
501.1-43.2
2.5
2,835.2
1,717.3550.0419.0409.3425.8332.1
182.7139.4114.525.056.272.9
381.1408.1228.8
122.5
2,835.2
411.4
2,423.9
2,298.3
125.6
6,687.54,389.74,769.5
5.2
484.0
615.7125.6107.0-6.3
235.2148.0
.0
-131.8-189.8
58.1
.0
477.1
532.5-55.3
-6.8
134Digitized for FRASER http://fraser.stlouisfed.org/ Federal Reserve Bank of St. Louis

55. Summary of U.S. international transactionsMillions of dollars; quarterly figures are seasonally adjusted except as noted.1
Item
1 Balance on current account2 Not seasonally adjusted
3 Merchandisetrade balance2
4 Merchandise exports5 Merchandise imports6 Military transactions, net7 Investment income, net3
8 Other service transactions, net. . .
9 Remittances, pensions,and other transfers
10 U.S. government grants(excluding military)
11 Change in U.S. governmentassets other than officialreserve assets, net(increase, — )
12 Change in U.S. official reserveassets (increase, — )
13 Gold14 Special drawing rights
15 Reserve position in Interna-tional Monetary Fund . . . .
16 Foreign currencies
17 Change in U.S. private assetsabroad (increase, — )3
18 Bank-reported claims19 Nonbank-reported claims20 U.S. purchases of foreign
securities, net21 U.S. direct investments
abroad, net3
22 Change in foreign officialassets in the United States(increase, +)
23 U.S. Treasury securities24 Other U.S. government
obligations25 Other U.S. government
liabilities4
26 Other U.S. liabilities reportedby U.S. banks
27 Other foreign official assets5 . .
28 Change in foreign privateassets in United States(increase, + )3
29 U.S. bank-reported liabilities. . .30 U.S. nonbank-reported
liabilities31 Foreign private purchases
of U.S. Treasurysecurities, net
32 Foreign purchases of otherU.S. securities, net
33 Foreign direct investments inUnited States net3
34 Allocations of SDRs
35 Discrepancy36 Owing to seasonal
adjustments37 Statistical discrepancy in
recorded data beforeseasonal adjustment
1982
-9,199
-36,469211,198
-247,667195
27,8027,331
-2 635
-5,423
-6,143
-4,965o-1 371
-2,552-1,041
- 107,790-111,070
6,626
-8,102
4,756
3,3185,728
-694
382
-1,747-351
91 86365,922
-2,383
7 062
6,396
14 865
o32,916
32,916
1983
-41,563
-61,055200,257
-261,312515
23,5084,121
-2 590
-6,060
-5 013
-1,196o-66
-4,4343 304
-43 281-25,391-5,333
-7,676
-4,881
5 3396,989
-487
199
433-1,795
76 38349,059
-1 318
8 731
8,612
11 299
0
9 331
9,331
Ql165330
-7,06455,482
-62,54652
7,2362,046
-624
-1,481
-803
-1 089o
-400
-547-142
- 30 068-33,343
3,879
-650
46
-3 221-1,327
-301
-89
- 1 ,684180
31 56625,856
-65
1 302
1,314
3 159
0
3 450
-964
4,414
19
Q2
1,9272,687
-5,80355,118
-60,921239
7,5351,758
-701
-1,101
-1 700
-1 132o
-241
-814-77
-38 577-39,403
-308
-502
1,636
1 399-2,094
258
428
2,79710
32 37326,125
-2 023
2098
2,543
3 630
o5 710
487
5,223
82
Q3
-4,976-7 189
-12,36352,079
-64,442-2
7,1152,019
-657
- 1 ,088
~2 555
-794o-434
-45999
- 22 867-21,405
808
-3,410
1,140
2 4774,803
-192
-177
-1,870-87
15 90710,884
-282
1 408
633
3 264
0
12 808
-2 276
15,084
Q4
-6,314-5,027
- 1 1 ,23948,519
-59,758-94
5,9191,506
-653
-1,753
-1 086
-1,949o-297
-732-920
- 16,279-16,919
2,247
-3,541
1,934
2,6644,346
-459
221
-990-454
12,0173,057
-13
2,254
1,907
4 812
0
10,947
2,752
8,195
Ql-2,943-2,332
-9,27749,246
-58,523790
5,2381,879
-599
-974
-I 130
-7870
-98
-2,1391 450
-22 447-18,175-3,199
-1,866
793
-2523,012
-371
-533
-1,978-382
16,13910,244
-2,337
2,924
3,003
2 305
o1 1 ,420
-579
11,999
19
Q2
-9,560-8,769
- 14,87048,745
-63,61553
5,9781,127
-638
-1,210
-1 251
160
= 303
-212531
1753,894-230
-3,257
-232
1 7391,985
-170
434
316-826
10 7141,698
-64
3 139
2,614
3 327
o-1 833
439
-2,272
83
Q3
-11,846- 14 498
-17,50150,437
-67,938-55
7,172681
-665
-1 478
-1 204
529o-209
-88826
-8 548-2 871
-233
-1,571
-3 873
-2 703-611
-363
137
- 1 ,403-463
22 28114,792
1 311
995
1,861
3 322
o1 491
-2 518
4,009
Q4
-17,213-15 964
-19,40751,829
-71,236-2735,119
434
-688
-2 398
-1 429
-953o545
-1,996498
-12 461-8 239-1,671
-983
-1 568
6 5552,603
417
161
3,498-124
27 24922,325
-228
1 673
1,134
2 345
o-1 748
2 657
-4,405
135Digitized for FRASER http://fraser.stlouisfed.org/ Federal Reserve Bank of St. Louis

55. Summary of U.S. international transactions—ContinuedMillions of dollars; quarterly figures are seasonally adjusted except as noted.1
Item
MEMOChanges in official assets
38 U.S. official reserve assets(increase — )
39 Foreign official assetsin the United Statesexcluding line 27(increase, +)
40 Changes in OPEC officialassets in the United States(part of line 22 above)
41 Transfers under military grantprograms (excluded fromlines 4, 6, and 10)
1989 1Q83 1982
Ql | Q2 Q3 Q4 Ql
-4 965 - 1 196 - 1 089 - 1 132 =794 - 1 949 -7?
2,936 5,140 -3,132 971 2,654 2,443 2£
7,291 -8,639 5,018 2,470 234 -431 -1,46
593 205 89 118 229 158 A
1983
| Q2 Q3 Q4
7 16 529 -953
1 1 ,305 - 2 840 6,394
6 -3,482 -2,051 -1,640
\2 30 49 84
56. U.S. foreign trade, 19831
Millions of dollars; monthly data are seasonally adjusted.
Item Year Jan. Feb. Mar. Apr. May June July Aug. Sept. Oct. Nov. Dec.
1 Exports of domestic and foreignmerchandise excludinggrant-aid shipments
2 General imports including merchan-dise for immediate consumptionplus entries into bonded ware-houses
3 Trade balance
200,486 17,232 16,311 16,690 16,095 15,655 16,959 16,486 16,582 17,257 17,033 17,063 17,298
258,048 20,127 18,804 19,527 19,914 21,446 20,916 21,828 22,714 22,451 24,333 23,115 22,976
-57,562 -2,895 -2,493 -2,837 -3,819 -5,791 -3,957 -5,341 -6,132 -5,195 -7,300 -6,051 -5,678
57. U.S. reserve assets, 1983Millions of dollars, end of period
Type
1 Total
2 Gold stock1
3 Special drawing rights2' 34 Reserve position in International Monetary Fund2' 4
5 Convertible foreign currencies^
1 Total
2 Gold stock1
3 Special drawing rights2' 34 Reserve position in International Monetary Fund2- 4
5 Convertible foreign currencies5
Jan.
33,936
11 1445,2678,0359490
July
33,373
11 1315,4969,4757 271
Feb.
34,233
11 1395,2848,5949 216
Aug,
32,624
11 1285,5439,2966 657
Mar.
34,261
11 1385,2299,2938 601
Sept.
33,066
11 1285,6289,3996911
Apr.
34,173
11 1325,1929,2848 565
Oct.
33,273
11 1265,6419,5546,952
May
33,931
11 1325,5259,4247 850
Nov.
33,655
11 1235,7359,8836914
June
33,876
11 1315 4789,4137 854
Dec.
33,747
11 1215 025
11,3126 289
136Digitized for FRASER http://fraser.stlouisfed.org/ Federal Reserve Bank of St. Louis

58. Selected U.S. liabilities to foreign official institutionsA. By typeMillions of dollars, end of period
1 Total1
2 Liabilities reported by banks in the United States2
3 U S Treasury bills and certificates3 . . .U.S. Treasury bonds and notes
4 Marketable5 Nonmarketable4 . . .6 U S securities other than U S Treasury securities^
1 Total1
2 Liabilities reported by banks in the United States2 . .3 U S Treasury bills and certificates3
U.S. Treasury bonds and notes4 Marketable5 Nonrtiarketable4 , .6 U S securities other than U S Treasury securities5
1 Total1 . .
2 Liabilities reported by banks in the United States2
3 U S Treasury bills and certificates3
U.S. Treasury bonds and notes4 Marketable . .5 Nonrnarketable4
6 U S securities other than U S Treasury securities^
Jan.
168,027
24 30152,306
54,02611,79125 603
Sept.
170,277
25,98044,450
64,9989,350
25,499
May
174,309
23,29349 281
70,6667 950
23,119
Feb.
166,104
24 74148 174
56,37411 29125 524
19
Oct.
170,643
26 46943,964
65 6399,350
25 221
June
174,304
23,32649 118
71,0727 950
22,838
Mar.
166,602
25 05347,048
57,69911,29125 511
82
Nov.
167,173
24 66242,906
65,8708,750
24 985
July
175,627
21,43053 484
70,1787 950
22,585
19
Apr.
165,118
26 11443,850
58,4901 1 ,05025 614
Dec.
172,718
24,98946,658
67,7338,750
24,588
19
Aug.
173,025
22,51150 965
69,2507,950
22,349
82
May
166,580
27 50342,741
59,96710,75025 619
Jan.
175,147
23,97750,432
67,7708,750
24,218
83
Sept.
171,516
21,97550,374
69,2057,950
22,012
June
167,571
27 85043,509
60,28510,15025 777
19
Feb.
172,923
21,59849,954
69,3227,950
24,099
Oct.
173,209
22,05751,618
69,7097,950
21,875
July
169,405
25 25245 824
63,0829 750
25 497
83
Mar.
173,001
23 Oil47,917
702897,950
23 834
Nov.
173,862
22,81652 558
68,9507 250
22,288
Aug.
168,614
26 07744 182
63,4989 350
25 507
Apr.
173,397
22 81448,399
70,6307,950
23 604
Dec.
177,922
25,50354 341
68,5147 250
22,314
137Digitized for FRASER http://fraser.stlouisfed.org/ Federal Reserve Bank of St. Louis

58. Selected U.S. liabilities to foreign official institutions—ContinuedB. By areaMillions of dollars, end of period
1 Total
2 Western Europe1
3 Canada4 Latin America and Caribbean5 Asia6 Africa7 Other countries2
1 Total
2 Western Europe1
3 Canada4 Latin America and Caribbean5 Asia6 Africa7 Other countries2
1 Total
2 Western Europe1
3 Canada4 Latin America and Caribbean5 Asia6 Africa7 Other countries
Jan.
168,027
63,2942,3695,929
93,9541,649
832
Sept.
170,277
61,2412,0576,493
95 0051,3034,178
May
174,309
63,0862,7395,918
95,6171,2035,746
Feb.
166,104
62,1181,6696,307
93,3861,4741,150
19
Oct.
170,643
60,6372,2047,231
94,5561,4524,563
June
174,305
63,6892,8156,500
94,7281,0755,498
Mar.
166,602
60,4801,6476,562
94,9761,3371,600
82
Nov.
167,173
59,2392,0445,909
93,3051,3715,305
July
175,627
66,4052,8695,429
94,3971,1385,389
19
Apr.
165,118
57,4811,7217,124
94,3701,8232,599
Dec.
172,718
61,2982,0706,057
96,0341,3505,909
19
Aug.
173,025
64,6462,7505,698
93,1721,1735,586
82
May
166,580
57,4901,3297,417
95,2181,3813,745
Jan.
175,147
62,3832,4067,160
95,4071,7166,075
83
Sept.
171,515
63,9242,7075,501
92,7661,1965,421
June
167,571
58,1141,5777,564
94,7661,4374,113
19
Feb.
172,924
61,9882,7176,172
95 7661,3274,954
Oct.
173,209
64,8872,8115,629
92,3041,0236,555
July
169,405
58,7031,5197,491
96,4071,4853 800
83
Mar.
173,001
61 5342,8745,618
96 8991,1624,914
Nov.
173,862
65,6502,6656,468
91,456798
6 825
Aug.
168,614
61,1031,7716811
94,2151,3263,388
Apr.
173,397
62 0412,6446,290
95 4391 2085,775
Dec.
177,922
67,6452,4386,248
92 544958
8 089
138Digitized for FRASER http://fraser.stlouisfed.org/ Federal Reserve Bank of St. Louis

59. Liabilities to foreigners, payable in U.S. dollars, reported by banks in the United StatesA. By holder and type of liabilityMillions of dollars, end of period
1 All foreigners
2 Banks' own liabilities3 Demand deposits . .4 Time deposits' .5 Other2
6 Own foreign offices**
7 Banks' custody liabilities4
8 U S Treasury bills and certificates5
9 Other negotiable and readily transferable instruments6 . . . .10 Other
1 1 Nonmonetary international and regional organizations^
12 Banks' own liabilities13 Demand deposits14 Time deposits1 . . . . . . . .15 Other2
16 Banks' custody liabilities4 . . .17 U.S. Treasury bills and certificates18 Other negotiable and readily transferable instruments6
19 Other
20 Official institutions8
21 Banks' own liabilities22 Demand deposits23 Time deposits1 . . . .24 Other2
25 Banks' custody liabilities4
26 U.S. Treasury bills and certificates5
27 Other negotiable and readily transferable instruments6
28 Other
29 Banks9 . . . .
30 Banks' own liabilities . .31 Unaffiliated foreign banks32 Demand deposits . . . . .33 Time deposits1
34 Other2
35 Own foreign offices^
36 Banks' custody liabilities4
37 U S Treasury bills and certificates38 Other negotiable and readily transferable instruments6
39 Other
40 Other foreigners . . . .
41 Banks' own liabilities . .42 Demand deposits43 Time deposits44 Other2
45 Banks' custody liabilities4
46 U S Treasury bills and certificates47 Other negotiable and readily transferable instruments6
48 Other
49 MEMO: Negotiable time certificates of deposit heldin custody for foreigners
Jan.
251,262
171 89217 89931 76716,899
105 326
79,37055 13818 7445487
2,148
37313086
156
1 775217
1,5580
76,607
14 9212 2953 7268,900
61 68652,3069,353
27
146,111
134 22628,90010 57410,9387 387
105 326
11 8851 8574,8525 176
26,395
22,3724 899
17 016456
4023757
2,981284
10 553
Feb.
255,251
180 71617,40436,98617,622
108 704
74,53551 15018,5434,842
2,091
2981357687
1 792277
1,5150
72,915
15,1562 17843488,630
57,75948,174
9,54937
152,054
141 ,30432,6001029213,8908 419
108 704
10,7501 8824,3984470
28,191
23,9584,799
18 673486
4233818
3,081335
10 930
Mar.
262,412
188 96216 13844,14919,479
109 196
73,45050 17318 6704607
2,153
553212146196
1 599109
1,4900
72,101
15,5472 03249388,577
56 55347,048
9,46540
158,600
147,41038,2149 177
18,83710 200
109 196
11,1912 2184,7184 255
29,558
25,4514 716
20 228508
4 107797
2,997313
11 201
19
Apr.
267,553
196 59917 67149,32919,125
1 10 474
70,95447 37518 9014,679
2,148
708149391168
1,439142
1,2970
69,964
17,3232 7835,6828,858
52,64143,850
8,608183
162,216
H9,40238,9289,914
19,4209,595
110 474
12,7232 5985,9644,161
33,316
29,1664,825
23 837504
4,150784
3,032334
11 703
82
May
277,391
206 60916,56754,60021,255
114 188
70,78246 50320,1384,141
3,213
1,445185621639
1,767253
1,5140
70,244
18,0102 1495,9939,868
52,23442,741
9,45340
167,654
155,08840,9009,700
21,14610,054
114,188
12,5662,7076,0933,766
36,280
32,0664,532
26,839694
4,214802
3,078335
12,700
June
289,511
216 85117 2705646222,386
120 733
72,66048 83219 8164011
4,003
1,235300588347
2 7681,4251,343
0
71,359
18,9793 1275400
10,452
52 37943,509
8,83633
176,733
164,03343,3009277
23,20410 819
120 733
12,70029266,5143,260
37,416
32,6034,566
27 270767
4813973
3,123718
12 921
July
288,162
212 89317 05360,42820,499
114 913
75,26951 224200364009
4,387
2,552343658
1,551
1 835487
1,349o71,076
16,3522 74865167,088
54,72445,824
8,86436
174,279
160,60545,692
9,38825,25211 053
114 913
13,6743 8726,6643,138
38,420
33,3844,574
28,002807
5,0361,0413,160
835
13 039
Aug.
295,301
220 41515 83162 95424 284
117 346
74 88549 65621 451
3 778
5 098
3 119265478
2 376
1 980328
1,6520
70,259
16 4931 9835 9308 581
53 76544 182
9,54637
179,800
165 58648,2408 765
26,91612 559
117 346
14 2143 9707,1063 138
40,144
35,2174,819
29 630768
49271,1773,147
603
13 933
139Digitized for FRASER http://fraser.stlouisfed.org/ Federal Reserve Bank of St. Louis

59, Liabilities to foreigners, payable in U.S. dollars, reported by banks in the United States—ContinuedA. By holder and type of liability—ContinuedMillions of dollars, end of period
Item1982
Sept. [ Oct. [ Nov. [ Dec.
1983
Jan. Feb. Mar. Apr.
1 All foreigners
2 Banks' own liabilities3 Demand deposits4 Time deposits1
5 Other2
6 Own foreign offices3
7 Banks' custody liabilities4
8 U.S. Treasury bills and certificates5
9 Other negotiable and readily transferable instruments6
10 Other
16 Banks' custody liabilities4
17 U.S. Treasury bills and certificates18 Other negotiable and readily transferable instruments6
19 Other
20 Official institutions8
21 Banks' own liabilities22 Demand deposits . .23 Time deposits1 . . .24 Other2
25 Banks' custody liabilities4
26 U.S. Treasury bills and certificates5
27 Other negotiable and readily transferable instruments6
28 Other
29 Banks9
30 Banks' own liabilities31 Unaffiliated foreign banks32 Demand deposits33 Time deposits1
34 Other2
35 Own foreign offices3
36 Banks' custody liabilities4
37 U.S. Treasury bills and certificates38 Other negotiable and readily transferable instruments6
39 Other
40 Other foreigners
41 Banks' own liabilities42 Demand deposits . .43 Time deposits1 . . .44 Other2
45 Banks' custody liabilities4
46 U.S. Treasury bills and certificates47 Other negotiable and readily transferable instruments6
48 Other
49 MEMO: Negotiable time certificates of deposit held in custodyfor foreigners
301,220 301,339 303,565 307,056 305,440 306,028 318,220 309,017
223,74615,40463,18823,481121,673
222,19717,00362,54023,033119,622
227,56117,07163,45224,569122,470
227,08915,88968,03523,946119,219
220,76115,89264,93623,123116,810
221,71417,42366,13820,558117,595
237,09216,36970,86824,344125,511
227,03615,50069,66121,043120,832
11 Nonmonetary international and regional organizations7
12 Banks' own liabilities13 Demand deposits14 Time deposits'15 Other2
77,474 79,142 76,004 79,96751,590 53,393 52,158 55,62821,804 22,034 20,241 20,6364,080 3,715 3,605 3,702
84,680 84,314 81,128 81,98262,157 61,925 58,771 60,10919,296 19,151 18,770 18,7583,227 3,238 3,588 3,114
5,108 6,173 6,641 4,922 6,790 6,135 5,079 6,273
2,811194792
1,825
2,298676
1,6210
2,474261569
1,645
3,6992,1601,539
0
3,563257
1,1452,161
3,0781,7741,304
0
1,909106
1,664139
3,0131,6211,392
0
1,965284
1,512170
4,8243,6031,221
0
1,860195
1,532134
4,2753,1531,122
0
2,433221
1,1481,064
2,6451,5011,144
0
2,898252
2,087559
3,3752,2301,145
0
70,430 70,433 67,568 71,647 74,409 71,553 70,928 71,213
16,8222,5105,5188,795
17,0382,0786,1328,829
16,6972,0465,5499,103
16,6401,8995,5289,212
16,5462,0694,9599,517
14,7962,0635,5157,218
16,4742,1815,3588,936
16,1812,2176,0297,935
53,607 53,394 50,871 55,00844,450 43,964 42,906 46,6589,118 9,396 7,936 8,321
39 34 28 28
57,864 56,756 54,454 55,03250,432 49,954 47,917 48,3997,396 6,769 6,512 6,618
35 33 25 15
184,027 183,522 186,414 185,881 179,337 182,082 193,943 183,520
168,19846,5258,13826,55711,830
167,02047,3989,88226,05811,458
170,13347,6639,66526,06311,936
169,44950,2308,67528,38613,169
162,51445,7048,15425,70811,842
164,07546,4809,62825,51511,338
175,56650,0558,26428,27113,520
165,06844,2367,60124,80211,833
121,673 119,622 122,470 119,219 116,810 117,595 125,511 120,832
15,829 16,502 16,281 16,432 16,823 18,007 18,376 18,4524,897 5,634 5,792 5,809 6,292 6,790 7,121 7,4747,920 8,065 7,796 7,857 7,702 8,345 8,265 8,0413,012 2,803 2,693 2,766 2,829 2,872 2,990 2,937
41,655 41,210 42,942 44,606 44,905 46,258 48,271 48,011
35,9154,56230,3221,031
5,7401,5663,1451,028
35,6644,78229,7811,100
37,1685,10330,6961,369
5,547 5,7741,634 1,6853,034 3,204878 884
39,0925,20932,4571,426
5,5141,5403,065908
39,7365,38632,7571,593
5,1691,8302,976363
40,9825,53833,5751,869
5,2762,0282,915333
42,6185,70336,091
824
5,6532,2312,849573
42,8895,43036,743
715
5,1222,0062,954162
13,545 15,040 14,421 14,307 13,312 11,557 11,323 11,539
140Digitized for FRASER http://fraser.stlouisfed.org/ Federal Reserve Bank of St. Louis

59. Liabilities to foreigners, payable in U.S. dollars, reported by banks in the United States—ContinuedA. By holder and type of liability—ContinuedMillions of dollars, end of period
1 AH foreigners .
2 Banks' own liabilities . . .3 Demand deposits4 Time deposits1
5 Other2
6 Own foreign offices^ . . . .
7 Banks' custody liabilities4
8 U S Treasury bills and certificates5 . . .9 Other negotiable and readily transferable instruments6
10 Other
1 1 Nonmonetary international and regional organizations7
12 Banks' own liabilities13 Demand deposits14 Time deposits'15 Other2
16 Banks' custody liabilities4
17 U S Treasury bills and certificates . .18 Other negotiable and readily transferable instruments6
19 Other
20 Official institutions8
21 Banks' own liabilities22 Demand deposits23 Time deposits1 . . . . . . . .24 Other2
25 Banks' custody liabilities4 ,26 U S Treasury bills and certificates5
27 Other negotiable and readily transferable instruments6
28 Other
29 Banks9
30 Banks' own liabilities31 Unaffiliated foreign banks . . . .32 Demand deposits33 Time deposits1 . . . . . .34 Other2
35 Own foreign offices^
36 Banks' custody liabilities4
37 U S Treasury bills and certificates . . .38 Other negotiable and readily transferable instruments6
39 Other
40 Other foreigners . .
41 Banks' own liabilities42 Demand deposits43 Time deposits'44 Other2
45 Banks' custody liabilities4
46 U S Treasury bills and certificates47 Other negotiable and readily transferable instruments6
48 Other
49 MEMO: Negotiable time certificates of deposit held in custodyfor foreigners
May
317,512
234 33416,82372,44822,711
122,351
83 17860,50619 1093,562
5,803
3,467267
2,511690
2,3351 2801,055
0
72,574
16,5471 9446,1448,460
56,02649 281
6,72422
189,252
169 83647,484
8 83225,70112 951
122 351
19,4167,8228 3153,280
49,884
44 4845,780
38 094610
5 4002,1233,016
261
1 1 ,477
June
322,009
238 37117,17775,69124 241
121,261
83 63861,33818 6133 687
5,686
3,278165
2,483630
2,4081 538
870o
72,445
16,4282 0606 0588,310
56,01749 118
6,88117
192,993
173 53252 2709 134
28 36714 769
121 261
19,4618 4027 7713 289
50,884
45 1325,817
38 783533
5 7522,2793,091
381
1 1 ,470
July
326,960
239 64115,59575,16421,618
127,265
87 32065,23717 9864,097
5,678
4,030307
3,010713
1,648678970
0
74,864
15,2121 7746,2047,234
59,65253 4846,139
29
195,346
175 21847,953
8 07426,84813 031
127,265
20,1288,6087 8213,699
51,073
45 1815,439
39 102640
5 8912,4663,055
369
10,941
19
Aug.
334,701
248,52115,67278,07223,947
130,830
86,18063,93917 9874,253
5,555
3,433325
2,507601
2,1211,294
828o
73,426
16,2251 6856,0128,529
57,20150,965
6,19639
203,173
182,72051,889
8,30229,42214,165
130,830
20,4549,0287,5813,845
52,546
46,1435,360
40,131652
6,4042,6523,383
369
10,730
83
Sept.
338,026
251 99416,32781,62424 656
129,387
8603264,06217 3024 669
5,308
3,024252
2,168605
2,2841 442
842o
72,299
16,1471 88662288,033
56,15250 374
5,74532
206,381
185 31355,9268 618
31,88315 425
129,387
21,0699,4407 5534,075
54,038
47 5105,571
41 345594
6 5282,8053,162
561
10,346
Oct.
338,117
249 95217,09480,86522 288
129,706
88 16565,73517 1825 247
4,619
3,294452
2,487355
1,325441884
0
73,675
16,5321 8186,6618,053
57,14451,618
5,48936
204,672
182 73153,0259 102
30,69113 232
129,706
21,94110,0367 5424,363
55,151
47 3965,723
41,025648
7 7553,6403,267
848
9,995
Nov.
351,382
262 22617,19884,73522 863
137 430
89 15666 74617 7214 690
6,363
4,939437
4,079423
1,424484939
o75,374
16,6732 0236 7237,926
58,70152 558
6,11528
214,010
192 57255,142
8 77032,67813 695
137,430
21,4389,9677 2514,221
55,635
48,0425,968
41,255819
7,5933,7373,415
441
10,385
Dec.
369,226
278 64417 59490,09826 100
144 851
90 58268 66917 5294 385
5,957
4 632297
3 885449
1 325463862
o
79 764
19 3151 8377 294
10,184
6044854 3416,082
25
226,485
204 94560 094
8 75636 73414 604
144 851
21,54010 1787 4853 877
57,021
49 7516,703
42 185863
7 2693,6863,100
483
10,407
141Digitized for FRASER http://fraser.stlouisfed.org/ Federal Reserve Bank of St. Louis

59. Liabilities to foreigners, payable in U.S. dollars, reported by banks in the United States—ContinuedB. By area and countryMillions of dollars, end of period
1 Total
2 Foreign countries
3 Europe4 Austria . . . . . . , ,5 Belgium-Luxembourg6 Denmark7 Finland . .8 France . .9 Germany
10 Greece . . . . . .1 1 Italy12 Netherlands13 Norway . . . . . .14 Portugal . . . . . .15 Spain16 Sweden . . . .17 Switzerland1 8 Turkey19 United Kingdom . .20 Yugoslavia21 Other Western Europe1 .22 U S S R . .23 Other Eastern Europe2
24 Canada
25 Latin America and Caribbean26 Argentina . . . . . .27 Bahamas28 Bermuda . .29 Brazil30 British West Indies31 Chile . .32 Colombia33 Cuba . . .34 Ecuador35 Guatemala36 Jamaica . .37 Mexico38 Netherlands Antilles . .39 Panama40 Peru41 Uruguay42 Venezuela . . . , .43 Other
44 AsiaChina
45 Mainland . .46 Taiwan . .47 Hong Kong48 India49 Indonesia50 Israel5 1 Japan52 Korea53 Philippines . . . . . . .54 Thailand55 Middle East oil-exporting countries^ . .56 Other
57 Africa58 Egypt59 Morocco60 South Africa . .61 Zaire62 Oil-exporting countries4
63 Other . . . .
64 Other countries65 Australia . .66 All other . . . . . .
67 Nonmonetary international and regional organizations68 International^69 Latin American regional70 Other regional6 . . . .
Jan.
251,262
249 114
90 372735
3,959512157
8,0786 936
4697,1042 8381 244
3011 0291 274
18,882336
30,834215
5 12968
272
11 581
92 2462,879
43 309680
1,60817 921
7712 861
7356485120
6 7403,1453 499
594481
4,5572 232
50 771
1832,2443,964
5131 230
54620 309
2,146758369
13 4415 069
3 065571
3625233
1 207966
1 078853225
2 1481 072
712364
Feb.
255,251
253 160
92 165658
3,254524292
8,0476 652
5356,4973 0271,129
275946
1,48018,529
21634,069
2195,482
52284
11 134
95 1212,897
43 837874
1,80318,861
8152 924
10370519100
7 3163,3363 376
531479
4,6092 464
50496
2152,2724,302
4151 241
50720994
2,162739494
13,4003 754
2,815339
3536840
1 112921
1 4301,204
226
2,0911 082
706303
Mar.
262,412
260,259
94,002552
2,992514273
7,8077 687
4724,3003,1611,518
2721,1361,358
19,141283
35,292223
6,57844
400
10,860
98,5823,038
44,9781,1121,352
18,942951
2,6547
513590129
7,7253,4344,215
532323
5,1262,960
52,633
2572,2314,272
4361 128
44922,0872,141
671340
14,5824,040
2,408302
3633069
6271,044
1 7751,550
225
2,1531,181
630342
19
Apr.
267,553
265 405
92 601474
2,898613229
6,7446 552
4573,6962 9631,666
2721 0551,373
20,358364
35,889259
6,35337
350
12 346
104,4122,742
45 8711,1641,462
19,656992
2,6406
491569133
8,6253,4744,273
620410
8,2363 048
50 186
3312,3094,678
545837537
19 3912,360
709517
13,8944078
3,119411
5230841
1 1441,163
2 7432,542
201
2,1481 369
450328
82
May
277,391
274 179
98 701456
3,090608212
6,3196947
5493,4222,7221,981
2761 1141,420
21,610204
40,794237
6,33830
371
10,655
107,6632,209
46,0341,3501,615
19,7711,2242,517
6465583104
9,8503,4494,373
755561
9,4423 357
50,526
2842,3944,828
603789562
18 9022,196
785474
13,7524958
2,636382
37305
27846
1,039
3 9973,752
245
3,2132,237
661314
June
289,511
285 508
103 638434
2,872510181
9,2416 215
5124,7222 8681 370
3651 1911 381
22,429167
41,974314
632844
521
11 603
111 8352,031
46 5411,2711,822
22 5781,1242 702
6559580100
9 4083,7285 4011,060
5429,3962 986
51 349
2442,3444 880
540584620
19 8231,866
841485
13 5795 543
2680447
59335
37901901
4 4024,174
228
4,0032 862
694446
July
288,162
283 775
107 291506
2,967452162
8,6425 619
5065,7602 7911,333
3651 1341 385
23,860222
44,983320
5 84441
397
11 206
107 0402,154
42 1021,3061,823
22,0891,4422701
7528613139
100963,6014 903
933609
9,1252 870
51 455
2612,3834918
551723476
19 8611,936
660450
13,5695 666
2,697430
52339
251 025
825
40853,831
254
4,3873 370
606412
Aug.
295,301
290 202
112 231538
3 218446224
8 1475 391
55967032 8291 634
4531 2241 278
25041287
46 892317
6 56147
440
12 245
109 4322,713
43 5871 2931,865
22 9361,1702 637
9480616136
9 5883,7934 675
985665
9 2443 038
50 187
2452,3344 551
655595486
19 2911 715
728369
13 4225 796
2 591405
47341
25908865
3 5163 317
199
5 0983 961
776362
142Digitized for FRASER http://fraser.stlouisfed.org/ Federal Reserve Bank of St. Louis

59. Liabilities to foreigners, payable in U.S. dollars, reported by banks in the United States—ContinuedB. By area and country—ContinuedMillions of dollars, end of period
1914s678Q
1011P11141S16171819707]9971
74
757697?89Q10111?1314151617181940414741
44
4*>46474849*iOMs?*i1MS556
57S8SQ60616761
646^66
67686070
Total
Foreign countries
EuropeAustriaBelgium-LuxembourgDenmarkFinlandFranceGermanyGreeceItalyNetherlandsNorwayPortugalSpainSwedenSwitzerlandTurkeyUnited KingdomYugoslaviaOther Western Europe1
U.S.S R.Other Eastern Europe2
Canada
Latin America and Caribbean ,ArgentinaBahamas .Bermuda ,BrazilBritish West Indies .ChileColombia . . .CubaEcuador . . . .GuatemalaJamaicaMexicoNetherlands AntillesPanamaPeruUnifiuavVenezuela .Other
AsiaChina
MainlandTaiwan
Hong KongIndiaIndonesiaIsraelJapanKoreaPhilippinesThailandMiddle East oil-exporting countries3
Other
Africa .Eevot^s^F1
MoroccoSouth AfricaZaireOil-exporting countries4
Other
Other countries .AustraliaAll other
Nonmonetary international and regional organizationsInternational5
Latin American regionalOther regional**
Sept.
301,220
296,112
114 324544
3 259149328
7,7205 326
4716,7142 8901 773
3861 1071 324
26,492301
48,504307
6 36147
322
11,662
112,2703 473
44,6981,5211 763
23,3841 2972,517
7526639121
8 8083,7136 237
976721
8 6443,223
50,500
2542,5004 946
407437583
18 8951,907
715310
13,3936 152
2 78538563
34420
1,074899
4,5724 355
216
5,1083,992
719397
19
Oct.
301,339
295,165
1 16,064518
2782166478
7,3585,330
5165,5413,0942,026
3561,3151,997
27,683317
49,008390
6,536111544
12,190
109,6303,485
43,8681,5092,024
23,1121,4502,407
7556636118
8,1403,6774,8001,033
8448,7993,166
49,174
2162,5724,957
439759612
16,8301,927
738365
13,4166,344
3,36924254
27923
1,6691,103
4,7384,530
207
6,1735,276
576322
82
Nov.
303,565
296,924
117,300448
2 499221572
7,0676,068
4964,7793,0972,197
4531 3011,615
28,050255
50,278470
690345
489
11,739
111,4023,439
44,8181,5981,988
24,3181,4452,426
8521639108
8,4473,5184,882
960651
8,3433,293
47,838
2142,7744,847
507535705
15,6801,778
769349
13,6596,020
3,19237366
56422
1,250918
5,4525,224
228
6,6415,697
534410
Dec.
307,056
302,134
117,756519
2 517509748
8,1715,351
5375,6263,3621,567
3881 4051,390
29,066296
48,172499
700650
576
12,232
114,1633,578
44,7441,5722,014
26,3811,6262,594
9455670126
8,3773,5974,8051,147
7598,4173,291
48,716
2032,7614,465
433857606
16,0781,692
770629
13,4336,789
3,124432
81292
231,2801,016
6,1435,904
239
4,9224,049
517357
Jan. ,
305,440
298,651
118 826467
2 270996473
8,4665 782
5894,9393 7731,476
3981 3161,317
29,004190
50,358470
6 08047
415
11,017
110,8604,835
43,0181,9721,934
24,6771,3412,385
10473682115
8,0313,7634,9301,052
7267,6653,249
48,273
2203,1944,542
5141,163
61415,836
1,473680489
12,3377,210
3,36252354
28125
1,603877
6,3146,080
235
6,7905,948
527316
19
Feb.
306,028
299 893
116 317513
2 2951 197
3697,7746 203
5954,5193 1971 407
3701 5241 653
30,278246
47 353452
5 99041
338
13,667
111,8454 788
45,3541,9131 926
24,1981 2802,336
10500669103
7,7693,4774958
903817
7 7373,108
49,701
1963,5305,050
962621515
16 6131,458
787529
11,7057735
3,12143253
33331
1,333940
5,2415,052
190
6,1355,352
487296
83
Mar. ,
318,220
313,141
1 16 606604
2 728765408
6,7826 471
5974,3313 7061,061
3651 6401,384
30,459254
47,792491
6 36540
365
15,230
120,5294,802
48,7492,0832,025
27,8911,1081,891
9575679134
8,1323,4655,651
922822
8,2013,390
52,619
2083,5495,732
521861990
17,0721,418
718488
13,1637,899
2,93354059
29533
9751,031
5,2244,933
291
5,0794,297
496285
Apr.
309,017
302 744
111 402576
2 808849437
7,0983 437
6705,0293 9701 565
3491 4841 210
29,427231
45 067504
6 22844
417
14,568
117,6594 626
48,5012,0802 501
24,2411 2081,825
12534671107
8,3763,4505,669
966860
8 6283,405
50,275
1873,6005,166
6691,028
76717 086
1,147712530
11,7637 620
2,841466
49310
281,071
916
5,9995,804
195
6,2735,550
494229
143Digitized for FRASER http://fraser.stlouisfed.org/ Federal Reserve Bank of St. Louis

59. Liabilities to foreigners, payable in U.S. dollars, reported by banks in the United States—ContinuedB. By area and country—ContinuedMillions of dollars, end of period
1 Total
2 Foreign countries . .
3 Europe4 Austria5 Belgium- Luxembourg6 Denmark7 Finland8 France .9 Germany
10 Greece1 1 Italy12 Netherlands1 3 Norway14 Portugal15 Spain16 Sweden . .17 Switzerland18 Turkey19 United Kingdom20 Yugoslavia21 Other Western Europe1
22 U S S R23 Other Eastern Europe2
24 Canada
25 Latin America and Caribbean26 Argentina .27 Bahamas28 Bermuda29 Brazil30 British West Indies31 Chile32 Colombia33 Cuba .34 Ecuador35 Guatemala . . .36 Jamaica37 Mexico38 Netherlands Antilles39 Panama40 Peru . .41 Uruguay42 Venezuela43 Other
44 AsiaChina
45 Mainland46 Taiwan47 Hong Kong48 India49 Indonesia50 Israel51 Japan52 Korea53 Philippines54 Thailand55 Middle East oil-exporting countries^56 Other
57 Africa58 Egypt59 Morocco60 South Africa61 Zaire62 Oil-exporting countries^63 Other
64 Other countries65 Australia66 All other
67 Nonmonetary international and regional organizations68 International5
69 Latin American regional . .70 Other regional6
May
317,512
311 709
116 143572
2,615732280
66503,971
6485 5733,5502 227
4301,6211 356
29 783248
48 863549
6,06678
330
12 232
114 1633,578
44 7441 5722,014
26 3811,6262 594
9455670126
8 3773,5974,8051 147
7598 4173 291
52 200
15837655 214
719765789
17 4471 459
783566
12 6107,926
2 876513
5035832
8671 057
5 9565 778
178
5,8035,078
457267
June
322,009
316,323
119 141640
2,852616447
6,7743,433
5676,6443,2471 719
3531,6151 493
29,956198
50 903504
6,65671
451
16 328
118 2064,750
49 1941 8002,486
23 5051,3471 873
8658711108
8 5603,6325,7731 005
9218 5823,293
52,071
2083,7445,615
669554839
17 0521 326
818702
11 8378,705
2 693467
54355
59743
1 014
5 5575 404
154
5,6864,980
443263
July
326,960
321,282
118,905610
2,960612292
8,8453,710
5887,7953,415
900340
1,6941 407
29,979224
48 095427
6,51445
453
16,369
120 4924,755
49 1002,0402,678
24 7951,3551 719
13581705130
90633,5215,7591 148
9578 6403,533
53,127
1923,9135,585
6061 245
67617 691
1 552770537
11 8808,482
2 91655457
40355
928919
5,4695 250
219
5,6784,987
454237
19
Aug.
334,701
329,146
123,812556
3,116573459
8,4833,537
6367,2773,6331,044
3151,5851,204
29,879315
53 776462
6,54631
384
16,838
124,0275,012
53 9832,3632,707
24,3371,3851 618
11532697108
9,1733,4365,6721,055
96077213,257
52,679
1764,0865,614
5^8839823
16,9371 553
933531
11 7708,887
2 85346548
45229
934926
5,7195 512
208
5,5554,861
441252
83
Sept.
338,026
332,718
125,969659
2,795593373
8,8273,438
6046,9313,8921,457
3021,6781,337
29,940333
55,708506
6,04823
525
17,918
126,1654,249
51 4802,8493,046
26,9701,4751 674
12601718106
9,4503,5015,9531,1291,0338,5873,331
54,948
1903,8526,586
712622848
17,4551 4781,181
58112 9758,468
3,132488
84520
34963
1 042
5,4905 284
206
5,3084,674
445189
Oct.
338,117
333,498
127,131570
2,856544372
8,6384,307
5957,7033,7351 072
2971,5921,489
30,822277
55,082464
6,10237
576
16,470
126,7094,148
49 5202,7063,406
28,5201,6161 611
10670758109
9,7023,5866,0841,2031,1168,3853,561
53,871
2163,9926511
830871812
17,1401 353
747522
12 8608,017
2 845576
7339443
7361 023
6,6756461
214
4,6193,944
437238
Nov.
351,382
345,019
130,671641
2,470538375
8,0834,337
5447,8243,7011 531
3061,5341 652
30,623319
58 437552
6,66027
518
16,335
126,6404,018
504962,6323,818
27,4661,6971 617
10825750105
94493,8885,9021,0491,2028 2023,513
54,278
1834,0636971
725661808
17 1381 5911,012
56912 6507,907
2 69458996
38932
679909
6 8686666
202
6,3635,598
415350
Dec.
369,226
363,269
138,006585
2,709466531
9,4413,599
5208,4594,2901 673
3731,6031 799
32,117467
60 658562
7,49365
596
16,369
134 1394,377
53 7032,5824,150
30,6241,7831 645
101,003
766234
9 4633,9415,9461,0901,1738 0243,626
58,351
2493,9976610
464997
1,72218 079
1 6481,234
71612 9609,676
2 800645
84449
87620917
8 0537 857
196
5,9575 273
419265
144Digitized for FRASER http://fraser.stlouisfed.org/ Federal Reserve Bank of St. Louis
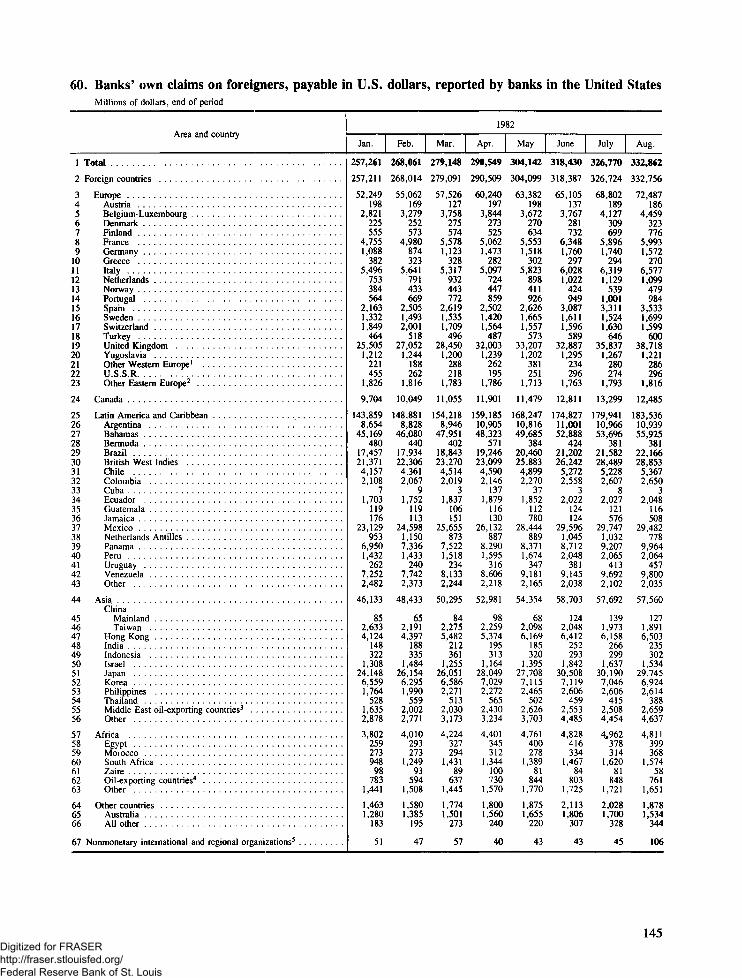
60. Banks9 own claims on foreigners, payable in U.S. dollars, reported by banks in the United StatesMillions of dollars, end of period
1 Total
2 Foreign countries
3 Europe . .4 Austria . . . .5 Belgium-Luxembourg6 Denmark7 Finland8 France9 Germany
10 Greece1 1 Italy12 Netherlands . . .1 3 Norway14 Portugal15 Spain16 Sweden .17 Switzerland18 Turkey19 United Kingdom20 Yugoslavia .21 Other Western Europe1
2 2 U S S R23 Other Eastern Europe2
24 Canada
25 Latin America and Caribbean26 Argentina27 Bahamas28 Bermuda29 Brazil30 British West Indies31 Chile32 Colombia33 Cuba34 Ecuador35 Guatemala36 Jamaica37 Mexico38 Netherlands Antilles39 Panama40 Peru41 Uruguay42 Venezuela43 Other
44 AsiaChina
45 Mainland46 Taiwan47 Hong Kong48 India49 Indonesia50 Israel51 Japan52 Korea53 Philippines . .54 Thailand55 Middle East oil-exporting countries^56 Other
57 Africa58 Egypt59 Morocco60 South Africa61 Zaire62 Oil-exporting countries4
63 Other
64 Other countries65 Australia66 All other
67 Nonmonetary international and regional organizations5
Jan.
257,261
257,211
52,249198
2,821225555
4,7551,088
3825 496
753384564
2 1631,3321,849
46425 505
1,212221455
1,826
9 704
143,8598 654
45,169480
17 45721,3714,1572 108
71,703
119176
23 129953
6,9501 432
2627 2522482
46 133
852 6334,124
148322
1,30824 1486,5591,764
5281 6352,878
3 802259273948
98783
1 441
1 4631,280
183
51
Feb.
268,061
268,014
55 062169
3,279252573
4,980874323
5 641791433669
25051,4932,001
51827052
1,244188262
1,816
10 049
148,8818 828
46,080440
17 93422,3064,3612067
91,752
119113
24 5981 1507,3361 433
2407 7422 373
48 433
652 1914,397
188335
1,48426 1546,2951,990
5592 0022,771
4010293273
1 24993
594I 508
1 5801,385
195
47
Mar.
279,148
279,091
57 526127
3,758275574
5,5781,123
3285 317
932443772
2 6191 5351,709
49628 450
1,200288218
1,783
11 055
154,2188 946
47,951402
18,84323,2704,5142 019
31,837
106151
25 655873
7,5221 518
2348 1332,244
50 295
842 2755,482
212361
1,25526 0516,5862,271
5132 0303,173
4 224327294
1 43189
6371 445
1,7741,501
273
57
19
Apr.
290,549
290,509
60240197
3,844273525
5,0621,473
2825 097
724447859
2 5021,4201,564
48732 003
1,239262195
1,786
11 901
159,1851090548,323
57119,24623,0994,5902 146
1371,879
116130
26 132887
8,2901 595
3168 6062,218
52 981
982 2595,374
195313
1,16428 0497,0292,272
5652 4303,234
4 401345312
1 344100730
1 570
1 8001,560
240
40
82
May
304,142
304,099
63 382198
3,672270634
5,5531,518
3025 823
898411926
2 6261 6651,557
57333 207
1,202381251
1 713
11 479
168,24710 81649,685
38420 46025 8834,8992 270
371,852
112780
28 444889
8,3711 674
3479 1812 165
54 354
682 0986,169
185320
1,39527 708
7,1152,465
5022 6263,703
4 761400278
1 38981
8441 770
1 8751,655
220
43
June
318,430
318 387
65 105137
3 767281732
63481 760
29760281 022
424949
3 0871 6111 596
58932 887
1 295234296
1 763
12 811
174,82711 00152 888
42421 20226 2425,2722 558
32,022
124124
29 5961 0458,7122 048
3819 1452038
58 703
1242 0486,412
252293
1,84230 508
7,1192 606
4592 5534,485
4 828416334
1 46784
8031 725
2 1131,806
307
43
July
326,770
326 724
68 802189
4 127309699
5 8961 740
2946 3191 129
5391 0013 3111 5241 630
64635 837
1 267280274
1 793
13 299
179 94110 96653 696
38121 58228 4895 2282 607
82027
121576
29 7471 0329 2072 065
41396922 102
57 692
1391 9736,158
266299
1 63730 1907,0462 606
4152 5084454
4,962378314
1 62081
8481 721
2 0281,700
328
45
Aug.
332,862
332 756
72 487186
4459323776
5 9931 572
2706 5771 099
479984
3 5331 6991 599
60038 718
1 221286296
1 816
12 485
183 53610 93955 925
38122 16628 8535 3672 650
32048
116508
29 482778
9 9642 064
4579 8002 035
57 560
1271 8916 503
235302
1 53429 7456,9242 614
3882 6594 637
4 811399368
1 57458
7611 651
1 8781,534
344
106
145Digitized for FRASER http://fraser.stlouisfed.org/ Federal Reserve Bank of St. Louis

60. Banks' own claims on foreigners, payable in U.S. dollars, reported by banksin the United States—ContinuedMillions of dollars, end of period
1 Total
2 Foreign countries
3 Europe4 Austria5 Belgium-Luxembourg . .6 Denmark .7 Finland . .8 France9 Germany
10 Greece1 1 Italy12 Netherlands13 Norway14 Portugal . . . .15 Spain16 Sweden17 Switzerland1 8 Turkey19 United Kingdom20 Yugoslavia21 Other Western Europe1
2 2 U S S R23 Other Eastern Europe2
24 Canada
25 Latin America and Caribbean . . . .26 Argentina27 Bahamas28 Bermuda29 Brazil30 British West Indies31 Chile32 Colombia33 Cuba34 Ecuador35 Guatemala36 Jamaica37 Mexico38 Netherlands Antilles39 Panama40 Peru41 Uruguay42 Venezuela43 Other
44 AsiaChina
45 Mainland46 Taiwan47 Hong Kong48 India49 Indonesia50 Israel5 1 Japan52 Korea53 Philippines54 Thailand55 Middle East oil-exporting countries3
56 Other .
57 Africa58 Egypt59 Morocco60 South Africa61 Zaire62 Oil-exporting countries4
63 Other
64 Other countries65 Australia66 All other
67 Nonmonetary international and regional organizations5
Sept.
343,351
343 307
77,910146
4 818358806
5 9101 611
2836,7421,104
5751 0053,4782,4041,862
60542,648
1,197325246
1,787
11,981
188 25210,96856,668
43223,12030,309
5,3942 826
32 127
119387
29,736825
10,6392 253
5509,8672 030
57,854
1261 9496,820
275297
1,62328 8837,3652,510
4092,5994,999
5,176386376
1,77559
8421,738
2 1341,792
342
44
19
Oct.
337,501
337 446
79,530183
4976396813
6 2621 522
3357,3581,288
5441 0253,5682,7991,651
60342,720
1,249266242
1,728
13,050
181 7361 1 ,02052,556
60223,01028,566
5,2762 838
32 057
111151
29,509685
10,3582 244
5729,9252 254
56,013
1432,0206,074
254315
1,74826 8907,7902,566
4422,8484,922
5,017365367
1,74461
7641,717
2,0991,715
384
56
82
Nov.
339,435
339 378
80,273208
5,409406904
6 6581 765
3737,7251,122
650931
3,6582,8041,526
59841,795
1,274380227
1,861
12,574
182,28810,83052,864
95723,04527,672
5,1122,913
32 109
140218
29,653731
10,6372 271
61410,3092 211
56,989
1982,2676,292
258317
1,89526 1348,5552,480
5023,1764,916
5,280349385
1,83758
9031,747
1 9751,530
445
57
Dec.6
355,705
355,636
85,584229
5,138554990
7,2511,876
4527,5601,425
572950
3,7443,0381,639
56045,781
1,430368263
1,762
13,678
187,96910,97456,649
60323,27129,1015,5133,211
32,062
124181
29,552839
10,2102,357
68610,643
1,991
60,952
2142,2886,787
222348
2,02928,3799,3872,625
6433,0874,943
5,346322353
2,01257
8011,802
2,1071,713
394
68
Jan.
359,395
359,132
84,906230
4,777614984
7,6161,420
5767,5781,467
625848
3,7163,1191,552
52745,584
1,395312230
1,737
14,311
192,58711,32457,974
60323,10632,921
5,2483,248
112,047
129206
29,512826
10,0992,309
69210,2762,057
59,481
1982,2357,265
230376
1,83726,8699,0772,469
6543,4334,839
5,613310342
2,06657
9141,924
2,2341,720
514
263
19
Feb.
362,988
362,896
85,866224
5,441655967
7 8321,740
6537,0411,358
587844
3,2352,6991,497
61646,777
1,430321240
1,709
15,442
194,28611,53656,920
52623,79533,7985,4213,162
22,148
120199
30,788870
9,3462 337
68510,4322,200
59,475
1951,9807,293
201434
1,76426,9309,2322,633
6523,4274,735
5,539286359
2,19455
8451,800
2,2881,710
578
92
83
Mar.
375,545
375,237
89,397258
5,8081,138
9617 7371,771
6557,1881,631
544823
3,1372,4611,668
59549,287
1,394330322
1,690
16,514
199,46611,30459,795
49123,60635,4645,2233,166
22054
84217
31,423894
9,8562 303
70710,6322,246
61,853
1951,8607,854
160518
1,74428,6349,2262,640
6253,8324,564
5,483309375
2,18552
8441,717
2,5251,967
557
308
Apr.
362,888
362 556
85,060307
5,4971,127
8447 3591 276
6317,4061,270
628812
3,0502,2771,646
60846,541
1,433259404
1,685
15,148
196,21311,24857,081
37523,75635,2095,1443,155
02,093
77196
31,896979
9,0312,333
85910,5732,208
57,950
2391,7867,624
163554
2,03625,0638,7792,637
7413,9474,381
5,701297382
2,123104750
2,045
2,4831,897
586
332
146Digitized for FRASER http://fraser.stlouisfed.org/ Federal Reserve Bank of St. Louis

60. Banks' own claims on foreigners, payable in U.S. dollars, reported by banksin the United States—ContinuedMillions of dollars, end of period
1 Total .
2 Foreign countries . . . .
3 Europe4 Austria . . . .5 Belgium-Luxembourg6 Denmark7 Finland8 France .9 Germany
10 Greece1 1 Italy12 Netherlands . . . . .13 Norway . . .14 Portugal15 Spain16 Sweden17 Switzerland . . . .1 8 Turkey19 United Kingdom . . .20 Yugoslavia21 Other Western Europe1
2 2 U S S R23 Other Eastern Europe2 . . . .
24 Canada . . . . .
25 Latin America and Caribbean . . . .26 Argentina27 Bahamas28 Bermuda29 Brazil . .30 British West Indies3 1 Chile32 Colombia . .33 Cuba34 Ecuador35 Guatemala . . .36 Jamaica37 Mexico . .38 Netherlands Antilles39 Panama40 Peru4 1 Uruguay42 Venezuela . . . . .43 Other
44 AsiaChina
45 Mainland . . . .46 Taiwan47 Hong Kong48 India49 Indonesia50 Israel51 Japan . .52 Korea53 Philippines . . . .54 Thailand55 Middle East oil-exporting countries3
56 Other . .
57 Africa58 Egypt . . . .59 Morocco60 South Africa61 Zaire . . .62 Oil-exporting countries4
63 Other
64 Other countries .65 Australia66 All other
67 Nonmonetary international and regional organizations5
May
365,086
364 919
84 384309
5,694I 069
7667 8441,211
6106 9921 282
683818
3 0812 3161 085
57846 281
1,482263356
1 664
16 607
198 33111 55858,786
62823 57333 4955 5813 485
02 040
90197
32 077827
9 6972 416
82410 7572,300
57 630
2191 6137 668
198576
1 92624 8328 9552 492
70740274418
5 542378441
2,12347
8511,702
2 4271 765
662
167
June
374,470
374,026
87 032342
5,8181 103
8707,9421,407
5777 3371 165
652849
3 2212 8591,612
57046,828
1,464346377
1,692
16753
199 3681 1 ,26361,944
44023,39432,7685 1743,601
02 038
90207
32 468522
8 8402,627
82011 0452,129
62 855
1661 7607,919
230551
2,18427 6119 1422,827
7884,4615 218
5 665450463
2,23146
8301,645
2 3521 732
620
443
July
368,035
367,698
85,131383
5,4811,101
7247,9531,112
4617,418
971598844
3 3582,9201,727
62945,841
1,381370292
1,566
16,576
195,61311,13258,932
33423,77330,4605 2043,661
02,018
96209
33,000977
9,2332,506
83311,1302,115
62 162
1241,7158,122
245602
1,65727,8869 6502,637
6894,0134,823
5 960501484
2,40745
8501,673
2,2561 644
613
336
19
Aug.
373,065
372,746
88 245338
5,9081 128
6378,5891,168
3787 4221,052
634848
3 3862 8361,639
59448 051
1,351409236
1,640
17,553
195 56711,35054,794
38124,25932,2935 4203,597
02 014
100204
33 727871
10 1082,421
82011 0542,152
62 648
1791 6448,028
275642
1,64827 4539 7072,546
7354,6645,126
6 547544444
2,63040
1 0521,837
2 1871 645
542
319
83
Sept.
376,847
376,249
91,041351
5,6731 135
6977,8691,428
4117,0831,189
550861
3 4023,0811,781
61651,183
1,369536219
1,606
16,578
195,06911,46455,179
56424,34031,2025 8083,670
02,006
112214
33,798917
9 2062,470
8571 1 ,0462,217
64 783
2271 8298,711
259695
1,72628,5479 6482,779
8064,1555,402
6 501610444
2,71938
9641,727
2,2761 683
593
598
Oct.
373,311
373 251
89 145334
5,5331 107
7897 4571,095
3727 7131 071
575893
3 1623 0591 625
66050041
1,468405211
1 575
15 892
194 99111 63855,756
47724 23231,0055 7563 653
32 141
115203
33 5621,0338 8352434
88310 8882,377
63 949
2951 6188,337
324704
1,78028 2809 3242 376
8314,6895 390
6910642462
2,57838
1 4851,705
2 3651 701
664
60
Nov.
375,118
375,048
90 243395
5,5481 272
8227 9421,256
4128 4591 396
590891
3 6543 2492,114
69347 762
1,582429173
1,603
16 382
197 78511,89956,131
62024,53232,251
5 8603 734
02 262
122210
33 7291,1868 3362,469
90311 0862,455
61 286
2491 5748,758
305711
1,81725 8299 6292,427
8674,2764 845
6 830692461
2,89237
1 0391,709
2 5221 899
624
70
Dec.
387,710
387 547
90 743401
5 6391 2751 0448 7611 294
47690131 302
690939
3 5733 3581 856
81246 372
1 673477192
1 598
16 330
203 26911 74058,351
56624 48234,9216 0293 745
02 307
129215
34 7101,1547 8482 536
97711 2872,271
67 648
2921 9088,429
330805
1,795305739 89120991 02149545 549
6 654747440
2,63433
1 0731,727
29042 272
632
164
147Digitized for FRASER http://fraser.stlouisfed.org/ Federal Reserve Bank of St. Louis

61. Banks9 own and domestic customers' claims on foreigners, payable in U.S. dollars,reported by banks in the United States1
Millions of dollars, end of period
1 Total
2 Banks' own claims on foreigners3 Foreign public borrowers , . . .4 Own foreign offices2 . . . . .5 Unaffiliated foreign banks6 Deposits . . . , . . . .7 Other8 All other foreigners
9 Claims of banks' domestic customers3
10 Deposits1 1 Negotiable and readily transferable instruments4
12 Outstanding collections and other claims
13 MEMO: Customer liability on acceptances . . .
Dollar deposits in banks abroad, reported by nonbankingbusiness enterprises in the United States5
1 Total
2 Banks' own claims on foreigners . . .3 Foreign public borrowers4 Own foreign offices2 . . . .5 Unaffiliated foreign banks . . .6 Deposits . .7 Other8 All other foreigners . . . . . . .
9 Claims of banks' domestic customers^10 Deposits . . . . .1 1 Negotiable and readily transferable instruments4 . . . . . . .12 Outstanding collections and other claims
13 MEMO: Customer liability on acceptances . . .
Dollar deposits in banks abroad, reported by nonbanking businessenterprises in the United States5 .
1 Total
2 Banks' own claims on foreigners3 Foreign public borrowers . . .4 Own foreign offices2 . . . .5 Unaffiliated foreign banks . . .6 Deposits7 Other . .8 All other foreigners
9 Claims of banks' domestic customers**10 Deposits1 1 Negotiable and readily transferable instruments4
12 Outstanding collections and other claims . .
13 MEMO: Customer liability on acceptances . . .
Dollar deposits in banks abroad, reported by nonbanking businessenterprises in the United States5 . . .
Jan.
257,261
257 26133 57596,47477 62124 61453 00749,591
43 143
Sept.
380,731
343,35142 824
126 899113,91842,75371 16559 710
37 3801 015
29,2487 117
35,528
44,885
May
365,086
365 08648,304
139,28311645244 75171 70061 048
44 161
Feb.
268,061
268 0613408198,30184 22026,62057,59951,460
44 719
19
Oct.
337,501
337,50142 601
117 893116,37243,96772 40560,635
47,007
June
410,173
374 47050,329
140,233121,42247 50973,91362485
35,7042,631
269376 135
34,901
41 ,633
Mar.
320,607
279 14834,306
101,78689 08329,57559,50853,973
41,4601,352
32 6777,431
30,802
41 837
82
Nov.
339,435
339,43542,574
118,636117,03542,85374,18261,189
48,245
July
368,035
368,03550,620
135,874118,48046 73371,74763,061
41,938
19
Apr.
290,549
290,54935,481
107,29192,49030,89361,59655,287
42,579
Dec.
396,015
355,70545,422
127,293121,37744,22377,15361,614
40,3102,491
30,7637,056
38,153
42,358
19
Aug.
373,065
373,06552,285
137,209121,18847,72873,45962,383
42,504
82
May
304,142
304 14238,507
109,70998 68735,17063,51757,238
45 202
Jan.
359,395
359,39544 974
133,654118,39343,27075,12362,374
40,043
83
Sept.
412,944
376 84754,379
137,609122,45548 70973,74662,404
36,0972,654
27 5505,892
34,619
42,526
June
359,438
318 43040 138
115,826103 99938,14465,85458,469
41,0071,174
32 5137,320
33,307
45 725
19
Feb.
362,988
362,98845 926
134,964120,61545,36575,25061,483
40,258
Oct.
373,311
373,31154,954
141,655115,02144 69770,32461,681
45,187
July
326,770
326 77040 686
115,227111 07642 08168,99459,781
46 493
83
Mar.
413,812
375,54547 589
143,976122,76349,76373,00061,217
38 2672,126
29,2616 880
35,223
40,021
Nov.
375,118
375 11856,026
137,520118,61944 73873,88162,952
48,672
Aug.
332,862
332 86241 729
119,827112 13943 14068 99859,168
45 194
Apr.
362,888
362,88848 199
135,721118,08845,24672,84260,881
42,387
Dec.
421,653
387,71057,255
144,016122,77946 39276,38763,661
33,9432,969
25 1045,870
37,324
44,994
148Digitized for FRASER http://fraser.stlouisfed.org/ Federal Reserve Bank of St. Louis

62. Banks' own claims on unaffiliated foreigners, payable in U.S. dollars,reported by banks in the United StatesMillions of dollars, end of period
1 Total
By borrower2 Maturity of I year or less2
3 Foreign public borrowers4 All other foreigners
5 Maturity of over 1 year2
6 Foreign public borrowers7 All other foreigners
By areaMaturity of 1 year or less2
8 Europe9 Canada
10 Latin America and Caribbean11 Asia12 Africa13 All other3
Maturity of over 1 year2
14 Europe15 Canada16 Latin America and Caribbean . .17 Asia18 Africa19 All other3
1981
Dec.1
154,590
116,39415,142
101,252
38,19715,58922,608
28,1304,662
48,71731,485
2457943
8,1001 808
25,2091,907
900272
Mar.
176,204
134,54316,629
117,914
41,66116,98924,673
34,8315,863
58,96630,7382,8961,249
8,3341,918
27,7782,2481,072
312
19
June
202,454
153,41419,421
133,993
49,04120,09528,945
39,9506,689
68,67433,621
3,2621,217
9,2192,354
33,0622,4791,298
628
82
Sept.
215,389
163,65320,118
143,534
51,73722,02629,710
45,9367,067
72,43133,4343,6211,163
10,5642,003
34,1143,0921,328
635
Dec.1
228,150
173,91721,256
152,661
54,23323,13731,095
50,5007,642
73,29137,5783,6801,226
11,6361,931
35,2473,1851,494
740
Mar.
230,439
174,34321,782
152,561
56,09625,09431,002
54,1276,878
75,26232,760
3,8721,444
12,0271,928
35,9163,5901,4851,150
19
June
232,704
175,02123,124
151,897
57,68326,45531,227
52,2087 110
74,96735,3453,8541,536
12,2891,861
36,7304,0701,6671,066
83
Sept.
237,162
176,27125,479
150 792
60,89128 23132,660
53,3326642
76,38333,89045701,454
12,3381 760
39,1024,7351,8191,136
Dec.
242,933
175,97024,258
151,712
66,9633248234,481
55,5506200
73,99734,5184 2061,499
13,3001 857
43,4984,8382,2781,191
63. Liabilities to and claims on foreigners, payable in foreign currencies,reported by banks in the United States*Millions of dollars, end of period
1 Banks1 own liabilities
2 Banks' own claims3 Deposits4 Other claims
5 Claims of banks' domestic customers2
1981
Dec.
3,523
4,9803,3981 582
971
Mar.
4,030
5,3003,5321 768
944
19
June
4,513
5,8953,5682 326
921
82
Sept.
4,575
6,3503,4322 918
506
Dec.
4,844
7,7074,2513 456
676
Mar.
5,088
8 1103 7284 382
637
19
June
5,880
7 8623 9123 950
684
83
Sept.
5,976
7 9843 0614 923
717
Dec.
5,205
7 2562 8384 418
1,059
149Digitized for FRASER http://fraser.stlouisfed.org/ Federal Reserve Bank of St. Louis

64. Marketable U.S. Treasury bonds and notes—Foreign holdings and transactionsMillions of dollars
Country or area
1 Estimated total2
2 Foreign countries2 . . . .
3 Europe2
4 Belgium-Luxembourg. . .
5 Germany2
6 Netherlands7 Sweden8 Switzerland2 . . . .9 United Kingdom . .
10 Other WesternEurope . . . .
1 1 Eastern Europe . . .
12 Canada . .
13 Latin America14 Venezuela15 Netherlands
Antilles16 Other Latin
America andCaribbean . . .
17 Asia1 8 Japan
19 Africa20 All other
21 Nonmonetary interna-tional and regionalorganizations . . . .
22 International23 Latin American
regional
24 Total2 .
25 Foreign countries2 . . . .26 Official institutions. . .27 Other foreign2
28 Nonmonetary interna-tional and regionalorganizations . . . .
MEMO: Oil-exportingcountries
29 Middle East3
30 Africa4
1982
Year Jan. Feb. Mar. Apr. May June July Aug. Sept. Oct. Nov. Dec.
Holdings (end of period)1
85,220
80,637
29,284
44714,8412,754
6771,5406,549
2,4760
602
1,076188
656
232
49,54311,578
7755
4,5834,186
6
71,534
65,885
24,408
61411,8982,034
644904
6,800
1,5140
533
721286
321
113
39,70010,844
5193
5,6495,603
1
73,852
68,314
25,372
36312,8452,073
635984
6,931
1,5400
499
727286
337
104
41,31011,022
4005
5,5385,493
-4
75,865
70,291
26,125
53913,0552,088
6971,0257,037
1,6850
458
759286
370
103
42,53111,203
40117
5,5745,529
-4
77,319
71,945
26,433
70913,2312,175
6621,1576,737
1,7620
473
886306
383
196
43,72911,381
40322
5,3745,278
-4
77,890
72,973
26,066
34012,9742,188
6551,1346,816
1,9590
506
938296
437
204
45,03711,396
40521
4,9174,823
-4
Transactions (purchas
14,972
16,07214,550
1,518
-1,097
7,575-552
1,286
1,320841478
-33
1,019-112
2,318
2,4292,348
80
-110
1,373-119
2,013
1,9781,325
653
35
4700
1,454
1,654791862
-200
9062
571
1,0281,476-448
-457
9072
78,252
73,027
25,784
15213,0222,212
6521,0396,679
2,0280
410
909253
432
224
45,49311,137
40526
5,2255,123-
-4
79,674
75,371
26,493
15513,5352,173
6501,0166,927
2,0380
446
848229
402
217
47,15611,289
40523
4,3034,167
-4
80,538
76,798
27,783
57613,9592,343
6541,1007,129
2,0230
353
1,165222
611
333
47,18011,247
30512
3,7403,629
-4
82,208
78,425
28,863
55114,5202,374
6451,2337,358
2,1830
428
1,204221
771
211
47,70911,410
17843
3,7833,558
-4
83,911
79,217
29,081
83414,4932,356
6651,2667,237
2,2300
482
1,086204
657
225
48,32911,396
17861
4,6944,417
= 4
84,719
79,498
29,457
44814,7042,473
6971,5327,099
2,5050
552
1,231172
758
300
48,12011,314
7762
5,2214,939
-4
85,220
80,637
29,284
44714,9812,754
6771,5406,549
2,4760
602
1,076188
656
232
49,54311,578
7755
4,5834,186
6
es, or sales ( — ), during period)
362
54318
-264
309
9240
1,421
2,3432,797-455
-921
1,3130
865
1,427416
1,011
-563
298-100
1,670
1,6271,500
127
43
173= 125
1,703
792641151
910
2090
808
28123150
527
-320-100
502
1,1391,866-727
-637
3030
150Digitized for FRASER http://fraser.stlouisfed.org/ Federal Reserve Bank of St. Louis

64. Marketable U.S. Treasury bonds and notes—Foreign holdings and transactions—ContinuedMillions of dollars
Country or area
t Estimated total2
2 Foreign countries2 . . . .
3 Europe2
4 Belgium-Luxembourg. . .
5 Germany2 . .6 Netherlands7 Sweden8 Switzerland2 . . . .9 United Kingdom . .
10 Other WesternEurope
1 1 Eastern Europe . . .
12 Canada
13 Latin America14 Venezuela .15 Netherlands
Antilles16 Other Latin
America andCaribbean . . .
17 Asia1 8 Japan
19 Africa20 All other
21 Nonmonetary interna-tional and regionalorganizations . . . .
22 International .23 Latin American
regional
24 Total2
25 Foreign countries2 . . . .26 Official institutions. . .27 Other foreign2
28 Nonmonetary interna-tional and regionalorganizations . . . .
MEMO: Oil-exportingcountries
29 Middle East3
30 Africa4
1983
Year Jan. Feb. Mar. Apr. May June July Aug. Sept. Oct. Nov. Dec.
Holdings (end of period)1
88,940
83,820
35,537
1617,2903,129
8671,1188,524
4,5920
1,301
86364
716
83
46,00013,910
7940
5,1204,404
6
85,533
80,928
29,889
72215,1512,839
6781,0136,721
2,7650
649
1,066190
720
156
49,18711,655
7760
4,6054,165
6
86,128
82,169
31,057
-8016,6493,011
6911,0396,941
2,8070
651
1,05074
792
185
49,29711,707
8034
3,9593,405
6
88,735
83,121
32,388
-32517,5603,194
6661,0447,478
2,7710
734
95177
690
184
48,93811,736
8031
5,6144,966
6
87,594
84,147
33,583
-9117,7993,230
6661,0707,721
3,1880
706
93272
676
184
48,80711,858
8039
3,4472,969
6
89,556
84,394
33,628
-7616,9543,255
680914
8,048
3,8550
873
1,03972
775
192
48,72912,130
7945
5,1624,514
6
91,114
84,931
33,638
-6816,8773,251
665877
8,233
3,8030
983
1,04172
773
196
49,13712,592
7953
6,1835,372
6
88,833
83,615
33,082
9916,3153,262
684855
8,235
3,6310
1,058
88662
636
188
48,43712,763
7974
5,2184,500
6
87,456
82,762
32,996
9516,1193,234
644965
8,270
3,6690
1,088
80062
622
116
47,70613,007
7994
4,6944,086
6
88,571
82,648
33,384
5816,1563,034
6911,0878,289
4,0700
1,063
77465
631
78
47,30113,210
7948
5,9235,421
6
90,938
84,283
34,469
1816,5702,987
7391,1778,629
4,3500
1,265
69566
540
89
47,72013,446
7956
6,6556,094
6
89,509
83,668
35,106
217,0923,048
7831,0648,626
4,4900
1,225
91464
674
176
46,30113,600
7943
5,8415,030
88,940
83,820
35,537
1617,2903,129
8671,1188,524
4,5920
1,301
86364
716
83
46,00013,910
7940
5,1204,404
6
Transactions (purchases, or sales ( — ), during period)
3,720
3,183806
2,381
531
-5,424-1
312
29134
256
21
1210
595
1,2411,552-310
-647
-2330
2,607
952966-14
1,655
-6910
-1,141
1,026341685
-2,167
-1090
65. Foreign official assets held at Federal ReserveMillions of dollars, end of period
Assets
1 Deposits
Assets held in custody2 U.S. Treasury securities2
3 Earmarked gold^ . . .
Jan.
366
115,87214,717
Feb.
352
116,42814,752
Mar.
424
114,99914,726
Apr.
322
14,88014,723
1,962
24736
211
1,714
-566-1
Banks
May
445
115,40114,727
1,558
537407130
1,020
-2770
-2,281
-1,315-895-420
-966
-1720
-1,377
-853-928
75
-524
-1,7910
1,116
-114-45-69
1,230
-3050
2,367
1,635510
1,125
732
-3730
-1,422
-615-773
158
-808
-9680
-576
152-401
554
-729
-600
, 19831
June
279
114,49914,724
July
369
118,10514,727
Aug.
248
113,47614,693
Sept.
297
13,49814,621
Oct.
339
116,32714,550
Nov.
360
116,39814,475
Dec.
190
117,67014,414
151Digitized for FRASER http://fraser.stlouisfed.org/ Federal Reserve Bank of St. Louis

66. Foreign transactions in securitiesMillions of dollars
Transactions,and area or country
STOCKS
1 Foreign purchases2 Foreign sales .
3 Net purchases, or sales ( — ). . .
4 Foreign countries . . . . .5 Europe6 France7 Germany . . . .8 Netherlands9 Switzerland
10 United Kingdom1 1 Canada . . . . .12 Latin America and
Caribbean13 Middle East1 .14 Other Asia . .15 Africa16 Other countries
17 Nonmonetary international andregional organizations . . . .
BONDS2
18 Foreign purchases19 Foreign sales
20 Net purchases, or sales(-) . . .
21 Foreign countries22 Europe23 France24 Germany25 Netherlands26 Swteerland27 United Kingdom28 Canada29 Latin America and
Caribbean .30 Middle East1
3 1 Other Asia32 Africa . . . . .33 Other countries
34 Nonmonetary international andregional organizations . . . .
35 Stocks, net purchases,or sales ( — )
36 Foreign purchases37 Foreign sales
38 Bonds, net purchases,or sales ( — )
39 Foreign purchases40 Foreign sales .
41 Net purchases, or sales ( — ),of stocks and bonds
42 Foreign countries43 Europe44 Canada45 Latin America and
Caribbean46 Asia .47 Africa48 Other countries
49 Nonmonetary international andregional organizations . . . .
Year Jan. Feb. Mar. Apr. May
1982
June July Aug. Sept. Oct. Nov. Dec.
U.S. corporate securities
41,881 2,020 2,525 2,64237,981 1,756 1,989 2,510
3,901 264 536 132
3,816 261 536 1242,530 230 347 172-143 0 -6 -51
333 15 17 42-63 3 38 1
- 579 40 - 33 - 603,117 168 318 228
222 =46 20 -120
317 =13 30 -19366 51 137 84247 40 -6 4
2 0 1 =31 3 1 - 1 6 6
85 3 0 8
21,639 946 929 1,60720,188 778 936 1,508
1,451 168 -7 99
1,479 154 4 1062,082 144 10 158
305 15 14 122,110 88 104 224
33 2 0 17157 19 8 15
-589 3 -102 -10324 29 15 29
159 17 -11 26-752 -89 -63 -69-22 53 52 -29- 1 9 0 0 - 6
7 0 2 =3
-28 14 -11 =6
2,3602,108
252
2461673329-9
-66176-7
5361
-400
12
6
2,2171,554
663
604471
20396
14465946
-8126
-18-13
1
59
2,6222,186
436
429306
= 4843366
279-10
22104
-211
27
6
2,0271,203
824
78479846
5001148
18923
15-112
6100
40
2,1671,868
299
295155
-251123
= 86222
1
257239-3
6
4
1,4831,147
336
36224826
1186
137320
6322100
= 1
-26
2,7042,691
13
7299
020-3
-33308
-36
-66-137-55
0
6
1,7041,633
71
36149
8257-4
-19-74
2
20-70-65
00
35
3,1902,647
543
541280-7
= 1212
-5337473
125101
-4415
2
1,4801,734
-254
= 118-34-15102
126
= 1113
17= 76-31
02
-136
4,3014,397
-96
-100-266-44-43-62
-14276
115
-75134
-1406
3
2,3142,236
78
1131122578
-10-26
292
2119
-4605
-36
5,9285,671
257
247141
= 3047
-102= 119
4015
141-98
220
35
10
2,8162,800
15
= 25421
-16187
0-3239
-155
= 20= 240-31
00
41
5,5805,239
341
33074-826
= 24-209
32372
549
11227
11
2,0542,219
-164
-174-218
2512-4
-14-311
10
29-23
2700
10
5,8434,918
925
899625
4313825
177245154
39-153
2103
22
25
2,0622,440
-379
-369-177
14644-145
-480-1
= 8-177
-50
= 1
-10
Foreign securities
-1,341 136 34 28 -67 -1197,163 526 521 696 385 4868,504 390 487 668 452 605
-6,631 -108 -128 -590 -248 43527,167 1,226 1,518 2,519 2,205 2,75533,798 1,334 1,646 3,110 2,253 2,321
- 7,972 29 - 94 - 562 - 115 316
-6,806 1 -154 -585 -50 96-2,584 128 61 61 -86 -47-2,363 =161 -629 -629 117 63
336 65 65 98 152 144- 1,822 - 10 -54 - 126 -215 -62
-9 -15 -1 -5 -17 -1-364 =6 -7 16 0 =1
-1,165 28 60 23 -65 219
74 47 8 - 1 60 = 308 - 738 - 277616 455 532 545 706 771 923542 409 523 705 1,014 1,509 1,200
-754 -725 -1,398 -1,122 =1,440 -360 =3931,678 1,882 3,012 2,755 2,612 2,514 2,4902,432 2,607 4,410 3,877 4,052 2,874 2,882
-680 -678 -1,389 -1,282 -1,748 -1,098 -670
-301 -686 =1,191 -791 =1,356 =1,074 -716-351 -56 -169 -250 -641 -534 -583-112 -346 -678 -297 -179 -10 -28
36 3 4 -75 =257 =10 71129 =296 =433 246 -282 -528 =191
0 3 17 1 0 4 4-2 6 29 -416 3 5 10
-379 7 -198 -491 =392 -24 47
152Digitized for FRASER http://fraser.stlouisfed.org/ Federal Reserve Bank of St. Louis

66. Foreign transactions in securities—ContinuedMillions of dollars
Transactions,and area or country
STOCKS
1 Foreign purchases2 Foreign sales
3 Net purchases, or sales ( — ) . . .
4 Foreign countries5 Europe6 France7 Germany8 Netherlands9 Switzerland
10 United Kingdom1 1 Canada12 Latin America and
Caribbean13 Middle East1
14 Other Asia15 Africa16 Other countries
17 Nonmonetary international andregional organizations . . . .
BONDS2
18 Foreign purchases19 Foreign sales
20 Net purchases, or sales( - ) . . .
21 Foreign countries22 Europe23 France24 Germany25 Netherlands26 Switzerland27 United Kingdom28 Canada29 Latin America and
Caribbean30 Middle East1
31 Other Asia32 Africa33 Other countries
34 Nonmonetary international andregional organizations . . . .
35 Stocks, net purchases,or sales ( — )
36 Foreign purchases37 Foreign sales
38 Bonds, net purchases,or sales ( — )
39 Foreign purchases40 Foreign sales
41 Net purchases, or sales < — ),of stocks and bonds
42 Foreign countries . . .43 Europe44 Canada45 Latin America and
Caribbean46 Asia47 Africa48 Other countries
49 Nonmonetary international andregional organizations . . . .
1983
Year Jan. Feb. Mar. Apr. May June July Aug. Sept. O<;t. Nov. Dec.
U.S. corporate securities
69,89664,466
5,430
5,3323,999-97
1,045-1091,3251,8181,151
529-807
3944224
98
23,97623,076
900
885904-89286
51632438123
100-1,159
8650
52
15
5,183 5,328 7,0914,369 4,348 6,163
814 979 927
804 959 901632 903 97745 53 8
119 138 2262 7 41
217 223 102189 456 57790 63 147
1 8 6 - 2 2-57 -13 -60116 -90 -218
5 4 818 6 60
10 21 26
1,871 1,801 2,3102,209 1,797 2,447
-338 4 -137
-336 30 -154-181 -146 -266-20 -10 -22-94 -33 127
16 1 325 112 -2
-94 -109 -1828 14 21
27 12 0-212 84 32
22 68 590 - 1 00 0 0
-2 -25 17
5,9465,350
597
54564829
22212
277133122
117-302-44
8-4
52
2,2751,885
390
405405
747
120942
-18
-3-56
60-521
-14
6,6256,365
260
258300-28
86-8126812292
62-192
13
-10
2
2,4582,289
169
193474
78512
18814122
10-378
62
2
-24
6,8646,467
397
422193
14-31-571919598
283664
12
-25
1,5461,741
-195
-197-122
-7-12-428
120-10
19-168
472
35
2
5,748 5,191 5,513 5,534 4,853 6,0205,203 5,158 5,115 5,388 4,794 5,745
545 33 398 145 60 275
536 34 390 141 59 283430 89 257 -93 -60 -278
33 -75 -10 -33 -68 -64135 54 39 55 53 -51
7 -12 -49 -15 24 13190 58 123 -18 - 9 7 - 2 0 840 92 174 -133 21 51
1 77 154 124 -1 183
35 -98 107 -40 14 239-59 -88 -178 49 45 13143 75 51 103 63 122
0 7 4 - 1 1 2-12 -28 -6 -1 -3 1
9 - 1 8 4 0 - 7
1 ,438 2, 1 39 1 ,900 2,537 2,039 1 ,6611 ,463 1 ,995 1 ,960 2,492 1 ,304 1 ,493
-25 144 -60 45 735 168
-49 42 -65 142 715 160-74 115 26 303 458 -87- 5 - 6 0 2 - 3 1 - 4-8 25 41 66 53 -10
5 -3 1 11 5 3-8 0 -19 7 15 78
-33 112 42 136 3 9 0 - 1 2 653 - 3 - 1 0 22 46 -22
13 -21 4 24 -6 20-119 -121 -130 -249 116 42
78 72 44 45 101 2070 0 2 0 0 00 0 - 2 - 4 0 0
24 102 6 - 9 7 20 7
Foreign securities
-3,867 -324 -221 -442 -548 -641 -638 -490 -214 -113 -13 -31 -19013,143 1,031 1,040 1,184 971 1,079 1,358 976 1,034 1,293 1,142 907 1,12617,010 1,355 1,262 1,626 1,519 1,720 1,996 1,467 1,248 1,407 1,155 939 1,317
-3,694 19 -289 -579 -690 -838 127 -219 -493 -12 -202 173 -68935,669 2,480 3,072 2,750 2,396 2,665 3,320 2,534 2,708 3,756 3,903 3,114 3,07239,363 2,461 3,361 3,329 3,087 3,503 3,092 2,754 3,201 3,768 4,105 2,940 3,761
-7,5(51 -306 -511 -1,021 -1,238 -1,479 -511 -710 -707 -125 -215 142 -879
-7,116 -290 -823 -735 -1,216 -973 -545 -720 -714 -153 -264 38 -719-5,713 -364 -702 -620 -672 -632 -582 -688 -331 117 -367 -426 -448-1,582 7 - 4 4 8 1 - 443 - 288 5 5 5 - 9 7 - 3 5 5 6 3 7 - 6 4
1 , 1 20 258 346 - 23 88 243 - 80 47 62 23 5 135 17-914 - 180 -31 - 140 -221 -310 - 182 - 145 23 105 90 158 - 18
141 -9 21 30 25 9 13 11 14 16 11 1 0- 166 -2 -9 16 7 4 280 0 - 3 8 5 -59 - 10 133 - 143
-445 - 16 313 -286 -22 -506 34 10 7 28 49 105 - 161
153Digitized for FRASER http://fraser.stlouisfed.org/ Federal Reserve Bank of St. Louis

67. Liabilities to unaffiliated foreigners, reported by nonbanking business enterprisesin the United StatesMillions of dollars, end of period
1 Total
2 Payable in dollars3 Payable in foreign currencies
By type4 Financial liabilities . .5 Payable in dollars6 Payable in foreign currencies
7 Commercial liabilities8 Trade payables9 Advance receipts and other liabilities .
10 Payable in dollars1 1 Payable in foreign currencies . . . . . .
By area or countryFinancial liabilities
12 Europe13 Belgium -Luxembourg14 France . . .15 Germany16 Netherlands , . .17 Switzerland18 United Kingdom
19 Canada20 Latin America and Caribbean21 Bahamas . . . .22 Bermuda23 Brazil24 British West Indies . .25 Mexico26 Venezuela
27 Asia28 Japan . . . . .29 Middle East oil-exporting countries1 . .
30 Africa .31 Oil-exporting countries2
32 All other* . . . . .
Commercial liabilities33 Europe34 Belgium-Luxembourg35 France36 Germany37 Netherlands . . .38 Switzerland39 United Kingdom . . .
40 Canada41 Latin America and Caribbean42 Bahamas43 Bermuda . . . . . .44 Brazil45 British West Indies46 Mexico . . . .47 Venezuela
48 Asia .49 Japan50 Middle East oil-exporting countries' . .
5 1 Africa52 Oil-exporting countries2
53 All other* . . . .
1980
Dec.
29,434
25,6893,745
11,3308 5282,802
18 10412,2015,903
17 161943
6,481479327582681354
3 923
9643 136
9641
231,452
9981
723644
38
111
15
4,40290
582679219499
1,209
8881,300
875
11135
367319
10,242802
8,098
817517456
Mar.
28,877
25,3163,560
11,7559,0952,660
17 12211,6335,489
16,222900
6,230548324498565315
3 866
1,0963,5201,217
119
1,4589785
880766
73
61
23
3,93783
558640247390994
8271,345
11218416
466253
9,743810
7,603
830523440
19
June
28,977
25,5803,397
11,91194382473
17 06611 5825,484
16 142924
6,401571451451775342
3 684
9783 3641,272
120
1,5389891
869750
53
50
24
3,98373
558617225380
1,029
7471,191
4725434
359290
9,847867
7,881
676392622
81
Sept. |
29,634
26,4043,230
13,08410 6882,396
16 55010 4566,094
15 715835
7,968507929430664465
4 800
9773 2931,019
620
1,39810790
81469651
31
29
3,96379
575590239569925
8531,137
31136111
392273
9,247775
6,908
757355593
Dec.
28,618
24,9093,709
12,15794992658
1646110 8185,643
15 4091,052
6,825471709491748715
3 565
9633 3561,279
722
1,24110298
97679275
140
24
3,77071
573545220424880
8971,044
26767
2340276
9,3841,0947,008
703344664
1982
Mar.
27,638
24 8892749
12 38210 431
1 951
15 25694835 773
14 457798
7,742562917503750707
4 195
9193 2231 095
627
1 3696797
47229363
130
12
3,50850
507473230400910
897827
22718327
218197
8,7581 1066,331
661247604
154Digitized for FRASER http://fraser.stlouisfed.org/ Federal Reserve Bank of St. Louis

67. Liabilities to unaffiliated foreigners, reported by nonbanking business enterprisesin the United States—ContinuedMillions of dollars, end of period
Type, and area or country
1 Total
2 Payable in dollars3 Payable in foreign currencies
By type4 Financial liabilities5 Payable in dollars6 Payable in foreign currencies
7 Commercial liabilities8 Trade payables9 Advance receipts and other liabilities
10 Payable in dollars1 1 Payable in foreign currencies
By area or countryFinancial liabilities
12 Europe13 Belgium-Luxembourg1 4 France15 Germany16 Netherlands17 Switzerland18 United Kingdom
19 Canada20 Latin America and Caribbean21 Bahamas22 Bermuda .23 Brazil24 British West Indies25 Mexico26 Venezuela
27 Asia28 Japan29 Middle East oil-exporting countries1
30 Africa31 Oil-exporting countries2
32 All other* . . . .
Commercial liabilities33 Europe34 Belgium-Luxembourg .35 France36 Germany37 Netherlands38 Switzerland39 United Kingdom
40 Canada41 Latin America and Caribbean ,42 Bahamas43 Bermuda44 Brazil45 British West Indies46 Mexico47 Venezuela
48 Asia49 Japan50 Middle East oil-exporting countries1
51 Africa52 Oil-exporting countries2
53 All other* . . .
June
25,532
22,7702,763
10,1448,2031,941
15,3889,4755,913
14,566822
5,944518581439517661
3,081
7842,8051,003
724
1,04483
100
58239566
170
11
3,84447
703457246412951
1,1341,460
20102622
769219
7,5911,0855,195
729340630
1982
Sept.
25,149
22,0513,099
10,8558,5652,291
14,2948,0846,209
13,486808
6,389494672446759670
3,212
7532,969
9389
28981
85104
714479
67
170
13
3,95750
762436277358
1,001
1,1971,235
648
1283
499269
6,6411,1924,178
669248595
Dec.
25,663
22,4703,193
11,0018,8292,172
14,6627,7076,955
13,6411,021
6,438557731470711753
3,075
7462,749
9041428
1,025121114
1,039715169
170
12
3,64952
597467346363850
1,4901,008
16896032
379165
7,1601,2264,531
704277651
1983
Mar.
23,450
20,4592,991
10,9968,9522,044
12,4545,6276,827
11,507947
6,319459725487699710
3,097
7332,787
8571839
1,053149121
1,124781168
200
13
3,44345
578455351354679
1,4331,066
4117514
355198
5,4371,2352,803
497158578
June
22,846
19,9222,924
11,1819,1202,061
11,6656,0265,640
10,802864
6,337482756460728629
3,108
8762,623
7761034
1,033151124
1,319943205
1709
3,36841
617439342357633
1,4651,024
1764922
399236
4,7991,2362,294
492167518
Sept.
24,762
21,8952,867
10,9468,9761,971
13,8157,0566,760
12,919896
6,027379785454730530
2,992
7882,709
7711332
1,023185117
1,388957201
190
15
3,38447
506461243448786
1,4071,067
1764814
429217
6,8521,2944,072
506204600
Dec.
23,571
20,4843,087
10,3838,5041,879
13,1896,4966,693
11,9801,208
5,715302820505581525
2,834
7702,541
7491332
896215124
1,330962170
180
10
3,12262
436436275232605
1,8271,063
16344
6491166
6,0401,2343,498
446157690
155Digitized for FRASER http://fraser.stlouisfed.org/ Federal Reserve Bank of St. Louis

68. Claims on unaffiliated foreigners, reported by nonbanking business enterprisesin the United States1
Millions of dollars, end of period
1 Total
2 Payable i n dollars . . .3 Payable in foreign currencies
By type4 Financial claims5 Deposits6 Payable in dollars7 Payable in foreign currencies
8 Other financial claims9 Payable in dollars
10 Payable in foreign currencies . . . . .
1 1 Commercial claims12 Trade receivables13 Advance payments and other claims
14 Payable in dollars15 Payable in foreign currencies
By area or countryFinancial claims
16 Europe1 7 Belgium-Luxembourg1 8 France19 Germany . . . . .20 Netherlands21 Switzerland22 United Kingdom
23 Canada24 Latin America and Caribbean25 Bahamas26 Bermuda27 Brazil . . .28 British West Indies29 Mexico30 Venezuela
31 Asia32 Japan33 Middle East oil-exporting countries2
3 4 Africa . . . . .35 Oil-exporting countries3
36 All other4
Commercial claims37 Europe . . . .38 Belgium-Luxembourg39 France40 Germany41 Netherlands42 Switzerland43 United Kingdom .
44 Canada45 Latin America and Caribbean46 Bahamas47 Bermuda48 Brazil49 British West Indies50 Mexico5 1 Venezuela .
52 Asia53 Japan54 Middle East oil-exporting countries2
55 Africa56 Oil-exporting countries^ .57 All other4
1980
Dec.
34,482
31,5282,955
19,76314,16613,381
785
5,5973,9141,683
1472013,960
759
14,233487
6,0691452982305154
4,987
5,0367,8113,477
13596
2,755208137
60718920
2082632
5,544233
1,129599318354929
9143,766
21108861
341,102
410
3,5221,052
825
653153321
Mar.
37,733
34,6623,071
22,15716 63215,831
801
5,5253 8581,667
15 57614,716
860
14,973602
6,0921703662136175
4,895
6,6388,6113,993
1322
3,427161131
594207
17
1862736
5,869211906625347462
1,191
1,0543,853
15170800
151,064
443
3,7951,314
928
679143327
1981
June
35,346
32,2563,090
20,07314 59713,860
736
5,4773 7121,765
15 27314,367
906
14,684589
5,0251743011255263
3,981
6,1948 1233,365
3320
3,421257144
52413819
1703937
5,508235785584308474
1,068
1,0163,826
2920882434
1,123421
3,8131,241
937
703135407
Sept.
34,214
31,2043,010
19,21513,65412,919
734
5,5613 8671,694
14,99914,062
937
14,417582
4,62326
2053144843
3,662
6,0407 7663,288
1566
3,315283143
50111329
16941
116
5,378220767582308404
1,034
1,0173,734
18241726
13985456
3,7001,129
829
717154453
Dec.
36,185
325823,603
21,14215 08114 456
625
6,0613 5992462
15 04314,007
1 036
14,527516
4,59643
28522450
1173,546
6,7558 8123,650
1830
3,971313148
75836637
1734648
5,405234776561299431985
9673,479
12223668
121,022
424
3,9591 245
905
112152461
1982
Mar.
30,757
28 1112646
18 17513 14512 687
457
50303 3621 668
12 58211 537
1 044
12 061520
4 57816
37519711453
3,586
5,0757 6563 547
2749
2,999281130
66826236
1644334
4428246698456222358
1 079
9392,925
80212417
23762396
3,2141 171
757
612143463
156Digitized for FRASER http://fraser.stlouisfed.org/ Federal Reserve Bank of St. Louis

68. Claims on unaffiliated foreigners, reported by nonbanking business enterprisesin the United States1—ContinuedMillions of dollars, end of period
Type snd area or country
1 Total
2 Payable in dollars3 Payable in foreign currencies
By type
4 Financial claims5 Deposits6 Payable in dollars7 Payable in foreign currencies
8 Other financial claims9 Payable in dollars
10 Payable in foreign currencies
1 1 Commercial claims12 Trade receivables13 Advance payments and other claims
14 Payable in dollars . .15 Payable in foreign currencies
By area or countryFinancial claims
16 Europe .1 7 Belgium-Luxembourg18 France .19 Germany20 Netherlands21 Switzerland ,22 United Kingdom
23 Canada24 Latin America and Caribbean25 Bahamas26 Bermuda . . . . .27 Brazil28 British West Indies29 Mexico30 Venezuela
3 1 Asia32 Japan33 Middle East oil-exporting countries^
34 Africa35 Oil-exporting countries3
36 All other4
Commercial claims37 Europe38 Belgium-Luxembourg39 France40 Germany4 1 Netherlands . . . .42 Switzerland43 United Kingdom
44 Canada45 Latin America and Caribbean .46 Bahamas47 Bermuda .48 Brazil . . .49 British West Indies50 Mexico5 1 Venezuela
52 Asia53 Japan54 Middle East oil-exporting countries^
55 Africa56 Oil-exporting countries^57 All other4 . . . .
June
31,039
28,5252 513
18,81414 04113,671
370
4,7733,1941,579
12,22511 0451,179
11,661564
4,86713
32414810674
3 930
4 4368,4873 832
4276
3 676274134
80232733
1564166
4,331211636394291414905
7142,790
30225423
10750383
3,3291 144
809
648138413
1982
Sept.
30,232
27,5712 661
18,35613 24112,828
413
5,1153,4191 696
1 1 ,87710,7701,106
11,324552
4,96716
32621511960
3 859
4 3867,9483 435
1676
3 411268133
846268
30
1655044
4,231178646427268291
1,035
6662 772
19154481
7869373
3,098973111
661148448
Dec.
28,483
25,8512 632
17,50112 96512 534
430
4,5362,8951 641
10,98299731,010
10,422561
4,86810
13417897
1074064
4 2877,4583 265
3262
3 171274139
698153
15
1584831
3,777150473356347339808
6322 521
21259258
12774351
3,0481 047
751
588140417
Mar.
31,230
28,5102 720
20,26115 61015 130
480
4,6513,0061 645
10,9699 7651,203
10,374595
6,2295898
127140107
5 434
4 6138 5273 811
2150
3 408352156
712233
18
1534525
3,594140489424309227754
6482 699
30172402
21894288
3 1281 115
702
559131342
19i
June
31,505
28,8492 656
20 89616 07215 632
439
4 8243,2261 598
10,6099 2411,367
9991618
6,84712
14021613637
6058
4 8858 0893 291
9248
3 447348152
771288
14
15448
149
3,410144499364242303739
7162 722
30108512
21956273
2 871949700
528130361
S3
Sept.
31,656
287802 877
20 83115 98715 542
445
4 8453,0191 826
10,8259 5261 299
10 219606
6 20225
1351518934
5 547
4 9588 6093 389
6249
3 932315137
764257
8
15145
148
3 349131486381282270734
7882 864
15242611
12897282
2 9361 037
719
562131326
Dec.
33,329
30 1693 160
22 29917 31816 821
497
498129192062
11 0309 6551 375
10 429601
6 42337
1301294938
5 768
5 7599 1104 332
9653
3 509273134
714246
4
14755
145
3 604142455346332295802
8222 697
g194493
7883273
3 0451 091
737
584139211
157Digitized for FRASER http://fraser.stlouisfed.org/ Federal Reserve Bank of St. Louis

69. Assets and liabilities of foreign branches of U.S. banks1
Millions of dollars, end of period
Assets
1 Total, all currencies
2 Claims on United States3 Parent bank4 Other5 Claims on foreigners6 Other branches of
parent bank7 Banks8 Public borrowers"9 Nonbank foreigners
10 Other assets
1982
Jan. Feb. Mar. Apr. May June July Aug. Sept. Oct. Nov. Dec.
All foreign countries
460,710
70,05850,47219,586
370,531
88,953145,65726,696
109,22520.121
461,982
69,79949,59120,208
372,070
88,583146,48926,937
110,06120.113
464,352
75,97953,35422,625
369,105
86,800147,10226,435
108,76819,268
460,980
78,14455,92022,224
363,188
86,116142,58425,727
108,76119,648
462,342
79,71257,17322,539
362,887
88,395139,75825,081
109,65319.743
459,446
83,62258,65424,968
356,926
87,200137,81525,332
106,57918,898
466,313
82,65256,04426.608
364,405
89,481142,99824,747
107,17919.256
472,115
89,05260,43128,621
362,717
91,628138,66124,569
107,85920.346
471,299
90,28760,87229,415
360,652
93,295135,48924,476
107,39220,360
464,153
89,07561,30727,768
354,870
90,052133,54124,001
107,27620,208
469,100
90,88662,51328,373
357,770
91,983133,54023,478
108,76920.444
469,432
91,76861,62930,139
358,258
91,143133,64024,090
109,38519.406
1 1 Total payable inU.S. dollars
12 Claims on United States13 Parent bank14 Other15 Claims on foreigners16 Other branches of
parent bank17 Banks18 Public borrowers2
19 Nonbank foreigners20 Other assets
351,549 353,551 355,948 351,788 352,230 354,121 360,342 366,533 369,877 361,999 364,033 361,712
21 Total, all currencies
22 Claims on United States23 Parent bank24 Other25 Claims on foreigners26 Other branches of
parent bank27 Banks28 Public borrowers2
29 Nonbank foreigners30 Other assets
68,50549,88918,616
270,830
71,945117,22221,23660,42712,214
68,24348,99719,246
273,188
72,049118,34421,56461,23112,120
74,46052,76521,695269,714
70,327117,45620,68761,24411,774
76,64055,46421,176263,242
69,352113,79420,22859,8681 1 ,906
78,10656,68821,418262,175
70,740111,05719,63860,7401 1 ,949
82,05558,15723,898260,781
70,423110,40219,99659,96011,285
81,00955,36525,644267,527
72,523115,21319,35260,43911,806
87,44459,75027,694266,680
74,287111,84919,09061,45412,409
88,63360,20728,426268,363
77,470110,62519,06061,20812,881
87,35560,56226,793262,050
74,032107,53818,72361,75712,594
89,01361,69927,314262,196
74,820106,85718,29562,22412,824
90,04860,97329,075259,646
73,512106,33818,37461,42212,018
United Kingdom
157,892
13,93510,2643,671
137,953
41,46856,1647,24933,0726,004
162,351
15,88412,0443,840
140,197
40.93557,9757,37033,9176,270
161,471
16,34312,4463,897
139,292
41,18656,9407,54133,6255,836
159,481
17,67613,7503,926
135,634
39,81155,5456,82233,4566,171
161,036
20,15515,8544,301
134,845
39,62154,6746,66333,8876,036
158,466
20,74216,7663,976
131,862
37,69854,7276,59532,8425,862
164,106
' 23,96219,6804,282
133,964
37,25056,4286,45633,8306,180
164,523
27,03122,7304,301
130,814
36,93753,5826,28634,0096,678
167,189
27,53422,9704,564
132,746
40,38552,2036,08634,0726,909
164,582
27,82923,7174,112
129,913
37,01352,5686,15734,1756,840
165,687
28,67724,2784,399
130,666
38,31951,4146,17034,7636.344
161,067
27.35423,0174,337
127,734
37,00050,7676,24033,7275,979
31 Total payable inU.S. dollars
32 Claims on United States33 Parent bank34 Other35 Claims on foreigners . . . .36 Other branches of
parent bank37 Banks38 Public borrowers2 . . . .39 Nonbank foreigners . . .40 Other assets
116,870 121,342 120,432 117,914 119,586 120,002 125,247 126,344 131,129 127,517 128,863 123,740
13,43810,0983,340
99,473
35,87540,6105,423
17,5653,959
15,391 15,84211,881 12,293
3,510 3,549101,861 100,500
35,69742,4535,467
18,2444,180
36,05540,7325,360
18,3534,090
17,18213,6233,559
96,595
34,24040,070
4,71717,5684,137
19,60815,6633,945
95,926
33,92239,5934,507
17,9044,052
20,254 23,42116,597 19,4513,657 3,970
95,859 97,699
32,56940,4794,655
18,1563,889
32,00742,515
4,51318,664
4,127
26,51422,496
4,01895,293
31,41440,3214,336
19,2224,537
26,91922,758
4,16199,008
35,70339,7864,214
19,3055,202
27,25523,478
3,77795,269
32,24339,0774,251
19,6984,993
28,09324,0354,058
95,870
33,15438,3104,281
20,1254,900
26,76122,7564,005
92,228
31,64836,7174.329
19,5344,751
Bahamas and Caymans
41 Total, all currencies 146,846 143,142 144,028 143,189 140,088 141,929 141,145 144,254 140,669 139,545 141,038 145,156
42 Claims on United States 50,911 49,320 54,253 55,763 54,421 56,724 52,661 56,126 55,487 55,728 57,081 59,40343 Parent bank 36,719 34,299 36,687 38,370 37,119 36,650 31,242 32,861 32,155 32,927 34,022 34,65344 Other 14,192 15,021 17,566 17,393 17,302 20,074 21,419 23,265 23.332 22,801 23,059 24,75045 Claims on foreigners 91,512 89,426 85,456 83,134 81,329 81,200 84,446 83,855 81,088 76,629 79,277 81,45046 Other branches of
parent bank 14,035 14,329 11,979 12,574 14,186 15,407 17,538 17,806 17,772 17,955 18,066 18,72047 Banks 50,722 48,970 47,852 45,786 43,306 42,777 44,259 43,636 41,367 40,529 41,117 42,69948 Public borrowers2 8,726 8,597 7,993 7,860 7,361 7,327 7,031 7,036 6.999 6,743 6,310 6.41349 Nonbank foreigners 18,029 17,530 17,632 16,914 16,476 15,689 15,618 15,377 14.950 14,402 13,784 13,61850 Other assets 4,423 4,396 4,319 4,292 4,338 4,005 4,038 4,273 4,094 4,188 4,680 4,303
51 Total payable inU.S. dollars 141,708 138,130 138,981 138,088 135,177 136,961 135,665 138,831 136,132 134,714 135,747 139,605
158Digitized for FRASER http://fraser.stlouisfed.org/ Federal Reserve Bank of St. Louis

69. Assets and liabilities of foreign branches of U.S. banks1—ContinuedMillions of dollars, end of period
Liabilities1982
Jan. Feb. Mar. Apr. May June July Aug. Sept. Oct. Nov. Dec.
52 Total, all currencies
53 To United States54 Parent bank55 Other banks in United States .56 Nonbanks57 To foreigners58 Other branches of
parent bank59 Banks60 Official institutions61 Nonbank foreigners62 Other liabilities
63 Total payable inU.S. dollars
64 To United States65 Parent bank66 Other banks in United States . . .67 Nonbanks68 To foreigners69 Other branches of
parent bank70 Banks71 Official institutions72 Nonbank foreigners73 Other liabilities
74 Total, all currencies .
75 To United States76 Parent bank77 Other banks in United States .78 Nonbanks79 To foreigners80 Other branches of
parent bank81 Banks82 Official institutions83 Nonbank foreigners84 Other liabilities
85 Total payable inU.S. dollars
86 To United States87 Parent bank88 Other banks in United States .89 Nonbanks95" To foreigners91 Other branches of
parent bank92 Banks93 Official institutions94 Nonbank foreigners95 Other liabilities
96 Total, all currencies .
97 To United States98 Parent bank99 Other banks in United States
100 Nonbanks101 To foreigners102 Other branches of
parent bank103 Banks104 Official institutions105 Nonbank foreigners106 Other liabilities
107 Total payable inU.S. dollars
All foreign countries
460,710 461,982 464,352 460,980 462,342 459,446 466,313 472,115 471,299 464,153 469,100 469,432
144,515 145,895 151,184 153.446 156,480 161,049 164,643 167,780 173,083 169,464 172,034 178.91856,350 55,742 59,076 57,244 56,578 59,300 61,033 64,502 69,680 64,252 66,477 75.56119,911 22,680 24,458 26,035 27,705 29,571 31,600 32,461 33,764 32,609 31,813 33.36868,254 67,473 67,650 70,167 72,197 72,178 72,010 70,817 69,639 72,603 73,744 69.989296,528 296,497 293,695 287,326 284,754 278,905 282,116 284,231 278,007 274,606 276,695 270,678
85,645 84,279 85,585 84,165118,660 119,111 117,202 111,80525,16667,057
24,62568,482
19,667 19,590
23,03967,86919,473
22,34069,01620,208
85.645 84,582 86,842107,521 105,336 106,22722.703 19,914 20,23968,885 69,073 68,80821,108 19,492 19.554
92,243 91,243103,685 100,01720,004 20,52768,299 66,22020,104 20,209
91,71698,36519,44065,08520,083
91.41298,39621,09565,79220,371
90,14896.73919,61464,17719,836
364,477 367,504 369,933 367,154 368,806 369,638 376,475 382,272 385,575 377,299 379,721 379,003
141,47154,24019,78467,447
211.,004
69,14274,42219,97947,46112,002
142,904 148,105 150,310 153,317 157,819 161,355 164,522 170,18753,694 56,979 55,151 54,583 57,239 59,018 62,452 67,76622,469 24,217 25,698 27,290 29,235 31,269 32,198 33,50966,741 66,909 69,461 71,444 71,345 71,068 69,872 68,912
213,153 210,374 205,125 202,690 200,412 204,000 205,955 204,034
166,495 168,56162,307 64,18432,364 31,47771,824 72,900199,356 199,236
68,26976,23419,32249,32811,447
69,50073,25018,12049,50411,454
68,06069,36817.49150,20611,719
68,55366,71717,90049,52012,799
68,55665,91715,37350,56611,407
70,46966,69715,73751,09711,120
75,38464,14915,67250,75011,795
75,96762,53516,60748,92511,354
76,26859,78215,25348,05311,448
74,73458,94616,77448,78211,924
175,43173,23533,00369,193192,348
72,87857,35515,05547,06011,224
United Kingdom
157,892 162,351 161,471 159,481 161,036 158,466 164,106 164,523 167,189 164,582 165,687 161,067
40,768 43,358 42,483 41.886 43,882 44,086 46,965 49,001 53.919 53,7776,413 6,765 6,313 8,006 6,694 6,323 6,679 8,022 11,336 10,5687,313 8,973 8,607 8,345 8,972 9,985 11,215 11,616 13,280 12,56727,042 27,620 27,561 25,535 28,216 27,778 29,071 29,363 29,303 30,642110,036 111,417 111,262 109,629 109,199 106,665 109,105 107,268 104,967 102,611
16,27049,62216,11028,0347,088
16,54649,93715,96528,9697,576
17,24549,61614,60829,7937,728
18.35847.54913,90829,8147,966
19,41246,20414,11929,4647,955
17,77146,62811,74630,5207,715
18,01048,54112,07630,4788,036
18,66647,50212,00629,0948,254
19,12345,52612,34827,9708,303
18,39945,60111,37927,2328,194
54,00310,59712,37431,032103,927
19,37244,26612,94027,3497,757
53,95413.09112,20528,65899,567
18,36144,02011,50425,6827,546
121,407 127,029 126,359 124,248 126,901 125,859 131,199 132,536 137,268 133,591 135,188 130,261
40,2766,2967,28926,691
42,8096,6608,88427,265
41,8856,2118,489
27,185
41,1987,9078,16725,124
43,1436,6248,75527,764
43,3236,2129,80627,305
46,1296,60311,04828,478
48,2667,92811,51028,828
53.26211,22313,14228,897
53,14610,44212,47230,232
53,05610,30612,18830,562
53.02912,81412,02628,189
77,463 80,581 80,825 79,444 79,914 78,794 81,207 79,954 80,025 76,519 77,982 73,477
11,90030,99513,49721,0713,668
12,25432,24913,41822,6603,639
13,13032,09012,19623,4093,649
14,10230,41511,56823,3593,606
14,95829,96511,82923.1623,844
13,90330,5579.84324,4913,742
14,20232,36410,20024,4413,863
14,51431,89810,32223,2204,316
15,54831,18711,01222,2783,981
14,61430,4049,80621,6953,926
15,31029,09211,19822,3824,150
14,30028,8109,66820,6993,755
Bahamas and Caymans
146,846 143,142 144,028 143,189 140,088 141,929 141,145 144,254 140,669 139,545 141,038 145,156
89,25537,96811,22840,05954,515
20,71018,6563,14912,0003,076
87.67536.88912,23438,55252,372
19,80118,2662,50511,8003,095
92,05239,36014,30538,38748,991
18,60916,4092,60711,3662,985
94,39936.03315,90342,46345,786
17,36414,7372,51211,1733,004
94,67736,65016,82741,20042,026
15,88713,4522.44810,2393,385
97.96639,46617,41041,09041,204
15,85512,7022,47110,1762,759
98,65441,16717,83139,65639,740
15,01811,7662,40710,5492,751
99,32943,03017,91138,38842,039
17,34811,5992,28810,8042,886
99,55444.42417,92737,20338,401
15,12610,9102,09110,2742,714
96,89440,30917,48139,10439,815
17,42110,2972,1379,9602,836
98,549 104.42541,974 47,08116,805 18,46639,770 38.87839,627 38,274
17,56610,413
1,8469.8022,862
15.79610.166
1.96710.3452,457
143,054 139,533 140,348 139,709 136,756 138,691 137,956 140,810 137,772 136,681 137,927 141,908
159
Digitized for FRASER http://fraser.stlouisfed.org/ Federal Reserve Bank of St. Louis

69. Assets and liabilities of foreign branches of U.S. banks1—ContinuedMillions of dollars, end of period
Assets1983
Jan. Feb. Mar. Apr. May June July Aug. Sept. Oct. Nov. Dec.
1 Total, all currencies . . .
2 Claims on United States ,Parent bankOther
Claims on foreigners .Other branches of
parent bank . .BanksPublic borrowers . .Nonbank foreigners
10 Other assets
11 Total payable inU.S. dollars
21 Total, all currencies . . .
22 Claims on United States .23 Parent bank24 Other25 Claims on foreigners . . .26 Other branches of
parent bank27 Banks28 Public borrowers29 Nonbank foreigners . .30 Other assets
31 Total payable inU.S. dollars
32 Claims on United States ,33 Parent bank34 Other35 Claims on foreigners . . .36 Other branches of
parent bank37 Banks38 Public borrowers39 Nonbank foreigners . .40 Other assets
41 Total, all currencies . .
42 Claims on United States .43 Parent bank44 Other45 Claims on foreigners . . .46 Other branches of
parent bank . . . .47 Banks48 Public borrowers49 Nonbank foreigners . ,50 Other assets
51 Total payable inU.S. dollars
All foreign countries
462,348 458,376 465,573 453,416 452,377 465,866 455,850 452,596 460,261 458,894 463,467 475,593
89,84859,84730,001
352,987
89,498131,09924,602
107,78819,513
87,569 93,957 91,382 92,035 97,914 96,963 99,484 101,356 102,497 109,511 114,95658,544 63,498 61,912 62,722 65,920 67,731 67,137 65,561 69,655 75,521 81,00429,025 30,459 29,470 29,313 31,994 29,232 32,347 35,795 32,842 33,990 33,952351,535 352,623 344,069 342,295 349,809 340,994 335,036 340,413 337,848 335,518 342,018
89,772129,29724,734107,73219,272
89,099 85,328132,316 126,87624,715106,49318,993
25,114106,75117,965
86,439 88,368124,031 130,25925,552106,27318,047
25,370105,81218,143
84,872 84,572123,536 119,28825,876 25,147106,710 106,029
89,304 87,543120,177 117,63124,982 25,061105,950 107,613
17,893 18,076 18,492 18,549
89,447114,49524,256107,32018,438
92,634117,57624,360107,44818,619
354,985 350,737 356,882 344,738 343,976 357,499 350,507 348,330 354,595 351,483 358,204 370,515
12 Claims on United States13 Parent bank14 Other15 Claims on foreigners16 Other branches of
parent bank17 Banks18 Public borrowers19 Nonbank foreigners20 Other assets
88,15459,07929,075
255,007
71,198103,667
18,78561,35711,824
85,961 91,520 89,105 89,679 95,637 94,549 96,995 98,510 99,938 107,015 112,85057,859 62,565 61,276 61,923 64,591 66,303 65,711 63,716 68,126 73,999 79,91428,102 28,955 27,829 27,756 31,046 28,246 31,284 34,794 31,812 33,016 32,936
253,149 253,757 245,097 243,894 251,249 245,188 241,063 245,541 241,221 240,768 247,080
71,937100,909
18,96261,34111,627
70,782103,648
18,76660,56111,605
66,79698,21918,94161,14110,536
67,790 69,51296,047 102,83619,00661,05110,403
18,68160,22010,613
67,16397,19419,10861,72310,770
66,60993,80618,80461,84410,272
71,27395,11318,45560,70010,544
69,32492,04818,64461,20510,324
71,45190,14317,75261,42210,421
75,13193,24817,81760,88410,585
United Kingdom
157,464 156,577 156,022 152,408 151,821 155,631 153,209 154,865 156,048 156,803 155,964 158,717
27,17522,5394,636
124,354
34,95949,4976,42133,4775,935
26,423 26,25921,962 21,9124,461 4,347
124,214 123,993
35,43748,5806,59233,6055,940
36,17148,9766,33732,5095,770
25,13920,6574,482
121,727
32,97348,3016,59133,8625,542
24,84720,4564,391
121,187
33,36147,6236,59933,6045,787
26,27921,3844,895
123,835
35,78748,3286,57033,1505,517
26,01220,8495,163
121,757
35,63246,6436,44033,0425,440
29,72222,1697,553
119,672
35,55544,3036,34233,4725,471
28,94720,8168,131
121,518
36,38245,4516,27433,4115,583
30,85325,5075,346
120,660
36,55643,8886,28033,9365,290
32,352 34,43326,872 29,1115,480 5,322
118,275 119,280
35,64242,6836,30733,6435,337
36,56543,3525,89833,4655,004
120,233 119,273 118,891 113,170 112,585 118,023 116,526 119,377 121,238 121,817 121,744 125,997
26,58122,2504,33189,137
29,38035,6164,60019,5414,515
25,82921,7004,12988,973
29,91834,4994,78919,7674,471
25,59721,6263,97188,797
30,58934,4424,41319,3534,497
24,37420,3544,02084,981
27,13133,2284,52220,1003,815
24,04420,0923,95284,779
27,57932,8014,49719,9023,762
25,536 25,18021,017 20,4344,519 4,74688,587 87,450
30,02534,4174,54719,5983,900
30,12233,1594,42019,7493,896
28,90521,7207,18586,868
30,05331,7184,41020,6873,604
27,83720,0367,80189,530
31,40933,2374,32920,5553,871
30,09525,0845,01188,253
31,41431,7964,34620,6973,469
31,67126,5375,13486,614
30,37131,1584,37720,7083,459
33,75628,7565,00088,917
31,83832,1884,19420,6973,324
Bahamas and Caymans
142,351 138,905 145,904 142,246 141,145 146,886 142,432 139,699 143,148 141,311 147,257 151,463
57,455 56,318 62,815 61,537 62,673 66,575 66,032 63,923 66,54733,111 32,932 38,123 38,091 39,157 40,591 42,946 40,308 40,15224,344 23,386 24,692 23,446 23,516 25,984 23,086 23,615 26,39580,803 78,606 79,150 77,034 74,814 76,709 72,683 72,021 72,826
20,10140,8416,43413,4274,093
19,73039,1806,49413,2023,981
17,51242,3536,54012,7453,939
18,29539,6826,38?12,6693,675
18,54037,5656,17512,5343,658
16,67441,6815,93512,4193,602
15,56837,3816,53813,1963,717
15,35437,3506,40412,9133,755
16,78936,6096,46112,9673,775
66,25340,10526,14871,268
15,81735,9646,64312,8443,790
71,36344,41426,94971,995
17,99335,3535,89012,7593,899
74,72847,70327,02572,788
17,34036,7676,08412,5973,947
136,514 133,059 139,790 136,312 135,317 140,796 136,301 133,233 136,851 134,684 140,841 145,017
160Digitized for FRASER http://fraser.stlouisfed.org/ Federal Reserve Bank of St. Louis

69. Assets and liabilities of foreign branches of U.S. banks1—ContinuedMillions of dollars, end of period
Liabilities1983
Jan. Feb. Mar. Apr. May June July Aug. Sept. Oct. Nov Dec.
52 Total, all currencies .
63 Total payable inU.S. dollars
64 To United States65 Parent bank66 Other banks in United States . ,67 Nonbanks68 To foreigners69 Other branches of
parent bank ,70 Banks71 Official institutions72 Nonbank foreigners73 Other liabilities
74 Total, all currencies
75 To United States76 Parent bank77 Other banks in United States .78 Nonbanks79 To foreigners80 Other branches of
parent bank81 Banks82 Official institutions83 Nonbank foreigners84 Other liabilities
85 Total payable inU.S. dollars
86 To United States87 Parent bank88 Other banks in United States . . .89 Nonbanks90 To foreigners91 Other branches of
parent bank92 Banks93 Official institutions94 Nonbank foreigners95 Other liabilities
96 Total, all currencies
97 To United States98 Parent bank99 Other banks in United States
100 Nonbanks101 To foreigners102 Other branches of
parent bank103 Banks104 Official institutions105 Nonbank foreigners106 Other liabilities
107 Total payable inU.S. dollars
All foreign countries
462,348 458,376 465,573 453,416 452,377 465,866 455,850 452,596 460,261 458,894 463,467 475,593
53 To United States54 Parent bank55 Other banks in United States56 Nonbanks57 To foreigners58 Other branches of
parent bank59 Banks60 Official institutions61 Nonbank foreigners62 Other liabilities
178,60180,10432,79765,700265,303
88,99392,87520,24663,18918,444
178,392 189,26179,595 85,43032,650 33,97466,147 69,857261,699 258,532
184,191 184,324 191,57981,224 81,061 84,57632,687 31,815 33,67270,280 71,448 73,331251,296 250,466 256,102
187,713 183,864 182,588 185,55181,752 77,556 78,027 85,02831,489 29,880 30,961 27,09474,472 76,428 73,600 73,429249,823 250,563 259,525 254,682
184,202 187,48179,574 80,45926,62478,364
29,17577,847
260,335 268,958
88,555 86,939 84,146 84,903 86,559 82,878 81,714 86,714 84,004 86,792 88,90390,244 91,726 86,950 84,637 87,140 84,649 85,433 86,550 84,533 88,023 92,80019,739 17,808 18,384 17,199 18,621 18,287 17,830 20,513 19,403 18,377 18,80163,161 62,059 61,816 63,727 63,782 64,009 65,586 65,748 66,742 67,143 68,45418,285 17,780 17,929 17,587 18,185 18,314 18,169 18,148 18,661 18,930 19,154
370,439 367,782 374,884 363,713 363,493 376,150 368,651 365,584 373,061 369,936 374,426 387,287
174,97777,83332,27364,871185,323
71,10052,22515,94046,05810,139
174,720 185,764 180,771 180,549 188,082 184,216 180,174 178,814 181,645 180,206 183,76677,263 83,120 79,143 78,796 82,380 79,497 75,245 75,743 82,661 77,127 78,25732,223 33,534 32,226 31,222 33,242 31,115 29,334 30,415 26,538 25,773 28,64165,234 69,110 69,402 70,531 72,460 73,604 75,595 72,656 72,446 77,306 76,868183,683 179,720 173,556 173,843 178,877 174,836 175,616 184,430 178,943 184,278 193,785
70,887 69,049 66,186 66,664 68,369 66,195 64,522 69,308 66,502 69,457 71,89951,234 52,133 48,428 47,424 49,903 48,062 49,522 50,862 48,264 52,072 57,01315,381 13,536 13,801 12,655 13,912 13,517 13,029 15,400 14,630 13,453 13,85246,181 45,002 45,141 47,100 46,693 47,062 48,543 48,860 49,547 49,296 51,0219,379 9,400 9,386 9,101 9,191 9,599 9,794 9,817 9,348 9,942 9,736
United Kingdom
157,464 156,577 156,022 152,408 151,821 155,631 153,209 154,865 156,048 156,803 155,964 158,717
52,65014,28712,34326,02097,827
19,34341,07312,37725,0346,987
51,92714,08012,19825,64997,515
21,00839,89212,02524,5907,135
55,30914,61613,17227,52193,835
19,65340,86710,25223,0636,878
52,88314,34312,11926,42192,460
19,47038,96010,52023,5107,065
53,60313,90712,77326,92391,071
20,23537,5949,41323,8297,147
56,95214,46113,50328,98891,545
18,37638,23810,84824,0837,134
56,95915,01112,99328,99589,198
17,54437,19210,14624,3167,052
58,34716,14512,46229,74089,458
17,59537,5719,58824,7047,060
56,92416,85212,17427,89892,122
19,36537,12211,44824,1877,002
60,90321,38510,75128,76788,727
18,28835,84710,61123,9817,173
57,09517,31210,17629,60791,714
18,84138,88810,07123,9147,155
55,79914,02111,32830,45095,847
19,03841,62410,15125,0347,071
126,286 126,007 126,088 120,683 120,324 124,760 123,265 125,656 127,868 128,600 127,234 131,152
51,80814,10512,12825,57571,000
15,08125,17710,65720,0853,478
50,97713,85912,04125,07771,994
16,70925,56310,12119,6013,036
54,52014,47612,98727,05768,309
14,91826,3958,41918,5773,259
51,99314,21211,92925,85265,485
14,81523,8218,47418,3753,205
52,47313,69612,43926,33864,621
15,63622,9607,30618,7193,230
56,09214,30813,31328,47165,428
14,11723,8958,78618,6303,240
56,08114,81212,83328,43663,818
13,38623,4538,06518,9143,366
57,35915,82912,22329,30764,801
13,42124,4477,63019,3033,496
55,93116,67311,88627,37268,252
15,16624,4789,38119,2273,685
59,82421,14510,52328,15665,347
14,54223,1368,74218,9273,429
55,90717,0949,88028,93368,011
15,04426,3438,02918,5953,316
54,69113,83911,04429,80873,279
15,40329,3208,27920,2773,182
Bahamas and Caymans
142,351 138,905 145,904 142,246 141,145 146,886 142,432 139,699 143,148 141,311 147,257 151,463
104,60950,65217,56136,39635,495
14,2589,2791,84910,1092,247
104,668 111,641 109,818 109,320 111,725 108,623 104,470 104,590 104,150 106,633 110,76249,782 55,836 52,183 51,362 53,720 50,777 46,491 45,493 48,235 46,676 50,18717,328 17,328 17,451 16,143 16,921 15,494 14,560 16,170 14,322 14,117 15,71137,558 38,477 40,184 41,815 41,084 42,352 43,419 42,927 41,593 45,840 44,86431,885 32,054 30,210 29,651 33,088 31,560 32,875 36,239 34,782 38,164 38,362
11,808 11,5478,451 8,9871,720 1,6789,906 9,8422,352 2,209
10,3148,1261,710
10,0602,218
10,0737,6181,73410,2262,174
11,8359,0111,79610,4462,073
11,2298,0122,101
10,2182,249
11,6218,7372,17010,3472,354
13,3579,5062,23711,1392,319
12,6349,0591,976
11,1132,379
15,5219,6181,624
11,4012,460
13,37611,869
1,91611,2012,339
138,939 135,553 142,707 139,108 138,064 143,597 139,247 136,228 139,855 137,514 143,604 147,658
161Digitized for FRASER http://fraser.stlouisfed.org/ Federal Reserve Bank of St. Louis

70. Assets and liabilities of U.S. branches and agencies of foreign banksA. March 31, 19831
Millions of dollars
Item
1 Total assets5
2 Cash and due from depositoryinstitutions
3 Currency and coin (U.S. and foreign) . . .4 Balances with Federal Reserve Banks . . .5 Balances with other central banks6 Demand balances with commercial
banks in United States7 All other balances with depository
institutions in United States andwith banks in foreign countries . . . .
8 Time and savings balances withcommercial banks in UnitedStates
9 Balances with other depositoryinstitutions in United States
10 Balances with banks in foreigncountries
11 Foreign branches of U.S. banks . . .12 Other banks in foreign countries . . .13 Cash items in process of collection . . . .
14 Total securities, loans, and leasefinancing receivables
15 Total securities, book value16 U S Treasury17 Obligations of other U.S. government
agencies and corporations18 Obligations of states and political
subdivisions in United States19 Other bonds, notes, debentures, and
corporate stock . . . . .
20 Federal funds sold and securities purchasedunder agreements to resell
By holder21 Commercial banks in United States . . . .22 Others
By type23 One-day maturity or continuing contract24 Securities purchased under agreements
to resell25 Other .26 Other securities purchased under
agreements to resell . .
27 Total loans, gross28 LESS: Unearned income on loans29 EQUALS* Loans net . . .
All states2
Total
212,373
35,92921
1,18647
995
33,556
15,635
122
17,7811,715
16,067125
130,453
7,0074,511
515
78
1,904
8,307
7,407900
8,125
2417,884
182
123,582137
123,445
Branches4
157,860
32,36518
1,12135
860
30,212
13,816
122
16,2741,689
14,585119
97,591
6,3484,157
495
73
1,623
6,965
6,155810
6,784
2296,555
181
91,33088
91,242
Agencies
54,514
3,5643
6511
135
3,345
1,836
0
1,50826
1,4826
32,862
659353
19
5
281
1,343
1,25390
1,341
121,329
2
32,25149
32,203
New
Branches4
139,462
30,76114
93635
790
28,873
13,044
122
15,7071,631
14,076113
84,927
6,0664,032
487
48
1,499
6,203
5,397806
6,023
605,963
180
78,94079
78,861
York
Agencies
6,966
6451
220
58
563
385
0
1784
1741
5,112
323284
2
1
37
668
58780
668
8659
0
4,79910
4,789
Cali-fornia,total3
43,983
2,8091
4411
60
2,690
1,421
1
1,26918
1,2503
24,858
34983
20
1
246
642
6375
642
4638
0
24,54637
24,509
Illinois,branches
9,198
1,2182
270
37
1,148
646
0
50156
4464
7,142
23186
0
23
122
509
5054
509
0509
1
6,9176
6,911
Other states2
Branches
7,707
3091
1420
23
140
98
0
432
412
4,192
3225
3
1
2
248
2480
248
16979
0
4,1622
4,160
Agencies
5,058
1881
150
27
143
60
0
834
792
4,222
60
2
4
0
38
335
36
036
2
4,2172
4,215
162Digitized for FRASER http://fraser.stlouisfed.org/ Federal Reserve Bank of St. Louis

70. Assets and liabilities of U.S. branches and agencies of foreign banks—ContinuedA. March 31, 1983l—ContinuedMillions of dollars
Item
Total loans, gross, by category30 Real estate loans . . .31 Loans to financial institutions32 Commercial banks in United States . . . .33 U.S. branches and agencies of other
foreign banks34 Other commercial banks35 Banks in foreign countries36 Foreign branches of U.S. banks37 Other38 Other financial institutions
39 Loans for purchasing or carryingsecurities
40 Commercial and industrial loans41 U.S. addressees (domicile)42 Non-U.S. addressees (domicile)43 Loans to individuals for household, family,
and other personal expenditures . . . ' . .44 AH other loans45 Loans to foreign governments and
official institutions . . .46 Other
47 Lease financing receivables48 All other assets49 Customers' liability on acceptances
outstanding50 U.S. addressees (domicile)51 Non-U.S. addressees (domicile)52 Net due from related banking
institutions^53 Other
All states2
Total
4,91847,10324,539
21,8692,670
21,065655
20,4091,500
68555,52332,37423,149
20515,147
13,6601,487
137,684
10,4715,8674,604
21,8445,369
Branches4
1,88236,08418,355
15,9372,418
16,559587
15,9731,169
68240,41122,63217,778
15512,117
10,7481,368
120,939
7,8353,8014,035
8,7694,334
Agencies
3,03611,0206,184
5,932252
4,50569
4,437330
315,1129,7415,371
503,031
2,912119
016,745
2,6362,067
569
13,0741,035
New York
Branches4
1,23132,57716,414
14,2332,181
15,376474
14,902786
60932,92216,59216,330
10911,492
10,2601,231
117,571
7,5393,6863,854
6,0583,974
Agencies
161,307
447
38562
7589
748103
32,283
5641,719
131,177
1,13047
0541
1535
148
193195
Cali-fornia,total3
2,0989,4555,724
5,566. 1583,510
973,413
220
'7311,2048,1593,045
401,678
1,62256
015,674
2,4322,062
370
12,444798
Illinois,branches
592,7691,426
1,217208962
75887381
03,6523,036
616
12425
38936
0329
907318
22216
Other states2
Branches
465250235
21817150
151
13,2442,472
773
25117
8295
02,958
18630
156
2,68785
Agencies
1,049746293
24944
4440
4449
02,2181,550
668
6199
17722
0610
711159
440100
163Digitized for FRASER http://fraser.stlouisfed.org/ Federal Reserve Bank of St. Louis

70. Assets and liabilities of U.S. branches and agencies of foreign banks—ContinuedA. March 31, 19831—ContinuedMillions of dollars
Item
54 Total liabilities5 .
55 Total deposits and credit balances56 Individuals, partnerships, and
corporations . . .57 U S addressees (domicile) . . .58 Non-U.S. addressees (domicile)59 U.S. government, states* and political
subdivisions in United States . .60 All other61 Foreign governments and official
institutions . . . .62 Commercial banks in United States . . .63 U.S. branches and agencies of
other foreign banks64 Other commercial banks in United
States65 Banks in foreign countries66 Foreign branches of U.S. banks . . .67 Other banks in foreign countries . . .68 Certified and officers' checks,
travelers checks, and letters ofcredit sold for cash
6 9 Demand deposits , . . . .70 Individuals, partnerships, and
corporations71 U S addressees (domicile) . . .72 Non-U.S. addressees (domicile)73 U.S. government, states, and political
subdivisions in United States74 All other75 Foreign governments and official
institutions76 Commercial banks in United States . . .77 U.S. branches and agencies
of other foreign banks78 Other commercial banks in United
States79 Banks in foreign countries80 Certified and officers' checks,
travelers checks, and letters ofcredit sold for cash
81 Time deposits82 Individuals, partnerships, and
corporations83 U S addressees (domicile)84 Non-U.S. addressees (domicile)85 U.S. government, states, and political
subdivisions in United States . .86 All other87 Foreign governments and official
institutions . .88 Commercial banks in United States . . .89 U.S. branches and agencies of
other foreign banks . .90 Other commercial banks in United
States91 Banks in foreign countries . . .
92 Savings deposits93 Individuals, partnerships, and
corporations94 U.S. addressees (domicile)95 Non-U.S. addressees (domicile)96 U.S. government, states, and political
subdivisions in United States97 All other . . . . .
All states2
Total
212,373
95,608
36,98825,52311,465
10158,520
5,43622,150
14,069
8,08130,3726,160
24,212
561
3,082
1,6771,067
609
61,399
19559
5
54584
561
91,609
34,58323,96110,622
9456,932
5,22122,043
14,033
8,01029,668
516
516390126
00
Branches4
157,860
84,400
34,86125,4559,406
10149,439
4,99217,933
11,187
6,74626,0635,082
20,981
450
2,850
1,5911,067
523
61,253
18748
5
43568
450
80,871
32,72923,961
8,768
9448,049
4,79917,847
11,151
6,69625,403
475
475390
85
00
Agencies
54,514
11,208
2,12768
2,059
09,081
4444,217
2,882
1,3354,3091,0783,231
111
232
860
86
0147
811
0
1116
111
10,737
1,8540
1,854
08,883
4224,196
2,882
1,3144,265
41
410
41
00
New
Branches4
139,462
76,527
28,93820,0908,848
1647,573
4,79717,188
10,736
6,45325,1654,836
20,329
422
2,593
1,394891503
51,194
16345
4
41564
422
73,452
27,20018,9478,253
1046,242
4,62817,105
10,700
6,40524,509
281
281219
62
00
York
Agencies
6,966
1,965
17935
144
01,786
300583
285
298832304527
71
71
000
071
00
0
00
71
1,736
710
71
01,666
288574
285
289805
0
000
00
Cali-fornia,total3
43,983
8,502
1,288231
1,057
47,210
2533,507
2,553
9543,426
7592,666
24
84
461234
038
81
0
15
24
8,322
1,148166982
47,170
2443,506
2,553
9533,420
70
703238
00
Illinois,branches
9,198
2,245
715614101
01,529
47651
433
218813206607
18
114
92884
022
10
0
03
18
2,061
554462
91
01,507
46651
433
218810
70
70646
00
Other states-
Branches
7,707
4,886
4,6504,540
110
80155
2371
13
58544014
8
115
82775
I33
23\
0
10
8
4,689
4,4874,386
100
80123
069
13
5653
80
80755
00
Agencies
5,058
1,484
1,21813
1,205
0266
16150
49
101831468
18
105
630
63
042
011
0
1112
18
1,349
1,1240
1,124
0224
15138
49
9070
15
150
15
00
164Digitized for FRASER http://fraser.stlouisfed.org/ Federal Reserve Bank of St. Louis

70. Assets and liabilities of U.S. branches and agencies of foreign banks—ContinuedA. March 31, 1983}— ContinuedMillions of dollars
Item
98 Credit balances99 Individuals, partnerships, and
corporations100 U S addressees (domicile)101 Non-U S addressees (domicile)102 U.S. government, states, and political
subdivisions in United States103 All other .104 Foreign governments and official
institutions . .105 Commercial banks in United States . . .106 U.S. branches and agencies of
other foreign banks107 Other commercial banks in United
States108 Banks in foreign countries109 Federal funds purchased and securities sold
under agreement to repurchase
By holder1 10 Commercial banks in United States . . . .1 1 1 Others
By type1 12 One-day maturity or continuing
contract ,. . .113 Securities sold under agreements to
repurchase . .114 Other115 Other securities sold under agreements
to repurchase . . . . . . .
1 16 Other liabilities for borrowed money1 17 Owed to banks118 U.S. addressees (domicile)1 19 Non-U. S. addressees (domicile)120 Owed to others . . . . .121 U.S. addressees (domicile)122 Non-U. S. addressees (domicile)
123 All other liabilities124 Acceptances executed and outstanding. . .125 Net due to related banking
institutions^*1 2 6 Other . . . .
MEMO127 Time deposits of $100,000 or more128 Certificates of deposit (CDs) in
denominations of $100,000 ormore . .
1 29 Other130 Savings deposits authorized for automatic
transfer and NOW accounts131 Money market time certificates of $10,000
and less than $100,000 withoriginal maturities of 26 weeks
132 Time certificates of deposit indenominations of $100,000 or morewith remaining maturity of more than12 months
133 Acceptances refinanced with a U.S.-chartered bank . . . .
1 34 Statutory or regulatory asset pledgerequirement
135 Statutory or regulatory asset maintenancerequirement
136 Commercial letters of credit137 Standby letters of credit, total . . .138 U.S. addressees (domicile)139 Non-U. S. addressees (domicile)140 Standby letters of credit conveyed to others
through participations (included intotal standby letters of credit)
All states2
Total
400
212104108
0188
2048
31
17120
18,989
15,6313,357
17,913
1,87316,040
1,076
50,05346,935
. 44,5482,3873,1182,848
270
47,7241 1 ,474
32,5933,657
74,233
32,96741,266
88
0
3,494
3,523
79,602
9,5386,914
15,81613,4862,330
3,106
Branches4
203
663630
0137
638
31
793
12,694
10,3992,296
11,721
1,7539,968
974
22,32119,85418,017
1,8372,4672,260
207
38,4448,605
26,8013,038
65,634
31,45634,177
69
0
3,479
2,660
78,002
9,3364,354
13,77211,774
1,999
2,911
Agencies
197
1466878
051
1410
0
1027
6,294
5,2331,061
6,192
1206,072
102
27,73227,08126,532
54965158863
9,2802,870
5,792619
8,599
1,5117,088
19
0
15
863
1,600
2022,5602,0441,713
331
195
New
Branches4
201
633330
0137
638
31
793
11,462
9,1912,271
10,518
1,5398,979
944
20,46418,06316,286
1,7772,4012,205
196
31,0098,296
19,9162,798
58,682
25,74032,942
47
0
3,003
2,475
72,522
5,6983,835
12,44610,7821,664
2,850
York
Agencies
158
1093574
049
1210
0
1027
1,224
896327
1,165
731,092
59
1,8331,8141,538
27620155
1,943197
1,65195
62
1349
0
0
0
101
1,348
3848129219399
118
Cali-fornia,total3
26
24213
02
11
0
00
4,234
4,124111
4,191
444,148
43
25,31124,67224,627
4563958059
5,9362,614
2,835487
8,059
1,1976,862
11
0
14
762
68
4272,0141,211
975236
93
Illinois,branches
0
000
00
00
0 .
00
754
72925
724
84640
30
1,1501,1151,100
153529
7
5,04992
4,843114
1,659
699959
11
0
80
40
5,417
737292648522126
27
Other states2
Branches
2
220
00
00
0
00
385
3850
385
130255
0
6466275874019190
1,791197
1,490103
4,629
4,494135
8
0
390
145
46
2,476210437286152
17
Agencies
14
1413
1
00
00
0
00
930
306624
929
3926
1
648645411234
303
1,99677
1,85960
1,142
824318
11
0
7
0
201
16281
783729
54
0
165Digitized for FRASER http://fraser.stlouisfed.org/ Federal Reserve Bank of St. Louis

70. Assets and liabilities of U.S. branches and agencies of foreign banks—ContinuedA. March 31, 1983'— ContinuedMillions of dollars
Item
141 Holdings of commercial paper included intotal gross loans
142 Holdings of acceptances included in totalcommercial and industrial loans
143 Immediately available funds with a maturitygreater than one day (included in otherliabilities for borrowed money)
144 Gross due from related bankinginstitutions6
145 U.S. addressees (domicile)146 Branches and agencies in the United
States147 In the same state as reporter148 In other states149 U S banking subsidiaries^150 Non-U S addressees (domicile)151 Head office and non-U.S. branches
and agencies152 Non-U.S. banking companies and
offices
153 Gross due to related banking institutions6 . .154 U.S. addressees (domicile)155 Branches and agencies in the United
States156 In the same state as reporter157 In other states158 U.S. banking subsidiaries7
159 Non-U S addressees (domicile)160 Head office and non-U.S. branches
and agencies161 Non-U.S. banking companies and
offices
Average for 30 calendar days (or calendarmonth) ending with report date
162 Total assets163 Cash and due from depository
institutions164 Federal funds sold and securities purchased
under agreements to resell165 Total loans166 Loans to banks in foreign countries167 Total deposits and credit balances168 Time CDs in denominations of $100,000
or more169 Federal funds purchased and securities sold
under agreements to repurchase170 Other liabilities for borrowed money
171 Number of reports filed8
All states2
Total
677
4,731
35,685
83,88122,039
21,707527
21,180332
61,842
59,487
2,355
94,63122,496
22,066649
21,417430
72,134
70,366
1,768
208,534
34,353
5,860120,816
19,29190,043
31,564
20,20646,966
419
Branches4
611
3,557
13,248
60,21710,118
9,953134
9,820165
50,099
48,054
2,045
78,24816,620
16,282358
15,925338
61,628
59,963
1,666
155,053
31,018
4,89689,50215,18479,609
30,070
13,60920,691
230
Agencies
66
1,175
22,438
23,66411,921
11,753393
11,360167
11,744
11,434
310
16,3825,876
5,784291
5,49393
10,506
10,404
102
53,481
3,335
96431,3144,106
10,433
1,494
6,59726,275
189
New
Branches4
579
3,414
12,057
54,5546,705
6,54799
6,448158
47,849
45,839
2,009
68,41111,362
11,057325
10,732306
57,049
55,480
1,569
136,959
29,456
4,56577,09214,08271,571
24,429
11,99418,850
140
York
Agencies
25
154
1,527
2,617603
57019
55134
2,014
1,940
73
4,0741,155
1,12119
1,10334
2,920
2,903
16
6,954
592
5284,603
6411,989
11
1,0231,782
43
Cali-fornia,total3
29
1,011
20,749
20,10911,036
10,898349
10,549138
9,073
8,914
159
10,5003,711
3,665269
3,39646
6,788
6,718
70
42,828
2,627
41823,936
3,2467,667
927
4,57224,031
113
Illinois,branches
30
45
833
1,90161
590
592
1,840
1,807
33
6,7223,330
3,3260
3,3264
3,392
3,303
89
8,918
1,220
2496,894
8962,329
745
1,1641,162
43
Other states2
Branches
2
96
326
3,5733,275
3,27535
3,2400
298
298
0
2,3761,613
1,61033
1,5772
763
763
0
7,684
270
734,212
114,989
4,616
327595
33
Agencies
13
11
192
1,128359
35926
3340
769
689
80
2,5471,325
1,2873
1,28438
1,222
1,199
24
5,192
189
264,079
4151,497
836
1,127546
47
166Digitized for FRASER http://fraser.stlouisfed.org/ Federal Reserve Bank of St. Louis

70. Assets and liabilities of U.S., branches and agencies of foreign banks—ContinuedB. June 30, 19831
Millions of dollars
Item
1 Total assets5
2 Cash and due from depositoryinstitutions . . . .
3 Currency and coin (U.S. and foreign) . . .4 Balances with Federal Reserve Banks . . .5 Balances with other central banks6 Demand balances with commercial banks
in United States7 All other balances with depository
institutions in United States and withbanks in foreign countries
8 Time and savings balances withcommercial banks in UnitedStates
9 Balances with other depositoryinstitutions in United States
10 Balances with banks in foreigncountries
11 Foreign branches of U.S. banks . . .12 Other banks in foreign countries . . .13 Cash items in process of collection . . . .
14 Total securities, loans, and leasefinancing receivables
15 Total securities, book value16 U S Treasury17 Obligations of other U.S. government
agencies and corporations18 Obligations of states and political
subdivisions in United States19 Other bonds, notes, debentures, and
corporate stock .
20 Federal funds sold and securities purchasedunder agreements to resell . . . . . .
By holder21 Commercial banks in United States . . . .22 Others
By type23 One-day maturity or continuing contract . .24 Securities purchased under agreements
to resell25 Other . . . .26 Other securities purchased under
agreements to resell
27 Total loans gross . .28 LESS: Unearned income on loans29 EQUALS: Loans, net . . . . . . .
Total
209,069
37,09222
1,16581
1,462
34,274
16,653
74
17,5461,710
15,83688
129,658
7,9405,309
492
82
2,057
7,989
7,175815
7,789
3087,481
201
121,846127
121,718
All states2
Branches3
154,361
33,59920
1,09475
1,251
31,078
14,692
73
16,3121,689
14,62483
96,282
7,1964,914
473
72
1,737
6,713
6,137576
6,514
2216,293
199
89,16883
89,085
Agencies
54,708
3,4932
726
211
3,196
1,961
1
1,23421
1,2135
33,377
744395
19
10
320
1,276
1,038239
1,275
871,189
1
32,67845
32,633
New York
Branches3
133,882
31,07815
93375
1,154
28,825
13,243
73
15,5091,620
13,88977
82,481
6,8664,743
468
48
1,607
6,068
5,546522
5,869
715,798
199
75,69075
75,615
Agencies
9,268
6321
300
119
481
326
I
1548
1461
6,100
393326
2
0
65
670
457213
670
52618
0
5,7147
5,707
Cali-fornia,total4
42,881
3,1882
506
83
3,045
1,920
0
1,12518
1,1073
25,077
38291
16
1
274
586
55333
585
23562
1
24,73337
24,695
Illinois,branches
10,142
1,6192
240
53
1,537
927
1
60959
5503
7,709
256124
0
23
109
471
42744
471
35436
0
7,4585
7,453
Other states2
Branches
7,725
3351
1170
22
192
133
0
590
593
4,213
2923
3
1
1
141
1410
141
11526
0
4,1862
4,184
Agencies
5,171
2401
120
30
195
104
0
916
852
4,076
132
2
9
0
53
503
53
1241
0
4,0652
4,063
167Digitized for FRASER http://fraser.stlouisfed.org/ Federal Reserve Bank of St. Louis
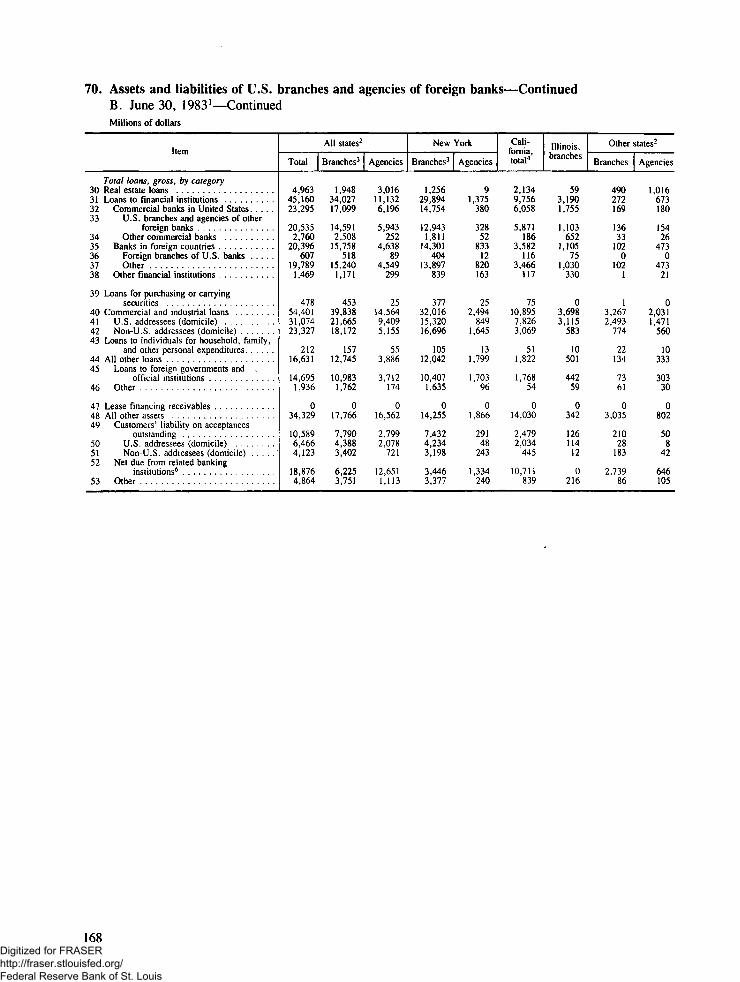
70. Assets and liabilities of U.S. branches and agencies of foreign banks—ContinuedB. June 30, 1983'—ContinuedMillions of dollars
Item
Total loans, gross, by category30 Real estate loans31 Loans to financial institutions . .32 Commercial banks in United States . .33 U.S. branches and agencies of other
foreign banks34 Other commercial banks35 Banks in foreign countries36 Foreign branches of U S banks37 Other38 Other financial institutions
39 Loans for purchasing or carryingsecurities
40 Commercial and industrial loans41 U S addressees (domicile)42 Non-U S addressees (domicile)43 Loans to individuals for household, family,
and other personal expenditures44 All other loans45 Loans to foreign governments and ,
official institutions46 Other
47 Lease financing receivables48 All other assets49 Customers' liability on acceptances
outstanding50 U.S. addressees (domicile)51 Non-U. S. addressees (domicile)52 Net due from related banking
institutions'*53 Other
All states2
Total.
4,96345,16023,295
20,5352,760
20,396607
19,7891,469
47854,40131,07423,327
21216,631
14,6951,936
034,329
10,5896,4664,123
18,8764,864
Branches3
1,94834,02717,099
14,5912,508
15,758518
15,2401,171
45339,83821,66518,172
15712,745
10,9831,762
017,766
7,7904,3883,402
6,2253,751
Agencies
3,01611,1326,196
5,943252
4,63889
4,549299
2514,5649,4095,155
553,886
3,712174
016,562
2,7992,078
721
12,6511,113
New
Branches3
1,25629,89414,754
12,9431,811
14,301404
13,897839
37732,01615,32016,696
10512,042
10,4071,635
014,255
7,4324,2343,198
3,4463,377
York
Agencies
91,375
380
32852
83312
820163
252,494
8491,645
131,799
1,70396
01,866
29148
243
1,334240
Cali-fornia,total4
2,1349,7566,058
5,871186
3,582116
3,466117
7510,8957,8263,069
511,822
1,76854
014,030
2,4792,034
445
10,711839
Illinois,branches
593,1901,755
1,103652
1,10575
1,030330
03,6983,115
583
10501
44259
0342
126114
12
0216
Other states2
Branches
490272169
13633
1020
1021
13,2672,493
774
22134
7361
03,035
21028
183
2,73986
Agencies
1,016673180
15426
4730
47321
02,0311,471
560
10333
30330
0802
508
42
646105
168Digitized for FRASER http://fraser.stlouisfed.org/ Federal Reserve Bank of St. Louis
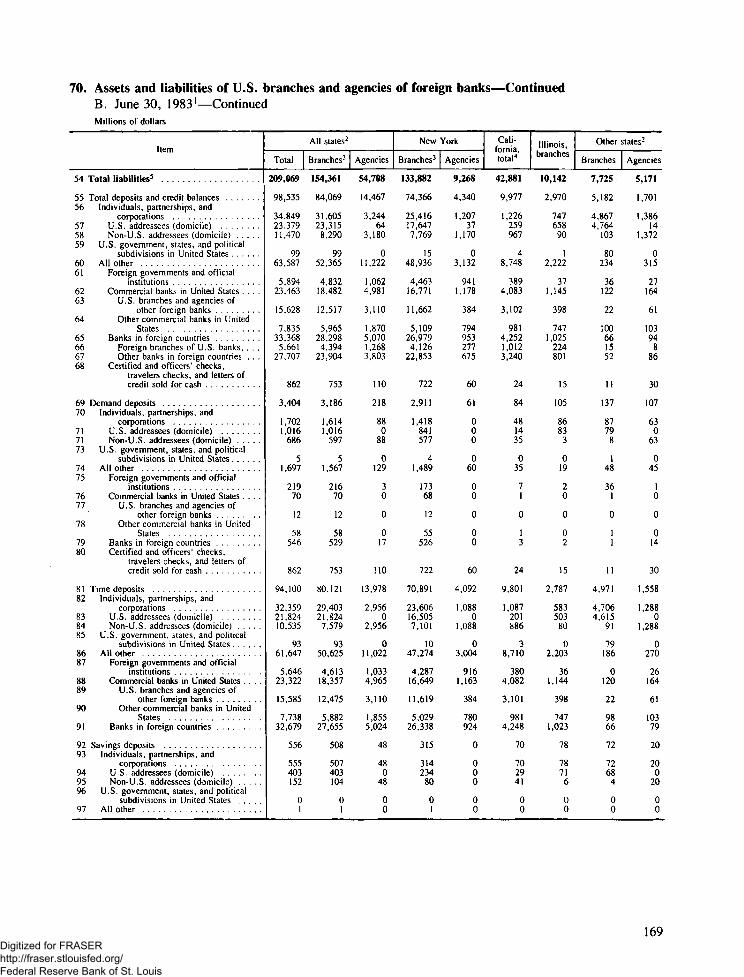
70. Assets and liabilities of U.S. branches and agencies of foreign banks—ContinuedB. June 30, 1983l— ContinuedMillions of dollars
Item
54 Total liabilities5
55 Total deposits and credit balances56 Individuals, partnerships, and
corporations57 U S addressees (domicile) . .58 Non-U.S. addressees (domicile)59 U.S. government, states, and political
subdivisions in United States60 All other61 Foreign governments and official
institutions . . . .62 Commercial banks in United States . . . .63 U.S. branches and agencies of
other foreign banks . . . .64 Other commercial banks in United
States65 Banks in foreign countries . . . .66 Foreign branches of U.S. banks. . . .67 Other banks in foreign countries . . .68 Certified and officers' checks,
travelers checks, and letters ofcredit sold for cash
69 Demand deposits . . . . . . . .70 Individuals, partnerships, and
corporations . .71 U.S. addressees (domicile)71 Non-U S addressees (domicile)73 U.S. government, states, and political
subdivisions in United States74 All other . . . . . . . .75 Foreign governments and official
institutions . .76 Commercial banks in United States . . . .77 U.S. branches and agencies of
other foreign banks78 Other commercial banks in United
States . . . . .79 Banks in foreign countries80 Certified and officers' checks,
travelers checks, and letters ofcredit sold for cash
81 Time deposits82 Individuals, partnerships, and
corporations83 U.S. addressees (domicile)84 Non-U S addressees (domicile) . . .85 U.S. government, states, and political
subdivisions in United States . . .86 All other . . . . . . . .87 Foreign governments and official
institutions88 Commercial banks in United States . . . .89 U.S. branches and agencies of
other foreign banks90 Other commercial banks in United
States91 Banks in foreign countries
92 Savings deposits93 Individuals, partnerships, and
corporations94 U.S. addressees (domicile)95 Non-U.S. addressees (domicile)96 U.S. government, states, and political
subdivisions in United States . . . .97 All other
All states2
Total Branches3
209,069 154,361
98,535 84,069
34,849 31,60523,379 23,31511,470 8,290
99 9963,587 52,365
5,894 " 4,83223,463 18,482
15,628 12,517
7,835 5,96533,368 28,298
5,661 4,39427,707 23,904
862 753
3,404 3,186
1,702 1,6141,016 1,016
686 597
5 51,697 1,567
219 21670 70
12 12
58 58546 529
862 753
94,100 80,121
32,359 29,40321,824 21,82410,535 7,579
93 9361,647 50,625
5,646 4,61323,322 18,357
15,585 12,475
7,738 5,88232,679 27,655
556 508
555 507403 403152 104
0 01 1
Agencies
54,708
14,467
3,24464
3,180
011,222
1,0624,981
3,110
1,8705,0701,2683,803
110
218
880
88
0129
30
0
017
110
13,978
2,9560
2,956
011,022
1,0334,965
3,110
1,8555,024
48
480
48
00
New York
Branches3
133,882
74,366
25,41617,6477,769
1548,936
4,46316,771
11,662
5,10926,9794,126
22,853
722
2,911
1,418841577
41,489
17368
12
55526
722
70,891
23,60616,5057,101
1047,274
4,28716,649
11,619
5,02926,338
315
314234
80
01
Agencies
9,268
4,340
1,20737
1,170
03,132
9411,178
384
794953111675
60
61
000
060
00
0
00
60
4,092
1,0880
1,088
03,004
9161,163
384
780924
0
000
00
Cali-fornia,total4
42,881
9,977
1,226259967
48,748
3894,083
3,102
9814,2521,0123,240
24
84
481435
035
71
0
13
24
9,801
1,087201886
38,710
3804,082
3,101
9814,248
70
702941
00
Illinois,branches
10,142
2,970
74765890
12,222
371,145
398
7471,025
224801
15
105
8683
3
019
20
0
02
15
2,787
583503
80
02,203
361,144
398
7471,023
78
78716
00
Other states2
Branches
7,725
5,182
4,8674,764
103
80234
36122
22
100661552
11
137
8779
8
148
361
0
11
11
4,971
4,7064,615
91
79186
0120
22
9866
72
7268
4
00
Agencies
5,171
1,701
1,38614
1,372
0315
27164
61
10394
886
30
107
630
63
045
10
0
014
30
1,558
1,2880
1,288
0270
26164
61
10379
20
200
20
00
169Digitized for FRASER http://fraser.stlouisfed.org/ Federal Reserve Bank of St. Louis
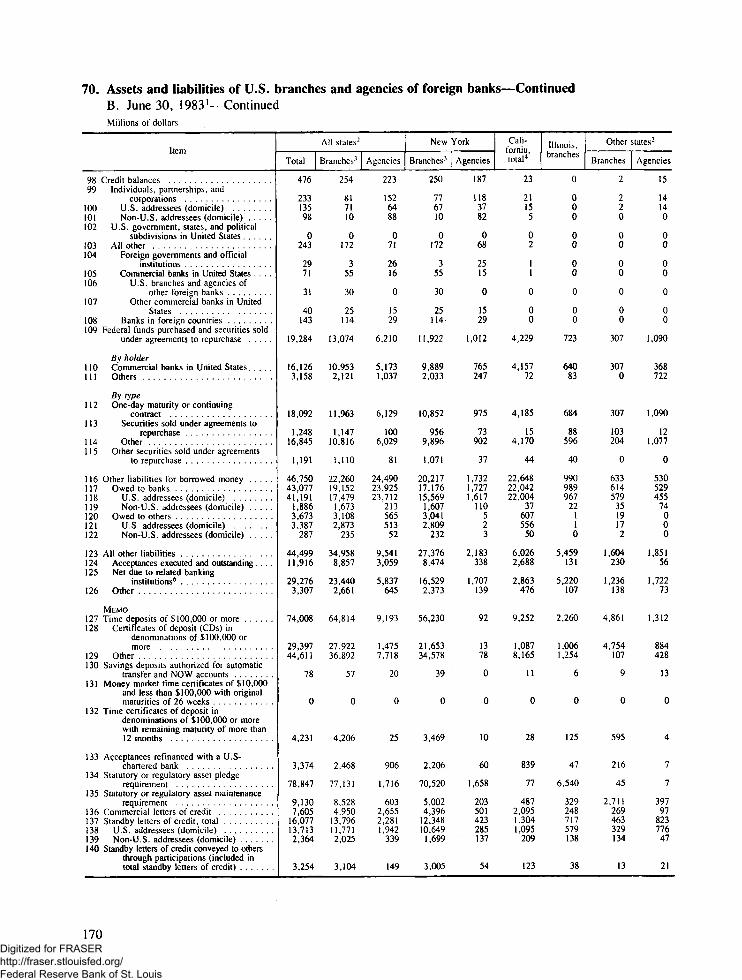
70. Assets and liabilities of U.S. branches and agencies of foreign banks—ContinuedB. June 30, 1983'—ContinuedMillions of dollars
Item
98 Credit balances .99 Individuals, partnerships, and
corporations100 U.S. addressees (domicile)101 Non-U.S. addressees (domicile)102 U.S. government, states, and political
subdivisions in United States103 AH other104 Foreign governments and official
institutions105 Commercial banks in United States . . . .106 U.S. branches and agencies of
other foreign banks107 Other commercial banks in United
States108 Banks in foreign countries109 Federal funds purchased and securities sold
under agreements to repurchase
By holder1 10 Commercial banks in United States1 1 1 Others
By type1 12 One-day maturity or continuing
contract1 1 3 Securities sold under agreements to
repurchase1 14 Other1 15 Other securities sold under agreements
to repurchase
116 Other liabilities for borrowed money117 Owed to banks118 U S addressees (domicile)1 19 Non-U S addressees (domicile) . .1 20 Owed to others121 U S addressees (domicile)122 Non-U.S. addressees (domicile)
123 All other liabilities . . . .1 24 Acceptances executed and outstanding . . . .125 Net due to related banking
institutions^1 26 Other
MEMO127 Time deposits of $100 000 or more . . .128 Certificates of deposit (CDs) in
denominations of $100,000 ormore ,
129 Other130 Savings deposits authorized for automatic
transfer and NOW accounts131 Money market time certificates of $10,000
and less than $100,000 with originalmaturities of 26 weeks
132 Time certificates of deposit indenominations of $100,000 or morewith remaining maturity of more than12 months
133 Acceptances refinanced with a U.S-chartered bank
134 Statutory or regulatory asset pledgerequirement
135 Statutory or regulatory asset maintenancerequirement . .
136 Commercial letters of credit137 Standby letters of credit total . .138 U S addressees (domicile)139 Non-U.S. addressees (domicile)140 Standby letters of credit conveyed to others
through participations (included intotal standby letters of credit)
All states2
Total
476
23313598
0243
2971
31
40143
19,284
16,1263,158
18,092
1,24816,845
1,191
46,75043,07741,191
1,8863,6733,387
287
44,49911,916
29,2763,307
74,008
29,39744,611
78
0
4,231
3,374
78,847
9,1307,605
16,07713,7132,364
3,254
Branches3
254
817110
0172
355
30
25114
13,074
10,9532,121
11,963
1,14710,816
1,110
22,26019,15217,479
1,6733,1082,873
235
34,9588,857
23,4402,661
64,814
27,92236,892
57
0
4,206
2,468
77,131
8,5284,950
13,79611,7712,025
3,104
Agencies
223
1526488
071
2616
0
1529
6,210
5,1731,037
6,129
1006,029
81
24,49023,92523,712
21356551352
9,5413,059
5,837645
9,193
1,4757,718
20
0
25
906
1,716
6032,6552,2811,942
339
149
New
Branches3
250
776710
0172
355
30
25114-
11,922
9,8892,033
10,852
9569,896
1,071
20,21717,17615,569
1,6073,0412,809
232
27,3768,474
16,5292,373
56,230
21,65334,578
39
0
3,469
2,206
70,520
5,0024,396
12,34810,649
1,699
3,005
York
Agencies
187
1183782
068
2515
0
1529
1,012
765247
975
73902
37
1,7321,7271,617
110523
2,183338
1,707139
92
1378
0
0
10
60
1,658
203501423285137
54
Cali-fornia,total4
23
21155
02
11
0
00
4,229
4,15772
4,185
154,170
44
22,64822,04222,004
37607556
50
6,0262,688
2,863476
9,252
1,0878,165
11
0
28
839
77
4872,0951,3041,095
209
123
Illinois,branches
0
000
00
00
0
00
723
64083
684
88596
40
990989967
221
0
5,459131
5,220107
2,260
1,0061,254
6
0
125
47
6,540
329248717579138
38
Other states2
Branches
2
220
00
00
0
00
307
3070
307
103204
0
633614579
3519172
1,604230
1,236138
4,861
4,754107
9
0
595
216
45
2,711269463329134
13
Agencies
15
14140
00
00
0
00
1,090
368722
1,090
121,077
0
530529455
74000
1,85156
1,72273
1,312
884428
13
0
4
7
7
39797
82377647
21
170Digitized for FRASER http://fraser.stlouisfed.org/ Federal Reserve Bank of St. Louis

70. Assets and liabilities of U.S. branches and agencies of foreign banks—ContinuedB. June 30, 1983'—ContinuedMillions of dollars
Item
141 Holdings of commercial paper included intotal gross loans
142 Holdings of acceptances included in totalcommercial and industrial loans
143 Immediately available funds with a maturitygreater than one day (included in otherliabilities for borrowed money) .
144 Gross due from related bankinginstitutions^
145 U S addressees (domicile)146 Branches and agencies in the United
States147 In the same state as reporter . . .148 In other states149 U S banking subsidiaries^150 Non-U.S. addressees (domicile)151 Head office and non-U.S. branches
and agencies152 Non-U.S. banking companies and
offices153 Gross due to related banking institutions6 . .154 U.S. addressees (domicile)155 Branches and agencies in the United
States156 In the same state as reporter157 In other states158 U.S banking subsidiaries^159 Non-U.S. addressees (domicile)160 Head office and non-U.S. branches and
agencies161 Non-U.S. banking companies and
offices
Average for 30 calendar days (or calendarmonth) ending with report date
162 Total assets163 Cash and due from depository
institutions164 Federal funds sold and securities purchased
under agreements to resell . .165 Total loans166 Loans to banks in foreign countries167 Total deposits and credit balances168 Time CDs in denominations of $100,000 or
more169 Federal funds purchased and securities sold
under agreements to repurchase170 Other liabilities for borrowed money
171 Number of reports filed**
All states2
Total 1 Branches3
564 507
4,767 3,503
32,855 13,493
79,668 53,90020,188 9,451
19,840 9,262822 398
19,018 8,864348 189
59,480 44,449
57,065 42,525
2,415 1,92490,068 71,11520,876 14,683
20,502 14,525656 277
19,846 14,248374 158
69,192 56,432
67,235 54,611
1,957 1,821
204,081 149,533
34,668 31,430
5,908 4,387118,958 86,819
19,680 15,04689,437 75,846
29,671 28,237
19,118 12,43344,922 20,984
425 240
Agencies
57
1,264
19,362
25,76810,736
10,578425
10,153158
15,031
14,540
49118,9536,193
5,977379
5,598216
12,760
12,624
136
54,548
3,238
1,52132,1394,634
13,591
1,434
6,68523,938
185
New
Branches3
486
3,377
12,019
47,7565,959
5,771363
5,407188
41,796
39,891
1,90560,8399,409
9,287246
9,042122
51,430
49,704
1,726
130,174
29,106
4,04974,09013,88466,803
21,958
10,91018,919
148
York
Agencies
12
147
1,442
6,1501,439
1,38545
1,34054
4,712
4,697
156,5232,021
1,86830
1,838153
4,502
'4,484
19
8,851
520
1,0135,071
7854,175
13
1,0321,775
40
Cali-fornia,total4
43
1,105
17,997
18,5538,870
8,766361
8,405104
9,682
9,309
37310,7042,976
2,914318
2,59663
7,728
7,617
42,722
3,070
51424,6033,5709,190
1,058
4,71222,074
114
Illinois,branches
7
56
770
2,08669
680
680
2,017
2,013
47,3053,441
3,4350
3,4356
3,864
3,777
87
9,301
1,450
1837,092
8862,421
999
1,0851,122
43
Other states3
Branches
4
62
370
3,7013,323
3,32234
3,2880
379
365
132,1981,577
1,57431
1,5432
622
622
0
7,611
315
1133,967
785,159
4,800
306549
33
Agencies
12
18
258
1,422528
52819
5090
894
790
1042,4981,452
1,42332
1,39129
1,046
1,031
15
5,423
207
364,134
4771,689
842
1,072484
47
171Digitized for FRASER http://fraser.stlouisfed.org/ Federal Reserve Bank of St. Louis
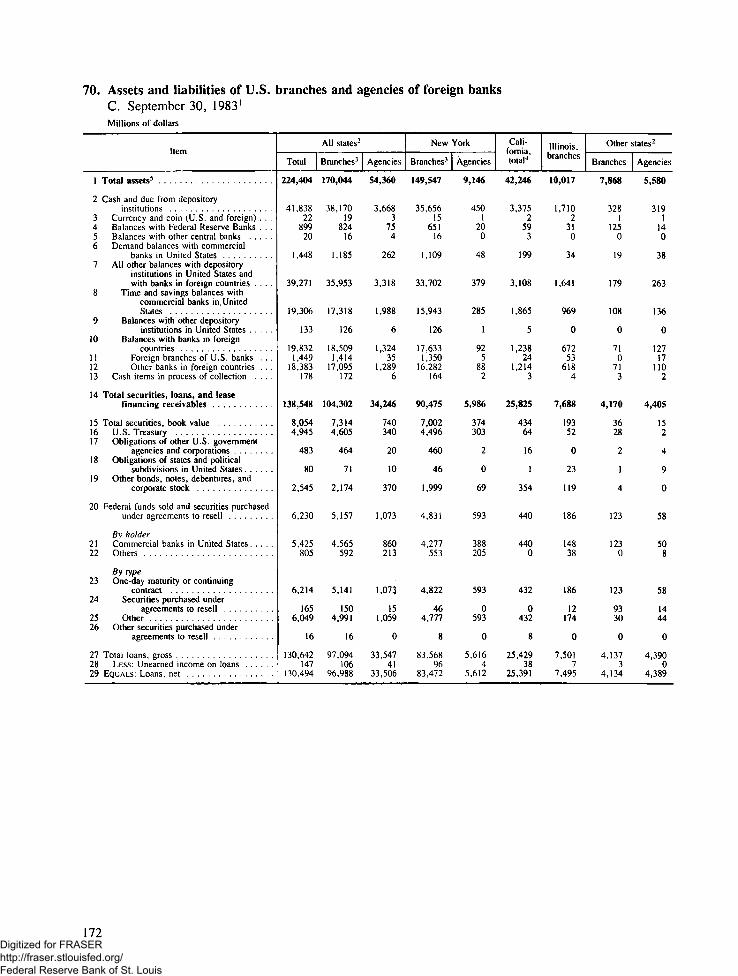
70. Assets and liabilities of U.S. branches and agencies of foreign banksC. September 30, 19831
Millions of dollars
Item
1 Total assets3
2 Cash and due from depositoryinstitutions
3 Currency and coin (U.S. and foreign) . . .4 Balances with Federal Reserve Banks . . .5 Balances with other central banks6 Demand balances with commercial
banks in United States7 All other balances with depository
institutions in United States andwith banks in foreign countries . . . .
8 Time and savings balances withcommercial banks in. UnitedStates
9 Balances with other depositoryinstitutions in United States
10 Balances with banks in foreigncountries . . .
1 1 Foreign branches of U.S. banks . , .12 Other banks in foreign countries . . .13 Cash items in process of collection . . . .
14 Total securities, loans, and leasefinancing receivables
15 Total securities, book value16 U S Treasury17 Obligations of other U.S. government
agencies and corporations18 Obligations of states and political
subdivisions in United States19 Other bonds, notes, debentures, and
corporate stock
20 Federal funds sold and securities purchasedunder agreements to resell
By holder21 Commercial banks in United States. . . .22 Others
By type23 One-day maturity or continuing
contract24 Securities purchased under
agreements to resell25 Other26 Other securities purchased under
agreements to resell . .
27 Total loans gross28 LESS: Unearned income on loans29 EQUALS* Loans net
Total
224,404
41,83822
89920
1,448
39,271
19,306
133
19 8321,449
18,383178
138,548
8,0544945
483
80
2,545
6,230
5 425805
6,214
1656 049
16
1 30 642147
130,494
All states2
Branches-1 Agencies
170,044 54,360
38,170 3,66819 3
824 7516 4
1,185 262
35,953 3,318
17,318 1,988
126 6
18,509 1,3241,414 35
17,095 1,289172 6
104,302 34,246
7,314 7404,605 340
464 20
71 10
2,174 370
5,157 1,073
4 565 860592 213
5,141 1,073
150 154 991 1 059
16 0
97 094 33 547106 41
96 988 33,506
New
Branches3
149,547
35,65615
65116
1,109
33,702
15,943
126
17 6331,350
16,282164
90,475
7,0024496
460
46
1,999
4,831
4 277553
4,822
464 777
8
83 56896
83 472
York
Agencies
9,146
4501
200
48
379
285
1
925
882
5,986
374303
2
0
69
593
388205
593
0593
0
5 6164
5,612
Cali-
total4
42,246
3,3752
593
199
3,108
1,865
5
1,23824
1,2143
25,825
43464
16
1
354
440
440o
432
0432
8
25 42938
25,391
Illinois,branches
10,017
1,7102
31o
34
1,641
969
0
67253
6184
7,688
19352
0
23
119
186
14838
186
12174
o7 501
77,495
Other states2
Branches Agencies
7,868 5,580
328 3191 1
125 140 0
19 38
179 263
108 136
0 0
71 1270 17
71 1103 2
4,170 4,405
36 1528 2
2 4
1 9
4 0
123 58
123 500 8
123 58
93 1430 44
0 0
4 137 4 3903 0
4 134 4 389
172Digitized for FRASER http://fraser.stlouisfed.org/ Federal Reserve Bank of St. Louis

70. Assets and liabilities of U.S. branches and agencies of foreign banks—ContinuedC. September 30, 19831—ContinuedMillions of dollars
Item
Total loans, gross, by category30 Real estate loans31 Loans to financial institutions . . . .32 Commercial banks in United States . . . .33 U.S. branches and agencies of other
foreign banks34 Other commercial banks35 Banks in foreign countries36 Foreign branches of U.S. banks37 Other . . . .38 Other financial institutions
39 Loans for purchasing or carryingsecurities . . . . . . . .
40 Commercial and industrial loans41 U.S. addressees (domicile)42 Non-U.S. addressees (domicile) . . . .43 Loans to individuals for household, family,
and other personal expenditures44 All other loans . . . . . . . .45 Loans to foreign governments and
official institutions46 Other
47 Lease financing receivables . .48 All other assets49 Customers' liability on acceptances
outstanding . . . . .50 U.S. addressees (domicile)51 Non-U.S. addressees (domicile)52 Net due from related banking
institutions6
53 Other . . .
All states2
Total Branches3
4,807 2,04651,286 39,13628,653 21,751
25,672 18,9722,981 2,780
21,011 16,168860 759
20,152 15,4091,622 1,217
912 86756,564 42,04032,401 22,96024,162 19,079
218 17016,854 12,835
15,006 11,1301,849 1,705
1 037,788 22,415
12,515 9,1498,079 5,5074,436 3,642
19,770 8,9325,503 4,334
Agencies
2,76112,1506,902
6,700201
4,843100
4,742405
4414,5249,4415,083
484,019
3,876143
115,373
3,3652,572
793
10,8381,169
New
Branches3
1,30635,26219,750
17,4582,292
14,602666
13,936910
78434,05916,75117,309
11612,041
10,4691,572
118,586
8,7315,3213,410
5,9563,899
York
Agencies
181,407
397
36532
79111
780220
292,334
7621,572
121,815
1,74175
02,118
30835
274
1,564246
Cali-fornia,total4
2,02410,4066,716
6,555162
3,52197
3,424169
8311,0057,6713,334
501,860
1,80852
012,607
2,9912,532
459
8,767850
Illinois,branches
1333,0131,449
1,020429
1,26445
1,219300
03,8043,237
567
9542
49547
0433
18216221
0250
Other states2
Branches
453332217
17443
1143678
1
13,1482,306
842
23180
10476
03,247
21915
204
2,920107
Agencies
873865123
10023
7205
71523
152,2131,675
538
8415
38926
1798
831468
564151
173Digitized for FRASER http://fraser.stlouisfed.org/ Federal Reserve Bank of St. Louis

70. Assets and liabilities of U.S. branches and agencies of foreign banks—ContinuedC. September 30, 1983'—ContinuedMillions of dollars
Item
54 Total liabilities5
55 Total deposits and credit balances . . .56 Individuals, partnerships, and
corporations57 U S addressees (domicile) . . . .58 Non-U.S. addressees (domicile)59 U.S. government, states, and political
subdivisions in United States60 All other . . . .61 Foreign governments and official
institutions62 Commercial banks in United States . . .63 U.S. branches and agencies of
other foreign banks64 Other commercial banks in United
States .65 Banks in foreign countries66 Foreign branches of U.S. banks . . .67 Other banks in foreign countries . . .68 Certified and officers' checks,
travelers checks, and letters ofcredit sold for cash
69 Demand deposits70 Individuals, partnerships, and
corporations . . . .71 U.S. addressees (domicile)72 Non-U S addressees (domicile)73 U.S. government, states, and political
subdivisions in United States74 All other75 Foreign governments and official
institutions76 Commercial banks in United States . . . .77 U.S. branches and agencies of
other foreign banks78 Other commercial banks in United
States79 Banks in foreign countries80 Certified and officers' checks,
travelers checks, and letters ofcredit sold for cash . ,
81 Time deposits82 Individuals, partnerships, and
corporations83 U.S. addressees (domicile)84 Non-U.S. addressees (domicile)85 U.S. government, states, and political
subdivisions in United States86 All other87 Foreign governments and official
institutions . . . . .88 Commercial banks in United States . . . .89 U.S. branches and agencies of
other foreign banks90 Other commercial banks in United
States91 Banks in foreign countries
92 Savings deposits . .93 Individuals, partnerships, and
corporations94 U S addressees (domicile) . .95 Non-U.S. addressees (domicile)96 U.S. government, states, and political
subdivisions in United States97 All other
All states2
Total
224,404
108,013
35,89321,937
3,956
7672,044
4,74728,750
19,645
9,10637,8496,662
31,187
698
3,126
1,6091,021
588
51,513
18644
6
38584
698
103,817
33,45820,40513,053
7170,288
4,53628,620
19,598
9,02137,132
598
597401195
01
Branches-1
170,044
92,654
32,20821,86410,344
7660,370
4,22322,773
15,276
7,49732,789
5,43927,350
585
2,896
1,5141,021
493
51,378
18344
6
38565
585
89,035
30,10320,4059,698
7158,861
4,03222,704
15,265
7,43932,125
540
539401138
01
Agencies
54,360
15,359
3,68573
3,612
01 1 ,674
5245,977
4,368
1,6095,0601,2233,837
113
230
950
95
0135
31
0
119
113
14,782
3,3550
3,355
011,427
5045,916
4,333
1,5835,007
58
580
58
00
New York
Branches5 Agencies
149,547 9,146
83,180 3,955
26,210 1,43016,340 309,870 1,400
10 056,960 2,525
3,788 36021,234 1,087
14,299 383
6,936 70431,379 1,010
5,222 29126,156 719
560 67
2,642 68
1,313 0835 0479 0
4 01,324 68
160 042 0
6 0
36 0563 0
560 67
80,008 3,646
24,497 1,29815,236 09,261 1,298
6 055,506 2,347
3,620 34321,168 1,027
14,288 348
6,880 67930,718 977
350 0
350 0235 0115 0
0 00 0
Cali-fornia,total"
42,246
11,103
1,301278
1,023
39,800
5185,152
4,341
8114,098
9273,171
32
86
491931
037
2.1
0
13
32
10,907
1,144197947
39,761
5155,151
4,341
8104,094
74
743043
00
Ill inois,branches
10,017
3,136
83173299
02,305
321,043
534
5091,214
1971,017
15
113
9491
3
019
20
0
02
15
2,946
66057189
02,285
301,043
534
5081,212
77
7770
7
00
Other states2
Branches
7,868
4,892
4,6324,546
86
63198
2184
33
51872067
6
H I
83775
028
211
0
10
6
4,707
4,4764,401
75
62168
083
33
5085
72
7166
5
01
Agencies
5,580
1,748
1,49112
1,478
0257
27150
55
9562
557
19
106
700
70
036
11
0
116
19
1,603
1,3820
1,382
0221
26149
55
9446
25
250
25
00
174Digitized for FRASER http://fraser.stlouisfed.org/ Federal Reserve Bank of St. Louis

70. Assets and liabilities of U.S. branches and agencies of foreign banks—ContinuedC. September 30, 1983'—ContinuedMillions of dollars
Item
98 Credit balances99 Individuals, partnerships, and
corporations100 U S addressees (domicile)101 Non-U.S. addressees (domicile) . . . . .102 U.S. government, states, and political
subdivisions in United States103 All other104 Foreign governments and officials
institutions105 Commercial banks in United States . . . .106 U.S. branches and agencies of
other foreign banks107 Other commercial banks in United
States108 Banks in foreign countries109 Federal funds purchased and securities sold
under agreements to repurchase
By holder1 10 Commercial banks in United States . . . .1 1 1 Others
By type1 12 One-day maturity or continuing
contract1 13 Securities sold under agreements to
repurchase1 14 Other1 15 Other securities sold under agreements
to repurchase
116 Other liabilities for borrowed money1 1 7 Owed to banks118 U.S. addressees (domicile)119 Non-U.S. addressees (domicile)120 Owed to others121 U.S. addressees (domicile)122 Non-U.S. addressees (domicile)
123 All other liabilities1 24 Acceptances executed and outstanding . . . .125 Net due to related banking
institutions^1 26 Other
MEMO127 Time deposts of $100,000 or more128 Certificates of deposit (CDs) in
denominations of $100,000 ormore
129 Other130 Savings deposits authorized for automatic
transfer and NOW accounts131 Money market time certificates of $10,000
and less than $100,000 with originalmaturities of 26 weeks
1 32 Time certificates of deposit indenominations of $100,000 or morewith remaining maturity of more than12 months
133 Acceptances refinanced with a U.S.-chartered bank
134 Statutory or regulatory asset pledgerequirement
135 Statutory or regulatory asset maintenancerequirement
136 Commercial letters of credit137 Standby letters of credit, total138 U.S. addressees (domicile)139 Non-U.S. addressees (domicile)140 Standby letters of credit conveyed to others
through participations (included intotal standby letters of credit)
All states2
Total
473
230110120
0243
2586
40
46131
19,809
16,7183,092
18,616
1,58717,028
1,193
48,69045,33143,349
1,9813,3603,135
225
47,89113,949
30,4073,535
80,122
28,11152,011
77
0
4,983
3,411
64,987
8,5948,236
14,36611,7142,652
2,517
Branches3
182
523715
0130
825
5
2098
14,274
1 1 ,4742,800
13,156
1,48511,671
1,118
26,29223,38221,716
1,6662,9102,774
136
36,82410,223
23,7492,851
70,037
26,36243,675
54
0
4,953
2,577
63,921
8,2265,365
12,0699,7092,359
2,378
Agencies
290
17873
105
0112
1861
35
2634
5,535
5,244291
5,459
1035,357
75
22,39821,94821,633
315450361
89
11,0683,726
6,658684
10,085
1,7488,336
23
0
30
835
1,065
3692,8712,2972,005
292
140
New York
Branches3
179
493415
0130
725
5
2098
13,362
10,6582,704
12,332
1,2391 1 ,092
1,030
24,37221,49919,8981,6012,8732,739
134
28,6339,790
16,3122,532
61,575
20,47741,099
35
0
4,186
2,249
57,141
4,9404,797
10,5398,5152,023
2,254
Agencies
241
13130
101
0110
1760
35
2533
974
760213
942
75867
32
2,5512,5092,266
24341
834
1,667386
1,133148
317
173144
0
0
10
131
1,005
13597502373129
72
Cali-fornia,total4
35
34322
02
10
0
00
4,410
4,33872
4,367
284,339
43
19,43318,99418,963
3243938257
7,3003,268
3,531502
9,849
1,0298,820
15
0
38
704
100
5132,0811,3381,149
188
112
Illinois,branches
0
000
00
00
0
00
544
48855
455
158297
88
85285182923000
5,486185
5,197103
2,502
9881,514
7
0
146
46
6,715
358250693547145
49
Other states2
Branches
2
220
00
00
0
00
284
24341
284
87196
0
68467863939650
2,008232
1,597178
4,621
4,56061
8
0
594
281
16
2,417279539405134
11
Agencies
15
14122
01
00
0
00
236
2306
236
0236
0
79879875444000
2,79788
2,63772
1,258
884374
12
0
8
0
10
35223175672532
20
175Digitized for FRASER http://fraser.stlouisfed.org/ Federal Reserve Bank of St. Louis

70. Assets and liabilities of U.S. branches and agencies of foreign banks—ContinuedC. September 30, 1983'—ContinuedMillions of dollars
Item
141 Holdings of commercial paper included intotal gross loans
142 Holdings of acceptances included in totalcommercial and industrial loans
143 Immediately available funds with a maturitygreater than one day (included in otherliabilities for borrowed money)
144 Gross due from related bankinginstitutions6
145 U S addressees (domicile)146 Branches and agencies in the United
States147 In the same state as reporter . . . . . .148 In other states149 U.S. banking subsidiaries7
150 Non-U.S. addressees (domicile)151 Head office and non-U.S. branches
and agencies152 Non-U.S. banking companies and
offices
153 Gross due to related banking institutions6 . .154 U.S. addressees (domicile)155 Branches and agencies in the United
States156 In the same state as reporter157 In other states158 U.S. banking subsidiaries7
159 Non-U S addressees (domicile)160 Head office and non-U.S. branches
and agencies161 Non-U.S. banking companies and
offices . .
Average for 30 calendar days (or calendarmonth) ending with report date
162 Total assets163 Cash and due from depository
institutions164 Federal funds sold and securities purchased
under agreements to resell . . .165 Total loans166 Loans to banks in foreign countries167 Total deposits and credit balances168 Time CDs in denominations of $100,000
or more169 Federal funds purchased and securities sold
under agreements to repurchase170 Other liabilities for borrowed money
171 Number of reports filed8
Total
608
4 776
35,170
86 94421 635
21,183751
20432452
65,309
62 741
2 568
97,58121,355
20,985711
20 274370
76 226
74,150
2,076
235 059
37,560
5,964125,92020 971
101,429
27 249
19,37347,509
434
All states2
Branches1
546
3 821
17,672
61 52710 998
10,745375
10 370253
50,530
48,355
2 175
76,34412,835
12,570361
12 210265
63 509
61,620
1,889
163 903
34,169
4 41092,53215 98886,240
25 573
13,53824,526
249
Agencies
62
955
17,498
25 41710 637
10,438376
10 062199
14,780
14 387
393
21,2378,520
8,415350
8 064105
12 717
12,530
187
71 156
3,391
1 55433,3884 984
15,189
1 676
5,83522,984
185
New
Branches-1
509
3 629
16,285
54 2217 215
6,969329
6 640246
47,006
44932
2 074
64,5776,450
6,245314
5 931205
58 127
56,332
1,794
143 213
31,737
4 14979,02414 35776,675
19 398
11,87722,541
155
York
Agencies
120
1,977
69601,570
1,50787
1,42063
5,390
5,373
17
6,5302,519
2,48991
2,39830
4,011
3,949
62
25,043
531
1 ,0065,296
8654,266
139
8772,341
40
Cali-
total4
33
840
15,352
17 3218 635
8,496275
8,220140
8,685
8,406
279
12,0853,886
3,814249
3,56472
8,199
8,091
108
42,837
2,992
49925,4543,608
10,566
934
4,99520,105
115
Illinois,branches
32
57
711
3 235186
1850
185]
3,049
2,956
93
8,4334,138
4,1200
4,12018
4,295
4,201
93
9,956
1,663
1527,5281,3172,952
976
1,103920
43
Other states2
Branches Agencies
1 22
122 8
392 453
3 774 1 4333 473 555
3 473 55321 39
3453 5140 2
301 878
293 780
8 98
2,452 3,5061,900 2,462
1,889 2,42918 39
1,870 239012 33
551 1 044
551 1,026
0 19
8 172 5 839
336 301
100 584,172 4,446
116 7095,277 1,693
4,948 854
283 238683 918
33 48
176Digitized for FRASER http://fraser.stlouisfed.org/ Federal Reserve Bank of St. Louis

70. Assets and liabilities of U.S. branches and agencies of foreign banksD. December 31, 19831
Millions of dollars
Item
1 Total assets5 . . . . . . . . .
2 Cash and due from depository institutions . . .3 Currency and coin (U.S. and foreign)4 Balances with Federal Reserve Banks . . .5 Balances with other central banks6 Demand balances with commercial
banks in United States &7 All other balances with depository
institutions in United States andwith banks in foreign countries . . . .
8 Time and savings balances withcommercial banks in UnitedStates . . . .
9 Balances with other depositoryinstitutions in United States
10 Balances with banks in foreigncountries
1 1 Foreign branches of U.S. banks . . .12 Other banks in foreign countries . . .1 3 Cash items in process of collection . . . .
14 Total securities, loans, and leasefinancing receivables
15 Total securities, book value16 U S Treasury17 Obligations of other U.S. government
agencies and corporations18 Obligations of states and political
subdivisions in United States19 Other bonds, notes, debentures, and
corporate stock
20 Federal funds sold and securities purchasedunder agreements to resell . .
By holder21 Commercial banks in United States22 Others
By type23 One-day maturity or continuing
contract24 Securities purchased under agreement
to resell . . ,25 Other26 Other securities purchased under
agreements to resell . . .
27 Total loans, gross28 LESS: Unearned income on loans29 EQUALS* Loans net
All states2
Total
228,417
40,96724
92820
1,489
38,260
18,592
161
19,5071,166
18,340248
137,721
8,8535,232
514
76
3,031
9,051
8,229822
8,871
1938,678
179
129,144276
128,868
Branches3
176,063
37,23921
86117
1,244
34,852
16,561
157
18,1351,129
17,005244
104,523
8,3085,155
493
67
2,594
7,517
6,929588
7,338
1327,206
179
96,439224
96,215
Agencies
52,354
3,7283
673
245
3,407
2,032
4
1,37237
1,3354
33,198
54577
21
10
436
1,534
1,299235
1,534
611,472
0
32,70552
32,653
New
Branches3
155,045
34,70317
71111
1,121
32,609
15,209
156
17,2441,064
16,180235
90,694
7,9815,039
484
43
2,415
6,984
6,397588
6,805
846,721
179
82,927214
82,713
York
Agencies
7,255
6331
200
84
527
360
0
16710
1571
5,182
7543
2
0
30
721
495226
721
27694
0
5,1147
5,107
Cali-fornia,total4
41,786
3,2761
493
140
3,079
1,755
0
1,32311
1,3124
25,182
54156
16
1
469
757
7570
757
15742
0
24,68645
24,640
Illinois,branches
10,465
1,7202
306
62
1,616
1,009
1
60744
5634
7,793
20770
5
23
109
396
3960
396
8388
0
7,5947
7,586
Other states2
Branches
7,988
3691
1030
39
223
160
0
622240
3
4,185
3224
2
1
4
100
1000
100
4060
0
4,1552
4,153
Agencies
5,878
2661
140
43
206
99
4
1031688
1
4,685
170
5
9
3
93
849
93
2073
0
4,6681
4,668
177Digitized for FRASER http://fraser.stlouisfed.org/ Federal Reserve Bank of St. Louis

70. Assets and liabilities of U*S* branches and agencies of foreign banks—ContinuedD. December 31, 19831—ContinuedMillions of dollars
Item
Total loans, gross, by category30 Real estate loans . .31 Loans to financial institutions32 Commercial banks in United States . . . .33 U.S. branches and agencies of other
foreign banks34 Other commercial banks35 Banks in foreign countries36 Foreign branches of U S banks37 Other38 Other financial institutions
39 Loans for purchasing or carryingsecurities
40 Commercial and industrial loans . .41 U S addressees (domicile)42 Non-U.S. addressees (domicile)43 Loans to individuals for household, family,
and other personal expenditures . .44 All other loans . . . .45 Loans to foreign governments and official
institutions . . .46 Other
47 Lease financing receivables48 AH other assets49 Customers' liability on acceptances
outstanding . . .50 U S addressees (domicile)51 Non-U S addressees (domicile)52 Net due from related banking
institutions6
53 Other
All states2
Total
5,26648,18125,000
22,0892,912
20,758676
20,0822,423
1,38756,39532,78223,612
21917,696
15,9531,743
040,678
13,2638,7634,500
21,6865,729
Branches3
2,19836,88418,709
16,0662,643
16,052538
15,5142,123
1,38042,31823,821
719,498
18613,473
11,8691,604
026,784
10,2346,3133,921
12,0014,549
Agencies
3,06711,2976,292
6,023269
4,705138
4,567300
714,0768,9615,115
344,224
4,084140
013,894
3,0292,451
579
9,6851,180
New
Branches3
1,45732,84516,476
14,1742,303
14,691473
14,2181,678
1,29534,53317,59416,939
13212,665
11,1621,502
022,664
9,7596,0033,755
8,7854,120
York
Agencies
161,299
406
34660
72112
709171
62,015
4191,596
21,776
1,71264
0720
886
82
435196
Cali-fornia,total4
2,1779,7536,149
5,983166
3,497138
3,359107
8510,6727,6013,072
331,965
1,90659
012,571
2,8382,418
420
8,836897
Illinois,branches
1453,0751,577
1,272305
1,06043
1,017438
03,8063,254
552
9560
51941
0556
298283
15
3256
Other states2
Branches
447419258
23622
16010
1501
13,0922,226
866
35161
11149
03,334
17525
151
3,06395
Agencies
1,024790134
7856
6270
62728
02,2761,689
588
9569
54227
0834
1052977
564165
178Digitized for FRASER http://fraser.stlouisfed.org/ Federal Reserve Bank of St. Louis

70. Assets and liabilities of U.S. branches and agencies of foreign banks—ContinuedD. December 31, 1983'—ContinuedMillions of dollars
Item
54 Total liabilities3
55 Total deposits and credit balances56 Individuals, partnerships,
and corporations57 U.S. addressees (domicile)58 Non-U.S. addressees (domicile)59 U.S. government, states, and political
subdivisions in United States60 All other61 Foreign governments and official
institutions62 Commercial banks in United States . .63 U.S. branches and agencies of
other foreign banks64 Other commercial banks in United
States65 Banks in foreign countries66 Foreign branches of U.S. banks . . .67 Other banks in foreign countries . . .68 Certified and officers' checks,
travelers checks, and letters ofcredit sold for cash
69 Demand deposits70 Individuals, partnerships, and
corporations .71 U.S addressees (domicile)72 Non-U.S. addressees (domicile)73 U.S. government, states, and political
subdivisions in United States74 AH other75 Foreign governments and official
institutions76 Commercial banks in United States . . . .77 U.S. branches and agencies of
other foreign banks78 Other commercial banks in United
States79 Banks in foreign countries80 Certified and officers' checks,
travelers checks, and letters ofcredit sold for cash . ,
81 Time deposits82 Individuals, partnerships, and
corporations83 U.S. addressees (domicile)84 Non-U.S. addressees (domicile)85 U.S. government, states, and political
subdivisions in United States86 All other87 Foreign governments and official
institutions88 Commercial banks in United States . . . .89 U.S. branches and agencies of
other foreign banks90 Other commercial banks in United
States . . . .91 Banks in foreign countries
92 Savings deposits93 Individuals, partnerships, and
corporations94 U S addressees (domicile)95 Non-U.S. addressees (domicile)96 U.S. government, states, and political
subdivisions in United States97 All other
All states2
Total
228,417
112,381
37,82623,23614,590
6874,487
5,33127,962
18,919
9,04340,4246.396
34,027
770
3,691
1,7871,032
755
91,896
280180
17
163665
770
107,639
35,12921,65613,472
5872,452
5,02227,768
18,896
8,87239,661
660
658413246
01
Branches3
176,063
97,900
35,26323,17212,092
6762,569
4,81922,223
14,718
7,50534,8195,035
29,784
709
3,501
1,6891,032
657
91,803
277179
17
162638
709
93,590
32,85921,65611,203
5860,673
4,53122,037
14,700
7,33734,105
598
596413184
0
Agencies
52,354
14,481
2,56364
2,499
011,918
5125,740
4,201
1,5395,6051,3624,243
62
190
970
97
093
32
0
126
62
14,049
2,2700
2,270
011,780
4925,731
4,196
1,5365,557
62
620
62
00
New
Branches3
155,045
88,422
29,32117,74611,574
2159,080
4,51420,840
13,758
7,08233,0444,696
28,348
683
3,203
1,447806640
81,748
254176
17
159635
683
84,614
27,36016,63510,724
1357,240
4,24920,657
13,741
6,91732,334
398
397236162
01
York
Agencies
7,255
2,411
991980
02,312
371942
361
581975283691
24
24
000
024
00
0
00
24
2,258
140
14
02,244
354936
356
581954
0
000
00
Cali-fornia,total4
41,786
11,652
1,446325
1,121
410,203
3755,060
4,167
8924,7431,0843,659
25
80
502128
030
21
0
12
25
11,475
1,302256
1,047
310,170
3725,057
4,167
8904,740
74
743142
00
Illinois,branches
10,465
3,255
932787145
02,323
13888
540
3481,410
3101,100
12
148
131127
4
017
30
0
02
12
3,030
724588137
02,306
10888
540
3481,408
77
77734
00
Other states2
Branches
7,988
4,743
4,4204,330
91
42280
20115
41
74135
19116
10
118
8478
7
\33
202
0
21
10
4,545
4,2574,178
80
42246
0113
41
72133
78
77734
00
Agencies
5,878
1,898
1,60728
1,579
0290
38118
52
66118
5114
16
118
750
75
043
21
0
124
16
1,717
1,4710
1,471
0246
36116
52
6593
33
330
33
00
179Digitized for FRASER http://fraser.stlouisfed.org/ Federal Reserve Bank of St. Louis

70. Assets and liabilities of U.S. branches and agencies of foreign banks—ContinuedD. December 31, 1983l—ContinuedMillions of dollars
Item
98 Credit balances99 Individuals, partnerships, and
corporations . . . . . .100 U.S. addressees (domicile)101 Non-U.S. addressees (domicile)102 U.S. government, states, and political
subdivisions in United States103 All other104 Foreign governments and official
institutions . .105 Commercial banks in United States . . . .106 U.S. branches and agencies of
other foreign banks107 Other commercial banks in United
States108 Banks in foreign countries109 Federal funds purchased and securities sold
under agreements to repurchase
By holder1 10 Commercial banks in United States . . . .1 1 1 Others
By type1 12 One-day maturity or continuing
contract . . . . . . . .1 13 Securities sold under agreements to
repurchase . . .114 Other1 15 Other securities sold under agreements
to repurchase . .
1 16 Other liabilities for borrowed money1 17 Owed to banks . . .118 U S addressees (domicile)1 19 Non-U S addressees (domicile)120 Owed to others121 U.S. addressees (domicile)122 Non-U.S. addressees (domicile)
123 All other liabilities . . .124 Acceptances executed and outstanding. . . .125 Net due to related banking
institutions6 . . .1 26 Other
MEMO127 Time deposits of $100 000 or more128 Certificates of deposit (CDs) in
denominations of $100,000or more
129 Other130 Savings deposits authorized for automatic
transfer and NOW accounts131 Money market time certificates of $10,000
and less than $100,000 with originalmaturities of 26 weeks
132 Time certificates of deposit indenominations of $100,000 or morewith remaining maturity of more than12 months . . . .
133 Acceptances refinanced with a U.S.-chartered bank
134 Statutory or regulatory asset pledgerequirement
135 Statutory or regulatory asset maintenancerequirement
136 Commercial letters of credit137 Standby letters of credit, total138 U.S. addressees (domicile)139 Non-U.S. addressees (domicile) .140 Standby letters of credit conveyed to others
through participations (included intotal standby letters of credit)
All states2
Total
390
253135118
0138
2813
6
896
16,866
13,9292,937
15,998
1,80914,188
869
48,85245,25442,746
2,5083,5973,200
398
50,31915,002
31,6463,670
81,491
31,58649,905
75
0
6,889
4,037
59,312
9,4997,288
14,54812,0662,482
2,976
Branches3
211
1197148
092
117
1
674
12,250
9,6462,604
11,499
1,7889,711
752
27,45824,25521,884
2,3713,2032,894
309
38,45611,524
23,8913,041
70,124
29,93140,193
49
0
6,835
2,860
58,827
9,0214,771
12,26910,0422,227
2,786
Agencies
180
1346470
046
176
5
122
4,616
4,283333
4,499
224,477
117
21,39421,00020,862
137394306
88
11,8633,478
7,755630
11,366
1,6549,712
27
0
54
1,177
485
4782,5172,2792,024
255
190
New York
Branches3 Agenc
Cali- niinles 3' bran
ois, Other
chesBranches
208 128 23 0 2
117 85 20 0 269 19 17 0 24 8 6 6 3 0 0
0 0 0 0 09 1 4 3 3 0 0
11 16 1 0 06 6 2 0 0
1 5 0 0 0
5 1 2 0 07 4 2 1 0 0 0
11,029 682 4,043 714 306
8,552 476 3,936 603 3062,477 206 107 112 0
10,300 608 3,999 692 306
1,537 11 11 134 1178,763 598 3,989 558 190
729 73 44 23 0
25,454 2,606 18,545 933 69822,314 2,549 18,166 933 67720,006 2,493 18,135 910 640
2,307 56 32 23 373,140 57 379 0 212,858 9 312 0 20
282 48 67 0 1
30,140 1,557 7,545 5,563 2,24111,044 155 3,212 298 180
16,322 1,289 3,834 5,127 1,9762,774 113 499 138 86
61,868 264 11,201 2,445 4,448
24,043 11 1,299 983 4,33937,825 253 9,902 1,462 109
28 0 15 7 9
0 0 0 0 0
5,966 1 82 175 626
2,450 104 1,072 64 346
51,768 424 107 6,985 18
5,561 67 528 370 2,5654,255 295 2,049 196 290
10,480 157 1,545 889 5218,611 65 1,366 707 4141,869 91 179 182 107
2,639 0 155 36 11
states'
Agencies
29
2828
1
01
00
0
01
92
5636
92
092
0
616616562
54000
3,272113
3,09861
1,264
910354
17
0
40
11
40820495690253
135
180Digitized for FRASER http://fraser.stlouisfed.org/ Federal Reserve Bank of St. Louis

70. Assets and liabilities of U.S. branches and agencies of foreign banks—ContinuedD. December 31, 1983l— ContinuedMillions of dollars
Item
141 Holdings of commercial paper included intotal gross loans . . . .
142 Holdings of acceptances included in totalcommercial and industrial loans
143 Immediately available funds with a maturitygreater than one day (included in otherliabilities for borrowed money)
144 Gross due from related bankinginstitutions^
145 U S addressees (domicile)146 Branches and agencies in the United
States147 In the same state as reporter148 In other states149 U.S. banking subsidiaries7
150 Non-U.S. addressees (domicile)151 Head office and non-U.S. branches
and agencies152 Non-U.S. banking companies and
offices . . . . .
153 Gross due to related banking institutions6 . . .154 U.S. addressees (domicile)155 Branches and agencies in the United
States . . .156 In the same state as reporter157 In other states158 U S banking subsidiaries7
159 Non-U.S. addressees (domicile)160 Head office and non-U.S. branches
and agencies161 Non-U.S. banking companies and
offices .
Average for 30 calendar days (or calendarmonth) ending with report date
162 Total assets163 Cash and due from depository institutions . . .164 Federal funds sold and securities purchased
under agreements to resell165 Total loans166 Loans to banks in foreign countries167 Total deposits and credit balances168 Time CDs in denominations of $100,000
or more169 Federal funds purchased and securities sold
under agreements to repurchase170 Other liabilities for borrowed money
171 Number of reports filed8 .
All states2
Total
556
5,237
33,833
90,22323,107
22,5761,172
21,404531
67,116
64,839
2,277
100,18323,236
22,900969
21,931336
76,947
74,644
2,304
399,12139,158
7,938127,13920,439
107,046
30,239
18,15946,573
437
Branches3
526
4,205
17,390
71,52514,796
14,525823
13,701271
56,730
54,769
1,961
83,41616,802
16,541599
15,942261
66,614
64,687
1,928
346,49135,431
6,49295,26215,79992,195
28,592
13,51825,742
260
Agencies
30
1,032
16,443
18,6978,311
8,051349
7,703260
10,386
10,070
316
16,7676,434
6,359370
5,98976
10,333
9,957
376
52,6293,727
1,44731,8774,641
14,851
1,646
4,64020,831
177
New
Branches3
462
3,953
15,940
64,34210,881
10,617782
9,835264
53,462
51,511
1,951
71,88010,482
10,359560
9,798124
61,397
59,556
1,842
326,16033,093
6,22082,06214,29283,003
22,679
12,45223,959
167
York
Agencies
0
70
2,146
1,48181
798
713
1,400
1,399
1
2,335375
3726
3663
1,960
1,817
144
7,023610
6864,725
7122,416
11
6022,424
32
Cali-fornia,total4
19
974
14,392
16,2817,849
7,591348
7,243258
8,432
8,209
223
11,2793,380
3,333347
2,98648
7,899
7,696
203
42,2793,238
71824,298
3,65212,015
1,263
4,10518,200
114
Illinois,branches
64
66
763
2,513182
1760
1766
2,331
2,322
8
7,6373,444
3,3270
3,327116
4,193
4,108
85
9,8701,564
1707,3151,0372,918
880
604813
43
Other states2
Branches
1
165
431
4,2103,566
3,56620
3,5461
644
642
2
3,1232,533
2,52018
2,50213
590
590
0
7,902312
764,160
1304,829
4,494
306611
32
Agencies
11
8
160
1,395547
54714
5330
847
756
92
3,9293,022
2,98837
2,95133
907
877
30
5,887341
684,579
6161,865
912
88565
49
181Digitized for FRASER http://fraser.stlouisfed.org/ Federal Reserve Bank of St. Louis

71. Claims on foreign countries held by U.S. offices and foreign branches of U.S.-chartered banks1
Billions of dollars, end of period
1 Total
2 G-10 countries and Switzerland3 Belgium— Luxembourg4 France5 Germany .6 Italy7 Netherlands8 Sweden . .9 Switzerland
10 United Kingdom1 1 Canada1 2 Japan
13 Other developed countries14 Austria1 5 Denmark1 6 Finland17 Greece18 Norway1 9 Portugal20 Spain . . .21 Turkey22 Other Western Europe23 South Africa24 Australia
25 OPEC countries2
26 Ecuador27 Venezuela28 Indonesia . . . . . . . . . . . .29 Middle East countries30 African countries
31 Non-OPEC developing countriesLatin America
32 Argentina ,33 Brazil34 Chile35 Colombia36 Mexico37 Peru38 Other Latin America
AsiaChina
39 Mainland40 Taiwan41 India42 Israel43 Korea (South)44 Malaysia45 Philippines46 Thailand47 Other Asia
Africa48 Esvot . . . .49 Morocco50 Zaire51 Other Africa3
52 Eastern Europe .53 U S S R54 Yugoslavia55 Other
56 Offshore banking centers57 Bahamas58 Bermuda . .59 Cayman Islands and other British West Indies60 Netherlands Antilles6 1 Panama4 .62 Lebanon63 Hong Kons64 Singapore65 Other
66 Miscellaneous and unallocated6 . . .
Mar.
419.6
174.513 216.012.5904.04.15.3
70 311.628.5
30.72.12.51.62.93.21.27.21.62.13.33.0
25.42.3
10.02.78.22.2
97.5
10.019.76.02.3
22.91.94.1
.25.1
.51.78.61.75.91.41.2
1.3.7.2
2.3
7.2.4
2.54.3
65.720.2
.712.13.27.2
.212.99.3
.1
18.5
19
June
435.3
176.314.116.512.7904.14.05.1
69411.429.9
32.12.12.61.62,13.21.57.31.52.23.54.0
26.42.4
10.12.88.72.5
103,6
9.621.46.42.6
25.22.54.0
.35.0
.52.28.91.96.31.31.1
1.3.7.2
2.3
6.7.4
2.43.9
72.024.1
.712.33.07.4
.214.39.9
.1
18.4
82
Sept.
438.2
175.413.615.812.29.73.84.75.1
70.311.029.3
32.72.02.51.82.63.41.67.71.52.13.64.0
27.32.3
10.42.99.02.7
104.0
9.222.46.22.8
25.02.64.3
.24.9
.51.99.31.86.01.31.3
1.3.8.1
2.2
6.3.3
2.23.8
72.121.4
.813.63.38.1
.115.09.8
.0
20.3
Dec.
438.6
179.713.117.112.710.33.65.05.0
72.110.430.2
33.71.92.42.23.03.31.57.51.42.33.74.4
27.42.2
10.53.28.72.8
107.0
8.922.96.33.1
24.52.64.0
.25.2
.62.3
10.82.16.31.6
1.2.7.1
2.4
6.2.3
2.23.7
66.819.0
.912.93,37.6
.113.99.1
.0
17.9
Mar.
440.6
182.113 717.113.410 24.34.34.6
72912.429.2
33.92.13.32.12.93.31.47.01.52.23.64.6
28.52.2
10.43.59.33.0
107.6
9.023.16.02.9
25.12.44.2
.25.1
.42.0
10.82.56.61.61.4
.8,1
2.3
5.8.3
2.23.3
66.117.3
1.011.93.17.1
.115.210.3
.0
16.7
19
June
436.5
176.713 317 112.610 5404.74.8
70210.828.7
34.42.13 42.12.93.41.47.21.42.03.94.5
28.22.2
10.43.29.53.0
108.2
9.422.55.83.2
25.22.64.3
.25.1
.52.3
10.82.66.41.81.2
1.3.8.1
2.2
5.7.4
2.33.0
67.319.5
.812.12.66.6
.114.511.0
.0
16.1
83
Sept.
425.5
167.812 616211.69 93 64 94.2
67 090
28.9
34.11.93 31.82.93.21.37.11.52.14.74.4
27.22.19.83.49.02.8
108.8
9.522.96.23.2
25.82.44.2
.25.2
.51.7
10.82.86.21.71.0
1.4.8.1
2.4
5.3.2
2.32.8
65.519.0
.810.24.15.7
.115.110.4
16.8
Dec.
435.7
167 112 416 311 411 73 55 14.3
64 18 3
30.0
3601.93 52 42.83.21 37.21.71.94.75.5
29.12.29.93.8
10.03.1
111 1
9.623.06.53.2
26.12.44.3
.35.3
.61.8
11.32.96.21.91.0
1.4.8.1
2.3
5.4.2
2.42.8
70.221.9
.912.04.16.0
14.910.2
.0
16.8
182Digitized for FRASER http://fraser.stlouisfed.org/ Federal Reserve Bank of St. Louis

72. Discount rates of foreign central banks, 19831
Percent per annum
Month-end Aus-tria
Bel-gium Brazil Can-
adaDen-mark France Ger-
many Italy JapanNeth-
er-lands
Nor-way
Swe-den
Swit-zer
landVene-zuela
January . .February .March . . .April . . . .May . . . .June . . . .JulyAugust . .SeptemberOctober . .NovemberDecember
4.754.753.75
11.511.511.010.09.59.0
9.010.0
49.0 9.819.439.519.469.389.489.519.579.529.459.63
10.010.08.57.5
7.57.07.0
12.3812.5
12T512.25
122512.0
5.05.04.0
18.018.018.017.0
5.5
5 55.05.0
4.54.53.53.54,5
4.'55.0
9.0
9.08.0
9.09.09.08.5
4.54.54.0
3.75 10.0 49.0 10.04 7.0 12.0 4.0 17.0 5.0
13.0
13T011.0
8.0 85 40 11.0
73. Foreign short-term interest rates, 19831
Percent per annum, averages of daily figures
Month
January . . . .FebruaryMarchAprilMayJuneJulyAugustSeptemberOctoberNovemberDecember
Euro-dollars
8.979.149259.238 96966
10.0010 279.829 549 7CJ
10.08
UnitedKingdom
11 0411.29109210.2110 189919.849 839.639 349269.34
Canada
9.879.699.369.399 309.419.429499.359 319.409.83
Germany
5.785.79"5 405.165 275.525.545 665.836 136266.43
Switzer-land
2.782.953.644.204484.984.774.614.394074.114.29
Nether-lands
4.974.824.345.195 655.815.576.026.156076.176.20
France
12.5512.8812 6412.1212 5112 5912.3312 3312.4212 4212 3112.16
Italy
18.9519.0419.1818.2017 7517.7217.5017 5017.4117 5117.7117.75
Belgium
12 2512.2513 3211 0510 049 739.089 259 259 449 88
10.50
Japan
6476636 726 346 266 466476 526686 526 356.45
74. Index of weighted-average value of U.S. dollar1
March 1973 = 100
Year
1983
Jan.
117.73
Feb.
119 70
Mar.
120.71
Apr.
121.82
May
122 05
June
125.16
July
126.62
Aug.
129 77
Sept.
129.74
Oct.
127 50
Nov.
130 26
Dec.
132 84
183Digitized for FRASER http://fraser.stlouisfed.org/ Federal Reserve Bank of St. Louis

75. Foreign exchange rates, 19831
Foreign currency units per dollar
Period
January . . . .FebruaryMarch
Zily
JuneJulyAugustSeptemberOctober . . .NovemberDecember
JanuaryFebruary . . .MarchAprilMayJuneJulyAugustSeptember . .OctoberNovemberDecember . .
JanuaryFebruaryMarchAprilMayJuneJulyAugust . . . .September . .OctoberNovember . . . . . . .December
January . . . .FebruaryMarchAprilMayJune . .JulyAugustSeptemberOctober . . . . . . . .November . .December
Australia2
(dollar)
98.2696.6288 3986.7687.8587 7287.5487.9388 7791 3791.599004
Germany(deutsche
mark)
2.3893242802.41102.43972 4665254902.59142 67362.66792 60322 68462.7500
Mexico(peso)
150.75157 81161.78153.77150.27149.02149 36151.59152.20157 18162.36164 84
Austria(schilling)
16.78317.07616 94017.17617.36817 97418.20818.79918 75418.30518.90019 383
Greece(drachma)
80.76183.62183.89784.03784 10584.48684.67789.21792.83792 9689622998.815
Nether-lands
(guilder)
2.63102.67792.68342.74862.77372.85572.89852.99122.9844292063.00783 0856
Spain(peseta)
126.84129.89133.50135.99137 76143.29147.97151.30152 02151.30154.66158.00
Belgium(franc)
46 88847.73947 51948.57749.23950 92851 86253.60953 8415303454.53855 939
Hong Kong(dollar)
6.52526.60606.65366.78686.96677.28227.16787.44168.00798 09477.81207.8044
NewZealand2
(dollar)
72.9271 89666465.73662565.6665 3865 1065.3266 1665.8565 12
Sri Lanka(rupee)
21 37822.35522 9822297122 97023.05024.08224 25724 39724.41024.57224 767
Brazil(cruzeiro)
262.30309.01401 30434.77465.65517 28571.73643.34701 38784.35870.21943 43
India(rupee)
9.7949.9189.9659.9829990
10.04910.08710 18710.20010 2291037810.490
Norway(krone)
7.04477.11717.18527.14607.11547.26787 32807.46417.42717 32447.469677237
Sweden(krona)
7.32277.43857 48827.49417 49787.63517.69367.85857 87737.78447.920180608
Canada(dollar)
.2287
.2277
.2263
.2325
.22922323
.2323
.2338
.2326
.2320
.23671 2469
Ireland2
(pound)
139.16136.81134.79129.53128.11123.81121.87117.99117.41119 15115.85112.91
Ph lippines(peso)
9.26329.44889.58969.8449
10.015010.393611.050011.0500J 1.050013.750014.050014.0500
Switzer-land
(franc)
1.96792.01802.06632.05872.05722.11232.11842.16322.16232.11222.17012.1983
China(yuan)
1.9238.9653.9834.9938.9895.9949.9966.9843.9867.9664.9940.9920
Israel(shekel)
34.86339.98638.86740.95143.42746.13849.61455.94960.05977.80889.344
100.599
Portugal(escudo)
94.54893.77195.86799.05599.521
107.391119.029123.028124.414124.407127.816131.912
Taiwan(dollar)
39.4238.7839.61
Denmark(krone)
8.41718.5811862238.66638.80039 12879.31429.6308959269.41729.679199530
Italy(lira)
1,374.711,399.781,429.721,452.361 ,467 761,510.981,533.411,589.741,602.621 582 811,625.791,666.88
Singapore(dollar)
2.07682.07582.08542.10102.09202.11982.12942.14162.14172.13502.13342.1317
Thailand(baht)
23.00022.99922.99122.99022.98822.99022.99022.99022.99022.99022.99022.992
Finland(markka)
5 31205.39075 42665.43425.43615 53515.58635.70635 70575.63905.74685 8515
Japan(yen)
232.73236.12238.25237.75234.76240.03240.52244.46242.35232.89235.03234.46
SouthAfrica2
(rand)
93.82491.04391.63891.41992.31491.64991.19089.54789.86288.82184.23382.148
UnitedKingdom2
(pound)
157.56153.29149.00153.61157.22154.80153.73150.26149.86149.69147.66143.38
France(franc)
6 77256.88557 02047 31487.41637 66217 78788.04428 05987 95268.16468 3839
Malaysia(ringgit)
2.28222.27572.28982.30632 30092.32442.33192.35232.3506234512.34502.3407
SouthKorea(won)
749.80752.19757.94765.29767.96775.82779.88787.19790.83791.37796.32799.23
Venezuela(bolivar)
4.29734.31017.95009.0429
10.233311.213612.595015.600013.833313.087512.781612.8343
184Digitized for FRASER http://fraser.stlouisfed.org/ Federal Reserve Bank of St. Louis

Part 2—Special Tables
Digitized for FRASER http://fraser.stlouisfed.org/ Federal Reserve Bank of St. Louis

76. Statement of condition of Federal Reserve Banks, December 31, 19831
Millions of dollars
Item
ASSETS
1 Gold certificateaccount
2 Special drawingrights certificateaccount
3 Coin
4 Loans
5 Acceptances heldunder repurchaseagreement
Federal agencyobligations
6 Bought outright . . . .7 Held under
repurchaseagreement . . . .
U.S, governmentsecurities
8 Bought outright2 . . .9 Held under
repurchaseagreement . . . .
10 Total loans andsecurities
1 1 Cash items in processof collection . . . .
12 Bank premises
Other assets13 Denominated in
foreigncurrencies3 . . . .
14 All other
15 Interdistrict SettlementAccount
16 Total assets
AllReserve BosBanks
11,121
4,618
415
918
418
8,645
208
New Phila-ton York delphia
927 3,058 541
241 1,335 225
20 24 18
14 124 158
418
406 2,831 288
208
150,558 7,062 49,294 5,023
1,384
162,131 7
11,520
547
3,6874,532
1,384
,482 54,259 5,469
405 1,362 374
96 25 50
95 900 162153 1,329 113
707 448 1 46
198,571 10,121 62,740 7,098
Cleve- Rich. A,lan(a cw St.land mono LOUIS
659 913 371 1,504 468
302 408 161 646 170
37 53 42 24 22
29 200 10 95 93
512 718 210 1,191 245
7-
8,920 12,502 3,651 20,748 4,267
9,46 1 1 3 ,420 3 ,87 1 22,034 4,605
314 1,806 1,210 1,054 678
27 105 34 20 16
269 195 295 502 103203 270 100 544 125
-694 -72 35 91 -97
10,578 17,098 6,119 26,419 6,090
golfs' KCkyaS Dallas Fr™-
143 605 750 1,182
61 241 310 518
20 46 28 81
49 53 70 23
106 444 598 1,096
1,843 7,739 10,417 19,092
1,998 8,236 11,085 20,211
469 1,310 1,101 1,437
25 25 18 106
133 170 254 60984 172 933 506
+ 329 - 91 5 _ i ,247 1 ,274
3,262 9,890 13,232 25,924
187Digitized for FRASER http://fraser.stlouisfed.org/ Federal Reserve Bank of St. Louis

76. Statement of condition of Federal Reserve Banks, December 31, 19831-Millions of dollars
-Continued
ItemAll
ReserveBanks
Boston NewYork
Phila-delphia
Cleve-land
Rich-mond Atlanta Chicago St.
LouisMinne-apolis
KansasCity Dallas
SanFran-cisco
LIABILITIES
17 Federal Reservenotes
Deposits18 Reserve accounts4. . .19 U.S. Treasury-
Generalaccount
20 Foreign— Officialaccounts
21 All other
22 Total deposits
23 Deferred-availabilitycash items
24 Other liabilities andaccrueddividends^ .
25 Total liabilities
CAPITAL ACCOUNTS
26 Capital paid in
27 Surplus
28 Other capitalaccounts
29 Total liabilities andcapital accounts . .
157,097
21,446
3,661
191831
26,129
9,957
2,462
19,645
1,465
1,465
198,575
8,961
614
419
637
333
110
10,041
40
40
10,121
49,474
6,228
3,661
77513
10,479
1,215
858
62,026
357
357
62,740
5,856
732
713
752
268
80
6,956
71
71
7,098
8,831
1,094
1123
1,128
275
142
10,376
101
101
10,578
13,762
1,214
840
1,262
1,730
196
16,950
74
74
17,098
3,156
1,559
127
1,578
1,074
67
5,875
122
122
6,119
22,425
2,341
2197
2,459
822
329
26,035
192
192
26,419
4,873
475
415
494
579
64
6,010
40
40
6,090
2,296
394
53
402
431
31
3,160
51
51
3,262
7,589
801
720
828
1,214
123
9,754
68
68
9,890
9,944
1,985
1029
2,024
885
163
13,016
108
108
13,232
19,930
4,009
2552
4,086
1,131
299
25,426
241
241
25,928
188Digitized for FRASER http://fraser.stlouisfed.org/ Federal Reserve Bank of St. Louis
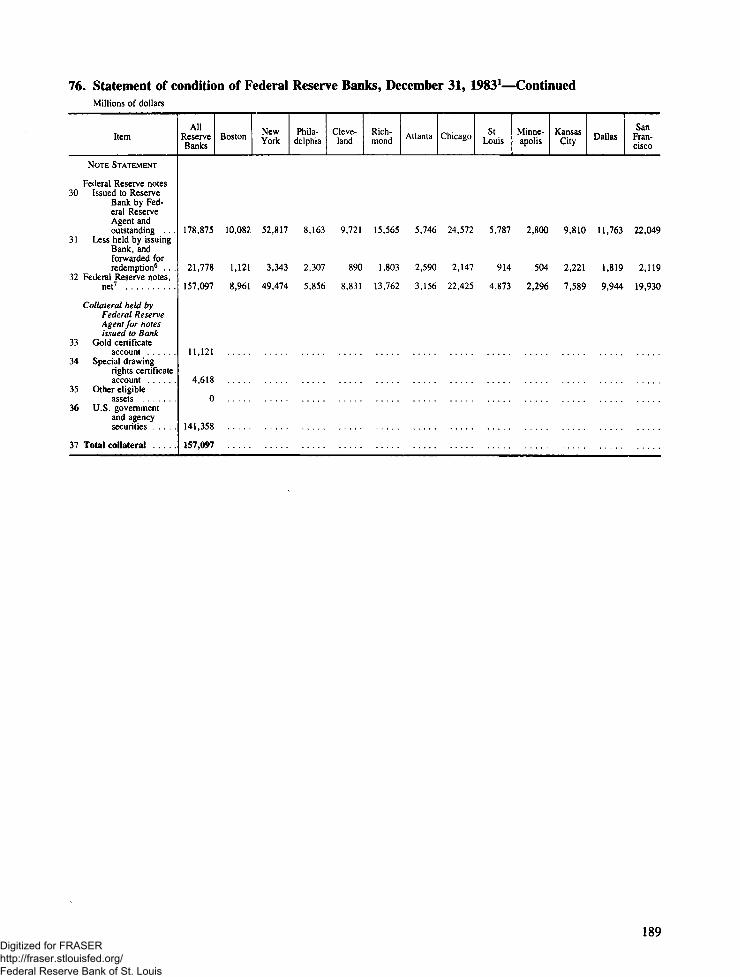
76. Statement of condition of Federal Reserve Banks, December 31, 19831—ContinuedMillions of dollars
ItemAll
ReserveBanks
Boston NewYork
Phila-delphia
Cleve-land
Rich-mond Atlanta Chicago St.
LouisMinne-apolis
KansasCity Dallas
SanFran-cisco
NOTE STATEMENT
Federal Reserve notes30 Issued to Reserve
Bank by Fed-eral ReserveAgent andoutstanding . .
31 Less held by issuingBank, andforwarded forredemption6 . .
32 Federal Reserve notes,net7
Collateral held byFederal ReserveAgent for notesissued to Bank
Gold certificateaccount
Special drawingrights certificateaccount
Other eligibleassets
U.S. governmentand agencysecurities
37 Total collateral
178,875 10,082 52,817 8,163 9,721 15,565 5,746 24,572 5,787 2,800 9,810 11,763 22,049
21,778 1,121 3,343 2,307 890 1,803 2,590 2,147 914 504 2,221 1,819 2,119
157,097 8,961 49,474 5,856 8,831 13,762 3,156 22,425 4,873 2,296 7,589 9,944 19,930
11,121
4,618
141,358
157,097
189Digitized for FRASER http://fraser.stlouisfed.org/ Federal Reserve Bank of St. Louis

77. Income and expenses of Federal Reserve Banks, 1983Dollars
Item
CURRENT INCOME
1 Loans2 Acceptances3 U.S. government securities4 Foreign currencies5 Priced services6 All other
7 Total . .
CURRENT EXPENSES
8 Salaries and other personnel expenses . . .9 Retirement and other benefits
10 Fees11 Travel . .12 Postage and other shipping costs1 3 Communications14 Materials and supplies
Building expenses15 Taxes on real estate16 Property depreciation17 Utilities18 Rent19 Other
Equipment20 Rentals2 1 Depreciation22 Repairs and maintenance23 Cost of earnings credits24 All other25 Shared costs, net1
26 Recoveries27 Expenses capitalized^
28 Total3
29 Reimbursements .30 Net expenses
PROFIT AND Loss
31 Current net incomeAdditions to current net income
32 Profits on sales of U.S. governmentsecurities
33 All other34 Total additions
Deductions from current net income35 Losses on foreign currency
transactions4
36 All other37 Total deductions38 Net additions to or deductions ( - ) from
current net incomeAssessments by Board
39 Board expenditures5
40 Cost of Federal Reserve currency . . . .41 Net income before payments to
U S Treasury42 Dividends paid43 Payments to U.S. Treasury (interest
on Federal Reserve notes)44 Transferred to surplus45 Surplus January 146 Surplus, December 31
Total
132,865,6186,002,058
15,150,174,988273 795 191496,248,128
9,276,134
16,068,362,117
499,601,810141,205,741
12 111,41116,407,03697,068,92020 980 19138,833,832
19,431,51918 938 04021,553,55911,501,30010 954 042
50,254,22239 710 00824,738,99371,759,09128 336 513
0-14,643,515-2601,833
1,100,235,074-76,556,600
1,023,678,474
15,044,683,644
20,985,05235 829 89456 814,946
456,297,385883,484
457,180,869
- 400 465 922
71,551,000152,135,488
14 420,631,23485 151 835
14,228,816,297106,663,100
1,357,449,2001,464,112,300
Boston
1,536,7530
703,948,6437 118 674
27,183,964316,890
740,104,924
30,903,5308,933,801
832 422790,390
4,257,4871,361 7741 ,950,987
3,224,2762,370,0781,965,115
505,036517,171
1,893,5801 716,8411,201,3384,414,4482,211,079
820,444-3,632,591- 107,646
66,129,558-3,715,63662,413,922
677,691,002
974,6251 485
976,110
11,863,7334,838
11,868,571
- 10 892 461
1,861,7008,203,654
656,733,1872,284,502
649,638,9354,809,750
34,953,20039,762,950
New York
35,493,0276,002,058
4,949,240,50366,806 02780,390,8853,408,563
5,141,341,063
107,308,33227,851,445
1 170,0562,179,756
12,817,7014,426,8177,511,411
2,998,5521,800,9524,195,3667,209,3222,286,769
11,348,5737,331,5914,725,9366,144,5554,130,4071,491,075
-1,549,820-4,369
215,374,427-18,588,582196,785,845
4,944,555,217
6,693,69620,850
6,714,546
111,336,562116,615
111,453,177
-104,738,631
17,513,20041,636,586
4,780,666,80020,884,084
4,733,958,86625,823,850
331,612,700357,436,550
Philadelphia
4,912,0310
502,849,58012,046 98917,332,387
242,571
537,383,558
24,637,3427,329,265
504,349729,994
4,231,9431,126,4182,029,739
1,424,5211,514,7771,843,426
40,989885,449
1,411,5861,777,6581,542,6804,059,1031,151,7011,278,289
-1,340,366-3,024
56,175,838-4,790,04451,385,794
485,997,765
699,6102,179
701,788
20,077,08512,783
20,089,868
-19,388,080
3,214,9008,308,678
455,086,1074,024,901
439,879,00611,182,20059,790,65070,972,850
Cleveland
2,378 0470
924,706,07219 987 04930,342,356
286,732
977,700,256
27,530,5308,470,436
657 3501,194,2796,770,4021 5120742,056,739
979,6381,044,3041,439,614
199,299513,535
4,121,7121,612,358
826,1556,514,9922,019,137-335,588-762,771-163,047
66,201,147-5,407,50260,793,645
916,906,611
1,336,30214,243
1,350,545
33,309,70945,472
33,355,181
-32,004,636
5,187,6008,472,971
871,241,4046,018,003
863,002,3522,221,050
99,146,300101,367,350
Richmond
6 448 7280
1,260,483,68014 511 14539 056 539
502,296
1,321,002,388
37,091,51810,946,323
501 5251,325,1308,724,3761 689 1023 654 209
1,642,8563 603 3871,975,577
359,7581,127,544
4,426,6644 433,7502,767,5535,638,6231,683,9291,007,004
-3,011,091-243,776
83,438,165-5,125,51278,312,653
1,242,689,736
1,767,54516,030
1,783,575
24,183,76161,785
24,245,546
-22,461,971
3,728,00011,850,262
1,204,649,5034,336,297
1,197,695,7562,617,450
71,546,60074,164,050
190Digitized for FRASER http://fraser.stlouisfed.org/ Federal Reserve Bank of St. Louis

Atlanta
2,877,1620
371,200,01921,903,61553,407,686
733,097
450,121,579
41,646,37511,633,9394,482,3791,409,8519,374,1922,110,1923,809,246
1,074,265988,938
1,874,560111,942612,938
6,280,9082,449,7022,038,5948,175,3462,481,548
-2,017,646-684,284-179,467
97,673,518-5,822,01491,851,504
358,270,074
525,4294,204
529,633
36,503,791101,695
36,605,485
-36,075,852
5,772,6006,037,702
310,383,9206,865,126
290,842,69512,676,100108,864,850121,540,950
Chicago
6,615,8500
2,096,979,15837,236,14672,017,6051,098,497
2,213,947,256
64,524,45418,485,2031,243,5142,320,39712,249,2532,268,9484,886,229
2,466,379807,063
2,217,5341,830,8621,729,671
7,104,6484,977,3653,351,28919,049,5694,486,156
-3,298,031-1,250,412-616,918
148,833,173-9,566,570139,266,603
2,074,680,653
2,948,5680
2,948,568
62,056,444102,895
62,159,33?
-59,210,771
9,692,70021,140,229
1,984,636,95311,399,351
1,966,025,8537,211,750
184,673,250191,885,000
St. Louis
3,044,0910
452,105,1317,666,26524,693,958
326,068
487,835,513
25,436,2427,647,576538,939730,228
6,185,105811,831
2,446,694
402,701561,887
1,144,244306,748530,781
1,574,0162,151,0381,155,240'3,063,6831,516,7991,375,023-593,280-115,773
56,869,722-4,042,01852,827,704
435,007,81,0
668,10426,283694,387
12,776,32756,609
12,832,936
-12,138,548
1,996,9005,514,625
415,357,7372,344,760
410,970,6272,042,35038,079,65040,122,000
Minneapolis
3,037,1940
186,219,8549,856,62728,590,949
185,342
227,889,966
23,642,1336,155,213511,391894,106
5,119,439992,639
1,625,048
2,158,2131,004,955841,77977,870594,114
2,264,3081,896,474934,802
4,049,2361,541,5101,154,088-176,856-63,619
55,216,843-2,522,50352,694,340
175,195,626
261,8121,858
263,671
16,426,7062,271
16,428,977
-16,165,306
2,560,2003,125,473
153,344,6462,983,463
148,823,9841,537,20048,984,20050,521,400
Kansas City
7,060,6310
755,652,63712,594,57935,813,697
108,909
811,230,453
32,990,5839,334,220523,462
1,373,5187,992,0431,428,8222,998,155
616,0431,042,0651,126,324
61,902628,325
1,884,1473,090,3921,869,0743,346,1811,492,778-639,675-639,156-558,895
69,960,307-4,791,96065,168,347
746,062,106
1,021,33555,362
1,076,697
20,989,680110,767
21,100,446
-20,023,749
3,264,5009,875,675
712,898,1823,901,708
703,007,0245,989,45061,908,45067,897,900
Dallas
50,351,1140
1,036,724,27218,891,86835,139,599
624,058
1,141,730,911
30,217,8088,445,620383,440
1,276,8887,305,4591,245,3702,430,214
699,335791,214
1,301,628738,506561,905
3,112,4693,450,7601,648,8942,579,1992,108,515
-2,410,705-191,689-439,743
65,255,083-3,699,23561,555,848
1,080,175,063
1,432,60811,138
1,443,746
31,484,519136,790
31,621,309
-30,177,563
5,024,20011,827,012
1,033,146,2886,160,847
1,013,593,43813,392,00094,257,600107,649,600
San Francisco
9,110,9900
1,910,065,43945,176,20752,278,5031,443,111
2,018,074,250
53,672,96315,972,700
762,584,2,182,49912,041,5202,006,2043,435,161
1,744,7403,408,4201,628,392
59,066965,840
4,831,6114,822,0792,677,4384,724,1563,512,9541,575,722-811,199= 105,556
119,107,293-8,485,024110,622,269
1,907,451,981
2,655,41835,676,26138,331,680
75,289,068130,965
75,420,033
-37,088,354
11,734,50016,142,621
1,842,486,50613,948,793
1,811,377,76217,159,950
223,631,750240,791,700
Line
123456
7
891011121314
1516171819
2021222324252627
282930
31
323334
353637
38
3940
4142
43444546
191Digitized for FRASER http://fraser.stlouisfed.org/ Federal Reserve Bank of St. Louis

78. Banks and branches—Number in operation, December 31, 1983, by state
State
United States
AlabamaAlaskaArizona .ArkansasCalifornia
Colorado . .ConnecticutDelaware . . .District of
Columbia . . . .Florida
GeorgiaHawaiiIdahoIllinoisIndiana
IowaKansasKentuckyLouisianaMaine
MarylandMassachusetts . . . .MichiganMinnesotaMississippi
MissouriMontanaNebraskaNevadaNew Hampshire . . .
New JerseyNew MexicoNew YorkNorth Carolina . . .North Dakota . . . .
OhioOklahomaOregonPennsylvaniaRhode Island
South Carolina . . .South Dakota . . . .TennesseeTexasUtah
VermontVirginiaWashingtonWest Virginia . . . .Wisconsin
WyomingPuerto RicoVirgin Islands . . . .
Commercial and mutual savings banks
Total
15,397
2731548
262443
55410833
22474
3941926
1,297397
64262433828653
92279374754162
738169482
1588
15294
44071
181
34453291
35623
72146336
1,73363
33191123231612
11210
Commercial .,IV
Total
15,023
2731448
262443
5545132
22474
3941926
1,297393
642624338286
31
89133374754162
738169482
1566
13694
36871
181
34453290
34818
72146336
1,73363
28191114231610
11210
Member
Na-tional
4,753
7765
73134
2081414
18197
5937
402114
10015677609
2566
12420234
12454
1225
30
7943
1082040
159210
7197
5
172969
8807
115523
102123
5000
State
1,053
24044
19
5813
041
904
6441
4022862
44
84344
3847914
126
3804
752318130
525115517
0843
2827
2910
Nonmember sa
In- Non- In_sured in~ , surec
sured2
Number maintaining branches or additional offices '
utualvings
Tntal
Non-in'
sured
8,655 562 277 97 7,516
172 0 0 0 1628 0 1 0 13
29 10 0 0 24182 3 0 0 168254 36 0 0 255
135 153 0 0 11836 0 57 0 10012 3 1 0 13
1 3 0 0 14227 10 0 0 326
325 1 0 0 25711 5 0 0 1515 0 0 0 22
781 50 0 0 531236 2 4 0 297
497 5 0 0 291445 1 0 0 150251 2 0 0 238220 0 0 0 21220 0 22 0 50
60 0 3 0 8056 7 49 97 236
164 2 0 0 320515 3 0 0 248123 1 0 0 134
571 5 0 0 38965 3 0 0 29
343 8 0 0 1038 1 0 0 11
31 1 22 0 69
45 0 16 0 13944 1 0 0 6954 168 72 0 23150 1 0 0 55
133 4 0 0 83
109 1 0 0 248292 7 0 0 161
55 10 1 0 53123 15 8 0 262
10 3 5 0 21
50 0 0 0 5891 1 0 0 51
252 4 0 0 258792 6 0 0 28637 2 0 0 40
16 1 5 0 2950 2 0 0 14674 14 9 0 83
101 0 0 0 93454 6 2 0 271
30 1 0 0 40 0 0 0 00 0 0 0 0
Commercial
Total
7,179
1621324
168255
1184512
14326
2571522
531295
29115023821229
77110320248134
38929
1031151
12469
1625583
24816152
25416
5851
25828640
251467493
271
400
Member
Na-tional
2,418
5363
5947
69137
13133
5326
21496
535766419
2460
1109832
741443
226
7231831926
125806
1395
161262676
949194662
100
State
530
11003
11
610
025
703
2627
176552
44
7164
246213
124
2703
5649
110
49
101310
059
1108
000
Nonmember
In- Non-sured In'
sured
4,205 26
98 07 0
20 1106 0191 6
43 031 05 0
1 0168 0
197 010 313 0
291 0172 0
221 087 0
167 0166 0
18 0
49 046 0
138 1144 098 0
291 09 0
58 08 0
22 0
40 034 040 1236 054 0
67 076 137 0
103 110 1
38 030 0
186 0206 024 0
16 038 054 037 0
201 0
3 00 00 0
Mutualsavings
In- Non-sured In-
sured
258 79
0 00 00 00 00 0
0 055 0
1 0
0 00 0
0 00 00 00 02 0
0 00 00 00 0
21 0
3 047 790 00 00 0
0 00 00 00 0
18 0
15 00 0
69 00 00 0
0 00 01 08 05 0
0 00 00 00 00 0
4 00 09 00 00 0
0 00 00 0
192Digitized for FRASER http://fraser.stlouisfed.org/ Federal Reserve Bank of St. Louis

78. Banks and branches—Number in operation, December 31, 1983, by state—Continued
State
United States
AlabamaAlaskaArizonaArkansasCalifornia
ColoradoConnecticutDelawareDistrict of
ColumbiaFlorida
GeorgiaHawaiiIdahoIllinois . . . .Indiana
IowaKansasKentuckyLouisianaMaine
MarylandMassachusettsMichiganMinnesotaMississippi
MissouriMontanaNebraskaNevadaNew Hampshire
New JerseyNew MexicoNew YorkNorth CarolinaNorth Dakota
OhioOklahomaOregonPennsylvaniaRhode Island
South CarolinaSouth DakotaTennesseeTexasUtah
VermontVirginiaWashingtonWest Virginia . . . . . . . .Wisconsin
WyomingPuerto RicoVirgin Islands
Branches and additional offices1
Class of bank
Total
43,128
702122622429
4,605
1061,014
160
1571,811
976231262653
1,221
530210750879428
1,1251,5082,137
332738
53226
144174250
1,914271
3,8201,790
122
2,270136622
2,851290
795165
1,011299337
2051,496
978115523
3262
18
Commercial banks
Total
40,808
702122623429
4,605
106619155
1571,811
976231262653
1,218
530210750879320
1,0601,0132,137
332738
53224
144174192
1,675271
3,2641,790
122
2,270136616
2,658228
795165
1,011299337
1811,496
867115523
3262
18
Member
Na-tional
21,222
36985
396198
2,860
6130444
1551,137
49911
189276558
10983
293319127
587473968145305
1181164
102101
1,060135
1,912879
32
1,66959
3611,345
113
40910041151
184
48605654
67136
02916
State
4,816
12400
11467
610
076
880
103890
457
623636
10340
5598
17
3864
3810
28520
1,10105
3743
10181
0
819541672
0670
41029
0350
Nonmember
In- Non-sured m'
sured
14,666 104
209 037 0
226 1220 0
1,267 11
39 0314 0111 0
2 0598 0
389 0168 5263 0
339 0570 0
376 0120 0395 0524 0157 0
370 0499 1609 1179 0416 0
376 09 0
76 034 087 0
330 0116 0239 12911 0
85 0
227 072 2
245 01,129 3
105 10
378 046 0
544 2232 0
81 0
133 0221 0209 0
38 0358 0
3 0189 9
2 0
Mutualsavings
In- Non-sured m"
sured
2,088 232
0 00 00 00 00 0
0 0395 0
5 0
0 00 0
0 00 00 00 03 0
0 00 00 00 0
108 0
65 0263 232
0 00 00 0
0 00 00 00 0
58 0
239 00 0
556 00 00 0
0 00 06 0
193 062 0
0 00 00 00 00 0
24 00 0
111 00 00 0
0 00 00 0
Location
Inhead-officecity
13,343
28249
159275606
9520842
157548
3998638
514612
26020747147764
202553852159241
38025
1424471
243181
1,35417840
646131132316
61
12635
549290
57
3324527971
155
300
Outside head-office city
Inhead-officecounty
12,506
2439
188147666
8429
77
0768
2766922
114605
2023
275387159
239851837135157
14701
25126
77480
68211249
9521
92994126
7938
3848
95
62206291
33283
000
Incontig-uouscoun-ties
7,651
2733
1854
933
218022
0169
1323
5320
2
6803
11142
37475
42536
161
411
2550
4457
873289
32
2992
1331,476
73
954427
152
59365165
468
010
Innon-
contig-uouscoun-ties
8,819
1503191
32,398
12219
0324
16973
14952
0004
62
30915232
153
100
801
2791
8731,211
1
3692
2692630
49546190
133
51680240
75
000
Bank-ing
facili-ties3
155
2121
25
900
18
176061
01122
21202
2
100
30402
35020
201
193
010301
100
193Digitized for FRASER http://fraser.stlouisfed.org/ Federal Reserve Bank of St. Louis
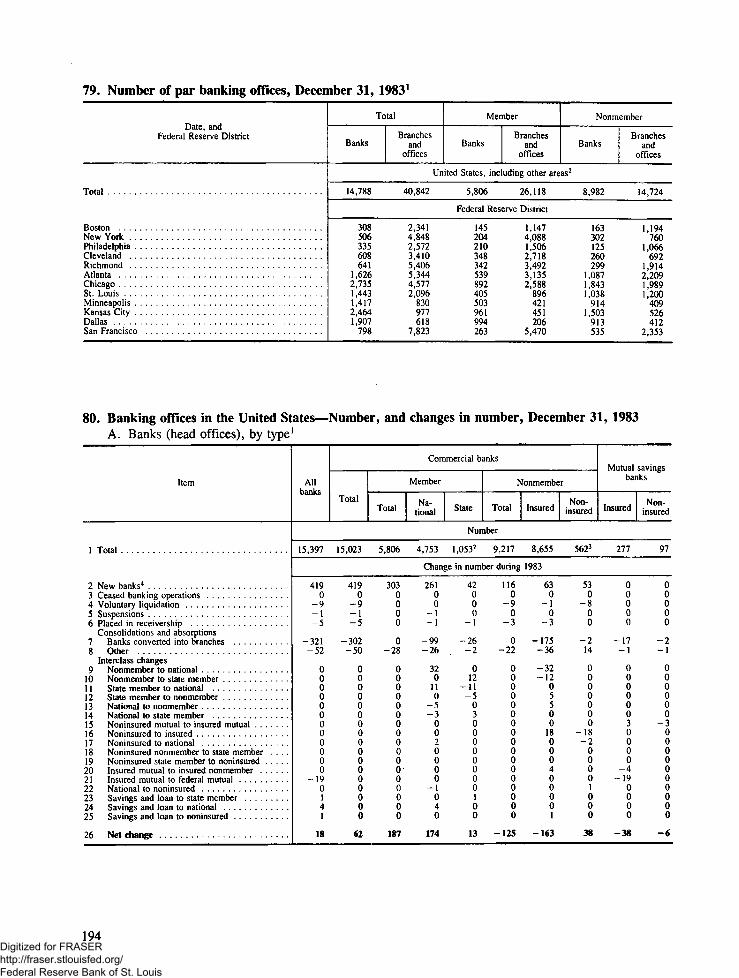
79. Number of par banking offices, December 31, 19831
Date, andFederal Reserve District
Total
BostonNew YorkPhiladelphia .ClevelandRichmondAtlantaChicagoSt LouisMinneapolisKansas CityDallasSan Francisco
Total
BanksBranches
andoffices
Member
BranchesBanks and
offices
Nonmember
BanksBranches
andoffices
United States, including other areas2
14,788 40,842 5,806 26,118 8,982 14,724
Federal Reserve District
308506335608641
1,6262,7351,4431,4172,4641,907
798
2,3414,8482,5723,4105,4065,3444,5772,096
830977618
7,823
145 1,147204 4,088210 1,506348 2,718342 3,492539 3,135892 2,588405 896503 421961 451994 206263 5,470
163302125260299
1,0871,8431,038
9141,503
913535
1,194760
1,066692
1,9142,2091,9891,200
409526412
2,353
80. Banking offices in the United States—Number, and changes in number, December 31, 1983A. Banks (head offices), by type1
Item
1 Total
2 New banks4
3 Ceased banking operations4 Voluntary liquidation5 Suspensions6 Placed in receivership . . . . .
Consolidations and absorptions7 Banks converted into branches . .8 Other .
Interclass changes9 Nonmember to national
10 Nonmember to state member1 1 State member to national12 State member to nonmember13 National to nonmember14 National to state member1 5 Noninsured mutual to insured mutual16 Noninsured to insured . . . . . . .17 Noninsured to national18 Noninsured nonmember to state member . . . .19 Noninsured state member to noninsured20 Insured mutual to insured nonmember21 Insured mutual to federal mutual22 National to noninsured23 Savings and loan to state member24 Savings and loan to national25 Savings and loan to noninsured
26 Net change
Commercial banks
All Member
Total NTotal tional State Tot
Number
Mutual caving*
Nonmember banks
al Insured in^°"e"d Insured ^j^
15,397 15,023 5,806 4,753 1,0532 9,217 8,655 5623 277 97
Change in number during 1983
419 419 303 261 42 116 63 53 0 00 0 0 0 0 0 0 0 0 0
- 9 - 9 0 0 0 - 9 - 1 - 8 0 0- 1 - 1 0 - 1 0 0 0 0 0 0- 5 - 5 0 - 1 - 1 - 3 - 3 0 0 0
-321 -302 0 -99 -26 0 -175 -2 -17 -2-52 -50 -28 -26 -2 -22 -36 14 -1 -1
0 0 0 3 2 0 0 - 3 2 0 0 00 0 0 0 1 2 0 - 1 2 0 0 00 0 0 1 1 - 1 1 0 0 0 0 00 0 0 0 - 5 0 5 0 0 00 0 0 - 5 0 0 5 0 0 00 0 0 - 3 3 0 0 0 0 00 0 0 0 0 0 0 0 3 - 30 0 0 0 0 0 1 8 - 1 8 0 00 0 0 2 0 0 0 - 2 0 00 0 0 0 0 0 0 0 0 00 0 0 0 0 0 0 0 0 00 0 0 0 0 0 4 0 - 4 0
-19 0 0 0 0 0 0 0 - 1 9 00 0 0 - 1 0 0 0 1 0 01 0 0 0 1 0 0 0 0 04 0 0 4 0 0 0 0 0 01 0 0 0 0 0 1 0 0 0
18 62 187 174 13 - 125 - 163 38 -38 -6
194Digitized for FRASER http://fraser.stlouisfed.org/ Federal Reserve Bank of St. Louis

80. Banking offices in the United States—Number, and changes in number, December 31, 1983—ContinuedB. Branches, additional offices, and facilities, by type of bank
Item
1 Total
Branches and additional offices2 De novo3 Banks converted4 Discontinued5 Other1
6 Net change
7 Number December 31, 1982
Banking facilities2
8 Established9 State member to national
10 Other
1 1 Net change
12 Number, December 31, 1983
Allbanks
43,128
Commercial banks
Total
40,808
Total
26,038
Member
Na-tional
21,222
Nonmember
State Total
Number
4,816 14,770
Change in number during
1,320245
-567-33
965
42,163
00i
_!
149
1,281225
-547370
1,329
39,479
00
-1
-1
149
678130
-356451
903
25,135
00
-1
1
124
577111
-290662
1,060
20,162
00
-1
-1
113
101 60319 95
-66 -191-211 -81
-157 426
4,973 14,344
0 00 00 0
-1 0
11 25
A Non-Insured insured
14,666 104
1983
583 2095 0
-191 0- 106 25
381 45
14,285 59
0 00 00 0
0 0
25 0
Mutual savingsbanks
i— —2,088 232
36 317 3
-19 -1-382 -21
-348 -16
2,436 248
0 00 00 0
0 0
0 0
195Digitized for FRASER http://fraser.stlouisfed.org/ Federal Reserve Bank of St. Louis

81. Changes in offices of commercial banks and nondeposit trust companies during 1983—Summary, by state
*
State
50 states and District ofColumbia— Total . . .
Statewide branchingstates
Limited branchingstates
Unit banking states
AlabamaAlaskaArizona .Arkansas .California
Colorado .ConnecticutDelawareDistrict of ColumbiaFlorida
GeorgiaHawaii . . . .Idaho .IllinoisIndiana
IowaKansasKentucky .LouisianaMaine
Maryland . .MassachusettsMichigan . .MinnesotaMississippi . . . .
MissouriMontana . . .NebraskaNevada . . .New Hampshire
New JerseyNew MexicoNew YorkNorth CarolinaNorth Dakota
OhioOklahomaOregonPennsylvaniaRhode Island
South CarolinaSouth DakotaTennessee . . . .TexasUtah
VermontVirginiaWashingtonWest VirginiaWisconsin
Wyoming
January 1-June 30
In opera-tion onJan. 1
54,492
26,822
19,2908,380
950129642673
4,904
630672180182
2,111
1,345184288
1,9181,595
1,163829
1,0791,122
351
1,1271,1372,5141,078
899
1,230195600177256
1,796356
3,6161,865
302
2,624652703
2,985250
851313
1,3381,908
395
2081,668
969325
1,092
116
Begin-ning
operation
753
405
203145
23462
116
15133
102
1813
1715
42
1123
3
171414116
160269
174
30132
12119
171
13I
17793
0225
1118
1
Ceasingoperation
278
168
9713
10003
40
0331
24
50355
40
1321
49
1143
50117
51
2823
1
110
1933
41
1110
011423
0
In opera-tion onJune 30
54,967
27,059
19,3968,512
963133648672
4,980
645670180184
2,189
1,358185288
1,9301,605
1,163831
1,0771,143
353
1,1401,1422,5171,085
902
1,241195601182258
1,808359
3,6381,855
303
2,625663693
2,999248
860313
1,3441,986
398
2081,679
970334
1,107
117
Net in-crease, ordecrease
(-)
475
237
106132
1346
-176
15-2
02
78
1310
1210
02
-2212
135373
110152
123
22-10
1
111
-1014
-2
906
783
01119
15
1
In opera-tion onJuly 1
54,%7
27,059
19,3968,512
963133648672
4,980
645670180184
2,189
1,358185288
1,9301,605
1,163831
1,0771,143
353
1,1401,1422,5171,085
902
1,241195601182258
1,808359
3,6381,855
303
2,625663693
2,999248
860313
1,3441,986
398
2081,679
970334
1,107
117
July
Begin-ning
operation
875
458
272145
301
1211
110
12940
109
3343
2321
116
13182
1215131010
242
1355
183
39252
151012270
157
1853
3
026102031
0
1-December 31
Ceasingoperation
430
237
17023
20002
53
21602
29
19015
11
54
1124
81165
12
30206
101
3993
1709
123
67
224
10
0g5
1016
0
In opera-tion onDec. 31
55,412
27,254
19,6118,520
973134660681
5,037
655663184182
2,269
1,372189289
1,9471,615
1,169833
1,0791,158
351
1,1451,1462,5241,090
901
1,262197612187257
1,816361
3,6251,871
302
2,623673696
3,014245
869313
1,3392,035
391
2081,697
975345
1,122
117
Net in-crease, ordecrease
(-)
445
221
102122
101
129
57
10-7
4-280
1442
1810
622
16-2
4475
-2
212
115
-1
820
16
-2103
15-3
90
-449-7
0185
1015
0
Type ofbranch-
ing1
LSSLS
USSSS
LSSUL
LULLS
SLLLL
UUUSS
SLSSU
LUSSS
SSLUS
SSSLL
U
196Digitized for FRASER http://fraser.stlouisfed.org/ Federal Reserve Bank of St. Louis

82. Percentage of total assets and total deposits held by 10 largest banking organizations(all commercial banks and trust companies), by state
State and item'
Alabama (221)Assets
Per organizationCumulative .
DepositsPer organizationCumulative
Alaska (13)Assets
Per organizationCumulative
DepositsPer organization .Cumulative
Arizona (44)Assets
Per organization . .Cumulative
DepositsPer organizationCumulative
Arkansas (256)Assets
Per organization .Cumulative
DepositsPer organizationCumulative
California (393)Assets
Per organizationCumulative
DepositsPer organizationCumulative
Colorado (391)Assets
Per organizationCumulative .
DepositsPer organization .Cumulative
Connecticut (48)Assets
Per organizationCumulative
DepositsPer organizationCumulative
Delaware (31)Assets
Per organizationCumulative
DepositsPer organizationCumulative
District of Columbia (18)Assets
Per organizationCumulative
DepositsPer organizationCumulative
Florida (301)Assets
Per organizationCumulative
DepositsPer organizationCumulative
1
17.017.0
16.216.2
24. 52
245
25.125 1
43.243.2
41.841 8
7.47 4
6.86 8
33.533.5
34 434.4
16 516.5
15.715.7
27.627.6
24.724.7
17 32
17.3
19.619.6
32.432.4
30.430.4
17 417 4
16 416 4
2
13.930.9
14.330.5
17.22
41.7
15.240.3
25.568.7
26.167 9
' 3.811 2
2.49 2
13.0465
12 346.7
14 531.0
13.329.0
24.852.4
23.748.5
16 533.9
13.833.4
29.962.4
29.259.6
11 929 3
12 328 8
3
13.044.0
10.440.9
13.02
54.7
14.254.5
14.282.9
14.382 3
3.715 0
3.512.8
10.456.9
7954.6
11.442.5
10.839.9
8.961.3
9.658.1
13 347.2
13.246.6
10.472.8
10.870.5
8 337 7
8237 0
4
11.655.7
10.751.7
10.064.7
9.163.6
6.589.5
6.6890
3.018 1
2.715.6
9.166.1
10.164.7
10.753.2
11.251.1
7.368.7
8.166.2
10 52
57.8
13.460.0
8.581.3
8.979.4
5 443 1
5.542 6
lank, by total assets
5 | 6
June 1983
5. I2 1.460.8 62.2
5.3 1.557.0 58.5
8.62 7.673.3 81.0
8.6 7.772.3 80.1
3.3 1.92
92.8 94.7
3.5 2.092.5 94 5
2.2 2. I2
20.3 22.4
1.9 1.617.6 19.2
8.2 3.174.3 77.5
7.5 2.872.2 75.0
8.1 3.561.3 64.8
8.3 3.559.5 63.0
6.0 4.974.7 79.7
6.2 5.272.5 77.7
76 5 365.4 70.8
10.6 5.770.7 76.4
7.7 2.289.0 91.2
7.6 2.687.0 89.6
4 3 4 247 5 51 7
4.3 3.646 9 50 6
7
1.42
63.7
1.560.1
6.887.8
7.087.1
l.O2
95.7
1.095 6
1.924.4
2.021.3
1.879.3
1.977.0
2.32
67.2
2.465.4
4.52
84.2
4.682.4
5 376.1
3.379.8
2.293.5
2.792.4
4 155 8
4054 6
8
1.32
65.0
1.361.4
4.22
92.0
4.591.6
.92
96.6
.9965
1.926.4
1.923.3
1.680.9
1 178.1
.868.1
.966.4
1.42
85.7
1.684.0
4 I2
80.3
5.285.0
1.995.4
2.394.7
2 558 4
2 557 2
9
1.22
66.2
1.362.8
2.694.7
2.894.4
.62
97.2
.697 2
1.728 1
1.825 1
1.182.0
1 279.3
.869.0
.967.3
l.O2
86.7
1.185.2
3 283.5
.085.0
.72
96 1
.895.6
2 560 9
2 659 8
10
.967.1
.963.8
1.996.6
1.996.4
.397.6
.397 5
1.529 6
1.526 7
1.083 0
1 280.5
869.8
.868.2
.987.6
1.086.2
2 586.0
2.587.6
.696 8
.896.4
2 463 3
2 562 4
197Digitized for FRASER http://fraser.stlouisfed.org/ Federal Reserve Bank of St. Louis
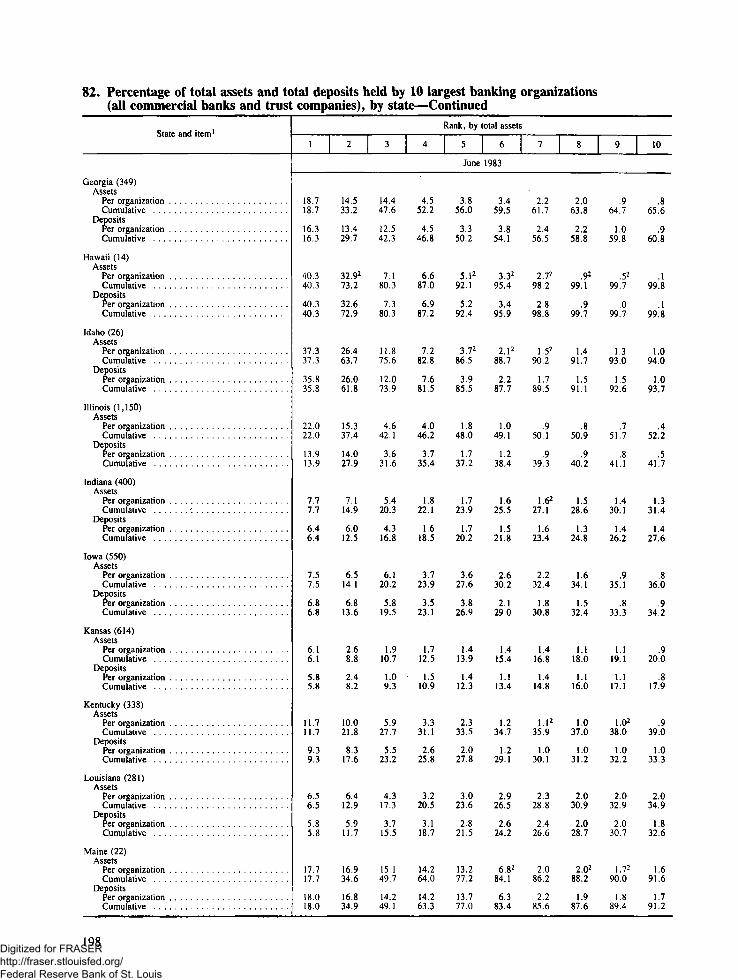
82. Percentage of total assets and total deposits held by 10 largest banking organizations(all commercial banks and trust companies), by state—Continued
State and item1
Georgia (349)Assets
Per organizationCumulative
DepositsPer organization . . . .Cumulative
Hawaii (14)Assets
Per organizationCumulative
DepositsPer organizationCumulative
Idaho (26)Assets
Per organizationCumulative . . . .
DepositsPer organizationCumulative . .
Illinois (1,150)Assets
Per organizationCumulative
DepositsPer organizationCumulative
Indiana (400)Assets
Per organizationCumulative . ' . . . .
DepositsPer organizationCumulative
Iowa (550)Assets
Per organization . . . .Cumulative
DepositsPer organizationCumulative
Kansas (614)Assets
Per organizationCumulative
DepositsPer organizationCumulative
Kentucky (338)Assets
Per organizationCumulative . . . .
DepositsPer organizationCumulative
Louisiana (281)Assets
Per organizationCumulative
DepositsPer organizationCumulative . . .
Maine (22)Assets
Per organizationCumulative
DepositsPer organizationCumulative
Rank, by total assets
1 2
18.718.7
16.316.3
40.340.3
40.340.3
37.337.3
35.835.8
22.022.0
13.913.9
7.77.7
6.46.4
7.57.5
6.86.8
6.16.1
5.85.8
11.711.7
9.39.3
6.56.5
5.85.8
17.717.7
18,018.0
14.533.2
13.429.7
32.92
73.2
32.672.9
26.463.7
26.061.8
15.337.4
14.027.9
7.114.9
6.012.5
6.514.1
6.813.6
2.68.8
2.48.2
10.021.8
8.317.6
6.412.9
5.911.7
16.934.6
16.834.9
3 4 5
June
14.447.6
12.542.3
7.180.3
7.380.3
11.875.6
12.073.9
4.642.1
3.631.6
5.420.3
4.316.8
6.120.2
5.819.5
1.910.7
1.09.3
5.927.7
5.523.2
4.317.3
3.715.5
15.149.7
14.249.1
4.552.2
4.546.8
6.687.0
6.987.2
7.282.8
7.681.5
4.046.2
3.735.4
1.822.1
1.618.5
3.723.9
3.523.1
1.712.5
1.510.9
3.331.1
2.625.8
3.220.5
3.118.7
14.264.0
14.263.3
3.856.0
3.350.2
5. 12
92.1
5.292.4
3.72
86.5
3.985.5
1.848.0
1.737.2
1.723.9
1.720.2
3.627.6
3.826.9
1.413.9
1.412.3
2.333.5
2.027.8
3.023.6
2.821.5
13.277.2
13.777.0
6 7
1983
3.459.5
3.854.1
3.32
95.4
3.495.9
2.12
88.7
2.287.7
1.049.1
1.238.4
1.625.5
1.521.8
2.630.2
2.129.0
1.415.4
13^4
1.234.7
1.229.1
2.926.5
2.624.2
6.82
84.1
6.383.4
2.261.7
2.456.5
2.72
98.2
2.898.8
1.52
90.2
1.789.5
.950.1
.939.3
1.62
27.1
1.623.4
2.232.4
1.830.8
1.416.8
1.414.8
l . l2
35.9
1.030.1
2.328.8
2.426.6
2.086.2
2.285.6
8
2.063.8
2.258.8
.92
99.1
.999.7
1.491.7
1.591.1
.850.9
.940.2
1.528.6
1.324.8
1.634.1
1.532.4
1.118.0
16^0
1.037.0
1.031.2
2.030.9
2.028.7
2.02
88.2
1.987.6
9
.964.7
1.059.8
.52
99.7
.099.7
1.393.0
1.592.6
.751.7
.841.1
1.430.1
1.426.2
.935.1
.833.3
1.119.1
1.117.1
l.O2
38.0
1.032.2
2.032.9
2.030.7
1.72
90.0
1.889.4
10
.865.6
.960.8
,\99.8
.199.8
1.094.0
1.093.7
.452.2
.541.7
1.331.4
1.427.6
.836.0
.934.2
.920.0
.817.9
.939.0
1.033.3
2.034.9
1.832.6
1.691.6
1.791.2
198Digitized for FRASER http://fraser.stlouisfed.org/ Federal Reserve Bank of St. Louis

82. Percentage of total assets and total deposits held by 10 largest banking organizations(all commercial banks and trust companies), by state—Continued
State and item1
Maryland (74)Assets
Per organizationCumulative
DepositsPer organizationCumulative
Massachusetts (77)Assets
Per organizationCumulative
DepositsPer organization .Cumulative
Michigan (212)Assets
Per organizationCumulative
DepositsPer organizationCumulative . . .
Minnesota (616)Assets
Per organizationCumulative
DepositsPer organizationCumulative
Mississippi (166)Assets
Per organizationCumulative
DepositsPer organizationCumulative
Missouri (467)Assets
Per organizationCumulative
DepositsPer organizationCumulative
Montana (108)Assets
Per organizationCumulative
DepositsPer organizationCumulative
Nebraska (462)Assets
Per organizationCumulative
DepositsPer organizationCumulative
Nevada (15)Assets
Per organizationCumulative
DepositsPer organizationCumulative
New Hampshire (53)Assets
Per organizationCumulative
DepositsPer organizationCumulative
j
20.820 8
18.518.5
29.129.1
20.620.6
18 718.7
15 615.6
31.231 2
24.824 8
14 314.3
11.811 8
12.212 2
10410.4
24 524.5
23 623.6
8 68 6
7 87 8
50.850 8
51.951 9
16.616 6
16 216 2
2
13.934 8
11.530.0
13.642.7
14.535.2
12 030.7
12 027 6
24.455 7
23.148 0
10 52
24.8
10.121 9
11.623 8
9 8202
12 336.8
12 335.9
6 314 9
5 313 1
22.173 0
20.972 9
15031 7
14 931 1
3
12.647 5
13.443.5
12.955.6
13.048.3
11 842.5
11 9395
3.959 6
4.152 1
392
28.8
3.825 8
8.131 9
8 128 3
6443.3
6442.4
5 720 6
4 717 9
10.92
84 0
11 083 9
7 038 7
6 537 7
4
10.057 5
10.554.1
10.466.1
13.061.3
8951 5
8 548.1
2.061 6
2.354 4
3 532.4
3.729 5
6.738 6
6 0343
6 349.6
5 648.1
3 924 6
3 521 4
6.92
91 0
6 790 6
672
45 5
6 944 6
Rank, by
5
June
9.1666
9.863.9
9.375.4
8.670.0
6758.2
7 155 2
1.663 3
1.656 1
3435.8
3.633 1
6.044 7
5 2396
4 954.6
5 153.2
2 927 5
2423 9
3.82
94 8
3 994 6
5 92
51 4
6 250 8
otal assets
6
1983
7.574.1
7.070.9
3.378.8
4.274.2
5 964 1
6 161 3
.964 3
1.157 2
252
38.4
2.735 9
6.050 7
6 345 9
4 459.0
4 557.7
1 228 8
1 225 1
2.297 0
2 397 0
432
55 7
4 555 4
7
4.278 4
4.675.6
2.681.4
3.377.6
1 966 1
2063 4
.564 9
.757 9
2 I2
40.5
2.238 2
2.653 3
2 748 7
2 461 5
2 3600
929 7
1 026 1
.92
98 0
998 0
292
58 7
2 858 2
8
2.02
80 5
2.377.9
1.82
83.3
2 379.9
1 868 0
2065 5
.52
65 4
.758 6
202
42.6
2.040 2
2.455 7
2 451 1
1 663 1
1 761 8
930 6
927 0
.52
98 5
598 6
2 561 3
2 560 8
9
1.42
81 9
1.679.6
1.684.9
1 881.7
1 669 6
1 667 1
.52
65 9
559 2
1 72
44.3
1.842 0
2.157 9
2 353 5
1 364 4
1 263 1
g31 5
928 0
.32
98 8
298 9
2 32
63 6
2 062 8
10
1.183 0
1 280.8
1.686.6
1 883.6
1 571 1
1 668 7
.366 3
459 6
1 646.0
1.743 7
2.160 1
1 955 5
1 265 7
1 3644
832 3
728 7
.299 1
299 1
1 965 6
1 764 6
199Digitized for FRASER http://fraser.stlouisfed.org/ Federal Reserve Bank of St. Louis
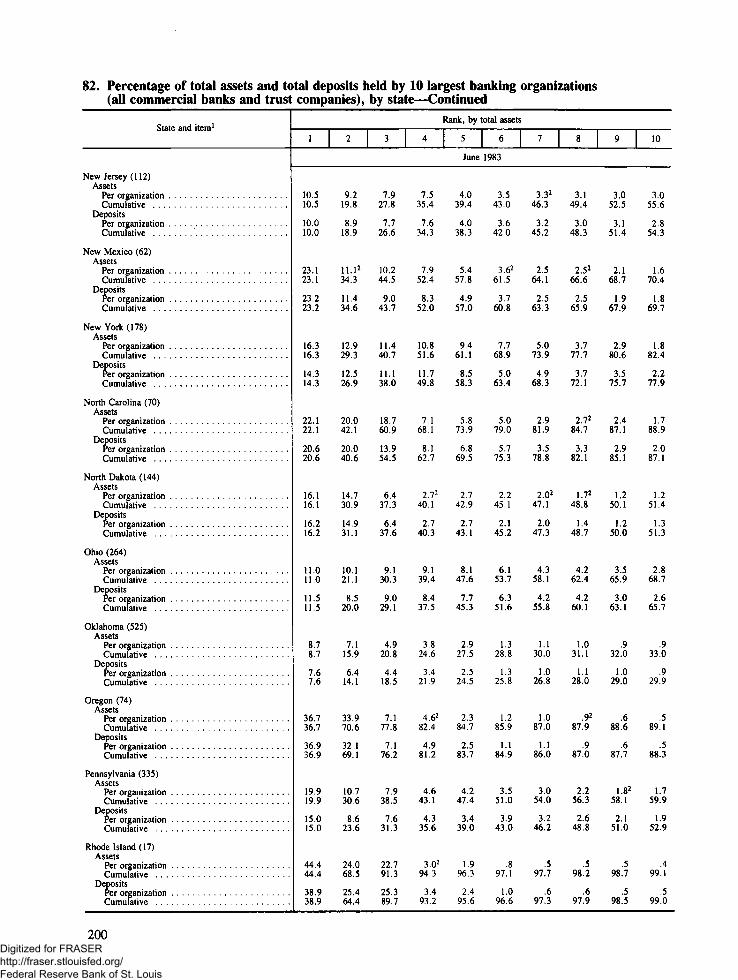
82. Percentage of total assets and total deposits held by 10 largest banking organizations(all commercial banks and trust companies), by state—Continued
State and item'
New Jersey (112)Assets
Per organizationCumulative
DepositsPer organizationCumulative
New Mexico (62)Assets
Per organizationCumulative
DepositsPer organizationCumulative
New York (178)Assets
Per organizationCumulative
DepositsPer organization . . . .Cumulative
North Carolina (70)Assets
Per organizationCumulative . . . . .
DepositsPer organizationCumulative .
North Dakota (144)Assets
Per organizationCumulative
DepositsPer organization ,Cumulative
Ohio (264)Assets
Per organizationCumulative
DepositsPer organizationCumulative
Oklahoma (525)Assets
Per organizationCumulative . .
DepositsPer organizationCumulative
Oregon (74)Assets
Per organizationCumulative
DepositsPer organizationCumulative . . . . . . .
Pennsylvania (335)Assets
Per organizationCumulative
DepositsPer organizationCumulative
Rhode Island (17)Assets
Per organizationCumulative
DepositsPer organizationCumulative
1
10.510.5
10.010.0
23.123 1
23.223 2
16.316 3
14.314 3
22.122.1
20.620.6
16 116.1
16.2162
11.011.0
11 511.5
878.7
7.67.6
36.736.7
36.936.9
19.919.9
15.015.0
44.444.4
38.938.9
2
9.219.8
8.918.9
11. 12
343
11.434 6
12.929 3
12.526 9
20042.1
20.040.6
14 730.9
14.931.1
10.121.1
8 520.0
7.115.9
6.414.1
33 970.6
32.169.1
10.730.6
8.623.6
24.068.5
25.464.4
3 | 4
7.9 7.527.8 35.4
7.7 7.626.6 34.3
10.2 7.944 5 52 4
9.0 8.343 7 52 0
11.4 10.840 7 516
11.1 11.738 0 49 8
18.7 7.160.9 68.1
13.9 8.154.5 62.7
6 4 2.72
37.3 40.1
6.4 2.737.6 40.3
9.1 9.130.3 39.4
90 8.429.1 37.5
4.9 3.820.8 24.6
4.4 3.418.5 21.9
7.1 4.62
77.8 82.4
7.1 4.976.2 81.2
7.9 4.638.5 43.1
7.6 4.331.3 35.6
22.7 3.02
91.3 94.3
25.3 3.489.7 93.2
Rank, by t
5
June
4.039.4
4.038.3
5.457 8
4.9570
9.461 1
8.558.3
5.873.9
6.869.5
2 742.9
2.743.1
8.147.6
7.745.3
2.927.5
2.524.5
2.384.7
2.583.7
4.247.4
3.439.0
1.996.3
2.495.6
otal assets
6
1983
3.543.0
3.642.0
3.62
61 5
3.760 8
7.7689
5.0634
5.079.0
5.775.3
2.245.1
2.145.2
6.153.7
6.351.6
1.328.8
1.325.8
1.285.9
1.184.9
3.551.0
3.943.0
.897.1
1.096.6
7
3.32
46.3
3.245.2
2.564.1
2.563 3
5.073.9
4.968.3
2.981.9
3.578.8
2.02
47.1
2.047.3
4.358.1
4.255.8
1.130.0
1.026.8
1.087.0
1.186.0
3.054.0
3.246.2
.597.7
.697.3
8
3.149.4
3.048.3
2.52
666
2.565 9
3.777.7
3.772.1
2.72
84.7
3.382.1
1.72
48.8
1.448.7
4.262.4
4.260.1
1.031.1
1.128.0
.92
87.9
.987.0
2.256.3
2.648.8
.598.2
.697.9
9
3.052.5
3 151.4
2.168 7
1.967 9
2.9806
3.575 7
2.487.1
2.985.1
1.250.1
1.250.0
3.565.9
3.063.1
.932.0
1.029.0
.688.6
.687.7
1.82
58.1
2.151.0
.598.7
.598.5
10
3.055.6
2 854.3
1.6704
1 869 7
1.882 4
2.2779
1.788.9
2.087.1
1.251.4
1.351.3
2.868.7
2.665.7
.933.0
.929.9
.589.1
.588.3
1.759.9
1.952.9
.499.1
.599.0
200Digitized for FRASER http://fraser.stlouisfed.org/ Federal Reserve Bank of St. Louis

82. Percentage of total assets and total deposits held by 10 largest banking organizations(all commercial banks and trust companies), by state—Continued
State and item1
South Carolina (75)Assets
Per organizationCumulative
DepositsPer organizationCumulative
South Dakota (129)Assets
Per organizationCumulative
DepositsPer organizationCumulative
Tennessee (386)Assets
Per organization . , .Cumulative
DepositsPer organization . . . . .Cumulative
Texas (1,181)Assets
Per organizationCumulative . .
DepositsPer organization . . . .Cumulative
Utah (55)Assets
Per organizationCumulative . . . .
DepositsPer organizationCumulative
Vermont (27)Assets
Per organizationCumulative
DepositsPer organization . .Cumulative
Virginia (154)Assets
Per organizationCumulative . .
Deposits
Cumulative .
Washington (98)Assets
Per organizationCumulative
DepositsPer organizationCumulative
West Virginia (236)Assets
Per organizationCumulative
DepositsPer organizationCumulative
Wisconsin (476)Assets
Per organization . . .Cumulative
DepositsPer organization .Cumulative
Rank, by total assets
1
19.319.3
17.01,7.0
32.632.6
27.627.6
15.315.3
14.114.1
13.213.2
11.611.6
30.930.9
30.330.3
22.22
22.2
22.422.4
15.815.8
14.314.3
31.631.6
28.328.3
4.84.8
4.44.4
13.513.5
11.811.8
2
15.62
35.0
15.933.0
15.147.7
16.544.2
11.927.2
11.525.7
9.923.2
8.920.5
22.253.1
20.651.0
11.834.1
11.433.9
12.428.3
12.626.9
21.052.6
21.449.8
3.07.8
2.67.1
9.523.1
8.320.2
3
14.049.0
13.646.7
12.059.8
12.356.5
8.836.1
8.734.4
9.632.8
8.529.1
9.562.7
10.061.0
11.245.4
11.345.2
10.338.6
10.036.9
9.862.5
10.560.3
2.62
10.5
2.09.1
7.330.4
7.127.4
4 5
June
13.562.5
13.159.8
2.562.4
2.759.3
8.144.2
7.642.0
9.442.2
9.038.2
7.670.3
7.868.9
11.256.6
11.256.5
10.248.8
9.346.3
8.370.8
8.468.7
2.62
13.1
2.311.5
3.133.6
3.230.7
7.470.0
8.268.1
2.364.7
2.561.8
5.950.2
5.347.4
6.248.4
5.844.0
6.82
77.1
7.376.2
8.72
65.4
8.765.3
8.857.6
8.855.1
6.177.0
6.174.9
1.814.9
1.813.3
2.436.0
2.433.1
6
1983
4.02
74.1
4.472.5
1,866.5
2.063.8
3.22
53.5
2.950.4
4.352.8
4.548.6
3.780.9
3.179.4
4.970.3
4.870.1
8.466.1
7.862.9
4.62
81.6
5.180.0
1.82
16.7
1.314.6
2.038.1
2.035.1
7
2. 12
76.2
2.274.7
1.868.3
2.065.8
2.055.5
2.052.4
4.056.8
4.152.7
3.584.4
3.783.1
3.974.3
3.974.1
7.073.1
7.870.8
2.584.2
2.782.7
1.718.5
1.616.3
1.940.0
1.937.0
8
1.42
77.7
1.676.3
1.469.7
1.567.4
1.156.7
1.153.6
2.959.8
2.955.6
1.786,2
1.885.0
2.777.1
2.776.8
4.777.9
5.175.9
1.92
86.2
2.184.9
1.72
20.2
1.417.7
1.741.7
1.738.8
9
1.22
79.0
1.377.7
1.271.0
1.468.8
l.l2
57.9
1.254.8
1.961.7
2.057.7
.987.2
1.086.1
2.32
79.4
2.379.2
2.480.3
2.678.5
1.32
87.5
1.486.3
1.52
21.8
1.519.3
1.543.2
1.540.3
10
1.280.2
1.279.0
1.172.2
1.270.0
1.058.9
1.055.9
1.262.9
1.359.0
.888.0
.987.1
1.881.2
1.881.0
.981.3
1.079.5
1.088.6
1.087.4
1.423.2
1.420.7
1.444.7
1.341.6
201Digitized for FRASER http://fraser.stlouisfed.org/ Federal Reserve Bank of St. Louis

82. Percentage of total assets and total deposits held by 10 largest banking organizations(all commercial banks and trust companies), by state—Continued
State and item1
Wyoming (70)Assets
Per organizationCumulative . . . .
DepositsPer organization '. .Cumulative
United States (12,227)Assets
Per organizationCumulative
DepositsPer organization . . . .Cumulative
Alabama (215)Assets
Per organizationCumulative
DepositsPer organizationCumulative
Alaska (13)Assets
Per organization . .Cumulative . . . . . .
DepositsPer organization . .Cumulative . . . . . .
Arizona (48)Assets
Per organizationCumulative . . . .
DepositsPer organizationCumulative . . . .
Arkansas (256)Assets
Per organizationCumulative . . . .
DepositsPer organizationCumulative . . . .
California (418)Assets
Per organizationCumulative . . . .
DepositsPer organization . . . .Cumulative
Colorado (393)Assets
Per organization . . .Cumulative . . . .
DepositsPer organizationCumulative . . . .
Connecticut (46)Assets
Per organizationCumulative . . . . .
DepositsPer organizationCumulative . . . .
Rank, by total assets
1 2
15.315.3
15.315.3
3.83.8
4.04.0
12.627.9
12.427.8
2.96.8
2.06.0
3
12.240.2
12.340.1
2.29.1
1.77.7
4
4.244.4
4.344.5
1.911.0
1.49.2
5
June
3.748.2
3.648.1
1.913.0
1.610.9
6
1983
3.42
51.7
3.451.6
1.814.9
1.912.8
7
2.854.5
2.954.5
1.716.6
1.214.0
8
2.457.0
2.557.1
1.518.1
.914.9
9
1.958.9
1.959.1
1.519.6
1.416.3
10
1.760.7
1.760.9
1.320.9
.617.0
December 1983
16.716.7
15.815.8
25. 02
25.0
25.425.4
42.642.6
41.441.4
8.58.5
8.08.0
32.632.6
34.034.0
17.117.1
16.816.8
28.628.6
27.127.1
14.231.0
14.230.1
16.541.5
14.740.1
25.568.1
26.067.4
7.516.1
5.013.0
13.746.4
12.346.4
12.629.8
10.227.1
23.952.6
22.449.5
13.144.1
11.942.1
12.72
54.3
11.751.9
14.582.6
14.381.8
3.319.4
3.116.2
9.355.7
7.954.3
11.140.9
10.537.7
8.661.2
9.258.7
12.556.7
10.752.8
9.163.5
9.060.9
6.689.3
6.988.8
2.321.8
2.418.6
9.265.0
10.164.4
10.151.1
10.748.4
7.068.3
7.666.3
5.061.7
5.258.0
8.972.4
9.670.6
3.192.4
3.292.1
2.324.1
1.920.6
7.972.9
7.071.5
7.858.9
8.056.5
6.574.8
6.572.9
1.72
63.5
1.959.9
7.62
80.0
8.278.8
1.92
94.4
2.094.1
2.02
26.1
2.022.6
3.376.3
3.074.5
4.763.6
5.161.6
5.380.1
5.478.3
1.665.1
1.661.6
7.287.2
7.286.0
.92
95.3
1.095.1
1.928.0
2.024.7
1.878.2
1.976.5
2.42
66.0
2.564.1
5.02
85.2
5.283.6
1.366.4
1.362.9
4.42
91.7
4.790.8
.92
96.2
1.096.1
1.729.8
1.726.4
1.579.7
1.077.5
.966.9
1.065.1
1.32
86.6
1.585.1
1.167.6
1.264.2
2.794.4
3.093.9
.52
96.8
.596.7
1.631.5
1.828.2
1.180.9
1.278.7
.867.8
.966.1
.92
87.5
1.186.2
.968.5
1.065.2
1.996.3
2.095.9
.397.1
.397.0
1.433.0
1.529.8
1.081.9
1.279.9
.768.6
.867.0
.988.5
1.087.2
202Digitized for FRASER http://fraser.stlouisfed.org/ Federal Reserve Bank of St. Louis

82. Percentage of total assets and total deposits held by 10 largest banking organizations(all commercial banks and trust companies), by state—Continued
State and item1
Delaware (32)Assets
Per organizationCumulative . . . . ,
DepositsPer organizationCumulative . . .
District of Columbia (19)Assets
Per organization . . .Cumulative
DepositsPer organization . .Cumulative
Florida (304)Assets
Per organizationCumulative . . .
DepositsPer organizationCumulative
Georgia (335)Assets
Per organizationCumulative
DepositsPer organization ,Cumulative
Hawaii (18)Assets
Per organizationCumulative
DepositsPer organization . . . .Cumulative
Idaho (25)Assets
Per organizationCumulative . . . . . . .
DepositsPer organizationCumulative
Illinois (1,118)Assets
Per organizationCumulative . . . . . . . .
DepositsPer organizationCumulative . . .
Indiana (392)Assets
Per organizationCumulative . . . .
DepositsPer organization ,Cumulative . . . . . . . . . . .
Iowa (542)Assets
Per organizationCumulative
DepositsPer organizationCumulative ,
Kansas (613)Assets
Per organizationCumulative . . . . . .
DepositsPer organizationCumulative . . .
Rank, by total assets
1 2 3 4 5 6 7 8 9 10
December 1983
14.22
14.2
11.611.6
35.835.8
36.336.3
17.317.3
15.915.9
19.219.2
16.616.6
39.139.1
40.340.3
37,037.0
35.335.3
21.821.8
13.713.7
7.87.8
6.56.5
7.87.8
7.17.1
6.86.8
6.36.3
14.028.3
17.329.0
28.063.8
26.062.3
12.129.4
12.728.7
15.634.9
13.630.2
32. 12
71.2
32.172.5
26.663.7
25.761.1
16.037.8
14.328.1
7.615.4
6.212.7
6.614.4
6.914.1
2.99.7
2.69.0
12.941.2
14.743.8
10.173.9
10.773.0
8.537.9
8.637.3
14.449.3
13.743.9
6.778.0
7.179.6
12.075.8
12.373.4
4.342.2
3.731.8
4.920.4
4.217.0
5.920.4
5.619.8
1.711.5
1.510.5
8.649.8
12.156.0
8.182.1
7.981.0
5.143.1
5.342.7
5.454.8
4.748.7
6.084.0
6.486.0
7.082.8
7.881.2
4.046.2
3.535.4
2.022.4
2.019.0
3.924.3
3.823.6
1.513.0
1.412.0
8.158.0
6.362.4
6.989.0
6.587.5
4.747.8
4.347.0
3.658.5
4.052.8
4.72
88.8
5.091.0
3.82
86.6
4.285.4
2.048.2
2.137.5
1.924.4
1.820.9
3.62
27.9
3.827.4
1.414.5
1.513.5
7.92
66.0
8,971.3
2.391.4
2.790.2
4.452.3
3.750.7
3.261.7
3.155.9
3.32
92.2
1.392.4
2.22
88.8
2.387.7
1.049.3
1.238.7
1.826.2
1.822.8
2.830.8
2.329.8
1.315.9
1.114.6
6.172.1
9.280.5
2.393.7
2.692.8
4.056.4
4.054.8
2.264.0
2.558.4
2.92
95.1
3.095.5
1.42
90.3
1.689.4
1.050.3
1.139.8
1.728.0
1.724.6
2.233.1
1.831.6
1.117.0
1.115.7
3.72
75,9
4.485.0
1.92
95.6
2.195.0
2.558.9
2.657.4
2.02
66.0
2.260.6
2.42
97.5
2.598.0
1.491.8
1.691.0
.951.3
.940.7
1.729.7
1.726.3
1.634.7
1.533.2
1.118.2
1,217.0
3.679.6
.085.0
.696.2
.895.8
2.461.3
2.459.9
.967.0
1.161.8
.72
98.3
.898.8
1.393.1
1.592.6
.752.0
.841.6
1.62
31.4
1.527.9
.935.6
.934.1
l . l 2
19.4
1.218.2
3.382.9
.085.0
.696.9
.796.6
2.363.7
2.562.5
.967.9
1.062.8
.698.9
.599.4
1.094.2
1.193.7
.552.5
.642.2
1.532.9
1.429.3
.936.6
.935.1
.920.3
.819.0
203Digitized for FRASER http://fraser.stlouisfed.org/ Federal Reserve Bank of St. Louis

82. Percentage of total assets and total deposits held by 10 largest banking organizations(all commercial banks and trust companies), by state—Continued
State and item1
Kentucky (337)Assets
Per organizationCumulative
DepositsPer organizationCumulative
Louisiana (286)Assets
Per organization .Cumulative . . . . . .
DepositsPer organizationCumulative
Maine (21)Assets
Per organization . . . .Cumulative
DepositsPer organizationCumulative . . . . . . . .
Maryland (70)Assets
Per organizationCumulative
DepositsPer organizationCumulative
Massachusetts (76)Assets
Per organizationCumulative
DepositsPer organization .Cumulative
Michigan (2 10)Assets
Per organization .Cumulative
DepositsPer organizationCumulative
Minnesota (607)Assets
Per organizationCumulative .
DepositsPer organization .Cumulative . . . .
Mississippi (162)Assets
Per organizationCumulative . . . .
DepositsPer organizationCumulative . . . . .
Missouri (463)Assets
Per organizationCumulative
DepositsPer organization .Cumulative
Montana (106)Assets
Per organization .Cumulative . . . . .
DepositsPer organization .Cumulative
Rank, by total assets
1 2 3 4 5 6 7 8 9 10
December 1983
12.812.8
10.710.7
6.46.4
5.95.9
22.922.9
23.023.0
21.421.4
18.518.5
26.926.9
20.220.2
19.219.2
15.615.6
31.831.8
25.425.4
15.315.3
12.912.9
12.512.5
11.711.7
26.426.4
23.623.6
9.822.7
8.319.0
6.012.4
5.211.1
17.440.4
17.941.0
13.535.0
12.130.6
13.040.0
13.033.2
11.831.0
11.527.1
23.255.0
23.048.4
11.62
26.9
11.023.9
12.024.5
10.121.9
11.838.3
11.935.5
5.628.3
5.224.3
4.617.0
3.915.0
15.155.6
13.554.5
12.147.2
12.843.4
12.852.8
13.947.2
11.442.5
11.939.1
3.758.8
3.752.2
4.02
30.9
3.927.9
8.733.2
8.029.9
6.244.5
5.741.3
3.732.0
2.827.2
3.320.3
3.118.1
14.369.9
14.268.8
11.658.8
11.855.3
10.963.7
12.659.9
8.851.3
8.447.6
2.060.8
2.254.4
3.634.5
3.731.6
8.241.4
7.437.4
6.250.7
6.447.7
2.134.2
2.029.2
3.223.6
2.921.1
13.383.3
13.982.7
9.768.6
10.465.7
8.372.0
6.966.9
6.858.1
7.154.7
1.762.5
1.656.1
3.438.0
3.635.3
6.447.8
6.443.9
4.855.5
4.952.7
1.22
35.5
1.230.4
3.226.8
3.124.2
2.42
85.7
2.084.8
7.275.8
6.972.7
3.62
75.7
4.371.2
5.964.0
6.160.8
1.063.5
1.057.2
2.640.6
2.838.1
5.152.9
5.549.4
4.359.9
4.557.3
1.136.6
1.131.6
2.329.1
2.426.7
2.12
87.8
2.287.1
4.179.9
4.477.2
3.579.2
4.275.4
1.966.0
2.162.9
.664.1
.757.9
2.22
42.8
2.240.4
2.555.4
2.652.1
2.362.2
2.359.6
1.037.6
1.032.6
2.131.3
2.128.8
1.92
89.7
2.089.2
2.02
82.0
2.379.6
3.482.6
4.179.6
1.867.8
1.964.9
.52
64.7
.758.6
1.92
44.7
1.942.3
2.357.8
2.354.4
1.663.9
1.761.4
1.038.7
1.033.7
1.933.2
1.930.7
1.72
91.5
1.891.0
1.383.4
1.581.2
1.984.5
2.381.9
1.62
69.4
1.666.6
.565.3
.659.2
1.72
46.4
1.744.1
2.260.1
2.456.8
1.265.1
1.362.7
1.039.7
.934.7
1.835.1
1.832.6
1.593.0
1.692.6
1.084.4
1.182.3
1.786.3
1.983.9
1.470.9
1.568.1
.365.6
.459.7
1.648.1
1.745.8
2.162.2
2.259.1
1.266.3
1.264.0
204Digitized for FRASER http://fraser.stlouisfed.org/ Federal Reserve Bank of St. Louis

82. Percentage of total assets and total deposits held by 10 largest banking organizations(all commercial banks and trust companies), by state—Continued
State find item'
Nebraska (467)Assets
Per organizationCumulative
DepositsPer organizationCumulative . . . .
Nevada (15)Assets
Per organizationCumulative i
DepositsPer organizationCumulative
New Hampshire (51)Assets
Per organizationCumulative
DepositsPer organizationCumulative
New Jersey (103)Assets
Per organizationCumulative
DepositsPer organizationCumulative
New Mexico (62)Assets
Per organizationCumulative
DepositsPer organizationCumulative .
New York (177)Assets
Per organizationCumulative
DepositsPer organizationCumulative . .
North Carolina (70)Assets
Per organizationCumulative
DepositsPer organizationCumulative >
North Dakota (144)Assets
Per organizationCumulative >.
DepositsPer organizationCumulative
Ohio (262)Assets
Per organizationCumulative
DepositsPer organizationCumulative
Oklahoma (528)Assets
Per organizationCumulative
DepositsPer organizationCumulative
Rank, by total assets
1 2 3 4 5 6 7 8 9 10
December 1983
8.38.3
7.97.9
49.449.4
50.950.9
17.417.4
16.916.9
13.213.2
12.312.3
23.323.3
23.423.4
16.616.6
14.314.3
22.022.0
20.420.4
17.417.4
16.416.4
11.511.5
11.811.8
8.48.4
6.76.7
6.114.4
5.012.9
23.172.6
21.272.1
16.534.0
16.333.3
12.625.8
12.324.7
10.52
33.9
10.534.0
12.529.1
13.127.5
20.442.5
20.641.1
14.331.7
14,731.1
9.621.1
8.320.2
7.015.5
6.212.9
6.020.4
5.118.1
10.82
83.5
10.983.0
7.541.5
6.840.1
7.933.8
7.532.2
9.443.4
8.142.1
11.540.6
11.639.2
19.261.7
13.754.8
6.338.1
6.437.6
9.030.2
9.429.6
5.320.8
4.817.8
4.324.8
3.922.0
7.22
90.7
7.090.1
6.52
48.0
6.646.8
7.641.5
7.539.8
7.751.1
8.150.3
10.751.4
10.749.9
7.369.0
7.962.8
3. 12
41.2
3.040.6
8.438.6
8.338.0
4.225.0
3.621.4
2.827.6
2.424.4
3.72
94.4
3.994.1
5.52
53.5
5.752.5
4.646.1
4.744.5
5,556.7
5.355.7
8.459.8
7.857.8
5.674.6
6.669.4
2.844.0
2.943.5
7.846.5
7.545.5
2.627.7
2.323.8
1.228.9
1.225.7
2.396.7
2.596.6
4.357.9
4.657.2
3.950.1
4.048.6
3.42
60.1
3.459.1
8.168.0
5.162.9
4.979.5
5.975.3
2.146.2
2.145.6
6.452.9
6.451.9
1.329.0
1.325.1
1.029.9
1.026.7
l.O2
97.8
1.197.8
3.22
61.2
3.160.3
3.22
53.4
3.251.9
2.762.8
2.761.9
5.373.3
4.967.9
3.182.7
3.879.1
1.92
48.1
2.047.7
4.257.1
4.156.0
1.230.2
1.126.3
.930.9
1.027.8
.52
98.3
.598.3
2.663.9
2.763.0
3.156.5
3.054.9
2.62
65.5
2.764.7
3.977.3
3.671.5
2.785.4
3.482.6
1.649.7
1.449.1
4.061.2
4.060.1
1.131.4
1.227.6
.831.8
.928.7
.42
98.7
.498.8
2.22
66.1
2.165.1
2.92
59.4
2.957.9
2.12
67.6
1.966.6
3.080.3
3.675.2
2.487.9
2.985.5
1.22
51.0
1.250.4
3.564.7
2.862.9
.932.3
.928.5
.832.6
.929.6
.399.0
.299.0
2.068.1
1.967.0
2.662.1
2.860.7
1.969.6
1.968.6
1.882.2
2.377.5
1.789.6
2.087.6
1.252.2
1.251.7
3.368.1
2.765.6
.933.3
1.029.5
205Digitized for FRASER http://fraser.stlouisfed.org/ Federal Reserve Bank of St. Louis

82. Percentage of total assets and total deposits held by 10 largest banking organizations(all commercial banks and trust companies), by state—Continued
State and item1
Oregon (74)Assets
Per organizationCumulative
DepositsPer organization . . . .Cumulative
Pennsylvania (324)Assets
Per organization . . . .Cumulative
DepositsPer organizationCumulative . . . .
Rhode Island (17)Assets
Per organizationCumulative . . . .
DepositsPer organizationCumulative . . . .
South Carolina (72)Assets •
Per organizationCumulative
DepositsPer organization . . . .Cumulative
South Dakota (127)Assets
Per organizationCumulative
DepositsPer organizationCumulative . . . .
Tennessee (281)Assets
Per organization . . . . . . .Cumulative
DepositsPer organizationCumulative . . . .
Texas (1,204)Assets
Per organizationCumulative . . . .
DepositsPer organization . . . . .Cumulative . . .
Utah (56)Assets
Per organizationCumulative . . . .
DepositsPer organizationCumulative . . . .
Vermont (26)Assets
Per organization . . . . . . .Cumulative
DepositsP e r organization . . .Cumulative
Virginia (151)Assets
Per organization . .Cumulative
DepositsPer organization .Cumulative
Rank, by total assets
1 2 3 4 5 6 7 8 9 10
December 1983
37.137.1
36.536.5
20.220.2
15.215.2
49.149.1
39.639.6
19.319.3
17.317.3
37.637.6
27.727.7
15.515.5
14.414.4
12.712.7
10.510.5
30.130.1
30.130.1
21.82
21.8
22.122.1
21.121.1
20.520.5
34.371.5
31.768.2
11.131.3
8.623.9
22.171.2
25.965.5
17.52
36.8
17.835.1
14.752.3
17.545.2
12.127.6
11.626.1
9.922.6
7.718.3
22.252.3
20.250.4
11.833.7
11.833.9
15.937.0
15.035.6
6.778.3
7.175.4
7.238.5
7.030.9
19.991.2
23.188.7
14.451.2
13.348.5
11.563.9
12.557.8
11.539.1
11.337.4
9.532.1
8.526.8
9.962.2
10.160.5
11.745.5
11.545.5
10.948.0
10.145.7
4.22
82.5
4.780.1
4.443.0
4.535.5
3. 12
94.3
4.092.7
14.265.4
14.262.8
2.366.2
2.760.5
8.147.3
7.645.0
9.141.3
9.035.9
7.870.1
8.068.6
11.256.7
11.356.8
9.857.9
9.355.0
2.184.6
2.482.6
4.147.2
3.739.2
1.996.3
2.595.3
7.372.8
8.170.9
2.168.3
2.463.0
6.053.3
5.550.6
6.647.9
6.342.2
7.12
77.2
7.576.1
9.065.8
8.965.8
8.065.9
7.762.7
1.686.3
1.884.5
3.550.8
3.943.2
.897.1
.996.3
4.076.8
4.375.3
1.670.0
1.964.9
3.556.8
3.153.8
4.452.4
4.646.9
3.680.8
3.379.4
4.870.6
4.770.5
6.872.8
7.770.5
1.087.3
1.185.7
3.053.8
3.346.6
.697.7
.797.1
2.12
78.9
2.277.6
1.471.4
1.666.6
1.258.1
1.355.1
4.456.9
4.751.6
3.384.1
3.783.1
3.874.5
3.774.3
5.478.3
5.876.3
.988.2
1.086.8
2.356.2
2.649.2
.598.2
.697.7
1.32
80.3
1.479.0
1.372.7
1.568.1
1.22
59.3
1.256.4
3.059.9
3.054.6
1.42
85.5
1.584.6
3.477.9
3.477.7
2.380.7
2.578.9
.92
89.2
.987.7
2.158.3
2.351.5
.598.7
.698.4
1.22
81.5
1.380.3
1.273.9
1.469.5
1.060.4
1.157.5
1.861.7
1.956.6
.986.4
.785.3
2.72
80.6
2.680.4
.981.6
.979.9
.589.8
.688.4
2.060.4
2.554.0
.399.1
.498.9
1.182.7
1.281.6
1.175.1
1.370.9
.961.4
1.058.6
1.463.1
1.558.1
.987.3
.986.3
1.882.4
1.882.3
.882.5
.980.8
206Digitized for FRASER http://fraser.stlouisfed.org/ Federal Reserve Bank of St. Louis

82. Percentage of total assets and total deposits held by 10 largest banking organizations(all commercial banks and trust companies), by state—Continued
State and item1
Washington (97)Assets
Per organizationCumulative
DepositsPer organizationCumulative
West Virginia (225)Assets
Per organizationCumulative
DepositsPer organization . . . .Cumulative
Wisconsin (467)Assets
Per organizationCumulative
DepositsPer organizationCumulative
Wyoming (64)Assets
Per organizationCumulative . . . . . . .
DepositsPer organizationCumulative . . , . . . .
United States (12,135)Assets
Per organizationCumulative
DepositsPer organizationCumulative .
Rank, by total assets
I 2 3 4 5 6 7 8 9 [ 10
December 1983
30.330.3
28.028.0
5.55.5
5.15.1
13.313.3
11.911.9
17.117.1
16.916.9
4.04.0
4.34.3
21.652.0
21.349.3
3.48.9
2.98.1
10.123.5
8.620.5
12.129.2
12.029.0
3,07.0
2.06.3
10.562.5
10.559.9
2.611.6
2.010.1
7.430.9
7.327.8
11.841.1
11.640.6
2.19.2
1.78.1
7.870.4
8.468.4
2.42
14.0
2.312.4
3.034.0
3.131.0
4.345.4
4.345.0
1.911.1
1.910.0
6.176.5
6,274.6
2.32
16.4
2.414.8
2.536.5
2.533.5
3.849.2
3.848.9
1.913.1
1.511.5
4.82
81.3
5.279.9
1.818.2
1.816.7
1.938.5
1.935.5
3.62
52.8
3.652.6
1.815.0
1.413.0
2.483.8
2.682.5
1.820.0
1.718.4
1.840.3
1.637.2
2.955.8
2.955.5
1.516.5
1.414.5
2.02
85.8
2.184.7
1.721.7
1.319.8
1.742.1
1.739.0
2.258.0
2.357.9
1.518.0
1.015.5
1.32 1.087.2 88.2
1.4 1.086.1 87.1
1.6 1.623.3 24.9
1.4 1.621.2 22.8
1.7 1.543.8 45.3
1.8 1.540.8 42.3
1.9 1.860.0 61.8
1.9 1.859.9 61.7
1.4 1.319.5 20.9
.8 .616.4 17.1
207Digitized for FRASER http://fraser.stlouisfed.org/ Federal Reserve Bank of St. Louis

83. Banking offices, assets, and deposits of banks in holding company groups1
A. Summary totals and comparisons
Item
Banking officesTotal
BanksBranches
Amounts (millionsof dollars)
AssetsDeposits
Banking officesTotal . . . .
BanksBranches
Amounts (millionsof dollars)
AssetsDeposits . . .
50 states and District of Columbia
Holding companygroups
41,4577,722
33,736
1,734,9481,279,454
42,5687,721
34,847
2,049,0181,587,430
All commercialbanks
56,11214,55841,554
2,019,9041,527,225
57,12014,55842,562
2,334,4221,835,621
Holding companygroups aspercentage
of all commercialbanks
December 31, 1983
73.9
85.983.8
December 31, 1982,
74.5
87.886.5
Statewide
domestic data only
22,3291,144
21,185
961,565684,156
ncluding foreign data
23,1871,144
22,043
1,221,300930,373
Type of branching
Limited
13,9193,099
10,820
415,485326,391
14,0623,099
10,963
432,140341,781
Unit
5,2093,4781,731
357,887268,898
5,3203,4791,841
395,588315,286
B. Multibank and one-bank classifications — Summary
Classification
Total (5,410companies) . . . .
Member . . .Nonmember
MultibankMemberNonmember
One- bankMemberNonmember
All commercialbanks
Total (5,410companies) . . . .
MemberNonmember
MultibankMemberNonmember
One-bankMemberNonmember
All commercialbanks
Number
Holdingcompanygroups*
5,084
616
4,4684
5,084
616
4,4684
Banks
7,7223,2504,472
3,2781,7501,528
4,4441,5002,944
14,558
7,7223,2504,472
3,2781,7501,528
4,4441,5002,944
14,558
Offices
Branches3
December 31, 1982
33,73623,45310,283
19,14514,7874,358
14,5918,6665,925
41,554
December 31, 1982,
34,84724,52010,327
20,05015,6814,369
14,7978,8395,958
42,562
Total
, domestic data only
41,45826,70314,755
22,42316,5375,886
19,03510,1668,869
56,112
including foreign data
42,56927,77014,799
23,32817,4315,897
19,24110,3398,902
57,120
Amounts(in millions of dollars)
Assets
1,734,9481,380,239
354,709
1,135,248976,684158,564
599,700403,555196,144
2,019,904
2,049,0281,688,503
360,526
1 ,404,0471,244,039
160,008
644,981444,463200,518
2,334,422
Deposits
1,279,454972,783306,671
805,027668,722136,304
474,428304,061170,367
1,527,225
1,587,4401,274,188
313,252
1,058,425920,183138,242
529,015354,005175,010
1,835,621
208Digitized for FRASER http://fraser.stlouisfed.org/ Federal Reserve Bank of St. Louis

83. Banking offices, assets, and deposits of banks in holding company groups1—ContinuedC. Details, by state
State, and class of bank
50 states and District ofColumbia — Total . . . .
MemberNonmember
AlabamaMemberNonmember . . .
Alaska . ,MemberNonmember
ArizonaMemberNonmember . . . .
ArkansasMemberNonmember
CaliforniaMemberNonmember
ColoradoMember . . . .Nonmember
Connecticut . . ,MemberNonmember
DelawareMember . . . . . .Nonmember
District of ColumbiaMemberNonmember
FloridaMemberNonmember
GeorgiaMemberNonmember
HawaiiMemberNonmember
Idaho .MemberNonmember
IllinoisMemberNonmember . . . . .
IndianaMemberNonmember
Numberof
holdingcom-
panies5
Numberof
holdingcompanygroups2'5
Number of offices
Banks Branches
Banks and branches
Total
December 31, 1983
5,410
60
7
14
99
178
161
10
23
17
148
114
5
12
500
145
5,084
58
6
10
94
150
154
10
15
11
124
105
4
12
472
144
7,722
3,2504,472
1145163
734
1037
1014061
1566195
307195112
164
12
14113
1111
294149145
16343
120
44
1349
606223383
1445886
33,736
23,45310,283
572458114
655015
577397180
277157120
4,2783,2721,006
1288543
472285187
673631
150150
1,6371,175
462
817579238
140140
22917851
438218220
823483340
41,458
26,70314,755
686509177
725319
587400187
378197181
4,4343,3331,101
435280155
488289199
814734
161161
1,9311,324
607
980622358
144144
24218260
1,044441603
967541426
As a per-centage
of allcom-
mercialbankingoffices
Assets
Inmillions
ofdollars
As a per-centage
of allcom-
mercialbankassets
Deposits
Inmillions
ofdollars
As a per-centageof allcom-
mercialbank
deposits
domestic data only
73.9
82.162.5
69.484.046.2
51.856.442.2
87.698.371.1
54.267.744.5
86.894.070.5
74.278,068.3
79.190.367.0
43.577.027.2
89.991.5
83.089.671.5
70.191.949.7
54.557.6
84.086.776.9
54.055.153.2
58.965.652.2
1,734,948
1,380,239354,709
16,64114,0242,617
2,3991,2211,178
18,02012,9585,062
9,5096,3003,210
213,553183,14330,410
19,75816,2013,557
16,29310,1686,125
8,9037,2801,623
10,64110,641
60,89545,91014,985
27,80522,1715,634
5,9555,955
5,8654,932
933
112,33191,30121,031
27,18318,3558,828
85.9
91.469.7
75.386.045.3
60.855.567.4
94.999.485.0
63.174.049.0
93.797.576.0
88.890.781.0
86.795.275.4
69.589.734.6
96.697.2
88.194.473.0
81.996.051.9
82.184.3
91.192.783.3
82.088.462.4
68.774.359.2
1,279,454
972,783306,671
12,90610,6092,297
1,9611,006
955
14,99210,6954,297
7,7914,9572,834
166,278139,79526,483
16,02012,8583,162
12,9587,7705,188
4,8693,933
936
8,1618,161
50,71937,48313,236
20,30415,3454,959
5,2575,257
4,7143,874
840
76,91458,25918,655
22,13314,3397,794
83.8
89.669.5
73.084.245.1
61.957.966.8
94.799.484.6
61.471.749.0
93.197.275.9
88.989.885.1
85.294.574.3
65.994.928.9
96.296.9
87.694.373.0
79.094.952.0
84.086.3
90.492.083.4
78.084.662.7
66.972.259.0
209
Digitized for FRASER http://fraser.stlouisfed.org/ Federal Reserve Bank of St. Louis

83. Banking offices, assets, and deposits of banks in holding company groups1—ContinuedC. Details, by state—Continued
State, and class of bank
IowaMemberNonmember .
KansasMember . . . . . .Nonmember
KentuckyMemberNonmember
Louisiana . . .Member . . .Nonmember
MaineMemberNonmember . . .
MarylandMemberNonmember
MassachusettsMemberNonmember
Michigan .MemberNonmember
MinnesotaMemberNonmember
MississippiMemberNonmember
MissouriMember .Nonmember
MontanaMemberNonmember
NebraskaMemberNonmember
NevadaMemberNonmember
New HampshireMemberNonmember
New JerseyMemberNonmember . . .
Number of offices
Number Numberof of
holding holdingcom- company Banks
panies5 groups2-5Branches
Banks and branches
Total
December 31, 1983
327 316 41898
320
421 402 412126286
129 129 1304288
128 126 1243094
7 6 166
10
23 15 341321
27 24 774532
52 49 212128
. . . 84
367 360 506183323
63 63 612140
253 231 508126382
64 56 1186751
312 302 314100214
4 3 431
12 12 281810
33 32 674819
465159306
19188
103
482291191
587284303
328190138
886622264
868460408
1,6861,279
407
292147145
436247189
439139300
3224
8
1367858
144142
2
1277750
1,2901,106
184
883257626
603214389
612333279
711314397
344196148
920635285
945505440
1,8981,407
491
798330468
497268229
947265682
1509159
450178272
148145
3
1559560
1,3571,154
203
As a per-centage
of allcom-
mercialbankingoffices
Assets
Inmillions
ofdollars
As a per-centageof allcom-
mercialbankassets
Deposits
Inmillions
ofdollars
As a per-centage
of allcom-
mercialbank
deposits
domestic data only
72.276.970.4
71.177.068.2
55.173.742.4
59.572.252.3
86.488.783.6
79.988.066.3
82.385.479.0
73.477.663.7
72.982.767.2
55.073.642.4
74.382.371.6
73.972.875.6
69.382.063.0
77.998.0
7.1
58.965.151.3
74.179.453.6
19,7738,592
11,181
16,4418,3018,141
16,96811,5885,380
23,40214,5478,854
3,6072,0011,606
18,72412,8315,892
38,22927,59110,638
50,31642,6887,628
36,65427,1949,460
8,8875,8513,035
37,31620,42616,889
5,8884,3171,571
12,1037,8584,244
4,2374,184
53
2,8301,882
948
36,11231,6334,479
73.475.172.2
78.684.973.1
67.082.947.4
71.084.456.3
85.886.684.8
85.490.975.5
89.595.976.3
81.586.262.5
88.194.074.6
60.781.740.6
87.194.179.9
85.585.685.5
82.591.470.0
84.698.96.8
59.471.844.3
77.683.152.9
17,0047,1039,901
14,1086,9307,178
13,2338,5934,640
19,37611,5767,800
3,0141,6291,384
14,3019,4124,889
26,97817,9229,056
40,13533,285
6,851
26,95318,6068,347
7,3844,6932,691
29,66114,86914,793
4,8283,4401,388
10,1336,3623,772
3,4363,389
47
2,3991,559
840
30,34226,388
3,954
73.575.172.4
78.284.273.2
64.480.547.0
69.783.056.2
84.985.484.4
83.489.174.2
87.394.475.8
79.784.462.7
86.292.874.5
59.380.140.8
86.193.180.0
84.584.185.5
82.190.870.6
84.398.9
7.3
58.170.443.9
76.882.552.6
210Digitized for FRASER http://fraser.stlouisfed.org/ Federal Reserve Bank of St. Louis
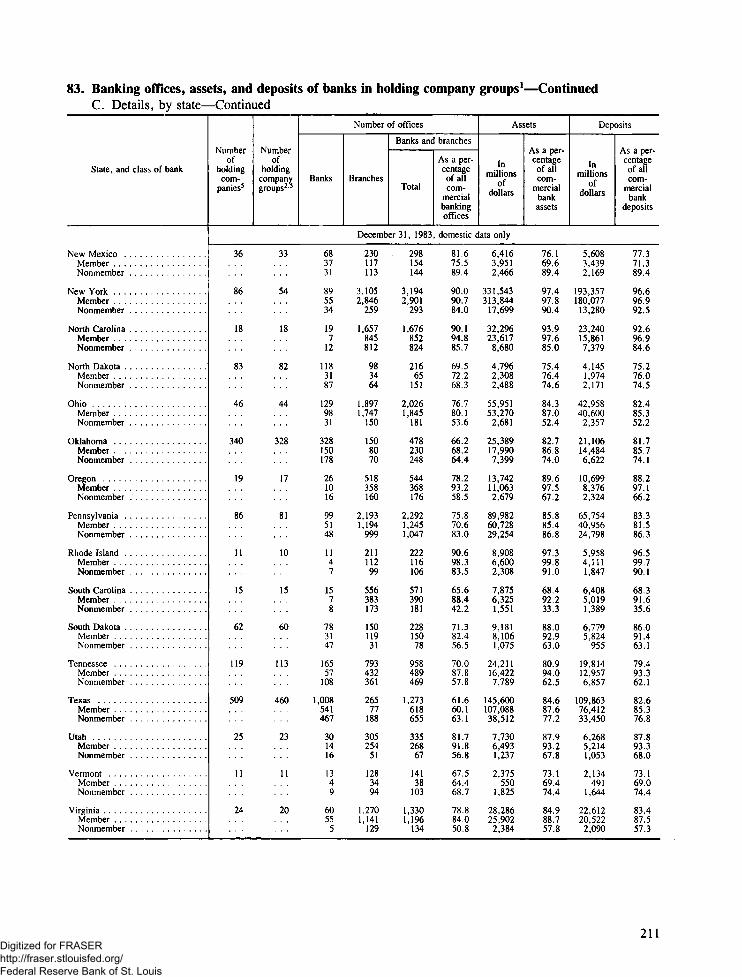
83. Banking offices, assets, and deposits of banks in holding company groups1—ContinuedC. Details, by state—Continued
State, and class of bank
New MexicoMemberNonmember . . .
New YorkMemberNonmember
North Carolina .MemberNonmember
North DakotaMemberNonmember
OhioMember . . .Nonmember
OklahomaMemberNonmember
OregonMemberNonmember
Pennsylvania .MemberNonmember
Rhode Island .MemberNonmember
South CarolinaMember . . .Nonmember
South DakotaMemberNonmember
TennesseeMemberNonmember . . .
TexasMemberNonmember
UtahMemberNonmember
VermontMemberNonmember
VirginiaMemberNonmember
Numberof
holdingcom-
panies5
Numberof
holdingcompanygroups2-5
Number of offices
Banks Branches
Banks and branches
Total
December 31, 1983
36
86
18
83
46
340
19
86
11
15
62
119
509
25
11
24
33
54
18
82
44
328
17
81
10
15
60
113
460
23
11
20
683731
895534
197
12
1183187
1299831
328150178
261016
995148
1147
1578
783147
16557
108
1,008541467
301416
1349
6055
5
230117113
3,1052,846
259
1,657845812
983464
1,8971,747
150
1508070
518358160
2,1931,194
999
21111299
556383173
15011931
793432361
26577
188
305254
51
1283494
1,2701,141
129
298154144
3,1942,901
293
1,676852824
21665
151
2,0261,845
181
478230248
544368176
2,2921,2451,047
222116106
571390181
22815078
958489469
1,273618655
33526867
14138
103
1,3301,196
134
As a per-centageof allcom-
mercialbankingoffices
Assets
Inmillions
ofdollars
As a per-centageof allcom-
mercialbankassets
Deposits
Inmillions
ofdollars
As a per-centage
of allcom-
mercialbank
deposits
domestic data only
81.675.589.4
90.090.784.0
90.194.885.7
69.572.268.3
76.780.153.6
66.268.264.4
78.293.258.5
75.870.683.0
90.698.383.5
65.688.442.2
71.382.456.5
70.087.857.8
61.660.163.1
81.791.856.8
67.564.468.7
78.884.050.8
6,4163,9512,466
331,543313,844
17,699
32,29623,6178,680
4,7962,3082,488
55,95153,270
2,681
25,38917,9907,399
13,74211,0632,679
89,98260,72829,254
8,9086,6002,308
7,8756,3251,551
9,1818,1061,075
24,21116,4227,789
145,600107,08838,512
7,7306,4931,237
2,375550
1,825
28,28625,9022,384
76.169.689.4
97.497.890.4
93.997.685.0
75.476.474.6
84.387.052.4
82.786.874.0
89.697.567.2
85.885.486.8
97.399.891.0
68.492.233.3
88.092.963.0
80.994.062.5
84.687.677.2
87.993.267.8
73.169.474.4
84.988.757.8
5,6083,4392,169
193,357180,077
13,280
23,24015,8617,379
4,1451,9742,171
42,95840,6002,357
21,10614,4846,622
10,6998,3762,324
65,75440,95624,798
5,9584,1111,847
6,4085,0191,389
6,7795,824
955
19,81412,9576,857
109,86376,41233,450
6,2685,2141,053
2,134491
1,644
22,61220,5222,090
77.371.389.4
96.696.992.5
92.696.984.6
75.276.074.5
82.485.352.2
81.785.774.1
88.297.166.2
83.381.586.3
96.599.790.1
68.391.635.6
86.091.463.1
79.493.362.1
82.685.376.8
87.893.368.0
73.169.074.4
83.487.557.3
211Digitized for FRASER http://fraser.stlouisfed.org/ Federal Reserve Bank of St. Louis

S3* Banking offices, assets, and deposits of banks in holding company groups1—ContinuedC. Details, by state—Continued
State, and class of bank
WashingtonMember . . .Nonmember
West VirginiaMember .Nonmember
WisconsinMemberNonmember
WyomingMemberNonmember
50 states and District ofColumbia— Total
MemberNonmember
AlabamaMemberNonmember
AlaskaMemberNonmember
ArizonaMember ,Nonmember
ArkansasMemberNonmember
CaliforniaMemberNonmember . . . . .
Colorado iMemberNonmember
ConnecticutMemberNonmember
DelawareMemberNonmember
District of ColumbiaMemberNonmember
Florida tMemberNonrnember
Number Numberof of
holding holdingcom- company
panies5 groups2-3
Number of offices
Banks Branches
Banks and branches
Total
December 31, 1983,
24 23
33 33
182 179
43 40
301218
392514
32088
232
886325
702639
63
28208
417164253
413
732651
81
674522
737252485
926428
As a per-centageof allcom-
mercialbankingoffices
Assets
Inmillions
ofdollars
As a per-centageof allcom-
mercialbankassets
Deposits
Inmillions
ofdollars
As a per-centageof allcom-
mercialbank
deposits
domestic data only
71.693.924.5
19.321.715.7
61.871.657.7
80.078.084.8
21,61120,468
1,144
4,3893,434
955
23,76213,04010,723
3,6642,951
713
86.497.129.0
34.839.923.9
72.680.165.1
85.384.986.7
17,54516,5211,024
3,5102,680
830
19,1989,8259,373
3,2352,597
638
85.496.829.4
32.937.423.7
71.078.064.8
85.485.086.9
December 31, 1983, including foreign data
5,410 5,084
60 58
7 6
14 10
99 94
178 150
161 154
10 10
23 15
17 11
148 124
7,7223,2504,472
1145163
734
1037
1014061
1566195
307195112
164
12
14113
1111
294149145
34,84724,52010,327
575461114
665115
582400182
277157120
4,4503,4351,015
1308743
480290190
693831
157157
1,6481,185
463
42,56927,77014,799
689512177
735419
592403189
378197181
4,6063,4961,110
437282155
496294202
834934
168168
1,9421,334
608
74.5 2,049,02882.7 1,688,50362.8 360,526
69.5 16,80784.1 14,19046.2 2,617
52.1 2,40056.8 1,22242.2 1,178
87.7 18,04498.3 12,98271.3 5,062
54.2 9,50967.7 6,30044.5 3,210
87.4 261,61094.3 231,05271.1 30,558
74.3 20,13578.1 16,57768.3 3,557
79.4 16,77890.5 10,63267.3 6,146
44.1 9,34877.8 7,72627.2 1,623
90.3 12,16791.8 12,167
83.189.771.5
61,28346,29714,985
87.8 1,587,44092.8 1,274,18870.0 313,252
75.5 13,05086.1 10,75345.3 2,297
60.8 1,96155.5 1,00667.4 955
94.9 15,01299.4 10,71585.0 4,297
63.1 7,79174.0 4,95749.0 2,834
94.7 213,25898.0 186,38775.8 26,871
89.0 16,39590.9 13,23481.0 3,162
87.0 13,44295.4 8,23375.5 5,209
70.6 5,32490.3 4,38734.6 936
97.0 9,76897.6 9,768
88.194.473.0
51,15737,92113,236
86.591.869.9
73.284.445.1
61.957.966.8
94.799.484.6
61.471.749.0
94.497.975.8
89.190.185.1
85.794.874.3
67.995.428.9
96.897.4
87.794.373.0
212Digitized for FRASER http://fraser.stlouisfed.org/ Federal Reserve Bank of St. Louis

83. Banking offices, assets, and deposits of banks in holding company groups1-C. Details, by state—Continued
-Continued
State, and class of bank
GeorgiaMemberNonmember
HawaiiMemberNonmember
IdahoMemberNonmember
IllinoisMemberNonmember
IndianaMember ,Nonmember
Iowa .MemberNonmember
KansasMemberNonmember
KentuckyMemberNonmember
LouisianaMemberNonmember
Maine ,MemberNonmember
MarylandMemberNonmember
MassachusettsMemberNonmember
MichiganMemberNonmember
MinnesotaMemberNonmember
MississippiMemberNonmember
MissouriMemberNonmember
Number of offices
Number Numberof of
holding holdingcom- company Banks
panics5 groups2-5Branches
Banks and branches
Total
As a per-centageof allcom-
mercialbankingoffices
Assets
Inmillions
ofdollars
As a per-centageof allcom-
mercialbankassets
Deposits
Inmillions
ofdollars
As a per-centageof allcom-
mercialbaqk
deposits
December 31, 1983, including foreign data
114 105 16343
120
5 4 4
4
12 12 1349
500 472 606223383
145 144 1445886
327 316 41898
320
421 402 412126286
129 129 1304288
128 126 1243094
7 6 166
10
23 15 341321
27 24 774532
52 49 21212884
367 360 506183323
63 63 612140
253 231 508126382
824586238
153
153
22917851
514294220
828488340
466160306
19188
103
484293191
590287303
328190138
893629264
934526408
1,7001,293
407
301156145
437248189
445145300
987629358
157
'l57
24218260
1,120517603
972546426
884258626
603214389
614335279
714317397
344196148
927642285
1,011571440
1,9121,421
491
807339468
498269229
953271682
70.892.050.4
68.9
73.4
84.086.776.9
55.759.053.2
59.165.852.2
72.277.070.4
71.177.068.2
55.273.842.4
59.672.452.3
86.488.783.6
80.088.166.3
83.386.979.0
73.677.763.8
73.183.167.2
55.073.742.4
74.482.671.6
28,23122,5975,634
6,431
6,431
5,8654,932
933
139,366118,35521,031
27,41218,5848,828
19,7858,604
11,181
16,4418,3018,141
17,29011,9105,380
23,46714,6128,854
3,6072,0011,606
19,34713,4545,892
46,99336,35510,638
52,54944,921
7,628
39,49330,0329,460
8,9285,8933,035
37,81420,92516,889
82.196.151.9
83.2
85.3
91.192.783.3
85.090.862.4
68.874.659.2
73.575.272.2
78.684.973.1
67.483.347.4
71.184.456.3
85.886.684.8
85.891.375.5
91.396.876.3
82.186.762.5
88.994.674.6
60.881.840.6
87.394.379.9
20,74715,7884,959
5,720
5,720
4,7143,874
840
109,79791,14218,655
22,36014,5667,794
17,0147,1139,901
14,1086,9307,178
13,5828,9414,640
19,52611,7?67,800
3,0141,6291,384
14,98410,0954,889
34,54125,4859,056
42,22335,3726,851
29,65921,312
8,347
7,4174,7262,691
30,15415,36114,793
79.395.152.0
85.1
87.3
90.492.083.4
83.589.662.7
67.272.659.0
73.575.172.4
78.284.273.2
65.081.247.0
69.883.256.2
84.985.484.4
84.089.874.2
89.896.075.8
80.585.162.7
87.393.674.5
59.480.240.8
86.393.380.0
213Digitized for FRASER http://fraser.stlouisfed.org/ Federal Reserve Bank of St. Louis

83. Banking offices, assets, and deposits of banks in holding company groups1—ContinuedC. Details, by state—Continued
State, and class of bank
MontanaMemberNonmember
Nebraska . . . . . . . . . .MemberNonmember
Nevada . . . .MemberNonmember
New Hampshire . . .MemberNonmember
New Jersey . . .MemberNonmember . .
New MexicoMember . . . ,Nonmember . . .
New YorkMember . . . .Nonmember
North CarolinaMemberNonmember . . .
North DakotaMember . . . . . . .Nonmember
OhioMemberNonmember . . . . .
OklahomaMemberNonmember
OregonMember . . .Nonmember . . .
PennsylvaniaMember . . . . . . .Nonmember
Rhode IslandMemberNonmember . . .
South CarolinaMember . . .Nonmember
South Dakota . . .MemberNonmember . . . .
Number Numberof of
holding holdingcom- company
panics5 groups2-5
Number of offices
Banks Branches
Banks and branches
Total
As a per-centageof allcom-
mercialbankingoffices
Assets
Inmillions
ofdollars
As a per-centageof allcom-
mercialbankassets
Deposits
Inmillions
ofdollars
As a per-centageof allcom-
mercialbank
deposits
December 31, 1983, including foreign data
64 56
312 302
4 3
12 12
33 32
36 33
86 54
18 18
83 82
46 44
340 328
19 17
86 81
11 10
15 15
62 60
1186751
314100214
431
281810
674819
683731
895534
197
12
1183187
1299831
328150178
261016
995148
1147
1578
783147
32248
1367858
144142
2
1388850
1,2981,114
184
230117113
3,6383,368
270
1,668855813
983464
1,9141,764
150
1548470
522362160
2,2291,2261,003
21511699
559386173
15011931
1509159
450178272
148145
3
16610660
1,3651,162
203
298154144
3,7273,423
304
1,687862825
21665
151
2,0431,862
181
482234248
548372176
2,3281,2771,051
226120106
574393181
22815078
73.972.875.6
69.382.063.0
77.998.0
7.1
63.172.651.3
74.179.553.6
81.675.589.4
91.492.085.4
90.294.885.8
69.572.268.3
76.980.353.6
66.668.664.8
78.393.258.5
76.171.283.1
94.698.490.6
65.888.542.2
71.382.456.5
5,8884,3171,571
12,1037,8584,244
4,2374,184
53
2,8301,882
948
36,56432,0864,479
6,4163,9512,466
525,457502,658
22,799
34,54325,8638,680
4,7962,3082,488
56,91854,237
2,681
25,39918,0007,399
14,02111,3422,679
98,49169,16529,327
9,2796,9712,308
7,8756,3251,551
9,1818,1061,075
85.585.685.5
82.591.470.0
84.698.96.8
59.471.844.3
77.883.352.9
76.169.689.4
98.398.692.3
94.297.885.0
75.476.474.6
84.787.352.4
82.786.874.0
89.897.667.2
86.986.986.8
97.499.891.0
68.492.233.3
88.092.963.0
4,8283,4401,388
10,1336,3623,772
3,4363,389
47
2,3991,559
840
30,78826,833
3,954
5,6083,4392,169
374,471355,554
18,918
26,39619,0177,379
4,1451,9742,171
43,90641,549
2,357
21,38714,7666,622
10,9768,6532,324
73,06948,19924,870
7,0545,2071,847
6,4085,0191,389
6,7795,824
955
84.584.185.5
82.190.870.6
84.398.9
7.3
58.170.443.9
77.082.752.6
77.371.389.4
98.198.394.6
93.597.484.6
75.276.074.5
82.985.752.2
81.986.074.1
88.497.266.2
84.783.886.3
97.099.890.1
68.391.635.6
86.091.463.1
214Digitized for FRASER http://fraser.stlouisfed.org/ Federal Reserve Bank of St. Louis

83. Banking offices, assets, and deposits of banks in holding company groups1—ContinuedC. Details, by state—Continued
State, and class of bank
Tennessee .MemberNonmember
TexasMember . . .Nonmember
UtahMemberNonmember
VermontMemberNonmember
VirginiaMember . .Nonmember
Washington . . .MemberNonmember
West VirginiaMember . . .Nonmember
WisconsinMemberNonmember
WyomingMemberNonmember
Numberof
holdingcom-
panies5
Numberof
holdingcompanygroups2'5
Number of offices
Banks Branches
Banks and branches
Total
As a per-centageof allcom-
mercialbankingoffices
Assets
Inmillions
ofdollars
As a per-centageof allcom-
mercialbankassets
Deposits
Inmillions
ofdollars
As a per-centageof allcom-
mercialbank
deposits
December 31, 1983, including foreign data
119
509
25
11
24
24
33
182
43
113
460
23
11
20
23
33
179
40
16557
108
1,008541467
301416
1349
60555
301218
392514
32088
232
886325
799438361
291103188
306255
51
1283494
1,2751,146
129
71865563
2820
8
422169253
413
964495469
1,299644655
33626967
14138
103
1,3351,201
134
74866781
674522
742257485
926428
70.487.958.1
62.161.163.1
81.891.856.8
67.564.468.7
78.984.050.8
72.094.124.5
19.321.715.7
61.972.057.7
80.0- 78.0
84.8
24,46116,6727,789
155,381116,86938,512
7,8506,6131,237
2,375550
1,825
28,86726,4832,384
22,85021,707
1,144
4,3893,434
955
24,09313,37010,723
3,6642,951
713
81.094.162.5
85.488.577.2
88.193.367.8
73.169.474.4
85.188.957.8
87.097.229.0
34.839.923.9
72.880.565.1
85.384.986.7
19,94413,0876,857
122,49189,04133,450
6,3885,3341,053
2,134491
1,644
23,19921,1092,090
18,52217,498
1,024
3,5102,680
830
19,51610,1439,373
3,2352,597
638
79.693.362.1
84.187.276.8
88.093.568.0
73.169.074.4
83.887.857.3
86.197.029.4
32.937.423.7
71.378.564.8
85.485.086.9
215Digitized for FRASER http://fraser.stlouisfed.org/ Federal Reserve Bank of St. Louis

83. Banking offices, assets, andD. Multibank, one-bank, and
deposits of banks in holding company groups1—Continuedall commercial bank comparisons, by state
State, and type ofholding company
50 states and Districtof Columbia —Total
MultibankOne-bank
Alabama . . .MultibankOne-bank
AlaskaMultibankOne-bank
ArizonaMultibank . . .One-bank . . .
ArkansasMultibankOne-bank
CaliforniaMultibankOne-bank
ColoradoMultibank . . . .One-bank . . ,
ConnecticutMultibank . . .One-bank
DelawareMultibankOne-bank
District ofColumbia
MultibankOne-bank . . .
FloridaMultibank . , . .One-bank
GeorgiaMultibankOne-bank . . .
Hawaii . . .MultibankOne-bank . . . .
IdahoMultibankOne-bank
IllinoisMultibank . . .One-bank
Indiana . , .MultibankOne-bank .
Type Nu^
*& c |̂6 groups2-3
5,0836
6154,4684
L 589
49
S 624
S 1019
L 945
89
S 15011
139
U 15426
128
S 1046
S 15114
S 111
10
S 1243094
L 1051887
S 413
S 1248
U 47173
398
L 1442
142
Number of offices
Holding companies
Banks
7,7213,2774,444
1146648
734
1019
1011289
15618
138
307181126
16106
14104
111
10
29420193
1637984
413
1358
605205400
1442
142
Branches
33,73619,14514,591
572495
77
659
56
577171406
27754
223
4,2781,8742,404
1288939
472212260
672938
15026
124
1,6371,369
268
817635182
14015
125
22919732
438171267
82335
788
Total B<
December 31
All commercial banks
inks Branches Total
Amounts (millions of dollars)
Assets
Holdingcom-
panies
All com-mercialbanks
Deposits
Holdingcom-
panies
All com-mercialbanks
1983, domestic data only
41,457 14,558 41,55422,42219,035
686 273 716561125
72 14 1251260
587 45 625172415
378 261 43766
312
4,434 411 4,6951,8922,542
435 446 140270165
488 51 566222266
81 30 1563942
161 19 16027
134
1,931 466 1,8601,570
361
980 391 1,007714266
144 16 24816
128
242 26 26220240
1,043 1,250 684376667
967 390 1,25137
930
56,112
989
139
670
698
5,106
586
617
186
179
2,326
1,398
264
288
1,934
1,641
1,734,937 2,019,904 1,279,444 1,527,2251,135,237 . . . 805,016
599,700 . . . 474,428
16,641 22,088 12,906 17,69214,156 . . . 10,7222,485 . . . 2,185
2,399 3,949 1,961 3,166428 . . . 371
1,971 . . . 1,590
18,020 18,988 14,992 15,8384,851 . . . 4,119
13,169 . . . 10,873
9,509 15,066 7,791 12,6952,214 . . . 1,7987,295 . . . 5,993
213,553 227,874 166,278 178,681102,620 . . . 82,136110,933 . . . 84,142
19,758 22,252 16,020 18,02515,825 . . . 12,5493,933 . . . 3,471
16,293 18,803 12,958 15,2108,103 . . . 6,4638,190 . . . 6,495
8,903 12,803 4,869 7,3856,284 . . . 3,2562,618 . . . 1,613
10,641 11,012 8,161 8,483902 . . . 672
9,740 . . . 7,489
60,895 69,149 50,719 57,89551,070 . . . 42,2089,825 . . . 8,511
27,805 33,956 20,304 25,71023,063 . . . 16,3014,742 . . . 4,002
5,955 7,251 5,257 6,261441 . . . 402
5,514 . . . 4,855
5,865 6,438 4,714 5,2165,334 . . . 4,240
532 . . . 474
112,321 136,972 76,904 98,61159,301 . . . 36,06153,020 . . . 40,843
27,183 39,591 22,133 33,0641,055 . . . 901
26,128 . . . 21,233
216Digitized for FRASER http://fraser.stlouisfed.org/ Federal Reserve Bank of St. Louis

83. Banking offices, assets, and deposits of banks in holding company groups1—ContinuedD. Multibank, one-bank, and all commercial bank comparisons, by state—Continued
State, and type ofholding company
IowaMultibankOne-bank
KansasMultibankOne-bank
KentuckyMultibankOne-bank
LouisianaMultibankOne-bank
MaineMultibankOne-bank
MarylandMultibank . . .One-bank
MassachusettsMultibankOne-bank
MichiganMultibankOne-bank
MinnesotaMultibankOne-bank
MississippiMultibankOne-bank
MissouriMultibankOne-bank
MontanaMultibankOne-bank
NebraskaMultibankOne-bank
NevadaMultibankOne-bank
New HampshireMultibankOne-bank
New JerseyMultibankOne-bank
Typeof
branch-ing7
Numberof
holdingcompanygroups2'5
Number of offices
Holding companies
Banks Branches Total
All commercial
Banks
December 31, 1983
L
U
L
L
S
S
L
L
L
L
U
U
U
S
S
S
31623
293
40212
390
1291
128
126
126
633
1578
249
15
492425
36026
334
63
' 63
23147
184
561244
3029
293
312
1257
321121
418125293
41219
393
1302
128
124
124
16133
34268
776215
21218725
506174332
61
61
508325183
1187543
31418
296
413
28217
674621
465244221
19122
169
48248
434
587
587
328180148
886676210
868745123
1,6861,564
122
292155137
436
436
439321118
3229
3
13625
111
1447272
1279334
1,290954336
883369514
60341
562
61250
562
711
711
344193151
920702218
945807138
1,8981,751
147
798329469
497
497
947646301
15010446
45043
407
1487375
15511441
1,3571,000
357
639
623
337
286
31
89
126
371
753
161
737
169
477
14
66
136
Branches
banks
Total
Amounts (millions of dollars)
Assets
Holdingcom-
panies
All com-mercialbanks
Deposits
Holdingcom-panies
All com-mercialbanks
domestic data only
584
225
773
908
367
1,063
1,022
2,214
342
743
538
34
172
176
197
1,696
1,223
848
1,110
1,194
398
1,152
1,148
2,585
1,095
904
1,275
203
649
190
263
1,832
19,7739,388
10,386
16,4412,326
14,115
16,9683,246
13,722
23,402
23,402
3,6072,1651,442
18,72414,0684,655
38,22931,9756,254
50,31647,461
2,855
36,65427,891
8,763
8,887
8,887
37,31631,779
5,537
5,8884,6351,253
12,1033,2028,900
4,2372,4771,760
2,8302,169
661
36,11227,397
8,715
26,921
20,907
25,315
32,959
4,206
21,917
42,715
61,755
41,602
14,634
42,827
6,884
14,663
5,010
4,761
46,540
17,0047,9989,006
14,1081,947
12,161
13,2332,199
11,034
19,376
19,376
3,0141,7961,217
14,30110,6253,677
26,97822,5154,463
40,13537,6092,527
26,95319,1807,774
7,384
7,384
29,66124,7294,933
4,8283,7121,116
10,1332,5127,622
3,4362,0781,359
2,3991,822
577
30,34222,7527,590
23,133
18,035
20,539
27,816
3,549
17,152
30,919
50,379
31,260
12,453
34,467
5,713
12,348
4,079
4,130
39,519
217Digitized for FRASER http://fraser.stlouisfed.org/ Federal Reserve Bank of St. Louis

83. Banking offices, assets, andD. Multibank, one-bank, and
deposits of banks in holding company groups1—Continuedall commercial bank comparisons, by state—Continued
State, and type ofholding company
New MexicoMultibankOne-bank
New YorkMultibankOne-bank
North CarolinaMultibankOne-bank
North DakotaMultibankOne-bank
OhioMultibankOne-bank . . . .
OklahomaMultibankOne-bank
OregonMultibankOne-bank . . . . . . . .
PennsylvaniaMultibankOne-bank
Rhode IslandMultibankOne-bank
South CarolinaMultibank . . .One-bank
South DakotaMultibankOne-bank
TennesseeMultibankOne-bank
Texas . . .MultibankOne-bank
UtahMultibankOne-bank
VermontMultibankOne-bank
VirginiaMultibankOne-bank
Typeof
branch-ing7
L
S
S
U
L
U
S
L
S
S
S
L
U
S
S
S
Numberof
holdingcompanygroups2'5
338
25
542034
182
16
828
74
441727
32811
317
174
13
811962
1019
151
14
601248
11312
101
46091
369
235
18
1129
208
12
Number of offices
Holding companies
Banks
684226
895633
193
16
1184573
12910326
32815
313
261313
993762
1129
151
14
783147
16565
100
1,008647361
301218
1349
604812
Branches Total B
December 3 1
23015476
3,1052,185
920
1,657257
1,400
984652
1,8971,638
259
1508
142
518408110
2,1931,272
921
21144
167
55665
491
1509951
793498295
26521055
305186119
1284286
1,270639631
298196102
3,1942,241
953
1,676260
1,416
21691
125
2,0261,741
285
47823
455
544421123
2,2921,309
983
22246
176
57166
505
22813098
958563395
1,273857416
335198137
1414695
1,330687643
All commercial banks
anks Branches Total
Amounts (millions of dollars)
Assets
Holdingcom-panies
All com-mercialbanks
Deposits
Holdingcom-panies
All com-mercialbanks
, 1983, domestic data only
93 272
204 3,343
70 1,790
180 131
343 2,299
527 195
81 615
333 2,691
15 230
72 798
146 174
332 1,037
1,727 339
61 349
28 181
191 1,497
365
3,547
1,860
311
2,642
722
696
3,024
245
870
320
1,369
2,066
410
209
1,688
6,4164,7541,663
331,543273,861
57,683
32,2967,873
24,424
4,7962,8281,968
55,95147,250
8,701
25,3892,987
22,401
13,74211,874
1,868
89,98263,22026,762
8,9082,0276,881
7,875469
7,406
9,1817,6941,487
24,21117,2316,980
145,600127,55818,042
7,7304,8612,869
2,375822
1,553
28,28612,08816,199
8,432
340,458
34,412
6,359
66,343
30,714
15,334
104,864
9,152
11,520
10,435
29,943
172,091
8,793
3,248
33,323
5,6084,1341,474
193,357155,20638,151
23,2405,392
17,848
4,1452,4151,731
42,95835,9756,982
21,1062,416
18,690
10,6999,0891,610
65,75443,50822,246
5,9581,5994,358
6,408411
5,998
6,7795,4671,312
19,81413,7306,084
109,86393,75816,105
6,2684,0152,252
2,134748
1,386
22,6129,956
12,656
7,253
200,215
25,086
5,512
52,121
25,833
12,134
78,982
6,175
9,382
7,886
24,941
133,082
7,137
2,920
27,100
218Digitized for FRASER http://fraser.stlouisfed.org/ Federal Reserve Bank of St. Louis

83. Banking offices, assets, andD. Multibank, one-bank, and
deposits of banks in holding company groups1 — Continuedall commercial bank comparisons, by state — Continued
State, and type ofholding company
WashingtonMultibankOne-bank ,
West VirginiaMultibankOne-bank
WisconsinMultibank . . . . . . . .One-bank
WyomingMultibankOne-bank
TOTALS BYSTATE-BRANCHING
CLASSIFICATION
Statewidebranching
MultibankOne-bank
Limited branching . . . .MultibankOne-bank
Unit bankingMultibankOne-bank
50 states andDistrict ofColumbia —Total
MultibankOne-bank . . . .
AlabamaMultibankOne-bank . .
AlaskaMultibankOne-bank
ArizonaMultibankOne-bank
ArkansasMultibankOne-bank
California . . . .MultibankOne-bank
ColoradoMultibankOne-bank
Type N7fber
branch- holdinS. 7 company* groups2-5
Number of offices
Holding companies
Banks Branches Total
All commercial banks
Banks
December 31, 1983
S 239
14
U 338
25
L 17932
147
U 401228
25 742175567
17 2,198205
1,993
9 2,198290
1,908
301614
391425
320174146
886028
1,144580564
3,0991,1221,977
3,4781,5751,903
702567135
281018
417305112
431
21,18511,6419,544
10,8206,5884,232
1,731916815
732583149
672443
737479258
926329
22,32912,22110,108
13,9197,7106,209
5,2092,4912,718
100
231
609
111
2,715
6,123
5,720
December 31, 1983,
5,083
6154,468
L 589
49
S 624
S 1019
L 945
89
S 15011
139
U 15426
128
7,721
3,2774,444
1146648
734
1019
1011289
15618
138
307181126
34,847
20,05014,797
57549877
669
57
582172410
27754
223
4,4502,0072,443
1309139
42,568
23,32719,241
689564125
731261
592173419
37866
312
4,6062,0252,581
437272165
14,558
273
14
45
261
411
446
Branches Total
Amounts (millions of dollars)
Assets
Holdingcom-panies
All com-mercialbanks
Deposits
Holdingcom-panies
All com-mercialbanks
domestic data only
923
116
584
4
24,787
14,500
2,267
1,023
347
1,193
115
27,502
20,623
7,987
21,61119,0722,540
4,3892,0322,357
23,76218,5025,261
3,6642,4091,255
961,565632,168329,397
415,485253,206162,280
357,887249,864108,023
25,021
12,604
32,753
4,298
1,055,262
537,389
427,253
17,54515,2932,252
3,5101,5661,944
19,19814,5594,638
3,2352,1091,126
684,156433,622250,533
326,391191,602134,788
268,898179,79289,106
20,547
10,658
27,050
3,789
764,127
433,516
329,583
including foreign data
42,562
719
126
630
437
4,858
142
57,120
992
140
675
698
5,269
588
2,049,018 2,334,422 1,587,430 1,835,621
1,404,036 . . . 1,058,415644,981 . . . 529,015
16,807 22,254 13,050 17,83514,322 . . . 10,8652,485 . . . 2,185
2,400 3,949 1,961 3,166428 . . . 371
1,971 . . . 1,590
18,044 19,012 15,012 15,8574,875 . . . 4,139
13,169 . . . 10,873
9,509 15,066 7,791 12,6952,214 . . . 1,7987,295 . . . 5,993
261,610 276,115 213,258 225,821140,831 . . . 114,576120,779 . . . 98,682
20,135 22,628 16,395 18,40016,201 . . . 12,9243,933 . . . 3,471
219Digitized for FRASER http://fraser.stlouisfed.org/ Federal Reserve Bank of St. Louis

83. Banking offices, assets, and deposits of banks in holding company groups1—ContinuedD. Multibank, one-bank, and all commercial bank comparisons, by state—Continued
State, and type ofholding company
ConnecticutMultibankOne-bank
DelawareMultibankOne-bank . .
District ofColumbia . . .
MultibankOne-bank
FloridaMultibankOne-bank
GeorgiaMultibankOne-bank
HawaiiMultibankOne-bank
IdahoMultibankOne-bank
Illinois . . .Multibank . . . . . . .One-bank .
IndianaMultibankOne-bank
IowaMultibankOne-bank . . . .
KansasMultibankOne-bank . . .
KentuckyMultibankOne-bank . . .
LouisianaMultibankOne-bank
MaineMultibankOne-bank .
MarylandMultibankOne-bank
MassachusettsMultibankOne-bank
Typeof
branch-ing7
S
S
S
S
L
S
S
u
L
L
U
L
L
S
S
L
Numberof
holdingcompanygroups2-5
1046
15114
111
10
1243094
1051887
413
1248
47173
398
1442
142
31623
293
40212
390
1291
128
126
126
633
1578
249
15
Number of offices
Holding companies
Banks
16106
14104
111
10
29420193
1637984
413
1358
605205400
1442
142
418125293
41219
393
1302
128
124
124
16133
34268
776215
Branches
480215265
693138
15727
130
1,6481,374
274
824642182
15315
138
22919732
514207307
82835
793
466245221
19122
169
48449
435
590
590
328180148
893682211
934809125
Total B
December 3 1 ,
496225271
834142
16828
140
1,9421,575
367
987721266
15716
141
24220240
1,119412707
97237
935
884370514
60341
562
61451
563
714
714
344193151
927708219
1,011871140
All commercial banks
anks Branches Total
Amounts (millions of dollars)
Assets
Holdingcom-panies
All com-mercialbanks
Deposits
Holdingcom-panies
All com-mercialbanks
1983, including foreign data
51 574
30 158
19 167
466 1,871
391 1,003
16 212
26 262
1,250 759
390 1,256
639 585
623 225
337 775
286 911
31 367
89 1,070
126 1,088
625
188
186
2,337
1,394
228
288
2,009
1,646
1,224
848
1,112
1,197
398
1,159
1,214
16,7788,1818,597
9,3486,7302,618
12,167940
11,227
61,28351,3919,892
28,23123,4894,742
6,431441
5,990
5,8655,334
532
139,35572,16167,194
27,4121,055
26,357
19,7859,399
10,386
16,4412,326
14,115
17,2903,420
13,870
23,467
23,467
3,6072,1651,442
19,34714,6784,668
46,99340,377
6,617
19,288
13,249
12,538
69,537
34,382
7,727
6,438
164,007
39,820
26,933
20,907
25,636
33,024
4,206
22,540
51,479
13,4426,5406,902
5,3243,7021,621
9,768710
9,059
51,15742,5868,570
20,74716,7454,002
5,720402
5,318
4,7144,240
474
109,78754,69255,095
22,360901
21,460
17,0148,0089,006
14,1081,947
12,161
13,5822,399
11,183
19,526
19,526
3,0141,7961,217
14,98411,2953,689
34,54129,7354,806
15,694
7,840
10,090
58,333
26,153
6,724
5,216
131,494
33,291
23,143
18,035
20,888
27,966
3,549
17,834
38,482
220Digitized for FRASER http://fraser.stlouisfed.org/ Federal Reserve Bank of St. Louis

83. Banking offices, assets, and deposits of banks in holding company groups1—ContinuedD. Multibank, one-bank, and all commercial bank comparisons, by state—Continued
State, and type ofholding company
Michigan . . . .MultibankOne-bank
MinnesotaMultibankOne-bank
MississippiMultibankOne-bank
MissouriMultibankOne-bank
MontanaMultibankOne-bank
NebraskaMultibankOne-bank
NevadaMultibankOne-bank
New HampshireMultibank . . . .One-bank
New JerseyMultibank . . .One-bank
New MexicoMultibankOne-bank
New YorkMultibankOne-bank
North CarolinaMultibankOne-bank
North DakotaMultibankOne-bank
OhioMultibankOne-bank
OklahomaMultibankOne-bank
OregonMultibankOne-bank
Typeof
branch-ing7
L
L
L
U
U
U
S
S
S
L
S
S
U
L
U
S
Numberof
holdingcompanygroups2-5
492425
36026
334
63
'63
23147
184
56\144
3029
293
312
1257
321121
338
25
542034
182
16
828
74
441727
32811
317
174
13
Number of offices
Holding companies
Banks
21218725
506174332
61
" 61
508325183
1187543
31418
296
413
2821
7
674621
684226
895633
193
16
1184573
12910326
32815
313
261313
Branches
1,7001,578
122
301164137
437
437
445327118
3229
3
13625
111
1447272
13810434
1,298961337
23015476
3,6382,675
963
1,668262
1,406
984652
1,9141,653
261
1549
145
522412110
Total B
December 31,
1,9121,765
147
807338469
498
498
953652301
15010446
45043
407
1487375
16612541
1,3651,007
358
298196102
3,7272,731
996
1,687265
1,422
21691
125
2,0431,756
287
48224
458
548425123
All commercial banks
anks Branches Total
Amounts (millions of dollars)
Assets
Holdingcom-panies
All com-mercialbanks
Deposits
Holdingcom-panies
All com-mercialbanks
1983, including foreign data
371 2,227
753 351
161 744
737 544
169 34
477 172
14 176
66 197
136 1,705
93 272
204 3,873
70 1,801
180 131
343 2,315
527 197
81 619
2,598
1,104
905
1,281
203
649
190
263
1,841
365
4,077
1,871
311
2,658
724
700
52,54949,694
2,855
39,49330,7298,763
8,928
8,928
37,81432,2785,537
5,8884,6351,253
12,1033,2028,900
4,2372,4771,760
2,8302,169
661
36,56427,839
8,725
6,4164,7541,663
525,457452,616
72,841
34,5439,430
25,113
4,7962,8281,968
56,91848,014
8,903
25,3992,987
22,412
14,02112,1531,868
63,988
44,441
14,675
43,326
6,884
14,663
5,010
4,761
47,003
8,432
534,712
36,659
6,359
67,211
30,725
15,613
42,22339,696
2,527
29,65921,8857,774
7,417
7,417
30,15425,2214,933
4,8283,7121,116
10,1332,5127,622
3,4362,0781,359
2,3991,822
577
30,78823,1877,600
5,6084,1341,474
374,471318,75055,721
26,3966,864
19,532
4,1452,4151,731
43,90636,7237,183
21,3872,461
18,926
10,9769,3661,610
52,467
33,966
12,486
34,959
5,713
12,348
4,079
4,130
39,975
7,253
381,669
28,243
5,512
52,970
26,115
12,411
221Digitized for FRASER http://fraser.stlouisfed.org/ Federal Reserve Bank of St. Louis

83. Banking offices, assets, andD. Multibank, one-bank, and
deposits of banks in holding company groups1—Continuedall commercial bank comparisons, by state—Continued
State, and type ofholding company
PennsylvaniaMultibankOne-bank
Rhode IslandMultibankOne-bank
South Carolina . . . .MultibankOne-bank
South DakotaMultibankOne-bank
TennesseeMultibankOne-bank
TexasMultibankOne-bank
UtahMultibankOne-bank
VermontMultibankOne-bank
VirginiaMultibankOne-bank
WashingtonMultibankOne-bank
West VirginiaMultibankOne- bank
WisconsinMultibankOne-bank
WyomingMultibankOne-bank
TOTALS BYSTATE-BRANCHING
CLASSIFICATION
Statewidebranching
MultibankOne-bank
Limited branching . . . .MultibankOne-bank
Unit branching . . . . . . .MultibankOne-bank
Type N7fter
*& «££&ms groups2-5
Number of offices
Holding companies
Banks Branches Total
All commercial banks
Banks Branches Total
Amounts (millions of dollars)
Assets
Holdingcom-panies
All com-mercialbanks
Deposits
Holdingcom-
panies
All com-mercialbanks
December 31, 1983, including foreign data
L 811962
S 1019
S 15I
14
S 601248
L 11312
101
U 46091
369
S 235
18
S 1129
S 208
12
S 239
14
U 338
25
L 17932
147
U 401228
25 742175567
17 2,198205
1,993
9 2,198290
1,908
993762
1129
15
14
783147
16565
100
1,008647361
301218
1349
604812
301614
391425
320174146
886028
1,144580564
3,0991,1221,977
3,4781,5751,903
2,2291,296
933
21545
170
55965
494
1509951
799504295
29123655
306186120
1284286
1,275639636
718583135
281018
422310112
431
22,04312,3509,693
10,9636,7144,249
1,841986855
2,3281,333
995
22647
179
57466
508
22813098
964569395
1,299883416
336198138
1414695
1,335687648
748599149
672443
742484258
926329
23,18712,93010,257
14,0627,8366,226
5,3192,5612,758
333
15
72
146
332
1,727
61
28
191
100
231
609
111
2,715
6,123
5,720
2,726
224
801
174
1,038
365
350
181
1,502
939
116
589
4
25,563
14,623
2,376
3,059
239
873
320
1,370
2,092
411
209
1,693
1,039
347
1,198
115
28,278
20,746
8,096
98,49170,90527,586
9,2792,0307,249
7,875469
7,406
9,1817,6941,487
24,46117,4816,980
155,381137,339
18,042
7,8504,8612,989
2,375822
1,553
28,86712,08816,780
22,85020,3112,540
4,3892,0322,357
24,09318,8335,261
3,6642,4091,255
1,221,300861,856359,444
432,140268,800163,339
395,578273,380122,197
113,374
9,524
11,520
10,435
30,193
181,872
8,913
3,248
33,904
26,260
12,604
33,084
4,298
1,315,534
553,944
464,943
73,069 86,29749,94823,121
7,054 7,2701,6035,451
6,408 9,382411
5,998
6,779 7,8865,4671,312
19,944 25,07113,8606,084
122,491 145,710106,38716,105
6,388 7,2574,0152,372
2,134 2,920748
1,386
23,199 27,6879,956
13,243
18,522 21,52416,2702,252
3,510 10,6581,5661,944
19,516 27,36814,8784,638
3,235 3,7892,1091,126
930,373 1,010,854640,842289,532
341,781 448,806205,655136,125
315,276 375,961211,918103,358
222Digitized for FRASER http://fraser.stlouisfed.org/ Federal Reserve Bank of St. Louis

84. Consolidated report of income, 19831
A. All insured commercial banksData are consolidated with respect to domestic and foreign offices. Figures are in thousands of dollars.
2 Interest and fees on loans . . . .3 Interest on balances with
depository institutions . . .4 Income on federal funds
sold and securitiespurchased underagreements to resellin domestic officesof bank and of itsEdge and Agreementsubsidiaries
5 Interest on U.S. Treasurysecurities and on obli-gations of other U.S.government agenciesand corporations
6 U.S. Treasury securities . . .7 Obligations of other U.S.
government agenciesand corporations
8 Interest on obligationsof states and politicalsubdivisions inUnited States
9 Income from all othersecurities
10 Interest on otherbonds, notes, anddebentures
1 1 Dividends on stock12 Income from lease financing. . .13 Income from fiduciary
activities14 Service charges on
deposit accountsin domestic offices
15 Other service charges,commissions, and fees . . .
16 Other operating income17 Trading income net18 Equity in net income
of unconsolidatedsubsidiaries andassociated companies . .
19 All other
151,626,394
16,761,907
9,258,579
24,248,605(2)
(2)
10,621,431
1,976,989
(2)(2)
1,966,939
4,190,153
5,405,026
7,281,2586,353,634
(2)
(2)(2)
24,815,212
931,418
2,279,149
8,657,081(2)
(2)
2,696,880
170,514
(2)(2)52,967
141,570
1,439,615
603,145395,999(2)
(2)C2)
15,297,020
979,371
1,304,060
4,278,823(2)
(2)
1,765,316
176,735
(2)(2)
63,055
357,011
805,450
476,309313,151(2)
(2)(2)
13,702,100
1,022,566
1,175,333
3,364,287(2)
(2)
1,444,240
223,562
(2)(2)104,172
450,349
698,849
658,410324,409(2)
(2)(2)
25,769,107
3,376,629
1,894,441
4,263,5023,037,062
1,226,440
2,269,790
315,9341
272,93443,000
377,540
1,234,428
1,100,816
2,058,6421,233,582
338,708
-1,458896,329
72,042,955
10,451,923
2,605,596
3,684,9122,755,218
929,694
2,445,205
1,090,244
1,022,07268,172
1,369,205
2,006,795
1,360,296
3,484,7524,086,4931,453,957
209,1012,423,435
119,284,929
14,692,052
6,824,393
14,924,326(2)
(2)
7,316,599
1 ,569,504
(2)(2)
1,780,697
3,709,057
3,651,586
6,266,9915,626,342
(2)
(2)(2)
32,341,465
2,069,855
2,434,186
9,324,279(~)
(2\
3,304,832
407,485
(2\
(2)186,242
481,096
1,753,440
1,014,267727,292(2)
(2)f 2 \
223Digitized for FRASER http://fraser.stlouisfed.org/ Federal Reserve Bank of St. Louis

84. Consolidated report of income, 19831—ContinuedA. All insured commercial banks—ContinuedData are consolidated with respect to domestic and foreign offices. Figures are in thousands of dollars.
Item
20 Operating expenses, total . .
21 Salaries and employeebenefits
22 Interest on time CDs of$100,000 or moreissued by domesticoffices . .
23 Interest on depositsin foreign offices
24 Interest on other deposits . . . .25 Expense of federal funds
purchased and securi-ties sold under agree-ments to repurchasein domestic offices ofbank and of itsEdge and Agreementsubsidiaries .
26 Interest on demand notes(note balances) issuedto U.S. Treasury andother borrowed money . . .
27 Demand notes (notebalances) issued toU S Treasury
28 Other borrowed money . . . .29 Interest on subordinated
notes and debentures . . .30 Occupancy expense of
bank premises, net,and furniture andequipment expense ,
3 1 Occupancy expense ofbank premises, gross . .
32 LESS* Rental income33 Occupancy expense of
bank premises, net . . .34 Furniture and equipment
expense35 Provision for possible
loan losses36 Provision for allocated
transfer riskreserves . .
37 Other operating expenses . . . .38 Minority interest in
consolidated sub-sidiaries
39 All other
40 Income before incometaxes and securitiesgains or losses
41 Applicable income taxes . . .42 Income before securities
gains or losses43 Securities gains or
losses (-), gross . . . .44 Applicable income taxes . . .45 Securities gains or
losses ( — ) net46 Income before extraordinary
items47 Extraordinary items,
gross48 Applicable income taxes . . .49 Extraordinary items, net
of tax effect
50 Net income
Total
220,678,803
33,719,308
22,589,254
29,021,59768,402,367
16,444,942
6,282,509
(2)(2)
680,397
11,138,055
(?)(2)
(2)
(2)
10,648,711
7,33021,744,288
0(2)
19,012,0214,099,242
14,912,789
-29,971- 14,765
-15,210
14,897,478
77,4917,625
69,910
14,967,373
Asset size class (millions of dollars)
0-99
37,861,846
6,155,829
3,117,700
12420,016,759
320,309
104,671
(?)(2)
36,112
1,934,098
(2)(2)
(2)
(2)
1,909,943
(2)4,266,251
(2)(2)
4,321,612840,209
3,481,413
20,765590
20,170
3,501,482
15,5351,234
14,345
3,515,812
100-299
23,325,540
3,841,475
2,447,245
8,01711,171,188
675,464
171,716
0(2)
49,662
1,276,839
©(2)
(2)
(2)
995,921
(2)2,688,015
(?)(2)
2,490,764394,317
. 2,096,448
-31,324- 14,263
- 17,059
2,079,386
12,978942
12,036
2,091,422
300-999
21,201,221
3,632,480
2,389,459
58,4038,721,793
1,276,035
203,743
(2)(2)
74,679
1,266,655
0(2)
(2)
(2)
944,136
02,633,837
00
1,967,055250,251
1,716,803
-13,089-2,547
-10,542
1,706,261
11,094948
10,146
1,716,407
1,000-4,999
40,402,887
6,902,879
5,193,168
1,914,35412,076,211
4,457,026
699,177
279,707419,470
203,729
2,357,939
1,469,218282,153
1,187,064
1,170,875
1,896,587
8614,700,093
1664,604,290
3,491,523505,186
2,986,337
-38,792-18,017
-20,776
2,965,564
32,8844,501
28,383
2,993,947
5,000and over
97,887,309
13,186,645
9,441,682
27,040,69916,416,416
9,716,108
5,103,202
559,3984,543,804
316,215
4,302,524
2,854,054382,807
2,471,247
1,831,277
4,902,124
6,4697,456,092
22,9327,388,797
6,741,0672,109,279
4,631,788
32,46919,472
12,997
4,644,785
5,0000
5,000
4,649,785
Member
171,642,328
25,518,863
17,085,604
28,421,55245,614,605
15,347,672
5,980,061
00
557,446
8,463,432
(?)0
0
0
8,333,988
7,30316,311,768
00
14,004,0893,195,238
10,808,863
-34,762- 17,204
- 17,558
10,791,267
51,3616,232
45,148
10,836,412
Non-member
49,036,475
8,200,445
5,503,650
600,04522,787,762
1,097,270
302,448
00
122,951
2,674,623
00
0
0
2,314,723
275,432,520
00
5,007,932904,004
4,103,926
4,7912,439
2,348
4,106,211
26,1301,393
24,762
4,130,961
224Digitized for FRASER http://fraser.stlouisfed.org/ Federal Reserve Bank of St. Louis

84. Consolidated report of income, 19831—ContinuedA. All insured commercial banks—ContinuedData are consolidated with respect to domestic and foreign offices. Figures are in thousands of dollars.
Equity capital account51 Balance, end of previous
year52 Adjustments53 Adjusted balance, end of
previous year54 Net income, or loss ( — ) . . . .55 Sale, conversion, acquisi-
tion, or retirementof capital, net
56 Transactions with ownholding company oraffiliates
57 Other58 Changes incident to mergers
and absorptions, net . . . .59 LESS: Cash dividends de-
clared on commonstock
60 LESS: Cash dividends de-clared on preferredstock
61 Other increases, ordecreases ( — )
62 Balance, end of period
Allowance for possibleloan losses
63 Balance, end of previousyear . . .
64 Recoveries credited toallowance
65 Changes incident to mergersand absorptions, net . . . .
66 Provision for possible loanlosses
67 LESS: Losses chargedto allowance
68 Foreign currency translationadjustment
69 Balance, end of period
MEMO70 Provision for U.S. federal
income taxes71 Provision for U.S. state and
local income taxes72 Provision for foreign
income taxes73 Total74 Provision for income
taxes, currentportion
75 Provision for incometaxes, deferredportion
76 Number of full-time equiva-lent employees3
77 Number of banks3
126,105,244116 850
126,208,31214,967,373
2 855 159
(2)
1,663,993
7 272 891
65 611
1 683 962140,040,274
12 992 384
2 059 645
211,913
10,648,711
10 472 079
-39 91915,400,327
1 827 471
876,701
1 388 3264 092 494
1 501 58714,451
30,421,58382,687
30,504,0693,515,812
1,104,368
(2)
61,430
1 403 515
11 287
202 90533,973,766
1 830,469
388,144
8,347
1,909,943
2 005 856
2,130,713
708,663
133,470
o842,131
315 79412,178
16,502,5325,548
16,508,0652,091,422
305,372
(2)
228,201
1 028 039
7,840
172 27318,269,456
1,304,860
196,577
26,164
995,921
1 003,560
1,519,963
299,301
80,580
1 403381,280
(2)
(2)
196 7541,576
13,552,26515,497
13,567,7621,716,407
237,854
(2)
524,692
864,461
10,507
110,21615,281,960
1,240,216
199,440
53,081
944,136
949,039
1,487,837
159,145
87,828
1 685248,660
(2)
(2)
182 254444
22,136,76413 913
22,137,1112,993,947
360,842
223,707137,135
659,700
1,273 141
14 911
401 12425,264,666
2,495,238
436,373
98,652
1,896,587
1 ,884 646
-1033,042,102
303,301
153,500
34 871491,672
410,340
81,330
311 099203
43,492,100-795
43,491,3054,649,785
846,723
851,065-4,342
189,970
2 703 735
21 066
797 44447,250,426
6,121,601
839,111
25,669
4,902,124
4 628 978
-39 8167,219,712
357,061
421,323
1 350 3672 128,751
1 ,966 725
162 026
495 68650
91,593,98539 259
91,619,51110,836,412
2 179,424
(2)
1,311,773
5 484 316
47 967
1 281 811101,696,645
10,447,337
1,610917
176,880
8,333,988
8 074 496
-3991912,454,431
1,139,699
665,154
1 379 3483 184 186
1 096 0665,804
34,511,25977 591
34,588,8014,130,961
675 735
(2)
352,220
1 788 575
17 644
402 15138,343,629
2,545,047
448 728
35,033
2,314,723
2 397 583
2,945,896
687 772
211,547
8 978908 308
(2)
(2)
405 5218,647
225Digitized for FRASER http://fraser.stlouisfed.org/ Federal Reserve Bank of St. Louis

84. Consolidated report of income, 19831—ContinuedB. Insured commercial banks with foreign officesData are consolidated with respect to domestic and foreign offices. Figures are in thousands of dollars for income and the like and in millions, forassets and liability items.
Item
CONSOLIDATED INCOME STATEMENT
1 Income before income taxes and securitiesgains or losses
2 Total interest income3 Total noninterest income . . .4 Total interest expense . . . ,5 Total noninterest expense6 LESS: Income taxes, security gains (losses), and
extraordinary items7 EQUALS: Net income
INTEREST INCOME AND INTEREST EXPENSE
Domestic offices8 Total interest income9 Interest and fees on loans . .
10 Interest on balances with depository institutions1 1 Income on federal funds sold and securities pur-
chased under agreements to resell in domesticoffices and Edge and Agreement subsidiaries
12 Interest on bonds, notes, and debentures13 Interest on U S Treasury securities14 Interest on obligations of other U.S. government
agencies and corporations ,15 Interest on obligations of states and political
subdivisions in United States16 Interest on other bonds, notes, and debentures17 Income from lease financing
18 Total interest expense19 Interest on time certificates of deposit of
$100 000 or more20 Interest on other deposits21 Expense of federal funds purchased and securities
sold under agreements to repurchase in domesticoffices and Edge and Agreement subsidiaries . . . .
22 Interest on subordinated notes and debentures23 Interest on other borrowed money
Foreign offices and Edge and Agreement subsidiaries24 Total interest income25 Interest and fees on loans .26 Interest on balances with depository institutions27 Income on federal funds sold and securities
purchased under agreement to resell in Edge andAgreement subsidiaries
28 Interest on bonds notes and debentures29 Income from lease financing
30 Total interest expense .31 Interest on deposits in foreign offices32 Expense of federal funds purchased and securities
sold under agreements to repurchase in Edgeand Agreement subsidiaries
33 Interest on subordinated notes and debentures34 Interest on other borrowed money
Total
8,907,740119,443,671
16,335,23486,067,91340,803,253
2,368,3356,539,405
84,802,44966,609,324
2,625,641
3,844,69410,592,8014,634,461
1,729,681
3,955,134273,526
1,129,989
53,138,972
13,310,64724,415,300
13,143,276465,152
1,804,597
36,205,48823,722,47310,869,411
58,1701,028,696
526,738
32,150,89029,021,419
66,06226,204
3,037,205
Asset size class (millions of dollars)
0-999
53,1731,279,085
178,104785,139618,877
-6,35859,531
1,143,706785,123
56,712
65,573230,887113,447
33,654
76,4747,3125,411
708,799
276,327336,672
79,6063,607
12,587
140,02949,49278,105
20312,229
0
70,20466,513
172,3171,357
1,000-4,999
2,113,50025,843,7513,849,589
17,248,45210,330,522
283,4111,830,089
22,757,54116,413,922
637,685
1,227,3074,197,0371,782,944
768,614
1,479,859165,621281,590
15,101,203
3,592,6387,662,212
3,399,028169,218278,107
3,344,7901,040,3042,270,627
4,18529,154
520
1,934,7321,914,207
14,5780
5,947
5,000and over
6,741,06792,320,83512,307,54168,034,32229,853,854
2,091,2824,649,785
60,901,20249,410,279
1,931,244
2,551,8146,164,8772,738,070
927,413
2,398,801100,593842,988
37,328,970
9,441,68216,416,416
9,664,642292,327
1,513,903
32,720,66922,632,677
8,520,679
53,782987,313526,218
30,145,95427,040,699
51,46723,887
3,029,901
Member
8,600,461114,790,86115,903,84182,868,77339,225,469
2,282,7336,317,728
80,942,35963,743,513
2,409,537
3,705,0349,987,2664,366,801
1,590,272
3,802,584227,610
1,097,009
50,557,781
12,396,41022,994,822
12,972,766434,958
1,758,825
35,383,15423,458,04910,347,766
57,985993,122526,232
31,547,04028,421,374
66,06023,887
3,035,719
Non-member
307,2794,652,810
431,3933,199,1401,577,784
85,602221,677
3,860,0902,865,811
216,104
139,660605,535267,660
139,409
152,55045,91632,980
2,581,191
914,2371 ,420,478
170,51030,19445,772
822,334264,424521,645
18535,574
506
603,850600,045
22,3171,486
226Digitized for FRASER http://fraser.stlouisfed.org/ Federal Reserve Bank of St. Louis

84. Consolidated report of income, 19831—ContinuedB. Insured commercial banks with foreign offices—ContinuedData are consolidated with respect to domestic and foreign offices. Figures are in thousands of dollars for income and the like and in millions, forassets and liability items.
Item Total
Asset size class (millions of dollars)
0-999 1,000-4,999 5,000and over
Member Non-member
INCOME ATTRIBUTABLE TO INTERNATIONAL BUSINESS(estimated)
35 Pretax income attributable to foreign offices and Edgeand Agreement subsidiaries 3,081,431 13,606
36 Pretax income attributable to international businessconducted in domestic offices 1,052,570 18,569
37 LESS: Coverage adjustment 168,264 8,85738 Pretax income attributable to international business 3,965,738 23,31839 LESS: All income taxes attributable to international
business 1,689,803 9,10640 EQUALS: Net income attributable to international
business 2,275,933 14,212
MEMO41 Provision for possible loan losses attributable to
international business 1,639,565
Noninterest income allocation42 Attributable to foreign offices and Edge and
Agreement subsidiaries 2,301,852 4,43543 Attributable to international business 3,042,756 6,607
Noninterest expense allocation44 Attributable to foreign offices and Edge and Agreement
subsidiaries 4,271,954 10,94745 Attributable to international business 5,459,251 17,529
Gross intracompany interest adjustments46 Intracompany interest income attributable to inter-
national business 6,060,99247 Intracompany interest expense attributable to inter-
national business 8,750,390
48 Interest income of domestic offices from foreigndomiciled customers 6,445,380
ASSETS AND LIABILITIES(average for 30 calendar days)
Domestic offices49 Federal funds sold and securities purchased under
agreements to repurchase 42,583 81850 Total loans 580,963 6,85851 Total deposits 650,976 10,78752 Cash and due from depository institutions 110,434 1,62253 Federal funds purchased and securities sold under
agreements to repurchase 145,605 96754 Total assets, year-end 1,025,241 13,569
Foreign offices55 Total loans 193,113 38156 Total deposits 299,337 70757 Cash and due from depository institutions 110,898 72058 Total assets, year-end 382,112 1,463
59 Number of banks3 195 26
229,593 2,838,232 3,050,457
184,541 849,46025,990 133,417388,145 3,554,275
155,890
232,254
1,524,807
2,029,467
12,790146,822197,05531,622
39,760284,542
8,84722,21023,39238,331
119
28,975427,282443,13477,189
104,877727,129
183,885276,41986,784342,318
50
972,419162,458
3,860,419
1,647,443
2,212,974
8,958 171,385 1,459,222 1,617,828
37,752 2,259,665 2,292,357175,999 2,860,150 3,022,106
124,479 4,136,528 4,241,312273,007 5,168,715 5,408,481
14,497 569,082 5,477,413 5,950,712
51,045 1,509,906 7,189,439 8,525,110
83,075 1,017,765 5,344,540 6,179,451
41,207555,262615,042105,748
143,726980,526
190,839292,734104,840372,339
168
30,974
80,1515,806
105,319
42,360
62,959
21,737
9,49520,650
30,64250,770
110,280
225,280
265,929
1,37625,70135,9344,685
1,87844,714
2,2736,6026,0579,772
27
227Digitized for FRASER http://fraser.stlouisfed.org/ Federal Reserve Bank of St. Louis

85. Income, expenses, and dividends of member banks, by Federal Reserve District, 19831
A. All member banksStatements for each bank reflect fully consolidated operations. Figures are in thousands of dollars.
Item
1 Operating income, total
2 Interest and fees on loans3 Interest on balances with depository institutions4 Income on federal funds sold and securities purchased under agreements to resell in
domestic offices of the bank and of its Edge and Agreement subsidiaries5 Interest on U.S. Treasury securities and on obligations of other U.S. government agencies
and corporations6 Interest on obligations of states and political subdivisions in United States7 Income from all other securities .8 Income from lease financing9 Income from fiduciary activities
10 Service charges on deposit accounts in domestic offices .1 1 Other service charges, commissions, and fees ,12 Other operating income
13 Operating expenses, total
14 Salaries and employee benefits .15 Interest on time CDs of $100,000 or more issued by domestic offices s . . . .16 Interest on deposits in foreign offices17 Interest ori other deposits18 Expense of federal funds purchased and securities sold under agreements to repurchase
in domestic offices of bank and of its Edge and Agreement subsidiaries19 Interest on demand notes (note balances) issued to U.S. Treasury and other
borrowed money .20 Interest on subordinated notes and debentures21 Occupancy expense of bank premises net and furniture and equipment expense22 Provision for possible loan losses23 Provision for allocated transfer risk reserves24 Other operating expenses
25 Income before income taxes and securities gains or losses .26 Applicable income taxes27 Income before securities gains or losses .28 Securities gains or losses ( — ) gross29 Applicable income taxes30 Securities gains or losses ( — ) net .31 Income before extraordinary items32 Extraordinary items gross33 Applicable income taxes . . . .34 Extraordinary items net of tax effect35 Net income
Equity capital account36 Balance end of previous year37 Adjustments .38 Adjusted balance end of previous year39 Net income or loss ( — ) . . .40 Sale conversion acquisition or retirement of capital, net . . . .41 Transactions with own holding company or affiliates . .42 Other .43 Changes incident to mergers and absorptions net .44 LESS* Cash dividends declared on common stock45 LESS* Cash dividends declared on preferred stock . . , . . -46 Other increases or decreases ( — V47 Balance end of period
Allowance for possible loan losses48 Balance, end of previous year49 Recoveries credited to allowance50 Changes incident to mergers and absorptions net . . . .51 Provision for possible loan losses52 LESS* Losses charged to allowance53 Foreign currency translation adjustment . . .54 Balance end of period
MEMO55 Provision for U S federal income taxes • • •56 Provision for U S state and local income taxes57 Provision for foreign income taxes
58 Total59 Number of full-time equivalent employees -60 Number of banks3
Boston
6,670,466
4,007 111674 794
1 84 875
485 084248 76063 704
136,863281 3941 10 052255,509222 320
6,084,656
1,077 132473,565963 091
1,313 992
699 957
451,23411 522
322,646152,995
(2)
618,520
585,811163 443422 369
7,4793,4873992
426,36140721,9222 150
428 511
2,663 8011,865
2,665 666428,511
40 12737,3382,789
69,873150,122
62916,836
3,070,262
347,72262,0966,434
152,995188,814
-239380,193
58 05356,58154,225
168,85948,497
145
New York
55,584,412
37 458 1055 599 942
1 275 432
2 151 5251 293 590
827 652661,810
1 141 086395 811
2,282,0152 497 446
50,593,257
6727 2163,444,624
17 268 7086 795 019
4 710 315
3,452,408202 928
2,307,4411,612,507
(2)
4,072,092
4,991,1551 717 7643 273 391
39,38919,91219478
3,292,8688 626
538 573
3,301,441
24,048,1227,436
24,055,5583,301,441
392 924384,415
8,509110,992
1,539,89826,864
723,27427,017,430
3,031,776421,040
8,9051,612,5071,612,849-32,238
3,429,140
386,460334,120
1,017,138
1,737,718243,252
203
Phila-delphia
5,932,397
3 450 160559 526
218 205
715 189321 26265 07034,601
155 715114 828184,973112 874
5,371,931
849,231473,043255 885
2,065 056
414 275
192,48681 735
288,483214,239
(2)
537,495
560,469111 432449,041= 6,369-2,846-3,526445,517
4,923450
4 471449,986
3,392,348907
3,393,255449,986138,422132,385
6,03715,458
186,0924,823
309,3784,115,583
326,43860,86420,784
214,239209,988
r)412,334
86,23115,4107,367
109,00840,043
209
228Digitized for FRASER http://fraser.stlouisfed.org/ Federal Reserve Bank of St. Louis
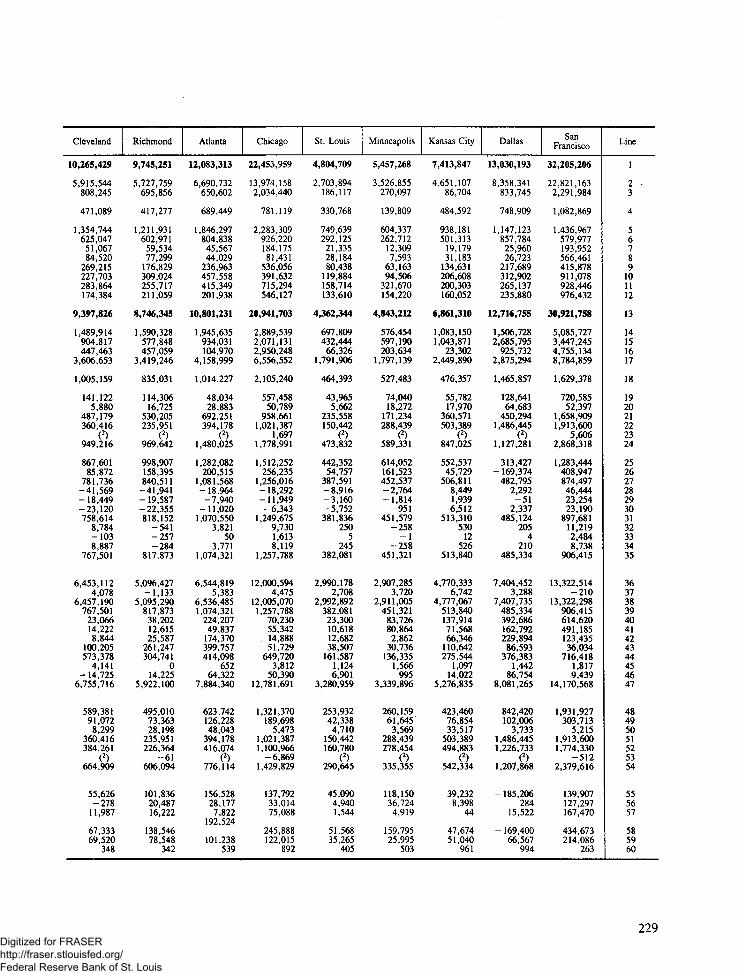
Cleveland
10,265,429
5,915,544808,245
471,089
1,354,744625,04751,06784,520269,215227,703283,864174,384
9,397,826
1,489,914904,817447,463
3,606,653
1,005,159
141,1225,880
487,179360,416
(2)949,216
867,60185,872781,736-41,569-18,449-23,120758,6148,784-1038,887
767,501
6,453,1124,078
6,457,190767,50123,06614,2228,844
100,205573,378
4,141- 14,7256,755,716
589,38191,0728,299
360,416384,261
(2)664,909
55,626-27811,987
67,33369,520
348
Richmond
9,745,251
5,727,759695,856
417,277
1,211,931602,97159,53477,299176,829309,024255,717211,059
8,746,345
1,590,328577,848457,059
3,419,246
835,031
114,30616,725530,205235,951
(2)969,642
998,907158,395840,511-41,941-19,587-22,355818,152-541-257-284
817,873
5,096,427-1,133
5,095,290817,87338,20212,61525,587261,247304,741
014,225
5,922,100
495,01073,36328,198235,951226,364
-61606,094
101,83620,48716,222
138,54678,548
342
Atlanta
12,083,313
6,690,732650,602
689,449
1,846,297804,83845,56744,029236,963457,558415,349201,938
10,801,231
1,945,635934,031104,970
4,158,999
1,014,227
48,03428,883692,251394,178
(2)1,480,025
1,282,082200,515
1,081,568-18,964-7,940-11,0201,070,550
3,82150
3,7711,074,321
6,544,8195,383
6,536,4851,074,321224,20749,837174,370399,757414,098
65264,322
7,884,340
623,742126,22848,043394,178416,074
(2)776,114
156,52828,1777,822
192,524
101,238539
Chicago
22,453,959
13,974,1582,034,440
781,119
2,283,309926,220184,17581,431536,056391,632715,294546,127
20,941,703
2,889,5392,071,1312,950,2486,556,552
2,105,240
557,45850,789958,661
1,021,3871,697
1,778,991
1,512,252256,235
1,256,016-18,292-11,949-6,343
1,249,6759,7301,6138,119
1,257,788
12,000,5944,475
12,005,0701,257,788
70,23055,342
. 14,88851,729649,720
3,81250,390
12,781,691
1,321,370189,6985,473
1,021,3871,100,966-6,869
1,429,829
137,79233,01475,088
245,888122,015
892
St. Louis
4,804,709
2,703,894186,117
330,768
749,639292,12521,33528,18480,438119,884158,714133,610
4,362,344
697,809432,44466,326
1,791,906
464,393
43,9655,662
235,558150,442
(2)473,832
442,35254,757387,591-8,916-3,160-5,752381,836
2505
245382,081
2,990,1782,708
2,992,892382,08123,30010,61812,68238,507161,587
1,1246,901
3,280,959
253,93242,3384,710
150,442160,780
(2)290,645
45,0904,9401,544
51,56835,265
405
Minneapolis
5,457,268
3,526,855270,097
139,809
604,337262,71212,3097,59363,16394,506321,670154,220
4,843,212
576,454597,190203,634
1,797,139
527,483
74,04018,272171,234288,439
(2)589,331
614,052161,523452,537-2,764-1,814-951
451,579-258-1
-258451,321
2,907,2853,720
2,911,005451,32183,72680,8642,86230,736136,335
1,566995
3,339,896
260,15961,6453,569
288,439278,454
(2)335,355
118,15036,7244,919
159,79525,995
503
Kansas City
7,413,847
4,651,10786,704
484,592
938,181501,31319,17931,183134,631206,608200,303160,052
6,861,310
1,083,1501,043,871
23,3022,449,890
476,357
55,78217,970360,571503,389
(2)847,025
552,53745,729506,8118,4491,9396,512
513,31053012
526513,840
4,770,3336,742
4,777,067513,840137,91471,56866,346110,642275,544
1,09714,022
5,276,835
423,46076,85433,517503,389494,883
(2)542,334
39,2328,398
44
47,67451,040
961
Dallas
13,030,193
8,358,341833,745
748,909
1,147,123857,78425,96026,723217,689312,902265,137235,880
12,716,755
1,506,7282,685,795925,732
2,875,294
1,465,857
128,64164,683450,294
1,486,445(2)
1,127,281
313,427- 169,374482,7952,292-512,337
485,1242054
210485,334
7,404,4523,288
7,407,735485,334392,686162,792229,89486,593376,383
1,44286,754
8,081,265
842,420102,0063,733
1,486,4451,226,733
(2)1,207,868
-185,206284
15,522
- 169,40066,567
994
SanFrancisco
32,205,206
22,821,1632,291,984
1,082,869
1,436,967579,977193,952566,461415,878911,078928,446976,432
30,921,758
5,085,7273,447,2454,755,1348,784,859
1,629,378
720,58552,397
1,658,9091,913,600
5,6062,868,318
1,283,444408,947874,49746,44423,25423,190897,68111,2192,4848,738
906,415
13,322,514-210
13,322,298906,415614,620491,185123,43536,034716,418
1,8179,439
14,170,568
1,931,927303,713
5,2151,913,6001,774,330
-5122,379,616
139,907127,297167,470
434,673214,086
263
Line
1
2 .3
4
56789101112
13
14151617
18
192021222324
2526272829303132333435
363738394041424344454647
48495051525354
555657
585960
229Digitized for FRASER http://fraser.stlouisfed.org/ Federal Reserve Bank of St. Louis

85. Income, expenses, and dividends of member banks, by District, 19831—ContinuedB. Large banksStatements for each bank reflect fully consolidated operations. Figures are in thousands of dollars.
Item
1 Operating income, total
2 Interest and fees on loans3 Interest on balances with depository institutions4 Income on federal funds sold and securities purchased under agreements to resell in
domestic offices of the bank and of its Edge and Agreement subsidiaries5 Interest on U.S. Treasury securities and on obligations of other U.S. government agencies
and corporations . . . . .6 Interest on obligations of states and political subdivisions in United States7 Income from all other securities8 Income from lease financing .9 Income from fiduciary activities
10 Service charges on deposit accounts in domestic offices1 1 Other service charges, commissions, and fees12 Other operating income . . . . .
13 Operating expenses, total
14 Salaries and employee benefits15 Interest on time CDs of $100,000 or more issued by domestic offices16 Interest on deposits in foreign offices17 Interest on other deposits18 Expense of federal funds purchased and securities sold under agreements to repurchase
in domestic offices of bank and of its Edge and Agreement subsidiaries19 Interest on demand notes (note balances) issued to U.S. Treasury and other
borrowed money20 Interest on subordinated notes and debentures21 Occupancy expense of bank premises net and furniture and equipment expense22 Provision for possible loan losses ,23 Provision for allocated transfer risk reserves24 Other operating expenses
25 Income before income taxes and securities gains or losses26 Applicable income taxes27 Income before securities gains or losses28 Securities gains, or losses ( — ), gross29 Applicable income taxes30 Securities gains, or losses ( — ), net3 1 Income before extraordinary items32 Extraordinary items, gross . . . .33 Applicable income taxes34 Extraordinary items, net of tax effect35 Net income
Equity capital account36 Balance end of previous year ,37 Adjustments38 Adjusted balance, end of previous year39 Net income, or loss ( — )40 Sale conversion, acquisition, or retirement of capital, net ,41 Transactions with own holding company or affiliates42 Other43 Changes incident to mergers and absorptions net44 LESS* Cash dividends declared on common stock45 LESS' Cash dividends declared on preferred stock46 Other increases or decreases ( — )47 Balance end of period . . . .
Allowance for possible loan losses48 Balance end of previous year .49 Recoveries credited to allowance50 Changes incident to mergers and absorptions net51 Provision for possible loan losses .52 LESS* Losses charged to allowance53 Foreign currency translation adjustment54 Balance end of period .
MEMO55 Provision for U S federal income taxes56 Provision for U S. state and local income taxes57 Provision for foreign income taxes
58 Total59 Number of full-time equivalent employees*'60 Number of banks3
Boston
3,525,890
2,101,508428,455
67,169
202,70365,45451,572
103,112175,63924,014
147,412158,852
3,240,415
518,139281,997859,494224,009
459,397
404,1265,199
143,76884,661
(2)259,625
285,475105,463180,012-3,020
1,548-1,472181,484
000
181,484
1,111,7670
1,111,767181,484
6,0006,000
00
53,0560
-9791,245,216
176,83632,401
73984,661
102,219-239
192,179
23,81830,02453,169
107,01121,233
4
New York
48,371,038
33,651,2664,839,018
994,015
1,338,087909,590672,738619,001
1,004,761255,295
1,728,2012,359,066
44,170,056
5,572,3682,989,031
16,843,4624,450,714
4,348,350
3,296,240188,436
1,883,4051,444,760
A3,153,294
4,200,9821,533,0322,667,950
41,46421,39420,070
2,688,020000
2,688,020
19,669,3970
19,669,3972,688,020
347,597351,939-4,342
-25,6221,273,374
21,066577,085
21,962,037
2,642,072343,797-3,195
1,444,7601,414,379-31,467
2,981,588
286,125261,717
1,006,584
1,554,426188,767
14
Phila-delphia
2,538,032
1,377,873336,724
103,081
213,280121,531
7,29933,182
118,11060,82783,56982,556
2,370,238
433,185174,982226,126654,512
291,890
81,64660,952
145,05288,087
(2)213,806
167,79415,990
151,804-462-237-225
151,5791,322
608714
152,293
1,267,3690
1,267,369152,293
161161
00
74,009800
137,7911,482,805
188,30738,122-366
88,087118,144
(2)196,006
7,0191,9757,367
16,36117,780
6
230Digitized for FRASER http://fraser.stlouisfed.org/ Federal Reserve Bank of St. Louis

Cleveland
6,234,613
3,682,440618,569
257,085
564,679334,85629,12859,494193,207122,739227,404145,012
5,714,075
913,837718,032445,087
1,640,332
834,449
117,1272,273
292,393209,238
(2)541,307
520,53863,056457,482-29,293-13,433-15,860441,6229,049
09,049
450,671
3,659,9880
3,659,988450,671
4,1114,111
04,484
393,4084,125
-21,8483,699,873
406,82759,731
740209,238228,904
(2)447,633
38,122-486
1 1 ,987
49,62338,280
15
Richmond
5,030,104
2,983,781496,602
179,329
491,388298,49910,79650,638113,137154,270122,789128,875
4,540,596
803,112342,409452,749
1,429,895
578,289
78,6869,545
267,122142,543
(2)436,246
489,50872,645416,863-22,359- 10,665-11,694405,169-1,161-501-660
404,509
2,489,417163
2,489,580404,50914,221-77915,00023,939127,908
0-642
2,803,699
286,19537,4952,149
142,543127,448
-61340,873
34,54710,70916,222
61,47836,765
12
Atlanta
4,997,266
2,743,491369,588
269,243
607,536333,46417,98825,645114,856185,077212,532117,846
4,456,431
827,973389,65289,937
1,407,242
628,612
23,86420,237295,751157,611
(2)615,522
540,83582,742458,093-6,372-1,904-4,468453,625
1530
153453,778
2,304,861659
2,305,519453,778-150
0-150
331,714153,275
1150,467
2,988,043
273,47352,62933,381157,611167,620
(2)349,474
64,6949,0767,068
80,03839,772
20
Chicago
13,792,070
9,232,5471,530,454
380,814
531,106400,77787,83360,642386,462181,422550,560449,453
13,040,064
1,667,8741,512,8362,923,7352,372,429
1,791,693
505,73636,092547,271730,025
1,697950,676
752,006144,577607,429- 14,970-8,521-6,449600,9803,3201,1462,174
603,154
6,261,442106
6,261,548603,15412,29512,295
010,250332,226
13629,959
6,584,843
889,638130,6492,294
730,025787,998-6,869957,738
43,82518,28975,088
137,20259,277
23
St. Louis
2,203,541
1,218,905137,485
186,305
170,215115,5489,21326,83651,44154,737121,919110,937
2,033,933
356,080251,86766,326494,562
392,218
34,1193,250
126,22462,559(2)
246,729
169,60815,973153,635-627-199-428
153,207000
153,207
1,165,001-495
1,164,506153,2074,0001,0003,00024,15171,476
7700
1,273,618
135,88524,6893,38062,55970,243(2)
156,270
11,8002,4301,544
15,77416,566
12
Minneapolis
1,831,283
1,105,539181,162
43,185
117,38395,7594,5304,04049,16120,53583,589126,400
1,692,441
181,755299,059203,634266,309
392,837
57,2028,60347,12194,476(2)
141,445
138,84214,717124,125-3,762-1,997-1,765122,360
000
122,360
829,2540
829,254122,36062,41962,169
2500
42,188986
-250970,609
91,91012,969-63194,47669,347(2)
129,377
-2,65810,4594,919
12,7206,549
8
Kansas City
2,123,686
1,342,93613,511
184,297
137,347132,8242,77113,76280,09036,97483,22295,952
2,039,472
320,823478,22323,302325,748
296,922
28,01610,783115,957158,397
(2)281,301
84,214-14,43298,6465,0132,1692,844
101,490000
101,490
1,125,155676
1,125,831101,49010,22310,223
097,45959,572
0-7,757
1,267,674
145,27823,16232,021158,397149,215
(2)209,644
- 10,926-1,380
44
-12,26314,156
17
Dallas
6,219,896
4,216,860654,108
201,264
244,995367,469
6,71319,981157,82749,099145,143156,437
6,431,386
563,7181,479,514907,114553,602
1,202,913
100,59349,152136,690
1,001,837(2)
436,253
-211,490-198,100-13,390-6,621-3,074-3,547- 16,937
000
-16,937
2,978,3091,589
2,979,898- 16,93733,50733,507
00
102,0920
30,1052,924,481
437,56225,6601,871
1,001,837742,809
(2)724,122
-215,1730
13,999
-201,17420,670
19
SanFrancisco
28,158,144
20,239,6102,090,298
959,475
974,483393,220181,858533,691370,970722,563818,175873,801
27,231,765
4,310,6243,132,9644,753,1407,305,670
1,463,031
698,63543,853
1,406,5291,739,177
5,6062,372,535
926,379324,776601,60335,50818,65116,857
618,4603,987
03,987
622,447
10,951,8925
10,951,897622,447414,469409,2095,260
0601,701
0-12,181
11,374,931
1,723,139272,871
7791,739,1771,612,146
-5122,123,308
64,316112,766166,345
343,427177,865
18
Line
1
23
4
56789101112
13
14151617
18
192021222324
2526272829303132333435
363738394041424344454647
48495051525354
555657
585960
231Digitized for FRASER http://fraser.stlouisfed.org/ Federal Reserve Bank of St. Louis

85. Income, expenses, and dividends of member banks, by District, 19831—ContinuedC. Other than large banksStatements for each bank reflect fully consolidated operations. Figures are in thousands of dollars.
Item
1 Operating income, total .
2 Interest and fees on loans3 Interest on balances with depository institutions4 Income on federal funds sold and securities purchased under agreements to resell in
domestic offices of the bank and of its Edge and Agreement subsidiaries5 Interest on U.S. Treasury securities and on obligations of other U.S. government agencies
and corporations . . .6 Interest on obligations of states and political subdivisions in United States7 Income from all other securities8 Income from lease financing9 Income from fiduciary activities
10 Service charges on deposit accounts in domestic offices .1 1 Other service charges commissions and fees12 Other operating income
13 Operating expenses, total
14 Salaries and employee benefits15 Interest on time CDs of $100 000 or more issued by domestic offices . .16 Interest on deposits in foreign offices17 Interest on other deposits1 8 Expense of federal funds purchased and securities sold under agreements to repurchase
in domestic offices of bank and of its Edge and Agreement subsidiaries19 Interest on demand notes (note balances) issued to U.S. Treasury and other
borrowed money20 Interest on subordinated notes and debentures21 Occupancy expense of bank premises, net, and furniture and equipment expense22 Provision for possible loan losses23 Other operating expenses . .
24 Income before income taxes and securities gains or losses25 Applicable income taxes26 Income before securities gains or losses27 Securities gains or losses ( — ), gross28 Applicable income taxes29 Securities gains or losses ( — ), net . . . . .30 Income before extraordinary items31 Extraordinary items, gross32 Applicable income taxes33 Extraordinary items net of tax effect . . .34 Net income
Equity capital account35 Balance end of previous year . . .36 Adjustments37 Adjusted balance end of previous year . .38 Net income or loss ( — ) * \39 Sale conversion acquisition, or retirement of capital net40 Transactions with own holding company or affiliates41 Other42 Changes incident to mergers and absorptions, net43 LESS' Cash dividends declared on common stock .44 LESS; Cash dividends declared on preferred stock45 Other increases or decreases ( — ) . ...46 Balance, end of period
Allowance for possible loan losses47 Balance end of previous year48 Recoveries credited to allowance .49 Changes incident to mergers and absorptions, net .50 Provision for possible loan losses51 LESS' Losses charged to allowance . .52 Foreign currency translation adjustment53 Balance end of period
MEMO54 Provision for U S federal income taxes55 Provision for U.S. state and local income taxes . . . . .56 Provision for foreign income taxes
57 Total58 Number of full-time equivalent employees3
59 Number of banks3
Boston
3,144,576
1,905,603246,339
117,706
282,381183,306
12,13233,751
105,75586,038
108,09763,468
2,844,241
558,993191,568103,597
1,089,983
240,560
47,1086,323
178,87868,334
358,895
300,33657,980
242,3574,4591,9392,520
244,8774,0721,9222,150
247,027
1,552,0341,865
1,553,899247,027
34,12731,3382,789
69,87397,066
62917,815
1,825,046
170,88629,6955,695
68,33486,595
(2)188,014
34,23526,557
1,056
61,84827,264
141
New York
7,213,374
3,806,839760,924
281,417
813,438384,000154,91442,809
136,325140,516553,814138,830
6,423,201
1,154,848455,593425,246
2,344,305
361,965
156,16814,492
424,036167,747918,798
790,173184,732605,441-2,075-1,482
-592604,848
8,62653
8,573613,421
4,378,7257,436
4,386,161613,421
45,32732,47612,851
136,614266,524
5,798146,189
5,055,393
389,70477,24312,100
167,747198,470
-771447,552
100,33572,40310,554
183,29254,485
189
Phila-delphia
3,394,365
2,072,287222,802
115,124
501,909199,73157,771
1,41937,60554,001
101,40430,318
3,001,693
416,046298,061
29,7591,410,544
122,385
1 10,84020,783
143,431126,152323,689
392,67595,442
297,237-5,907-2,609-3,301293,938
3,601-1583,757
297,693
2,124,979907
2,125,886297,693138,261132,224
6,03715,458
112,0834,023
171,5872,632,778
138,13122,74221,150
126,15291,844
(2)216,328
79,21213,435
0
92,64722,263
203
232Digitized for FRASER http://fraser.stlouisfed.org/ Federal Reserve Bank of St. Louis

Cleveland
4,030,816
2,233,104189,676
214,004
790,065290,19121,93925,02676,008104,96456,46029,372
3,683,751
576,077186,7852,376
1,966,321
170,710
23,9953,607
194,786151,178407,909
347,06322,816324,254- 12,276-5,016-7,260316,992-265-103-162
316,830
2,793,1244,078
2,797,202316,83018,95510,1118,84495,721179,970
167,123
3,055,843
182,55431,3417,559
151,178155,357(2)
217,276
17,5042080
17,71031,240
333
Richmond
4,715,147
2,743,978199,254
237,948
720,543304,47248,73826,66163,692154,754132,92882,184
4,205,749
787,216235,439
4,3101,989,351
256,742
35,6207,180
263,08393,408533,396
509,39985,750423,648- 19,582-8,922-10,661412,983
620244376
413,364
2,607,010-1,296
2,605,710413,36423,98113,39410,587
237,308176,833
014,867
3,118,401
208,81535,86826,04993,40898,916(2)
265,221
67,2899,778
0
77,06841,783
330
Atlanta
7,086,047
3,947,241281,014
420,206
1,238,761471,37427,57918,384122,107272,481202,81784,092
6,344,800
1,117,662544,37915,033
2,751,757
385,615
24,1708,646
396,500236,567864,473
741,247117,773623,475- 12,592-6,036-6,552616,9253,668
503,618
620,543
4,239,9584,724
4,230,966620,543224,35749,837174,52068,043260,823
64113,855
4,896,297
350,26973,59914,662
236,567248,454(2)
426,640
91,83419,101754
111,68661,466
519
Chicago
8,661,889
4,741,611503,986
400,305
1,752,203525,44396,34220,789149,594210,210164,73496,674
7,901,639
1,221,665558,29526,513
4,184,123
313,547
51,72214,697
411,390291,362828,315
760,246111,658648,587-3,322-3,428
106648,695
6,410467
5,945654,634
5,739,1524,369
5,743,522654,63457,93543,04714,88841,479317,4943,67620,431
6,196,848
431,73259,0493,179
291,362312,968(2)
472,091
93,96714,725
0
108,68662,738
869
St. Louis
2,601,168
1,484,98948,632
144,463
579,424176,57712,1221,34828,99765,14736,79522,673
2,328,411
341,729180,577
01,297,344
72,175
9,8462,412
109,33487,883227,103
272,74438,784233,956-8,289-2,961-5,324228,629
2505
245228,874
1,825,1773,203
1,828,386228,87419,3009,6189,68214,35690,111
3546,901
2,007,341
118,04717,6491,33087,88390,537(2)
134,375
33,2902,510
0
35,79418,699
393
Minneapolis
3,625,985
2,421,31688,935
96,624
486,954166,9537,7793,55314,00273,971238,08127,820
3,150,771
394,699298,131
01,530,830
134,646
16,8389,669
124,113193,963447,886
475,210146,806328,412
998183814
329,219-258-1
-258328,961
2,078,0313,720
2,081,751328,96121,30718,6952,61230,73694,147
5801,245
2,369,287
168,24948,6764,200
193,963209,107(2)
205,978
120,80826,265
0
147,07519,446495
Kansas City
5,290,161
3,308,17173,193
300,295
800,834368,48916,40817,42154,541169,634117,08164,100
4,821,838
762,327565,648
02,124,142
179,435
27,7667,187
244,614344,992565,724
468,32360,161408,1653,436-2303,668
411,82053012
526412,350
3,645,1786,066
3,651,236412,350127,69161,34566,34613,183215,972
1,09721,779
4,009,161
278,18253,6921,496
344,992345,668(2)
332,690
50,1589,778
0
59,93736,884944
Dallas
6,810,281
4,141,481179,637
547,645
902,128490,31519,2476,74259,862263,803119,99479,443
6,285,369
943,0101,206,281
18,6182,321,692
262,944
28,04815,531
313,604484,608691,028
524,91728,726496,185
8,9133,0235,884
502,0612054
210502,271
4,426,1431,699
4,427,837502,271359,179129,285229,89486,593274,291
1,44256,649
5,156,784
404,85876,3461,862
484,608483,924(2)
483,746
29,967284
1,523
31,77445,897
975
SanFrancisco
4,047,062
2,581,553201,686
123,394
462,484186,75712,09432,77044,908188,515110,271102,631
3,689,993
775,103314,281
1,9941,479,189
166,347
21,9508,544
252,380174,423495,783
357,06584,171272,89410,9364,6036,333
279,2217,2322,4844,751
283,968
2,370,622-215
2,370,401283,968200,15181,976118,17536,034114,717
1,81721,620
2,795,637
208,78830,8424,436
174,423162,184(2)
256,308
75,59114,5311,125
91,24636,221
245
Line
1
23
4
56789101112
13
14151617
18
1920212223
2425262728293031323334
35363738 *3940414243444546
47484950515253
545556
575859
233Digitized for FRASER http://fraser.stlouisfed.org/ Federal Reserve Bank of St. Louis

86. Selected assets and liabilities of minority-owned banks, in the United States by size of bank,December 31, 19831
Thousands of dollars, except for number of banks
Account
ASSETS
1 Cash and due from depositories . .
Total securities held2 U S Treasury3 U S government agencies and corporations4 States and political subdivisions . . .5 All others
6 Federal funds sold and securities purchasedunder agreements to resell
7 Net loans8 Lease financing receivables9 Bank premises etc .
10 Real estate owned, not bank premises1 1 Other assets . . . .12 Intangible assets
13 Total assets
Allsize
classes
543,511
610,494387,538246,801
39,105
512,2052,054,151
7,400109,400
17,92494,165
729
4,623,423
Asset size (in millions of dollars)
Under 10
11,108
8,9387,261
10276
7,16028,595
03,222
2021,326
0
68.098
10=24
95,897
101,87871,25716,2134,750
73,721334,539
47620,0992,552
13,6090
734,991
25-49
98,424
69,22556,71046,889
1,236
78,326326,998
78716,320
1,98714,241
0
711,143
50 and over
338,082
430,453252,310183,68932,843
352,9981,364,019
6,13769,75913,18364,989
729
3,109,191
LIABILITIES
Deposits14 Demand-— Individuals, partnerships, and corporations15 Time and savings— Individuals, partnerships,
and corporations16 U S government . .17 States and political subdivisions18 All other19 Certified and officers checks
20 Total deposits21 Demand22 Nontransaction accounts
23 Federal funds purchased and securities sold underagreements to repurchase
24 Treasury note balances and other borrowings . .25 Mortgage indebtedness26 All other liabilities .
27 Total liabilities
28 Subordinated notes and debentures
EQUITY CAPITAL
29 Preferred stock — Par30 Common stock— Par . . .3 1 Surplus32 Undivided profits and capital reserves
33 Total equity capital
34 Total liabilities and equity capital
35 Number of banks
750,633
2 532 001105,098472,267
12 624105,191
3,977,8151 01 1 6722,966,143
176,24358 8355,235
71 634
4,289,762
7 782
7 866112,755138 78766,469
325,878
4,623,422
101
13,093
32 6111,8267,433
591,584
56,60617 80638,800
1201,684
181,128
59,556
0
106,0235 787
-3,268
8,542
68,098
10
133,358
36497836,36892,552
1,62914,589
643,474180,648462,826
2,8875,2791,3199,386
662,345
2,512
4,10334,00831,222
799
70,133
734,990
43
156,180
375,91628,68166,352
86010,618
638,607186,847451,760
6,786649513
8,558
655,113
1,247
318,98821,05114,741
54,783
711,143
20
448,002
1 758 49638,223
305,93010,07678,400
2,639,128626,371
2,012,757
166,45051,2233,385
52,562
2,912,748
4023
3 76053,73680,72754,197
192,420
3,109,191
28
234Digitized for FRASER http://fraser.stlouisfed.org/ Federal Reserve Bank of St. Louis

87. Denominations of U.S. currency in circulation, 1983Millions of dollars, end of period
Item
1 Total in circulation1
2 Coin and small-denomination currency3 Coin4 $125 $26 $57 $108 $20
9 Large-denomination currency10 $50 . . . .11 $10012 $50013 $1 000 . . . .14 $5 00015 $10000
Qi156,158
79 63113,5973,682
6844,810
11,67745,181
76,52716,78559,392
159185
24
Q2
155,714
78,36813,6483,504
6834,547
11,15744,829
77,34616,93460,063
159184
24
Q3
162,027
81,02013,9093,559
6864,646
11,42546,795
81,00517,87062,788
158184
23
Q4
162,814
80,16614,0743,449
6974,568
1 1 ,08746,291
82 64718,11364,188
158183
23
88. Assets of pension funds, 1972-83A. Totals for private and public fundsBook value of all assets other than equities at end of year, billions of dollars
Type
1 All types2 Private funds3 Insured4 Noninsured1
5 Public funds6 State and local government . . . .7 U S government8 Civil service2
9 Railroad retirement
1972
322.3208.4
52.3156.1114.080.633.429.14.3
1973
310.6190.456.1
134.3120.284.735.531.44.1
1974
302.5176.360.8
115.5126.288.038.234.43.9
1975
365.7219.072.2
146.8146.7104.841.938.5
3.4
1976
427.7260.9
89.0171.9166.9120.446.443.13.3
1977
465.2279.8101.5178.3185.4132.552.950.02.9
1978
531.1317.5119.1198.3213.6153.959.856.73.1
1979
598.6361.2139.2222.0237.4169.767.764.6
3.1
1980
727.1452.6165.8286.8274.5198.176.473.92.5
1981
796.2485.8192.7293.1310.4224.2
86.284.8
1.4
1982
932.6570.5228.9341.6362.1264.297.997.4
.5
1983
1,105.6679.9270.6409.3425.7313.7112.0111.4
.6
B, Types held by private noninsured fundsBook value of all assets other than equities at end of year, billions of dollars
Type
1 Total financial assets
2 Demand deposits and currency . . .3 Time deposits4 Corporate equities . . .5 U.S. government securities . . . .6 Corporate and foreign bonds . . .7 Mortgages8 Miscellaneous assets
1972
156.1
1.6.3
115.23.7
27.62.75.0
1973
134.3
1.41.1
90.54.4
29.52.45.1
1974
115.5
1.33.7
63.35.5
34.02.45.3
1975
146.8
1.52.4
88.610.835.82.45.5
1976
171.9
1.62.3
109.714.735.52.45.7
C. Types held by state and local government retirementBook value of all assets other than equities at end of year, billions of dollars
Type
1 Total financial assets2 Corporate bonds3 Corporate equities4 U.S. government securities . . . .5 Other
1972
80.643.214.95.7
16.8
1973
84.748.418.35.8
12.1
1974
88.054.920.96.26.0
1975
104.861.823.2
7.812.0
1976
120.466.926.410.916.2
1977
178.3
1.74.8
101.920.142.12.55.2
funds
1977
132.572.930.016.313.2
1978
198.3
1.810.3
107.922.248.02.85.4
1978
153.981.932.723.415.9
1979
222.0
1.98.9
123.725.053.7
3.15.8
1979
169.785.036.830.117.8
1980
286.8
1.910.3
175.830.958.13.76.2
1980
198.194.542.140.021.4
1981
293.1
2.012.0
167.140.061.73.76.6
1981
224.2104.750.550.718.3
1982
341.6
2.19.3
200.453.565.14.17.0
1982
264.2112.158.169.024.9
1983
409.3
2.27.0
250.768.668.25.27.4
1983
313.7116.675.585.536.1
235Digitized for FRASER http://fraser.stlouisfed.org/ Federal Reserve Bank of St. Louis

89. Terms of consumer installment credit1
Percent per annum; unless noted otherwise
Item
INTEREST RATESCommercial banks2
1 48-month new car' . . . .2 24-month personal3 120-month mobile home3
4 Credit cardAuto finance companies
5 New car .6 Used car
OTHER TERMS4
Maturity (months)7 New car8 Used car
Loan-to-value ratio9 New car
10 Used carAmount financed (dollars)
1 1 New car12 Used car
INTEREST RATESCommercial banks2
1 48-month new car3
2 24-month personal3 120-month mobile home3 .4 Credit card
Auto finance companies5 New car . . . . . .6 Used car
OTHER TERMS4
Maturity (months)7 New car . . .8 Used car
Loan-to-value ratio9 New car
10 Used carAmount financed (dollars)
1 1 New car12 Used car
1981
16.5418.0917.4517 78
16.172000
45 435.8
86.191.8
7,3394,343
1982
16.8318 6518.0518 51
16.152075
46034.0
85 390.3
8,1784,746
June
11.5718.58
45 638 0
87.092 0
8 5125,039
1983
13.92166815.9118 78
12.5818 74
45 937.9
86092.0
8,7875,033
July
11.8418.28
45 738 0
87.093 0
8 6425,052
Jan.
12.2520 20
46038.2
86 090.0
8,6834,742
Aug.
13 5016 2815 5818.75
12 7718.25
45 938 0
87.093 0
8 7245,103
Feb.
14.81174716.7318 82
12.051991
45.937.7
86090.0
8,7554,731
1983
Sept.
13.6218.21
46 238 0
87.093 0
8 7925,144
1983
Mar.
12.0719 38
45 937 7
84 091.0
8 8294,802
Oct.
13.5418.15
46238 0
86.093 0
8 9825,213
Apr.
11 9018 91
45 837 7
86091 0
8 6624 869
Nov.
13 4616 3915 4718 75
13 5018.16
46 338 0
86093 0
9 1185 316
May
13 9016 5715 8418 79
11 9418 76
45 4379
86092.0
8 5724984
Dec.
139218.06
46 337 9
87.092 0
9 1675 401
90. Security credit reported by nonbank lenders subject to margin regulations, June 30, 19831
Millions of dollars
Type of credit
1 Margin accounts3
2 "Plan lenders'1 . . . .
3 Total
NYSEmembers
18,737
18,737
Regulation T
Otherbrokers
and dealers2
5
5
Total
18,742
18,742
Regulation G
108100
208
Total
18,850100
18,950
236Digitized for FRASER http://fraser.stlouisfed.org/ Federal Reserve Bank of St. Louis

91. Detailed debit and credit balances at brokers carrying margin accounts, June 30, 1983Millions of dollars, except for number of firms
Item Memberfirms1
ASSETS
Debit balances due from public customers1 Margin accounts2 Cash accounts3 Nonsecurities accounts4 Other accounts
5 Total
6 Debit balances in firm investment and trading accounts7 Amount to be received for securities held under repurchase agreements .8 All other assets
9 Total assets
LIABILITIES AND CAPITAL
Credit balances due to public customers10 Margin accounts11 Cash accounts12 Nonsecurities accounts13 Other accounts
14 Total
15 Credit balances in firm investment and trading accounts ,
Credit balances due on loans16 U.S. banks17 Foreign banks18 Other lenders
19 Total
20 Amounts to be repaid for securities sold under repurchase agreements .21 All other liabilities and capital
22 Total liabilities and capital
MEMO: Number of margin accounts23 Debit status24 Credit status
25 Total
18,7425,542
1871,828
26,299
47,54851,44836,494
161,788
4,7649,7811,1681,633
17,346
26,926
9,005762
3,828
13,595
58,15545,766
161,788
946,4231,182,529
2,128,952
237Digitized for FRASER http://fraser.stlouisfed.org/ Federal Reserve Bank of St. Louis

92. Commitments of life insurance companies for income-property mortgages1
Period
19811982
1983JanuaryFebruaryMarch . . . . . . . . . .AprilMayJuneJulyAugust . . . .SeptemberOctoberNovember . . . . .December
Numberof loans
493671
1,181989691
10289
1431927561607995
Totalamount
committed(millions
of dollars)
3,262.34,828.5
9,965.9639.6638 5731.7833 4703.3
1,187.21 338 1
725.4831.4381 4938.8
1,017.2
Loanamount
(thousandsof dollars)
6,4096,815
8,7346,5276,6518,0418 1717,9028,3026,9699,671
13,6296,356
11,88310,707
Contractinterest
rate(percent)
14.4414.66
12.5612.9612.8312.8612 4812.2812.0612.1312.4112.6612 8312.6212.62
Maturity(years/
months)
15/311/3
9/58/8
8/108/109/1010/49/10
9/110/311/511/89/8
8/10
Averages3
Loan-to- value
ratio(percent)
70.066.2
70.168.670.770.371 369.870.869.568.569.172.371.368.7
Capitaliza-tion rate(percent)
13 112.4
11.111.511.511.311 311 010.810710.611.112 510.910.5
Debtcoverage
ratio
.31
.34
.27
.3228
.3026.29.25.29.27.2533.18.21
Percentconstant
14 714.9
12 913.313 013.112 812 612.412 412 913.013 513 112.9
238Digitized for FRASER http://fraser.stlouisfed.org/ Federal Reserve Bank of St. Louis

Part 3—Notes to Tables
Digitized for FRASER http://fraser.stlouisfed.org/ Federal Reserve Bank of St. Louis

Notes to Tables
Part 1—Regular Tables
TABLE 1
1. Unless otherwise noted, rates of change are calculated fromaverage amounts outstanding in preceding month or quarter. Growthrates for reserves are adjusted for discontinuities in series that resultfrom changes in Regulations D and M.
2. Figures incorporate adjustments for discontinuities associatedwith the implementation of the Monetary Control Act and otherregulatory changes to reserve requirements. To adjust for discon-tinuities due to changes in reserve requirements on reservable non-deposit liabilities, the sum of such required reserves is subtractedfrom the actual series. Similarly, in adjusting for discontinuities inthe monetary base, required clearing balances and adjustments tocompensate for float also are subtracted from the actual series.
3. Total reserves not adjusted for discontinuities consist of re-serve balances with Federal Reserve Banks, which exclude requiredclearing balances and adjustments to compensate for float, plusvault cash used to satisfy reserve requirements. Such vault cashconsists of all vault cash held during the lagged computation periodby institutions having required reserve balances at Federal ReserveBanks plus the amount of vault cash equal to required reservesduring the maintenance period at institutions having no requiredreserve balances.
4. The monetary base not adjusted for discontinuities consistsof total reserves plus required clearing balances and adjustments tocompensate for float at Federal Reserve Banks and the currencycomponent of the money stock less the amount of vault cash hold-ings of thrift institutions that is included in the currency componentof the money stock plus, for institutions not having required reservebalances, the excess of current vault cash over the amount appliedto satisfy current reserve requirements. After the introduction ofcontemporaneous reserve requirements (CRR), currency and vaultcash figures are measured over the weekly computation periodending Monday.
Before CRR, all components of the monetary base other thanexcess reserves are seasonally adjusted as a whole, rather than bycomponent, and excess reserves are added on a not seasonallyadjusted basis. After CRR, the seasonally adjusted series consistsof seasonally adjusted total reserves, which include excess reserveson a not seasonally adjusted basis, plus the seasonally adjustedcurrency component of the money stock and the remaining itemsseasonally adjusted as a whole.
5. Composition of money stock and debt measures is as follows:Ml: (1) currency outside the Treasury, Federal Reserve Banks,
and the vaults of commercial banks; (2) travelers checks of nonbankissuers; (3) demand deposits at all commercial banks other thanthose due to domestic banks, the U.S. government, and foreign
banks and official institutions less cash items in the process ofcollection and Federal Reserve float; and (4) other checkable de-posits (OCD) consisting of negotiable order of withdrawal (NOW)and automatic transfer service (ATS) accounts at depository insti-tutions, credit union share draft accounts, and demand deposits atthrift institutions. The currency and demand deposit componentsexclude the estimated amount of vault cash and demand depositsrespectively held by thrift institutions to service their OCD liabil-ities.
M2: Ml plus overnight (and continuing contract) repurchaseagreements (RPs) issued by all commercial banks and overnightEurodollars issued to U.S. residents by foreign branches of U.S.banks worldwide, MMDAs, savings and small-denomination timedeposits (time deposits—including retail RPs—in amounts of lessthan $100,000), and balances in both taxable and tax-exempt gen-eral purpose and broker/dealer money market mutual funds. Ex-cludes individual retirement accounts (IRA) and Keogh balancesat depository institutions and money market funds. Also excludesall balances held by U.S. commercial banks, money market funds(general purpose and broker/dealer), foreign governments and com-mercial banks, and the U.S. government. Also subtracted is aconsolidation adjustment that represents the estimated amount ofdemand deposits and vault cash held by thrift institutions to servicetheir time and savings deposits.
M3: M2 plus large-denomination time deposits and term RPliabilities (in amounts of $100,000 or more) issued by commercialbanks and thrift institutions, term Eurodollars held by U.S. residentsat foreign branches of U.S. banks worldwide and at all bankingoffices in the United Kingdom and Canada, and balances in bothtaxable and tax-exempt, institution-only money market mutual funds.Excludes amounts held by depository institutions, the U.S. gov-ernment, money market funds, and foreign banks and official in-stitutions. Also subtracted is a consolidation adjustment that representsthe estimated amount of overnight RPs and Eurodollars held byinstitution-only money mutual funds.
L: M3 plus the nonbank public holdings of U.S. savings bonds,short-term Treasury securities, commercial paper and bankers ac-ceptances, net of money market mutual fund holdings of theseassets.
Debt: Debt of domestic nonfinancial sectors consists of outstand-ing credit market debt of the U.S. government, state and localgovernments, and private nonfinancial sectors. Private debt consistsof corporate bonds, mortgages, consumer credit (including bankloans), other bank loans, commercial paper, bankers acceptances,and other debt instruments. The source of data on domestic non-financial debt is the Federal Reserve Board's flow of funds ac-counts. Debt data are on an end-of-month basis. Growth rates reflect
241Digitized for FRASER http://fraser.stlouisfed.org/ Federal Reserve Bank of St. Louis

adjustments for discontinuities over time in the levels of debt pre-sented in other tables.
6. Sum of overnight RPs and overnight Eurodollars, money mar-ket fund balances (general purpose and broker/dealer), MMDAs,and savings and small time deposits, less the consolidation ad-justment that represents the estimated amount of demand depositsand vault cash held by thrift institutions to service their time andsavings deposits liabilities.
7. Sum of large time deposits, term RPs and term Eurodollarsof U.S. residents, money market fund balances (institution-only),less a consolidation adjustment that represents the estimated amountof overnight RPs and Eurodollars held by institution-only moneymarket funds.
8. Savings deposits exclude MMDAs.9. Small-denomination time deposits—including retail RPs—
are those issued in amounts of less than $100,000. All individualretirement accounts (IRA) and Keogh accounts at commercial banksand thrifts are subtracted from small time deposits.
10. Large-denomination time deposits are those issued in amountsof $100,000 or more, excluding those booked at international bank-ing facilities.
11. Large-denomination time deposits at commercial banks lessthose held by money market mutual funds, depository institutionsP
and foreign banks and official institutions.12. Changes calculated from figures shown in table 14. Rates
beginning December 1981 and 1981 Q4 reflect shifts of foreignloans and securities from banking offices to international bankingfacilities.
TABLE 2
1. Includes securities loaned—securities fully guaranteed by theU.S. government pledged with Federal Reserve Banks—and ex-cludes any securities sold and scheduled to be bought back undermatched sale-purchase transactions.
2. Amounts of currency and coin held as reserves are shown intable 3, line 3 plus line 4.
3. As of August 13, 1981, excludes required clearing balancesof all depository institutions.
TABLE 3
1. As of August 13, 1981, excludes required clearing balancesof all depository institutions.
2. Total vault cash at institutions without required reserve bal-ances less vault cash equal to their required reserves.
3. Adjusted to include waivers of penalties for reserve deficien-cies in accordance with Board policy of permitting transitional reliefon a graduated basis over a 24-month period when a nonmemberbank merges into an existing member bank, or when a nonmemberbank joins the Federal Reserve System.
4. Reserve balances with Federal Reserve Banks plus vault cashat institutions with required reserve balances plus vault cash equalto required reserves at other institutions.
5. Reserve balances with Federal Reserve Banks plus vault cashused to satisfy reserve requirements less required reserves. (Thismeasure of excess reserves is comparable to the old excess reserveconcept published historically.)
TABLE 4
1. Daily average borrowings in immediately available funds of121 large member banks (banks with assets of $1 billion or moreas of December 31, 1977) disaggregated by lender and term tomaturity.
Immediately available funds are those that borrowing banks re-ceive the same day that the transfer of these funds is initiated.Unsecured borrowings in immediately available funds—federalfunds—are acquired mainly from commercial banks and, to a lesserextent, from other depository institutions and federal agencies. Otherborrowings in immediately available funds are principally sales ofU.S. Treasury and federal agency obligations under an agreementto repurchase—security repurchase agreements—and are obtainedfrom a much wider range of customers, including nonbank securitiesdealers, nonfinancial corporations, and state and local governments.There is also a small amount of borrowing in immediately availablefunds in the form of promissory notes, repurchase agreements in-volving other assets, due bills, and certain other obligations.
Borrowings of immediately available funds may have a specifiedterm to maturity—as short as one business day—or may be madeunder continuing contract. Transactions under continuing contractremain in effect until terminated, without any requirement of priornotice by either borrower or lender. Information is provided on twomaturity categories: one-day plus continuing-contract borrowings,and all other maturities.
TABLE 5
1. Rate applied to discounts of eligible paper and advances se-cured to the satisfaction of the Federal Reserve Bank pursuant tosection 201.4(b) of Regulation A. Adjustment credit is extendedto assist an institution in meeting temporary requirements for fundsor to cushion more persistent outflows of funds pending an orderlyadjustment of an institution's assets and liabilities. (See section201.3(a) of Regulation A.)
2. Rate applied on advances to assist smaller depository insti-tutions in meeting regular needs for funds arising from expectedpatterns of movement in deposits and loans. (See section 201.3(b)(l)of Regulation A.)
3. Rate applicable to advances when exceptional circumstancesor practices involve only a particular depository institution and toadvances when an institution is under sustained liquidity pressures.(See section 201.3(b)(2) of Regulation A.) The current structureapplies the basic rate to the first 60 days of borrowing and addson a surcharge of 1 percentage point for the next 90 days, and of2 percentage points thereafter.
TABLE 6
1. For changes in reserve requirements beginning in 1963, seeAnnual Statistical Digest, 1971-1975 and for earlier changes, seeBoard of Governors of the Federal Reserve System, 63rd AnnualReport, 1976, table 13. Under provisions of the Monetary ControlAct, depository institutions include commercial banks, mutual sav-ings banks, savings and loan associations, credit unions, agenciesand branches of foreign banks, and Edge Act corporations.
2. Requirement schedules are graduated, and each deposit in-terval applies to that part of the deposits of each bank. Demanddeposits subject to reserve requirements are gross demand depositsminus cash items in process of collection and demand balances duefrom domestic banks.
The Federal Reserve Act as amended through 1978 specifieddifferent ranges of requirements for reserve city banks and for otherbanks. Reserve cities were designated under a criterion adoptedeffective November 9, 1972, by which a bank having net demanddeposits of more than $400 million was considered to have thecharacter of business of a reserve city bank. The presence of thehead office of such a bank constituted designation of that place asa reserve city. Cities in which there were Federal Reserve Banksor branches were also reserve cities. Any banks having net demand
242Digitized for FRASER http://fraser.stlouisfed.org/ Federal Reserve Bank of St. Louis

deposits of $400 million or less were considered to have the char-acter of business of banks outside of reserve cities and were per-mitted to maintain reserves at ratios set for such banks.
Effective August 24, 1978, the Regulation M reserve require-ments on net balances due from domestic banks to their foreignbranches and on deposits that foreign branches lend to U.S. resi-dents were reduced to zero from 4 percent and 1 percent respec-tively. The Regulation D reserve requirement of borrowings fromunrelated banks abroad was also reduced to zero from 4 percent.
Effective with the reserve computation period beginning Novem-ber 16, 1978, domestic deposits of Edge corporations were subjectto the same reserve requirements as deposits of member banks.
3. Negotiable order of withdrawal (NOW) accounts and timedeposits such as Christmas and vacation club accounts are subjectto the same requirements as savings deposits.
The average reserve requirement on savings and other time de-posits before implementation of the Monetary Control Act had tobe at least 3 percent, the minimum specified by law.
4. Effective November 2, 1978, a supplementary reserve re-quirement of 2 percent was imposed on large time deposits of$100,000 or more, obligations of affiliates, and ineligible accep-tances. This supplementary requirement was eliminated with thereserve maintenance period beginning July 24, 1980.
Effective with the reserve maintenance period beginning Octo-ber 25, 1979, a marginal reserve requirement of 8 percent wasadded to managed liabilities in excess of a base amount. Thismarginal requirement was increased to 10 percent beginningApril 3, 1980, was decreased to 5 percent beginning June 12, 1980,and was eliminated as of July 24, 1980. Managed liabilities aredefined as large time deposits, Eurodollar borrowings, repurchaseagreements against U.S. government and federal agency securities,federal funds borrowings from nonmember institutions, and certainother obligations. In general, the base for the marginal reserverequirement was originally the greater of (a) $ 100 million or (b) theaverage amount of the managed liabilities held by a member bank,Edge corporation, or family of U.S. branches and agencies of aforeign bank for the two reserve computation periods ending Sep-tember 26, 1979. For the computation period beginning March 20,1980, the base was lowered by (a) 7 percent or (b) the decrease inan institution's U.S. office gross loans to foreigners and grossbalances due from foreign offices of other institutions between thebase period (September 13-26, 1979) and the week endingMarch 12,1980, whichever was greater. For the computation periodbeginning May 29, 1980, the base was increased by 7!/2 percentabove the base used to calculate the marginal reserve in the state-ment week of May 14-21, 1980. In addition, beginning March 19,1980, the base was reduced to the extent that foreign loans andbalances declined.
5. The Garn-St Germain Depository Institutions Act of 1982(Public Law 97-320) provides that $2 million of reservable liabilities(transaction accounts, nonpersonal time deposits, and Eurocurrencyliabilities) of each depository institution be subject to a zero percentreserve requirement. The Board is to adjust the amount of reservableliabilities subject to this zero percent reserve requirement each yearfor the next succeeding calendar year by 80 percent of the per-centage increase in the total reservable liabilities of all depositoryinstitutions, measured on an annual basis as of June 30. No cor-responding adjustment is to be made in the event of a decrease.Effective December 9, 1982, the amount of the exemption wasestablished at $2.1 million. Beginning Dec. 15, 1983, for quarterlyreporters and Dec. 29, for weekly reporters, the amount of theexemption was $2.2 million. In determining the reserve require-ments of a depository institution, the exemption shall apply in thefollowing order; (1) nonpersonal money market deposit accounts(MMDAs) authorized under 12 CFR section 1204.122; (2) net NOWaccounts (NOW accounts less allowable deductions); (3) net othertransaction accounts; and (4) nonpersonal time deposits or Euro-currency liabilities starting with those with the highest reserve ratio.With respect to NOW accounts and other transaction accounts, the
exemption applies only to such accounts that would be subject toa 3 percent reserve requirement.
6. For nonmember banks and thrift institutions that were notmembers of the Federal Reserve System on or after July 1, 1979,a phase-in period will end September 3, 1987. For banks that weremembers on or after July 1, 1979, but withdrew on or beforeMarch 31, 1980, the phase-in period established by Public Law97-320 will end on October 24, 1985. For existing member banksthe phase-in period is about three years, depending on whether theirnew reserve requirements are greater or less than the old require-ments. All new institutions will have a two-year phase-in beginningwith the date that they open for business, except for those insti-tutions that have total reservable liabilities of $50 million or more.
7. Transaction accounts include all deposits on which the ac-count holder is permitted to make withdrawals by negotiable ortransferable instruments, payment orders of withdrawal, and tele-phone and preauthorized transfers (in excess of three per month)for the purpose of making payments to third persons or others.However, certain accounts are not considered transaction accountsbut rather savings deposits subject to time deposit reserve require-ments: MMDAs and similar accounts offered by institutions notsubject to the rules of the Depository Institutions DeregulationCommittee that permit no more than six preauthorized, automatic,or other transfers per month of which no more than three can bechecks.
8. The Monetary Control Act of 1980 requires that the amountof transaction accounts against which the 3 percent reserve require-ment applies be modified annually by 80 percent of the percentageincrease in transaction accounts held by all depository institutionsdetermined as of June 30 each year. Effective on the followingdates, the amount was increased accordingly from $25 million;December 31, 1981, to $26 million; December 30, 1982, to $26.3million; and December 29, 1983, to $28.9 million.
9. In general, nonpersonal time deposits are time deposits, in-cluding savings deposits, that are not transaction accounts and inwhich the beneficial interest is held by a depositor that is not anatural person. Also included are certain transferable time depositsheld by natural persons, and certain obligations issued to depositoryinstitution offices located outside the United States. For details, seesection 204.2 of Regulation D.
TABLE 7
1. Regulations G, T, and U of the Board of Governors of theFederal Reserve System, prescribed in accordance with the Secu-rities Exchange Act of 1934, limit the amount of credit to purchaseand carry margin stocks that may be extended on securities ascollateral by prescribing a maximum loan value, which is a specifiedpercentage of the market value of the collateral at the time the creditis extended. Margin requirements are the difference between themarket value (100 percent) and the maximum loan value. The term"margin stocks" is defined in the corresponding regulation.
Special margin requirements for bonds convertible into stockswere adopted by the Board of Governors effective March 11, 1968.
2. The margin is expressed as a percent of the market value ofthe stock underlying the option.
TABLE 8
1. Effective October 1, 1983, restrictions on the maximum ratesof interest payable by commercial banks and thrift institutions onvarious categories of deposits were removed. For information re-garding previous interest rate ceilings on all categories of accounts,see earlier issues of the Federal Reserve Bulletin, the Federal HomeLoan Bank Board Journal, and the Annual Report of the FederalDeposit Insurance Corporation before November 1983.
243Digitized for FRASER http://fraser.stlouisfed.org/ Federal Reserve Bank of St. Louis

2. Effective December 1, 1983, IRA/Keogh (HR 10) Plan ac-counts are not subject to minimum deposit requirements.
3. Effective December 14, 1982, depository institutions are au-thorized to offer a new account with a required initial balance of$2,500 and an average maintenance balance of $2,500 not subjectto interest rate restrictions. No minimum maturity period is requiredfor this account, but depository institutions must reserve the rightto require seven days notice before withdrawals. When the averagebalance is less than $2,500, the account is subject to the maximumceiling rate of interest for NOW accounts; compliance with theaverage balance requirement may be determined over a period ofone month. Depository institutions may not guarantee a rate ofinterest for this account for a period longer than one month orcondition the payment of a rate on a requirement that the fundsremain on deposit for longer than one month.
4. Deposits of less than $2,500 issued to governmental unitscontinue to be subject to an interest rate ceiling of 8 percent.
TABLE 9
1. Sales, redemptions, and negative figures reduce holdings ofthe System Open Market Account; all other figures increase suchholdings. Details may not add to totals because of rounding.
TABLE 10-A
1. Includes securities loaned—securities fully guaranteed by U.S.government pledged with Federal Reserve Banks—and excludesany securities sold and scheduled to be bought back under matchedsale-purchase transactions.
2. Includes U.S. government securities held under repurchaseagreement against receipt of foreign currencies and foreign curren-cies warehoused for the U.S. Treasury. Assets shown in this lineare revalued monthly at market exchange rates.
3. Includes special investment account at Chicago Bank of Trea-sury bills maturing within 90 days.
4. Includes exchange-translation account reflecting the monthlyrevaluation at market exchange rates of foreign-exchange commit-ments.
TABLE 10-B
1. Federal Reserve notes held by the Reserve Bank are exemptfrom the collateral requirement.
TABLE 10-C
1. Holdings under repurchase agreements are classified as ma-turing within 15 days in accordance with maximum maturity of theagreements.
TABLE 11
1. Accounts of individuals, partnerships, and corporations, andof states and political subdivisions.
2. Accounts authorized for negotiable orders of withdrawal (NOW)and accounts authorized for automatic transfer to demand deposits(ATS). ATS data are available starting in December 1978.
3. Excludes ATS and NOW accounts as well as special clubaccounts, such as Christmas and vacation clubs.
SOURCES. Data for demand deposits are available beginning in1970 estimated in part from the debits series for 233 SMSAs that
were available through June 1977. Data for ATS and NOW accountsand savings deposits are available beginning in July 1977. Backdata are available on request from the Banking Section, Divisionof Research and Statistics, Board of Governors of the Federal Re-serve System, Washington, D.C. 20551.
TABLE 12
1. Composition of the money stock measures and debt is asfollows:
Ml: (1) currency outside the Treasury, Federal Reserve Banks,and the vaults of commercial banks; (2) travelers checks of nonbankissuers; (3) demand deposits at all commercial banks other thanthose due to domestic banks, the U.S. government, and foreignbanks and official institutions less cash items in the process ofcollection and Federal Reserve float; and (4) other checkable de-posits (OCD) consisting of negotiable order of withdrawal (NOW)and automatic transfer service (ATS) accounts at depository insti-tutions, credit union share draft accounts, and demand deposits atthrift institutions. The currency and demand deposit componentsexclude the estimated amount of vault cash and demand depositsrespectively held by thrift institutions to service their OCD liabil-ities.
M2: Ml plus overnight (and continuing contract) repurchaseagreements (RPs) issued by all commercial banks and overnightEurodollars issued to U.S. residents by foreign branches of U.S.banks worldwide. MMDAs, savings and small-denomination timedeposits (time deposits—including retail RPs—in amounts of lessthan $100,000), and balances in both taxable and tax-exempt gen-eral purpose and broker/dealer money market mutual funds. Ex-cludes individual retirement accounts (IRA) and Keogh balancesat depository institutions and money market funds. Also excludesall balances held by U.S. commercial banks, money market funds(general purpose and broker/dealer), foreign governments and com-mercial banks, and the U.S. government. Also subtracted is aconsolidation adjustment that represents the estimated amount ofdemand deposits and vault cash held by thrift institutions to servicetheir time and savings deposits.
M3: M2 plus large-denomination time deposits and term RPliabilities (in amounts of $100,000 or more) issued by commercialbanks and thrift institutions, term Eurodollars held by U.S. residentsat foreign branches of U.S. banks worldwide and at all bankingoffices in the United Kingdom and Canada, and balances in bothtaxable and tax-exempt, institution-only money market mutual funds.Excludes amounts held by depository institutions, the U.S. gov-ernment money market funds, and foreign banks and official in-stitutions. Also subtracted is a consolidation adjustment that representsthe estimated amount of overnight RPs and Eurodollars held byinstitution-only money mutual funds.
L: M3 plus the nonbank public holdings of U.S. savings bonds,short-term Treasury securities, commercial paper and bankers ac-ceptances, net of money market mutual fund holdings of theseassets.
Debt: Debt of domestic nonfmancial sectors consists of outstand-ing credit market debt of the U.S. government, state and localgovernments, and private nonfinancial sectors. Private debt consistsof corporate bonds, mortgages, consumer credit (including bankloans), other bank loans, commercial paper, bankers acceptances,and other debt instruments. The source of data on domestic non-financial debt is the Federal Reserve Board's flow of funds ac-counts. Debt data are on an end-of-month basis.
2. Currency outside the U.S. Treasury, Federal Reserve Banks,and vaults of commercial banks. Excludes the estimated amountof vault cash held by thrift institutions to service their OCD lia-bilities.
3. Outstanding amount of U. S. dollar-denominated travelers checksof nonbank issuers. Travelers checks issued by depository insti-tutions are included in demand deposits.
244Digitized for FRASER http://fraser.stlouisfed.org/ Federal Reserve Bank of St. Louis
4. Demand deposits at commercial banks and foreign-relatedinstitutions other than those due to domestic banks, the U.S. gov-ernment, and foreign banks and official institutions less cash itemsin the process of collection and Federal Reserve float. Excludesthe estimated amount of demand deposits held at commercial banksby thrift institutions to service their OCD liabilities.
5. Consists of NOW and ATS balances at all depository insti-tutions, credit union share draft balances, and demand deposits atthrift institutions. Other checkable deposits seasonally adjusted equalsthe difference between the seasonally adjusted sum of demanddeposits plus OCD and seasonally adjusted demand deposits. In-cluded are all ceiling free "Super NOWs," authorized by the De-pository Institutions Deregulation committee to be offered beginningJanuary 5, 1983.
6. Sum of overnight RPs and overnight Eurodollars, money mar-ket fund balances (general purpose and broker/dealer), MMDAs,and savings and small time deposits, less the consolidation ad-justment that represents the estimated amount of demand depositsand vault cash held by thrift institutions to service their time andsavings deposit liabilities,
7. Sum of large time deposits, term RPs and term Eurodollarsof U.S. residents, money market fund balances (institution-only),less a consolidation adjustment that represents the estimated amountof overnight RPs and Eurodollars held by institution-only moneymarket funds.
8. Consists of overnight and continuing contract RPs issued bycommercial banks to other than depository institutions and moneymarket mutual funds (general purpose and broker/dealer), and over-night Eurodollars issued by foreign branches of U.S. banks world-wide to U.S. residents other than depository institutions and moneymarket mutual funds (general purpose and broker/dealer).
9. Savings deposits exclude MMDAs.10. Small-denomination time deposits—including retail RPs—
are those issued in amounts of less than $100,000. All individualretirement accounts (IRA) and Keogh accounts at commercial banksand thrifts are subtracted from small time deposits.
11. Large-denomination time deposits are those issued in amountsof $100,000 or more, excluding those booked at international bank-ing facilities.
TABLE 13
1. Figures incorporate adjustments for discontinuities associatedwith the implementation of the Monetary Control Act and otherregulatory changes to reserve requirements. To adjust for discon-tinuities due to changes in reserve requirements on reservable non-deposit liabilities, the sum of such required reserves is subtractedfrom the actual series. Similarly, in adjusting for discontinuities inthe monetary base, required clearing balances and adjustments tocompensate for float also are subtracted from the actual series.
2. Total reserves not adjusted for discontinuities consist of re-serve balances with Federal Reserve Banks, which exclude requiredclearing balances and adjustments to compensate for float, plusvault cash used to satisfy reserve requirements. Such vault cashconsists of all vault cash held during the lagged computation periodby institutions having required reserve balances at Federal ReserveBanks plus the amount of vault cash equal to required reservesduring the maintenance period at institutions having no requiredreserve balances.
3. Extended credit consists of borrowing at the discount windowunder the terms and conditions established for the extended creditprogram to help depository institutions deal with sustained liquiditypressures. Because there is not the same need to repay such bor-rowing promptly as there is with traditional short-term adjustmentcredit, the money market impact of extended credit is similar tothat of nonborrowed reserves.
4. The monetary base not adjusted for discontinuities consistsof total reserves plus required clearing balances and adjustments to
compensate for float at Federal Reserve Banks and the currencycomponent of the money stock less the amount of vault cash hold-ings of thrift institutions that is included in the currency componentof the money stock plus, for institutions not having required reservebalances, the excess of current vault cash over the amount appliedto satisfy current reserve requirements. After the introduction ofcontemporaneous reserve requirements (CRR), currency and vaultcash figures are measured over the weekly computation periodending Monday.
Before CRR, all components of the monetary base other thanexcess reserves are seasonally adjusted as a whole, rather than bycomponent, and excess reserves are added on a not seasonallyadjusted basis. After CRR, the seasonally adjusted series consistsof seasonally adjusted total reserves, which include excess reserveson a not seasonally adjusted basis, plus the seasonally adjustedcurrency component of the money stock and the remaining itemsseasonally adjusted as a whole.
5. Reflects actual reserve requirements, including those on non-deposit liabilities, with no adjustments to eliminate the effects ofdiscontinuities associated with implementation of the MonetaryControl Act or other regulatory changes to reserve requirements.
6. Reserve balances with Federal Reserve Banks plus vault cashused to satisfy reserve requirements less required reserves.
TABLE 14
1. All commercial banks include domestically chartered banks,U.S. branches and agencies of foreign banks, New York investmentcompanies majority owned by foreign banks, and Edge Act cor-porations owned by domestically chartered and foreign banks. Dataare prorated averages of Wednesday estimates for domesticallychartered banks, based on weekly reports of a sample of domesti-cally chartered banks and quarterly reports of all domestically char-tered banks. For foreign-related institutions, data are averages ofmonth-end estimates based on weekly reports from large agenciesand branches and quarterly reports from all agencies, branches,investment companies, and Edge Act corporations engaged in bank-ing.
2. Adjusted to exclude federal funds sold to commercial banksand domestic commercial interbank loans.
3. Due to loan reclassifications, several categories have breaksin series: beginning January 12, 1983, real estate loans increased$0.4 billion and loans to individuals decreased $0.2 billion. As ofJanuary 26, 1983, other securities increased $0.2 billion and totalloans and commercial and industrial loans decreased $0.2 billion.
4. Reclassifications of loans beginning February 2, 1983, in-creased real estate loans $0.5 billion and decreased commercial andindustrial loans $0.5 billion.
5. Beginning October 5, 1983, a reclassification of loans in-creased commercial and industrial loans and decreased all otherloans by $0.3 billion. Due to a merger and sale of loans, total loansand securities, total loans and all other loans were reduced $1.0billion as of October 19, 1983.
6. Loans sold are those sold outright to a bank's own foreignbranches, nonconsolidated nonbank affiliates of the bank, the bank'sholding company (if not a bank), and nonconsolidated nonbanksubsidiaries of the holding company.
7. U.S. includes the 50 states and the District of Columbia.
TABLE 15
1. Commercial banks are those in the 50 states and the Districtof Columbia with national or state charters plus U.S. agencies andbranches of foreign banks, New York investment companies ma-jority owned by foreign banks, and Edge Act corporations ownedby domestically chartered and foreign banks.
245Digitized for FRASER http://fraser.stlouisfed.org/ Federal Reserve Bank of St. Louis

2. Includes seasonally adjusted federal funds, RPs, and otherborrowings from nonbanks and not seasonally adjusted net Euro-dollars and loans to affiliates. Includes averages of Wednesday datafor domestically chartered banks and averages of current and pre-vious month-end data for foreign-related institutions.
3. Other borrowings are borrowings on any instrument, such asa promissory note or due bill, given for the purpose of borrowingmoney for the banking business. This includes borrowings fromFederal Reserve Banks and from foreign banks, term federal funds,overdrawn due from bank balances, loan RPs, and participationsin pooled loans. Includes averages of Wednesday figures for mem-ber banks and averages of current and previous month-end data forforeign-related institutions. Beginning November 1980, fluctua-tions of federal funds, RPs, and other borrowings from nonbanks(lines 3 and 4) are derived from changes in the following: securityRP borrowings (lines 13 and 14), borrowings from Federal ReserveBanks, borrowings from foreign banks, one-day and term federalfunds purchased and RPs from other depository institutions, foreignbanks, and foreign official institutions.
4. Loans initially booked by the bank and later sold to affiliatesthat are still held by affiliates. Averages of Wednesday data.
5. Averages of daily figures for member and nonmember banks.Before October 1980, nonmember banks were interpolated fromquarterly call report data.
6. Includes averages of current and previous month-end datauntil August 1979; beginning September 1979 averages of dailydata.
7. Based on daily average data reported by 122 large banksbeginning February 1980 and 46 banks before February 1980.
8. Includes U.S. Treasury demand deposits and Treasury tax-and-loan notes at commercial banks. Averages of daily data.
9. Averages of Wednesday figures.10. Beginning August 28, 1974, loans sold outright to bank
affiliates reflect a newly issued definition of the group of affiliatesincluded as well as a somewhat different group of reporting banks.Total loans sold were reduced $100 million on the new basis.
11. As of December 1, 1979, loans sold to affiliates were re-duced $800 million due to corrections of two New York City banks.
12. Estimated effects of shifts of foreign assets from U.S. bank-ing offices to international banking facilities (IBFs).
TABLE 16
1. Figures are partly estimated; all data are for the last Wednes-day of the month. Domestically chartered commercial banks includeall commercial banks in the United States except U.S. branches offoreign banks. Figures for all bank-premises subsidiaries and othersignificant majority-owned domestic subsidiaries are included; fig-ures for securities are reported gross—that is, before deduction ofvaluation reserves.
2. All commercial banking institutions include domesticallychartered commercial banks, agencies and branches of foreign bankslocated in the United States, Edge Act corporations owned bydomestically chartered and foreign banks, and New York Stateforeign investment companies majority owned by foreign banks.Data for domestically chartered commercial banks (partly esti-mated) are for the last Wednesday of the month. Data for foreign-related institutions are based on last-Wednesday-of-the-month re-ports from large agencies and branches and quarterly reports fromall agencies, branches, investment companies, and Edge Act cor-porations engaged in banking.
TABLE 17
1. The report of condition was substantially revised for com-mercial banks on December 31, 1978. Commercial banks with
assets less than $100 million and with domestic offices only weregiven the option to complete either the abbreviated or the standardset of reports. Banks with foreign offices began reporting in greaterdetail on a consolidated domestic and foreign basis. This tablereflects the varying levels of reporting detail.
2. All transactions between domestic and foreign offices of abank are reported in "Net due from" and "Net due to" (lines 80and 104). All other lines represent transactions with parties otherthan the domestic and foreign offices of each bank. Because theseintraoffice transactions are erased by consolidation, total assets andliabilities are the sum of all except intraoffice balances.
3. Foreign offices include branches in foreign countries and inU.S. territories and possessions, subsidiaries in foreign countries,and all offices of Edge Act and Agreement corporations whereverlocated.
4. This item is unavailable for all or some of the banks becauseof the lesser detail available from banks without foreign offices,the inapplicability of certain items to banks that have only domesticoffices, and the absence of detail on a fully consolidated basis forbanks with foreign offices.
5. Equity capital is not allocated between the domestic and for-eign offices of banks with foreign offices.
6. Demand deposits adjusted equal demand deposits other thandomestic commercial interbank and U.S. government less cashitems in process of collection.
TABLES 18 AND 19
1. The report of condition was substantially revised for com-mercial banks on December 31, 1978. Commercial banks withassets less than $100 million and with domestic offices only weregiven the option to complete either the abbreviated or the standardset of reports. Banks with foreign offices began reporting in greaterdetail on a consolidated domestic and foreign basis. This tablereflects the varying levels of reporting detail.
Domestic offices exclude branches in foreign countries and inU.S. territories and possessions, subsidiaries in foreign countries,and all offices of Edge Act and Agreement corporations whereverlocated.
2. This item contains the capital accounts of the U.S. banks thathave no Edge or foreign operations and reflects the differencebetween domestic office assets and liabilities of U.S. banks withEdge or foreign operations excluding the capital accounts of theirEdge or foreign subsidiaries.
3. Demand deposits adjusted equal demand deposits other thandomestic commercial interbank and U.S. government less cashitems in process of collection.
TABLE 20-A
!. All large weekly reporting commercial banks are those withdomestic assets of $750 million or more on December 31, 1977.This panel began reporting on January 3, 1979. For partially es-timated historical data, see the ANNUAL STATISTICAL DIGEST, 1970-1979, pages 88-141.
2. Includes securities purchased under agreements to resell.3. Other than financial institutions and brokers and dealers.4. Includes federal funds purchased and securities sold under
agreements to repurchase.5. This is not a measure of equity capital for use in capital
adequacy analysis or for other analytic uses.6. Adjustment bank amounts represent accumulated adjustments
originally made to offset the cumulative effects of mergers. Theseadjustment amounts should be added to outstanding data for anydate in the year to establish comparability with any date in thesubsequent year. A description of the adjustment process is avail-
246Digitized for FRASER http://fraser.stlouisfed.org/ Federal Reserve Bank of St. Louis

able in Banking and Monetary Statistics, 1941-1970, pages148-49.
TABLE 20-B
1. All large weekly reporting commercial banks are those withdomestic assets of $750 million or more on December 31, 1977.This panel began reporting on January 3, 1979. For partially es-timated historical data, see the ANNUAL STATISTICAL DIGEST, 1970-1979, pages 88-129 and 142-43.
2. Exclusive of loans and federal funds transactions with do-mestic commercial banks.
3. All demand deposits except U.S. government and domesticcommercial banks less cash items in process of collection.
4. Loans sold are those sold outright to a bank's own foreignbranches, nonconsolidated nonbank affiliates of the bank, the bank'sholding company (if not a bank), and nonconsolidated nonbanksubsidiaries of the holding company.
5. Adjustment bank amounts represent accumulated adjustmentsoriginally made to offset the cumulative effects of mergers. Theseadjustment amounts should be added to outstanding data for anydate in the year to establish comparability with any date in thesubsequent year. A description of the adjustment process is avail-able in Banking and Monetary Statistics, 1941-1970, pages148-49.
TABLE 21
1. Figures include cash items in process of collection. Estimatesof gross deposits are based on reports supplied by a sample ofcommercial banks. Types of depositors in each category are de-scribed in Federal Reserve Bulletin, vol. 57 (June 1971), page 466.
TABLE 22
1. Institutions engaged primarily in commercial, savings, andmortgage banking; sales, personal, and mortgage financing; fac-toring, finance leasing, and other business lending; insurance un-derwriting; other investment activities; and the like.
2. Includes all financial company paper sold by dealers in theopen market.
3. As reported by financial companies that place their paperdirectly with investors.
4. Includes public utilities and firms engaged primarily in ac-tivities such as communications, construction, manufacturing, min-ing, wholesale and retail trade, transportation, and services.
5. Effective December 1, 1982, there was a break in the com-mercial paper series. The key changes in the content of the datainvolved additions to the reporting panel, the exclusion of brokeror dealer-placed borrowings under any master note agreements fromthe reported data, and the reclassification of a large portion of bank-related paper from dealer-placed to directly placed.
TABLE 23
1. The prime rate is the rate that banks charge their most credit-worthy business customers on short-term loans. The table showsthe date on which a new rate came to be the predominant onequoted, rather than the date on which the first bank made a changein the rate.
banks. The sample data are collected over one business week andused to estimate lending terms at all insured commercial banks.Short-term loans have original maturities of less than one year, andlong-term loans have maturities of one year or more. Constructionand land development loans include both unsecured loans and loanssecured by real estate. Thus some of the construction and landdevelopment loans would be reported on the statement of conditionas real estate loans and the remainder as business loans. Loans tofanners exclude loans secured by real estate.
2. Average maturities are weighted by loan volumes exclusiveof loans with no stated maturity (demand loans).
3. The approximate compounded annual interest rate on eachloan is calculated from survey data on the stated rate and otherterms of the loan; then, in computing the average of these approx-imate effective rates, each loan is weighted by its dollar amount.
4. Large banks correspond roughly to banks with more than $500million in total assets.
TABLE 25
1. Average of offering rates quoted by at least five dealers (inthe case of commercial paper) or finance companies (in the caseof finance paper).
2. Yields are quoted on a bank-discount basis.3. Dealer closing offered rates for top-rated banks. Most rep-
resentative rate (which may be, but need not be, the average of therates quoted by the dealers).
4. Averages of offering rates quoted by five dealers.5. Annual figures are averages of the individual observations.
For the other series, annual averages are constructed from the monthlyaverages.
6. Except for auction averages, yields are computed from dailyclosing bid prices; auction averages are recorded in the week inwhich the bills are issued.
7. Yields on the more actively traded issues adjusted to constantmaturities by the U.S. Treasury, based on daily closing bid prices.
8. Each weekly figure is calculated on a biweekly basis and isthe average of five business days ending on the Monday followingthe calendar week. Until Mar. 31, 1983, these data determined themaximum interest rate payable on small saver certificates.
9. Averages of yields (to maturity or call) for all outstandingbonds neither due nor callable in less than 10 years, includingseveral very low yielding "flower" bonds.
10. General obligations only, based on figures for Thursday,from Moody's Investors Service.
11. Twenty issues of mixed quality.12. Averages of daily figures from Moody's Investors Service.13. Data are a compilation of the Board of Governors of the
Federal Reserve System. This series is an estimate of the yield onrecently-offered, A-rated utility bonds with a 30-year maturity and5 years of call protection. Weekly data are based on Friday quo-tations. The Federal Reserve previously published interest rate se-ries on both newly-issued and recently-offered Aaa utility bonds,but discontinued these series in January 1984 owing to the lack ofAaa issues.
14. Provided by Standard & Poor's Corporation.15. Weekly figures are seven-day averages of daily effective
rates for the week ending Wednesday; the daily effective rate is anaverage of the rates on a given day weighted by the volume oftransactions at these rates.
16. Weekly figures are averages of daily quotations for the weekending Wednesday.
TABLE 24
1. The survey of terms of bank lending covers loans of $1,000or more made at about 340 banks selected to represent all sizes of
TABLE 26
1. Beginning July 5, 1983, the American Stock Exchange re-based its index, making August 31, 1973 = 50, rather than 100.
247Digitized for FRASER http://fraser.stlouisfed.org/ Federal Reserve Bank of St. Louis

Data before that date have been revised to reflect this index basechange.
2. Margin credit includes all credit extended to purchase or carrystocks or related equity instruments and secured at least in part bystock. Credit extended is end-of-month data for member firms ofthe New York Stock Exchange.
Besides assigning a current loan value to margin stock generally,Regulation T permits special loan values for convertible bonds andstock acquired through exercise of subscription rights.
3. A distribution of this total by equity class is shown in part Cof this table.
4. Free credit balances are in accounts with no balance due tothe brokers and are subject to withdrawal by customers on demand.
5. Each customer's equity in his collateral (market value ofcollateral less net debit balance) is expressed as a percentage ofcurrent collateral values.
6. Balances that may be used by customers as the margin depositrequired for additional purchases. Balances may arise with transfersbased increases in loan values of other collateral in the customer'smargin account or with deposits of cash (usually sale proceeds).
TABLE 27-A
1. Beginning in 1982, a regulatory accounting change providesthat certain balances that had been reported as liabilities be reportedas contra-assets and deducted from asset balances. Total assets andliabilities plus net worth are net of these items.
2. Holdings of stock in the Federal Home Loan Banks are in-cluded in "Other" (line 4).
3. Beginning in 1982, loans in process are classified as contra-assets and are not included in total liabilities and net worth. Totalassets are net of loans in process.
4. Includes general reserves, paid-in surplus, individual profits,and permanent stock in the case of stock associations.
5. Excludes figures for loans in process.SOURCE. Estimates by the Federal Home Loan Bank Board for
all savings and loan associations in the United States. Data arebased on monthly reports of federally insured associations andannual reports of other associations. Even when revised, data forthe current and the preceding year are subject to further revision.
TABLE 27-B
1. Data are reported on a net-of-valuation-reserves basis.Data for December 31, 1982, are revised as follows;
1 AssetsLoans
2 Mortgage3 Other
Securities4 U.S government2
5 State and local government6 Corporate and other*7 Cash8 Other assets
9 Liabilities
10 Deposits1 1 Regular4
12 Ordinary savings . .13 Time14 Other15 Other liabilities16 General reserve accounts
17 MEMO: Mortgage loan commitments outstanding5 . . . .
174,197
94,09116 957
9,7432 470
36 1616,9197,855
174,197
155 196152,77746,86296 369
2,4198,3369 235
1,285
2. Data include obligations of U.S. government agencies.
3. Item includes securities of foreign governments and inter-national organizations.
4. Excludes checking, club, and school accounts.5. Commitments outstanding (including loans in process) of banks
in New York State as reported to the Savings Banks Associationof that state.
SOURCE. Estimates of National Council of Savings Institutionsfor all savings banks in the United States,
TABLE 27-C
1. Direct and guaranteed obligations. Excludes federal agencyissues not guaranteed, which are shown in this table under "Busi-ness."
2. Issues of foreign governments and their subdivisions and bondsof the International Bank for Reconstruction and Development.
SOURCE. Estimates of the American Council of Life Insurancefor all life insurance companies in the United States. Annual figuresare annual-statement asset values, with bonds carried on an am-ortized basis and stocks at year-end market values. Adjustmentsfor interest due and accrued and for differences between marketand book values are not made on each item separately but areincluded, in total, in "Other assets."
TABLE 27-D
SOURCE. Estimates by the National Credit Union Administrationbased on a group of federal and state-chartered credit unions thataccount for about 30 percent of credit union assets. Figures arepreliminary and are revised annually to incorporate recent bench-mark data.
TABLE 28
1. Supplemental medical insurance premiums and voluntary hos-pital insurance premiums have been reclassified from social insur-ance receipts to offsetting receipts in the health function.
2. Half-year figures are calculated as a residual (total surplus ordeficit less trust-fund surplus or deficit).
3. Other off-budget includes the Postal Service Fund, RuralElectrification and Telephone Revolving Fund, and Rural Tele-phone Bank; it also includes, effective November 1981, petroleumacquisition and transportation and strategic petroleum reserve.
4. Data include U.S. Treasury operating cash accounts, specialdrawing rights, gold tranche drawing rights, loans to the Interna-tional Monetary Fund, and other cash and monetary assets.
5. Item includes accrued interest payable to the public, alloca-tions of special drawing rights, deposit funds, miscellaneous lia-bility (including checks outstanding) and asset accounts, seigniorage,increment on gold, profit on sale of gold, net gain or loss for U.S.currency-valuation adjustment, and net gain or loss for IMF loan-valuation adjustment.
SOURCES. U.S. Treasury Department, "Monthly Treasury State-ment of Receipts and Outlays of the U.S. Government," and Trea-sury Bulletin, various issues; and The Budget of the United StatesGovernment, Fiscal Year 1985.
TABLE 29-A
1. Supplemental medical insurance premiums and voluntary hos-pital insurance premiums have been reclassified from social insur-ance receipts to offsetting receipts in the health function.
2. Old-age, disability, and hospital insurance, and railroad re-tirement accounts.
248Digitized for FRASER http://fraser.stlouisfed.org/ Federal Reserve Bank of St. Louis

3. Old-age, disability, and hospital insurance.4. Federal employee retirement contributions, and civil service
retirement and disability fund.5. Deposits of earnings by Federal Reserve Banks and other
miscellaneous receipts.SOURCES. "Monthly Treasury Statement of Receipts and Outlays
of the U.S. Government" and the Budget of the U.S. Government,Fiscal Year 1985.
TABLE 29-B
1. Supplemental medical insurance premiums and voluntary hos-pital insurance premiums have been reclassified from social insur-ance receipts to offsetting receipts in the health function.
2. Consists of rents and royalties on the outer continental shelf,and U.S. government contributions for employee retirement.
SOURCES. "Monthly Treasury Statement of Receipts and Outlaysof the U.S. Government" and the Budget of the U.S. Government,Fiscal Year 1985. For some categories, an adjustment was madeto the last month of the fiscal year so that functional totals for thefiscal years match those in the Budget.
TABLE 30
1. Includes guaranteed debt of U.S. government agencies, spec-ified participation certificates, notes to international lending or-ganizations, and District of Columbia stadium bonds.
SOURCE. Treasury Bulletin.
TABLE 31
1. Includes (not shown separately) securities issued to the RuralElectrification Administration; depository bonds; retirement planbonds; and individual retirement bonds.
2. Nonmarketable dollar-denominated and foreign currency-de-nominated series held by foreigners.
3. Held almost entirely by U.S. government agencies and trustfunds.
4. Data for Federal Reserve Banks and U.S. government agen-cies and trust funds are actual holdings; data for other groups areTreasury estimates.
5. Consists of investments of foreign and international accounts.Excludes non-interest-bearing notes issued to the InternationalMonetary Fund.
6. Includes savings and loan associations, nonprofit institutions,credit unions, mutual savings banks, corporate pension trust funds,dealers and brokers, certain U.S. government deposit accounts, andU.S. government-sponsored agencies.
SOURCES. Data by type of security, U.S. Treasury Department,Monthly Statement of the Public Debt of the United States; data byholder, Treasury Bulletin.
TABLE 32-A
1. Transactions are market purchases and sales of U.S. govern-ment securities dealers reporting to the Federal Reserve Bank ofNew York. The figures exclude allotments of, and exchanges for,new U.S. government securities, redemptions of called or maturedsecurities, purchases or sales of securities under repurchase agree-ment, reverse repurchase (resale), or similar contracts.
2. Includes, among others, all other dealers and brokers in com-modities and securities, nondealer departments of commercial banks,foreign banking agencies, and the Federal Reserve System.
3. Futures transactions are standardized agreements arranged onan organized exchange in which parties commit to purchase or sellsecurities for delivery at a future date.
4. Forward transactions are agreements arranged in the over-the-counter market in which securities are purchased (sold) fordelivery after five business days from the date of the transactionfor government securities (Treasury bills, notes, and bonds) or afterthirty days for mortgage-backed agency issues.
TABLE 32-B
1. Positions are shown net and are on a commitment basis.2. Immediate positions are net amounts (in terms of par values)
of securities owned by nonbank dealer firms and dealer departmentsof commercial banks on a commitment, that is, trade-date basis,including any such securities that have been sold under agreementsto repurchase (RPs). The maturities of some repurchase agreementsare sufficiently long, however, to suggest that the securities in-volved are not available for trading purposes. Securities owned,and hence dealer positions, do not include securities to resell (re-serve RPs).
TABLE 32-C
1. Figures cover financing involving U.S. government and fed-eral agency securities, negotiable certificates of deposit, bankersacceptances, and commercial paper (based on Wednesday figures,in terms of actual money borrowed or lent).
2. Includes all reverse repurchase agreements, including thosethat have been arranged to make delivery on short sales and thosefor which the securities obtained have been used as collateral onborrowings, that is, matched agreements.
3. Includes both repurchase agreements undertaken to financepositions and "matched book" repurchase agreements.
TABLE 33
1. Consists of mortgages assumed by the Defense Departmentbetween 1957 and 1963 under family housing and homeownersassistance programs.
2. Includes participation certificates reclassified as debt begin-ning October 1, 1976.
3. Off-budget August 17, 1974, through September 30, 1976;on-budget thereafter.
4. Consists of debentures issued in payment of Federal HousingAdministration insurance claims. Once issued, these securities maybe sold privately on the securities market.
5. Certificates of participation issued before fiscal 1969 by theGovernment National Mortgage Association acting as trustee forthe Farmers Home Administration; Department of Health, Edu-cation, and Welfare; Department of Housing and Urban Devel-opment; Small Business Administration; and the VeteransAdministration.
6. Off-budget.7. Includes outstanding noncontingent liabilities: Notes, bonds,
and debentures.8. Before late 1981, the Association obtained financing through
the Federal Financing Bank.9. The FFB, which began operations in 1974, is authorized to
purchase or sell obligations issued, sold, or guaranteed by otherfederal agencies. Since FFB incurs debt solely for the purpose oflending to other agencies, its debt is not included in the main portionof the table in order to avoid double counting.
10. Includes FFB purchases of agency assets and guaranteedloans; the latter contains loans guaranteed by numerous agencieswith the guarantees of any particular agency being generally small.The Farmers Home Administration item consists exclusively ofagency assets, while the Rural Electrification Administration entrycontains both agency assets and guaranteed loans.
249Digitized for FRASER http://fraser.stlouisfed.org/ Federal Reserve Bank of St. Louis
TABLE 34
1. Par amounts of long-term issues based on date of sale.2. Consists of tax-exempt issues guaranteed by the Fanners Home
Administration.SOURCE. Public Securities Association.
TABLE 35
1. Figures, which represent gross proceeds of issues maturingin more than one year sold for cash in the United States, are theprincipal amount or the number of units multiplied by the offering
. price. Excludes private placement offerings, offerings of less than$100,000, secondary offerings, undefined or exempted issues asdefined in the Securities Act of 1933, employee stock plans, in-vestment companies other than closed-end, intracorporate trans-actions, and sales to foreigners.
SOURCES. U.S. Securities and Exchange Commission and theBoard of Governors of the Federal Reserve System.
TABLE 36
1. Excluding money market funds.2. Includes reinvestment of investment income dividends. Ex-
cludes reinvestment of capital gains distributions and share issuesof conversions from one fund to another in the same group.
3. Excludes share redemptions resulting from conversions fromone fund to another in the same group.
4. Market value at end of period, less current liabilities.5. Also includes all U.S. government securities and other short-
term debt securities.SOURCE. (Investment Company Institute. Data based on reports
of members, which are substantially all open-end investment com-panies registered with the Securities and Exchange Commission.Data reflect newly formed companies after their initial offering ofsecurities.
TABLE 37
SOURCE. Survey of Current Business (U.S. Department of Com-merce).
TABLE 38
1. For description of series, see Federal Reserve Bulletin, vol.64 (July 1978), pages 533-37.
2. The ratio of total current assets to total current liabilities.SOURCE. Federal Trade Commission and Bureau of the Census.
TABLE 39
1. "Other" consists of construction; social services and mem-bership organizations; and forestry, fisheries, and agriculturalservices.
SOURCE. Survey of Current Business (U.S. Department of Com-merce) .
TABLE 42
1. Weighted averages based on sample surveys of mortgagesclosed by major institutional lenders during the first five full work-ing days of the month. Compiled by the Federal Home Loan BankBoard in cooperation with the Federal Deposit Insurance Corpo-ration.
2. Includes all fees, commissions, discounts, and "points" paid(by the borrower or the seller) to obtain a loan.
3. Average effective interest rates on loans closed, assumingprepayment at the end of 10 years,
4. Average contract rates on new commitments for conventionalfirst mortgages, from U.S. Department of Housing and Urban De-velopment.
5. Average gross yields on 30-year, minimum-downpaymentfirst mortgages, insured by the Federal Housing Administration forimmediate delivery in the private secondary market. Any gaps indata are in periods of adjustment to changes in maximum permis-sible contract rates.
6. Average net yields to investors on fully modified pass-throughsecurities backed by mortgages and guaranteed by the GovernmentNational Mortgage Association, assuming prepayment in 12 yearson pools of 30-year mortgages insured by the Federal HousingAgency or guaranteed by the Veterans Administration. Monthlyfigures are unweighted averages of Thursday quotations for themonth.
7. Includes commitments for residential mortgages to be addedto FNMA's portfolio. The total excludes commitments to issuesecurities backed by pools of conventional mortgages under a pro-gram begun in October 1981. By December 1981, about $2.6 billionin mostly optional-delivery commitments were outstanding underthe new program.
8. Includes participations as well as whole loans.9. Includes both conventional mortgages and a small amount of
government-underwritten loans.
TABLE 43
1. Minor revisions in some items were made for 1977 and 1978.These revisions are available from the Mortgage and ConsumerFinance Section, Board of Governors of the Federal Reserve Sys-tem, Washington, D.C. 20551.
2. Includes loans held by nondeposit trust companies but notbank trust departments.
3. Outstanding principal balances of mortgage-backed securitiesinsured or guaranteed by the agency indicated.
4. Other holders include mortgage companies, real estate in-vestment trusts, state and local credit agencies, state and localgovernment retirement funds, noninsured pension funds, credit unions,and U.S. agencies for which amounts are small or separate dataare not readily available.
SOURCES. Based on data from various institutional and govern-ment sources, with figures for some quarters estimated in part bythe Federal Reserve in conjunction with the Federal Home LoanBank Board and the U.S. Department of Commerce. Separation ofnonfami mortgage debt by type of property, if not reported directly,and interpolations and extrapolations, when required, are estimatedmainly by the Federal Reserve. Multifamily debt refers to loans onstructures of five or more units.
TABLE 44
1. The consumer installment credit series covers most short- andintermediate-term credit extended to individuals through regularbusiness channels, usually for the financing of the purchase ofconsumer goods and services or the refinancing of debts incurredfor such purposes, and scheduled to be repaid (or with the optionof repayment) in two or more installments.
The series generally excludes mortgage financing, which is re-ported elsewhere, although some credit secured by junior liens onreal estate may be reported in the data for certain holders, such asfinance companies. Also excluded are (1) credit card or other re-ceivables held by a holding company rather than by its subsidiaryfinancial institution; (2) extensions of funds against the cash value
250Digitized for FRASER http://fraser.stlouisfed.org/ Federal Reserve Bank of St. Louis

of life insurance policies or, generally, against savings accounts;(3) loans to farmers; and (4) noninstallment credit extended toindividuals. Some components include unearned (precomputed) fi-nance charges.
2. Retailers include auto dealers and exclude 30-day charge creditheld by travel and entertainment companies.
3. For 1982 and earlier, net change equals extensions, seasonallyadjusted less liquidations, seasonally adjusted. Beginning 1983, netchange equals outstandings, seasonally adjusted less outstandings,of the previous period, seasonally adjusted.
4. Data not available after 1982.A Data are revised.
TABLE 45
1. Excess of total assets over total liabilities consists of gold,special drawing rights (SDKs), and corporate equities not includedin liabilities minus total floats and discrepancies in adjacent column.
2. Rest-of-the-world total holdings of gold and SDRs appear asassets and are included in totals because in flow tables transactionsin these categories are treated as purchases and sales of existingassets without associated liabilities.
3. Assets are shown at market value; nonbank finance liabilityis redemption value of shares of open-end investment companies.No specific liability is attributed to issuers of stocks other thanopen-end investment companies for amounts outstanding.
4. Includes savings bonds and other nonmarketable debt held bythe public. Postal savings system deposits are included in "Mis-cellaneous" in part A, line 34.
5. Issues by agencies in the budget (Commodity Credit Cor-poration, Government National Mortgage Association, TennesseeValley Authority, Federal Housing Administration) and by spon-sored credit agencies in financial sectors. Includes loan participationcertificates and securities backed by mortgage pools.
6. Entry under business assets is corporate only. Noncorporatetrade credit is deducted in liabilities total to conform to quarterlyflow tables.
TABLE 46-C
1. Excludes corporate equities.2. Corporate bonds include net issues by Netherlands Antilles
subsidiaries, and U.S. foreign direct investment is before subtract-ing reflows of capital from Netherlands Antilles subsidiaries' for-eign financing.
3. Industrial revenue bonds. Issued by state and local govern-ments to finance private investment and secured in interest andprincipal by the industrial user of the funds.
4. Loans and short-term paper, profit taxes payable, and tradedebt. Includes loans due in more than one year and excludes currentmaturities of securities and mortgages.
TABLE 47
Monthly data for line 20 for 1970-82 are revised as follows:
1. Annual data for line 11 are revised as follows:
197919801981
122.0107.0108.0
Annual data for line 20 for 1970-82 are revised as follows:
1970 . . .1971197219731974
. . . . 126.9137 2147 9
. . . . 166.9182.2
1975 . .1976 . .19771978 . . .
. . . 200.1218 0239 8
. . . 269.0
1979 . . .1980 . . .19811982 . . .
. . . 301.2
... 333 8373 7
. . . 397.3
Year
19701971 . . . .1972197319741975
1976 . . . .1977197819791980 . . . .
19811982
1970 . . .1971 . . .1972 . . .1973 . . .1974 . . .1975
19761977197819791980
19811982
Jan.
121.7133.1141.5157.7175.0187.9
210.7227.8253.5286.9321.5
355.9387.2
July
128.0137.5147.5167.4184.1200.4
218.3241.8270.8303.2334.1
377.7399.9
Feb.
122.6133.5143.1160.8175.9189.0
212.8227.2256.1289.4323.0
358.9388.3
Aug.
128.9138.5149.1168.8184.7202.7
219.7243.6273.1305.9336.5
382.3399.0
Mar.
123.4134.6143.7162.7176.9189.9
213.7232.4260.1292.9325.6
362.6389.7
Sept.
129.6138.8149.9170.5185.7204.3
220.9245.8275.3307.6340.1
385.5401.0
Apr.
126.7135.1144.6164.0178.4195.0
214.5233.8263.2294.7325.6
364.6393.4
Oct.
129.3139.1152.9172.1187.3206.0
222.1248.3278.6310.5344.5
387.0404.2
May
126.2135.8146.0164.7180.7208.5
215.7235.3264.8296.3326.3
366.1394.4
Nov.
129.5139.6155.3173.7187.3207.1
224.8250.6281.3313.0348.1
387.4406.9
June
126.1139.4144.5166.0182.2201.7
216.3238.2266.8298.2328.1
370.2394.3
Dec.
130.7141.4156.7174.5188.3208.0
226.4253.1284.8315.4352.1
386.7408.7
2. Ratios of indexes of production to indexes of capacity. FederalReserve estimates.
3. Index of dollar value of total construction contracts, includingresidential, nonresidential, and heavy engineering, from McGraw-Hill Informations Systems Company, F.W. Dodge Division.
Data for 1970 and 1971 are based at 1972 - 100.4. Based on data in Employment and Earnings (U.S. Department
of Labor). Series covers employees only, excluding personnel inthe Armed Forces.
5. Based on data in Survey of Current Business (U.S. Depart-ment of Commerce).
6. Based on U.S. Bureau of Census data published in Survey ofCurrent Business.
7. Not seasonally adjusted. Based on data published by the U.S.Department of Labor, Bureau of Labor Statistics.
SOURCE. Basic data (not index numbers) for series mentioned innotes 5 and 6 and indexes for series mentioned in notes 3 and 7may also be found in Survey of Current Business.
TABLE 48
1. Primary processing includes textiles; lumber; paper; industrialchemicals; petroleum refining; rubber and plastics; stone, clay, andglass; and primary and fabricated metals.
2. Advanced processing includes food, tobacco, apparel, fur-niture, printing, chemical products such as drugs and toiletries,leather, machinery, transportation equipment, instruments, mis-cellaneous manufacturing, and ordnance.
3. Industrial materials are items both produced and used as inputsby manufacturing plants, mines, and utilities; industrial materialscover many of the items represented in the primary-processinggrouping of manufacturing as well as some of the output of minesand utilities such as iron ore, crude oil, and electricity sold toindustry.
4. Capacity utilization is calculated as the ratio of the FederalReserve's seasonally adjusted index of industrial production to thecorresponding index of capacity.
251Digitized for FRASER http://fraser.stlouisfed.org/ Federal Reserve Bank of St. Louis
For a detailed description of these series, see Federal ReserveMeasures of Capacity and Capacity Utilization (Board of Governorsof the Federal Reserve System, 1978); "New Federal Reserve Mea-sures of Capacity and Capacity Utilization," Federal Reserve Bul-letin, vol. 69 (July 1983), pages 515-21; and "Capacity Utilization:Manufacturing, Mining, and Utilities, January 1967-December 1982' *(Federal Reserve statistical release, July 1983).
TABLE 49
1. Persons 16 years of age and over. Monthly figures, whichare based on sample data, relate to the calendar week that containsthe 12th day; annual data are averages of monthly figures. Bydefinition, seasonality does not exist in population figures. Basedon data from Employment and Earnings (U.S. Department ofLabor),
2. Includes self-employed, unpaid family, and domestic serviceworkers.
3. Data include all full- and part-time employees who workedduring, or received pay for, the pay period that includes the 12thday of the month, and exclude proprietors, self-employed persons„domestic servants, unpaid family workers, and members of theArmed Forces. Data are adjusted to the March 1983 benchmark.Based on data from Employment and Earnings.
TABLE 50
1. Not at annual rates.
TABLE 51
1. Published groupings include some series and subtotals notshown separately. For a detailed description of the 1976 revisionand for historical data, see ' 'Industrial Production: 1976 Revision''(Board of Governors, 1979).
2. 1972 dollar value.3. Value of new construction data in recent periods may not be
strictly comparable with data in prior periods because of changesby the Bureau of the Census in its estimating techniques. For adescription of these changes see Construction Reports (C-30-76-5), issued by the Bureau in July 1976.
SOURCE, Census Bureau estimates for all series except (a) mobilehomes, which are private, domestic shipments as reported by theManufactured Housing Institute and seasonally adjusted by the Cen-sus Bureau, and (b) sales and prices of existing units, which arepublished by the National Association of Realtors. All back andcurrent figures are available from originating agency. Permit au-thorizations are those reported to the Census Bureau from 16,000jurisdictions beginning with 1978.
TABLE 52
1. Not seasonally adjusted.2. Figures for consumer prices are those for all urban consumers.3. Excludes intermediate materials for food manufacturing and
manufactured animal feeds.SOURCE. Bureau of Labor Statistics.
TABLE 53
1. With inventory valuation and capital consumption adjust-ments.
2. With capital consumption adjustment.3. For after-tax profits, dividends, and the like, see table 37.SOURCE. Survey of Current Business (Department of Commerce).
TABLE 54
1. With inventory valuation and capital consumption adjust-ments.
2. With capital consumption adjustment.SOURCE. Survey of Current Business (Department of Commerce).
TABLE 55
1. Seasonal factors are no longer calculated for lines 6, 10, 12-16, 18-20, 22-34, and 38-41.
2. Data are on an international accounts (I.A.) basis, whichdiffers from the Census basis data for reasons of coverage andtiming. Military exports are excluded from merchandise data andare included in line 6.
3. Includes reinvested earnings.4. Associated primarily with military sales contracts and other
transactions arranged with or through foreign official agencies.5. Consists of investments in U.S. corporate stocks and in debt
securities of private corporations and state and local governments.SOURCES FOR TABLES 55-68.Data in table 55 are from Survey of Current Business (U.S.
Department of Commerce, Bureau of Economic Analysts).FT900 "Summary of U.S. Export and Import Merchandise Trade"
(U.S. Department of Commerce, Bureau of the Census).Table 57 is based on U.S. Treasury Department data and on data
reported to the Treasury Department by the International MonetaryFund.
Tables 58 through 66 are based on Treasury Department dataand on data reported to the Treasury Department by banks (in-cluding Federal Reserve Banks) and brokers in the United States.The data exclude the holdings of dollars by the International Mon-etary Fund derived from payments of the U.S. subscription andfrom the exchange transactions and other operations of the IMF.The data also exclude U.S. Treasury letters of credit and U.S.nonnegotiable, noninterest-bearing notes held by nonmonetary in-ternational and regional organizations.
Tables 67 and 68 are based on data reported to the TreasuryDepartment by nonbanking business enterprises.
The term "foreigners" covers all institutions and individualsdomiciled outside the United States (including U.S. citizens dom-iciled abroad), and the foreign branches, subsidiaries, and officesof U.S. banks and business concerns; the central governments,central banks, and other official institutions of foreign countries,wherever located; and international and regional organizations,wherever located. The term "foreigners" also includes persons inthe United States when it is known by reporting institutions thatthey are acting on behalf of foreigners.
TABLE 56
1. Data are on a Census/customs valuation basis. For reasonsof coverage and timing, these data differ from the merchandisetrade data shown in table 55, "Summary of U.S. InternationalTransactions."
252Digitized for FRASER http://fraser.stlouisfed.org/ Federal Reserve Bank of St. Louis

TABLE 57 TABLE 59-A
1. Includes gold in Exchange Stabilization Fund. Gold held un-der earmark at Federal Reserve Banks for foreign and internationalaccounts is not included in the gold stock of the United States; seetable 65. Gold stock and earmarked gold are valued at $42.22 perfine troy ounce.
2. Beginning July 1974, the International Monetary Fund adopteda technique for valuing the special drawing right based on a weightedaverage of exchange rates for the currencies of member countries.From July 1974 through December 1980, 16 currencies were used;from January 1981, 5 currencies have been used. The U.S. SDRholdings, and reserve position in the IMF are valued on this basisbeginning in July 1974. At valuation used before July 1974(SDR1 = $1.20635) total U.S. reserve assets, SDR holdings, andreserve position in IMF were as follows (in millions of dollars, endof period).
Month
1983JanuaryFebruaryMarchAprilMayJune . .JulyAugustSeptember . . .OctoberNovemberDecember
Total
34 68234 94735 14435 00734 87034 94034,62734 04734 3213449335 01735,081
SDRs
5 8485 8485 8485 7916 1866 1866,28064016 4256,4256 5855,791
Reservepositionin IMF
8 2008,7449 5579 5199 7029 7699,9459 8619 8579,990
10 39511,880
3. Includes allocations by the IMF of special drawing rights asfollows: $867 million on January 1, 1970; $717 million on Jan-uary 1, 1971; $710 million on January 1, 1972; $1,139 million onJanuary 1, 1979; $1,152 million on January 1, 1980; and $1,093million on January 1, 1981; plus net transactions in SDRs.
4. Represents the U.S. reserve tranche position in the IMF (theU.S. quota, plus net U.S. loans to the IMF, minus IMF holdingsof dollars), which is the amount that the United States could pur-chase in foreign currencies automatically if needed. Under appro-priate conditions, the United States could purchase additional amountsrelated to the U.S. quota.
5. Valued at current market exchange rates.Sources appear at the end of notes for table 55.
1. Excludes negotiable time certificates of deposit, which areincluded in "Other negotiable and readily transferable instru-ments."
2. Includes borrowing under repurchase agreements.3. U.S. banks: includes amounts due to own foreign branches
and foreign subsidiaries consolidated in "Consolidated report ofcondition" filed with bank regulatory agencies. Agencies, branches,and majority-owned subsidiaries of foreign banks: principally amountsdue to head office or parent foreign bank and to foreign branches,agencies, or wholly owned subsidiaries of head office or parentforeign bank.
4. Financial claims on residents of the United States, other thanlong-term securities, held by or through reporting banks.
5. Includes nonmarketable certificates of indebtedness and Trea-sury bills issued to official institutions of foreign countries.
6. Principally bankers acceptances, commercial paper, and ne-gotiable time certificates of deposit.
7. Principally the International Bank for Reconstruction and De-velopment and the Inter-American and Asian Development Banks.Data exclude "holdings of dollars" of the International MonetaryFund.
8. Foreign central banks and foreign central governments andthe Bank for International Settlements.
9. Excludes central banks, which are included in "Official in-stitutions."
Sources appear at the end of notes for table 55.
TABLE 59-B
1. Includes the Bank for International Settlements. Also includesEastern European countries not included in line 23.
2. Comprises Bulgaria, Czechoslovakia, the German Demo-cratic Republic, Hungary, Poland, and Romania.
3. Comprises Bahrain, Iran, Iraq, Kuwait, Oman, Qatar, SaudiArabia, and United Arab Emirates (Trucial States),
4. Comprises Algeria, Gabon, Libya, and Nigeria.5. Excludes "holdings of dollars" of the International Monetary
Fund.6. Asian, African, Middle Eastern, and European regional or-
ganizations, except the Bank for International Settlements, whichis included in "Other Western Europe."
Sources appear at the end of notes for table 55.
TABLE 58-A
1. Includes the Bank for International Settlements.2. Principally demand deposits, time deposits, bankers accep-
tances, commercial paper, negotiable time certificates of deposit,and borrowings under repurchase agreements.
3. Includes nonmarketable certificates of indebtedness (includ-ing those payable in foreign currencies) and nonmarketable Trea-sury bills issued to official institutions of foreign countries.
4. Excludes notes issued to foreign official nonreserve agencies.Includes bonds and notes payable in foreign currencies.
5. Debt securities of U. S. government corporations and federallysponsored agencies, and U.S. corporate stocks and bonds.
Sources appear at the end of notes for table 55.
TABLE 58-B
1. Includes the Bank for International Settlements.2. Includes countries in Oceania and Eastern Europe.Sources appear at the end of notes for table 55.
TABLE 60
1. Includes the Bank for International Settlements. Also includesEastern European countries not included in line 23.
2. Comprises Bulgaria, Czechoslovakia, the German Demo-cratic Republic, Hungary, Poland, and Romania.
3. Comprises Bahrain, Iran, Iraq, Kuwait, Oman, Qatar, SaudiArabia, and United Arab Emirates (Trucial States).
4. Comprises Algeria, Gabon, Libya, and Nigeria.5. Excludes the Bank for International Settlements, which is
included in "Other Western Europe."Sources appear at the end of notes for table 55.
TABLE 61
1. Data for banks' own claims are given on a monthly basis,but the data for claims of banks' own domestic customers areavailable on a quarterly basis only.
2. U.S. banks: includes amounts due from own foreign branchesand foreign subsidiaries consolidated in "Consolidated report ofcondition" filed with bank regulatory agencies. Agencies, branches,
253Digitized for FRASER http://fraser.stlouisfed.org/ Federal Reserve Bank of St. Louis

and majority-owned subsidiaries of foreign banks: includes prin-cipally amounts due from head office or parent foreign bank, andforeign branches, agencies, or wholly owned subsidiaries of headoffice or parent foreign bank.
3. Assets owned by customers of the reporting bank located inthe United States that represent claims on foreigners held by re-porting banks for the account of their domestic customers.
4. Principally negotiable time certificates of deposit and bankersacceptances.
5. Includes demand and time deposits and negotiable and non-negotiable certificates of deposit denominated in U.S. dollars issuedby banks abroad.
Sources appear at the end of notes for table 55.
TABLE 62
1. Liabilities and claims of banks in the United States wereincreased, beginning in December 1981, by the shift from foreignbranches to international banking facilities in the United States ofliabilities to, and claims on, foreign residents.
2. Remaining time to maturity.3. Includes nonmonetary international and regional organiza-
tions.Sources appear at the end of notes for table 55.
TABLE 63
1. Data on claims exclude foreign currencies held by U. S. mone-tary authorities.
2. Assets owned by customers of the reporting bank located inthe United States that represent claims on foreigners held by re-porting banks for the accounts of their domestic customers.
Sources appear at the end of notes for table 55.
TABLE 64
1. Estimated official and private holdings of marketable U.S.Treasury securities with an original maturity of more than one year.Data are based on a benchmark survey of holdings as of Jan-uary 31, 1971, and monthly transaction reports. Excludes non-marketable U.S. Treasury bonds and notes held by official insti-tutions of foreign countries.
2. Includes U.S. Treasury notes, denominated in foreign cur-rencies, publicly issued to private foreign residents.
3. Comprises Bahrain, Iran, Iraq, Kuwait, Oman, Qatar, SaudiArabia, and United Arab Emirates (Trucial States).
4. Comprises Algeria, Gabon, Libya, and Nigeria.Sources appear at the end of notes for table 55.
TABLE 65
1. Excludes deposits and U.S. Treasury securities held for in-ternational and regional organizations.
2. Marketable U.S. Treasury bills, notes, and bonds; and non-marketable U.S. Treasury securities payable in dollars and in for-eign currencies.
3. Earmarked gold is gold held for foreign and internationalaccounts; it is not included in the gold stock of the United States.Earmarked gold and the gold stock are valued at $42.22 per finetroy ounce.
Sources appear at the end of notes for table 55.
TABLE 66
1. Comprises oil-exporting countries as follows: Bahrain, Iran,
Iraq, Kuwait, Oman, Qatar, Saudi Arabia, and United Arab Emir-ates (Trucial States).
2. Includes state and local government securities, and securitiesof U.S. government agencies and corporations. Also includes issuesof new debt securities sold abroad by U.S. corporations organizedto finance direct investments abroad.
Sources appear at the end of notes for table 55.
TABLE 67
1. Comprises Bahrain, Iran, Iraq, Kuwait, Oman, Qatar, SaudiArabia, and United Arab Emirates (Trucial States).
2. Comprises Algeria, Gabon, Libya, and Nigeria.3. Includes nonmonetary international and regional organiza-
tions.Sources appear at the end of notes for table 55.
TABLE 68
1. Table 61, "Banks1 own and domestic customers' claims onforeigners," includes monthly figures for U.S. dollar deposits inbanks abroad, reported by nonbanking business enterprises in theUnited States.
2. Comprises Bahrain, Iran, Iraq, Kuwait, Oman, Qatar, SaudiArabia, and United Arab Emirates (Trucial States).
3. Comprises Algeria, Gabon, Libya, and Nigeria.4. Includes nonmonetary international and regional organiza-
tions.Sources appear at the end of notes for table 55.
TABLE 69
1. For a given month, total assets may not equal total liabilitiesbecause some branches did not adjust the net position of the bankin the branch to reflect unrealized paper profits and paper lossescaused by changes in exchange rates, which are used to convertforeign currency values into equivalent dollar values.
2. In May 1978 a broader category of claims on foreign publicborrowers, including corporations that are majority owned by for-eign governments, replaced the previous, more narrowly definedclaims on foreign official institutions.
TABLE 70
1. Data are aggregates of categories reported on the quarterlyform FFEEC 002, "Report of Assets and Liabilities of U.S. Branchesand Agencies of Foreign Banks." This form was first used forreporting data as of June 30, 1980. From November 1972 throughMay 1980, U.S. branches and agencies of foreign banks had fileda monthly FR 886a report. Aggregate data from that report wereavailable through the Federal Reserve statistical release G. l l , lastissued on July 10, 1980. Data in this table and in the G.ll tablesare not strictly comparable because of differences in reporting pan-els and in definitions of balance sheet items.
2. Includes the District of Columbia.3. Agencies account for virtually all of the assets and liabilities
reported in California.4. Includes all offices that have the power to accept deposits
from U.S. residents, including any such offices that are consideredagencies under state law.
5. Total assets and total liabilities include net balances, if any,due from or due to related banking institutions in the United States
254Digitized for FRASER http://fraser.stlouisfed.org/ Federal Reserve Bank of St. Louis

and in foreign countries (see footnote 6). On the former monthlybranch and agency report, available through the G.l l statisticalrelease, gross balances were included in total assets and total lia-bilities. Therefore, total asset and total liability figures in this tableare not comparable to those in the G.ll tables.
6. "Related banking institutions" includes the foreign head of-fice and other U.S. and foreign branches and agencies of the bank,the bank's parent holding company, and majority-owned bankingsubsidiaries of the bank and of its parent holding company (in-cluding subsidiaries owned both directly and indirectly). Grossamounts due from and due to related banking institutions are shownas memo items.
7. "U.S. banking subsidiaries" refers to U.S. banking subsid-iaries majority-owned by the foreign bank and by related foreignbanks and includes U.S. offices of U.S.-chartered commercial banks,of Edge Act and Agreement corporations, and of New York State(Article XII) investment companies.
8. In some cases two or more offices of a foreign bank withinthe same metropolitan area file a consolidated report.
TABLE 74
1. Index of weighted-average exchange value of U.S. dollaragainst currencies of other Group of Ten (G-10) countries plusSwitzerland. Weights are 1972-76 global trade of each of the 10countries. Series revised as of August 1978 (see Federal ReserveBulletin, vol. 64, August 1978, p. 700).
TABLE 75
1. Averages of certified noon buying rates in New York forcable transfers.
2. Cents per unit of foreign currency.
Part 2—Special Tables
TABLE 71
1. The banking offices covered by these data are the U.S. officesand foreign branches of U.S.-owned banks and of U.S. subsidiariesof foreign-owned banks. Offices not covered include (1) U.S. agen-cies and branches of foreign banks, and (2) foreign subsidiaries ofU.S. banks. To minimize duplication, the data are adjusted toexclude the claims on foreign branches held by a U.S. office oranother foreign branch of the same banking institution. The datain this table combine foreign branch claims in table 69 (the sumof lines 6 through 9) with the claims of U.S. offices in table 60(excluding those held by agencies and branches of foreign banksand those constituting claims on own foreign branches).
The claims of the U.S. offices in this table include only banks'own claims payable in dollars.
2. In addition to the Organization of Petroleum Exporting Coun-tries shown individually, this group includes other members ofOPEC (Algeria, Gabon, Iran, Iraq, Kuwait, Libya, Nigeria, Qatar,Saudi Arabia, and United Arab Emirates) as well as Bahrain andOman (not formally members of OPEC).
3. Excludes Liberia.4. Includes Canal Zone beginning December 1979.5. Foreign branch claims only.6. Includes New Zealand, Liberia, and international and regional
organizations.
TABLE 72
1. Rates are mainly those at which the central bank either dis-counts or makes advances against eligible commercial paper orgovernment securities for commercial banks or brokers. For coun-tries with more than one rate applicable to such discounts or ad-vances, the rate shown is the one at which it is understood thecentral bank transacts the largest proportion of its credit operations.
The compounded annual rate is based on the official rate perday.
TABLE 76
1. See the Board's Annual Report for statements of conditionof the Federal Reserve Banks for other years.
2. Includes securities loaned—securities fully guaranteed by U.S.government pledged with Federal Reserve Banks; and excludes anysecurities sold and scheduled to be bought back under matched sale-purchase transactions.
3. Such assets are revalued monthly at market exchange rates.4. Includes reserves of all depository institutions.5. Includes exchange-translation account reflecting the monthly
revaluation at market exchange rates of foreign exchange commit-ments.
6. Beginning September 1980, Federal Reserve notes held bythe Reserve Banks are exempt from the collateral requirement.
7. Includes Federal Reserve notes held by U.S. Treasury andby Federal Reserve Banks other than the issuing Bank.
TABLE 77
1. Includes distribution of costs for projects performed by oneBank for the benefit of one or more other Banks.
2. This item includes expenses for labor and materials tempo-rarily capitalized and charged to activities when the products areconsumed.
3. The total expense for Richmond has been adjusted to exclude$5,905,795, which was allocated to the expenses of other FederalReserve Banks for operation of the Federal Reserve Communica-tions System.
4. This item consists of unrealized net losses related to reval-uation of assets denominated in foreign currencies to market ex-change rates.
5. For additional details, see the Board of Governors of theFederal Reserve System, 70th Annual Report, 1983, (1984), pages208-11,
NOTE. Details may not add to totals because of rounding.
TABLE 73
1. Rates are for three-month interbank loans except for Canada,finance company paper; Belgium, three-month Treasury bills; andJapan, Gensaki rate.
TABLE 78
1. Number excludes banks that have banking facilities only;banking facilities are shown separately; see note 2.
255Digitized for FRASER http://fraser.stlouisfed.org/ Federal Reserve Bank of St. Louis

Except for the following, branches and additional offices arelocated in the same state as the parent bank. (In this table thesebranches are shown according to their own location rather than thatof the parent bank.)
Type and location of bank Number and locationof branches
1 national in New Jersey1 national in California
1 noninsured unincorporatedin New York
3 insured nonmember inPuerto Rico
1 in Pennsylvania3 in Washington and 1
in Oregon1 in Massachusetts and
1 in Pennsylvania17 in New York and 1 in
California
2. As of December 31, 1983, includes 13 state member non-insured trust companies and 1 noninsured national trust company.
3. Banking facilities (other than branches) that are provided atmilitary and other government establishments through arrangementsmade by the Treasury; 78 banks operated such facilities and 23 hadno other type of branch or facility in 1983.
TABLE 79
1. Includes all commercial banking offices (including facilities)on which checks are drawn. There were no nonpar banking officesas of December 31, 1983.
2. Other areas are Puerto Rico, the Virgin Islands, AmericanSamoa, and Guam. For purposes of Regulation J (Collection ofChecks and Other Items by Federal Reserve Banks), Puerto Ricoand the Virgin Islands are assigned to the New York District,American Samoa and Guam to the San Francisco District.
TABLE 80-A
1. Figures include all banks in Alaska and Hawaii, but excludenonmember banks in territories and possessions.
2. State member figures include 1 bank in Puerto Rico.3. As of December 31, 1983, includes 13 state member non-
insured and 1 noninsured national trust companies.4. Figures exclude new banks organized to succeed operating
banks.
TABLE 80-B
1. Individual breakdowns by type of bank are not available.Therefore, the "Other" category of changes are the residual changesfrom the differences between figures for the current and previousyear, minus the actual changes from the first three (3) categories.
2. Provided at military and other government establishmentsthrough arrangements made by the U.S. Treasury Department.
TABLE 82
1. Number in parentheses is total of banking organizations instate.
2. Independent bank.
TABLE 83
1. Companies included are those that have reported to the Boardof Governors of the Federal Reserve System pursuant to the re-quirements of the Bank Holding Company Act; the number includessome companies that have filed registration statements, but whoseholding company status has not yet been determined by the Board,Lists showing the names, offices, total assets, and total depositsof the subsidiary banks in the holding company groups (both do-mestic and domestic including foreign) for 1983 are available fromPublications Services, Board of Governors of the Federal ReserveSystem, Washington, D.C. 20551.
Figures exclude banking subsidiaries located in Puerto Rico andholding companies whose only banking subsidiaries are located inPuerto Rico.
2. Companies that are subsidiaries of other bank holding com-panies are eliminated.
3. Branches include locations other than the bank's head office;that is, domestic branches, customer-bank communication terminals(CBCTs), facilities, foreign branches and subsidiaries, and EdgeAct and Agreement corporations, when applicable.
4. Companies whose only bank subsidiary is also a subsidiaryof another, unrelated bank holding company are included.
5. Data for each state represent the number of bank holdingcompanies or groups having subsidiary banks in that state ratherthan the number of registered bank holding companies or groupswhose principal offices are located in the state.
6. The total does not necessarily equal the sum of the figuresfor states because it has been corrected for duplications; that is,holding companies or groups that have subsidiary banks in morethan one state are included in the total only once.
7. S = statewide branching; L = limited branching; U = unitbanking.
TABLES 84 and 85
1. Data exclude 17 noninsured trust companies that are membersof the Federal Reserve System.
2. This item is unavailable for all or some of the banks becauseof the lesser detail available from banks without foreign offices,the inapplicability of certain items to banks that have only domesticoffices, the absence of detail on a fully consolidated basis for bankswith foreign offices, and the absence of detail for banks, with assetsless than $100 million and with domestic offices only, that completean abbreviated set of reports.
3. The number of full-time equivalent employees on payroll andthe number of banks are as of the end of the year.
TABLE 81
1. S = statewide branching; L = limited branching; U = unitbanking.
SOURCES. Compiled from unpublished data from the Board ofGovernors of the Federal Reserve System and the Federal DepositInsurance Corporation.
TABLE 86
1. Minority-owned banks are defined as those in which morethan 50 percent of the stock is owned by minority groups, as wellas those independently controlled by minority group members.
The following tabulation shows numbers of minority-owned banksfor 1983 classified in two ways:
256Digitized for FRASER http://fraser.stlouisfed.org/ Federal Reserve Bank of St. Louis

By type of minority By type of bank charter
BlackHispanicWomenAsianAmerican IndianMultiracial
4928
81433
Federal Reserve memberNationalState
Nonmember state
484
53
TABLE 87
1. Outside Treasury and Federal Reserve Banks.2. Paper currency only; $1 silver coins reported under coin.SOURCE. Condensed from U.S. Treasury Department, Treasury
Bulletin (quarterly),
TABLE 88
1. Includes deferred profit-sharing funds and pension funds ofcorporations, unions, multiemployer groups, and nonprofit orga-nizations.
2. Includes Foreign Service Retirement and Disability Trust Fund.
TABLE 89
1. Rates are reported on an annual percentage rate basis as spec-ified in Regulation Z (Truth in Lending) of the Board of Governors.Commercial bank rates are "most common" rates for direct loanswith specified maturities; finance company rates are weighted av-erages for purchased contracts on automobile loans. For descriptionof data, see Federal Reserve Bulletin, vol. 59 (September 1973),pages 641-45.
2. Data are available for midmonth of quarter only.3. Before 1983 the maturity for new car loans was 36 months,
and for mobile home loans was 84 months.4. At auto finance companies.
TABLE 90
1. Annual data for bank lending under Regulation U ceased tobe collected after June 1977.
2. Includes data for firms that are members of the AmericanStock Exchange but not of the New York Stock Exchange thatreport directly to the Board of Governors of the Federal ReserveSystem.
3. Margin accounts include credit extended on stock and non-convertible, and convertible bonds under the new consolidated methodof reporting in Regulation T.
TABLE 91
1. These are members of either the American Stock Exchangeor the New York Stock Exchange.
TABLE 92
1. American Council of Life Insurance data for new commit-ments of $100,000 and over each on mortgages for multifamilyand nonresidential nonfarm properties, most of which are locatedin the United States. The series covers 20 companies with 61 percentof industry assets and 67 percent of nonfarm mortgages.
2. Averages, which are based on number of loans, vary in partwith loan composition by type and location of property, type andpurpose of loan, and loan amortization and prepayment terms. Datafor the following are limited to cases for which information wasavailable or estimates could be made: capitalization rate (net sta-bilized property earnings divided by property value); debt-coverageratio (net stabilized earnings divided by debt service); and percentconstant (annual level payment, including principal and interest,per $100 of debt). All statistics exclude construction loans, in-creases in existing loans in a company's portfolio, reapprovals, andloans secured by land only.
257Digitized for FRASER http://fraser.stlouisfed.org/ Federal Reserve Bank of St. Louis
Part 4—Index to Tables
Digitized for FRASER http://fraser.stlouisfed.org/ Federal Reserve Bank of St. Louis

Index to TablesReferences are to table numbers, not page numbers
Acceptances, bankers (See Bankers acceptances)Agricultural loans, commercial banks, 17, 18, 19, 20(A), 24Assets and deposits
Banking organizations, percentage of total assets held byten largest, 82
Banks in holding company groups, 83Assets and liabilities (See also Foreigners)
Banks, by classes, 16, 17, 18, 19, 20(A)Domestic finance companies, 40Federal Reserve Banks, 10(A), 76Foreign banks, U.S. branches and agencies, 70Minority-owned banks, 86Nonfinancial corporations, 38Savings institutions, 27
Assets of pension funds, 88Automobiles
Consumer installment credit, 44Production, 50
Bankers acceptances, 9, 22(B), 25, 32(A, B), 77Bankers balances, 16, 17, 18, 19, 20 (See also Foreigners)Banking offices
Banks in holding company groups, 83In operation, number and changes, 78, 80, 81Par, number, 79
Banks for Cooperatives, 33Banks in holding company groups, 83Bonds, new issues, 35 (See also U.S. government securities)Branch banks, 69, 70, 78, 80(B)Budget, U.S. (See Federal finance)Business activity, nonfinancial, 47Business expenditures on new plant, equipment, 39Business loans (See Commercial and industrial loans)
Capacity utilization, 47, 48(C)Capital accounts
Banks, by classes, 16, 17, 18, 19Federal Reserve Banks, 10(A), 76
Central banks, foreign discount rates, 72Certificates of deposit, 20(B), 25, 32(A, B)Commercial and industrial loans
Commercial banks, 14, 16, 17, 18, 19, 24, 70Weekly reporting banks, 20
Commercial banksAssets and liabilities, 16, 17, 18, 19, 20(A)Banking offices, number and changes, 78, 80, 81Banking organizations, percentage of total assets and deposits
held by ten largest, 82Business loans, 23Commercial and industrial loans, 14, 16, 17, 18, 19, 24, 70Consumer loans held, by type and term, 44, 89
Commercial banks—ContinuedDebits and deposit turnover, 11Loans and securities, 14Loans sold outright, 20(B)Nondeposit funds, 15Number, by classes, 17, 18, 19Real estate mortgages held, by type of holder and property, 43Time and savings deposits, 1
Commercial paper, 22(A), 25, 32(A, B), 40Condition statements (See Assets and liabilities)Construction, 47, 51Consumer installment credit, 44, 89Consumer prices, 47, 52Consumption expenditures, 53, 54Corporations
Nonfinancial, assets and liabilities, 38Profits and their distribution, 37Security issues, 35
Cost of living (See Consumer prices)Credit unions, 27(D), 44, (See also Thrift institutions)Currency and coin, 16, 17, 18, 19Currency in circulation, 2, 12, 87Customer credit, stock market, 26(B, C, D), 90, 91
Debits to deposit accounts, 11Debt (See specific types of debt or securities)Demand deposits
Banks, by classes, 11, 16, 17, 18, 19, 20Ownership by individuals, partnerships, and corporations, 21Turnover, 11
Depository institutionsReserve requirements, 6Reserves and related items, 1, 2, 3, 13
Deposits (See also specific types)Banking organizations, percentage of total deposits held by ten
largest, 82Banks, by classes, 1, 16, 17, 18, 19, 20, 27(B)Banks in holding company groups, 83Federal Reserve Banks, 2, 10(A), 76Turnover, 11
Discount rates at Federal Reserve Banks and at foreign central banks(See Interest rates)
Discounts and advances by Federal Reserve Banks (See Loans)Dividends
Corporate, 37Federal Reserve Banks, 77Member banks, 85
Dollar, U.S., index of weighted-average value, 74
Employment, 47, 49Eurodollars, 25
261Digitized for FRASER http://fraser.stlouisfed.org/ Federal Reserve Bank of St. Louis

Farm mortgage loans, 43Federal agency obligations, 2, 9, 10(A, C), 32(A, B), 76Federal credit agencies, 33Federal finance
Debt subject to statutory limit, types and ownership, 30Receipts and outlays, 28, 29Treasury financing of surplus or deficit, 28Treasury operating balance, 28
Federal Financing Bank, 28, 33Federal funds, 4, 20(A), 25, 28Federal Home Loan Banks, 33Federal Home Loan Mortgage Corporation, 33, 42, 43Federal Housing Administration, 33, 42, 43Federal Land Banks, 43Federal National Mortgage Association, 33, 42, 43Federal Reserve Banks
Capital stock, 76Condition statement, 10(A), 76Discount rates (See Interest rates)Interest, expenses, and dividends, 77Payments to U.S. Treasury on earnings, 77Surplus, 77U.S. government securities held, 2, 10(A, C), 31, 76
Federal Reserve credit, 2, 3, 10(A, C), 76Federal Reserve notes, 10(A, B), 76, 77Federally sponsored credit agencies, 33Finance companies
Assets and liabilities, 40Business credit, 41Loans, 20(A), 44, 89Paper, 22(A), 25
Finance rates (See Interest, rates)Financial institutions, loans to, 20(A)Float, 2Flow of funds, 45, 46Foreign banks, assets and liabilities of U.S. branches and
agencies, 70Foreign currency operations, 10(A), 76, 77Foreign deposits in U.S. banks, 2, 10(A), 20(A), 76Foreign exchange rates, 75Foreign trade, 56Foreigners
Claims on, 60, 61, 62, 63, 68, 69, 71Liabilities to, 20, 58, 59, 63, 64, 65, 66, 67, 69
GoldCertificate account, 10(A), 76Stock, 2, 57
Government National Mortgage Association, 33, 42, 43Gross national product, 53, 54
Housing, new and existing units, 51
Income, personal, and national, 47, 53, 54Income and expenses
Federal Reserve Banks, 77Insured commercial banks, 84Member banks, 85
Industrial production, 47, 50Installment loans, 44, 89Insurance companies, 27(C), 31, 43, 92Insured commercial banks, 17, 18, 19, 78, 80, 84Interest rates
Business loans of banks, 24Federal Reserve Banks, 5Foreign central banks, 72Foreign countries, 73Installment credit, selected types, 89Money and capital markets, 25
Interest rates—ContinuedMortgages, 42Prime rate, 23Time and savings deposits, 8
International banking facilities, 15International capital transactions of United States, 55-71International organizations, 58, 59, 60, 64, 65, 66Inventories, 53Investment companies, issues and assets, 36Investments (See also specific types)
Banks, by classes, 16, 27(B)Commercial banks, 1, 14, 16, 17, 18, 19, 20Federal Reserve Banks, 10(A, C), 76Savings institutions, 27, 43, 92
Labor force, 49Life insurance companies (See Insurance companies)Loans (See also specific types)
Banks, by classes, 17, 18, 19, 20, 27(B)Commercial banks, 1, 14, 16-20, 24, 70Federal Reserve Banks, 2, 3, 5, 10(A, C), 76, 77Insured or guaranteed by United States, 42, 43Savings institutions, 27, 43, 92
ManufacturingCapacity utilization, 47, 48(C)Employment, 47Production, 48(A)
Margin accountsBrokers' detailed debit and credit balances, 91Selected statistics, 26(B, C, D)
Margin regulations, credit subject to, by type, 90Margin requirements, 7Member banks (See also Depository institutions)
Banking offices, number and changes, 78, 80Federal funds and repurchase agreements,-4Income and expenses, 85Reserve requirements, 6
Mobile homes shipped, 51Monetary and credit aggregates, 1, 13Money and capital market rates (See Interest rates)Money stock measures and components, 1, 12Mortgages (See Real estate loans)Mutual funds (See Investment companies)Mutual savings banks, 20(A), 27(B), 31, 43, 44, 78, 80
(See also Thrift institutions)
National banks, offices in operation, number, changes, 78, 80National defense outlays, 29(B)National income, 53Nondeposit funds of commercial banks, 15Nonmember banks
Banking offices, number and changes, 78, 80Income and expenses, 84
Open market transactions, 9
Par banking offices, number, 79Pension funds, assets, 88Personal income, 47, 53, 54Prices
Consumer and producer, 47, 52Stock market, 26(A)
Prime rate, 23Producer prices, 47, 52Production, 47, 50Profit and loss, Federal Reserve Banks, 77Profits, corporate, 37
262Digitized for FRASER http://fraser.stlouisfed.org/ Federal Reserve Bank of St. Louis

Real estate loansBanks, by classes, 17, 18, 19, 20(A)Life insurance companies, 92Savings institutions, 27Terms, yields, and activity, 42Type of holder and property mortgaged, 43
Repurchase agreements, 4, 20(A)Reserve requirements, 6Reserves
Commercial banks, 16, 17Depository institutions, 1, 2, 3, 13, 76Federal Reserve Banks, 76U.S. reserve assets, 57
Residential mortgage loans, 42Retail credit, 44, 89Retail sales, 47
SavingFlow of funds, 45, 46National income accounts, 53
Savings and loan associations, 27(A), 43, 44(See also Thrift institutions)
Savings deposits (See Time and savings deposits)Savings institutions, assets and liabilities, 27Securities (See also U.S. government securities)
Credit reported by lenders, 26(B, C, D), 90, 91Federal and federally sponsored credit agencies, 33Foreign transactions, 66New issues, 34, 35Prices, 26(A)
Special drawing rightsAllocations, 55Certificate account, 2, 10(A, B), 76Holdings, 45, 55, 57
State and local governmentsDeposits, 20(A)Holdings of U.S. government securities, 31New security issues, 34Ownership of securities issued by, 27(B, C)
State member banks, offices in operation, 78, 80Stock market, 26Stocks (See also Securities)
New issues, 35Prices, 26(A)
Student Loan Marketing Association, 33
Tax receipts, federal, 29(A)Thrift institutions, 1 (See also Credit unions, Mutual savings banks,
and Savings and loan associations)Time and savings deposits, 1, 8, 16, 17, 18, 19, 20Trade, foreign, 56Treasury currency and Treasury cash, 2Treasury deposits, 2, 10(A), 28, 76Treasury operating balance, 28
Unemployment, 49U.S. government balances
Commercial bank holdings, 20(A)Treasury deposits at Reserve Banks, 2, 10(A), 28, 76
U.S. government securitiesBank holdings, 16, 17, 18, 19, 20(A)Dealers' transactions, positions, and financing, 32Federal Reserve Bank holdings and earnings, 10(A, C), 31, 76,
77Foreign and international holdings and transactions, 10(A), 31,
64,65Open market transactions, 9Outstanding, by type and ownership, 31Ownership of securities issued by, 27(B, C)Rates, 25
U.S. international capital transactions, 55-71
Veterans Administration, 42, 43
Weekly reporting banks, 20Wholesale (producer) prices, 47, 52
Yields (See Interest rates)
263Digitized for FRASER http://fraser.stlouisfed.org/ Federal Reserve Bank of St. Louis