
Software Engineering 1 N.L. Hsueh, SE-Lab IECS FCU Software Architecture N.L. Hsueh.
Upload
phamkhuongCategory
view
212download
0
Annual Report 20
13
ALFA, S.A.B. DE C.V.Av. Gómez Morín 1111 SurCol. CarrizalejoSan Pedro Garza García, N.L.C.P. 66254, Mexico
www.alfa.com.mx
ANNUAL REPORT

ALFA is the largest independent producer of aluminum
engine components for the automotive industry in
the world, and one of the world’s largest producers of
polyester (PTA, PET and fibers). In addition, it leads the
Mexican market in petrochemicals such as polypropylene,
expandable polystyrene and caprolactam. It is the leading
maker of processed meats in North America, and of cheese
in Mexico, as well as a leading company in information
technology and communications services for the business
segment in this country. Since 2006, it participates in the
hydrocarbon industry in the U.S.
In 2013, ALFA reported revenues of Ps. 203,456 million
(U.S. $15.9 billion), and EBITDA of Ps. 24,534 million
(U.S. $1.9 billion).
Currently, ALFA has manufacturing operations in 18
countries and employs 61,000 people. ALFA’s shares are
quoted on the Mexican Stock Exchange and on Latibex,
the market for Latin American shares of the Madrid Stock
Exchange.
ContentsPage
The Year in Summary 1Global Footprint and Businesses 2Financial Highlights 4Letter to Shareholders 5Alpek 8Nemak 10Sigma 12Alestra 14Newpek 16Board of Directors 18Management Team 20Corporate Governance 20Consolidated Financial Statements 22
NOTE: In this annual report, monetary figures are expressed in nominal Mexican pesos (Ps.), and in nominal dollars (U.S. $) unless otherwise specified. Conversions from pesos to dollars were made using the average rate of the month in which the revenues or disbursements were made. The percentages of variation between 2013 and 2012 are expressed in nominal terms.
The Company
des
ign:s
ign
i.co
m.m
x Independent AuditorPwC
Investor RelationsEnrique FloresVice-President Corporate CommunicationsPhone: +52 (81) 8748 [email protected]
Luis OchoaInvestor Relations DirectorPhone: +52 (81) 8748 [email protected]
Raúl GonzálezInvestor Relations ManagerPhone: +52 (81) 8748 [email protected]
Juan Andrés MartínInvestor RelationsPhone: +52 (81) 8748 [email protected]
Mexican Stock ExchangeALFADate listedAugust 1978
Latibex (Madrid Stock Exchange)ALFA C/I-s/ADate listedDecember 2003

1
• ALFA: revenues and EBITDA continue growing.Investments are made in all business groupsto expand production capacity and improvecompetitiveness.
• A challenging year for Alpek amid pressure onmargins for its main products. However, itsfinancial condition enables it to continue to investin plant capacity and cost-saving programs.
• Unprecedented results for Nemak: revenuesand EBITDA up 13% and 21%, respectively. Aninvestment in Russia is announced. A secondplant starts up in China.
• Sigma: another year of positive results.Ventures into Europe. Strengthens the cheesebusiness in Costa Rica and the foodservicebusiness in Mexico.
• Alestra brings in record results. It invests inthe construction of a fifth Data Center toexpand its market coverage and capacity toprovide services to business clients.
• Newpek continues to grow. It expandsoperations into other regions in the U.S. Startsoffering services to oil & gas companies inMexico. Constitutional amendments enactedin Mexico towards the end of 2013, createpotentially enormous investment opportunitiesin the energy industry in the country.
The Year in Summary

28
31
33
4428 36
24 27 24
39
51 5 2
2
n Alpek n Nemakn Sigman Alestran Newpek
Alpek
Sigma
Nemak
Alestra
Newpek
• The largest petrochemical company in Mexico.
• The leading producer of polyester in North America and one of the most important worldwide.
• Operates the largest expandable polystyrene (EPS) plant in the Americas.
• Sole producer of polypropylene and caprolactam in Mexico.
• The leading maker of processed meats in North America, and of cheese in Mexico.
• The largest producer of hot dogs in the U.S., Mexico and Central America.
• Owns one of the largest refrigerated food distribution networks in Latin America. It serves 440,000 points of sale. Owns a solid portfolio of leading brands.
• The world’s largest independent producer of complex aluminum powertrain components for the automotive industry.
• Leading provider of IT and communications services for corporate customers in Mexico.
• Company engaged in hydrocarbons exploration and production activities.
Revenues(%)
EBITDA(%)
Assets(%)
Global Footprint and Businesses

3
ArgentinaAustriaBrazilCanadaChinaCosta RicaCzech RepublicDominican RepublicEl Salvador GermanyHungaryIndiaMexicoPeruPolandSlovakiaSpainU.S.A.
MAIN PRODUCTS
• Polyester (PTA, PET and fibers)
• Plastics and chemicals (polypropylene, EPS, polyurethanes and caprolactam)
MAIN PRODUCTS
• Processed meats
• Cheese and yogurt
• Prepared meals
MAIN PRODUCTS
• Aluminum heads and blocks for gas and diesel engines
• Transmission parts
MAIN SERVICES
• Data centers
• Cloud applications, information security, managed networks
• Consultancy services, vertical applications for specific industries
MAIN PRODUCTS
• Hydrocarbons
Markets: food & beverages, consumer products, textile, construction and automotive.
Plants: 16, in three countries.
Capacity: 5.3 million tons per year.
Revenues in 2013: U.S. $7.0 billion.
Employees: 4,528.
Markets: food.
Plants: 41 and 134 distribution centers, in ten countries.
Points of sale served: 440,000.
Production volume in 2013: 1.2 million tons.
Revenues in 2013: U.S. $3.8 billion.
Employees: 29,562.
Markets: automotive.
Plants: 34, in 14 countries.
Capacity: 55 million equivalent heads per year.
Revenues in 2013: U.S. $4.4 billion.
Employees: 20,724.
Markets: corporate customers.
Presence: 200 cities in Mexico.
Revenues in 2013: U.S. $395 million.
Employees: 1,860.
Markets: energy, oil and gas.
Revenues in 2013: U.S. $133 million.
Employees: 25.
13
12,6
48
11,8
54
10,8
16
9,0
84
8,27
7
1211100913
1,915
1,854
1,623
1,26
0
1,055
1211100913
15,8
70
15,15
2
14,7
46
10,7
73
8,53
6
12111009
4
Financial Highlights
Revenues(U.S. $ Millions)
EBITDA(U.S. $ Millions)
Assets(U.S. $ Millions)
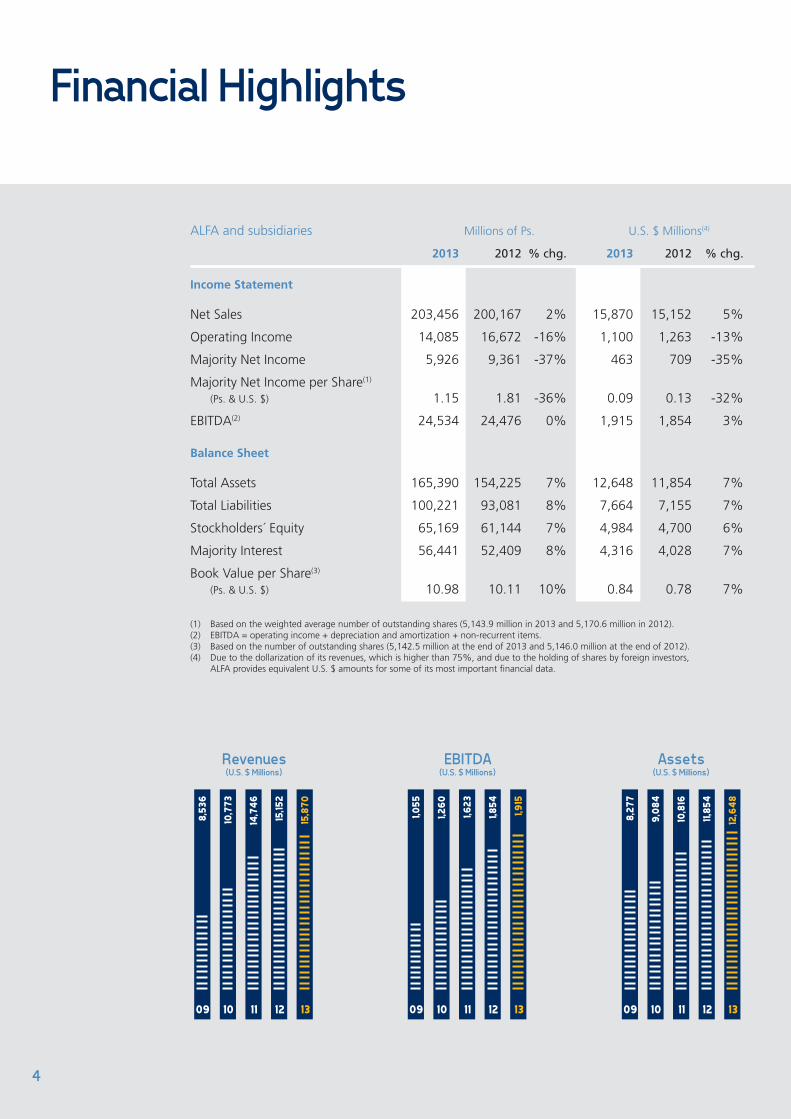
ALFA and subsidiaries Millions of Ps. U.S. $ Millions(4)
2013 2012 % chg. 2013 2012 % chg.
Income Statement
Net Sales 203,456 200,167 2% 15,870 15,152 5%
Operating Income 14,085 16,672 -16% 1,100 1,263 -13%
Majority Net Income 5,926 9,361 -37% 463 709 -35%
Majority Net Income per Share(1)
(Ps. & U.S. $) 1.15 1.81 -36% 0.09 0.13 -32%
EBITDA(2) 24,534 24,476 0% 1,915 1,854 3%
Balance Sheet
Total Assets 165,390 154,225 7% 12,648 11,854 7%
Total Liabilities 100,221 93,081 8% 7,664 7,155 7%
Stockholders´ Equity 65,169 61,144 7% 4,984 4,700 6%
Majority Interest 56,441 52,409 8% 4,316 4,028 7%
Book Value per Share(3) (Ps. & U.S. $) 10.98 10.11 10% 0.84 0.78 7%
(1) Based on the weighted average number of outstanding shares (5,143.9 million in 2013 and 5,170.6 million in 2012).(2) EBITDA = operating income + depreciation and amortization + non-recurrent items.(3) Based on the number of outstanding shares (5,142.5 million at the end of 2013 and 5,146.0 million at the end of 2012).(4) Due to the dollarization of its revenues, which is higher than 75%, and due to the holding of shares by foreign investors, ALFA provides equivalent U.S. $ amounts for some of its most important financial data.

1,915
1,854
1312
15,8
70
15,15
2
1312
5
Dear shareholders:
In 2013, ALFA’s results were driven by the performance of
the auto parts and food businesses. Revenues and EBITDA
grew 5% and 3% over 2012. Financial condition remained
strong: Net Debt to EBITDA was 1.8 times, while Interest
Coverage was 6.7 times. Cash flow generation during
the year and the refinancing of debt in the international
financial markets favored the former.
Investments were carried out to expand production
capacity and increase efficiency: Alpek invested in power
cogeneration; Nemak built a second plant in China; Sigma
made acquisitions, highlighting that of 45% of the capital
of Campofrio Food Group, Europe’s leading producer of
processed meats that allows Sigma entry in that region;
Alestra built its fifth Data Center and Newpek continued
drilling for natural gas and oil in Texas.
Letter to Shareholders
EBITDA(U.S. $ Millions)
Revenues(U.S. $ Millions)

6
Performance
Alpek continued to face an oversupply in the global polyester markets, caused by excess production capacity in Asia. It took measures such as the closure of its Cape Fear plant, whose production moved to the Columbia and Pearl River plants. Progress was made in the construction of a cogeneration unit in Mexico and a contract with M&G was signed to have access to 400 thousand tons of PET per year, to be produced at a new plant that this company will build in Corpus Christi, Texas.
Nemak benefitted from the U.S. auto industry’s ongoing recovery to increase its sales volume by 14%. In Europe, the automotive market shrank by 2%. However, Nemak’s biggest clients in that area took advantage of export opportunities to sustain their sales, and this supported Nemak as well. The company continued to build capacity so it can better respond to its customers’ needs. It invested to expand production capacity in North America, Europe and Asia, including a new plant in China.
Sigma’s sales volume rose 4% thanks to a stronger distribution network and new marketing and commercial support campaigns. This despite the fact the Mexican food market decreased by an estimated 1% in the year.
Sigma acquired 45% of the equity of Campofrio, taking a major step forward in its strategy of becoming a leading global player in the refrigerated food market. To this date, the company is awaiting the Spanish Securities Commission’s approval to proceed with a tender offer for the Campofrio shares in the market.
Sigma also bought Monteverde, a Costa Rican cheese producer, and ComNor, a business operating in the Mexican foodservice market.
Alestra reinforced its strategy of focusing on value-added IT and communications services in the Mexican business segment. Revenues from this grew 15% in 2013 and accounted for 84% total sales of these services. Alestra broadened its coverage of the northwestern and southeastern markets of Mexico by acquiring G-Tel Comunicación. It built a new Data Center, the company’s fifth, which gives it the capacity to provide more and better services to its clients. It also built a “Sperto Center” in Mexico City and expanded its fiber optic network and last-mile access.
Newpek continued to drill more wells and connect them to sales in the south of Texas, totaling 411 wells in production at the end of 2013. Also, as part of its strategy of strengthening operating capacity in the U.S., it invested in new conventional and unconventional oil and gas fields in Kansas, Texas, Oklahoma and Colorado. In Mexico, it formalized a strategic alliance with the British company Petrofac, to jointly offer services to companies in the oil and gas industries.
Financial results
ALFA’s revenues for 2013 totaled U.S. $15,870 million, an increase of 5% over the previous year. This was driven by higher sales volume and average prices that reflected a rise in raw material costs in some products.

7
EBITDA rose to U.S. $1,915 million, 3% more than in 2012. Lower margins on petrochemical products in export markets precluded an even stronger growth.
Majority Net Income was U.S. $463 million, a decline of 32% from the previous year. The reduction was due mainly to foreign-exchange losses following the Mexican peso’s depreciation against the U.S. dollar.
ALFA continued to invest in expanding production capacity and strengthening its businesses. In 2013, it invested U.S. $1,550 million, including the abovementioned acquisitions by Sigma and Alestra.
During the year, the ALFA companies refinanced U.S. $1.3 billion at improved terms and conditions. Thus, the average life of debt increased from 4.5 to 5.0 years. As part of this effort, Alpek and Nemak issued bonds for the equivalent of U.S. $800 million on international financial markets. At the end of 2013, 40% of the consolidated debt matures after 2018.
At year’s end, and in order to accelerate the development of Mexico’s energy industry, a constitutional reform was approved that aims to open to private investment areas of the energy industry reserved until now for the Mexican State. As of the date of this letter, the drafting of the laws that will enforce the constitutional amendments is in progress. ALFA has been carrying out activities in the energy industry outside Mexico for seven years. This has allowed it to gain experience so that it is ready to take advantage of business opportunities that may become available in Mexico. Greater clarity on this matter may be in place in the coming months.
The Board of Directors recognizes and is grateful for the support received from shareholders, employees, customers, suppliers, financial institutions and the community at large, during the year reported here.
All of ALFA’s businesses are prepared with valuable human capital, cutting-edge technology, strong cash flow generation and sound financial condition, so that they can better capture emerging opportunities for growth and value generation.
San Pedro Garza García, N.L., Mexico January 29, 2014.
Armando Garza SadaChairman of the Board of Directors
Álvaro Fernández GarzaPresident

8
• The construction of a cogeneration plant in Veracruz is almost complete.
• A contract is signed to sell IntegRex® technology for a new PTA/PET plant.
• Alpek secures the right to 400,000 tons/year of PET out of this plant.
• A joint venture agreement is signed for the construction of a PET plant in Russia.
• U.S. $7.0 billion in revenues in 2013.
Alpek
I n 2013, Alpek undertook projects to improve its operating efficiency and increase the integration of its operations. This in an
environment of declining margins in global polyester and caprolactam markets.
In line with its integration strategy, Alpek invested U.S. $109 million in building a cogeneration plant in Veracruz, Mexico, which will ensure a reliable and efficient supply of energy starting in the first half of 2014.
The consolidation of its polyester operations through the closure of its Cape Fear plant will result in an estimated annual savings of U.S. $30 million. Alpek also finished clearing bottlenecks at its Columbia plant, increasing its annual capacity by 60,000 tons.
In 2013, Alpek signed an IntegRex® licensing agreement and a PTA/PET supply contract with Gruppo M&G, for construction of an integrated PTA/PET plant in Texas.
Besides advantages in conversion costs, the IntegRex® technology has proven to be an efficient vehicle of international expansion, opening an investment opportunity in a PET plant in Russia.
To improve efficiency, Alpek signed a caprolactam technology licensing agreement with DSM Fibers Intermediates and approved construction of a spherical propylene storage tank.
To face the challenging market environment, Alpek is working on a second cogeneration project and has made progress on the integration to monoethylene glycol, under an alliance with Pemex.

9
76
24
8
60
2
30
In terms of financial results, in 2013 the global petrochemical industry continued to face challenges resulting from overcapacity in China and lower demand in export markets, like Europe. Therefore, Alpek’s sales totaled U.S. $7,028 million, while EBITDA came to U.S. $572 million, 3% and 21% lower, respectively, than in 2012.
Mexico’s energy reform, recently passed by Congress, brightens the outlook for the country’s
petrochemical industry by improving the availability of energy and raw materials under more competitive conditions. Access to natural gas and inputs like ethane and propane are fundamental to maximizing Alpek’s integration strategy. •
Revenue breakdown
(%)
End markets (%)
n Food & beveragen Consumer productsn Textilen Construction
n Polyester productsnPlastic & chemicals

10
• Increase in production capacity in North America, Europe and Asia.
• A second plant in China came on stream.
• Investment in Russia is announced.
• U.S. $4.4 billion in revenues in 2013.
Nemak
F or Nemak, 2013 was an unprecedented year, fuelled by the solid performance of the U.S. automotive industry and the company’s
focus on premium clients in Europe. Furthermore, aluminum auto parts are increasingly being used as replacements for cast iron parts, a trend which also favors the company.
Sales volume grew 14%, to 47.6 million equivalent engine heads. In North America, auto sales grew 8% last year to a total of 15.6 million vehicles. Pent-up demand and the availability of consumer credit were the main drivers.
In Europe, the market shrank by 2%, but Nemak’s increased participation on German automakers, which have been successful in finding export opportunities outside of the Eurozone, permitted sales volume growth of 6%.
Nemak also integrated new value-added services, like machining, and made its operations significantly more efficient by optimizing its 34 plants around the world.
The company waged an ambitious capex program over the course of the year, expanding production capacity in North America, Europe and Asia to better serve the incremental demand of its clients.
At the end of the year, Nemak started up a second plant in China, in the city of Chongqing, turning out engine blocks and transmission parts. It also announced its decision to build a plant in

11
51
3314
2
47.
6
42.
0
1312
Russia, where it will produce engine heads and blocks for a German carmaker. This plant will have an annual capacity of 600,000 units and will start up at the end of 2015. Industry analysts expect that Russia will become Europe’s largest market by the end of the decade, surpassing Germany.
As a result of the operating advances, revenues and EBITDA rose to U.S. $4,391 million and
U.S. $611 million, respectively. This represents increases of 13% and 21% over 2012.
Recent investments are part of Nemak’s strategy of increasing participation in regions where auto production is growing fast, like China and Russia, while strengthening its presence in America and Europe. •
Revenue breakdown
(%)
n HeadsnBlocksnTransmissionsnOther
Sales volume
(million equivalent heads)

12
• The Campofrio acquisition will allow Sigma to enter the European market with a leadership position.
• Foodservice business gains relevance.
• 300 new refrigerated vehicles are added to the distribution fleet.
• U.S. $3.8 billion in revenues in 2013.
D espite estimated weak performance in the Mexican food industry in 2013, Sigma posted positive results, selling 1.2
million tons of food, 4% more than in 2012.
The company carried out three strategic acquisitions. The most important one was the purchase of a 45% stake in Campofrio Food Group (Campofrio), which gives Sigma an entry into the European market. Campofrio is the market leader in Europe, where it has presence in eight countries and in the U.S.
Related to this investment, Sigma signed an agreement with the Chinese company WH Group (formerly Shuanghui), a global leader in pork meat production which owns 37% equity of Campofrio, to launch a tender offer which will increase Sigma’s 45% equity position up to 63%.
The Campofrio acquisition represents an opportunity for Sigma to capitalize on the strength of that company’s brands and its robust operating assets, as well as its excellent management and renowned capacity for innovation.
Also in the year, ALFA acquired the companies ComNor and Monteverde. The first of these operates two plants and eight distribution centers, where processes and sells various types of meat for the Mexican foodservice market, while the other is the leader in the mature cheese business in Costa Rica.
Additionally, to expand the coverage of its retail distribution network, Sigma added 300 new vehicles to its fleet, bringing the total to 4,300.
Sigma

13
65
29
6
8
69
23
Regarding financial results, revenues totaled U.S. $3,820 million and EBITDA was U.S. $524 million, 11% more than in 2012 in both cases.
These increases reflect greater sales of processed meats and dairy products in Mexico and other countries; in addition to improvements in productivity and distribution.
Through investments as those explained above, Sigma continues to execute its strategy of
expanding its core businesses while venturing into new segments and regions that are attractive platforms for consolidating its leadership. •
Revenue breakdown
(%)
Revenue breakdown by region
(%)
n MexiconU.S.A.nCentral America, the Caribbean & Peru
n Processed meatsnDairy productsnOther

14
• Alestra builds its fifth Data Center.
• G-Tel Comunicación, a company in Mexico’s northwestern region, is acquired.
• A new Sperto Center is dedicated in Mexico City.
• U.S. $395 million in revenues in 2013.
Alestra
I n 2013, Alestra rolled out a major capex program aimed at expanding its infrastructure and portfolio of solutions. With this, it
strengthened its position as leader in the information technology and communications (ITC) service market for corporate customers in Mexico.
Alestra continued promoting value-added services, like cloud applications, security and managed networks, as well as data, Internet and local services, which accounted for 84% of the company’s revenues in 2013.
To strengthen its infrastructure and portfolio of solutions and keep its clients at the forefront of industry mega-trends, the company invested U.S. $150 million in fixed assets and systems, more than double the 2012 amount. This figure includes the acquisition of G-Tel Comunicación, a leading supplier of integral voice, data and video services in northwest and southeast Mexico.
Alestra also completed construction of a new Data Center located in Querétaro, which is considered the most innovative and sustainable in Latin America.
Additionally, at the end of the year it launched a new Sperto Center, located in Mexico City. This center has the most innovative technological solutions and serves Alestra to demonstrate its capacity to current or potential customers. The Sperto centers have become a powerful tool to attract new clients and encourage them to adopt the latest technologies.

15
50
16
34
170
137
1312
Confirming its commitment to developing and offering the most complete and reliable range of ITC services in Mexico, Alestra established new alliances with Cisco, HP, SAP and other technological partners, who are leaders in their respective fields.
In 2013, revenues were U.S. $395 million, 13% more than in 2012. EBITDA totaled U.S. $170 million, 24% more than the previous year.
Alestra continues to position itself as a leading ITC service supplier by developing cutting edge services and building up its infrastructure to offer its customers the technological options that can generate the best value for them. •
Revenue breakdown
(%)
n Business data, Internet and local services nBusiness IT services nLong distance
EBITDA(U.S. $ Millions)

16
• 125 new wells are connected to sales. 411 in operation at the end of the year.
• Operations expand to other areas within the U.S.
• Services are offered to Oil & Gas companies in Mexico.
• U.S. $133 million in revenues in 2013.
Newpek
I n 2013, Newpek continued to expand operations, turning in positive results. The company continued drilling at the Eagle Ford
Shale, where it connected 125 new wells to sales, bringing the total to 411 currently in operation. Net production to sales was 6,737 equivalent barrels of oil per day, 37% more than in 2012.
In line with its growth strategy, Newpek completed two major acquisitions in the U.S. The first involved 90,000 acres in Kansas, where it will explore and drill shallow oil formations in partnership with a prestigious local company. The second consists of a portfolio of 150,000 acres located in Texas, Oklahoma and Colorado. These acquisitions, along with the recruitment of technical staff with ample experience in the industry, strengthen the operational capabilities of Newpek.
In Mexico, Newpek in association with Monclova Pirineos Gas, took over the operation and development of two mature oil fields of Pemex in
Veracruz, Mexico. This in accordance with service contracts for the exploration, development and production of hydrocarbons won in June 2012. Operations in these fields are proceeding according to plan.
Newpek also formed a partnership with the British company Petrofac Plc in 2013. Together, these two companies created a subsidiary called

17
82
18
6.7
4.9
1312
Petroalfa, which provides comprehensive services to companies operating in the Mexican oil and gas industry.
Revenues and EBITDA totaled U.S. $133 million and U.S. $91 million in 2013, increasing 43% and 37%, respectively, compared to 2012.
Since its foundation, in 2006, Newpek has executed a strategy of growth and learning in the
value chain of the oil and gas industry. Now, with the approval of an energy reform that opens the door to the development of the energy industry in Mexico, its business prospects are more promising than ever. •
Revenue breakdown
(%)
n Oil and condensates nNatural gas
Production volume
(thousand equivalent barrels of oil per day)

18
Board of Directors
José Calderón Rojas (2A)
Chairman of the Board and Chief Executive Officer of Franca Industrias, S.A. de C.V. and FrancaServicios, S.A. de C.V.Board member since April 2005.Member of the Boards of FEMSA and BBVA Bancomer (Regional Board). President of Asociación Amigos del Museo del Obispado, A.C.
Enrique Castillo Sánchez Mejorada (1A)
Managing Partner of Ventura Capital Privado, S.A. de C.V.Board member since March 2010.Member of the Boards of Maxcom Telecomunicaciones, Southern Copper Corporation, Grupo Herdez, Organización Cultiba, Médica Sur and Grupo Aeroportuario del Pacífico. Alternate Board member of Grupo Financiero Banorte and Grupo Gigante.
Francisco Javier Fernández Carbajal (1C)
Chairman of the Board of Primero Fianzas, S.A. de C.V.Board member since March 2010.President of the Planning and Finance Committee.Member of the Boards of Visa Inc., FEMSA, CEMEX and Fresnillo PLC.
Álvaro Fernández Garza (3C)
President of ALFA, S.A.B. de C.V.Board member since April 2005.Member of the Boards of Vitro, Cydsa and Universidad de Monterrey. Currently, he is President of the Chamber of Industry of Nuevo León (CAINTRA).
Armando Garza Sada (3C)
Chairman of the Board of ALFA, S.A.B. de C.V.Board member since April 1991.Member of the Boards of FEMSA, Frisa, Grupo Financiero Banorte, Lamosa, Liverpool, Proeza, ITESM and Stanford University.
Claudio X. González Laporte (1B)
Chairman of the Board of Kimberly Clark de México, S.A.B. de C.V.Board member since December 1987.Member of the Boards of Fondo México, Grupo Carso, Grupo Financiero Inbursa, Grupo México, Grupo Televisa and Bolsa Mexicana de Valores. Consultant for Capital Group and President of Consejo Mexicano de Hombres de Negocio.
Ricardo Guajardo Touché (1B)
Board member since March 2000.Member of the Boards of Liverpool, Grupo Aeroportuario del Sureste, Grupo Bimbo, FEMSA, Coca-Cola FEMSA, Grupo Coppel and ITESM.
David Martínez Guzmán (1C)
Managing Director of Fintech Advisory Limited Board member since March 2010.Member of the Board of Vitro.

19
Adrián Sada González (1B)
Chairman of the Board of Vitro, S.A.B. de C.V.Board member since April 1994. President of the Corporate Practices Committee. Member of the Boards of Gruma, Cydsa and Consejo Mexicano de Hombres de Negocios.
Federico Toussaint Elosúa (1A)
Chairman of the Board and Chief Executive Officer of Grupo Lamosa, S.A.B. de C.V.Board member since April 2008. President of the Audit Committee.Member of the Boards of Xignux, Grupo Iconn, Universidad de Monterrey, Centro Roberto Garza Sada, Fibra Inn, Banco de México (Regional Board), President of Centro de Competitividad de México and Board member of Consejo Mexicano de Hombres de Negocios.
Guillermo F. Vogel Hinojosa (1C)
Chairman of the Board of Grupo Collado, S.A.B. de C.V., Vice Chairman of the Board of Tenaris, S.A. de C.V. and Vice Chairman of the Board of Estilo y Vanidad, S.A. de C.V.Board member since April 2008.Member of the Boards of Corporación Mexicana de Inversiones de Capital, Universidad Panamericana-IPADE, Fondo Nacional de Infraestructura, Corporación San Luis, Innovare and Eximpro.
Carlos Jiménez Barrera
Secretary of the Board
Keys:(1) Independent Board member(2) Independent Proprietary Board member(3) Related Proprietary Board member
(A) Audit Committee(B) Corporate Practices Committee(C) Planning and Finance Committee

20
Corporate Governance
• ALFA adheres to Mexico’s current Code of Best Corporate Practices in force in Mexico since 2000. This Code was developed at the initiative of the securities authorities of Mexico and its purpose is to establish a framework on corporate governance to increase investor confidence in Mexican companies.
• Companies whose stocks trade on the Mexican Stock Exchange must disclose the way they adhere to the Code of Best Corporate Practices. This is done annually by responding to a questionnaire, which is available to the public through the Mexican Stock Exchange’s web site.
• Following is a summary of ALFA’s corporate governance as stated in the June 2013 questionnaire, with any pertinent information updated.
A. The Board of Directors comprises 11 proprietary members who have no alternates. Of this number, 9 are independent. This annual report provides information on all of the Board’s members, identifying those who are independent and the Committees in which they participate.
B. Three Committees assist the Board of Directors in carrying out its duties: Audit, Corporate Practices, and Planning and Finance. Board members participate in at least one committee each. All three committees are headed by an independent board member. The Audit and Corporate Practices Committees are formed by independent members only.
C. The Board of Directors meets every two months. Meetings of the Board can be called by agreement of the Chairman of the Board, the President of the Audit Committees, the President of the Corporate Practices Committee, the Secretary of the Board or of at least 25% of its members. At least one of these meetings is dedicated to defining the company’s medium and long term strategy.
Armando Garza Sada
Chairman of the BoardJoined ALFA in 1978. B.S. from MIT. MBA from Stanford University.
Álvaro Fernández Garza
PresidentJoined ALFA in 1991. Graduated in Economics from Notre Dame University. Master’s degree in Management from ITESM and MBA from Georgetown University.
Mario H. Páez González
President of SigmaJoined ALFA in 1974. Graduated in Accounting and Master’s degree in Management from ITESM. MBA from Tulane University.
Armando Tamez Martínez
President of NemakJoined ALFA in 1984. Graduated in Engineering from ITESM. Master’s degree in Administration and Engineering from George Washington University.
José de Jesús Valdez Simancas
President of AlpekJoined ALFA in 1976. Graduated in Engineering. Master’s degree in Management from ITESM. Master’s degree in Industrial Engineering from Stanford University.
Management Team

21
D. Members must inform the Chairman of any conflicts of interest that may arise, and abstain from participating in the corresponding deliberations. Average attendance at Board meetings was 95% during 2013.
E. The Audit Committee studies and issues recommendations to the Board on matters such as the selection and determination of fees to the external auditor, coordinating with the internal audit area of the company, and studying accounting policies, among others.
F. The company has internal control systems with general guidelines. These are submitted to the Audit Committee for its opinion. In addition, the external auditor validates the effectiveness of the internal control system and issues the corresponding reports.
G. The Planning and Finance Committee evaluates all matters relating to its particular area and issues recommendations to the Board on matters such as feasibility of investments, strategic positioning of the company, alignment of investment and financing policies, and review of investment projects.
H. The Corporate Practices Committee is responsible for issuing recommendations to the Board in such matters as employment terms and severance payments for senior executives, and compensation policies, among others.
I. There is a department dedicated to maintaining an open line of communication between the company and its shareholders and investors. This ensures that investors have the financial and general information they require in order to evaluate the company’s development and progress.
Paulino J. Rodríguez Mendívil
Senior Vice President, Human CapitalJoined ALFA in 2004. Graduated in Engineering and Master’s degree in Energy Technology from the University of the Basque Country, Spain.
Manuel Rivera Garza
Senior Vice President, DevelopmentJoined ALFA in 1976. Graduated in Engineering from ITESM. Master’s degree in Industrial Engineering from Stanford University.
Ramón A. Leal Chapa
Chief Financial OfficerJoined ALFA in 2009. Graduated in Accounting from Universidad de Monterrey. Master’s degree in Operations Management from ITESM. MBA from Harvard University.
Alejandro M. Elizondo Barragán
Senior Vice President, DevelopmentJoined ALFA in 1976. Graduated in Engineering from ITESM. MBA from Harvard University.
Carlos Jiménez Barrera
Senior Vice President, Legal and Corporate AffairsJoined ALFA in 1976. Graduated in Law from Universidad de Monterrey. Master’s degree in Law from New York University.
Rolando Zubirán Shetler
President of AlestraJoined ALFA in 1999. Graduated in Engineering from UNAM. Master’s degree in Operations Research from the University of Southern California. Ph.D. in Philosophy from Universidad Autónoma de Nuevo León, with specialization in Management.

2222
Consolidated Financial Statements
Contents PageManagement’s Analysis 24Report of the Independent Auditors 35
Consolidated Financial StatementsConsolidated Statements of Financial Position 36Consolidated Statements of Income 38Consolidated Statements of Comprehensive Income 39Consolidated Statements of Changes in Stockholders’ Equity 40Consolidated Statements of Cash Flows 42Notes to the Consolidated Financial Statements 43Glossary 104

23

24
ALFA, S. A. B. DE C. V. AND SUBSIDIARIES
Management´s Analysis
2013The following report should be read in conjunction with Letter to Shareholders (pages 5 – 7) and the Audited Financial Statements (pages 35 – 101). Unless otherwise indicated, the figures from 2011 to 2013 are stated in millions of nominal Mexican pesos (Ps). Percentage changes are stated in nominal terms. In addition, some figures are stated in millions of US dollars (US$).
The financial information contained in this Analysis has been expanded in some sections to include three years and adjust it to the General Regulations, applicable to Issuers and Other Securities Market Participants, issued by the National Banking and Securities Commission (CNBV in spanish acronym) up to July 15, 2013.
The financial information contained in this Management Analysis corresponds to the last three years (2011, 2012 and 2013), and has been prepared in accordance with International Financial Reporting Standards (IFRS).
San Pedro Garza García, N. L., January 29, 2014.
ECONOMIC ENVIRONMENTAfter the Mexican economy reported a healthy growth in 2012, the economic environment suffered a slow down during 2013. The performance of the Gross Domestic Product (GDP) and other key variables are described in the following paragraphs:
At the date of the report, it is estimated that the Gross Domestic Product (GDP) in Mexico grew 1.3% in 2013, a lower percentage than in 2012. Consumer price inflation in México was 4.0%(b) in 2013, higher than the 3.6%(b) figure recorded in 2012. During 2013, the Mexican peso had an annual nominal depreciation of 0.5%(c), compared with an appreciation of 6.9%(c) in 2012. In real terms the annual average overvaluation of the Mexican peso vis-á-vis the U.S. dollar amounted to 15.5% (d) in 2013 compared with 14.2%(d) in 2012.
With respect to the interest rate in Mexico, the TIIE was 4.3%(b) in 2013 in nominal terms, compared with 4.8% in 2012. In real terms there was a decrease from an annual accumulated percentage of 1.3% in 2012 to 0.4% in 2013.
The average nominal dollar 3-months LIBOR, for the year 2013 was 0.3%(e) in 2013, similar to 0.4%(e) observed in 2012. Adjusting for the nominal depreciation of the Mexican pesos vis-á-vis the US dollar LIBOR in constant pesos changed from -9.7%(a) in 2012 to -3.1%(a) in 2013.
Sources:(a) Consultores Económicos Especializados, S. A. de C. V. (CEE).(b) Banco de México (Banxico).(c) Banxico. Exchange rate for liquidating liabilities denominated in foreign currency and payable in Mexico.(d) CEE. 1990 basis. Bilateral with the United States, adjusting for consumer prices. (e) British Bankers Association.

25
Revenue indexes(2008=100)
ALFA CONTINUES TO GROWALFA obtained favorable results in 2013. Its revenues and cash flow were increased as compared to 2012, achieving a solid financial position. The generation of cash flow during the year and the refinancing of the debt in international financial markets were favorable.
RESULTS REVENUESThe following table shows ALFA´s revenues for the years 2013, 2012 and 2011 breaking down its components of volume and price (the indexes are calculated on a base of 2008=100):
Change Change Concept 2013 2012 2011 2013-2012 (%) 2012-2011 (%)
Consolidated Revenues 203,456 200,167 182,967 2 9Volume index 147.8 143.8 129.6 3 11Price index pesos 116.1 117.5 120.1 (1) (2)Price index in US dollars 101.3 99.4 107.1 2 (7)
Likewise, the consolidated revenues broken down by ALFA’s principal bussines groups were as follows:
Change Change Concept 2013 2012 2011 2013-2012 2012-2011
Alpek 90,061 96,163 90,667 (6,102) 5,496Sigma 48,989 45,476 41,078 3,513 4,398Nemak 56,299 51,385 44,669 4,914 6,716Alestra 5,067 4,634 4,697 433 (63)Newpek 1,706 1,227 573 479 654Others 1,334 1,282 1,283 52 (1)Consolidated total 203,456 200,167 182,967 3,289 17,200
The behavior of revenues is explained as follows:
13
148
144
130111
98
12111009
VolumesPrices
13
116117
120118
104
12111009
101991079282
Pesos
Dollars

26
2013-2012:Consolidated sales in 2013 amounted to Ps203,456 (US $15,870), 2% over 2012 (5% in US dollars). Following is a discussion of the performance of each of the principal bussines groups:
Alpek’s sales in US dollars during 2013 were 3% lower than those of 2012. An environment of lower prices and margins in global polyester and caprolactam markets translates into a reduction in sales volume. However, the company continues to implement projects to improve efficiency and the integration of its operations.
In 2013, Sigma sold 1.2 million tons of food, 4% more than in 2012. Revenues were increased to US $3,280, 11% more than in 2012. These increases reflect greater sales of cold meats and dairy in Mexico, in addition to an improved productivity and distribution network.
On the other hand, in Nemak, the sales volume grew 11%, adding 47.6 million equivalent pieces. As a result, revenues increased to US $4,391, an increase of 13% vis-à-vis 2012.
In North America, the sales of cars grew 8%, adding 15.6 million vehicles. The decreased demand and consumer credit availability were the main drivers of this increase. In Europe, the market decreased 2%; however, the higher the concentration of Nemak with German warehouses, which have been successful in finding export opportunities outside the Eurozone, favored the Company’s increase of sales volume by 3%.
Furthermore, the use of aluminum auto parts to replace iron auto parts continues to grow, which also favored the company.
Alestra continued to promote added value services, such as cloud applications, security and administrative networks, as well as data services, internet and local for the business segment, which contributed with 84% of the company’s revenues in 2013. Revenues amounted to US $395, 13% over 2012.
Finally, Newpek connected 125 new wells to sales, to add up to 411. Of the above, 371 operate in Eagle Ford Shale and 40 in Edwards Trend. The net production to sales amounted to 6,737 equivalent average oil barrels per day, 37% more than in 2012. From the total volume, 52% corresponded to liquids and oil, with a considerably higher value to that of the dry gas, compared with 50% in 2012.
2012-2011:Consolidated sales in 2012 amounted to Ps200,167 (US $15,152), 9% over 2011 (3% in US dollars). Following is a discussion of the performance of each of the principal bussines gruops:
Alpek’s sales in Mexican pesos during 2012 were 6% higher than those of 2011. Sales were favorably impacted by a higher volume and by the monthly average exchange rate that was lower than during 2011, resulting in an increase in sales expressed in Mexican pesos. On the other hand, they were unfavorably affected by lower raw material prices during the second quarter of the year, which resulted in lower sales prices.
Sigma’s sales increased 11% in Mexican pesos in 2012. The markets serviced by Sigma in Mexico and US showed a healthy demand during most of the year, above all in Mexico. The efforts to win new clients, as well as the organic growth, were the origin of the increase in sales observed specially in yoghurt and cheese.
The sales in pesos of Nemak increased 15% vis-à-vis last year. This increase was based on the sales volume of 42 million heads equivalent heads in the year, 14% more than in 2011. Part of the growth is explained by the acquisition of JL French, company in the business of aluminum pieces for automotive transmission. Also, in continuing with the trend of replacing iron pieces for other aluminum pieces in automotive engines, as well as in the increase in sales of Nemak’s main clients. In Europe in particular, sales remained stable for German assemblers, who demanded new programs and were successful in finding export markets for their vehicles.
Alestra’s revenues decreased 1% as a result of a lower income from traditional long-distance services. The growth in domestic services of added value, fully compensated the decrease in revenues from AGN services, which Alestra ceased to offer after acquiring the shares of AT&T held by ALFA in 2011. Value added services represented 82% of total revenues at 2012 year end.
Finally, Newpek started operations in 135 new wells in 2012. The net sales production of equivalent crude barrels per day during 2012 grew 93% as compared to 2011. Approximately 50% of this volume corresponded to liquid hydrocarbons, including oil, with a substantially higher value than that of dry gas. Total revenues increased 114% in Mexican pesos with respect to 2011.

27
OPERATING PROFITOperating profit in 2013 and 2012, is explained as follows:
2013-2012: Change by group
Operating profit 2013 2012 Change Alpek Sigma Nemak Alestra Newpek Other
Revenues 203,456 200,167 3,289 (6,102) 3,513 4,914 433 479 52Operating profit 14,085 16,672 (2,587) (4,550) 495 961 370 148 (11)Consolidated operating margin (%) 6.9 8.1Alpek (%) 3.2 7.8Sigma (%) 10.8 10.5Nemak (%) 8.0 6.9Alestra (%) 26.2 20.8Newpek (%) 48.4 55.3
The 14% decrease in consolidated operating profit from 2012 to 2013 is explained by the individual performance of ALFA companies, as explained below:
In the case of Alpek, additionally to the lower margin environment in global markets of polyester and caprolactam, an item of Ps2,421 was charged to income, corresponding to the cost of closing facilities and discounting fixed assets of Cape Fear, which had an impact on operating profit.
In Sigma, the increase in sales explained above was shown in an increase in operating profit.
Nemak recorded operating profit in Mexican pesos, which was higher than that of 2012 by 27%. This was a result of an increase in the sales volume, as well as to a greater efficiency in the use of assets and obtaining of synergies among its 34 plants at a global level, as well as the initial integration of some other value-adding services, such as machined parts.
In 2013, Alestra continued strengthening its income mix, increasing its margins and strengthening its infrastructure to reduce costs. Additionally, it obtained a favorable legal resolution in fixed interconnection tariffs. This allowed a 39% increase in operating profit in US dollars vs. 2012. It is important to mention that in 2012, profit included the benefit of an agreement in favor of Alestra regarding fixed-mobile interconnection tariffs.
Operating income in Mexican pesos of Newpek increased 22% in 2013 vs. 2012. This is a consequence of having more operating wells. It is important to mention that the operating profit to sales ratio decreased in 2013 in relation to 2012 due to expenses related to the new projects that the company will start to develop in 2014.
2012-2011: Change by group
Operating profit 2012 2011 Change Alpek Sigma Nemak Alestra Newpek Other
Revenues 200,167 182,967 17,200 5,496 4,398 6,716 (63) 654 (1)Operating profit 16,672 12,672 4,000 (113 ) 1,387 1,568 426 468 264Consolidated operating margin (%) 8.1 7.0Alpek (%) 7.8 8.4Sigma (%) 10.5 8.3Nemak (%) 6.9 4.5Alestra (%) 20.8 11.8Newpek (%) 55.3 36.5
The 29% increase in consolidated operating profit from 2011 to 2012 is explained by the individual performance of ALFA companies, as explained below:
In Alpek’s case, income was reduced by 2% as a consequence of a reduced margin of exports of PTA, PET and Caprolactam, due to a greater competition in Asian markets.
In Sigma, prices of raw materials, such as meat and dairy increased significantly and this put pressure on the markets. However, the company faced this situation effectively and with higher productivity measures and an adequate policy, which allowed it to obtain a higher income that that of 2011. The synergies obtained in BAR-S operations also contributed to the result of the year.
Nemak recorded operating profit in Mexican pesos, which was higher than that of 2011 by 67%. This was the result of an increase in sales volume, combined with operating efficiencies for the advance in the launching curve for new market programs.

28
In 2012, Alestra improved its income mix, it obtained a favorable resolution regarding fixed-mobile interconnection tariffs and increased its operating efficiency. This allowed a 44% increase in operating profit vs. 2011, year in which such profit had shown an extraordinary adjustment from depreciation of assets, to adjust the useful lives of these assets to the new technological conditions.
Operating income of Newpek increased 225% in 2012 vs. 2011. This was a result of having more operating wells, as well as of producing a richer mix of liquid hydrocarbons and dry gas.
COMPOSITION OF REVENUES AND OPERATING PROFITThe percentage structure of revenues and operating profit of ALFA underwent changes between 2013, 2012 and 2011 mainly with a decrease in revenues and operating profit of Alpek and an incremental change in operating profit of Sigma and Nemak, all of which are explained above.
The following table shows these effects;
% of total
Revenues Operating profit
2013 2012 2011 2013 2012 2011Alpek 44 48 50 21 45 60Sigma 24 23 22 37 29 27Nemak 28 26 24 32 21 16Alestra 2 2 3 9 6 4Newpek 1 1 0 6 4 2Others 1 0 1 (5) (5) (9)Total 100 100 100 100 100 100
FINANCE COST, NETThe exchange gain is explained mainly by the macroeconomic environment during the year. As explained in the beginning, the Mexican peso had an annual nominal depreciation of only 0.5% in 2013. Therefore, it was not a determining factor of ALFA’s Finance cost, net during 2013 (even though it is a factor in the variation vs. 2012 as may be seen below). This year, the main component of Finance cost, net were the financial expenses, as explained below:
Finance cost, net determinants 2013 2012
General inflation (Dec. - Dec.) 4.0 3.6Variation % in nominal exchange rate at year end (0.5) 6.9Closing exchange rate, nominal 13.08 13.01Real appreciation (depreciation) Mexican pesos / dollars with respect to the prior year Year end 1.9 8.6 Average of the year 5.1 (4.2)Average interest rate: Nominal LIBOR 0.3 0.4 Nominal implicit, ALFA debt 5.9 6.1 LIBOR in real terms (3.1) (9.7) Real implicit, ALFA debt 2.6 (5.4)Average monthly debt of ALFA in US$ 4,170 4,225
Expressed in US$, the finance cost,net for the year of 2013, 2012 and 2011 were $295, $279 and $283, respectively.
Variation in finance cost, net in US$ 12/11 13/12
Due to a (higher) lower interest rate (34) (21)Due to a (higher) lower net petty cash debt 18 25Net Change (16) 4
Net financial expenses in profit include premiums paid in operations, such as: refinancing, operating interests, in 2013, 2012 and 2011, interest rate swaps and swaps of gas and gasoline and equity swaps in 2011, besides financial bank expenses.

29
Measures in pesos, the finance cost, net was integrated as follows:
Change
Finance cost,net 2013 2012 2011 13/12 12/11
Financial expenses: (3,978) (4,412) (4,120) 434 (292)Financial income 270 719 606 (449) 113Financial expenses, net (3,708) (3,693) (3,514) (15) (179)
Result from exchange fluctuation, net of derivative financial exchange rate operations. (349) 962 (1,244) (1,311) 2,206Total finance cost,net (4,057) (2,731) (4,758) (1,326) 2,027
The depreciation of the Mexican peso during 2013 vs. the appreciation of the peso in 2012 was the main factor to determine the negative finance cost, net variation between 2013 and 2012.
The fair value of ALFA’s derivative financial instruments at December 2013 and 2012 are as follows:
Fair value (Millions of US dollars)
Type of derivative, value or contract Dec. 13 Dec. 12
Exchange rate 0 0Cross currency swaps (29) (24)Interest rate (2) (20)Energy 2 (27)
INCOME TAX Following is an analysis of the principal determinants of income tax in each one of the years in comparison, starting from the concept of the Income Before Tax defined as operating profit less finance cost,net and share of losses of associates recognized by the equity method.
Change
2013 2012 2011 13/12 12/11
Income tax:Profit before income tax 9,987 13,941 7,883 (3,954) 6,058Share of losses of associates recognized by the equity method 41 31 41 (31) 10,028 13,941 7,914 (3,913) 6,027Statutory rate 30% 30% 30%Income tax at statutory rate (3,008) (4,182) (2,375) 1,174 (1,807)
+ / (-) Tax effect of permanent tax accounting differences:Tax vs. accounting basis of finance cost, net 338 652 (364) (314) 1,016
Other permanent differences, net (139) 241 106 (380) 135Total tax effect of permanent differences 199 893 (258) (694) 1,151Total income tax provision based on operations of the year (2,809) (3,289) (2,633) 480 (656)Recalculation of back taxes and other (383) (101) 82 (282) (183)Total income tax provision (charged) credited to profit (3,192) (3,390) (2,551) 198 (839)Effective tax rate 32% 25% 32%
Income tax:Currently payable (3,531) (3,315) (2,017) (216) (1,298)Deferred 339 (75) (534) 414 459Total income tax provision charged to profit (3,192) (3,390) (2,551) 198 (839)

30
2013 NET PROFITDuring the year, ALFA obtained net consolidated profit, as broken down in the table below and it is the result of that explained with regard to the operating profit, finance cost, net and taxes:
Change
Statement of income 2013 2012 2011 13/12 12/11
Operating profit 14,085 16,672 12,672 (2,587) 4,000Finance cost, net (1) (4,057) (2,731) (4,758) (1,326) 2,027Equity in shares of losses of associates (41) (31) (41) 31Taxes (2) (3,192) (3,390) (2,551) 198 (839)Net consolidated income (loss) 6,795 10,551 5,332 (3,756) 5,219Net income (loss) of the controlling interest 5,926 9,361 4,748 (3,435) 4,613
(1) Comprehensive financing result(2) Income tax (payable and deferred)
COMPREHENSIVE INCOMEComprehensive income is shown in the statement of changes in stockholders’ equity and its objective is to show the total effect of all transactions and events which affected earned surplus. Operations between the company and its shareholders are excluded, mainly dividends paid. Comprehensive income in 2013, 2012 and 2011 was as follows:
Consolidated
Comprehensive income 2013 2012 2011
Net profit 6,795 10,551 5,332Effects of translation of foreign entities 456 (2,887) 3,492Effects of derivative financial instruments 234 87 (354)Remeasurement of obligations for the employees’ benefits 734 (306) (248)Consolidated comprehensive income 8,219 7,445 8,222Owners of the controlling company 7,740 6,332 7,176Non-controlling interest 479 1,113 1,046Comprehensive income for the year 8,219 7,445 8,222
A previous section in this report explains the net profit obtained in 2013, 2012 and 2011. The translation effect of subsidiaries abroad, which shows the effect from using different exchange rates between asset and liability accounts, against income and capital accounts, experienced an important change due to the volatility of the exchange rates of the currencies of different countries where ALFA is present. The effect in capital of derivative instruments, represents the effect for energy by-products that, in accordance with International Financial Reporting Standards, is shown in stockholders’ equity. The effect of remeasurement of obligations for employees’ benefits is the gain (loss) in actuarial estimates.
DIVIDENDS DECLARED AND INCREASE IN STOCKHOLDERS’ EQUITY
• ALFA’s Ordinary Stockholders’ Meeting approved the payment of an ordinary dividend of Ps1,513 equal to 0.29 pesos per share, 12% higher to that paid in 2012. Also, in December, an additional dividend was declared in the amount of Ps2,006 equal to 0.39 pesos per share. In 2012, the payment of an ordinary dividend was approved by Ps1,348, equal to 2.60 pesos per share, 19% higher than that paid in 2011. In turn, in 2011 an ordinary dividend was declared by PS1,133, equal to 2.12 pesos per share.
• In 2013, capital was increased by 7%. On the one hand, it was increased by the net income, due to the effect of labor liabilities in actuarial gains or losses and due to the translation effect, explained above, derived mainly from the depreciation of the Mexican peso, and on the other hand, decreasing due to the repurchase of own shares and the payment of dividends.
31
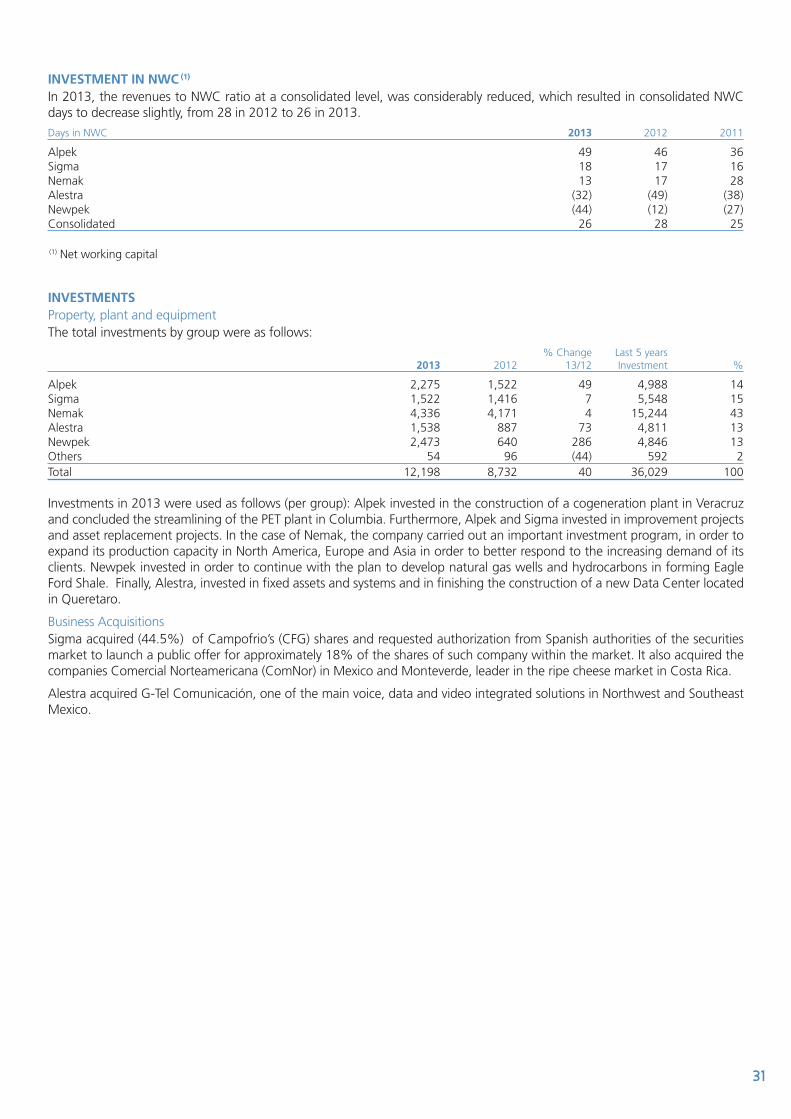
INVESTMENT IN NWC (1) In 2013, the revenues to NWC ratio at a consolidated level, was considerably reduced, which resulted in consolidated NWC days to decrease slightly, from 28 in 2012 to 26 in 2013.
Days in NWC 2013 2012 2011
Alpek 49 46 36Sigma 18 17 16Nemak 13 17 28Alestra (32) (49) (38)Newpek (44) (12) (27)Consolidated 26 28 25
(1) Net working capital
INVESTMENTSProperty, plant and equipmentThe total investments by group were as follows:
% Change Last 5 years 2013 2012 13/12 Investment %
Alpek 2,275 1,522 49 4,988 14Sigma 1,522 1,416 7 5,548 15Nemak 4,336 4,171 4 15,244 43Alestra 1,538 887 73 4,811 13Newpek 2,473 640 286 4,846 13Others 54 96 (44) 592 2Total 12,198 8,732 40 36,029 100
Investments in 2013 were used as follows (per group): Alpek invested in the construction of a cogeneration plant in Veracruz and concluded the streamlining of the PET plant in Columbia. Furthermore, Alpek and Sigma invested in improvement projects and asset replacement projects. In the case of Nemak, the company carried out an important investment program, in order to expand its production capacity in North America, Europe and Asia in order to better respond to the increasing demand of its clients. Newpek invested in order to continue with the plan to develop natural gas wells and hydrocarbons in forming Eagle Ford Shale. Finally, Alestra, invested in fixed assets and systems and in finishing the construction of a new Data Center located in Queretaro.
Business AcquisitionsSigma acquired (44.5%) of Campofrio’s (CFG) shares and requested authorization from Spanish authorities of the securities market to launch a public offer for approximately 18% of the shares of such company within the market. It also acquired the companies Comercial Norteamericana (ComNor) in Mexico and Monteverde, leader in the ripe cheese market in Costa Rica.
Alestra acquired G-Tel Comunicación, one of the main voice, data and video integrated solutions in Northwest and Southeast Mexico.

32
CASH FLOWSBased on the cash flows generated by operations, the following table shows the main transactions in 2013
2013 2012
Cash flows provided by operations 19,758 20,987Property, machinery and equipment and others (12,198) (8,732)Business acquisitions (5,983) (2,401)Increase (Decrease) in Bank Financing 4,918 (4,378)Dividends paid by ALFA SAB (3,510) (1,348)Dividends paid to non-controlling interest (1,612) (790)Repurchase of shares 0 (1,074)Changes in non-controlling interest 0 8,646Net Interest Paid (3,631) (3,796)Other 449 (1,113)(Decrease) increase in cash (1,809) 6,001Adjustment in cash flows from changes in exchange rates 50 (594)Cash and cash equivalents at beginning of year 13,661 8,254Total cash at end of year 11,902 13,661
The principal changes in the net debt of ALFA and its groups were the following:
Changes in net petty cash debt (DNC) US$ Consolidated Alpek Sigma Nemak Alestra Others Newpek
Balance at December 31, 2012 2,878 616 872 1,322 145 (13) (64)Long-term financing, net of payments: Financing 2,094 498 364 1,106 30 93 3 Payments (1,864) (507) (6) (1,214) 0 0 (137) 230 (9) 358 (108) 30 93 (134)
Short term financing, net of payments 144 15 55 (21) (26) 0 121Total financing, net of payments 374 6 413 (129) 4 93 (13)
Translation effect 18 (5) 11 14 (4) 0 2Debt variation in the statement of cash flows. 392 1 424 (115) 0 93 (11)Debt from acquired companies and others 20 0 (9) 0 29 0 0Total debt variation 412 1 415 (115) 29 93 (11)
Decrease (increase) in petty cash and restricted cash 177 149 31 (73) 0 3 67Change in interest payable 6 0 1 6 1 0 (2)Increase (decrease) in debt net of petty cash 595 150 447 (182) 30 96 54Balance at December 31, 2013 3,473 766 1,319 1,140 175 83 (10)

33
Sigma’s debt increases mainly due to the acquisitions made. The rest of the group, except for Nemak, also increased due to investment in fixed assets.
Supported by the different refinancing operations, the average life of ALFA’s total debt was increased as compared to last year. The maturity calendar of ALFA and its groups of companies underwent the following changes.
Short and long term Alpek Sigma Nemak Alestra Othersdebt by group 2013 2012 2013 2012 2013 2012 2013 2012 2013 2012
Debt balances (US$) 1,118 1,116 1,465 1,048 1,293 1,409 230 200 273 195
Debt balance percentageShort-term debt 3 2 4 1 3 4 0 0 37 26Long-term 1 year 2 1 15 1 6 7 87 0 18 32 2 6 15 0 21 8 11 0 100 34 42 3 4 6 4 0 12 33 13 0 0 0 4 0 4 0 0 13 35 0 0 9 0 5 years or more 85 72 77 77 58 10 0 0 2 0Total 100 100 100 100 100 100 100 100 100 100
Average life, long-term debt (years) 8.1 5.7 4.5 4.9 6.0 3.8 2.5 1.5 2.1 1.5Average life, total debt (years) 7.7 5.5 3.7 4.9 5.5 3.5 0.8 1.5 1.2 0.9
US$ % of total
Consolidated short and long term debt: 2013 2012 Change 2013 2012
Short-term debt 243 132 111 6 3Long-term 1 year 561 185 376 13 5 2 271 809 (538) 6 20 3 286 534 (248) 7 13 4 191 538 (347) 4 14 5 years or more 2,826 1,771 1,055 64 45Total 4,378 3,969 409 100 100
Average term of long-term debt (years) 5.9 4.3Average term of total debt (years) 4.9 4.0

34
FINANCIAL RATIOS LIQUIDITYThe ratio of DNC to cash flow increased at a consolidated level in 2013, mainly due to the increase in debt in Sigma and Alpek as shown in the following table:
Debt net of cash / Cash flows (in US dollars, last 12 months) groups 2013 2012
Alpek 1.34 0.83Sigma 2.52 1.83Nemak 1.87 2.58Alestra 1.03 1.05Newpek 0.91 (0.20)Consolidated 1.81 1.53
Interest coverage increased both at a consolidated level as at a group level. This is mainly due to the increase in cash flow.
Due to Change Cash Financial Interest coverage (in US dollars) * 2013 2012 13/12 flow expenses
Alpek 7.1 6.2 0.9 (1.3) 2.2Sigma 6.7 6.9 (0.2) 0.8 (1.0)Nemak 6.1 6.7 (0.6) 1.4 (2.0)Alestra 7.5 5.5 2.0 1.4 0.6Consolidated 6.7 6.4 0.3 0.2 0.1
* Defined as operating profit plus depreciation and amortization, divided by net financial expense.
FINANCIAL STRUCTUREALFA’s financial structure indicators improved during 2013, as observed in the table below:
Financial ratios 2013 2012
Total liabilities / Stockholdres’ equity 1.54 1.51Long-term debt / Total debt (%) 82 92Total currency debt / Total debt (%) 88 87

35
ALFA, S. A. B. DE C. V. AND SUBSIDIARIES
Report of the Independent Auditors
Monterrey, N. L., January 29, 2014
To the Shareholders’ Meeting of Alfa, S. A. B. de C. V.
We have audited the accompanying consolidated financial statements of Alfa, S.A.B. de C.V and subsidiaries, which comprise the consolidated statement of financial position as at December 31, 2013 and 2012, and the consolidated statements of income, comprehensive income, changes in stockholders’ equity and cash flows for the years ended December 31, 2013 and 2012, and a summary of significant accounting policies and other explanatory information.
Management’s Responsibility for the Consolidated Financial Statements Management is responsible for the preparation and fair presentation of these consolidated financial statements in accordance with International Financial Reporting Standards, and for such internal control as management determines is necessary to enable the preparation of consolidated financial statements that are free from material misstatement, whether due to fraud or error.
Auditor’s ResponsibilityOur responsibility is to express an opinion on these consolidated financial statements based on our audit. We conducted our audit in accordance with International Standards on Auditing. Those standards require that we comply with ethical requirements and plan and perform the audit to obtain reasonable assurance about whether the consolidated financial statements are free from material misstatement.
An audit involves performing procedures to obtain audit evidence about the amounts and disclosures in the consolidated financial statements. The procedures selected depend on the auditor’s judgment, including the assessment of the risks of material misstatement of the consolidated financial statements, whether due to fraud or error. In making those risk assessments, the auditor considers internal control relevant to the entity’s preparation and fair presentation of the consolidated financial statements in order to design audit procedures that are appropriate in the circumstances, but not for the purpose of expressing an opinion on the effectiveness of the entity’s internal control. An audit also includes evaluating the appropriateness of the accounting policies used and the reasonableness of accounting estimates made by management, as well as evaluating the overall presentation of the consolidated financial statements.
We believe that the audit evidence we have obtained is sufficient and appropriate to provide a basis for our audit opinion.
OpinionIn our opinion, the accompanying consolidated financial statements present fairly, in all material respects, the financial position of Alfa, S. A. B. de C. V. and its subsidiaries as at December 31, 2013 and 2012, and its financial performance and its cash flows for the years ended December 31, 2013 and 2012, in accordance with International Financial Reporting Standards (IFRS).
PricewaterhouseCoopers, S.C.
Alberto Cano CharlesAudit Partner

36
Consolidated Statements of Financial Position
ALFA, S. A. B. DE C. V. AND SUBSIDIARIES
As of December 31, 2013 and 2012(Millions of Mexican pesos) Note 2013 2012 (Restructured *)
AssetsCURRENT ASSETS:Cash and cash equivalents 6 Ps 11,902 Ps 13,661Restricted cash and cash equivalents 7 364 577Customers and other accounts receivable, net 8 23,564 21,903Inventories 9 22,692 21,728Derivative financial instruments 10 86 129Other assets 11 1,043 976Total current assets 59,651 58,974
NON-CURRENT ASSETS:Property, plant and equipment, net 12 73,974 74,244Goodwill and intangible assets, net 13 23,906 18,732Deferred income tax 18 1,211 1,062Investments accounted using the equity method and others 14 6,648 1,213Total non-current assets 105,739 95,251
Total assets Ps 165,390 Ps 154,225

37
The accompanying notes are an integral part of these consolidated financial statements.
Álvaro Fernández Garza Ramón A. Leal ChapaPresident Chief Financial Officer
Note 2013 2012 (Restructured *)
Liabilities and Stockholders’ equityCURRENT LIABILITIES:Current debt 17 Ps 10,522 Ps 4,598Suppliers and other accounts payable 16 30,252 27,562Income tax payable 3.m 481 535Derivative financial instruments 10 78 378Provisions 19 833 -Other liabilities 20 534 559Total current liabilities 42,700 33,632
NON-CURRENT LIABILITIES:Non-current debt 17 46,932 47,175Derivative financial instruments 10 337 587Provisions 19 543 716Deferred income tax 18 3,534 3,373Deferred income tax from tax consolidation 18 3,785 4,473Employees’ benefits 21 1,891 2,690Other liabilities 20 499 435Total non-current liabilities 57,521 59,449Total liabilities 100,221 93,081
STOCKHOLDERS’ EQUITY:Controlling interest:Capital stock 22 210 211Retained earnings 22 55,643 52,106Other reserves 22 588 92Total controlling interest 56,441 52,409
Non-controlling interest 8,728 8,735Total stockholders’ equity 65,169 61,144Total liabilities and stockholders’ equity Ps 165,390 Ps 154,225
* Restructured to reflect the adjustments to provisional fair values previously recognized in business combinations as described in Note 2.m.

38
Consolidated Statements of Income
ALFA, S. A. B. DE C. V. AND SUBSIDIARIES
For the years ended December 31, 2013 and 2012 (Millions of Mexican pesos) Note 2013 2012 (Restructured *)
Revenue 3.u and 32 Ps 203,456 Ps 200,167Cost of sales 25 (166,829) (164,599)Gross profit 36,627 35,568
Selling expenses 25 (11,142) (10,845)Administrative expenses 25 (9,189) (8,369)Other revenues (expenses), net 26 210 (49)Operating profit before non-recurring items 16,506 16,305
Non-recurring items 27 (2,421) 367Operating profit 14,085 16,672
Financial income, including foreign exchange gain of Ps16 and Ps962 in 2013 and 2012, respectively 28 286 1,681Financial costs, including foreign exchange loss of Ps365 in 2013 28 (4,343) (4,412)Financial costs, net (4,057) (2,731)
Share of losses of investments accounted for using the equity method 14 (41) -Profit before income tax 9,987 13,941
Income tax expense 30 (3,192) (3,390)Net consolidated profit Ps 6,795 Ps 10,551
Profit attributable to:Controlling interest Ps 5,926 Ps 9,361
Non-controlling interest 869 1,190 Ps 6,795 Ps 10,551Earnings per basic and diluted share, in pesos Ps 1.15 Ps 1.81Weighted average of outstanding shares (thousands of shares) 5,143,886 5,170,650
* Restructured to reflect the adjustments to provisional fair values previously recognized in business combinations as described in Note 2.m.
The accompanying notes are an integral part of these consolidated financial statements.
Álvaro Fernández Garza Ramón A. Leal ChapaPresident Chief Financial Officer

39
Consolidated Statements of Comprehensive Income
ALFA, S. A. B. DE C. V. AND SUBSIDIARIES
The accompanying notes are an integral part of these consolidated financial statements.
For the years ended December 31, 2013 and 2012 (Millions of Mexican pesos) Note 2013 2012 (Restructured *)
Net consolidated profit Ps 6,795 Ps 10,551
Other comprehensive income (loss) for the year, net of tax:Items not to be reclassified to income statement Remeasurement of obligations for employees’ benefits 20 734 (306)Items to be reclassified to income statement Effect of derivative financial instruments designated as cash flow hedges 10 234 87 Effect of translation of foreign entities 21 456 (2,887)Total other comprehensive income (loss) for the year 1,424 (3,106)Total comprehensive income for the year Ps 8,219 Ps 7,445
Attributable to:Controlling interest Ps 7,740 Ps 6,332Non-controlling interest 479 1,113Total comprehensive income for the year Ps 8,219 Ps 7,445
* Restructured to reflect the adjustments to provisional fair values previously recognized in business combinations as described in Note 2.m.
Álvaro Fernández Garza Ramón A. Leal ChapaPresident Chief Financial Officer

40
Consolidated Statements of Changes in Stockholders’ Equity
ALFA, S. A. B. DE C. V. AND SUBSIDIARIES
For the years ended December 31, 2013 and 2012(Millions of Mexican pesos) Total Non- Total Capital Retained Other controlling controlling stockholders’ Note Stock earnings reserves interest interest equity
Balances at January 1, 2012 Ps 217 Ps 40,662 Ps 2,815 Ps 43,694 Ps 4,571 Ps 48,265
Transactions with shareholders:
Dividends declared by Alfa 21 - (1,348) - (1,348) - (1,348)
Repurchase of own shares 21 (6) (1,068) - (1,074) - (1,074)
Dividends from subsidiaries to non-controlling interest 3.b - - - - (790) (790)
Changes in the non-controlling interest 3.b - 4,805 - 4,805 3,841 8,646
(6) 2,389 - 2,383 3,051 5,434
Net profit (Restructured*) - 9,361 - 9,361 1,190 10,551
Total other comprehensive income for the year - (306) (2,723) (3,029) (77) (3,106)
Comprehensive income (Restructured*) - 9,055 (2,723) 6,332 1,113 7,445
Balances at December 31, 2012 (Restructured*) 211 52,106 92 52,409 8,735 61,144
Transactions with shareholders:
Dividends declared by Alfa 21 - (3,529) - (3,529) - (3,529)
Repurchase of own shares 21 (1) (98) - (99) - (99)
Dividends from subsidiaries to non-controlling interest 3.b - - - - (1,612) (1,612)
Changes in the non-controlling interest 2.n - - - - 1,133 1,133
(1) (3,627) - (3,628) (479) (4,107)
Net profit - 5,926 5,926 869 6,795
Total other comprehensive income for the year - 1,318 496 1,814 (390) 1,424
Comprehensive income - 7,244 496 7,740 479 8,219
Effects from adoption of new accounting policies 3.x - (80) - (80) (7) (87)
Balances at December 31, 2013 Ps 210 Ps 55,643 Ps 588 Ps 56,441 Ps 8,728 Ps 65,169
The accompanying notes are an integral part of these consolidated financial statements.
* Restructured to reflect the adjustments to provisional fair values previously recognized in business combinations as described in Note 2.m.
Álvaro Fernández Garza Ramón A. Leal ChapaPresident Chief Financial Officer

41
Consolidated Statements of Changes in Stockholders’ Equity
For the years ended December 31, 2013 and 2012(Millions of Mexican pesos) Total Non- Total Capital Retained Other controlling controlling stockholders’ Note Stock earnings reserves interest interest equity
Balances at January 1, 2012 Ps 217 Ps 40,662 Ps 2,815 Ps 43,694 Ps 4,571 Ps 48,265
Transactions with shareholders:
Dividends declared by Alfa 21 - (1,348) - (1,348) - (1,348)
Repurchase of own shares 21 (6) (1,068) - (1,074) - (1,074)
Dividends from subsidiaries to non-controlling interest 3.b - - - - (790) (790)
Changes in the non-controlling interest 3.b - 4,805 - 4,805 3,841 8,646
(6) 2,389 - 2,383 3,051 5,434
Net profit (Restructured*) - 9,361 - 9,361 1,190 10,551
Total other comprehensive income for the year - (306) (2,723) (3,029) (77) (3,106)
Comprehensive income (Restructured*) - 9,055 (2,723) 6,332 1,113 7,445
Balances at December 31, 2012 (Restructured*) 211 52,106 92 52,409 8,735 61,144
Transactions with shareholders:
Dividends declared by Alfa 21 - (3,529) - (3,529) - (3,529)
Repurchase of own shares 21 (1) (98) - (99) - (99)
Dividends from subsidiaries to non-controlling interest 3.b - - - - (1,612) (1,612)
Changes in the non-controlling interest 2.n - - - - 1,133 1,133
(1) (3,627) - (3,628) (479) (4,107)
Net profit - 5,926 5,926 869 6,795
Total other comprehensive income for the year - 1,318 496 1,814 (390) 1,424
Comprehensive income - 7,244 496 7,740 479 8,219
Effects from adoption of new accounting policies 3.x - (80) - (80) (7) (87)
Balances at December 31, 2013 Ps 210 Ps 55,643 Ps 588 Ps 56,441 Ps 8,728 Ps 65,169

42
ALFA, S. A. B. de C. V. Y SUBSIDIARIAS
Consolidated Statements of Cash Flows
The accompanying notes are an integral part of these consolidated financial statements.
For the years ended December 31, 2013 and 2012(Millions of Mexican pesos) Note 2013 2012 (Restructured *)
Cash flows from operating activitiesProfit before income tax Ps 9,987 Ps 13,941Depreciation and amortization 12 7,932 7,962Impairment of long-lived assets 25 2,518 270Costs associated with seniority premiums and pension plan 93 (206)Loss on sale of property, plant and equipment 25 (1) (37)Effect of changes in fair value of derivative financial instruments 50 (497)Foreign exchange, net 365 (739)Other non-operating expenses and finance products, net 2,808 3,799Increase in customers and other accounts receivable (1,131) (103)Increase in inventory (584) (1,419)Increase (decrease) in suppliers and other accounts payable 2,104 (379)Income tax paid (4,383) (1,605)Net cash generated from operating activities 19,758 20,987
Cash flows from investing activitiesInterest received 267 315Acquisition of property, plant and equipment 12 (7,763) (7,318)Purchases of intangible assets 13 (4,435) (1,414)Business acquisitions 2 (7,116) (2,401)Restricted cash 6 474 (278)Dividends received 43 58Other assets (373) (1,063)Net cash used in investing activities (18,903) (12,101)
Cash flows from financing activitiesProceeds from borrowings or debt 16 38,247 22,076Payments of borrowings or debt 16 (33,329) (26,454)Interest paid (3,631) (3,796)Dividends paid by Alfa, S. A .B. de C. V. (3,510) (1,348)Dividends paid to the non-controlling interest 3.b (1,612) (790)Repurchase of shares 22 (99) (1,074)Changes in the non-controlling interest 2.n 1,133 8,646Other 137 (145)
Cash used in financing activities (2,664) (2,885)Net increase in cash and cash equivalents (1,809) 6,001Exchange losses (gains) on cash and cash equivalents 50 (594)Cash and cash equivalents at beginning of year 13,661 8,254Cash and cash equivalents at end of year Ps 11,902 Ps 13,661
* Restructured to reflect the adjustments to provisional fair values previously recognized in business combinations as described in Note 2.m.
ALFA, S. A. B. DE C. V. AND SUBSIDIARIES
Álvaro Fernández Garza Ramón A. Leal ChapaPresident Chief Financial Officer

43
ALFA, S. A. B. de C. V. Y SUBSIDIARIAS
At December 31, 2013 and 2012
1 ALFA companies’ activities
Alfa, S. A. B. de C. V. and subsidiaries (“ALFA” or “the Company”), is a Mexican company controlling five business groups with the following activities: Alpek, engaged in the production of petrochemicals and synthetic fibers; Sigma, a refrigerated food producer; Nemak, engaged in the manufacture of high-tech aluminum auto parts; Alestra, in the telecommunications sector, and Newpek, a natural gas and hydrocarbons company .
ALFA has an outstanding competitive position globally in the auto parts segment as a producer of aluminum engine heads and blocks, as well as in the manufacture of PTA (raw material for the manufacture of polyester), and is a leader in the Mexican market for refrigerated foods. ALFA operates industrial production and distribution centers mainly in Mexico, the United States (U.S.), Canada, Germany, Slovakia, the Czech Republic, Costa Rica, the Dominican Republic, El Salvador, Argentina, Peru, Austria, Brazil, China, Hungary, Spain, India and Poland. The company markets its products in over 40 countries worldwide and employs over 60,000 people.
ALFA’s shares are traded on the Mexican Stock Exchange, S. A. B. de C. V., and Latibex, the Latin American market of the Madrid Stock Exchange.
ALFA is located in Avenida Gómez Morín Sur No. 1111, Col. Carrizalejo, San Pedro Garza García, Nuevo León, Mexico.
In the following notes to the financial statements references to pesos or “Ps”, mean millions of Mexican pesos. References to “US$”, mean millions of dollars from the United States. References to “€”, it means millions of euros.
2 Acquisitions and other significant events
2013a) Nemak debt refinancingIn December 2013, Nemak concluded the refinancing of its bank debt, which was authorized by the Board of Directors. This process included the bank debt of the main current contracts of Tenedora Nemak with Banks: “The Senior Unsecured Syndicated Loan Agreement”, held in August 2011 and the “Senior Unsecured Loan Agreement” in June 2012. This refinancing process involved expenses incurred by the company of Ps51 that were recorded in the statement of financial position and will be amortized during the life of the loan.
b) Acquisition of CampofrioOn November 13, 2013, Sigma signed purchase agreements with certain important stockholders of Campofrio Food Group, S. A. (Campofrio), a public company in Spain, through which it acquired 44.5% of that company’s capital stock, all in the form of ordinary shares.
This acquisition, in accordance with the applicable regulations in Spain, obligated Sigma to request authorization from the Spanish National Stock Market Commission (“Commission” or “CNMV” Spanish acronym) to make a public offer to acquire the remaining shares of Campofrio, since its shares are traded on the stock markets of both Madrid and Barcelona. This request was submitted on November 14, 2013, at an offering price of 6.80 euros per share.
Subsequently, on December 23, 2013, before the Commission had authorized the offer to the remaining shareholders, Sigma reached an agreement with another shareholder owning 36.99% of Campofrio’s capital stock, under which that shareholder joined Sigma in making the proposed offer. As a result of this agreement the request filed with the Commission, as well as the related notifications and approval requests filed with the competition authorities, have had to be amended. In addition, among other effects, the agreement contemplates that the other shareholder will remain as a shareholder of Campofrio with the same percentage shareholding as previously, and also contemplates an increase in the offer share price to 6.90 euros per share.
At December 31, 2013, the public offer had not yet been authorized by the Commission, nor had approval of the acquisition been given by the competition authorities. Consequently, at December 31, 2013 Sigma had not yet finalized its offer for the remaining outstanding shares.
Notas sobre los estados financieros consolidadosNotes to the Consolidated Financial Statements
ALFA, S. A. B. DE C. V. AND SUBSIDIARIES

44
As mentioned in Note 34, in addition to continuing with the process of preparing the purchase offer, which in accordance with Spanish law must be launched when authorization is received from the Commission, Sigma has continued to acquire Campofrio shares after December 31, 2013 outside the scope of the proposed offer. At December 31, 2013 Sigma had increased its shareholding in Campofrio to 45% by making additional purchases outside the scope of the offer.
Campofrio is based in Madrid, Spain. Its principal activity is the manufacture and distribution of all kinds of sausages, processed meats and related products based on pork, beef and other food products. Campofrio operates in Spain and other countries such as France, Belgium, the Netherlands, Portugal, Germany, Italy, the United Kingdom, the United States of America and Romania.
Campofrio is strategic for ALFA and its acquisition would involve incorporating new operations and best industry practices into the group, as well as accessing other European markets.
Campofrio prepares its consolidated financial information in conformity with International Financial Reporting Standards (IFRS), which have been adopted by the European Union, as well as with the related Spanish regulations applicable to public companies. Campofrio is currently audited by another auditing firm in Spain. The latest audited financial information available to the public is the consolidated financial statements for the year 2012.
Management has carried out a study to determine whether Sigma has control of Campofrio in accordance with IFRS 10, “Consolidated Financial Statements”. The study concluded that at the acquisition date and at December 31, 2013 Sigma had significant influence over Campofrio, but not control, and that the investment should be treated as an investment in an associated company which in management’s opinion is material to the group and should therefore be accounted for by the equity method.
Campofrio reports its financial information to the public annually and quarterly. At the acquisition date and at December 31, 2013 the most recent interim financial information available publicly to investors is as of September 30, 2013. At December 31, 2013 the Company presents its investment in Campofrio at cost, including the consideration paid and the costs directly associated with the purchase of the investment. Due to the limited availability of financial information mentioned previously, it has not been possible to record the effects of the equity method since the acquisition date through to December 31, 2013, nor to determine the fair values of the net assets acquired and any resulting goodwill.
The book value of the investment in Campofrio at December 31, 2013 was Ps5,632, the fair value of the shares in Campofrio, owned by ALFA was Ps5,715 (6.90 euros per share).
The following is a summary of the balance sheet of Campofrio included in its interim financial information at September 30, 2013 (unaudited): Euros Pesos
Cash and cash equivalents € 139 Ps 2,507Other current assets (excluding cash) 571 10,300Current assets 710 12,807Non-current assets 1,511 27,257Total assets € 2,221 Ps 40,064
Financial liabilities (excluding accounts payable to suppliers) € 71 Ps 1,280Other current liabilities 755 13,620Total current liabilities 826 14,900Financial liabilities 542 9,777Other non-current liabilities 266 4,798Total liabilities 1,634 29,475Stockholders’ equity 587 10,589Total liabilities and stockholders’ equity € 2,221 Ps 40,064
At December 31, 2013, no information on revenues and expenses has been included, due to the limitation on the financial information.
There are no contingent liabilities related to this investment of Campofrio.
c) Issuance of debt of Nemak 144ADuring February 2013, Nemak completed an issuance of debt obligations (“Senior Notes”) in international markets for a nominal amount of US$500 (Ps6,538) maturing in 2023. Interests of Senior Notes will be payable semi-annually at a 5.5% annual rate (effective interest rate of 5.68%) as from September 2013. Nemak capitalized debt costs of Ps118. The proceeds of the issuance were used partially to settle the Syndicated bank loan. This payment resulted in an advance amortization of issuance expenses amounting Ps100.

45
d) LicensesLicense IntegRex® technology license and signature of a supply agreement with M&G
During April 2013, Alpek, S. A. B. de C. V. (Alpek) through its subsidiary Grupo Petrotemex, S. A. de C. V. held a licensing agreement for IntegRex® PTA technology and another PTA-PET supply agreement with Gruppo M&G (“M&G”). These agreements will allow M&G to use the IntegRex® PTA technology in the PTA-PET integrated plant to be constructed in Corpus Christi, Texas in the United States (the Plant). On the other hand, Alpek will pay US$350 to M&G during the construction of the Plant and will obtain supply rights of the Plant to 400 thousand tons of PET (manufactured with 336 thousand tons of PTA) a year. In accordance with the supply agreement, Alpek would supply raw materials for the manufacturing of its PTA-PET volume. It is estimated that the M&G plant in Corpus Christi will start operations in 2016.
License with BasellThe subsidiary Indelpro held in 2004, a contract with Basell Poliolefine Italia S.r.l. (a company of the Basell Group) in relation to engineering licenses, use of patents and technical information for the production of polypropylene, to start the construction of a second production line of polypropylene, therefore Indelpro on that date, made an initial required payment of US$9.5 to use such licenses, patents and technical information for building the production line of the products under these patents (called the second production line) which at June 30, 2013, the Company has estimated that it has an estimated remaining useful life of 21 years. This contract, which is valid for an indefinite period, provides annual royalty payments from July 2013 which would be determined based on 1.22% of the value of net sales.
Until July 1, 2013 it was required to pay the royalties referred to in the preceding paragraph, based on 1.22% of net sales. The royalty payments would last until Indelpro completed a total of US$11 as compensation, this amount was calculated as the net present value at the date the contract was signed (2004 ), using an annual discount rate of 8%, according to what was established in the contract. The contract also includes the option for Indelpro to pay in advance the maximum amount of royalties indicated above.
In relation to the above, April 26, 2013 , Indelpro decided to prepay the maximum amount of royalties and determined that the total was US$21 (Ps258), equivalent to the value of US$11 updated by the rate previously mentioned, from the date of conclusion of the contract until the date of payment, as established in the contract, the amount paid to Basell Poliolefine Italy, S. r. l.
e) Acquisition of Corporación Monteverde, C. R. Sociedad Anónima (Monteverde)On April 2, 2013, Sigma acquired all the representative shares of the capital stock of Monteverde, a company engaged in the preparation of cheese, yoghurt and meat processing in Costa Rica. The total consideration paid amounts to Ps112 (US$9). This amount was paid in cash. The business acquisition is included in the segment of Sigma, see Note 32.
At December 31, 2013, the Company is in the process of concluding the purchase price allocation of the fair values of acquired assets, since the necessary information is not available to determine definitive values. Such analysis will be concluded within a maximum period of twelve months since the acquisition date.
The assignment is as follows:
Current assets (1) Ps 111Property, machinery and equipment 120Current liabilities (2) (213)Goodwill 94Consideration paid Ps 112
(1) Current assets consist of cash and cash equivalents of Ps4, accounts receivable of Ps32 and inventories of Ps65, recoverable taxes of Ps4, advance payments of Ps2 and other current assets of Ps4.
(2) Current liabilities consist of suppliers and accounts payable of Ps76, taxes payable of Ps2 and debt of Ps135.
No contingent liabilities have arisen from this acquisition that should be recorded. Neither are there any contingent consideration agreements.
The costs related to the acquisition amounts to Ps1 and were recorded in the statement of income under the item of other expenses.
Revenues contributed by the assets of Monteverde included in the consolidated statement of income since the acquisition date up to December 31, 2013 amounted to Ps210 and a net loss of Ps54. If the acquisition had occurred on January 1, 2013, the revenues would have increased by Ps105 and the net profit would have decreased by approximately Ps27.

46
f) Acquisition of Comercial Norteamericana, S. de R.L. de C.V. (ComNor)On May 31, 2013, Sigma acquired the total representative shares of the capital stock of ComNor, company dedicated to process and commercialize several types of meat. The company processes and commercializes beef, poultry and pork meat. This acquisition will allow Sigma to extend the product portfolio and to reinforce its market position in the Food service segment. ComNor is based in Monterrey, where it operates a plant certified by the United States Department of Agriculture (“USDA” English acronym). It also has another plant in Hermosillo, as well as eight distribution centers in Mexico City, Cancún, Hermosillo, Monterrey, Guadalajara, Los Cabos, Puerto Vallarta and León.
The total consideration paid amounts to Ps1,557 (US$120). This amount was paid in cash. The business acquisition is included in the segment of Sigma, see Note 32.
At December 31, 2013, the Company is in the process of concluding the purchase price allocation of the fair values of acquired assets, since the necessary information is not available to determine definitive values. Such analysis will be concluded within a maximum period of twelve months since the acquisition date.
The assignment is as follows:
Current assets (1) Ps 590Property, plant and equipment 267Intangible assets (brands) 109Current liabilities (2) (88)Employees’ benefits (27)Goodwill 705Consideration paid Ps 1,556
(1) Current assets consist of cash and cash equivalents of Ps10, accounts receivable of Ps172 and inventories of Ps400, recoverable taxes of Ps6, and advance payments and other current assets of Ps2.
(2) Current liabilities consist of suppliers and accounts payable of Ps67, taxes payable of Ps1 and debt of Ps20.
No contingent liabilities have arisen from this acquisition that should be recorded. Neither are there any contingent consideration agreements.
The costs related to the acquisition amounts to Ps4 and were recorded in the statement of income under the item of other expenses.
Revenues contributed by the assets of ComNor included in the consolidated statement of income since the acquisition date up to December 31, 2013 amounted to Ps1,037 and a net profit of Ps68. If the acquisition had occurred on January 1, 2013, the revenues would have increased by Ps741 and the net profit would have increased by approximately Ps39.
g) Acquisition of G Tel Comunicaciones SAPI (“G Tel”)On August 19, 2013, Alestra acquired 100% of the shares of G Tel, a company that provides integrated voice, data and video solution services through an extensive service portfolio to medium and big companies. G Tel has concessions issued by the Ministry of Communications and Transportation through the Federal Telecommunication Commission, to operate a public Telecommunications network and, consequently, offer services using point to multipoint technology in the 10,5 GHz frequency in the Northeast and Southeast of Mexico, using their own network.
The total consideration paid amounts to Ps49, this amount was paid in cash. The business acquisition is included in the segment of Alestra, see Note 32.
At December 31, 2013, the Company is in the process of concluding the purchase price allocation of the fair values of acquired assets, since the necessary information is not available to determine definitive values. Such analysis will be concluded within a maximum period of twelve months since the acquisition date.
The assignment at the moment of acquisition is as follows:
Current assets Ps 25Property, plant and equipment 28Other assets 48Financial liabilities (341)Other current liabilities (7)Goodwill 296Consideration paid Ps 49
No contingent liabilities have arisen from this acquisition that should be recorded. Neither are there any contingent consideration agreements.
The costs related to the acquisition amounts to Ps2 and were recorded in the statement of income under the item of other expenses.
Revenues contributed by the assets of GTel included in the consolidated statement of income since the acquisition date up to December 31, 2013 amounted to Ps105 and a net profit of Ps23. If the acquisition had occurred on January 1, 2013, the revenues would have increased by Ps284 and the net profit would have increased by approximately Ps7.

47
h) Closing of Cape Fear plants in North CarolinaIn June 2013, Alpek announced the planned closure of all its operations at its Cape Fear plant, in Wilmington, North Carolina. The purpose of this closing was to improve cost competitively and distribute production to the most efficient plants in its productive network. The closing of operations took place in September 2013.
The Company communicated with authorities in North Carolina and committed to the dismantling and demolition of assets, as well as to the environmental remediation for damage caused before the plan operations began, for which the Company estimated costs of Ps487 and Ps372, respectively, (US$67) that were initially recognized as part of the assets of the plant of which Ps78 were incurred in 2013 and the remaining will be incurred during the following three years.
Additionally, other direct costs attributable to the closing, mainly for indemnity concepts for dismissal and cancellation of contracts, the Company estimated costs of Ps198 (US$16) incurring Ps117 in 2013.
As a result of this, the company recorded a provision for restructuring costs of Ps 1,057 (US$83), see Note 19.
The Company also performed impairment tests of assets associated to the plant and recorded a charge for impairment related to these assets for Ps 2,224 (US$173). The total impact on the net income of the Company for this restructuring event amounted to Ps1,501 (US$117), composed of Ps2,421 (US$189) for restructuring costs and impairment of assets, which were recorded as non-recurring items within the operating income less Ps920 (US$72) of deferred tax.
i) Issuance of debt of Alpek 144ADuring August 2013, Alpek completed an issuance of debt obligations (“Senior Notes”) in international markets for a nominal amount of US$300 (Ps3,923) maturing in 2023. The interest of the Senior Notes will be payable semi-annually at a 5.375% annual rate (effective interest rate of 5.479%) as from February 20, 2014. Alpek capitalized debt issuance costs of Ps31. The proceeds from the issuance were used to pay debt in advance and for general corporate purposes. This payment led to an advance amortization of issuance expenses amounting Ps4.
j) Co-investment agreementOn September 26, 2013, Alpek, through its subsidiary Grupo Petrotemex, S.A. de C.V. (“GPT”), signed a co-investment agreement with United Petrochemical Company (“UPC”), a subsidiary of JSFC System (“System”), for the construction of an integrated plant of purified terephthalic acid (“PTA”) - polytherephthalate (“PET”) in Ufa, Baskortostan, Russia. Under the terms of the agreement, two new entities will be created: “RusPET Holding B.V.” (“JVC”) and “RusPET Limited Liability Company” (“RusCo”) and reserved matters of operations of the entities requiring approval by both shareholders.
On December 6, 2013 the incorporation by-laws of JVC were signed. The JVC issued initial capital of €8 of which UPC has 51% (represented by Class A ordinary shares) bought with a contribution of €4.1 and GPT has 49% (represented by Class B ordinary shares) bought with a contribution of €3.9.
In an analysis performed by management, it was assessed whether Alpek has control over JVC in accordance with IFRS 10 “Consolidated Financial Statements”. The conclusion of such analysis on control indicates that at the date of acquisition and at December 31, 2013, Alpek has joint control and the investment should be treated as an investment in a joint venture, which in the opinion of management it is not material for the group; therefore, it is accounted for using the equity method.
At December 31, 2013, the Company presents its investment in JVC recorded at cost including the paid consideration. Since JVC operations have not started, the equity method has not been recorded since the acquisition date until December 31, 2013.
k) Construction of plant in Russia by NemakNemak planned the construction of an aluminum auto parts plant for engines in Russia. The investment for its construction will be of approximately US$80 and it will supply aluminum heads and monoblocks for a new high technology engine to the Volkswagen group in Russia. The initial capacity of the plant will be of 600,000 equivalent units a year and will start production in 2015. At the date of issuance of these financial statements the company is in the process of signing the corresponding agreements.
2012l) Issuance of debt of Alpek 144ADuring November 2012, Alpek, S. A. B. de C. V., (Alpek) completed an issuance of debt obligations (“Senior Notes”) for a nominal amount of US$650 (Ps8,477) maturing in 2022. The interest of the Senior Notes will be payable semi-annually at a 4.5% annual rate as from May 20, 2013.
m) Acquisition of J.L. FrenchDuring the second quarter of 2012, Nemak Exterior, S. L., a subsidiary of Tenedora Nemak, S. A. de C. V. (TNemak) acquired 100% of the capital stock of J.L. French Automotive Castings, Inc.(“J.L. French”), company producing high-precision aluminum foundry pieces for the manufacturing of automotive components, with an emphasis on transmission parts. This transition has several significant advantages for TNemak, featuring the expansion to other high-added value aluminum components, as structural and suspension parts. The company operates 3 manufacturing plants in the USA, Spain and China. The business acquisition is included in the segment of Nemak, see Note 32.
The allocation of the acquisition price reported at December 31, 2012, was determined in accordance with IFRS and it was restructured during 2013 to show the restructured information obtained in accordance with events and circumstances at the acquisition date. The final allocation of the acquisition price is shown in US dollars since it is the functional and recording currency of the acquired subsidiary, the exchange rate at the transaction date was of Ps13.99 pesos per US dollar, additionally, Note 3.c shows the principal exchange rates used and in the translation processes.

48
The following shows the consideration paid and the final fair values of acquired assets and assumed liabilities: Adjustments to Previously provisional reported fair value Restructured
Current assets (1) US$ 64 US$ - US$ 64Property, plant and equipment 113 13 126Intangible assets 1 - 1Other assets 24 40 64Current liabilities (2) (6) - (6)Labor obligations (5) - (5)Net acquired assets 191 53 244Paid consideration 216 - 216Goodwill 25 (25) -Bargain purchase gain (3) - (28) (28)
(1) Current assets consist of cash and net working capital.(2) Current liabilities consist of suppliers of US$1 and other accounts payable for US$5.(3) This gain was presented in the consolidated statement of income as a non-recurring item.
The fair value of net acquired assets has been adjusted retrospectively. The consolidated financial statements of the Company at December 31, 2012 and for the year then ended, as well as the related notes, have been restructured to show the effects of these adjustments, considering the facts and circumstances at the date of acquisition. The aforementioned is due to the conclusion of the valuation from the recovery of deferred tax assets associated to operating losses and to the identification of future tax gains against which the deductible temporary differences may be used. This asset is presented as part of other assets.
The value of accounts receivable acquired approximates its fair value due to its short term maturity. It is estimated that acquired accounts receivable are recovered in the short term.
No contingent liabilities have arisen from this acquisition that should be recorded. Neither are there any contingent consideration agreements. ALFA is not responsible for environmental liabilities except for those that may have their origin in or after the acquisition date.
The costs related to the acquisition amounts to Ps22 (US$1.7) and were recorded in the statement of income under the item of other expenses.
Revenues contributed for the J.L. French business in the consolidated statement of income since the acquisition date and up to December 31, 2012 amounted to Ps273 and a net profit of Ps4.
n) Initial Public offering (IPO) of capital of Alpek sharesi. During the months of April and May 2012, Alpek, S. A. de C. V. carried out an initial public offer (IPO) of shares in Mexico
and a private offer of shares in international markets (together “Global Offering”) as follows:
• On April 26, 2012, Alpek, S. A. de C. V. issued 330,259,322 shares at a placement price of 27.50 pesos. The offer included an overallotment option of up to 49,038,898 shares. The amount initial offering was of Ps9,082.
• On May 8, 2012, the underwriters, both in Mexico, and abroad, exercised the agreed overallotment options. The amount of overallotments was Ps1,349, corresponding to 49,038,898 shares at a placement price of 27.50 pesos each.
As a result, the total funds ALFA obtained from the Global Offering amounted to Ps10,155, net of issuance costs of Ps276. Subsequent to the Global Offering, the capital subscribed and paid of Alpek, S. A. B. de C. V. (“Alpek”), is represented by a total of 2,118,163,635 Class I, Series A shares.
ii. Likewise, as part of the Global Offering, ALFA acquired additional shares of capital stock of Alpek, at 2013 and 2012 year ends, the balance amounts to Ps448 and Ps1,602, respectively.
iii. As a result of the foregoing, ALFA’s interest in the capital stock of Alpek was diluted from 100% to 85.48% the 2012 year end and 82% the 2013 year end and the monetary effects are shown in the item “changes in the non-controlling interest” in the statements of cash flows and of changes in stockholders’ equity.
o) Exploration and exploitation of hydrocarbons (PEMEX)During June 2012, ALFA through a consortium between its subsidiary Alfasid del Norte, S. A. de C. V. (Alfasid), and another Mexican company called Monclova Pirineos Gas, S. A. de C. V. (MPG), won two tenders made by Petróleos Mexicanos, S.A. (PEMEX) through Pemex-Exploración y Producción (PEP) for the exploration and production of hydrocarbons in two mature oil fields located in San Andrés and Tierra Blanca, Veracruz, México.

49
Alfasid in association with MPG has created a couple of legal entities Petrolíferos Tierra Blanca, S. A. de C. V. (Petrolíferos) and Oleorey, S. A. de C. V. (Oleorey) with the objective of exploiting, developing and producing Hydrocarbons, the aforementioned through a”Service Contracts for the Exploitation, Development and Production of Hydrocarbons” entered into with PEP during August 2012 with a duration of 30 years. These contracts establish an Initial Minimum Program which have a value of US$24.1 and US$23.9 to be developed during the first two years from the signing of each contract. At December 31, 2013; Petrolíferos y Oleorey had issued bonds to guarantee the amount of the initial minimum program in each contract. In case of non-compliance PEP has the right to execute the guarantees previously mentioned.
p) Incorporation of a new entity.In 2012, Alpek signed an agreement to invest approximately US$130 during the next two years, in a steam and electrical energy cogerenation project through its subsidiary Petrotemex. This cogeneration plant will generate about 95 megawatts of electricity and all the steam necessary to meet the requirements of the PTA and PET plants located in Cosoleacaque, Veracruz, Mexico. The cogeneration plant will also supply energy to other ALFA entities outside Cosoleacaque.
To implement this project, on January 31, 2012, Petrotemex and its subsidiary Dak Resinas Américas México, S. A. de C. V. (both subsidiaries of Alpek), formed a new company called Cogeneración de Energía Limpia de Cosoleacaque, S. A. de C. V. (“Cogeneradora”). The project will increase the competitiveness of the site, assuring supplies of cheap energy with low emissions.
3 Summary of significant accounting policies
The accompanying consolidated financial statements and notes were authorized for issuance on January 29, 2014, by officials with the legal power to sign the basic financial statements and accompanying notes.
The following are the most significant accounting policies followed by ALFA and its subsidiaries, which have been consistently applied in the preparation of their financial information in the years presented, unless otherwise specified:
a. Basis for preparationThe consolidated financial statements of ALFA, S. A. B. de C. V. and subsidiaries have been prepared in accordance with International Financial Reporting Standards (IFRS) issued by the International Accounting Standards Board (IASB). IFRS include all International Accounting Standards (“IAS”) in force and all related interpretations issued by the International Financial Reporting Interpretations Committee (IFRIC), including those previously issued by the Standing Interpretations Committee (SIC).
In accordance with the amendments to the Rules for Mexican Public Companies and Other Securities Market Participants, issued by the National Banking and Securities Commission (CNBV in Spanish) on January 27, 2009, the Company is required to prepare its financial statements as of 2012 using IFRS as its accounting policy framework.
The consolidated financial statements have been prepared on a historical cost basis, except for the cash flow hedges which are measured at fair value, and for the financial assets and liabilities at fair value through profit or loss with changes reflected in the statement of income and for financial assets available for sale.
The preparation of the consolidated financial statements in conformity with IFRS requires the use of certain critical accounting estimates. Additionally, it requires management to exercise judgment in the process of applying the Company’s accounting policies. The areas involving a higher degree of judgment or complexity, or areas where judgments and estimates are significant to the consolidated financial statements, are disclosed in Note 5.
b. Consolidationi. SubsidiariesThe subsidiaries are all the entities over which the Company has the power to govern the financial and operating policies of the entity. The Company controls an entity when it is exposed, or has the right to variable returns from its interest in the entity and it is capable of affecting the returns through its power over the entity. Where the Company’s participation in subsidiaries is less than 100%, the share attributed to outside shareholders is reflected recorded as non-controlling interest.
Subsidiaries are consolidated in full from the date on which control is transferred to the Company and up to the date it loses that control.
The method of accounting used by the Company for business combinations is the acquisition method. The consideration transferred for the acquisition of a subsidiary is the fair value of the assets transferred, the liabilities incurred and the equity interests issued by the Company. The consideration transferred includes the fair value of any asset or liability resulting from a contingent consideration arrangement. Identifiable acquired assets and liabilities and contingent liabilities assumed in a business combination are initially measured at their fair values at the acquisition date. The Company recognizes any non-controlling interest in the acquiree based on the share of the non-controlling interest in the net identifiable assets of the acquired entity.
The Company accounts for business combinations using the predecessor method in a jointly controlled entity. The predecessor method involves the incorporation of the carrying amounts of the acquired entity, which includes the goodwill recognized at the consolidated level with respect to the acquiree. Any difference between the carrying value of the net assets acquired at the level of the subsidiary and its carrying amount at the level of the Company are recognized in stockholders´ equity.
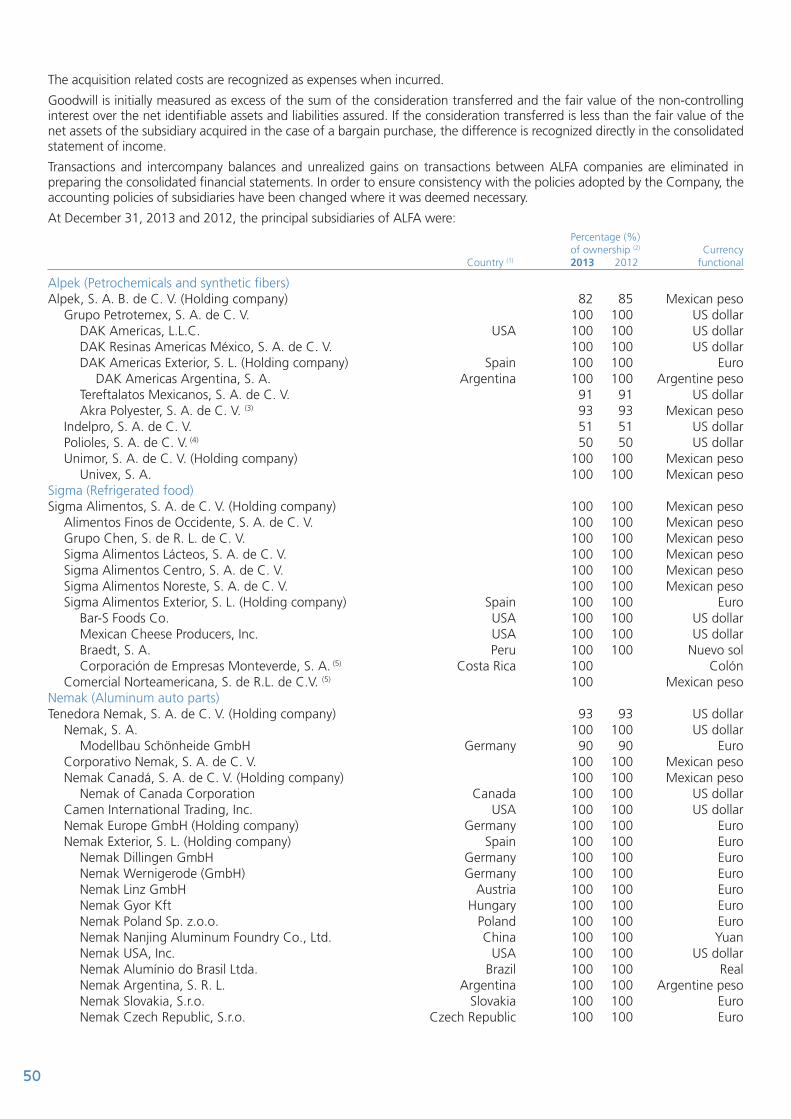
50
The acquisition related costs are recognized as expenses when incurred.
Goodwill is initially measured as excess of the sum of the consideration transferred and the fair value of the non-controlling interest over the net identifiable assets and liabilities assured. If the consideration transferred is less than the fair value of the net assets of the subsidiary acquired in the case of a bargain purchase, the difference is recognized directly in the consolidated statement of income.
Transactions and intercompany balances and unrealized gains on transactions between ALFA companies are eliminated in preparing the consolidated financial statements. In order to ensure consistency with the policies adopted by the Company, the accounting policies of subsidiaries have been changed where it was deemed necessary.
At December 31, 2013 and 2012, the principal subsidiaries of ALFA were: Percentage (%) of ownership (2) Currency Country (1) 2013 2012 functional
Alpek (Petrochemicals and synthetic fibers)Alpek, S. A. B. de C. V. (Holding company) 82 85 Mexican peso Grupo Petrotemex, S. A. de C. V. 100 100 US dollar DAK Americas, L.L.C. USA 100 100 US dollar DAK Resinas Americas México, S. A. de C. V. 100 100 US dollar DAK Americas Exterior, S. L. (Holding company) Spain 100 100 Euro DAK Americas Argentina, S. A. Argentina 100 100 Argentine peso Tereftalatos Mexicanos, S. A. de C. V. 91 91 US dollar Akra Polyester, S. A. de C. V. (3) 93 93 Mexican peso Indelpro, S. A. de C. V. 51 51 US dollar Polioles, S. A. de C. V. (4) 50 50 US dollar Unimor, S. A. de C. V. (Holding company) 100 100 Mexican peso Univex, S. A. 100 100 Mexican pesoSigma (Refrigerated food)Sigma Alimentos, S. A. de C. V. (Holding company) 100 100 Mexican peso Alimentos Finos de Occidente, S. A. de C. V. 100 100 Mexican peso Grupo Chen, S. de R. L. de C. V. 100 100 Mexican peso Sigma Alimentos Lácteos, S. A. de C. V. 100 100 Mexican peso Sigma Alimentos Centro, S. A. de C. V. 100 100 Mexican peso Sigma Alimentos Noreste, S. A. de C. V. 100 100 Mexican peso Sigma Alimentos Exterior, S. L. (Holding company) Spain 100 100 Euro Bar-S Foods Co. USA 100 100 US dollar Mexican Cheese Producers, Inc. USA 100 100 US dollar Braedt, S. A. Peru 100 100 Nuevo sol Corporación de Empresas Monteverde, S. A. (5) Costa Rica 100 Colón Comercial Norteamericana, S. de R.L. de C.V. (5) 100 Mexican pesoNemak (Aluminum auto parts)Tenedora Nemak, S. A. de C. V. (Holding company) 93 93 US dollar Nemak, S. A. 100 100 US dollar Modellbau Schönheide GmbH Germany 90 90 Euro Corporativo Nemak, S. A. de C. V. 100 100 Mexican peso Nemak Canadá, S. A. de C. V. (Holding company) 100 100 Mexican peso Nemak of Canada Corporation Canada 100 100 US dollar Camen International Trading, Inc. USA 100 100 US dollar Nemak Europe GmbH (Holding company) Germany 100 100 Euro Nemak Exterior, S. L. (Holding company) Spain 100 100 Euro Nemak Dillingen GmbH Germany 100 100 Euro Nemak Wernigerode (GmbH) Germany 100 100 Euro Nemak Linz GmbH Austria 100 100 Euro Nemak Gyor Kft Hungary 100 100 Euro Nemak Poland Sp. z.o.o. Poland 100 100 Euro Nemak Nanjing Aluminum Foundry Co., Ltd. China 100 100 Yuan Nemak USA, Inc. USA 100 100 US dollar Nemak Alumínio do Brasil Ltda. Brazil 100 100 Real Nemak Argentina, S. R. L. Argentina 100 100 Argentine peso Nemak Slovakia, S.r.o. Slovakia 100 100 Euro Nemak Czech Republic, S.r.o. Czech Republic 100 100 Euro

51
Percentage (%) of ownership (2) Currency Country (1) 2013 2012 functional
Nemak Aluminum Castings India Private, Ltd. India 100 100 Rupee Nemak Automotive Castings, Inc., formerly J.L. French (6) USA 100 100 US dollarAlestra (Telecommunications)Alestra, S. de R. L. de C. V. 100 100 Mexican peso G Tel Comunicación, SAPI de C.V. (5) 100 Mexican pesoNewpek (Natural gas and hydrocarbons)Alfa Energía Exterior, S.L. (Holding company) Spain 100 100 Euro Newpek, L. L. C. USA 100 100 US dollarAlfasid del Norte, S. A. de C. V. 100 100 Mexican pesoOther companiesColombin Bel, S. A. de C. V. 100 100 US dollarTerza, S. A. de C. V. 51 51 Mexican pesoAlfa Corporativo, S. A. de C. V. 100 100 Mexican peso
(1) Companies incorporated in Mexico, except those indicated.(2) Ownership percentage that ALFA has in the holding companies of each business group and ownership percentage that such holding
companies have in the companies integrating the groups. Ownership percentages and the right to vote are one and the same.(3) On September 1, 2012, Productora de Tereftalatos de Altamira, S. A. de C. V. was merged into Akra Polyester, S. A. de C. V. (Akra). After
the merger ALFA owns 93.35% of shares of Akra and BP Amoco Chemical Company the remaining 6.65%.(4) The Company owns 50% plus one share.(5) Companies acquired in 2013, see comments in Note 2 paragraphs, e., f., and g.(6) Companies acquired in 2012, see comments in Note 2 paragraph m.
At December 2013 and 2012, there are no significant restrictions for investment in shares of subsidiary companies mentioned above.
ii. Absorption (dilution) of control in subsidiariesThe effect of absorption (dilution) of control in subsidiaries, i.e., an increase or decrease in the percentage of control, is recorded in stockholders’ equity, directly in retained earnings, in the period in which the transactions that cause such effects occur. The effect of absorption (dilution) of control is determined by comparing the book value of the investment before the event of dilution or absorption against the book value after the relevant event. In the case of loss of control the dilution effect is recognized in income. During 2012 the company recognized the dilution effect on of its equity in its subsidiary Alpek, as explained in Note 2.n.
iii. Sale or disposal of subsidiariesWhen the Company ceases to have control any retained interest in the entity is re-measured at fair value, and the change in the carrying amount is recognized in the income statement. The fair value is the initial carrying value for the purposes of accounting for any subsequent retained interest in the associate, joint venture or financial asset. Any amount previously recognized in comprehensive income in respect of that entity is accounted for as if the Company had directly disposed of the related assets and liabilities. This implies that the amounts recognized in the comprehensive income are reclassified to income for the year.
iv. AssociatesAssociates are all entities over which the Company has significant influence but not control. Generally an investor must hold between 20% and 50% of the voting rights in an investee for it to be an associate. Investments in associates are accounted for using the equity method and are initially recognized at cost. The Company’s investment in associates includes goodwill identified at acquisition, net of any accumulated impairment loss.
If the equity in an associate is reduced but significant influence is maintained, only a portion of the amounts recognized in the comprehensive income are reclassified to income for the year, where appropriate.
The Company’s share of profits or losses of associates, post-acquisition, is recognized in the income statement and its share in the other comprehensive income of associates is recognized as other comprehensive income. The cumulative movements after acquisition are adjusted against the carrying amount of the investment. When the Company’s share of losses in an associate equals or exceeds its equity in the associate, including unsecured receivables, the Company does not recognize further losses unless it has incurred obligations or made payments on behalf of the associate.
The Company assesses at each reporting date whether there is objective evidence that the investment in the associate is impaired. If so, the Company calculates the amount of impairment as the difference between the recoverable amount of the associate and its carrying value and recognizes it in “share of profit/loss of associates recognized by the equity method” in the income statement.

52
Unrealized gains on transactions between the Company and its associates are eliminated to the extent of the Company´s equity in such gains. Unrealized losses are also eliminated unless the transaction provides evidence that the asset transferred is impaired. In order to ensure consistency with the policies adopted by the Company, the accounting policies of associates have been modified. When the Company ceases to have significant influence over an associate, any difference between the fair value of the remaining investment, including any consideration received from the partial disposal of the investment and the book value of the investment is recognized in the income statement.
v. Joint arrangementsJoint arrangements are those where there is joint control since the decisions over relevant activities require the unanimous consent of each one of the parties sharing control.
Investments in joint arrangements are classified in accordance with the contractual rights and obligations of each investor such as: joint operations or joint ventures. When the Company holds the right over assets and obligations for related assets under a joint arrangement, this is classified as a joint operation. When the company holds rights over net assets of the joint arrangement, this is classified as a joint venture. The Company has assessed the nature of its joint arrangements and classified them as joint ventures. Joint ventures are accounted for by using the equity method applied to an investment in associates.
c. Foreign currency translationi. Functional and presentation currencyThe amounts included in the financial statements of each of the Company’s subsidiaries and associates should be measured using the currency of the primary economic environment in which the entity operates (“the functional currency”). In the case of Alfa, S. A. B. de C. V., the functional currency is determined to be the Mexican peso. The consolidated financial statements are presented in Mexican pesos, which is the Company’s presentation currency.
ii. Transactions and balancesTransactions in foreign currencies are translated into the functional currency using the foreign exchange rates prevailing at the transaction date or valuation date when the amounts are re-measured. Gains and losses resulting from the settlement of such transactions and from the translation of monetary assets and liabilities denominated in foreign currencies at the closing exchange rates are recognized as foreign exchange gain or loss in the income statement, except for those which are deferred in comprehensive income and qualify as cash flow hedges.
Changes in the fair value of securities or monetary financial assets denominated in foreign currency classified as available for sale are divided between fluctuations resulting from changes in the amortized cost of such securities and other changes in value. Subsequently, currency fluctuations are recognized in income and changes in the carrying amount arising from any other circumstances are recognized as part of comprehensive income.
Translation differences on non-monetary assets, such as investments classified as available for sale, are included in other comprehensive income.
iii. Consolidation of subsidiaries with a functional currency different from the presentation currencyIncorporation of subsidiaries whose functional currency is different from their recording currency.The financial statements of foreign subsidiaries, having a recording currency different from their functional currency were translated into the functional currency in accordance with the following procedure:
a. The balances of monetary assets and liabilities denominated in the recording currency were translated at the closing exchange rates.
b. To the historical balances of monetary assets and liabilities and shareholders’ equity translated into the functional currency the movements that occurred during the period were added, which were translated at historical exchange rates. In the case of the movements of non-monetary items recognized at fair value, which occurred during the period, stated in the recording currency, these were translated using the historical exchange rates in effect on the date when the fair value was determined.
c. The income, costs and expenses of the periods, expressed in the recording currency, were translated at the historical exchange rate of the date they were accrued and recognized in the income statement, except when they arose from non-monetary items, in which case the historical exchange rate of the non-monetary items was used.
d. The differences in exchange arising in the translation from the recording currency to the functional currency were recognized as income or expense in the income statement in the period they arose.
Incorporation of subsidiaries whose functional currency is different from their presentation currency.The results and financial position of all ALFA entities (none of which is in a hyperinflationary environment) that have a functional currency different from the presentation currency are translated into the presentation currency as follows:
a) Assets and liabilities for each balance sheet presented are translated at the closing exchange rate at the balance sheet date;
b) The stockholders’ equity of each balance sheet presented is translated at historical rates.
c) Income and expenses for each income statement are translated at average exchange rate (when the average exchange rate is not a reasonable approximation of the cumulative effect of the rates of the transaction, to the exchange rate at the date of the transaction is used); and
d) All the resulting exchange differences are recognized in comprehensive income.

53
The goodwill and adjustments to fair value arising at the date of acquisition of a foreign operation so as to measure them at fair value, are recognized as assets and liabilities of the foreign entity and translated at the exchange rate at the closing date. Exchange differences arising are recognized in equity.
Listed below are the principal exchange rates in the various translation processes: Local currency to Mexican pesos
Closing exchange Average exchange rate at rate at December 31, December 31,
Country Local currency 2013 2012 2013 2012
Canada Canadian dollar 12.31 13.08 12.33 13.10USA US dollar 13.08 13.01 13.00 13.02Brazil Brazilian Real 5.53 6.35 5.57 6.26Argentina Argentine peso 2.01 2.65 2.07 2.67Peru Nuevo sol 4.68 5.10 4.68 5.07Czech Republic Euro 18.02 17.21 17.91 17.08Germany Euro 18.02 17.21 17.91 17.08Austria Euro 18.02 17.21 17.91 17.08Hungary Euro 18.02 17.21 17.91 17.08Poland Euro 18.02 17.21 17.91 17.08Slovakia Euro 18.02 17.21 17.91 17.08Spain Euro 18.02 17.21 17.91 17.08China RenMinBi Yuan 1.69 2.09 2.15 2.09India Indian Rupee 0.21 0.24 0.21 0.24
d. Cash and cash equivalentsCash and cash equivalents include cash on hand, bank deposits available for operations and other short-term investments of high liquidity with original maturities of three months or less, all of which are subject to insignificant risk of changes in value. Bank overdrafts are presented as loans as a part of the current liabilities.
e. Restricted cash and cash equivalentsCash and cash equivalents whose restrictions cause them not to comply with the definition of cash and cash equivalents given above, are presented in a separate line in the statement of financial position and are excluded from cash and cash equivalents in the statement cash flows.
f. Financial instrumentsFinancial assetsThe Company classifies its financial assets in the following categories: at fair value through profit or loss, loans and receivables, investments held to maturity and available for sale. The classification depends on the purpose for which the financial assets were acquired. Management determines the classification of its financial assets upon initial recognition. Purchases and sales of financial assets are recognized on the settlement date.
Financial assets are written off in full when the right to receive the related cash flows expires or is transferred and the Company has also transferred substantially all risks and rewards of ownership, as well as control of the financial asset.
i. Financial assets at fair value through profit or lossFinancial assets at fair value through profit or loss are financial assets held for trading. A financial asset is classified in this category if acquired principally for the purpose of selling in the short term. Derivatives are also categorized as held for trading unless they are designated as hedges.
Financial assets at fair value through profit or loss are initially recognized at fair value and transaction costs are expensed in the income statement. Gains or losses from changes in fair value of these assets are presented in the income statement as incurred.
ii. Loans and receivablesThe receivables are non-derivative financial assets with fixed or determinable payments that are not quoted in an active market. They are included in current assets, except for maturities greater than 12 months after the balance sheet date. These are classified as non-current assets.
Loans and receivables are measured initially at fair value plus directly attributable transaction costs and subsequently at amortized cost, using the effective interest method. When circumstances occur that indicate that the amounts receivable will not be collected at the amounts originally agreed or will be collected in a different period, the receivables are impaired.
iii. Maturity investmentsIf the Company intends and has the demonstrable ability to hold debt securities to maturity, they are classified as held to maturity. Assets in this category are classified as current assets if expected to be settled within the next 12 months, otherwise they are classified as non-current. Initially they are recognized at fair value plus any directly attributable transaction costs, and subsequently they are valued at amortized cost using the effective interest method. Investments held to maturity are recognized or derecognized on the day they are transferred to or by the Company. At December 31, 2013 and 2012, the Company had no such investments.

54
iv. Financial assets available for saleFinancial assets available for sale are non-derivative financial assets that are either designated in this category or not classified in any of the other categories. They are included in non-current assets unless their maturity is less than 12 months or management intends to dispose of the investment within the next 12 months after the balance sheet date.
Financial assets available for sale are initially recognized at fair value plus directly attributable transaction costs. Subsequently, these assets are carried at fair value (unless they cannot be measured by their value in an active market and the value is not reliable, in which case they will be recognized at cost less impairment).
Gains or losses arising from changes in fair value of monetary and non-monetary instruments are recognized directly in the consolidated statement of comprehensive income in the period in which they occur.
When instruments classified as available for sale are sold or impaired, the accumulated fair value adjustments recognized in equity are included in the income statement.
Financial liabilitiesFinancial liabilities that are not derivatives are initially recognized at fair value and are subsequently valued at amortized cost using the effective interest method. Liabilities in this category are classified as current liabilities if expected to be settled within the next 12 months, otherwise they are classified as non-current.
Trade payables are obligations to pay for goods or services that have been acquired or received from suppliers in the ordinary course of business. Loans are initially recognized at fair value, net of transaction costs incurred. Loans are initially recognized at fair value, net of transaction costs incurred. Loans are subsequently carried at amortized cost; any difference between the funds received (net of transaction costs) and the settlement value is recognized in the income statement over the term of the loan using the effective interest method.
Offsetting financial assets and liabilitiesAssets and liabilities are offset and the net amount is presented in the balance sheet when there is a legally enforceable right to offset the recognized amounts and there is an intention to settle on a net basis or to realize the asset and settle the liability simultaneously.
Impairment of financial instrumentsa) Financial assets carried at amortized costThe Company assesses at the end of each year whether there is objective evidence of impairment of each financial asset or group of financial assets. An impairment loss is recognized if there is objective evidence of impairment as a result of one or more events that occurred after the initial recognition of the asset (a “loss event”) and provided that the loss event (or events) has an impact on the estimated future cash flows arising from the financial asset or group of financial assets that can be reliably estimated.
Aspects evaluated by the Company to determine whether there is objective evidence of impairment are:
- Significant financial difficulty of the issuer or debtor.
- Breach of contract, such as late payments of interest or principal
- Granting a concession to the issuer or debtor, by the Company, as a result of financial difficulties of the issuer or debtor and that would not otherwise be considered.
- There is a likelihood that the issuer or debtor will enter bankruptcy or other financial reorganization.
- Disappearance of an active market for that financial asset due to financial difficulties.
- Verifiable information indicates that there is a measurable decrease in the estimated future cash flows related to a group of financial assets after initial recognition, although the decrease cannot yet be identified with the individual financial assets of the Company, including:
(i) Adverse changes in the payment status of borrowers in the group of assets
(ii) National or local conditions that correlate with breaches of noncompliance by the issuers of the asset group
Based on the items listed above, the Company assesses whether there is objective evidence of impairment. Subsequently, for the category of loans and receivables, when impairment exists, the amount of loss is measured as the difference between the asset’s carrying amount and the present value of estimated future cash flows (excluding future credit losses that have not been incurred) discounted at the original effective interest rate. The carrying amount of the asset is reduced by that amount, which is recognized in the income statement.
If a loan or held-to-maturity investment has a variable interest rate, the discount rate for measuring any impairment loss is the current effective interest rate determined under the contract. Alternatively, the Company could determine the impairment of the asset given its fair value determined on the basis of a current observable market price.
If in the subsequent years, the impairment loss decreases and the decrease can be related objectively to an event occurring after the date on which such impairment was recognized (such as an improvement in the debtor’s credit rating), the reversal of the loss impairment is recognized in the income statement.

55
b) Financial assets available for saleIn the case of debt financial instruments, the Company also uses the above-listed criteria to identify whether there is objective evidence of impairment. In the case of equity financial instruments, a significant or prolonged reduction in its fair value below its cost is also considered objective evidence of impairment.
Subsequently, in the case of financial assets available for sale, an impairment loss determined by computing the difference between the acquisition cost and the current fair value of the asset, less any impairment loss previously recognized, is reclassified from the other comprehensive income accounts and recorded in the income statement. Impairment losses recognized in the income statement related to equity financial instruments are not reversed through the income statement. Impairment losses recognized in the income statement related to financial debt instruments could be reversed in subsequent years, if the fair value of the asset is increased as a result of a subsequent event.
g. Derivative financial instruments and hedging activitiesAll derivative financial instruments are identified and classified as fair value hedging hedges or cash flow hedges, for trading or the hedging of market risks and are recognized in the balance sheet as assets and/or liabilities at fair value and similarly measured subsequently at fair value. The fair value is determined based on recognized market prices and its fair value is determined using valuation techniques accepted in the financial sector.
The fair value of hedging derivatives is classified as a non-current asset or liability if the remaining maturity of the hedged item is more than 12 months and as a current asset or liability if the remaining maturity of the hedged item is less than 12 months.
Changes in the fair value of derivative financial instruments are recognized in finance income or expense, except for changes in the fair value of cash flow hedges, in which case such changes are recognized in equity. Derivative financial instruments classified as hedges are contracted for risk hedging purposes and meet all hedging requirements; their designation at the beginning of the hedging operation is documented, describing the objective, primary position, risks to be hedged and the effectiveness of the hedging relationship, characteristics, accounting recognition and how the effectiveness is to be measured.
Fair value hedgesChanges in the fair value of derivative financial instruments are recorded in the income statement. The change in fair value hedges and the change in the primary position attributable to the hedged risk are recorded in the income statement in the same line item as the hedged position. At December 31, 2013 and 2012, the Company has no derivative financial instruments classified as fair value hedges.
Cash flow hedgesThe changes in the fair value of derivative instruments associated to cash flow hedges are recorded in stockholders’ equity. The effective portion is temporarily recorded in comprehensive income, within stockholders’ equity and is reclassified to profit or loss when the hedged position affects these. The ineffective portion is immediately recorded in income.
Net investment hedgeNet investment hedge in a foreign business is recorded similarly to cash flow hedges. Any gain or loss of the related hedged instrument with the effective portion of the hedge is recorded in comprehensive income. The gain or loss of the ineffective portion is recorded in the statement of income. Accumulated gains and losses in equity are recorded in the statement of income when partially the foreign operation is partially disposed of or sold. At December 31, 2013 and 2012, the Company has no derivative financial instruments classified as net investment hedges.
Suspension of hedge accountingThe Company suspends the hedges accounting when the derivative has expired, has been sold, is cancelled or exercised, when it does not reach high effectiveness to offset the changes in the fair value or the cash flow of the hedged item, or when the Company decides to cancel the hedges designation.
On suspending hedge accounting, in the case of fair value hedges, the adjustment to the carrying amount of a hedged amount for which the effective interest rate method is used, is amortized to income over the period to maturity. In the case of cash flow hedges, the amounts accumulated in equity as a part of comprehensive income remain in equity until the time when the effects of the forecasted transaction affect income. In the event the forecasted transaction is not likely to occur, the income or loss accumulated in comprehensive income are immediately recognized in the income statement. When the hedge of a forecasted transaction appears satisfactory and subsequently does not meet the effectiveness test, the cumulative effects in comprehensive income in stockholders’ equity are transferred proportionally to the income statement, to the extent the forecasted transaction impacts it.
The fair value of derivative financial instruments reflected in the financial statements of the Company, is a mathematical approximation of their fair value. It is computed using proprietary models of independent third parties using assumptions based on past and present market conditions and future expectations at the respective balance sheet date.

56
h. InventoriesInventories are stated at the lower of cost and net realizable value. Cost is determined using the average cost method. The cost of finished goods and work-in-progress includes cost of product design, raw materials, direct labor, other direct costs and production overheads (based on normal operating capacity). It excludes borrowing costs. The net realizable value is the estimated selling price in the normal course of business, less the applicable variable selling expenses. Costs of inventories include any gain or loss transferred from equity corresponding to raw material purchases that qualify as cash flow hedges.
i. Property, plant and equipmentItems of property, plant and equipment are recorded at cost less the accumulated depreciation and any accrued impairment losses. The costs include expenses directly attributable to the asset acquisition.
Subsequent costs are included in the asset’s carrying amount or recognized as a separate asset, as appropriate, only when it is probable that future economic benefits associated with the item will flows to the Company and the cost of the item can be reliably measured. The carrying amount of the replaced part is derecognized. Repairs and maintenance are recognized in the income statement during the year they are incurred. Major improvements are depreciated over the remaining useful life of the related asset.
Depreciation is calculated using the straight-line method, considering separately each of the asset’s components, except for land, which is not subject to depreciation. The average useful lives of assets families are as follows:
Buildings and constructions 33 to 50 yearsMachinery and equipment 10 to 14 yearsTransportation equipment 4 to 8 yearsTelecommunications network 3 to 33 yearsFurniture and laboratory equipment and information technology 6 to 10 yearsTooling and spare parts 3 to 20 yearsLeasehold improvements 3 to 20 yearsOther assets 3 to 20 years
The spare parts to be used after one year and attributable to specific machinery are classified as property, plant and equipment in other fixed assets.
Borrowing costs related to financing of property, plant and equipment whose acquisition or construction requires a substantial period (nine months or more), are capitalized as part of the cost of acquiring such qualifying assets, up to the moment when they are suitable for their intended use or sale.
Assets classified as property, plant and equipment are subject to impairment tests when events or circumstances occur indicating that the carrying amount of the assets may not be recoverable. An impairment loss is recognized in the income statement in other expenses, net, for the amount by which the carrying amount of the asset exceeds its recoverable amount. The recoverable amount is the higher of fair value less costs to sell and value in use.
The residual value and useful lives of assets are reviewed at least at the end of each reporting period and, if expectations differ from previous estimates, the changes are accounted for as a change in accounting estimate.
Gains and losses on disposal of assets are determined by comparing the sale value with the carrying amount and are recognized in other expenses, net, in the income statement.
j. LeasingThe classification of leases as finance or operating depends on the substance of the transaction rather than the form of the contract.
Leases in which a significant portion of the risks and rewards relating to the leased property are retained by the lessor are classified as operating leases. Payments made under operating leases (net of incentives received by the lessor) are recognized in the income statement based on the straight-line method over the lease period.
Leases where the Company assumes substantially all the risks and rewards of ownership are classified as finance leases. Finance leases are capitalized at the beginning of the lease, at the lower of the fair value of the leased property and the present value of the minimum lease payments. If its determination is practical, in order to discount the minimum lease payments to present value, the interest rate implicit in the lease is used; otherwise, the incremental borrowing rate of the lessee should be used. Any initial direct costs of the leases are added to the original amount recognized as an asset.
Each lease payment is allocated between the liability and finance charges to achieve a constant rate on the outstanding balance. The corresponding rental obligations are included in non-current debt, net of finance charges. The interest element of the finance cost is charged to the income for the year during the period of the lease, so as to produce a constant periodic rate of interest on the remaining balance of the liability for each period. Property, plant and equipment acquired under finance leases are depreciated over the shorter of the asset’s useful life and the lease term.

57
k. Intangible assetsIntangible assets are recognized in the balance sheet when they meet the following conditions: they are identifiable, provide future economic benefits and the Company has control over such benefits.
Intangible assets are classified as follows:
i) Indefinite useful life. - These intangible assets are not amortized and are subject to annual impairment assessment. To date, no factors have been identified limiting the life of these intangible assets.
ii) Finite useful life. - These assets are recognized at cost less accumulated amortization and impairment losses recognized. They are amortized on a straight line basis over their estimated useful life, determined based on the expectation of generating future economic benefits, and are subject to impairment tests when triggering events of impairment are identified.
The estimated useful lives of intangible assets with finite useful lives are summarized as follows:
Development costs 5 to 20 yearsExploration costs (1)
Trademarks 40 yearsCustomer relationships 15 to 17 yearsSoftware and licenses 3 to 11 yearsIntellectual property rights 20 to 25 yearsOther (patents, concessions, non-compete agreements, etc.) 5 to 20 years
(1) Exploration costs are depreciated based on the unit-of-production method based on proven reserves of hydrocarbons.
a) GoodwillGoodwill represents the excess of the acquisition cost of a subsidiary over the Company’s equity in the fair value of the identifiable net assets acquired, determined at the date of acquisition, and is not subject to amortization. Goodwill is shown under goodwill and intangible assets and is recognized at cost less accumulated impairment losses, which are not reversed. Gains or losses on the disposal of an entity include the carrying amount of goodwill relating to the entity sold.
b) Development costsResearch costs are recognized in income as incurred. Expenditures on development activities are recognized as intangible assets when such costs can be reliably measured, the product or process is technically and commercially feasible, potential future economic benefits are obtained and the Company intends also has sufficient resources to complete the development and to use or sell the asset. Their amortization is recognized in income by the straight-line method over the estimated useful life of the asset. Development expenditures that do not qualify for capitalization are recognized in income as incurred.
c) Exploration costsThe Company uses the successful efforts method of accounting for its oil and gas properties. Under this method, all costs associated with productive and non-productive wells are capitalized while non-productive and geological exploration costs are recognized in the income statement as incurred. Net capitalized costs of unproved reserves are reclassified to proven reserves when they are found. The costs of operating the wells and field equipment are recognized in the income statement as incurred.
d) Intangible assets acquired in a business combinationWhen an intangible asset is acquired in a business combination it is recognized at fair value at the acquisition date. Subsequently, such assets are as follows: trademarks, customer relations, intellectual property rights, no-competition agreements, among others, are carried at cost less accumulated depreciation and accumulated impairment losses.
l. Impairment of non-financial assetsAssets that have an indefinite useful life, for example goodwill, are not depreciable or amortizable and are subject to annual impairment tests. Assets that are subject to amortization are reviewed for impairment when events or changes in circumstances indicate that the carrying amount may not be recoverable. An impairment loss is recognized for the amount by which the asset’s carrying amount exceeds its recoverable amount. The recoverable amount is the higher of the asset’s fair value less costs to sell and its value in use. For the purpose of assessing impairment, assets are grouped at the lowest levels at which separately identifiable cash flows exist (cash generating units). Non-financial long-term assets other than goodwill that have suffered impairment are reviewed for possible reversal of the impairment at each reporting date.
m. Income taxThe amount of income taxes in the income statement represents the sum of the current and deferred income taxes.
The Company and its subsidiaries in Mexico consolidate their results for the purposes of Income Tax.
The deferred income taxes are determined in each subsidiary by the asset and liability method, applying the rate established by legislation enacted or substantially enacted at the balance sheet date wherever ALFA and its subsidiaries operate and generate taxable income. The applicable rates are applied to the total of the temporary differences resulting from comparing the accounting and tax bases of assets and liabilities in accordance with the years in which the deferred asset tax is realized or the deferred liability tax is expected to be settled, considering, when applicable, any tax loss carry forwards expected to be that are considered to be recoverable. The effect of a change in tax rates is recognized in the income of the period in which the rate change is enacted.

58
Management periodically evaluates positions taken in tax returns with respect to situations in which the applicable law is subject to interpretation. Provisions are recognized when appropriate based on the amounts expected to be paid to the tax authorities.
Deferred tax assets are recognized only when it is probable that future taxable profits will exist against which the deductions for temporary differences can be taken.
The deferred income tax on temporary differences arising from investments in subsidiaries and associates is recognized, unless the period of reversal of temporary differences is controlled by ALFA and it is probable that the temporary differences will not reverse in the near future.
Deferred tax assets and liabilities are offset when a legal right exists and when the taxes are levied by the same tax authority.
n. Employee benefitsi. Pension plansDefined contribution plans:A defined contribution plan is a pension plan under which the Company pays fixed contributions into a separate entity. The Company has no legal or constructive obligations to pay further contributions if the fund does not hold sufficient assets to pay all employees the benefits relating to their service in the current and past periods. The contributions are recognized as employee benefit expense when they are due.
Defined benefit plans:A defined benefit plan is a plan which specifies the amount of the pension an employee will receive on retirement, usually dependent on one or more factors such as age, years of service and compensation.
The liability recognized in the balance sheet in respect of defined benefit plans is the present value of the defined benefit obligation at the balance sheet date less the fair value of plan assets. The defined benefit obligation is calculated annually by independent actuaries using the projected unit credit method. The present value of the defined benefit obligation is determined by discounting the estimated future cash outflows using discount rates in conformity with the IAS 19 that are denominated in the currency in which the benefits will be paid, and have maturities that approximate the terms of the pension liability.
Actuarial gains and losses from adjustments and changes in actuarial assumptions are recognized directly in stockholders’ equity in other items of the comprehensive income in the year they occur.
The Company determines the net finance expense (income) by applying the discount rate to the liabilities (assets) from net defined benefits.
Past-service costs are recognized immediately in the income statement.
ii. Post-employment medical, benefitsThe Company provides medical benefits to retired employees after termination of employment. The right to access these benefits usually depends on the employee´s having worked until retirement age and completing a minimum of years of service. The expected costs of these benefits are accrued over the period of employment using the same criteria as those described for defined benefit pension plans.
iii. Termination benefitsTermination benefits are payable when employment is terminated by the Company before the normal retirement date or when an employee accepts voluntary termination of employment in exchange for these benefits. The Company recognizes termination benefits in the first of the following dates: (a) when the Company can no longer withdraw the offer of these benefits, and (b) when the Company recognizes the costs from restructuring within the scope of the IAS 37 and it involves the payment of termination benefits. If there is an offer that promotes the termination of the employment relationship voluntarily by employees, termination benefits are valued based on the number of employees expected to accept the offer. Any benefits to be paid more than 12 months after the balance sheet date are discounted to their present value.
iv. Short-term benefitsThe Company provides benefits to employees in the short term, which may include wages, salaries, annual compensation and bonuses payable within 12 months. ALFA recognizes an undiscounted provision when it is contractually obligated or when past practice has created an obligation.
v. Employee participation in profits and bonusesThe Company recognizes a liability and an expense for bonuses and employee participation in profits when it has a legal or assumed obligation to pay these benefits and determines the amount to be recognized based on the profit for the year after certain adjustments.

59
o. ProvisionsLiability provisions represent a present legal obligation or a constructive obligation as a result of past events where an outflow of resources to meet the obligation is likely and where the amount has been reliably estimated. Provisions are not recognized for future operating losses.
Provisions are measured at the present value of the expenditures expected to be required to settle the obligation using a pre-tax rate that reflects current market assessments of the value of money over time and the risks specific to the obligation. The increase in the provision due to the passage of time is recognized as interest expense.
When there are a number of similar obligations, the likelihood that an outflow will be required in settlement is determined by considering the class of obligations as a whole. A provision is recognized even if the likelihood of an outflow with respect to any one item included in the same class of obligations may be small.
Provisions for legal claims are recognized when the Company has a present obligation (legal or assumed) as a result of past events, it is likely that an outflow of economic resources will be required to settle the obligation and the amount can be reasonably estimated.
A restructuring provision is recorded when the Company has developed a formal detailed plan for the restructure, and a valid expectation for the restructure has been created between the people affected, possibly for having started the plan implementation or for having announced its main characteristics to them.
p. Share-based paymentsThe Company’s compensation plans are based on the market value of its shares in favor of certain senior executives of the Company and its subsidiaries. The conditions for granting such compensation to the eligible executives include among other things, compliance with certain metrics such as the level of profit achieved, remaining in the Company for up to 5 years, etc. The Board of Directors has appointed a technical committee to manage the plan, and it reviews the estimated cash settlement of this compensation at the end of the year. The payment plan is always subject to the discretion of the senior management of ALFA. Adjustments to this estimate are charged or credited to the income statement.
The fair value of the amount payable to employees in respect of share-based payments which are settled in cash is recognized as an expense, with a corresponding increase in liabilities, over the period of service required. The liability is included under other liabilities and is adjusted at each reporting date and the settlement date. Any change in the fair value of the liability is recognized as compensation expense in the income statement.
q. Treasury sharesThe Shareholders’ Meeting periodically authorizes a maximum amount for the acquisition of the Company’s own shares. Upon the occurrence of a repurchase of its own shares, they become treasury shares and the amount is charged to stockholders’ equity at purchase price: a portion to capital stock at its modified historical value, and the balance to retained earnings. These amounts are stated at their historical value.
r. Capital stockALFA’s common shares are classified as capital stock within stockholders’ equity. Incremental costs directly attributable to the issuance of new shares are included in equity as a deduction from the consideration received, net of tax. The capital stock includes the effect of inflation recognized up to December 31, 1997.
s. Comprehensive incomeComprehensive income is composed of net income plus other capital reserves, net of taxes, which comprise the effects of the translation of foreign subsidiaries, the effects of derivative financial instruments for cash flow hedging, actuarial gains or losses, the effects of changes in the fair value of financial instruments available for sale, the equity in other items of comprehensive income of associates, and other items specifically required to be reflected in stockholders’ equity and which do not constitute capital contributions, reductions or distributions.
t. Segment reportingSegment information is presented consistently with the internal reporting provided to the chief executive who is the highest authority in operational decision-making, resource allocation and assessment of operating segment performance.
u. Revenue recognitionRevenue comprises the fair value of the consideration received or receivable for the sale of goods and services in the normal course of operations. Revenue is shown net of estimated customer returns, rebates and similar discounts and after eliminating intercompany sales.
The Company grants discounts and incentives to customers, which are recognized as a deduction from income or as selling expenses depending on their nature. These programs include customer discounts for sales of products based on: i) sales volume (usually recognized as a reduction of revenue) and ii) promotions in retail products (usually recognized as selling expenses).
Revenue from the sale of goods and products are recognized when all and each of the following conditions are met:
- The risks and rewards of ownership have been transferred
- The amount of revenue can be reliably measured
- It is likely that future economic benefits will flow to the Company
- The company retains no involvement associated with ownership nor effective control of the sold goods
- The costs incurred or to be incurred in respect of the transaction can be measured reasonably.

60
In the Alestra segment, revenues from services are recognized as follows:
- Revenue from the provision of data transmission services, internet and local services are recognized when services are rendered.
- Revenues from national and international long distance outgoing and incoming services are recognized based on minutes of traffic processed by the Company and processed by a third party, respectively.
- Installation revenues and related costs are recognized as income during the period of the contract with the customers.
- The estimates are based on historical results, taking into consideration the type of customer, the type of transaction and the specifics of each arrangement.
Dividend income from investments is recognized once the rights of shareholders to receive this payment have been established (when it is probable that the economic benefits will flow to the entity and the revenue can be reliably valued).
Interest income is recognized when it is likely that the economic benefits will flow to the entity and the amount of revenue can be reliably valued by applying the effective interest rate.
v. Earnings per shareEarnings per share are calculated by dividing the profit attributable to the shareholders of the parent by the weighted average number of common shares outstanding during the year. There are no dilutive effects from financial instruments potentially convertible into shares.
w. Non-recurring itemsNon-recurring items are those which require judgment from management to be disclosed, due to their size or incidence. These items are disclosed in the consolidated statement of income and in Note 27. Operations that gave rise to non-recurring items are restructuring activities and impairments.
x. Changes in accounting policies and disclosuresThe accounting policies adopted are consistent with those of the previous financial year except for the adoption of new standards effective at January 1, 2013. The nature and impact of each new standard or modification are described as follows:
• IAS 1 (amended) - “Presentation of Financial Statements” The amendment requires entities to separate the items presented in other comprehensive income in two groups based on whether they can be recycled to the income statement in the future or not. Items that cannot be recycled are presented separately from the items that may be recycled in the future. Entities that decide to present items of other comprehensive income before taxes, should show the taxes related to the two groups separately. For the Company, this amendment became effective on January 1, 2013. The amendment affected the presentation only and had no effect on the Company´s financial position or performance.
• IAS 19 (Revised) - “Employee benefits” There are a number of amendments that have been applied retrospectively; these eliminate the option to defer the recognition of actuarial gains and losses in the defined benefit post-employment plans, known as the “corridor method”. The Company has not previously applied this option and has recognized the gains and losses in other comprehensive income. Therefore, this change in the standard has no impact on the Company’s consolidated financial statements. The expected returns on plan assets are no longer recognized in the statement of income for the year, instead, there is a requirement to recognize interest on the net defined benefit liability (asset) in the statement of income, calculated using the discount rate used to measure the defined benefit obligation. This change had no significant impact on the consolidated financial statements of the Company.
Past-service costs are recognized in the statement of income in the period of a plan amendment, instead of deferring the portion related to the unvested benefits. Previously the Company recognized past-service costs immediately in income, unless the changes to the pension plan are conditional on the employees remaining in service for a specified period (vesting period), management determined that the effect of the net income of the Company for 2012 is not significant. As a result of the adoption of the amendment to IAS 19, the Company adjusted against retained earnings, an accumulated balance for unamortized past-service costs amounting to Ps87, net of deferred income tax at January 1, 2013. The IAS 19 (Revised) was adopted prospectively and prior periods were not restated since management determined that the effect is not significant for the Company’s financial position.
• IFRS 10, ‘Consolidated financial statements’ – IFRS 10 was issued in May 2011 and replaces all the guidance on control and consolidation in IAS 27, “Consolidated and separate financial statements’, and SIC 12, “Consolidation - Special purpose entities’. Under IFRS 10, subsidiaries are all entities (including the structured entities) over which the Company has control. The Company controls an entity when it has power over an entity, is exposed to, or has rights to variable returns from its interest in the entity and has the ability to affect these returns through its power over the entity. Subsidiaries are fully consolidated from the date when the control is transferred to the Company. They are deconsolidated from the date control ceases. The Company has applied IFRS 10 retrospectively in conformity with transition provisions described in this standard.

61
The aforementioned had no impact on the consolidation of investments held by the Company.
• IFRS 11 “Joint arrangements” The standard focuses on the rights and obligations of the parties to determine whether there is a joint arrangement, over other factors such as the legal form. There are two types of joint arrangements: Joint operations and joint ventures. Joint operations occur when investors have rights to the assets and obligations for the liabilities of an arrangement, a joint operator accounts for his portion of assets, liabilities, revenues and expenses. A joint venture occurs when investors have rights over the net assets of the arrangement, joint ventures are accounted for using the equity method. Proportional consolidation is not allowed under this standard. This change had no effect on the consolidated financial statements of the Company.
• IFRS 12, “Disclosure of Interests in Other Entities” requires an entity to disclose information that enables users of financial information to evaluate the nature and risks associated with its interests in other entities, including joint arrangements, associates, special purpose entities and other off balance sheet entities; in addition to the effects of these interests in its financial position and performance, and its cash flows. The Company made the required disclosures in the consolidated financial statements at December 31, 2013.
• IFRS 13, “Fair Value Measurements”. The objective of IFRS 13 is to provide a precise definition of fair value and be a single source for the measurement and disclosure requirements for fair value when it is required or permitted by other IFRS, except for transactions within the scope of IFRS 2 “Share-based payments”, IAS 17 “Leases”, measurements that have similarities to fair value but not considered as such, and the net realizable value under the scope of the IAS 2 “Inventories” or the value in use in IAS 36 “Impairment of long-lived assets”. The application of IFRS 13 has not significantly impacted the fair value measurements made by the Company.
• 2011 annual improvements include an improvement to IAS 16 “Property, plant and equipment” clarifying that main spare parts and maintenance equipment that comply with the definition of Property, plant and equipment, are not part of the inventory, and the improvement to IAS 32 “Financial instruments presentation” clarifies that income taxes derived from distributions to shareholders are accounted for in accordance with IAS 12 “Taxes on gains”. These improvements had no effect on the Company.
• IAS 36 “Impairment of assets” In May 2013, the IASB amended IAS 36. This amendment indicates the disclosure of information over the recoverable value of impaired assets if the amount is calculated based on the fair value method less cost of sale. The Company adopted this amendment in advance.
y. New accounting pronouncements effective from January 1, 2014The following sets out the new pronouncements and amendments issued, which are effective from January 1, 2014 that have not been adopted and early adopted by the Company.
- IFRS 9, “Financial Instruments”
IFRS 9 was issued in November 2009 and included requirements for classification and measurement of financial assets. Requirements for financial liabilities were included as part of the IFRS 9 in October 2010. IFRS 9 is the first standard issued as part of the project to replace IAS 39. IFRS 9 maintains and simplifies two types of measurement models and establishes two main categories of financial assets: at amortized cost and fair value. The classification basis depends on the business model of the Company and the characteristics of contractual cash flows of financial instruments. IAS 39 guide to impairment of financial assets and hedge accounting continues to be applicable. For the Company, this amendment is obligatory as from January 1, 2015.
- IAS 32, “Financial instruments: presentation”
In December 2011, the IASB amended IAS 32. These amendments are in the application guide and clarify some of the requirements for offsetting financial assets and financial liabilities in the statement of financial position. For the Company, this amendment is obligatory as from January 01, 2014.
- IAS 39, “Financial Instruments”: Recognition and Measurement”
In June 2013, the IASB modified IAS 39 to clarify that there is no need to suspend hedge accounting when novation of a hedging instrument to a central counter party meets certain requirements. For the Company, this amendment is applicable to annual periods starting on or subsequent to January 1, 2014.
At the date of the financial statements, the Company’s management is in the process of quantifying the effects of adoption of the new standards and amendments mentioned above.
There are no additional standards, amendments or interpretations issued but not effective that could have a significant effect on the company.

62
4 Financial risk management
4.1 Financial risk factorsThe Company’s activities expose it to various financial risks: market risk (including foreign exchange risk, interest rate risk on cash flows and interest rate risk on fair value), credit risk and liquidity risk. The Company’s risk management plan considers the unpredictability of the financial markets and seeks to minimize the potential negative effects on the financial performance of the Company. The Company uses derivative financial instruments to hedge some risk exposures.
The objective is to protect the financial health of the business taking into account the volatility associated with exchange rates and interest rates. Additionally, due to the nature of the industries in which it participates, the Company has entered into derivative hedges of input prices.
ALFA has a Risk Management Committee, consisting of the Chairman, the Chief Executive Officer, the Chief Financial Officer of the Company and a financial executive of the Company who acts as technical secretary. The Committee oversees derivatives transactions proposed by the subsidiaries of ALFA in which the maximum possible loss exceeds US$1. This Committee supports both the Executive Director and the Chairman of the Company. All new derivative transactions that the Company proposes to make, and the renewal of existing derivatives, require approval by both the subsidiary and ALFA in accordance with the following schedule of authorizations: Possible Maximum Loss US$
Cumulative Individual transactions transactions annual
Business Group General Manager 1 5ALFA Risk Management Committee 30 100Finance Committee 100 300ALFA Board of Directors >100 >300
The proposed transactions must meet certain criteria, including that the hedges are lower than exposures, and that they are the result of a fundamental analysis and properly documented. Sensitivity analyses and other risk analyses should be performed before the operation is carried out.
(a) Market risk(i) Exchange rate riskThe Company operates internationally and is exposed to foreign exchange risk, primarily related to the Mexican peso and the currencies other than the functional currency in which its subsidiaries operate. The Company is exposed to foreign exchange risk arising from future commercial transactions in assets and liabilities in foreign currencies and investments abroad.
The respective exchange rates of the Mexican peso, the U.S. dollar and the euro are very important factors for ALFA due to the effect they have on their results. Moreover, ALFA has no influence over their movements. ALFA estimates that between 75% and 85% of its revenues are denominated in foreign currency, either because they come from products that are exported from Mexico or because they come from products that are manufactured and sold abroad, or because even if sold in Mexico the price of such products are set based on international prices in foreign currencies such as the U.S. dollar.
For this reason, in the past, in times when the Mexican peso has appreciated in real terms against other currencies such as the dollar, ALFA’s profit margins have been reduced. On the other hand, when the Mexican peso has lost value, ALFA´s profit margins have been increased. However, although this factor correlation has appeared on several occasions in the recent past, there is no assurance that it will be repeated if the exchange rates between the Mexican peso and other currencies fluctuate again.
The Company participates in operations with derivative financial instruments on exchange rates for the purpose of controlling the total comprehensive cost of its financing and the volatility associated with exchange rates. Additionally, it is important to note the high “dollarization” of the Company’s revenues, since a large proportion of its sales are made abroad, providing a natural hedge against its obligations in dollars, while at the same time its income level is affected in the event exchange rate appreciation. Based on the overall exchange rate exposure at December 31, 2013 and 2012, a hypothetical variation of 5% in the exchange rate MXN/USD, holding all other variables constant, would result in an effect on the income statement by Ps16.6 and Ps48.1, respectively.

63
The risk management policy of the Company is to cover as a maximum the following percentages with respect to the predicted exposure: Current year Prior year
Commodities 90 100Energy costs 65 75Exchange rate for operating transactions 70 80Exchange rate for financial transactions 90 100Interest rates 90 100
The Company has certain investments in foreign operations, whose net assets are exposed to the risk of foreign currency translation. The currency exposure arising from the net assets of the Company’s foreign operations are frequently managed through borrowings denominated in the relevant foreign currency.
(ii) Price riskIn carrying out its activities, the Company depends on the supply of raw materials provided by its suppliers, both in Mexico and abroad, among which are intermediate petrochemicals, beef products, pork and poultry, dairy products and aluminum scrap, principally.
In recent years, the price of some inputs have shown volatility, especially those related to oil, natural gas, food, such as meat, cereals and milk, and metals.
In order to fix the selling prices of certain of its products, the Company has entered into agreements with certain customers. At the same time, it has entered into transactions involving derivatives on natural gas that seek to reduce price volatility of the prices of this input.
Additionally, it has entered into derivative financial instruments transactions to hedge purchases of certain raw materials, since these inputs have a direct or indirect relationship with the prices of its products.
The derivative financial operations have been privately contracted with various financial institutions, whose financial strength was highly rated at the time by rating agencies. The documentation used to formalize the contract operations is that based generally on the “Master Agreement”, generated by the “International Swaps & Derivatives Association” (“ISDA”), which is accompanied by various accessory documents known in generic terms as “Schedule”, “Credit Support Annex” and “Confirmation”.
Regarding natural gas, Pemex is the only supplier in Mexico. The selling price of natural gas at first hand is determined by the price of that product on the “spot” market in South Texas, USA, which has experienced the volatility. For its part, the CFE is a decentralized public company in charge of producing and distributing electricity in Mexico. Electricity rates have also been influenced by volatility of natural gas, since most power plants are gas-based.
The Company entered into various derivative agreements with various counterparties to protect it against increases in prices of natural gas and other raw materials. In the case of natural gas derivatives, hedging strategies for products were designed to mitigate the impact of potential increases in prices. The purpose is to protect the price from volatility by taking positions that provide stable cash flow expectations, and thus avoid price uncertainty. The reference market price for natural gas is the Henry Hub New York Mercantile Exchange (NYMEX). The average price per MMBTU for 2013 and 2012 was 3.65 and 2.79 US dollars, respectively.
At December 31, 2012, the Company had hedges of natural gas prices for a portion expected of consumption needs in Mexico and the United States. Based on the general input exposure at December 31, 2013 and 2012, a hypothetical increase (decrease) of 10% in market prices applied to fair value and keeping all other variables constant, such as exchange rates, the increase (decrease) would result in an immaterial effect on the income statement for 2013 and 2012.
(iii) Interest rate and cash flow riskThe interest rate risk for the Company arises from long-term loans. Loans at variable rates expose the Company to interest rate risk on cash flows that are partially offset by cash held at variable rates. Loans at fixed rates expose the Company to interest rate risk at fair value.
For the purpose of controlling the total comprehensive cost of its financing and the volatility of interest rates, the Company has contracted interest rate swaps to convert certain variable rate loans to fixed rates.
At December 31, 2013 and 2012, if interest rates on variable rate loans were increased/decreased by 10%, interest expense would increase/decrease by Ps1.7 and Ps2, respectively.

64
(b) Credit riskCredit risk is managed on a group basis, except for the credit risk related to accounts receivable balances. Each subsidiary is responsible for managing and analyzing credit risk for each of its new customers before setting the terms and conditions of payment. Credit risk is generated from cash and cash equivalents, derivative financial instruments and deposits with banks and financial institutions as well as credit exposure to customers, including receivables and committed transactions. If wholesale customers are rated independent these are the ratings used. If there is no independent rating, the Company´s risk control group evaluates the creditworthiness of the customer, taking into account their financial position, past experience and other factors.
Individual risk limits are determined base on internal and external ratings in accordance with limits set by the Board. The use of credit risk is monitored regularly. Sales to retail customers are in cash or by credit card.
During 2013 and 2012, credit limits were not exceeded and management does not expect losses in excess of the impairment recognized in the corresponding periods.
The impairment provision for doubtful accounts represents estimated losses resulting from the inability of customers to make required payments. In determining the allowance for doubtful accounts, significant estimates have to be made. The Company performs ongoing credit evaluations of its customers and adjusts credit limits based upon payment history and the customer’s current creditworthiness, as determined by a review of their current credit information. In addition, the Company considers a number of factors to determine the size and appropriate timing for the recognition of allowances, including historical collection experience, customer base, current economic trends and the ageing of the accounts receivable portfolio.
(c) Liquidity riskProjected cash flows are determined at each operating entity of the Company and subsequently the finance department consolidates this information. The finance department of the Company continuously monitors the cash flow projections and liquidity requirements of the Company ensuring that sufficient cash and highly liquid investments are maintained to meet operating needs, and it’s that some flexibility is maintained through open and committed credit lines. The Company regularly monitors and makes decisions ensuring that the limits or covenants set forth in debt contracts are not violated. The projections consider the financing plans of the Company, compliance with covenants, compliance with minimum liquidity ratios and internal legal or regulatory requirements.
The Company´s treasury invests those funds in time deposits and marketable securities whose maturities or liquidity allow flexibility to meet the cash needs of the Company. At December 31, 2013 and 2012, the Company had time deposits of Ps6,639 and Ps10,070, respectively, which are considered sufficient to adequately manage liquidity risk.
The following table analyzes the derivative and non-derivative, grouped according to their maturity, from the balance sheet date to the contractual maturity date. Derivative financial liabilities are included in the analysis if their contractual maturities are required to understand the timing of the Company’s cash flows. The amounts disclosed in the table are contractual undiscounted cash flows. From From Less than 1 to 2 2 to 5 More than 5 one year years years years
At December 31, 2013Suppliers and other accounts payable Ps 30,252 Ps - Ps - Ps -Current and non-current debt (excluding debt issuance costs) 10,522 3,542 8,719 34,854Derivative financial instruments 78 337 - -Other liabilities 534 500 - -
At December 31, 2012Suppliers and other accounts payable Ps 27,562 Ps - Ps - Ps -Current and non-current debt (excluding debt issuance costs) 4,442 10,527 13,942 23,047Derivative financial instruments 378 468 119 -Other liabilities 559 435 - -
4.2 Equity risk managementThe Company’s objectives when managing equity are to safeguard the Company’s ability to continue as a going concern, so that it can continue to provide returns for shareholders and benefits for other stakeholders and to maintain an optimal capital structure so as to reduce the cost of equity.
To maintain or adjust the equity structure, the Company may adjust the amount of dividends paid to shareholders, return equity to shareholders, issue new shares or sell assets to reduce debt.
ALFA monitors equity based on the degree of leverage. This percentage is calculated by dividing total liabilities by total equity.
The financial ratio of total liabilities/total equity was 1.54 and 1.53 at December 31, 2013 and 2012, respectively.

65
4.3 Fair value estimationThe following is an analysis of financial instruments measured by the fair value valuation method. The 3 different levels used are presented below:
- Level 1: Quoted prices for identical instruments in active markets.
- Level 2: Other valuations including quoted prices for similar instruments in active markets that are directly or indirectly non-observable.
- Level 3: Valuations made through techniques wherein one or more of their significant data inputs are not observable.
The following table presents the ALFA’s assets and liabilities that are measured at fair value at December 31, 2013:Assets Level 1 Level 2 Level 3 Total
Financial assets at fair value through profit or loss:- Trading derivatives Ps - Ps 58 Ps - Ps 58Derivatives used for hedging - 28 - 28Financial assets available for sale - - 227 227Total Assets Ps - Ps 86 Ps 227 Ps 313
Liabilities Level 1 Level 2 Level 3 Total
Financial liabilities at fair value through profit or loss- Trading derivatives Ps - Ps 157 Ps - Ps 157Derivatives used for hedging - 258 - 258Employees’ benefits based on shares 702 - - 702Total liabilities Ps 702 Ps 415 Ps - Ps 1,117
The following table presents the ALFA’s assets and liabilities that are measured at fair value at December 31, 2012:Assets Level 1 Level 2 Level 3 Total
Financial assets at fair value through profit or loss:- Trading derivatives Ps 38 Ps 6 Ps - Ps 44Derivatives used for hedging 43 42 - 85Financial assets available for sale - - 333 333Total Assets Ps 81 Ps 48 Ps 333 Ps 462
Liabilities Level 1 Level 2 Level 3 Total
Financial liabilities at fair value through profit or loss- Trading derivatives Ps 417 Ps 128 Ps - Ps 545Derivatives used for hedging - 420 - 420Employees’ benefits based on shares 594 - - 594Total liabilities Ps 1,011 Ps 548 Ps - Ps 1,559
Level 1The fair value of financial instruments traded in active markets is based on quoted market prices at the balance sheet date. A market is considered active if quoted prices are clearly and regularly available from a stock exchange, dealer, broker, industry group, pricing service or regulatory agency, and those prices represent actual and regular market transactions at arm-length conditions. The trading price used for financial assets held by ALFA is the current bid price.
Level 2The fair value of financial instruments that are not traded in an active market is determined by using valuation techniques. These valuation techniques maximize the use of observable market data when available and rely as little as possible on estimates specific to the Company. If all significant inputs required to measure an instrument at fair value are observable, the instrument is classified at Level 2.
Level 3If one or more of the significant inputs is not based on observable market data, the instrument is classified at Level 3.
Specific valuation techniques used to value financial instruments include:
- Market quotations or offers from retailers for similar instruments.
- The fair value of interest rate swaps calculated as the present value of estimated future cash flows based on observable yield curves.
- The fair value of forward exchange contracts determined using the exchange rates on the balance sheet date, with the resulting value discounted to present value.
- Other techniques, such as the analysis of discounted cash flows, which are used to determine fair value for the remaining financial instruments

66
The following table presents the movement in Level 3 instruments for the year ended December 31, 2013 and 2012: Financial assets available for sale Total
Initial balance at January 1, 2012 Ps 202 Ps 202Purchases 32 32Final balance at December 31, 2012 (Restructured*) 234 234Purchases - -Disposals (7) (7)Final balance at December 31, 2013 Ps 227 Ps 227
* Restructured to reflect the adjustments to provisional fair values previously recognized in business combinations as described in Note 2.m.
5 Critical accounting estimates and judgments
Estimates and judgments are continually evaluated and are based on historical experience and other factors, including expectations of future events that are believed to be reasonable under the circumstances.
5.1 Critical accounting estimates and judgmentsThe Company makes estimates and assumptions concerning the future. The resulting accounting estimates will, by definition, seldom equal the related actual results. The estimates and assumptions that have a significant risk of causing a material adjustment to the carrying amounts of assets and liabilities within the next financial year are addressed below.
(a) Estimated impairment of goodwillThe Company tests annually whether goodwill has suffered any impairment, in accordance with the established accounting policy (see Note 13). The recoverable amounts of cash-generating units have been determined based on value-in-use calculations. These calculations require the use of estimates.
(b) Income taxThe Company is subject to income taxes in numerous jurisdictions. Significant judgment is required in determining the worldwide provision for income taxes. There are many transactions and calculations for which the ultimate tax determination is uncertain. The Company recognizes liabilities for anticipated tax audit issues based on estimates of whether additional taxes will be due. Where the final tax outcome of these matters is different from the amounts that were initially recorded, such differences will impact the current and deferred income tax assets and liabilities in the period in which such determination is made. If income before taxes increases/decreases by 5%, income tax will be increased/decreased by Ps160.
(c) Fair value of derivativesThe fair value of financial instruments that are not traded in an active market is determined by using fair value hierarchies. The Company uses its judgment to select a variety of methods and make assumptions that are based mainly on market conditions existing at the end of each reporting period. If the fair value estimation varies by 5%, the effect on income would be modified by Ps80.
(d) Contingent lossesManagement also makes judgments and estimates in recording provisions for matters relating to claims and litigation, primarily in relation to rates of interconnection services. Actual costs may vary from estimates for several reasons, such as changes in cost estimates for resolution of complaints and disputes based on different interpretations of the law, opinions and evaluations concerning the amount of loss.
Contingencies are recorded as provisions when it is likely that a liability has been incurred and the amount of the loss is reasonably estimable. It is not practical to estimate sensitivity to potential losses if other assumptions were used to record these provisions, due to the number of underlying assumptions and the range of possible reasonable outcomes regarding potential actions by third parties, such as regulators, both in terms of loss probability and estimates of such loss.
5.2 Critical judgments in applying the entity’s accounting policies(a) Revenue recognitionThe Company has recognized revenue amounting to Ps195,358 for sales of goods to third parties in the Nemak, Sigma and Alpek segments during 2013. The buyer has the right to return the goods if their customers are dissatisfied. The Company believes that, based on past experience with similar sales, the dissatisfaction rate will not exceed 2.5%. The Company has, therefore, recognized revenue on this transaction with a corresponding provision against revenue for estimated returns. If the estimate changes by 10%, the revenue will be reduced/increased by Ps488.

67
(b) Basis of consolidationThe financial statements include the assets, liabilities and results of all entities in which the Company has a controlling interest. The outstanding balances and significant intercompany transactions have been eliminated in consolidation. To determine control, the Company considers whether it has the power to govern the financial and operational strategy of the respective entity and not just the power of the capital held by the Company. As a result of this analysis, the Company has exercised critical judgment to decide whether to consolidate the financial statements of Polioles and Indelpro, where the determination of control is not clear. Based on the principal substantive right of Alpek in accordance with the by-laws of Polioles to appoint the General Director, who has control over the relevant decision making and based on the by-laws of Indelpro and supported in the General Law of Mercantile Organizations, which allow Alpek to control the decisions over relevant activities by a simple majority through an ordinary shareholders’ meeting, where it holds 51% of Indelpro. Management has concluded that there are circumstances and factors described in the bylaws of Polioles and applicable standards that allow the Company to conduct the daily operations of Polioles and Indelpro, wich therefore demonstrate control. The Company will continue to evaluate these circumstances at the date of each statement of financial position to determine if this critical judgment is still valid. If the Company determines that it has no control over Polioles and Indelpro, Polioles and Indelpro will need to be deconsolidated and be recorded using the equity method.
6 Cash and cash equivalents
Cash and cash equivalents presented in the statements of financial position consist of the following: December 31,
2013 2012
Cash at bank and in hand Ps 5,263 Ps 3,591Short-term bank deposits 6,639 10,070Total cash and cash equivalents (excluding bank overdrafts) Ps 11,902 Ps 13,661
For purposes of the cash flow statement the cash and cash equivalents include the following items: December 31,
2013 2012
Cash and cash equivalents Ps 11,902 Ps 13,661Bank overdrafts (classified as debt in current liabilities) - (4)Cash and cash equivalents at end of year Ps 11,902 Ps 13,657
7 Restricted cash and cash equivalents
The value of restricted cash and cash equivalents are composed as follows: December 31,
2013 2012
Current (a) Ps 364 Ps 577Non-current (b) 153 435Restricted cash and cash equivalents Ps 517 Ps 1,012
a) Applies to deposits relating to lawsuits with authorities arising from differences in the interpretation of some laws in countries where two subsidiaries operate relating to Nemak segment.
b) This restricted cash is for proceedings before The Mexican Federal Telecommunications Commission in connection with a dispute arising from a resale of interconnection rates that Alestra has with Teléfonos de Mexico, S. A. de C. V. (“Telmex”) and Teléfonos del Norte (“Telnor”, a subsidiary of Telmex). The parties request a resolution regarding tariff rates for interconnection of traffic telecommunication networks applicable during 2010 and the interconnection traffic of long distance (interurban transport) during 2009 and 2008. On September 8, 2009, the Company and Telmex created a trust with BBVA Bancomer (as trustee) to ensure the payment of fixed interconnection services on the dispute applicable to 2008. The trust agreement was amended to include the amounts in dispute for 2009 and 2010.
The restricted cash representing the balance of the trust is presented in the statement of financial position within non-current assets. At December 31, 2013 and 2012, the balance of the trust was Ps153 (Ps435 in 2012), composed of contributions by Alestra and corresponding yields. During April 2013, Alestra obtained a favorable resolution releasing Ps282 of this trust’s deposit.

68
8 Customers and other accounts receivable, net
December 31,
2013 2012
Customers Ps 18,979 Ps 18,251Recoverable taxes 344 -Interest receivable 2 1Other debtors: Short-term notes receivable 100 5 Sundry debtors 4,731 4,113 Long-term notes receivable 212 225 Other non-current assets - 64Provision for impairment of customers and other accounts receivable (592) (467) 23,776 22,192Less: non-current portion (1) 212 289Current portion Ps 23,564 Ps 21,903
(1) The non-current accounts receivable represent long-term receivables and other non-current assets, and are presented in the statement of financial position in other noncurrent assets.
Customers and other accounts receivable include past-due balances of Ps3,157, Ps2,841 at December 31, 2013 and 2012, respectively.
The analysis by age of the balances due from customers and other receivables not covered by impairment provisions is as follows: December 31,
2013 2012
1 to 30 days Ps 1,708 Ps 2,02530 to 90 days 632 39990 to 180 days 373 267More than 180 days 444 150 Ps 3,157 Ps 2,841
At December 31, 2013 and 2012, trade and other accounts receivable of Ps23,710 and Ps22,364, respectively have an impairment provision (represented by customers and sundry debtors). The amount of the impairment provision at December 31, 2013 and 2012 amounts to Ps592 and Ps467, respectively. Trade and other accounts receivable impaired correspond mainly to companies going through difficult economic situations. Part of the impaired accounts are expected to be recovered.
Movements in the provision for impairment of customers and other receivables are analyzed as follows: 2013 2012
Initial balance (January 1) Ps 467 Ps 472Provision for impairment of customers and other receivables 224 154Receivables written off during the year (99) (159)Final balance (December 31) Ps 592 Ps 467
Increases in the provision for impairment of customers and other receivables are recorded in the statement of income under sales expenses.
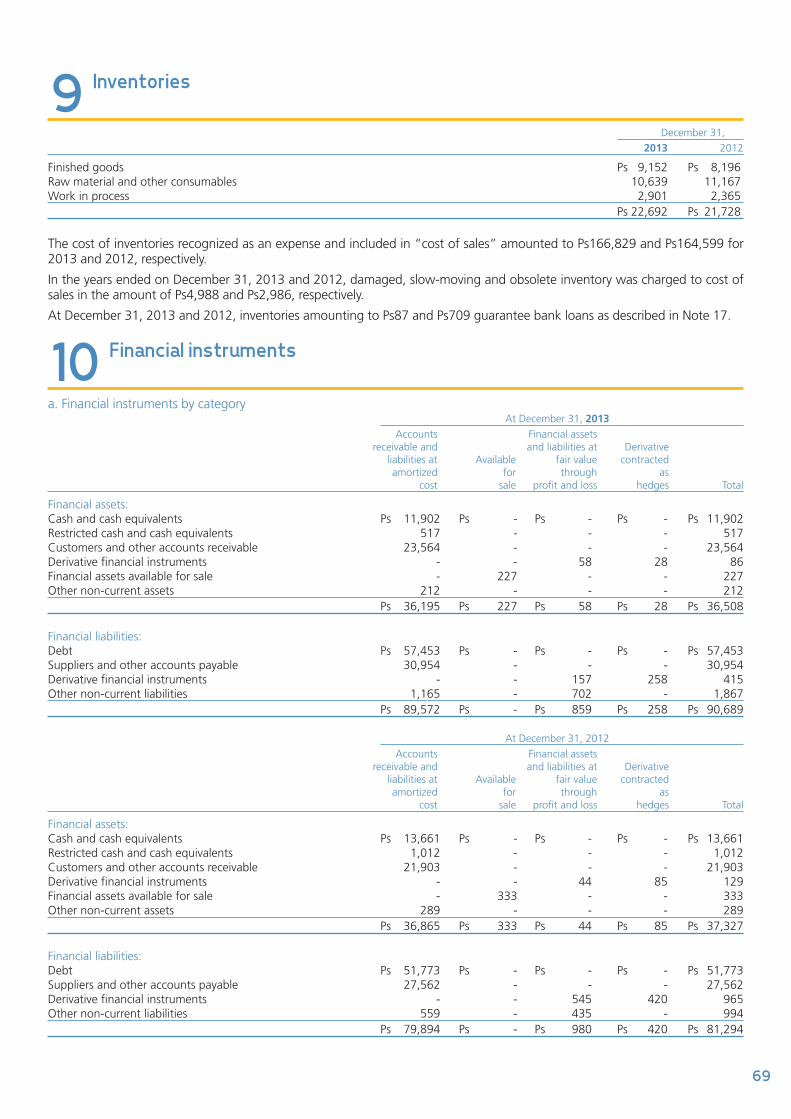
69
9 Inventories
December 31,
2013 2012
Finished goods Ps 9,152 Ps 8,196Raw material and other consumables 10,639 11,167Work in process 2,901 2,365 Ps 22,692 Ps 21,728
The cost of inventories recognized as an expense and included in “cost of sales” amounted to Ps166,829 and Ps164,599 for 2013 and 2012, respectively.
In the years ended on December 31, 2013 and 2012, damaged, slow-moving and obsolete inventory was charged to cost of sales in the amount of Ps4,988 and Ps2,986, respectively.
At December 31, 2013 and 2012, inventories amounting to Ps87 and Ps709 guarantee bank loans as described in Note 17.
10 Financial instruments
a. Financial instruments by category At December 31, 2013 Accounts Financial assets receivable and and liabilities at Derivative liabilities at Available fair value contracted amortized for through as cost sale profit and loss hedges Total
Financial assets:Cash and cash equivalents Ps 11,902 Ps - Ps - Ps - Ps 11,902Restricted cash and cash equivalents 517 - - - 517Customers and other accounts receivable 23,564 - - - 23,564Derivative financial instruments - - 58 28 86Financial assets available for sale - 227 - - 227Other non-current assets 212 - - - 212 Ps 36,195 Ps 227 Ps 58 Ps 28 Ps 36,508
Financial liabilities:Debt Ps 57,453 Ps - Ps - Ps - Ps 57,453Suppliers and other accounts payable 30,954 - - - 30,954Derivative financial instruments - - 157 258 415Other non-current liabilities 1,165 - 702 - 1,867 Ps 89,572 Ps - Ps 859 Ps 258 Ps 90,689
At December 31, 2012
Accounts Financial assets receivable and and liabilities at Derivative liabilities at Available fair value contracted amortized for through as cost sale profit and loss hedges Total
Financial assets:Cash and cash equivalents Ps 13,661 Ps - Ps - Ps - Ps 13,661Restricted cash and cash equivalents 1,012 - - - 1,012Customers and other accounts receivable 21,903 - - - 21,903Derivative financial instruments - - 44 85 129Financial assets available for sale - 333 - - 333Other non-current assets 289 - - - 289 Ps 36,865 Ps 333 Ps 44 Ps 85 Ps 37,327
Financial liabilities:Debt Ps 51,773 Ps - Ps - Ps - Ps 51,773Suppliers and other accounts payable 27,562 - - - 27,562Derivative financial instruments - - 545 420 965Other non-current liabilities 559 - 435 - 994 Ps 79,894 Ps - Ps 980 Ps 420 Ps 81,294

70
b. Credit quality of financial assetsThe credit quality of financial assets that are neither past due nor impaired can be assessed by reference to external credit ratings (if available) or to historical information about counterparty default rates: December 31,
2013 2012
Counterparties with external credit rating“A” Ps 62 Ps 182“A+“ 207 3“A-“ 362 -“BB+” 780 500“BBB+” 74 -“BBB” 300 7“BBB-” 216 9“BB” 78 - “BB-“ 1,004 -Other categories 925 818 4,008 1,519Counterparties without external credit ratingCustomers and other accounts receivable (less than 6 months) - Group X 9,434 11,415Customers and other accounts receivable (more than 6 months) without impairment - Group Y 4,995 3,015Customers and other accounts receivable (more than 6 months) with impairment - Group Z 11 13 14,440 14,443Total unimpaired trade receivables Ps 18,448 Ps 15,962
December 31,
2013 2012
Cash and cash equivalents with and without restrictions, except for cash in hand “A” Ps 704 Ps 1,269“A+” 163 218“A-” 1,124 15“BB” 27 3,584“BB-” 18 -“BB+” 129 49“BBB” 2,065 853“BBB+” 2,403 926“BBB-” 183 16Other categories 2,072 424Not rated 1,034 398 Ps 9,922 Ps 7,752
Group X – new customers/related parties (less than 6 months).
Group Y – customers/current related parties (more than 6 months) without default in the past.
Group Z – current customers/related parties (more than 6 months) with some defaults in the past. All past-due amounts were fully recovered.
c. Fair value of financial assets and liabilities valued at amortized costThe amounts of cash and cash equivalents, restricted cash and cash equivalents, customers and other receivables, other current assets, suppliers and other payables, outstanding debt, provisions and other current liabilities approximate their fair value due to their short maturity. The carrying value of these accounts represents the expected cash flow at December 31, 2013 and 2012.
The carrying value and estimated fair value of financial assets and financial liabilities carried at amortized cost are as follows: At December 31, 2013 At December 31, 2012
Carrying Fair Carrying Fair amount value amount value
Financial assets:Non-current accounts receivable Ps 212 Ps 200 Ps 289 Ps 264Financial liabilities:Non-current debt 46,413 50,294 47,175 50,660
The estimated fair values were determined based on discounted cash flows. These fair values do not consider the current portion of financial assets and liabilities, since the current portion approximates their fair value.

71
d. Derivative financial instrumentsThe effectiveness of derivative financial instruments designated as hedges is measured periodically. At December 31, 2013 and 2012 the Company’s management has assessed the effectiveness of its hedges for accounting purposes and has concluded that they are highly effective.
Notional amounts related to derivative financial instruments reflect the contracted reference volume; however they do not reflect the amounts at risk with respect to future cash flows. The amounts at risk are generally limited to the unrealized profit or loss from the market valuation of such instruments, which may vary according to changes in the market value of the underlying, its volatility and the credit quality of the counterparties.
The principal obligations which the Company is subject to depends on the type of contract and the conditions established in each one of the derivative financial instruments in force at December 31, 2013 and 2012.
Trading derivatives are classified as current assets or liabilities. The fair value of hedges is classified as a non-current asset or liability if the remaining maturity of the hedged item is more than 12 months and as a current asset or liability if the remaining maturity of the hedged item is less than 12 months.
In the year ended December 31, 2013 and 2012, the Company had no effects from ineffective portions of fair value and cash flows hedges.
(a) Forward exchange contractsPositions in foreign currency derivative financial instruments are summarized as follows: At December 31, 2013 Value of underlying asset Maturity by yearType of derivative, Notional Fair Collateral / value or contract amount Units Reference value 2014 2015 2016+ guarantee
For hedging purposes:USD/MXN (CCS1)2 Ps (3,500) Peso / Dollar 13.08 Ps (279) Ps - Ps (14) Ps (265) Ps -For trading purposes:EUR/USD (CCS1) Ps 1,023 Dollar / Euro 1.38 (102) (20) (32) (50) - Ps (381) Ps (20) Ps (46) Ps (315) Ps -
At December 31, 2012
Value of underlying asset Maturity by yearType of derivative, Notional Fair Collateral / value or contract amount Units Reference value 2013 2014 2015+ guarantee
For hedging purposes:USD/MXN (CCS1)2 Ps (3,500) Peso / Dollar 13.01 Ps (243) Ps - Ps - Ps (243) Ps -For trading purposes:USD/MXN (CCS1) (27) Peso / Dollar 13.01 (6) (6) - - -EUR/USD (CCS1) 1,218 Dollar / Euro 1.32 (68) (11) (11) (46) -USD/MXN (325) Peso / Dollar 13.01 6 6 - - - Ps (311) Ps (11) Ps (11) Ps (289) Ps -
1 Cross currency swaps2 Fair value hedges

72
(b) Interest rate swapsPositions in interest rate derivative financial instruments are summarized as follows: At December 31, 2013 Value of underlying asset Maturity by yearType of derivative, Notional Fair Collateral / value or contract amount Units Reference value 2014 2015 2016+ guarantee
For hedging purposes:On Libor 1 Ps 785 % per year 0.49 Ps (20) Ps (12) Ps (7) Ps (1) Ps - Ps (20) Ps (12) Ps (7) Ps (1) Ps -
At December 31, 2012
Value of underlying asset Maturity by yearType of derivative, Notional Fair Collateral / value or contract amount Units Reference value 2013 2014 2015+ guarantee
For hedging purposes:On Libor 1 Ps 2,862 % per year 0.39 Ps (200) Ps (42) Ps (56) Ps (102) Ps -For trading purposes:On Libor 2,309 % per year 0.39 (54) (54) - - - Ps (254) Ps (96) Ps (56) Ps (102) Ps -
1 Cash flow hedges
(c) CommoditiesPositions in derivative financial instruments covering natural gas, gasoline and ethylene are summarized as follows: At December 31, 2013 Value of underlying asset Maturity by yearType of derivative, Notional Fair Collateral / value or contract amount Units Reference value 2014 2015 2016+ guarantee
For hedging purposes:Ethylene 1 Ps 155 Dollar cents/lb 58.75 Ps 12 Ps 11 Ps 1 Ps - Ps -Natural gas 1 444 Dollar / MBTU 4.29 7 15 - (8) -Ethane 1 23 Dollar Cents/ Gallon 28.03 (3) (3) - - -Px1 226 Dollar/MT 1.435 (2) (2) - - -Crude WTI 1 417 Dollar/BBL 93.33 (3) (3) - - -For trading purposes:Gasoline 923 Dollar / Gallon 2.72 54 54 - - -Natural gas 25 Dollar / MBTU 4.29 (53) (53) - - -Crude Brent 60 Dollar / BBL 108.53 2 2 - - - Ps 14 Ps 21 Ps 1 Ps (8) Ps -
At December 31, 2012
Value of underlying asset Maturity by yearType of derivative, Notional Fair Collateral / value or contract amount Units Reference value 2013 2014 2015+ guarantee
For hedging purposes:Ethylene 1 Ps 476 Dollar Cents/lb 55.1 Ps 40 Ps 42 Ps (2) Ps - Ps -Natural gas 1 857 Dollar / MBTU 3.6 43 43 - - -Ethane 1 55 Dollar Cents/ Gallon 23.9 (16) (16) - - -For trading purposes:Natural gas 78 Dollar / MBTU 3.6 (393) (339) (54) - -Gasoline 1,138 Dollar / Gallon 2.7 14 20 (6) - - Ps (312) Ps (250) Ps (62) Ps - Ps -
1 Cash flow hedges

73
At December 31, 2013 and 2012, the net fair value of derivative financial instruments above amounts to Ps329 and Ps836, respectively, which is shown in the consolidated statements of financial position as follows: At December 31, 2013 Fair Initial Net value value position recorded
Current assets Ps 86 Ps - Ps 86Non-current assets - - -Current liabilities (78) - (78)Non-current liabilities (395) 58 (337)Net position Ps (387) Ps 58 Ps (329)
At December 31, 2012
Fair Initial Net value value position recorded
Current assets Ps 129 Ps - Ps 129Non-current assets - - -Current liabilities (378) - (378)Non-current liabilities (628) 41 (587)Net position Ps (877) Ps 41 Ps (836)
11 Other current assets
Other current assets consist of the following: December 31,
2013 2012
Advance payments (1) Ps 822 Ps 891Accounts receivable – affiliates (Note 8) 184 85Other current assets 37 -Total other current assets Ps 1,043 Ps 976
(1) This item comprises mainly advertising and insurance paid in advance.

74
12 Property, plant and equipment
Furniture, fittings and Tooling Improvements Other Buildings and Machinery Transportation Telecommunication information and Construction to leased fixed Land constructions and equipment equipment network technology spare parts in process property assets Total
At January 1, 2012Cost Ps 7,186 Ps 20,947 Ps 88,495 Ps 2,862 Ps 10,899 Ps 3,824 Ps 286 Ps 5,661 Ps 510 Ps 568 Ps 141,238Accumulated depreciation - (8,830) (43,596) (1,674) (6,984) (2,933) (102) - (247) (492) (64,858)Net value in books at January 1, 2012 Ps 7,186 Ps 12,117 Ps 44,899 Ps 1,188 Ps 3,915 Ps 891 Ps 184 Ps 5,661 Ps 263 Ps 76 Ps 76,380
Year ended December 31, 2012Opening net book amount Ps 7,186 Ps 12,117 Ps 44,899 Ps 1,188 Ps 3,915 Ps 891 Ps 184 Ps 5,661 Ps 263 Ps 76 Ps 76,380Exchange differences (176) (691) (2,817) (23) (1) (29) (125) (403) - (4) (4,269)Additions 21 169 1,650 49 16 125 124 6,212 3 59 8,428Additions from businesscombinations (Restructured*) 37 401 1,116 2 - 18 152 210 - - 1,936Disposals (42) (48) (346) (19) (9) (37) (44) (101) 9 2 (635)Impairment charge for the year - - (78) - - 6 (3) (31) - (4) (110)Depreciation charge for the year - (529) (5,110) (298) (703) (337) (112) - (24) (19) (7,132)Transfers (63) 488 3,463 339 738 213 57 (5,658) 31 37 (355)Closing net book amount at December 31, 2012 (Restructured*) Ps 6,963 Ps 11,907 Ps 42,777 Ps 1,238 Ps 3,956 Ps 850 Ps 233 Ps 5,890 Ps 282 Ps 147 Ps 74,243
At January 1, 2013 (Restructured*)Cost Ps 6,963 Ps 21,333 Ps 87,424 Ps 3,023 Ps 11,550 Ps 3,376 Ps 465 Ps 5,890 Ps 573 Ps 302 Ps 140,899Accumulated depreciation - (9,426) (44,647) (1,785) (7,594) (2,526) (232) - (291) (155) (66,656)Net book amount at January 1, 2013 (Restructured*) Ps 6,963 Ps 11,907 Ps 42,777 Ps 1,238 Ps 3,956 Ps 850 Ps 233 Ps 5,890 Ps 282 Ps 147 Ps 74,243
Year ended December 31, 2013Opening net book amount (Restructured*) Ps 6,963 Ps 11,907 Ps 42,777 Ps 1,238 Ps 3,956 Ps 850 Ps 233 Ps 5,890 Ps 282 Ps 147 Ps 74,243Exchange difference 3 43 (39) (3) - 5 4 53 - - 66Additions 72 135 1,714 390 33 142 98 6,656 46 26 9,312Additions from business combinations 116 107 84 24 26 12 - - 5 - 374Disposals (17) (18) (168) (43) (13) (10) (6) (157) (4) (4) (440)Impairment charge for the year (Note2.h) - (328) (2,044) (2) - 3 (1) (30) - (17) (2,419)Depreciation charge for the year - (605) (4,919) (308) (699) (296) (102) - (27) (13) (6,969)Transfers (15) 496 3,629 18 801 185 (34) (5,271) 27 (29) (193)Closing net book amount at December 31, 2013 Ps 7,122 Ps 11,737 Ps 41,034 Ps 1,314 Ps 4,104 Ps 891 Ps 192 Ps 7,141 Ps 329 Ps 110 Ps 73,974
At December 31, 2013Cost Ps 7,122 Ps 21,730 Ps 89,885 Ps 3,179 Ps 12,364 Ps 3,587 Ps 512 Ps 7,141 Ps 648 Ps 204 Ps 146,372Accumulated depreciation - (9,993) (48,851) (1,865) (8,260) (2,696) (320) - (319) (94) (72,398)Net value in books at December 31, 2013 Ps 7,122 Ps 11,737 Ps 41,034 Ps 1,314 Ps 4,104 Ps 891 Ps 192 Ps 7,141 Ps 329 Ps 110 Ps 73,974
* Restructured to reflect the adjustments to provisional fair values, previously recognized in business combinations as described in Note 2.m.
Of the total depreciation expense, Ps6,237 and Ps6,366 were charged to cost of sales, Ps305 and Ps474 to selling expenses and Ps427 and Ps292 to administrative expenses in 2013 and 2012, respectively.
At December 31, 2012 there were no property, plant and equipment pledged as collateral.
Assets under finance leases comprise the following amounts in which the Company is the lessee: December 31,
2013 2012
Cost - capitalized financial lease Ps 647 Ps 287Accumulated depreciation (332) (95)Carrying value, net Ps 315 Ps 192
The Company has entered into various non-cancellable lease agreements as lessee. The lease terms are between 2 and 3 years, and the ownership of the assets lies with the Company.

75
12 Property, plant and equipment
Furniture, fittings and Tooling Improvements Other Buildings and Machinery Transportation Telecommunication information and Construction to leased fixed Land constructions and equipment equipment network technology spare parts in process property assets Total
At January 1, 2012Cost Ps 7,186 Ps 20,947 Ps 88,495 Ps 2,862 Ps 10,899 Ps 3,824 Ps 286 Ps 5,661 Ps 510 Ps 568 Ps 141,238Accumulated depreciation - (8,830) (43,596) (1,674) (6,984) (2,933) (102) - (247) (492) (64,858)Net value in books at January 1, 2012 Ps 7,186 Ps 12,117 Ps 44,899 Ps 1,188 Ps 3,915 Ps 891 Ps 184 Ps 5,661 Ps 263 Ps 76 Ps 76,380
Year ended December 31, 2012Opening net book amount Ps 7,186 Ps 12,117 Ps 44,899 Ps 1,188 Ps 3,915 Ps 891 Ps 184 Ps 5,661 Ps 263 Ps 76 Ps 76,380Exchange differences (176) (691) (2,817) (23) (1) (29) (125) (403) - (4) (4,269)Additions 21 169 1,650 49 16 125 124 6,212 3 59 8,428Additions from businesscombinations (Restructured*) 37 401 1,116 2 - 18 152 210 - - 1,936Disposals (42) (48) (346) (19) (9) (37) (44) (101) 9 2 (635)Impairment charge for the year - - (78) - - 6 (3) (31) - (4) (110)Depreciation charge for the year - (529) (5,110) (298) (703) (337) (112) - (24) (19) (7,132)Transfers (63) 488 3,463 339 738 213 57 (5,658) 31 37 (355)Closing net book amount at December 31, 2012 (Restructured*) Ps 6,963 Ps 11,907 Ps 42,777 Ps 1,238 Ps 3,956 Ps 850 Ps 233 Ps 5,890 Ps 282 Ps 147 Ps 74,243
At January 1, 2013 (Restructured*)Cost Ps 6,963 Ps 21,333 Ps 87,424 Ps 3,023 Ps 11,550 Ps 3,376 Ps 465 Ps 5,890 Ps 573 Ps 302 Ps 140,899Accumulated depreciation - (9,426) (44,647) (1,785) (7,594) (2,526) (232) - (291) (155) (66,656)Net book amount at January 1, 2013 (Restructured*) Ps 6,963 Ps 11,907 Ps 42,777 Ps 1,238 Ps 3,956 Ps 850 Ps 233 Ps 5,890 Ps 282 Ps 147 Ps 74,243
Year ended December 31, 2013Opening net book amount (Restructured*) Ps 6,963 Ps 11,907 Ps 42,777 Ps 1,238 Ps 3,956 Ps 850 Ps 233 Ps 5,890 Ps 282 Ps 147 Ps 74,243Exchange difference 3 43 (39) (3) - 5 4 53 - - 66Additions 72 135 1,714 390 33 142 98 6,656 46 26 9,312Additions from business combinations 116 107 84 24 26 12 - - 5 - 374Disposals (17) (18) (168) (43) (13) (10) (6) (157) (4) (4) (440)Impairment charge for the year (Note2.h) - (328) (2,044) (2) - 3 (1) (30) - (17) (2,419)Depreciation charge for the year - (605) (4,919) (308) (699) (296) (102) - (27) (13) (6,969)Transfers (15) 496 3,629 18 801 185 (34) (5,271) 27 (29) (193)Closing net book amount at December 31, 2013 Ps 7,122 Ps 11,737 Ps 41,034 Ps 1,314 Ps 4,104 Ps 891 Ps 192 Ps 7,141 Ps 329 Ps 110 Ps 73,974
At December 31, 2013Cost Ps 7,122 Ps 21,730 Ps 89,885 Ps 3,179 Ps 12,364 Ps 3,587 Ps 512 Ps 7,141 Ps 648 Ps 204 Ps 146,372Accumulated depreciation - (9,993) (48,851) (1,865) (8,260) (2,696) (320) - (319) (94) (72,398)Net value in books at December 31, 2013 Ps 7,122 Ps 11,737 Ps 41,034 Ps 1,314 Ps 4,104 Ps 891 Ps 192 Ps 7,141 Ps 329 Ps 110 Ps 73,974

76
* Restructured to reflect the adjustments to provisional fair values, previously recognized in business combinations as described in Note 2.m.
13 Goodwill and intangible assets
Finite life Indefinite life
Development Exploration Customers’ Software and Undefined costs costs Trademarks Relationships Copyrights Other Goodwill Brands Other Total
CostAt January 1, 2012 Ps 1,617 Ps 1,016 Ps 43 Ps 2,707 Ps 1,278 Ps 1,440 Ps 962 Ps 10,731 Ps 2,607 Ps 17 Ps 22,418Exchange differences 51 (98) (5) (129) (9) - (137) (502) - - (829)Additions 576 593 70 9 149 - 131 - - - 1,528Additions from business combinations - - 1 - 1 - 14 76 - - 92Impairment charge for the year - (1) - - - - - - - - (1)Transfers (114) - - - (3) - (12) - - - (129)Disposals - - - (113) (31) - - - - - (144)At December 31, 2012 (Restructured*) 2,130 1,510 109 2,474 1,385 1,440 958 10,305 2,607 17 22,935Exchange differences 42 59 - 42 4 - 53 - 8 1 209Additions 1,236 1,704 - 155 171 - 1,256 1,120 109 - 5,751Additions from business combinations - - 8 51 - - - - - - 59Impairment charge for the year - (8) - - - - - - (8)Transfers (1) (2) - 17 6 - (3) - - (13) 4Disposals - - - (51) (1) - (15) . - - (67)At December 31, 2013 Ps 3,407 Ps 3,263 Ps 117 Ps 2,688 Ps 1,565 Ps 1,440 Ps 2,249 Ps 11,425 Ps 2,724 Ps 5 Ps 28,883
Accumulated amortizationAt January 1, 2012 Ps (1,041) Ps (487) Ps (9) Ps (533) Ps (1,038) Ps (68) Ps (385) Ps - Ps - Ps - Ps (3,561)Amortizations (211) (192) (24) (187) (82) - (135) - - - (831)Disposals - - - 113 19 - - - - - 132Transfers 119 - - - 4 - (8) - - - 115Exchange differences (77) 34 - (7) 6 - (14) - - - (58)At December 31, 2012 (Restructured*) (1,210) (645) (33) (614) (1,091) (68) (542) - - - (4,203)Amortizations (192) (49) (39) (188) (94) (68) (92) - - - (722)Additions - - (3) - - - - - - - (3)Disposals - - - 1 1 - 4 - - - 6Transfers (1) - 4 (13) (10) - 14 - - - (6)Exchange differences (14) (4) (1) (24) (4) - (2) - - - (49)At December 31, 2013 Ps (1,417) Ps (698) Ps (72) Ps (838) Ps (1,198) Ps (136) Ps (618) Ps - Ps - Ps - Ps (4,977)
Net carrying valueCost Ps 2,130 Ps 1,510 Ps 109 Ps 2,474 Ps 1,385 Ps 1,440 Ps 958 Ps 10,305 Ps 2,607 Ps 17 Ps 22,935Accumulated amortization (1,210) (645) (33) (614) (1,091) (68) (542) - - (4,203)At December 31, 2012 (Restructured*) Ps 920 Ps 865 Ps 76 Ps 1,860 Ps 294 Ps 1,372 Ps 416 Ps 10,305 Ps 2,607 Ps 17 Ps 18,732
Cost Ps 3,407 Ps 3,263 Ps 117 Ps 2,688 Ps 1,565 Ps 1,440 Ps 2,249 Ps 11,425 2,724 Ps 5 Ps 28,883Accumulated amortization (1,417) (698) (72) (838) (1,198) (136) (618) - - - (4,977)At December 31, 2013 Ps 1,990 Ps 2,565 Ps 45 Ps 1,850 Ps 367 Ps 1,304 Ps 1,631 Ps 11,425 Ps 2,724 Ps 5 Ps 23,906
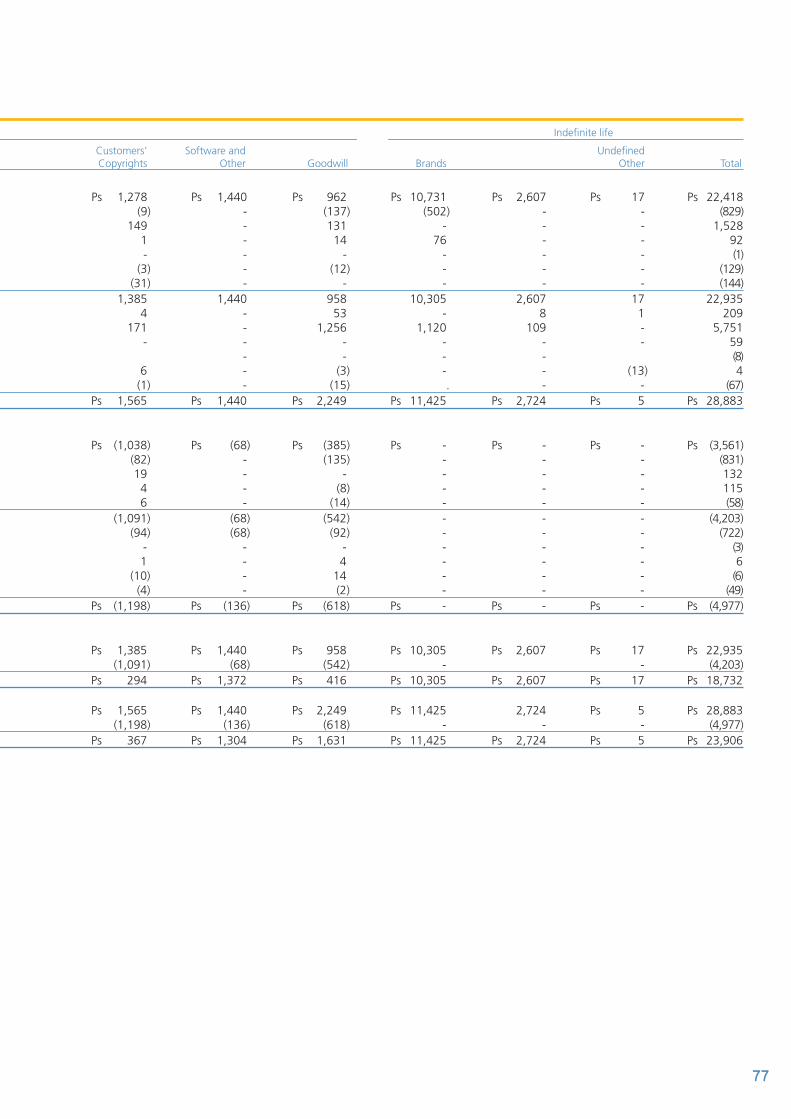
77
13 Goodwill and intangible assets
Finite life Indefinite life
Development Exploration Customers’ Software and Undefined costs costs Trademarks Relationships Copyrights Other Goodwill Brands Other Total
CostAt January 1, 2012 Ps 1,617 Ps 1,016 Ps 43 Ps 2,707 Ps 1,278 Ps 1,440 Ps 962 Ps 10,731 Ps 2,607 Ps 17 Ps 22,418Exchange differences 51 (98) (5) (129) (9) - (137) (502) - - (829)Additions 576 593 70 9 149 - 131 - - - 1,528Additions from business combinations - - 1 - 1 - 14 76 - - 92Impairment charge for the year - (1) - - - - - - - - (1)Transfers (114) - - - (3) - (12) - - - (129)Disposals - - - (113) (31) - - - - - (144)At December 31, 2012 (Restructured*) 2,130 1,510 109 2,474 1,385 1,440 958 10,305 2,607 17 22,935Exchange differences 42 59 - 42 4 - 53 - 8 1 209Additions 1,236 1,704 - 155 171 - 1,256 1,120 109 - 5,751Additions from business combinations - - 8 51 - - - - - - 59Impairment charge for the year - (8) - - - - - - (8)Transfers (1) (2) - 17 6 - (3) - - (13) 4Disposals - - - (51) (1) - (15) . - - (67)At December 31, 2013 Ps 3,407 Ps 3,263 Ps 117 Ps 2,688 Ps 1,565 Ps 1,440 Ps 2,249 Ps 11,425 Ps 2,724 Ps 5 Ps 28,883
Accumulated amortizationAt January 1, 2012 Ps (1,041) Ps (487) Ps (9) Ps (533) Ps (1,038) Ps (68) Ps (385) Ps - Ps - Ps - Ps (3,561)Amortizations (211) (192) (24) (187) (82) - (135) - - - (831)Disposals - - - 113 19 - - - - - 132Transfers 119 - - - 4 - (8) - - - 115Exchange differences (77) 34 - (7) 6 - (14) - - - (58)At December 31, 2012 (Restructured*) (1,210) (645) (33) (614) (1,091) (68) (542) - - - (4,203)Amortizations (192) (49) (39) (188) (94) (68) (92) - - - (722)Additions - - (3) - - - - - - - (3)Disposals - - - 1 1 - 4 - - - 6Transfers (1) - 4 (13) (10) - 14 - - - (6)Exchange differences (14) (4) (1) (24) (4) - (2) - - - (49)At December 31, 2013 Ps (1,417) Ps (698) Ps (72) Ps (838) Ps (1,198) Ps (136) Ps (618) Ps - Ps - Ps - Ps (4,977)
Net carrying valueCost Ps 2,130 Ps 1,510 Ps 109 Ps 2,474 Ps 1,385 Ps 1,440 Ps 958 Ps 10,305 Ps 2,607 Ps 17 Ps 22,935Accumulated amortization (1,210) (645) (33) (614) (1,091) (68) (542) - - (4,203)At December 31, 2012 (Restructured*) Ps 920 Ps 865 Ps 76 Ps 1,860 Ps 294 Ps 1,372 Ps 416 Ps 10,305 Ps 2,607 Ps 17 Ps 18,732
Cost Ps 3,407 Ps 3,263 Ps 117 Ps 2,688 Ps 1,565 Ps 1,440 Ps 2,249 Ps 11,425 2,724 Ps 5 Ps 28,883Accumulated amortization (1,417) (698) (72) (838) (1,198) (136) (618) - - - (4,977)At December 31, 2013 Ps 1,990 Ps 2,565 Ps 45 Ps 1,850 Ps 367 Ps 1,304 Ps 1,631 Ps 11,425 Ps 2,724 Ps 5 Ps 23,906

78
Other intangible assets consist mainly of patents, concessions and agreements not to compete.
Of the total amortization expense, Ps658 and Ps509, were charged to cost of sales, Ps87 and Ps103 to selling expenses and Ps218 and Ps219 to administrative expenses in 2013 and 2012, respectively.
Research expenses incurred and recorded in the results of 2013 and 2012 were Ps77 and Ps61, respectively.
Goodwill was increased in 2013 due to the acquisition of ComNor and Monteverde in the Sigma segment and to the acquisition of G Tel in the Alestra segment.
Impairment testing of goodwillGoodwill is allocated to operating segments that are expected to benefit from the synergies of the business combination, irrespective of whether other assets or liabilities of the acquiree are assigned to those units or groups of units, as follows: December 31,
2013 2012
(Restructured*)Alpek Ps 221 Ps 221Sigma 6,057 5,112Nemak 4,494 4,616Alestra 297 (1) -Other segments 356 356 Ps 11,425 Ps 10,305
* Restructured to reflect the adjustments to provisional fair values, previously recognized in business combinations as described in Note 2.m.(1) This goodwill was generated during 2013, so no key assumptions were determined for evaluation at the end of 2013.
The amount of recovery from the operating segments has been determined based on calculations of values in use. These calculations use cash flow projections based on pre-tax financial budgets approved by management covering a period of 5 years.
The key assumptions used in calculating the value in use in 2013 and 2012 were as follows: 2013 Other Alpek Sigma Nemak segments
Estimated gross margin 3.0% 7.3% 14.5% 6.4%Growth rate 3.8% 3.8% 1.5% 3.9%Discount rate 10.2% 9.5% 10.6% 11.5%
2012
Other Alpek Sigma Nemak segments
Estimated gross margin 3.0% 9.4% 11.8% 6.3%Growth rate 2.2% 7.5% 1.5% 7.6%Discount rate 10.0% 8.4% 8.3% 10.5%
With regard to the calculation of the value in use of the operating segments, ALFA Management considers that a possible change in the key assumptions used, would not cause the carrying value of the operating segments to materially exceed their value in use.

79
14 Investments accounted for using the equity method and others
December 31,
2013 2012
(Restructured*)Non-current portion of customers and other accounts receivable (Note 8) Ps 212 Ps 289Financial assets available for sale 227 234Other assets 110 -Restricted cash (Note 7) 153 435Other non-current financial assets 702 958Investment in associates 5,660 255Joint arrangements 286 -Total other non-current assets Ps 6,648 Ps 1,213
* Restructured to reflect the adjustments to provisional fair values, previously recognized in business combinations as described in Note 2.m.
Financial assets available for saleThese assets are investments in shares of companies not listed on the market, representing less than 1% of their capital stock and equity investments in social clubs. No impairment loss was recognized at December 31, 2013.
The movement of financial assets available for sale was as follows: 2013 2012
(Restructured*)Balance at January 1 Ps 234 Ps 202Acquisitions (disposals) (7) 32Balance at December 31 Ps 227 Ps 234
Financial assets available for sale are denominated in Mexican pesos.
Investments in associatesThe financial information of the most important associate of the Company (Campofrio), which was acquired during the last quarter of 2013, is disclosed in Note 2.b.
The accumulated summarized financial information for associates of the group accounted for by the equity method, not considered material, is as follows: 2013 2012
Operating income Ps (131) Ps (155)Other comprehensive income items - -Comprehensive loss (131) (155)Investment in associates (not material) at December 31 28 82
There are no contingent liabilities related to the investment of the group in the associates
Joint arrangementsThe accumulated summarized financial information for joint arrangements of the group accounted for by the equity method, not considered material, is as follows: 2013 2012
Income from ongoing operations Ps (129) Ps 38Income from discontinued operations - -Other comprehensive income - -Comprehensive loss (129) (38)Joint arrangements (not material) at December 31 286 173
There are no contingent liabilities related to the investment of the group in the joint arrangements.
The group has no commitments with respect to joint arrangements at December 31, 2013.

80
15 Subsidiaries with significant non-controlling interest
The non-controlling interest for the year ended December 31, 2013 and 2012 is integrated as follows: Non-controlling Non-controlling Non-controlling interest interest ownership income for the period at December 31, percentage 2013 2012 2013 2012
Alpek, S. A. B. de C. V. 18% Ps 689 Ps 1,125 Ps 7,173 Ps 7,424Tenedora Nemak, S. A. de C. V. 7% 181 54 1,256 1,014Non-controlling interest of non-significant subsidiaries (1) 11 299 297 Ps 869 Ps 1,190 Ps 8,728 Ps 8,735
The summarized financial information at December 31, 2013 and 2012 and for the year then ended, corresponding to each subsidiary with a significant non-controlling interest is shown below: Tenedora Nemak, S.A.de C.V. Alpek, S. A. B. de C. V. 2013 2012 2013 2012 (Restructured*)Statement of financial positionCurrent assets Ps 15,347 Ps 13,195 Ps 29,672 Ps 31,960Non-current assets 37,923 36,603 28,456 29,735Current liabilities 15,212 13,036 12,305 12,048Non-current liabilities 19,603 21,480 18,735 19,996Stockholders’ equity 18,455 15,282 27,088 29,651
Statement of incomeRevenues 56,299 51,384 90,061 96,163Net profit 2,615 1,163 1 4,383Comprehensive income for the year 3,173 422 1,509 2,979Comprehensive income attributable to non-controlling interest 4 1 644 474Dividends paid to non-controlling interest - - (1,093) (605)
Cash flowsCash flows from operating activities 8,380 6,928 5,542 5,483Net cash used from investments activities (4,426) (7,175) (2,382) (1,805)Net cash used from financing activities (2,887) 45 (5,045) (280)Net increase in cash and cash equivalents 1,067 (202) (1,885) 3,398
* Restructured to reflect the adjustments to provisional fair values, previously recognized in business combinations as described in Note 2.m.
The information above does not include the elimination of intercompany balances and transactions.
16 Suppliers and other accounts payable
December 31,
2013 2012
Suppliers Ps 20,934 Ps 19,868Short-term employee benefits 914 424Advance payments from customers 1,578 940Taxes other than income tax 2,210 1,439Other accounts payable and accrued expenses 4,616 4,891 Ps 30,252 Ps 27,562

81
17 Debt
December 31,
2013 2012
Current:Bank loans (1) Ps 3,015 Ps 1,659Current portion of non-current debt 7,340 2,792Notes payable (1) 167 147Current debt Ps 10,522 Ps 4,598
December 31,
2013 2012
Non-current:In dollars:Senior Notes Ps 30,793 Ps 21,738Secured bank loans 1,210 -Unsecured bank loans 13,885 16,856Finance leases 51 59Other 92 60In local currency:Unsecured bank loans - 67Unsecured stock certificates 6,844 6,740In euros:Unsecured bank loans 1,227 4,168Finance leases 24 39Other currencies:Unsecured bank loans - 90Finance leases 146 150 54,272 49,967Less: current portion of non-current debt (7,340) (2,792)Non-current debt (2) Ps 46,932 Ps 47,175
(1) At December 31, 2013 and 2012, short-term bank loans and notes payable bore interest at an average rate of 5.46%, and 3.97%, respectively.
The fair value of bank loans and notes payable approximates their current book value, as the impact of discounting is not significant.(2) The carrying amounts, terms and conditions of non-current debt were as follows:

82
Costs of Balance at Balance at Maturity Initial debt Interest December 31, December 31, date Interes Description Currency balance issuance payable 2013 2012 DD/MM/AAAA rate
Directo TF USD 1,210 - - Ps 1,210 Ps - 31/12/2015 3.25%Secured bank loans 1,210 -Club Loan-Dls (Citi) USD 4,864 (50) 7 4,822 02/12/2018 1.99%Club Loan-Eur (Citi) EUR 1,238 (13) 2 1,227 02/12/2018 1.99%Others USD 24 - 24 15/06/2015 2.00%Directo/Libor +275bp USD 327 - 327 15/01/2017 2.93%Directo/ Libor+337.5 bp USD 581 - 581 17/10/2014 3.63%Directo TF USD 392 (4) 3 391 10/07/2016 2.62%Bilateral Libor +1.30 USD 262 - 262 15/09/2014 1.59%Bilateral Libor +1.30 USD 458 - 458 15/09/2014 1.58%Bilateral Libor +1.30 USD 458 - 458 08/09/2014 1.57%Bilateral Libor +1.20 USD 392 - 392 20/06/2016 1.47%Bilateral Libor +1.20 USD 392 - 392 17/06/2016 1.47%Bilateral Libor +1.25 USD 3,942 - 3,944 13/11/2018 1.47%Directo Libor +1.80 USD 785 8 794 01/04/2016 2.05%Línea Comprometida Libor +1.60 USD 285 - 286 31/01/2015 1.77%Directo Libor +1.60 USD 654 2 656 16/08/2016 1.84%Directo TERZA USD 98 98 - 22/10/2018 2.3%Bilateral / TF ARS 26 26 25/03/2014 18.00%Bilateral / TF ARS 64 64 16/12/2014 22.50%Directo/ TF EUR 45 45 16/12/2014 2.00%Club Deal/Euribor+187.5 bp EUR 1,485 (16) 5 1,474 15/06/2015 2.11%Sindicado/Euribor+275 bp EUR 2,672 (33) 10 2,649 12/08/2016 3.03%Sindicado/ TIIE+25 bps MXN 67 67 26/04/2013 5.10%Directo/ TF USD 16 16 08/07/2016 2.00%Línea Comprometida/ Libor+200 bps USD 65 65 24/09/2015 2.31%Línea Comprometida/ Libor+200 bps USD 111 111 06/03/2014 2.43%Bilateral/ Libor+250 bps USD 195 196 28/02/2017 2.96%Directo/ Libor+325 bp USD 234 234 25/10/2013 3.75%Bilateral/ Libor+130 bps USD 260 260 15/09/2014 1.78%Directo/ Libor+275 bp USD 325 325 15/08/2014 3.22%Bilateral/ Libor+215 bps USD 390 391 20/09/2015 2.59%Bilateral/ Libor+130 bps USD 455 456 15/09/2014 1.78%Bilateral/ Libor+130 bps USD 455 456 08/09/2014 1.80%Bilateral/ Libor+160 bps USD 651 653 16/08/2016 2.08%Bilateral/ Libor+180 bps USD 781 789 01/04/2016 2.05%Directo/ Libor+337.5 bp USD 1,156 1,156 17/10/2014 3.63%Club Deal/Libor+187.5 bp USD 1,399 1,390 15/06/2015 2.185% - 2.30%Bilateral/ Libor+307 bps USD 2,082 2,123 23/08/2017 3.98%Sindicado/ Libor+275 bp USD 8,304 8,235 12/08/2016 3.06%- 3.22%Unsecured bank loans 15,112 21,181Certificado Bursátil/TIIE+20 bps MXN 1,000 2 1,002 1,000 08/12/2014 5.04%Certificado Bursátil/ TF MXN 1,000 47 1,047 1,000 12/07/2018 10.25%Certificado Bursátil/ TF MXN 635 3 638 635 12/07/2018 8.75%Certificado Bursátil/ UDIS MXN 605 605 12/07/2018 5.32%Certificado Bursátil/ UDIS MXN 628 15 644 12/07/2018 5.32%Certificado Bursátil/ TIIE+280 bp MXN 3,500 12 3,513 3,500 10/11/2017 6.58%Unsecured stock certificates 6,844 6,740Bono 144A/ TF USD 6,538 (123) 132 6,547 28/02/2023 5.50%Bono 144A/ TF USD 2,615 (9) 123 2,730 11/08/2014 11.75%Bono 144A/ TF USD 5,852 (28) 71 5,895 14/04/2018 5.63%Bono 144A/ TF USD 3,226 (34) 9 3,202 16/12/2019 6.88%Bono 144A/ TF USD 8,477 (72) 42 8,448 20/11/2022 4.5%Bono 144A/ TF USD 3,923 (34) 83 3,972 08/08/2023 5.38%Bono 144A/ TF USD 8,433 (74) 42 8,401 20/11/2022 4.50%Bono 144A/ TF USD 1,564 (6) 51 1,609 19/08/2014 9.50%Bono 144A/ TF USD 5,817 (40) 70 5,847 14/04/2018 5.63%Bono 144A/ TF USD 3,204 (32) 9 3,181 16/12/2019 6.88%Bono 144A/ TF USD 2,602 (23) 120 - 2,700 11/08/2014 11.75%Senior Notes 30,793 21,738Others/ TF USD 151 (8) - 143 60 - - Others 143 60China Leasing RMB 138 138Spain EUR 24 24Arrendamiento/ TF SOLES 8 8 9 01/08/2015 6.95%Arrendamiento/ TF SOLES 4 4 01/03/2016 8.32%Arrendamiento/ TF USD 59 59 25/03/2014 5.24%Arrendamiento/ TF RMB 137 137 28/02/2026 5.80%Arrendamientos y préstamos subvencionados/Euribor+104 bp EUR 39 39 28/02/2026 1.80%Finance leases 170 248Total Ps 54,272 Ps 49,967

83
At December 31, 2013, the annual maturities of non-current debt are as follows: 2018 2015 2016 2017 onwards Total
Bank loans and others Ps 3,351 Ps 2,149 Ps 734 Ps 7,219 Ps 13,453Senior Notes - - - 28,018 28,018Stock certificates 175 1,575 1,750 1,628 5,128Finance leases 16 9 9 106 140 Ps 3,542 Ps 3,733 Ps 2,493 Ps 36,971 Ps 46,739
At December 31, 2012, the annual maturities of non-current debt are as follows: 2017 2014 2015 2016 onwards Total
Bank loans and others Ps 4,663 Ps 6,755 Ps 5,413 Ps 1,618 Ps 18,449Senior Notes 4,166 - - 17,572 21,738Stock certificates 1,635 175 1,575 3,355 6,740Finance leases 63 12 12 161 248 Ps 10,527 Ps 6,942 Ps 7,000 Ps 22,706 Ps 47,175
At December 31, 2013 and 2012, the Company has contractual credit lines unused for a total of US$785 and US$898, respectively.
Covenants:Most existing debt agreements contain restrictions for the Company, primarily with respect to compliance with certain financial ratios, including:
a) Interest coverage ratio: which is defined as EBITDA for the period of the last four complete quarters divided by financial expenses, net or gross as appropriate, for the last four quarters, which shall not be less than 3.0 times.
b) Leverage ratio: which is defined as consolidated debt at that date, being the gross debt or net debt appropriate, divided by EBITDA for the period of the last four complete quarters, which shall not be more than 3.5 times.
During 2013 and 2012, the financial ratios were calculated according to the formulas set out in the loan agreements.
Currently, the company is in compliance with all obligations and covenants contained in the credit agreements of its subsidiaries; such obligations, among other conditions and subject to certain exceptions, require or limit the ability of the subsidiaries to:
- Provide certain financial information;- Maintain books and records;- Maintain assets in appropriate conditions;- Comply with applicable laws, rules and regulations applicable;- Incur additional indebtedness;- Pay dividends;- Grant liens on assets;- Enter into transactions with affiliates;- Perform a consolidation, merger or sale of assets, and- Carry out sale and lease-back operations
At December 31, 2013 and the date of issuance of these financial statements, the Company and its subsidiaries complied satisfactorily with such covenants and restrictions.
Pledge assets:At December 31, 2013 Newpek is assets were pledged as collateral under a line of credit for an amount up to US$120, maturing on December 31, 2015 (as at December 31, 2013 US$92.5 had been used).
Loan contracts and debt agreements contain restrictions, primarily relating to compliance with financial ratios, incurring additional debt or making loans that require mortgaging assets, dividend payments and submission of financial information, which if not met or remedied within a specified period to the satisfaction of creditors may cause the debt to become payable immediately. At December 31, 2013 and at the date of issuance of these financial statements, ALFA and its subsidiaries satisfactorily complied with such covenants and restrictions.
84
Relevant debt transactions:2013a) In February 2013, Nemak issued a bond in the international market under standard 144A, Reg-S. The amount of the bond
was of US$500. The issued bond should be settled in 10 years and an interest rate of 5.50% (effective interest rate of 5.68%). The Company capitalized the debt issuonce costs of Ps118. The proceed were used for the partial payment of the bank debt of the “Senior Unsecured Syndicated Loan Agreement” effective at that date. This payment led to an advance amortization of issuance expenses amounting Ps100.
b) On August 8, 2013, Alpek completed an issuance of Senior Notes for a nominal amount of US$300 with a single maturity of August 8, 2023. Interests of Senior Notes will be payable semi-annually at a 5.375% annual rate from February 8, 2014. The Senior Notes were issued through a private issuance under Rule 144A of the “Securities Act” of 1933 (“Rule 144A of the Securities Act of 1933”) of the United States of America and they are unconditionally guaranteed, in an unsubordinated manner, for the joint obligation of certain subsidiaries of the Company.
Additionally, the issuance of Senior Notes originated issuance costs and expenses in the amount of US$2. Issuance costs and expenses, including the placement discount of Senior Notes is presented net of the debt and amortized together with the loan based on the effective rate method.
c) On September 26, 2013, Grupo Petrotemex, S.A. de C.V. (subsidiary of Alpek) settled in advance the principal amount of “Senior Notes” 144A/Reg. S” issued in 2009, the amount of principal pending payment at that date was of US$120 million
The proceeds of the issuance of Senior Notes were used mainly to make advance debt payments of certain subsidiaries of the Company.
d) In December 2013, Nemak concluded the refinancing of its bank debt, which was authorized by the Board of Directors. This process included the bank debt of the main current contracts of Tenedora Nemak with Banks: The “Senior Unsecured Syndicated Loan Agreement”, held in August 2011 and the Senior Unsecured Loan Agreement” in June 2012. This refinancing process involved expenses incurred by the company of Ps51 that were recorded in the statement of financial position and will be amortized during the life of the loan.
e) On November 13, 2013, Sigma obtained a syndicated loan with the Bank of Tokyo-Mitsubishi UFJ, Ltd. as global coordinator and administrative agent together with a group of banks (the “Syndicated Loan”) for the amount of up to U.S. $ 1,000 maturing on November 13, 2018, with four equal repayments in May 2017, November 2017, May 2018 and November 2018 (US $ 301.5 had been used as at December 31, 2013). Syndicated Loan interest will be payable monthly at LIBOR plus 1.250% of surtax. The proceeds of the syndicated loan are being used by the Company to complete the acquisition of Campofrio Food Group, SA (“Campofrio”).
This loan has no specific guarantees but there is joint and several liability and endorsement by certain subsidiaries.
2012f) On June 28, 2012 Nemak completed the acquisition of JL French Automotive Castings, Inc. in the amount of US$215, which
was financed by a loan from four banks for a term of three years.
g) On August 13, 2012, Grupo Petrotemex repurchased US$154.2 (“Tender Offer”) of the principal amount of the Senior Notes 144A/Reg. S issued in 2009, leaving a balance at December 31, 2012 of US$120.8, due in 2014. Additionally, after the Tender Offer, the Petrotemex Group achieved majority consent of the holders of the Senior Notes to amend certain terms of the contract that governs them, and as a result the Senior Notes that did not adhere to the tender offer remain in force but without the effect of the financial covenants.
h) On November 20, 2012, Alpek completed an issuance of Senior Notes for a nominal amount of US$650 with a single maturity on November 20, 2022. Interests of Senior Notes will be payable semi-annually at a 4.500% annual rate as from May 20, 2013. The Senior Notes were issued through a private placement under Rule 144A / Reg. S. of the Securities Act of 1933 of the United States of America and are unconditionally guaranteed as unsubordinated jointly and severally by certain subsidiaries of the Company.
Additionally, the issuance of Senior Notes involved issuance costs and expenses to the amount of US$5.7. The costs and expenses, including the discount on the placement of the Senior Notes, are presented net of debt and are being amortized along with the loan based on the effective interest method.
The proceeds of the issuance of Senior Notes were used mainly to make advance debt payments of certain subsidiaries of the Company.

85
The finance lease liabilities are effectively secured as the rights to the leased asset which revert to the lessor in the event of default. December 31,
2013 2012
Obligation for finance leases - minimal payments, gross - Less than 1 year Ps 30 Ps 6 - More than 1 year and less than 5 years 132 13Present value of finance less liabilities Ps 162 Ps 19
The present value of finance lease liabilities are analyzed as follows: December 31,
2013 2012
Less than 1 year Ps 30 Ps 7More than 1 year and less than 5 years 42 6More than 5 years 90 - Ps 162 Ps 13
18 Deferred taxes
The analysis of the deferred tax asset and deferred tax liability is as follows: December 31,
2013 2012
(Restructured*)
Deferred tax asset: - To be recovered in more than 12 months Ps (11,087) Ps (9,899) - To be recovered within 12 months (813) (796) (11,900) (10,695)Deferred tax liability: - To be covered in more than 12 months 12,370 11,321 - To be covered within 12 months 1,853 1,685 14,223 13,006Deferred tax liabilities, net Ps 2,323 Ps 2,311
* Restructured to reflect the adjustments to provisional fair values previously recognized in business combinations as described in Note 2.m.
The gross movement in the deferred income tax account is as follows: 2013 2012
(Restructured*)
At January 1 Ps 2,311 Ps 3,098Exchange differences (64) (148)Charge to income statement (339) 75Business acquisition - (620)Tax related to components of other comprehensive income 415 (94)At December 31 Ps 2,323 Ps 2,311
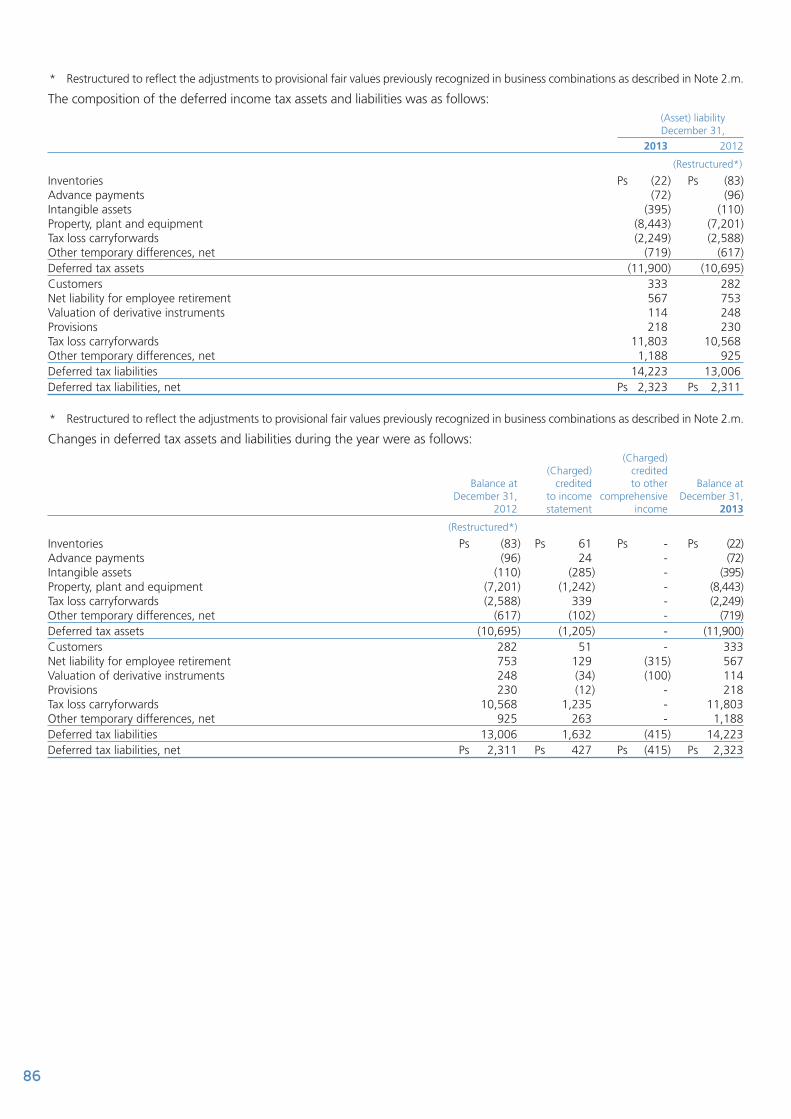
86
* Restructured to reflect the adjustments to provisional fair values previously recognized in business combinations as described in Note 2.m.
The composition of the deferred income tax assets and liabilities was as follows: (Asset) liability December 31,
2013 2012
(Restructured*)
Inventories Ps (22) Ps (83)Advance payments (72) (96)Intangible assets (395) (110)Property, plant and equipment (8,443) (7,201)Tax loss carryforwards (2,249) (2,588)Other temporary differences, net (719) (617)Deferred tax assets (11,900) (10,695)Customers 333 282Net liability for employee retirement 567 753Valuation of derivative instruments 114 248Provisions 218 230Tax loss carryforwards 11,803 10,568Other temporary differences, net 1,188 925Deferred tax liabilities 14,223 13,006Deferred tax liabilities, net Ps 2,323 Ps 2,311
* Restructured to reflect the adjustments to provisional fair values previously recognized in business combinations as described in Note 2.m.
Changes in deferred tax assets and liabilities during the year were as follows: (Charged) (Charged) credited Balance at credited to other Balance at December 31, to income comprehensive December 31, 2012 statement income 2013
(Restructured*)
Inventories Ps (83) Ps 61 Ps - Ps (22)Advance payments (96) 24 - (72)Intangible assets (110) (285) - (395)Property, plant and equipment (7,201) (1,242) - (8,443)Tax loss carryforwards (2,588) 339 - (2,249)Other temporary differences, net (617) (102) - (719)Deferred tax assets (10,695) (1,205) - (11,900)Customers 282 51 - 333Net liability for employee retirement 753 129 (315) 567Valuation of derivative instruments 248 (34) (100) 114Provisions 230 (12) - 218Tax loss carryforwards 10,568 1,235 - 11,803Other temporary differences, net 925 263 - 1,188Deferred tax liabilities 13,006 1,632 (415) 14,223Deferred tax liabilities, net Ps 2,311 Ps 427 Ps (415) Ps 2,323

87
* Restructured to reflect the adjustments to provisional fair values previously recognized in business combinations as described in Note 2.m.
(Charged) (Charged) credited (Charged) credited Balance at from credited to other Balance at January 1, business to the income comprehensive December 31, 2012 acquisitions statement income 2012
(Restructured*)
Inventories Ps - Ps - Ps (83) Ps - Ps (83)Advance payments (37) - (59) - (96)Intangible assets (139) - 29 (110)Property, plant and equipment (8,198) - 997 - (7,201)Tax loss carryforwards (1,477) (620) (491) - (2,588)Other temporary differences, net (1,702) - 1,085 - (617)Deferred tax assets (11,553) (620) 1,478 - (10,695)
Inventories 81 - (81) -Customers 265 - 17 - 282Valuation of derivative instruments 583 - (298) (37) 248Net liability for employee retirement 606 - 16 131 753Provisions 504 - (274) - 230Tax loss carryforwards 11,647 - (1,079) - 10,568Other temporary differences, net 965 - (40) - 925Deferred tax liabilities 14,651 - (1,739) 94 13,006Deferred tax liabilities, net Ps 3,098 Ps (620) Ps (261) Ps 94 Ps 2,311
* Restructured to reflect the adjustments to provisional fair values previously recognized in business combinations as described in Note 2.m.
Tax loss carry forwards are recognized as a deferred tax asset to the extent that realization of the related tax benefit through future taxable profits is probable. Tax losses amounted to Ps7,497 in 2013 and Ps6,560 in 2012.
Tax losses at December 31, 2013 and 2012 expire in the following years: Year of Year of loss 2013 2012 expiration
2008 and prior Ps 4,781 Ps 5,180 2018 2009 285 276 2019 2010 155 149 2020 2011 101 97 2021 2012 970 858 2022 2013 1,205 - 2023 Ps 7,497 Ps 6,560
New Mexican Income Tax LawOn December 11, 2013 the decree for the new Income Tax Law was published (new LISR) becoming effective on January 1, 2014, repealing the LISR published as of January 1, 2002 (former LISR). The new LISR maintains the essence of the former LISR; however, it makes significant amendments among which the most important are:
i. Limiting deductions in contributions to pension and exempt salary funds, automobile leases, restaurant consumption and social security fees; it also eliminates the immediate deduction in fixed assets.
ii. Amending the mechanics to accumulate revenues derived from the term alienation and generalizing the procedure to determine the gain in alienation of shares.
iii. Amending the procedure to determine the taxable basis for the Employees’ Profit Sharing (PTU spanish acronym), establishing the mechanics to determine the initial balance of the capital contribution account (CUCA spanish acronym) and the Net Tax Profit Account (CUFIN spanish acronym) and establishing new mechanics for the recovery of Asset Tax (IA spanish acronym)
iv. Establishing an ISR rate applicable for 2014 and the following years of 30%. In contrast to the LISR above that established a 30%, 29% and 28% rate for 2013, 2014 and 2015, respectively.
v. The tax provisions for tax consolidation regime purposes of 2014 are reformed, added and revoked.
The Company has reviewed and adjusted the deferred tax balance at December 31, 2013, considering in the determination of temporary differences, the application of these new provisions. However, the effects in deduction limitations and others indicated previously will be applied from 2014 and will mainly affect the tax incurred as of that year.

88
Income tax under tax consolidation regime in MexicoIn 2013 and 2012, the Company determined consolidated taxable income of Ps4,351 and Ps5,337, respectively. The consolidated tax result differs from the accounting profit principally in respect of items which are taxed or reduced in different periods for accounting and tax purposes, due to the recognition of the effects of the inflation for tax purposes, as well as due to items only affecting either the accounting or tax result.
ALFA incurred consolidated income tax up to 2013 with its Mexican subsidiaries. Since the effective Income Tax Law effective up to December 31, 2013 was revoked, the tax consolidation regime was eliminated; therefore, ALFA is obliged to make a deferred tax payment determined at that date during the following ten years as from 2014, as shown below.
At the date of issuance of these financial statements, ALFA is in the process of assessing the option to incorporate the new Optional Regime for Groups of Companies as from 2014.
In accordance with paragraph d) of section XV of the ninth transitory article of the 2014 Law, and provided that the Company at December 31, 2013 was acting as the controlling company and was subject, at that date, to the payment system contained in section VI of the fourth article of the transitory provisions of the Income Tax Law published in the federal official gazette on December 7, 2009, or article 70-A of the 2013 Income Tax Law that was revoked, shall continue paying the tax consolidation deferred tax in fiscal years 2007 and prior years in conformity with the abovementioned provisions, until payment is concluded.
Income tax from deferred tax consolidation at December 31, 2013 and 2012 amounts to Ps4,136 and Ps4,473, respectively and will be paid off in installments in accordance with the table shown below: Year of payment
2018 2014 2015 2016 2017 onwards Total
Tax losses Ps 233 Ps 499 Ps 619 Ps 583 Ps 1,875 Ps 3,809Special consolidation items 2 - - - - 2Dividends distributed by the controlled companies that do not come from CUFIN and the reinvested CUFIN 116 69 56 42 42 325Total Ps 351 Ps 568 Ps 675 Ps 625 Ps 1,917 Ps 4,136
The current portion of income tax from deferred tax consolidation amounts to Ps351 and is recorded as part of the income tax payable in the current liabilities.
19 Provisions
Restructuring Indemnities and Environmental for dismissal Disputes (1) demolition(2) remediation(2) and others(2) Total
At January 1, 2012 Ps 578 Ps - Ps - Ps - Ps 578Additions 138 - - - 138At December 31, 2012 716 - - - 716Additions 67 487 372 198 1,124Exchange effects - 7 5 10 22Payments (291) (78) - (117) (486)At December 31, 2013 Ps 492 Ps 416 Ps 377 Ps 91 Ps 1,376
2013 2012
Short-term provisions Ps 833 Ps -Long-term provisions 543 716At December 31, Ps 1,376 Ps 716
(1) This provision corresponds to the contingency mentioned in Note 33 and is considered long term.(2) Corresponds to the closing of the cape fear plant, as mentioned in Note 2.h.

89
20 Other liabilities
December 31,
2013 2012
Share-based employee benefits (Note 24) Ps 701 Ps 594Dividends payable 65 43Accounts payable – affiliates (Note 31) 267 357Total other liabilities Ps 1,033 Ps 994
Current portion Ps 534 Ps 559Non-current portion 499 435Total other liabilities Ps 1,033 Ps 994
21 Employee benefits
The valuation of employee benefits for retirement plans (covering approximately 80% of workers in 2013 and 80% in 2012) and is based primarily on their years of service, current age and estimated salary at retirement date.
The principal subsidiaries of the Company have established funds for the payment of retirement benefits through irrevocable trusts.
The employee benefit obligations recognized in the statement of financial position, by country, are shown below: December 31,
Country 2013 2012
Mexico Ps 801 Ps 1,032United States 644 1,211Others 446 447Total Ps 1,891 Ps 2,690
Following is a summary of the main financial information of such employee benefits: December 31,
2013 2012
Liabilities in the balance sheet for: Pension benefits Ps 1,229 Ps 1,920 Post-employment medical benefits 662 770Liabilities in the balance sheet Ps 1,891 Ps 2,690
Charge in the income statements for: Pension benefits Ps (265) Ps (67) Post-employment medical benefits (54) (31) Ps (319) Ps (98)
Actuarial losses recognized in the statement of other comprehensive income for the period Ps 1,049 Ps (306)
Cumulative actuarial losses recognized other comprehensive income Ps 495 Ps (554)

90
Pension benefitsThe Company operates defined benefit pension plans based on employees pensionable remuneration and length of service. Most plans are externally funded. Plan assets are held in trusts, foundations or similar entities, governed by local regulations and practice in each country, as is the nature of the relationship between the Company and the respective trustees (or equivalent).
Amounts recognized in the balance sheet are determined as follows: December 31,
2013 2012
Present value of defined benefit obligations Ps 5,371 Ps 5,920Fair value of plan assets (4,142) (3,878)Present value of unfunded obligations 1,229 2,042Past service cost not recognized - (122)Liabilities in the balance sheet Ps 1,229 Ps 1,920
The movement in the defined benefit obligation during the year was as follows: 2013 2012
At January 1 Ps 5,920 Ps 5,130Current service cost 215 99Interest cost 251 258Employee contributions 1 1Remeasurements: Demographic actuarial losses/(gains) (350) 721 Financial actuarial losses/(gains) (191) -Exchange differences 35 68Benefits paid (457) (358)Liabilities acquired in business combinations - 10Reductions (35) (5)Settlements (18) (4)At December 31 Ps 5,371 Ps 5,920
The movement in the fair value of plan assets for the year was as follows: 2013 2012
At January 1 Ps (3,878) Ps (3,315)Expected return on plan assets (178) (280)Remeasurements - expected return on plan assets, excluding interest income (327) (324)Exchange differences (17) (8)Employer contributions (62) (160)Employee contributions (1) (1)Benefits paid (1) 308 210Liabilities acquired in business combinations 13 -At December 31 Ps (4,142) Ps (3,878)
(1) With respect to the closing of the Cape Fear plant, the Company incurred in losses from termination and a settlement agreement with the trustees, effective as at October 10, 2013 for a total of Ps107, settling all retirement benefit plan obligations in relation with the site’s employees.
Amounts recorded in the statement of income are as follows: 2013 2012
Current service cost Ps (215) Ps (83)Financial revenues (costs), net (73) 25Past service cost - (10)Loss from reduction 23 1Total included in personal costs Ps (265) Ps (67)
The principal actuarial assumptions were as follows: December 31,
2013 2012
Discount rate 6.75% 5.50%Inflation rate 4.25% 4.25%Salary increase rate 5.25% 5.25%Future salary increase 4.25% 4.25%Medical inflation rate 7.50% 7.50%

91
The average life of defined benefit obligations is 13 and 14 years at December 31, 2013 and 2012, respectively.
The sensitivity analysis of the main assumptions for defined benefit obligations were as follows: Effect in defined benefit obligations
Change in Increase in Decrease in assumptions assumptions assumptions
Discount rates +1% Decreases by Ps284 Increases by Ps348
Post-employment medical benefitsThe Company operates post-employment medical benefits schemes mainly in Mexico and the United States. The method of accounting, assumptions and the frequency of valuations are similar to those used for defined benefit pension schemes. Most of these plans are not being funded.
Amounts recognized in the balance sheet are determined as follows: December 31,
2013 2012
Present value of defined benefit obligations Ps 666 Ps 775Fair value of plan assets (4) (4)Deficit in funded plans 662 771Present value of unfunded obligations - (1)Liabilities in the balance sheet Ps 662 Ps 770
The movements of defined benefit obligations are as follows: 2013 2012
At January 1 Ps 770 Ps 678Current service cost 19 11Interest cost 35 31Employee contributions 8 7 Demographic actuarial losses/(gains) (97) 60 Financial actuarial losses/(gains) (42) -Exchange differences - 9Reductions 3 -Benefits paid (30) (26)At December 31 Ps 666 Ps 770
The movement in the fair value of plan assets for the year was as follows: 2013 2012
At January 1 Ps 4 Ps 3Expected return on plan assets without interest income - 1Benefits paid - -At December 31 Ps 4 Ps 4
Amounts recorded in the statement of income are as follows: 2013 2012
Current service cost Ps (19) Ps -Interest cost (35) (31)Total included in personal costs Ps (54) Ps (31)
The sensitivity analysis of the main assumptions for defined benefit obligations were as follows: Effect in defined benefit obligations
Change in Increase in Decrease in assumptions assumptions assumptions
Medical inflation rate +1% Increases by Ps77 Decreases by Ps59

92
22 Stockholders’ equity
In an extraordinary Shareholders’ Meeting of Alfa, S. A. B. de C. V., held on August 30, 2012, it was agreed to carry out a stock split as of September 28, 2012. As of that date the Company proceeded to exchange “November 2006”share certificates of ALFA for “25 September 2012” share certificates, at the rate of ten (10) new shares for each share of the previous issue.
At December 31, 2013, the capital stock is variable, with a fixed minimum without withdrawal rights of Ps210, represented by 5,200,000,000 “Class I” Series “A” shares, without par value, fully subscribed and paid. The variable capital entitled to withdrawal will be represented, if issued, by registered “Class II” Series “A” shares without par value. Thousand shares
At December 31, 2011 5,400,000Cancelled on February 29, 2012 (200,000)At December 31, 2012 and 2013 5,200,000
During 2013 and 2012 the Company repurchased 3,500,000 and 53,317,000, shares respectively, for a total of Ps99 and Ps1,074, in connection with a share repurchase program that was approved by the shareholders of the Company and carried out at the discretion of the Administration. At December 31, 2013 and 2012, the Company held 57,500,000 and 54,000,000 treasury shares and the market value of the share was 36.62 and 27.38 pesos, respectively.
The profit for the period is subject to the legal provision requiring at least 5% of the profit for each period to be set aside to increase the legal reserve until it reaches an amount equivalent to 20% of the capital stock. At December 31, 2013 and 2012, the legal reserve amounted to Ps60, which is included in retained earnings.
Dividends paid are not subject to income tax if paid from the Net Tax Profit Account (CUFIN spanish acronym). Any dividends paid in excess of this account will cause a tax equivalent to 30%if they are paid in 2013. This tax is payable by the Company and may be credited against its income tax in the same year or the following two years or, if applicable, against the flat tax of the period. Dividends paid from profits which have previously paid income tax are not subject to tax withholding or to any additional tax payment. At December 31, 2012, the tax value of the consolidated CUFIN and value of the Capital Contribution Account (CUCA spanish acronym) amounted to Ps11,258 and Ps34,941 respectively.
In the event of a capital reduction, the Income Tax Law provides that any excess of stockholders’ equity over adjusted capital contribution will receive the same tax treatment as dividends.
The movements in cumulative other comprehensive income for 2013 and 2012 are presented below: Effect of Effect from cash flow foreign hedge currency derivative translation instruments Total
At December 31, 2011 Ps 3,031 Ps (216) Ps 2,815Gains (losses) on fair value - 121 121Tax on gain (loss) on fair value - (34) (34)Gains (losses) on translation of foreign entities (2,810) - (2,810)At December 31, 2012 221 (129) 92Gains (losses) on fair value - 334 334Tax on gain (loss) on fair value - (100) (100)Gains (losses) on translation of foreign entities 262 - 262At December 31, 2013 Ps 483 Ps 105 Ps 588
Foreign currency translation
The foreign exchange differences arising from the translation of financial statements of foreign subsidiaries are recorded.
Effect of derivative financial instruments
The effect of derivative financial instruments contracted as cash flow hedges contains the effective portion of cash flow hedges in force at the reporting date.
The directors and executive officers of the Company do not own more than 1% of its capital. Furthermore, no shareholder owns more than 10% of its capital, or has significant influence or control or has power to govern the company.

93
23 Foreign currency position
At January 29, 2014, the date of issuance of these financial statements, the exchange rate was 13.07 Mexican pesos per dollar.
The figures below are expressed in millions of dollars, since this is the prevailing foreign currency for Company.
At December 31, 2013 and 2012 had the following assets and liabilities in foreign currencies: December 31, 2013 Dollars (USD) Other currencies
Total Mexican Mexican Mexican USD pesos USD pesos pesos
Monetary assets Ps 2,021 Ps 26,427 Ps 533 Ps 6,972 Ps 33,399LiabilitiesCurrent (1,234) (16,132) (573) (7,489) (23,621)Non-current (3,057) (39,977) (94) (1,228) (41,205)Monetary position in foreign currencies Ps (2,270) Ps (29,682) Ps (134) Ps (1,745) Ps (31,427)
December 31, 2012
Dollars (USD) Other currencies
Mexican Mexican Mexican pesos USD pesos USD pesos pesos
Monetary assets Ps 1,262 Ps 20,319 Ps 615 Ps 8,001 Ps 28,320LiabilitiesCurrent (971) (12,628) (956) (12,439) (25,067)Non-current (2,329) (30,298) (1,601) (20,827) (51,125)Monetary position in foreign currencies Ps (2,038) Ps (22,607) Ps (1,942) Ps (25,265) Ps (47,872)
24 Share-based payments
ALFA has a compensation scheme referenced to the value of its own shares for senior executives of ALFA and its subsidiaries. According to the terms of the plan, eligible executives will receive a cash payment conditional on the achievement of certain quantitative and qualitative metrics based on the following financial measures:
• Improved share price
• Improvement in net income
• Permanence of the executives in the Company
The program consists of determining a number of shares on which the executives shall be based. The bonus will be paid in cash over the next five years, i.e. 20% each year at the average price of the share at the end of each year. The average price of the share in 2013 and 2012 was 38.86 and 27.8 pesos, respectively.
At December 31, 2013 and 2012 the liability for share-based payments amounted to Ps702 and Ps594, respectively.
The short-term and long-term liability was analyzed as follows: December 31,
2013 2012
Short-term Ps 203 Ps 160Long-term 499 434Total carrying value Ps 702 Ps 594

94
25 Expenses classified by their nature
The total cost of sales and selling and administrative expenses, classified by the nature of the expense, were as follows: 2013 2012
Raw materials Ps (121,374) Ps (123,771)Outsourced production (5,357) (5,139)Employee benefit expenses (Note 29) (24,459) (22,284)Maintenance (5,658) (4,983)Depreciation and amortization (7,932) (7,962)Freight charges (4,309) (4,409)Advertising expenses (1,261) (1,210)Lease expenses (947) (772)Consumption of energy and fuel (6,775) (5,799)Travel expenses (617) (564)Technical assistance, professional fees and administrative services (4,143) (1,779)Other (4,328) (5,141)Total Ps (187,160) Ps (183,813)
26 Other expenses, net
2013 2012
Expenses for acquisition projects Ps (29) Ps (17)Valuation of derivative financial transactions 41 152Reorganization costs (5) (21)Refinancing expense 19 (8)Impairment loss (294) (270)Loss on sale of waste (56) (53)Gain on sale of assets 1 37Gain on sale of shares 326 112Other 207 19Total other expenses Ps 210 Ps (49)
27 Non-recurring items
2013 2012
Changes from operation restructuring (1) Ps (2,421) Ps -Business acquisition at a bargain price (2) - 367Total non-recurring items Ps (2,421) Ps 367
(1) These expenses correspond to the closing of the Cape fear plant as mentioned in Note 2.h.(2) These revenues correspond to the acquisition of JL French as mentioned in Note 2.m.

95
28 Financial cost, net
2013 2012
Financial income: - Interest income on short-term bank deposits Ps 206 Ps 267 - Expected return on plan assets - 261 - Interest rate swaps - 138 - Other finance income 64 53Financial income, excluding foreign exchange loss 270 719Gain on foreign exchange 16 962Total financial income Ps 286 Ps 1,681
Financial expenses: - Interest expense on bank loans Ps (1,775) Ps (2,152) - Interest expense on exchange - traded debt certificates (1,609) (1,516) - Interest expense on sale of receivables (172) (164) - Interest cost on benefit to employees (105) (268) - Interest expense of suppliers (5) (34) - Interest rate swaps: fair value hedging (107) (16) - Other financial expenses (290) (265)Finance costs (4,063) (4,415)Less: amounts capitalized on qualifying fixed assets 85 3Interest expense, excluding foreign exchange loss (3,978) (4,412)Foreign exchange loss (365) -Total finance cost Ps (4,343) Ps (4,412)
Financing cost, net Ps (4,057) Ps (2,731)
29 Employee benefit expenses
2013 2012
Salaries, wages and benefits Ps 21,107 Ps 19,180Contributions to social security 2,604 2,435Employees’ benefits (Note 21) 570 485Other contributions 178 184Total Ps 24,459 Ps 22,284
30 Income tax for the year
2013 2012
Tax currently payable:Income tax on profits of the period Ps (3,202) Ps (3,431)Adjustment for previous years (383) 217Total tax currently payable (3,585) (3,214)Deferred tax:Origination and reversal of temporary differences 339 (75)Total deferred tax 339 (75)Effect of tax consolidation on income tax 54 (101)Income taxes charged to income Ps (3,192) Ps (3,390)

96
The reconciliation between the statutory and effective rates of income tax was as follows: 2013 2012
Profit before taxes Ps 9,987 Ps 13,941Share in losses of associates recognized through equity method 41 -Income before equity in associates 10,028 13,941Statutory rate 30% 30%
Tax at statutory rate (3,008) (4,182)(Add) deduct tax effect of:Differences in calculating interest deductions 338 652Other permanent differences, net (139) 241Provision based on operations of the year (2,809) (3,289)Recalculation of back taxes and other (383) (101)Total provision for income taxes charged to income Ps (3,192) Ps (3,390)
Effective rate 32% 25%
The tax charge/(credit) relating to components of other comprehensive income was as follows: 2013 2012
Tax Tax Before charged After Before charged After tax (credited) tax tax (credited) tax
Effect of derivative financial instruments hired as cash flow hedges Ps 334 Ps (100) Ps 234 Ps 124 Ps (37) Ps 87Actuarial losses on labor liabilities 1,049 (315) 734 (437) 131 (306)Translation effect of foreign entities 456 - 456 (2,887) - (2,887)Other items of comprehensive income Ps 1,839 Ps (415) Ps 1,424 Ps (3,200) Ps 94 Ps (3,106)Deferred taxes Ps (415) Ps 94
31 Related party transactions
Transactions with related parties during the years ended December 31, 2013 and 2012, which were carried out in terms similar to those of arm’s-length transactions with independent third parties, were as follows: 2013 2012
Sale of goods and services:Affiliates Ps 20,478 Ps 17,556Purchase of goods and services:Affiliates Ps 16,014 Ps 15,260
For the year ended December 31, 2013, wages and benefits received by top officials of the company were Ps741 (Ps603 in 2012), an amount comprising base salary and legal benefits, supplemented by a variable compensation program primarily based on the results of the Company and the market value of its shares.
At December 31, 2013 and 2012, the balances with related parties were as follows: December 31,
Nature of the transaction 2013 2012
Receivables:Affiliates Sales of products Ps 1,355 Ps 1,645Shareholders with significant influence over subsidiaries Service rendering Ps 185 Ps 85
Payable:Affiliates Purchase of raw materials Ps 266 Ps 357
Balances payable to related parties at December 31, 2013 are payable in 2014 and do not bear interest.
The Company and its subsidiaries report that they had no significant transactions with related parties or conflicts of interest to disclose.

97
32 Segment reporting
Segment information is presented consistently with the internal reporting provided to the chief executive who is the highest authority in operational decision-making, resource allocation and assessment of operating segment performance.
An operating segment is defined as a component of an entity on which separate financial information is regularly being evaluated.
The company manages and evaluates its operation through 5 basic operating segments which are:
- Alpek: This segment operates in the petrochemical and synthetic fibers industry, and its revenues are derived from sales of its main products: polyester, plastics and chemicals.
- Sigma: This segment operates in the refrigerated food sector and its revenues are derived from sales of its main products: deli meats, dairy and other processed foods.
- Nemak: This segment operates in the automotive industry and its revenues are derived from sales of its main product: aluminum engine heads and blocks.
- Alestra: This segment operates in the telecommunications sector and its revenues are derived from the provision of data transmission services, Internet and long distance phone service.
- Newpek: This segment is dedicated to the exploration and exploitation of natural gas and oil fields.
- Other segments: includes all other companies operating in business services and others which are non-reportable segments and do not meet the quantitative limits in the years presented and, therefore, are presented in aggregate, as well as being substantially eliminated in consolidation.
These operating segments are managed and controlled independently because the products and the markets they serve are different. Their activities are performed through various subsidiaries.
The operations between operating segments are performed at market value and the accounting policies with which the financial information by segments is prepared, are consistent with those described in Note 3.
The Company evaluates the performance of each of the operating segments based on income before financial results, income taxes, depreciation and amortization (“EBITDA”), considering that this indicator is a good metric to evaluate operating performance and the ability to meet principal and interest obligations with respect to indebtedness, and the ability to fund capital expenditures and working capital requirements. Nevertheless, EBITDA is not a measure of financial performance under IFRS and should not be considered as an alternative to net income as a measure of operating performance or cash flows as a measure of liquidity.
The Company has defined the ADJUSTED EBITDA as the result of adding to the operating profit depreciation and amortization and asset impairment.
Following is the condensed financial information of these operating segments:

98
Year ended December 31, 2013 Other segments and Alpek Sigma Nemak Alestra Newpek Eliminations Total
Statement of incomeRevenue by segment Ps 90,061 Ps 48,989 Ps 56,299 Ps 5,067 Ps 1,706 Ps 3,322 Ps 205,444Intersegment revenue (243) - - (113) - (1,632) (1,988)Revenue from external customers Ps 89,818 Ps 48,989 Ps 56,299 Ps 4,954 Ps 1,706 Ps 1,690 Ps 203,456
Adjusted EBITDA Ps 7,344 Ps 6,710 Ps 7,823 Ps 2,166 Ps 1,166 Ps (674) Ps 24,535Depreciation and amortization (2,025) (1,353) (3,282) (828) (330) (114) (7,932)Asset impairment (2,394) (80) (24) (9) (11) - (2,518)Operating profit 2,925 5,277 4,517 1,329 825 (788) 14,085Financial result (1,172) (1,039) (1,456) (309) (18) (63) (4,057)Share of losses of associates (30) (4) 19 - 8 (34) (41)Profit or loss before tax Ps 1,723 Ps 4,234 Ps 3,080 Ps 1,020 Ps 815 Ps (885) Ps 9,987
Statement of financial positionInvestment in associates Ps 41 Ps 5,632 Ps 174 Ps 10 Ps - Ps 89 Ps 5,946Other assets 58,086 32,753 52,684 8,332 3,955 3,634 159,444Total assets 58,127 38,385 52,858 8,342 3,955 3,723 165,390Total liabilities 31,040 26,002 34,432 4,649 2,133 1,966 100,221Net assets Ps 27,087 Ps 12,383 Ps 18,426 Ps 3,693 Ps 1,822 Ps 1,757 Ps 65,169
Capital expenditures (Capex) Ps (2,276) Ps (1,522) Ps (4,336) Ps (1,538) Ps (2,473) Ps (53) Ps (12,198)
Year ended December 31, 2012 Other segments and Alpek Sigma Nemak Alestra Newpek Eliminations Total
(Restructured*)Statement of incomeRevenue by segment Ps 96,163 Ps 45,476 Ps 51,384 Ps 4,634 Ps 1,227 Ps 3,715 Ps 202,599Intersegment revenue (360) - (3) (111) - (1,958) (2,432)Revenue from external customers Ps 95,803 Ps 45,476 Ps 51,381 Ps 4,523 Ps 1,227 Ps 1,757 Ps 200,167
ADJUSTED EBITDA Ps 9,609 Ps 6,214 Ps 6,671 Ps 1,804 Ps 875 Ps (697) Ps 24,476Non-recurring items 367 367Depreciation and amortization (2,129) (1,409) (3,287) (833) (197) (107) (7,962)Asset impairment (4) (23) (214) (12) (1) (16) (270)Income from dividends - - 18 - - 43 61Operating profit (loss) 7,476 4,782 3,555 959 677 (777) 16,672Financial result (1,331) 54 (1,393) (133) (8) 80 (2,731)Share of losses of associates (39) - 38 - - 1 -Profit or loss before taxes Ps 6,106 Ps 4,836 Ps 2,200 Ps 826 Ps 669 Ps (696) Ps 13,941
Statement of financial positionInvestment in associates Ps 2 Ps - Ps 243 Ps 10 Ps - Ps - Ps 255Other assets 61,694 30,616 49,818 7,363 1,701 2,778 153,970Total assets Ps 61,696 Ps 30,616 Ps 50,061 Ps 7,373 Ps 1,701 Ps 2,778 Ps 154,225Total liabilities 32,045 20,416 34,777 4,244 456 1,143 93,081Net assets Ps 29,651 Ps 10,200 Ps 15,284 Ps 3,129 Ps 1,245 Ps 1,635 Ps 61,144
Capital expenditures (Capex) Ps (1,522) Ps (1,416) Ps (4,171) Ps (887) Ps (640) Ps 96 Ps (8,732)
* Restructured to reflect the adjustments to provisional fair values previously recognized in business combinations as described in Note 2.m.

99
Revenue to external customers as well as property, plant and equipment, goodwill and intangible assets by geographic area are shown below. The revenue to external customers were classified based on their origin:
Year ended December 31, 2013 Revenue to Property, external plant and Intangible customers equipment Goodwill assets
Mexico Ps 78,302 Ps 48,553 Ps 3,776 Ps 5,819United States 57,585 11,231 219 5,345Canada 1,632 969 - 47Central and South America 13,563 2,896 - 27Other countries 52,374 10,325 7,336 1,337Total Ps 203,456 Ps 73,974 Ps 11,331 Ps 12,575
For the year ended December 31, 2012 (Restructured*) Revenue to Property, external plant and Intangible customers equipment Goodwill assets
Mexico Ps 109,026 Ps 47,475 Ps 3,639 Ps 4,662United States 60,333 13,015 218 2,852Canada 1,578 1,201 - 25Central and South America 11,670 2,902 - 45Other countries 17,560 9,651 6,448 843Total Ps 200,167 Ps 74,244 Ps 10,305 Ps 8,427
* Restructured to reflect the adjustments to provisional fair values previously recognized in business combinations as described in Note 2.m.
The revenue to outside customers by product or service were as follows: 2013 2012
AlpekPolyester-Pet/PTA Ps 68,636 Ps 75,105Plastics and chemicals 21,425 20,698Total 90,061 95,803SigmaProcessed meats 31,672 30,307Dairy 14,270 13,213Other refrigerated products 3,047 1,956Total 48,989 45,476NemakAluminum automotive products 56,299 51,381Total 56,299 51,381AlestraBusiness segment 4,825 4,303Other segments 242 220Total 5,067 4,523NewpekHydrocarbons 1,706 1,227Total 1,706 1,227Other segments 1,334 1,757Total Ps 203,456 Ps 200,167

100
33 Contingencies and commitments
At December 31, 2013, the Company had the following contingencies:
a. In the normal course of its business, the Company is involved in disputes and litigation. While the results of the disputes cannot be predicted, the Company does not believe that there are current or threatened actions, claims or legal proceedings against or affecting the Company which, if determined adversely to it, would damage significantly its individual or overall results of operations or financial position.
b. As a result of Contracts for Services for Exploration, Development and Production signed with Pemex Exploración y Producción (PEP) as mentioned in Note 2, Petrolíferos and Oleorey gave bonds for a total value of US$48 as security for the amount of the Initial Minimum Program, since in case of non-compliance, PEP has the right to execute these guarantees. The amount of the financing corresponds to 50% responsibility for ALFA and the remaining 50% for MPG.
At December 31, 2013, the Company and its subsidiaries had the following commitments:
a. During 2013, the Company through its subsidiary Grupo Petrotemex, signed an agreement with M&G for the rights to supply the plant for 400 thousand tons of PET (manufactured with 336 thousand tons of PTA) a year, by which it is obliged to pay an amount of US$350 during the construction of the plant. At December 31, 2013 Alpek had made a payment of Ps455 (US$35), presented within goodwill and intangible assets, net. See Note 13.
b. Various subsidiaries’ contracts with suppliers and customers, for the acquisition of raw materials used in the manufacture of products and purchase of equipment and other capital expenditures related to the expansion of the telephone network and sale of finished goods, respectively. The contracts, lasting between one and five years, stipulate certain restrictions and guarantees for the parties.
c. In September 2007, a subsidiary renewed a contract with PEMEX Refinación, for the supply of raw materials maturing in December 2018.
d. In connection with operational expansion projects, a subsidiary entered into various agreements related to the acquisition of engineering licenses and its own design of production lines. These contracts provide various confidentiality restrictions on the engineering used and monthly royalty payments based on monthly production.
e. In February 2005, a subsidiary signed a contract to pay royalties for the granting of a long-term concession for finished products. This agreement ends upon payment of a total amount of US$15.5.

101
34 Subsequent events
In preparing the financial statements the Company has evaluated the events and transactions for recognition or disclosure subsequent to December 31, 2013 and through January 29, 2014 (date of issuance of the financial statements), and has identified the following subsequent events:
Acquisition of CampofrioAs described in Note 2 the Company has continued to purchase Campofrio shares outside the framework of the proposed public purchase offer. Subsequent to December 31, 2013, the Company has acquired an additional 0.33% of Campofrio’s ordinary shares amounting to Ps44.
At the date of issuance of the financial statements, the Spanish Stock Market Commission has still not authorized the public offer to purchase the remaining outstanding shares and the European competition authorities have not yet issued the resolutions relating to the amended application filed by the Company together with another shareholder, (see Note 2.b). Also the Company and the other shareholder have initiated the process of applying for authorization from the Ministry of Commerce of the People´s Republic of China. Consequently, at December 31, 2013 Sigma had not yet finalized its offer for the remaining outstanding shares.
AlestraAt January 24, 2014, Alestra issued a redemption notification to the holders of its Senior Notes (maturity in August 2014). The notification states the intention of Alestra to prepay the debt during February in an amount of US$200. That same day, Alestra informed the U.S. Securities and Exchange Commission, its decision to delist from such Commission.
Álvaro Fernández Garza Ramón A. Leal ChapaPresident Chief Financial Officer

102
Caprolactam: Product derived from oil (cyclohexane), used as raw material to produce nylon.
Cloud applications: Business model where applications are accessed through the Internet, and are not physically present in the customer’s facilities.
CO2: Carbon dioxide.
Expandable polystyrene (EPS): Thermoplastic used for insulation and packaging.
Gigajoul (abbreviated GJ): An energy measure. One GJ equals 278 kWh.
Independent Board Member: A Board member who does not own company shares and is not involved in the day-to-day management of the company.
Independent Proprietary Board Member: A Board member who owns company shares but is not involved in the day-to-day management of the company.
IntegRex®: Alpek-owned technology for producing PTA and PET from paraxylene (PX) and monoethylene glycol (MEG), offering significant cost savings and fewer intermediate steps in the production process.
kWh: Kilowatt - hour
Managed Services: Services provided by an external supplier to operate, monitor, configure and provide support in case of failure of telecommunications equipment and their value-added services.
PET (Polyethylene Terephtalate): Plastic resin mostly used to manufacture bottles.
Polyester: Plastic resin used to manufacture textile fibers, films, and containers.
Polypropylene: Propylene byproduct used to make plastics and fibers, among other products.
Polyurethanes: Chemical compounds derived from oil, used to manufacture plastic foam.
PTA (Purified Terephtalic Acid): Raw material used to manufacture polyester.
Related Proprietary Board Member: A Board member who owns company shares and is involved in the day-to-day management of the company.
Glossary

ALFA is the largest independent producer of aluminum
engine components for the automotive industry in
the world, and one of the world’s largest producers of
polyester (PTA, PET and fibers). In addition, it leads the
Mexican market in petrochemicals such as polypropylene,
expandable polystyrene and caprolactam. It is the leading
maker of processed meats in North America, and of cheese
in Mexico, as well as a leading company in information
technology and communications services for the business
segment in this country. Since 2006, it participates in the
hydrocarbon industry in the U.S.
In 2013, ALFA reported revenues of Ps. 203,456 million
(U.S. $15.9 billion), and EBITDA of Ps. 24,534 million
(U.S. $1.9 billion).
Currently, ALFA has manufacturing operations in 18
countries and employs 61,000 people. ALFA’s shares are
quoted on the Mexican Stock Exchange and on Latibex,
the market for Latin American shares of the Madrid Stock
Exchange.
ContentsPage
The Year in Summary 1Global Footprint and Businesses 2Financial Highlights 4Letter to Shareholders 5Alpek 8Nemak 10Sigma 12Alestra 14Newpek 16Board of Directors 18Management Team 20Corporate Governance 20Consolidated Financial Statements 22
NOTE: In this annual report, monetary figures are expressed in nominal Mexican pesos (Ps.), and in nominal dollars (U.S. $) unless otherwise specified. Conversions from pesos to dollars were made using the average rate of the month in which the revenues or disbursements were made. The percentages of variation between 2013 and 2012 are expressed in nominal terms.
The Companyd
esig
n: s
ign
i.co
m.m
x Independent AuditorPwC
Investor RelationsEnrique FloresVice-President Corporate CommunicationsPhone: +52 (81) 8748 [email protected]
Luis OchoaInvestor Relations DirectorPhone: +52 (81) 8748 [email protected]
Raúl GonzálezInvestor Relations ManagerPhone: +52 (81) 8748 [email protected]
Juan Andrés MartínInvestor RelationsPhone: +52 (81) 8748 [email protected]
Mexican Stock ExchangeALFADate listedAugust 1978
Latibex (Madrid Stock Exchange)ALFA C/I-s/ADate listedDecember 2003

Annual Report 20
13
ALFA, S.A.B. DE C.V.Av. Gómez Morín 1111 SurCol. CarrizalejoSan Pedro Garza García, N.L.C.P. 66254, Mexico
www.alfa.com.mx
ANNUAL REPORT


![Crude Assay Report · 15 Vacuum Gas Oil Cuts - Gas Oil [325-370°C] 15 16 Vacuum Gas Oil Cuts - Gas Oil 1[370 - 540°C] 16 17 Vacuum Gas Oil Cuts - Heavy Vacuum Gas Oil [370 - 548°C]](https://static.fdocuments.in/doc/165x107/5e68681c2598ff04995c67bc/crude-assay-report-15-vacuum-gas-oil-cuts-gas-oil-325-370c-15-16-vacuum-gas.jpg)

