Annual Runway - Online Collections
96
Annual Runway Safety Report 2009
Transcript of Annual Runway - Online Collections
Annual RunwaySafety Report 2009
Federal Aviation Administration
800 Independence Avenue, SW
Washington, DC 20591
Air Traffic Organization
2009-AJS-129
A Message from the FAA Administrator
Dear Colleagues:
We’re making progress on the issue of runway safety, but as an agency and as an industry, we need to do more. This report details the strides we’ve made over the last year. It also includes our next steps to take what is arguably one of the safest locations in all of aviation — a U.S. runway — and make it safer still.
In the long term, runway safety is very, very good. Last year, we had 25 serious runway incursions. That’s out of more than 58 million operations. Serious runway incursions have dropped by more than half since 2001. Nine of those 25 serious incursions last year involved commercial aircraft. The 25 incursions were up one from the previous year, which was an all-time low.
But the 2008 totals show that we must increase our vigilance. Last year, runway incursions of all types increased by some 13 percent over 2007, rising from 891 to 1,009.
So far in fiscal year 2009, the data look promising with a projected drop in total incursions for the full year by some five percent and an accompanying reduction in serious incursions by at least 50 percent.
These data are encouraging. But while the actual runway incursion numbers are still a very thin slice of overall operations, as an aviation professional, I believe that very good is still not good enough.
As a result, we’ve redoubled our efforts to see more positive results in the short term. Since almost two thirds of incursions last year resulted from pilot deviations, we’ve required air carriers to retrain their crews. We also moved to have the carriers review cockpit procedures to identify and develop plans to minimize pilot distractions during taxi. All 112 carriers have complied with these efforts. Carriers also are emphasizing their recurrent training programs for non-pilots who operate aircraft or other vehicles on the airfield.
Earlier this year, more than 485,000 pilots received brochures and DVDs on runway safety via cooperative mailings with the Aircraft Owners and Pilots Association and the National Association of Flight Instructors.
We’ve taken action in other areas as well such as new technology, end-around taxiways, runway safety areas, new ATC procedures, and airport markings, lighting and signage. The pages that follow outline those and other initiatives.
As a pilot and as a passenger, I’m confident that they will bear fruit in the form of increased safety on our runways.
Sincerely,
J. Randolph Babbitt Administrator, Federal Aviation Administration
12009 Runway Safety Report
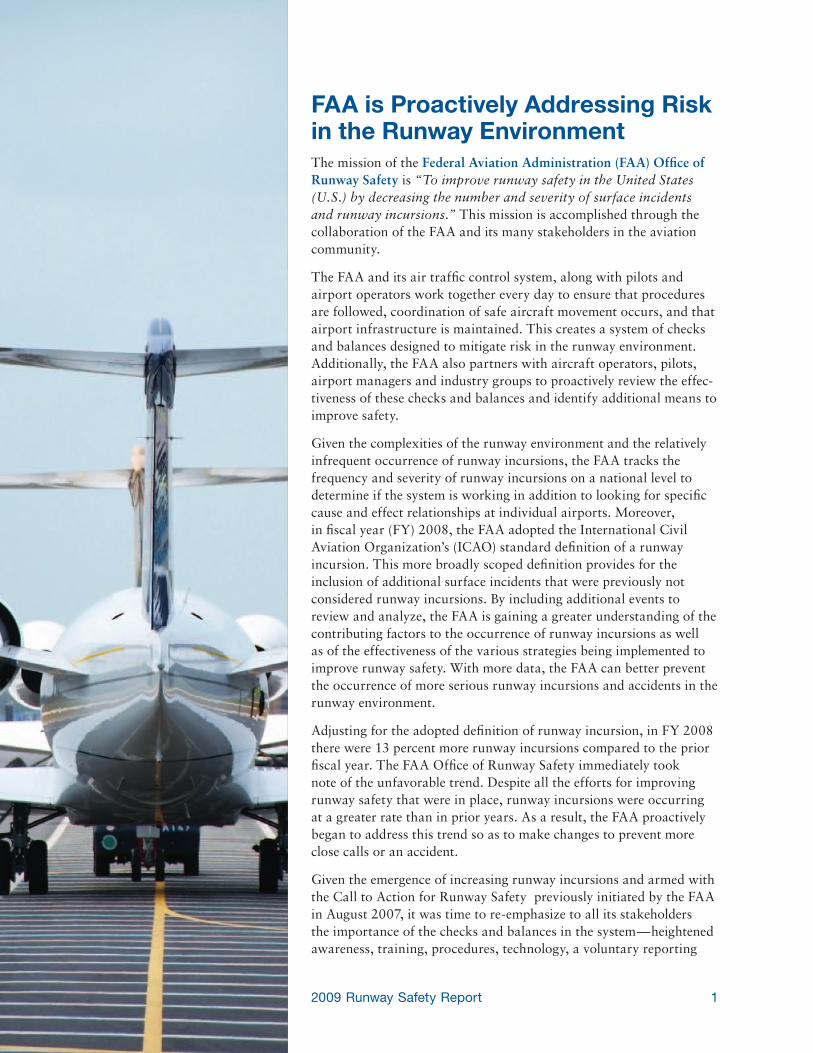
FAA is Proactively Addressing Risk in the Runway EnvironmentThe mission of the Federal Aviation Administration (FAA) Office of Runway Safety is “To improve runway safety in the United States (U.S.) by decreasing the number and severity of surface incidents and runway incursions.” This mission is accomplished through the collaboration of the FAA and its many stakeholders in the aviation community.
The FAA and its air traffic control system, along with pilots and airport operators work together every day to ensure that procedures are followed, coordination of safe aircraft movement occurs, and that airport infrastructure is maintained. This creates a system of checks and balances designed to mitigate risk in the runway environment. Additionally, the FAA also partners with aircraft operators, pilots, airport managers and industry groups to proactively review the effec-tiveness of these checks and balances and identify additional means to improve safety.
Given the complexities of the runway environment and the relatively infrequent occurrence of runway incursions, the FAA tracks the frequency and severity of runway incursions on a national level to determine if the system is working in addition to looking for specific cause and effect relationships at individual airports. Moreover, in fiscal year (FY) 2008, the FAA adopted the International Civil Aviation Organization’s (ICAO) standard definition of a runway incursion. This more broadly scoped definition provides for the inclusion of additional surface incidents that were previously not considered runway incursions. By including additional events to review and analyze, the FAA is gaining a greater understanding of the contributing factors to the occurrence of runway incursions as well as of the effectiveness of the various strategies being implemented to improve runway safety. With more data, the FAA can better prevent the occurrence of more serious runway incursions and accidents in the runway environment.
Adjusting for the adopted definition of runway incursion, in FY 2008 there were 13 percent more runway incursions compared to the prior fiscal year. The FAA Office of Runway Safety immediately took note of the unfavorable trend. Despite all the efforts for improving runway safety that were in place, runway incursions were occurring at a greater rate than in prior years. As a result, the FAA proactively began to address this trend so as to make changes to prevent more close calls or an accident.
Given the emergence of increasing runway incursions and armed with the Call to Action for Runway Safety previously initiated by the FAA in August 2007, it was time to re-emphasize to all its stakeholders the importance of the checks and balances in the system — heightened awareness, training, procedures, technology, a voluntary reporting
2 Measuring Runway Safety and Strategies for Continuous Improvement
system, airport signage and markings — and to work together to identify other places where the system may be vulnerable to human error and therefore create potential for runway incursions to occur.
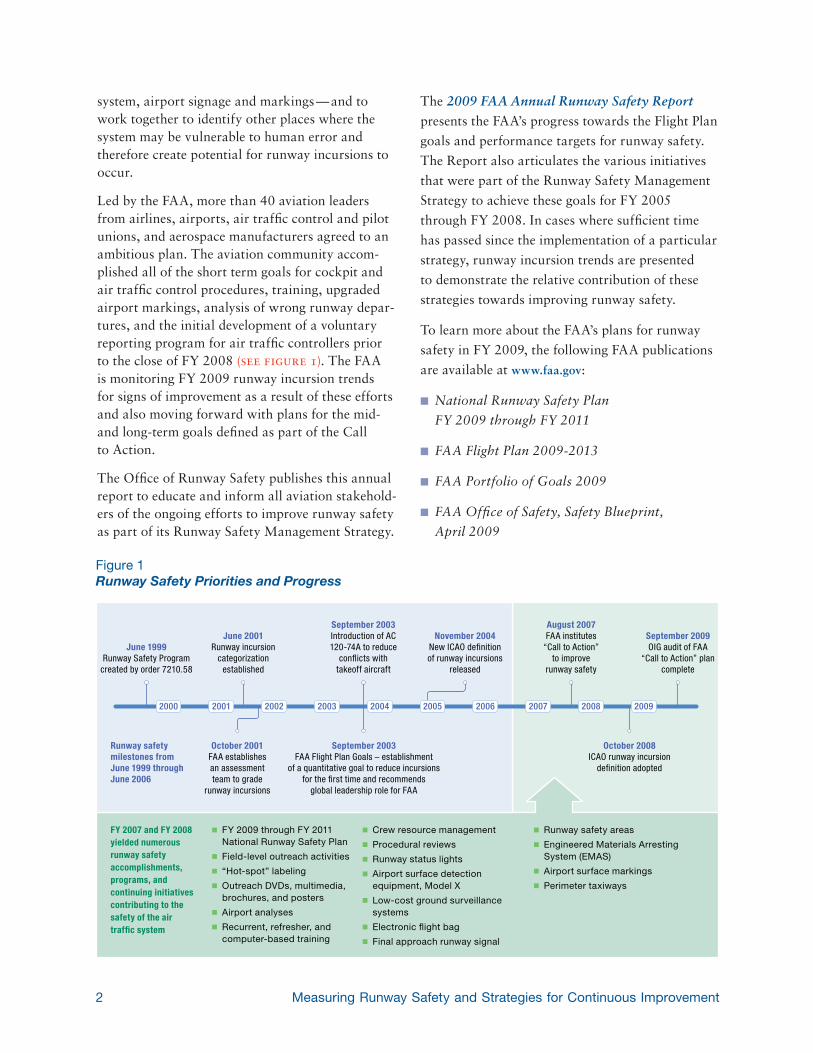
Led by the FAA, more than 40 aviation leaders from airlines, airports, air traffic control and pilot unions, and aerospace manufacturers agreed to an ambitious plan. The aviation community accom-plished all of the short term goals for cockpit and air traffic control procedures, training, upgraded airport markings, analysis of wrong runway depar-tures, and the initial development of a voluntary reporting program for air traffic controllers prior to the close of FY 2008 (see figure 1). The FAA is monitoring FY 2009 runway incursion trends for signs of improvement as a result of these efforts and also moving forward with plans for the mid- and long-term goals defined as part of the Call to Action.
The Office of Runway Safety publishes this annual report to educate and inform all aviation stakehold-ers of the ongoing efforts to improve runway safety as part of its Runway Safety Management Strategy.
The 2009 FAA Annual Runway Safety Report
presents the FAA’s progress towards the Flight Plan
goals and performance targets for runway safety.
The Report also articulates the various initiatives
that were part of the Runway Safety Management
Strategy to achieve these goals for FY 2005
through FY 2008. In cases where sufficient time
has passed since the implementation of a particular
strategy, runway incursion trends are presented
to demonstrate the relative contribution of these
strategies towards improving runway safety.
To learn more about the FAA’s plans for runway
safety in FY 2009, the following FAA publications
are available at www.faa.gov:
n National Runway Safety Plan
FY 2009 through FY 2011
n FAA Flight Plan 2009-2013
n FAA Portfolio of Goals 2009
n FAA Office of Safety, Safety Blueprint,
April 2009
Figure 1Runway Safety Priorities and Progress
October 2001FAA establishesan assessmentteam to grade
runway incursions
September 2003FAA Flight Plan Goals – establishment
of a quantitative goal to reduce incursionsfor the first time and recommends
global leadership role for FAA
October 2008ICAO runway incursion
definition adopted
June 1999Runway Safety Program
created by order 7210.58
June 2001Runway incursion
categorizationestablished
Runway safetymilestones fromJune 1999 throughJune 2006
September 2003Introduction of AC120-74A to reduce
conflicts withtakeoff aircraft
November 2004New ICAO definitionof runway incursions
released
August 2007FAA institutes
“Call to Action”to improve
runway safety
September 2009OIG audit of FAA
“Call to Action” plancomplete
2000 2001 2002 2003 2004 2005 2006 2007 2008 2009
FY 2007 and FY 2008 yielded numerous runway safety accomplishments, programs, and continuing initiatives contributing to the safety of the air traffic system
Crew resource management
Procedural reviews
Runway status lights
Airport surface detection equipment, Model X
Low-cost ground surveillance systems
Electronic �ight bag
Final approach runway signal
FY 2009 through FY 2011 National Runway Safety Plan
Field-level outreach activities
“Hot-spot” labeling
Outreach DVDs, multimedia, brochures, and posters
Airport analyses
Recurrent, refresher, and computer-based training
Runway safety areas
Engineered Materials Arresting System (EMAS)
Airport surface markings
Perimeter taxiways

32009 Runway Safety Report
4 Measuring Runway Safety and Strategies for Continuous Improvement
FAA Measures Runway SafetyPilots safely completed more than 58 million takeoffs and landings at over 500 U.S. airports with air traffic control towers in FY 2008 alone. To continuously operate safely and efficiently, the National Airspace System (NAS) relies on clear communication and smooth coordination among more than 15,000 air traffic controllers, nearly 600,000 pilots, and a wide variety of airport vehicle operators. Runway safety is ultimately a shared responsibility. Pilots, air traffic controllers, ground crews, and airport operators all work together to keep our runways safe.
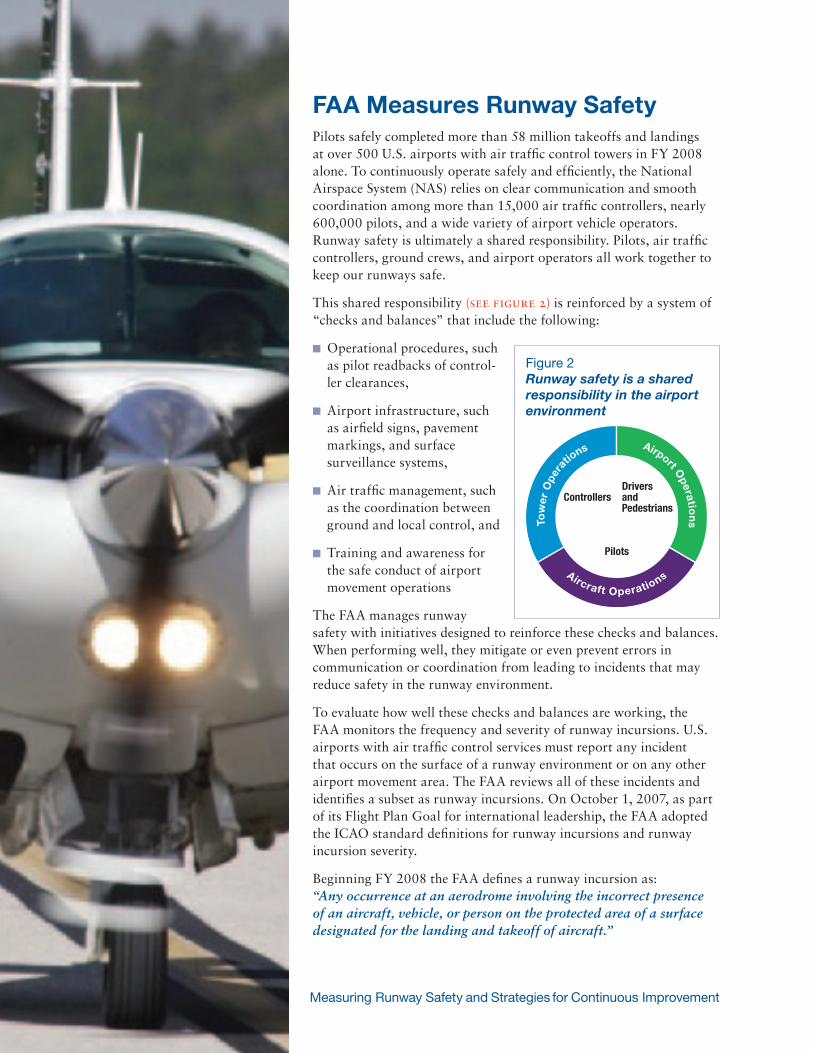
This shared responsibility (see figure 2) is reinforced by a system of “checks and balances” that include the following:
n Operational procedures, such as pilot readbacks of control-ler clearances,
n Airport infrastructure, such as airfield signs, pavement markings, and surface surveillance systems,
n Air traffic management, such as the coordination between ground and local control, and
n Training and awareness for the safe conduct of airport movement operations
The FAA manages runway safety with initiatives designed to reinforce these checks and balances. When performing well, they mitigate or even prevent errors in communication or coordination from leading to incidents that may reduce safety in the runway environment.
To evaluate how well these checks and balances are working, the FAA monitors the frequency and severity of runway incursions. U.S. airports with air traffic control services must report any incident that occurs on the surface of a runway environment or on any other airport movement area. The FAA reviews all of these incidents and identifies a subset as runway incursions. On October 1, 2007, as part of its Flight Plan Goal for international leadership, the FAA adopted the ICAO standard definitions for runway incursions and runway incursion severity.
Beginning FY 2008 the FAA defines a runway incursion as: “Any occurrence at an aerodrome involving the incorrect presence of an aircraft, vehicle, or person on the protected area of a surface designated for the landing and takeoff of aircraft.”
Airport Operatio
nsTo
wer
Ope
ra
tions
Aircraft Operations
DriversandPedestrians
Controllers
Pilots
Figure 2Runway safety is a shared responsibility in the airport environment
52009 Runway Safety Report
1 FY 2005 through FY 2007 data has been interpolated using the new definition of severity and as such are only estimates. FY 2008 data was collected using the new definition of severity and as such are actual. Reference Data IV lists the number and rate of runway incursions for all U.S. towered airports that reported at least one runway incursion or surface incident over the four year period.
2 For the purposes of this report, runway incursion data prior to FY 2008 was re-categorized to reflect the ICAO definition, FY 2005 through FY 2007 data shown in the chart above are estimates to reflect the re-categorization.
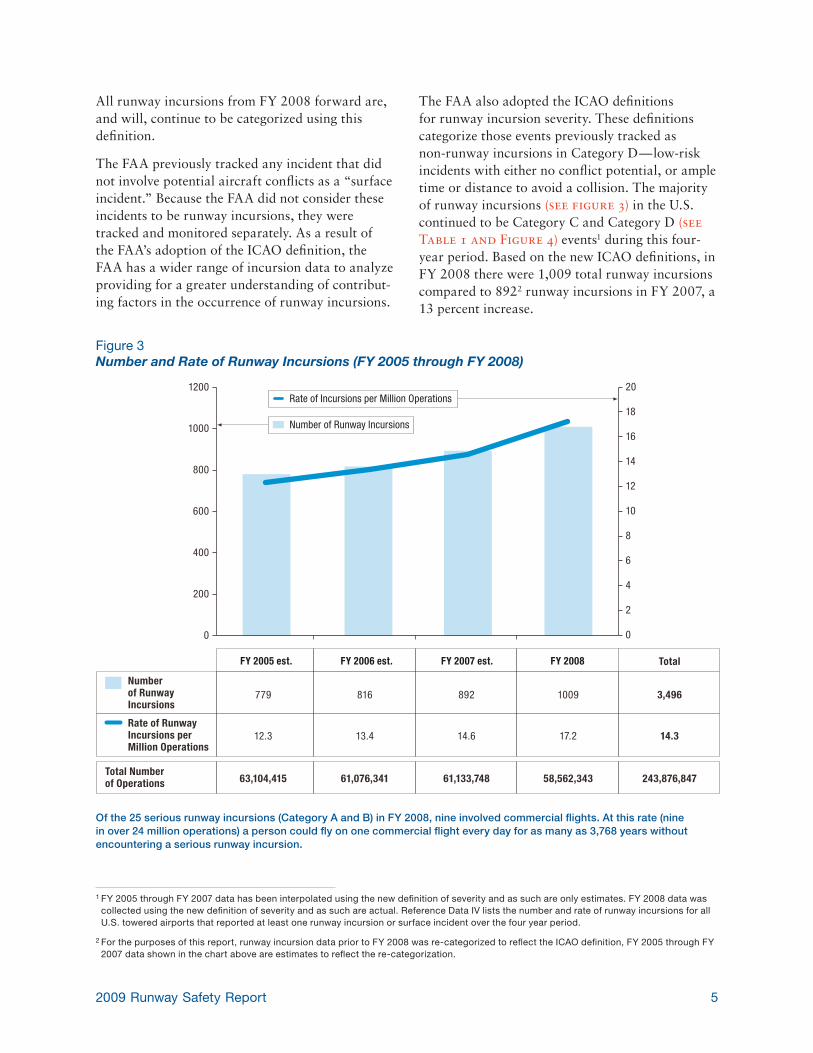
Figure 3Number and Rate of Runway Incursions (FY 2005 through FY 2008)
Of the 25 serious runway incursions (Category A and B) in FY 2008, nine involved commercial flights. At this rate (nine in over 24 million operations) a person could fly on one commercial flight every day for as many as 3,768 years without encountering a serious runway incursion.
0
400
200
600
800
1000
1200
0
2
4
6
8
10
12
14
16
18
20Rate of Incursions per Million Operations
Number of Runway Incursions
779Numberof RunwayIncursions
816 892 1009
Rate of RunwayIncursions perMillion Operations
Total Numberof Operations
3,496
12.3 13.4 14.6 17.2 14.3
63,104,415 61,076,341 61,133,748 58,562,343 243,876,847
TotalFY 2005 est. FY 2006 est. FY 2007 est. FY 2008
All runway incursions from FY 2008 forward are, and will, continue to be categorized using this definition.
The FAA previously tracked any incident that did not involve potential aircraft conflicts as a “surface incident.” Because the FAA did not consider these incidents to be runway incursions, they were tracked and monitored separately. As a result of the FAA’s adoption of the ICAO definition, the FAA has a wider range of incursion data to analyze providing for a greater understanding of contribut-ing factors in the occurrence of runway incursions.
The FAA also adopted the ICAO definitions for runway incursion severity. These definitions categorize those events previously tracked as non-runway incursions in Category D — low-risk incidents with either no conflict potential, or ample time or distance to avoid a collision. The majority of runway incursions (see figure 3) in the U.S. continued to be Category C and Category D (see Table 1 and Figure 4) events1 during this four-year period. Based on the new ICAO definitions, in FY 2008 there were 1,009 total runway incursions compared to 8922 runway incursions in FY 2007, a 13 percent increase.
6 Measuring Runway Safety and Strategies for Continuous Improvement
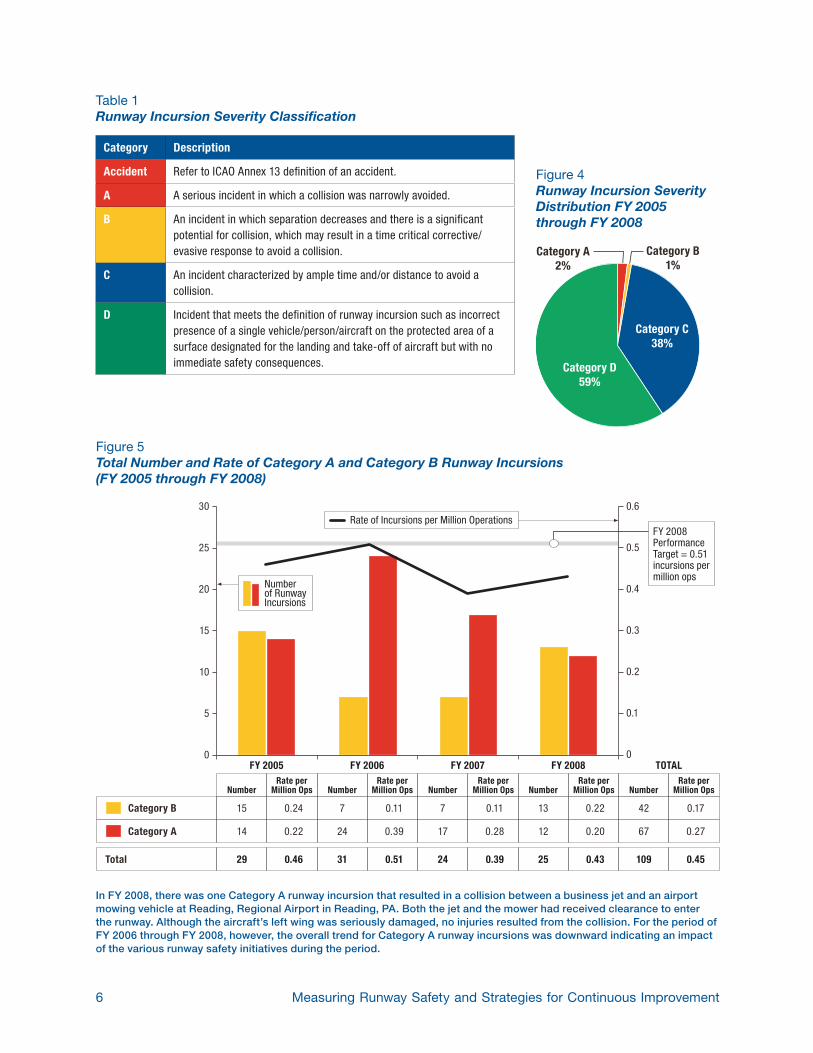
Table 1Runway Incursion Severity Classification
Category Description
Accident Refer to ICAO Annex 13 definition of an accident.
A A serious incident in which a collision was narrowly avoided.
B An incident in which separation decreases and there is a significant potential for collision, which may result in a time critical corrective/evasive response to avoid a collision.
C An incident characterized by ample time and/or distance to avoid a collision.
D Incident that meets the definition of runway incursion such as incorrect presence of a single vehicle/person/aircraft on the protected area of a surface designated for the landing and take-off of aircraft but with no immediate safety consequences.
Category A2%
Category B1%
Category C38%
Category D59%
Figure 4Runway Incursion Severity Distribution FY 2005 through FY 2008
Figure 5Total Number and Rate of Category A and Category B Runway Incursions (FY 2005 through FY 2008)
0
10
5
15
20
25
30
0
0.1
0.2
0.3
0.4
0.5
0.6Rate of Incursions per Million Operations
FY 2008PerformanceTarget = 0.51incursions permillion ops
Numberof RunwayIncursions
15Category B
14Category A
0.24
0.22
FY 2005 FY 2006 FY 2007 FY 2008
NumberRate per
Million Ops
7
24
0.11
0.39
NumberRate per
Million Ops
7
17
0.11
0.28
NumberRate per
Million Ops
13
12
0.22
0.20
29Total 0.46 31 0.51 24 0.39 25 0.43
NumberRate per
Million Ops
TOTAL
42
67
0.17
0.27
109 0.45
NumberRate per
Million Ops
In FY 2008, there was one Category A runway incursion that resulted in a collision between a business jet and an airport mowing vehicle at Reading, Regional Airport in Reading, PA. Both the jet and the mower had received clearance to enter the runway. Although the aircraft’s left wing was seriously damaged, no injuries resulted from the collision. For the period of FY 2006 through FY 2008, however, the overall trend for Category A runway incursions was downward indicating an impact of the various runway safety initiatives during the period.
72009 Runway Safety Report
The FAA Flight Plan for 2008 – 2012 performance target is to limit the most serious runway incur-sions (Category A and Category B) to a rate of no more than 0.45 runway incursions per million operations by FY 2010 and maintain or improve that rate through FY 2013. The FAA FY 2008
Portfolio of Goals sets forth a performance target of 0.51 runway incursions per million operations specifically for FY 2008. The FAA met both of these goals by holding runway incursions to a rate of 0.43 runway incursions per million operations in FY 2008 (see figure 5).
8 Measuring Runway Safety and Strategies for Continuous Improvement
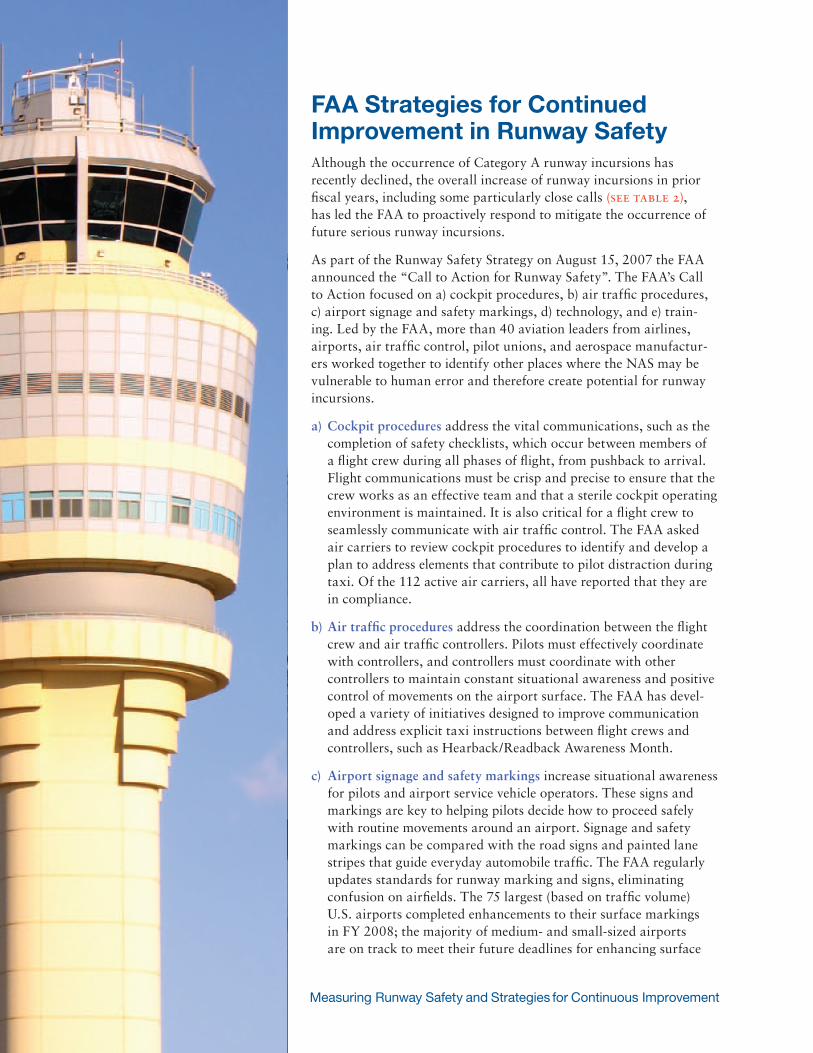
FAA Strategies for Continued Improvement in Runway SafetyAlthough the occurrence of Category A runway incursions has recently declined, the overall increase of runway incursions in prior fiscal years, including some particularly close calls (see table 2), has led the FAA to proactively respond to mitigate the occurrence of future serious runway incursions.
As part of the Runway Safety Strategy on August 15, 2007 the FAA announced the “Call to Action for Runway Safety”. The FAA’s Call to Action focused on a) cockpit procedures, b) air traffic procedures, c) airport signage and safety markings, d) technology, and e) train-ing. Led by the FAA, more than 40 aviation leaders from airlines, airports, air traffic control, pilot unions, and aerospace manufactur-ers worked together to identify other places where the NAS may be vulnerable to human error and therefore create potential for runway incursions.
a) Cockpit procedures address the vital communications, such as the completion of safety checklists, which occur between members of a flight crew during all phases of flight, from pushback to arrival. Flight communications must be crisp and precise to ensure that the crew works as an effective team and that a sterile cockpit operating environment is maintained. It is also critical for a flight crew to seamlessly communicate with air traffic control. The FAA asked air carriers to review cockpit procedures to identify and develop a plan to address elements that contribute to pilot distraction during taxi. Of the 112 active air carriers, all have reported that they are in compliance.
b) Air traffic procedures address the coordination between the flight crew and air traffic controllers. Pilots must effectively coordinate with controllers, and controllers must coordinate with other controllers to maintain constant situational awareness and positive control of movements on the airport surface. The FAA has devel-oped a variety of initiatives designed to improve communication and address explicit taxi instructions between flight crews and controllers, such as Hearback/Readback Awareness Month.
c) Airport signage and safety markings increase situational awareness for pilots and airport service vehicle operators. These signs and markings are key to helping pilots decide how to proceed safely with routine movements around an airport. Signage and safety markings can be compared with the road signs and painted lane stripes that guide everyday automobile traffic. The FAA regularly updates standards for runway marking and signs, eliminating confusion on airfields. The 75 largest (based on traffic volume) U.S. airports completed enhancements to their surface markings in FY 2008; the majority of medium- and small-sized airports are on track to meet their future deadlines for enhancing surface
92009 Runway Safety Report
markings. A safety review performed by the FAA at 20 airports resulted in more than 100 short-term initiatives, of which all have been completed. Implementation of these initiatives resulted in reducing serious runway incursions (Category A and Category B) by 50 percent.
d) Technology implementation in the airport environment, control tower and cockpit are designed to support operators in their compli-ance to procedures and recognition of potential hazards in the runway environment. The FAA is in the process of helping airports across the country install runway safety-enhancing technologies such as Airport Surface Detection Equipment, Model X (ASDE-X), Runway Status Lights (RWSL), and Final Approach Runway Occupancy Signal (FAROS). Low-cost ground surveillance systems are currently being tested at
small and medium sized airports, providing scal-able and adaptable coverage to the entire airport movement area, addressing poor visibility condi-tions. This technology provides near-term safety improvements for these airports, providing the future option of layering additional runway safety technologies as needed.
e) Training provides pilots, air traffic controllers, and ground crews with the skills they need to perform their jobs safely. The FAA issued an advisory recommending initial and regular recurrent ground movement training for all individuals with access to airport movement areas, including non-airport employees. Updated guidance soon to be released, was specifically designed for tug and tow operators to comple-ment existing air carrier tug and tow training programs.
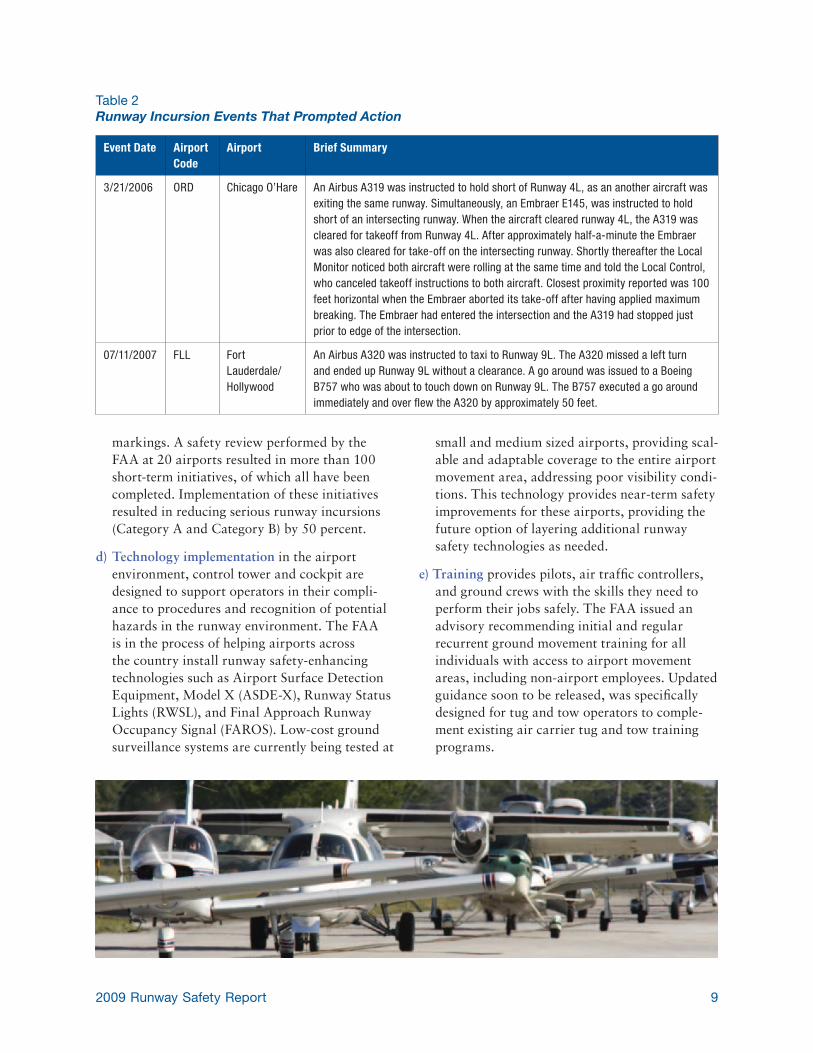
Table 2Runway Incursion Events That Prompted Action
Event Date Airport Code
Airport Brief Summary
3/21/2006 ORD Chicago O’Hare An Airbus A319 was instructed to hold short of Runway 4L, as an another aircraft was exiting the same runway. Simultaneously, an Embraer E145, was instructed to hold short of an intersecting runway. When the aircraft cleared runway 4L, the A319 was cleared for takeoff from Runway 4L. After approximately half-a-minute the Embraer was also cleared for take-off on the intersecting runway. Shortly thereafter the Local Monitor noticed both aircraft were rolling at the same time and told the Local Control, who canceled takeoff instructions to both aircraft. Closest proximity reported was 100 feet horizontal when the Embraer aborted its take-off after having applied maximum breaking. The Embraer had entered the intersection and the A319 had stopped just prior to edge of the intersection.
07/11/2007 FLL Fort Lauderdale/ Hollywood
An Airbus A320 was instructed to taxi to Runway 9L. The A320 missed a left turn and ended up Runway 9L without a clearance. A go around was issued to a Boeing B757 who was about to touch down on Runway 9L. The B757 executed a go around immediately and over flew the A320 by approximately 50 feet.
10 Measuring Runway Safety and Strategies for Continuous Improvement
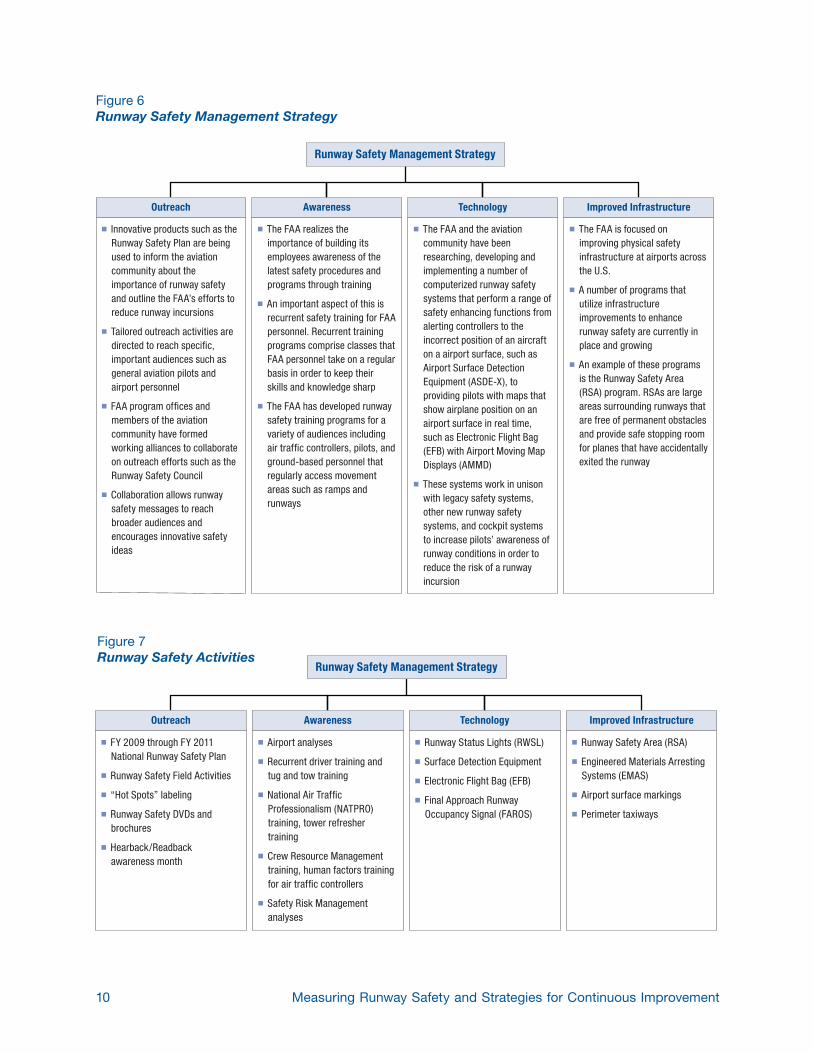
Figure 6Runway Safety Management Strategy
Runway Safety Management Strategy
■ Innovative products such as the Runway Safety Plan are being used to inform the aviation community about the importance of runway safety and outline the FAA’s efforts to reduce runway incursions
■ Tailored outreach activities are directed to reach specific, important audiences such as general aviation pilots and airport personnel
■ FAA program offices and members of the aviation community have formed working alliances to collaborate on outreach efforts such as the Runway Safety Council
■ Collaboration allows runway safety messages to reach broader audiences and encourages innovative safety ideas
Outreach
■ The FAA realizes the importance of building its employees awareness of the latest safety procedures and programs through training
■ An important aspect of this is recurrent safety training for FAA personnel. Recurrent training programs comprise classes that FAA personnel take on a regular basis in order to keep their skills and knowledge sharp
■ The FAA has developed runway safety training programs for a variety of audiences including air traffic controllers, pilots, and ground-based personnel that regularly access movement areas such as ramps and runways
Awareness
■ The FAA and the aviation community have been researching, developing and implementing a number of computerized runway safety systems that perform a range of safety enhancing functions from alerting controllers to the incorrect position of an aircraft on a airport surface, such as Airport Surface Detection Equipment (ASDE-X), to providing pilots with maps that show airplane position on an airport surface in real time, such as Electronic Flight Bag (EFB) with Airport Moving Map Displays (AMMD)
■ These systems work in unison with legacy safety systems, other new runway safety systems, and cockpit systems to increase pilots’ awareness of runway conditions in order to reduce the risk of a runway incursion
Technology
■ The FAA is focused on improving physical safety infrastructure at airports across the U.S.
■ A number of programs that utilize infrastructure improvements to enhance runway safety are currently in place and growing
■ An example of these programs is the Runway Safety Area (RSA) program. RSAs are large areas surrounding runways that are free of permanent obstacles and provide safe stopping room for planes that have accidentally exited the runway
Improved Infrastructure
Figure 7Runway Safety Activities
Runway Safety Management Strategy
■ FY 2009 through FY 2011 National Runway Safety Plan
■ Runway Safety Field Activities
■ “Hot Spots” labeling
■ Runway Safety DVDs and brochures
■ Hearback/Readbackawareness month
Outreach
■ Airport analyses
■ Recurrent driver training and tug and tow training
■ National Air Traffic Professionalism (NATPRO) training, tower refresher training
■ Crew Resource Management training, human factors training for air traffic controllers
■ Safety Risk Management analyses
Awareness
■ Runway Status Lights (RWSL)
■ Surface Detection Equipment
■ Electronic Flight Bag (EFB)
■ Final Approach Runway Occupancy Signal (FAROS)
Technology
■ Runway Safety Area (RSA)
■ Engineered Materials Arresting Systems (EMAS)
■ Airport surface markings
■ Perimeter taxiways
Improved Infrastructure
112009 Runway Safety Report
Runway Safety Management Strategy
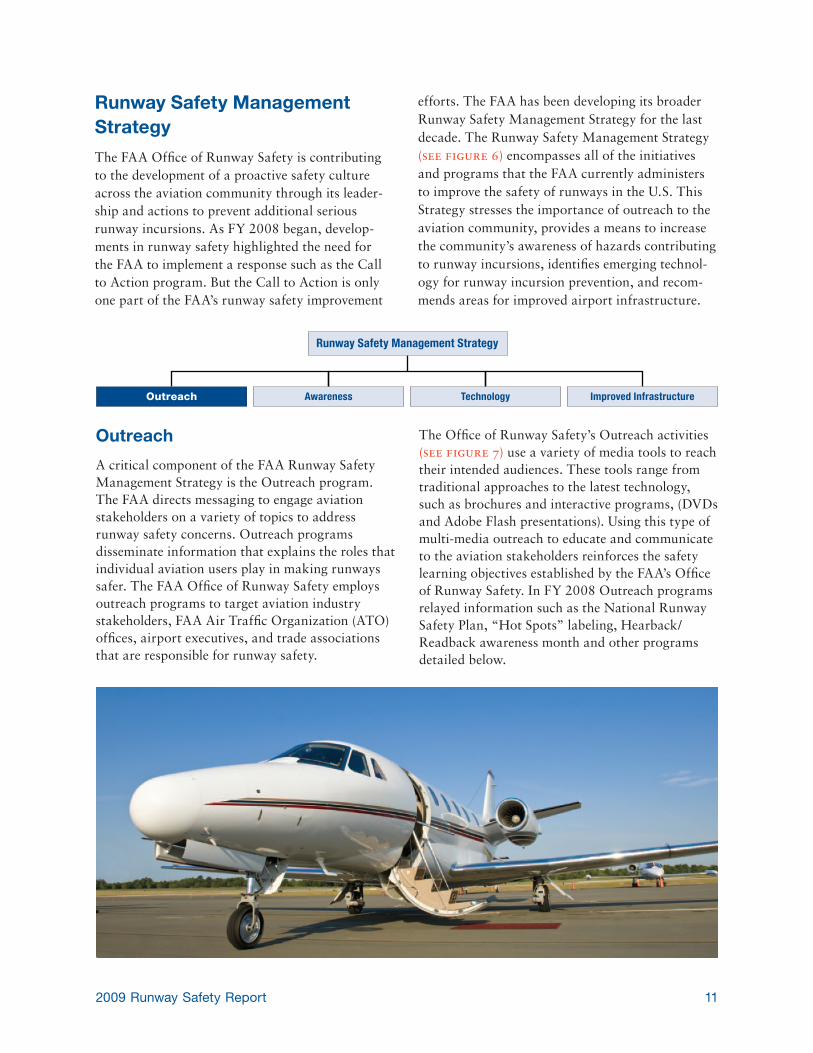
The FAA Office of Runway Safety is contributing to the development of a proactive safety culture across the aviation community through its leader-ship and actions to prevent additional serious runway incursions. As FY 2008 began, develop-ments in runway safety highlighted the need for the FAA to implement a response such as the Call to Action program. But the Call to Action is only one part of the FAA’s runway safety improvement
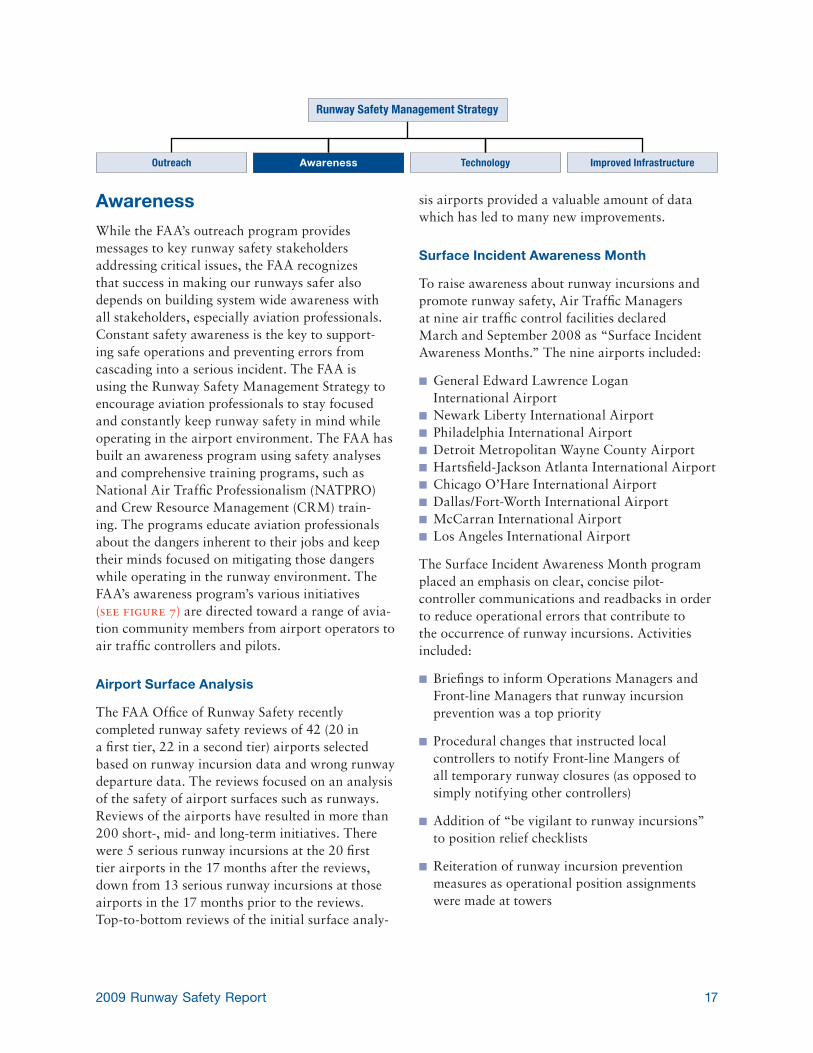
efforts. The FAA has been developing its broader Runway Safety Management Strategy for the last decade. The Runway Safety Management Strategy (see figure 6) encompasses all of the initiatives and programs that the FAA currently administers to improve the safety of runways in the U.S. This Strategy stresses the importance of outreach to the aviation community, provides a means to increase the community’s awareness of hazards contributing to runway incursions, identifies emerging technol-ogy for runway incursion prevention, and recom-mends areas for improved airport infrastructure.
Runway Safety Management Strategy
Outreach Awareness Technology Improved Infrastructure
Outreach
A critical component of the FAA Runway Safety Management Strategy is the Outreach program. The FAA directs messaging to engage aviation stakeholders on a variety of topics to address runway safety concerns. Outreach programs disseminate information that explains the roles that individual aviation users play in making runways safer. The FAA Office of Runway Safety employs outreach programs to target aviation industry stakeholders, FAA Air Traffic Organization (ATO) offices, airport executives, and trade associations that are responsible for runway safety.
The Office of Runway Safety’s Outreach activities (see figure 7) use a variety of media tools to reach their intended audiences. These tools range from traditional approaches to the latest technology, such as brochures and interactive programs, (DVDs and Adobe Flash presentations). Using this type of multi-media outreach to educate and communicate to the aviation stakeholders reinforces the safety learning objectives established by the FAA’s Office of Runway Safety. In FY 2008 Outreach programs relayed information such as the National Runway Safety Plan, “Hot Spots” labeling, Hearback/Readback awareness month and other programs detailed below.
12 Measuring Runway Safety and Strategies for Continuous Improvement
National Runway Safety Plan
In 2007, the General Accounting Office (GAO) issued a report entitled Aviation Runway and Ramp Safety: Sustained Efforts to Address Leadership, Technology, and Other Challenges Needed to Reduce Accidents and Incidents. The GAO suggested that the FAA develop a forward-looking plan to inform Congress and other aviation stakeholders of the FAA’s plans for runway safety management and achieving its performance targets. In early 2009 the Office of Runway Safety published the National Runway Safety Plan for FY 2009 – FY 2011.
The National Runway Safety Plan outlines the FAA’s goals to improve runway safety including near- and mid-term actions designed to reduce the severity and occurrence of runway incursions. The plan addresses recommendations from the Department of Transportation (DOT) Inspector General, National Transportation Safety Board (NTSB), and the GAO for:
n Human factors that lead to runway incursions
n Improvements to airport layout and movement areas to increase safety
n Improvements to airport signage, lighting and markings, training, education and awareness programs
n The need for increased industry participation, international cooperation, and the development of various technologies
Safety Summit
The Office of Runway Safety has proactively reached out to the aviation workforce by delivering safety messages tailored to specific programs and airports. The FAA has engaged aviation employees at the regional and local airport levels to address the unique safety concerns of individual facilities. For example, the Office of Runway Safety hosted Regional Runway Safety Summits in Fort Worth, Atlanta, and Seattle in April, June, and July 2008, respectively. The Summits featured presentations from noted aviation safety leaders and experts. Breakout working groups and FAA safety recom-mendation sessions provided real-time feedback
for stakeholders. Registrations for the Summits were free and attracted more than 500 combined participants from various segments of the aviation industry.
Regional Runway Safety Program Managers (RRSPM) coordinate and administer most of the FAA’s outreach activities at the local airports. One of the primary activities RRSPMs are involved in is the conduct of Runway Safety Action Team (RSAT) meetings, which are held at airports that report frequent or severe runway incursions. The goal of these meetings is to identify and address existing and potential runway safety problems. One of the 115 RSAT meetings held in 2008 was “The Methods Used by Professional Pilots to Ensure Runway Safety.” This meeting, held in South Burlington, VT, targeted general aviation pilots and highlighted best practices used by professional pilots.
Additional outreach activities which RRSPMs coordinate in the field include Safety Meetings, Incident Investigations, and Fly-Ins such as “Runway Safety – Fly-In / Drive-In Breakfast Safety Seminar” which occurred at Youngstown-Warren Regional Airport (YNG). The fly-in provided the opportunity for pilots to come together and discuss local procedures and how to safely fly in the Youngstown Ohio area. RRSPMs also conducted a variety of local follow-up meetings such as the “Rocky Mountain Metropolitan Airport Runway Safety Action Team Out Briefing” which was held in June 2008 at Rocky Mountain Metropolitan Airport in Broomfield, CO. The briefing provided
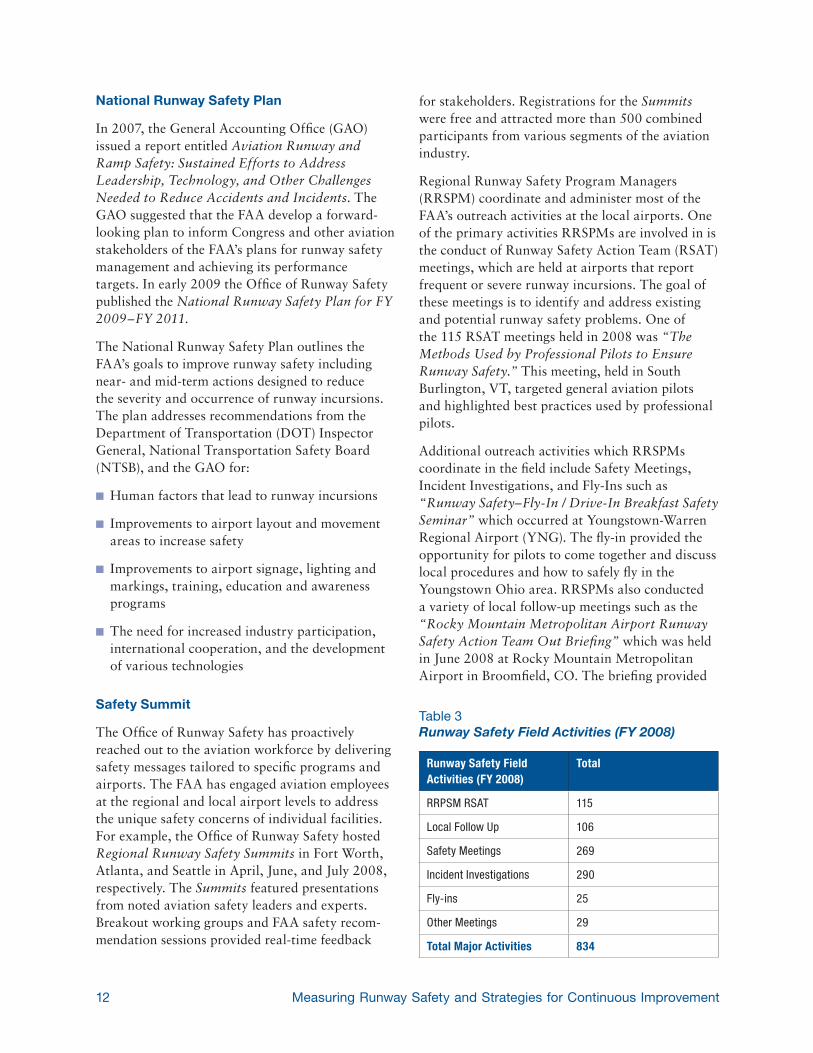
Table 3Runway Safety Field Activities (FY 2008)
Runway Safety Field Activities (FY 2008)
Total
RRPSM RSAT 115
Local Follow Up 106
Safety Meetings 269
Incident Investigations 290
Fly-ins 25
Other Meetings 29
Total Major Activities 834
132009 Runway Safety Report
the local community with an opportunity to review the results of a recent FAA safety inspection. RRSPMs successfully oversaw the completion of a total of 834 various meetings in FY 2008 (see table 3). This commitment to addressing safety concerns on a local level helps regions and individual airports more effectively tailor the safety concepts and programs directed by the Office of Runway Safety to their unique needs.
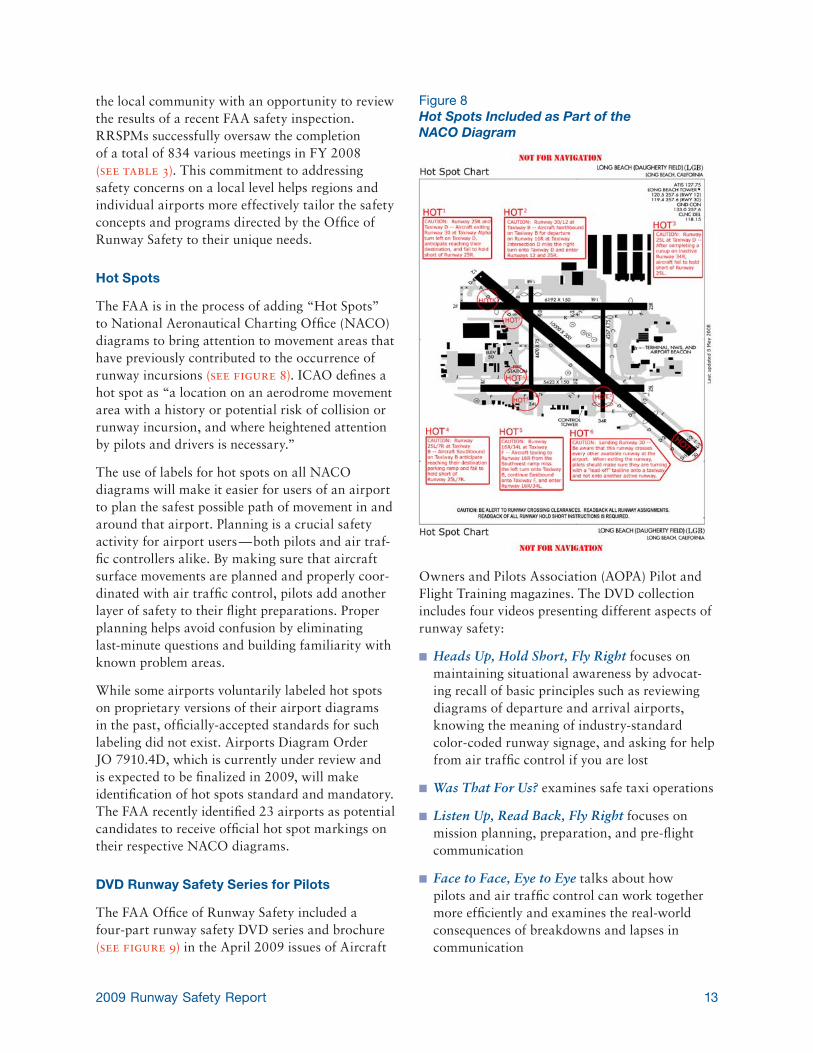
Hot Spots
The FAA is in the process of adding “Hot Spots” to National Aeronautical Charting Office (NACO) diagrams to bring attention to movement areas that have previously contributed to the occurrence of runway incursions (see figure 8). ICAO defines a hot spot as “a location on an aerodrome movement area with a history or potential risk of collision or runway incursion, and where heightened attention by pilots and drivers is necessary.”
The use of labels for hot spots on all NACO diagrams will make it easier for users of an airport to plan the safest possible path of movement in and around that airport. Planning is a crucial safety activity for airport users — both pilots and air traf-fic controllers alike. By making sure that aircraft surface movements are planned and properly coor-dinated with air traffic control, pilots add another layer of safety to their flight preparations. Proper planning helps avoid confusion by eliminating last-minute questions and building familiarity with known problem areas.
While some airports voluntarily labeled hot spots on proprietary versions of their airport diagrams in the past, officially-accepted standards for such labeling did not exist. Airports Diagram Order JO 7910.4D, which is currently under review and is expected to be finalized in 2009, will make identification of hot spots standard and mandatory. The FAA recently identified 23 airports as potential candidates to receive official hot spot markings on their respective NACO diagrams.
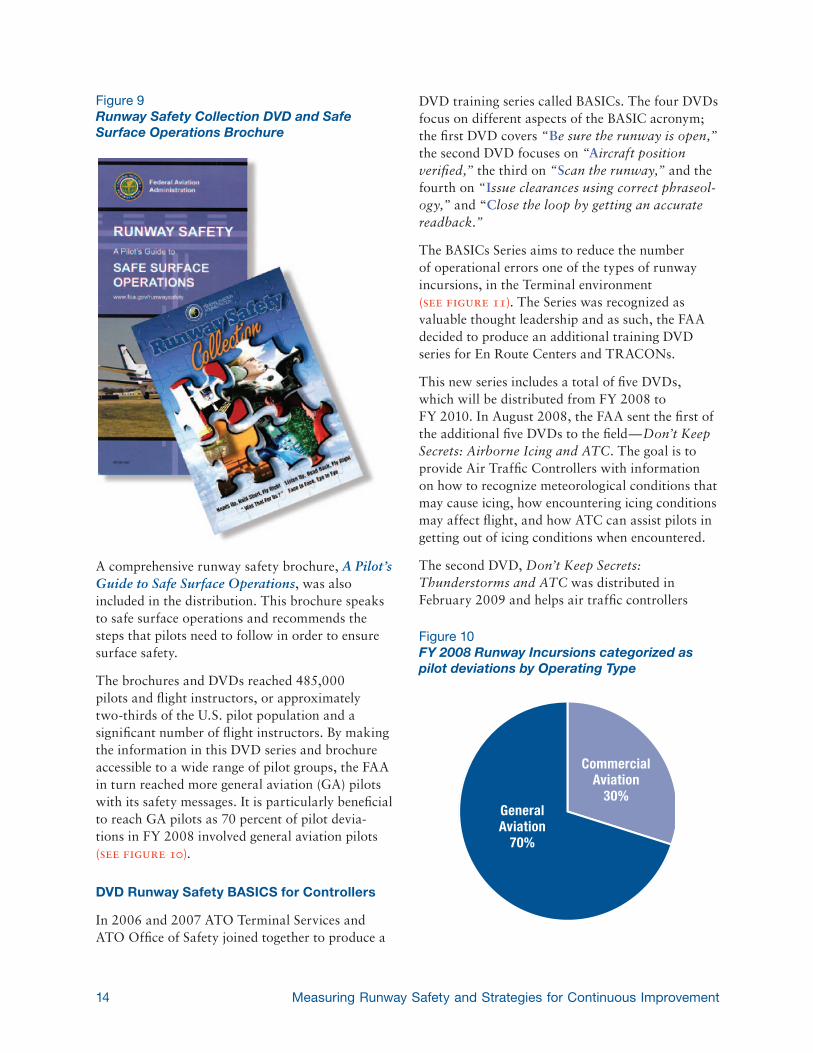
DVD Runway Safety Series for Pilots
The FAA Office of Runway Safety included a four-part runway safety DVD series and brochure (see figure 9) in the April 2009 issues of Aircraft
Owners and Pilots Association (AOPA) Pilot and Flight Training magazines. The DVD collection includes four videos presenting different aspects of runway safety:
n Heads Up, Hold Short, Fly Right focuses on maintaining situational awareness by advocat-ing recall of basic principles such as reviewing diagrams of departure and arrival airports, knowing the meaning of industry-standard color-coded runway signage, and asking for help from air traffic control if you are lost
n Was That For Us? examines safe taxi operations
n Listen Up, Read Back, Fly Right focuses on mission planning, preparation, and pre-flight communication
n Face to Face, Eye to Eye talks about how pilots and air traffic control can work together more efficiently and examines the real-world consequences of breakdowns and lapses in communication
Figure 8Hot Spots Included as Part of the NACO Diagram
14 Measuring Runway Safety and Strategies for Continuous Improvement
A comprehensive runway safety brochure, A Pilot’s Guide to Safe Surface Operations, was also included in the distribution. This brochure speaks to safe surface operations and recommends the steps that pilots need to follow in order to ensure surface safety.
The brochures and DVDs reached 485,000 pilots and flight instructors, or approximately two-thirds of the U.S. pilot population and a significant number of flight instructors. By making the information in this DVD series and brochure accessible to a wide range of pilot groups, the FAA in turn reached more general aviation (GA) pilots with its safety messages. It is particularly beneficial to reach GA pilots as 70 percent of pilot devia-tions in FY 2008 involved general aviation pilots (see figure 10).
DVD Runway Safety BASICS for Controllers
In 2006 and 2007 ATO Terminal Services and ATO Office of Safety joined together to produce a
DVD training series called BASICs. The four DVDs focus on different aspects of the BASIC acronym; the first DVD covers “Be sure the runway is open,” the second DVD focuses on “Aircraft position verified,” the third on “Scan the runway,” and the fourth on “Issue clearances using correct phraseol-ogy,” and “Close the loop by getting an accurate readback.”
The BASICs Series aims to reduce the number of operational errors one of the types of runway incursions, in the Terminal environment (see figure 11). The Series was recognized as valuable thought leadership and as such, the FAA decided to produce an additional training DVD series for En Route Centers and TRACONs.
This new series includes a total of five DVDs, which will be distributed from FY 2008 to FY 2010. In August 2008, the FAA sent the first of the additional five DVDs to the field — Don’t Keep Secrets: Airborne Icing and ATC. The goal is to provide Air Traffic Controllers with information on how to recognize meteorological conditions that may cause icing, how encountering icing conditions may affect flight, and how ATC can assist pilots in getting out of icing conditions when encountered.
The second DVD, Don’t Keep Secrets: Thunderstorms and ATC was distributed in February 2009 and helps air traffic controllers
Figure 10FY 2008 Runway Incursions categorized as pilot deviations by Operating Type
CommercialAviation
30%GeneralAviation
70%
Figure 9Runway Safety Collection DVD and Safe Surface Operations Brochure
152009 Runway Safety Report
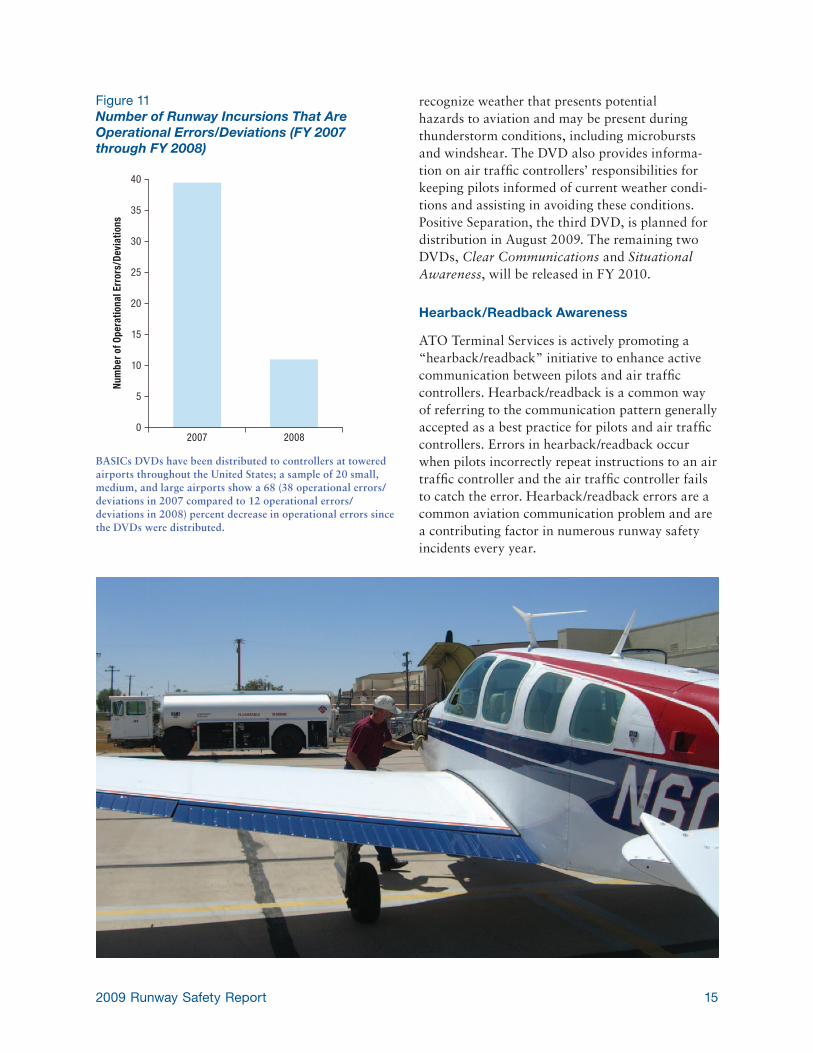
recognize weather that presents potential hazards to aviation and may be present during thunderstorm conditions, including microbursts and windshear. The DVD also provides informa-tion on air traffic controllers’ responsibilities for keeping pilots informed of current weather condi-tions and assisting in avoiding these conditions. Positive Separation, the third DVD, is planned for distribution in August 2009. The remaining two DVDs, Clear Communications and Situational Awareness, will be released in FY 2010.
Hearback/Readback Awareness
ATO Terminal Services is actively promoting a “hearback/readback” initiative to enhance active communication between pilots and air traffic controllers. Hearback/readback is a common way of referring to the communication pattern generally accepted as a best practice for pilots and air traffic controllers. Errors in hearback/readback occur when pilots incorrectly repeat instructions to an air traffic controller and the air traffic controller fails to catch the error. Hearback/readback errors are a common aviation communication problem and are a contributing factor in numerous runway safety incidents every year.
Figure 11Number of Runway Incursions That Are Operational Errors/Deviations (FY 2007 through FY 2008)
0
20
15
10
5
25
30
35
40
2007
Num
ber o
f Ope
ratio
nal E
rror
s/De
viat
ions
2008
BASICs DVDs have been distributed to controllers at towered airports throughout the United States; a sample of 20 small, medium, and large airports show a 68 (38 operational errors/deviations in 2007 compared to 12 operational errors/deviations in 2008) percent decrease in operational errors since the DVDs were distributed.
16 Measuring Runway Safety and Strategies for Continuous Improvement
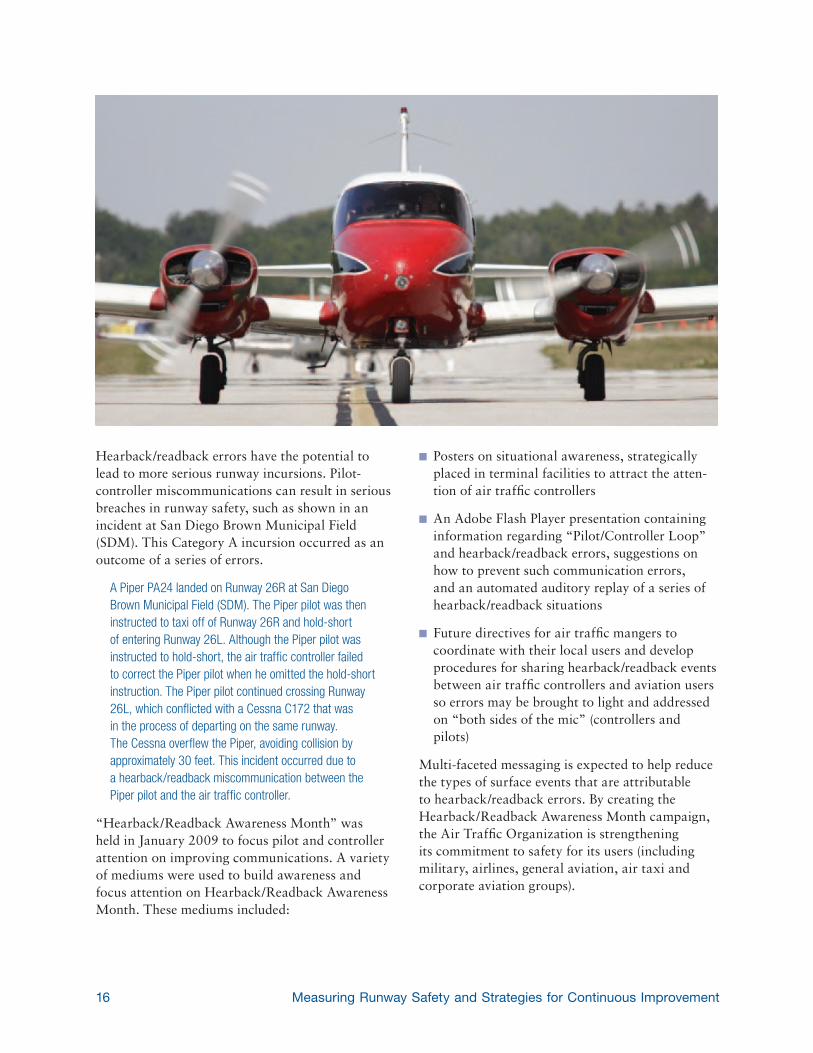
Hearback/readback errors have the potential to lead to more serious runway incursions. Pilot-controller miscommunications can result in serious breaches in runway safety, such as shown in an incident at San Diego Brown Municipal Field (SDM). This Category A incursion occurred as an outcome of a series of errors.
A Piper PA24 landed on Runway 26R at San Diego Brown Municipal Field (SDM). The Piper pilot was then instructed to taxi off of Runway 26R and hold-short of entering Runway 26L. Although the Piper pilot was instructed to hold-short, the air traffic controller failed to correct the Piper pilot when he omitted the hold-short instruction. The Piper pilot continued crossing Runway 26L, which conflicted with a Cessna C172 that was in the process of departing on the same runway. The Cessna overflew the Piper, avoiding collision by approximately 30 feet. This incident occurred due to a hearback/readback miscommunication between the Piper pilot and the air traffic controller.
“Hearback/Readback Awareness Month” was held in January 2009 to focus pilot and controller attention on improving communications. A variety of mediums were used to build awareness and focus attention on Hearback/Readback Awareness Month. These mediums included:
n Posters on situational awareness, strategically placed in terminal facilities to attract the atten-tion of air traffic controllers
n An Adobe Flash Player presentation containing information regarding “Pilot/Controller Loop” and hearback/readback errors, suggestions on how to prevent such communication errors, and an automated auditory replay of a series of hearback/readback situations
n Future directives for air traffic mangers to coordinate with their local users and develop procedures for sharing hearback/readback events between air traffic controllers and aviation users so errors may be brought to light and addressed on “both sides of the mic” (controllers and pilots)
Multi-faceted messaging is expected to help reduce the types of surface events that are attributable to hearback/readback errors. By creating the Hearback/Readback Awareness Month campaign, the Air Traffic Organization is strengthening its commitment to safety for its users (including military, airlines, general aviation, air taxi and corporate aviation groups).
172009 Runway Safety Report
Runway Safety Management Strategy
Outreach Awareness Technology Improved Infrastructure
Awareness
While the FAA’s outreach program provides messages to key runway safety stakeholders addressing critical issues, the FAA recognizes that success in making our runways safer also depends on building system wide awareness with all stakeholders, especially aviation professionals. Constant safety awareness is the key to support-ing safe operations and preventing errors from cascading into a serious incident. The FAA is using the Runway Safety Management Strategy to encourage aviation professionals to stay focused and constantly keep runway safety in mind while operating in the airport environment. The FAA has built an awareness program using safety analyses and comprehensive training programs, such as National Air Traffic Professionalism (NATPRO) and Crew Resource Management (CRM) train-ing. The programs educate aviation professionals about the dangers inherent to their jobs and keep their minds focused on mitigating those dangers while operating in the runway environment. The FAA’s awareness program’s various initiatives (see figure 7) are directed toward a range of avia-tion community members from airport operators to air traffic controllers and pilots.
Airport Surface Analysis
The FAA Office of Runway Safety recently completed runway safety reviews of 42 (20 in a first tier, 22 in a second tier) airports selected based on runway incursion data and wrong runway departure data. The reviews focused on an analysis of the safety of airport surfaces such as runways. Reviews of the airports have resulted in more than 200 short-, mid- and long-term initiatives. There were 5 serious runway incursions at the 20 first tier airports in the 17 months after the reviews, down from 13 serious runway incursions at those airports in the 17 months prior to the reviews. Top-to-bottom reviews of the initial surface analy-
sis airports provided a valuable amount of data which has led to many new improvements.
Surface Incident Awareness Month
To raise awareness about runway incursions and promote runway safety, Air Traffic Managers at nine air traffic control facilities declared March and September 2008 as “Surface Incident Awareness Months.” The nine airports included:
n General Edward Lawrence Logan International Airport
n Newark Liberty International Airportn Philadelphia International Airportn Detroit Metropolitan Wayne County Airportn Hartsfield-Jackson Atlanta International Airportn Chicago O’Hare International Airportn Dallas/Fort-Worth International Airportn McCarran International Airportn Los Angeles International Airport
The Surface Incident Awareness Month program placed an emphasis on clear, concise pilot-controller communications and readbacks in order to reduce operational errors that contribute to the occurrence of runway incursions. Activities included:
n Briefings to inform Operations Managers and Front-line Managers that runway incursion prevention was a top priority
n Procedural changes that instructed local controllers to notify Front-line Mangers of all temporary runway closures (as opposed to simply notifying other controllers)
n Addition of “be vigilant to runway incursions” to position relief checklists
n Reiteration of runway incursion prevention measures as operational position assignments were made at towers
18 Measuring Runway Safety and Strategies for Continuous Improvement
n Placement of runway incursion awareness placards throughout air traffic facilities at the nine airports involved with Surface Incident Awareness Months
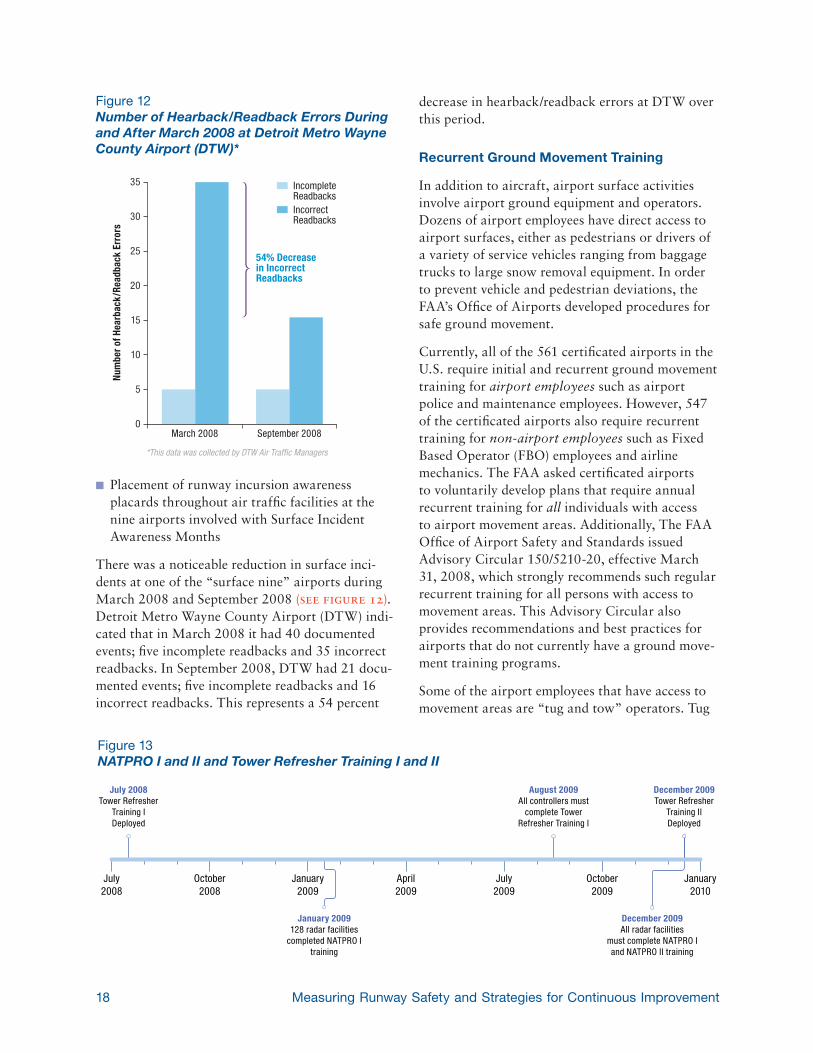
There was a noticeable reduction in surface inci-dents at one of the “surface nine” airports during March 2008 and September 2008 (see figure 12). Detroit Metro Wayne County Airport (DTW) indi-cated that in March 2008 it had 40 documented events; five incomplete readbacks and 35 incorrect readbacks. In September 2008, DTW had 21 docu-mented events; five incomplete readbacks and 16 incorrect readbacks. This represents a 54 percent
decrease in hearback/readback errors at DTW over this period.
Recurrent Ground Movement Training
In addition to aircraft, airport surface activities involve airport ground equipment and operators. Dozens of airport employees have direct access to airport surfaces, either as pedestrians or drivers of a variety of service vehicles ranging from baggage trucks to large snow removal equipment. In order to prevent vehicle and pedestrian deviations, the FAA’s Office of Airports developed procedures for safe ground movement.
Currently, all of the 561 certificated airports in the U.S. require initial and recurrent ground movement training for airport employees such as airport police and maintenance employees. However, 547 of the certificated airports also require recurrent training for non-airport employees such as Fixed Based Operator (FBO) employees and airline mechanics. The FAA asked certificated airports to voluntarily develop plans that require annual recurrent training for all individuals with access to airport movement areas. Additionally, The FAA Office of Airport Safety and Standards issued Advisory Circular 150/5210-20, effective March 31, 2008, which strongly recommends such regular recurrent training for all persons with access to movement areas. This Advisory Circular also provides recommendations and best practices for airports that do not currently have a ground move-ment training programs.
Some of the airport employees that have access to movement areas are “tug and tow” operators. Tug
Figure 13NATPRO I and II and Tower Refresher Training I and II
July 2008Tower Refresher
Training IDeployed
January 2009128 radar facilities
completed NATPRO Itraining
August 2009All controllers must
complete TowerRefresher Training I
December 2009Tower Refresher
Training IIDeployed
December 2009All radar facilities
must complete NATPRO Iand NATPRO II training
July2008
October2008
January2009
April2009
July2009
October2009
January2010
Figure 12Number of Hearback/Readback Errors During and After March 2008 at Detroit Metro Wayne County Airport (DTW)*
0
20
15
10
5
25
30
35
March 2008
Num
ber o
f Hea
rbac
k/Re
adba
ck E
rror
s
September 2008
IncompleteReadbacks
54% Decreasein IncorrectReadbacks
IncorrectReadbacks
*This data was collected by DTW Air Traffic Managers
192009 Runway Safety Report
and tow operators drive ground service equipment that shuttles airplanes when they aren’t operating under their own power. To assist air carriers in their ground movement training efforts, FAA’s Flight Standards Services is developing a new training DVD that addresses updated tug and tow operational procedures. The new DVD will supple-ment and enhance current air carrier training programs with updated information pertaining to tug and tow operations. The new DVD is planned for release to all Code of Federal Regulation (CFR) Federal Air Regulation (FAR) Part 121 and Part 135 operators by December of 2009. An updated Advisory Circular addressing guidance to air carriers regarding tug and tow operations is also planned for release in summer of 2009.
National Air Traffic Professionalism
National Air Traffic Professionalism (NATPRO) is a two-part training program that was developed to increase air traffic controllers’ awareness of the mental skills that affect their performance. NATPRO combines conventional classroom instruction and computer-based (CBI) skill build-ing scenarios. NATPRO consists of 210 exercises designed to improve the reaction time as well as cognitive and awareness skills necessary for high performance of air traffic control duties. NATPRO modules specifically target “centering,” “being in the zone,” attention allocation strategies, visualiza-tion, and concentration. The course is presented in a way that relates to the real world and uses mental dexterity concepts similar to those found in athletic improvement programs. The sharpened mental acuity that course participants gain heightens their sense of awareness to activity in the sky and on the ground, thereby increasing the likelihood that they will notice and mitigate unsafe situations before they lead to a runway incursion.
NATPRO I focuses on situational awareness for air traffic controllers; as of the end of January 2009, 128 radar facilities completed the training. Tower facilities must complete the NATPRO I training by December 31, 2009. NATPRO II focuses on auditory skills and hearback/readback; all radar facilities must complete NATPRO II training by December 31, 2009 (see figure 13).
Controller Refresher Training
The FAA also recently developed a comprehensive refresher training presentation for air traffic controllers that serves as another job-performance improvement program. The refresher training includes eight modules, one of which is specifically focused on runway incursion prevention. The training presentation includes airport-specific information such as unique airport characteristics, local procedures, and a review of events that have occurred at that airport. The tower refresher presentation was deployed on August 1, 2008 and all tower controllers are required to complete it by September 30, 2009. Tower refresher II training, which will further focus on awareness of runway incursion prevention techniques, is scheduled to begin at the end of December 2009 (see figure 13).
Controller Training for Crew Resource Management
ATO Office of Safety developed a comprehensive Crew Resource Management (CRM) program to address human behaviors that may lead to errors. The intent of this program is to enhance controller teams’ situational awareness so that they can better detect and correct controller and pilot mistakes before they result in operational errors or accidents.
“Crew Resource Management: Human Factors for Air Traffic Controllers” is a one-day workshop that builds on threat-detection, team dynamics, and individual performance concepts that the FAA successfully used for pilots in the aircraft cockpit environment in the past. The application of these concepts to an additional group of aviation operators demonstrates a system-wide approach to safety management. Crew Resource Management: Human Factors for Air Traffic Controllers has three primary objectives:
n Threat and Error Management (TEM), which recognizes that human error is inevitable and seeks to identify, reduce, and eliminate all possible internal or external risks associated with human error
20 Measuring Runway Safety and Strategies for Continuous Improvement
n Individual Performance, which focuses on two key air traffic controller skill areas: maintaining situational awareness and executing the plan
n Improving Teamwork, which focuses on using methods such as team self-evaluation, initiative, communication, and support to reduce the likeli-hood of an accident
As of April 2009, the FAA conducted workshops at 38 Operational Evolution Partnership (OEP) and high-operational-error-rate Terminal facilities. Training has continued in FY 2009 for the follow-ing towers:
n Northern California TRACON
n Southern California TRACON
n Potomac TRACONn Orlandon Seattle Tower and
TRACONn Baltimore-Washingtonn Pittsburghn Atlanta-Hartsfield
TRACON
n Denver Tower and TRACON
n St. Louis Tower and TRACON
n Tampan San Franciscon Cincinnatin Honolulun Chicago TRACONn Chicago-Midway
The ATO Office of Safety also has trained Cadre Instructors to conduct workshops at En Route facilities, and as of April 2009, the following Air Route Traffic Control Centers have trained all of their personnel:
n Los Angelesn Jacksonvillen Chicago
n Indianapolisn Minneapolisn Atlanta
FY 2009 plans will focus on continued training at En Route Centers.
Taxi Clearance Procedures
As part of the Call to Action discourse, the FAA held a one-day meeting with key aviation industry representatives to discuss short- and long-term measures to improve runway safety. The partici-pants of the meeting recommended that taxi clear-ance procedures be improved to increase runway safety. The FAA followed-up on this suggestion by forming a panel, the Safety Risk Management (SRM) Panel, which conducted a formal safety risk analysis. On May 19, 2008 the FAA issued Notice JO 7110.482 which instituted new taxi instruction procedures that are intended to reduce runway
212009 Runway Safety Report
incursions caused by controller, pilot, and vehicle driver errors. Under the new procedures which have been incorporated into Order JO7110.65, air traffic controllers must instruct all aircraft and vehicle drivers to follow a specific route when traveling across an airfield. Previously, controllers simply issued aircraft and vehicles with an intended destination point.
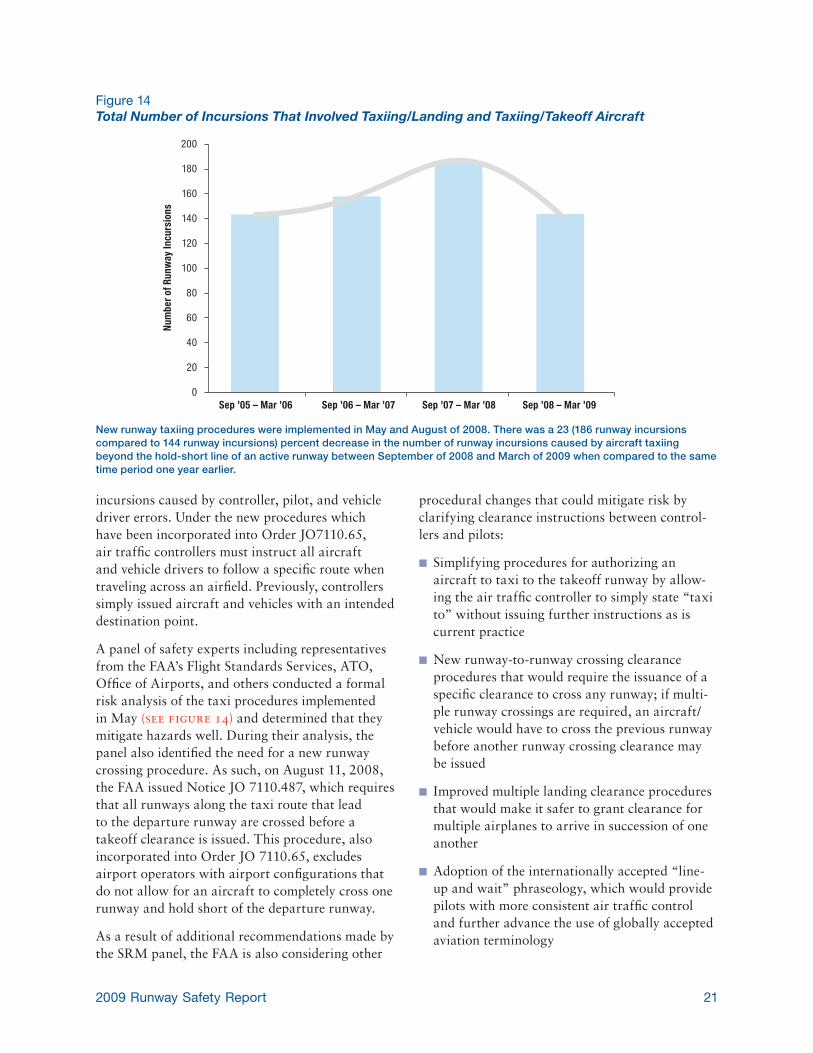
A panel of safety experts including representatives from the FAA’s Flight Standards Services, ATO, Office of Airports, and others conducted a formal risk analysis of the taxi procedures implemented in May (see figure 14) and determined that they mitigate hazards well. During their analysis, the panel also identified the need for a new runway crossing procedure. As such, on August 11, 2008, the FAA issued Notice JO 7110.487, which requires that all runways along the taxi route that lead to the departure runway are crossed before a takeoff clearance is issued. This procedure, also incorporated into Order JO 7110.65, excludes airport operators with airport configurations that do not allow for an aircraft to completely cross one runway and hold short of the departure runway.
As a result of additional recommendations made by the SRM panel, the FAA is also considering other
procedural changes that could mitigate risk by clarifying clearance instructions between control-lers and pilots:
n Simplifying procedures for authorizing an aircraft to taxi to the takeoff runway by allow-ing the air traffic controller to simply state “taxi to” without issuing further instructions as is current practice
n New runway-to-runway crossing clearance procedures that would require the issuance of a specific clearance to cross any runway; if multi-ple runway crossings are required, an aircraft/vehicle would have to cross the previous runway before another runway crossing clearance may be issued
n Improved multiple landing clearance procedures that would make it safer to grant clearance for multiple airplanes to arrive in succession of one another
n Adoption of the internationally accepted “line-up and wait” phraseology, which would provide pilots with more consistent air traffic control and further advance the use of globally accepted aviation terminology
Figure 14Total Number of Incursions That Involved Taxiing/Landing and Taxiing/Takeoff Aircraft
New runway taxiing procedures were implemented in May and August of 2008. There was a 23 (186 runway incursions compared to 144 runway incursions) percent decrease in the number of runway incursions caused by aircraft taxiing beyond the hold-short line of an active runway between September of 2008 and March of 2009 when compared to the same time period one year earlier.
0
120
100
80
60
40
20
140
160
180
200
Sep ’05 – Mar ’06
Num
ber o
f Run
way
Incu
rsio
ns
Sep ’06 – Mar ’07 Sep ’07 – Mar ’08 Sep ’08 – Mar ’09
22 Measuring Runway Safety and Strategies for Continuous Improvement
Technology
Technological advancement is indispensable to making runways safer. In recent years, the FAA worked closely with the aviation industry to develop, test, and deploy a number of technolo-gies that enhance runway safety (see figure 7). These technologies provide pilots and air traffic controllers with additional tools for making safe operational decisions and help to prevent runway incursions by bolstering pilot and air traffic controller situational awareness. Technological aviation safety innovations can be of particular use in adverse operating conditions such as loss of communications, poor visibility, or heavy traffic. Some of the FAA’s safety-enhancing tools are mature technologies that are operational at select high-traffic airports; other tools are still in test and evaluation at one or two key sites. As Next Generation technologies evolve, many of the existing technologies mentioned in this report may undergo re-evaluation to determine their continued effectiveness and cost benefit.
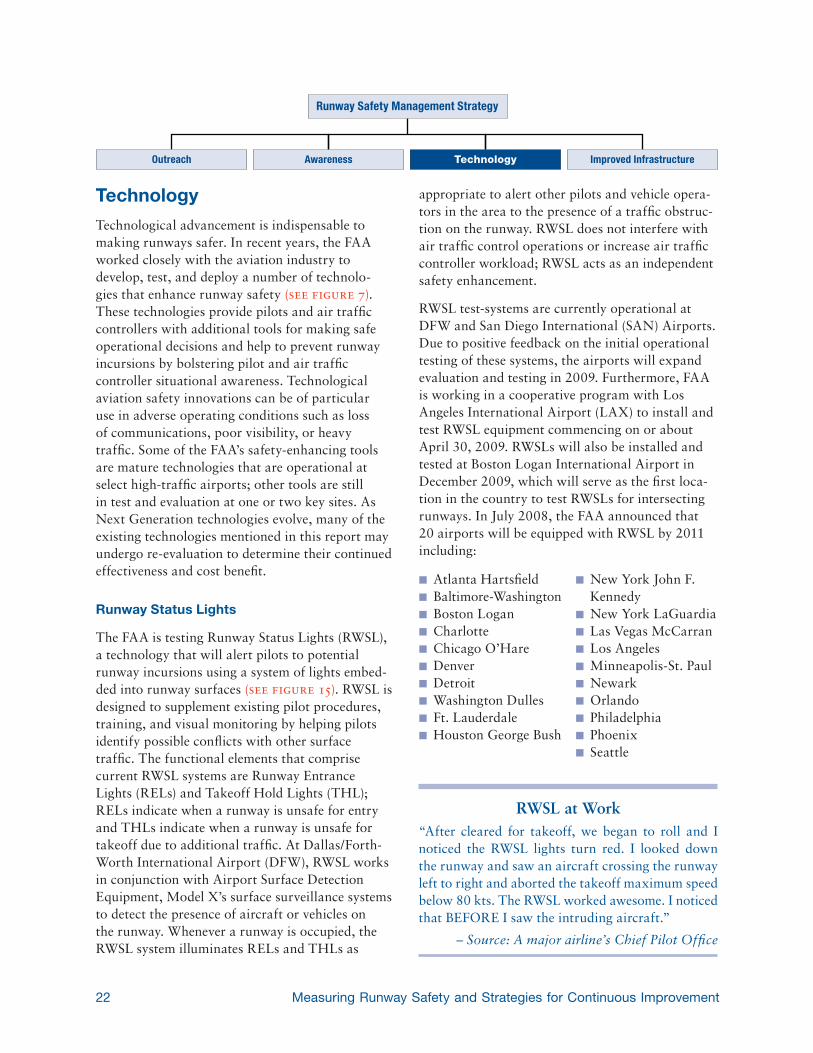
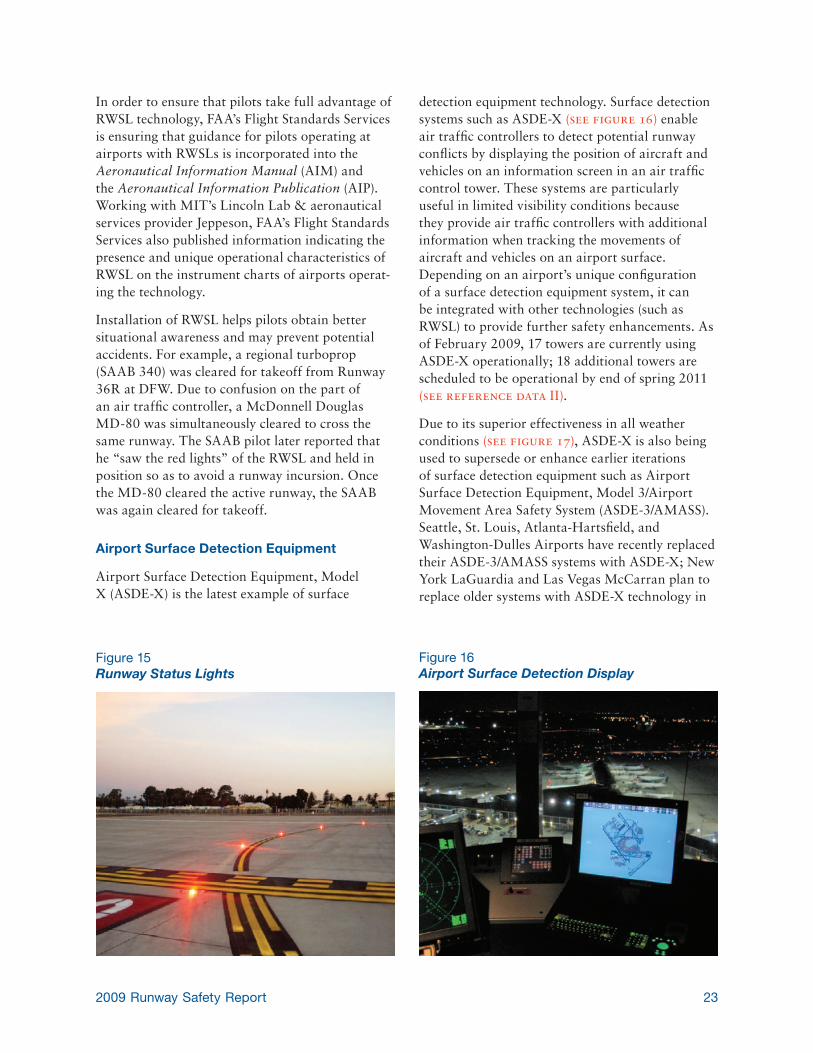
Runway Status Lights
The FAA is testing Runway Status Lights (RWSL), a technology that will alert pilots to potential runway incursions using a system of lights embed-ded into runway surfaces (see figure 15). RWSL is designed to supplement existing pilot procedures, training, and visual monitoring by helping pilots identify possible conflicts with other surface traffic. The functional elements that comprise current RWSL systems are Runway Entrance Lights (RELs) and Takeoff Hold Lights (THL); RELs indicate when a runway is unsafe for entry and THLs indicate when a runway is unsafe for takeoff due to additional traffic. At Dallas/Forth-Worth International Airport (DFW), RWSL works in conjunction with Airport Surface Detection Equipment, Model X’s surface surveillance systems to detect the presence of aircraft or vehicles on the runway. Whenever a runway is occupied, the RWSL system illuminates RELs and THLs as
appropriate to alert other pilots and vehicle opera-tors in the area to the presence of a traffic obstruc-tion on the runway. RWSL does not interfere with air traffic control operations or increase air traffic controller workload; RWSL acts as an independent safety enhancement.
RWSL test-systems are currently operational at DFW and San Diego International (SAN) Airports. Due to positive feedback on the initial operational testing of these systems, the airports will expand evaluation and testing in 2009. Furthermore, FAA is working in a cooperative program with Los Angeles International Airport (LAX) to install and test RWSL equipment commencing on or about April 30, 2009. RWSLs will also be installed and tested at Boston Logan International Airport in December 2009, which will serve as the first loca-tion in the country to test RWSLs for intersecting runways. In July 2008, the FAA announced that 20 airports will be equipped with RWSL by 2011 including:
n Atlanta Hartsfieldn Baltimore-Washingtonn Boston Logann Charlotten Chicago O’Haren Denvern Detroitn Washington Dullesn Ft. Lauderdalen Houston George Bush
n New York John F. Kennedy
n New York LaGuardian Las Vegas McCarrann Los Angelesn Minneapolis-St. Pauln Newarkn Orlandon Philadelphian Phoenixn Seattle
RWSL at Work“After cleared for takeoff, we began to roll and I noticed the RWSL lights turn red. I looked down the runway and saw an aircraft crossing the runway left to right and aborted the takeoff maximum speed below 80 kts. The RWSL worked awesome. I noticed that BEFORE I saw the intruding aircraft.”
– Source: A major airline’s Chief Pilot Office
Runway Safety Management Strategy
Outreach Awareness Technology Improved Infrastructure
232009 Runway Safety Report
In order to ensure that pilots take full advantage of RWSL technology, FAA’s Flight Standards Services is ensuring that guidance for pilots operating at airports with RWSLs is incorporated into the Aeronautical Information Manual (AIM) and the Aeronautical Information Publication (AIP). Working with MIT’s Lincoln Lab & aeronautical services provider Jeppeson, FAA’s Flight Standards Services also published information indicating the presence and unique operational characteristics of RWSL on the instrument charts of airports operat-ing the technology.
Installation of RWSL helps pilots obtain better situational awareness and may prevent potential accidents. For example, a regional turboprop (SAAB 340) was cleared for takeoff from Runway 36R at DFW. Due to confusion on the part of an air traffic controller, a McDonnell Douglas MD-80 was simultaneously cleared to cross the same runway. The SAAB pilot later reported that he “saw the red lights” of the RWSL and held in position so as to avoid a runway incursion. Once the MD-80 cleared the active runway, the SAAB was again cleared for takeoff.
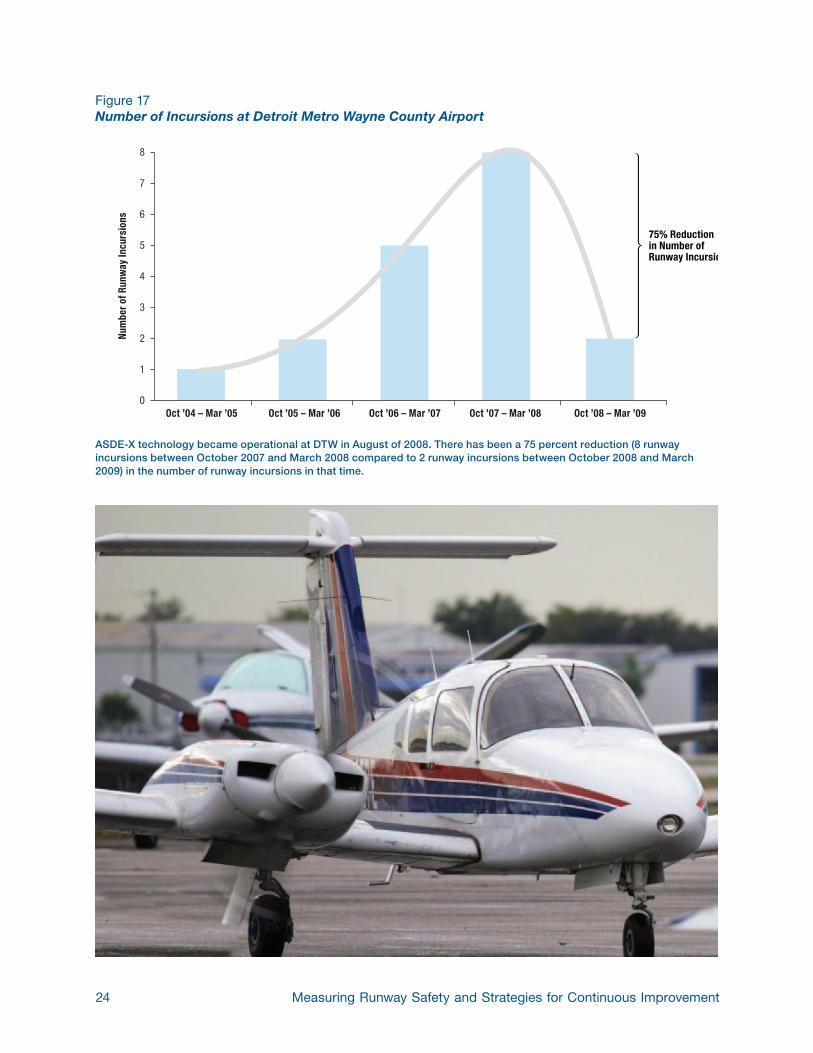
Airport Surface Detection Equipment
Airport Surface Detection Equipment, Model X (ASDE-X) is the latest example of surface
detection equipment technology. Surface detection systems such as ASDE-X (see figure 16) enable air traffic controllers to detect potential runway conflicts by displaying the position of aircraft and vehicles on an information screen in an air traffic control tower. These systems are particularly useful in limited visibility conditions because they provide air traffic controllers with additional information when tracking the movements of aircraft and vehicles on an airport surface. Depending on an airport’s unique configuration of a surface detection equipment system, it can be integrated with other technologies (such as RWSL) to provide further safety enhancements. As of February 2009, 17 towers are currently using ASDE-X operationally; 18 additional towers are scheduled to be operational by end of spring 2011 (see reference data II).
Due to its superior effectiveness in all weather conditions (see figure 17), ASDE-X is also being used to supersede or enhance earlier iterations of surface detection equipment such as Airport Surface Detection Equipment, Model 3/Airport Movement Area Safety System (ASDE-3/AMASS). Seattle, St. Louis, Atlanta-Hartsfield, and Washington-Dulles Airports have recently replaced their ASDE-3/AMASS systems with ASDE-X; New York LaGuardia and Las Vegas McCarran plan to replace older systems with ASDE-X technology in
Figure 16Airport Surface Detection Display
Figure 15Runway Status Lights
24 Measuring Runway Safety and Strategies for Continuous Improvement
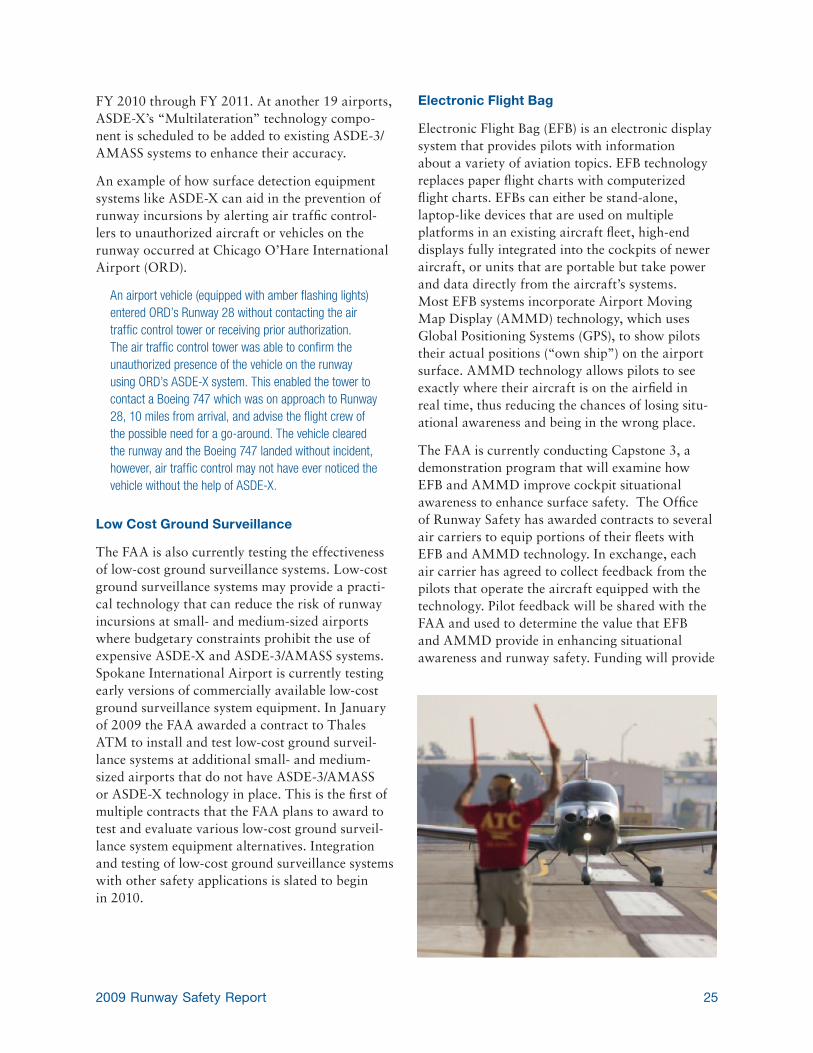
Figure 17Number of Incursions at Detroit Metro Wayne County Airport
ASDE-X technology became operational at DTW in August of 2008. There has been a 75 percent reduction (8 runway incursions between October 2007 and March 2008 compared to 2 runway incursions between October 2008 and March 2009) in the number of runway incursions in that time.
0
6
5
4
3
2
1
7
8
Oct ’04 – Mar ’05
Num
ber o
f Run
way
Incu
rsio
ns
Oct ’05 – Mar ’06 Oct ’06 – Mar ’07 Oct ’07 – Mar ’08 Oct ’08 – Mar ’09
75% Reductionin Number ofRunway Incursions
252009 Runway Safety Report
FY 2010 through FY 2011. At another 19 airports, ASDE-X’s “Multilateration” technology compo-nent is scheduled to be added to existing ASDE-3/AMASS systems to enhance their accuracy.
An example of how surface detection equipment systems like ASDE-X can aid in the prevention of runway incursions by alerting air traffic control-lers to unauthorized aircraft or vehicles on the runway occurred at Chicago O’Hare International Airport (ORD).
An airport vehicle (equipped with amber flashing lights) entered ORD’s Runway 28 without contacting the air traffic control tower or receiving prior authorization. The air traffic control tower was able to confirm the unauthorized presence of the vehicle on the runway using ORD’s ASDE-X system. This enabled the tower to contact a Boeing 747 which was on approach to Runway 28, 10 miles from arrival, and advise the flight crew of the possible need for a go-around. The vehicle cleared the runway and the Boeing 747 landed without incident, however, air traffic control may not have ever noticed the vehicle without the help of ASDE-X.
Low Cost Ground Surveillance
The FAA is also currently testing the effectiveness of low-cost ground surveillance systems. Low-cost ground surveillance systems may provide a practi-cal technology that can reduce the risk of runway incursions at small- and medium-sized airports where budgetary constraints prohibit the use of expensive ASDE-X and ASDE-3/AMASS systems. Spokane International Airport is currently testing early versions of commercially available low-cost ground surveillance system equipment. In January of 2009 the FAA awarded a contract to Thales ATM to install and test low-cost ground surveil-lance systems at additional small- and medium-sized airports that do not have ASDE-3/AMASS or ASDE-X technology in place. This is the first of multiple contracts that the FAA plans to award to test and evaluate various low-cost ground surveil-lance system equipment alternatives. Integration and testing of low-cost ground surveillance systems with other safety applications is slated to begin in 2010.
Electronic Flight Bag
Electronic Flight Bag (EFB) is an electronic display system that provides pilots with information about a variety of aviation topics. EFB technology replaces paper flight charts with computerized flight charts. EFBs can either be stand-alone, laptop-like devices that are used on multiple platforms in an existing aircraft fleet, high-end displays fully integrated into the cockpits of newer aircraft, or units that are portable but take power and data directly from the aircraft’s systems. Most EFB systems incorporate Airport Moving Map Display (AMMD) technology, which uses Global Positioning Systems (GPS), to show pilots their actual positions (“own ship”) on the airport surface. AMMD technology allows pilots to see exactly where their aircraft is on the airfield in real time, thus reducing the chances of losing situ-ational awareness and being in the wrong place.
The FAA is currently conducting Capstone 3, a demonstration program that will examine how EFB and AMMD improve cockpit situational awareness to enhance surface safety. The Office of Runway Safety has awarded contracts to several air carriers to equip portions of their fleets with EFB and AMMD technology. In exchange, each air carrier has agreed to collect feedback from the pilots that operate the aircraft equipped with the technology. Pilot feedback will be shared with the FAA and used to determine the value that EFB and AMMD provide in enhancing situational awareness and runway safety. Funding will provide
26 Measuring Runway Safety and Strategies for Continuous Improvement
for two EFBs per aircraft in up to 20 aircraft per carrier. EFB installations will be coordinated with air carrier maintenance program schedules and EFB hardware/software availability.
Twenty-one high-incursion airports will serve as test locations for the Capstone 3 project. These airports include:
n Los Angeles, Bostonn Chicago-O’Haren Newarkn Clevelandn Ft. Lauderdalen Houston Hobbyn Anchoragen San Franciscon Las Vegan McCarrann Charlotten Miami
n Philadelphian Albuquerquen Daytona Beachn Phoenixn Dallas-Ft. Worthn New York John F.
Kennedyn New York LaGuardian Atlanta Hartsfieldn Seattle Tacoma
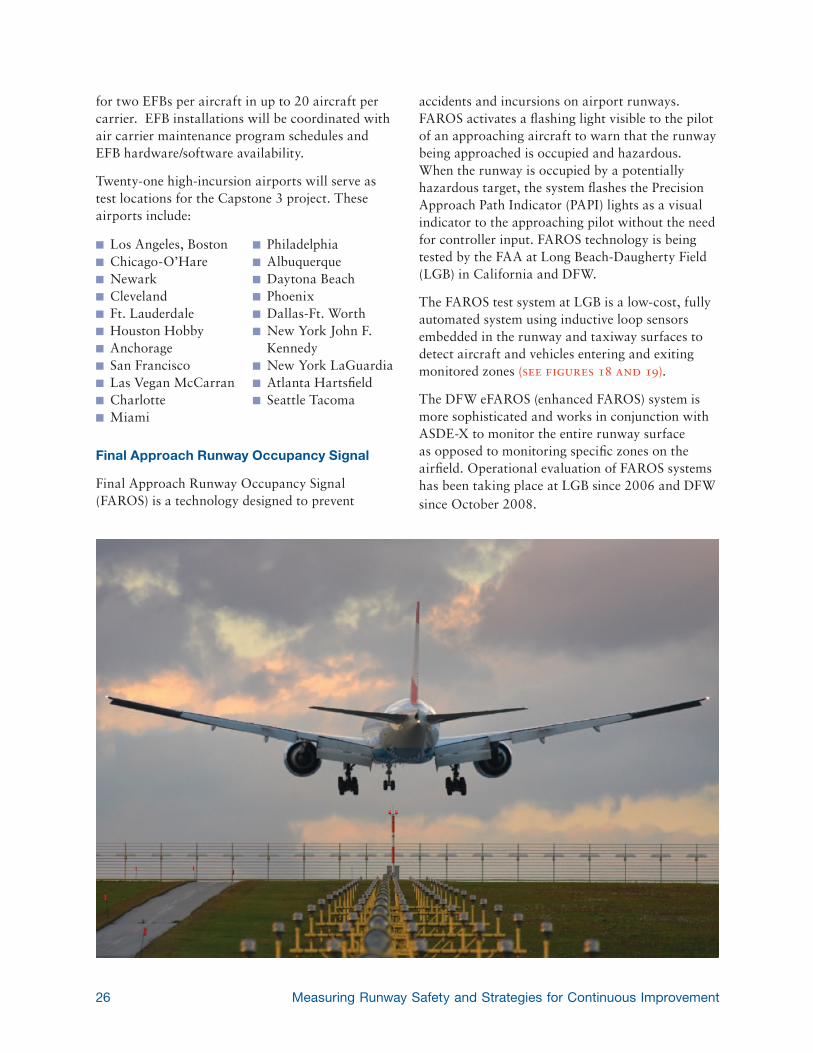
Final Approach Runway Occupancy Signal
Final Approach Runway Occupancy Signal (FAROS) is a technology designed to prevent
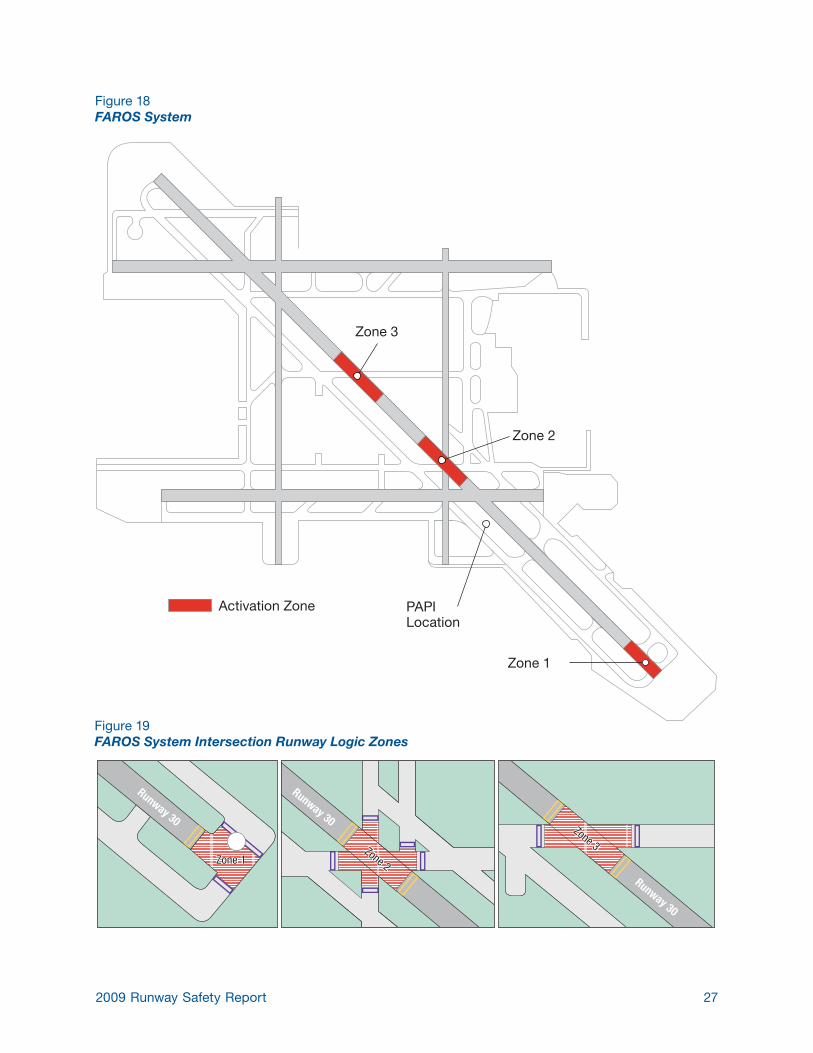
accidents and incursions on airport runways. FAROS activates a flashing light visible to the pilot of an approaching aircraft to warn that the runway being approached is occupied and hazardous. When the runway is occupied by a potentially hazardous target, the system flashes the Precision Approach Path Indicator (PAPI) lights as a visual indicator to the approaching pilot without the need for controller input. FAROS technology is being tested by the FAA at Long Beach-Daugherty Field (LGB) in California and DFW.
The FAROS test system at LGB is a low-cost, fully automated system using inductive loop sensors embedded in the runway and taxiway surfaces to detect aircraft and vehicles entering and exiting monitored zones (see figures 18 and 19).
The DFW eFAROS (enhanced FAROS) system is more sophisticated and works in conjunction with ASDE-X to monitor the entire runway surface as opposed to monitoring specific zones on the airfield. Operational evaluation of FAROS systems has been taking place at LGB since 2006 and DFW since October 2008.
272009 Runway Safety Report
Activation Zone
Zone 3
Zone 2
Zone 1
PAPILocation
Figure 18FAROS System
Figure 19FAROS System Intersection Runway Logic Zones
Zone 1Zone 2Zone 1Zone 2
Zone 3Zone 3
Runway 30
Runway 30
Runway 30
28 Measuring Runway Safety and Strategies for Continuous Improvement
Improved Infrastructure
Although technology is critical to the achieve-ment of goals for runway safety, a well developed infrastructure must also be in place. Safe aircraft operations depend on the presence of clearly marked, un-obstructed, and efficiently accessible space. Pilots depend on clearly marked surfaces to maintain situational awareness, ample sprawl is required to avoid confusing, dangerous, and opera-tionally inefficient taxi- and runway crossings, and passengers need assurance that airport surfaces can accommodate their plane without dangerous obstruction. The FAA is working to ensure that airport surfaces around the country meet a safe standard. Often, this means developing innova-tive solutions to deal with physical constraints, legal issues, and environmental concerns. The FAA is actively addressing these concerns and has partnered with industry groups to research, develop, and deploy safety solutions that will
continue to improve runway surfaces in the future (see figure 7).
Runway Safety Area
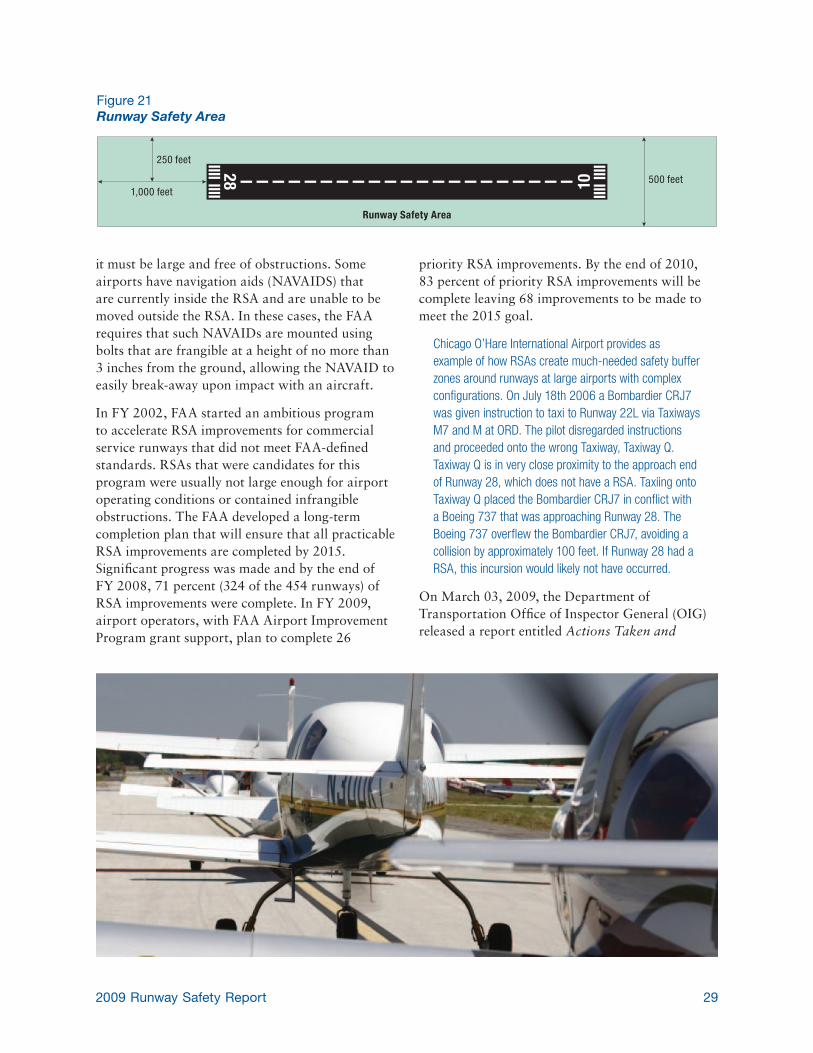
Runway Safety Areas (RSA) are un-obstructed zones established around the perimeter of a runway to enhance safety in the event that an aircraft undershoots, overruns, or engages in an excursion from the side of the runway. Standard RSAs extend from 240 feet to 1,000 feet beyond each runway end and are between 120 feet and 500 feet wide (see figure 21). The size of a RSA depends on the type of instrument approach procedures and size and type of aircraft served by the runway. Airports that have a greater proportion of instrument approaches (those approaches in which a pilot relies almost strictly on cockpit instruments rather than line of sight) and service a large number of commercial aircraft generally need the largest possible RSA. In order for an RSA to be effective
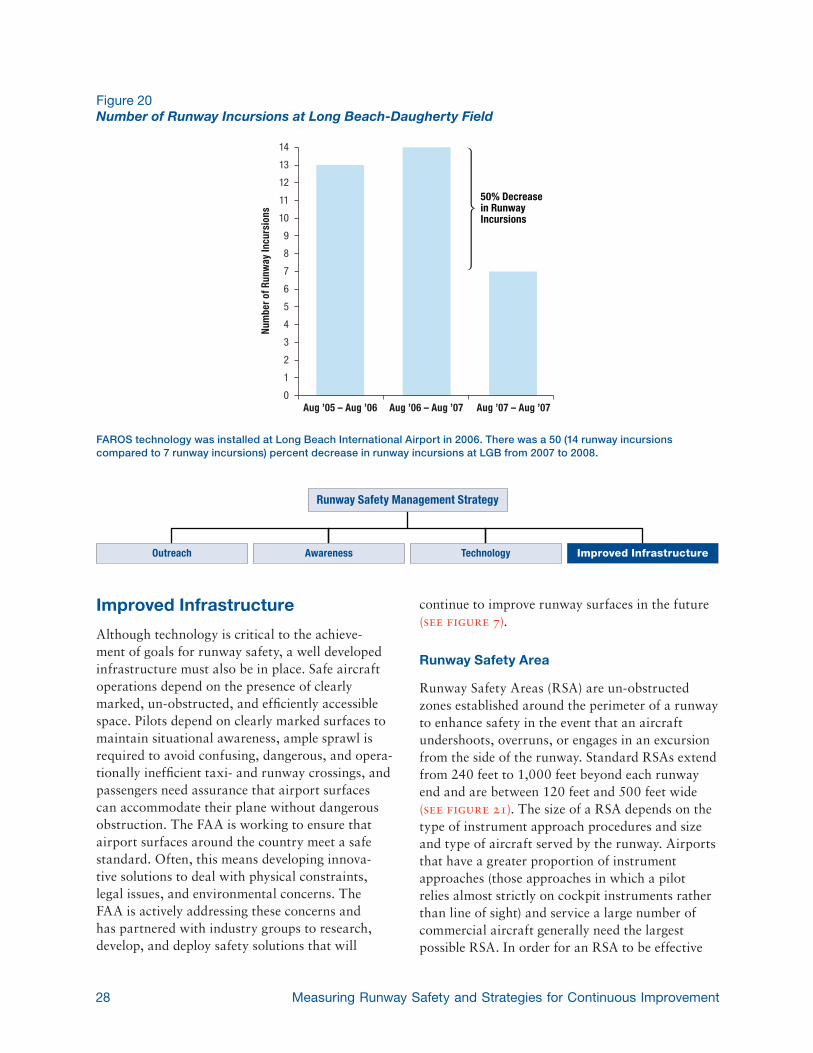
Figure 20Number of Runway Incursions at Long Beach-Daugherty Field
FAROS technology was installed at Long Beach International Airport in 2006. There was a 50 (14 runway incursions compared to 7 runway incursions) percent decrease in runway incursions at LGB from 2007 to 2008.
0
10
9
8
7
6
5
4
3
2
1
11
12
13
14
Aug ’05 – Aug ’06
Num
ber o
f Run
way
Incu
rsio
ns
Aug ’06 – Aug ’07 Aug ’07 – Aug ’07
50% Decreasein RunwayIncursions
Runway Safety Management Strategy
Outreach Awareness Technology Improved Infrastructure
292009 Runway Safety Report
it must be large and free of obstructions. Some airports have navigation aids (NAVAIDS) that are currently inside the RSA and are unable to be moved outside the RSA. In these cases, the FAA requires that such NAVAIDs are mounted using bolts that are frangible at a height of no more than 3 inches from the ground, allowing the NAVAID to easily break-away upon impact with an aircraft.
In FY 2002, FAA started an ambitious program to accelerate RSA improvements for commercial service runways that did not meet FAA-defined standards. RSAs that were candidates for this program were usually not large enough for airport operating conditions or contained infrangible obstructions. The FAA developed a long-term completion plan that will ensure that all practicable RSA improvements are completed by 2015. Significant progress was made and by the end of FY 2008, 71 percent (324 of the 454 runways) of RSA improvements were complete. In FY 2009, airport operators, with FAA Airport Improvement Program grant support, plan to complete 26
priority RSA improvements. By the end of 2010, 83 percent of priority RSA improvements will be complete leaving 68 improvements to be made to meet the 2015 goal.
Chicago O’Hare International Airport provides as example of how RSAs create much-needed safety buffer zones around runways at large airports with complex configurations. On July 18th 2006 a Bombardier CRJ7 was given instruction to taxi to Runway 22L via Taxiways M7 and M at ORD. The pilot disregarded instructions and proceeded onto the wrong Taxiway, Taxiway Q. Taxiway Q is in very close proximity to the approach end of Runway 28, which does not have a RSA. Taxiing onto Taxiway Q placed the Bombardier CRJ7 in conflict with a Boeing 737 that was approaching Runway 28. The Boeing 737 overflew the Bombardier CRJ7, avoiding a collision by approximately 100 feet. If Runway 28 had a RSA, this incursion would likely not have occurred.
On March 03, 2009, the Department of Transportation Office of Inspector General (OIG) released a report entitled Actions Taken and
Figure 21Runway Safety Area
Runway Safety Area
250 feet
1,000 feet
28 500 feet10
30 Measuring Runway Safety and Strategies for Continuous Improvement
Needed to Improve FAA’s Runway Safety Area Program. The report assessed airport sponsors’ and FAA’s progress and challenges in fulfilling the congressional RSA mandate and evaluated the effectiveness of FAA’s process for identifying, prioritizing, and funding needed for RSA improve-ments. Overall, the OIG found that the FAA and airport sponsors made significant process since 2000 in reporting that more than 70 percent of the RSAs have been improved; however, the OIG also found that 11 of the 30 largest airports failed to fully implement RSA standards. The audit also found that the FAA was generally effective in identifying, prioritizing, and funding needed RSA improvements. The report identifies two areas for the FAA to address: 1) FAA-owned NAVAIDs must be relocated or made frangible by 2015 and 2) Provide a greater level of quality and detail in the data provided to congressional decision makers.
The report recommended the following actions to FAA’s Office of Airports:
1) Develop and implement an action plan for ensuring that RSAs at the 11 large airports are improved to the fullest extent practical
2) Work with the FAA’s ATO to develop and implement an effective program for addressing un-frangible NAVAIDs located in RSAs
3) Issue detailed guidance and conduct training for all field offices on the proper identification, tracking, and reporting of RSA status, including NAVAIDs
4) Implement quality control procedures to ensure the accuracy and integrity of RSA data
5) Expand the annual report to Congress to identify which RSAs do not meet the full RSA design standards and list specific reasons for noncompliance, identify plans in place to allow these RSAs to attain full standards, identify challenges that exist to prevent these RSAs from meeting the full standards by 2015, and identify financial assistance needed to achieve planned improvements
The FAA concurred with all five recommendations and is taking corrective action to include:
1) The FAA has energized its efforts on completing RSA improvement plans for each of the 11 major airports cited in the OIG report
2) The FAA will develop procedures to address non-compliant NAVAIDs in RSAs and will develop a budget and schedule to complete the improvements by 2015
3) The FAA intends to issue an advisory circular on frangible bolts in Spring 2009
4) The FAA plans take a number of steps to improve the quality of the RSA Inventory data in its annual report to Congress
Engineered Materials Arresting System
Engineered Materials Arresting System (EMAS) is an airport improvement that provides the safety benefits of an RSA in cases where land is not avail-able, land is too expensive to feasibly purchase, or it is otherwise not possible to have a standard dimension RSA. EMAS uses a light-weight, crush-able concrete material, placed beyond the depar-ture end of a runway to stop or greatly slow an aircraft that overruns the runway (see figure 22). EMAS works by exerting predictable deceleration forces on aircraft landing gear as its material crushes. EMAS is currently installed on more than 41 runway ends at 28 airports (see refer-ence data III). As of March 2009, the FAA had plans to install 9 additional EMAS systems at 6 additional airports in the United States: Key West,
Figure 22EMAS Installation
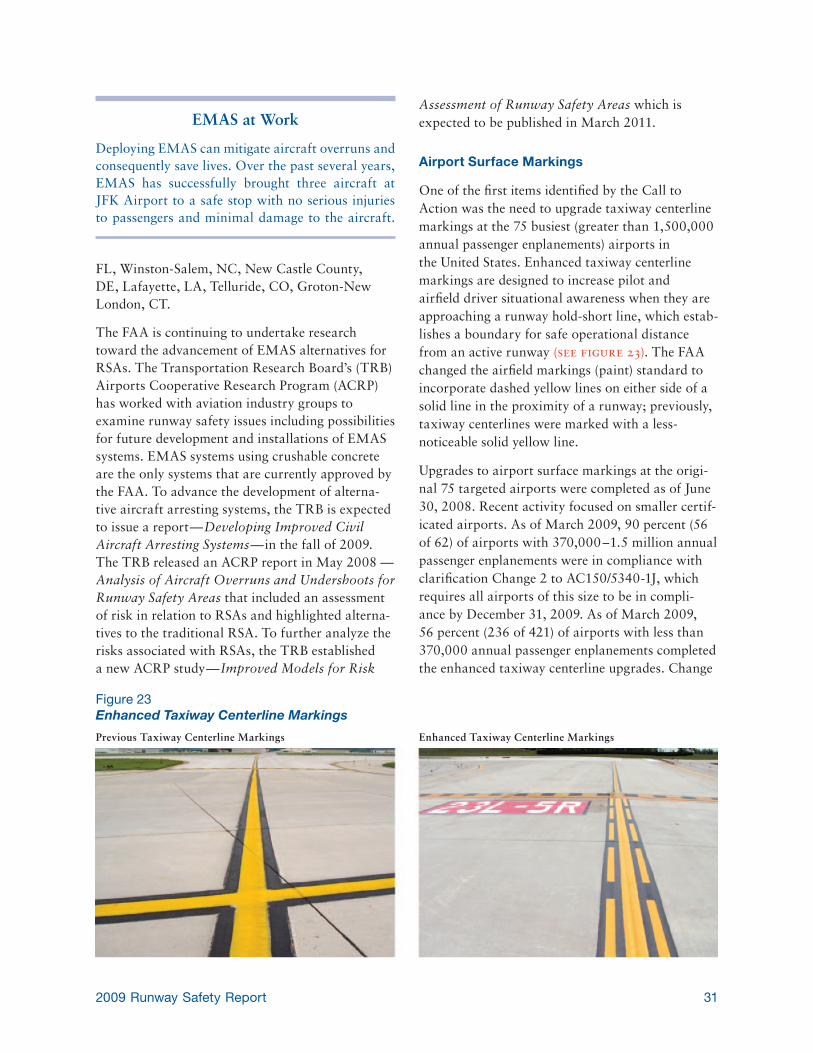
312009 Runway Safety Report
FL, Winston-Salem, NC, New Castle County, DE, Lafayette, LA, Telluride, CO, Groton-New London, CT.
The FAA is continuing to undertake research toward the advancement of EMAS alternatives for RSAs. The Transportation Research Board’s (TRB) Airports Cooperative Research Program (ACRP) has worked with aviation industry groups to examine runway safety issues including possibilities for future development and installations of EMAS systems. EMAS systems using crushable concrete are the only systems that are currently approved by the FAA. To advance the development of alterna-tive aircraft arresting systems, the TRB is expected to issue a report — Developing Improved Civil Aircraft Arresting Systems — in the fall of 2009. The TRB released an ACRP report in May 2008 — Analysis of Aircraft Overruns and Undershoots for Runway Safety Areas that included an assessment of risk in relation to RSAs and highlighted alterna-tives to the traditional RSA. To further analyze the risks associated with RSAs, the TRB established a new ACRP study — Improved Models for Risk
Assessment of Runway Safety Areas which is expected to be published in March 2011.
Airport Surface Markings
One of the first items identified by the Call to Action was the need to upgrade taxiway centerline markings at the 75 busiest (greater than 1,500,000 annual passenger enplanements) airports in the United States. Enhanced taxiway centerline markings are designed to increase pilot and airfield driver situational awareness when they are approaching a runway hold-short line, which estab-lishes a boundary for safe operational distance from an active runway (see figure 23). The FAA changed the airfield markings (paint) standard to incorporate dashed yellow lines on either side of a solid line in the proximity of a runway; previously, taxiway centerlines were marked with a less-noticeable solid yellow line.
Upgrades to airport surface markings at the origi-nal 75 targeted airports were completed as of June 30, 2008. Recent activity focused on smaller certif-icated airports. As of March 2009, 90 percent (56 of 62) of airports with 370,000 – 1.5 million annual passenger enplanements were in compliance with clarification Change 2 to AC150/5340-1J, which requires all airports of this size to be in compli-ance by December 31, 2009. As of March 2009, 56 percent (236 of 421) of airports with less than 370,000 annual passenger enplanements completed the enhanced taxiway centerline upgrades. Change
Figure 23Enhanced Taxiway Centerline Markings
Previous Taxiway Centerline Markings Enhanced Taxiway Centerline Markings
EMAS at Work
Deploying EMAS can mitigate aircraft overruns and consequently save lives. Over the past several years, EMAS has successfully brought three aircraft at JFK Airport to a safe stop with no serious injuries to passengers and minimal damage to the aircraft.
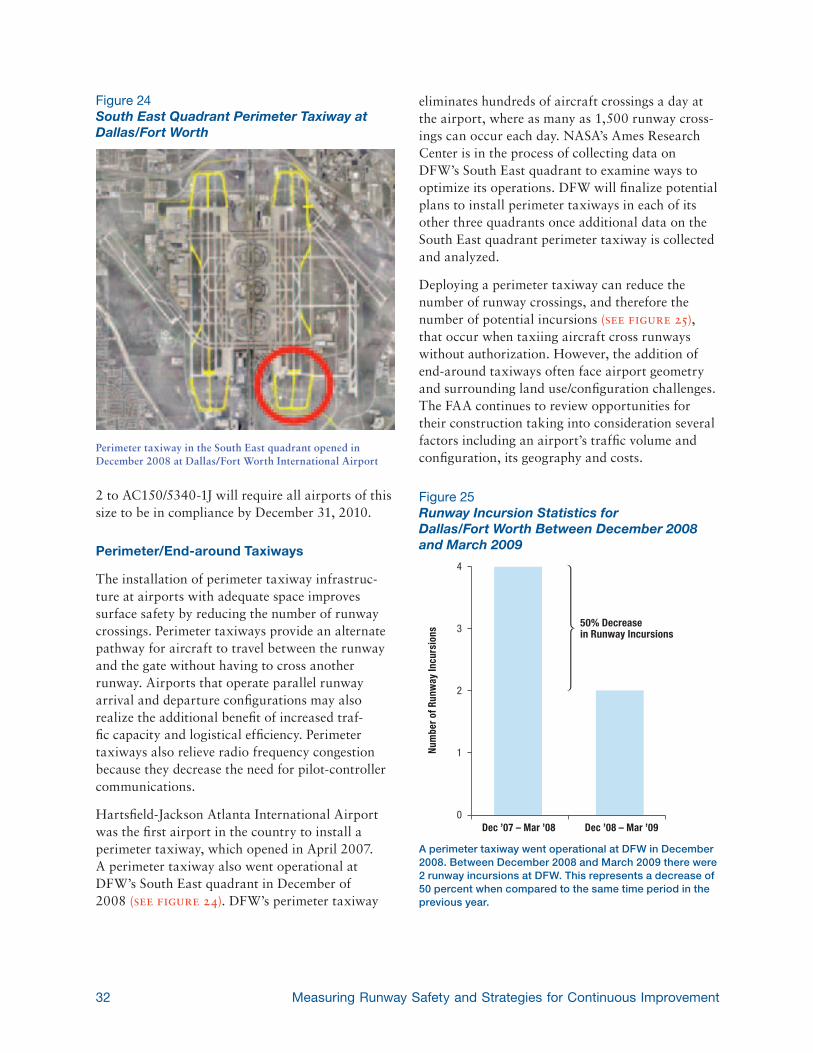
32 Measuring Runway Safety and Strategies for Continuous Improvement
2 to AC150/5340-1J will require all airports of this size to be in compliance by December 31, 2010.
Perimeter/End-around Taxiways
The installation of perimeter taxiway infrastruc-ture at airports with adequate space improves surface safety by reducing the number of runway crossings. Perimeter taxiways provide an alternate pathway for aircraft to travel between the runway and the gate without having to cross another runway. Airports that operate parallel runway arrival and departure configurations may also realize the additional benefit of increased traf-fic capacity and logistical efficiency. Perimeter taxiways also relieve radio frequency congestion because they decrease the need for pilot-controller communications.
Hartsfield-Jackson Atlanta International Airport was the first airport in the country to install a perimeter taxiway, which opened in April 2007. A perimeter taxiway also went operational at DFW’s South East quadrant in December of 2008 (see figure 24). DFW’s perimeter taxiway
eliminates hundreds of aircraft crossings a day at the airport, where as many as 1,500 runway cross-ings can occur each day. NASA’s Ames Research Center is in the process of collecting data on DFW’s South East quadrant to examine ways to optimize its operations. DFW will finalize potential plans to install perimeter taxiways in each of its other three quadrants once additional data on the South East quadrant perimeter taxiway is collected and analyzed.
Deploying a perimeter taxiway can reduce the number of runway crossings, and therefore the number of potential incursions (see figure 25), that occur when taxiing aircraft cross runways without authorization. However, the addition of end-around taxiways often face airport geometry and surrounding land use/configuration challenges. The FAA continues to review opportunities for their construction taking into consideration several factors including an airport’s traffic volume and configuration, its geography and costs.
Figure 24South East Quadrant Perimeter Taxiway at Dallas/Fort Worth
Perimeter taxiway in the South East quadrant opened in December 2008 at Dallas/Fort Worth International Airport
Figure 25Runway Incursion Statistics for Dallas/Fort Worth Between December 2008 and March 2009
A perimeter taxiway went operational at DFW in December 2008. Between December 2008 and March 2009 there were 2 runway incursions at DFW. This represents a decrease of 50 percent when compared to the same time period in the previous year.
0
3
2
1
4
Dec ’07 – Mar ’08
Num
ber o
f Run
way
Incu
rsio
ns
Dec ’08 – Mar ’09
50% Decreasein Runway Incursions
332009 Runway Safety Report
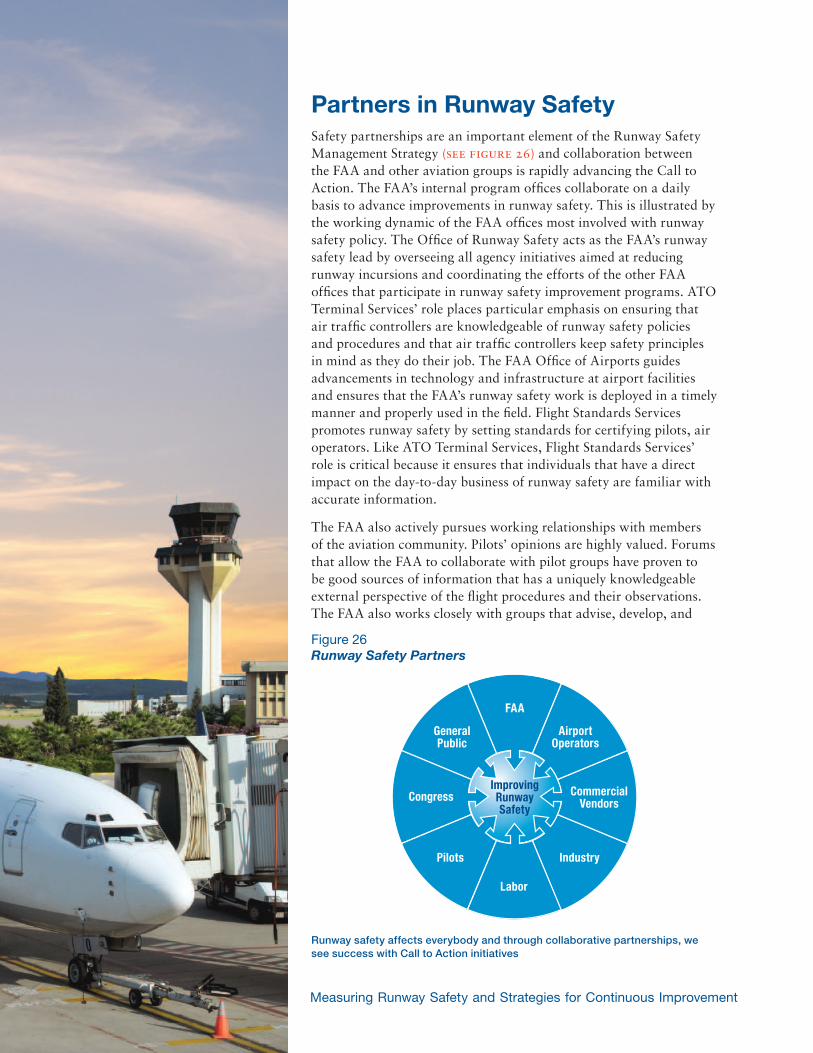
34 Measuring Runway Safety and Strategies for Continuous Improvement
Partners in Runway SafetySafety partnerships are an important element of the Runway Safety Management Strategy (see figure 26) and collaboration between the FAA and other aviation groups is rapidly advancing the Call to Action. The FAA’s internal program offices collaborate on a daily basis to advance improvements in runway safety. This is illustrated by the working dynamic of the FAA offices most involved with runway safety policy. The Office of Runway Safety acts as the FAA’s runway safety lead by overseeing all agency initiatives aimed at reducing runway incursions and coordinating the efforts of the other FAA offices that participate in runway safety improvement programs. ATO Terminal Services’ role places particular emphasis on ensuring that air traffic controllers are knowledgeable of runway safety policies and procedures and that air traffic controllers keep safety principles in mind as they do their job. The FAA Office of Airports guides advancements in technology and infrastructure at airport facilities and ensures that the FAA’s runway safety work is deployed in a timely manner and properly used in the field. Flight Standards Services promotes runway safety by setting standards for certifying pilots, air operators. Like ATO Terminal Services, Flight Standards Services’ role is critical because it ensures that individuals that have a direct impact on the day-to-day business of runway safety are familiar with accurate information.
The FAA also actively pursues working relationships with members of the aviation community. Pilots’ opinions are highly valued. Forums that allow the FAA to collaborate with pilot groups have proven to be good sources of information that has a uniquely knowledgeable external perspective of the flight procedures and their observations. The FAA also works closely with groups that advise, develop, and
Figure 26Runway Safety Partners
Runway safety affects everybody and through collaborative partnerships, we see success with Call to Action initiatives
FAA
AirportOperators
ImprovingRunwaySafety
Congress
GeneralPublic
CommercialVendors
Pilots
Labor
Industry
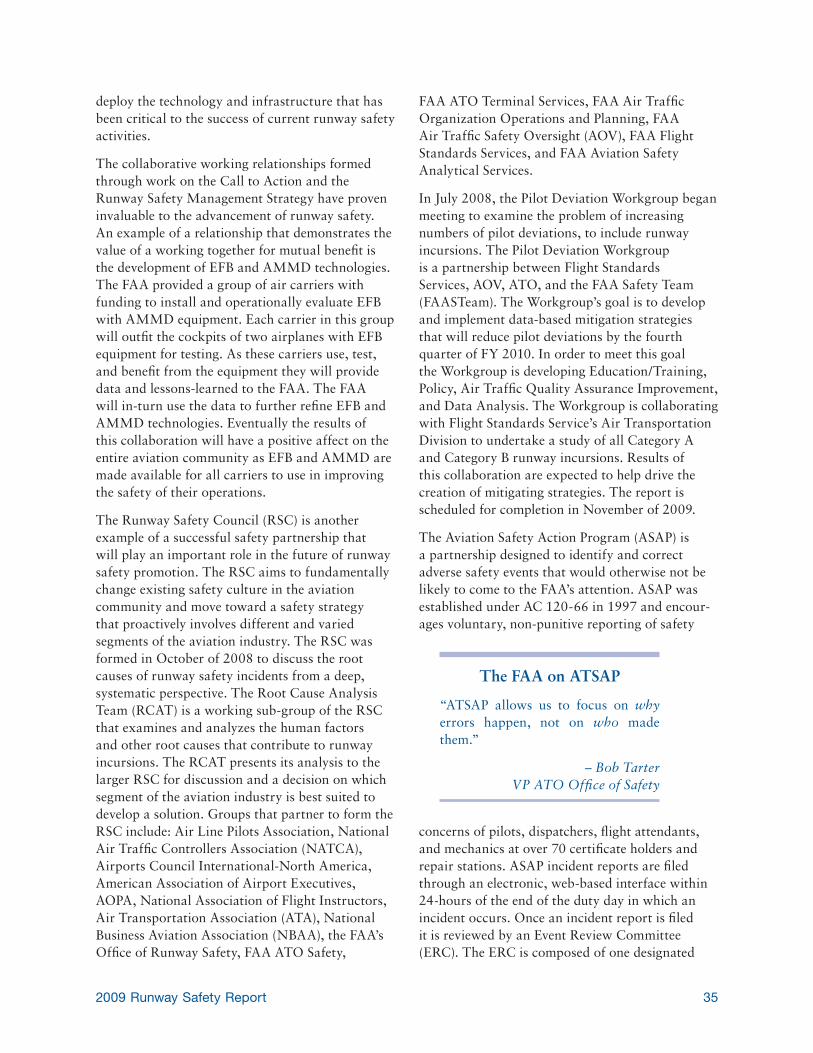
352009 Runway Safety Report
deploy the technology and infrastructure that has been critical to the success of current runway safety activities.
The collaborative working relationships formed through work on the Call to Action and the Runway Safety Management Strategy have proven invaluable to the advancement of runway safety. An example of a relationship that demonstrates the value of a working together for mutual benefit is the development of EFB and AMMD technologies. The FAA provided a group of air carriers with funding to install and operationally evaluate EFB with AMMD equipment. Each carrier in this group will outfit the cockpits of two airplanes with EFB equipment for testing. As these carriers use, test, and benefit from the equipment they will provide data and lessons-learned to the FAA. The FAA will in-turn use the data to further refine EFB and AMMD technologies. Eventually the results of this collaboration will have a positive affect on the entire aviation community as EFB and AMMD are made available for all carriers to use in improving the safety of their operations.
The Runway Safety Council (RSC) is another example of a successful safety partnership that will play an important role in the future of runway safety promotion. The RSC aims to fundamentally change existing safety culture in the aviation community and move toward a safety strategy that proactively involves different and varied segments of the aviation industry. The RSC was formed in October of 2008 to discuss the root causes of runway safety incidents from a deep, systematic perspective. The Root Cause Analysis Team (RCAT) is a working sub-group of the RSC that examines and analyzes the human factors and other root causes that contribute to runway incursions. The RCAT presents its analysis to the larger RSC for discussion and a decision on which segment of the aviation industry is best suited to develop a solution. Groups that partner to form the RSC include: Air Line Pilots Association, National Air Traffic Controllers Association (NATCA), Airports Council International-North America, American Association of Airport Executives, AOPA, National Association of Flight Instructors, Air Transportation Association (ATA), National Business Aviation Association (NBAA), the FAA’s Office of Runway Safety, FAA ATO Safety,
FAA ATO Terminal Services, FAA Air Traffic Organization Operations and Planning, FAA Air Traffic Safety Oversight (AOV), FAA Flight Standards Services, and FAA Aviation Safety Analytical Services.
In July 2008, the Pilot Deviation Workgroup began meeting to examine the problem of increasing numbers of pilot deviations, to include runway incursions. The Pilot Deviation Workgroup is a partnership between Flight Standards Services, AOV, ATO, and the FAA Safety Team (FAASTeam). The Workgroup’s goal is to develop and implement data-based mitigation strategies that will reduce pilot deviations by the fourth quarter of FY 2010. In order to meet this goal the Workgroup is developing Education/Training, Policy, Air Traffic Quality Assurance Improvement, and Data Analysis. The Workgroup is collaborating with Flight Standards Service’s Air Transportation Division to undertake a study of all Category A and Category B runway incursions. Results of this collaboration are expected to help drive the creation of mitigating strategies. The report is scheduled for completion in November of 2009.
The Aviation Safety Action Program (ASAP) is a partnership designed to identify and correct adverse safety events that would otherwise not be likely to come to the FAA’s attention. ASAP was established under AC 120-66 in 1997 and encour-ages voluntary, non-punitive reporting of safety
concerns of pilots, dispatchers, flight attendants, and mechanics at over 70 certificate holders and repair stations. ASAP incident reports are filed through an electronic, web-based interface within 24-hours of the end of the duty day in which an incident occurs. Once an incident report is filed it is reviewed by an Event Review Committee (ERC). The ERC is composed of one designated
The FAA on ATSAP
“ATSAP allows us to focus on why errors happen, not on who made them.”
– Bob Tarter VP ATO Office of Safety
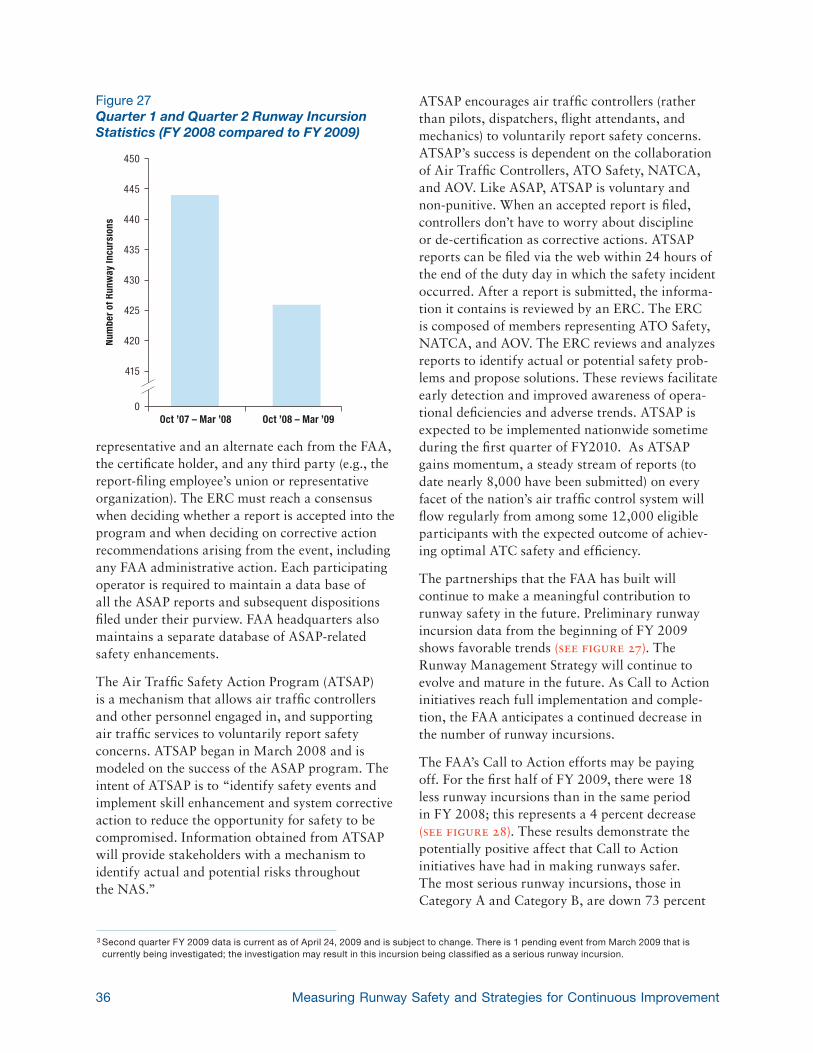
36 Measuring Runway Safety and Strategies for Continuous Improvement
representative and an alternate each from the FAA, the certificate holder, and any third party (e.g., the report-filing employee’s union or representative organization). The ERC must reach a consensus when deciding whether a report is accepted into the program and when deciding on corrective action recommendations arising from the event, including any FAA administrative action. Each participating operator is required to maintain a data base of all the ASAP reports and subsequent dispositions filed under their purview. FAA headquarters also maintains a separate database of ASAP-related safety enhancements.
The Air Traffic Safety Action Program (ATSAP) is a mechanism that allows air traffic controllers and other personnel engaged in, and supporting air traffic services to voluntarily report safety concerns. ATSAP began in March 2008 and is modeled on the success of the ASAP program. The intent of ATSAP is to “identify safety events and implement skill enhancement and system corrective action to reduce the opportunity for safety to be compromised. Information obtained from ATSAP will provide stakeholders with a mechanism to identify actual and potential risks throughout the NAS.”
ATSAP encourages air traffic controllers (rather than pilots, dispatchers, flight attendants, and mechanics) to voluntarily report safety concerns. ATSAP’s success is dependent on the collaboration of Air Traffic Controllers, ATO Safety, NATCA, and AOV. Like ASAP, ATSAP is voluntary and non-punitive. When an accepted report is filed, controllers don’t have to worry about discipline or de-certification as corrective actions. ATSAP reports can be filed via the web within 24 hours of the end of the duty day in which the safety incident occurred. After a report is submitted, the informa-tion it contains is reviewed by an ERC. The ERC is composed of members representing ATO Safety, NATCA, and AOV. The ERC reviews and analyzes reports to identify actual or potential safety prob-lems and propose solutions. These reviews facilitate early detection and improved awareness of opera-tional deficiencies and adverse trends. ATSAP is expected to be implemented nationwide sometime during the first quarter of FY2010. As ATSAP gains momentum, a steady stream of reports (to date nearly 8,000 have been submitted) on every facet of the nation’s air traffic control system will flow regularly from among some 12,000 eligible participants with the expected outcome of achiev-ing optimal ATC safety and efficiency.
The partnerships that the FAA has built will continue to make a meaningful contribution to runway safety in the future. Preliminary runway incursion data from the beginning of FY 2009 shows favorable trends (see figure 27). The Runway Management Strategy will continue to evolve and mature in the future. As Call to Action initiatives reach full implementation and comple-tion, the FAA anticipates a continued decrease in the number of runway incursions.
The FAA’s Call to Action efforts may be paying off. For the first half of FY 2009, there were 18 less runway incursions than in the same period in FY 2008; this represents a 4 percent decrease (see figure 28). These results demonstrate the potentially positive affect that Call to Action initiatives have had in making runways safer. The most serious runway incursions, those in Category A and Category B, are down 73 percent
Figure 27Quarter 1 and Quarter 2 Runway Incursion Statistics (FY 2008 compared to FY 2009)
0
415
445
440
435
430
425
420
450
Oct ’07 – Mar ’08
Num
ber o
f Run
way
Incu
rsio
ns
Oct ’08 – Mar ’09
3 Second quarter FY 2009 data is current as of April 24, 2009 and is subject to change. There is 1 pending event from March 2009 that is currently being investigated; the investigation may result in this incursion being classified as a serious runway incursion.
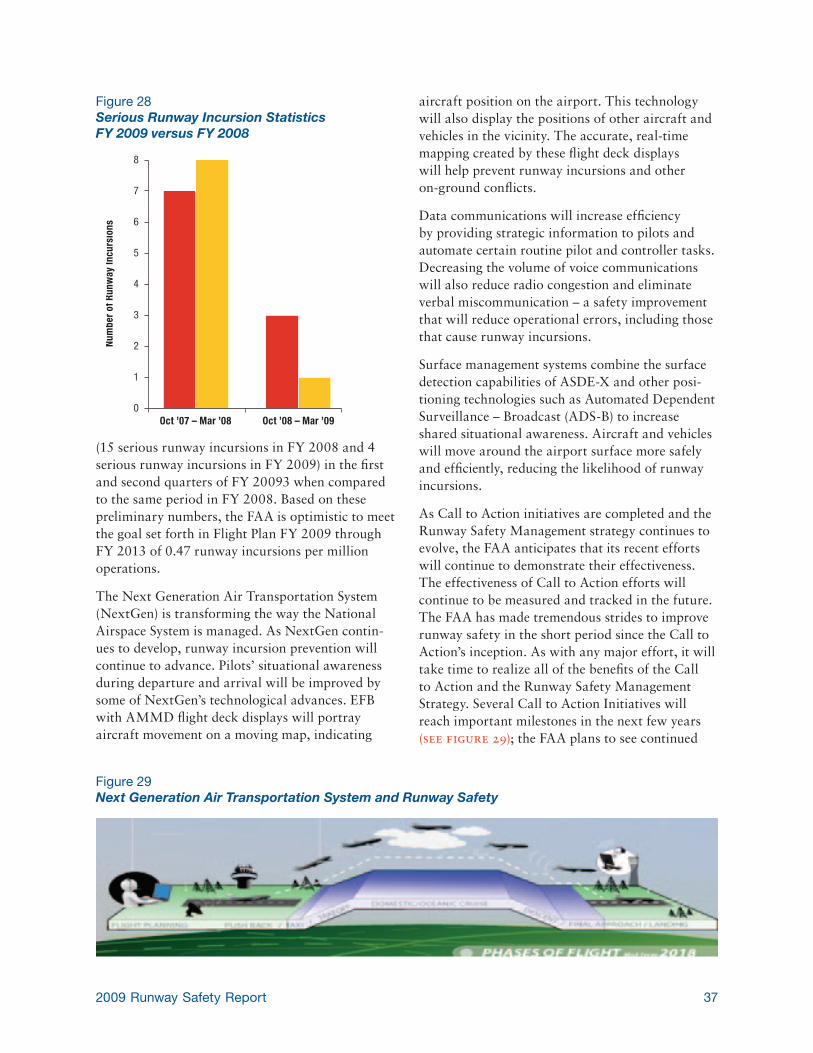
372009 Runway Safety Report
(15 serious runway incursions in FY 2008 and 4 serious runway incursions in FY 2009) in the first and second quarters of FY 20093 when compared to the same period in FY 2008. Based on these preliminary numbers, the FAA is optimistic to meet the goal set forth in Flight Plan FY 2009 through FY 2013 of 0.47 runway incursions per million operations.
The Next Generation Air Transportation System (NextGen) is transforming the way the National Airspace System is managed. As NextGen contin-ues to develop, runway incursion prevention will continue to advance. Pilots’ situational awareness during departure and arrival will be improved by some of NextGen’s technological advances. EFB with AMMD flight deck displays will portray aircraft movement on a moving map, indicating
aircraft position on the airport. This technology will also display the positions of other aircraft and vehicles in the vicinity. The accurate, real-time mapping created by these flight deck displays will help prevent runway incursions and other on-ground conflicts.
Data communications will increase efficiency by providing strategic information to pilots and automate certain routine pilot and controller tasks. Decreasing the volume of voice communications will also reduce radio congestion and eliminate verbal miscommunication – a safety improvement that will reduce operational errors, including those that cause runway incursions.
Surface management systems combine the surface detection capabilities of ASDE-X and other posi-tioning technologies such as Automated Dependent Surveillance – Broadcast (ADS-B) to increase shared situational awareness. Aircraft and vehicles will move around the airport surface more safely and efficiently, reducing the likelihood of runway incursions.
As Call to Action initiatives are completed and the Runway Safety Management strategy continues to evolve, the FAA anticipates that its recent efforts will continue to demonstrate their effectiveness. The effectiveness of Call to Action efforts will continue to be measured and tracked in the future. The FAA has made tremendous strides to improve runway safety in the short period since the Call to Action’s inception. As with any major effort, it will take time to realize all of the benefits of the Call to Action and the Runway Safety Management Strategy. Several Call to Action Initiatives will reach important milestones in the next few years (see figure 29); the FAA plans to see continued
Figure 28Serious Runway Incursion Statistics FY 2009 versus FY 2008
Figure 29Next Generation Air Transportation System and Runway Safety
0
5
2
1
8
6
7
4
3
Oct ’07 – Mar ’08
Num
ber o
f Run
way
Incu
rsio
ns
Oct ’08 – Mar ’09
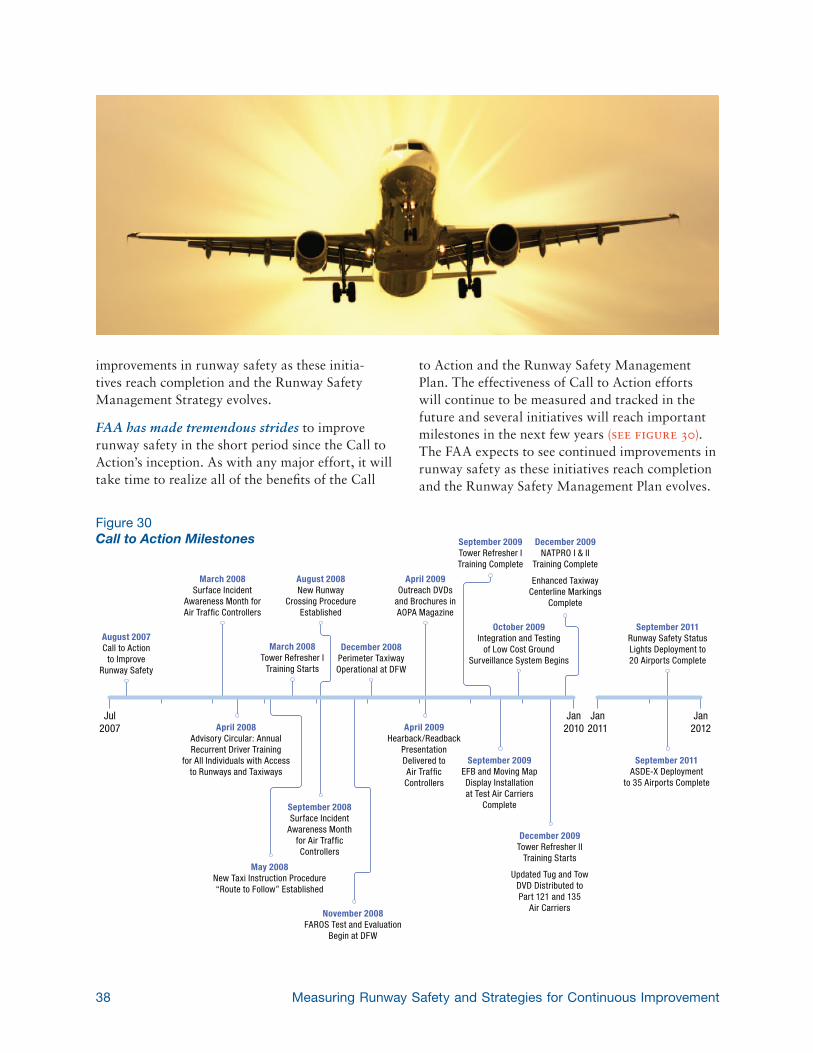
38 Measuring Runway Safety and Strategies for Continuous Improvement
Figure 30Call to Action Milestones
August 2007Call to Action
to ImproveRunway Safety
March 2008Surface Incident
Awareness Month forAir Traffic Controllers
April 2008Advisory Circular: AnnualRecurrent Driver Training
for All Individuals with Accessto Runways and Taxiways
April 2009Outreach DVDs
and Brochures inAOPA Magazine
October 2009Integration and Testing
of Low Cost GroundSurveillance System Begins
September 2011Runway Safety StatusLights Deployment to20 Airports Complete
August 2008New Runway
Crossing ProcedureEstablished
April 2009Hearback/Readback
PresentationDelivered toAir TrafficControllers
November 2008FAROS Test and Evaluation
Begin at DFW
September 2008Surface Incident
Awareness Monthfor Air TrafficControllers
December 2009Tower Refresher II
Training Starts
Updated Tug and TowDVD Distributed toPart 121 and 135
Air Carriers
September 2009EFB and Moving MapDisplay Installationat Test Air Carriers
Complete
September 2011ASDE-X Deployment
to 35 Airports Complete
May 2008New Taxi Instruction Procedure“Route to Follow” Established
March 2008Tower Refresher I
Training Starts
December 2008Perimeter TaxiwayOperational at DFW
September 2009Tower Refresher ITraining Complete
December 2009NATPRO I & II
Training Complete
Enhanced TaxiwayCenterline Markings
Complete
Jul2007
Jan2010
Jan2012
Jan2011
improvements in runway safety as these initia-tives reach completion and the Runway Safety Management Strategy evolves.
FAA has made tremendous strides to improve runway safety in the short period since the Call to Action’s inception. As with any major effort, it will take time to realize all of the benefits of the Call
to Action and the Runway Safety Management Plan. The effectiveness of Call to Action efforts will continue to be measured and tracked in the future and several initiatives will reach important milestones in the next few years (see figure 30). The FAA expects to see continued improvements in runway safety as these initiatives reach completion and the Runway Safety Management Plan evolves.
RD-12009 Runway Safety Report – Reference Data
Reference Data
I. Types of Runway Incursions
II. Airports that have ASDE-X Operational or are Planned to Receive ASDE-X
III. Airports with EMAS Installations
IV. Runway Incursion Data for FY 2005 through FY 2008 by Airport (Sorted Alphabetically by State)
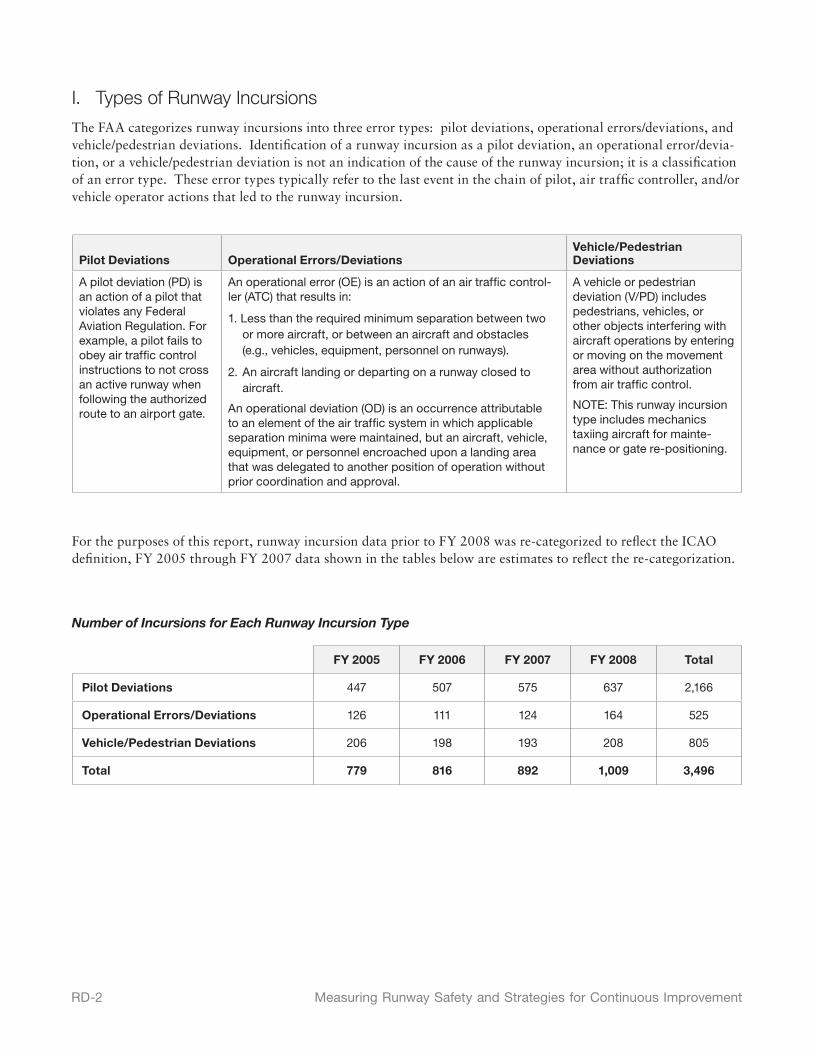
RD-2 Measuring Runway Safety and Strategies for Continuous Improvement
Number of Incursions for Each Runway Incursion Type
FY 2005 FY 2006 FY 2007 FY 2008 Total
Pilot Deviations 447 507 575 637 2,166
Operational Errors/Deviations 126 111 124 164 525
Vehicle/Pedestrian Deviations 206 198 193 208 805
Total 779 816 892 1,009 3,496
I. Types of Runway Incursions
The FAA categorizes runway incursions into three error types: pilot deviations, operational errors/deviations, and vehicle/pedestrian deviations. Identification of a runway incursion as a pilot deviation, an operational error/devia-tion, or a vehicle/pedestrian deviation is not an indication of the cause of the runway incursion; it is a classification of an error type. These error types typically refer to the last event in the chain of pilot, air traffic controller, and/or vehicle operator actions that led to the runway incursion.
Pilot Deviations Operational Errors/DeviationsVehicle/Pedestrian Deviations
A pilot deviation (PD) is an action of a pilot that violates any Federal Aviation Regulation. For example, a pilot fails to obey air traffic control instructions to not cross an active runway when following the authorized route to an airport gate.
An operational error (OE) is an action of an air traffic control-ler (ATC) that results in:
1. Less than the required minimum separation between two or more aircraft, or between an aircraft and obstacles (e.g., vehicles, equipment, personnel on runways).
2. An aircraft landing or departing on a runway closed to aircraft.
An operational deviation (OD) is an occurrence attributable to an element of the air traffic system in which applicable separation minima were maintained, but an aircraft, vehicle, equipment, or personnel encroached upon a landing area that was delegated to another position of operation without prior coordination and approval.
A vehicle or pedestrian deviation (V/PD) includes pedestrians, vehicles, or other objects interfering with aircraft operations by entering or moving on the movement area without authorization from air traffic control.
NOTE: This runway incursion type includes mechanics taxiing aircraft for mainte-nance or gate re-positioning.
For the purposes of this report, runway incursion data prior to FY 2008 was re-categorized to reflect the ICAO definition, FY 2005 through FY 2007 data shown in the tables below are estimates to reflect the re-categorization.
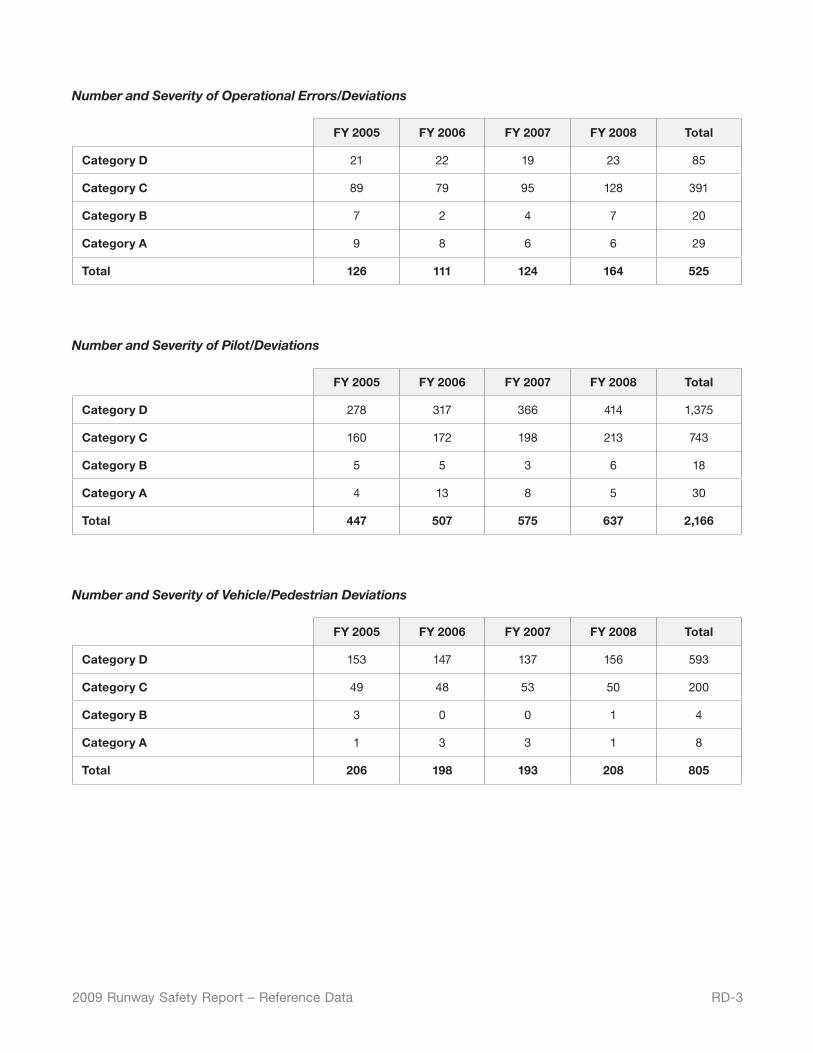
RD-32009 Runway Safety Report – Reference Data
Number and Severity of Operational Errors/Deviations
FY 2005 FY 2006 FY 2007 FY 2008 Total
Category D 21 22 19 23 85
Category C 89 79 95 128 391
Category B 7 2 4 7 20
Category A 9 8 6 6 29
Total 126 111 124 164 525
Number and Severity of Pilot/Deviations
FY 2005 FY 2006 FY 2007 FY 2008 Total
Category D 278 317 366 414 1,375
Category C 160 172 198 213 743
Category B 5 5 3 6 18
Category A 4 13 8 5 30
Total 447 507 575 637 2,166
Number and Severity of Vehicle/Pedestrian Deviations
FY 2005 FY 2006 FY 2007 FY 2008 Total
Category D 153 147 137 156 593
Category C 49 48 53 50 200
Category B 3 0 0 1 4
Category A 1 3 3 1 8
Total 206 198 193 208 805
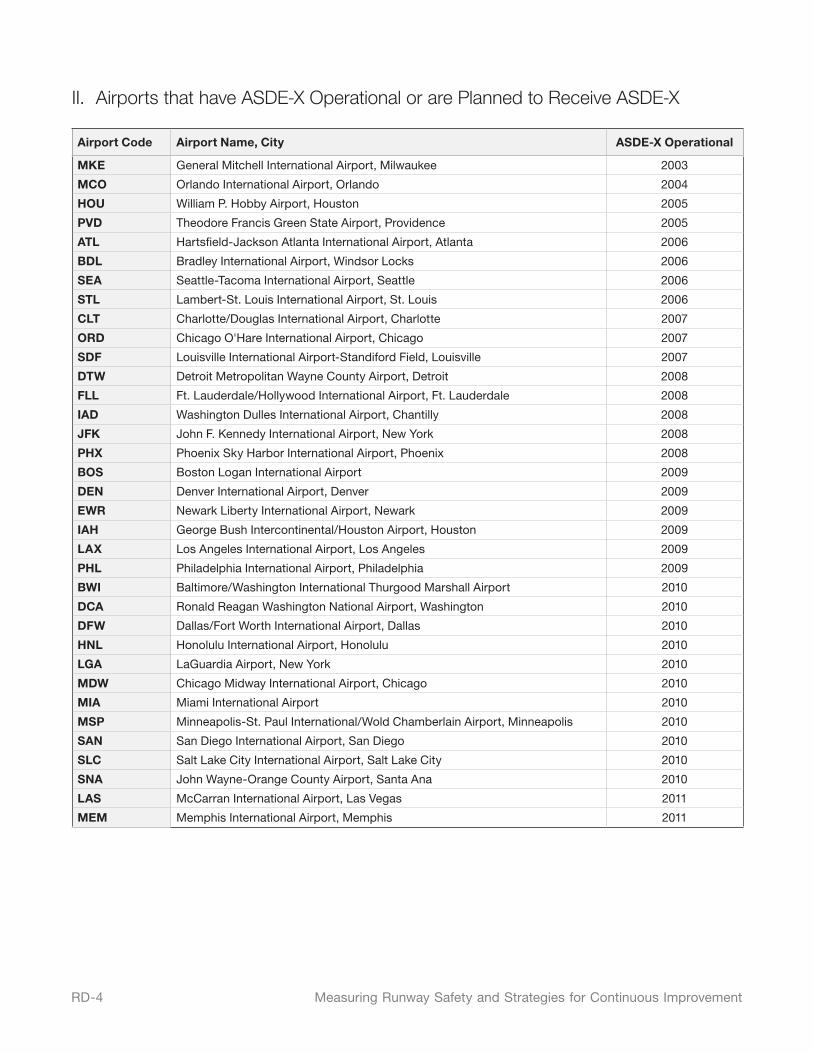
RD-4 Measuring Runway Safety and Strategies for Continuous Improvement
II. Airports that have ASDE-X Operational or are Planned to Receive ASDE-X
Airport Code Airport Name, City ASDE-X Operational
MKE General Mitchell International Airport, Milwaukee 2003
MCO Orlando International Airport, Orlando 2004
HOU William P. Hobby Airport, Houston 2005
PVD Theodore Francis Green State Airport, Providence 2005
ATL Hartsfield-Jackson Atlanta International Airport, Atlanta 2006
BDL Bradley International Airport, Windsor Locks 2006
SEA Seattle-Tacoma International Airport, Seattle 2006
STL Lambert-St. Louis International Airport, St. Louis 2006
CLT Charlotte/Douglas International Airport, Charlotte 2007
ORD Chicago O'Hare International Airport, Chicago 2007
SDF Louisville International Airport-Standiford Field, Louisville 2007
DTW Detroit Metropolitan Wayne County Airport, Detroit 2008
FLL Ft. Lauderdale/Hollywood International Airport, Ft. Lauderdale 2008
IAD Washington Dulles International Airport, Chantilly 2008
JFK John F. Kennedy International Airport, New York 2008
PHX Phoenix Sky Harbor International Airport, Phoenix 2008
BOS Boston Logan International Airport 2009
DEN Denver International Airport, Denver 2009
EWR Newark Liberty International Airport, Newark 2009
IAH George Bush Intercontinental/Houston Airport, Houston 2009
LAX Los Angeles International Airport, Los Angeles 2009
PHL Philadelphia International Airport, Philadelphia 2009
BWI Baltimore/Washington International Thurgood Marshall Airport 2010
DCA Ronald Reagan Washington National Airport, Washington 2010
DFW Dallas/Fort Worth International Airport, Dallas 2010
HNL Honolulu International Airport, Honolulu 2010
LGA LaGuardia Airport, New York 2010
MDW Chicago Midway International Airport, Chicago 2010
MIA Miami International Airport 2010
MSP Minneapolis-St. Paul International/Wold Chamberlain Airport, Minneapolis 2010
SAN San Diego International Airport, San Diego 2010
SLC Salt Lake City International Airport, Salt Lake City 2010
SNA John Wayne-Orange County Airport, Santa Ana 2010
LAS McCarran International Airport, Las Vegas 2011
MEM Memphis International Airport, Memphis 2011
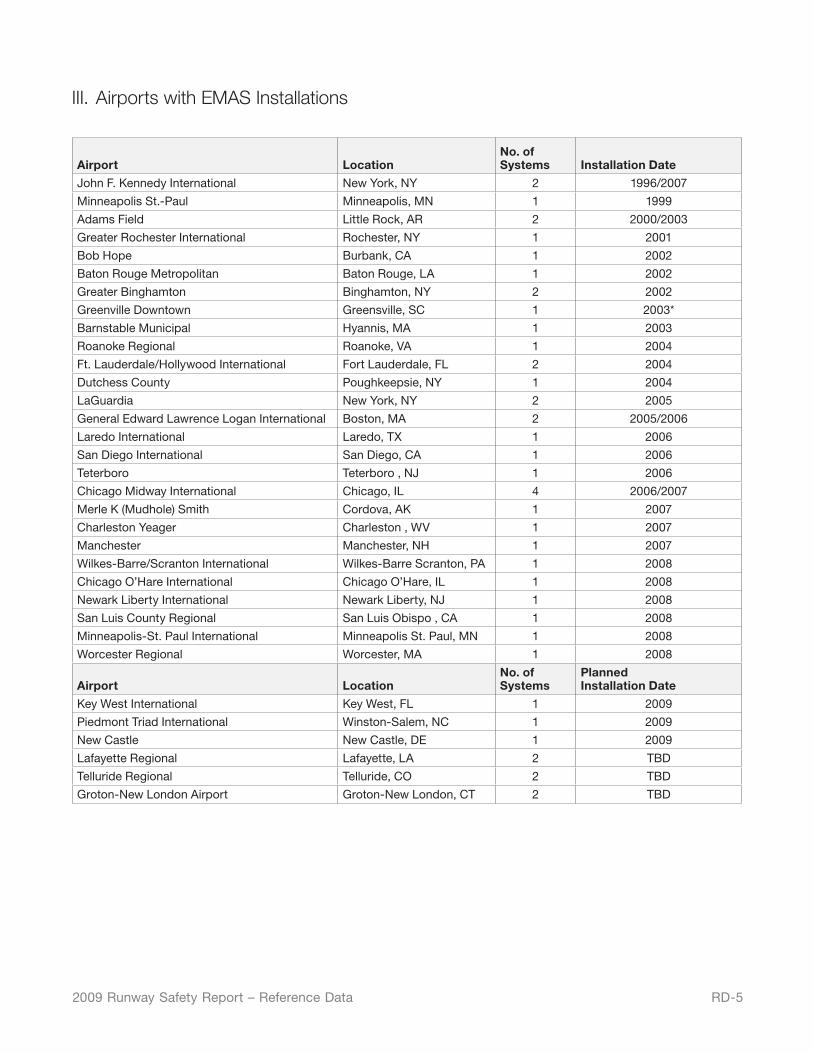
RD-52009 Runway Safety Report – Reference Data
III. Airports with EMAS Installations
Airport LocationNo. of Systems Installation Date
John F. Kennedy International New York, NY 2 1996/2007
Minneapolis St.-Paul Minneapolis, MN 1 1999
Adams Field Little Rock, AR 2 2000/2003
Greater Rochester International Rochester, NY 1 2001
Bob Hope Burbank, CA 1 2002
Baton Rouge Metropolitan Baton Rouge, LA 1 2002
Greater Binghamton Binghamton, NY 2 2002
Greenville Downtown Greensville, SC 1 2003*
Barnstable Municipal Hyannis, MA 1 2003
Roanoke Regional Roanoke, VA 1 2004
Ft. Lauderdale/Hollywood International Fort Lauderdale, FL 2 2004
Dutchess County Poughkeepsie, NY 1 2004
LaGuardia New York, NY 2 2005
General Edward Lawrence Logan International Boston, MA 2 2005/2006
Laredo International Laredo, TX 1 2006
San Diego International San Diego, CA 1 2006
Teterboro Teterboro , NJ 1 2006
Chicago Midway International Chicago, IL 4 2006/2007
Merle K (Mudhole) Smith Cordova, AK 1 2007
Charleston Yeager Charleston , WV 1 2007
Manchester Manchester, NH 1 2007
Wilkes-Barre/Scranton International Wilkes-Barre Scranton, PA 1 2008
Chicago O’Hare International Chicago O’Hare, IL 1 2008
Newark Liberty International Newark Liberty, NJ 1 2008
San Luis County Regional San Luis Obispo , CA 1 2008
Minneapolis-St. Paul International Minneapolis St. Paul, MN 1 2008
Worcester Regional Worcester, MA 1 2008
Airport LocationNo. of Systems
Planned Installation Date
Key West International Key West, FL 1 2009
Piedmont Triad International Winston-Salem, NC 1 2009
New Castle New Castle, DE 1 2009
Lafayette Regional Lafayette, LA 2 TBD
Telluride Regional Telluride, CO 2 TBD
Groton-New London Airport Groton-New London, CT 2 TBD

RD-6 Measuring Runway Safety and Strategies for Continuous Improvement
This page intentionally left blank
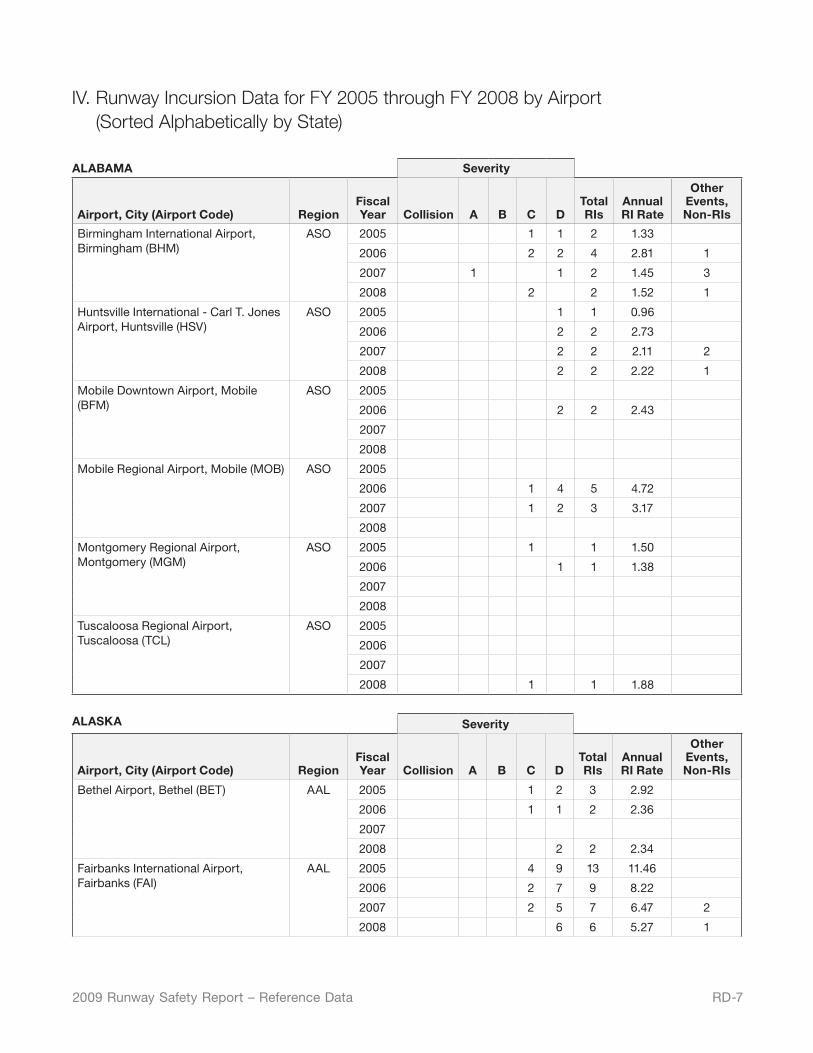
RD-72009 Runway Safety Report – Reference Data
IV. Runway Incursion Data for FY 2005 through FY 2008 by Airport (Sorted Alphabetically by State)
ALABAMA Severity
Airport, City (Airport Code) RegionFiscal Year Collision A B C D
Total RIs
Annual RI Rate
Other Events, Non-RIs
Birmingham International Airport, Birmingham (BHM)
ASO 2005 1 1 2 1.33
2006 2 2 4 2.81 1
2007 1 1 2 1.45 3
2008 2 2 1.52 1
Huntsville International - Carl T. Jones Airport, Huntsville (HSV)
ASO 2005 1 1 0.96
2006 2 2 2.73
2007 2 2 2.11 2
2008 2 2 2.22 1
Mobile Downtown Airport, Mobile (BFM)
ASO 2005
2006 2 2 2.43
2007
2008
Mobile Regional Airport, Mobile (MOB) ASO 2005
2006 1 4 5 4.72
2007 1 2 3 3.17
2008
Montgomery Regional Airport, Montgomery (MGM)
ASO 2005 1 1 1.50
2006 1 1 1.38
2007
2008
Tuscaloosa Regional Airport, Tuscaloosa (TCL)
ASO 2005
2006
2007
2008 1 1 1.88
ALASKA Severity
Airport, City (Airport Code) RegionFiscal Year Collision A B C D
Total RIs
Annual RI Rate
Other Events, Non-RIs
Bethel Airport, Bethel (BET) AAL 2005 1 2 3 2.92
2006 1 1 2 2.36
2007
2008 2 2 2.34
Fairbanks International Airport, Fairbanks (FAI)
AAL 2005 4 9 13 11.46
2006 2 7 9 8.22
2007 2 5 7 6.47 2
2008 6 6 5.27 1
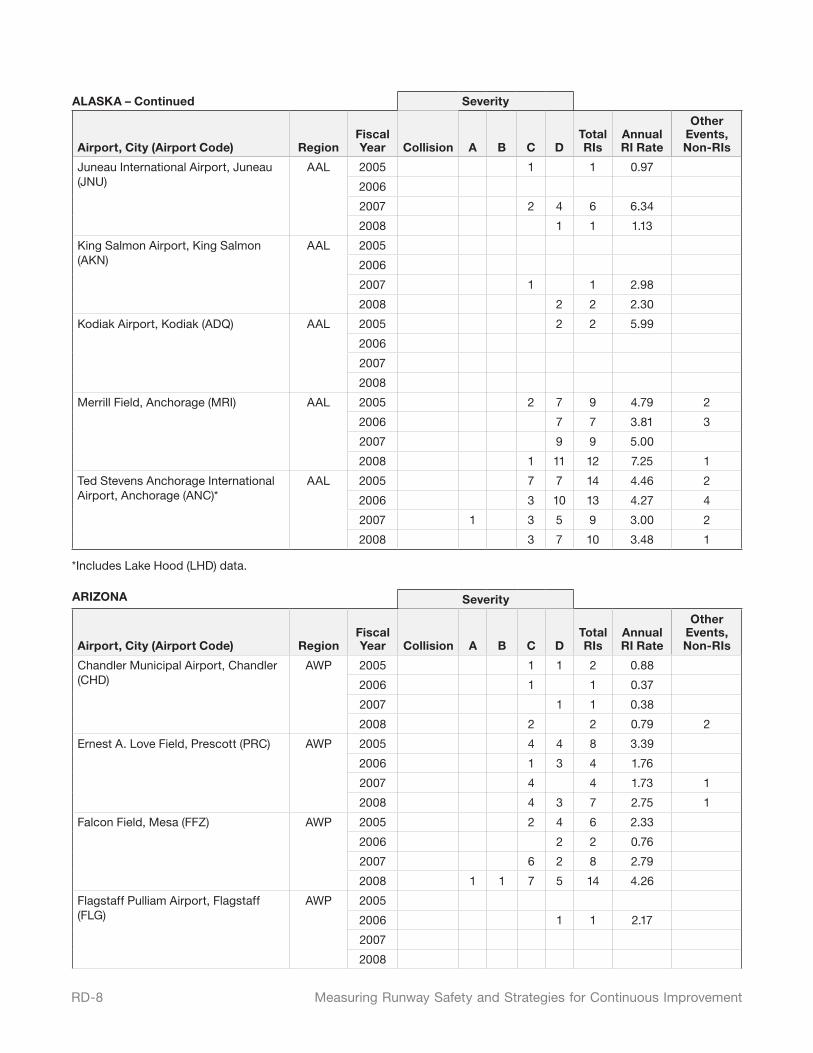
RD-8 Measuring Runway Safety and Strategies for Continuous Improvement
ALASKA – Continued Severity
Airport, City (Airport Code) RegionFiscal Year Collision A B C D
Total RIs
Annual RI Rate
Other Events, Non-RIs
Juneau International Airport, Juneau (JNU)
AAL 2005 1 1 0.97
2006
2007 2 4 6 6.34
2008 1 1 1.13
King Salmon Airport, King Salmon (AKN)
AAL 2005
2006
2007 1 1 2.98
2008 2 2 2.30
Kodiak Airport, Kodiak (ADQ) AAL 2005 2 2 5.99
2006
2007
2008
Merrill Field, Anchorage (MRI) AAL 2005 2 7 9 4.79 2
2006 7 7 3.81 3
2007 9 9 5.00
2008 1 11 12 7.25 1
Ted Stevens Anchorage International Airport, Anchorage (ANC)*
AAL 2005 7 7 14 4.46 2
2006 3 10 13 4.27 4
2007 1 3 5 9 3.00 2
2008 3 7 10 3.48 1
*Includes Lake Hood (LHD) data.
ARIZONA Severity
Airport, City (Airport Code) RegionFiscal Year Collision A B C D
Total RIs
Annual RI Rate
Other Events, Non-RIs
Chandler Municipal Airport, Chandler (CHD)
AWP 2005 1 1 2 0.88
2006 1 1 0.37
2007 1 1 0.38
2008 2 2 0.79 2
Ernest A. Love Field, Prescott (PRC) AWP 2005 4 4 8 3.39
2006 1 3 4 1.76
2007 4 4 1.73 1
2008 4 3 7 2.75 1
Falcon Field, Mesa (FFZ) AWP 2005 2 4 6 2.33
2006 2 2 0.76
2007 6 2 8 2.79
2008 1 1 7 5 14 4.26
Flagstaff Pulliam Airport, Flagstaff (FLG)
AWP 2005
2006 1 1 2.17
2007
2008
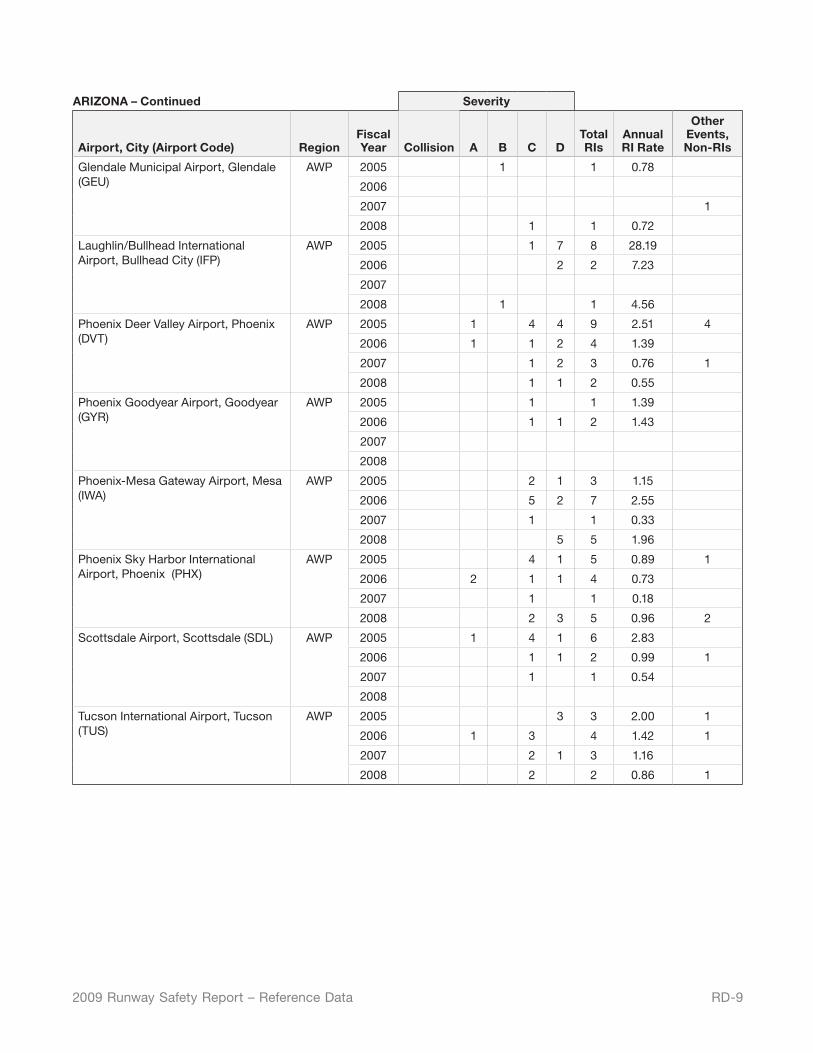
RD-92009 Runway Safety Report – Reference Data
ARIZONA – Continued Severity
Airport, City (Airport Code) RegionFiscal Year Collision A B C D
Total RIs
Annual RI Rate
Other Events, Non-RIs
Glendale Municipal Airport, Glendale (GEU)
AWP 2005 1 1 0.78
2006
2007 1
2008 1 1 0.72
Laughlin/Bullhead International Airport, Bullhead City (IFP)
AWP 2005 1 7 8 28.19
2006 2 2 7.23
2007
2008 1 1 4.56
Phoenix Deer Valley Airport, Phoenix (DVT)
AWP 2005 1 4 4 9 2.51 4
2006 1 1 2 4 1.39
2007 1 2 3 0.76 1
2008 1 1 2 0.55
Phoenix Goodyear Airport, Goodyear (GYR)
AWP 2005 1 1 1.39
2006 1 1 2 1.43
2007
2008
Phoenix-Mesa Gateway Airport, Mesa (IWA)
AWP 2005 2 1 3 1.15
2006 5 2 7 2.55
2007 1 1 0.33
2008 5 5 1.96
Phoenix Sky Harbor International Airport, Phoenix (PHX)
AWP 2005 4 1 5 0.89 1
2006 2 1 1 4 0.73
2007 1 1 0.18
2008 2 3 5 0.96 2
Scottsdale Airport, Scottsdale (SDL) AWP 2005 1 4 1 6 2.83
2006 1 1 2 0.99 1
2007 1 1 0.54
2008
Tucson International Airport, Tucson (TUS)
AWP 2005 3 3 2.00 1
2006 1 3 4 1.42 1
2007 2 1 3 1.16
2008 2 2 0.86 1
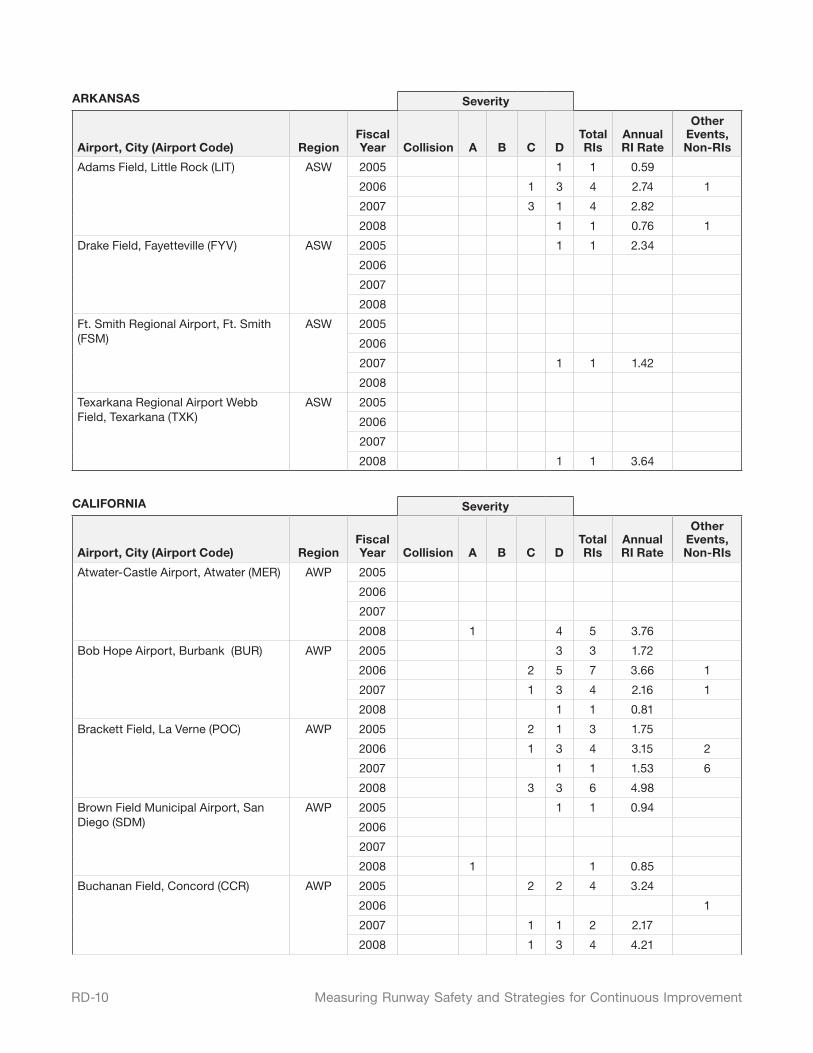
RD-10 Measuring Runway Safety and Strategies for Continuous Improvement
ARKANSAS Severity
Airport, City (Airport Code) RegionFiscal Year Collision A B C D
Total RIs
Annual RI Rate
Other Events, Non-RIs
Adams Field, Little Rock (LIT) ASW 2005 1 1 0.59
2006 1 3 4 2.74 1
2007 3 1 4 2.82
2008 1 1 0.76 1
Drake Field, Fayetteville (FYV) ASW 2005 1 1 2.34
2006
2007
2008
Ft. Smith Regional Airport, Ft. Smith (FSM)
ASW 2005
2006
2007 1 1 1.42
2008
Texarkana Regional Airport Webb Field, Texarkana (TXK)
ASW 2005
2006
2007
2008 1 1 3.64
CALIFORNIA Severity
Airport, City (Airport Code) RegionFiscal Year Collision A B C D
Total RIs
Annual RI Rate
Other Events, Non-RIs
Atwater-Castle Airport, Atwater (MER) AWP 2005
2006
2007
2008 1 4 5 3.76
Bob Hope Airport, Burbank (BUR) AWP 2005 3 3 1.72
2006 2 5 7 3.66 1
2007 1 3 4 2.16 1
2008 1 1 0.81
Brackett Field, La Verne (POC) AWP 2005 2 1 3 1.75
2006 1 3 4 3.15 2
2007 1 1 1.53 6
2008 3 3 6 4.98
Brown Field Municipal Airport, San Diego (SDM)
AWP 2005 1 1 0.94
2006
2007
2008 1 1 0.85
Buchanan Field, Concord (CCR) AWP 2005 2 2 4 3.24
2006 1
2007 1 1 2 2.17
2008 1 3 4 4.21
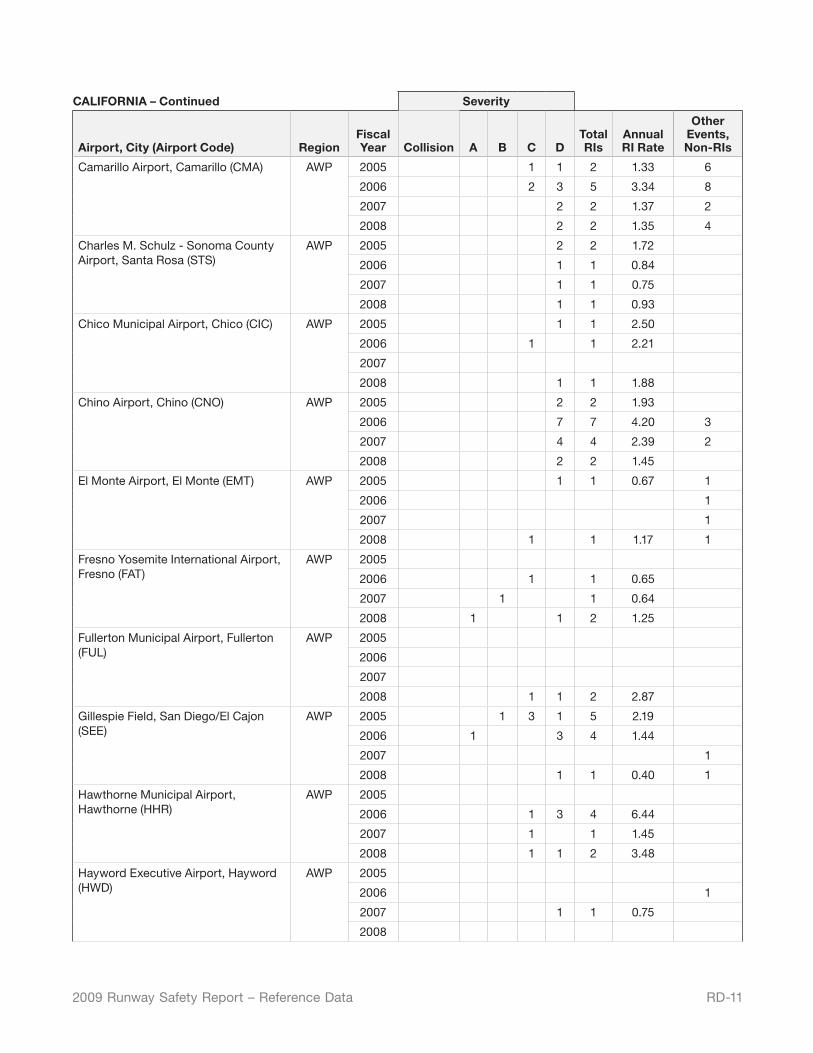
RD-112009 Runway Safety Report – Reference Data
CALIFORNIA – Continued Severity
Airport, City (Airport Code) RegionFiscal Year Collision A B C D
Total RIs
Annual RI Rate
Other Events, Non-RIs
Camarillo Airport, Camarillo (CMA) AWP 2005 1 1 2 1.33 6
2006 2 3 5 3.34 8
2007 2 2 1.37 2
2008 2 2 1.35 4
Charles M. Schulz - Sonoma County Airport, Santa Rosa (STS)
AWP 2005 2 2 1.72
2006 1 1 0.84
2007 1 1 0.75
2008 1 1 0.93
Chico Municipal Airport, Chico (CIC) AWP 2005 1 1 2.50
2006 1 1 2.21
2007
2008 1 1 1.88
Chino Airport, Chino (CNO) AWP 2005 2 2 1.93
2006 7 7 4.20 3
2007 4 4 2.39 2
2008 2 2 1.45
El Monte Airport, El Monte (EMT) AWP 2005 1 1 0.67 1
2006 1
2007 1
2008 1 1 1.17 1
Fresno Yosemite International Airport, Fresno (FAT)
AWP 2005
2006 1 1 0.65
2007 1 1 0.64
2008 1 1 2 1.25
Fullerton Municipal Airport, Fullerton (FUL)
AWP 2005
2006
2007
2008 1 1 2 2.87
Gillespie Field, San Diego/El Cajon (SEE)
AWP 2005 1 3 1 5 2.19
2006 1 3 4 1.44
2007 1
2008 1 1 0.40 1
Hawthorne Municipal Airport, Hawthorne (HHR)
AWP 2005
2006 1 3 4 6.44
2007 1 1 1.45
2008 1 1 2 3.48
Hayword Executive Airport, Hayword (HWD)
AWP 2005
2006 1
2007 1 1 0.75
2008
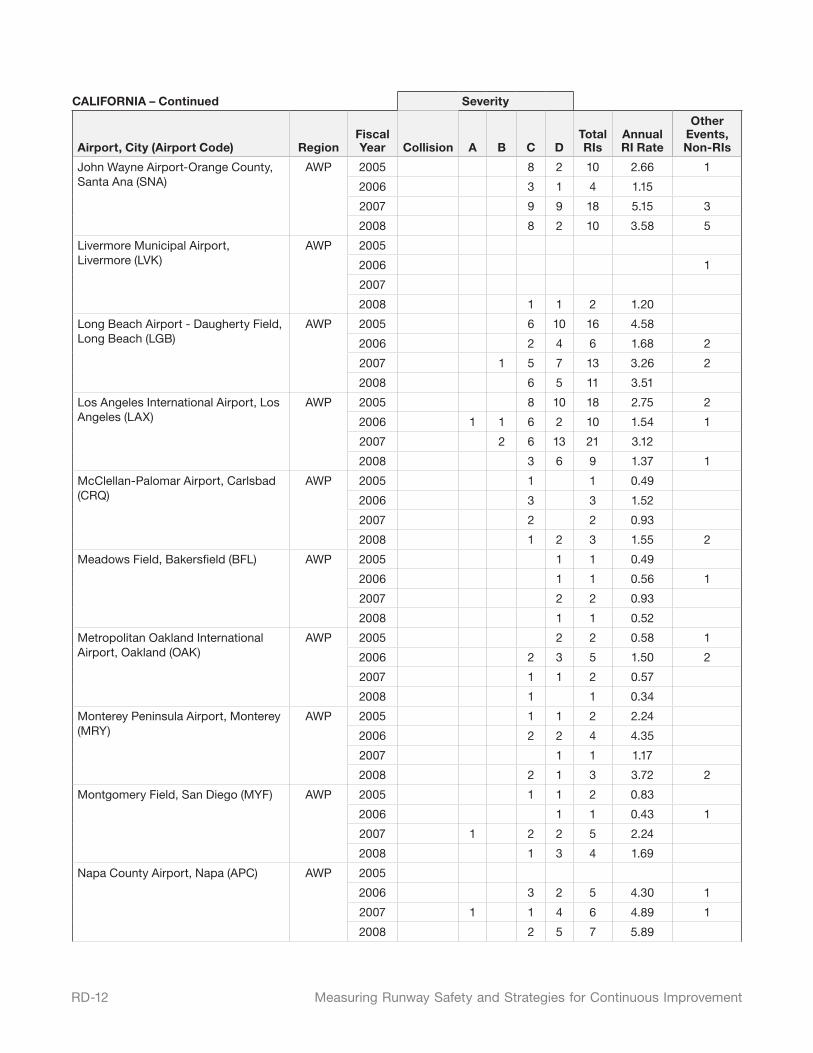
RD-12 Measuring Runway Safety and Strategies for Continuous Improvement
CALIFORNIA – Continued Severity
Airport, City (Airport Code) RegionFiscal Year Collision A B C D
Total RIs
Annual RI Rate
Other Events, Non-RIs
John Wayne Airport-Orange County, Santa Ana (SNA)
AWP 2005 8 2 10 2.66 1
2006 3 1 4 1.15
2007 9 9 18 5.15 3
2008 8 2 10 3.58 5
Livermore Municipal Airport, Livermore (LVK)
AWP 2005
2006 1
2007
2008 1 1 2 1.20
Long Beach Airport - Daugherty Field, Long Beach (LGB)
AWP 2005 6 10 16 4.58
2006 2 4 6 1.68 2
2007 1 5 7 13 3.26 2
2008 6 5 11 3.51
Los Angeles International Airport, Los Angeles (LAX)
AWP 2005 8 10 18 2.75 2
2006 1 1 6 2 10 1.54 1
2007 2 6 13 21 3.12
2008 3 6 9 1.37 1
McClellan-Palomar Airport, Carlsbad (CRQ)
AWP 2005 1 1 0.49
2006 3 3 1.52
2007 2 2 0.93
2008 1 2 3 1.55 2
Meadows Field, Bakersfield (BFL) AWP 2005 1 1 0.49
2006 1 1 0.56 1
2007 2 2 0.93
2008 1 1 0.52
Metropolitan Oakland International Airport, Oakland (OAK)
AWP 2005 2 2 0.58 1
2006 2 3 5 1.50 2
2007 1 1 2 0.57
2008 1 1 0.34
Monterey Peninsula Airport, Monterey (MRY)
AWP 2005 1 1 2 2.24
2006 2 2 4 4.35
2007 1 1 1.17
2008 2 1 3 3.72 2
Montgomery Field, San Diego (MYF) AWP 2005 1 1 2 0.83
2006 1 1 0.43 1
2007 1 2 2 5 2.24
2008 1 3 4 1.69
Napa County Airport, Napa (APC) AWP 2005
2006 3 2 5 4.30 1
2007 1 1 4 6 4.89 1
2008 2 5 7 5.89
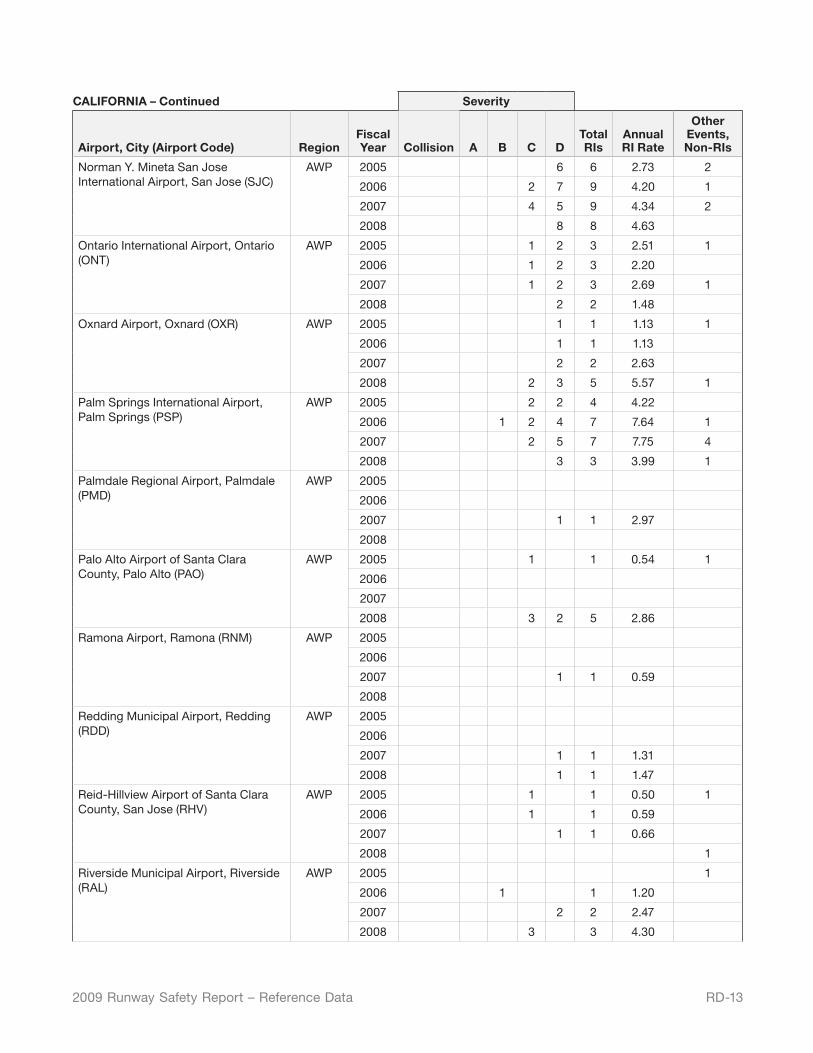
RD-132009 Runway Safety Report – Reference Data
CALIFORNIA – Continued Severity
Airport, City (Airport Code) RegionFiscal Year Collision A B C D
Total RIs
Annual RI Rate
Other Events, Non-RIs
Norman Y. Mineta San Jose International Airport, San Jose (SJC)
AWP 2005 6 6 2.73 2
2006 2 7 9 4.20 1
2007 4 5 9 4.34 2
2008 8 8 4.63
Ontario International Airport, Ontario (ONT)
AWP 2005 1 2 3 2.51 1
2006 1 2 3 2.20
2007 1 2 3 2.69 1
2008 2 2 1.48
Oxnard Airport, Oxnard (OXR) AWP 2005 1 1 1.13 1
2006 1 1 1.13
2007 2 2 2.63
2008 2 3 5 5.57 1
Palm Springs International Airport, Palm Springs (PSP)
AWP 2005 2 2 4 4.22
2006 1 2 4 7 7.64 1
2007 2 5 7 7.75 4
2008 3 3 3.99 1
Palmdale Regional Airport, Palmdale (PMD)
AWP 2005
2006
2007 1 1 2.97
2008
Palo Alto Airport of Santa Clara County, Palo Alto (PAO)
AWP 2005 1 1 0.54 1
2006
2007
2008 3 2 5 2.86
Ramona Airport, Ramona (RNM) AWP 2005
2006
2007 1 1 0.59
2008
Redding Municipal Airport, Redding (RDD)
AWP 2005
2006
2007 1 1 1.31
2008 1 1 1.47
Reid-Hillview Airport of Santa Clara County, San Jose (RHV)
AWP 2005 1 1 0.50 1
2006 1 1 0.59
2007 1 1 0.66
2008 1
Riverside Municipal Airport, Riverside (RAL)
AWP 2005 1
2006 1 1 1.20
2007 2 2 2.47
2008 3 3 4.30
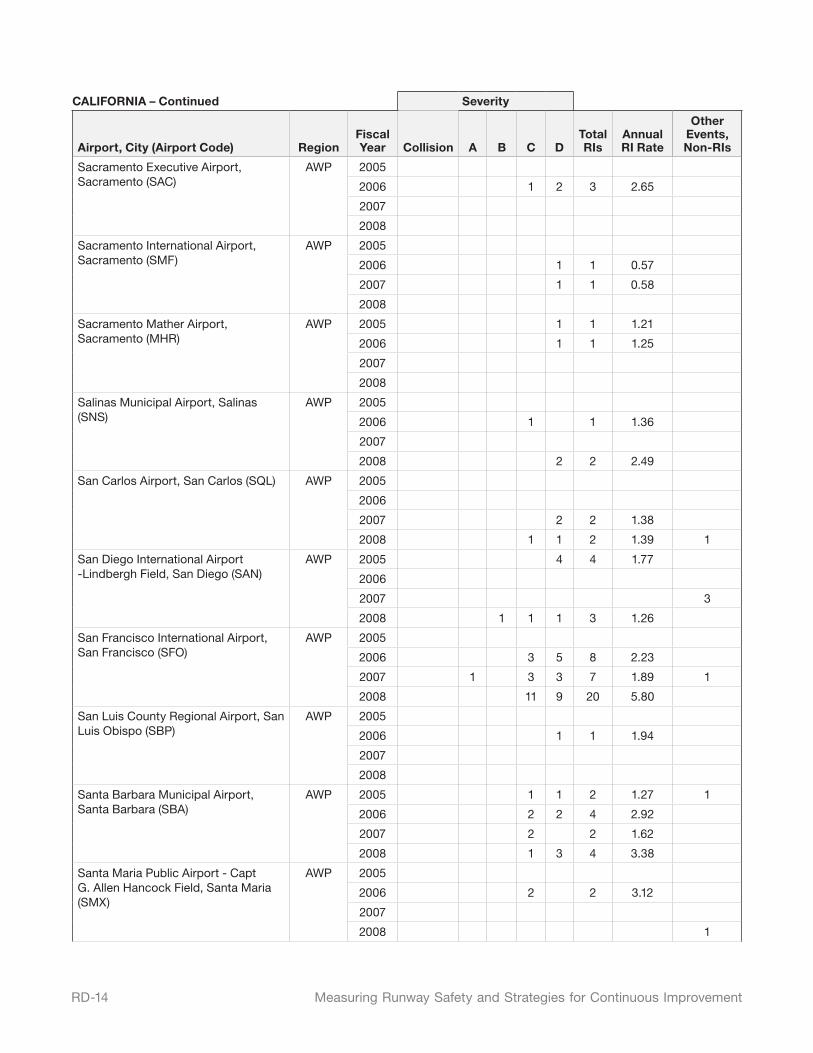
RD-14 Measuring Runway Safety and Strategies for Continuous Improvement
CALIFORNIA – Continued Severity
Airport, City (Airport Code) RegionFiscal Year Collision A B C D
Total RIs
Annual RI Rate
Other Events, Non-RIs
Sacramento Executive Airport, Sacramento (SAC)
AWP 2005
2006 1 2 3 2.65
2007
2008
Sacramento International Airport, Sacramento (SMF)
AWP 2005
2006 1 1 0.57
2007 1 1 0.58
2008
Sacramento Mather Airport, Sacramento (MHR)
AWP 2005 1 1 1.21
2006 1 1 1.25
2007
2008
Salinas Municipal Airport, Salinas (SNS)
AWP 2005
2006 1 1 1.36
2007
2008 2 2 2.49
San Carlos Airport, San Carlos (SQL) AWP 2005
2006
2007 2 2 1.38
2008 1 1 2 1.39 1
San Diego International Airport -Lindbergh Field, San Diego (SAN)
AWP 2005 4 4 1.77
2006
2007 3
2008 1 1 1 3 1.26
San Francisco International Airport, San Francisco (SFO)
AWP 2005
2006 3 5 8 2.23
2007 1 3 3 7 1.89 1
2008 11 9 20 5.80
San Luis County Regional Airport, San Luis Obispo (SBP)
AWP 2005
2006 1 1 1.94
2007
2008
Santa Barbara Municipal Airport, Santa Barbara (SBA)
AWP 2005 1 1 2 1.27 1
2006 2 2 4 2.92
2007 2 2 1.62
2008 1 3 4 3.38
Santa Maria Public Airport - Capt G. Allen Hancock Field, Santa Maria (SMX)
AWP 2005
2006 2 2 3.12
2007
2008 1
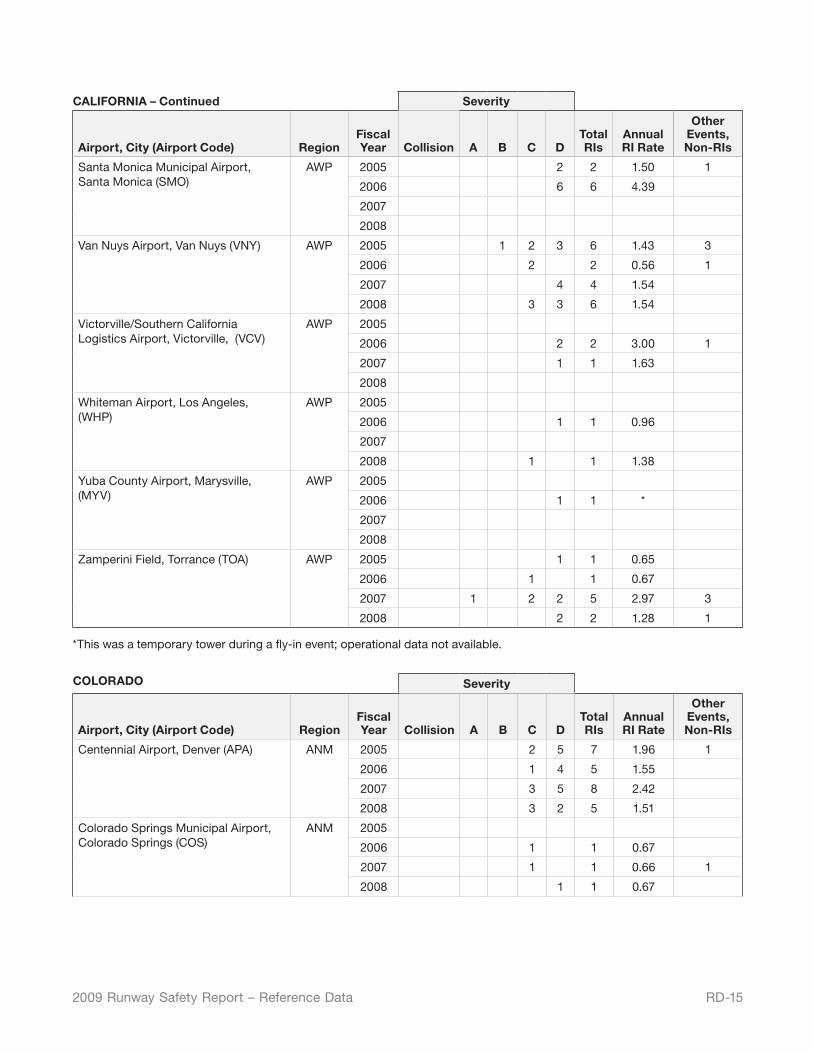
RD-152009 Runway Safety Report – Reference Data
CALIFORNIA – Continued Severity
Airport, City (Airport Code) RegionFiscal Year Collision A B C D
Total RIs
Annual RI Rate
Other Events, Non-RIs
Santa Monica Municipal Airport, Santa Monica (SMO)
AWP 2005 2 2 1.50 1
2006 6 6 4.39
2007
2008
Van Nuys Airport, Van Nuys (VNY) AWP 2005 1 2 3 6 1.43 3
2006 2 2 0.56 1
2007 4 4 1.54
2008 3 3 6 1.54
Victorville/Southern California Logistics Airport, Victorville, (VCV)
AWP 2005
2006 2 2 3.00 1
2007 1 1 1.63
2008
Whiteman Airport, Los Angeles, (WHP)
AWP 2005
2006 1 1 0.96
2007
2008 1 1 1.38
Yuba County Airport, Marysville, (MYV)
AWP 2005
2006 1 1 *
2007
2008
Zamperini Field, Torrance (TOA) AWP 2005 1 1 0.65
2006 1 1 0.67
2007 1 2 2 5 2.97 3
2008 2 2 1.28 1
*This was a temporary tower during a fly-in event; operational data not available.
COLORADO Severity
Airport, City (Airport Code) RegionFiscal Year Collision A B C D
Total RIs
Annual RI Rate
Other Events, Non-RIs
Centennial Airport, Denver (APA) ANM 2005 2 5 7 1.96 1
2006 1 4 5 1.55
2007 3 5 8 2.42
2008 3 2 5 1.51
Colorado Springs Municipal Airport, Colorado Springs (COS)
ANM 2005
2006 1 1 0.67
2007 1 1 0.66 1
2008 1 1 0.67
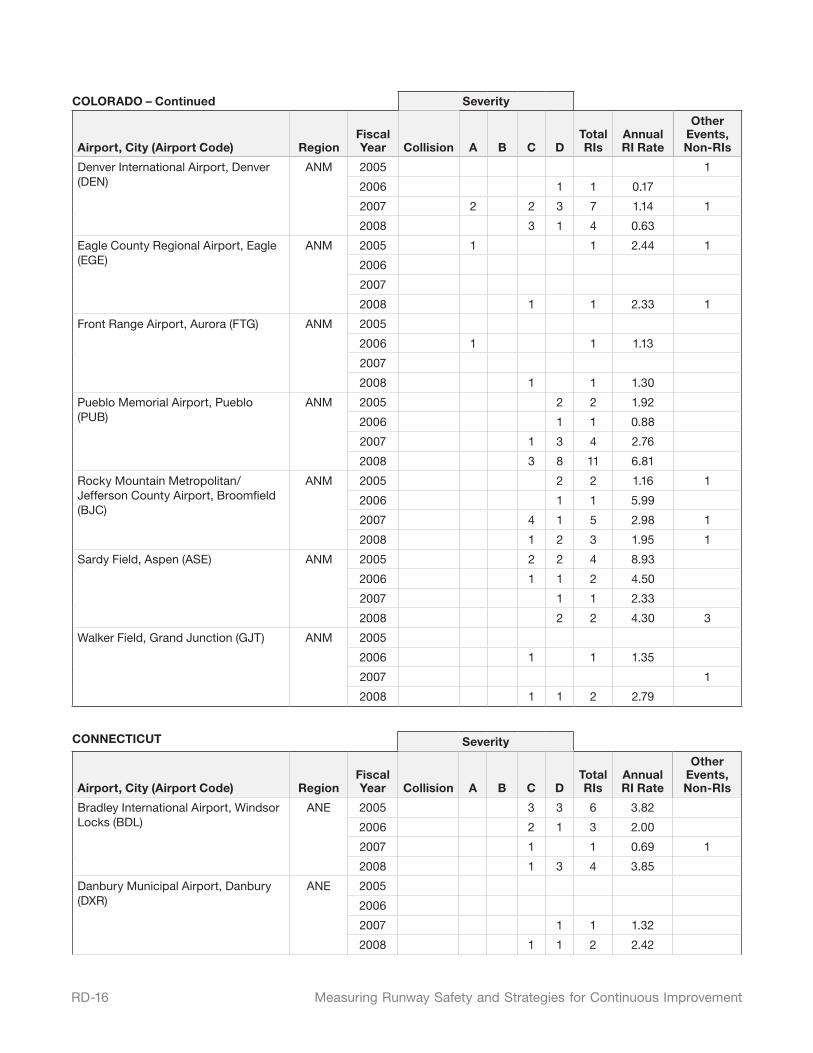
RD-16 Measuring Runway Safety and Strategies for Continuous Improvement
COLORADO – Continued Severity
Airport, City (Airport Code) RegionFiscal Year Collision A B C D
Total RIs
Annual RI Rate
Other Events, Non-RIs
Denver International Airport, Denver (DEN)
ANM 2005 1
2006 1 1 0.17
2007 2 2 3 7 1.14 1
2008 3 1 4 0.63
Eagle County Regional Airport, Eagle (EGE)
ANM 2005 1 1 2.44 1
2006
2007
2008 1 1 2.33 1
Front Range Airport, Aurora (FTG) ANM 2005
2006 1 1 1.13
2007
2008 1 1 1.30
Pueblo Memorial Airport, Pueblo (PUB)
ANM 2005 2 2 1.92
2006 1 1 0.88
2007 1 3 4 2.76
2008 3 8 11 6.81
Rocky Mountain Metropolitan/Jefferson County Airport, Broomfield (BJC)
ANM 2005 2 2 1.16 1
2006 1 1 5.99
2007 4 1 5 2.98 1
2008 1 2 3 1.95 1
Sardy Field, Aspen (ASE) ANM 2005 2 2 4 8.93
2006 1 1 2 4.50
2007 1 1 2.33
2008 2 2 4.30 3
Walker Field, Grand Junction (GJT) ANM 2005
2006 1 1 1.35
2007 1
2008 1 1 2 2.79
CONNECTICUT Severity
Airport, City (Airport Code) RegionFiscal Year Collision A B C D
Total RIs
Annual RI Rate
Other Events, Non-RIs
Bradley International Airport, Windsor Locks (BDL)
ANE 2005 3 3 6 3.82
2006 2 1 3 2.00
2007 1 1 0.69 1
2008 1 3 4 3.85
Danbury Municipal Airport, Danbury (DXR)
ANE 2005
2006
2007 1 1 1.32
2008 1 1 2 2.42
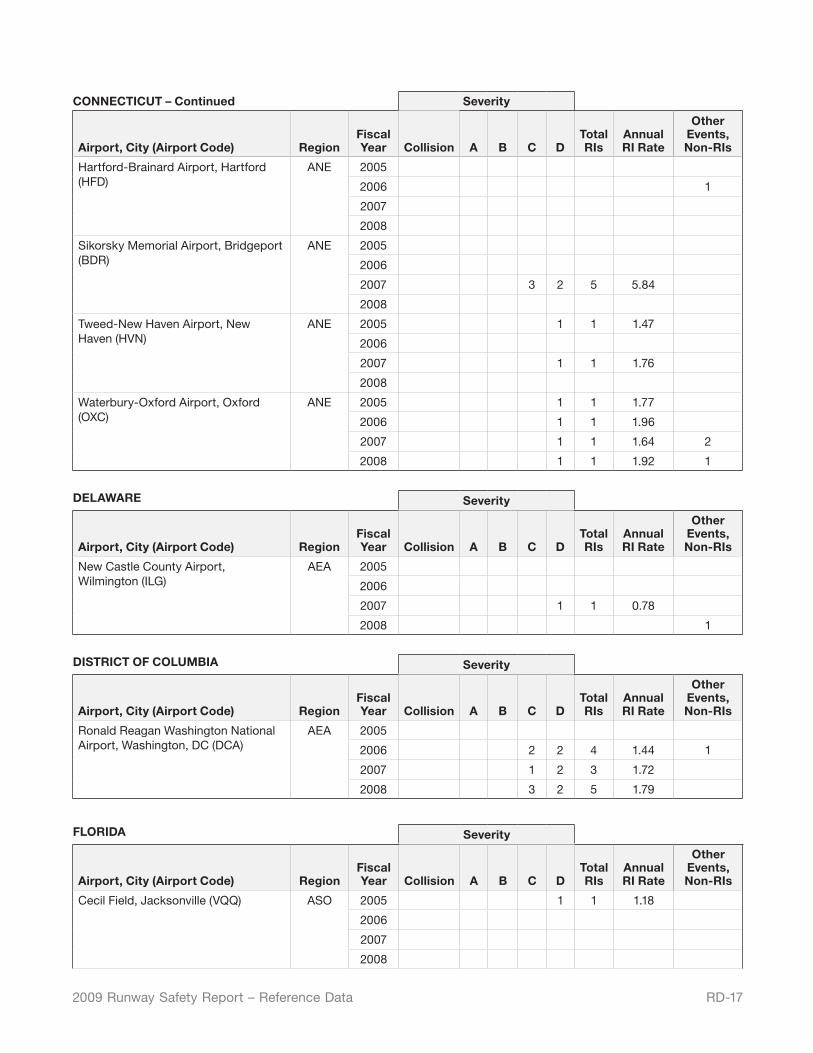
RD-172009 Runway Safety Report – Reference Data
CONNECTICUT – Continued Severity
Airport, City (Airport Code) RegionFiscal Year Collision A B C D
Total RIs
Annual RI Rate
Other Events, Non-RIs
Hartford-Brainard Airport, Hartford (HFD)
ANE 2005
2006 1
2007
2008
Sikorsky Memorial Airport, Bridgeport (BDR)
ANE 2005
2006
2007 3 2 5 5.84
2008
Tweed-New Haven Airport, New Haven (HVN)
ANE 2005 1 1 1.47
2006
2007 1 1 1.76
2008
Waterbury-Oxford Airport, Oxford (OXC)
ANE 2005 1 1 1.77
2006 1 1 1.96
2007 1 1 1.64 2
2008 1 1 1.92 1
DELAWARE Severity
Airport, City (Airport Code) RegionFiscal Year Collision A B C D
Total RIs
Annual RI Rate
Other Events, Non-RIs
New Castle County Airport, Wilmington (ILG)
AEA 2005
2006
2007 1 1 0.78
2008 1
DISTRICT OF COLUMBIA Severity
Airport, City (Airport Code) RegionFiscal Year Collision A B C D
Total RIs
Annual RI Rate
Other Events, Non-RIs
Ronald Reagan Washington National Airport, Washington, DC (DCA)
AEA 2005
2006 2 2 4 1.44 1
2007 1 2 3 1.72
2008 3 2 5 1.79
FLORIDA Severity
Airport, City (Airport Code) RegionFiscal Year Collision A B C D
Total RIs
Annual RI Rate
Other Events, Non-RIs
Cecil Field, Jacksonville (VQQ) ASO 2005 1 1 1.18
2006
2007
2008
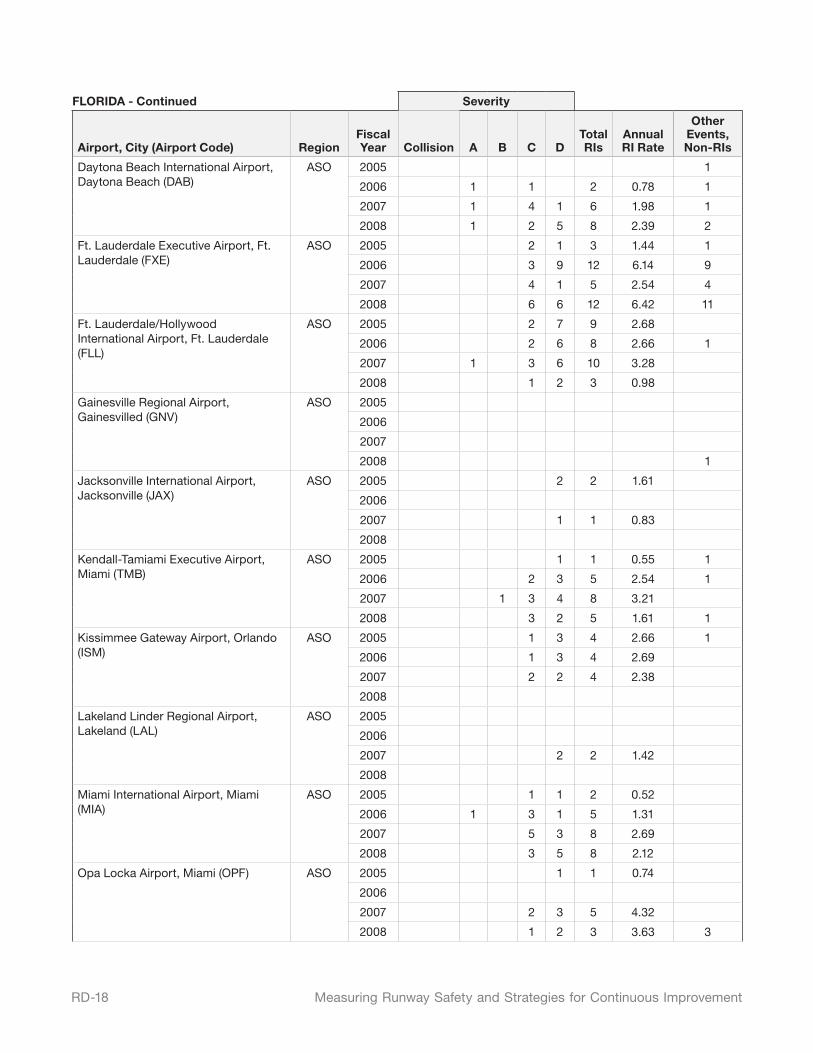
RD-18 Measuring Runway Safety and Strategies for Continuous Improvement
FLORIDA - Continued Severity
Airport, City (Airport Code) RegionFiscal Year Collision A B C D
Total RIs
Annual RI Rate
Other Events, Non-RIs
Daytona Beach International Airport, Daytona Beach (DAB)
ASO 2005 1
2006 1 1 2 0.78 1
2007 1 4 1 6 1.98 1
2008 1 2 5 8 2.39 2
Ft. Lauderdale Executive Airport, Ft. Lauderdale (FXE)
ASO 2005 2 1 3 1.44 1
2006 3 9 12 6.14 9
2007 4 1 5 2.54 4
2008 6 6 12 6.42 11
Ft. Lauderdale/Hollywood International Airport, Ft. Lauderdale (FLL)
ASO 2005 2 7 9 2.68
2006 2 6 8 2.66 1
2007 1 3 6 10 3.28
2008 1 2 3 0.98
Gainesville Regional Airport, Gainesvilled (GNV)
ASO 2005
2006
2007
2008 1
Jacksonville International Airport, Jacksonville (JAX)
ASO 2005 2 2 1.61
2006
2007 1 1 0.83
2008
Kendall-Tamiami Executive Airport, Miami (TMB)
ASO 2005 1 1 0.55 1
2006 2 3 5 2.54 1
2007 1 3 4 8 3.21
2008 3 2 5 1.61 1
Kissimmee Gateway Airport, Orlando (ISM)
ASO 2005 1 3 4 2.66 1
2006 1 3 4 2.69
2007 2 2 4 2.38
2008
Lakeland Linder Regional Airport, Lakeland (LAL)
ASO 2005
2006
2007 2 2 1.42
2008
Miami International Airport, Miami (MIA)
ASO 2005 1 1 2 0.52
2006 1 3 1 5 1.31
2007 5 3 8 2.69
2008 3 5 8 2.12
Opa Locka Airport, Miami (OPF) ASO 2005 1 1 0.74
2006
2007 2 3 5 4.32
2008 1 2 3 3.63 3
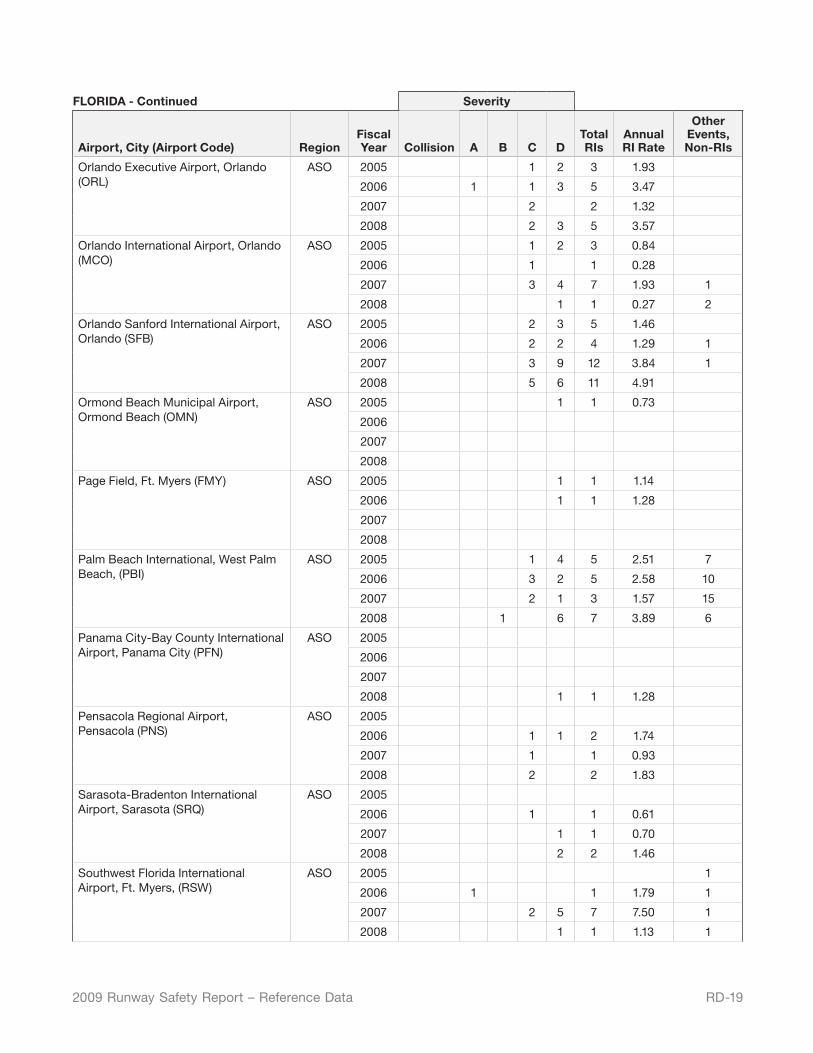
RD-192009 Runway Safety Report – Reference Data
FLORIDA - Continued Severity
Airport, City (Airport Code) RegionFiscal Year Collision A B C D
Total RIs
Annual RI Rate
Other Events, Non-RIs
Orlando Executive Airport, Orlando (ORL)
ASO 2005 1 2 3 1.93
2006 1 1 3 5 3.47
2007 2 2 1.32
2008 2 3 5 3.57
Orlando International Airport, Orlando (MCO)
ASO 2005 1 2 3 0.84
2006 1 1 0.28
2007 3 4 7 1.93 1
2008 1 1 0.27 2
Orlando Sanford International Airport, Orlando (SFB)
ASO 2005 2 3 5 1.46
2006 2 2 4 1.29 1
2007 3 9 12 3.84 1
2008 5 6 11 4.91
Ormond Beach Municipal Airport, Ormond Beach (OMN)
ASO 2005 1 1 0.73
2006
2007
2008
Page Field, Ft. Myers (FMY) ASO 2005 1 1 1.14
2006 1 1 1.28
2007
2008
Palm Beach International, West Palm Beach, (PBI)
ASO 2005 1 4 5 2.51 7
2006 3 2 5 2.58 10
2007 2 1 3 1.57 15
2008 1 6 7 3.89 6
Panama City-Bay County International Airport, Panama City (PFN)
ASO 2005
2006
2007
2008 1 1 1.28
Pensacola Regional Airport, Pensacola (PNS)
ASO 2005
2006 1 1 2 1.74
2007 1 1 0.93
2008 2 2 1.83
Sarasota-Bradenton International Airport, Sarasota (SRQ)
ASO 2005
2006 1 1 0.61
2007 1 1 0.70
2008 2 2 1.46
Southwest Florida International Airport, Ft. Myers, (RSW)
ASO 2005 1
2006 1 1 1.79 1
2007 2 5 7 7.50 1
2008 1 1 1.13 1
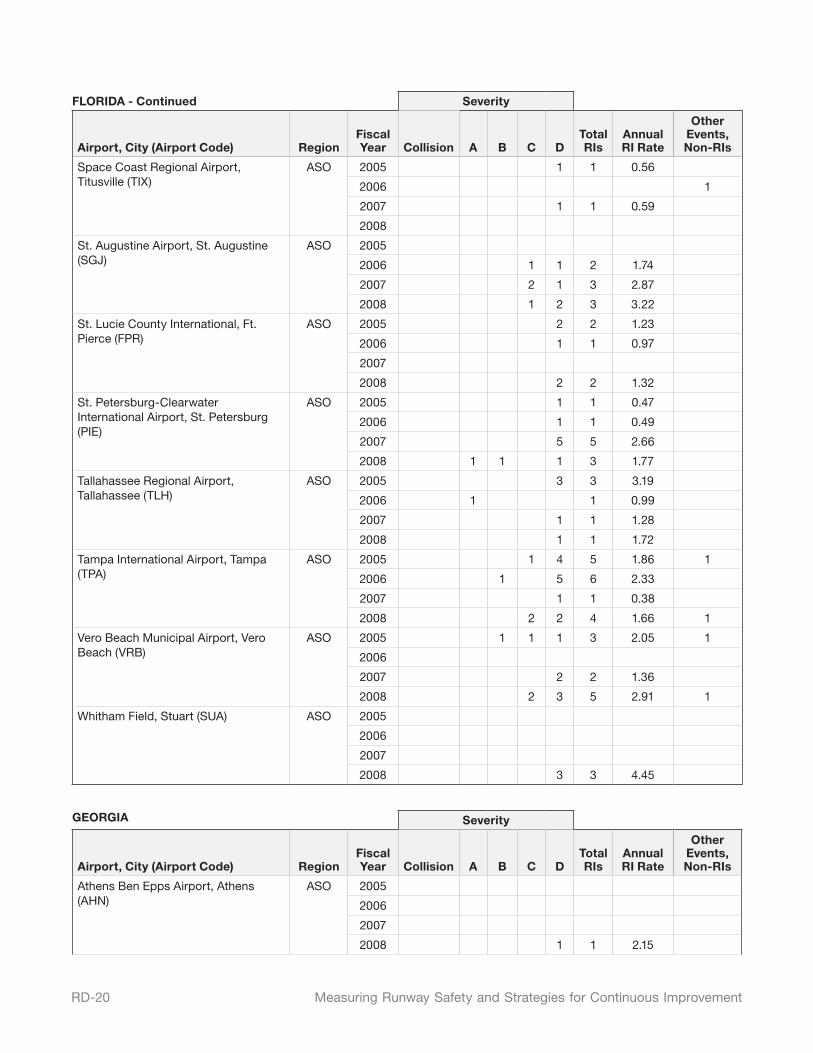
RD-20 Measuring Runway Safety and Strategies for Continuous Improvement
FLORIDA - Continued Severity
Airport, City (Airport Code) RegionFiscal Year Collision A B C D
Total RIs
Annual RI Rate
Other Events, Non-RIs
Space Coast Regional Airport, Titusville (TIX)
ASO 2005 1 1 0.56
2006 1
2007 1 1 0.59
2008
St. Augustine Airport, St. Augustine (SGJ)
ASO 2005
2006 1 1 2 1.74
2007 2 1 3 2.87
2008 1 2 3 3.22
St. Lucie County International, Ft. Pierce (FPR)
ASO 2005 2 2 1.23
2006 1 1 0.97
2007
2008 2 2 1.32
St. Petersburg-Clearwater International Airport, St. Petersburg (PIE)
ASO 2005 1 1 0.47
2006 1 1 0.49
2007 5 5 2.66
2008 1 1 1 3 1.77
Tallahassee Regional Airport, Tallahassee (TLH)
ASO 2005 3 3 3.19
2006 1 1 0.99
2007 1 1 1.28
2008 1 1 1.72
Tampa International Airport, Tampa (TPA)
ASO 2005 1 4 5 1.86 1
2006 1 5 6 2.33
2007 1 1 0.38
2008 2 2 4 1.66 1
Vero Beach Municipal Airport, Vero Beach (VRB)
ASO 2005 1 1 1 3 2.05 1
2006
2007 2 2 1.36
2008 2 3 5 2.91 1
Whitham Field, Stuart (SUA) ASO 2005
2006
2007
2008 3 3 4.45
GEORGIA Severity
Airport, City (Airport Code) RegionFiscal Year Collision A B C D
Total RIs
Annual RI Rate
Other Events, Non-RIs
Athens Ben Epps Airport, Athens (AHN)
ASO 2005
2006
2007
2008 1 1 2.15
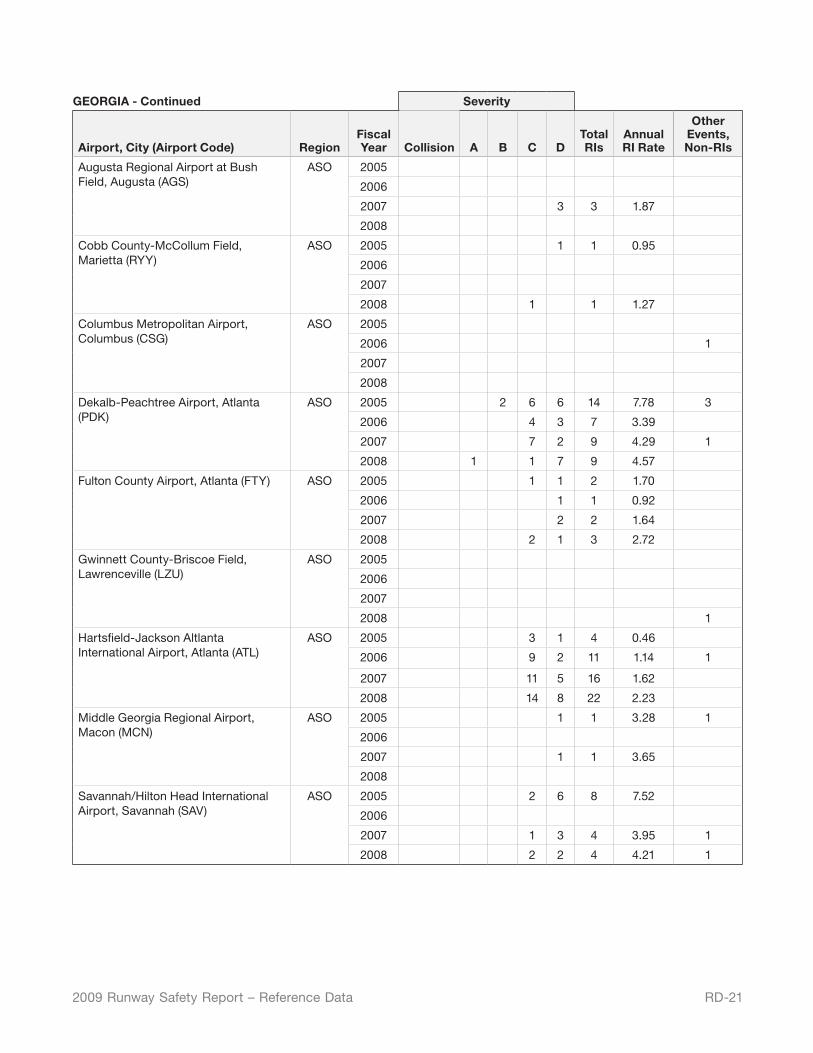
RD-212009 Runway Safety Report – Reference Data
GEORGIA - Continued Severity
Airport, City (Airport Code) RegionFiscal Year Collision A B C D
Total RIs
Annual RI Rate
Other Events, Non-RIs
Augusta Regional Airport at Bush Field, Augusta (AGS)
ASO 2005
2006
2007 3 3 1.87
2008
Cobb County-McCollum Field, Marietta (RYY)
ASO 2005 1 1 0.95
2006
2007
2008 1 1 1.27
Columbus Metropolitan Airport, Columbus (CSG)
ASO 2005
2006 1
2007
2008
Dekalb-Peachtree Airport, Atlanta (PDK)
ASO 2005 2 6 6 14 7.78 3
2006 4 3 7 3.39
2007 7 2 9 4.29 1
2008 1 1 7 9 4.57
Fulton County Airport, Atlanta (FTY) ASO 2005 1 1 2 1.70
2006 1 1 0.92
2007 2 2 1.64
2008 2 1 3 2.72
Gwinnett County-Briscoe Field, Lawrenceville (LZU)
ASO 2005
2006
2007
2008 1
Hartsfield-Jackson Altlanta International Airport, Atlanta (ATL)
ASO 2005 3 1 4 0.46
2006 9 2 11 1.14 1
2007 11 5 16 1.62
2008 14 8 22 2.23
Middle Georgia Regional Airport, Macon (MCN)
ASO 2005 1 1 3.28 1
2006
2007 1 1 3.65
2008
Savannah/Hilton Head International Airport, Savannah (SAV)
ASO 2005 2 6 8 7.52
2006
2007 1 3 4 3.95 1
2008 2 2 4 4.21 1
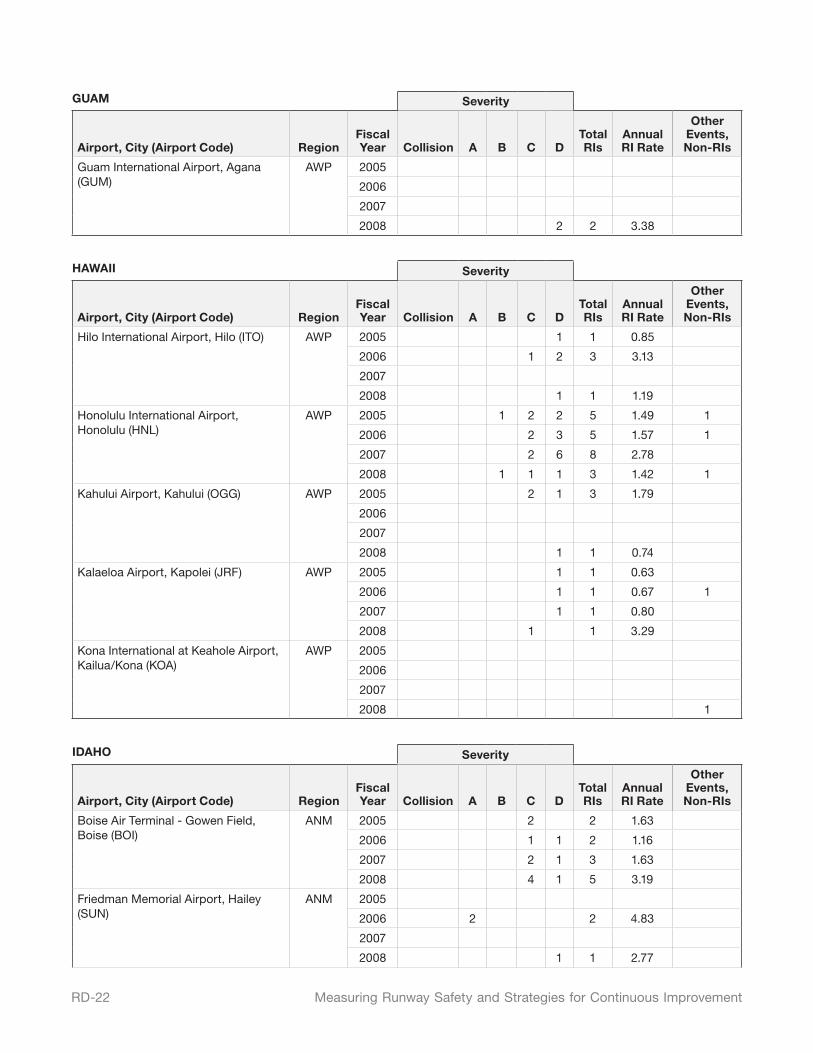
RD-22 Measuring Runway Safety and Strategies for Continuous Improvement
GUAM Severity
Airport, City (Airport Code) RegionFiscal Year Collision A B C D
Total RIs
Annual RI Rate
Other Events, Non-RIs
Guam International Airport, Agana (GUM)
AWP 2005
2006
2007
2008 2 2 3.38
HAWAII Severity
Airport, City (Airport Code) RegionFiscal Year Collision A B C D
Total RIs
Annual RI Rate
Other Events, Non-RIs
Hilo International Airport, Hilo (ITO) AWP 2005 1 1 0.85
2006 1 2 3 3.13
2007
2008 1 1 1.19
Honolulu International Airport, Honolulu (HNL)
AWP 2005 1 2 2 5 1.49 1
2006 2 3 5 1.57 1
2007 2 6 8 2.78
2008 1 1 1 3 1.42 1
Kahului Airport, Kahului (OGG) AWP 2005 2 1 3 1.79
2006
2007
2008 1 1 0.74
Kalaeloa Airport, Kapolei (JRF) AWP 2005 1 1 0.63
2006 1 1 0.67 1
2007 1 1 0.80
2008 1 1 3.29
Kona International at Keahole Airport, Kailua/Kona (KOA)
AWP 2005
2006
2007
2008 1
IDAHO Severity
Airport, City (Airport Code) RegionFiscal Year Collision A B C D
Total RIs
Annual RI Rate
Other Events, Non-RIs
Boise Air Terminal - Gowen Field, Boise (BOI)
ANM 2005 2 2 1.63
2006 1 1 2 1.16
2007 2 1 3 1.63
2008 4 1 5 3.19
Friedman Memorial Airport, Hailey (SUN)
ANM 2005
2006 2 2 4.83
2007
2008 1 1 2.77
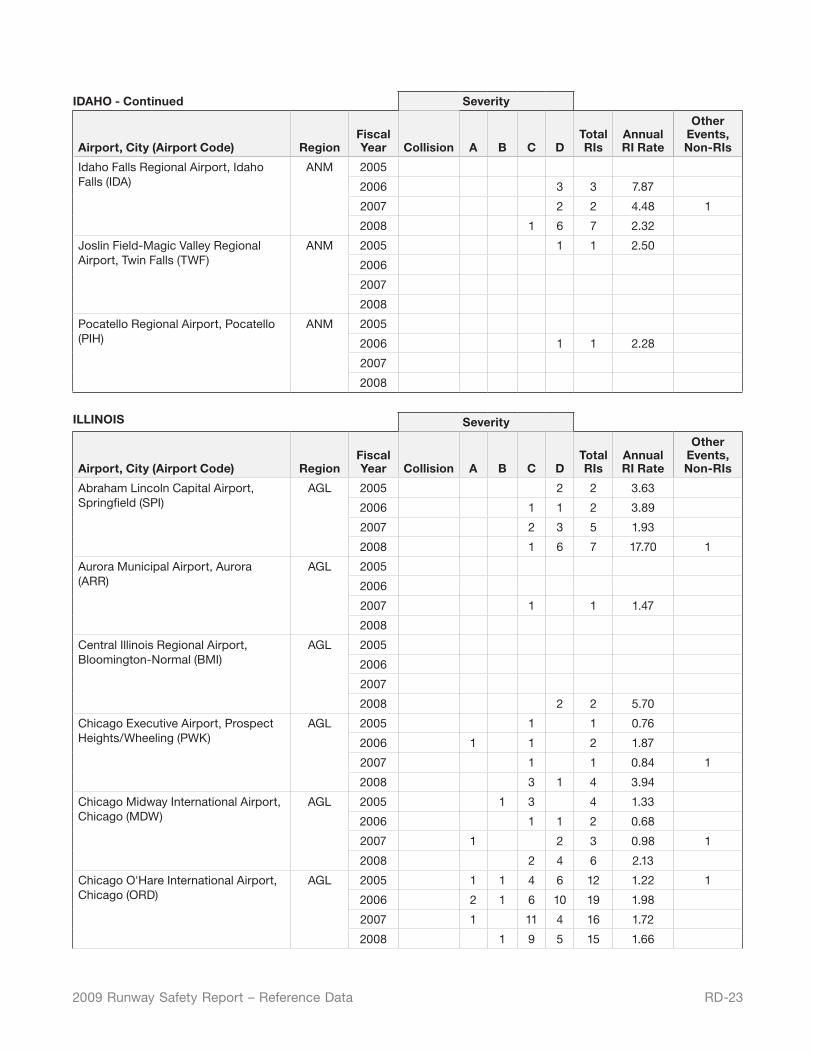
RD-232009 Runway Safety Report – Reference Data
IDAHO - Continued Severity
Airport, City (Airport Code) RegionFiscal Year Collision A B C D
Total RIs
Annual RI Rate
Other Events, Non-RIs
Idaho Falls Regional Airport, Idaho Falls (IDA)
ANM 2005
2006 3 3 7.87
2007 2 2 4.48 1
2008 1 6 7 2.32
Joslin Field-Magic Valley Regional Airport, Twin Falls (TWF)
ANM 2005 1 1 2.50
2006
2007
2008
Pocatello Regional Airport, Pocatello (PIH)
ANM 2005
2006 1 1 2.28
2007
2008
ILLINOIS Severity
Airport, City (Airport Code) RegionFiscal Year Collision A B C D
Total RIs
Annual RI Rate
Other Events, Non-RIs
Abraham Lincoln Capital Airport, Springfield (SPI)
AGL 2005 2 2 3.63
2006 1 1 2 3.89
2007 2 3 5 1.93
2008 1 6 7 17.70 1
Aurora Municipal Airport, Aurora (ARR)
AGL 2005
2006
2007 1 1 1.47
2008
Central Illinois Regional Airport, Bloomington-Normal (BMI)
AGL 2005
2006
2007
2008 2 2 5.70
Chicago Executive Airport, Prospect Heights/Wheeling (PWK)
AGL 2005 1 1 0.76
2006 1 1 2 1.87
2007 1 1 0.84 1
2008 3 1 4 3.94
Chicago Midway International Airport, Chicago (MDW)
AGL 2005 1 3 4 1.33
2006 1 1 2 0.68
2007 1 2 3 0.98 1
2008 2 4 6 2.13
Chicago O'Hare International Airport, Chicago (ORD)
AGL 2005 1 1 4 6 12 1.22 1
2006 2 1 6 10 19 1.98
2007 1 11 4 16 1.72
2008 1 9 5 15 1.66
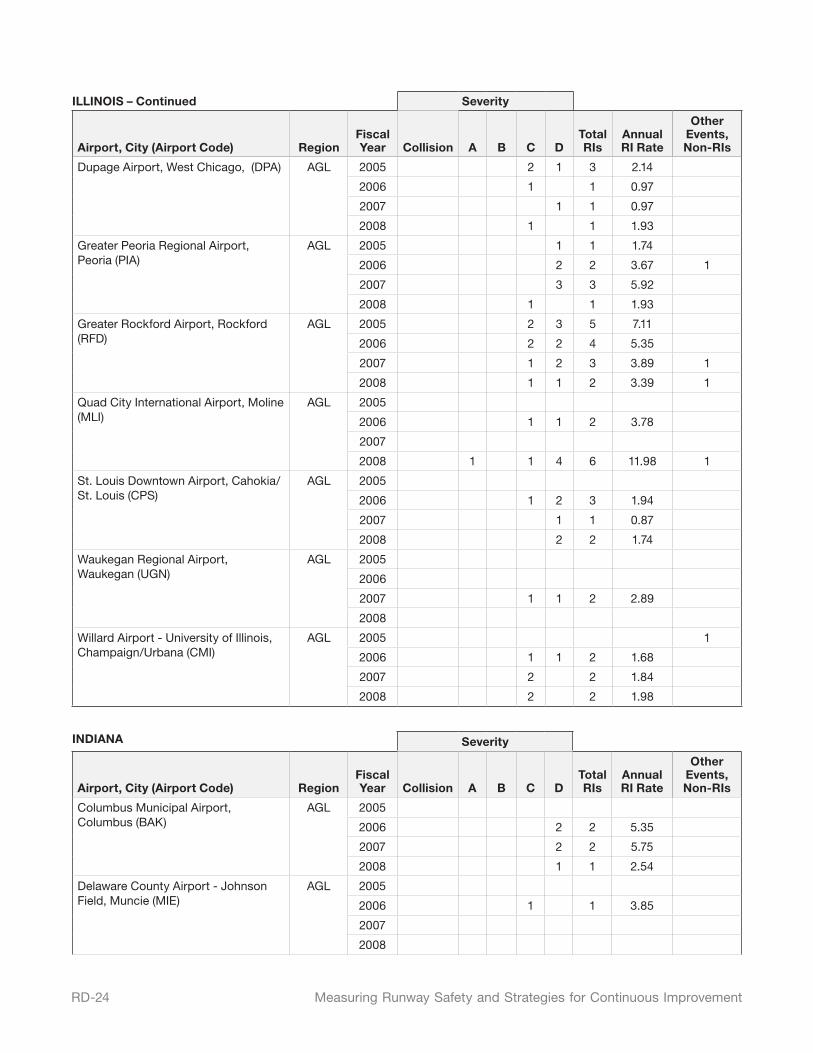
RD-24 Measuring Runway Safety and Strategies for Continuous Improvement
ILLINOIS – Continued Severity
Airport, City (Airport Code) RegionFiscal Year Collision A B C D
Total RIs
Annual RI Rate
Other Events, Non-RIs
Dupage Airport, West Chicago, (DPA) AGL 2005 2 1 3 2.14
2006 1 1 0.97
2007 1 1 0.97
2008 1 1 1.93
Greater Peoria Regional Airport, Peoria (PIA)
AGL 2005 1 1 1.74
2006 2 2 3.67 1
2007 3 3 5.92
2008 1 1 1.93
Greater Rockford Airport, Rockford (RFD)
AGL 2005 2 3 5 7.11
2006 2 2 4 5.35
2007 1 2 3 3.89 1
2008 1 1 2 3.39 1
Quad City International Airport, Moline (MLI)
AGL 2005
2006 1 1 2 3.78
2007
2008 1 1 4 6 11.98 1
St. Louis Downtown Airport, Cahokia/St. Louis (CPS)
AGL 2005
2006 1 2 3 1.94
2007 1 1 0.87
2008 2 2 1.74
Waukegan Regional Airport, Waukegan (UGN)
AGL 2005
2006
2007 1 1 2 2.89
2008
Willard Airport - University of Illinois, Champaign/Urbana (CMI)
AGL 2005 1
2006 1 1 2 1.68
2007 2 2 1.84
2008 2 2 1.98
INDIANA Severity
Airport, City (Airport Code) RegionFiscal Year Collision A B C D
Total RIs
Annual RI Rate
Other Events, Non-RIs
Columbus Municipal Airport, Columbus (BAK)
AGL 2005
2006 2 2 5.35
2007 2 2 5.75
2008 1 1 2.54
Delaware County Airport - Johnson Field, Muncie (MIE)
AGL 2005
2006 1 1 3.85
2007
2008
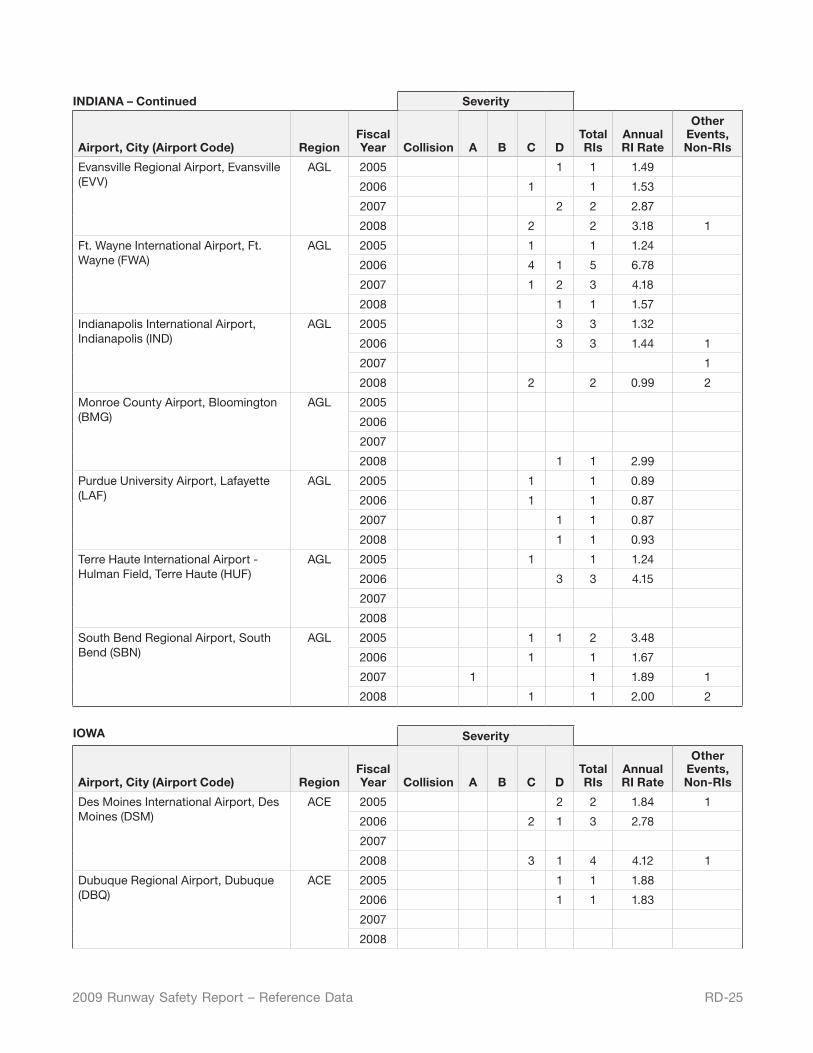
RD-252009 Runway Safety Report – Reference Data
INDIANA – Continued Severity
Airport, City (Airport Code) RegionFiscal Year Collision A B C D
Total RIs
Annual RI Rate
Other Events, Non-RIs
Evansville Regional Airport, Evansville (EVV)
AGL 2005 1 1 1.49
2006 1 1 1.53
2007 2 2 2.87
2008 2 2 3.18 1
Ft. Wayne International Airport, Ft. Wayne (FWA)
AGL 2005 1 1 1.24
2006 4 1 5 6.78
2007 1 2 3 4.18
2008 1 1 1.57
Indianapolis International Airport, Indianapolis (IND)
AGL 2005 3 3 1.32
2006 3 3 1.44 1
2007 1
2008 2 2 0.99 2
Monroe County Airport, Bloomington (BMG)
AGL 2005
2006
2007
2008 1 1 2.99
Purdue University Airport, Lafayette (LAF)
AGL 2005 1 1 0.89
2006 1 1 0.87
2007 1 1 0.87
2008 1 1 0.93
Terre Haute International Airport - Hulman Field, Terre Haute (HUF)
AGL 2005 1 1 1.24
2006 3 3 4.15
2007
2008
South Bend Regional Airport, South Bend (SBN)
AGL 2005 1 1 2 3.48
2006 1 1 1.67
2007 1 1 1.89 1
2008 1 1 2.00 2
IOWA Severity
Airport, City (Airport Code) RegionFiscal Year Collision A B C D
Total RIs
Annual RI Rate
Other Events, Non-RIs
Des Moines International Airport, Des Moines (DSM)
ACE 2005 2 2 1.84 1
2006 2 1 3 2.78
2007
2008 3 1 4 4.12 1
Dubuque Regional Airport, Dubuque (DBQ)
ACE 2005 1 1 1.88
2006 1 1 1.83
2007
2008
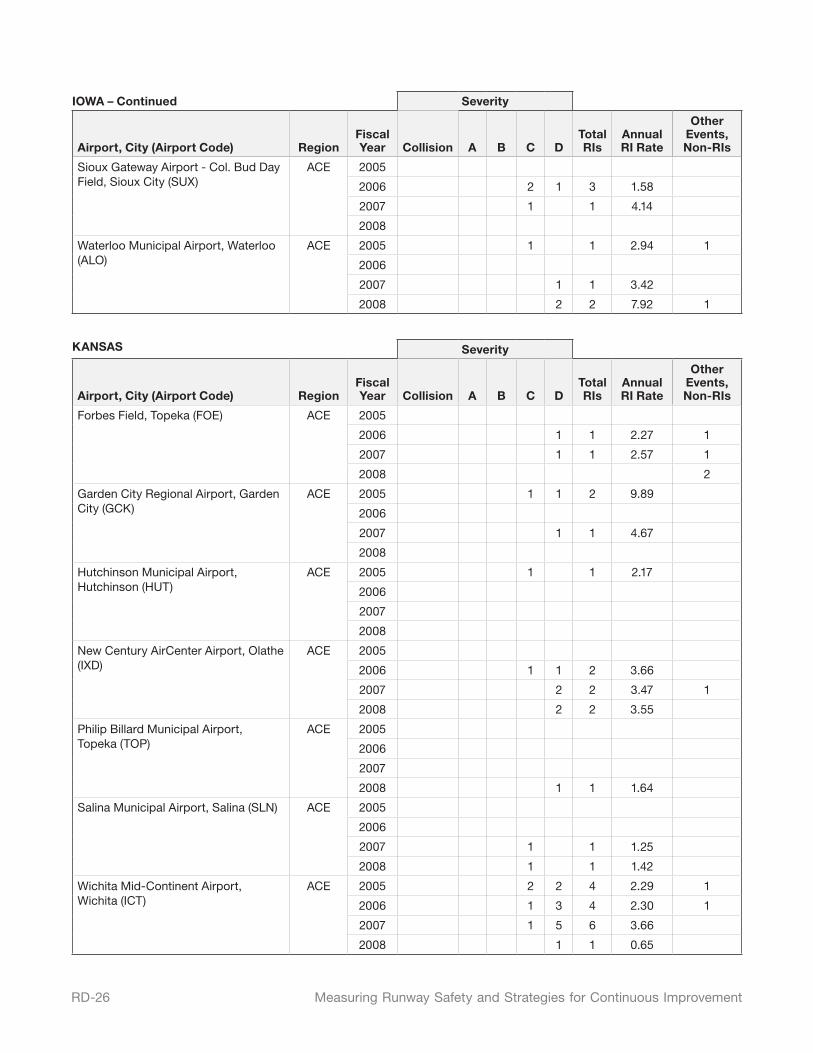
RD-26 Measuring Runway Safety and Strategies for Continuous Improvement
IOWA – Continued Severity
Airport, City (Airport Code) RegionFiscal Year Collision A B C D
Total RIs
Annual RI Rate
Other Events, Non-RIs
Sioux Gateway Airport - Col. Bud Day Field, Sioux City (SUX)
ACE 2005
2006 2 1 3 1.58
2007 1 1 4.14
2008
Waterloo Municipal Airport, Waterloo (ALO)
ACE 2005 1 1 2.94 1
2006
2007 1 1 3.42
2008 2 2 7.92 1
KANSAS Severity
Airport, City (Airport Code) RegionFiscal Year Collision A B C D
Total RIs
Annual RI Rate
Other Events, Non-RIs
Forbes Field, Topeka (FOE) ACE 2005
2006 1 1 2.27 1
2007 1 1 2.57 1
2008 2
Garden City Regional Airport, Garden City (GCK)
ACE 2005 1 1 2 9.89
2006
2007 1 1 4.67
2008
Hutchinson Municipal Airport, Hutchinson (HUT)
ACE 2005 1 1 2.17
2006
2007
2008
New Century AirCenter Airport, Olathe (IXD)
ACE 2005
2006 1 1 2 3.66
2007 2 2 3.47 1
2008 2 2 3.55
Philip Billard Municipal Airport, Topeka (TOP)
ACE 2005
2006
2007
2008 1 1 1.64
Salina Municipal Airport, Salina (SLN) ACE 2005
2006
2007 1 1 1.25
2008 1 1 1.42
Wichita Mid-Continent Airport, Wichita (ICT)
ACE 2005 2 2 4 2.29 1
2006 1 3 4 2.30 1
2007 1 5 6 3.66
2008 1 1 0.65
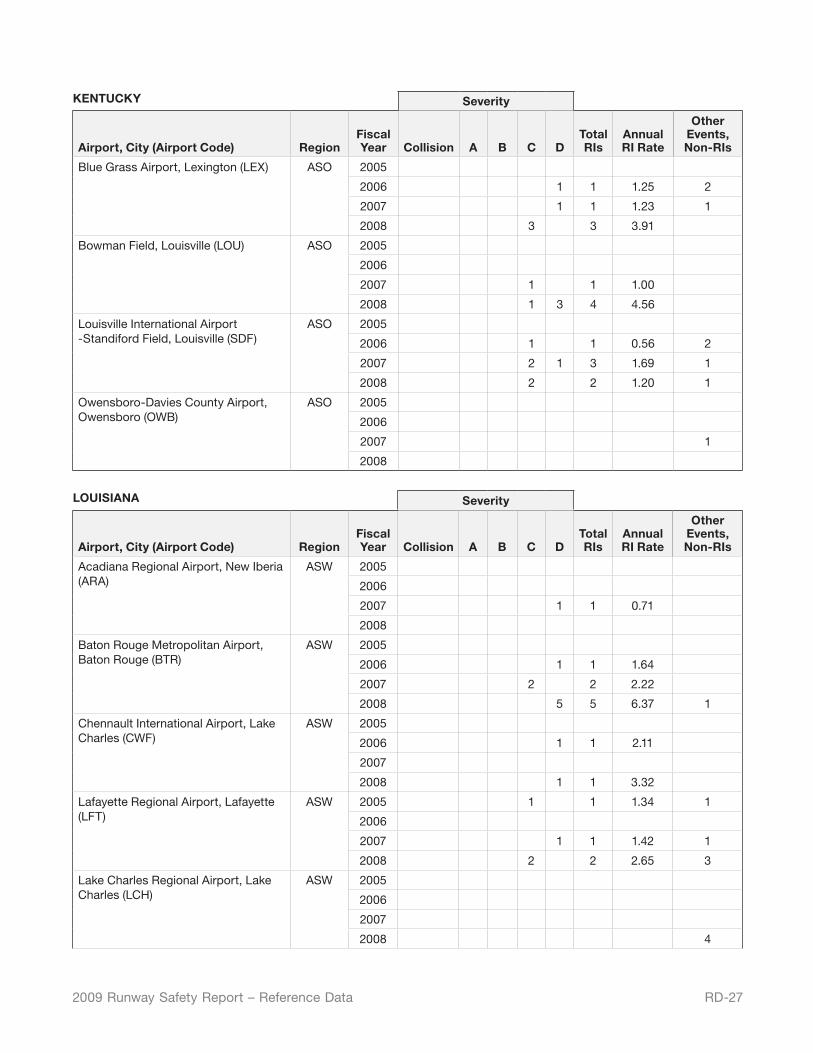
RD-272009 Runway Safety Report – Reference Data
KENTUCKY Severity
Airport, City (Airport Code) RegionFiscal Year Collision A B C D
Total RIs
Annual RI Rate
Other Events, Non-RIs
Blue Grass Airport, Lexington (LEX) ASO 2005
2006 1 1 1.25 2
2007 1 1 1.23 1
2008 3 3 3.91
Bowman Field, Louisville (LOU) ASO 2005
2006
2007 1 1 1.00
2008 1 3 4 4.56
Louisville International Airport -Standiford Field, Louisville (SDF)
ASO 2005
2006 1 1 0.56 2
2007 2 1 3 1.69 1
2008 2 2 1.20 1
Owensboro-Davies County Airport, Owensboro (OWB)
ASO 2005
2006
2007 1
2008
LOUISIANA Severity
Airport, City (Airport Code) RegionFiscal Year Collision A B C D
Total RIs
Annual RI Rate
Other Events, Non-RIs
Acadiana Regional Airport, New Iberia (ARA)
ASW 2005
2006
2007 1 1 0.71
2008
Baton Rouge Metropolitan Airport, Baton Rouge (BTR)
ASW 2005
2006 1 1 1.64
2007 2 2 2.22
2008 5 5 6.37 1
Chennault International Airport, Lake Charles (CWF)
ASW 2005
2006 1 1 2.11
2007
2008 1 1 3.32
Lafayette Regional Airport, Lafayette (LFT)
ASW 2005 1 1 1.34 1
2006
2007 1 1 1.42 1
2008 2 2 2.65 3
Lake Charles Regional Airport, Lake Charles (LCH)
ASW 2005
2006
2007
2008 4
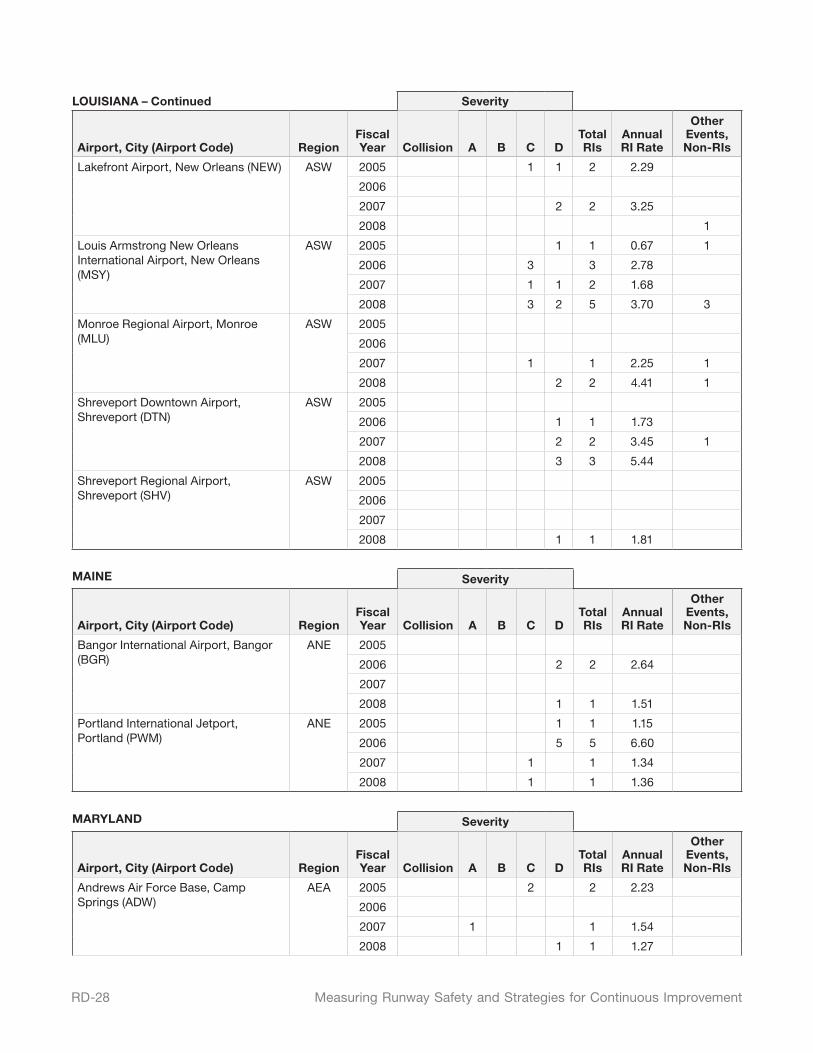
RD-28 Measuring Runway Safety and Strategies for Continuous Improvement
LOUISIANA – Continued Severity
Airport, City (Airport Code) RegionFiscal Year Collision A B C D
Total RIs
Annual RI Rate
Other Events, Non-RIs
Lakefront Airport, New Orleans (NEW) ASW 2005 1 1 2 2.29
2006
2007 2 2 3.25
2008 1
Louis Armstrong New Orleans International Airport, New Orleans (MSY)
ASW 2005 1 1 0.67 1
2006 3 3 2.78
2007 1 1 2 1.68
2008 3 2 5 3.70 3
Monroe Regional Airport, Monroe (MLU)
ASW 2005
2006
2007 1 1 2.25 1
2008 2 2 4.41 1
Shreveport Downtown Airport, Shreveport (DTN)
ASW 2005
2006 1 1 1.73
2007 2 2 3.45 1
2008 3 3 5.44
Shreveport Regional Airport, Shreveport (SHV)
ASW 2005
2006
2007
2008 1 1 1.81
MAINE Severity
Airport, City (Airport Code) RegionFiscal Year Collision A B C D
Total RIs
Annual RI Rate
Other Events, Non-RIs
Bangor International Airport, Bangor (BGR)
ANE 2005
2006 2 2 2.64
2007
2008 1 1 1.51
Portland International Jetport, Portland (PWM)
ANE 2005 1 1 1.15
2006 5 5 6.60
2007 1 1 1.34
2008 1 1 1.36
MARYLAND Severity
Airport, City (Airport Code) RegionFiscal Year Collision A B C D
Total RIs
Annual RI Rate
Other Events, Non-RIs
Andrews Air Force Base, Camp Springs (ADW)
AEA 2005 2 2 2.23
2006
2007 1 1 1.54
2008 1 1 1.27
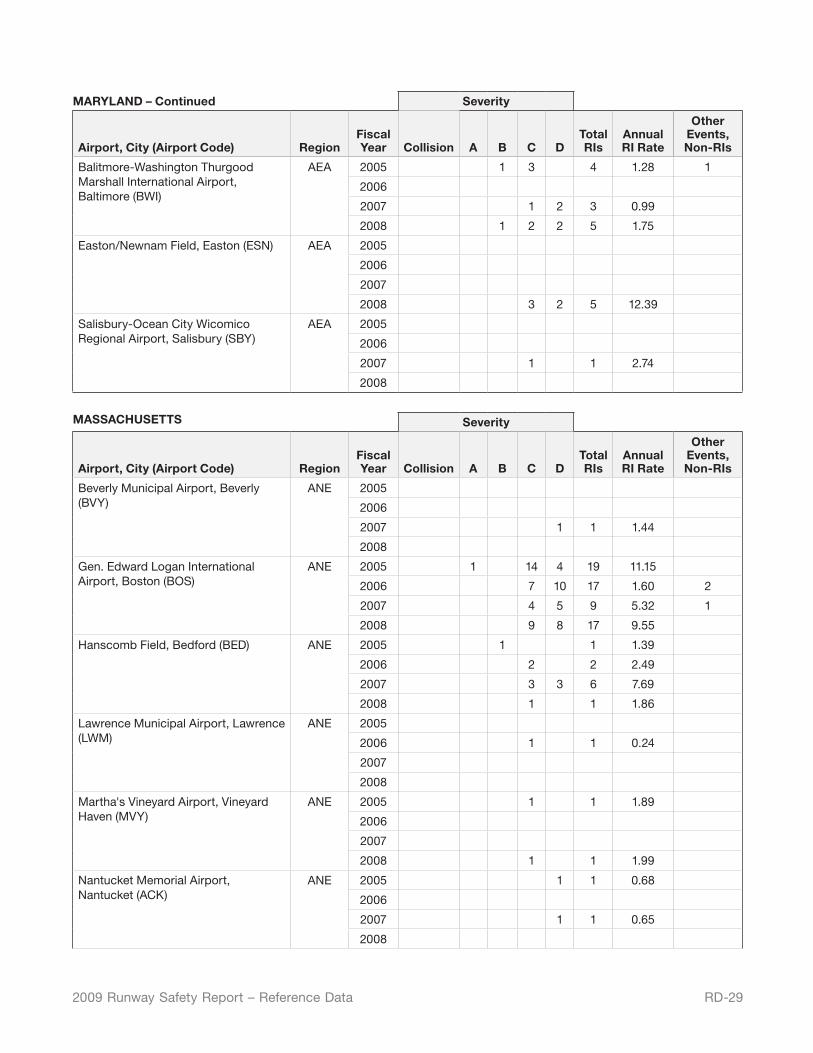
RD-292009 Runway Safety Report – Reference Data
MARYLAND – Continued Severity
Airport, City (Airport Code) RegionFiscal Year Collision A B C D
Total RIs
Annual RI Rate
Other Events, Non-RIs
Balitmore-Washington Thurgood Marshall International Airport, Baltimore (BWI)
AEA 2005 1 3 4 1.28 1
2006
2007 1 2 3 0.99
2008 1 2 2 5 1.75
Easton/Newnam Field, Easton (ESN) AEA 2005
2006
2007
2008 3 2 5 12.39
Salisbury-Ocean City Wicomico Regional Airport, Salisbury (SBY)
AEA 2005
2006
2007 1 1 2.74
2008
MASSACHUSETTS Severity
Airport, City (Airport Code) RegionFiscal Year Collision A B C D
Total RIs
Annual RI Rate
Other Events, Non-RIs
Beverly Municipal Airport, Beverly (BVY)
ANE 2005
2006
2007 1 1 1.44
2008
Gen. Edward Logan International Airport, Boston (BOS)
ANE 2005 1 14 4 19 11.15
2006 7 10 17 1.60 2
2007 4 5 9 5.32 1
2008 9 8 17 9.55
Hanscomb Field, Bedford (BED) ANE 2005 1 1 1.39
2006 2 2 2.49
2007 3 3 6 7.69
2008 1 1 1.86
Lawrence Municipal Airport, Lawrence (LWM)
ANE 2005
2006 1 1 0.24
2007
2008
Martha's Vineyard Airport, Vineyard Haven (MVY)
ANE 2005 1 1 1.89
2006
2007
2008 1 1 1.99
Nantucket Memorial Airport, Nantucket (ACK)
ANE 2005 1 1 0.68
2006
2007 1 1 0.65
2008
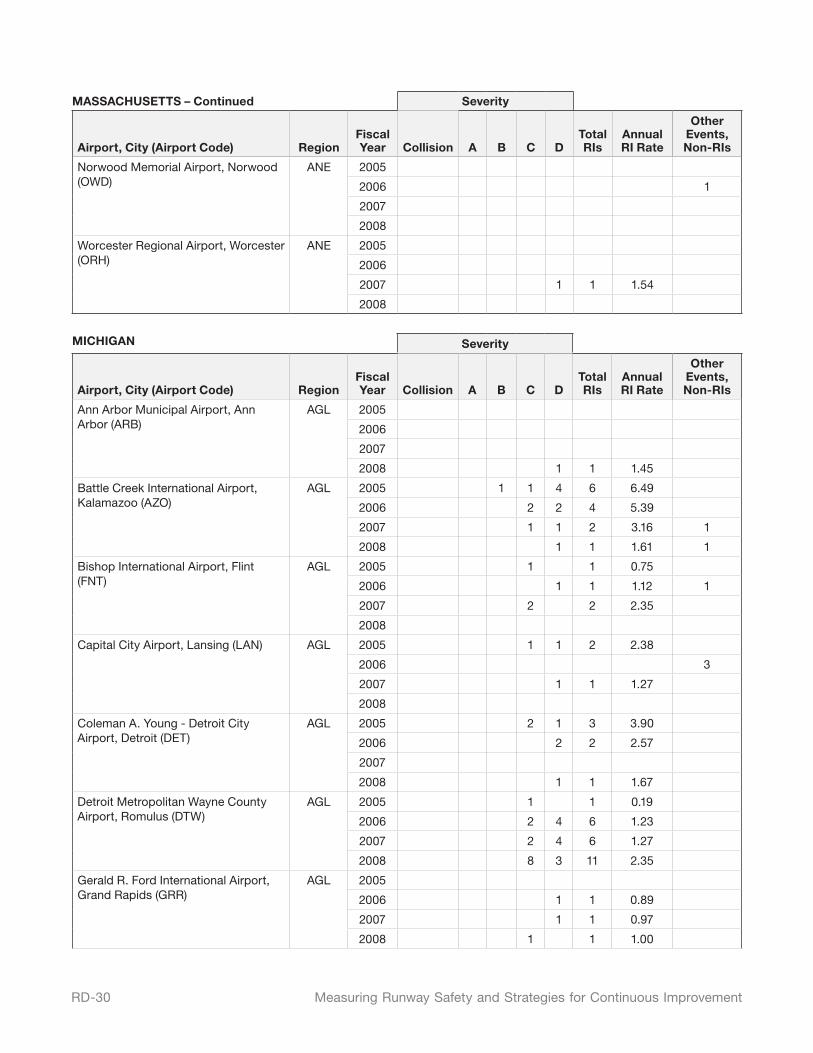
RD-30 Measuring Runway Safety and Strategies for Continuous Improvement
MASSACHUSETTS – Continued Severity
Airport, City (Airport Code) RegionFiscal Year Collision A B C D
Total RIs
Annual RI Rate
Other Events, Non-RIs
Norwood Memorial Airport, Norwood (OWD)
ANE 2005
2006 1
2007
2008
Worcester Regional Airport, Worcester (ORH)
ANE 2005
2006
2007 1 1 1.54
2008
MICHIGAN Severity
Airport, City (Airport Code) RegionFiscal Year Collision A B C D
Total RIs
Annual RI Rate
Other Events, Non-RIs
Ann Arbor Municipal Airport, Ann Arbor (ARB)
AGL 2005
2006
2007
2008 1 1 1.45
Battle Creek International Airport, Kalamazoo (AZO)
AGL 2005 1 1 4 6 6.49
2006 2 2 4 5.39
2007 1 1 2 3.16 1
2008 1 1 1.61 1
Bishop International Airport, Flint (FNT)
AGL 2005 1 1 0.75
2006 1 1 1.12 1
2007 2 2 2.35
2008
Capital City Airport, Lansing (LAN) AGL 2005 1 1 2 2.38
2006 3
2007 1 1 1.27
2008
Coleman A. Young - Detroit City Airport, Detroit (DET)
AGL 2005 2 1 3 3.90
2006 2 2 2.57
2007
2008 1 1 1.67
Detroit Metropolitan Wayne County Airport, Romulus (DTW)
AGL 2005 1 1 0.19
2006 2 4 6 1.23
2007 2 4 6 1.27
2008 8 3 11 2.35
Gerald R. Ford International Airport, Grand Rapids (GRR)
AGL 2005
2006 1 1 0.89
2007 1 1 0.97
2008 1 1 1.00
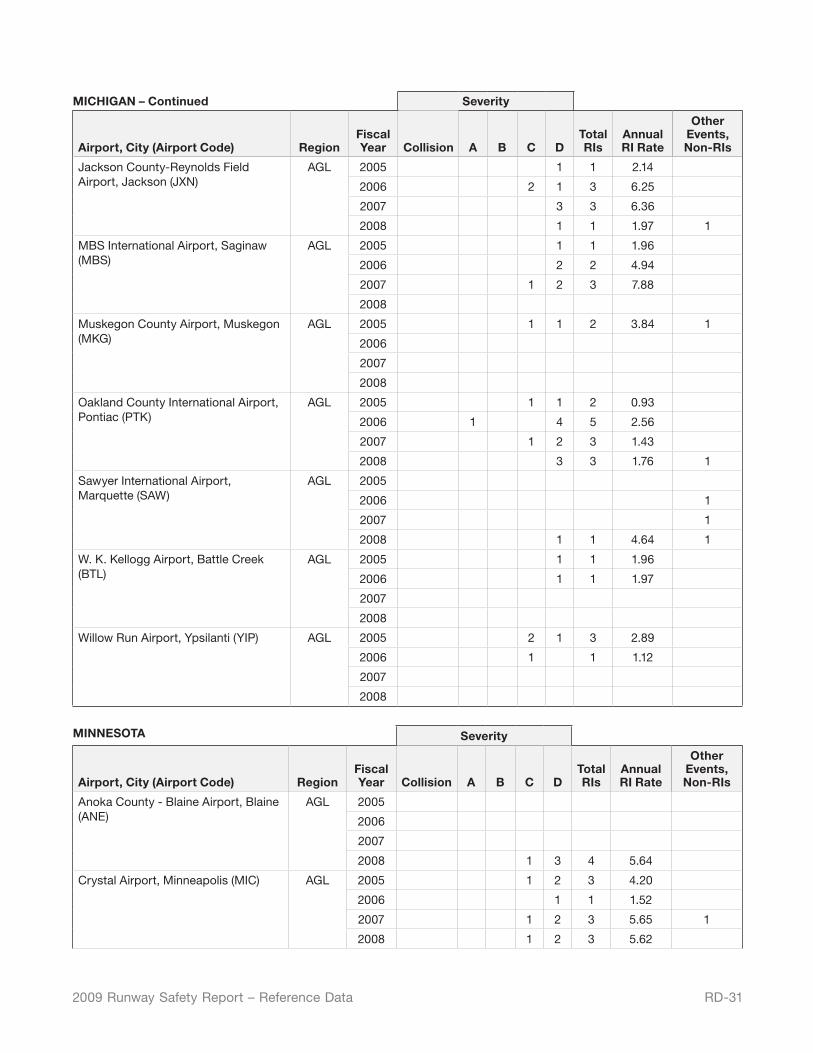
RD-312009 Runway Safety Report – Reference Data
MICHIGAN – Continued Severity
Airport, City (Airport Code) RegionFiscal Year Collision A B C D
Total RIs
Annual RI Rate
Other Events, Non-RIs
Jackson County-Reynolds Field Airport, Jackson (JXN)
AGL 2005 1 1 2.14
2006 2 1 3 6.25
2007 3 3 6.36
2008 1 1 1.97 1
MBS International Airport, Saginaw (MBS)
AGL 2005 1 1 1.96
2006 2 2 4.94
2007 1 2 3 7.88
2008
Muskegon County Airport, Muskegon (MKG)
AGL 2005 1 1 2 3.84 1
2006
2007
2008
Oakland County International Airport, Pontiac (PTK)
AGL 2005 1 1 2 0.93
2006 1 4 5 2.56
2007 1 2 3 1.43
2008 3 3 1.76 1
Sawyer International Airport, Marquette (SAW)
AGL 2005
2006 1
2007 1
2008 1 1 4.64 1
W. K. Kellogg Airport, Battle Creek (BTL)
AGL 2005 1 1 1.96
2006 1 1 1.97
2007
2008
Willow Run Airport, Ypsilanti (YIP) AGL 2005 2 1 3 2.89
2006 1 1 1.12
2007
2008
MINNESOTA Severity
Airport, City (Airport Code) RegionFiscal Year Collision A B C D
Total RIs
Annual RI Rate
Other Events, Non-RIs
Anoka County - Blaine Airport, Blaine (ANE)
AGL 2005
2006
2007
2008 1 3 4 5.64
Crystal Airport, Minneapolis (MIC) AGL 2005 1 2 3 4.20
2006 1 1 1.52
2007 1 2 3 5.65 1
2008 1 2 3 5.62
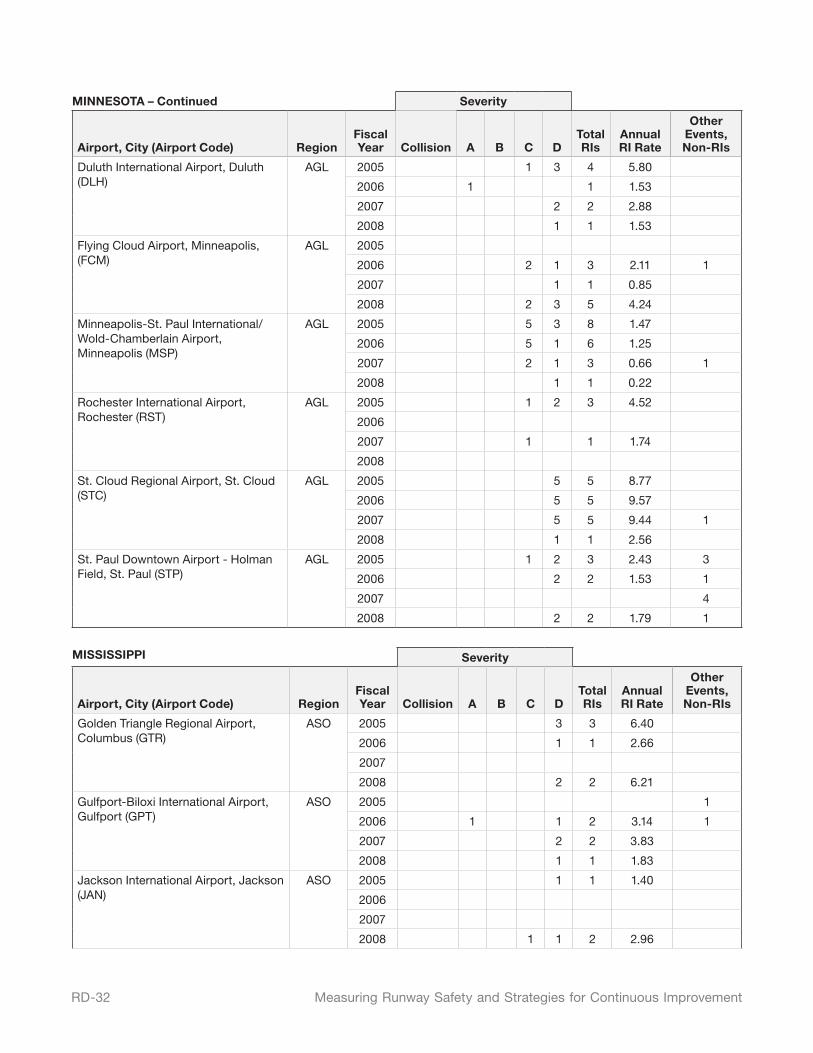
RD-32 Measuring Runway Safety and Strategies for Continuous Improvement
MINNESOTA – Continued Severity
Airport, City (Airport Code) RegionFiscal Year Collision A B C D
Total RIs
Annual RI Rate
Other Events, Non-RIs
Duluth International Airport, Duluth (DLH)
AGL 2005 1 3 4 5.80
2006 1 1 1.53
2007 2 2 2.88
2008 1 1 1.53
Flying Cloud Airport, Minneapolis, (FCM)
AGL 2005
2006 2 1 3 2.11 1
2007 1 1 0.85
2008 2 3 5 4.24
Minneapolis-St. Paul International/Wold-Chamberlain Airport, Minneapolis (MSP)
AGL 2005 5 3 8 1.47
2006 5 1 6 1.25
2007 2 1 3 0.66 1
2008 1 1 0.22
Rochester International Airport, Rochester (RST)
AGL 2005 1 2 3 4.52
2006
2007 1 1 1.74
2008
St. Cloud Regional Airport, St. Cloud (STC)
AGL 2005 5 5 8.77
2006 5 5 9.57
2007 5 5 9.44 1
2008 1 1 2.56
St. Paul Downtown Airport - Holman Field, St. Paul (STP)
AGL 2005 1 2 3 2.43 3
2006 2 2 1.53 1
2007 4
2008 2 2 1.79 1
MISSISSIPPI Severity
Airport, City (Airport Code) RegionFiscal Year Collision A B C D
Total RIs
Annual RI Rate
Other Events, Non-RIs
Golden Triangle Regional Airport, Columbus (GTR)
ASO 2005 3 3 6.40
2006 1 1 2.66
2007
2008 2 2 6.21
Gulfport-Biloxi International Airport, Gulfport (GPT)
ASO 2005 1
2006 1 1 2 3.14 1
2007 2 2 3.83
2008 1 1 1.83
Jackson International Airport, Jackson (JAN)
ASO 2005 1 1 1.40
2006
2007
2008 1 1 2 2.96
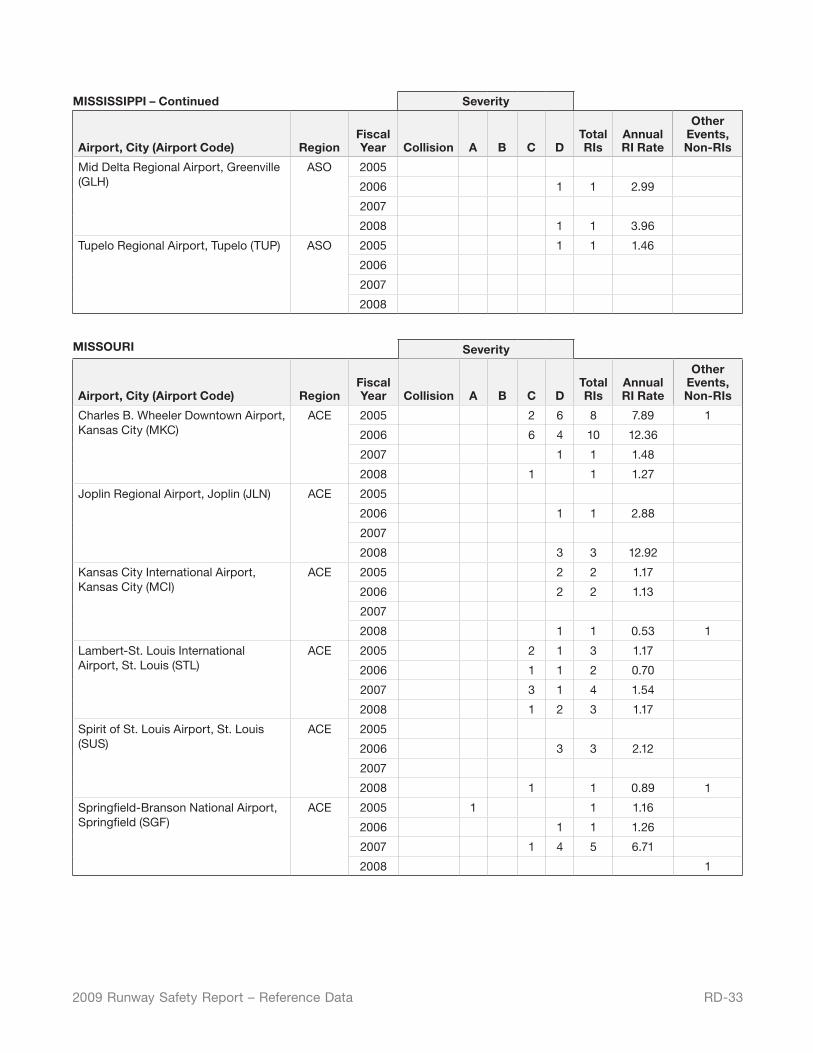
RD-332009 Runway Safety Report – Reference Data
MISSISSIPPI – Continued Severity
Airport, City (Airport Code) RegionFiscal Year Collision A B C D
Total RIs
Annual RI Rate
Other Events, Non-RIs
Mid Delta Regional Airport, Greenville (GLH)
ASO 2005
2006 1 1 2.99
2007
2008 1 1 3.96
Tupelo Regional Airport, Tupelo (TUP) ASO 2005 1 1 1.46
2006
2007
2008
MISSOURI Severity
Airport, City (Airport Code) RegionFiscal Year Collision A B C D
Total RIs
Annual RI Rate
Other Events, Non-RIs
Charles B. Wheeler Downtown Airport, Kansas City (MKC)
ACE 2005 2 6 8 7.89 1
2006 6 4 10 12.36
2007 1 1 1.48
2008 1 1 1.27
Joplin Regional Airport, Joplin (JLN) ACE 2005
2006 1 1 2.88
2007
2008 3 3 12.92
Kansas City International Airport, Kansas City (MCI)
ACE 2005 2 2 1.17
2006 2 2 1.13
2007
2008 1 1 0.53 1
Lambert-St. Louis International Airport, St. Louis (STL)
ACE 2005 2 1 3 1.17
2006 1 1 2 0.70
2007 3 1 4 1.54
2008 1 2 3 1.17
Spirit of St. Louis Airport, St. Louis (SUS)
ACE 2005
2006 3 3 2.12
2007
2008 1 1 0.89 1
Springfield-Branson National Airport, Springfield (SGF)
ACE 2005 1 1 1.16
2006 1 1 1.26
2007 1 4 5 6.71
2008 1
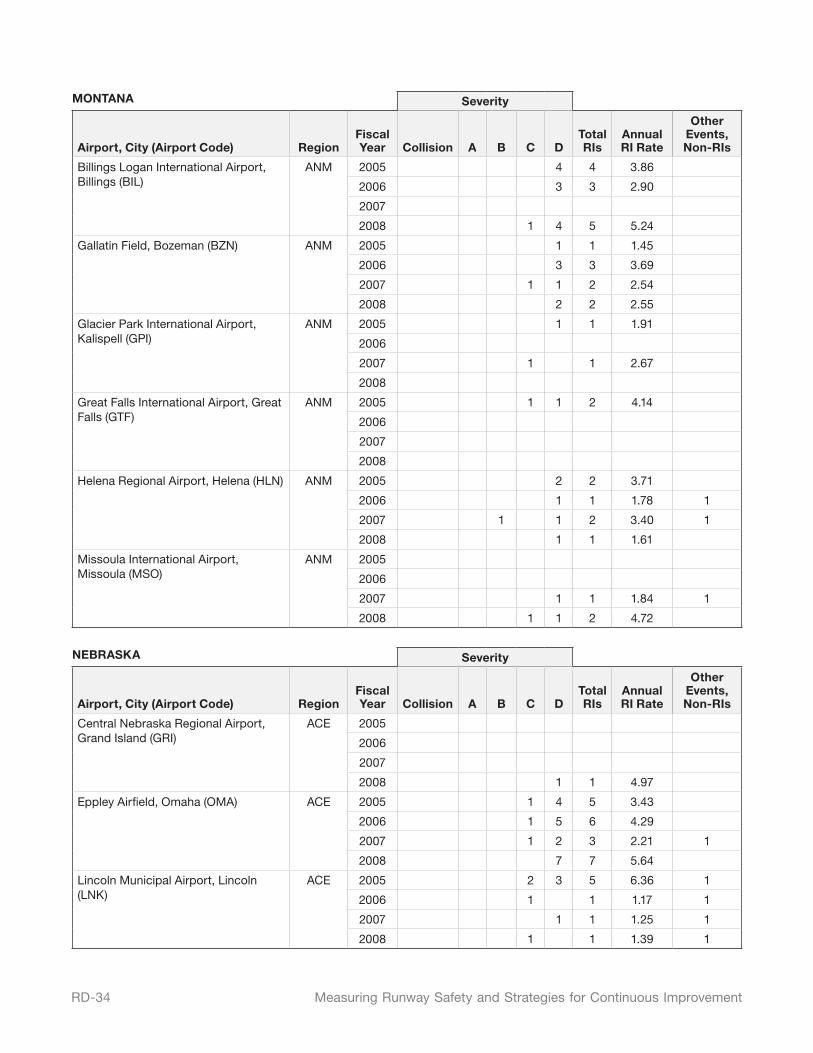
RD-34 Measuring Runway Safety and Strategies for Continuous Improvement
MONTANA Severity
Airport, City (Airport Code) RegionFiscal Year Collision A B C D
Total RIs
Annual RI Rate
Other Events, Non-RIs
Billings Logan International Airport, Billings (BIL)
ANM 2005 4 4 3.86
2006 3 3 2.90
2007
2008 1 4 5 5.24
Gallatin Field, Bozeman (BZN) ANM 2005 1 1 1.45
2006 3 3 3.69
2007 1 1 2 2.54
2008 2 2 2.55
Glacier Park International Airport, Kalispell (GPI)
ANM 2005 1 1 1.91
2006
2007 1 1 2.67
2008
Great Falls International Airport, Great Falls (GTF)
ANM 2005 1 1 2 4.14
2006
2007
2008
Helena Regional Airport, Helena (HLN) ANM 2005 2 2 3.71
2006 1 1 1.78 1
2007 1 1 2 3.40 1
2008 1 1 1.61
Missoula International Airport, Missoula (MSO)
ANM 2005
2006
2007 1 1 1.84 1
2008 1 1 2 4.72
NEBRASKA Severity
Airport, City (Airport Code) RegionFiscal Year Collision A B C D
Total RIs
Annual RI Rate
Other Events, Non-RIs
Central Nebraska Regional Airport, Grand Island (GRI)
ACE 2005
2006
2007
2008 1 1 4.97
Eppley Airfield, Omaha (OMA) ACE 2005 1 4 5 3.43
2006 1 5 6 4.29
2007 1 2 3 2.21 1
2008 7 7 5.64
Lincoln Municipal Airport, Lincoln (LNK)
ACE 2005 2 3 5 6.36 1
2006 1 1 1.17 1
2007 1 1 1.25 1
2008 1 1 1.39 1
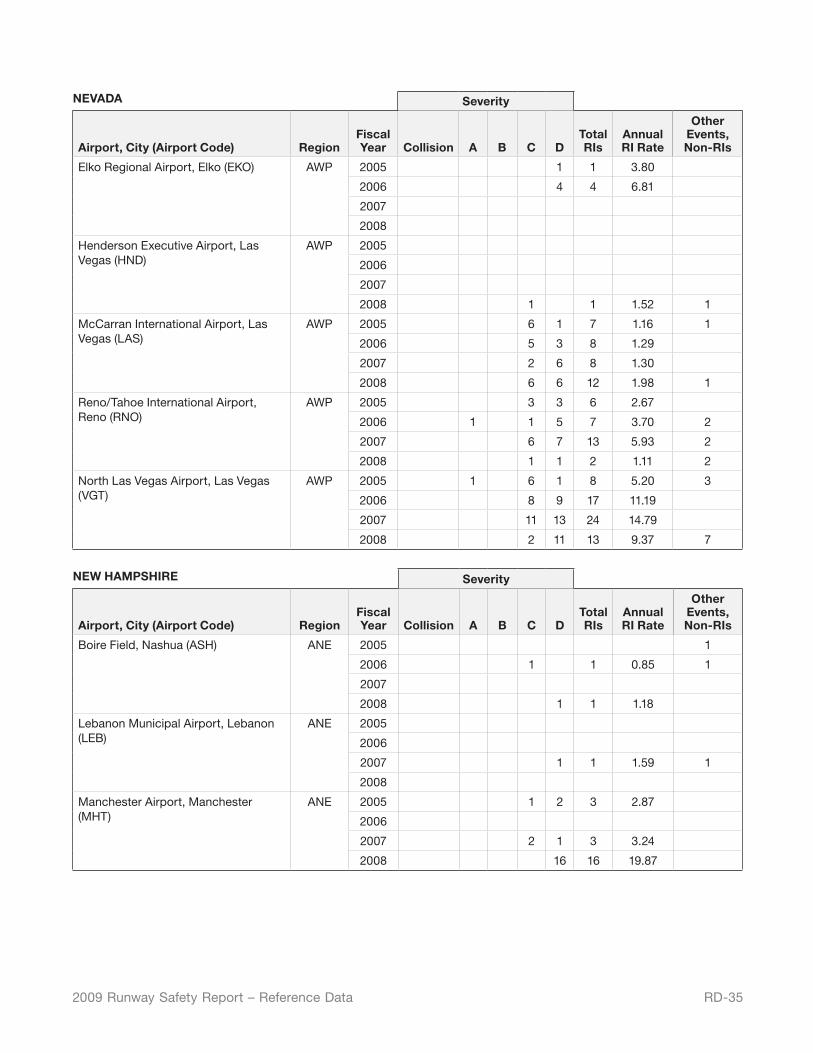
RD-352009 Runway Safety Report – Reference Data
NEVADA Severity
Airport, City (Airport Code) RegionFiscal Year Collision A B C D
Total RIs
Annual RI Rate
Other Events, Non-RIs
Elko Regional Airport, Elko (EKO) AWP 2005 1 1 3.80
2006 4 4 6.81
2007
2008
Henderson Executive Airport, Las Vegas (HND)
AWP 2005
2006
2007
2008 1 1 1.52 1
McCarran International Airport, Las Vegas (LAS)
AWP 2005 6 1 7 1.16 1
2006 5 3 8 1.29
2007 2 6 8 1.30
2008 6 6 12 1.98 1
Reno/Tahoe International Airport, Reno (RNO)
AWP 2005 3 3 6 2.67
2006 1 1 5 7 3.70 2
2007 6 7 13 5.93 2
2008 1 1 2 1.11 2
North Las Vegas Airport, Las Vegas (VGT)
AWP 2005 1 6 1 8 5.20 3
2006 8 9 17 11.19
2007 11 13 24 14.79
2008 2 11 13 9.37 7
NEW HAMPSHIRE Severity
Airport, City (Airport Code) RegionFiscal Year Collision A B C D
Total RIs
Annual RI Rate
Other Events, Non-RIs
Boire Field, Nashua (ASH) ANE 2005 1
2006 1 1 0.85 1
2007
2008 1 1 1.18
Lebanon Municipal Airport, Lebanon (LEB)
ANE 2005
2006
2007 1 1 1.59 1
2008
Manchester Airport, Manchester (MHT)
ANE 2005 1 2 3 2.87
2006
2007 2 1 3 3.24
2008 16 16 19.87
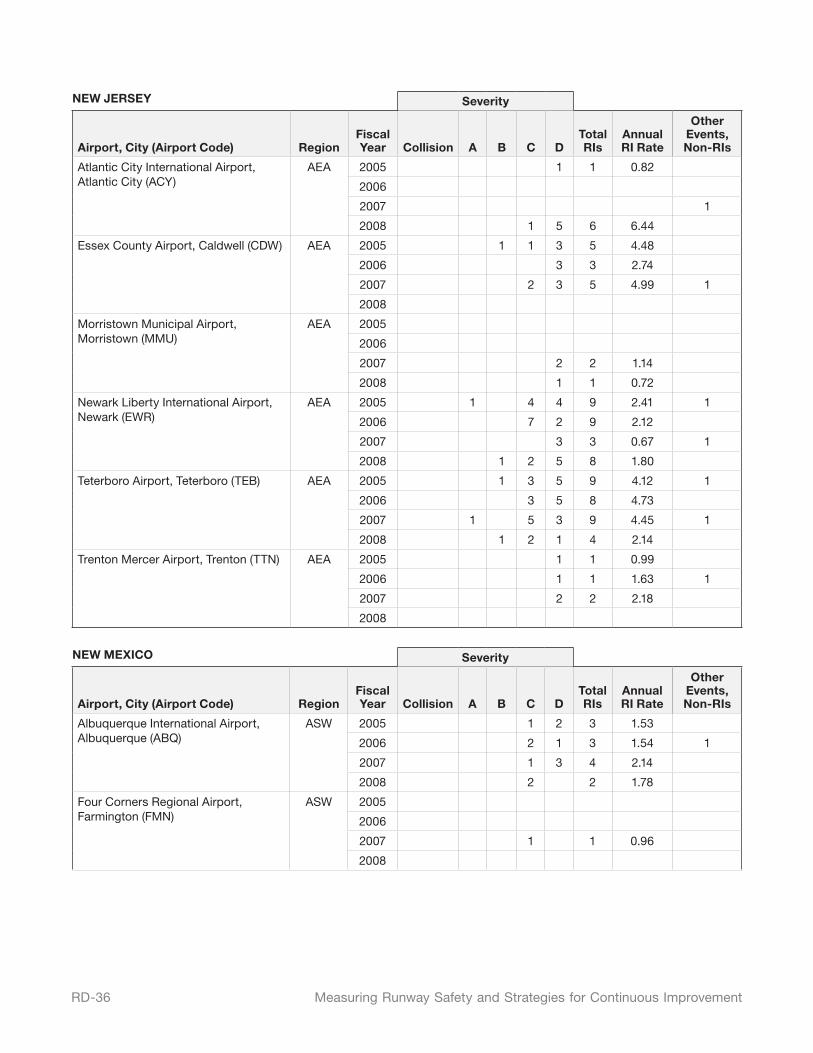
RD-36 Measuring Runway Safety and Strategies for Continuous Improvement
NEW JERSEY Severity
Airport, City (Airport Code) RegionFiscal Year Collision A B C D
Total RIs
Annual RI Rate
Other Events, Non-RIs
Atlantic City International Airport, Atlantic City (ACY)
AEA 2005 1 1 0.82
2006
2007 1
2008 1 5 6 6.44
Essex County Airport, Caldwell (CDW) AEA 2005 1 1 3 5 4.48
2006 3 3 2.74
2007 2 3 5 4.99 1
2008
Morristown Municipal Airport, Morristown (MMU)
AEA 2005
2006
2007 2 2 1.14
2008 1 1 0.72
Newark Liberty International Airport, Newark (EWR)
AEA 2005 1 4 4 9 2.41 1
2006 7 2 9 2.12
2007 3 3 0.67 1
2008 1 2 5 8 1.80
Teterboro Airport, Teterboro (TEB) AEA 2005 1 3 5 9 4.12 1
2006 3 5 8 4.73
2007 1 5 3 9 4.45 1
2008 1 2 1 4 2.14
Trenton Mercer Airport, Trenton (TTN) AEA 2005 1 1 0.99
2006 1 1 1.63 1
2007 2 2 2.18
2008
NEW MEXICO Severity
Airport, City (Airport Code) RegionFiscal Year Collision A B C D
Total RIs
Annual RI Rate
Other Events, Non-RIs
Albuquerque International Airport, Albuquerque (ABQ)
ASW 2005 1 2 3 1.53
2006 2 1 3 1.54 1
2007 1 3 4 2.14
2008 2 2 1.78
Four Corners Regional Airport, Farmington (FMN)
ASW 2005
2006
2007 1 1 0.96
2008
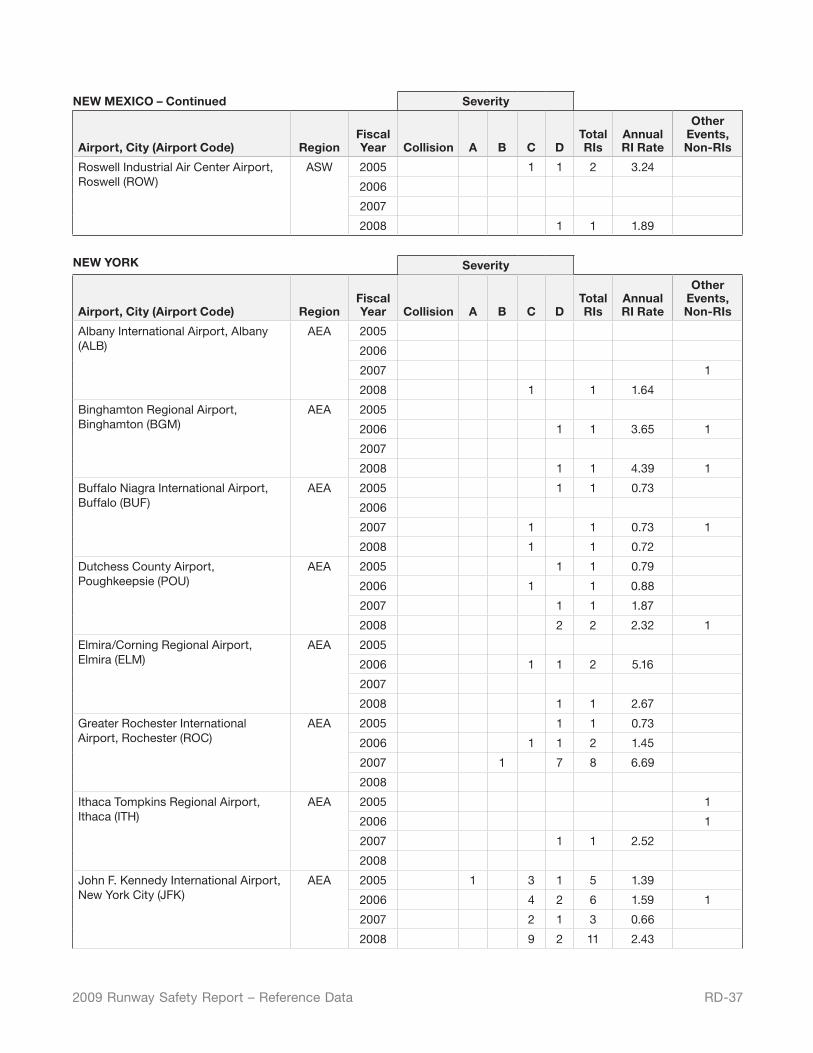
RD-372009 Runway Safety Report – Reference Data
NEW MEXICO – Continued Severity
Airport, City (Airport Code) RegionFiscal Year Collision A B C D
Total RIs
Annual RI Rate
Other Events, Non-RIs
Roswell Industrial Air Center Airport, Roswell (ROW)
ASW 2005 1 1 2 3.24
2006
2007
2008 1 1 1.89
NEW YORK Severity
Airport, City (Airport Code) RegionFiscal Year Collision A B C D
Total RIs
Annual RI Rate
Other Events, Non-RIs
Albany International Airport, Albany (ALB)
AEA 2005
2006
2007 1
2008 1 1 1.64
Binghamton Regional Airport, Binghamton (BGM)
AEA 2005
2006 1 1 3.65 1
2007
2008 1 1 4.39 1
Buffalo Niagra International Airport, Buffalo (BUF)
AEA 2005 1 1 0.73
2006
2007 1 1 0.73 1
2008 1 1 0.72
Dutchess County Airport, Poughkeepsie (POU)
AEA 2005 1 1 0.79
2006 1 1 0.88
2007 1 1 1.87
2008 2 2 2.32 1
Elmira/Corning Regional Airport, Elmira (ELM)
AEA 2005
2006 1 1 2 5.16
2007
2008 1 1 2.67
Greater Rochester International Airport, Rochester (ROC)
AEA 2005 1 1 0.73
2006 1 1 2 1.45
2007 1 7 8 6.69
2008
Ithaca Tompkins Regional Airport, Ithaca (ITH)
AEA 2005 1
2006 1
2007 1 1 2.52
2008
John F. Kennedy International Airport, New York City (JFK)
AEA 2005 1 3 1 5 1.39
2006 4 2 6 1.59 1
2007 2 1 3 0.66
2008 9 2 11 2.43
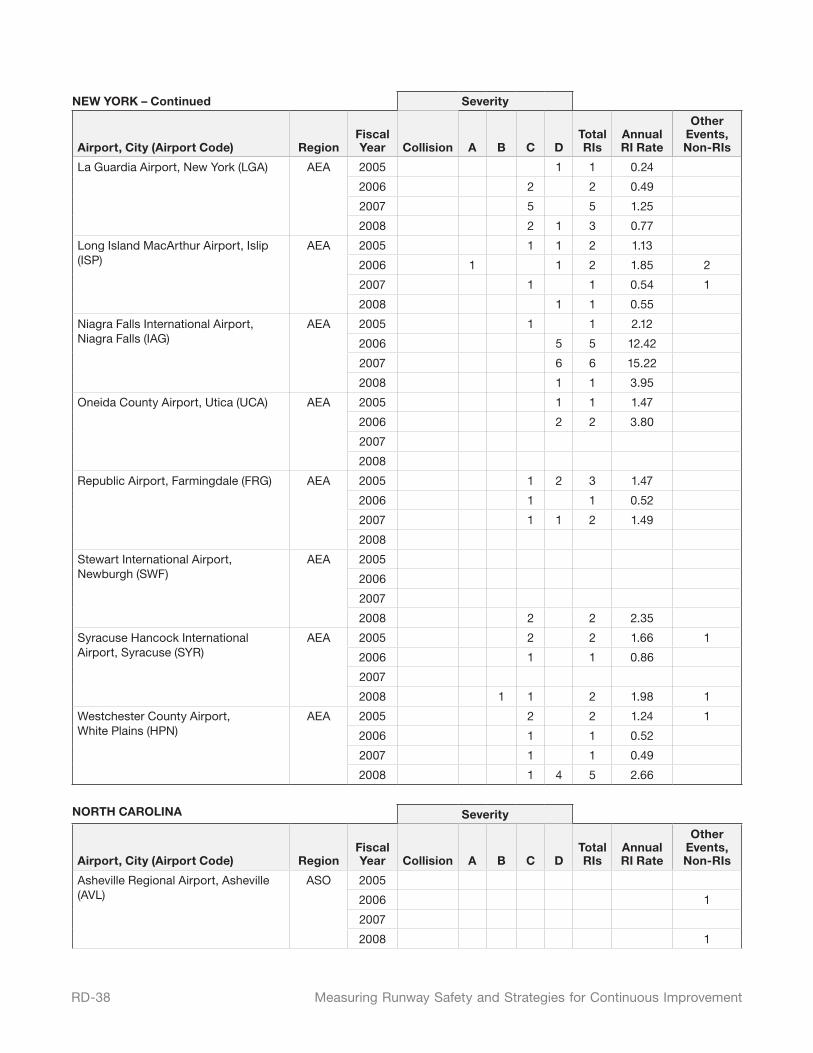
RD-38 Measuring Runway Safety and Strategies for Continuous Improvement
NEW YORK – Continued Severity
Airport, City (Airport Code) RegionFiscal Year Collision A B C D
Total RIs
Annual RI Rate
Other Events, Non-RIs
La Guardia Airport, New York (LGA) AEA 2005 1 1 0.24
2006 2 2 0.49
2007 5 5 1.25
2008 2 1 3 0.77
Long Island MacArthur Airport, Islip (ISP)
AEA 2005 1 1 2 1.13
2006 1 1 2 1.85 2
2007 1 1 0.54 1
2008 1 1 0.55
Niagra Falls International Airport, Niagra Falls (IAG)
AEA 2005 1 1 2.12
2006 5 5 12.42
2007 6 6 15.22
2008 1 1 3.95
Oneida County Airport, Utica (UCA) AEA 2005 1 1 1.47
2006 2 2 3.80
2007
2008
Republic Airport, Farmingdale (FRG) AEA 2005 1 2 3 1.47
2006 1 1 0.52
2007 1 1 2 1.49
2008
Stewart International Airport, Newburgh (SWF)
AEA 2005
2006
2007
2008 2 2 2.35
Syracuse Hancock International Airport, Syracuse (SYR)
AEA 2005 2 2 1.66 1
2006 1 1 0.86
2007
2008 1 1 2 1.98 1
Westchester County Airport, White Plains (HPN)
AEA 2005 2 2 1.24 1
2006 1 1 0.52
2007 1 1 0.49
2008 1 4 5 2.66
NORTH CAROLINA Severity
Airport, City (Airport Code) RegionFiscal Year Collision A B C D
Total RIs
Annual RI Rate
Other Events, Non-RIs
Asheville Regional Airport, Asheville (AVL)
ASO 2005
2006 1
2007
2008 1
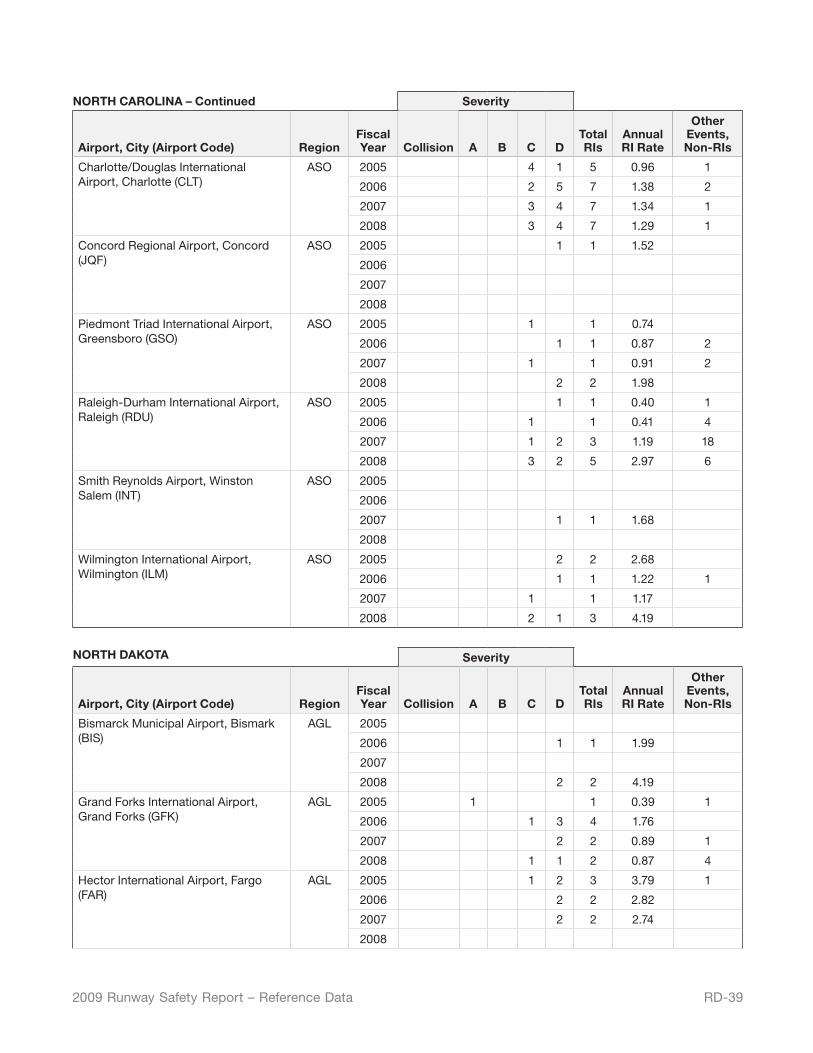
RD-392009 Runway Safety Report – Reference Data
NORTH CAROLINA – Continued Severity
Airport, City (Airport Code) RegionFiscal Year Collision A B C D
Total RIs
Annual RI Rate
Other Events, Non-RIs
Charlotte/Douglas International Airport, Charlotte (CLT)
ASO 2005 4 1 5 0.96 1
2006 2 5 7 1.38 2
2007 3 4 7 1.34 1
2008 3 4 7 1.29 1
Concord Regional Airport, Concord (JQF)
ASO 2005 1 1 1.52
2006
2007
2008
Piedmont Triad International Airport, Greensboro (GSO)
ASO 2005 1 1 0.74
2006 1 1 0.87 2
2007 1 1 0.91 2
2008 2 2 1.98
Raleigh-Durham International Airport, Raleigh (RDU)
ASO 2005 1 1 0.40 1
2006 1 1 0.41 4
2007 1 2 3 1.19 18
2008 3 2 5 2.97 6
Smith Reynolds Airport, Winston Salem (INT)
ASO 2005
2006
2007 1 1 1.68
2008
Wilmington International Airport, Wilmington (ILM)
ASO 2005 2 2 2.68
2006 1 1 1.22 1
2007 1 1 1.17
2008 2 1 3 4.19
NORTH DAKOTA Severity
Airport, City (Airport Code) RegionFiscal Year Collision A B C D
Total RIs
Annual RI Rate
Other Events, Non-RIs
Bismarck Municipal Airport, Bismark (BIS)
AGL 2005
2006 1 1 1.99
2007
2008 2 2 4.19
Grand Forks International Airport, Grand Forks (GFK)
AGL 2005 1 1 0.39 1
2006 1 3 4 1.76
2007 2 2 0.89 1
2008 1 1 2 0.87 4
Hector International Airport, Fargo (FAR)
AGL 2005 1 2 3 3.79 1
2006 2 2 2.82
2007 2 2 2.74
2008
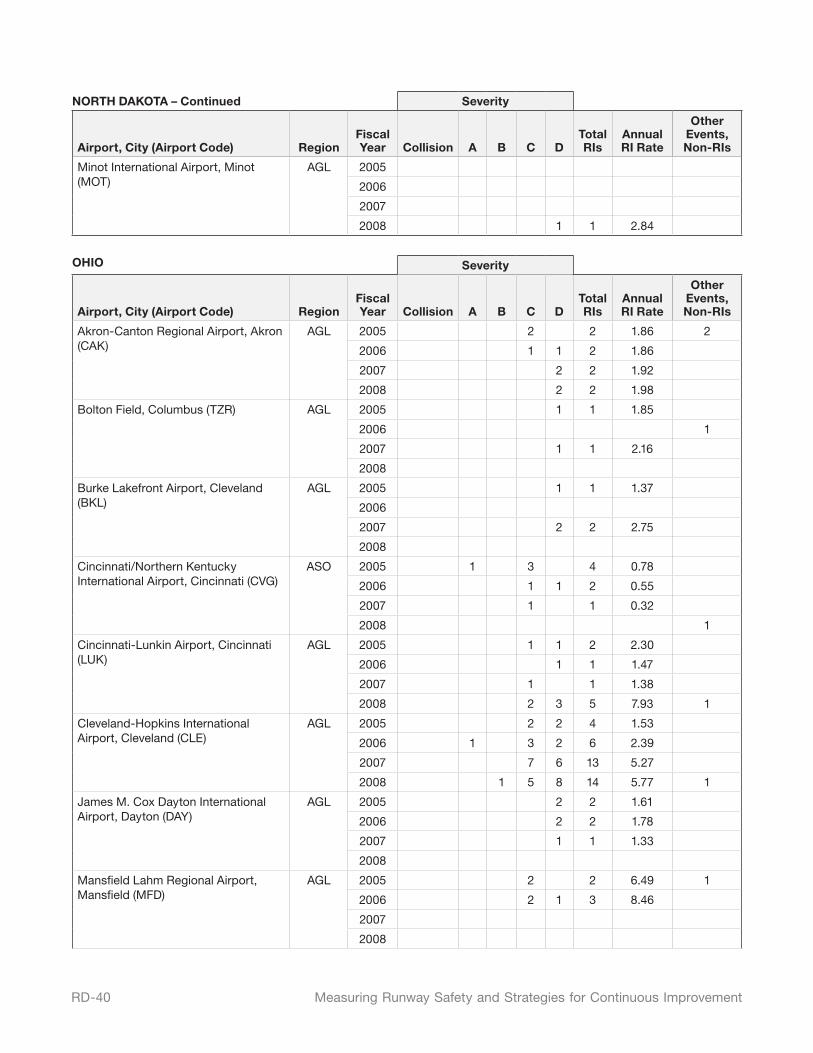
RD-40 Measuring Runway Safety and Strategies for Continuous Improvement
NORTH DAKOTA – Continued Severity
Airport, City (Airport Code) RegionFiscal Year Collision A B C D
Total RIs
Annual RI Rate
Other Events, Non-RIs
Minot International Airport, Minot (MOT)
AGL 2005
2006
2007
2008 1 1 2.84
OHIO Severity
Airport, City (Airport Code) RegionFiscal Year Collision A B C D
Total RIs
Annual RI Rate
Other Events, Non-RIs
Akron-Canton Regional Airport, Akron (CAK)
AGL 2005 2 2 1.86 2
2006 1 1 2 1.86
2007 2 2 1.92
2008 2 2 1.98
Bolton Field, Columbus (TZR) AGL 2005 1 1 1.85
2006 1
2007 1 1 2.16
2008
Burke Lakefront Airport, Cleveland (BKL)
AGL 2005 1 1 1.37
2006
2007 2 2 2.75
2008
Cincinnati/Northern Kentucky International Airport, Cincinnati (CVG)
ASO 2005 1 3 4 0.78
2006 1 1 2 0.55
2007 1 1 0.32
2008 1
Cincinnati-Lunkin Airport, Cincinnati (LUK)
AGL 2005 1 1 2 2.30
2006 1 1 1.47
2007 1 1 1.38
2008 2 3 5 7.93 1
Cleveland-Hopkins International Airport, Cleveland (CLE)
AGL 2005 2 2 4 1.53
2006 1 3 2 6 2.39
2007 7 6 13 5.27
2008 1 5 8 14 5.77 1
James M. Cox Dayton International Airport, Dayton (DAY)
AGL 2005 2 2 1.61
2006 2 2 1.78
2007 1 1 1.33
2008
Mansfield Lahm Regional Airport, Mansfield (MFD)
AGL 2005 2 2 6.49 1
2006 2 1 3 8.46
2007
2008
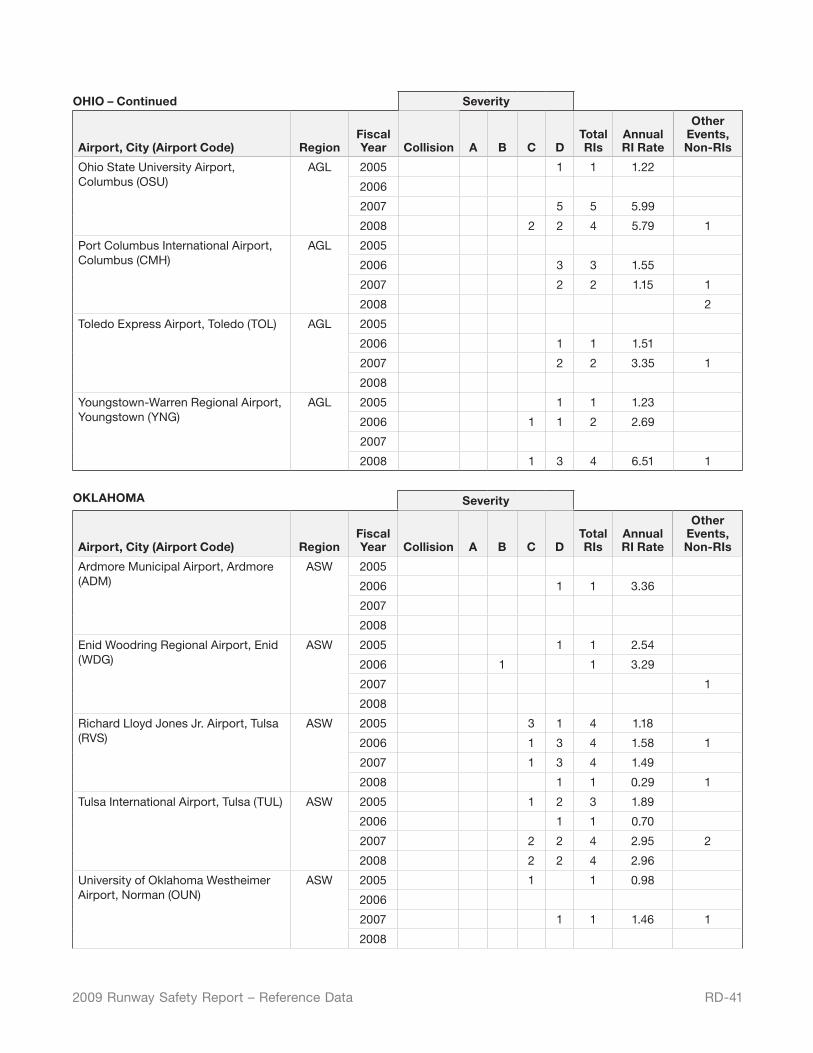
RD-412009 Runway Safety Report – Reference Data
OHIO – Continued Severity
Airport, City (Airport Code) RegionFiscal Year Collision A B C D
Total RIs
Annual RI Rate
Other Events, Non-RIs
Ohio State University Airport, Columbus (OSU)
AGL 2005 1 1 1.22
2006
2007 5 5 5.99
2008 2 2 4 5.79 1
Port Columbus International Airport, Columbus (CMH)
AGL 2005
2006 3 3 1.55
2007 2 2 1.15 1
2008 2
Toledo Express Airport, Toledo (TOL) AGL 2005
2006 1 1 1.51
2007 2 2 3.35 1
2008
Youngstown-Warren Regional Airport, Youngstown (YNG)
AGL 2005 1 1 1.23
2006 1 1 2 2.69
2007
2008 1 3 4 6.51 1
OKLAHOMA Severity
Airport, City (Airport Code) RegionFiscal Year Collision A B C D
Total RIs
Annual RI Rate
Other Events, Non-RIs
Ardmore Municipal Airport, Ardmore (ADM)
ASW 2005
2006 1 1 3.36
2007
2008
Enid Woodring Regional Airport, Enid (WDG)
ASW 2005 1 1 2.54
2006 1 1 3.29
2007 1
2008
Richard Lloyd Jones Jr. Airport, Tulsa (RVS)
ASW 2005 3 1 4 1.18
2006 1 3 4 1.58 1
2007 1 3 4 1.49
2008 1 1 0.29 1
Tulsa International Airport, Tulsa (TUL) ASW 2005 1 2 3 1.89
2006 1 1 0.70
2007 2 2 4 2.95 2
2008 2 2 4 2.96
University of Oklahoma Westheimer Airport, Norman (OUN)
ASW 2005 1 1 0.98
2006
2007 1 1 1.46 1
2008
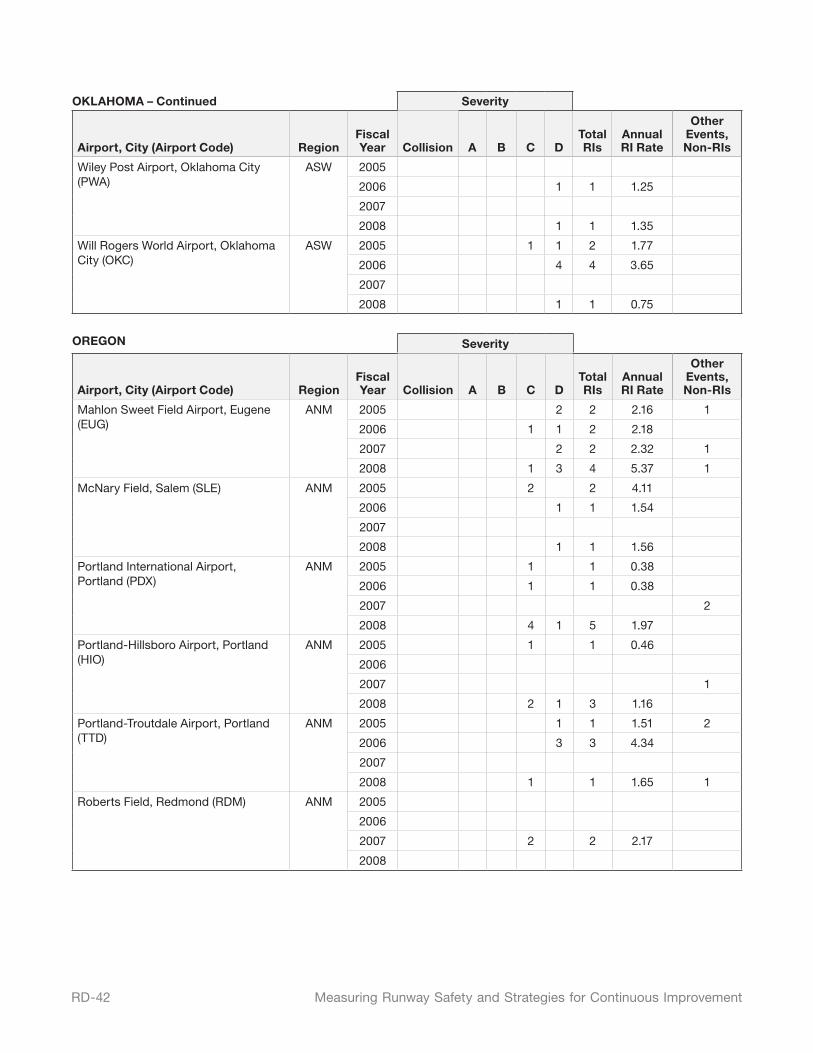
RD-42 Measuring Runway Safety and Strategies for Continuous Improvement
OKLAHOMA – Continued Severity
Airport, City (Airport Code) RegionFiscal Year Collision A B C D
Total RIs
Annual RI Rate
Other Events, Non-RIs
Wiley Post Airport, Oklahoma City (PWA)
ASW 2005
2006 1 1 1.25
2007
2008 1 1 1.35
Will Rogers World Airport, Oklahoma City (OKC)
ASW 2005 1 1 2 1.77
2006 4 4 3.65
2007
2008 1 1 0.75
OREGON Severity
Airport, City (Airport Code) RegionFiscal Year Collision A B C D
Total RIs
Annual RI Rate
Other Events, Non-RIs
Mahlon Sweet Field Airport, Eugene (EUG)
ANM 2005 2 2 2.16 1
2006 1 1 2 2.18
2007 2 2 2.32 1
2008 1 3 4 5.37 1
McNary Field, Salem (SLE) ANM 2005 2 2 4.11
2006 1 1 1.54
2007
2008 1 1 1.56
Portland International Airport, Portland (PDX)
ANM 2005 1 1 0.38
2006 1 1 0.38
2007 2
2008 4 1 5 1.97
Portland-Hillsboro Airport, Portland (HIO)
ANM 2005 1 1 0.46
2006
2007 1
2008 2 1 3 1.16
Portland-Troutdale Airport, Portland (TTD)
ANM 2005 1 1 1.51 2
2006 3 3 4.34
2007
2008 1 1 1.65 1
Roberts Field, Redmond (RDM) ANM 2005
2006
2007 2 2 2.17
2008
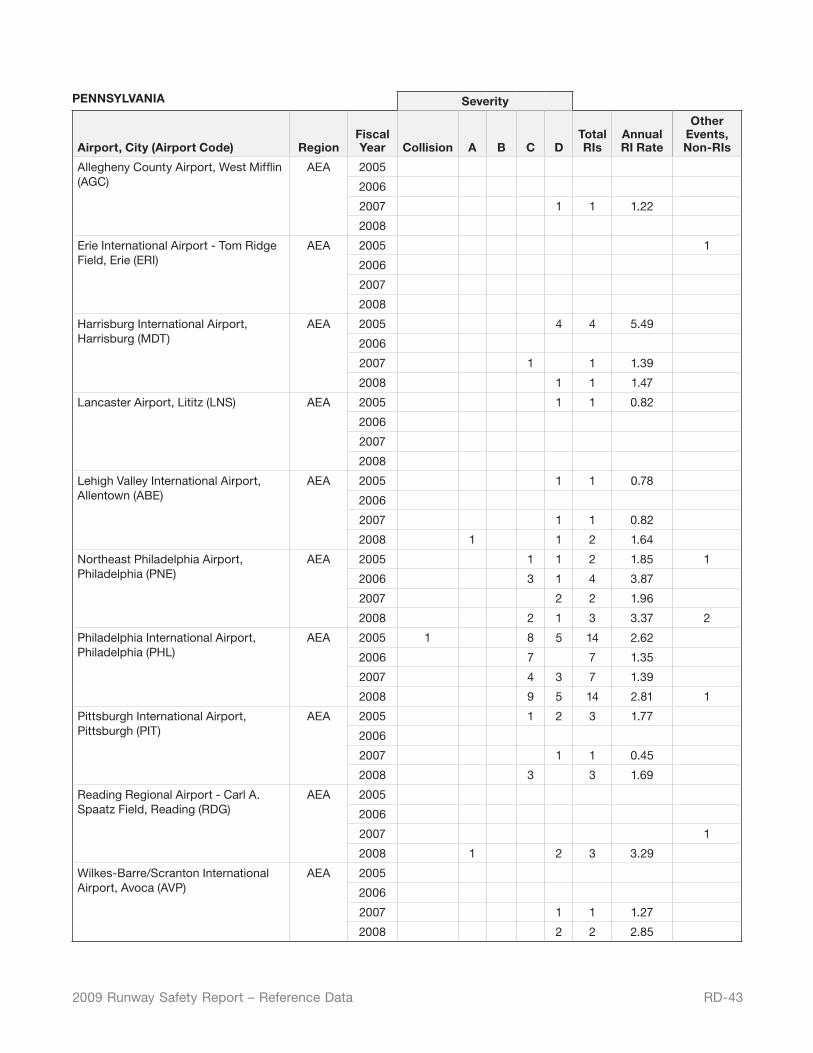
RD-432009 Runway Safety Report – Reference Data
PENNSYLVANIA Severity
Airport, City (Airport Code) RegionFiscal Year Collision A B C D
Total RIs
Annual RI Rate
Other Events, Non-RIs
Allegheny County Airport, West Mifflin (AGC)
AEA 2005
2006
2007 1 1 1.22
2008
Erie International Airport - Tom Ridge Field, Erie (ERI)
AEA 2005 1
2006
2007
2008
Harrisburg International Airport, Harrisburg (MDT)
AEA 2005 4 4 5.49
2006
2007 1 1 1.39
2008 1 1 1.47
Lancaster Airport, Lititz (LNS) AEA 2005 1 1 0.82
2006
2007
2008
Lehigh Valley International Airport, Allentown (ABE)
AEA 2005 1 1 0.78
2006
2007 1 1 0.82
2008 1 1 2 1.64
Northeast Philadelphia Airport, Philadelphia (PNE)
AEA 2005 1 1 2 1.85 1
2006 3 1 4 3.87
2007 2 2 1.96
2008 2 1 3 3.37 2
Philadelphia International Airport, Philadelphia (PHL)
AEA 2005 1 8 5 14 2.62
2006 7 7 1.35
2007 4 3 7 1.39
2008 9 5 14 2.81 1
Pittsburgh International Airport, Pittsburgh (PIT)
AEA 2005 1 2 3 1.77
2006
2007 1 1 0.45
2008 3 3 1.69
Reading Regional Airport - Carl A. Spaatz Field, Reading (RDG)
AEA 2005
2006
2007 1
2008 1 2 3 3.29
Wilkes-Barre/Scranton International Airport, Avoca (AVP)
AEA 2005
2006
2007 1 1 1.27
2008 2 2 2.85
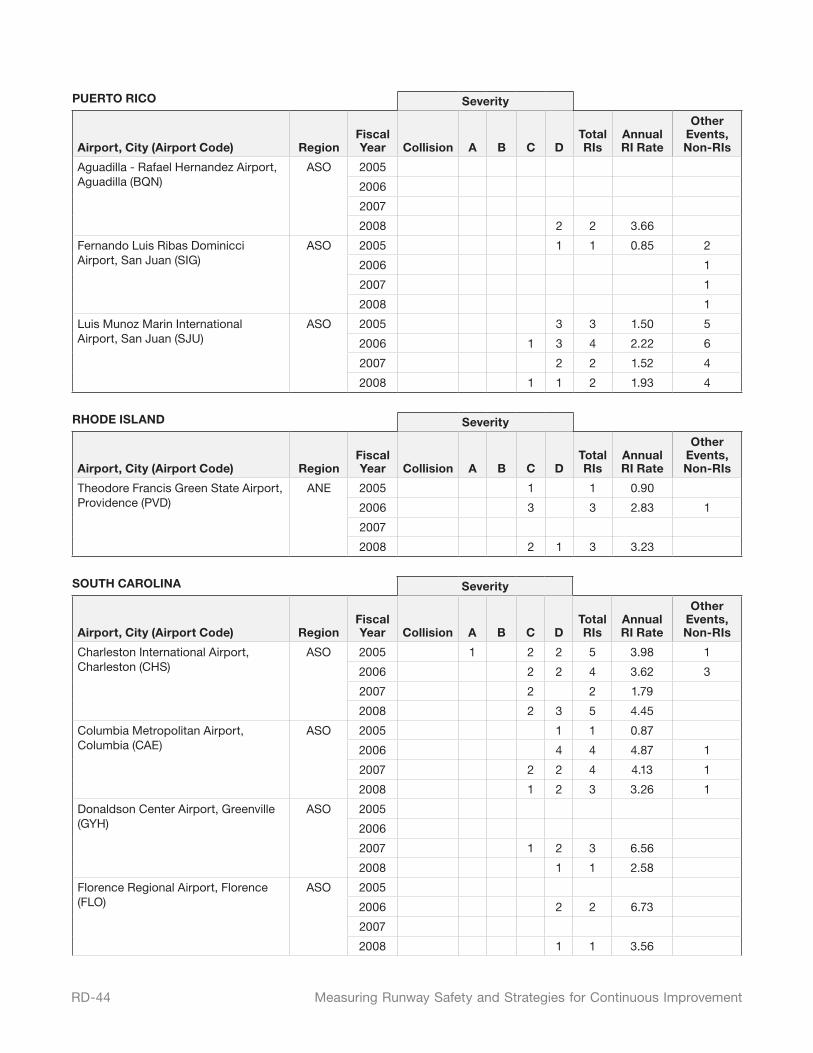
RD-44 Measuring Runway Safety and Strategies for Continuous Improvement
PUERTO RICO Severity
Airport, City (Airport Code) RegionFiscal Year Collision A B C D
Total RIs
Annual RI Rate
Other Events, Non-RIs
Aguadilla - Rafael Hernandez Airport, Aguadilla (BQN)
ASO 2005
2006
2007
2008 2 2 3.66
Fernando Luis Ribas Dominicci Airport, San Juan (SIG)
ASO 2005 1 1 0.85 2
2006 1
2007 1
2008 1
Luis Munoz Marin International Airport, San Juan (SJU)
ASO 2005 3 3 1.50 5
2006 1 3 4 2.22 6
2007 2 2 1.52 4
2008 1 1 2 1.93 4
RHODE ISLAND Severity
Airport, City (Airport Code) RegionFiscal Year Collision A B C D
Total RIs
Annual RI Rate
Other Events, Non-RIs
Theodore Francis Green State Airport, Providence (PVD)
ANE 2005 1 1 0.90
2006 3 3 2.83 1
2007
2008 2 1 3 3.23
SOUTH CAROLINA Severity
Airport, City (Airport Code) RegionFiscal Year Collision A B C D
Total RIs
Annual RI Rate
Other Events, Non-RIs
Charleston International Airport, Charleston (CHS)
ASO 2005 1 2 2 5 3.98 1
2006 2 2 4 3.62 3
2007 2 2 1.79
2008 2 3 5 4.45
Columbia Metropolitan Airport, Columbia (CAE)
ASO 2005 1 1 0.87
2006 4 4 4.87 1
2007 2 2 4 4.13 1
2008 1 2 3 3.26 1
Donaldson Center Airport, Greenville (GYH)
ASO 2005
2006
2007 1 2 3 6.56
2008 1 1 2.58
Florence Regional Airport, Florence (FLO)
ASO 2005
2006 2 2 6.73
2007
2008 1 1 3.56
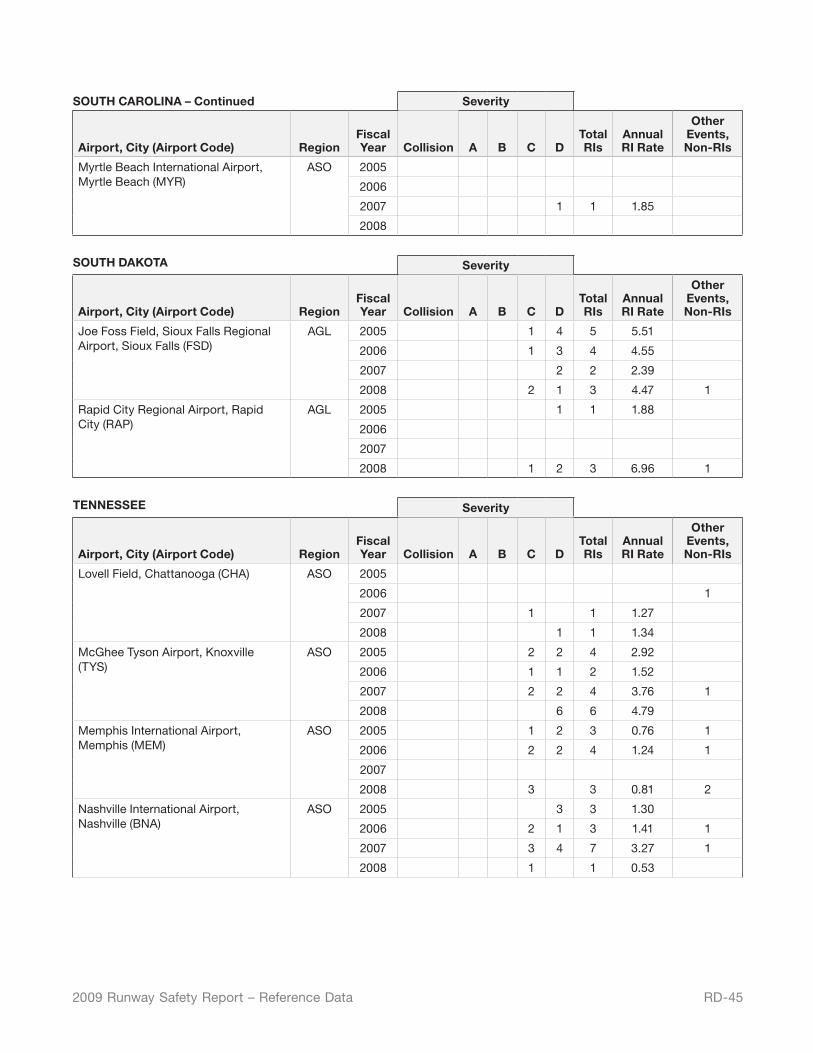
RD-452009 Runway Safety Report – Reference Data
SOUTH CAROLINA – Continued Severity
Airport, City (Airport Code) RegionFiscal Year Collision A B C D
Total RIs
Annual RI Rate
Other Events, Non-RIs
Myrtle Beach International Airport, Myrtle Beach (MYR)
ASO 2005
2006
2007 1 1 1.85
2008
SOUTH DAKOTA Severity
Airport, City (Airport Code) RegionFiscal Year Collision A B C D
Total RIs
Annual RI Rate
Other Events, Non-RIs
Joe Foss Field, Sioux Falls Regional Airport, Sioux Falls (FSD)
AGL 2005 1 4 5 5.51
2006 1 3 4 4.55
2007 2 2 2.39
2008 2 1 3 4.47 1
Rapid City Regional Airport, Rapid City (RAP)
AGL 2005 1 1 1.88
2006
2007
2008 1 2 3 6.96 1
TENNESSEE Severity
Airport, City (Airport Code) RegionFiscal Year Collision A B C D
Total RIs
Annual RI Rate
Other Events, Non-RIs
Lovell Field, Chattanooga (CHA) ASO 2005
2006 1
2007 1 1 1.27
2008 1 1 1.34
McGhee Tyson Airport, Knoxville (TYS)
ASO 2005 2 2 4 2.92
2006 1 1 2 1.52
2007 2 2 4 3.76 1
2008 6 6 4.79
Memphis International Airport, Memphis (MEM)
ASO 2005 1 2 3 0.76 1
2006 2 2 4 1.24 1
2007
2008 3 3 0.81 2
Nashville International Airport, Nashville (BNA)
ASO 2005 3 3 1.30
2006 2 1 3 1.41 1
2007 3 4 7 3.27 1
2008 1 1 0.53
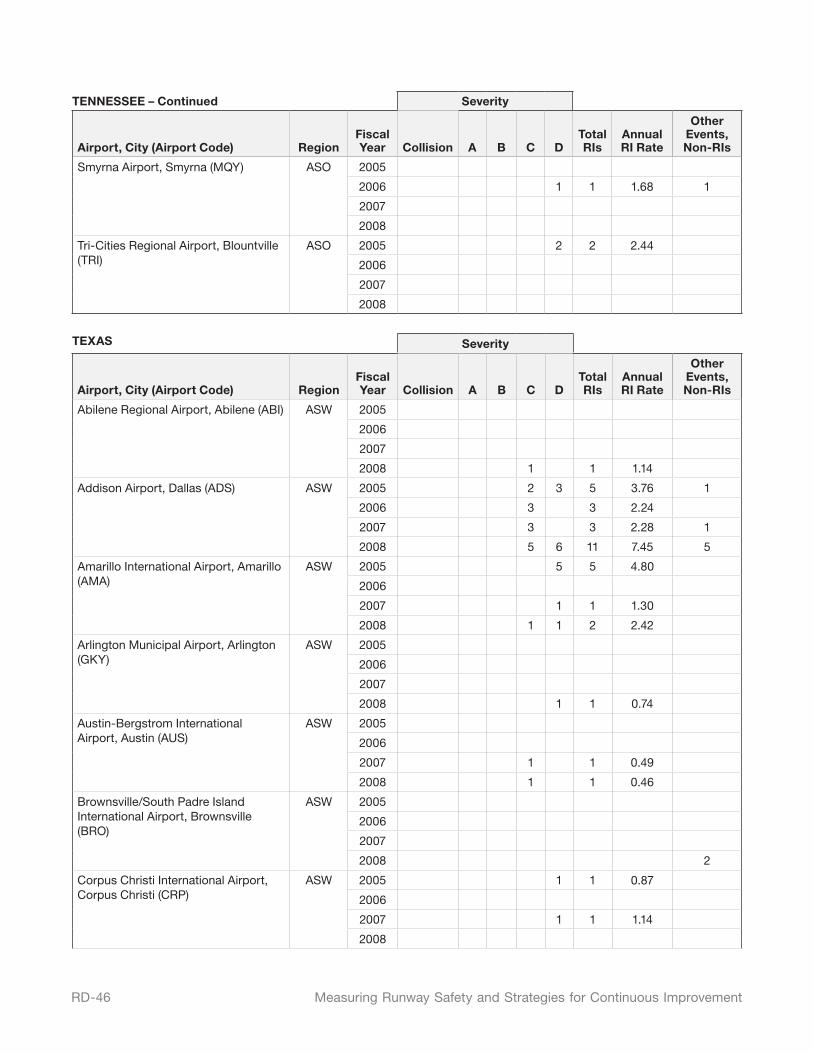
RD-46 Measuring Runway Safety and Strategies for Continuous Improvement
TENNESSEE – Continued Severity
Airport, City (Airport Code) RegionFiscal Year Collision A B C D
Total RIs
Annual RI Rate
Other Events, Non-RIs
Smyrna Airport, Smyrna (MQY) ASO 2005
2006 1 1 1.68 1
2007
2008
Tri-Cities Regional Airport, Blountville (TRI)
ASO 2005 2 2 2.44
2006
2007
2008
TEXAS Severity
Airport, City (Airport Code) RegionFiscal Year Collision A B C D
Total RIs
Annual RI Rate
Other Events, Non-RIs
Abilene Regional Airport, Abilene (ABI) ASW 2005
2006
2007
2008 1 1 1.14
Addison Airport, Dallas (ADS) ASW 2005 2 3 5 3.76 1
2006 3 3 2.24
2007 3 3 2.28 1
2008 5 6 11 7.45 5
Amarillo International Airport, Amarillo (AMA)
ASW 2005 5 5 4.80
2006
2007 1 1 1.30
2008 1 1 2 2.42
Arlington Municipal Airport, Arlington (GKY)
ASW 2005
2006
2007
2008 1 1 0.74
Austin-Bergstrom International Airport, Austin (AUS)
ASW 2005
2006
2007 1 1 0.49
2008 1 1 0.46
Brownsville/South Padre Island International Airport, Brownsville (BRO)
ASW 2005
2006
2007
2008 2
Corpus Christi International Airport, Corpus Christi (CRP)
ASW 2005 1 1 0.87
2006
2007 1 1 1.14
2008
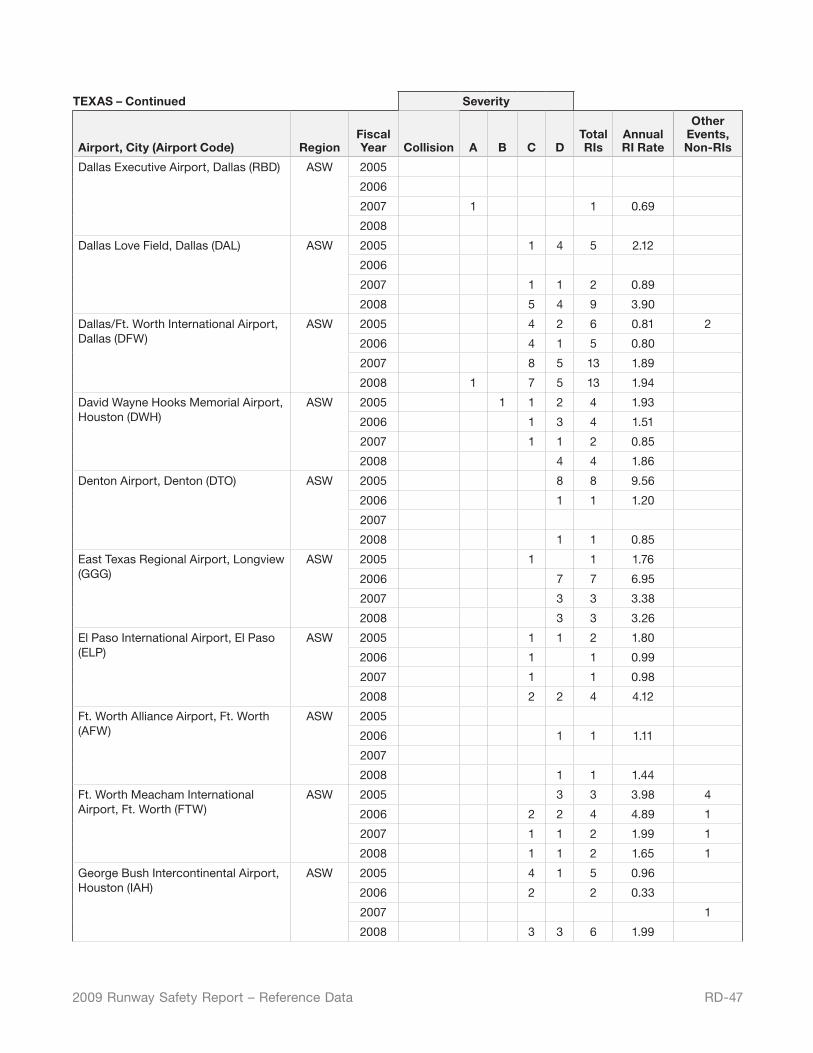
RD-472009 Runway Safety Report – Reference Data
TEXAS – Continued Severity
Airport, City (Airport Code) RegionFiscal Year Collision A B C D
Total RIs
Annual RI Rate
Other Events, Non-RIs
Dallas Executive Airport, Dallas (RBD) ASW 2005
2006
2007 1 1 0.69
2008
Dallas Love Field, Dallas (DAL) ASW 2005 1 4 5 2.12
2006
2007 1 1 2 0.89
2008 5 4 9 3.90
Dallas/Ft. Worth International Airport, Dallas (DFW)
ASW 2005 4 2 6 0.81 2
2006 4 1 5 0.80
2007 8 5 13 1.89
2008 1 7 5 13 1.94
David Wayne Hooks Memorial Airport, Houston (DWH)
ASW 2005 1 1 2 4 1.93
2006 1 3 4 1.51
2007 1 1 2 0.85
2008 4 4 1.86
Denton Airport, Denton (DTO) ASW 2005 8 8 9.56
2006 1 1 1.20
2007
2008 1 1 0.85
East Texas Regional Airport, Longview (GGG)
ASW 2005 1 1 1.76
2006 7 7 6.95
2007 3 3 3.38
2008 3 3 3.26
El Paso International Airport, El Paso (ELP)
ASW 2005 1 1 2 1.80
2006 1 1 0.99
2007 1 1 0.98
2008 2 2 4 4.12
Ft. Worth Alliance Airport, Ft. Worth (AFW)
ASW 2005
2006 1 1 1.11
2007
2008 1 1 1.44
Ft. Worth Meacham International Airport, Ft. Worth (FTW)
ASW 2005 3 3 3.98 4
2006 2 2 4 4.89 1
2007 1 1 2 1.99 1
2008 1 1 2 1.65 1
George Bush Intercontinental Airport, Houston (IAH)
ASW 2005 4 1 5 0.96
2006 2 2 0.33
2007 1
2008 3 3 6 1.99
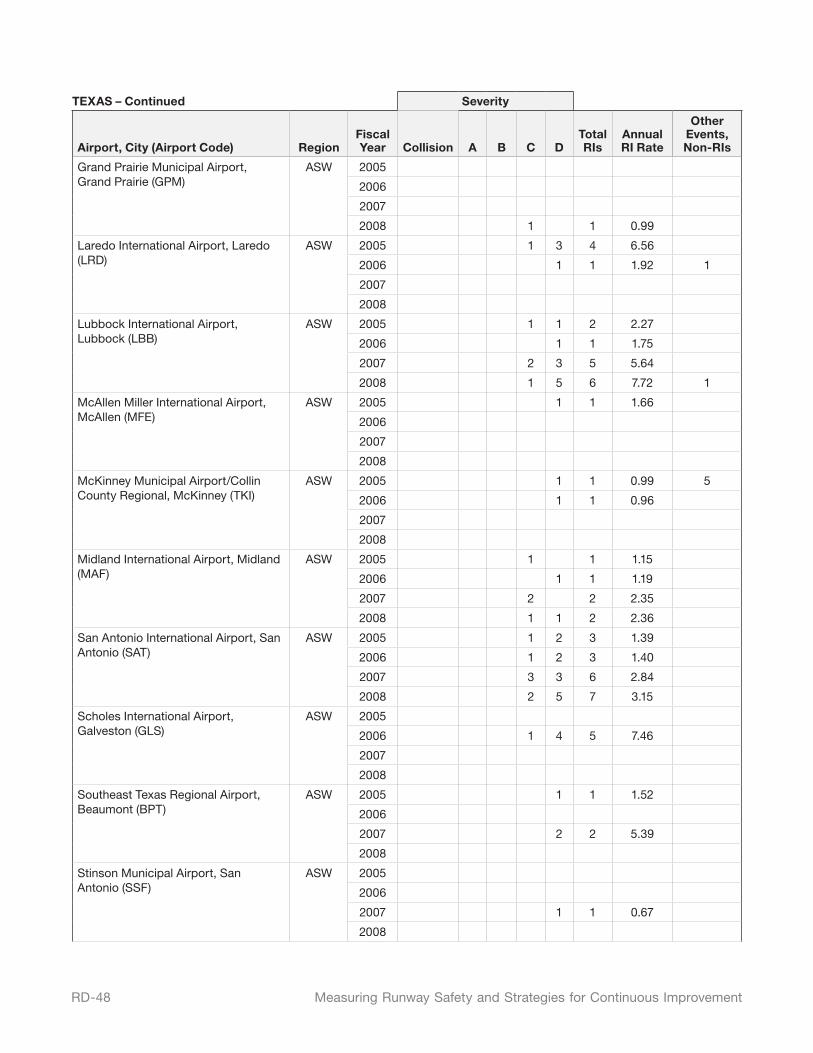
RD-48 Measuring Runway Safety and Strategies for Continuous Improvement
TEXAS – Continued Severity
Airport, City (Airport Code) RegionFiscal Year Collision A B C D
Total RIs
Annual RI Rate
Other Events, Non-RIs
Grand Prairie Municipal Airport, Grand Prairie (GPM)
ASW 2005
2006
2007
2008 1 1 0.99
Laredo International Airport, Laredo (LRD)
ASW 2005 1 3 4 6.56
2006 1 1 1.92 1
2007
2008
Lubbock International Airport, Lubbock (LBB)
ASW 2005 1 1 2 2.27
2006 1 1 1.75
2007 2 3 5 5.64
2008 1 5 6 7.72 1
McAllen Miller International Airport, McAllen (MFE)
ASW 2005 1 1 1.66
2006
2007
2008
McKinney Municipal Airport/Collin County Regional, McKinney (TKI)
ASW 2005 1 1 0.99 5
2006 1 1 0.96
2007
2008
Midland International Airport, Midland (MAF)
ASW 2005 1 1 1.15
2006 1 1 1.19
2007 2 2 2.35
2008 1 1 2 2.36
San Antonio International Airport, San Antonio (SAT)
ASW 2005 1 2 3 1.39
2006 1 2 3 1.40
2007 3 3 6 2.84
2008 2 5 7 3.15
Scholes International Airport, Galveston (GLS)
ASW 2005
2006 1 4 5 7.46
2007
2008
Southeast Texas Regional Airport, Beaumont (BPT)
ASW 2005 1 1 1.52
2006
2007 2 2 5.39
2008
Stinson Municipal Airport, San Antonio (SSF)
ASW 2005
2006
2007 1 1 0.67
2008
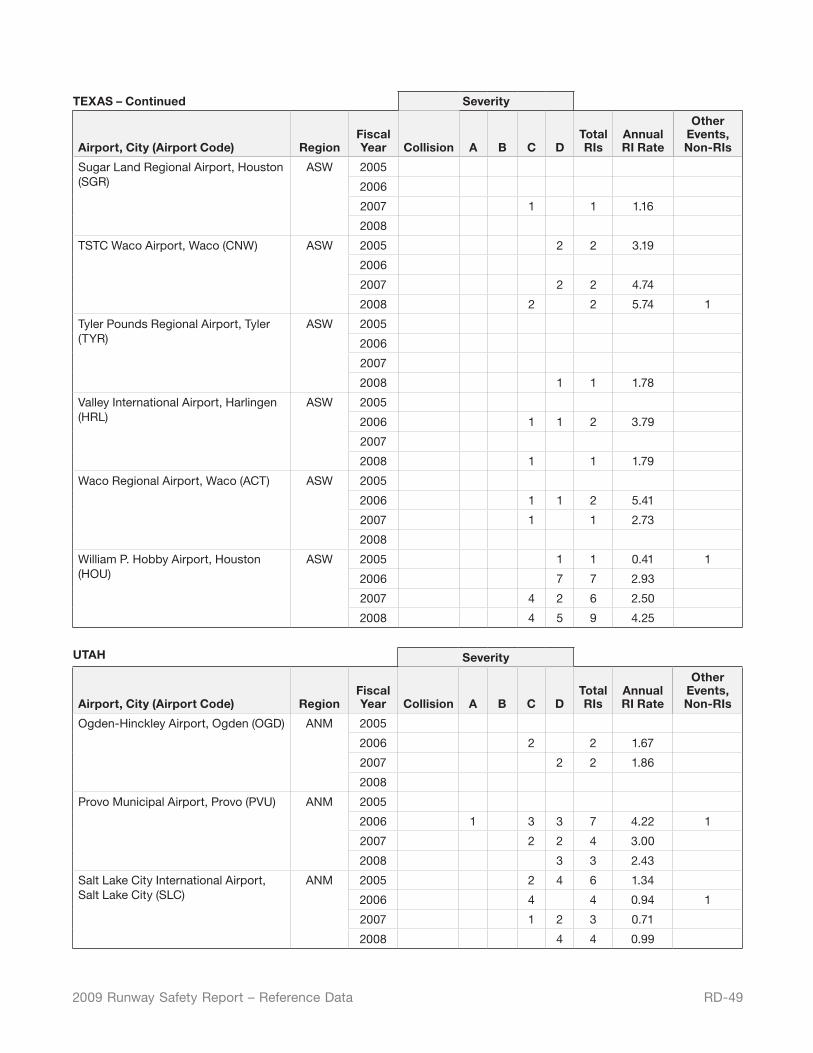
RD-492009 Runway Safety Report – Reference Data
TEXAS – Continued Severity
Airport, City (Airport Code) RegionFiscal Year Collision A B C D
Total RIs
Annual RI Rate
Other Events, Non-RIs
Sugar Land Regional Airport, Houston (SGR)
ASW 2005
2006
2007 1 1 1.16
2008
TSTC Waco Airport, Waco (CNW) ASW 2005 2 2 3.19
2006
2007 2 2 4.74
2008 2 2 5.74 1
Tyler Pounds Regional Airport, Tyler (TYR)
ASW 2005
2006
2007
2008 1 1 1.78
Valley International Airport, Harlingen (HRL)
ASW 2005
2006 1 1 2 3.79
2007
2008 1 1 1.79
Waco Regional Airport, Waco (ACT) ASW 2005
2006 1 1 2 5.41
2007 1 1 2.73
2008
William P. Hobby Airport, Houston (HOU)
ASW 2005 1 1 0.41 1
2006 7 7 2.93
2007 4 2 6 2.50
2008 4 5 9 4.25
UTAH Severity
Airport, City (Airport Code) RegionFiscal Year Collision A B C D
Total RIs
Annual RI Rate
Other Events, Non-RIs
Ogden-Hinckley Airport, Ogden (OGD) ANM 2005
2006 2 2 1.67
2007 2 2 1.86
2008
Provo Municipal Airport, Provo (PVU) ANM 2005
2006 1 3 3 7 4.22 1
2007 2 2 4 3.00
2008 3 3 2.43
Salt Lake City International Airport, Salt Lake City (SLC)
ANM 2005 2 4 6 1.34
2006 4 4 0.94 1
2007 1 2 3 0.71
2008 4 4 0.99
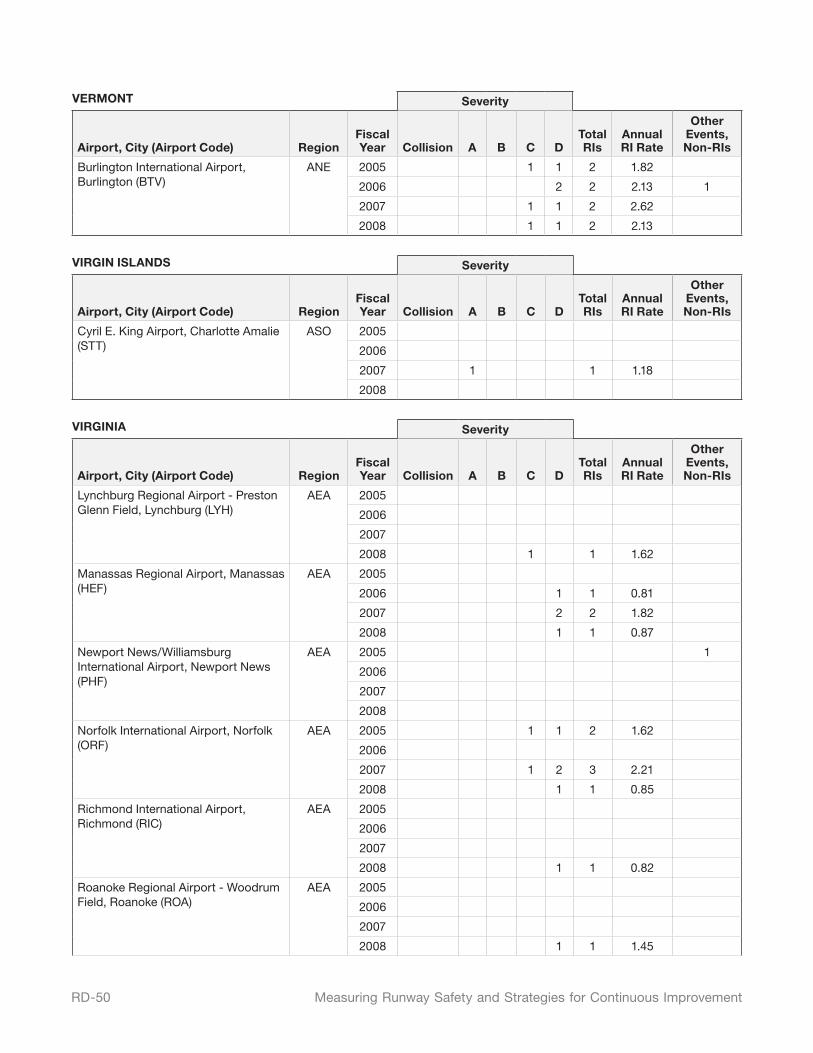
RD-50 Measuring Runway Safety and Strategies for Continuous Improvement
VERMONT Severity
Airport, City (Airport Code) RegionFiscal Year Collision A B C D
Total RIs
Annual RI Rate
Other Events, Non-RIs
Burlington International Airport, Burlington (BTV)
ANE 2005 1 1 2 1.82
2006 2 2 2.13 1
2007 1 1 2 2.62
2008 1 1 2 2.13
VIRGIN ISLANDS Severity
Airport, City (Airport Code) RegionFiscal Year Collision A B C D
Total RIs
Annual RI Rate
Other Events, Non-RIs
Cyril E. King Airport, Charlotte Amalie (STT)
ASO 2005
2006
2007 1 1 1.18
2008
VIRGINIA Severity
Airport, City (Airport Code) RegionFiscal Year Collision A B C D
Total RIs
Annual RI Rate
Other Events, Non-RIs
Lynchburg Regional Airport - Preston Glenn Field, Lynchburg (LYH)
AEA 2005
2006
2007
2008 1 1 1.62
Manassas Regional Airport, Manassas (HEF)
AEA 2005
2006 1 1 0.81
2007 2 2 1.82
2008 1 1 0.87
Newport News/Williamsburg International Airport, Newport News (PHF)
AEA 2005 1
2006
2007
2008
Norfolk International Airport, Norfolk (ORF)
AEA 2005 1 1 2 1.62
2006
2007 1 2 3 2.21
2008 1 1 0.85
Richmond International Airport, Richmond (RIC)
AEA 2005
2006
2007
2008 1 1 0.82
Roanoke Regional Airport - Woodrum Field, Roanoke (ROA)
AEA 2005
2006
2007
2008 1 1 1.45
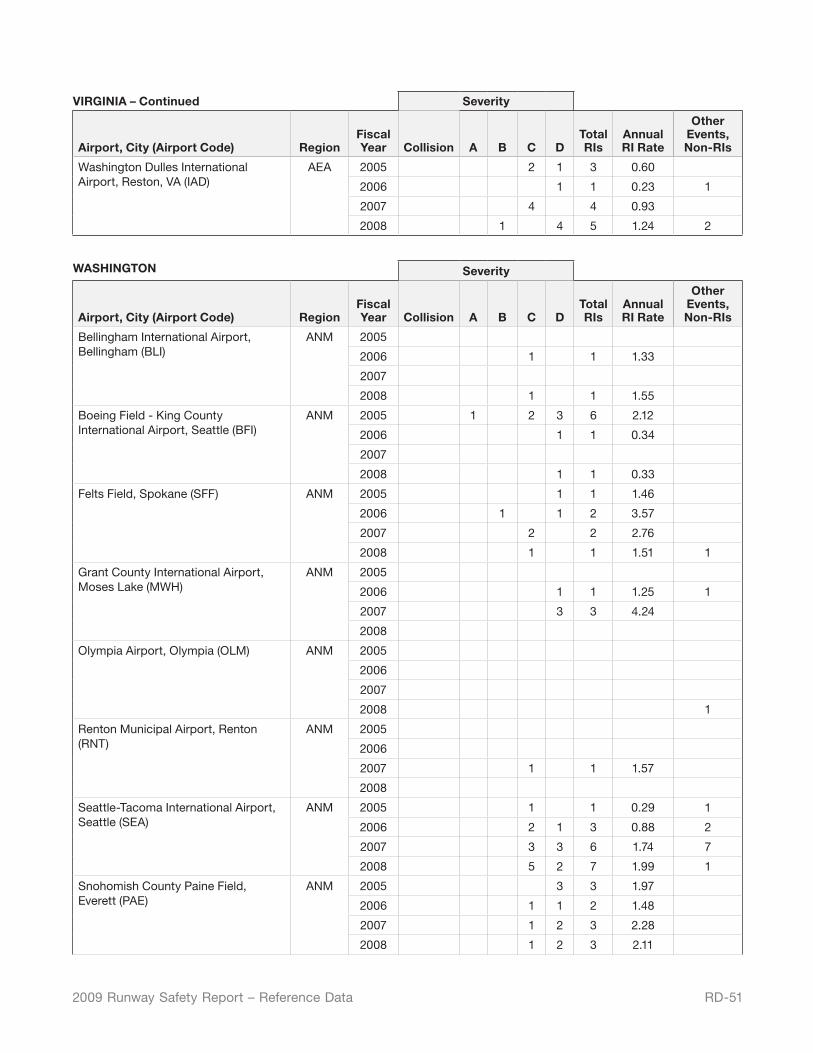
RD-512009 Runway Safety Report – Reference Data
VIRGINIA – Continued Severity
Airport, City (Airport Code) RegionFiscal Year Collision A B C D
Total RIs
Annual RI Rate
Other Events, Non-RIs
Washington Dulles International Airport, Reston, VA (IAD)
AEA 2005 2 1 3 0.60
2006 1 1 0.23 1
2007 4 4 0.93
2008 1 4 5 1.24 2
WASHINGTON Severity
Airport, City (Airport Code) RegionFiscal Year Collision A B C D
Total RIs
Annual RI Rate
Other Events, Non-RIs
Bellingham International Airport, Bellingham (BLI)
ANM 2005
2006 1 1 1.33
2007
2008 1 1 1.55
Boeing Field - King County International Airport, Seattle (BFI)
ANM 2005 1 2 3 6 2.12
2006 1 1 0.34
2007
2008 1 1 0.33
Felts Field, Spokane (SFF) ANM 2005 1 1 1.46
2006 1 1 2 3.57
2007 2 2 2.76
2008 1 1 1.51 1
Grant County International Airport, Moses Lake (MWH)
ANM 2005
2006 1 1 1.25 1
2007 3 3 4.24
2008
Olympia Airport, Olympia (OLM) ANM 2005
2006
2007
2008 1
Renton Municipal Airport, Renton (RNT)
ANM 2005
2006
2007 1 1 1.57
2008
Seattle-Tacoma International Airport, Seattle (SEA)
ANM 2005 1 1 0.29 1
2006 2 1 3 0.88 2
2007 3 3 6 1.74 7
2008 5 2 7 1.99 1
Snohomish County Paine Field, Everett (PAE)
ANM 2005 3 3 1.97
2006 1 1 2 1.48
2007 1 2 3 2.28
2008 1 2 3 2.11
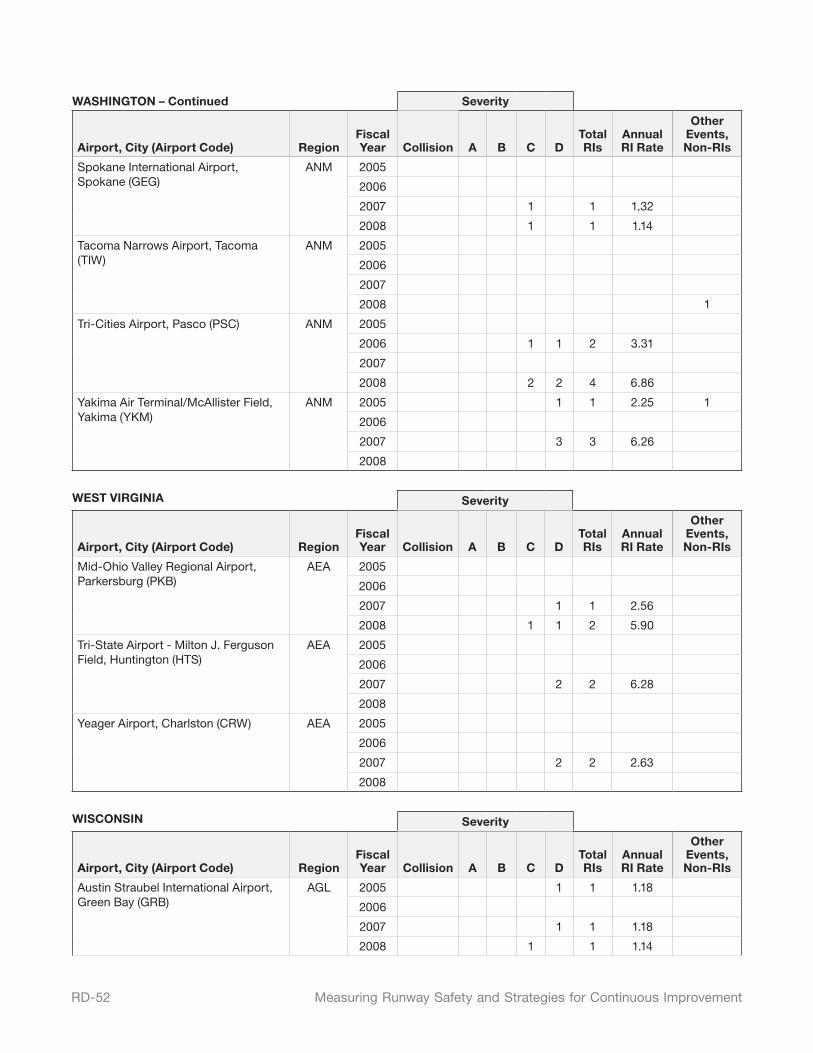
RD-52 Measuring Runway Safety and Strategies for Continuous Improvement
WASHINGTON – Continued Severity
Airport, City (Airport Code) RegionFiscal Year Collision A B C D
Total RIs
Annual RI Rate
Other Events, Non-RIs
Spokane International Airport, Spokane (GEG)
ANM 2005
2006
2007 1 1 1.32
2008 1 1 1.14
Tacoma Narrows Airport, Tacoma (TIW)
ANM 2005
2006
2007
2008 1
Tri-Cities Airport, Pasco (PSC) ANM 2005
2006 1 1 2 3.31
2007
2008 2 2 4 6.86
Yakima Air Terminal/McAllister Field, Yakima (YKM)
ANM 2005 1 1 2.25 1
2006
2007 3 3 6.26
2008
WEST VIRGINIA Severity
Airport, City (Airport Code) RegionFiscal Year Collision A B C D
Total RIs
Annual RI Rate
Other Events, Non-RIs
Mid-Ohio Valley Regional Airport, Parkersburg (PKB)
AEA 2005
2006
2007 1 1 2.56
2008 1 1 2 5.90
Tri-State Airport - Milton J. Ferguson Field, Huntington (HTS)
AEA 2005
2006
2007 2 2 6.28
2008
Yeager Airport, Charlston (CRW) AEA 2005
2006
2007 2 2 2.63
2008
WISCONSIN Severity
Airport, City (Airport Code) RegionFiscal Year Collision A B C D
Total RIs
Annual RI Rate
Other Events, Non-RIs
Austin Straubel International Airport, Green Bay (GRB)
AGL 2005 1 1 1.18
2006
2007 1 1 1.18
2008 1 1 1.14
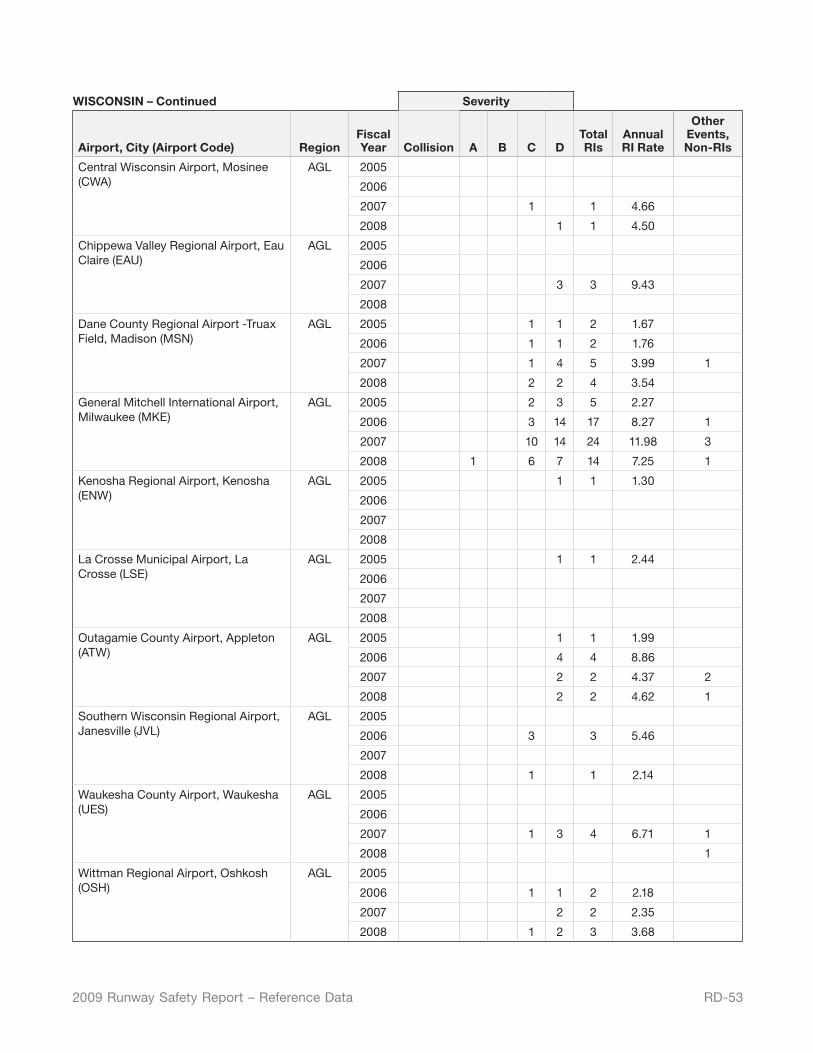
RD-532009 Runway Safety Report – Reference Data
WISCONSIN – Continued Severity
Airport, City (Airport Code) RegionFiscal Year Collision A B C D
Total RIs
Annual RI Rate
Other Events, Non-RIs
Central Wisconsin Airport, Mosinee (CWA)
AGL 2005
2006
2007 1 1 4.66
2008 1 1 4.50
Chippewa Valley Regional Airport, Eau Claire (EAU)
AGL 2005
2006
2007 3 3 9.43
2008
Dane County Regional Airport -Truax Field, Madison (MSN)
AGL 2005 1 1 2 1.67
2006 1 1 2 1.76
2007 1 4 5 3.99 1
2008 2 2 4 3.54
General Mitchell International Airport, Milwaukee (MKE)
AGL 2005 2 3 5 2.27
2006 3 14 17 8.27 1
2007 10 14 24 11.98 3
2008 1 6 7 14 7.25 1
Kenosha Regional Airport, Kenosha (ENW)
AGL 2005 1 1 1.30
2006
2007
2008
La Crosse Municipal Airport, La Crosse (LSE)
AGL 2005 1 1 2.44
2006
2007
2008
Outagamie County Airport, Appleton (ATW)
AGL 2005 1 1 1.99
2006 4 4 8.86
2007 2 2 4.37 2
2008 2 2 4.62 1
Southern Wisconsin Regional Airport, Janesville (JVL)
AGL 2005
2006 3 3 5.46
2007
2008 1 1 2.14
Waukesha County Airport, Waukesha (UES)
AGL 2005
2006
2007 1 3 4 6.71 1
2008 1
Wittman Regional Airport, Oshkosh (OSH)
AGL 2005
2006 1 1 2 2.18
2007 2 2 2.35
2008 1 2 3 3.68
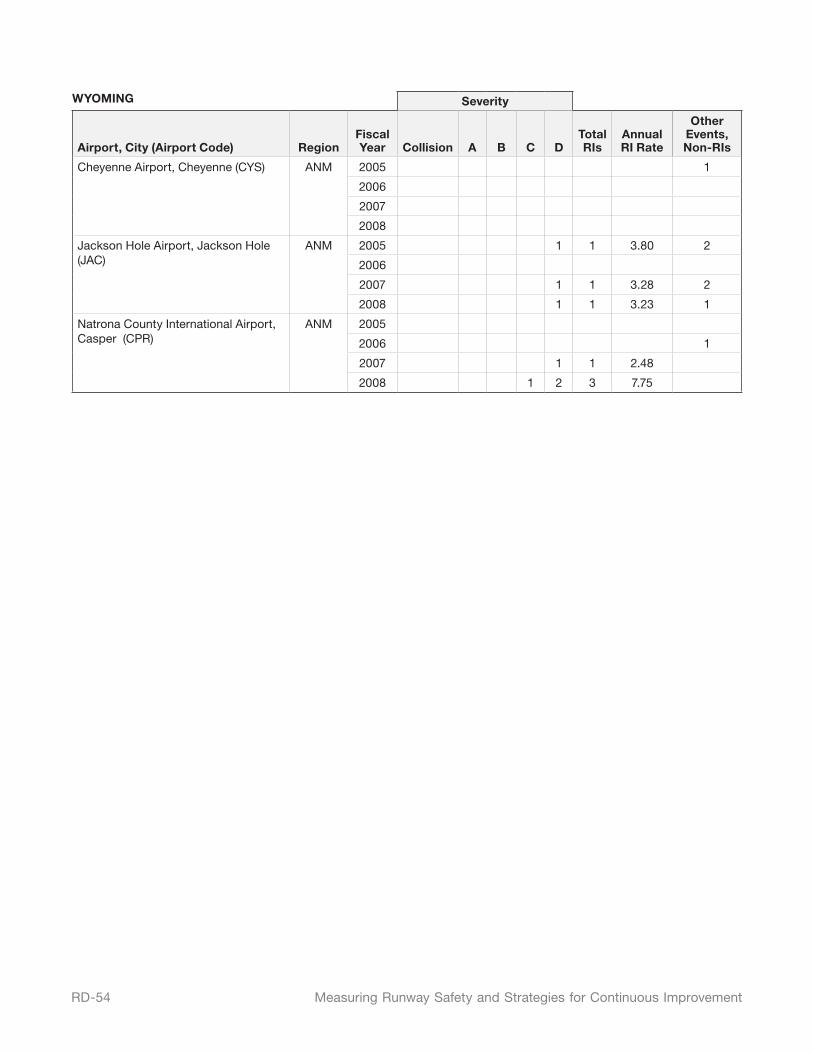
RD-54 Measuring Runway Safety and Strategies for Continuous Improvement
WYOMING Severity
Airport, City (Airport Code) RegionFiscal Year Collision A B C D
Total RIs
Annual RI Rate
Other Events, Non-RIs
Cheyenne Airport, Cheyenne (CYS) ANM 2005 1
2006
2007
2008
Jackson Hole Airport, Jackson Hole (JAC)
ANM 2005 1 1 3.80 2
2006
2007 1 1 3.28 2
2008 1 1 3.23 1
Natrona County International Airport, Casper (CPR)
ANM 2005
2006 1
2007 1 1 2.48
2008 1 2 3 7.75
A Message from the FAA Director of Runway Safety
Dear Colleagues:
The FAA’s Runway Safety Call to Action initiative launched two years ago was an ambitious undertaking aimed squarely at reducing the frequency and severity of runway incursions. A series of near-, mid- and long-term goals comprised the Call to Action ranging from training and heightening awareness at airports and in cockpits to enhanced airport signage and markings to moving map technology for pilots and vehicle drivers. As you will conclude from this annual report, progress has been formidable and is on track to continue.
While the Call to Action provided a considerable boost to our redoubling of runway safety efforts, the stark reality is such that a never-ending continuum is fundamental to achieving long-term success. Over the coming months and years, new techniques, procedures, lighting and technology will be introduced — all with the specific focus of preventing incursions and enhancing runway safety. Some examples include a change to the “Position and Hold” instruction from a controller to an aircraft which has been used for decades to maximize runway utilization and streamline operations. That phrase soon will be replaced by “Line Up and Wait”, which will more clearly convey the instruction as well as provide U.S. compliance with worldwide ICAO standards. Runway Status Light Systems, which warn pilots of an occupied runway while taxiing, taking off or landing, will be installed at 22 airports across the United States by 2011. Finally, a cockpit moving map display with “own ship” capability that will enable flight crews to determine exactly where their aircraft is on an airport vis-à-vis runways and other aircraft is currently being tested and will be operational within a few years.
I urge you to carefully review this Runway Safety Report as it will provide you with facts, figures and an accurate perspective of where we have come from, where we are, and where we are going in the never-ending challenge to improve runway safety.
Sincerely,
Wes Timmons Director, Office of Runway Safety
Annual RunwaySafety Report 2009
Federal Aviation Administration
800 Independence Avenue, SW
Washington, DC 20591
Air Traffic Organization
05.012.09