ANNUAL RESULTS
148
ANNUAL RESULTS STRATEGY RESULTS CSR
-
Upload
truonglien -
Category
Documents
-
view
226 -
download
1
Transcript of ANNUAL RESULTS

ANNUAL RESULTS
STRATEGY RESULTS CSR


2013 Annual Results
CONTENTS I. MANAGEMENT AND SUPERVISORY BODIES
at 31 December 2013
II. ANNUAL REPORT 3 1 Risk and uncertainty factors .................................................................................................................3
2 Group activities.....................................................................................................................................8
3 Cash and capital resources................................................................................................................22
III. CONSOLIDATED FINANCIAL STATEMENTS AT 31
DECEMBER 2013 2 Consolidated statement of income.........................................................................................................28
Consolidated statements of income and expenses recognised directly in equity..................................30
Consolidated balance sheets .................................................................................................................32
Consolidated statement of cash flows....................................................................................................34
Consolidated statement of changes in equity ........................................................................................36
Notes to the consolidated financial statements......................................................................................37
IV. STATUTORY AUDITORS’ REPORT ON THE 2013
CONSOLIDATED FINANCIAL STATEMENTS 1
PSA PEUGEOT CITROËN 2013 Annual Results - 1
I. MANAGEMENT AND SUPERVISORY BODIES at 31 December 2013
Supervisory Board CHAIRMAN Thierry Peugeot DEPUTY CHAIRMEN Jean-Philippe Peugeot Jean-Louis Silvant SUPERVISORY BOARD MEMBERS Patricia Barbizet Louis Gallois Pamela Knapp Jean-François Kondratiuk (employee representative) Jean-Paul Parayre Robert Peugeot Thierry Pilenko Henri Philippe Reichstul Dominique Reiniche Marie-Hélène Roncoroni Geoffroy Roux de Bézieux Anne Valleron (employee shareholder representative) NON-VOTING ADVISORS Marc Friedel François Michelin Roland Peugeot
Managing Board CHAIRMAN Philippe Varin MEMBERS OF THE MANAGING BOARD
Jean-Baptiste de Chatillon Grégoire Olivier Jean-Christophe Quémard Carlos Tavares (at 01/01/2014)
II. ANNUAL REPORT 1. RISK AND UNCERTAINTY FACTORS
Principal risk factors specific to the Group and its activity In its various business lines, the PSA Peugeot Citroën Group ensures that the risks inherent in its activities are controlled. The various operating units identify and assess risks and evaluate the related internal controls on an on-going basis, in France and abroad, within the main units of the Automotive Division and the non-Automotive subsidiaries (except Faurecia which has its own system). The principal specific risk factors to which the Group may be exposed will be described in depth in the 2013 Registration Document that will be published in March 2014, and include notably:
1.1 Operational risks
They include in particular: risks related to the Group's operating and geopolitical environment, risks related to the development, launch and sale of new vehicles, customer and dealer risks, raw material risks, supplier risks, industrial risks, environmental risks, risks related to occupational health and safety, risks related to cooperation agreements and risks related to information systems.
• Risks related to the Group's operating and geopolitical environment
A difficult operating environment is likely to influence the Group's activities and thus its financial results. Therefore, periods of reduced economic activity and, even more so, periods of crisis may contribute to substantial fall in demand in one or more geographic markets. The impact for the Group can be even greater if the falloff in demand hits the regions where PSA Peugeot Citroën has a strong sales presence.
In areas outside Europe, the Group is, de facto, exposed to various risks, including:
- Exchange rate risk: sharp falls in local currencies against the euro or currency overvaluation may affect the Group’s ability to sell its products in certain markets;
- unfavourable changes in tax and/or customs regulations in the countries with which the Group trades;
- Geopolitical events: the Group may be exposed to risks such as popular uprisings, diplomatic crises, the overthrow of a regime, arbitrary or discriminatory behaviour, or a war in a foreign country. For instance, the Group decided to suspend its shipments to Iran because of difficulties finding secure sources of funding.
Risk management and control processes
The Group has a tight managerial organisation enabling it to react very rapidly to various types of risk situations: thus, in a context of strong commercial competition where the European market is expected to be depressed on a long-term basis, the Group decided to strengthen its performance plan by implementing new cost reduction operations. The Group’s globalisation strategy – which primarily involves internationalising its business activities – is part of its strategy to deal with any negative consequences that could arise in a particular geographic area as a result of a recession or serious geopolitical events.
The Group’s exposure to exchange rate risks is managed mostly on a centralised basis by PSA International (PSAI) which sets up the appropriate currency hedges where required. In addition, the impact of negative currency effects is passed on in selling prices wherever possible. In addition, please refer to Note 36 in the Notes to the consolidated financial statements at 31 December 2013.
• Risks related to the development, launch and sale of new vehicles
The decision to develop new vehicle models or subassemblies and to introduce them in the market is backed by marketing and profitability studies. Profitability calculations are based primarily on unit sales forecasts. Any downward adjustment in a unit sales forecast may lead to the recognition of i) an impairment loss on moulds and tooling or capitalised development costs depreciated/amortised over the commercial life of the vehicle models concerned or ii) a provision to cover any contractual penalties that may be imposed in the event of a breach of take-or-pay clauses included in the Group’s cooperation agreements with other carmakers.
PSA PEUGEOT CITROËN 2013 Annual Results - 3

The development of new vehicles and subassemblies also exposes the Group to risks arising from constant changes in European and global regulations, particularly in the areas of safety and the environment. The overall trend is towards increasingly strict regulations. New regulations on the CO2 emissions of light commercial vehicles are expected. China is also reinforcing its regulations on new technologies and CO2 emissions. In Brazil, the 2013-2017 INOVAR Auto regulatory obligations imposed on vehicle sales (CO2 level, Local Integration level, R&D expenditure level in Brazil) apply to the Group and to its competitors.
Technical risks related to product quality and safety can lead carmakers to recall vehicles in order to correct the identified defects.
As regards sales risks, the Group is strongly exposed to the mature European market, in a current context of relative economic decline of the European countries, saturation of vehicle fleets and reduced space allocated for vehicles in urban areas. On the European market, given the substantial amounts allocated to selling expenses for promoting sales, there is also a risk concerning the effective use of selling expense budgets.
The strong growth in volumes in China leads the Group to be increasingly exposed to the Chinese market. The main risk concerns reduced growth in this market which would soon lead to a situation of overcapacity given the rate of investment by manufacturers, and thus to tension on prices and margins. The method of developing PSA activities in China via the two 50% joint ventures: Dongfeng Peugeot Citroën Automobile (DPCA) and Changan PSA Automotive Division (CAPSA), nevertheless shares the financial risk with the partners.
Concerning its development in the Southern Common Market, the Group is potentially exposed to all the risk factors described in the paragraph on risks associated with the Group's operating and geopolitical environment.
Risk management and control processes
The Automotive Programmes Department is tasked with deploying the Group’s strategic vision and enhancing value creation by ensuring the alignment of all of the contributing processes and by leading the implementation of Group programmes. This mission is global in scope. It ensures in particular that project inductions are carried out in accordance with the Worldwide Master Plan, both by the programme functions (vehicles, modules, services), and by the contributing departments (industrial, human resources, etc.) and that the economic performance of programmes is kept in line with the objectives defined in the strategic planning framework.
To cover the project management risks related to new vehicle development and process engineering, the Group leverages a comprehensive design and development process, known as the operational development plan, which is regularly updated. For each vehicle project, a set of product services, profitability, quality, time-to-market and CO2 reduction objectives are set. Progress in meeting these objectives is tracked by a system of project milestones, corresponding to the various stages at which senior management reviews all the financial and technical indicators. In addition, the Quality Department authorises the sale of each vehicle that leaves the production line and organises any necessary recalls of faulty vehicles delivered to dealers or customers. It also ensures that vehicles in the marketing or design stage comply with the applicable regulations, particularly those relating to safety and the environment. Close consideration of customer after-sales requirements, from vehicle design onwards (ease of repairs, diagnostics, etc.), also contributes to constant quality improvement in the Group's new models.
The Group considers it of great importance that effective time-frames for new regulations are determined based on the results of objective impact studies and that they are realistic, taking into account the time that carmakers will reasonably need to adapt. The Group’s interaction with the regulatory authorities is designed to ensure this is the case. In Brazil, the Group has set up centralised management of the INOVAR Auto regulatory obligations.
Regulatory watch systems and appropriate Action Plans have been set up in Europe and in the Group’s main host countries outside Europe.
In Europe, the Group has strengthened its market forecast process, relying on a cautious approach to the development of European markets. Actions to strengthen internal controls and manage margins and variable selling expenses were also taken in 2013. Thus the Group deployed a self-assessment approach to the internal controls of its subsidiaries over selling expenses, and introduced in all countries a new system for analysing margins and variable selling expenses. Audits targeted by country or by kind of expenditure were also conducted by the Audit and Risk Management Department. Finally, the Group is gradually freeing itself from its dependence on the European market through its growing internationalisation.
To date in China, the development of the market appears well controlled in so far as the developing areas in the country are taking over from saturated cities. The Group is managing the vehicle and subassembly projects of its two joint ventures via dedicated internal governance, as well as via the boards of its two joint ventures. Concerning CAPSA, the industrial and sales development of the premium-oriented DS range are under way and do not contribute any specific alerts. The strengthening of the partnership with DPCA will also enable the Group to have an engineering and export base for the rest of Asia, the activity of which may help compensate for any decline in the Chinese market.
In the Southern Common Market, the specific risk management and control processes were strengthened during 2013, with in particular:
- the introduction of routine risk analyses before validation of the vehicle programming process;
- strengthening Local Integration action plans on vehicle and subassembly projects aiming to reduce the Group's exposure to currency risk;
- strengthening the currency hedging policy on the Southern Common Market;

- introducing crisis management procedures in order to react rapidly (particularly given the macro-economic tensions concerning Argentina).
• Raw materials risks
The Group’s Automotive Division and Automotive Equipment Division (Faurecia) are exposed to raw materials risk either as a result of their direct purchases of raw materials or indirectly when purchasing components from suppliers. Purchases of raw materials thus represented 30% of the Purchasing series budget in 2013. They are either industrial products such as steel and plastics whose prices and related adjustments are negotiated between purchasing officers and vendors, or commodities traded on organised markets, such as aluminium, copper, lead or precious metals, in which case the purchase prices of the raw materials or components concerned are based directly on quoted market prices. Raw materials with the greatest impact on production costs are as follows, in declining order:
- for negotiated raw materials: steel (38% of total raw material series purchasing costs), thermoplastics and elastomers (24%);
- for listed raw materials: aluminium (8% of the total cost of raw material purchases), precious metals (3%) and non-ferrous metals (copper, zinc, lead) (3%).
The Group has identified two different types of raw materials risk:
1. supply risk associated with the availability of raw materials;
2. financial risk associated with fluctuations in raw material prices.
Risk management and control processes
To respond to these two risks, the strategy implemented by the Purchasing Department is aimed at fully leveraging a number of action points, such as optimising global sourcing, using bulk purchases for raw materials (for both direct and indirect transactions), increasing flexibility in terms of substitute materials, using recycled and green materials, recovering and reusing by-products and putting in place financial hedging mechanisms.
The implementation of this materials strategy is managed by quarterly reviews chaired by the Director of Research and Development and the Director of Group Purchasing. It is deployed by technical Purchasing units organised by material, which are responsible for implementing the action points and regularly monitoring the supply risks.
In order to limit the economic risk for listed raw materials, the Purchasing Department and Corporate Finance have set up a medium-term (3-year) financial hedging policy through the subsidiary PSA International. This policy is subject to quarterly review, chaired by the Group's Financial Director and the Purchasing Director, during which decisions on the positions taken are ratified in accordance with the governance regulations, updated consumption estimates and the major market trends. No speculative positions are taken and the principle in periods of rising prices is to secure at least 50 % of requirements for the coming year and 20 % of requirements for the next 2 years.
In addition, please refer to Note 36 in the Notes to the consolidated financial statements at 31 December 2013.
• Risks associated with cooperation agreements
To accelerate its development and reduce engineering and production costs, PSA Peugeot Citroën has implemented a policy of entering into cooperation agreements with other carmakers. This policy, based on mutual trust and risk sharing, forms part of the Worldwide Master Plan. This policy applies both to vehicle platforms and subassemblies (gear boxes, engines and electrical components). The Group also regularly grants production licences to certain industrial partners.
In the pre-signature negotiation phase for cooperation agreements there is a risk that the partner concerned could use the information provided to it by PSA Peugeot Citroën.
Once the cooperation agreement has been signed, the risk run by PSA Peugeot Citroën is basically financial. It takes the form of potential payment of penalties for failure to take the volumes reserved or to compensate for the negative impact of volume reductions on component purchase prices, for R&D cost overruns or overvaluation, and for investments, when the partner is acting as project manager.
In cases where a project’s profitability is jeopardised, a provision for onerous contracts and/or an asset impairment loss is recorded in the consolidated financial statements to reflect the future costs that will be incurred.
Failure to respect intellectual property in cases where the partner grants licences to third parties with no pecuniary consideration for PSA Peugeot Citroën is another form of risk, as is a low-quality product manufactured by the partner, requiring remedial action with customers which could affect the image of PSA Peugeot Citroën products.
The strategic alliance between the PSA Peugeot Citroën Group and General Motors announced on 29 February 2012 (the "Alliance") and signed on 19 December 2012, gave rise to contracts in relation to the implementation of the Alliance. These contracts contain a certain number of termination provisions, such as those relating to a change in control or a material adverse event.
In addition, the estimated amount and timing of the synergies announced by the Group in connection with the Alliance are based on assumptions, including the successful implementation of the next steps of the Alliance, which may not be realised.
PSA PEUGEOT CITROËN 2013 Annual Results - 5

The announced amount of synergies may not be achieved, or may be achieved only at a later time than currently expected, which could have a material adverse effect on the business, results, prospects or reputation of the Group.
Risk management and control processes
To limit risk relating to performance of the contract from the exploratory phase, the Group has strengthened its control processes for projects termed strategic, via stricter regulations in terms of Contract Management, a procedure approved by the Executive Committee in May 2013 specifying the arrangements for responsibility, sequencing (authority and guidelines, monitoring the negotiation, validation prior to signature, monitoring contract performance) and validation (Executive Committee, Managing Board).
At the operational level, Corporate Finance and the Programmes Department have set up a process for verifying that the partners involved in cooperation ventures comply with their contractual commitments.
Part of this process entails setting up governance bodies for each venture, with a referral procedure for settling any disputes that may arise. These entities enable regular activity and joint decision-making, in particular, action plans aimed at rectifying any potential problems or mitigating the related risks.
1.2. Financial market risks
The Group is exposed to liquidity risk, as well as interest rate risks, counterparty risks, exchange rate risk and other market risks related in particular to fluctuations in commodity prices and in equity markets. Note 36 to the 2013 consolidated financial statements provides information on risk management, which is primarily carried out by Corporate Finance, and identified risks and the Group policies designed to manage them.
1.3. Risks associated with Banque PSA Finance activity
These include in particular risks associated with financial markets and the financial institution status of Banque PSA Finance, operational risks and credit risks. (See Note 36 in the Notes to the consolidated financial statements at 31 December 2013).
For more detail, please refer to the 2013 annual report of Banque PSA Finance, available on the website, www.banquepsafinance.com
1.4. Legal and contractual risks
These risks include in particular: legal and arbitration proceedings, financial covenants, pension obligations and end-of-career benefits, risks associated with intellectual property rights, commitments made as part of cooperation agreements, whether they are charged to a provision or recognised as off-balance-sheet commitments.
The PSA Peugeot Citroën Group is exposed to legal risks as an employer and in connection with the design and distribution of vehicles, the purchase of components and the supply of services.
To manage these risks, the Group implements preventive policies covering workplace health and safety, industrial and intellectual property, the manufacturing environment, vehicle safety, product and service quality and the security of the Group’s transactions from a legal standpoint.
Like all economic operators, the Group is exposed, in France and in other countries where it is established, to legal risks associated with competition law. The identified risks have been mapped; they concern the fields of purchasing, trade and cooperation agreements.
To prevent these risks, the Group has, both centrally and in the countries where it is established, in-house lawyers and external advisors, experts in competition law, who work closely with the line managers concerned. Furthermore, in 2013 the Group initiated continuing education actions on competition law for the line managers likely to face risks of anti-competitive practices, while at the same time deploying classroom and distance training courses. In 2013, these actions were initiated in the trade field. In 2014, these actions will continue and will be extended within the Group.
• Legal and arbitration proceedings
As of 31 December 2013, no Group company was involved in any claims or litigation that had a material impact on the consolidated financial statements.

During the period covering the last twelve months, there were no government, court or arbitration proceedings that could have or have had a material impact on the Group's financial situation or profitability. Similarly, the Group is not aware of any proceedings pending or threatened, likely to have a material impact on its financial position or profitability.
Concerning provisions for claims and litigation, please refer to Note 27.2 to the Consolidated Financial Statements at 31 December 2013.
• Financial covenants
The details of financial covenants applicable to debts and undrawn lines of credit are given in Note 36.1 A for manufacturing and sales activities and financing activities.
All clauses are currently complied with.
For more details, please refer to Chapter 4 Risk factors of the 2013 Registration Document, which will be published in March 2014.
PSA PEUGEOT CITROËN 2013 Annual Results - 7

2. GROUP ACTIVITIES
2.1 Significant events in the 2013 financial year
2.1.1 Sale of BNP Paribas shares On 14 March 2013, PSA Peugeot Citroën* announced that it had sold its entire participating interest, representing 4,004,695 BNP Paribas shares, i.e. 0.32% of the capital in BNP Paribas, for a total amount of around €177 million.
These shares were placed at a price of €44.24 per share.
Pursuant to this transaction, PSA Peugeot Citroën will no longer hold any BNP Paribas share. This transaction comes within the framework of its active balance sheet management by PSA Peugeot Citroën.
(*) Through its subsidiary Grande Armée Participations
2.1.2 New milestones in PSA Peugeot Citroën’s development in China On 2 July 2013 in Wuhan, China, Philippe Varin, Chairman of the PSA Peugeot Citroën Managing Board, opened the third plant operated by Dongfeng Peugeot Citroën Automobiles (DPCA), the Group's joint venture with the Chinese manufacturer Dongfeng.
This third plant will enable DPCA to increase its production capacity from 450,000 to 600,000 vehicles/year from 2013, before reaching 750,000 vehicles/year in 2015.
The opening of the Wuhan plant allowed the partners to begin production of the new Citroën C-Elysée, which represents a new step in DPCA’s sales offensive. The Wuhan 3 plant started production of the Peugeot 301 at the end of 2013.
DPCA clearly confirms its market share target of 5% for 2015, supported by its on-going sales offensive.
On 28 September 2013, Philippe Varin opened a new plant in Shenzhen in Guangdong province, China. This is the first plant operated by Changan PSA Automobile Co., Ltd (CAPSA), the Group's joint venture with the Chinese manufacturer “China Changan Automobile Group”. This plant will give CAPSA capacity to build 200,000 vehicles per year.
The joint venture will also have its own R&D centre - construction started in July 2013 - in which CAPSA invests RMB 500 million. The centre’s engineers will work closely with the China Tech Centre, the Group’s R&D centre in Shanghai.
The Shenzhen plant, world best in class for its compactness, high technology process and its Excellence Management System, will produce the Chinese version of the DS5, which was unveiled at the Chengdu Auto Show on 30 August 2013. The new model will spearhead the DS brand’s market offensive in China.
Since "DS World", an institutional showcase for the brand, opened in March 2013 in Shanghai, the sales network has grown rapidly. Following the successive market launches of the imported DS5, DS4 and DS3, CAPSA is writing a new chapter in its history with the introduction of the locally produced DS5.
2.1.3 New Social Contract: agreement signed A New Social Contract was signed following the Central Works Council meeting of 24 October 2013.It is designed to involve employees in the Group’s recovery and to maintain PSA Peugeot Citroën’s industrial and technological base in France, while preserving employees’ basic interests.
It focuses on four main pathways:
• Greater involvement by employees and their representatives in the Group's strategic vision and in each department and site's forward-looking projects;
• A new approach that secures jobs while carrying out collective transformations, particularly to improve the utilisation rate of our plants;
• Deployment of a PSA intergenerational contract that provides for senior leave and the hiring, under work-study schemes, of 2,000 young people;
• Flexibility and wage moderation measures (with no decline in remuneration paid).
The New Social Contract also gives employees a stake in the Company’s recovery through an improved discretionary profit sharing agreement and an additional profit-sharing payment (discretionary or non-discretionary) in early 2014.
Annual expenses related to the New Social Contract are disclosed in Note 9.3.
2.1.4 Carlos Tavares nominated to the Managing Board of PSA Peugeot Citroën to succeed Philippe Varin in 2014
Appointed in June 2009 as President of the Managing board of PSA Peugeot Citroën, confirmed with a new mandate, Philippe Varin, with his management team, has defined and led an extensive program of upgrading the Group's strategic, industrial, commercial and financial plans, all in the context of the major crisis that the European automotive industry has been enduring.
As the Managing Board, with the support of the Supervisory Board, has begun negotiations with different partners on industrial and commercial projects, Philippe Varin expressed the wish that the next step of consolidation and conquest be undertaken under the leadership of a new pilot, enabling the strategy of the Group to be implemented over the long term.
He asked the Supervisory Board to set up a succession process leading to the rapid appointment of a new member of the Managing Board in order to succeed him in 2014.
After conducting extensive research, the Supervisory Board chose Carlos Tavares to succeed the current President of the Managing Board. With this aim, Carlos Tavares joined the Managing Board on 1 January 2014 pending his appointment as President of the Managing Board during 2014.
During this period Philippe Varin will continue his mission as President of the Managing Board, in particular with the responsibility of carrying out strategic discussions begun with the various partners. Carlos Tavares is working with the Managing Board on the action plans aimed at continuing the recovery of the Group.
2.1.5 Impairment loss on Automotive Division assets In accordance with IAS36, the Group’s 2013 financial statements recorded an impairment charge on Automotive Division assets, reflecting the impact of worsening automobile markets and unfavourable exchange rates in Russia and Latin America. This allowance amounts to €1,009 million (see Note 9.1).
It is also maintaining its objectives for 2014 and to this end is stepping up its action plans to offset the negative impact of exchange rates on operating free cash flow.
2.1.6 Implementation of the industrial reorganisation and workforce redeployment plans
As a result of reduced activity in the Automotive Division in Europe, an industrial activity reorganisation and workforce redeployment plan, announced in July 2012, has been implemented since May 2013, following the consultation procedure with employee representative bodies. It includes the following measures:
• The shutdown of production activities at the Aulnay plant (concerning 3,000 persons);
• Adjustment of the production facilities in Rennes, leading to redeployment of 1,400 workers out of a total of 5,600;
A special process for reorienting the Aulnay and Rennes sites towards new industrial and automotive-related activities was established with all the stakeholders concerned.
• Adjusting the Group’s overhead staff.
The Group is continuing to reduce its costs and improve its operational activity, which led to a reduction of 3,600 jobs distributed across all the sites in France. This reduction was achieved through voluntary redundancies.
At the end of December, the Group recorded 7,300 staff members including 2,250 staff departures.
2.1.7 End of vehicle production at the Aulnay site On 25 October 2013, the last car to be produced at the Aulnay-sous-Bois site came off the assembly line. The car was a Citroën C3, which will join the Citroën brand Heritage Conservation Centre.
The Aulnay site will produce spare parts in its body-in-white workshop until 2014. Citroën C3 production will then be entirely carried out at the Poissy (Yvelines) site.
2.1.8 Progress report on the General Motors Alliance • Confirmation of the joint development of two vehicles on PSA platforms:
a B-MPV segment vehicle and a C-CUV segment vehicle;
• Add a new generation B-segment light commercial vehicle cooperation;
• Announce balanced cross vehicle manufacturing ;
• Proceed with purchasing collaboration and confirm early favourable results;
PSA PEUGEOT CITROËN 2013 Annual Results - 9
• After detailed evaluation, the collaboration on a B segment platform and associated small petrol engine is dropped from consideration.
PSA Peugeot Citroen (PSA) and General Motors (GM) announced further steps in their strategic Alliance on 12 December 2013. The Alliance remains structured around the main pillars of joint programs, purchasing, and logistics, focused on Europe and is extended into cross manufacturing.
The two groups confirmed their continuing cooperation for the development of vehicles on PSA platforms: a B-MPV segment model and a C-CUV model. Additionally, the partners will cooperate on new generation products in the light commercial vehicle B-segment, which are based on a PSA new generation platform. The first vehicles from the Alliance are expected to launch starting in 2016.
In addition, the parties will balance manufacturing – with each company producing one vehicle for the other. As announced in October, B-MPVs from both companies will be built in the General Motors Zaragoza plant in Spain.
It was decided that future C-CUV segment vehicles will be produced in the French PSA plant in Sochaux.
The updated synergies expected from the Alliance are estimated at approximately $1.2 billion by 2018. The synergies will be shared about evenly between the two companies.
GM and PSA also amended certain other terms of the Alliance. They will simplify the joint governance of the Alliance and removed as a ground for terminating the Alliance the failure to achieve a minimum number of cooperation programmes within a specific time. GM also waived its right to terminate the Alliance, under certain conditions, in the event of certain other investors acquiring interests in Peugeot S.A., provided that said investors support the Alliance.
On 12 December 2013, PSA Peugeot Citroën formally noted the transfer by GM of its participating interest of 7% in the Group's capital, as well as GM's strongly reaffirmed commitment to the strategic Alliance.
2.1.9 New financing and French State guarantee The Group undertook several financing transactions during the year.
For the Automotive division, these transactions chiefly comprised two bond issues by Peugeot S.A. in a total amount of €1.6 billion, and a further loan of €300 million from the European Investment Bank (EIB).
Faurecia also reconstituted its entire syndicated loan by repaying sums drawn in a total amount of €300 million (see Note 31.3).
Banque PSA Finance issued a €1.2 billion bond and carried out seven securitisation transactions.
The bonds issued by Banque PSA Finance since 2013 are covered by a first demand guarantee by the French State, under the authorisation given by the European Commission for a total principal amount capped at €7 billion (see Note 36.1.A. (b)).
To complement its funding sources, Banque PSA Finance launched in March 2013 a savings account offer targeting individual customers in France under the Distingo brand. Deposits totalled €955 million as of 31 December 2013.
Banque PSA Finance also renewed its bank funding facilities in 2013 (see Note 36.1.A. (b)).
2.1.10 Development of PSA Peugeot Citroën's participating interest in Faurecia
On 30 November 2013, Faurecia announced its decision to proceed with early repayment of the bonds convertible into new or existing shares (OCEANE), issued in 2009. Following this operation, PSA Peugeot Citroën now holds 51.7% of the capital and 68% of the voting rights in Faurecia (see Note 29.2).
2.1.11 Change in PSA Peugeot Citroën's participating interest in the share capital of Française de Mécanique
In 2013, PSA Peugeot Citroën and Renault each expressed the desire to acquire full independence in the management of Française de Mécanique and Société de Transmissions Automatiques and take responsibility for the strategic future of an exclusively owned subsidiary.
Henceforth, PSA Peugeot Citroën has exclusive control of Française de Mécanique and sold its equity stake in Société de Transmissions Automatiques in 2013.
2.1.12 Products Successful launches during the year
2013 was a particularly good year in terms of new products with 17 launches over the year, including nine in the first half, bringing the average age of the range to 3.1 years in 2014.
In particular, these launches include:
- the Peugeot 2008, the new urban crossover from Peugeot, which significantly exceeded its targets, necessitating the setting up of a second production team at the Mulhouse plant;
- the new Peugeot 308, which was a resounding success with nearly 42,000 sales just [three] months after its launch, and a high trim mix;
- the new Citroën C4 Picasso, and Grand C4 - Picasso, best in its category for CO2 emissions.
Innovation and technology
On 22 January 2013, several brand new technologies developed by PSA Peugeot Citroën were presented at the Innovation Day. In particular, in a world first, the Group has unveiled a revolutionary technology: Hybrid Air, a petrol and compressed air full-hybrid solution.
Other brand new solutions to emerging expectations were also presented, available from 2013 on Peugeot and Citroën brand vehicles, including EMP2, the Group's new global modular platform.
On 26 November, and during a Capital Day dedicated to financial analysts and investors gathered together at the ADN Tech Centre in Vélizy, PSA Peugeot Citroën presented the development plan for the Peugeot and Citroën brands and their respective vehicle lines.
This meeting was also the occasion to present the technologies developed by the Group, as well as its innovation strategy.
2.1.13 Important events since the year-end The Group will announce on 19 February 2014, with three specific press releases, major projects of operations to this effect.
Please refer to Note 40 in the Notes to the consolidated financial statements at 31 December 2013.
PSA PEUGEOT CITROËN 2013 Annual Results - 11

2.2 Overview of sales activities
Significant events in 2013
• Worldwide sales of assembled vehicles and spare parts at 2,819,000 units, a fall of 4.9% over the year, and sales of assembled vehicles stable at -0.1%;
• An annual trend that reversed in the fourth quarter with a rise of 4% in sales of assembled vehicles; • Further increase in the share of sales outside Europe to 42% versus 38% in 2012; • Continued upscaling strategy with 19% premium sales, compared with 9% in 2009; • Success of the Peugeot 2008 and 308; • Success of the Citroën C4 Picasso and Grand C4 Picasso; • Successful launch of the DS brand in China; • PSA Peugeot Citroën remains a leader in CO2 emission reduction, with an average of 116.2 grams/km, i.e. a fall of
6.2 grams compared with 2012. In 2013, the world’s automotive markets showed decidedly mixed trends. Thus, the European and Russian markets continued their fall with drops of 1.6% (Europe 30) and 5.4% respectively. In contrast, the Chinese market experienced a rise of +19.1%, and the Latin American market of +2.9%.
In this context, the Group's worldwide sales (assembled vehicles and spare parts) totalled 2,819,000 units, a fall of 4.9%. Sales of assembled vehicles remained almost stable at 2,818,000 units, a fall of 0.1% compared with 2012, and grew by 4% over the fourth quarter.
European market recording further decline
After a fall of 8.6% in 2012, the European market (Europe 30) again dropped in 2013 by 1.6%.
In 2013, only a few markets grew, such as Great Britain and Spain (respectively 11% and 4.1%).
Those markets that experienced a recovery are a long way from the 2007 levels: Spain grew in 2013 to 809,000 vehicle registrations compared with 1,892,000 in 2007.
France recorded a decline of 5.5% and Italy of 7.6% to 1,404,000 vehicle registrations - the lowest level since 1979 - compared with 2,739,000 in 2007.
Across Europe, with 304,000 Light Commercial Vehicle (LCV) registrations, the Group retains its leadership and has a 20.7% market share, almost stable compared with 2013.
In this context, the Group is focusing on the most profitable distribution channels and its market share is 11.9% in Europe 30 compared with 12.7% in 2012.
The Group's internationalisation is confirmed
The internationalisation strategy continues to yield positive results: the share of vehicles sold outside Europe has grown strongly since 2009. With 42% of sales outside Europe in 2013, PSA Peugeot Citroën is on track to achieve its objective of 50% of its sales outside Europe in 2015.
China: very strong growth
The Chinese market recorded growth of 19.1% in 2013. In this context, Group sales increased by 26.1% to 557,000 units versus 442,000 in 2012. The market share is 3.64%. China is PSA Peugeot Citroën's second largest market after France.
Peugeot recorded another rise of 25.8% with 272,000 units sold compared with 216,000 in 2012. Citroën sales grew by 26.3% to 285,000 units as against 226,000 in 2012.
The Peugeot 3008 and the Citroën C4L, launched at the start of the year, and the Peugeot 301 and Citroën C-Elysée, on sale from the second half of 2013, contributed strongly to the commercial development of the Group in China.
In 2014, PSA Peugeot Citroën's sales are expected to continue to grow, particularly with development of the sales network throughout the country and a wider offer.
The middle classes, the Group's core sales target in China, today represent 25% of the Chinese population but will represent 40% by 2020. To accompany this development, the Group is planning annual production capacity of 950,000 vehicles in its Shenzhen (200,000 units for CAPSA) and Wuhan (750,000 units for DPCA) plants. Construction of a fourth plant by DPCA is being studied.

Latin America: still a mixed situation
The Latin American market (Argentina, Brazil, Chile, Mexico) grew overall by 2.9% in 2013 with 5,937,000 vehicle registrations. Detailed analysis of this figure shows major local disparities.
Thus the Brazilian market fell by 1.5% for the first time in 10 years. This decline appears despite the cut in IPI1 introduced in 2012 being maintained throughout 2013, and aggressive sales offers, particularly in the second half of the year. However, the exchange rate trend in the area (versus €) was very unfavourable and strongly penalised the Group's economic performance.
The low level of local integration in the Group's activities amplifies this exchange rate effect.
In this context, PSA Peugeot Citroën's sales in the area are up by 7% compared with 2012, with 303,000 units sold in the Latin America area and a market share of 4.9%. In Argentina, the PSA group is continuing its strong growth, with 140,100 vehicle registrations in 2013 representing growth of 25.5% compared with 2012. In particular, the Group successfully launched the Peugeot 208 and the Citroën C4 Lounge, sales of which have already exceeded forecasts. Group vehicle registrations recorded strong growth both in Chile (+31.5%) and Mexico (+33.4%), well above the markets, which rose respectively by +10.3% and +7.9%.
Russia: major decline in the automotive market
In the context of a slowdown in the Russian economy, the automotive market experienced a distinct decline of 5.4% in 2013. The Group's market share dropped by 0.3 points, to 2.3%.
In 2013, the launches of vehicles adapted for the market, the Peugeot 301 and 208 and the Citroën C-Elysée, added to the product range. Note that the Citroën C4 Sedan, produced locally in Kaluga, was launched in June. These models will allow the Group to strengthen its presence in the Russian market in 2014.
Rest of the World
Thanks to the success of the Peugeot 301 and Citroën C4L and C-Elysée, Group sales are also growing outside these three destinations, particularly in Algeria (+6.9%) and Turkey (+7.6%).
Premium sales increasing
The Group's upscaling strategy relies on strong brands, with clearly differentiated customer territories.
Group upscaling takes the form of increased premium sales2, which went from 505,000 units in 2012 to 540,000 units in 2013, i.e. 19% of the total sales volume.
Vehicles equipped with the "Hybrid4" diesel hybrid technology contribute to the brand upscaling: In Europe, they represent 11% of Peugeot 3008, 16% of Peugeot 508 and 34% of Citroën DS5 sales.
In total, the Group sold 24,319 Hybrids in 2013, and thus became the number two for hybrid sales in Europe.
Successful launches
In 2013, PSA Peugeot Citroën successfully launched several new vehicles.
The urban crossover Peugeot 2008, launched last spring, and the new Peugeot 308 recorded better results than the objectives, with respectively 82,000 and 34,000 orders.
For Citroën, the new C4-Picasso and Grand C4-Picasso, with 58,000 orders, help to boost brand results.
1"Imposto sobre Produtos Industrializados" (tax on industrial products) 2 Premium vehicles offer a level of driving pleasure, safety, quality of finish, connectivity and comfort, etc. that serves as a benchmark in their
segment. They include distinctive models in segments A, B et C (Peugeot 207CC, 2008, 308CC, RCZ, 3008, 4008 and Citroën DS3, DS3 Cabrio, DS4, C4-AIRCROSS) and models in segments D and E (Peugeot 508, 407 and Citroën DS5, C5, C6).
PSA PEUGEOT CITROËN 2013 Annual Results - 13
CO2 emission reduction: PSA Peugeot Citroën is leading the way and is ahead of European standards
The Group is continuing CO2 emission reduction in its vehicles and emerging as one of the European leaders in this field. With an average of 116.2g of CO2 emitted per km3 in 2013, versus 122.4g CO2 per km in 2012, the objectives set by Brussels for 2015 (130g CO2/km) have already been achieved and exceeded.
55.3% of vehicles sold by the Group in Europe emit less than 111g CO2/km, up from 39.1% in 2012.
CO2 emissions are being reduced through new technologies developed and launched during 2013:
- The new generation modular platform EMP2 deployed from 2013 on the Vigo sites for the new Citroën C4 Picasso and at Sochaux for the new Peugeot 308. This new platform will allow diversified silhouettes to be developed on segments C and D, with unequalled performance, particularly as regards CO2 emissions;
- Optimised internal combustion engines with its family of three-cylinder petrol engines, including the Turbo PureTech 110 and 130 hp versions, were launched at the end of October at the Française de Mécanique site;
- The exclusive emission control technology, Diesel Blue HDi, in order to meet the Euro 6 standard and lower nitrogen oxide emissions from the Diesel engine to the level of petrol. This new exhaust stream, launched at the end of 2013 on the Peugeot 508 and the Citroën C4, will gradually be deployed on the Diesel range of vehicles during 2014;
- Hybrid technologies with broader deployment of second-generation Stop & Start e-HDi on the diesel Peugeot and Citroën ranges;
- "Hybrid4" diesel hybrid technology, which is continuing to be developed in Europe, with over 50,000 Peugeot and Citroën vehicles equipped with this technology sold since their launch.
2.3 Capital expenditure and Research & Development
Innovation, research and development are priorities for PSA Peugeot Citroën. They are a powerful lever for addressing major auto industry challenges (changing standards and legislation, rising environmental awareness, emerging mobility and networking needs, product appeal, etc.). and thus developing competitive advantages.
In 2013, investments and capitalised R&D expenses amounted to €2,397 million, including €802 million for Faurecia, compared to €3,814 million in 2012, including €861 million for Faurecia. To meet its objective of achieving 50% of its sales outside Europe by 2015, PSA Peugeot Citroën has invested in its priority development areas: Asia, Latin America and Russia with a peak over the 2011-2012 period (additional capacity at Wuhan III and Shenzhen sites in China, Porto Real in Brazil and Kaluga in Russia).
After two years of significant investment associated with increasing international capacity, and investment for the EB engines, the Group returned in 2013 to a more usual level of investment. This level will enable the Group to continue its investment in product R&D and innovation, thanks, in particular, to improved efficiency and sharing development costs with partners, including GM through the Alliance.
In 2013, R&D projects were directed towards:
• solutions to reduce CO2 emissions: solutions to reduce carbon emissions: measures to lower vehicle weight, make more energy efficient powertrains with smaller carbon footprints and pave the way for alternative hybrid and electric powertrain development;
• vehicle development associated with renewal of the Peugeot and Citroën ranges: thus the average age of the range is kept at 3.5 years, with 17 launches in 2013. The rate of change will continue, along with significant innovations;
• the emergence of the communicating car with improved driver assistance systems for even greater safety and comfort and work on the connectivity between the driver and vehicle to integrate new clients uses in the cars.
R&D projects continue to expand internationally to such places as China, Latin America and Russia. They resulted in 17 launches in 2013: the new Peugeot 208 XY, 208 GTI, 2008, 308, Partner Electric, the new 5- and 7-seat Citroën C4 Picasso and the DS3 Cabrio, the electric Berlingo; and also specific launches in China (3008 and 301, C4L, C-Elysée and DS5), Latin America (208 and C4 Lounge) and Russia (C4 Sedan). The Group also launched a new engine in 2013: the EB Turbo Tech and the new manual 5-speed and automatic 6-speed gear boxes.
3Data updated at the end of November 2013

2.4 Financial position and results
2.4.1 2013 Group Operating Results The Group financial statements at 31 December 2012, presented for comparison, have been adjusted compared with the previously published financial statements: Amendment to IAS 19 Employee Benefits.
For more details, please refer to Note 3 in the Notes to the consolidated financial statements at 31 December 2013.
2.4.1.1 Revenue
The Group’s operations are organised around four main segments:
- the Automotive Division, covering the design, manufacture and sale of passenger cars and light commercial vehicles under the Peugeot and Citroën brands;
- the Automotive Equipment Division, corresponding to the Faurecia Group comprising Interior Systems, Automotive Seating, Automotive Exteriors and Emissions Control Technologies;
- the Finance Division, corresponding to the Banque PSA Finance Group, which provides retail financing to customers of the Peugeot and Citroën brands and wholesale financing to the two brands’ dealer networks;
- other Businesses, which include the operations of Peugeot S.A., the Group’s holding company, and Peugeot Motocycles. The income from the Gefco group, accounted for by the equity method, is presented under these businesses.
The table below shows consolidated revenue by business.
(in million euros) 2013 2012 %Automotive Division 36,461 38,299 -4.8%
Faurecia 18,029 17,365 3.8%
Banque PSA Finance 1,773 1,910 -7.2%Other Businesses and intersegment eliminations (2,173) (2,128) -
TOTAL 54,090 55,446 -2.4% Consolidated revenue does not include the contribution of our Chinese company, Dongfeng Peugeot Citroën Automobile (DPCA), as it is jointly controlled on a 50/50 basis with our local partner and is therefore accounted for by the equity method.
In 2013, PSA Peugeot Citroën consolidated revenue was down 2.4% to €54,090 million from €55,446 million in 2012.
The Automotive Division saw its revenue fall by €1,838 million in a year marked by a declining European market and a negative trend in foreign exchange. Faurecia’s revenue increased by €664 million, while Banque PSA Finance revenue fell by €137 million. The performances of each business are commented on in Section 2.4.1.3.
The table below shows consolidated revenue by region, based on the location of the customer.
(in million euros) 2013 2012Consolidated revenue 54,090 55,446 Net contribution to consolidated revenue by region
Europe 65.8% 68.1%Russia 3.3% 3.2%
Asia 7.6% 6.2%
Latin America 10.1% 9.6%Rest of the World 13.2% 12.9%
TOTAL 100% 100%
PSA PEUGEOT CITROËN 2013 Annual Results - 15

2.4.1.2 Recurring operating income The following table shows recurring operating income (loss) by business.
(in million euros) 2013 2012Automotive Division (1,042) (1,496)Faurecia 538 516
Banque PSA Finance 368 391
Other businesses and intersegment eliminations (41) 29TOTAL (177) (560) The Group reported a recurring operating loss of €177 million in 2013, compared with a loss of €560 million in 2012. The Automotive Division’s recurring operating loss improved by €454 million to €1,042 million over the year. Faurecia's performance rose 4.3% to €538 million. As regards Banque PSA Finance, its operatioresult fell 5.9% to €368 million.
2.4.1.3 Analysis of revenue and recurring operating income by division
Automotive Division
(in million euros) 2013 2012Revenue 36,461 38,299
Recurring operating income (loss) (1,042) (1,496)
As a % of revenue -2.9% -3.9%
Revenue
Automotive Division revenue totalled €36,461 million in 2013, a fall of 4.8% in a European market down by 1.6%. The second half of the year was less unfavourable with a drop in revenue of 1.8%.
New vehicle revenue declined by 8% to €25,532 million in 2013, down from €27,765 million in 2012. The product mix continues to be favourable at +0.8%, reflecting the success of recent launches (17 in 2013) and with the average age of the range falling. The price effect was also favourable over the year at +0.7%, thanks to the Group’s pricing policy. These two effects were not, however, enough to offset the strong contraction in volumes (-5.4%) reflecting in particular shrinking European markets and market share losses, and intensified by the disruptions to Citroën C3 sales due to production shutdowns at the Aulnay plant in the first half of the year. The exchange rate effect was strongly negative (-3.5%), resulting in particular from the unfavourable movements in the Argentinian peso, the Brazilian real and the pound. The country mix was slightly unfavourable over the year, at -0.3%, and the "other" effect at -0.4% was mainly a result of fall in the price of diesel over the year.
The Group's market share fell 0.8 points in Europe, to11.9% in 2013 versus 12.7% in 2012, impacted by disruptions to the sales of the Citroën C3, the channel and country mix and the Group’s pricing policy.
The proportion of sales made outside Europe continued to expand, rising to 42% over the period:
In this difficult environment, the Group maintained the steady pace of new model launches, with 17 launches in 2013, and continued its upscaling strategy.
Recurring operating income (loss)
The Automotive Division reported a recurring operating loss of €1,042 million in 2013, up from the €1,496 million loss recorded the previous year. The €454 million difference is associated with an unfavourable environment, for -€886 million, and with the Group's performance, for +€1,340 million.
The change in the Automotive Division’s reported performance was due to the following factors:
Operating Environment
The deteriorating operating environment had a negative impact of €886 million on the recurring operating income.
• The non-recurring exchange rate effect had a negative impact of €500 million, including €526 million in negative foreign currency impact, mainly due to depreciation of the euro against the Argentinian peso, the Brazilian real and the pound;
• The shrinking market demand had a negative impact of €147 million;
• Higher raw material costs and other external costs had a negative impact of €239 million.

Underlying Automotive Division Performance
The Automotive Division’s underlying performance contributed positively to the recurring operating income, at €1,340 million over the 2013 financial year.
• The improvement in production costs and other costs continued for €933 million, as well as a reduction in research and development expenses of €140 million, including the positive impact as a result of the non-recurring depreciation of Automotive Division assets recognised in 2012 4;
• Improvement in the product mix continued, with €406 million associated in particular with recent launches;
• The price effect was positive, at €287 million, thanks to prices being maintained in Europe and increased in Latin America in order to counter the negative foreign exchange effect;
• These positive effects offset the impact of the fall in market share for €264 million.
Faurecia
(in million euros) 2013 2012Revenue 18,029 17,365
Recurring operating income (loss) 538 516
As a % of revenue +3.0% +3.0%
Revenue
Faurecia’s total sales for fiscal 2013 stood at €18.03 billion, up 5.0% over 2012 sales of €17.36 billion.
Product sales (delivery of parts and components to automakers) totaled €13.69 billion, up 3.9% from 2012 sales of €13.30 billion.
In 2013, Asia accounted for 13% of product sales (a 3 point increase), while North America represented 27% and South America 5%. Sales outside Europe represented 46% of the total. Faurecia reinforced the diversification of its customer portfolio, posting substantial growth with Nissan, Daimler and Ford; the latter consolidating its position as Faurecia’s second largest customer with 15% of product sales. Business for commercial vehicles rose 17% over the year.
Product sales in 2013 break down as follows:
• in Europe, product sales were stable at €7.41 billion, in line with automotive production evolution ;
• in North America, product sales stood at €3.71 billion, compared to €3.64 billion in 2012, a 1.3% increase, while automotive production rose 5% ;
• in Asia, product sales reached €1.71 billion, compared to €1.39 billion in 2012, up 24.3% while automotive production grew 5%. Sales in China climbed to €1.39 billion. This 27.7% increase is nearly double the growth of the Chinese automobile market (14%) ;
• in South America, product sales stood at €717 million, up from €662 million a year earlier, representing a 26.3% increase compared with a 6% rise in automotive production.
Product sales by business group
The Business Group with the most dynamic growth was Emissions Control Technologies, where product sales totaled €6.4 billion, up 7.3% driven by growth in Asia (up 22%) and the commercial vehicle segment (up 17%). The increase in the second half was 12.1%.
Product sales for the Automotive Seating Business Group totaled €5.2 billion, compared to €5.1 billion in 2012, an increase of 3.4%.
Product sales at the Interior Systems Business Group totaled €4.6 billion, versus €4.3 billion in 2012, up 4.1%. This growth was driven by a sales increase with Ford in North America and double-digit growth in Asia.
Product sales at Automotive Exteriors stood at €1.9 billion, an increase of 3.9% over 2012.
4 Non-recurring depreciation of Automotive Division assets recognised in 2012 (IAS 36) generated a reduction in amortisation expenses leading to
a positive €595 milion effect, recognized in manufacturing and purchasing, R&D and production costs.
PSA PEUGEOT CITROËN 2013 Annual Results - 17

Recurring operating income (loss)
Operating income stood at €538 million, or 3.0% of total sales, compared with €516 million (3.0% of sales) in 2012.
By region, operating income is explained as follows:
• in Asia, at 8.3%, the margin continued to improve over the year, thanks to a business model that combines strong growth and excellence in execution ;
• in Europe, at 2.7%, the margin slipped slightly due to the 4.0% drop in automotive production in the first half. The margin improvement in the second half (up 60 basis points to reach 3.0%), reflects the first effects of the fixed cost reduction plan launched late 2012;
• in North America, at 2.1%, operating income posted a slight gain over the year, but profitability remains below targeted levels. A limited number of product and new technology launches had operational difficulties;
• in South America, at -3.2%, the margin has been impacted by the negative effects of inflation, currency fluctuations and higher costs of raw materials.
By Business Group, operating income evolved as follows:
• Automotive Seating: at 4.2% of sales (€198.7 million) for the fiscal year and 4.5% in the second half, operating income reached benchmark competition levels. The 50 basis points margin increase for the year stems from a good performance in Asia and a strong margin improvement in the mechanisms division;
• Emissions Control Technologies: at 3.1% of sales (€217.4 million), the gap with competition was reduced. The margin increase of 70 basis points is the result of significant progress in North America, a marked improvement in Europe and a margin which remains high in Asia;
• Interior Systems: at 1.8% of sales (€98.3 million) faced some launch difficulties particularly in North America;
• Automotive Exteriors: at 2.0% of sales (€37.9 million), the margin was impacted by launch costs in South America and transformation costs in the composites business. The margin in Europe remained satisfactory at 4.5%.
More detailed information about Faurecia is provided in the Bank’s Annual Report, which can be downloaded from its website at www.faurecia.com.
Banque PSA Finance
(in million euros) 2013 2012Revenue 1,773 1,910
Net banking revenue 891 1,075
Recurring operating income (loss) 368 391As a % of revenue 20.8% 20.5%
Revenue
Banque PSA Finance’s revenue for 2013 totalled €1,773 million, down 7.2% from the €1,910 million recorded in 2012.
In what continues to be a challenging economic climate, our end-user financing business continued to perform well overall, with 29.1% new vehicle financing, the best performance in the last ten years, apart from the record high of 29.8% in 2012. Despite this strong performance in terms of penetration, we recorded an 8,0% drop in the number of new vehicle contracts on our eligible market (sales of new Peugeot and Citroën vehicles) which was itself down 5.8%.
Due to wide variances from one country to another depending on the continued effects of the financial crisis on the car market, BPF recorded a decrease in overall volumes of end-user financing for new and used vehicles in 2013, with 731,003 contracts compared to 805,143 in 2012. The table below provides information relating to BPF's end-user financing activity in 2012 and 2013.
New retail financing granted in 2013 totalled €7,256 million, down 10.9% from €8,449 million in 2012.
At 31 December 2013, the retail loan book stood at €15,762 million, down from €17,007 million at 31 December 2012.
Our corporate dealer financing business fell off sharply in 2013. The decrease was particularly significant in the second semester, mainly due to the conservative policy adopted by the brand driven primarily by the decline in the European markets.
We provided corporate dealer financing for a total of 1,619,118 vehicles in 2013, a significant decrease compared with 2012 in volume. Vehicle financing amounts followed the same trend, with a 9.8% drop.
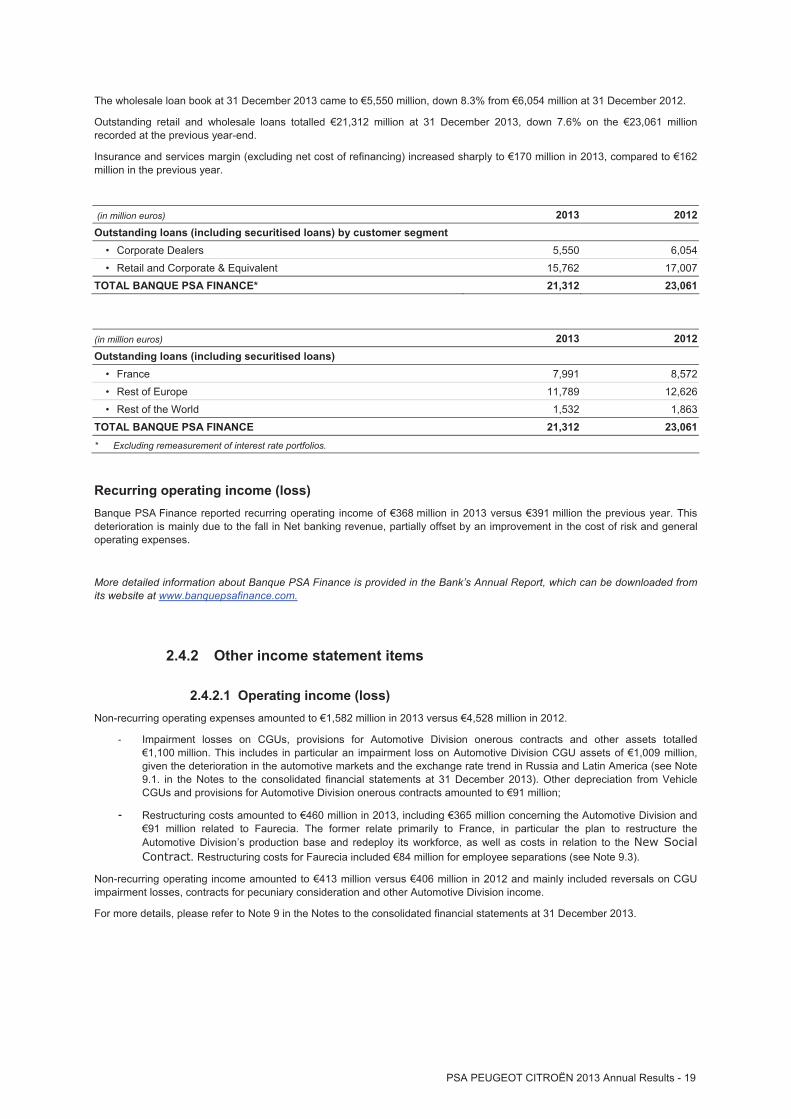
The wholesale loan book at 31 December 2013 came to €5,550 million, down 8.3% from €6,054 million at 31 December 2012.
Outstanding retail and wholesale loans totalled €21,312 million at 31 December 2013, down 7.6% on the €23,061 million recorded at the previous year-end.
Insurance and services margin (excluding net cost of refinancing) increased sharply to €170 million in 2013, compared to €162 million in the previous year.
(in million euros) 2013 2012Outstanding loans (including securitised loans) by customer segment
• Corporate Dealers 5,550 6,054
• Retail and Corporate & Equivalent 15,762 17,007TOTAL BANQUE PSA FINANCE* 21,312 23,061
(in million euros) 2013 2012Outstanding loans (including securitised loans)
• France 7,991 8,572
• Rest of Europe 11,789 12,626• Rest of the World 1,532 1,863
TOTAL BANQUE PSA FINANCE 21,312 23,061* Excluding remeasurement of interest rate portfolios.
Recurring operating income (loss) Banque PSA Finance reported recurring operating income of €368 million in 2013 versus €391 million the previous year. This deterioration is mainly due to the fall in Net banking revenue, partially offset by an improvement in the cost of risk and general operating expenses.
More detailed information about Banque PSA Finance is provided in the Bank’s Annual Report, which can be downloaded from its website at www.banquepsafinance.com.
2.4.2 Other income statement items
2.4.2.1 Operating income (loss) Non-recurring operating expenses amounted to €1,582 million in 2013 versus €4,528 million in 2012.
- Impairment losses on CGUs, provisions for Automotive Division onerous contracts and other assets totalled €1,100 million. This includes in particular an impairment loss on Automotive Division CGU assets of €1,009 million, given the deterioration in the automotive markets and the exchange rate trend in Russia and Latin America (see Note 9.1. in the Notes to the consolidated financial statements at 31 December 2013). Other depreciation from Vehicle CGUs and provisions for Automotive Division onerous contracts amounted to €91 million;
- Restructuring costs amounted to €460 million in 2013, including €365 million concerning the Automotive Division and €91 million related to Faurecia. The former relate primarily to France, in particular the plan to restructure the Automotive Division’s production base and redeploy its workforce, as well as costs in relation to the New Social Contract. Restructuring costs for Faurecia included €84 million for employee separations (see Note 9.3).
Non-recurring operating income amounted to €413 million versus €406 million in 2012 and mainly included reversals on CGU impairment losses, contracts for pecuniary consideration and other Automotive Division income.
For more details, please refer to Note 9 in the Notes to the consolidated financial statements at 31 December 2013.
PSA PEUGEOT CITROËN 2013 Annual Results - 19

As a result of these factors, the Group ended 2013 with a consolidated operating loss of €1,346 million, compared with operating income of €4,682 million in 2012.
(in million euros) 2013 2012Automotive Division (2,111) (5,752)Faurecia 431 428
Banque PSA Finance 368 390
Other Businesses and holding company (34) 252TOTAL PSA PEUGEOT CITROËN (1,346) (4,682)
2.4.2.2 Net financial income (expense) Net financial expense came to €658 million in 2013 compared with €430 million the previous year. This amount includes interest income from loans and on cash and cash equivalents, finance costs and other financial income and expense.
This increase is explained mainly by the rise in financial expenses associated with bond issues during the year, partially offset by the disposal of BNP securities for €89.3 million.
For more information, please refer to Notes 10 and 11 in the Notes to the Consolidated Financial Statements at 31 December 2013.
2.4.2.3 Income tax expense Income tax expense stands at €387 million in 2013 compared to €774 million in 2012. Income tax before impairment losses on the French tax group amounted to €835 million. Unrecognised tax assets corresponding to tax loss carryforwards for the French tax group amounted to €746 million, impairment losses on the French tax group totalled €80 million and other impairment losses amounted to €396 million at 31 December 2013. The current tax expense stands at €387 million in 2013 compared to €774 million in 2012. New deficits generated in the year amounted to €824 million and were not recognised in income.
For more details, please refer to Note 12 in the Notes to the consolidated financial statements at 31 December 2013.
2.4.2.4 Share in net earnings of companies at equity The net income of companies accounted at equity was €176 million for the 2013 financial year, compared to €160 million in 2012. The companies accounted at equity are firstly Dongfeng Peugeot Citroën Automobile (DPCA), Changan PSA Automobiles (CAPSA), and secondly cooperations with other car manufacturers, when they have a specific legal structure, as is the case for the joint ventures with Fiat and Toyota. In 2013, the PSA Peugeot Citroën Group took exclusive control of Française de Mécanique, previously 50%-owned.
The DPCA contributed €187 million to income in 2013, compared with €171 million in 2012 (see Note 16.5).
Toyota Peugeot Citroën Automobiles’ contributed €4 million to the Group’s result, compared to €15 million in 2012. The contribution from the companies created by the cooperation with Fiat amounted to €2 million, compared to the negative contribution of €1 million in 2012. The contribution of Française de Mécanique, previously held in cooperation with Renault, amounted to a loss of €3 million in 2013 compared to a loss of €5 million in 2012.
For more information about the Group’s share in the net earnings of companies at equity, please refer to the Notes to the consolidated financial statements at 31 December 2013 (Note 16 - Investments in Companies at Equity).
2.4.2.5 Consolidated profit (loss) from continuing operations The Group ended the year with a consolidated loss of €2,215 million compared to a loss of €5,726 million in 2012.
2.4.2.6 Profit (loss) from discontinued operations The net loss from discontinued operations was €3 million in 2013 compared with a profit of €803 million in 2012. The 2012 result mainly included the capital gain on the breakup of GEFCO.
2.4.2.7 Consolidated profit (loss) for the year The Group ended the year with a consolidated loss of €2,218 million compared with a loss of €4,923 million in 2012.

2.4.2.8 Consolidated profit (loss) attributable to equity holders of the parent The consolidated loss attributable to the parent company’s equity holders was €2,317 million in 2013 compared to a loss of €5,008 million in 2012.
2.4.2.9 Earnings per share The basic loss per share amounted to €6.77 compared with a basic loss per share of €15.59 in 2012. Diluted loss per €1 par value share was €6.77 versus a loss of €15.60 in 2012.
Please refer to the Notes to the consolidated financial statements to 31 December 2013 (Note 13 - Earnings per Share).
2.5 Outlook
In 2014, PSA Peugeot Citroën expects growth in automotive demand to be slightly positive at around 2% in Europe and around 10% in China, with a 2% decline in Latin America, and a stable market in Russia.
Continuing the trend of 2013, we will pursue our active cash management to target positive operational free cash flow in 2016 at the latest. Beyond, the operating free cash flow generation should accelerate due to the structural benefit of the projects of transactions.
PSA PEUGEOT CITROËN 2013 Annual Results - 21

3. CASH AND CAPITAL RESOURCES
3.1 Equity
Consolidated equity amounted to €7,791 million at 31 December 2013, down on the €10,167 million recorded at the previous year-end. This difference is mainly due to taking into account the result of the fiscal year, which was particularly impacted by the depreciation of the Automotive Division’s assets.
At 31 December 2013, the share capital comprised 354,848,992 shares with a par value of one euro each. The Group holds 12,788,627 treasury shares, enabling it to cover its requirements under its current stock option plans, and to cover part of the OCEANE bond issue of June 2009. No treasury shares were bought back in 2013.
3.2 Net debt of manufacturing and sales companies and net debt-to-equity ratio
Consolidated current and non-current financial liabilities of the manufacturing and sales companies amounted to €11,120 million compared with €10,734 million on 31 December 2012 (see Note 31.1 to the consolidated financial statements at 31 December 2013). Manufacturing and sales company financial assets amounted to €6,972 million at 31 December 2013 versus €7,586 million at 31 December 2012.
The net debt of the manufacturing and sales companies thus deteriorated at 31 December 2013 to a loss of €4,148 million, compared with a loss of €3,148 million at the end of December 2012 (see Note 31 to the Consolidated Financial Statements at 31 December 2013). Faurecia's net debt represents €1,629 million, compared to €1,892 million in 2012. The net debt of the Automobile Division (manufacturing and sales companies excluding Faurecia) grew by €1,263 million over the period to €2,519 million.
Funds from operations in the 2013 financial year amounted to €700 million (including €588 million used in restructuring) and is down compared with 2012 (€1,033 million).
The Working Capital Requirement (WCR) had a positive impact of €397 million, thanks to good inventory control (up by €323 million compared with 31 December 2012). Trade receivables rose by €9 million compared to 31 December 2012. Trade payables rose by €77 million compared to 31 December 2012. The “Other Changes in Working Capital Requirements” item fell by €12 million compared to 31 December 2012.
Capital expenditure and capitalised Research & Development expenses amounted to €2,397 million in 2013. It fell by €1,417 million following two years of significant investment in increasing the international capacity and investment for the EB engines. This amount includes a reduction in investments of €610 million, in accordance with the objective set by the Rebound Plan at €600 million.
In addition, the Group made a number of financial investments totalling €71 million net, for the most part in relation to the capital increase by the CAPSA joint venture in China.
Payment of Group subsidiary dividends totalled €286 million in 2013, including €281 million from Banque PSA Finance.
Asset sales provided a cash injection of €37 million in 2013. This figure includes additional costs linked to the disposal of Gefco.
Free cash flow5 ended the year at €-1,048 million, versus €-1,387 million a year earlier. Operational free cash flow, excluding disbursement of €588 million for restructuring, excluding non-recurring items (CAPSA financing and sale of fixed assets) for €34 million, amounted to -€426 million.
The net debt-to-equity ratio stood at 53% at 31 December 2013, compared to 31% a year earlier (see Note 31.3).
5 Free Cash Flow of manufacturing and sales companies: the dividends received from Banque PSA Finance have been included in Free Cash
Flow since 2010. This is equal to: operating flows + investment flows + net dividends received from Group companies.

3.3 Origin, amount and description of consolidated cash flows
3.3.1 Consolidated cash flows For more information, please refer to the Consolidated Financial Statements - Consolidated Statements of Cash Flows for the year ended 31 December 2013.
3.3.2 Cash flows for manufacturing and sales companies The following table presents the manufacturing and sales companies’ cash flows for 2013 and 2012:
Manufacturing and sales companies (in million euros) 2013 2012Net Profit (2,453) (6,019)
Funds from operations 700 1,033
Change in working capital 397 (602)Net cash from (used in) operating activities 1,097 431Net cash used in investing activities (2,431) (2,450)Net cash from/(used in) financing activities 2,204 2,387Effect of changes in exchange rates (91) (6)
Net increase (decrease) in cash and cash equivalents from continuing operations 779 362Net cash from discontinued operations (41) 345
Cash and cash equivalents at beginning of year 5,399 4,692
Net cash and cash equivalents at end of period 6,137 5,399
Cash flows from operating activities of manufacturing and sales companies
Funds from operations for manufacturing and sales companies stood at €700 million in 2013 versus €1,033 million in 2012. This represents 1.3% of revenue for the manufacturing and sales companies, compared with 1.9% the previous year.
The €397 million change in working capital requirements mainly reflects good inventory management for €323 million.
Consequently, funds from manufacturing and sales companies present a positive balance of €1,097 million compared to €431 million in 2012.
The table below shows new vehicle inventory levels for the Group and in the independent dealer network:
(in thousands of new vehicles) 2013 2012 2011The Group 169 184 234
Independent dealer network 215 232 259
TOTAL 384 416 493 The new vehicles inventory at 31 December 2013 totalled 384,000 new vehicles, representing a ratio of 62 days’ sales,6 inline with the announced objective. At 31 December 2012, there were 416,000 new vehicles in inventory, representing 65 days’ sales.
Cash flows from manufacturing and sales company investment activities
Flows connected to investment in manufacturing and sales companies stand at €2,431 million at the end of 2013, compared with €2,450 million at the end of 2012. These investments, beyond those carried out by the Automotive Division, include investments made by Faurecia. Capitalised development expenditure stood at €835 million versus €1,262 million in 2012. (See note 8 to the Consolidated Financial Statements at 31 December 2013).
6 Sales ratio: ratio calculated on the basis of sales forecasts for the next three months.
PSA PEUGEOT CITROËN 2013 Annual Results - 23

Cash flows from financing activities of manufacturing and sales companies
Flows from the financing activities of the manufacturing and sales companies totalled €2,204 million, compared to €2,387 million at 31 December 2012.
Net cash and cash equivalents at end of year - manufacturing and sales companies
Given the flows from operations, investment flows, and flows from financial operations explained above, and after taking the negative foreign exchange rate conversions of €91 million into account, net cash and cash equivalents at the year end totals €6,137 million, compared with €5,399 million at 31 December 2012.
Liquidity reserves for the manufacturing and sales companies amounted to €10,121 million at end-2013 versus €10,574 million at end-2012, with €6,571 million in cash and current & non-current financial assets, and €3,550 million in undrawn lines of credit (see Note 31.4).
3.3.3 Net cash and cash equivalents at end of year - finance companies At the end of 2013, Banque PSA Finance cash stood at €1,804 million versus €1,669 million at the end of 2012 (see Note 25.2 to the Consolidated Financial Statements at 31 December 2013).
3.4 Liquidity and funding
3.4.1. Manufacturing and sales companies In the prevailing economic environment, the Group continued with its diversified, proactive financing strategy and conservative liquidity policy in order to meet its general financing needs, particularly the financing of its business and of its development projects. This strategy enabled the Group to refinance its debt maturities on favourable terms. The refinancing transactions strengthened the balance sheet by maintaining the average life of debt.
Refinancing transactions carried out during 2013 included the following in particular:
• On 28 February 2013, Peugeot S.A. issued a €1 billion 7.375% bond maturing in March 2018;
• In September 2013, Peugeot S.A. issued a €600 million 6.5% bond maturing in January 2019;
• In December 2013, the Group took out a €300 million 2.283% loan with the EIB, maturing in December 2018.
Peugeot S.A. and GIE PSA Trésorerie also have a confirmed line of credit for €2,400 million, which matures in July 2015 for €2,225 million, leaving a balance of €175 million due in July 2014. This facility was not drawn at 31 December 2013 (see Note 29.1). Faurecia has undrawn confirmed lines of credit amounting to €1,150 million at 31 December 2013.
3.4.2. Banque PSA Finance In 2013, Banque PSA Finance made use of different sources of financing: bank deposits (launch of the "DISTINGO" passbook savings account on March 7, 2013), bonds, securitization, and syndicated backup and revolving bilateral lines. As a regulated credit institution, we also have access to sources of liquidity such as the European Central Bank (ECB).
At December 31, 2013, 22% of the financing came from drawn bank loans, 38% from the capital markets, 25% from securitization transactions on the markets, 10% from financings of public origin such as the ECB or the SFEF ('Société de Financement de l'Economie Française'), which raised funds in 2008 and 2009 in order to lend them to the banks and financial institutions during the previous crisis), and 5% from the bank deposit business started in March 2013. At December 31, 2012, these sources provided 23%, 42%, 20%, 15% and 0% of our financing, respectively.
Furthermore, Banque PSA Finance pursued its securitization program in 2013 with the success of eight securitization transactions completed in three countries (France, Germany and Switzerland) for a total amount at the outset of €1,529 million of senior securities.
In 2013, Banque PSA Finance borrowed from the European Central Bank (ECB) under its long-term refinancing operation (LTRO). At 31 December 2013, this amounted to €1,700 million.
A bank loan collateralised by Belgian credit sale receivables was implemented in April 2013, generating net funding of €92 million at inception.
On 25 March 2013, Banque PSA Finance issued a fixed-rate bond maturing in April 2016 for €1.2 billion, with a coupon of 0.625%. The bond was issued in the context of the European Commission's authorisation to use the French State's guarantee (cf. note 36.1.A(b)).

In March 2013, the Distingo interest-bearing passbook savings account was introduced for private customers in France. The total funds for these accounts at 31 December 2013 were €955 million out of total amounts owed to customers of €1,446 million repayable at any time.
Financial security
Financial security amounted to €8,400 million at 31 December 2013, compared to €8,233 million at 31 December 2012. (see
Note 32.8).
More detailed information about Banque PSA Finance is provided in the Bank’s Annual Report, which can be downloaded from its website at www.banquepsafinance.com.
PSA PEUGEOT CITROËN 2013 Annual Results - 25

Consolidated financial statements at 31 December 2013
Contents
Consolidated Statements of Income ............................................................................................28
Consolidated Statements of Income and Expenses Recognised in Equity ...........................30
Consolidated Balance Sheets .......................................................................................................32
Consolidated Statements of Cash Flows ....................................................................................34
Consolidated Statements of Changes in Equity .........................................................................36
Notes to the Consolidated Financial Statements .......................................................................37
The consolidated financial statements of the PSA Peugeot Citroën Group are presented for the years ended31 December 2013 and 2012. The 2011 consolidated financial statements are included in the RegistrationDocument that was filed with the French securities regulator (Autorité des Marchés Financiers) on 5 March2012 under no. D.12-0128.

PSA PEUGEOT CITROËN 2013 Annual Results - 27

CONSOLIDATED STATEMENTS OF INCOME
(in million euros)
Manufacturingand sales
companiesFinance
companies Eliminations Total
Continuing operationsSales and revenue (Note 6) 52 627 1 773 (310) 54 090
Cost of goods and services sold (45 260) (1 014) 310 (45 964)Selling, general and administrative expenses (6 027) (391) - (6 418)Research and development expenses (Note 8) (1 885) - - (1 885)Recurring operating income (loss) (545) 368 - (177)
Non-recurring operating income (Note 9) 413 - - 413Non-recurring operating expenses (Note 9) (1 582) - - (1 582)Operating income (loss) (1 714) 368 - (1 346)
Interest income 138 - - 138Finance costs (Note 10) (624) - - (624)Other financial income (Note 11) 71 - - 71Other financial expenses (Note 11) (243) - - (243)Income (loss) before tax of fully consolidated companies (2 372) 368 - (2 004)
Current taxes (198) (123) - (321)Deferred taxes (51) (15) - (66)Income taxes (Note 12) (249) (138) - (387)Share in net earnings of companies at equity (Note 16) 168 8 - 176Consolidated profit (loss) from continuing operations (2 453) 238 - (2 215)
Attributable to equity holders of the parent (2 544) 223 6 (2 315)
Discontinued operations
Profit (loss) from discontinued operations (3) - - (3)
Consolidated profit (loss) for the period (2 456) 238 - (2 218)
Attributable to equity holders of the parent (2 546) 223 6 (2 317)Attributable to minority interests 90 15 (6) 99
(in euros)
(6.76)(6.77)
(6.76)(6.77)
2013
Diluted earnings per 1 par value share of continuing operations - attributable to equity holders of the parent(Note 13)Diluted earnings per 1 par value share - attributable to equity holders of the parent (Note 13)
Basic earnings per 1 par value share of continuing operations - attributable to equity holders of the parent(Note 13)Basic earnings per 1 par value share - attributable to equity holders of the parent (Note 13)
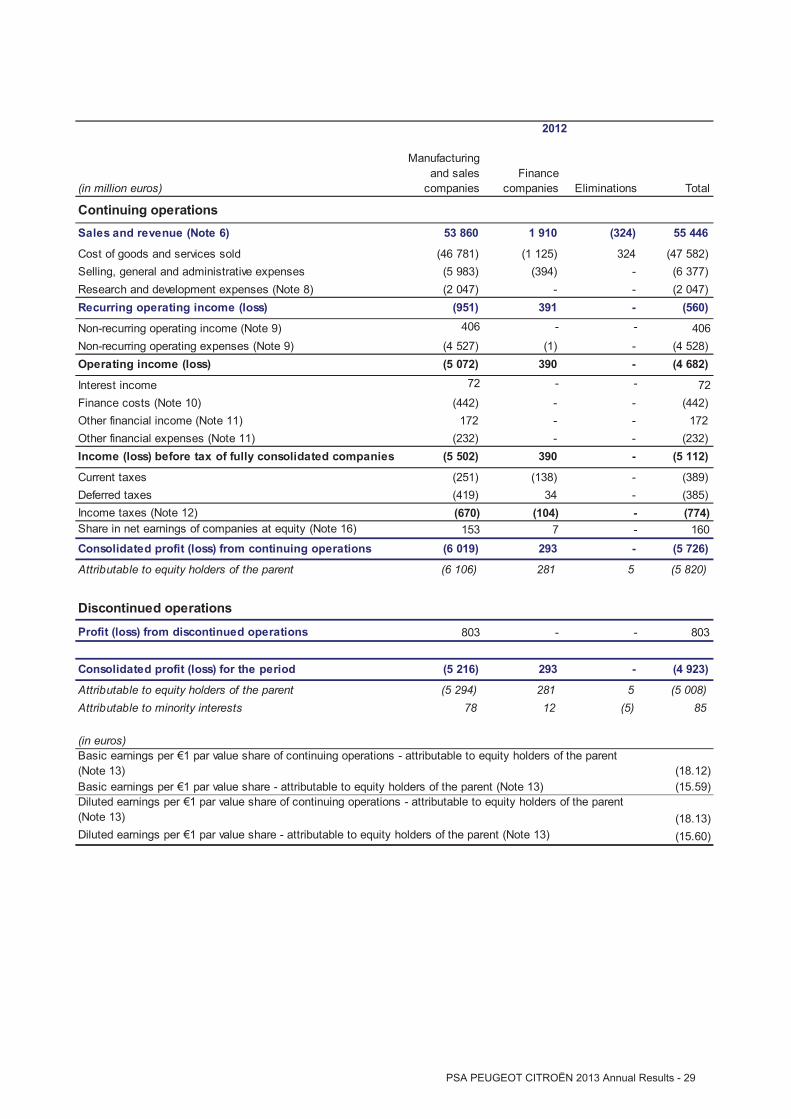
(in million euros)
Manufacturingand sales
companiesFinance
companies Eliminations Total
Continuing operationsSales and revenue (Note 6) 53 860 1 910 (324) 55 446
Cost of goods and services sold (46 781) (1 125) 324 (47 582)Selling, general and administrative expenses (5 983) (394) - (6 377)Research and development expenses (Note 8) (2 047) - - (2 047)Recurring operating income (loss) (951) 391 - (560)
Non-recurring operating income (Note 9) 406 - - 406Non-recurring operating expenses (Note 9) (4 527) (1) - (4 528)Operating income (loss) (5 072) 390 - (4 682)
Interest income 72 - - 72Finance costs (Note 10) (442) - - (442)Other financial income (Note 11) 172 - - 172Other financial expenses (Note 11) (232) - - (232)Income (loss) before tax of fully consolidated companies (5 502) 390 - (5 112)
Current taxes (251) (138) - (389)Deferred taxes (419) 34 - (385)Income taxes (Note 12) (670) (104) - (774)Share in net earnings of companies at equity (Note 16) 153 7 - 160Consolidated profit (loss) from continuing operations (6 019) 293 - (5 726)
Attributable to equity holders of the parent (6 106) 281 5 (5 820)
Discontinued operations
Profit (loss) from discontinued operations 803 - - 803
Consolidated profit (loss) for the period (5 216) 293 - (4 923)
Attributable to equity holders of the parent (5 294) 281 5 (5 008)Attributable to minority interests 78 12 (5) 85
(in euros)
(18.12)(15.59)
(18.13)(15.60)
2012
Diluted earnings per 1 par value share - attributable to equity holders of the parent (Note 13)
Basic earnings per 1 par value share of continuing operations - attributable to equity holders of the parent(Note 13)Basic earnings per 1 par value share - attributable to equity holders of the parent (Note 13)Diluted earnings per 1 par value share of continuing operations - attributable to equity holders of the parent(Note 13)
PSA PEUGEOT CITROËN 2013 Annual Results - 29
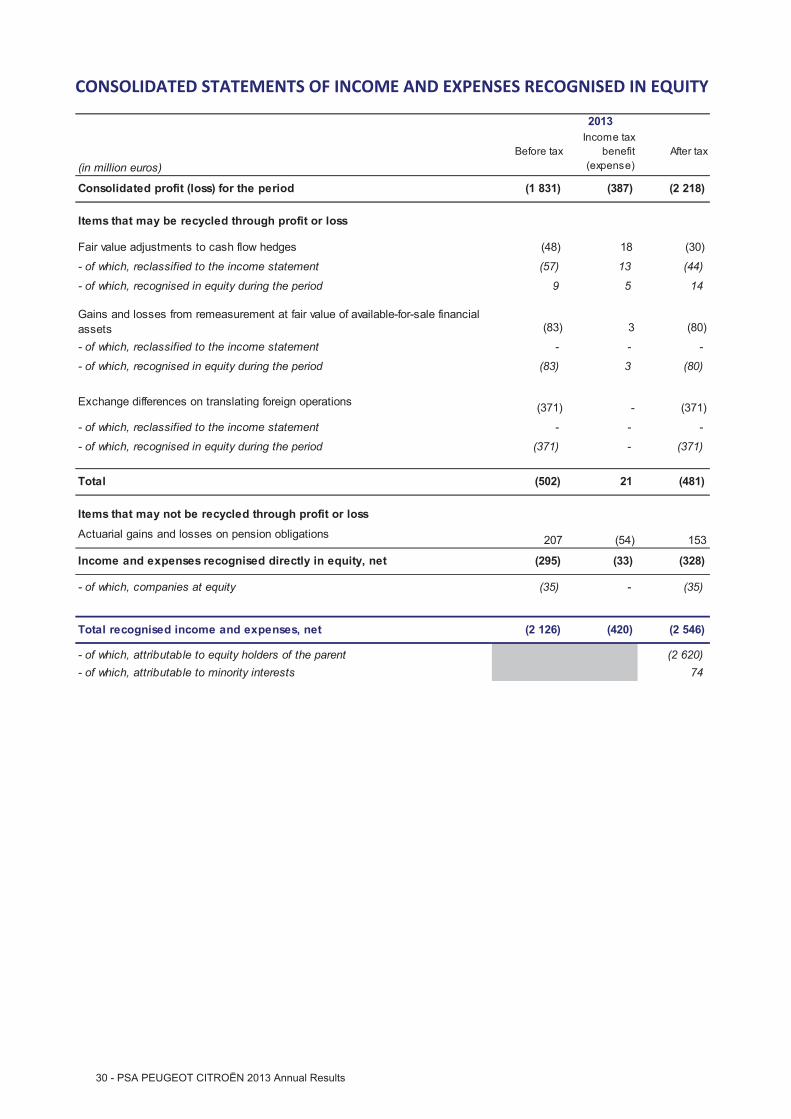
CONSOLIDATED STATEMENTS OF INCOME AND EXPENSES RECOGNISED IN EQUITY
(in million euros)Before tax
Income taxbenefit
(expense)After tax
Consolidated profit (loss) for the period (1 831) (387) (2 218)
Items that may be recycled through profit or loss
Fair value adjustments to cash flow hedges (48) 18 (30)
- of which, reclassified to the income statement (57) 13 (44)
- of which, recognised in equity during the period 9 5 14
(83) 3 (80)
- of which, reclassified to the income statement - - -
- of which, recognised in equity during the period (83) 3 (80)
(371) - (371)
- of which, reclassified to the income statement - - -
- of which, recognised in equity during the period (371) - (371)
Total (502) 21 (481)
Items that may not be recycled through profit or lossActuarial gains and losses on pension obligations 207 (54) 153
Income and expenses recognised directly in equity, net (295) (33) (328)
- of which, companies at equity (35) - (35)
Total recognised income and expenses, net (2 126) (420) (2 546)
- of which, attributable to equity holders of the parent (2 620)- of which, attributable to minority interests 74
2013
Gains and losses from remeasurement at fair value of available-for-sale financialassets
Exchange differences on translating foreign operations

(in million euros)Before tax
Income taxbenefit
(expense)After tax
Consolidated profit (loss) for the period (4 149) (774) (4 923)
Items that may be recycled through profit or loss
Fair value adjustments to cash flow hedges (2) 3 1
- of which, reclassified to the income statement 42 (6) 36
- of which, recognised in equity during the period (44) 9 (35)
50 (2) 48
- of which, reclassified to the income statement - 2 - 2
- of which, recognised in equity during the period - 48 (2) 46
(132) - (132)
- of which, reclassified to the income statement - - - -
- of which, recognised in equity during the period - (132) - (132)
Total (84) 1 (83)
Items that may not be recycled through profit or loss
Actuarial gains and losses on pension obligations (363) 99 (264)
Income and expenses recognised directly in equity, net (447) 100 (347)
- of which, companies at equity (19) - (19)
Total recognised income and expenses, net (4 596) (674) (5 270)
- of which, attributable to equity holders of the parent (5 331)- of which, attributable to minority interests 61
2012
Gains and losses from remeasurement at fair value of available-for-sale financialassets
Exchange differences on translating foreign operations
PSA PEUGEOT CITROËN 2013 Annual Results - 31

CONSOLIDATED BALANCE SHEETSASSETS
(in million euros)
Manufacturingand sales
companiesFinance
companies Eliminations TotalContinuing operationsGoodwill (Note 14) 1 484 77 - 1 561Intangible assets (Note 14) 3 962 70 - 4 032Property, plant and equipment (Note 15) 10 898 17 - 10 915Investments in companies at equity (Note 16) 1 490 83 - 1 573Investments in non-consolidated companies 22 10 - 32Other non-current financial assets (Note 17) 670 53 - 723Other non-current assets (Note 18) 598 5 (1) 602Deferred tax assets (Note 12) 459 74 - 533Total non-current assets 19 583 389 (1) 19 971Operating assetsLoans and receivables - finance companies (Note 19) - 21 335 (55) 21 280Short-term investments - finance companies (Note 20) - 829 - 829Inventories (Note 21) 5 626 - - 5 626Trade receivables - manufacturing and sales companies (Note 22) 1 821 - (156) 1 665Current taxes (Note 12) 161 43 (16) 188Other receivables (Note 23) 1 640 657 (131) 2 166
9 248 22 864 (358) 31 754Current financial assets (Note 24) 141 - - 141Cash and cash equivalents (Note 25) 6 161 1 804 (210) 7 755Total current assets 15 550 24 668 (568) 39 650Total assets of continuing operations 35 133 25 057 (569) 59 621
Total assets held for sale 43 - - 43Total assets 35 176 25 057 (569) 59 664
31 December 2013
EQUITY AND LIABILITIES
(in million euros)
Manufacturingand sales
companiesFinance
companies Eliminations TotalEquity (Note 26)
Share capital 355Treasury stock (351)Retained earnings and other accumulated equity,excluding minority interests 6 878Minority interests 909Total equity 7 791Continuing operationsNon-current financial liabilities (Note 29) 8 081 - - 8 081Other non-current liabilities (Note 30) 3 045 - (1) 3 044Non-current provisions (Note 27) 1 067 16 - 1 083Deferred tax liabilities (Note 12) 475 347 - 822Total non-current liabilities 12 668 363 (1) 13 030Operating liabilitiesFinancing liabilities (Note 32) - 20 444 (216) 20 228Current provisions (Note 27) 2 564 89 - 2 653Trade payables 8 177 - (12) 8 165Current taxes (Note 12) 116 44 (16) 144Other payables (Note 33) 4 110 828 (281) 4 657
14 967 21 405 (525) 35 847Current financial liabilities (Note 29) 3 039 - (43) 2 996Total current liabilities 18 006 21 405 (568) 38 843Total liabilities of continuing operations (1) 30 674 21 768 (569) 51 873
Total liabilities related to assets held for sale - - - -Total equity and liabilities 59 664(1) excluding equity
31 December 2013

(in million euros)
Manufacturingand sales
companiesFinance
companies Eliminations TotalContinuing operationsGoodwill (Note 14) 1 487 77 - 1 564Intangible assets (Note 14) 4 047 86 - 4 133Property, plant and equipment (Note 15) 12 423 15 - 12 438Investments in companies at equity (Note 16) 1 490 46 - 1 536Investments in non-consolidated companies 50 12 - 62Other non-current financial assets (Note 17) 664 108 - 772Other non-current assets (Note 18) 511 3 - 514Deferred tax assets (Note 12) 536 77 - 613Total non-current assets 21 208 424 - 21 632Operating assetsLoans and receivables - finance companies (Note 19) - 23 146 (51) 23 095Short-term investments - finance companies (Note 20) - 867 - 867Inventories (Note 21) 6 193 - - 6 193Trade receivables - manufacturing and sales companies (Note 22) 2 014 - (187) 1 827Current taxes (Note 12) 105 62 (17) 150Other receivables (Note 23) 1 966 955 (122) 2 799
10 278 25 030 (377) 34 931Current financial assets (Note 24) 1 501 - - 1 501Cash and cash equivalents (Note 25) 5 421 1 669 (279) 6 811Total current assets 17 200 26 699 (656) 43 243Total assets of continuing operations 38 408 27 123 (656) 64 875
Total assets held for sale 9 - - 9Total assets 38 417 27 123 (656) 64 884
31 décembre 2012
(in million euros)
Manufacturingand sales
companiesFinance
companies Eliminations TotalEquity
Share capital 355Treasury stock (351)Retained earnings and other accumulated equity,excluding minority interests 9 463Minority interests 700Total equity 10 167Continuing operationsNon-current financial liabilities (Note 18) 7 828 - - 7 828Other non-current liabilities 3 184 - - 3 184Non-current provisions (Note 17) 1 163 19 - 1 182Deferred tax liabilities 475 326 - 801Total non-current liabilities 12 650 345 - 12 995Operating liabilitiesFinancing liabilities (Note 20) - 22 140 (279) 21 861Current provisions (Note 17) 2 988 76 - 3 064Trade payables 8 472 - (9) 8 463Current taxes 130 54 (17) 167Other payables 4 475 1 091 (309) 5 257
16 065 23 361 (614) 38 812Current financial liabilities (Note 18) 2 906 - (42) 2 864Total current liabilities 18 971 23 361 (656) 41 676Total liabilities of continuing operations (1) 31 621 23 706 (656) 54 671
Total liabilities related to assets held for sale 46 - - 46Total equity and liabilities 64 884(1) excluding equity
31 décembre 2012
PSA PEUGEOT CITROËN 2013 Annual Results - 33

CONSOLIDATED STATEMENTS OF CASH FLOWS
(in million euros)Manufacturing and
sales companiesFinance
companies Eliminations TotalConsolidated profit (loss) from continuing operations (2 453) 238 - (2 215)
Adjustments for non-cash items:
• Depreciation, amortisation and impairment (Note 34.4) 3 458 28 - 3 486• Provisions (368) 14 - (354)• Changes in deferred tax 46 15 - 61• (Gains) losses on disposals and other (39) - - (39)Share in net (earnings) losses of companies at equity, netof dividends received (36) (8) - (44)Revaluation adjustments taken to equity and hedges ofdebt 129 - - 129
Change in carrying amount of leased vehicles (37) - - (37)
Funds from operations (1)700 287 - 987
Changes in working capital (Note 34.2) 397 182 64 643
Net cash from (used in) operating activities 1 097 469 64 1 630
Proceeds from disposals of shares in consolidatedcompanies and of investments in non-consolidatedcompanies (9) - - (9)Capital increase and acquisitions of consolidatedcompanies and equity interests (2) (90) (30) - (120)Proceeds from disposals of property, plant and equipmentand of intangible assets 182 8 - 190Investments in property, plant and equipment (1 385) (12) - (1 397)Investments in intangible assets (1 002) (7) - (1 009)Change in amounts payable on fixed assets (173) - - (173)Other 46 (1) - 45
Net cash from (used in) investing activities (2 431) (42) - (2 473)
Dividends paid:• Intragroup 286 (286) - -• To minority shareholders of subsidiaries (48) - - (48)
Dividends received from Gefco S.A. - - - -Proceeds from issuance of shares 10 - - 10(Purchases) sales of treasury stock - - - -Changes in other financial assets and liabilities (Note 31.2) 1 956 - - 1 956
Net cash from (used in) financing activities 2 204 (286) - 1 918
Effect of changes in exchange rates (91) (6) 5 (92)Net increase (decrease) in cash and cash equivalentsfrom continuing operations 779 135 69 983
Net cash from discontinued operations (41) - - (41)
Net cash and cash equivalents at beginning of period 5 399 1 669 (279) 6 789
Net cash and cash equivalents of continuingoperations at end of period (Note 34.1) 6 137 1 804 (210) 7 731
2013
(1) Interest received and paid by the manufacturing and sales companies is presented in Note 34.5 Income tax paid (net ofrefunds) during the year is presented in Note 12.3.(2) of which 17 million in acquisitions in 2013 ( 104 million in 2012).
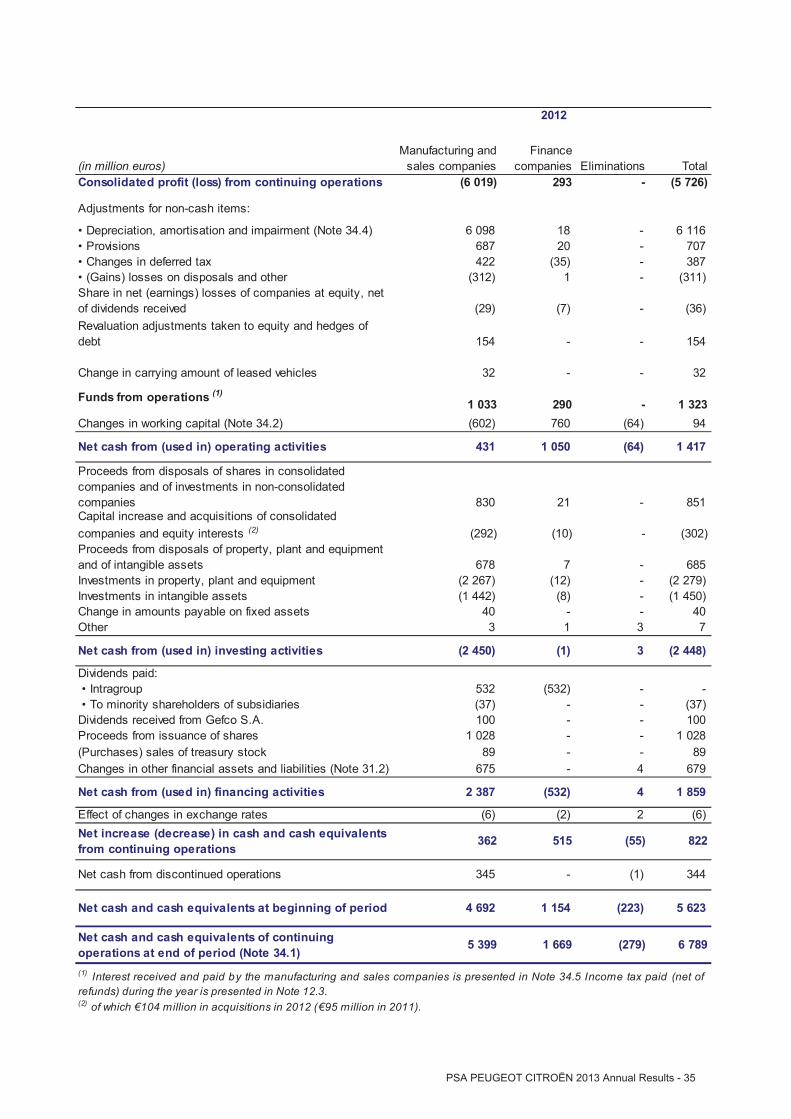
(in million euros)Manufacturing and
sales companiesFinance
companies Eliminations TotalConsolidated profit (loss) from continuing operations (6 019) 293 - (5 726)
Adjustments for non-cash items:
• Depreciation, amortisation and impairment (Note 34.4) 6 098 18 - 6 116• Provisions 687 20 - 707• Changes in deferred tax 422 (35) - 387• (Gains) losses on disposals and other (312) 1 - (311)Share in net (earnings) losses of companies at equity, netof dividends received (29) (7) - (36)Revaluation adjustments taken to equity and hedges ofdebt 154 - - 154
Change in carrying amount of leased vehicles 32 - - 32
Funds from operations (1) 1 033 290 - 1 323Changes in working capital (Note 34.2) (602) 760 (64) 94
Net cash from (used in) operating activities 431 1 050 (64) 1 417
Proceeds from disposals of shares in consolidatedcompanies and of investments in non-consolidatedcompanies 830 21 - 851Capital increase and acquisitions of consolidatedcompanies and equity interests (2) (292) (10) - (302)Proceeds from disposals of property, plant and equipmentand of intangible assets 678 7 - 685Investments in property, plant and equipment (2 267) (12) - (2 279)Investments in intangible assets (1 442) (8) - (1 450)Change in amounts payable on fixed assets 40 - - 40Other 3 1 3 7
Net cash from (used in) investing activities (2 450) (1) 3 (2 448)
Dividends paid:• Intragroup 532 (532) - -• To minority shareholders of subsidiaries (37) - - (37)
Dividends received from Gefco S.A. 100 - - 100Proceeds from issuance of shares 1 028 - - 1 028(Purchases) sales of treasury stock 89 - - 89Changes in other financial assets and liabilities (Note 31.2) 675 - 4 679
Net cash from (used in) financing activities 2 387 (532) 4 1 859
Effect of changes in exchange rates (6) (2) 2 (6)Net increase (decrease) in cash and cash equivalentsfrom continuing operations 362 515 (55) 822
Net cash from discontinued operations 345 - (1) 344
Net cash and cash equivalents at beginning of period 4 692 1 154 (223) 5 623
Net cash and cash equivalents of continuingoperations at end of period (Note 34.1) 5 399 1 669 (279) 6 789
2012
(1) Interest received and paid by the manufacturing and sales companies is presented in Note 34.5 Income tax paid (net ofrefunds) during the year is presented in Note 12.3.(2) of which 104 million in acquisitions in 2012 ( 95 million in 2011).
PSA PEUGEOT CITROËN 2013 Annual Results - 35

CONSOLIDATED STATEMENTS OF CHANGES IN EQUITY
At 31 December 2011 234 (502) 13 850 (40) 32 - 262 13 836 658 14 494
First adoption of IAS 19R - - (48) - - (64) (1) (113) (17) (130)
At 1 January 2012 234 (502) 13 802 (40) 32 (64) 261 13 723 641 14 364
Income and expenses recogniseddirectly in equity for the period
- - (5 008) (2) 48 (246) (123) (5 331) 61 (5 270)
Measurement of stock optionsand performance share grants
- - (5) - - - - (5) (1) (6)
Minority shareholder puts - - - - - - - - 15 15
Effect of changes in scope ofconsolidation and other
- - (5) - - - - (5) 10 5
Issuance of shares 121 - 845 - - - - 966 - 966
Purchases and sales of treasurystock
- 151 (62) - - - - 89 - 89
Equity component (conversionoption) of Oceane bonds
- - 30 - - - - 30 22 52
Dividends paid by other Groupcompanies
- - - - - - - - (48) (48)
At 31 December 2012 355 (351) 9 597 (42) 80 (310) 138 9 467 700 10 167
Income and expenses recogniseddirectly in equity for the period
- - (2 317) (32) (80) 145 (336) (2 620) 74 (2 546)
Measurement of stock optionsand performance share grants
- - 1 - - - - 1 1 2
Minority shareholder puts - - - - - - - - 6 6
Effect of changes in scope ofconsolidation and other
- - (6) - - 5 - (1) (12) (13)
Issuance of shares (1) - - 35 - - - - 35 189 224
Dividends paid by other Groupcompanies
- - - - - - - - (49) (49)
At 31 December 2013 355 (351) 7 310 (74) - (160) (198) 6 882 909 7 791
(1) This item essentially concerns the increase in Faurecia's shareholders' equity resulting from the early repayment of the 2015 OCEANE
Equity -Minority
interestsTotalequity
Cash flowhedges
Available-for-sale
financialassets
Actuarialgains andlosses on
pensionobligations
Translationadjust-ments(in million euros)
Sharecapital
Treasurystock
Retainedearningsexcluding
revaluations
Revaluations - excluding minority interests
Equity -Attributableto equityholders ofthe parent

NOTES TO THE CONSOLIDATED FINANCIAL STATEMENTSat December 2013
General InformationNote 1 - Significant Events........................................................................................................ ....................... 39Note 2 - Accounting Policies....................................................................................................... ..................... 41Note 3 - Changes to Financial Statements Previously Reported..................................................................... 57Note 4 - Scope of Consolidation..................................................................................................... ................. 58Note 5 - Segment Information....................................................................................................... .................. 59
Statements of IncomeNote 6 - Sales and Revenue.......................................................................................................... ................... 61Note 7 - Recurring Operating Expenses Analysed by Nature.......................................................................... 61Note 8 - Research and Development Expenses............................................................................................... 62Note 9 - Non-Recurring Operating Income and Expenses............................................................................... 62Note 10 - Finance Costs ............................................................................................................ ....................... 65Note 11 - Other Financial Income and Expenses............................................................................................. 65Note 12 - Income Taxes............................................................................................................. ...................... 66Note 13 - Earnings per Share........................................................................................................ ................... 69
Balance Sheets - AssetsNote 14 - Goodwill and Intangible Assets ....................................................................................................... 70Note 15 - Property, Plant and Equipment .............................................................................................. ......... 71Note 16 - Investments in Companies at Equity ............................................................................................... 73Note 17 - Other Non-Current Financial Assets ................................................................................................ 77Note 18 - Other Non-Current Assets ............................................................................................................... 78Note 19 - Loans and Receivables – Finance Companies.................................................................................. 78Note 20 - Short-Term Investments – Finance Companies............................................................................... 81Note 21 - Inventories....................................................................................................................................... 82Note 22 - Trade Receivables – Manufacturing and Sales Companies ............................................................. 82Note 23 - Other Receivables............................................................................................................................ 82Note 24 - Current Financial Assets .................................................................................................................. 83Note 25 - Cash and Cash Equivalents .............................................................................................................. 84
Balance Sheets – Equity and LiabilitiesNote 26 - Equity.................................................................................................................. ............................. 85Note 27 - Current and Non-Current Provisions............................................................................................... 89Note 28 - Pensions and Other Post-Employment Benefits ............................................................................. 90Note 29 - Current and Non-Current Financial Liabilities – Manufacturing and Sales Companies .................. 94Note 30 - Other Non-Current Liabilities .......................................................................................................... 99Note 31 - Net Financial Position of Manufacturing and Sales Companies.................................................... 100Note 32 - Financing Liabilities – Finance Companies ................................................................................... . 102Note 33 - Other Payables .............................................................................................................................. 105
Additional InformationNote 34 - Notes to the Consolidated Statements of Cash Flows .................................................................. 105Note 35 - Financial Instruments .................................................................................................................... 108Note 36 - Management of Financial Risks..................................................................................................... 113Note 37 - Off-Balance Sheet Commitments and Contingent Liabilities ........................................................ 127Note 38 - Related Party Transactions............................................................................................................ 129Note 39 - Management Compensation.................................................................................................. ....... 130Note 40 - Subsequent Events ........................................................................................................ ................ 131Note 41 - Fees Paid to the Auditors .............................................................................................................. 132Note 42 - Consolidated Companies at 31 December 2013 ........................................................................... 133
PSA PEUGEOT CITROËN 2013 Annual Results - 37

Preliminary note
The consolidated financial statements for 2013 including explanatory notes were approved for issue by the ManagingBoard of Peugeot S.A. on 11 February 2014, with Note 40 taking into account events that occurred in the period up tothe Supervisory Board meeting on 18 February 2014.
NOTE 1 - SIGNIFICANT EVENTS
1.1. ALLIANCE WITH GENERAL MOTORS
PSA Peugeot Citroën (PSA) and General Motors (GM) announced further steps in their strategic Alliance in December2013. The Alliance remains structured around the main pillars of joint programs, purchasing, and logistics, focused onEurope and is extended into cross manufacturing.
The two groups confirmed their continued cooperation for the development of two vehicles on PSA platforms. Thepartners will also cooperate to develop a new light commercial vehicle based on the new-generation PSA platform.The first vehicles from the Alliance are expected to launch starting in 2016. In addition, the two groups will share themanufacturing of these vehicles equally.
GM and PSA also amended certain other terms of the Alliance. They will simplify the joint governance of the Allianceand have removed as a ground for terminating the Alliance the failure to achieve a minimum number of cooperationprogrammes. GM also waived its right to terminate the Alliance, under certain conditions, in the event of certain otherinvestors acquiring interests in Peugeot S.A., provided that said investors support the Alliance. Following the change inthe Alliance, GM sold its 7% stake in Peugeot S.A.’s share capital.
1.2. PSA PEUGEOT CITROËN’S NEW SOCIAL CONTRACT
Following a meeting of the Central Works Council, the New Social Contract was signed on 24 October 2013. Theagreement is designed to involve employees in the Group's recovery and to maintain PSA Peugeot Citroën's industrialand technological base in France, while preserving employees' basic interests.
The New Social Contract focuses on four main pathways:
Greater involvement by employees and their representatives in the Group's strategic vision and in eachdepartment's and site's forward-looking projects.A new approach that secures jobs while carrying out collective transformations, particularly to improve theutilization rate of our plants.Deployment of a PSA intergenerational contract that provides for senior leave and the hiring, under work-studyschemes, of young people.Flexibility and wage moderation measures (with no decline in remuneration paid).
The New Social Contract also gives employees a stake in the Company's recovery through an improved discretionaryprofit sharing agreement and an additional profit-sharing payment (discretionary or non-discretionary) in early 2015.
Annual expenses related to the New Social Contract are disclosed in Note 9.3.
1.3. NEW FINANCING AND FRENCH STATE GUARANTEE
The Group undertook several financing transactions during the year.
For the Automotive Division, these transactions chiefly comprised two bond issues by Peugeot S.A. in a total amountof 1.6 billion, and a new loan of 300 million from the European Investment Bank (EIB).
Faurecia also reconstituted its entire syndicated loan by repaying sums drawn in a total amount of 300 million (seeNote 31.3).
PSA PEUGEOT CITROËN 2013 Annual Results - 39

Banque PSA Finance issued a 1.2 billion bond and carried out eight securitisation transactions.
Bond issues carried out by Banque PSA Finance since 2013 benefit from a first-demand guarantee from the FrenchState within the framework of the authorisation granted by the European Commission, capped at a total principalamount of 7 billion (see Note 36.1.A. (b)).
To complement its sources of funding, in March 2013 Banque PSA Finance launched a savings account targetingindividual customers in France under the name Distingo. Deposits totalled 955 million as of 31 December 2013.
Banque PSA Finance also renewed its bank facilities in 2013 (see Note 36.1.A. (b)).
1.4. IMPAIRMENT LOSSES ON AUTOMOTIVE DIVISION ASSETS
In accordance with accounting standard IAS 36, PSA Peugeot Citroën recorded an impairment loss on its AutomotiveDivision assets in Russia and Latin America, notably reflecting a context of deteriorating automotive markets andfluctuations in exchange rates in those areas. The impairment charge totalled 1,009 million (see Note 9.1).

NOTE 2 - ACCOUNTING POLICIES
The PSA Peugeot Citroën Group's consolidated financial statements have been prepared in accordance withInternational Financial Reporting Standards (IFRS) as adopted for use in the European Union on 31 December2013, the balance sheet date.1
International Financial Reporting Standards include IFRSs and IASs (International Accounting Standards) and therelated interpretations as prepared by the Standing Interpretations Committee (SIC) and the InternationalFinancial Reporting Interpretations Committee (IFRIC).
All IFRS standards and interpretations published by the IASB and the IFRS Interpretation Committee whoseapplication is compulsory in financial years beginning on or after 1 January 2013 have been adopted for useand are compulsory in the European Union, except for :
IAS 39 which has only been partially adopted for use in the European Union. There are no items in the PSAPeugeot Citroen Group's financial statements that would be affected by the unadopted provisions of thisstandard.
IFRS 10, 11 and 12, and amendments to IAS 27, 28 and 31, for which the European Union has deferredcompulsory application until 1 January 2014, with the possibility of early application. The Group hasnot opted for early application of these standards. The impact of the new standards is describedbelow.
New compulsory standards and interpretations
First applicationin the EU forannual periodsbeginning on orafter:
Impacts
Amendment to IAS 19 "Employee Benefits" 01.01.2013 See Note 2.21
IFRS 13 "Fair Value Measurement "This standard provides guidance on determining fair value when theapplication is required or permitted by another IFRS
01.01.2013 Without materialimpact
Amendment to IAS 1 "Presentation of Financial Statements: Presentation of Items of OtherComprehensive Income".This standard has resulted in the separation of non-recyclable itemswithin income and expense being recognised in equity.
01.07.2012 See ConsolidatedStatement ofIncome andExpensesRecognised in Equity
Amendment to IFRS 7 " Disclosures – Offsetting Financial Assets and Financial Liabilities".This standard mainly concerns margin call agreements on OTCderivatives held by finance companies.
01.01.2013 Without materialimpact
1 The International Financial Reporting Standards adopted for use in the European Union can be downloaded from theEuropean Commission's website (http://ec.europa.eu/internal_market/accounting/ias/index_en.htm)
PSA PEUGEOT CITROËN 2013 Annual Results - 41
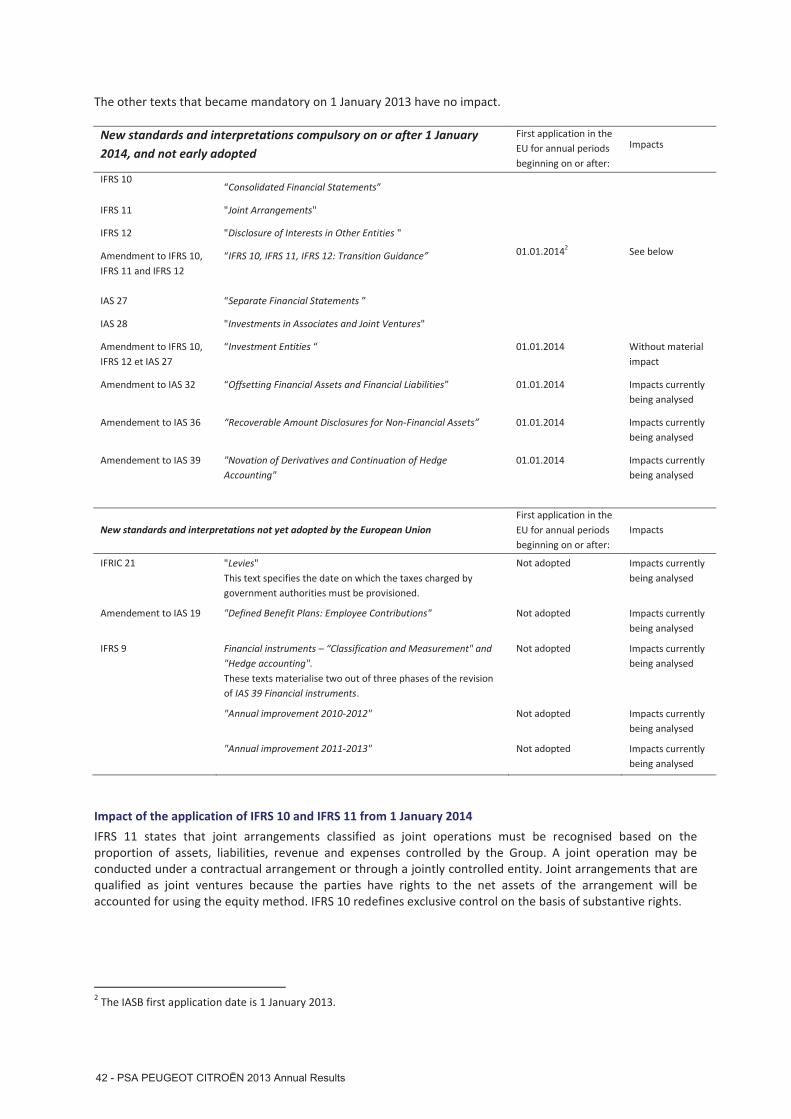
The other texts that became mandatory on 1 January 2013 have no impact.
New standards and interpretations compulsory on or after 1 January2014, and not early adopted
First application in theEU for annual periodsbeginning on or after:
Impacts
IFRS 10“Consolidated Financial Statements”
01.01.20142 See below
IFRS 11 "Joint Arrangements"
IFRS 12 "Disclosure of Interests in Other Entities "
Amendment to IFRS 10,IFRS 11 and IFRS 12
“IFRS 10, IFRS 11, IFRS 12: Transition Guidance”
IAS 27 “Separate Financial Statements ”
IAS 28 "Investments in Associates and Joint Ventures"
Amendment to IFRS 10,IFRS 12 et IAS 27
“Investment Entities “ 01.01.2014 Without materialimpact
Amendment to IAS 32 “Offsetting Financial Assets and Financial Liabilities” 01.01.2014 Impacts currentlybeing analysed
Amendement to IAS 36 “Recoverable Amount Disclosures for Non-Financial Assets” 01.01.2014 Impacts currentlybeing analysed
Amendement to IAS 39 "Novation of Derivatives and Continuation of HedgeAccounting"
01.01.2014 Impacts currentlybeing analysed
New standards and interpretations not yet adopted by the European UnionFirst application in theEU for annual periodsbeginning on or after:
Impacts
IFRIC 21 "Levies"This text specifies the date on which the taxes charged bygovernment authorities must be provisioned.
Not adopted Impacts currentlybeing analysed
Amendement to IAS 19 "Defined Benefit Plans: Employee Contributions" Not adopted Impacts currentlybeing analysed
IFRS 9 Financial instruments – “Classification and Measurement" and"Hedge accounting".These texts materialise two out of three phases of the revisionof IAS 39 Financial instruments.
Not adopted Impacts currentlybeing analysed
"Annual improvement 2010-2012" Not adopted Impacts currentlybeing analysed
"Annual improvement 2011-2013" Not adopted Impacts currentlybeing analysed
Impact of the application of IFRS 10 and IFRS 11 from 1 January 2014
IFRS 11 states that joint arrangements classified as joint operations must be recognised based on theproportion of assets, liabilities, revenue and expenses controlled by the Group. A joint operation may beconducted under a contractual arrangement or through a jointly controlled entity. Joint arrangements that arequalified as joint ventures because the parties have rights to the net assets of the arrangement will beaccounted for using the equity method. IFRS 10 redefines exclusive control on the basis of substantive rights.
2 The IASB first application date is 1 January 2013.

In practice:the main companies under joint control classified as joint ventures are DPCA and CAPSA. They willcontinue to be consolidated by the equity method;the companies classified as joint operations at 31 December 2013 are Toyota Peugeot Citroën Automobile,Sevel SpA and PCMA Automotive Rus, as well as Française de Mécanique prior to its takeover (see Note 4).TPCA and Sevel SpA are currently consolidated by the equity method. In view of the rights held by theGroup in the event of a conflict between shareholders, PCMAR was deemed to be controlled in applicationof the previous standards and therefore fully consolidated. With regard to IFRS 10, these rights are nolonger deemed to provide exclusive control.
The main impact of the new standards will be the recognition of the Group share of the carrying amount of therelevant subsidiaries' assets in assets on the consolidated balance sheet and that of the Group share of theirdebt among liabilities. The main impact will be, on 1 January 2013, an increase of 227 million in the net debtof the Group, consolidating the net debt of the Française de Mécanique company for 188 million. In view ofthe takeover of Française de Mécanique, its debt is included in the Group's net debt at 31 December 2013. Atthat date, the impact of the application of these new standards was therefore limited to an increase of 33million.
2.1. CONSOLIDATION
Consolidation methodsA.
The generic name PSA Peugeot Citroën refers to the Group of companies of which Peugeot S.A. is the parent.
The financial statements of Peugeot S.A. and companies in which Peugeot S.A. directly or indirectly exercisesexclusive control are fully consolidated.
Companies in which Peugeot S.A. directly or indirectly exercises joint control or significant influence overoperating and financial policies are included in the consolidated financial statements using the equity method.
Certain companies meeting the above criteria have not been consolidated because they do not meet any of thefollowing minimum requirements:- revenue in excess of 50 million;- total assets in excess of 20 million;- total debt in excess of 5 million.
Investments in these companies are recorded under "Investments in non-consolidated companies" inaccordance with the general accounting principles described in Note 2.16.B(2)(a). Their consolidation wouldnot have a material impact on the consolidated financial statements.
All significant intragroup transactions and internal margins are eliminated in consolidation.
The Group attributes the profit or loss of a subsidiary between the parent and minority interests based on theirrespective ownership interests. As a result, if there is no agreement committing the parent to absorbing thelosses of the subsidiary, minority interests may be negative.
Changes in scope of consolidation resulting in exclusive controlB.
Business combinations occurring after 1 January 2010 are accounted for using the acquisition method, inaccordance with IFRS 3 (Revised) – Business Combinations.The identifiable assets acquired and liabilities and contingent liabilities assumed are measured at acquisition-date fair value, provided that they meet the accounting criteria of IFRS 3 (revised). The residual goodwillrepresents anticipated post-acquisition cash flows due to synergies in addition to the assets and liabilitiesrecognised on initial consolidation. Acquisition-related costs are recognised as expenses in the period in whichthe costs are incurred.
PSA PEUGEOT CITROËN 2013 Annual Results - 43

In the event of a price adjustment in the 12 months following the acquisition date, the provisional initialassessment is adjusted against goodwill. Any subsequent adjustment is recognised as debt or credit againstprofit or loss.
Other changes in scope of consolidationC.
Puttable financial instruments - corresponding to put options granted to minority shareholders - are recognisedas debt in accordance with the principles described in Note 2.16.E.
Following any change in ownership interest that results in the loss of control of an entity, the initial interest isremeasured at fair value and the gain or loss is recognised in non-recurring operating income or expense (ifmaterial).Changes in ownership interests that do not result in a loss of control of the subsidiary are accounted for asequity transactions (transactions with owners in their capacity as owners) and therefore lead to equity,including transaction costs, being reallocated between the parent and the minority interests.
2.2. TRANSLATION OF THE FINANCIAL STATEMENTS OF FOREIGN SUBSIDIARIES
Standard methodA.
The Group’s functional currency is the euro ( ), which is also the presentation currency in the consolidatedfinancial statements. The functional currency of most foreign subsidiaries is their local currency, correspondingto the currency in which the majority of their transactions are denominated. The balance sheets of thesesubsidiaries are translated at the year- end exchange rate and their income statements are translated on amonthly basis at the average exchange rate for each month. Gains and losses resulting from the translation offinancial statements of foreign subsidiaries are recorded in equity under "Translation reserve". Goodwill arisingon the acquisition of these subsidiaries is measured in their functional currency.
Specific methodB.
Certain subsidiaries outside the euro zone carry out most of their transactions in euros or US dollars, which isaccordingly recognised as their functional currency. Non-monetary items in these subsidiaries' accounts aretranslated at the historical exchange rate and monetary items at the year-end rate. The resulting translationgains and losses are recognised directly in profit or loss.
2.3. TRANSLATION OF TRANSACTIONS IN FOREIGN CURRENCIES
Transactions in foreign currencies are measured and recognised in accordance with IAS 21 – the Effects ofChanges in Foreign Exchange Rates. In compliance with this standard, transactions in foreign currencies aretranslated into the subsidiary's functional currency at the exchange rate on the transaction date.At each balance sheet date, monetary items are translated at the closing rate and the resulting exchangedifference is recognised in profit or loss, as follows:
in recurring operating income, for commercial transactions carried out by all Group companies and forfinancing transactions carried out by the Banque PSA Finance Group;in interest income or finance costs for financial transactions carried out by the manufacturing and salescompanies.
2.4. USE OF ESTIMATES AND ASSUMPTIONS
The preparation of financial statements in accordance with IFRS requires management to make estimates andassumptions in order to determine the reported amounts of certain assets, liabilities, income and expenseitems, as well as certain amounts disclosed in the notes to the financial statements relating to contingentassets and liabilities.

The estimates and assumptions used are those deemed by management to be the most pertinent and accuratein view of the Group’s circumstances and past experience. To reduce uncertainty, estimates and assumptionsare reviewed periodically.Nevertheless, given the uncertainty inherent in any projections, actual results may differ from initial estimates.
For the preparation of the 2013 annual financial statements, special attention was paid to the following itemswhich are particularly exposed to estimation uncertainty in a crisis environment:
The recoverable amount of Automotive Division intangible assets and property, plant and equipment (seeNote 9.1);Provision for onerous contracts entered into pursuant to cooperation agreements (see Note 9.1);Deferred tax assets (see Note 12);Receivables – finance companies (see Note 19).
The use of estimates and assumptions is also crucial for the following item:Pension obligations (see Note 28);Provisions (particularly vehicle warranty provisions, restructuring provisions, claims and litigation) (seeNote 27 and Note 9.3);The recoverable amount of inventories and other receivables (see Note 21 and Note 22);The fair value of derivative financial instruments (see Note 35);Sales incentives (see Note 2.6).
2.5. REVENUE
Manufacturing and sales companiesA.
(a) Automotive Division
Sales and revenue of the manufacturing and sales companies include mainly revenues from the sale and leasingof vehicles and the sale of other goods and services.In accordance with IAS 18 – Revenue,new vehicle sales are recognised on the date the risks and rewards ofownership are transferred. This generally corresponds to the date when the vehicles are made available tonon-group dealers or the delivery date, in the case of direct sales.
Sales at cost of items purchased on behalf of other parties and sales to subcontractors of raw materials, partsand mechanical sub-assemblies that are intended to be bought back at cost are not included in revenue.
Sales of new vehicles with a buyback commitment are not recognised at the time of delivery but accounted foras operating leases when it is probable that the vehicle will be bought back. This principle applies:
whatever the duration of the buyback commitment;for both direct sales and sales financed by Banque PSA Finance and its subsidiaries.
The difference between the sale price and the buyback price is recognised as rental revenue on a straight-linebasis over the duration of the buyback commitment. The vehicle is initially recognised at production cost inproperty, plant and equipment. Depreciation expense is calculated over the term of the lease by the straight-line method, on the basis of the vehicle’s cost less its estimated residual value, representing the anticipatedresale price on the used vehicle market. Any additional gain made on the final sale of the vehicle is recognisedin the period in which it is sold on the used vehicle market. If the net difference is a loss, an allowance isbooked when the buyback contract is signed.
(b) Automotive Equipment Division
The Automotive Equipment Division performs development work and manufactures or purchases specifictooling to produce parts or modules for programmes covered by specific customer orders.
The revenue recognition criteria provided for in IAS 18 are not met in cases where development and toolingcosts are paid in proportion to parts delivered to the customer, with their full recovery being subject to anunguaranteed minimum level of orders placed by the customer. Under such circumstances, development work
PSA PEUGEOT CITROËN 2013 Annual Results - 45

and tooling cannot be considered as having being sold. The development costs are recognised in intangibleassets (see Note 2.13.A) and tooling in property, plant and equipment (see Note 2.14.A).
If the contract includes a payment guarantee, the development and tooling costs are recognised in inventoriesand work-in-progress. The corresponding revenue is recognised when the customer signs off on each technicalphase.
Finance companiesB.
The Group’s finance companies provide wholesale financing to dealer networks and retail financing tocustomers. Financing may take the form of conventional loans, finance leases, buyback contracts or long-termleasing. The different forms of financing are treated as lending transactions and are recognised in the balancesheet in the amount of the Banque PSA Finance Group's net financial commitment (see Note 2.16.B). Salesfinancing revenues are recorded using the yield-to-maturity method, so as to recognise a constant rate ofinterest over the life of the loan.
2.6. SALES INCENTIVES
The cost of current and future sales incentive programmes is accrued on the basis of historical costs for theprevious three months, determined country by country, and charged against profit for the period in which thecorresponding sales are recognised. In cases where the cost of the programme varies according to sales, it isdeducted from revenue.
The Group’s incentive programmes include retail financing granted at a significant discount to market interestrates. The corresponding cost is recognised at the time of the sale.
2.7. SELLING, GENERAL AND ADMINISTRATIVE EXPENSES
Selling, general and administrative expenses correspond to general administrative expenses, indirect sellingexpenses and warranty costs.
Warranties
A provision is recorded to cover the estimated cost of vehicle and spare parts warranties at the time of sale toindependent dealer networks or end-customers. Revenues from the sale of extended warranties ormaintenance contracts are recognised over the period during which the service is provided.
2.8. RESEARCH AND DEVELOPMENT EXPENDITURE
Under IAS 38 - Intangible Assets, research expenditure is recognised as an expense, while developmentexpenditure is recognised as an intangible asset when certain conditions are met (see Note 2.13.A).In accordance with this standard, all research costs and all development expenditure other than that describedin Note 2.13.A are recognised as an expense for the period in which they are incurred, as is the amortisation ofcapitalised development costs (see Note 8).
2.9. OPERATING INCOME (LOSS)
Operating income corresponds to profit before net financial income or expense, current and deferred taxes andthe Group's share in the net earnings of companies at equity.
The Group uses recurring operating income as its main business performance indicator. Recurring operatingincome corresponds to operating income before other non-recurring income and expenses, defined as materialitems of income and expense that are unusual in nature or infrequent in occurrence whose inclusion inoperating income creates a distorted view of the Group’s underlying performance.
In practice, other non-recurring operating income and expenses consist mainly of the following items which aredescribed in the notes to the financial statements where appropriate (see Note 9):
restructuring and early-termination plan costs;impairment losses (and subsequent adjustments) recognised on (i) non-current assets followingimpairment tests performed on the cash-generating units (CGUs) to which they belong, and (ii) thecorresponding onerous contracts;gains on disposals of real estate and impairment of real estate held for sale.
2.10. SHARE IN EARNINGS OF COMPANIES AT EQUITY
The share in earnings of companies at equity represents the Group’s share of the earnings of those companies,plus any impairment of investments in companies at equity.
Gains on disposals of investments in companies at equity are recorded in operating income.
2.11. BORROWING COSTS
Effective from 1 January 2009, borrowing costs that are directly attributable to the acquisition, construction orproduction of an item of property, plant and equipment or an intangible asset that takes at least twelvemonths to get ready for its intended use are capitalised as part of the cost of that asset (the “qualifying asset”).Group inventories do not meet the definition of qualifying assets under IAS 23 – Borrowing Costs and theircarrying amount does not therefore include any borrowing costs.When funds are borrowed specifically for the purpose of obtaining a qualifying asset, the amount of borrowingcosts eligible for capitalisation corresponds to the actual borrowing costs incurred during the period less anyinvestment income on the temporary investment of any borrowed funds not yet used.When funds borrowed for general corporate purposes are used to obtain a qualifying asset, the amount ofborrowing costs eligible for capitalisation is determined by applying a capitalisation rate equal to the weightedaverage borrowing costs for the period of the operating segment that obtains the qualifying asset.
2.12. GOODWILL
In accordance with IAS 36 – Impairment of Assets, goodwill is not amortised but tested for impairmentannually, or more frequently if events or changes in circumstances indicate that it might be impaired (see Note2.15).
Goodwill attributable to acquisitions of associates and joint arrangements is the excess of the cost of shares,including directly attributable acquisition costs, over the Group’s equity in the acquisition-date fair value of theidentifiable assets and liabilities acquired. It is included in “Investments in companies at equity” and tested forimpairment at the level of the associate or joint arrangement concerned.
2.13. INTANGIBLE ASSETS
Research and development expenditureA.
Under IAS 38 – Intangible Assets, development expenditure is recognised as an intangible asset if the entity candemonstrate in particular:
its intention to complete the intangible asset and use or sell it, as well as the availability of adequatetechnical, financial and other resources for this purpose;that it is probable that the future economic benefits attributable to the development expenditure will flowto the entity;that the cost of the asset can be measured reliably.
Capitalised development costs include related borrowing costs (see Note 2.11).
(a) Automotive Division
PSA PEUGEOT CITROËN 2013 Annual Results - 47

Development expenditure on vehicles and mechanical sub-assemblies (engines and gearboxes) incurredbetween the project launch (corresponding to the styling decision for vehicles) and the start-up of pre-seriesproduction is recognised in intangible assets. It is amortised from the start-of-production date over the asset’suseful life, representing up to seven years for vehicles and ten years for mechanical sub-assemblies andmodules. The capitalised amount mainly comprises payroll costs of personnel directly assigned to the project,the cost of prototypes and the cost of external services related to the project. No overheads or indirect costsare included, such as rent, building depreciation and information system utilisation costs. The capitalisedamount also includes the portion of qualifying development expenditure incurred by the Group undercooperation agreements that is not billed to the partner. Generally, development costs billed to the Group byits partners under cooperation agreements are also capitalised, unless they relate to a project with milestonesand are incurred after the final capitalisation milestone. All development expenditure incurred to developmechanical sub-assemblies compliant with new emissions standards is monitored on a project-by-project basisand is also capitalised.
(b) Automotive Equipment Division
Development work is undertaken for all programmes covered by specific customer orders. Where developmentcosts are paid in proportion to parts delivered to the customer, with their full recovery being subject to anunguaranteed minimum level of orders placed by the customer, the costs incurred during the period betweenthe customer's acceptance of the commercial offer and the start-of-production date of the parts or modulesare recognised in intangible assets. The intangible asset is amortised based on the quantity of parts deliveredto the customer, provided that accumulated amortisation at each year-end does not represent less than theamount that would be recognised if the asset were amortised on a straight- line basis over five years. If thecontract includes a payment guarantee, the development expenditure is recognised in inventories and work-in-progress.
Other research and development expenditure is recognised as an expense for the period in which it is incurred(see Note 2.8).
Other internally-developed or purchased intangible assetsB.
The portion of development costs relating to software for internal use that corresponds to directly attributableinternal or external costs necessary to create the software or improve its performance is recognised as anintangible asset when it is probable that these costs will generate future economic benefits. The capitalisedcosts are amortised over the estimated useful life of the software, ranging from four to twelve years. Othersoftware acquisition and development costs are expensed as incurred.
Other intangible assets (consisting principally of patents and trademarks) are amortised on a straight- line basisover the estimated period of benefit, not to exceed twenty years.
2.14. PROPERTY, PLANT AND EQUIPMENT
CostA.
In accordance with IAS 16 - Property, Plant and Equipment, property, plant and equipment are stated atacquisition or production cost. They are not revalued.
Capitalised costs include the portion of specific tooling expenses incurred by the Group under cooperationagreements that is not billed to its partners. All specific tooling expenditure billed to the Group by its partnersunder cooperation agreements is also capitalised.
The cost of items of property, plant and equipment that take at least twelve months to get ready for theirintended use includes related borrowing costs (see Note 2.11).
Government grants are recognised as a reduction in the cost of the corresponding assets.Maintenance costs are expensed as incurred.

Leased assets include vehicles leased to retail customers by the Group's leasing companies and vehicles soldwith a buyback commitment, which are recognised according to the method described in Note 2.5.A.
Assets acquired under finance leases, as defined in IAS 17 - Leases, are recognised at an amount equal to thepresent value of the future lease payments, or to the fair value of the leased property, whichever is lower. Afinancial liability is recognised in the same amount. The assets are depreciated by applying the method andrates indicated below.
DepreciationB.
(a) Standard method
Depreciation is calculated on a straight-line basis to write off the acquisition or production cost of the assets,less any residual value, over their estimated useful lives. Property, plant and equipment generally have noresidual value, except for rental vehicles. The main useful lives of property, plant and equipment are as follows:
(in years)Buildings 20 - 30Plant and equipment 4 - 16Computer equipment 3 - 4Vehicles and handling equipment 4 - 7Fixtures and fittings 10 - 20
(b) Specific toolingIn the Automotive Division, specific tooling is depreciated over the estimated lives of the correspondingmodels, which are generally shorter than the useful lives of the tooling concerned due to the frequency ofmodel changes.In the Automotive Equipment Division, specific tooling is depreciated based on the quantity of parts deliveredto the customer, provided that accumulated depreciation at each year-end does not represent less than theamount that would be recognised if the asset were depreciated on a straight-line basis over five years.The estimated useful lives of property, plant and equipment are reviewed periodically, particularly whenever adecision is made to halt production of a vehicle or mechanical sub-assembly.
2.15. IMPAIRMENT OF LONG-LIVED ASSETS
In accordance with IAS 36 – Impairment of Assets, the recoverable amount of property, plant and equipmentand intangible assets is tested for impairment at each balance sheet date, whenever events or changes incircumstances indicate that it might be impaired. The recoverable amount of an asset is the higher of its valuein use and its fair value less costs to sell. The impairment test usually consists of estimating the asset’s value inuse. Value in use is measured as the net present value of estimated future cash flows. Assets with indefiniteuseful lives, i.e. mainly goodwill, are tested for impairment at least once a year.
The tests are performed at the level of cash generating unit (CGU) to which the assets belong. CGUs aredefined as the smallest identifiable Group of assets that generates cash inflows that are largely independent ofthe cash inflows from other assets or groups of assets. If a CGU’s recoverable amount is less than its carryingamount, an impairment loss is recognised in profit or loss and, to the extent possible, as an adjustment to thecarrying amount of any goodwill allocated to the CGU.The Automotive Division comprises a number of Vehicle CGUs, each corresponding to a vehicle model. Theassets included in a Vehicle CGU consist of tooling and other specific plant and equipment used to manufacturethe model, as well as capitalised model development expenditure (see Note 2.13.A(a)). The AutomotiveDivision CGU consists of the Vehicle CGUs and all other fixed assets, including goodwill.In the Automotive Equipment Division, each CGU corresponds to a programme and comprises all customercontract-related intangible assets (corresponding to capitalised development costs) and property, plant andequipment. These CGUs are combined in Business Units (Automotive Seating, Interior Systems, AutomotiveExteriors and Emissions Control Technologies) to which support assets and goodwill are allocated. The
PSA PEUGEOT CITROËN 2013 Annual Results - 49

Automotive Equipment Division CGU comprises the assets of the CGUs in the above four Business Units and theFaurecia goodwill recognised in the PSA Peugeot Citroën Group’s consolidated financial statements.
Within the Banque PSA Finance group, fixed assets used in a given country constitute a homogeneous group ofassets (CGU).
2.16. FINANCIAL ASSETS AND LIABILITIES
DefinitionsA.
Under IAS 39, financial assets include loans and receivables, available-for-sale financial assets and financialassets at fair value through profit or loss (including financial assets designated upon initial recognition as beingat fair value through profit or loss) (See Note 35).
Financial liabilities as defined by IAS 39 comprise financial liabilities at amortised cost (see details of the itemsin Note 35).
Financial assets and liabilities with maturities of more than one year at the balance sheet date are classified asnon-current. All other assets and liabilities are reported as current.
As allowed under IAS 39, the Group has chosen to recognise financial assets and liabilities at the transactiondate. Consequently, when the transaction (or commitment) date is different from the settlement date, thesecurities to be delivered or received are recognised on the transaction date.
Recognition and measurement of financial assetsB.
(1) Financial assets at fair value through profit or loss
(a) Manufacturing and sales companies
These assets are recognised in the balance sheet at fair value. Any change in their fair value is recognised inprofit or loss for the period.This mainly covers marketable securities and cash investments not meeting the criteria for classification as cashequivalents.
Cash primarily represents cash in bank current accounts, and excludes bank overdrafts. Cash equivalentsconsist primarily of cash investments and negotiable debt securities that are readily convertible to knownamounts of cash, subject to an insignificant risk of change in value and held in order to meet short-term cashcommitments (Note 25).
(b) Short-term investments - finance companies
Marketable securities are carried at amortised cost or under the fair value option if they benefit from interestrate hedges. Changes in the fair value of the hedged securities are recognized directly in profit or loss, togetherwith the offsetting change fair value of the economic hedges.
(2) Available-for-sale financial assetsAvailable-for-sale financial assets are securities that are not intended to be held to maturity and that are notclassified either as financial assets at fair value through profit or loss or as loans and receivables. They may beheld on a lasting basis or sold in the short term.
Available-for-sale financial assets are recognised in the balance sheet at fair value. Gains and losses arisingfrom remeasurement at fair value are recognised directly in equity. Only impairment losses reflecting aprolonged or significant decline in fair value are recognised in the income statement.The Group uses the following criteria to assess whether it is prolonged or significant: an impairment loss issystematically recognised in profit or loss where the value falls by over 50% compared to the acquisition cost or
over a minimum of three years. Furthermore, a special line-by-line analysis is carried out where the value fallsover 30% compared to the acquisition cost or within a minimum of 1 year.
Assets classified as “available-for-sale” are described in Note 35.
(3) Loans and receivables
(a) Loans and receivables - finance companies
Loans and receivables reported in the balance sheet correspond to Banque PSA Finance's net financialcommitment in respect of the loans and receivables. Consequently, their carrying amount includes theoutstanding principal and accrued interest plus the following items (before the effect of hedge accounting):
commissions paid to referral agents as well as directly attributable administrative expenses incurred withthird parties on inception of loans and receivables, which are added to the outstanding principal;contributions received from the brands, which are deducted from the outstanding principal;unamortised loan set-up costs, which are deducted from the outstanding principal;deposits received at the inception of finance leases, which are deducted from the amount financed.
Interest income is allocated by the effective interest method, with the effective interest rate being the rate thatexactly discounts estimated future cash receipts through the expected life of the loan.
Loans and receivables are generally hedged against interest rate risks, with the hedged portion of the loanremeasured at fair value in accordance with hedge accounting principles. Gains and losses arising fromremeasurement at fair value are recognised in profit or loss and are offset by the effective portion of the loss orgain arising from remeasurement at fair value of the hedging instrument. (see Note 2.16.D).
Loans and receivables are tested for impairment when a loss event occurs, corresponding in practice to defaulton a single instalment. Impairment is measured by comparing the carrying amount of the loan or receivable tothe present value of estimated future cash flows discounted at the effective interest rate.
For retail loans and receivables:an impairment loss is recognised on sound loans when the borrower defaults on a single instalment.Impairment is assessed based on the probability of the outstanding loan being classified as non-performingand on the discounted average loss ratio;impairment losses on non-performing loans are determined based on the average loss ratio discounted atthe loans’ effective interest rate, which is used to calculate provisions for credit losses on non-performingand doubtful loans.
For other loans and receivables (consisting mainly of wholesale loans), provisions for known credit risks aredetermined on a case-by-case basis, when the first instalment is missed or at the latest when the loan isreclassified as non-performing. Reclassification occurs when at least one instalment is over 91 days past due, orwithin a maximum of 451 days if it can be demonstrated that there is no counterparty risk. In the case of anaggravated risk, the loan may be reclassified as non-performing before the 91-day period has expired.
(b) Loans and receivables of the manufacturing and sales companies
“Loans and receivables” are carried at amortised cost measured using the effective interest method.They mainly comprise trade receivables (Note 22 and section 2.18), other receivables (Note 23) and other loansand deposits.
PSA PEUGEOT CITROËN 2013 Annual Results - 51
Recognition and measurement of financial liabilitiesC.
Borrowings and other financial liabilities are generally stated at amortised cost measured using the effectiveinterest method.Items hedged by interest rate swaps are accounted for using fair value hedge accounting. The hedged portionof the financial liability is remeasured at fair value, with changes in fair value attributable to the hedged risktaken to profit or loss and offset by the loss or gain arising from remeasurement at fair value of the hedginginstrument.
The Oceane convertible bonds issued by the Group are recognised and measured as follows:the debt component is recognised in liabilities at amortised cost, determined using the market interestrate for debt securities with similar characteristics but without the conversion feature. The carryingamount is stated net of a proportionate share of the debt issuance costs;the conversion option is recognised in equity for an amount equal to the difference between the totalissue proceeds and the value of the debt component. The carrying amount is stated net of a proportionateshare of the debt issuance costs and corresponding deferred taxes.
The conversion option is recognised in equity because the conversion ratio is fixed (i.e. bond holders willreceive a fixed number of shares in exchange for a fixed amount of bonds). It is not subsequently remeasuredat fair value, unless there is a change in the bonds’ estimated life. It will, however, be adjusted, for allconversions of bonds. A deferred tax liability calculated on the gross value of the conversion option is alsorecognised in equity.
The government loans at below-market interest rates obtained by the Group are adjusted when the effect ismaterial. The adjustment consists of calculating the loans’ amortised cost by multiplying future cash flows onthe loans by an effective interest rate based on market rates. The subsidy corresponding to the below-marketinterest rate is recognised in accordance with IAS 20 as related either to assets (see Note 2.14.A) or to income,depending on the purpose for which the funds are used.
Recognition and measurement of derivative instrumentsD.
Derivative instruments are stated at fair value.
They may be classified as hedging instruments if:at the inception of the hedge there is formal designation and documentation of the hedging relationship;the effectiveness of the hedge is demonstrated at inception and in each financial reporting period forwhich the hedge is designated.
The Group uses two hedging relationships:fair value hedges:The hedged portion of the asset or liability is recognised in the balance sheet and measured at fair value.Gains and losses arising from remeasurement at fair value are recognised in profit or loss, and are offset bythe effective portion of the loss or gain arising from remeasurement at fair value of the hedginginstrument;cash flow hedges:The effective portion of the gain or loss arising from remeasurement at fair value of the hedginginstrument is recognised directly in equity, since the gain or loss arising from remeasurement at fair valueof the hedged portion of the underlying future transaction is not recognised in the balance sheet. Theineffective portion is recognised in profit or loss. Cumulative gains and losses recognised in equity arereclassified to profit or loss when the hedged item affects profit or loss. The effective portion of the gain orloss arising from remeasurement at fair value of hedges of raw materials purchases does not affect thevalue at which the raw materials are recognised in inventory.

The Group implements currency hedges to protect against changes in the value of receivables and payablesdenominated in foreign currencies. Despite being effective, they do not qualify as hedges under IFRS in theabsence of documentation. However, this has no effect on the Group’s operating income or net financialincome. Change in the fair value of these derivatives is recorded in the income statement, offsetting thechange in receivables and payables denominated in foreign currencies, recognised in profit or loss.
Commitments to purchase minority interestsE.
In accordance with IAS 32, put options granted to minority shareholders of subsidiaries are recognised in thebalance sheet under "Non-current financial liabilities" with an offsetting adjustment to equity. The adjustmentis recorded as a deduction from minority interests to the extent possible, with any excess deducted from equityattributable to equity holders of the parent.The liability is remeasured at the present value of the redemption amount at each period-end.
2.17. INVENTORIES
Inventories are stated at the lower of cost and net realisable value, in accordance with IAS 2 - Inventories.Cost is determined by the first-in-first-out (FIFO) method and includes all direct and indirect variableproduction expenses, plus fixed production expenses based on the normal capacity of the production facility.As inventories do not take a substantial period of time to get ready for sale, their cost does not include anyborrowing costs.The net realisable value of inventories intended to be sold corresponds to their selling price, as estimatedbased on market conditions and any relevant external information sources, less the estimated costs necessaryto complete the sale (such as variable direct selling expenses, refurbishment costs not billed to customers forused vehicles and other goods).
The Automotive Equipment Division performs development work and manufactures or purchases specifictooling to produce parts or modules for programmes covered by specific customer orders. When the contractincludes a payment guarantee, the development costs are recognised in inventories and work-in-progress andthe corresponding revenue is recognised when the customer signs off on each technical phase.
2.18. TRADE RECEIVABLES
A provision for impairment is recorded on the manufacturing and sales companies’ trade receivables if theGroup believes that there is a risk that the receivables will not be recovered. Indications of probableimpairment include the existence of unresolved claims or litigation, the age of the receivables and the obligor’ssignificant financial difficulties.
In accordance with IAS 39, the Group derecognises receivables for which the contractual rights to receive thecash flows have been transferred along with substantially all of the risks and rewards of ownership. In analysingthe transfer of risks, dilution risk is not included inasmuch as it has been defined and correctly segregatednotably from the risk of late payment. Transferred receivables are not derecognised when the default risk isretained by the Group. Costs incurred in transferring a receivable are recognised in financial expense.This rule also applies to Automotive Division receivables sold to Group finance companies, in the analyses byoperating segment.
2.19. DEFERRED TAXES
In accordance with IAS 12 - Income Taxes, deferred taxes are calculated for all temporary differences betweenthe tax base of assets and liabilities and their carrying amount. Deferred tax liabilities are systematicallyrecognised, while deferred tax assets are recognised only when there is a reasonable expectation that they willbe recovered.
PSA PEUGEOT CITROËN 2013 Annual Results - 53

A deferred tax liability is recognised for all taxable temporary differences associated with investments insubsidiaries and companies at equity, except to the extent that both of the following conditions are satisfied:
the Group is able to control the timing of the reversal of the temporary difference; andit is probable that the temporary difference will not reverse in the foreseeable future.
In practice:for subsidiaries, a deferred tax liability is recognised only in respect of distribution taxes on dividends thatwill be paid by the subsidiary in the following year by decision of the Group;for companies at equity, a deferred tax liability on dividend distributions is recognised for all differencesbetween the tax base of the shares and their carrying amount;current tax benefits generated by intragroup provisions and sales are not cancelled by recognisingdeferred tax liabilities, except when the difference is considered to be temporary, for example, when theGroup plans to divest the subsidiary.
2.20. PROVISIONS
In accordance with IAS 37 – Provisions, Contingent Liabilities and Contingent Assets, a provision is recognisedwhen, at the balance sheet date, the Group has a present obligation towards a third party, it is probable thatan outflow of resources embodying economic benefits will be required to settle the obligation, and no inflow ofresources of an equivalent amount is expected. Provisions for restructuring costs are recognised only when therestructuring has been announced and the Group has drawn up or has started to implement a detailed formalplan. Provisions are discounted only when the effect is material. In this case, the discount rate is based on arisk-free rate.
2.21. PENSIONS AND OTHER POST- EMPLOYMENT BENEFITS
In addition to pension benefits paid in accordance with the laws and regulations of the countries in which theyoperate, Group companies are liable for the payment of supplementary pensions and retirement benefits (seeNote 28.1). These benefits are paid under defined contribution and defined benefit plans.
The payments made under defined contribution plans are in full discharge of the Group’s liability and arerecognised as an expense for the period.
In accordance with IAS 19 - Employee Benefits, obligations under defined benefit plans are measured byindependent actuaries using the projected unit credit method. This method sees each period of service asgiving rise to an additional unit of benefit entitlement and measures each unit separately to build up the finalobligation, which is then discounted to present value. The calculations mainly take into account:
an assumption concerning the expected retirement date;an appropriate discount rate;an inflation rate;assumptions concerning future salary levels and staff turnover rates.
The projected benefit obligation is measured twice a year for the main plans, at mid-year and at year-end, andevery three years for the other plans, except when more frequent valuations are necessary to take into accountchanges in actuarial assumptions or significant changes in demographic statistics.
Changes in actuarial assumptions and experience adjustments – corresponding to the effects of differencesbetween previous actuarial assumptions and what has actually occurred – give rise to actuarial gains andlosses. These actuarial gains and losses are recorded under “income (expense) recognised directly in equity”,and are not recyclable in the income statement.
In the event of change in the benefits conferred by a pension plan, the effects of changes taking place after1 January 2012 are recognised in full in the income statement of the period in which they are incurred, in“operating income”.
As a result, for each defined benefit plan, the Group records a provision in an amount equal to the projectedbenefit obligation less the fair value of the plan assets.The purpose of external funds is to cover the total projected benefit obligation. In some cases the amount ofthese external funds exceeds the recognised portion of the projected benefit obligation. This leads to therecognition of a non-current asset.
In the case of plans that are subject to a minimum funding requirement under the law or the plan rules, if theGroup does not have an unconditional right to a refund of a surplus within the meaning of IFRIC 14, this affectsthe asset ceiling. Regardless of whether the plan has a deficit or a surplus, a liability is recognised for theportion of the present value of the minimum funding in respect of services already received that, once paid andafter covering the shortfall resulting from applying IAS 19, would generate a surplus in excess of the assetceiling determined in accordance with IAS 19.
The net cost of defined benefit pension plans for the period therefore corresponds to the sum of the following:The service cost (recognised in "Recurring operating income");The accretion expense of the net commitment of the return on plan hedging assets (in financial incomeand expense). These two components (accretion and return on assets) are determined based on thediscount rate of commitments;Any adjustment to the IFRIC 14 minimum funding requirement liability (recognised in "Non-recurringoperating income or expense").
Other employee benefit obligations recognised in the balance sheet concern:- long-service awards payable by French and foreign subsidiaries;- healthcare costs paid by certain subsidiaries in the United States.
2.22. OPTIONS TO PURCHASE EXISTING OR NEWLY ISSUED SHARES AT AN AGREED PRICE ANDPERFORMANCE SHARE GRANTS
Stock options and performance shares are granted to Group management and certain employees under equity-settled share-based payment plans. These plans are recognised in accordance with IFRS 2 Share-basedPayment.
2.23. TREASURY STOCK
All Peugeot S.A. shares held by the Group are recorded at cost as a deduction from equity. Proceeds from salesof treasury stock are taken to equity, so that any disposal gains or losses have no impact on profit.
2.24. ASSETS HELD FOR SALE AND DISCONTINUED OPERATIONS
A non-current asset or disposal group (operations) is classified as held for sale when its carrying amount will berecovered principally through a sale transaction rather than through continuing use. For this to be the case, theasset (or disposal group) must be available for immediate sale and its sale must be highly probable.Assets held for sale and discontinued operations are measured at the lower of the carrying amount and theestimated selling price, less costs to sell. Such non-current assets are no longer depreciated from the date onwhich these assets or disposal group are considered by the Group to satisfy the criteria for classification as heldfor sale.Such assets and related liabilities are presented on separate headings under other Group assets and liabilities:“Assets held for sale and discontinued operations” and “Liabilities related to assets held for sale anddiscontinued operations”.The items in the income statement, statement of cash flows and other comprehensive income relating toassets held for sale are presented separately in the consolidated financial statements for all periods presented.
PSA PEUGEOT CITROËN 2013 Annual Results - 55

2.25. CONSOLIDATED STATEMENT OF CASH FLOWS
The statement of cash flows is partitioned into cash flows from operating activities, cash flows from investingactivities and cash flows from financing activities depending on the nature of the transactions.
The Group’s main choices as regards presentation were as follows:Interest flows were kept under cash flows from operating activities;Payments received in connection with grants were allocated by function to cash flows from investingactivities or cash flows from operating activities depending on the nature of the grant;The conversion options of convertible bonds (involving both optional and mandatory conversion) arepresented on a capital increase line under cash flows from financing activities;Voluntary contributions paid into pension funds are recognised under cash flows from operating activities;Payments made on the deferred portion of a fixed asset purchase are presented under cash flows frominvesting activities for the period (“Change in amounts payable on fixed assets”);Tax payments are classified under cash flows from operating activities.

NOTE 3 - CHANGES TO FINANCIAL STATEMENTS PREVIOUSLY REPORTED
The Group's financial statements at 31 December 2012, presented comparatively, have been restated as explainedbelow, relative to the financial statements previously reported.
3.1. AMENDMENT TO IAS 19 EMPLOYEE BENEFITS
The amendment to IAS 19 Employee Benefits is compulsory for financial years commencing on 1 January 2013 andretroactively for financial years presented previously. Accordingly, the summary statements for the 2012 financial yearand the first half of 2012 have been restated. The main impacts on the 2012 consolidated financial statements are:
Balance sheet:- Reduction in equity,- Increase in non-current provisions,- Reduction in deferred tax liabilities,- Increase in deferred tax assets;
Income statement :- Cancellation of amortisation of actuarial gains and losses previously recognised in Recurring
operating income,- Use of a standard rate to calculate the return on hedging assets instead of an expected rate.
The main impact on the consolidated financial statements at 1 January 2012 is a reduction in equity in the amount of130 million, stemming primarily from an increase in the pension provision of 183 million, net of deferred taxes. The
impact at 31 December 2012 is a 390 million reduction in equity and a 536 million increase in pension provisions(see Note 3.2 on restatement of the 2012 consolidated financial statements).
3.2. RESTATEMENT OF FINANCIAL STATEMENTS
The impacts on the 2012 financial statements of this adjustment are shown in the tables below:
Statement of income
2012 2012
(in million euros)reported in
February 2013Impact as at 31December 2013
Continuing operationsSales and revenue 55 446 55 446 -Recurring operating income (loss) (576) (560) 16Operating income (loss) (4 698) (4 682) 16Income (loss) before tax of fully consolidatedcompanies
(5 116) (5 112) 4
Consolidated profit (loss) from continuing operations (5 728) (5 726) 2
Discontinued operationsProfit (loss) from discontinued operations 803 803 -
Consolidated profit (loss) for the year (4 925) (4 923) 2Atributable to equity holders of the parent (5 010) (5 008) 2Atributable to equity minority interests 85 85 -
2012impact
PSA PEUGEOT CITROËN 2013 Annual Results - 57

Balance sheets - Assets
31 December2012
31 December2012
(in million euros)Total non-current assets 21 597 21 632 35Of which:
Other non-current assets 518 514 (4)Deferred tax assets 574 613 39
Total assets 64 849 64 884 35
2012impact
reported inFebruary 2013
Impact as at 31December 2013
Balance sheets – Equity and liabilities
31 December2012
31 December2012
(in million euros)
Total equity 10 557 10 167 (390)
Total non-current liabilities 12 570 12 995 425Of which:
Non-current provisions 646 1 182 536Deferred tax liabilities 912 801 (111)
Total equity and liabilities 64 849 64 884 35
2012impact
reported inFebruary 2013
Impact as at 31December 2013
NOTE 4 - SCOPE OF CONSOLIDATION
31 December2013
31 December2012
Fully consolidated companiesManufacturing and sales companies 321 318Finance companies 50 45
371 363Companies at equityManufacturing and sales companies 43 47Finance companies 1 1
44 48Consolidated companies at 31 December 2013 415 411
There was no significant change in the scope of consolidation in 2013, aside from the full takeover of Française deMécanique.
The Group owns 51.7% of Faurecia’s capital and 68% of the voting rights due to the existence of shares with doublevoting rights. If all of the dilutive instruments issued by Faurecia were to be exchanged for shares, this would have noimpact on the Group’s exclusive control.

NOTE 5 - SEGMENT INFORMATION
In accordance with IFRS 8 Operating Segments, segment information is presented in line with the indicators usedinternally by management to measure the performance of the Group's different business segments. The disclosuresbelow are derived from the internal reporting system and have been prepared in accordance with the IFRSs adoptedby the European Union. The Group's main performance indicator is recurring operating income.
5.1. BUSINESS SEGMENTS
The Group's operations are organised around four main segments:The Automotive Division, covering the design, manufacture and sale of passenger cars and light commercialvehicles under the Peugeot and Citroën brands;The Automotive Equipment Division, corresponding to the Faurecia group comprising Interior Systems,Automotive Seating, Automotive Exteriors and Emissions Control Technologies;The Finance Division, corresponding to the Banque PSA Finance group, which provides retail financing tocustomers of the Peugeot and Citroën brands and wholesale financing to the two brands' dealer networks;Other Businesses, which include the operations of Peugeot S.A., the Group's holding company, and PeugeotMotocycles. The equity-accounted earnings of the Gefco group are included among these businesses.
The balances for each segment shown in the table below are on a stand-alone basis. Faurecia and Banque PSA Financepublish consolidated financial statements and segment information for these two businesses is therefore presenteddown to the level of net profit. For the other segments, as cash positions and taxes are managed jointly in somecountries, only operating income and share in net earnings of companies at equity are presented by segment. Allintersegment balance sheet items and transactions are eliminated and, for the purposes of reconciliation with theGroup's financial statements, are shown under the heading "Eliminations and reconciliations" together withunallocated amounts.
All intersegment commercial transactions are carried out on an arm's length basis on the same terms and conditionsas those applicable to the supply of goods and services to third parties.
2013 Automotive FinanceEliminations
and(in million euros) Automotive equipment companies Other reconciliations TotalSales and revenue- third parties 36 460 16 067 1 463 100 - 54 090- intragroup, intersegment 1 1 962 310 92 (2 365) -Total 36 461 18 029 1 773 192 (2 365) 54 090Recurring operating income (loss) (1 042) 538 368 (42) 1 (177)Non-recurring operating income 396 5 - 12 - 413Restructuring costs (365) (91) - (4) - (460)
(1 100) - - (1) - (1 101)
- (21) - - - (21)Operating income (loss) (2 111) 431 368 (35) 1 (1 346)Interest income 9 - 129 138Finance costs (208) - (416) (624)Other financial income 4 - 67 71Other financial expenses (39) - (204) (243)Net financial income (expense) - (234) - - (424) (658)Income taxes expense (65) (138) (184) (387)
142 14 8 12 - 176
146 238 (2 215)(3) - (3)143 238 (2 218)
1 610 775 19 2 2 406Depreciation and amortisation (1 849) (533) (26) 1 (2 407)
Impairment of CGUs, provisions for onerouscontracts and other.Other non-recurring operating income and(expenses), net
Share in net earnings of companies at equityConsolidated profit (loss) from continuingoperationsProfit (loss) from discontinued operationsConsolidated profit (loss) for the period
Capital expenditure (excl. sales with abuyback commitment)
In 2013, Banque PSA Finance (Finance Companies segment) reported net banking revenue of 891 million. Netprovision expense (cost of risk) for the year amounted to 131 million.
PSA PEUGEOT CITROËN 2013 Annual Results - 59
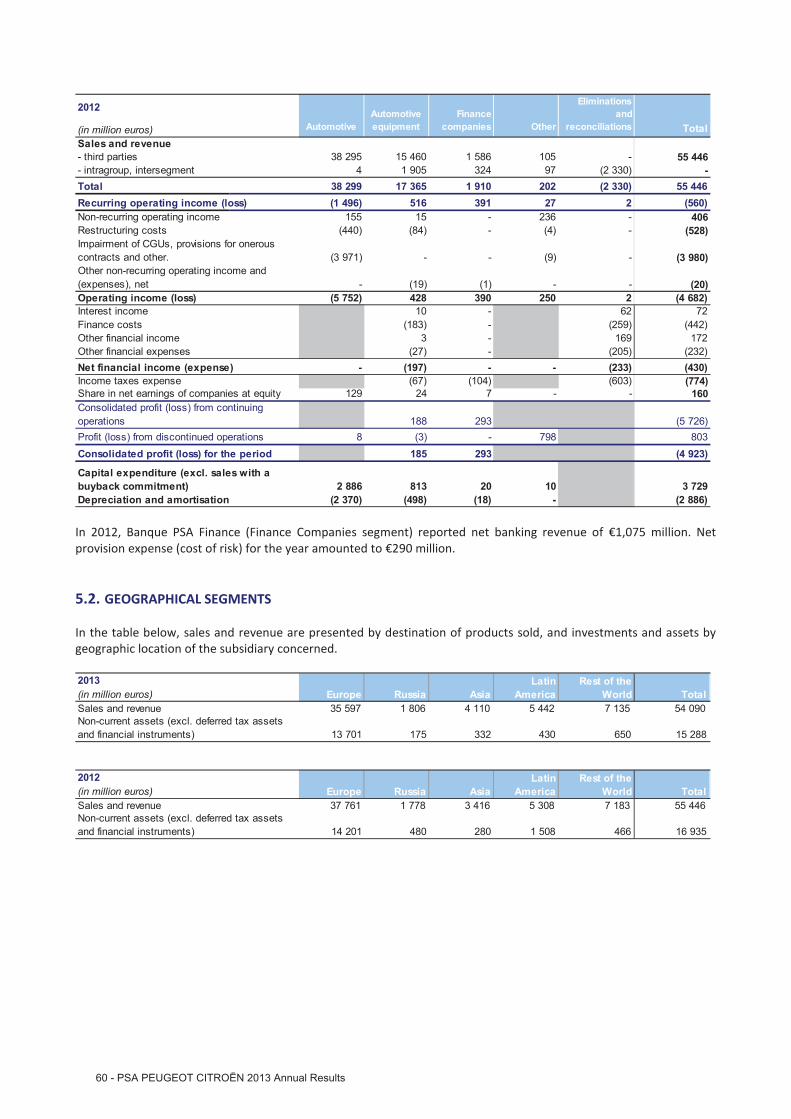
2012 Automotive FinanceEliminations
and(in million euros) Automotive equipment companies Other reconciliations TotalSales and revenue- third parties 38 295 15 460 1 586 105 - 55 446- intragroup, intersegment 4 1 905 324 97 (2 330) -Total 38 299 17 365 1 910 202 (2 330) 55 446Recurring operating income (loss) (1 496) 516 391 27 2 (560)Non-recurring operating income 155 15 - 236 - 406Restructuring costs (440) (84) - (4) - (528)
(3 971) - - (9) - (3 980)
- (19) (1) - - (20)Operating income (loss) (5 752) 428 390 250 2 (4 682)Interest income 10 - 62 72Finance costs (183) - (259) (442)Other financial income 3 - 169 172Other financial expenses (27) - (205) (232)Net financial income (expense) - (197) - - (233) (430)Income taxes expense (67) (104) (603) (774)
129 24 7 - - 160
188 293 (5 726)8 (3) - 798 803
185 293 (4 923)
2 886 813 20 10 3 729Depreciation and amortisation (2 370) (498) (18) - (2 886)
Share in net earnings of companies at equityConsolidated profit (loss) from continuingoperationsProfit (loss) from discontinued operationsConsolidated profit (loss) for the period
Impairment of CGUs, provisions for onerouscontracts and other.
Capital expenditure (excl. sales with abuyback commitment)
Other non-recurring operating income and(expenses), net
In 2012, Banque PSA Finance (Finance Companies segment) reported net banking revenue of 1,075 million. Netprovision expense (cost of risk) for the year amounted to 290 million.
5.2. GEOGRAPHICAL SEGMENTS
In the table below, sales and revenue are presented by destination of products sold, and investments and assets bygeographic location of the subsidiary concerned.
2013(in million euros) Europe Russia Asia TotalSales and revenue 35 597 1 806 4 110 5 442 7 135 54 090
13 701 175 332 430 650 15 288
2012(in million euros) Europe Russia Asia TotalSales and revenue 37 761 1 778 3 416 5 308 7 183 55 446
14 201 480 280 1 508 466 16 935
Rest of theWorld
Non-current assets (excl. deferred tax assetsand financial instruments)
Rest of theWorld
Non-current assets (excl. deferred tax assetsand financial instruments)
LatinAmerica
LatinAmerica

NOTE 6 - SALES AND REVENUE
(in million euros) 2013 2012Sales of vehicles and other goods 51 248 52 442Service revenues 1 379 1 418Financial services revenue 1 463 1 586Total 54 090 55 446
Sales of goods consist mainly of sales of vehicles and automobile parts, sub-assemblies and components.Service revenues primarily comprise auto repairs and servicing by captive dealers, and vehicle leasing services asdescribed in Note 15.2.Financial services revenue corresponds for the most part to interest income, insurance premiums and other grossrevenues.
NOTE 7 - RECURRING OPERATING EXPENSES ANALYSED BY NATURE
Broken down by type, operating expenses include staff costs and the depreciation or amortisation of intangible assetsand property, plant and equipment, explained below. Other recurring operating expenses are analysed by eachDivision at its own appropriate level with the result that they cannot be presented on a consistent basis at Grouplevel.
Personnel Costs
Group personnel costs are as follows:
(in million euros) 2013 2012Automotive Division (5 506) (5 769)Automotive Equipment Division (2 986) (2 929)Finance companies (147) (147)Other businesses (87) (87)Total (8 726) (8 932)
The Competitiveness and Employment Tax Credit (CICE) established in 2013 has been deducted from personnelexpenses in the amount of 72 million.Details of pension costs are disclosed in Note 28.7.
Depreciation and amortisation expense
Depreciation and amortisation expense included in recurring operating income breaks down as follows:
(in million euros) 2013 2012Automotive Division (758) (936)Automotive Equipment Division (86) (78)Finance companies (517) (640)Other businesses (1 046) (1 232)Total (2 407) (2 886)
PSA PEUGEOT CITROËN 2013 Annual Results - 61

NOTE 8 - RESEARCH AND DEVELOPMENT EXPENSES
(in million euros) 2013 2012(1 966) (2 373)
835 1 262(1 131) (1 111)
Amortisation of capitalised development expenditure (Note 14.1) (754) (936)Total (1 885) (2 047)
Total expenditureCapitalised development expenditure (1)
Non-capitalised expenditure
(1) In addition to this expenditure, borrowing costs are capitalised pursuant to IAS 23 "Borrowing Costs" (Revised) (see Note 14.1).
The amounts presented in the above table are stated net of research funding received by the Group.
NOTE 9 - NON-RECURRING OPERATING INCOME AND EXPENSES
(in million euros) 2013 2012Net gains on disposals of real estate assets 28 389
366 1Other non-recurring operating income 19 16Total non-recurring operating income 413 406pDivision CGUs and other assets (1 100) (3 971)Impairment loss on Faurecia CGUs and other Faurecia assets (Note 9.2) - -Impairment loss on Other businesses CGUs (1) (9)Restructuring costs (Note 9.3) (460) (528)Other non-recurring operating expenses (21) (20)
(1 582) (4 528)Total non-recurring operating expenses
Reversal of impairment loss on Automotive Division CGUs and other assets and provisions for AutomotiveDivision onerous contracts (Note 9.1)
9.1. IMPAIRMENT TEST ON AUTOMOTIVE DIVISION CGUS AND PROVISIONS FOR AUTOMOTIVE DIVISIONONEROUS CONTRACTS
The results of the impairment tests on the assets of the Automotive Division CGU and each Vehicle CGU were updatedat 31 December 2013. These tests are based on the Group’s best estimates in what is an uncertain economicenvironment.
AUTOMOTIVE DIVISION CGU
In view of the changes observed in the second half of 2013, the Group updated the projections used for testing theimpairment of the Automotive Division CGU in December 2013. Testing was based on the most recent medium-termplan (MTP), covering the years 2014-2018.The automotive market forecasts used are the Group’s most recent estimates, which are based on external forecasts.The MTP’s exchange rate assumptions were reviewed on the basis of major trends in the second half of 2013. Forecastsynergies with General Motors were updated to reflect changes in the agreements.
Together, these parameters pointed to signs of impairment losses on plants in Latin America and Russia, and specificimpairment tests were therefore carried out on these.
The estimate of annual recurring operating income used to determine the terminal value was also updated. It is basedon an estimate of the operating margin achievable in the medium term, in light of the various actions planned by theGroup. The terminal value is based on a perpetual growth rate of 1%, unchanged compared with the previous tests.

The after-tax discount rate applied was 9.5% for 2014-2018 and 10.5% for the terminal value. These rates areunchanged compared with those used for the periods ended 31 December 2012 and 30 June 2013, and are consistentwith industry benchmarks.
Specific tests performed on plants in Latin America and Russia led to the recognition of a total impairment charge of1,009 million, recorded in non-current operating income (loss). It relates to intangible assets in the amount of 205million, and property, plant and equipment in the amount of 804 million. Testing of the Automotive Division CGU asa whole did not result in the recognition of changes in value other than those relating to these plants in fiscal 2013. Asof 31 December 2013, taking into account impairment recognised previously, net impairment charges totalled 4,713million. As such, the carrying amount of the intangible assets and property, plant and equipment of the AutomotiveDivision was 12,145 million.
The sensitivity to changes in the main assumptions is as follows: impairment would increase by 443 million with a0.5% higher discount rate, 335 million with a perpetual growth rate limited to 0.5%, 1,067 million as a result of a0.5% reduction in the operating margin in the reference year used to calculate the terminal value and 1,239 million ifthese three factors were combined.
The impairment tests were carried out on the basis of a medium-term plan for which the financing terms were notdefinitively agreed at 31 December 2013. The Group is confident of its ability to put the corresponding financing inplace.
VEHICLE CGUs AND OTHER AUTOMOTIVE ASSETS
In addition to the impairment of 1,009 million described previously, the other impairment losses on Vehicle CGUsand the provisions for onerous contracts of the Automotive Division totalled 91 million.
Concerning the assets allocated to Vehicle CGUs, except for the Vehicle CGUs referred to below, impairment tests at31 December 2013 did not identify any impairment losses other than those found in the course of the aforementionedtest.
For the Vehicle CGUs corresponding to vehicles produced under cooperation agreements, in addition to testing ofassets for impairment, provisions for long-term contract losses were recorded for any projected losses arising frompurchase commitments.
The updating of data relating to volumes and margins for these vehicles as well as forecast currency exchange ratesfor purchasing currencies, led to a reversal of the provision for losses on onerous contracts amounting to 201 millionover the year, due in particular to the depreciation of the yen against the euro.
A +/- 5% increase or decrease in the projected yen/euro exchange rate would have the effect of reducing the chargefor the year by 26 million or increasing it by 49 million.
Other reversals of provisions and income were recognised in the amount of 165 million, i.e. a total of 366 millionincluding the reversal of the 201 million provision for loss on onerous contracts.
9.2. IMPAIRMENT TEST ON FAURECIA GROUP CGUS AND OTHER ASSETS
FAURECIA GROUP CGUs
The carrying amount of each group of assets was compared with the higher of its fair value and value in use. Value inuse is defined as the present value of estimated future cash flows expected to be generated by each cash-generatingunit based on the latest projections from the Medium-Term Plan (2014-2017 plan for 2013 impairment tests, asrevised at end-2013 based on the latest 2014 budget assumptions). The volume assumptions used to prepare the2014-2017 Medium-Term Plan were based on external data.The main assumption affecting value in use is the level of recurring operating income, particularly for the calculationof terminal value. 2017 margin was projected at 4.9%.
PSA PEUGEOT CITROËN 2013 Annual Results - 63

The calculation was performed by extrapolating to perpetuity projected cash flows for the last year of the Medium-Term Plan (2017) using a growth rate of 1.5% identical to the rate applied in the impairment tests carried out in thetwo previous years.
Future cash flows were discounted at an unchanged after-tax rate of 9.5%.
The test performed at end-2013 confirmed that the goodwill allocated to the four CGUs was fairly stated in thebalance sheet. The balance sheet values are presented in the table below:
(in million euros) 2013 2012• Automotive Seating 793 792• Emissions Control Technologies 333 339• Automotive Exteriors 125 123• Interior Systems 46 46Total 1 297 1 300
The sensitivity of the impairment test to changes in the assumptions used to determine at end-2013 the value in useof the CGUs accounting for the bulk of goodwill is illustrated in the table below:
(in million euros) Test margin (1)
Perpetualgrowth rate
- 50 bps
Previous threefactors
combined
Automotive Seating 1 564 (197) (161) (247) (552)
Interior Systems 771 (108) (89) (148) (315)
Emissions Control Technologies 1 341 (154) (126) (248) (479)
Automotive Exteriors 394 (46) (37) (62) (133)
Discount rate appliedto cash flows
+ 50 bpsTerminal recurring operating
margin - 50 bps
(1) Test margin = value in use - carrying amount
The declines in values in use that would result from each of the above simulations and the three factors combinedwould not affect the amount at which the goodwill allocated to the CGUs is carried in the balance sheet.
FAURECIA CGU IN THE ACCOUNTS OF PSA PEUGEOT CITROËN
Faurecia goodwill was tested for impairment at end-2013 based on the PSA Peugeot Citroën Group's share in the sumof the discounted cash flows, net of capital employed including related goodwill, generated by Faurecia's businessesas determined based on the above assumptions. Following the conversion of OCEANE convertible bonds during theyear, the Group’s interest in Faurecia was 51.7% as of 31 December 2013. The test carried out at end-2013 made itpossible to confirm the carrying amount of the goodwill allocated to this CGU. The balance sheet value is presented inNote 14.2.
The sensitivity of the impairment test to changes in the assumptions used to determine the value in use of Faureciagoodwill at end-2013 is illustrated in the table below:
(in million euros) Test margin (1)
Perpetualgrowth rate
- 50 bps
Previous threefactors
combined1 917 (261) (213) (364) (764)
(1) Test margin = value in use - carrying amount
Discount rate appliedto cash flows
+ 50 bpsTerminal recurring operating
margin - 50 bps
The declines in values in use that would result from each of the above simulations and the three factors combinedwould not affect the amount at which the Faurecia goodwill is carried in the balance sheet.
The stock market value of the Faurecia shares held by Peugeot S.A. at 31 December 2013 was 1,756 million,representing the price that would be paid in a transaction between minority shareholders not leading to theacquisition of control.The Group's share of Faurecia's net assets in the consolidated balance sheet is valued at 935 million (including thegoodwill recognised by Peugeot S.A. at that date). In light of these values no impairment loss was recognised on theFaurecia goodwill at 31 December 2013.

9.3. RESTRUCTURING COSTS
Restructuring costs consist mainly of workforce reductions.
(in million euros) 2013 2012Automotive Division (365) (440)Automotive Equipment Division (91) (84)Finance companies - -Other businesses (4) (4)Total (460) (528)
Automotive DivisionAutomotive Division restructuring costs amounted to 365 million. For France, they mainly include:
177 million in additional expenses for the restructuring of the Automotive Division’s French production base andthe redeployment the workforce, together with the support mechanisms offered to employees;140 million in new provisions under the measures announced at the Central Works Council meeting of 5December 2013, within the framework of the New Social Contract. Charges for the year relate mainly to personseligible for the older employees plan as of 31 December 2013.
Automotive Equipment Division (Faurecia Group)In 2013, Faurecia group restructuring costs totalled 91 million, including 84 million in provisions for redundancycosts, mainly in France, Germany and Spain.
NOTE 10 - FINANCE COSTS
Interest on other borrowings corresponds to interest accrued according to the method set out in Note 2.16.C.
(in million euros) 2013 2012Interest on borrowings (1) (549) (374)Interest on bank overdrafts (35) (30)Interest on finance lease liabilities (12) (15)Foreign exchange gain (loss) on financial transactions (22) (16)Other (6) (7)Total (624) (442)
(1) Interest on borrowings does not include 135 million in borrowing costs capitalised in 2013 in accordance with IAS 23 - "Borrowing Costs" ( 180million in 2012).
NOTE 11 - OTHER FINANCIAL INCOME AND EXPENSES
(in million euros) 2013 2012Expected return on pension funds 11 10Other financial income 60 162Financial income 71 172Interest cost on employee benefit obligations (37) (37)Ineffective portion of the change in fair value of financial instruments (9) 5Other financial expenses (197) (200)Financial expenses (243) (232)
PSA PEUGEOT CITROËN 2013 Annual Results - 65
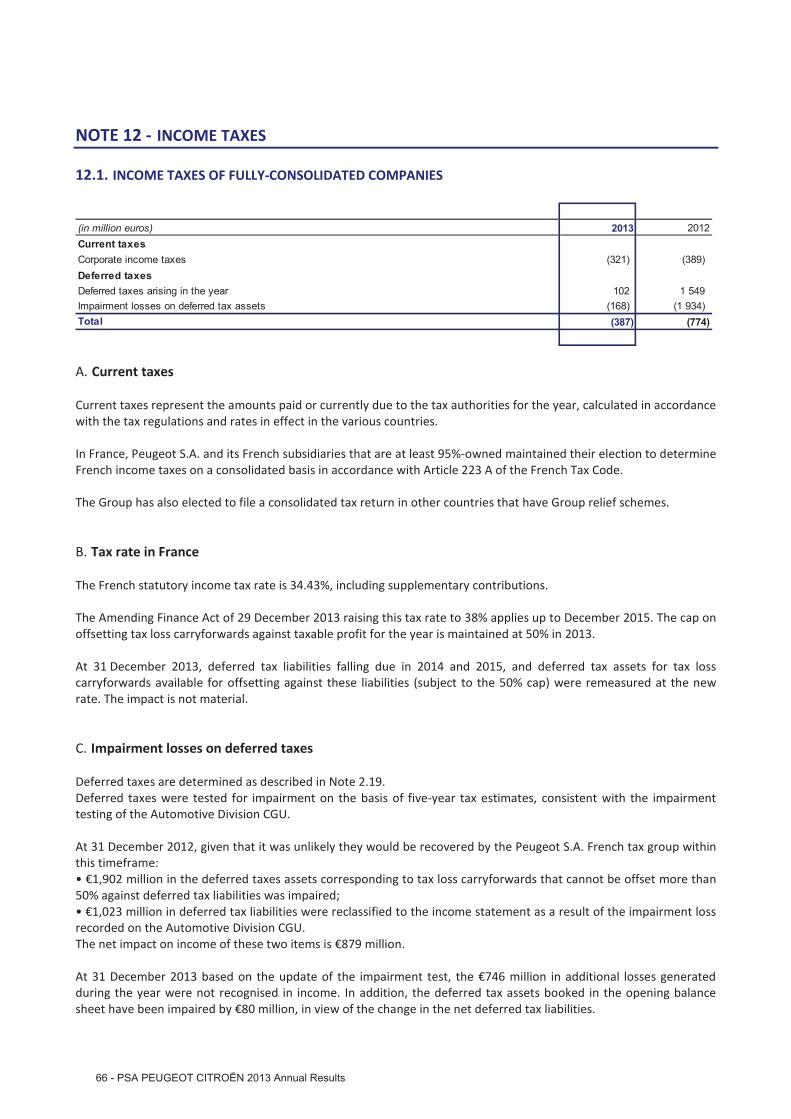
NOTE 12 - INCOME TAXES
12.1. INCOME TAXES OF FULLY-CONSOLIDATED COMPANIES
(in million euros) 2013 2012Current taxesCorporate income taxes (321) (389)Deferred taxesDeferred taxes arising in the year 102 1 549Impairment losses on deferred tax assets (168) (1 934)Total (387) (774)
Current taxesA.
Current taxes represent the amounts paid or currently due to the tax authorities for the year, calculated in accordancewith the tax regulations and rates in effect in the various countries.
In France, Peugeot S.A. and its French subsidiaries that are at least 95%-owned maintained their election to determineFrench income taxes on a consolidated basis in accordance with Article 223 A of the French Tax Code.
The Group has also elected to file a consolidated tax return in other countries that have Group relief schemes.
Tax rate in FranceB.
The French statutory income tax rate is 34.43%, including supplementary contributions.
The Amending Finance Act of 29 December 2013 raising this tax rate to 38% applies up to December 2015. The cap onoffsetting tax loss carryforwards against taxable profit for the year is maintained at 50% in 2013.
At 31 December 2013, deferred tax liabilities falling due in 2014 and 2015, and deferred tax assets for tax losscarryforwards available for offsetting against these liabilities (subject to the 50% cap) were remeasured at the newrate. The impact is not material.
Impairment losses on deferred taxesC.
Deferred taxes are determined as described in Note 2.19.Deferred taxes were tested for impairment on the basis of five-year tax estimates, consistent with the impairmenttesting of the Automotive Division CGU.
At 31 December 2012, given that it was unlikely they would be recovered by the Peugeot S.A. French tax group withinthis timeframe:• 1,902 million in the deferred taxes assets corresponding to tax loss carryforwards that cannot be offset more than50% against deferred tax liabilities was impaired;• 1,023 million in deferred tax liabilities were reclassified to the income statement as a result of the impairment lossrecorded on the Automotive Division CGU.The net impact on income of these two items is 879 million.
At 31 December 2013 based on the update of the impairment test, the 746 million in additional losses generatedduring the year were not recognised in income. In addition, the deferred tax assets booked in the opening balancesheet have been impaired by 80 million, in view of the change in the net deferred tax liabilities.
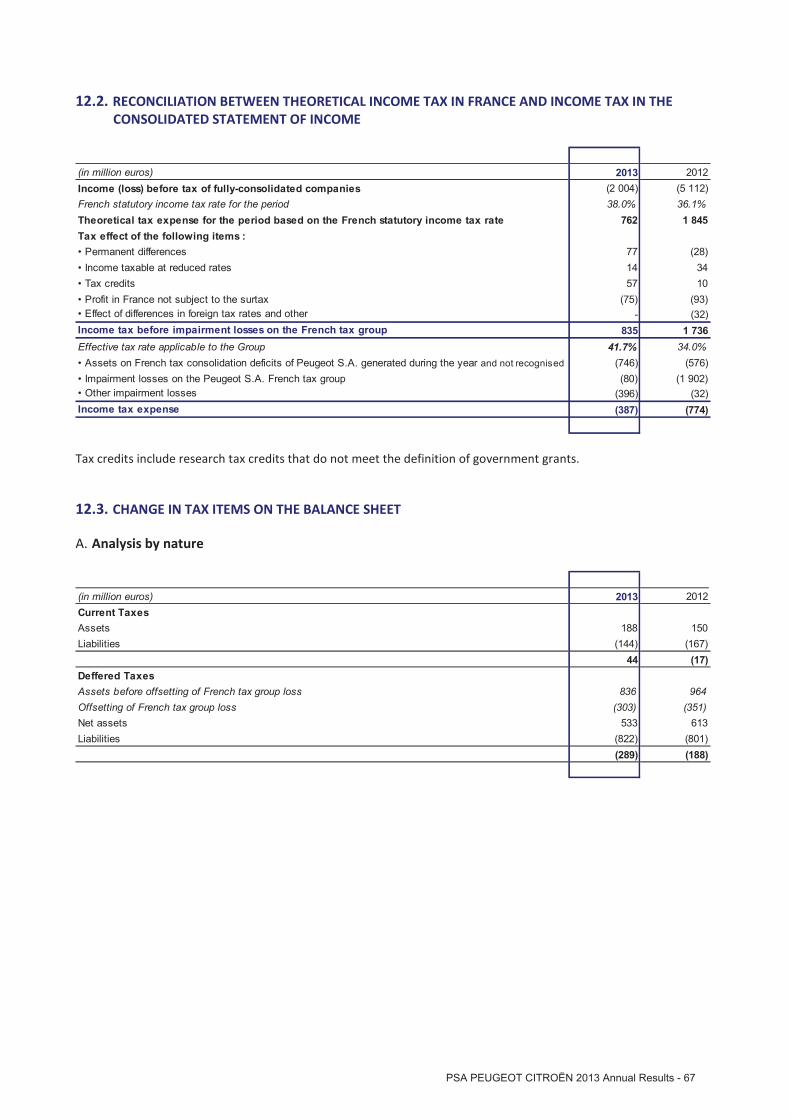
12.2. RECONCILIATION BETWEEN THEORETICAL INCOME TAX IN FRANCE AND INCOME TAX IN THECONSOLIDATED STATEMENT OF INCOME
(in million euros) 2013 2012Income (loss) before tax of fully-consolidated companies (2 004) (5 112)French statutory income tax rate for the period 38.0% 36.1%Theoretical tax expense for the period based on the French statutory income tax rate 762 1 845Tax effect of the following items :• Permanent differences 77 (28)• Income taxable at reduced rates 14 34• Tax credits 57 10• Profit in France not subject to the surtax (75) (93)• Effect of differences in foreign tax rates and other - (32)Income tax before impairment losses on the French tax group 835 1 736Effective tax rate applicable to the Group 41.7% 34.0%• Assets on French tax consolidation deficits of Peugeot S.A. generated during the year and not recognised (746) (576)• Impairment losses on the Peugeot S.A. French tax group (80) (1 902)• Other impairment losses (396) (32)Income tax expense (387) (774)
Tax credits include research tax credits that do not meet the definition of government grants.
12.3. CHANGE IN TAX ITEMS ON THE BALANCE SHEET
Analysis by natureA.
(in million euros) 2013 2012Current TaxesAssets 188 150Liabilities (144) (167)
44 (17)Deffered TaxesAssets before offsetting of French tax group loss 836 964Offsetting of French tax group loss (303) (351)Net assets 533 613Liabilities (822) (801)
(289) (188)
PSA PEUGEOT CITROËN 2013 Annual Results - 67
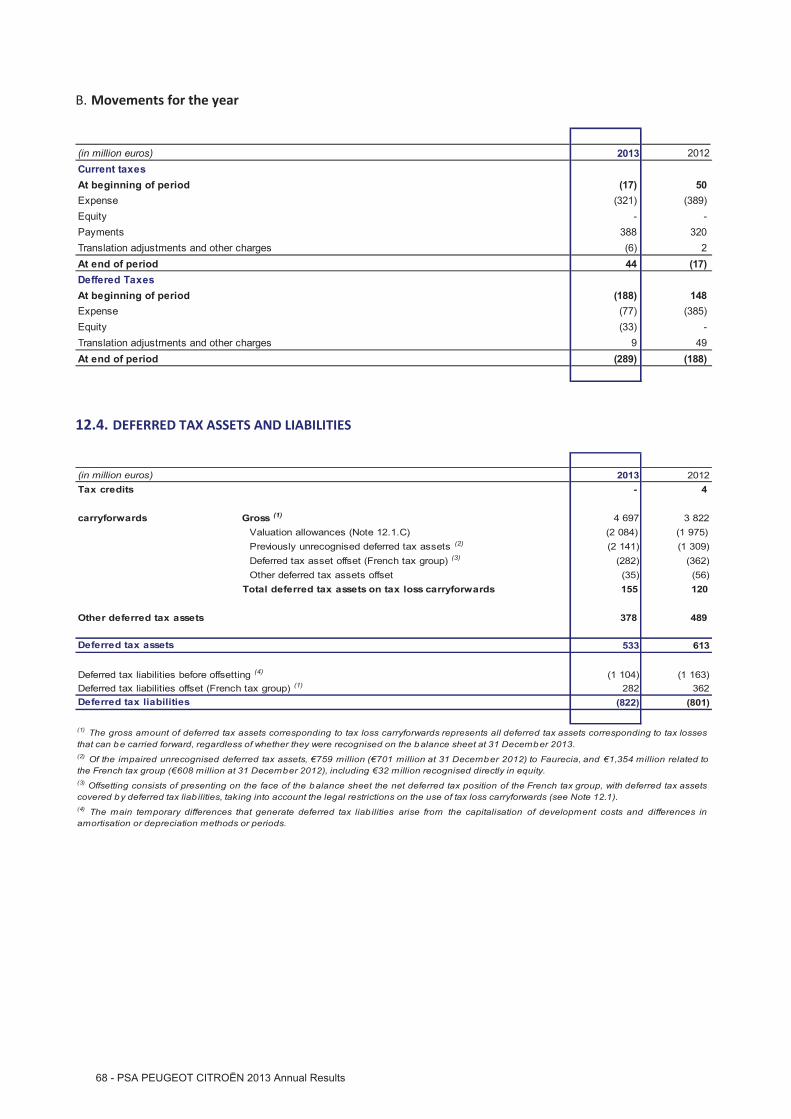
Movements for the yearB.
(in million euros) 2013 2012Current taxesAt beginning of period (17) 50Expense (321) (389)Equity - -Payments 388 320Translation adjustments and other charges (6) 2At end of period 44 (17)Deffered TaxesAt beginning of period (188) 148Expense (77) (385)Equity (33) -Translation adjustments and other charges 9 49At end of period (289) (188)
12.4. DEFERRED TAX ASSETS AND LIABILITIES
(in million euros) 2013 2012Tax credits - 4
carryforwards Gross (1) 4 697 3 822Valuation allowances (Note 12.1.C) (2 084) (1 975)Previously unrecognised deferred tax assets (2) (2 141) (1 309)
(282) (362)(35) (56)
Total deferred tax assets on tax loss carryforwards 155 120
Other deferred tax assets 378 489
Deferred tax assets 533 613
Deferred tax liabilities before offsetting (4) (1 104) (1 163)282 362
Deferred tax liabilities (822) (801)
Other deferred tax assets offsetDeferred tax asset offset (French tax group) (3)
Deferred tax liabilities offset (French tax group) (1)
(1) The gross amount of deferred tax assets corresponding to tax loss carryforwards represents all deferred tax assets corresponding to tax lossesthat can be carried forward, regardless of whether they were recognised on the balance sheet at 31 December 2013.(2) Of the impaired unrecognised deferred tax assets, 759 million ( 701 million at 31 December 2012) to Faurecia, and 1,354 million related tothe French tax group ( 608 million at 31 December 2012), including 32 million recognised directly in equity.(3) Offsetting consists of presenting on the face of the balance sheet the net deferred tax position of the French tax group, with deferred tax assetscovered by deferred tax liab ilities, taking into account the legal restrictions on the use of tax loss carryforwards (see Note 12.1).(4) The main temporary differences that generate deferred tax liab ilities arise from the capitalisation of development costs and differences inamortisation or depreciation methods or periods.

NOTE 13 - EARNINGS PER SHARE
Basic earnings per share and diluted earnings per share are presented at the foot of the income statement. They arecalculated as follows:
13.1. BASIC EARNINGS PER SHARE
Basic earnings per share are calculated on the basis of the weighted average number of shares outstanding during theperiod.
The average number of shares outstanding is calculated by taking into account the number of shares issued andcancelled during the period and changes in the number of shares held in treasury stock.
2013 2012
(2 315) (5 820)Consolidated basic earnings - attributable to equity holders of the parent (in million euros) (2 317) (5 008)Average number of 1 par value shares outstanding 342 051 814 321 185 403
(6.76) (18.12)Basic earnings per 1 par value share (in euros) (6.77) (15.59)
Consolidated basic earnings of continuing operations - attributable to equity holders of the parent (inmillion euros)
Basic earnings per 1 par value share of continuing operations - attributable to equity holders of theparent (in euros)
13.2. DILUTED EARNINGS PER SHARE
Diluted earnings per share are calculated by the treasury stock method. This consists of taking into account theexercise of stock options, performance share grants to employees and the conversion of Oceane convertible bondswhen it is not accretive.
There were no dilutive potential shares in 2012 or 2013 resulting from the Peugeot S.A. Oceane convertible bonds, the2010 performance share plan or the stock option plans.
The following table shows the effects of the calculation:
Effect on the average number of sharesA.
2013 2012Average number of 1 par value shares outstanding 342 051 814 321 185 403Dilutive effect, calculated by the treasury stock method, of:- Stock option plans (Note 26.3) - -- Outstanding Oceane convertible bonds (Note 29.2) - -
342 051 814 321 185 403Diluted average number of shares
PSA PEUGEOT CITROËN 2013 Annual Results - 69

Effect of Faurecia dilution on consolidated earnings of continuing operations - attributable to equityB.holders of the parent
(in million euros) 2013 2012Consolidated profit (loss) from continuing operations - attributable to equity holders of the parent (2 315) (5 820)
- (2)
Consolidated profit (loss) from continuing operations (after Faurecia dilution effect) (2 315) (5 822)
(6.76) (18.13)
Dilutive effect of Faurecia Oceane bond conversions, stock options and performanceshare grants
Diluted earnings of continuing operations - attributable to equity holders of the parent per 1 par valueshare (in euros)
Effect of Faurecia dilution on consolidated earnings - attributable to equity holders of the parentC.
(in million euros) 2013 2012Consolidated profit (loss) attributable to equity holders of the parent (2 317) (5 008)
- (2)
Consolidated profit (loss) after Faurecia dilution (2 317) (5 010)(6.77) (15.60)Diluted earnings attributable to equity holders of the parent per 1 par value share (in euros)
Dilutive effect of Faurecia Oceane bond conversions, stock options and performance share grants
The Faurecia Oceane convertible bonds issued in September 2012 and performance share grants have a potentialimpact on the total number of Faurecia shares outstanding without affecting the number of shares held by the PSAPeugeot Citroën Group. Consequently, they have a dilutive effect on consolidated profit attributable to the PSAPeugeot Citroën Group.
The conversion of the November 2009 OCEANE convertible bond in December 2013 had no impact on basic earningsper share in 2013.
The Faurecia stock options are anti-dilutive in 2012 and 2013 due to the plans' terms.
NOTE 14 - GOODWILL AND INTANGIBLE ASSETS
14.1. CHANGE IN CARRYING AMOUNT
31 December 2013 Goodwill Development Software Intangible
(in million euros) expenditure and other assets
At beginning of period 1 564 3 757 376 4 133Purchases/additions (1) - 928 79 1 007Amortisation for the year - (758) (86) (844)Impairment losses (2) - (200) (4) (204)Disposals - (55) (13) (68)Change in scope of consolidation and other 4 17 23 40Translation adjustment (7) (30) (2) (32)
1 561 3 659 373 4 032At period-end(1) Including borrowing costs of 93 million capitalised in accordance with IAS 23 (Revised) - "Borrowing Costs" (see Note 2.11).(2) of which 227 million in impairment losses on other assets of the Automotive Division CGU (see Note 9.1).
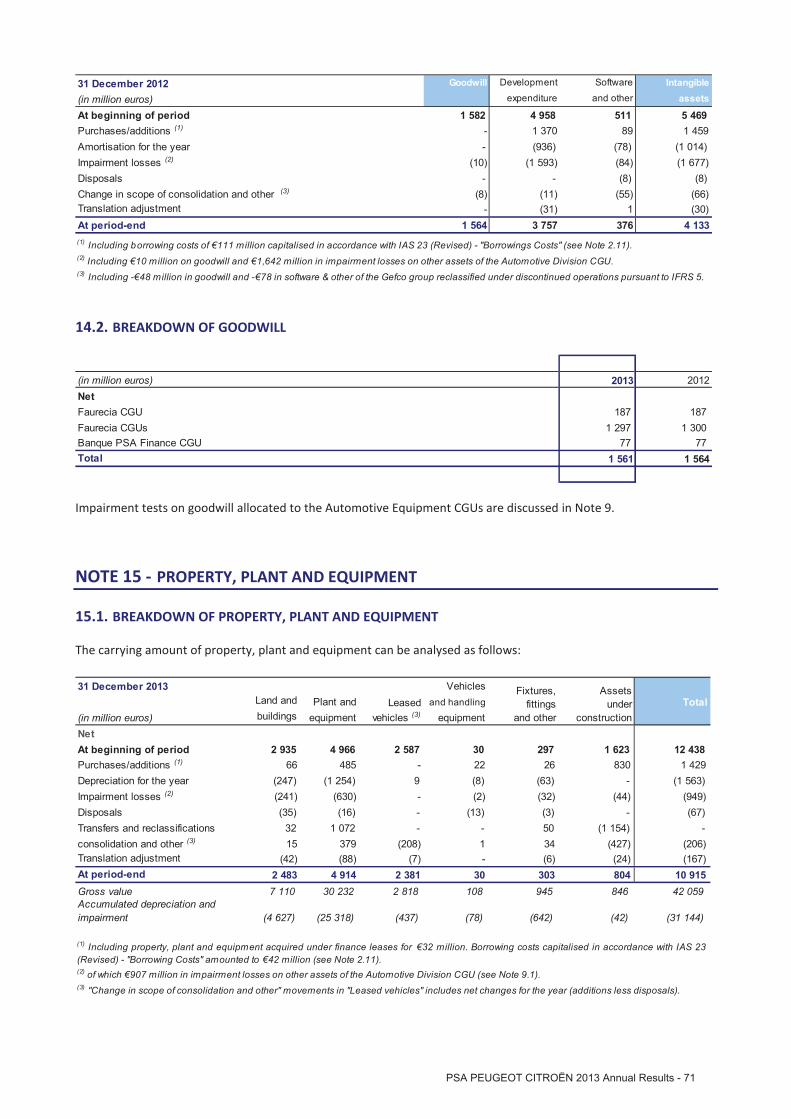
31 December 2012 Goodwill Development Software Intangible
(in million euros) expenditure and other assets
At beginning of period 1 582 4 958 511 5 469Purchases/additions (1) - 1 370 89 1 459Amortisation for the year - (936) (78) (1 014)Impairment losses (2) (10) (1 593) (84) (1 677)Disposals - - (8) (8)Change in scope of consolidation and other (3) (8) (11) (55) (66)Translation adjustment - (31) 1 (30)
1 564 3 757 376 4 133
(3) Including - 48 million in goodwill and - 78 in software & other of the Gefco group reclassified under discontinued operations pursuant to IFRS 5.
At period-end(1) Including borrowing costs of 111 million capitalised in accordance with IAS 23 (Revised) - "Borrowings Costs" (see Note 2.11).(2) Including 10 million on goodwill and 1,642 million in impairment losses on other assets of the Automotive Division CGU.
14.2. BREAKDOWN OF GOODWILL
(in million euros) 2013 2012NetFaurecia CGU 187 187Faurecia CGUs 1 297 1 300Banque PSA Finance CGU 77 77Total 1 561 1 564
Impairment tests on goodwill allocated to the Automotive Equipment CGUs are discussed in Note 9.
NOTE 15 - PROPERTY, PLANT AND EQUIPMENT
15.1. BREAKDOWN OF PROPERTY, PLANT AND EQUIPMENT
The carrying amount of property, plant and equipment can be analysed as follows:
31 December 2013 VehiclesLand and Plant and and handling Total
(in million euros) buildings equipment equipmentNetAt beginning of period 2 935 4 966 2 587 30 297 1 623 12 438Purchases/additions (1) 66 485 - 22 26 830 1 429Depreciation for the year (247) (1 254) 9 (8) (63) - (1 563)Impairment losses (2) (241) (630) - (2) (32) (44) (949)Disposals (35) (16) - (13) (3) - (67)Transfers and reclassifications 32 1 072 - - 50 (1 154) -consolidation and other (3) 15 379 (208) 1 34 (427) (206)Translation adjustment (42) (88) (7) - (6) (24) (167)At period-end 2 483 4 914 2 381 30 303 804 10 915Gross value 7 110 30 232 2 818 108 945 846 42 059Accumulated depreciation andimpairment (4 627) (25 318) (437) (78) (642) (42) (31 144)
Leasedvehicles (3)
Fixtures,fittings
and other
Assetsunder
construction
(1) Including property, plant and equipment acquired under finance leases for 32 million. Borrowing costs capitalised in accordance with IAS 23(Revised) - "Borrowing Costs" amounted to 42 million (see Note 2.11).
(3) "Change in scope of consolidation and other" movements in "Leased vehicles" includes net changes for the year (additions less disposals).
(2) of which 907 million in impairment losses on other assets of the Automotive Division CGU (see Note 9.1).
PSA PEUGEOT CITROËN 2013 Annual Results - 71

31 December 2012 VehiclesLand and Plant and and handling Total
(in million euros) buildings equipment equipmentNetAt beginning of period 3 133 6 101 2 693 99 273 1 775 14 074Purchases/additions (1) 268 687 - 11 59 1 361 2 386Depreciation for the year (264) (1 531) (14) (7) (56) - (1 872)Impairment losses (2) (66) (1 523) - - (2) (2) (1 593)Disposals (237) (21) - (9) (8) - (275)Transfers and reclassifications 62 1 032 - 5 36 (1 135) -consolidation and other (3) 63 293 (101) (69) (3) (370) (187)Translation adjustment (24) (72) 9 - (2) (6) (95)At period-end 2 935 4 966 2 587 30 297 1 623 12 438Gross value 7 133 30 166 3 015 109 853 1 625 42 901Accumulated depreciation andimpairment (4 198) (25 200) (428) (79) (556) (2) (30 463)
(3) "Change in scope of consolidation and other" movements in "Leased vehicles" includes net changes for the year (additions less disposals).
Leasedvehicles (3)
Fixtures,fittings
and other
Assetsunder
construction
(1) Including property, plant and equipment acquired under finance leases for 108 million. Borrowing costs capitalised in accordance with IAS 23(Revised) - "Borrowing Costs" amounted to 69 million (see Note 2.11).(2) Including 1,357 million in impairment losses on assets of the Automotive Division CGU.
15.2. LEASED VEHICLES
Leased vehicles include vehicles leased under short-term leases to retail customers by the Group's companies andvehicles sold with a buyback commitment, which are recognised according to the method described in Note 2.5.A.(a).
They break down as follows:
(in million euros) 2013 2012Vehicles sold with a buyback commitment 2 374 2 547Vehicles under short-term leases 7 40Total, net 2 381 2 587
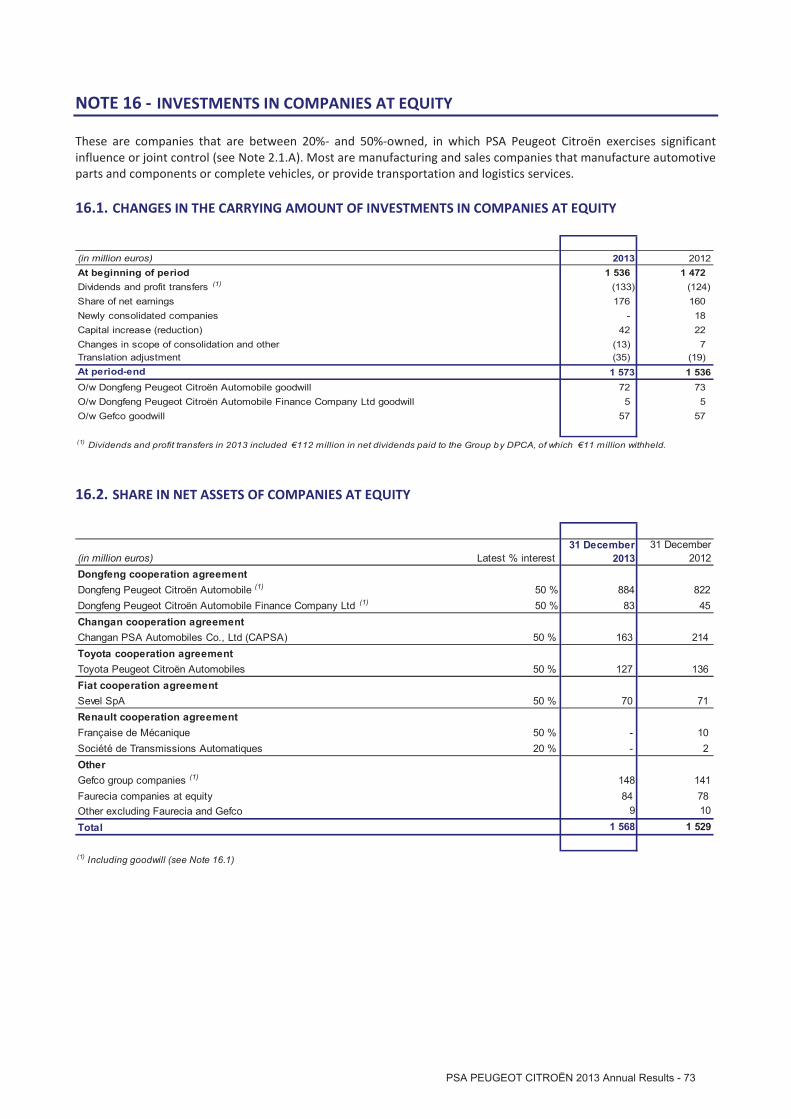
NOTE 16 - INVESTMENTS IN COMPANIES AT EQUITY
These are companies that are between 20%- and 50%-owned, in which PSA Peugeot Citroën exercises significantinfluence or joint control (see Note 2.1.A). Most are manufacturing and sales companies that manufacture automotiveparts and components or complete vehicles, or provide transportation and logistics services.
16.1. CHANGES IN THE CARRYING AMOUNT OF INVESTMENTS IN COMPANIES AT EQUITY
(in million euros) 2013 2012At beginning of period 1 536 1 472Dividends and profit transfers (1) (133) (124)Share of net earnings 176 160Newly consolidated companies - 18Capital increase (reduction) 42 22Changes in scope of consolidation and other (13) 7Translation adjustment (35) (19)At period-end 1 573 1 536O/w Dongfeng Peugeot Citroën Automobile goodwill 72 73O/w Dongfeng Peugeot Citroën Automobile Finance Company Ltd goodwill 5 5O/w Gefco goodwill 57 57
(1) Dividends and profit transfers in 2013 included 112 million in net dividends paid to the Group by DPCA, of which 11 million withheld.
16.2. SHARE IN NET ASSETS OF COMPANIES AT EQUITY
(in million euros) Latest % interest31 December
201331 December
2012Dongfeng cooperation agreementDongfeng Peugeot Citroën Automobile (1) 50 % 884 822Dongfeng Peugeot Citroën Automobile Finance Company Ltd (1) 50 % 83 45Changan cooperation agreementChangan PSA Automobiles Co., Ltd (CAPSA) 50 % 163 214Toyota cooperation agreementToyota Peugeot Citroën Automobiles 50 % 127 136Fiat cooperation agreementSevel SpA 50 % 70 71Renault cooperation agreementFrançaise de Mécanique 50 % - 10Société de Transmissions Automatiques 20 % - 2Other
148 141Faurecia companies at equity 84 78Other excluding Faurecia and Gefco 9 10Total 1 568 1 529
Gefco group companies (1)
(1) Including goodwill (see Note 16.1)
PSA PEUGEOT CITROËN 2013 Annual Results - 73

16.3. SHARE IN NET EARNINGS OF COMPANIES AT EQUITY
(in million euros) Latest % interest 2013 2012Dongfeng cooperation agreementDongfeng Peugeot Citroën Automobile 50 % 187 171Dongfeng Peugeot Citroën Automobile Finance Company Ltd 50 % 8 7Changan cooperation agreementChangan PSA Automobiles Co., Ltd (CAPSA) 50 % (49) (18)Toyota cooperation agreementToyota Peugeot Citroën Automobiles 50 % 4 15Fiat cooperation agreementSevelind 50 % - (1)Sevel SpA 50 % 2 -Renault cooperation agreementFrançaise de Mécanique 50 % (3) (5)Société de Transmissions Automatiques 20 % - -BMW cooperation agreementBMW Peugeot Citroën Electrification BV 0% - (35)Other
12 -Faurecia companies at equity 14 24Other excluding Faurecia and Gefco 1 2Total 176 160
Gefco group companies
16.4. KEY FINANCIAL DATA OF COMPANIES AT EQUITY – ATTRIBUTABLE TO THE GROUP
Aggregate dataA.
(in million euros)31 December
201331 December
2012Property, plant and equipment 1 697 1 640Working capital (1) (899) (565)Other capital employed (2) 646 534Capital employed 1 444 1 609Long and medium-term debt (337) (151)Other financial items 461 71Net financial position 124 (80)Total equity (Note 16.2) 1 568 1 529Capital expenditure 445 408
(1) Changan PSA Automobiles Co., Ltd's capital was not fully paid up at 31 December 2012. The portion not paid up ( 75 million) was included inworking capital.This amount has been paid to CAPSA in 2013.(2) At 31 December 2013, the main balance sheet items included in "Other capital employed" concern intangib le assets for 561 million ( 517million at 31 December 2012) and provisions for 100 million ( 118 million at 31 December 2012).

Key financial data by companyB.
(a) Capital employed
(in million euros) Latest % interest31 December
201331 December
2012Dongfeng cooperation agreementDongfeng Peugeot Citroën Automobile 50 % 508 634Dongfeng Peugeot Citroën Automobile Finance Company Ltd 50 % 83 45Changan cooperation agreementChangan PSA Automobiles Co., Ltd (CAPSA) 50 % 289 252Toyota cooperation agreementToyota Peugeot Citroën Automobiles 50 % 158 154Fiat cooperation agreementSevel SpA 50 % 181 207Renault cooperation agreementFrançaise de Mécanique 50 % - 93Société de Transmissions Automatiques 20 % - 1Other
177 169Faurecia companies at equity 49 52Other excluding Faurecia and Gefco (1) 2Total 1 444 1 609
Gefco group companies
(b) Net financial position
(in million euros) Latest % interest31 December
201331 December
2012Dongfeng cooperation agreementDongfeng Peugeot Citroën Automobile 50 % 376 188Dongfeng Peugeot Citroën Automobile Finance Company Ltd 50 % - -Changan cooperation agreementChangan PSA Automobiles Co., Ltd (CAPSA) 50 % (126) (38)Toyota cooperation agreementToyota Peugeot Citroën Automobiles 50 % (31) (18)Fiat cooperation agreementSevel SpA 50 % (111) (136)Renault cooperation agreementFrançaise de Mécanique 50 % - (83)Société de Transmissions Automatiques 20 % - 1Other
(29) (28)Faurecia companies at equity 35 26Other excluding Faurecia and Gefco 10 8Total 124 (80)
Gefco group companies
PSA PEUGEOT CITROËN 2013 Annual Results - 75

16.5. ADDITIONAL INFORMATION ON DONGFENG PEUGEOT CITROËN AUTOMOBILE
Key financial data for Dongfeng Peugeot Citroën Automobile on a full basis under IFRS are provided in the table below:
(in million euros)31 December
201331 December
2012Sales and revenue 7 034 5 222Recurring operating income (loss) 439 285Profit (loss) for the year 375 343Total assets 4 945 4 095Net financial position 752 376Dividends received by the PSA Peugeot Citroën group 112 94Withholding tax on dividends received 11 10
(in million yuans) 2013 2012Sales and revenue 57 447 42 358Recurring operating income (loss) 3 621 2 312Profit (loss) for the year 3 057 2 781Total assets 41 284 33 663Net financial position 6 280 3 080Dividends received by the PSA Peugeot Citroën group 906 776Withholding tax on dividends received 91 78
16.6. RELATED PARTY TRANSACTIONS – COMPANIES AT EQUITY
Transactions with companies at equity are billed on arm's length terms.
Receivables and payables with companies at equity are as follows:
(in million euros)31 December
201331 December
2012Long-term loans - 57Short-term loans - 333Trade receivables 263 282Trade payables (703) (1 041)
Sale and purchase transactions carried out by the consolidated Group with companies at equity are as follows:
(in million euros) 2013 2012Sales (1) 1 489 1 137Purchases (2) (4 539) (3 473)
(1) of which 1,226 million in sales to DCPA in 2013 ( 858 million in 2012).(2) of which 25 million in purchases from DCPA in 2013 ( 31 million in 2012).

NOTE 17 - OTHER NON-CURRENT FINANCIAL ASSETS
The recognition and measurement principles applicable to loans and receivables, short-term investments classified as"available-for-sale financial assets", short-term investments classified as "financial assets at fair value through profit orloss" and derivatives are described in Note 2.16.B.
31 December 2013
Loans and "Available- "At fair value Derivative
(in millions of euros)receivables for-sale" through profit
or loss"instruments Total
GrossAt beginning of period 344 171 374 - 889Purchases/additions 188 - 55 - 243Disposals (27) (88) (68) - (183)Remeasurement at fair value - (83) 4 17 (62)Transfers to current financial assets (1) (10) - - - (10)
(16) - (9) (2) (27)At period-end 479 - 356 15 850ProvisionsAt beginning of period (117) - - - (117)Net charge for the year (5) - - - (5)Translation adjustment and changes in scope of consolidation (5) - - - (5)At period-end (127) - - - (127)Carrying amount at 1 January 227 171 374 - 772Carrying amount at 31 December 352 - 356 15 723
Financial assetsclassified as
Translation adjustment and changes in scope of consolidation
(1) Financial assets classified as "at fair value through profit or loss" transferred to current financial assets correspond to money market securitieswith maturities of less than one year at 31 December 2013.
Financial assets classified as "available for sale" at 31 December 2012 concerned BNP Paribas shares sold by the Groupon 14 March 2013 for a total of 177 million. This transaction generated a pre-tax gain of 89 million, taking intoaccount the reclassification of changes in fair value previously classified under Income and expenses recogniseddirectly in equity.Changes in current financial assets are due in particular to a change in the structure of investments in favour of short-term financial instruments (initially less than three months), classified as cash.
31 December 2012
Loans and "Available- "At fair value Derivative
(in millions of euros)receivables for-sale" through profit
or loss"instruments Total
GrossAt beginning of period 272 122 547 235 1 176Purchases/additions 95 5 63 - 163Disposals (2) (4) (6) (304) (316)Remeasurement at fair value - 48 12 69 129Transfers to current financial assets (1) (19) - (239) - (258)
(2) - (3) - (5)At period-end 344 171 374 - 889ProvisionsAt beginning of period (115) - - - (115)Net charge for the year (2) - - - (2)Translation adjustment and changes in scope of consolidation - - - - -At period-end (117) - - - (117)Carrying amount at 1 January 157 122 547 235 1 061Carrying amount at 31 December 227 171 374 - 772
classified as
Translation adjustment and changes in scope of consolidation
(1) Financial assets classified as "at fair value through profit or loss" transferred to current financial assets correspond to money market securitieswith maturities of less than one year at 31 December 2012.
Financial assets
PSA PEUGEOT CITROËN 2013 Annual Results - 77

NOTE 18 - OTHER NON-CURRENT ASSETS
(in million euros)31 December
201331 December
2012261 15064 74
- 2277 288602 514
(1) Corresponding to the non-current portion of derivative instruments hedging commodity risks.
Excess of payments to external funds over pension obligations (Note 28)Units in the FMEA fundsDerivative instruments (1)
Guarantee deposits and otherTotal
The Group has invested in the two "Fonds de Modernisation des Equipementiers Automobiles" (FMEA - tier 1 and tier2). The Group has committed 204 million to these two funds, 125 million of which has been paid to date. Theseunits have been classified as "available-for-sale" in accordance with IAS 39 and are therefore measured at fair value(see Note 2.16.B (2)). They are reported as non-current assets because of the lock-up applicable to the Group'sinvestment.
In light of the difficulties experienced by automotive equipment manufacturers, the FMEA units were written down by52 million at 31 December 2012 based on the valuation published by the fund manager, Caisse des Dépôts etConsignations.
The Group considers that an impairment loss lasting more than three years qualifies as "prolonged" (see Note 2.16.(B)(2)). As it believes that this will be the case for the FMEA units, the impairment loss was recognised through profit andloss.
NOTE 19 - LOANS AND RECEIVABLES – FINANCE COMPANIES
The recognition and measurement principles are described in Note 2.16.B (3) (a).
19.1. ANALYSIS
(in million euros)31 December
201331 December
2012"Retail, Corporate and Equivalent"Credit sales 8 863 9 777Long-term leases 4 681 4 703Leases subject to buyback commitments 2 039 2 280Other receivables 133 152Ordinary accounts and other 46 95Total net "Retail, Corporate and Equivalent" 15 762 17 007Corporate DealersWholesale Finance Receivables 4 495 5 007Other receivables 725 733Other 330 314Total net "Corporate Dealers" 5 550 6 054Remeasurement of interest rate hedged portfolios 23 85Eliminations (55) (51)Total 21 280 23 095
The fair value of the loans and receivables of finance companies was 21,234 million as of 31 December 2013( 22,896 million as of 31 December 2012).

Retail, Corporate and Equivalent finance receivables represent loans provided by the finance companies to Peugeotand Citroën customers to purchase or lease vehicles.Wholesale finance receivables represent amounts due to Peugeot and Citroën by their dealer networks and certainEuropean importers which have been transferred to Group finance companies, and working capital loans provided bythe finance companies to the dealer networks.
Retail, Corporate and Equivalent finance receivables included 8,788 million in securitised automotive receivables thatwere still carried on the balance sheet at 31 December 2013 ( 6,742 million at 31 December 2012).
The Banque PSA Finance group carried out several securitisation transactions in 2013 through special purpose entities.
On 9 April 2013, the subsidiary Sofira sold 818 million in wholesale finance receivables to Auto ABS DFP MasterCompartment France 2013, for 808 million after haircut. The fund issued 550 million worth of Aaa/AAA-rated Abonds, 30 million of Aaa/AAA-rated S bonds and 228 million of B bonds.
On 4 May 2013, the German branch of Banque PSA Finance assigned receivables in an amount of 478 million relatingto future payments on long-term leasing contracts to FCT Auto ABS 2013-1. The fund issued 362 million worth ofAAA/Aaa-rated A bonds and 116 million of B bonds.
On 7 June 2013, the subsidiary Crédipar assigned 495 million in automobile finance receivables to FCT Auto ABS2013-2. The fund issued 450 million worth of AAA/Aaa-rated A bonds, 20 million of A+/A2-rated B mezzanine bondsand 25 million of C bonds.
In October 2013, the German branch of Banque PSA Finance assigned receivables in the amount of 20 million relatingto future payments on long-term leasing contracts to FCT Auto ABS German Lease Master. The fund issued 14 millionworth of AAA/Aaa-rated A bonds and 6 million of B bonds. Concurrently, the subsidiary Crédipar assigned receivablesin the amount of 735 million relating to future payments on long-term leasing contracts to FCT Auto ABS2 2013-A.The fund issued 522 million worth of Aaa/AAA-rated A bonds, 52 million of A2/A-rated B bonds and 162 million ofC bonds.
In November 2013, the German branch sold 302 million of wholesale finance receivables for 297 million afterhaircut to FCT Auto ABS DFP Master Compartment Germany 2013. The fund issued 189 million worth of Aaa/AAA-rated A bonds and 108 million of B bonds. It also assigned 230 million in automobile finance receivables to FCT AutoABS German Loans Master. The fund issued 196 million worth of AAA/Aaa-rated A bonds and 34 million of B bonds.
In November 2013, the Swiss subsidiary assigned receivables in a total amount of 245 million relating to futurepayments on long-term leasing contracts to Auto ABS Swiss Leases 2013 GmbH. The fund issued 196 million worth ofA bonds and a subordinate certificate in the amount of 49 million subscribed by the Swiss subsidiary.
The Banque PSA Finance subsidiaries and branches have rights to obtain the majority of benefits of the specialpurpose entities and are exposed to risks incident to these entities' activities. Therefore, the special purpose entitiesare fully consolidated.
Liabilities corresponding to securities issued by securitisation funds are shown in Note 32 “Financing liabilities -finance companies”.
PSA PEUGEOT CITROËN 2013 Annual Results - 79

19.2. AUTOMOTIVE DIVISION SALES OF RECEIVABLES
The following table shows outstanding Automotive Division receivables sold to the finance companies for which theAutomotive Division pays the financing cost:
(in million euros)31 December
201331 December
20123 260 3 600
19.3. MATURITIES OF LOANS AND RECEIVABLES
31 December 2013(in million euros) TotalUnallocated 432 153 178 183 303 1 249Less than three months 966 189 683 3 467 153 5 458Three to six months 800 170 527 705 59 2 261Six months to one year 1 737 318 974 222 168 3 419Two to five years 5 212 1 344 2 601 11 371 9 539Beyond five years 89 5 - - 63 157Total gross loans andreceivables outstanding 9 236 2 179 4 963 4 588 1 117 22 083Guarantee deposits on leases - - (64) (72) - (136)Allowances (348) (96) (96) (21) (74) (635)Total net loans andreceivables outstanding 8 888 2 083 4 803 4 495 1 043 21 312
Credit sales
Leases witha buyback
commitmentLong-term
leases
Wholesalefinance
receivables Other (1)
(1) Other receivables include "ordinary accounts" and "items taken into account in amortised cost calculations".
31 December 2012(in million euros) TotalUnallocated 478 151 177 200 354 1 360Less than three months 1 048 204 604 3 969 148 5 973Three to six months 918 185 507 575 80 2 265Six months to one year 1 902 361 900 347 131 3 641Two to five years 5 558 1 507 2 821 14 383 10 283Beyond five years 292 5 1 - 77 375Total gross loans andreceivables outstanding 10 196 2 413 5 010 5 105 1 173 23 897Guarantee deposits on leases - - (135) (74) - (209)Allowances (375) (86) (93) (24) (49) (627)Total net loans andreceivables outstanding 9 821 2 327 4 782 5 007 1 124 23 061(1) Other receivables include "ordinary accounts" and "items taken into account in amortised cost calculations".
Credit sales
Leases witha buyback
commitmentLong-term
leases
Wholesalefinance
receivables Other (1)

19.4. ALLOWANCES FOR CREDIT LOSSES
Net retail, corporate and equivalent loans and receivables outstandingA.
(in million euros)31 December
201331 December
2012Performing loans with no past due balances 15 051 16 207Performing loans with past due balances 631 698Non-performing loans 668 706Total gross Retail, Corporate and Equivalent loans and receivables outstanding 16 350 17 611Items taken into account in amortised cost calculations 45 92Guarantee deposits (63) (115)Allowances for performing loans with past due balances (43) (47)Allowances for non-performing loans (527) (534)Allowances (570) (581)Total net Retail, Corporate and Equivalent loans and receivables outstanding 15 762 17 007Allowances booked during the period (147) (276)Allowances released during the period (utilisations) 151 108
Net corporate dealer loans and receivables outstandingB.
(in million euros)31 December
201331 December
2012Performing loans with no past due balances 5 438 5 912Performing loans with past due balances 10 40Non-performing loans 250 264Total gross Corporate Dealer loans and receivables outstanding 5 698 6 216Items taken into account in amortised cost calculations (10) (10)Guarantee deposits (73) (94)Allowances (65) (58)Total net Corporate Dealer loans and receivables outstanding 5 550 6 054Allowances booked during the period (29) (35)Allowances released during the period (utilisations) 22 15
NOTE 20 - SHORT-TERM INVESTMENTS – FINANCE COMPANIES
The recognition and measurement principles applicable to short-term investments of the finance companies aredescribed in Note 2.16.B (1) (b).Short-term investments consist primarily of certificates of deposit held by the securitisation funds.
PSA PEUGEOT CITROËN 2013 Annual Results - 81

NOTE 21 - INVENTORIES
(in million euros) Gross Allowance Net Gross Allowance NetRaw materials and supplies 995 (167) 828 955 (165) 790Semi-finished products and work-in-progress 984 (22) 962 1 049 (24) 1 025Goods for resale and used vehicles 1 248 (215) 1 033 1 356 (208) 1 148Finished products and replacement parts 2 978 (175) 2 803 3 478 (248) 3 230Total 6 205 (579) 5 626 6 838 (645) 6 193
31 December 2013 31 December 2012
NOTE 22 - TRADE RECEIVABLES – MANUFACTURING AND SALES COMPANIES
31 December2013
31 December2012
Trade receivables 1 964 2 166Allowances for doubtful accounts (143) (152)Total - manufacturing and sales companies 1 821 2 014Elimination of transactions with the finance companies (156) (187)
1 665 1 827
(in million euros)
Total
This item does not include dealer receivables transferred to the finance companies, which are reported in theconsolidated balance sheet under "Loans and receivables - finance companies" (see Note 19.2).
At 31 December 2013, receivables totalling 928 million sold under the programmes described in Note 29.6 had beenderecognised in line with the principles set out in Note 2.18. A further 327 million worth of sold receivables were notderecognised. In cases where financing has been received in respect of the sold receivables, a debt is recognised foran amount equal to the sale proceeds.
NOTE 23 - OTHER RECEIVABLES
23.1. MANUFACTURING AND SALES COMPANIES
31 December2013
31 December2012
966 1 21046 50
194 24551 65
212 200171 196
1 640 1 966
(1) In 2013, the Group sold 105 million worth of 2012 French research tax credits (see Note 29.6).
Total
(in million euros)State, regional and local taxes excluding income tax (1)
Personnel-related payablesDue from suppliersDerivative instrumentsPrepaid expensesMiscellaneous other receivables

23.2. FINANCE COMPANIES
31 December2013
31 December2012
47 6592 329
Deferred income and accrued expenses 183 257335 304657 955
Miscellaneous other receivablesTotal
(1) This item corresponds to the fair value of instruments purchased by the Group to primarily hedge interest rate risks on financing liabilities andreceivab les.
(in million euros)Taxes payable other than income taxesDerivative instruments (1)
NOTE 24 - CURRENT FINANCIAL ASSETS
The recognition and measurement principles applicable to current financial assets are described in Note 2.16.B forloans and receivables, Note 2.16.B for financial assets at "fair value through profit or loss", and Note 2.16.D forderivative instruments.
2013
(in millions euros)At beginning of period 812 688 1 1 501Purchases/additions 125 - - 125Disposals (801) (683) - (1 484)Remeasurement at fair value (1) - 8 7Transfers (see Note 17) 10 - - 10Translation adjustment and changes in scope of consolidation (13) (5) - (18)At period-end 132 - 9 141
141
Loans andreceivables
Financialassets
classified as"at fair value
Derivativeinstruments Total
Manufacturing and sales companies
2012
(in millions euros)At beginning of period 238 - 27 265Purchases/additions 794 475 - 1 269Disposals (679) (84) - (763)Remeasurement at fair value - - (26) (26)Transfers (see Note 17) (1) 15 297 - 312Translation adjustment and changes in scope of consolidation 444 - - 444At period-end 812 688 1 1 501
1 501(1) Transfers of financial assets classified as at "fair value through profit or loss", corresponding to short-term investments with maturities of underone year.
Loans andreceivables
Financialassets
classified as"at fair value
Derivativeinstruments Total
Manufacturing and sales companies
Loans and receivables include 475 million in debt securities issued with an original maturity of four months, and witha residual maturity of two months at 31 December 2012.
PSA PEUGEOT CITROËN 2013 Annual Results - 83
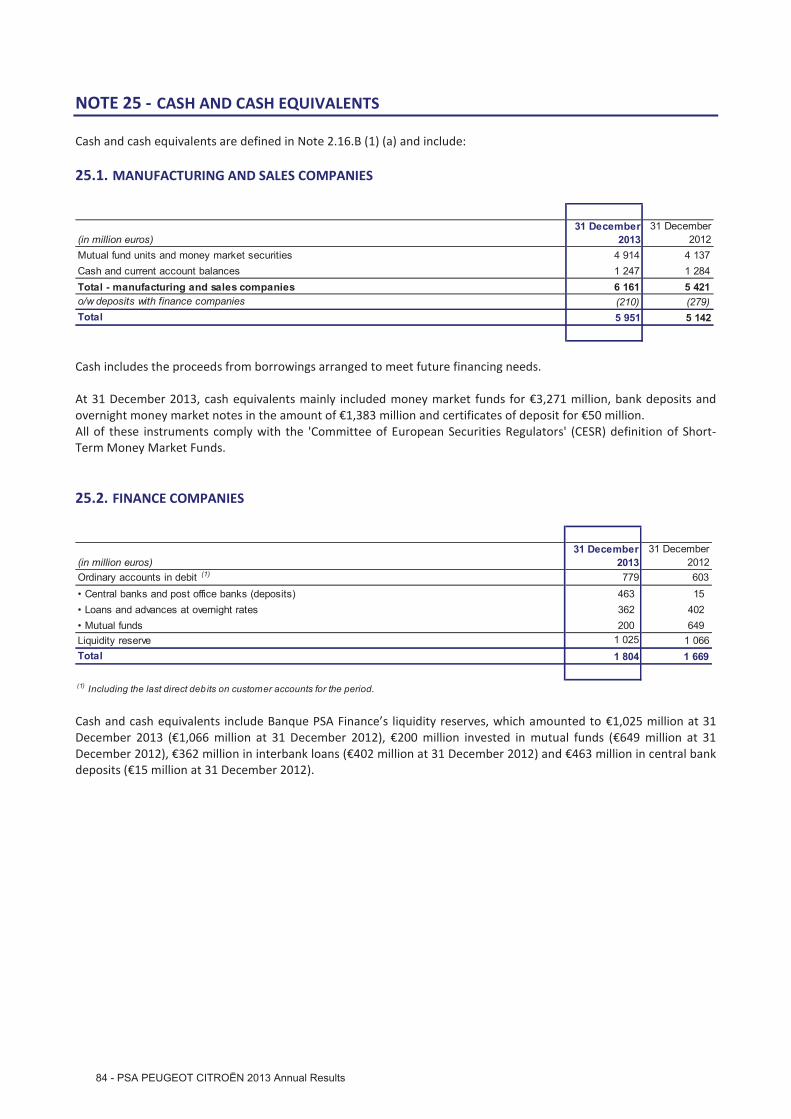
NOTE 25 - CASH AND CASH EQUIVALENTS
Cash and cash equivalents are defined in Note 2.16.B (1) (a) and include:
25.1. MANUFACTURING AND SALES COMPANIES
(in million euros)31 December
201331 December
2012Mutual fund units and money market securities 4 914 4 137Cash and current account balances 1 247 1 284Total - manufacturing and sales companies 6 161 5 421o/w deposits with finance companies (210) (279)Total 5 951 5 142
Cash includes the proceeds from borrowings arranged to meet future financing needs.
At 31 December 2013, cash equivalents mainly included money market funds for 3,271 million, bank deposits andovernight money market notes in the amount of 1,383 million and certificates of deposit for 50 million.All of these instruments comply with the 'Committee of European Securities Regulators' (CESR) definition of Short-Term Money Market Funds.
25.2. FINANCE COMPANIES
(in million euros)31 December
201331 December
2012779 603
• Central banks and post office banks (deposits) 463 15• Loans and advances at overnight rates 362 402• Mutual funds 200 649Liquidity reserve 1 025 1 066Total 1 804 1 669
Ordinary accounts in debit (1)
(1) Including the last direct debits on customer accounts for the period.
Cash and cash equivalents include Banque PSA Finance’s liquidity reserves, which amounted to 1,025 million at 31December 2013 ( 1,066 million at 31 December 2012), 200 million invested in mutual funds ( 649 million at 31December 2012), 362 million in interbank loans ( 402 million at 31 December 2012) and 463 million in central bankdeposits ( 15 million at 31 December 2012).

NOTE 26 - EQUITY
26.1. CAPITAL MANAGEMENT POLICY
The capital management policy relates to equity as defined under IFRS. It is designed to optimise the Group's cost ofcapital and ensure that it has secure long-term capital resources. Managing capital essentially involves deciding thelevel of capital to be held currently or in the future and setting dividend policies.
Equity breaks down into portions attributable to minority interests and to equity holders of the parent company.
Equity attributable to equity holders of the parent is equal to the share capital of Peugeot S.A. less any treasury stock,plus reserves and retained earnings of the Group's various businesses.Minority interests mainly represent non-Group shareholders of Faurecia. Equity attributable to minority interestsvaries in line with changes in the Faurecia group's consolidated equity (in particular net earnings and change intranslation reserves) and - exceptionally - in the event of a sale, purchase or any other equity transaction carried outby Peugeot S.A. in respect of Faurecia.
There are no financial covenants based on consolidated equity. The drawdown on the confirmed credit facilities ofPeugeot S.A. and GIE PSA Trésorerie is subject to compliance with an equity-based financial ratio (see Note 31.3).Banque PSA Finance complies with the capital adequacy ratio and other capital requirements imposed under bankingregulations.
Peugeot S.A. shares are held in treasury for the following purposes:to allot shares in connection with equity transactions;to award shares to employees, directors and officers of the Company or of companies or groupings that areaffiliated with it when the stock options are exercised;to reduce the company's share capital.
Furthermore, the Group may carry out capital increases when holders of Peugeot S.A. OCEANE bonds present theirbonds for conversion. (See Note 26.2). There was no capital increase as a result of the conversion of OCEANE bonds in2013.
26.2. ANALYSIS OF SHARE CAPITAL AND CHANGES IN THE YEAR
The share capital amounted to 354,848,992 at 31 December 2013, represented by shares with a par value of 1 each.It is fully paid-up. Shares may be held in registered or bearer form, at the shareholder's discretion. In accordance witharticle 11 of the bylaws, shares registered in the name of the same holder for at least four years carry double votingrights.
(in euros)31 December
201331 December
2012354 848 992 234 049 344
Rights issue - 120 799 648OCEANE bonds - -
354 848 992 354 848 992
Share capital at beginning of period
Share capital at end of period
At 31 December 2013, the Peugeot family group held 25.5% of Peugeot S.A.'s shares and 38.1% of the voting rights atShareholders Meetings. After taking account of the dilutive effect of potential shares represented by stock options,the family group's share of voting rights stands at 37.0%.
In December 2013, General Motors sold its 7% equity stake. As part of the change in the Alliance, GM also waived itsright to terminate the Alliance, under certain conditions, in the event of certain other investors acquiring interests inPeugeot S.A., provided that said investors support the Alliance.
PSA PEUGEOT CITROËN 2013 Annual Results - 85

26.3. EMPLOYEE STOCK OPTIONS
Plan characteristicsA.No plan was awarded between 2009 and 2013. Former plans awarded each year between 1999 and 2008 to certainemployees, directors and officers of the Company and its subsidiaries, allowing them to purchase shares at a specifiedprice, have the following characteristics:
Vestingdate
Last exercisedate
Number ofinitial
grantees
Exerciseprice (ineuros)
Number ofoptionsgranted
2005 Plan 23/08/2008 22/08/2013 169 44.76 953 0002006 Plan 23/08/2009 22/08/2014 92 35.16 983 5002007 Plan 22/08/2010 21/08/2015 169 51.65 1 155 0002008 Plan 22/08/2011 19/08/2016 194 28.27 1 345 000
23/08/200523/08/200622/08/200722/08/2008
Date ofManaging Board
decision
On 31 December 2013, the share price was 9.44.
Changes in the number of options outstandingB.
Changes in the number of options outstanding under these plans (exercisable for 1 par value shares) are shownbelow:
(number of options) 2013 2012Total at 1 January 4 371 970 4 698 000Adjustment to the number of options granted as a result of the capital increase - 797 810Options granted - -Options exercised - -Cancelled options (54 405) (56 800)Expired options (1 005 030) (1 067 040)Total at 31 December 3 312 535 4 371 970o/w exercisable options 3 312 535 4 371 970
Options outstanding at the year-end are as follows:
(number of options)31 December
201331 December
20122005 Plan - 1 005 0302006 Plan 992 500 1 003 6152007 Plan 1 052 415 1 067 6252008 Plan 1 267 620 1 295 700Total at 31 December 3 312 535 4 371 970

Weighted average value of options and underlying sharesC.
(in euros)
Exercise price Share price Exercise price Share priceValue at 1 January 39.4 46.3New options - 39.6Options granted - - - -Options exercised - - - -Cancelled options 36.2 36.2 37.4 25.3
44.8 37.1 40.7 24.3Value at 31 December 37.8 39.4
2013 2012
Expired options
Personnel costs arising from stock option plansD.
In line with the principles described in Note 2.22, the Peugeot S.A. and Faurecia stock-option plans did not generateany personnel costs.
26.4. PERFORMANCE SHARE PLANS
Peugeot S.A. performance share planNo performance share plans are currently in force at Peugeot S.A.
Faurecia performance share planIn 2010, Faurecia established a performance share plan for executives of group companies. These shares are subjectto service and performance conditions.The amount recognised in income for the period is a prior expense of 2.1 million (compared with a reversal of priorexpenses of 2.7 million in 2012).
The details of performance share plans are provided in the following table:
(number of shares)- objective
achievedDate of Managing Board decision:
23/07/2012 736 500 957 45024/07/2013 911 000 1 184 300
Maximum number of performance sharesdue if:
- objective exceeded
Following the achievement of the performance target of the first plan (Board meeting of 23 June 2010), 478,400shares were granted, leaving 241,800 still to be granted. The performance target in the third plan established by theBoard on 25 July 2011 was not achieved.
26.5. PEUGEOT S.A. SHARES
The Group may use the buyback authorisations given at Shareholders' Meetings to buy back Peugeot S.A. shares. Noshares were bought back in 2012 and 2013.
PSA PEUGEOT CITROËN 2013 Annual Results - 87
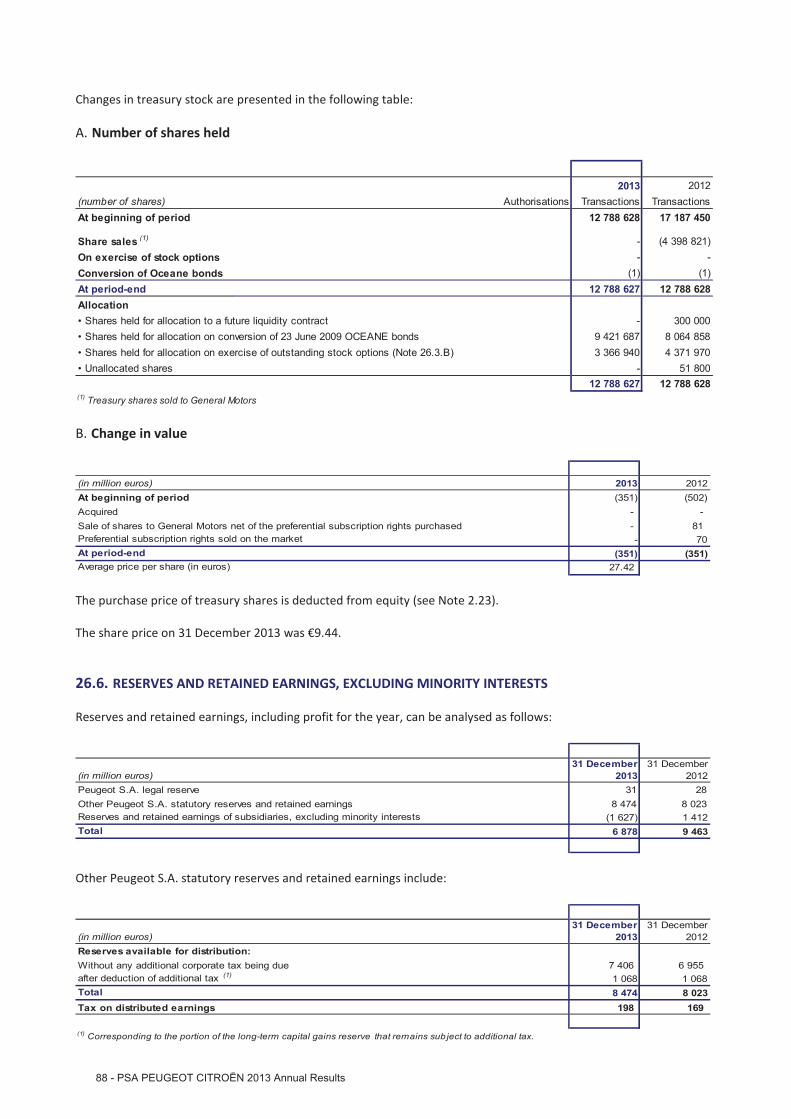
Changes in treasury stock are presented in the following table:
Number of shares heldA.
2013 2012(number of shares) Authorisations Transactions TransactionsAt beginning of period 12 788 628 17 187 450
Share sales (1) - (4 398 821)On exercise of stock options - -Conversion of Oceane bonds (1) (1)At period-end 12 788 627 12 788 628Allocation• Shares held for allocation to a future liquidity contract - 300 000• Shares held for allocation on conversion of 23 June 2009 OCEANE bonds 9 421 687 8 064 858• Shares held for allocation on exercise of outstanding stock options (Note 26.3.B) 3 366 940 4 371 970• Unallocated shares - 51 800
12 788 627 12 788 628(1) Treasury shares sold to General Motors
Change in valueB.
(in million euros) 2013 2012At beginning of period (351) (502)Acquired - -Sale of shares to General Motors net of the preferential subscription rights purchased - 81Preferential subscription rights sold on the market - 70At period-end (351) (351)
27.42Average price per share (in euros)
The purchase price of treasury shares is deducted from equity (see Note 2.23).
The share price on 31 December 2013 was 9.44.
26.6. RESERVES AND RETAINED EARNINGS, EXCLUDING MINORITY INTERESTS
Reserves and retained earnings, including profit for the year, can be analysed as follows:
(in million euros)31 December
201331 December
2012Peugeot S.A. legal reserve 31 28Other Peugeot S.A. statutory reserves and retained earnings 8 474 8 023Reserves and retained earnings of subsidiaries, excluding minority interests (1 627) 1 412Total 6 878 9 463
Other Peugeot S.A. statutory reserves and retained earnings include:
(in million euros)31 December
201331 December
2012Reserves available for distribution:Without any additional corporate tax being due 7 406 6 955after deduction of additional tax (1) 1 068 1 068Total 8 474 8 023Tax on distributed earnings 198 169
(1) Corresponding to the portion of the long-term capital gains reserve that remains sub ject to additional tax.

26.7. MINORITY INTERESTS
Minority interests correspond mainly to the interests of other shareholders of Faurecia.
NOTE 27 - CURRENT AND NON-CURRENT PROVISIONS
27.1. NON-CURRENT PROVISIONS
Analysis by typeA.
31 December2013
31 December2012
Pensions (Note 28.6) 954 1 040Other employee benefit obligations 113 124Other 16 18Total 1 083 1 182
(in million euros)
Movements for the yearB.
(in million euros) 2013 2012At beginning of period 1 182 972Movements taken to profit or lossAdditions 160 150Releases (utilisations) (98) (145)Releases (unused provisions) (84) (106)
(22) (101)Other changesTranslation adjustment (13) (2)Recognised in equity during the period. (147) 294Change in scope of consolidation and other 83 19At period-end 1 083 1 182
Provision releases mainly concern pensions. These reversals of moot pension provisions relate mainly to staff whosedeparture is expected under workforce adjustment mechanisms (see Note 9.3).
27.2. CURRENT PROVISIONS
Analysis by typeA.
31 December2013
31 December2012
Warranties 709 689465 443
Restructuring plans 752 847Long-term contract losses 258 587Sales with a buyback commitment 176 194Other 293 304Total 2 653 3 064
(in million euros)
Commercial and tax claims and litigation
The provision for warranties mainly concerns sales of new vehicles, where the contractual obligations generally covertwo years.
PSA PEUGEOT CITROËN 2013 Annual Results - 89

It corresponds to the expected cost of warranty claims related to vehicles and replacement parts. The amountexpected to be recovered from suppliers is recognised as an asset, under "Miscellaneous other receivables" (Note 23).Provisions for tax claims concern a number of claims primarily outside France.
Movements for the yearB.
(in million euros) 2013 2012At beginning of period 3 064 2 299Movements taken to profit or lossAdditions (1) 1 358 2 112Releases (utilisations) (1 271) (1 134)Releases (unused provisions) (2) (431) (170)
(344) 808Other changes
(91) (38)24 (5)
At period-end 2 653 3 064
(2) The decline in warranty costs resulting from improvements to vehicle quality led to a 71 million reduction in the related provisions in 2013( 71 million reduction in 2012).
Translation adjustmentChange in scope of consolidation and other
(1) The main additions for restructuring plans in 2013 are discussed in Note 9.3.
NOTE 28 - PENSIONS AND OTHER POST-EMPLOYMENT BENEFITS
28.1. PLAN DESCRIPTIONS
Group employees in certain countries are entitled to supplementary pension benefits payable annually to retirees, orretirement bonuses representing one-off payments made at the time of retirement. These benefits are paid underdefined contribution and defined benefit plans. The Group’s only obligation under defined contribution plans is to payfixed contributions into the fund concerned. The payments are recognised in income for the year. Payments underdefined benefit plans concern primarily France and the United Kingdom.
In France, the existing defined benefit plans concern:the retirement bonuses provided for by collective bargaining agreements;the portion of the top-hat pension scheme for engineers and management personnel that was not transferred toan external fund in 2002 and guarantees an aggregate replacement rate from all plans of up to 60% of theemployee's final salary (currently covering 2,700 retired employees);the pension plan set up by the former subsidiary of the Chrysler group in France (Talbot), which was closed tonew entrants in 1981 and covers 17,700 retired employees at end-2013;the closed Citroën supplementary plan (ACC) that covered 6,600 retired employees at end-2013.
Members of the managing bodies benefit from a supplementary pension plan, subject to two conditions: firstly, tohave held office as a member of managing bodies for a minimum term; secondly, to end their career as employees ofthe Company. This plan, whose rules have been amended with effect from 1 January 2014, provides a supplementarypension representing a maximum of 30% of the reference compensation, determined on the basis of the average fixedcompensation of the last three years of activity before retirement, plus a percentage equal to the average of the ratiosof variable compensation to fixed compensation for the eight years of activity before retirement.
In the United Kingdom, the Group has four trustee-administered defined benefit plans. These plans have been closedto new entrants since May 2002. At 31 December 2013, 20,700 beneficiaries were covered by these plans, including900 active employees, 8,100 former employees not yet retired and 11,700 retired employees. The plans guarantee areplacement rate of up to 66% of the employee's final salary.

The supplementary pension plan for Faurecia group executives in France comprises :a non-contributory defined contribution plan for which contribution rates are based on salary bands A and B;a supplementary defined benefit plan based on salary band C;a supplementary pension scheme closed in 2005, guaranteeing a pension based on the beneficiary’s salary andcovering 450 potential beneficiaries.
28.2. ASSUMPTIONS
Euro zone United-KingdomDiscount Rate2013 3.25 % 4.50 %2012 3.00 % 4.25 %Inflation Rate2013 1.80 % 3.20 %2012 1.80 % 2.70 %Average Duration (in years)2013 11 152012 11 15
At each period-end, the discount rate is determined based on the most representative returns on prime corporatebonds with a life that approximates the duration of the benefit obligation.
Prime corporate bonds are defined as bonds awarded one of the top two ratings by a recognised rating agency (forexample, bonds rated AA or AAA by Moody's or Standard & Poor's).
The assumptions regarding future salary increases take into account inflation and forecast individual pay rises in eachcountry. The assumption for French plans is inflation plus 1.0% in 2013, and inflation plus 0.5% for subsequent years.The assumption for UK plans is inflation plus 1%.Mortality and staff turnover assumptions are based on the specific economic conditions of each host country.
Sensitivity of assumptions: a 0.25-point increase or decrease in the discount rate and in the inflation rate in France orthe UK would lead to the following increases or decreases in projected benefit obligations:
France -2.47% 3.03%United Kingdom -3.31% 2.86%
Discount rate Inflation rate
A 1-point increase or decrease in the expected return on external funds would have led to an increase or decrease inthe investment income recognised in 2013 of 11 million for French plans and 19 million for UK plans.In 2012, the Group arranged an interest rate swap for the United Kingdom within the pension fund, making it possibleto vary hedging assets in response to changes in the liability at the discount rate.
28.3. INFORMATIONS ON EXTERNAL FUNDS
The projected benefit obligation is partially covered by dedicated external funds.
The breakdown of external funds is as follows:
Equities Bonds Equities BondsFrance 10 % 90 % 20 % 80 %United Kingdom 40 % 60 % 40 % 60 %
31 December 2013 31 December 2012
The fair value of shares and bonds was at level 1 in 2013 and 2012.
PSA PEUGEOT CITROËN 2013 Annual Results - 91

In 2013, the actual return on external funds managed by the Group in France and by the pension trusts in the UnitedKingdom was +3.3% for the French funds and +10.3% for the UK funds. In France, equity funds consist of DJ Eurostoxxindex tracker funds and international index tracker funds, while bond funds are invested in prime Europeangovernment bonds and in European corporate bonds rated A or higher.
In the United Kingdom, 60% of the equity portfolio is invested in funds that track the main UK, European, US andJapanese stock market indices. The remaining 40% are actively managed and invested in UK stocks. Half of the bondportfolio is comprised of inflation-linked government bonds denominated in pounds sterling. The other half iscomprised mainly of corporate bonds rated A or higher.
In France, the Group is free to decide the amount of its contributions to the external funds. At 31 December 2013, nodecision had been made as to the amount of contributions to be paid in 2014.In 2013, no contribution was paid to the external fund for the top-hat pension plan for Peugeot S.A. senior executives.
In the United Kingdom, the Group's annual contribution amounted to £53 million ( 63 million) in 2013. It is estimatedat £54 million ( 65 million) for 2014, although this sum may change in light of the negotiations planned for 2014.
28.4. IMPACT OF THE APPLICATION OF THE AMENDEMENT TO IAS 19 APPLICABLE TO PREVIOUSLYPUBLISHED DATA
(in million euros) France UnitedKingdom
Other Total France UnitedKingdom
Other Total
Present value of projected benefit obligation (1 747) (1 782) (654) (4 183) (1 747) (1 782) (654) (4 183)
Fair value of external funds 1 107 1 893 305 3 305 1 107 1 893 305 3 305
Plan surplus (deficit) (640) 111 (349) (878) (640) 111 (349) (878)
Unrecognised actuarial gains and (losses) - - - - 319 36 122 477
Unrecognised past service cost - - - - 58 - - 58
Net (liability) asset recognised in the balance sheet beforeminimum funding requirement (IFRIC 14)
(640) 111 (349) (878) (263) 147 (227) (343)
Minimum funding requirement liability (IFRIC 14) - (12) - (12) - (12) - (12)
Net (liability) asset recognised in the balance sheet (640) 99 (349) (890) (263) 135 (227) (355)
Of w hich, liability (641) (50) (349) (1 040) (264) (18) (227) (509)
Of w hich, asset 1 149 - 150 1 153 - 154
Actuarial gains and losses and past service costs recognised directly inequity (before deferred taxes)
377 36 122 535
Actuarial gains and losses and past service costs recognised directly inequity (after deferred taxes)
265 19 101 385
31 December 2012 IAS19R 31 December 2012 IAS19

28.5. MOVEMENT FOR THE YEAR
Excluding minimum funding requirement (IFRIC 14)
(in million euros) FranceUnited
Kingdom Other Total FranceUnited
Kingdom Other TotalProjected benefit obligation
At beginning of period: Present value (1 747) (1 782) (654) (4 183) (1 587) (1 621) (579) (3 787)Service cost (84) (14) (20) (118) (50) (15) (18) (83)Interest cost (54) (73) (19) (146) (70) (80) (24) (174)Benefit payments for the year 134 48 30 212 96 71 31 198Unrecognised actuarial gains and (losses): - -- amount 80 (17) 30 93 (252) (101) (98) (451)- as a % of projected benefit obligation 4.6 % 1.0 % 4.6 % 2.2 % 15.9 % 6.2 % 16.9 % 11.9 %Past service cost - - 2 2 - - - -Translation adjustment - 35 12 47 - (38) 2 (36)Effect of changes in scope of consolidation and other (38) (35) (1) (74) 17 2 26 45Effect of curtailments and settlements 80 - 1 81 99 - 6 105At period-end: Present value (1 629) (1 838) (619) (4 086) (1 747) (1 782) (654) (4 183)External fund
At beginning of period: Fair value 1 107 1 893 305 3 305 1 101 1 735 301 3 137Normative return on external funds 32 78 10 120 47 87 13 147
Actuarial gains and (losses): - -- amount 26 82 3 111 55 18 1 74- as a % of projected benefit obligation 2.3 % 4.3 % 1.0 % 3.4 % 5.0 % 1.0 % 0.3 % 2.4 %Translation adjustment - (36) (3) (39) - 40 - 40Employer contributions 4 63 15 82 3 82 21 106Benefit payments for the year (139) (48) (23) (210) (92) (71) (21) (184)Effect of changes in scope of consolidation and other - 35 - 35 (7) 2 (8) (13)Effect of curtailments and settlements - - - - - - (2) (2)At period-end: Fair value 1 030 2 067 307 3 404 1 107 1 893 305 3 305
2013 2012
28.6. RECONCILIATION OF BALANCE SHEET ITEMS
(in million euros) FranceUnited
Kingdom Other Total FranceUnited
Kingdom Other TotalPresent value of projected benefit obligation (1 629) (1 838) (619) (4 086) (1 747) (1 782) (654) (4 183)Fair value of external funds 1 030 2 067 307 3 404 1 107 1 893 305 3 305Net (liability) asset recognised in the balance sheetbefore minimum funding requirement (IFRIC 14) (599) 229 (312) (682) (640) 111 (349) (878)
Minimum funding requirement liability (IFRIC 14) - (11) - (11) - (12) - (12)Net (liability) asset recognised in the balance sheet (599) 218 (312) (693) (640) 99 (349) (890)Of which, liability (Note 28.1.A) (607) (34) (313) (954) (641) (50) (349) (1 040)Of which, asset 8 252 1 261 1 149 - 150Of which, unfunded plans 1.0 % 0.0 % 5.9 % 1.3 % 1,1% 0,0% 6,0% 1,4%
31 December 2013 31 December 2012
The projected benefit obligation of French companies includes benefit obligations in respect of supplementarypensions owed to members of the managing bodies (described in Note 39), which were revised in the amount of 27million starting in December 2013. This amount does not include the additional 30% contribution due above thethreshold pursuant to Article L. 137-11 of the French Social Security Code (provisioned in the amount of 2 million). Inaddition, commitments in respect of retirement benefits for members of managing bodies are provisioned in theamount of 1 million. The service cost for these two plans, excluding the impact of the revision of December 2013,was 9 million in fiscal 2013.
PSA PEUGEOT CITROËN 2013 Annual Results - 93
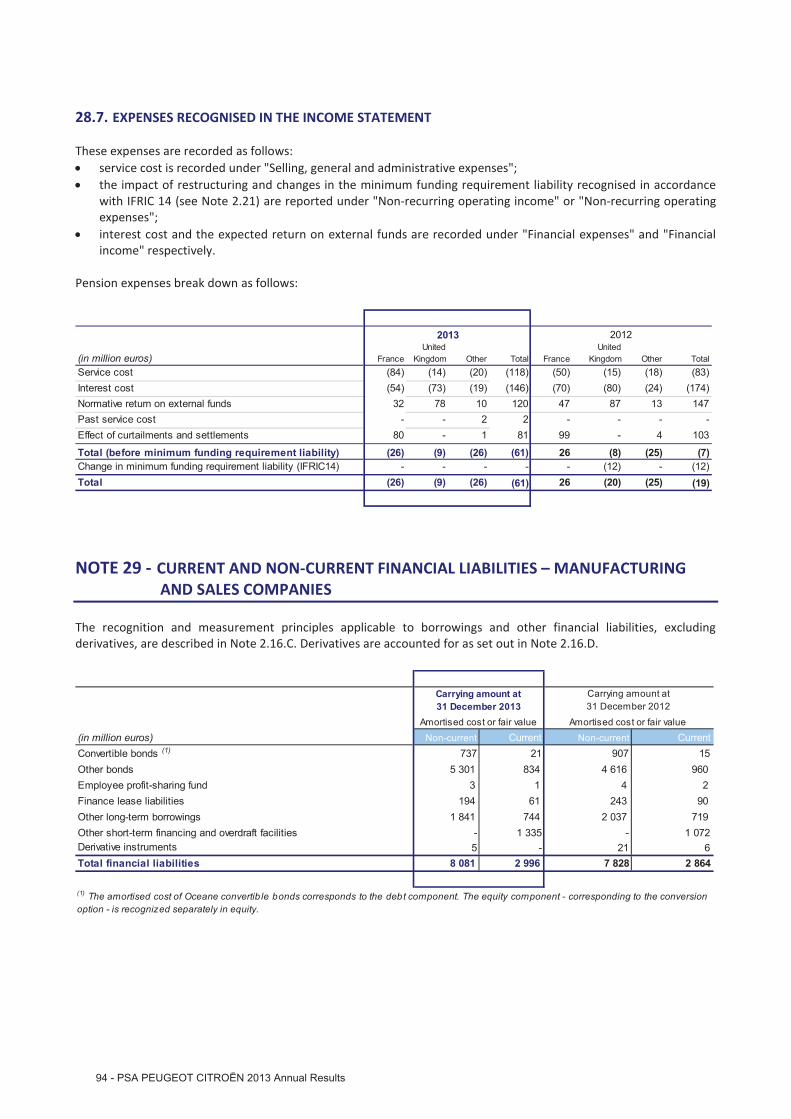
28.7. EXPENSES RECOGNISED IN THE INCOME STATEMENT
These expenses are recorded as follows:service cost is recorded under "Selling, general and administrative expenses";the impact of restructuring and changes in the minimum funding requirement liability recognised in accordancewith IFRIC 14 (see Note 2.21) are reported under "Non-recurring operating income" or "Non-recurring operatingexpenses";interest cost and the expected return on external funds are recorded under "Financial expenses" and "Financialincome" respectively.
Pension expenses break down as follows:
(in million euros) FranceUnited
Kingdom Other Total FranceUnited
Kingdom Other TotalService cost (84) (14) (20) (118) (50) (15) (18) (83)Interest cost (54) (73) (19) (146) (70) (80) (24) (174)Normative return on external funds 32 78 10 120 47 87 13 147Past service cost - - 2 2 - - - -Effect of curtailments and settlements 80 - 1 81 99 - 4 103
Total (before minimum funding requirement liability) (26) (9) (26) (61) 26 (8) (25) (7)Change in minimum funding requirement liability (IFRIC14) - - - - - (12) - (12)Total (26) (9) (26) (61) 26 (20) (25) (19)
2013 2012
NOTE 29 - CURRENT AND NON-CURRENT FINANCIAL LIABILITIES – MANUFACTURINGAND SALES COMPANIES
The recognition and measurement principles applicable to borrowings and other financial liabilities, excludingderivatives, are described in Note 2.16.C. Derivatives are accounted for as set out in Note 2.16.D.
(in million euros) Non-current Current Non-current CurrentConvertible bonds (1) 737 21 907 15Other bonds 5 301 834 4 616 960Employee profit-sharing fund 3 1 4 2Finance lease liabilities 194 61 243 90Other long-term borrowings 1 841 744 2 037 719
- 1 335 - 1 072Derivative instruments 5 - 21 6Total financial liabilities 8 081 2 996 7 828 2 864
Carrying amount at31 December 2013
Carrying amount at31 December 2012
Amortised cost or fair value Amortised cost or fair value
Other short-term financing and overdraft facilities
(1) The amortised cost of Oceane convertib le bonds corresponds to the debt component. The equity component - corresponding to the conversionoption - is recognized separately in equity.
29.1. PRINCIPALES OPERATIONS DE FINANCEMENT DE L’EXERCICE
The financial risk management policy is set out in Note 36.1.
The main transactions during the year were as follows:
Bond issues by manufacturing and sales companies (excluding Faurecia)On 28 February 2013, Peugeot S.A. issued a 1 billion 7.375% bond maturing in March 2018.
On 24 April 2013, Peugeot Citroën Automobiles repaid at maturity the 400 million loan granted by the EuropeanInvestment Bank (EIB).
Peugeot Citroën do Brasil subscribed new loans during the year, primarily from Banco Nacional Do Desinvolvimento(BNDES), in a total amount of 186 million.
In September 2013, Peugeot S.A. made partial redemptions in a total amount of 300 million:o 82 million on the 750 million bond maturing in July 2014;o 40 million on the 500 million bond maturing in June 2015;o 75 million on the 500 million bond maturing in October 2013 and;o 103 million on the 500 million bond maturing in March 2016.
In September 2013, Peugeot S.A. issued a 600 million 6.5% bond maturing in January 2019.
In October 2013, Peugeot S.A. made two bond redemptions in a total amount of 775 million.
In December 2013, the Group concluded with the EIB a loan of 300 million maturing in December 2018, with anannual interest rate of 2.283%.
Peugeot S.A. syndicated credit facility
On 9 July 2010, Peugeot S.A rolled over in advance a 2,400 million three-year syndicated revolving credit facility (withtwo extensions of one year at the banks’ option) with a group of 21 banks.In July 2011, a first one-year extension was accepted by the banks, to July 2014.In July 2012, PSA Peugeot Citroën obtained a second one-year extension to July 2015 for a 2,225 million tranche,with the remainder still due July 2014.
Faurecia syndicated credit facility
In December 2011, Faurecia obtained a new 1,150 million syndicated credit facility. The facility comprises a 690million tranche expiring in November 2014 with a two-year extension option and a 460 million tranche expiring inDecember 2016.Following the exercise of the two extension options, the first tranche is now split into a 36 million tranche maturingin December 2014 and a 654 million tranche maturing in December 2016. As of 31 December 2013, Faurecia had notdrawn on any of its syndicated loan facilities.
29.2. CHARACTERISTICS OF THE PEUGEOT S.A. AND FAURECIA OCEANE CONVERTIBLE BONDS:
OCEANE Peugeot S.A.
On 23 June 2009, Peugeot S.A. issued 575 million worth of Oceane bonds convertible or exchangeable for new orexisting shares, i.e. 25.10 per share. The 22,908,365 bonds are due 1 January 2016 and pay interest at an annualnominal rate of 4.45%.At 31 December 2013, 1,312 bonds had been converted. At inception, the debt component of the OCEANE convertiblebonds amounted to 441 million and the equity component to 125 million. The conversion ratio is 1 OCEANE bondfor 1.2 shares.
OCEANE Faurecia
OCEANE 2015
PSA PEUGEOT CITROËN 2013 Annual Results - 95

On 26 November 2009, Faurecia issued 211 million worth of Oceane bonds convertible or exchangeable for new orexisting shares, i.e. 18.69 per share. The 11,306,058 bonds are due 1 January 2015 and pay interest at an annualnominal rate of 4.50%.
On 30 November 2013, Faurecia announced its decision to redeem early the bonds issued on 26 November 2009,convertible into new shares or exchangeable for existing shares. There were 11,304,290 outstanding bonds as of 31October 2013.
Bondholders opted almost unanimously to convert their bonds into Faurecia shares:11,284,793 bonds, or 99.83% of the total outstanding number, will be converted into 11,736,190 new Faurecia shares.
This prepayment at the initiative of Faurecia allowed the Group to strengthen its capital base and reduce its net debtby 213 million.
Following the transaction, finalised on 30 December 2013, the total number of Faurecia shares outstanding was122,588,135, putting Peugeot S.A.’s stake at 51.7%.
OCEANE 2018
On 18 September 2012, Faurecia issued 250 million worth of Oceane bonds convertible or exchangeable for new orexisting shares, i.e. 19.48 per share. The 12,833,675 bonds are due on 1 January 2018 and pay interest at an annualnominal rate of 3.25%.
At 31 December 2012, no bond had been converted. At inception, the debt component of the OCEANE convertiblebonds amounted to 198 million and the equity component to 47 million. The conversion ratio is 1 OCEANE bond for1 share.
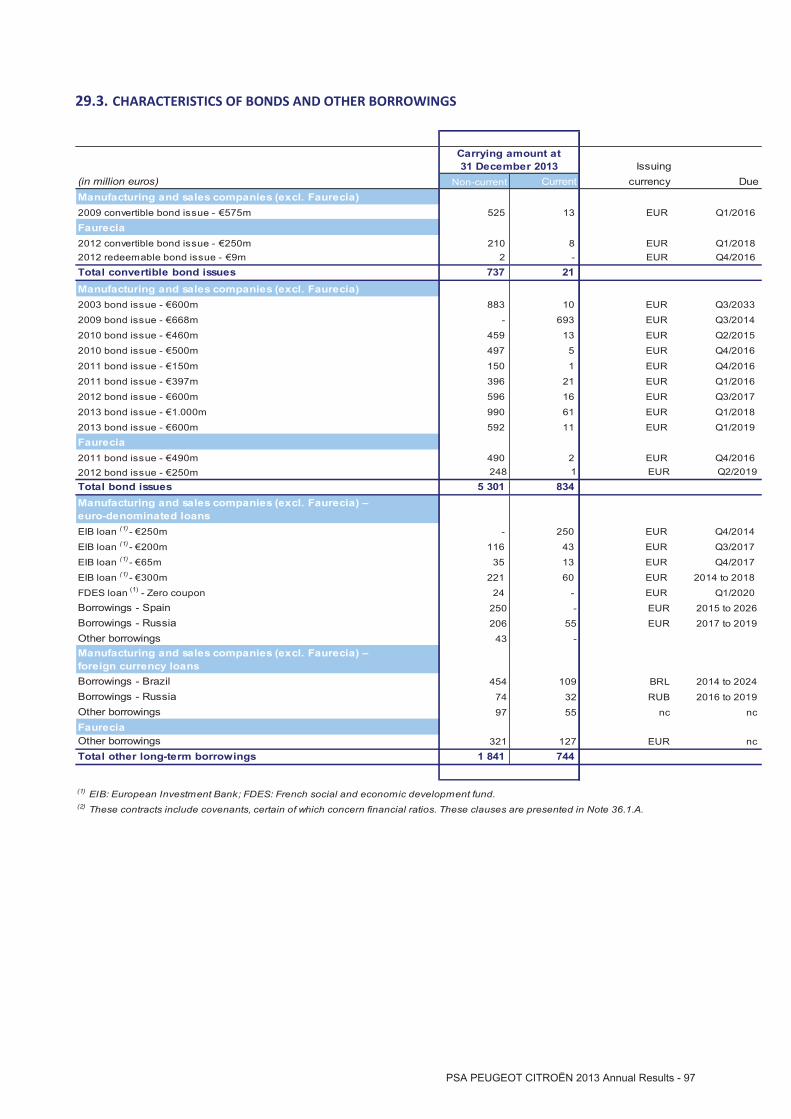
29.3. CHARACTERISTICS OF BONDS AND OTHER BORROWINGS
Issuing(in million euros) Non-current Current currency Due
2009 convertible bond issue - 575m 525 13 EUR Q1/2016
2012 convertible bond issue - 250m 210 8 EUR Q1/20182012 redeemable bond issue - 9m 2 - EUR Q4/2016Total convertible bond issues 737 21
2003 bond issue - 600m 883 10 EUR Q3/2033
2009 bond issue - 668m - 693 EUR Q3/2014
2010 bond issue - 460m 459 13 EUR Q2/2015
2010 bond issue - 500m 497 5 EUR Q4/2016
2011 bond issue - 150m 150 1 EUR Q4/2016
2011 bond issue - 397m 396 21 EUR Q1/2016
2012 bond issue - 600m 596 16 EUR Q3/2017
2013 bond issue - 1.000m 990 61 EUR Q1/2018
2013 bond issue - 600m 592 11 EUR Q1/2019
2011 bond issue - 490m 490 2 EUR Q4/20162012 bond issue - 250m 248 1 EUR Q2/2019Total bond issues 5 301 834
EIB loan (1) - 250m - 250 EUR Q4/2014
EIB loan (1) - 200m 116 43 EUR Q3/2017
EIB loan (1) - 65m 35 13 EUR Q4/2017
EIB loan (1) - 300m 221 60 EUR 2014 to 2018
FDES loan (1) - Zero coupon 24 - EUR Q1/2020
250 - EUR 2015 to 2026Borrowings - Russia 206 55 EUR 2017 to 2019Other borrowings 43 -
Borrowings - Brazil 454 109 BRL 2014 to 2024Borrowings - Russia 74 32 RUB 2016 to 2019Other borrowings 97 55 nc ncFaureciaOther borrowings 321 127 EUR ncTotal other long-term borrowings 1 841 744
(1) EIB: European Investment Bank; FDES: French social and economic development fund.(2) These contracts include covenants, certain of which concern financial ratios. These clauses are presented in Note 36.1.A.
Manufacturing and sales companies (excl. Faurecia) –foreign currency loans
Carrying amount at31 December 2013
Manufacturing and sales companies (excl. Faurecia)
Faurecia
Manufacturing and sales companies (excl. Faurecia)
Faurecia
Manufacturing and sales companies (excl. Faurecia) –euro-denominated loans
Borrowings - Spain
PSA PEUGEOT CITROËN 2013 Annual Results - 97

29.4. CHARACTERISTICS OF OTHER SHORT-TERM FINANCING AND OVERDRAFT FACILITIES
Issuing Carrying amount at Carrying amount at
(in million euros) currency 31 December 2013 31 December 2012
Commercial paper EUR 334 224Short-term loans N/A 506 402Bank overdrafts N/A 438 392Payments issued (1) N/A 24 22
N/A 33 32Total 1 335 1 072Factoring liabilities on assets that have not been derecognised
(1) This item corresponds to payments issued but not yet debited from the bank accounts, as the due date was not a bank business day.
29.5. FINANCE LEASE LIABILITIES
The present value of future payments under finance leases reported in "Other borrowings" can be analysed as followsby maturity:
(in million euros)31 December
201331 December
20122013 - 1052014 73 432015 52 422016 15 132017 12 122018 9 122019 9 -Subsequent years 112 129
282 356Less interest portion (27) (23)Present value of future lease payments 255 333Of which short-term 61 90Of which long-term 194 243

29.6. FINANCING BY THE ASSIGNMENT OF RECEIVABLES
The Automotive Division and Faurecia meet part of their financing needs by selling receivables to financial institutions(see Note 22).The sold receivables are derecognised when they meet the criteria specified in IFRS (see Note 2.18).
(in million euros)Total
receivablessold to non-
Groupfinancial
institutions
Portion soldbut not
derecognised
Portion soldand
derecognised
Totalreceivablessold to non-
Groupfinancial
institutions
Portion sold butnot derecognised
Portion sold andderecognised
1 911 1 501- of which Faurecia group 803 710
1 255 327 928 864 186 678
- of which Faurecia group 379 154 225 282 105 177
Financed portion (1) 1 154 226 928 799 121 678- of which Faurecia group 363 138 225 266 89 177
101 101 65 65- of which Faurecia group 16 16 16 16
Maximum authorised facilities
Receivables sold to non-Group financialinstitutions
Portion not financed (including guaranteedeposit)
(1) The financed portion of the receivables corresponds to the portion that gives rise to a cash inflow.
31 December 2013 31 December 2012
In 2013, Peugeot S.A. and Faurecia sold and derecognised their 2012 French research tax credits for a total of105 million. The cash proceeds received at 31 December 2013 amounted to 98 million.
The sale of receivables constitutes usual short-term financing.No transaction was carried out in December 2013 outside of the sale of receivables programme.
NOTE 30 - OTHER NON-CURRENT LIABILITIES
(in million euros)31 December
201331 December
2012Liabilities related to vehicles sold with a buyback commitment 2 913 3 166Other 131 18Total 3 044 3 184
PSA PEUGEOT CITROËN 2013 Annual Results - 99

NOTE 31 - NET FINANCIAL POSITION OF MANUFACTURING AND SALES COMPANIES
Net debt of the manufacturing and sales companies is a financial indicator not defined by IFRS. According to theGroup's definition, it is equal to the financial liabilities net of financial assets used as collateral, or that may be utilisedto redeem these liabilities, as well as those assigned to specific expenses of the manufacturing and sales companies.This definition remains unchanged from the date of first adoption of IFRS in the Group. The share of these financialassets not readily available is not taken into consideration in the financial security of the manufacturing and salescompanies (see Note 31.4).
31.1. COMPOSITION OF NET DEBT
(in million euros)31 December
201331 December
2012Financial assets and liabilities of the manufacturing and sales companiesNon-current financial liabilities (8 081) (7 828)Current financial liabilities (3 039) (2 906)Other non-current financial assets 670 664Current financial assets 141 1 501Cash and cash equivalents 6 161 5 421
(4 148) (3 148)Of which external loans and borrowings (4 315) (3 385)Of which financial assets and liabilities with finance companies 167 237
(Net debt) Net financial position of the manufacturing and sales companies
31.2. CHANGE IN NET DEBT
In 2013, the Group kept up the proactive refinancing strategy and conservative liquidity policy described in Note36.1.A.
Net cash from operating activities for the year totalled positive 1,097 million, representing funds from operations of700 million and the positive impact of a 397 million increase in working capital. Changes in working capital arediscussed in Note 34.2.
Investments for the year in property, plant and equipment and intangible assets, net of disposals, amounted to 2,378million. Other financing needs stood at 101 million for the year and concerned primarily paying up the residualcapital of CAPSA in the amount of 71 million.
Cash inflows for the year were as follows:281 million in dividends from Banque PSA Finance, and 5 million in dividends from PSA Assurance;10 million capital increase subscribed in Faurecia's subsidiaries by minority shareholders;1,086 million increase in net debt.
Hence:
Cash reserves amounted to 6,661 million at 31 December 2013 versus 5,421 million at 31 December 2012.Current financial assets amounted to 141 million at 31 December 2013 versus 1,501 million at 31 December2012. Changes in current financial assets are due in particular to a change in the structure of investments. Cashreserves are invested in risk-free financial instruments issued by blue chip financial institutions;Net debt before cash and cash equivalents increased by 1,956 million, due in the main to:
- New borrowings in the amount of 2,556 million,- A reduction in short-term investments in the amount of 1,359 million,- A rise in short-term financing in the amount of 251 million,- Loan repayments in the amount of 2,199 million, notably 775 million in maturing debt for Peugeot
S.A., 400 million from the EIB and 300 million in partial redemptions (see Note 29.1).

The change in other financial assets and liabilities is described in the table below:
(in million euros) 2013 2012Increase in borrowings 2 556 1 943Repayment of borrowings and conversion of bonds (2 199) (599)(Increase) decrease in non-current financial assets (11) 187(Increase) decrease in current financial assets 1 359 (505)Increase (decrease) in current financial liabilities 251 (351)
1 956 675Net cash flows with Group finance companies - 4Total 1 956 679
Furthermore, the non-cash changes represented a decrease of 86 million in the net debt of the Group. Theyessentially concern the early repayment of Faurecia's 2015 OCEANE (see Note 29.2) and the recognition of the netdebt of Française de Mécanique as a result of the Group’s takeover on 31 December 2013 (see Note 4).
31.3. SYNDICATED LINES OF CREDIT
The Group's manufacturing and sales companies have the following additional borrowing capacity under revolvinglines of credit expiring at various dates through to 2016:
(in million euros)31 December
201331 December
2012Peugeot S.A. and GIE PSA Trésorerie 2 400 2 400Faurecia 1 150 850
3 550 3 250Undrawn confirmed lines of credit
This 2,400 million line of credit of Peugoet S.A. and GIE PSA Trésorerie is due to expire in July 2015 for 2,225 million.The 175 million tranche is expiring in July 2014. This facility, which is subject to the respect of a net debt position ofthe manufacturing and sales companies on Group’s equity lower than one, was not drawn down at the period-end.
The net debt of manufacturing and sales companies is defined and disclosed in Note 31.1. The Group’s equity is thatlisted under “Total Equity” in liabilities. As of 31 December 2013, this ratio was 0.53.
Faurecia's additional borrowing capacity, other than through Peugeot SA, results from a 1,150 million syndicated lineof credit that was not drawn down at end-2013:
A 36 million tranche expiring in December 2014;A 654 million tranche expiring in December 2016 after the exercise of the two extension options;A 460 million tranche expiring in December 2016.
PSA PEUGEOT CITROËN 2013 Annual Results - 101

31.4. LIQUIDITY RESERVES
Financial security is made up of available cash, other readily available financial assets and undrawn credit lines.
19 million ( 1,353 million at 31 December 2012) and 391 million ( 550 million at 31 December 2012) in current andnon-current financial assets respectively were included in the calculation of financial security, representing a total of410 million ( 1,903 million at 31 December 2012).
(in million euros)31 December
201331 December
2012Cash and cash equivalents (Note 25.1) 6 161 5 421Current & non current financial assets 410 1 903Total 6 571 7 324Lines of credit (undrawn) – excluding Faurecia (Note 31.3) 2 400 2 400Lines of credit (undrawn) – Faurecia (Note 31.3) 1 150 850Total financial security 10 121 10 574
of which Faurecia 1 911 1 530
NOTE 32 - FINANCING LIABILITIES – FINANCE COMPANIES
Financing liabilities are accounted for as described in Note 2.16.C.
(in million euros)31 December
201331 December
2012Bond debt - 413Securities issued by securitisation funds (Note 32.1) 5 057 4 246Other debt securities (Note 32.2) 7 677 8 891Bank borrowings (Note 32.3) 6 264 8 103
18 998 21 653Customer deposits (Note 32.4) 1 446 487
20 444 22 140Amounts due to Group manufacturing and sales companies (216) (279)Total 20 228 21 861
32.1. BONDS ISSUED BY SECURISATION FUNDS
Banque PSA Finance derives part of its financing from securitisation transactions, mainly involving pools of automobileloans. The new securitisation transactions carried out in 2013 with external investors are described in Note 19 “Loansand receivables - Finance companies”.These transactions are reported under “Bonds issued by securitisation funds” for 5,057 million at 31 December 2013( 4,246 million at 31 December 2012).
32.2. OTHER DEBT SECURITIES
“Other debt securities” consist mainly of EMTN/BMTNs for 7,183 million ( 8,099 million at 31 December 2012) andcertificates of deposit and commercial paper for 64 million ( 147 million at 31 December 2012).
On 25 March 2013, Banque PSA Finance issued a fixed-rate bond maturing in April 2016 for 1.2 billion, with a couponof 0.625%.The bond was issued in the context of the European Commission's authorisation to use the French State's guarantee(cf. note 36.1.A(b)).
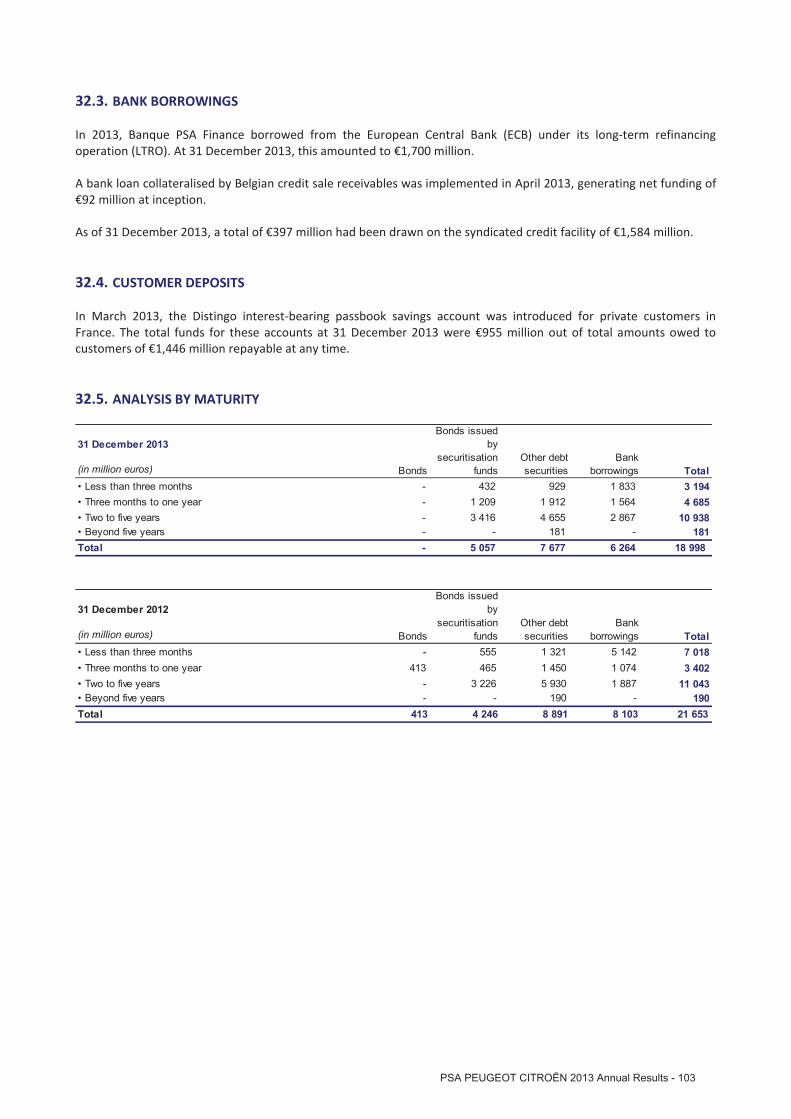
32.3. BANK BORROWINGS
In 2013, Banque PSA Finance borrowed from the European Central Bank (ECB) under its long-term refinancingoperation (LTRO). At 31 December 2013, this amounted to 1,700 million.
A bank loan collateralised by Belgian credit sale receivables was implemented in April 2013, generating net funding of92 million at inception.
As of 31 December 2013, a total of 397 million had been drawn on the syndicated credit facility of 1,584 million.
32.4. CUSTOMER DEPOSITS
In March 2013, the Distingo interest-bearing passbook savings account was introduced for private customers inFrance. The total funds for these accounts at 31 December 2013 were 955 million out of total amounts owed tocustomers of 1,446 million repayable at any time.
32.5. ANALYSIS BY MATURITY
31 December 2013
(in million euros)
• Less than three months - 432 929 1 833 3 194• Three months to one year - 1 209 1 912 1 564 4 685• Two to five years - 3 416 4 655 2 867 10 938• Beyond five years - - 181 - 181Total - 5 057 7 677 6 264 18 998
TotalBank
borrowingsOther debtsecurities
Bonds issuedby
securitisationfundsBonds
31 December 2012
(in million euros)
• Less than three months - 555 1 321 5 142 7 018• Three months to one year 413 465 1 450 1 074 3 402• Two to five years - 3 226 5 930 1 887 11 043• Beyond five years - - 190 - 190Total 413 4 246 8 891 8 103 21 653
Bonds
Bonds issuedby
securitisationfunds
Other debtsecurities
Bankborrowings Total
PSA PEUGEOT CITROËN 2013 Annual Results - 103

32.6. ANALYSIS BY REPAYMENT CURRENCY
All bonds are mainly repayable in euros. Other financial liabilities can be analysed as follows by repayment currency:
Other debtsecurities
Bankborrow ings
Total Other debtsecurities
Bankborrow ings
Total
EUR 9 965 5 428 15 393 10 885 7 065 17 950GBP 881 322 1 203 899 302 1 201USD 907 - 907 947 - 947JPY - - - 44 - 44BRL 538 188 726 540 320 860CHF 379 2 381 186 2 188CZK - - - - 58 58
Other 64 324 388 49 356 405Other currencies 2 769 836 3 605 2 665 1 038 3 703Total 12 734 6 264 18 998 13 550 8 103 21 653
(in million euros)
31 December 2013 31 December 2012
Liabilities consisting of debt securities include bonds, securities issued as part of securitisation transactions and otherdebt securities.
32.7. CREDIT LINES
(in million euros)31 December
201331 December
20127 006 6 726Undrawn confirmed lines of credit
In order of drawdown, the credit lines are:2,299 million undrawn from the 4,099 million syndicated term loan, comprising mainly long-term financingcommitments received;1,187 million in undrawn revolving bilateral lines of credit for 1,584 million, comprising mainly long-termfinancing commitments received;120 million in undrawn bank lines of credit;the following syndicated back-up credit facilities totalling 3,400 million:
- 184 million expiring in June 2014;- 70 million expiring in December 2014;- 136 million expiring in December 2015;- 1,216 million expiring in January 2016- 1,794 million expiring in December 2016.
A change in the Banque PSA Finance's rating could lead to an adjustment of the financial terms of some of these creditlines, but their amount would not be reduced.
32.8. FINANCIAL SECURITY
(in million euros)31 December
201331 December
2012Liquidity reserve (Note 25.2) 1 025 1 066Lines of credit (confirmed and undrawn) 7 006 6 726Available collateral with the ECB 369 441Total financial security 8 400 8 233

NOTE 33 - OTHER PAYABLES
33.1. MANUFACTURING AND SALES COMPANIES
31 December2013
31 December2012
Taxes payable other than income taxes 662 706Personnel-related payables 955 961Payroll taxes 430 454Payable on fixed asset purchases 240 421Customer prepayments 700 747Derivative instruments (1) 113 71Deferred income 572 638Miscellaneous other payables 438 477
4 110 4 475
(in million euros)
Total
(1) This item corresponds to the fair value of instruments purchased by the Group to hedge currency risks on current or forecast operatingreceivab les and payables. These instruments are analysed by maturity in Note 36, "Management of financial risks".
33.2. FINANCE COMPANIES
(in million euros)31 December
201331 December
2012Personnel-related payables and payroll taxes 117 118Derivative instruments (1) 65 116Deferred income and accrued expenses 253 465Miscellaneous other payables 393 392Total 828 1 091
(1) This item corresponds to the fair value of instruments purchased by the Group to hedge interest rate risks on financing liab ilities and receivab les.These instruments are analysed by maturity in Note 36, "Management of financial risks"
NOTE 34 - NOTES TO THE CONSOLIDATED STATEMENTS OF CASH FLOWS
34.1. ANALYSIS OF NET CASH AND CASH EQUIVALENT REPORTED IN THE STATEMENTS OF CASH FLOWS
(in million euros)31 December
201331 December
2012Cash and cash equivalents (Note 25.1) 6 161 5 421Payments issued (Note 29.4) (24) (22)Net cash and cash equivalents - manufacturing and sales companies 6 137 5 399Net cash and cash equivalents - finance companies (Note 25.2) 1 804 1 669Elimination of intragroup transactions (210) (279)Total 7 731 6 789
PSA PEUGEOT CITROËN 2013 Annual Results - 105
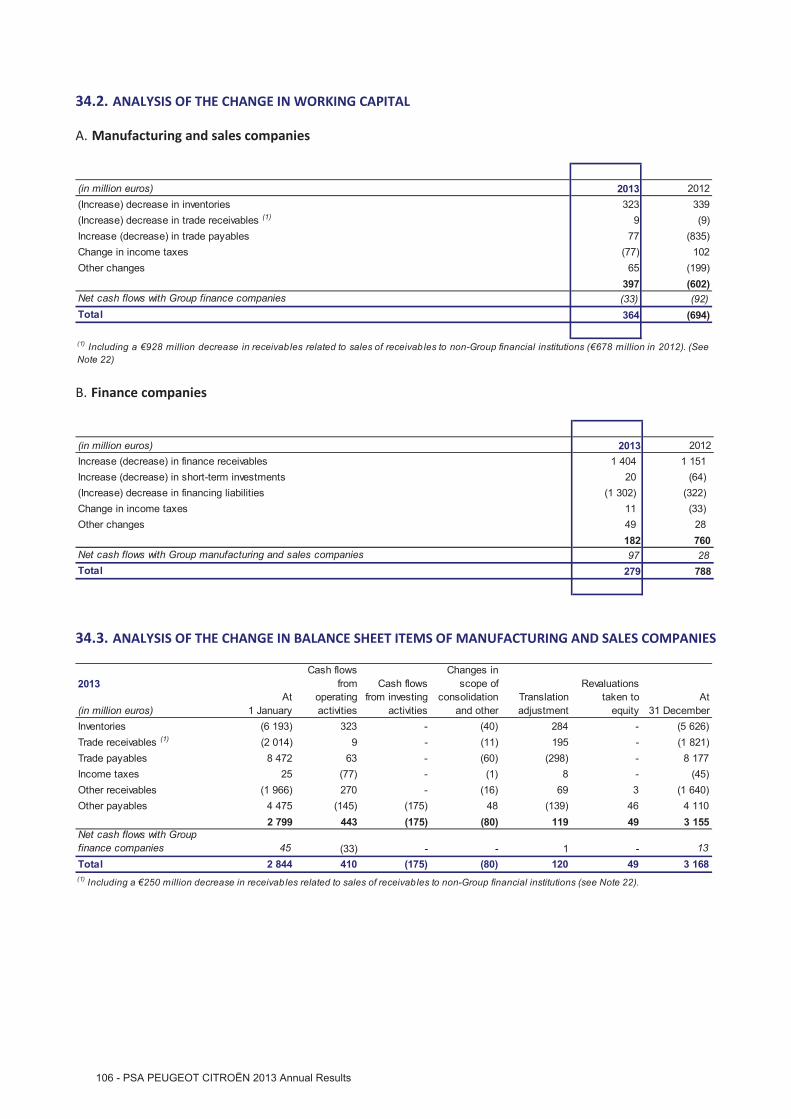
34.2. ANALYSIS OF THE CHANGE IN WORKING CAPITAL
Manufacturing and sales companiesA.
(in million euros) 2013 2012(Increase) decrease in inventories 323 339(Increase) decrease in trade receivables (1) 9 (9)Increase (decrease) in trade payables 77 (835)Change in income taxes (77) 102Other changes 65 (199)
397 (602)Net cash flows with Group finance companies (33) (92)Total 364 (694)
(1) Including a 928 million decrease in receivables related to sales of receivab les to non-Group financial institutions ( 678 million in 2012). (SeeNote 22)
Finance companiesB.
(in million euros) 2013 2012Increase (decrease) in finance receivables 1 404 1 151Increase (decrease) in short-term investments 20 (64)(Increase) decrease in financing liabilities (1 302) (322)Change in income taxes 11 (33)Other changes 49 28
182 760Net cash flows with Group manufacturing and sales companies 97 28Total 279 788
34.3. ANALYSIS OF THE CHANGE IN BALANCE SHEET ITEMS OF MANUFACTURING AND SALES COMPANIES
2013
(in million euros)At
1 JanuaryInventories (6 193) 323 - (40) 284 - (5 626)Trade receivables (1) (2 014) 9 - (11) 195 - (1 821)Trade payables 8 472 63 - (60) (298) - 8 177Income taxes 25 (77) - (1) 8 - (45)Other receivables (1 966) 270 - (16) 69 3 (1 640)Other payables 4 475 (145) (175) 48 (139) 46 4 110
2 799 443 (175) (80) 119 49 3 155Net cash flows with Groupfinance companies 45 (33) - - 1 - 13Total 2 844 410 (175) (80) 120 49 3 168
Cash flowsfrom
operatingactivities
Cash flowsfrom investing
activities
Changes inscope of
consolidationand other
Translationadjustment
Revaluationstaken to
equityAt
31 December
(1) Including a 250 million decrease in receivab les related to sales of receivables to non-Group financial institutions (see Note 22).

The change in working capital in the consolidated statement of cash flows at 31 December 2013 ( 397 million positiveeffect) corresponds to cash flows from operating activities ( 443 million positive effect), exchange differences ( 121million negative effect) and other movements ( 75 million positive effect) including the impact of the payment for theinvestment in Changan PSA Automobiles Co. Ltd. recognised in 2012, having no impact on the statement of cash flows.
Cash flows from operating activities of manufacturing and sales companies 443Exchange differences (121)Other changes 75
397Change in working capital in the statement of cash flows
34.4. NET CHARGES TO DEPRECIATION, AMORTISATION AND IMPAIRMENT IN THE STATEMENT OF CASHFLOWS
(in million euros) 2013 2012Depreciation and amortisation expense (Note 7) (2 407) (2 886)Impairment of:• goodwill (Note 14.1) (177) (1 593)• capitalised development costs (Note 14.1) - (10)• intangible assets (Note 14.1) (2) (84)• property, plant and equipment (Note 15) (850) (1 593)Negative goodwill recognised on a bargain purchase (Note 9) (17) 67Other (33) (17)Total (3 486) (6 116)
34.5. INTEREST RECEIVED AND PAID BY THE MANUFACTURING AND SALES COMPANIES
Interest received and paid by manufacturing and sales companies is included in working capital provided byoperations, and is as follows:
(in million euros) 2013 2012Interest received 38 51Interest paid (602) (474)Net interest received (paid) (564) (423)
PSA PEUGEOT CITROËN 2013 Annual Results - 107

NOTE 35 - FINANCIAL INSTRUMENTS
35.1. FINANCIAL INSTRUMENTS REPORTED IN THE BALANCE SHEET
(in million euros)Carryingamount
Fairvalue
Instrumentsat fair value
through profitor loss
Available-for-sale financial
assets
Loans,receivables
and otherliabilities
Borrowingsat
amortisedcost
Derivativeinstruments
Investments in non-consolidated companies 32 32 - 32 - - -Other non-current financial assets 723 723 356 - 352 - 15Other non-current assets (1) 341 341 - 67 274 - -Loans and receivables - finance companies 21 280 21 234 - - 21 280 - -Short-term investments - finance companies 829 829 829 - - - -Trade receivables - manufacturing and sales companies 1 665 1 665 - - 1 665 - -Other receivables 2 166 2 166 - - 2 031 - 135Current financial assets 141 141 - - 132 - 9Cash and cash equivalents 7 755 7 755 7 755 - - - -Assets 34 932 34 886 8 940 99 25 734 - 159
Non-current financial liabilities (2) 8 081 8 313 - - 105 7 971 5Other non-current liabilities 131 131 - - 112 - 19Financing liabilities - finance companies 20 228 20 361 - - - 20 228 -Trade payables 8 165 8 165 - - 8 165 - -Other payables 4 657 4 657 - - 4 486 - 171Current financial liabilities 2 996 2 996 - - - 2 996 -Liabilities 44 258 44 623 - - 12 868 31 195 195
31 December 2013 Analysis by class of instrument
(2) The fair values of the OCEANE convertible bonds respectively issued by Peugeot S.A. ( 577 million) and Faurecia ( 398 million) correspond to theirquoted market prices at the balance sheet date and therefore include both the debt component measured at amortised cost and the equity componentrepresented by the conversion option.
(1) Other non-current assets exclude the amount of pension plan surpluses (see Note 28.6), which are not financial assets as defined by IAS 39.

(in million euros)Carryingamount
Fairvalue
Instrumentsat fair value
through profitor loss
Available-for-sale financial
assets
Loans,receivables
and otherliabilities
Borrowingsat
amortisedcost
Derivativeinstruments
Investments in non-consolidated companies 62 62 - 62 - - -Other non-current financial assets 772 772 374 171 227 - -Other non-current assets (1) 364 364 0 79 283 - 2Loans and receivables - finance companies 23 095 22 896 - - 23 095 - -Short-term investments - finance companies 867 867 867 - - - -Trade receivables - manufacturing and sales companies 1 827 1 827 - - 1 827 - -Other receivables 2 799 2 799 - - 2 419 - 380Current financial assets 1 501 1 501 688 - 812 - 1Cash and cash equivalents 6 811 6 811 6 811 - - - -Assets 38 098 37 899 8 740 312 28 663 - 383
Non-current financial liabilities (2) 7 828 7 708 - - 85 7 722 21Other non-current liabilities 18 18 - - 6 - 12Financing liabilities - finance companies 21 861 22 410 - - - 21 861 -Trade payables 8 463 8 463 - - 8 463 - -Other payables 5 257 5 257 - - 5 085 - 172Current financial liabilities 2 864 2 892 - - - 2 858 6Liabilities 46 291 46 748 - - 13 639 32 441 211
31 December 2012 Analysis by class of instrument
(2) The fair values of the OCEANE convertib le bonds respectively issued by Peugeot S.A. ( 602 million) and Faurecia ( 468 million) correspond to theirquoted market prices at the balance sheet date and therefore include both the debt component measured at amortised cost and the equity componentrepresented by the conversion option.
(1) Other non-current assets exclude the amount of pension plan surpluses (see Note 28.6), which are not financial assets as defined by IAS 39.
The fair value of financial instruments held by the Group is calculated whenever it can be estimated reliably on thebasis of market data for assets considering that they are not intended to be sold. The fair value of financialinstruments traded on an active market is based on the market price at the balance sheet date. The market price usedfor financial assets held by the Group is the bid price on the market at the measurement date.
The main valuation methods applied are as follows:
Financial assets classified as “at fair value through profit or loss” and “derivative instruments”- The fair value of “cash and cash equivalents” is equivalent to their carrying amount, in view of their very
short maturities.- Other items recognised at fair value through profit or loss and derivative interest rate and currency hedging
instruments are measured by using a valuation technique that benchmarks interbank rates (such as Euribor,etc) and daily foreign exchange rates set by the European Central Bank. Derivative commodity hedginginstruments are valued by external experts. All the financial instruments in this category are financial assetsand liabilities designated at fair value through profit or loss on initial recognition in accordance with thecriteria set out in Note 2.16.
Financial assets classified as “available for sale”- “Investments in non-consolidated companies” are stated at fair value in the balance sheet, in accordance
with IAS 39. They are carried on the balance sheet at their acquisition cost, which the Group considers to berepresentative of fair value, except in cases of impairment (see Note 2.16.B (2)).
- For Other non-current financial assets classified as available-for-sale, fair value corresponds to their quotedmarket price at the balance sheet date.
- “Other non-current assets” classified as “available-for-sale” correspond to units in Fonds de Modernisationdes Equipementiers Automobiles (FMEA). FMEA is a fund to support automotive equipment manufacturersset up at the French government's initiative under France's Automotive Industry Pact signed on 9 February2009. The units are measured at fair value. This corresponds to their net asset value at the balance sheetdate. This net asset value reflects the fair value of the investments made by the fund.
PSA PEUGEOT CITROËN 2013 Annual Results - 109

Financial assets and liabilities classified as “loans and receivables and other liabilities”- “Loans and receivables - finance companies” are stated at amortised cost measured using the effective
interest method. They are generally hedged against interest rate risks. The hedged portion is remeasured atfair value in accordance with hedge accounting principles. The margin on the outstanding principal is thusexcluded from the remeasurement. The fair value presented above is estimated by discounting future cashflows at the rate applicable to similar loans granted at the balance sheet date.
- The fair value of “Trade receivables - manufacturing and sales companies”, “Other receivables”, “Tradepayables” and “Other payables” is considered as being equivalent to their carrying amount, after deductingaccumulated impairment if any (Note 2.19), due to their very short maturities.
- The fair value of other financial assets and liabilities classified in “Loans and receivables and other liabilities”also corresponds to the carrying amount.
Financial liabilities classified as "at amortised cost"- “Non-current financial liabilities”, “Current financial liabilities” and “Financing liabilities – finance companies”
are stated at amortised cost measured using the effective interest method. Financial liabilities hedged byinterest rate swaps are accounted for in accordance with hedge accounting principles. The portion affectedby changes in interest rates is remeasured at fair value. The fair value of financial liabilities presented aboveis determined by taking into account market data and the Group's estimated credit risk at the balance sheetdate.
35.2. INFORMATION ABOUT FINANCIAL ASSETS AND LIABILITIES MEASURED AT FAIR VALUE
(in million euros)Derivative
instruments
Instrumentsat fair value
through profitor loss
Available-forsale financial
assetsDerivative
instruments
Instrumentsat fair value
throughprofit or loss
Available-forsale
financialassets
Level 1 fair value inputs: quoted prices in active marketsOther non-current financial assets - 305 - - 263 171
Current financial assets - - - - 213 -
Cash and cash equivalents - 6 205 - - 5 539 -
Level 2 fair value inputs: based on observable market dataOther non-current financial assets 15 51 - - 111 -Other non-current assets - - - 2 - -Short-term investments - finance companies - 829 - - 867 -Other receivables 135 - - 380 - -Current financial assets 9 - - 1 475 -Cash and cash equivalents (1) - 1 550 - - 1 272 -
Investments in non-consolidated companies - - 32 - - 62
Other non-current assets - - 67 - - 79
159 8 940 99 383 8 740 312
31 December 201231 December 2013
Level 3 fair value inputs: not based on observable marketdata
Total financial assetsmeasured at fair value(1) Corresponding to traditional instruments for investing availab le cash such as certificates of deposit, commercial paper and money market notes.
The change in level 3 fair value does not contain any material items.

(in million euros)Derivative
instruments
Instrumentsat fair value
through profitor loss
Available-forsale financial
assetsDerivative
instruments
Instrumentsat fair value
throughprofit or loss
Available-forsale
financialassets
Level 1 fair value inputs: quoted prices in active markets
Level 2 fair value inputs: based on observable market data
Non-current financial l iabil ities (5) - - (21) - -
Other non-current liabilities (19) - - (12) - -Other payables (171) - - (172) - -Current financial l iabil ities - - - (6) - -
Non-current financial liabilities (1) - - (105) - - (85)Total financial liabilities measured at fair value (195) - (105) (211) - (85)
Level 3 fair value inputs: not based on observable marketdata
31 December 2013 31 December 2012
(1) The change in “Non-current financial assets” as measured based on Level 3 fair value imputs is recognised in “Income and expenses recogniseddirectly in equity, net”.
35.3. INFORMATION ABOUT FINANCIAL ASSETS AND LIABILITIES NOT MEASURED AT FAIR VALUE
(in million euros)Carryingamount Fair value Level 1 Level 2 Level 3
AssetsLoans and receivables - finance companies 21 280 21 234 - - 21 234LiabilitiesNon-current financial liabilities 8 076 8 308 6 452 1 856 -Financing liabilities - finance companies 18 988 19 121 12 739 - 6 382Current financial liabilities 2 996 2 996 850 2 146 -
31 December 2013 Fair value level
(in million euros)Carryingamount Fair value Level 1 Level 2 Level 3
AssetsLoans and receivables - finance companies 23 095 22 896 - - 22 896LiabilitiesNon-current financial liabilities 7 807 7 687 5 569 2 118 -Financing liabilities - finance companies 21 650 22 199 14 016 - 8 183Current financial liabilities 2 858 2 886 984 1 902 -
31 December 2012 Fair value level
PSA PEUGEOT CITROËN 2013 Annual Results - 111

35.4. EFFECT OF FINANCIAL INSTRUMENTS ON PROFIT OR LOSS
2013
(in million euros)
IncomeStatement
Impact
Instrumentsat fair value
through profitor loss
Available-forsale financial
assets
Loans,receivables
and otherliabilities
Borrowingsat
amortisedcost
Derivativeinstruments
Manufacturing and sales companiesTotal interest income 19 - - 19 - -Total interest expense (596) - - - (596) -Remeasurement (1) (33) 119 - (8) (3) (141)Disposal gains and dividends (212) - 1 (213) - -Net impairment (35) - (38) 3 - -Total - manufacturing and sales companies (857) 119 (37) (199) (599) (141)Finance companiesTotal interest income 1 477 - - 1 477 - -Total interest expense (675) - - - (675) -Remeasurement (1) 36 12 - (62) 120 (34)Net impairment (131) - - (131) - -Total - finance companies 707 12 - 1 284 (555) (34)Net gain (loss) (150) 131 (37) 1 085 (1 154) (175)
(1) For instruments classified as "at fair value through profit or loss", remeasurement includes interest and dividends received.
Analysis by class of instrument
2012
(in million euros)
IncomeStatement
Impact
Instrumentsat fair value
through profitor loss
Available-forsale financial
assets
Loans,receivables
and otherliabilities
Borrowingsat
amortisedcost
Derivativeinstruments
Manufacturing and sales companiesTotal interest income 9 - - 9 - -Total interest expense (419) - - - (419) -Remeasurement (1) (22) 65 - (6) 6 (87)Disposal gains and dividends (205) - 5 (210) - -Net impairment (36) - (4) (32) - -Total - manufacturing and sales companies (673) 65 1 (239) (413) (87)Finance companiesTotal interest income 1 608 - - 1 608 - -Total interest expense (702) - - - (702) -Remeasurement (1) 61 19 - 12 (42) 72Net impairment (290) - - (290) - -Total - finance companies 677 19 - 1 330 (744) 72Net gain (loss) 4 84 1 1 091 (1 157) (15)
(1) For instruments classified as "at fair value through profit or loss", remeasurement includes interest and dividends received.
Analysis by class of instrument
In the case of the finance companies, the total net gain or loss on financial assets and liabilities, as defined in IAS 39, isrecognised in recurring operating income.

NOTE 36 - MANAGEMENT OF FINANCIAL RISKS
36.1. FINANCIAL RISK MANAGEMENT POLICY
In the course of its business, PSA Peugeot Citroën is exposed to liquidity risks, as well as interest rate, counterparty,currency and other market risks arising, in particular, from changes in commodity prices and equity prices.
Liquidity riskA.
(a) Management of liquidity risk: manufacturing and sales companies
In the prevailing economic environment, the Group continued with its diversified, proactive financing strategy andconservative liquidity policy in order to meet its general financing needs, particularly the financing of its business andof its development projects. The financing strategy is defined by the Managing Board, and implemented under thedirection of the Chief Financial Officer with the Corporate Finance & Treasury Department and submitted to theSupervisory Board’s Finance and Audit Committee. The Group's cash forecasts, financing needs and interest incomeand expenses, as well as the level of liquidity reserves are reviewed at monthly meetings of the Treasury and ForeignExchange Committee chaired by the Chief Financial Officer. The financing plan is implemented by the CorporateFinance & Treasury Department.
Pursuant to this policy, the Group:issues bonds under an EMTN programme;has recourse to bank borrowings in France and abroad;sells receivables;arranges confirmed lines of credit for its financial security;and, where necessary, issues convertible bonds.
The Group could also raise funds by a capital increase.
This financing policy allows it to seize market opportunities to pre-finance itself and to thereby optimise its financialsecurity.
At 31 December 2013, the net debt of the manufacturing and sales companies was 4,148 million compared to 3,148million at 31 December 2012. The breakdown of the net debt can be found in Note 31.1, and changes thereto in Note31.2. The repayment schedule of financial liabilities is set out in the table below.In June 2010, Peugeot S.A. put in place a 5 billion EMTN programme, 3,707 million of which had been drawn downat end-December 2013.
At 31 December 2013, the Group had liquidity reserves of 10,121 million (see Note 31.4) compared to 10,574million at end-December 2012.
It covers all currently anticipated financing needs for the manufacturing and sales companies over the coming 12months.
PSA PEUGEOT CITROËN 2013 Annual Results - 113

Contractual repayment schedule of financial liabilities and derivative instruments: manufacturing and salescompanies
The following table shows undiscounted cash flows from financial liabilities and derivative instruments. They includeprincipal repayments as well as future contractual interest payments. Foreign currency cash flows and variable orindexed cash flows have been determined on the basis of market data at the year-end.
(in million euros) 0-3 months 3-6 months 6-12 months 2-5 years > 5 yearsFinancial liabilitiesBonds - principal repaymentsManufacturing and sales companies - excluding Faurecia (5 756) - - (668) (3 682) (1 200)Faurecia (950) - - - (749) (250)Other long-term debt - principal repaymentsManufacturing and sales companies - excluding Faurecia (2 073) - - (597) (1 252) (284)Faurecia (448) (127) - - (293) (28)Total bonds and other borrowingsManufacturing and sales companies - excluding Faurecia (7 829) - - (1 265) (4 934) (1 484)Faurecia (1 398) (127) - - (1 042) (278)Bond interestManufacturing and sales companies - excluding Faurecia (176) (121) (26) (172) (907) (579)Faurecia (11) (8) (34) (34) (224) -Interest on other long-term debtManufacturing and sales companies - excluding Faurecia (64) (3) (18) (35) (29) -Faurecia - - - - - -
Manufacturing and sales companies - excluding Faurecia (240) (124) (44) (207) (936) (579)Faurecia (11) (8) (34) (34) (224) -Other short-term debt (1 378) (1 378) - - - -Finance lease liabilities (255) - - (61) (88) (121)Employee profit-sharing fund (4) - - (1) (3) -Derivative instrumentsDerivative instruments
- - - - - - -- (5) - - - (1) -
- of which trading instruments (1) - - - - - - -Currency derivatives
12 (8) - - - - -41 (1) 9 4 4 3 9
- of which trading instruments (2) 13 (50) 5 (10) (6) (12) -Commodity derivatives
- - - - - - -- of which cash flow hedges 1 (73) (1) (13) (19) (23) -- of which trading instruments - - - - - - -TOTAL 67 (11 252) (1 624) (97) (1 589) (7 260) (2 453)
- of which fair value hedges
- of which cash flow hedges
Assets LiabilitiesUndiscounted contractual cash flows
Total interest on bonds and other borrowings
- of which fair value hedges- of which cash flow hedges
- of which fair value hedges
(1) Interest rate trading instruments: derivative instruments not qualifying for hedge accounting under IAS 39. This item corresponds to the fair value of economichedges of borrowings or investments.(2) Currency trading instruments: derivative instruments not qualifying for hedge accounting under IAS 39. As IAS 21 requires receivables and payablesdenominated in foreign currencies to be systematically remeasured at the closing exchange rate with any gains or losses taken to income, the Group haselected not to designate these receivables and payables as part of a documented hedging relationship, although their impact on income is the same.
Contractual repayment schedule of long-term borrowings (principal)
(in million euros)1 265 935 1 986 839 1 156 4 916 1 484 7 665
Long-term borrowings Faurecia 127 90 616 56 280 1 042 278 1 447
1 392 1 025 2 602 895 1 436 5 958 1 762 9 112
Long-term borrowings excluding Faurecia
Total long-term borrowings ofmanufacturing and sales companies
2014 2015 2016 2017 2018 2 to 5 years > 5 years Total
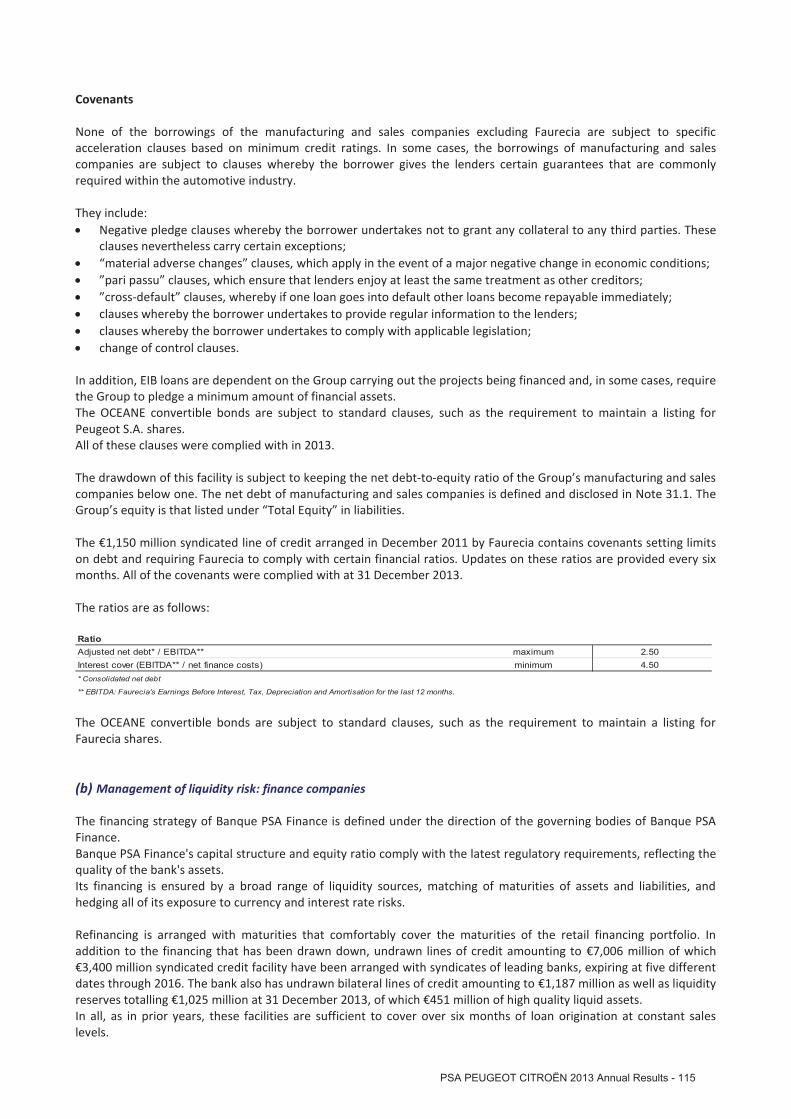
Covenants
None of the borrowings of the manufacturing and sales companies excluding Faurecia are subject to specificacceleration clauses based on minimum credit ratings. In some cases, the borrowings of manufacturing and salescompanies are subject to clauses whereby the borrower gives the lenders certain guarantees that are commonlyrequired within the automotive industry.
They include:Negative pledge clauses whereby the borrower undertakes not to grant any collateral to any third parties. Theseclauses nevertheless carry certain exceptions;“material adverse changes” clauses, which apply in the event of a major negative change in economic conditions;”pari passu” clauses, which ensure that lenders enjoy at least the same treatment as other creditors;”cross-default” clauses, whereby if one loan goes into default other loans become repayable immediately;clauses whereby the borrower undertakes to provide regular information to the lenders;clauses whereby the borrower undertakes to comply with applicable legislation;change of control clauses.
In addition, EIB loans are dependent on the Group carrying out the projects being financed and, in some cases, requirethe Group to pledge a minimum amount of financial assets.The OCEANE convertible bonds are subject to standard clauses, such as the requirement to maintain a listing forPeugeot S.A. shares.All of these clauses were complied with in 2013.
The drawdown of this facility is subject to keeping the net debt-to-equity ratio of the Group’s manufacturing and salescompanies below one. The net debt of manufacturing and sales companies is defined and disclosed in Note 31.1. TheGroup’s equity is that listed under “Total Equity” in liabilities.
The 1,150 million syndicated line of credit arranged in December 2011 by Faurecia contains covenants setting limitson debt and requiring Faurecia to comply with certain financial ratios. Updates on these ratios are provided every sixmonths. All of the covenants were complied with at 31 December 2013.
The ratios are as follows:
Ratio
** EBITDA: Faurecia's Earnings Before Interest, Tax, Depreciation and Amortisation for the last 12 months.
Adjusted net debt* / EBITDA** maximum 2.50Interest cover (EBITDA** / net finance costs) minimum 4.50* Consolidated net debt
The OCEANE convertible bonds are subject to standard clauses, such as the requirement to maintain a listing forFaurecia shares.
(b) Management of liquidity risk: finance companies
The financing strategy of Banque PSA Finance is defined under the direction of the governing bodies of Banque PSAFinance.Banque PSA Finance's capital structure and equity ratio comply with the latest regulatory requirements, reflecting thequality of the bank's assets.Its financing is ensured by a broad range of liquidity sources, matching of maturities of assets and liabilities, andhedging all of its exposure to currency and interest rate risks.
Refinancing is arranged with maturities that comfortably cover the maturities of the retail financing portfolio. Inaddition to the financing that has been drawn down, undrawn lines of credit amounting to 7,006 million of which3,400 million syndicated credit facility have been arranged with syndicates of leading banks, expiring at five differentdates through 2016. The bank also has undrawn bilateral lines of credit amounting to 1,187 million as well as liquidityreserves totalling 1,025 million at 31 December 2013, of which 451 million of high quality liquid assets.In all, as in prior years, these facilities are sufficient to cover over six months of loan origination at constant saleslevels.
PSA PEUGEOT CITROËN 2013 Annual Results - 115

Financing strategy put in place in 2012In March 2013, Banque PSA Finance launched a savings account targeting individual customers in France under theDistingo name. Deposits totalled 995 million as of 31 December 2013. Banque PSA Finance had increased recourse tosecuritisation and to ECB financing totalling 4,612 million and 1,700 million respectively in 2013, compared to with3,714 million and 2,900 million respectively in 2012.Against this background, the following agreements have been put in place.
7 billion guarantee from the French StateUnder Article 85 of the Amending Finance Act of 29 December 2012, the Minister for the Economy is authorised toprovide a State guarantee for a fee for securities issued between 1 January 2013 and 31 December 2016 by BanquePSA Finance in order to enable it to refinance itself. It is a guarantee for a maximum of 7 billion in capital, and doesnot represent a transfer of funds from the French State to Banque PSA Finance. It is only in the event of Banque PSAFinance defaulting that the Bank's counterparties could ask the State to honour the guarantee.An initial guarantee agreement for an amount of 1,200 million has been signed on 5 March 2013 after reception ofthe temporary authorization from the European Commission under state rescue aid rules on 12 February 2013. Onthis basis, on 25 March 2013 Banque PSA Finance issued a 1,200 million bond maturing in April 2016.
The final approval of the European Commission on the French State guarantee in favour of Banque PSA Finance wasobtained on 30 July 2013. Under the terms of the agreement, The French State has made a certain number ofundertakings to the European Commission, which will remain in effect until 15 December 2015. Key aspects of theseundertakings include a commitment relative to the Group’s return to viability, pursuant to which PSA Peugeot Citroënwould be obliged to take appropriate measures to reduce net debt if it were to exceed a given threshold, and acommitment to seek the prior approval of the European Commission to make acquisitions in excess of 100 millionper annum.
A second guarantee agreement corresponding to the remaining 5,800 million tranche was signed on 28 October2013 between the French State, Peugeot S.A. and Banque PSA Finance. A five-member guarantee monitoringcommittee, comprising representatives of the French State and the PSA Peugeot Citroën Group, will oversee theimplementation of the guarantee.
Renewal of bank facilitiesOn 11 January 2013, Banque PSA Finance signed a new five-year 4,009 million syndicated line of credit, involving 19banks in eight different countries.As part of the restructuring and extension of its backup facilities, Banque PSA Finance also agreed that day theextension of a 1,200 million revolving line of credit, that will now expire in January 2016. Furthermore, Banque PSAFinance exercised its option to extend the 2,000 million syndicated line of credit, arranged in December 2011 andexpiring in December 2014, with 1,800 million now expiring in December 2015, and the remainder expiring inDecember 2014. In December 2013, Banque PSA Finance received a second extension of one year of its syndicatedloan maturing in December 2015, extending maturity to December 2016. The initial amount of 1,784 million wasraised to 1,794 million.
These agreements contain acceleration clauses on top of the pre-existing covenants: a prohibition on providing PSAwith more than 500 million in financing, a Common Equity Tier One ratio of at least 11% and the need to retain theFrench State guarantee for bond issues from 2013 to 2015.
Finally, Banque PSA Finance also obtained in 2013 commitments to renew the bulk of the bilateral bank facilities for atotal amount exceeding of 1,000 million.
The renewal of these bank facilities, combined with the securitisation drive undertaken in 2013 and the final approvalof the guarantee from the French State, satisfy the refinancing needs of Banque PSA Finance for at least the comingtwelve months.

Contractual cash flows: finance companiesLiquidity risk is analysed based on the contractual timing of cash inflows and outflows from detailed asset and liabilityitems, determined by reference to the remaining period to maturity used to calculate Banque PSA Finance'sconsolidated liquidity ratio. As a result, the future contractual interest payments are not included in the schedule. Thederivative instruments used to hedge contractual future interest payments are not analysed by period.
Banque PSA Finance(in million euros)AssetsCash 1 804 - 1 804 - - - -Short-term investments - finance companies 829 39 785 - - 5 -Derivative instruments (1) 92 92 - - - - -Other non-current financial assets 53 5 - - - 48 -Loans and receivables - finance companies 21 335 501 5 458 2 261 3 419 9 539 157Total cash flows from assets 24 113 637 8 047 2 261 3 419 9 592 157LiabilitiesDerivative instruments (1) 65 65 - - - - -Financing liabilities 20 444 8 4 600 2 315 2 398 10 940 183Total cash flows from liabilities 20 509 73 4 600 2 315 2 398 10 940 183
(1) Intercompany loans and borrowings with manufacturing and sales companies are mainly short-term.
31 December2012
Notanalysed 0-3 months 3-6 months 6-12 months 2-5 years > 5 years
CovenantsThe loan agreements signed by Banque PSA Finance, mainly in connection with issues of debt securities, include thecustomary acceleration clauses requiring the group to give certain covenants to lenders. They include :
“negative pledge” clauses whereby the borrower undertakes not to grant any collateral to any third parties.These clauses nevertheless comprise exceptions allowing the Group to carry out securitisation programmes or togive assets as collateral;“material adverse changes” clauses, which apply in the event of a major negtive change in economic and financialconditions;“pari passu” clauses, which ensure that lenders enjoy at least the same treatment as the borrower’s othercreditors;“cross-default” clauses, whereby if one loan goes into default, all other loans from the same lender automaticallybecome repayable immediately;clauses whereby the borrower undertakes to provide regular information to the lenders;clauses whereby the borrower undertakes to comply with applicable legislation;clauses whereby no change in control of the company is authorised.
Many of BPF's agreements include four specific acceleration clauses requiring it to maintain a banking licence and tothereby comply with the capital ratios applicable to all French banks. And, from 2013, the need to retain the optionalguarantee from the French State for bond issues and a Common Equity Tier One ratio of at least 11%.All applicable clauses were complied with in 2013.
Interest Rate RisksB.
(a) Management of interest rate risks: manufacturing and sales companies
Trade receivables and payables are due within one year and their value is not affected by the level of interest rates.
Cash reserves and short-term financing needs of manufacturing and sales companies - excluding AutomotiveEquipment companies - are mainly centralised at the level of GIE PSA Trésorerie, which invests net cash reserves onthe financial markets. These short-term instruments are indexed to variable rates.
The gross borrowings of manufacturing and sales companies - excluding Automotive Equipment companies - consistmainly of fixed- and adjustable-rate long-term loans. New borrowings obtained since 2009 have been kept at fixedrate in order to retain the benefit of record low fixed interest rates. The GIE's bond maturing in 2033 had initially beenconverted to variable rate by means of derivatives qualifying for hedge accounting under IFRS. This hedging wasterminated in November 2012.
PSA PEUGEOT CITROËN 2013 Annual Results - 117

The proportion of the manufacturing and sales companies' borrowings - excluding Automotive Equipment companies -at variable rates of interest is now 11%, based on the principal borrowed.
Faurecia independently manages its interest rate risk on a centralised basis. This is organised by Faurecia's Financeand Treasury Department, which reports to its executive management. Hedging decisions are made by a Market RiskCommittee that meets on a monthly basis. Issues of conventional and convertible bonds in 2012 were at fixed rate,increasing the proportion of fixed-rate debt compared to the previous year. Nevertheless, with a significant portion ofthe debt (syndicated line of credit, short-term borrowings, commercial paper) being variable rate, the hedging policyaims to limit the effect on Faurecia's profit of an increase in short-term rates. This hedging is mainly implementedthrough the use of interest rate swaps, primarily in euros. Substantially all variable rate interest payable in 2013 and2014 is hedged, and to a lesser extent in 2015.
Some of Faurecia's derivative instruments have qualified for hedge accounting under IAS 39 since 2008. The otherderivative instruments purchased by Faurecia represent economic hedges of interest rate risks on borrowings but donot meet the criteria in IAS 39 for the application of hedge accounting.Faurecia is the only entity that holds cash flow hedges of interest rate risks.
The net interest rate position of manufacturing and sales companies is as follows:
31 December 2013 (in million euros) TotalFixed rate 924 202 296 1 422Variable rate 5 370 24 2 5 396Fixed rate (1 201) (4 645) (2 502) (8 348)Variable rate (2 400) (6) - (2 406)Fixed rate (277) (4 443) (2 206) (6 926)Variable rate 2 970 18 2 2 990Fixed rate - (583) (139) (722)Variable rate 252 470 - 722Fixed rate (277) (5 026) (2 345) (7 648)Variable rate 3 222 488 2 3 712
Intraday to 1 year 2 to 5 years Beyond 5 years
Total assets
Total liabilities
Net position before hedging
Derivative financial instruments
Net position after hedging
31 December 2012 (in million euros) TotalFixed rate 1 074 100 177 1 351Variable rate 5 859 - - 5 859Fixed rate (1 246) (4 615) (1 810) (7 671)Variable rate (2 618) (1) - (2 619)Fixed rate (172) (4 515) (1 633) (6 320)Variable rate 3 241 (1) - 3 240Fixed rate (223) (567) (166) (956)Variable rate 223 567 166 956Fixed rate (395) (5 082) (1 799) (7 276)Variable rate 3 464 566 166 4 196
Intraday to 1 year 2 to 5 years Beyond 5 years
Total assets
Total liabilities
Net position before hedging
Derivative financial instruments
Net position after hedging
(b) Management of interest rate risks: finance companies
Banque PSA Finance's fixed-rate loans to customers of the Automotive Division are refinanced mainly throughadjustable rate borrowings. Banque PSA Finance's policy aims to offset the impact of changes in interest rates usingappropriate financial instruments to match interest rates on the loans and the related refinancing.
Implementation of this strategy is overseen by the Bank's Refinancing Committee and led by Corporate Treasury.Interest rate risks on outstanding loans are attenuated through an assertive hedging policy, with a 3% ceiling onunhedged exposures (by country and by half-yearly maturity band) arising from the difficulty of precisely matchingloan balances with the notional amounts of derivatives.
Concerning assets, fixed rate instalment loans are hedged by interest rate swaps that are purchased on the market assoon as the financing is granted. In practice, the swaps are purchased at ten-day intervals. Wholesale financing isgranted at rates based on short-term market rates, while the liquidity reserve is invested at the same rates.
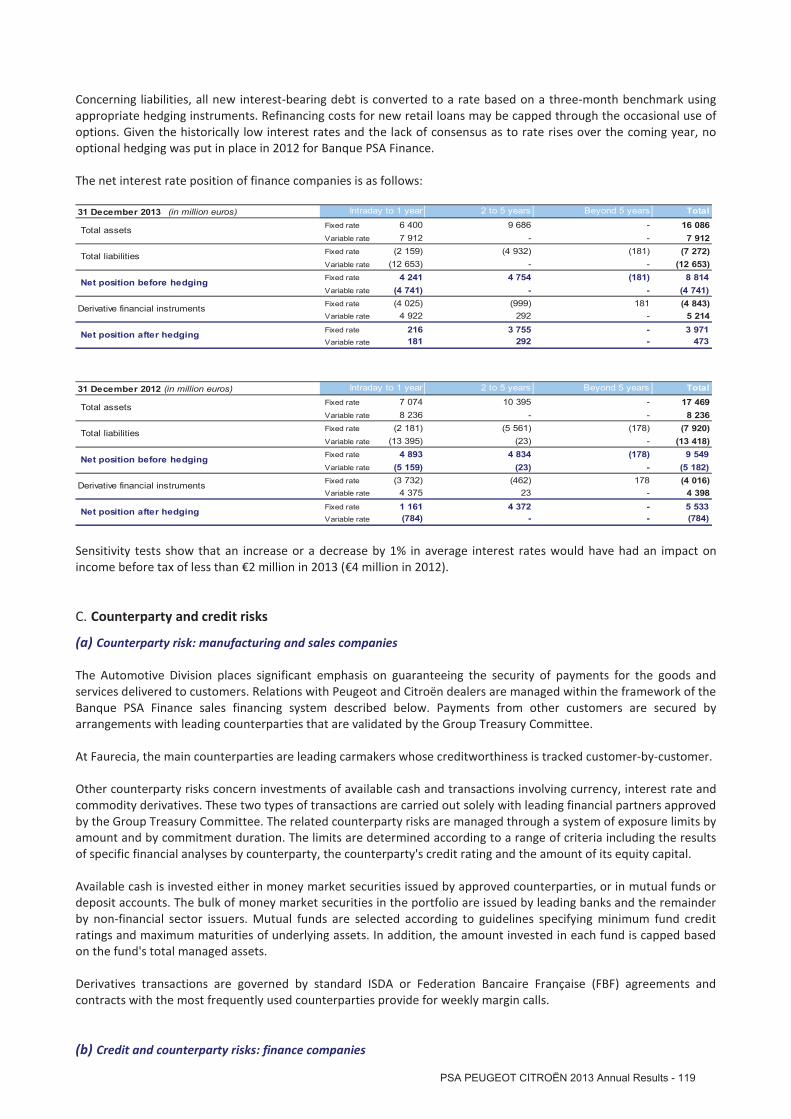
Concerning liabilities, all new interest-bearing debt is converted to a rate based on a three-month benchmark usingappropriate hedging instruments. Refinancing costs for new retail loans may be capped through the occasional use ofoptions. Given the historically low interest rates and the lack of consensus as to rate rises over the coming year, nooptional hedging was put in place in 2012 for Banque PSA Finance.
The net interest rate position of finance companies is as follows:
31 December 2013 (in million euros) TotalFixed rate 6 400 9 686 - 16 086Variable rate 7 912 - - 7 912Fixed rate (2 159) (4 932) (181) (7 272)Variable rate (12 653) - - (12 653)Fixed rate 4 241 4 754 (181) 8 814Variable rate (4 741) - - (4 741)Fixed rate (4 025) (999) 181 (4 843)Variable rate 4 922 292 - 5 214Fixed rate 216 3 755 - 3 971Variable rate 181 292 - 473
Beyond 5 years
Total assets
Total liabilities
Net position before hedging
Derivative financial instruments
Intraday to 1 year 2 to 5 years
Net position after hedging
31 December 2012 (in million euros) TotalFixed rate 7 074 10 395 - 17 469Variable rate 8 236 - - 8 236Fixed rate (2 181) (5 561) (178) (7 920)Variable rate (13 395) (23) - (13 418)Fixed rate 4 893 4 834 (178) 9 549Variable rate (5 159) (23) - (5 182)Fixed rate (3 732) (462) 178 (4 016)Variable rate 4 375 23 - 4 398Fixed rate 1 161 4 372 - 5 533Variable rate (784) - - (784)
Total liabilities
Net position before hedging
Derivative financial instruments
Net position after hedging
Intraday to 1 year 2 to 5 years Beyond 5 years
Total assets
Sensitivity tests show that an increase or a decrease by 1% in average interest rates would have had an impact onincome before tax of less than 2 million in 2013 ( 4 million in 2012).
Counterparty and credit risksC.
(a) Counterparty risk: manufacturing and sales companies
The Automotive Division places significant emphasis on guaranteeing the security of payments for the goods andservices delivered to customers. Relations with Peugeot and Citroën dealers are managed within the framework of theBanque PSA Finance sales financing system described below. Payments from other customers are secured byarrangements with leading counterparties that are validated by the Group Treasury Committee.
At Faurecia, the main counterparties are leading carmakers whose creditworthiness is tracked customer-by-customer.
Other counterparty risks concern investments of available cash and transactions involving currency, interest rate andcommodity derivatives. These two types of transactions are carried out solely with leading financial partners approvedby the Group Treasury Committee. The related counterparty risks are managed through a system of exposure limits byamount and by commitment duration. The limits are determined according to a range of criteria including the resultsof specific financial analyses by counterparty, the counterparty's credit rating and the amount of its equity capital.
Available cash is invested either in money market securities issued by approved counterparties, or in mutual funds ordeposit accounts. The bulk of money market securities in the portfolio are issued by leading banks and the remainderby non-financial sector issuers. Mutual funds are selected according to guidelines specifying minimum fund creditratings and maximum maturities of underlying assets. In addition, the amount invested in each fund is capped basedon the fund's total managed assets.
Derivatives transactions are governed by standard ISDA or Federation Bancaire Française (FBF) agreements andcontracts with the most frequently used counterparties provide for weekly margin calls.
(b) Credit and counterparty risks: finance companies
PSA PEUGEOT CITROËN 2013 Annual Results - 119

Banque PSA Finance's exposure to credit risk corresponds to the risk of losses due to borrower default or borrowerfailure to fulfil their contractual obligations. The counterparties concerned are Peugeot and Citroën dealers and thedealers' retail customers. In the event of default, Banque PSA Finance generally has the right to repossess the vehicleand sell it on the used vehicle market. The risk that the vehicle's selling price on the used vehicle market will be lessthan the outstanding debt is taken into account in determining the amount of the related impairment (see Note1.16.B).
Wholesale lending decisions for fleet customers and dealers are made based on a detailed risk assessment inaccordance with strict rules on lending limits, either by the local Banque PSA Finance credit committees, or by theGroup credit committee. The level of credit lines is dependent on the item to be financed, the client’s risk rating andlastly the general level of risk borne by the approving Credit Committee.
Banque PSA Finance's Corporate Lending Department is responsible for controlling the credit risk of these activitiesthroughout the credit cycle. It uses Basel II-compliant credit scoring systems. The systems are tested regularly toensure that they are reliable. They contribute to determining commitment levels and lending limits, and to definingdetailed management and control rules. Their effectiveness is underpinned by high quality credit analyses performedby local units and headquarters teams, as well as by warning systems designed to ensure that incurred risks areidentified and dealt with on a timely basis.
Retail loan acceptance processes are based on a local credit scoring system that is managed and overseen by adedicated expert unit at the Bank’s headquarters. To enhance its effectiveness, the scoring system is adaptedaccording to the specific characteristics of each local market. The headquarters-based credit risk control unit regularlyassesses the credit scoring system's effectiveness, working closely with the French and international operating unitsthat perform regular reviews of requests, acceptances and payment incidents. For partnership subsidiaries, customerselection is the responsibility of the partner which uses the decision-making tools that it has developed. Nevertheless,teams at Banque PSA Finances’s headquarters monitor the level of risk of requests and acceptance closely on an on-going basis, as well as the characteristics of files with past due instalments.A dedicated headquarters-based collections unit leads the activities of all the finance companies in this area, managestheir shared collection systems and coordinates the results. It also oversees two collection call centres.
The following table presents the ageing analysis of sound finance company loans with past due instalments that havenot been written down:
31 December2013
31 December2012
293 3191 21 11 1
296 323More than 1 year past dueTotal
Ageing analysis of sound loans with past due instalments that have not been written down
(in million euros)Up to 90 days past due90 to 180 days past due180 days to 1 year past due
Loans to corporate dealers and corporate and equivalent financing for which one or more instalments are more than90 days past due (or 270 days for loans to local administrations) are not classified as non-performing when non-payment is due to an incident or a claim and is not related to the borrower's ability to pay.
Concerning concentration of credit risks, Banque PSA Finance continually monitors its largest exposures to ensure thatthey remain at reasonable levels and do not exceed the limits set in banking regulations. The Bank's ten largestweighted exposures other than with PSA Peugeot Citroën Group entities amounted to 2,057 million compared to2,110 million in 2013.As Banque PSA Finance is structurally in a net borrower position, its exposure to other financial counterparties islimited to (i) the investment of funds corresponding to the liquidity reserve and of any excess cash, and (ii) the use ofderivatives (swaps and options) to hedge currency and interest rate risks.Available cash is invested in money market securities issued by leading banks, in deposit accounts with leading banksor in mutual funds offering a capital guarantee and a guaranteed yield.
Financial analyses are performed to ensure that each counterparty operates on a sustainable basis and has adequatecapital resources. The results of the analysis are used to award an internal rating to the counterparty and to set

acceptable exposure limits. These limits are defined by type of transaction (investments and derivatives), and coverboth amounts and durations. Utilisation of these limits is assessed and checked daily. Derivatives transactions aregoverned by standard ISDA or FBF agreements and contracts with the most frequently used counterparties provide forweekly margin calls. Derivative contracts are entered into solely with counterparties rated A or higher.
Currency riskD.
(a) Management of currency risk: manufacturing and sales companies
The manufacturing and sales companies manage their foreign exchange positions on transactions denominated inforeign currencies with the objective of hedging the risk of fluctuations in exchange rates. Automotive Divisioncurrency risks are managed centrally, for the most part by PSA International S.A. (PSAI) under the supervision ofexecutive management. All products used by PSAI are standard products covered by International Swaps andDerivatives Association (ISDA) master agreements.
The goal is to minimise Automotive Division exchange differences by systematically hedging as soon as the foreigncurrency invoice is booked.At Group level, currency risks are managed by requiring manufacturing companies to bill sales companies in thelatter's local currency (except in rare cases or where this is not allowed under local regulations). Currency risks onthese intragroup billings are also hedged using forward foreign exchange contracts. In most cases, foreign currencyintragroup loans of Automotive Division companies are also hedged.
A new foreign currency policy includes the hedging of future flows for the Automotive Division. It consists of hedgingthe main net exposures to G10 currencies. These hedges are underpinned by governance rules and a strict decision-making process. They are classified as cash flow hedges under IAS 39. The maximum horizon for these hedges is twoyears. The hedging ratios depend on the maturity.
At 31 December 2013, the Automotive Division had cash flow hedges on the following currencies: GBP, JPY, CHF, SEKand NOK.
The Group does not hedge its net investment in foreign operations.
PSAI also carries out proprietary transactions involving currency instruments. These transactions are subject to verystrict exposure limits and are closely monitored on a continuous basis. They are the only non-hedging transactionscarried out by companies in the PSA Peugeot Citroën Group and have a very limited impact on consolidated profit.
The historical Value at Risk (VaR) method is used to identify and manage market risks. The historical VaR usesvolatilities and exchange rates for the various currencies since the beginning of 2008. VaR represents the maximumpossible loss on the portfolio, based on the confidence level. The confidence levels measured are 95% and 99%. Forboth of these confidence levels, applying historical VaR to the portfolio at 31 December 2013 would not have had amaterial impact on Group earnings. This method assumes that future VaR will follow the same trend as historical VaR.It does not provide an indication of the losses that would be incurred under an extreme stress scenario.
Faurecia manages the currency risks incurred by its subsidiaries on commercial transactions principally throughforward purchase and sale contracts or options, and foreign currency financing. Future transactions are hedged on thebasis of cash flow forecasts drawn up during the budgeting process and approved by management. The derivativeinstruments used to hedge these future transactions qualify for cash flow hedge accounting, insofar a hedgingrelationship exists under IAS 39 standard. Subsidiaries located outside the euro zone receive intragroup loans in theirfunctional currency. These loans are refinanced in euros, and the related currency risk is hedged by swaps.
PSA PEUGEOT CITROËN 2013 Annual Results - 121

Net position of the manufacturing and sales companies in the main currencies (open positions at 31 December)
The net position of the manufacturing and sales companies in the main foreign currencies is as follows:
31 December 2013(in million euros) GBP JPY USD PLN CHF RUB CZK Other TotalTotal assets 221 79 622 47 23 103 116 232 1 443Total liabilities (112) (74) (3) (12) - (276) (139) (8) (624)Future transactions (1) 312 2 92 (104) 163 42 (51) 137 593Exposure to fixed chargecoverage commitments - (321) - - - - - - (321)Net position before hedging 421 (314) 711 (69) 186 (131) (74) 361 1 412
Derivative financial instruments (430) 185 (632) 63 (186) 167 35 (350) (1 148)Net position after hedging (9) (129) 79 (6) - 36 (39) 11 264
(1) This item mainly includes hedges of Faurecia's exposure on forecast transactions for the next six months.
31 December 2012(in million euros) GBP JPY USD PLN CHF RUB CZK Other TotalTotal assets 262 68 644 31 22 196 127 350 1 700Total liabilities (161) (124) (2) (18) - (298) (145) (81) (829)Future transactions (1) 73 (8) 37 (55) 134 - (27) 70 224Exposure to fixed chargecoverage commitments - (509) - - - - - - (509)Net position before hedging 174 (573) 679 (42) 156 (102) (45) 339 586
Derivative financial instruments (184) 224 (635) 21 (156) 99 23 (411) (1 019)Net position after hedging (10) (349) 44 (21) - (3) (22) (72) (433)
(1) This item mainly includes hedges of Faurecia's exposure on forecast transactions for the next six months.
A 5% increase or decrease in the year-end exchange rate of the main currencies in which the manufacturing and salescompanies had open balance sheet positions at 31 December 2013 (see table below) would have the following directimpact on income before tax and equity :
(in million euros) PLN/EUR CZK/EUR JPY/EUR USD/CAD USD/EUR USD/DZD JPY/RUB OtherHypothetical fluctuation against the euro 5.0 % 5.0 % 5.0 % 5.0 % 5.0 % 5.0 % 5.0 % 5.0%Impact on income before tax 1 1 - 5 1 2 - 1Impact on equity 5 1 6 - 1 - - -
The following table shows the net position of the manufacturing and sales companies in the main foreign currenciesversus the other currencies:
31 December 2013 (in million euros) RUB/UAH USD/CAD USD/BRL USD/ARS USD/DZD UAH/USD RUB/USD JPY/RUBTotal assets - 98 62 69 - - - -Total liabilities (1) - (166) (137) (45) (17) - (3)Future transactions (1) - (15) - - - - - -Net position before hedging (1) 83 (104) (68) (45) (17) - (3)
Derivative financial instruments - (85) 99 73 - - - -Net position after hedging (1) (2) (5) 5 (45) (17) - (3)
(1) This item mainly includes hedges of Faurecia's exposure on forecast transactions for the next six months.
31 December 2012 (in million euros) RUB/UAH USD/CAD USD/BRL USD/ARS USD/DZD UAH/USD RUB/USD JPY/RUBTotal assets - 84 37 92 - - - -Total liabilities (2) - (52) (87) (162) (12) (2) (63)Future transactions (1) - (19) - - - - - -Net position before hedging (2) 65 (15) 5 (162) (12) (2) (63)
Derivative financial instruments - (65) 15 - - - - -Net position after hedging (2) - - 5 (162) (12) (2) (63)
(1) This item mainly includes hedges of Faurecia's exposure on forecast transactions for the next six months.

(b) Management of currency risk: finance companies
Group policy consists of not entering into any operational currency positions. Liabilities are matched with assets in thesame currency, entity-by-entity, using appropriate financial instruments. The hedging is achieved using cross currencyswaps, currency swaps and forward foreign exchange contracts.The Group does not hedge its net investment in foreign operations.
The net position of the finance companies in the main foreign currencies is as follows:
31 December 2013(in million euros) GBP HUF PLN CHF RUB CZK USD Other TotalTotal assets 2 735 10 119 205 63 50 10 54 3 246Total liabilities (1 278) - - (234) - - (916) (113) (2 541)Net position before hedging 1 457 10 119 (29) 63 50 (906) (59) 705Derivative financial instruments (1 457) (10) (119) 29 (63) (50) 906 59 (705)Net position after hedging - - - - - - - - -
31 December 2012(in million euros) GBP JPY PLN CHF RUB CZK USD Other TotalTotal assets 2 341 - 146 363 153 70 - 103 3 176Total liabilities (1 087) (44) - (188) - (54) (947) (60) (2 380)Net position before hedging 1 254 (44) 146 175 153 16 (947) 43 796Derivative financial instruments (1 254) 44 (146) (175) (153) (16) 947 (42) (795)Net position after hedging - - - - - - - 1 1
In view of the Group's hedging policy, a change in exchange rates at the level of the finance companies would nothave any material impact on consolidated profit or equity.
Commodity riskE.
The Automotive Division's exposure to commodity risks is tracked jointly by the Purchasing Department and PSAInternational S.A. (PSAI) which is responsible for hedging the Group's currency and commodity risks, while Faurecia'srisks are managed independently. The Automotive Division’s commodity risks are reviewed at quarterly intervals by aMetals Committee chaired by the Group’s Chief Financial Officer. This Committee monitors hedging gains and losses,reviews each commodity that may have a material impact on the Group’s operating income and sets hedging targetsin terms of volumes and prices over periods of up to three years. Cash flow hedges are used only when they qualify forhedge accounting under IAS 39.
The production costs of the Automotive Division and Faurecia are exposed to the risk of changes in certain rawmaterials prices, either as a result of their direct purchases or indirectly through the impact of these changes on theirsuppliers' costs. These raw materials are either industrial products such as steel and plastics whose prices and relatedadjustments are negotiated between buyers and vendors, or commodities traded on organised markets, such asaluminium, copper, lead or precious metals, for which the transaction price is determined by direct reference to theprices quoted on the commodity market.
Part of the Automotive Division's exposure to fluctuations in commodity prices is hedged using derivative instrumentstraded on regulated markets. The aim of these hedges is to minimize the impact of changes in commodity prices onphysical deliveries for the Group's production needs. In 2013, hedging volumes were lower than in previous years withhedging extending to the first half of 2016.
In 2013, commodity hedges concerned purchases of aluminium, copper, lead, platinum, palladium and rhodium.
For the Automotive Division, in the event of a 28% rise (fall) in base metal prices (aluminium, copper and lead) and a19% rise (fall) in precious metal prices (platinum, palladium and rhodium), the impact of the commodity hedges heldat 31 December 2013 would have been a 83 million increase (decrease) in consolidated equity at 31 December 2013(versus 133 million at 31 December 2012). As all commodity hedges qualified as cash flow hedges under IAS 39,changes in the fair value of these instruments resulting from changes in the prices of the hedged commodities wouldnot have had any impact on 2013 profit.
PSA PEUGEOT CITROËN 2013 Annual Results - 123

The commodity price trend assumptions were determined based on the average historical and implicit volatilitiesobserved on the relevant commodity markets in the reporting year.
Faurecia's sales contracts with customers do not include any indexation clause based on commodity prices. The risk ofan unfavourable change in commodity prices is attenuated through a policy of regular price negotiations withcustomers and tight inventory management. Faurecia does not use derivative instruments to hedge its commodityand energy purchases.
36.2. HEDGING INSTRUMENTS: MANUFACTURING AND SALES COMPANIES
The various types of hedging instrument used and their accounting treatment are described in Note 2.16.D.
Details of values of hedging instruments and notional amounts hedged: manufacturing and salesA.companies
31 December 2013 Maturity(in million euros) Assets Liabilities < 1 year 2 to 5 years > 5 yearsCurrency riskFair value hedges:• Forward foreign exchange contracts 3 - 73 73 - -• Currency options - (8) 74 74 - -• Currency swaps 6 - 665 665 - -• Cross-currency swaps 3 - 36 36 - -Cash flow hedges:• Forward foreign exchange contracts 26 (1) 252 252 - -• Cross-currency swaps 15 - 261 - 150 111• Currency options - - 391 374 17 -Trading instruments (1) 13 (50) 6 928 6 773 155 -Of which Intragroup - -Total currency risks 66 (59) 8 680 8 247 322 111Interest rate riskFair value hedges:• Interest rate swaps - - - - - -Cash flow hedges:• Interest rate options - (5) 522 - 470 52• Cross-currency swaps - - - - - -
Trading instruments (2) - - - - - -Of which Intragroup - -Total interest rate risks - (5) 522 - 470 52Commodity riskCash flow hedges:• Swaps 1 (73) 421 246 175 -Total commodity risks 1 (73) 421 246 175 -TOTAL 67 (137) 9 623 8 493 967 163Of which:
12 (8) 848 848 - -42 (79) 1 847 872 812 163
Total fair value hedgesTotal cash flow hedges
(1) Currency trading instruments: derivative instruments not qualifying for hedge accounting under IAS 39. As IAS 21 requires receivables and payablesdenominated in foreign currencies to be systematically remeasured at the closing exchange rate with any gains or losses taken to income, the Group haselected not to designate these receivables and payables as part of a documented hedging relationship, although their impact on income is the same.(2) Interest rate trading instruments: derivative instruments not qualifying for hedge accounting under IAS 39. This item corresponds to the fair value of economichedges of borrowings or investments.
Carrying amount Notionalamount
Hedging instruments that are not subject to compensation clauses in case of default by either party do not represent asignificant amount for the Automotive Division.

31 December 2012 Maturity(in million euros) Assets Liabilities < 1 year 2 to 5 years > 5 yearsCurrency riskFair value hedges:• Forward foreign exchange contracts - - 6 6 - -• Currency options - (3) 61 61 - -• Currency swaps 1 (3) 756 756 - -Cash flow hedges:• Forward foreign exchange contracts 10 (1) 283 283 - -• Cross-currency swaps - (11) 298 - 188 110• Currency options - - 258 254 4 -Trading instruments (1) 51 (26) 7 019 6 988 31 -Of which Intragroup - -Total currency risks 62 (44) 8 681 8 348 223 110Interest rate riskFair value hedges:• Interest rate swaps - - - - - -Cash flow hedges:• Interest rate options - (13) 700 223 420 57• Cross-currency swaps - - - - - -Trading instruments (2) - - - - - -Of which Intragroup - -Total interest rate risks - (13) 700 223 420 57Commodity riskCash flow hedges:• Swaps 6 (45) 516 297 219 -Total commodity risks 6 (45) 516 297 219 -TOTAL 68 (102) 9 897 8 868 862 167Of which:
1 (6) 823 823 - -16 (70) 2 055 1 057 831 167
Carrying amount Notionalamount
Total fair value hedgesTotal cash flow hedges
(1) Currency trading instruments: derivative instruments not qualifying for hedge accounting under IAS 39. As IAS 21 requires receivables and payablesdenominated in foreign currencies to be systematically remeasured at the closing exchange rate with any gains or losses taken to income, the Group haselected not to designate these receivables and payables as part of a documented hedging relationship, although their impact on income is the same.(2) Interest rate trading instruments: derivative instruments not qualifying for hedge accounting under IAS 39. This item corresponds to the fair value of economichedges of borrowings or investments.
Impact of hedging instruments on income and equity: manufacturing and sales companiesB.
(a) Impact of cash flow hedges
(in million euros)Change in effective portion recognised in equityChange in ineffective portion recognised in profit or lossEffective portion reclassified to the income statement under "Cost of goods and services sold"Effective portion reclassified to the income statement under "Finance costs"
2013 2012- (33)
(2) 325 (41)28 (8)
(b) Impact of fair value hedges
(in million euros)Gains and losses on hedged borrowings recognised in profit or lossChange in ineffective portion recognised in profit or lossGains and losses on hedges of borrowings recognised in profit or lossNet impact on income
2013 2012
(7) 2
- (63)(7) 2- 63
The “Net gain (loss) on hedges of borrowings” presented in Note 10 also includes gains and losses on economichedges that do not qualify for hedge accounting under IAS 39.
PSA PEUGEOT CITROËN 2013 Annual Results - 125

36.3. HEDGING INSTRUMENTS: FINANCE COMPANIES
The different types of hedges and their accounting treatment are described in Note 2.16.D.
Details of values of hedging instruments and notional amounts hedged: finance companiesA.
Offsetting notional amounts have been netted to make the financial statements easier to read. However, separatedisclosures are made at the foot of the page.
31 December 2013 Maturity(in million euros) Assets Liabilities < 1 year 2 to 5 years > 5 yearsCurrency riskFair value hedges:
• Currency swaps 35 (3) 2 679 2 679 - -Interest rate riskFair value hedges:
• Swaps on borrowings 3 - 150 100 50 -• Swaps on EMTN/BMTN issues 108 (3) 6 793 2 018 4 594 181• Swaps on EMTN issues at variable rate - - - - - -
17 (17) - - - -• Swaps on certificates of deposit - - - - - -
- - - - - -• Swaps on retail financing 7 (21) 11 400 5 793 5 607 -
(81) (18) - - - -Cash flow hedges:
• Swaps - - 67 31 36 -Trading instruments 3 (3) 372 368 4 -Total 92 (65) 21 461 10 989 10 291 181Of which Intragroup - (7)Total fair value hedges 89 (62) 21 022 10 590 10 251 181Total cash flow hedges - - 67 31 36 -
Carrying amount Notionalamount
• Swaps on bonds (1)
• Swaps on other debt securities
• Accrued income/expenses on swaps
(1) This item includes 3,778 million in swaps acquired as hedges that represent closed positions in the consolidated financial statements.
31 December 2012 Maturity(in million euros) Assets Liabilities < 1 year 2 to 5 years > 5 yearsCurrency riskFair value hedges:- Currency swaps 83 - 2 777 2 777 - -Interest rate riskFair value hedges:
- Swaps on borrowings 8 - 255 100 155 -- Swaps on EMTN/BMTN issues 214 (2) 7 633 2 048 5 407 178- Swaps on bonds (1) 18 (18) - - - -- Swaps on certificates of deposit - - 17 17 - -
1 - 16 16 - -- Swaps on retail financing 2 (79) 11 894 5 871 6 023 -
1 (15) - - - -Cash flow hedges:
- Swaptions - - 42 19 23 -Trading instruments 2 (2) 382 382 - -Total 329 (116) 23 016 11 230 11 608 178Of which Intragroup 14 (6)Total fair value hedges 327 (114) 22 592 10 829 11 585 178Total cash flow hedges - - 42 19 23 -
- Swaps on other debt securities
- Accrued income/expenses on swaps
(1) This item includes 3,714 million in swaps acquired as hedges that represent closed positions in the consolidated financial statements.
Carrying amount Notionalamount

Impact of hedging instruments on income and equity: finance companiesB.
(a) Impact of cash flow hedges
(in million euros)
Change in effective portion recognised in equityChange in ineffective portion recognised in profit or lossEffective portion reclassified to the income statement under "Cost of goods and services sold"
- -4 7
2013 2012
- -
(b) Impact of fair value hedges
(in million euros)
Gains and losses on hedged customer loans recognised in profit or lossGains and losses on hedges of customer loans recognised in profit or lossNet impact on incomeGains and losses on remeasurement of financial liabilities recognised in profit or lossGains and losses on remeasurement of hedges of financial liabilities recognised in profitNet impact on income
2013 2012
(2) 7
1 -99 (42)
(101) 49
(48) 1249 (12)
NOTE 37 - OFF-BALANCE SHEET COMMITMENTS AND CONTINGENT LIABILITIES
Off-balance sheet commitments given in the normal course of business were as follows at 31 December 2013:
(in million euros)31 December
201331 December
2012Manufacturing and sales companies
Financing commitments (Note 37.1)Guarantees given 304 201Pledged or mortgaged assets 497 921
Operating commitments (Note 37.2)
Capital commitments for the acquisition of non-current assets 408 879Orders for research and development work 16 34Financing commitments - 30Minimum purchase commitments 285 170Non-cancellable lease commitments 1 462 1 018
2 972 3 253Finance companiesFinancing commitments to customers 1 257 1 426Guarantees given on behalf of customers and financial institutions (1) 3 268 5 508
4 525 6 934
(1) This item primarily includes receivables given as collateral as follows:• 2,957 million to the European Central Bank for 700 million in long-term refinancing and 1,000 million in short-term refinancing;• 165 million to Société de Financement de l'Economie Française (SFEF) for 105 million in refinancing;• 72 million to CA-CIB and Société Générale;• 61 million to Mediobanca.
PSA PEUGEOT CITROËN 2013 Annual Results - 127

37.1. FINANCING-RELATED COMMITMENTS
Pledged or mortgaged assets
This item includes the French government bonds (OATs) given as collateral for loans from the European InvestmentBank (EIB).The following table analyses pledged and mortgaged assets by commitment period :
Pledges or mortgages expiring in the years indicated
(in million euros)31 December
201331 December
20122013 - 1012014 414 2702015 16 102016 14 22017 11 12018 16 -2019 - -
26 537Total pledged or mortgaged assets 497 921Total assets 59 664 64 884Percentage of total assets 0.8% 1.4%
Subsequent years
37.2. OPERATIONS-RELATED COMMITMENTS
Minimum purchase commitments
In order to speed up its growth and reduce costs, the Group has entered into cooperation agreements with othercarmakers for the joint development and/or manufacture of mechanical sub-assemblies or vehicles. These jointarrangements enable the partners to share project costs, delivering economies of scale that translate into competitiveadvantage.
Under the terms of these agreements, the Group is committed to financing investment in research and developmentand specific tooling and to taking delivery of a minimum quantity of products manufactured by the jointarrangements. If it fails to honour this minimum purchase commitment, it will be required to pay a penalty designedto cover the related production costs borne by the partner.Any adverse consequences of these commitments are reflected in the consolidated financial statements as soon asthey are considered probable, in the form of asset impairments or, if necessary, provisions for contingencies.For contracts where the products are manufactured by the Group's partner, capacity reservation fees are accountedfor as off- balance sheet commitments net of any provisions.
Capital commitments for the acquisition of non-current assets
This item corresponds mainly to commitments to purchase property, plant and equipment. It also includes theGroup's commitment towards the two Fonds de Modernisation des Equipementiers Automobiles (FMEA - tier 1 andtier 2), two funds set up to support automotive equipment manufacturers. The Group's total commitment to FMEAamounted to 204 million. At 31 December 2013, the Group had already paid 125 million into this fund.

Non-cancellable lease commitments
Periods
(in million euros)31 December
201331 December
20122013 - 1872014 261 1572015 215 1322016 186 1132017 154 882018 135 702019 119 -Subsequent years 392 271
1 462 1 018Total non-cancellable lease commitments
Non-cancellable leases are entered into in the normal course of business and consist mainly of leases on commercialproperty and vehicles. The lease terms reflect local practices in each country.
37.3. CONTINGENT LIABILITIES
The Group is involved in claims and litigation arising in the normal course of business. Based on the informationcurrently available, the outcome of this litigation is not expected to result in an outflow of economic resourceswithout anything in return.
37.4. COMMITMENTS CONNECTED WITH THE GEFCO GROUP
Representations and warranties were made to JSC Russian Railways (RZD) as part of its acquisition of the Gefco Groupfrom PSA. At 31 December 2013, the Group had not identified any material risks associated with theserepresentations and warranties.
Under the logistics and transportation service agreements entered into by the PSA and Gefco groups, the Group gaveguarantees regarding the satisfactory performance of the logistics contracts and a five-year exclusivity clause. At 31December 2013, the Group had not identified any material risks associated with these representations and warranties.
NOTE 38 - RELATED PARTY TRANSACTIONS
Related parties are companies subject to significant influence consolidated by the equity method, members of themanaging bodies and shareholders holding more than 10% of Peugeot S.A. capital.
Transactions with companies accounted for by the equity method are disclosed in Note 16.6. Other than thesetransactions, there were no significant transactions with other related parties.
PSA PEUGEOT CITROËN 2013 Annual Results - 129
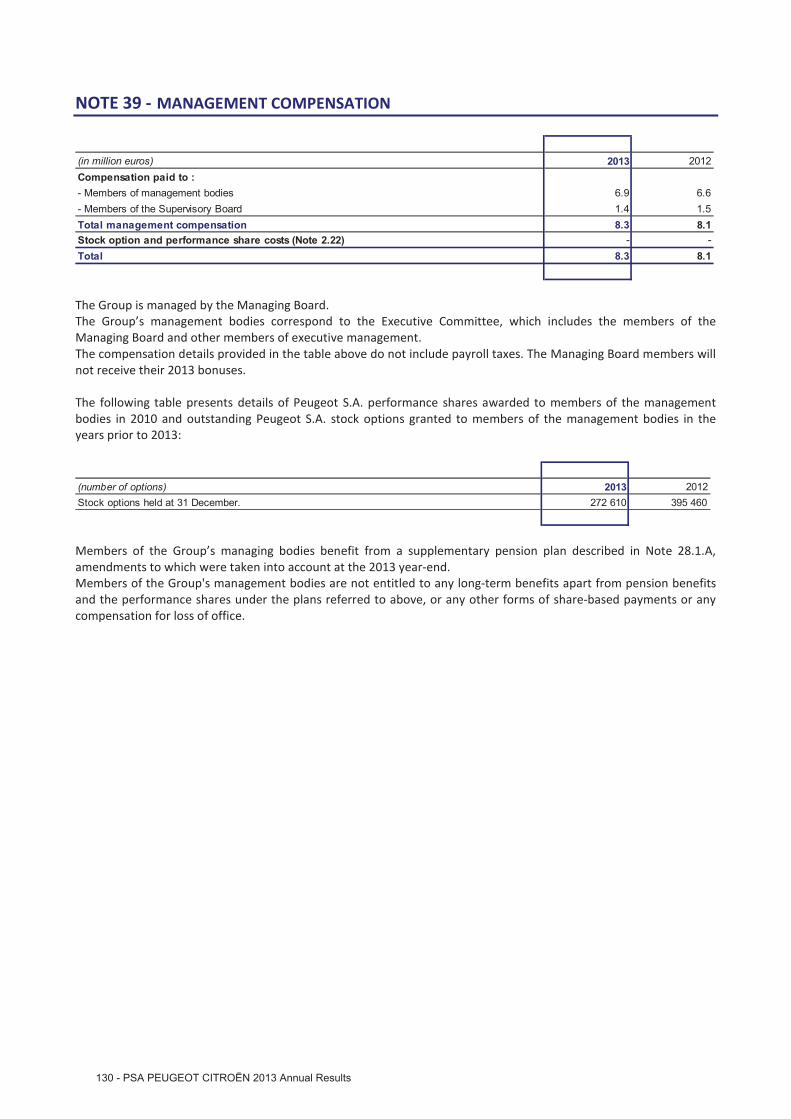
NOTE 39 - MANAGEMENT COMPENSATION
(in million euros) 2013 2012Compensation paid to :- Members of management bodies 6.9 6.6- Members of the Supervisory Board 1.4 1.5Total management compensation 8.3 8.1
- -Total 8.3 8.1Stock option and performance share costs (Note 2.22)
The Group is managed by the Managing Board.The Group’s management bodies correspond to the Executive Committee, which includes the members of theManaging Board and other members of executive management.The compensation details provided in the table above do not include payroll taxes. The Managing Board members willnot receive their 2013 bonuses.
The following table presents details of Peugeot S.A. performance shares awarded to members of the managementbodies in 2010 and outstanding Peugeot S.A. stock options granted to members of the management bodies in theyears prior to 2013:
(number of options) 2013 2012272 610 395 460Stock options held at 31 December.
Members of the Group’s managing bodies benefit from a supplementary pension plan described in Note 28.1.A,amendments to which were taken into account at the 2013 year-end.Members of the Group's management bodies are not entitled to any long-term benefits apart from pension benefitsand the performance shares under the plans referred to above, or any other forms of share-based payments or anycompensation for loss of office.

NOTE 40 - SUBSEQUENT EVENTS
The Group will announce on 19 February 2014, with three specific press releases, major projects of operations to thiseffect:
The first press release is related to the reinforcement of the industrial and commercial partnership with DongfengMotor Corporation, a 3 billion capital increase, with the attribution of free equity warrants to existing shareholdersof Peugeot S.A.
These major projects of operations are aimed at improving the competitiveness of the Group, accelerating itsglobalisation and emerging markets expansion strategy, while reinforcing its financial strength.
The operations would consist of:
1. The strengthening and deepening of the existing industrial and commercial partnership with Dongfeng MotorCorporation (“DFM”), China’s second largest carmaker, in order to capitalise on the Group’s current success in theworld’s largest automobile market, which is now the primary source of growth for the automotive industry.
2. A 3 billion capital increase including:A reserved 1,048 million capital increase subscribed by DFM and the French State, on an equal basis, at asubscription price of 7.50 per share;A c. 1.95 billion rights issue open to all Peugeot S.A. shareholders (including DFM and the French State), andunderwritten by a syndicate of banks for the shares not subscribed by DFM, the French State and FFP/EPF;Prior to capital increase, an attribution of free equity warrants to existing Peugeot S.A. shareholders, withone warrant granted by existing share, based on an subscription ratio of 10 warrants for 3 new Peugeot S.A.shares. The warrants could be exercised over three years, and would be exercisable from the 2nd year, with astrike price equal to the subscription price of the reserved capital increase in favour of DFM and the FrenchState, i.e. 7.5 per share.
3. A capital increase reserved for employees will be offered to them in the course of 2014, in order to give them theopportunity to participate in the value creation potential of the Group.
These operations, which have been agreed in principle by the parties involved, remain subject to the signature of abinding documentation, planned at the end of March 2014, and the approval of regulatory bodies, notably in Franceand China, as well as the approval of the Extraordinary General Meeting of Peugeot S.A. shareholders due to takeplace in the second quarter 2014.
These operations are aimed at financing among others the current medium-term plan of the Group and revitalizing itsdevelopment.
The second press release is related to the renewal of an amount of 2.7 billion syndicated credit facility, constitutiveof confirmed line of credit. It would comprise a 2.0 billion five-year tranche and a 0.7 billion three-year tranche withtwo optional one-year extensions. It would replace the 2.4 billion line of credit set up in July 2010 and maturing inJuly 2014 for 0.2 billion and July 2015 for 2.2 billion. The new line would be subject to the completion of the 3billion capital increase announced here.
The third press release announces the entrance in exclusive negotiations to form a partnership in financing activitiesbetween Banque PSA Finance and Santander Consumer Finance.
The partnership with the consumer finance division of Santander, the largest bank in the Eurozone by marketcapitalisation, would result in the creation of local partnerships, each 50/50 owned by Banque PSA Finance andSantander Consumer Finance, across PSA Peugeot Citroën’s main European markets. This partnership would create acompetitive, sustainable and dynamic captive financing activity dedicated to Group brands. This partnership wouldnot need the French State guarantee for the funding of its activities. The contemplated perimeter of the transactionwould cover approximately 90% of Banque PSA Finance’s current activities.
The entering into the agreements to implement this partnership is subject to the finalization of the relevantagreements and the prior information and consultation of the relevant employee representative bodies, and includingthe approval of the competent banking authorities in the main European countries. The closing of the transactionwould then be expected to occur in H2 2015.
PSA PEUGEOT CITROËN 2013 Annual Results - 131

The details of the terms of these operations and their potential consequences for the Group are given in the specificpress releases.
NOTE 41 - FEES PAID TO THE AUDITORS
(in million euros) 2013 2012 2013 2012 2013 2012
Audit
• Peugeot S.A. 0.2 0.3 0.3 0.4 - -• Fully-consolidated subsidiaries 2.7 2.6 8.8 9.0 2.9 3.2
o/w France 1.4 1.4 2.6 2.7 0.8 1.0
o/w International 1.3 1.2 6.2 6.3 2.1 2.2
• Peugeot S.A. - - - - - -• Fully-consolidated subsidiaries 0.1 0.1 0.1 0.1 - -
o/w France 0.1 0.1 0.1 0.1 - 0.0
o/w International - - - - - -
Sub-total 3.0 3.0 9.2 9.5 2.9 3.2o/w Faurecia - - 4.8 4.8 2.9 3.2Excluding Faurecia 3.0 3.0 4.4 4.7 - -
100% 100% 99% 98% 97% 97%
Legal and tax services - - 0.1 0.2 0.1 0.1Other - - - - - -Sub-total - - 0.1 0.2 0.1 0.1o/w Faurecia - - - - - -Excluding Faurecia - - 0.1 0.2 0.1 0.1
0% 0% 1% 2% 3% 3%
TOTAL 3.0 3.0 9.3 9.7 3.0 3.3
o/w Faurecia - - 4.8 4.8 2.9 3.2Excluding Faurecia 3.0 3.0 4.5 4.9 0.1 0.1
Audit-related services
Other services provided to subsidiaries
Mazars Ernst & Young PricewaterhouseCoopers
Statutory and contractual audit services
Faurecia’s Statutory Auditors are Ernst & Young and PricewaterhouseCoopers

NOTE 42 - CONSOLIDATED COMPANIES AT 31 DECEMBER 2013
Company Country F/E %interest
HOLDING ET AUTRES ACTIVITÉS
PEUGEOT S.A. France I 100D.J. 06 France I 100EMOTION France I 100FINANCIERE PERGOLESE France I 100G.I.E. PSA TRESORERIE France I 100GRANDE ARMEE PARTICIPATIONS France I 100PEUGEOT MOTOCYCLES France I 100PEUGEOT MOTOCYCLES DEUTSCHLAND GmbH Germany I 100PEUGEOT MOTOCYCLES ITALIA S.p.A. Italy I 100SOCIETE ANONYME DE REASSURANCE LUXEMBOURGEOISE - SARAL Luxembourg I 100PSA INTERNATIONAL S.A. Switzerland I 100JINAN QUIGQI PEUGEOT MOTORCYCLES China E 50GEFCO France E 25
AUTOMOBILE
PEUGEOT MOTORS SOUTH AFRICA Ltd South Africa I 100PEUGEOT ALGERIE S.p.A. Algeria I 100CISA Argentina I 100PEUGEOT CITROEN ARGENTINA S.A. Argentina I 100CITROEN OSTERREICH GmbH Austria I 100PEUGEOT AUSTRIA GmbH Austria I 100PEUGEOT WIEN GmbH Austria I 100CITROEN BELUX S.A. - NV Belgium I 100PEUGEOT BELGIQUE LUXEMBOURG S.A. Belgium I 100S.A. PEUGEOT DISTRIBUTION SERVICE N.V. Belgium I 100CITROEN do BRASIL Brazil I 100PCI do BRASIL Ltda Brazil I 100PEUGEOT CITROEN COMERCIAL EXPORTADORA Brazil I 100PEUGEOT CITROEN do BRASIL AUTOMOVEIS Ltda Brazil I 100AUTOMOTORES FRANCO CHILENA S.A. Chile I 100PEUGEOT CHILE Chile I 97PCA (CHINA) AUTOMOTIVE DRIVE Co China I 100CITROEN - HRVATSKA d.o.o. Croatia I 100PEUGEOT HRVATSKA d.o.o. Croatia I 100CITROEN CESKA REPUBLICA s.r.o. Czech Republic I 100PCA LOGISTIKA CZ Czech Republic I 100PEUGEOT CESKA REPUBLICA s.r.o. Czech Republic I 100CITROEN DANMARK A/S Denmark I 100AUTOMOBILES CITROEN France I 100AUTOMOBILES PEUGEOT France I 100CENTRAUTO France I 100CITROEN ARGENTEUIL France I 100CITROEN CHAMP DE MARS France I 100CITROEN DUNKERQUE France I 100CITROEN ORLEANS France I 100EPINETTES France I 100FRANCAISE DE MECANIQUE France I 100G.I.E. PSA PEUGEOT CITROEN France I 100GISEVEL France I 100GRANDS GARAGES DU LIMOUSIN France I 100MECANIQUE ET ENVIRONNEMENT France I 100PEUGEOT CITROEN AULNAY S.N.C. France I 100PEUGEOT CITROEN AUTOMOBILES S.A. France I 100PEUGEOT CITROEN MECANIQUE DU GRAND EST S.N.C. France I 100PEUGEOT CITROEN MECANIQUE DU NORD-OUEST S.N.C. France I 100PEUGEOT CITROEN MULHOUSE S.N.C. France I 100PEUGEOT CITROEN POISSY S.N.C. France I 100PEUGEOT CITROEN RENNES S.N.C. France I 100PEUGEOT CITROEN SOCHAUX S.N.C. France I 100
PSA PEUGEOT CITROËN 2013 Annual Results - 133
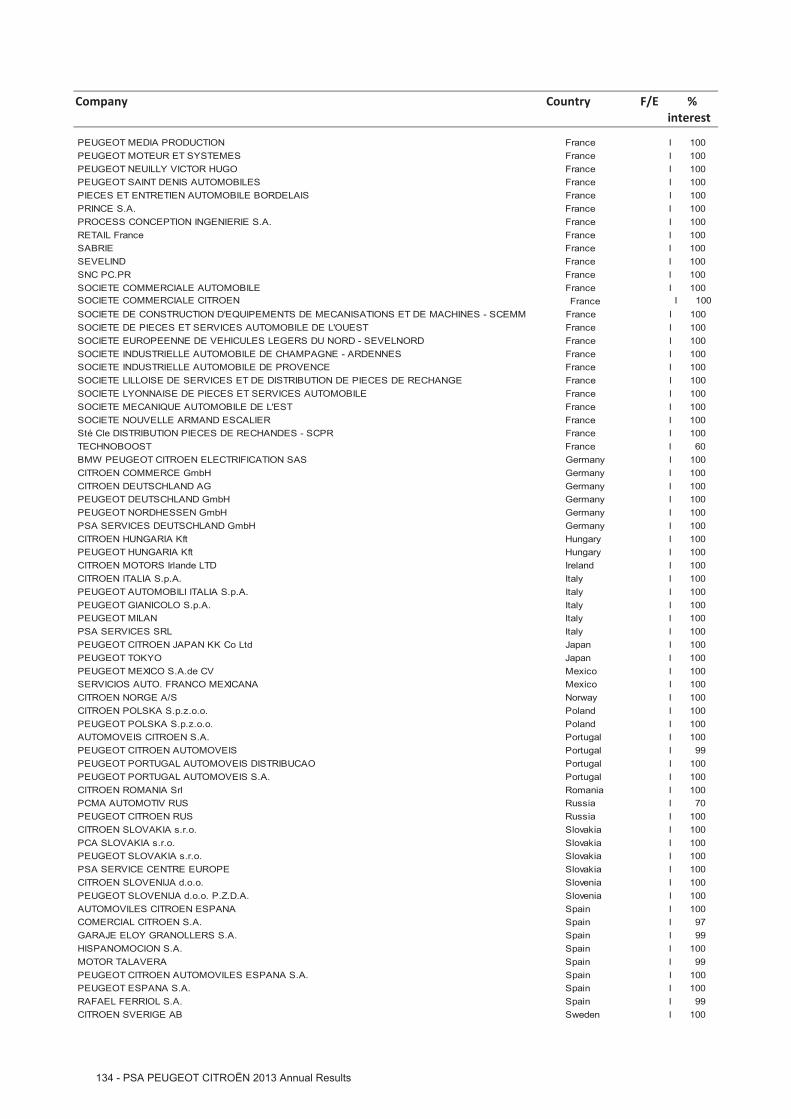
Company Country F/E %interest
PEUGEOT MEDIA PRODUCTION France I 100PEUGEOT MOTEUR ET SYSTEMES France I 100PEUGEOT NEUILLY VICTOR HUGO France I 100PEUGEOT SAINT DENIS AUTOMOBILES France I 100PIECES ET ENTRETIEN AUTOMOBILE BORDELAIS France I 100PRINCE S.A. France I 100PROCESS CONCEPTION INGENIERIE S.A. France I 100RETAIL France France I 100SABRIE France I 100SEVELIND France I 100SNC PC.PR France I 100SOCIETE COMMERCIALE AUTOMOBILE France I 100SOCIETE COMMERCIALE CITROEN France I 100SOCIETE DE CONSTRUCTION D'EQUIPEMENTS DE MECANISATIONS ET DE MACHINES - SCEMM France I 100SOCIETE DE PIECES ET SERVICES AUTOMOBILE DE L'OUEST France I 100SOCIETE EUROPEENNE DE VEHICULES LEGERS DU NORD - SEVELNORD France I 100SOCIETE INDUSTRIELLE AUTOMOBILE DE CHAMPAGNE - ARDENNES France I 100SOCIETE INDUSTRIELLE AUTOMOBILE DE PROVENCE France I 100SOCIETE LILLOISE DE SERVICES ET DE DISTRIBUTION DE PIECES DE RECHANGE France I 100SOCIETE LYONNAISE DE PIECES ET SERVICES AUTOMOBILE France I 100SOCIETE MECANIQUE AUTOMOBILE DE L'EST France I 100SOCIETE NOUVELLE ARMAND ESCALIER France I 100Sté Cle DISTRIBUTION PIECES DE RECHANDES - SCPR France I 100TECHNOBOOST France I 60BMW PEUGEOT CITROEN ELECTRIFICATION SAS Germany I 100CITROEN COMMERCE GmbH Germany I 100CITROEN DEUTSCHLAND AG Germany I 100PEUGEOT DEUTSCHLAND GmbH Germany I 100PEUGEOT NORDHESSEN GmbH Germany I 100PSA SERVICES DEUTSCHLAND GmbH Germany I 100CITROEN HUNGARIA Kft Hungary I 100PEUGEOT HUNGARIA Kft Hungary I 100CITROEN MOTORS Irlande LTD Ireland I 100CITROEN ITALIA S.p.A. Italy I 100PEUGEOT AUTOMOBILI ITALIA S.p.A. Italy I 100PEUGEOT GIANICOLO S.p.A. Italy I 100PEUGEOT MILAN Italy I 100PSA SERVICES SRL Italy I 100PEUGEOT CITROEN JAPAN KK Co Ltd Japan I 100PEUGEOT TOKYO Japan I 100PEUGEOT MEXICO S.A.de CV Mexico I 100SERVICIOS AUTO. FRANCO MEXICANA Mexico I 100CITROEN NORGE A/S Norway I 100CITROEN POLSKA S.p.z.o.o. Poland I 100PEUGEOT POLSKA S.p.z.o.o. Poland I 100AUTOMOVEIS CITROEN S.A. Portugal I 100PEUGEOT CITROEN AUTOMOVEIS Portugal I 99PEUGEOT PORTUGAL AUTOMOVEIS DISTRIBUCAO Portugal I 100PEUGEOT PORTUGAL AUTOMOVEIS S.A. Portugal I 100CITROEN ROMANIA Srl Romania I 100PCMA AUTOMOTIV RUS Russia I 70PEUGEOT CITROEN RUS Russia I 100CITROEN SLOVAKIA s.r.o. Slovakia I 100PCA SLOVAKIA s.r.o. Slovakia I 100PEUGEOT SLOVAKIA s.r.o. Slovakia I 100PSA SERVICE CENTRE EUROPE Slovakia I 100CITROEN SLOVENIJA d.o.o. Slovenia I 100PEUGEOT SLOVENIJA d.o.o. P.Z.D.A. Slovenia I 100AUTOMOVILES CITROEN ESPANA Spain I 100COMERCIAL CITROEN S.A. Spain I 97GARAJE ELOY GRANOLLERS S.A. Spain I 99HISPANOMOCION S.A. Spain I 100MOTOR TALAVERA Spain I 99PEUGEOT CITROEN AUTOMOVILES ESPANA S.A. Spain I 100PEUGEOT ESPANA S.A. Spain I 100RAFAEL FERRIOL S.A. Spain I 99CITROEN SVERIGE AB Sweden I 100

Company Country F/E %interest
CITROEN (SUISSE) S.A. Switzerland I 100LOWEN GARAGE AG Switzerland I 97PEUGEOT (SUISSE) S.A. Switzerland I 100PEUGEOT CITROEN GESTION INTERNATIONAL Switzerland I 100CITROEN NEDERLAND B.V. The Netherlands I 100PCMA HOLDING The Netherlands I 70PEUGEOT NEDERLAND N.V. The Netherlands I 100PEUGEOT OTOMOTIV PAZARLAMA AS - POPAS Turkey I 100TEKOTO MOTORLU TASTLAR ANKARA Turkey I 100TEKOTO MOTORLU TASTLAR BURSA Turkey I 100TEKOTO MOTORLU TASTLAR ISTAMBUL Turkey I 100PEUGEOT CITROEN UKRAINE Ukraine I 100ASTON LINE MOTORS Ltd United Kingdom I 100BOOMCITE Ltd United Kingdom I 100CITROEN U.K.Ltd United Kingdom I 100ECONOMYDRIVE CARS United Kingdom I 100MELVIN MOTORS (BISHOPBRIGGS) Ltd United Kingdom I 100PEUGEOT CITROEN AUTOMOBILES UK United Kingdom I 100PEUGEOT MOTOR COMPANY PLC United Kingdom I 100ROBINS & DAY Ltd United Kingdom I 100ROOTES Ltd United Kingdom I 100WARWICK WRIGHT MOTORS CHISWICK Ltd United Kingdom I 100CAPSA China E 50DONGFENG PEUGEOT CITROEN AUTOMOBILES CY Ltd China E 50WUHAN SHELONG HONGTAI AUTOMOTIVE KO Ltd China E 10TOYOTA PEUGEOT CITROEN AUTOMOBILES Czech s.r.o. Czech Republic E 50SOCIETA EUROPEA VEICOLI LEGGERI - SEVEL S.p.A. Italy E 50STAFIM Tunisia E 34STAFIM - GROS Tunisia E 34
ÉQUIPEMENT AUTOMOBILE
FAURECIA France I 57FAURECIA ARGENTINA S.A. Argentina I 57FAURECIA EXTERIORS ARGENTINA Argentina I 57FAURECIA SISTEMAS DE ESCAPE ARGENTINA S.A. Argentina I 57FAURECIA INDUSTRIE N.V. Belgium I 57SOCIETE INTERNATIONALE DE PARTICIPATIONS Belgium I 57FAURECIA AUTOMOTIVE DO BRASIL LTDA Brazil I 57FAURECIA SISTEMAS DE ESCAPAMENTO DO BRASIL LTDA Brazil I 57FAURECIA AUTOMOTIVE SEATING CANADA LTD Canada I 57FAURECIA EMISSIONS CONTROL TECHNOLOGIES CANADA LTD Canada I 57CHANGCHUN FAURECIA XUANG INTERIOR SYSTEMS COMPANY LIMITED China I 34CHANGCHUN FAURECIA XUYANG AUTOMOTIVE SEAT CO., LTD (CFXAS) China I 34CHENGDU FAURECIA. LIMIN INTERIOR & EXTERIOR SYSTEMS China I 29CHONGQING GUANGNENG FAURECIA INTERIOR SYST China I 29CUMMINGS BEIJING China I 57FAURECIA (CHANGCHUN) AUTOMOTIVE SYSTEMS CO., LTD China I 57FAURECIA (CHINA) HOLDING CO. LTD China I 57FAURECIA (GUANGZHOU) AUTOMOTIVE SYSTEMS CO., LTD China I 57FAURECIA (NANJING) AUTOMOTIVE SYSTEMS CO., LTD China I 57FAURECIA (QINGDAO) EXHAUST SYSTEMS CO, Ltd China I 57FAURECIA (SHANGHAI) AUTOMOTIVE SYSTEMS CO., LTD China I 57FAURECIA (SHENYANG) AUTOMOTIVE SYSTEMS CO., LTD China I 57FAURECIA (WUHAN) AUTOMOTIVE COMPONENTS SYSTEMS CO., LTD China I 57FAURECIA (WUHAN) AUTOMOTIVE SEATING CO., LTD China I 57FAURECIA (WUHU) EXHAUST SYSTEMS CO, LTD China I 57FAURECIA (WUXI) SEATING COMPONENTS CO., LTD China I 57FAURECIA (YANCHENG) AUTOMOTIVE SYSTEMS CO LTD China I 57FAURECIA EMISSIONS CONTROL TECHNOLOGIES (NINGBO HANGZHOU BAY NEW DISTRICT) CO. LTD China I 38FAURECIA EMISSIONS CONTROL TECHNOLOGIES DEVELOPMENT (SHANGHAI) COMPANY LTD China I 57FAURECIA EMISSIONS CONTROL TECHNOLOGIES FOSHAN COMPANY LIMITED China I 29FAURECIA EMISSIONS CONTROL TECHNOLOGIES, (Chongqing) Co., Ltd China I 41FAURECIA EMISSIONS CONTROL TECHNOLOGIES, (Shanghai) Co., Ltd China I 57FAURECIA EMISSIONS CONTROL TECHNOLOGIES, (Yantai) Co., Ltd China I 57FAURECIA EMISSIONS CONTROL TECHNOLOGIES, Chengdu China I 57FAURECIA EXHAUST SYSTEMS CHANGCHUN CO., LTD China I 29FAURECIA- GSK (WUHAN) AUTOMOTIVE SEATING CO., LTD China I 29FAURECIA HONGHU EXHAUST SYSTEMS SHANGHAI, Co. Ltd (ex SHEESC) China I 29
PSA PEUGEOT CITROËN 2013 Annual Results - 135

Company Country F/E %interest
FAURECIA NHK (XIANGYANG) AUTOMOTIVE SEATING CO., LTD China I 29FAURECIA TONGDA EXHAUST SYSTEM (WUHAN) CO., LTD China I 29FOSHAN FAURECIA XUYANG INTERIOR SYSTEMS COMPANY LIMITED China I 34NANCHANG China I 29NINGBO China I 52FAURECIA AUTOMOTIVE CZECH REPUBLIC, s.r.o. Czech Republic I 57FAURECIA COMPONENTS PISEK s.r.o. Czech Republic I 57FAURECIA EMISSIONS CONTROL TECHNOLOGIES, Mlada Boleslav, s.r.o Czech Republic I 57FAURECIA EXHAUST SYSTEMS S.R.O. Czech Republic I 57FAURECIA INTERIOR SYSTEMS BOHEMIA s.r.o. Czech Republic I 57AUTOMOTIVE SANDOUVILLE France I 57EAK - COMPOSANTS POUR L'AUTOMOBILE (EAK SAS) France I 29EAK - COMPOSANTS POUR L'AUTOMOBILE (EAK SNC) France I 29ECSA - ETUDES ET CONSTRUCTION DE SIEGES POUR L'AUTOMOBILE France I 57FAURECIA ADP HOLDING France I 34FAURECIA AUTOMOTIVE HOLDINGS France I 57FAURECIA AUTOMOTIVE INDUSTRIE France I 57FAURECIA AUTOMOTIVES COMPOSITES France I 57FAURECIA BLOC AVANT France I 57FAURECIA EXHAUST INTERNATIONAL France I 57FAURECIA INDUSTRIES France I 57FAURECIA INTERIEUR INDUSTRIE France I 57FAURECIA INTERIEUR MORNAC France I 57FAURECIA INTERIEUR SAINT QUENTIN France I 57FAURECIA INVESTMENTS France I 57FAURECIA SERVICES GROUPE France I 57FAURECIA SIEGES D'AUTOMOBILES France I 57FAURECIA SYSTÈMES D'ECHAPPEMENT France I 57FAURECIA-METALLOPRODUKCIA Holding France I 34FINANCIERE FAURECIA France I 57HAMBACH AUTOMOTIVE EXTERIORS SAS France I 57SIEBRET France I 57SIEDOUBS France I 57SIELEST France I 57SIEMAR France I 57SIENOR France I 57SIETO France I 57SOTEXO France I 57TRECIA France I 57FAURECIA ABGASTECHNIK GmbH Germany I 57FAURECIA Angell-Demmel GmbH Germany I 57FAURECIA AUTOMOTIVE GmbH Germany I 57FAURECIA AUTOSITZE GmbH Germany I 57FAURECIA EMISSIONS CONTROL TECHNOLOGIES, Finnentrop GmbH Germany I 57FAURECIA EMISSIONS CONTROL TECHNOLOGIES, Germany GmbH Germany I 57FAURECIA EMISSIONS CONTROL TECHNOLOGIES, Novaferra GmbH Germany I 57FAURECIA EXTERIORS GmbH Germany I 57FAURECIA INNENRAUM SYSTEME GmbH Germany I 57FAURECIA KUNSTSTOFFE AUTOMOBILSYSTEME GmbH Germany I 57EMCON Technologies Kft Hungary I 57Faurecia Magyarorszag Kipufogo-rendszer Kft Hungary I 57FAURECIA AUTOMOTIVE SEATING INDIA PRIVATE LIMITED India I 57FAURECIA EMISSIONS CONTROL TECHNOLOGIES INDIA India I 57Faurecia Emissions Control Technologies, India Private Limited India I 42FAURECIA TECHNOLOGY CENTER INDIA PVT Ltd India I 57FAURECIA EMISSIONS CONTROL TECHNOLOGIES, Italy SRL Italy I 57FAURECIA HOWA INTERIOR'S Japan I 29FAURECIA JAPAN K.K. Japan I 57FAURECIA AST Luxembourg S.A Luxembourg I 57FAURECIA HICOM EMISSIONS CONTROL TECHNOLOGIES Malaya I 37ET Mexico Holdings I, S. de R.L.de C.V. Mexico I 57ET Mexico Holdings II, S. de R.L.de C.V. Mexico I 57Exhaust Services Mexicana, S.A. de C.V. Mexico I 57Faurecia Exhaust Mexicana, S.A. de C.V. Mexico I 57FAURECIA SISTEMAS AUTOMOTRICES DE MEXICO, S.A. de C.V. (ex FAURECIA DUROPLAST MEXICO, S.A Mexico I 57SERVICIOS CORPORATIVOS DE PERSONAL ESPECIALIZADO, S.A. DE C.V. Mexico I 57FAURECIA EQUIPEMENTS AUTOMOBILES MAROC Morocco I 57FAURECIA AUTOMOTIVE POLSKA Spolka Akcyjna Poland I 57FAURECIA GORZOW Spolka Akcyjna Poland I 57

Company Country F/E %interest
FAURECIA GROJEC R&D CENTER Spolka Akcyjna Poland I 57FAURECIA LEGNICA Spolka Akcyjna Poland I 57FAURECIA WALBRZYCH Spolka Akcyjna Poland I 57EDA - ESTOFAGEM DE ASSENTOS, LDA, Portugal I 57FAURECIA - ASSENTOS DE AUTOMOVEL, LIMITADA Portugal I 57FAURECIA - SISTEMAS DE ESCAPE PORTUGAL, LDA Portugal I 57FAURECIA SISTEMAS DE INTERIOR DE PORTUGAL. COMPONENTES PARA AUTOMOVEIS S.A. (Ex SAI POPortugal I 57SASAL Portugal I 57EURO AUTO PLASTIC SYSTEMS S.R.L. Romania I 29FAURECIA SEATING TALMACIU S.R.L. Romania I 57OOO FAURECIA ADP Russia I 34OOO FAURECIA AUTOMOTIVE DEVELOPMENT Russia I 57OOO FAURECIA METALLOPRODUKCIA EXHAUST SYSTEMS Russia I 34FAURECIA SLOVAKIA s.r.o. Slovakia I 57Emission Control Technologies Holdings S.A. (Pty) Ltd South Africa I 57Emission Control Technologies S.A. (CapeTown) (Pty) Ltd South Africa I 57Emission Control Technologies S.A. (Ga-Rankuwa) (Pty) Ltd South Africa I 57FAURECIA EXHAUST SYSTEMS SOUTH AFRICA LTD South Africa I 57FAURECIA INTERIOR SYSTEMS PRETORIA (PTY) LTD South Africa I 57FAURECIA INTERIOR SYSTEMS SOUTH AFRICA (PTY) LTD South Africa I 57FAURECIA AUTOMOTIVE SYSTEMS KOREA LTD South Korea I 57FAURECIA EMISSIONS CONTROL SYSTEMS KOREA (ex DAEKI) South Korea I 57FAURECIA JIT AND SEQUENCING KOREA South Korea I 57FAURECIA SHIN SUNG CO. LTD South Korea I 57FAURECIA TRIM KOREA LTD South Korea I 57ASIENTOS DE CASTILLA LEON, S.A. Spain I 57ASIENTOS DE GALICIA, S.L. Spain I 57ASIENTOS DEL NORTE, S.A. Spain I 57FAURECIA ASIENTOS PARA AUTOMOVIL ESPAÑA, S.A. Spain I 57FAURECIA AUTOMOTIVE ESPAÑA, S.L. Spain I 57FAURECIA AUTOMOTIVE EXTERIORS ESPANA, S.A. (Ex Plastal Spain S.A.) Spain I 57FAURECIA EMISSIONS CONTROL TECHNOLOGIES, Pampelona, S.L. Spain I 57FAURECIA INTERIOR SYSTEMS ESPAÑA, S.A. Spain I 57FAURECIA INTERIOR SYSTEMS SALC ESPAÑA, S.L. Spain I 57FAURECIA SISTEMAS DE ESCAPE ESPAÑA, S.A. Spain I 57INCALPLAS, S.L. Spain I 57INDUSTRIAS COUSIN FRERES, S.L. Spain I 29TECNOCONFORT Spain I 29VALENCIA MODULOS DE PUERTA, S.L. Spain I 57FAURECIA EXHAUST SYSTEMS AB Sweden I 57FAURECIA INTERIOR SYSTEMS SWEDEN AB Sweden I 57UNITED PARTS EXHAUST SYSTEMS AB Sweden I 57FAURECIA & SUMMIT INTERIOR SYSTEMS Thailand I 29FAURECIA EMISSIONS CONTROL TECHNOLOGIES, Thailand Co., Ltd Thailand I 57FAURECIA INTERIOR SYSTEMS THAILAND CO., LTD. Thailand I 57ET Dutch Holding BV The Netherlands I 57ET Dutch Holding II BV The Netherlands I 57ET Dutch Holdings Cooperatie U.A. The Netherlands I 57FAURECIA AUTOMOTIVE SEATING B.V. The Netherlands I 57FAURECIA EMISSIONS CONTROL TECHNOLOGIES, Netherlands B.V. The Netherlands I 57FAURECIA NETHERLANDS HOLDING B.V. The Netherlands I 57FAURECIA INFORMATIQUE TUNISIE Tunisia I 57SOCIETE TUNISIENNE D'EQUIPEMENTS D'AUTOMOBILE Tunisia I 57FAURECIA POLIFLEKS OTOMOTIV SANAYI VE TICARET ANONIM SIRKETI Turkey I 57FAURECIA AUTOMOTIVE SEATING UK LIMITED United Kingdom I 57FAURECIA EMISSIONS CONTROL TECHNOLOGIES, UK Limited United Kingdom I 57FAURECIA MIDLANDS Limited United Kingdom I 57SAI AUTOMOTIVE FRADLEY LTD United Kingdom I 57SAI AUTOMOTIVE WASHINGTON LIMITED United Kingdom I 57FAURECIA AUTOMOTIVE DEL URUGUAY Uruguay I 57FAURECIA AUTOMOTIVE SEATING, LLC USA I 57Faurecia Emissions Control Technologies, USA, LLC USA I 57FAURECIA EXHAUST SYSTEMS, INC. USA I 57FAURECIA INTERIOR SYSTEMS SALINE LLC USA I 57FAURECIA INTERIOR SYSTEMS, INC. USA I 57FAURECIA INTERIORS LOUISVILLE, LLC USA I 57FAURECIA INTERIORS SYSTEMS HOLDING USA I 57FAURECIA MADISON AUTOMOTIVE SEATING INC USA I 57FAURECIA NORTH AMERICA HOLDINGS LLC USA I 57
PSA PEUGEOT CITROËN 2013 Annual Results - 137
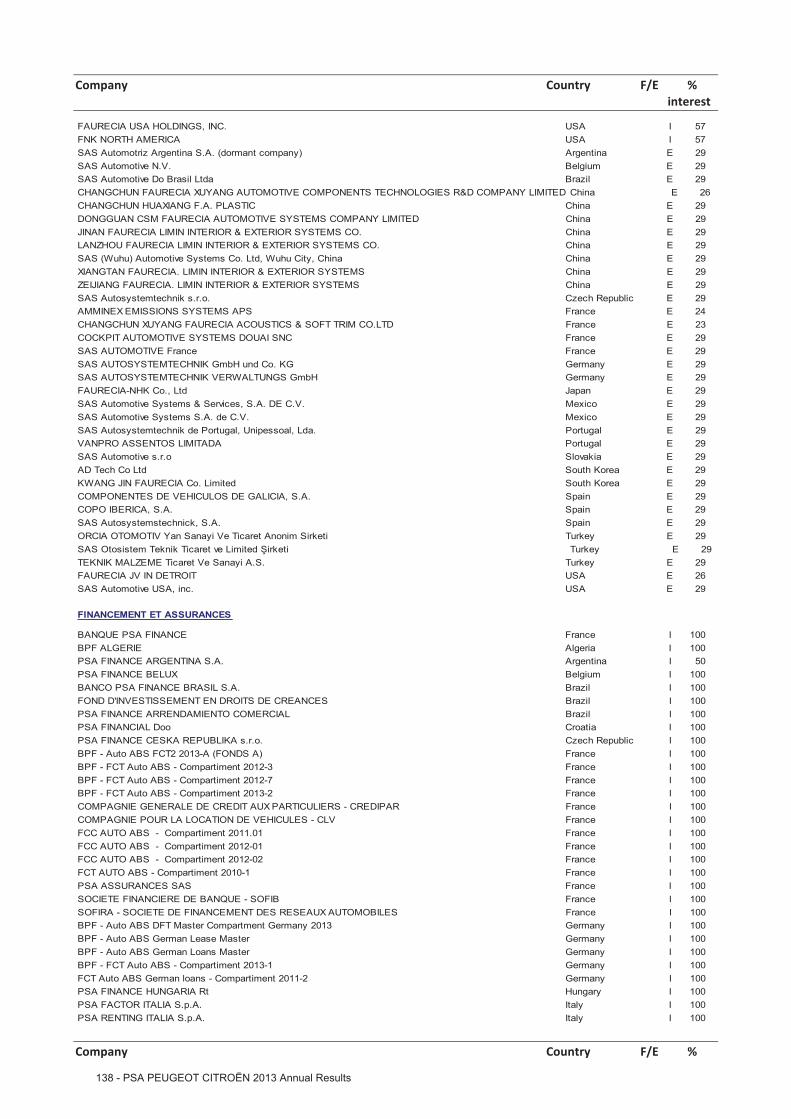
Company Country F/E %interest
FAURECIA USA HOLDINGS, INC. USA I 57FNK NORTH AMERICA USA I 57SAS Automotriz Argentina S.A. (dormant company) Argentina E 29SAS Automotive N.V. Belgium E 29SAS Automotive Do Brasil Ltda Brazil E 29CHANGCHUN FAURECIA XUYANG AUTOMOTIVE COMPONENTS TECHNOLOGIES R&D COMPANY LIMITED China E 26CHANGCHUN HUAXIANG F.A. PLASTIC China E 29DONGGUAN CSM FAURECIA AUTOMOTIVE SYSTEMS COMPANY LIMITED China E 29JINAN FAURECIA LIMIN INTERIOR & EXTERIOR SYSTEMS CO. China E 29LANZHOU FAURECIA LIMIN INTERIOR & EXTERIOR SYSTEMS CO. China E 29SAS (Wuhu) Automotive Systems Co. Ltd, Wuhu City, China China E 29XIANGTAN FAURECIA. LIMIN INTERIOR & EXTERIOR SYSTEMS China E 29ZEIJIANG FAURECIA. LIMIN INTERIOR & EXTERIOR SYSTEMS China E 29SAS Autosystemtechnik s.r.o. Czech Republic E 29AMMINEX EMISSIONS SYSTEMS APS France E 24CHANGCHUN XUYANG FAURECIA ACOUSTICS & SOFT TRIM CO.LTD France E 23COCKPIT AUTOMOTIVE SYSTEMS DOUAI SNC France E 29SAS AUTOMOTIVE France France E 29SAS AUTOSYSTEMTECHNIK GmbH und Co. KG Germany E 29SAS AUTOSYSTEMTECHNIK VERWALTUNGS GmbH Germany E 29FAURECIA-NHK Co., Ltd Japan E 29SAS Automotive Systems & Services, S.A. DE C.V. Mexico E 29SAS Automotive Systems S.A. de C.V. Mexico E 29SAS Autosystemtechnik de Portugal, Unipessoal, Lda. Portugal E 29VANPRO ASSENTOS LIMITADA Portugal E 29SAS Automotive s.r.o Slovakia E 29AD Tech Co Ltd South Korea E 29KWANG JIN FAURECIA Co. Limited South Korea E 29COMPONENTES DE VEHICULOS DE GALICIA, S.A. Spain E 29COPO IBERICA, S.A. Spain E 29SAS Autosystemstechnick, S.A. Spain E 29ORCIA OTOMOTIV Yan Sanayi Ve Ticaret Anonim Sirketi Turkey E 29
TEKNIK MALZEME Ticaret Ve Sanayi A.S. Turkey E 29FAURECIA JV IN DETROIT USA E 26SAS Automotive USA, inc. USA E 29
FINANCEMENT ET ASSURANCES
BANQUE PSA FINANCE France I 100BPF ALGERIE Algeria I 100PSA FINANCE ARGENTINA S.A. Argentina I 50PSA FINANCE BELUX Belgium I 100BANCO PSA FINANCE BRASIL S.A. Brazil I 100FOND D'INVESTISSEMENT EN DROITS DE CREANCES Brazil I 100PSA FINANCE ARRENDAMIENTO COMERCIAL Brazil I 100PSA FINANCIAL Doo Croatia I 100PSA FINANCE CESKA REPUBLIKA s.r.o. Czech Republic I 100BPF - Auto ABS FCT2 2013-A (FONDS A) France I 100BPF - FCT Auto ABS - Compartiment 2012-3 France I 100BPF - FCT Auto ABS - Compartiment 2012-7 France I 100BPF - FCT Auto ABS - Compartiment 2013-2 France I 100COMPAGNIE GENERALE DE CREDIT AUX PARTICULIERS - CREDIPAR France I 100COMPAGNIE POUR LA LOCATION DE VEHICULES - CLV France I 100FCC AUTO ABS - Compartiment 2011.01 France I 100FCC AUTO ABS - Compartiment 2012-01 France I 100FCC AUTO ABS - Compartiment 2012-02 France I 100FCT AUTO ABS - Compartiment 2010-1 France I 100PSA ASSURANCES SAS France I 100SOCIETE FINANCIERE DE BANQUE - SOFIB France I 100SOFIRA - SOCIETE DE FINANCEMENT DES RESEAUX AUTOMOBILES France I 100BPF - Auto ABS DFT Master Compartment Germany 2013 Germany I 100BPF - Auto ABS German Lease Master Germany I 100BPF - Auto ABS German Loans Master Germany I 100BPF - FCT Auto ABS - Compartiment 2013-1 Germany I 100FCT Auto ABS German loans - Compartiment 2011-2 Germany I 100PSA FINANCE HUNGARIA Rt Hungary I 100PSA FACTOR ITALIA S.p.A. Italy I 100PSA RENTING ITALIA S.p.A. Italy I 100
Company Country F/E %

interest
PSA FINANCE SCS Luxembourg I 100PSA INSURANCE LTD Malta I 100PSA LIFE INSURANCE LTD Malta I 100PSA SERVICES LTD Malta I 100BPF MEXICO S.A. DE CV Mexico I 100PSA FINANCE POLSKA Poland I 100PSA GESTAO COMERCIO E ALUGER DE VEICULOS Portugal I 100BANK PSA FINANCE RUS Russia I 100PSA FINANCE SLOVAKIA s.r.o. Slovakia I 100BPF FINANCIRANJE D.o.o. Slovenia I 50BPF - FCT Auto ABS - Compartiment 2012-5 Spain I 100BPF - Auto ABS Swiss Lease 2013 GmbH Switzerland I 100PSA FINANCE SUISSE S.A. Switzerland I 100PEUGEOT FINANCE INTERNATIONAL N.V. The Netherlands I 100PSA FINANCE NEDERLAND B.V. The Netherlands I 100PSA FINANCIAL HOLDING B.V. The Netherlands I 100BPF PAZARLAMA A.H.A.S. Turkey I 100BPF - Auto ABS UK Loans PLC - Compartiment 2012-5 United Kingdom I 100PSA WHOLESALE Ltd United Kingdom I 100VERNON WHOLESALE INVESTMENTS CO Ltd United Kingdom I 100DONGFENG PEUGEOT CITROEN AUTOMOBILE FINANCE COMPANY China E 50Dont 12,5% via Dongfeng Peugeot Citroën Automobile
PSA PEUGEOT CITROËN 2013 Annual Results - 139

IV. STATUTORY AUDITORS’ REPORT ON THE CONSOLIDATED FINANCIAL STATEMENTS
To the Shareholders,
In compliance with the assignment entrusted to us by your annual general meeting, we hereby report to you, for the year ended December 31, 2013, on:
• the audit of the accompanying consolidated financial statements of Peugeot S.A.;
• the justification of our assessments;
• the specific verification required by law.
These consolidated financial statements have been approved by the Managing Board. Our role is to express an opinion on these consolidated financial statements based on our audit.
I. Opinion on the consolidated financial statements
We conducted our audit in accordance with professional standards applicable in France; those standards require that we plan and perform the audit to obtain reasonable assurance about whether the consolidated financial statements are free of material misstatement. An audit involves performing procedures, using sampling techniques or other methods of selection, to obtain audit evidence about the amounts and disclosures in the consolidated financial statements. An audit also includes evaluating the appropriateness of accounting policies used and the reasonableness of accounting estimates made, as well as the overall presentation of the consolidated financial statements. We believe that the audit evidence we have obtained is sufficient and appropriate to provide a basis for our audit opinion.
In our opinion, the consolidated financial statements give a true and fair view of the assets and liabilities and of the financial position of the group as at December 31, 2013 and of the results of its operations for the year then ended in accordance with International Financial Reporting Standards as adopted by the European Union.
Without qualifying our opinion, given the context of the group's economic and financial environment as described in the group’s management report, we draw your attention to the following notes to the consolidated financial statements:
• note 2.4 on significant estimates and assumptions which specifies the accounts for which estimates and assumptions used are particularly sensitive;
• note 9.1 on the impairment test on the assets of the automotive segment which leads to the recognition of an impairment for an amount of €1,009m. This note indicates that the tests have been performed based on a medium-term plan for which the funding arrangements had not been finalized as at December 31, 2013. It further indicates that the Group is confident in its ability to implement the corresponding funding;
• note 40 on subsequent events. It indicates, in particular, that the Managing Board and the Supervisory Board decided, on February 18, 2014, to submit a capital increase of € 3 billion to the next Shareholders’ meeting. It specifies that this capital increase is aimed at financing among others the current medium-term plan of the Group and revitalizing its development;
• note 36 which sets out the Group's and Banque PSA Finance's liquidity position;
• note 3 which sets out the impact of the first application of IAS 19 (revised) concerning employee benefits.
II. Justification of our assessments
In accordance with the requirements of article L. 823-9 of the French Commercial Code (Code de commerce) relating to the justification of our assessments, we bring to your attention the following matters:
• The preparation of the consolidated financial statements requires your company to make estimates and assumptions regarding the valuation of certain assets, liabilities, income and expenses, the most significant of which are outlined in note 2.4 to the consolidated financial statements “Accounting principles – Use of Estimates and Assumptions.” For all of these matters, we examined the appropriateness of the accounting rules and methods used and the information given in the notes to the financial statements. In addition, we examined the consistency of the assumptions used, their translation into figures, and the available documentation, and on that basis we assessed the reasonableness of the estimates made.
• Note 2.15 to the consolidated financial statements "Accounting Principles – Impairment of Long-Lived Assets" describes the accounting methods and assumptions used for impairment tests. According to note 9.1 “Impairment

Loss on Automotive Division CGUs and Provisions for Automotive Division Onerous Contracts”, impairment tests led to the recognition of an impairment on the Latin American and Russian plants for €1,009m. We verified that the impairment tests were carried out correctly, we verified the reasonableness of the underlying estimates and assumptions, we reviewed the calculations which led to the recognition of the impairment and we verified that the notes mentioned above provide relevant information. We also examined the funding arrangements for the medium-term plan contemplated by management and described in note 40 “Subsequent events.”
• As indicated in note 2.19 "Accounting Principles – Deferred Taxes", deferred tax assets and liabilities are accounted for in the statement of financial position as set forth in note 12 “Income tax”. This note indicates amongst other things that, in the absence of any prospect of recovery within the medium-term plan period, tax-loss carry forwards relating to the French tax consolidation generated over the year have not been recognized. We examined the group's tax forecasts, deferred tax assets and liabilities timelines and the consistency of overall assumptions used for this depreciation.
• Within the context of our assessment of the continuity of the company as a going concern, we made an in-depth review of the liquidity position of the group and of Banque PSA Finance detailed in note 31 “Current And Non-Current Financial Liabilities – Manufacturing And Sales Companies”, note 32 ”Financing Liabilities – Finance Companies” and note 36.1 A “Management of Financial Risks – Financial Risk Management Policy – Liquidity Risk”. We notably reviewed the cash flow forecasts, the debt schedules, the covenants applicable to them, and the provisions relating to the State guarantee for the refinancing of Banque PSA Finance.
These assessments were made as part of our audit of the consolidated financial statements taken as a whole, and therefore contributed to the opinion we formed which is expressed in the first part of this report.
III. Specific verification
As required by law we have also verified, in accordance with professional standards applicable in France, the information presented in the group’s management report.
We have no matters to report as to its fair presentation and its consistency with the consolidated financial statements.
Courbevoie and Paris-La Défense, February 19, 2014
The statutory auditors French original signed by
MAZARS ERNST & YOUNG et Autres
Loïc Wallaert Jean-Louis Simon Christian Mouillon Marc Stoessel
PSA PEUGEOT CITROËN 2013 Annual Results - 141


PSA PEUGEOT CITROËN 2013 Annual Results - 143


This document was printed in France by an Imprim’ Vert
certified printer on recyclable, chlorine-free and PEFC
certifi ed paper produced from sustainably managed forests.
PEUGEOT S.A.Incorporated in France with issued capital of €354,848,992
Governed by a Managing Board and a Supervisory BoardRegistered Offi ce: 75, avenue de la Grande-Armée
75116 Paris – FranceR.C.S. Paris B 552 100 554 – Siret 55 2 100 554 00021
Phone: + 33 (0)1 40 66 55 11 – Fax: + 33 (0)1 40 66 54 14psa-peugeot-citroen.com
Cove
r: H
ead-
up d
ispl
ay. P
hoto
cre
dit:
F. C
amuz
at. C
reat
ion: