ANNUAL RESULTS ANNOUNCEMENT final - … Results Announcement Year ended 17 September 2011 2 For...
35
1 For release 8 November 2011 ASSOCIATED BRITISH FOODS plc Annual Results Announcement Year ended 17 September 2011
-
Upload
truongkhue -
Category
Documents
-
view
217 -
download
0
Transcript of ANNUAL RESULTS ANNOUNCEMENT final - … Results Announcement Year ended 17 September 2011 2 For...

1
For release 8 November 2011
ASSOCIATED BRITISH FOODS plc
Annual Results Announcement
Year ended 17 September 2011

2
For release 8 November 2011
Associated British Foods plc results for 52 weeks ended 17 September 2011
Another year of progress for ABF
Financial Highlights • Group revenue up 9% to £11.1bn
• Adjusted operating profit up 1% to £920m*
• Adjusted profit before tax up 1% to £835m**
• Adjusted earnings per share up 2% to 74.0p**
• Dividends per share up 4% to 24.75p
• Net capital investment of £825m
• Net debt of £1,285m
• Operating profit up 3% to £842m, profit before tax down 1% to £757m and basic earnings per share down 1% to 68.7p. Last year included a profit of £28m on disposal of businesses, principally the Polish sugar operation.
George Weston, Chief Executive of Associated British Foods, said: “These results reflect another year of progress for the group. Operating profit improved as our businesses overcame the challenges of high commodity cost inflation and weaker consumer demand. Further substantial investment saw the completion of a number of major capital projects and a sizeable increase in the Primark estate. Opportunities for further investment are exciting, particularly in Primark, and the strength of the group balance sheet and a strong cash flow will enable us to pursue them with confidence.” * before amortisation of non-operating intangibles and profits less losses on disposal of non-
current assets ** before amortisation of non-operating intangibles, profits less losses on disposal of non-current
assets, and profits less losses on the sale and closure of businesses All adjustments to profit measures are shown on the face of the consolidated income
statement. These results are presented for the 52 week period ended 17 September 2011. Prior year
results were for the 53 week period ended 18 September 2010. On a comparable basis adjusted operating profit was 3% ahead of last year.
For further information please contact:
Associated British Foods: Until 15.00 only John Bason, Finance Director Tel: 020 7638 9571
Chris Barrie/Nicola Swift/ Kate Lehane, Citigate Dewe Rogerson Tel: 020 7638 9571 Jonathan Clare Tel: 07770 321881
After 15.00 John Bason, Finance Director Tel: 020 7399 6500

3
Notes to Editors Associated British Foods is a diversified international food, ingredients and retail group with sales of £11.1bn and 102,000 employees in 46 countries. It has significant businesses in Europe, southern Africa, the Americas, China and Australia. Our aim is to achieve strong, sustainable leadership positions in markets that offer potential for profitable growth. We look to achieve this through a combination of growth of existing businesses, acquisition of complementary new businesses and achievement of high levels of operating efficiency.

4
ASSOCIATED BRITISH FOODS plc ANNUAL RESULTS ANNOUNCEMENT FOR THE 52 WEEKS ENDED 17 SEPTEMBER 2011
For release 8 November 2011 CHAIRMAN'S STATEMENT A year ago we could not have foreseen the extraordinary world events that would unfold, or the impact that they would have on even the most stable economies. That the group has been able to deliver 9% sales growth and adjusted earnings per share 2% ahead of last year’s 53 week period is testament to the strength of our businesses and the exceptional efforts made by our employees. Substantial inflation in commodity costs during the year, particularly cotton, wheat, vegetable oil, molasses and energy, presented our businesses with challenges. The impact on margins in Grocery was mitigated in most part through price increases and by extensive management action to drive efficiencies through reduced energy consumption, reformulated recipes and packaging, and better distribution. Primark’s determination to offer the best value clothing on the high street led to its decision not to pass on the full effect of cost increases to customers and understandably this reduced margins. Competitive pressures prevented AB Mauri from recovering its higher costs in Europe and the US. Some businesses benefited from high prices and volatile markets however. World sugar prices have been at 30-year highs for most of the year, enabling AB Sugar to deliver a record profit and more than offset the higher costs associated with weather related production shortfalls in the UK and Africa. Volatile wheat prices throughout the year created exceptional grain trading opportunities for Frontier which, together with growth in speciality feeds and nutrition, contributed to AB Agri also delivering a record profit. The last few years have seen intensive capital investment in the food businesses with a number of new and expanded factories already in production which are expected to deliver improved profitability in the coming year. 2012 will see completion of two of the group’s most ambitious investments to date: the new meat factory in Castlemaine near Melbourne in Australia and Vivergo’s wheat bioethanol plant being constructed in Hull. We expect this level of investment to moderate and, in the near term, a greater proportion of our expenditure will therefore be on new stores for Primark. Cash flow from operations will strengthen further as a consequence. Governance Corporate governance has continued to evolve over the past year and emerging practice has remained a regular subject for discussion at the board. We have always sought to run our business in a responsible way, recognising that good corporate governance supports the long-term health of the group. The board also recognises the importance of its stewardship responsibilities including its role in setting the values which underpin our group culture. Our governance reporting obligations are defined by the updated Combined Code, renamed in June 2010 as the UK Corporate Governance Code. We fully support the new Code and the direction in which it is taking the practice of good governance in the UK and, in particular, the emphasis placed on the board’s responsibility for providing the leadership necessary for long-term success. I am also mindful of my personal responsibility as Chairman to lead the board and to ensure that it is working effectively. This year’s board evaluation process was undertaken with the Financial Reporting Council’s guidance on board effectiveness very much in mind and we took a close look at how we might develop further. The new Code also prompted us to re-examine our governance procedures including a review of the matters reserved to the board and the terms of reference of its committees. We have followed the debate on the annual election of directors with interest and will be adopting this practice, with all of our directors standing for re-election at this year’s annual general meeting.

5
Diversity We very much welcome the publication, in February, of the Davies Review of Women on Boards. We recognise the benefits of diversity throughout the business, including gender diversity, and we employ many senior female managers across the group including, importantly, in operational areas. The issue of gender diversity at board level is of unanimous concern and was a specific issue considered during this year’s board evaluation process. Both as a business and a board, we will continue to appoint on merit but it has now been agreed with the Nominations committee that we will ask executive search agencies to ensure that half of the candidates they put forward are women. We have a gender diversity task force with representation from across the group’s businesses, the aims of which are to increase the visibility of, and opportunities for, women at all levels of seniority, and to encourage them in their development. Interim report For a number of years the Company has not been required to issue a printed copy of its interim results but has chosen to do so for the convenience of those shareholders who do not have easy access to the internet. It is clear that this practice is now out of step with the vast majority of leading FTSE companies and therefore, from 2012 onwards, a hard copy of the interim results will no longer be sent to shareholders. Our results will be disseminated to the stock market by way of a Stock Exchange announcement and will be published on the Company’s website (www.abf.co.uk). A hard copy of the announcement will be made available upon request to the Company Secretary’s office. Directorate After 47 years as a director on our board, Galen Weston has decided that he does not wish to stand for re-election at the forthcoming annual general meeting. When he joined the board in 1964, serving under his father Garfield, the group’s revenues were £260m and profit after tax was £8m, derived largely from milling and baking operations in the UK, Australasia and South Africa. During a remarkable period in the group’s evolution Galen has provided sound guidance and support, and his contribution has been greatly valued. Employees Good results, and especially those achieved in difficult trading conditions, are not delivered by chance. They are the consequence of the hard work and enterprise of our employees who, for the first time, exceed 100,000 in number this year. On behalf of shareholders, I thank them all for their efforts and the success they have achieved in the past year. Dividends A final dividend of 16.85p is proposed, to be paid on 13 January 2012 to shareholders on the register on 9 December 2011. Together with the interim dividend of 7.9p paid on 8 July 2011, this will make a total of 24.75p for the year, an increase of 4%. Outlook The outlook for economic growth in developed economies around the world is subdued and we believe will remain so in the medium term. We expect continued pressure on consumer disposable incomes. However, commodity costs appear to be subsiding although the effect of forward purchasing means that the benefit to the group will not be felt immediately and, in the case of Primark, not until the beginning of the new calendar year. Improved sugar pricing is expected to benefit AB Sugar in the coming year and

6
we have made a good start to this year’s production campaigns in the northern hemisphere. The group is also expected to benefit from the returns on recently completed capital investments. As a result we expect growth in sales and adjusted operating profit in the coming year, with the profit improvement weighted towards the second half. Charles Sinclair Chairman

7
OPERATING REVIEW This was another year of progress for the group. Revenue increased by 9% to £11.1bn and adjusted operating profit was 1% ahead of last year at £920m. These results were achieved in a difficult trading environment which was characterised by substantial increases in many of our commodity costs and a weakening of consumer demand in developed markets as disposable incomes reduced. There were a number of highlights this year. AB Sugar achieved a significant improvement in profit driven by our Chinese and Iberian businesses and AB Agri had another record year. In Grocery, Twinings and Ovaltine achieved excellent revenue growth and Jordans Ryvita and AB World Foods delivered on the investment in recent years with growth and much improved margins. Like-for-like sales growth at Primark was notable when most of its high street competitors showed a decline. Our investment across the group was substantial this year with a number of projects completed or expected to complete next year. We have made a major investment in our sugar businesses in recent years with the acquisition of Azucarera in Iberia, the development of our presence in China in both cane and beet sugar and capacity expansions in Illovo. It is pleasing to report the growth in profit for this group, now named AB Sugar, driven by our investment in Azucarera and in China. In the UK, British Sugar worked hard to meet its supply obligations, albeit at some cost, after the production shortfall arising from the effects of the harsh winter on the beet crop. Looking ahead the combination of an increase in production, a further improvement in our operations and higher sugar prices are expected to benefit our business. Grocery’s major challenge during the year was the mitigation of the effects of rising commodity costs and consumers seeking ever better value. All of our businesses improved their consumer offering and management has delivered on investments made in recent years, contained costs and achieved price increases. The reported reduction in profitability in Australia was, however, a major disappointment. To address this, we have appointed a new management team and a programme of cost reduction and the full commissioning of the meat factory will be their focus for the coming year. Our increased investment in Primark this year demonstrates our commitment to support the continued growth of this business. Much attention has been paid to the effects of the increase in input costs, especially cotton, during the year. The decision to maintain our value position on the high street, even at the expense of margin, has proven to be successful and the achievement of like-for-like sales growth of 3% and growth in market share in a challenged consumer environment is a demonstration of this. Some of these cost pressures are now reducing. Our experience in continental Europe continues to be encouraging both in terms of strong consumer demand and selling space expansion and gives us confidence for future growth. The combination of higher input costs and increased competition for yeast in some parts of the world contributed to a decline in margin for Ingredients. We remain committed to our investment in building capacity, with new factories being constructed in China and Mexico, and in developing a sharper and more differentiated offering for both yeast and bakery ingredients. Profit improvement is expected as molasses costs begin to subside in some of our markets. Net capital investment in the group was £825m this year which included a much higher level of expenditure for Primark on new stores, and on the refit and extension of existing stores, as we increased the retail selling space by 12% on what has become a substantial estate. Our development in continental Europe gathered pace and there was a 10% increase in the UK. Elsewhere we completed major projects for yeast at Harbin in China, an increase in sugar capacity in Swaziland and in efficient production at Allied Bakeries. In the coming financial year we will see the completion of the Vivergo bioethanol plant in Hull and of the commissioning of the meat factory at Castlemaine in Australia. Looking forward investment in Primark is expected to continue at least at these levels but with some reduction in the level of expenditure in the rest of the group.
8
SUGAR 2011 2010 change Revenue £m 2,134 1,941 +10% Adjusted operating profit £m 315 240 +31% Adjusted operating profit margin 14.8% 12.4% Return on average capital employed 17.3% 14.0% AB Sugar is a leading multinational in the growing market for sugar and sugar derived products and co-products. In the EU, Azucarera is the major producer in Iberia and British Sugar is the sole processor of the UK sugar beet crop and Europe’s most efficient producer. Illovo is the largest sugar processor in Africa and is one of the world’s foremost low-cost producers. The group has substantial businesses in China with cane sugar in the south and beet sugar in the north east. The group currently operates 34 plants in ten countries and will be capable, next year, of producing some 5 million tonnes of sugar and 600 million litres of ethanol, including potable alcohol. It will also have the capacity to generate power sufficient to meet most of its internal needs. AB Sugar aims to achieve growth through excellence in agriculture and operations, the application of new technologies for the sustainable processing of beet and cane, and the further development of co-products. The group performed very well this year with revenue ahead by 10%, operating profit up 31% and an increase in margin to 14.8%. This was achieved with a significant increase in Chinese beet sugar production, an improvement in Iberia and the benefit of strong world prices. However, it was affected by weather-related poor harvests in South Africa, southern China and the UK. In the UK, the profit of British Sugar reflected the impact of the crop shortfall resulting from the frost damage sustained during the severe weather last winter. The decision was taken to meet all customer requirements, despite the very tight market, using a combination of destocking, additional in-house refining and supplementary supplies secured from third parties at high cost. Despite the very poor quality of beet at the end of the campaign, operational innovation by the business enabled just under 1.0 million tonnes of sugar to be produced. To prioritise sugar availability, bioethanol production was ended prematurely after all existing supply contracts had been fulfilled. These actions came at significant additional cost, a proportion of which was recovered through a mid-year price increase. A number of capital projects continued at the Wissington sugar factory during the year. Expansion of the glasshouse adjacent to the factory, by 70% to 18 hectares, was completed on time and on budget. This uses waste heat and CO2 from the sugar factory and production has risen to 140 million tomatoes annually. Construction, in conjunction with Air Liquide, of the CO2 liquefaction plant at the bioethanol facility is almost complete and will be commissioned in January. A planning application was submitted in mid August, as part of a feasibility study, for a renewable-energy facility which would provide 25% of the factory’s energy needs from anaerobic digestion of sugar beet pulp. Following delays caused by contractor performance issues, construction activity recommenced at Vivergo’s bioethanol plant in Hull. The plant, which will produce up to 420 million litres of bioethanol and up to 500,000 tonnes of high-protein, high-fibre animal feed, is now scheduled to be operational in spring 2012. In Iberia, Azucarera delivered a much improved performance. Beet campaigns in both the north and south of Spain progressed well and output totalled 410,000 tonnes of beet sugar against a quota of 378,000 tonnes. In addition, the Guadalete refinery substantially increased its output, processing 248,000 tonnes of cane sugar compared with 145,000 tonnes in the previous year. The refinery’s 15MW combined heat and power plant is now successfully exporting power to Spain’s national grid. The high world sugar price resulted in a shortfall of raw sugar imports into the EU leaving the market in deficit. In an attempt to overcome this, the European Commission supplemented volumes with two tranches of tariff-free sugar imports and the conversion of some industrial sugar to quota sugar. Despite this, EU stocks are forecast to remain low and prices to remain firm in the coming year.

9
The terms of the current EU sugar regime will continue unchanged until September 2015. The European Commission has recently published its proposals for reform in 2015 which include the abolition of internal production quotas for sugar. These proposals and alternatives will be discussed over the coming months by the European Council of Ministers and the European Parliament and will be subject to consultation with relevant stakeholders. The tariffs for sugar imports into the EU are not affected by these proposals. At Illovo, profit in the second half was ahead of last year but the result for the year as a whole fell short of the previous year affected by lower volumes, especially in South Africa, and by the strength of the rand. Local and regional prices rose in response to world market pressures and export prices to the EU improved. Production in our financial year totalled 1.6 million tonnes, down from 1.8 million tonnes last year, driven by the drought-affected South African crop. In Zambia, the new season is progressing well with the expanded factory performing at capacity. In Swaziland, the major factory expansion and power co-generation project at Ubombo was commissioned in April 2011. Over the longer term this will allow the factory to produce an additional 100,000 tonnes of sugar each year. The plant also generates enough electricity from renewable sources to cover all of the mill’s power needs, with any surplus being commercially exported into the Swaziland national grid. In South Africa, the expansion of the Noodsberg refinery was also completed, increasing capacity by 20% to 350,000 tonnes. In Tanzania, irrigation expansion and drainage improvement schemes aimed at increasing cane yields continued. Revenue and profit in our Chinese sugar businesses built on last year’s improvements and were substantially ahead reflecting both higher prices and volumes. Beet sugar production doubled to 210,000 tonnes with the benefit of the ongoing and intensive work with growers to increase mechanisation, fertiliser and chemical use, and improve irrigation and harvesting practices. In the south, sugar production of 415,000 tonnes was held back by unfavourable weather conditions which reduced the sucrose levels in the cane. However, the Chinese sugar price was firm during the year, rising in line with the increases in the world market price during the latter part of 2010, and then remaining relatively steady. Relocation of the Zhangbei beet sugar factory, from its original site which was redesignated by local government for alternative use, has commenced and is making good progress. The relocation is due to be completed for the 2012/13 campaign. AGRICULTURE 2011 2010 change Revenue £m 1,127 954 +18% Adjusted operating profit £m 40 33 +21% Adjusted operating profit margin 3.5% 3.5% Return on average capital employed 19.0% 18.1% AB Agri procures grain and oilseeds from farmers and co-products from the food, drink and bioethanol industries. It manufactures and sells animal feeds and premixes to farmers and micro ingredients to farmers and feed manufacturers. It also provides agronomy advice and crop inputs. In the UK, AB Agri sells services to the food supply chain, from farmer to retailer, aimed at product differentiation, efficiency and sustainability. It has facilities in the UK and China and markets products in 55 countries worldwide. Investments made in recent years, in new technologies, products and emerging markets, particularly for animal feed enzymes and premixes, are now developing into substantial businesses and will provide opportunities for more growth in the medium term. Revenues were 18% ahead with growth achieved in all sectors, driven by commodity price increases in UK feed and strong development of feed enzymes, speciality feeds and nutrition. This growth, together with an excellent performance from Frontier, drove operating profit up 21% on last year. UK feed revenues and profit both grew, benefiting from the long-term relationships developed with major customers. This was achieved despite a difficult year for the UK livestock industry which experienced one of the worst winters on record and agricultural commodities showing extremes in both the overall high level and in day-to-day volatility of cereal prices. At Premier Nutrition, sales of pig starter feeds and premixes continued to grow strongly, particularly in Eastern Europe and Russia. Expansion of the premix factory at Rugeley is progressing to plan and will come on stream next autumn. AB Vista

10
achieved strong revenue growth and significant market share gains in feed enzymes, and sales in the US benefited from the regulatory approval of our new Quantum TR product in March 2011. Good feed volume growth was achieved in China, as higher prices for pigs, eggs and milk led to increased farm incomes and a greater enthusiasm for agricultural investment. This market is nonetheless challenging, particularly with high raw material commodity prices driving up the cost base. At Frontier, firm wheat prices and high volatility throughout the year created exceptional grain trading opportunities with record volumes purchased and traded. High crop prices underpinned good farm profitability resulting in strong growth in fertiliser and seed sales, and increased usage by farmers of crop protection products. RETAIL 2011 2010* % change Revenue £m 3,043 2,682 +13% Adjusted operating profit £m 309 335 -8% Adjusted operating profit margin 10.2% 12.5% Return on average capital employed 18.2% 23.5% * 52 week basis Primark is a major clothing retailer employing 36,000 people across the UK, Ireland, Spain, Portugal, Germany, the Netherlands and Belgium. It offers customers high-quality, up-to-the-minute fashion at value for money prices. Over the last ten years we have doubled the number of stores, quadrupled the retail square footage and profit has increased by almost five times. We see substantial opportunities for further growth in selling space in those countries where we currently operate. Adjusting 2010 on to a comparable 52 week basis, revenue was 13% ahead of last year. We achieved like-for-like sales growth of 3% driven by a strong performance in continental Europe and some growth in the UK and Ireland. This was achieved against a background of weaker consumer demand reflecting a reduction in disposable incomes, particularly in the UK. Profit on the adjusted basis was 8% lower than last year reflecting the decision to absorb some of the margin pressure caused by high cotton prices and the increase in VAT in the UK. By not increasing prices to recover all of its cost inflation, Primark chose to forfeit increased profitability for the support of its loyal customer base and maintained its position as offering the best value on the high street. Revenue and adjusted operating profit for 2010 on a 53 week reported basis and, as shown in the segmental analysis in note 1, were £2,730m and £341m respectively. Primark continued to strengthen its ethical trade programme this year with a focus on seeking improvements in workers’ rights within individual workplaces and more widely across the industry. We conducted 1,266 audits in the last calendar year, and ethical trade training is given to every new Primark employee. The ethical trade team based in the key sourcing regions was further expanded to increase our capability to work on delivering sustainable improvements in our supply chain. We share more than 98% of the factories we use with other high street brands and, in collaboration with other retailers and non-governmental organisations, we seek to address the challenges of the industry. During the year our store design evolved to provide a more contemporary shopping experience with an improved layout, enhanced merchandising, more fashionable shop windows and customer-friendly navigational signage. This was showcased at the recent openings of stores in Dortmund, Germany and Stratford City in London in September. Store expansion in this financial year was very strong with 19 stores and 0.8 million sq ft of selling space added. 11 new stores were opened in the UK, three in Spain including two stores in the Canary Islands, two in each of Portugal and Germany and one in the Netherlands. This brings the total number of stores to 223 at the year end and, having also completed a number of store extensions, we were trading from 7.3 million sq ft of selling space.

11
UK Republic of
Ireland Iberia
Northern Continental
Europe Total
sq ft ‘000
stores sq ft ‘000
stores sq ft ‘000
stores sq ft ‘000
stores sq ft ‘000
stores
Sept 2010
4,720 143 1,010 38 570 19 180 4 6,480 204
Change in year
470 11 - - 190 5 140 3
800 19
Sept 2011
5,190 154 1,010 38 760 24 320 7 7,280 223
+10% - +33% +78% +12%
The momentum of our store opening programme continues into the new financial year. Since the year end we have already opened in Braga Parque in northern Portugal, Malaga in Spain and Hannover in Germany which, at 94,000 sq ft, is our largest store outside the UK. Highlights later in the year will include a 75,000 sq ft store on Princes Street in Edinburgh, scheduled to open just before Christmas, our second store on London’s Oxford Street adding a further 80,000 sq ft next summer and our first store in Berlin. We are continually working to secure new stores in each of the countries in which we operate. We have made further investment to improve the efficiency, and increase the capacity, of our logistics network. The new warehouse in Naas, Ireland is fully operational. The warehouse at Torija, Spain was doubled in size and is now capable of handling garments shipped on hangers. Plans are being developed for a new distribution centre in northern continental Europe to service our fast developing presence there. New store openings: El Mirador, Las Palmas (Spain) Hoofdorp (The Netherlands) Scunthorpe (UK) Las Arenas, Las Palmas (Spain) Bournemouth (UK) Stockport (UK) La Coruna (Spain) Cwmbran (UK) Stratford City (UK) Forum Sintra, Lisbon (Portugal) Harrogate (UK) Winchester (UK) Portimao (Portugal) Ilford (UK) Worcester (UK) Dortmund (Germany) Kings Lynn (UK) Gelsenkirchen (Germany) Perth (UK) Relocations: Yeovil (UK)
GROCERY 2011 2010 % change Revenue £m 3,638 3,406 +7% Adjusted operating profit £m 249 229 +9% Adjusted operating profit margin 6.8% 6.7% Return on average capital employed 17.6% 19.7%
Grocery comprises our businesses that manufacture and market a variety of grocery brands, many of which hold leading positions, both nationally and internationally. Revenue increased by 7%, adjusted operating profit was 9% ahead and margin improved slightly to 6.8%. The growth in profit was driven by strong performances from Twinings, Ovaltine and our UK grocery businesses, and benefited from a lower charge for restructuring. The trading performance at George Weston Foods in Australia was disappointing. The average level of capital employed increased by 22% reflecting higher working capital, driven by higher commodity costs, and by capital investment in our production facilities to improve the

12
efficiency of our operations and expand capacity. Return on average capital employed fell as a result but some of the investment has still to deliver benefits. Twinings achieved strong sales growth especially in the important markets of the UK, the US and Australia. A programme of sustained improvement in products and packaging continued throughout the year in many markets. Capacity expansion at our factory in China is complete and the new tea plant in Poland is now fully operational with both factories supplying our international markets and the Andover facility now dedicated to UK supply. Twinings was again the fastest growing tea brand in the US and we increased our market share in Australia. Ovaltine also achieved strong sales growth driven again by its developing markets. In Brazil, we supported the powder business with a successful television advertising campaign and we recently launched into the ready-to-drink segment. We delivered strong growth and maintained our market-leading position in Thailand despite increased competitor pressure. In the UK, Allied Bakeries traded well with success for Kingsmill bakery snacks and rolls, and strong growth in the 50/50 range which was extended into sandwich alternatives including wraps and pitta pockets. The brand was supported by a strong advertising and marketing programme. Increased in-store promotion supported Burgen which introduced a new product line and Allinson continued to lead the premium wholemeal sector with a relaunch in August. Margins tightened, however, with the higher level of promotional expenditure and an extremely competitive market. Major progress was made with the capital programme to improve manufacturing efficiency and upgrade product quality. An extensive upgrade to the West Bromwich bakery was completed with a new bulk handling system, warehouse extension and improved site access. Roll production was consolidated there when the new plant came on stream, as planned, in March. Installation of a new bread plant and bulk handling system in Glasgow was completed during the summer and production is building following successful commissioning. For the third year running Allied Bakeries was named the Branded Bakery Supplier of the Year by The Grocer magazine. Jordans Ryvita had a very successful year with good sales growth across the range and a substantial improvement in margin. Growth of Ryvita was achieved by a combination of very successful crispbread advertising and the launch of new products. Jordans benefited from advertising on Country Crisp and Frusli together with the introduction of new products in the range. International revenues increased substantially with the launch of Country Crisp in the Benelux countries and strong growth of Ryvita in Australia, Norway and South Africa. Elsewhere in the UK, Silver Spoon performed well despite significant cost inflation. Granulated sugar for domestic use continued to decline but was offset by further growth in caster and icing sugars for home baking and substantial volume growth for the Billington’s and Allinson brands. Westmill’s performance was weak, affected by declines in the Chinese and Indian restaurant trade in the UK and strong price-based competition in branded rice where profitability was defended through effective buying and strong action on supply chain costs. AB World Foods made good progress in a competitive trading environment and recovered higher commodity costs through price increases. Blue Dragon was relaunched in the year with new products and packaging, and Patak’s continued to grow, particularly in its international trade. At ACH in the US and Mexico, price increases were implemented in the first half to recover higher commodity costs, particularly in vegetable oil and spices. Commodity costs continued to rise and, with consumers increasingly looking for value, further price increases became difficult to realise and margins were compressed in the second half. Stratas made good progress in streamlining its operations and reducing overheads with a resultant improvement in profit. Difficult trading conditions for George Weston Foods in Australia led to lower revenues and a substantial reduction in profitability. Much greater promotional price activity on everyday staples by the major supermarkets has had a significant impact on a number of categories and supplier margins have been reduced as a consequence. Our Australian bakery business was particularly affected and also saw a switch to lower margin, private-label and in-store bakery bread. The floods in Queensland in January severely damaged our flour mill at Moorooka. Alternative sources of supply for the local market were quickly secured and the plant resumed full operation by the end of the financial year. The cost of restoration is included in the group’s central costs. Our New Zealand bakery business continued to perform well with strong sales growth, primarily due to the launch of Ploughman’s, a premium bread, and

13
despite the challenges of the Christchurch earthquakes. The meat business was also impacted by retailer price competition with a higher proportion of sales being subject to promotional discounts. Commissioning of the new factory at Castlemaine, Victoria is progressing, albeit at a higher cost than expected, and the old plant in Melbourne was closed in August. In the coming year, much work will need to be undertaken to deliver the planned efficiencies from the new plant. INGREDIENTS 2011 2010 % change Revenue £m 1,123 1,067 +5% Adjusted operating profit £m 56 104 -46% Adjusted operating profit margin 5.0% 9.7% Return on average capital employed 8.3% 16.5% The Ingredients segment comprises AB Mauri and ABF Ingredients. AB Mauri has a major global presence in bakers’ yeast, with significant market positions in the Americas, Europe and Asia, and is a technology leader in and supplier of bakery ingredients. It operates from 49 plants in 25 countries. ABF Ingredients markets enzymes, yeast extracts, speciality proteins and lipids worldwide and has manufacturing facilities in Europe, the US and China. Ingredients achieved a revenue increase of 5% over last year but operating profit fell by 46% as a consequence of significant raw material cost increases, a highly competitive trading environment in many of our markets and substantial commissioning costs of the new yeast factory in China. We nonetheless remain committed to our investment in building capacity and developing a sharper and more differentiated offering for both yeast and bakery ingredients. Profit improvement is expected as molasses costs begin to subside in some of our markets. The AB Mauri yeast and bakery ingredients business achieved revenue growth throughout the year, driven primarily by good performances in Asia and South America. However, difficult market conditions in Europe and North America and substantial raw material cost inflation in a number of key markets saw operating profit sharply lower. The European yeast market was extremely competitive all year and weakness in the bakery industry in North America led to lower sales of wet yeast. Full recovery of higher input costs was consequently challenging in these markets. In China, we achieved good volume growth benefiting from favourable market conditions. Although prices were increased, profit was nonetheless held back. A shortage of molasses, used as a substrate in yeast manufacture, not only drove the price significantly higher, but also drove the need to use higher-cost corn syrup to make up for the shortfall. Profit was further affected by the commissioning of the new yeast facility in Harbin which added to the cost base ahead of full utilisation. A new fresh yeast plant is under construction in Shandong province and dry yeast capacity at our Xinjiang facility is being expanded. These investments, which are expected to be commissioned in 2012, will provide the capacity to support the continuing market growth. Our performance in Latin America was encouraging, benefiting from strong economic growth and continued development across a broadened range of products. Significant raw material cost pressure here was successfully offset by price increases. In Mexico, growth remained strong and the business will be further strengthened when the new yeast production facility, currently under construction at Veracruz, is commissioned at the end of 2012. Bakery ingredients had another year of strong revenue growth. Considerable progress was made in building relationships with key global customers, and innovation continued to drive new product development enabling us to maintain technology leadership in key markets. At ABF Ingredients, sales of feed, bakery and speciality enzymes made good progress driven by the successful introduction of new products and expansion into new sales territories. Speciality lipid sales were encouraging driven by a growth in pharmaceutical excipients underpinned by capital investment and a focus on higher value niche products. Yeast extracts are now supplied to Europe from the new factory in Harbin, China easing capacity constraints at our Hamburg factory and customer service levels

14
have improved as a consequence. Commissioning costs of the factory in China were higher than forecast but it is now fully operational and plant efficiency is improving. Yeast extract margins were also reduced by high molasses costs. SUMMARY Operating profit improved as our businesses overcame the challenges of high commodity cost inflation and weaker consumer demand. Further substantial investment saw the completion, or near completion, of a number of major capital projects and a sizeable increase in the Primark estate. Opportunities for further investment are exciting, particularly in Primark, and the strength of the group balance sheet and a strong cash flow will enable us to pursue them with confidence. George Weston Chief Executive

15
FINANCIAL REVIEW GROUP PERFORMANCE Group revenue increased by 9% to £11.1bn with growth again achieved in every business segment. On a constant currency basis and with last year’s revenues restated on to a comparable 52 week basis, the underlying revenue increase was also 9%. Adjusted operating profit increased by 1% to £920m and movements in currency exchange rates had no material effect on this result. This profit benefited from lower restructuring charges compared with the previous year, particularly in Grocery. When the 2010 result is adjusted on to a 52 week basis, year-on-year profit growth was 3%. In calculating adjusted operating profit, the amortisation charge on non-operating intangibles and any profits or losses on disposal of non-current assets are excluded. Together, these items amounted to £78m this year compared with £90m last year. No profits or losses arose on the sale and closure of businesses this year compared with a profit of £28m last year on the disposal of the Polish sugar operation in November 2009. These profits are excluded from the calculation of adjusted earnings, and revenue and profit from disposed businesses are disclosed separately in the segmental analysis. Finance expense less finance income of £92m compared with a charge of £76m last year, as the level of average net debt throughout the year was consistently higher than last year, driven partly by the effect of substantially higher commodity costs on working capital. Other financial income of £7m compared with an expense of £8m last year and related primarily to the net income on retirement benefit schemes, being the expected return on scheme assets less the charge on pension scheme liabilities. Profit before tax fell slightly from £763m to £757m. The reduction included the lower profit on sale or closure of businesses this year, partly offset by this year’s small profit on sale of property, plant and equipment compared with last year’s loss. Adjusted to exclude these items, underlying profit before tax increased by 1% to £835m. TAXATION The tax charge of £180m included an underlying charge of £205m, at an effective rate of 24.6% (2010 - 26.8%) on the adjusted profit before tax. The reduction in the effective rate is a result of the enacted reduction in the UK corporation tax rate from 27% to 25% (2010 – 28% to 27%), yielding a credit of £12m from the calculation of deferred tax liabilities at the lower rate, together with the agreement, with tax authorities, of liabilities for several open years in a number of jurisdictions around the group. Proposed future reductions in the UK tax rate to 23% will be reflected in the year that the relevant legislation is substantively enacted. With increasing profitability in jurisdictions with a higher corporate tax rate than the UK, we expect the group’s effective tax rate to be higher in future years. The overall tax charge for the year benefited from a £25m (2010 - £27m) credit for tax relief on the amortisation of non-operating intangible assets and goodwill arising from acquisitions. No tax arose on the profit on disposal of non-current assets. EARNINGS AND DIVIDENDS Earnings attributable to equity shareholders were £541m, £5m lower than last year, and the weighted average number of shares in issue used to calculate earnings per share was 788 million, consistent with last year. Earnings per ordinary share were 1% lower than last year at 68.7p. Adjusted earnings per share which provides a more consistent measure of performance increased by 2% from 72.2p to 74.0p. The interim dividend was increased by 4% to 7.9p and a final dividend has been proposed at 16.85p which represents an overall increase of 4% for the year. In accordance with IFRS, no accrual has been made in these accounts for the proposed dividend which is expected to cost £133m and will be charged next year. Dividend cover, on an adjusted basis, remains at three times.

16
BALANCE SHEET Non-current assets of £7,039m increased by £546m as a result of an increase in property, plant and equipment of £524m which was driven by the high level of capital expenditure in the year net of depreciation. Working capital was again tightly managed and average working capital across the year expressed as a percentage of sales revenues was little changed from last year despite much higher commodity costs. However, the absolute level of working capital was substantially higher and at the year end was £231m greater than last year. Provisions were £69m lower than last year end as a large proportion of those created for restructuring were utilised. Provisions that were acquired with the Azucarera sugar business were settled during the year with a corresponding recovery from the vendor. Net borrowings at the year end were £469m higher than last year at £1,285m as a consequence of the high level of capital investment and the funding of working capital. A currency gain of £91m arose on the translation into sterling of the group’s foreign currency denominated net assets. This resulted from a strengthening of the euro, Australian dollar and Chinese renminbi against sterling at the end of the year. The group’s net assets increased by £431m to £6,175m. The high level of capital expenditure, much of which was incurred on projects in progress, and only a modest increase in operating profit, saw return on capital employed (ROCE) for the group fall from 17.8% to 15.8% this year. Sugar and Agriculture both delivered an improvement through higher profits but the lower profit at Primark and Ingredients combined with recent investment meant a significant reduction in their returns. The average level of capital employed in Grocery increased by 22% reflecting higher working capital, driven by higher commodity costs, and by capital investment in our production facilities to improve the efficiency of our operations and expand capacity. ROCE fell as a result but some of the investment has still to deliver benefits. ROCE is calculated by expressing adjusted operating profit as a percentage of the average capital employed for the year. CASH FLOW Net cash flow from operating activities was £736m compared with £1,172m last year. This substantial reduction reflects the reversal of last year’s £193m working capital inflow to an outflow of £199m this year and is the consequence of substantially higher commodity costs and growth in the business. We continued to invest in the future growth of the group with a net £825m spent on property, plant and equipment and intangibles net of disposals during the year. Capital expenditure amounted to £794m of which £314m was spent by Primark on the acquisition of new stores and the fit-out of new and existing stores. Expenditure elsewhere was incurred on a wide variety of projects, the largest of which were: completion of factory expansion and construction of a new power co-generation plant in Swaziland; the new meat factory in Australia which is almost complete; the Vivergo bioethanol plant in Hull which is scheduled to begin operation next spring; new yeast plants in Mexico and Shandong province in China and expansion of dry yeast capacity at Xinjiang in China and Casteggio in Italy, all of which are in progress We invested £53m on acquisitions, principally deferred consideration payable on acquisitions made in previous years and the buyout of the non-controlling interests in the beet sugar business in China. FINANCING Cash and cash equivalents totalled £341m at the year end. These were managed during the year by a central treasury department, operating under strictly controlled guidelines, which also arranges term bank finance for acquisitions and to meet short-term working capital requirements, particularly for the sugar beet and wheat harvests. The group has total committed borrowing facilities amounting to £2.3bn, half of which is provided under a syndicated, revolving credit facility which does not mature until July 2015. £1.4bn was drawn down on these facilities at the year end. The strength and breadth of the 12 banks in the syndicate provide support for our financial needs and reflect the scale and international presence of the business. The group also had access, at the year end, to £750m of uncommitted credit lines under which £214m was drawn.

17
PENSIONS Pensions are accounted for in accordance with IAS 19 Employee benefits and on this basis, liabilities in the group’s defined benefit pension schemes exceeded employee benefit assets by £44m compared with last year’s deficit of £99m. This improvement was primarily due to an increase in the market value of the UK scheme’s investments in government bonds in line with falling yields, and a deficit reduction contribution made to the UK scheme. The last triennial actuarial valuation of the UK Pension Scheme was undertaken in 2008 and revealed a funding deficit of £163m which, by agreement with the Trustees, the Company is eliminating with five deficit payments of £30m each, the third of which was made in March 2011. Total contributions to defined benefit plans in the year amounted to £70m (2010 - £66m). For defined contribution schemes the charge for the year is equal to the contributions made which amounted to £51m (2010 - £45m). John Bason Finance Director The annual report and accounts is available at www.abf.co.uk and will be despatched to shareholders on 10 November 2011. The annual general meeting will be held at Congress Centre, 28 Great Russell Street, London. WC1B 3LS at 11am on Friday, 9 December 2011.

18
PRINCIPAL RISKS AND UNCERTAINTIES Each business is responsible for its own risk management assessment which is reported to the group’s Director of Financial Control annually. Our decentralised business model empowers the boards and management of our businesses to identify, evaluate and manage the risks they face on a timely basis. Key risks and internal control procedures are reviewed at group level by the board. We require all businesses to implement appropriate levels of risk management to ensure compliance with all relevant legislation, our group health, safety and environment policies, our overriding business principles and group policies relating to them, taking into account business needs and local circumstances. Each business is responsible for regularly assessing its health, safety and environmental risks with managers, operators, contracting companies and specialist staff working together to identify hazards. Appropriate operational procedures and controls are put in place to mitigate risks and all employees are provided with appropriate information, training and supervision. Further details of our risk mitigation activities can be found in our Corporate Responsibility report at www.abf.co.uk/Our-principles-accordion.aspx. The board reviews annually the material financial and non-financial risks facing our businesses and, on a rolling cycle basis, reviews the effectiveness of the risk management process and the resources that our individual businesses devote to them. The principal risks currently identified by our businesses and reviewed by the board are:
Issue Risk Mitigation
People
Product safety Reputational damage caused by food hygiene or safety incidents. Non-compliance with regulatory requirements. Safety concerns over use of Bisphenol-A in packaging.
Food safety put before economic considerations. Consistently high standards maintained in sourcing and handling of raw materials and manufacturing. Food safety systems regularly reviewed for efficacy and compliance. Documented and tested product recall procedures regularly reviewed.
New scientific research monitored pro-actively. Independent audit processes in place which provide a level of assurance on product safety. All sites have quality and food safety audits carried out by local quality control staff.
Health and nutrition
Health concerns over fat, sugar and salt content of foods. Inappropriate advertising to children.
Our recipes are regularly reviewed and reformulation is conducted as necessary to optimise the nutritional profile of products. Our UK Grocery group has signed the UK Government’s “Responsibility Deal on Public Health” and associated pledges to reduce salt, remove trans fats and to promote healthy eating and lifestyle options to our employees. Guideline Daily Amount or equivalent nutritional information provided to consumers in the UK and Australia. Products marketed responsibly, following accepted codes of practice.
Workplace health and safety
Potential for fatal accidents and serious injuries to employees and visitors.
Group Health and Safety policy in place. Increased financial investment in health and safety management. Information and guidance provided to our businesses. Internal and external audits of health, safety and management reporting extended.
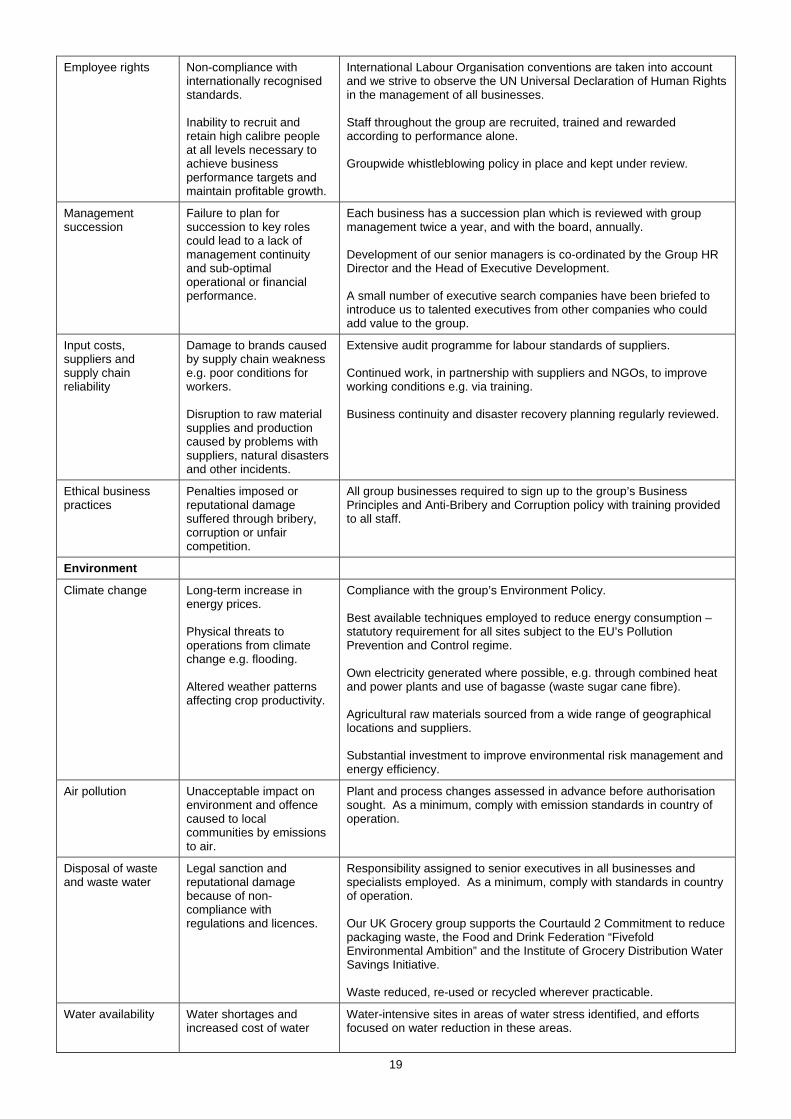
19
Employee rights
Non-compliance with internationally recognised standards. Inability to recruit and retain high calibre people at all levels necessary to achieve business performance targets and maintain profitable growth.
International Labour Organisation conventions are taken into account and we strive to observe the UN Universal Declaration of Human Rights in the management of all businesses. Staff throughout the group are recruited, trained and rewarded according to performance alone. Groupwide whistleblowing policy in place and kept under review.
Management succession
Failure to plan for succession to key roles could lead to a lack of management continuity and sub-optimal operational or financial performance.
Each business has a succession plan which is reviewed with group management twice a year, and with the board, annually. Development of our senior managers is co-ordinated by the Group HR Director and the Head of Executive Development. A small number of executive search companies have been briefed to introduce us to talented executives from other companies who could add value to the group.
Input costs, suppliers and supply chain reliability
Damage to brands caused by supply chain weakness e.g. poor conditions for workers. Disruption to raw material supplies and production caused by problems with suppliers, natural disasters and other incidents.
Extensive audit programme for labour standards of suppliers. Continued work, in partnership with suppliers and NGOs, to improve working conditions e.g. via training. Business continuity and disaster recovery planning regularly reviewed.
Ethical business practices
Penalties imposed or reputational damage suffered through bribery, corruption or unfair competition.
All group businesses required to sign up to the group’s Business Principles and Anti-Bribery and Corruption policy with training provided to all staff.
Environment
Climate change Long-term increase in energy prices. Physical threats to operations from climate change e.g. flooding. Altered weather patterns affecting crop productivity.
Compliance with the group’s Environment Policy. Best available techniques employed to reduce energy consumption – statutory requirement for all sites subject to the EU’s Pollution Prevention and Control regime. Own electricity generated where possible, e.g. through combined heat and power plants and use of bagasse (waste sugar cane fibre). Agricultural raw materials sourced from a wide range of geographical locations and suppliers. Substantial investment to improve environmental risk management and energy efficiency.
Air pollution Unacceptable impact on environment and offence caused to local communities by emissions to air.
Plant and process changes assessed in advance before authorisation sought. As a minimum, comply with emission standards in country of operation.
Disposal of waste and waste water
Legal sanction and reputational damage because of non-compliance with regulations and licences.
Responsibility assigned to senior executives in all businesses and specialists employed. As a minimum, comply with standards in country of operation. Our UK Grocery group supports the Courtauld 2 Commitment to reduce packaging waste, the Food and Drink Federation “Fivefold Environmental Ambition” and the Institute of Grocery Distribution Water Savings Initiative. Waste reduced, re-used or recycled wherever practicable.
Water availability Water shortages and increased cost of water
Water-intensive sites in areas of water stress identified, and efforts focused on water reduction in these areas.
20
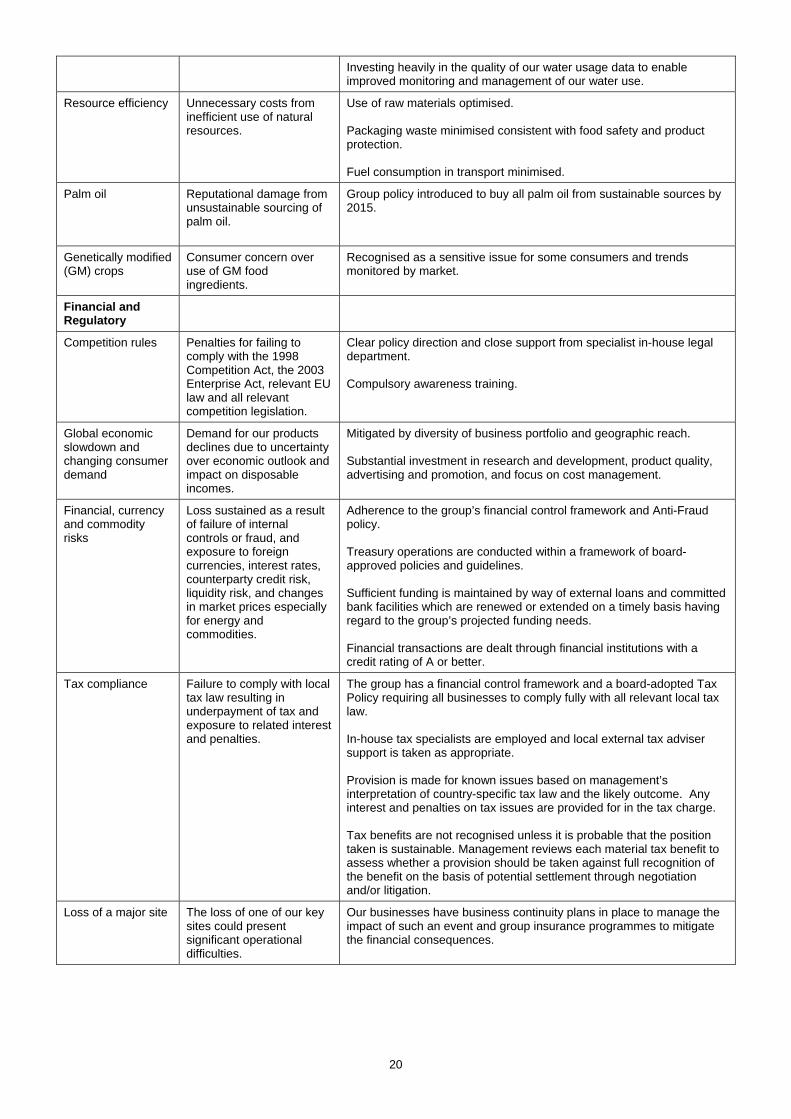
Investing heavily in the quality of our water usage data to enable improved monitoring and management of our water use.
Resource efficiency
Unnecessary costs from inefficient use of natural resources.
Use of raw materials optimised. Packaging waste minimised consistent with food safety and product protection. Fuel consumption in transport minimised.
Palm oil
Reputational damage from unsustainable sourcing of palm oil.
Group policy introduced to buy all palm oil from sustainable sources by 2015.
Genetically modified (GM) crops
Consumer concern over use of GM food ingredients.
Recognised as a sensitive issue for some consumers and trends monitored by market.
Financial and Regulatory
Competition rules
Penalties for failing to comply with the 1998 Competition Act, the 2003 Enterprise Act, relevant EU law and all relevant competition legislation.
Clear policy direction and close support from specialist in-house legal department. Compulsory awareness training.
Global economic slowdown and changing consumer demand
Demand for our products declines due to uncertainty over economic outlook and impact on disposable incomes.
Mitigated by diversity of business portfolio and geographic reach. Substantial investment in research and development, product quality, advertising and promotion, and focus on cost management.
Financial, currency and commodity risks
Loss sustained as a result of failure of internal controls or fraud, and exposure to foreign currencies, interest rates, counterparty credit risk, liquidity risk, and changes in market prices especially for energy and commodities.
Adherence to the group’s financial control framework and Anti-Fraud policy. Treasury operations are conducted within a framework of board-approved policies and guidelines. Sufficient funding is maintained by way of external loans and committed bank facilities which are renewed or extended on a timely basis having regard to the group’s projected funding needs. Financial transactions are dealt through financial institutions with a credit rating of A or better.
Tax compliance
Failure to comply with local tax law resulting in underpayment of tax and exposure to related interest and penalties.
The group has a financial control framework and a board-adopted Tax Policy requiring all businesses to comply fully with all relevant local tax law. In-house tax specialists are employed and local external tax adviser support is taken as appropriate. Provision is made for known issues based on management’s interpretation of country-specific tax law and the likely outcome. Any interest and penalties on tax issues are provided for in the tax charge. Tax benefits are not recognised unless it is probable that the position taken is sustainable. Management reviews each material tax benefit to assess whether a provision should be taken against full recognition of the benefit on the basis of potential settlement through negotiation and/or litigation.
Loss of a major site
The loss of one of our key sites could present significant operational difficulties.
Our businesses have business continuity plans in place to manage the impact of such an event and group insurance programmes to mitigate the financial consequences.

21
Regulatory and political
Failure to recognise political or cultural differences in the many countries in which we operate could directly impact the success of our operations.
We remain vigilant to future changes and the increased risk presented by emerging markets. We engage with governments and NGOs to ensure the views of our stakeholders are represented and we try to anticipate, and contribute to, important changes in public policy. Our financial control requirements are consistently applied wherever we operate.
Major capital projects and acquisitions
Risk of overspending initial cost estimates, overrunning construction timelines and failure to meet design specifications.
All major projects are managed by dedicated teams who work in close liaison with business management. Project plans are reviewed and approved by group management and, for larger projects, by the board. Updates on progress are provided throughout the project.
CAUTIONARY STATEMENTS This report contains forward-looking statements. These have been made by the directors in good faith based on the information available to them up to the time of their approval of this report. The directors can give no assurance that these expectations will prove to have been correct. Due to the inherent uncertainties, including both economic and business risk factors underlying such forward-looking information, actual results may differ materially from those expressed or implied by these forward-looking statements. The directors undertake no obligation to update any forward-looking statements whether as a result of new information, future events or otherwise.
22
DIRECTORS’ RESPONSIBILITIES IN RESPECT OF THE FINANCIAL STATEMENTS The financial statements, prepared in accordance with International Financial Reporting Standards as adopted by the EU, give a true and fair view of the assets, liabilities, financial position and profit of the Company and the undertakings included in the consolidation taken as a whole. Pursuant to Disclosure and Transparency Rules, Chapter 4, the following sections of the Company's annual report contain a fair review of the development and performance of the business and the position of the Company, and the undertakings included in the consolidation taken as a whole, together with a description of the principal risks and uncertainties that they face:
1. The Chairman's statement on pages 4 and 5; 2. Operating review on pages 16 to 27 which includes a review of the external environment,
key strategic aims, future development and performance measures; 3. Financial review on pages 28 and 29; 4. Other disclosures: ‘Research and development’; 5. Other disclosures: ‘Financial instruments’; 6. Other disclosures: ‘Property, plant and equipment’; 7. Other disclosures: ‘Power of the directors’; and 8. Other disclosures: ‘Principal risks and uncertainties’
The contents of this announcement, including the responsibility statement above, have been extracted from the annual report and accounts for the 52 weeks ended 17 September 2011 which can be found at www.abf.co.uk and will be despatched to shareholders on 10 November 2011. Accordingly this responsibility statement makes reference to the financial statements of the Company and the group and to the relevant narrative appearing in that annual report and accounts rather than the contents of this announcement. On behalf of the board Charles Sinclair George Weston John Bason Chairman Chief Executive Finance Director 8 November 2011

23
CONSOLIDATED INCOME STATEMENT
52 weeks ended 17 September 2011
53 weeks ended 18 September 2010
£m £m Continuing operations Note Revenue 1 11,065 10,167 Operating costs (10,265) (9,355) 800 812 Share of profit after tax from joint ventures and associates 37 16 Profits less losses on disposal of non-current assets 5 (9)Operating profit 842 819 Adjusted operating profit 1 920 909 Profits less losses on disposal of non-current assets 5 (9)Amortisation of non-operating intangibles (83) (81)
Profits less losses on sale and closure of businesses - 28 Profit before interest 842 847 Finance income 9 12 Finance expense (101) (88)Other financial income/(expense) 7 (8)Profit before taxation 757 763
Adjusted profit before taxation 835 825 Profits less losses on disposal of non-current assets 5 (9)Amortisation of non-operating intangibles (83) (81)Profits less losses on sale and closure of businesses - 28 Taxation - UK (92) (83)Taxation - Overseas (88) (111) 3 (180) (194)Profit for the period 577 569
Attributable to Equity shareholders 541 546 Non-controlling interests 36 23 Profit for the period 577 569
Basic and diluted earnings per ordinary share (pence) 4 68.7 69.3 Dividends per share paid and proposed for the period (pence) 5 24.75 23.8

24
CONSOLIDATED STATEMENT OF COMPREHENSIVE INCOME
52 weeks 53 weeks ended ended 17 September 18 September 2011 2010 £m £m Profit for the period recognised in the income statement 577 569 Other comprehensive income Actuarial gains/(losses) on defined benefit schemes 12 (22)Deferred tax associated with defined benefit schemes (4) 3 Effect of movements in foreign exchange 89 228 Net gain/(loss) on hedge of net investment in foreign subsidiaries 2 (11)Deferred tax associated with movements in foreign exchange (1) (4)Reclassification adjustment for movements in foreign exchange on subsidiaries disposed - (28)Current tax associated with movements in foreign exchange (1) (4)Movement in cash flow hedging position 6 41 Deferred tax associated with movement in cash flow hedging position (1) (11)Share of other comprehensive income of joint ventures and associates - 1 Other comprehensive income for the period 102 193 Total comprehensive income for the period 679 762 Attributable to Equity shareholders 657 715 Non-controlling interests 22 47 Total comprehensive income for the period 679 762

25
CONSOLIDATED BALANCE SHEET
17 September
2011 18 September 2010
£m £m Non-current assets Intangible assets 1,893 1,925 Property, plant and equipment 4,465 3,941 Biological assets 99 97 Investments in joint ventures 150 121 Investments in associates 44 38 Employee benefits assets 35 - Deferred tax assets 150 180 Other receivables 203 191 Total non-current assets 7,039 6,493 Current assets Inventories 1,425 1,238 Biological assets 112 100 Trade and other receivables 1,259 1,079 Derivative assets 26 33 Cash and cash equivalents 341 345 Total current assets 3,163 2,795 TOTAL ASSETS 10,202 9,288 Current liabilities Loans and overdrafts (729) (367) Trade and other payables (1,627) (1,491) Derivative liabilities (22) (38) Income tax (133) (132) Provisions (31) (99) Total current liabilities (2,542) (2,127) Non-current liabilities Loans (897) (794) Provisions (105) (106) Deferred tax liabilities (404) (418) Employee benefits liabilities (79) (99) Total non-current liabilities (1,485) (1,417) TOTAL LIABILITIES (4,027) (3,544) NET ASSETS 6,175 5,744 Equity Issued capital 45 45 Other reserves 175 175 Translation reserve 712 606 Hedging reserve - (4) Retained earnings 4,816 4,471 TOTAL EQUITY ATTRIBUTABLE TO EQUITY SHAREHOLDERS 5,748 5,293 Non-controlling interests 427 451 TOTAL EQUITY 6,175 5,744

26
CONSOLIDATED CASH FLOW STATEMENT
52 weeks 53 weeks ended ended 17 September 18 September 2011 2010 £m £m Cash flow from operating activities Profit before taxation 757 763 Profits less losses on disposal of non-current assets (5) 9 Profits less losses on sale and closure of businesses - (28)Finance income (9) (12)Finance expense 101 88Other financial (income)/expense (7) 8Share of profit after tax from joint ventures and associates (37) (16)Amortisation 96 89 Depreciation 317 324 Net change in the fair value of biological assets (21) (8)Share-based payment expense 8 11 Pension costs less contributions (38) (34)(Increase)/decrease in inventories (176) 61 (Increase)/decrease in receivables (138) 105Increase in payables 115 27Purchases less sales of current biological assets (2) (3)Decrease in provisions (69) (57)Cash generated from operations 892 1,327 Income taxes paid (156) (155)Net cash from operating activities 736 1,172 Cash flows from investing activities Dividends received from joint ventures and associates 9 6Purchase of property, plant and equipment (794) (694)Purchase of intangibles (49) (32)Purchase of non-current biological assets (1) - Sale of property, plant and equipment 18 27 Purchase of subsidiaries, joint ventures and associates (24) (36)Sale of subsidiaries, joint ventures and associates 3 4 Loans to joint ventures (25) (74)Purchase of non-controlling interests (29) (14)Interest received 11 11 Net cash from investing activities (881) (802) Cash flows from financing activities Dividends paid to non-controlling interests (22) (29)Dividends paid to equity shareholders (190) (171)Interest paid (99) (84)Financing:
Increase/(decrease) in short-term loans 342 (241)Increase/(decrease) in long-term loans 105 (30)Net proceeds of rights issue taken up by non-controlling interests - 115 Redemption of deferred shares - (2)Movements from changes in own shares held (16) (4)
Net cash from financing activities 120 (446) Net decrease in cash and cash equivalents (25) (76)Cash and cash equivalents at the beginning of the period 309 361 Effect of movements in foreign exchange 7 24 Cash and cash equivalents at the end of the period 291 309

27
CONSOLIDATED STATEMENT OF CHANGES IN EQUITY Attributable to equity shareholders
Issued capital
Other reserves
Translation reserve
Hedging reserve
Retained earnings Total
Non-controlling
interests Total
equity £m £m £m £m £m £m £m £m Balance as at 13 September 2009 47 173 439 (32) 4,121 4,748 328 5,076 Total comprehensive income Profit for the period recognised in the income statement - - - - 546 546 23 569 Actuarial losses on defined benefit schemes - - - - (22) (22) - (22)Deferred tax associated with defined benefit schemes - - - - 3 3 - 3 Effect of movements in foreign exchange - - 204 - - 204 24 228 Net loss on hedge of net investment in foreign subsidiaries - - (9) - - (9) (2) (11)Reclassification adjustment for movements in foreign exchange on subsidiaries disposed
- - (28) - - (28) - (28)
Deferred tax associated with movements in foreign exchange - - - - (4) (4) - (4)Current tax associated with movements in foreign exchange - - - - (4) (4) - (4)Movement in cash flow hedging position - - - 38 - 38 3 41 Deferred tax associated with movement in cash flow hedging position
- - - (10) - (10) (1) (11)
Share of other comprehensive income of joint ventures and associates
- - - - 1 1 - 1
Other comprehensive income - - 167 28 (26) 169 24 193 Total comprehensive income - - 167 28 520 715 47 762 Transactions with owners Dividends paid to equity shareholders - - - - (171) (171) - (171)Redemption of deferred shares (2) 2 - - (2) (2) - (2)Net movement in own shares held - - - - 7 7 - 7 Dividends paid to non-controlling interests - - - - - - (29) (29)Disposal of subsidiary - - - - - - (3) (3)Changes in ownership of subsidiaries - - - - (4) (4) 108 104 Total transactions with owners (2) 2 - - (170) (170) 76 (94)Balance as at 18 September 2010 45 175 606 (4) 4,471 5,293 451 5,744 Total comprehensive income Profit for the period recognised in the income statement - - - - 541 541 36 577 Actuarial gains on defined benefit schemes - - - - 12 12 - 12 Deferred tax associated with defined benefit schemes - - - - (4) (4) - (4)Effect of movements in foreign exchange - - 105 - - 105 (16) 89 Net gain on hedge of net investment in foreign subsidiaries - - 1 - - 1 1 2 Deferred tax associated with movements in foreign exchange - - - - (1) (1) - (1)Current tax associated with movements in foreign exchange - - - - (1) (1) - (1)Movement in cash flow hedging position - - - 5 - 5 1 6 Deferred tax associated with movement in cash flow hedging position
- - - (1) - (1) - (1)
Other comprehensive income - - 106 4 6 116 (14) 102 Total comprehensive income - - 106 4 547 657 22 679 Transactions with owners Dividends paid to equity shareholders - - - - (190) (190) - (190)Net movement in own shares held - - - - (8) (8) - (8)Deferred tax associated with share-based payments - - - - 2 2 - 2 Dividends paid to non-controlling interests - - - - - - (22) (22)Changes in ownership of subsidiaries - - - - (6) (6) (24) (30)Total transactions with owners - - - - (202) (202) (46) (248)Balance as at 17 September 2011 45 175 712 - 4,816 5,748 427 6,175

28
NOTES TO THE ANNUAL RESULTS ANNOUNCEMENT For the 52 weeks ended 17 September 2011 1. Operating segments
The group discloses five operating segments, as described below. These are the group’s operating divisions, based on the group’s management and internal reporting structure, which combine businesses with common characteristics. The board is the chief operating decision maker. Inter-segment pricing is determined on an arm’s length basis. Segment result is adjusted operating profit, as shown on the face of the consolidated income statement. Segment assets comprise all non-current assets except employee benefits assets and deferred tax assets, and all current assets except cash and cash equivalents. Segment liabilities comprise trade and other payables, derivative liabilities and provisions. Segment results, assets and liabilities include items directly attributable to a segment as well as those that can be allocated on a reasonable basis. Unallocated items comprise mainly corporate assets and expenses, cash, borrowings, employee benefits balances and current and deferred tax balances. Segment non-current asset additions are the total cost incurred during the period to acquire segment assets that are expected to be used for more than one year, comprising property, plant and equipment, operating intangibles and biological assets. The group is comprised of the following operating segments: Grocery The manufacture of grocery products, including hot beverages, sugar & sweeteners, vegetable oils, bread &
baked goods, cereals, ethnic foods, herbs & spices, and meat products, which are sold to retail, wholesale and foodservice businesses.
Sugar The growing and processing of sugar beet and sugar cane for sale to industrial users and to Silver Spoon, which is included in the grocery segment.
Agriculture The manufacture of animal feeds and the provision of other products for the agriculture sector. Ingredients The manufacture of bakers’ yeast, bakery ingredients, speciality proteins, enzymes, lipids and yeast extracts. Retail Buying and merchandising value clothing and accessories through the Primark and Penneys retail chains. Geographical information In addition to the required disclosure for operating segments, disclosure is also given of certain geographical information about the group’s operations, based on the geographical groupings: United Kingdom; Europe & Africa; The Americas; and Asia Pacific. Revenues are shown by reference to the geographical location of customers. Profits are shown by reference to the geographical location of the businesses. Segment assets are based on the geographical location of the assets.
Revenue Adjusted operating profit
52 weeksended
17 September2011
53 weeksended
18 September2010
52 weeks ended
17 September 2011
53 weeksended
18 September2010
Operating segments £m £m £m £m Grocery 3,638 3,406 249 229 Sugar 2,134 1,941 315 240 Agriculture 1,127 954 40 33 Ingredients 1,123 1,067 56 104 Retail 3,043 2,730 309 341 Central - - (48) (42) 11,065 10,098 921 905 Businesses disposed: Grocery - 17 (1) - Sugar - 19 - 4 Agriculture - 33 - - - 69 (1) 4 11,065 10,167 920 909 Geographical information United Kingdom 4,788 4,411 491 480 Europe & Africa 2,735 2,495 213 219 The Americas 1,176 1,120 118 121 Asia Pacific 2,366 2,072 99 85 11,065 10,098 921 905 Businesses disposed: United Kingdom - 33 - - Europe & Africa - 19 - 4 The Americas - 17 (1) - - 69 (1) 4 11,065 10,167 920 909
29
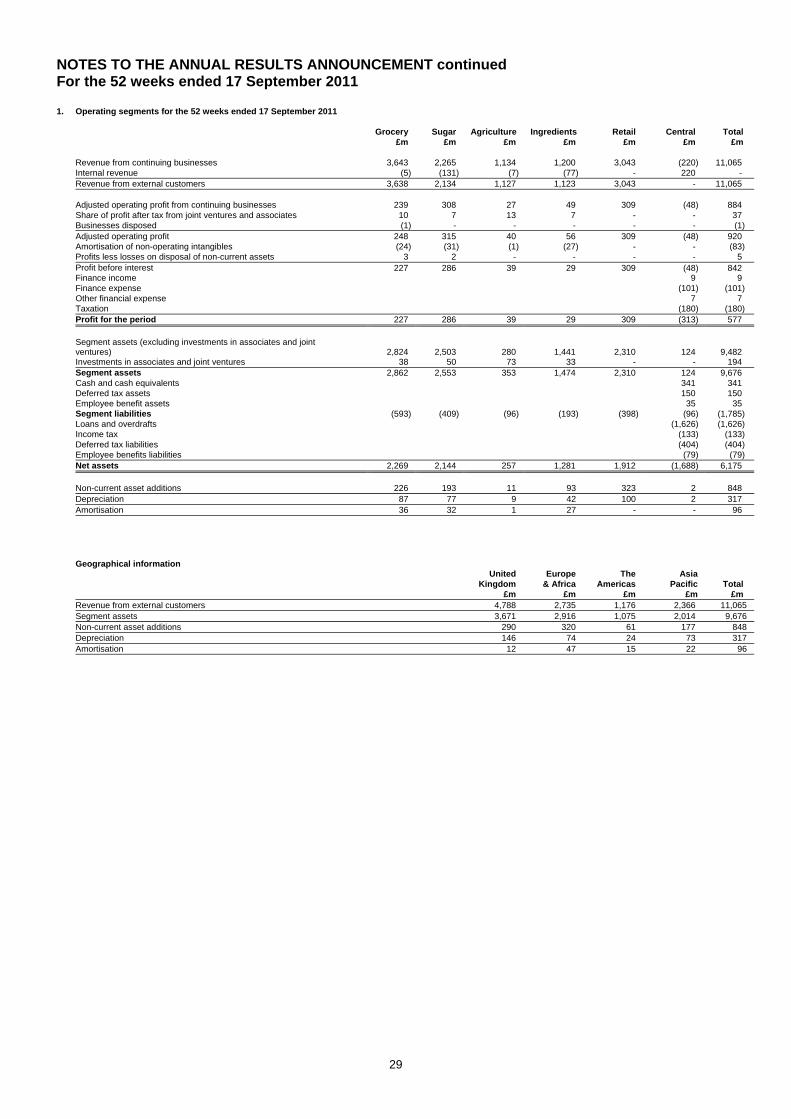
NOTES TO THE ANNUAL RESULTS ANNOUNCEMENT continued For the 52 weeks ended 17 September 2011 1. Operating segments for the 52 weeks ended 17 September 2011 Grocery Sugar Agriculture Ingredients Retail Central Total £m £m £m £m £m £m £m Revenue from continuing businesses 3,643 2,265 1,134 1,200 3,043 (220) 11,065 Internal revenue (5) (131) (7) (77) - 220 - Revenue from external customers 3,638 2,134 1,127 1,123 3,043 - 11,065 Adjusted operating profit from continuing businesses 239 308 27 49 309 (48) 884 Share of profit after tax from joint ventures and associates 10 7 13 7 - - 37 Businesses disposed (1) - - - - - (1) Adjusted operating profit 248 315 40 56 309 (48) 920 Amortisation of non-operating intangibles (24) (31) (1) (27) - - (83) Profits less losses on disposal of non-current assets 3 2 - - - - 5 Profit before interest 227 286 39 29 309 (48) 842 Finance income 9 9 Finance expense (101) (101) Other financial expense 7 7 Taxation (180) (180) Profit for the period 227 286 39 29 309 (313) 577 Segment assets (excluding investments in associates and joint
ventures) 2,824 2,503 280 1,441 2,310 124 9,482 Investments in associates and joint ventures 38 50 73 33 - - 194 Segment assets 2,862 2,553 353 1,474 2,310 124 9,676 Cash and cash equivalents 341 341 Deferred tax assets 150 150 Employee benefit assets 35 35 Segment liabilities (593) (409) (96) (193) (398) (96) (1,785) Loans and overdrafts (1,626) (1,626) Income tax (133) (133) Deferred tax liabilities (404) (404) Employee benefits liabilities (79) (79) Net assets 2,269 2,144 257 1,281 1,912 (1,688) 6,175 Non-current asset additions 226 193 11 93 323 2 848 Depreciation 87 77 9 42 100 2 317 Amortisation 36 32 1 27 - - 96
Geographical information United Europe The Asia Kingdom & Africa Americas Pacific Total £m £m £m £m £m Revenue from external customers 4,788 2,735 1,176 2,366 11,065 Segment assets 3,671 2,916 1,075 2,014 9,676 Non-current asset additions 290 320 61 177 848 Depreciation 146 74 24 73 317 Amortisation 12 47 15 22 96

30
NOTES TO THE ANNUAL RESULTS ANNOUNCEMENT continued For the 52 weeks ended 17 September 2011 1. Operating segments for the 53 weeks ended 18 September 2010 Grocery Sugar Agriculture Ingredients Retail Central Total £m £m £m £m £m £m £m Revenue from continuing businesses 3,410 2,030 958 1,142 2,730 (172) 10,098 Internal revenue (4) (89) (4) (75) - 172 - External revenue from continuing businesses 3,406 1,941 954 1,067 2,730 - 10,098 Businesses disposed 17 19 33 - - - 69 Revenue from external customers 3,423 1,960 987 1,067 2,730 - 10,167 Adjusted operating profit from continuing businesses 229 242 23 96 341 (42) 889 Share of profit after tax from joint ventures and associates - (2) 10 8 - - 16 Businesses disposed - 4 - - - - 4 Adjusted operating profit 229 244 33 104 341 (42) 909 Amortisation of non-operating intangibles (26) (33) - (22) - - (81) Profits less losses on disposal of non-current assets 12 (24) 3 (1) - 1 (9) Profits less losses on sale and closure of businesses (7) 35 - - - - 28 Profit before interest 208 222 36 81 341 (41) 847 Finance income 12 12 Finance expense (88) (88) Other financial expense (8) (8) Taxation (194) (194) Profit for the period 208 222 36 81 341 (319) 569 Segment assets (excluding investments in associates and joint
ventures) 2,555 2,454 227 1,354 1,892 122 8,604 Investments in associates and joint ventures 26 40 61 32 - - 159 Segment assets 2,581 2,494 288 1,386 1,892 122 8,763 Cash and cash equivalents 345 345 Deferred tax assets 180 180 Segment liabilities (566) (402) (91) (184) (342) (149) (1,734) Loans and overdrafts (1,161) (1,161) Income tax (132) (132) Deferred tax liabilities (418) (418) Employee benefits liabilities (99) (99) Net assets 2,015 2,092 197 1,202 1,550 (1,312) 5,744 Non-current asset additions 251 171 10 81 214 12 739 Depreciation 98 84 7 32 102 1 324 Impairment of property, plant and equipment - 13 - 1 - - 14 Amortisation 32 34 - 23 - - 89 Impairment of intangibles - 10 - - - - 10
Geographical information United Europe The Asia Kingdom & Africa Americas Pacific Total £m £m £m £m £m Revenue from external customers 4,444 2,514 1,137 2,072 10,167 Segment assets 3,344 2,629 1,043 1,747 8,763 Non-current asset additions 227 250 43 219 739 Depreciation 155 79 29 61 324 Impairment of property, plant and equipment - - - 14 14 Amortisation 14 41 20 14 89 Impairment of intangibles - - - 10 10

31
NOTES TO THE ANNUAL RESULTS ANNOUNCEMENT continued For the 52 weeks ended 17 September 2011 2. Profits less losses on sale and closure of businesses No profits or losses on sale and closure of businesses arose in 2011. During 2010, the group realised a net gain of £28m on
the sale or closure of businesses. The group’s Polish sugar business was sold on 25 November 2009 for a profit of £33m, following clearance from the Polish National Competition Authority. A profit of £2m was realised on the sale of South African agricultural assets. A provision of £7m was made for the closure of the group’s abattoir operations in Queensland, Australia. See note 6 for further details.
3. Income tax expense 52 weeks 53 weeks ended ended 17 September 18 September 2011 2010 £m £m Current tax expense
UK – corporation tax at 27.1% (2010 – 28%) 80 92 Overseas – corporation tax 88 99 UK – underprovided in prior periods 16 1 Overseas – overprovided in prior periods (25) (11) 159 181Deferred tax expense UK deferred tax (5) (8)Overseas deferred tax 22 14 UK – underprovided in prior periods 1 - Overseas – underprovided in prior periods 3 7 21 13Total income tax expense in income statement 180 194 Reconciliation of effective tax rate Profit before taxation 757 763 Less share of profit after tax from joint ventures and associates (37) (16)Profit before taxation excluding share of profit after tax from joint ventures and associates 720 747 Nominal tax charge at UK corporation tax rate of 27.1% (2010 – 28%) 195 209 Benefit of lower tax rates (35) (27)Expenses not deductible for tax purposes 22 13 Utilisation of losses (2) (6)Deferred tax not recognised 5 8 Adjustments in respect of prior periods (5) (3) 180 194 Income tax recognised directly in equity Deferred tax associated with defined benefit schemes 4 (3)Deferred tax associated with share-based payments (2) - Deferred tax associated with movement in cash flow hedging position 1 11 Deferred tax associated with movements in foreign exchange 1 4 Current tax associated with movements in foreign exchange 1 4 5 16 Following the enactment of legislation in the UK to reduce the corporation tax rate to 25% from 1 April 2012, the effective tax rate this year includes the impact on the income statement of calculating the UK deferred tax balances at the lower UK corporation tax rate. The impact of this rate change is a £12m reduction in the tax charge in the income statement. Proposed future reductions in the UK tax rate to 23% will be reflected when the relevant legislation is substantively enacted.

32
NOTES TO THE ANNUAL RESULTS ANNOUNCEMENT continued For the 52 weeks ended 17 September 2011 4. Earnings per share
The calculation of basic earnings per share at 17 September 2011 was based on the net profit attributable to equity shareholders of £541m (2010 - £546m), and a weighted average number of shares outstanding during the year of 788 million (2010 – 788 million). The calculation of the weighted average number of shares excludes the shares held by the Employee Share Ownership Plan Trust on which the dividends are being waived. Adjusted earnings per ordinary share, which exclude the impact of profits less losses on disposal of non-current assets and the sale and closure of businesses, amortisation of non-operating intangibles, and the associated tax credits, is shown to provide clarity on the underlying performance of the group. The diluted earnings per share calculation takes into account the dilutive effect of share options and share incentives. The diluted, weighted average number of shares is 788 million (2010 – 788 million). There is no difference between basic and diluted earnings.
52 weeks 53 weeks ended ended 17 September 18 September 2011 2010 pence pence Adjusted earnings per share 74.0 72.2 Disposal of non-current assets 0.6 (1.1) Sale and closure of businesses - 3.6 Amortisation of non-operating intangibles (10.5) (10.3) Tax credit on non-operating intangibles amortisation and goodwill 3.2 3.4
Non-controlling interests’ share of amortisation of non-operating intangibles net of tax 1.4 1.5
Earnings per ordinary share 68.7 69.3 5. Dividends
2011 2010 pence pence 2011 2010 per share per share £m £m 2009 final - 14.10 - 111 2010 interim - 7.60 - 60 2010 final 16.20 - 128 - 2011 interim 7.90 - 62 -
24.10 21.70 190 171
The 2011 interim dividend was declared on 27 April 2011 and paid on 8 July 2011. The 2011 final dividend of 16.85 pence, total value of £133m, will be paid on 13 January 2012 to shareholders on the register on 9 December 2011. Dividends relating to the period were 24.75 pence per share totalling £195m (2010 – 23.8 pence per share totalling £188m).
6. Acquisitions and disposals 2011
During 2011, the group completed no new business combinations. Cash flow on purchase of subsidiaries, joint ventures and associates of £24m comprises £15m in respect of previous acquisitions and £9m investment in a joint venture. During 2011, the group completed no business disposals. Cash flow on sale of subsidiaries, joint ventures and associates of £3m in the cash flow statement comprises receipts of deferred consideration in respect of previous business disposals.
2010
During 2010, the group completed no new business combinations. Minor provisional fair value adjustments were finalised during the year. These comprised a £9m reduction in non-operating intangibles, a £3m reduction in other non-current receivables, a £1m reduction in trade and other receivables and a £4m increase in deferred tax liabilities. This reduction in net identifiable assets and liabilities of £17m resulted in a £2m increase in goodwill and a £15m decrease in deferred consideration. There were no changes to pre-acquisition carrying amounts. Cash flow on purchase of subsidiaries, joint ventures and associates of £36m in the cash flow statement comprised £35m paid in respect of previous acquisitions and £1m investment in a joint venture.

33
NOTES TO THE ANNUAL RESULTS ANNOUNCEMENT continued For the 52 weeks ended 17 September 2011 6. Acquisitions and disposals continued
During 2010, the group disposed of its Polish sugar business and some agricultural assets in South Africa. The group also announced the closure of its abattoir operations in Queensland, Australia. Costs associated with these disposals were included within cash and deferred consideration.
Business disposals and closures had the following effect on the group’s assets and liabilities:
2010 carrying values
£m NET ASSETS Intangible assets 1 Property, plant and equipment 82 Biological assets 3 Inventories 37 Trade and other receivables 20 Cash and cash equivalents 2 Trade and other payables (37)Intercompany payables (13)Loans (7)Taxation (2)Net identifiable assets and liabilities 86Goodwill 29 Non-controlling interests (3)Recycle of effect of movements in foreign exchange (28)Profit less losses on sale and closure of business 28 Total consideration 112 SATISFIED BY Cash consideration 123 Deferred consideration 5 Provisions made (16) 112 NET CASH Cash consideration 125 Cash and cash equivalents disposed (2)Cash consideration in respect of previous disposals 3 126 Provisions made on the sale and closure of businesses mainly comprised rationalisation costs and warranty provisions. The net cash of £126m in the disposal table above differs from the cash flow on sale of subsidiaries, joint ventures and associates shown in the cash flow statement by £122m as this cash was received in the preceding financial year.
7. Analysis of net debt
At 18 September 2010
Cash flow
Exchange adjustments
At 17 September 2011
£m £m £m £m Cash at bank and in hand, cash
equivalents and overdrafts 309 (25)
7 291 Short-term borrowings (331) (342) (6) (679) Loans over one year (794) (105) 2 (897) (816) (472) 3 (1,285)
Cash and cash equivalents comprise cash balances, call deposits and investments with original maturities of three months or less. Bank overdrafts that are repayable on demand are included as a component of cash and cash equivalents for the purpose of the cash flow statement.
34
NOTES TO THE ANNUAL RESULTS ANNOUNCEMENT continued For the 52 weeks ended 17 September 2011 8. Related party transactions
The group has a controlling related party relationship with its parent company, which is also its ultimate parent company. The group also has a related party relationship with its associates and joint ventures and with its directors. In the course of normal operations, related party transactions entered into by the group have been contracted on an arm’s length basis. Material transactions and year end balances with related parties were as follows:
2011 2010 Sub note £’000 £’000Charges to Wittington Investments Limited in respect of services provided by the Company and its subsidiary undertakings 249 240 Dividends paid by ABF and received in a beneficial capacity by: (i) Trustees of the Garfield Weston Foundation 1 6,960 6,447 (ii) Directors of Wittington Investments Limited who are not trustees of the Foundation 952 858 (iii) Directors of the Company who are not trustees of the Foundation and are not
directors of Wittington Investments Limited 18 7 (iv) a member of the Weston family employed within the ABF group 2 706 634 Sales to fellow subsidiary undertakings on normal trading terms 3 2,802 3,296 Sales to companies with common key management personnel on normal trading terms 4 14,870 5,439 Amounts due from fellow subsidiary undertakings 3 23 243 Amounts due from a company with common key management personnel 4 1,530 588 Sales to joint ventures on normal trading terms 5 36,421 156,565 Sales to associates on normal trading terms 15,116 34,674 Purchases from joint ventures on normal trading terms 273,533 245,531 Purchases from associates on normal trading terms 23,149 18,694 Amounts due from joint ventures 196,288 151,514 Amounts due from associates 1,509 1,850 Amounts due to joint ventures 11,859 22,626 Amounts due to associates 804 466
1. The Garfield Weston Foundation (‘the Foundation’) is an English charitable trust, established in 1958 by the late W Garfield Weston. The Foundation has no direct interest in the Company, but as at 17 September 2011 was the beneficial owner of 683,073 shares (2010 – 683,073 shares) in Wittington Investments Limited representing 79.2% (2010 – 79.2%) of that company’s issued share capital and is, therefore, the Company’s ultimate controlling party. At 17 September 2011 trustees of the Foundation comprised two children and two grandchildren of the late W Garfield Weston and five children of the late Garry H Weston.
2. A member of the Weston family who is employed by the group and is not a director of the Company or Wittington Investments Limited and is not a Trustee of the Foundation.
3. The fellow subsidiary undertaking is Fortnum and Mason plc. 4. The companies with common key management personnel are in the George Weston Limited group, in
Canada. 5. Until February 2010, sales were made by ACH to Stratas Foods under the transitional supply agreement
entered into on creation of the joint venture.
Amounts due from joint ventures comprise £19m (2010 - £20m) of finance lease receivables and £150m (2010 - £126m) of loan receivables. The remainder of the balance is trading balances. The loan receivables are all non-current (2010 – all non-current), and all but £3m (2010 - £2m) of the finance lease receivables are non-current.
9. Other information
The financial information set out above does not constitute the Company's statutory accounts for the 52 weeks ended 17 September 2011, or the 53 weeks ended 18 September 2010. Statutory accounts for 2010 have been delivered to the Registrar of Companies and those for 2011 will be delivered following the Company’s annual general meeting. The auditors have reported on those accounts. Their reports were (i) unqualified, (ii) did not include references to any matters to which the auditors drew attention by way of emphasis without qualifying their reports and (iii) did not contain a statement under section under section 498(2) or (3) of the Companies Act 2006 in respect of the accounts.
35
NOTES TO THE ANNUAL RESULTS ANNOUNCEMENT continued For the 52 weeks ended 17 September 2011 10. Basis of preparation
Associated British Foods plc (“the Company") is a company domiciled in the United Kingdom. The consolidated financial statements of the Company for the 52 weeks ended 17 September 2011 comprise those of the Company and its subsidiaries (together referred to as “the group") and the group's interest in joint ventures and associates. The consolidated financial statements were authorised for issue by the directors on 8 November 2011. The consolidated financial statements have been prepared and approved by the directors in accordance with International Financial Reporting Standards as adopted by the EU. Under IFRS, management is required to make judgements, estimates and assumptions about the reported amounts of assets and liabilities, income and expenses and the disclosure of contingent assets and liabilities. The estimates and associated assumptions are based on experience. Actual results may differ from these estimates. The estimates and underlying assumptions are reviewed on a regular basis. Revisions to accounting estimates are recognised from the period in which the estimates are revised. The consolidated financial statements are presented in sterling, rounded to the nearest million. They are prepared on the historical cost basis except that biological assets and certain financial instruments are stated at fair value. Assets classified as held for sale are stated at the lower of carrying amount and fair value less costs to sell. The consolidated financial statements of the group are prepared to the Saturday nearest to 15 September. Accordingly, these financial statements have been prepared for the 52 weeks ended 17 September 2011. To avoid delay in the preparation of the consolidated financial statements, the results of certain subsidiaries, joint ventures and associates are included up to 31 August 2011. The results of Illovo are included for the period to 30 September 2011 in line with Illovo’s local reporting date. Adjustments are made as appropriate for significant transactions or events occurring between 31 August and 30 September.
11. Significant accounting policies
The accounting policies applied by the group in this annual results announcement are the same as those applied by the group in its consolidated financial statements for the year ended 17 September 2011.