ANNUAL RESULTS 2015...Port (Qatar), Northwind and Godewind wind farms • GeoSea projects ongoing...
94
ANNUAL RESULTS 2015 2015 April 27, 2016
Transcript of ANNUAL RESULTS 2015...Port (Qatar), Northwind and Godewind wind farms • GeoSea projects ongoing...
ANNUAL RESULTS
20152015April 27, 2016
AvH at a glance
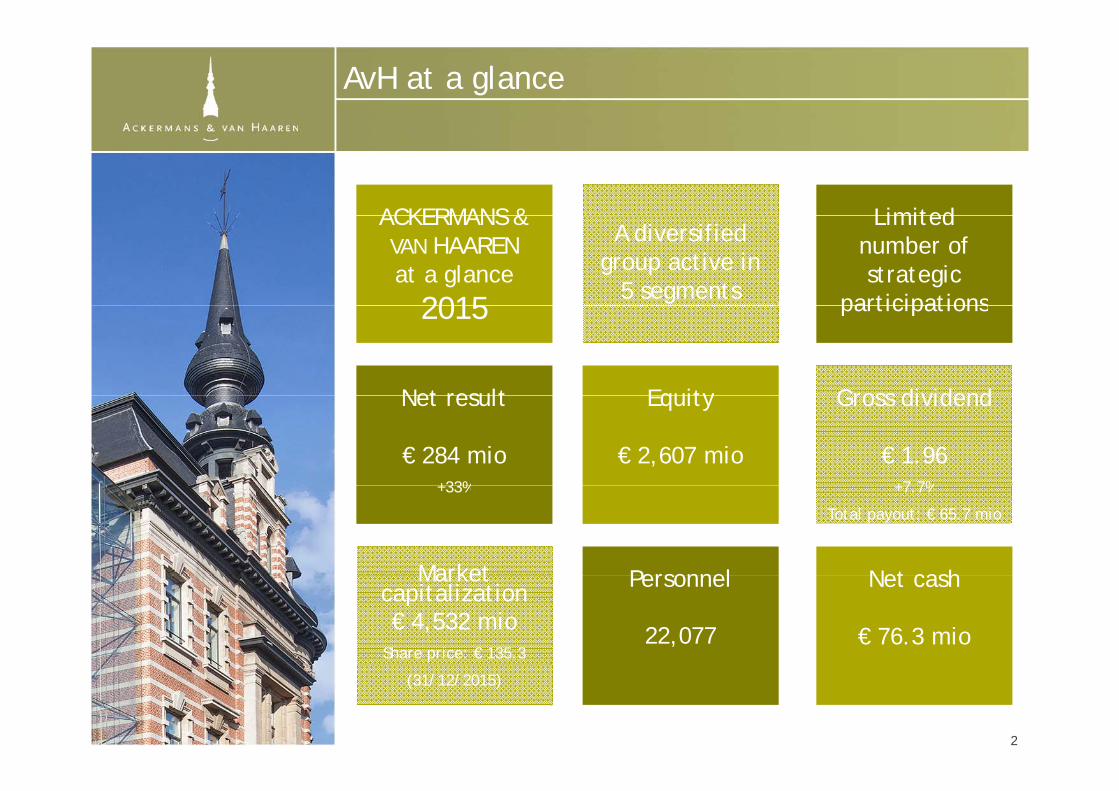
ACKERMANS & Limited ACKERMANS & VAN HAAREN at a glance
2015
A diversified group active in
5 segments
Limited number of strategic
participations
Net result
2015
Equity Gross dividend
participations
Net result
€ 284 mio+33%
Equity
€ 2,607 mio
Gross dividend
€ 1.96+7 7%
Market Personnel Net cash
+33% +7.7%
Total payout: € 65.7 mio
Market capitalization€ 4,532 mio
Share price: € 135.3
Personnel
22,077
Net cash
€ 76.3 mio
(31/12/2015)
2
Ackermans & van Haaren: Introduction (1/3)
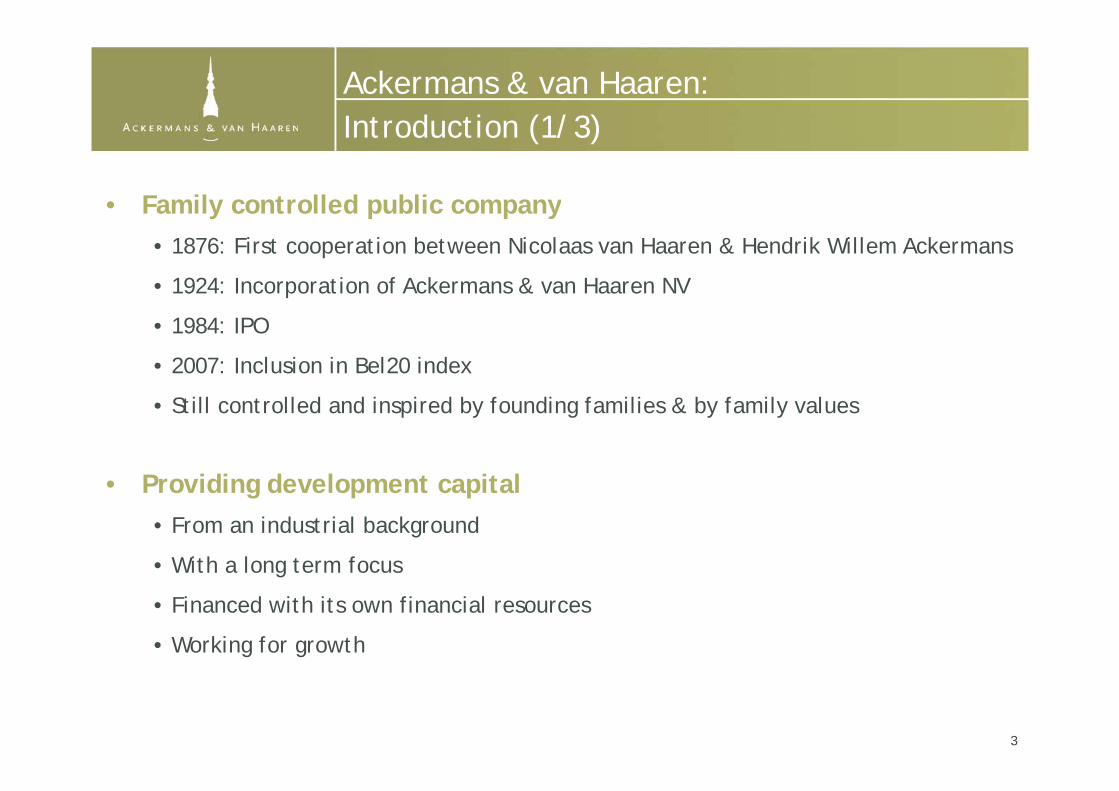
• Family controlled public company
Introduction (1/3)
y p p y• 1876: First cooperation between Nicolaas van Haaren & Hendrik Willem Ackermans
• 1924: Incorporation of Ackermans & van Haaren NV
• 1984: IPO
• 2007: Inclusion in Bel20 index
• Still controlled and inspired by founding families & by family values
• Providing development capital• Providing development capital• From an industrial background
• With a long term focusg
• Financed with its own financial resources
• Working for growth
3
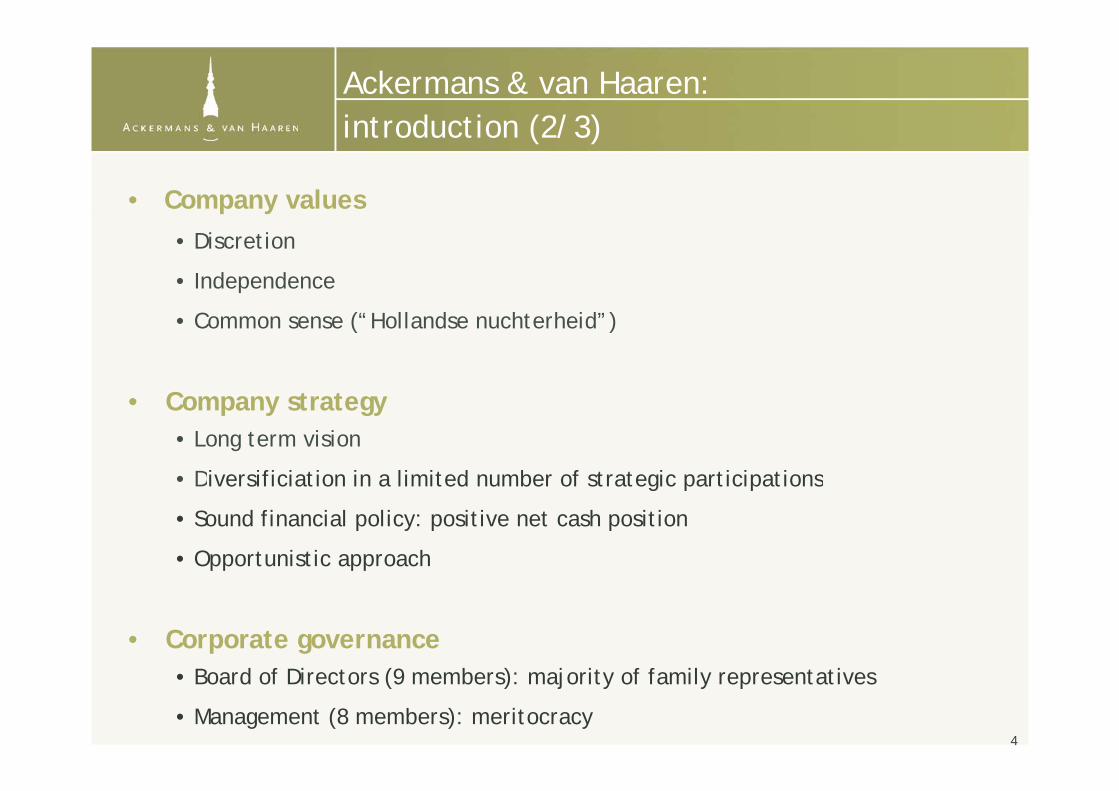
Ackermans & van Haaren: introduction (2/3)
• Company values
introduction (2/3)
• Discretion
• Independence
• Common sense (“Hollandse nuchterheid”)
C t t g• Company strategy• Long term vision
• Diversificiation in a limited number of strategic participationsDiversificiation in a limited number of strategic participations
• Sound financial policy: positive net cash position
• Opportunistic approach
• Corporate governance• Board of Directors (9 members): majority of family representatives
• Management (8 members): meritocracy4
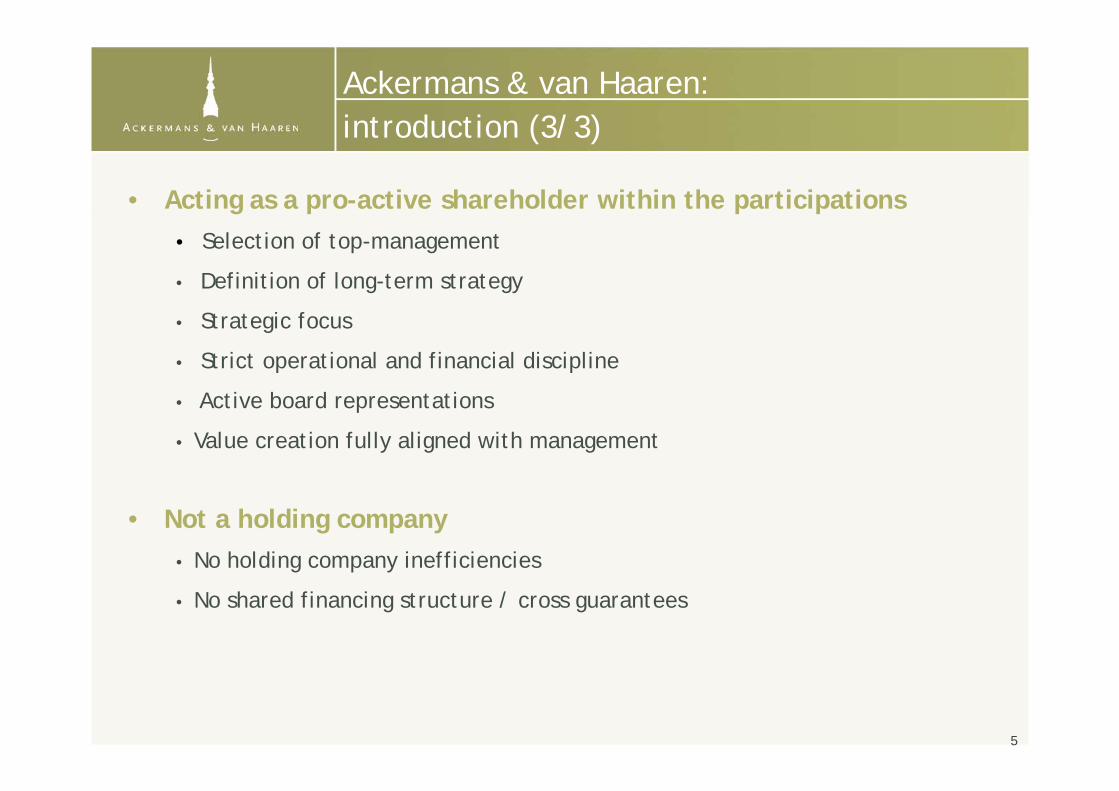
Ackermans & van Haaren: introduction (3/3)
• Acting as a pro-active shareholder within the participations
introduction (3/3)
• Selection of top-management
• Definition of long-term strategy
• Strategic focus
• Strict operational and financial discipline
A ti b d t ti• Active board representations
• Value creation fully aligned with management
• Not a holding company• No holding company inefficiencies
• No shared financing structure / cross guarantees
5
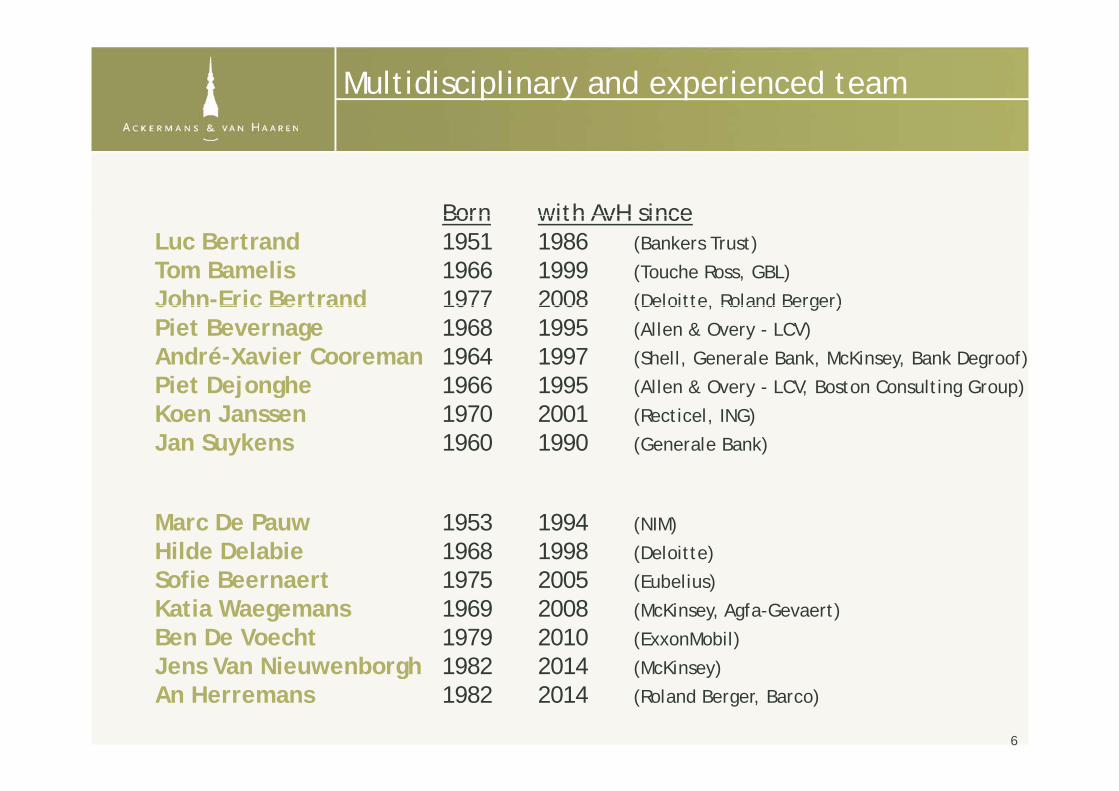
Multidisciplinary and experienced team
Born with AvH sinceBorn with AvH sinceLuc Bertrand 1951 1986 (Bankers Trust)
Tom Bamelis 1966 1999 (Touche Ross, GBL)
John-Eric Bertrand 1977 2008 (Deloitte, Roland Berger)John Eric Bertrand 1977 2008 (Deloitte, Roland Berger)
Piet Bevernage 1968 1995 (Allen & Overy - LCV)
André-Xavier Cooreman 1964 1997 (Shell, Generale Bank, McKinsey, Bank Degroof)
Piet Dejonghe 1966 1995 (Allen & Overy - LCV, Boston Consulting Group)j g ( y , g p)
Koen Janssen 1970 2001 (Recticel, ING)
Jan Suykens 1960 1990 (Generale Bank)
Marc De Pauw 1953 1994 (NIM)
Hilde Delabie 1968 1998 (Deloitte)
Sofie Beernaert 1975 2005 (E b li )Sofie Beernaert 1975 2005 (Eubelius)
Katia Waegemans 1969 2008 (McKinsey, Agfa-Gevaert)
Ben De Voecht 1979 2010 (ExxonMobil)
Jens Van Nieuwenborgh 1982 2014 (McKinsey)Jens Van Nieuwenborgh 1982 2014 (McKinsey)
An Herremans 1982 2014 (Roland Berger, Barco)
6

Historical overview (1/3)
1880 Foundation by H.W. Ackermans & Nicolaas van Haaren
1964 Foundation of Forasol SA
1974 Merger of dredging activities with SGD (CFE-SGB)g g g ( )
1984 I.P.O.
1988 1st diversification into brewery sector (Alken Maes)1988 1st diversification into brewery sector (Alken-Maes)
1991 Acquisition of Creyf’s Interim (renamed Solvus)
1992 Acquisition of Belcofi – Delen (start of Private banking)
1994 Acquisition of privatised Société Nationale d’Investissement(start of private equity via Sofinim and of real estate via Leasinvest)(start of private equity via Sofinim and of real estate via Leasinvest)
1996 Sale of Forasol – Foramer to Pride Petroleum
1998 Creation of joint holding company (Finaxis) of Bank Delenwith Bank J. Van Breda & C° (AvH 60% / beneficial 30%)
7
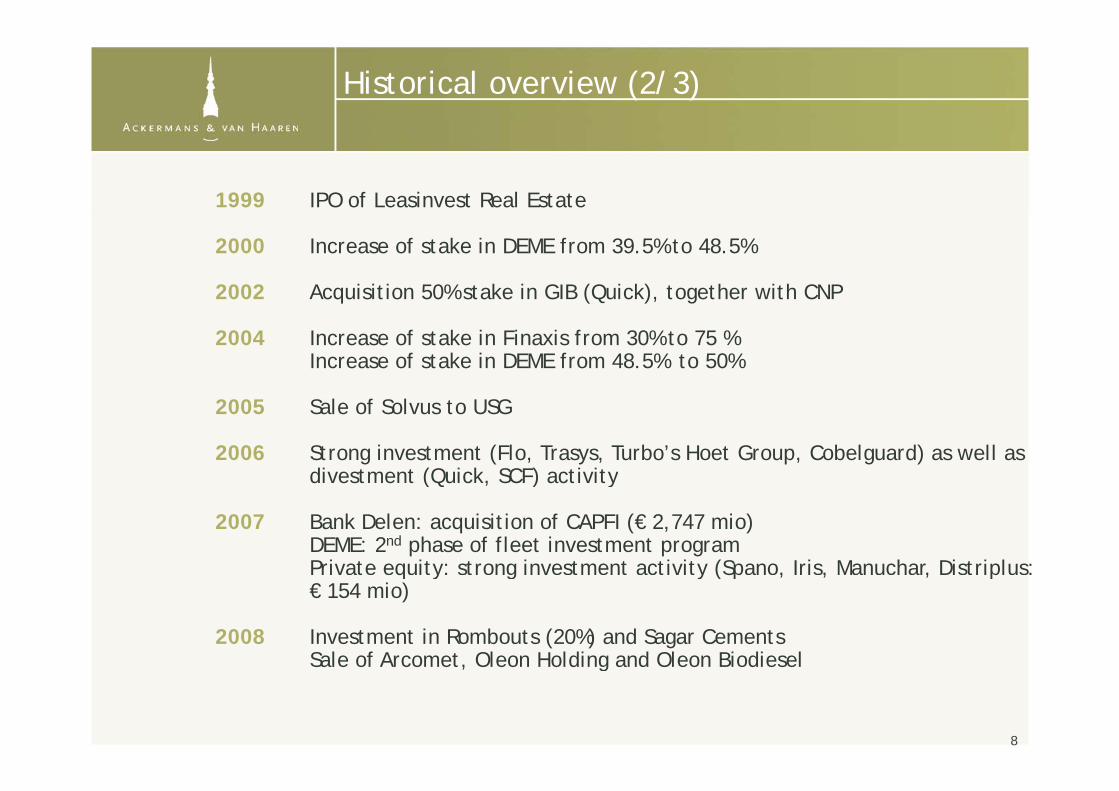
Historical overview (2/3)
1999 IPO of Leasinvest Real Estate
2000 Increase of stake in DEME from 39.5% to 48.5%
2002 Acquisition 50% stake in GIB (Quick), together with CNP
2004 Increase of stake in Finaxis from 30% to 75 %Increase of stake in DEME from 48.5% to 50%
2005 Sale of Solvus to USG
2006 Strong investment (Flo, Trasys, Turbo’s Hoet Group, Cobelguard) as well as divestment (Quick, SCF) activity(Q , ) y
2007 Bank Delen: acquisition of CAPFI (€ 2,747 mio)DEME: 2nd phase of fleet investment programPrivate equity: strong investment activity (Spano, Iris, Manuchar, Distriplus: q y g y (Sp , , , p€ 154 mio)
2008 Investment in Rombouts (20%) and Sagar CementsSale of Arcomet, Oleon Holding and Oleon BiodieselSale of Arcomet, Oleon Holding and Oleon Biodiesel
8
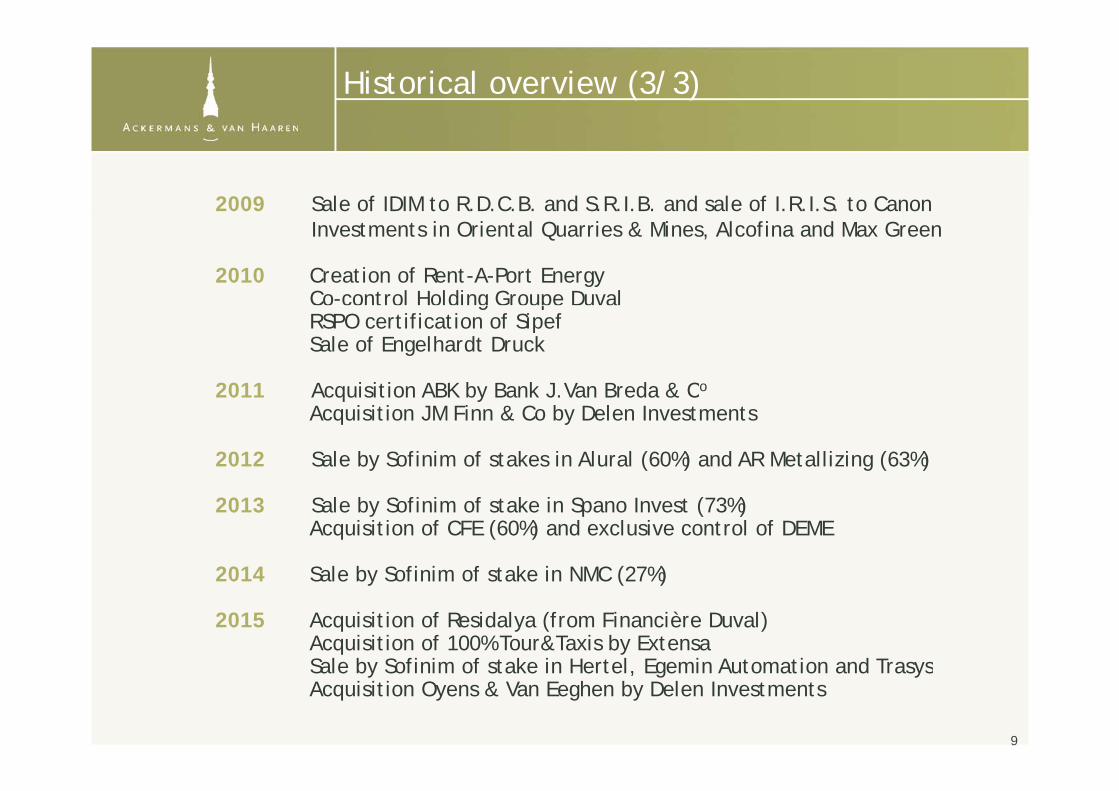
Historical overview (3/3)
2009 Sale of IDIM to R.D.C.B. and S.R.I.B. and sale of I.R.I.S. to CanonInvestments in Oriental Quarries & Mines, Alcofina and Max Green
2010 Creation of Rent-A-Port EnergyCo-control Holding Groupe Duvalg pRSPO certification of SipefSale of Engelhardt Druck
2011 Acquisition ABK by Bank J.Van Breda & Co2011 Acquisition ABK by Bank J.Van Breda & CAcquisition JM Finn & Co by Delen Investments
2012 Sale by Sofinim of stakes in Alural (60%) and AR Metallizing (63%)
2013 Sale by Sofinim of stake in Spano Invest (73%) Acquisition of CFE (60%) and exclusive control of DEME
2014 Sale by Sofinim of stake in NMC (27%) 2014 Sale by Sofinim of stake in NMC (27%)
2015 Acquisition of Residalya (from Financière Duval) Acquisition of 100% Tour&Taxis by ExtensaSale by Sofinim of stake in Hertel Egemin Automation and TrasysSale by Sofinim of stake in Hertel, Egemin Automation and TrasysAcquisition Oyens & Van Eeghen by Delen Investments
9
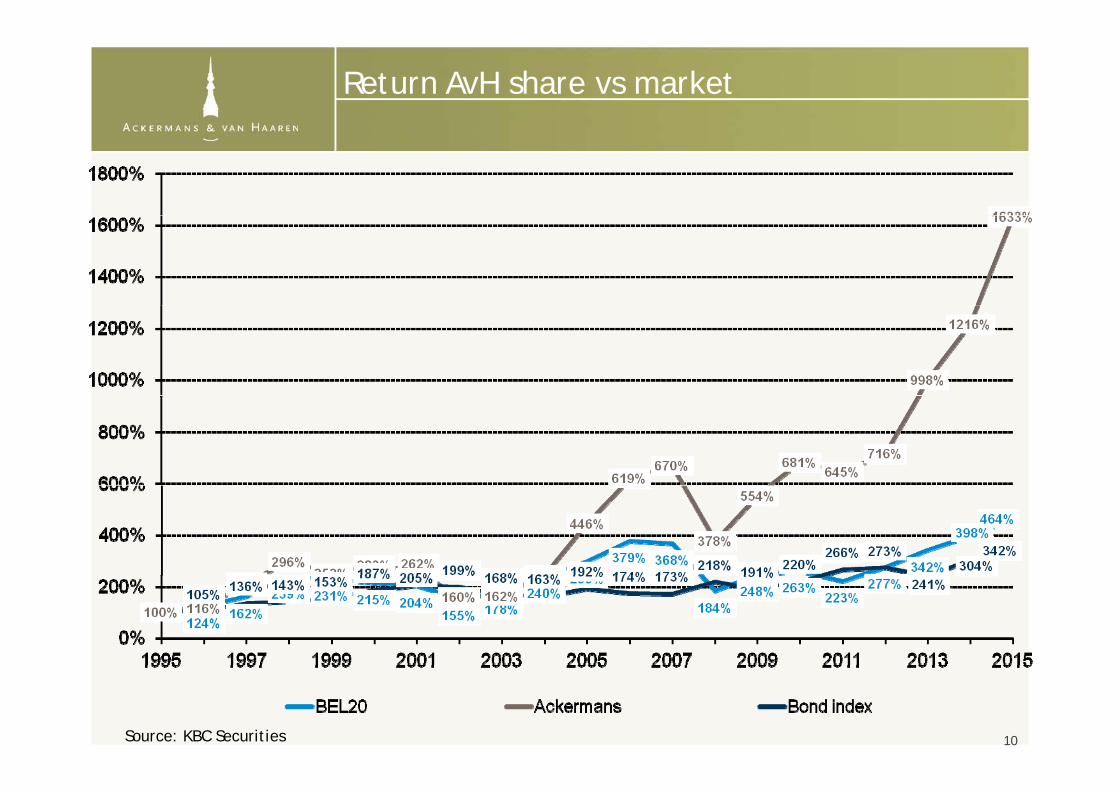
Return AvH share vs market
Source: KBC Securities 10
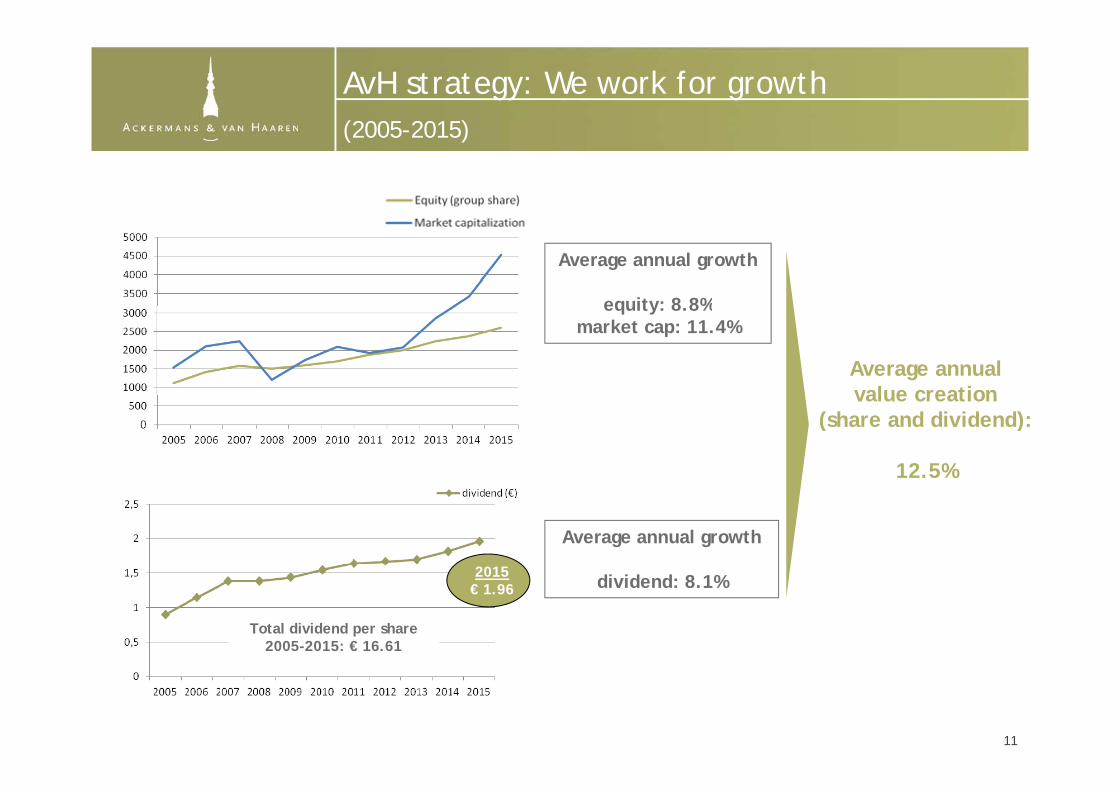
AvH strategy: We work for growth (2005 2015)(2005-2015)
Average annual growth
equity: 8 8%
Average annual value creation
equity: 8.8%market cap: 11.4%
value creation (share and dividend):
12.5%
Average annual growth
di id d 8 1% 2015 dividend: 8.1% 2015€ 1.96
Total dividend per share 2005-2015: € 16.61
1111
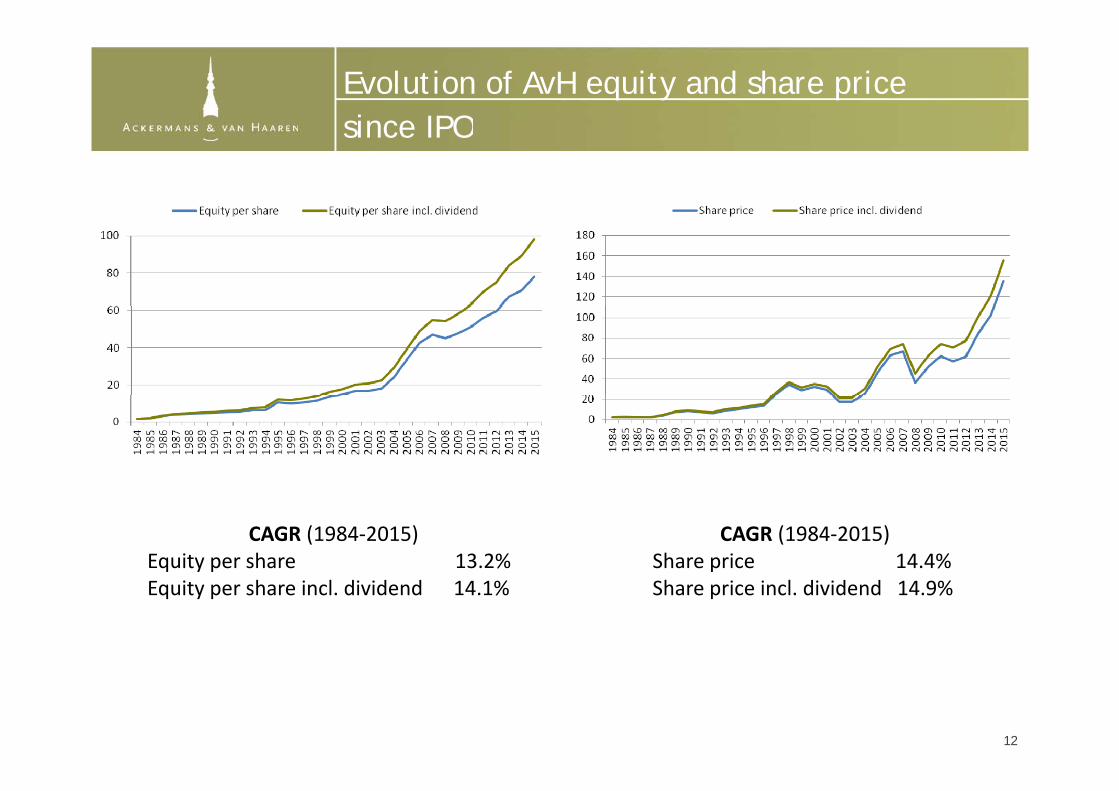
Evolution of AvH equity and share price since IPOsince IPO
CAGR (1984‐2015) Equity per share 13.2%
CAGR (1984‐2015) Share price 14.4%
Equity per share incl. dividend 14.1% Share price incl. dividend 14.9%
12
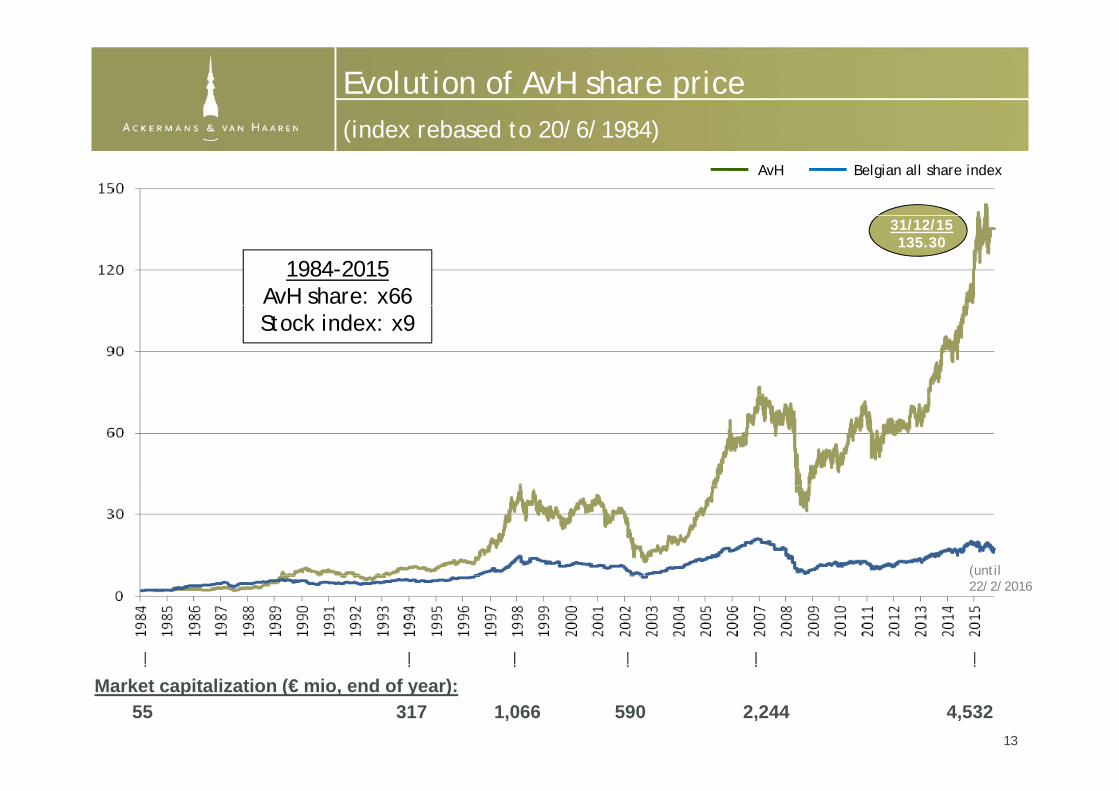
Evolution of AvH share price (index rebased to 20/6/1984)
AvH Belgian all share index
(index rebased to 20/6/1984)
1984-2015AvH share: x66
31/12/15135.30
Stock index: x9
(until (22/2/2016
13
55 317 2,2445901,066 4,532Market capitalization (€ mio, end of year):
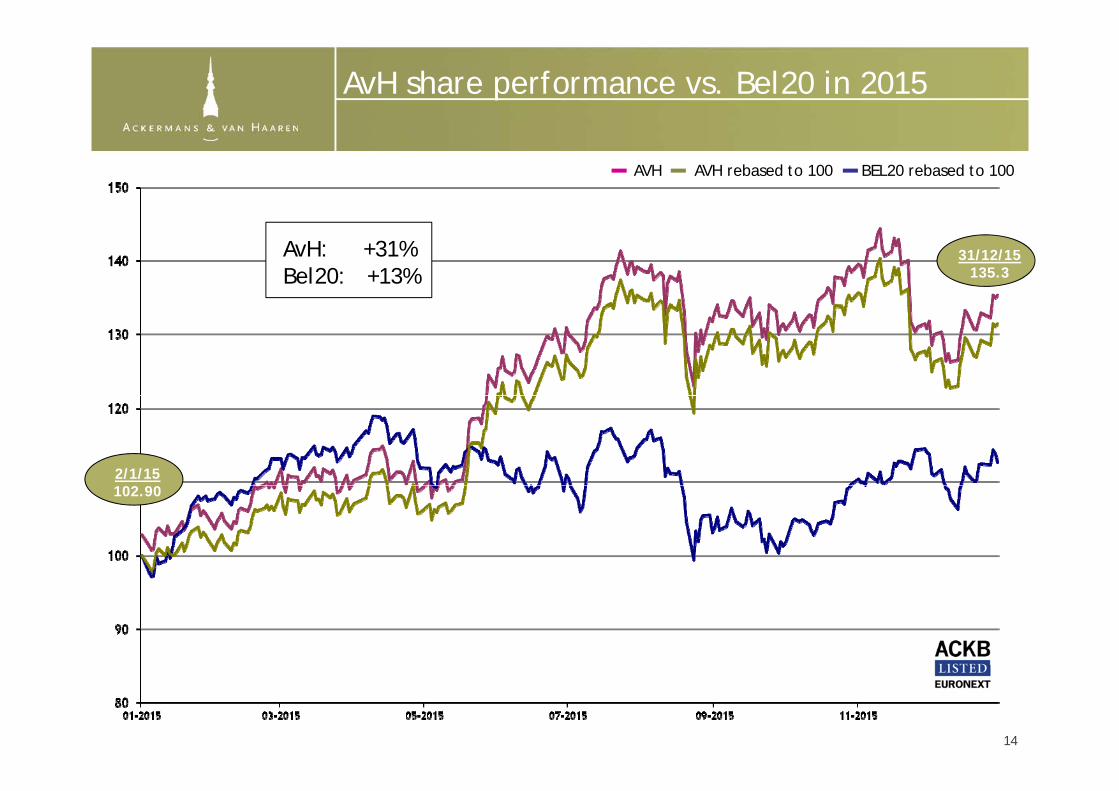
AvH share performance vs. Bel20 in 2015
AVH AVH rebased to 100 BEL20 rebased to 100
31/12/15135.3
AvH: +31%Bel20: +13%
2/1/15102.90
14
15

Pro forma group figures by segment(based on consolidated results 2015; pro forma: all (exclusive) control interests
Group personnel ‘Consolidated’ turnover(in € mio)
( p ( )incorporated in full, the other interests proportionally)
22,077 5,26922,633 5,862
16

Consolidated group result
(in € mio) 2014-2015 2015 2014(1) 2013( )
Marine Engineering & Infrastructure +4% 110.8 106.2 59.7Private Banking +14% 104 0 91 4 84 5Private Banking +14% 104.0 91.4 84.5Real Estate & Senior Care +142% 35.6 14.7 15.8Energy & Resources -78% 4.2 18.0 8.7Development Capital 8 7 6 7 6 6Development Capital 8.7 -6.7 -6.6
Result from participations +18% 263.3 223.6 162.1C it l i d l t it l 1 2 15 4 29 5Capital gains development capital -1.2 -15.4 29.5Result from participations (incl. capital gains) +26% 262.1 208.2 191.6
AvH & subholdings -7.9 -7.1 -7.2
Other non-recurrent result 29.9 12.5 109.5Consolidated group result +33% 284.1 213.6 293.9
17
(1) Restated re IAS41R

Other key figures
€ 20 20 20 3Consolidated balance sheet AvH group(in € mio) 2015 2014 2013
Shareholders' equity (group share) 2,607.3 2,372.1(1) 2,251.5Net cash AvH and subholdings 76.3 21.3 -3.1g
Key figures per share
(1) Restated re IAS41R
(in €) 2015 2014 2013
Number of shares (#) 33,496,904 33,496,904 33,496,904
Key figures per share
Net result per share 8.58 6.45(1) 8.87
Gross dividend 1.96 1.82 1.70
Net equity 77.84 70.81 67.22Stock price: highest (11/11/15) 144.40 103.40 85.16 lowest (6/1/15) 100.80 78.71 62.74 close (31/12/15) 135.30 102.10 85.16
18
(1) Restated re IAS41R

Backhoe dredger Pinocchio – La Réunion
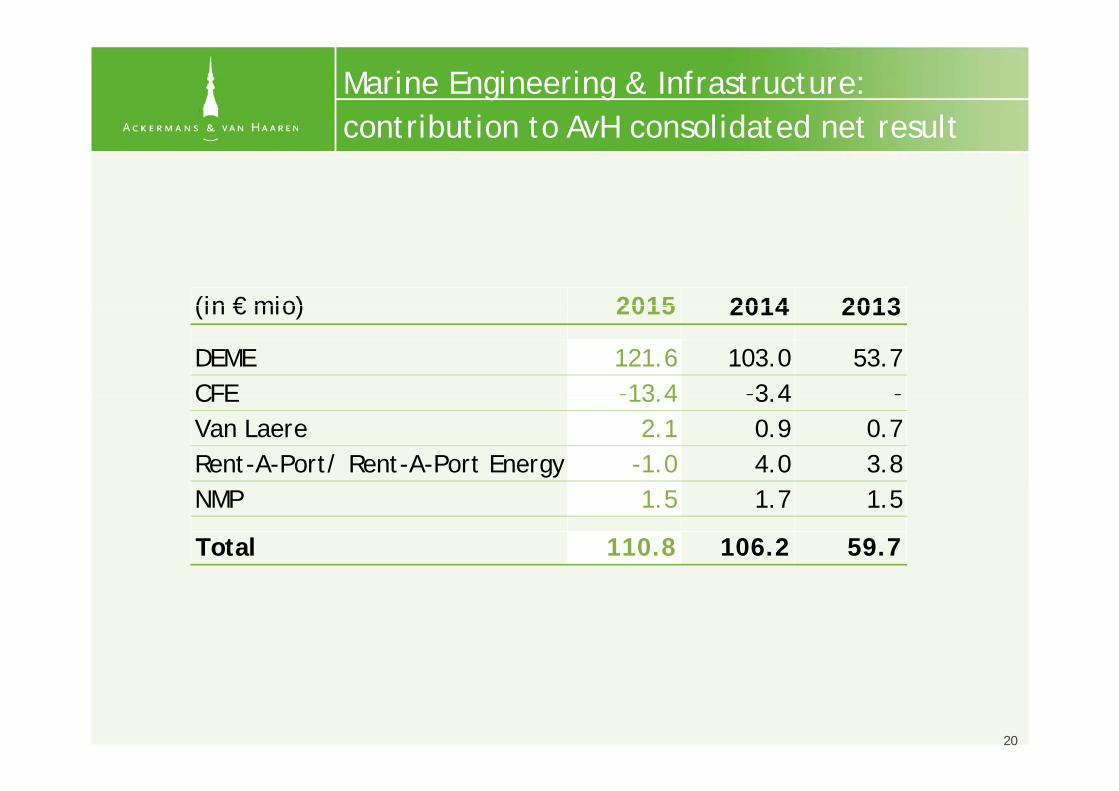
Marine Engineering & Infrastructure:contribution to AvH consolidated net resultcontribution to AvH consolidated net result
(in € mio) 2015 2014 2013(in € mio) 2015 2014 2013
DEME 121.6 103.0 53.7CFE -13 4 -3 4 -CFE 13.4 3.4Van Laere 2.1 0.9 0.7Rent-A-Port/ Rent-A-Port Energy -1.0 4.0 3.8NMP 1.5 1.7 1.5
Total 110.8 106.2 59.7
20
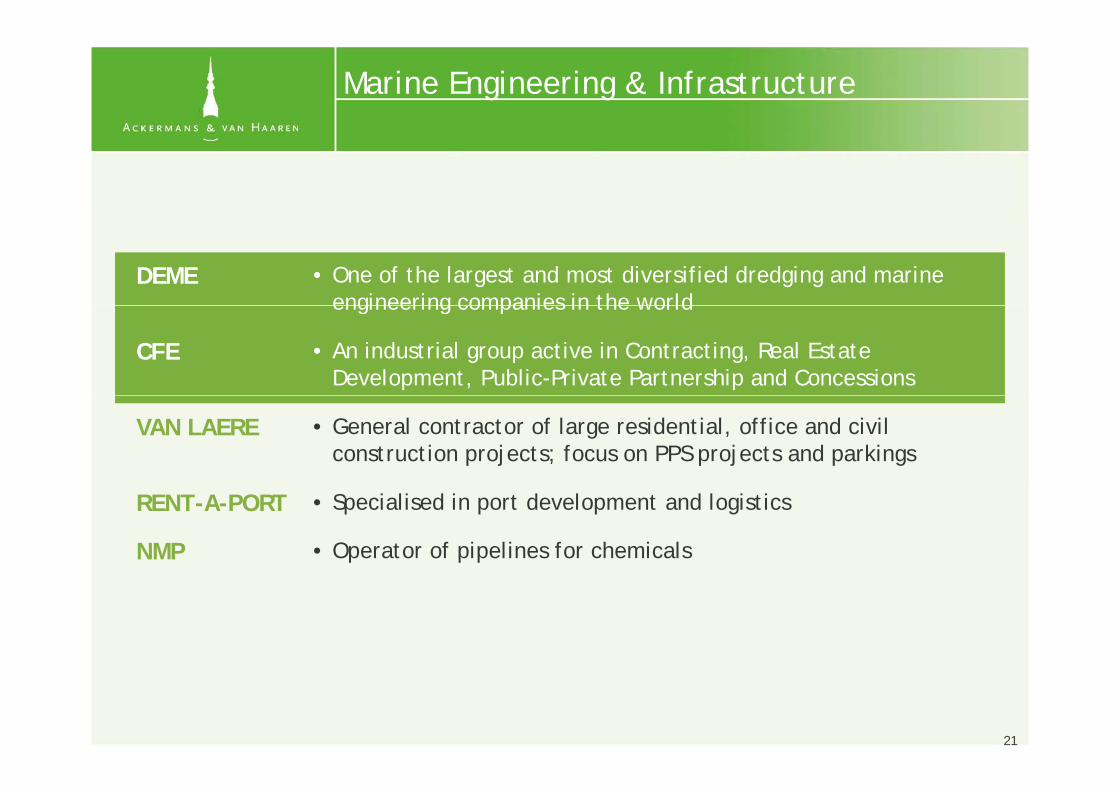
Marine Engineering & Infrastructure
• One of the largest and most diversified dredging and marine engineering companies in the world
DEME
CFE
engineering companies in the world
• An industrial group active in Contracting, Real Estate Development, Public-Private Partnership and Concessions
VAN LAERE • General contractor of large residential, office and civil construction projects; focus on PPS projects and parkings
NMP • Operator of pipelines for chemicals
• Specialised in port development and logisticsRENT-A-PORT
21
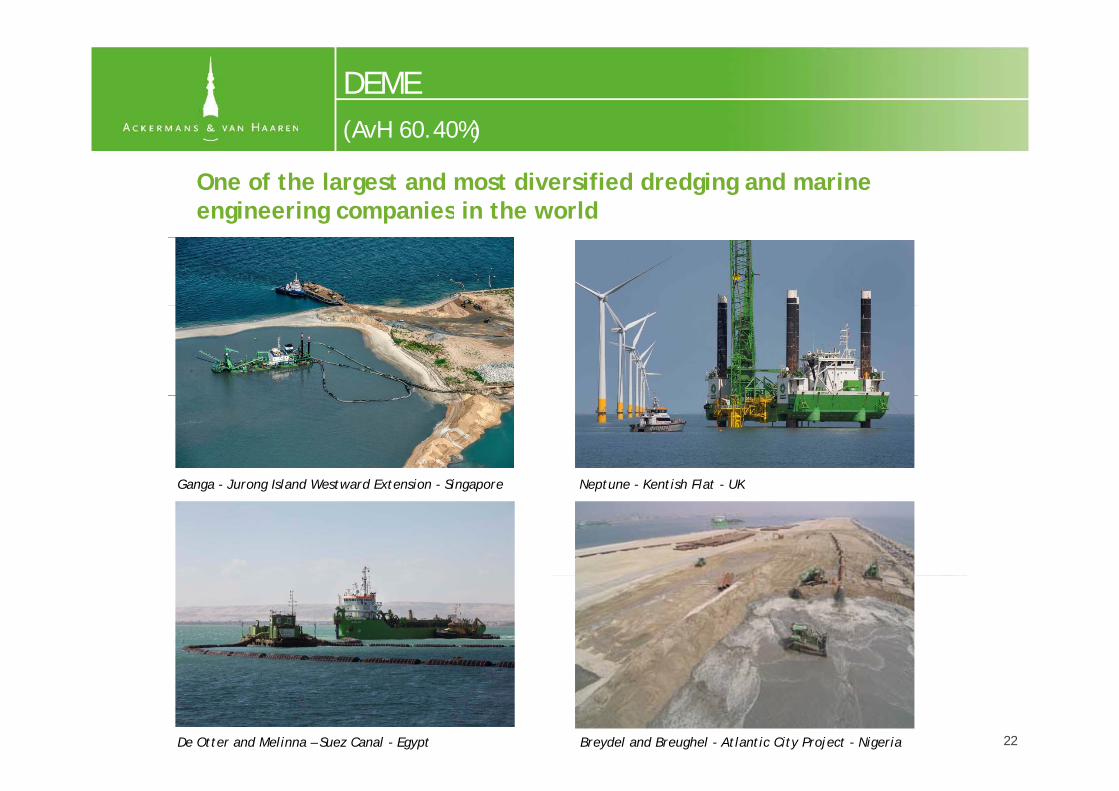
DEME(AvH 60 40%)
One of the largest and most diversified dredging and marine engineering companies in the world
(AvH 60.40%)
engineering companies in the world
Ganga - Jurong Island Westward Extension - Singapore Neptune - Kentish Flat - UKGanga - Jurong Island Westward Extension - Singapore Neptune - Kentish Flat - UK
22
Innovation – Godewind (Germany)
De Otter and Melinna – Suez Canal - Egypt Breydel and Breughel - Atlantic City Project - Nigeria

DEME: key figures (1/2)
(in € mio) 2013
(1) (2) (1) (2) (2)Turnover 2,286.1 2,351.0 2,419.7 2,586.9 2,531.6
2015 2014
, 6 , , 9 , 6 9 , 6EBITDA 489.2 558.4 443.6 501.5 437.8EBIT 269.2 318.4 223.5 259.1 216.5Net result 199.2 199.2 169.0 169.0 109.1
Shareholder's equity 1,132.9 1,132.9 986.7 986.7 847.7Net financial position -269.5 -266.7 -126.8 -212.8 -711.3Total assets 3,149.8 3,233.5 2,901.5 3,132.7 2,920.5
Net capex (incl. IAS16) 340.8(3) 146 209
# personnel 4,186 4,311 4,582
(1) Following the introduction of the new accounting standards IFRS10 and IFRS11, group companies jointly controlled by DEME are accounted for using the equity method with effect from 1 January 2014.(2) In this presentation, the group companies that are jointly controlled by DEME are still proportionally integrated. Although this is not in accordance
ith th IFRS10 d IFRS11 ti t d d it th l i l t i t f th ti d t /li biliti f th with the new IFRS10 and IFRS11 accounting standards, it nevertheless gives a more complete picture of the operations and assets/liabilities of those companies. In the equity accounting as applied under (1), the contribution of the group companies is summarized under one single item on the balance sheet and in the income statement.(3) Including 50% of enterprise value HGO purchased in 1H15
23
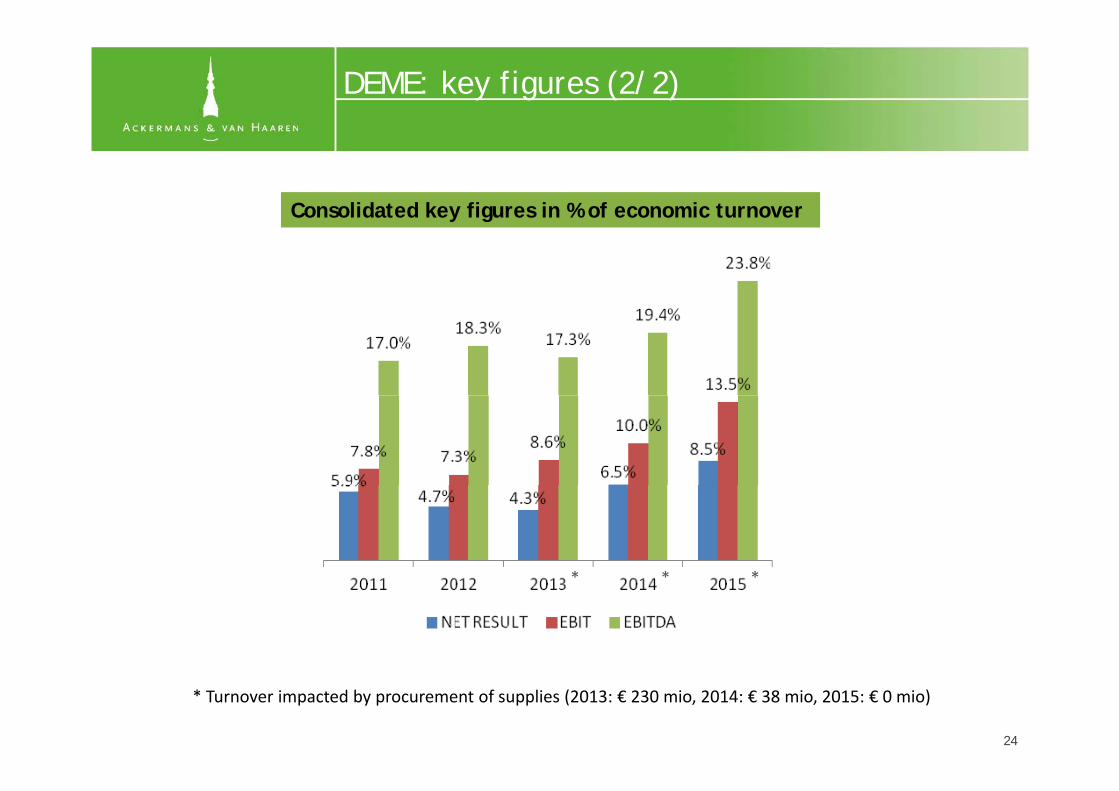
DEME: key figures (2/2)
Consolidated key figures in % of economic turnoverConsolidated key figures in % of economic turnover
** * ** *
* Turnover impacted by procurement of supplies (2013: € 230 mio, 2014: € 38 mio, 2015: € 0 mio)
24
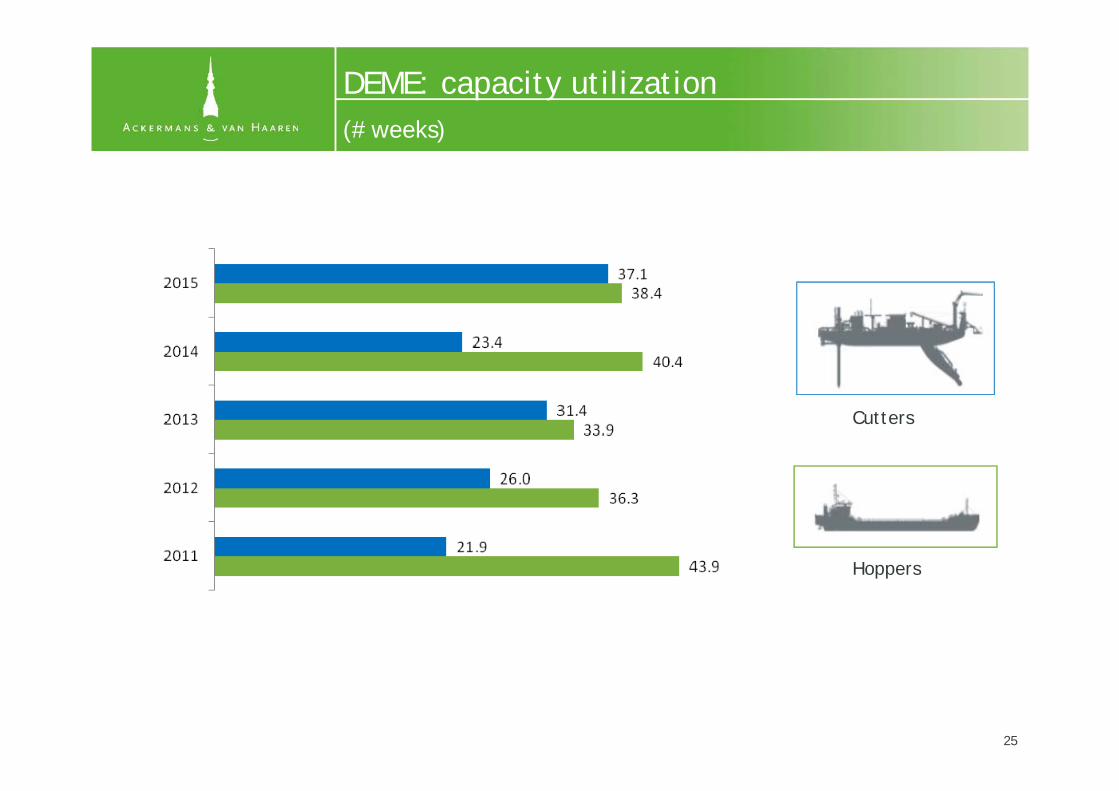
DEME: capacity utilization(# weeks)(# weeks)
Cutters
Hopperspp
25
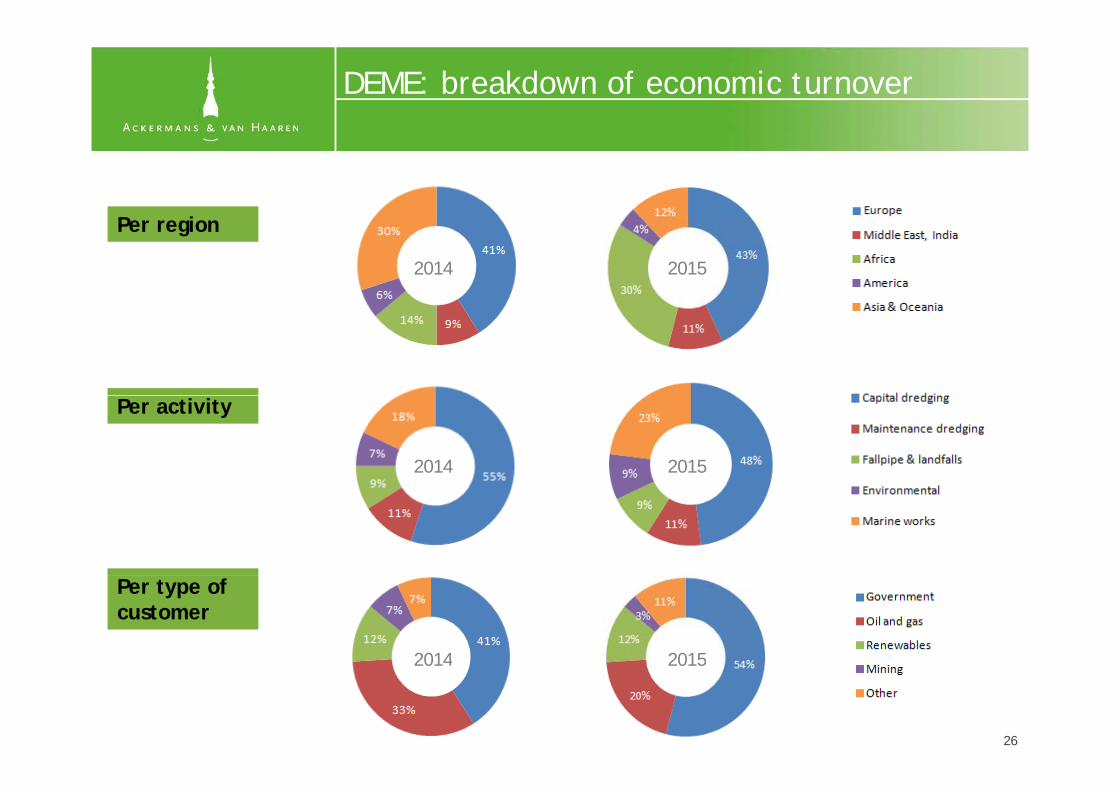
DEME: breakdown of economic turnover
Per region
2014 2015
Per activity
2014 2015
Per type of customer
2014 20152014
26
2015
DEME: highlights
Highlights 2015• Significant increase of net result to € 199.2 mio (2014: € 169.0 mio) despite decrease of economic
turnover to € 2 351 mio (2014: € 2 587 mio)turnover to € 2,351 mio (2014: € 2,587 mio)• Major projects finalized in 2015: Wheatstone, Hay Point (Australia), Suez Canal (Egypt), Doha New
Port (Qatar), Northwind and Godewind wind farms • GeoSea projects ongoing for Kentish Flats (UK) and Galloper (UK) windfarms• Order backlog of € 3,185 mio at end December 2015 (see next page). Galloper project (€ 340 mio)
and contracts in Egypt, Panama and Turkey (total € 150 mio) added in 4Q15
• Limited increase of net financial debt to € 266.7 mio, after € 373.0 mio investment in fleet ,(€ 340.8 mio net, including sale of assets)
• GeoSea finalized agreement on acquisition of offshore assets from HOCHTIEF, leading to full ownership of Innovation, Thor, Wismar, Bremen and Stralsund. Total investment of € 166 mio (enterprise value incl assumption of debt)(enterprise value, incl. assumption of debt)
• Further expansion announced of dredging fleet with decision to build 3 new trailing suction hopper dredgers (1,500 m³, 3,500 m³ (end 2016), 8,000 m³ (early 2017)). Early 2016, new trailing suction hopper dredger Bonny River (14,500 m³) ordered.New investments to be operational from 2017: Apollo (jack up vessel 800 ton crane able to • New investments to be operational from 2017: Apollo (jack-up vessel, 800 ton crane, able to operate in water depths of up to 70 m), Living Stone (multipurpose fall-pipe vessel for offshore energy market), Rambiz4000 (heavy-lift vessel, 2 cranes each with lifting capacity of 2,000 tons)
• New division for maritime civil engineering: DEME Infra Sea Solutions (DISS) and DEME Infra Marine Contractor (DIMCO). Repositioning of CFE Nederland and GEKA Bouw under DIMCO, and transfer of part of personnel from civil engineering CFE België
27
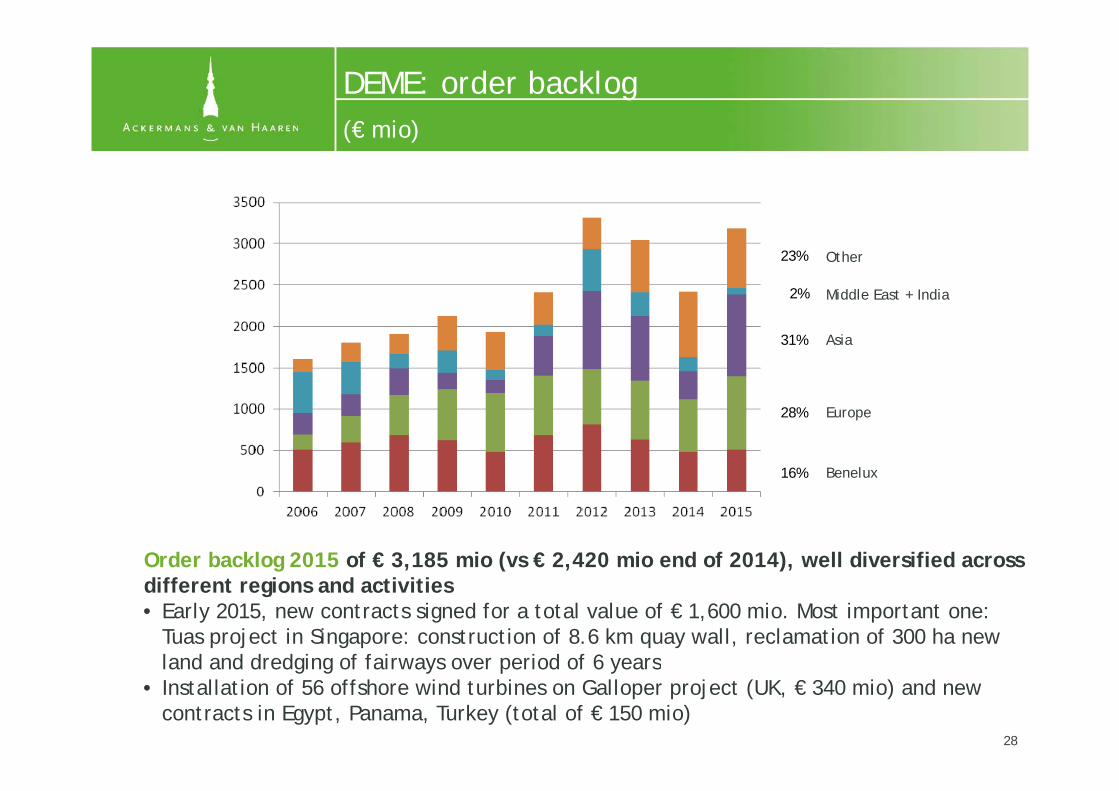
DEME: order backlog(€ mio)(€ mio)
Other
Middle East + India
23%
2%
Asia31%
Europe
Benelux
28%
16%
Order backlog 2015 of € 3,185 mio (vs € 2,420 mio end of 2014), well diversified across different regions and activities• Early 2015, new contracts signed for a total value of € 1,600 mio. Most important one:
Tuas project in Singapore: construction of 8.6 km quay wall, reclamation of 300 ha new land and dredging of fairways over period of 6 yearsland and dredging of fairways over period of 6 years
• Installation of 56 offshore wind turbines on Galloper project (UK, € 340 mio) and new contracts in Egypt, Panama, Turkey (total of € 150 mio)
28
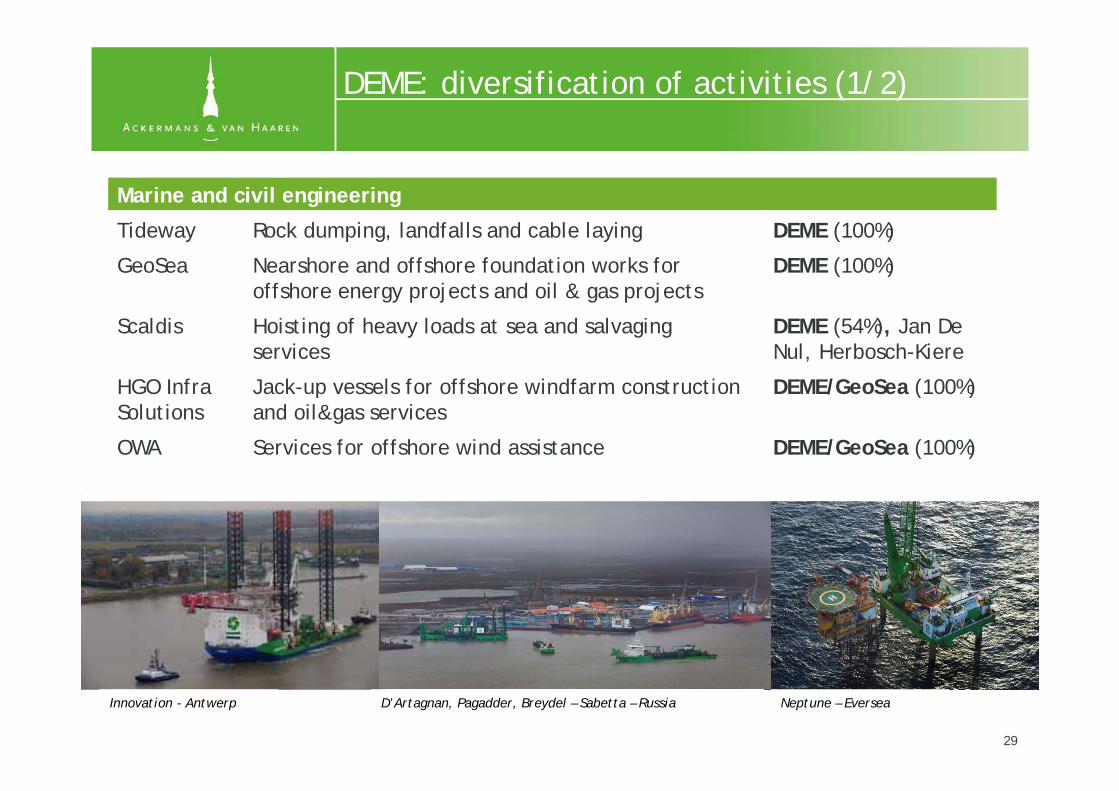
DEME: diversification of activities (1/2)
Marine and civil engineering
Tideway Rock dumping, landfalls and cable laying DEME (100%)
GeoSea Nearshore and offshore foundation works for offshore energy projects and oil & gas projects
DEME (100%)
Scaldis Hoisting of heavy loads at sea and salvaging services
DEME (54%), Jan De Nul, Herbosch-Kiere
HGO Infra Jack-up vessels for offshore windfarm construction DEME/GeoSea (100%)Solutions
pand oil&gas services
( )
OWA Services for offshore wind assistance DEME/GeoSea (100%)
29
Neptune – EverseaInnovation - Antwerp D’Artagnan, Pagadder, Breydel – Sabetta – Russia
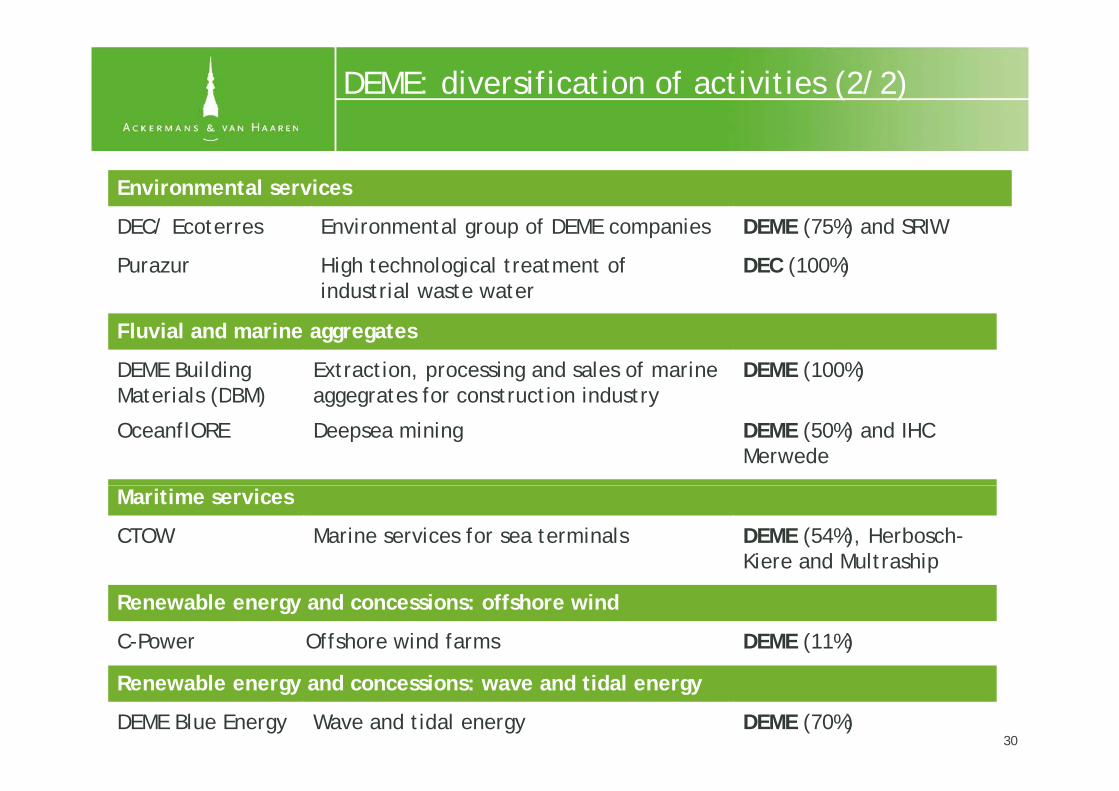
DEME: diversification of activities (2/2)
Environmental services
DEC/ Ecoterres Environmental group of DEME companies DEME (75%) and SRIW
Purazur High technological treatment of industrial waste water
DEC (100%)
Fluvial and marine aggregates
DEME Building Materials (DBM)
Extraction, processing and sales of marine aggegrates for construction industry
DEME (100%)Materials (DBM) aggegrates for construction industry
OceanflORE Deepsea mining DEME (50%) and IHC Merwede
Maritime services
CTOW Marine services for sea terminals DEME (54%), Herbosch-Kiere and Multraship
Renewable energy and concessions: offshore wind
C-Power Offshore wind farms DEME (11%)
Renewable energy and concessions: wave and tidal energy
DEME Blue Energy Wave and tidal energy DEME (70%)30
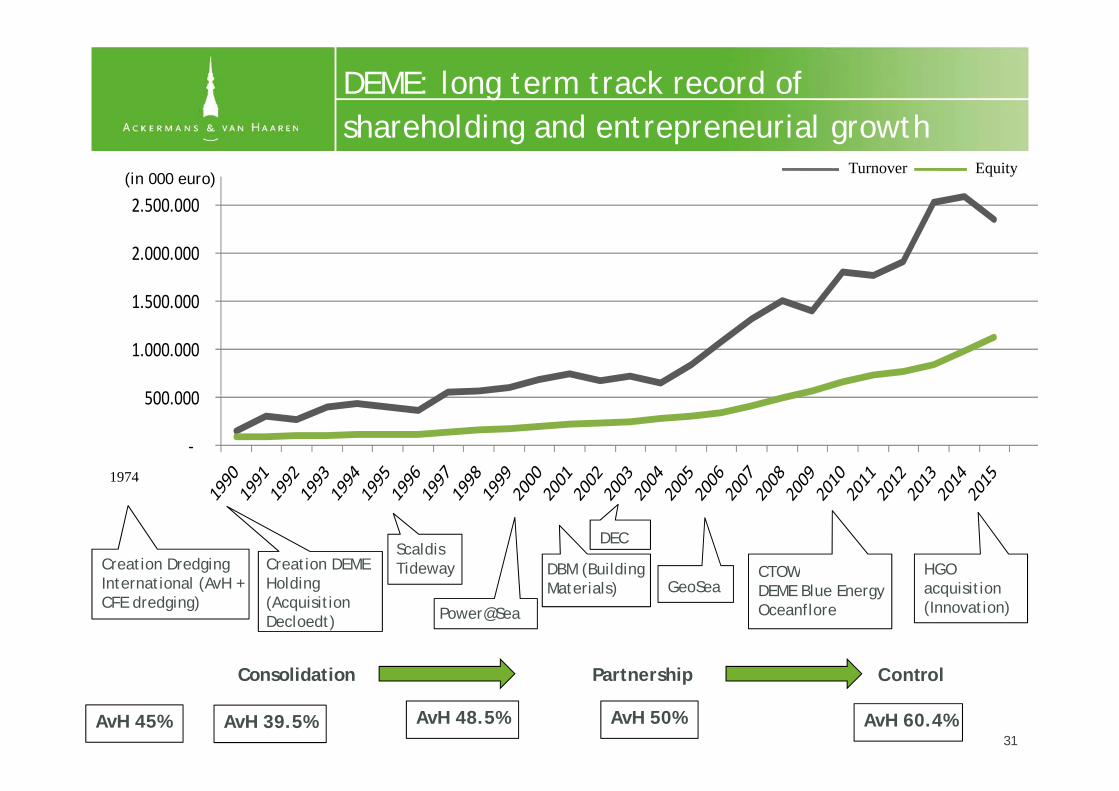
DEME: long term track record ofshareholding and entrepreneurial growth
2.500.000 (in 000 euro)
Turnover Equity
shareholding and entrepreneurial growth
1.500.000
2.000.000
500 000
1.000.000
1.500.000
‐
500.000
1974
ScaldisTideway DBM (Building Creation DEME CTOWCreation Dredging
DEC
HGO y ( gMaterials)Holding
(Acquisition Decloedt)
GeoSeaCTOWDEME Blue EnergyOceanflore
International (AvH + CFE dredging)
Power@Sea
acquisition (Innovation)
AvH 39.5% AvH 48.5% AvH 50% AvH 60.4%
Consolidation Partnership
AvH 45%
Control
31
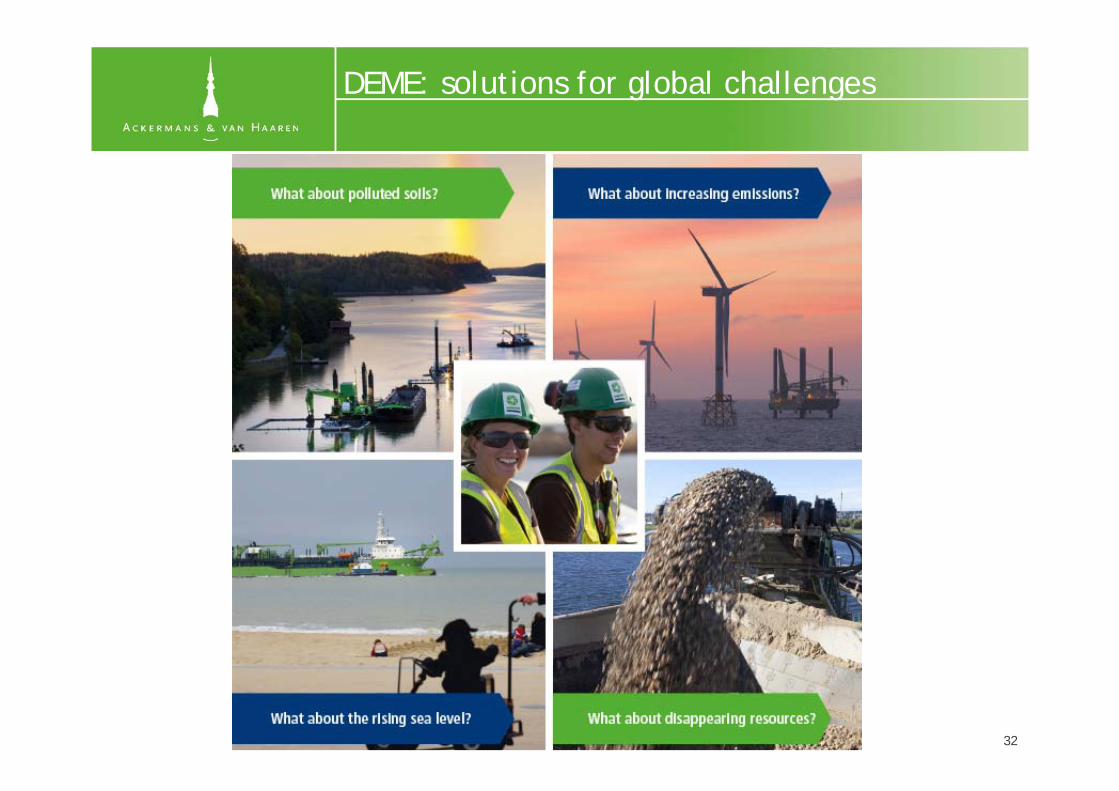
DEME: solutions for global challenges
32

Structural growth drivers of global dredging market
Global population increase Global warming leading to rising sea levels
dredging market
Northwind
E l ti f b t dEvolution of seaborne trade
33

CFE(AvH 60 40%)
Belgian industrial group active in Contracting, Real Estate Development Public Private Partnership and Concessions
(AvH 60.40%)
Development, Public-Private Partnership and Concessions
K l k W P l dKolska – Warsaw - Poland
34Baelskaai - OstendToison d’Or - Brussels
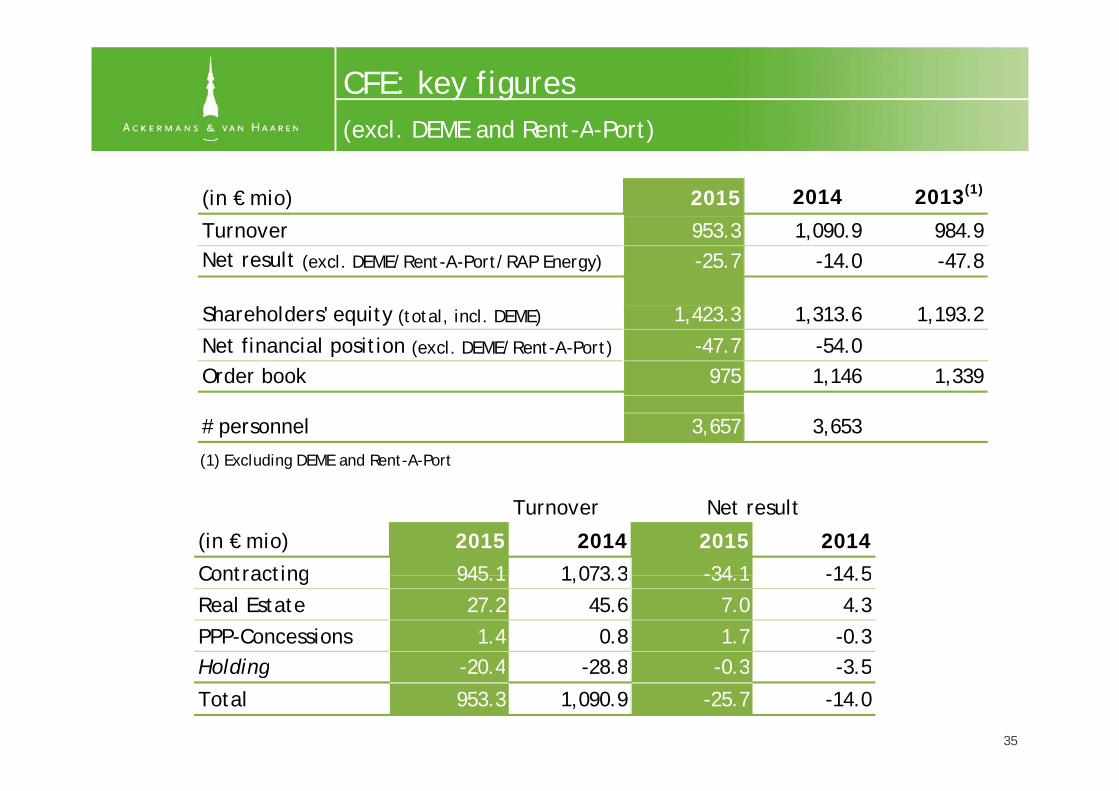
CFE: key figures(excl DEME and Rent A Port)
(in € mio) 2015 2014(1) 2013(1)
(excl. DEME and Rent-A-Port)
Turnover 953.3 1,090.9 984.9Net result (excl. DEME/Rent-A-Port/RAP Energy) -25.7 -14.0 -47.8
h h ldShareholders' equity (total, incl. DEME) 1,423.3 1,313.6 1,193.2Net financial position (excl. DEME/Rent-A-Port) -47.7 -54.0Order book 975 1,146 1,339
# personnel 3,657 3,653
(1) Excluding DEME and Rent-A-Port
(in € mio) 2015 2014 2015 2014Contracting 945 1 1 073 3 -34 1 -14 5
Turnover Net result
Contracting 945.1 1,073.3 -34.1 -14.5Real Estate 27.2 45.6 7.0 4.3PPP-Concessions 1.4 0.8 1.7 -0.3Holding 20 4 28 8 0 3 3 5
35
Holding -20.4 -28.8 -0.3 -3.5
Total 953.3 1,090.9 -25.7 -14.0

CFE: highlights(excl DEME and Rent A Port)
Highlights 2015• Decrease of turnover (excl. DEME and Rent-A-Port) to € 953.3 mio.
1 Disposal of road-building operations (sold beginning of 2015) contributed € 45 mio in 2014
(excl. DEME and Rent-A-Port)
1. Disposal of road-building operations (sold beginning of 2015) contributed € 45 mio in 20142. More selective order intake3. Limitation of international exposure
• Real estate activities, buildings Flanders, multitechnics and rail realized positive contribution• Negative results from civil engineering international activities and large projects in Brussels• Negative results from civil engineering, international activities and large projects in Brussels• Two projects for Chad government leading to an exposure of approx. € 60 mio. In close cooperation
with Chad authorities, CFE is investigating financing solutions allowing the receivables to be paid.• Decrease of order book to € 975 mio, after transfer of civil engineering Netherlands to DEME and more
selective tendering T O d b kselective tendering
(in € mio) 2015 2014 2015 2014
Civil engineering 91.8 116.3 50.6 169.3
B ildi B l 530 7 523 1 601 1 651 0
Turnover Order book
Buildings Benelux 530.7 523.1 601.1 651.0
Buildings Internat. 118.2 165.9 149.2 125.1
Multitechnics/Rail 204.4 268.0 165.1 181.8
T t l t ti 945 1 1 073 3 966 0 1 127 2
• Internal reorganization of the CFE group completed• Building activities (Belgium, Luxembourg, Poland and Tunisia), and multitechnics and rail infra
repositioned under CFE Contracting a wholly owned subsidiary of CFE
Total construction 945.1 1,073.3 966.0 1,127.2
repositioned under CFE Contracting, a wholly owned subsidiary of CFE • New CEO, Raymund Trost, for CFE Contracting since November 2015• Real estate activities centralized under BPI (Jacques Lefèvre)• Civil engineering and the other international activities to be streamlined under CFE
36
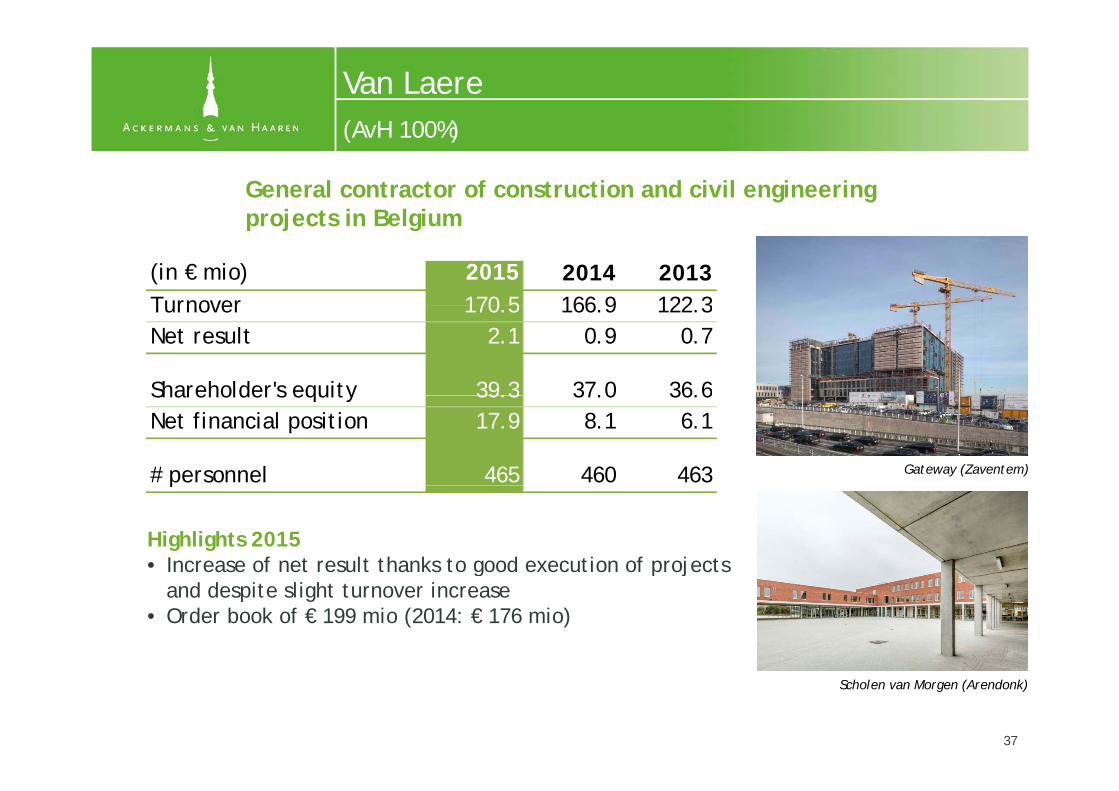
Van Laere(AvH 100%)
General contractor of construction and civil engineering projects in Belgium
(AvH 100%)
projects in Belgium
(in € mio) 2015 2014 2013Turnover 170 5 166 9 122 3Turnover 170.5 166.9 122.3Net result 2.1 0.9 0.7
Shareholder's equity 39.3 37.0 36.6Shareholder s equity 39.3 37.0 36.6Net financial position 17.9 8.1 6.1
# personnel 465 460 463 Gateway (Zaventem)
Highlights 2015• Increase of net result thanks to good execution of projects
p
g p jand despite slight turnover increase
• Order book of € 199 mio (2014: € 176 mio)
37
Scholen van Morgen (Arendonk)
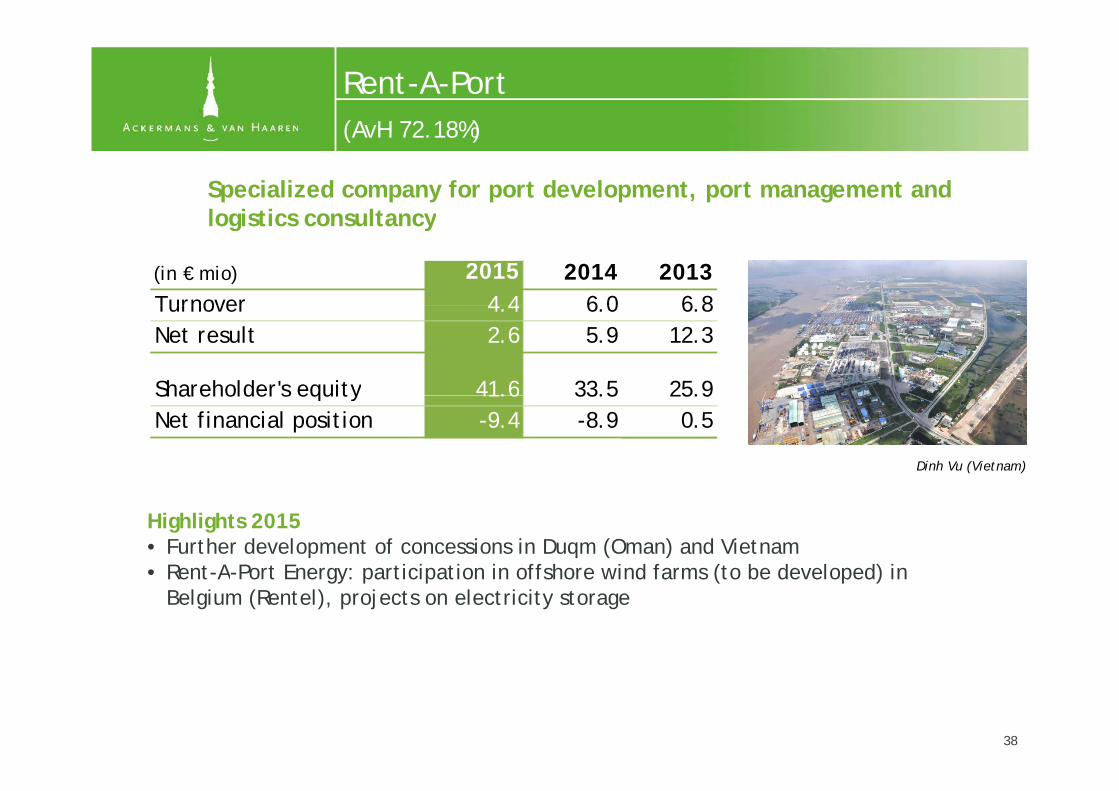
Rent-A-Port(AvH 72 18%)
Specialized company for port development, port management and logistics consultancy
(AvH 72.18%)
logistics consultancy
(in € mio) 2015 2014 2013Turnover 4 4 6 0 6 8Turnover 4.4 6.0 6.8Net result 2.6 5.9 12.3
Shareholder's equity 41.6 33.5 25.9Shareholder s equity 41.6 33.5 25.9Net financial position -9.4 -8.9 0.5
Dinh Vu (Vietnam)
Highlights 2015• Further development of concessions in Duqm (Oman) and Vietnam • Rent-A-Port Energy: participation in offshore wind farms (to be developed) in Rent A Port Energy: participation in offshore wind farms (to be developed) in
Belgium (Rentel), projects on electricity storage
38
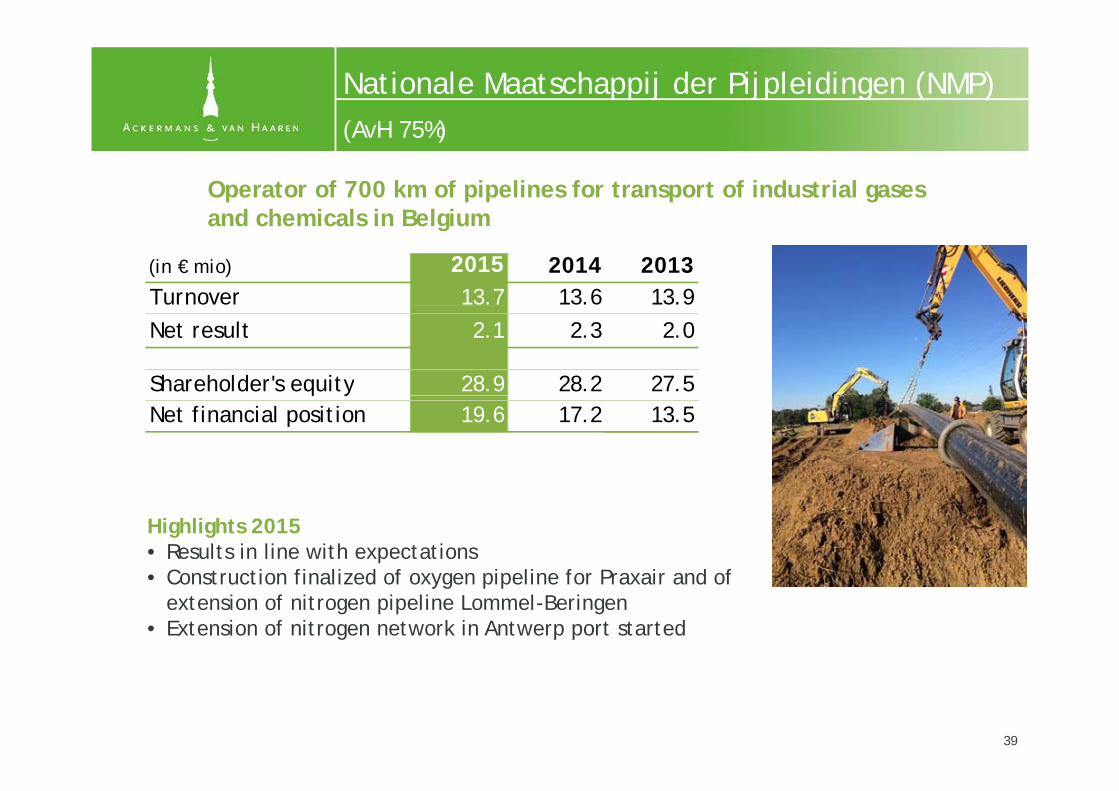
Nationale Maatschappij der Pijpleidingen (NMP)(AvH 75%)
Operator of 700 km of pipelines for transport of industrial gases and chemicals in Belgium
(AvH 75%)
and chemicals in Belgium
(in € mio) 2015 2014 2013Turnover 13.7 13.6 13.9Net result 2.1 2.3 2.0
Shareholder's equity 28.9 28.2 27.5q yNet financial position 19.6 17.2 13.5
Highlights 2015• Results in line with expectations• Construction finalized of oxygen pipeline for Praxair and of • Construction finalized of oxygen pipeline for Praxair and of
extension of nitrogen pipeline Lommel-Beringen• Extension of nitrogen network in Antwerp port started
39
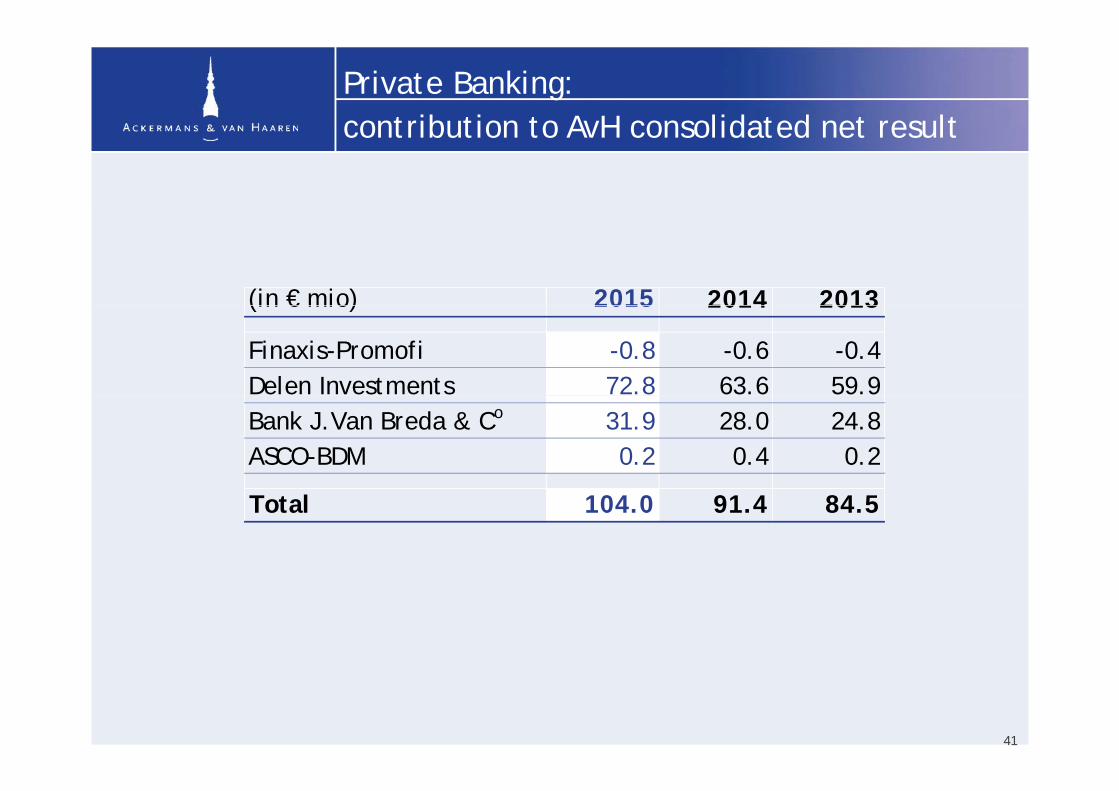
Private Banking:contribution to AvH consolidated net resultcontribution to AvH consolidated net result
(in € mio) 2015 2014 2013(in € mio) 2015 2014 2013
Finaxis-Promofi -0.8 -0.6 -0.4Delen Investments 72.8 63.6 59.9Bank J.Van Breda & Co 31.9 28.0 24.8ASCO-BDM 0.2 0.4 0.2
Total 104.0 91.4 84.5
41
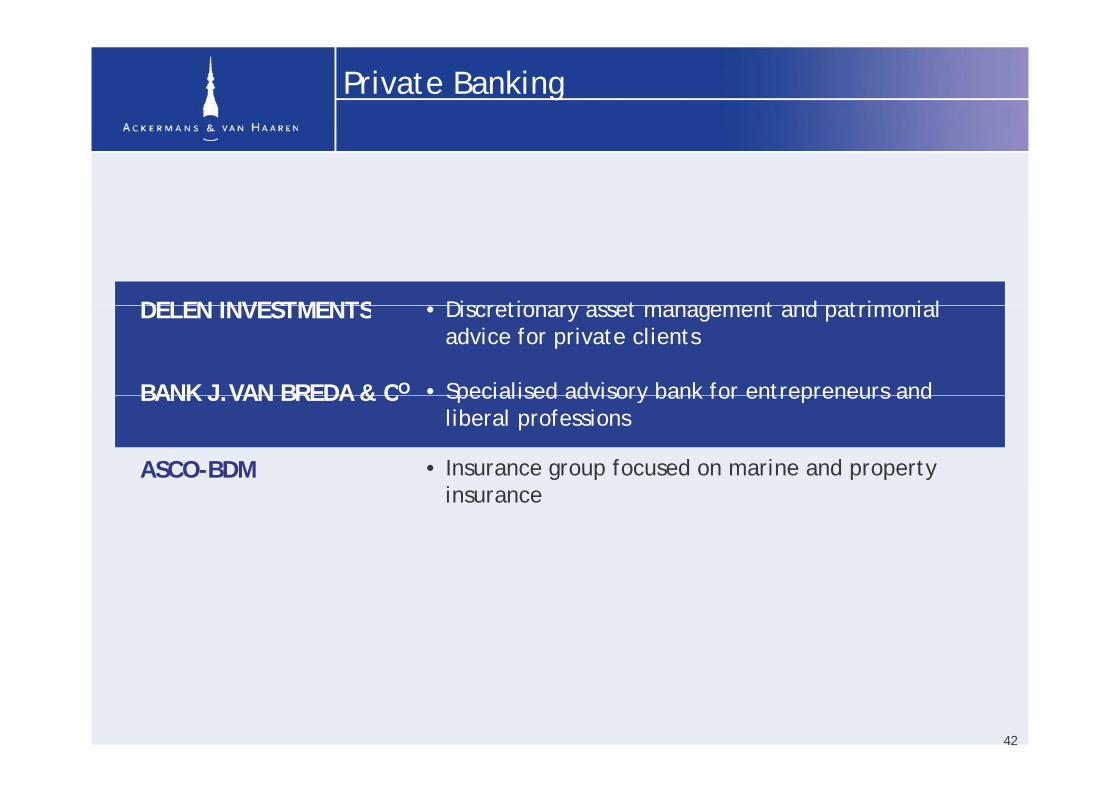
Private Banking
DELEN INVESTMENTS Discretionary asset management and patrimonial DELEN INVESTMENTS
• Specialised advisory bank for entrepreneurs and
• Discretionary asset management and patrimonial advice for private clients
BANK J VAN BREDA & CO Specialised advisory bank for entrepreneurs and liberal professions
BANK J.VAN BREDA & C
• Insurance group focused on marine and property ASCO-BDMinsurance
42

Finaxis organization chart
AvH Promofi
78 75% 21 25%
Finaxis
78.75% 21.25%
Bank J Van Breda & CoDelen Investments CVA
99% 100%
Bank J.Van Breda & CDelen Investments CVA
100% 73% 99.9%100%
JM Finn & CoDelen Private Bank ABK bankOyens & Van
Eeghen
43
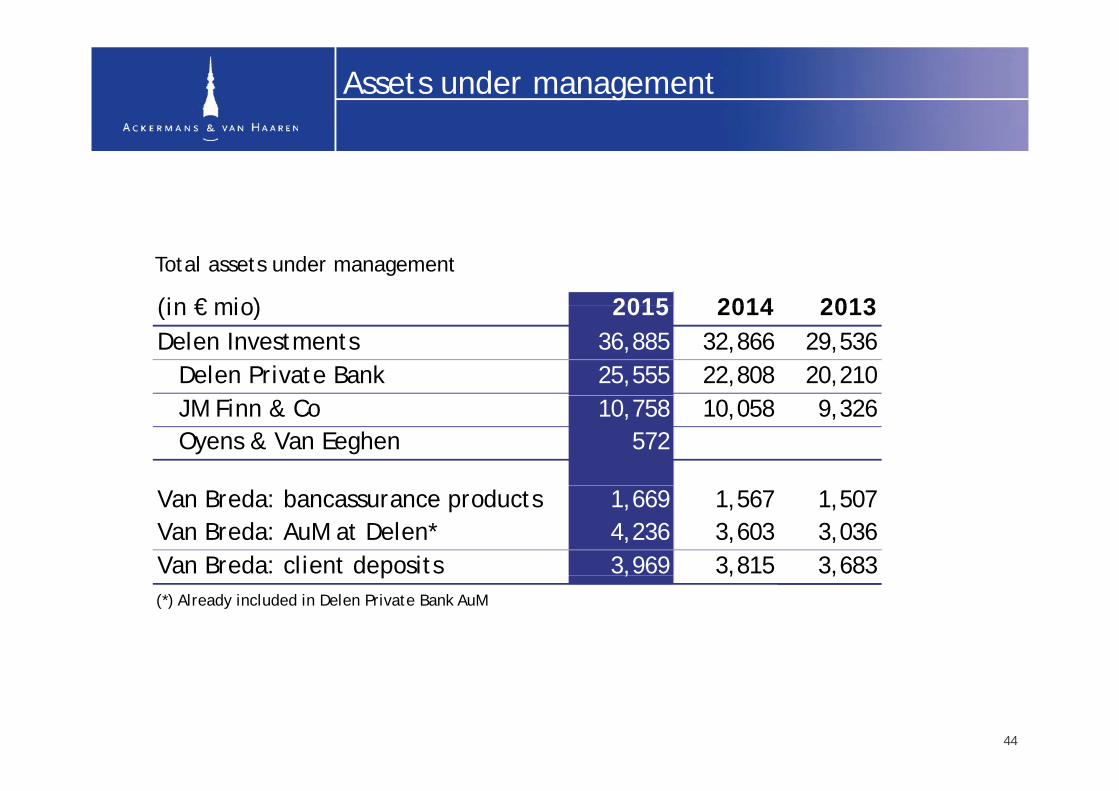
Assets under management
(in € mio) 2015 2014 2013
Total assets under management
(in € mio) 2015 2014 2013Delen Investments 36,885 32,866 29,536 Delen Private Bank 25,555 22,808 20,210 JM Finn & Co 10,758 10,058 9,326 Oyens & Van Eeghen 572
Van Breda: bancassurance products 1,669 1,567 1,507Van Breda: AuM at Delen* 4,236 3,603 3,036Van Breda: client deposits 3,969 3,815 3,683p , , ,(*) Already included in Delen Private Bank AuM
44

Delen Investments: funds under management(AvH 78 75%)
Private banking and wealth management. Focused on discretionary
(AvH 78.75%)
AuM Delen Investmentsg g yasset management for private clients, in Belgium and UK
AuM Delen InvestmentsCAGR 2006-2015: 17.8%
JM Finn
Capfi
45
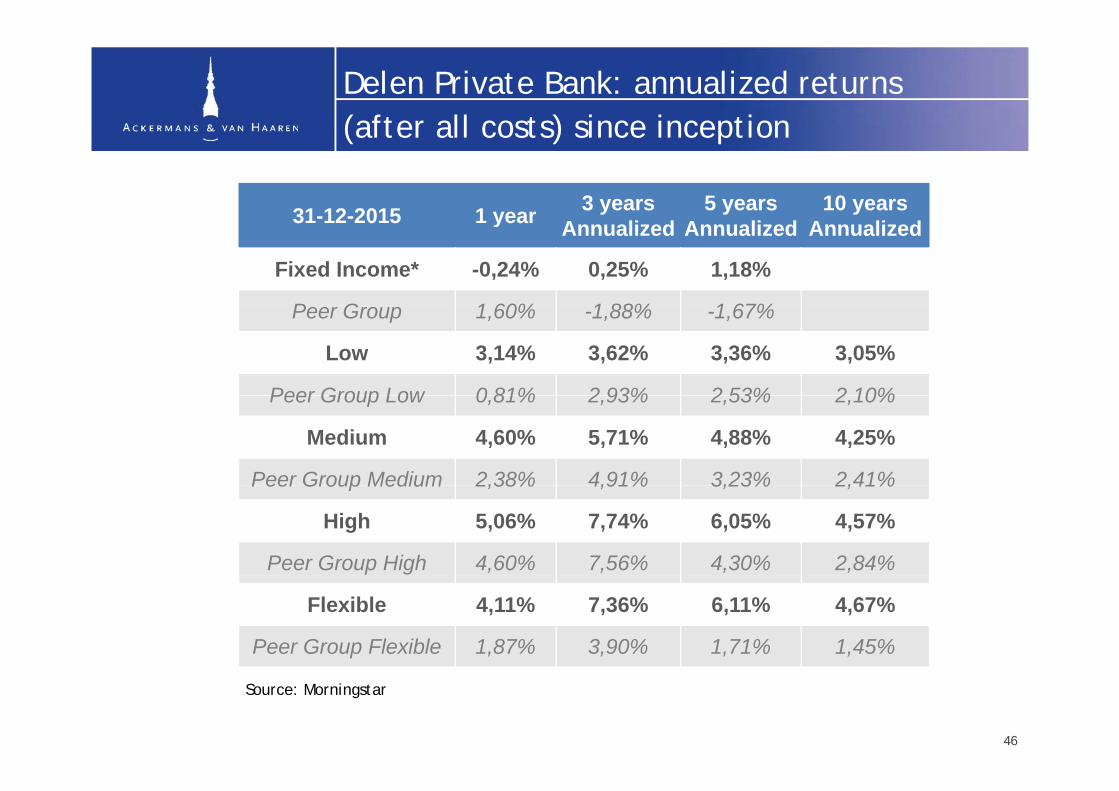
Delen Private Bank: annualized returns(after all costs) since inception(after all costs) since inception
31-12-2015 1 year 3 years 5 years 10 years 31-12-2015 1 year Annualized Annualized Annualized
Fixed Income* -0,24% 0,25% 1,18%
P G 1 60% 1 88% 1 67%Peer Group 1,60% -1,88% -1,67%
Low 3,14% 3,62% 3,36% 3,05%
Peer Group Low 0 81% 2 93% 2 53% 2 10%Peer Group Low 0,81% 2,93% 2,53% 2,10%
Medium 4,60% 5,71% 4,88% 4,25%
Peer Group Medium 2,38% 4,91% 3,23% 2,41%Peer Group Medium 2,38% 4,91% 3,23% 2,41%
High 5,06% 7,74% 6,05% 4,57%
Peer Group High 4,60% 7,56% 4,30% 2,84%
Flexible 4,11% 7,36% 6,11% 4,67%
Peer Group Flexible 1,87% 3,90% 1,71% 1,45%
Source: Morningstar
46
Delen Investments: key figures
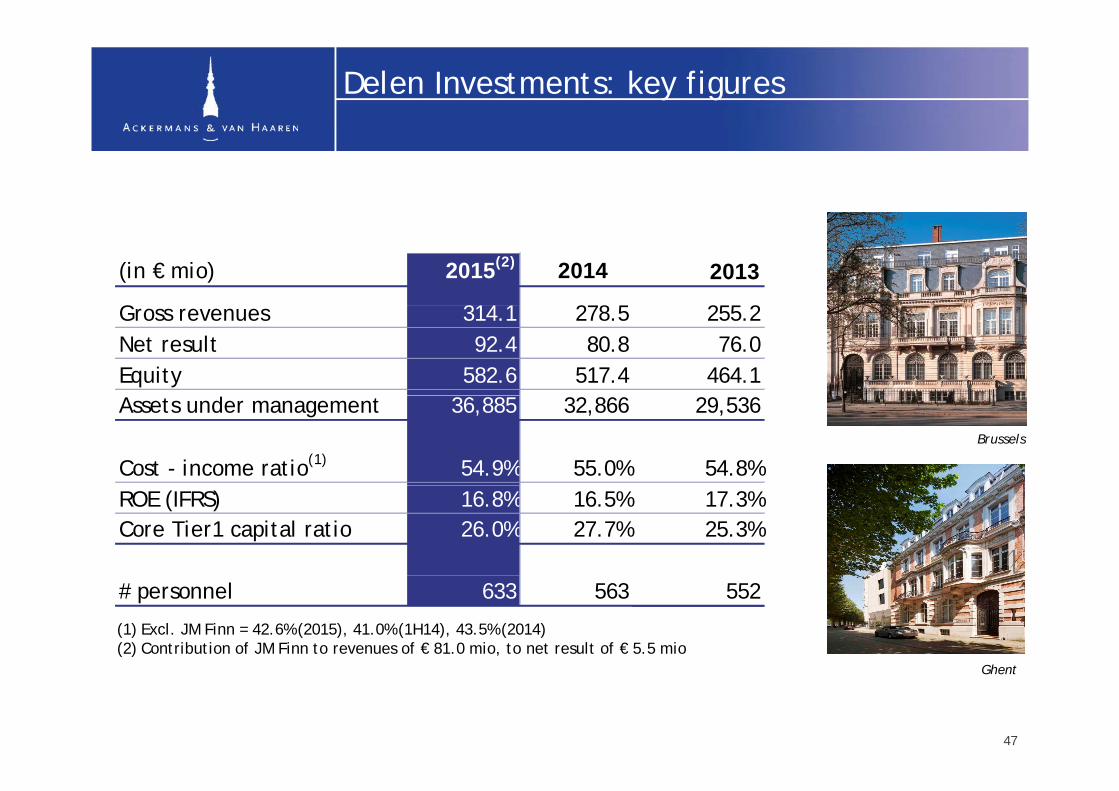
(in € mio) 2015(2) 2014(2) 2013
G 314 1 278 5 255 2Gross revenues 314.1 278.5 255.2Net result 92.4 80.8 76.0Equity 582.6 517.4 464.1Assets under management 36,885 32,866 29,536
Cost - income ratio(1) 54.9% 55.0% 54.8%Brussels
ROE (IFRS) 16.8% 16.5% 17.3%Core Tier1 capital ratio 26.0% 27.7% 25.3%
# personnel 633 563 552
(1) Excl. JM Finn = 42.6% (2015), 41.0% (1H14), 43.5% (2014)(2) Contribution of JM Finn to revenues of € 81.0 mio, to net result of € 5.5 mio
GhGhent
47
Delen Investments: highlights
Highlights 2015g g• Continued growth of AuM to € 36,885 mio (Delen Private Bank € 25,555 mio, JM Finn €
10,758 mio, Oyens & Van Eeghen € 572 mio), positively impacted by strong inflow in Belgium as well as by financial markets, by exchange rate £/€ and by acquistion of Oyens & Van EeghenOyens & Van Eeghen
• Competitive cost - income ratio at 54.9% (2014: 55.0%): Delen Private Bank 42.6%, JM Finn & Co 86.1%
• Net equity increased to € 583 mio (2014: € 517 mio), largely exceeding Basel II and III requirements
• Core Tier1 of 26.0%, well above sector average• Net result of € 92.4 mio (of which € 5.5 mio from JM Finn & Co)
• Acquisition of Oyens & Van Eeghen (renowned Dutch wealth management company with AuM of € 1,254 mio, of which € 572 mio private clients) finalized in December 2015
48
Acquisition of Oyens & Van Eeghen
• In July 2015, agreement reached to acquire Oyens & Van EeghenCl i i D b 2015• Closing in December 2015
• Renowned Dutch wealth management company• Established in 1797, one of the oldest independent financial institutions in
the Netherlands• Offices in Amsterdam and ‘s HertogenboschOffices in Amsterdam and s Hertogenbosch
• Focus on investment management and fiduciary advice for high net-worth individuals, entrepreneurial families, foundations, local authorities and institutional clients
• High-quality, knowledge-driven and independent approach with strong client focus
• AuM of € 1,254 mio, of which € 572 mio for private clients and foundations (31/12/2015)
49
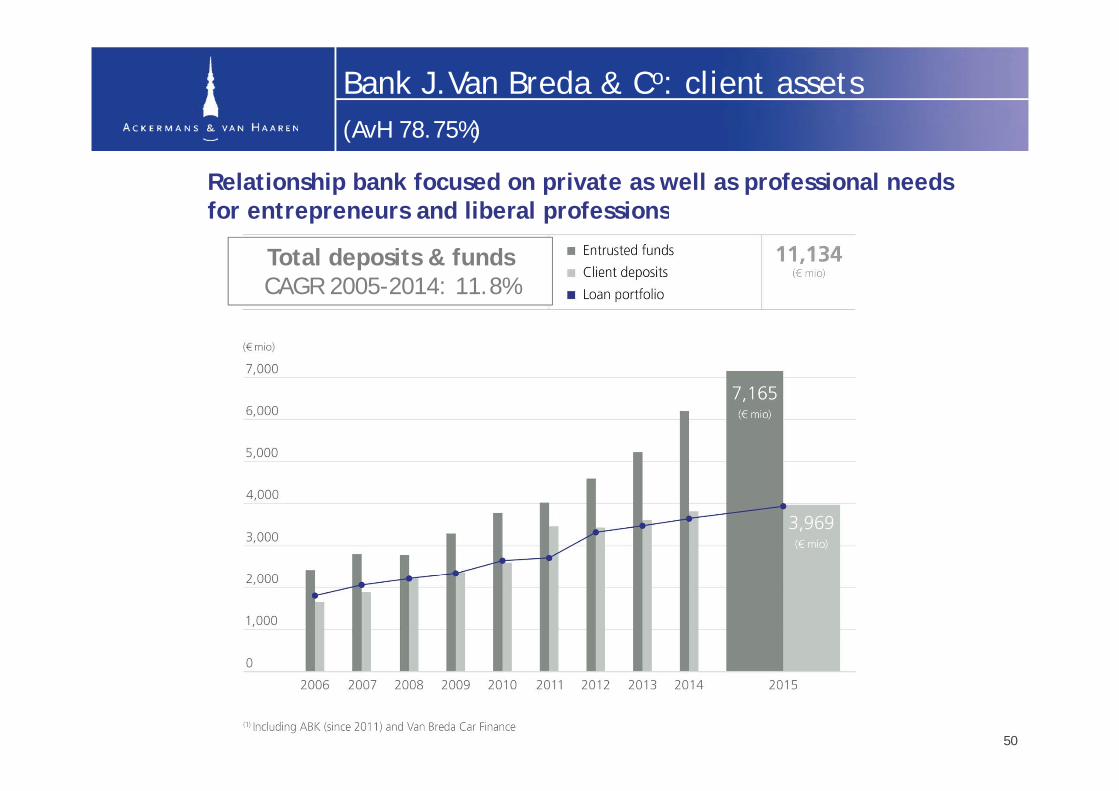
Bank J.Van Breda & Co: client assets(AvH 78 75%)
Relationship bank focused on private as well as professional needs for entrepreneurs and liberal professions
(AvH 78.75%)
for entrepreneurs and liberal professions
Total deposits & fundsCAGR 2005-2014: 11.8%
50
Bank J.Van Breda & Co: key figures
(in € mio) 2015 2014 2013
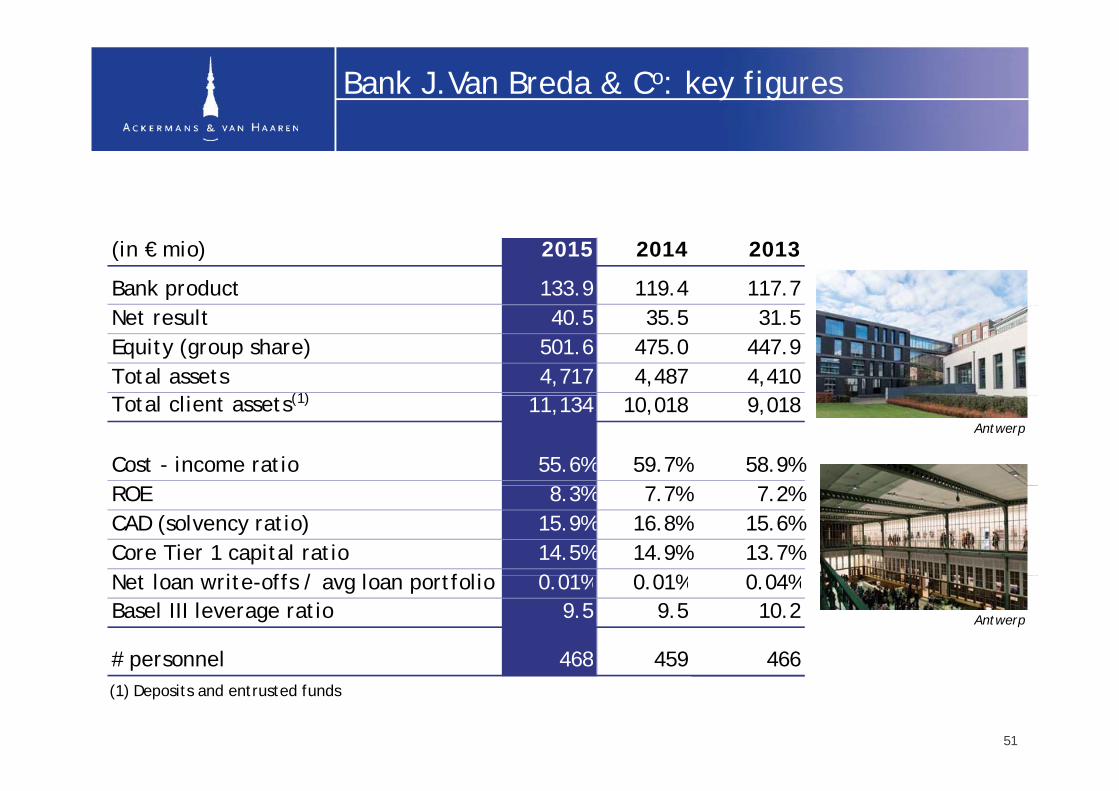
Bank product 133.9 119.4 117.7Net result 40.5 35.5 31.5Equity (group share) 501.6 475.0 447.9Total assets 4,717 4,487 4,410
l l (1)Total client assets(1) 11,134 10,018 9,018
Cost - income ratio 55.6% 59.7% 58.9%
Antwerp
ROE 8.3% 7.7% 7.2%CAD (solvency ratio) 15.9% 16.8% 15.6%Core Tier 1 capital ratio 14.5% 14.9% 13.7%N t l it ff / l tf li 0 01% 0 01% 0 04%Net loan write-offs / avg loan portfolio 0.01% 0.01% 0.04%Basel III leverage ratio 9.5 9.5 10.2
# personnel 468 459 466
Antwerp
(1) Deposits and entrusted funds
51
# personnel 468 459 466
Bank J.Van Breda & Co: highlights
Highlights 2015Highlights 2015• Third consecutive year of growing results• Increase of total client deposits and entrusted funds to € 11,134 mio (vs € 10,018 mio as of
31.12.14), of which € 3,969 mio client deposits and € 7,165 mio entrusted fundsC i d h f l f li (i l ABK b k d V B d C Fi ) € 3 932 i • Continued growth of loan portfolio (incl. ABK bank and Van Breda Car Finance): € 3,932 mio (€ 3,639 mio as of 31.12.14)
• Very limited net loan loss provisions: 0.01% • Decrease of cost - income ratio to 55.6% (vs 59.7% for 2014), despite increase of bank tax ( ) p
with 49%• Net equity increased to € 502 mio (vs € 475 mio as of 31.12.14), with a Core Tier1 ratio of
14.5% and Basel III leverage ratio of 9.5%• Net result of € 40.5 mio driven by strong financial results of Bank J.Van Breda & Co, ABK bank Net result of € 40.5 mio driven by strong financial results of Bank J.Van Breda & C , ABK bank
and Van Breda Car Finance
52
Bank J.Van Breda & Co:competitive positioning (sector analysis NBB)competitive positioning (sector analysis NBB)
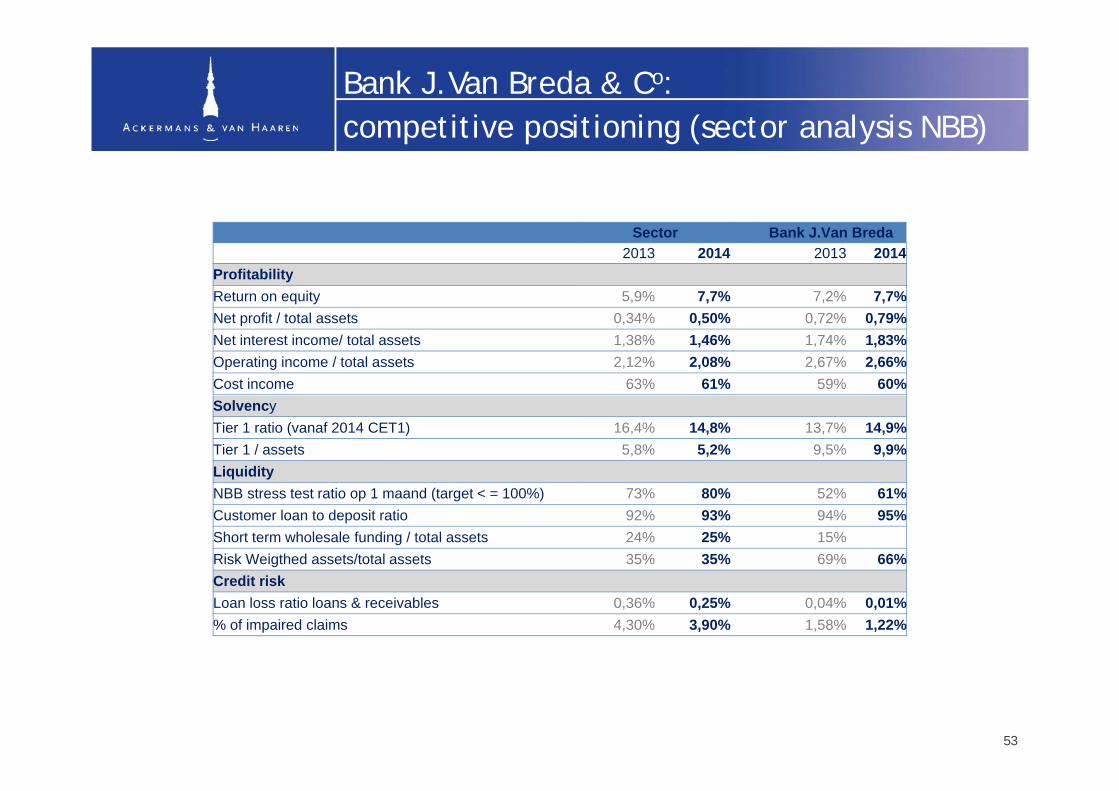
Sector Bank J.Van Breda2013 2014 2013 2014
ProfitabilityReturn on equity 5,9% 7,7% 7,2% 7,7%Net profit / total assets 0,34% 0,50% 0,72% 0,79%Net interest income/ total assets 1,38% 1,46% 1,74% 1,83%Operating income / total assets 2,12% 2,08% 2,67% 2,66%Cost income 63% 61% 59% 60%SolvencyTier 1 ratio (vanaf 2014 CET1) 16,4% 14,8% 13,7% 14,9%Tier 1 / assets 5,8% 5,2% 9,5% 9,9%LiquidityNBB stress test ratio op 1 maand (target < = 100%) 73% 80% 52% 61%Customer loan to deposit ratio 92% 93% 94% 95%Short term wholesale funding / total assets 24% 25% 15%Risk Weigthed assets/total assets 35% 35% 69% 66%Credit riskLoan loss ratio loans & receivables 0,36% 0,25% 0,04% 0,01%% of impaired claims 4,30% 3,90% 1,58% 1,22%
53
Structural growth drivers of the Belgianprivate banking market
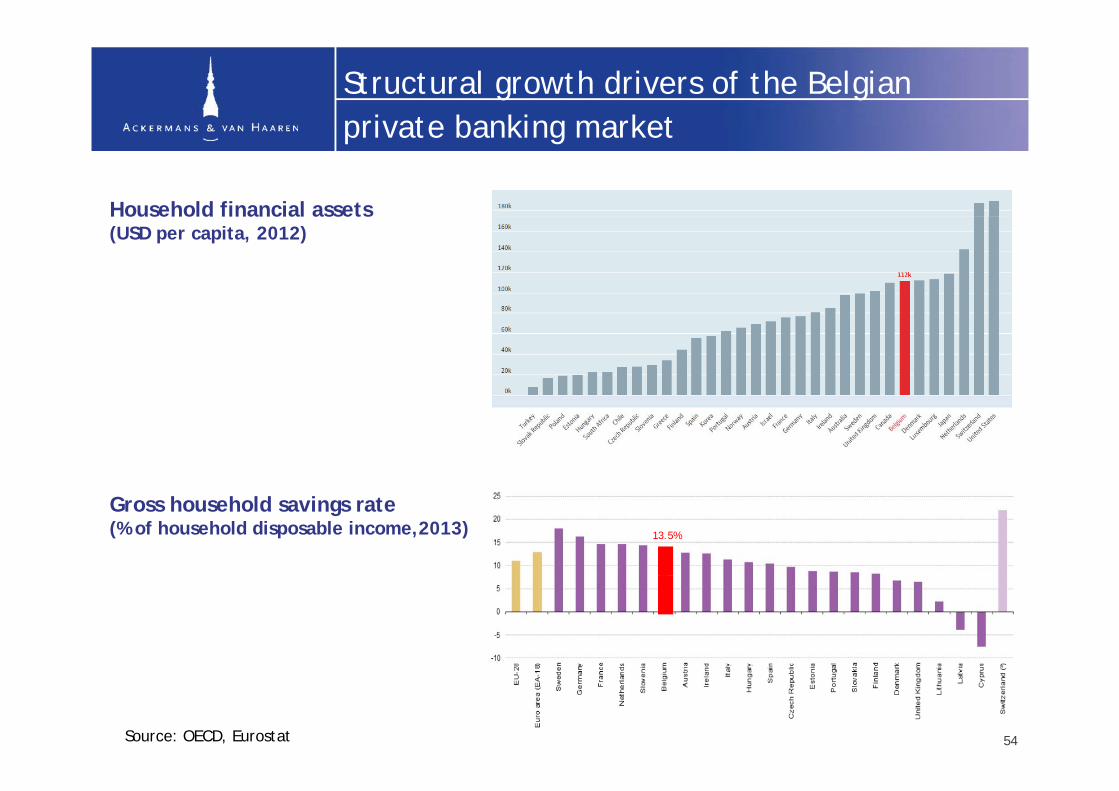
Household financial assets
private banking market
Household financial assets (USD per capita, 2012)
Gross household savings rate (% of household disposable income,2013) 13.5%
Source: OECD, Eurostat 54

Real Estate & Senior Care:contribution to AvH consolidated net resultcontribution to AvH consolidated net result
(in € mio) 2015 2014 2013
Leasinvest Real Estate 9 9 10 3 8 7Leasinvest Real Estate 9.9 10.3 8.7Extensa 31.0 3.4 4.5Anima Care 1.1 0.5 0.6Residalya 1.6 - 0.6Groupe Financière Duval -8.0 0.5 2.0
T t l 35 6 14 7 15 8Total 35.6 14.7 15.8
Remeasurement Tour&Taxis 23 5Remeasurement Tour&Taxis 23.5Total 59.2
56

Real Estate & Senior Care
LEASINVEST REAL ESTATE • Public regulated real estate comany for retail, offices and logistics in Luxembourg, Belgium and Switzerland
EXTENSA • Real estate and land development in Belgium and Luxembourg
ANIMA CARE • Health & senior care sector in Belgium• Total portfolio of more than 1,400 beds and service flats
(1,127 beds and 183 service flats in operation)
RESIDALYA • Senior care sector in France• Total portfolio of 2,273 beds spread over 30 retirement
homes
FINANCIERE DUVAL • Real estate group with activities in real estate promotion, tourism (Odalys: 120,000 beds, 350 sites) and
lf (NGF 47 lf i f hi h 20 i P i )
homes
golf (NGF: 47 golf sites of which 20 in Paris)• Impaired to realisation value (Held for sale)
57
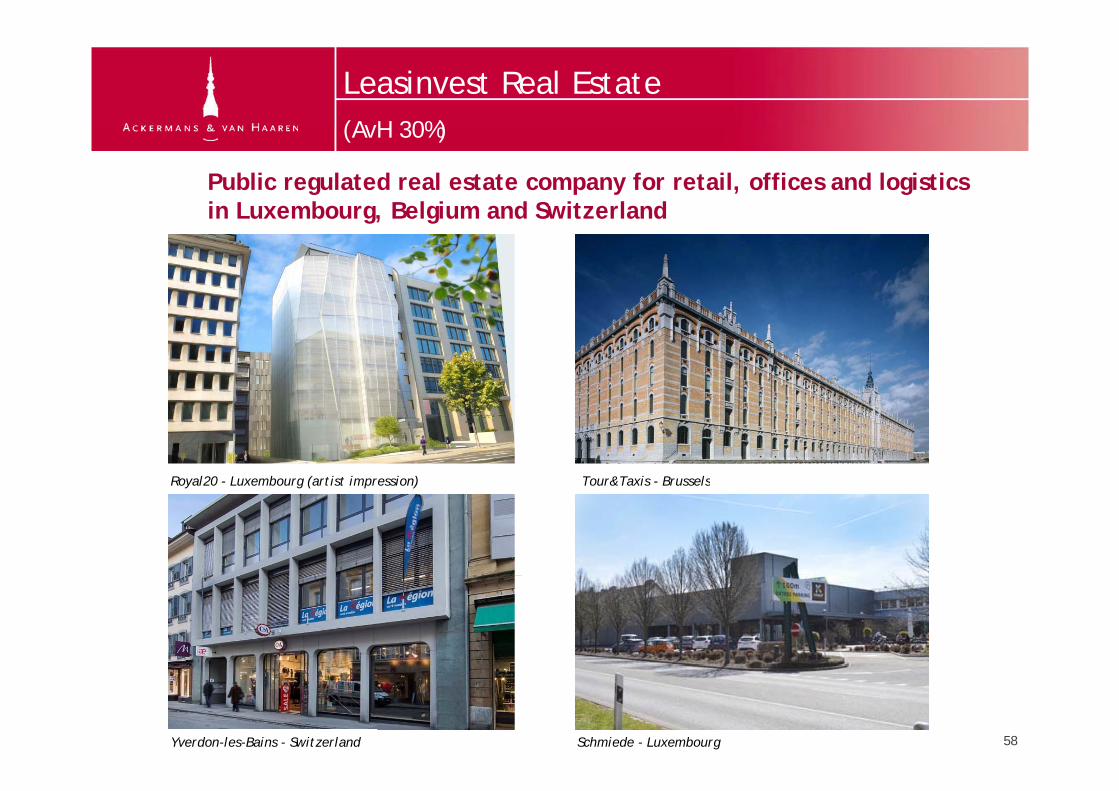
Leasinvest Real Estate(AvH 30%)
Public regulated real estate company for retail, offices and logistics in Luxembourg, Belgium and Switzerland
(AvH 30%)
in Luxembourg, Belgium and Switzerland
Royal20 - Luxembourg (artist impression) Tour&Taxis - BrusselsRoyal20 Luxembourg (artist impression) Tour&Taxis Brussels
58Yverdon-les-Bains - Switzerland Schmiede - Luxembourg
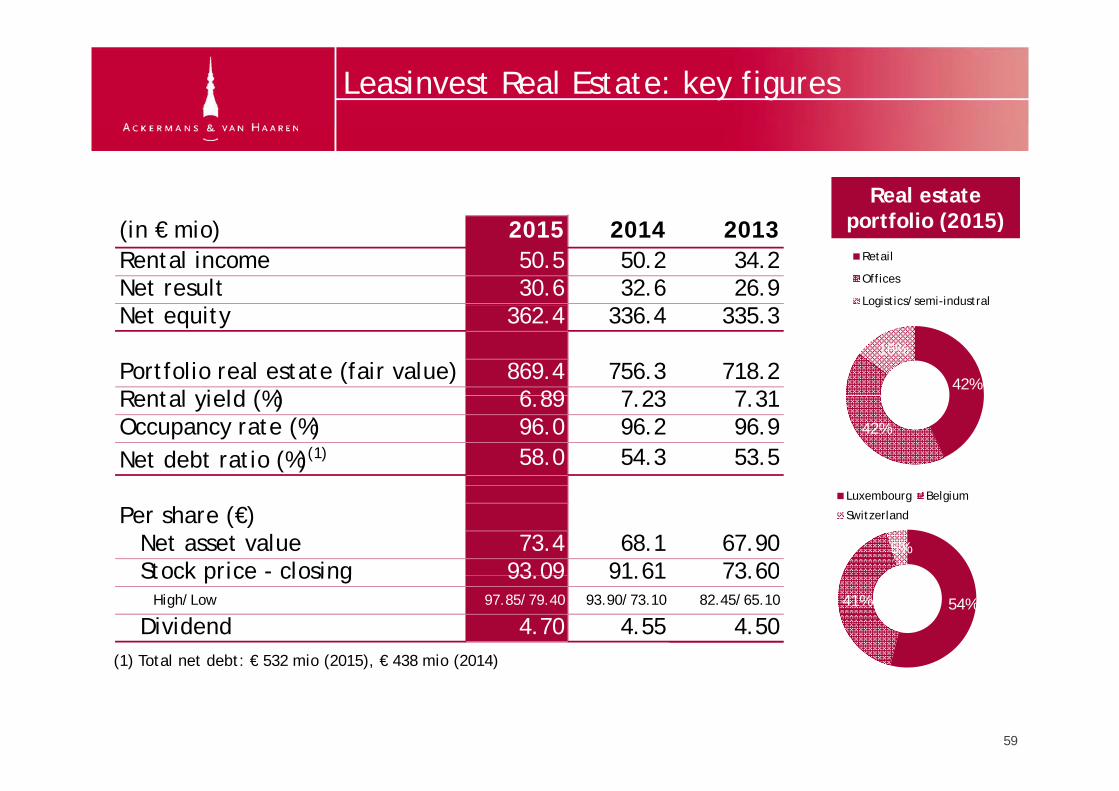
Leasinvest Real Estate: key figures
Real estate tf li (2015)(in € mio) 2015 2014 2013
Rental income 50.5 50.2 34.2Net result 30.6 32.6 26.9
Retail
Offices
Logistics/semi-industral
portfolio (2015)
Net equity 362.4 336.4 335.3
Portfolio real estate (fair value) 869.4 756.3 718.2Rental yield (%) 6 89 7 23 7 31
42%
16%
g
Rental yield (%) 6.89 7.23 7.31Occupancy rate (%) 96.0 96.2 96.9Net debt ratio (%)(1) 58.0 54.3 53.5
42%
Per share (€) Net asset value 73.4 68.1 67.90 Stock price - closing 93 09 91 61 73 60
5%
Luxembourg Belgium
Switzerland
(1) Total net debt: € 532 mio (2015), € 438 mio (2014)
Stock price closing 93.09 91.61 73.60 High/Low 97.85/79.40 93.90/73.10 82.45/65.10
Dividend 4.70 4.55 4.5054%41%
(1) Total net debt: € 532 mio (2015), € 438 mio (2014)
59
Leasinvest Real Estate: highlights
Highlights 2015Highlights 2015• Slight decrease of occupancy rate (96.0%) and rental yield (6.89%)• Stable rental income (€ 50.5 mio) and average duration (4.8 years)• Decrease of net result due to temporary vacancy of Monnet and Square de Meeûsp y y q• Increase of net debt to € 532 mio after acquisition of Royal Depot. Debt rate expected
to decrease in 2Q16 after sale of Royal20
• Real estate portfolio of € 869 4 mio (€ 756 3 mio end 2014)• Real estate portfolio of € 869.4 mio (€ 756.3 mio end 2014)• Acquisition of Royal Depot of Tour & Taxis for € 108 mio in December 2015• Sale of office building Kiem (Lux.) to private investor for € 6.3 mio (excl. costs),
in line with fair value• Canal Logistics phase 2 sold for € 16.75 mio (excl. costs), in line with fair value• Warehouse building in Meer sold for € 1.5 mio• Forward sale agreement (2016) signed in April for Royal20 under construction
(Lux ) for € 62 5 mio (excl VAT)(Lux.) for € 62.5 mio (excl. VAT)
60

Extensa Group(AvH 100%)
Real estate developer with focus on residential and mixed projects in Belgium and Luxembourg
(AvH 100%)
Belgium and Luxembourg
Herman Teirlinck – Tour & Taxis (artist impression) Gloria Residence – Tour & Taxis (artist impression)
61Cloche d’Or - Luxembourg (artist impression)
Trnava (Slowakia)
Cloche d’Or - Luxembourg (artist impression)
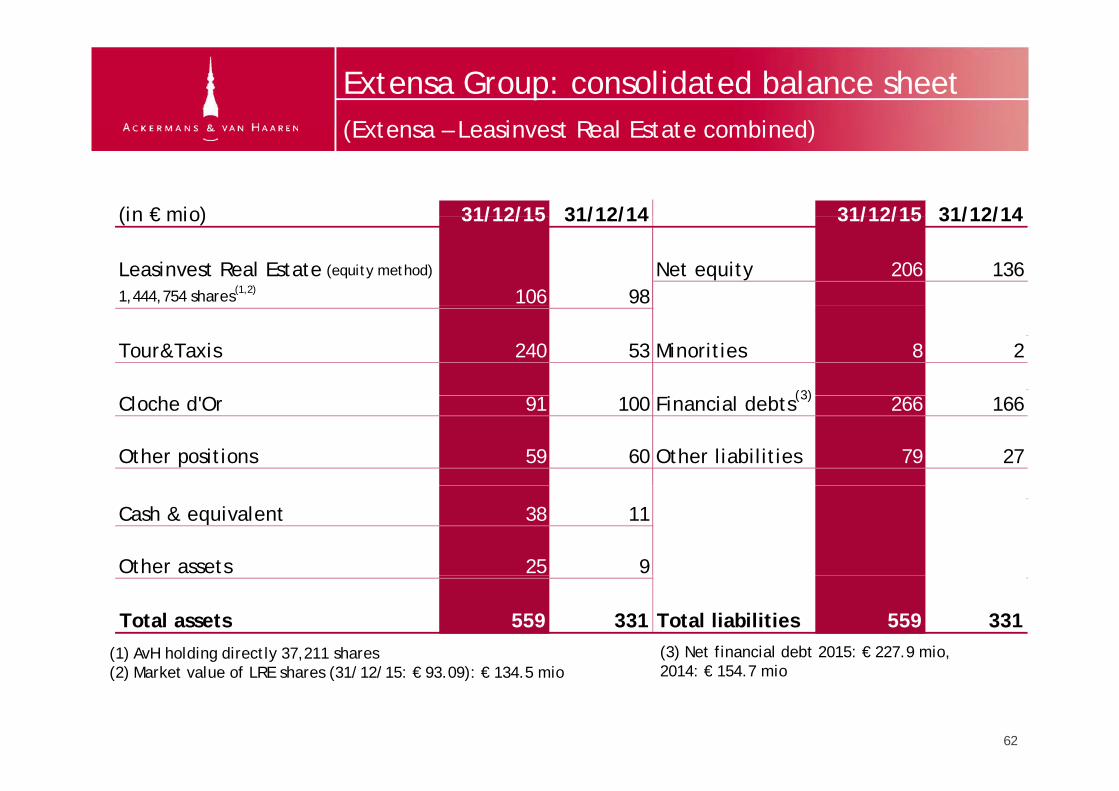
Extensa Group: consolidated balance sheet(Extensa Leasinvest Real Estate combined)
(in € mio) 31/12/15 31/12/14 31/12/15 31/12/14
(Extensa – Leasinvest Real Estate combined)
(in € mio) 31/12/15 31/12/14 31/12/15 31/12/14
Leasinvest Real Estate (equity method) Net equity 206 1361,444,754 shares(1,2) 106 98
Tour&Taxis 240 53 Minorities 8 2
(3)Cloche d'Or 91 100 Financial debts(3) 266 166
Other positions 59 60 Other liabilities 79 27
Cash & equivalent 38 11
Other assets 25 9
Total assets 559 331 Total liabilities 559 331(1) AvH holding directly 37,211 shares (3) Net financial debt 2015: € 227.9 mio,
2014 € 154 7 i(2) Market value of LRE shares (31/12/15: € 93.09): € 134.5 mio 2014: € 154.7 mio
62

Extensa Group: highlights
Highlights 2015d k l h d• Extensa increased its stake in Tour&Taxis to 100%. As a result, Extensa had to
“remeasure” its original (50%) interest in Tour&Taxis (according to IFRS) to the transaction value with IRET and Royal Property Group. This has a total positive impact of € 42.1 mio on Extensa’s results for 2015, of which € 18.6 mio integrated in Extensaof € 42.1 mio on Extensa s results for 2015, of which € 18.6 mio integrated in Extensaresult and € 23.5 mio presented as “remeasurement”.
• Sale of Royal Depot of Tour & Taxis to Leasinvest Real Estate in December 2015 for € 108 i€ 108 mio
• Good progress in 2 large city development projects (Tour&Taxis - Brussels and Cloche d’Or - Luxembourg)d Or Luxembourg)
• Tour&Taxis: works continuing on first residential building (115 apartments) and Herman Teirlinck administrative building (43,914 m²), to be delivered by 2017. Special zoning plan for further development being draftedCl h d’O (L b ) (E t 50% 20 h 400 000 ²) t ti f th fi t • Cloche d’Or (Luxembourg) (Extensa 50%, 20 ha – 400,000 m²): construction of the first apartment buildings started (186 apartments), to be developed by September 2017. Building permits for office buildings for Deloitte Lux (31,273 m²) and Alterdomus (10,631 m²) expected in end 2015/ early 2016. Building permit for shopping center (10,631 m ) expected in end 2015/ early 2016. Building permit for shopping center obtained and development rights may now be transferred to the buyer (Auchan Group)
63
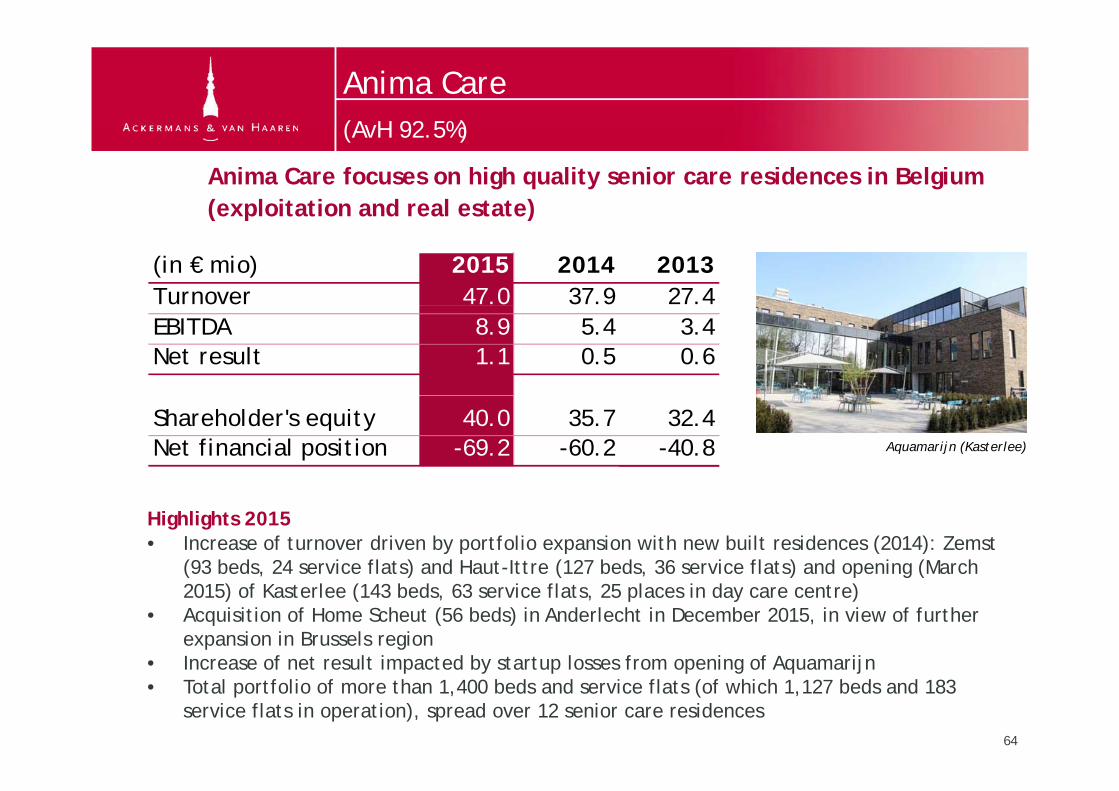
Anima Care(AvH 92 5%)
Anima Care focuses on high quality senior care residences in Belgium (exploitation and real estate)
(AvH 92.5%)
(exploitation and real estate)
(in € mio) 2015 2014 2013Turnover 47.0 37.9 27.4 Azur Soins et Santé
EBITDA 8.9 5.4 3.4Net result 1.1 0.5 0.6
Shareholder's equity 40.0 35.7 32.4Net financial position -69.2 -60.2 -40.8 Aquamarijn (Kasterlee)
Highlights 2015• Increase of turnover driven by portfolio expansion with new built residences (2014): Zemst
(93 beds, 24 service flats) and Haut-Ittre (127 beds, 36 service flats) and opening (March ( , ) ( , ) p g (2015) of Kasterlee (143 beds, 63 service flats, 25 places in day care centre)
• Acquisition of Home Scheut (56 beds) in Anderlecht in December 2015, in view of further expansion in Brussels region
• Increase of net result impacted by startup losses from opening of Aquamarijn• Increase of net result impacted by startup losses from opening of Aquamarijn• Total portfolio of more than 1,400 beds and service flats (of which 1,127 beds and 183
service flats in operation), spread over 12 senior care residences64
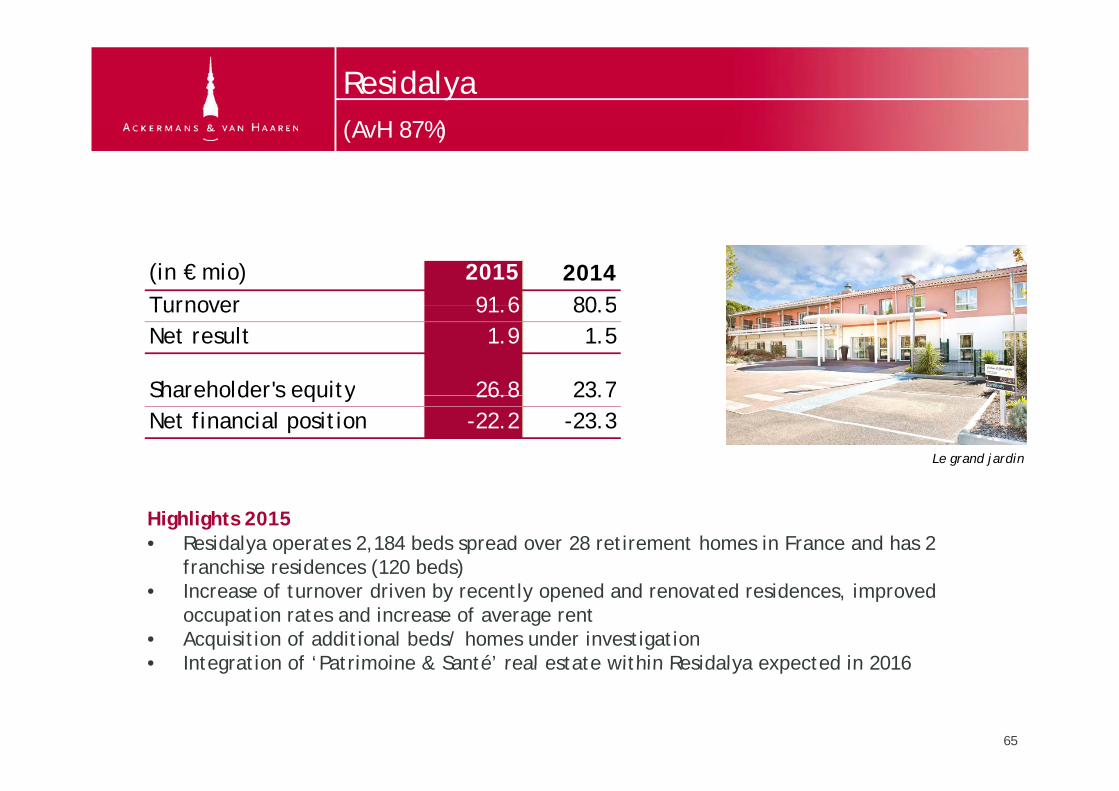
Residalya(AvH 87%)(AvH 87%)
(in € mio) 2015 2014Turnover 91 6 80 5Turnover 91.6 80.5Net result 1.9 1.5
Shareholder's equity 26.8 23.7Shareholder s equity 26.8 23.7Net financial position -22.2 -23.3
Le grand jardin
Highlights 2015• Residalya operates 2,184 beds spread over 28 retirement homes in France and has 2
franchise residences (120 beds)( )• Increase of turnover driven by recently opened and renovated residences, improved
occupation rates and increase of average rent• Acquisition of additional beds/ homes under investigation• Integration of ‘Patrimoine & Santé’ real estate within Residalya expected in 2016
65
• Integration of Patrimoine & Santé real estate within Residalya expected in 2016

From real estate leasing over real estatedevelopment to real estate services
Extensa
it250 (€ mio)
development to real estate services
equity
150
200
50
100
‐
50
AvH 100% Acquisition -Creation of LREAvH 60% AvH 100%Extensa(real estate development)
(investment trust)-Acquisition Brixton(real estate management)
AvH 60%(equipment & real estate leasing)
Diversification into ‘Real estate services’
Groupe Duval (41%) France (real estate exploitation & services)
Anima Care (100%)Senior care facilities & services
66
Residalya (87%)Senior care in France
67
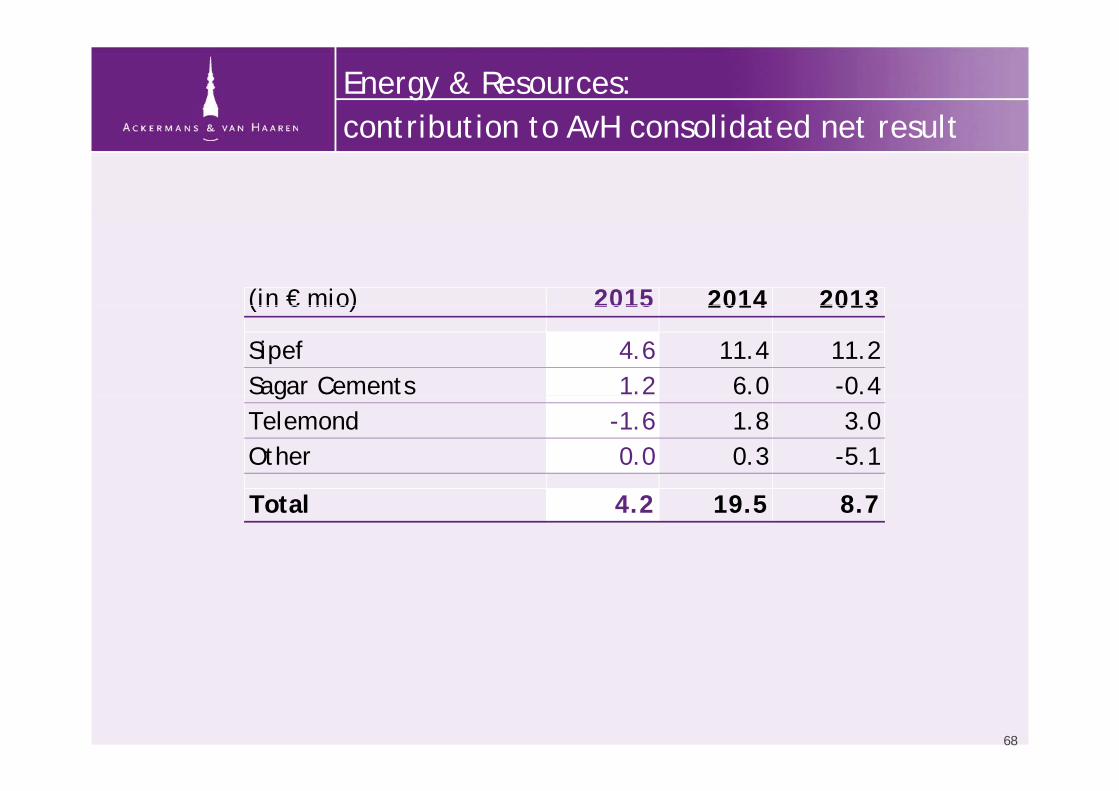
Energy & Resources:contribution to AvH consolidated net resultcontribution to AvH consolidated net result
(in € mio) 2015 2014 2013(in € mio) 2015 2014 2013
Sipef 4.6 11.4 11.2Sagar Cements 1.2 6.0 -0.4gTelemond -1.6 1.8 3.0Other 0.0 0.3 -5.1
Total 4.2 19.5 8.7
68

Energy & Resources
SIPEF • Agro industrial group with plantations of palm oil, rubber and tea in Indonesia and Papua New Guinea and tea in Indonesia and Papua New Guinea
• Production of cement. In partnership with the Reddy family (Hyderabad)
SAGAR CEMENTS
ORIENTAL QUARRIES & MINES
• Stone quarries producing building aggregates. In partnership with the Bakshi family (Delhi)
• Development & manufacturing (Poland) of welded steel structures and equipment
TELEMOND GROUP
69
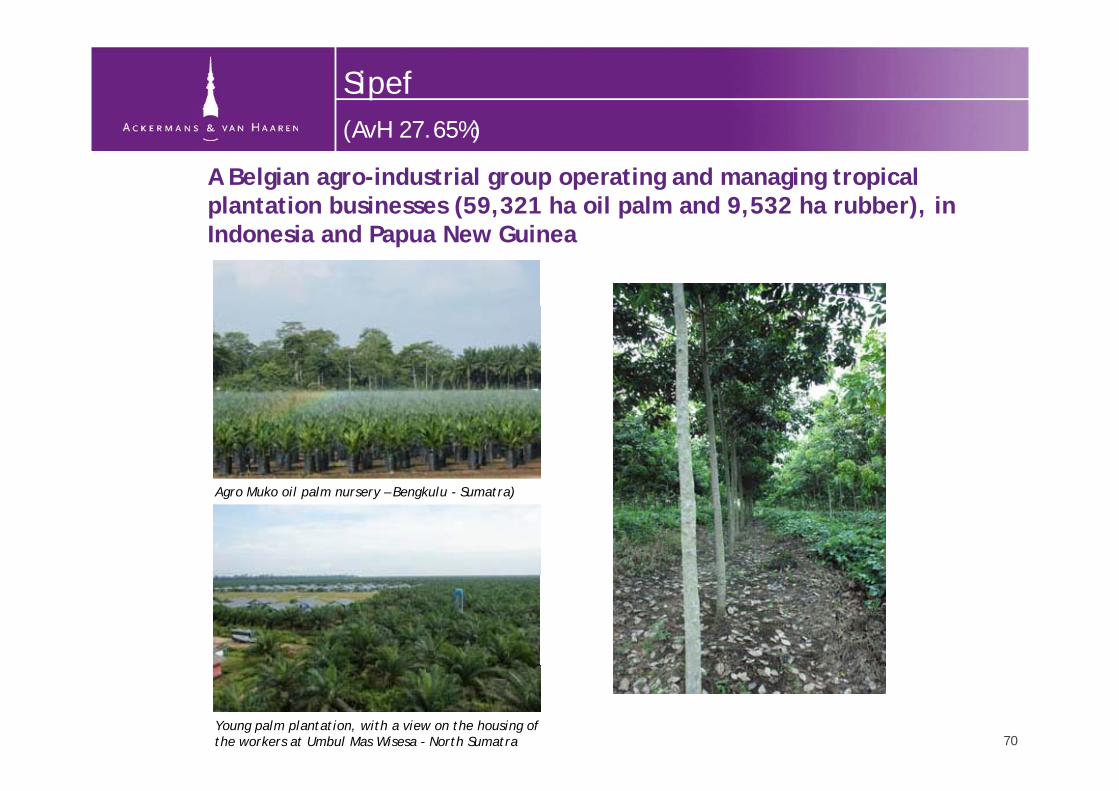
Sipef(AvH 27 65%)
A Belgian agro-industrial group operating and managing tropical plantation businesses (59,321 ha oil palm and 9,532 ha rubber), in
(AvH 27.65%)
p ( , p , ),Indonesia and Papua New Guinea
Agro Muko oil palm nursery – Bengkulu - Sumatra)
70Young palm plantation, with a view on the housing of the workers at Umbul Mas Wisesa - North Sumatra
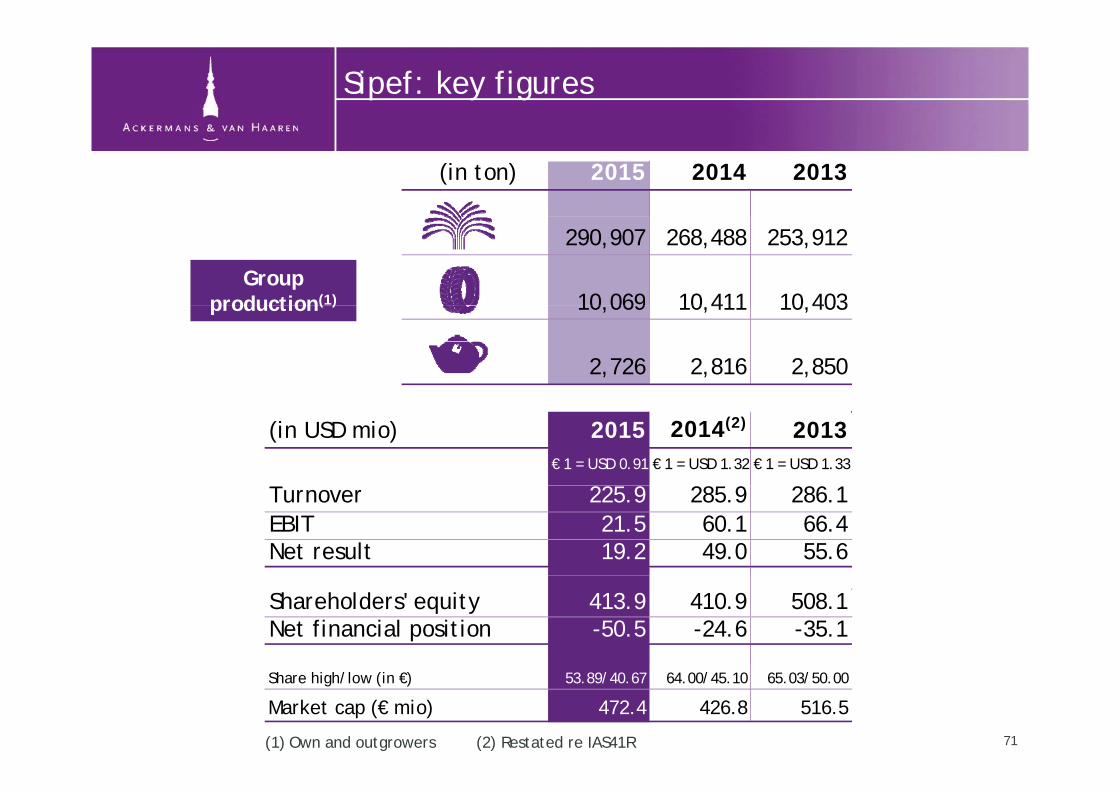
Sipef: key figures
(in ton) 2015 2014 2013
290,907 268,488 253,912
10 069 10 411 10 403Group
production(1) 10,069 10,411 10,403
2,726 2,816 2,850
production( )
(in USD mio) 2015 2014(2) 2013€ 1 = USD 0.91 € 1 = USD 1.32 € 1 = USD 1.33
Turnover 225.9 285.9 286.1EBIT 21.5 60.1 66.4Net result 19.2 49.0 55.6
Shareholders' equity 413.9 410.9 508.1Net financial position -50.5 -24.6 -35.1
(1) Own and outgrowers
Share high/low (in €) 53.89/40.67 64.00/45.10 65.03/50.00
Market cap (€ mio) 472.4 426.8 516.5
71(2) Restated re IAS41R

Sipef: highlights
Highlights 2015f l l d h k f bl d• Increase of palm oil production (+8% to 290,907 ton) thanks to favorable circumstances in 2H15 and
opening of new plants in Papua New Guinea and North Sumatra• Decrease of turnover with 21%, mainly due to strong decrease of market prices
(i USD/t ) 2015 2014 2013 2012(in USD/ton) 2015 2014 2013 2012€ 1 = USD 1.32 (2014)
Palm oil 622 821 857 999Rubber 1,559 1,958 2,795 3,377
• Decrease of net result despite depreciation of local currencies and efforts to reduce production costs. Negative impact (USD 2.6 mio) due to fixed export tax (50 USD) introduced in Indonesia (as f J l 2015) b l l l f USD 750
,559 ,958 , 95 3,3
from July 2015) below a level of USD 750
• Expansion plans continued
Sli ht i f A H ti i ti t 27 65%• Slight increase of AvH participation to 27.65%
Outlook 2016• At current selling prices Sipef expects a slightly lower result in 2016
72

Sagar Cements(AvH 18 55%)
Cement group, located near Hyderabad (Andra Pradesh - India), with capacity of 3 75 million tonnes cement per year
(AvH 18.55%)
capacity of 3.75 million tonnes cement per year
(in € mio) 2015 2014 2013€ 1 = INR 71.43 € 1 = INR 80.65 € 1 = INR 77.52
Turnover 105.3 65.9 61.7EBITDA 19.7 46.3 3.7Net result 6.4 32.7 -2.4
Shareholder's equity 75.6 65.3 29.7Net financial position -0.5 -25.0
Highlights 2015• Overall improvement of market dynamics in India• Net result positively impacted by diversification towards markets outside Andhra Pradesh
and Telangana and lower electricity and coal prices• Acquisition of BMM Cements (1 million tonnes cement per year, 25 MW captive power
plant) completed in 2015plant) completed in 2015
73

Telemond Group(AvH 50%)
Development and manufacturing of welded structures with a particular emphasis on telescopic cranes for mobile crane vehicles as well as
(AvH 50%)
(in € mio) 2015 2014 2013
emphasis on telescopic cranes for mobile crane vehicles as well as loading platforms and kippers for light trucks
(in € mio) 2015 2014 2013Turnover 69.9 79.6 78.7Net result -2.6 3.8 6.6
Net financial position -17.8 -17.2 -10.9Kostrzyn (Poland)
Highlights 2015• Decrease of turnover due to disappointing sales of cranes by customers of Telemond
(mainly South America and China) leading to lower than foreseen orders and (mainly South America and China), leading to lower than foreseen orders and overcapacity
• Impact from cost saving initiatives expected in 2016• Negative impact on result from start up costs of new production site in Stettin (Poland)g p p p ( )
74

Development Capital:contribution to AvH consolidated net resultcontribution to AvH consolidated net result
(in € mio) 2015 2014 2013
Sofinim -1.8 -2.9 -2.8Contribution participations Sofinim 23.8 3.0 -6.3C t ib ti ti i ti GIB 13 3 6 8 2 5Contribution participations GIB -13.3 -6.8 2.5
Development capital 8.7 -6.7 -6.6
Capital gains/ impairments -1.2 -15.4 29.5
Total (including capital gains) 7.5 -22.1 22.9
76

77
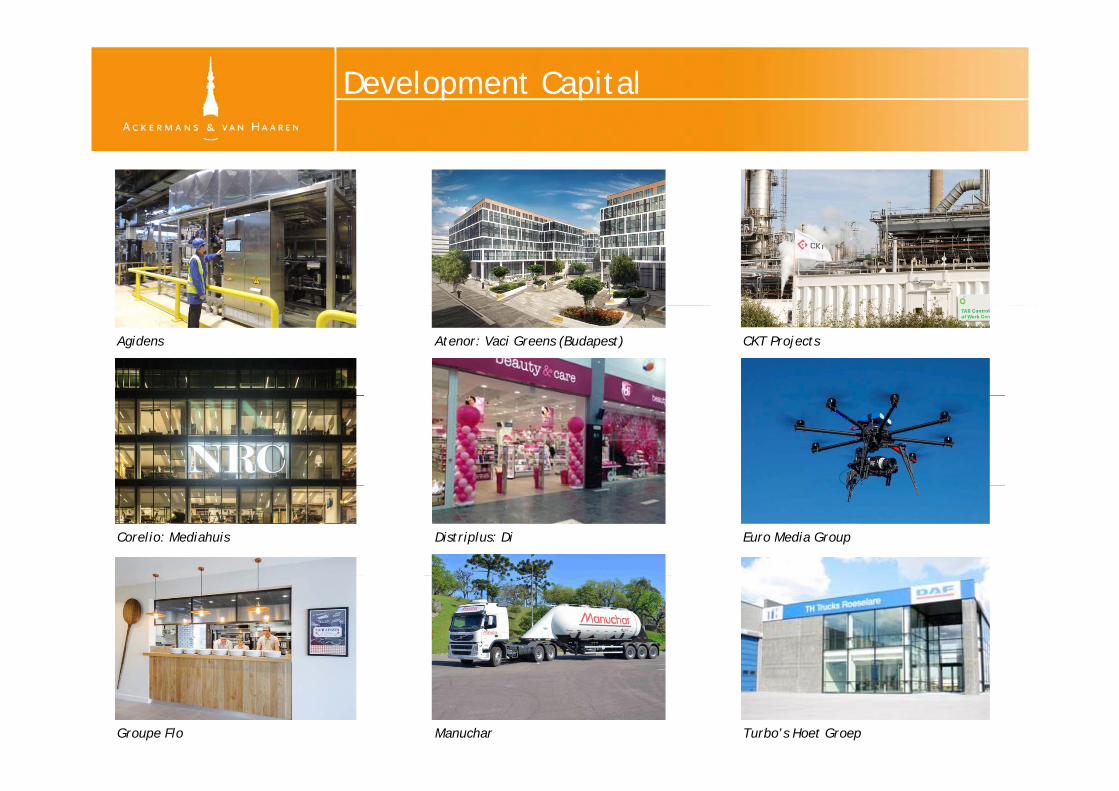
Development Capital
Atenor: Vaci Greens (Budapest)Agidens CKT Projects
Distriplus: Di Euro Media GroupCorelio: Mediahuis
78Turbo’s Hoet GroepManucharGroupe Flo

Development Capital:adjusted net asset valueadjusted net asset value
(in € mio) 2015 2014
Equity development capital (incl. third parties) 522.6 512.1
Correction for listed shares at market valueCorrection for listed shares at market value - Atenor 13.8 10.8
Share price Atenor (in €) 46.99 40.00
- Groupe Flo 0 0 -14 2 Groupe Flo 0.0 14.2Share price Groupe Flo (in €) 2.27 2.50
Total Development Capital 536.4 508.7
79

Development Capital: highlights (1/2)
Highlights 2015• Sale of Hertel to Altrad closed in 2Q15 Positive impact of approx € 86 mio on cash position Sale of Hertel to Altrad closed in 2Q15. Positive impact of approx. € 86 mio on cash position
of AvH and limited capital gain (IRR of 0.2%). Hertel Offshore changed its name in CKT Projects and has been acquired by Sofinim (47.5%), NPM Capital and Hertel management. Negative result of CKT Projects in 2015 due to difficult markets and losses on some large projectsprojects.
• Agreement between Egemin Group and KION Group on the sale of Handling Automation for an entreprise value of € 72 mio. Transaction closed in 3Q15 with capital gain of € 31.7 mio (AvH share). Other activities (Process Automation, Life Sciences, Infra Automation and Consulting & Services) continue under the new brand Agidens. After buyout of minority shareholders, Sofinim holds 86.3% participation (beneficial, incl. via Axe Investments) in Agidens.
• In July 2015, agreement between GIB and NRB on the sale of Trasys (GIB 84.7%). Closing finalized in October 2015. Cash proceeds for GIB (AvH 50%) of € 14 mio
• Result of Atenor driven by further development of portfolio (Trebel Port du Bon Dieu AIR Result of Atenor driven by further development of portfolio (Trebel, Port du Bon Dieu, AIR, Les Brasseries de Neudorf) and rental income from projects in Hungary and Romania
• Corelio: Mediahuis’ Flemish newspapers persisted, while national advertising market under pressure Acquisition of Dutch NRC Media closed in February 2015 Entry of Telenet in De pressure. Acquisition of Dutch NRC Media closed in February 2015. Entry of Telenet in De Vijver Media finalized with participation of Corelio of 30%.
80
Development Capital: highlights (2/2)
Highlights 2015• Distriplus: Stable turnover of Planet Parfum in competitive market and increase of turnover Distriplus: Stable turnover of Planet Parfum in competitive market and increase of turnover
of Di thanks to make-up. Loss of €-13.1 mio largely due to goodwill impairment (€ 15 mio)
• Acquisitions of Broadcast RF (UK) and Netco Sports (France) strenghtens Euro Media Group’s market position Good progress in Belgium UK and Italy but losses in French activities market position. Good progress in Belgium, UK and Italy, but losses in French activities. Restructuring plan implemented by new management of Euro Media France to return to profitability from 2016 onwards.
G Fl ill ff d b d li i i i i F ll b d Si i • Groupe Flo still affected by decline in restaurant visits in France across all brands. Situation appears to be bottoming out at Hippopotamus. Turnover decrease by 6% to € 295 mio. Net loss of € -51.5 mio impacted by impairments of € 34.9 mio
• The results at Manuchar differ widely across the various segments: strong year for steel in a difficult market with prices under pressure, improved profitability for chemicals, strong growth in paper and disappointing result in wood trade
• Clear improvement of market environment for Transpalux (acquired from EMG) in 2H15.
• Turbo’s Hoet Groep: Higher sales in Bulgaria, France and Belgium offset by strong decline in Russian market Strong increase of result thanks to contribution from leasing and renting Russian market. Strong increase of result thanks to contribution from leasing and renting activities, dealerships and turbo division.
81
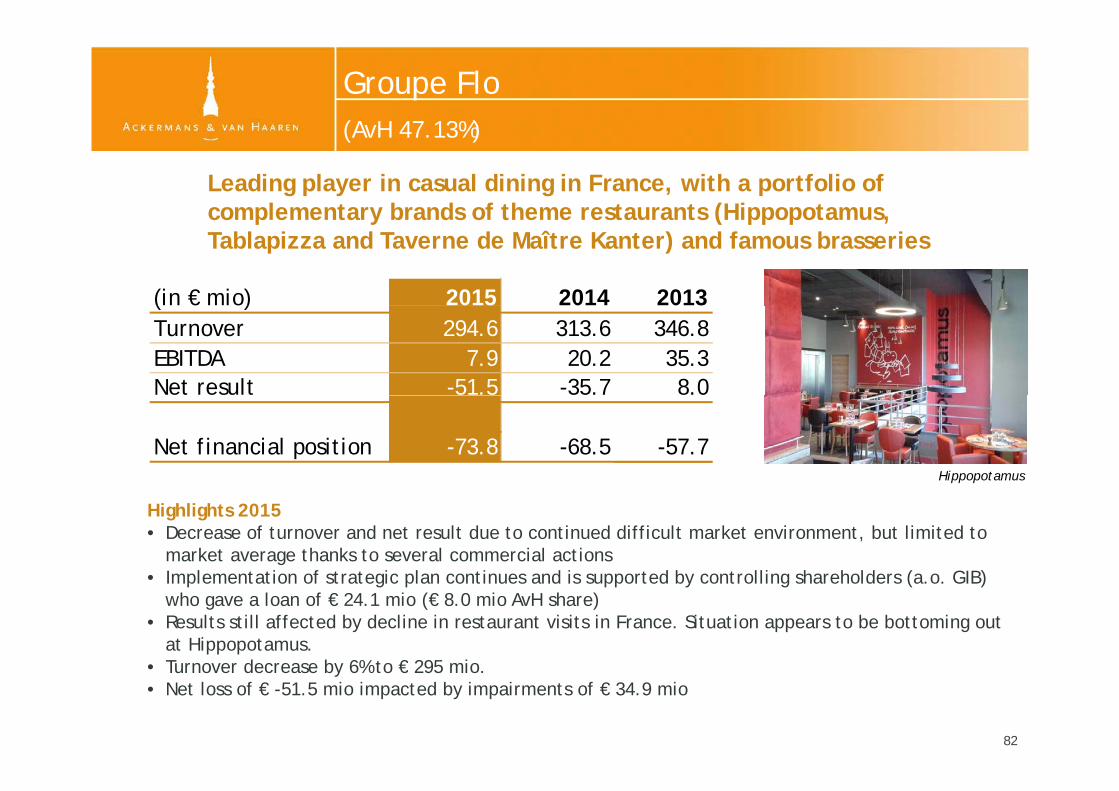
Groupe Flo(AvH 47 13%)
Leading player in casual dining in France, with a portfolio of complementary brands of theme restaurants (Hippopotamus
(AvH 47.13%)
(in € mio) 2015 2014 2013
complementary brands of theme restaurants (Hippopotamus, Tablapizza and Taverne de Maître Kanter) and famous brasseries
( )Turnover 294.6 313.6 346.8EBITDA 7.9 20.2 35.3Net result -51.5 -35.7 8.0
Net financial position -73.8 -68.5 -57.7Hippopotamus
Highlights 2015• Decrease of turnover and net result due to continued difficult market environment, but limited to
market average thanks to several commercial actionsImplementation of strategic plan continues and is supported by controlling shareholders (a o GIB) • Implementation of strategic plan continues and is supported by controlling shareholders (a.o. GIB) who gave a loan of € 24.1 mio (€ 8.0 mio AvH share)
• Results still affected by decline in restaurant visits in France. Situation appears to be bottoming out at Hippopotamus. Turnover decrease by 6% to € 295 mio • Turnover decrease by 6% to € 295 mio.
• Net loss of € -51.5 mio impacted by impairments of € 34.9 mio
82
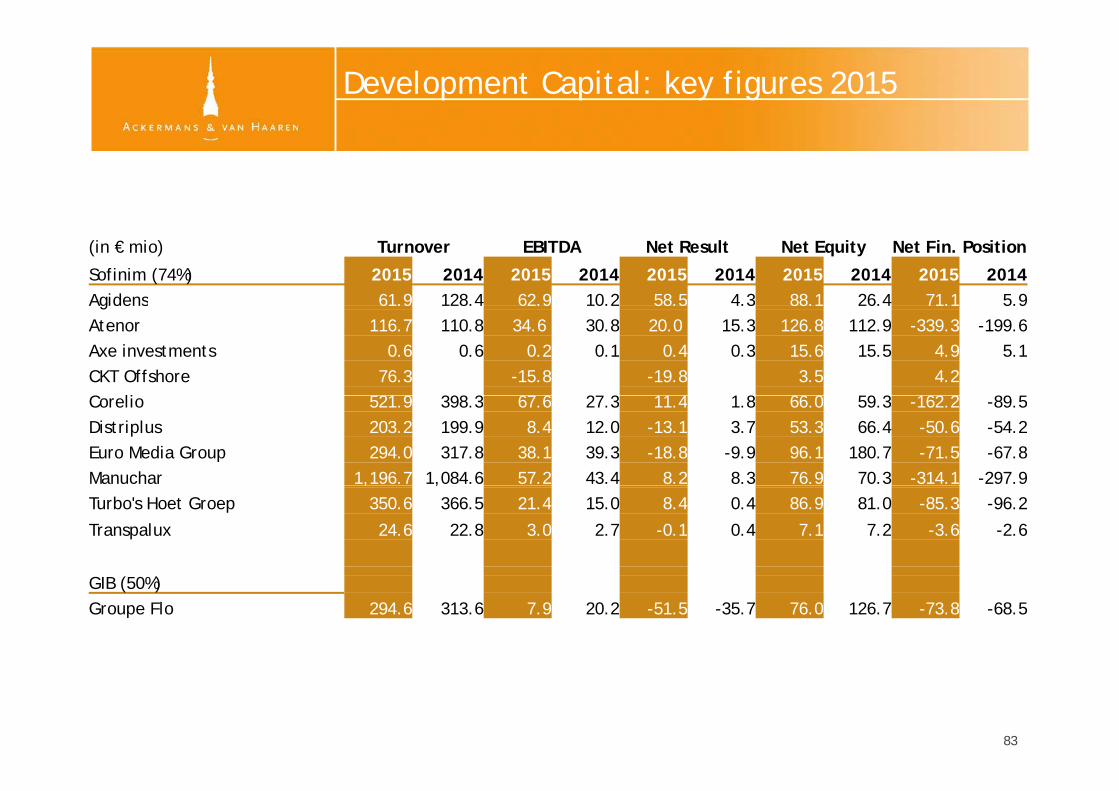
Development Capital: key figures 2015
(in € mio) Turnover EBITDA Net Result Net Equity Net Fin. Position
Sofinim (74%) 2015 2014 2015 2014 2015 2014 2015 2014 2015 2014Agidens 61.9 128.4 62.9 10.2 58.5 4.3 88.1 26.4 71.1 5.9Agidens 61.9 128.4 62.9 10.2 58.5 4.3 88.1 26.4 71.1 5.9Atenor 116.7 110.8 34.6 30.8 20.0 15.3 126.8 112.9 -339.3 -199.6Axe investments 0.6 0.6 0.2 0.1 0.4 0.3 15.6 15.5 4.9 5.1CKT Offshore 76.3 -15.8 -19.8 3.5 4.2C li 521 9 398 3 67 6 27 3 11 4 1 8 66 0 59 3 162 2 89 5Corelio 521.9 398.3 67.6 27.3 11.4 1.8 66.0 59.3 -162.2 -89.5Distriplus 203.2 199.9 8.4 12.0 -13.1 3.7 53.3 66.4 -50.6 -54.2Euro Media Group 294.0 317.8 38.1 39.3 -18.8 -9.9 96.1 180.7 -71.5 -67.8Manuchar 1,196.7 1,084.6 57.2 43.4 8.2 8.3 76.9 70.3 -314.1 -297.9, ,Turbo's Hoet Groep 350.6 366.5 21.4 15.0 8.4 0.4 86.9 81.0 -85.3 -96.2
Transpalux 24.6 22.8 3.0 2.7 -0.1 0.4 7.1 7.2 -3.6 -2.6
GIB (50%)Groupe Flo 294.6 313.6 7.9 20.2 -51.5 -35.7 76.0 126.7 -73.8 -68.5
83

Development Capital:overview of major divestments
64 1
2002 2003 2004 2005 2006 2007 2008 2009 2010 2012 2013 2014 2015
overview of major divestments
53.7
64.1
IRR %
34 1
39.0
34.1
28.3
22.626.7 24.9
31.9
25.5
19 0
-0.8
16.5
-1.3
16.5
11.114.8
3.4 5.7 2.2
19.014.8
0.2 8.3
3 8 5 3 10 10 4 9 11 4 6 8 8 7 15 2 5 6 11 6 12 17 9
Investment term (# years)84
Outlook 2016
‘The board of directors believes that the companies The board of directors believes that the companies in which AvH participates are generally well positioned, although major uncertainties in the p , g jeconomic situation and on the financial markets call for caution when making specific profit projections. Nevertheless, the board of directors is confident about the group’s development in 2016.’
85
For further questions or additional information, please consult our website: www.avh.be
Contact:Luc BertrandCh i f th E ti C ittChairman of the Executive Committee
Jan SuykensMember of the Executive Committee
Tom BamelisMember of the Executive Committee
T +32 3 231 87 79E [email protected]
86

Annexes
87

Net cash position AvH group
(in € 000)AvH &
subholdingsDevelopment
capitalTotal
(31/12/2015)
Investment portfolio* 39 681 1 465 41 146Investment portfolio 39,681 1,465 41,146Term deposits 26,870 4,809 31,680Intercompany deposits -232,365 232,365 0Cash 4,536 388 4,924Cash 4,536 388 4,924Long term debt 0 0Short term debt - commercial paper -30,480 -30,480Own shares (#359,132) 28,381 28,381( , ) , ,Net cash GIB (50%) and Other 694(equity consolidation)
-163,377 239,028 76,345, , ,
* Primarily Delen Private Bank funds
88

Delen Investments: income statement
Conso (in € 000) 2015 2014 2013Conso (in € 000) 2015 2014 2013
Net interest income 2,562 3,346 2,994Gross fee income 306,477 269,329 245,800Other income 5 056 5 871 6 417Other income 5,056 5,871 6,417Gross revenues 314,094 278,546 255,211
Fees paid -30,300 -26,994 -21,892
Operational expenses -134,238 -117,394 -112,725Amortisations & provisions -15,492 -13,047 -11,243Other expenses -5,373 -7,391 -2,328Loan loss provision -32 -29 -27pExpenses -155,134 -137,861 -126,324
Profit before tax 128,660 113,692 106,996
I t 33 752 30 110 28 804Income taxes -33,752 -30,110 -28,804
Profit of the period Minority interests -2,490 -2,757 -2,159 Share of the group 92 417 80 825 76 033 Share of the group 92,417 80,825 76,033
89
Delen Investments: balance sheet
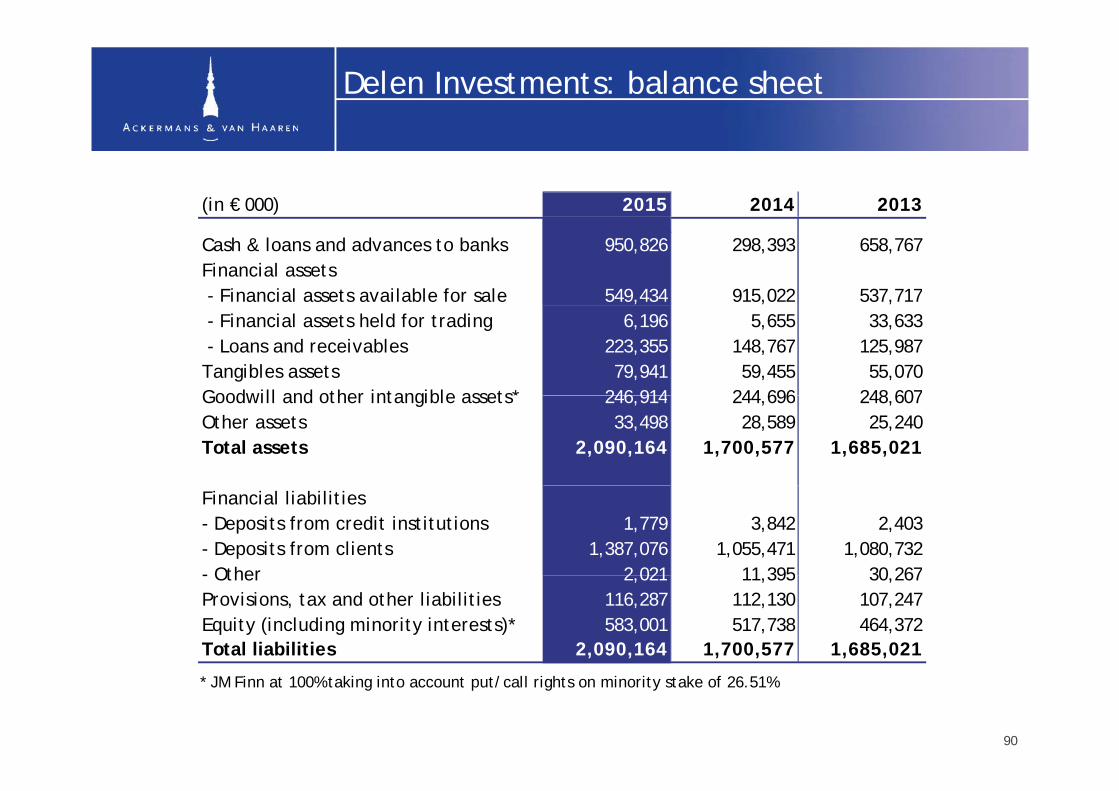
(in € 000) 2015 2014 2013
Cash & loans and advances to banks 950,826 298,393 658,767Financial assets - Financial assets available for sale 549,434 915,022 537,717 - Financial assets held for trading 6,196 5,655 33,633 - Loans and receivables 223,355 148,767 125,987Tangibles assets 79,941 59,455 55,070Goodwill and other intangible assets* 246 914 244 696 248 607Goodwill and other intangible assets 246,914 244,696 248,607Other assets 33,498 28,589 25,240Total assets 2,090,164 1,700,577 1,685,021
Financial liabilities- Deposits from credit institutions 1,779 3,842 2,403- Deposits from clients 1,387,076 1,055,471 1,080,732- Other 2 021 11 395 30 267- Other 2,021 11,395 30,267Provisions, tax and other liabilities 116,287 112,130 107,247Equity (including minority interests)* 583,001 517,738 464,372Total liabilities 2,090,164 1,700,577 1,685,021
* JM Finn at 100% taking into account put/call rights on minority stake of 26.51%
90
Bank J.Van Breda & Co: income statement
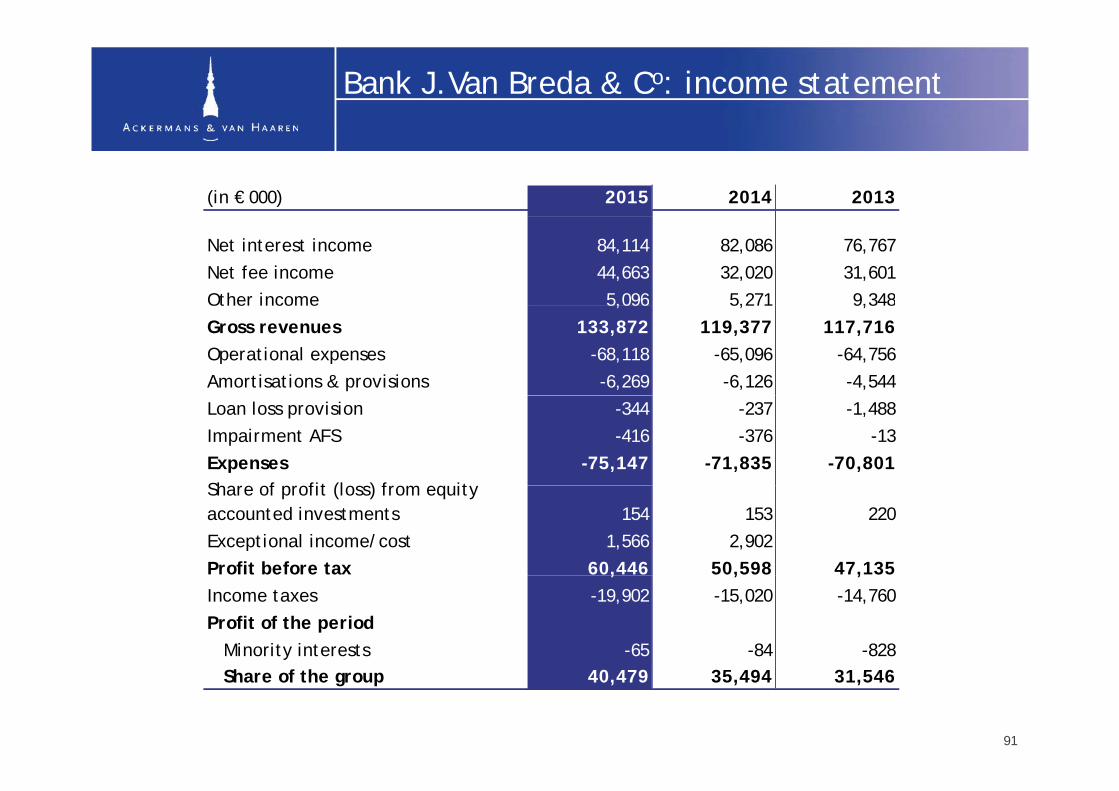
(in € 000) 2015 2014 2013
Net interest income 84,114 82,086 76,767Net fee income 44,663 32,020 31,601Other income 5,096 5,271 9,348Ot e co e 5,096 5, 9,3 8Gross revenues 133,872 119,377 117,716Operational expenses -68,118 -65,096 -64,756Amortisations & provisions -6,269 -6,126 -4,544Loan loss provision -344 -237 -1,488Impairment AFS -416 -376 -13Expenses -75,147 -71,835 -70,801Sh f fit (l ) f it Share of profit (loss) from equity accounted investments 154 153 220Exceptional income/cost 1,566 2,902Profit before tax 60,446 50,598 47,135, , ,Income taxes -19,902 -15,020 -14,760Profit of the period Minority interests -65 -84 -828 Share of the group 40,479 35,494 31,546
91
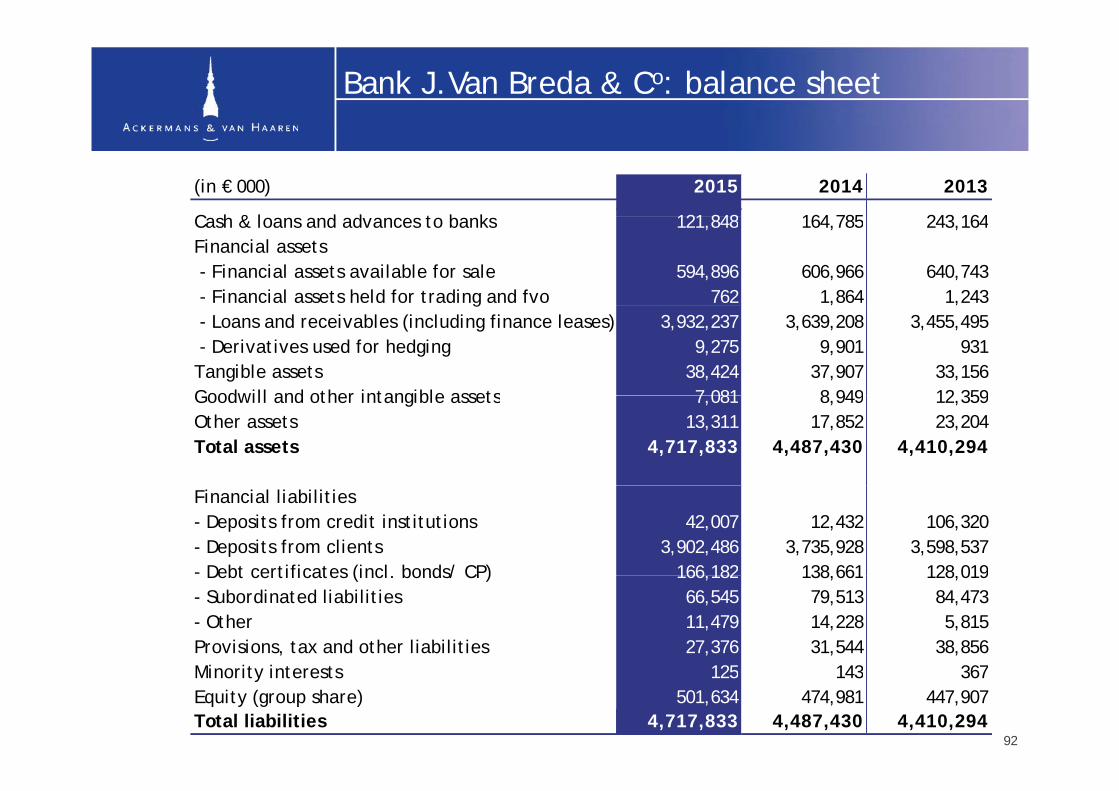
Bank J.Van Breda & Co: balance sheet
(in € 000) 2015 2014 2013
C h & l d d t b k 121 848 164 785 243 164Cash & loans and advances to banks 121,848 164,785 243,164Financial assets - Financial assets available for sale 594,896 606,966 640,743 - Financial assets held for trading and fvo 762 1,864 1,243g , , - Loans and receivables (including finance leases) 3,932,237 3,639,208 3,455,495 - Derivatives used for hedging 9,275 9,901 931Tangible assets 38,424 37,907 33,156Goodwill and other intangible assets 7 081 8 949 12 359Goodwill and other intangible assets 7,081 8,949 12,359Other assets 13,311 17,852 23,204Total assets 4,717,833 4,487,430 4,410,294
Financial liabilities- Deposits from credit institutions 42,007 12,432 106,320- Deposits from clients 3,902,486 3,735,928 3,598,537- Debt certificates (incl bonds/ CP) 166 182 138 661 128 019 Debt certificates (incl. bonds/ CP) 166,182 138,661 128,019- Subordinated liabilities 66,545 79,513 84,473- Other 11,479 14,228 5,815Provisions, tax and other liabilities 27,376 31,544 38,856Mi i i 125 143 367Minority interests 125 143 367Equity (group share) 501,634 474,981 447,907Total liabilities 4,717,833 4,487,430 4,410,294
92
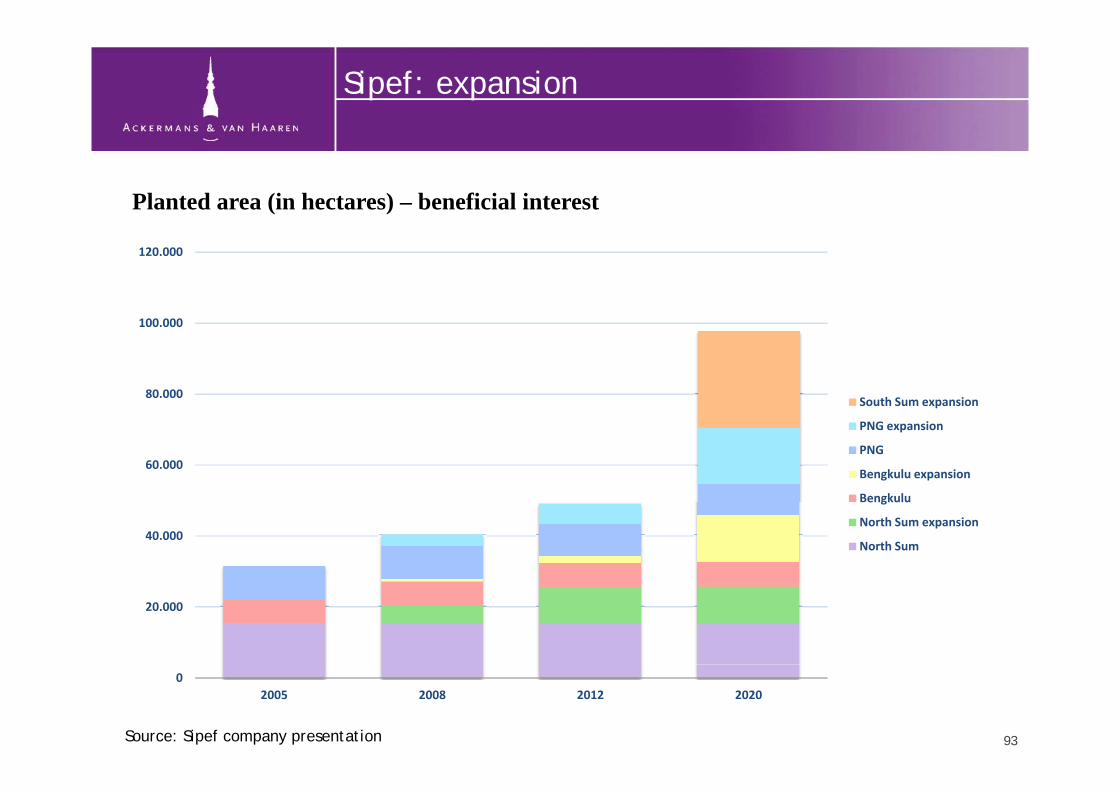
Sipef: expansion
Planted area (in hectares) – beneficial interest
120.000
80 000
100.000
60.000
80.000 South Sum expansion
PNG expansion
PNG
Bengkulu expansion
40.000
Bengkulu
North Sum expansion
North Sum
20.000
02005 2008 2012 2020
Source: Sipef company presentation 93

For further questions or additional information, please consult our website: www.avh.be
Contact:Luc BertrandCh i f th E ti C ittChairman of the Executive Committee
Jan SuykensMember of the Executive Committee
Tom BamelisMember of the Executive Committee
T +32 3 231 87 79E [email protected]
94