Annual results 2015 - and December October November ... Includes compensation for the tariff freeze...
58
Annual results 2015 Financial analysts’ meeting 24 February 2016
Transcript of Annual results 2015 - and December October November ... Includes compensation for the tariff freeze...
Annual results 2015
Financial analysts’ meeting
24 February 2016
Highlights
Benoît de Ruffray
Chairman and Chief Executive Officer

Highlights - Contracting
3
Ongoing recovery of marginsEnergy
Margin resilienceConstruction
Record in reservations and first operation in LuxembourgProperty
development
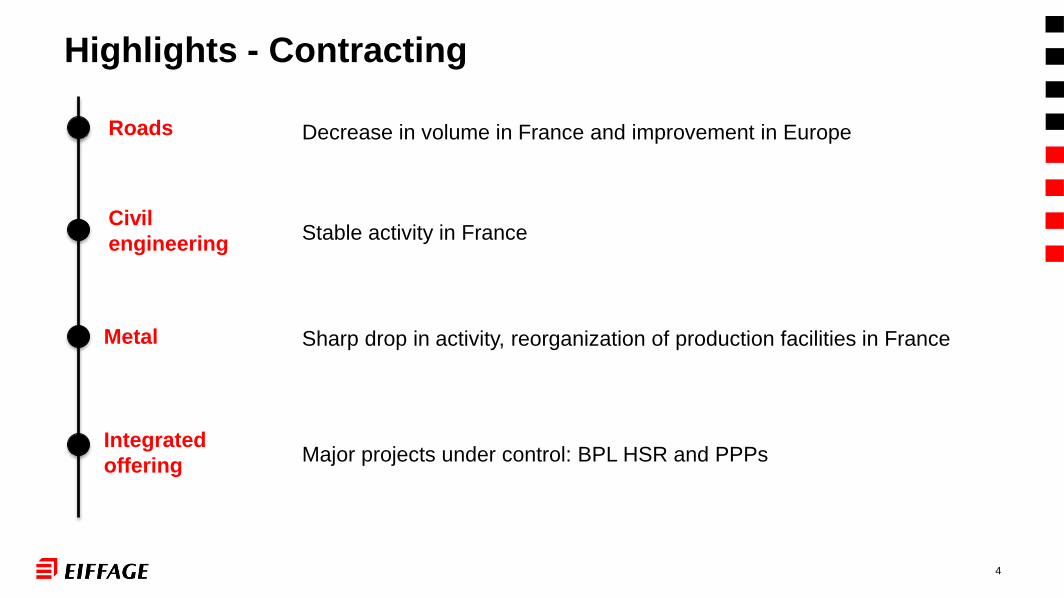
Highlights - Contracting
4
Sharp drop in activity, reorganization of production facilities in FranceMetal
Stable activity in FranceCivil
engineering
Decrease in volume in France and improvement in EuropeRoads
Major projects under control: BPL HSR and PPPsIntegrated
offering

Highlights - APRR and AREA
Initial concession
maturity
Motorway
Stimulus Package
Maurice Lemaire
tunnel integration Actual concession
maturity
APRR 31-12-2032 +25 months +10 months 30-11-2035
AREA 31-12-2032 +45 months No impacts 30-09-2036
Effective date 23rd August 2015 31st January 2016
5
Successive lengthening of the concessions contracts Exceptional events
• Traffic growth +2.7%
• EBITDA margin improvement to the record level of 71.8% (+ 110 bps)
• Decrease of 16% of APRR and Eiffarie financial expenses
Operation

6
Highlights - Other concessions
• Further improvement in traffic and profitability of the A65
• Integration of the Viaduct service area in the Viaduct of Millau concession
• Important traffic growth of « Autoroute de l’Avenir » in Senegal and
opening of the new extension during 2016
Motorways
concessions
• Commercial successes in building in France and infrastructure in Germany
• Opening of the University of Grenoble and disposal of Eifficentre
PPP
portfolio
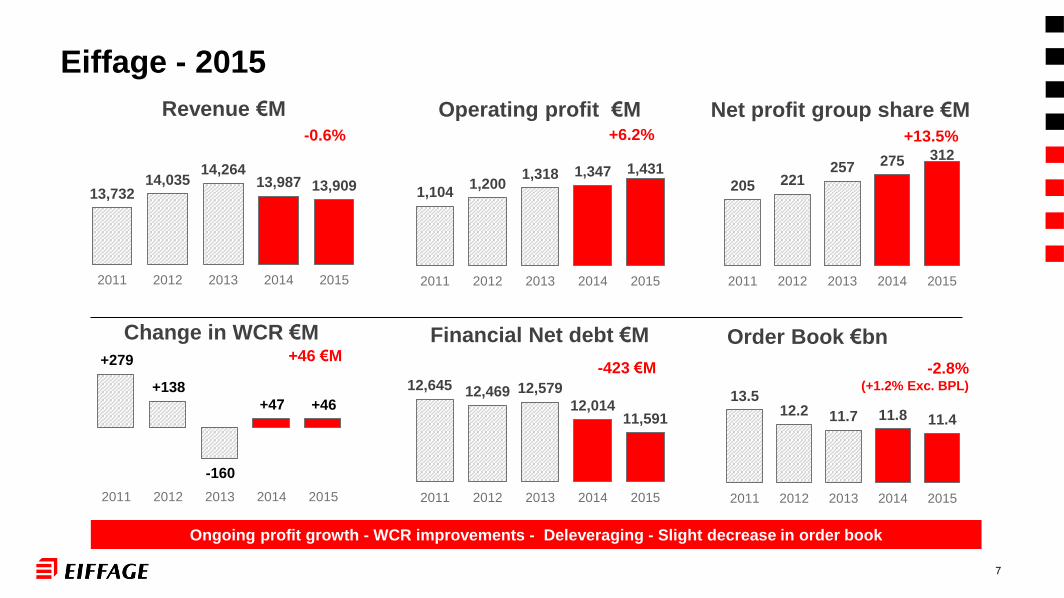
Eiffage - 2015
Revenue €M-0.6%
13,73214,035
14,26413,987 13,909
2011 2012 2013 2014 2015
Financial Net debt €M
-423 €M12,645 12,469 12,579
12,01411,591
2011 2012 2013 2014 2015
Order Book €bn
-2.8%(+1.2% Exc. BPL)
13.512.2 11.7 11.8 11.4
2011 2012 2013 2014 2015
Ongoing profit growth - WCR improvements - Deleveraging - Slight decrease in order book
Operating profit €M+6.2%
1,1041,200
1,318 1,347 1,431
2011 2012 2013 2014 2015
205 221257 275 312
2011 2012 2013 2014 2015
Net profit group share €M+13.5%
Change in WCR €M+46 €M+279
+138
-160
+47 +46
2011 2012 2013 2014 2015
7

Slight decrease of activity
New profit growth
Proposal of a dividend of €1.50 per share (+25%)
Outlook - 2016
8

Results by business line and financial results
Christian Cassayre
Chief Financial Officer
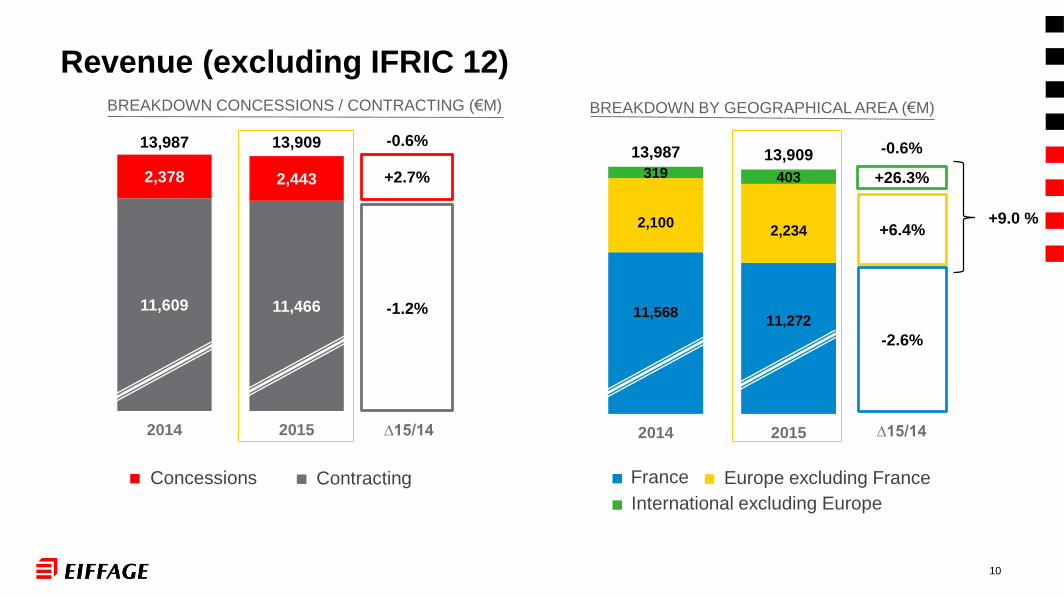
11,609 11,466
2,378 2,443
13,987 13,909
2014 2015
10
Revenue (excluding IFRIC 12)
-1.2%
+2.7%
BREAKDOWN CONCESSIONS / CONTRACTING (€M)
ContractingConcessions
11,56811,272
2,1002,234
319 403
13,987 13,909
2014 2015
-2.6%
+6.4%
BREAKDOWN BY GEOGRAPHICAL AREA (€M)
+26.3%
-0.6% -0.6%
∆15/14 ∆15/14
International excluding Europe
France Europe excluding France
+9.0 %

11
Contracting revenue (excluding IFRIC 12)CONTRACTING BREAKDOWN
BY GEOGRAPHICAL AREA (€M) AND % OF TOTAL
3,306 3,578
4,570 4,374
3,733 3,514
11,609 11,466
2014 2015
+8.2%
-4.3%
-5.9%
BREAKDOWN BY DIVISION (€M)
Construction Infrastructures Energy
-3.9%
+6.3%
+27%
-1.2% -1.2%
∆15/14 ∆15/14
9,2098,852
2,100 2,233
300381
11,609 11,466
2014 2015
(3%)
(18%)
(79%)(77%)
(20%)
(3%)
International excluding Europe
France Europe excluding France

12
Operating profit on ordinary activities and margins
Growth of operating profit on ordinary activities of 6.2% to €1,431M (+€84M)
Operating margin increase by 70 bps to 10.3% of revenue
2014 2015∆ 15/14
€M % revenue €M % revenue
Construction 156 4.2% 136 3.9% -12.8%
Infrastructures 108 2.4% 75 1.7% -30.6%
Energy 116 3.5% 132 3.7% +13.8%
Sub-total Contracting 380 3.3% 343 3.0% -9.7%
Concessions 985 41.4% 1,106 45.3% +12.3%
Holding -18 -18
GROUP TOTAL 1,347 9.6% 1,431 10.3% +6.2%

1,1041,200
1,318 1,3471,431
8.0%
8.6%
9.2%9.6%
10.3%
2011 2012 2013 2014 2015
13
Evolution of the operating margin
Continuous growth of the operating profit and margin to the level of 10.3%
Operating profit (M€) and margin (%)
14
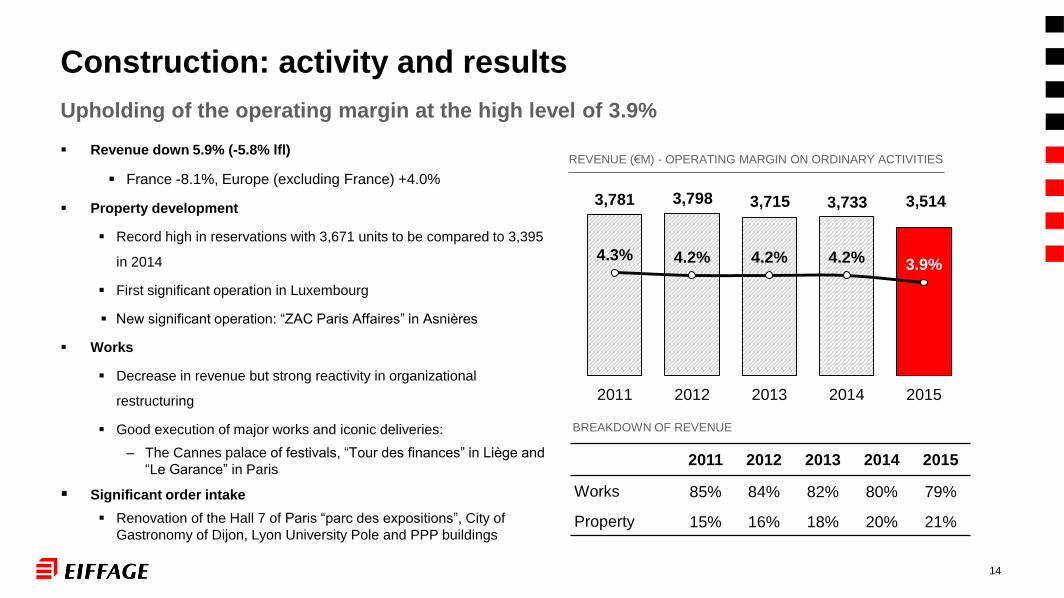
Construction: activity and results
Revenue down 5.9% (-5.8% lfl)
France -8.1%, Europe (excluding France) +4.0%
Property development
Record high in reservations with 3,671 units to be compared to 3,395
in 2014
First significant operation in Luxembourg
New significant operation: “ZAC Paris Affaires” in Asnières
Works
Decrease in revenue but strong reactivity in organizational
restructuring
Good execution of major works and iconic deliveries:
– The Cannes palace of festivals, “Tour des finances” in Liège and
“Le Garance” in Paris
Significant order intake
Renovation of the Hall 7 of Paris “parc des expositions”, City of
Gastronomy of Dijon, Lyon University Pole and PPP buildings
3,781 3,798 3,715 3,733 3,514
4.3% 4.2% 4.2% 4.2% 3.9%
2011 2012 2013 2014 2015
2011 2012 2013 2014 2015
Works 85% 84% 82% 80% 79%
Property 15% 16% 18% 20% 21%
BREAKDOWN OF REVENUE
Upholding of the operating margin at the high level of 3.9%
REVENUE (€M) - OPERATING MARGIN ON ORDINARY ACTIVITIES

Le Garance - Paris Pyrénées - Paris 20e
15

4,390 4,5274,854
4,570 4,374
0.7%
1.8%
2.6% 2.4%
1.7%
2011 2012 2013 2014 2015
Decrease of the operating margin by 70 bps to 1.7%
Deterioration of the metal construction in France
16
Infrastructures(1): activity and results
Revenue down 4.3% (-6.1% lfl)
France -7.7%, Europe excluding France +9.1% and outside
Europe -2.8%
Drop in the metal construction activities in France
Margin evolution
Stable margin in civil engineering
Reorganization in roads
Reorganization in Metal construction works
Major projects
Bretagne-Pays de la Loire HSR: progress in line with
expectations
International development
A94 Motorway in Germany (PPP)
Metal walkways in Angola
REVENUE (€M) - OPERATING MARGIN ON ORDINARY ACTIVITIES
(1) Previously Public works and Metallic construction
Industries 2011 2012 2013 2014 2015
Coatings-M tons 9 8 9 9 9
Quarries-M tons 21 19 21 20 19
Binders -K tons 183 162 174 177 174
VOLUME FIGURES
Short lived street Art on the Paris ring road
17

Energy(1): activity and results
3,417 3,535 3,434 3,306 3,578
2.2%2.6%
3.0%
3.5%3.7%
2011 2012 2013 2014 2015
Continuous growth of the operating margin over the last 5 years
Increase of the operating margin by 20 bps over the year to 3.7%
Revenue up 8.2% (+7.5% lfl)
France +5.9%, Europe excluding France +4.8% and
x2 outside Europe
Increased operating margins
Good performance of the system divisions
Gradual acquisition (mainly in France regions)
Iconic delivery
Successful realization of the largest photovoltaic farm in
Europe (Cestas)
Major Projects
Photovoltaic farms in Chili
Bretagne-Pays de la Loire HSR: ramping up
18
REVENUE (€M) - OPERATING MARGIN ON ORDINARY ACTIVITIES
(1) Previously Energy and Industrial maintenance

Deployment of optical fiber
19

2,144 2,175 2,2612,378 2,443
40.4%41.1%
42.2%41.4%
45.3%
2011 2012 2013 2014 2015
Revenue up 2.7% (+2.8% lfl)
Motorways concessions (exc. APRR): +9% at €M 117
117
Other concessions and PPPs : -7,9% at €112M (CHSF disposal)
Operating margin +12% at €M 1,106
APRR / Eiffarie: +11% at €M 964
Other concessions and PPPs: +25% at €M 142
Concessions contracts evolution
APRR +35 months and AREA +45 months with the stimulus package and the
Maurice Lemaire Tunnel integration
Concession enlargement: integration of the Viaduct service area in the Millau
viaduct concession
Concessions: activity and results
Increase of the operating margin up 390 bps to the high level of 45.3%
Motorways Revenue €M (∆15/14 %) LV Traffic HGV Traffic
A65 52 (+8.3%) +4.9% +14.2%
Millau Viaduct 43 (+5.3%) +1.4% +4.4%
Autoroute de l’Avenir 22 (+20%) +18% in transactions
TOTAL 117 (+9%)
Signing of new PPPs
Metz university, Var Colleges, biology and health campus of
Nancy
A94 motorway in Germany
Opening : GreEn-ER University in Grenoble
Disposal : Energy Efficiency contract Efficentre
20
REVENUE (€M) - OPERATING MARGIN ON ORDINARY ACTIVITIES

21
Eiffage Marathon of the Dakar motorway

Revenue (Exc. Ifric 12) up 3.0%
Total traffic increase up 2.7%
LV +2.6% and HGV +2.9%
Operating margin up
Ongoing optimization of the structures
Productivity gains in the core operations
Extension to the concessions contracts
APRR +35 months
AREA +45 months
Application of the contractual toll increase in 2016
Openings
A719 Vichy / Gannat (January)
A466 north of Lyon (July)
REVENUE (€M) – EBITDA / REVENUE
22
APRR: activity and results
2,022 2,0392,099
2,1492,214
69.2%
70.0%70.3%
70.7%
71.8%
2011 2012 2013 2014 2015
Continuous growth of EBITDA and EBITDA margin over the last 5 years
Increase of the EBITDA margin by 110 bps to the record level of 71.8%
TRAFFIC TOLL RECEIPTS REVENUE MIX
HGV
15%
LV
85%
HGV
33%
LV
67%
Other
3%
Tolls
97%
Winter Activities - APRR
23

24
APRR & Eiffarie: Refinancing in 2015
New credit facilities and bonds issues for APRR and Eiffarie for a total of €bn 4.6
Bank debt(*)
APRR
Bank debt
Eiffarie
EIB
APRR
Bonds
APRR
Bonds
APRRTOTAL
Date February FebruaryJune and
DecemberOctober November
Amount (€bn) 1.8 1.5 0.3 0.5 0.5 4.6
CostFloating
+45 bps
Floating
+100 bps
Floating
+40 bps
Fixed rate
1.5%
Floating
+70 bps
Maturity5 years + 2x1
year
5 years + 2x1
year7 years 8 years 4 years
Reimbursement On maturity
Progressive
€100M/year an
average
On maturity On maturity On maturity
* Revolving credit facility (RCF)

25
APRR & AREA: Tariff formulae 2016 - 2023
2017 2018 2019 2020 2021 2022 2023
Tariff increase 1st of February 2016
85% x I 85% x I 70% x I 70% x I 70% x I 70% x I 70% x I
+ + + + + + +
APRR 1.23% 0.59% 1.13% 0.25% 0.25% 0.25% 0.25% 0.25%
AREA 1.27% 0.62% 1.17% 0.26% 0.26% 0.26% 0.26% 0.26%
Includes management contract tariff formulae 2014-2018
Includes compensation for the Increase in the land tax
rates since 2013
Absent of new management contract
Includes compensation for the tariff freeze of 2015
I = Inflation
Contractual tariff increase and compensations
26
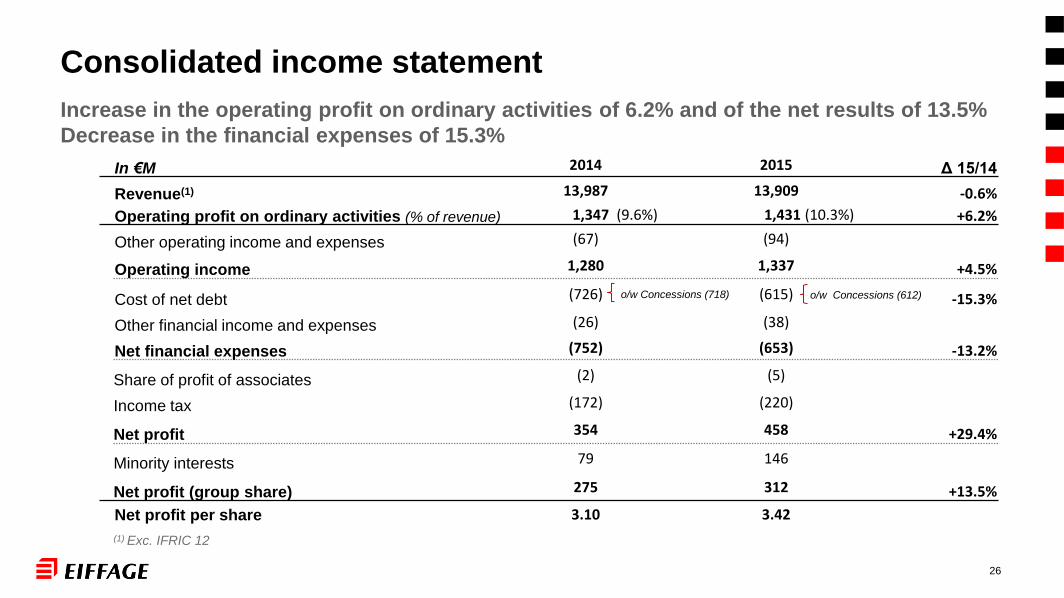
Consolidated income statement
Increase in the operating profit on ordinary activities of 6.2% and of the net results of 13.5%
Decrease in the financial expenses of 15.3%
In €M 2014 2015 Δ 15/14
Revenue(1) 13,987 13,909 -0.6%
Operating profit on ordinary activities (% of revenue) 1,347 (9.6%) 1,431 (10.3%) +6.2%
Other operating income and expenses (67) (94)
Operating income 1,280 1,337 +4.5%
Cost of net debt (726) (615) -15.3%
Other financial income and expenses (26) (38)
Net financial expenses (752) (653) -13.2%
Share of profit of associates (2) (5)
Income tax (172) (220)
Net profit 354 458 +29.4%
Minority interests 79 146
Net profit (group share) 275 312 +13.5%
Net profit per share 3.10 3.42
(1) Exc. IFRIC 12
o/w Concessions (718) o/w Concessions (612)

205 €M221 €M
257 €M275 €M
312 €M
2.36€
2.59€
2.96€3.10€
3.42€
2011 2012 2013 2014 2015
Total capital’s shares in millions
87.1 87.1 89.4 92.3 95.4
Continuous growth of the net profit and profit per share over the last 5 years
Net profit (group share) and profit per share
27
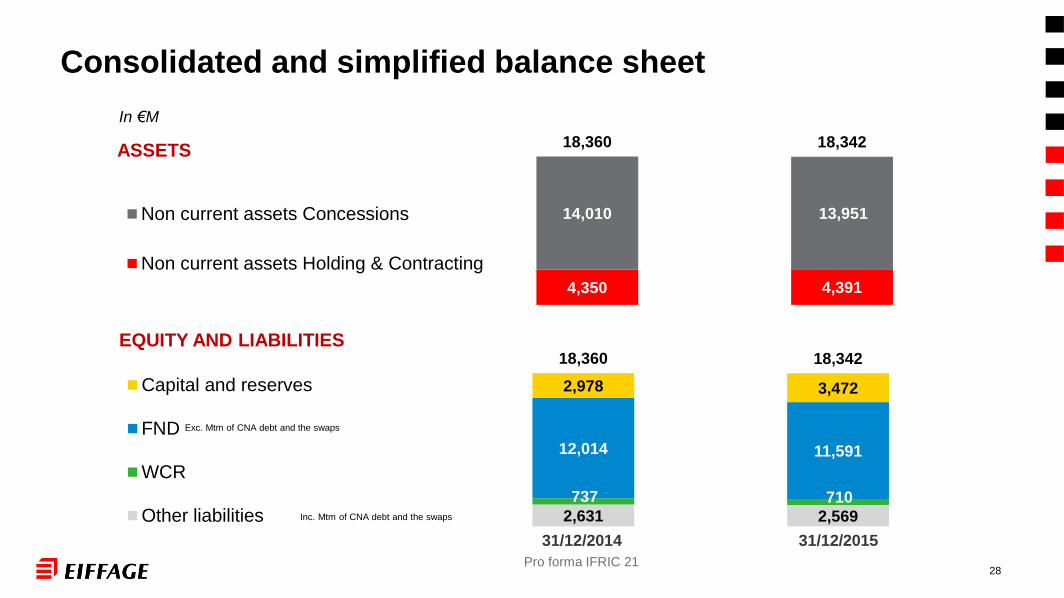
2,5692,631
710737
11,59112,014
3,4722,978
18,34218,360
Capital and reserves
FND
WCR
Other liabilities Inc. Mtm of CNA debt and the swaps
4,3914,350
13,95114,010
18,34218,360
Non current assets Concessions
Non current assets Holding & Contracting
Consolidated and simplified balance sheet
ASSETS
In €M
31/12/2014 31/12/2015
EQUITY AND LIABILITIES
Exc. Mtm of CNA debt and the swaps
28Pro forma IFRIC 21

33 (55) 81
(2,074)
(46)
890 111
637
Capex
748
Acquisitions
& disposals
Financial net debt evolution (€M)
EBITDAChange in WCR:
Holding & Contracting (93)
Concessions 47
Net Capex
Contracting
& Holding
Capex
Concessions
Dividends
&
Capital
transactions
12,014
11,591
FND 31/12/2014* FND 31/12/2015**Exc. Mtm of the CNA debt and the swaps :
M€ 799 M€ 603
(2,035) (47) 987 81 642 (306) 55 58
Operation
(1,230)
723(1 095)
29
2014 figures Pro forma of Capex reclassification
Interest &
taxes paid
Variations
without
flows of
funds
&
misc

Financial net debt structure (€M)
Financial net debt down €0.4bn over 1 year €1bn over 2 years
Exc. Mtm of the CNA debt and the swaps :
€M 1,065 €M 1,302 €M 860 €M 799 €M 603
12,294
13144 27
166
31/12/12 31/12/13
12,57912,469
FND Holding
& Contracting
FND
Concessions
with recourse
DFN
Concessions
without recourse
12 386
12,014
31/12/14
12,386 7
-31
12,038 12 386
11,591
31/12/15
-334
11,925
12,472
13241
31/12/11
12,645
30
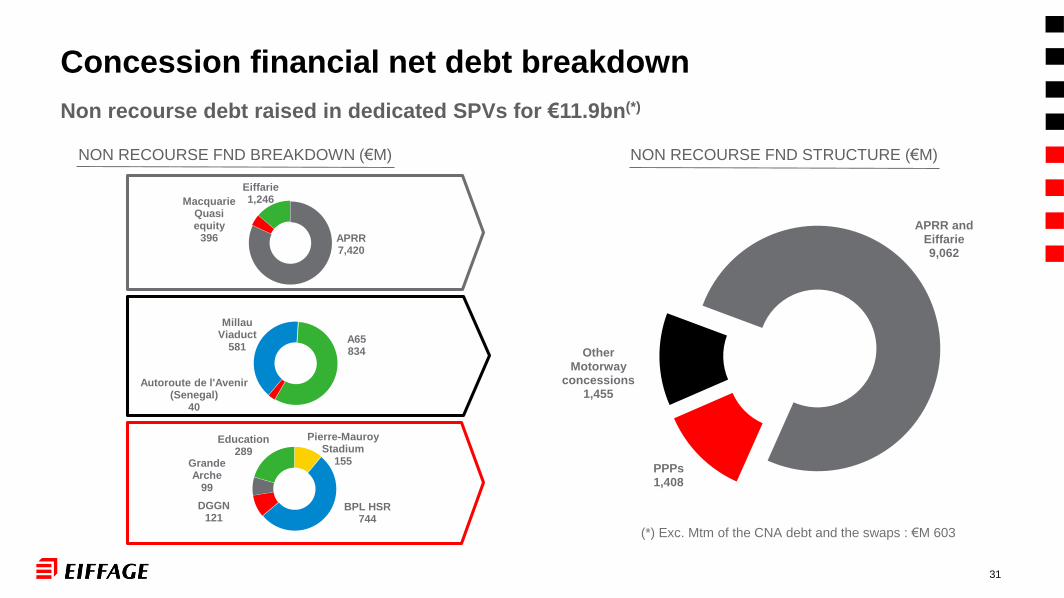
Pierre-Mauroy Stadium
155
BPL HSR744
DGGN121
Grande Arche
99
Education289
APRR7,420
Macquarie Quasi equity
396
Eiffarie1,246
PPPs1,408
Other Motorway
concessions1,455
APRR and Eiffarie9,062
NON RECOURSE FND STRUCTURE (€M)NON RECOURSE FND BREAKDOWN (€M)
Concession financial net debt breakdown
Non recourse debt raised in dedicated SPVs for €11.9bn(*)
Millau Viaduct
581A65834
Autoroute de l'Avenir (Senegal)
40
(*) Exc. Mtm of the CNA debt and the swaps : €M 603
31

13.512.1 11.7 11.8 11.4
31/12/11 31/12/12 31/12/13 31/12/14 31/12/15
ORDER BOOK (€bn) AND EQUIVALENT NUMBER OF
MONTHS OF THE CONTRACTING TURNOVER
32
Activity and commercial dynamism
3.1 2.8
4.0 3.9
4.7 4.8
11.8 11.4
31/12/14 31/12/15
BREAKDOWN BY DIVISION (€bn)
12 MONTHS VARIATIONS
Construction Infrastructures Energy
-7.8%
-4.6%
+2.1%
Strong order book at €11.4bn down 2.8% over one year (+1.2% Exc. BPL)
-2.8%
∆15/14
13.9
months
12.3
months12.0
months
12.2
months12.0
months

Appendices

Free float47.6%
Employees24.3%
Treasury shares3.0%
BPI18.8%
BlackRock6.3%
SHAREHOLDERS AT 31/12/2015 (95,4 M Shares)SHAREHOLDERS at 30/06/2015 (95,4 M Shares)
34
Group shareholding structure
Free float51.2%
Employees23.7%
Treasury shares4.9%
BPI13.9%
BlackRock6.3%

Benelux797
Germany657
Spain344
Poland199
Other237
France11,272
Europe Excluding
France2,234
International Excluding
Europe403
REVENUE BREAKDOWN IN EUROPE
EXCLUDING FRANCE (€M)REVENUE BREAKDOWN (€M)
35
Revenue (excluding IFRIC 12)

36
Consolidated balance sheet - Assets
In €M 31/12/2013 (*) 31/12/2014(*) 31/12/2015
Property, plant and equipment 1,474 1,463 1,481
Investment property 6 5 4
Fixed assets held under concessions 12,415 12,069 11,701
Goodwill on acquisition 2,849 2,873 2,904
Other intangible assets 172 175 172
Investment accounted for using the equity method 107 102 82
Financial assets on service concessions non-current 1,374 1,406 1,732
Other financial assets 273 267 266
Deferred tax assets 296 301 292
Total non current assets 18,966 18,661 18,634
Inventories 556 518 600
Trade receivables 4,151 3,962 3,966
Current tax receivables 5 90 137
Financial assets on service concessions current 15 17 20
Other current assets 1,457 1,259 1,116
Cash and cash equivalent 2,097 4,265 3,641
Asset held for sale 83 49 -
Total current assets 8,364 10,160 9,480
Total assets 27,330 28,821 28,114
* Pro forma IFRIC 21

37
Consolidated balance sheet - Equity and liabilities
In €M 31/12/2013(*) 31/12/2014(*) 31/12/2015
Share capital 358 369 382
Consolidated reserves 2,430 2,617 2,789
Profit & losses directly accounted for in equity (340) (359) (286)
Net profit for the period 257 275 312
Total capital and reserves, attributable to the Group 2,705 2,902 3,197
Minority interests (7) 87 275
Total capital and reserves 2,698 2,989 3,472
Long-term debt 13,261 14,140 12,847
Deferred tax liabilities 1,050 1,077 1,159
Non current provisions 529 599 581
Other non current liabilities 52 51 46
Total non current liabilities 14,892 15,867 14,633
Trade creditors 3,169 2,884 2,924
Short-term loans and other borrowings 1,184 1,337 1,520
Non current borrowings due with in one year 1,091 1,601 1,468
Current tax liabilities 74 65 106
Current provisions 475 477 523
Other creditors and accruals 3,693 3,592 3,468
Liabilities held for sale 54 20 -
Total current liabilities 9,740 9,976 10,009
Total liabilities and share holder’s equity 27,330 28,821 28,114
* Pro forma IFRIC 21
38
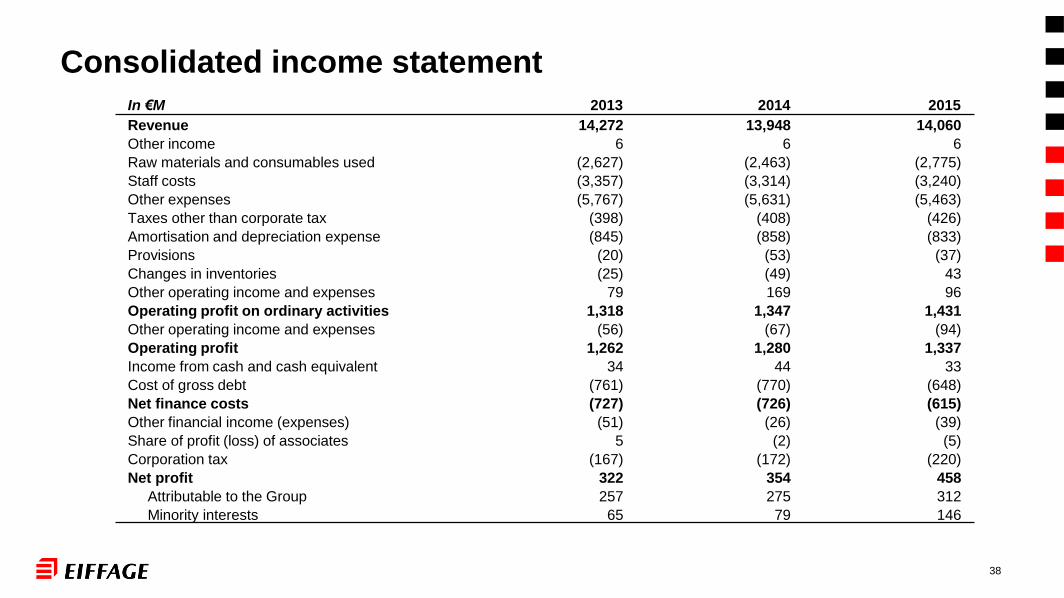
Consolidated income statement
In €M 2013 2014 2015
Revenue 14,272 13,948 14,060
Other income 6 6 6
Raw materials and consumables used (2,627) (2,463) (2,775)
Staff costs (3,357) (3,314) (3,240)
Other expenses (5,767) (5,631) (5,463)
Taxes other than corporate tax (398) (408) (426)
Amortisation and depreciation expense (845) (858) (833)
Provisions (20) (53) (37)
Changes in inventories (25) (49) 43
Other operating income and expenses 79 169 96
Operating profit on ordinary activities 1,318 1,347 1,431
Other operating income and expenses (56) (67) (94)
Operating profit 1,262 1,280 1,337
Income from cash and cash equivalent 34 44 33
Cost of gross debt (761) (770) (648)
Net finance costs (727) (726) (615)
Other financial income (expenses) (51) (26) (39)
Share of profit (loss) of associates 5 (2) (5)
Corporation tax (167) (172) (220)
Net profit 322 354 458
Attributable to the Group 257 275 312
Minority interests 65 79 146
39
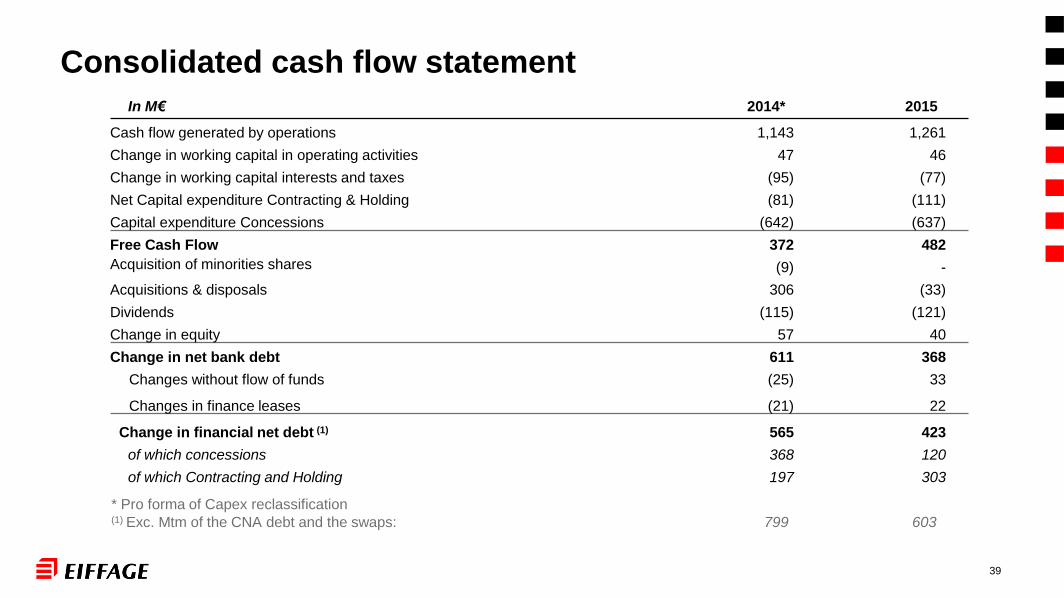
Consolidated cash flow statement
In M€ 2014* 2015
Cash flow generated by operations 1,143 1,261
Change in working capital in operating activities 47 46
Change in working capital interests and taxes (95) (77)
Net Capital expenditure Contracting & Holding (81) (111)
Capital expenditure Concessions (642) (637)
Free Cash Flow 372 482
Acquisition of minorities shares (9) -
Acquisitions & disposals 306 (33)
Dividends (115) (121)
Change in equity 57 40
Change in net bank debt 611 368
Changes without flow of funds (25) 33
Changes in finance leases (21) 22
Change in financial net debt (1) 565 423
of which concessions 368 120
of which Contracting and Holding 197 303
* Pro forma of Capex reclassification(1) Exc. Mtm of the CNA debt and the swaps: 799 603

40
Group financial structure
In €M 31/12/2011 31/12/2012 31/12/2013 31/12/2014 31/12/2015
Concessions
- Financial debt 11,762 11,565 11,678 11,458 11,529
- Macquarie quasi equity 710 729 708 580 396
Sub-total without recourse 12,472 12,294 12,386 12,038 11,925
- With recourse 41 44 27 7 -
Concessions financial net debt 12,513 12,338 12,413 12,045 11,925
Holding & Contracting
- Net cash (656) (759) (921) (1,678) (1,804)
- Gross debt 788 890 1,087 1,647 1,470
Holding & Contracting financial net debt 132 131 166 -31 -334
Total financial net debt (1) 12,645 12,469 12,579 12,014 11,591
(1) Exc.Mtm of the CNA debt and the swaps: 1,065 1,302 860 799 603
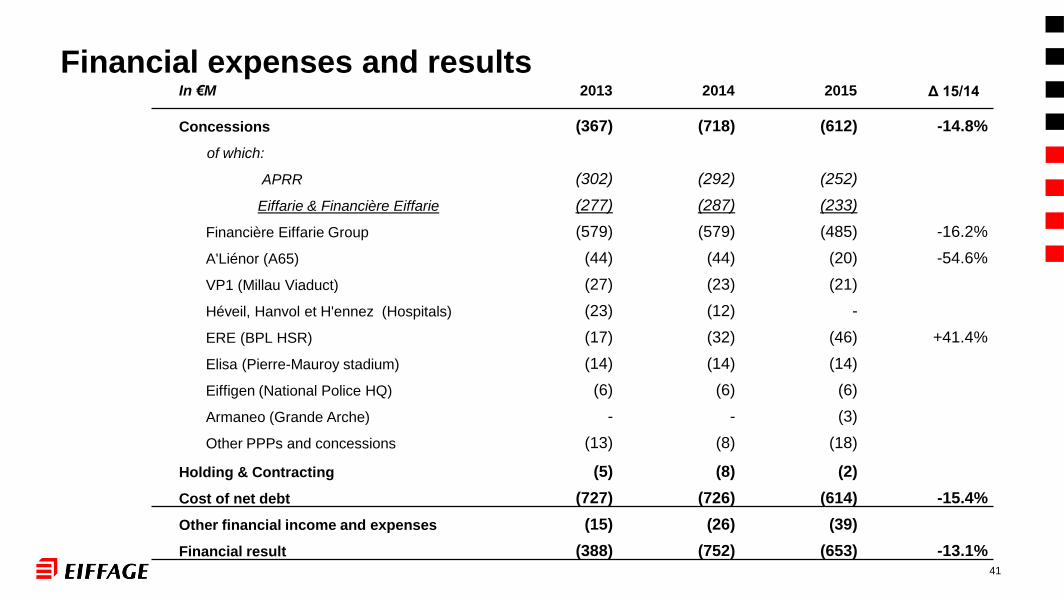
Financial expenses and resultsIn €M 2013 2014 2015 Δ 15/14
Concessions (367) (718) (612) -14.8%
of which:
APRR (302) (292) (252)
Eiffarie & Financière Eiffarie (277) (287) (233)
Financière Eiffarie Group (579) (579) (485) -16.2%
A'Liénor (A65) (44) (44) (20) -54.6%
VP1 (Millau Viaduct) (27) (23) (21)
Héveil, Hanvol et H'ennez (Hospitals) (23) (12) -
ERE (BPL HSR) (17) (32) (46) +41.4%
Elisa (Pierre-Mauroy stadium) (14) (14) (14)
Eiffigen (National Police HQ) (6) (6) (6)
Armaneo (Grande Arche) - - (3)
Other PPPs and concessions (13) (8) (18)
Holding & Contracting (5) (8) (2)
Cost of net debt (727) (726) (614) -15.4%
Other financial income and expenses (15) (26) (39)
Financial result (388) (752) (653) -13.1%41
42
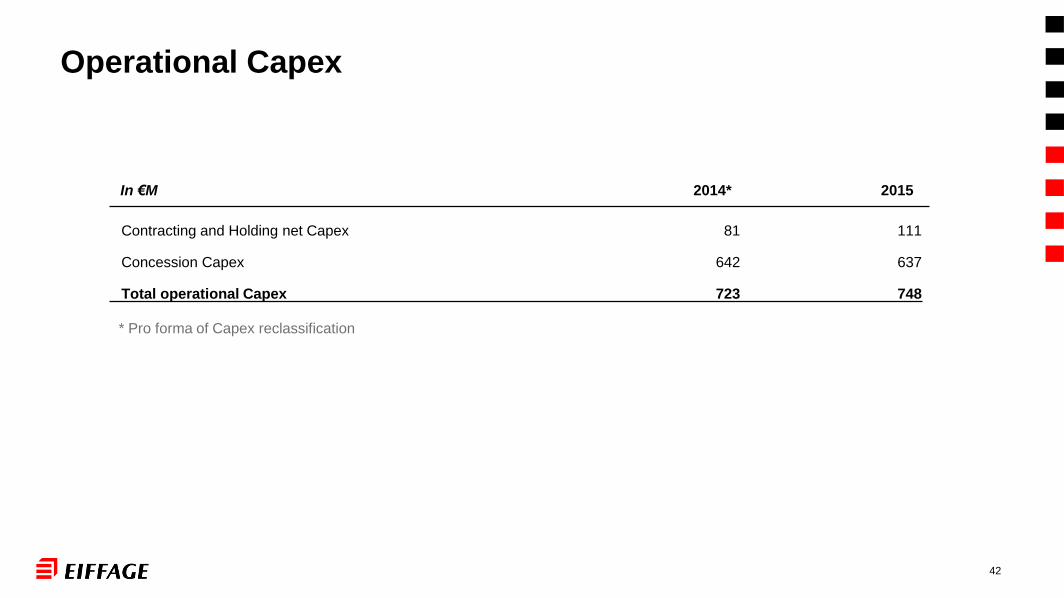
Operational Capex
In €M 2014* 2015
Contracting and Holding net Capex 81 111
Concession Capex 642 637
Total operational Capex 723 748
* Pro forma of Capex reclassification

43
Roads56%
Civil Engineering
20%
Earthworks6%
Environment8%
Railways and other
10%
INFRASTRUCTURES
Electric Engineering
70%
Climatic Engineering
13%
O&M17%
ENERGY
Equipements / Non residential50%
Civil engineering
11%
Residential39%
CONSTRUCTION
Contracting: market segmentation

44
Private62%
Public38%
CONSTRUCTION
Private75%
Public25%
ENERGY
Private48%
Public52%
INFRASTRUCTURES
Contracting: customer segmentation

Concessions length Tariffs Development of Investments Regulation
Motorway stimulus Package
and Integration of the Tunnel
Maurice Lemaire in the APRR
concession
Compensation of the 2015
tariff freeze by an additional
toll increase between 2019
and 2023
€720M of investments
Establishment of an
independent authority
(ARAFER) and increased
transparency
APRR: 35 months lengthening
to the end of November 2035
Compensation of the raise
in the land tax rates since
2013 by an additional toll
increase between 2016 and
2018
Contribution to a dedicated
investment fund which will
invest in the ecological
modernization of transportation
Strengthening of the
protection against further
taxation
AREA: 45 months lengthening
to the end of September 2036
Commercial policies:
carpooling, ecological vehicle,
student and youth, “Macron”
bus.
Implementation of a
mechanism capping the
profitability via the revenues
Voluntary exceptional annual
contribution to the AFITF
45
APRR & AREA - 2015 & 2016 evolutions

€500M of capex covering growth and modernization of the network
Major infrastructure projects
Construction of the A89-A6 junction north of Lyon
A43 / A41 / high speed urban road of Chambéry
Three widenings on the A6 at Auxerre (southbound), on the A71 north of
Clermont-Ferrand (northbound), and on the A41 north of Annecy
(in both directions)
Operating investments
Renovation of rest areas
Environmental protection
Improvement of service and security
46
APRR & AREA - 2014 - 2018 Management contracts
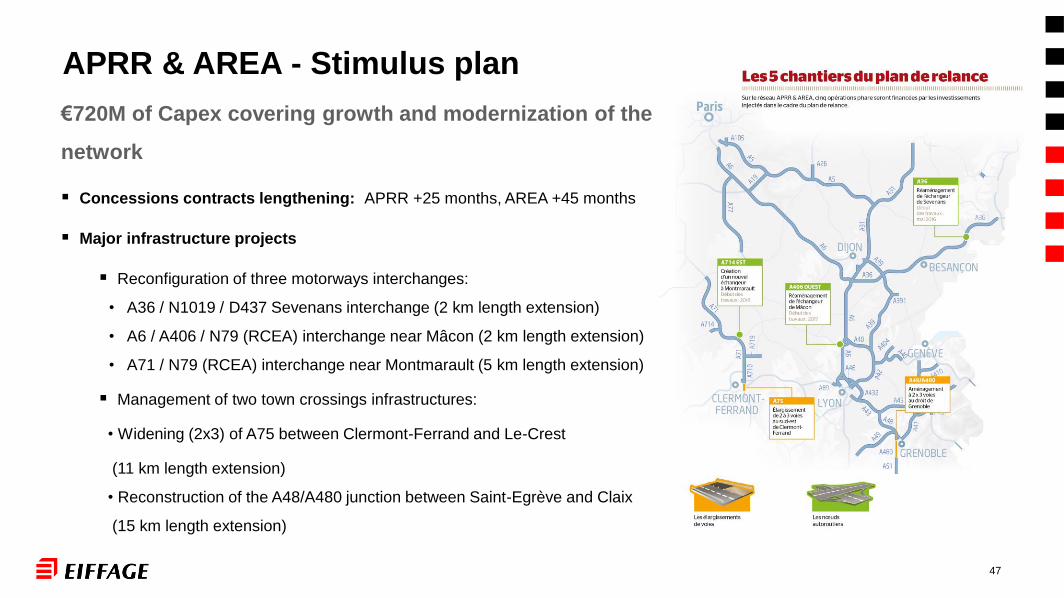
€720M of Capex covering growth and modernization of the
network
Concessions contracts lengthening: APRR +25 months, AREA +45 months
Major infrastructure projects
Reconfiguration of three motorways interchanges:
• A36 / N1019 / D437 Sevenans interchange (2 km length extension)
• A6 / A406 / N79 (RCEA) interchange near Mâcon (2 km length extension)
• A71 / N79 (RCEA) interchange near Montmarault (5 km length extension)
Management of two town crossings infrastructures:
• Widening (2x3) of A75 between Clermont-Ferrand and Le-Crest
(11 km length extension)
• Reconstruction of the A48/A480 junction between Saint-Egrève and Claix
(15 km length extension)
47
APRR & AREA - Stimulus plan

Exc. Mtm of the CNA debt and the swaps
€M 800 €M 931 €M 656 €M 592 €M 431
APRR & Eiffarie – Financial structure (€M)
6,0966,760 6,751 6,696
7,420
3,522 2,482 2,331 2,2201,246
710729 708
580396
10,3289,971 9,790
9,4969,062
31/12/2011 31/12/2012 31/12/2013 31/12/2014 31/12/2015
Macquarie quasiequity
Eiffarie
APRR
48

49
APRR - Debt profile
Debt profile as at 31/12/2015 (€M)
EMTN bonds details
Amount in €M Coupon Maturity Yield on 31/12/2015
300 Eur3m+0.87% 18/1/2016 0.22%
500 4.375% 25/1/2016 0.27%
1,000 5 % 12/1/2017 0.28%
500 5.125% 18/1/2018 0.45%
500 4.875% 21/1/2019 0.63%
500 Eur3m+0.75% 31/3/2019 0.62%
500 Eur3m+0.70% 3/1/2020 0.65%
500 2.25% 16/1/2020 0.81%
700 1.125% 15/1/2021 0.98%
52 RPI indexed 25/1/2021
500 1.50% 15/01/2024 1.45%
700 1.875% 15/1/2025 1.66%
435 391
714
1,000
52
500
500
500
300
500
500
700700
500
500
275
75 75
100
2016 2017 2018 2019 2020 2021 2022 2023 2024 2025
CNA EMTN program EIB*Reimbursed at the end of January 2016
2036
*
*

Km travelled, 12 months rolling average, rebased to Q4 2007
50
APRR - Traffic evolution
84
88
92
96
100
104
108
112
HGV
LV
Total

CONSTRUCTION /
CAPEX
TENDEROPERATION
RAMP UP
51
PPP life cycle
Eiffage
Call of tender 5% - 10% Equity
90% - 95% Debt
Construction contract
Maintenance contract
Sale of equity
Preservation of O&M contract
Debt deconsolidation
Financial investor
Length
in years1 3 to 6 1 to 2 15 to 20
Value Financial
structuring
PPP contracts
signing
OPERATION

Assets in concession
Name Type CountryEnd of
concessionStatus % Shares
Consolidation
method
APRR Toll Concession FR 2035/2036 Operational 50.1% Full consolidation
A65 Toll Concession FR 2067 Operational 65.0% Full consolidation
Millau viaduct Toll Concession FR 2079 Operational 51.0% Full consolidation
Norscut Toll Concession PT 2037 Operational 36.0% Equity method
Prado Carénage Tunnel Toll Concession FR 2025 Operational 32.9% Equity method
Prado Sud Tunnel Toll Concession FR 2054 Operational 41.5% Equity method
“Autoroute de l’Avenir” motorway Toll Concession SEN 2040 Operational 100.0% Full consolidation
HSR Perpignan-Figueras Railroad in concession FR / SP 2057 Operational 50.0% Equity method
HSR Bretagne-Pays de la Loire Railroad in PPP FR 2036 Under construction 100.0% Full consolidation
Prison Lot 1 PPP FR 2037 Operational 19.9% Not consolidated
Marche-en-Famenne prison PPP BEL 2038 Operational 19.0% Not consolidated
Le Plessis-Robinson (92) covered market PPP FR 2030 Operational 100.0% Full consolidation
National police HQ PPP FR 2043 Operational 100.0% Full consolidation
Pierre-Mauroy stadium PPP FR 2043 Operational 100.0% Full consolidation
Jean-Zay high school - Lorraine PPP FR 2034 Operational 100.0% Full consolidation
GreEn-ER university - Grenoble PPP FR 2041 Operational 100.0% Full consolidation
Bretagne university PPP FR 2038 Under construction 10.0% Not consolidated
Lille university PPP FR 2041 Under construction 100.0% Full consolidation
Aix-en-Provence university PPP FR 2042 Under construction 100.0% Full consolidation
Metz university PPP FR 2042 Under construction 100.0% Full consolidation
Seine-St-Denis colleges lot 1 PPP FR 2034 Operational 100.0% Full consolidation
Seine-St-Denis colleges lot 3 PPP FR 2034 Operational 100.0% Full consolidation
Var colleges PPP FR 2043 Under construction 100.0% Full consolidation
Kreis Lippe road network PPP GER 2033 Operational 100.0% Full consolidation
“La Grande Arche La Défense” renovation PPP FR 2034 Under construction 100.0% Full consolidation
52
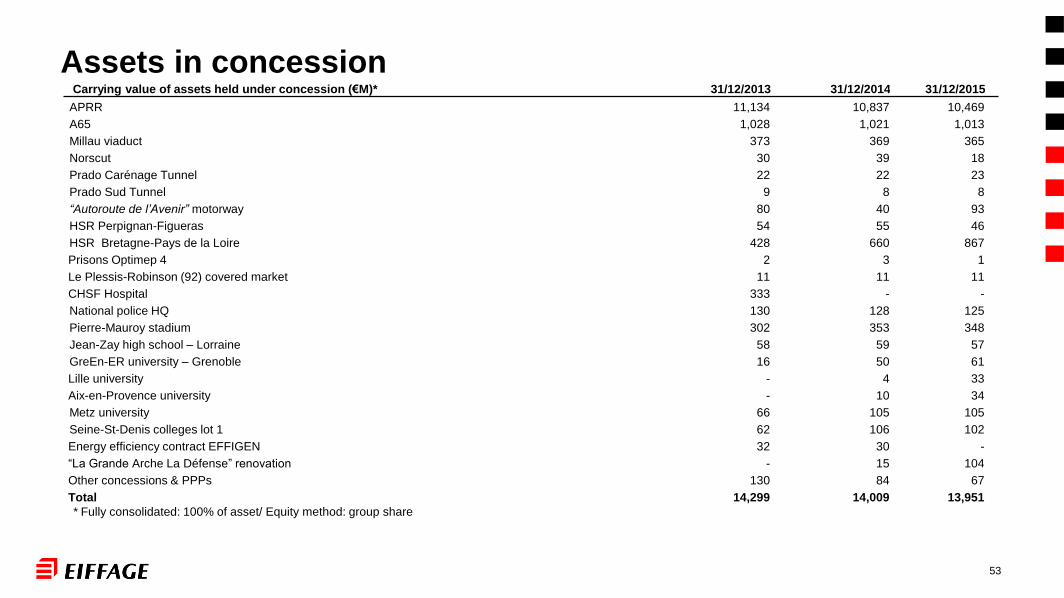
Assets in concessionCarrying value of assets held under concession (€M)* 31/12/2013 31/12/2014 31/12/2015
APRR 11,134 10,837 10,469
A65 1,028 1,021 1,013
Millau viaduct 373 369 365
Norscut 30 39 18
Prado Carénage Tunnel 22 22 23
Prado Sud Tunnel 9 8 8
“Autoroute de l’Avenir” motorway 80 40 93
HSR Perpignan-Figueras 54 55 46
HSR Bretagne-Pays de la Loire 428 660 867
Prisons Optimep 4 2 3 1
Le Plessis-Robinson (92) covered market 11 11 11
CHSF Hospital 333 - -
National police HQ 130 128 125
Pierre-Mauroy stadium 302 353 348
Jean-Zay high school – Lorraine 58 59 57
GreEn-ER university – Grenoble 16 50 61
Lille university - 4 33
Aix-en-Provence university - 10 34
Metz university 66 105 105
Seine-St-Denis colleges lot 1 62 106 102
Energy efficiency contract EFFIGEN 32 30 -
“La Grande Arche La Défense” renovation - 15 104
Other concessions & PPPs 130 84 67
Total 14,299 14,009 13,951
* Fully consolidated: 100% of asset/ Equity method: group share
53
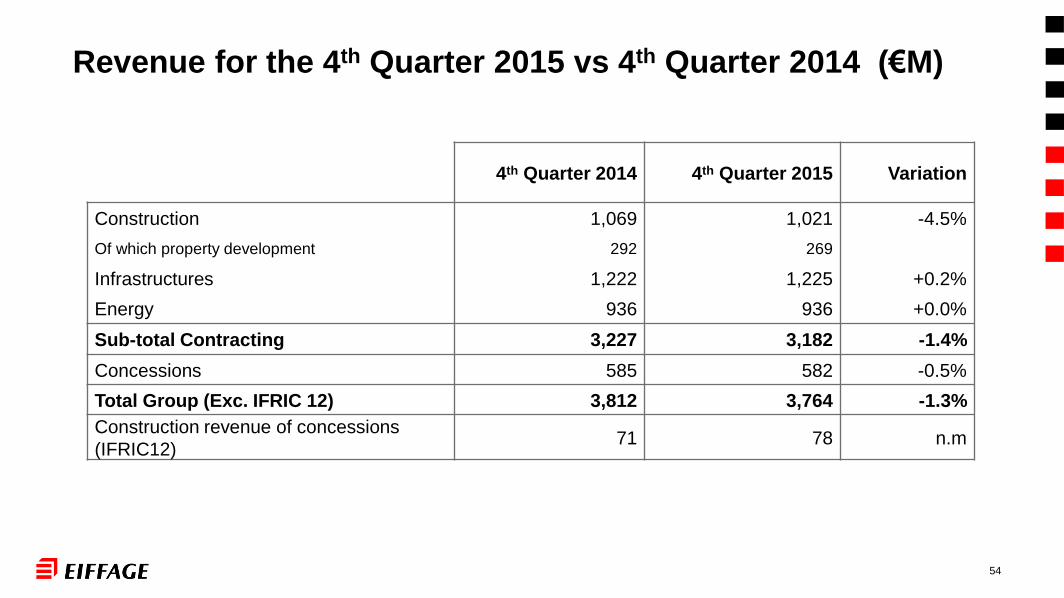
54
Revenue for the 4th Quarter 2015 vs 4th Quarter 2014 (€M)
4th Quarter 2014 4th Quarter 2015 Variation
Construction 1,069 1,021 -4.5%
Of which property development 292 269
Infrastructures 1,222 1,225 +0.2%
Energy 936 936 +0.0%
Sub-total Contracting 3,227 3,182 -1.4%
Concessions 585 582 -0.5%
Total Group (Exc. IFRIC 12) 3,812 3,764 -1.3%
Construction revenue of concessions
(IFRIC12)71 78 n.m

55
Summary revenue and operational profit on ordinary activities
2011-2015 (€M)
RevenueOperational profit on ordinary
activitiesOperational margin
2011 2012 2013 2014 2015 2011 2012 2013 2014 2015 2011 2012 2013 2014 2015
Construction 3,781 3,798 3,715 3,733 3,514 163 160 156 156 136 4.3% 4.2% 4.2% 4.2% 3.9%
Infrastructures 4,390 4,527 4,854 4,570 4,374 29 83 125 108 75 0.7% 1.8% 2.6% 2.4% 1.7%
Energy 3,417 3,535 3,434 3,306 3,578 75 92 103 116 132 2.2% 2.6% 3.0% 3.5% 3.7%
Sub-total
Contracting11,588 11,860 12,003 11,609 11,466 267 335 384 380 343 2.3% 2.8% 3.2% 3.3% 3.0%
Concessions 2,144 2,175 2,261 2,378 2,443 866 893 954 985 1,106 40.4% 41.1% 42.2% 41.4% 45.3%
Holding (29) (28) (20) (18) (18)
Total Group 13,732 14,035 14,264 13,987 13,909 1,104 1,200 1,318 1,347 1,431 8.0% 8.6% 9.2% 9.6% 10.3%
56
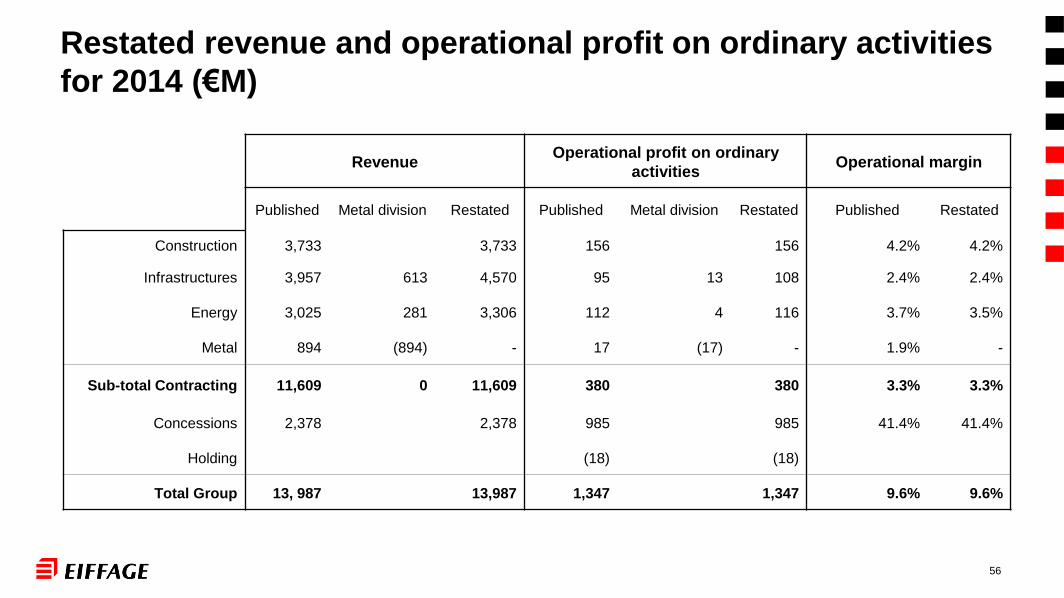
Restated revenue and operational profit on ordinary activities
for 2014 (€M)
RevenueOperational profit on ordinary
activitiesOperational margin
Published Metal division Restated Published Metal division Restated Published Restated
Construction 3,733 3,733 156 156 4.2% 4.2%
Infrastructures 3,957 613 4,570 95 13 108 2.4% 2.4%
Energy 3,025 281 3,306 112 4 116 3.7% 3.5%
Metal 894 (894) - 17 (17) - 1.9% -
Sub-total Contracting 11,609 0 11,609 380 380 3.3% 3.3%
Concessions 2,378 2,378 985 985 41.4% 41.4%
Holding (18) (18)
Total Group 13, 987 13,987 1,347 1,347 9.6% 9.6%
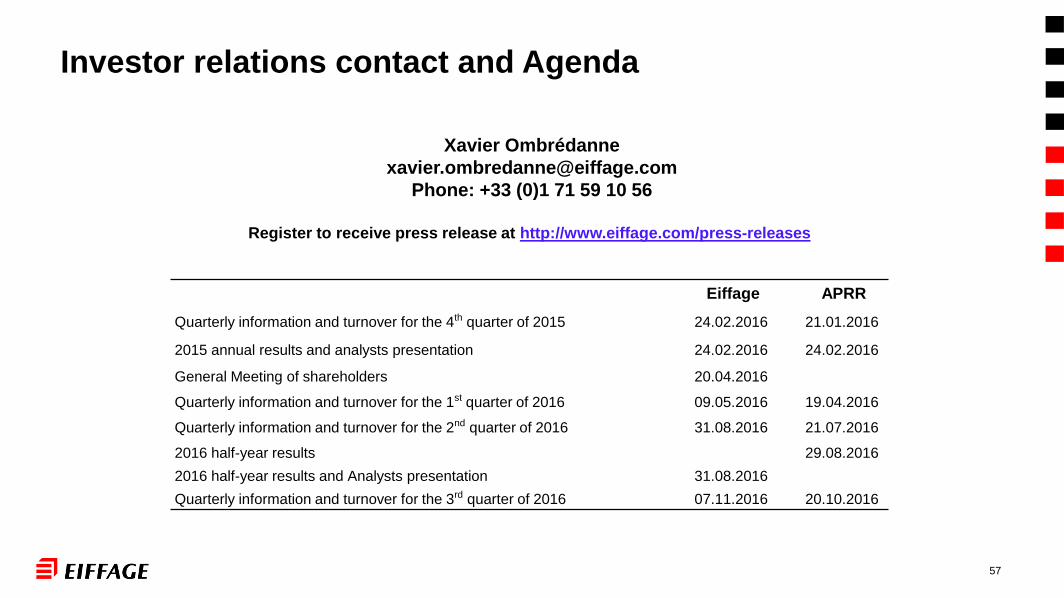
Xavier Ombrédanne
Phone: +33 (0)1 71 59 10 56
Register to receive press release at http://www.eiffage.com/press-releases
57
Investor relations contact and Agenda
Eiffage APRR
Quarterly information and turnover for the 4th quarter of 2015 24.02.2016 21.01.2016
2015 annual results and analysts presentation 24.02.2016 24.02.2016
General Meeting of shareholders 20.04.2016
Quarterly information and turnover for the 1st quarter of 2016 09.05.2016 19.04.2016
Quarterly information and turnover for the 2nd quarter of 2016 31.08.2016 21.07.2016
2016 half-year results 29.08.2016
2016 half-year results and Analysts presentation 31.08.2016
Quarterly information and turnover for the 3rd quarter of 2016 07.11.2016 20.10.2016

58
Disclaimer
This presentation may contain forward-looking statements and information about the financial situation, operating
results, activities and development strategy of Eiffage. These statements and this information are based on
assumptions that may prove incorrect and that are subject to major risks and uncertainties. This information is
pertinent only on the day it was formulated. Eiffage assumes no responsibility to update this information or to revise
the statements on becoming privy to new information or because of future or other events taking place, subject to
applicable regulations in this matter. Additional information on factors that could influence the financial results of
Eiffage are contained in the document filed by the Group with the French financial markets supervisor (Autorité des
Marchés Financiers - AMF), which is available on the Group’s website www.eiffage.com or on request from the
company’s registered office.