Annual Report2014 - People's Choice Credit Union › globalassets › ...Annual Financial Report for...
72
Australian Central Credit Union Ltd (trading as People’s Choice Credit Union) and its Controlled Entities for the Year Ended 30 June 2014 Annual Report 2014
Transcript of Annual Report2014 - People's Choice Credit Union › globalassets › ...Annual Financial Report for...

Annual Financial Report for the Year Ended 30 June 2014
1Australian Central Credit Union Ltd (trading as People’s Choice Credit Union) and its Controlled Entities for the Year Ended 30 June 2014
Annual Report2014

Annual Financial Report for the Year Ended 30 June 2014
2

Annual Financial Report for the Year Ended 30 June 2014
3
Contents
Chair’s and Managing Director’s Report 4 - 5
Year in Review 6 - 7
Annual Financial Report
Directors’ Report 8 - 10
Lead Auditor’s Independence Declaration 11
Corporate Governance Statement 12 - 17
Independent Auditor’s Report 18 - 19
Directors’ Declaration 20
Statements of Profit or Loss and Other Comprehensive Income 21
Statements of Financial Position 22
Statements of Changes in Equity 23 - 24
Statements of Cash Flows 25
Notes to the Financial Statements 26 - 70
Annual Financial Report for the Year Ended 30 June 2014
4
Chair’s and Managing Director’s Report
Mutuals at the crossroads
The mutual banking sector, which has long been an important part of Australia’s financial system, is at a critical point. We have seen considerable changes over the past few years, such as the advent of mutual banks. The sector’s 5% market share has deteriorated as the major banks have enjoyed a significant boost to their competitive position since the global financial crisis thanks to Government-supported legislation and regulatory bias.
Despite this, our sector has the opportunity, and the responsibility to ourselves and our members, to grow in relevance to become the genuine alternative to the Big Four banks with a thriving and sustainable business model.
People’s Choice Credit Union and our larger mutual banking peers have been encouraging our industry body, the Customer Owned Banking Organisation (COBA), to take a leadership role and develop an industry vision to which we can all be held to account.
As a result, COBA’s Board has begun working with its member organisations to develop a compelling strategic vision for our sector with a roadmap for growth, as a collaborative, forward-looking approach to improving the sector’s relevance, market share and growth prospects.
Through this work, our sector will develop key areas for differentiation, sector capacity and collaboration, and set targets and benchmarks for performance. This strategic vision will be launched during the first half of 2014/15, then progressed and promoted through the coming years.
People’s Choice is playing a pivotal role in the revitalisation of the mutual sector. Our Director Terry McGuirk, who was elected to the COBA Board in 2013, has been championing this need for an industry vision through the COBA Board and through his participation in its strategic vision sub-committee.
Managing Director Peter Evers was re-elected to the Cuscal Board during the year, and People’s Choice continues to have considerable influence as its second-largest shareholder. Cuscal provides access to payment systems, card schemes, inter-institutional settlement arrangements and one of the nation’s largest ATM networks, rediATM, to People’s Choice and many of our mutual banking peers. Cuscal, which is a key strategic partner for People’s Choice, is undergoing an exciting period of innovation and change, and has signed off on its next five-year plan with a strategic focus on the future of payments.
Solid results in challenging times
People’s Choice achieved solid results during 2013/14 despite another year of subdued consumer confidence and challenging economic conditions.
In last year’s Annual Report, we forecast a ‘slow and steady’ improvement in business conditions in the coming year, particularly after the Federal Election. Disappointingly, our expectations of a boost in consumer sentiment and business investment did not eventuate.
Australians have remained cautious about their financial commitments following the election of the new Federal Government, contrary to the usual trend of increased economic activity. The austerity focus of the Federal and State budgets also contributed to conservative consumer sentiment.
Despite this, we achieved year-on-year sales growth across our portfolio, demonstrating a resilient trend of sustainable business growth.
This year’s net profit after tax of $25.5 million represents a solid result during a period of lower-than-expected economic activity. Prudent cost management and careful investment in our strategic priorities have helped us maintain our profitability while positioning us well for the future.
We will reinvest these profits into improving our products, services and pricing, broadening access for our 345,000 members, and making a difference to the communities in which we live and work.
People’s Choice ended the 2013/14 financial year with total assets of $5.871 billion plus $802 million of third party loans under management and more than $1.223 billion in funds under advice.
Financial System Inquiry must deliver improved competition
People’s Choice welcomed the announcement of the Federal Government’s Financial System Inquiry during the year; the direct result of pressure from the mutual sector and others in the finance industry.
We have been an active participant in the working committee that provided detailed input into COBA’s submission to the Inquiry, to ensure our interests are promoted and that we achieve more competition in banking to benefit our members.
We have also been vocal in the media about the need for reforms that will make banking clearer and more competitive for consumers, based on the findings of in-depth research commissioned by People’s Choice.
If the Financial System Inquiry is to increase competition and lower financial costs for all Australians, it must address the unfair advantage enjoyed by the Big Four. People’s Choice believes this shouldn’t be through penalties to the big banks, but rather by delivering equality at all levels – funding, regulation and prudential standards – to give healthy competition every chance.
Better, tougher competition will benefit everyone in Australia because it will offer more choice and drive down fees and charges.
Strategy reaffirmed for 2015-18
During the year, the Board reviewed and reaffirmed our Purpose, Vision, Values and Strategy, and signed off on a four-year strategic plan driven by our existing strategic drivers to be the preferred banking alternative, grow our membership, build a stronger credit union and make a difference in the community.

Annual Financial Report for the Year Ended 30 June 2014
5
Chair’s and Managing Director’s Report (continued)
The coming years will see us focus on delivering a simpler, more seamless experience for our members by making the most of new technologies that will give members better access to information and support – be that via mobile, online, telephone or in person. Our new website launched in September 2014, with further improvements to come over the following months.
We are also investing in financial coaching to help our members be better informed about how to grow their financial independence. We’ll continue to improve our data analysis to better understand our members’ needs, which in turn will help us make the right offers at the right time. This will also help our members feel that they can actively help their family members to reach their goals so we support them as a family unit.
Looking ahead to the next 12 months, we’re expecting consumer caution to continue, with a slight uplift towards the end of the year. At the same time, as we develop our business and invest in the things that make us different – our people, our products and our technology – we believe we can outperform the market in a material way.
Board and our people
Our members voted to re-elect Jan McMahon and John Cossons as Directors of People’s Choice at our Annual General Meeting in October 2013.
At the same time our Chair Bill Cossey announced that he intended to retire as Chair and not seek re-election to the Board at the end of his current term. Bill stepped down as Chair effective 31 May 2014 but will remain as a Director until the close of the 2014 AGM. Bill has been dedicated to the values of the mutual banking industry and was instrumental in the transformational merger between Savings & Loans and Australian Central in 2009 to create People’s Choice.
Former Deputy Chair John Cossons succeeded Bill as Chair from 1 June 2014. John has a long history with our organisation. He joined the Northern Territory Credit Union’s Board in 1981 and was elected Chairman of Australian Central in 2003 until the merger with Savings & Loans where he became Deputy Chair.
The Board has once again played an integral part in the success of People’s Choice throughout the year. Their commitment and dedication has enabled us to advance as a leading financial services provider despite challenging economic conditions and during a period of change for our sector.
Finally, we would like to pay tribute to our executive team and all of our staff who provide an outstanding level of service and professionalism. Their leadership of the opportunities and challenges throughout the year has ensured we maintain a strong position in the industry.
We are excited about the future and remain dedicated to working together to strengthen our credit union, serve our members better and invest in our people and communities.
John Cossons, Chair
Peter Evers, Managing Director
Annual Financial Report for the Year Ended 30 June 2014
6
Year in Review
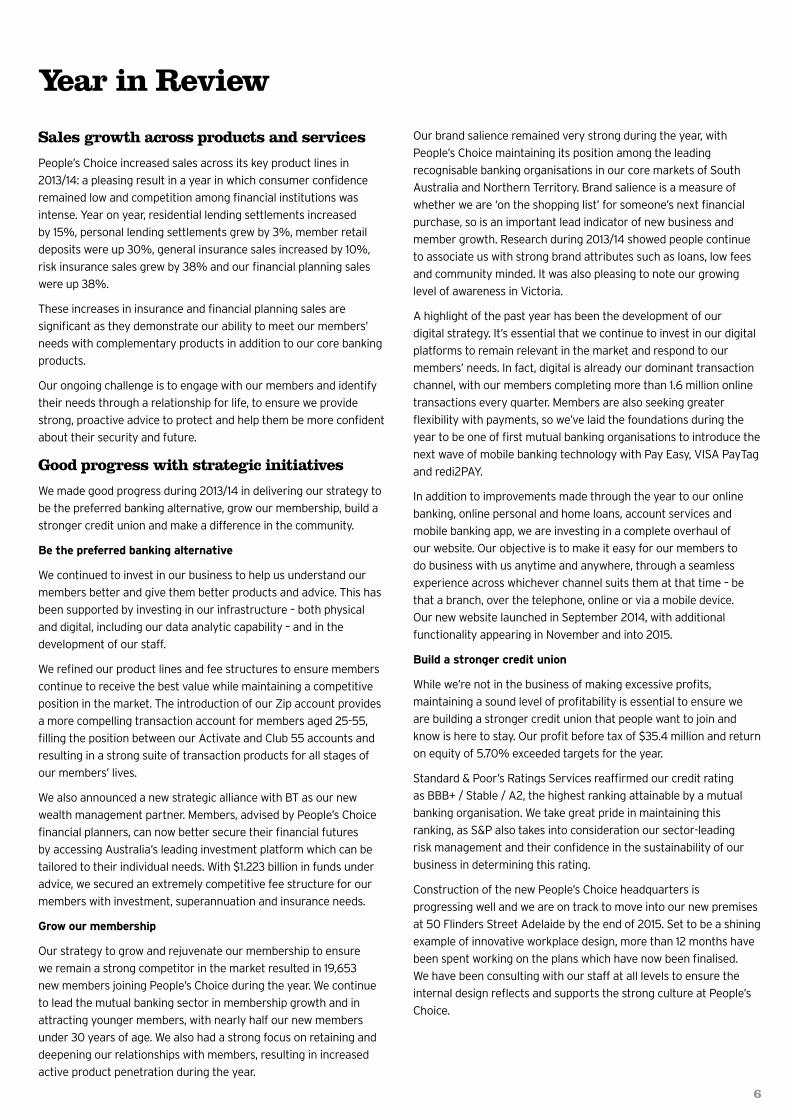
Sales growth across products and services
People’s Choice increased sales across its key product lines in 2013/14: a pleasing result in a year in which consumer confidence remained low and competition among financial institutions was intense. Year on year, residential lending settlements increased by 15%, personal lending settlements grew by 3%, member retail deposits were up 30%, general insurance sales increased by 10%, risk insurance sales grew by 38% and our financial planning sales were up 38%.
These increases in insurance and financial planning sales are significant as they demonstrate our ability to meet our members’ needs with complementary products in addition to our core banking products.
Our ongoing challenge is to engage with our members and identify their needs through a relationship for life, to ensure we provide strong, proactive advice to protect and help them be more confident about their security and future.
Good progress with strategic initiatives
We made good progress during 2013/14 in delivering our strategy to be the preferred banking alternative, grow our membership, build a stronger credit union and make a difference in the community.
Be the preferred banking alternative
We continued to invest in our business to help us understand our members better and give them better products and advice. This has been supported by investing in our infrastructure – both physical and digital, including our data analytic capability – and in the development of our staff.
We refined our product lines and fee structures to ensure members continue to receive the best value while maintaining a competitive position in the market. The introduction of our Zip account provides a more compelling transaction account for members aged 25-55, filling the position between our Activate and Club 55 accounts and resulting in a strong suite of transaction products for all stages of our members’ lives.
We also announced a new strategic alliance with BT as our new wealth management partner. Members, advised by People’s Choice financial planners, can now better secure their financial futures by accessing Australia’s leading investment platform which can be tailored to their individual needs. With $1.223 billion in funds under advice, we secured an extremely competitive fee structure for our members with investment, superannuation and insurance needs.
Grow our membership
Our strategy to grow and rejuvenate our membership to ensure we remain a strong competitor in the market resulted in 19,653 new members joining People’s Choice during the year. We continue to lead the mutual banking sector in membership growth and in attracting younger members, with nearly half our new members under 30 years of age. We also had a strong focus on retaining and deepening our relationships with members, resulting in increased active product penetration during the year.
Our brand salience remained very strong during the year, with People’s Choice maintaining its position among the leading recognisable banking organisations in our core markets of South Australia and Northern Territory. Brand salience is a measure of whether we are ‘on the shopping list’ for someone’s next financial purchase, so is an important lead indicator of new business and member growth. Research during 2013/14 showed people continue to associate us with strong brand attributes such as loans, low fees and community minded. It was also pleasing to note our growing level of awareness in Victoria.
A highlight of the past year has been the development of our digital strategy. It’s essential that we continue to invest in our digital platforms to remain relevant in the market and respond to our members’ needs. In fact, digital is already our dominant transaction channel, with our members completing more than 1.6 million online transactions every quarter. Members are also seeking greater flexibility with payments, so we’ve laid the foundations during the year to be one of first mutual banking organisations to introduce the next wave of mobile banking technology with Pay Easy, VISA PayTag and redi2PAY.
In addition to improvements made through the year to our online banking, online personal and home loans, account services and mobile banking app, we are investing in a complete overhaul of our website. Our objective is to make it easy for our members to do business with us anytime and anywhere, through a seamless experience across whichever channel suits them at that time – be that a branch, over the telephone, online or via a mobile device. Our new website launched in September 2014, with additional functionality appearing in November and into 2015.
Build a stronger credit union
While we’re not in the business of making excessive profits, maintaining a sound level of profitability is essential to ensure we are building a stronger credit union that people want to join and know is here to stay. Our profit before tax of $35.4 million and return on equity of 5.70% exceeded targets for the year.
Standard & Poor’s Ratings Services reaffirmed our credit rating as BBB+ / Stable / A2, the highest ranking attainable by a mutual banking organisation. We take great pride in maintaining this ranking, as S&P also takes into consideration our sector-leading risk management and their confidence in the sustainability of our business in determining this rating.
Construction of the new People’s Choice headquarters is progressing well and we are on track to move into our new premises at 50 Flinders Street Adelaide by the end of 2015. Set to be a shining example of innovative workplace design, more than 12 months have been spent working on the plans which have now been finalised. We have been consulting with our staff at all levels to ensure the internal design reflects and supports the strong culture at People’s Choice.

Annual Financial Report for the Year Ended 30 June 2014
7
Year in Review (continued)
The sustained engagement and loyalty of our staff is demonstrated by our low staff turnover rate of 10% – considerably lower than industry benchmarks – and the results from our 2014 Values Survey which place us among the top employers. The survey results in 2014 were outstanding, with 87% employee engagement and 90% of staff agreeing we are living up to our values – again, well above industry benchmarks.
We continued to invest in training and developing our people to provide rewarding careers and outstanding service to our members. We invested approximately $1 million and provided 38,465 hours of training this year which includes 6,260 hours of leadership development programs, including providing Diploma and Certificate IV management qualifications to many staff, all with the aim of developing a qualified, talented team that delivers a better experience for our members. Some 40 employees graduated with formal qualifications from these programs during the year.
Make a difference to the community
The past year has seen People’s Choice deepen its commitment to strengthening the economic and social wellbeing of our members and the community. People’s Choice contributed 5% of pre-tax profit to corporate community investment during 2013/14. This is 8.5 times the 0.59% average contribution made by major Australian and New Zealand companies (source: LBG Australia). Including funds raised through the Community Lottery and other programs, we generated $3.6 million for the community during the year and made a difference to more than one million Australians.
The 2013 Community Lottery concluded with a record $1,573,130 returned to 996 participating charities, community groups, schools and sporting clubs. The Lottery rewrote the record books in 2014, with 1,062 not-for-profit groups across Australia raising a record $1,577,182.
The impact of the People’s Choice Undies Run for Bowel Cancer increased in its second year with 1,433 participants (up 14%) raising $156,000 (up 30%), including 160 staff who got involved as runners or volunteers. This event has now raised more than $280,000 for our partner Cancer Council SA. We also increased our support of HeartKids through Community Lottery ticket sales and the introduction of the People’s Choice PJs Run to our Run Melbourne sponsorship in July 2014.
During the year we doubled our subscriptions to The Big Issue’s Women’s Subscription Enterprise, making us its largest supporter in South Australia and one of the largest nationally. We now fund the safe employment of two disadvantaged women in Victoria and two in South Australia through our 400 subscriptions.
Our partnership with Riding for the Disabled achieved significant milestones during the year, as the construction of the O’Halloran Hill riding centre’s covered arena and the interior fit-out of the administration building nears completion in South Australia. We donated a people mover to the Darwin riding centre, and sold more than 4,700 Pony Banks through our branches, raising $13,000 for Riding for the Disabled in South Australia, the Northern Territory and Victoria.
We completed the rollout of our corporate social responsibility program with the launch of our innovative New Horizons program with Life Without Barriers. Through this program, we have funded a Coordinator to work with disadvantaged young people in care to help them make the transition to adulthood.
Our staff exceeded last year’s fundraising and volunteering efforts, raising $36,519 through workplace donations and contributing 1277 hours in volunteering. This is a fantastic reflection of the strength of our culture, evidenced by the Values Survey result for ‘staff perception of community’ increasing from an already high 95% last year to 96% this year.
In our brand salience survey, People’s Choice was once again associated with being community-minded in the top cluster in South Australia and the Northern Territory, supported by our sponsorship of major community events including the Credit Union Christmas Pageant, People’s Choice Classic at the Santos Tour Down Under, The Age Run Melbourne presented by People’s Choice, People’s Choice BASSINTHEGRASS concert and the People’s Choice Teddy Bear’s Picnic.

Annual Financial Report for the Year Ended 30 June 2014
8
Directors’ Report DIRECTORS' REPORT
The Directors present their report together with the financial report of Australian Central Credit Union Ltd (trading as People's Choice Credit Union) (the “Credit Union”), and its controlled entities (together referred to as the “Group”), for the year ended 30 June 2014 and the Auditor's Report thereon.
DIRECTORS The Directors of the Credit Union at any time during or since the end of the financial year are: John Leonard Cossons Non-Executive Chair (Appointed Chair effective 1st June 2014) FAMI, MAICD Peter Hans Torsten Evers Managing Director BA (Acc), FCPA, FAICD, SF Fin William Raymond Cossey AM Non-Executive Director (Retired from Chair effective 31st May 2014) B.Sc, FAICD Dr Rosemary Helen Simon Brooks Non-Executive Director PhD, MBA, MA, BA (Hons), LLB (Hons), GDLP, FAICD, FAMI, JP Stephen Mark Day Non-Executive Director B.Bus, Grad Dip (Applied Finance and Investment), FAICD, SA Fin Edward Terrence McGuirk Non-Executive Director BA (Hons), FAICD, FAMI, SA Fin Jan McMahon Non-Executive Director BA (Hons), FAICD, FAIST Kathryn Anne Skipper AM Non-Executive Director Dip. Nursing, FAICD, FAIM
Details of Directors, their experience and any special responsibilities, are set out in the Online Annual Report, which is available from our website at www.peopleschoicecu.com.au.
Certain Directors have associations with other organisations. Some of these organisations conduct business with the Credit Union. This business is conducted on standard terms and conditions.
Directors were in office from the beginning of the financial year until the date of this report.
The number of Directors' meetings (including meetings of committees of Directors) and number of meetings attended by each of the Directors during the financial year is shown in the Corporate Governance Statement commencing on page 6.
CORPORATE SECRETARY Mr Peter Evers is the sole Corporate Secretary upon resignation of Mrs Rosie Bolingbroke effective 2 July 2014.
ANNUAL FINANCIAL REPORT FOR YEAR ENDED 30 JUNE 2014
2
12.

Annual Financial Report for the Year Ended 30 June 2014
9
Directors’ Report (continued)
DIRECTORS' REPORT (Continued)
PRINCIPAL ACTIVITIES
The principal activities of Australian Central Credit Union Ltd (trading as People's Choice Credit Union) (the “Credit Union”), and its controlled entities (together referred to as the “Group”) during the year were the provision of loans to members and customers (including "Choice of Home Loans" via a panel of lenders), savings and investment facilities, the sale of insurance policies, Mutual Aid, financial planning and corporate superannuation services. There was no significant change in the nature of these activities during the year.
DIVIDENDS
The Credit Union's Constitution prohibits the payment of dividends on member shares.
REVIEW OF OPERATIONS
The Group recorded a profit after tax for the year ended 30 June 2014 of $25.497 million (2013: $28.825 million).
The total on balance sheet assets for the Group were $5.871 billion (2013: $5.797 billion), representing an increase of $73.372 million from 30 June 2013. On balance sheet lending settlements for the twelve months ended 30 June 2014 were $1,302.998 million (2013: $1,059.718 million) an increase of 22.96% and member retail deposits grew by $254.105 million (2013: $194.379 million) representing an increase of 30.73%. Mortgages under advice off balance sheet increased by 5.85% to $802.148 million during the year (2013: $757.846 million). For further analysis of the financial year performance refer to the Chairʼs and Managing Directorʼs report commencing on page 4.
STATE OF AFFAIRS
In the opinion of the Directors, there have been no significant changes in the state of affairs of the Group that occurred during the financial year under review not otherwise disclosed in this report or the financial statements.
DIRECTORS' INTERESTS
None of the above Directors has declared any interest in existing or proposed contracts with the Credit Union since 1 July 2013.
EVENTS SUBSEQUENT TO THE REPORTING DATE
There has not arisen in the interval between the end of the financial year and the date of this report, any item, transaction or event of a material and unusual nature likely, in the opinion of the Directors of the Credit Union, to affect significantly the operations of the Group, the results of those operations, or the state of affairs of the Group in future financial years.
LIKELY DEVELOPMENTS
Further information as to likely developments in the operations of the Group and the expected results of those operations in subsequent financial years has not been included in this report because disclosure of the information would be likely to result in unreasonable prejudice to the Group.
REGULATORY DISCLOSURES
Prudential Standard APS 330 Public Disclosure requires the Group to meet minimum requirements for the public disclosure of information on its risk profile, risk management, capital adequacy, capital instruments and remuneration practices to contribute to the transparency of the financial markets and to enhance market discipline. This information is published on the Credit Union's public website under Regulatory Disclosures.

Annual Financial Report for the Year Ended 30 June 2014
10
Directors’ Report (continued)
11

Annual Financial Report for the Year Ended 30 June 2014
11
Lead Auditor’s Independence Declaration

Annual Financial Report for the Year Ended 30 June 2014
12
Corporate Governance Statement CORPORATE GOVERNANCE STATEMENT HOW WE DO BUSINESS Australian Central Credit Union Ltd trades as People’s Choice Credit Union (“People’s Choice”). The People’s Choice Board and Management are committed to acting responsibly, ethically and with the highest standards of integrity to ensure that People’s Choice’s activities are continually structured and delivered in a manner that allows us to meet the needs of our members.
A principles based approach is taken to achieve sound corporate governance and business practices. To achieve this, policies have been adopted by the Board and cascaded throughout all levels of People’s Choice. We strive to ensure that our governance “in action” is of the highest standard, consistent with our mutual underpinnings, while at the same time practical and transparent to our members. Further information can be found in the People’s Choice Corporate Governance section on our website: www.peopleschoicecu.com.au.
The Board has committed to following the Australian Securities Exchange Corporate Governance Council’s “Principles of Good Corporate Governance and Best Practice Recommendations, 3rd Edition” to the extent that they are applicable to People’s Choice, as a mutual organisation. Further, the Board has carefully considered and implemented a “fit and proper” framework in accordance with relevant regulation which endeavours to ensure that Directors and senior management of People’s Choice are appropriate persons to lead the credit union. The “fit and proper” framework deals with matters such as minimum competencies, Director development, independence, Director refreshment and renewal and performance.
ROLE OF THE BOARD
The Board comprises a majority of Non-Executive Directors, who together with the Managing Director have extensive business acumen and bring accountability and judgement to the Board’s deliberations to ensure optimum benefit to members, employees and the wider community. The role and responsibilities of the Board are set out in the Board Charter, a copy of which is published in the Corporate Governance section of our website.
In particular, the Board:
Provides strategic direction to People’s Choice; Provides leadership in terms of corporate governance; Appoints and manages the performance of the Managing Director; Reports to members and monitors compliance with regulatory requirements; Approves the remuneration of the Managing Director, Executive General Managers and other designated
persons in accordance with the Board Remuneration Policy and Australian Prudential Regulation Authority (“APRA”) Prudential Standards;
Oversees People’s Choice’s financial performance and position and monitors its business and affairs on behalf of all members;
Oversees internal controls and processes for identifying areas of significant business risk; Makes decisions in relation to major expenditures, acquisitions or merger opportunities; Ensures that the People’s Choice business is conducted ethically and transparently.
Responsibility for day-to-day activities in relation to the operation of People’s Choice is delegated to the Managing Director by the Board.
The framework for delegations of authority to Executive Management is documented in People’s Choice’s policies and approved by the Board.
ANNUAL FINANCIAL REPORT FOR YEAR ENDED 30 JUNE 2014
6

Annual Financial Report for the Year Ended 30 June 2014
13
Corporate Governance Statement (continued)
CORPORATE GOVERNANCE STATEMENT (CONTINUED)
STRUCTURE OF THE BOARD
The size and composition of the Board is determined by the Board subject to the limits set out in Peopleʼs Choiceʼs Constitution, which requires a minimum of four member elected Non-Executive Directors. The Constitution also allows for Board and merger appointed Non-Executive Directors, or a Managing Director. At all times, member elected Directors must constitute a majority of Directors, a requirement which protects our mutuality.
The Corporate Governance Committee reviews the independence of each Non-Executive Director on an annual basis. All Non-Executive Directors have been determined to be independent.
The Board currently comprises seven Non-Executive Directors, six of whom are member elected and one Board appointed Director (Mr Day) and one Managing Director (Mr Evers), ensuring independence and objectivity. All Directors are shareholding members of Peopleʼs Choice. Board members are elected by the members or appointed in accordance with the Constitution. The Chair of the Board is a member elected Non-Executive Director. Generally all elected Directors are appointed for a term of three years upon election. The above framework operates to ensure that the Board is able to function independently of Executive Management.
Directors who held office during or since the end of the financial year and the year in which each was appointed to the Board (including the Board of the pre-merged entities) are set out below:
Directors – Non-Executive Year First Elected/Appointed R.H.S. Brooks 1995 W.R. Cossey 1999 J.L. Cossons (Chair) 1981 S.M. Day (Appointed) 2006 E.T. McGuirk 1996 J. McMahon 1989 K.A. Skipper 2002 Directors – Executive Year First Appointed P.H.T. Evers (Managing Director) 2003
Further details on the Directors can be found on page 8 of the Annual Report and on our website.
Minimum Competencies
Board policy sets out the minimum competencies regarding personal attributes, skills and knowledge that each Director will bring to Peopleʼs Choice. The Nominations Committee in forming its view assesses all election nominees with regard to these minimum competencies. During the year the Board completed a review of the skills, experience and diversity of Directors to determine if there were any gaps that needed to be filled either through Director development, additional appointments or by bringing in the expertise as and when required. No material gaps were identified, however the Board is mindful of the changing and competitive environment in which Peopleʼs Choice operates and continues to monitor its current competencies in line with increasing regulatory requirements and consumer expectation particularly around new and emerging digital technologies.
As a behavioural principle, Directors are required to be independent in both judgement and action. Each Director is required to maintain and demonstrate this independence of thought and action at all times while acting in the role of Director. Board policy also addresses issues relating to Director benefits and conflicts of interest. Directors generally are not permitted to offer, seek or accept benefits in the performance of their duties and any unsolicited benefits received are to be disclosed at the following Board meeting. Where a Director has a material personal interest in a matter, that Director is required to disclose the interest and leave the meeting during the consideration of, or voting on, that matter.

Annual Financial Report for the Year Ended 30 June 2014
14
Corporate Governance Statement (continued) CORPORATE GOVERNANCE STATEMENT (CONTINUED) STRUCTURE OF THE BOARD (Continued) Director Development
Relevant Board policy outlines the knowledge requirements for Directors and provides the high level guidelines for new Director induction, new committee member induction as well as the standards for ongoing Director development. As part of the development program each Director is expected to attend at least one industry related conference annually.
Refreshment and Renewal
Individual Directors are required on a regular basis to refresh and renew their knowledge generally and specific to People’s Choice and the environment in which it operates. Board policy requires that each Director must be able to demonstrate his/her own refreshment and renewal process to the Board and relevant third parties as needed. Refreshment and renewal are also included as part of an individual Director’s performance assessment and this is also tested externally as part of the Nominations Committee process where Directors offer themselves for re-election. In accordance with Board policy the Corporate Governance Committee is required to undertake a review of the Board’s refreshment and renewal where effective change in the composition of the Board has not occurred over a three year period.
Performance
The Board conducts an annual review of the performance of itself, its committees and individual Directors including the Chair. To ensure objectivity, an independent Board and Director Assessment process was undertaken during the first half of 2013/14 using an external facilitator. The outcome of this process will provide a benchmark against which the Board can assess its collective and individual progress and performance over time. In other years the performance reviews are undertaken via a survey of relevant questions completed by Directors and where appropriate Executive Managers. Whole of Board review findings are then discussed by Directors and development plans formulated at a subsequent meeting, as are committee findings at the next committee meeting. Findings from individual Director surveys are discussed on a confidential basis between each Director and the Chair and findings from the Chair’s review are discussed between the Chair and the Audit Committee Chair.
COMMITTEES OF THE BOARD
The Board has established three standing committees as described below to consider detailed matters. Generally, committees consider the various matters and make recommendations to the Board; however some decisions, within the parameters of Board policy, have been delegated to committees. Each committee’s authority and responsibilities are set out in their individual terms of reference, as approved by the Board. Other committees may be established from time to time to consider matters of particular importance. Committee members are chosen for the skills, experience and other relevant qualities they bring to the committee.
The committees generally meet to consider and make recommendations or decisions on matters within their terms of reference. Committee Chairs give verbal reports to the Board at the next Board meeting, and minutes of all committee meetings are reviewed by the Board. All information prepared for the consideration of committees is also available to the Board.
Standing committees in operation during or since the end of the financial year were:
Audit Committee – the Audit Committee meets at least quarterly and assists the Board in fulfilling its responsibilities relating to the audit, accounting and reporting obligations, monitoring compliance with the established policies of People’s Choice, monitoring Internal and External Auditors (including the independence of the Internal and External Auditors). This committee has a number of particular requirements which include that the Chair of the committee cannot be the Chair of the Board and that the committee can and did meet with the Internal and/or External Auditors without the presence of the Managing Director or Management.
ANNUAL FINANCIAL REPORT FOR YEAR ENDED 30 JUNE 2014
8

Annual Financial Report for the Year Ended 30 June 2014
15
Corporate Governance Statement (continued) CORPORATE GOVERNANCE STATEMENT (CONTINUED) COMMITTEES OF THE BOARD (Continued) Corporate Governance Committee – the Corporate Governance Committee meets at least three times a year and assists the Board in adopting and implementing good corporate governance in the areas of the Managing Director’s appointment, Non-Executive Director appointment, remuneration, recommending to the Board management remuneration levels in accordance with the Board Remuneration Policy, Board performance reviews, oversight of the “fit and proper” framework, monitoring the size and composition of the Board and reviewing Executive and Director succession plans. The committee is also responsible for the oversight and conduct of the Director elections and the Annual General Meeting. A Nominations Committee is established in association with Director elections, and operates under the guidance of the Corporate Governance Committee. The Nominations Committee comprises the Chair of the Board (except when standing for re-election); and two external members with suitable skills and knowledge who are not Directors, staff or members of People’s Choice. The Nominations Committee assists the Board to manage the process for nomination of Directors, including conducting interviews with nominees and preparing statements to assist Members to make an informed voting decision.
Risk Committee – the Risk Committee meets bi-monthly and ensures that People’s Choice adopts an integrated approach to risk management including treasury risk management and capital management dealing with all risks of the portfolio including those to do with the balance sheet and interest rates, credit risk that arises in the credit portfolio, operational risk management including regulatory risk management as part of the day to day conduct of the business and alignment with prudential standards. The Risk Committee is also responsible for ensuring work health and safety risks are properly identified and effectively managed and that the work health and safety performance of People’s Choice is monitored and the relevant policies reviewed regularly. This committee has a particular requirement that the Chair of the committee cannot be the Chair of the Board.
STANDARDS
The Board acknowledges the need for, and continued maintenance of the highest standards of corporate governance and therefore adopts practices including:
A Code of Conduct that applies to all staff, management and Directors; An annual review of Board performance; Active participation by all Directors at all meetings and open access to information; Regular executive management presentations; The Managing Director, Executive General Manager Risk and Executive General Manager Corporate Services
provide an assurance statement on the accuracy and completeness of financial information and risk management processes, in accordance with relevant standards and regulatory legislation;
The Managing Director and Executive General Managers provide assurance to the Board that the business of People’s Choice has been conducted ethically and all dealings have been conducted transparently with the Board;
Annual performance evaluations are undertaken for all executive management; The transparency of information to members through publication of regulatory notices on the People’s Choice
website; The gearing of Board Policies towards risk management to safeguard the assets and interests of People’s
Choice whilst maintaining a balanced view of its operating environment; Non-Executive Director remuneration approved by members at the Annual General Meeting. The Board
regularly undertakes benchmarking and/or seeks independent advice to determine recommended Non-Executive Director remuneration levels;
Allowing Non-Executive Directors to seek independent professional advice at the expense of People’s Choice.
REMUNERATION REPORT
In accordance with APRA standard APS330, the People’s Choice remuneration report can be found under About Us in the Regulatory Disclosures section on our website.
ANNUAL FINANCIAL REPORT FOR YEAR ENDED 30 JUNE 2014
9

Annual Financial Report for the Year Ended 30 June 2014
16
Corporate Governance Statement (continued) CORPORATE GOVERNANCE STATEMENT (CONTINUED) DIVERSITY
The Board is committed to diversity and the promotion of an environment conducive to the appointment of well qualified employees, Executive Management and Directors. A diversity policy has been developed and is in place to assist People’s Choice maintain a workplace which values and respects individual differences. This policy recognises the diversity of People’s Choice’s workforce and has established measurable targets that support achieving diversity in the workplace. These targets will be reported to, and monitored by the Board on an annual basis.
People’s Choice has achieved gender diversity at all levels. The gender breakdown at People’s Choice is as follows:
Male % Female % Total
Board Members 5 63 3 37 8
Executive Managers 2 40 3 60 5
Other Managers 76 45 93 55 169
Other Employees 237 25 698 75 935
Total Workforce 320 29 797 71 1117
INTERNAL AUDIT
The People’s Choice Internal Audit department assists the Board via the Audit Committee in reviewing, reporting and making recommendations on the existence, effectiveness and efficiency of internal controls and compliance with internal controls and regulatory requirements. The Audit Committee is responsible for approving the program and scope of Internal and External Audit activities each financial year.
INTERNAL AND EXTERNAL AUDIT INDEPENDENCE
The Audit Committee oversees, and makes recommendations to the Board on the appointment of People’s Choice’s External Auditors. In addition, the appointment or dismissal of the head of Internal Audit is subject to endorsement by the Audit Committee Chair.
The External Auditors were appointed in 1997. The current lead External Audit engagement partner was appointed at the conclusion of the 2013 AGM as a result of normal rotation procedures. The Audit Committee oversees the procedure for rotation of the lead External Audit engagement partner.
The Audit Committee closely monitors the independence of the External Auditors and regularly reviews the independence safeguards put in place by the External Auditors.
During the course of the financial year the Audit Committee meets with the Internal Auditor without the External Auditors or other members of management being present and with the External Auditors without the Internal Auditor or members of management being present.
REMUNERATION OF THE BOARD
The Corporate Governance Committee reviews and recommends the level of the Managing Director’s remuneration for approval by the Board. The Corporate Governance Committee assists the Board in determining the aggregate level of remuneration of Non-Executive Directors to be recommended for approval by members at the Annual General Meeting following benchmarking and/or receipt of independent advice.
ANNUAL FINANCIAL REPORT FOR YEAR ENDED 30 JUNE 2014
10

Annual Financial Report for the Year Ended 30 June 2014
17
Corporate Governance Statement (continued) CORPORATE GOVERNANCE STATEMENT (CONTINUED) BOARD POLICIES
People’s Choice maintains policies relating to its operational, compliance, legal and regulatory reporting requirements which are reviewed on a regular basis. These policies are supported by procedures to ensure compliance and effective monitoring of People’s Choice’s business. Further details can be found on the Corporate Governance Section of our website.
MEETINGS OF THE BOARD AND BOARD COMMITTEES The membership and details of attendances at meetings of the People’s Choice Board and Committees are outlined below:
Director Director Type Board Audit Corporate Governance
Risk
A (1) B A B A B A B J.L. Cossons (Chair) (3) M 10 10 5 5 6 6 P.H.T. Evers (Managing Director) E 10 10 Dr R.H.S. Brooks (2) M 10 9 4 4 W. R. Cossey (3) M 10 10 5 5 S.M. Day D 10 10 6 6 E.T. McGuirk M 10 10 4 4 J. McMahon (2) M 10 9 4 4 6 5 K.A. Skipper (2) M 10 10 5 4 (1) Ten scheduled Board meetings were held during the year.(2) All absences from Board and Committee meetings were approved leaves of absence.(3) Director Cossey stepped down as Chair effective 31 May 2014 and Director Cossons was appointed as Chair
effective 1 June 2014.
A The number of meetings held during the period the Director was a member of the Board or Board Committee B The number of meetings attended by the Director.
M Member elected Directors E Executive Directors D Board appointed Directors
ANNUAL FINANCIAL REPORT FOR YEAR ENDED 30 JUNE 2014
11

Annual Financial Report for the Year Ended 30 June 2014
18
Independent Auditor’s Report

Annual Financial Report for the Year Ended 30 June 2014
19
Independent Auditor’s Report (continued)

Annual Financial Report for the Year Ended 30 June 2014
20
Directors’ Declaration
21 to 70

Annual Financial Report for the Year Ended 30 June 2014
21
Statements of Profit or Loss and Other Comprehensive IncomeSTATEMENTS OF PROFIT OR LOSS AND OTHER COMPREHENSIVE INCOMEFOR THE YEAR ENDED 30 JUNE 2014
Note
2014 2013 2014 2013$'000 $'000 $'000 $'000
Interest income 4 316,947 347,926 320,458 349,113 Interest expense 4 (173,926) (214,402) (179,834) (218,096)Net interest income 143,021 133,524 140,624 131,017
Net change in fair value of financial assets/liabilities at fair value through profit or loss 830 1,971 830 1,971 Share in net profit of associates 14 753 - - - Other income 4 66,529 73,396 65,886 72,839 Non-interest income 68,112 75,367 66,716 74,810
Impairment losses on loans and advances 9 (4,451) (2,297) (4,451) (2,297)Other expenses 5 (171,309) (170,740) (169,394) (169,004)
Profit before tax 35,373 35,854 33,495 34,526
Income tax expense 6 (9,876) (7,029) (9,207) (6,629)
Profit for the year 25,497 28,825 24,288 27,897
Profit attributable to:Members of the parent 25,497 28,825 24,288 27,897
Other comprehensive income
Cash flow hedges:Net change in fair value of cash flow hedges transferred to profit or loss 1,596 2,195 1,596 2,195 Effective portion of changes in fair value of cash flow hedges (826) 1,938 (826) 1,938
Equity-accounting fair values 3,257 - - - (585) (465) (585) (465)
Income tax on items of other comprehensive income (1,033) (1,100) (56) (1,100)
2,409 2,568 129 2,568
Total comprehensive income for the year 27,906 31,393 24,417 30,465
Consolidated Credit Union
The Statements of Profit or Loss and Other Comprehensive Income are to be read in conjunction with theaccompanying notes to the financial statements.
Changes in fair value of available-for-sale financial assets
Other comprehensive income for the year, net of income tax
ANNUAL FINANCIAL REPORT FOR YEAR ENDED 30 JUNE 2014
15

Annual Financial Report for the Year Ended 30 June 2014
22
Statements of Financial Position STATEMENTS OF FINANCIAL POSITIONFOR THE YEAR ENDED 30 JUNE 2014
Consolidated Credit Union
2014 2013 2014 2013Note $'000 $'000 $'000 $'000
Assets
Cash and cash equivalents 7 130,012 151,592 118,058 144,826 Loans and advances 8 5,024,310 4,891,855 5,024,310 4,891,855 Available-for-sale investment securities 10 636,921 674,823 626,041 661,543 Other investments 10 1,809 1,701 40,789 45,011 Property, plant and equipment 11 23,426 21,661 23,426 21,661 Intangible assets 12 12,335 14,641 4,000 6,306 Assets held-for-sale 13 - 951 - 951 Investments in associates 14 5,184 1,492 1,492 1,492 Current tax receivable 6 - - - 295 Deferred tax assets 6 14,500 13,686 15,150 15,458 Derivative assets 30 1,578 4,468 2,362 6,188 Other assets 15 20,718 20,551 22,826 20,559 Total Assets 5,870,793 5,797,421 5,878,454 5,816,145
Liabilities
Deposits 16 4,335,835 4,004,950 4,336,480 4,006,107 Derivative liabilities 30 5,220 9,710 3,642 5,361 Other payables 17 56,713 82,021 60,910 86,889 Borrowings 18 979,253 1,241,523 993,287 1,262,027 Current tax payable 6 5,575 101 5,029 - Deferred tax liabilities 6 1,792 1,630 1,393 3,451 Provisions 19 19,338 18,325 19,167 18,181 Total Liabilities 5,403,726 5,358,260 5,419,908 5,382,016
Net Assets 467,067 439,161 458,546 434,129
Equity
Reserves 20 178,168 177,976 178,162 177,970 Retained earnings 288,899 261,185 280,384 256,159 Total Equity 467,067 439,161 458,546 434,129
The Statements of Financial Position are to be read in conjunction with the accompanying notes to the financialstatements.
ANNUAL FINANCIAL REPORT FOR YEAR ENDED 30 JUNE 2014
16

Annual Financial Report for the Year Ended 30 June 2014
23
Statements of Financial Position Statements of Changes in Equity STATEMENTS OF CHANGES IN EQUITYFOR THE YEAR ENDED 30 JUNE 2014
Consolidated EntityReserves Retained
earnings Total
Note $'000 $'000 $'000
Opening balance at 1 July 2013 177,976 261,185 439,161
Profit for the year after tax - 25,497 25,497
Other comprehensive income, net of income taxCash flow hedges: Effective portion of changes 20 1,117 - 1,117 Taken to profit or loss 20 (578) - (578)Equity-accounting fair value 14 - 2,280 2,280Change in fair value of available-for-sale financial assets 20 (410) - (410)Total comprehensive income for the period 129 2,280 2,409
Transactions recorded directly in equityRedeemed member shares 20 47 (47) - General reserve for credit losses 20 163 (163) - Sale of assets held-for-sale 20 (147) 147 - Total transfer to reserves 63 (63) -
Closing balance at 30 June 2014 178,168 288,899 467,067
Opening balance at 1 July 2012 176,532 231,106 407,638
Profit for the year after tax - 28,825 28,825
Other comprehensive income, net of income taxCash flow hedges: Effective portion of changes 20 1,357 - 1,357 Taken to profit or loss 20 1,536 - 1,536Change in fair value of available-for-sale financial assets 20 (325) - (325)Total comprehensive income for the period 2,568 - 2,568
Transactions recorded directly in equityRedeemed member shares 20 56 (56) - General reserve for credit losses 20 (1,205) 1,205 - Transfer of revaluation on disposal of land and buildings 20 (105) 105 - Revaluation of assets held-for-sale 13 130 - 130Total transfer to reserves (1,124) 1,254 130
Closing balance at 30 June 2013 177,976 261,185 439,161
The Statements of Changes in Equity are to be read in conjunction with the accompanying notes to the financialstatements.
ANNUAL FINANCIAL REPORT FOR YEAR ENDED 30 JUNE 2014
17

Annual Financial Report for the Year Ended 30 June 2014
24
Statements of Changes in Equity STATEMENTS OF CHANGES IN EQUITYFOR THE YEAR ENDED 30 JUNE 2014
Credit UnionReserves Retained
earnings Total
Note $'000 $'000 $'000
Opening balance at 1 July 2013 177,970 256,159 434,129
Profit for the year after tax - 24,288 24,288
Other comprehensive income, net of income taxCash flow hedges: Effective portion of changes 20 1,117 - 1,117 Taken to profit or loss 20 (578) - (578)Change in fair value of available-for-sale financial assets 20 (410) - (410)Total comprehensive income for the period 129 - 129
Transactions recorded directly in equityRedeemed member shares 20 47 (47) - General reserve for credit losses 20 163 (163) - Sale of assets held-for-sale 20 (147) 147 - Total transfer to reserves 63 (63) -
Closing balance at 30 June 2014 178,162 280,384 458,546
Opening balance at 1 July 2012 176,526 227,008 403,534
Profit for the year after tax - 27,897 27,897
Other comprehensive income, net of income taxCash flow hedges: Effective portion of changes 20 1,357 - 1,357 Taken to profit or loss 20 1,536 - 1,536Change in fair value of available-for-sale financial assets 20 (325) - (325)Total comprehensive income for the period 2,568 - 2,568
Transactions recorded directly in equityRedeemed member shares 20 56 (56) - General reserve for credit losses 20 (1,205) 1205 - Transfer of revaluation on disposal of land and buildings 20 (105) 105 - Revaluation of assets held-for-sale 13 130 - 130Total transfer to reserves (1,124) 1,254 130
Closing balance at 30 June 2013 177,970 256,159 434,129
The Statements of Changes in Equity are to be read in conjunction with the accompanying notes to the financialstatements.
ANNUAL FINANCIAL REPORT FOR YEAR ENDED 30 JUNE 2014
18

Annual Financial Report for the Year Ended 30 June 2014
25
Statements of Cash FlowsSTATEMENTS OF CASH FLOWSFOR THE YEAR ENDED 30 JUNE 2014
Note
2014 2013 2014 2013$'000 $'000 $'000 $'000
Cash from operating activitiesInterest received 317,250 351,516 317,659 351,718 Interest paid (183,026) (223,310) (183,309) (225,566)Fee and commission received 41,037 34,723 35,886 40,943 Other income received 26,172 26,586 28,219 19,834 Net (increase)/decrease in loans and advances (135,741) (78,995) (135,741) (78,995)Net increase in deposits and withdrawable share capital 330,886 26,474 330,374 26,989 Payments to employees and suppliers (181,491) (159,968) (179,077) (144,414)Income taxes paid (6,260) (7,860) (5,865) (7,469)Net cash from operating activities 21 208,827 (30,834) 208,146 (16,960)
Cash from investing activitiesNet decrease/(increase) in available-for-sale investment securities 37,493 88,460 35,091 94,740 Acquisition of non-tradeable investments (108) (800) (108) (14,150)Proceeds from sale of non-tradeable investments - 153 4,330 2,992 Acquisition of property plant and equipment (8,803) (10,578) (8,803) (10,578)Proceeds from sale of property, plant and equipment 951 20,858 951 20,858 Dividends from equity accounted investees 317 - - - Dividends and distributions received 2,013 2,271 2,364 2,271 Net cash from investing activities 31,863 100,364 33,825 96,133
Cash from financing activitiesNew borrowings 64,080 181,975 64,080 181,975 Proceeds from residential backed securities issue - 450,000 - - Repayment of borrowings (127,392) (515,406) (332,819) (255,222)Payment to Noteholders (198,958) (182,669) - - Net cash from financing activities (262,270) (66,100) (268,739) (73,247)
Net (decrease)/increase in cash and cash equivalents (21,580) 3,430 (26,768) 5,926
Cash and cash equivalents at 1 July 151,592 148,162 144,826 138,900
Cash and cash equivalents at 30 June 7 130,012 151,592 118,058 144,826
Credit UnionConsolidated
The Statements of Cash Flows are to be read in conjunction with the accompanying notes to the financial statements.
ANNUAL FINANCIAL REPORT FOR YEAR ENDED 30 JUNE 2014
19

Annual Financial Report for the Year Ended 30 June 2014
26
Notes to the Financial Statements NOTES TO THE FINANCIAL STATEMENTS 1. CORPORATE INFORMATION
The financial report of Australian Central Credit Union Ltd (trading as People's Choice Credit Union) (the “Credit Union”), and its controlled entities (together referred to as the “Group”) for the year ended 30 June 2014 was authorised for issue in accordance with a resolution by the Directors on 1 September 2014.
The Credit Union is a for-profit entity and domiciled in Australia. The Group is primarily involved in the provision of loans to members and customers (including "Choice of Home Loans" via a panel of lenders), savings and investment facilities, the sale of insurance policies, Mutual Aid, financial planning and corporate superannuation services. There was no significant change in the nature of these activities during the year. The controlling entity in the Group is Australian Central Credit Union Ltd. The registered office and principal place of business is: Australian Central Credit Union Ltd, (trading as “People's Choice Credit Union”) 60 Light Square, Adelaide, SA, Australia 5000. 2. SUMMARY OF SIGNIFICANT ACCOUNTING POLICIES
The accounting policies set out below have been consistently applied by each entity in the Group.
2.1 Basis of preparation
a) Statement of compliance The financial report is a general purpose financial report which has been prepared in accordance with Australian Accounting Standards (“AASBs”) adopted by the Australian Accounting Standards Board ("AASB") and the Corporations Act 2001. The financial reports of the Group and of the Credit Union comply with International Financial Reporting Standards ("IFRSs") and interpretations adopted by the International Accounting Standards Board ("IASB"). b) Basis of measurement The financial report has been prepared in accordance with the historical cost convention, except for derivative financial assets and liabilities, available-for-sale financial investments, land and buildings and assets held-for-sale which are measured at their fair value. Loans and advances and financial liabilities are carried at amortised cost.
The financial report has been prepared on a going concern basis.
c) Functional and presentation currency
The financial report is presented in Australian dollars and all values have been rounded to the nearest thousand dollars ($’000) unless otherwise stated under the option available to the group under ASIC Class Order 98/100.
ANNUAL FINANCIAL REPORT FOR YEAR ENDED 30 JUNE 2014
20

Annual Financial Report for the Year Ended 30 June 2014
27
Notes to the Financial Statements NOTES TO THE FINANCIAL STATEMENTS 2. SUMMARY OF SIGNIFICANT ACCOUNTING POLICIES (Continued)
2.1 Basis of preparation (continued)
d) Use of judgements and estimates
The preparation of a financial report in conformity with IFRSs requires management to make judgements, estimates and assumptions that affect the application of accounting policies and reported amounts of assets and liabilities, income and expenses. The estimates and associated assumptions are based on historical experience and various other factors that are believed to be reasonable when making the judgement about carrying values of assets and liabilities that are not readily apparent from other sources.
In particular, information about significant areas of estimation uncertainty and critical judgements in applying accounting policies that have the most significant effect on the amounts recognised in the financial statements are described in the following notes:
Note 2.3 b) and 9 Provision for impairment of loans and advances Note 12 Measurement of the recoverable amounts of cash generating units Note 31 Fair value of financial instruments
Actual results may differ from these estimates. The estimates and underlying assumptions are reviewed on an ongoing basis. Revisions to accounting estimates are recognised in the period in which the estimate is revised and in any future periods affected.
2.2 Basis of consolidation
Controlled entities
The Credit Union ‘controls’ a controlled entity if it is exposed to, or has rights to, variable returns from its involvement with the investee and has the ability to affect those returns through its power over the controlled entity. The financial statements of controlled entities are included in the consolidated financial statements from the date on which control commences until the date when control ceases.
In the financial report, investments in controlled entities are carried at cost. Intragroup balances and transactions, and any unrealised income and expenses arising from intragroup transactions are eliminated in preparing the consolidated financial report. Unrealised losses are eliminated in the same way as unrealised gains, but only to the extent that there is no evidence of impairment.
Special purpose entities
The Group has established a number of special purpose entities ("SPEs") for the purpose of the issuance of Residential Mortgage Backed Securities ("RMBS"). The SPEs have been consolidated as the Group is exposed to the majority of the residual risks and rewards of the SPEs. For the accounting policy on securitisation, refer to Note 2.11.
Interests in equity-accounted investees
The Group’s interests in equity-accounted investees comprise interests in associates. Associates are those entities in which the Group has significant influence, but not control or joint control, over the financial and operating policies.
Interests in associates are accounted for using the equity method. They are recognised initially at cost, which includes transaction costs. Subsequent to initial recognition, the consolidated financial statements include the Group’s share of the Profit or Loss and Other Comprehensive Income (“OCI”) of equity-accounted investees, until the date on which significant influence ceases.
ANNUAL FINANCIAL REPORT FOR YEAR ENDED 30 JUNE 2014
21

Annual Financial Report for the Year Ended 30 June 2014
28
Notes to the Financial Statements NOTES TO THE FINANCIAL STATEMENTS 2. SUMMARY OF SIGNIFICANT ACCOUNTING POLICIES (Continued) 2.3 Financial assets and liabilities
a) Cash and cash equivalents Cash and cash equivalents comprise notes and coins on hand and deposits at call with Approved Deposit-Taking Institutions (“ADIs”) and are stated at their gross value of the outstanding balance. Bank overdrafts that are repayable on demand and form an integral part of the Group’s cash management are included as a component of cash and cash equivalents for the purpose of the Statements of Cash Flows.
b) Loans and advances
Loans and advances comprise term and revolving credit facilities provided to members and members' overdrawn savings accounts. Loans and advances are initially measured at fair value plus incremental direct transaction costs, and subsequently measured at their amortised cost using the effective interest rate method, less impairment losses. The effective interest rate is the rate that exactly discounts estimated future cash payments through the expected life of the loan or advance to the carrying amount of the loan or advance. When estimating the future cash flows, the Credit Union considers all contractual terms of the loan or advance excluding any future credit losses. Included in this calculation are all fees paid or received that are integral to the contract.
Impairment of loans and advances
All loans are subject to a continuous management review process to assess whether there is any objective evidence that any loan or group of loans is impaired.
Impairment of loans and advances is recognised when objective evidence is available that a loss event has occurred.
If there is objective evidence that an impairment loss has been incurred, the amount of the loss is measured as the difference between the asset's carrying amount and the present value of estimated future cash flows (excluding future expected credit losses that have not yet been incurred).
Impairment losses are recognised in profit or loss.
(i) Specific Provision
Loans and advances, that meet significant delinquency and loan size criteria, are individually assessed for impairment to estimate the likely loss on the loan.
(ii) Collective Provision
Loans and advances that do not meet significant delinquency criteria are not individually assessed but are placed into portfolios of assets with similar risk profiles and a collective assessment of impairment is performed based on objective evidence from historical experience.
The evaluation process is subject to a series of estimates and judgements. In the risk rated exposure, the risk rating system, including the frequency of default and loss given default rates, loss history, and the size, structure and diversity of individual borrowers are considered. Current developments in portfolios (industry, geographic and term) are reviewed.
In the statistically managed retail exposures, the history of defaults and losses, and the size, structure and diversity of portfolios are considered.
ANNUAL FINANCIAL REPORT FOR YEAR ENDED 30 JUNE 2014
22

Annual Financial Report for the Year Ended 30 June 2014
29
Notes to the Financial Statements NOTES TO THE FINANCIAL STATEMENTS 2. SUMMARY OF SIGNIFICANT ACCOUNTING POLICIES (Continued)
2.3 Financial assets and liabilities (continued)
b) Loans and advances (continued)
In addition, management considers overall indicators of portfolio performance, quality and economic conditions. Changes in these estimates could have a direct impact on the level of provision determined.
The amount required to bring the collective provision to the level assessed is recognised in the Statements of Profit or Loss and Other Comprehensive Income as set out in Note 9.
(iii) General Reserve for Credit Losses
The difference between the impairment provisions calculated under IFRS and those required by the Australian Prudential Regulation Authority (“APRA”) is represented by a General Reserve for Credit Losses within equity. Transfers to and from the General Reserve for Credit Losses are made as an appropriation of retained earnings.
Loans and advances are reviewed and graded according to the assessed level of credit risk. Classifications adopted are as follows:
Past-due loans - are loans and advances where the borrower has failed to make a repayment when contractually due.
Restructured loans - arise when the borrower is granted concessional terms or conditions due to difficulties in meeting the original contractual terms, and the revised terms are more favourable than comparable new facilities.
Impaired loans - are loans and advances where the full recovery of outstanding principal and interest is considered doubtful.
Assets acquired through the enforcement of security - are assets (usually residential property or motor vehicles) acquired in full or partial settlement of an advance through the enforcement of security arrangements. The recoverable value of such assets forms part of the net value of loans and advances as part of the estimated future cash flows.
c) Financial instruments - non-derivative financial instruments
Non-derivative financial instruments comprise investments in equity and debt securities, trade and other receivables, cash and cash equivalents, loans and borrowings, and trade and other payables.
Investments in equity instruments that do not have a quoted market price in an active market and whose fair value cannot be reliably measured are carried at cost. Investments in controlled entities are carried at cost.
(i) Available-for-sale investment securities
Financial instruments held by the Group classified as being available-for-sale are non-derivative financial assets and are stated at fair value, with any resultant gain or loss recognised in other comprehensive income and presented within equity in the fair value reserve, except for impairment losses. Where the financial instruments are derecognised, the cumulative gain or loss previously recognised in other comprehensive income, and presented in the fair value reserve in equity, is transferred to profit or loss. Where these investments are interest-bearing, interest calculated using the effective interest rate method is recognised in profit or loss.
The fair value of financial instruments classified as available-for-sale is estimated using discounted cash flow analysis, based on current market rates for similar arrangements.
Financial instruments classified as available-for-sale investment securities are recognised/derecognised by the Group on the date it commits to purchase/sell the investments.
ANNUAL FINANCIAL REPORT FOR YEAR ENDED 30 JUNE 2014
23

Annual Financial Report for the Year Ended 30 June 2014
30
Notes to the Financial Statements NOTES TO THE FINANCIAL STATEMENTS 2. SUMMARY OF SIGNIFICANT ACCOUNTING POLICIES (Continued)
2.3 Financial assets and liabilities (continued)
c) Financial instruments - non-derivative financial instruments (continued)
(ii) Liabilities
The Credit Union initially recognises debt securities issued and subordinated liabilities on the date that they are originated. All other financial liabilities are recognised initially on the trade date at which the Credit Union becomes a party to the contractual provisions of the instrument. The Credit Union derecognises a financial liability when its contractual obligations are discharged or cancelled or expire.
Non-derivative financial liabilities are recognised initially at fair value plus any directly attributable transaction costs. Subsequent to initial recognition these financial liabilities are measured at amortised cost using the effective interest rate method.
(iii) Other
Other non-derivative financial instruments are measured at amortised cost using the effective interest rate method, less any impairment losses.
d) Interest-bearing borrowings
Interest-bearing borrowings (inclusive of member deposits) are recognised initially at fair value less attributable transaction costs. Subsequent to initial recognition, interest-bearing borrowings are stated at amortised cost with any difference between cost and redemption value being recognised in profit or loss over the period of the borrowings using an effective interest rate method.
e) Financial instruments - derivative financial instruments
The Group uses interest rate swaps to hedge its exposure to interest rate risks arising from operational and financing activities. In accordance with its treasury policy, the Group does not hold or issue derivative financial instruments for trading purposes. However derivatives that do not qualify for hedge accounting are accounted for at fair value through profit and loss.
Derivative financial instruments are recognised initially at cost. Subsequent to initial recognition, derivative financial instruments are stated at fair value. The gain or loss on remeasurement to fair value is recognised immediately in profit or loss. However, where derivatives qualify for hedge accounting, recognition of any resultant gain or loss depends on the nature of the item being hedged (refer Note 2.3 e) (i)).
The fair value of interest rate swaps is the present value of the future cash flows that the Group would receive or pay to terminate the swap at the balance date, taking into account current interest rates and the current creditworthiness of the swap counterparties.
Where a financial asset does not qualify for derecognition the associated basis swaps are recognised on an accrual basis in accordance with AASB139 Financial Instruments Recognition and Measurement.
Further details of derivative financial instruments are disclosed in Note 30.
ANNUAL FINANCIAL REPORT FOR YEAR ENDED 30 JUNE 2014
24

Annual Financial Report for the Year Ended 30 June 2014
31
Notes to the Financial Statements NOTES TO THE FINANCIAL STATEMENTS 2. SUMMARY OF SIGNIFICANT ACCOUNTING POLICIES (Continued)
2.3 Financial assets and liabilities (continued)
e) Financial instruments - derivative financial instruments (continued)
Sale of a security with a total return swap
The Group sells debt securities that are subject to a concurrent total return swap. In all cases, the Group retains substantially all of the risks and rewards of ownership resulting in the Group continuing to recognise the transferred securities in its Statements of Financial Position. The cash received is recognised as a financial asset and a corresponding liability is recognised.
The Group does not separately recognise the total return swap that prevents derecognition of the security as a derivative because doing so would result in recognising the same rights and obligations twice. Because the Group sells the contractual rights to the cash flows of the securities, it does not have the ability to use the transferred assets during the term of the arrangement.
(i) Hedging
On entering into a hedging relationship, the Group formally designates and documents the hedge relationship and the risk management objective and strategy for undertaking the hedge. The documentation includes identification of the hedging instrument, the hedged item or transaction, the nature of risk being hedged and how the entity will assess the hedging instrument's effectiveness in offsetting the exposure to changes in the hedged item's fair value or cash flows attributable to the hedged risk. Such hedges are expected to be highly effective in achieving offsetting changes in fair value or cash flows and are assessed on an ongoing basis to determine that they actually have been highly effective throughout the financial reporting period as designated.
(ii) Cash flow hedges
Where a derivative financial instrument is designated as a hedge of the variability in cash flows of a recognised asset or liability, or a highly probable forecast transaction, the effective part of any gain or loss on the derivative financial instrument is recognised directly in other comprehensive income. When the forecast transaction subsequently results in the recognition of a non-financial asset or non-financial liability, or the forecast transaction for a non-financial asset or non-financial liability the associated cumulative gain or loss is removed from other comprehensive income and included in the initial cost or other carrying amount of the non-financial asset or liability. If a hedge of a forecast transaction subsequently results in the recognition of a financial asset or financial liability, then the associated gains or losses that were recognised directly in other comprehensive income are reclassified into profit in the same period or periods during which the asset acquired or liability assumed affects the Statements of Profit or Loss and Other Comprehensive Income (i.e. when the interest income is recognised).
Effectiveness tests are performed on derivative financial instruments to determine if they are still providing the protection originally intended when entered into by the Group. Where a derivative financial instrument that was previously considered to be effective no longer satisfies the effectiveness test criteria, any gain or loss on the instrument previously recognised in other comprehensive income is reversed through profit or loss with all subsequent gains or losses recognised through profit or loss.
When a derivative financial instrument is not designated in a qualifying hedge relationship, all changes to its fair value are recognised directly in profit or loss.
ANNUAL FINANCIAL REPORT FOR YEAR ENDED 30 JUNE 2014
25

Annual Financial Report for the Year Ended 30 June 2014
32
Notes to the Financial Statements NOTES TO THE FINANCIAL STATEMENTS 2. SUMMARY OF SIGNIFICANT ACCOUNTING POLICIES (Continued)
2.3 Financial assets and liabilities (continued)
f) Other receivables
Other assets include non-interest bearing receivables that are stated at their cost less impairment losses (see Note 2.5).
g) Other payables
Payables are non-interest bearing and are normally settled on thirty day terms and are stated at their amortised cost.
2.4 Non-financial assets and liabilities
a) Acquisition of assets
All assets acquired, including property, plant and equipment and intangibles (other than goodwill), are initially recorded at their cost of acquisition at the date of acquisition, being their fair value of the consideration provided plus incidental costs directly attributable to the acquisition.
Where settlement of any part of cash consideration is deferred, the amounts payable are recorded at their present value, discounted at the rate applicable to the Group if a similar borrowing were obtained from an independent financier under comparable terms and conditions. The unwinding of the discount is treated as interest expense.
The costs of assets constructed or internally generated by the Group (other than goodwill), include the cost of materials and direct labour. Directly attributable overheads and other incidental costs are also capitalised to the asset.
Expenditure, including that on internally generated assets (other than research and development costs), is only recognised as an asset when the entity controls future economic benefits as a result of the costs incurred that are probable and can be measured reliably. Costs attributable to feasibility and alternative approach assessments are expensed as incurred.
Owned assets
Land and buildings
Land and buildings are held at their fair value. Independent valuations of land and buildings are performed on a regular basis to ensure the carrying amount of each asset is stated at its fair value at reporting date.
Property, plant and equipment
Property, plant and equipment are measured at cost, less any accumulated depreciation and impairment losses.
Depreciation
Depreciation is calculated on a straight line basis over the estimated useful life of the assets as follows:
Land and buildings Held at fair value Leasehold and freehold improvements 5 – 10 years Furniture, equipment and technology 4 – 13 1/3 years The expected useful life and the depreciation method applied to an asset are reassessed at least annually.
ANNUAL FINANCIAL REPORT FOR YEAR ENDED 30 JUNE 2014
26

Annual Financial Report for the Year Ended 30 June 2014
33
Notes to the Financial Statements NOTES TO THE FINANCIAL STATEMENTS 2. SUMMARY OF SIGNIFICANT ACCOUNTING POLICIES (Continued)
2.4 Non-financial assets and liabilities (continued)
a) Acquisition of assets (continued)
Leased assets
Leases of plant and equipment under which the Group assumes substantially all the risks and benefits of ownership are classified as finance leases. Other leases are classified as operating leases and not recognised in the Group’s Statements of Financial Position. The Group is not currently engaged in any finance leases.
Payments made under operating leases are expensed over the term of the lease.
b) Assets held-for-sale
Non-current assets are classified as held-for-sale if it is highly probable that they will be recovered primarily through the sale or distribution rather than their continuing use in the next twelve months.
Assets classified as held-for-sale are measured at the lower of their carrying amount and fair value less cost to sell, unless the nature of the asset requires it to be measured in line with another accounting standard.
Once classified as held-for-sale, assets held for sale are no longer amortised or depreciated.
c) Intangible assets (i) Goodwill
Goodwill is stated at cost less any accumulated amortisation and accumulated impairment losses. Goodwill is allocated to cash generating units and is tested annually for impairment (refer Note 12).
Negative goodwill arising on acquisition is recognised directly in profit or loss.
(ii) Acquired Contractual Rights
The amount relating to acquired contractual rights to future cash flows is measured at cost less accumulated amortisation and accumulated impairment losses. Acquired contractual rights are amortised to profit or loss over the expected useful life of the asset. (iii) Software
Software assets that are not integral to the operation of hardware are recognised as intangible assets with a finite life. Where the expenditure is of a significant amount and there are related benefits which are expected to be realised over the medium to long term, it is deferred and amortised on a straight line basis over the period in which the benefits are expected to be realised.
ANNUAL FINANCIAL REPORT FOR YEAR ENDED 30 JUNE 2014
27

Annual Financial Report for the Year Ended 30 June 2014
34
Notes to the Financial Statements NOTES TO THE FINANCIAL STATEMENTS 2. SUMMARY OF SIGNIFICANT ACCOUNTING POLICIES (Continued)
2.4 Non-financial assets and liabilities (continued)
c) Intangible assets (continued)
(iv) Core deposit intangible
A core deposit intangible was recognised following the merger with Savings & Loans Credit Union (S.A.) Limited and represents the value of having a deposit base from customer and business transaction accounts, savings accounts and term deposits, providing a more favourable source of funding than alternative sources of funding such as in wholesale and securitisation markets. The core deposit intangible is amortised over a period of nine years and is stated at cost less accumulated amortisation and accumulated impairment losses. The amortisation period is based on the underlying expected life of the deposit portfolio. The core deposit intangible is assessed for any indication of impairment at each reporting date.
(v) Amortisation
Items of intangible assets are amortised so as to write off the net cost of each non-current asset over their expected useful lives. The amortisation rates used for each class of intangible asset in the current and comparative periods are as follows:
Acquired contractual rights 5 years Software 2 – 7 years Core deposit intangibles 9 years
Amortisation methods, useful lives and residual values are reviewed at least annually and adjusted where appropriate.
(vi) Impairment
For goodwill and other intangible assets that have an indefinite life, the recoverable amount is estimated annually.
An impairment loss is recognised whenever the carrying amount of an asset (either in its own right or as part of a cash generating unit) exceeds its recoverable amount. Impairment losses are recognised in profit or loss unless the asset has previously been revalued, in which case the impairment loss is recognised as a reversal to the extent of that previous revaluation with any excess recognised in profit or loss.
Impairment losses recognised in respect of cash generating units are allocated first to reduce the carrying amount of any goodwill allocated to the cash-generating unit (group of units) and then, to reduce the carrying amount of the other assets in the unit (group of units) on a pro rata basis.
d) Provisions Employee entitlements (i) Short-term employee benefits
Short-term employee benefits are expensed as the related service is provided. A liability is recognised for the amount expected to be paid if the Group has a present legal or constructive obligation to pay this amount as a result of past service provided by the employee and the obligation can be estimated reliably.
ANNUAL FINANCIAL REPORT FOR YEAR ENDED 30 JUNE 2014
28

Annual Financial Report for the Year Ended 30 June 2014
35
Notes to the Financial Statements NOTES TO THE FINANCIAL STATEMENTS 2. SUMMARY OF SIGNIFICANT ACCOUNTING POLICIES (Continued)
2.4 Non-financial assets and liabilities (continued)
d) Provisions (continued) (ii) Defined contribution plans
All employees, upon satisfying eligibility tests, may participate in an accumulation superannuation scheme. The Credit Union's contributions to defined contribution plans are recognised as an expense in profit or loss as incurred. The Credit Union has no legal obligation to cover any shortfall in the fund's obligation to provide benefits to employees on retirement.
(iii) Other long-term employee benefits
The Group’s net obligation in respect of long-term employee benefits is the amount of future benefit that employees have earned in return for their service in the current and prior periods. That benefit is discounted to determine its present value. Remeasurements are recognised in profit or loss in the period in which they arise.
(iv) Make good
A provision is made for the anticipated costs of restoring leased premises to their original condition at the end of the lease term in current dollar values. The provision is assessed at each balance date for expired leases.
2.5 Impairment
The carrying amount of the Group’s assets, other than deferred tax assets (see Note 2.8) and loans and advances (see Note 2.3 b)), are reviewed at each reporting date to determine whether there is any indication of impairment. If such indication exists, the asset's recoverable amount is estimated (see Note 2.3 b)) for signs of objective evidence indicating that impairment may have occurred. Where objective evidence of impairment exists the asset's recoverable amount is determined.
At each reporting date, the Group assesses whether there is objective evidence that financial assets not carried at fair value through profit or loss are impaired. A financial asset or a group of financial assets is impaired when objective evidence demonstrates that a loss event has occurred after the initial recognition of the asset(s) and that the loss event has an impact on the future cash flows of the asset(s) that can be estimated reliably.
Objective evidence that financial assets are impaired includes:
significant financial difficulty of the borrower or issuer; default or delinquency by a borrower; the restructuring of a loan or advance by the Group on terms that the Group would not consider otherwise; indications that a borrower or issuer will enter bankruptcy; the disappearance of an active market for a security; or observable data relating to a group of assets such as adverse changes in the payment status of borrowers or
issuers in the group, or economic conditions that correlate with details in the group.
In addition, for an investment in an equity security, a significant or prolonged decline in its fair value below its cost is objective evidence of impairment. In general, the Group considers a decline of 20% to be ‘significant’ and a period of nine months to be ‘prolonged’. However, in specific circumstances a smaller decline or a shorter period may be appropriate.
ANNUAL FINANCIAL REPORT FOR YEAR ENDED 30 JUNE 2014
29

Annual Financial Report for the Year Ended 30 June 2014
36
Notes to the Financial Statements NOTES TO THE FINANCIAL STATEMENTS 2. SUMMARY OF SIGNIFICANT ACCOUNTING POLICIES (Continued)
2.5 Impairment (continued)
When a decline in the fair value of an available-for-sale financial asset has been recognised in other comprehensive income, and presented in the fair value reserve in equity and there is objective evidence that the asset is impaired, the cumulative loss that had been recognised in other comprehensive income is transferred to profit or loss even though the financial asset has not been derecognised. The amount of the cumulative loss that is removed from other comprehensive income and recognised in profit or loss is the difference between the acquisition cost and current fair value, less any impairment loss on that financial asset previously recognised in profit or loss.
The recoverable amount of financial assets is calculated as the present value of estimated future cash flows, discounted at the original effective interest rate (i.e. the effective interest rate computed at initial recognition of these financial assets). Receivables with a short-term duration are not discounted.
The recoverable amount of other assets is the greater of their fair value less costs to sell and value in use. In assessing the value in use, the estimated future cash flows are discounted to the present value using a pre-tax discount rate that reflects current market assessments of the time value of money and the risks specific to the asset.
For an asset that does not generate largely independent cash flows, the recoverable amount is determined for the cash generating unit to which the asset belongs.
(i) Reversals of impairment
An impairment loss in respect of a receivable carried at amortised cost is reversed if the subsequent increase in the recoverable amount can be related objectively to an event occurring after the impairment loss was recognised.
An impairment loss in respect of an investment in an equity instrument classified as available-for-sale is not reversed through profit or loss. If the fair value of a debt instrument classified as available-for-sale increases and the increase can be objectively related to an event occurring after the impairment loss was recognised in profit or loss, the impairment loss shall be reversed, with the reversal recognised in profit or loss.
Impairment losses, other than in respect of goodwill, are reversed when there is an indication that the impairment loss may no longer exist and there has been a change in the estimate used to determine the recoverable amount.
An impairment loss in respect of goodwill is not reversed.
An impairment loss is reversed only to the extent that the asset's carrying amount does not exceed the carrying amount that would have been determined, net of depreciation or amortisation, if no impairment loss had been recognised.
ANNUAL FINANCIAL REPORT FOR YEAR ENDED 30 JUNE 2014
30

Annual Financial Report for the Year Ended 30 June 2014
37
Notes to the Financial Statements NOTES TO THE FINANCIAL STATEMENTS 2. SUMMARY OF SIGNIFICANT ACCOUNTING POLICIES (Continued)
2.6 Derecognition of financial assets and liabilities
A financial asset (or, where applicable, a part of a financial asset or part of a group of similar financial assets) is derecognised when:
a) the right to receive cash flows from the asset has expired;
b) the Group retains the right to receive cash flows from the asset, but has assumed an obligation to pay them without material delay to a third party; or
c) the Group has transferred its rights to receive cash flows from the asset and either:
(i) has transferred substantially all the risks and rewards of the asset; or
(ii) has neither transferred nor retained substantially all the risks and rewards of the asset, but has transferred control of the asset.
A financial liability is derecognised when the obligation under the liability is discharged, cancelled or expired. When an existing financial liability is replaced by another from the same lender on substantially different terms, or the terms of an existing liability are substantially modified, such an exchange or modification is treated as a derecognition of the original liability and the recognition of a new liability. The difference in the respective carrying amounts is recognised in profit or loss.
2.7 Revenue recognition (i) Loan interest
Interest on loans and advances is recognised as it accrues using the effective interest rate method. The effective interest rate is the rate that exactly discounts estimated future cash payments through the expected life of the loan or advance to the net carrying amount of the loan or advance. When estimating the future cash flows the Credit Union considers all contractual terms of the loan or advance excluding any future credit losses. Included in this calculation are all fees paid or received that are integral to the contract (refer Note 2.3 b)). All interest is recognised on an accruals basis.
(ii) Revenue from services rendered
Revenue from services rendered is recognised in profit or loss in proportion to the stage of completion of the transaction at the reporting date. No revenue is recognised if there are significant uncertainties regarding recovery of the consideration due or the costs incurred or to be incurred cannot be measured reliably. (iii) Dividends
Dividends from other investments are recognised when the right to receive the dividend has been established.
(iv) Fees and commissions
Revenue is recognised on an accruals basis upon the provision of services from acting in the capacity of an agent rather than as the principal in a transaction. (v) Other non-interest income
Mutual Aid income is recognised over the average life of the associated loans.
ANNUAL FINANCIAL REPORT FOR YEAR ENDED 30 JUNE 2014
31

Annual Financial Report for the Year Ended 30 June 2014
38
Notes to the Financial Statements NOTES TO THE FINANCIAL STATEMENTS 2. SUMMARY OF SIGNIFICANT ACCOUNTING POLICIES (Continued)
2.8 Income tax
Income tax expense comprises current and deferred tax. Current and deferred tax are recognised in profit or loss except to the extent that it relates to a business combination, or items recognised directly in equity or in other comprehensive income.
Current tax is the expected tax payable on the taxable income for the year, using tax rates enacted or substantially enacted at the reporting date, and any adjustment to tax payable in respect of previous years.
Deferred tax is recognised in respect of temporary differences between the carrying amounts of assets and liabilities for the financial reporting purposes and the amounts used for taxation purposes. The amount of deferred tax provided is based on the expected manner of realisation or settlement of the carrying amount of assets and liabilities, using tax rates enacted or substantially enacted at the reporting date.
Deferred tax assets and liabilities are offset only if certain criteria are met.
Tax consolidation
The Credit Union and its Australian wholly-owned controlled entities formed a tax-consolidated group with effect from 1 July 2003 and are therefore taxed as a single entity from that date. The head entity within the consolidated group is Australian Central Credit Union Ltd, trading as People's Choice Credit Union.
Current tax expense/income, deferred tax liabilities and deferred tax assets arising from temporary differences of the members of the tax-consolidated group are recognised in the separate financial statements of the members of the tax-consolidated group using the separate taxpayer within group approach by reference to the carrying amounts in the separate financial statements of each entity and the tax values applying under tax consolidation.
Franking account
The Group has generated franking credits through paying income tax, including credits which will arise from the payment of income tax provided for in the financial statements. The ability to use these franking credits is restricted by the Constitution of the Credit Union which does not currently permit dividend payments. The balance of the franking account is adjusted for franking credits that the Credit Union is currently prevented from distributing in the subsequent financial year.
2.9 Goods and services tax (GST)
Revenues, expenses and assets are recognised net of the amount of goods and services tax ("GST"), except where the amount of GST incurred is not recoverable from the Australian Taxation Office ("ATO"). In these circumstances the GST is recognised as part of the cost of acquisition of the asset or as part of an item of the expense.
Receivables and payables are stated with the amount of GST included. The net amount of GST recoverable from, or payable to, the ATO is included as an asset or liability in the Statements of Financial Position.
The GST components of cash flows arising from investing and financing activities which are recoverable from, or payable to, the ATO are classified as operating cash flows.
2.10 Deferred borrowing costs
Deferred borrowing costs include costs associated with the establishment of a number of separate securitisation facilities. These costs are amortised over the expected life of the facilities.
ANNUAL FINANCIAL REPORT FOR YEAR ENDED 30 JUNE 2014
32

Annual Financial Report for the Year Ended 30 June 2014
39
Notes to the Financial Statements NOTES TO THE FINANCIAL STATEMENTS 2. SUMMARY OF SIGNIFICANT ACCOUNTING POLICIES (Continued)
2.11 Securitisation
The Credit Union through its loan securitisation program securitises mortgage loans to SPEs, which in turn issue rated securities to investors. Fees are received for various services provided to the SPEs on an arms-length basis, including servicing fees and management fees and are reported in profit or loss. The Credit Union also provides arms-length interest rate swaps and loan facilities to the SPEs.
Costs incurred in the establishment of a securitisation issue are amortised over the expected life of the issue.
Details of the transfer of financial assets to third parties and/or SPEs during the year are disclosed in Note 24.
2.12 Reclassification of comparatives
Certain items have been reclassified from the Group’s prior year financial report to conform to the current period’s presentation. The items that have been reclassified in the Statements of Financial Position and accompanying notes are:
Trade and other receivables is now included in other assets (2013: Consolidated $15.288 million, Credit Union $15.318 million);
Shares in unlisted entities has been reallocated from other investments to available-for-sale investment securities (2013: Consolidated $10.787 million, Credit Union $10.787 million);
Shares in unlisted entities (Data Action Pty Ltd) reallocated from available-for-sale investment securities to investments in associates (2013: Consolidated $1.492 million, Credit Union $1.492 million); and
Provision for make good has been reallocated from payables to provisions (2013: Consolidated $1.753 million, Credit Union $1.753 million).
2.13 Changes in accounting policy
AASB2012-2 Amendments to Australian Accounting Standards – Disclosures - Offsetting Financial Assets and Financial Liabilities requires disclosures to enable users of financial statements to evaluate the effect or the potential effects of netting arrangements, including rights of set off associated with an entity’s recognised financial assets and recognised financial liabilities, on the Statements of Financial Position. The amendments do not have any impact on the Group’s financial position or performance, however have resulted in additional disclosures in the notes to the financial statements.
ANNUAL FINANCIAL REPORT FOR YEAR ENDED 30 JUNE 2014
33

Annual Financial Report for the Year Ended 30 June 2014
40
Notes to the Financial Statements NOTES TO THE FINANCIAL STATEMENTS
3. COMPLIANCE WITH IFRS
a) Recently issued or amended standards not yet effective
The following standards, amendments to standards and interpretations have been identified as those which may impact the Group in the period of initial application. They are available for early adoption at 30 June 2014, but have not been applied in preparing this financial report:
Reference Title Nature of change to accounting policy
Impact to the Group Application date of Standard
Application date for Group
AASB 2012-3
Amendments to Australian Accounting Standards - Offsetting Financial Assets and Financial Liabilities.
AASB 2012-3 adds application guidance to AASB 132 Financial Instruments: Presentation to address inconsistencies identified in applying some of the offsetting criteria of AASB 132.
The amendments are not expected to have a material impact on the Group.
1 January 2014 1 July 2014
AASB 9 Financial Instruments
AASB 9 includes requirements for the classification and measurement of financial assets.
The Group is not expecting this change in standard to have a material impact Quantification will be finalised upon the issuance of the final standard.
1 January 2015 1 July 2015
A number of other AASB standards are also available for early adoption, but have not been applied by the Group in these financial statements. These relate to standards that have limited / no application to the Group.
b) Recently adopted standards
The Group has adopted AASB 136 Impairment of Assets for the first time for the year ended 30 June 2014.
ANNUAL FINANCIAL REPORT FOR YEAR ENDED 30 JUNE 2014
34

Annual Financial Report for the Year Ended 30 June 2014
41
Notes to the Financial StatementsNOTES TO THE FINANCIAL STATEMENTS
2014 2013 2014 2013$'000 $'000 $'000 $'000
4. REVENUE
Interest incomeCash and cash equivalents 3,450 4,530 3,189 4,194 Loans and advances 290,733 315,123 290,720 315,105 Available-for-sale investment securities 22,720 28,235 22,356 27,849 Interest rate derivatives - - 2,262 - Other investments 44 38 1,931 1,965 Total interest income 316,947 347,926 320,458 349,113
Interest expenseDeposits 122,757 147,288 122,757 147,293 Borrowings 46,656 58,840 57,077 70,699 Interest rate derivatives 4,513 8,274 - 104 Total interest expense 173,926 214,402 179,834 218,096
Net interest income 143,021 133,524 140,624 131,017
Other incomeLoan fee income 3,508 2,926 3,508 2,926 Transactional fee income 11,898 14,741 11,898 14,741 Insurance fees and commissions 13,620 12,810 13,620 12,810 Financial planning fees and commissions 12,114 10,887 9,073 8,085 Other fee income 11,864 11,637 13,909 13,882 Bad debts recovered 1,166 883 1,166 883 Dividends received 2,011 2,271 2,364 2,271 Mutual Aid income 10,314 8,997 10,314 8,997 Gain on sale of property, plant and equipment 5 8,191 5 8,191 Other income 29 53 29 53 Total other income 66,529 73,396 65,886 72,839
5. EXPENSES
Salary and wages 81,644 80,255 80,667 79,306 Superannuation 6,697 6,277 6,597 6,209 Administrative expenses 17,789 18,392 17,144 17,787 Depreciation on property, plant and equipment 6,766 6,842 6,766 6,841 Amortisation on intangible computer software 2,025 2,324 2,025 2,324 Amortisation on acquired intangible assets 546 2,128 546 2,128 Marketing costs 10,751 9,472 10,859 9,642 Rental operating leases 12,764 11,400 12,580 11,219 Other occupancy expenses 4,641 7,063 4,528 6,963 Distribution channel costs 15,947 15,906 15,947 15,906 Information technology costs 11,727 10,210 11,723 10,208 Loss on sale of property, plant and equipment 12 471 12 471 Total other expenses 171,309 170,740 169,394 169,004
Credit UnionConsolidated
ANNUAL FINANCIAL REPORT FOR YEAR ENDED 30 JUNE 2014
35
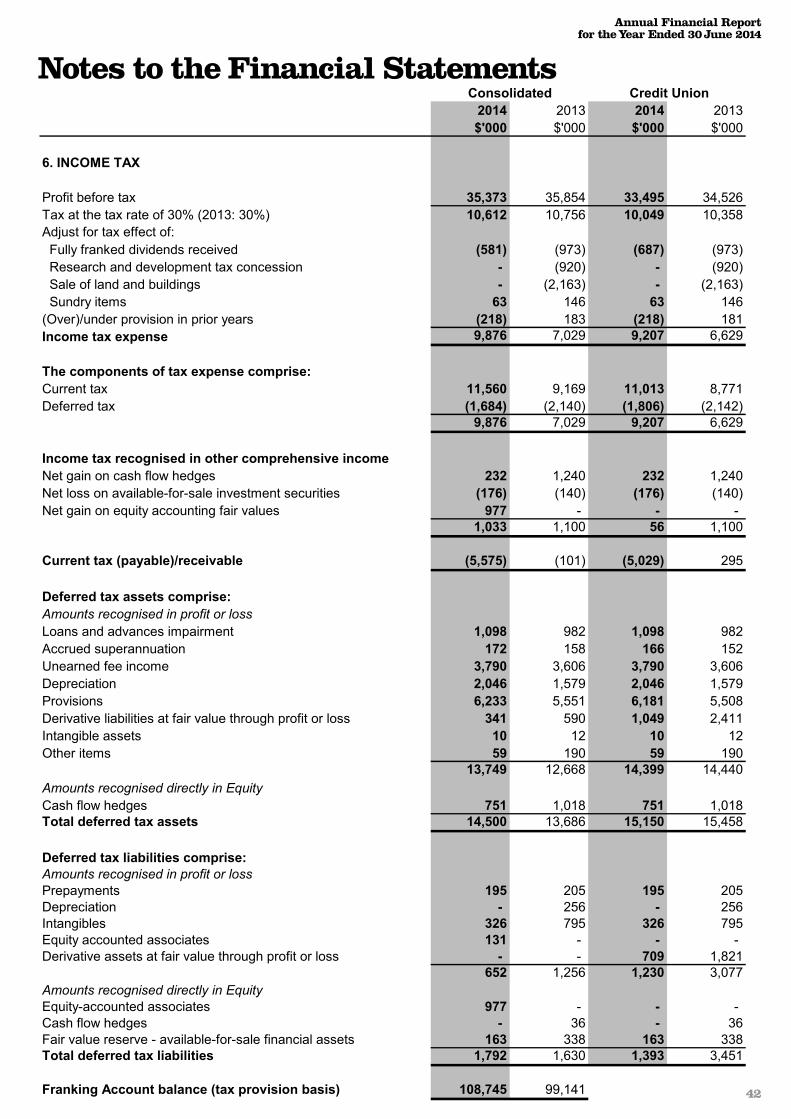
Annual Financial Report for the Year Ended 30 June 2014
42
NOTES TO THE FINANCIAL STATEMENTS
2014 2013 2014 2013$'000 $'000 $'000 $'000
6. INCOME TAX
Profit before tax 35,373 35,854 33,495 34,526 Tax at the tax rate of 30% (2013: 30%) 10,612 10,756 10,049 10,358 Adjust for tax effect of: Fully franked dividends received (581) (973) (687) (973) Research and development tax concession - (920) - (920) Sale of land and buildings - (2,163) - (2,163) Sundry items 63 146 63 146 (Over)/under provision in prior years (218) 183 (218) 181 Income tax expense 9,876 7,029 9,207 6,629
The components of tax expense comprise:Current tax 11,560 9,169 11,013 8,771 Deferred tax (1,684) (2,140) (1,806) (2,142)
9,876 7,029 9,207 6,629
Income tax recognised in other comprehensive incomeNet gain on cash flow hedges 232 1,240 232 1,240 Net loss on available-for-sale investment securities (176) (140) (176) (140)Net gain on equity accounting fair values 977 - - -
1,033 1,100 56 1,100
Current tax (payable)/receivable (5,575) (101) (5,029) 295
Deferred tax assets comprise:Amounts recognised in profit or lossLoans and advances impairment 1,098 982 1,098 982 Accrued superannuation 172 158 166 152 Unearned fee income 3,790 3,606 3,790 3,606 Depreciation 2,046 1,579 2,046 1,579 Provisions 6,233 5,551 6,181 5,508 Derivative liabilities at fair value through profit or loss 341 590 1,049 2,411 Intangible assets 10 12 10 12 Other items 59 190 59 190
13,749 12,668 14,399 14,440 Amounts recognised directly in EquityCash flow hedges 751 1,018 751 1,018 Total deferred tax assets 14,500 13,686 15,150 15,458
Deferred tax liabilities comprise:Amounts recognised in profit or lossPrepayments 195 205 195 205Depreciation - 256 - 256Intangibles 326 795 326 795Equity accounted associates 131 - - - Derivative assets at fair value through profit or loss - - 709 1,821
652 1,256 1,230 3,077 Amounts recognised directly in EquityEquity-accounted associates 977 - - - Cash flow hedges - 36 - 36 Fair value reserve - available-for-sale financial assets 163 338 163 338Total deferred tax liabilities 1,792 1,630 1,393 3,451
Franking Account balance (tax provision basis) 108,745 99,141
Credit UnionConsolidated
ANNUAL FINANCIAL REPORT FOR YEAR ENDED 30 JUNE 2014
36
Notes to the Financial Statements
42

Annual Financial Report for the Year Ended 30 June 2014
43
Notes to the Financial StatementsNOTES TO THE FINANCIAL STATEMENTS
2014 2013 2014 2013$'000 $'000 $'000 $'000
7. CASH AND CASH EQUIVALENTS
Cash on hand and at bank 18,390 16,070 18,389 9,304 Deposits at call 111,622 135,522 99,669 135,522
130,012 151,592 118,058 144,826
8. LOANS AND ADVANCES
Revolving credit facilities 400,601 451,963 400,601 451,963 Term loans 4,630,502 4,446,670 4,630,502 4,446,670 Gross loans and advances 5,031,103 4,898,633 5,031,103 4,898,633
Provision for impairment (Note 9) (3,660) (3,273) (3,660) (3,273)Loan origination and processing costs 2,033 1,624 2,033 1,624 Unearned income (5,166) (5,129) (5,166) (5,129)Net loans and advances 5,024,310 4,891,855 5,024,310 4,891,855
The loan portfolio of the Group does not include any loans orgroups of related loans which represent 10 % or more of capital(2013: $Nil).
9. IMPAIRMENT OF LOANS AND ADVANCES
Specific provision:Balance at beginning of year 2,255 2,480 2,255 2,480 Decrease in provision (753) (225) (753) (225)Balance at end of year 1,502 2,255 1,502 2,255
Collective provision:Balance at beginning of year 1,018 1,841 1,018 1,841 Increase/(decrease) in provision 1,140 (823) 1,140 (823)Balance at end of year 2,158 1,018 2,158 1,018
Total provision for impairment 3,660 3,273 3,660 3,273
Charge to profit or loss comprises:Provision for loan impairment 387 (1,048) 387 (1,048)Loans written off during the year as uncollectible 4,064 3,345 4,064 3,345 Total charge to profit or loss 4,451 2,297 4,451 2,297
Impaired LoansGross impaired loans 4,381 2,322 4,381 2,322 Specific provision for impairment (1,502) (2,255) (1,502) (2,255)
2,879 67 2,879 67
Restructured loans 5,367 7,717 5,367 7,717
Assets acquired through the enforcement of security 4,108 2,259 4,108 2,259
Credit UnionConsolidated
ANNUAL FINANCIAL REPORT FOR YEAR ENDED 30 JUNE 2014
37

Annual Financial Report for the Year Ended 30 June 2014
44
Notes to the Financial StatementsNOTES TO THE FINANCIAL STATEMENTS
2014 2013 2014 2013$'000 $'000 $'000 $'000
10. INVESTMENTS
a) Available-for-sale investment securitiesInterest-bearing deposits 65,876 133,420 54,996 120,140 Negotiable certificates of deposit 460,049 450,812 460,049 450,812 Floating rate notes 97,176 76,736 97,176 76,736 Bonds 3,033 3,068 3,033 3,068 Shares in unlisted entities 10,787 10,787 10,787 10,787 Total available-for-sale investment securities 636,921 674,823 626,041 661,543
b) Other investmentsCapital notes - - 33,992 38,162 Other investments 1,809 1,701 1,809 1,701 Shares in controlled entities - - 4,988 5,148 Total other investments 1,809 1,701 40,789 45,011
Total Investments 638,730 676,524 666,830 706,554
c) Shares in controlled entities 2014 2013 2014 2013
$ $ % %
Controlled entities70 Light Square Pty Ltd * - - - 100 Austral Financial Planning Pty Ltd* - 1 - 100 Australian Central Services Pty Ltd - - 100 100 Australian Central Travel Pty Ltd* - 2 - 100 Financial Solutions Australasia Pty Ltd 4,987,973 4,987,973 100 100 Flinders Finance Pty Ltd** - 160,000 100 100 Let's Talk Home Loans Group Pty Ltd 1 1 100 100 People's Choice Community Foundation Limited - - 100 100
4,987,974 5,147,977
Special purpose entitiesLight Trust No. 1Light Trust No. 2Light Trust No. 3Light Trust No. 4Light Trust No. 5R (registered in February 2014 however not yet trading)
* Dormant entities were deregistered during the 2013-14 financial year.
** Ceased trading as at 31 May 2014. All capital has been returned to the Credit Union. Flinders Finance Pty Ltd is in the process of deregistrationwith the official deregistration to take place during the year ended 30 June 2015.
Book value of shares/units held
% held by Holding Entity
Australian Central Credit Union Ltd (trading as People's Choice Credit Union)
Credit UnionConsolidated
ANNUAL FINANCIAL REPORT FOR YEAR ENDED 30 JUNE 2014
38

Annual Financial Report for the Year Ended 30 June 2014
45
Notes to the Financial StatementsNOTES TO THE FINANCIAL STATEMENTS
11. PROPERTY, PLANT AND EQUIPMENT
Land and Buildings
Leasehold and Freehold
Improvements
Furniture, Equipment and
Technology
Capital Works in Progress
(WIP)Total
Consolidated $,000 $,000 $,000 $,000 $,000
At 1 July 2013, net of accumulated depreciation - 10,242 9,026 2,393 21,661
Additions - 2,795 5,415 - 8,210 Fair value adjustments - - - - - Disposals - (4) (8) - (12)Net movement in WIP - - - 333 333 Depreciation expense - (3,347) (3,419) - (6,766)Balance at 30 June 2014 - 9,686 11,014 2,726 23,426
At 30 June 2014Cost - 34,945 51,381 2,726 89,052 Accumulated depreciation - (25,259) (40,367) - (65,626)Net carrying amount - 9,686 11,014 2,726 23,426
At 1 July 2012, net of accumulated depreciation 13,325 8,777 7,162 2,702 31,966
Additions - 5,117 5,624 - 10,741Fair value adjustments 130 - - - 130Disposals (12,650) (219) (205) - (13,074)Net movement in WIP - - - (309) (309)Depreciation expense - (3,299) (3,543) - (6,842)Reclassification to held-for-sale (Note 13) (805) (134) (12) - (951)Balance at 30 June 2013 - 10,242 9,026 2,393 21,661
At 30 June 2013Cost - 34,170 48,195 2,393 84,758Accumulated depreciation - (23,928) (39,169) - (63,097)Net carrying amount - 10,242 9,026 2,393 21,661
ANNUAL FINANCIAL REPORT FOR YEAR ENDED 30 JUNE 2014
39

Annual Financial Report for the Year Ended 30 June 2014
46
Notes to the Financial StatementsNOTES TO THE FINANCIAL STATEMENTS
11. PROPERTY, PLANT AND EQUIPMENT (Continued)
Land and Buildings
Leasehold and Freehold
Improvements
Furniture, Equipment and
Technology
Capital Works in Progress
(WIP)Total
Credit Union $,000 $,000 $,000 $,000 $,000
At 1 July 2013, net of accumulated depreciation - 10,242 9,026 2,393 21,661
Additions - 2,795 5,415 - 8,210 Fair value adjustments - - - - - Disposals - (4) (8) - (12)Net movement in WIP - - - 333 333 Depreciation expense - (3,347) (3,419) - (6,766)Balance at 30 June 2014 - 9,686 11,014 2,726 23,426
At 30 June 2014Cost - 34,938 50,439 2,726 88,103 Accumulated depreciation - (25,252) (39,425) - (64,677)Net carrying amount - 9,686 11,014 2,726 23,426
At 1 July 2012, net of accumulated depreciation 13,325 8,777 7,162 2,702 31,966
Additions - 5,117 5,624 - 10,741Fair value adjustments 130 - - - 130Disposals (12,650) (219) (205) - (13,074)Net movement in WIP - - - (309) (309)Depreciation expense - (3,299) (3,543) - (6,842)Reclassification to held-for-sale (Note 13) (805) (134) (12) - (951)Balance at 30 June 2013 - 10,242 9,026 2,393 21,661
At 30 June 2013Cost - 34,163 48,118 2,393 84,674Accumulated depreciation - (23,921) (39,092) - (63,013)Net carrying amount - 10,242 9,026 2,393 21,661
ANNUAL FINANCIAL REPORT FOR YEAR ENDED 30 JUNE 2014
40
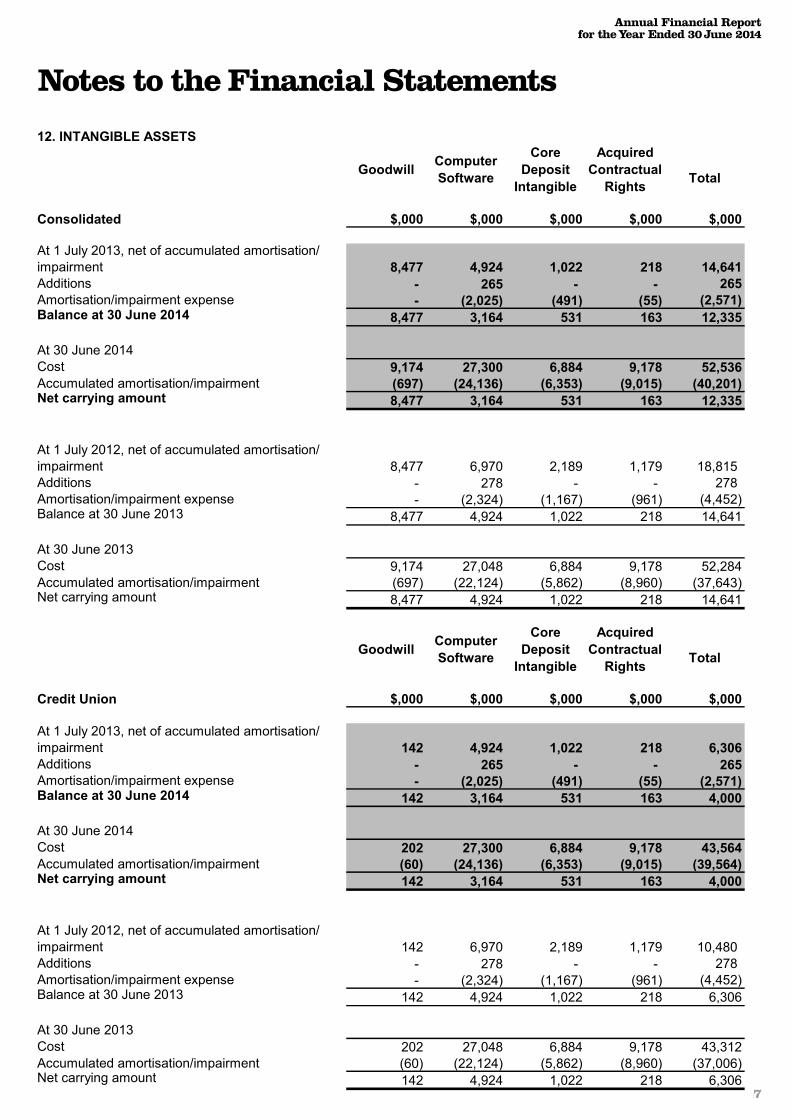
Annual Financial Report for the Year Ended 30 June 2014
47
Notes to the Financial StatementsNOTES TO THE FINANCIAL STATEMENTS
12. INTANGIBLE ASSETS
Goodwill Computer Software
Core Deposit
Intangible
Acquired Contractual
Rights Total
Consolidated $,000 $,000 $,000 $,000 $,000
At 1 July 2013, net of accumulated amortisation/ impairment 8,477 4,924 1,022 218 14,641Additions - 265 - - 265Amortisation/impairment expense - (2,025) (491) (55) (2,571)Balance at 30 June 2014 8,477 3,164 531 163 12,335
At 30 June 2014Cost 9,174 27,300 6,884 9,178 52,536 Accumulated amortisation/impairment (697) (24,136) (6,353) (9,015) (40,201)Net carrying amount 8,477 3,164 531 163 12,335
At 1 July 2012, net of accumulated amortisation/ impairment 8,477 6,970 2,189 1,179 18,815Additions - 278 - - 278Amortisation/impairment expense - (2,324) (1,167) (961) (4,452)Balance at 30 June 2013 8,477 4,924 1,022 218 14,641
At 30 June 2013Cost 9,174 27,048 6,884 9,178 52,284Accumulated amortisation/impairment (697) (22,124) (5,862) (8,960) (37,643)Net carrying amount 8,477 4,924 1,022 218 14,641
Goodwill Computer Software
Core Deposit
Intangible
Acquired Contractual
Rights Total
Credit Union $,000 $,000 $,000 $,000 $,000
At 1 July 2013, net of accumulated amortisation/ impairment 142 4,924 1,022 218 6,306Additions - 265 - - 265 Amortisation/impairment expense - (2,025) (491) (55) (2,571)Balance at 30 June 2014 142 3,164 531 163 4,000
At 30 June 2014Cost 202 27,300 6,884 9,178 43,564 Accumulated amortisation/impairment (60) (24,136) (6,353) (9,015) (39,564)Net carrying amount 142 3,164 531 163 4,000
At 1 July 2012, net of accumulated amortisation/ impairment 142 6,970 2,189 1,179 10,480Additions - 278 - - 278Amortisation/impairment expense - (2,324) (1,167) (961) (4,452)Balance at 30 June 2013 142 4,924 1,022 218 6,306
At 30 June 2013Cost 202 27,048 6,884 9,178 43,312Accumulated amortisation/impairment (60) (22,124) (5,862) (8,960) (37,006)Net carrying amount 142 4,924 1,022 218 6,306
ANNUAL FINANCIAL REPORT FOR YEAR ENDED 30 JUNE 2014
41
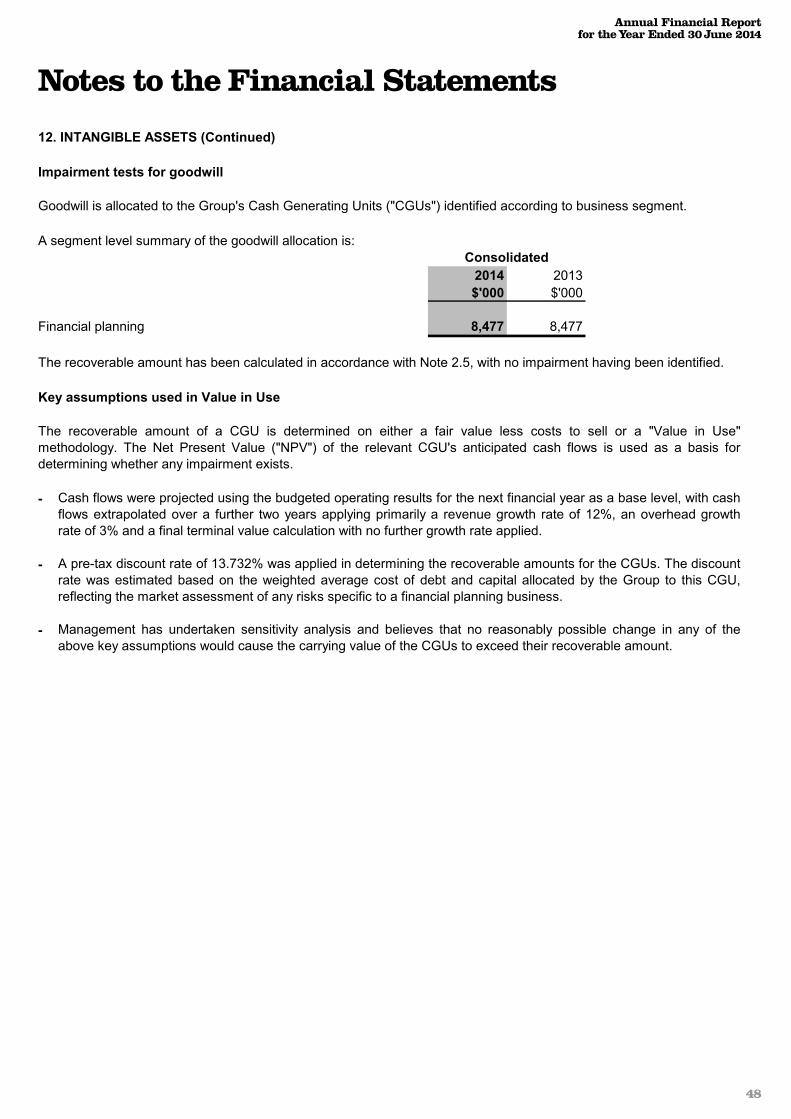
Annual Financial Report for the Year Ended 30 June 2014
48
Notes to the Financial StatementsNOTES TO THE FINANCIAL STATEMENTS
12. INTANGIBLE ASSETS (Continued)
Impairment tests for goodwill
A segment level summary of the goodwill allocation is:
2014 2013$'000 $'000
Financial planning 8,477 8,477
The recoverable amount has been calculated in accordance with Note 2.5, with no impairment having been identified.
Key assumptions used in Value in Use
-
-
- Management has undertaken sensitivity analysis and believes that no reasonably possible change in any of theabove key assumptions would cause the carrying value of the CGUs to exceed their recoverable amount.
Goodwill is allocated to the Group's Cash Generating Units ("CGUs") identified according to business segment.
Consolidated
The recoverable amount of a CGU is determined on either a fair value less costs to sell or a "Value in Use"methodology. The Net Present Value ("NPV") of the relevant CGU's anticipated cash flows is used as a basis fordetermining whether any impairment exists.
Cash flows were projected using the budgeted operating results for the next financial year as a base level, with cashflows extrapolated over a further two years applying primarily a revenue growth rate of 12%, an overhead growthrate of 3% and a final terminal value calculation with no further growth rate applied.
A pre-tax discount rate of 13.732% was applied in determining the recoverable amounts for the CGUs. The discountrate was estimated based on the weighted average cost of debt and capital allocated by the Group to this CGU,reflecting the market assessment of any risks specific to a financial planning business.
ANNUAL FINANCIAL REPORT FOR YEAR ENDED 30 JUNE 2014
42

Annual Financial Report for the Year Ended 30 June 2014
49
Notes to the Financial StatementsNOTES TO THE FINANCIAL STATEMENTS
13. ASSETS HELD-FOR-SALE
2014 2013 2014 2013$'000 $'000 $'000 $'000
Land and buildings - 805 - 805 Property, plant and equipment - 146 - 146
- 951 - 951
14. INVESTMENTS IN ASSOCIATES
2014 2013 2014 2013$'000 $'000 $'002 $'000
Carrying amount of investment in associates 5,184 1,492 1,492 1,492
Share of associate's balance sheet as at 1 July 2013Current assets 3,992 - Non-current assets 1,830 -
Current liabilities 898 - Non-current liabilities 176 - Share of net assets 4,748 -
Add: share of associate's profit or lossRevenue 8,358 - Expenses 7,318 - Profit/(loss) before income tax 1,040 - Income tax expense 287 - Profit/(loss) after income tax 753 -
Less: dividend received 317 -
Consolidated Credit Union
The Group entered into a contract on the 16 May 2013 to sell its building and certain plant, property and equipment atits Mitcham, Victoria site. Settlement on the property occurred on 16 September 2013.
The assets included under the sale transaction that were reclassified as assets held for sale comprised of the following:
There are no cumulative income or expenses included in other comprehensive income related to the sale of theseassets.
The Group has an interest in Data Action Pty Ltd ("Data Action") and owns 24.67% of the equity interests and holds25% of the voting rights.
The following table analyses, in aggregate, the carrying amount and share of profit and other comprehensive income ofthis associate:
Consolidated Credit Union
Management has reassessed the Group's relationship with Data Action following changes in Data Action’sshareholdings during the year. The Group has determined that it exercises significant influence over Data Action andaccordingly, the investment is now classified as an associate and accounted for under the equity method. Prior toclassification as an associate the investment was classified as an available-for-sale asset with changes in fair value,where able to be determined, accounted for through reserves.
ANNUAL FINANCIAL REPORT FOR YEAR ENDED 30 JUNE 2014
43
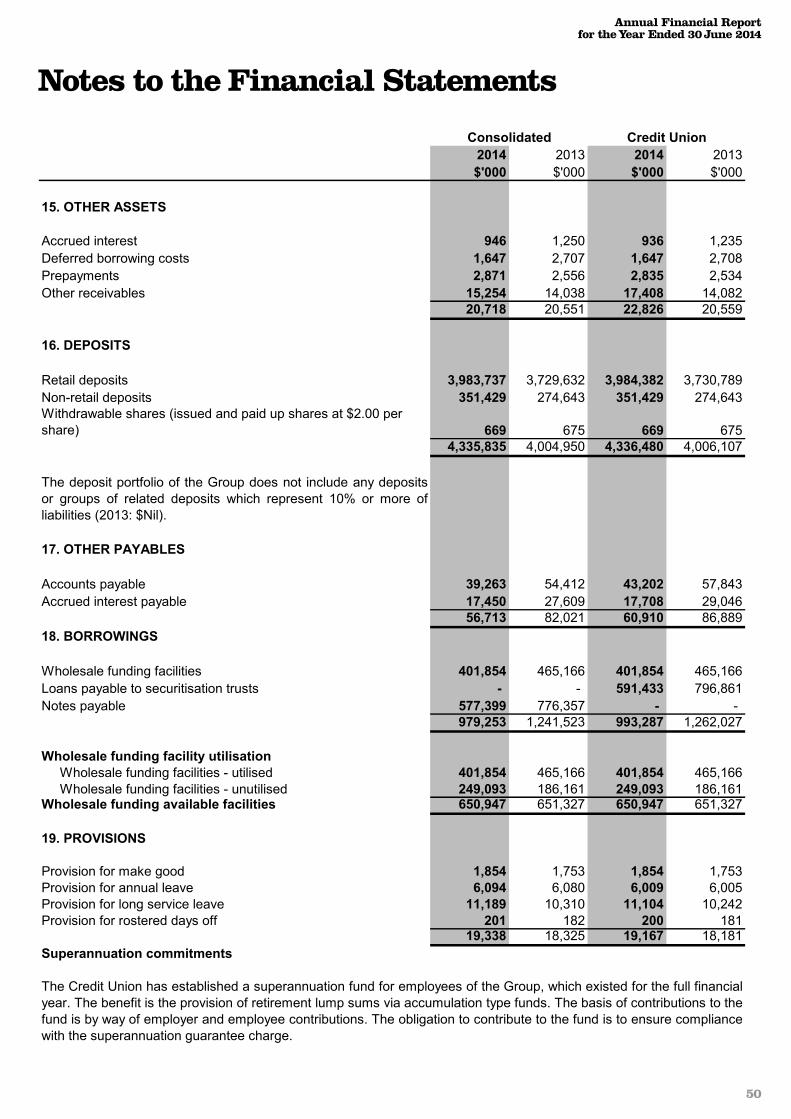
Annual Financial Report for the Year Ended 30 June 2014
50
Notes to the Financial StatementsNOTES TO THE FINANCIAL STATEMENTS
2014 2013 2014 2013$'000 $'000 $'000 $'000
15. OTHER ASSETS
Accrued interest 946 1,250 936 1,235 Deferred borrowing costs 1,647 2,707 1,647 2,708 Prepayments 2,871 2,556 2,835 2,534 Other receivables 15,254 14,038 17,408 14,082
20,718 20,551 22,826 20,559
16. DEPOSITS
Retail deposits 3,983,737 3,729,632 3,984,382 3,730,789 Non-retail deposits 351,429 274,643 351,429 274,643 Withdrawable shares (issued and paid up shares at $2.00 per share) 669 675 669 675
4,335,835 4,004,950 4,336,480 4,006,107
The deposit portfolio of the Group does not include any depositsor groups of related deposits which represent 10% or more ofliabilities (2013: $Nil).
17. OTHER PAYABLES
Accounts payable 39,263 54,412 43,202 57,843 Accrued interest payable 17,450 27,609 17,708 29,046
56,713 82,021 60,910 86,889 18. BORROWINGS
Wholesale funding facilities 401,854 465,166 401,854 465,166 Loans payable to securitisation trusts - - 591,433 796,861 Notes payable 577,399 776,357 - -
979,253 1,241,523 993,287 1,262,027
Wholesale funding facility utilisation Wholesale funding facilities - utilised 401,854 465,166 401,854 465,166 Wholesale funding facilities - unutilised 249,093 186,161 249,093 186,161 Wholesale funding available facilities 650,947 651,327 650,947 651,327
19. PROVISIONS
Provision for make good 1,854 1,753 1,854 1,753 Provision for annual leave 6,094 6,080 6,009 6,005 Provision for long service leave 11,189 10,310 11,104 10,242 Provision for rostered days off 201 182 200 181
19,338 18,325 19,167 18,181 Superannuation commitments
Credit UnionConsolidated
The Credit Union has established a superannuation fund for employees of the Group, which existed for the full financialyear. The benefit is the provision of retirement lump sums via accumulation type funds. The basis of contributions to thefund is by way of employer and employee contributions. The obligation to contribute to the fund is to ensure compliancewith the superannuation guarantee charge.
ANNUAL FINANCIAL REPORT FOR YEAR ENDED 30 JUNE 2014
44

Annual Financial Report for the Year Ended 30 June 2014
51
Notes to the Financial StatementsNOTES TO THE FINANCIAL STATEMENTS
2014 2013 2014 2013$'000 $'000 $'000 $'000
20. RESERVES
Redeemed member shares 640 593 640 593 Fair value reserve - available-for-sale financial assets 379 789 379 789 General reserve for credit losses 7,151 6,988 7,151 6,988 Hedging reserve - cash flow hedges (1,753) (2,292) (1,753) (2,292)Asset revaluation reserve 6 153 - 147 Other equity reserves 171,745 171,745 171,745 171,745
178,168 177,976 178,162 177,970
Redeemed member shares
Nature and purpose:Under the Corporations Act 2001 (s254K), redeemablepreference shares (Members $2 Shares) may only be redeemedout of the Credit Union's profit or through a new issue of sharesfor the purpose of the redemption. The Credit Union therefore hastransferred the value of member shares redeemed since 1 July1999 (the date that the Corporations Act 2001 applied to theCredit Union), from retained earnings to the redeemed preferenceshare capital account. The value of membersʼ shares for existingmembers is disclosed in Note 16.
Opening balance 1 July 593 537 593 537Transfers to retained earnings 47 56 47 56 Balance 640 593 640 593
Fair value reserve - available-for-sale financial assets
Nature and purpose:The fair value reserve is the difference in the carrying amount andthe fair value of the available-for-sale financial assets held by theGroup.
Opening balance 1 July 789 1114 789 1114Net unrealised gains/(losses) 1,870 (325) (410) (325)Equity-accounting fair value adjustment transfer to retained earnings (2,280) - - - Balance 379 789 379 789
General reserve for credit losses
Nature and purpose:APRA requires ADI's to maintain a prescribed level of provisionfor regulatory purposes. The difference between the impairmentprovisions calculated under IFRS and those required by APRA isrepresented by the general reserve for credit losses. The reservehas been appropriated from retained earnings.
Opening balance 1 July 6,988 8,193 6,988 8,193 Increase/(decrease) in general reserve for credit losses 163 (1,205) 163 (1,205)Balance 7,151 6,988 7,151 6,988
Consolidated Credit Union
ANNUAL FINANCIAL REPORT FOR YEAR ENDED 30 JUNE 2014
45

Annual Financial Report for the Year Ended 30 June 2014
52
Notes to the Financial StatementsNOTES TO THE FINANCIAL STATEMENTS
2014 2013 2014 2013$'000 $'000 $'000 $'000
20. RESERVES (Continued)
Hedging reserve - cash flow hedges
Nature and purpose:The hedging reserve comprises the effective portion of thecumulative net change in the fair value of cash flow hedginginstruments related to hedge transactions that have not yetoccurred.
Opening balance 1 July (2,292) (5,185) (2,292) (5,185)Effective portion of changes in fair values 1,117 1,357 1,117 1,357 Net change in fair value taken to profit or loss (578) 1,536 (578) 1,536 Balance (1,753) (2,292) (1,753) (2,292)
Asset revaluation reserve
Nature and purpose:The asset revaluation reserve relates to property, plant andequipment, measured at fair value in accordance with applicableAASB's.
Opening balance 1 July 153 128 147 122 Transfer of revaluation on disposal of land and buildings - (105) - (105)Revaluation of assets held-for-sale - 130 - 130 Disposal of assets held-for-sale (147) - (147) - Balance 6 153 - 147
Other equity reserves
Nature and purpose:The other equity reserves represents the retained earnings ofSavings & Loans Credit Union (S.A.) Limited recognised upon themerger with the Credit Union.
Balance 171,745 171,745 171,745 171,745
Consolidated Credit Union
ANNUAL FINANCIAL REPORT FOR YEAR ENDED 30 JUNE 2014
46

Annual Financial Report for the Year Ended 30 June 2014
53
Notes to the Financial StatementsNOTES TO THE FINANCIAL STATEMENTS
2014 2013 2014 2013$'000 $'000 $'000 $'000
21. NOTES TO THE STATEMENTS OF CASH FLOW
Reconciliation of profit after income tax to net cash from operating activities
Profit for the period 25,497 28,825 24,288 27,897
Adjustments for:Depreciation and amortisation 9,337 11,293 9,337 11,293 Increase/(decrease) in provision for impairment 387 (1,048) 387 (1,048)Net change in fair value of financial assets/liabilities at fair value through profit or loss (830) (1,971) (830) (1,971)Bad debts written off 4,064 3,345 4,064 3,345 Dividend income classified as investing cash flow (2,330) (2,271) (2,364) (2,271)Net profit on sale of property, plant & equipment 5 (7,720) 5 (7,720)Share of profit of equity accounted investees (753) - - -
Change in assets and liabilities:Increase in provisions 1,013 1,710 986 1,735 Increase in provision for income tax 5,474 1,447 5,324 1,441 Increase in deferred tax assets and liabilities (652) (1,039) (1,750) (1,041)Decrease in interest payable (10,159) (5,864) (11,338) (5,640)Decrease in other payables (15,149) (3,088) (14,641) 10,681 Increase in net loans and advances (136,906) (79,389) (136,906) (79,389)Increase in deposits and withdrawable share capital 330,885 26,474 330,373 26,989 Decrease in interest receivable 304 5,032 299 5,033 (Decrease)/increase in derivative assets/liabilities (769) (6,928) 2,937 (6,700)(Increase)/decrease in other assets (591) 358 (2,025) 406
Net cash from operating activities 208,827 (30,834) 208,146 (16,960)
Consolidated Credit Union
ANNUAL FINANCIAL REPORT FOR YEAR ENDED 30 JUNE 2014
47

Annual Financial Report for the Year Ended 30 June 2014
54
Notes to the Financial StatementsNOTES TO THE FINANCIAL STATEMENTS
22. COMMITMENTS
Capital expenditure commitments
2014 2013Lease expenditure commitments $'000 $'000
Non-cancellable operating leases: not later than 1 year 14,387 13,457 later than 1 and not later than 2 years 15,312 12,110 later than 2 and not later than 5 years 42,551 31,936 later than 5 years 58,621 64,691 Aggregate lease expenditure contracted for at 30 June 130,871 122,194
Credit commitments
The Group has the following credit commitments:
2014 2013$'000 $'000
Loans approved not disbursed 150,123 124,256 Members unused credit facility 450,006 449,734
600,129 573,990
23. CONTINGENT ASSETS AND LIABILITIES
Guarantees
The Group has issued guarantees as follows:
Guarantee issued for members 2,186 2,539
CUFSS Limited
Consolidated
At 30 June 2014, the Group has commitments of $6.200 million (2013: $Nil) predominantly relating to the integrated fitout works for the Group's new head office building in Flinders Street, Adelaide.
The Group leases various motor vehicles, office (including the new head office) and branch premises under non-cancellable operating leases expiring within one to twelve years. The leases have varying terms, escalation clauses andrenewal rights. On renewal the terms of the leases are renegotiated.
Consolidated
• Agrees, in conjunction with other members, to fund the operating costs of CUFSS.
With effect from 1 July 1999, the Credit Union is a party to an Industry Support Contract (“ISC”) administered by CUFSSLimited (“CUFSS”). The ISC is certified by APRA under Section 11CB of the Banking Act 1959 (Cth) and is a voluntaryfinancial support scheme whose members are Credit Unions, Mutual Banks and Cuscal Limited. CUFSS is a companylimited by guarantee, each member’s guarantee being $100. As a member of CUFSS, the Credit Union:
• May be required to advance funds (excluding permanent loans) of up to 3% of total assets to another CUFSS memberrequiring financial support;• May be required to advance permanent loans of up to 0.2% of total assets per financial year to another CUFSSmember requiring financial support; and
As the probability and value of guarantees may be called upon is unpredictable, it is not practical to state the timing ofany payment.
ANNUAL FINANCIAL REPORT FOR YEAR ENDED 30 JUNE 2014
48

Annual Financial Report for the Year Ended 30 June 2014
55
Notes to the Financial StatementsNOTES TO THE FINANCIAL STATEMENTS
24. SECURITISATION
2014 2013$'000 $'000
25. STANDBY BORROWING FACILITIES
The Credit Union has the following borrowing facilities:
Overdraft facilityGross facility amount 5,000 5,000 Less: current borrowing - - Net available 5,000 5,000
26. SIGNIFICANT ALLIANCES
Fiserv (aspac) Pte. Ltd
CU Technology Development Ltd
Data Action Pty Ltd
In the ordinary course of business, the Group enters into transactions that result in the transfer of financial assets tothird parties or special purpose entities on an arm’s length basis. The Credit Union transferred loans totalling $82.903million (2013: $232.698 million) during the financial year as part of its ongoing funding program. The loan transfers aremade to either warehouse funding facilities $82.903 million (2013: $34.003 million) and/or to SPE’s $Nil (2013:$198.695 million). The total value of transferred loans as at 30 June 2014 was $996.427 million (2013: $1,284.567million). The Group has not transferred substantially all of the risks and rewards associated with these loans andaccordingly these loans are carried on the Group's balance sheet. The Group does invest in some of its ownsecuritisation programs where the Credit Union holds notes equivalent to $33.992 million as at 30 June 2014 (2013:$38.162 million).
Refer to Note 10 b) for information on capital notes held by the Credit Union and Note 29 Related Parties for moreinformation on loan balances and net distributions to unitholders.
This company operates a computer bureau which operates a processing system of the Credit Union.
Credit Union
This company provides the Credit Union with the rights to, and the production of member's cheques, ATM managementservices, Redicards and Visa cards, provides finance facilities, settlement with bankers, electronic funds deposit,central banking and money market services. In addition, this company operates the switching system that linksrediATM's, other approved EFT suppliers, Visa acquirers and merchants to the Credit Union's computer systems.
This company is a member of an international group which owns core computer software which the Credit Unionoperates.
This company has been formed on behalf of credit unions to oversee the continued development and futureimplementations of the Credit Union's core banking system.
The Credit Union has a significant alliance with the following suppliers of services:
Cuscal Limited
ANNUAL FINANCIAL REPORT FOR YEAR ENDED 30 JUNE 2014
49

Annual Financial Report for the Year Ended 30 June 2014
56
Notes to the Financial StatementsNOTES TO THE FINANCIAL STATEMENTS
2014 2013 2014 2013$'000 $'000 $'000 $'000
27. AUDITOR'S REMUNERATION
- Auditing the financial report 237 227 208 201 - Other regulatory activities 57 88 51 85 - Other assurance services 85 71 85 71 - Taxation services 134 159 134 159 - Other services 19 12 19 12
532 557 497 528
28. KEY MANAGEMENT PERSONNEL
a) Directors
J.L. Cossons (Chair) (Appointed Chair effective 1st June 2014)W. R. Cossey AM (Retired from Chair effective 31st May 2014)P.H.T. Evers (Managing Director)Dr. R. H. S. BrooksS. M. DayE. T. McGuirkJ. McMahonK. A. Skipper AM
b) Other key management personnel
D. Bateman (Executive General Manager Sales and Distribution)A. Hamilton (Executive General Manager Marketing and Product Management)D. Mattiske-Wood (Executive General Manager Organisational Development)S. Laidlaw (Executive General Manager Corporate Services)L. Wilkinson (Executive General Manager Risk)A. Hampton (General Manager Technology) *D. Lewis (General Manager Retail Banking) *
* From 2 September 2013, no longer deemed to be key management personnel.
Consolidated Credit Union
The following were Directors of the Group from the beginning of the financial year to the date of this report.
The following persons, employed by the Credit Union, also had authority and responsibility for planning, directing and controlling the activities of the Group, directly or indirectly, during the financial year:
Amounts paid or payable to the external auditors - KPMG
ANNUAL FINANCIAL REPORT FOR YEAR ENDED 30 JUNE 2014
50

Annual Financial Report for the Year Ended 30 June 2014
57
Notes to the Financial StatementsNOTES TO THE FINANCIAL STATEMENTS
28. KEY MANAGEMENT PERSONNEL (Continued)
c) Key management personnel compensation
Directors and other key management personnel compensation for the Group comprised:
Short-term employee benefits
Post-employment
benefits - superannuation
Other long term benefits Total
$'000 $'000 $'000 $'0002014 3,153 199 99 3,4512013 3,347 215 87 3,649
d) Loans
2014 2013$'000 $'000
Total aggregate loans as at the reporting date (30 June) 3,677 5,032
Other transactions with key management personnel
Loans to Directors and other key management personnel are either unsecured or secured by registered mortgage overeligible security in accordance with standard lending policies.
As required to be a member of the Credit Union, each Director and each other key management personnel memberholds one $2 share.
All loans to Directors and other key management personnel are made on normal staff terms and conditions that areapplicable to normal staff benefit packages.
The Directors and key management personnel who conducted loan accounts with the Credit Union during the year wereJ.L. Cossons, W.R. Cossey AM, P.H.T. Evers, S.M. Day, K.A. Skipper AM, D. Bateman, A. Hamilton, A. Hampton, D.Lewis and L. Wilkinson.
Apart from the details under this disclosure, no Director or other key management personnel have entered into amaterial contract with the Credit Union or the Consolidated Entity since the end of the previous year and there were nomaterial contracts involving key management personnel interests existing at year end.
Financial transactions (including loans disclosed within this report) of Directors (including the Managing Director) occur inthe ordinary course of business on an arms length basis. For other key management personnel, financial transactions(other than loans disclosed within this report) are made on normal staff terms and conditions that are applicable tonormal staff benefit packages. Disclosure of financial transactions regularly made as part of normal banking operationsis limited to disclosure of such transactions with key management personnel and entities controlled or significantlyinfluenced by them. All such financial transactions that have occurred between entities within the Group and their keymanagement personnel were in the nature of normal personal banking.
ANNUAL FINANCIAL REPORT FOR YEAR ENDED 30 JUNE 2014
51

Annual Financial Report for the Year Ended 30 June 2014
58
Notes to the Financial StatementsNOTES TO THE FINANCIAL STATEMENTS
29. RELATED PARTIES
Controlled entities
2014 2013 2014 2013 2014 2013$'000 $'000 $'000 $'000 $'000 $'000
Financial Solutions Australasia Pty Ltd 216 217 2,748 1,756 - - Australian Central Services Pty Ltd 105 115 140 117 - - Flinders Finance Pty Ltd** - (4) - (4) - 198Let's Talk Home Loans Group Pty Ltd - - (147) (114) 481 425People's Choice Community Foundation Limited (476) (428) (3) 12 164 115
2014 2013 2014 2013 2014 2013$'000 $'000 $'000 $'000 $'000 $'000
Light Trust No. 1 (1,143) (1,426) 68,247 87,698 1,605 2,059 Light Trust No. 2 (205) (926) 57,869 77,512 752 1,036 Light Trust No. 3 (1,708) (2,547) 189,608 253,387 2,151 2,983 Light Trust No. 4 (3,428) 1,502 275,708 378,263 2,268 2,092 Light Trust No. 5R - - - - - -
** Ceased trading as at 31 May 2014. All capital has been returned to the Credit Union. Flinders Finance Pty Ltd is in the process of deregistrationwith the official deregistration to take place during the year ended 30 June 2015.
Residual unitholder net distribution Loan
Net Interest Rate Swap Expense
The Credit Union entered into transactions with its Controlled Entities. These transactions were all carried out undernormal commercial terms and are eliminated in the financial reports. The following table provides the total amount oftransactions that were entered into with related parties for the relevant financial year.
Aggregate amounts included in the
accounts of the Credit Union
Income/(expense)
Payable to the Credit Union/(receivable from
Credit Union)
Deposits with the Credit Union
ANNUAL FINANCIAL REPORT FOR YEAR ENDED 30 JUNE 2014
52

Annual Financial Report for the Year Ended 30 June 2014
59
Notes to the Financial Statements NOTES TO THE FINANCIAL STATEMENTS 30. RISK MANAGEMENT a) Financial risk management objectives The Group is exposed to a range of risks as part of its daily operations.
These risks are managed using an enterprise wide approach in line with sound business practice, Australian risk management standards, prudential requirements and the Board’s approved risk appetite, providing the Board with a comprehensive view of its risk profile.
As part of the risk management framework, a risk management strategy is maintained which includes policies and plans which detail the Group’s approach to the management of risk exposures. The risk management strategy includes systems for the identification, analysis, evaluation, treatment, monitoring and reporting of risk, is subject to regular review and is responsive to the changing regulatory and operating environments.
The Board ensures a sound risk management culture is maintained and embedded in the Group’s values and behaviours and the conduct of business. The material financial risks faced by the Group include liquidity risk, credit risk and market risk (incorporating interest rate risk).
b) Liquidity risk management
Liquidity risk is the risk that the Group will not be able to meet its financial obligations as they fall due. The Group's approach to managing liquidity risk is to ensure, as far as possible, that it will always have sufficient liquidity to meet its liabilities when due, under both normal and stressed conditions, without incurring unacceptable losses or risking damage to its reputation.
The Group has in place information systems and a structured process to monitor and manage liquidity risk. The management process incorporates specific liquidity management strategies and liquidity contingency plans that manage liquidity on a daily basis under normal situations and assumed adverse scenarios. The liquidity strategy requires the holding of surplus funds in liquid assets which meet APRA’s criteria for classification as eligible Minimum Liquidity Holdings (“MLH”) the availability of appropriate standby lines of funding; maintenance of reliable sources of funding (retail and wholesale) and daily liquidity projections.
APRA Prudential Standards place specific management and reporting requirements on ADIs in relation to liquidity risk. The Prudential Standards provide that liquidity strategies and liquidity holdings can be based on either a scenario analysis or on a minimum liquidity holdings basis. APRA has approved the adoption by the Credit Union of a minimum MLH basis whereby the Credit Union is required to maintain a minimum holding in specified eligible assets at all times. The Credit Union and the Group complied with all APRA liquidity requirements throughout the year.
The Credit Union's liquidity ratio as at the reporting date (30 June) is provided below:
Credit Union
2014 2013
% %
Liquidity ratio
13.29
12.88 The Credit Union also maintains additional liquid assets which are not MLH eligible. After taking into consideration these assets the total liquidity of the Credit Union at 30 June 2014 is 14.16%.
Contractual undiscounted cash flows
The following tables summarise the maturity profile of the Group's and the Credit Union's financial liabilities as at 30 June 2014 based on contractual undiscounted repayment obligations. Repayments which are subject to notice are treated as if notice is given immediately. However, the Group or the Credit Union expect that many members will not request repayment on the earliest date the Group or the Credit Union could be required to pay and the tables do not reflect the cash flows indicated by the Group's or the Credit Union's deposit retention history. Derivatives designated are based on their contractual maturity. The amounts represent principal and interest cash flows and may differ when compared to the carrying amounts reported on the Statements of Financial Position.
ANNUAL FINANCIAL REPORT FOR YEAR ENDED 30 JUNE 2014
53

Annual Financial Report for the Year Ended 30 June 2014
60
Notes to the Financial StatementsNOTES TO THE FINANCIAL STATEMENTS
30. RISK MANAGEMENT (Continued)
b) Liquidity risk management (continued)
Consolidated EntityAt call 3 Months
or less 3 to 12 months
1 to 5 years
greater than 5 years
Total Carrying amount
$'000 $'000 $'000 $'000 $'000 $'000 $'0002014
Financial LiabilitiesDeposits 2,637,835 773,137 819,389 139,275 - 4,369,636 4,335,835 Other payables - 56,713 - - - 56,713 56,713 Borrowings - 35,819 471,280 178,608 805,837 1,491,544 979,253 Derivative Financial InstrumentsInterest rate swaps (assets)/liabilities - 835 2,146 879 - 3,860 3,642 Total cash flows 2,637,835 866,504 1,292,815 318,762 805,837 5,921,753 5,375,443
2013
Financial LiabilitiesDeposits 2,237,345 914,548 784,247 109,106 - 4,045,246 4,004,950 Other payables - 82,021 - - - 82,021 82,021 Borrowings - 51,876 521,397 243,042 1,161,058 1,977,373 1,241,523 Derivative Financial InstrumentsInterest rate swaps (assets)/liabilities - 1,721 3,219 367 - 5,307 5,242 Total cash flows 2,237,345 1,050,166 1,308,863 352,515 1,161,058 6,109,947 5,333,736
Credit Union
2014
Financial LiabilitiesDeposits 2,638,480 773,137 819,389 139,275 - 4,370,281 4,336,480 Other payables - 60,910 - - - 60,910 60,910 Borrowings - 36,091 472,096 182,949 825,423 1,516,559 993,287 Derivative Financial InstrumentsInterest rate swaps (assets)/liabilities - 418 1,063 (582) - 899 1,280 Total cash flows 2,638,480 870,556 1,292,548 321,642 825,423 5,948,649 5,391,957
2013
Financial LiabilitiesDeposits 2,238,503 914,548 784,247 109,106 - 4,046,404 4,006,107 Other payables - 86,889 - - - 86,889 86,889 Borrowings - 52,278 522,603 249,461 1,191,721 2,016,063 1,262,027 Derivative Financial InstrumentsInterest rate swaps (assets)/liabilities - 1,348 2,158 (3,112) (1,156) (762) (827) Total cash flows 2,238,503 1,055,063 1,309,008 355,455 1,190,565 6,148,594 5,354,196
Contractual cash flows
ANNUAL FINANCIAL REPORT FOR YEAR ENDED 30 JUNE 2014
54

Annual Financial Report for the Year Ended 30 June 2014
61
Notes to the Financial StatementsNOTES TO THE FINANCIAL STATEMENTS
30. RISK MANAGEMENT (Continued)
c) Credit risk management
2014 2013 2014 2013$'000 $'000 $'000 $'000
Cash and cash equivalents 111,622 135,522 99,669 135,522 Other assets 20,718 20,551 22,826 20,559 Available-for-sale investment securities 626,134 664,036 615,254 650,756 Derivative assets 1,578 4,468 2,362 6,188 Financial assets other than loans and advances 760,052 824,577 740,111 813,025 Loans and advances 5,031,103 4,898,633 5,031,103 4,898,633 Total Financial assets 5,791,155 5,723,210 5,771,214 5,711,658 Credit commitments 600,129 573,990 600,129 573,990 Total potential exposure to credit risk 6,391,284 6,297,200 6,371,343 6,285,648
Distribution of financial assets
Neither past due nor impairedFinancial assets other than loans and advances 760,052 824,577 740,111 813,025 Loans and advances 4,883,760 4,745,681 4,883,760 4,745,681 Past due but not impaired Loans and advances 142,962 150,630 142,962 150,630 ImpairedLoans and advances 4,381 2,322 4,381 2,322
5,791,155 5,723,210 5,771,214 5,711,658 Gross loans and advances which are past duebut not impaired 1 - 30 days 109,559 120,918 109,559 120,918 31 - 60 days 15,013 16,345 15,013 16,345 61 - 90 days 6,756 5,832 6,756 5,832 > 90 days 11,634 7,535 11,634 7,535 Total 142,962 150,630 142,962 150,630
Credit risk refers to the risk that a counterparty will default on its contractual obligations resulting in financial loss to theGroup. The Group has adopted a policy of only dealing with credit worthy counterparties and obtaining sufficient othersecurity where appropriate, as a means of mitigating the risk of financial loss from defaults.
The Group's maximum exposure to credit risk at balance date in relation to each class of recognised financial assets isthe carrying amount of those assets as indicated in the Statements of Financial Position. The maximum credit exposuredoes not take into account the value of any collateral or other security held, in the event other entities/parties fail toperform their obligations under the financial instruments in question. The value of collateral held against individualexposures is generally only assessed at the time of borrowing or when a specific review of that exposure is undertakenin accordance with policy.
The Group holds collateral against loans and advances to members in the form of mortgage interests over realproperty. Estimates of fair value are based on the value of collateral assessed at the time of borrowing and generallyare not updated except when a loan is individually assessed as impaired.
The maximum exposure to credit risk at the reporting date (30 June) was:
Consolidated Credit Union
ANNUAL FINANCIAL REPORT FOR YEAR ENDED 30 JUNE 2014
55

Annual Financial Report for the Year Ended 30 June 2014
62
Notes to the Financial StatementsNOTES TO THE FINANCIAL STATEMENTS
30. RISK MANAGEMENT (Continued)
c) Credit risk management (continued)
2014 2013 2014 2013$'000 $'000 $'000 $'000
Geographic concentration of credit risk for gross loans and advances
South Australia 3,761,236 3,742,793 3,761,236 3,742,793 Northern Territory 560,853 525,997 560,853 525,997 Victoria 353,839 311,944 353,839 311,944 New South Wales 163,034 149,088 163,034 149,088 Western Australia 86,961 78,147 86,961 78,147 Queensland 79,047 73,279 79,047 73,279 Australian Capital Territory 18,901 10,571 18,901 10,571 Tasmania 7,232 6,814 7,232 6,814
5,031,103 4,898,633 5,031,103 4,898,633
d) Capital adequacy
2014 2013$'000 $'000
Capital Adequacy Ratio 15.84% 14.75%
Qualifying capitalTier 1 434,297 406,138 Tier 2 7,530 7,779 Total qualifying capital 441,827 413,917
Risk Weighted Assets 2,788,851 2,806,462
Consolidated Credit Union
The Group's capital adequacy ratio as at the end of the reporting date (30 June) and the comparative are as follows:
For further detail on the Group's capital adequacy please refer to our public disclosures under APS 330 , which islocated on the Credit Union's website under Regulatory Disclosures.
The management of the capital of a financial institution is a fundamental part of its risk management process as anessential element of capital is its availability to absorb future, unexpected and unidentified losses.
APRA Prudential Standards require ADI's to maintain at all times a minimum ratio of capital to risk weighted assets. Aspart of its risk management process, the Credit Union has developed a methodology with financial modelling to assist indetermining the optimum level of capital that is consistent with assessed risk exposure and business activity. Theoptimum capital is managed within a range well above the minimum required by APRA and incorporates anassessment of the combined risk exposure for operations, market, credit and strategic risk.
The capital management plan ensures the ongoing capital management of the Credit Union is maintained with the leveland extent of the risks the Credit Union is exposed to from its activities. The Credit Union and the Group complied withall APRA capital adequacy requirements throughout the year.
Consolidated
ANNUAL FINANCIAL REPORT FOR YEAR ENDED 30 JUNE 2014
56

Annual Financial Report for the Year Ended 30 June 2014
63
Notes to the Financial StatementsNOTES TO THE FINANCIAL STATEMENTS
30. RISK MANAGEMENT (Continued)
e) Market risk management
f) Interest rate risk
2014 2013 2014 2013Consolidated % % $'000 $'000
50 bp rise 0.37 0.20 5,468 3,675 50 bp fall (0.37) (0.20) (3,746) (3,659)
100 bp rise 0.73 0.40 10,982 7,366 100 bp fall (0.75) (0.40) (7,485) (7,304)
Market risk is the risk of exposure to changes to financial prices affecting the value of positions held by the Group aspart of its normal trading activities. As the Group does not deal in foreign exchange contracts or commodities, marketrisk for the Group consists solely of interest rate risk.
Interest rate risk arises from the possibility that changes in interest rates will affect future cash flows or the fair valuesof financial instruments. The Board has established limits on the interest rate risk volatility of net interest income andmarket value of equity exposures. Positions are monitored regularly and approved hedging strategies are executed toensure sensitivities and exposures are maintained within the established limits.
The following table demonstrates the sensitivity to reasonably possible changes in interest rates, on the Group’sincome statement and in equity with all other variables held constant.
The sensitivity in the Statements of Profit or Loss and Other Comprehensive Income is the effect of assumed changesin interest rates on the net interest for one year, based on the floating rate financial assets and financial liabilities heldat 30 June 2014, including the effect of hedging instruments. The sensitivity of equity is calculated by revaluing thefixed rate of loans and advances, available for sale financial assets (including the effect of any associated hedges),and interest rate swaps designated as cash flow hedges, at 30 June 2014 for the effects of the assumed changes ininterest rates. The sensitivity of equity is analysed by maturity of the asset or interest rate swap, with sensitivity basedon the assumption that there are parallel shifts in the yield curve.
Monitoring of adherence to policies, limits and procedures is controlled through the Management Asset and LiabilityCommittee ("MALCO") and the Board Risk Committee.
Equity SensitivityNet Revenue Sensitivity
ANNUAL FINANCIAL REPORT FOR YEAR ENDED 30 JUNE 2014
57

Annual Financial Report for the Year Ended 30 June 2014
64
Notes to the Financial StatementsNOTES TO THE FINANCIAL STATEMENTS
30. RISK MANAGEMENT (Continued)
f) Interest rate risk (continued)
ConsolidatedFloating interest
rate
<1 yrs 1-5 yrs > 5 yrs Non-interest bearing
Total
2014 $'000 $'000 $'000 $'000 $'000 $'000
Financial AssetsCash and cash equivalents 111,622 - - - 18,390 130,012 Loans and advances 3,133,825 414,432 1,466,018 10,035 - 5,024,310 Available-for-sale investment securities - 628,143 - - 8,778 636,921 Other investments 1,809 - - - - 1,809
3,247,256 1,042,575 1,466,018 10,035 27,168 5,793,052 Financial LiabilitiesDeposits 2,635,981 1,566,818 132,367 - 669 4,335,835 Borrowings - 979,253 - - - 979,253
2,635,981 2,546,071 132,367 - 669 5,315,088
Interest rate swaps - assets/(liabilities) 798,767 (183,544) (594,126) (21,097) - -
2013
Financial AssetsCash and cash equivalents 142,528 - - - 9,064 151,592 Loans and advances 3,285,440 326,594 1,264,706 15,115 - 4,891,855 Available-for-sale investment securities - 664,036 - - 12,279 676,315 Other investments 1,701 - - - - 1,701
3,429,669 990,630 1,264,706 15,115 21,343 5,721,463 Financial LiabilitiesDeposits 2,229,065 1,673,189 102,021 - 675 4,004,950 Borrowings - 1,241,523 - - - 1,241,523
2,229,065 2,914,712 102,021 - 675 5,246,473
Interest rate swaps - Assets/(liabilities) 557,459 (159,553) (359,357) (38,549) - -
The Group is exposed to interest rate risk, which is the risk that a financial instrument’s value will fluctuate as a resultof changes in market interest rates and the effective weighted average interest rate on classes of financial assets andfinancial liabilities.
Fixed interest rate maturing:
The Group's exposure to interest rate risk at balance date is shown in the following table and does not differ materiallyfrom that of the Credit Union.
ANNUAL FINANCIAL REPORT FOR YEAR ENDED 30 JUNE 2014
58

Annual Financial Report for the Year Ended 30 June 2014
65
Notes to the Financial StatementsNOTES TO THE FINANCIAL STATEMENTS
30. RISK MANAGEMENT (Continued)
g) Interest rate swap contracts
Asset Liability Asset Liability
$'000 $'000 $'000 $'000 $'000 $'000Consolidated
Derivatives at fair value through profit and lossInterest rate swaps 263,767 1,578 (2,715) 202,459 4,348 (6,317)
Derivatives held as cash flow hedgesInterest rate swaps 535,000 - (2,505) 355,000 120 (3,393)
798,767 1,578 (5,220) 557,459 4,468 (9,710)
Credit Union
Derivatives at fair value through profit and lossInterest rate swaps 185,779 2,362 (1,138) 237,732 6,068 (1,968)
Derivatives held as cash flow hedgesInterest rate swaps 535,000 - (2,504) 355,000 120 (3,393)
720,779 2,362 (3,642) 592,732 6,188 (5,361)
The Group uses interest rate contracts in managing interest rate exposure, including interest rate swap contracts. Forinterest rate swap contracts, the Group agrees to exchange the difference between fixed and floating rate interestamounts calculated on agreed notional principal amounts. Such contracts enable the Group to mitigate the risk ofchanging interest rates. The Group enters into interest rate swap contracts for the sole purpose of managing interestrate exposures in the Statements of Financial Position and not for speculative purposes.
2014 2013
Fair Value Fair Value Notional amount
Notional amount
ANNUAL FINANCIAL REPORT FOR YEAR ENDED 30 JUNE 2014
59

Annual Financial Report for the Year Ended 30 June 2014
66
Notes to the Financial StatementsNOTES TO THE FINANCIAL STATEMENTS
30. RISK MANAGEMENT (Continued)
g) Interest rate swap contracts (continued)
Net Fair ValueNotional principal
amount2014 2013 2014 2013$'000 $'000 $'000 $'000
Less than 1 year (2,857) (4,878) 183,544 159,5531 to 2 years (769) (623) 266,701 150,7562 to 5 years (16) 259 327,425 208,601> 5 years - - 21,097 38,549
(3,642) (5,242) 798,767 557,459
Offsetting financial assets and financial liabilities
Master netting arrangement – not currently enforceable
Financial assets and financial liabilities are offset and the net amount reported in the Statements of Financial Positionwhen there is a legally enforceable right to offset the recognised amounts and there is an intention to settle on a netbasis or realise the asset and settle the liability simultaneously. The Group does not have a legally enforceable right toset-off any interest rate swap agreements.
Agreements with derivative counterparties are based on the International Swaps and Derivatives Association ("ISDA")Master Agreement. Under the terms of these arrangements, only where certain credit events occur (such as default),the net position owing/receivable to a single counterparty in the same currency will be taken as owing and all therelevant arrangements terminated. As neither the Group nor the Credit Union presently have a legally enforceable rightof set-off, these amounts have not been offset in the Statements of Financial Position and accordingly derivative assetsand derivative liabilities are shown on a gross basis in the Statements of Financial Position.
If under the ISDA Master Agreement there was a legally enforceable right of set-off, there would be a reduction in boththe derivative asset and derivative liability of the Credit Union and the Group of $1.578 million as at 30 June 2014($4.468 million at 30 June 2013).
The following table details the Group's net fair values and notional principal amounts at the remaining terms of interestrate swap contracts outstanding as at the reporting date:
ANNUAL FINANCIAL REPORT FOR YEAR ENDED 30 JUNE 2014
60

Annual Financial Report for the Year Ended 30 June 2014
67
Notes to the Financial Statements
NOTES TO THE FINANCIAL STATEMENTS 31. FAIR VALUE OF FINANCIAL INSTRUMENTS a) Fair value methodologies Disclosed below is the estimated fair value of the Group's financial instruments presented in accordance with the requirements of Accounting Standard AASB 7 "Financial Instruments - Disclosure”.
A financial instrument is defined by AASB 132 “Financial Instruments - Presentation” as any contract that gives rise to both a financial asset of one entity and a financial liability or equity instrument of another entity. A financial liability is a contractual obligation either to deliver cash or another financial asset to another entity, or, to exchange financial instruments with another entity under conditions that are potentially unfavourable.
The methodologies and assumptions used in measuring fair value depend on the terms and risk characteristics of the various instruments and include the following:
Cash and cash equivalents Being cash on hand and at call deposits, the carrying amount is the net fair value. Loans and advances The net fair value of loans has been estimated using discounted cash flow analysis, based on current rates offered by the Group for loans with similar terms. The net fair value of impaired loans has been estimated as their carrying amount net of the aggregate provision for impairment.
Available-for-sale investment securities Estimated using discounted cash flow analysis, based on current market rates for similar arrangements.
Other investments Other investments represent both capital notes and shares in unlisted companies. The fair value of capital notes is estimated using discounted cash flow analysis, based on current market rates for similar arrangements. The fair value of unlisted companies cannot be reliably measured as no active market exists for these assets. There are no current intentions to dispose of these investments.
Derivative financial instruments Estimated using discounted cash flow analysis, based on current market rates for similar arrangements. Other assets This includes items such as sundry debtors, which are short-term by nature and the carrying amount is therefore a reasonable estimate of fair value.
Deposits The net fair value of deposits has been estimated using discounted cash flow analysis, based on current rates offered by the Group for deposits with similar terms.
Other payables Carrying amount approximates net fair value because of the short term to settlement of the amounts due. Borrowings Estimated using discounted cash flow analysis, based on current market rates for similar arrangements.
ANNUAL FINANCIAL REPORT FOR YEAR ENDED 30 JUNE 2014
61

Annual Financial Report for the Year Ended 30 June 2014
68
Notes to the Financial StatementsNOTES TO THE FINANCIAL STATEMENTS
31. FAIR VALUE OF FINANCIAL INSTRUMENTS (Continued)
a) Fair value methodologies (continued)
2014 2013 2014 2013$'000 $'000 $'000 $'000
Consolidated
Financial AssetsCash and cash equivalents 130,012 151,592 130,012 151,592 Loans and advances 5,024,310 4,891,855 5,040,371 4,906,712 Available-for-sale investment securities 636,921 674,823 636,921 674,823 Other investments 1,809 1,701 1,809 1,701 Derivative assets 1,578 4,468 1,578 4,468 Other assets 20,718 20,551 20,718 20,551
5,815,348 5,744,990 5,831,409 5,759,847
Financial LiabilitiesDeposits 4,335,835 4,004,950 4,329,848 4,001,623 Other payables 56,713 82,021 56,713 82,021 Borrowings 979,253 1,241,523 984,189 1,244,584 Derivative liabilities 5,220 9,710 5,220 9,710
5,377,021 5,338,204 5,375,970 5,337,938
Credit Union
Financial AssetsCash and cash equivalents 118,058 144,826 118,058 144,826 Loans and advances 5,024,310 4,891,855 5,040,371 4,906,712 Available-for-sale investment securities 626,041 661,543 626,041 661,543 Other investments 40,789 45,011 40,789 45,011 Derivative assets 2,362 6,188 2,362 6,188 Other assets 22,826 20,559 22,826 20,559
5,834,386 5,769,982 5,850,447 5,784,839
Financial LiabilitiesDeposits 4,336,480 4,006,107 4,330,493 4,001,623 Other payables 60,910 86,889 60,910 86,889 Borrowings 993,287 1,262,027 998,223 1,262,568 Derivative liabilities 3,642 5,361 3,642 5,361
5,394,319 5,360,384 5,393,268 5,356,441
The following table provides comparison of carrying amounts and net fair values for financial instruments:
Carrying value Fair value
ANNUAL FINANCIAL REPORT FOR YEAR ENDED 30 JUNE 2014
62

Annual Financial Report for the Year Ended 30 June 2014
69
NOTES TO THE FINANCIAL STATEMENTS
31. FAIR VALUE OF FINANCIAL INSTRUMENTS (Continued)
b) Fair value hierarchy
- Level 1: Quoted prices (unadjusted) in active markets for identical assets or liabilities.- Level 2:
- Level 3: Inputs for the asset or liability that are not based on observable market data (unobservable inputs).
Level 1 Level 2 Level 3 Total$'000 $'000 $'000 $'000
Consolidated Entity
2014Financial Assets Financial assets available-for-sale - 636,921 - 636,921 Derivative assets - 1,578 - 1,578
- 638,499 - 638,499 Financial LiabilitiesDerivative financial liabilities - (5,220) - (5,220)
- (5,220) - (5,220)
2013Financial Assets Financial assets available-for-sale - 674,823 - 674,823 Derivative assets - 4,468 - 4,468
- 679,291 - 679,291 Financial LiabilitiesDerivative financial liabilities - (9,710) - (9,710)
- (9,710) - (9,710)
Credit Union
2014Financial Assets Financial assets available-for-sale - 626,041 - 626,041 Derivative assets - 2,362 - 2,362
- 628,403 - 628,403 Financial LiabilitiesDerivative financial liabilities - (3,642) - (3,642)
- (3,642) - (3,642)
2013Financial Assets Financial assets available-for-sale - 661,543 - 661,543 Derivative assets - 6,188 - 6,188
- 667,731 - 667,731 Financial LiabilitiesDerivative financial liabilities - (5,361) - (5,361)
- (5,361) - (5,361)
The following table analyses financial instruments at fair value at the reporting date by the level in the fair value hierarchyinto which the fair value measurement is categorised. The different levels within the hierarchy are as follows:
Inputs other than quoted prices included within Level 1 that are observable for the assets or liabilities,either directly (i.e. as prices) or indirectly (i.e. derived from prices).
The fair value of the financial instruments is summarised in the table below:
ANNUAL FINANCIAL REPORT FOR YEAR ENDED 30 JUNE 2014
63
Notes to the Financial Statements

Annual Financial Report for the Year Ended 30 June 2014
70
Notes to the Financial Statements
NOTES TO THE FINANCIAL STATEMENTS 32. EVENTS SUBSEQUENT TO REPORTING DATE
There has not arisen in the interval between the end of the financial year and the date of this report, any item, transaction or event of a material and unusual nature likely, in the opinion of the Directors of the Credit Union, to affect significantly the operations of the Group, the results of those operations, or the state of affairs of the Group in future financial years.
ANNUAL FINANCIAL REPORT FOR YEAR ENDED 30 JUNE 2014
64

Annual Financial Report for the Year Ended 30 June 2014
71
Registered Office
Australian Central Credit Union Ltd ABN 11 087 651 125
AFSL/ACL 244310
60 Light Square Adelaide SA 5000
Telephone
13 11 82
Annual General Meeting
Thursday, 30 October 2014 Commencing 11.00am, Central Daylight Saving Time Sebel Playford Adelaide, 120 North Terrace, Adelaide
Bankers
Cuscal Ltd National Australia Bank Limited Westpac Banking Corporation
Auditors
KPMG
Tax Agent
KPMG
Solicitors
Clayton Utz DMAW Fisher Jeffries Holley Nethercote Hunt & Hunt Piper Alderman Wallmans

Annual Financial Report for the Year Ended 30 June 2014
72People’s Choice Credit Union, a trading name of Australian Central Credit Union Ltd ABN 11 087 651 125, acts under its own Australian Financial Services Licence (AFSL 244310) and Australian Credit Licence (ACL 244310).