Annual Report - Yusen Logistics
44
Yusen Logistics Co.,Ltd. Annual Report Annual Report 2011 Yusen Logistics Co Ltd 2011
Transcript of Annual Report - Yusen Logistics

Yusen Logistics Co.,Ltd.Annual Report
An
nu
al
Re
po
rt
20
11
Yu
se
nL
og
istic
sC
oL
td
2011

FUSION
Fusion of
organizations
Fusion of
employee awareness
Fusion of
governanceINTEGRATION
2
1YAS NYK Logistics
“Fusion” of Operation
Promote “Fusion” of employee awareness, organization and governance, in order to maximize synergies, share corporate values worldwide within the Yusen Logistics (YLK) Group and aim to achieve its goals.
“GO FORWARD, Yusen Logistics”
In October 2010, Yusen Logistics Co., Ltd. was born out of
integration of Yusen Air & Sea Service, a logistics provider of 55
years of experience and with strength in air freight forwarding, with
NYK Logistics (Japan), another logistics provider having 27 years of
experience with its core business in ocean freight forwarding.
We are currently proceeding with gradual integration with NYK
Logistics’ overseas business which has strength in ocean freight
forwarding and contract logistics. Once completed, we will be
able to satisfy diversified customer needs in all services that
seamlessly cover air and ocean freight forwarding, land transport
and contract logistics.
We will accomplish steady “Integration,” promote “Fusion” of
internal values and then make “Dramatic Progress” to be able to
provide high-quality services that satisfy requests from many
customers, with an ultimate goal of becoming a total logistics
provider operating globally with world-class scale and quality.
By accomplishing three steps of “Integration,” “Fusion” and “Dramatic Progress,” we aim to be A Total Logistics Provider operating globally with world-class scale and quality.
Mission
Vision
Maximize enterprise value by contributing to the development of the global economy and earning the confidence of customers through the provision of sophisticated, high-quality logistics services.
A Total Logistics Provider operating globally with world-class scale and quality.
Values
Customer Centric
Quality /Gemba Focused
HR-oriented Management
Environmental Management
IntensityIntegrity Innovation
Completion of “Integration”
Plans to complete business integration with NYK Logistics business by March 2012.

3 DRAMATIC
PROGRESS
Portfolio by
Business segment YLK (YAS) NYK Logistics
(Companies to be Integrated only)
YLK (YAS) NYK Logistics(Companies to be Integrated only)
Yusen Logistics
Yusen Logistics
AirOceanLand transportLogisticsOthers
AmericasEuropeSouth Asia & OceaniaEast AsiaJapan
5%
26%
27%
42%
4%
33%
24%
14%
25%
2%
30%
33%
12%
23%
8%
9%
15%
18%
50%
23%
24%
14%
16%
23% 24%
19%
18%
18%
21%
37%
37%
13%
13%
3%
68%
21%
8%
FY2013FY2010
Portfolio by
Geographical segment
FY2013FY2010
For “Dramatic Progress”
Establish the “3D Management” that positions business, sales and area strategies as three basic strategies, and aim to be A Total Logistics Provider operating globally with world-class scale and quality.
Yusen Logistics
Yusen Logistics
Sales Strategy Area Strategy
Business
StrategyToward World-Top Class Total LogisticsProvider
(forecast)
(forecast)
1Yusen Logistics Annual Report 2011

Millions of Yen Thousands of U.S. Dollars(Note)
2009 2010 2011 2011
Results of Operations Net sales ¥ 167,460 ¥ 123,453 ¥ 160,788 $ 1,933,716
Operating income 4,574 2,310 4,947 59,499
Net income 1,083 1,545 3,621 43,542
Financial Position Total assets ¥ 75,733 ¥ 81,443 ¥ 88,363 $ 1,062,691
Total equity 51,249 53,663 55,360 665,781
Yen U.S. Dollars (Note)
Per Share Data Basic net income ¥ 25.68 ¥ 36.63 ¥ 85.85 $ 1.032
Net assets 1,173.84 1,225.21 1,260.69 15.162
Cash dividends 18.00 16.00 18.00 0.216
Key Ratios Return on equity (ROE) (%) 2.0 3.1 6.9
Net income to total assets (%) 1.2 2.0 4.3
Equity ratio (%) 65.4 63.4 60.2
Number of employees 5,326 5,252 5,623
Note: The U.S. dollar amounts represent translations of Japanese yen amounts at the rate of ¥83.15 = US$1. See Note 1 to the consolidated fi nancial statements on page 23.
20
15
10
5
0
2007 2008 2009 2010
ROE
Net income to total assets
8,000
6,000
4,000
2,000
0
-2,000
2007 2008 2009 2010
100,000
80,000
60,000
40,000
20,000
0
2007 2008 2009 2010
2007 2008 2009 2010
8,000
6,000
4,000
2,000
0
12,000
8,000
4,000
0
2007 2008 2009 2010
Free Cash Flows (Millions of Yen)
ROE / Net income to total assets (%)
200,000
150,000
100,000
50,000
0
2007 2008 2009 2010
Total Assets (Millions of Yen)
Net Sales (Millions of Yen)
Operating Income (Millions of Yen)
Net Income (Millions of Yen)
201120112011
201120112011
2 Yusen Logistics Annual Report 2011
Yusen Logistics Co., Ltd. and Consolidated SubsidiariesYears Ended March 31
Consolidated Financial Highlights
I was appointed to President of Yusen Logistics Co., Ltd. on April 1, 2011.
Yusen Logistics was born in October 2010, out of the integration of Yusen Air & Sea Service and NYK
Logistics (Japan), and is working to realize the business target of being a total logistics provider
operating globally with world-class scale and quality.
In fi scal 2010 (that ended March 31, 2011), we recorded net sales of ¥160.8 billion and ordinary
income of ¥6.1 billion. By implementing our new medium-term business plan that began in fi scal
2011, "GO FOWARD, Yusen Logistics," we aim to achieve net sales of ¥500 billion and ordinary income
of ¥18.5 billion in fi scal 2013 by realizing integration effects and growth. In addition to becoming
bigger in scale, the new company now has a better sales mix by business and region, which enables
us to respond to increasingly sophisticated logistics needs of our customers in all types of services in
air and ocean freight forwarding, land transport and contract logistics. We expect to (1) grow mainly
in ocean freight forwarding and in Asia, (2) realize integration effects, (3) develop global operations
and (4) expand services to our customers.
We plan to complete integration of our overseas businesses by March 2012. In order to make 1+1
into 3 or 4, we need the “Fusion” of our operations. Within the forwarding business, air and ocean
freight forwarding differ in various ways and in their business culture. We will spend a year or two to
build workplaces where people respect each other through sharing of the new company’s policies
and through exchanges among the workforce. As we believe that revitalization of human resources is
most critical in creating value, we will pursue empowerment, promote young workers and invest in
training of our workforce.
With regard to dividends, we recognize that the return of profi ts to shareholders is a matter of high
managerial priority. We are committed to pay stable dividends, as long as we generate suffi cient
profi t. With due consideration to our group’s growth and expansion plans, our basic policy is to
increasingly reward our shareholders. Based on this policy, we expect to pay ¥20 per share dividend
based on our current earnings forecasts for fi scal 2011.
We would like to ask for your continued support and patronage.
Hiromitsu Kuramoto President
3Yusen Logistics Annual Report 2011
To Our Shareholders

New Medium-Term Business Plan “GO FORWARD, Yusen Logistics”
Completion of Integration
Integration
(Consolidation)
Schedule
2010 2011 2012
Oct., 1, 2010
“Yusen Logistics” New system starts
Scope of Consolidation(including equity-method companies) 41
Apr., 1, 2011~ Overseas new system starts
The U.S., UK, Hong Kong, etc.Integration of 22 countries and regions
China, UAE, and othersSchedule for completion of Integration of overseas businesses
Jul., 1, 2011~ By the end of March
From July, integration of Philippines, India, etc.
From Oct., integration of Thailand
Oct. Nov. Dec. Jan. Feb. Mar. Apr. May Jun. Jul. - Dec. Jan. Feb. Mar.
61companies companies
After the Lehman Bankruptcy in 2008, our freight forwarding
volume dropped in 2009 but returned to an uptrend in 2010,
thanks to a global economic recovery. In addition to growth in
Asia, demand has picked up in the developed countries in Europe
and Americas. Demand for international freight forwarding is on
an uptrend in the medium to long term, as manufacturing bases
and retailers’ procurement have become globalized.
However, the Great East Japan Earthquake of March 11,
2011 has further delayed a recovery in Japan-related freight,
growth of which had already been slow due to the appreciation
of the yen and overseas inventory adjustment.
We recorded a decrease in sales and income in fiscal 2009,
mainly due to the worldwide recession triggered by the Lehman
Bankruptcy. In fiscal 2010, however, we achieved growth in
sales and profits. Net sales increased by 30.2% year-on-year
to ¥160.8 billion and ordinary income by 82.5% to ¥6.1 billion,
thanks mainly to global economic recovery and our group-wide
cost reduction efforts. In the fi rst half, our business recovered
substantially thanks to an increase in international freight
forwarding handling volume, particularly in Asian countries
and the effects of our “Project Plus One” an upgraded version
of the “Urgent project to improve balances” that was launched
in fiscal 2009. In the second half of fiscal 2010, overseas
freight forwarding businesses were robust in general but the
appreciation of the yen and overseas inventory adjustment
resulted in a decrease in export and import freight volumes in
Japan. Moreover, the Great East Japan Earthquake of March
11, 2011 affected some businesses. Overall, we had a diffi cult
time in Japan but that was offset by strong achievement
overseas, in particular based on a recovery in East Asia and a
turnaround in profi tability in Americas and Europe.
Q1 Q2
A1 A2
Will you explain the trend in the freight forwarding industry and effects of the Great East Japan Earthquake?
How do you evaluate your fi scal 2010 business results?
The industry is recovering from a drop in business since the Lehman Bankruptcy. Demand for international freight forwarding is on an uptrend in the medium to long term.
We achieved growth in sales and profi ts, led by favorable business in Asia, Americas and Europe.
4 Yusen Logistics Annual Report 2011
An Interview with the President

In the previous business plan for fi scal 2008-2010, we initially
aimed to become a total logistics provider and achieve
numerical targets of ¥260 billion in net sales and ¥15 billion
in ordinary income. However, we lowered numerical targets
to ¥140 billion in net sales and ¥6.5 billion in ordinary income
in January 2010 because of the global economic recession
triggered by the Lehman Bankruptcy in 2008. By the end
of the final year, we achieved the net sales target, thanks
to integration with NYK Logistics (Japan) and higher-than
expected overseas freight volumes, but fell short of ordinary
income target because of sluggish growth in Japan’s freight
volume.
In contrast, we made signifi cant progress toward becoming
a total logistics provider by realizing business integration. We
obtained the first JISQ9100 (the Quality Management System
for Aerospace parts) certification in transportation industry,
which proved our quality enhancement, while we promoted
improvement of our human resources by opening the Yusen
Logistics Professional College.
Our theme in the new business plan for fi scal 2011-2013, which
we announced in April 2011, is to become a total logistics
provider operating globally with world-class scale and quality.
We set our numerical targets at ¥500 billion in net sales and
¥18.5 billion in ordinary income for fi scal 2013. Our net sales
were ¥160.8 billion in fiscal 2010 but are expected to reach
¥338 billion in fi scal 2011 when integration with NYK Logistics’
overseas business is completed. By then, we will become a
large-scale company with approximately 16,600 employees.
A global network that covers most countries and regions in
the world will be instantly established with a service portfolio
seamlessly spanning air, ocean and land transport.
In order to be recognized as a global player, we have to
have the suffi cient levels of freight volume and quality services
that are required for the world top fi ve players. By fi scal 2013,
we aim to achieve ocean freight volume of 1 million TEU and
air freight volume of 500 thousand tons. At the same time, we
target to become a “No. 1 Kaizen (Improvement) Company” in
contract logistics and our sales department aims to establish
the “Yusen Logistics” brand in the global market.
Q3 Q4
A3 A4
Please review your previous medium-term business plan, the “YAS FIVE-STAR PROJECT.”
What are the targets in “GO FORWARD, Yusen Logistics” your new medium-term business plan?
We were forced to lower numerical targets due to the global economic crisis but improved management quality substantially.
We aim to achieve ¥500 billion in net sales and ¥18.5 billion in ordinary income in fi scal 2013.
Fusion of employee awareness Numerical target(Billions of Yen)
Net sales
Ordinary income
Net income
All companies to be integrated, total (note)YLK (consolidated)
All companies to be integrated, total (note)YLK (consolidated)
YLK (consolidated)
(Note) Total of companies to be integrated by March 2012.
FY 2011 FY 2012 FY 2013
338
370427
500
18.515
9.1
3.7 6.7 8.2
12.5
Fusion of organizations
Fusion of governance
Fusion of Operations – Toward Maximization of Synergies – Target Performance for the Final Year of the Project
・Group value sharing (Integrity, Innovation, and Intensity)
・Rebuild awareness toward A Total Logistics Provider operating globally
・Organic unification, streamlining and IT system cooperation of each of integrated companies
・Improvement of organizational management by each regional headquarters
・Establishment of 3D management
・Restructuring of global compliance system
* Ordinary income is calculated by adding to or subtracting from operating income items such interest income or expenses, foreign exchange gains or
losses, dividend income, securities sales gains, losses, or evaluation losses. Ordinary income is the Company’s important income indicator. 5Yusen Logistics Annual Report 2011

ITOrganization
FinanceCSR
Customer Centric Quality/”Gemba” FocusedInnovationIntensity
Environmental Management
HR-oriented Management
Integrity
Business Strategy
Sales Strategy
Area StrategyCustomer 1
Customer 2
Customer 3
Customer 4
Customer 5
Japan
East Asia
South Asia/O
ceania
Europe
Am
ericas
AirOcean
Contract Logistics
Land Transport
3D Management
Basic Management Strategy
Value
The Concept of
3D Management( )
The “3D Management” means to operate business efficiently
from three dimensions, namely, by area, by business and by
customers or their industries, manage them from various
aspects, and ensure to generate balanced profi ts.
As a logistics company in the Nippon Yusen Group, we
will put much value on "Customer Centric," "Quality/Gemba
Focused," "HR-oriented Management" and "Environmental
Management" with integrity, innovation and intensity. We will at
the same time establish the “3D Management.” We will make
best use of our comprehensive capability and respond to more
diversifying customer needs for freight forwarding with an
ultimate goal of becoming a total logistics provider operating
globally with world-class scale and quality.
What I emphasize most is to revitalize human resources.
We strive to build a meaningful and satisfying company for
our employees, meaning workplaces where people respect
each other through sharing of the new company’s policies
and exchanges among the workforce. When highly-motivated
employees with a sense of responsibility make constant efforts
in improving proposals and service quality, customers will
become more satisfi ed and the company’s business will grow.
In order to revitalize employees, we will pursue empowerment,
promote young workers, and invest in development of human
resources. In particular from fiscal 2011 when we enter into
a “Fusion” stage to generate synergies, it will be important
for people to respect each other through sharing of the new
company’s policies and exchanges among the workforce.
Our majority of employees are non-Japanese, with
Japanese accounting for merely about 10% of total workforce.
“Fusion” between Japanese employees and foreign employees
is an important issue. I myself will get involved in this
revitalizing and fusion effort but expect to take a year or two to
achieve the goal.
Q5 Q6
A5 A6
What is the “3D Management”? What do you as a president fi nd most precious?
This is a scheme to effi ciently expand and manage business from three dimensions, namely, by area, by business and by customers or their industries.
I fi nd human resources are most important.
6 Yusen Logistics Annual Report 2011
An Interview with the President

In the new medium-term business plan “GO FOWARD, Yusen
Logistics,” we will fi rst focus on integration and fusion. When
we become a lively job-oriented company of employees who
understand the corporate philosophy and with progress in
fusion worldwide, we will become a company that can provide
the world best quality total logistics solutions to our customers
worldwide. This should result in our becoming a total logistics
provider operating globally with world-class scale and quality.
We aim to achieve ¥500 billion in net sales by fi scal 2013 but,
once the “Dramatic Progress” materializes, we can grow into a
¥1 trillion company in sales. I appreciate your supports to our
endeavor.
We are planning to generate ¥338 billion in net sales and ¥9.1
billion in ordinary income in fi scal 2011, thanks to progress in
integration of major overseas subsidiaries.
By region, we expect a profit improvement in Americas,
Europe, South Asia and Oceania. In Japan we are looking
for negative impacts from the Great East Japan Earthquake
of March 11, 2011 but a recovery in freight forwarded in the
second half of the year when reconstruction works progress at
production bases.
Integration with NYK Logistics’ business, which has a global
network, will help increase sales signifi cantly in Americas and
Europe, where our contract
logistics and land transport
bus inesses wi l l expand.
In As ia , prof i t growth is
expected.
Q7 Q8
A7 A8
Please talk about the “Dramatic Progress” which you target after the “Integration” and the “Fusion.”
What are your earnings forecasts for fi scal 2011?
We will achieve the status of A Total Logistics Provider operating globally with world-class scale and quality.
We will record a growth in sales and earnings, partly due to business integration.
Business Strategy
Strategy_01
Strategy_02
Strategy_03
Ocean Forwarding Business
FY2013: 1 million TEUToward World-Top Class Forwarder
Toward World-Top Class Total LogisticsProvider
Sales Strategy
Product and Quality Strategy
Purchasing Strategy
Handling target
Air Forwarding Business
FY2013: 500 thousand tonsHandling target
Contract Logistics Business
Aim to be No. 1 Kaizen (Improvement) Company
Competitive “Gemba,” front line
●Standard quality creation●Elaboration to meet needs●Thorough cost management●Reliable launch
Eco-friendly handling
Cutting-edge technology IT
Quality standards
Cultivation of human resources
Assistance for launch
Strengthen weakness (SWOT)
Cost management
Strategy_01. 02
Strategy_03
Quantitative expansion by service quality and price competitiveness
Sales expansion through product development enhanced by global network and further quality improvements
By brand enhancement as “No. 1 Kaizen (Improvement) Company,” heighten synergies with forwarding business
7Yusen Logistics Annual Report 2011

Basic Stance and Initiatives on Corporate Governance
YLK (the Company) seeks to maintain its standing as a good corporate
citizen, earning the trust of all stakeholders and their ongoing support.
To this end, the Company upholds a high standard of ethics its business
activities-global logistics services-and strives to engage in fair and
dependable business practices in compliance with prevailing laws and
within accepted social parameters.
Corporate Governance Structure
Outline of Corporate Governance Structure and Reasons for its
Adoption
The Board of Directors, which is the Company’s decision-making body,
consists of seven directors who are engaged in determination of legal
matters, resolving of signifi cant basic policies and surveillance of the
execution of operations. The Company has also adopted the Executive
Officer System with the aim of accelerating decision making in the
execution of operations. At present, the Board of Executive Officers,
comprised of 19 executive offi cers, discusses and resolves signifi cant
matters to execute operations.
In addition, the Board of Corporate Auditors consists of four
auditors, two of which are from outside the Company, and whose
assignment is to audit the execution of duties of the Board of Directors
and the Board of Executive Officers from an objective and neutral
perspective.
The Company has chosen the above system which it believes to
ensure management transparency and efficiency, with prompt and
appropriate decision making and clear identification of duties and
responsibilities in the execution of operations.
Status of the Internal Control System
The Company carries out efficient compliance promotion, risk
management and internal audits to ensure that its internal control
system functions effectively.
Compliance
The Company established a Code of Conduct in May 2005 to ensure
that each YLK Group employee carries out and accomplishes
corporate activities and routine work in accordance with corporate
ethical guidelines and social morals, as well as by observing laws
and regulations. The Company also distributed the Group Compliance
Manual group-wide (domestically in March 2006 and overseas in March
2008). All Group executives and employees have since adhered to its
guidelines in their daily activities.
As an internal compliance system, the Compliance Committee,
chaired by the President, the position of Chief Compliance Officer
(CCO) and the CSR/Risk Management Chamber have been established.
Moreover, 66 employees of the Company and its Group companies have
been assigned as CSR Leaders to promote compliance within their
workplaces.
Risk Management System
The Company has established the CSR/Risk Management Chamber,
which specializes in managing significant risks that might affect the
management of the Company or might have Company-wide effect.
The CSR/Risk Management Chamber always identifi es, analyzes, and
assesses risks and takes appropriate action.
Each division manage risks relating to its operations in accordance
with relevant internal regulations and in cooperation with the CSR/Risk
Management Chamber.
The CSR/Risk Management Chamber reports risks and risk
management to the Compliance Committee, which is chaired by the
President, and to the Disaster Risk Management Meeting.
Internal Audits, Corporate Audits, and Accounting Audits
The Company has established the Internal Audit Chamber, staffed by
four employees, to undertake regular internal audits of the Group. The
corporate audits are conducted by four auditors including two external
auditors, in accordance with the auditing plan established by the
Board of Auditors. Motonobu Kobayashi, a full-time auditor, had held
a position of executive managing director of NYK Logistics (Japan) Co.,
Ltd. while Masaaki Hashimoto, another full-time auditor, had served as
president of Yusen Air & Sea Service (Chugoku) Co., Ltd. and Yusen Air
& Sea Service (Korea) Co., Ltd. Both auditors have long accumulated
experience and knowledge of logistics business management. The two
external auditors have knowledge and understanding of management:
Makoto Satani through his long experience and performance in the oil
industry; and Setsuko Kusumoto through her experience in business
and academic fi elds.
At the beginning of each fiscal year, the Company's corporate
auditors hear from the accounting auditor’s representatives regarding
their auditing plan for the year, and at the year-end, they receive their
reports on the audit results and confi rm the methods used. They also
hear from the Internal Audit Chamber regarding its auditing plan and
receive regular updates on auditing results.
The certified public accountants who execute accounting audits
of the Company are Takashi Nagata, Tomoyasu Maruyama and Kenji
Morita, all from Deloitte Touche Tohmatsu. They are assisted in their
accounting operations by three additional certifi ed public accountants
and seven assistants.
External Directors and External Auditors
Among two external auditors, Makoto Satani is an executive consultant
of JX Nippon Oil & Energy Corporation and a councilor of Nippon Kaiji
Kyokai, while Setsuko Kusumoto is a professor at Musashi University.
The Company has no business transaction with JX Nippon Oil & Energy
Corporation, Nippon Kaiji Kyokai and Musashi University and neither of
our two external auditors has any particular interest in the Company.
External Auditors attend the Board of Directors and the Board of
Corporate Auditors and contribute to the meetings from an independent
perspective and with insights and views accumulated from a great deal
of experience. The Company believes that the Board of Directors is
ensured to make objective and neutral decisions by refl ecting views of
External Auditors in its auditing and using their independent external
perspectives in managing the Company.
While the Company has not appointed an External Director for this
year, the monitoring capability toward the Board of Directors, which is
a management decision-making body and has a function of authority
and direction regarding execution of duties of Directors and Executive
Offi cers, has been enhanced by having two external auditors among the
four auditors. The current structure ensures the function of external
objective and neutral management surveillance, which the Company
believes is an important element of corporate governance.
8 Yusen Logistics Annual Report 2011
Corporate Governance
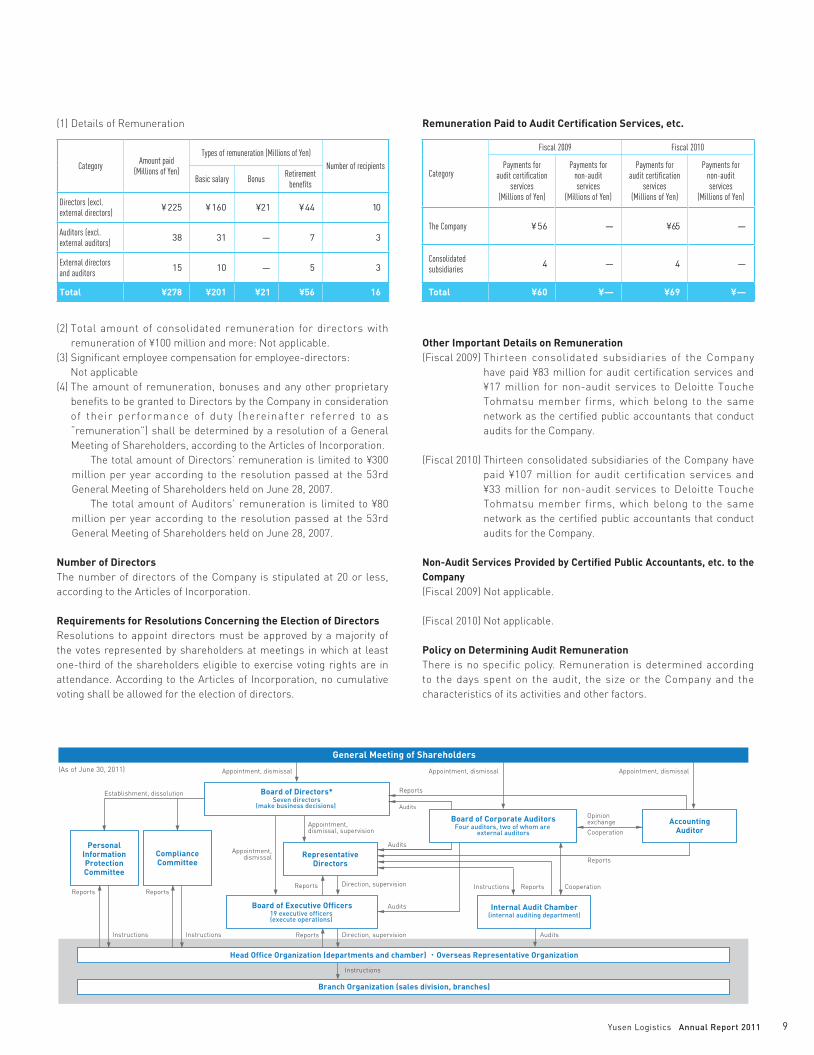
Instructions
General Meeting of Shareholders
Direction, supervision
Appointment, dismissal Appointment, dismissal Appointment, dismissal
Appointment,dismissal
Appointment,dismissal, supervision
ReportsEstablishment, dissolution
Audits
Audits
Audits
Cooperation
Opinionexchange
Reports
ReportsReportsReports
Instructions
Instructions CooperationReports
Instructions Direction, supervisionReports
Board of Directors*Seven directors
(make business decisions)
Board of Corporate AuditorsFour auditors, two of whom are
external auditors
RepresentativeDirectors
AccountingAuditor
Internal Audit Chamber(internal auditing department)
Board of Executive Officers19 executive officers (execute operations)
PersonalInformationProtectionCommittee
ComplianceCommittee
Head Office Organization (departments and chamber) ・Overseas Representative Organization
Branch Organization (sales division, branches)
Audits
(2) Total amount of consolidated remuneration for directors with
remuneration of ¥100 million and more: Not applicable.
(3) Signifi cant employee compensation for employee-directors:
Not applicable
(4) The amount of remuneration, bonuses and any other proprietary
benefi ts to be granted to Directors by the Company in consideration
of their performance of duty (hereinafter referred to as
“remuneration”) shall be determined by a resolution of a General
Meeting of Shareholders, according to the Articles of Incorporation.
The total amount of Directors’ remuneration is limited to ¥300
million per year according to the resolution passed at the 53rd
General Meeting of Shareholders held on June 28, 2007.
The total amount of Auditors’ remuneration is limited to ¥80
million per year according to the resolution passed at the 53rd
General Meeting of Shareholders held on June 28, 2007.
Number of Directors
The number of directors of the Company is stipulated at 20 or less,
according to the Articles of Incorporation.
Requirements for Resolutions Concerning the Election of Directors
Resolutions to appoint directors must be approved by a majority of
the votes represented by shareholders at meetings in which at least
one-third of the shareholders eligible to exercise voting rights are in
attendance. According to the Articles of Incorporation, no cumulative
voting shall be allowed for the election of directors.
Remuneration Paid to Audit Certifi cation Services, etc.
Other Important Details on Remuneration
(Fiscal 2009) Thirteen consolidated subsidiaries of the Company
have paid ¥83 million for audit certifi cation services and
¥17 million for non-audit services to Deloitte Touche
Tohmatsu member firms, which belong to the same
network as the certifi ed public accountants that conduct
audits for the Company.
(Fiscal 2010) Thirteen consolidated subsidiaries of the Company have
paid ¥107 million for audit certification services and
¥33 million for non-audit services to Deloitte Touche
Tohmatsu member firms, which belong to the same
network as the certifi ed public accountants that conduct
audits for the Company.
Non-Audit Services Provided by Certifi ed Public Accountants, etc. to the
Company
(Fiscal 2009) Not applicable.
(Fiscal 2010) Not applicable.
Policy on Determining Audit Remuneration
There is no specific policy. Remuneration is determined according
to the days spent on the audit, the size or the Company and the
characteristics of its activities and other factors.
Category
Fiscal 2009 Fiscal 2010
Payments foraudit certifi cation
services(Millions of Yen)
Payments fornon-auditservices
(Millions of Yen)
Payments foraudit certifi cation
services(Millions of Yen)
Payments fornon-auditservices
(Millions of Yen)
The Company ¥ 56 — ¥65 —
Consolidated subsidiaries 4 — 4 —
Total ¥60 ¥— ¥69 ¥—
CategoryAmount paid
(Millions of Yen)
Types of remuneration (Millions of Yen)Number of recipients
Basic salary BonusRetirement
benefi ts
Directors (excl. external directors)
¥ 225 ¥ 160 ¥21 ¥ 44 10
Auditors (excl. external auditors)
38 31 — 7 3
External directors and auditors
15 10 — 5 3
Total ¥278 ¥201 ¥21 ¥56 16
(1) Details of Remuneration
(As of June 30, 2011)
9Yusen Logistics Annual Report 2011

Board of Directors
Shunichi
Yano
Chairman
Hiromitsu
Kuramoto
President
Masahiko
Fukatsu
Director,
Senior Managing
Executive Offi cer
Masahiro
Omori
Director,
Managing
Executive Offi cer
Hiroyuki
Yasukawa
Director,
Managing
Executive Offi cer
Kazuo
Kato
Director,
Managing
Executive Offi cer
Shoji
Murakami
Director,
Managing
Executive Offi cer
Corporate Auditors
Masaaki
Hashimoto
Auditor
Motonobu
Kobayashi
Auditor
Makoto
Satani
External Auditor
Setsuko
Kusumoto
External Auditor
Executive Offi cers
Takashi
Isobe
Executive Offi cer
Kunio
Fujii
Executive Offi cer
Tatsuhiko
Saeki
Executive Offi cer
Hiroyuki
Okamoto
Executive Offi cer
Shotaro
Omura
Managing
Executive Offi cer
Tatsuo
Aoyagi
Executive Offi cer
Eiichi
Suzuki
Executive Offi cer
Toshio
Maekawa
Executive Offi cer
Taiji
Kitagawa
Executive Offi cer
Kenichi
Kotoku
Executive Offi cer
Akio
Futami
Executive Offi cer
Toshiyuki
Kimura
Executive Offi cer
Kazuo
Ishizuka
Executive Offi cer
*Representative Director *Representative Director
10 Yusen Logistics Annual Report 2011
Board of Directors, Corporate Auditors and Executive Offi cers

F I N A N C I A L S E C T I O N
Consolidated Six-Year Summary 12
Management’s Discussion and Analysis 13
Consolidated Balance Sheets 18
Consolidated Statements of Income 20
Consolidated Statement of Comprehensive Income 20
Consolidated Statements of Changes in Equity 21
Consolidated Statements of Cash Flows 22
Notes to Consolidated Financial Statements 23
Independent Auditors’ Report 39
Corporate History 40
Shareholders’ Information 41
Financial Section Contents
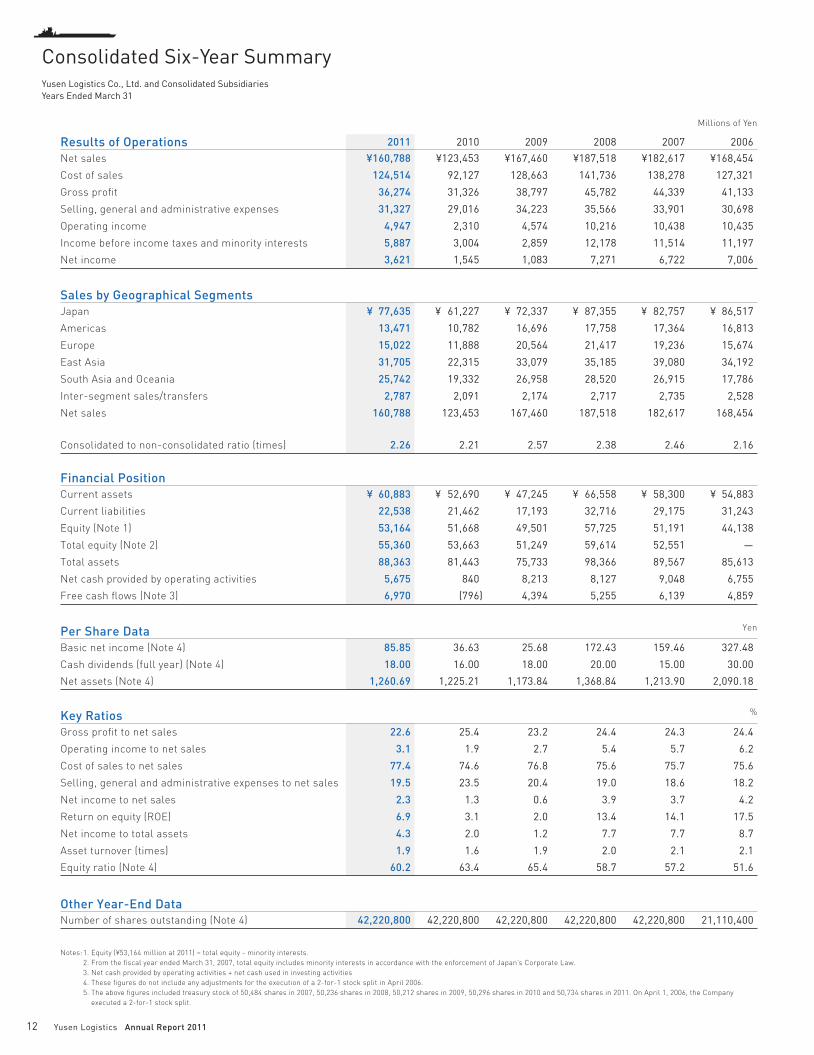
Millions of Yen
Results of Operations 2011 2010 2009 2008 2007 2006
Net sales ¥160,788 ¥123,453 ¥167,460 ¥187,518 ¥182,617 ¥168,454
Cost of sales 124,514 92,127 128,663 141,736 138,278 127,321
Gross profi t 36,274 31,326 38,797 45,782 44,339 41,133
Selling, general and administrative expenses 31,327 29,016 34,223 35,566 33,901 30,698
Operating income 4,947 2,310 4,574 10,216 10,438 10,435
Income before income taxes and minority interests 5,887 3,004 2,859 12,178 11,514 11,197
Net income 3,621 1,545 1,083 7,271 6,722 7,006
Sales by Geographical SegmentsJapan ¥ 77,635 ¥ 61,227 ¥ 72,337 ¥ 87,355 ¥ 82,757 ¥ 86,517
Americas 13,471 10,782 16,696 17,758 17,364 16,813
Europe 15,022 11,888 20,564 21,417 19,236 15,674
East Asia 31,705 22,315 33,079 35,185 39,080 34,192
South Asia and Oceania 25,742 19,332 26,958 28,520 26,915 17,786
Inter-segment sales/transfers 2,787 2,091 2,174 2,717 2,735 2,528
Net sales 160,788 123,453 167,460 187,518 182,617 168,454
Consolidated to non-consolidated ratio (times) 2.26 2.21 2.57 2.38 2.46 2.16
Key Ratios %
Gross profi t to net sales 22.6 25.4 23.2 24.4 24.3 24.4
Operating income to net sales 3.1 1.9 2.7 5.4 5.7 6.2
Cost of sales to net sales 77.4 74.6 76.8 75.6 75.7 75.6
Selling, general and administrative expenses to net sales 19.5 23.5 20.4 19.0 18.6 18.2
Net income to net sales 2.3 1.3 0.6 3.9 3.7 4.2
Return on equity (ROE) 6.9 3.1 2.0 13.4 14.1 17.5
Net income to total assets 4.3 2.0 1.2 7.7 7.7 8.7
Asset turnover (times) 1.9 1.6 1.9 2.0 2.1 2.1
Equity ratio (Note 4) 60.2 63.4 65.4 58.7 57.2 51.6
Financial PositionCurrent assets ¥ 60,883 ¥ 52,690 ¥ 47,245 ¥ 66,558 ¥ 58,300 ¥ 54,883
Current liabilities 22,538 21,462 17,193 32,716 29,175 31,243
Equity (Note 1) 53,164 51,668 49,501 57,725 51,191 44,138
Total equity (Note 2) 55,360 53,663 51,249 59,614 52,551 —
Total assets 88,363 81,443 75,733 98,366 89,567 85,613
Net cash provided by operating activities 5,675 840 8,213 8,127 9,048 6,755
Free cash fl ows (Note 3) 6,970 (796) 4,394 5,255 6,139 4,859
Other Year-End DataNumber of shares outstanding (Note 4) 42,220,800 42,220,800 42,220,800 42,220,800 42,220,800 21,110,400
Per Share Data Yen
Basic net income (Note 4) 85.85 36.63 25.68 172.43 159.46 327.48
Cash dividends (full year) (Note 4) 18.00 16.00 18.00 20.00 15.00 30.00
Net assets (Note 4) 1,260.69 1,225.21 1,173.84 1,368.84 1,213.90 2,090.18
Notes: 1. Equity (¥53,164 million at 2011) = total equity - minority interests.
2. From the fi scal year ended March 31, 2007, total equity includes minority interests in accordance with the enforcement of Japan’s Corporate Law.
3. Net cash provided by operating activities + net cash used in investing activities
4. These fi gures do not include any adjustments for the execution of a 2-for-1 stock split in April 2006.
5. The above fi gures included treasury stock of 50,484 shares in 2007, 50,236 shares in 2008, 50,212 shares in 2009, 50,296 shares in 2010 and 50,734 shares in 2011. On April 1, 2006, the Company
executed a 2-for-1 stock split.
12 Yusen Logistics Annual Report 2011
Yusen Logistics Co., Ltd. and Consolidated SubsidiariesYears Ended March 31
Consolidated Six-Year Summary

As of March 31, 2011, the Yusen Logistics Group comprised Yusen
Logistics Co., Ltd. (“the Company”), Nippon Yusen Kabushiki Kaisha
(parent company), 35 consolidated subsidiaries and fi ve equity-method
affi liates. The Group’s major business activities are the cargo business
and the travel business. As of April 1, 2011, Yusen Air & Sea Service
(U.S.A.) Inc. changed its name to Yusen Logistics (Americas) Inc., Yusen
Air & Sea Service (Europe) B.V. changed to Yusen Logistics (Europe)
B.V., Yusen Air & Sea Service (H.K.) Ltd. changed to Yusen Logistics
(Hong Kong) Limited and Yusen Air & Sea Service (Singapore) Pte. Ltd.
changed to Yusen Logistics (Singapore) Pte. Ltd.
Overview
During the fiscal year under review, the world economy recovered
gradually, thanks to economic stimulus measures implemented
by many countries, but the growth has slowed down since the third
quarter (October to December, 2010.) The U.S. saw some bright spots
in consumer spending but little improvement in employment or the
housing market, while Europe in aggregate continued to grow slowly
due to austere fiscal policies that were implemented to deal with
fi nancial problems. In contrast, China maintained high economic growth
rates, while Vietnam, India and other Asian countries grew steadily,
supported by robust growth in domestic demand.
Japan’s economy was supported by external demand from Asian
economic growth and turned from a sluggish stage to a recovery stage
by the third quarter. However, the Great East Japan Earthquake of
March 11, 2011 affected Japan’s economic activities signifi cantly.
Against this backdrop, the global air freight market generally
recovered steadily despite some differences between region. In Asia,
particularly in fast-growing China, the freight movements of electronic
and automotive components were favorable and contributed to an
increase in freight volumes handled by the Yusen Logistics Group
(hereafter referred to as “the YLK Group” or “the Group”). On the other
hand, freight movements have been slow in Japan since the third
quarter, partly due to the appreciation of the yen.
In fiscal 2010, net sales increased by 30.2% year-on-year to
¥160,788 million (US$1,934 million). Operating income was 114.1%
higher at ¥4,947 million (US$59 million), while net income increased by
134.4% to ¥3,621 million (US$44 million).
Geographical Segment Information(Figures include inter-segment transactions)
Japan
The Japan segment, including domestic consolidated subsidiaries,
recorded sales of ¥77,635 million (US$934 million; up 26.8% year-on-
year) and segment profi t of ¥333 million (US$4 million; down 64.7% year-
on-year.)
Air freight exports, a growth was seen in handling of office
equipment-related freight to Europe and construction machinery-related
freight to Asia at the beginning of the fiscal year under review, but
freight to Europe and the U.S. slowed down in the second quarter due to
the sharp appreciation of the yen and completion of inventory rebuilding
in overseas markets. In the fourth quarter, handling of automotive
components began to recover but did not make a full-fl edged recovery
as the Great East Japan Earthquake caused a temporary setback in
freight movements in March. As a result, freight volumes handled during
the year under review increased by only 4.3% year-on-year.
Regarding air freight imports, handling of semiconductor-related
products and apparel products from Asia has slowed down since the
third quarter, but handling of medical equipment-related products from
Americas was steady and that of Beaujolais Nouveau from Europe was
robust. As a result, the number of shipments handled during the year
under review increased by 5.8% year-on-year.
The Company's ocean freight forwarding business handled exports
of precision equipment and imports of large medical equipment. In
addition, it completed business integration with NYK Logistics (Japan)
Co., Ltd. and established a new business structure. The volume of ocean
freight exports handled increased from the previous year.
In the travel services segment, demand for corporate business travel
gradually recovered and cruise sales posted a steady performance.
During the fi scal year under review, the Group generated expenses
that were related to a relocation of the head office and integration of
domestic and overseas logistics businesses of Nippon Yusen Kabushiki
Kaisha.
Americas
The Americas segment recorded sales of ¥13,471 million (US$162
million; up 24.9% year-on-year) and segment profi t of ¥749 million (US$9
million; compared to a ¥5 million operating loss in the previous year) .
■■ Net Sales (Left)
Gross Profit Ratio (Right)
Operating Income Ratio (Right)
■■ Cost of Sales (Left)
Cost of Sales Ratio (Right)
■■ Selling, general and
administrative expenses (Left)
Selling, general and
administrative expenses Ratio (Right)
■■ Net Income (Left)
Basic net Income per Share (Right)
2007 2008 2009 2010 2011
200
150
100
50
0
(Billions of Yen)
40
30
20
10
0
(%)
2007 2008 2009 2010
200
150
100
50
0
(Billions of Yen)
100
75
50
25
0
(%)
40
30
20
10
0
(Billions of Yen)
40
30
20
10
0
(%)
2007 2008 2009 2010
8
6
4
2
0
(Billions of Yen)
400
300
200
100
0
(Yen)
2007 2008 2009 20102011 2011 2011
13Yusen Logistics Annual Report 2011
Management’s Discussion and Analysis

While air freight exports were temporarily stagnant because of a
series of airport closures caused by winter storms in North America in
January 2011, air freight exports to Japan were favorable throughout
the year, particularly the handling of automotive components,
semiconductor-related products, spot shipments of wine, and urgent
shipments of medical equipment-related products. As a result, freight
volumes handled during the year increased by 40.3% year-on-year.
Among air freight imports, handling of electronic components,
automotive components, PC-related products as well as fl at-screen TV
sets related has been steady. However, air freight imports showed signs
of sluggishness, similar to air freight exports, and resulted in growth of
14.0% year-on-year in the number of shipments handled.
In the case of ocean freight exports, strong growth was recorded,
thanks to favorable freight volumes of automotive components as well
as steady freight volumes of frozen meat to Japan.
Ocean freight imports were also fi rm for automotive components,
similar to ocean freight exports.
Europe
The Europe segment recorded sales of ¥15,022 million (US$181 million;
up 26.4% year-on-year) and segment profit of ¥527 million (US$6
million; compared to a ¥472 million operating loss in the previous year).
In air freight exports, shipments were steady for automotive
components to Asia and medical equipment and pharmaceuticals,
while handling of solar panels in the environmental and energy area,
the industry in which the YLK Group is making strong sales efforts, was
favorable. In January, we handled chocolate from Belgium to Japan,
thanks to its seasonal demand. As a result, freight volumes handled
during the year increased by 67.3% year-on-year.
In air freight imports, handling of offi ce equipment related products
and electronic components continued to be strong. Although the volume
handled decreased in the fourth quarter, as a reaction following the
December peak season, the number of shipments handled for the year
grew by 27.5% year-on-year.
Ocean freight exports, shipments were far exceeded those of the
previous year, thanks to steady handling of automotive components as
well as favorable handling of apparel products to Asia.
In ocean freight imports, handling of motorcycle-related products
from Asia and electronic equipment was fi rm.
East Asia
The East Asia segment recorded sales of ¥31,705 million (US$381
million; up 42.1% year-on-year) and segment profit of ¥2,001 million
(US$24 million; up 207.6% year-on-year.)
With regard to air freight exports, we did not experience a peak
freight shipment, which we normally do in the third quarter, and the
freight movements in the fourth quarter were sluggish, partly due to an
impact of the Chinese New Year holidays. Handling of major products,
namely, PC-related products or digital home appliances, was subdued,
despite rush demand prior to Chinese New Year holidays and some
urgent spot shipments. As a result, freight volumes handled during the
year under review increased by 27.2% year-on-year.
Air freight imports, thanks to steady handling of digital home
appliances, PC- and semiconductor-related products as well as
electronic and automotive components from the Asian region, the
number of shipments handled during the year increased by 16.9% year-
on-year.
In the ocean freight exports, handling of game equipment bound
for China and motorcycle-related products for Europe and the U.S. was
steady.
Regarding ocean freight imports, handling of game equipment, just
as for exports, and glass substrates for fl at-screen TVs was strong.
Steady profi ts were ensured as we did not see a big swing in freight
rates from airline companies, because of lack of a peak in seasonal
demand which we normally see prior to the Christmas season in the U.S.
and Europe.
South Asia and Oceania
The South Asia and Oceania segment recorded sales of ¥25,742 million
(US$310 million; up 33.2% year-on-year) and segment profi t of ¥1,352
million (US$16 million; up 12.8% year-on-year).
Air freight exports, handling of automotive components to Thailand,
China and Japan, and electronic components within the Asian region
has been steady throughout the year. Despite a setback in freight
movements in the fourth quarter partly due to infl uence of the Chinese
New Year holidays, freight volumes handled during the year increased
by 32.5% year-on-year.
Air freight imports, handling of automotive components was steady
throughout the year, despite a slowdown in shipment movements
Net Sales by Geographic Region (%)
Japan■ Total Sales (Left)
■ Profit (Right)
2007 2008 2009 2010
100
75
50
25
0
8
6
4
2
0
(Billions of Yen)
Americas■ Total Sales (Left)
■ Profit (Loss) (Right)
2007 2008 2009 2010
30
20
10
0
-10
3
2
1
0
-1
(Billions of Yen)
Europe■ Total Sales (Left)
■ Profit (Loss) (Right)
2007 2008 2009 2010
30
20
10
0
-10
3
2
1
0
-1
(Billions of Yen)
■ Japan
■ Americas
■ Europe
■ East Asia
■ South Asia &
Oceania
47.5%
8.2%9.2%
19.4%
15.7%
2011 2011 2011Note: Percentages include inter-segment sales/
transfers.
14 Yusen Logistics Annual Report 2011
caused by a decrease in material imports that was in turn triggered by
electronic component production adjustment from the third quarter. As
a result, the number of shipment handled during the year increased by
16.1% year-on-year.
Ocean freight exports, freight volumes were increased, due to
steady handling of automotive components to the U.S. and Japan. The
ocean freight imports, shipments were also favorable, supported by
handling of automotive components, similar to ocean freight exports,
and handling of plant equipment and devices. In Australia, we handled
imports of construction equipment from the U.S. to the areas damaged
by the fl oods in Queensland.
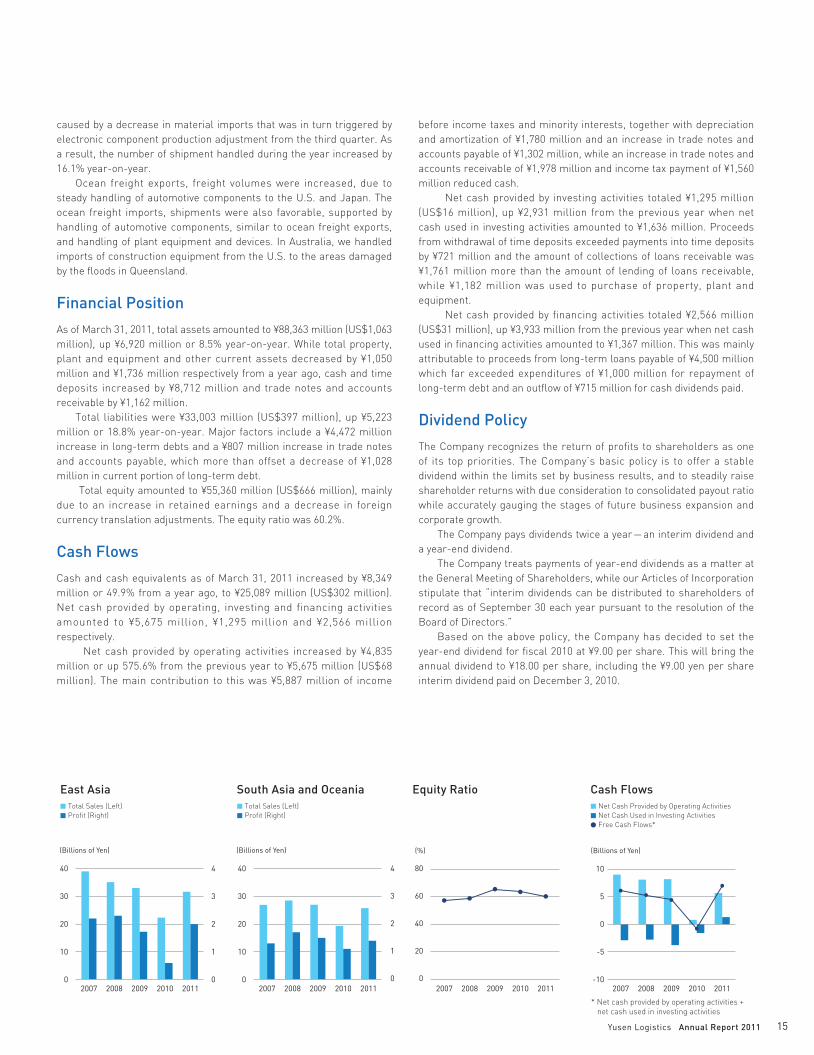
Financial Position
As of March 31, 2011, total assets amounted to ¥88,363 million (US$1,063
million), up ¥6,920 million or 8.5% year-on-year. While total property,
plant and equipment and other current assets decreased by ¥1,050
million and ¥1,736 million respectively from a year ago, cash and time
deposits increased by ¥8,712 million and trade notes and accounts
receivable by ¥1,162 million.
Total liabilities were ¥33,003 million (US$397 million), up ¥5,223
million or 18.8% year-on-year. Major factors include a ¥4,472 million
increase in long-term debts and a ¥807 million increase in trade notes
and accounts payable, which more than offset a decrease of ¥1,028
million in current portion of long-term debt.
Total equity amounted to ¥55,360 million (US$666 million), mainly
due to an increase in retained earnings and a decrease in foreign
currency translation adjustments. The equity ratio was 60.2%.
Cash Flows
Cash and cash equivalents as of March 31, 2011 increased by ¥8,349
million or 49.9% from a year ago, to ¥25,089 million (US$302 million).
Net cash provided by operating, investing and financing activities
amounted to ¥5,675 million, ¥1,295 million and ¥2,566 million
respectively.
Net cash provided by operating activities increased by ¥4,835
million or up 575.6% from the previous year to ¥5,675 million (US$68
million). The main contribution to this was ¥5,887 million of income
80
60
40
20
0
40
30
20
10
0
40
30
20
10
0
4
3
2
1
0
4
3
2
1
0
10
5
0
-5
-10
South Asia and Oceania■ Total Sales (Left)
■ Profit (Right)
2007 2008 2009 2010
(Billions of Yen)
Equity Ratio
2007 2008 2009 2010
(%)
Cash Flows■ Net Cash Provided by Operating Activities
■ Net Cash Used in Investing Activities
● Free Cash Flows*
2007 2008 2009 2010
(Billions of Yen)
2011 2011
East Asia■ Total Sales (Left)
■ Profit (Right)
2007 2008 2009 2010
(Billions of Yen)
2011 2011
* Net cash provided by operating activities +
net cash used in investing activities
before income taxes and minority interests, together with depreciation
and amortization of ¥1,780 million and an increase in trade notes and
accounts payable of ¥1,302 million, while an increase in trade notes and
accounts receivable of ¥1,978 million and income tax payment of ¥1,560
million reduced cash.
Net cash provided by investing activities totaled ¥1,295 million
(US$16 million), up ¥2,931 million from the previous year when net
cash used in investing activities amounted to ¥1,636 million. Proceeds
from withdrawal of time deposits exceeded payments into time deposits
by ¥721 million and the amount of collections of loans receivable was
¥1,761 million more than the amount of lending of loans receivable,
while ¥1,182 million was used to purchase of property, plant and
equipment.
Net cash provided by financing activities totaled ¥2,566 million
(US$31 million), up ¥3,933 million from the previous year when net cash
used in fi nancing activities amounted to ¥1,367 million. This was mainly
attributable to proceeds from long-term loans payable of ¥4,500 million
which far exceeded expenditures of ¥1,000 million for repayment of
long-term debt and an outfl ow of ¥715 million for cash dividends paid.
Dividend Policy
The Company recognizes the return of profi ts to shareholders as one
of its top priorities. The Company’s basic policy is to offer a stable
dividend within the limits set by business results, and to steadily raise
shareholder returns with due consideration to consolidated payout ratio
while accurately gauging the stages of future business expansion and
corporate growth.
The Company pays dividends twice a year-an interim dividend and
a year-end dividend.
The Company treats payments of year-end dividends as a matter at
the General Meeting of Shareholders, while our Articles of Incorporation
stipulate that “interim dividends can be distributed to shareholders of
record as of September 30 each year pursuant to the resolution of the
Board of Directors.”
Based on the above policy, the Company has decided to set the
year-end dividend for fi scal 2010 at ¥9.00 per share. This will bring the
annual dividend to ¥18.00 per share, including the ¥9.00 yen per share
interim dividend paid on December 3, 2010.
15Yusen Logistics Annual Report 2011

Fiscal 2011 is a particular important year for the Company, as being
the year to complete overseas business integration and the fi rst year of
the new medium-term business plan. The Company will make group-
wide efforts for raising its corporate value. The Company sincerely asks
our shareholders for their continued support and understanding.
Business Risk Factors1. General Business Trends
Demand for international transportation services can be infl uenced by
economic conditions of a specifi c country or region and, in particular,
by those of Europe and the U.S., which tend to greatly affect the status
of the world economy. Indeed, air freight forwarding services are used
predominantly for products and components intended for consumers,
such as digital home appliances and IT-related goods. Business
conditions of the importing countries could have an impact on demand
for such services.
The YLK Group seeks to build an operating structure that facilitates
stable growth, and therefore is working to boost transactions for
products, such as medical equipment, pharmaceuticals and automotive
components, which are relatively less susceptible to the changing
economic conditions.
2. Fuel Price Fluctuations
Typically, the fuel surcharge charged by airline companies in line
with short-term fl uctuations in fuel prices is a fee that customers are
required to pay on top of air freight. Consequently, a surcharge in and of
itself should not have a material impact on the operating results or the
fi nancial conditions of the YLK Group. However, the Group’s profi tability
may be temporarily impaired if and when conditions precipitate a
sudden rise in the fuel surcharge.
3. Inherent in Global Business Expansion
The Group’s business activities extend beyond Japan to other areas
of Asia, as well as Oceania, the Middle East, Europe and Americas.
Roughly half of the Group’s sales activities are conducted outside of
Japan. Possible risks that could emerge as the Group works to expand
its presence globally are:
ⅰ. Political and economic factors,
ⅱ. Impacts of offi cial rules and regulations, such as business and
investment permits, taxation, foreign exchange control, and trade
regulations,
ⅲ. Impacts from natural disasters, such as earthquakes, tsunami,
typhoons, and hurricanes,
ⅳ. Social unrest prompted by such events as war, international
disputes, riots, terrorism, and strikes,
ⅴ. Globally pervasive economic disruption caused by sudden fl uctuations
in exchange rates,
ⅵ. An epidemic of a highly infectious disease with a high mortality rate,
such as a new type of infl uenza.
When expanding to a new overseas location, we closely examine
local political and economic conditions as well as its culture, customs
and public health situation, and strive to eliminate as effectively as
possible whatever risks may exist. Nevertheless, unexpected events
do occur and the state of the world does change in ways that cannot
always be fully anticipated. Such developments, which include advanced
information and communications technology, increasingly borderless
economic and cultural environments, the frequency of terrorist activities
and the spread of new infectious diseases, could have a material impact
on the business results and fi nancial conditions of the Group.
4. Computer Viruses, Hackers and Cyber-Terrorism
The Company has established a backup system for its computer lines.
We are also working to enhance backup capabilities to minimize
damage to hardware and data in the event of natural disasters, such as
earthquakes or severe storms and flooding. The Company has taken
all possible measures to prevent unauthorized access to its systems
from outside and to block infection of its systems by computer viruses.
Specifi cally, we have installed fi rewalls and virus-checking software into
our mail servers and all terminals. Despite these defensive measures,
it is possible that unforeseen situations, such as the use of technology
that breaches presumed security protocols and allows a hacker to
gain entry to in-house information systems, could lead to a temporary
shutdown of system functions or facilitate unauthorized disclosure of
information. Such situation could hurt the business results and fi nancial
conditions of the Group.
5. Leaks of Customer Information Leading to Claims for
Damages and Tarnished Credibility
The YLK Group handles a vast amount of customer information and also
undertake customs clearance services. We thus have an obligation to
protect customer information and strive to prevent information from
leaking outside. Despite such precautions, it is possible that unforeseen
circumstance could result in an information leak. The Group’s business
results could be adversely affected if, for example, such leak were to
lead to claims for damages or if the situation tarnished the Group’s
reputation.
6. Exchange Rate Fluctuations
The YLK Group endeavors to minimize the impact of exchange rate
fl uctuations on foreign-currency-denominated receivables and payables
by utilizing forward exchange contracts, and does not take such risk
that would exert a major impact on the Group’s business. However, in
preparing the Group’s consolidated fi nancial statements, the Company
translates the financial results of overseas consolidated subsidiaries
into yen, and changes in exchange rates could affect the consolidated
business results and fi nancial conditions of the Group.
7. Statutory Regulations
The Company is licensed by the Ministry of Land, Infrastructure,
Transport and Tourism as a provider of type 2 freight use forwarding
services, based on Article 20 of the Freight Use Forwarding Business
Law, and conducts air and ocean freight forwarding operations – the
primary business of the YLK Group. While this license has no expiration
date, if and when an event of the Company justifies suspension or
withdrawal of the business as stipulated on Article 33 of the law,
the Company’s business could be partially or completely suspended
for a set period or permission to engage in such business could be
withdrawn. As of preparation of this document, the YLK Group has not
encountered any such event, but if and when such situations, including
withdrawal of permission to conduct business, may occur for whatever
reason, they could have a material impact on the Group’s business
results and fi nancial conditions.
In addition, the YLK Group is subject to various statutory regulations
in different parts of the world. Major ones include social regulations
(such as those ensuring safety) and legal regulations associated with
transportation services. In Japan, the Company has obtained approval
and required licenses, including the aforementioned permission
to provide type 2 freight use forwarding services, from the relevant
authorities. If statutory regulations pertaining to such approval and
licenses are amended or if approval and licensing status currently held
are cancelled, the fiscal performance and financial conditions of the
16 Yusen Logistics Annual Report 2011

Group could be adversely affected.
Approval and licenses currently held by the Company are listed
below:
8. Relationship with the NYK Group
(1) Role of the Company within the NYK Group As of March 31, 2011, the NYK Group consisted of Nippon Yusen
Kabushiki Kaisha (NYK), 687 consolidated subsidiaries and 112
companies accounted for by the equity method. These companies
primarily conduct integrated logistics business centered largely on
ocean transportation.
The business of the Company, one of consolidated subsidiaries
of NYK, and its Group companies, centers largely on the use of air
transportation. No other company within the NYK Group conducts
business operations using air transportation in the same manner as
the Company, which is licensed by the Ministry of Land, Infrastructure,
Transport and Tourism as a provider of type 2 freight use forwarding
services.
Moreover, the Company strives to ensure its independence as a
listed company. As such, the Company does not need prior approval
from NYK for its own decision-making.
(2) Business relationship with NYK and its consolidated subsidiaries (excluding the YLK Group)
The Company’s main business relationships with NYK and its
consolidated subsidiaries during this fiscal year are as follows.
Approval and Licensing Designation Issuing Authority Requirements forApproval and Licensing Validity
Type 2 freight use forwarding services Minister for Land, Infrastructure, Transport and Tourism Business license Open
Air service agency business Minister for Land, Infrastructure, Transport and Tourism Application to operate as a business Open
Customs brokerage services Director-General of Customers in each jurisdictional area Business license Open
General cargo transportation services Director of District Transport Bureaus in each jurisdictional area Business registration Open
Warehousing services Director of District Transport Bureaus in each jurisdictional area Business registration Open
Medical devices manufacturing business:
packaging, labeling or storage categoryPrefectural Governors Business license
Sept. 26, 2010 to
Sept. 25, 2015
Retail or rental business of specially
controlled medical devicesPrefectural Governors Business license
June 12, 2007 to
June 11, 2013
Business transactions take place under the same conditions as general
transactions, taking market conditions into consideration.
a) Transactions with NYKThe main business relationships between the Company and NYK are
transactions in which NYK consigns the transportation of ocean cargo
to the Company. Business transactions in this fi scal year amounted
to ¥594 million.
b) Transactions with other consolidated subsidiaries of NYKThe Company’s main business relationships with other companies
in the NYK Group are transactions involving ocean transportation
and related peripheral business, which are consigned to UNI-X
Corporation and 51 other companies. In this fiscal year business
transactions amounted to ¥7,662 million.
17Yusen Logistics Annual Report 2011

Millions of YenThousands of
U.S. Dollars (Note 1)
ASSETS 2011 2010 2011
CURRENT ASSETS:
Cash and cash equivalents (Note 11) ¥25,089 ¥16,740 $ 301,733
Time deposits (Note 11) 1,986 1,623 23,886
Trade notes and accounts receivable (Note 11) 30,169 29,007 362,831
Deferred tax assets-current (Note 9) 841 732 10,116
Other current assets 2,993 4,729 35,996
Allowance for doubtful accounts (195) (141) (2,349)
Total current assets 60,883 52,690 732,213
PROPERTY, PLANT AND EQUIPMENT:
Land (Note 4) 6,716 6,856 80,773
Buildings and structures (Note 4) 17,582 17,851 211,447
Furniture and fi xtures 4,368 4,255 52,530
Machinery, equipment and vehicles 1,015 1,039 12,210
Construction in progress 5 2 54
Total 29,686 30,003 357,014
Accumulated depreciation (12,670) (11,937) (152,376)
Total property, plant and equipment 17,016 18,066 204,638
INVESTMENTS AND OTHER ASSETS:
Investments in securities (Notes 5 and 11) 823 990 9,899
Investments in unconsolidated subsidiaries and affi liate companies 2,028 1,992 24,388
Goodwill 52 12 620
Deposits 1,837 1,725 22,090
Deferred tax assets—non-current (Note 9) 2,254 2,261 27,110
Other assets 3,470 3,707 41,733
Total investments and other assets 10,464 10,687 125,840
TOTAL ¥88,363 ¥81,443 $1,062,691
18 Yusen Logistics Annual Report 2011
Consolidated Balance SheetsYusen Logistics Co., Ltd. and Consolidated SubsidiariesMarch 31, 2011 and 2010

Millions of YenThousands of
U.S. Dollars (Note 1)
LIABILITIES AND EQUITY 2011 2010 2011
CURRENT LIABILITIES:
Trade notes and accounts payable (Note 11) ¥15,328 ¥14,521 $ 184,337
Current portion of long-term debt (Notes 6 and 11) 35 1,063 424
Accrued income taxes (Note 11) 1,046 562 12,585
Accrued bonuses to employees 1,615 1,232 19,427
Deferred tax liabilities-current (Note 9) 2 8 19
Other current liabilities 4,512 4,076 54,266
Total current liabilities 22,538 21,462 271,058
LONG-TERM LIABILITIES:
Long-term debt (Notes 6 and 11) 4,537 65 54,561
Accrued pension and severance costs for:
Employees (Note 7) 3,617 3,923 43,491
Directors and corporate auditors 356 358 4,287
Provision for alleged Anti-Monopoly Act violation 1,728 1,728 20,785
Negative goodwill 2 5 21
Deferred tax liabilities-non-current (Note 9) 75 75 904
Other long-term liabilities 150 164 1,803
Total long-term liabilities 10,465 6,318 125,852
EQUITY (Notes 8 and 17):
Common stock, no par value-
authorized; 160,000,000 shares in 2011 and 2010,
issued; 42,220,800 shares in 2011 and 20104,301 4,301 51,726
Capital surplus 4,812 4,812 57,866
Retained earnings 51,375 47,691 617,855
Treasury stock-at cost; 50,734 shares in 2011 and 50,296 shares in 2010 (69) (68) (828)
Accumulated other comprehensive income
Unrealized gain on available-for-sale securities 142 160 1,707
Foreign currency translation adjustments (7,397) (5,228) (88,957)
Total 53,164 51,668 639,369
Minority interests in consolidated subsidiaries 2,196 1,995 26,412
Total equity 55,360 53,663 665,781
TOTAL ¥88,363 ¥81,443 $1,062,691
See notes to consolidated fi nancial statements.
19Yusen Logistics Annual Report 2011

See notes to consolidated fi nancial statements.
Millions of YenThousands of
U.S. Dollars (Note 1)
2011 2010 2011NET SALES ¥160,788 ¥123,453 $1,933,716
COST OF SALES 124,514 92,127 1,497,460Gross profi t 36,274 31,326 436,256
SELLING, GENERAL AND ADMINISTRATIVE EXPENSES (Note 14) 31,327 29,016 376,757Operating income 4,947 2,310 59,499
OTHER INCOME (EXPENSES):Interest and dividend income 144 164 1,739Interest expense (20) (31) (241)Foreign currency exchange gain-net 570 528 6,845Equity in earnings of unconsolidated subsidiaries and affi liate companies 304 221 3,659Amortization of negative goodwill (Note 16) 3 3 36Loss on impairment of fi xed assets (Note 4) (66) (229) (797)Loss on revaluation of investments in securities (155) (19) (1,868)Loss on adoption of accounting standard for asset retirement obligations (11) - (137)Others-net 171 57 2,066
Other income (expense)-net 940 694 11,303INCOME BEFORE INCOME TAXES AND MINORITY INTERESTS 5,887 3,004 70,802
INCOME TAXES (Note 9):Current 1,968 1,100 23,672Deferred (140) (6) (1,682)
Total income taxes 1,828 1,094 21,990
NET INCOME BEFORE MINORITY INTERESTS 4,059 1,910 48,812
MINORITY INTERESTS IN NET INCOME OF CONSOLIDATED SUBSIDIARIES 438 365 5,270
NET INCOME ¥ 3,621 ¥1,545 $ 43,542
Yen U.S. Dollars
PER SHARE:Basic net income per share (Note 17) ¥85.85 ¥36.63 $1.032Cash dividends 18.00 16.00 0.216
Millions of YenThousands of
U.S. Dollars (Note 1)
2011 2011NET INCOME BEFORE MINORITY INTERESTS ¥4,059 $ 48,812OTHER COMPREHENSIVE INCOME (Note 15):
Unrealized gain (loss) on available-for-sale securities (18) (217)
Foreign currency translation adjustments (2,233) (26,852)
Share of other comprehensive income in associates (59) (710)
Total other comprehensive income (2,310) (27,779)
COMPREHENSIVE INCOME (Note 15) ¥1,749 $ 21,033
TOTAL COMPREHENSIVE INCOME ATTRITUTABLE TO (Note 15):
Owners of the parent ¥1,437 $ 17,278
Minority interests 312 3,755
See notes to consolidated fi nancial statements.
20 Yusen Logistics Annual Report 2011
Yusen Logistics Co., Ltd. and Consolidated SubsidiariesYears Ended March 31, 2011 and 2010
Consolidated Statements of Income
Consolidated Statement of Comprehensive IncomeYusen Logistics Co., Ltd. and Consolidated SubsidiariesYears Ended March 31, 2011
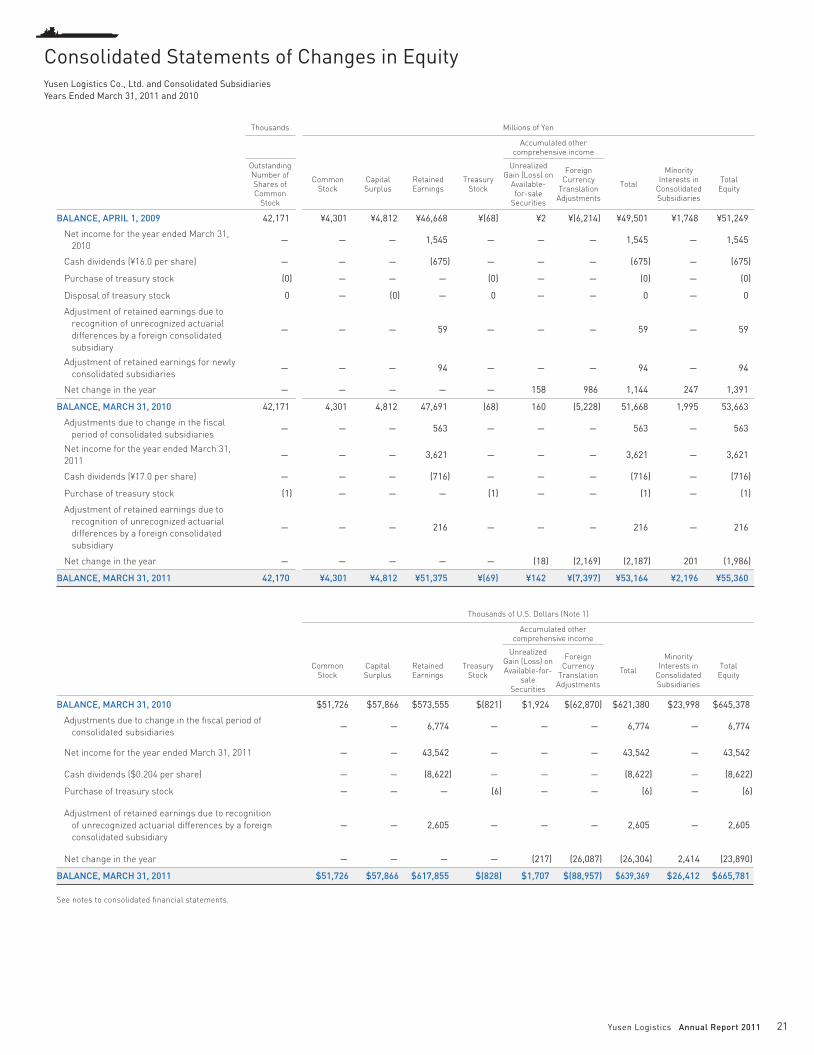
Thousands Millions of Yen
Accumulated other comprehensive income
OutstandingNumber ofShares ofCommon
Stock
CommonStock
CapitalSurplus
RetainedEarnings
TreasuryStock
UnrealizedGain (Loss) on
Available-for-sale
Securities
Foreign Currency
Translation Adjustments
Total
MinorityInterests in
ConsolidatedSubsidiaries
TotalEquity
BALANCE, APRIL 1, 2009 42,171 ¥4,301 ¥4,812 ¥46,668 ¥(68) ¥2 ¥(6,214) ¥49,501 ¥1,748 ¥51,249
Net income for the year ended March 31,
2010- - - 1,545 - - - 1,545 - 1,545
Cash dividends (¥16.0 per share) - - - (675) - - - (675) - (675)
Purchase of treasury stock (0) - - - (0) - - (0) - (0)
Disposal of treasury stock 0 - (0) - 0 - - 0 - 0
Adjustment of retained earnings due to
recognition of unrecognized actuarial
differences by a foreign consolidated
subsidiary
- - - 59 - - - 59 - 59
Adjustment of retained earnings for newly
consolidated subsidiaries- - - 94 - - - 94 - 94
Net change in the year - - - - - 158 986 1,144 247 1,391
BALANCE, MARCH 31, 2010 42,171 4,301 4,812 47,691 (68) 160 (5,228) 51,668 1,995 53,663
Adjustments due to change in the fi scal
period of consolidated subsidiaries- - - 563 - - - 563 - 563
Net income for the year ended March 31,
2011- - - 3,621 - - - 3,621 - 3,621
Cash dividends (¥17.0 per share) - - - (716) - - - (716) - (716)
Purchase of treasury stock (1) - - - (1) - - (1) - (1)
Adjustment of retained earnings due to
recognition of unrecognized actuarial
differences by a foreign consolidated
subsidiary
- - - 216 - - - 216 - 216
Net change in the year - - - - - (18) (2,169) (2,187) 201 (1,986)
BALANCE, MARCH 31, 2011 42,170 ¥4,301 ¥4,812 ¥51,375 ¥(69) ¥142 ¥(7,397) ¥53,164 ¥2,196 ¥55,360
Thousands of U.S. Dollars (Note 1)
Accumulated other comprehensive income
CommonStock
CapitalSurplus
RetainedEarnings
TreasuryStock
UnrealizedGain (Loss) on Available-for-
saleSecurities
Foreign Currency
Translation Adjustments
Total
MinorityInterests in
ConsolidatedSubsidiaries
TotalEquity
BALANCE, MARCH 31, 2010 $51,726 $57,866 $573,555 $(821) $1,924 $(62,870) $621,380 $23,998 $645,378
Adjustments due to change in the fi scal period of
consolidated subsidiaries- - 6,774 - - - 6,774 - 6,774
Net income for the year ended March 31, 2011 - - 43,542 - - - 43,542 - 43,542
Cash dividends ($0.204 per share) - - (8,622) - - - (8,622) - (8,622)
Purchase of treasury stock - - - (6) - - (6) - (6)
Adjustment of retained earnings due to recognition
of unrecognized actuarial differences by a foreign
consolidated subsidiary
- - 2,605 - - - 2,605 - 2,605
Net change in the year - - - - (217) (26,087) (26,304) 2,414 (23,890)
BALANCE, MARCH 31, 2011 $51,726 $57,866 $617,855 $(828) $1,707 $(88,957) $639,369 $26,412 $665,781
See notes to consolidated fi nancial statements.
21Yusen Logistics Annual Report 2011
Yusen Logistics Co., Ltd. and Consolidated SubsidiariesYears Ended March 31, 2011 and 2010
Consolidated Statements of Changes in Equity

Millions of YenThousands of
U.S. Dollars (Note 1)
2011 2010 2011
OPERATING ACTIVITIES:Income before income taxes and minority interests ¥ 5,887 ¥ 3,004 $ 70,802Adjustment for:
Depreciation and amortization 1,780 1,743 21,409Amortization of goodwill 16 6 192Increase (decrease) in accrued pension and severance costs 72 81 868Interest and dividend income (145) (164) (1,739)Interest expense 20 31 241Loss (gain) on foreign currency exchange, net (17) (7) (210)Equity in earnings of unconsolidated subsidiaries and affiliate companies (304) (221) (3,659)Decrease (increase) in trade notes and accounts receivable (1,978) (5,260) (23,789)Increase (decrease) in trade notes and accounts payable 1,302 3,258 15,658Loss on sale of property, plant and equipment, net 6 13 68Loss on impairment of fixed assets 66 229 797Loss (gain) on sale of investments in securities (35) 67 (423)Loss on revaluation of investments in securities 155 19 1,868Loss on write-down of golf club membership 3 13 36Loss (gain) on sales of membership (5) - (56)Increase (decrease) in allowance for doubtful accounts (85) 21 (1,020)Loss on adoption of accounting standard for asset retirement obligations 11 - 137Other-net 366 450 4,394
Total 7,115 3,283 85,574Interest and dividend received 149 177 1,788Interest paid (29) (49) (354)Fine for alleged Anti-Monopoly Act violation paid - (1,728) -Income taxes paid (1,560) (843) (18,760)
Net cash provided by operating activities 5,675 840 68,248INVESTING ACTIVITIES:
Payments into time deposits (2,375) (3,018) (28,567)Proceeds from withdrawal of time deposits 3,096 2,130 37,238Purchase of property, plant and equipment (1,182) (986) (14,211)Proceeds from sale of property, plant and equipment 22 399 266Purchase of investments in securities (12) (18) (150)Proceeds from sale of investments in securities 74 42 894Proceeds from sales of membership 6 - 70Increase in investments in unconsolidated subsidiaries and affiliate company - (55) -Lending of loans receivable (6,204) (9,511) (74,616)Collection of loans receivable 7,965 9,241 95,795Payments for transfer of business (143) - (1,719)Other-net 48 140 573
Net cash used in investing activities 1,295 (1,636) 15,573FINANCING ACTIVITIES:
Short-term bank loans, net (45) (3) (540)Proceeds from long-term loans payable 4,500 - 54,119Repayment of long-term debt (1,000) (500) (12,026)Repayment of obligations under finance lease (53) (82) (640)Cash dividends paid (715) (674) (8,603)Cash dividends paid to minority shareholders (120) (108) (1,443)Other-net (1) (0) (7)
Net cash used in financing activities 2,566 (1,367) 30,860FOREIGN CURRENCY TRANSLATION ADJUSTMENTS ON CASH AND CASH EQUIVALENTS (1,123) 565 (13,505)INCREASE (DECREASE) IN CASH AND CASH EQUIVALENTS 8,413 (1,598) 101,177CASH AND CASH EQUIVALENTS, BEGINNING OF YEAR 16,740 18,196 201,326CASH AND CASH EQUIVALENTS OF NEWLY CONSOLIDATED SUBSIDIARIES, BEGINNING OF YEAR
- 142 -
INCREASE (DECREASE) IN BEGINNING BALANCE OF CASH AND CASH EQUIVALENTS DUE TO CHANGES IN FISCAL PERIODS OF CONSOLIDATED SUBSIDIARIES
(64) - (770)
CASH AND CASH EQUIVALENTS, END OF YEAR ¥25,089 ¥16,740 $301,733
See notes to consolidated fi nancial statements.
22 Yusen Logistics Annual Report 2011
Yusen Logistics Co., Ltd. and Consolidated SubsidiariesYears Ended March 31, 2011 and 2010
Consolidated Statements of Cash Flows
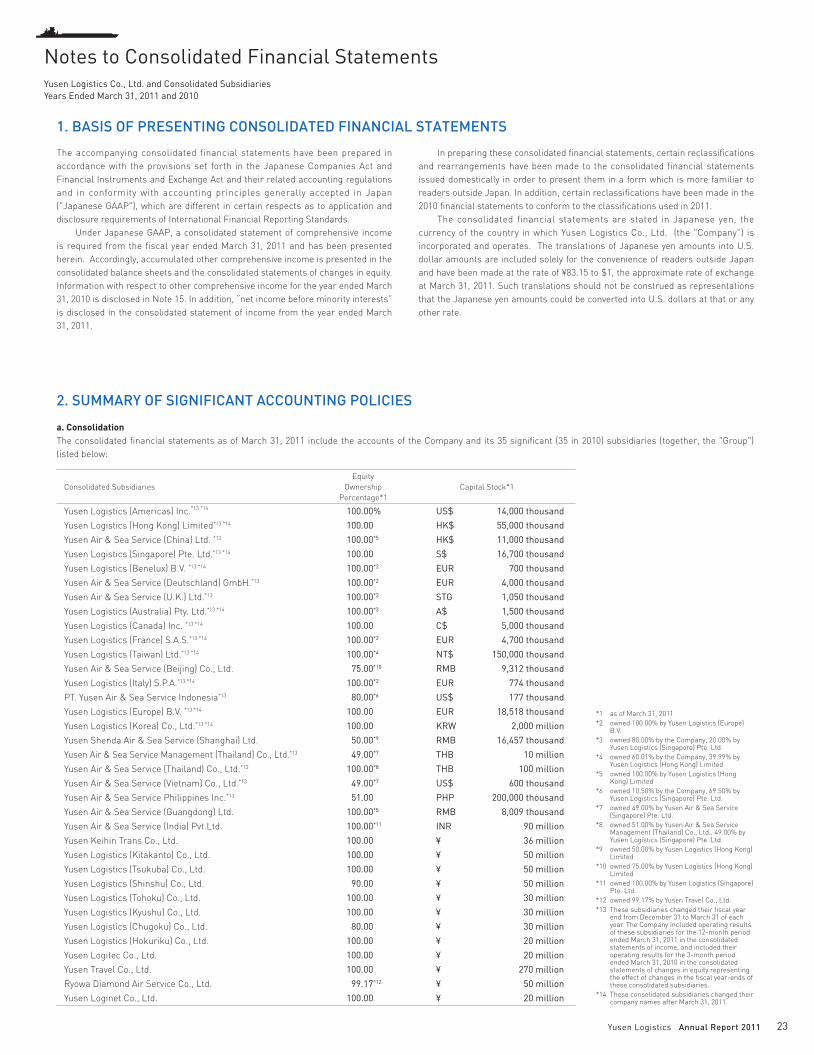
1. BASIS OF PRESENTING CONSOLIDATED FINANCIAL STATEMENTS
2. SUMMARY OF SIGNIFICANT ACCOUNTING POLICIES
The accompanying consolidated financial statements have been prepared in
accordance with the provisions set forth in the Japanese Companies Act and
Financial Instruments and Exchange Act and their related accounting regulations
and in conformity with accounting principles generally accepted in Japan
("Japanese GAAP"), which are different in certain respects as to application and
disclosure requirements of International Financial Reporting Standards.
Under Japanese GAAP, a consolidated statement of comprehensive income
is required from the fiscal year ended March 31, 2011 and has been presented
herein. Accordingly, accumulated other comprehensive income is presented in the
consolidated balance sheets and the consolidated statements of changes in equity.
Information with respect to other comprehensive income for the year ended March
31, 2010 is disclosed in Note 15. In addition, “net income before minority interests”
is disclosed in the consolidated statement of income from the year ended March
31, 2011.
In preparing these consolidated fi nancial statements, certain reclassifi cations
and rearrangements have been made to the consolidated financial statements
issued domestically in order to present them in a form which is more familiar to
readers outside Japan. In addition, certain reclassifi cations have been made in the
2010 fi nancial statements to conform to the classifi cations used in 2011.
The consolidated financial statements are stated in Japanese yen, the
currency of the country in which Yusen Logistics Co., Ltd. (the "Company") is
incorporated and operates. The translations of Japanese yen amounts into U.S.
dollar amounts are included solely for the convenience of readers outside Japan
and have been made at the rate of ¥83.15 to $1, the approximate rate of exchange
at March 31, 2011. Such translations should not be construed as representations
that the Japanese yen amounts could be converted into U.S. dollars at that or any
other rate.
a. Consolidation
The consolidated fi nancial statements as of March 31, 2011 include the accounts of the Company and its 35 signifi cant (35 in 2010) subsidiaries (together, the "Group")
listed below:
Consolidated Subsidiaries
Equity
Ownership
Percentage*1
Capital Stock*1
Yusen Logistics (Americas) Inc.*13 *14 100.00% US$ 14,000 thousand
Yusen Logistics (Hong Kong) Limited*13 *14 100.00 HK$ 55,000 thousand
Yusen Air & Sea Service (China) Ltd. *13 100.00*5 HK$ 11,000 thousand
Yusen Logistics (Singapore) Pte. Ltd.*13 *14 100.00 S$ 16,700 thousand
Yusen Logistics (Benelux) B.V. *13 *14 100.00*2 EUR 700 thousand
Yusen Air & Sea Service (Deutschland) GmbH.*13 100.00*2 EUR 4,000 thousand
Yusen Air & Sea Service (U.K.) Ltd.*13 100.00*2 STG 1,050 thousand
Yusen Logistics (Australia) Pty. Ltd.*13 *14 100.00*3 A$ 1,500 thousand
Yusen Logistics (Canada) Inc. *13 *14 100.00 C$ 5,000 thousand
Yusen Logistics (France) S.A.S.*13 *14 100.00*2 EUR 4,700 thousand
Yusen Logistics (Taiwan) Ltd.*13 *14 100.00*4 NT$ 150,000 thousand
Yusen Air & Sea Service (Beijing) Co., Ltd. 75.00*10 RMB 9,312 thousand
Yusen Logistics (Italy) S.P.A.*13 *14 100.00*2 EUR 774 thousand
PT. Yusen Air & Sea Service Indonesia*13 80.00*6 US$ 177 thousand
Yusen Logistics (Europe) B.V. *13 *14 100.00 EUR 18,518 thousand
Yusen Logistics (Korea) Co., Ltd.*13 *14 100.00 KRW 2,000 million
Yusen Shenda Air & Sea Service (Shanghai) Ltd. 50.00*9 RMB 16,457 thousand
Yusen Air & Sea Service Management (Thailand) Co., Ltd.*13 49.00*7 THB 10 million
Yusen Air & Sea Service (Thailand) Co., Ltd.*13 100.00*8 THB 100 million
Yusen Air & Sea Service (Vietnam) Co., Ltd.*13 49.00*7 US$ 600 thousand
Yusen Air & Sea Service Philippines Inc.*13 51.00 PHP 200,000 thousand
Yusen Air & Sea Service (Guangdong) Ltd. 100.00*5 RMB 8,009 thousand
Yusen Air & Sea Service (India) Pvt.Ltd. 100.00*11 INR 90 million
Yusen Keihin Trans Co., Ltd. 100.00 ¥ 36 million
Yusen Logistics (Kitakanto) Co., Ltd. 100.00 ¥ 50 million
Yusen Logistics (Tsukuba) Co., Ltd. 100.00 ¥ 50 million
Yusen Logistics (Shinshu) Co., Ltd. 90.00 ¥ 50 million
Yusen Logistics (Tohoku) Co., Ltd. 100.00 ¥ 30 million
Yusen Logistics (Kyushu) Co., Ltd. 100.00 ¥ 30 million
Yusen Logistics (Chugoku) Co., Ltd. 80.00 ¥ 30 million
Yusen Logistics (Hokuriku) Co., Ltd. 100.00 ¥ 20 million
Yusen Logitec Co., Ltd. 100.00 ¥ 20 million
Yusen Travel Co., Ltd. 100.00 ¥ 270 million
Ryowa Diamond Air Service Co., Ltd. 99.17*12 ¥ 50 million
Yusen Loginet Co., Ltd. 100.00 ¥ 20 million
*1 as of March 31, 2011
*2 owned 100.00% by Yusen Logistics (Europe) B.V.
*3 owned 80.00% by the Company, 20.00% by Yusen Logistics (Singapore) Pte. Ltd.
*4 owned 60.01% by the Company, 39.99% by Yusen Logistics (Hong Kong) Limited
*5 owned 100.00% by Yusen Logistics (Hong Kong) Limited
*6 owned 10.50% by the Company, 69.50% by Yusen Logistics (Singapore) Pte. Ltd.
*7 owned 49.00% by Yusen Air & Sea Service (Singapore) Pte. Ltd.
*8 owned 51.00% by Yusen Air & Sea Service Management (Thailand) Co., Ltd., 49.00% by Yusen Logistics (Singapore) Pte. Ltd.
*9 owned 50.00% by Yusen Logistics (Hong Kong) Limited
*10 owned 75.00% by Yusen Logistics (Hong Kong) Limited
*11 owned 100.00% by Yusen Logistics (Singapore) Pte. Ltd.
*12 owned 99.17% by Yusen Travel Co., Ltd.
*13 These subsidiaries changed their fi scal year end from December 31 to March 31 of each year. The Company included operating results of these subsidiaries for the 12-month period ended March 31, 2011 in the consolidated statements of income, and included their operating results for the 3-month period ended March 31, 2010 in the consolidated statements of changes in equity representing the effect of changes in the fi scal year-ends of these consolidated subsidiaries.
*14 These consolidated subsidiaries changed their company names after March 31, 2011.
23Yusen Logistics Annual Report 2011
Yusen Logistics Co., Ltd. and Consolidated SubsidiariesYears Ended March 31, 2011 and 2010
Notes to Consolidated Financial Statements

Under the control or influence concept, those companies in which the
Company, directly or indirectly, is able to exercise control over operations are
fully consolidated, and those companies over which the Group has the ability to
exercise signifi cant infl uences are accounted for by the equity method.
Investments in three (three in 2010) unconsolidated subsidiaries and
two (two in 2010) affi liate companies are accounted for by the equity method.
Investments in the remaining unconsolidated subsidiaries and affiliate
companies are stated at cost, which is determined by the moving-average
method. If the equity method of accounting had been applied to the investments
in these companies, the effect on the accompanying consolidated financial
statements would not be material.
The excess of the cost of an acquisition over the fair value of the net assets
of the acquired subsidiary at the date of acquisition is being amortized over a
period of fi ve years. The goodwill resulting from the acquisition of the business of
NYK Logistics (Japan) Co., Ltd. is being amortized over a period of three years.
All significant intercompany balances and transactions have been
eliminated in consolidation. All material unrealized profit included in assets
resulting from transactions within the Group is eliminated.
b. Unifi cation for Accounting Policies Applied to Foreign Subsidiaries for the
Consolidated Financial Statements
In May 2006, the Accounting Standards Board of Japan (the “ASBJ”) issued ASBJ
Practical Issues Task Force (PITF) No.18, “Practical Solution on Unification
of Accounting Policies Applied to Foreign Subsidiaries for the Consolidated
Financial Statements”. PITF No.18 prescribes: (1) the accounting policies
and procedures applied to a parent company and its subsidiaries for similar
transactions and events under similar circumstances should in principle
be unified for the preparation of the consolidated financial statements, (2)
financial statements prepared by foreign subsidiaries in accordance with
either International Financial Reporting Standards or the generally accepted
accounting principles in the United States of America tentatively may be used
for the consolidation process, (3) however, the following items should be
adjusted in the consolidation process so that net income is accounted for in
accordance with Japanese GAAP unless they are not material: 1) amortization
of goodwill; 2) scheduled amortization of actuarial gain or loss of pensions that
has been directly recorded in the equity; 3) expensing capitalized development
costs of R&D; 4) cancellation of the fair value model accounting for property,
plant, and equipment and investment properties and incorporation of the cost
model accounting; 5) recording the prior years' effects of changes in accounting
policies in the income statement where retrospective adjustments to fi nancial
statements have been incorporated; and 6) exclusion of minority interests from
net income, if contained.
c. Business Combination
In October 2003, the Business Accounting Council (the “BAC”) issued a Statement
of Opinion, “Accounting for Business Combinations”, and in December 2005,
the ASBJ issued ASBJ Statement No.7, “Accounting Standard for Business
Divestitures” and ASBJ Guidance No.10, “Guidance for Accounting Standard for
Business Combinations and Business Divestitures”. The accounting standard for
business combinations allowed companies to apply the pooling of interests method
of accounting only when certain specifi c criteria are met such that the business
combination is essentially regarded as a uniting-of-interests. For business
combinations that did not meet the uniting-of-interests criteria, the business
combination was considered to be an acquisition and the purchase method
of accounting was required. This standard also prescribed the accounting for
combinations of entities under common control and for joint ventures.
In December 2008, the ASBJ issued a revised accounting standard
for business combinations, ASBJ Statement No.21, “Accounting Standard
for Business Combinations.” Major accounting changes under the revised
accounting standard are as follows: (1) The revised standard requires
accounting for business combinations only by the purchase method. As a result,
the pooling of interests method of accounting is no longer allowed. (2) The
current accounting standard accounts for research and development costs to be
charged to income as incurred. Under the revised standard, in-process research
and development (IPR&D) acquired in the business combination is capitalized as
an intangible asset. (3) The previous accounting standard provided for a bargain
purchase gain (negative goodwill) to be systematically amortized over a period
not exceeding 20 years. Under the revised standard, the acquirer recognizes
the bargain purchase gain in profi t or loss immediately on the acquisition date
after reassessing and confi rming that all of the assets acquired and all of the
liabilities assumed have been identifi ed after a review of the procedures used in
the purchase allocation. This standard was applicable to business combinations
undertaken on or after April 1, 2010. The Company adopted this standard on
April 1, 2010.
d. Cash Equivalents
Cash equivalents are short-term investments that are readily convertible
into cash and that are exposed to insignifi cant risk of changes in value. Cash
equivalents include time deposits of which mature or become due within three
months of the date of acquisition.
e. Investments in Securities
Securities are classified into three categories, depending on management's
intent: trading, available-for-sale or held-to-maturity. The Company classifi es
all investments in securities as available-for-sale securities. Marketable
available-for-sale securities are reported at fair value, with unrealized
gains and losses, net of applicable taxes, reported under accumulated other
comprehensive income in a separate component of equity. Non-marketable
available-for-sale securities are stated at cost determined by the moving-
average method. For other than temporary declines in fair value, non-
marketable investment securities are reduced to net realizable value by a
charge to income.
f. Property, Plant and Equipment
Property, plant and equipment are stated at cost. Depreciation of property,
plant and equipment of the Company and domestic consolidated subsidiaries is
computed substantially by the declining-balance method at rates based on the
estimated useful lives of the assets, except for the buildings and structures at
Toyooka distribution center, Iwata distribution center and Yusen Air Fukumoto
building which are depreciated on the straight-line method. The depreciation of
property, plant and equipment of foreign consolidated subsidiaries is generally
computed by the straight-line method over the estimated useful lives of the
assets. The range of useful lives is principally as follows:
Buildings and structures ............................3-60 years
Furniture and fi xtures ................................2-20 years
Machinery, equipment and vehicles ...........4-6 years
g. Other Assets
Amortization of intangible assets included in other assets is computed by the
straight-line method. Software for internal use is amortized over a five-year
period.
h. Long-lived Assets
The Group reviews its long-lived assets for impairment whenever events or
changes in circumstance indicate the carrying amount of an asset or asset
group may not be recoverable. An impairment loss would be recognized
if the carrying amount of an asset or asset group exceeds the sum of the
undiscounted future cash fl ows expected to result from the continued use and
eventual disposition of the asset or asset group. The impairment loss would be
measured as the amount by which the carrying amount of the asset exceeds its
recoverable amount, which is the higher of the discounted cash fl ows from the
continued use and eventual disposition of the asset or the net selling price at
disposition.
i. Allowance for Doubtful Accounts
The Group provides an allowance for doubtful accounts based on the aggregated
amount of estimated credit losses for doubtful receivables plus an amount for
receivables other than doubtful receivables calculated using historical write off
experience over a certain period.
j. Accrued Bonuses to Employees
Employees are paid bonuses in June of every year. The bonuses include amounts
for services rendered during the previous fiscal year which are recorded as
accrued bonuses on the balance sheet as of the respective fi scal year-end.
24 Yusen Logistics Annual Report 2011

k. Accrued Pension and Severance Costs
Employee's retirement and pension plans—The Company and certain domestic
consolidated subsidiaries have a non-contributory funded defined benefit
pension plan and an unfunded retirement benefi t plan. Certain of the Company’s
domestic consolidated subsidiaries have a contributory funded defined
contribution pension plan, while certain foreign consolidated subsidiaries have
either a non-contributory funded defi ned benefi t pension plan or a contributory
funded defi ned contribution pension plan.
The liability for employees' retirement benefi ts is accounted for based on
projected benefi t obligations and plan assets at the balance sheet date.
In July 2008, the ASBJ issued ASBJ Statement No. 19, “Partial Amendments
to Accounting Standard for Retirement Benefits (Part 3)”, which removed the
option of using a discount rate determined by taking into consideration the
fluctuations in yield of bonds over a certain period, as provided in Note 7 of
“Interpretive Note to the Accounting Standard for Retirement Benefits”. The
yield of a long term safe bond on closing date should be used for the calculation
of the discount rate in this accounting standard. The Company applied the
revised accounting standard effective April 1, 2009, however, there was no effect
from this change.
Retirement allowance for directors and corporate auditors—Retirement allowance
for directors and corporate auditors for certain subsidiaries are recorded to
state the liability at the amount that would be required if all directors and
corporate auditors retired at each balance sheet date.
l. Asset Retirement Obligations
In March 2008, the ASBJ published the accounting standard for asset retirement
obligations, ASBJ Statement No.18 “Accounting Standard for Asset Retirement
Obligations” and ASBJ Guidance No.21 “Guidance on Accounting Standard
for Asset Retirement Obligations”. Under this accounting standard, an asset
retirement obligation is defi ned as a legal obligation imposed either by law or
contract that results from the acquisition, construction, development and the
normal operation of a tangible fi xed asset and is associated with the retirement
of such tangible fi xed asset. The asset retirement obligation is recognized as
the sum of the discounted cash fl ows required for the future asset retirement
and is recorded in the period in which the obligation is incurred if a reasonable
estimate can be made. If a reasonable estimate of the asset retirement
obligation cannot be made in the period the asset retirement obligation is
incurred, the liability should be recognized when a reasonable estimate of asset
retirement obligation can be made. Upon initial recognition of a liability for an
asset retirement obligation, an asset retirement cost is capitalized by increasing
the carrying amount of the related fi xed asset by the amount of the liability. The
asset retirement cost is subsequently allocated to expense through depreciation
over the remaining useful life of the asset. Over time, the liability is accreted
to its present value each period. Any subsequent revisions to the timing or the
amount of the original estimate of undiscounted cash fl ows are refl ected as an
increase or a decrease in the carrying amount of the liability and the capitalized
amount of the related asset retirement cost. This standard was effective for
fi scal years beginning on or after April 1, 2010.
The Company applied this accounting standard effective April 1, 2010.
The effect of this change was to decrease operating income by ¥ 1 million ($ 9
thousand) and income before income taxes and minority interests by ¥ 12 million
($ 147 thousand). The asset retirement obligations that the Group recognized
upon applying this standard aggregated ¥14 million ($ 167 thousand).
m. Provision for alleged Anti-Monopoly Act violation
On March 18, 2009 the Company received the notice of a cease-and-desist
order and a surcharge payment order from the Japan Fair Trade Commission
(the "JFTC") for violations of Article 3 of the Anti-Monopoly Act (prohibition
of unreasonable restraint of trade). In the period that followed, the Company
scrutinized, confirmed and carefully examined the JFTC orders. Determining
that it was unable to accept the orders as a result of these steps, the Company
resolved at an Extraordinary Meeting of the Board of Directors held on April 17,
2009 to fi le an application for the commencement of hearings with the JFTC and
received the notices of the acceptance of hearings on July 3, 2009. The hearings
were conducted twice during the current fiscal year and still continue as of
the fi lling date of the consolidated fi nancial statements. The estimated losses
arising from surcharge payment order were recorded as a provision in the
balance sheet as of March 31, 2011 and 2010.
n. Leases
In March 2007, the ASBJ issued ASBJ Statement No. 13, “Accounting Standard
for Lease Transactions”, which revised the previous accounting standard for
lease transactions issued in June 1993. The revised accounting standard for lease
transactions was effective for fi scal years beginning on or after April 1, 2008.
Under the previous accounting standard, fi nance leases that were deemed
to transfer ownership of the leased property to the lessee were capitalized.
However, other fi nance leases were permitted to be accounted for as operating
lease transactions if certain “as if capitalized” information was disclosed in
the note to the lessee’s fi nancial statements. The revised accounting standard
requires that all finance lease transactions be capitalized to recognize lease
assets and lease obligations in the balance sheet. In addition, the accounting
standard permits leases which existed at the transition date and do not transfer
ownership of the leased property to the lessee to continue to be accounted for
as operating lease transactions.
The Company applied the revised accounting standard effective April 1,
2008. In addition, the Company continues to account for leases which existed at
the transition date and do not transfer ownership of the leased property to the
lessee as operating lease transactions.
All other leases are accounted for as operating leases.
o. Income Taxes
The provision for income taxes is computed based on the pretax income included
in the consolidated statement of income. The asset and liability approach is
used to recognize deferred tax assets and liabilities for the expected future tax
consequences of temporary differences between the carrying amounts and the
tax bases of assets and liabilities. Deferred taxes are measured by applying
currently enacted tax laws to the temporary differences.
p. Accounting for the Consumption Tax
In Japan, the consumption tax is imposed at a fl at rate of 5% on all domestic
consumption of goods and services (with certain exemptions). The consumption
tax imposed on the Group's domestic sales to customers is withheld by the
Group at the time of sale and is subsequently paid to the national government.
The consumption tax withheld upon sale and the consumption tax paid by the
Group on the purchases of goods and services are not included in the related
amounts in the accompanying consolidated statements of income.
q. Appropriation of Retained Earnings
Appropriations of retained earnings are refl ected in the fi nancial statements for
the following year upon shareholders' approval.
r. Treasury Stock
Under the Japanese Companies Act, the Company is allowed to acquire its own
shares to the extent that the aggregate cost of treasury stock does not exceed
the maximum amount available for dividends. Treasury stock is stated at cost
in the equity of the accompanying consolidated balance sheets. Net gain on
disposal of treasury stock is presented under "Capital surplus'' in the equity of
the accompanying consolidated balance sheets.
s. Foreign Currency Transactions
All short-term and long-term monetary receivables and payables denominated
in foreign currencies are translated into Japanese yen at the exchange rates at
the balance sheet date. The foreign exchange gains and losses from translation
are recognized in the consolidated statement of income.
t. Foreign Currency Financial Statements
The balance sheet accounts of foreign consolidated subsidiaries, and foreign
subsidiaries accounted for by the equity method are translated into Japanese
yen at the current exchange rate as of the balance sheet date except for equity,
which is translated at historical rate. Differences arising from such translations
are shown as "Foreign currency translation adjustments" under accumulated
25Yusen Logistics Annual Report 2011

other comprehensive income in a separate component of equity.
Revenue and expense accounts of foreign consolidated subsidiaries are
translated into Japanese yen at the average exchange rates.
u. Derivatives
The Group uses derivative fi nancial instruments to manage their exposures to
fl uctuations in foreign exchange and interest rates. Foreign exchange forward
contracts are utilized by the Group. The Group does not enter into derivatives
for trading or speculative purposes.
Derivative financial instruments and foreign currency transactions are
classified and accounted for as follows: (a) all derivatives are recognized as
either assets or liabilities and measured at fair value, and gains or losses on
derivative transactions are recognized in the consolidated statement of income
and (b) for derivatives used for hedging purposes, if derivatives qualify for hedge
accounting because of high correlation and effectiveness between the hedging
instruments and the hedged items, gains or losses on derivatives are deferred
until maturity of the hedged transactions.
The foreign exchange forward contracts employed to hedge foreign
exchange exposures in the Group's operating activities measured at the fair
value and the unrealized gains/losses are recognized in income.
v. Per Share Information
Net assets per share is computed based on the outstanding shares of common
stock at relevant balance sheet dates.
Basic net income per share is computed by dividing net income available
to shareholders by the weighted-average number of shares of common stock
outstanding for the period.
Diluted net income per share for the years ended March 31, 2011 and 2010
is not presented since the Company had no securities with dilutive effect.
Cash dividends per share presented in the accompanying consolidated
statements of income are dividends applicable to the respective years including
dividends to be paid after the end of the year.
w. New Accounting Pronouncements
Accounting Changes and Error Corrections—In December 2009, ASBJ issued
ASBJ Statement No. 24 “Accounting Standard for Accounting Changes and Error
Corrections” and ASBJ Guidance No. 24 “Guidance on Accounting Standard for
Accounting Changes and Error Corrections”. Accounting treatments under this
standard and guidance are as follows:
(1) Changes in Accounting Policies - When a new accounting policy is
applied with revision of accounting standards, the new policy is applied
retrospectively unless the revised accounting standards include specific
transitional provisions. When the revised accounting standards include
specific transitional provisions, an entity shall comply with the specific
transitional provisions.
(2) Changes in Presentations - When the presentation of financial statements
is changed, prior period financial statements are reclassified in accordance
with the new presentation.
(3) Changes in Accounting Estimates - A change in an accounting estimate is
accounted for in the period of the change if the change affects that period
only, and is accounted for prospectively if the change affects both the period
of the change and future periods.
(4) Corrections of Prior Period Errors - When an error in prior period financial
statements is discovered, those statements are restated.
This accounting standard and the guidance are applicable to accounting
changes and corrections of prior period errors which are made from the
beginning of the fiscal year that begins on or after April 1, 2011.
3. BUSINESS COMBINATION
4. LONG-LIVED ASSETS
On October 1, 2010, the Company acquired certain of the net assets of NYK
Logistics (Japan) Co., Ltd. (“NLJ”) as well as NLJ’s operations related to
international ocean freight forwarding, related agency services, container
consolidation, and other services.
The Company and Nippon Yusen Kabushiki Kaisha (NYK LINE) have agreed
to integrate their logistics businesses with the purpose of establishing a firm
position as a world-class logistics service provider through the reorganization and
optimization of their logistics business units. This acquisition was an integration of
their domestic logistics businesses as a part of the overall integration.
The results of operations of NLJ are included in the Group’s consolidated
fi nancial statements of income from the date of acquisition.
In accordance with the ASBJ Statement No.21, “Accounting Standard for
Business Combinations” and ASBJ Guidance No.10, “Guidance on Accounting
Standard for Business Combinations and Accounting Standard for Business
Divestitures”, this acquisition was accounted as an acquisition with cash
consideration of a business under common control.
The aggregate acquisition cost was ¥143 million ($ 1,719 thousand) in cash in
accordance with the Business Transfer Agreement. Goodwill of ¥59 million ($702
thousand) which represents the expected excess earnings power in the future
from the business integration is reported within the Japan segment. The amount
of the goodwill is net of taxes and is subject to amortization using the straight-
line method over a period of three years.
The proforma information giving effect as if the combination had been
completed at the beginning of the current fi scal year is not presented due to minor
effect on the consolidated statements of income.
The Group reviewed its long-lived assets for impairment as of the year ended
March 31, 2011 and 2010. Due to a signifi cant decline in market value of certain
fi xed assets which were planned to be disposed by sale, the Group recognized an
impairment loss of ¥66 million ($797 thousand) and ¥229 million as other expense
for the years ended March 31, 2011 and 2010 respectively. The impairment loss
of ¥66 million for the year ended March 31, 2011 was recorded on idle assets in
Osaka. The impairment loss for the year ended March 31, 2010 consisted of ¥136
million on certain land, building and structure in Aichi and ¥93 million on idle
assets in Osaka. The carrying amounts of the relevant assets were written down to
the recoverable amounts. The recoverable amounts of those assets planned to be
disposed by sale were measured at their net selling price determined by quotation
from a third-party vendor.
26 Yusen Logistics Annual Report 2011

5. INVESTMENTS IN SECURITIES
The cost and aggregate fair values of the investments classifi ed as "available-for-sale securities" at March 31, 2011 and 2010 are as follows:
(2) Proceeds from sale of available-for-sale securities and total amounts of gain and loss on sale of available-for-sale securities:
(1) Available-for-sale securities for which market quotations are available:
(3 ) The impairment losses of securities for the year ended March 31, 2011 amounted to ¥ 155 million ($ 1,868 thousand) which consists of ¥ 16 million ($ 188 thousand) for
available-for-sale securities and ¥ 139 million ($ 1,680 thousand) for the securities of non-consolidated subsidiaries.
The impairment losses of securities for the year ended March 31, 2010 was ¥ 19 million, which was for available-for-sale securities.
Millions of Yen Thousands of U.S. Dollars
2011 2010 2011
CostFair Value(Carrying Amount)
Difference CostFair Value(Carrying Amount)
Difference CostFair Value(Carrying Amount)
Difference
Securities for which market value exceeds cost-
Equity securities ¥264 ¥447 ¥183 ¥304 ¥582 ¥278 $3,174 $5,372 $2,198Government bonds 41 42 1 59 60 1 495 503 8
Securities for which market value does not exceed cost-
Equity securities 105 90 (15) 74 70 (4) 1,262 1,089 (173)Total ¥410 ¥579 ¥169 ¥437 ¥712 ¥275 $4,931 $6,964 $2,033
Millions of Yen Thousands of U.S. Dollars
2011 2010 2011Proceeds from sale of available-for-sale securities ¥74 ¥41 $894Total amount of gain on sale of available-for-sale securities 39 14 472Total amount of loss on sale of available-for-sale securities 4 81 49
6. SHORT-TERM BANK LOANS AND LONG-TERM DEBT
There were no short term bank loan at March 31, 2011 and 2010.
Long-term debt at March 31, 2011 and 2010 consisted of the following:
Millions of YenThousands of U.S. Dollars
2011 2010 2011
Unsecured loans from banks and other financial institutions, due serially to 2016 with average interest rates of 0.50% (2011) and 1.08% (2010)
¥4,500 ¥1,000 $54,119
Finance lease obligation 72 128 866Total 4,572 1,128 54,985
Less current portion (35) (1,063) (424)Long-term debt, less current portion ¥4,537 ¥65 $54,561
Year Ending March 31 Millions of YenThousands of U.S. Dollars
2012 ¥ 35 $ 4242013 18 2122014 11 1372015 2,504 30,1182016 and thereafter 2,004 24,094Total ¥4,572 $54,985
Annual maturities of long-term debt including fi nancial lease obligation at March
31, 2011, were as follows:
As is customary in Japan, the Company maintains substantial deposit balances with banks with which it has borrowings. Such deposit balances are not legally or
contractually restricted as to withdrawal.
General agreements with respective banks provide, as is customary in Japan, that additional collateral must be provided under certain circumstances if requested by
such banks and that certain banks have the right to offset cash deposited with them against any long-term or short-term debt or obligation that becomes due and, in case
of default and certain other specifi ed events, against all other debt payable to the banks. The Company has never been requested to provide any additional collateral.
Millions of YenThousands of U.S. Dollars
2011 2010 2011Projected benefit obligation ¥10,492 ¥10,601 $126,184Fair value of plan assets (6,101) (5,931) (73,379)Unrecognized actuarial gain (1,037) (1,075) (12,473)Prepaid pension cost 263 328 3,159
Accrued pension and severance costs for employees
¥ 3,617 ¥ 3,923 $ 43,491
7. RETIREMENT AND PENSION PLANS
The Company and certain consolidated subsidiaries have severance payment plans
for employees, directors and corporate auditors. Under most circumstances,
employees terminating their employment are entitled to retirement benefits
determined based on the rate of pay at the time of termination, years of service
and certain other factors. Such retirement benefits are made in the form of a
lump-sum severance payment from the Company or from certain consolidated
subsidiaries and annuity payments from a trustee. Employees are entitled to
larger payments if the termination is involuntary, by retirement at the mandatory
retirement age, by death, or by voluntary retirement at certain specifi c ages prior
to the mandatory retirement age.
Accrued pension and severance costs for employees at March 31, 2011 and 2010
consisted of the following:
27Yusen Logistics Annual Report 2011
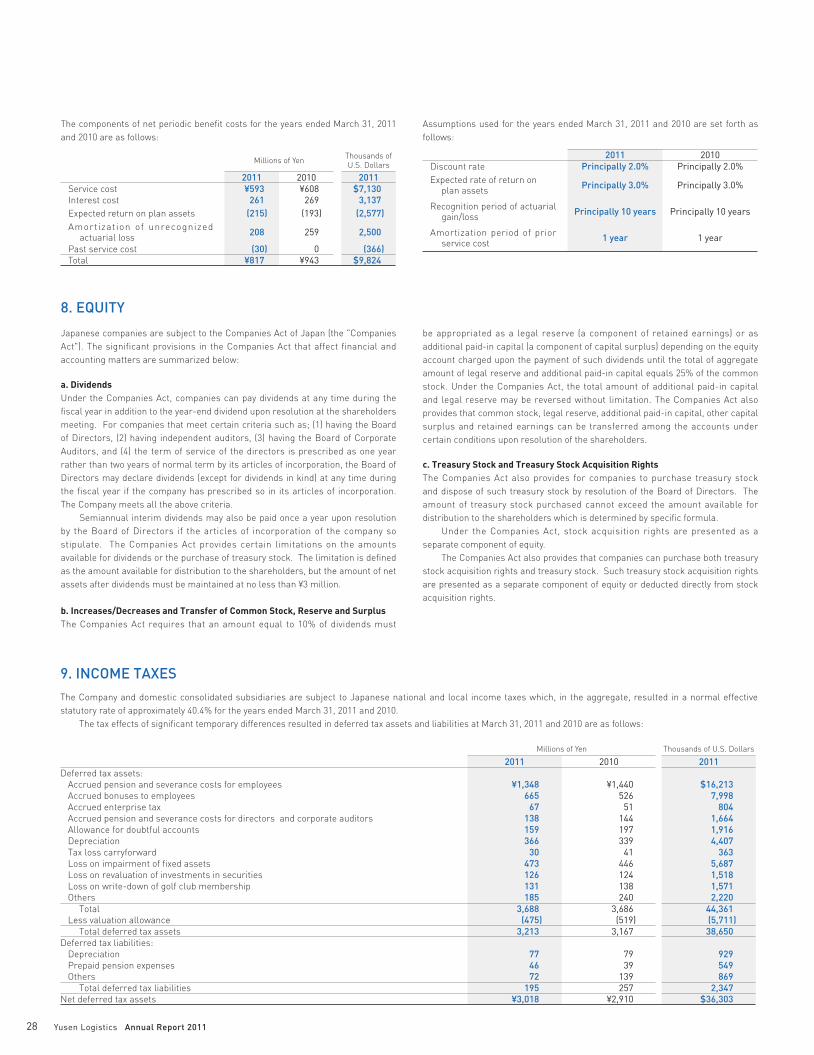
Millions of YenThousands of U.S. Dollars
2011 2010 2011Service cost ¥593 ¥608 $7,130Interest cost 261 269 3,137Expected return on plan assets (215) (193) (2,577)Amortization of unrecognized
actuarial loss208 259 2,500
Past service cost (30) 0 (366)Total ¥817 ¥943 $9,824
2011 2010Discount rate Principally 2.0% Principally 2.0%Expected rate of return on
plan assetsPrincipally 3.0% Principally 3.0%
Recognition period of actuarial gain/loss
Principally 10 years Principally 10 years
Amortization period of prior service cost
1 year 1 year
The components of net periodic benefi t costs for the years ended March 31, 2011
and 2010 are as follows:
Assumptions used for the years ended March 31, 2011 and 2010 are set forth as
follows:
8. EQUITY
Japanese companies are subject to the Companies Act of Japan (the "Companies
Act"). The significant provisions in the Companies Act that affect financial and
accounting matters are summarized below:
a. Dividends
Under the Companies Act, companies can pay dividends at any time during the
fi scal year in addition to the year-end dividend upon resolution at the shareholders
meeting. For companies that meet certain criteria such as; (1) having the Board
of Directors, (2) having independent auditors, (3) having the Board of Corporate
Auditors, and (4) the term of service of the directors is prescribed as one year
rather than two years of normal term by its articles of incorporation, the Board of
Directors may declare dividends (except for dividends in kind) at any time during
the fi scal year if the company has prescribed so in its articles of incorporation.
The Company meets all the above criteria.
Semiannual interim dividends may also be paid once a year upon resolution
by the Board of Directors if the articles of incorporation of the company so
stipulate. The Companies Act provides certain limitations on the amounts
available for dividends or the purchase of treasury stock. The limitation is defi ned
as the amount available for distribution to the shareholders, but the amount of net
assets after dividends must be maintained at no less than ¥3 million.
b. Increases/Decreases and Transfer of Common Stock, Reserve and Surplus
The Companies Act requires that an amount equal to 10% of dividends must
be appropriated as a legal reserve (a component of retained earnings) or as
additional paid-in capital (a component of capital surplus) depending on the equity
account charged upon the payment of such dividends until the total of aggregate
amount of legal reserve and additional paid-in capital equals 25% of the common
stock. Under the Companies Act, the total amount of additional paid-in capital
and legal reserve may be reversed without limitation. The Companies Act also
provides that common stock, legal reserve, additional paid-in capital, other capital
surplus and retained earnings can be transferred among the accounts under
certain conditions upon resolution of the shareholders.
c. Treasury Stock and Treasury Stock Acquisition Rights
The Companies Act also provides for companies to purchase treasury stock
and dispose of such treasury stock by resolution of the Board of Directors. The
amount of treasury stock purchased cannot exceed the amount available for
distribution to the shareholders which is determined by specifi c formula.
Under the Companies Act, stock acquisition rights are presented as a
separate component of equity.
The Companies Act also provides that companies can purchase both treasury
stock acquisition rights and treasury stock. Such treasury stock acquisition rights
are presented as a separate component of equity or deducted directly from stock
acquisition rights.
9. INCOME TAXES
Millions of Yen Thousands of U.S. Dollars
2011 2010 2011Deferred tax assets:
Accrued pension and severance costs for employees ¥1,348 ¥1,440 $16,213Accrued bonuses to employees 665 526 7,998Accrued enterprise tax 67 51 804Accrued pension and severance costs for directors and corporate auditors 138 144 1,664Allowance for doubtful accounts 159 197 1,916Depreciation 366 339 4,407Tax loss carryforward 30 41 363Loss on impairment of fi xed assets 473 446 5,687Loss on revaluation of investments in securities 126 124 1,518Loss on write-down of golf club membership 131 138 1,571Others 185 240 2,220
Total 3,688 3,686 44,361Less valuation allowance (475) (519) (5,711)
Total deferred tax assets 3,213 3,167 38,650Deferred tax liabilities:
Depreciation 77 79 929Prepaid pension expenses 46 39 549Others 72 139 869
Total deferred tax liabilities 195 257 2,347Net deferred tax assets ¥3,018 ¥2,910 $36,303
The Company and domestic consolidated subsidiaries are subject to Japanese national and local income taxes which, in the aggregate, resulted in a normal effective
statutory rate of approximately 40.4% for the years ended March 31, 2011 and 2010.
The tax effects of signifi cant temporary differences resulted in deferred tax assets and liabilities at March 31, 2011 and 2010 are as follows:
28 Yusen Logistics Annual Report 2011
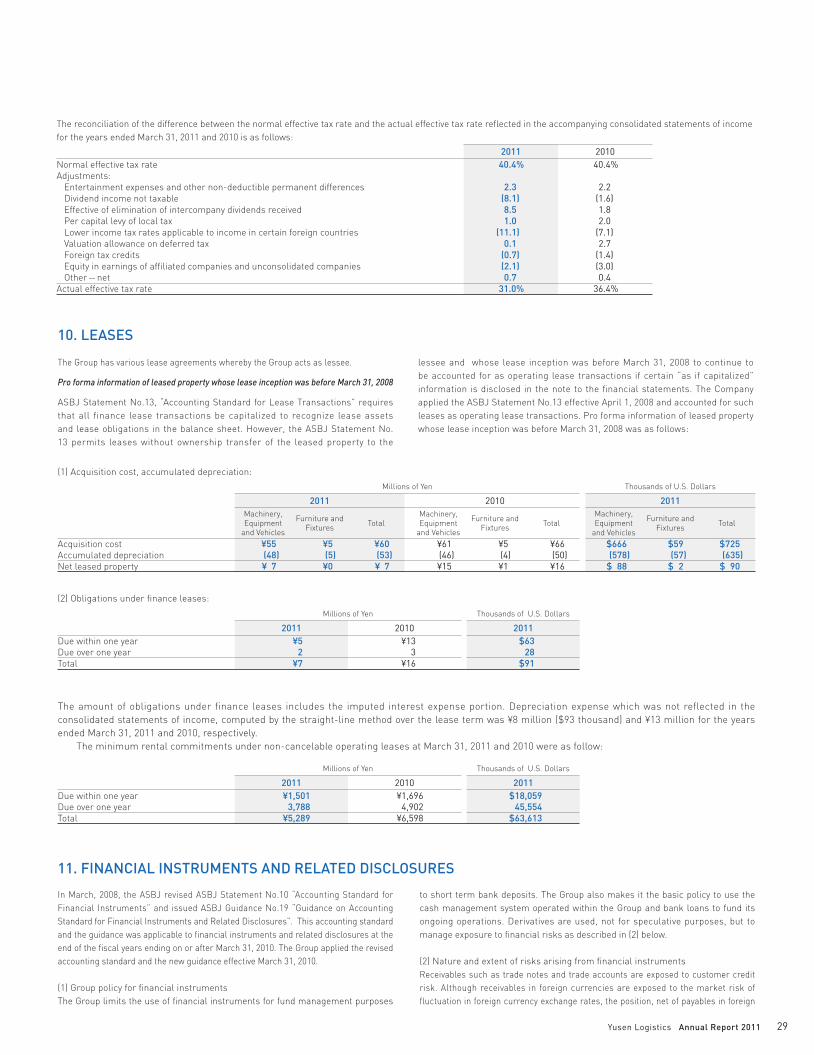
2011 2010Normal effective tax rate 40.4% 40.4%Adjustments:
Entertainment expenses and other non-deductible permanent differences 2.3 2.2Dividend income not taxable (8.1) (1.6)Effective of elimination of intercompany dividends received 8.5 1.8Per capital levy of local tax 1.0 2.0Lower income tax rates applicable to income in certain foreign countries (11.1) (7.1)Valuation allowance on deferred tax 0.1 2.7Foreign tax credits (0.7) (1.4)Equity in earnings of affi liated companies and unconsolidated companies (2.1) (3.0)Other-net 0.7 0.4
Actual effective tax rate 31.0% 36.4%
The reconciliation of the difference between the normal effective tax rate and the actual effective tax rate refl ected in the accompanying consolidated statements of income
for the years ended March 31, 2011 and 2010 is as follows:
The Group has various lease agreements whereby the Group acts as lessee.
Pro forma information of leased property whose lease inception was before March 31, 2008
ASBJ Statement No.13, “Accounting Standard for Lease Transactions” requires
that all finance lease transactions be capitalized to recognize lease assets
and lease obligations in the balance sheet. However, the ASBJ Statement No.
13 permits leases without ownership transfer of the leased property to the
lessee and whose lease inception was before March 31, 2008 to continue to
be accounted for as operating lease transactions if certain “as if capitalized”
information is disclosed in the note to the fi nancial statements. The Company
applied the ASBJ Statement No.13 effective April 1, 2008 and accounted for such
leases as operating lease transactions. Pro forma information of leased property
whose lease inception was before March 31, 2008 was as follows:
10. LEASES
Millions of Yen Thousands of U.S. Dollars
2011 2010 2011Machinery,Equipment
and Vehicles
Furniture and Fixtures
TotalMachinery,Equipment
and Vehicles
Furniture and Fixtures
TotalMachinery,Equipment
and Vehicles
Furniture and Fixtures
Total
Acquisition cost ¥55 ¥5 ¥60 ¥61 ¥5 ¥66 $666 $59 $725 Accumulated depreciation (48) (5) (53) (46) (4) (50) (578) (57) (635)Net leased property ¥ 7 ¥0 ¥ 7 ¥15 ¥1 ¥16 $ 88 $ 2 $ 90
Millions of Yen Thousands of U.S. Dollars
2011 2010 2011Due within one year ¥5 ¥13 $63 Due over one year 2 3 28Total ¥7 ¥16 $91
Millions of Yen Thousands of U.S. Dollars
2011 2010 2011Due within one year ¥1,501 ¥1,696 $18,059 Due over one year 3,788 4,902 45,554Total ¥5,289 ¥6,598 $63,613
(1) Acquisition cost, accumulated depreciation:
The amount of obligations under finance leases includes the imputed interest expense portion. Depreciation expense which was not reflected in the
consolidated statements of income, computed by the straight-line method over the lease term was ¥8 million ($93 thousand) and ¥13 million for the years
ended March 31, 2011 and 2010, respectively.
The minimum rental commitments under non-cancelable operating leases at March 31, 2011 and 2010 were as follow:
(2) Obligations under fi nance leases:
11. FINANCIAL INSTRUMENTS AND RELATED DISCLOSURES
In March, 2008, the ASBJ revised ASBJ Statement No.10 “Accounting Standard for
Financial Instruments” and issued ASBJ Guidance No.19 “Guidance on Accounting
Standard for Financial Instruments and Related Disclosures”. This accounting standard
and the guidance was applicable to fi nancial instruments and related disclosures at the
end of the fi scal years ending on or after March 31, 2010. The Group applied the revised
accounting standard and the new guidance effective March 31, 2010.
(1) Group policy for fi nancial instruments
The Group limits the use of fi nancial instruments for fund management purposes
to short term bank deposits. The Group also makes it the basic policy to use the
cash management system operated within the Group and bank loans to fund its
ongoing operations. Derivatives are used, not for speculative purposes, but to
manage exposure to fi nancial risks as described in (2) below.
(2) Nature and extent of risks arising from fi nancial instruments
Receivables such as trade notes and trade accounts are exposed to customer credit
risk. Although receivables in foreign currencies are exposed to the market risk of
fl uctuation in foreign currency exchange rates, the position, net of payables in foreign
29Yusen Logistics Annual Report 2011

currencies, is hedged by using forward foreign currency contracts. Investment
securities, mainly equity securities of customers and suppliers of the Group, are
exposed to the risk of market price fl uctuations.
Payment terms of payables, such as trade notes and trade accounts, are less
than one year. Although payables in foreign currencies are exposed to the market risk
of fl uctuation in foreign currency exchange rates, those risks are netted against the
balance of receivables denominated in the same foreign currency as noted above.
Loans, principally from financial institutions, in long-term debt are mainly for
fi nancing related to business integration and investment in property.
Derivatives, which are forward foreign currency contracts, are used to manage
exposure to market risks from changes in foreign currency exchange rates of
receivables and payables. Please see Note 12 for more detail about derivatives.
(3) Risk management for fi nancial instruments
Credit Risk ManagementCredit risk is the risk of economic loss arising from a counterparty's failure to
repay or service debt according to the contractual terms. The Group manages
its credit risk from receivables on the basis of internal guidelines, which include
monitoring of payment term and balances of major customers by each business
administration department to identify the default risk of customers in early stage.
The maximum credit risk exposure of financial assets is limited to their
carrying amounts as of March 31, 2011.
Market risk management (foreign exchange risk and interest rate risk)Foreign currency trade receivables and payables are exposed to market risk
resulting from fluctuations in foreign currency exchange rates. Such foreign
exchange risk is hedged principally by forward foreign currency contracts. In
addition, when foreign currency trade receivables and payables are expected from
forecasted transaction, forward foreign currency contract may be used under the
limited contract term of quarter year.
Investment securities are managed by monitoring market values and fi nancial
position of issuers on a regular basis.
The execution and management of derivative transactions are approved by
CFO or the board of directors according to the internal guidelines which prescribe
the authority and the limit for each transaction. Counterparties to these derivative
transactions are limited to major fi nancial institutions in order to mitigate credit
risks.
Liquidity risk managementLiquidity risk comprises the risk that the Group cannot meet its contractual
obligations in full on maturity dates. The Group manages its liquidity risk by
holding adequate volumes of liquid assets, along with adequate fi nancial planning
by the corporate treasury department.
(4) Fair values of fi nancial instruments
Fair values of fi nancial instruments are based on quoted price in active markets.
If quoted price is not available, other rational valuation techniques are used
instead. As the valuation needs various assumptions, the fair values of fi nancial
instruments are subject to change when different assumptions are used. Also
please see Note 12 for the detail of fair value for derivatives.
(a) Fair value of fi nancial instrumentsMillions of Yen
March 31, 2011 Carrying amount Fair value Unrealized gain/loss
Cash and cash equivalents ¥25,089 ¥25,089 —Time deposits 1,986 1,986 —Trade notes and accounts receivable 30,169 30,169 —Investments in securitiesavailable-for-sale securities
579 579 —
Total ¥57,823 ¥57,823 —Trade notes and accounts payable ¥15,328 ¥15,328 —Current portion of long-term debt 35 35 —Accrued income taxes 1,046 1,046 —Long-term debt 4,537 4,537 —Total ¥20,946 ¥20,946 —
Millions of Yen
March 31, 2010 Carrying amount Fair value Unrealized gain/loss
Cash and cash equivalents ¥16,740 ¥16,740 —Time deposits 1,623 1,623 —Trade notes and accounts receivable 29,007 29,007 —Investments in securitiesavailable-for-sale securities
712 712 —
Total ¥48,082 ¥48,082 —Trade notes and accounts payable ¥14,521 ¥14,521 —Current portion of long-term debt 1,063 1,063 —Accrued income taxes 562 562 —Long-term debt 65 65 —Total ¥16,211 ¥16,211 —
Thousands of U.S.Dollars
March 31, 2011 Carrying amount Fair value Unrealized gain/loss
Cash and cash equivalents $301,733 $301,733 —Time deposits 23,886 23,886 —Trade notes and accounts receivable 362,831 362,831 —
Investments in securitiesavailable-for-sale securities
6,964 6,964 —
Total $695,414 $695,414 —Trade notes and accounts payable $184,337 $184,337 —Current portion of long-term debt 424 424 —Accrued income taxes 12,585 12,585 —Long-term debt 54,561 54,561 —Total $251,907 $251,907 —
30 Yusen Logistics Annual Report 2011

Current assets and liabilitiesThe fair value of all current assets and liabilities (cash and cash equivalents, time
deposit, trade notes and accounts receivable, trade notes and accounts payable,
current portion of long-term debt, and accrued income taxes) is considered to be
equivalent to their carrying amount due to their short- term maturities.
Investments in securities (available-for-sale securities)The fair values of investments in securities are measured at the quoted market
price of the stock exchange of the equity instruments, and at the quotes obtained
from the fi nancial institution for certain debt instruments.
All investments in securities are classifi ed as available-for-sale securities.
The information of the fair values of investments in securities is included in Note 5.
Long-term debt-Long-term loans payableThe fair value of long-term debt on floating rates approximates carrying
amount due to the fl oating rate determined by the market interest rate in the
short term.
- Lease obligationsThe fair value of lease obligations approximates carrying amount.
DerivativesThe information of the fair value for derivatives is included in Note 12.
Millions of Yen
March 31, 2011 Due in one year or lessDue after one yearthrough fi ve years
Due after fi ve yearsthrough ten years
Due after ten years
Cash and cash equivalents ¥25,089 - - -Time deposits 1,986 - - -Trade notes and accounts receivable 30,169 - - -Investments in securities
Available-for-sale securities with contractual maturities - ¥42 - -Total ¥57,244 ¥42 - -
Thousands of U.S. Dollars
March 31, 2011 Due in one year or lessDue after one yearthrough fi ve years
Due after fi ve yearsthrough ten years
Due after ten years
Cash and cash equivalents $301,733 - - -Time deposits 23,886 - - -Trade notes and accounts receivable 362,831 - - -Investments in securities
Available-for-sale securities with contractual maturities - $503 - -Total $688,450 $503 - -
Carrying Amount
Millions of Yen Thousands of U.S. Dollars
March 31, 2011 2011 2010 2011Investments in equity instruments that do not have a quoted market price in an active market ¥ 244 ¥ 279 $2,934
(5) Maturity analysis for fi nancial assets and securities with contractual maturities
(b) Financial instruments whose fair value cannot be reliably determined
12. DERIVATIVES
The Group enters into foreign exchange forward contracts to reduce the exposure to fl uctuations in interest rates risks and foreign exchange rates associated with certain
assets and liabilities denominated in foreign currencies.
All derivative transactions are entered into to hedge interest and foreign currency exposures incorporated within its business. Accordingly, market risk in these
derivatives is basically offset by opposite movements in the value of hedged assets or liabilities.
Because the counterparties to these derivatives are limited to major international fi nancial institutions, the Group does not anticipate any losses arising from credit risk.
Derivative transactions entered into by the Group have been made in accordance with internal policies which regulate their authorization.
The Group had the following derivatives contracts outstanding at March 31, 2011 and 2010:
Millions of Yen Thousands of U.S. Dollars
2011 2010 2011Contracts OutstandingDue Within One Year
Unrealized Gain (Loss)
Contracts OutstandingDue Within One Year
Unrealized Gain (Loss)
Contracts OutstandingDue Within One Year
Unrealized Gain (Loss)
Foreign currency forward contracts:
Selling U.S. dollar ¥ 8 ¥(0) ¥185 ¥(0) $ 98 $ (2)Buying U.S. dollar 319 2 391 7 3,835 28Buying Swiss franc − − 36 1 − −Buying Hong Kong dollar 162 (2) 178 (2) 1,946 (20)Buying Thai baht 69 (0) 19 1 832 (7)Buying euro 657 16 322 (6) 7,907 197Buying Swedish kronor − − 3 (0) − −Buying Canadian dollar 460 12 11 0 5,523 145
Derivative transactions to which hedge accounting is not applied.
31Yusen Logistics Annual Report 2011

The contract or notional amounts of derivatives which are shown in the above table do not represent the amounts exchanged by the parties and do not measure the Group's
exposure to credit or market risk.
Derivative transactions to which hedge accounting is applied.There is no derivative transactions to which hedge accounting was applied for the year ended March 31, 2011 and 2010.
13. COMMITMENTS AND CONTINGENT LIABILITIES
The Group was contingently liable for guarantees of trade payables and bank loans owed by their unconsolidated subsidiaries, affi liate companies and a third party company
in the amount of ¥36 million ($438 thousand) and ¥46 million at March 31, 2011 and 2010, respectively.
14. BREAKDOWN OF SELLING, GENERAL AND ADMINISTRATIVE EXPENSES
15. COMPREHENSIVE INCOME
Selling, general and administrative expenses for the years ended March 31, 2011 and 2010 are summarized as follows:
Total comprehensive income for the year ended March 31, 2010 was the following: Other comprehensive income for the year ended March 31, 2010 consisted of the
following:
For the year ended March 31, 2010
Millions of Yen Thousands of U.S. Dollars
2011 2010 2011Labor and payroll cost ¥14,059 ¥13,406 $169,082 Provision for accrued bonuses to employees 1,319 953 15,866Provision for accrued pension and severance costs for:
Employees 706 806 8,490Directors and corporate auditors 112 101 1,346
Provision for doubtful accounts 79 61 951Depreciation 1,223 1,112 14,712Other 13,829 12,577 166,310Total ¥31,327 ¥29,016 $376,757
Millions of Yen
2010Total comprehensive income attributable to:
Owners of the parent ¥ 2,688Minority interests 411
Total comprehensive income ¥ 3,099
Millions of Yen
2010Other comprehensive income:
Unrealized gain (loss) on available-for-sale securities ¥158Foreign currency translation adjustments 991Share of other comprehensive income in associates 40
Total other comprehensive income ¥1,189
16. SEGMENT INFORMATION
In March 2008, the ASBJ revised ASBJ Statement No.17 “Accounting Standard for Segment Information Disclosures” and issued ASBJ Guidance No.20 “Guidance on
Accounting Standard for Segment Information Disclosures”. Under the standard and guidance, an entity is required to report fi nancial and descriptive information about
its reportable segments. Reportable segments are operating segments or aggregations of operating segments that meet specifi ed criteria. Operating segments are
components of an entity about which separate fi nancial information is available and such information is evaluated regularly by the chief operating decision maker in
deciding how to allocate resources and in assessing performance. Generally, segment information is required to be reported on the same basis as is used internally for
evaluating operating segment performance and deciding how to allocate resources to operating segments. This accounting standard and the guidance are applicable to
segment information disclosures for the fi scal years beginning on or after April 1, 2010.
The segment information for the year ended March 31, 2010 under the revised accounting standard is also disclosed hereunder as required.
For the year ended March 31, 2011 and 2010
1. Description of reportable segments The Group's reportable segments are those for which separate fi nancial information is available and regular evaluation by the Company's management is being performed
in order to decide how resources are allocated among the Group. The Group mainly provides global logistics services. In order to provide its services over large region,
the regional headquarters which are located in Japan, USA, Netherlands, Hong Kong, and Singapore control the group companies in Japan, Americas, Europe, East Asia,
and South Asia and Oceania, respectively. Thus, the Group's reportable operating segments are based on geographical service providing structures, which consist of fi ve
regions: Japan, Americas, Europe, East Asia and South Asia and Oceania.
32 Yusen Logistics Annual Report 2011

Millions of Yen
2011Reportable Segment
ReconciliationConsolidated
TotalJapan Americas Europe East AsiaSouth Asia and
OceaniaTotal
Sales
Sales to external customers ¥ 77,424 ¥12,843 ¥14,200 ¥30,768 ¥25,553 ¥160,788 − ¥160,788Inter-segment sales/transfers 211 628 822 937 189 2,787 (2,787) −
Total 77,635 13,471 15,022 31,705 25,742 163,575 (2,787) 160,788Segment profi t ¥ 333 ¥ 749 ¥ 527 ¥ 2,001 ¥ 1,352 ¥ 4,962 ¥ (15) ¥ 4,947Segment assets ¥ 45,589 ¥ 7 ,264 ¥11,178 ¥15,826 ¥12,038 ¥ 91,895 ¥(3,532) ¥ 88,363Other:
Depreciation 1,102 119 152 98 309 1,780 − 1,780Amortizations of goodwill 10 − − − 5 15 4 19Investments in unconsolidated subsidiaries and affi liate companies accounted for by the equity method *1
502 − − − − 502 730 1,232
Increase in property, plant and equipment and intangible assets
869 56 64 104 185 1,278 − 1,278
Millions of Yen
2010Reportable Segment
ReconciliationConsolidated
TotalJapan Americas Europe East AsiaSouth Asia and
OceaniaTotal
Sales
Sales to external customers ¥61,047 ¥10,198 ¥11,219 ¥21,813 ¥19,176 ¥123,453 − ¥123,453Inter-segment sales/transfers 180 584 669 502 156 2,091 (2,091) −
Total 61,227 10,782 11,888 22,315 19,332 125,544 (2,091) 123,453Segment profi t ¥ 944 ¥ (5) ¥ (472) ¥ 651 ¥ 1,198 ¥ 2,316 ¥ (6) ¥ 2,310Segment assets ¥45,324 ¥ 8,149 ¥ 9,988 ¥15,107 ¥10,779 ¥ 89,347 ¥(7,904) ¥ 81,443Other:
Depreciation 1,019 136 183 108 297 1,743 − 1,743Amortizations of goodwill 0 − − − 5 5 4 9Investments in unconsolidated subsidiaries and affi liate companies accounted for by the equity method *1
502 − − − − 502 494 996
Increase in property, plant and equipment and intangible assets
706 29 42 50 143 970 − 970
2. Methods of measurement for the amounts of sales, profi t (loss), assets, liabilities and other items for each reportable segmentThe accounting policies of each reportable segment are consistent with those disclosed in Note 2, “Summary of Signifi cant Accounting Policies”.
Information about sales, profi t (loss), assets, liabilities and other items is as follows.
Thousands of U.S. Dollars
2011Reportable Segment
ReconciliationConsolidated
TotalJapan Americas Europe East AsiaSouth Asia and
OceaniaTotal
Sales
Sales to external customers $931,138 $154,460 $170,775 $ 370,028 $307,315 $1,933,716 − $1,933,716Inter-segment sales/transfers 2,538 7,553 9,884 11,274 2,265 33,514 (33,514) −
Total 933,676 162,013 180,659 381,302 309,580 1,967,230 (33,514) 1,933,716Segment profi t $ 4,007 $ 9,007 $ 6,341 $ 24,063 $ 16,257 $ 59,675 $ (176) $ 59,499Segment assets $548,273 $ 87,360 $134,433 $190,329 $144,781 $1,105,176 $(42,485) $1,062,691Other:
Depreciation 13,257 1,435 1,826 1,175 3,716 21,409 − 21,409Amortizations of goodwill 118 − − − 66 184 43 227Investments in unconsolidated subsidiaries and affi liate companies accounted for by the equity method *1
6,031 − − − − 6,031 8,785 14,816
Increase in property, plant and equipment and intangible assets
10,457 668 775 1,255 2,220 15,375 − 15,375
NOTES: 1. The breakdown for the reconciliation in each item for the year ended March 31, 2011 and 2010 are as follows:
Millions of Yen Thousands of U.S. Dollars
2011 2010 2011Sales:
Elimination of inter-segment transactions ¥(2,787) ¥(2,091) $(33,514)Total ¥(2,787) ¥(2,091) $(33,514)
33Yusen Logistics Annual Report 2011

Millions of Yen
2010Geographic Segment
Elimination/Corporate
ConsolidatedTotalJapan Americas Europe East Asia
South Asiaand Oceania
Total
a. Net sales and operating incomeNet sales:
Net sales to outside customers ¥61,047 ¥10,198 ¥11,219 ¥21,813 ¥19,176 ¥123,453 - ¥123,453Inter-segment sales/transfers 180 584 669 502 156 2,091 ¥(2,091) -
Total sales 61,227 10,782 11,888 22,315 19,332 125,544 (2,091) 123,453Operating expenses 60,283 10,787 12,360 21,664 18,134 123,228 (2,085) 121,143Operating income ¥ 944 ¥ (5) ¥ (472) ¥ 651 ¥ 1,198 ¥ 2,316 ¥ (6) ¥ 2,310
b. Assets ¥45,324 ¥ 8,149 ¥ 9,988 ¥15,107 ¥10,779 ¥ 89,347 ¥(7,904) ¥ 81,443
*1: The reconciliation column for investments in unconsolidated subsidiaries and affi liate companies accounted for by the equity method contains the investments which are not attributable to
any reportable segments.
*2: The common assets mainly consisted of cash and deposits and investment securities.
Millions of Yen Thousands of U.S. Dollars
2011 2010 2011Segment profi t:
Elimination of inter-segment transactions ¥(11) ¥(2) $ (135)Amortization of goodwill (4) (4) (43)Others 0 0 2
Total ¥(15) ¥(6) $ (176)
Millions of Yen Thousands of U.S. Dollars
2011 2010 2011Segment asset:
Elimination of inter-segment receivables and payables ¥(5,477) ¥(3,772) $ (65,874)Elimination of inter-segment investments and equity accounts (6,693) (6,925) (80,490)Common assets *2 8,726 2,882 104,942Others (88) (89) (1,063)
Total ¥(3,532) ¥(7,904) $ (42,485)
2. Segment profi t is reconciled to operating income in the consolidated statements of income.
(1) Industry Segments
For the year ended March 31, 2010
The Group operates principally in the following three industry segments:
(1) Air and sea cargo
(2) Travel
(3) Other
Notes: The amounts of the common assets included in the column "Elimination or Corporate" were ¥2,882 million for the years ended March 31, 2010, which mainly consisted of surplus funds (cash and securities).
Notes: The amounts of the common assets included in the column "Elimination or Corporate" were ¥2,882 million for the years ended March 31, 2010, which mainly consisted of surplus funds (cash and securities).
(2) Geographical Segments
The segment information of the Group in respect to the years ended March 31, 2010, classifi ed by industry segments is presented below:
Millions of Yen
2010Industry Segment Elimination/
CorporateConsolidated
TotalAir and Sea Cargo Travel Other Total
a. Net sales and operating incomeNet sales:
Net sales to outside customers ¥120,181 ¥3,160 ¥ 112 ¥123,453 - ¥123,453Inter-segment sales/transfers - - 1,355 1,355 ¥(1,355) -
Total sales 120,181 3,160 1,467 124,808 (1,355) 123,453Operating expenses 118,198 3,018 1,281 122,497 (1,354) 121,143Operating income ¥ 1,983 ¥ 142 ¥ 186 ¥ 2,311 ¥ (1) ¥ 2,310
b. Assets, depreciation and capital expendituresAssets ¥ 72,592 ¥5,770 ¥6,538 ¥ 84,900 ¥(3,457) ¥81,443Depreciation 1,577 47 119 1,743 - 1,743Capital expenditures 925 41 4 970 - 970
(3) Net Sales in Foreign Countries
Net sales in foreign countries for the years ended March 31, 2010 amounted to ¥ 63,124 million.
34 Yusen Logistics Annual Report 2011

Related information
Millions of Yen
2011 2010Air and
Sea CargoTravel Other Total
Air and Sea Cargo
Travel Other Total
Sales to external customers ¥ 156,945 ¥ 3,732 ¥ 111 ¥ 160,788 ¥ 120,181 ¥ 3,160 ¥ 112 ¥ 123,453
Thousands of U.S. Dollars
2011Air and
Sea CargoTravel Other Total
Sales to external customers $ 1,887,493 $ 44,877 $ 1,346 $ 1,933,716
1. Information about services
Millions of Yen
2011 2010
Japan Americas Europe East AsiaSouth Asia and
OceaniaOthers Total Japan Americas Europe East Asia
South Asia and Oceania
Others Total
¥76,579 ¥12,992 ¥14,424 ¥30,973 ¥25,818 ¥2 ¥160,788 ¥60,329 ¥10,323 ¥11,444 ¥21,972 ¥19,382 ¥3 ¥123,453
Millions of Yen
2011 2010
Japan Americas Europe East AsiaSouth Asia and
OceaniaTotal Japan Americas Europe East Asia
South Asia and Oceania
Total
¥11,782 ¥1,861 ¥1,421 ¥823 ¥1,129 ¥17,016 ¥12,069 ¥2,097 ¥1,753 ¥930 ¥1,217 ¥18,066
Millions of Yen
2011 2010
Japan Americas Europe East AsiaSouth Asia and
OceaniaTotal Japan Americas Europe East Asia
South Asia and Oceania
Total
¥66 - - - - ¥66 ¥229 - - - - ¥229
Thousands of U.S. Dollars
2011
Japan Americas Europe East AsiaSouth Asia and
OceaniaOthers Total
$ 920,975 $ 156,245 $ 173,470 $ 372,494 $ 310,498 $ 34 $ 1,933,716
Thousands of U.S. Dollars
2011
Japan Americas Europe East AsiaSouth Asia and
OceaniaTotal
$ 141,695 $ 22,386 $ 17,086 $ 9,894 $ 13,577 $ 204,638
Thousands of U.S. Dollars
2011
Japan Americas Europe East AsiaSouth Asia and
OceaniaTotal
$ 797 - - - - $ 797
2. Information about geographical areas
(1) Sales
(2) Property, plant and equipment
(4) Information about loss on impairment of fi xed assets
(3) Information about major customers
Notes: Sales are classifi ed in countries or regions based on location of customers. The countries and regions classifi ed in the above geographical areas are as follows:
(1) Americas: U.S.A., Canada
(2) Europe: U.K., Germany, France, Italy, Netherlands
(3) East Asia: China, Hong Kong, Taiwan, South Korea
(4) South Asia and Oceania: Singapore, Indonesia, Australia, Thailand, Vietnam, Philippines, India
(5) Others: Other than those above
The Group have omitted information about major customers, as sales to any customers is not over 10% of sales of consolidated.
35Yusen Logistics Annual Report 2011

Millions of Yen
2011
Japan Americas Europe East AsiaSouth Asia and
OceaniaElimination / Corporate
Total
Amortization of goodwill ¥10 - - - ¥5 ¥4 ¥19 Goodwill at March 31, 2011 49 - - - 3 - 52 Amortization of negative goodwill 3 - - - - - 3 Negative goodwill at March 31, 2011 2 - - - - - 2
Thousands of U.S. Dollars
2011
Japan Americas Europe East AsiaSouth Asia and
OceaniaElimination / Corporate
Total
Amortization of goodwill $118 - - - $66 $43 $227 Goodwill at March 31, 2011 587 - - - 33 - 620 Amortization of negative goodwill 36 - - - - - 36 Negative goodwill at March 31, 2011 21 - - - - - 21
Millions of Yen
2010
Japan Americas Europe East AsiaSouth Asia and
OceaniaElimination / Corporate
Total
Amortization of goodwill ¥0 - - - ¥5 ¥4 ¥9 Goodwill at March 31, 2010 0 - - - 8 4 12 Amortization of negative goodwill 3 - - - - - 3 Negative goodwill at March 31, 2010 5 - - - - - 5
(5) Information about amortization of goodwill and negative goodwill
17. PER SHARE INFORMATION
Per share information for the years ended March 31, 2011 and 2010 are summarized as follows:
Diluted net income per share is not presented since there were no securities with dilutive effect for the years ended March 31, 2011 and 2010.
Per share information is computed based on the following:
Yen U.S. Dollars
2011 2010 2011Net assets per share ¥1,260.69 ¥1,225.21 $15.162Basic net income per share ¥85.85 36.63 1.032
Number of Shares of Common Stock
2011 2010Weighted-average shares for the period 42,170,233 42,170,622
Millions of Yen Thousands of U.S. Dollars
2011 2010 2011Net income ¥3,621 ¥1,545 $43,542Net income not subject to distribution to common shareholders - - -Net income subject to current and future distribution to common stock 3,621 1,545 43,542
18. RELATED PARTY TRANSACTIONSMajor transactions and major balances the years ended March 31, 2011 and 2010, respectively, with related parties are as follows:
For the year ended March 31, 2011Transaction for the Year Balance at End of Year
Name AddressAmount of
CapitalNature of Business
Ownership Interest (%)
RelationshipDescription
of the Transactions
Millions of Yen
Thousands of U.S.Dollars
Account NameMillions of Yen
Thousands ofU.S. Dollars
Transaction with subsidiaries of a common parent:
NYK FTC (Singapore) Pte. Ltd.
Singapore $5,000thousand Finance — Financing
Loan 5,767 69,362Other current
assets(Loan receivable)
- -
Interest received 7 82
Other current assets(Accrued interest
receivable)- -
36 Yusen Logistics Annual Report 2011

19. SUBSEQUENT EVENT
Ⅰ. The Company made an appropriation of retained earnings, proposed by the board of directors and approved by shareholders at the general meeting on June 29, 2011, as follows:
Ⅱ. As released in "Execution of the Basic Agreement on Integration of Overseas Businesses of NYK and Yusen Logistics" on December 22, 2010, the Company and Nippon Yusen Kabushiki Kaisha (NYK LINE) (head office: Chiyoda-ku, Tokyo, Japan; president: Yasumi Kudo) (hereinafter "NYK") have conducted the reorganization and integration of the logistics businesses in order to gain a position as a world-class logistics service provider by reorganizing and optimizing logistics business units. The outlines of the important transactions are as follows
1. The U.S. logistics businesses have been integrated through an absorption-type merger. Yusen Logistics (Americas)Inc. (formerly, Yusen Air & Sea Service (USA) Inc.),
which is a consolidated subsidiary of the company, became the surviving company and NYK LOGISTICS (AMERICAS) INC., which is a consolidated subsidiary of NYK,
became the extinct company.
After the merger became effective, the company acquired the shares of Yusen Logistics (Americas) Inc. from NYK GROUP AMERICAS INC.,etc. As a result, the
shareholding ratio of the company is 51.0%.
(1) Outline of the business combination (2) Calculation of Acquisition cost
1. Name, business and recent performance of the acquired company
1) Name of the acquired company
NYK LOGISTICS (AMERICAS) INC.
2) Business of the acquired company
International ocean freight-forwarding, contract logistics, domestic
transportation., etc.
3) Performance of the acquired company for period ending 31 March 2011.
1. Type of shares and merger ratio
1 share of common stock of NYK LOGISTICS (AMERICAS) INC.
: 531 shares of common stock of Yusen Logistics (Americas) Inc.
2. Basis for calculation of the merger ratio
In order to ensure the fairness and appropriateness of the merger ratio, the
Company and NYK decided individually to request a third-party appraiser
that is independent from the two companies to calculate the merger ratio.
Yusen Logistics has appointed PricewaterhouseCoopers Co., Ltd.
(hereinafter “PwC”) as its third-party appraiser and NYK has appointed
KPMG FAS Co., Ltd. (hereinafter “KPMG”) as its third-party appraiser.
The company and NYK agreed on the shareholding ratio after careful
consideration by referring to the results calculated by these third-party
appraisers, and by taking into account all factors such as the fi nancial condition,
the state of assets, and the future outlook of each integration subsidiary.
3. Number of shares delivered
569,763 shares2. Date of the business combination
April 1, 2011
3. Legal form of the business combination
Absorption-type merger
4. Name of the company after the business combination:
Yusen Logistics (Americas) Inc.
(Formerly, Yusen Air & Sea Service (U.S.A.) Inc.)
5. Ratio of voting rights acquired
19.7%
Millions of Yen Thousands of U.S. Dollars
Cash dividends (¥9 ($0.11) per share) ¥380 $4,564
Millions of YenThousands ofU.S. Dollars
Sales ¥67,784 $815,205 Operating Loss (17) (198)Ordinary Loss (28) (338)Net Loss (¥683) ($8,215)
Information of parent company
Nippon Yusen Kabushiki Kaisha (NYK LINE) (Listed in Tokyo Stock Exchange, Nagoya Stock Exchange and Osaka Securities Exchange)
Notes: Consumption taxes are excluded from the amount of transactions. Business policy on terms and conditions Interest on loans is decided in consideration of market rate.
For the year ended March 31, 2010Transaction for the Year Balance at End of Year
Name AddressAmount of
CapitalNature of Business
Ownership Interest (%)
RelationshipDescription of
the TransactionsMillions of Yen Account Name Millions of Yen
Transaction with subsidiaries of a common parent:
NYKCruisesCo., Ltd.
Tokyo, Japan ¥2,000 million
Marine transportationTravel business
(Owns the Company's
shares)0.0
Purchasing cruise tours
Operatingcost ¥1,366
Other current assets(Prepaid cost) ¥ 503
Trade notes andaccounts payable 88
NYK FTC (Singapore) Pte. Ltd.
Singapore $5,000thousand Finance — Financing
Loan 6,215 Other current assets(Loan receivable) 2,035
Interest received 15
Other current assets(Accrued interest
receivable)0
(3) Amounts of assets and liabilities acquired on the day of the business combination
Millions of YenThousands ofU.S. Dollars
Current Assets ¥ 8,912 $107,175 Fixed Assets 8,417 101,228 Total assets ¥17,329 $208,403 Current Liabilities 7,476 89,910 Fixed Liabilities 463 5,569 Total liabilities ¥ 7,939 $ 95,479
37Yusen Logistics Annual Report 2011

(4) Contents of share acquisition
1. Number of acquired Shares and Acquisition cost
Number of acquired Shares: 221,980 shares of common stock
Acquisition cost: ¥ 4,083 million ($ 49,109 thousand)
2. Status of share acquisition after the transfer
Number of Shares
before the Transfer
(shareholding ratio)
Yusen Logistics Co., Ltd.:140,000 shares(19.7%)
NYK Group Americas Inc.: 563,922 sharesNYK Logistics (Japan) Co., Ltd.: 5,841 sharesTotal: 569,763 shares (80.3%)
Number of Shares
after the Transfer
(shareholding ratio)
Yusen Logistics Co., Ltd.:361,980 shares(51.0%)
NYK Group Americas Inc.: 347,783 shares(49.0%)
(1) Outline of the business combination
1. Name, business and recent performance of the acquired company
1) Name of the acquired company
NYK LOGISTICS (EUROPE CONTINENT) B.V.
2) Business of the acquired company
Holding company of European logistics companies of NYK Group
3) Performance for period ending 31 March 2011.
2. The European holding companies related to the logistics businesses of the
two groups have been integrated through an absorption-type merger. Yusen
Logistics (Europe) B.V. (formerly, Yusen Air & Sea Service (Europe) B.V.), which
is a consolidated subsidiary of the company, became the surviving company and
NYK LOGISTICS (EUROPE CONTINENT) B.V., which is a consolidated subsidiary
of NYK, became the extinct company.
2. Date of the business combination
April 1, 2011
3. Legal form of the business combination
Absorption-type merger
4. Name of the company after the business combination:
Yusen Logistics (Europe) B.V.
(Formerly, Yusen Air & Sea Service (Europe) B.V.)
5. Ratio of voting rights acquired
53.7%
Millions of YenThousands ofU.S. Dollars
Sales ¥38,180 $459,174 Operating Income 143 1,720 Ordinary Loss (3) (34)Net Income ¥ 118 $ 1,419
(2) Calculation of Acquisition cost
1. Type of shares and merger ratio
1 share of common stock of NYK LOGISTICS (EUROPE CONTINENT) B.V.
: 88.75 shares of common stock of Yusen Logistics (Europe) B.V.
2. Basis for calculation of the merger ratio
In order to ensure the fairness and appropriateness of the merger ratio, the
Company and NYK decided individually to request a third-party appraiser
that is independent from the two companies to calculate the merger ratio.
Yusen Logistics has appointed PricewaterhouseCoopers Co., Ltd.
(hereinafter “PwC”) as its third-party appraiser and NYK has appointed
KPMG FAS Co., Ltd. (hereinafter “KPMG”) as its third-party appraiser.
The company and NYK agreed on the shareholding ratio after careful
consideration by referring to the results calculated by these third-party
appraisers, and by taking into account all factors such as the fi nancial condition,
the state of assets, and the future outlook of each integration subsidiary.
3. Number of shares delivered
15,975 shares
(3) Amounts of assets and liabilities acquired on the day of the business combination
3. NYK Group Europe Ltd., which is the holding company of the NYK Group in
U.K., transferred all of the shares of Yusen Logistics (UK) Ltd. (formerly, NYK
LOGISTICS (UK) Ltd.), which is a U.K. logistics business company of the NYK
Group, to Yusen Logistics (Europe) B.V. which is a European holding company of
Yusen Logistics Group.
4 . Yusen Logistics (Hong Kong) Limited (formerly, Yusen Air & Sea Service
(H.K.) Ltd.) purchased a part of the logistics business of NYK LOGISTICS
(HONG KONG) LTD., a consolidated subsidiary of NYK, in the form of a business
transfer to Yusen Logistics (Hong Kong) Limited
(1) Name of the company transferring shares
NYK Group Europe Ltd.
(2) Name, business and recent performance of the acquired company
1. Name of the acquired company
Yusen Logistics (UK) Ltd. (formerly, NYK LOGISTICS (UK) Ltd.)
2. Business of the acquired company
International ocean freight-forwarding, contract logistics, domestic
transportation, etc.
3. Performance for period ending 31 March 2011.
(4) Contents of share acquisition
1. Number of acquired Shares and Acquisition cost
Number of acquired Shares: 40,930,000 shares of common stock
Acquisition cost: ¥ 2,054 million ($ 24,702 thousand)
Number of Shares after the acquisition (shareholding ratio): 40,930,000
shares of common stock (100%)
(1) Corporate Name of the Transferor
NYK LOGISTICS (HONG KONG) LTD.
(2) Business transferred International ocean freight-forwarding, contract logistics, domestic
transportation, etc.
(3) Assets and Liabilities to be Transferred
(4) Cost for the business transferred2,145 Millions of Yen ($ 25,800 thousand)
(5) The date of the business transferred April 1, 2011
Millions of YenThousands ofU.S. Dollars
Current Assets ¥14,610 $175,711 Fixed Assets 12,510 150,450 Total assets ¥27,120 $326,161 Current Liabilities 12,595 151,472 Fixed Liabilities 3,324 39,972 Total liabilities ¥15,919 $191,444
Millions of YenThousands ofU.S. Dollars
Current Assets ¥ 107 $ 1,289 Fixed Assets 2,165 26,037 Total assets ¥2,272 $27,326 Current Liabilities 76 909 Total liabilities ¥ 76 $ 909
Millions of YenThousands ofU.S. Dollars
Sales ¥24,476 $294,359 Operating Income 155 1,868 Ordinary Loss (6) (70)Net Loss (¥315) ($3,788)
(3) Date of share transfer
April 17, 2011
38 Yusen Logistics Annual Report 2011

39Yusen Logistics Annual Report 2011
Independent Auditors’ Report

1955Feb. Established ‘‘Kokusai Ryoko Kosha”
for handling of general travel and air
cargo industry.
Mar. Transferred the goodwill from
International Travel Consultants Inc.
(ITC), the member of International Air
Transport Association (IATA).
Jun. Acquired a customs broker license and
started customs clearance.
1959Sep. NYK Line acquired stocks which Osaka
Shosen Kaisha (O.S.K. Line) owned, and
made a subsidiary company by naming it
‘‘Yusen Air Service Co., Ltd.”
1961Nov. Changed English corporate name to “Yusen
Air & Sea Service Co., Ltd.”
1968Oct. Established Yusen Air & Sea Service
(U.S.A.) Inc.
1973Aug. Established Yusen Air & Sea Service
(H.K.) Ltd.
1979Mar. Established Yusen Air & Sea Service
(Singapore) Pte. Ltd.
Dec. Acquired the license of domestic
airfreight forwarder.
1983Dec. Setting up Logistics Department in Harbor
Division of NYK Head Quarter
Establishment of "Japan Intermodal
Transport” (later, JIT Co., Ltd.) in Japan,
mainly handling ocean freight forwarding.
First half of 1980Establishment of subsidiaries in Asian countries,
following precedent one in Thailand
1984Feb. Acquired the license of international
airfreight forwarder.
Second half of 1980Expansion of network in Europe and Americas
through buyouts or establishment of subsidiaries
1986Oct. Established Yusen Air International B.V.
and Yusen Air & Sea Service (Benelux)
B.V. in the Netherlands.
1987Mar. Established Yusen Air & Sea Service
(Deutschland) GmbH.
2000 and afterBuilding up global network and organization by
expanding its business to Eastern Europe and
BRICs
2000Feb. Established Yusen Air & Sea Service
(Chugoku) Co., Ltd. in Kurashiki City,
Okayama.
Sep. Established Yusen Air & Sea Service
(China) Ltd. in Hong Kong.
2001Jul. Established Yusen Air Staff Service Co.,
Ltd. in Chuo-ku, Tokyo.
Sep. Established Yusen Air & Sea Service
Logistics (Shanghai) Co., Ltd. in China.
Oct. Established Yusen Air & Sea Service
(Europe) B.V. to succeed Yusen
Air International B.V. to preside
the European business corporation.
2002Jan. Yusen Air & Sea Service (Singapore) Pte.
Ltd. invested in PT. Pusaka Yudhanusa
of Indonesia, and changed name to PT.
Yusen Air & Sea Service Indonesia.
Jun. Established Yusen Air Logistics (Xiamen)
Co., Ltd. in China.
Sep. Established Yusen Air & Sea Service
(Czech) s.r.o.
Established Yusen Air & Sea Service
(Thailand) Co., Ltd. and Yusen Air & Sea
Service Management (Thailand) Co., Ltd.
Nov. Established Yusen Air & Sea Service
(Korea) Co., Ltd. in South Korea.
Dec. Established Yusen Shenda Air & Sea
Service (Shanghai) Ltd. in China.
2003Sep. Tosho Unyu Co., Ltd. changed its name
to Yusen Air & Sea Service Keihin Trans
Co., Ltd.
Nov. Established Yusen Air & Sea Service
(Beijing) Co., Ltd. in China.
2004Integration of brand name to NYK Logistics
internationally
2004Jun. Established the Istanbul Representative
Offi ce in Turkey.
Sep. Established Yusen Air & Sea Service
(Vietnam) Co., Ltd.
Nov. Established the Krakow Representative
Offi ce in Poland.
Apr. Established Yusen Air & Sea Service
(U.K.) Ltd.
Dec. Invested in Tosho Unyu Co., Ltd. in
Naka-ku, Yokohama City, Kanagawa.
1988Jun. Established Yusen Air & Sea Service
(Australia) Pty. Ltd.
Oct. Established Yusen Air & Sea Service
(Canada) Inc.
1989Nov. Established Yusen Air & Sea Service
(France) S.a.r.l.
1990Jul. Established Yusen Air & Sea Service
(Taiwan) Ltd.
1991Jul. Established Yusen Air & Sea Service
(Kitakanto) Co., Ltd. in Utsunomiya City,
Tochigi.
1992Apr. Established Yusen Air & Sea Service
Philippines Inc.
Oct. Established Yusen Air & Sea Service
(Tsukuba) Co., Ltd. in Ibaraki.
1994Apr. Established Yusen Travel Co., Ltd. in
Chiyoda-ku, Tokyo.
Oct. Transferred the sales section of the travel
department to Yusen Travel Co., Ltd.
1996Jan. Established Yusen Air & Sea Service
(Italia) S.r.l.
Feb. Established Yusen Air & Sea Service
(Shinshu) Co., Ltd. in Okaya City, Nagano.
Nov. Registered as over-the-counter stocks
to Japan Securities Dealers Association.
1997Feb. Established Yusen Air & Sea Service
(Tohoku) Co., Ltd. in Yamagata City,
Yamagata.
Apr. Established Yusen Air Logistics (Nagoya)
Co., Ltd. in Nagoya City, Aichi.
Jun. Invested in Ryowa Diamond Air Service
Co., Ltd. in Chuo-ku, Tokyo.
Nov. Established Yusen Air & Sea Service Do
Brasil Ltda.
1998Feb. Established Yusen Air & Sea Service
(Kyushu) Co., Ltd. in Hakata-ku,
Fukuoka City, Fukuoka.
Established Yusen Air & Sea Service
(Hokuriku) Co., Ltd. in Komatsu city, Ishikawa.
Yusen Air & Sea Service
NYK Logistics
Yusen Logistics
40 Yusen Logistics Annual Report 2011
Corporate History

41Yusen Logistics Annual Report 2011
Head Offi ceSumitomo Fudosan Shiba-Koen Tower
2-11-1, Shiba-Koen Minato-ku, Tokyo 105-0011, Japan
Phone: +81-3-6703-8231
Fax: +81-3-3578-3552
URL: http://www.jp.yusen-logistics.com
EstablishedFebruary 28, 1955
Paid-in Capital¥4,301 million
Common SharesNumber of authorized shares: 160,000,000
Number of shares outstanding: 42,220,800
Number of Shareholders4,756
Number of Employees (Consolidated)5,623
General Meeting of ShareholdersThe 57th General Meeting of shareholders
in June 29, 2011 in Tokyo, Japan.
Independent Registered Public Accounting FirmDeloitte Touche Tohmatsu LLC
MS Shibaura Building, 13-23, Shibaura 4-chome, Minato-ku, Tokyo 108-8530, Japan
Transfer AgentThe Mitsubishi UFJ Trust and Banking Corporation
4-5, Marunouchi 1-chome, Chiyoda-ku,Tokyo 100-8212, Japan
Stock ListingFirst Section of the Tokyo Stock Exchange
*Stock prices are based on the Tokyo Stock Exchange trading.
For Contact:Corporate Communications & IR Department,Yusen Logistics Co., Ltd.
E-mail: [email protected]
Stock PriceYears ended March 31 (Yen)
2007 2008 2009 2010 2011
High 3,750 3,210 2,140 1,446 1,522
Low 2,330 1,066 841 932 975
Major Shareholders
Name
Number ofshares held
(Hundred of Shares)
Percentage of Shares Held
Nippon Yusen Kabushiki Kaisha (NYK) 251,321 59.53%
BBH for Fidelity Low-Priced Stock Fund 42,215 10.00%
The Master Trust Bank of Japan, Ltd.
(Trust Account)12,693 3.01%
Japan Trustee Services Bank, Ltd.
(Trust Account)11,610 2.75%
Trust & Custody Service Bank, Ltd. (Pension Trust Account) 6,338 1.50%
Yamato Holdings Co., Ltd. 6,058 1.43%
Morgan Stanley & Co. Inc. 5,884 1.39%
Japan Trustee Services Bank, Ltd.
(Trust Account 9)5,407 1.28%
Bank of Tokyo-Mitsubishi UFJ, Ltd. 5,376 1.27%
Tokio Marine & Nichido Fire Insurance Co., Ltd. 4,064 0.96%
(As of March 31, 2011)
Shareholders’ Information
2005Feb. Listed on the First Section of the Tokyo
Stock Exchange.
Nov. Established Yusen Air & Sea Service
Logistics (Shenzhen) Ltd. in China.
2006Feb. Established Yusen Air & Sea Service
(Guangdong) Ltd. in China.
Apr. Established Dubai Representative Offi ce
in United Arab Emirates.
Jun. Yusen Air & Sea Staff Service Co., Ltd.
changed its name to Yusen Air Loginet
Co., Ltd.
2007Oct. Merger of "NYK Logistics (Japan) Co., Ltd."
with "JIT Co., Ltd." in Japan
2007Mar. Established Yusen Air & Sea Service
(India) Pvt. Ltd.
May Established Yusen Air & Service (RUS)
LLC. in Russia.
Jun. Yusen Air Logistics (Nagoya) Co., Ltd.
changed name to Yusen Air Logitec
Co., Ltd.
2008Oct. Established Yusen Air & Sea Service
Logistics (Suzhou) Co., Ltd. in China.
Nov. Established Yusen Air & Sea Service
(Mexico) S.A.de C.V.
2009Nov. Commenced discussions for reorganization
and integration of logistics business with
Nippon Yusen.
2010Feb. Basic letter of agreement concerning
integration of businesses of Yusen Air & Sea
Service Co., Ltd. and NYK Logistics (Japan)
Co., Ltd.
May Transfer of business agreement between
Yusen Air & Sea Service Co., Ltd. and NYK
Logistics (Japan) Co., Ltd.
Oct. Inauguration of Yusen Logistics Co., Ltd.

Sumitomo Fudosan Shiba-Koen Tower 2-11-1, Shiba-Koen Minato-ku, Tokyo 105-0011, Japan
An
nu
al R
ep
or
t 2
01
1Y
us
en
Lo
gis
tics
Co
.,Ltd
.


![Frequently Asked Questions - Yusen Logisticsgriffin2.hk.yusen-logistics.com/ebookingeuro/help/GriffinSupplier... · [FREQUENTLY ASKED QUESTIONS] Yusen Logistics Griffin FAQ v1 | Oct](https://static.fdocuments.in/doc/165x107/5c776d6a09d3f2a94e8bd20e/frequently-asked-questions-yusen-frequently-asked-questions-yusen-logistics.jpg)