Annual Report - University of Western Australia
124
Annual Report 2020
Transcript of Annual Report - University of Western Australia
Annual Report 2020

The University of Western Australia acknowledges that its campuses are situated on Noongar land, and that Noongar people remain the spiritual and cultural custodians of their land, and continue to practise their values, languages, beliefs and knowledge.
The University of Western Australia | uwa.edu.au
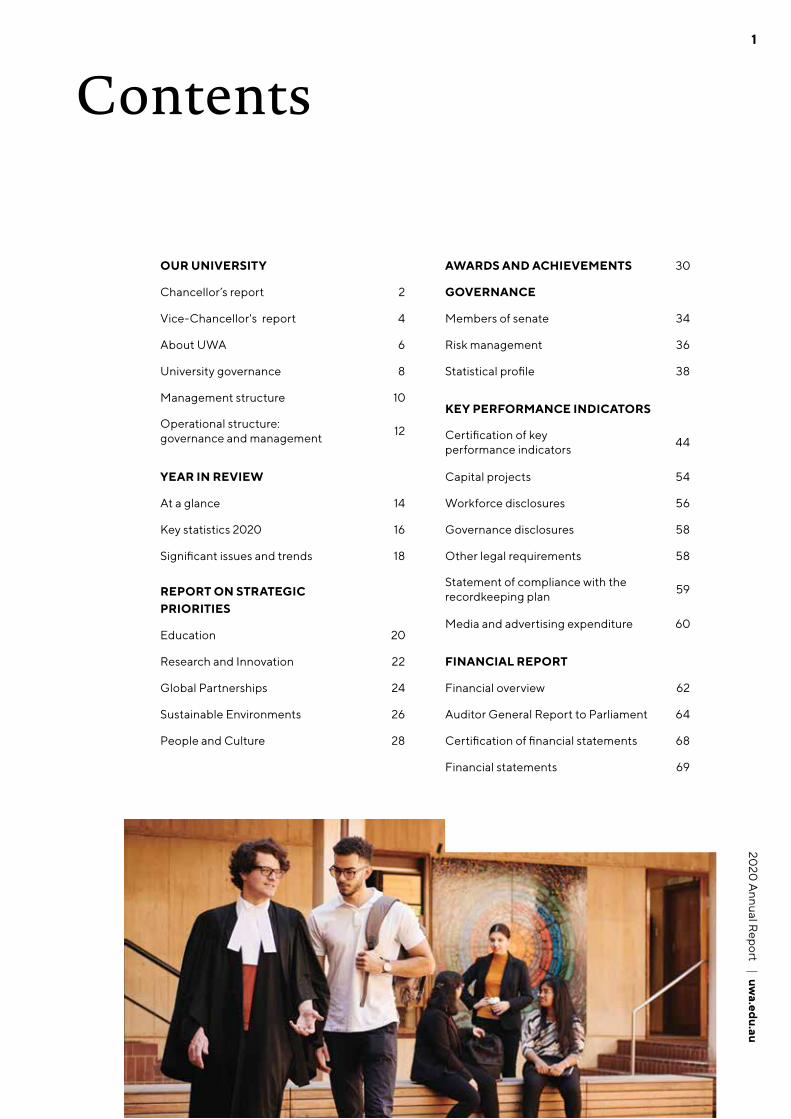
OUR UNIVERSITY
Chancellor’s report 2
Vice-Chancellor's report 4
About UWA 6
University governance 8
Management structure 10
Operational structure: governance and management 12
YEAR IN REVIEW
At a glance 14
Key statistics 2020 16
Significant issues and trends 18
REPORT ON STRATEGIC PRIORITIES
Education 20
Research and Innovation 22
Global Partnerships 24
Sustainable Environments 26
People and Culture 28
Contents
AWARDS AND ACHIEVEMENTS 30
GOVERNANCE
Members of senate 34
Risk management 36
Statistical profile 38
KEY PERFORMANCE INDICATORS
Certification of key performance indicators 44
Capital projects 54
Workforce disclosures 56
Governance disclosures 58
Other legal requirements 58
Statement of compliance with the recordkeeping plan 59
Media and advertising expenditure 60
FINANCIAL REPORT
Financial overview 62
Auditor General Report to Parliament 64
Certification of financial statements 68
Financial statements 69
120
20 A
nnual Report | uw
a.edu.au1

The year 2020 was a year of radical discontinuity for Australian and global societies, for their people, their governments, their institutions and their economies. That discontinuity was effected by the COVID-19 pandemic and by historic geo-political changes. It is a discontinuity which has impacted upon The University of Western Australia which, even without those external circumstances, was entering an important period of change in its history.
In March 2020, the Vice-Chancellor, Professor Dawn Freshwater, left to take up the post of Vice-Chancellor of The University of Auckland. Professor Jane den Hollander, former Vice-Chancellor of Deakin University, accepted appointment as Strategic Change Director in the last few weeks of Professor Freshwater’s term and then as Interim Vice-Chancellor until the arrival in July of the new Vice-Chancellor, Professor Amit Chakma.
The University is immensely grateful to Professor den Hollander for the leadership she provided in responding to the impact of the COVID-19 pandemic. She set a tone of frank engagement with academic and professional staff about the problems which had to be addressed in terms of delivery of our courses and meeting the budgetary challenge. The staff response was heartening and generous. It demonstrated the value and power of our people. In addition to accepting the burdens of moving quickly to online course delivery and living with the constraints imposed by the pandemic, they voted to vary their Enterprise Agreements to assist the University in meeting its financial challenge. Happily, their contribution and other measures meant that the variation of the Enterprise Agreement was able to be lifted well in advance of its allotted span.
Under the new Vice-Chancellor, Professor Chakma, important steps have been taken to place the University’s operating finances on a more sustainable footing addressing underlying issues unrelated to COVID-19. That objective has necessarily been linked to structural change including the abolition of the faculties as administrative units. Administrative and financial accountability will devolve to newly empowered schools which will also enjoy greater flexibility in course and unit arrangements.
Although 2020 has been dominated by intense engagement with financial and administrative issues, it has also been a year of signal achievement. In last year’s report, I mentioned some of the highlights of staff achievement in 2019. They included the national recognition of Emeritus Professor Cheryl Praeger, who received the Prime Minister’s Prize for Science. In 2020, another of our outstanding academic staff, Professor David Blair, shared the Prime Minister’s Prize for Science for his contribution to the development of technology for the detection of gravitational waves, with three other physicists, two from the Australian National University and one from The University of Adelaide. Professor Ryan Lister was named Joint Scientist of the Year in the 2020 Premier’s Science Awards. Professor Helen Milroy, UWA’s first Indigenous medical graduate, was named joint winner of the 2020 Australian Mental Health Prize and as Western Australia’s 2021 Australian of the Year.
There were many other achievements and milestones in the journey of the University through the year that has been. They are set out in the pages of this Annual Report.
At the governance level, the Senate has been greatly encouraged by the approach being taken by Professor Chakma in clearly defining his priorities and setting out his plans and doing so in a strategic way while engaging with the urgent issues that confronted the University throughout the year. For him it has been something of a baptism of fire and his response to the demands of his new role, in a new country, has been exemplary.
The Senate has embarked upon a process of self-examination — commissioning an independent review of its governance to ensure that it meets the requirements of the Higher Education Standards. It has also established a Working Group, comprising Senate Members Robert Olivier, Joanne Farrell and Susan Murphy to make recommendations for the more effective presentation of information to the Senate and its more effective operation.
Chancellor’s report
2 The University of Western Australia | uwa.edu.au

I am grateful to all members of the Senate and to those not on the Senate who serve on its committees and make their expertise and experience available to the University. I particularly express my thanks to those members of the Senate who left us in 2020: Lynton Hayes, who served for 12 years and Michele Dolin who served for nine years on Senate and as Chair of the Audit and Risk Committee.
The staff-elected members who joined the Senate in 2020 were Nin Kirkham, elected by Academic Staff and Jill Benn, elected by General Staff. Professor Ray da Silva Rosa, President of the Academic Board, continued on Senate, elected by the Academic Board. The two student representatives who served through 2020, Bre Shanahan and Rahul Kumar completed their terms at the end of the year. Both made substantial contributions to our work and we wish them well in their future careers. We also welcomed two new student elected members: Emma Mezger, Guild President for 2021 and Joseph Chan, the newly elected President of the Postgraduate Students’ Association.
2020 saw an important development in governance — the adoption by the Senate of a simplified single Statute for the University. Many people contributed to the task of bringing that Statute to fruition. An important early impetus came from the work of former University Secretary, Deidre de Souza, followed by her successor, Acting Secretary, Kabilan Krishnasamy and by Sue Moore who was appointed as Secretary in January 2020.
The number of people who contributed to the work of forming, drafting and finalising the Statute is too numerous to mention them by name. However, I would express my thanks to Convocation for facilitating the timely passage of the Statute in accordance with its responsibilities under the University of Western Australia Act. I also take the opportunity to thank the new Warden of Convocation, Clinical Professor Lesley Cala and the Council of Convocation for their support for the University. A Joint Committee established in 2020 between Convocation and Development and Alumni Relations (DAR), chaired by Convocation-elected Senate Member, Adjunct Professor Warren Kerr AM, should provide for closer cooperation between Convocation and DAR in the important work of maintaining and enhancing relations with our alumni.
The Senate at its last meeting in December 2020 adopted a UWA Code on Freedom of Speech and Academic Freedom. It resolved that UWA policies and codes should be reviewed to ensure consistency with the Code on Freedom of Speech and Academic Freedom.
There are considerable tasks facing the University as a whole but they are able to be faced with a new sense of optimism. I look forward to the coming year.
The Hon. Robert French AC CitWA Chancellor
The Hon. Robert French AC CitWA Chancellor
320
20 A
nnual Report | uw
a.edu.au3

We must also ensure that we remain resolute and determined, for the sake of us all: the University community, the State and national community, and a world we have enhanced through our research and our teaching.
We are custodians of this great University. We have a future and generations of future students to serve. The University has already taken steps to strengthen our core and protect and preserve our primary functions.
There will be many challenges ahead. We will face them with determination, confidence in each other’s abilities and resilience, and respect for each other’s achievements. Together, we will ensure that The University of Western Australia remains an outstanding contributor to the prosperity and welfare of the people of Western Australia.
Professor Amit Chakma Vice-Chancellor
Professor Amit ChakmaVice-Chancellor
The University of Western Australia had much to be proud of in 2020. We have been tested and challenged in ways many of us have never encountered before. Under three different Vice-Chancellors, our University has fought for its future. I am very proud to have joined the University in 2020 and of what we have collectively achieved throughout the year.
Thanks to the extraordinary and heroic efforts of staff, courses were put online under immense pressure and with remarkable care and alacrity so that our students could continue with their studies.
Vice-Chancellors, staff union representatives and students agreed to work together for the future sustainability of the University. Admirably, academic and general staff voted overwhelmingly to receive less pay in order to help UWA cope with the COVID-19 crisis.
On its foundation more than a century ago, The University of Western Australia was given a mission: “to advance the prosperity and welfare of the people” of a state larger than most nations.
As we face the challenges ahead, we are guided by our commitment to the community we serve. We are fortified by our determination to pursue excellence as we continue to Seek Wisdom.
In the most recent of university global rankings, issued by US News and World Report, UWA was rated in the top 80 universities in the world.
Our position amongst the world’s leading universities has been won by researchers who continue to make discoveries of global significance, including: exploring gravitational waves and the nature of the universe, the effects of bee venom on cancer cells, improving crop resilience, and finding new and better means of safeguarding the mental health of vulnerable people.
As we look back on 2020, we have discovered that we are resilient and flexible. As we look ahead to 2021, we do so optimistically; we must live within our means while endeavouring to increase and strengthen those means.
Vice-Chancellor's report
4 The University of Western Australia | uwa.edu.au

520
20 A
nnual Report | uw
a.edu.au5

ABOUT UWAEstablished in 1911 as the State's first university, The University of Western Australia (UWA) was also the first free university in the British Empire, actively promoting equal access to tertiary education for all social classes. Today UWA is ranked in the world's top 100 universities and number one in Western Australia.
UWA has an international reputation for remarkable and life-changing contributions across research, learning and teaching. In 2020, UWA educated more than 25,000 students from across 100 countries.
As one of Australia’s leading research-intensive universities UWA operates more than 40 intensive research centres and 22 schools, in addition to having a broad range of successful industry partnerships.
The University is a member of the internationally recognised Australian Group of Eight universities and a foundation member of the Matariki Network of high-quality, research-intensive universities with a particular focus on student experience.
UWA has a strong connection to industry and government, supports communities both locally and internationally, and is driven to make the most of its collective potential and contribute to the world’s advancement.
OUR CAMPUSES PERTH/CRAWLEY CAMPUSSet on 65-hectares, UWA’s historic main campus sits on the banks of the Swan River, next to Kings Park and just minutes from Perth’s central business district, with additional facilities in Claremont and Nedlands.
UWA HEALTH CAMPUSLocated at the Queen Elizabeth II Medical Centre grounds in Nedlands, the UWA Health Campus connects students and researchers with hospitals, institutes and healthcare providers.
UWA ALBANY CENTREBased in the state’s Great Southern region and situated in a biodiversity hotspot, the UWA Albany Centre allows students to experience all that regional WA has to offer. In addition to being able to complete an undergraduate degree in the region, there are opportunities for students to participate in research projects in the fields of environmental research and wave energy.
6 The University of Western Australia | uwa.edu.au

VALUES EXCELLENCEWe consistently pursue the highest levels of achievement, creating the best outcomes possible.
INTEGRITYWe are honest and ethical and show respect for, and appreciate, each other, our partners and our communities — valuing our differences.
INNOVATIONWe are constantly, and creatively, improving and adapting.
COLLABORATIONWe share our collective intelligence to achieve more.
EQUITYWe are committed to providing everyone at UWA equality of opportunity, experience and access.
MISSIONTo provide world-class education, research and community engagement for the advancement of the prosperity and welfare of our communities.
VISIONCreating the next generation of global leaders through experience-rich education and world-leading, trustworthy research.
MOTTOSeek Wisdom
OUR PROMISEAs a university we will:
• prepare our students to be globally relevant and
responsible leaders
• enable and promote trustworthy and influential research
• build just and equitable societies
• work closely with our communities to improve
our environment
• recognise and value Indigenous peoples’ rights,
knowledge, culture and values.
720
20 A
nnual Report | uw
a.edu.au7

University Governance 2021
GUILD OF UNDERGRADUATESUWA Act, 1911
UWA Statute Chapter 5
VICE-CHANCELLORUWA Statute Chapter 3
SENATEUWA ACT, 1911
CONVOCATIONUWA Act, 1911
UWA Statute Chapter 4
ACADEMIC BOARDUWA Statute Chapter 6
8 The University of Western Australia | uwa.edu.au

EXECUTIVE
ACADEMIC COUNCIL
ACADEMIC COUNCIL/BOARD COMMITTEES
VICE-CHANCELLOR’S ADVISORY COMMITTEES
SENIOR DEPUTY VICE-CHANCELLOR
HEADS OF SCHOOL
Audit and Risk Committee
Strategic Resources Committee
Chancellor’s Committee
Honorary Degrees Committee
Committees of Senate
Senior Deputy Vice-Chancellor
Chief Financial Officer
Deputy Vice-Chancellor (Education)
Deputy Vice-Chancellor (Research)
Executive *Proposed. School academic governance structure under development.
School boards*
School committees*
920
20 A
nnual Report | uw
a.edu.au9

UWA Management
Senior DeputyVice-Chancellor
Head of School Allied Health
Head of School Agriculture and Environment
Head of School Biological Sciences
Head of School Earth Sciences
Head of School Biomedical Sciences
Pro Vice-Chancellor Research
Pro Vice-Chancellor Academic
Chief Digital Officer
Director Venues Management
Pro Vice-Chancellor Engagement
Director McCusker Centre
for Citizenship
Pro Vice-Chancellor Health and Medical
Research
Director Albany Centre
Director Institute of Agriculture
Deputy Vice-Chancellor Global Partnerships
Pro Vice-Chancellor Indigenous Education
Executive Director International Centre for Radio Astronomy
Research
Dean and Head of School Dentistry
Deputy Vice-Chancellor Research
Deputy Vice-Chancellor Education
Chief FinancialOfficer
Structure 2021
VICE-CHANCELLOR
Dean and Head of School Engineering
Dean and Head of School Business
Head of School Design
Dean and Head of School Grad. School of Education
Head of School Humanities
Head of School Conservatorium of Music
10 The University of Western Australia | uwa.edu.au

Chief Advancement Officer Development and Alumni Relations
Structure 2021
Head of School Molecular Sciences
Head of School Human Sciences
Head of School Psychological Sciences
Dean and Head of School Medicine
Head of School Population and Global Health
Director Campus Management
Director Strategy, Planning and
Performance
Director Office of Service Delivery
Dean and Head of School Law
Head of SchoolSchool of Indigenous Studies
Head of School Social Sciences
Head of School Physics, Maths and Computing
Head of School Oceans Graduate School
Dean Graduate Research School
Director Student Life
Director Office of Research
Chief Marketing Officer
Director Oceans Institute
University Librarian
Director Lawrence Wilson Art Gallery
Director Governance and
Legal Counsel
Directors Research Infrastructure
Centres
Director Institute of Advanced Studies
Director Public Policy Institute
Director Human Resources
College of Schools
Director Confucius Institute
1120
20 A
nnual Report | uw
a.edu.au11

Operational Structure: governance and
management SENATE
The governing body of the University is the Senate, as constituted by the University of Western Australia Act 1911. Senate oversees all major decisions concerning the conduct of the University through the making of statutes, regulations and by-laws, and through the management of income and expenditure.
In October 2020 following a major legislative review, the new University of Western Australia Statute came into force. This consolidates 24 statutes into a single UWA Statute.
The University also complies with the corporate and academic governance requirements of:
• University Colleges Act 1926
• University Medical School Teaching Hospitals Act 1955
• QEII Medical Centre Act 1966.
And at a Federal level:
• Tertiary Education Quality and Standards Agency Act 2011, Higher Education Standards Framework (Threshold Standards) 2015
• Education Services for Overseas Students Act 2000.
The University is responsible to the State Minister for Education for the proper conduct of its business, under the State legislation. However, the majority of its funding is invested by the Commonwealth and it is therefore responsible to the Commonwealth Minister for Education for the delivery of its teaching and research programs, and for the provision of adequate infrastructure to support those programs.
Senate’s key activities are:
• setting strategic directions
• the oversight, audit and review of governance processes to ensure proper systems of control, accountability and risk management
• the assessment and monitoring of performance against agreed targets and benchmarks, including financial performance
• making and amending of University legislation.
Standing Committees of the Senate are as follows:
Audit and Risk Committee reviews the University’s financial reporting, the effectiveness of systems of internal control and the risk management framework, reviews and assesses the University’s compliance with relevant regulatory and legal requirements and the fulfilment of its contractual obligations.
Chancellor’s Committee coordinates planning for the programs of the Senate and its key committees. It advises Senate on matters related to the Vice-Chancellor and the Vice-Chancellor on matters related to the University Executives. It provides advice and recommendations on appointments and co-options to the Senate and its Standing Committees, and reviews the induction and professional development programs of Senate members.
Honorary Degrees Committee makes recommendations to the Senate on the awarding of honorary degrees and Chancellor’s medals.
Strategic Resources Committee monitors, makes recommendations and reports to the Senate on the financial welfare of the University (including University investments, campus planning initiatives and major infrastructure developments), and monitors policy of staffing resources.
Academic Board is the University’s peak academic body. Established by the Senate under the UWA Statute, the Board is chaired by a member of the academic community.
12 The University of Western Australia | uwa.edu.au

Convocation of UWA GraduatesAll graduates of the University are life-long members of the Convocation of UWA Graduates. The UWA Act and UWA Statute assign the roles of: representative, governance, contribution, engagement, and promotion to Convocation. In a governance capacity, elected members of Convocation are represented on the University Senate.
UWA Student Guild The UWA Student Guild was founded by students, for students, in 1913. It is the peak student representative body, elected by the student body. The University Guild Council leads the Guild and provides student representation on the University Senate and a number of University boards and committees.
EXECUTIVE 2020
In March 2020, Vice-Chancellor, Professor Dawn Freshwater left the University. Professor Jane den Hollander took up the position as interim Vice-Chancellor until the arrival of the new Vice-Chancellor, Professor Amit Chakma in July.
During 2020 the University Executive also comprised of a number of other key roles, including the Chief Operating Officer and Executive Deans. The Vice-Chancellor reformed the Executive in October 2020.
EXECUTIVE 2021
The Senate appoints the Vice-Chancellor and works in partnership with the incumbent in this role to maximise the University’s capacity and performance, and to ensure its fiscal viability.
Vice-Chancellor — Professor Amit ChakmaAppointed as the Chief Executive Officer and is delegated operational responsibility of the University. The Vice-Chancellor appoints an executive group to assist with responsibilities for the academic, financial, administrative and other business of the University.
Senior Deputy Vice-Chancellor — Professor Simon BiggsResponsible for broad line management of the Heads of School, academic performance, staffing policy, and deputising for the Vice-Chancellor in his absence.
Deputy Vice-Chancellor (Education) — Professor David SadlerResponsible for undergraduate and postgraduate coursework education, education policy, and the UWA student experience.
Deputy Vice-Chancellor (Research) — Professor Tim ColmerResponsible for research and research training, research policy, research translation and commercialisation, and the University Library.
Chief Financial Officer — Ms Leona MarquandResponsible for the University’s financial strategy, policy and compliance, including financial planning and budget, financial administration, financial management and reporting, procurement, and investment and debt portfolios.
The Vice-Chancellor may also appoint other roles whose responsibilities extend across the University.
Deputy Vice-Chancellor (Global Partnerships) – Mr Tayyeb Shah
Pro Vice-Chancellor (Academic) – Professor Graham Brown
Pro Vice-Chancellor (Engagement) – Ms Samantha Tough
Pro Vice-Chancellor (Indigenous Education) – Professor Jill Milroy AM
Pro Vice-Chancellor (Research) – Professor Andrew Page
1320
20 A
nnual Report | uw
a.edu.au13

14 The University of Western Australia | uwa.edu.au
Three science, technology, engineering and mathematics (STEM) researchers, Professor Robyn Owens, Professor Ryan Lister and Professor Harvey Millar, are elected as 2020 Fellows of the Australian Academy of Science, which recognises the nation’s most distinguished scientists.
The $80 million EZONE UWA Student Hub is completed, delivering a world-class learning space for engineering and mathematical sciences students, researchers, and industry.
JUNEUWA launches a suite of new courses, designed to respond to needs of the Western Australian economy, industry and society, and prepare students for a rapidly changing world. Automation and robotics, AI and international cybersecurity are among the new courses available from 2021.
JULYNew Vice-Chancellor Professor Amit Chakma joins UWA, bringing a wealth of experience and knowledge to lead the University.
The Lawrence Wilson Art Gallery provides access to its collections in digital format, launching an online database for the Cruthers Collection of Women's Art, and an online exhibition from the Berndt Collection titled Expressions of India.
UWA researchers are part of a new $10.8 million liver research centre that will apply the latest techniques to analyse patient tumours and test new treatments.
The McCusker Centre for Citizenship internship program at UWA, which provides students with the opportunity to volunteer in the community, surpasses a milestone of more than 1,000 internships and 100,000 hours of service to the community.
Completion of Bilya Marlee – our new River of the Swan building – places Indigenous studies at the heart of our campus and embeds Indigenous wisdom across all we do.
Staff vote in favour of variations to Academic and Professional Enterprise Agreements, ratified by the Fair Work Commission, to deliver cost-saving measures, while protecting jobs.
2020 at a glance
In 2020 we effectively responded to the rapidly evolving COVID-19 situation, and also celebrated many significant achievements and milestones across the University.
FEBRUARYUWA is one of 11 organisations to receive an internationally recognised Athena SWAN Bronze Award for its commitment to gender diversity in the STEMM subjects of science, technology, engineering, mathematics and medicine.
Four academics receive awards to recognise their contributions to student education in the 2020 Australian Awards for University Teaching – Associate Professor Christopher Etherton-Beer, Dr Demelza Ireland, Dr Zhangxin (Frank) Liu and Dr Nicola Mitchell.
MARCHThe University moves rapidly to online learning with more than 3,000 units moved online in just two weeks to offer continuity and support for students during the COVID-19 pandemic.
APRILUniversity academics respond enthusiastically as the pandemic unfolds – offering their expertise in the media and using their research and scientific experience to offer support to the community during the pandemic.
Researchers from UWA join an expert taskforce of more than 100 experts across the Group of Eight universities to help the Federal Government plot the best path through COVID-19.
UWA introduces new admissions pathways to alleviate the concerns of Year 12 students, many of whom were anxious and unsure about what would happen with ATAR this year.
MAYUWA researchers are part of an interdisciplinary team that manufactures thousands of face shields to support the WA health system and protect frontline workers responding to COVID-19.
UWA researchers and chief scientist Professor Peter Klinken and team manufacturing face masks to protect healthcare workers from COVID-19

1520
20 A
nnual Report | uw
a.edu.au15
SEPTEMBERProfessor Ryan Lister is awarded joint Scientist of the Year in the 2020 Premier’s Science Awards for his contribution to advancing understanding of the molecular programming in cells. Professor Mark Randolph is inducted into the Science Hall of Fame.
UWA scientist Dr Ciara Duffy discovers honeybee venom can induce cancer cell death in aggressive breast cancer.
OCTOBEREmeritus Professor David Blair is awarded the prestigious Prime Minister’s Prize for Science for his contribution to the first detection of gravitational waves.
Bachelor of Philosophy (Honours) student Max Anderson Loake is named Western Australia’s Rhodes Scholar for 2021, recognising his potential as a young global ambassador.
NOVEMBERProfessor Helen Milroy, UWA’s first Indigenous medical graduate, is named joint winner of the 2020 Australian Mental Health Prize and Western Australia’s 2021 Australian of the Year.
Three academics, Dr Sarah Collins, Professor Jo McDonald and Professor Tim Winter, are elected as fellows of the Australian Academy of Humanities, the highest honour for achievement in the humanities in Australia.
World-renowned expert in fluid dynamics Professor Liang Cheng is elected a Fellow of the Australian Academy of Technology and Engineering, joining a league of the nation’s leading innovators.
DECEMBER A new facility, the Coastal and Offshore Engineering Laboratory, opens at UWA. It will enable research and testing of solutions to some of WA’s most significant ocean engineering challenges, including protecting our coastline from flooding and erosion, finding new ways to harness renewable energy resources and gaining insights critical to protect and rehabilitate coral reefs.
Professor Ryan Lister, a pioneer in epigenomics, is awarded joint Scientist of the Year in the 2020 Premier’s Science Awards
Rhodes Scholar 2021 recipient Max Anderson Loake
Emeritus Professor David Blair, recipient of the 2020 Prime Minister's Prize for Science
UWA 2020 Fellows of the Australian Academy of Science. L-R, Professor Harvey Millar, Professor Ryan Lister and Professor Robyn Owens
UWA scientists will run a new Coastal and Offshore Engineering Laboratory that will tackle complex ocean engineering challenges
2020 Australian Mental Health Prize winner and Western Australia’s 2021 Australian of the Year Professor Helen Milroy
16 The University of Western Australia | uwa.edu.au
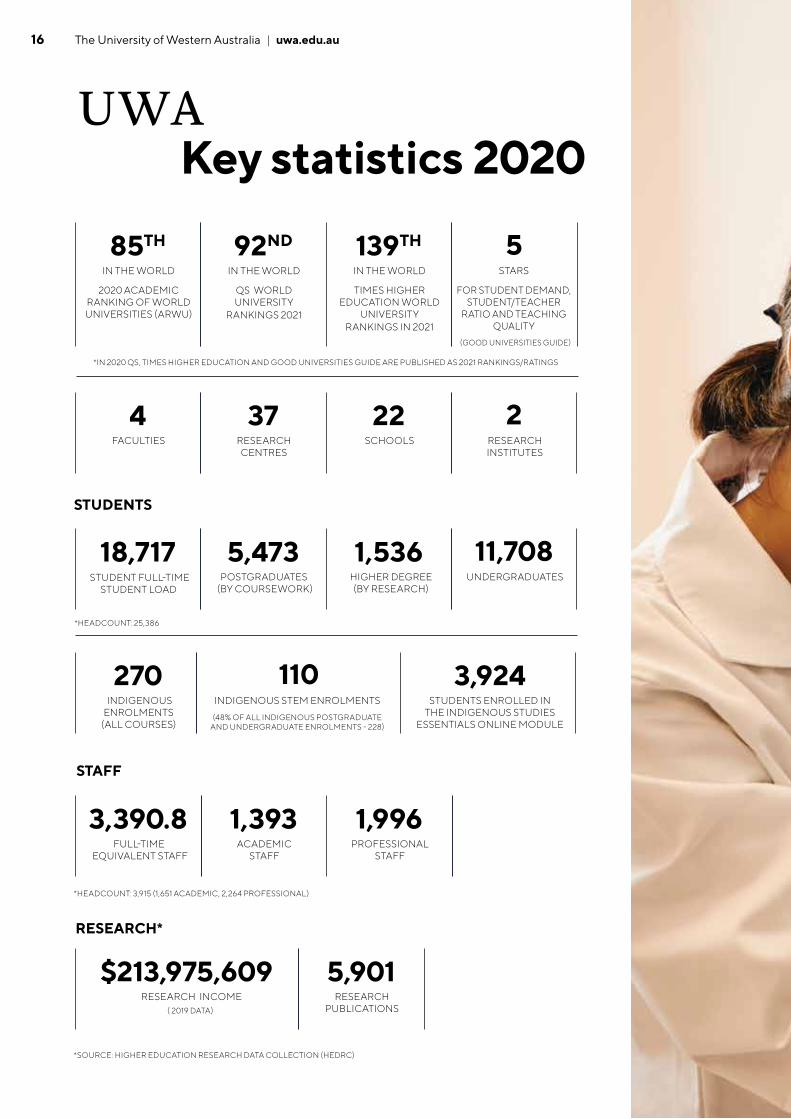
UWA Key statistics 2020
*IN 2020 QS, TIMES HIGHER EDUCATION AND GOOD UNIVERSITIES GUIDE ARE PUBLISHED AS 2021 RANKINGS/RATINGS
*HEADCOUNT: 25,386
85TH
IN THE WORLD
2020 ACADEMIC RANKING OF WORLD UNIVERSITIES (ARWU)
139TH
IN THE WORLD
TIMES HIGHER EDUCATION WORLD
UNIVERSITY RANKINGS IN 2021
5STARS
FOR STUDENT DEMAND, STUDENT/TEACHER
RATIO AND TEACHING QUALITY
(GOOD UNIVERSITIES GUIDE)
92ND
IN THE WORLD
QS WORLD UNIVERSITY
RANKINGS 2021
4FACULTIES
22SCHOOLS
2RESEARCH INSTITUTES
37RESEARCH CENTRES
18,717
270
STUDENT FULL-TIME STUDENT LOAD
INDIGENOUS ENROLMENTS
(ALL COURSES)
1,536
3,924
HIGHER DEGREE (BY RESEARCH)
STUDENTS ENROLLED IN THE INDIGENOUS STUDIES
ESSENTIALS ONLINE MODULE
11,708UNDERGRADUATES
5,473
110
POSTGRADUATES (BY COURSEWORK)
INDIGENOUS STEM ENROLMENTS
(48% OF ALL INDIGENOUS POSTGRADUATE AND UNDERGRADUATE ENROLMENTS - 228)
3,390.8FULL-TIME
EQUIVALENT STAFF
1,996PROFESSIONAL
STAFF
1,393ACADEMIC
STAFF
$213,975,609RESEARCH INCOME
5,901RESEARCH
PUBLICATIONS
*SOURCE: HIGHER EDUCATION RESEARCH DATA COLLECTION (HEDRC)
*HEADCOUNT: 3,915 (1,651 ACADEMIC, 2,264 PROFESSIONAL)
RESEARCH*
STAFF
STUDENTS
( 2019 DATA)

1720
20 A
nnual Report | uw
a.edu.au17

18 The University of Western Australia | uwa.edu.au
Market dynamicsUWA operates in a growing higher education market that continues to see increased competition. In 2020, the University was focused on adapting to the impacts of COVID-19 on student mobility and course delivery.
Nationally, the past five years saw strong growth in international students alongside low growth in domestic enrolments. In contrast, WA experienced flat domestic student enrolments and low growth in international students.
In 2019, Perth was reinstated to the regional migration scheme, a policy expected to drive future demand. However, in 2020 border restrictions introduced to contain COVID-19 led to a decline in international student enrolments nationwide. Strong demand for face-to-face learning is expected to drive some international students to reconsider their study destinations in the short term.
Amongst increasing competition, Australia remains the world’s third most popular education destination. WA and UWA hold a small share of this market with plenty of capacity for growth and WA universities, along with government agencies, continue work to raise awareness of Perth, and consequently UWA, as a study destination. As with all Australian universities, UWA aims to balance the profile of its international students to safeguard against market fluctuations.
Domestically, over the past five years the WA population of 15 to 30 year olds remained flat, and a declining proportion of high school graduates attained an ATAR and progressed into traditional university entry pathways. University enabling programs and certain VET courses have grown. These dynamics increased competition. Positively, there is strong growth forecast for the school-age population over the five years to 2025.
In response to these dynamics UWA is expanding its range of courses, increasing accessibility, and launching short courses. The University is also enhancing its online and blended learning delivery, and building an improved offering for regional students.
Government and policyThe COVID-19 global pandemic dominated public policy decision-making at both the State and Federal levels. In the early days of the pandemic, the Commonwealth closed the borders to travellers from China, and subsequently to all travellers, which left many of UWA’s international students overseas for the commencement of Semester 1.
Universities were excluded from measures implemented by the WA and Commonwealth governments to support businesses impacted by the COVID-19 global pandemic, such as the JobKeeper scheme and payroll tax deferral. Governments also declined to provide financial support to UWA’s international students who had lost their employment due to the economic impacts of the pandemic. Despite work across the sector with Commonwealth and State governments on controlled entry programs, Australia’s borders remain closed to international students.
In June, the Federal Education Minister announced the Job-ready Graduates Package, a comprehensive reorganisation of the funding model for Commonwealth supported students. The package creates additional student places over the coming decade to keep pace with the coming demographic bulge in university-aged young people. The additional places are funded by increasing the overall student contribution to university fees. To encourage STEM students, the Government has reduced student contributions for STEM units, but significantly increased the student contributions for many humanities units. Importantly for UWA, the package also gives universities more flexibility to transfer allocated Commonwealth places between postgraduate and undergraduate courses.
In August, the Commonwealth commissioned Professor Sally Walker AM to review the implementation of the Model Code on Freedom of Speech created by the Hon. Robert French AC, UWA’s Chancellor, on behalf of the Government in 2019. Professor Walker’s report was released in December, and found UWA to be fully compliant with the French Model Code.
Significant issues and trends
1920
20 A
nnual Report | uw
a.edu.au19
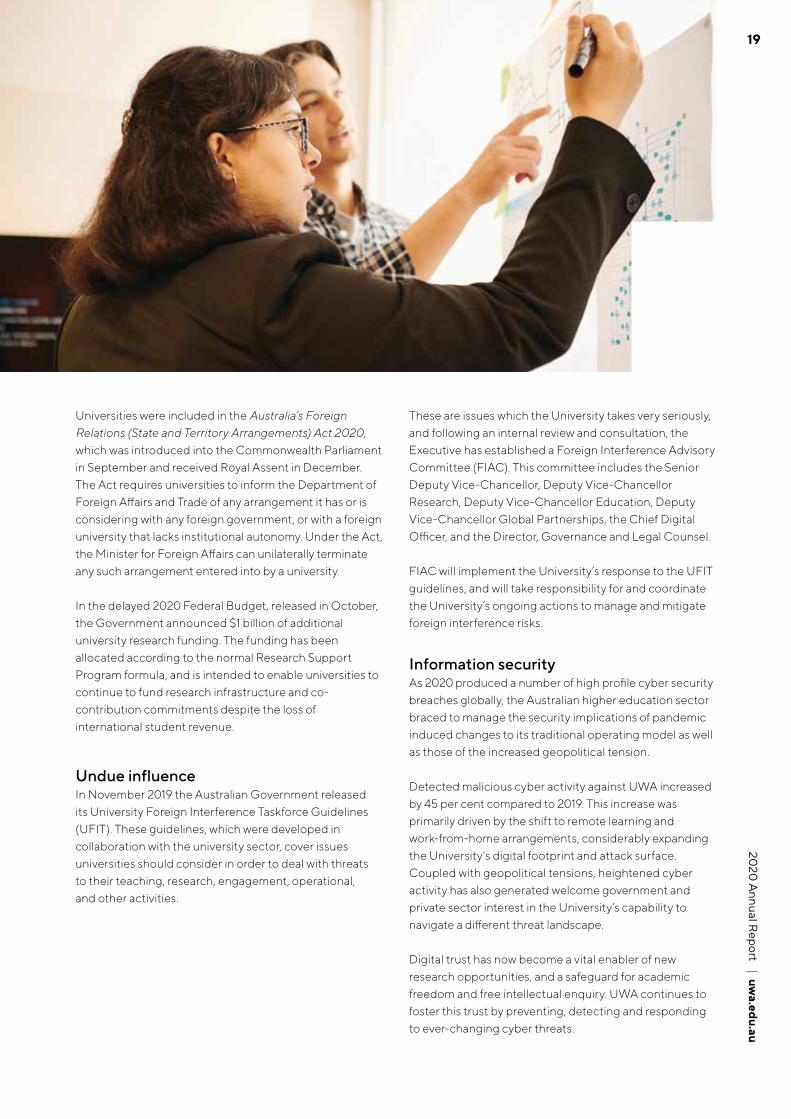
Universities were included in the Australia’s Foreign Relations (State and Territory Arrangements) Act 2020, which was introduced into the Commonwealth Parliament in September and received Royal Assent in December. The Act requires universities to inform the Department of Foreign Affairs and Trade of any arrangement it has or is considering with any foreign government, or with a foreign university that lacks institutional autonomy. Under the Act, the Minister for Foreign Affairs can unilaterally terminate any such arrangement entered into by a university.
In the delayed 2020 Federal Budget, released in October, the Government announced $1 billion of additional university research funding. The funding has been allocated according to the normal Research Support Program formula, and is intended to enable universities to continue to fund research infrastructure and co-contribution commitments despite the loss of international student revenue.
Undue influenceIn November 2019 the Australian Government released its University Foreign Interference Taskforce Guidelines (UFIT). These guidelines, which were developed in collaboration with the university sector, cover issues universities should consider in order to deal with threats to their teaching, research, engagement, operational, and other activities.
These are issues which the University takes very seriously, and following an internal review and consultation, the Executive has established a Foreign Interference Advisory Committee (FIAC). This committee includes the Senior Deputy Vice-Chancellor, Deputy Vice-Chancellor Research, Deputy Vice-Chancellor Education, Deputy Vice-Chancellor Global Partnerships, the Chief Digital Officer, and the Director, Governance and Legal Counsel.
FIAC will implement the University’s response to the UFIT guidelines, and will take responsibility for and coordinate the University’s ongoing actions to manage and mitigate foreign interference risks.
Information securityAs 2020 produced a number of high profile cyber security breaches globally, the Australian higher education sector braced to manage the security implications of pandemic induced changes to its traditional operating model as well as those of the increased geopolitical tension.
Detected malicious cyber activity against UWA increased by 45 per cent compared to 2019. This increase was primarily driven by the shift to remote learning and work-from-home arrangements, considerably expanding the University's digital footprint and attack surface. Coupled with geopolitical tensions, heightened cyber activity has also generated welcome government and private sector interest in the University’s capability to navigate a different threat landscape.
Digital trust has now become a vital enabler of new research opportunities, and a safeguard for academic freedom and free intellectual enquiry. UWA continues to foster this trust by preventing, detecting and responding to ever-changing cyber threats.

20 The University of Western Australia | uwa.edu.au
In this remarkable and unpredictable year we remained focused on delivering a positive University experience for our students.
Our teaching excellence was nationally recognised when The Good Universities Guide awarded UWA five stars for undergraduate teaching quality, placing us in the top 20 per cent for Australia; a significant achievement for a research-intensive university. Our commitment to high-quality teaching was demonstrated in the growing UWA Academy Fellowship Scheme, now comprising 17 Associate Fellows, 27 Fellows, 43 Senior Fellows, and three Principal Fellows.
EducationPRIORITIES
• Ceaselessly drive innovation in our curriculum to create unique and globally relevant educational experiences.
• Exploit the potential of disruptive digital technology to positively transform the student experience.
• Broaden the variety of courses we offer and the diversity of students we attract.
The pandemic brought forward new ways of working. The Education portfolio was at the forefront of transforming the University’s teaching and learning model to meet the curriculum challenges of 2020. This included moving 3,000 units online in a matter of weeks, moving exams predominantly online (more than 40,000 sittings scheduled for Semester 1), and transferring all student services to a fully online model while maintaining a high-level of service. Our staff, both academic and professional, dug deep and demonstrated exceptional pedagogic innovation, embraced educational technologies and overcame challenges to ensure the high-quality delivery of learning.
The University responded to changing environments by redesigning the curriculum, to better support our growth agenda and, to ensure alignment with the Federal Government’s Job-ready Graduate Program. Innovations included new specialised degrees – such as combined Bachelor/Masters, new short courses and microcredentials – and the reform of undergraduate ‘broadening’ requirements to increase flexibility for students.
Each of these innovations seeks to strengthen UWA’s competitive position in local and international markets, and despite the challenges presented by COVID-19, the University retained more enrolled students than expected (85.8%) – owing to an excellent suite of student support programs and rapid adaption to virtual delivery.
UWA supported our students through this difficult year by establishing the UWA Hardship Scheme (estimated $1.9 million) to respond to student welfare, providing Financial Hardships Grants (estimated $1.67 million) to more than 1,400 students in need, more than 900 tailored welfare packs with food and provisions, rent support at UWA residential colleges, rent relief for Crawley Village tenants and loaning out more than 350 IT devices.

2120
20 A
nnual Report | uw
a.edu.au21
Launch of The Living Room project – a space where students can access wellbeing initiatives to help reduce daily pressure
In 2020 the portfolio led the development of the UWA Grand Challenges program to serve as a unifying narrative across the University bringing together significant initiatives, programs and research, and generating interest with current and future students, industry, and the community. Grand Challenges represent the most complex, multidisciplinary and important issues facing communities at local, regional and global levels. They do not lend themselves to easy resolution, but are areas where fresh thinking is needed and the combination of research applications and ‘students as future leaders’ will shape ever more effective responses. Two Grand Challenges focus topics have been selected, in partnership with the Guild: Climate change (2020-2023); and A more just and equitable world post COVID-19 (2020-end of 2021).
The portfolio is steering UWA’s partnership with Edith Cowan University to deliver the Children’s University Australasia program. Launched this year, this program marks a significant way for UWA to inspire and support lifelong learning, and aspirations and engagement with children from a young age. The program was delivered to three pilot schools (in Peel and Perth), and will commence at three schools in Albany in 2021.
The development of the UWA Regional Strategy draws together and strengthens the University’s existing work and partnerships to develop an action-oriented approach to achieving outcomes that support stronger, sustainable communities across the State. The first phase of Strategy development is complete, with broader consultation on the Green Paper planned for early 2021.
A remarkable effort was undertaken by our Student Life team working on the front line to provide welfare and support to our students with the funds raised from the Support Our Students (SOS) COVID-19 Emergency Appeal.
The launch of The Living Room in October – a project developed in partnership with the UWA Young Lives Matter Foundation – will provide students with access to mental health support and connection to appropriate services and activities on campus or in the community. Believed to be the first of its kind on a university campus in Australia, The Living Room will become a hub for student-focused health and wellbeing initiatives including mindfulness meditation sessions and yoga classes, as well as weekly visits from therapy and companion dogs.
In response to the events of this year and the unprecedented disruption for high school leavers, UWA took the decision to accept students’ Year 11 predicted ATAR results as a basis for admission in 2021. Students were required to complete WACE, sit Year 12 ATAR exams, and choose to use their final ATAR as entry if the result was higher than the Year 11 predicted ATAR. The approach was developed in consultation with high schools and continues to be explored within our Schools Engagement program, with feedback overwhelmingly positive.
For the first time, our annual Open Day event moved online, providing an engagement opportunity for thousands of prospective students, their families, and other influencers throughout Australia and overseas, with live and on-demand content.

22 The University of Western Australia | uwa.edu.au
Research and Innovation
PRIORITIES
• Focus our research on resolving the world’s Grand Challenges to improve lives and our environment.
• Engage in research that is digitally driven and data-intensive.
• Be the world leader in open, accessible and trusted research.
The University achieved its highest-ever place among the world’s top universities in 2020, jumping from 99 to 85 in the Academic Ranking of World Universities, which reaffirmed UWA’s place among the top 100 universities in the world.
Our research not only ranks highly internationally, but our research results have also been recognised for delivering impacts that benefit our industry partners and wider communities. Many of our researchers received prestigious honours, awards or fellowships during 2020 (see pages 30-33). Notable in terms of future research, on proteins in crops, is the awarding of an ARC Laureate Fellowship to Professor Harvey Millar.
Strengthening world-leading collaborations is at the heart of the University’s research strategy, and in 2020 this resulted in UWA jointly leading with University of Queensland the establishment of the Cooperative Research Centre on Transformations in Mining Economies. Partners include BHP, Rio Tinto, Deswik, Decipher, the state governments of Western Australia and Queensland, and the Northern Territory, as well as researchers from eight Australian universities and the CSIRO. The UWA-led Future Energy Exports Cooperative Research Centre also commenced, involving 28 industry, government and research collaborators. UWA researchers were successful in many other grants, including two National Health and Medical Research Council Centres of Excellence, an ARC Industrial Transformation Research Hub, and as lead organisation for the ‘Resilient Landscapes Hub’ awarded by the National Environmental Science Program to UWA and a consortium of partners across Australia.
The University is engaged in research that is digitally driven and data-intensive. The International Centre for Radio Astronomy Research, a joint venture with Curtin University and supported by our State Government, continues to make key advancements in data science. In addition, a new consortium, the Australian Remote Operations for Space and Earth, supported by the WA State Government will position Perth as a centre for remote operations in space. UWA researchers will contribute expertise and facilities in areas such as robotics, automation, communications, energy and space exploration.
The University is committed to digitising its cultural collections for the benefit of generations and this was fast-tracked in 2020 by an ARC Linkage Infrastructure, Equipment and Facilities grant. All five WA universities, the WA State Library and the WA Museum will collaborate to establish a world-class archival Digitisation Centre. The Centre will enable researchers to digitise a diverse range of cultural objects and thus support a wide spectrum of research needs.

2320
20 A
nnual Report | uw
a.edu.au23
Access to cutting-edge infrastructure is essential for world-class research. The University is a key partner in several of the National Collaborative Research Infrastructure Scheme capabilities, supported by the federal and state governments and UWA together with a consortium of WA partners. New research infrastructure has been delivered such as the Cryo-Electron Microscopy suite (Microscopy Australia) or is planned for 2021 such as the significant expansion of the National Imaging Facility. The other new facilities range from nano-fabrication, complex biology and population health data, to ocean radar and wave buoys.
UWA’s research strategy includes Indigenous knowledge and research as a priority area by supporting Aboriginal academic staff and students and collaborations with community research projects. The University received funding from the Federal Government’s Medical Research Future Fund Million Minds Mission. Professor Pat Dudgeon, a Bardi woman, is developing clinically and culturally capable mental health service models in collaboration with families and communities. In a different project, an international team including UWA researchers is working with Kimberley Traditional Owner groups on cultural objects from past German expeditions through Australia’s North West. A third example is a seagrass restoration project with the Malgana rangers in Shark Bay (Gathaagudu).
Finally, in the uncertain times of COVID-19 the University continued to support its researchers, including Higher Degree by Research students, to deliver outcomes under contract with governments, business and industry. Researchers adapted to the new work arrangements with physical distancing, assisted by support to students and researchers from the Library, Graduate Research School, Research Infrastructure Centres and Office of Research, as well as from areas outside the Research portfolio with coordination by the UWA Critical Incident Management Team and the COVID-19 Recovery Management Team. In addition, UWA researchers contributed to a Group of Eight Australian universities taskforce on options for a recovery roadmap, as well as to the WA research response to COVID-19 supported by the WA State Government, so that expert knowledge was available to support the Australian community.
ARC Australian Laureate Fellowship recipient, Professor Harvey Millar

24 The University of Western Australia | uwa.edu.au
PRIORITIES
• Be the pre-eminent academic leader in the Indian Ocean Rim.• Build deeper and broader partnerships with industry, governments
and not-for-profits to inform and translate our research.• Engage openly and ensure our research benefits the widest
possible range of communities.
Global
In an environment where Australia’s international borders were closed most of the year, the Global Partnerships portfolio maintained the vibrancy of UWA’s local, national and international connections and partner relationships through virtual means.
The University was able to continue to support its largest offshore student cohort in China through the establishment of in-country Learning Centres to supplement online teaching and learning. The Summer Down Under Research Internship taster program was successfully provided in an online format, while the Centre for English Language Teaching facilitated online English language teaching and Study Tours for students from a number of countries. The pre-COVID-19 introduction of virtual student exchange or collaborative online international learning initiatives was given greater impetus and will continue to be rolled out throughout 2021. UWA also signed an innovative university-wide collaborative PhD agreement with Soochow University.
The University participated in the Australia India Institute’s national India Week celebrations in October. This included co-hosting an on campus formal event with the Consulate of India, Perth, to mark the end of a year of celebrations of the 150th birth anniversary of Mahatma Gandhi. The University also joined in celebrations to mark the ten-year anniversary of the Matariki Network of Universities, an international group of seven research-led universities of which UWA is a founding member.
Partnerships Minimum ATAR 92 or equivalent STAT Not Applicable Intake months February and July Completion 4 years full time
The Innovation and Industry Engagement team delivered partnerships with industry to a value of $15 million and developed an ongoing pipeline of over $22 million in a variety of industry sectors. A number of inaugural strategic sessions were held with industry, helping to deepen partnerships and optimise the impact and translation from our research expertise.
In a challenging year, the philanthropic support from our community including Trusts and Foundations and bequests saw solid results in fundraising with over $18 million raised by the end of October. Development and Alumni Relations in collaboration with Student Life, the Student Guild and UWA Convocation held the SOS COVID-19 Emergency Appeal to support students experiencing hardship as a result of the pandemic, raising $827,850 for student grants and welfare packs. Additional support provided by our alumni in the form of legal and financial advice was gratefully received by our students. The generosity of all our supporters has inspired the most heartfelt student messages and letters of thanks to pass on to the community.
Our Alumni Relations program continued to meet the demand from students and recent graduates for alumni career mentoring and advice programs delivering 22 virtual career webinars 2020. The Global Ambassador program across an initial five national and international Alumni Networks was launched. This is designed to support our recent international graduates. In addition, a move to digital engagement enabled many more of our graduates to connect to our research efforts.

2520
20 A
nnual Report | uw
a.edu.au25
Minimum ATAR 92 or equivalent STAT Not Applicable Intake months February and July Completion 4 years full time
UWA Convocation adapted to the virtual world to hold its 2020 Ordinary Meetings which were well received. In February, Convocation Day included a beautiful celebration of the 75th anniversary of the first performance in the Somerville Auditorium with over 170 attendees. The 2020 Convocation 50th Reunion Lunch had strong support celebrating our 1970 graduates.
UWA Publishing received multiple nominations for literary awards in 2020, with Hearing Maud by Jessica White winning the 2020 Michael Crouch Award for a Debut Work in the New South Wales Literary Awards, and the Courier-Mail People's Choice Queensland Book of the Year Award.
Perth Festival’s Highway to Hell was named a winner at the 2020 Australian Event Awards. Celebrating the closing of the 2020 Perth Festival, the Highway to Hell marked the 40th anniversary of the burial of Fremantle local and legendary AC/DC front man Bon Scott. More than 144,000 people reclaimed 10 kilometres of Canning Highway as the world’s longest stage for an epic one-day carnival of music, art, and suburban mythmaking.
The event doubled trade for local businesses, had a direct economic impact of $6.1 million and a flow-on economic benefit of $17.2 million.
The Lawrence Wilson Art Gallery maintained a dynamic program of exhibitions including celebration of its 30th year since opening. The year commenced with great acclaim for the Long Kiss Goodbye exhibition, and with the Berndt Museum’s successful Boomerang: A National Symbol exhibition. A full program of exhibitions were opened in the second half of the year with HERE&NOW20, A Sorrowful Act, and (Un)ladylike Acts. The University’s collections were made available in digital format, including the launch of an online database for the Cruthers Collection of Women's Art, and an online exhibition from the Berndt Collection titled Expressions of India that featured in the India Week celebrations.

26 The University of Western Australia | uwa.edu.au
Sustainable Environments
PRIORITIES
• Establish modern and fully integrated physical and digital environments that foster world-leading education and research and reflect Indigenous place and our shared history.
• Embed sustainability and fair-trade principles into the developmental and operational activities of the campus.
• Create new opportunities for collaboration, co-location and connectivity.
The disruption of 2020 has had an impact on UWA’s campus environment, both in its use and plans for its enhancement. Following both State and Federal guidelines and other expert medical advice, demands on UWA’s campus and infrastructure shifted in the first quarter of 2020. Staff and students were moved toward significantly higher online engagements and activities in line with COVID-19 related advice to minimise potential risks. There was a greater return to campus starting in Semester 2, but ongoing planning continues in line with evolving health advice and shifts in institutional needs.
Despite this impact, there has been notable progression in UWA evolving its built environment in line with the UWA Strategic Plan 2020-25. The Bilya Marlee (River of the Swan) building was completed, providing a purpose-built facility integrated with the extension of Prescott Court through to Hackett Drive within the campus Village Quarter, greatly improving the student experience for the School of Indigenous Studies, the Centre for Aboriginal Medical and Dental Health and Poche Centre for Indigenous Health.

2720
20 A
nnual Report | uw
a.edu.au27
This year also saw the opening of EZONE Central, an exciting step forward in a major University project, the EZONE UWA Student Hub. EZONE seeks to transform the way students learn, research and engage with community, industry and alumni. EZONE Central’s completion followed the opening of EZONE North in Semester 2, 2019.
The staged delivery of the fit-out supporting the establishment of the Doctor of Optometry commenced construction over the academic break in December 2020 with a subsequent stage to be implemented in late 2021/22.
The completion of these significant buildings, along with other related activities, has progressed the University in its strategic aims of both preserving the existing distinct and vibrant campus identity while also improving campus connections. This has been embodied in the 2020 UWA Crawley Campus Masterplan and supporting strategies, approved by Senate.
There has also been progress towards the University's aim of creating a more clean, green and environmentally sustainable campus. A key goal in this space is achieving carbon neutrality by no later than 2030, which will involve a range of actions such as improving energy efficiency of existing facilities, installing greater solar photovoltaic generation capacity, increased real-time monitoring of energy usage, implementation of our Thermal Energy Strategy and improved on-campus energy storage options.
Recognising the challenges facing the arts and hospitality industries, Venues Management responded rapidly and strategically to mitigate the impacts of COVID-19 on University Venues and The University Club. These strategies included, diversification of The University Club membership to family and friends; introduction of contact-free pick-up and delivery meal services and narrowing conference bookings into condensed periods.
Successfully navigating the challenging circumstances, The University Club commenced a measured approach to reopening, safely and enthusiastically welcoming back their supportive members and guests in late May 2020. This was closely followed by University Venues, with the phased reopening of University Theatres and other venues mid-year.
UWA’s digital environment was significantly tested in 2020, with the rapid movement of students to online learning and staff to working from home situations. The University was able to adapt to and accommodate this increased demand with minimal disruption. Looking forward, it is recognised that off-campus support of both students and staff is likely to require increased attention as traditional ways of working have been disrupted. Our focus on information technology and complementary on campus learning and working requirements will be developed to support that evolution.

28 The University of Western Australia | uwa.edu.au
PRIORITIES
• Build a workforce with the capabilities to deliver the objectives of UWA 2030 and develop leadership to motivate and engage colleagues to succeed.
• Foster a high-performance culture that is values-led, collaborative and open, and that embraces diversity.
• Encourage innovation and development through high-quality training, recognition and reward.
While our primary focus for 2020 was responding to and managing the impact of COVID-19 on the University’s workforce, we were able to progress aspects of the People and Culture Strategy from the UWA Strategic Plan 2020–25.
Our People and Culture Strategy was developed in consultation with staff from across the University and is based on four objectives:
• defining, creating and supporting the careers of the future that will attract world-class people
• developing an inclusive and diverse workforce that lives its values
• driving and rewarding a high performing workforce capable of driving real change
• building engagement and motivation of and for all staff.
These objectives underpin our priorities, and were the guide for how we redirected our workforce to work from home during the pandemic. The rapid transition to home-based working enabled us to accelerate many changes that would have otherwise taken much longer to achieve. By necessity, our workforce became more flexible, resilient and outcomes-focused as staff adjusted to the realities of working remotely. Managers improved their change leadership capabilities and supported their teams in navigating new ways of working and communicating with one another.
Our workforce was supported through the provision of advice and support that was delivered and enabled through technology and remote, self-directed learning. We developed a Job Match scheme allowing us to match talent that would otherwise have been stood-down – due to the pandemic – with other available work. This supported staff to perform, develop and explore new career opportunities.
This year, the performance review process was simplified and streamlined to focus on outcomes and achievements. As we move into the new COVID-19 normal workplace, we will assess the benefits of these changes and refine them where necessary.
We also developed a proposal for significant structural reform of the University, commencing with the Executive and its associated management structures. Through engagement and consultation with our workforce and other stakeholders, we finalised a new Executive structure that took effect in early January 2021.
and Culture People

2920
20 A
nnual Report | uw
a.edu.au29
Support through COVID-19The Human Resources team provided direct support and advice to staff throughout the pandemic.
Travel guidance and self-isolation recommendations for staff and students were updated as government regulations changed. Working with UWA’s healthcare and risk management provider Healix, the team ensured nearly 170 staff and students who were stranded overseas were given assistance to return to their home countries.
A Health and Wellbeing Management Plan for staff and students was created as we rapidly altered our ways of working. The plan included responses for various scenarios along with triage, isolation and management processes for areas such as the University Medical Centre and student residences.
A staff guide to understanding COVID-19 was developed and updated regularly. During March, the guide was updated almost daily.
Information sessions were conducted that reached nearly 2,000 staff and advised on best practices to avoid the spread of COVID-19. A public health campaign was rolled out across campus to educate staff and students on the importance of proper hygiene and physical distancing measures.
The impact of COVID-19 wasn’t limited to physical wellbeing. Recognising sensitivities and the need to be inclusive, the team developed guides for acting respectfully and sensitively approaching students who might appear unwell.
At the same time, thousands of staff transitioned to working from home. The working from home process was streamlined, with advice provided for both managers and staff. Leave guidelines were also updated, and additional personal leave was introduced to support staff who were facing personal and family challenges.
Our Health and Wellbeing team offered ergonomic assessments via phone or Zoom, and worked with UWA’s Exercise and Performance Centre to offer staff free individual exercise physiology consultations and wellness group classes, run by Master of Clinical Exercise Physiology students.
Adjustments were also made to our Employee Assistance Program to give staff access to a wider range of services, including mental wellbeing, financial counselling and nutrition services. Staff were offered webinars on work-life balance, managing technology and enhancing productivity while working from home, and coping with change and uncertainty. More than 130 staff participated in these online workshops.
HR’s Organisational Development team created a LinkedIn Learning package to help remote workers. Hundreds of staff completed courses including Learning Zoom, Microsoft Teams Essential Training and Being an Effective Team Member.

30 The University of Western Australia | uwa.edu.au
Awards and achievements in 2020FELLOWSHIPSAUSTRALIAN LAUREATE FELLOWSHIP
Professor Harvey Millar School of Molecular Sciences and Director of the ARC Centre of Excellence in Plant Energy Biology
NATIONAL HEALTH AND MEDICAL RESEARCH COUNCIL LEADERSHIP FELLOW
Professor Jane Pillow School of Human Sciences
PEW MARINE FELLOWSHIP
Dr Ana Martins-Sequeira School of Biological Sciences and UWA Oceans Institute
AUSTRALIAN LEARNED ACADEMY FELLOWS
ACADEMY OF THE SOCIAL SCIENCES IN AUSTRALIA
Professor Matthew Tonts School of Social Sciences
Professor Rod Tyers Business School
AUSTRALIAN ACADEMY OF HEALTH AND MEDICAL SCIENCES
Professor Ian Constable Centre for Ophthalmology and Visual Science
Professor Alistair Forrest Centre for Medical Research
AUSTRALIAN ACADEMY OF THE HUMANITIES
Dr Sarah Collins Conservatorium of Music
Professor Jo McDonald School of Social Sciences
Professor Tim Winter School of Social Sciences
AUSTRALIAN ACADEMY OF SCIENCE
Professor Ryan Lister School of Molecular Sciences
Professor Harvey Millar School of Molecular Sciences and Director of the ARC Centre of Excellence in Plant Energy Biology
Emeritus Professor Robyn Owens School of Physics, Mathematics and Computing
AUSTRALIAN ACADEMY OF TECHNOLOGY AND ENGINEERING
Professor Liang ChengSchool of Engineering
AMERICAN PHYSICAL SOCIETY
Professor Snezhana AbarzhiSchool of Physics, Mathematics and Computing
AUSTRALIAN RESEARCH COUNCIL FUTURE FELLOWSHIPS
Professor Elise Bant Law School
Dr Luke DaviesInternational Centre for Radio Astronomy Research, School of Physics, Mathematics and Computing
Associate Professor Andrea GaynorSchool of Humanities
Associate Professor Stephen Moggach School of Molecular Sciences
Dr Aaron RobothamInternational Centre for Radio Astronomy Research, School of Physics, Mathematics and Computing
AUSTRALIAN RESEARCH COUNCIL DISCOVERY EARLY CAREER RESEARCHER AWARDS
Dr Philipp BayerSchool of Biological Sciences
Dr Sarah ClementSchool of Social Sciences
Dr David FriesemSchool of Social Sciences
Dr Gina Trapp School of Population and Global Health
FORREST FELLOWSHIP
Dr Matthew Dodd
Dr Jason Eshraghian
Dr Mark Wong
FORREST PROSPECT FELLOWSHIP
Dr Shannon Algar
Dr Francesco De Toni
Dr Lucy Furfaro
Dr Samuel Lymberry
Dr Ben McAllister
Dr Andrea Rassell
Dr Arman Siahvashi
Dr Catriona Stevens
Dr Samantha Winter
Dr Rachael Zemek

3120
20 A
nnual Report | uw
a.edu.au31
STATE AND NATIONAL AWARDS AND PRIZES
PRIME MINISTER’S PRIZE FOR SCIENCE
Emeritus Professor David Blair School of Physics, Mathematics and Computing, Joint Winner
SENIOR AUSTRALIAN OF THE YEAR
Professor John Newnham AM Medical School
PREMIER’S SCIENCE AWARDS
Emeritus Professor Mark Randolph Oceans Graduate School, inducted into WA Science Hall of Fame
SCIENTIST OF THE YEAR
Professor Ryan Lister School of Molecular Sciences, Joint Winner
Professor Wendy Erber School of Biomedical Sciences, Finalist
Professor Eric May School of Engineering, Finalist
WOODSIDE EARLY CAREER SCIENTIST OF THE YEAR
Dr Chris Brennan-Jones Medical School, Winner
Dr Sam Buckberry School of Molecular Sciences, Finalist
Dr Arman Siahvashi School of Engineering, Finalist
EXXONMOBIL STUDENT SCIENTIST OF THE YEAR
Todd Bond School of Biological Sciences, Joint Winner
SHELL ABORIGINAL STEM STUDENT OF THE YEAR
Simone Harrington School of Psychological Science, Winner
Shondell Hayden Medical School, Finalist
ORDER OF AUSTRALIA
AUSTRALIA DAY HONOURS LIST
Dr Anthony Mylius Medical School, Appointed as a Member
WESTERN AUSTRALIA’S AUSTRALIAN OF THE YEAR AWARDS
WA AUSTRALIAN OF THE YEAR
Professor Helen Milroy Medical School
WA SENIOR AUSTRALIAN OF THE YEAR
Dr Richard Walley OAM School of Indigenous Studies
WESTERN AUSTRALIAN YOUNG AUSTRALIAN OF THE YEAR
Yarlalu Thomas Precision Public Health Fellow in Genetic and Rare Diseases (Pilbara)
SOUTH AUSTRALIAN YOUNG AUSTRALIAN OF THE YEAR
Zibeon Fielding (Mimili Community, Anangu Pitjantjatjara Yankunytjatjara Lands), School of Indigenous Studies
WESTPAC - FUTURE LEADERS SCHOLARSHIP
Kelly MacKinnon
Somayra Mamsa
FULBRIGHT FUTURE SCHOLARSHIPS
Paul Branson
Francesca Carey
Dr Martin Ebert
Dr Arman Siahvashi
Isaac Ward
FULBRIGHT ANNE WEXLER SCHOLARSHIP IN PUBLIC POLICY
Liam Tay Kearney
WA FULBRIGHT SCHOLARSHIP
Michael Lukin
NEW COLOMBO PLAN SCHOLARSHIP
Rosanna Radici
RHODES SCHOLAR WESTERN AUSTRALIA
Max Anderson Loake
AUSTRALIAN ACADEMY OF SCIENCE – JOHN BOOKER MEDAL
Associate Professor Britta Bienen Oceans Graduate School
AUSTRALIAN ART MUSIC AWARD
James Ledger Conservatorium of Music, Work of the Year: Large Ensemble
Dr Louise Devenish Conservatorium of Music, Performance of the Year: Notated Composition

32 The University of Western Australia | uwa.edu.au32
CERTIFIED PRACTICING ACCOUNTANT (CPA) AUSTRALIA WA DIVISION
Professor Phil Hancock Business School, Divisional President's Award for Excellence – Achievement in Academia
AUSTRALIAN LEGAL RESEARCH AWARDS
Associate Professor Stella Tarrant Law School, Non-Traditional Research Output Award
CONCRETE RISING STARS AWARD
Farhad Aslani School of Engineering
Jenny Lu School of Engineering
40UNDER40 AWARDS
Dr Christopher Brennan-Jones Medical School, Woodside STEM Excellence Award
INTELLIGENT TRANSPORT SYSTEMS AUSTRALIA NATIONAL AWARDS
Dr Kai Li Lim School of Engineering, Smart Transport Infrastructure Award , Finalist
WA YOUNG TALL POPPY SCIENCE AWARD
Associate Professor Hayley Christian School of Population and Global Health
3M EUREKA PRIZE FOR EMERGING LEADER IN SCIENCE
Associate Professor Asha Bowen Medical School
AUSTRALIAN INSTITUTE OF LANDSCAPE ARCHITECTS
School of Design staff and students WA Landscape Architecture Awards, Award of Excellence – Gardens
NATIONAL ARCHITECTURE AWARDS
Adjunct Professor Patrick Beale School of Design, Commendation for Sustainable Architecture
AUSTRALIAN MENTAL HEALTH PRIZE
Professor Helen Milroy Medical School, Joint Winner
UWA WINTHROP LEADERS SCHOLARSHIP
Ellaby HansenBachelor of Science
Alexander RippeyBachelor of Philosophy
Megha ShethBachelor of Arts
Nathan TownshendBachelor of Philosophy
Joshua TroyBachelor of Philosophy
UWA WINTHROP SCHOLARSHIP
Amy Ahearn Bachelor of Biomedical Science
Jahin AnwarBachelor of Biomedical Science
Nicole CarterBachelor of Biomedical Science
Shevanka Dias Bachelor of Biomedical Science
Deepak JeyarajanBachelor of Biomedical Science
Sineng Jiang Bachelor of Biomedical Science
Tristan LeBachelor of Biomedical Science
Tyler Marlow Bachelor of Biomedical Science
Char NgBachelor of Biomedical Science
Bertrand NheuBachelor of Biomedical Science Alex Sng Bachelor of Biomedical Science
Bartholomew TangBachelor of Biomedical Science
Briana Jansen Bachelor of Biomedical Science
Gary ZhengBachelor of Philosophy
SOCIETY FOR MENTAL HEALTH RESEARCH FOUNDERS MEDAL
Professor Vera Morgan School of Population and Global Health
SUPERSTARS OF STEM, SCIENCE AND TECHNOLOGY AUSTRALIA
Dr Sabine Bellstedt School of Physics, Mathematics and Computing
Dr Jessica Buck Centre for Child Health Research
Associate Professor Parwinder Kaur School of Agriculture and Environment
WOMEN IN TECHNOLOGY WA (WITWA) TECH AWARD
Dr Yael Perry Centre for Child Health Research
Ms Karina Price School of Molecular Sciences
Adjunct Professor Nerida Wilson School of Biological Sciences
DR HARRY BLACKMORE AWARD, DEAFNESS COUNCIL WA
Dr Dona Jayakody Medical School
UWA FOGARTY FOUNDATION SCHOLARSHIP
James BartonBachelor of Biomedical Science
Emma BondBachelor of Philosophy (Honours)
Hannah BowdenBachelor of Philosophy (Honours)
Rana IbrahimBachelor of Philosophy (Honours)
Lachlan McDonaldBachelor of Philosophy (Honours)
Patrick MortonBachelor of Philosophy (Honours)
Luke OsborneBachelor of Philosophy (Honours)
Lucie O’SullivanBachelor of Philosophy (Honours)
Wini Taylor-WilliamsBachelor of Biomedical Science
Alexander van HoekBachelor of Biomedical Science

3320
20 A
nnual Report | uw
a.edu.au33
2020 Annual R
eport | uwa.edu.au
HIGHLY CITED RESEARCHERS
Professor David Edwards School of Biological Sciences
Professor Davey Jones School of Agriculture and Environment
Adjunct, Dr Etienne Laliberte School of Biological Sciences
Professor Hans Lambers School of Biological Sciences
Professor Ryan Lister School of Molecular Sciences
Professor Harvey Millar School of Molecular Sciences
Professor Kadambot Siddique The UWA Institute of Agriculture
Professor Enrico Valdinoci School of Physics, Mathematics and Computing
Adjunct Professor Rajeev Varshney The UWA Institute of Agriculture
Professor Gerald Watts Medical School
Dr Thomas Wernberg School of Biological Sciences
Adjunct Professor Shaun Wilson Oceans Graduate School
OTHER
Sophie Coffin John Koowarta Reconciliation Law Scholarship 2020
Kurtis Gray 2020 Australian Pharmacy Student of the Year
Professor Marit Kragt School of Agriculture and Environment, Australian Academy of Science – Inaugural STEM Women Changemakers
Wint Ye Phu 2020 Pharmaceutical Society of Australia (PSA) Intern Pharmacist of the Year
Professor Stephen Powles School of Agriculture and Environment, BASF Industry Recognition Award
Professor Leigh Simmons School of Biological Sciences, The ASAB Medal 2020 – Association for the Study of Animal Behaviour
AWARDS FOR EXCELLENCE IN TEACHING AND LEARNING
AUSTRALIAN AWARDS FOR UNIVERSITY TEACHING Rewarding outstanding learning and teaching at a national level (awarded in 2020 from 2019 nominations)
AWARD FOR TEACHING EXCELLENCE
Dr Demelza Ireland School of Biomedical Sciences, in (Early Career)
CITATIONS FOR OUTSTANDING CONTRIBUTIONS TO STUDENT LEARNING
Associate Professor Christopher Etherton-Beer Medical School
Dr Zhangxin (Frank) Liu Business School
Dr Nicola Mitchell School of Biological Sciences
UWA AWARDS Acknowledging the University's outstanding teaching and support staff
AWARD FOR EXCELLENCE IN TEACHING
Dr Joseph Carpini Business School Dr Marco Ghisalberti Oceans Graduate School
Dr Fiona McGaughey Law School
Dr Gemma Scarparolo Graduate School of Education
CITATIONS FOR OUTSTANDING CONTRIBUTIONS TO STUDENT LEARNING
Dr Andrzej Gwizdalski Business School
Mr Craig McCormack School of Design
Professor Elizabeth Quail Schools of Biomedical and Molecular Sciences
Mr David Tulley School of Humanities (Early Career)
TEAM Dr Amber Boyatzis, Dr Rob White, Professor Elizabeth Quail and Associate Professor Daniela Ulgiati School of Molecular Sciences
PROFESSIONAL AWARD FOR SERVICE AND SUPPORT
Dr Mary Lynn De Silva Educational Enhancement Unit, Office of the Deputy Vice-Chancellor (Education)
Ms Michelle Fisher Service Delivery Centre
TEAM Careers and Employability Team: Mrs Karen Abbott, Ms Jacqueline Gower, Ms Diane McLaren, Ms Catherine Lightfoot, Mr Ryan Whiddett, Ms Eve Ha and Ms Sherri Russell Student Life, Office of the Deputy Vice-Chancellor (Education)
TEAM University Library Experience Team: Ms Fiona Alexander, Ms Karlee Calderwood, Mr Andrew Card, Mr Daniel Chan, Ms Diana Clapham, Ms Michelle Coles, Ms Sara Drake, Ms Julianne Filardi, Ms Emma Helsby, Ms Sylvia Kalitsis, Mr Paul Marion, Ms Sandy Norman, Mr Philip Pegg, Ms Tatjana Petrovic, Mr Jay Ratta, Ms Alissa Sputore, Mr Suresh Subramaniam, Ms Megan Sutherland, Ms Susie Vacca, Mr Nick Vincent and Ms Valerie Zimdahl University Library, Office of the Deputy Vice-Chancellor (Research)
UWA STUDENT GUILD AWARD
Associate Professor Lisa Wood School of Population and Global Health, Students’ Choice Award
MATARIKI NETWORK OF UNIVERSITIES’ THREE-MINUTE THESIS
Olivia Johnston Graduate School of Education, Runner up
THREE-MINUTE THESIS
Chayan Chatterjee School of Physics, Mathematics and Computing, Winner and People's Choice Award
Please note: This is not a comprehensive list of every award winner at UWA.

34 The University of Western Australia | uwa.edu.au
CHANCELLOR The Hon Robert S. French AC BSc LLB W.Aust. (2017) 2023
APPOINTED BY THE GOVERNOR Lynton Hayes BEc W.Aust., MPA PhD Indiana, Hon.FAIM (2008) 2020*
Susan Murphy AO BEng W.Aust. (2015) 2022
Joanne Farrell BSc W.Aust., GradDip Management Curtin, BLP UNSW, SLP LBS (2019*) 2022
ELECTED BY CONVOCATION Simon Dawkins BEc W.Aust., DipEd Canberra CAE, MPhil City (UK), FAICD (2010) 2021
Warren Kerr AM BArch W.Aust., MHP NSW LFRAIA FACHSM FAIM, Hon. AIA Hon. FNZIA (2015) 2022
ELECTED BY ACADEMIC STAFF Nin Kirkham BA PhD W.Aust. (2020*) 2023
ELECTED BY ACADEMIC BOARD Raymond da Silva Rosa BCom PhD W.Aust. (2015) 2023
ELECTED BY GENERAL STAFF Jill Benn BComms (Media) Hons ECU, GradDip InfoLibStds Curtin, GAICD (2020*) 2023
ELECTED BY STUDENTS Bre Shanahan, BA W.Aust., former Guild President (2019) 2020*
Rahul MS, BTech SRM, former PSA President (2019) 2020*
Emma Mezger, BSc W.Aust., new Guild President (2020*) 2021
Joseph Chan, BCom DipAMusA W.Aust., new PSA President (2020*) 2021
MEMBER EX-OFFICIO The Vice-Chancellor, Amit Chakma Diplng IAP, MASc PhD UBC, DEng (Hon) Waterloo, DSc (Hon) Dhaka, PEng, ICD.D (2020*)
The Vice-Chancellor, Jane den Hollander AO BSc (Hons), MSc Wits., PhD Wales, Hon Doc Deakin (2020*)
The Vice-Chancellor, Dawn Freshwater BA Manc., PhD Nott., FRCN, RN (2020*)
CO-OPTED MEMBERS Pro-Chancellor Frank Cooper AO BCom W.Aust. (2012) 2023
Michele Dolin BA Maryland, MA Mich.State, MBA Melb., FCPA (2012*) 2021
Sue Gordon AM LLB Hon.DLitt W.Aust. (2019) 2021
Michael Byrne MSc Denver DU (2019) 2021
Robert (Bob) Olivier BSc W.Aust., BSocSci (Hons) Curtin, PhD W.Aust. (2019*) 2022
The following persons were members of the University Senate in 2020. The date in brackets at the end of each entry indicates the year a person first became a member of the Senate. The second date indicates the year of expiry of the current term of office. An (*) indicates membership for part of the year only.
Members of senate
Meeting dates 2020 Monday 9 March Monday 20 April Monday 18 May Monday 6 July Monday 31 August Monday 19 October Monday 7 December
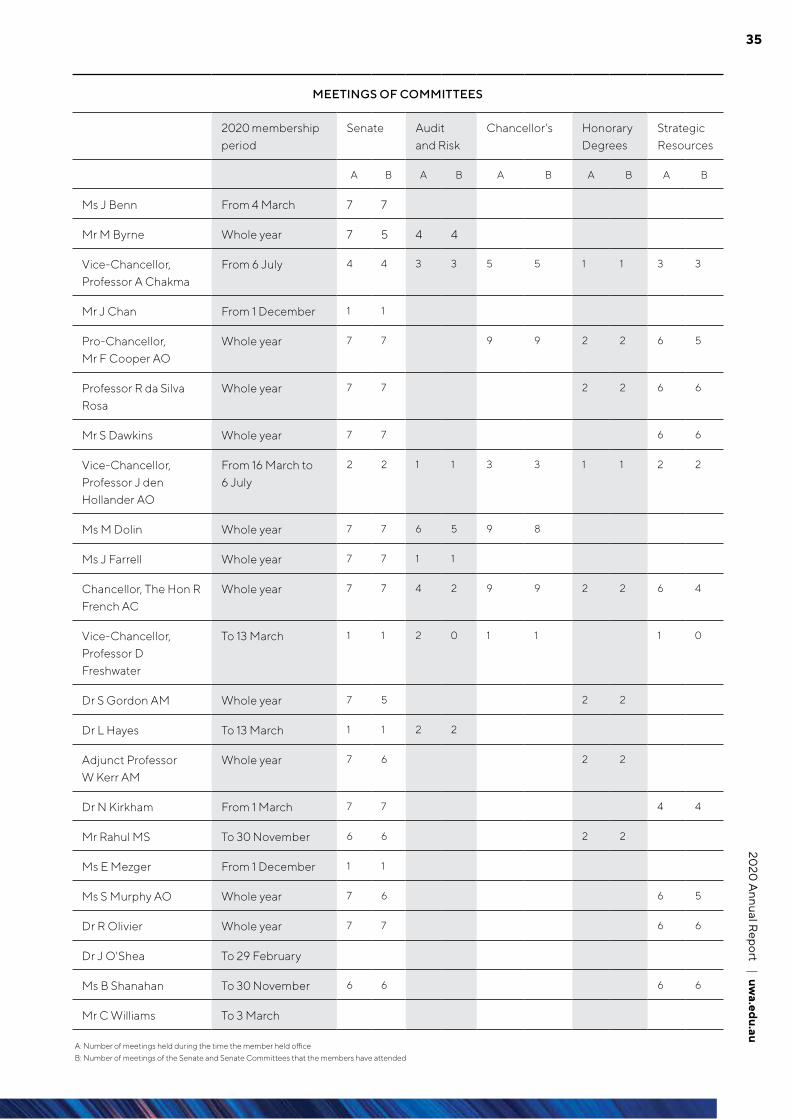
3520
20 A
nnual Report | uw
a.edu.au35
MEETINGS OF COMMITTEES
2020 membership period
Senate Audit and Risk
Chancellor's Honorary Degrees
Strategic Resources
A B A B A B A B A B
Ms J Benn From 4 March 7 7
Mr M Byrne Whole year 7 5 4 4
Vice-Chancellor, Professor A Chakma
From 6 July 4 4 3 3 5 5 1 1 3 3
Mr J Chan From 1 December 1 1
Pro-Chancellor, Mr F Cooper AO
Whole year 7 7 9 9 2 2 6 5
Professor R da Silva Rosa
Whole year 7 7 2 2 6 6
Mr S Dawkins Whole year 7 7 6 6
Vice-Chancellor, Professor J den Hollander AO
From 16 March to 6 July
2 2 1 1 3 3 1 1 2 2
Ms M Dolin Whole year 7 7 6 5 9 8
Ms J Farrell Whole year 7 7 1 1
Chancellor, The Hon R French AC
Whole year 7 7 4 2 9 9 2 2 6 4
Vice-Chancellor, Professor D Freshwater
To 13 March 1 1 2 0 1 1 1 0
Dr S Gordon AM Whole year 7 5 2 2
Dr L Hayes To 13 March 1 1 2 2
Adjunct Professor W Kerr AM
Whole year 7 6 2 2
Dr N Kirkham From 1 March 7 7 4 4
Mr Rahul MS To 30 November 6 6 2 2
Ms E Mezger From 1 December 1 1
Ms S Murphy AO Whole year 7 6 6 5
Dr R Olivier Whole year 7 7 6 6
Dr J O'Shea To 29 February
Ms B Shanahan To 30 November 6 6 6 6
Mr C Williams To 3 March
A: Number of meetings held during the time the member held officeB: Number of meetings of the Senate and Senate Committees that the members have attended

36 The University of Western Australia | uwa.edu.au
The University is committed to maintaining robust and effective risk management practices in accordance with the risk management standard AS ISO 31000:2018.
The University’s Risk Management Framework includes the Risk Management Policy, Risk Guidelines, Risk Appetite and Risk Matrix. The Senate, through its standing Audit and Risk Committee, oversees the University’s system of internal control and the risk management framework. As part of its oversight and monitoring, some of the key matters that came before the Committee in 2020 included:
• Summary reports regarding strategic and operational risks
• Updates on regulatory compliance
• Reports of internal audits
• Safety and health updates
• Specific risk exposures including cybersecurity, academic quality management and foreign interference risks
• Response to COVID-19
• Reports from the Chief Financial Officer, Senior Deputy Vice-Chancellor and the Vice-Chancellor.
managementRisk

3720
20 A
nnual Report | uw
a.edu.au37
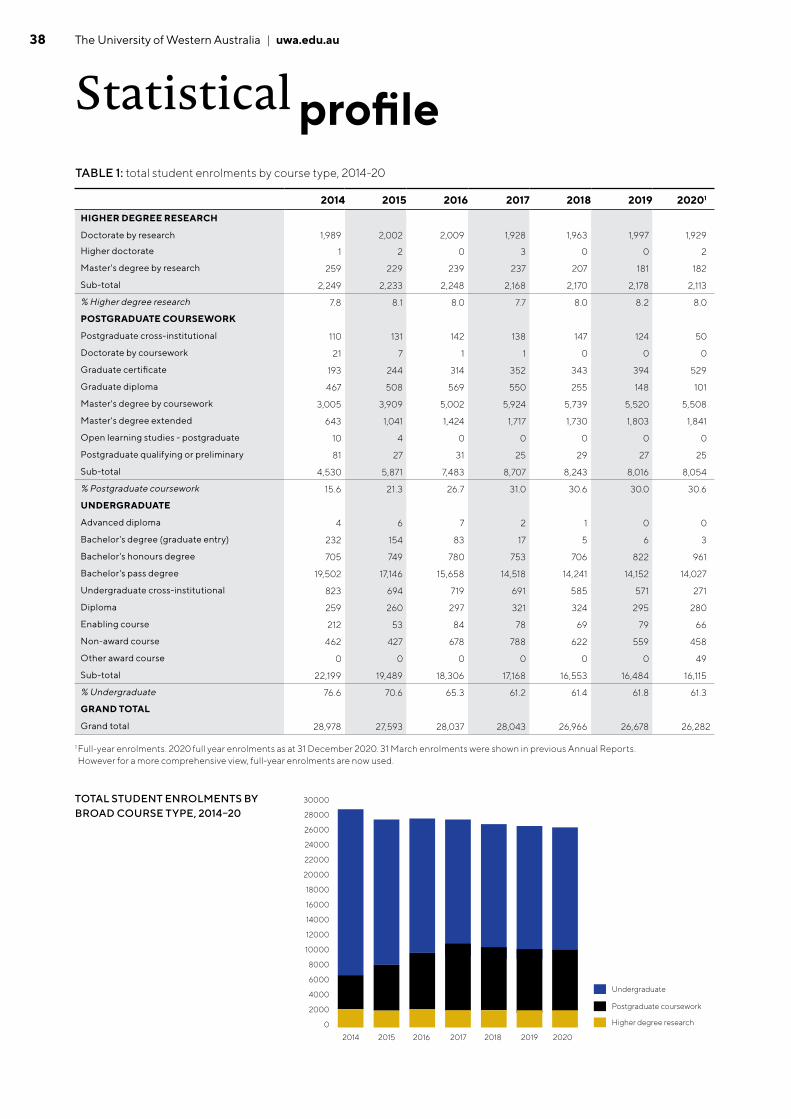
38 The University of Western Australia | uwa.edu.au
0
2000
4000
6000
8000
10000
12000
14000
16000
18000
20000
22000
24000
26000
28000
30000
Undergraduate
Postgraduate coursework
Higher degree research
2014 2015 2016 2017 2018 2019 2020
Statistical profileTABLE 1: total student enrolments by course type, 2014-20
2014 2015 2016 2017 2018 2019 20201
HIGHER DEGREE RESEARCH
Doctorate by research 1,989 2,002 2,009 1,928 1,963 1,997 1,929
Higher doctorate 1 2 0 3 0 0 2
Master's degree by research 259 229 239 237 207 181 182
Sub-total 2,249 2,233 2,248 2,168 2,170 2,178 2,113
% Higher degree research 7.8 8.1 8.0 7.7 8.0 8.2 8.0
POSTGRADUATE COURSEWORK
Postgraduate cross-institutional 110 131 142 138 147 124 50
Doctorate by coursework 21 7 1 1 0 0 0
Graduate certificate 193 244 314 352 343 394 529
Graduate diploma 467 508 569 550 255 148 101
Master's degree by coursework 3,005 3,909 5,002 5,924 5,739 5,520 5,508
Master's degree extended 643 1,041 1,424 1,717 1,730 1,803 1,841
Open learning studies - postgraduate 10 4 0 0 0 0 0
Postgraduate qualifying or preliminary 81 27 31 25 29 27 25
Sub-total 4,530 5,871 7,483 8,707 8,243 8,016 8,054
% Postgraduate coursework 15.6 21.3 26.7 31.0 30.6 30.0 30.6
UNDERGRADUATE
Advanced diploma 4 6 7 2 1 0 0
Bachelor's degree (graduate entry) 232 154 83 17 5 6 3
Bachelor's honours degree 705 749 780 753 706 822 961
Bachelor's pass degree 19,502 17,146 15,658 14,518 14,241 14,152 14,027
Undergraduate cross-institutional 823 694 719 691 585 571 271
Diploma 259 260 297 321 324 295 280
Enabling course 212 53 84 78 69 79 66
Non-award course 462 427 678 788 622 559 458
Other award course 0 0 0 0 0 0 49
Sub-total 22,199 19,489 18,306 17,168 16,553 16,484 16,115
% Undergraduate 76.6 70.6 65.3 61.2 61.4 61.8 61.3
GRAND TOTAL
Grand total 28,978 27,593 28,037 28,043 26,966 26,678 26,282
1 Full-year enrolments. 2020 full year enrolments as at 31 December 2020. 31 March enrolments were shown in previous Annual Reports. However for a more comprehensive view, full-year enrolments are now used.
TOTAL STUDENT ENROLMENTS BY BROAD COURSE TYPE, 2014–20

3920
20 A
nnual Report | uw
a.edu.au39
TABLE 2: student load (EFTSL) by funding source and broad course type, actual 2014-19 and 2020 preliminary
1 2020 full year load as at 31 December 2020. Time-limit and non-award category includes unknown funding group.Discrepancies between the sums of component items and totals are due to rounding.
2014 2015 2016 2017 2018 2019 20201
DOMESTIC - COMMONWEALTH-SUPPORTED
Postgraduate coursework 1,322.8 2,172.1 2,940.2 3,289.6 2,910.4 2,849.4 3,040.2
Undergraduate 13,796.5 11,742.5 10,606.0 9,747.1 9,734.2 9,614.8 9,641.5
Sub-total 15,119.4 13,914.6 13,546.2 13,036.8 12,644.6 12,464.1 12,681.8
% Domestic - Commonwealth supported 71.0 69.8 68.3 66.1 65.8 65.7 67.8
DOMESTIC - FEE-PAYING
Higher degree research 0.0 0.0 0.0 0.5 0.5 0.5 0.5
Postgraduate coursework 636.1 791.0 920.9 945.5 894.1 832.6 717.5
Undergraduate 1.0 0.0 1.0 2.0 1.8 0.1 3.0
Sub-total 637.1 791.0 921.9 948.0 896.4 833.2 721.0
% Domestic - fee-paying 3.0 4.0 4.6 4.8 4.7 4.4 3.9
DOMESTIC - NON-AWARD AND OTHERS
Higher degree research 84.0 83.2 76.2 75.8 86.1 65.9 48.2
Undergraduate 42.5 43.1 44.1 37.1 8.9 8.6 6.9
Postgraduate coursework 0.0 0.2 1.8 2.5 5.8 5.9 5.8
Sub-total 126.5 126.6 122.1 115.4 100.7 80.4 60.8
% Domestic - non-awards and others 0.6 0.6 0.6 0.6 0.5 0.4 0.3
DOMESTIC - RTP
Higher degree research 983.0 1,005.9 991.1 931.6 890.3 898.5 881.2
Sub-total 983.0 1,005.9 991.1 931.6 890.3 898.5 881.2
% Domestic - RTP 4.6 5.0 5.0 4.7 4.6 4.7 4.7
INTERNATIONAL - OFFSHORE
Higher degree research 28.5 29.8 22.0 27.8 30.8 20.2 24.5
Postgraduate coursework 15.5 10.1 6.2 3.0 1.0 0.0 0.0
Undergraduate 695.1 520.4 320.5 187.5 56.9 38.1 35.9
Sub-total 739.1 560.2 348.8 218.2 88.6 58.4 60.4
% International - offshore 3.5 2.8 1.8 1.1 0.5 0.3 0.3
INTERNATIONAL - ONSHORE
Higher degree research 490.5 463.9 456.4 325.6 317.5 325.8 360.1
Postgraduate coursework 802.7 965.7 1,311.2 1,841.9 1,894.0 1,835.4 1,709.4
Undergraduate 2,404.5 2,100.0 2,147.5 2,169.0 2,198.0 2,228.9 2,021.0
Sub-total 3,697.7 3,529.5 3,915.1 4,336.5 4,409.5 4,390.0 4,090.5
% International - onshore 17.4 17.7 19.7 22.0 23.0 23.1 21.9
INTERNATIONAL - RTP
Higher degree research 0.0 0.0 0.0 121.2 182.9 242.8 221.6
Sub-total 0.0 0.0 0.0 121.2 182.9 242.8 221.6
% International - RTP 0.0 0.0 0.0 0.6 1.0 1.3 1.2
UNKNOWN
Postgraduate coursework 3.0 1.0 0.0 0.0 0.0 0.0 0.0
Higher degree research 0.0 0.0 0.0 1.0 0.0 0.0 0.0
Sub-total 3.0 1.0 0.0 1.0 0.0 0.0 0.0
% Unknown 0.0 0.0 0.0 0.0 0.0 0.0 0.0
GRAND TOTAL
Grand total 21,305.8 19,928.9 19,845.1 19,708.7 19,213.1 18,967.4 18,717.2
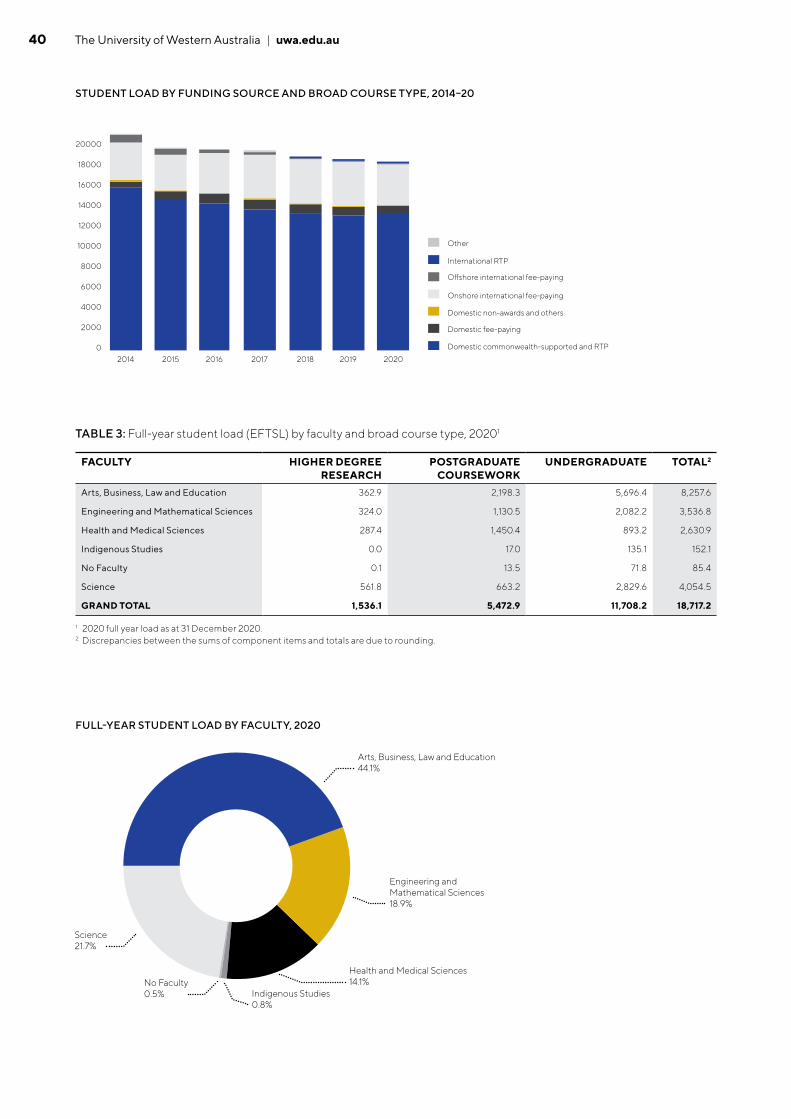
40 The University of Western Australia | uwa.edu.au
0
2000
4000
6000
8000
10000
12000
14000
16000
18000
20000
22000
Other
International RTP
Oshore international fee-paying
Onshore international fee-paying
Domestic non-awards and others
Domestic fee-paying
Domestic commonwealth-supported and RTP2014 2015 2016 2017 2018 2019 2020
STUDENT LOAD BY FUNDING SOURCE AND BROAD COURSE TYPE, 2014–20
TABLE 3: Full-year student load (EFTSL) by faculty and broad course type, 20201
1 2020 full year load as at 31 December 2020. 2 Discrepancies between the sums of component items and totals are due to rounding.
FULL-YEAR STUDENT LOAD BY FACULTY, 2020
FACULTY HIGHER DEGREE RESEARCH
POSTGRADUATE COURSEWORK
UNDERGRADUATE TOTAL2
Arts, Business, Law and Education 362.9 2,198.3 5,696.4 8,257.6
Engineering and Mathematical Sciences 324.0 1,130.5 2,082.2 3,536.8
Health and Medical Sciences 287.4 1,450.4 893.2 2,630.9
Indigenous Studies 0.0 17.0 135.1 152.1
No Faculty 0.1 13.5 71.8 85.4
Science 561.8 663.2 2,829.6 4,054.5
GRAND TOTAL 1,536.1 5,472.9 11,708.2 18,717.2
student load by faculty
Arts, Business, Law and Education44.1%
Science21.7%
No Faculty0.5% Indigenous Studies
0.8%
Health and Medical Sciences14.1%
Engineering and Mathematical Sciences18.9%

4120
20 A
nnual Report | uw
a.edu.au41
TABLE 4: Degrees and awards conferred by course type, 2014-20
DEGREES AND AWARDS CONFERRED, 2014-20
COURSE TYPE 2014 2015 2016 2017 2018 2019 2020
Higher degree research
Higher doctorate 2 2 1
Doctorate by research 268 259 328 273 264 296 281
Master's degree by research 59 55 50 45 49 48 34
Sub-total higher degree research 327 314 380 318 315 344 316
% Higher degree research 5.0% 4.2% 4.7% 4.5% 5.0% 4.8% 4.9%
Postgraduate coursework
Master's degree by coursework 764 747 1,139 1,403 1,635 2,061 1,732
Graduate diploma 336 285 313 327 323 121 75
Graduate certificate 105 103 130 188 157 208 240
Master's degree extended 44 21 74 161 101 468 479
Sub-total postgraduate coursework 1,249 1,156 1,656 2,079 2,216 2,858 2,526
% Postgraduate coursework 19.1% 15.5% 20.4% 29.3% 35.0% 40.2% 39.0%
Undergraduate
Bachelor's degree (graduate entry) 91 87 133 6 7 3 2
Bachelor's honours degree 967 935 772 537 426 385 304
Bachelor's pass degree 3,894 4,893 5,086 4,105 3,298 3,431 3,276
Diploma 24 51 85 57 73 82 49
Undergraduate short course 6
Other award course 23 2
Sub-total undergraduate 4,976 5,966 6,076 4,705 3,804 3,901 3,639
% Undergraduate 75.9% 80.2% 74.9% 66.2% 60.0% 54.9% 56.1%
Total 6,552 7,436 8,112 7,102 6,335 7,103 6,481
0
1000
2000
3000
4000
5000
6000
7000
8000
9000
Undergraduate
Postgraduate coursework
Higher degree research
2014 2015 2016 2017 2018 2019 2020
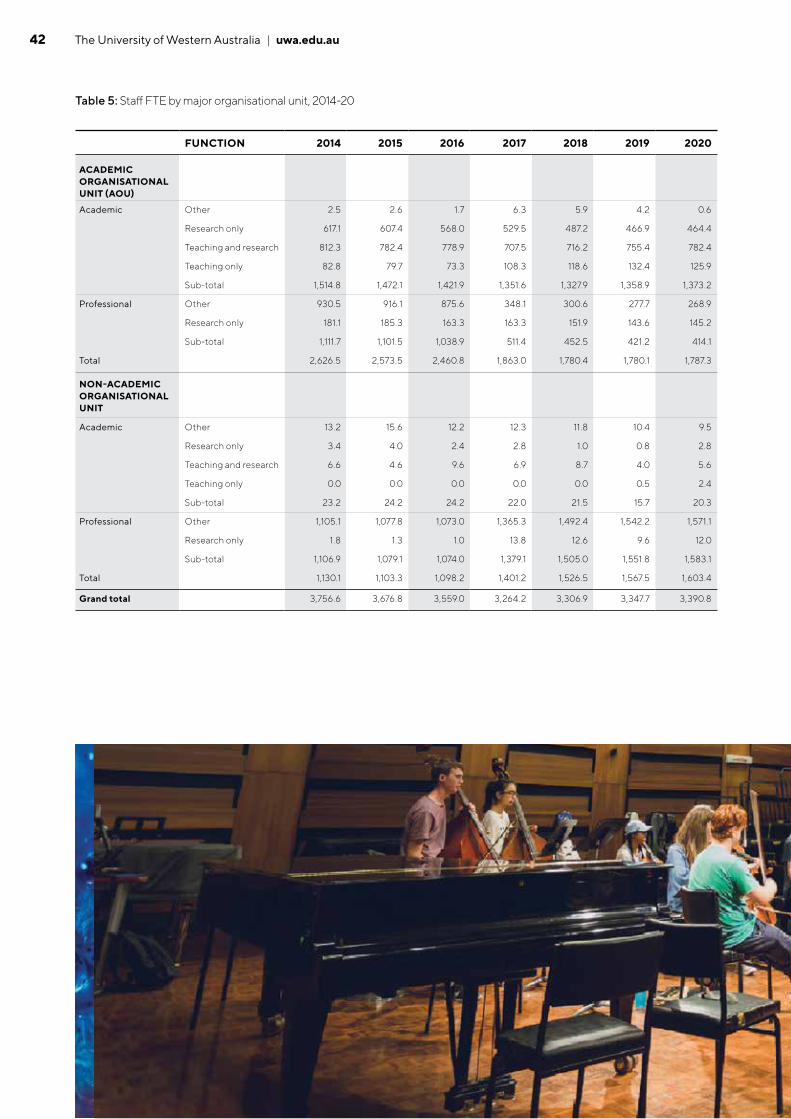
42 The University of Western Australia | uwa.edu.au
Table 5: Staff FTE by major organisational unit, 2014-20
FUNCTION 2014 2015 2016 2017 2018 2019 2020
ACADEMIC ORGANISATIONAL UNIT (AOU)
Academic Other 2.5 2.6 1.7 6.3 5.9 4.2 0.6
Research only 617.1 607.4 568.0 529.5 487.2 466.9 464.4
Teaching and research 812.3 782.4 778.9 707.5 716.2 755.4 782.4
Teaching only 82.8 79.7 73.3 108.3 118.6 132.4 125.9
Sub-total 1,514.8 1,472.1 1,421.9 1,351.6 1,327.9 1,358.9 1,373.2
Professional Other 930.5 916.1 875.6 348.1 300.6 277.7 268.9
Research only 181.1 185.3 163.3 163.3 151.9 143.6 145.2
Sub-total 1,111.7 1,101.5 1,038.9 511.4 452.5 421.2 414.1
Total 2,626.5 2,573.5 2,460.8 1,863.0 1,780.4 1,780.1 1,787.3
NON-ACADEMIC ORGANISATIONAL UNIT
Academic Other 13.2 15.6 12.2 12.3 11.8 10.4 9.5
Research only 3.4 4.0 2.4 2.8 1.0 0.8 2.8
Teaching and research 6.6 4.6 9.6 6.9 8.7 4.0 5.6
Teaching only 0.0 0.0 0.0 0.0 0.0 0.5 2.4
Sub-total 23.2 24.2 24.2 22.0 21.5 15.7 20.3
Professional Other 1,105.1 1,077.8 1,073.0 1,365.3 1,492.4 1,542.2 1,571.1
Research only 1.8 1.3 1.0 13.8 12.6 9.6 12.0
Sub-total 1,106.9 1,079.1 1,074.0 1,379.1 1,505.0 1,551.8 1,583.1
Total 1,130.1 1,103.3 1,098.2 1,401.2 1,526.5 1,567.5 1,603.4
Grand total 3,756.6 3,676.8 3,559.0 3,264.2 3,306.9 3,347.7 3,390.8
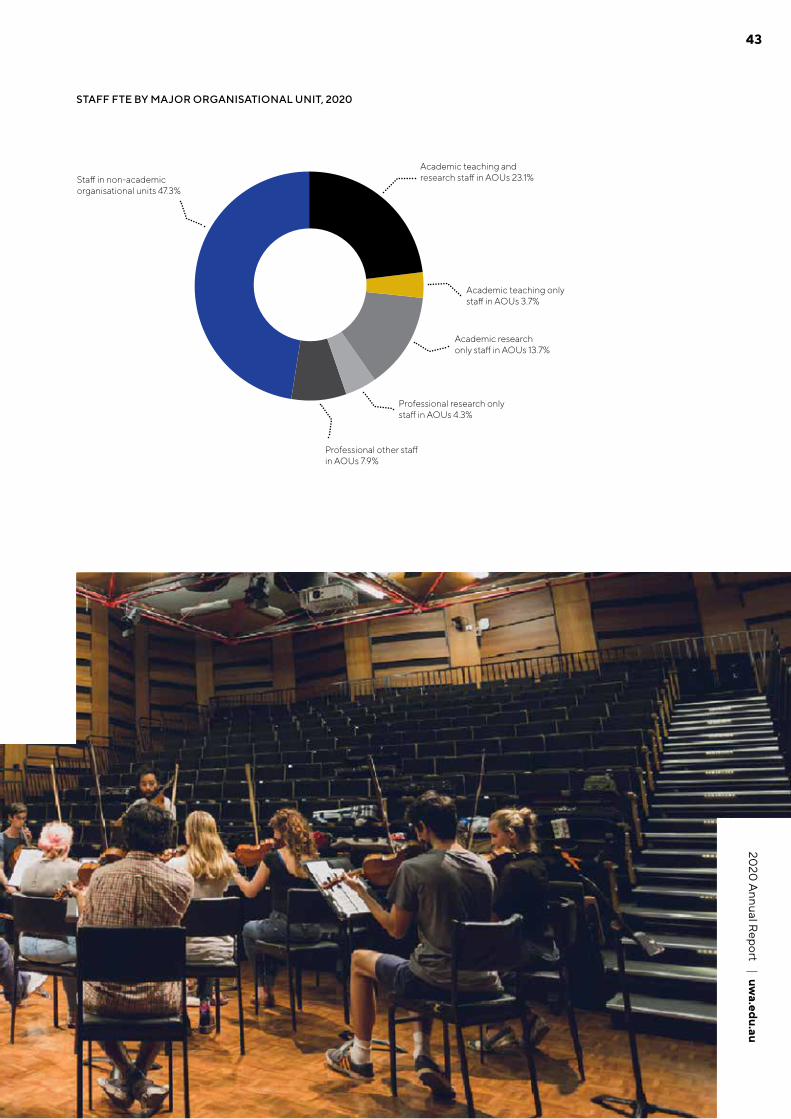
4320
20 A
nnual Report | uw
a.edu.au43
STAFF FTE BY MAJOR ORGANISATIONAL UNIT, 2020
Sta� in non-academic organisational units 47.3%
Professional other sta� in AOUs 7.9%
Professional research only sta� in AOUs 4.3%
Academic research only sta� in AOUs 13.7%
Academic teaching only sta� in AOUs 3.7%
Academic teaching and research sta� in AOUs 23.1%
44 The University of Western Australia | uwa.edu.au
Key performance indicatorsUWA’s mission is to provide world-class education, research and community engagement for the advancement of the prosperity and welfare of our communities. The University has a vision of creating the next generation of global leaders through experience-rich education and world-leading, trustworthy research. The following KPIs are designed to evidence progress towards our vision and mission.
The set of KPIs is generally consistent with the 2019 Annual Report and reflects the focus and activities of our UWA 2030 vision and Strategic Plan 2020-25, which are the best representation of UWA’s strategic aspirations. Where an indicator is new or changed, it is noted. Relationships with previous reporting are referenced in the notes for each indicator.

4520
20 A
nnual Report | uw
a.edu.au45
Strategic goalA UWA education will empower students to create the best possible future for themselves and, through their leadership, others. We will be globally acclaimed for our stimulating curriculum built on social responsibility, experience-rich learning and cutting-edge research.
Key performance indicatorsAchievement of this goal will be measured by the following effectiveness indicators:
1.1 Student numbers
1.2 Retention
1.3 Participation
1.4 Student satisfaction
1.5 Graduate outcomes
1.6 Staff excellence
1.1 STUDENT NUMBERS
This effectiveness indicator measures the University’s ability to attract and retain students. Attracting students from both within Australia and from around the world is a key aspect in delivering on UWA’s educational goals and financial targets. This metric tracks the size of the UWA student body and the mix of students to ensure the balancing of demand from the global community and UWA’s provision of an excellent education for all our students.
In a difficult year where borders were closed and there was significant financial disruption around the world, the University was not able to achieve its overall student load target. Although international student load was notably impacted overall, a number of rapidly introduced in-country and virtual recruitment and student support initiatives helped to minimise the significance of that impact.
A strategic decision was made in 2020 to redistribute unused postgraduate Commonwealth Supported Places (CSPs) to courses that had previously been full fee-paying, because the course met the requirement for either initial entry to a profession, response to local economic or community need, or focus on supporting access to underrepresented students. This resulted in an increase in postgraduate CSPs, against an expected decline; and, conversely, a decrease in domestic fee-paying postgraduates, against a targeted increase. The net result of this on overall number of domestic postgraduate enrolments was positive, with an increase of around 72 equivalent full-time student load (EFTSL) of domestic postgraduate students against an expected decline of around 175 EFTSL.
The University will be responding to current events through the further delivery of online and blended course options and in its response to the Federal Government’s Job-ready Graduate funding package.
ENROLMENTS (AS STUDENT LOAD)
COURSE LEVEL 2019 2020 2020 TARGET
Undergraduate – domestic 9,629.0 9,651.4 9,722.0
Undergraduate – international 2,267.1 2,056.9 2,256.0
Postgraduate coursework – domestic commonwealth supported places
2,851.9 3,040.2 2,627.0
Postgraduate coursework – domestic fee-paying 839.4 723.3 889.0
Postgraduate coursework - international 1,837.4 1,709.4 1,955.0
Higher Degree by research - domestic 959.3 929.9 954.0
Higher Degree by research – international 593.8 606.3 597.0
TOTAL 18,977.9 18,717.2 19,000.0
Enrolments (as Student Load)
Data source: Internal management reporting data source.
Notes: This indicator was included in the 2019 Annual Report. The number of students is shown as EFTSL. Figures are rounded to one decimal place.
1 | Education
1.2 RETENTION
This measures the provision of high-quality education through the retention of existing students. Retaining students after their first year is an important milestone and indicator of successfully completing a degree. As such, retention is an indicator of the quality and relevance of our student experience, support services and course offerings.
The University continued to achieve a high retention rate in 2020, even as COVID-19 has impacted on students. There is ongoing commitment to supporting students in completing their studies through this disrupted period, with options such as improved online teaching and support being implemented for next year.
Retention1ST YEAR RETENTION OF DOMESTIC UNDERGRADUATES
2019 2020 2020 TARGET
UWA 86.4% 85.8% 88.0%
Data source: Internal management reporting data source.
Notes: This indicator was included in the 2019 Annual Report. The methodology is consistent with the New Normal Retention Rate calculated by the Federal Department of Education, Skills and Employment. This retention rate is defined as the proportion of domestic students who commenced a bachelor degree in the given year that returned in the following year at the same course and/or institution. Due to lags in data reporting, the year disclosed is the retention result for the cohort in the previous year (i.e. the retention result reported in 2020 refers to the 2019 cohort).

46 The University of Western Australia | uwa.edu.au
1.3 PARTICIPATION
UWA recognises the importance of creating an environment that supports achieving a more diverse student population. The participation rate allows for the monitoring of UWA’s ability to attract, retain, progress and support students from designated equity groups: low socio-economic status (SES) students, students from a non-English speaking background (NESB), Indigenous students, students with disabilities, and students from regional and remote locations.
Equity is one of UWA's core values. Participation rates from these equity groups provide an indicator of the University's effectiveness in achieving diversity and inclusion to support success.
The University has achieved its participation targets for Indigenous students and students with disabilities this year, but was not able to achieve this for other key equity groups. A number of factors impacted on achieving these targets, including the negative impacts on student-related employment due to COVID-19, decreasing participation in the Australian Tertiary Admission Rank (ATAR) within Western Australia (and particularly in school areas of low socio-economic advantage) and increased deferments among regional and remote students.
Approaches that improve attraction, retention and engagement such as improvements in the Broadway UWA program to assist low socio-economic advantage students, new entry options, broader course offerings, the introduction of Hackett Scholarships to attract high performing students from low socio-economic advantage areas and development of a new University-wide Student Access and Participation Plan will address similar impacts among this cohort moving forward.
Participation (%)
COHORT 2019 2020 2020 TARGET
Indigenous students 1.3 1.4 1.3
Students with disabilities 9.5 10.3 10.0
Non-English speaking background
3.9 3.9 5.0
Low SES students 12.3 11.8 14.0
Regional/remote students
8.7 8.0 10.0
Data source: Internal management reporting system.
Notes: This indicator was included in the 2019 Annual Report, but was reported to two decimal places. The number of decimal places has been reduced to one for 2020. Indigenous students and students with disability are those students who self-declared; NESB students are those who arrived in Australia in the previous 10 years and who speak a language other than English at home; low SES students are determined by 2016 (SEIFA) classification; and regional / remote students are determined by (ASGS) classification.
1.4 STUDENT SATISFACTION
Student perceptions of the overall student experience at UWA are critical in understanding the University’s ability to deliver quality courses, relevant pedagogy and curriculum and an enjoyable learning experience. A critical contributor to this and our UWA 2030 vision is student satisfaction with the quality of teaching. This includes the incorporation of perspectives from domestic and international students across undergraduate and postgraduate coursework degrees.
COVID-19 had a dramatic effect on the higher education sector across Australia. Within UWA, the impact of COVID-19 on course delivery – where students were rapidly transitioned from face-to-face teaching to online learning environments, with delays in curriculum delivery where this wasn’t possible – resulted in a decline in satisfaction with overall student experience among both undergraduates and postgraduates. This was not unexpected given the reactive response to an evolving pandemic. UWA is proactively examining how to improve its online options for students across future periods.
Student satisfactionTEACHING (% OVERALL)
2016 2017 2018 2019 2020 2020 TARGET
UWA 80 75 79 80 78 80
WA average 84 83 83 84 *
National average 81 80 81 81 *
OVERALL EXPERIENCE (% OF UNDERGRADUATES)
2016 2017 2018 2019 2020 2020 TARGET
UWA 77 78 79 80 68 80
WA average 83 83 83 82 *
National average 80 79 79 78 *
OVERALL EXPERIENCE (% OF POSTGRADUATES)
2016 2017 2018 2019 2020 2020 TARGET
UWA 66 69 71 65 71
WA average 73 75 77 *
National average 75 76 76 *
STUDENT EXPERIENCE SURVEY RESPONSE RATE (%)
2016 2017 2018 2019 2020 2020 TARGET
UWA 48 28 37 33 *
Data source: Student Experience Survey: Reporting source produced by Quality Indicators for Learning and Teaching (QILT) (via the Social Research Centre); national data sets including institutional response rates for 2020 Student Experience Survey are not yet available. Postgraduate students were only included in Student Experience Survey from 2017.
Notes: This indicator was included in the 2019 Annual Report, but the previously included International Student Barometer (ISB) satisfaction result was removed from reporting. ISB results were unable to be reported due to data collection delays in 2020 driven by COVID-19 impacts and from 2018 were only available every second year. ISB outcomes are currently not planned to be included as annual report indicators moving forward. Student Experience Survey reports full year 2020 data. Results reported show the proportion of students satisfied with their overall experience at the University. *Full year figures for response rates, WA and National averages will not be available until the full release of 2020 data via QILT.
Education (continued)

4720
20 A
nnual Report | uw
a.edu.au47
1.5 GRADUATE OUTCOMES
Students value not only their experiences at university, but also the ability to achieve positive outcomes as a result of their qualification. Gaining meaningful employment post-study is of great importance to a large number of students. Monitoring the employment rates of students provides an indication that UWA’s education offerings are relevant to employer expectations, enhancing the opportunity for graduates to be on their career path soon after graduation.
Local economic conditions have seen declines in graduate employment outcomes this year. University undergraduates experienced a decline in full-time employment rates that was matched across Western Australia, while strong postgraduate full-time employment was maintained. Further development of work-integrated learning opportunities and employment options within existing course curricular and University services will continue to be developed and implemented across the next year. These will include continued rollout of virtual collaborative online international learning opportunities and virtual internships.
Graduate outcomes for undergraduates (%)
2016 2017 2018 2019 2020 2020
TARGET
UWA 63.7 58.5 55.4 57.8 54.5 61 .0
WA average
68.9 64.9 65.6 66.3 63.5
Graduate outcomes for postgraduates (%)2016 2017 2018 2019 2020 2020
TARGET
UWA 82 .0 80.4 82.2 80.5 82.1 83 .0
WA average
82.6 81.7 80.5 79.1 78.9
Graduate outcomes survey response rate (%) 2016 2017 2018 2019 2020
UWA 35.2 39.9 41.9 42 .0 35.3
Data source: Datasets and dashboard provided by Quality Indicators for Learning and Teaching (QILT) (via the national Social Research Centre).
Notes: This indicator was included in the 2019 Annual Report. This metric represents the number of graduates who were employed full-time four months after completing their course, as a percentage of those graduates who were available for full-time employment. Benchmarking averages include UWA. Domestic student outcomes shown only; response rate includes international students. The Graduate Outcomes Survey began in its current format in 2016 for students graduating in 2015. QILT reports show as collection year (one year on from graduation). Year refers to the reference year of the survey, e.g. 2020 represents 2019 graduates.
1.6 STAFF EXCELLENCE
UWA has a core value of excellence and seeks to have areas and individuals recognised by esteemed peer groups, academies and otherwise for excellence in their respective fields.
Excellent education cannot be delivered without high-quality teaching staff. UWA ensures that excellent teaching performance is recognised and celebrated, especially when such recognition comes from independent and external organisations. This indicator reports the number of Australian Awards for University Teaching (AAUT) program awards and citations received by staff, and the number of Advance Higher Education Fellowships (Principal and Senior) awarded to UWA staff.
The University has continued to build on its increased focus on teaching excellence and engagement with independent programs that assess our performance in this space. Following implementation of Advance Higher Education Fellowships in 2019, there has been significant and active participation among academics at all levels, which has led to the large number of high level fellowships being awarded within the University.
Staff excellence – teaching 2019 2020 2020
TARGET
Awards 1 2 1
Citations 1 3 2
Fellowships – Principal and Senior Fellows
6 46 6
Data source: Awards and Citations AAUT data from Universities Australia website and Fellowships from active recognitions on the Advance Higher Education website.
Notes: This indicator was included in the 2019 Annual Report as 5.1 Staff Excellence. Data is current to December 2020. The reported AAUT awards and citations were awarded in 2020 at the 2019 AAUT Awards Ceremony.

48 The University of Western Australia | uwa.edu.au
Strategic goalAs one of the world’s elite, research-intensive universities, we will be known for our trusted, reproducible, transformative, open research and accessible data. We will be recognised for leading teams in resolving real-world challenges that are critical to the planet and its people.
Key performance indicatorsAchievement of this goal will be measured by the following effectiveness and efficiency indicators:
2.1 Research income (effectiveness and efficiency)
2.2 Ranking performance (effectiveness)
2.3 Publications and outputs (effectiveness)
2.4 Highly cited staff (effectiveness)
2.1 RESEARCH INCOME
Research funding earned by an institution provides an indication of its effectiveness in conducting relevant and valued research, while also informing the community about the efficiency of the University in funding its efforts towards the enhancement of knowledge.
Total research income grew this year, driven by growth in funding achieved by medical research institutes (MRIs) affiliated with the University. The University's affiliation agreement with the Telethon Kids Institute commenced in 2019, contributing to improved Industry, International and Philanthropic income results that outperformed the target, and was a key aspect in the growth of MRI-linked funding.
The target set for research income per level B and higher academic was ambitious and wasn't met partly due to research staff full-time equivalent (FTE) increasing in 2019.
The Cooperative Research Centre (CRC) income space is highly competitive and involves a lag between conceiving a bid and eventual success. The University had success as host organisation for the CRC Transformations in Mining Economies but this funding only commenced in mid-2020. Some significant bids were not successful; our researchers and partners are preparing new bids for the next round.
2 | Research and innovation
Research income awarded to UWA2015 2016 2017 2018 2019 2019
TARGET
Total research ($millions) - effectiveness
$195 $190 $167 $177 $214 $203
Research income/FTE (level B+) ($thousands) - efficiency
$157 $158 $144 $154 $183 $207
UWA share of total national research income - effectiveness
5.2% 5.0% 4.2% 4.2% 4.7%
Australian competitive grants income ($millions) - effectiveness
$87 $86 $79 $76 $85 $84
Government income ($millions) - effectiveness
$47 $45 $30 $39 $52 $51
Industry, international and philanthropic ($millions) - effectiveness
$58 $56 $55 $61 $75 $65
Cooperative research ($millions) - effectiveness
$2 $3 $3 $2 $2 $4
Data source: Commonwealth Government Higher Education Research Data Collection for year ending 31 December, with 2019 as the most recent data. Academic Staff from Department of Education Table 1.7 (FTE for Full-time and Fractional Full-time Staff by State, Higher Education Institution, Current Duties Classification and Gender, 2019). Figures in millions are rounded to the nearest million.
Notes: This indicator was in the 2019 Annual Report. The Academic Staff FTE for Level B or above excluding casuals was used to calculate the research income / FTE indicator. 2019 is the most current year available for reporting. Individual research income components may not equal the total research income due to rounding effects. The UWA share of total national research income did not have a target set and is provided as a benchmarking metric indicating relative performance within the sector.

4920
20 A
nnual Report | uw
a.edu.au49
2.2 RANKING PERFORMANCE
UWA is among the top global institutions and this indicator evidences our performance. To provide a robust reflection of the University's comparative performance, UWA's international ranking is measured using the three most influential international rankings instruments:
• Shanghai Jiao Tong Academic Ranking of World Universities (ARWU) – based on research measures
• Quacquarelli Symonds (QS) World University Ranking – based on research measures, reputation measures, the mix of international staff and students and the staff to student ratio
• Times Higher Education (THE) World University Ranking – based on research measures, a teaching score and an international mix component.
The 2020 ARWU result includes the 2018 Fields Medal awarded to alumni Akshay Venkatesh which has notably improved the University’s ranking result. Both the QS and THE rankings are influenced by reputational factors which were weaker than expected among academic sources, although QS ranking remains within our target range. The University is focusing on maintaining its existing ranking performance as a top 100 institution within ARWU and QS rankings despite current exceptional circumstances around the world.
International ranks2016 2017 2018 2019 2020 2020
TARGET
ARWU 96 91 93 99 85 75-85
QS 102 93 91 86 92 90-95
THE 125 111 134 131 139 120-130
Data source: ARWU www.shanghairanking.com, QS www.topuniversities.com, THE www.timeshighereducation.co.uk/world-university-rankings
Notes: This indicator was included in the 2019 Annual Report. Methodological changes are not uncommon in international ranking. Reporting year is the year of data release, not the year of naming convention from the ranking institutions. 2019 ARWU includes an omission by Shanghai Ranking of UWA Alumni Fields medal that was rectified in the 2020 rankings.
2.3 PUBLICATIONS AND OUTPUTS
UWA is committed to communicating its research globally through high-quality publications. Publications in the top journal quintile are used to benchmark research outputs regardless of differences in size and disciplinary profiles, and to showcase the presence of publications in journals considered to be the most prestigious around the world. International co-authorship provides a means of monitoring collaboration and partnership activity. This provides some insight into how globally relevant and impactful institutional research activity is.
The University has maintained its strong international partnerships and collaboration performance with a significant portion of published articles involving international co-authorship. The level of high-quality research output in 2020 remained consistent with 2019's performance. Ensuring high-quality research outputs will continue to be a strategic focus for the University.
Percentage of UWA articles published in top 20% of journals
2016 2017 2018 2019 2020 2020 TARGET
UWA 47% 47% 47% 44% 45% 49%
Percentage of UWA articles published with international co-authorship
2019 2020 2020 TARGET
UWA 65% 65% 61%
Data source: Top 20% outputs - Clarivate’s Journal Citation Reports, Web of Science and Incites. International Collaborations - Clarivate’s Incites.
Notes: This indicator was included in the 2019 Annual Report. 2020 is the most current reporting year for publications and is compared against the latest available top 20% journals list, which refers to 2019 citations.
2.4 HIGHLY CITED STAFF
UWA has a core value of excellence and seeks to have disciplines and individuals recognised by peers in their fields of research and beyond. The number of highly cited staff recognises the extensive contribution and influence these individuals have on their fields of research.
The University has decreased in the number of highly cited staff this year, with two staff not having met the metrics required for inclusion in 2020 and another two having changed their primary affiliation away from UWA. Increasing the number of highly cited staff – researchers who have been ranked with the greatest numbers of articles in the top one per cent of citations for their field in Web of Science for the past decade – is an ongoing strategic priority.
Highly cited staff2019 2020 2020
TARGET
Highly cited staff
13 9 13
Data source: The Institute for Scientific Information highly cited researcher list is produced by Clarivate Analytics. Citation data are sourced from the Web of Science and so this metric is not available for all fields of research at UWA.
Notes: This indicator was included in the 2019 Annual Report.
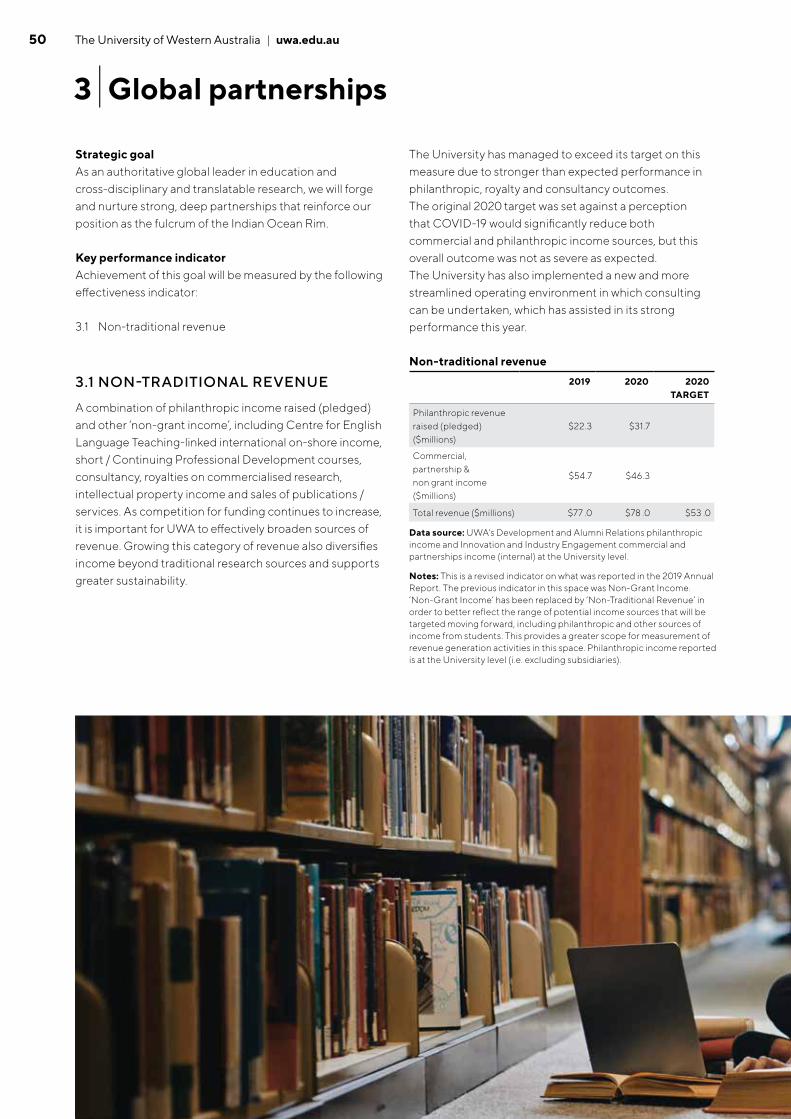
50 The University of Western Australia | uwa.edu.au
Strategic goalAs an authoritative global leader in education and cross-disciplinary and translatable research, we will forge and nurture strong, deep partnerships that reinforce our position as the fulcrum of the Indian Ocean Rim.
Key performance indicatorAchievement of this goal will be measured by the following effectiveness indicator:
3.1 Non-traditional revenue
3.1 NON-TRADITIONAL REVENUE
A combination of philanthropic income raised (pledged) and other ‘non-grant income’, including Centre for English Language Teaching-linked international on-shore income, short / Continuing Professional Development courses, consultancy, royalties on commercialised research, intellectual property income and sales of publications / services. As competition for funding continues to increase, it is important for UWA to effectively broaden sources of revenue. Growing this category of revenue also diversifies income beyond traditional research sources and supports greater sustainability.
The University has managed to exceed its target on this measure due to stronger than expected performance in philanthropic, royalty and consultancy outcomes. The original 2020 target was set against a perception that COVID-19 would significantly reduce both commercial and philanthropic income sources, but this overall outcome was not as severe as expected. The University has also implemented a new and more streamlined operating environment in which consulting can be undertaken, which has assisted in its strong performance this year.
Non-traditional revenue2019 2020 2020
TARGET
Philanthropic revenue raised (pledged) ($millions)
$22.3 $31.7
Commercial, partnership & non grant income ($millions)
$54.7 $46.3
Total revenue ($millions) $77 .0 $78 .0 $53 .0
Data source: UWA's Development and Alumni Relations philanthropic income and Innovation and Industry Engagement commercial and partnerships income (internal) at the University level.
Notes: This is a revised indicator on what was reported in the 2019 Annual Report. The previous indicator in this space was Non-Grant Income. ‘Non-Grant Income’ has been replaced by ‘Non-Traditional Revenue’ in order to better reflect the range of potential income sources that will be targeted moving forward, including philanthropic and other sources of income from students. This provides a greater scope for measurement of revenue generation activities in this space. Philanthropic income reported is at the University level (i.e. excluding subsidiaries).
3 | Global partnerships

5120
20 A
nnual Report | uw
a.edu.au51
Strategic goalWe will be recognised as a vibrant, sustainable and connected hub that blends our heritage with our future and welcomes our partners, the community and the wider world.
Key performance indicatorAchievement of this goal will be measured by the following efficiency indicator:
4.1 Campus intensity
4.1 CAMPUS INTENSITY
Campus intensity reflects the potential use of campus space by staff and students through the creation of a ‘gross floor area (in square metres) per student (in student load) and staff (in full-time equivalent)’ metric. It is a space utilisation indicator that is commonly used in the University sector to look at the efficiency of space utilisation across the entire campus area.
4 | Sustainable environments
A key priority within the University’s Sustainable Environments enabling strategy was appropriate investment in the University's physical and digital environment. The impact of these activities would include improved space utilisation and intensification, which 'campus intensity' is used to measure.
The University has come close to achieving its target campus intensity on an annual level. The Campus Masterplan seeks to rejuvenate and further activate UWA’s campus over the upcoming period, which will help develop a managed shift in campus intensity results in the future.
Campus intensity2019 2019 TARGET
Gross Floor Area per Person (m2)
18.3 18.0
Data source: The student load (EFTSL) and staff FTE are taken from an internal management reporting data source. Campus information was taken from information shared with the Tertiary Education Facilities Management Association. 2019 is the most current year available for reporting.
Notes: This indicator is new and was not included in the 2019 Annual Report.

52 The University of Western Australia | uwa.edu.au
Strategic goalUWA will be a remarkable place to work, attracting and retaining world-class staff from diverse backgrounds who want to build careers, drive change, provide leadership and create opportunities in an institution renowned for its excellence.
Key performance indicatorAchievement of this goal will be measured by the following efficiency indicator:
5.1 Staff turnover
5.1 STAFF TURNOVER
Appropriate management of voluntary staff turnover is an important aspect of operations and managing human resources. Although some staff turnover is expected, unplanned levels of voluntary separations can represent loss of key skills, reduced productivity and increased employee search costs. Staff turnover measures voluntary employee-initiated turnover within the University over an annual period and reveals the University’s ability to efficiently plan for staff who choose to leave employment at the University as a proportion of overall staff.
5 | People and culture
The University has managed to maintain its voluntary staff turnover at acceptable levels this year and is also lower than the national average turnover rate of 8.9 per cent. Appropriate workforce planning and ensuring staff levels are matched to required workloads will be a priority in 2021.
Staff turnover
2019 2019 TARGET
Voluntary separation rate
7.7% 8.5%
Data source: Australian Higher Education Industrial Association (AHEIA) Universities Human Resources (HR) Benchmarking Program 2020: HR Performance Indicators for the University of Western Australia Compared with Australian Universities For the period 2015 to 2020 report. This result is classified as “Voluntary Employee Initiated Turnover” within this report. 2019 is the most current year available for reporting to AHEIA.
Notes: This indicator is new and was not included in the 2019 Annual Report.

5320
20 A
nnual Report | uw
a.edu.au53
6 | Effective and sustainable operations
Strategic goalOfferings (academic and administrative) will be high-quality, timely and user-focused and will be designed to enable us to meet our education, research and engagement aspirations.
Key performance indicatorAchievement of this goal will be measured by the following efficiency indicator:
6.1 Operating margin*
6.1 OPERATING MARGIN*
The indicator used is earnings before interest, taxation, depreciation and amortisation (EBITDA) margin adjusted to remove total investment income to calculate the operating margin and represents the total funding available for servicing debt and investment into physical and capital infrastructure, ensuring sustainable operations. The University has adjusted the EBITDA margin to exclude investment income, removing this volatility in comparing any given year. The University separately monitors the effectiveness of its investment strategy and portfolio.
Performance on this indicator is primarily driven by fee-paying student load and the efficiency in delivering core operations before the cost of servicing debt (interest) and the cost of capital investments (depreciation and amortisation). This indicator is also influenced by the timing of income and expenditure associated capital grants and donations, as well as expenditure associated with investments in academic excellence, student experience and other University strategic priorities.
The University has exceeded both its 2019 performance and its 2020 target. This outcome was the result of a managed approach to reduce expenditure in light of uncertainty in current and future student revenues, as a result of the COVID-19 pandemic, as well as an early response in addressing the University’s structural deficit. The favourable uplift in margin against the prior year is also attributable to one-off capital donations receipted in 2020 to fund the construction of EZONE Student Hub and Forrest Hall (stage 2). The University’s long-term target for adjusted EBITDA margin is greater than 10 per cent to sustain suitable investment into core infrastructure and operations. Continuing to improve operating margin over future periods will be a key strategic focus for the University.
Operating margin*
2019 2020 2020 TARGET
Operating margin* (excluding total investment income)
4.2% 6.6% 5.0%
Data source: Audited financial statements at University level.
Notes: This indicator is revised compared to the margin result included in the 2019 Annual Report. The previously reported figure included total investment income in its calculation which has now been excluded. *’Operating margin’ refers to the earnings before interest, taxation, depreciation and amortisation (EBITDA) margin, adjusted to exclude investment income.

54 The University of Western Australia | uwa.edu.au
PHYSICAL INFRASTRUCTURE
MAJOR CAPITAL PROJECTS
The University defines major capital projects as those costing more than $5 million. During 2020 the University spent $28 million ($47 million in 2019) on major capital projects. Total capital expenditure for Campus Management in 2020 was $36 million ($57 million in 2019).
COMPLETED PROJECTS
2020 saw the completion of two significant capital projects, namely EZONE Student Hub and Bilya Marlee. Both projects were completed within budget and met all other project objectives.
Construction of the $80 million transformational EZONE Student Hub project commenced in April 2018 and was completed in April 2020. Activation of the building has been key to its success as a vibrant hub, and in spite of the wider impact of COVID-19 on the overall level of activity on the campus, the utilisation of the EZONE building since its opening has been very strong.
Construction was also completed on the $17 million Bilya Marlee (River of the Swan) building for the School of Indigenous Studies, Centre for Aboriginal Medical and Dental Health and Poche Centre for Indigenous Health. The precinct includes the expansion of Prescott Court towards Hackett Drive, enhancing internal and external space integration.
An $11 million Asset Integrity and Minor Works program was also delivered focusing primarily on compliance, safety and essential infrastructure projects as well as an element of teaching and learning space improvements at discrete locations.
PROJECTS IN PROGRESS
Stage 2 of Forrest Hall is now well under way and is expected to be completed in 2021. The building has been designed to keep within the style of the existing Forrest Hall building and has been made possible by a generous donation from the Minderoo Foundation. The fit out of the office space for Minderoo (who will occupy the ground floor) will run concurrently with the main build thereby ensuring all construction works are complete by the aforementioned date.
The first stage of works to create accommodation for the new Doctor of Optometry course is now on site at QEII Medical Centre. The course will be taught in N Block and construction works are scheduled in two stages, with a subsequent stage expected to commence in late 2021/22. Total allocated budget for the project is $3.1 million.
A major infrastructure project is in progress to enhance the University’s building cooling resilience via its central chilled water system, to ensure critical performance criteria are met. The project is highly technical in nature and comprises of three primary components – thermal energy storage capacity, supply and distribution management, and demand management. The total project costs are $5.2 million.
An additional $9.5 million has been allocated in 2021 to address infrastructure and compliance projects. This work will be delivered through the course of 2021.
Capital projects

5520
20 A
nnual Report | uw
a.edu.au55
DIGITAL INFRASTRUCTURE
MAJOR TECHNOLOGY CAPITAL PROJECTS
We continue to advance our information and communications technology infrastructure and digital transformation by optimising products, channels, and platforms, supporting smarter network growth, implementing reliable core business systems, and protecting against cyber threats.
COMPLETED PROJECTS
The University spent $9.4 million on major technology projects in 2020 (compared to $8.7 million in 2019), which delivered improvements in the following key areas.
Student experience – establish a rich, curated, interactive online student experience that matches our campus environment.
Migration of student data and services from the Google Apps platform to Microsoft 365, providing a common collaboration platform for students and staff:
• a holistic technology refresh of teaching laboratory spaces to ensure a contemporary experience
• instant course offers for prospective students through the streamlining of the application and acceptance processes
• enhanced application tracking and management for our agent network.
Trusted digital campus – establish a contemporary culture, practice and technical IT security and identity capability. Cybersecurity is one of our highest priorities, as ensuring the safety of our services and data are paramount to our students and staff alike.
Introduction of multi-factor authentication for staff and student accounts, to further protect against account compromises:
• migration of disparate sign-on methods to a single-sign-on experience
• enhanced email and internet threat protection through the introduction of a security analytics platform.
Next generation core digital refresh program – build integrated corporate management, analytical and automation capabilities.
• implementation of a business intelligence and data platform – with matching capability – to provide insights via analytics and visualisation to monitor and improve institutional performance.
FUTURE PROJECTS
The University has allocated $10.65 million in 2021 for the delivery of the following digital initiatives:
• enhanced lead management capabilities to improve student conversion
• a Higher Degree by Research candidature management system to support improved completion rate
• continuation of major upgrades to the University’s physical network to support education and research through ubiquitous, high performance network access, allowing study and work anytime/anywhere to enable national and global collaboration and research
• further improvements to cybersecurity and identity management to address the threats present in higher education sector and increased regulatory compliance requirements, such as Foreign Influence Transparency Scheme and the need to protect critical infrastructure
• adopting a cloud-first approach, utilising Microsoft Azure and external hosted data centres, the University will continue to migrate critical application and integrated systems.

56 The University of Western Australia | uwa.edu.au
DIVERSITY AND INCLUSION
In February 2020 the University was one of 11 organisations to be awarded an internationally recognised Athena SWAN Bronze Award for its commitment to gender diversity in the STEMM subjects of science, technology, engineering, maths and medicine. In fulfilling the Athena SWAN objectives, UWA’s Gender Equity Working Group, in collaboration with HR, established a three-to-four-year action plan that aims to ensure UWA maintains its bronze accreditation and achieves Athena SWAN silver accreditation in coming years. Other actions implemented in 2020 included a panel pledge on gender equity, by UWA Executive, and the development of a family-friendly meeting times guideline.
UWA has also increased awareness on key topics relating to diversity across the University through the Unconscious Bias training and seminar series. The seminar series improved awareness of key issues in relation to gender equity, LGBTIQA+, disability, and harassment through presentations and panel discussions.
The University also retained its Australia Workplace Equality Index platinum status this year, in recognition of its long-term Gold Employer status in 2020.
EMPLOYEE RELATIONS
Human Resources played a key role in supporting the University through the pandemic and responded to a number of challenges. Significant achievements included developing the UWA COVID-19 Health and Wellbeing Management Plan, streamlining the Home Based Work process, tailoring the UWA Wellbeing program to support staff while working remotely, and establishing the UWA COVID-19 Leader Guide for a safe and productive return to campus. Human Resources also facilitated a swift transition to remote working for University staff, provided guidance on leave entitlements, and worked to minimise the need to stand down staff.
Another key achievement was the successful variation to the University’s two largest enterprise agreements, to respond to the impact of COVID-19 on the University and provide a range of protections to staff during an uncertain time. This required an ambitious strategic communication process, which increased engagement with all staff at a time when they were not physically on campus.
Alongside providing COVID-19 support, Human Resources continued to deliver core services in injury prevention and injury management, increasing support for non-work related mental health issues. In 2020, UWA saw a reduction in workers’ compensation claims and costs, potentially linked with provision of preventative services. Having identified mental health as a key risk to people and culture, the team developed a customised training package for leaders in supporting staff through change and managing mental health in the workplace.
Human Resources also continued its focus on compliance in 2020. This included the establishment of a new service to help staff resolve questions about their pay or other entitlements, in circumstances where they may feel uncomfortable doing so with their manager. This focus will continue in 2021.
In 2021, Human Resources will plan for enterprise bargaining, the introduction of model health and safety laws with a key focus on officer due diligence in the mental health space, and continue to actively mitigate risks in relation to staff conduct and industrial relations issues. It will also continue to support the University on its change journey by providing strategic advice and working on fundamental initiatives such as transitioning HR information to the Staff Intranet and reviewing HR policies and processes.
WORK HEALTH AND SAFETY
Executive Commitment to Occupational Safety, Health and Injury ManagementUWA is committed to providing a safe and healthy working and learning environment for its staff, students, visitors and contractors and takes a proactive approach to minimising the potential for injury, illness and harm. This commitment is articulated in the University Work Health and Safety Policy, and supported by a range of health and safety procedures, guidelines and protocols that meet legislative obligations.
In 2020, the UWA Safety and Health team worked on developing the following key documents that will be finalised and endorsed before the end of quarter one, 2021:
• UWA Safety and Health Policy Statement
• UWA Safety and Health Strategic Plan 2021-25
• UWA Safety and Health Leadership and Governance Framework.
Workforce disclosures
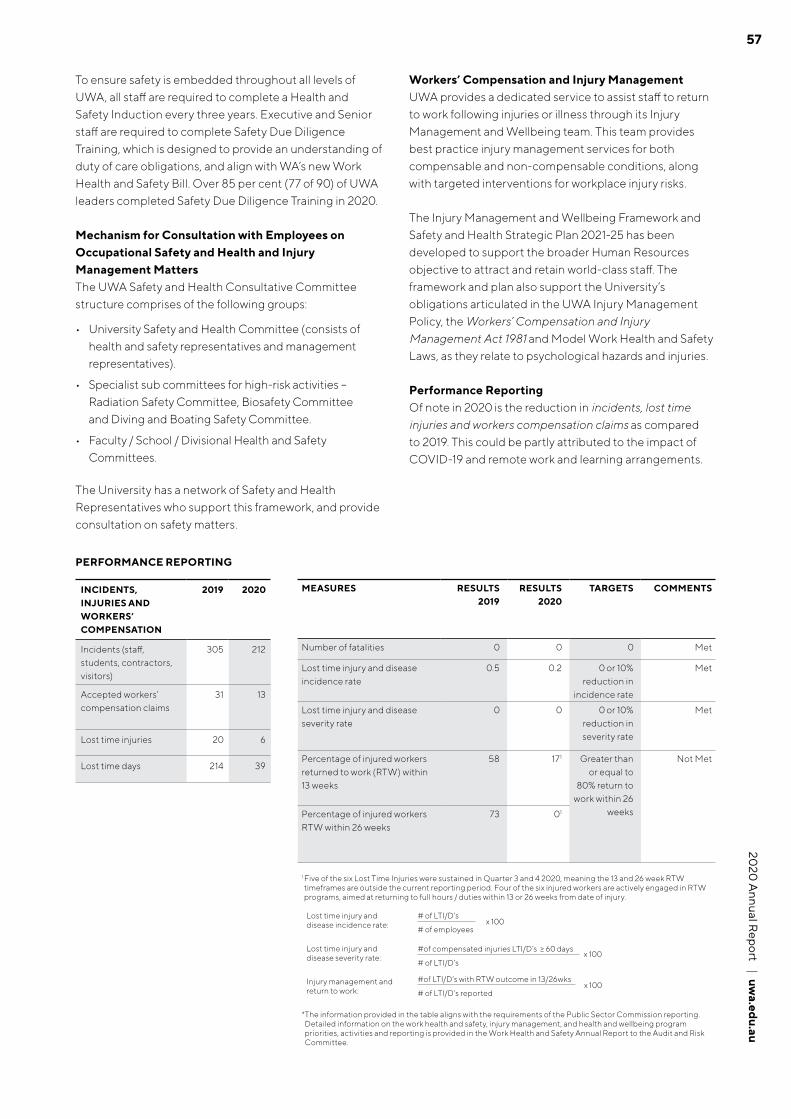
5720
20 A
nnual Report | uw
a.edu.au57
To ensure safety is embedded throughout all levels of UWA, all staff are required to complete a Health and Safety Induction every three years. Executive and Senior staff are required to complete Safety Due Diligence Training, which is designed to provide an understanding of duty of care obligations, and align with WA’s new Work Health and Safety Bill. Over 85 per cent (77 of 90) of UWA leaders completed Safety Due Diligence Training in 2020.
Mechanism for Consultation with Employees on Occupational Safety and Health and Injury Management MattersThe UWA Safety and Health Consultative Committee structure comprises of the following groups:
• University Safety and Health Committee (consists of health and safety representatives and management representatives).
• Specialist sub committees for high-risk activities – Radiation Safety Committee, Biosafety Committee and Diving and Boating Safety Committee.
• Faculty / School / Divisional Health and Safety Committees.
The University has a network of Safety and Health Representatives who support this framework, and provide consultation on safety matters.
Workers’ Compensation and Injury ManagementUWA provides a dedicated service to assist staff to return to work following injuries or illness through its Injury Management and Wellbeing team. This team provides best practice injury management services for both compensable and non-compensable conditions, along with targeted interventions for workplace injury risks.
The Injury Management and Wellbeing Framework and Safety and Health Strategic Plan 2021-25 has been developed to support the broader Human Resources objective to attract and retain world-class staff. The framework and plan also support the University’s obligations articulated in the UWA Injury Management Policy, the Workers’ Compensation and Injury Management Act 1981 and Model Work Health and Safety Laws, as they relate to psychological hazards and injuries.
Performance Reporting Of note in 2020 is the reduction in incidents, lost time injuries and workers compensation claims as compared to 2019. This could be partly attributed to the impact of COVID-19 and remote work and learning arrangements.
Lost time injury and disease incidence rate:
Lost time injury and disease severity rate:
Injury management and return to work:
# of LTI/D’s
#of compensated injuries LTI/D’s ≥ 60 days
#of LTI/D’s with RTW outcome in 13/26wks
1 Five of the six Lost Time Injuries were sustained in Quarter 3 and 4 2020, meaning the 13 and 26 week RTW timeframes are outside the current reporting period. Four of the six injured workers are actively engaged in RTW programs, aimed at returning to full hours / duties within 13 or 26 weeks from date of injury.
MEASURES RESULTS2019
RESULTS2020
TARGETS COMMENTS
Number of fatalities 0 0 0 Met
Lost time injury and disease incidence rate
0.5 0.2 0 or 10% reduction in
incidence rate
Met
Lost time injury and disease severity rate
0 0 0 or 10% reduction in severity rate
Met
Percentage of injured workers returned to work (RTW) within 13 weeks
58 171 Greater than or equal to
80% return to work within 26
weeks
Not Met
Percentage of injured workers RTW within 26 weeks
73 01
PERFORMANCE REPORTING
# of employees
# of LTI/D’s
# of LTI/D’s reportedx 100
x 100
x 100
INCIDENTS, INJURIES AND WORKERS’ COMPENSATION
2019 2020
Incidents (staff, students, contractors, visitors)
305 212
Accepted workers’ compensation claims
31 13
Lost time injuries 20 6
Lost time days 214 39
* The information provided in the table aligns with the requirements of the Public Sector Commission reporting. Detailed information on the work health and safety, injury management, and health and wellbeing program priorities, activities and reporting is provided in the Work Health and Safety Annual Report to the Audit and Risk Committee.

58 The University of Western Australia | uwa.edu.au
Details of shares in any subsidiary body of the agency held as a nominee or held beneficially by a senior officer of the agency.There is nothing to report under this heading.
Particulars of any interest in any existing or proposed contract which a senior officer, or a firm of which a senior officer is a member, or any entity in which a senior officer has a substantial financial interest has made with the University.Ms Michelle Dean is a member of the Senate and the University’s Audit and Risk Committee, and is also a partner in the Australian national law firm Corrs Chambers Westgarth (Corrs). Corrs are instructed to undertake legal work on behalf of the University from time to time. Ms Dean was not involved in any of that legal work. In 2020, the University paid Corrs a total of $84,283.50 for legal work.
Governance disclosures
Other legal requirements
PUBLIC INTEREST DISCLOSURE ACT
The University complies with the Public Interest Disclosure Act 2003 (the PID Act) and has four Public Interest Disclosure Officers. No matters were reported under the PID Act in 2020.
ENVIRONMENTAL LEGISLATION
UWA was contacted by the Department of Biodiversity, Conservation and Attractions (DBCA) in January 2020 about an alleged breach under S40 of the Biodiversity Conservation Act 2016. The alleged breach related to UWA firebreak maintenance work undertaken in response to a notice from the City of Gosnells to UWA to adequately maintain firebreaks. Subsequently, the firebreak maintenance plan was approved and a formal exemption received from DBCA, to continue with such firebreak maintenance in the future.
The amount of any insurance premium paid to indemnify any director. In 2020, the University paid a premium of $186,631.25 for Directors’ and Officers’ Liability Insurance, excluding GST.

5920
20 A
nnual Report | uw
a.edu.au59
The University faced challenges this year due to the impacts of COVID-19. As a result, there has been significant disruption to, and rapid evolution of, UWA’s Information Management (IM) practices and records management and archives services to accommodate remote working, online learning and assessments, and the provision of digital access to physical records collections. Accelerated use of hosted services has required increased emphasis on the custody, control and return of UWA’s records within Agreements, Contracts and Services in accordance with State Records Commission Standard 6.
The University has an approved Recordkeeping Plan 2018 (RKP) and Sector Disposal Authority (SDA) in compliance with the State Records Act 2000.
Statement of compliance WITH THE RECORDKEEPING PLAN
Key achievements and improvements for 2020 include:
• implementation of TRIM* automated capture for records associated with the UWA’s new Research Online Application Portal
• completion of market review and replacement choice for Tabularium*
• publication of refreshed and new Information Governance policies
• replacement of the Research File Thesaurus with classification titling for Research Records
• migration of TRIM to the cloud as part of the migration of primary University business systems to the cloud.
* TRIM is the University’s official electronic document and records management system.
*Tabularium is the University’s Archives System.

60 The University of Western Australia | uwa.edu.au
Media and advertisingexpenditure
In compliance with section 175ZE of the Electoral Act 1907, the University is required to report on expenditure incurred during the financial year in relation to advertising agencies, market research organisations, polling organisations, direct mail organisations and media advertising organisations. The details of the report, for the University and its subsidiaries, are as follows:
EXPENDITURE WITH ADVERTISING AGENCIES
$ 1,060,361
Buggy Buddys
Hybrid News Limited
Maxco Australia Pty Ltd
Medium Rare Content Agency Pty Ltd
Okmg Pty Ltd
Paper Scouts
Studio Bravo Pty Ltd
The Brand Agency
EXPENDITURE WITH MARKET RESEARCH ORGANISATIONS
$229,702
Culture Counts Australia
Isentia Pty Ltd
Metrix Consulting
EXPENDITURE WITH POLLING ORGANISATIONS
$ -
EXPENDITURE WITH DIRECT MAIL ORGANISATIONS
$34,398
AO Lets Go Poster Distribution
Mueller Marricks Pty
The Poster Girls
WordFly
EXPENDITURE WITH MEDIA ADVERTISING ORGANISATIONS
$2,454,823
Albany and Great Southern Weekender
Arts Radio Ltd - Rtr Fm 92.1
Business News Pty Ltd
Carat Australia Media Services Pty Ltd
Community Newspaper Group
Jcdecaux Australia Trading
Lomax Media
Seven Network (Operations) Limited
Southern Cross Austereo Pty Ltd
The Big Issue
Tv18 Broadcast Limited
Unruly Media Pty Ltd
West Australian Newspapers Limited
TOTAL EXPENDITURE $3,779,284

6120
20 A
nnual Report | uw
a.edu.au61

62 The University of Western Australia | uwa.edu.au
Financial overviewThe 2020 financial year was always going to be a challenging year, as the University planned to address its financial sustainability and operating model, creating financial capacity to invest in digital and physical environments, with a focus on enhancing the excellence of student experience.
To achieve our strategy and ensure future financial sustainability and capacity for reinvestment, the University is targeting a 15% cash margin on its underlying operations by 2025. This includes sustainably growing and diversifying underlying revenue by $80 million per annum and addressing an underlying structural deficit of $70 million per annum1. As at the end of 2020, the University has addressed $12 million of the deficit, leaving $58 million to be addressed across 2021/2022.
The impact of the uncertainty and disruption of the global pandemic meant the University needed to refocus its attention from longer-term change initiatives to responding to the crisis, which presented the potential for significant risk to liquidity and unrestricted funding over the short-to-medium term.
In response to the pandemic the University took immediate steps to grow student recruitment and retention, ensuring course accessibility and student experience, whilst further reducing underlying operational expenditure. This included (but was not limited to) moving all student units and exams online, establishing offshore learning centres, implementation of a job protection framework and implementation of enhanced treasury and debt management measures.
2020 FINANCIAL PERFORMANCE
While the University’s reported financial statements reflect a true and fair view of the financial performance and position in accordance with applicable accounting standards, the University’s financial focus is on the underlying EBITDA2 margin, adjusted to exclude investment income. This represents the total operational funding available for debt servicing and strategic and capital reinvestment and acknowledges the predominately restricted nature of our investment funds (other financial assets).
The underlying EBITDA (adjusted to exclude investment income) was 6.6% for the year (2019: 4.2%). This rise is largely driven by early responses to the University’s structural deficit and the recognition of one-off capital donations.
Other drivers to changes in the operating result was the adoption of the application of AASB 15 to Research Grants. The full impact of the new standards is disclosed in note 1.5 of the financial statements.
The University also monitors its financial performance using a financial measure referred to as the ‘underlying result’, which is widely used by the Australian Group of Eight universities as a measure of a university’s capacity to operate sustainably. The underlying result adjusts the University’s net result for items that are one-off or restricted in nature.
1 Targets were set in reference to a 2019 baseline
2 EBITDA represents the earnings before interest, tax, depreciation and amortisation
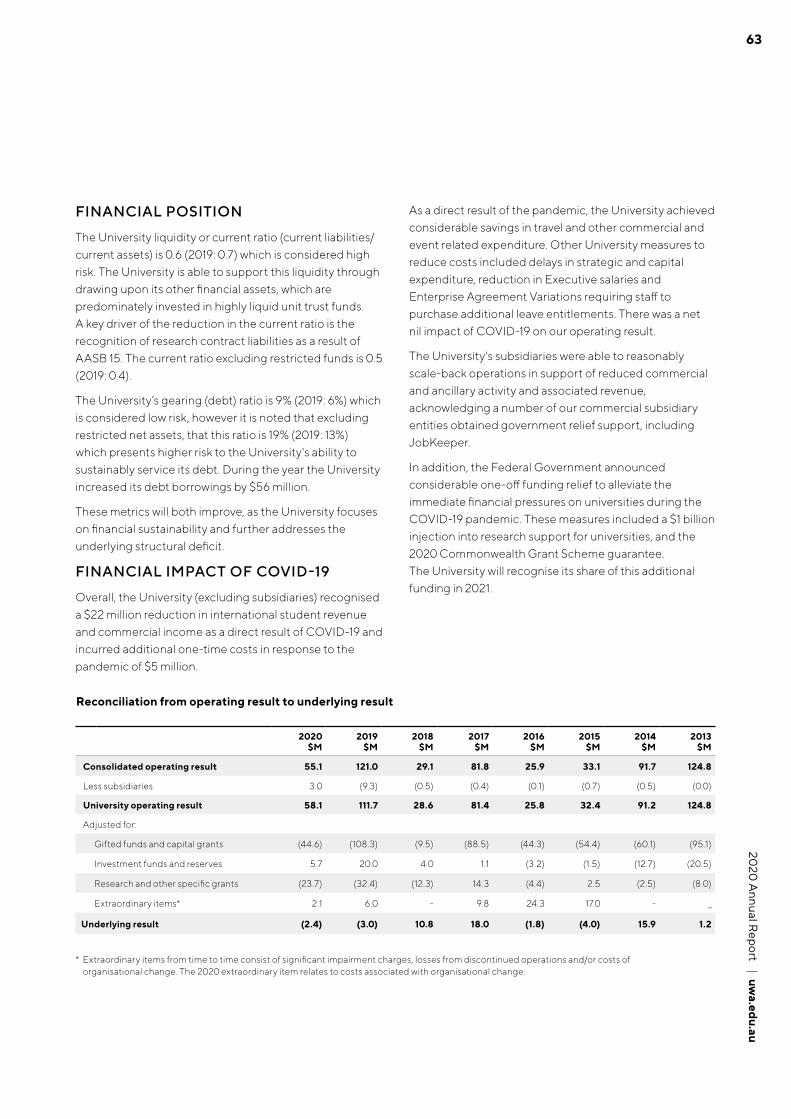
6320
20 A
nnual Report | uw
a.edu.au63
FINANCIAL POSITION
The University liquidity or current ratio (current liabilities/current assets) is 0.6 (2019: 0.7) which is considered high risk. The University is able to support this liquidity through drawing upon its other financial assets, which are predominately invested in highly liquid unit trust funds. A key driver of the reduction in the current ratio is the recognition of research contract liabilities as a result of AASB 15. The current ratio excluding restricted funds is 0.5 (2019: 0.4).
The University’s gearing (debt) ratio is 9% (2019: 6%) which is considered low risk, however it is noted that excluding restricted net assets, that this ratio is 19% (2019: 13%) which presents higher risk to the University's ability to sustainably service its debt. During the year the University increased its debt borrowings by $56 million.
These metrics will both improve, as the University focuses on financial sustainability and further addresses the underlying structural deficit.
FINANCIAL IMPACT OF COVID-19
Overall, the University (excluding subsidiaries) recognised a $22 million reduction in international student revenue and commercial income as a direct result of COVID-19 and incurred additional one-time costs in response to the pandemic of $5 million.
2020 $M
2019 $M
2018 $M
2017 $M
2016 $M
2015 $M
2014 $M
2013 $M
Consolidated operating result 55.1 121.0 29.1 81.8 25.9 33.1 91.7 124.8
Less subsidiaries 3.0 (9.3) (0.5) (0.4) (0.1) (0.7) (0.5) (0.0)
University operating result 58.1 111.7 28.6 81.4 25.8 32.4 91.2 124.8
Adjusted for:
Gifted funds and capital grants (44.6) (108.3) (9.5) (88.5) (44.3) (54.4) (60.1) (95.1)
Investment funds and reserves 5.7 20.0 4.0 1.1 (3.2) (1.5) (12.7) (20.5)
Research and other specific grants (23.7) (32.4) (12.3) 14.3 (4.4) 2.5 (2.5) (8.0)
Extraordinary items* 2.1 6.0 - 9.8 24.3 17.0 - _
Underlying result (2.4) (3.0) 10.8 18.0 (1.8) (4.0) 15.9 1.2
Reconciliation from operating result to underlying result
* Extraordinary items from time to time consist of significant impairment charges, losses from discontinued operations and/or costs of organisational change. The 2020 extraordinary item relates to costs associated with organisational change.
As a direct result of the pandemic, the University achieved considerable savings in travel and other commercial and event related expenditure. Other University measures to reduce costs included delays in strategic and capital expenditure, reduction in Executive salaries and Enterprise Agreement Variations requiring staff to purchase additional leave entitlements. There was a net nil impact of COVID-19 on our operating result.
The University's subsidiaries were able to reasonably scale-back operations in support of reduced commercial and ancillary activity and associated revenue, acknowledging a number of our commercial subsidiary entities obtained government relief support, including JobKeeper.
In addition, the Federal Government announced considerable one-off funding relief to alleviate the immediate financial pressures on universities during the COVID-19 pandemic. These measures included a $1 billion injection into research support for universities, and the 2020 Commonwealth Grant Scheme guarantee. The University will recognise its share of this additional funding in 2021.

64 The University of Western Australia | uwa.edu.au
Auditor General
Page 1 of 4
7th Floor Albert Facey House 469 Wellington Street Perth MAIL TO: Perth BC PO Box 8489 Perth WA 6849 TEL: 08 6557 7500 FAX: 08 6557 7600
INDEPENDENT AUDITOR’S REPORT
To the Parliament of Western Australia
THE UNIVERSITY OF WESTERN AUSTRALIA
Report on the Financial Statements
OpinionI have audited the financial statements of The University of Western Australia which comprises the Statement of Financial Position as at 31 December 2020, the Income Statement, Statement of Comprehensive Income, Statement of Changes in Equity, Statement of Cash Flows for the University and the consolidated entity for the year then ended, as well as notes comprising a summary of significant accounting policies and other explanatory information.
In my opinion, the financial statements are based on proper accounts and present fairly, in all material respects, the operating results and cash flows of The University of Western Australia and the consolidated entity for the year ended 31 December 2020 and the financial position at the end of that period. They are in accordance with Australian Accounting Standards, the Financial Management Act 2006 and relevant Treasurer’s Instructions and Division 60 of the Australian Charities and Not-for-profits Commission Act 2012 (ACNC Act), Australian Charities and Not-for-profits Commission Regulation 2013.
Basis for OpinionI conducted my audit in accordance with the Australian Auditing Standards. My responsibilities under those standards are further described in the Auditor’s Responsibilities for the Audit of the Financial Statements section of my report. I am independent of the University in accordance with the Auditor General Act 2006, ACNC Act and the relevant ethical requirements of the Accounting Professional and Ethical Standards Board’s APES 110 Code of Ethics for Professional Accountants (the Code) that are relevant to my audit of the financial statements. I have also fulfilled my other ethical responsibilities in accordance with the Code. I believe that the audit evidence I have obtained is sufficient and appropriate to provide a basis for my opinion.
The University Senate’s Responsibilities for the Financial StatementsThe University Senate is responsible for keeping proper accounts, and the preparation and fair presentation of the financial statements in accordance with Australian Accounting Standards, the Financial Management Act 2006 and relevant Treasurer’s Instructions, and for such internal control as the University Senate determines is necessary to enable the preparation of financial statements that are free from material misstatement, whether due to fraud or error.
In preparing the financial statements, the University Senate is responsible for assessing the University’s ability to continue as a going concern, disclosing, as applicable, matters related to going concern and using the going concern basis of accounting.

6520
20 A
nnual Report | uw
a.edu.au65
Page 2 of 4
Auditor’s Responsibilities for the Audit of the Financial StatementsAs required by the Auditor General Act 2006, my responsibility is to express an opinion on the financial statements. The objectives of my audit are to obtain reasonable assurance about whether the financial statements as a whole are free from material misstatement, whether due to fraud or error, and to issue an auditor’s report that includes my opinion. Reasonable assurance is a high level of assurance, but is not a guarantee that an audit conducted in accordance with Australian Auditing Standards will always detect a material misstatement when it exists. Misstatements can arise from fraud or error and are considered material if, individually or in the aggregate, they couldreasonably be expected to influence the economic decisions of users taken on the basis of the financial statements.
A further description of my responsibilities for the audit of the annual financial report is located on the Auditing and Assurance Standards Board website at https://www.auasb.gov.au/auditors_responsibilities/ar4.pdf. This includes the identification and assessment of the risk of material misstatement due to fraud arising from management override of controls. This description forms part of my auditor’s report.
Report on Controls
OpinionI have undertaken a reasonable assurance engagement on the design and implementation of controls exercised by The University of Western Australia. The controls exercised by the Universityare those policies and procedures established by the University Senate to ensure that the receipt, expenditure and investment of money, the acquisition and disposal of property, and the incurring of liabilities have been in accordance with legislative provisions (the overall control objectives).
My opinion has been formed on the basis of the matters outlined in this report.
In my opinion, in all material respects, the controls exercised by The University of Western Australia are sufficiently adequate to provide reasonable assurance that the receipt, expenditure and investment of money, the acquisition and disposal of property and the incurring of liabilities have been in accordance with legislative provisions during the year ended 31 December 2020.
The University Senate's ResponsibilitiesThe University Senate is responsible for designing, implementing and maintaining controls to ensure that the receipt, expenditure and investment of money, the acquisition and disposal of property, and the incurring of liabilities are in accordance with the Financial Management Act 2006,relevant Treasurer’s Instructions and other relevant written law.
Auditor General’s ResponsibilitiesAs required by the Auditor General Act 2006, my responsibility as an assurance practitioner is to express an opinion on the suitability of the design of the controls to achieve the overall control objectives, and the implementation of the controls as designed. I conducted my engagement in accordance with Standard on Assurance Engagements ASAE 3150 Assurance Engagements on Controls issued by the Australian Auditing and Assurance Standards Board. That standard requires that I comply with relevant ethical requirements and plan and perform my procedures to obtain reasonable assurance about whether, in all material respects, the controls are suitably designed to achieve the overall control objectives and the controls, necessary to achieve the overall control objectives, were implemented as designed.

66 The University of Western Australia | uwa.edu.au
Page 3 of 4
An assurance engagement to report on the design and implementation of controls involves performing procedures to obtain evidence about the suitability of the design of controls to achieve the overall control objectives, and the implementation of those controls. The procedures selected depend on my judgement, including the assessment of the risks that controls are not suitably designed or implemented as designed. My procedures included testing the implementation of those controls that I consider necessary to achieve the overall control objectives.
I believe that the evidence I have obtained is sufficient and appropriate to provide a basis for myopinion.
Limitations of ControlsBecause of the inherent limitations of any internal control structure, it is possible that, even if the controls are suitably designed and implemented as designed, once the controls are in operation, the overall control objectives may not be achieved so that fraud, error, or noncompliance with laws and regulations may occur and not be detected. Any projection of the outcome of the evaluation of the suitability of the design of controls to future periods is subject to the risk that the controls may become unsuitable because of changes in conditions.
Report on the Key Performance Indicators
OpinionI have undertaken a reasonable assurance engagement on the key performance indicators of The University of Western Australia for the year ended 31 December 2020. The key performance indicators are the key effectiveness indicators and the key efficiency indicators that provide performance information about achieving outcomes and delivering services.
In my opinion, in all material respects, the key performance indicators of The University of Western Australia are relevant and appropriate to assist users to assess the University’s performance and fairly represent indicated performance for the year ended 31 December 2020.
The University Senate’s Responsibility for the Key Performance IndicatorsThe University Senate is responsible for the preparation and fair presentation of the key performance indicators in accordance with the Financial Management Act 2006 and the Treasurer’s Instructions, and for such internal control as the University Senate determines necessary to enable the preparation of key performance indicators that are free from material misstatement, whether due to fraud or error.
In preparing the key performance indicators, the University Senate is responsible for identifying key performance indicators that are relevant and appropriate having regard to their purpose in accordance with Treasurer’s Instruction 904U Key Performance Indicators.
Auditor General’s ResponsibilityAs required by the Auditor General Act 2006, my responsibility as an assurance practitioner is to express an opinion on the key performance indicators. The objectives of my engagement are to obtain reasonable assurance about whether the key performance indicators are relevant and appropriate to assist users to assess the University’s performance, and whether the key performance indicators are free from material misstatement, whether due to fraud or error, and to issue an auditor’s report that includes my opinion. I conducted my engagement in accordance with Standard on Assurance Engagements ASAE 3000 Assurance Engagements Other than Audits or Reviews of Historical Financial Information issued by the Australian Auditing and Assurance Standards Board. That standard requires that I comply with relevant ethical requirements relating to assurance engagements.

6720
20 A
nnual Report | uw
a.edu.au67
Page 4 of 4
An assurance engagement involves performing procedures to obtain evidence about the amounts and disclosures in the key performance indicators. It also involves evaluating the relevance and appropriateness of the key performance indicators against the criteria and guidance in Treasurer’s Instruction 904U for measuring the extent of outcome achievement and the efficiency of service delivery. The procedures selected depend on my judgement, including the assessment of the risks of material misstatement of the key performance indicators. In making these risk assessments I obtain an understanding of internal control relevant to the engagement in order to design procedures that are appropriate in the circumstances.
I believe that the evidence I have obtained is sufficient and appropriate to provide a basis for my opinion.
My Independence and Quality Control Relating to the Reports on Controls and Key Performance IndicatorsI have complied with the independence requirements of the Auditor General Act 2006 and the relevant ethical requirements relating to assurance engagements. In accordance with ASQC 1 Quality Control for Firms that Perform Audits and Reviews of Financial Reports and Other Financial Information, and Other Assurance Engagements, the Office of the Auditor General maintains a comprehensive system of quality control including documented policies and procedures regarding compliance with ethical requirements, professional standards and applicable legal and regulatory requirements.
Matters Relating to the Electronic Publication of the Audited Financial Statements and Key Performance IndicatorsThis auditor’s report relates to the financial statements and key performance indicators of The University of Western Australia for the year ended 31 December 2020 included on the University’s website. The University’s management is responsible for the integrity of the University’s website. This audit does not provide assurance on the integrity of the University’s website. The auditor’s report refers only to the financial statements and key performance indicators described above. It does not provide an opinion on any other information which may have been hyperlinked to/from these financial statements or key performance indicators. If users of the financial statements and key performance indicators are concerned with the inherent risks arising from publication on a website, they are advised to refer to the hard copy of the audited financial statements and key performance indicators to confirm the information contained in this website version of the financial statements and key performance indicators.
CAROLINE SPENCERAUDITOR GENERAL FOR WESTERN AUSTRALIAPerth, Western Australia 5 March 2021

68 The University of Western Australia | uwa.edu.au
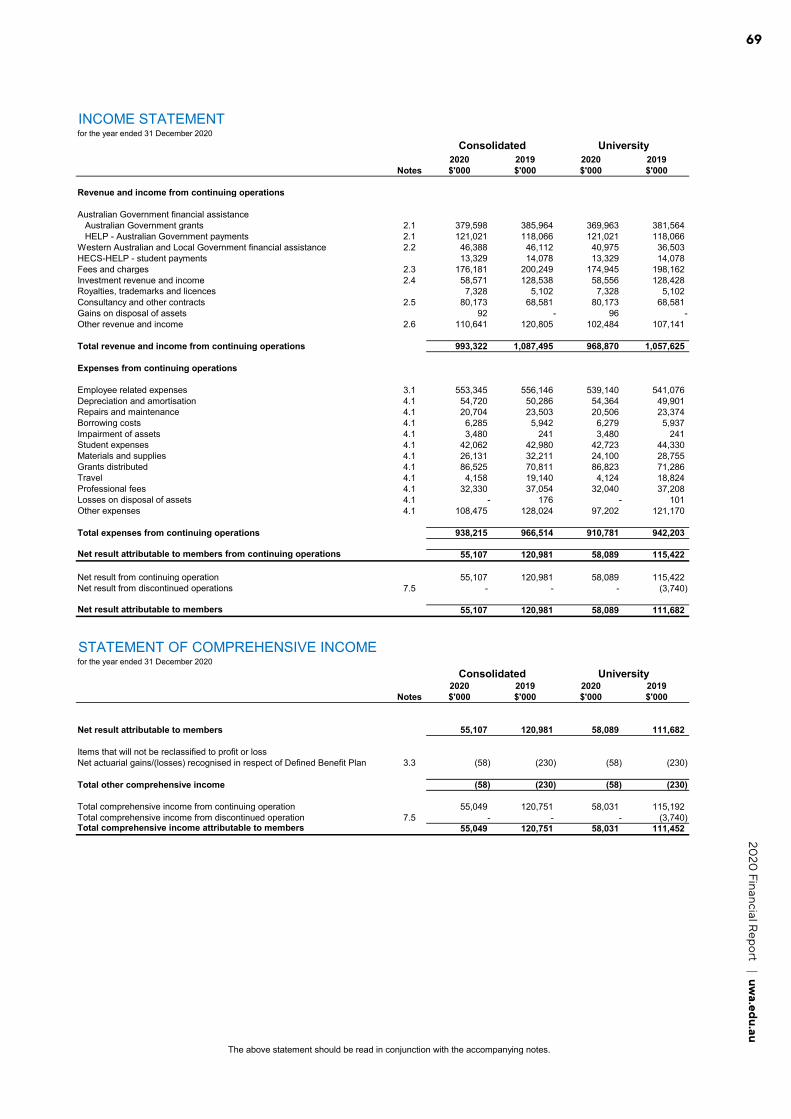
6920
20 Financial R
eport | uwa.edu.au
69
The above statement should be read in conjunction with the accompanying notes.
Consolidated University2020 2019 2020 2019
Notes $'000 $'000 $'000 $'000
Revenue and income from continuing operations
Australian Government financial assistance Australian Government grants 2.1 379,598 385,964 369,963 381,564 HELP - Australian Government payments 2.1 121,021 118,066 121,021 118,066Western Australian and Local Government financial assistance 2.2 46,388 46,112 40,975 36,503HECS-HELP - student payments 13,329 14,078 13,329 14,078Fees and charges 2.3 176,181 200,249 174,945 198,162Investment revenue and income 2.4 58,571 128,538 58,556 128,428Royalties, trademarks and licences 7,328 5,102 7,328 5,102Consultancy and other contracts 2.5 80,173 68,581 80,173 68,581Gains on disposal of assets 92 - 96 -Other revenue and income 2.6 110,641 120,805 102,484 107,141
Total revenue and income from continuing operations 993,322 1,087,495 968,870 1,057,625
Expenses from continuing operations
Employee related expenses 3.1 553,345 556,146 539,140 541,076Depreciation and amortisation 4.1 54,720 50,286 54,364 49,901Repairs and maintenance 4.1 20,704 23,503 20,506 23,374Borrowing costs 4.1 6,285 5,942 6,279 5,937Impairment of assets 4.1 3,480 241 3,480 241Student expenses 4.1 42,062 42,980 42,723 44,330Materials and supplies 4.1 26,131 32,211 24,100 28,755Grants distributed 4.1 86,525 70,811 86,823 71,286Travel 4.1 4,158 19,140 4,124 18,824Professional fees 4.1 32,330 37,054 32,040 37,208Losses on disposal of assets 4.1 - 176 - 101Other expenses 4.1 108,475 128,024 97,202 121,170
Total expenses from continuing operations 938,215 966,514 910,781 942,203
Net result attributable to members from continuing operations 55,107 120,981 58,089 115,422
Net result from continuing operation 55,107 120,981 58,089 115,422Net result from discontinued operations 7.5 - - - (3,740)
Net result attributable to members 55,107 120,981 58,089 111,682
Consolidated University2020 2019 2020 2019
Notes $'000 $'000 $'000 $'000
Net result attributable to members 55,107 120,981 58,089 111,682
Items that will not be reclassified to profit or lossNet actuarial gains/(losses) recognised in respect of Defined Benefit Plan 3.3 (58) (230) (58) (230)
Total other comprehensive income (58) (230) (58) (230)
Total comprehensive income from continuing operation 55,049 120,751 58,031 115,192Total comprehensive income from discontinued operation 7.5 - - - (3,740)Total comprehensive income attributable to members 55,049 120,751 58,031 111,452
INCOME STATEMENT for the year ended 31 December 2020
STATEMENT OF COMPREHENSIVE INCOMEfor the year ended 31 December 2020
2
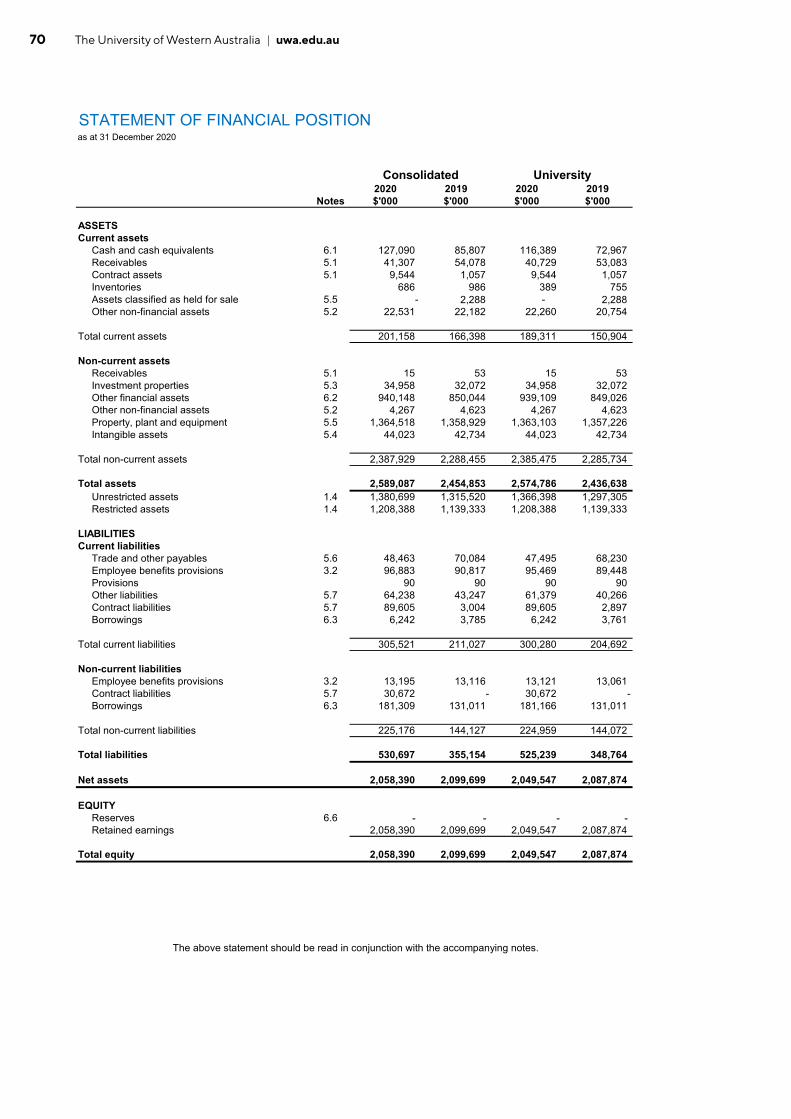
70 The University of Western Australia | uwa.edu.au
The above statement should be read in conjunction with the accompanying notes.
2020 2019 2020 2019Notes $'000 $'000 $'000 $'000
ASSETSCurrent assets Cash and cash equivalents 6.1 127,090 85,807 116,389 72,967 Receivables 5.1 41,307 54,078 40,729 53,083 Contract assets 5.1 9,544 1,057 9,544 1,057 Inventories 686 986 389 755 Assets classified as held for sale 5.5 - 2,288 - 2,288 Other non-financial assets 5.2 22,531 22,182 22,260 20,754
Total current assets 201,158 166,398 189,311 150,904
Non-current assets Receivables 5.1 15 53 15 53 Investment properties 5.3 34,958 32,072 34,958 32,072 Other financial assets 6.2 940,148 850,044 939,109 849,026 Other non-financial assets 5.2 4,267 4,623 4,267 4,623 Property, plant and equipment 5.5 1,364,518 1,358,929 1,363,103 1,357,226 Intangible assets 5.4 44,023 42,734 44,023 42,734
Total non-current assets 2,387,929 2,288,455 2,385,475 2,285,734
Total assets 2,589,087 2,454,853 2,574,786 2,436,638 Unrestricted assets 1.4 1,380,699 1,315,520 1,366,398 1,297,305 Restricted assets 1.4 1,208,388 1,139,333 1,208,388 1,139,333
LIABILITIESCurrent liabilities Trade and other payables 5.6 48,463 70,084 47,495 68,230 Employee benefits provisions 3.2 96,883 90,817 95,469 89,448 Provisions 90 90 90 90 Other liabilities 5.7 64,238 43,247 61,379 40,266 Contract liabilities 5.7 89,605 3,004 89,605 2,897 Borrowings 6.3 6,242 3,785 6,242 3,761
Total current liabilities 305,521 211,027 300,280 204,692
Non-current liabilities Employee benefits provisions 3.2 13,195 13,116 13,121 13,061 Contract liabilities 5.7 30,672 - 30,672 - Borrowings 6.3 181,309 131,011 181,166 131,011
Total non-current liabilities 225,176 144,127 224,959 144,072
Total liabilities 530,697 355,154 525,239 348,764
Net assets 2,058,390 2,099,699 2,049,547 2,087,874
EQUITY Reserves 6.6 - - - - Retained earnings 2,058,390 2,099,699 2,049,547 2,087,874
Total equity 2,058,390 2,099,699 2,049,547 2,087,874- - - -
STATEMENT OF FINANCIAL POSITIONas at 31 December 2020
Consolidated University
3

7120
20 Financial R
eport | uwa.edu.au
71
The above statement should be read in conjunction with the accompanying notes.
ReservesRetainedearnings Total
Notes $'000 $'000 $'000
Consolidated
Balance at 1 January 2019 32,793 1,954,050 1,986,843Effect of adoption of new accounting standards (7,895) (7,895)Balance as restated 32,793 1,946,155 1,978,948Net result - 120,981 120,981Other comprehensive income- Remeasurement of Defined Benefit Plan 3.3 - (230) (230)Total comprehensive income - 120,751 120,751Transfer to/(from) reserves 6.6 (32,793) 32,793 -Balance at 31 December 2019 - 2,099,699 2,099,699
Balance at 1 January 2020 - 2,099,699 2,099,699Effect of adoption of new accounting standards 1.5 (96,358) (96,358)Balance as restated - 2,003,341 2,003,341Net result - 55,107 55,107Other comprehensive income- Remeasurement of Defined Benefit Plan 3.3 - (58) (58)Total comprehensive income - 55,049 55,049Transfer to/(from) reserves 6.6 - - -Balance at 31 December 2020 - 2,058,390 2,058,390
University
Balance at 1 January 2019 32,793 1,951,524 1,984,317Effect of adoption of new accounting standards (7,895) (7,895)Balance as restated 32,793 1,943,629 1,976,422Net result - 111,682 111,682Other comprehensive income- Remeasurement of Defined Benefit Plan 3.3 - (230) (230)Total comprehensive income - 111,452 111,452Transfer to/(from) reserves 6.6 (32,793) 32,793 -Balance at 31 December 2019 - 2,087,874 2,087,874
Balance at 1 January 2020 - 2,087,874 2,087,874Effect of adoption of new accounting standards 1.5 - (96,358) (96,358)Balance as restated - 1,991,516 1,991,516Net result - 58,089 58,089Other comprehensive income- Remeasurement of Defined Benefit Plan 3.3 - (58) (58)Total comprehensive income - 58,031 58,031Transfer to/(from) reserves 6.6 - - -Balance at 31 December 2020 - 2,049,547 2,049,547
STATEMENT OF CHANGES IN EQUITYfor the year ended 31 December 2020
4
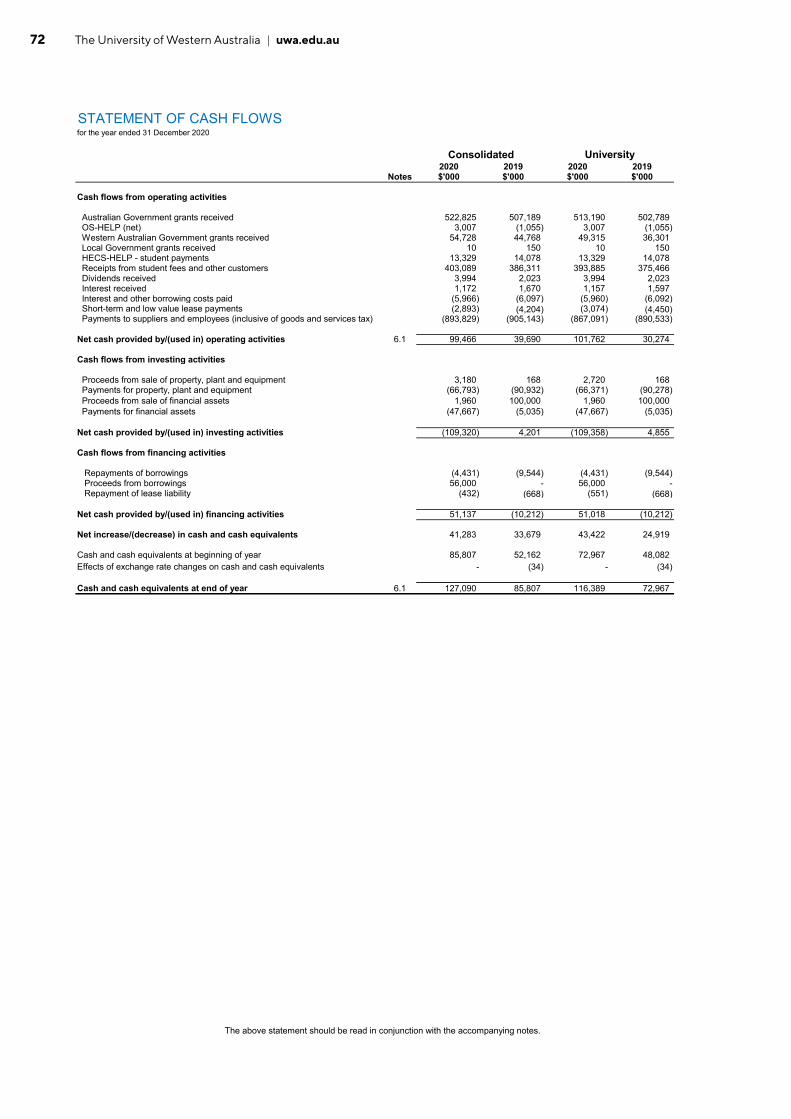
72 The University of Western Australia | uwa.edu.au
The above statement should be read in conjunction with the accompanying notes.
Consolidated2020 2019 2020 2019
Notes $'000 $'000 $'000 $'000
Cash flows from operating activities
Australian Government grants received 522,825 507,189 513,190 502,789 OS-HELP (net) 3,007 (1,055) 3,007 (1,055) Western Australian Government grants received 54,728 44,768 49,315 36,301 Local Government grants received 10 150 10 150 HECS-HELP - student payments 13,329 14,078 13,329 14,078 Receipts from student fees and other customers 403,089 386,311 393,885 375,466 Dividends received 3,994 2,023 3,994 2,023 Interest received 1,172 1,670 1,157 1,597 Interest and other borrowing costs paid (5,966) (6,097) (5,960) (6,092) Short-term and low value lease payments (2,893) (4,204) (3,074) (4,450) Payments to suppliers and employees (inclusive of goods and services tax) (893,829) (905,143) (867,091) (890,533)
Net cash provided by/(used in) operating activities 6.1 99,466 39,690 101,762 30,274
Cash flows from investing activities
Proceeds from sale of property, plant and equipment 3,180 168 2,720 168 Payments for property, plant and equipment (66,793) (90,932) (66,371) (90,278) Proceeds from sale of financial assets 1,960 100,000 1,960 100,000 Payments for financial assets (47,667) (5,035) (47,667) (5,035)
Net cash provided by/(used in) investing activities (109,320) 4,201 (109,358) 4,855
Cash flows from financing activities
Repayments of borrowings (4,431) (9,544) (4,431) (9,544) Proceeds from borrowings 56,000 - 56,000 - Repayment of lease liability (432) (668) (551) (668)
Net cash provided by/(used in) financing activities 51,137 (10,212) 51,018 (10,212)
Net increase/(decrease) in cash and cash equivalents 41,283 33,679 43,422 24,919
Cash and cash equivalents at beginning of year 85,807 52,162 72,967 48,082Effects of exchange rate changes on cash and cash equivalents - (34) - (34)
Cash and cash equivalents at end of year 6.1 127,090 85,807 116,389 72,967
STATEMENT OF CASH FLOWSfor the year ended 31 December 2020
University
5

7320
20 Financial R
eport | uwa.edu.au
73
Contents of the notes to the financial statements
1 About this report1.1 Basis of preparation1.2 Significant accounting policies1.3 Critical estimates and judgements1.4 Unrestricted and restricted assets1.5 Initial application of AAS
2 How we are funded2.12.22.3 Fees and charges2.4 Net investment revenue and income2.5 Consultancy and other contracts2.6 Other revenue and income
3 Employee benefits3.1 Employee related expenses3.2 Employee benefits provisions 3.3 Defined benefit plan 3.4 Remuneration of key management personnel
4 Our expenditure4.1 Expenses
5 Operating assets and liabilities5.1 Receivables and contract assets5.2 Other non-financial assets5.3 Investment properties5.4 Intangible assets5.5 Property, plant and equipment and Assets classified as held for sale5.6 Trade and other payables5.7 Contract and other liabilities
6 Capital and financial risk management6.1 Cash and cash equivalents6.2 Other financial assets6.3 Borrowings6.4 Financial risk management6.5 Fair value measurements6.6 Reserves6.7 Commitments6.8 Contingencies
7 Other disclosures7.1 Remuneration of auditors7.2 Subsidiaries and Associates7.3 Related parties7.4 Supplementary financial information7.5 Discontinued operations7.6 Events occurring after the end of the reporting period7.7 New standards issued but not yet effective7.8 Acquittal of Australian Government financial assistance
NOTES TO THE FINANCIAL STATEMENTSfor the year ended 31 December 2020
Australian Government financial assistance including HECS - HELP and other Australian Government loan programsWestern Australian and Local Government financial assistance
6

74 The University of Western Australia | uwa.edu.au
1 About this report• 1.1 Basis of preparation • 1.4 Unrestricted and restricted assets• 1.2 Significant accounting policies • 1.5 Initial application of AAS• 1.3 Critical estimates and judgements
1.1 Basis of preparationBackground
••
••
••
Covid-19
1.2 Significant accounting policies
(a) TaxationIncome tax
Goods and services tax (GST)
•
•
Fringe benefits tax
Payroll tax
(b) Foreign currency transactions
NOTES TO THE FINANCIAL STATEMENTSfor the year ended 31 December 2020
present reclassified or restated comparative information where appropriate to enhance comparability; and
constitute general purpose financial statements;have been prepared in accordance with Australian Accounting Standards, the Framework, Statement of Accounting Concepts and other authoritativepronouncements of the Australian Accounting Standards Board as applied by the Treasurer's Instructions, with the exception of certain Treasurer’s Instructions -several of the Australian Accounting Standards, the Framework, Statements of Accounting Concepts and other authoritative pronouncements of the AustralianAccounting Standards Board are modified by the Treasurer's Instructions to vary application, disclosure, format and wording;
have been prepared on the accrual basis of accounting using the historical cost convention except for equity financial assets that have been measured at fairvalue through profit or loss and investment properties;
The financial statements include separate financial statements for The University of Western Australia as the parent entity and the consolidated entity consisting ofthe University and its subsidiaries. The University of Western Australia is a not-for-profit entity and these statements have been prepared on that basis. Some ofthe Australian Accounting Standards requirements for not-for-profit entities are inconsistent with International Financial Reporting Standards requirements.
The financial statements were authorised for issue by the Senate members of The University of Western Australia on 5 March 2021.
The principal address of The University of Western Australia is 35 Stirling Highway, Crawley WA 6009, Australia.
These financial statements:
have been prepared in accordance with the requirements of the Australian Charities and Not-for-profits Commission Act 2012;
are presented in Australian dollars ($), which is the Group’s functional and presentation currency with all values rounded to the nearest thousand dollars ($'000)unless otherwise stated.
The Financial Management Act 2006 and the Treasurer's Instructions are legislative provisions governing the preparation of financial statements and takeprecedence over Australian Accounting Standards, the Framework, Statements of Accounting Concepts and other authoritative pronouncements of the AustralianAccounting Standards Board, the requirements of the Australian Government Department of Education, Skills and Employment and other State/AustralianGovernment legislative requirements.
Where modification is required and has a material or significant financial effect upon the reported results, details of that modification and the resulting financialeffect are disclosed in the notes to the financial statements.
These financial statements contain all significant accounting policies that summarise the recognition and measurement basis used and are relevant to providing anunderstanding of the financial statements. Accounting policies that are specific to a note to the financial statements are described in the note to which they relate.Other accounting policies are set out below.
The Group has consistently applied the accounting policies to all periods presented in these consolidated financial statements, except if mentioned otherwise.
Foreign currency transactions are initially translated into Australian currency at the rate of exchange at the date of the transaction. At the reporting date, amountspayable and receivable in foreign currencies are translated to Australian currency at rates of exchange at that date. Non-monetary items held at the reporting dateare measured using the exchange rate at the date of the initial transaction. Resulting exchange differences are recognised in the income statement.
The Group is exempt from income tax as per Subdivision 50-B of the Income Tax Assessment Act 1997.
Revenue, expenses and assets are recognised net of the amount of GST except:Where the GST incurred on a purchase of goods and services is not recoverable from the taxation authority, then the GST is recognised as part of the cost ofacquisition or as part of the expense item as applicable; andReceivables and payables are stated with the amount of GST included.
The net amount of GST recoverable from, or payable to, the taxation authority is included as part of receivables or payables in the Statement of Financial Position.
The GST component of cash flows arising from investing and financing activities, which are recoverable from or payable to the taxation authority, is classified asan operating cash flow.
The University is liable to pay Fringe Benefits Tax, and it is included in ‘Employee related expense’ in the Income Statement.
The University is liable to pay Payroll Tax, and it is included in ‘Employee related expenses’ in the Income Statement.
The COVID-19 pandemic developed rapidly in 2020, with a significant number of cases. Measures taken by various governments to contain the virus haveaffected economic activity. The Group took active measures, in line with the recommendations of the World Health Organisation (WHO) and national healthministries, to preserve the health and well-being of our staff and students, including a move to online teaching and assessments, working from home, and rigorouscleaning and sanitation. These adjustments will remain under review as the Group continue to respond to the ongoing impact of Covid-19.
At this stage, the impact of Covid-19 on the group’s results has not been significant. This is because we undertook significant action to address both ourunderlying cash position and the shortfall in revenue. This included a series of cost saving measures that include executive staff volunteering a 20% pay reduction,moratorium on new staff appointments and contract renewals, reduction in travel, entertainment and discretionary spend and deferring all uncommitted capitalactivity. The Group entered into an agreement to vary the employee bargaining agreements in order to preserve University jobs. In addition the Group offeredhardship grants to students affected by Covid-19.
The impact of Covid-19 on future performance, will inform our capacity to respond to the challenges ahead and the active measure required to be taken topreserve liquidity. At this stage, the Group has sufficient cash reserves to meet our obligations as and when they become due and payable.
We will continue to follow the various government policies and advice and, in parallel, we will do our utmost to continue our operations in the best and safest waypossible without jeopardising the health of our staff and students.
7

7520
20 Financial R
eport | uwa.edu.au
75
NOTES TO THE FINANCIAL STATEMENTSfor the year ended 31 December 2020
1.3 Critical estimates and judgements
SectionAASB15 Revenue from Contracts with Customers and
AASB 1058 Income of Not-for-Profit Entities - Revenue recognition 2Unrestricted and restricted assets 1.4Classification of funding received 2.6Long service leave 3.2Valuation of investment properties 5.3Property, plant and equipment 5.5Impairment 5.5
1.4 Unrestricted and restricted assets Consolidated University2020 2019 2020 2019$'000 $'000 $'000 $'000
Unrestricted assetsCash and cash equivalents 62,996 43,687 52,295 30,847Receivables 41,322 54,131 40,744 53,136Contract assets 310 1,057 310 1,057Inventories 686 986 389 755Other non-financial assets 26,798 26,805 26,527 25,377Other financial assets 116,973 68,957 115,934 67,939Properties, plant and equipment 1,087,591 1,077,163 1,086,176 1,075,460Intangible assets 44,023 42,734 44,023 42,734Total unrestricted assets 1,380,699 1,315,520 1,366,398 1,297,305
Restricted AssetsCash and cash equivalents 64,094 42,120 64,094 42,120Contract assets 9,234 - 9,234 -Assets classified as held for sale - 2,288 - 2,288Investment properties 34,958 32,072 34,958 32,072Other financial assets 823,175 781,087 823,175 781,087Property, plant and equipment 276,927 281,766 276,927 281,766Total restricted assets 1,208,388 1,139,333 1,208,388 1,139,333
In the classification between unrestricted and restricted assets, the Group has classified receivables as unrestricted, acknowledging a portion of the receivables are attributable to restricted activity. They will be reclassified as restricted on receipt.
Critical accounting estimates and judgements: Restricted assetsThe University receives assets from a large number of diverse and variable sources with a variety of legislative, contractual and compliance obligations. The assets that are not available for discretionary use by the University and must be used for the purposes stipulated are considered restricted and includes:• Research funds; and•Endowment and gifted funds, including land endowed by the State Government and gifts and bequests subject to external requirements formalised within a Will or Deed of Gift.
In preparation of the financial statements, management is required to exercise its judgement when applying the accounting policies. The estimates and underlyingassumptions are reviewed on an ongoing basis. When there is a higher degree of judgement or complexity or areas where assumptions and estimates aresignificant to the financial statements, these are disclosed separately. The areas involving a higher degree of judgement or complexity, or areas whereassumptions and estimates are significant to the financial statements, are described in the notes below:
8

76 The University of Western Australia | uwa.edu.au
1.5 Initial application of AAS
AASB15 / AASB1058 - Research Grants (where deferral was applied as part of AASB 2019-6)
The nature and effect of the changes as a result of adoption of AASB15 and AASB1058 are described as follows:
Ref 1 Jan 20 Ref 1 Jan 20adjustments $’000 adjustments $’000
AssetsContract assets a 8,900 a 8,900Total assets 8,900 8,900
Contract liabilities b 104,687 b 104,687Other liabilities c 571 c 571Total liabilities 105,258 105,258
Total adjustment on equity (96,358) (96,358)Retained earnings (96,358) (96,358)
Income StatementFor year ended 31 December 2020 Ref
adjustments AASB15/AASB1058
Previous AAS Increase/ decrease
AASB15/AASB1058
Previous AAS Increase/ decrease
$’000 $’000 $’000 $’000 $’000 $’000Revenue and income from continuing operations Australian Government grants a, b, c 379,598 379,950 (352) 369,963 370,315 (352) HELP - Australian Government payments 121,021 121,021 121,021 121,021 -Western Australian and Local Government financial assistance a, b, c 46,388 52,892 (6,504) 40,975 47,479 (6,504)HECS-HELP - student payments 13,329 13,329 13,329 13,329 -Fees and charges 176,181 176,181 174,945 174,945 -Investment revenue and income 58,571 58,571 58,556 58,556 -Royalties, trademarks and licences 7,328 7,328 7,328 7,328 -Consultancy and contracts a, b, c 80,173 83,366 (3,193) 80,173 83,366 (3,193)Gains on disposal of assets 92 92 96 96Other revenue and income b, c 110,641 115,779 (5,138) 102,484 107,622 (5,138)Total revenue and income from continuing operations 993,322 1,008,509 (15,187) 968,870 984,057 (15,187)
Expenses from continuing operationsEmployee-related expenses 553,345 553,348 (3) 539,140 539,143 (3)Depreciation and amortisation 54,720 54,720 54,364 54,364 -Repairs and maintenance 20,704 20,705 (1) 20,506 20,507 (1)Borrowing costs 6,285 6,285 6,279 6,279 -Impairment of assets 3,480 3,480 3,480 3,480 -Student expenses c 42,062 43,820 (1,758) 42,723 44,481 (1,758)Materials and supplies 26,131 26,142 (11) 24,100 24,111 (11)Grants distributed 86,525 86,525 86,823 86,823 -Travel 4,158 4,157 1 4,124 4,123 1Professional fees 32,330 32,331 (1) 32,040 32,041 (1)Other expenses 108,475 108,479 (4) 97,202 97,206 (4)Total expenses from continuing operations 938,215 939,992 (1,777) 910,781 912,558 (1,777)
Net result from continuing operations 55,107 68,517 (13,410) 58,089 71,499 (13,410)
Set out below are the amounts by which each financial statement line item is affected as at and for the year ended 31 December 2020 as a result of the adoption of AASB15and AASB1058 in relation to research grants. The first column shows amounts prepared under AASB15 and AASB1058 for research grants and the second column showswhat the amounts would have been had AASB15 and AASB1058 not been adopted:
Amounts prepared under
a - contract assets are revenue receivables and the adjustment reflect research output that have been delivered but considerations have not been received as at reportingdate.
b - contract liabilities are deferred revenue as a result of consideration received in advance but research output not been delivered as at reporting date. The adjustmentsreflect the University's future obligations to deliver research outputs to the grantors/customers.c - other liabilities adjustments relates to scholarships recognised as a financial liability under AASB9, as funding provided to the University for the purpose of paying cash orstipends to students and other parties. Income and associated expenditure is no longer recognised for these activities, as previously reported under AASB1004.
Consolidated University
The nature of the adjustments as at 1 January 2020 and the reasons for the significant changes in the income statement for the year ended 31 December 2020 aredescribed below:
NOTES TO THE FINANCIAL STATEMENTSfor the year ended 31 December 2020
For research grants income, the Group adopted AASB15 and AASB1058 using the modified retrospective method of transition, with the date of initial application of 1January 2020. In accordance with the provisions of this transition approach, the Group recognised the cumulative effect of applying these new standards as an adjustmentto opening retained earnings at the date of initial application, i.e., 1 January 2020. Consequently, the comparative information presented has not been restated and continues to be reported under the previous standards on revenue and income. In addition, the Group has applied the practical expedient and elected to apply these standardsretrospectively only to contracts and transactions that were not completed contracts at the date of initial application, i.e., as at 1 January 2020.
As the Group is applying the modified retrospective approach, the Group did apply the practical expedient described in AASB15.C5(c), for contracts that were modifiedbefore the beginning of the earliest period presented.
The Group did not retrospectively restate the contract for those modifications in accordance with AASB15.20-21. Instead, the Group reflected the aggregate effect of all ofthe modifications that occur before the beginning of the earliest period presented when:
• Identifying the satisfied and unsatisfied performance obligations • Determining the transaction price • Allocating the transaction price to the satisfied and unsatisfied performance obligation.
Under the new income recognition model applicable to not-for-profit entities in accounting for research grants, the Group shall first determine whether an enforceableagreement exists and whether the promises to transfer goods or services to the customer are ‘sufficiently specific’.If an enforceable agreement exists and the promises are ‘sufficiently specific’ (to a transaction or part of a transaction), the Group applies the general AASB15 principles todetermine the appropriate revenue recognition. If these criteria are not met, the Group shall consider whether AASB1058 applies.
UniversityConsolidated
9

7720
20 Financial R
eport | uwa.edu.au
77
NOTES TO THE FINANCIAL STATEMENTSfor the year ended 31 December 2020
Statement of financial position
AASB15/AASB1058
Previous AAS Increase/ decrease
AASB15/AASB1058
Previous AAS Increase/ decrease
As at 31 December 2020 $’000 $’000 $’000 $’000 $’000 $’000AssetsContract assets a 9,544 899 8,645 9,544 899 8,645Other assets 2,579,543 2,579,543 - 2,565,242 2,565,242 -Total assets 2,589,087 2,580,442 8,645 2,574,786 2,566,141 8,645
Contract liabilities b 120,277 2,817 (117,460) 120,277 2,817 (117,460)Other liabilities c 410,420 409,467 (953) 404,962 404,009 (953)Total liabilities 530,697 412,284 (118,413) 525,239 406,826 (118,413)
EquityRetained earnings 2,058,390 2,168,158 (109,768) 2,049,547 2,159,315 (109,768)Total equity 2,058,390 2,168,158 (109,768) 2,049,547 2,159,315 (109,768)
AASB 1059 - Service Concession Arrangements: GrantorAustralian Accounting Standard AASB 1059 addresses the accounting for a service concession arrangement by a grantor that is a public sector entity. This arrangementtypically involves an operator constructing assets used to provide the public service or upgrading the assets and operate and maintaining the assets for a specified period oftime e.g. student accommodation.
The standard applies to annual reporting periods beginning on or after 1 January 2020.
The Group do not have any service concession asset or arrangement in 2020.
The nature of the adjustments as at 1 January 2020 and the reasons for the significant changes in the income statement for the year ended 31 December 2020 aredescribed below:
c - other liabilities adjustments relates to scholarships recognised as a financial liability under AASB9, as funding provided to the University for the purpose of paying cash orstipends to students and other parties. Income and associated expenditure is no longer recognised for these activities, as previously reported under AASB1004.
b - contract liabilities are deferred revenue as a result of consideration received in advance but research output has not been delivered as at reporting date. The adjustmentsreflect the University's future obligations to deliver research outputs to the grantors/customers.
a - contract assets are revenue receivables and the adjustment reflect research output that have been delivered but considerations have not been received as at reportingdate.
Amounts prepared under
Consolidated University
10

78 The University of Western Australia | uwa.edu.au
2 How we are funded
• 2.3 Fees and charges• 2.4 Net investment revenue and income• 2.5 Consultancy and other contracts• 2.6 Other revenue and income
Critical accounting estimates and judgements: AASB 15 Revenue from Contracts with Customers and AASB 1058 Income of Non-for-Profit Entities - Revenue recognition
2.1 Consolidated University2020 2019 2020 2019$'000 $'000 $'000 $'000
(a) Commonwealth Grant Scheme and other grants Commonwealth Grant Scheme 7.8(a) 155,191 146,520 155,191 146,520 Indigenous Student Success Program 7.8(a) 1,303 1,454 1,303 1,454 Access and Participation Fund 7.8(a) 1,135 1,162 1,135 1,162 Disability Performance Funding 7.8(a) 118 131 118 131 Learning and Teaching Performance Fund 7.8(a) - - - - Diversity and Structural Adjustment 7.8(a) - - - - Promotion of Excellence in Learning and Teaching 7.8(a) - - - -Total Commonwealth Grant Scheme and other grants 157,747 149,267 157,747 149,267
Accounting policy
(b) EDUCATION research Research Support Program 7.8(c) 42,276 43,720 42,276 43,720 Research Training Program 7.8(c) 46,594 47,407 46,594 47,407Total EDUCATION research grants 88,870 91,127 88,870 91,127
Accounting policy
(c) Other capital funding Linkage Infrastructure, Equipment and Facilities grant 7.8(e) 2,819 415 2,819 415Total other capital funding 2,819 415 2,819 415
Accounting policy
(d) Australian Research Council Discovery 7.8(f) 17,826 18,231 17,826 18,231 Linkages 7.8(f) 3,233 3,514 3,233 3,514 Networks and Centres 7.8(f) 4,073 4,159 4,073 4,159Total Australian Research Council 25,132 25,904 25,132 25,904
NOTES TO THE FINANCIAL STATEMENTSfor the year ended 31 December 2020
This section provides information on how the University and its subsidiaries are funded, through both Government grantsand investment income.• 2.1 Australian Government financial assistance including HECS-HELP and other Australian Government loan programs• 2.2 Western Australian and Local Government financial assistance
Australian Government financial assistance including HECS-HELP and other Australian Government loan programs
Commonwealth Grant Scheme funding represents subsidies for tuition costs for higher education students. This falls under AASB15 andthe revenue is recognised over time as the students receive the tuition services.
Indigenous Support Program funding represents grants provided to accelerate improvements in the university enrolment, progression andaward completions of Indigenous Australians. This falls under AASB1058 (as the performance obligations are not ‘sufficiently specific’)and the revenue is recognised when received.
Access and Participation Funding represents grants provided to undertake activities and implement strategies that improve access toundergraduate courses for people from low SES backgrounds, as well as improving the retention and completion rates of those students.This falls under AASB15 and the revenue is recognised over time as the grant funds are expended.
The remaining revenue in this category falls under AASB1058 and the revenue is recognised when received.
Research Support Program funding represents grants provided to support the systemic costs of research not supported directly throughcompetitive and other grants. This falls under AASB1058 (as the performance obligations are not ‘sufficiently specific’) and the revenue isrecognised when received.
Research Training Program funding represents grants provided to support both domestic and overseas students undertaking ResearchDoctorate and Research Masters degrees. This falls under AASB1058 (as the performance obligations are not ‘sufficiently specific’) andthe revenue is recognised when received.
Other capital funding represents grants provided to acquire or construct a recognisable non-financial asset (e.g. land, buildings,infrastructure, plant and equipment) to be controlled by the Group. This falls under AASB1058 and the revenue is recognised over time asthe asset is acquired or constructed.
The adoption of the above standards required significant judgement to identify and assess the performance obligations and whether thepromises to transfer goods or services to the customer are ‘sufficiently specific’ which determine whether the contracts are recognised inaccordance with AASB 15 or alternatively under another standard such as AASB 1058.
11

7920
20 Financial R
eport | uwa.edu.au
79
NOTES TO THE FINANCIAL STATEMENTSfor the year ended 31 December 2020
Accounting policy
(e) Other Australian Government financial assistance
Non-capital National Health and Medical Research Council 29,851 36,585 29,851 36,585 Other Commonwealth research grants 48,559 58,249 48,559 58,249 Other Commonwealth grants 26,620 24,417 16,985 20,017Total non-capital grants 105,030 119,251 95,395 114,851
Capital Other grants - - - -Total capital grants - - - -
Total other Australian Government financial assistance 105,030 119,251 95,395 114,851
Total Australian Government grants 379,598 385,964 369,963 381,564
Accounting policyNational Health and Medical Research Council funding represents research grants to advance health and medical knowledge to improvethe health status of all Australians. This falls under AASB15 and the revenue is recognised over time as the grant funds are expended.This is on the basis that the grant agreements contain specific performance obligations including research data being made available tograntors on at least an annual basis.
The remaining revenue in this category consists of a mix of other operating and research grants provided by the CommonwealthGovernment.
Grants revenue recognition is determined by reference to the specific contract terms including enforceability and existence of sufficientlyspecific performance obligations. Grant agreements that contain specific performance obligations including research data being madeavailable to grantors on at least an annual basis falls under AASB15 and the revenue is recognised over time as the grant funds areexpended. If not, this falls under AASB1058 and revenue is recognised when received.
Australian Research Council funding represents grants to support the highest-quality fundamental and applied research and researchtraining. This falls under AASB15 and the revenue is recognised over time as the grant funds are expended. This is on the basis that thegrant agreements contain specific performance obligations including research data being made available to grantors on at least an annualbasis.
Grant that is considered "shared" if part of a payment is passed from the primary recipient to another party according to a grant, contractor other enforceable agreement. This falls under AASB9 and recognise as a liability which extinguishes as the Group transfer the grant.
12

80 The University of Western Australia | uwa.edu.au
NOTES TO THE FINANCIAL STATEMENTSfor the year ended 31 December 2020
(f) Higher Education Loan Programs HECS-HELP 7.8(b) 102,172 98,112 102,172 98,112 FEE-HELP 7.8(b) 16,707 18,474 16,707 18,474 SA-HELP 7.8(b) 2,142 1,480 2,142 1,480Total Higher Education Loan Programs 121,021 118,066 121,021 118,066
Total Australian Government financial assistance 500,619 504,030 490,984 499,630
Accounting policy
2.2 Consolidated University2020 2019 2020 2019$'000 $'000 $'000 $'000
Non-capitalWestern Australian research grants 17,145 16,872 17,145 16,872Western Australian other grants 29,237 29,090 23,824 19,481Local Government research grants 6 150 6 150Total non-capital grants 46,388 46,112 40,975 36,503
CapitalOther grants - - - -Total capital grants - - - -
46,388 46,112 40,975 36,503
Accounting policyThe revenue in this category consists of a mix of operating and research grants provided by state and local governments.
Grants revenue recognition is determined by reference to the specific contract terms including enforceability and existence of sufficientlyspecific performance obligations. Grant agreements that contain specific performance obligations including research data being madeavailable to grantors on at least an annual basis falls under AASB15 and the revenue is recognised over time as the grant funds areexpended. If not, this falls under AASB1058 and revenue is recognised when received.
Western Australian and Local Government financial assistance
Total Western Australian and Local Government financial assistance
HELP represents financial assistance provided by the Commonwealth Government (in the form of a loan between the government and thestudent) that allows eligible students to pay their student contribution amounts (HECS-HELP), tuition fees (FEE-HELP), and studentservices and amenities fee (SA-HELP). This falls under AASB15 and the revenue is recognised over time as the students receive thetuition services and the amenities.
13

8120
20 Financial R
eport | uwa.edu.au
81
NOTES TO THE FINANCIAL STATEMENTSfor the year ended 31 December 2020
2.3 Fees and charges Consolidated University2020 2019 2020 2019$'000 $'000 $'000 $'000
Course fees and chargesFee-paying overseas students - onshore courses 138,227 149,576 138,227 149,576Fee-paying overseas students - offshore courses 1,510 1,442 1,510 1,442Continuing education and short courses 6,442 11,659 6,442 11,659Fee-paying domestic postgraduate students 5,730 6,489 5,730 6,489Total course fees and charges 151,909 169,166 151,909 169,166
Other non-course fees and chargesStudent Services and Amenities Fees from students 3,312 4,090 3,312 4,090Student accommodation 7,071 8,637 7,071 8,637Parking fees 2,412 3,334 2,410 3,334Registration fees 8,545 11,034 8,526 10,900Rental and hire charges 2,174 3,093 959 1,140Other 758 895 758 895Total non-course fees and charges 24,272 31,083 23,036 28,996
Total fees and charges 176,181 200,249 174,945 198,162
Accounting policy
2.4 Net investment revenue and income Consolidated University2020 2019 2020 2019$'000 $'000 $'000 $'000
Investment revenueDividend income 3,994 693 3,994 693Interest income 1,172 1,670 1,157 1,560Trust distributions 21,315 30,471 21,315 30,471Imputation credits 3,547 6,542 3,547 6,542Total investment revenue 30,028 39,376 30,013 39,266
Other investment incomeOther investment income 2,632 2,890 2,632 2,890Total other investment income 2,632 2,890 2,632 2,890
Investment gains/(losses)Fair value gain/(loss) on other financial assets 23,025 81,432 23,025 81,432Fair value gain/(loss) on investment properties 2,886 4,840 2,886 4,840Total investment gains/(losses) 25,911 86,272 25,911 86,272
Net investment revenue and income 58,571 128,538 58,556 128,428
Accounting policyInterest
Dividends, trust distributions and imputation credits
Investment gains/(losses)
Course fees and charges relate to undergraduate programs, graduate and professional degree programs, and continuing education andexecutive programs. It excludes fees and charges for Commonwealth Government funded courses (this is categorised separately asAustralian Government Financial Assistance). This falls under AASB15 and the revenue is recognised over time as the students receivethe tuition services.
Student services and amenities fee revenue is derived when a student pays their fee up-front to the University (and does not enter into aSA-HELP loan arrangement with the Commonwealth Government if eligible to do so). This falls under AASB15 and the revenue isrecognised over time as the students receive the student services and amenities.
Other non-course fees and charges include student accommodation, parking fees etc.Revenue is recognised:- Over time as and when the service is provided, such as student accommodation.- At a point in time when the income has been received from the student, such as parking fees and registration fees.
Recognised on an accruals basis taking into account interest rates applicable to the financial assets.
Revenue is recognised when (a) the Group's right to receive the payment is established, which is generally when shareholders approvethe dividend, (b) it is probable that the economic benefits associated with the dividend will flow to the entity; and (c) the amount of thedividend can be measured reliably.
Refer to note 5.3 and 6.2 for the accounting policy for investment gains/(losses).
14

82 The University of Western Australia | uwa.edu.au
NOTES TO THE FINANCIAL STATEMENTSfor the year ended 31 December 2020
2.5 Consultancy and other contracts Consolidated University2020 2019 2020 2019$'000 $'000 $'000 $'000
International research grants 19,550 12,946 19,550 12,946Philanthropic research grants 243 266 243 266Industry and other research grants 52,304 48,192 52,304 48,192Consultancy 8,076 7,177 8,076 7,177Total consultancy and contracts 80,173 68,581 80,173 68,581
Accounting policyResearch grants
2.6 Other revenue and income Consolidated University2020 2019 2020 2019$'000 $'000 $'000 $'000
Sales of goods and services 14,055 17,224 6,421 6,721Donations and bequests 37,423 41,625 36,553 40,525Salary contributions from external parties 20,310 23,079 20,431 23,161Expense recoveries 6,003 8,617 6,538 9,084Sponsorships 6,359 6,213 4,571 4,005Scholarships and prizes 643 183 643 183Rental income 5,812 6,517 5,806 6,502Other general grants 8,495 4,324 8,671 4,328Performance and production 3,819 4,712 - -Insurance claim income 1,129 863 1,323 988Subscriptions 290 291 290 291Conference and symposium Income 504 1,078 504 1,078Property management income - - 6,613 5,866Other 5,799 6,079 4,120 4,409Total other revenue 110,641 120,805 102,484 107,141
Accounting policy
Critical accounting estimates and judgements: The Group receives funding from a number of external sources. In preparing these financial statements the Group exercises judgement indetermining whether certain sources of funding meet the definition of a contribution, revenue, or a reduction to associated costs. Salarycontributions totalling $20.3 million (2019: $23.1 million) received have been designated as contract income and recorded within totalconsolidated income from continuing operations. Changing the classification of these amounts, to net them off against associatedexpenses, would not change the net operating result for the period, but would reduce total income and expenses.
Sale of goods includes the sale of books, food and drink. This falls under AASB15 and the revenue is recognised when the promisedgoods are provided to the customer (i.e. when the customer obtains control).
Sale of services includes the provision of professional examinations, catered functions and event production and organisation. This fallsunder AASB15 and the revenue is recognised when the promised service is provided to the customer.
Donations and bequests consist of voluntary, unencumbered gifts where no material benefit or advantage is received by the donor. Alldonations and bequests fall under AASB1058 (as there are no performance obligations on how the supporting activity is to be undertaken)and the revenue is recognised when received.
Salary contributions from external parties are recognised as income by the Group over time as and when the service is provided to thecustomer.
Scholarships (stipends) represent funds received by the Group from non-government entities to provide support to students to further theireducation. This falls under AASB9 and recognise as a financial liability which extinguishes as the Group provides the scholarships.
Other revenue consists of other small revenue items that are not classified elsewhere. They fall under AASB1058 and the revenue isrecognised when received.
Consultancy revenue is derived when a customer accesses the skills and expertise of the Group’s staff and/or is provided access toequipment or facilities. This falls under AASB15 and the revenue is recognised when the promised good or service is transferred to thecustomer.
Contract research revenue represents grants received from non-government entities that relate to research and experimentaldevelopment. This falls under AASB15 and the revenue is recognised over time as the grant funds are expended. This is on the basis thatthe grant agreements contain specific performance obligations including research data being made available to grantors on at least anannual basis.
Revenue recognition is determined by reference to the specific contract terms including enforceability and existence of sufficiently specificperformance obligations. Agreements that contain specific performance obligations including research data being made available tograntors on at least an annual basis falls under AASB15 and the revenue is recognised over time as the grant funds are expended. If not,this falls under AASB1058 and revenue is recognised when received.
15
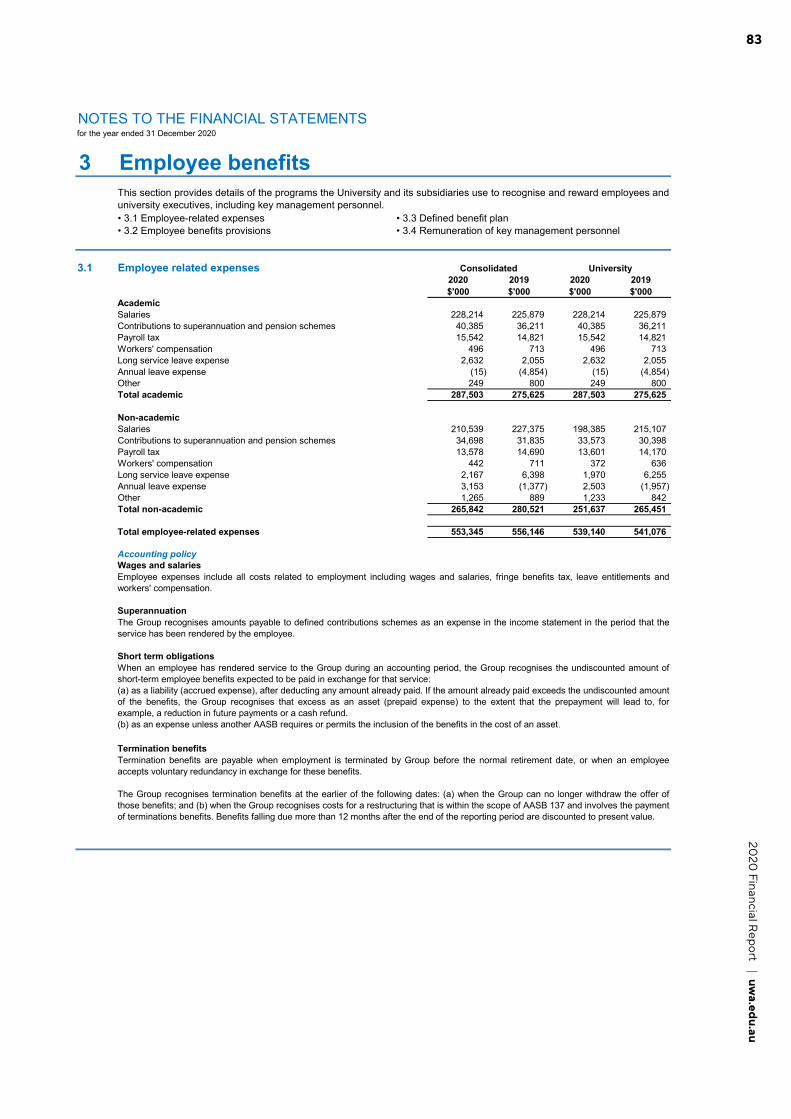
8320
20 Financial R
eport | uwa.edu.au
83
3 Employee benefits
• 3.1 Employee-related expenses • 3.3 Defined benefit plan • 3.2 Employee benefits provisions • 3.4 Remuneration of key management personnel
3.1 Employee related expenses Consolidated University2020 2019 2020 2019$'000 $'000 $'000 $'000
AcademicSalaries 228,214 225,879 228,214 225,879Contributions to superannuation and pension schemes 40,385 36,211 40,385 36,211Payroll tax 15,542 14,821 15,542 14,821Workers' compensation 496 713 496 713Long service leave expense 2,632 2,055 2,632 2,055Annual leave expense (15) (4,854) (15) (4,854)Other 249 800 249 800Total academic 287,503 275,625 287,503 275,625
Non-academicSalaries 210,539 227,375 198,385 215,107Contributions to superannuation and pension schemes 34,698 31,835 33,573 30,398Payroll tax 13,578 14,690 13,601 14,170Workers' compensation 442 711 372 636Long service leave expense 2,167 6,398 1,970 6,255Annual leave expense 3,153 (1,377) 2,503 (1,957)Other 1,265 889 1,233 842Total non-academic 265,842 280,521 251,637 265,451
Total employee-related expenses 553,345 556,146 539,140 541,076
Accounting policyWages and salaries
Superannuation
Short term obligations
Termination benefitsTermination benefits are payable when employment is terminated by Group before the normal retirement date, or when an employeeaccepts voluntary redundancy in exchange for these benefits.
The Group recognises termination benefits at the earlier of the following dates: (a) when the Group can no longer withdraw the offer ofthose benefits; and (b) when the Group recognises costs for a restructuring that is within the scope of AASB 137 and involves the paymentof terminations benefits. Benefits falling due more than 12 months after the end of the reporting period are discounted to present value.
When an employee has rendered service to the Group during an accounting period, the Group recognises the undiscounted amount ofshort-term employee benefits expected to be paid in exchange for that service:(a) as a liability (accrued expense), after deducting any amount already paid. If the amount already paid exceeds the undiscounted amountof the benefits, the Group recognises that excess as an asset (prepaid expense) to the extent that the prepayment will lead to, forexample, a reduction in future payments or a cash refund.(b) as an expense unless another AASB requires or permits the inclusion of the benefits in the cost of an asset.
for the year ended 31 December 2020NOTES TO THE FINANCIAL STATEMENTS
This section provides details of the programs the University and its subsidiaries use to recognise and reward employees anduniversity executives, including key management personnel.
Employee expenses include all costs related to employment including wages and salaries, fringe benefits tax, leave entitlements andworkers' compensation.
The Group recognises amounts payable to defined contributions schemes as an expense in the income statement in the period that theservice has been rendered by the employee.
16

84 The University of Western Australia | uwa.edu.au
for the year ended 31 December 2020NOTES TO THE FINANCIAL STATEMENTS
3.2 Employee benefits provisions Consolidated University2020 2019 2020 2019$'000 $'000 $'000 $'000
Current provisions
Expected to be settled within 12 monthsAnnual leave 26,037 24,988 25,568 24,518Long service leave 9,467 8,997 9,334 8,867Employment on-costs provision 2,299 2,202 2,299 2,202Purchased leave (558) - (558) -
Expected to be settled after more than 12 monthsAnnual leave 7,021 5,868 6,895 5,758Long service leave 48,970 45,422 48,282 44,763Employment on-costs provision 3,647 3,340 3,649 3,340
Total current provisions 96,883 90,817 95,469 89,448
Non-current provisionsDefined benefit obligation 2,649 3,217 2,649 3,217Long service leave 9,889 9,281 9,815 9,226Employment on-costs provision 657 618 657 618Total non-current provisions 13,195 13,116 13,121 13,061
Total employee benefits provision 110,078 103,933 108,590 102,509
Accounting policyAnnual leave
Long service leave
Purchased leave
Critical accounting estimates and judgements: Long service leave
Annual leave is classified as a current provision as the Group does not have an unconditional right to defer the settlement of the liabilityfor at least twelve months after the reporting period, however the liability is not expected to be settled in full within twelve months of thereporting period. The annual leave liability is recognised and measured at the present value of amounts expected to be paid when theliabilities are settled using the remuneration rate expected to apply at the time of settlement.
The liability for long service leave is recognised in the provision for employee benefits and measured at the present value of expectedfuture payments to be made in respect of services provided by employees up to the reporting date using the projected unit credit method.Consideration is given to expected future wage and salary levels, experience of employee departures and periods of service. Expectedfuture payments are discounted using market yields at the reporting date on national government bonds with terms to maturity andcurrency that match, as closely as possible, the estimated future cash outflows.
Several estimations and assumptions used in calculating the Group’s long service leave provision include expected future salary rates,discount rates, employee retention rates and expected future payments. Changes in these estimations and assumptions may impact onthe carrying amount of the long service leave provision.
The Group entered into an Employee Agreement Variation in July 2020, which included the requirement for staff to purchase leave as partof the response to COVID-19. Leave taken in excess of purchase leave payment at the reporting date is set-off against employeeprovision.
17

8520
20 Financial R
eport | uwa.edu.au
85
for the year ended 31 December 2020NOTES TO THE FINANCIAL STATEMENTS
3.3 Defined benefit plan
The following table discloses details pertaining to the defined benefit plan.
2020 2019 2020 2019$'000 $'000 $'000 $'000
Amounts recognised in the income statementCurrent service cost - - - -Interest cost 33 68 33 68Total included in employee benefits expenses 33 68 33 68
Amounts recognised in other comprehensive incomeActuarial gains/(losses) (58) (230) (58) (230)Total included in other comprehensive income (58) (230) (58) (230)
Amounts included in the statement of financial positionPresent value of the defined benefit obligations 2,649 3,217 2,649 3,217Net liability arising from defined benefit obligations 2,649 3,217 2,649 3,217
Accounting policyThe Group meets the benefits of the schemes as they fall due and are paid from fund held in the Medium Term Pool investment. Thereare no plan assets within the scheme.
The present value of the defined benefit obligation is based on expected future payments which arise from membership of the fund to thereporting date, calculated annually by independent actuaries using the projected unit credit method. Expected future payments arediscounted using market yields at the reporting date on national government bonds with terms to maturity and currency that match, asclosely as possible, the estimated future cash outflows.
Consolidated University
Actuarial gains and losses arising from experience adjustments and changes in actuarial assumptions are recognised in the period inwhich they occur in other comprehensive income. Past service costs are recognised immediately in income, unless the changes to thesuperannuation fund are conditional on the employees remaining in service for a specified period of time (the vesting period). In this case,the past service costs are amortised on a straight-line basis over the vesting period.
A group of employees are entitled, on retirement, death or disablement, to defined benefits under The University of Western AustraliaSupplementary Pension Scheme or University of Western Australia Supplementary Benefit Scheme. The Schemes provide pension andlump sum benefits respectively. The Schemes are not regulated superannuation plans. There are a number of risks to which the benefitsexposes the University, the more significant risks are salary growth risk and longevity risk.
18

86 The University of Western Australia | uwa.edu.au
for the year ended 31 December 2020NOTES TO THE FINANCIAL STATEMENTS
3.4 Remuneration of key management personnel
(a) Key management personnelKey management personnel comprises the Senate members and the University executives.
(b) Key management personnel compensation 2020 2019 2020 2019$'000 $'000 $'000 $'000
Short-term employee benefits 1,379 1,425 2,591 3,275Post-employment benefits 116 104 560 636Other long-term benefits 142 167 305 424Termination benefits - - 950 -Total remuneration of key management personnel 1,637 1,696 4,406 4,335
(c) 2020 2019 2020 2019
Nil to $9,999 15 15 - -$20,000 - $29,999 1 ^ - - 1 ^$30,000 - $39,999 1 ^ - - -$50,000 - $59,999 - - 1^ -$120,000 - $129,999 1 - - -$140,000 - $149,999 - 1 - -$160,000 - $169,999 - 1 - -
$230,000 - $239,999 1 - 1 ^ -$240,000 - $249,999 2 ^ - - -$260,000 - $269,999 - - 2 ^ -$280,000 - $289,999 - 1 - -$290,000 - $299,999 - - - 1 ^
$340,000 - $349,999 - - - 1$360,000 - $369,999 1 ^ - - -$370,000 - $379,000 1 ^ - 1 -$380,000 - $389,999 - - 1 ^ -
$430,000 - $439,999 - - 1 -$440,000 - $449,999 - - - 2
$510,000 - $519,999 - - - 2$540,000 - $549,999 - - - 1 ^$550,000 - $559,999 * - - 2 ^ -$560,000 - $569,999 - - - 1$570,000 - $579,999 * - - 1 ^ -$630,000 - $639,999 - - - 1
$700,000 - $709,999 * - - 1 ^ -
$1,090,000 - $1,099,999 - 1 - -
* These include termination benefit payments made.
Senate members University executives
Remuneration of the University's Senate members and executives#
Number Number
Senate members
^ Include employees who became or ceased to be key management personnel during the year.
# As required by AASB 124 Related Party Disclosures, total remuneration of the University’s Senate members and executives includessalaries plus payroll on-costs including an accrual reflecting annual leave and long service leave entitlements, as well as post-employmentsuperannuation costs and termination benefits. Members of the University's Senate do not receive remuneration for being a member ofthe Senate. In 2020, 15 members of Senate received nil remuneration. The remaining 8 members, who were University employees duringthe year, received remuneration for the services performed in their substantive position at the University.
University executives
19

8720
20 Financial R
eport | uwa.edu.au
87
4 Our expenditure
4.1 Expenses Consolidated University2020 2019 2020 2019$'000 $'000 $'000 $'000
(a) Depreciation and amortisationDepreciation 47,232 44,869 46,876 44,484Amortisation 7,488 5,417 7,488 5,417Total depreciation and amortisation 54,720 50,286 54,364 49,901
(b) Repairs and maintenanceBuilding repairs and maintenance 13,764 15,776 13,794 15,752Ground maintenance 4,027 4,518 4,027 4,518General repairs and maintenance 2,913 3,209 2,685 3,104Total repairs and maintenance 20,704 23,503 20,506 23,374
(c) Borrowing costsBorrowing costs 6,285 5,942 6,279 5,937Total borrowing costs 6,285 5,942 6,279 5,937
(d) Impairment of assetsProperty, plant and equipment 3,480 241 3,480 241Total impairment of assets 3,480 241 3,480 241
(e) Student expensesScholarships and studentships 36,831 36,639 36,811 36,606Grants and prizes 880 3,590 1,561 3,598Amenities and services expenses 4,351 2,751 4,351 4,126Total student expenses 42,062 42,980 42,723 44,330
(f) Materials and suppliesLaboratory, workshop and medical supplies 16,471 18,431 16,272 18,489General office expenses 4,355 6,247 4,110 5,786Other general consumables and supplies 5,305 7,533 3,718 4,480Total materials and supplies 26,131 32,211 24,100 28,755
(g) Grants distributedGrants distributed 86,525 70,811 86,823 71,286Total grants distributed 86,525 70,811 86,823 71,286
(h) TravelTravel 4,158 19,140 4,124 18,824Total travel 4,158 19,140 4,124 18,824
(i) Professional feesProfessional fees 32,330 37,054 32,040 37,208Total professional fees 32,330 37,054 32,040 37,208
(j) Losses on disposal of assetsLosses on disposal of assets - 176 - 101Total losses on disposal of assets - 176 - 101
(k) Other expensesComputing costs 24,515 23,077 24,010 22,820Books, periodicals and electronic library resources 7,869 9,220 7,858 9,200Utilities and rates 12,321 13,844 12,242 13,826Non-capital equipment purchases 5,511 9,972 5,447 9,863Performance and production costs 10,303 9,872 - -Insurance 5,192 3,967 5,230 3,992Advertising, marketing and promotional expenses 5,079 7,689 3,942 6,323Conference and course fees 841 3,771 866 3,738Rental, hire and leasing fees 2,893 4,204 3,074 4,450Cleaning and waste disposal 6,276 7,127 6,025 6,835Intellectual property, royalties and commissions 11,868 13,072 11,868 13,072Loss on disposal of discontinued operations - - - 3,507Other miscellaneous expenses 15,807 22,209 16,640 23,544Total other expenses 108,475 128,024 97,202 121,170
Total non-employee related expenses 384,870 410,368 371,641 401,127
Accounting policy
NOTES TO THE FINANCIAL STATEMENTSfor the year ended 31 December 2020
This section provides details information on the expenses incurred in running the University and its subsidiaries.
Expenses, other than depreciation and amortisation, are applied to the income statement during the financial year in which they areincurred, on an accruals basis.
Refer to notes 5.4 and 5.5 for the accounting policy for depreciation and amortisation.
20

88 The University of Western Australia | uwa.edu.au
5 Operating assets and liabilities
• 5.1 Receivables and contract assets • 5.5 Property, plant and equipment• 5.2 Other non-financial assets • 5.6 Trade and other payables• 5.3 Investment properties • 5.7 Contract and other liabilities• 5.4 Intangible assets
5.1 Receivables and contract assets Consolidated University2020 2019 2020 2019$'000 $'000 $'000 $'000
CurrentTrade receivables 28,363 33,936 28,035 32,684Less: Allowances for expected credit losses (2,082) (1,847) (2,060) (1,823)
26,281 32,089 25,975 30,861Accrued income 15,026 21,989 14,754 22,222Total current receivables 41,307 54,078 40,729 53,083
Contract Assets 9,544 1,057 9,544 1,057
Total current receivables and contract assets 50,851 55,135 50,273 54,140
Non-currentTrade receivables 15 53 15 53Total non-current receivables and contract assets 15 53 15 53
Total receivables and contract assets 50,866 55,188 50,288 54,193
Set out below is the movement in the allowance for expected credit losses of trade receivables:
At 1 January 1,847 2,142 1,823 2,114Additions 1,166 529 1,150 533Write-off (931) (824) (912) (824)At 31 December 2,082 1,847 2,061 1,823
Accounting policy
Expected credit losses
The information about the credit exposures are disclosed in Note 6.4 Financial Risk Management
For trade receivables the Group applies a simplified approach in calculating expected credit losses (ECLs). Therefore, the Group does nottrack changes in credit risk, but instead recognises a loss allowance based on lifetime ECLs at each reporting date. The Group hasestablished a provision matrix that is based on its historical credit loss experience, adjusted for forward-looking factors specific to thedebtors and the economic environment.
Trade receivables are held to collect contractual cash flows and give rise to cash flows representing solely payments of principal andinterest. These are classified and measured as debt instruments at amortised cost. Trade receivables are due for settlement no more than14 days from the date of recognition.
NOTES TO THE FINANCIAL STATEMENTSfor the year ended 31 December 2020
This section provides information relating to the operating assets and liabilities of the University and its subsidiaries.
The Group assesses the expected credit losses associated with its trade and other receivables on a forward-looking basis. Covid-19 hasnot had a material impact on the loss allowances recognised at the end of the period.
Contract assetsContract asset are revenue receivables and represent right to payment for goods and services or research output that have beendelivered but considerations have not been received as at reporting date. This arises where expenditure has occurred under a researchand/or non-research grant and the grant funds have not yet been received.
21

8920
20 Financial R
eport | uwa.edu.au
89
NOTES TO THE FINANCIAL STATEMENTSfor the year ended 31 December 2020
5.2 Other non-financial assets Consolidated University2020 2019 2020 2019$'000 $'000 $'000 $'000
CurrentAdvances and prepayments 22,531 22,182 22,260 20,754Total current other non-financial assets 22,531 22,182 22,260 20,754
Non-currentAdvances and prepayments 4,267 4,623 4,267 4,623Total non-current other non-financial assets 4,267 4,623 4,267 4,623
Total other non-financial assets 26,798 26,805 26,527 25,377
Advances and prepayments include $1.4 million of prepayments for property, plant and equipment (2019: $3.7 million).
Accounting policy
5.3 Investment properties Consolidated University2020 2019 2020 2019$'000 $'000 $'000 $'000
At fair valueOpening balance at 1 January 32,072 27,232 32,072 27,232Net gain/(loss) from fair value adjustment 2,886 4,840 2,886 4,840Closing balance at 31 December 34,958 32,072 34,958 32,072
Accounting policy
Critical accounting estimates and judgements: Valuation of investment properties The Group carried its investment properties at fair value with changes in the fair values recognised in the income statement. It obtainsindependent valuations at least annually. At the end of the reporting period the Group updates its assessment of the fair value of eachproperty, taking into account the most recent valuations. Where an investment property is acquired at no cost or for nominal consideration,its cost shall be deemed to be its fair value as at the date of acquisition.
The Group recognises a prepayment as an asset when the payments for goods and services have been made in advance of the Groupobtaining a right to access those goods and services.
Initially, investment properties are measured at cost including transaction costs. Subsequent to initial recognition, investment propertiesare stated at fair value determined annually by an external valuer. Any gains or losses arising from changes in the fair values ofinvestment properties are included in the income statement in the year in which they arise.
Fair value consists of the amounts for which properties could be exchanged between willing parties in an arm's length transaction, basedon comparable market transactions.
22

90 The University of Western Australia | uwa.edu.au
NOTES TO THE FINANCIAL STATEMENTSfor the year ended 31 December 2020
5.4 Intangible assetsConsolidated and University
Software
Software work in
progress
Electronic library
resources Total$'000 $'000 $'000 $'000
At 1 January 2019Cost 11,129 7,450 47,053 65,632Accumulated amortisation and impairment (11,129) - (19,895) (31,024)Net book value - 7,450 27,158 34,608
Year ended 31 December 2019Opening net book value - 7,450 27,158 34,608Additions - 6,529 7,014 13,543Disposals - - - -Amortisation (552) - (4,865) (5,417)Transfer 6,520 (6,520) - -Closing net book value 5,968 7,459 29,307 42,734
At 31 December 2019Cost 17,649 7,459 54,067 79,175Accumulated amortisation and impairment (11,681) - (24,760) (36,441)Net book value 5,968 7,459 29,307 42,734
Year ended 31 December 2020Opening net book value 5,968 7,459 29,307 42,734Additions - 8,148 629 8,777Disposals - - - -Amortisation (2,285) - (5,203) (7,488)Transfer 3,673 (3,673) - -Closing net book value 7,356 11,934 24,733 44,023
At 31 December 2020Cost 21,322 11,934 54,696 87,952Accumulated amortisation and impairment (13,966) - (29,963) (43,929)Net book value 7,356 11,934 24,733 44,023
Accounting policy
The amortisation rate policy is as follows:
Asset Class Amortisation rate Amortisation methodSoftware 20% Straight lineElectronic library resources 10% Straight line
Impairment testing is performed when an indicator of impairment is identified.
SoftwareSoftware includes both acquired and internally generated software, and is stated at historic cost less amortisation and, where applicable,any impairment losses.
Electronic library resourcesElectronic library resources can be categorised into perpetual access and annual subscriptions. Perpetual access based resources arecapitalised and amortised 10 per cent annually over 10 years. Annual subscriptions are expensed as incurred.
23

9120
20 Financial R
eport | uwa.edu.au
91
5.5
Pr
oper
ty, p
lant
and
equ
ipm
ent a
nd A
sset
s cl
assi
fied
as h
eld
for s
ale
5.5
(a)
Prop
erty
, pla
nt a
nd e
quip
men
tFr
eeho
ld
Leas
ehol
dB
uild
ings
Wor
k in
Plan
t and
A
rtw
orks
Libr
ary
Rig
ht o
fSp
ecia
l To
tal
land
land
prog
ress
equi
pmen
tbo
oks
Use
Ass
ets
colle
ctio
nsN
otes
$'00
0$'
000
$'00
0$'
000
$'00
0$'
000
$'00
0$'
000
$'00
0$'
000
Con
solid
ated
At 1
Jan
uary
201
9C
ost
189,
075
80,0
001,
096,
571
53,7
6826
2,57
629
,392
10,5
68-
66,5
181,
788,
468
Accu
mul
ated
dep
reci
atio
n-
-(2
12,6
57)
-(2
05,8
83)
-(6
,672
)-
-(4
25,2
12)
Accu
mul
ated
impa
irmen
t(1
,873
)-
(12,
339)
--
--
-(2
1,01
8)(3
5,23
0)N
et b
ook
valu
e18
7,20
280
,000
871,
575
53,7
6856
,693
29,3
923,
896
-45
,500
1,32
8,02
6
Year
end
ed 3
1 D
ecem
ber 2
019
Ope
ning
net
boo
k va
lue
187,
202
80,0
0087
1,57
553
,768
56,6
9329
,392
3,89
61,
254
45,5
001,
329,
280
Addi
tions
--
2256
,965
19,4
0326
028
5-
603
77,5
38D
ispo
sals
--
(182
)-
(347
)-
--
-(5
29)
Dep
reci
atio
n-
-(2
2,76
4)-
(20,
331)
-(1
,069
)(7
05)
-(4
4,86
9)Im
pairm
ent
(181
)-
(60)
--
--
--
(241
)Tr
ansf
er-
-6,
931
(19,
201)
12,2
70-
--
--
Tran
sfer
of c
arry
ing
amou
nt to
ass
ets
held
for s
ale
(2,0
00)
-(2
50)
--
--
--
(2,2
50)
Clo
sing
net
boo
k va
lue
185,
021
80,0
0085
5,27
291
,532
67,6
8829
,653
3,11
254
946
,103
1,35
8,92
9
At 3
1 D
ecem
ber 2
019
Cos
t18
7,07
580
,000
1,10
2,25
791
,532
289,
465
29,6
5210
,853
1,25
467
,121
1,85
9,20
9Ac
cum
ulat
ed d
epre
ciat
ion
--
(235
,140
)-
(221
,777
)-
(7,7
41)
(705
)-
(465
,363
)Ac
cum
ulat
ed im
pairm
ent
(2,0
54)
-(1
1,84
5)-
--
--
(21,
018)
(34,
917)
Net
boo
k va
lue
185,
021
80,0
0085
5,27
291
,532
67,6
8829
,652
3,11
254
946
,103
1,35
8,92
9
Year
end
ed 3
1 D
ecem
ber 2
020
Ope
ning
net
boo
k va
lue
185,
021
80,0
0085
5,27
291
,532
67,6
8829
,652
3,11
254
946
,103
1,35
8,92
9Ad
ditio
ns-
-57
342
,604
11,1
1642
020
22,
120
113
57,1
48D
ispo
sals
--
(300
)(1
38)
(101
)(3
08)
--
-(8
47)
Dep
reci
atio
n-
-(2
5,18
8)-
(19,
877)
-(9
61)
(1,2
06)
-(4
7,23
2)Im
pairm
ent
(89)
-(2
,517
)(8
74)
--
--
-(3
,480
)Tr
ansf
er-
-97
,560
(98,
746)
1,18
6-
--
--
Tran
sfer
of c
arry
ing
amou
nt to
ass
ets
held
for s
ale
--
--
--
--
--
Clo
sing
net
boo
k va
lue
184,
932
80,0
0092
5,40
034
,378
60,0
1229
,764
2,35
31,
463
46,2
161,
364,
518
At 3
1 D
ecem
ber 2
020
Cos
t18
7,07
580
,000
1,19
9,88
635
,252
287,
007
29,7
6411
,055
2,38
467
,234
1,89
9,65
7Ac
cum
ulat
ed d
epre
ciat
ion
--
(260
,124
)-
(226
,995
)-
(8,7
02)
(921
)-
(496
,742
)Ac
cum
ulat
ed im
pairm
ent
(2,1
43)
-(1
4,36
2)(8
74)
--
--
(21,
018)
(38,
397)
Net
boo
k va
lue
184,
932
80,0
0092
5,40
034
,378
60,0
1229
,764
2,35
31,
463
46,2
161,
364,
518
NO
TES
TO T
HE
FIN
ANC
IAL
STAT
EMEN
TS
for t
he y
ear e
nded
31
Dec
embe
r 202
0
24

92 The University of Western Australia | uwa.edu.au
5.5
Pr
oper
ty, p
lant
and
equ
ipm
ent a
nd A
sset
s cl
assi
fied
as h
eld
for s
ale
5.5
(a)
Prop
erty
, pla
nt a
nd e
quip
men
tFr
eeho
ld
Leas
ehol
dB
uild
ings
Wor
k in
Plan
t and
A
rtw
orks
Libr
ary
Rig
ht o
fSp
ecia
l To
tal
land
land
prog
ress
equi
pmen
tbo
oks
Use
Ass
ets
colle
ctio
nsN
otes
$'00
0$'
000
$'00
0$'
000
$'00
0$'
000
$'00
0$'
000
$'00
0$'
000
NO
TES
TO T
HE
FIN
ANC
IAL
STAT
EMEN
TS
for t
he y
ear e
nded
31
Dec
embe
r 202
0
Uni
vers
ity
At 1
Jan
uary
201
9C
ost
189,
075
80,0
001,
095,
294
53,6
1726
0,84
829
,392
10,5
69-
66,5
181,
785,
313
Accu
mul
ated
dep
reci
atio
n-
-(2
12,1
30)
-(2
04,7
60)
-(6
,673
)-
-(4
23,5
63)
Accu
mul
ated
impa
irmen
t(1
,873
)-
(12,
339)
--
--
-(2
1,01
8)(3
5,23
0)N
et b
ook
valu
e18
7,20
280
,000
870,
825
53,6
1756
,088
29,3
923,
896
-45
,500
1,32
6,52
0
Year
end
ed 3
1 D
ecem
ber 2
019
Ope
ning
net
boo
k va
lue
187,
202
80,0
0087
0,82
553
,617
56,0
8829
,392
3,89
61,
254
45,5
001,
327,
775
Addi
tions
--
2256
,616
19,3
3026
028
5-
603
77,1
16D
ispo
sals
--
(41)
-(3
41)
(308
)-
--
(690
)D
epre
ciat
ion
--
(22,
728)
-(1
9,98
2)-
(1,0
69)
(705
)-
(44,
484)
Impa
irmen
t(1
81)
-(6
0)-
--
--
-(2
41)
Tran
sfer
--
6,93
1(1
8,96
8)12
,037
--
--
-Tr
ansf
er o
f car
ryin
g am
ount
to a
sset
s he
ld fo
r sal
e(2
,000
)-
(250
)-
--
--
-(2
,250
)C
losi
ng n
et b
ook
valu
e18
5,02
180
,000
854,
699
91,2
6567
,133
29,3
443,
112
549
46,1
031,
357,
226
At 3
1 D
ecem
ber 2
019
Cos
t18
7,07
580
,000
1,10
1,19
191
,265
286,
660
29,3
4410
,854
1,25
467
,121
1,85
4,76
4Ac
cum
ulat
ed d
epre
ciat
ion
--
(234
,647
)-
(219
,527
)-
(7,7
42)
(705
)-
(462
,621
)Ac
cum
ulat
ed im
pairm
ent
(2,0
54)
-(1
1,84
5)-
--
--
(21,
018)
(34,
917)
Net
boo
k va
lue
185,
021
80,0
0085
4,69
991
,265
67,1
3329
,344
3,11
254
946
,103
1,35
7,22
6
Year
end
ed 3
1 D
ecem
ber 2
020
Ope
ning
net
boo
k va
lue
185,
021
80,0
0085
4,69
991
,265
67,1
3329
,344
3,11
254
946
,103
1,35
7,22
6Ad
ditio
ns-
-57
342
,604
10,6
9442
020
21,
964
113
56,5
70D
ispo
sals
--
(295
)-
(43)
--
--
(338
)D
epre
ciat
ion
--
(25,
105)
-(1
9,62
1)-
(961
)(1
,189
)-
(46,
876)
Impa
irmen
t(8
9)-
(2,5
17)
(874
)-
--
--
(3,4
80)
Tran
sfer
--
97,4
32(9
8,61
7)1,
185
--
--
-Tr
ansf
er o
f car
ryin
g am
ount
to a
sset
s he
ld fo
r sal
e-
--
--
--
--
-C
losi
ng n
et b
ook
valu
e18
4,93
280
,000
924,
787
34,3
7859
,348
29,7
642,
353
1,32
446
,216
1,36
3,10
2
At 3
1 D
ecem
ber 2
020
Cos
t18
7,07
580
,000
1,19
8,70
135
,252
283,
838
29,7
6411
,056
2,22
967
,234
1,89
5,14
9Ac
cum
ulat
ed d
epre
ciat
ion
--
(259
,552
)-
(224
,489
)-
(8,7
03)
(905
)-
(493
,649
)Ac
cum
ulat
ed im
pairm
ent
(2,1
43)
-(1
4,36
2)(8
74)
--
--
(21,
018)
(38,
397)
Net
boo
k va
lue
184,
932
80,0
0092
4,78
734
,378
59,3
4929
,764
2,35
31,
324
46,2
161,
363,
103
25
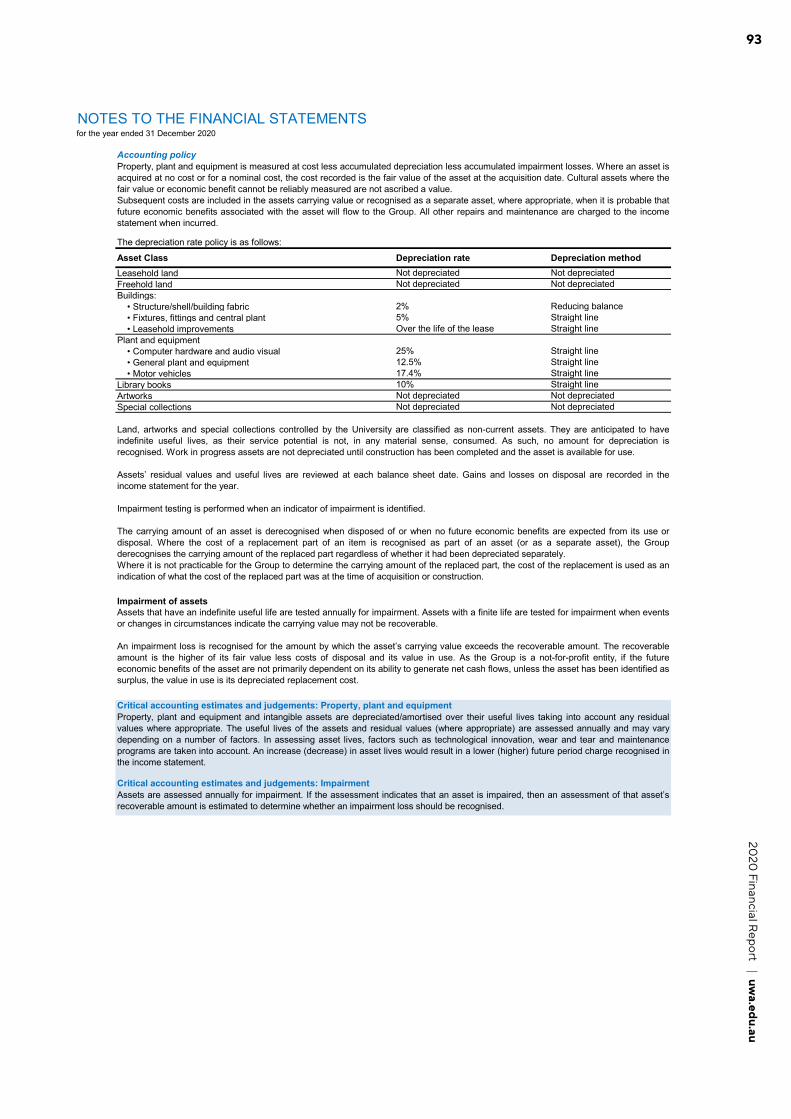
9320
20 Financial R
eport | uwa.edu.au
93
Accounting policy
The depreciation rate policy is as follows:
Asset Class Depreciation rate Depreciation methodLeasehold land Not depreciated Not depreciatedFreehold land Not depreciated Not depreciatedBuildings: • Structure/shell/building fabric 2% Reducing balance • Fixtures, fittings and central plant 5% Straight line • Leasehold improvements Over the life of the lease Straight linePlant and equipment • Computer hardware and audio visual 25% Straight line • General plant and equipment 12.5% Straight line • Motor vehicles 17.4% Straight lineLibrary books 10% Straight lineArtworks Not depreciated Not depreciatedSpecial collections Not depreciated Not depreciated
Impairment of assets
Critical accounting estimates and judgements: Property, plant and equipment
Critical accounting estimates and judgements: Impairment
NOTES TO THE FINANCIAL STATEMENTSfor the year ended 31 December 2020
Property, plant and equipment is measured at cost less accumulated depreciation less accumulated impairment losses. Where an asset isacquired at no cost or for a nominal cost, the cost recorded is the fair value of the asset at the acquisition date. Cultural assets where thefair value or economic benefit cannot be reliably measured are not ascribed a value.Subsequent costs are included in the assets carrying value or recognised as a separate asset, where appropriate, when it is probable thatfuture economic benefits associated with the asset will flow to the Group. All other repairs and maintenance are charged to the incomestatement when incurred.
Land, artworks and special collections controlled by the University are classified as non-current assets. They are anticipated to haveindefinite useful lives, as their service potential is not, in any material sense, consumed. As such, no amount for depreciation isrecognised. Work in progress assets are not depreciated until construction has been completed and the asset is available for use.
Assets’ residual values and useful lives are reviewed at each balance sheet date. Gains and losses on disposal are recorded in theincome statement for the year.
Impairment testing is performed when an indicator of impairment is identified.
The carrying amount of an asset is derecognised when disposed of or when no future economic benefits are expected from its use ordisposal. Where the cost of a replacement part of an item is recognised as part of an asset (or as a separate asset), the Groupderecognises the carrying amount of the replaced part regardless of whether it had been depreciated separately.Where it is not practicable for the Group to determine the carrying amount of the replaced part, the cost of the replacement is used as anindication of what the cost of the replaced part was at the time of acquisition or construction.
Assets that have an indefinite useful life are tested annually for impairment. Assets with a finite life are tested for impairment when eventsor changes in circumstances indicate the carrying value may not be recoverable.
An impairment loss is recognised for the amount by which the asset’s carrying value exceeds the recoverable amount. The recoverableamount is the higher of its fair value less costs of disposal and its value in use. As the Group is a not-for-profit entity, if the futureeconomic benefits of the asset are not primarily dependent on its ability to generate net cash flows, unless the asset has been identified assurplus, the value in use is its depreciated replacement cost.
Property, plant and equipment and intangible assets are depreciated/amortised over their useful lives taking into account any residualvalues where appropriate. The useful lives of the assets and residual values (where appropriate) are assessed annually and may varydepending on a number of factors. In assessing asset lives, factors such as technological innovation, wear and tear and maintenanceprograms are taken into account. An increase (decrease) in asset lives would result in a lower (higher) future period charge recognised inthe income statement.
Assets are assessed annually for impairment. If the assessment indicates that an asset is impaired, then an assessment of that asset’srecoverable amount is estimated to determine whether an impairment loss should be recognised.
26

94 The University of Western Australia | uwa.edu.au
NOTES TO THE FINANCIAL STATEMENTSfor the year ended 31 December 2020
Right-of-use assets
Consolidated University2020 2019 2020 2019
Right-of-use asset - Buildings $'000 $'000 $'000 $'000At 1 January 510 1,180 510 1,180Additions of right-of-use assets 2,120 - 1,964 -Depreciation charge (1,171) (670) (1,155) (670)At 31 December 1,459 510 1,319 510
Right-of-use asset - EquipmentAt 1 January 39 74 39 74Additions of right-of-use assets - - - -Depreciation charge (34) (35) (34) (35)At 31 December 5 39 5 39
Accounting policyLeases
5.5 (b) Assets classified as held for sales
Right-of-use assets predominately relate to long-term property leases.
Assessment of whether a contract is, or contains, a lease
At inception of a contract, the Group assesses whether a contract is, or contains, a lease. A contract is, or contains, a lease if the contractconveys a right to control the use of an identified asset for a period of time in exchange for consideration.
The Group assesses whether:a. The contract involves the use of an identified asset. The asset may be explicitly or implicitly specified in the contract.b. The customer has the right to obtain substantially all of the economic benefits from the use of the asset throughout the period of use.c. The customer has the right to direct the use of the asset throughout the period of use. The customer is considered to have the right todirect the use of the asset only if either:cci. The customer has the right to direct how and for what purpose the identified asset is used throughout the period of use; orccii. The relevant decisions about how and for what purposes the asset is used is predetermined and the customer has the right to operateccccthe asset, or the customer designed the asset in a way that predetermines how and for what purpose the asset will be used throughout the period of use.
Accounting for leases – Group as lesseeIn contracts where the Group is a lessee, the Group recognises a right-of-use asset and a lease liability at the commencement date of the lease, unless the short-term or low-value exemption is applied.
Right-of-use assetA right-of-use asset is initially measured at cost, comprising the initial measurement of the lease liability adjusted for any lease payments made before the commencement date (reduced by lease incentives received); plus initial direct costs incurred in obtaining the lease and an estimate of costs to be incurred in dismantling and removing the underlying asset, restoring the site on which it is located, or restoring the underlying asset to the condition required by the terms and conditions of the lease.
A right-of-use asset associated with land and buildings is subsequently measured at cost. All other property, plant and equipment are measured as described in the accounting policy for property, plant and equipment.
Concessionary (peppercorn) leasesLeased assets arising from significantly below market leases are measured at cost at the inception of the lease whereas the lease liability is recognised at present value of peppercorn lease payment amounts. The difference between the right-of-use asset and lease liability is recorded as income in the income statement under AASB1058.
The Group has elected to measure a class (or classes) of right-of-use assets arising under ‘concessionary leases’ at initial recognition at cost, in accordance with AASB16 paragraphs 23–25, which incorporates the amount of the initial measurement of the lease liability.
During the year, the Group disposed the following asset classified as held for sale in 2019 which is surplus to the Group's requirementsand recognised a profit of $287,000;
Allendale Farm, 264 Chedaring Rd, Wundowie, WA.
27

9520
20 Financial R
eport | uwa.edu.au
95
NOTES TO THE FINANCIAL STATEMENTSfor the year ended 31 December 2020
5.6 Trade and other payables Consolidated University2020 2019 2020 2019$'000 $'000 $'000 $'000
Trade payables 4,785 30,547 3,689 28,901Other payables 40,144 39,010 40,272 38,802OS-HELP liability to the Australian Government 3,534 527 3,534 527Total trade and other payables 48,463 70,084 47,495 68,230
Accounting policy
5.7 Contract and other liabilities Consolidated University2020 2019 2020 2019$'000 $'000 $'000 $'000
CurrentOther LiabilitiesAustralian Government financial assistance 14,510 - 14,510 -Student fees 26,394 19,336 26,393 19,336Funds held for outside parties 4,927 6,067 4,926 6,064Other 18,407 17,844 15,550 14,866Total liabilities 64,238 43,247 61,379 40,266
Contract liabilities 89,605 3,004 89,605 2,897
Total current contract and other liabilities 153,843 46,251 150,984 43,163
Non-currentContract liabilities 30,672 - 30,672 -Total non-current contract and other liabilities 30,672 - 30,672 -
Total contract and other liabilities 184,515 46,251 181,656 43,163
Other funds held for outside parties that do not qualify for recognition in the financial statements
Payables represent liabilities for goods or services incurred on or before the reporting date. Trade payables are initially recorded at fairvalue and subsequently recorded at amortised cost. Due to the short duration and other terms of payment these amounts usually equateto cost.
Accounting policyA contract liability is the obligation to transfer goods or services to a customer for which the Group has received consideration from thecustomer. If a customer pays consideration before the Group transfers goods or services to the customer, a contract liability is recognisedwhen the payment is made or the payment is due (whichever is earlier). Contract liabilities are recognised as revenue when the Groupperforms under the contract. This arises where cash funds have been receipted under a research and/or non-research grant and the grantactivity and related expenditure have not yet been performed and expended.
Contract liabilitiesThe Group assesses, based on the contract terms, facts and circumstances whether a contract liability is classified as current or non-current on the basis when the Group expects to satisfy its performance obligations.
As at reporting date, the Group held $17.7 million (2019: $16.8 million) in financial assets on behalf of various outside parties. The Groupperforms administrative functions for these entities. These funds do not meet the asset recognition criteria and consequently have notbeen included in the assets (or the related liabilities) of the consolidated entity or the Group.
28

96 The University of Western Australia | uwa.edu.au
6 Capital and financial risk management
• 6.1 Cash and cash equivalents • 6.5 Fair value measurements• 6.2 Other financial assets • 6.6 Reserves• 6.3 Borrowings • 6.7 Commitments• 6.4 Financial risk management • 6.8 Contingencies
6.1 Cash and cash equivalents Consolidated University2020 2019 2020 2019$'000 $'000 $'000 $'000
Cash at bank and on hand 44,048 19,251 33,347 13,925Short-term deposits 83,042 66,556 83,042 59,042Total cash and cash equivalents 127,090 85,807 116,389 72,967
The Group has pledged $123,243 (2019: $123,243) against cash assets as at 31 December 2020.
(a) Cash at bank and on handCash at bank is interest bearing at an average interest rate of 0.08% as at 31 December 2020 (2019: 0.42%).
(b) Short-term deposits
Cash held in imprest is non-interest bearing.
(c) Reconciliation of net result to net cash provided by/(used in) operating activities
Net result for the year 55,107 120,981 58,089 111,682
Adjustments: non-cash items Depreciation, amortisation and impairment 58,200 50,525 57,844 50,142 Investment adjustments (47,282) (125,546) (47,261) (124,887) Net (profit)/loss on sale of non-current assets (92) 176 (96) 101 Donation of artworks and equipment (662) (1,966) (658) (1,967) Net exchange differences - 34 - 34
Changes in assets and liabilities Decrease/(increase) in receivables and prepayments 15,656 (278) 14,084 1,930 Decrease/(increase) in inventories 300 (259) 366 (274) (Decrease)/increase in payables, contract liabilities and borrowings (8,273) (7,278) (7,475) (7,524) (Decrease)/increase in other liabilities 20,377 1,938 20,799 (11) (Decrease)/increase in provisions 6,135 1,363 6,070 1,048
Net cash provided by/(used in) operating activities 99,466 39,690 101,762 30,274
Accounting policy
NOTES TO THE FINANCIAL STATEMENTSfor the year ended 31 December 2020
This section provides information relating to the University and its subsidiaries capital structure, financing, its exposure tofinancial risk, and how those risks are managed.
These deposits are bearing an average fixed interest rate of 0.40% as at 31 December 2020 (2019: 1.32%). These deposits have anaverage maturity of 45 days (2019: 37 days).
Cash and cash equivalents includes cash on hand, bank accounts and deposits and other short-term, highly liquid money marketinvestments that are readily convertible to known amounts of cash, and which are subject to an insignificant risk of changes in value.
29

9720
20 Financial R
eport | uwa.edu.au
97
NOTES TO THE FINANCIAL STATEMENTSfor the year ended 31 December 2020
6.2 Other financial assets Consolidated University2020 2019 2020 2019$'000 $'000 $'000 $'000
Non-currentOther financial assets at fair value through profit or loss# 939,283 849,142 938,244 848,124Other financial assets at amortised cost 1,314 1,351 1,314 1,351Less: Impairment (449) (449) (449) (449)Total non-current other financial assets 940,148 850,044 939,109 849,026
ImpairmentAllowance for debt instruments other than receivables.
At 1 January (449) (449) (449) (449)Additions - - - -Write-off - - - -At 31 December (449) (449) (449) (449)
The information about the credit exposures are disclosed in Note 6.4 Financial risk management.
Accounting policyFinancial assets
Initial recognition and measurement
Set out below is the movement in the allowance for debt instruments other than receivables:
# Other financial assets recognised through profit or loss relates predominantly to the University investment portfolio and equityinstruments.
Changes in fair values of other financial assets at fair value through profit or loss are recorded in other income in the income statement(note 2.4 Net investment revenue).
A financial instrument is any contract that gives rise to a financial asset of one entity and a financial liability or equity instrument of anotherentity.
Financial assets are classified, at initial recognition, at amortised cost, fair value through other comprehensive income (OCI), and fairvalue through profit or loss.
The classification of financial assets at initial recognition depends on the financial asset’s contractual cash flow characteristics and theGroup’s business model for managing them. With the exception of trade receivables that do not contain a significant financing componentor for which the Group has applied the practical expedient, the Group initially measures a financial asset at its fair value plus, in the caseof a financial asset not at fair value through profit or loss, transaction costs.
In order for a financial asset to be classified and measured at amortised cost or fair value through OCI, it needs to give rise to cash flowsthat are ‘solely payments of principal and interest (SPPI)’ on the principal amount outstanding. This assessment is referred to as the SPPItest and is performed at an instrument level. The Group’s business model for managing financial assets refers to how it manages itsfinancial assets in order to generate cash flows. The business model determines whether cash flows will result from collecting contractualcash flows, selling the financial assets, or both.
Purchases or sales of financial assets that require delivery of assets within a time frame established by regulation or convention in themarket place (regular way trades) are recognised on the trade date, i.e., the date that the Group commits to purchase or sell the asset.
30
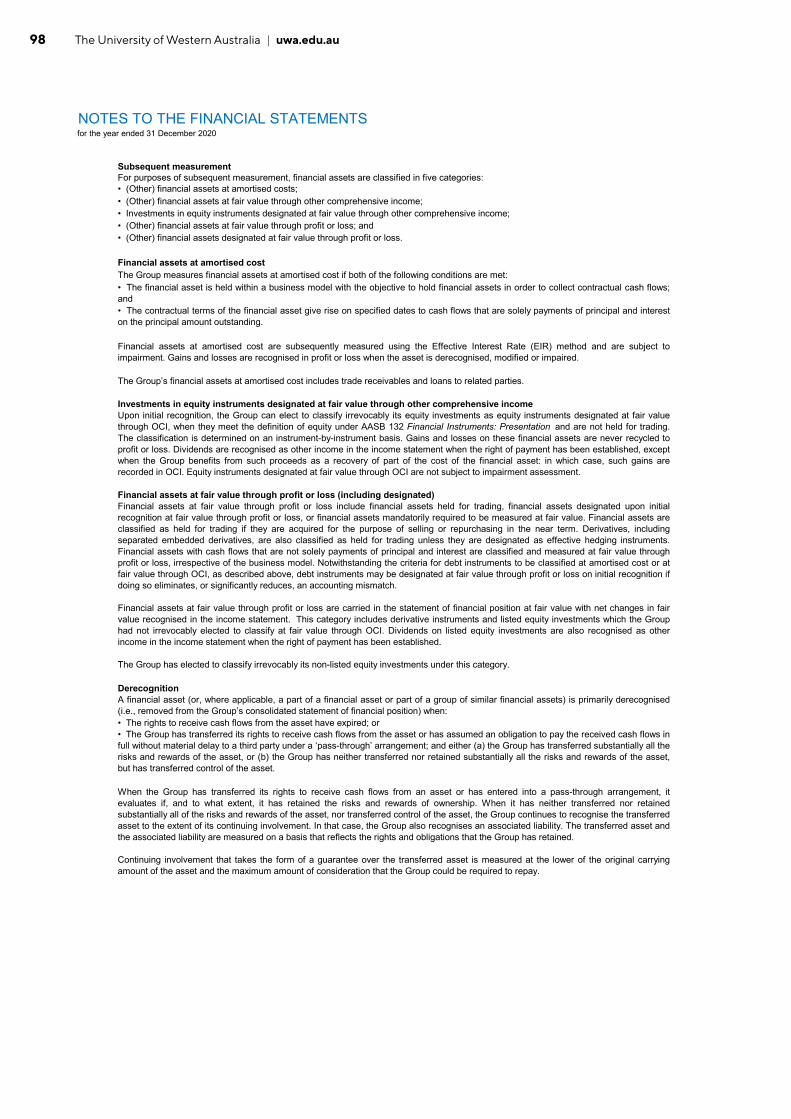
98 The University of Western Australia | uwa.edu.au
NOTES TO THE FINANCIAL STATEMENTSfor the year ended 31 December 2020
Subsequent measurement
Financial assets at amortised cost
• The rights to receive cash flows from the asset have expired; or
The Group’s financial assets at amortised cost includes trade receivables and loans to related parties.
• (Other) financial assets at amortised costs;• (Other) financial assets at fair value through other comprehensive income;• Investments in equity instruments designated at fair value through other comprehensive income;• (Other) financial assets at fair value through profit or loss; and• (Other) financial assets designated at fair value through profit or loss.
The Group measures financial assets at amortised cost if both of the following conditions are met:• The financial asset is held within a business model with the objective to hold financial assets in order to collect contractual cash flows;and• The contractual terms of the financial asset give rise on specified dates to cash flows that are solely payments of principal and intereston the principal amount outstanding.
Financial assets at amortised cost are subsequently measured using the Effective Interest Rate (EIR) method and are subject toimpairment. Gains and losses are recognised in profit or loss when the asset is derecognised, modified or impaired.
Financial assets at fair value through profit or loss include financial assets held for trading, financial assets designated upon initialrecognition at fair value through profit or loss, or financial assets mandatorily required to be measured at fair value. Financial assets areclassified as held for trading if they are acquired for the purpose of selling or repurchasing in the near term. Derivatives, includingseparated embedded derivatives, are also classified as held for trading unless they are designated as effective hedging instruments.Financial assets with cash flows that are not solely payments of principal and interest are classified and measured at fair value throughprofit or loss, irrespective of the business model. Notwithstanding the criteria for debt instruments to be classified at amortised cost or atfair value through OCI, as described above, debt instruments may be designated at fair value through profit or loss on initial recognition ifdoing so eliminates, or significantly reduces, an accounting mismatch.
Financial assets at fair value through profit or loss are carried in the statement of financial position at fair value with net changes in fairvalue recognised in the income statement. This category includes derivative instruments and listed equity investments which the Grouphad not irrevocably elected to classify at fair value through OCI. Dividends on listed equity investments are also recognised as otherincome in the income statement when the right of payment has been established.
The Group has elected to classify irrevocably its non-listed equity investments under this category.
Derecognition
Investments in equity instruments designated at fair value through other comprehensive incomeUpon initial recognition, the Group can elect to classify irrevocably its equity investments as equity instruments designated at fair valuethrough OCI, when they meet the definition of equity under AASB 132 Financial Instruments: Presentation and are not held for trading.The classification is determined on an instrument-by-instrument basis. Gains and losses on these financial assets are never recycled toprofit or loss. Dividends are recognised as other income in the income statement when the right of payment has been established, exceptwhen the Group benefits from such proceeds as a recovery of part of the cost of the financial asset: in which case, such gains arerecorded in OCI. Equity instruments designated at fair value through OCI are not subject to impairment assessment.
A financial asset (or, where applicable, a part of a financial asset or part of a group of similar financial assets) is primarily derecognised(i.e., removed from the Group’s consolidated statement of financial position) when:
• The Group has transferred its rights to receive cash flows from the asset or has assumed an obligation to pay the received cash flows infull without material delay to a third party under a ‘pass-through’ arrangement; and either (a) the Group has transferred substantially all therisks and rewards of the asset, or (b) the Group has neither transferred nor retained substantially all the risks and rewards of the asset,but has transferred control of the asset.
When the Group has transferred its rights to receive cash flows from an asset or has entered into a pass-through arrangement, itevaluates if, and to what extent, it has retained the risks and rewards of ownership. When it has neither transferred nor retainedsubstantially all of the risks and rewards of the asset, nor transferred control of the asset, the Group continues to recognise the transferredasset to the extent of its continuing involvement. In that case, the Group also recognises an associated liability. The transferred asset andthe associated liability are measured on a basis that reflects the rights and obligations that the Group has retained.
Continuing involvement that takes the form of a guarantee over the transferred asset is measured at the lower of the original carryingamount of the asset and the maximum amount of consideration that the Group could be required to repay.
For purposes of subsequent measurement, financial assets are classified in five categories:
Financial assets at fair value through profit or loss (including designated)
31

9920
20 Financial R
eport | uwa.edu.au
99
NOTES TO THE FINANCIAL STATEMENTSfor the year ended 31 December 2020
6.3 BorrowingsConsolidated University
2020 2019 2020 2019$'000 $'000 $'000 $'000
CurrentWestern Australian Treasury Corporation 5,655 3,420 5,655 3,419Lease liabilities 587 365 587 342Total current borrowings 6,242 3,785 6,242 3,761
Non-currentWestern Australian Treasury Corporation 180,502 130,850 180,502 130,850Lease liabilities 807 161 664 161Total non-current borrowings 181,309 131,011 181,166 131,011
Total borrowings 187,551 134,796 187,408 134,772
Maturity date Principal outstanding Average interest rate2020 2019 2020 2019
Western Australian Treasury Corporation Loans- Term floating rate lending 15/10/2019 - - - 1.96%- Debt portfolio manager - term fixed rate 15/01/2021 - 15/10/2030 114,125 98,125 3.31% 3.85%- Debt portfolio manager - term floating rate 21/01/2021 - 21/10/2025 24,600 20,600 0.67% 1.84%- Fixed rate project 15/10/2023 10,968 14,360 3.78% 3.78%- Fixed rate project 15/01/2035 34,962 - 1.96% -Total WATC loans 184,655 133,085
Financial assets and financial liabilities are offset and the net amount is reported in the consolidated statement of financial position if thereis a currently enforceable legal right to offset the recognised amounts and there is an intention to settle on a net basis, to realise theassets and settle the liabilities simultaneously.
The Group considers a financial asset in default when contractual payments are 90 days past due. However, in certain cases, the Groupmay also consider a financial asset to be in default when internal or external information indicates that the Group is unlikely to receive theoutstanding contractual amounts in full before taking into account any credit enhancements held by the Group. A financial asset is writtenoff when there is no reasonable expectation of recovering the contractual cash flows.
Impairment of debt instruments other than receivablesThe Group recognises an allowance for expected credit losses (ECLs) for all debt instruments other than receivables and not held at fairvalue through profit or loss. ECLs are based on the difference between the contractual cash flows due in accordance with the contract andall the cash flows that the Group expects to receive, discounted at an approximation of the original effective interest rate. The expectedcash flows will include cash flows from the sale of collateral held or other credit enhancements that are integral to the contractual terms.
ECLs are recognised in two stages. For credit exposures for which there has not been a significant increase in credit risk since initialrecognition, ECLs are provided for credit losses that result from default events that are possible within the next 12-months (a 12-monthECL). For those credit exposures for which there has been a significant increase in credit risk since initial recognition, a loss allowance isrequired for credit losses expected over the remaining life of the exposure, irrespective of the timing of the default (a lifetime ECL).
Offsetting
Average interest rates are calculated based on the total interest expenses and average borrowing amount of each loan during thereporting period.
The borrowings, excluding the fixed rate project facility, have varying maturity dates up to 10 years and are expected to be refinanced orrolled over under a rolling facility arrangement. The Fixed Rate Project loans have fixed maturity dates with annual repayments for theloan maturing in 2023 and semi-annual repayments for the loan maturing 2035.
The Group has the following loans with the WATC for the purpose of financing the University's Capital Program and other specific capitalprojects:
Borrowings are measured at amortised cost using the effective interest rate method. The difference between total Western AustralianTreasury Corporation (WATC) borrowings of $186.2 million and the principal outstanding on the loans of $184.7 million represents theamortised cost adjustment. The amortised cost adjustment recognises the difference between the proceeds and the redemption amountover the period of the borrowings, which for the Group predominately represents the impact of accrued interest payments at each period-end.
32

100 The University of Western Australia | uwa.edu.au
NOTES TO THE FINANCIAL STATEMENTSfor the year ended 31 December 2020
Principal outstanding2020 2019
Financing facilities availableThe following facilities had been negotiated and were available as atreporting date:
Facilities used at reporting date: - WATC loans 184,655 133,085Facilities unused at reporting date: - WATC loans 1,313 56,215Total debt facilities 185,968 189,300
Asset pledged as security
Accounting policy
Lease liabilitiesA lease liability is initially measured at the present value of unpaid lease payments at the commencement date of the lease. To calculatethe present value, the unpaid lease payments are discounted using the interest rate implicit in the lease if the rate is readily determinable.If the interest rate implicit in the lease cannot be readily determined, the incremental borrowing rate at the commencement date of thelease is used.
Lease payments included in the measurement of lease liabilities comprise: - Fixed payments, including in-substance fixed payments- Variable lease payments that depend on an index or a rate, initially measured using the index or rate as at the commencement date(e.g. payments varying on account of changes in CPI)- Amounts expected to be payable by the lessee under residual value guarantees- The exercise price of a purchase option if the group is reasonably certain to exercise that option- Payments of penalties for terminating the lease, if the lease term reflects the lessee exercising an option to terminate the lease.For a contract that contains a lease component and one or more additional lease or non-lease components, the Group allocates theconsideration in the contract to each lease component on the basis of the relative stand-alone price of the lease component and theaggregate stand-alone price of the non-lease components.
Subsequently, the lease liability is measured at amortised cost using the effective interest rate method resulting in interest expense beingrecognised as a borrowing cost in the income statement. The lease liability is remeasured when there are changes in future leasepayments arising from a change in an index or rate with a corresponding adjustment to the right-of-use asset.
The adjustment amount is factored into depreciation of the right-of-use asset prospectively.Right-of-use assets are presented within property, plant and equipment in Note 5.5 and lease liabilities are presented as borrowings inNote 6.3.
Short-term leases and leases of low-value assetsThe Group has elected not to recognise right-of-use assets and lease liabilities for short-term leases i.e. leases with a lease term of 12months or less and leases of low-value assets i.e., when the value of the leased asset when new is $20,000 or less. The Grouprecognises the lease payments associated with these leases as expense on a straight-line basis over the lease term.
The Group has not pledged any assets as security against the borrowings in the current and previous financial year. A State Treasurer'sGuarantee has been provided, at a cost of 0.7% (2019 0.7%) per annum of the outstanding loan principal.
BorrowingsBorrowings are recognised initially at fair value net of transaction costs that are directly attributable to its issue. After initial recognition,borrowings are subsequently measured at amortised cost using the Effective Interest Rate (EIR) method. Gains and losses arerecognised in the income statement when the liabilities are derecognised, as well as through the EIR amortisation process. Amortised costis calculated by taking into account any discount or premium on acquisition and fees or costs that are an integral part of the EIR. The EIRamortisation is included in finance costs in the income statement.
Borrowings are classified as current liabilities unless the Group has an unconditional right to defer settlement of the liability for at least 12months after the balance sheet date and does not expect to settle the liability for at least 12 months after the balance sheet date.
Borrowing costs incurred for the construction of any qualifying asset are capitalised during the period of time that is required to completeand prepare the asset for its intended use or sale. Other borrowing costs are expensed.
33

10120
20 Financial R
eport | uwa.edu.au
101
6.4 Financial risk management
(a) Financial risk management - overview
(b) Credit risk
Receivables
Consolidated 31 December 2020
< 30 days 31-90 days 91-120 days > 120 days$'000 $'000 $'000 $'000 $'000 $'000
Expected credit loss rate (%) 0.02% 0.20% 0.26% 1.73% 22.88%Total gross carrying amount at default 6,400 8,896 3,465 693 8,924 28,378Expected credit losses 1 18 9 12 2,042 2,082
Consolidated 31 December 2019
< 30 days 31-90 days 91-120 days > 120 days$'000 $'000 $'000 $'000 $'000 $'000
Expected credit loss rate (%) 0.00% 0.00% 0.08% 1.01% 19.09%Total gross carrying amount at default 5,002 13,154 4,781 1,478 9,574 33,989Expected credit losses 0 0 4 15 1,828 1,847
The Group evaluates the concentration of risk with respect to trade receivables as low, as its customers are located in several jurisdictionsand industries and operate in largely independent markets.
Total
The University is committed to a strong, integrity-driven risk culture and transparent risk management practices. The Senate, Audit andRisk Committee and the Vice-Chancellor oversee the University’s risk management framework, which includes policies, procedures and arisk appetite guidance statement. The University’s risk profile informs the annual internal audit plan.
During 2019, a revised strategic risk profile was completed to support the 2020–2025 strategic plan. In addition, regulatory compliancepractices were enhanced and risk workshops were conducted across business units to assess key operational risks. Highlights, trends andissues were reported to the Senate and Audit and Risk Committee throughout the year.
A major component of the University's governance framework is the annual Planning and Budget cycle. This cycle involves two keyprocesses, being the preparation of budgets and the review of actual performance against budget or other relevant benchmarks. Wherenecessary, the monthly reporting process highlights significant financial issues and risks. The monitoring and review process is fulfilled bythe University Management and Executive, Strategic Resources Committee and Senate.
The Group has exposure to credit, market and liquidity risk.
The Group has appointed an Implemented Consultant to manage the Group’s investment portfolio. The Implemented Consultant provides afully implemented investment management solution via a manager of managers style approach to portfolio construction, strategyimplementation, diversification, management and overarching risk management.
Credit risk arises principally from the Group's investment securities, and to a limited extent from its receivables and other financial assets atamortised cost. The carrying amount of the financial assets represents the maximum credit risk exposure at the reporting date.
In accordance with the Group’s Investment Policy, credit risk is minimised by appropriate diversification of investments gained throughasset allocation, investment styles, manager and portfolio construction.
Current
Day past due
Day past due
Current
NOTES TO THE FINANCIAL STATEMENTSfor the year ended 31 December 2020
The University's Governing Body, the Senate, has overall responsibility for risk management. To assist in fulfilling this aspect of its role, theSenate has established two standing committees - the Strategic Resources Committee and the Audit and Risk Committee, both of whichreport directly to the Senate. The Strategic Resources Committee has, as part of its role, responsibility for monitoring the financial welfareof the University; and, within the limits of agreed delegations, making decisions, or recommendations to Senate, on investments, debt andthe capital structure within a framework of strategy approved by Senate. The Audit and Risk Committee has, as part of its role,responsibility to satisfy the Senate that the University has sound policies and arrangements in place for corporate governance and forcontrolling the institution's exposure to risk. The Audit and Risk Committee also oversees how the University’s management monitorscompliance with the risk management policies and reviews the adequacy of the risk management framework in relation to the financial risksfaced by the University.
Total
Credit risk is managed at group level subject to the Group's established policy, procedures and control relating to credit risk management.Credit quality of a customer is assessed based on individual credit limits. Outstanding receivables are regularly monitored.
An impairment analysis is performed at each reporting date using a provision matrix to measure expected credit losses. The provision ratesare based on days past due for groupings of various customer segments with similar loss patterns (i.e., by geographical region, producttype, customer type and rating). The calculation reflects the probability-weighted outcome, the time value of money and reasonable andsupportable information that is available at the reporting date about past events, current conditions and forecasts of future economicconditions. Generally, trade receivables are written off if past due for more than one year not subject to enforcement activity. The maximumexposure to credit risk at the reporting date is the carrying value of each class of financial assets disclosed in the notes above.
34

102 The University of Western Australia | uwa.edu.au
NOTES TO THE FINANCIAL STATEMENTSfor the year ended 31 December 2020
Financial instruments and cash deposits
(c) Liquidity risk
Consolidated 31 December 2020
Less than1 year
1 to 5years
5+years Total
% $'000 $'000 $'000 $'000 $'000 $'000Financial assetsCash and cash equivalents 0.88% 93 126,998 127,090 - - 127,090Receivables - 41,322 - 41,322 - - 41,322Other financial assets - 940,148 - - - 940,148 940,148Total 981,563 126,998 168,412 - 940,148 1,108,560
Financial liabilitiesTrade and other payables - 44,929 - 44,929 - - 44,929Borrowings 3.45% - 187,551 24,049 82,434 81,068 187,551Other financial liabilities - 19,437 - 19,437 - - 19,437Total 64,366 187,551 88,415 82,434 81,068 251,917
Less than1 year
1 to 5years
5+years Total
% $'000 $'000 $'000 $'000 $'000 $'000Financial assetsCash and cash equivalents 1.12% 75 85,731 85,806 - - 85,806Accounts receivable - 54,079 - 54,079 - - 54,079Other financial assets - 850,044 - - - 850,044 850,044Total 904,198 85,731 139,885 - 850,044 989,929
Financial liabilitiesTrade and other payables - 69,557 - 69,557 - - 69,557Borrowings 4.10% - 134,796 18,850 66,883 49,063 134,796Other financial liabilities - 4,801 - 4,801 - - 4,801Total 74,358 134,796 93,208 66,883 49,063 209,154
Consolidated 31 December 2019
The Investment Policy Statement, which is managed by the Strategic Resources Committee and approved by Senate, sets out investmentpolicy for matters such as performance objectives, investment restrictions, performance benchmarks and monitoring, and the strategicasset allocation benchmark for each investment pool. The investment policy is formally reviewed every two years. An investment consultantis appointed to undertake an independent review every four years and at any time a material change to the policy is proposed.
Average interest rate
Non-interest bearing
Interest bearing
Liquidity risk is the risk that the Group will not be able to meet its financial obligations as they fall due. The Group's approach to managingliquidity is to ensure, as far as possible, that it will always have sufficient liquidity to meet its liabilities when due, under both normal andstressed conditions, without incurring unacceptable losses or other related costs. Under normal conditions, the Group aims to achieve theoptimum level of cash holding, so that it minimises liquidity risk to an acceptable level, while at the same time maximising return frominvestment, for an agreed level of risk.
To manage these conflicting objectives, and achieve a workable solution, the Group prepares daily rolling liquidity forecasts, so that pro-active, informed decisions may be made in relation to liquidity management. In addition, the Group has the flexibility to liquidate a portion ofits pool investments in a short time-frame, if required.
The Group has a lending agreement with the Western Australian Treasury Corporation. The maximum amount eligible for draw down underthe agreement is $185.9 million (2019: $189.3 million). As at reporting date the outstanding balance owing by the Group, including accruedinterest and guarantee levy fees is $186.2 million (2019: $134.3 million). The borrowings provide liquidity to support the Group’s capitalprogram, and to fund the student accommodation under the National Rental Affordability Scheme (NRAS).
The following table presents the maturities of the financial assets and financial liabilities at the reporting date:
Average interest rate
Non-interest bearing
The majority of the Group's exposure to credit risk from other financial assets at amortised cost is denominated in Australian dollars. TheGroup's credit control policy is designed to ensure that credit facilities are provided to customers with an appropriate credit history.Thereafter, the Group has an active credit management policy.
The Group's cash and cash equivalent transactions are invested only through pre-approved authorised deposit-taking institutions and inaccordance with the Group's Investment Policy, where maximum exposure limits are set for each institution according to their risk profile.
Maturity Profile
Maturity Profile
Interest bearing
35

10320
20 Financial R
eport | uwa.edu.au
103
NOTES TO THE FINANCIAL STATEMENTSfor the year ended 31 December 2020
(d) Market risk
(i) Foreign exchange risk
2020 instrument Notional amount Rate ExpiryForward Foreign Exchange contract (buy) USD $0.56 million 0.6506 30/03/2021
USD $0.13 million 0.6508 29/01/2021USD $0.14 million 0.6504 29/04/2021USD $0.03 million 0.6507 26/02/2021
2019 instrument Notional amount Rate ExpiryForward Foreign Exchange contract (buy) USD $0.24 million 0.7280 31/01/2020
Subsequent to the year-end, a Forward Exchange contract with a notional value USD $6 million expiring 31/12/2021 was entered into.
(ii) Interest rate risk
Details of the forward exchange contracts outstanding at the end of the reporting period are given below:
Where possible, the Group requires that transactions be contracted in Australian dollars and, if this is not possible, then forward currencycontracts may be considered to manage the currency exposure. The Group enters into a forward contract when there is an underlyingactual exposure and not for speculative purposes.
The Group's portfolio of investment assets includes, amongst other things, investments in unit trusts which have underlying exposure tointernational debt, equity and property asset classes. This risk is managed under the Investment Policy Statement, which sets parametersfor the level of exposure to unhedged asset classes. Currently, the Group only invests in unit trusts priced in Australian dollars,consequently there is no direct foreign currency risk, risk is reflected in other price risk through changes in Australian dollar quoted unitprices.
The Debt Management Policy restricts borrowings so that all borrowings are in Australian currency only. Specific Senate approval isrequired for foreign currency borrowings.
Given these risk management procedures, the level of foreign exchange risk exposure is considered minimal.
Interest rate risk arises from holding interest-bearing financial assets. Fixed interest rate investments expose the Group to changes in fairvalue through profit and loss, while variable interest rate investments expose the Group to fluctuations in interest income and cash flow.However, fixed and floating rate interest securities are critical to a well diversified investment strategy, forming the defensive component ofthe overall investment strategy.
The Group has interest bearing liabilities by way of a long term borrowing for financing the Group's capital program and other specificcapital projects. Interest rate risk arises on the borrowing portfolio and is managed by using a portfolio of debt diversified across a range ofdebt maturities and interest rate term exposures and diversification of fixed and floating rate debt.
The Capital Debt Management Policy Statement, which is reviewed by the Strategic Resources Committee and approved by Senate, setsout the debt policy requirements for the administration and management of the portfolio and includes interest rate and short: longbenchmarks, borrowing restrictions and reporting and monitoring obligations. The Capital Debt Management Policy Statement is regularlyand routinely reviewed.
The objective of market risk management is to manage and control market risk exposures within acceptable parameters, while optimisingthe return. The Group Investment Policy provides strategies for managing the impact from market risk.
Foreign exchange risk arises principally from overseas sources of income and expenditure in relation to the Group's international offshoreteaching programmes, foreign donors, foreign customers and foreign sourced supplies. For the purposes of managing some internationaltransactional activities, the Group holds a US dollar bank account. At year end, the Group has foreign exchange risk exposure on thesebank accounts, as disclosed in the market sensitivity analysis.
Foreign Exchange ContractsThe Group enters into forward exchange contracts which are economic hedges that are not designated for hedge accounting; consequently,fair value gains and losses are recorded in the income statement. Foreign exchange contracts are used to manage foreign exchange risk tospecifically identified transactional activity.
36
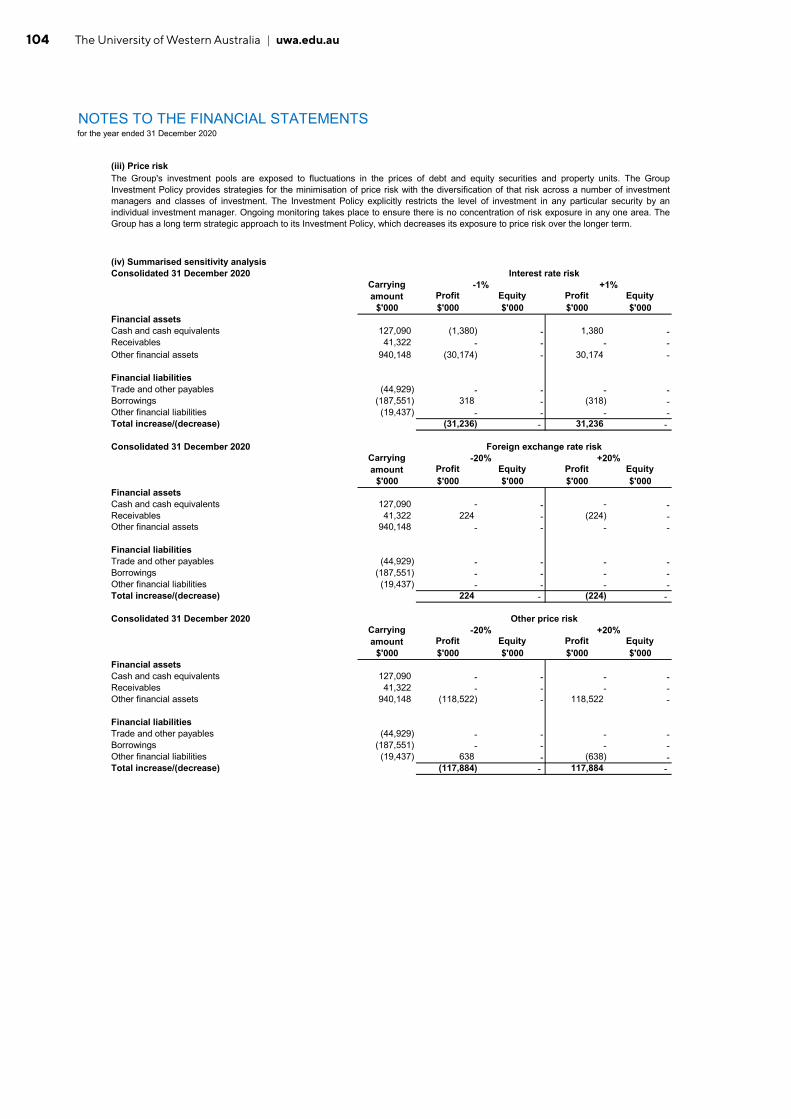
104 The University of Western Australia | uwa.edu.au
NOTES TO THE FINANCIAL STATEMENTSfor the year ended 31 December 2020
(iii) Price risk
(iv) Summarised sensitivity analysisConsolidated 31 December 2020
Profit Equity Profit Equity $'000 $'000 $'000 $'000 $'000
Financial assetsCash and cash equivalents 127,090 (1,380) - 1,380 -Receivables 41,322 - - - -Other financial assets 940,148 (30,174) - 30,174 -
Financial liabilitiesTrade and other payables (44,929) - - - -Borrowings (187,551) 318 - (318) -Other financial liabilities (19,437) - - - -Total increase/(decrease) (31,236) - 31,236 -
Consolidated 31 December 2020
Profit Equity Profit Equity $'000 $'000 $'000 $'000 $'000
Financial assetsCash and cash equivalents 127,090 - - - -Receivables 41,322 224 - (224) -Other financial assets 940,148 - - - -
Financial liabilitiesTrade and other payables (44,929) - - - -Borrowings (187,551) - - - -Other financial liabilities (19,437) - - - -Total increase/(decrease) 224 - (224) -
Consolidated 31 December 2020
Profit Equity Profit Equity $'000 $'000 $'000 $'000 $'000
Financial assetsCash and cash equivalents 127,090 - - - -Receivables 41,322 - - - -Other financial assets 940,148 (118,522) - 118,522 -
Financial liabilitiesTrade and other payables (44,929) - - - -Borrowings (187,551) - - - -Other financial liabilities (19,437) 638 - (638) -Total increase/(decrease) (117,884) - 117,884 -
Carrying amount
Other price risk
The Group's investment pools are exposed to fluctuations in the prices of debt and equity securities and property units. The GroupInvestment Policy provides strategies for the minimisation of price risk with the diversification of that risk across a number of investmentmanagers and classes of investment. The Investment Policy explicitly restricts the level of investment in any particular security by anindividual investment manager. Ongoing monitoring takes place to ensure there is no concentration of risk exposure in any one area. TheGroup has a long term strategic approach to its Investment Policy, which decreases its exposure to price risk over the longer term.
+20%
-20% +20%
Interest rate riskCarrying amount
Carrying amount
-20%
-1% +1%
Foreign exchange rate risk
37

10520
20 Financial R
eport | uwa.edu.au
105
NOTES TO THE FINANCIAL STATEMENTSfor the year ended 31 December 2020
Consolidated 31 December 2019
Profit Equity Profit Equity $'000 $'000 $'000 $'000 $'000
Financial assetsCash and cash equivalents 85,806 (857) - 857 -Accounts receivable 54,079 - - - -Other financial assets 850,044 (18,791) - 18,791 -
Financial liabilitiesTrade and other payables (68,865) - - - -Borrowings (134,796) 267 - (267) -Other financial liabilities (4,801) - - - -Total increase/(decrease) (19,381) - 19,381 -
Consolidated 31 December 2019
Profit Equity Profit Equity $'000 $'000 $'000 $'000 $'000
Financial assetsCash and cash equivalents 85,806 184 - (184) -Accounts receivable 54,079 113 - (113) -Other financial assets 850,044 - - - -
Financial liabilitiesTrade and other payables (68,865) - - - -Borrowings (134,796) - - - -Other financial liabilities (4,801) - - - -Total increase/(decrease) 297 - (297) -
Consolidated 31 December 2019
Profit Equity Profit Equity $'000 $'000 $'000 $'000 $'000
Financial assetsCash and cash equivalents 85,806 - - - -Accounts receivable 54,079 - - - -Other financial assets 850,044 (107,641) - 107,641 -
Financial liabilitiesTrade and other payables (68,865) - - - -Borrowings (134,796) - - - -Other financial liabilities (4,801) 960 - (960) -Total increase/(decrease) (106,681) - 106,681 -
(e) Capital management
Carrying amount
Foreign exchange rate risk-20% +20%
Carrying amount
Other price risk-20% +20%
The Group is funded principally by equity capital which is comprised of retained earnings. The Group also employs debt funding tospecifically support the Group's capital program as outlined in note 6.3. Senate’s policy is to maintain a strong capital base to ensure thatthe Group is able to continue to provide the services to the community for which it was originally established.
The Group is not subject to externally imposed capital requirements, but does have responsibilities in relation to maintaining the level ofrestricted funds derived from funds that have been endowed upon the Group referred to in Note 1.4 - Unrestricted and restricted assets.The Group continuously monitors its profitability and level of restricted and unrestricted funds, within its risk management framework.
+1%Interest rate risk
Carrying amount
-1%
38

106 The University of Western Australia | uwa.edu.au
NOTES TO THE FINANCIAL STATEMENTSfor the year ended 31 December 2020
6.5 Fair value measurements
(a) Fair value measurements
Consolidated 31 December 2020 2019 2020 2019$'000 $'000 $'000 $'000
Financial liabilitiesBorrowings (include lease liabilities) 187,551 134,796 200,770 143,553
(b) Fair value hierarchy
• Managed investments
• Direct investments
• Other financial assets at amortised cost
Consolidated 31 December 2020 2020 Level 1 Level 2 Level 3Recurring fair value measurements Note $'000 $'000 $'000 $'000
Financial assetsOther financial assets 6.2 940,148 870,012 13,172 56,964Total financial assets 940,148 870,012 13,172 56,964
Non-financial assetsInvestment properties 5.3 34,958 - 34,958 -Total non-financial assets 34,958 - 34,958 -
Carrying amount Fair value
The fair value of financial assets and financial liabilities must be estimated for recognition and measurement or for disclosure purposes.
Holdings have been classified based on the market price of each holding and have been classified as level 1 fair value assets. Holdings in unlisted equity instruments have been classified as level 3 fair value assets.Fair value is estimated as the present value of all future cash receipts discounted using the prevailing market rates of interest for a similar instrument, net of impairment.
Fair value measurements recognised in the balance sheet are categorised into the following levels:
The valuation level has been determined on the basis of the lowest level input.
The level classification for financial assets at fair value through profit or loss have been determined by type of investments:Classified based on valuation of the investments, being either unit trusts or direct holdings. Unit trusts are priced based on the latest net asset price per unit. The managed investments are classified as level 1 fair value assets and consist either of publicly quoted unit trusts or assets with quoted pricing readily available, all in active markets.
The following table shows the carrying amounts and fair values of financial assets and financial liabilities. It does not include fair valueinformation for financial assets and financial liabilities measured at fair value if the carrying amount is a reasonable approximation of fairvalue.
Due to the short-term nature of the cash and cash equivalents and current receivables, they are not included in the table below as theircarrying value is assumed to approximate their fair value, and based on credit history it is expected that the receivables that are neitherpast due nor impaired will be received when due.
The University categorises assets and liabilities measured at fair value into a hierarchy based on the level of inputs used in measurement: · Level 1: Unadjusted quoted prices in active markets for identical assets or liabilities; · Level 2: Inputs other than quoted prices within Level 1 that are observable for the asset or liability, either directly or indirectly; and · Level 3: Inputs for the asset or liability that are not based on observable market data, that is, unobservable inputs.
(i) Recognised fair value measurements
39

10720
20 Financial R
eport | uwa.edu.au
107
NOTES TO THE FINANCIAL STATEMENTSfor the year ended 31 December 2020
Consolidated 31 December 2019 2019 Level 1 Level 2 Level 3Recurring fair value measurements Note $'000 $'000 $'000 $'000
Financial assetsOther financial assets 6.2 850,044 802,182 902 46,960Total financial assets 850,044 802,182 902 46,960
Non-financial assetsInvestment properties 5.3 32,072 - 32,072 -Total non-financial assets 32,072 - 32,072 -
(c)
The Group measures and recognises the following assets and liabilities at fair value on a recurring basis:
TypeInvestment property
Unlisted shares held by the University - fair value is based on their last issue price orfundraising value, net tangible asset value, discounted net asset value or at cost where themarket is generally limited.
· Financial assets at fair value through profit and loss;· Investment properties; and· Other financial assets at amortised cost.
(ii) Non-recurring fair value measurements
All of the resulting fair value estimates are included in level 2 except for unlisted equity securities, explained in (d) below.
The Group has a number of assets and liabilities which are not measured at fair value, but for which the fair values are disclosed in thenotes.
The carrying value of cash and cash equivalents, net accounts receivable, trade and other payables and other liabilities are considered areasonable approximation of fair value due to the relatively short-term nature of the instruments. The provision for impairment brings theface value of account receivables to fair value.
The fair value of borrowings for disclosure purposes is determined after consideration of the premium or discount that would be requiredunder a hypothetical settlement at the reporting date.
Other financial liabilities consists of funds held for outside parties effectively at call and the carrying value represents the amount theUniversity is required to pay to settle the liabilities.
There were no transfers between fair value hierarchy levels during the year. The Group's policy is to recognise transfers into and transfersout of fair value hierarchy levels as at the end of the reporting period.
The Group uses a variety of methods and makes assumptions that are based on market conditions existing at each balance date. Thefollowing table shows the valuation technique used in measuring Level 2 and 3 fair values:
The University has no assets or liabilities measured at fair value on a non-recurring basis.
The fair value of financial instruments that are not traded in an active market is determined using valuation techniques. These valuationtechniques maximise the use of observable market data where it is available and rely as little as possible on entity-specific estimates. If allsignificant inputs required to fair value an instrument are observable, the instrument is included in level 2. If one or more of the significantinputs is not based on observable market data, the instrument is included in level 3. This is the case for unlisted equity securities.
(i) Recurring fair value measurements
Unlisted shares held by the University
Other financial assets at amortised cost
Valuation techniques used to derive level 2 and level 3 fair values
(ii) Disclosed fair values
Valuation techniqueFair values were determined by an independent valuer, and were derived from the salesprices of comparable properties after adjusting for differences in key attributes such asproperty size.Fair value is estimated as the present value of all future cash receipts discounted using theprevailing market rates of interest for a similar instrument, net of impairment.
40

108 The University of Western Australia | uwa.edu.au
NOTES TO THE FINANCIAL STATEMENTSfor the year ended 31 December 2020
(d)
Level 3 fair value measurements for other financial assets 2020 2019$'000 $'000
Opening balance 46,959 29,854Effect of adoption of new accounting standards - -Opening balance as restated 46,959 29,854Acquisitions - 480Total gains/(losses) 10,005 16,625Recognised in profit or loss* 10,005 16,625Recognised in other comprehensive income - -Closing balance 56,964 46,959
10,005 16,625
DescriptionFair value at 31 Dec 2020
$'000
Fair value at 31 Dec 2019
$'000
Range of inputs
50,092 39,723 15% (2019:30%)
5,713 5,749 -
Unlisted shares with intellectual property assets 1,159 1,487 Not applicable - measured at cost
The fair value of unlisted shares held by the University with underlying investment or infrastructure assets was determined by anindependent valuer, and was derived by calculating the entity's net assets and, where applicable, applying a discount rate to factor inrestrictions that prevent the entity from disposing its underlying net assets.
The unlisted shares with intellectual property assets held by the University are held for operational or research commercialisation purposeswhere no active market exists. The fair value of these assets cannot be reliably measured and are recognised at cost.
(iii) Valuation processes
Unlisted shares with underlying investment or infrastructure assets Valuation based on
management financial statements
The higher the valuation, the greater the fair value
The higher the discount rate, the lower the fair value
*Unrealised gains/(losses) recognised in profit or loss attributable to assets held at the end of the reporting period
The following table summarises the quantitative information about the significant unobservable inputs used in level 3 fair valuemeasurements. See (c) above for the valuation techniques adopted.
Fair value measurements using significant unobservable inputs (level 3)
(i) Transfers between categories and changes in valuation techniques
Unobservable inputs
Discount rate
There were no transfers between categories or changes in valuation techniques during the year.
(ii) Valuation inputs and relationships to fair value
Relationship of unobservable inputs to fair
value
Under AASB 139, equity instruments that did not have an active market and whose fair value could not be reliably measured were classified as available-for-sale financial assets, with gains/(losses) recognised in other comprehensive income. As part of the adoption of AASB 9,these assets have been reclassified to other financial assets at fair value through profit and loss.
41

10920
20 Financial R
eport | uwa.edu.au
109
NOTES TO THE FINANCIAL STATEMENTSfor the year ended 31 December 2020
Accounting policy
6.6 Reserves Consolidated University2020 2019 2020 2019$'000 $'000 $'000 $'000
(a) MovementsShort-term investment fluctuation reservesBalance 1 January - 32,793 - 32,793Transfer from/(to) accumulated funds - (32,793) - (32,793)Balance 31 December - - - -
(b) Nature and purpose of reserveThe short-term investment fluctuation reserves were created to provide a degree of smoothing in regards to investment incomedistributions from year to year and provide increased predictability for planning and budgeting purposes. The Group policy for the short-term investment pool is to distribute the income at a smoothed rate and to credit any excess or debit any shortfall to the investmentfluctuation reserve. These reserves were retired in 2019, as changes to the risk profile of the short-term investment pool removed the needfor a formal reserve.
The fair value of assets and liabilities must be measured for recognition and disclosure purposes. The Group measures financialinstruments and investment properties at fair value at each balance sheet date.
The Group classifies fair value measurements using a fair value hierarchy that reflects the significance of the inputs used in making themeasurements.
The fair value of assets or liabilities traded in active markets is based on quoted market prices for identical assets or liabilities at thebalance sheet date (level 1). The quoted market price used for assets held by the Group is the most representative of fair value in thecircumstances within the bid-ask spread.
The fair value of assets or liabilities that are not traded in an active market is determined using valuation techniques. The Group uses avariety of methods and makes assumptions that are based on market conditions existing at each balance date. Quoted market prices ordealer quotes for similar instruments (level 2) are used for long-term debt instruments held. Other techniques that are not based onobservable market data (level 3) are used to determine fair value for the remaining assets and liabilities. The level in the fair valuehierarchy is determined on the basis of the lowest level input that is significant to the fair value measurement in its entirety.
Fair value measurement of non-financial assets is based on the highest and best use of the asset. The Group considers marketparticipants’ use of, or purchase price of the asset, to use it in a manner that would be highest and best use.
The carrying value less impairment provision of trade receivables and payables is assumed to approximate their fair values due to theirshort-term nature. The fair value of financial liabilities for disclosure purposes is estimated by discounting the future contractual cash flowsat the current market interest rate that is available to the Group for similar financial instruments.
42

110 The University of Western Australia | uwa.edu.au
NOTES TO THE FINANCIAL STATEMENTSfor the year ended 31 December 2020
6.7 Commitments Consolidated University2020 2019 2020 2019$'000 $'000 $'000 $'000
(a) Capital commitments
Land and buildings Within one year 32,467 26,437 32,467 26,437 Later than one year but no later than five years - - - - Later than five years - - - -
32,467 26,437 32,467 26,437Other plant and equipment Within one year 11,327 9,818 11,324 9,818 Later than one year but no later than five years 13 - - - Later than five years - - -
11,340 9,818 11,324 9,818Intangible assets Within one year 3,741 2,583 3,741 2,583 Later than one year but no later than five years 129 2,712 129 2,712 Later than five years - - - -
3,870 5,295 3,870 5,295
(b) Lease commitments
Short-term leases
Within one year 791 975 692 975 Later than one year but no later than five years - - - - Later than five years - - - -
791 975 692 975
6.8 Contingencies(a)
(b)
Total future minimum lease payments
The Group discloses certain items as contingent liabilities, as they are either possible obligations whose existence will be confirmed only byuncertain future events, or they are present obligations where a transfer of economic resources is not probable or cannot be reliablymeasured. Contingent liabilities are not recognised on the balance sheet but are disclosed unless an outflow of economic resources isremote.
Building claddingThe Group is required to report known and suspected buildings with combustible cladding to the Western Australian Department of Mines,Industry Regulation and Safety (DMIRS). The DMIRS classifies these suspected buildings with combustible cladding as high or low riskfollowing detailed investigation. The Group will have a liability in respect of investigation or remediation expenses.
At the date of this report, seven buildings have been identified as requiring remedial action; one building having high risk AluminiumComposite Panel (ACP) has been remediated and another building with partial high risk ACP cladding component replaced, leaving onlymedium risk cladding. Assessment is being carried out on the remaining six buildings having low to medium risk ACP cladding. Dependingon the replacement strategy, the estimated cost are between $3.2 million for a partial ACP replacement strategy and $13.7 million for a fullACP replacement strategy. There is no externally or statutorily imposed timeframe for completion of ACP remediation, other thandemonstrating that activities are underway.
Employee benefitsThe Group has a significant workforce, including casual staff, and the industrial instrument framework and legislation in which employeebenefits are determined and applied is complex. The Group has a program of review over the application of its instruments and engagesexternal specialist advice, where deemed appropriate.
Given inconsistent application of historical industrial agreements across sectors, as well as evolving legislative and interpretations andongoing industry investigations, the Group continues to monitor and review its application of employee benefits. At the date of this report,known outcomes have been reflected in the financial statements. The outcomes and possible financial impact of ongoing reviews cannot bereliably determined at this time.
OtherAs at 31 December 2020 or at the date of this report, there are no other known contingent liabilities which are likely to materially affect theGroup’s financial position.
Contingent liabilities
Contingent assetsContingent assets exist in relation to funds bequeathed to the Group through a number of wills that are pending at year end. The amountand timing of the future inflow of economic benefits cannot be reasonably determined.
As at 31 December 2020 or at the date of this report, there are no other known contingent assets which are likely to materially affect theUniversity’s financial position.
Capital expenditure contracted for at the reporting date but not recognised as liabilities are payable as follows:
The nature of the short-term lease commitments disclosed below relates to property and equipment leases.
43

11120
20 Financial R
eport | uwa.edu.au
111
7 Other disclosures
• 7.1 Remuneration of auditors • 7.5 Discontinued operations• 7.2 Subsidiaries and Associates • 7.6 Events occurring after the end of the reporting period• 7.3 Related parties • 7.7 New standards issued but not yet effective• 7.4 Supplementary financial information • 7.8 Acquittal of Australian Government financial assistance
7.1 Remuneration of auditors Consolidated University2020 2019 2020 2019$'000 $'000 $'000 $'000
Audit and review of the Financial StatementsOffice of the Auditor General 416 372 324 315Total paid for audit and review of the Financial Statements 416 372 324 315
Other audit and assurance services*Office of the Auditor General 20 14 20 14AvantEdge Consulting 15 18 15 15Butler Settineri 3 - 3 -Ernst and Young 213 214 213 214KPMG Australia 37 20 37 20Marsden Stantons 4 4Latitude Creative Services 4 4 4 4PSZ Accounting 6 6 6 6Quantum Assurance 3 3 3 3RSM Australia Pty Ltd 30 29 30 29ShineWing Australia 30 1 30 1Total paid for other audit and assurance services 365 309 365 306
Total remuneration of auditors 781 681 689 621
* Other audit and assurance services are related to compliance audits, internal audits, grant acquittals and research project audits.
NOTES TO THE FINANCIAL STATEMENTSfor the year ended 31 December 2020
This section provides details on other required disclosures relating to the University and its subsidiaries compliance withaccounting standards.
During the year, the following fees were paid for services provided by the auditor of the parent entity, its related practices and non-related audit firms:
44

112 The University of Western Australia | uwa.edu.au
NOTES TO THE FINANCIAL STATEMENTSfor the year ended 31 December 2020
7.2 Subsidiaries and Associates
(a) Subsidiaries
2020 2019
The University Club of Western Australia Pty Ltd Australia Ordinary 100 100 Events and function centre
UWA Sport Pty Ltd Australia Ordinary 100 100Sports and recreational activities
UWA Accommodation Services Pty Ltd Australia Ordinary 100 100 Student accommodation
Australia Ordinary 100 100 Arts and culture events
Young Lives Matter Foundation UWA Limited* Australia - 100 100Youth suicide prevention research
* The company is "Limited by Guarantee".
Accounting policy
(b) Associates
2020 2019 2020 2019
Perth USAsia Centre Limited* Australia - 50 50 - -
Collaborative research on US and Australia relationship
Accounting policy
Principal activityName of entity
Equity holding %
The consolidated financial statements incorporate the assets and liabilities of all subsidiaries of The University of Western Australia (‘parententity’) as at 31 December 2020 and the results of all subsidiaries for the year then ended. The University of Western Australia and itssubsidiaries together are referred to in this financial report as the Group or the consolidated entity.
Subsidiaries are all those entities (including structured entities) over which the Group has control. The Group has control over an investeewhen it is exposed, or has rights, to variable returns from its involvement with the investee and has the ability to affect those returns throughits power over the investee. Power over the investee exists when the Group has existing rights that give it current ability to direct therelevant activities of the investee. The existence and effect of potential voting rights that are currently exercisable or convertible areconsidered when assessing whether the Group controls another entity. Returns are not necessarily monetary and can be only positive, onlynegative, or both positive and negative.
Subsidiaries are fully consolidated from the date on which control is transferred to the Group. They are de-consolidated from the date thatcontrol ceases.
The acquisition method of accounting is used to account for the acquisition of subsidiaries by the Group.
Intercompany transactions, balances and unrealised gains on transactions between Group companies are eliminated. Unrealised losses arealso eliminated unless the transaction provides evidence of the impairment of the asset transferred. Accounting policies of subsidiaries havebeen changed where necessary to ensure consistency with the policies adopted by the Group.
Name of entityPrincipal place of business
Class of shares
Principal activity
Perth International Arts Festival Ltd
Associates are all entities over which the Group has significant influence but not control, generally accompanying a shareholding of between20 per cent and 50 per cent of the voting rights. Investments in associates are accounted for in the parent entity financial statements usingthe cost method and in the consolidated financial statements using the equity method of accounting, after initially being recognised at cost.The Group’s investment in associates includes goodwill (net of any accumulated impairment loss) identified on acquisition.
The Group’s share of its associates’ post acquisition profits or losses is recognised in the income statement, and its share of post acquisitionmovements in reserves is recognised in reserves. The cumulative post acquisition movements are adjusted against the carrying amount ofthe investment. Dividends receivable from associates are recognised in the parent entity’s income statement, while in the consolidatedfinancial statements they reduce the carrying amount of the investment.
Gains or losses resulting from ‘upstream’ and ‘downstream’ transactions, involving assets that do not constitute a business, are recognisedin the parent’s financial statements only to the extent of unrelated investors’ interests in the associate or joint venture. Gains or lossesresulting from the contribution of non-monetary assets in exchange for an equity interest are accounted for in the same method.
When the Group’s share of losses in an associate equals or exceeds its interest in the associate, including any other unsecured receivables,the Group does not recognise further losses, unless it has incurred obligations or made payments on behalf of the associate.
* The company is "Limited by Guarantee". The constitution of the company prohibits distribution of funds to the members. Accordingly, theresult of the company is equity accounted at nil value.
Ownership interest %
Carrying amount $'000Country of
incorporationClass of shares
45

11320
20 Financial R
eport | uwa.edu.au
113
NOTES TO THE FINANCIAL STATEMENTSfor the year ended 31 December 2020
7.3 Related parties
(a) Parent entityThe parent entity within the Group is The University of Western Australia.
(b) Subsidiaries and associates· Interests in subsidiaries are set out in note 7.2.· Interests in associates are set out in note 7.2.
(c) Key management personnelDisclosures relating to key management personnel are set out in note 3.4.
(d) Transactions with related parties Consolidated University2020 2019 2020 2019$'000 $'000 $'000 $'000
The following transactions occurred with related parties:Sales of goods and services Subsidiaries - - 8,490 8,339Purchase of goods and services Subsidiaries - - 3,999 7,238Grant expense Subsidiaries - - 610 - Associates 400 501 400 501
(e) Outstanding balancesThe following balances are outstanding at the reporting date in relation to transactions with related parties:Current receivables (sales of goods and services) Subsidiaries - - 518 202Current payables (purchases of goods and services) Subsidiaries - - 182 685
(f) Terms and conditionsAmounts were billed based on market rates for such supplies/services and were due and payable under normal payment terms.
7.4 Supplementary financial information Consolidated University2020 2019 2020 2019$'000 $'000 $'000 $'000
(a) Write-offs
Trade and other receivables 931 815 913 815Property, plant and equipment - 17 - 17
931 832 913 832(b)
6 - - -
6 - - -
In the current and previous financial year, no allowance for credit losses have been raised in relation to any outstanding balances, and noexpense has been recognised in respect of credit losses from related parties.
Losses through theft and default
Bad debts and other write-offs, written off by the Senate, University Club Executive and UWA Sport Pty Ltd board during the financial year:
Losses through theft, default and other causes
46

114 The University of Western Australia | uwa.edu.au
NOTES TO THE FINANCIAL STATEMENTSfor the year ended 31 December 2020
7.5 Discontinued operations Consolidated University2020 2019 2020 2019$'000 $'000 $'000 $'000
(a) Operations discontinued during the year
(b)
- - - 6,938- - - 10,678- - - (3,740)
- - - -- - - (3,740)
Consideration received or receivable - - - -Carrying amount of net assets sold - - 3,507Loss on disposal - - - 3,507
Income from discontinued operationsWestern Australian and Local Government financial assistance - - - 443Investment revenue and income - - - 37Other revenue - - - 6,458Total income from discontinued operations - - - 6,938
Expenses from discontinued operationsEmployee related expenses - - - 1,239Materials and supplies - - - 21Grants distributed - - - (610)Travel - - - 65Other expenses - - - 9,963Total expenses from discontinued operations - - - 10,678
Net result from discontinued operations - - - (3,740)
7.6 Events occurring after the end of the reporting period
The financial performance information and cash flow information for 2019 are presented for the four months ended 1 May 2019.
Perth Festival, previously a business unit of the University of WesternAustralia, became a wholly owned subsidiary from 1 May 2019 with netassets transferred to Perth International Arts Festival Ltd for nilproceeds. The income and expenditure of Perth Festival from 1 Januaryto 30 April 2019 have been recognised as net result from discontinuedoperations, whilst the net result of the new subsidiary is recognised inthe consolidated net result of the Group.
RevenueExpenses
The Group continues to monitor the Covid-19 pandemic situation and will take further action as necessary in response to any economicdisruption. Action taken to date have preserved liquidity and the Group has sufficient cash reserves to meet our obligations when theybecame due and payable.
Other than the matters reported above, there are no significant events occurring after the end of the reporting period up until the date of thisreport which are likely to materially affect the Group's financial position.
Financial performance and cash flow information
Profit/(loss) from discontinued operationsGain on sale of the division
Net result of discontinued operations
47

11520
20 Financial R
eport | uwa.edu.au
115
7.7
New
sta
ndar
ds is
sued
but
not
yet
effe
ctiv
e
Stan
dard
Amen
dmen
tAp
plic
atio
n da
teLi
kely
impa
ct o
n in
itial
app
licat
ion
AA
SB
202
0-1
and
AA
SB
202
0-6
Am
endm
ents
to A
ustra
lian
Acc
ount
ing
Sta
ndar
ds –
Cla
ssifi
catio
n of
Lia
bilit
ies
as C
urre
nt o
r Non
-cur
rent
and
Am
endm
ents
to A
ustra
lian
Acc
ount
ing
1 Ja
nuar
y 20
23N
o m
ater
ial i
mpa
ct
AA
SB
202
0-3
Am
endm
ents
to A
ustra
lian
Acc
ount
ing
Sta
ndar
ds –
Ann
ual I
mpr
ovem
ents
20
18–2
020
and
Oth
er A
men
dmen
ts1
Janu
ary
2022
No
mat
eria
l im
pact
AA
SB
202
0-4
Am
endm
ents
to A
ustra
lian
Acc
ount
ing
Sta
ndar
ds –
Cov
id-1
9-R
elat
ed R
ent
Con
cess
ions
1 Ja
nuar
y 20
21N
o m
ater
ial i
mpa
ct
AA
SB
202
0-5
Am
endm
ents
toA
ustra
lian
Acc
ount
ing
Sta
ndar
ds-
Def
erra
lofE
ffect
ive
Dat
eof
Am
endm
ents
to A
AS
B 1
71
Janu
ary
2023
No
mat
eria
l im
pact
.
AA
SB
202
0-8
Am
endm
ents
toA
ustra
lian
Acc
ount
ing
Sta
ndar
ds–
Inte
rest
Rat
eB
ench
mar
kR
efor
m
1 Ja
nuar
y 20
22N
o m
ater
ial i
mpa
ct.
AA
SB
201
7-5
Am
endm
ents
toA
ustra
lian
Acc
ount
ing
Sta
ndar
ds–
Effe
ctiv
eD
ate
ofA
men
dmen
ts to
AA
SB
10
and
AA
SB
128
1 Ja
nuar
y 20
22N
o m
ater
ial i
mpa
ct.
Cer
tain
new
acco
untin
gst
anda
rds
and
inte
rpre
tatio
nsha
vebe
enpu
blis
hed
that
are
notm
anda
tory
for3
1D
ecem
ber2
020
repo
rting
perio
ds.T
heG
roup
has
elec
ted
nott
oea
rlyad
opta
nyof
thes
est
anda
rds.
The
Gro
up's
ass
essm
ent o
f the
impa
ct o
f the
se n
ew s
tand
ards
and
inte
rpre
tatio
ns is
set
out
bel
ow:
NO
TES
TO
TH
E F
INA
NC
IAL
STA
TEM
EN
TSfo
r the
yea
r end
ed 3
1 D
ecem
ber 2
020
48

116 The University of Western Australia | uwa.edu.au
7.8
Acqu
ittal
of A
ustr
alia
n G
over
nmen
t fin
anci
al a
ssis
tanc
e
a)20
2020
1920
2020
1920
2020
1920
2020
1920
2020
1920
2020
19N
ote
$'00
0$'
000
$'00
0$'
000
$'00
0$'
000
$'00
0$'
000
$'00
0$'
000
$'00
0$'
000
Fina
ncia
l ass
ista
nce
rece
ived
in C
AS
H d
urin
g th
e re
porti
ng p
erio
d (to
tal c
ash
rece
ived
from
the
Aus
tralia
n G
over
nmen
t for
the
prog
ram
s)16
9,70
114
6,52
01,
135
1,16
2-
-11
813
11,
303
1,45
4-
-N
et a
ccru
al a
djus
tmen
ts(1
4,51
0)-
--
--
--
--
--
Rev
enue
for t
he p
erio
d2.
1(a)
155,
191
146,
520
1,13
51,
162
--
118
131
1,30
31,
454
--
Sur
plus
/(def
icit)
from
the
prev
ious
yea
r-
-29
513
797
227
--
142
7414
514
8To
tal r
even
ue in
clud
ing
accr
ued
reve
nue
155,
191
146,
520
1,43
01,
299
9722
711
813
11,
445
1,52
814
514
8Le
ss e
xpen
ses
incl
udin
g ac
crue
d ex
pens
es(1
55,1
91)
(146
,520
)(1
,063
)(1
,004
)(1
8)(1
30)
(118
)(1
31)
(1,2
92)
(1,3
86)
-(3
)S
urpl
us/(d
efic
it) fo
r the
repo
rting
per
iod
--
367
295
7997
--
153
142
145
145
1In
clud
es th
e ba
sic
CG
S g
rant
am
ount
, CG
S –
Reg
iona
l Loa
ding
, CG
S –
Ena
blin
g Lo
adin
g, C
GS
– M
edic
al s
tude
nt L
oadi
ng, A
lloca
ted
Pla
ces,
Non
-Des
igna
ted
Cou
rses
and
CG
S –
Spe
cial
Adv
ance
s fro
m F
utur
e Ye
ars.
2D
isab
ility
Per
form
ance
Fun
ding
incl
udes
Add
ition
al S
uppo
rt fo
r Stu
dent
with
Dis
abilit
ies
and
Aus
tralia
n D
isab
ility
Cle
arin
ghou
se o
n E
duca
tion
& T
rain
ing.
3 Indi
geno
us S
tude
nt S
ucce
ss P
rogr
am re
plac
ed th
e In
dige
nous
Com
mon
wea
lth S
chol
arsh
ips
Pro
gram
and
the
Indi
geno
us S
uppo
rt P
rogr
am a
s of
1 J
anua
ry 2
017.
2020
2019
2020
2019
Not
e$'
000
$'00
0$'
000
$'00
0
Fina
ncia
l ass
ista
nce
rece
ived
in C
AS
H d
urin
g th
e re
porti
ng p
erio
d (to
tal c
ash
rece
ived
from
the
Aus
tralia
n G
over
nmen
t for
the
prog
ram
s)-
-17
2,25
714
9,26
7N
et a
ccru
al a
djus
tmen
ts-
-(1
4,51
0)-
Rev
enue
for t
he p
erio
d2.
1(a)
--
157,
747
149,
267
Sur
plus
/(def
icit)
from
the
prev
ious
yea
r19
8969
867
5To
tal r
even
ue in
clud
ing
accr
ued
reve
nue
1989
158,
445
149,
942
Less
exp
ense
s in
clud
ing
accr
ued
expe
nses
(10)
(70)
(157
,692
)(1
49,2
44)
Sur
plus
/(def
icit)
for t
he re
porti
ng p
erio
d9
1975
369
8
NO
TES
TO
TH
E F
INA
NC
IAL
STA
TEM
EN
TSfo
r the
yea
r end
ed 3
1 D
ecem
ber 2
020
Uni
vers
ityC
omm
onw
ealth
Gra
nt
Sche
me
1Ac
cess
and
Pa
rtic
ipat
ion
Fund
Prom
otio
n of
Ex
celle
nce
in L
earn
ing
and
Teac
hing
Dis
abili
ty P
erfo
rman
ce
Fund
ing
2In
dige
nous
Stu
dent
Su
cces
s Pr
ogra
m 3
Div
ersi
ty a
nd S
truc
tura
l Ad
just
men
t Fun
d
Educ
atio
n - C
omm
onw
ealth
Gra
nt S
chem
e an
d ot
her E
duca
tion
gran
ts
Uni
vers
ityLe
arni
ng a
nd T
each
ing
Perf
orm
ance
Fun
dTo
tal
Educ
atio
n - C
omm
onw
ealth
Gra
nt S
chem
e an
d ot
her E
duca
tion
gran
ts (c
ontin
ued)
49

11720
20 Financial R
eport | uwa.edu.au
117
NO
TES
TO
TH
E F
INA
NC
IAL
STA
TEM
EN
TSfo
r the
yea
r end
ed 3
1 D
ecem
ber 2
020
b)20
2020
1920
2020
1920
2020
1920
2020
19N
ote
$'00
0$'
000
$'00
0$'
000
$'00
0$'
000
$'00
0$'
000
Cas
h P
ayab
le/(R
ecei
vabl
e) a
t the
beg
inni
ng o
f ye
ar(2
,504
)(9
82)
(136
)-
--
(2,6
40)
(982
)Fi
nanc
ial a
ssis
tanc
e re
ceiv
ed in
CA
SH
dur
ing
the
repo
rting
per
iod
109,
679
96,5
9019
,705
18,3
382,
142
1,48
013
1,52
611
6,40
8C
ash
avai
labl
e fo
r per
iod
107,
175
95,6
0819
,569
18,3
382,
142
1,48
012
8,88
611
5,42
6
Rev
enue
and
inco
me
earn
ed2.
1(f)
(102
,172
)(9
8,11
2)(1
6,70
7)(1
8,47
4)(2
,142
)(1
,480
)(1
21,0
21)
(118
,066
)C
ash
Pay
able
/(Rec
eiva
ble)
at e
nd o
f yea
r5,
003
(2,5
04)
2,86
2(1
36)
--
7,86
5(2
,640
)
c)20
2020
1920
2020
1920
2020
19N
ote
$'00
0$'
000
$'00
0$'
000
$'00
0$'
000
Fina
ncia
l ass
ista
nce
rece
ived
in C
AS
H d
urin
g th
e re
porti
ng p
erio
d (to
tal c
ash
rece
ived
from
the
Aus
tralia
n G
over
nmen
t for
the
prog
ram
s)46
,594
47,4
0742
,276
43,7
2088
,870
91,1
27N
et a
ccru
al a
djus
tmen
ts-
--
--
-R
even
ue fo
r the
per
iod
2.1(
b)46
,594
47,4
0742
,276
43,7
2088
,870
91,1
27
Sur
plus
/(def
icit)
from
the
prev
ious
yea
r-
--
--
-To
tal r
even
ue in
clud
ing
accr
ued
reve
nue
46,5
9447
,407
42,2
7643
,720
88,8
7091
,127
Less
exp
ense
s in
clud
ing
accr
ued
expe
nses
(46,
594)
(47,
407)
(42,
276)
(43,
720)
(88,
870)
(91,
127)
Sur
plus
/(def
icit)
for t
he re
porti
ng p
erio
d-
--
--
-
Hig
her E
duca
tion
Loan
Pro
gram
s (e
xcl O
S-H
ELP)
Dep
artm
ent o
f Edu
catio
n, S
kills
and
Em
ploy
men
t Res
earc
h
Uni
vers
ityH
ECS
- HEL
P
(C
omm
onw
ealth
Pa
ymen
ts)
FEE
- HEL
PSA
- H
ELP
Tota
l
Uni
vers
ityR
esea
rch
Trai
ning
Pr
ogra
mR
esea
rch
Supp
ort
Prog
ram
Tota
l
50
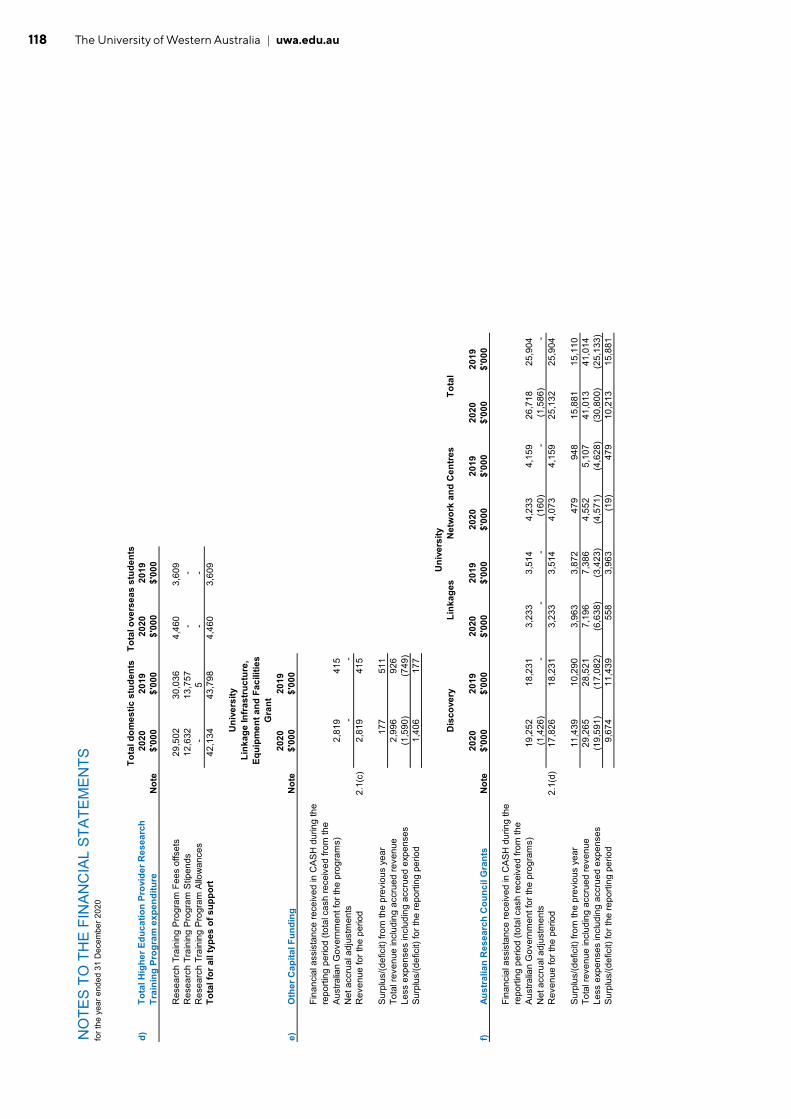
118 The University of Western Australia | uwa.edu.au
NO
TES
TO
TH
E F
INA
NC
IAL
STA
TEM
EN
TSfo
r the
yea
r end
ed 3
1 D
ecem
ber 2
020
Tota
l dom
estic
stu
dent
sTo
tal o
vers
eas
stud
ents
d)20
2020
1920
2020
19N
ote
$'00
0$'
000
$'00
0$'
000
Res
earc
h Tr
aini
ng P
rogr
am F
ees
offs
ets
29,5
0230
,036
4,46
03,
609
Res
earc
h Tr
aini
ng P
rogr
am S
tipen
ds12
,632
13,7
57-
-R
esea
rch
Trai
ning
Pro
gram
Allo
wan
ces
-5
--
Tota
l for
all
type
s of
sup
port
42,1
3443
,798
4,46
03,
609
2020
2019
e)O
ther
Cap
ital F
undi
ngN
ote
$'00
0$'
000
Fina
ncia
l ass
ista
nce
rece
ived
in C
AS
H d
urin
g th
e re
porti
ng p
erio
d (to
tal c
ash
rece
ived
from
the
Aus
tralia
n G
over
nmen
t for
the
prog
ram
s)2,
819
415
Net
acc
rual
adj
ustm
ents
--
Rev
enue
for t
he p
erio
d2.
1(c)
2,81
941
5
Sur
plus
/(def
icit)
from
the
prev
ious
yea
r17
751
1To
tal r
even
ue in
clud
ing
accr
ued
reve
nue
2,99
692
6Le
ss e
xpen
ses
incl
udin
g ac
crue
d ex
pens
es(1
,590
)(7
49)
Sur
plus
/(def
icit)
for t
he re
porti
ng p
erio
d1,
406
177
2020
2019
2020
2019
2020
2019
2020
2019
f)Au
stra
lian
Res
earc
h C
ounc
il G
rant
sN
ote
$'00
0$'
000
$'00
0$'
000
$'00
0$'
000
$'00
0$'
000
Fina
ncia
l ass
ista
nce
rece
ived
in C
AS
H d
urin
g th
e re
porti
ng p
erio
d (to
tal c
ash
rece
ived
from
the
Aus
tralia
n G
over
nmen
t for
the
prog
ram
s)19
,252
18,2
313,
233
3,51
44,
233
4,15
926
,718
25,9
04N
et a
ccru
al a
djus
tmen
ts(1
,426
)-
--
(160
)-
(1,5
86)
-R
even
ue fo
r the
per
iod
2.1(
d)17
,826
18,2
313,
233
3,51
44,
073
4,15
925
,132
25,9
04
Sur
plus
/(def
icit)
from
the
prev
ious
yea
r11
,439
10,2
903,
963
3,87
247
994
815
,881
15,1
10To
tal r
even
ue in
clud
ing
accr
ued
reve
nue
29,2
6528
,521
7,19
67,
386
4,55
25,
107
41,0
1341
,014
Less
exp
ense
s in
clud
ing
accr
ued
expe
nses
(19,
591)
(17,
082)
(6,6
38)
(3,4
23)
(4,5
71)
(4,6
28)
(30,
800)
(25,
133)
Sur
plus
/(def
icit)
for t
he re
porti
ng p
erio
d9,
674
11,4
3955
83,
963
(19)
479
10,2
1315
,881
Tota
l Hig
her E
duca
tion
Prov
ider
Res
earc
h Tr
aini
ng P
rogr
am e
xpen
ditu
re
Uni
vers
ityLi
nkag
e In
fras
truc
ture
, Eq
uipm
ent a
nd F
acili
ties
Gra
nt
Uni
vers
ityD
isco
very
Link
ages
Net
wor
k an
d C
entr
esTo
tal
51

11920
20 Financial R
eport | uwa.edu.au
119
NO
TES
TO
TH
E F
INA
NC
IAL
STA
TEM
EN
TSfo
r the
yea
r end
ed 3
1 D
ecem
ber 2
020
g)20
2020
19$'
000
$'00
0
Cas
h re
ceiv
ed d
urin
g th
e re
porti
ng p
erio
d93
,998
118,
010
Cas
h sp
ent d
urin
g th
e re
porti
ng p
erio
d(9
3,99
8)(1
18,0
10)
Net
cas
h re
ceiv
ed-
-
Cas
h su
rplu
s/(d
efic
it) fr
om p
revi
ous
perio
d-
-C
ash
surp
lus/
(def
icit)
for r
epor
ting
perio
d-
-
2020
2019
h)O
S-H
ELP
$'00
0$'
000
Cas
h re
ceiv
ed d
urin
g th
e re
porti
ng p
erio
d3,
102
1,46
0C
ash
spen
t dur
ing
the
repo
rting
per
iod
(95)
(2,5
14)
Net
cas
h re
ceiv
ed3,
007
(1,0
54)
Cas
h su
rplu
s/(d
efic
it) fr
om p
revi
ous
perio
d52
71,
581
Cas
h su
rplu
s/(d
efic
it) fo
r rep
ortin
g pe
riod
5.6
3,53
452
7
2020
2019
i)St
uden
t Ser
vice
s an
d Am
eniti
es F
eeN
ote
$'00
0$'
000
Uns
pent
/(ove
rspe
nt) r
even
ue fr
om p
revi
ous
perio
d-
-S
A-H
ELP
reve
nue
earn
ed2.
1(f)
2,14
21,
480
Stu
dent
ser
vice
s an
d am
eniti
es fe
es fr
om s
tude
nts
2.3
3,31
24,
090
Tota
l rev
enue
exp
enda
ble
in p
erio
d5,
454
5,57
0S
tude
nt s
ervi
ces
expe
nses
dur
ing
perio
d(5
,454
)(5
,570
)U
nspe
nt/(o
vers
pent
) stu
dent
ser
vice
s re
venu
e-
-
Oth
er A
ustr
alia
n G
over
nmen
t Fin
anci
al
Assi
stan
ce
Stud
ent S
ervi
ces
and
Amen
ities
Fee
Uni
vers
ityO
ther
Aus
tral
ian
Gov
ernm
ent F
inan
cial
As
sist
ance
Uni
vers
ityO
S-H
ELP
Uni
vers
ity
52

120 The University of Western Australia | uwa.edu.au
THIS PAGE HAS BEEN LEFT INTENTIONALLY BLANK

121

Get in touch
Stay connected
CALL US +61 8 6488 2450
EMAIL [email protected]
CORRESPONDENCE University Secretary The University of Western Australia35 Stirling Highway, Perth, Western Australia 6009
VISIT US ONLINE annualreport.uwa.edu.au
WRIKE 545833700 CRICOS Provider Code: 00126G
universitywa uwanews universitywa universitywa