Jeff Campos Was The President & CEO Of Hispanic Chamber of Commerce Metro Denver

OPM.GOV FEBRUARY 2021
United StateS Office Of PerSOnnel ManageMent
Annual Report to the President Hispanic Employment in the
Federal Government
Fiscal Year 2018

The President The White House 1600 Pennsylvania Ave, NW Washington, DC 20500
Dear Mr. President:
This letter transmits the U.S. Office of Personnel Management’s (OPM) Eighteenth Annual
Report on Hispanic Employment in the Federal Government for Fiscal Year (FY) 2018. This report provides data on Hispanic representation in the Federal workforce in compliance with Executive Order 13171.
According to the U.S. Census Bureau, the Hispanic population of the United States as of July 1, 2018 was 59.9 million and 18.3 percent of the nation’s total population, making people of Hispanic origin the nation’s largest ethnic or racial minority. As of 2010, the Hispanic Civilian Labor Force was 10.8 percent of the total civilian workforce,1 taking into account citizenship, which is required for most Federal positions. The total number of Hispanics onboard in the permanent Federal workforce increased from 173,234 in FY 2017 to 178,215 in FY 2018, an increase from 8.9 percent to 9.1 percent.
Among the 18 reporting executive departments, 16 increased their percentage of Hispanic employees onboard and two remained unchanged when compared to FY 2017. Among the 27 independent agencies reported, 19 increased their percentage of Hispanic employees onboard, 6 remained unchanged, and two decreased from the previous reporting period. The overall Hispanic percentage of permanent new hires remained unchanged at 9.4 percent in FY 2017 and FY 2018, although the number of Hispanic new hires increased over the same time period.
OPM continues to be committed to enhancing Hispanic employment in the Federal Government through strategic outreach in partnership with diverse organizations, which include the former Federal Interagency Working Group on Educational Excellence for Hispanics, Federal agencies, academic partners, workforce centers, and other stakeholders. OPM also expanded past efforts to support the White House Initiatives on Excellence – Hispanic-Serving Institutions (HSIs) and Historically Black Colleges and Universities (HBCUs) by delivering presentations that touched more than 80 HBCUs and 250 HSIs and looks forward to collaborating with these organizations again. Additionally, OPM provided technical guidance briefings on recruiting qualified applicants from all segments of society to
1 Equal Employment Opportunity Tabulation 2006-2010 (5-year American Community Survey Data), including Puerto Rico.
over 1,000 Federal agency human resources practitioners and hiring managers. These efforts are designed to build and sustain a 21st century Federal workforce.
Respectfully,
Kathleen M. McGettigan Acting Director
1
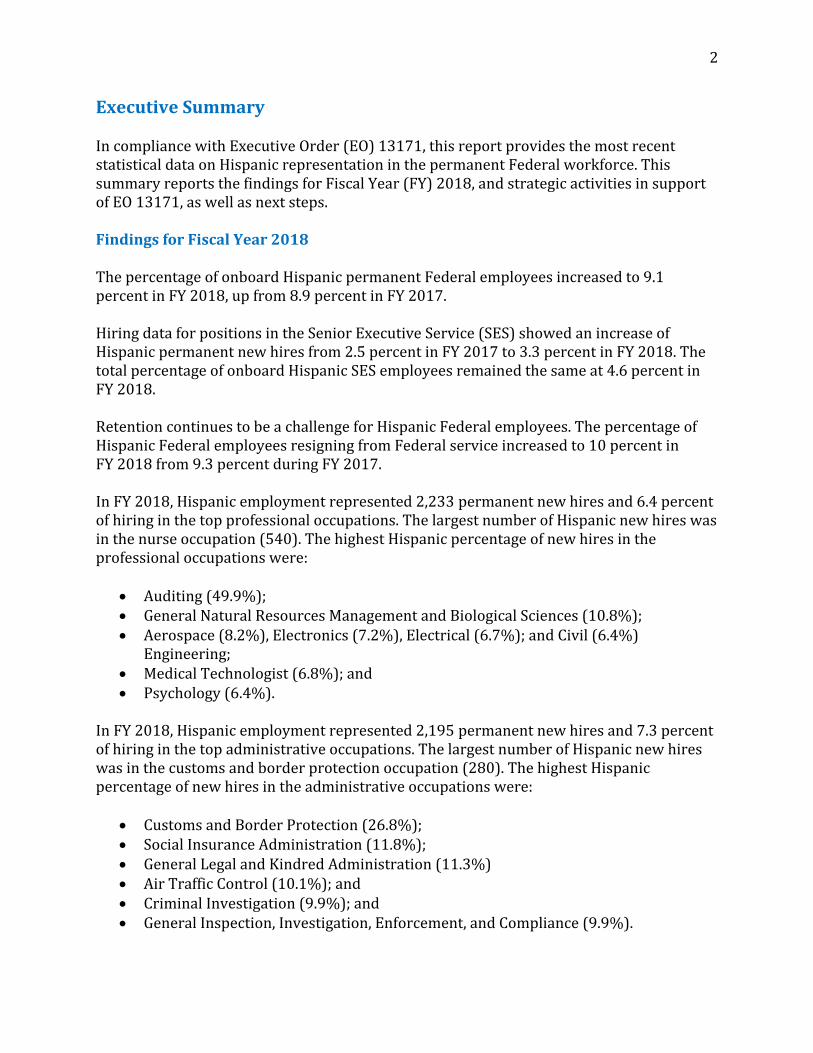
Table of Contents
Executive Summary ............................................................................................................................................ 2
Findings for Fiscal Year 2018 ..................................................................................................................... 2
Strategic Activities .......................................................................................................................................... 3
Looking Ahead .................................................................................................................................................. 4
Conclusion .......................................................................................................................................................... 4
Hispanic Representation in the Permanent Federal Civilian Workforce September 2000-2018 ....................................................................................................................................... 5
Percent Composition of Federal Workforce at a Glance FY 2018 ................................................... 6
Hispanic Representation in the Federal Permanent Workforce by Executive Department September 2017-2018 ....................................................................................................................................... 7
Hispanic Representation in the Federal Permanent Workforce by Independent Agency September 2017-2018 ....................................................................................................................................... 8
Hispanic Permanent New Hires in Executive Departments FY 2017-2018 ............................... 9
Hispanic Permanent New Hires in Independent Agencies FY 2017-2018 .............................. 10
Hispanic Permanent New Hires by Pay System FY 2017-2018 .................................................... 11
Hispanic Permanent Onboard Workforce by Pay System FY 2017-2018 ................................ 12
Hispanic Separations Among the Permanent Federal Civilian Workforce FY 2014-2018 ..................................................................................................................................................... 13
Hispanic Representation Among Permanent Employee Transfers Out FY 2017-2018 ..... 14
Hispanic Representation Among Permanent Employee Resignations FY 2017-2018 ....... 15
Hispanic Representation Among Permanent Employee Retirements FY 2017-2018 ........ 16
Hispanic Hiring into Professional and Administrative Occupations FY 2017-2018 ........... 17
Hispanic Hiring into the Top Professional Occupations FY 2018 ................................................ 18
Hispanic Hiring into the Top Administrative Occupations FY 2018........................................... 19
Hispanic Permanent Federal Civilian Workforce by State September 2018 .......................... 20
Agency Successful/Promising Practices ................................................................................................. 21
2
Executive Summary
In compliance with Executive Order (EO) 13171, this report provides the most recent statistical data on Hispanic representation in the permanent Federal workforce. This summary reports the findings for Fiscal Year (FY) 2018, and strategic activities in support of EO 13171, as well as next steps.
Findings for Fiscal Year 2018
The percentage of onboard Hispanic permanent Federal employees increased to 9.1 percent in FY 2018, up from 8.9 percent in FY 2017.
Hiring data for positions in the Senior Executive Service (SES) showed an increase of Hispanic permanent new hires from 2.5 percent in FY 2017 to 3.3 percent in FY 2018. The total percentage of onboard Hispanic SES employees remained the same at 4.6 percent in FY 2018.
Retention continues to be a challenge for Hispanic Federal employees. The percentage of Hispanic Federal employees resigning from Federal service increased to 10 percent in FY 2018 from 9.3 percent during FY 2017.
In FY 2018, Hispanic employment represented 2,233 permanent new hires and 6.4 percent of hiring in the top professional occupations. The largest number of Hispanic new hires was in the nurse occupation (540). The highest Hispanic percentage of new hires in the professional occupations were:
• Auditing (49.9%);• General Natural Resources Management and Biological Sciences (10.8%);• Aerospace (8.2%), Electronics (7.2%), Electrical (6.7%); and Civil (6.4%)
Engineering;• Medical Technologist (6.8%); and• Psychology (6.4%).
In FY 2018, Hispanic employment represented 2,195 permanent new hires and 7.3 percent of hiring in the top administrative occupations. The largest number of Hispanic new hires was in the customs and border protection occupation (280). The highest Hispanic percentage of new hires in the administrative occupations were:
• Customs and Border Protection (26.8%);• Social Insurance Administration (11.8%);• General Legal and Kindred Administration (11.3%)• Air Traffic Control (10.1%); and• Criminal Investigation (9.9%); and• General Inspection, Investigation, Enforcement, and Compliance (9.9%).
3
New Mexico leads the states with the highest percentage of permanent Hispanic Federal workers with 27.4 percent, followed by Texas, California, Arizona, and Florida.
Strategic Activities
In Fiscal Year (FY) 2018, OPM continued to highlight improving the quality and diversity of new hires, to include the recruitment and retention of Hispanic talent in the Federal workforce through the following activities:
➢ OPM has sustained a strong, mutually beneficial relationship with Hispanic-servingaffinity groups, associations, and leaders in the Hispanic community through theHispanic Council on Federal Employment (HCFE) and all of its members. In FY 2018, theCouncil brought together leaders from the Hispanic community, Human Resources(HR), Equal Employment Opportunity (EEO), and Diversity and Inclusion (D&I). TheCouncil actively advised the Director of OPM on specific practices andrecommendations related to the recruitment, retention, and advancement of Hispanicsin the Federal workplace. As a result of the Council’s efforts, agencies across the FederalGovernment with at least 1,000 employees conducted a barrier analysis onHispanic/Latino employment at the GS-12 through SES levels, which were included inthe agency’s Management Directive 715 report submission to EEOC. The focusedanalysis provided agencies with a better understanding of their Hispanic employmentand areas of opportunity.
➢ OPM’s commitment to attracting diverse talent from all segments of society is reflectedin the over 30,000 job seekers prepared to apply for Federal jobs by attending webinarson topics like finding and applying for Federal jobs and resumé writing. In FY 2018,OPM presented to staff from over 400 workforce centers across the nation to educatethem on the Federal hiring process so that they can better serve job seekers.
➢ OPM has established, and continues to cultivate, strong ties with diverse communities,including Hispanic-Serving Institutions (HSIs); Historically Black Colleges andUniversities (HBCUs); Tribal Colleges and Universities (TCUs); Asian American andNative American Pacific Islander Institutions (AANAPISIs) students; students withdisabilities, and other minority-serving organizations. In FY 2018, OPM’s outreach teambriefed students from diverse groups from over 1,500 schools including over 250 HSIsrepresented in these popular webinars.
➢ OPM delivered briefings to members of minority and professional organizations such asthe Hispanic Association of Colleges and Universities (HACU), the CongressionalHispanic Caucus, League of United Latin American Citizens (LULAC), and the Society ofAmerican Indian Government Employees (SAIGE). OPM staff participated as speakersfor events targeted for diverse populations and those hosted by organizations includingLULAC and National Image, Inc.
➢ OPM partnered with colleges and universities, minority organizations, non-profitorganizations, and other stakeholders with the common goal of expanding Federal

4
employment opportunities for all segments of society. OPM also expanded efforts to support the White House Initiatives on Educational Excellence for HBCUs and HSIs by delivering presentations that touched more than 80 HBCUs and 250 HSIs.
➢ OPM’s academic engagement program continued to reach over 3,000 institutions ofhigher learning to offer to educate academic advisors and career counselors on Federalemployment and to provide career exploration resources. OPM delivered 32 separatebriefings for over 1,700 academic partners from approximately 650 colleges anduniversities in FY 2018.
➢ OPM led Governmentwide and nationwide outreach initiatives to promote Federalcareer opportunities in mission critical occupations such as cybersecurity and Science,Technology, Engineering, and Mathematics (STEM), and Pathways Programs forstudents and recent graduates. In FY 2018, OPM briefed 378 colleges and universitieswith programs in cybersecurity to increase awareness of Federal careers andemployment programs.
Looking Ahead
OPM looks forward to partnering with the White House Initiative on Educational Excellence for Hispanics (WHIEEH) by conducting joint outreach to students and recent graduates from Hispanic-Serving Institutions (HSI) and other WHIEEH stakeholders. The outreach will include providing information on career opportunities, the Pathways Programs for Students and Recent Graduates, and other Federal job search information.
OPM will also continue to support Federal agencies in accessing diverse talent pools by providing new guidance on sourcing diverse talent using events, online marketing, and social media. Additionally, OPM will continue to provide technical assistance to senior leaders and agency staff across Government. Technical Assistance is the process of providing targeted guidance and recommendations to an agency with a specific need or challenge in their diversity and inclusion, strategic recruitment, and outreach programs, including retention, to assist them in taking a holistic approach to effectively build program-specific capacity.
We look forward to reporting back to you on our progress.
Conclusion
OPM remains committed to support proactively agencies across the Federal Government to develop innovative strategies to recruit, hire, develop, advance, and retain Hispanics in the Federal Government, consistent with the merit system principles.

5
Figure 1 Hispanic Representation in the Permanent Federal Civilian Workforce
September 2000-2018
6.5%6.6%
6.9%
7.1%
7.3%7.4%
7.5%
7.8%7.9%
8.0% 8.0%8.1%
8.2%8.3%
8.4%8.5%
8.6%
8.9%
9.1%
6.0%
6.2%
6.4%
6.6%
6.8%
7.0%
7.2%
7.4%
7.6%
7.8%
8.0%
8.2%
8.4%
8.6%
8.8%
9.0%
9.2%
2000 2001 2002 2003 2004 2005 2006 2007 2008 2009 2010 2011 2012 2013 2014 2015 2016 2017 2018
Perc
en
t o
f P
erm
an
en
t F
ed
era
l C
ivlian
Wo
rkfo
rce
Fiscal Year
Data Source:U.S. Office of Personnel ManagementCPDF, EHRI-SDMas of September 30 of each year: 2000-2018
Figure 1 illustrates an increase in Hispanic representation in the permanent Federal civilian workforce between FY 2000 (6.5%) and FY 2018 (9.1%).
6
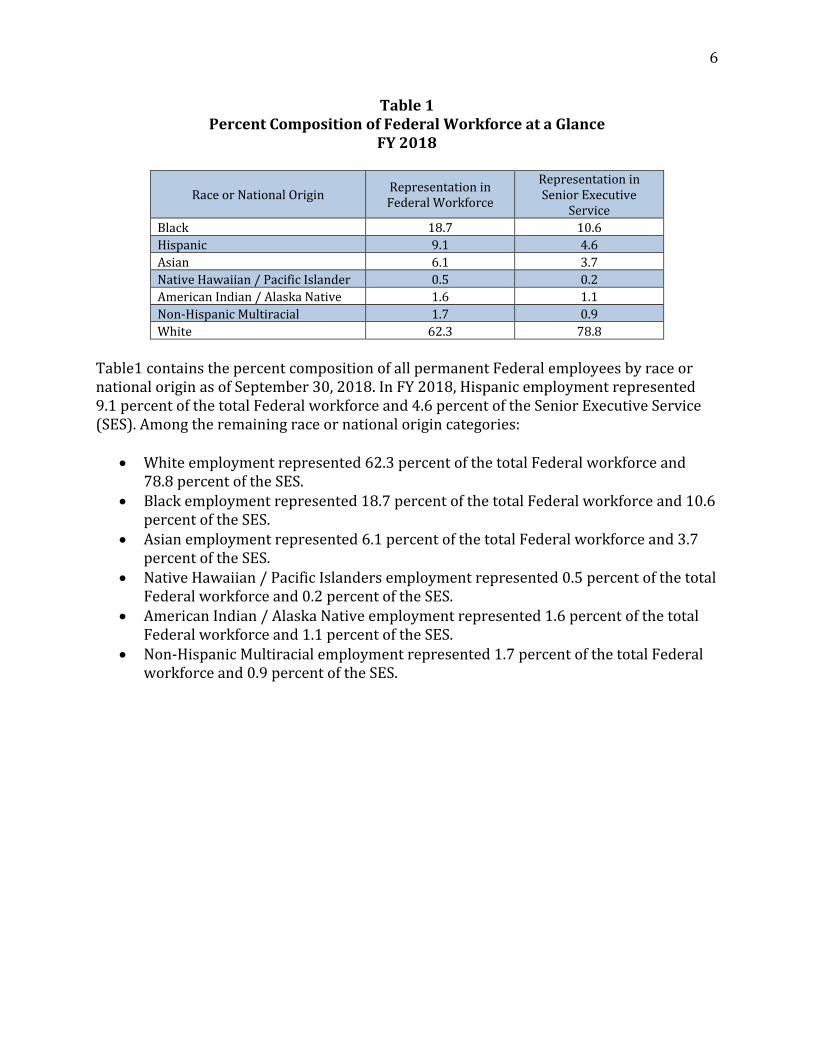
Table 1 Percent Composition of Federal Workforce at a Glance
FY 2018
Race or National Origin Representation in Federal Workforce
Representation in Senior Executive
Service
Black 18.7 10.6
Hispanic 9.1 4.6
Asian 6.1 3.7
Native Hawaiian / Pacific Islander 0.5 0.2
American Indian / Alaska Native 1.6 1.1
Non-Hispanic Multiracial 1.7 0.9
White 62.3 78.8
Table1 contains the percent composition of all permanent Federal employees by race or national origin as of September 30, 2018. In FY 2018, Hispanic employment represented 9.1 percent of the total Federal workforce and 4.6 percent of the Senior Executive Service (SES). Among the remaining race or national origin categories:
• White employment represented 62.3 percent of the total Federal workforce and78.8 percent of the SES.
• Black employment represented 18.7 percent of the total Federal workforce and 10.6percent of the SES.
• Asian employment represented 6.1 percent of the total Federal workforce and 3.7percent of the SES.
• Native Hawaiian / Pacific Islanders employment represented 0.5 percent of the totalFederal workforce and 0.2 percent of the SES.
• American Indian / Alaska Native employment represented 1.6 percent of the totalFederal workforce and 1.1 percent of the SES.
• Non-Hispanic Multiracial employment represented 1.7 percent of the total Federalworkforce and 0.9 percent of the SES.
7
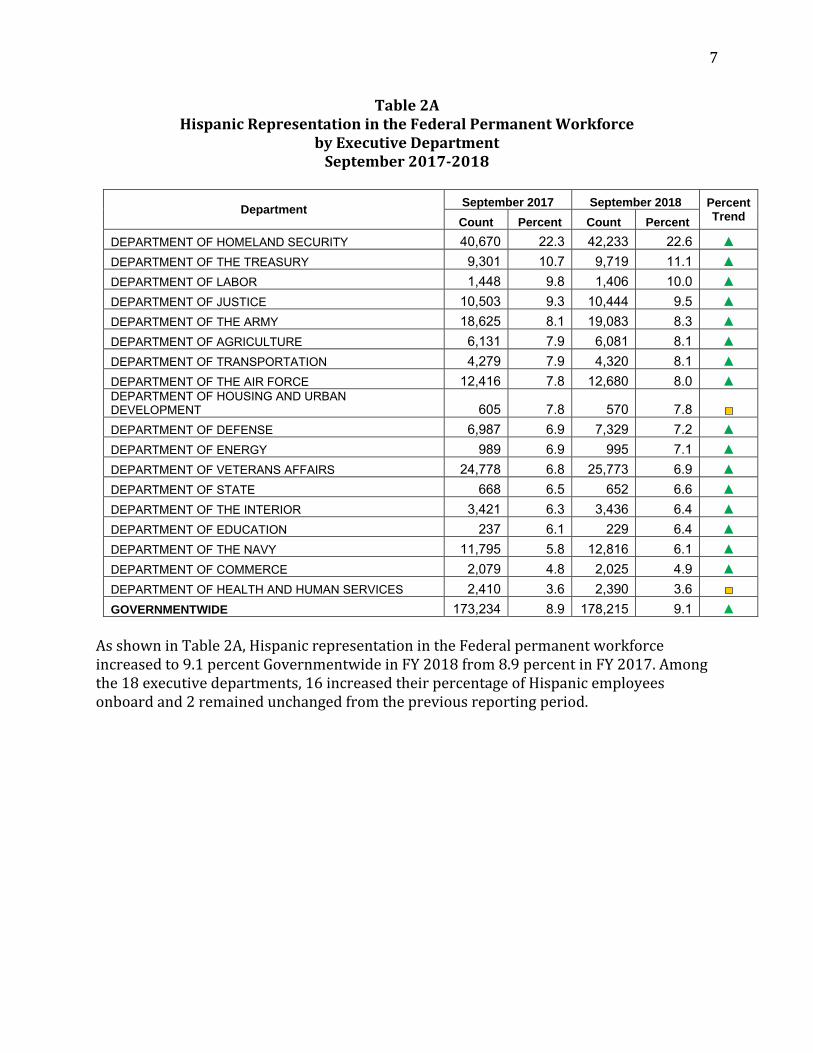
Table 2A Hispanic Representation in the Federal Permanent Workforce
by Executive Department September 2017-2018
Department September 2017 September 2018 Percent
Trend Count Percent Count Percent
DEPARTMENT OF HOMELAND SECURITY 40,670 22.3 42,233 22.6 ▲
DEPARTMENT OF THE TREASURY 9,301 10.7 9,719 11.1 ▲
DEPARTMENT OF LABOR 1,448 9.8 1,406 10.0 ▲
DEPARTMENT OF JUSTICE 10,503 9.3 10,444 9.5 ▲
DEPARTMENT OF THE ARMY 18,625 8.1 19,083 8.3 ▲
DEPARTMENT OF AGRICULTURE 6,131 7.9 6,081 8.1 ▲
DEPARTMENT OF TRANSPORTATION 4,279 7.9 4,320 8.1 ▲
DEPARTMENT OF THE AIR FORCE 12,416 7.8 12,680 8.0 ▲ DEPARTMENT OF HOUSING AND URBAN DEVELOPMENT 605 7.8 570 7.8 ■
DEPARTMENT OF DEFENSE 6,987 6.9 7,329 7.2 ▲
DEPARTMENT OF ENERGY 989 6.9 995 7.1 ▲
DEPARTMENT OF VETERANS AFFAIRS 24,778 6.8 25,773 6.9 ▲
DEPARTMENT OF STATE 668 6.5 652 6.6 ▲
DEPARTMENT OF THE INTERIOR 3,421 6.3 3,436 6.4 ▲
DEPARTMENT OF EDUCATION 237 6.1 229 6.4 ▲
DEPARTMENT OF THE NAVY 11,795 5.8 12,816 6.1 ▲
DEPARTMENT OF COMMERCE 2,079 4.8 2,025 4.9 ▲
DEPARTMENT OF HEALTH AND HUMAN SERVICES 2,410 3.6 2,390 3.6 ■
GOVERNMENTWIDE 173,234 8.9 178,215 9.1 ▲
As shown in Table 2A, Hispanic representation in the Federal permanent workforce increased to 9.1 percent Governmentwide in FY 2018 from 8.9 percent in FY 2017. Among the 18 executive departments, 16 increased their percentage of Hispanic employees onboard and 2 remained unchanged from the previous reporting period.

8
Table 2B Hispanic Representation in the Federal Permanent Workforce
by Independent Agency September 2017-2018
Department September 2017 September 2018 Percent
Trend Count Percent Count Percent
SOCIAL SECURITY ADMINISTRATION 9,569 15.5 9,621 15.6 ▲
EQUAL EMPLOYMENT OPPORTUNITY COMMISSION 303 15.0 314 15.4 ▲
NATIONAL LABOR RELATIONS BOARD 174 12.1 160 12.3 ▲
SMALL BUSINESS ADMINISTRATION 262 10.0 259 10.0 ■
RAILROAD RETIREMENT BOARD 75 8.5 77 9.0 ▲
BROADCASTING BOARD OF GOVERNORS 121 8.4 119 8.5 ▲ NATIONAL AERONAUTICS AND SPACE ADMINISTRATION 1,296 7.6 1,321 7.7 ▲
ENVIRONMENTAL PROTECTION AGENCY 1,017 7.1 996 7.3 ▲
NUCLEAR REGULATORY COMMISSION 216 6.9 211 7.1 ▲
FEDERAL RESERVE SYSTEM 98 6.3 98 6.7 ▲
CONSUMER PRODUCT SAFETY COMMISSION 33 6.5 33 6.5 ■
GENERAL SERVICES ADMINISTRATION 613 5.5 671 6.2 ▲
NATIONAL CREDIT UNION ADMINISTRATION 57 5.0 68 6.2 ▲
U.S. AGENCY FOR INTERNATIONAL DEVELOPMENT 172 5.7 174 6.0 ▲
OFFICE OF PERSONNEL MANAGEMENT 300 5.6 320 5.9 ▲
FEDERAL HOUSING FINANCE AGENCY 39 5.5 42 5.9 ▲
SECURITIES AND EXCHANGE COMMISSION 248 5.5 243 5.6 ▲
COURT SERVICES AND OFFENDER SUPERVISION AGENCY FOR THE DISTRICT OF COLUMBIA 59 5.1 55 4.9 ▼
SMITHSONIAN INSTITUTION 222 4.7 223 4.8 ▲
NATIONAL SCIENCE FOUNDATION 54 4.3 55 4.3 ■
PENSION BENEFIT GUARANTY CORPORATION 36 4.0 38 4.2 ▲
FEDERAL DEPOSIT INSURANCE CORPORATION 230 4.1 229 4.1 ■
FEDERAL TRADE COMMISSION 43 4.0 41 4.0 ■
FEDERAL COMMUNICATIONS COMMISSION 51 3.5 50 3.5 ■
COMMODITY FUTURES TRADING COMMISSION 23 3.4 22 3.3 ▼
NATIONAL ARCHIVES AND RECORDS ADMINISTRATION 88 3.1 88 3.2 ▲
GOVERNMENT PRINTING OFFICE 29 1.7 31 1.8 ▲
GOVERNMENTWIDE 173,234 8.9 178,215 9.1 ▲
Table 2B contains Hispanic representation in the Federal permanent workforce data for independent agencies with 500 or more permanent employees in FY 2018. Among the 27 agencies reported, 19 increased their percentage of Hispanic employees onboard, 6 remained unchanged, and 2 decreased from the previous reporting period.

9
Table 3A Hispanic Permanent New Hires in Executive Departments
FY 2017-2018
Department September 2017 September 2018 Percent
Trend Count Percent Count Percent
DEPARTMENT OF HOMELAND SECURITY 3,636 23.5 4,513 25.2 ▲
DEPARTMENT OF THE TREASURY 1,064 16.4 769 14.3 ▼
DEPARTMENT OF JUSTICE 468 10.3 420 11.6 ▲ DEPARTMENT OF HOUSING AND URBAN DEVELOPMENT 14 5.1 14 10.5 ▲
DEPARTMENT OF AGRICULTURE 378 9.9 273 10.3 ▲
DEPARTMENT OF LABOR 68 14.6 31 8.8 ▼
DEPARTMENT OF DEFENSE 738 9.6 757 8.3 ▼
DEPARTMENT OF TRANSPORTATION 185 9.2 132 8.3 ▼
DEPARTMENT OF EDUCATION 13 9.2 3 8.3 ▼
DEPARTMENT OF ENERGY 48 7.7 39 7.8 ▲
DEPARTMENT OF COMMERCE 116 6.2 105 7.4 ▲
DEPARTMENT OF THE AIR FORCE 645 7.1 812 6.9 ▼
DEPARTMENT OF VETERANS AFFAIRS 2,035 5.8 2,804 6.8 ▲
DEPARTMENT OF THE INTERIOR 148 5.2 161 6.7 ▲
DEPARTMENT OF STATE 34 8.3 24 6.7 ▼
DEPARTMENT OF THE ARMY 1,163 7.8 1,050 6.0 ▼
DEPARTMENT OF THE NAVY 727 5.5 1,189 5.9 ▲
DEPARTMENT OF HEALTH AND HUMAN SERVICES 137 3.2 99 3.1 ▼
GOVERNMENTWIDE 12,209 9.4 13,901 9.4 ■
As shown in Table 3A, data indicates the Hispanic percentage of new hires remained unchanged at 9.4 percent Governmentwide from FY 2017 to FY 2018. Among the 18 executive departments, 9 increased their Hispanic percentage of new hires and 9 decreased from the previous reporting period.
10
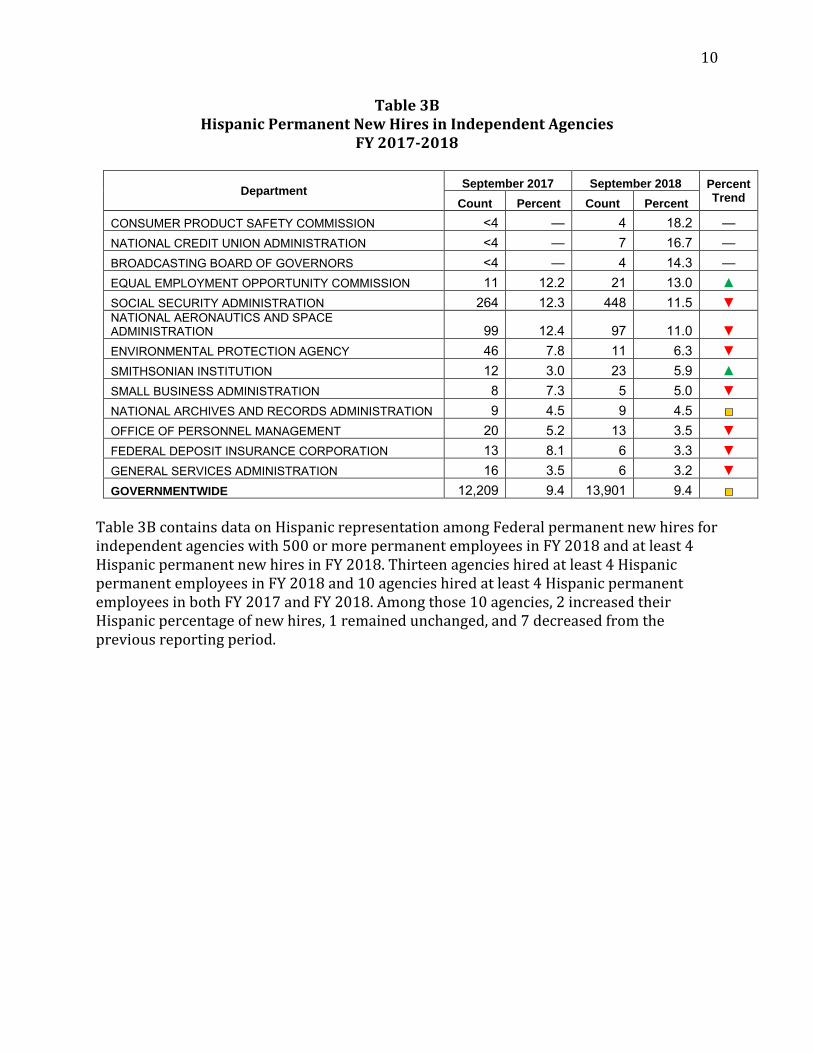
Table 3B Hispanic Permanent New Hires in Independent Agencies
FY 2017-2018
Department September 2017 September 2018 Percent
Trend Count Percent Count Percent
CONSUMER PRODUCT SAFETY COMMISSION <4 — 4 18.2 — NATIONAL CREDIT UNION ADMINISTRATION <4 — 7 16.7 — BROADCASTING BOARD OF GOVERNORS <4 — 4 14.3 — EQUAL EMPLOYMENT OPPORTUNITY COMMISSION 11 12.2 21 13.0 ▲
SOCIAL SECURITY ADMINISTRATION 264 12.3 448 11.5 ▼ NATIONAL AERONAUTICS AND SPACE ADMINISTRATION 99 12.4 97 11.0 ▼
ENVIRONMENTAL PROTECTION AGENCY 46 7.8 11 6.3 ▼
SMITHSONIAN INSTITUTION 12 3.0 23 5.9 ▲
SMALL BUSINESS ADMINISTRATION 8 7.3 5 5.0 ▼
NATIONAL ARCHIVES AND RECORDS ADMINISTRATION 9 4.5 9 4.5 ■
OFFICE OF PERSONNEL MANAGEMENT 20 5.2 13 3.5 ▼
FEDERAL DEPOSIT INSURANCE CORPORATION 13 8.1 6 3.3 ▼
GENERAL SERVICES ADMINISTRATION 16 3.5 6 3.2 ▼
GOVERNMENTWIDE 12,209 9.4 13,901 9.4 ■
Table 3B contains data on Hispanic representation among Federal permanent new hires for independent agencies with 500 or more permanent employees in FY 2018 and at least 4 Hispanic permanent new hires in FY 2018. Thirteen agencies hired at least 4 Hispanic permanent employees in FY 2018 and 10 agencies hired at least 4 Hispanic permanent employees in both FY 2017 and FY 2018. Among those 10 agencies, 2 increased their Hispanic percentage of new hires, 1 remained unchanged, and 7 decreased from the previous reporting period.
11
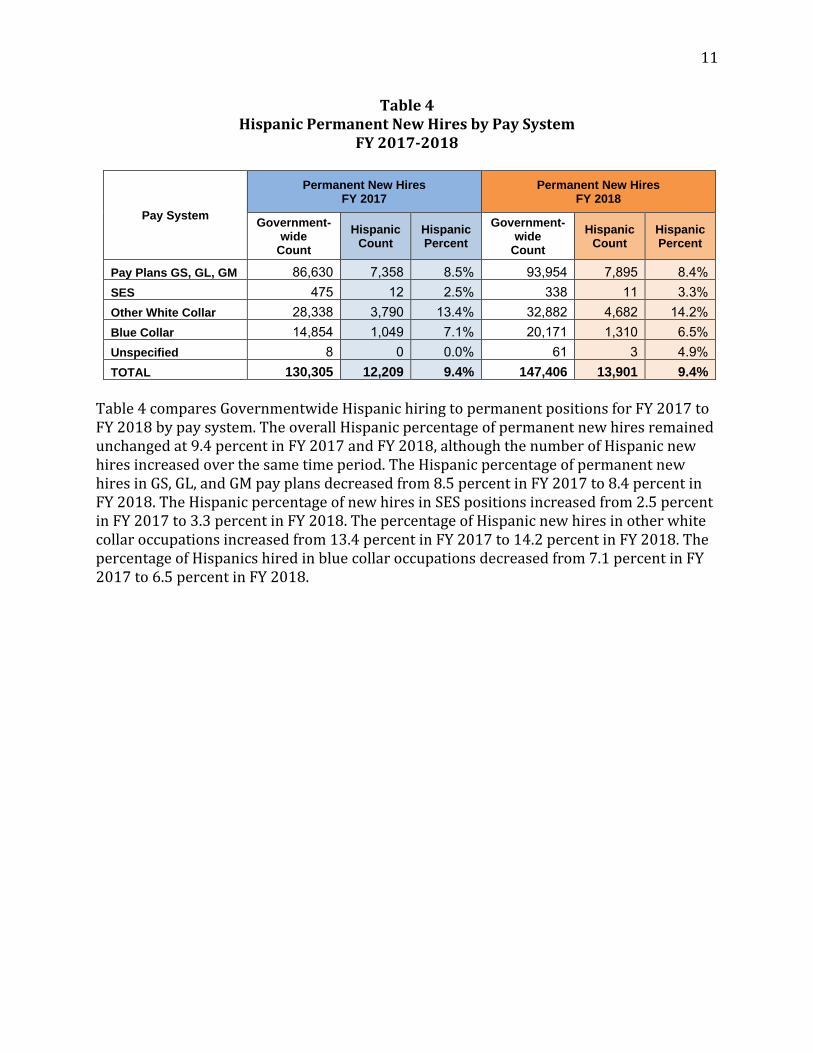
Table 4 Hispanic Permanent New Hires by Pay System
FY 2017-2018
Pay System
Permanent New Hires FY 2017
Permanent New Hires FY 2018
Government-wide
Count
Hispanic Count
Hispanic Percent
Government-wide
Count
Hispanic Count
Hispanic Percent
Pay Plans GS, GL, GM 86,630 7,358 8.5% 93,954 7,895 8.4% SES 475 12 2.5% 338 11 3.3% Other White Collar 28,338 3,790 13.4% 32,882 4,682 14.2% Blue Collar 14,854 1,049 7.1% 20,171 1,310 6.5% Unspecified 8 0 0.0% 61 3 4.9% TOTAL 130,305 12,209 9.4% 147,406 13,901 9.4%
Table 4 compares Governmentwide Hispanic hiring to permanent positions for FY 2017 to FY 2018 by pay system. The overall Hispanic percentage of permanent new hires remained unchanged at 9.4 percent in FY 2017 and FY 2018, although the number of Hispanic new hires increased over the same time period. The Hispanic percentage of permanent new hires in GS, GL, and GM pay plans decreased from 8.5 percent in FY 2017 to 8.4 percent in FY 2018. The Hispanic percentage of new hires in SES positions increased from 2.5 percent in FY 2017 to 3.3 percent in FY 2018. The percentage of Hispanic new hires in other white collar occupations increased from 13.4 percent in FY 2017 to 14.2 percent in FY 2018. The percentage of Hispanics hired in blue collar occupations decreased from 7.1 percent in FY 2017 to 6.5 percent in FY 2018.

12
Table 5 Hispanic Permanent Onboard Workforce by Pay System
FY 2017-2018
Pay System
Permanent Onboard FY 2017
Permanent Onboard FY 2018
Government-wide
Count
Hispanic Count
Hispanic Percent
Government-wide
Count
Hispanic Count
Hispanic Percent
Pay Plans GS, GL, GM 1,370,892 125,733 9.2% 1,368,659 128,812 9.4% SES 7,824 360 4.6% 7,745 360 4.6% Other White Collar 388,440 33,138 8.5% 397,103 34,904 8.8% Blue Collar 179,863 14,002 7.8% 180,114 14,088 7.8% Unspecified 29 1 3.4% 1,066 51 4.8% TOTAL 1,947,048 173,234 8.9% 1,954,687 178,215 9.1%
Table 5 compares Governmentwide and Hispanic onboard permanent employment for FY 2017 to FY 2018 by pay system. Hispanic representation in the Federal permanent workforce increased from 8.9 percent in FY 2017 to 9.1 percent in FY 2018.

13
Figure 2 Hispanic Separations Among the Permanent Federal Civilian Workforce
FY 2014-2018
1,6892,142
2,4071,984 2,163
4,376 4,234
5,0065,321
5,852
4,221 4,191 4,150 4,0724,523
0
1,000
2,000
3,000
4,000
5,000
6,000
7,000
FY 2014 FY 2015 FY 2016 FY 2017 FY 2018
Nu
mb
er
of
Sep
arat
ion
s
Transfer Out Resignation Retirement
Separation Type
FY 2014 FY 2015 FY 2016 FY 2017 FY 2018
# % # % # % # % # %
Transfer Out 1,689 8.1% 2,142 7.6% 2,407 7.9% 1,984 8.1% 2,163 8.7%
Resignation 4,376 8.5% 4,234 8.2% 5,006 8.9% 5,321 9.3% 5,852 10.0%
Retirement 4,221 6.2% 4,191 6.5% 4,150 6.6% 4,072 6.6% 4,523 6.9%
Figure 2 illustrates the number and percentage of Hispanic Federal permanent employees who transferred to different agencies or separated from Federal service through resignation or retirement from FY 2014 through FY 2018. Hispanic employees represented 8.7 percent of permanent employees who transferred to another agency, 10.0 percent of permanent employees who resigned from Federal service, and 6.9 percent of permanent employees who retired in FY 2018.
14
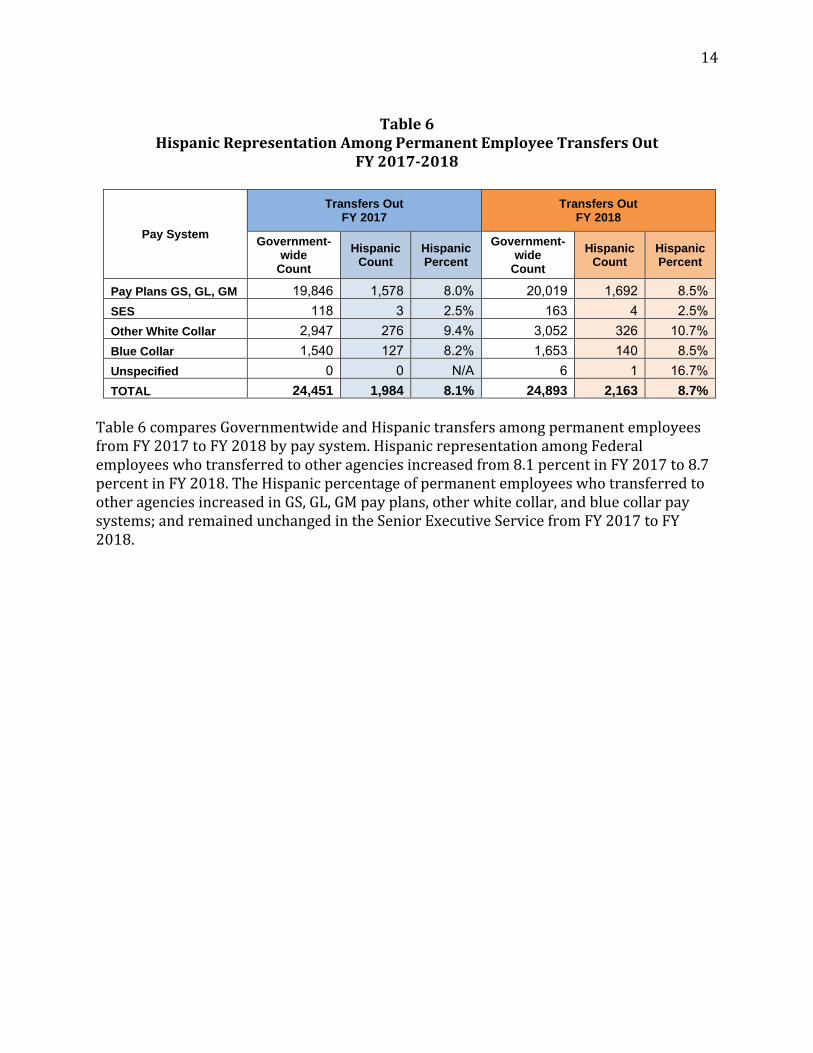
Table 6 Hispanic Representation Among Permanent Employee Transfers Out
FY 2017-2018
Pay System
Transfers Out FY 2017
Transfers Out FY 2018
Government-wide
Count
Hispanic Count
Hispanic Percent
Government-wide
Count
Hispanic Count
Hispanic Percent
Pay Plans GS, GL, GM 19,846 1,578 8.0% 20,019 1,692 8.5% SES 118 3 2.5% 163 4 2.5% Other White Collar 2,947 276 9.4% 3,052 326 10.7% Blue Collar 1,540 127 8.2% 1,653 140 8.5% Unspecified 0 0 N/A 6 1 16.7% TOTAL 24,451 1,984 8.1% 24,893 2,163 8.7%
Table 6 compares Governmentwide and Hispanic transfers among permanent employees from FY 2017 to FY 2018 by pay system. Hispanic representation among Federal employees who transferred to other agencies increased from 8.1 percent in FY 2017 to 8.7 percent in FY 2018. The Hispanic percentage of permanent employees who transferred to other agencies increased in GS, GL, GM pay plans, other white collar, and blue collar pay systems; and remained unchanged in the Senior Executive Service from FY 2017 to FY 2018.

15
Table 7 Hispanic Representation Among Permanent Employee Resignations
FY 2017-2018
Pay System
Resignations FY 2017
Resignations FY 2018
Government-wide
Count
Hispanic Count
Hispanic Percent
Government-wide
Count
Hispanic Count
Hispanic Percent
Pay Plans GS, GL, GM 37,104 3,147 8.5% 37,918 3,401 9.0% SES 801 43 5.4% 237 8 3.4% Other White Collar 13,275 1,686 12.7% 13,617 1,898 13.9% Blue Collar 5,855 444 7.6% 6,444 544 8.4% Unspecified 6 1 16.7% 19 1 5.3% TOTAL 57,041 5,321 9.3% 58,235 5,852 10.0%
Table 7 compares Governmentwide and Hispanic resignations among permanent employees from FY 2017 to FY 2018 by pay system. Hispanic representation among Federal employees who resigned from Federal service increased from 9.3 percent in FY 2017 to 10.0 percent in FY 2018. The Hispanic percentage of permanent employees who resigned increased in GS, GL, GM pay plans, other white collar, and blue collar pay systems; and decreased in the Senior Executive Service from FY 2017 to FY 2018.
16
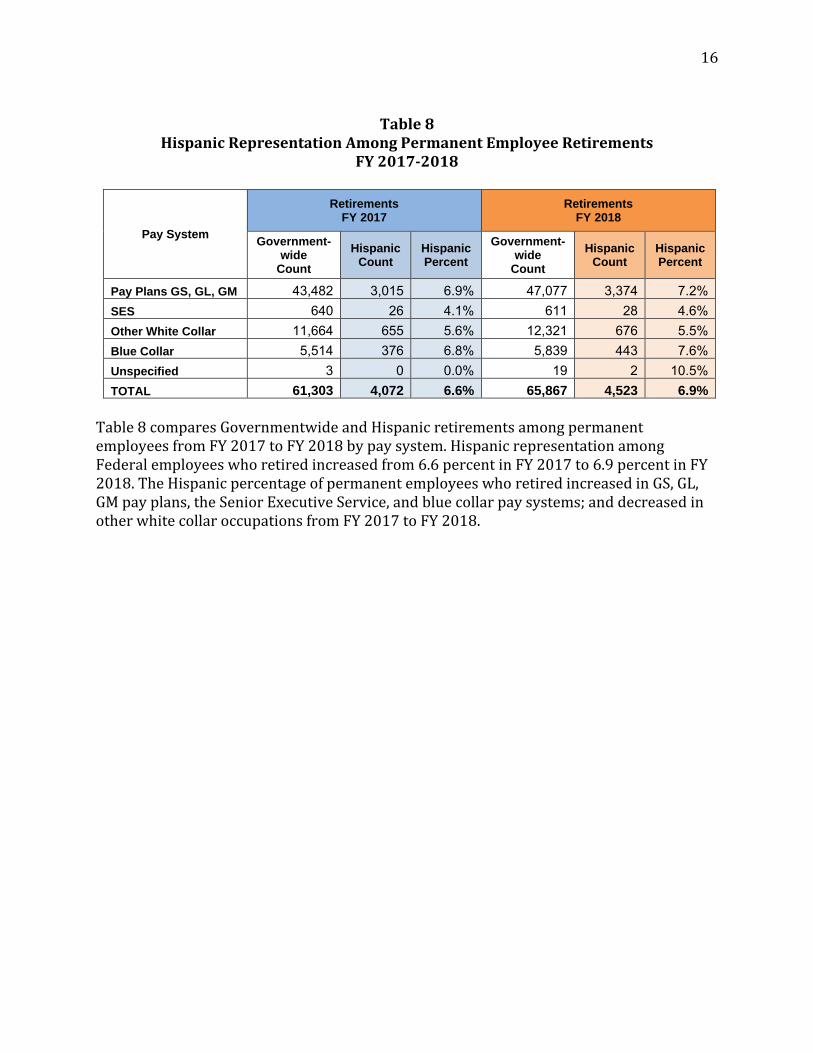
Table 8 Hispanic Representation Among Permanent Employee Retirements
FY 2017-2018
Pay System
Retirements FY 2017
Retirements FY 2018
Government-wide
Count
Hispanic Count
Hispanic Percent
Government-wide
Count
Hispanic Count
Hispanic Percent
Pay Plans GS, GL, GM 43,482 3,015 6.9% 47,077 3,374 7.2% SES 640 26 4.1% 611 28 4.6% Other White Collar 11,664 655 5.6% 12,321 676 5.5% Blue Collar 5,514 376 6.8% 5,839 443 7.6% Unspecified 3 0 0.0% 19 2 10.5% TOTAL 61,303 4,072 6.6% 65,867 4,523 6.9%
Table 8 compares Governmentwide and Hispanic retirements among permanent employees from FY 2017 to FY 2018 by pay system. Hispanic representation among Federal employees who retired increased from 6.6 percent in FY 2017 to 6.9 percent in FY 2018. The Hispanic percentage of permanent employees who retired increased in GS, GL, GM pay plans, the Senior Executive Service, and blue collar pay systems; and decreased in other white collar occupations from FY 2017 to FY 2018.

17
Table 9 Hispanic Hiring into Professional and Administrative Occupations
FY 2017-2018
Occupational Category
Professional and Administrative New Hires FY 2017
Professional and Administrative New Hires FY 2018
Government-wide
Count
Hispanic Count
Hispanic Percent
Government-wide
Count
Hispanic Count
Hispanic Percent
Professional 31,799 1,944 6.1% 34,751 2,233 6.4% Administrative 26,969 1,976 7.3% 30,240 2,195 7.3% TOTAL 58,768 3,920 6.7% 64,991 4,428 6.8%
Table 9 compares Governmentwide Hispanic representation among new hires into professional and administrative occupations from FY 2017 to FY 2018. The Hispanic percentage of new hires into professional and administrative occupations increased from 6.7 percent in FY 2017 to 6.8 percent in FY 2018. The Hispanic percentage of new hires into professional occupations increased from 6.1 percent in FY 2017 to 6.4 percent in FY 2018. The Hispanic percentage of new hires into administrative occupations remained unchanged at 7.3 percent from FY 2017 to 2018.
18
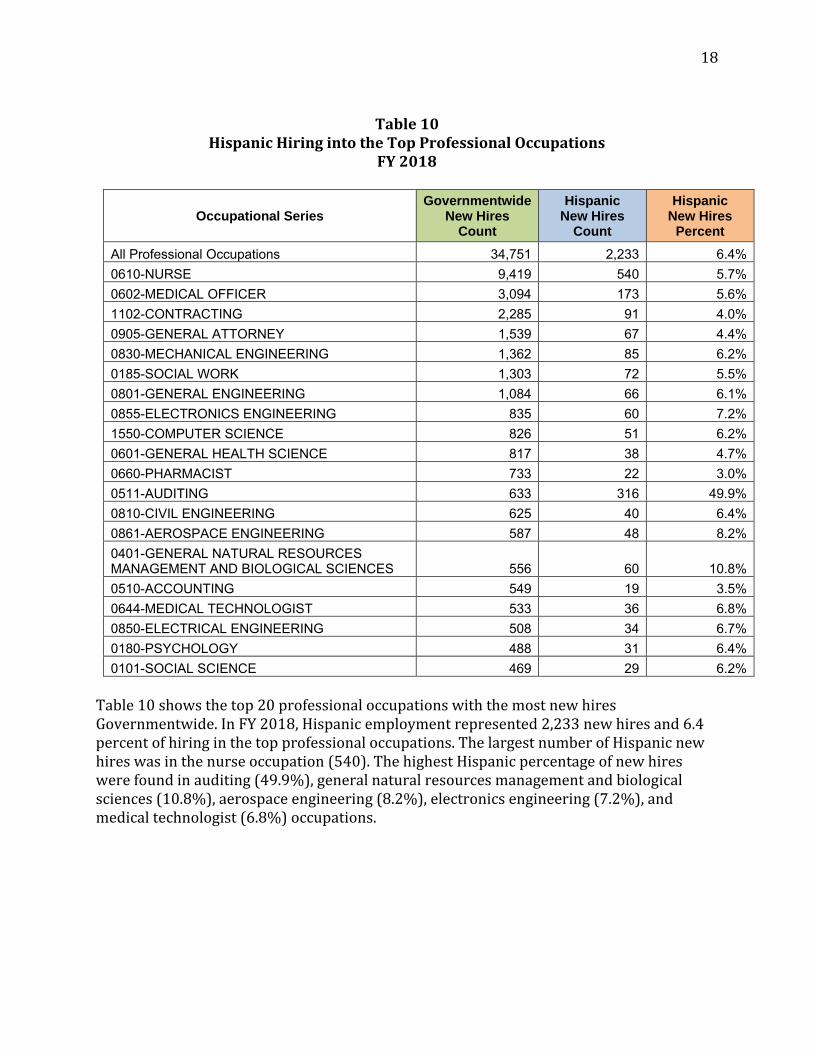
Table 10 Hispanic Hiring into the Top Professional Occupations
FY 2018
Occupational Series Governmentwide
New Hires Count
Hispanic New Hires
Count
Hispanic New Hires
Percent
All Professional Occupations 34,751 2,233 6.4% 0610-NURSE 9,419 540 5.7% 0602-MEDICAL OFFICER 3,094 173 5.6% 1102-CONTRACTING 2,285 91 4.0% 0905-GENERAL ATTORNEY 1,539 67 4.4% 0830-MECHANICAL ENGINEERING 1,362 85 6.2% 0185-SOCIAL WORK 1,303 72 5.5% 0801-GENERAL ENGINEERING 1,084 66 6.1% 0855-ELECTRONICS ENGINEERING 835 60 7.2% 1550-COMPUTER SCIENCE 826 51 6.2% 0601-GENERAL HEALTH SCIENCE 817 38 4.7% 0660-PHARMACIST 733 22 3.0% 0511-AUDITING 633 316 49.9% 0810-CIVIL ENGINEERING 625 40 6.4% 0861-AEROSPACE ENGINEERING 587 48 8.2% 0401-GENERAL NATURAL RESOURCES MANAGEMENT AND BIOLOGICAL SCIENCES 556 60 10.8% 0510-ACCOUNTING 549 19 3.5% 0644-MEDICAL TECHNOLOGIST 533 36 6.8% 0850-ELECTRICAL ENGINEERING 508 34 6.7% 0180-PSYCHOLOGY 488 31 6.4% 0101-SOCIAL SCIENCE 469 29 6.2%
Table 10 shows the top 20 professional occupations with the most new hires Governmentwide. In FY 2018, Hispanic employment represented 2,233 new hires and 6.4 percent of hiring in the top professional occupations. The largest number of Hispanic new hires was in the nurse occupation (540). The highest Hispanic percentage of new hires were found in auditing (49.9%), general natural resources management and biological sciences (10.8%), aerospace engineering (8.2%), electronics engineering (7.2%), and medical technologist (6.8%) occupations.

19
Table 11 Hispanic Hiring into the Top Administrative Occupations
FY 2018
Occupational Series Governmentwide
New Hires Count
Hispanic New Hires
Count
Hispanic New Hires
Percent
All Administrative Occupations 30,240 2,195 7.3%
2210-INFORMATION TECHNOLOGY MANAGEMENT 4,782 230 4.8% 0301-MISCELLANEOUS ADMINISTRATION AND PROGRAM 3,109 188 6.0% 0343-MANAGEMENT AND PROGRAM ANALYSIS 2,006 82 4.1% 1811-CRIMINAL INVESTIGATION 1,288 127 9.9% 1801-GENERAL INSPECTION, INVESTIGATION, ENFORCEMENT, AND COMPLIANCE SERIES 1,242 123 9.9% 0346-LOGISTICS MANAGEMENT 1,240 75 6.0% 0201-HUMAN RESOURCES MANAGEMENT 1,153 76 6.6% 0501-FINANCIAL ADMINISTRATION AND PROGRAM 1,107 50 4.5% 1895-CUSTOMS AND BORDER PROTECTION 1,045 280 26.8% 0132-INTELLIGENCE 1,036 73 7.0% 0996-VETERANS CLAIMS EXAMINING 989 75 7.6% 0105-SOCIAL INSURANCE ADMINISTRATION 913 108 11.8% 0080-SECURITY ADMINISTRATION 831 57 6.9% 0901-GENERAL LEGAL AND KINDRED ADMINISTRATION 585 66 11.3% 2152-AIR TRAFFIC CONTROL 554 56 10.1% 1910-QUALITY ASSURANCE 530 29 5.5% 1101-GENERAL BUSINESS AND INDUSTRY 530 32 6.0% 0560-BUDGET ANALYSIS 488 31 6.4% 1712-TRAINING INSTRUCTION 413 19 4.6% 0340-PROGRAM MANAGEMENT 359 13 3.6%
Table 11 shows the top 20 administrative occupations with the most new hires governmentwide. In FY 2018, Hispanic employment represented 2,195 new hires and 7.3 percent of hiring in the top administrative occupations. The largest number of Hispanic new hires was in the customs and border protection occupation (280). The highest Hispanic percentage of new hires were found in customs and border protection (26.8%), social insurance administration (11.8%), general legal and kindred administration (11.3%), air traffic control (10.1%), criminal investigation (9.9%), and General Inspection, Investigation, Enforcement, and Compliance Series (9.9%) occupations.

20
Table 12 Hispanic Permanent Federal Civilian Workforce by State
September 2018
State %
Hispanic State %
Hispanic State % Hispanic
NEW MEXICO 27.4% VIRGINIA 5.1% SOUTH CAROLINA 3.3%
TEXAS 26.3% KANSAS 5.0% MISSOURI 3.0%
CALIFORNIA 18.5% OREGON 5.0% MONTANA 3.0%
ARIZONA 18.1% WASHINGTON 5.0% OHIO 3.0%
FLORIDA 16.9% OKLAHOMA 4.8% VERMONT 3.0%
NEW YORK 10.7% WYOMING 4.8% IOWA 2.9%
COLORADO 10.5% DISTRICT OF COLUMBIA 4.7% ALABAMA 2.8%
NEW JERSEY 10.5% NORTH CAROLINA 4.7% INDIANA 2.7%
NEVADA 9.9% DELAWARE 4.4% MINNESOTA 2.7%
CONNECTICUT 8.6% GEORGIA 4.2% KENTUCKY 2.6%
ILLINOIS 7.5% MARYLAND 4.2% MISSISSIPPI 2.5%
UTAH 6.7% PENNSYLVANIA 4.0% TENNESSEE 2.3%
MASSACHUSETTS 6.6% LOUISIANA 3.9% NORTH DAKOTA 2.2%
HAWAII 5.6% WISCONSIN 3.8% ARKANSAS 2.1%
IDAHO 5.5% NEW HAMPSHIRE 3.6% MAINE 2.0%
RHODE ISLAND 5.2% MICHIGAN 3.5% SOUTH DAKOTA 1.7%
ALASKA 5.1% NEBRASKA 3.4% WEST VIRGINIA 1.4%
Table 12 shows the percentage of Hispanics in the permanent Federal civilian workforce by state. In FY 2018 New Mexico and Texas had the highest percentages of Hispanics in the permanent Federal civilian workforce, followed by California, Arizona, and Florida.

21
Agency Successful/Promising Practices
Throughout FY 2018, Federal Government agencies continued to develop and introduce strategies to strengthen their efforts related to the employment lifecycle. Following are examples of successful or promising practices that agencies are implementing. This information was provided as a component of FY 2018 agency submissions.
Consumer Financial Protection Bureau (CFPB) The Office of Minority and Women within CFPB, supported Adelante, a Bureau recognized Employee Resource Group (ERG), focusing on Hispanic/Latino employees and supporters. Adelante fosters professional and leadership development to improve Hispanic/Latino representation at the BCFP and aids with retention, recruitment, and recognition. Adelante hosted a series of coffee chats and participated in the Acting Director’s Chat with the Congressman Henry Cuellar of Texas to celebrate Hispanic Heritage Month.
Farm Credit Administration (FCA) FCA attended the Harvesting the Leaders of Tomorrow Career Fair sponsored by the U.S. Department of Agriculture’s Hispanic-Serving Institutions (HSIs) National Program with seven participating California colleges and universities. This event enabled new recruiting and networking opportunities for FCA. FCA also continued to attend HSIs career fairs at other universities and network events with student groups and university staff. As part of its overall recruitment efforts, FCA focused its targeted recruiting strategy on underrepresented groups that it identified during its demographic analysis.
Federal Trade Commission (FTC) FTC continued to maintain and further cultivated effective partnerships by sponsoring employees to attend the 43rd Hispanic National Bar Association’s Convention. The FTC’s Office of Equal Employment Opportunity and Workplace Inclusion (OEEOWI), also sponsored employees who wished to attend the League of United Latin American Citizens’ Federal Training Institute.
National Science Foundation (NSF) As part of its overall recruitment efforts, NSF analyzed its applicant flow data to provide NSF with information on how it can refine recruitment efforts to reach Hispanics and other underrepresented demographic groups. Additionally, NSF developed memorandums of understanding (MOU) with Prospanica (formerly the National Society of Hispanic Master of Business Administration) and has collaborated with Prospanica to share information about NSF's STEM and non-STEM career opportunities. This partnership is ongoing. Pension Benefit Guaranty Corporation (PBGC) PBGC created the “State of Hispanics in PBGC and the Federal Government” infographic for Hispanic Heritage month (September 15 – October 15).
U.S. Agency for International Development (USAID) The USAID Donald M. Payne International Development Fellowship was created to attract outstanding young people who are interested in pursuing careers in the Foreign Service.
22
The Fellowship encourages applications from members of minority groups, to include Hispanics, who have historically been underrepresented in international development careers. Since the program's inception in 2012, the fellowship has resulted in the following demographic profile for participants to-date: Hispanic 25 percent; African American 35 percent; Asian American 25 percent; Native American 5 percent; White 10 percent. The fellowship's diversity profile is attributed to the agency's participation in outreach and recruitment events at institutions serving diverse quality talent. Over the last five years USAID has increased the number of Fellowship participants (slots) every year. As a result of USAID’s improved targeted outreach strategies and efforts, as part of its overall recruitment efforts, it has seen an increase in Hispanic applicants for their student internship and fellowship programs. Such programs include the Donald M. Payne International Fellowship Program. USAID continued an enhanced Hispanic Outreach and Recruitment Strategic Plan through its Development Diplomats in Residence (DDIR) program. This program is modeled after the Department of State's Diplomats in Residence with positions filled with Senior Foreign Service Officers to serve as representatives, an Ambassador, a recruiter, and a resource of the agency to our external partners, primarily to minority serving institutions. Each of the DDIRs cover a region; the Western Region consists of California, Nevada, and Hawaii, and the Southern Region consists of Georgia, Tennessee, Alabama, Florida, Louisiana, and Mississippi. The DDIRs implement local strategic partnerships and influence the institutions curriculums to include USAID development subject matters. U.S. Commodity Futures Trading Commission (CFTC) CFTC partnered with the League of United Latin American Citizens (LULAC) Federal Training Institute (FTI), OPM, and more than 60 Federal agencies to conduct a no-cost leadership training (hosted by the Departments of Transportation and Labor). Twenty-two CFTC employees participated in this training event. In addition, a few CFTC employees volunteered as moderators and mentors for this training event. One of CFTC's Hispanic executive females conducted training on the Senior Executive Service (SES) executive core qualifications (ECQs) and performance language course. This training provided an opportunity to strengthen employees’ leadership skills. U.S. Department of Agriculture (USDA) USDA’s Office of Human Resource Management facilitated the Leadership, Education, and Development (LEAD) Initiative to encourage GS-13 to GS-15 Hispanic/Latino employees to continue their leadership journey into the executive ranks by offering networking, mentorship, and training and developmental opportunities during the first half of the fiscal year. U.S. Department of Commerce (DOC) DOC’s Office of Civil Rights (OCR) began the development of a Retention Survey to invite and encourage the Department’s workforce to provide insight into why employees may want to leave the Department, as well as their reasons for staying. Once implemented, results from the survey will lead to the improvement of policies, practices, and procedures that can positively affect retention of Hispanic employees and other minority groups. OCR
23
partnered with the Center for Behavioral Science Methods (CBSM) at Census and entered into a Memorandum of Understanding (MOU) to utilize their expertise for the survey and expects to launch the survey in FY 2019. U.S. Department of Defense (DOD) As part of its overall recruiting program, the Defense Contract Management Agency (DCMA) recruiters conducted a social media campaign on LinkedIn targeting Hispanic engineering professionals, which generated over 117,000 impression and candidate engagements. These outreach efforts were conducted to attract and increase the number of highly qualified Hispanic applicants with skill sets that matched acquisition positions within the agency. The Defense Contract Audit Agency (DCAA) participated in the DOD Hiring Hero career fairs and the U.S. Chamber of Commerce's Hiring Our Heroes event to promote hiring opportunities. DCAA also attended college fairs at HSIs and maintained relationships with numerous Hispanic affinity groups. U.S. Department of Education (Education) In 2018, as part of the White House Initiative on Educational Excellence for Hispanics (Initiative), the Department of Education reinvigorated the Federal Interagency Working Group (FIWG). The FIWG consists of senior officials from various Federal agencies and offices working together to strengthen the link between the Federal government and the Hispanic community. The FIWG works to align activities on key education issues affecting the Hispanic community through convening Federal agencies to collaborate on shared initiatives. In addition, the FIWG is focused on sharing Federal resources targeting Hispanic Serving Institutions (HSIs), students and families. The commitment to the Initiative demonstrates the strong support for the critical role Hispanics play in the overall prosperity of the nation and highlights the Federal Government’s commitment to expanding educational opportunities and improving educational outcomes for all students. U.S. Department of Energy (DOE) During FY 2018, DOE’s Nuclear Security Administration’s (NNSA) formalized LCDP (Leadership and Career Development Programs) provided various formal training and developmental opportunities to employees at all levels (Entry, Mid, Supervisors, Managers, and Executives) to over 40 participants. As a result, Hispanic employees’ participation (16.70%) in LCDPs offered during FY 2018 was on parity with the participation rate of Hispanics within the NNSA’s total workforce (16%). U.S. Department of Health and Human Services (HHS) The National Institutes of Health (NIH), a subcomponent of HHS, continued to develop a framework for data-driven strategies derived from efforts currently underway to address the overall low representation of Hispanic employees, which has remained relatively constant over the last five years. Additionally, there are no Hispanics in the NIH Senior Executive Service (SES). Considering instructions from OPM and EEOC on Hispanic Employment in the Federal Government, NIH’s Office of Equity, Diversity, and Inclusion

24
(EDI) began conducting a more focused barrier analysis in FY 2018 to identify triggers and potential barriers at the GS-12 through GS-15 and SES pay scales. NIH’s Hispanic/Latino Outreach Initiatives Committee (HLOIC) Working Group was tasked with identifying strategies and opportunities to attract Hispanic and Latino communities to consider the NIH as a valued employer. In 2018, the HLOIC developed a presentation for current NIH Post Docs looking for scientific employment at NIH. The NIH Corporate Recruitment Unit continued to enhance its relationship with Florida International University (FIU), a Hispanic Serving Institution. In 2018, members of the NIH Inclusive Recruitment Initiatives Subcommittee and other NIH representatives served as panelists for a FIU webinar to provide information on NIH opportunities and how to navigate the Federal application process. The webinar reached 60 FIU attendees – a mix of graduate and PhD students in social work, medicine, science, nursing and public health. U.S. Department of Housing and Urban Development (HUD) In an effort to create better access, a one stop, easy to navigate and engaging information and resource service, HUD’s Equal Employment Opportunity Division (EEOD) reconstructed its website and respective webpages for the Federal Women’s, Hispanic, and Disability Employment Programs. Part of the reconstruction allows HUD to present information quickly and clearly, providing demographical information in a visually engaging way to attract the respective audiences and anyone interested in the data. U.S. Department of Labor (DOL) DOL hosted the 2018 League of United Latin American Citizens (LULAC) Federal Training Institute Partnership’s (FTIP) SES Mentoring and Leadership Roundtables. The FTIP provides an intensive and structured career-development program for government employees. The FTIP offers plenary sessions, workshops, and executive coaching sessions. It is designed to enable government employees at all levels to enhance their skills and develop Executive Core Qualifications skills required for leadership positions and entry into the Senior Executive Service. The Bureau of Labor Statistics (BLS) utilized the new Diversity Initiatives feature (DIN) in DOL’s Human Resources Management System (DOORS). It allowed BLS to load, save, categorize and store multiple recruitment sources in the system. As each vacancy was prepared, the HR Specialist can select specific professional associations and educational institutions, including Hispanic Serving Institutions, to receive vacancy announcement notifications. The Employee Benefits Security Administration (EBSA) sent notifications and posted jobs to diverse student populations. In addition, jobs were posted for Spanish-speaking applicants to increase the number of possible Hispanic applicants and to ensure the availability of Spanish-speaking employees, especially those with public-facing responsibilities.
25
U.S. Nuclear Regulatory Commission (NRC) The NRC funded multiple research and development, educational and training, and experiential learning projects to enhance academic excellence and to help produce a diverse and skilled future workforce. In FY 2018, NRC awarded grants totaling $2,323,252 to nine Hispanic-Serving Institutions (HSIs). The NRC awarded incremental funds totaling $541,095 to five HSIs, who are existing grantees of the agency’s Minority Serving Institutions Grants Program (MSIGP). The NRC has in place a Hispanic Employment Program Advisory Committee (HEPAC) that works with the Office of Small Business and Civil Rights (SBCR) to identify issues of concern to Hispanic-Americans in the NRC, implement initiatives to increase their representation at all levels in the agency, and to eliminate barriers that may hinder their equal opportunity in hiring, training, retention, and career advancement. During FY 2018, the HEPAC hosted a variety of events designed to enhance the work environment for Hispanic Americans at the NRC. The HEPAC, along with the Office of the Chief Human Capital Officer, hosted a panel discussion on preparing for the Senior Executive Service Candidate Development Program (SES CDP). The SES panel discussed the process for applying to the SES CDP, life as an SES, and answered questions from employees. The HEPAC, along with several other advisory committees, conducted a training course titled, “Context-Challenge-Action-Result (CCAR) Writing Workshop: Presenting your Accomplishments for Leadership Opportunities.” This interactive workshop was designed to help NRC employees prepare high-quality narratives for leadership opportunities by applying the CCAR writing model. U.S. Department of State (State) The Department of State’s Diplomats in Residence (DIRs) are career Foreign Service Officers and Specialists located throughout the U.S. who provide guidance and advice on careers, internships and fellowships to students and professionals in the communities they serve. DIRs are available to answer questions and share insight with those interested in Foreign and Civil Service careers, internships and fellowships. There are 15 regional recruiters assigned as DIRs on university campuses throughout the United States, as well as seven Washington-based recruiters, who visited Hispanic-Serving Institutions (HSIs) and Hispanic Association of Colleges and Universities (HACU) members as well as other area institutions. U.S. Department of the Treasury (Treasury) Treasury’s departmental offices work with bureau offices to address underrepresentation, career development, and retention of Hispanics. Specifically, the Office of Civil Rights and Diversity (OCRD) launched a new Treasury-wide Employee Resource Group: Adelante. This employee-driven group supports professional development, group mentoring, training, cultural exchange, and retention of Hispanic employees. Additionally, in FY 2018, the IRS utilized the Internship Program hiring authority to select new interns, which included 21 new Hispanic interns from Hispanic-Serving Institutions.

26
As demonstrated by the efforts described above, agencies across the Federal workforce have been intentional about implementing strategies and initiative to help broaden the outreach to the Hispanic community, as part of their overall recruitment efforts.
ES/ODI-03399-02/2021
U.S. Office of Personnel Management
Employee Services1900 E Street, NW, Washington, DC 20415
OPM.GOV