ANNUAL REPORT - Saudi Central Bank
168
ANNUAL REPORT 1441H-2020 ANNUAL REPORT 1441H-2020
Transcript of ANNUAL REPORT - Saudi Central Bank

ANNUALREPORT
1441H-2020
ANNUALREPORT
1441H-2020


Saudi Arabian Monetary Authority
56th Annual Report1441H (2020)
4
BOARD OF DIRECTORSSAMA
1.The Governor, Dr. Ahmed A. AlkholifeyChairman 2. The Vice Governor, Ayman M. Al-Sayari Vice Chairman 3. Mr. Hamad S. Al-Sayari 4. Mr. Abdulaziz M. Al-Athel 5. Mr. Khaled A. Al-Juffali
5
It gives me pleasure to present, in the name of the Board of Directors, the 56th Annual Report of the Saudi Arabian Monetary Authority, which reviews the latest developments in the Saudi economy during fiscal year 1440/41H (2019). The Report covers developments in various areas of the domestic economy, including monetary developments, banking activity, capital market, prices, public finance, national accounts, foreign trade and balance of payments. It also provides an overview of the latest economic developments in various domestic productive sectors, apart from giving a full description of SAMA’s functions, such as setting and managing monetary policy and supervising banking, insurance and finance sectors. In addition, the Report includes the auditors’ report on SAMA’s balance sheet for fiscal year ended on June 30th, 2019. In addition to data issued by SAMA, the Report mainly relies on official data obtained from ministries, government departments and public entities, to which I would like to extend my sincere thanks for their cooperation in providing valuable information and data that enabled SAMA to prepare this Report. I also would like to thank all SAMA’s staff for their efforts in preparing this Report and in carrying out all functions entrusted to SAMA.
Ahmed A. AlKholifey Governor and Chairman
Ramadan 1441HMay 2020

6
SAMA Head Office and Branches:
Head OfficeRiyadh Branches:MakkahMadinahRiyadhJeddahDammamTa’ifBuraydahJazanTabukAbha
For correspondence and inquiries: Postal address:Saudi Arabian Monetary AuthorityEconomic Research Department P.O. Box 2992, Riyadh 11169Kingdom of Saudi Arabia Telephone: (+966) 11 - 4633000Email: [email protected] For the latest reports, monetary and banking statistics, quarterly balance of payments estimates and instructions issued to financial institutions supervised by SAMA, please visit SAMA’s websitehttp://www.sama.gov.sa
7
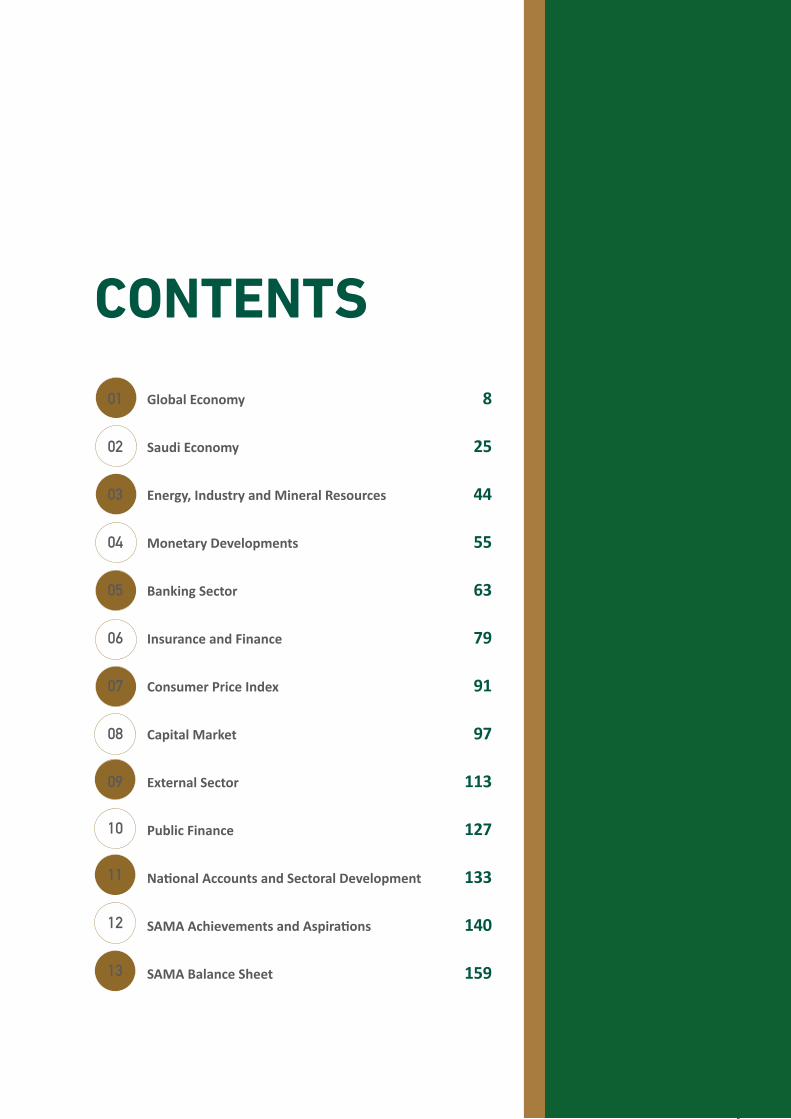
Global Economy 8
Saudi Economy 25
Energy, Industry and Mineral Resources 44
Monetary Developments 55
Banking Sector 63
Insurance and Finance 79
Consumer Price Index 91
Capital Market 97
External Sector 113
Public Finance 127
National Accounts and Sectoral Development 133
SAMA Achievements and Aspirations 140
SAMA Balance Sheet 159
CONTENTS01
02
03
04
05
06
07
08
09
10
11
12
13


GLOBALECONOMY
Saud
i Ara
bian
Mon
etar
y Au
thor
ity |
56th
Ann
ual R
epor
t
10
Global Economy
World Economic SituationIn 2019, the global economy registered a growth rate of 2.9 percent compared to 3.6 percent in 2018. According to the April 2020 IMF World Economic Outlook (WEO), the global economy is projected to contract by 3.0 percent in 20201.
Economic Growth Growth in the advanced economies slowed to 1.7 percent in 2019 versus 2.2 percent in 2018. The slowdown stemmed primarily from the growth rate declines in the United States and the euro area. US growth slowed to 2.3 percent in 2019, as compared to a growth of 2.9 percent in the preceding year. The euro area growth rate decreased to 1.2 percent in 2019 against 1.9 percent in the preceding year. France, Germany and Italy recorded decreased growth rates of 1.3 percent, 0.6 percent and 0.3 percent, respectively, in 2019 compared to 1.7 percent, 1.5 percent and 0.8 percent, respectively, in the preceding year. In emerging market and developing economies, the overall growth rate declined from 4.5 percent in 2018 to 3.7 percent in 2019. The growth rate in China decreased to 6.1 percent in 2019 from 6.7 percent in 2018 and in India to 4.2 percent from 6.1 percent in 2018. Furthermore, the growth rate in the MENA countries declined from 1.0 percent in 2018 to 0.3 percent in 2019. Emerging and developing Europe registered a decreased growth rate of 2.1 percent in 2019 compared to 3.2 percent in the preceding year. Latin America and the Caribbean
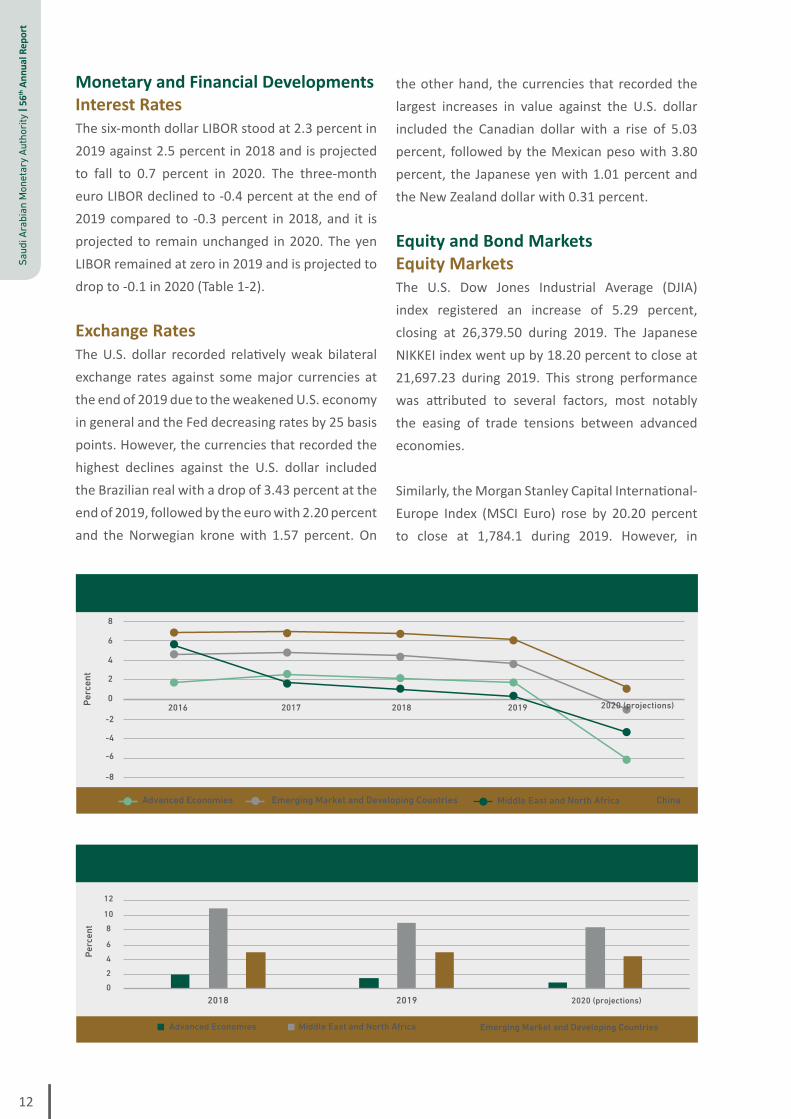
countries also registered a decreased growth of 0.1 percent in 2019 versus 1.1 percent in 2018. The overall growth rate in emerging and developing Asia declined to 5.5 percent in 2019 compared to 6.3 percent in 2018. In contrast, the growth rate of the U.K. slightly increased from 1.3 percent in 2018 to 1.4 percent in 2019. Japan also recorded an increased growth rate of 0.7 percent against 0.3 percent in 2018.According to the April 2020 WEO, the global economy is projected to contract by 3.0 percent in 2020, triggered by the COVID-19 pandemic, as compared to a growth rate of 2.9 percent in 2019. The advanced economies are expected to contract by 6.1 percent in 2020. The US economy is expected to contract by 5.9 percent, the euro-area economy by 7.5 percent, and emerging market and developing economies by 1.0 percent in 2020. China’s growth is expected to drop to 1.2 percent in 2020 (Table 1-1). Chart 1-1 shows the real GDP growth rates in the major countries and country groups over the 2016-2020 period.
Inflation In the advanced economies, average inflation dropped to 1.4 percent in 2019 from 2.0 percent in 2018. In the United States, the inflation rate decreased to 1.8 percent in 2019 from 2.4 percent in 2018. In the euro area, the rate decreased to 1.2 percent in 2019 from 1.8 percent in 2018. In the MENA countries, the rate also decreased to 9.0 percent in 2019 compared to 11.0 percent in the preceding year. However, in the emerging market and developing countries, the inflation rate rose from 4.8 percent in 2018 to 5.0 percent in 2019 (Table 1-2). Chart 1-2 shows the percentage change in consumer prices for various country groups during 2018-2020.
1 According to the June 2020 IMF World Economic Outlook (WEO) Update, global growth is projected at -4.9 percent in 2020, 1.9 percentage
points below the April 2020 WEO forecast. The IMF updated projections stemmed from that the COVID-19 pandemic has had a more negative impact on activity than anticipated and that the recovery is projected to be gradual than previously forecast. The slower recovery in the updated forecast reflects persistent social distancing and greater damage to global supply chains.

11
Glob
al E
cono
my
UnemploymentThe weighted average unemployment rate in advanced economies decreased from 7.1 percent in 2018 to 6.6 percent in 2019. In the United States, unemployment also went down to 3.7 percent in 2019 from 3.9 percent in 2018. In the euro area, it decreased from 8.2 percent in 2018 to 7.6 percent in 2019. Additionally, the unemployment rate in Italy, France and Germany declined slightly to 10.0 percent, 8.5 percent and 3.2 percent, respectively, in 2019 compared to 10.6 percent, 9.0 percent and 3.4 percent, respectively, in 2018. Moreover, the unemployment rate in the United Kingdom fell to 3.8 percent versus 4.1 percent in 2018. On the other hand, unemployment rate in Japan remained unchanged at 2.4 percent (Table 1-3).
Chart 1-3 shows average unemployment rates for selected groups of countries during 2017-2020.
Fiscal Balances in Advanced EconomiesThe overall fiscal deficit in advanced economies rose to 3.0 percent of GDP in 2019, from 2.6 percent in 2018. The United States deficit increased from 5.7 percent in 2018 to 5.8 percent in 2019. The deficit in the euro area increased from 0.5 percent in 2018 to 0.7 percent in 2019. In France, it increased from 2.3 percent to 3.0 percent. The fiscal deficit in Japan also rose from 2.4 percent to 2.8 percent in 2019. On the other hand, the surplus in Germany decreased from 1.9 percent in 2018 to 1.4 percent in 2019. In Italy, the deficit declined from 2.2 percent to 1.6 percent. In the United Kingdom, the deficit went down from 2.2 percent to 2.1 percent in 2019 (Table 1-4).
Table 1-1: Real GDP Growth Rates
(Percentage)
2013 2014 2015 2016 2017 2018 2019Projections
2020
World 3.5 3.6 3.5 3.4 3.9 3.6 2.9 -3.0
Advanced Economies 1.4 2.1 2.3 1.7 2.5 2.2 1.7 -6.1
USA 1.8 2.5 2.9 1.6 2.4 2.9 2.3 -5.9
Euro area -0.2 1.4 2.1 1.9 2.5 1.9 1.2 -7.5
Germany 0.4 2.2 1.7 2.2 2.5 1.5 0.6 -7.0
France 0.6 1.0 1.1 1.1 2.3 1.7 1.3 -7.2
Italy -1.8 -0.01 0.8 1.3 1.7 0.8 0.3 -9.1
Japan 2.0 0.4 1.2 0.5 2.2 0.3 0.7 -5.2
UK 2.1 2.6 2.4 1.9 1.9 1.3 1.4 -6.5
Canada 2.3 2.9 0.7 1.0 3.2 2.0 1.6 -6.2
Emerging and Developing Economies 5.1 4.7 4.3 4.6 4.8 4.5 3.7 -1.0
Sub-Saharan Africa 5.2 5.1 3.2 1.4 3.0 3.3 3.1 -1.6
Emerging and Developing Asia 6.9 6.8 6.8 6.8 6.7 6.3 5.5 1.0
China 7.8 7.3 6.9 6.8 6.9 6.7 6.1 1.2
India 6.4 7.4 8.0 8.3 7.0 6.1 4.2 1.9
Middle East and North Africa 2.5 2.7 2.4 5.5 1.7 1.0 0.3 -3.3
Emerging and Developing Europe 3.1 1.9 0.9 1.8 4.0 3.2 2.1 -5.2
Latin America and the Caribbean 2.9 1.3 0.3 -0.6 1.3 1.1 0.1 -5.2
Brazil 3.0 0.5 -3.6 -3.3 1.3 1.3 1.1 -5.3
Commonwealth of Independent States 3.7 2.5 1.0 -1.9 0.8 2.4 -- --
Russia 1.8 0.7 -2.0 0.3 1.8 2.5 1.3 -5.5
Source: World Economic Outlook (WEO), IMF, April 2020.
Saud
i Ara
bian
Mon
etar
y Au
thor
ity |
56th
Ann
ual R
epor
t
12
Chart 1-1: World Real GDP Growth Rates
Chart 1-2: Percentage Change in Consumer Prices in Selected Groups of Countries
China
Perc
ent
Middle East and North AfricaEmerging Market and Developing Countries Advanced Economies
-8
-6
-4
-2
0
2
4
6
8
2016 2017 2018 2019 2020 (projections)
2018 2019 2020 (projections)
0246
810
Pe
rcen
t
Middle East and North Africa Emerging Market and Developing Countries Advanced Economies
12
Monetary and Financial DevelopmentsInterest RatesThe six-month dollar LIBOR stood at 2.3 percent in 2019 against 2.5 percent in 2018 and is projected to fall to 0.7 percent in 2020. The three-month euro LIBOR declined to -0.4 percent at the end of 2019 compared to -0.3 percent in 2018, and it is projected to remain unchanged in 2020. The yen LIBOR remained at zero in 2019 and is projected to drop to -0.1 in 2020 (Table 1-2).
Exchange RatesThe U.S. dollar recorded relatively weak bilateral exchange rates against some major currencies at the end of 2019 due to the weakened U.S. economy in general and the Fed decreasing rates by 25 basis points. However, the currencies that recorded the highest declines against the U.S. dollar included the Brazilian real with a drop of 3.43 percent at the end of 2019, followed by the euro with 2.20 percent and the Norwegian krone with 1.57 percent. On
the other hand, the currencies that recorded the largest increases in value against the U.S. dollar included the Canadian dollar with a rise of 5.03 percent, followed by the Mexican peso with 3.80 percent, the Japanese yen with 1.01 percent and the New Zealand dollar with 0.31 percent.
Equity and Bond Markets Equity MarketsThe U.S. Dow Jones Industrial Average (DJIA) index registered an increase of 5.29 percent, closing at 26,379.50 during 2019. The Japanese NIKKEI index went up by 18.20 percent to close at 21,697.23 during 2019. This strong performance was attributed to several factors, most notably the easing of trade tensions between advanced economies.
Similarly, the Morgan Stanley Capital International-Europe Index (MSCI Euro) rose by 20.20 percent to close at 1,784.1 during 2019. However, in

13
Glob
al E
cono
my
Table 1-2: Inflation and Interest Rates
(Percentage)
2018 2019Projections
2020
Global inflation
Advanced economies 2.0 1.4 0.5
USA 2.4 1.8 0.6
Euro area 1.8 1.2 0.2
Emerging and Developing Economies 4.8 5.0 4.6
Middle East and North Africa 11.0 9.0 8.2
London interbank offered rate (LIBOR)*
U.S. dollar deposits 2.5 2.3 0.7
Japanese yen deposits 0.0 0.0 -0.1
Euro deposits -0.3 -0.4 -0.4
* Six-month rate for USA and Japan and three-month rate for Euro area. Source: World Economic Outlook, IMF, April 2020.
Chart 1-3: Unemployment Rates
2018 2019 2020 (projections)
0246
810
Pe
rcen
t
Advanced Economies in Europe Euro Area
12
2017
the United Kingdom, the Financial Times Stock Exchange 100 Index (FTSE 100 Index) declined by 1.17 percent to 7,276.48. Bond MarketsYields on U.S. treasury bonds of all maturities declined at the end of 2019, with the 2-year bond yield falling to 1.56 percent, the 5-year yield to 1.68 percent, the 7-year yield to 1.82 percent, and the 10-year yield to 1.92 percent. The decreases in yields on medium- and long-term bonds were attributed to the supply and demand for bonds in conjunction with the slowdown of the global economy and the preference of a large percentage of investors for safe investments.
Yields on Japanese government bonds (JGB) of all maturities also declined at the end of 2019. The
JGB 30-year yield dropped to 0.41 percent, 20-year yield to 0.27 percent, 10-year yield to -0.022 percent, 7-year yield to 0.109 percent, 5-year yield to 0.128 percent, two-year yield to 1.27 percent, and 3-month yield to -0.100 percent.
In the euro area, all government bond yields of all maturities declined at the end of 2019, with the 5-year yield recording the highest decline to -0.463 percent, followed by the 10-year yield falling to -0.187 percent and then the 15-year yield to -0.039 percent. These decreases at the end of 2019 were attributed to the protests in France and companies’ declining trust in the euro economy.
In the United Kingdom, government bond yields of all maturities declined at the end of 2019. The 10-year yield recorded the highest decline, reaching

Saud
i Ara
bian
Mon
etar
y Au
thor
ity |
56th
Ann
ual R
epor
t
14
Table 1-3: Advanced Economies: Unemployment Rates
(Ratio to labor force)
2017 2018 2019 Projections2020
Advanced Economies 7.9 7.1 6.6 9.1
USA 4.3 3.9 3.7 10.4
Euro area 9.1 8.2 7.6 10.4
Germany 3.8 3.4 3.2 3.9
France 9.4 9.0 8.5 10.4
Italy 11.3 10.6 10.0 12.7
Japan 2.8 2.4 2.4 3.0
UK 4.4 4.1 3.8 4.8
Canada 6.3 5.8 5.7 7.5
Source: World Economic Outlook (WEO), IMF, April 2020.
0.825 percent. The 12-year yield came next at 0.97 percent, followed by 5-year yield at 0.61 percent and 2-year yield at 0.54 percent. The declining yields on all government bonds were mainly due to the rising concerns following the Brexit. World Trade and Balances of PaymentsA. World TradeThe growth rate of world trade volume fell from 3.8 percent in 2018 to 0.9 percent in 2019. Total world trade is expected to record a negative growth rate of 11.0 percent in 2020. As for goods and services exports, advanced economies registered a slow growth rate of 1.2 percent in 2019. The volume of such exports is projected to decrease by 12.8 percent in 2020. Exports of emerging market and developing economies recorded a growth rate of 0.8 percent in 2019. However, they are projected to decrease by 9.6 percent in 2020.The growth in imports of goods and services in advanced economies slowed to 1.5 percent in 2019 and is projected to decrease by 11.5 percent in 2020. Imports in emerging market and developing economies declined to 0.8 percent in 2019, and they are projected to contract by 8.2 percent in 2020 (Table 1-5).
B. Current Account BalancesThe surplus recorded by the ratio of the current
account balance to GDP in advanced economies remained stable at 0.7 percent in 2019, unchanged from that registered in 2018. In the United States, the current account deficit declined to 2.3 percent in 2019 from 2.4 percent in 2018. However, the deficit is projected to increase to 2.6 percent in 2020. In the euro area, the current account surplus stood at 2.7 percent in 2019, against a surplus of 3.1 percent in 2018, and it is expected to decrease to 2.6 percent in 2020. In Germany, the surplus decreased to 7.1 percent in 2019 compared to 7.4 percent in 2018; it is projected to decline to 6.6 percent in 2020. In France, the current account deficit rose to 0.8 percent in 2019 from 0.6 percent in 2018, but it is projected to decline to 0.7 percent in 2020. As for Italy, the ratio of the current account balance to GDP recorded a surplus of 3.0 percent in 2019 against a surplus of 2.5 percent in 2018; the surplus is projected to rise to 3.1 percent in 2020. The current account deficit in the United Kingdom declined to 3.8 percent in 2019 from 3.9 percent in 2018, but it is projected to rise to 4.4 percent in 2020. The surplus in Japan rose from 3.5 percent in 2018 to 3.6 percent in 2019; however, it is expected to shrink to 1.7 percent in 2020.
In emerging and developing Asia, the aggregate current account (as a percentage of GDP) recorded a

15
Glob
al E
cono
my
Table 1-4: Trends of Fiscal Balances*
(Percentage)
2017 2018 2019Projections
2020
Advanced economies -2.3 -2.6 -3.0 -10.6
USA -4.5 -5.7 -5.8 -15.4
Euro area -0.9 -0.5 -0.7 -7.5
Germany 1.2 1.9 1.4 -5.5
France -2.8 -2.3 -3.0 -9.2
Italy -2.4 -2.2 -1.6 -8.3
Japan -3.1 -2.4 -2.8 -7.1
UK -2.5 -2.2 -2.1 -8.3
Canada -0.1 -0.4 -0.4 -11.8
* Ratio of deficit(-)/surplus(+) to GDP. Source: World Economic Outlook (WEO), IMF, April 2020.
surplus of 0.6 percent in 2019 against a deficit of 0.1 percent in the preceding year, and it is projected to record a surplus of 0.1 percent in 2020. In the total for MENA countries, Afghanistan and Pakistan, the current account recorded a surplus of 0.4 percent against 2.5 percent in 2018, but it is expected to register a deficit of 5.7 percent in 2020 (Table 1-5). C. Financial Account BalancesAccording to the latest IMF data, the surplus of the BOP financial account balance for the advanced economies declined to $355.9 billion in 2018 against a surplus of $439.9 billion in 2017; the surplus is estimated to drop to $311.9 billion in 2019. In the United States, the BOP financial account deficit rose to $465.2 billion in 2018 compared to $331.9 billion in 2017. In the euro area, the financial account showed a surplus of $466.7 billion in 2018 against a surplus of $473.2 billion in the preceding year. In Germany, the financial account surplus declined to $274.7 billion in 2018 from $316.3 billion in the preceding year. The financial account deficit in France increased to $45.7 billion in 2018 as compared to $36.0 billion in the preceding year. In Japan, the financial account surplus increased to $183.8 billion in 2018, compared to $158.0 billion in 2017.
As for emerging market and developing economies, the overall BOP financial account deficit decreased to $83.8 billion in 2018, compared to $255.6 billion in 2017. In Sub-Saharan Africa, the financial account recorded a deficit of $53.6 billion in 2018 against a deficit of $34.2 billion in the preceding year. With regard to emerging and developing Asia, the financial account deficit increased slightly to $95.5 billion in 2018, compared to a deficit of $95.2 billion in the preceding year. In the total for MENA countries, Afghanistan and Pakistan, the BOP financial account recorded a surplus of $66.3 billion in 2018 against a deficit of $14.6 billion in the preceding year. A deficit of $21.9 billion is projected for 2019 (Table 1-6).
Economic Developments in GCC CountriesAccording to the IMF April 2020 WEO, real economic growth rates in all GCC countries, except Bahrain, declined in 2019. The growth rate in the UAE declined from 1.7 percent in 2018 to 1.3 percent in 2019. The growth rate in Kuwait decreased from 1.2 percent to 0.7 percent, and in Oman from 1.8 percent to 0.5 percent. In contrast, the growth rate in Bahrain increased from 1.8 percent in 2018 to 2.0 percent in 2019.

Saud
i Ara
bian
Mon
etar
y Au
thor
ity |
56th
Ann
ual R
epor
t
16
Table 1-5: World Trade and Current Account
(Percentage)
2018 2019 Projections2020
World Trade Growth 3.8 0.9 -11
Exports (Goods and Services)
Advanced economies 3.3 1.2 -12.8
Emerging and Developing Economies 4.1 0.8 -9.6
Imports (Goods and Services)
Advanced economies 3.3 1.5 -11.5
Emerging and Developing Economies 5.1 -0.8 -8.2
Current account *
Advanced economies 0.7 0.7 0.1
USA -2.4 -2.3 -2.6
Euro area 3.1 2.7 2.6
Germany 7.4 7.1 6.6
France -0.6 -0.8 -0.7
Italy 2.5 3.0 3.1
Japan 3.5 3.6 1.7
UK -3.9 -3.8 -4.4
Emerging and Developing Economies -0.1 0.1 -0.9
Emerging and Developing Asia -0.1 0.6 0.1
Commonwealth of Independent States -- -- --
Middle East, North Africa, Afghanistan, and Pakistan 2.5 0.4 -5.7
Sub-Saharan Africa -2.5 -4.0 -4.7
Latin America and the Caribbean -2.4 -1.7 -1.5
* Ratio of deficit(-)/surplus(+) to GDP. Source: World Economic Outlook (WEO), IMF, April 2020.
As for inflation, rates went down in all GCC countries, except Kuwait. In Bahrain, inflation rate declined from 2.1 percent in 2018 to 1.0 percent in 2019. The UAE recorded a negative inflation of 1.9 percent in 2019 compared to 3.1 percent in 2018. In Oman, the inflation rate decreased from 0.9 percent in 2018 to 0.1 percent in 2019. However, inflation rose in Kuwait from 0.6 percent to 1.1 percent. GCC countries recorded different current account balances (as a percentage of GDP). The current account surplus in the UAE declined to 7.4 percent in 2019 from 10.0 percent in 2018. The deficit in Bahrain declined from 5.9 percent in 2018 to 2.9 percent in 2019, and in Oman from 5.5 percent to 5.2 percent. Kuwait also recorded a decrease in the
current account surplus to 8.9 percent compared to 14.5 percent in the preceding year (Table 1-7).
Regional and International Cooperation1. Latest Developments of the Gulf Monetary Council In 2019, the Gulf Monetary Council (GMCO) continued developing its work in line with the objectives set out in its statute and the tasks it undertakes. The new developments included carrying out several projects, conducting research, and preparing reports with the central banks of member countries. GMCO continued its efforts to develop and improve the macroeconomic model that is aimed at studying GCC economies and the impact of political challenges and unforeseen

17
Glob
al E
cono
my
Table 1-6: Financial Account Balances
(Billion USD)
2017 2018 Projections2019
Advanced Economies 439.9 355.9 311.9
USA -331.9 -465.2 -507.1
Euro area 473.2 466.7 --
Germany 316.3 274.7 279.6
France -36 -45.7 -7.9
Italy 58.0 40.0 60.2
Japan 158.0 183.8 177.4
UK -115.7 -85.8 -120
Canada -40.4 -37.8 -53.7
Emerging and Developing Economies -255.6 -83.8 -106
Sub-Saharan Africa -34.2 -53.6 -52.2
Emerging and Developing Asia -95.2 -95.5 -11.3
MENA countries, Afghanistan and Pakistan -14.6 66.3 -21.9
Emerging and Developing Europe -48.5 -4.5 -3.1
Latin America and the Caribbean -85.9 -110 -102.4
Commonwealth of Independent States 22.8 113.3 84.8
Source: World Economic Outlook (WEO), IMF, April 2019.
changes on the future of the economy. In addition, GMCO contributed to building technical capabilities in terms of setting standard models in member countries, exchanging relevant technical opinions, and seeking technical comments and advice on such models from official authorities. Moreover, GMCO worked with the national central banks to develop a comprehensive framework for managing banking liquidity forecasts with the aim of enhancing the efficiency of monetary policy management. GMCO also prepared a report to assess member compliance with the Special Data Dissemination Standard (SDDS) for publication of statistics, given the relative difference among the statistical data publication systems used in the GCC countries in terms of the availability of data, frequency of publication, and compatibility with international statistical standards. GMCO is working on preparing a model for financial programming and macroeconomic policies. The model is a comprehensive framework for analyzing the current economic state in member countries, forecasting the economic trends,
and identifying the economic policies affecting the regional economy. Furthermore, GMCO participated in many workshops. It also organized a “Liquidity Forecasting and Management” workshop with the participation of international financial institutions, monetary agencies, and central banks in the GCC countries. Holding the workshop reflected the increasing importance of banking liquidity management and the GMCO’s keenness to implement the recommendations contained in Article IV Consultations issued by the IMF for all member countries. During the workshop, participants had technical discussions and shared practical experiences. In addition, GCC monetary agencies and central banks provided technical comments and advice. 2. Gulf Common Market (GCM)GCC intra-trade transactions (exports and imports) increased steadily from $92.7 billion in 2010 to $145.5 billion in 2018. Statistics show that more GCC citizens are benefiting from the GCM decisions,

Saud
i Ara
bian
Mon
etar
y Au
thor
ity |
56th
Ann
ual R
epor
t
18
Table 1-7: Key Economic Developments in GCC Countries
United Arab Emirates Bahrain Kingdom of
Saudi Arabia Oman Qatar Kuwait
2018 2019 2018 2019 2018 2019 2018 2019 2018 2019 2018 2019
Real GDP Growth 1.70 1.30 1.80 2.00 2.40 0.30 1.80 0.50 1.50 0.10 1.20 0.70
Inflation Rate 3.1 -1.9 2.1 1.0 2.5 -1.2 0.9 0.1 0.2 -0.6 0.6 1.1
Imports (billion USD) -235.4 -- -19.1 -- -139.0 -- -26.0 -- -32.0 -- -31.0 --
Exports (billion USD) 316.9 -- 18.3 -- 260.0 -- 40.5 -- 75.0 -- 68.5 --
Current account (billion USD) 37.8 -- -2.2 -- 32.0 -- -6.7 -- 9.8 -- 14.6 --
Current Account to GDP 10.0 7.4 -5.9 -2.9 9.0 6.3 -5.5 -5.2 8.7 2.4 14.5 8.9
Ratio of surplus/deficit in fiscal balance 2.0 -0.8 -11.9 -10.6 -5.9 -4.5 -7.9 -7.0 5.2 4.1 9.0 4.8
Population (million)* 9.6 9.7 1.6 1.7 33.7 34.2 4.8 5.0 2.8 2.8 4.1 4.2
Source: World Economic Outlook (WEO), IMF, April 2020 & Arab Economic Outlook, 2020. *World Bank 05/04/2020.
bringing the number of citizens travelling between GCC countries to 28 million in 2018. Furthermore, the number of licenses granted to GCC citizens practicing different economic activities in other GCC countries increased, pushing the total number of such licenses to more than 47,827. The number of GCC citizens benefiting from real estate’s ownership decisions rose, with 45,893 purchases made in 2018. As for stock markets, the number of citizens trading in other GCC stock markets was about 428,089 shareholders in 644 joint-stock companies during 2018.
3. Arab Financial Institutions Arab financial institutions hold their annual meetings in the spring of every year. In these meetings, they review their performance and agendas. The following is a brief of these institutions and their activities.
A. Arab Monetary Fund (AMF)As of the end of 2018, the balance of loan commitments stood at 188.7 million Arab Accounting Dinars (AAD) ($793 million). Total loans extended by the AMF to member countries up to the end of 2018 were AAD 2.32 billion ($10 billion). A total of 184 loans were extended by the AMF to 14 member countries.
Loans (automatic, ordinary, compensatory and extended loans) extended by the AMF were at the top of credit facilities granted by the AMF from the beginning of its lending activities in 1978 until the end of 2018, representing 60.3 percent of total loans extended throughout this period. The structural adjustment facilities extended came next with 29.9 percent, followed by the trade reform facility with 2.8 percent and the oil facility with 1.4 percent.
B. Arab Bank for Economic Development in Africa (BADEA)In 2018, 15 loans with a value of $565 million were approved for development projects in Africa. Infrastructure lending had the largest share of total loans, amounting to 53.4 percent. Lending for both the social sector and the agriculture and rural development sector accounted for 23.3 percent, each, of total loans.
BADEA continued its policy of maintaining a sound financial position, which resulted in an increase of its net assets to $4.9 billion at the end of 2018 compared to $ 4.8 billion at the end of 2017.Net income declined to $39.9 million in 2018 compared to $271.6 million in 2017 due to loss in equity investments.

19
Glob
al E
cono
my
C. Arab Fund for Economic and Social Development (AFESD) During 2018, the AFESD extended 11 loans with a total of Kuwaiti dinar (KWD) 464 billion to finance projects in six Arab countries. The ratio of loans to total cost of these projects was estimated at 78.6 percent. The cumulative value of 677 loans extended by the AFESD, starting from the commencement of its operations in 1974 up to the end of 2018, reached KWD 10.3 billion.
Total revenues for 2018 stood at KWD 61.4 million compared to KWD 126.6 million in 2017. Administrative expenses were KWD 8.4 million in 2018, and net profit stood at KWD 49 million compared to KWD 112.8 million in 2017. Member country total rights stood at KWD 3.6 billion at the end of 2018, versus KWD 3.5 billion at the end of 2017.
D. Arab Investment and Export Credit Guarantee Corporation (Dhaman) Dhaman’s assets in 2018 totaled $150 million, 66.67 percent of which was in investments, 31.68 percent in cash and deposits and 1.65 percent in other assets. Equity stood at $468 million at the end of 2018, compared to $471 million in the preceding year. Total income of Dhaman was $17 million in 2018. Of this amount, $12.3 million was from guarantees, banks and bonds interest income, accounts on demand and other miscellaneous income; and $11.8 million was from investment income, dividends income, the sale of a number of investments in bonds, financial funds, investment portfolios and currency spreads. Dhaman’s general and administration expenses for 2018 reached $9.8 million. In 2018, Dhaman incurred losses of $3.1 million against profits of $17.5 million in the preceding year.
E. Arab Authority for Agricultural Investment and Development (AAAID)AAAID’s contribution to the capital accounts of existing and to-be-formed companies in 2018 (contributions and loans) amounted to $607 million, or 84 percent of its paid-up capital of $720.7 million. Total income of AAAID was $36 million in 2018, versus $73 million in the preceding year. The income was generated mainly from investment portfolios, loans and companies’ profits. Net profit reached $9.4 million, compared to $15.5 million in the preceding year. Total assets stood at $979 million at the end of 2018 against $193 million in the preceding year. AAAID’s total liabilities stood at $45.9 million in 2018 compared to $45.6 million in the preceding year. In 2018, its net income reached $12 million versus $21 million in the preceding year.
4. Islamic Development Bank (IsDB)IsDB’s total assets rose from $30.6 billion at the end of 2018 to $32.6 billion at the end of 2019. Total liabilities also grew from $18.5 billion to $20.1 billion. In addition, total revenues increased from $747.8 million to $896 million, and net income almost doubled, rising from $116.7 million to $230.3 million. IsDB’s total granted loans rose from $2.4 billion to $2.8 billion in 2019. Outstanding loans also went up from $18.9 billion at the end of 2018 to $20.3 billion at the end of 2019, and repaid loans from $18.9 billion to $20.3 billion. On the other hand, total expenditure declined from $223 million in 2018 to $216.3 million in 2019.
5. OPEC Fund for International Development (OFID)OFID’s equity (including reserves and member country contributions) increased to $7.4 billion at the end of 2019 against $7.2 billion at the end of 2018. OFID’s total assets rose to $7.6 billion at the

Saud
i Ara
bian
Mon
etar
y Au
thor
ity |
56th
Ann
ual R
epor
t
20
end of 2019 compared to $7.4 billion at the end of the preceding year. OFID’s total extended loans increased to $1.5 billion in 2019 against $1.4 billion in 2018. Total repaid loans increased to $1.2 billion against $1.1 billion in 2018. Total income for 2019 reached $303.1 million compared to $160.6 million in 2018. OFID’s net income in 2019 was $232.7 million against $92.5 million in 2018.
6. International Monetary Fund (IMF)International Monetary and Financial Committee (IMFC)The IMFC held its 41st virtual meeting on April 16, 2020. The meeting discussed the global economy, noting that it will witness a sharp contraction in 2020 due to the COVID-19 pandemic. The meeting indicated that such economic contraction reflects the necessary health measures taken by countries to contain the virus, disruptions in economic supply and demand, and tightening financial conditions. The IMFC also discussed the high uncertainty surrounding the global economy. It expected a recovery in the economic growth with the continuous employment of all available monetary and financial policy tools to overcome the pandemic, protect jobs, and restore economic growth. In addition, it welcomed the actions of central banks and financial authorities to alleviate stressed global financial conditions and maintain financial stability. It also confirmed that it will take further financial stability measures to facilitate a speedy return of the global economy to strong and sustainable growth.
Moreover, the IMFC welcomed the pledges to the Catastrophe Containment and Relief Trust (CCRT) and the Poverty Reduction and Growth Trust (PRGT) received so far and called for additional contributions to ensure that the IMF can support its poorest and most vulnerable members. It also welcomed the coordinated approach agreed by the G20 and the Paris Club, supported by the IMF and World Bank, toward a time-bound suspension by
bilateral official creditors of debt service payments for the poorest countries that request forbearance. It called on private creditors to participate in the initiative on comparable terms.
The IMFC reaffirmed its commitment to a strong, quota-based, and adequately resourced IMF at the center of the global financial safety net. It stressed that it will keep demands on the IMF’s resources under close review. The IMFC meeting noted that the IMF’s lending capacity of US$1 trillion is critical to maintain confidence that the IMF can fulfill its mandate by helping its members overcome the crisis. Furthermore, the IMFC affirmed its commitment to revisiting the adequacy of quotas and continuing the process of IMF governance reform under the 16th General Review of Quotas, including a new quota formula as a guide, by December 15, 2023.
7. World Bank Group (WBG)Development Committee The WBG Development Committee held its virtual meeting on April 17, 2020. The meeting reviewed the difficult challenges due to the COVID-19 pandemic. Moreover, it noted that the COVID-19 pandemic underscores that the development community increasingly faces global challenges requiring decisive, collective action and innovation. It emphasized that multilateral cooperation is needed to contain the pandemic and mitigate its health, social, and economic consequences.
The Development Committee also encouraged the WBG and the International Monetary Fund (IMF), within their respective mandates, to continue helping all clients, in partnership with the World Health Organization, other UN agencies, international financial institutions, and bilateral partners. It asked them to collaborate in addressing the pandemic and supporting economic recovery.

21
Glob
al E
cono
my
Further, the Development Committee pointed out that the global economy is experiencing an exceptional negative shock as a result of COVID-19. The attendant sharp decline in global investor confidence has severely tightened external financing conditions for countries across the income spectrum. The pandemic is disrupting trade, supply chains and investment flows. The Development Committee stressed that special attention should be paid to the provision of affordable medical supplies. It also asked that all countries ensure the flow of vital medical supplies, critical agricultural products, and other goods and services across borders, and that they work to resolve disruptions to the global supply chains, to support the recovery.
The Development Committee welcomed the WBG’s estimated financial support of up to US$150-160 billion over the next 15 months, with a focus on the poorest and vulnerable in all client countries. It also welcomed the IMF’s stepping up of financial support for developing countries through both its regular facilities and emergency funding.
The Development Committee emphasized that the WBG has the financial firepower to provide a meaningful long-term response to this crisis thanks to the capital increases for the International Bank for Reconstruction and Development (IBRD) and the International Finance Corporation (IFC), as well as the successful replenishment of the International Development Association’s resources (IDA19 Replenishment). It encouraged all shareholders to accelerate the subscription processes and front-load their contributions to the greatest extent possible.
The Development Committee noted that the WBG must not only address immediate economic needs, but also support long-term development priorities, ensure affordable energy access, and build energy security and resilience to
economic and environmental vulnerabilities and climate change. In addition, the Development Committee urged the WBG and the IMF to ensure effectiveness on the ground and help countries create the conditions for inclusive and sustainable long-term growth.
8. Bank for International Settlements (BIS) The BIS 2019 Annual Economic Report concluded that the global economy witnessed significant improvement in the first half of 2018, but the slowdown in the second half of 2018 negatively affected the stability of the financial markets. The main factors behind this slowdown were that global trade came to a halt, manufacturing decelerated and investment lost pace. The report addressed short- and medium-term projections, which are as follows:• Political factors, especially those related to
trade policies and trade tensions between countries, will cast a long if unpredictable shadow over the world economy.
• The global production growth will slow down, affected by the finance factor and inflation rate.
The report also referred to the competitive threat posed by large technology firms (“big techs”) to commercial banks. Big techs have made significant progress in providing innovative financial services to their large network of customers. Building on their e-commerce platforms, some big techs have ventured into lending to consumers and have acted as a distribution channel for third-party providers, e.g. by offering wealth management or insurance products. Consequently, the market capitalization of big techs has exceeded that of some commercial banks.
9. Financial Stability Board (FSB) The Financial Stability Board (FSB) Plenary discussed in its last meeting in 2019 the vulnerabilities in the global financial system,

Saud
i Ara
bian
Mon
etar
y Au
thor
ity |
56th
Ann
ual R
epor
t
22
FinTech developments, and impact of interest rate change on the financial stability. The Plenary also reviewed developments in crypto-asset markets. FSB members endorsed an augmented framework for monitoring potential financial stability risks in those markets to take account of the development of so-called ‘global stablecoin’ systems, recognizing that these are developing rapidly. In addition, members discussed the potential financial stability implications from the entry of BigTech firms into finance and from third-party dependencies in cloud services. The FSB approved publishing initial reports on these key topics. Moreover, the Plenary discussed key elements of the International Association of Insurance Supervisors (IAIS) holistic framework for the assessment and mitigation of systemic risk in the insurance sector. Members discussed the FSB’s work program for 2020, including deliverables to Saudi Arabia’s Presidency of the G20. Main priorities for the FSB work program are as follows: 1. Addressing new and emerging vulnerabilities
in the financial system,2. Finalizing and operationalizing post-crisis
reforms, and3. Monitoring the implementation and
evaluating the effects of the reforms.
10. Basel Committee on Banking Supervision (BCBS)In 2019, the BCBS issued various standards, guidelines, and reports, which are briefed as follows: • The minimum capital requirements for
market risk: The standard has been revised to address issues that the Basel Committee identified in the course of monitoring the implementation and impact of the framework.
• Revisions to leverage ratio disclosure requirements: The publication sets out additional requirements for banks to disclose their leverage ratios based on quarter-end
and on daily average values of securities financing transactions.
• Revisions to margin requirements for non-centrally cleared derivatives: The 2015 framework for margin requirements for non-centrally cleared derivatives was revised. The revisions extend by one year the final implementation of the margin requirements. With this extension, the final implementation phase will take place on 1 September 2021.
• Basel III Monitoring Report: This report presents the results of the Basel Committee’s latest Basel III monitoring exercise, based on data as of 30 June 2018. Through a rigorous reporting process, the Committee regularly reviews the implications of the Basel III standards for banks.
• Standardised approach–implementing the mapping process: This document sets out guidelines for supervisors in the process of assigning the credit risk assessments of an eligible external credit assessment institution (ECAI) to the risk weights available under the standardised approach to credit risk.
• Regulatory Consistency Assessment Program (RCAP): Assessment of the Basel Committee’s large exposures framework and assessment of the Basel Committee’s Net Stable Funding Ratio (NSFR) standard. The Basel Committee monitors the timely adoption of regulations by its members and assesses the regulations’ consistency with the Basel framework.
• A report on proportionality in bank regulation and supervision.
• Overview of Pillar 2 supervisory review practices and approaches: The report describes key concepts of Pillar 2 and supervisory review practices in use across Basel Committee member jurisdictions.
• Frequently asked questions (FAQs) on the Basel III standardised approach for operational risk: The BCBS finalized the new standardised approach for operational risk

23
Glob
al E
cono
my
capital, as published in the Basel III: Finalizing Post-Crisis Reforms in December 2017.
• Consultative document on the revised market risk disclosure requirements: The document includes the introduction of a “traffic light” approach for capital requirements as a consequence of the outcome of the profit and loss attribution test for banks using the internal models approach.
• Report on open banking and application programming interfaces (APIs): The report discusses the challenges facing banks as a result of sharing and leveraging of customer-permissioned data from banks with third party developers and firms to build applications and services to provide more efficient and transparent options in banking.
• Guiding principles for the operationalization of a sectoral countercyclical buffer: Basel III standard includes a countercyclical capital buffer (CCyB) regime. National authorities can implement a CCyB requirement to ensure that the banking system has an additional buffer of capital to protect against potential future losses related to downturns in the credit cycle.
• Consultative document on credit valuation adjustment risk-targeted revisions: Improvements to the capital framework to better capture credit valuation adjustment (CVA) risk is one of the key elements of the Basel Committee’s overall efforts to reform global regulatory standards in response to the global financial crisis.
• Launch of the consolidated Basel Framework: The framework comprises 14 “standards”, setting out requirements on specific topics, each of which is further divided into “chapters”. This modular format will make it easier to maintain the standards over time.
• Consultative document on voluntary disclosure of sovereign exposures: The Committee is seeking views on three Pillar
3 templates for the disclosure of banks’ sovereign exposures. The implementation of these templates is voluntary-that is they are mandatory for banks only when required by national supervisors at a jurisdictional level.
11. The Group of Twenty (G20)The G20 Leaders’ Summit was convened in Osaka, Japan on 28-29 June 2019 to make united efforts to address global economic challenges. The G20 Leaders announced their commitment to lead the efforts to foster development and address global challenges to achieve strong, sustainable, balanced and inclusive growth, as envisioned in the 2030 Agenda for Sustainable Development. The Summit focused on challenges to the global economy, fostering robust global economic growth, technological innovation, quality infrastructure investment, anti-corruption, future of work, and women’s empowerment. The Summit indicated that the global growth appears to be stabilizing and is generally projected to pick up moderately till 2020. This recovery is supported by the stimulus measures taking effect in some countries.The G20 Leaders also reaffirmed their commitment to use all policy tools to achieve strong, sustainable, balanced and inclusive growth, and safeguard against downside risks, by stepping up dialogue and actions to enhance confidence. In addition, the Summit stressed the importance of rebuilding buffers where needed and ensuring debt as a share of GDP is on a sustainable path. It indicated that monetary policy will continue to support economic activity and ensure price stability. Moreover, it reaffirmed the exchange rate commitments made by the finance ministers and central bank governors in March 2018. The Summit touched upon demographic changes, including population aging. It noted that these changes will require policy actions that span fiscal, monetary, financial, labor market and other structural policies. The Summit endorsed the G20

Saud
i Ara
bian
Mon
etar
y Au
thor
ity |
56th
Ann
ual R
epor
t
24
Fukuoka Policy Priorities on Aging and Financial Inclusion.The Summit welcomed the G20 Ministerial Statement on Trade and Digital Economy. It emphasized that member countries strive to realize a free, fair, non-discriminatory, transparent, predictable and stable trade and investment environment, and to keep markets open. It also confirmed that international trade and investment are important engines of growth, productivity, innovation, job creation and development. It reaffirmed its support for the necessary reform of the World Trade Organization (WTO) to improve its functions. Further, it pledged to work constructively with other WTO members.
The Summit discussed digitalization and indicated that the cross-border flow of data, information, ideas and knowledge generates higher productivity, greater innovation, and improved sustainable development. Besides, the Summit explored how to continue addressing challenges related to privacy, data protection, intellectual property rights, and security.
In addition, the G20 Leaders discussed the infrastructure, as a driver of economic growth and prosperity. They endorsed the G20 Principles for Quality Infrastructure Investment, emphasizing that quality infrastructure is an essential part to achieve sustainable growth and development.
12. Organization of the Petroleum Exporting Countries (OPEC)The 177th Meeting of the OPEC Conference reviewed a number of reports, most notably the Secretary General’s report, the report and recommendations of the Joint Ministerial Monitoring Committee (JMMC), whose work continues to be supported by the Joint Technical Committee (JTC) and the OPEC Secretariat, the report of the Economic Commission Board, as well as various administrative matters. The
Conference also discussed a number of topics, including global oil market developments. The Conference commended all OPEC Member Countries, as well as non-OPEC countries participating in the ‘Declaration of Cooperation’ (DoC), for their continued commitment to achieving and sustaining balance and stability in the oil market. The Conference deliberated on the key developments of negotiations at the COP-25 United Nations Framework Climate Change Conference in Madrid, Spain, and underscored that all OPEC Member Countries are actively engaged and supportive of the Paris Agreement. In another regard, the Conference elected HE Mohamed Arkab, Minister of Energy of Algeria, as President of the Conference for one year, with effect from 1 January 2020, and HE Dr. Diamantino Pedro Azevedo, Angola’s Minister of Mineral Resources and Petroleum, as Alternate President for the same period. In addition, the Conference appointed Mr. Etienne Lepoukou, Gabon’s Governor for OPEC, as Chairman of the Board of Governors for the year 2020, and Mr. Hossein Kazempour Ardebili, IR Iran’s Governor for OPEC, as Alternate Chairman for the same period.

SAUDIECONOMY
Saud
i Ara
bian
Mon
etar
y Au
thor
ity |
56th
Ann
ual R
epor
t
26
Saudi Economy
The Saudi economy grew in 2019 due to the support of the non-oil sector, which registered a strong performance. This economic growth occurred despite the substantial decline in oil sector output, driven by Saudi Arabia’s commitment to the OPEC+ deal aiming to achieve stability in the oil market. The Saudi economy benefited from the economic and financial reforms package taken by the government during recent years to achieve the aspirations of the Saudi Vision 2030. The domestic economy showed the resilience and ability to absorb economic shocks resulting from oil price volatility. This resilience can be attributed to ongoing government expenditure on development projects and the support of Saudi Vision 2030 programs that contributed to neutralizing the impacts of these shocks. In continuation of its efforts aimed at increasing domestic economic efficiency, diversifying its production base by activating the role of the private sector as a major partner in the Saudi Vision initiative, and periodically assessing and reviewing the Vision 2030 programs, the government of Saudi Arabia adopted a myriad of resolutions during 2019. With these resolutions, Saudi Arabia aims to make developmental leaps, introduce sustainable solutions to increase national workforce participation in the Saudi labor market, and support the private sector to achieve sustainable growth of the domestic economy.
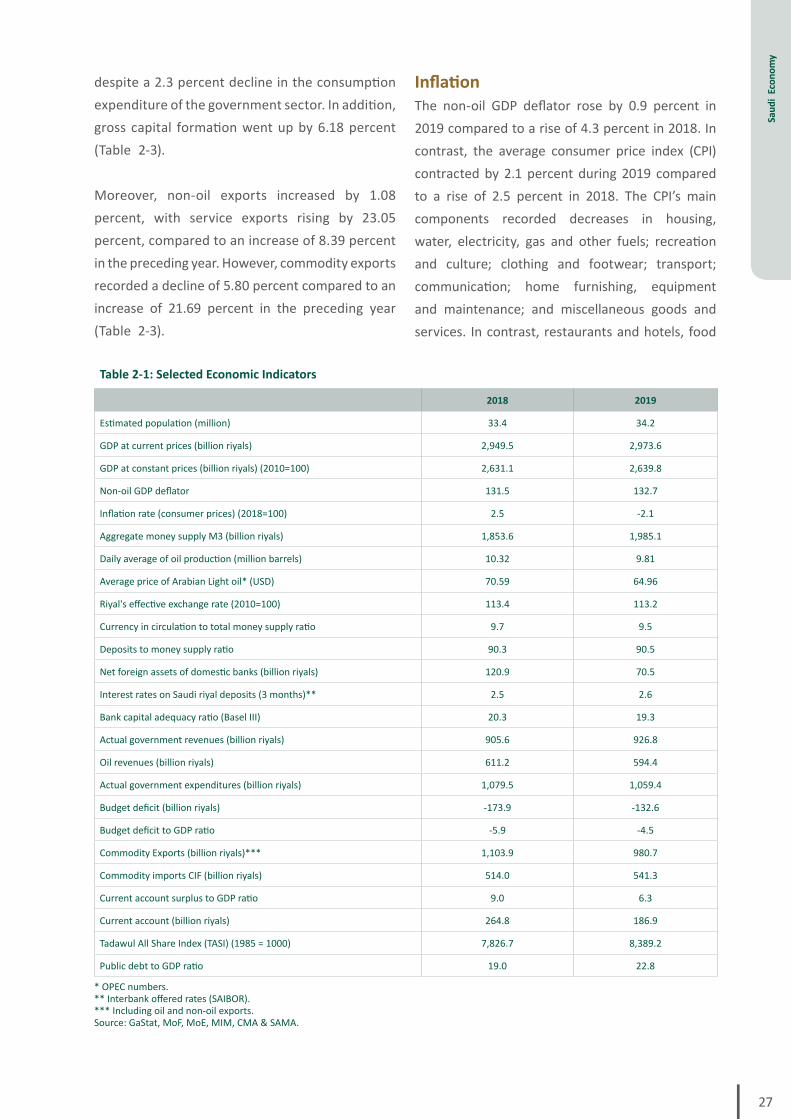
Economic GrowthPreliminary data on GDP at constant prices indicate that the GDP grew by 0.33 percent to SAR 2,639.8 billion in 2019 compared to an increase of
2.43 percent in 2018 (Table 2-1). This slowdown in growth was attributed to a 3.65 percent decrease in the oil sector GDP to SAR 1,096.2 billion. In contrast, the non-oil sector GDP recorded a significant growth of 3.31 percent to SAR 1,527.3 billion. The non-oil private sector GDP recorded a growth rate of 3.78 percent to SAR 1,073.7 billion, and the non-oil government sector GDP grew by 2.20 percent to SAR 453.6 billion.
Most major economic production activities at constant prices grew in 2019, albeit at varied rates (Table 2-2). Community, social and personal services activity grew by 6.94 percent; wholesale and retail trade, restaurants and hotels by 6.27 percent; transportation, storage and communications by 5.60 percent; finance, insurance, real estate and business services by 5.53 percent; construction and building by 4.60 percent; imputed bank services by 3.46 percent; producers of government services by 1.51 percent; and agriculture, forestry and fishing by 1.31 percent. On the other hand, mining and quarrying; manufacturing industries; and electricity, gas and water declined by 3.64 percent, 1.56 percent, and 3.96 percent, respectively.
Domestic Supply and DemandThe total supply of goods and services from the non-oil sector (at current prices) recorded an increase of 4.44 percent in 2019. The non-oil GDP (at current prices) increased by 4.21 percent, with a contribution of 4.41 percent and 4.11 percent from the government sector and private sector, respectively. Total imports of goods and services also rose by 5.30 percent.
The total demand for goods and services by the non-oil sector (at current prices) recorded an increase of 2.32 percent in 2019. The final consumption of the private sector increased by 1.23 percent due to a 3.5 percent increase in the consumption expenditure of the private sector
27
Saud
i Ec
onom
y
despite a 2.3 percent decline in the consumption expenditure of the government sector. In addition, gross capital formation went up by 6.18 percent (Table 2-3).
Moreover, non-oil exports increased by 1.08 percent, with service exports rising by 23.05 percent, compared to an increase of 8.39 percent in the preceding year. However, commodity exports recorded a decline of 5.80 percent compared to an increase of 21.69 percent in the preceding year (Table 2-3).
InflationThe non-oil GDP deflator rose by 0.9 percent in 2019 compared to a rise of 4.3 percent in 2018. In contrast, the average consumer price index (CPI) contracted by 2.1 percent during 2019 compared to a rise of 2.5 percent in 2018. The CPI’s main components recorded decreases in housing, water, electricity, gas and other fuels; recreation and culture; clothing and footwear; transport; communication; home furnishing, equipment and maintenance; and miscellaneous goods and services. In contrast, restaurants and hotels, food
Table 2-1: Selected Economic Indicators
2018 2019
Estimated population (million) 33.4 34.2
GDP at current prices (billion riyals) 2,949.5 2,973.6
GDP at constant prices (billion riyals) (2010=100) 2,631.1 2,639.8
Non-oil GDP deflator 131.5 132.7
Inflation rate (consumer prices) (2018=100) 2.5 -2.1
Aggregate money supply M3 (billion riyals) 1,853.6 1,985.1
Daily average of oil production (million barrels) 10.32 9.81
Average price of Arabian Light oil* (USD) 70.59 64.96
Riyal's effective exchange rate (2010=100) 113.4 113.2
Currency in circulation to total money supply ratio 9.7 9.5
Deposits to money supply ratio 90.3 90.5
Net foreign assets of domestic banks (billion riyals) 120.9 70.5
Interest rates on Saudi riyal deposits (3 months)** 2.5 2.6
Bank capital adequacy ratio (Basel III) 20.3 19.3
Actual government revenues (billion riyals) 905.6 926.8
Oil revenues (billion riyals) 611.2 594.4
Actual government expenditures (billion riyals) 1,079.5 1,059.4
Budget deficit (billion riyals) -173.9 -132.6
Budget deficit to GDP ratio -5.9 -4.5
Commodity Exports (billion riyals)*** 1,103.9 980.7
Commodity imports CIF (billion riyals) 514.0 541.3
Current account surplus to GDP ratio 9.0 6.3
Current account (billion riyals) 264.8 186.9
Tadawul All Share Index (TASI) (1985 = 1000) 7,826.7 8,389.2
Public debt to GDP ratio 19.0 22.8
* OPEC numbers. ** Interbank offered rates (SAIBOR). *** Including oil and non-oil exports. Source: GaStat, MoF, MoE, MIM, CMA & SAMA.

Saud
i Ara
bian
Mon
etar
y Au
thor
ity |
56th
Ann
ual R
epor
t
28
and beverages, education, tobacco, and health recorded increases. Furthermore, the wholesale price index (WPI) increased by 2.0 percent in 2019 against a rise of 16.0 percent in 2018.
Energy, Industry and Mineral ResourcesData of the Organization of Petroleum Exporting Countries (OPEC) for 2019 show a decrease of 8.0 percent in the average price of the Arabian Light crude oil to $64.96 per barrel from $70.59 per barrel in 2018. According to the Ministry of Energy (MOE) data, Saudi Arabia’s average daily production of crude oil decreased by 4.9 percent to 9.81 million barrels in 2019 compared to 10.32 million barrels in 2018 (Table 2-1).
With regard to electricity, the Saudi Electricity Company (SEC)’s sales of electricity in 2019 amounted to 279.7 million megawatt-hours (MWh). By type of consumption, residential consumption accounted for 45.8 percent (128.1 million MWh) of total electricity consumption in Saudi Arabia, followed by industrial consumption with 17.7 percent (49.4 million MWh). Commercial consumption came third with 16.7 percent (46.8 million MWh), followed by government consumption with 13.5 percent (37.8 million MWh). The peak load of electricity was 62,076 megawatts in 2019, and the actual capacity of electricity generation was 53,104 megawatts.
As for industry and mineral resources, the latest data issued by the Ministry of Industry and
Table 2-2: Gross Domestic Product by Economic Sector at Producers’ Values at Constant Prices (2010=100)
(Million SAR)
2017 2018 2019* Change% 2019
A. Industries and other producers (excluding government services’ producers)
1. Agriculture, forestry & fishing 60,422 60,617 61,410 1.31
2. Mining & quarrying 1,010,104 1,046,918 1,008,789 -3.64
a. Crude petroleum & natural gas 1,000,160 1,036,740 998,125 -3.72
b. Other mining & quarrying activities 9,944 10,178 10,664 4.77
3. Manufacturing 311,982 318,529 313,553 -1.56
a. Petroleum refining 96,533 94,376 91,370 -3.18
b. Other industries 215,449 224,153 222,183 -0.88
4. Electricity, gas & water 34,132 34,776 33,398 -3.96
5. Construction & building 117,259 113,172 118,381 4.60
6. Wholesale & retail trade, restaurants & hotels 229,378 231,569 246,085 6.27
7. Transport, storage & communication 151,789 154,946 163,618 5.60
8. Finance, insurance, real estate and business services 249,794 257,692 271,938 5.53
a. Real estate activities 134,487 137,934 142,621 3.40
b. Others 115,307 119,758 129,317 7.98
9. Community, social & personal services 50,323 52,918 56,591 6.94
10. Less imputed bank services charge 20,963 21,232 21,966 3.46
B. Government services' producers 355,600 366,165 371,677 1.51
Total (excluding import duties) 2,549,820 2,616,070 2,623,474 0.28
Import duties 18,749 15,021 16,338 8.77
GDP 2,568,569 2,631,091 2,639,811 0.33
* Preliminary data. Source: GaStat

29
Saud
i Ec
onom
y
Mineral Resources (MIM) show that the mining and mineral industries sector contributed with SAR 63.8 billion in 2019. Saudi Arabia’s revenues from the mining and mineral industries sector reached SAR 4.9 billion.
In addition, the sector’s total exports stood at SAR 26.3 billion. Besides, the number of employees in the sector reached 250 thousand. In 2019, MIM issued 163 building material quarrying licenses, bringing the total number of licenses in this field to 1,399. MIM also renewed 497 mining licenses, including 168 licenses for exploration of gold, other precious minerals and base metals, bringing the total number of licenses in this field to 536. At the end of 2019, the number of valid mining licenses stood at 2,095 compared to 2,045 at the end of the preceding year. Moreover, as a result of MIM’s prospecting for metals, more than 3000 metal deposits were identified in the Arabian Shield. MIM reserved five sites rich in precious metal resources, bringing the total number of mining complexes to 375 sites with an area of more than 65,000 square kilometers
spread over Saudi Arabia. Currently, Saudi Arabia has 6 gold mines and 2 copper and zinc mines. In 2019, the production from these mines exceeded 12 tons of gold, 63,000 tons of copper, and 19,000 tons of zinc.
Money Supply and Banking ActivityBroad money supply (M3) increased by 7.1 percent to SAR 1,985 billion in 2019 compared to an increase of 2.7 percent in 2018. Bank deposits, which represented 90.5 percent of M3, recorded an increase of 7.3 percent to SAR 1,796.0 billion in 2019 compared to an increase of 2.5 percent in 2018. Currency in circulation also grew by 5.0 percent compared to a growth of 4.7 percent in 2018. A breakdown of the components of bank deposits to M3 in 2019 indicates that demand deposits constituted 55.4 percent, time and savings deposits 25.3 percent, and other quasi-money deposits 9.8 percent of aggregate money supply (M3). A breakdown of deposits by sector at the end of 2019 shows that deposits of the private sector increased by 4.5 percent to SAR 1,390.5 billion (constituting 77.4 percent of total
Table 2-3: Total Domestic Non-Oil Sector’s Supply and Demand (At Current Prices)
(Million SAR)
2017 2018 2019* Change% 2019
Total supply** 2,327,965 2,458,194 2,567,320 4.44
Non-oil GDP 1,823,518 1,944,202 2,026,064 4.21
Government 576,059 643,346 671,743 4.41
Private 1,247,459 1,300,856 1,354,322 4.11
Total imports 504,447 513,993 541,256 5.30
Total demand** 2,588,327 2,772,273 2,836,499 2.32
Final consumption 1,694,622 1,844,341 1,866,990 1.23
Government 630,978 726,101 709,171 -2.33
Private consumption 1,063,644 1,118,241 1,157,819 3.54
Gross capital formation 632,232 618,793 657,030 6.18
Non-oil exports 261,473 309,138 312,480 1.08
Commodity exports 193,479 235,443 221,798 -5.80
Service exports 67,994 73,696 90,682 23.05
* Preliminary data. ** The mismatch between supply and demand is because total imports and gross capital formation include oil imports. Source: GaStat

Saud
i Ara
bian
Mon
etar
y Au
thor
ity |
56th
Ann
ual R
epor
t
30
bank deposits). The public sector’s deposits also increased by 18.2 percent to SAR 405.5 billion at the end of 2019, accounting for 22.6 percent of total bank deposits.
Moreover, a breakdown of bank claims on the private and public sectors at the end of 2019 shows that total bank claims on the private sector went up by 7.0 percent to SAR 1,546.5 billion, accounting for 86.1 percent of total bank deposits compared to 86.4 percent in 2018. In addition, total bank claims on the public sector increased by 24.1 percent to SAR 445.3 billion, representing 24.8 percent of total bank deposits. Consequently, total claims on both sectors at the end of 2019 increased to 110.9 percent of total bank deposits compared to 107.8 percent at the end of the previous year.
The consolidated financial position of commercial banks data in 2019 indicate an increase of 7.4 percent in commercial banks’ reserves to SAR 239.4 billion compared to a decrease of 8.4 percent in the preceding year. Consequently, capital and reserves of commercial banks increased by 13.0 percent to SAR 343.0 billion compared to a decline of 4.3 percent in the preceding year. Accordingly, the ratio of capital and reserves to total bank deposits increased to 19.1 percent. Similarly, the ratio of capital and reserves to total assets rose to 13.0 percent at the end of 2019. The ratio of capital to risk-weighted assets according to Basel standard (Capital Adequacy Ratio) stood at 19.4 percent, well above the ratio recommended by Basel Committee. Commercial banks’ profits went up by 4.5 percent to SAR 50.3 billion in 2019 compared to an increase of 9.8 percent in 2018.
Insurance Sector The insurance penetration rate (gross written premiums to non-oil GDP) in Saudi Arabia stood at 1.9 percent in 2019, up from 1.8 percent in the preceding year. Net written premiums (gross
written premiums less the share of reinsurance) amounted to SAR 31.7 billion, constituting 83.6 percent of gross written premiums compared to 85.8 percent in 2018.
Domestic Stock Market The Tadawul All Share Index (TASI) registered an annual rise of 7.2 percent to 8,389.2 at the end of 2019. The market capitalization of issued shares rose by 385.5 percent to SAR 9,025.4 billion at the end of 2019 from SAR 1,859.0 billion at the end of the preceding year. However, the number of shares traded in 2019 decreased by 13.1 percent to 33.1 billion with a value of SAR 880.1 billion.
Public FinanceActual revenue and expenditure data for fiscal year 1440/1441H (2019) indicate that revenues rose by 2.3 percent to SAR 926.8 billion, compared to SAR 905.6 billion in 2018. Oil revenues declined by 2.8 percent to SAR 594.4 billion while non-oil revenues increased by 12.9 percent to SAR 332.4 billion. In contrast, actual expenditures went down by 1.9 percent to SAR 1,059.4 billion compared to SAR 1,079.5 billion in 2018. The actual deficit also declined by 23.7 percent to SAR 132.6 billion as compared to SAR 173.9 billion in 2018.
Current Account and External Trade Estimates of Saudi Arabia’s balance of payments indicate that the current account declined in 2019, recording a surplus of SAR 186.9 billion or 6.3 percent of GDP. Preliminary figures of external trade indicate a decrease of 5.9 percent from the preceding year in the volume of Saudi Arabia’s commodity trade to SAR 1,521.9 billion in 2019. This decrease is attributed to a decline of 11.2 percent in the value of total exports to SAR 980.7 billion, with oil exports declining by 12.6 percent to SAR 758.9 billion and non-oil exports by 5.8 percent to SAR 221.8 billion. On the other hand, commodity imports increased by 5.3 percent to SAR 541.3 billion in 2019.

31
Saud
i Ec
onom
y
Trade and InvestmentThe commercial sector continued to record positive growth rates. In 2019, the Ministry of Commerce (MC) issued commercial registers for 9,889 various new companies, a rise of 27.8 percent from 7,735 companies in 2018. The number of valid commercial registers of companies up to the end of 2019 amounted to 115.5 thousand. A breakdown of commercial registers by region up to the end of 2019 shows that Riyadh region accounted for the largest share with 44.3 percent of the total, followed by Makkah region with 24.1 percent and then the Eastern Region with 16.7 percent. As for foreign investment, the number of companies licensed by the Ministry of Investment of Saudi Arabia (MISA) reached 6,703 at the end of 2019, with the total number of employees reaching 524.3 thousand and a total capital of SAR 643.3 billion. The number of licenses reached 4,660 granted in the services sector, 1,582 in the industrial sector, and 311 in the commercial sector.
TourismLatest data of the Ministry of Tourism (MT) indicate that tourism GDP rose by 2.2 percent to SAR 64.3 billion in 2018, constituting 3.3 percent of non-oil GDP (gross value-added) as estimated for 2018.
Expenditure on domestic tourism trips rose by 9.6 percent to SAR 52.7 billion in 2019 from SAR 48.1 billion in 2018. This rise was attributed to expenditure increases of 40.7 percent for religion-related trips, 12.5 percent for vacation trips, and 4.0 percent for business-related trips. Nonetheless, expenditure on visits to relatives and friends declined by 10.9 percent and on other purposes by 14.1 percent.
On the other hand, expenditure on inbound tourism trips went up by 7.8 percent to SAR 100.8 billion in 2019 against SAR 93.5 billion in 2018. This increase was attributed to expenditure increases of 13.0 percent for tourism trips for
other purposes, 11.3 percent for business-related purposes, 9.8 percent for visits to relatives and friends, and 7.0 percent for religion-related purposes. However, expenditure on vacation and shopping trips decreased by 1.0 percent. Expenditure on outbound tourism trips also declined, by 7.0 percent to SAR 70.0 billion in 2019, against SAR 75.2 billion in 2018.
According to latest data issued by the Ministry of Tourism and the Tourism Information and Research Centre (MAS Centre), the number of hotels of various classes operating in Saudi Arabia rose by 9.0 percent to 2,621 in 2019. As for the share distribution, the Makkah region took the lead with a share of 65.8 percent of operating hotels. Al-Madinah region came next with 17.2 percent, followed by the Eastern Region and Riyadh region with 4.6 percent each. Moreover, the number of furnished housing units stood at 5,660 in all cities of Saudi Arabia at the end of 2019. The Riyadh region accounted for the largest share of 27.8 percent, followed by the Makkah region with 22.4 percent and then the Eastern Region with 11.4 percent. According to latest projections of the Ministry of Tourism, the tourism sector is expected to continue its contribution, directly and indirectly, to creating many job opportunities for the national workforce (Tables 2-4 and 2-5).
Agriculture, Water and Animal HusbandryWaterThe number of water desalination plants in Saudi Arabia stood at 33 spread over the eastern and western coasts, 8 of which were on the Arabian Gulf coast and 25 were on the Red Sea coast. In 2019, the production of desalinated water by the Saline Water Conversion Corporation (SWCC) was 1,883.6 million cubic meters versus 1,803.1 million cubic meters in the preceding year, with an average daily production of 5.2 million cubic meters compared to 5.0 million cubic meters per

Saud
i Ara
bian
Mon
etar
y Au
thor
ity |
56th
Ann
ual R
epor
t
32
day in the preceding year. The amount of electric energy produced at SWCC’s plants in 2019 reached 39.9 million MWh.
In addition, data of the Ministry of Environment, Water and Agriculture (MEWA) indicate that the average monthly water consumption bill declined during 2019 because of the new tariff, installation of new smart meters, and the ongoing water rationalization awareness campaigns. The volume of drinking water consumption in Saudi regions from all sources reached 3.5 billion cubic meters in 2019. Residential water consumption accounted for 2.9 billion cubic meters while commercial consumption accounted for 595.4 million cubic meters. As for consumption by administrative regions in Saudi Arabia, Riyadh region came first with 31.2 percent, followed by Makkah region with 23.7 percent and then the Eastern Region with 18.9 percent.
The number of dams constructed across Saudi Arabia rose to 521 in 2019, with a total storage capacity of 2.30 billion cubic meters. 105 sewerage
projects with a value of more than SAR 4.5 billion were carried out and completed in 2019. These projects included the installation of sewerage connections and the construction of lines, main and subsidiary networks, and wastewater treatment plants to reduce the environmental impacts of wastewater and increase the sewerage service coverage across Saudi Arabia. At the end of 2019, the sewerage service coverage reached 56.65 percent. Besides, 1,628 km of sewerage system networks were constructed, and 81,441 sewerage connections were installed during 2019.
Agricultural ProductionAccording to latest estimates issued by the General Authority for Statistics (GaStat) for 2019, agricultural production volume stood at 14.4 million tons. A breakdown of agricultural production shows that production of fodder reached 9.1 million tons, vegetables 1.9 million tons, grain 1.5 million tons, and fruit 1.9 million tons. The total cultivated area of fodder, grain and vegetables in Saudi Arabia reached 843 thousand hectares, of which fodder cultivation constituted
Table 2-4: Direct Jobs in Tourism Sector
Sub-sector 2017 2018*
Accommodation 114,957 118,941
Restaurants and cafés 289,491 298,487
Travel & tourism agencies 25,140 25,560
Tourist transportation services** 88,275 90,939
Entertainment services 12,966 13,359
Total 530,829 547,286
Saudization (%) 28.5 28.5
* Estimates. ** Including airlines, railways, mass transit companies and car rental companies, excluding taxis. Source: MAS Centre, Ministry of Tourism.
Table 2-5: Expected Job Opportunities in Tourism Sector
(Thousand jobs)
2023 2028
Direct jobs 1,418 1,906
Indirect jobs 709 953
Total 2,127 2,859
Source: MAS Centre, Ministry of Tourism.

33
Saud
i Ec
onom
y
57.8 percent, grain 31.9 percent, and vegetables 10.3 percent. At the end of 2018, the total number of fruit-bearing palm trees in Saudi Arabia reached 31.2 million; the number of permanent fruit-bearing trees (excluding palm trees) was 20.6 million.
Animal ProductionAccording to the latest statistics issued by GaStat, Saudi Arabia’s livestock total (camels, sheep, goats, cows and poultry) was estimated at 20.0 million in 2018, increasing by 1.1 percent over the preceding year.
Transport and CommunicationsThe transport, storage and communications activity contributed 6.24 percent of real GDP at constant prices or SAR 163.6 billion in 2019 compared to 5.92 percent in the previous year.
TransportTransport operations (including inter-city travel in Saudi Arabia and overseas travel by air, land and sea) recorded a rise of 2.9 percent in 2019. The number of passengers rose to 111.0 million from 107.9 million in the preceding year (Table 2-6).
According to its latest data, the Ministry of Transport (MoT) carried out many significant projects during 2018, including the construction of roads totaling 737.3 km, of which 54.7 km were highways, 12.7 km were secondary roads, 524.9 km were feeder roads, and 145 km were paved roads. A number of construction projects are underway, totaling 11,913 km with a cost exceeding SAR 39 billion.
According to data and information issued by the Royal Commission for Riyadh City regarding King Abdul Aziz Project for Public Transport in Riyadh, Riyadh Metro project consists of 85 stations with 6 lines of metro network of 176 km. The design of all its elements is in accordance with high-quality
technical specifications, the most prominent of which is the use of automated (driverless) rail systems. The tracks of the train network are distributed among 3 levels: underground lines (31 percent of the network), ground-level lines (19 percent), and elevated lines (50 percent). In addition, Riyadh Metro has four major stations, namely King Abdullah Financial District (KAFD) Station, STC Station, Qasr Al Hokm Metro Station, and the Western Station. The stations are located in highly populated areas and at the intersection of train and bus tracks. They also offer various services supporting the public transport system. The project includes 25 car parking sites with different capacities, ranging from 200 to 1000 vehicles. Riyadh Metro project also has 7 housing and maintenance centers (depots) as well as a center for control and operation of the public transport system in Riyadh. Moreover, the Riyadh Bus project is being currently carried out to achieve optimal integration between the metro and bus networks and facilitate their use instead of using private transportation to move within the city. This project includes 650 sites across Riyadh for the construction of the bus network. A total of 80 bus routes, spread over 1,900 km, will cover all districts of Riyadh.
As regards the latest railway project developments, the latest data issued by the Transport General Authority indicate the start of the study phase of the Saudi Landbridge Project connecting Saudi Arabia’s ports on the Arabian Gulf coast with its ports on the Red Sea coast. Further, the GCC Railway project is being currently carried out. As part of the project, the construction work of the 187km railway linking Ras Al Khair, Jubail Industrial City and Dammam has started. As for southern roads project, the Transport General Authority is currently updating the comprehensive plan of the project. It also works, in cooperation with the National Center for Privatization and PPP (NCP), on setting

Saud
i Ara
bian
Mon
etar
y Au
thor
ity |
56th
Ann
ual R
epor
t
34
Table 2-6: Transport of Passengers
Type of transport2018 2019
No. of passengers(Million)
No. of passengers(Million)
Air transport 99.8 102.9
Land transport 6.8 6.8
Railways 1.7 1.8
Inter-city transport 5.1 5.1
International transport -- --
Maritime transport 1.3 1.3
Total 107.9 111.0
Source: Ministry of Transport, General Authority of Civil Aviation, Saudi Railways Organization & Saudi Ports Authority.
a regulatory framework and an implementation mechanism for public transport projects, which would engage the private sector as a strategic partner to deliver projects and services. In 2019, 30 companies were qualified to provide truck weight measurement and monitoring service. According to the latest data and information issued by the General Authority of Civil Aviation (GACA), the number of airports operating in Saudi Arabia stood at 28 (7 international airports, 8 regional airports, and 13 domestic airports). Three domestic airports are witnessing expansion projects. In addition, some international terminals at King Khalid International Airport are being currently upgraded. Moreover, 93 percent of the development project of Terminal 1 at King Abdul Aziz International Airport was completed, and Terminal 1 is expected to return to full operation by the end of 2020. Furthermore, the number of national airlines licensed to operate in Saudi Arabia reached 5, namely the Saudi Arabian Airlines (Saudia), flynas, SaudiGulf Airlines, Nesma Airlines, and flyadeal.
According to the data of the Saudi Ports Authority (MAWANI), 31 projects have been carried out since the beginning of 2019. They involved development and upgrade of ports’ infrastructure, establishment of storm drainage systems, construction of power
plants, development of electrical network systems, increasing the depth of port docks and filling security gaps, and development of fire protection and alarm systems to raise the level of fire preparedness at seaports. Data also show that the total volume of cargos handled at ports reached 262 million tons in 2019. The number of ships docked at ports was 12,731 carrying a total of 1.3 million passengers in 2019.
Telecommunication and Information TechnologyOne of the most prominent achievements of the communications and information technology sector during 2019 was its contribution to the significant progress Saudi Arabia made in terms of the adoption of information and communications technology (ICT) as indicated by the Global Competitiveness Index 2019. The latest data of the Ministry of Communications and Information Technology (MCIT) show that Saudi Arabia has jumped 16 places on the ICT pillar of the index owing to the rapid deployment of broadband technology and a significant increase in internet users. The internet use increased by 18.4 percent, pushing Saudi Arabia to rank 13th globally. MCIT also prepared and approved a five-year sectoral strategy that aims to raise the cumulative GDP for the sector by SAR 50 billion and create 25,000 new jobs in the sector.

35
Saud
i Ec
onom
y
According to data of the Communications and Information Technology Commission (CITC), the number of working landline telephones in Saudi Arabia was 3.1 million at the end of 2018, with the household penetration rate reaching 31.8 percent. Residential subscriptions accounted for 55.3 percent while the business sector accounted for 44.7 percent of total working landlines. The number of subscriptions to mobile phone services reached 41.3 million at the end of 2018, with household penetration rate reaching 126.9 percent. Prepaid subscriptions constituted 68.8 percent, and postpaid subscriptions constituted 31.2 percent of total subscriptions.
In addition, the number of broadband subscriptions through landlines (DSL, WiMAX, optical fiber, and other wired lines) reached 1.9 million, with household penetration rate standing at 33.7 percent. The total number of subscriptions to broadband services through mobile networks was 29.1 million, with a population penetration rate of 89.5 percent (Table 2-7). Moreover, the Internet penetration rate in Saudi Arabia grew to 95.7 percent at the end of 2019 as per the latest date of the Ministry of Communications and Information Technology. Financial statements of telecommunication companies show that they yielded total direct revenues of SAR 76.6 billion from their operations in Saudi Arabia in 2019, a 6.7 percent rise over the previous year (Chart 2-1).
Saudi PostAs part of the legislative and regulatory reforms of the post sector, the Council of Ministers issued a resolution giving the Ministry of Communications and Information Technology the task of supervising the post sector. MCIT is also tasked with setting the sector’s general policies and development plans, proposing its draft laws and any amendments to them, coordinating with relevant authorities regarding services provided for government entities, and
representing Saudi Arabia in domestic, regional and international bodies concerned with the post sector. Additionally, the resolution stipulated that the Communications and Information Technology Commission has the regulatory and supervisory powers over this sector. CITC is responsible for the governance of the post sector and establishment of the rules, principles and conditions for the universal access and universal service. During 2019, the regulatory responsibilities were separated from the operating ones in the post sector. Besides, CITC registered 40 companies providing delivery services through apps. It also completed the preparation of the “Rules for Protecting the Rights of Postal Service Beneficiaries”, in addition to launching the Postal Call Center. It is expected that these efforts will raise the contribution of the post sector to the total GDP and will support e-commerce growth.
E-Commerce According to the latest data issued by the Ministry of Communications and Information Technology, Saudi Arabia occupied an advanced position among the top 10 fastest growing e-commerce markets. The e-commerce market size in Saudi Arabia exceeded SAR 20 billion in 2019, registering a growth of 17.7 percent over the previous year. It constituted 4.3 percent of total commercial transactions in the retail sector, and it is expected to reach 6.5 percent by 2023. The value of e-commerce transactions via “mada” and “atheer” services grew by 100 percent and 600 percent, respectively, in 2019.
Education, Health and Social ServicesPublic EducationThe total number of public education students (males and females) amounted to 5.8 million during the academic year 2018/2019. The number of teachers (males and females) at all levels of public education (including kindergarten, elementary, intermediate and secondary schools;

Saud
i Ara
bian
Mon
etar
y Au
thor
ity |
56th
Ann
ual R
epor
t
36
adult education; and special education) totaled 493.2 thousand. In addition, the number of schools stood at 23.1 thousand, 12.6 thousand (54.5 percent) of which were girls’ schools.
Higher EducationThe total number of students (males and females) enrolled in higher education institutions in Saudi Arabia during the academic year 2018/2019 stood at 1.65 million. The number of newly-enrolled students at various institutions of higher education totaled 381.8 thousand; 63.0 percent of those were at the bachelor’s level, 32.7 percent at the
intermediate diploma level, 3.2 percent at Master’s level, 0.6 percent at PhD level, and 0.5 percent at higher diploma level. Male students constituted 54.9 percent of the total freshmen enrolled while female students accounted for 45.1 percent. Male and female students studying abroad during the academic year 2018/2019 totaled 100.6 thousand. Students on scholarship programs provided by various government entities accounted for 85.5 percent, while those studying at their own expense accounted for 14.5 percent. In addition, the total number of graduates from all levels of higher education in Saudi Arabia stood at 236.7
Chart 2-1: Telecommunication Service Sector’s Revenue
01020304050607080
2016 2017 2018 2019
B
illio
n SA
R
Table 2-7: 2018 Communication Services by Region
(Thousand)
Region Fixed telecommunication subscriptions(Total subscriptions)
Fixed broadband subscriptions(Total subscriptions)
Riyadh 1,208 592
Makkah 737 508
Madinah 122 93
Qassim 98 68
Eastern Region 580 361
Asir 143 93
Tabuk 47 39
Hail 32 25
Northern Borders Region 19 15
Jazan 49 47
Najran 32 24
Baha 33 21
Jawf 22 16
Total 3,123 1,901
Source: Communications and Information Technology Commission.
37
Saud
i Ec
onom
y
thousand during the academic year 2018/2019. Of these, 55.6 percent were female graduates and 44.4 percent were male graduates. Moreover, the total number of faculty at institutions of higher education in Saudi Arabia in the academic year 2018/2019 stood at 84.5 thousand.
Technical, Vocational and Administrative TrainingTrainees at the Technical and Vocational Training Corporation (TVTC)’s colleges and institutes totaled 178.5 thousand during the academic year 2018/2019, receiving their education and training in 133 educational units in various regions of Saudi Arabia. The total number of the teaching staff at TVTC stood at 9.7 thousand, and the number of trainees (males and females) under private training programs supervised by TVTC totaled 411 thousand in 958 educational units. Additionally, the total number of male and female graduates stood at 29.6 thousand in the academic year 2018/2019.
On the other hand, the Institute of Public Administration (IPA) continued its training programs aimed at achieving administrative development and meeting customer needs. In the academic year 2018/2019, the IPA organized a number of general and private training courses, applied seminars, symposia, meetings and conferences at its head office in Riyadh as well as its male and female branches. The number of trainees participating in such activities came to 69.3 thousand, 9.8 thousand of which were females. Furthermore, the number of graduates from executed preparatory programs totaled 1,556, of whom 1,182 were graduates of the IPA’s head office in Riyadh while 374 graduated from preparatory programs delivered by Jeddah and Dammam branches of the IPA. The total number of training staff at IPA reached 955 at the end of 2019, 85.0 percent of whom were Saudis.
Health AffairsData issued by the Ministry of Health (MoH)
in 2019 indicate that the number of hospitals operating in Saudi Arabia rose to 498, an increase of six hospitals over the preceding year. Of these, 286 were run by MoH, 48 by other government sectors, and 164 by the private sector. In 2019, the number of healthcare centers totaled 2,261 and that of private health complexes reached 2,980. In addition, the number of physicians (including dentists) working in Saudi Arabia stood at 113.1 thousand (3.3 per 1,000 capita). The number of male and female nurses totaled 199.0 thousand, and the number of assistant healthcare roles (including pharmacists and other healthcare assistants) stood at 354.5 thousand. Moreover, the total number of beds in Saudi Arabia’s hospitals rose to 77.0 thousand (2.25 per 1,000 capita).
Social ServicesThe Social Charity Fund (SCF) of the Ministry of Human Resources and Social Development (MHRSD) aims to combat poverty in Saudi Arabia by enabling citizens to access job market, developing productive family programs, contributing to creating small business incubators, developing social participation, and encouraging the private sector to contribute to social development. Since its establishment, SCF has introduced a number of initiatives and programs aiming at social development and poverty reduction. The following is a brief summary of the most prominent programs and achievements of SCF in 2019.• Scholarship programs: 708 students obtained
their bachelor’s degrees, with a total expenditure of SAR 49.4 million. In addition, 175 students are still studying, funded by SCF.
• Small Businesses and Productive Family Support Program: SCF follows up on outstanding loans in cooperation with a number of non-profit organizations.
• Micro-enterprise guarantee portfolio: In 2019, SCF opened a SAR 90 million portfolio to guarantee and sponsor the targeted group’s enterprises by helping such group obtain
Saud
i Ara
bian
Mon
etar
y Au
thor
ity |
56th
Ann
ual R
epor
t
38
the required funding to establish its own businesses.
Citizen AccountThe Saudi government introduced the Citizen Account Program in the last quarter of 2017 with a view to redistributing subsidies and meeting the citizens’ need for government benefits in a manner that ensures high efficiency, reduces the impact of economic reforms, and increases the efficiency of government subsidies. The program is also aimed at encouraging rationalization of consumption and putting in place a safety net for eligible households whereby support is paid in cash based on household size. The results of eligibility, which were issued by the Ministry of Human Resources and Social Development at the end of 2019, show that the total number of beneficiaries (along with dependents) reached 12.7 million supported by a total outlay of SAR 30.7 billion. Of these beneficiaries, 47.8 percent received a full allowance, while 44.9 percent received partial support and 7.3 percent the minimum support (SAR 300).
SME Financing Guarantee Program (Kafalah)The SME Financing Guarantee Program (Kafalah) under the General Authority for Small and Medium Enterprises (Monsha’at) supported 3,886 enterprises with total financing of SAR 7.4 billion in 2019, compared to SAR 4.9 billion and 3,395 enterprises in 2018. A breakdown of support by sector shows that enterprises benefiting from Kafalah Program amounted to 1,634 with total financing of SAR 2.9 billion in the trade sector; 1,143 (SAR 2.2 billion) in the building and construction sector; 322 (SAR 701.8 million) in the industrial sector; 286 (SAR 551.4 million) in the tourism and entertainment sector; 217 (SAR 304.4 million) in the financial and business services sector; 200 (SAR 462.5 million) in the social and personal services sector; 2 (SAR 1.5 million) in the
mining and oil sector and its subgroups; 12 (SAR 27.5 million) in the agriculture and fishing sector; and 6 (SAR 4.2 million) in the electricity, gas and water sector.
HousingIn continuation of its role in achieving its strategic objectives of increasing the supply of housing units and fulfilling the needs of citizens, the Ministry of Housing launched several programs to stimulate the private and public sectors through building strategic partnerships between them. The Ministry also financed a number of companies to support construction technologies in the private sector. Moreover, the Ministry worked on providing support for rent defaulters of citizens via the “Rent Support Program”. Additionally, it developed housing indicators and launched its e-portal for value-added tax management. Also, it launched several services to examine the quality of houses built from the ground up by individuals and of ready-made buildings in the market. At the end of 2019, the number of ready-made housing units under the Developmental Housing Program amounted to 5,341. The Riyadh region accounted for the largest share of 40.3 percent, followed by Al-Jawf region with 10.7 percent and the Asir region with 10.3 percent of the total ready-made housing units. The total number of ready-made housing units under real-estate development projects amounted to 106.0 thousand with a total value of SAR 62.6 billion. In addition, the total number of developed residential land lots reached 64.6 thousand.
Pension and Social InsuranceThe number of subscribers to the civil pension scheme of the Public Pension Agency (PPA) increased by 6.2 percent to 1.24 million at the end of 2019 compared to 1.17 million at the end of the previous year. The funds (pension deductions and equivalent shares) collected from on-the-job subscribers increased to SAR 45.77 billion

39
Saud
i Ec
onom
y
from SAR 45.16 billion in the previous year. Total disbursements by PPA to beneficiaries amounted to SAR 78.50 billion, a 1.9 percent decrease from the preceding year. The number of surviving pensioners increased by 5.9 percent to 697 thousand. The number of deceased pensioners also rose by 0.8 percent to 248 thousand. In addition, the number of heirs benefiting from pension payments increased by 6.2 percent to 520 thousand.
Furthermore, the number of private and government establishments subscribing to the social insurance scheme of the General Organization for Social Insurance (GOSI) rose by 14.6 percent and 3.9 percent, respectively, to 554.90 thousand and 1,289, respectively. The number of subscribers covered by the social insurance scheme went up by 3.7 percent to 28.97 million at the end of 2019 from 27.94 million at the end of the preceding year. However, the number of on-the-job subscribers decreased by 3.6 percent to 8.53 million from 8.86 million at the end of the preceding year.
PopulationGaStat estimates indicate that the total population of Saudi Arabia in 2019 rose by 2.4 percent to 34.2 million compared to 33.4 million in 2018. Saudis constituted 61.7 percent (21.1 million) of the total. Estimates of Saudi Arabia’s population by gender indicate that the male population accounted for 57.7 percent while the female population represented 42.3 percent of the total population. The Saudi male population represented 50.9 percent while Saudi females constituted 49.1 percent of total Saudis. The non-Saudi male population accounted for 68.6 percent and the non-Saudi female population was 31.4 percent of total non-Saudi population of Saudi Arabia (Table 2-8).
Labor MarketNumber of Employees in the Public SectorThe latest statistics issued by the Ministry of Human Resources and Social Development (MHRSD) indicate that the number of employees
Table 2-8: Selected Indicators for Population and Labor Force
Area2018 2019
Male Female Total Male Female Total
Population
Saudis 10,575,895 10,192,732 20,768,627 10,743,666 10,359,532 21,103,198
Non-Saudis 8,665,061 3,979,972 12,645,033 8,995,390 4,119,581 13,114,971
Total 19,240,956 14,172,704 33,413,660 19,739,056 14,479,113 34,218,169
Unemployment rate
Saudis 6.6 32.5 12.7 4.9 30.8 12.0
Non-Saudis 0.6 4.4 1.0 0.3 1.3 0.4
Total 2.9 22.6 6.0 2.2 21.3 5.7
Government sector employees
Saudis 726,749 496,674 1,223,423 728,299 498,401 1,226,700
Non-Saudis 24,928 22,429 47,357 24,767 22,295 47,062
Total 751,677 519,103 1,270,780 753,066 520,696 1,273,762
Private sector employees
Saudis 1,159,462 541,177 1,700,639 1,141,653 556,511 1,698,164
Non-Saudis 6,682,499 214,295 6,896,794 6,303,539 232,530 6,536,069
Total 7,841,961 755,472 8,597,433 7,445,192 789,041 8,234,233
Banking sector employees Total 40,143 7,013 47,156 39,664 7,517 47,181
*Unemployment rates are from the Labor Force Survey.Source: GaStat, MHRSD & SAMA.

Saud
i Ara
bian
Mon
etar
y Au
thor
ity |
56th
Ann
ual R
epor
t
40
in the government sector (Saudis and non-Saudis) stood at 1.27 million at the end of 2019. Saudis represented 96.3 percent of total employees in the government sector, with the number of Saudi male employees reaching 728.3 thousand at the end of 2019 while that of Saudi female employees standing at 498.4 thousand. On the other hand, the number of non-Saudi male workers in the government sector amounted to 24.8 thousand, while that of non-Saudi female workers was 22.3 thousand (Table 2-8).
Number of Employees in the Private SectorThe latest figures issued by MHRSD show that the number of employees in the private sector (Saudis and non-Saudis) was 8.2 million at the end of 2019, a decline of 4.2 percent from the preceding year. The ratio of Saudis working in the private sector to total employees in the sector stood at 20.6 percent.
A breakdown of employees in the private sector shows that the number of Saudi male employees amounted to 1.1 million at the end of 2019, declining by 1.5 percent from the preceding year. However, the number of Saudi female employees reached 0.6 million, increasing by 2.8 percent over the preceding year. On the other hand, the number of non-Saudi male employees at the end of 2019 stood at 6.3 million, a 5.7 percent decline from the previous year. The number of non-Saudi female employees, however, reached 0.2 million, rising by 8.5 percent over the preceding year (Table 2-8).
The total number of Saudi job seekers reached 945.4 thousand at the end of 2019, of which 82.6 percent were females and 17.4 percent were males. By administrative regions, the majority of job seekers were concentrated in Makkah region, Riyadh region and the Eastern Region, accounting for 20.6 percent, 20.4 percent and 12.7 percent, respectively.
UnemploymentThe latest GaStat data indicate that the overall unemployment rate in Saudi Arabia declined to 5.7 percent in 2019. Unemployed Saudis accounted for 12.0 percent of the total Saudi labor force. Unemployed Saudi males accounted for 4.9 percent of the total Saudi male labor force. Unemployed Saudi females accounted for 30.8 percent of the total Saudi female labor force. Moreover, unemployed non-Saudis reached 0.4 percent of the total non-Saudi labor force in Saudi Arabia.
Specialized Credit Institutions (SCIs)SCIs continued to provide loans that contribute to the achievement of the development objectives in Saudi Arabia. Latest statistics indicate that the actual loans disbursed by SCIs in 2018 totaled SAR 15.2 billion, decreasing by 17.5 percent, compared to SAR 18.4 billion in 2017. Total loan repayments amounted to SAR 20.7 billion, decreasing by 2.3 percent from 2017. The balance of outstanding loans went down by 2.6 percent at the end of 2018 to SAR 230.7 billion compared to the end of the preceding year.
Saudi Industrial Development Fund (SIDF)Loan disbursements approved by SIDF amounted to SAR 9.4 billion in 2018, increasing by 26.5 percent over 2017. Loan repayments stood at SAR 4.7 billion, rising by 10.1 percent over 2017. Total outstanding loans amounted to SAR 42.9 billion at the end of 2018, increasing by 11.2 percent over 2017.
Real Estate Development Fund(REDF)Loan disbursements approved by REDF amounted to SAR 3.0 billion in 2018, down by 47.0 percent from 2017. Loan repayments stood at SAR 6.1 billion, decreasing by 1.1 percent from 2017. Total outstanding loans amounted to SAR 153.5 billion

41
Saud
i Ec
onom
y
at the end of 2018, a decline of 2.4 percent from 2017.
Agricultural Development Fund (ADF)Loan disbursements approved by ADF amounted to SAR 419 million in 2018, down by 13.5 percent from 2017. Total loans repayments stood at SAR 874 million, increasing by 41.3 percent over 2017. Outstanding loans totaled SAR 7.3 billion at the end of 2018, decreasing by 5.8 percent from 2017.
Social Development Bank (SDB)The SDB’s total approved loan disbursements stood at SAR 2.4 billion in 2018, decreasing by 50.8 percent from 2017. Loan repayments stood at SAR 9.0 billion, declining by 10.8 percent from 2017. Outstanding loans balance amounted to SAR 26.9 billion at the end of 2018, a decline of 19.0 percent from 2017.
Public Investment Fund (PIF)The PIF seeks to enhance its role in accelerating the national economic transformation, achieving a positive and sustainable change, and contributing effectively to the development of the domestic economy by launching and developing new promising sectors. In order to achieve its objectives efficiently and maximize returns in line with Saudi Vision 2030, the PIF also aims to diversify its income sources by expanding its international investments, building strategic partnerships, and launching major initiatives.
Among the most prominent achievements of the PIF during 2019 was the growth of its investment portfolio, pushing the total value of its assets under management to over SAR 1.2 trillion. In addition, the PIF signed a memorandum of understanding (MoU) with OYO Hotels & Homes, an Indian hospitality company, to develop tourism and hospitality industries in Saudi Arabia, create new job opportunities, and launch new and promising national sectors. OYO Hotels & Homes
is a leading international company operating in the field of hospitality and hotel technologies. Thus, the employment of these technologies in Saudi Arabia would support the expansion in the localization of technology.
Moreover, the PIF signed an MoU with the National Energy Administration in the People’s Republic of China to cooperate in the renewable energy sector. The MoU aims to strengthen cooperation between the two entities in the renewable energy sector and utilize Saudi Arabia’s position as a hub for development of renewable energy projects. This MoU will contribute to enhancing PIF’s efforts in building strategic partnerships in order to develop infrastructures in Saudi Arabia, create job opportunities, and encourage the private sector to enter into investment partnerships in the field of renewable energy. Accordingly, the MoU will support Saudi Arabia’s efforts to transfer and localize advanced knowledge and skills in the field of renewable energy.
Furthermore, the PIF announced the launch of the Helicopter Company, the first national commercial helicopter operator in Saudi Arabia. The Helicopter Company was established with an initial capital of SAR 565 million to meet the growing demand in Saudi Arabia for luxury tourism and air transportation services. It will effectively provide helicopter transportation services within major cities in Saudi Arabia and strengthen and expand the aviation sector in Saudi Arabia. It will also provide access to remote tourism destinations in Saudi Arabia and offer a high-end experience on a par with other global high quality services.
Additionally, the PIF made a private transaction, selling its majority stake of 70 percent in the Saudi Basic Industries Corporation (SABIC) for a total price of SAR 259.1 billion. The transaction, which is considered the largest ever in the Saudi market, will allow the PIF to direct its investments
Saud
i Ara
bian
Mon
etar
y Au
thor
ity |
56th
Ann
ual R
epor
t
42
toward different areas domestically and globally. The PIF also signed a SAR 37.5 billion syndicated bridge loan. The proceeds of this loan will be used for general corporate purposes and will enable the PIF to accelerate the implementation of its investment program.
Domestic Loan and Subsidy Program Actual loans disbursed under the Domestic Loan Program totaled SAR 485 million in 2019, increasing by 10.8 percent over the preceding year. Loan repayments stood at SAR 406 million, increasing by 6.1 percent over 2018. In 2019, 11 loans were approved, five of which were for educational projects, five for healthcare projects, and one for hospitality and tourism projects.
Total subsidies provided in 2019 stood at SAR 3.9 billion. The fodder subsidy stood at SAR 2.5 billion, infant formula subsidy SAR 362.9 million, livestock and poultry farmers’ subsidies SAR 400 million, King Salman Humanitarian Aid and Relief Centre subsidy SAR 168.8 million, Equestrian Club subsidy SAR 135 million, Falcons Club subsidy SAR 100 million, King Abdulaziz Public Library subsidy SAR 72.8 million, the International Dialogue Centre (KAICIID) subsidy SAR 72.3 million, King Abdulaziz Center for National Dialogue (KACND) subsidy SAR 42.8 million, the Secretariat of the Finance Committee subsidy SAR 30 million, and Waqf libraries subsidy SAR 10 million.
Economic and Fiscal Reforms and Key Resolutions In continuation of the efforts exerted by Saudi Arabia to raise the efficiency of economic performance and achieve optimal utilization of available resources, the Saudi economy witnessed a number of resolutions in 2019 with a view to further developing the economic ecosystem in Saudi Arabia. The most notable resolutions were as follows:
• Resolution of the Board of the Capital Market Authority, approving the Saudi Arabian Oil Company (Saudi Aramco) application for registration and IPO of part of its shares.
• Approval of SAMA’s request to be authorized to establish the Saudi Payments Company, a Saudi joint-stock company wholly owned by SAMA. The Saudi Payments Company owns all national payment systems and is responsible for their operations and development as well as the development of their infrastructure and operational environment. The company will enable all government and commercial entities to benefit from services provided by its payment systems.
• Approval of the draft of the customs cooperation agreement between the Saudi Customs Authority and competent customs authorities in other countries for the mutual recognition of the Authorized Economic Operator (AEO) programs.
• Approval to grant a license to Standard Chartered Bank and Credit Suisse Group to establish branches in Saudi Arabia. In carrying out their banking business in Saudi Arabia, the banks shall adhere to the laws, regulations and instructions applicable in Saudi Arabia. In addition, SAMA shall coordinate with the banks to complete the necessary legal procedures.
• Approval of the establishment of a general authority for foreign trade with a corporate personality under the name of “General Authority of Foreign Trade”.
• Approval of the Implementing Regulations of the Law of Terrorism Crimes and Financing.
• Approval of the statute of the General Entertainment Authority.
• Approval of the Competition Law.• Approval of the organizational arrangements
for the Local Content and Government Procurement Authority.
• Approval of waiving, for a period of five years

43
Saud
i Ec
onom
y
starting from 01/10/2019, expat levies for licensed industrial establishments holding industrial licenses.
• Approval of the new Professional Companies Law.
• Approval of the General Strategy of the National Tourism Development Project.
• Approval of the statute of the National Center for Educational Professional Development.

ENERGY, INDUSTRY & MINERALRESOURCES
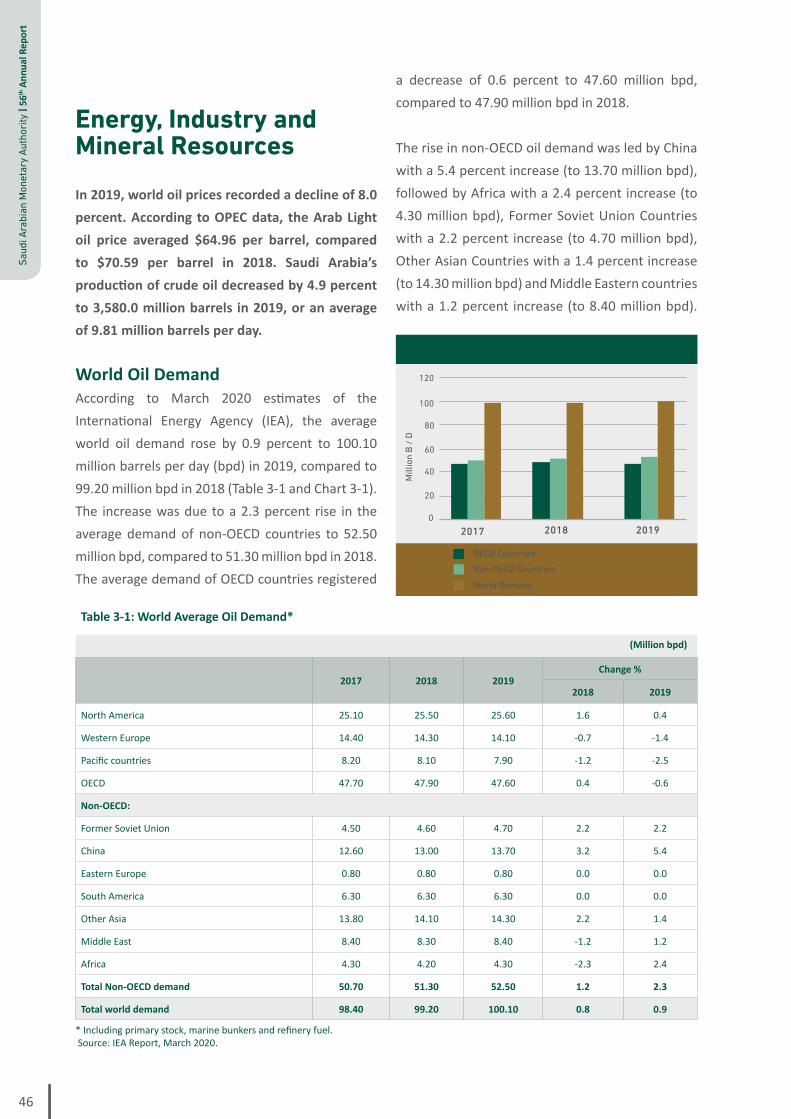
Saud
i Ara
bian
Mon
etar
y Au
thor
ity |
56th
Ann
ual R
epor
t
46
Energy, Industry and Mineral ResourcesIn 2019, world oil prices recorded a decline of 8.0 percent. According to OPEC data, the Arab Light oil price averaged $64.96 per barrel, compared to $70.59 per barrel in 2018. Saudi Arabia’s production of crude oil decreased by 4.9 percent to 3,580.0 million barrels in 2019, or an average of 9.81 million barrels per day.
World Oil DemandAccording to March 2020 estimates of the International Energy Agency (IEA), the average world oil demand rose by 0.9 percent to 100.10 million barrels per day (bpd) in 2019, compared to 99.20 million bpd in 2018 (Table 3-1 and Chart 3-1). The increase was due to a 2.3 percent rise in the average demand of non-OECD countries to 52.50 million bpd, compared to 51.30 million bpd in 2018. The average demand of OECD countries registered
a decrease of 0.6 percent to 47.60 million bpd, compared to 47.90 million bpd in 2018.
The rise in non-OECD oil demand was led by China with a 5.4 percent increase (to 13.70 million bpd), followed by Africa with a 2.4 percent increase (to 4.30 million bpd), Former Soviet Union Countries with a 2.2 percent increase (to 4.70 million bpd), Other Asian Countries with a 1.4 percent increase (to 14.30 million bpd) and Middle Eastern countries with a 1.2 percent increase (to 8.40 million bpd).
Table 3-1: World Average Oil Demand*
(Million bpd)
2017 2018 2019Change %
2018 2019
North America 25.10 25.50 25.60 1.6 0.4
Western Europe 14.40 14.30 14.10 -0.7 -1.4
Pacific countries 8.20 8.10 7.90 -1.2 -2.5
OECD 47.70 47.90 47.60 0.4 -0.6
Non-OECD:
Former Soviet Union 4.50 4.60 4.70 2.2 2.2
China 12.60 13.00 13.70 3.2 5.4
Eastern Europe 0.80 0.80 0.80 0.0 0.0
South America 6.30 6.30 6.30 0.0 0.0
Other Asia 13.80 14.10 14.30 2.2 1.4
Middle East 8.40 8.30 8.40 -1.2 1.2
Africa 4.30 4.20 4.30 -2.3 2.4
Total Non-OECD demand 50.70 51.30 52.50 1.2 2.3
Total world demand 98.40 99.20 100.10 0.8 0.9
* Including primary stock, marine bunkers and refinery fuel. Source: IEA Report, March 2020.
Chart 3-1: World Oil Demand
Mill
ion
B / D
2017 2018 2019
0
20
40
60
80
100
120
Non-OECD Countries
World Demand
OECD Countries
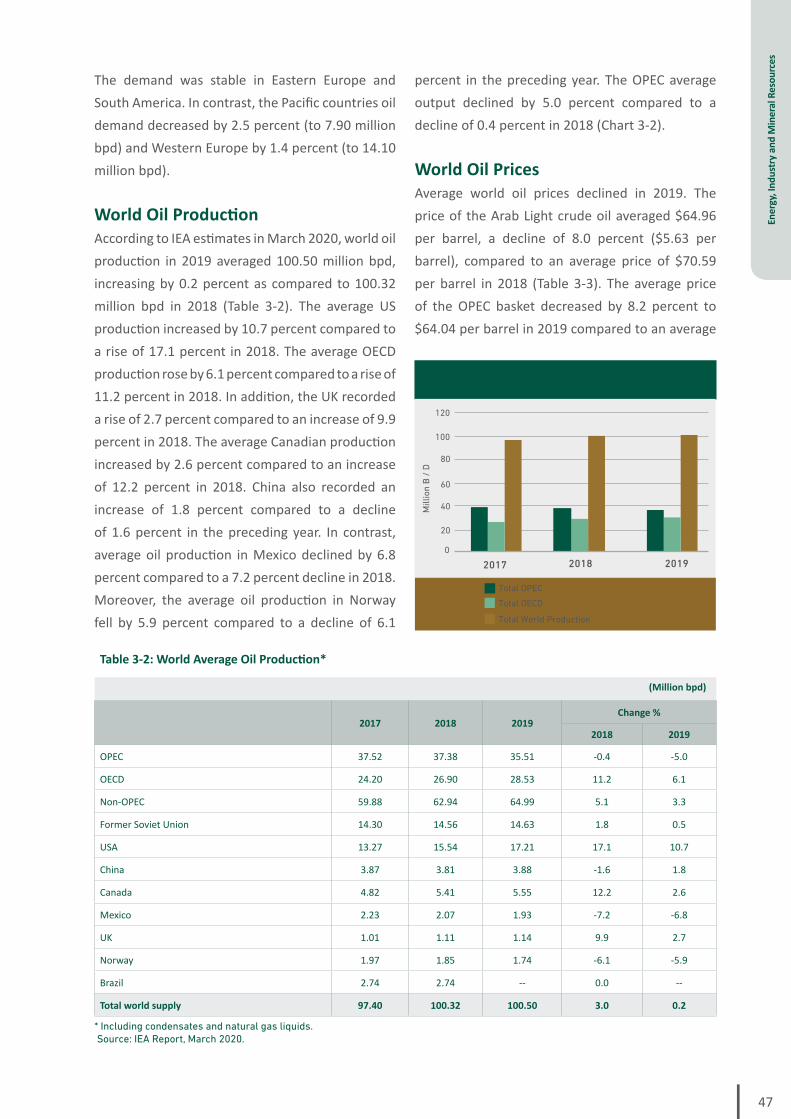
47
Ener
gy, I
ndus
try
and
Min
eral
Res
ourc
es
The demand was stable in Eastern Europe and South America. In contrast, the Pacific countries oil demand decreased by 2.5 percent (to 7.90 million bpd) and Western Europe by 1.4 percent (to 14.10 million bpd).
World Oil ProductionAccording to IEA estimates in March 2020, world oil production in 2019 averaged 100.50 million bpd, increasing by 0.2 percent as compared to 100.32 million bpd in 2018 (Table 3-2). The average US production increased by 10.7 percent compared to a rise of 17.1 percent in 2018. The average OECD production rose by 6.1 percent compared to a rise of 11.2 percent in 2018. In addition, the UK recorded a rise of 2.7 percent compared to an increase of 9.9 percent in 2018. The average Canadian production increased by 2.6 percent compared to an increase of 12.2 percent in 2018. China also recorded an increase of 1.8 percent compared to a decline of 1.6 percent in the preceding year. In contrast, average oil production in Mexico declined by 6.8 percent compared to a 7.2 percent decline in 2018. Moreover, the average oil production in Norway fell by 5.9 percent compared to a decline of 6.1
percent in the preceding year. The OPEC average output declined by 5.0 percent compared to a decline of 0.4 percent in 2018 (Chart 3-2).
World Oil PricesAverage world oil prices declined in 2019. The price of the Arab Light crude oil averaged $64.96 per barrel, a decline of 8.0 percent ($5.63 per barrel), compared to an average price of $70.59 per barrel in 2018 (Table 3-3). The average price of the OPEC basket decreased by 8.2 percent to $64.04 per barrel in 2019 compared to an average
Chart 3-2: World Crude Oil Production
Table 3-2: World Average Oil Production*
(Million bpd)
2017 2018 2019Change %
2018 2019
OPEC 37.52 37.38 35.51 -0.4 -5.0
OECD 24.20 26.90 28.53 11.2 6.1
Non-OPEC 59.88 62.94 64.99 5.1 3.3
Former Soviet Union 14.30 14.56 14.63 1.8 0.5
USA 13.27 15.54 17.21 17.1 10.7
China 3.87 3.81 3.88 -1.6 1.8
Canada 4.82 5.41 5.55 12.2 2.6
Mexico 2.23 2.07 1.93 -7.2 -6.8
UK 1.01 1.11 1.14 9.9 2.7
Norway 1.97 1.85 1.74 -6.1 -5.9
Brazil 2.74 2.74 -- 0.0 --
Total world supply 97.40 100.32 100.50 3.0 0.2
* Including condensates and natural gas liquids. Source: IEA Report, March 2020.
Total OPEC
Total World Production
Total OECD
2019
0
20
40
60
80
100
120
2017 2018
Mill
ion
B / D
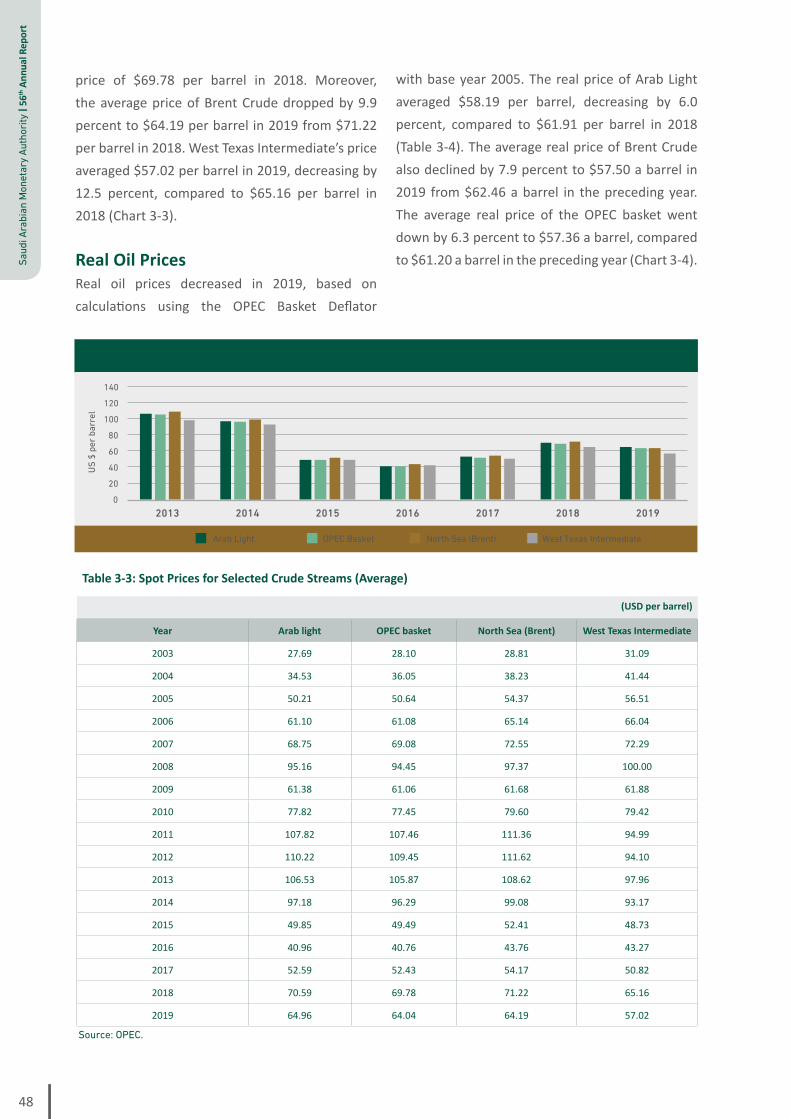
Saud
i Ara
bian
Mon
etar
y Au
thor
ity |
56th
Ann
ual R
epor
t
48
price of $69.78 per barrel in 2018. Moreover, the average price of Brent Crude dropped by 9.9 percent to $64.19 per barrel in 2019 from $71.22 per barrel in 2018. West Texas Intermediate’s price averaged $57.02 per barrel in 2019, decreasing by 12.5 percent, compared to $65.16 per barrel in 2018 (Chart 3-3).
Real Oil PricesReal oil prices decreased in 2019, based on calculations using the OPEC Basket Deflator
with base year 2005. The real price of Arab Light averaged $58.19 per barrel, decreasing by 6.0 percent, compared to $61.91 per barrel in 2018 (Table 3-4). The average real price of Brent Crude also declined by 7.9 percent to $57.50 a barrel in 2019 from $62.46 a barrel in the preceding year. The average real price of the OPEC basket went down by 6.3 percent to $57.36 a barrel, compared to $61.20 a barrel in the preceding year (Chart 3-4).
Table 3-3: Spot Prices for Selected Crude Streams (Average)
(USD per barrel)
Year Arab light OPEC basket North Sea (Brent) West Texas Intermediate
2003 27.69 28.10 28.81 31.09
2004 34.53 36.05 38.23 41.44
2005 50.21 50.64 54.37 56.51
2006 61.10 61.08 65.14 66.04
2007 68.75 69.08 72.55 72.29
2008 95.16 94.45 97.37 100.00
2009 61.38 61.06 61.68 61.88
2010 77.82 77.45 79.60 79.42
2011 107.82 107.46 111.36 94.99
2012 110.22 109.45 111.62 94.10
2013 106.53 105.87 108.62 97.96
2014 97.18 96.29 99.08 93.17
2015 49.85 49.49 52.41 48.73
2016 40.96 40.76 43.76 43.27
2017 52.59 52.43 54.17 50.82
2018 70.59 69.78 71.22 65.16
2019 64.96 64.04 64.19 57.02
Source: OPEC.
Chart 3-3: Average Spot Oil Prices
0
20
40
60
80
100
120
140
2013 2014 2015 2016 2017 2018 2019
US $
per
bar
rel
Arab Light OPEC Basket West Texas Intermediate North Sea (Brent)

49
Ener
gy, I
ndus
try
and
Min
eral
Res
ourc
es
It should be noted that 2019 real oil prices were lower than those in 1980 although 2019 nominal prices were higher than those in 1980. For instance, the average real price of Brent Crude stood at $57.50 a barrel during 2019, lower by $25.57 a barrel than its price in 1980 ($83.10 a barrel). In contrast, its nominal price stood at $64.19 per barrel in 2019, higher by $26.30 a barrel than its nominal price in 1980 ($37.89 a barrel) (Table 4-3).
Saudi Arabia’s Reserves of Crude Oil and Natural Gas Saudi Arabia’s proven reserves of crude oil stood at 267.07 billion barrels at the end of 2019, rising
slightly by 0.02 percent compared to 267.02 billion barrels in the preceding year. Proven reserves of natural gas also increased by 1.4 percent to 324.9 trillion standard cubic feet at the end of 2019, compared to 320.45 trillion standard cubic feet at the end of 2018.
Saudi Crude Oil OutputSaudi Arabia’s production of crude oil decreased by 4.9 percent to 3,580.0 million barrels in 2019 compared to 3,765.1 million barrels in 2018. Accordingly, Saudi Arabia’s average daily output amounted to 9.81 million bpd in 2019 (Table 3-5).
Table 3-4: Nominal and Real Oil Prices (Base year 2005) (USD per barrel)
Year Nominal Oil Prices Real Oil Prices*
Arab Light North Sea (Brent) OPEC basket Arab Light North Sea (Brent) OPEC basket
1980 28.67 37.89 28.64 62.85 83.07 62.79
1990 20.82 23.99 22.26 28.40 32.72 30.36
2000 26.81 28.44 27.60 35.64 37.81 36.69
2011 107.82 111.36 107.46 88.79 91.70 88.50
2012 110.22 111.62 109.45 93.06 94.24 92.40
2013 106.53 108.62 105.87 88.95 90.70 88.40
2014 97.18 99.08 96.29 80.34 81.91 79.60
2015 49.85 52.41 49.49 46.47 48.86 46.13
2016 40.96 43.76 40.76 38.32 40.94 38.13
2017 52.59 54.17 52.43 48.46 49.92 48.31
2018 70.59 71.22 69.78 61.91 62.46 61.20
2019 64.96 64.19 64.04 58.19 57.50 57.36
* Real prices have been calculated by using the OPEC Basket Deflator with base year 2005. Source: OPEC.
Chart 3-4: Real Oil Prices (Base year = 2005)
0
20
40
60
80
100
1990 2000 2011 2015 2016 2017 2018 2019
Arab Light OPEC BasketNorth Sea (Brent)
US $
per
bar
rel
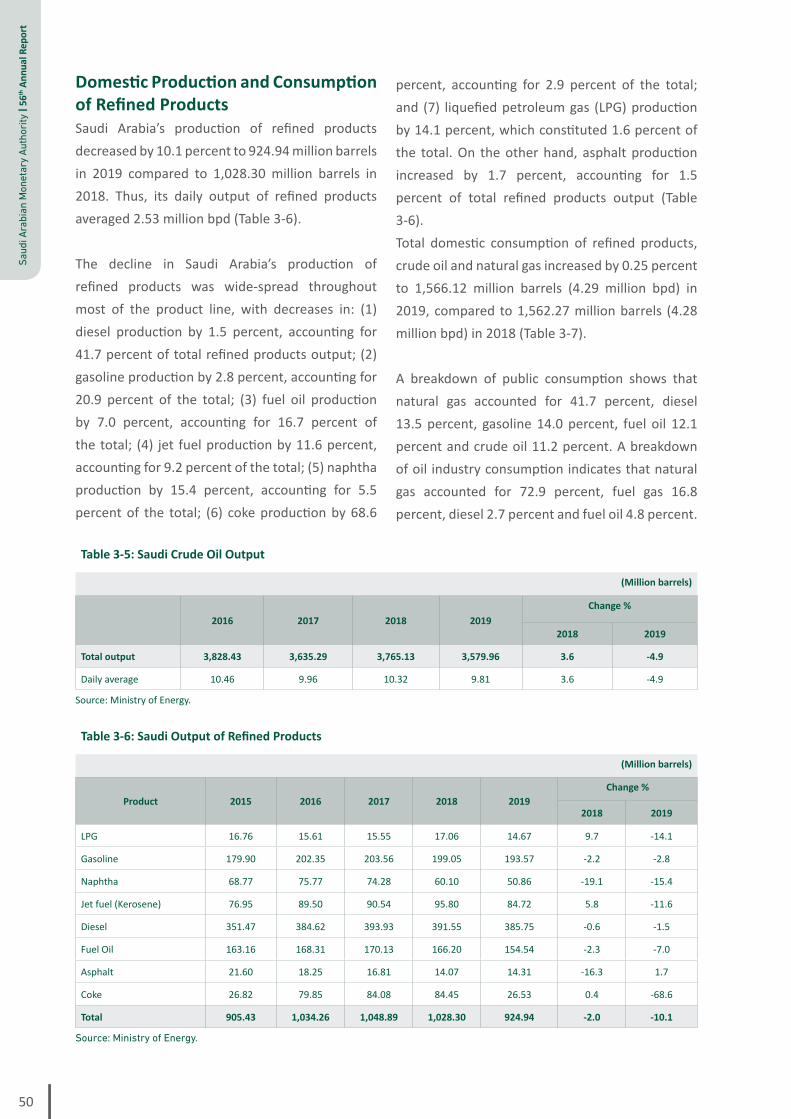
Saud
i Ara
bian
Mon
etar
y Au
thor
ity |
56th
Ann
ual R
epor
t
50
Domestic Production and Consumption of Refined ProductsSaudi Arabia’s production of refined products decreased by 10.1 percent to 924.94 million barrels in 2019 compared to 1,028.30 million barrels in 2018. Thus, its daily output of refined products averaged 2.53 million bpd (Table 3-6).
The decline in Saudi Arabia’s production of refined products was wide-spread throughout most of the product line, with decreases in: (1) diesel production by 1.5 percent, accounting for 41.7 percent of total refined products output; (2) gasoline production by 2.8 percent, accounting for 20.9 percent of the total; (3) fuel oil production by 7.0 percent, accounting for 16.7 percent of the total; (4) jet fuel production by 11.6 percent, accounting for 9.2 percent of the total; (5) naphtha production by 15.4 percent, accounting for 5.5 percent of the total; (6) coke production by 68.6
percent, accounting for 2.9 percent of the total; and (7) liquefied petroleum gas (LPG) production by 14.1 percent, which constituted 1.6 percent of the total. On the other hand, asphalt production increased by 1.7 percent, accounting for 1.5 percent of total refined products output (Table 3-6).Total domestic consumption of refined products, crude oil and natural gas increased by 0.25 percent to 1,566.12 million barrels (4.29 million bpd) in 2019, compared to 1,562.27 million barrels (4.28 million bpd) in 2018 (Table 3-7).
A breakdown of public consumption shows that natural gas accounted for 41.7 percent, diesel 13.5 percent, gasoline 14.0 percent, fuel oil 12.1 percent and crude oil 11.2 percent. A breakdown of oil industry consumption indicates that natural gas accounted for 72.9 percent, fuel gas 16.8 percent, diesel 2.7 percent and fuel oil 4.8 percent.
Table 3-6: Saudi Output of Refined Products
(Million barrels)
Product 2015 2016 2017 2018 2019Change %
2018 2019
LPG 16.76 15.61 15.55 17.06 14.67 9.7 -14.1
Gasoline 179.90 202.35 203.56 199.05 193.57 -2.2 -2.8
Naphtha 68.77 75.77 74.28 60.10 50.86 -19.1 -15.4
Jet fuel (Kerosene) 76.95 89.50 90.54 95.80 84.72 5.8 -11.6
Diesel 351.47 384.62 393.93 391.55 385.75 -0.6 -1.5
Fuel Oil 163.16 168.31 170.13 166.20 154.54 -2.3 -7.0
Asphalt 21.60 18.25 16.81 14.07 14.31 -16.3 1.7
Coke 26.82 79.85 84.08 84.45 26.53 0.4 -68.6
Total 905.43 1,034.26 1,048.89 1,028.30 924.94 -2.0 -10.1
Source: Ministry of Energy.
Table 3-5: Saudi Crude Oil Output
(Million barrels)
2016 2017 2018 2019Change %
2018 2019
Total output 3,828.43 3,635.29 3,765.13 3,579.96 3.6 -4.9
Daily average 10.46 9.96 10.32 9.81 3.6 -4.9
Source: Ministry of Energy.

51
Ener
gy, I
ndus
try
and
Min
eral
Res
ourc
es
Saudi Arabia’s Exports of Crude Oil and Refined ProductsSaudi Arabia’s total oil exports (crude and refined) stood at 3,043.30 million barrels in 2019, averaging 8.33 million bpd. Crude oil exports fell by 4.5 percent to 2,568.90 million barrels in 2019, compared to 2,690.61 million barrels in 2018. Refined product exports also decreased by 34.1 percent to 474.41 million barrels in 2019 (averaging 1.3 million bpd), compared to 719.49 million barrels in 2018 (Table 3-8).
Asia and the Far East region dominated the bulk of Saudi Arabia’s exports of crude oil and refined products in 2019, accounting for 73.4 percent of
total crude oil exports and 26.5 percent of total exports of refined products (Chart 3-5). Western Europe countries came second, accounting for 11.3 percent of total crude oil exports and 31.0 percent of total exports of refined products, followed by North America with 8.0 percent of total exports of crude oil and 2.1 percent of total exports of refined products. The Middle Eastern countries accounted for 3.8 percent of Saudi Arabia’s total crude oil exports and 15.1 percent of its refined product exports. Finally, African countries accounted for 2.5 percent and 24.6 percent of total exports of crude oil and refined products, respectively.
Table 3-7: Domestic Consumption of Refined Products, Crude Oil and Natural Gas
(Million barrels)
Product 2015 2016 2017 2018 2019
A. Public consumption
LPG 12.60 13.40 12.87 13.23 12.59
Gasoline 203.98 203.37 208.00 194.49 194.09
Jet fuel & Kerosene 31.37 32.05 36.14 37.88 36.72
Diesel 276.07 248.54 207.91 182.75 187.89
Fuel oil 140.43 166.07 180.29 173.96 168.58
Crude oil 209.42 182.41 167.37 149.74 155.16
Asphalt 29.12 19.14 20.36 20.73 20.66
Lubricating oils 1.68 1.48 1.34 1.51 27.55
Natural gas 506.07 557.44 573.78 581.36 579.74
Naphtha -- 1.81 11.19 8.92 0.75
Reformate -- -- 10.48 10.16 6.18
Subtotal 1,410.72 1,425.72 1,429.73 1,374.72 1,389.89
B. Oil industry consumption
LPG 3.52 4.58 4.39 3.91 4.12
Fuel oil 5.20 6.12 6.61 6.98 8.37
Diesel 8.04 8.03 7.68 7.71 4.67
Fuel gas 31.80 34.33 34.40 33.98 29.63
Crude oil 0.05 0.04 0.01 0.00 0.00
Natural gas 121.28 106.02 121.48 127.31 128.52
Others 5.60 5.46 5.64 7.66 0.93
Subtotal 175.48 164.58 180.21 187.56 176.23
Total 1,586.20 1,590.30 1,609.94 1,562.27 1,566.12
Source: Ministry of Energy.

Saud
i Ara
bian
Mon
etar
y Au
thor
ity |
56th
Ann
ual R
epor
t
52
Table 3-8: Saudi Exports of Crude Oil and Refined Products (By Destination)
(Million barrels)
2017 2018 2019 % in 2019
Exports to Crude oil Refined products Crude oil Refined
products Crude oil Refined products Crude oil Refined
products
North America 366.26 2.66 372.43 16.66 204.59 10.03 8.0 2.1
South America 26.01 -- 25.72 0.69 24.33 1.64 0.9 0.3
Western Europe 283.76 98.39 317.28 150.90 291.07 147.17 11.3 31.0
Middle East 56.60 182.57 97.40 337.02 97.09 71.57 3.8 15.1
Africa 59.78 125.29 59.80 83.70 64.61 116.64 2.5 24.6
Asia and Far East 1,747.99 249.06 1,815.64 129.05 1,885.73 125.89 73.4 26.5
Oceania 3.03 -- 2.34 1.47 1.47 1.48 0.1 0.3
Total 2,543.44 657.97 2,690.61 719.49 2,568.90 474.41 100.0 100.0
* Including liquefied petroleum gas (LPG) and natural gas. Source: Ministry of Energy.
Table 3-9: Production of Minerals in Saudi Arabia
Year Gold (kg) Silver (kg) Copper (Ton) Zinc (Ton)
2014 4,789 4,800 33,116 39,798
2015 5,089 4,500 46,253 39,008
2016 6,946 4,710 110,000 41,610
2017 10,333 5,069 67,097 21,787
2018 11,765 5,322 60,340 18,000
2019* 12,353 5,588 63,357 18,900
* Estimates. Source: Deputy Ministry for Mineral Resources.
Saudi Arabia’s Petrochemical IndustryProduction of the Saudi Basic Industries Corporation (SABIC) in its plants in Saudi Arabia declined by 3 percent to 65.9 million metric tons annually in 2019 against 67.8 million metric tons
during 2018. This was due to lower feedstock supplies as a result of the recent attack on the Abqaiq and Khurais facilities in addition to the increase in maintenance works.
Chart 3-5: Saudi Exports of Crude Oil and Refined Products by Destination in 2019
%8.0
%0.9
%11.3
%3.8
%2.5
%73.4
%0.1
%2.1%0.3
%31.1
%15.1%24.7
%26.6
Asia and Far East South America Africa North America
Middle East Western Europe Oceania
Refined Products Crude Oil

53
Ener
gy, I
ndus
try
and
Min
eral
Res
ourc
es
Mineral ResourcesThe Deputy Ministry for Mineral Resources supervises mining activities in Saudi Arabia. Its tasks include encouraging mining investments, providing services and consultations, and issuing mining licenses and concessions in accordance with the laws and regulations in force. At the end of 2019, the number of valid mining licenses stood at 2,095, including 536 for exploration, which enable their holders to conduct detailed studies on the mineral ores required under the exploration license; and 68 for small-sized mines for various minerals, such as silica sand, gypsum, salt, limestone, clay, pozzolan, industrial marble, low-concentration steel (cement industry), dolomite, feldspar, baryte, sandstone, perlite and pyrophyllite. Licenses of mining and raw material quarries stood at 92 for various metal ores (such as gold, copper, zinc, iron, phosphate, accompanied metals and gems such as peridot). Licenses of construction material quarries stood at 1,399 for various construction materials, such as sand, crusher materials, decoration stones and others.
With regard to the production of gold, silver and associated minerals from Mahd Al-Dhahab, Al-Sukhaybarat, Al-Hajar, Bulghah and Al-Amar, the output of gold stood at 12,353 kg and that of
silver stood at 5,588 kg in 2019. Table 3-9 shows the output of minerals in Saudi Arabia during 2014-2019. Note that Saudi Arabia’s production of copper and zinc during 2019 increased to 63,357 tons and 18,900 tons, respectively.
More than 537 million tons of various ores were extracted in 2019, including limestone, silica sand, salt, clay, feldspar, marble for industrial purposes, iron sand, kaolin, gypsum, marble blocks, granite blocks, crusher materials, phosphate, bauxite and sand used in building and construction. Table 3-10 shows Saudi Arabia’s various extracted ores during 2015-2019.
As for industry, the Ministry of Industry and Mineral Resources issued industrial licenses in 2019 for 515 new factories in various industrial activities with a total capital of SAR 9.7 billion, creating more than 26.7 thousand job opportunities.
At the end of 2019, the total cumulative number of industrial units in Saudi Arabia licensed by the Ministry of Industry and Mineral Resources rose to 7,625, providing 981.7 thousand job opportunities.
With regard to electricity, the Saudi Electricity Company (SEC)’s sales of electricity in 2019 amounted to 267.1 million megawatt-hours (MWh). Residential consumption accounted for 47.9 percent (128.1 million MWh) of total electricity consumption in Saudi Arabia, followed by industrial consumption with 18.5 percent (49.4 million MWh). Commercial consumption came third with 17.5 percent (46.8 million MWh), followed by government consumption with 14.1 percent (37.7 million MWh). The peak load of electricity was 63,007 megawatts in 2019, and the actual capacity of electricity generation was 53,105 megawatts. The number of subscribers to the utility in
Chart 3-6: Electricity Sales Growth of the Saudi
Electricity Company (2016 - 2019)
0
20
40
60
80
100
Thou
sand
Mig
awat
ts /
h
Central
Eastern Southern
Western
2016 2017 2018 2019

Saud
i Ara
bian
Mon
etar
y Au
thor
ity |
56th
Ann
ual R
epor
t
54
Table 3-11: Electricity Generation Capacity and Number of Subscribers for FY 1440/1441H (2019)
(Megawatt)
RegionActual
generation capacity
Peak load
Electricity power soldNo. of
subscribersResidential Commercial Government Industrial Agricultural
Central 13,782 20,186 42,064,993 16,333,361 10,998,733 6,938,622 3,130,364 3,122,954
Eastern 20,080 19,202 25,019,012 9,156,218 9,713,434 35,331,676 867,271 1,733,854
Western 13,926 17,695 44,575,740 16,614,079 11,919,416 6,607,871 874,460 3,463,863
Southern 5,317 5,924 16,480,978 4,716,819 5,121,860 557,493 112,707 1,438,077
Total 53,105 63,007 128,140,724 46,820,477 37,753,442 49,435,662 4,984,802 9,758,748
Source: Saudi Electricity Company.
Table 3-10: Mineral Ores Extracted (Thousand ton)
Type 2015 2016 2017 2018 2019*
Limestone 60,000 63,300 66,150 69,457 72,930
Clay 8,800 9,240 9,702 10,187 10,696
Salt 2,000 2,400 2,520 2,646 2,778
Silica sand 1,230 1,300 1,365 1,433 1,505
Crusher materials (pebbles) 330,000 347,000 364,000 382,200 401,310
Sand 31,800 22,155 23,000 24,000 25,000
Iron sand 672 706 741 778 817
Gypsum 2,780 3,000 3,150 3,307 3,472
Marble for industrial purposes 2,700 2,800 2,940 2,947 3,094
Marble blocks 22 12 13 13 14
Granite blocks 1,100 1,053 1,105 1,160 1,218
Limestone blocks 1,320 104 109 114 120
Kaolinite 187 196 206 216 227
Barite 43 41 -- -- --
Feldspar 179 188 197 206 216
Basalt -- 30 32 33 35
Pozzolan 480 504 529 555 583
Dolomite 203 2,131 2,237 2,348 2,465
Schist 576 604 634 665 600
Pyrophyllite 40 42 44 46 48
Low-grade bauxite 922 968 1,016 438 297
Bauxite 2,100 3,800 3,990 4,623 4,830
Diammonium phosphate 5,100 5,400 5,670 5,444 5,716
* Estimates. Source: Deputy Ministry for Mineral Resources.
Saudi Arabia amounted to 9.7 million at the end of 2019. The western region accounted for the largest share of total subscribers with 35.5 percent (3.4 million subscribers), followed by the
central region with 17.8 percent (3.1 million), the eastern region with 17.8 percent (1.7 million), and the southern region with 14.7 percent (1.4 million) of the total (Table 3-11 and Chart 3-6).

MONETARY DEVELOPMENTS

Saud
i Ara
bian
Mon
etar
y Au
thor
ity |
56th
Ann
ual R
epor
t
56
Monetary Developments
The Saudi Arabian Monetary Authority (SAMA) manages and implements the monetary policy of Saudi Arabia. The policy aims to maintain the stability of the national currency exchange rate and domestic prices as well as the soundness and stability of the financial system to support economic growth. Furthermore, SAMA continued to implement a fixed exchange rate policy of the Saudi riyal against the US dollar at an official exchange rate of SAR 3.75 per US dollar, thus stabilizing and strengthening the monetary and financial systems in general. In 2019, the liquidity in the financial system was ample enough to meet all of the funding needs required to support the Kingdom’s economic activity.
Monetary Policy ToolsIn line with SAMA’s policy to maintain monetary stability in the face of developments in global financial markets, SAMA gradually reduced the repo rate and reverse repo rate three times in 2019. At the end of the year, the repo rate was fixed at 2.25 percent and the reverse repo rate at 1.75 percent, a drop of 75 basis points from the preceding year. During 2019, the financial system had abundant liquidity, despite a decline in the average daily reverse repo transaction total to SAR 53.7 billion, versus a SAR 65 billion average in 2018. On the other hand, the average daily repo transactions rose to SAR 864 million in 2019 from SAR 246 million in the preceding year. SAMA also maintained the cash reserve requirements at 4.0 percent for time and savings deposits and at 7.0 percent for demand deposits, unchanged from the preceding year. Furthermore, SAMA continued to maintain the weekly issuance ceiling for SAMA bills at SAR 3 billion.
Money Supply GrowthBroad money (M3), which comprises currency in circulation and aggregate bank deposits, rose by 7.1 percent (SAR 131.5 billion) to SAR 1,985 billion in 2019, compared to a 2.7 percent increase (SAR 48.5 billion) in 2018. Bank deposits, which represented 90.5 percent of M3, increased by 7.3 percent (SAR 122.5 billion) compared to an increase of 2.5 percent (SAR 40.4 billion) in 2018. Currency in circulation rose by 5.0 percent (SAR 9.0 billion) in 2019 compared to 4.7 percent (SAR 8.1 billion) in 2018.
A breakdown of bank deposits shows that demand deposits made upconstituted the largest share of M3, standing at 55.4 percent in 2019, compared to 56.1 percent in 2018. Furthermore, demand deposits increased by 5.6 percent (SAR 58.5 billion) in 2019 compared to a rise of 3.8 percent (SAR 38.2 billion) in the preceding year. Time and savings deposits increased by 13.2 percent (SAR 58.6 billion) in 2019 compared to a drop of 2.5 percent (SAR 11.1 billion) in 2018. The share of time and savings deposits in M3 increased to 25.3 percent in 2019 compared to 23.9 percent in the preceding year. Other quasi-monetary deposits, which include residents’ foreign currency deposits, deposits against outstanding letter of credits (LCs), guarantees and remittances, and banks’ repo transactions with the private sector, recorded an increase of 2.8 percent (SAR 5.3 billion) in 2019 compared to an increase of 7.5 percent (SAR 13.3 billion) in 2018. The share of other quasi-monetary deposits in M3 fell to 9.8 percent in 2019 compared to 10.2 percent in 2018 (Tables 4-1, 4-2 and 4-3; and Charts 4-1 and 4-2).
As for the other key monetary aggregates (M1 and M2), which include relatively more liquid deposits, M1 (which comprises currency in circulation and demand deposits) recorded an increase of 5.5 percent (SAR 67.5 billion) in 2019 compared to a rise of 3.9 percent (SAR 46.3 billion) in the preceding

57
Mon
etar
y De
velo
pmen
ts
Chart 4-1: Growth Rates of Money Supply (M3)
year. The share of demand deposits in M1 slightly increased to 85.3 percent in 2019 compared to 85.2 percent in the preceding year. Moreover, the less liquid M2 (comprising M1 plus time and savings deposits) grew by 7.6 percent (SAR 126.2 billion) in 2019 compared to an increase of 2.2 percent (SAR 35.2 billion) in 2018. The ratio of M1 to M3 fell from 65.9 percent in 2018 to 64.9 percent in 2019. The ratio of M2 to M3 slightly
rose to 90.2 percent in 2019, compared to 89.8 percent in 2018 (Table 4-4).
Broad Money (M3): Causal FactorsThe M3 growth rate recorded a substantial increase of 7.1 percent in 2019 compared to the two preceding years, due to higher net domestic government expenditure, which amounted to SAR 600 billion compared to SAR 569.1 billion in the
Table 4-1: Money Supply and Components
(Million SAR)
End of year
Currency in circulation
Demand deposits
M1(1+2)
Time and savings
deposits
M2(3+4)
Other quasi-money
deposits*
M3(5+6)
( 1 ) ( 2 ) ( 3 ) ( 4 ) ( 5 ) ( 6 ) ( 7 )
2015 168,492 980,151 1,148,642 439,377 1,588,020 197,562 1,785,582
2016 170,323 976,086 1,146,409 496,019 1,642,429 157,279 1,799,708
2017 172,046 1,002,468 1,174,514 454,152 1,628,666 176,505 1,805,171
2018 180,132 1,040,665 1,220,797 443,022 1,663,820 189,826 1,853,645
2019 189,160 1,099,151 1,288,311 501,667 1,789,978 195,161 1,985,139
* Include residents’ foreign currency deposits, marginal deposits for LCs, outstanding remittances, and banks’ repo transactions with private parties.
Table 4-2: Growth Rates of Money Supply and Components
(Percentage)
End of year Currency in circulation
Demand deposits M1
Time and savings
depositsM2
Other quasi-money
deposits M3
2015 9.59 -1.13 0.31 8.91 2.55 2.19 2.51
2016 1.09 -0.41 -0.19 12.89 3.43 -20.39 0.79
2017 1.01 2.70 2.45 -8.44 -0.84 12.22 0.30
2018 4.70 3.81 3.94 -2.45 2.16 7.55 2.69
2019 5.01 5.62 5.53 13.24 7.58 2.81 7.09
0
2
4
6
8
10
2015
2016 2017 2018 2019
Perc
enta
ge
0
500
1000
1500
2000
2500
2015
2016 2017 2018 2019
Billi
on R
iyal
s
Money Supply (M1) Money Supply (M2) Money Supply (M3)
Chart 4-2: Components of Money Supply
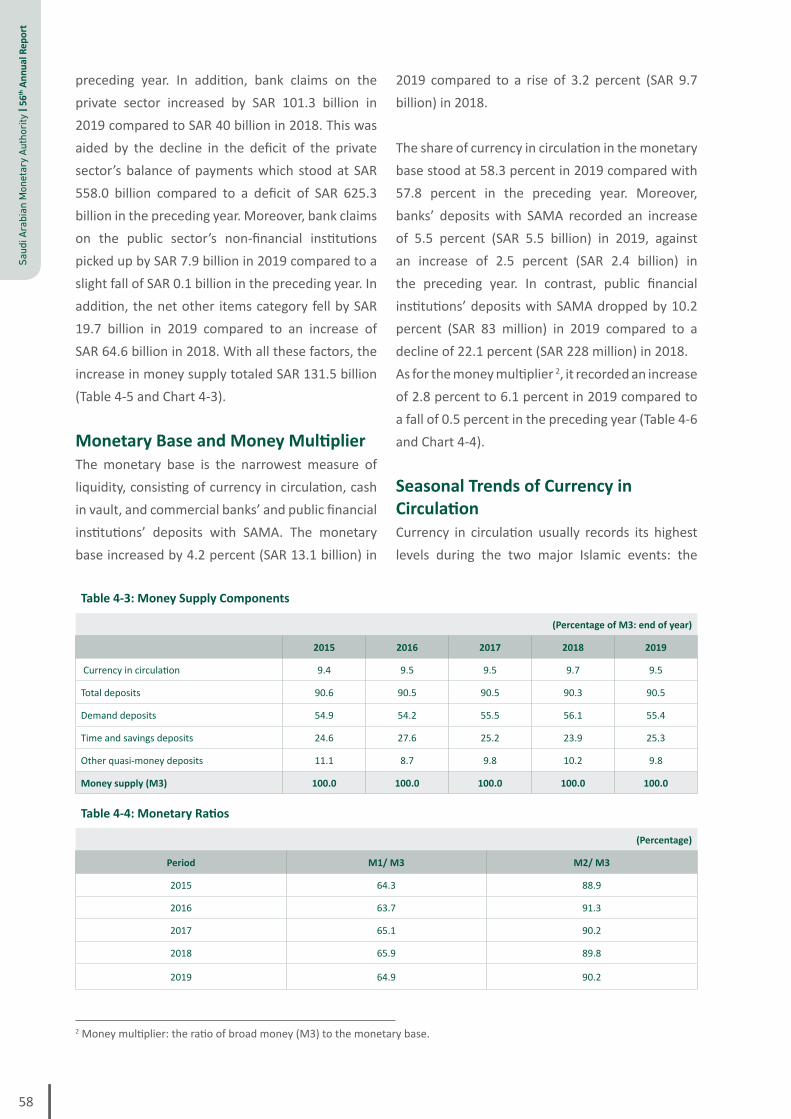
Saud
i Ara
bian
Mon
etar
y Au
thor
ity |
56th
Ann
ual R
epor
t
58
preceding year. In addition, bank claims on the private sector increased by SAR 101.3 billion in 2019 compared to SAR 40 billion in 2018. This was aided by the decline in the deficit of the private sector’s balance of payments which stood at SAR 558.0 billion compared to a deficit of SAR 625.3 billion in the preceding year. Moreover, bank claims on the public sector’s non-financial institutions picked up by SAR 7.9 billion in 2019 compared to a slight fall of SAR 0.1 billion in the preceding year. In addition, the net other items category fell by SAR 19.7 billion in 2019 compared to an increase of SAR 64.6 billion in 2018. With all these factors, the increase in money supply totaled SAR 131.5 billion (Table 4-5 and Chart 4-3).
Monetary Base and Money MultiplierThe monetary base is the narrowest measure of liquidity, consisting of currency in circulation, cash in vault, and commercial banks’ and public financial institutions’ deposits with SAMA. The monetary base increased by 4.2 percent (SAR 13.1 billion) in
2019 compared to a rise of 3.2 percent (SAR 9.7 billion) in 2018.
The share of currency in circulation in the monetary base stood at 58.3 percent in 2019 compared with 57.8 percent in the preceding year. Moreover, banks’ deposits with SAMA recorded an increase of 5.5 percent (SAR 5.5 billion) in 2019, against an increase of 2.5 percent (SAR 2.4 billion) in the preceding year. In contrast, public financial institutions’ deposits with SAMA dropped by 10.2 percent (SAR 83 million) in 2019 compared to a decline of 22.1 percent (SAR 228 million) in 2018.As for the money multiplier 2, it recorded an increase of 2.8 percent to 6.1 percent in 2019 compared to a fall of 0.5 percent in the preceding year (Table 4-6 and Chart 4-4).
Seasonal Trends of Currency in CirculationCurrency in circulation usually records its highest levels during the two major Islamic events: the
Table 4-4: Monetary Ratios
(Percentage)
Period M1/ M3 M2/ M3
2015 64.3 88.9
2016 63.7 91.3
2017 65.1 90.2
2018 65.9 89.8
2019 64.9 90.2
2 Money multiplier: the ratio of broad money (M3) to the monetary base.
Table 4-3: Money Supply Components
(Percentage of M3: end of year)
2015 2016 2017 2018 2019
Currency in circulation 9.4 9.5 9.5 9.7 9.5
Total deposits 90.6 90.5 90.5 90.3 90.5
Demand deposits 54.9 54.2 55.5 56.1 55.4
Time and savings deposits 24.6 27.6 25.2 23.9 25.3
Other quasi-money deposits 11.1 8.7 9.8 10.2 9.8
Money supply (M3) 100.0 100.0 100.0 100.0 100.0

59
Mon
etar
y De
velo
pmen
ts
Chart 4-3: Causative Factors for Change in M3
Table 4-5: Causal Factors for Change in M3
(Billion SAR)
2017 2018 2019
Change in M3 5.5 48.5 131.5
Causal Factors
Net domestic government expenditure* 580.7 569.1 600.0
Change in banks’ claims on the private sector -12.7 40.0 101.3
Change in banks’ claims on public non-financial institutions -1.5 -0.1 7.9
Deficit in the private sector’s balance of payments** -679.7 -625.3 -558.0
Other items (net) 118.6 64.6 -19.7
Total 5.5 48.5 131.5
* Domestic government expenditure in riyals less local revenues in riyals. ** Estimates.
0
200
400
600
800
1000
2015
Net Government Domestic Expenditures in Riyal
2016 2017 2018 2019
Billi
on R
iyal
s
-1000
-800
-600
-400
-200
0
2015
Private Sector's B.O.P. Deficit
2016 2017 2018 2019
Billi
on R
iyal
s
-200
-100
0
100
200
2015
Other Items (Net)
2016 2017 2018 2019
Billi
on R
iyal
s
-20
0
4060
100
120
2015
Change in Bank Claims on the Private Sector
2016 2017 2018 2019
Billi
on R
iyal
s20
140
0
50
100
150
200
2015
Net Effect on M3
2016 2017 2018 2019
Billi
on R
iyal
s

Saud
i Ara
bian
Mon
etar
y Au
thor
ity |
56th
Ann
ual R
epor
t
60
month of Ramadan and the Hajj season, which move through the Gregorian calendar but have coincided with the second and third quarters of the last few years. This is demonstrated in the time series data on currency in circulation (Table 4-7 and Chart 4-5). Currency in circulation reached its peak of SAR 196.9 billion at the end of May 2019 (26 Ramadan 1440H) and recorded its lowest level of SAR 181.1 billion at the end of January 2019 (25 Jumada I 1440H).
Monetary SurveyThe monetary survey is aimed at assessing the status of the Saudi banking system (SAMA and commercial banks) as well as arranging the items of the assets and claims of the banking system to understand changes. The 2019 monetary survey indicated an increase in the assets of the banking system as a whole by 4.1 percent (SAR 154 billion) to SAR 3,915 billion at the end of 2019 compared to an increase of 1.9 percent (SAR 71.1 billion) in 2018 (Table 4-8).
Net foreign assets fell by 1.7 percent (SAR 33.7 billion) in 2019 compared to a drop of 1.0 percent (SAR 19.5 billion) in the preceding year. As a result, their share in total assets decreased from 52.0 percent at the end of 2018 to 49.1 percent at the end of 2019. This is due to a decline in foreign assets of commercial banks by 41.7 percent (SAR 50.4 billion) against an increase of 10.4 percent (SAR 187.7 billion) in domestic credit consisting of bank claims on the private sector, the government, and the public non-financial institutions at the end of 2019 (Table 4-8).Government deposits with SAMA also fell, recording a drop of 8.6 percent (SAR 58.5 billion) in 2019 compared to a fall of 7.6 percent (SAR 56.2 billion) in the preceding year.
Interest Rate TrendsThe average three-month Saudi interbank offered rate (SAIBOR) rose by 18 basis points to 2.63 percent in 2019 compared to 2.45 percent in 2018. The average three-month interest rate on USD
Table 4-6: Monetary Base and Money Multiplier
2016 2017 2018 2019
Money multiplier 6.0 6.0 5.9 6.1
Monetary base (million SAR)
Currency in circulation 170,323 172,046 180,132 189,160
Cash in vault 29,666 31,311 30,733 29,319
Deposits with SAMA: local banks’ deposits 97,839 97,534 99,943 105,470
Deposits with SAMA: public financial institutions’ deposits 4,576 1,035 807 724
Total 302,404 301,926 311,615 324,674
Chart 4-4: Monetary Base and Money Multiplier
Money Multiplier
Mon
etar
y Ba
se (B
illio
n Ri
yals
)
Mon
ey M
ultip
lier
4.0
4.5
5.0
5.5
6.0
6.5
7.0
0
50
100
150
200
250
300
350
2015 2016 2017 2018 2019
Monetary Base
Chart 4-5: Seasonal Trends in Currency in Circulation
0
50
100
150
200
250
2015
2016 2017 2018 2019
Billi
on R
iyal
s
Lowest level Highest level

61
Mon
etar
y De
velo
pmen
ts
Table 4-7: Seasonal Trends of Currency in Circulation
Highest Level of Currency in Circulation During the Year Lowest Level of Currency in Circulation During the Year
End of Gregorian month
Corresponding Hijri date Quantity End of Gregorian
monthCorresponding Hijri
date Quantity
07/2015 14/10/1436 179,078 01/2015 10/04/1436 156,921
06/2016 26/09/1437 181,838 01/2016 21/04/1437 167,404
06/2017 06/10/1438 184,312 10/2017 11/02/1439 167,459
06/2018 16/10/1439 189,877 01/2018 14/05/1439 175,134
05/2019 26/09/1440 196,878 01/2019 25/05/1440 181,105
Table 4-8: Monetary Survey* (End of year)
(Million SAR)
2015 2016 2017 2018 2019
Assets
Net foreign assets 2,506,009 2,120,078 1,976,292 1,956,765 1,923,100
SAMA 2,283,382 1,982,348 1,833,355 1,835,866 1,852,626
Commercial banks 222,627 137,730 142,938 120,899 70,475
Domestic credit 1,510,002 1,651,672 1,713,578 1,804,171 1,991,837
Banks’ claims on the private sector 1,384,858 1,417,920 1,405,210 1,445,252 1,546,519
Banks’ claims on the government 86,158 178,416 254,545 305,154 383,672
Banks’ claims on public sector non-financial institutions 38,986 55,336 53,823 53,765 61,646
Total 4,016,011 3,771,750 3,689,871 3,760,936 3,914,938
Liabilities
Money supply (M3) 1,785,582 1,799,708 1,805,171 1,853,645 1,985,139
Government deposits** 1,162,521 875,424 737,716 681,492 622,945
Other items (net) 1,067,908 1,096,619 1,146,983 1,225,799 1,306,853
Total 4,016,011 3,771,750 3,689,871 3,760,936 3,914,938
(Percent change)
Net foreign assets -12.6 -15.4 -6.8 -1.0 -1.7
Domestic credit 10.2 9.4 3.7 5.3 10.4
Banks’ claims on the private sector 9.0 2.4 -0.9 2.8 7.0
Banks’ claims on the government 61.8 107.1 42.7 19.9 25.7
Banks’ claims on public sector non-financial institutions -15.4 41.9 -2.7 -0.1 14.7
Money supply (M3) 2.5 0.8 0.3 2.7 7.1
Government deposits** -25.5 -24.7 -15.7 -7.6 -8.6
Other items (net) 14.1 2.7 4.6 6.9 6.6
* The consolidated financial position of SAMA and commercial banks. ** Including letters of credit and bills for collection.

Saud
i Ara
bian
Mon
etar
y Au
thor
ity |
56th
Ann
ual R
epor
t
62
deposits (LIBOR) slightly increased by 2.0 basis points from 2.31 percent in 2018 to 2.33 percent in 2019. The interest rate spread (the differential between the two average rates) increased slightly to 30 basis points in 2019 in favor of the Saudi riyal compared to 14 basis points in the preceding year (Table 4-9 and Chart 4-6).
Exchange Rate TrendsSAMA maintained its US dollar-pegged monetary policy, which aims to maintain the stability of the Saudi riyal exchange rate in order to serve
the interests of the Saudi economy. This policy positively reflected on the exchange rate which remained fixed at SAR 3.75 per US dollar in the spot markets in 2019 (Table 4-10). It is worth mentioning that the Saudi riyal exchange rate averaged SAR 3.7508 per US dollar in 2019, compared to SAR 3.7506 in the preceding year. The highest exchange rate recorded in 2019 was SAR 3.7535 versus 3.7530 in 2018. The lowest exchange rate recorded in 2019 was 3.7500 versus 3.7498 in the preceding year.
Table 4-9: Interest Rates on SAR and USD Deposits*
(3-Month Average Rates)
Year SAR deposits (SAIBOR 3M) USD deposits (LIBOR 3M) Difference between SAR and USD interest rates
2015 0.88 0.32 0.56
2016 2.07 0.73 1.34
2017 1.81 1.26 0.55
2018 2.45 2.31 0.14
2019 2.63 2.33 0.30
* SAIBOR.
Table 4-10: Indicators of USD/SAR Exchange Rate in the Spot Market*
Year Weakest SAR Strongest SARAverage rate
(for the entire period)
2015 3.7615 3.7498 3.7512
2016 3.7587 3.7489 3.7508
2017 3.7518 3.7499 3.7503
2018 3.7530 3.7498 3.7506
2019 3.7535 3.7500 3.7508
* Source: Bloomberg.
Chart 4-6: Interest Rates on Riyal and Dollar Deposits (Average rates for 3-month deposits)
0.0
0.5
1.0
1.5
2.0
2.5
2015
2016 2017 2018 2019
Aver
age
rate
s
3.0
SAR Deposits USD Deposits

BANKING SECTOR

Saud
i Ara
bian
Mon
etar
y Au
thor
ity |
56th
Ann
ual R
epor
t
64
Banking Sector
The banking sector continued to register good growth rates in line with the positive economic developments witnessed by the Saudi economy at all levels during 2019. These good rates were attributable to SAMA’s regulatory and supervisory role over the banking system with the aim of enhancing its resilience and solvency and promoting the quality of its services. Consequently, the good performance of commercial banks during 2019 was reflected in their improved general activities and enhanced financial position. Total assets of banks went up by 9.7 percent, bank deposits by 7.3 percent, and profits by 4.5 percent, compared to the preceding year.
Consolidated Financial Position of Commercial BanksCommercial banks performed well in 2019 as their assets rose by 9.7 percent (SAR 233 billion) to SAR
2,631.1 billion, compared to an increase of 2 percent (SAR 47.3 billion) in the preceding year (Table 5-1).
Bank DepositsTotal bank deposits increased by 7.3 percent (SAR 122.5 billion) to SAR 1,796 billion in 2019 compared to an increase of 2.5 percent (SAR 40.4 billion) in the preceding year (Table 5-2 and Charts 5-1 and 5-2).
A review of developments in bank deposits by type shows that demand deposits rose by 5.6 percent (SAR 58.5 billion) to SAR 1,099.2 billion in 2019 compared to a rise of 3.8 percent (SAR 38.2 billion) in the preceding year. However, their share in total deposits dropped to 61.2 percent from 62.2 percent at end-2018. On the other hand, time and savings deposits increased by 13.2 percent (SAR 58.6 billion) to SAR 501.7 billion compared to a decline of 2.5 percent (SAR 11.1 billion) in the preceding year. Their share in total deposits also rose to 27.9 percent from 26.5 percent at the end of the preceding year. Moreover, other quasi-monetary deposits (the majority of which is residents’ foreign currency deposits) increased by 2.8 percent (SAR 5.3 billion) to SAR 195.2 billion in 2019, compared
Table 5-1: Consolidated Financial Position of Commercial Banks (End of year)
(Million SAR)
2015 2016 2017 2018 2019
Assets
Bank reserves 147,973 239,920 243,294 222,856 239,375
Foreign Assets 322,614 233,832 262,124 231,832 243,629
Claims on the public sector 125,144 233,752 308,368 358,919 445,318
Claims on the private sector 1,384,858 1,417,920 1,405,210 1,445,252 1,546,519
Claims on non-monetary financial institutions 2,904 4,442 2,600 1,041 1,398
Other assets 249,761 159,136 129,295 138,246 154,888
Total Assets (Liabilities) 2,233,254 2,289,001 2,350,891 2,398,147 2,631,128
Liabilities
Bank deposits 1,617,090 1,629,385 1,633,125 1,673,513 1,795,979
Foreign Liabilities 99,987 96,101 119,186 110,933 173,155
Capital and reserves 270,418 298,392 317,067 303,439 342,976
Profits 42,420 40,398 43,857 48,148 50,315
Other liabilities 203,339 224,725 237,655 262,113 268,703
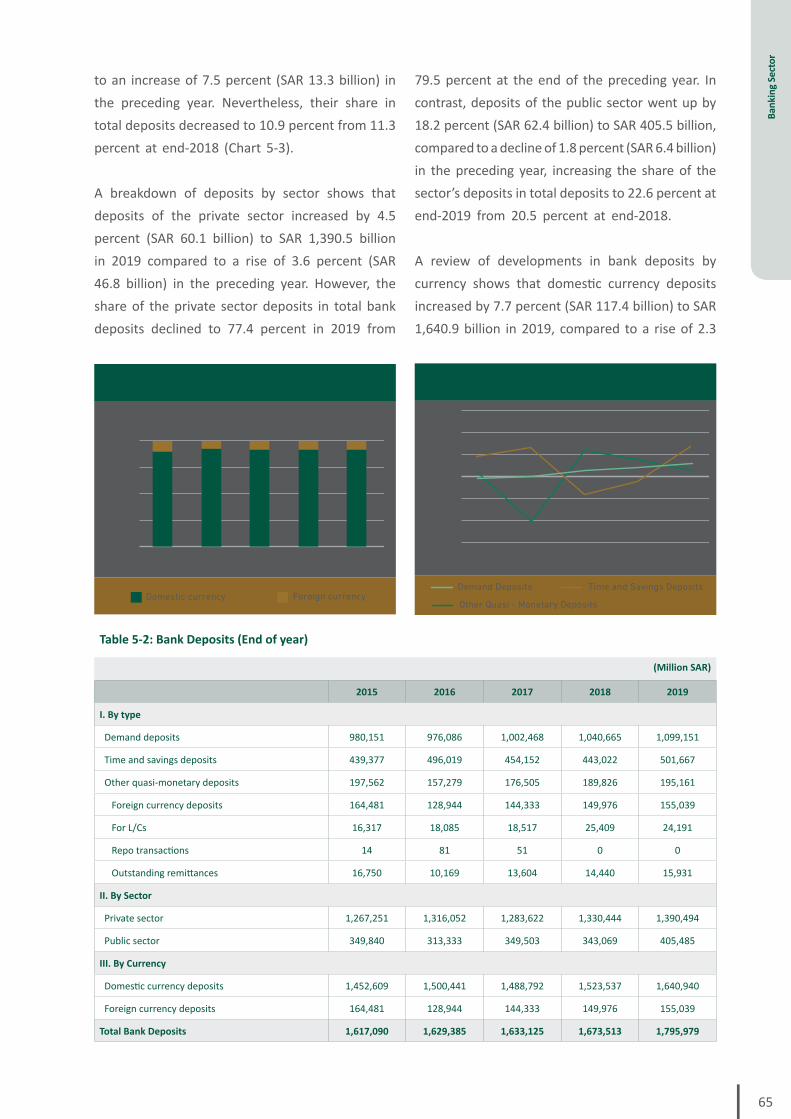
65
Bank
ing
Sect
or
to an increase of 7.5 percent (SAR 13.3 billion) in the preceding year. Nevertheless, their share in total deposits decreased to 10.9 percent from 11.3 percent at end-2018 (Chart 5-3).
A breakdown of deposits by sector shows that deposits of the private sector increased by 4.5 percent (SAR 60.1 billion) to SAR 1,390.5 billion in 2019 compared to a rise of 3.6 percent (SAR 46.8 billion) in the preceding year. However, the share of the private sector deposits in total bank deposits declined to 77.4 percent in 2019 from
79.5 percent at the end of the preceding year. In contrast, deposits of the public sector went up by 18.2 percent (SAR 62.4 billion) to SAR 405.5 billion, compared to a decline of 1.8 percent (SAR 6.4 billion) in the preceding year, increasing the share of the sector’s deposits in total deposits to 22.6 percent at end-2019 from 20.5 percent at end-2018.
A review of developments in bank deposits by currency shows that domestic currency deposits increased by 7.7 percent (SAR 117.4 billion) to SAR 1,640.9 billion in 2019, compared to a rise of 2.3
Chart 5-2: Growth Rates of Bank Deposits
Table 5-2: Bank Deposits (End of year)
(Million SAR)
2015 2016 2017 2018 2019
I. By type
Demand deposits 980,151 976,086 1,002,468 1,040,665 1,099,151
Time and savings deposits 439,377 496,019 454,152 443,022 501,667
Other quasi-monetary deposits 197,562 157,279 176,505 189,826 195,161
Foreign currency deposits 164,481 128,944 144,333 149,976 155,039
For L/Cs 16,317 18,085 18,517 25,409 24,191
Repo transactions 14 81 51 0 0
Outstanding remittances 16,750 10,169 13,604 14,440 15,931
II. By Sector
Private sector 1,267,251 1,316,052 1,283,622 1,330,444 1,390,494
Public sector 349,840 313,333 349,503 343,069 405,485
III. By Currency
Domestic currency deposits 1,452,609 1,500,441 1,488,792 1,523,537 1,640,940
Foreign currency deposits 164,481 128,944 144,333 149,976 155,039
Total Bank Deposits 1,617,090 1,629,385 1,633,125 1,673,513 1,795,979
100
75
50
25
020162015 2017 2018 2019
Perc
enta
ge
Domestic currency Foreign currency
Chart 5-1: Deposits By Currency
0
-10
-20
-30
30
20
10
20162015 2017 2018 2019
Perc
enta
ge
Demand Deposits
Other Quasi - Monetary Deposits
Time and Savings Deposits

Saud
i Ara
bian
Mon
etar
y Au
thor
ity |
56th
Ann
ual R
epor
t
66
percent (SAR 34.7 billion) in the preceding year. Their share in total deposits rose slightly to 91.4 percent at end-2019. In addition, foreign currency deposits went up by 3.4 percent (SAR 5.1 billion) to SAR 155.0 billion, compared to a rise of 3.9 percent (SAR 5.6 billion) in the preceding year. The share of foreign currency deposits in total deposits, however, declined to 8.6 percent at end-2019.
Bank Claims on Private and Public SectorsTotal bank claims on the private and public sectors increased by 10.4 percent (SAR 188 billion) to SAR 1,993.2 billion in 2019 against an increase of 5.2 percent (SAR 89 billion) in 2018. Total claims on the private and public sectors at end-2019 accounted for 111 percent of total bank deposits, compared to 107.9 percent at the end of the preceding year.Total bank claims on the private sector went up by 7.0 percent (SAR 101.3 billion) to SAR 1,546.5 billion in 2019 compared to a rise of 2.8 percent (SAR 40 billion) in the preceding year. These claims constituted 86.1 percent of total bank deposits at end-2019, compared to 86.4 percent at end-2018.
Moreover, bank claims on the public sector (loans to public institutions and government and quasi-government bonds) increased by 24.1 percent
(SAR 86.4 billion) to SAR 445.3 billion in 2019, compared to a rise of 16.4 percent (SAR 50.6 billion) in the preceding year. This increase was attributable to a 25.7 percent (SAR 78.5 billion) rise in government and quasi-government bonds to SAR 383.7 billion, compared to a rise of 19.9 percent (SAR 50.6 billion) in the preceding year. In addition, bank credit to public institutions went up by 14.7 percent (SAR 7.9 billion) to SAR 61.6 billion in 2019 compared to a decrease of 0.1 percent (SAR 57 million) in the preceding year. Furthermore, claims on non-monetary financial institutions went up by 34.3 percent (SAR 357 million) at end-2019, compared to a decrease of 59.9 percent (SAR 1.6 billion) at the end of the preceding year (Table 5-3 and Charts 5-4 and 5-5).
Other Quasi - Monetary Deposits
Time and Savings DepositsDemand Deposits
60
40
20
0
100
80
20162015 2017 2018 2019
Perc
enta
ge
Chart 5-3: Shares of Deposit Components
Table 5-3: Bank Claims on the Private and Public Sectors (End of year)
(Million SAR)
2017 2018 2019
Amount Share Amount Share Amount Share
Claims on the private sector 1,405,210 81.9 1,445,252 80.1 1,546,519 77.6
Bank credit 1,351,127 78.7 1,388,940 76.9 1,490,833 74.8
Loans and advances 1,338,555 78.0 1,375,628 76.2 1,477,980 74.1
Bills discounted 12,572 0.7 13,312 0.7 12,853 0.6
Investments in private securities 54,083 3.2 56,312 3.1 55,686 2.8
Claims on the public sector 308,368 18.0 358,919 19.9 445,318 22.3
Bank credit to public institutions 53,823 3.1 53,765 3.0 61,646 3.1
Government and quasi-government bonds 254,545 14.8 305,154 16.9 383,672 19.2
Claims on non-monetary financial institutions 2,600 0.2 1,041 0.1 1,398 0.1
Total 1,716,179 100.0 1,805,213 100.0 1,993,235 100.0

67
Bank
ing
Sect
or
Bank Credit by MaturityShort-term bank credit (less than one year) extended to the private sector and institutions of the public sector decreased by 4.4 percent (SAR 31.7 billion) to SAR 683.2 billion in 2019, compared to an increase of 2.0 percent (SAR 13.7 billion) in 2018. In contrast, medium-term credit (1-3 years) rose by 2.9 percent (SAR 6.7 billion) to SAR 234.6 billion, compared to a decrease of 14.7 percent (SAR 39.2 billion) in the preceding year. Long-term credit (more than 3 years) also increased at a considerably faster pace, by 27 percent (SAR 134.8 billion) to SAR 634.6 billion compared to an increase of 14.5 percent (SAR 63.3 billion) in the preceding year (Table 5-4).
Bank Credit by Economic ActivityA breakdown of bank credit by economic activity during 2019 shows mixed trends. Bank credit extended to transport and communications recorded the highest increase rate of 18.4 percent (SAR 8.0 billion) to SAR 51.2 billion, compared to
a decline of 10.6 percent (SAR 5.1 billion) in 2018. Bank credit extended to water, electricity, gas and health services also increased by 17.0 percent (SAR 8.9 billion) to SAR 61 billion, compared to a rise of 0.6 percent (SAR 335.2 million) in the preceding year. In addition, bank credit extended to the finance activity rose by 11.1 percent (SAR 4.2 billion) to SAR 41.5 billion, compared to an increase of 4.8 percent (SAR 1.7 billion) in the preceding year. Moreover, bank credit extended to the services activity went up by 3.0 percent (SAR 2.4 billion) to SAR 81.2 billion, compared to a rise of 8.4 percent (SAR 6.1 billion) in the preceding year. Bank credit extended to the commerce activity grew by 2 percent (SAR 5.6 billion) to SAR 287.9 billion, compared to a decline of 10.4 percent (SAR 32.8 billion) in the preceding year. Bank credit extended to mining and quarrying slowly increased by 1.8 percent (SAR 354 million) to SAR 19.7 billion, compared to a rise of 30.3 percent (SAR 4.5 billion) in the preceding year. On the other hand, bank credit extended to manufacturing
20162015 2017 2018 2019
Private Sector (Left) Public Sector (Right)
1000 050100150200250300350400450500
11001200130014001500160017001800
Billi
on R
iyal
s
20162015 2017 2018 2019
Bank Credit (Left) Investments (Right)
1000 30405060708090100
1100
1200
1300
1400
1500
1600
Billi
on R
iyal
s
Chart 5-5: Bank Claims By Sector (Monthly) Chart 5-4: Bank Claims On Private Sector (Monthly)
Table 5-4: Bank Credit by Maturity
(Million SAR)
End of year Short term Medium term Long term Total
2015 694,241 242,438 437,919 1,374,598
2016 711,227 266,524 441,193 1,418,945
2017 701,233 267,155 436,562 1,404,950
2018 714,927 227,911 499,867 1,442,705
2019 683,215 234,625 634,639 1,552,479
Note: Short term: Less than 1 year, Medium term: 1 - 3 years, and Long term: More than 3 years.

Saud
i Ara
bian
Mon
etar
y Au
thor
ity |
56th
Ann
ual R
epor
t
68
and production declined by 9.3 percent (SAR 16.1 billion) to SAR 156.7 billion, compared to an increase of 6.1 percent (SAR 9.9 billion) in the preceding year. Bank credit extended to building and construction also fell by 4.6 percent (SAR 4.5 billion) to SAR 92.9 billion, compared to a rise of 8.6 percent (SAR 7.7 billion) in the preceding year. Bank credit extended to agriculture and fishing activity declined by 0.9 percent (SAR 127 million) to SAR 14.7 billion, compared to an increase of 20.7 percent (SAR 2.5 billion) in the preceding year (Table 5-5 and Chart 5-6).
Syndicated LoansData on loans extended to residents by syndicates of domestic and foreign banks indicate that the number of loans decreased by 8.1 percent to 525 in 2019 while those extended to non-residents went up by 25.6 percent to 98. Total value of syndicated loans extended to residents rose by 30.7 percent to SAR 446 billion in 2019, and those to non-residents also rose by 52.4 percent to SAR 21.6 billion (Table 5-6).
Chart 5-6: Bank Credit to the Private Sector By Economic Activity
2018 2019
Building and Construction Transport and CommunicationsMining and Quarrying
Miscellaneous Manufacturing and Production Commerce
Services
FinanceElectricity, Water & Other Utilities
Agriculture and Fishing
%42.5%45.9
%5.7
%2.7%3.1
%20.3
%7.0 %3.8%1.4
%12.4
%1.1
%5.4
%2.8
%3.4
%19.3
%6.2%4.1
%1.3
%10.5
%1.0
Table 5-5: Bank Credit Extended to Private Sector by Economic Activity (End of year)
(Million SAR)
2017 2018 2019
Amount Share Amount Share Amount Share
Agriculture and fishing 12,249 0.9 14,780 1.1 14,653 1.0
Manufacturing and production 162,939 12.1 172,858 12.4 156,754 10.5
Mining and quarrying 14,849 1.1 19,354 1.4 19,707 1.3
Water, electricity, gas and health services 51,836 3.8 52,171 3.8 61,049 4.1
Building and construction 89,642 6.6 97,326 7.0 92,850 6.2
Commerce 315,138 23.3 282,344 20.3 287,923 19.3
Transport and Communications 48,388 3.6 43,282 3.1 51,237 3.4
Finance 35,608 2.6 37,313 2.7 41,465 2.8
Services 72,737 5.4 78,860 5.7 81,217 5.4
Other miscellaneous services 547,741 40.5 590,652 42.5 683,977 45.9
Total 1,351,127 100.0 1,388,940 100.0 1,490,833 100.0

69
Bank
ing
Sect
or
Consumer and Credit Card LoansConsumer and credit card loans extended by banks went up by 4.7 percent to SAR 352.5 billion at end-2019 compared to SAR 336.6 billion at end-2018 (Table 5-7A and Chart 5-7B).
Real Estate Bank CreditRetail and corporate real estate loans extended by banks continued their growth to SAR 297.4 billion, increasing by 24.7 percent (SAR 58.8 billion) in 2019, compared to a 2018 growth rate of 13.1 percent (SAR 27.6 billion). Retail real estate loans
Table 5-7A: Consumer and credit card loans*
(Million SAR)
Year(End of year)
Consumer loans
Total Credit cards**
Renovation & property
improvement
Motor vehicles & personal
transportation
Furniture & durable
goodsEducation Health
careTourism &
travel Other
2015 37,020.5 9,429.2 4,911.9 636.6 312.2 85.3 254,789.2 307,184.9 10,212.7
2016 29,080.2 9,327.8 4,821.8 957.6 506.5 72.1 273,499.5 318,265.5 10,957.7
2017 30,028.0 16,720.0 10,783.9 3,722.5 565.6 324.3 255,515.0 317,659.3 12,094.0
2018 28,055.1 16,789.4 12,498.7 3,522.2 703.5 483.6 259,234.4 321,286.9 15,331.9
2019 25,648.2 15,625.0 12,462.1 3,239.0 559.4 454.7 275,450.4 333,438.7 19,054.3
* Excluding real estate finance, leasing, and finance for stocks trading. ** Including Visa, MasterCard, American Express and others.
Table 5-6: Syndicated Loans
PeriodNo. of Syndicated loans Value of Syndicated loans (Billion SAR)
Resident Non-resident Total Resident Non-resident Total
2015 469 65 534 134 12 146
2016 555 76 631 195 16 211
2017 513 74 587 189 12 201
2018 571 78 649 341 14 355
2019 525 98 623 446 22 467
Table 5-7B: Real Estate Bank Credit
(Million SAR)
(End of year) Retail Corporate Total
2015 102,503 82,799 185,302
2016 110,484 89,918 200,402
2017 121,249 89,744 210,992
2018 140,276 98,268 238,544
2019 198,100 99,272 297,372
20162015 2017 2018 2019240
260
280
300
320
340
360
Billi
on R
iyal
s
Chart 5-7: Total Consumer Loans

Saud
i Ara
bian
Mon
etar
y Au
thor
ity |
56th
Ann
ual R
epor
t
70
recorded a rise of 41.2 percent (SAR 57.8 billion) to SAR 198.1 billion, compared to an increase of 15.7 percent (SAR 19 billion) in the preceding year, accounting for 66.6 percent of total real estate loans at end-2019. Corporate real estate loans extended by commercial banks also rose by 1.0 percent (SAR 1 billion) to SAR 99.3 billion in 2019, compared to a 2018 growth of 9.5 percent (SAR 8.5 billion), accounting for 33.4 percent of total real estate loans (Table 5-7B).
Commercial Banks’ Foreign Assets and LiabilitiesForeign assets of commercial banks rose by 5.1 percent (SAR 11.8 billion) to SAR 243.6 billion at end-2019, compared to a decrease of 11.6 percent (SAR 30.3 billion) in the preceding year. In addition, foreign liabilities of commercial banks jumped by 56.1 percent (SAR 62.2 billion) to SAR 173.2 billion in 2019, compared to a 2018 decline of 6.9 percent (SAR 8.3 billion). As a result, commercial banks’ net foreign assets (foreign assets less foreign liabilities)
Foreign Assets Foreign Liabilities
30
80
130
180
230
280
330
380
20162015 2017 2018 2019
Billi
on R
iyal
s
0
5
10
20
15
20162015 2017 2018 2019
Foreign Assets Foreign Liabilities
Perc
enta
ge
Chart 5-8: Foreign Assets and Liabilities of BanksChart 5-9: Ratio of Foreign Assets and Liabilities to Total Assets and Liabilities
Table 5-8: Commercial Banks’ Foreign Assets and Liabilities (End of year)
(Million SAR)
Amount Change
2018 20192018 2019
Amount % Amount %
Foreign Assets
Due from foreign banks 66,195 47,538 12,829 24.0 -18,657 -28.2
Due from branches abroad 39,942 63,227 -30,427 -43.2 23,285 58.3
Other assets 26,943 35,253 3,042 12.7 8,310 30.8
Investments abroad 98,753 97,612 -15,736 -13.7 -1,141 -1.2
Total 231,832 243,629 -30,292 -11.6 11,797 5.1
Foreign Liabilities
Due to foreign banks 60,781 102,350 3,064 5.3 41,569 68.4
Due to branches abroad 32,082 38,705 -12,040 -27.3 6,622 20.6
Due from others 18,070 32,100 723 4.2 14,031 77.6
Total 110,933 173,155 -8,253 -6.9 62,222 56.1
Net Foreign Assets 120,899 70,475 -22,039 -15.4 -50,424 -41.7

71
Bank
ing
Sect
or
dropped by 41.7 percent (SAR 50.4 billion) to SAR 70.5 billion in 2019, compared to a decrease of 15.4 percent (SAR 22 billion) in the preceding year (Table 5-8 and Charts 5-8 and 5-9).
Commercial Banks’ ReservesCommercial banks’ reserves (cash in vault and deposits with SAMA) went up by 7.4 percent (SAR 16.5 billion) to SAR 239.4 billion at end-2019, compared to a decrease of 8.4 percent (SAR 20.4 billion) in the preceding year. The increase was due to a 15 percent (SAR 13.9 billion) increase in other deposits with SAMA, to stand at SAR 106.5 billion at end-2019 from SAR 92.7 billion at end-2018. Statutory deposits with SAMA also increased by SAR 4.9 billion or 5.0 percent to SAR 102.9 billion.
In contrast, current deposits with SAMA fell by 57.7 percent (SAR 807.8 million) to SAR 593.2 million. Cash in bank vaults declined by 4.6 percent or SAR 1.4 billion to SAR 29.3 billion in 2019 from SAR 30.7 billion at end-2018 (Table 5-9).
Banks’ Capital and ReservesBank capital and reserves increased by SAR 39.5 billion or 13.0 percent to SAR 343 billion in 2019, compared to a decline of SAR 13.6 billion or 4.3 percent in the preceding year. Their ratio to total deposits increased from 18.1 percent at end-2018 to 19.1 percent at end-2019, and their ratio to total assets rose from 12.7 percent at end-2018 to 13.0 percent at end-2019. The capital adequacy ratio (CAR) based on the Basel Standard stood at 19.4
Table 5-9: Commercial Banks’ Reserves (End of year)
(Million SAR)
2015 2016 2017 2018 2019
Cash in vault 29,420 29,666 31,311 30,733 29,319
Deposits with SAMA
Current deposits 358 328 268 1,401 593
Statutory deposits 97,974 97,267 96,282 98,060 102,918
Other deposits 20,221 112,659 115,433 92,662 106,545
Banks' reserves 147,973 239,920 243,294 222,856 239,375
Ratios to bank deposits (%)
Cash in vault 1.82 1.82 1.92 1.84 1.63
Deposits with SAMA
Current deposits 0.02 0.02 0.02 0.08 0.03
Statutory deposits 6.06 5.97 5.90 5.86 5.73
Other deposits 1.25 6.91 7.07 5.54 5.93
Banks' reserves 9.15 14.72 14.90 13.32 13.33
Table 5-10: Capital and Reserves of Commercial Banks (End of year)
(Million SAR)
2015 2016 2017 2018 2019
Capital and reserves 270,418 298,392 317,067 303,439 342,976
Capital and reserves as a ratio of
Bank deposits 16.7 18.3 19.4 18.1 19.1
Total assets 12.1 13.0 13.5 12.7 13.0
Capital to risk-weighted assets ratio (%)
(Basel Standard) 18.1 19.5 20.4 20.3 19.4

Saud
i Ara
bian
Mon
etar
y Au
thor
ity |
56th
Ann
ual R
epor
t
72
percent at end-2019, which is higher than the ratio recommended by the Basel Committee (Table 5-10).
Sources and Uses of Financial Resources of Commercial Banks in 2019Total added financial resources of commercial banks jumped by 127.4 percent to SAR 226.5 billion in 2019, compared to SAR 99.6 billion in the preceding year. Key added financial resources were concentrated in total deposits and foreign liabilities, accounting for 54.1 percent (SAR 122.5 billion) and 27.5 percent (SAR 62.2 billion) of total added resources, respectively. The capital base also went up by SAR 41.8 billion (accounting for 18.5 percent of the total). Most of these financial resources were used during 2019 to increase cash and reserves with an amount of SAR 16.5 billion (accounting for 7.3 percent of total resources used). In addition, foreign assets increased by SAR 11.8 billion (5.2 percent of the total). Claims on the private and public sectors went up by SAR 101.3 billion and SAR 7.9 billion, respectively. Claims on the private sector accounted for 44.7 percent of total resources used, whereas claims on the public sector accounted for 3.5 percent. In addition, claims on the central government rose by SAR 86.3 billion, accounting for 38.1 percent of total financial resources used (Table 5-11).
Commercial Banks’ ProfitsCommercial banks’ 2019 profits increased by 4.5 percent to SAR 50.3 billion over the previous year’s profits of SAR 48.1 billion.
Number of Banks and BranchesThe number of commercial banks operating in Saudi Arabia at end-2019 stood at 29 (including branches of foreign banks) as two new banks were licensed to engage in banking activities in the country. Moreover, two other foreign banks were licensed to open more branches (21 branches) in Saudi Arabia. The number of commercial banks’ branches increased to 2,076, with 12 new bank branches beginning operations in Saudi Arabia. The distribution of bank branches by administrative regions shows that the Riyadh region accounted for 626 branches (30.2 percent of total bank branches), Makkah region 442 branches (21.3 percent), the Eastern Region 408 branches (19.7 percent), the Asir region 128 branches (6.2 percent), Al-Qassim region 120 branches (5.8 percent), and Al-Madinah region 104 branches (5.0 percent) (Table 5-12).
Number of Employees in Banking SectorThe number of employees in the banking sector grew by 0.1 percent to 47,181 in 2019. Saudi employees (both male and female) represented
Table 5-11: Key Sources and Uses of Financial Resources of Commercial Banks in 2019
(Billion SAR)
Uses Amount Share Resources Amount Share
Cash and reserves 16.5 7.3 Total deposits 122.5 54.1
Foreign assets 11.8 5.2 Foreign liabilities 62.2 27.5
Claims on the private sector 101.3 44.7 Capital base 41.8 18.5
Claims on non-monetary financial institutions 0.4 0.2
Claims on the public sector 7.9 3.5
Claims on the central govern-ment 86.3 38.1
Net other liabilities 2.5 1.1
Total 226.5 100.0 Total 226.5 100.0

73
Bank
ing
Sect
or
94.3 percent (44,482) of the total number of employees in the banking sector. Saudi male employees accounted for 78.4 percent of the total number of employees as compared to 5.7 percent of non-Saudi male employees. Saudi female employees represented 15.9 percent of the total number of employees, and non-Saudi female employees accounted for 0.04 percent.
Banking Technology Developments in 2019I. Clearing House OperationsThe number of commercial and personal checks cleared through clearing houses in Saudi Arabia decreased by 14.6 percent (491.9 thousand checks) in 2019, bringing down their value by 8.6 percent to SAR 260.5 billion. However, the average check value increased by 7 percent from SAR 84,652 in
2018 to SAR 90,576 in 2019.In general, the decrease in the number of commercial and personal checks was due to the expansion in using banking technology, including POS terminals. The number of checks in the Riyadh clearing house fell by 15.8 percent to one million, Dammam 14.7 percent to 823.9 thousand, Jeddah 13.9 percent to 621 thousand, Madinah 26.6 percent to 63.5 thousand, Buraidah 10.7 percent to 131 thousand, Makkah 8.8 percent to 74.4 thousand, Tabuk 11.4 percent to 28 thousand, Ta’if 10.3 percent to 21 thousand, and Abha 5.2 percent to 79.9 thousand (Chart 5-10).
II. MadaDuring 2019, the Saudi Payment Network (Mada) achieved a positive growth in all of its operations. The number of ATMs operating in Saudi Arabia
Chart 5-10: Percentage Shares of Commercial and Personal Checks Cleared by City
0 5 10 15 20 25 30 35 40 45 50 0 5 10 15 20 25 30 35 40 45 50
2018 2019
Al-Ta'if
Tabuk
Jazan
Makkah
Al-Madinah
Abha
Buraydah
Jeddah
Dammam
Riyadh
Table 5-12: Bank Branches Classified by Administrative Region (End of year)
Riyadh Makkah Madinah Eastern Region Qassim Asir Tabuk Hail
Northern Borders Region
Jawf Jazan Najran Baha Total
2015 613 423 92 386 114 119 49 40 15 25 49 25 26 1,976
2016 624 433 100 393 116 124 50 42 16 27 50 27 27 2,029
2017 631 436 106 405 119 126 51 42 17 28 53 27 28 2,069
2018 629 435 105 401 120 127 50 42 17 28 55 28 27 2,064
2019 626 442 104 408 120 128 51 42 17 27 57 27 27 2,076

Saud
i Ara
bian
Mon
etar
y Au
thor
ity |
56th
Ann
ual R
epor
t
74
went up by 1.1 percent to 18,882 compared to a 1.9 percent rise in the preceding year. The number of ATM cards issued also increased by 10.4 percent to 31.5 million at-end 2019 compared to an increase of 0.6 percent in 2018.
The number of withdrawal transactions carried out through Mada increased by 3.6 percent to 983 million in 2019 compared to a rise of 9 percent in the preceding year. The value of withdrawals carried out through Mada rose by 3.5 percent to SAR 468.8 billion compared to a rise of 2.8 percent
in the preceding year. Nonetheless, the number of transactions executed through banks’ networks fell by 3.0 percent to 1.1 billion compared to a rise of 3.1 percent in 2018. The value of cash withdrawals made through banks’ networks also declined by 8.0 percent to SAR 271.8 billion, compared to a 2018 rise of 2.6 percent. As a result, total cash withdrawals declined by 1.0 percent to SAR 740.6 billion (Table 5-13 and Chart 5-11).
On the other hand, the number of POS terminals went up by 24.7 percent to 438,618 in 2019
Table 5-13: ATM Statistics
Year No. of ATMs No. of issued ATM cards
No. of transactions (Million)
Cash withdrawals (Million SAR)
Mada Bank networks Total Mada Bank networks Total
2015 17,223 22,459,275 727 1,069 1,796 435,177 342,023 777,200
2016 17,887 26,537,349 822 1,100 1,923 446,300 307,149 753,449
2017 18,333 28,402,914 870 1,142 2,012 440,729 287,782 728,511
2018 18,685 28,559,828 949 1,177 2,126 452,931 295,394 748,325
2019 18,882 31,540,067 983 1,142 2,125 468,849 271,791 740,640
Chart 5-11: Automated Teller Machine Statistics
20162015 2017 2018 2019
Thou
sand
s
No. of ATMs
0.0
3.0
6.0
9.012.0
15.018.0
21.0
20162015 2017 2018 2019
No. of Cards Issued
0.0
40.0
30.0
20.0
10.0
Mill
ions
Mill
ion
Tra
nsac
tions
Billi
on R
iyal
s
500
600700800
9001000
11001200
1600
1700
1800
1900
2000
2100
2200
2015 2016 2017 2018 2019
Transactions and Withdrawals
No. of Transactions (Left) Cash Withdrawals (Right)

75
Bank
ing
Sect
or
compared to a rise of 15.9 percent in 2018. The number of sales transactions executed through POS terminals rose by 56.5 percent to 1,614 million compared to a rise of 45.7 percent in the preceding year. The value of these transactions also rose by 22.8 percent to SAR 285.3 billion compared to an increase of 15.9 percent in the preceding year (Table 5-14 and Chart 5-12). Higher growth rates in ATM cards and transactions executed through ATMs and POS terminals indicate their expansion in the retail sector in addition to customers’ increased confidence in modern banking technology.
III. Saudi Arabian Riyal Interbank Express System (SARIE)The total number of transactions executed via SARIE increased by 17.1 percent to 159 million in 2019 compared to a rise of 31.2 percent in 2018. A breakdown of SARIE transactions by single and bulk customer payments shows that the number of single payments rose by 23.6 percent to 13.2
million transactions and their value by 24 percent to SAR 4,953.1 billion. The number of bulk payments also increased by 17.2 percent to 143.2 million, and their value went up by 10.8 percent to SAR 2,924 billion.
A classification of SARIE transactions by interbank payments shows that the number of single interbank transactions increased by 22.3 percent to 627.3 thousand during 2019; however, their value fell by 7.1 percent to SAR 40,156.9 billion. In addition, the number of bulk interbank transactions executed through SARIE increased by 27.6 percent to 156.2 thousand and their value by 32.1 percent to SAR 139.8 billion (Tables 5-15A and 5-15B and Chart 5-13).
IV. SADADThe total number of billers from various sectors (such as electricity, water, communications, airline companies, insurance and credit cards) linked to SADAD stood at 211 at the end of 2019. The
Table 5-14: POS Statistics
YearSales
(Million SAR)No. of transactions
(Million)No. of POS terminals
2015 172,835 395 225,372
2016 182,749 525 267,827
2017 200,468 708 303,464
2018 232,306 1,032 351,645
2019 285,319 1,614 438,618
No. of POS Terminals
20162015 2017 2018 2019100150200250300350400
500450
Thou
sand
s
Chart 5-12: OPERATIONS OF P.O.S.
20162015 2017 2018 2019
No. of Transactions (Left) Sales (Right)
300100
12101416182022242628303234363840
500700900
11001300150017001900
Mill
ion
Tran
sact
ions
POS Operation (Monthly)
Billi
on R
iyal
s

Saud
i Ara
bian
Mon
etar
y Au
thor
ity |
56th
Ann
ual R
epor
t
76
number of active billers reached 186. In addition, the number of banks linked to SADAD reached 17. Two new banks are in their final stages of linkage to SADAD. The number of transactions executed during 2019 totaled 263.5 million with a total value of SAR 421.8 billion compared to 235.6 million transactions with a total value of SAR 356.5 billion in 2018 (Chart 5-14).
Derivative Market ActivityDerivative transactions in Saudi Arabia increased by 2.4 percent (SAR 27 billion) to SAR 1,133 billion in 2019, compared to SAR 1,106 billion in the preceding year.
Banking CreditworthinessThe Saudi Credit Bureau (SIMAH) continued to
Mill
ion
Tran
sact
ion
Billi
on R
iyal
s
20162015 2017 2018 2019100
150200
250
300
350400450
100
140120
160
200180
220240260280
Volume of Bills Paid Through SADAD (Left)
Value of BillsThrough SADAD (Right)
Chart 5-13: SARIE TransactionsChart 5-14: Volume and value of bill paid through SADAD
Table 5-15A: Number Of SARIE Transactions
(Thousand)
YearCustomer payments Interbank payments Other Total
Bulk Single Total (1) Bulk Single Total (2) (3) (1+2+3)
2015 70,639 8,023 78,663 72 464 537 2,335 81,534
2016 76,084 9,156 85,240 79 468 547 3,497 89,285
2017 89,806 10,299 100,105 137 514 651 2,714 103,470
2018 122,236 10,676 132,912 122 513 635 2,218 135,766
2019 143,230 13,191 156,421 156 627 784 1,779 158,983
Table 5-15B: Value of SARIE Transactions
(Billion SAR)
YearCustomer payments Interbank payments Other* Total
Bulk Single Total (1) Bulk Single Total (2) (3) (1+2+3)
2015 1,984 3,349 5,333 59.2 43,450 43,510 23 48,865
2016 2,067 3,396 5,463 61.4 34,161 34,222 31 39,717
2017 2,180 3,839 6,019 80.1 56,048 56,128 42 62,189
2018 2,640 3,994 6,634 105.8 43,226 43,332 18 49,984
2019 2,924 4,953 7,877 139.8 40,157 40,297 37 48,211
* Including direct debit transactions and SAMA’s claims on banks.
Total Operations of SARIE (Monthly)
Mill
ion
Tran
sact
ions
Billi
on R
iyal
s
20162015 2017 2018 20190.02.04.06.08.0
10.012.014.016.018.0
1000
2000
3000
4000
5000
6000
7000
8000
Number (Left) Value (Right)
77
Bank
ing
Sect
or
improve its services and products provided to all relevant entities during 2019, particularly the retail system “SIMATI”, the corporate system “SIMAT”, the “Shaiki” project, and SMEs evaluation system project “TAQEEM”. Through these services and products, SIMAH aims to provide the necessary and accurate credit information that contributes to enhancing risk assessments, evaluating the creditworthiness of borrowers, and reducing financial risks. SIMAH continued to meet the goals for which it was established as an independent credit information body. Such goals include the following: (1) to complement the finance ecosystem in Saudi Arabia and (2) to develop the credit information sector and its various services in preparation for the expansion of the credit market in Saudi Arabia according to the economic environment and Saudi Vision 2030.
During 2019, SIMAH continued to find the necessary means to develop SIMAT and improve its services. In line with SAMA’s standards, SIMAH introduced a number of enhancements to corporate credit reporting, which included expanding the collateral list, enabling the preview of overall credit facility information, and introducing the “shared limit” concept for facilities in order to have a calculation suite for all possible uses of credit facilities as agreed between the financier and the borrower. Furthermore, SIMAH allowed its members to link their account with one or more specified projects. The linkage helps financiers review and assess the positions and creditworthiness of companies and make a sound decision regarding the financial soundness and credit worthiness of such companies. In addition, SIMAH made enhancements to the way in which credit information is presented in credit reports and increased quality standards to reduce potential errors.
In order to serve the corporate sector at the GCC level, SIMAH further developed SIMAT by initiating
the GCC credit information linkage project. It completed all the technical requirements for linkage through the e-government program “YESSER” in 2019 in preparation for the program’s actual launch in 2020.
In 2019, SIMAH carried on providing credit performance comparison reports, which enable financial institutions to support private sector growth, thus achieving the objectives of the Financial Sector Development Program (FSDP) according to Vision 2030. The reports consider actual challenges that creditors face, the most important of which are the approved credit strategies, marketing plans and credit risk management. These reports also enable creditors to compare their credit performance with their counterparts in the same sector in the market.
In terms of technological advancement, SIMAH is still working on developing electronic linkage systems, including improving the electronic linkage with the Ministry of Justice (MOJ). Through this linkage, the MOJ can obtain the information sufficient for settling enforcement courts’ cases. In addition, SIMAH launched in 2019 the registration in SIMAH services through the National Single Sign-On (SSO) service, with the aim of simplifying procedures that come before obtaining a report and to facilitate access to credit reports and to all other services and products for individuals.
As regards credit education, SIMAH contributed to promoting credit awareness among all segments of society in 2019. It continued to print and distribute copies of the “Procedural Manual for Customer Awareness” that was approved by SAMA in 2018, in addition to publishing it on SIMAH’s website. The manual is aimed at raising customers’ awareness of their credit rights stipulated by the Credit Information Law and its Implementing Regulations.

Saud
i Ara
bian
Mon
etar
y Au
thor
ity |
56th
Ann
ual R
epor
t
78
Developments in Implementation of the Basel III Framework in Saudi ArabiaSAMA continued its efforts toward the timely implementation of Basel Committee on Banking Supervision (BCBS) standards. This included instituting the Internal Liquidity Adequacy Assessment Process (ILAAP), which came into force in January 2018 in order to meet Basel III requirements that stress the importance of measuring and monitoring liquidity risks. Considering that banks have proactively implemented these standards since the beginning of 2016, SAMA has been monitoring their compliance and detecting and addressing any gaps in the implementation process as well as monitoring compliance with any updates to these standards.
Regarding Basel III standards, BCBS has recently issued revisions to the capital requirements relating to credit, market and operational risks as well as the leverage ratio disclosure requirements in order to improve the supervisory framework and lay a foundation for the banking sector’s resilience. SAMA has been studying the revisions issued by BCBS to update relevant instructions in a way that enhances resilience of the banking sector in Saudi Arabia. SAMA has also been updating a number of instructions
to align them with the standards issued by BCBS, in addition to updating the “Rules on Large Exposures of Banks” that set limits on bank exposures for the purpose of managing concentration risk and enhancing supervision of such exposures. Moreover, SAMA issued rules for relevant parties aimed at regulating exposures of banks to related parties so as to avoid conflict of interest.
To support the Saudi economy stability as well as distressed companies, SAMA issued a number of instructions in line with the standards issued by BCBS and international best practices and standards. One of these instructions is the Rules on Management of Problem Loans. The rules set a framework for managing problem loans provided by banks for legal entities. The rules also regulate restructuring processes, thus supporting bank customers including large, medium, small and micro-enterprises. Additionally, SAMA issued rules for disclosing prices of finance and savings products. The rules set the minimum information to be disclosed by finance companies and banks through their marketing channels. The issuance of these rules reflects SAMA’s efforts to improve disclosure and transparency in the financial sector and to provide tools that help consumers choose products that suit their needs.
INSURANCEANDFINANCE

Saud
i Ara
bian
Mon
etar
y Au
thor
ity |
56th
Ann
ual R
epor
t
80
Insurance and Finance Insurance Sector SAMA is keen on improving and developing every aspect that contributes to the growth of insurance sector in order to achieve the objectives of Saudi Vision 2030. This will be accomplished by raising awareness of the social and economic importance of insurance, in addition to continuously updating and improving laws, regulations and instructions in line with changes in the insurance sector and the economy. In this context, SAMA issued Rules for Licensing and Supervision of Branches of Foreign Insurance and Reinsurance Companies in Saudi Arabia. In addition, SAMA adopted several initiatives aimed at improving customer satisfaction, including the following: no claim discounts, encouraging digitization of insurance companies, and requiring companies to establish customer care departments. SAMA also monitors the mechanisms of underwriting and pricing, especially for motor insurance, to ensure that they are based on fair technical foundations. SAMA adopted a number of initiatives to improve Saudi human resources working in the sector through training courses, on-job training, professional certification, and participation in many regional and international workshops. All these measures and initiatives are expected to enhance the quality of the insurance industry, increase competitiveness among companies, promote growth and stability, and reduce potential risks. Consequently, the industry customers in Saudi Arabia will be positively affected. The following were the key developments in 2019.
I. Regulations of Insurance Sector and Key Developments in 2019• SAMA issued the Sound Implementation of
the Transition Plan to IFRS17 to assist in its monitoring of insurance and reinsurance companies’ four-phase transition plan to the standard.
• SAMA issued the Rules for Licensing and Supervision of Branches of Foreign Insurance and/or Reinsurance Companies in Saudi Arabia.
• SAMA issued the draft Rules Governing Insurance Aggregators Activities to keep abreast of the latest technological developments in the financial services sector.
• SAMA updated the Unified Compulsory Motor Insurance Policy to set a maximum limit of one year for insurance companies to use their right of recourse to the insured and claim compensation for what was paid. The update also gives the right for insurance companies to report the insured to a credit information company only if the insured fails to pay the insurance premium and not the outstanding claims based on the right of recourse.
• SAMA updated The Actuarial Work Regulation for Insurance and/or Reinsurance Companies to enhance and regulate actuaries’ performance, which will positively reflect on the insurance industry in Saudi Arabia.
• SAMA banned brokers from combining insurance brokerage activities and reinsurance brokerage activities. This action was taken in order to develop the business environment of brokers and strengthen professional communication with insurance and reinsurance companies, in addition to reducing wrongful practices in their contractual relationships. This will increase retention ratios in local insurance
81
Insu
ranc
e Se
ctor
companies and support the development of national talents and human resources in the insurance sector. SAMA set a one-year grace period to comply with this decision.
• SAMA launched a traffic safety awareness campaign in cooperation with Najm Company for Insurance Services and the General Department of Traffic in line with the Saudi Vision 2030 mandate to improve the quality of life and building a vibrant society and safe roads.
• SAMA encouraged health insurance companies to develop and provide voluntary health insurance for Saudi families, and hold workshops for the companies to further explain this initiative, address challenges and provide solutions and suggestions in this regard.
• The General Secretariat of the Committees for Resolution of Insurance Disputes and Violations established the Conciliation Center at the Secretariat. The Center is tasked with settling claims filed by individuals against insurance companies in disputes arising from motor insurance contracts for individuals, in which the claim amount does not exceed SAR 50,000 in accordance with the rules specified in the Procedures Governing Insurance Dispute Conciliation starting from 19/08/1440H (24/04/2019).
• After coordination with SAMA and the Council of Cooperative Health Insurance, the Ministry of Hajj and Umrah launched the insurance of expatriate Umrah visitors program that provides health and other insurance services. The Program is dedicated to serving Umrah pilgrims from the moment they arrive until they leave.
• SAMA approved the building warranty insurance product, which is the first of its kind in Saudi Arabia. This will contribute to the diversification and expansion of
insurance products.The number of insurance-related rules and regulations until the end of 2019 reached 21, which were published on SAMA’s website.
II. Saudization in the Insurance SectorArticle 2 of the Implementing Regulations of the Cooperative Insurance Companies Control Law states that a key objective of the Law and its Regulations is to develop the insurance sector in Saudi Arabia, including training and Saudization. Furthermore, Article 4 states that the business plan prepared by insurance companies and insurance service providers shall specify the expected number of employees and include a plan for recruiting and qualifying Saudis.In addition, Article 50 emphasizes that insurance companies and insurance service providers must provide SAMA, 45 days prior to the end of each fiscal year, with a report specifying the number, percentage and positions of Saudi employees at the company level and at each branch and/or department level. Article 79 stipulates that “Saudi employees shall not be less than 30 percent at the end of the first year, and to be increased annually in accordance with the business plan submitted to SAMA”. In this context, the total number of employees at insurance companies stood at 11,213 at the end of 2019 compared to 11,726 at the end of 2018, with Saudi employees accounting for 74 percent of total number of employees compared to 72 percent in 2018.
III. TrainingSAMA has exerted substantial efforts to regulate the insurance sector and has urged companies and their employees to be professional and practice insurance business on a technical and methodological basis pursuant to its laws, regulations and instructions. In support of this effort, SAMA has designated the Insurance Fundamentals Certificate Exam (IFCE) as a

Saud
i Ara
bian
Mon
etar
y Au
thor
ity |
56th
Ann
ual R
epor
t
82
Table 6-1: Insurance Indicators
Insurance type
2017 2018 2019
GWP(Million
SAR) Share
NWP(Million
SAR)
NWP/GWP (retention
ratio)*
GWP(Million
SAR) Share
NWP(Million
SAR)
NWP/GWP (Retention
ratio)*
GWP(Million
SAR) Share
NWP(Million
SAR)
NWP/GWP (retention
ratio)*
Accident, liability and others
1,054.2 2.9 506.3 48.0 1,001.3 2.9 470.4 47.0 1,121.4 3.0 486.6 43.4
Motor insurance 11,136.4 30.5 10,388.2 93.3 9,423.3 26.9 8,860.4 94.0 8,603.6 22.7 8,117.1 94.3
Property/fire insurance
1,708.5 4.7 322.4 18.9 1,697.9 4.8 314.0 18.5 1,844.6 4.9 314.6 17.1
Marine insurance 621.8 1.7 172.4 27.7 544.6 1.6 155.4 28.5 653.6 1.7 181.2 27.7
Aviation insurance 134.9 0.4 5.7 4.2 148.0 0.4 5.3 3.6 158.5 0.4 4.0 2.5
Energy insurance 739.0 2.0 17.2 2.3 511.5 1.5 3.5 0.7 700.4 1.8 12.8 1.8
Engineering insurance 932.4 2.6 168.6 18.1 701.7 2.0 120.2 17.1 1,198.4 3.2 144.2 12.0
Total general insurance
16,327.4 44.7 11,580.9 70.9 14,028.4 40.1 9,929.2 70.8 14,280.7 37.7 9,260.6 64.8
Total health insurance 19,035.5 52.1 18,411.6 96.7 19,883.4 56.8 19,319.4 97.2 22,474.9 59.3 21,622.0 96.2
Total protection and savings insurance
1,140.3 3.1 846.2 -- 1,102.7 3.1 794.8 -- 1,134.9 3.0 797.2 --
Total 36,503.2 100.0 30,838.7 84.5 35,014.5 100.0 30,043.4 85.8 37,890.5 100.0 31,679.7 83.6
(--) Retention ratios for protection and savings insurance are not included because the savings component included in Saudi companies’ contracts should be retained; therefore, retention ratios of this insurance type cannot be compared to other types of insurance.
mandatory requirement that should be obtained by employees of insurance companies and insurance service providers. The IFCE covers the main principles of insurance rules and regulations and allows workers in the insurance sector to obtain qualification by giving them the basic knowledge and skills. The key achievements in 2019 were as follows:• Several development workshops on the Risk-
Based Supervisory Framework and the IFRS17 were held.
• SAMA launched the second version of the Advanced Diploma in Insurance (ACII) provided by the Chartered Insurance Institute for 15 participants working in the sector under SAMA’s full support and supervision.
IV. Insurance Market in Saudi Arabia in 2019a) Overall Market Performance • The insurance market witnessed an increase
of 8.2 percent in gross written premiums (GWP) to SAR 37.9 billion in 2019 compared to a decrease of 4.1 percent in 2018 (Table 6-1).
• Health insurance GWP, which represented 59.3 percent of the total GWP, increased by 13 percent to SAR 22.5 billion at the end of 2019 compared to a rise of 4.5 percent in 2018.
• General insurance GWP, which represented 37.7 percent of the total GWP, increased by 1.8 percent to SAR 14.3 billion at the end of 2019 compared to a decline of 14.1 percent in 2018. Motor insurance GWP, which

83
Insu
ranc
e Se
ctor
Table 6-2: Insurance Penetration to GDP (At Current Prices)
(Percentage)
Insurance type2017 2018 2019 Change%
GDP Non-oil GDP GDP Non-oil
GDP GDP Non-oil GDP GDP Non-oil
GDP
Total general insurance 0.64 0.89 0.48 0.73 0.48 0.70 0.45 -3.1
Total health insurance 0.74 1.04 0.68 1.03 0.76 1.11 11.54 7.6
Total protection and savings insurance
0.04 0.06 0.04 0.06 0.04 0.06 1.56 -2.0
Total 1.42 1.99 1.19 1.82 1.27 1.87 6.78 3.0
represented 60.2 percent of the total general insurance GWP, dropped by 8.7 percent to SAR 8.6 billion at the end of 2019 compared to a decline of 15.4 percent in 2018.
• Protection and savings insurance GWP, which represented 3 percent of the total GWP, went up by 2.9 percent to SAR 1.1 billion at the end of 2019 compared to a decrease of 3.3 percent in 2018.
b) Net Written Premiums (NWP)NWP is defined as the gross written premiums less the share of reinsurance. Health and motor insurance accounted for 68.3 percent and 25.6 percent respectively of total NWP in 2019. Total health insurance NWP grew by 11.9 percent, while motor insurance NWP recorded a fall of 8.4 percent. Total aviation insurance NWP dropped by 23.7 percent. Other insurance types recorded an annual increase compared to 2018 as energy insurance registered the highest increase of 265.9 percent, followed by engineering insurance with 20 percent and Marine insurance with 16.6 percent (Table 6-1).
c) Retention RatioThe retention ratio is a measure of risks in written premiums retained by an insurance company as there is a direct relationship between the retention ratio and risks. The ratio is calculated by dividing the NWP by GWP. The overall retention ratio of insurance companies in the Saudi insurance market was 83.6 percent in 2019 compared to 85.8 percent
in 2018. This ratio was largely affected by the high retention ratios for motor and health insurance, which were estimated at 94.3 percent and 96.2 percent, respectively. On the other hand, energy insurance recorded the lowest retention ratio of 1.8 percent in 2019 (Table 6-1).
d) Insurance Market Penetration and DensityInsurance penetration is measured by the ratio of gross written premiums to GDP. The level of insurance penetration in Saudi Arabia stood at 1.27 percent in 2019 compared to 1.19 percent in 2018, with GWP to Non-oil GDP ratio amounting to 1.87 percent in 2019 compared to 1.82 percent in 2018 (Table 6-2).Insurance density is defined as per capita expenditure on insurance (GWP divided by the total population). The per capita insurance density increased by 5.7 percent to SAR 1,107.3 in 2019 from SAR 1,047.9 in 2018 (Table 6-3).
e) Commissions Paid to Insurance Brokers and Agents The amount of commissions paid by insurance companies to insurance brokers and agents totaled SAR 1.76 billion in 2019 compared to SAR 1.4 billion in 2018. Motor insurance commissions constituted 29.5 percent of total commissions paid in 2019 compared to 35.8 percent in 2018, while those of health insurance accounted for 43.6 percent of total commissions paid in 2019 compared to 43.9 percent in 2018 (Table 6-4).

Saud
i Ara
bian
Mon
etar
y Au
thor
ity |
56th
Ann
ual R
epor
t
84
f) Total Claims Paid by Type of Insurance Total claims paid increased by 4.5 percent to SAR 28.4 billion in 2019 compared to SAR 27.2 billion in 2018. Health and motor insurance claims accounted for 65.2 percent and 22.9 percent, respectively, of total claims paid in 2019. These high ratios reflected the high shares of these types of insurance in the total market premiums. Energy insurance recorded the highest growth rate of total claims paid with a hike of 193.9 percent in 2019, followed by marine insurance with 98.7 percent. However, engineering insurance registered the highest decline of 37.7 percent (Table 6-5).
V. Status of Insurance Companies in Saudi Arabia The number of insurance and reinsurance companies approved by the Council of Ministers until the end of 2019 was 34, of which 33 are
already operating in the industry (Table 6-6). The Saudi insurance sector witnessed several mergers in 2019, supported by SAMA’s desire to strengthen insurance companies and increase their ability to compete in the market to avoid the outflow of insurance investments. Furthermore, SAMA received merger applications from local insurance companies operating in the sector. Two insurance companies announced receiving SAMA’s no objection letters on their merger, and other companies signed non-binding bilateral memorandums of understanding to assess the feasibility of merger.
VI. Council of Cooperative Health Insurance At the end of 2019, the total number of individuals with health insurance reached 11.1 million, including 7.6 million expatriates. The number of
Table 6-3: Insurance Market Density
(Riyals per capita)
Insurance type 2015 2016 2017 2018 2019 Change%
Total general insurance 536.0 540.3 501.6 419.8 417.3 -0.6
Total health insurance 616.4 586.1 584.8 595.1 656.8 10.4
Total protection and savings insurance 33.7 33.1 35.0 33.0 33.2 0.5
Total 1,186.1 1,159.4 1,121.4 1,047.9 1,107.3 5.7
Table 6-4: Commissions Paid by Type of Business
Insurance type
2017 2018 2019 Change%
Million SAR Share Million
SAR Share MillionSAR Share 2018-2019
Accident, liability and others 85.0 4.54 86.3 6.15 119.5 6.77 38.44
Motor insurance 780.8 41.68 502.6 35.83 521.1 29.55 3.69
Property/fire insurance 117.4 6.27 103.6 7.39 169.4 9.61 63.54
Marine insurance 43.2 2.31 35.9 2.56 58.1 3.29 61.58
Aviation insurance 1.1 0.06 1.3 0.09 2.0 0.11 50.24
Energy insurance 1.1 0.06 1.2 0.08 5.5 0.31 378.39
Engineering insurance 51.5 2.75 36.6 2.61 65.5 3.72 78.95
Total general insurance 1,080.0 57.65 767.6 54.72 941.1 53.37 22.62
Total health insurance 762.8 40.72 615.8 43.90 769.7 43.64 24.99
Total protection and savings insurance 30.5 1.63 19.4 1.38 52.7 2.99 171.83
Total 1,873.3 100.00 1,402.8 100.00 1,763.5 100.00 25.72
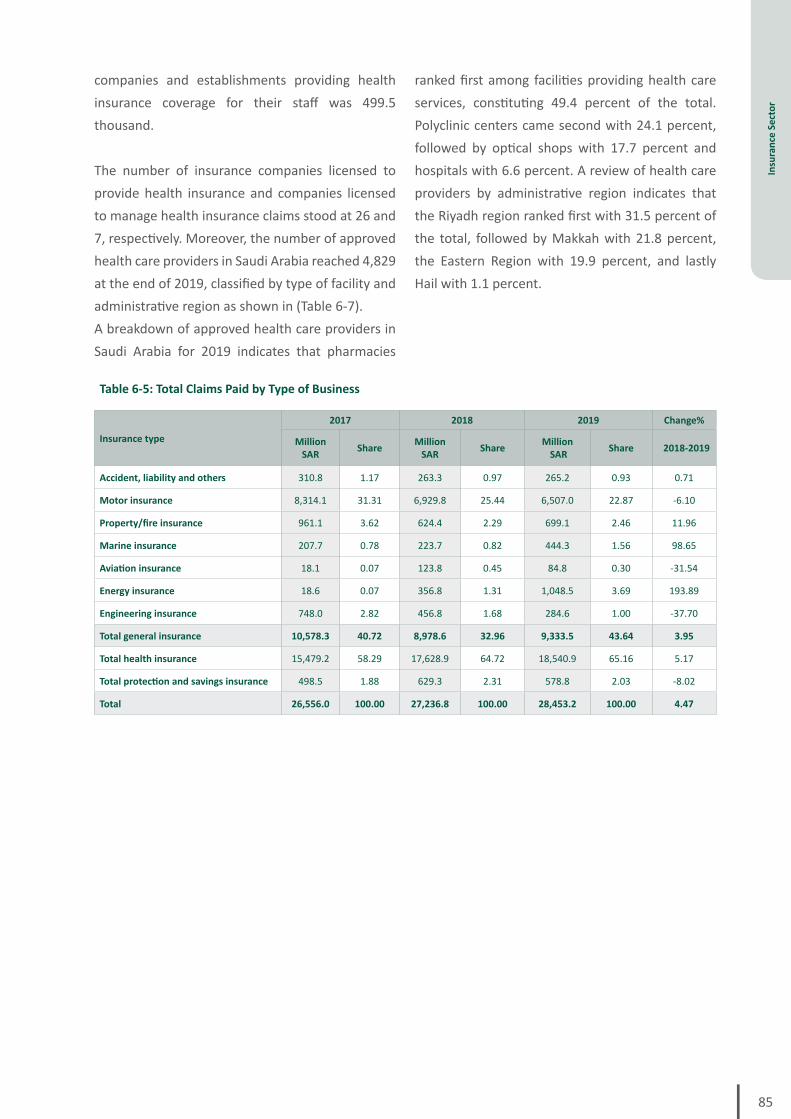
85
Insu
ranc
e Se
ctor
companies and establishments providing health insurance coverage for their staff was 499.5 thousand.
The number of insurance companies licensed to provide health insurance and companies licensed to manage health insurance claims stood at 26 and 7, respectively. Moreover, the number of approved health care providers in Saudi Arabia reached 4,829 at the end of 2019, classified by type of facility and administrative region as shown in (Table 6-7).A breakdown of approved health care providers in Saudi Arabia for 2019 indicates that pharmacies
Table 6-5: Total Claims Paid by Type of Business
Insurance type
2017 2018 2019 Change%
Million SAR Share Million
SAR Share Million SAR Share 2018-2019
Accident, liability and others 310.8 1.17 263.3 0.97 265.2 0.93 0.71
Motor insurance 8,314.1 31.31 6,929.8 25.44 6,507.0 22.87 -6.10
Property/fire insurance 961.1 3.62 624.4 2.29 699.1 2.46 11.96
Marine insurance 207.7 0.78 223.7 0.82 444.3 1.56 98.65
Aviation insurance 18.1 0.07 123.8 0.45 84.8 0.30 -31.54
Energy insurance 18.6 0.07 356.8 1.31 1,048.5 3.69 193.89
Engineering insurance 748.0 2.82 456.8 1.68 284.6 1.00 -37.70
Total general insurance 10,578.3 40.72 8,978.6 32.96 9,333.5 43.64 3.95
Total health insurance 15,479.2 58.29 17,628.9 64.72 18,540.9 65.16 5.17
Total protection and savings insurance 498.5 1.88 629.3 2.31 578.8 2.03 -8.02
Total 26,556.0 100.00 27,236.8 100.00 28,453.2 100.00 4.47
ranked first among facilities providing health care services, constituting 49.4 percent of the total. Polyclinic centers came second with 24.1 percent, followed by optical shops with 17.7 percent and hospitals with 6.6 percent. A review of health care providers by administrative region indicates that the Riyadh region ranked first with 31.5 percent of the total, followed by Makkah with 21.8 percent, the Eastern Region with 19.9 percent, and lastly Hail with 1.1 percent.

Saud
i Ara
bian
Mon
etar
y Au
thor
ity |
56th
Ann
ual R
epor
t
86
Table 6-6: Licensed Insurance and Reinsurance Companies Up to the End of 2019
Name Paid-up capital (Million SAR) Licensed on
National Company for Cooperative Insurance (NCCI) 1,250 02/12/2004
Malath Cooperative Insurance & Reinsurance Company 500 11/09/2007
The Mediterranean & Gulf Cooperative Insurance & Reinsurance (MedGulf) 800 11/09/2007
Salama Cooperative Insurance Company 250 11/09/2007
SABB Takaful 340 11/09/2007
Arabian Shield Cooperative Insurance 300 11/09/2007
AlAhli Takaful Company 167 11/09/2007
Saudi Arabian Cooperative Insurance Company (SAICO) 300 11/09/2007
Gulf Union Cooperative Insurance Company 150 11/09/2007
Sanad for Cooperative Insurance and Reinsurance (SANAD) 200 08/03/2008
Assurance Saudi Fransi (Allians) 200 08/03/2008
Trade Union Cooperative Insurance Company 400 31/03/2008
Al Sagr Cooperative Insurance Company 400 31/03/2008
Saudi Indian Company for Cooperative Insurance 100 10/06/2008
Arabia Insurance Cooperative Company 265 18/06/2008
Saudi United Cooperative Insurance company (Wala'a) 528 02/07/2008
Saudi Reinsurance Company (Saudi Re) 810 21/07/2008
Bupa Arabia for Cooperative Insurance 1,200 10/08/2008
United Cooperative Assurance (UCA) 400 30/12/2008
Al Ahlia for Cooperative Insurance 123 20/03/2009
Allied Cooperative Insurance Group (ACIG) 200 10/05/2009
Al-Rajhi Company for Cooperative Insurance 400 17/11/2009
Chubb Arabia Cooperative Insurance Company 200 08/12/2009
Al-Alamiya Co-operative Insurance Company 400 13/12/2009
AXA Cooperative Insurance Company 500 26/01/2010
Gulf General Cooperative Insurance Company 200 03/06/2010
MetLife Inc. and AIG, the Arab Bank for Cooperative Insurance 180 29/03/2010
Buruj Cooperative Insurance Company 300 29/05/2010
National Insurance Company 200 16/06/2010
AMANA Cooperative Insurance 240 06/07/2010
Solidarity Saudi Takaful Company 250 20/03/2011
Saudi Enaya Cooperative Insurance Company 300 07/08/2012
Alinma Tokio Marine Company 300 30/09/2012
Aljazira Takaful Taawuni Company 350 18/12/2013

87
Insu
ranc
e Se
ctor
Table 6-7: Authorized Healthcare Providers in 2019
Regi
on/T
ype
of In
stitu
tions
Hosp
itals
Gen
eral
med
ical
com
plex
es
(One
-day
ope
ratio
n ce
nter
s) +
sp
ecia
lized
med
ical
com
plex
es
(One
-day
ope
ratio
n ce
nter
s)
Med
ical
com
plex
es
One
-phy
sici
an c
linic
s
X-ra
y ce
nter
s
Phys
ical
ther
apy
cent
ers
Med
ical
labo
rato
ries
Phar
mac
ies
Opti
cal s
tore
s
Devi
ces a
nd p
rost
hetic
s sto
res
Dial
ysis
cen
ters
Pros
theti
cs c
ente
rs
Nut
rition
cen
ters
Spee
ch a
nd h
earin
g ce
nter
s
Psyc
hoth
erap
y ce
nter
s
Care
and
reha
bilit
ation
cen
ters
fo
r per
sons
with
dis
abili
ties
Hear
ing
aid
cent
ers
Mai
n ce
nter
s of S
audi
Red
Cr
esce
nt A
utho
rity
Oth
ers
Disp
ensa
ries
Tota
l
Riyadh 72 12 405 1 1 12 3 649 357 0 0 0 1 5 0 1 3 1 0 0 1,523
Makkah 71 6 267 1 2 9 2 536 149 0 1 0 0 5 1 0 2 1 0 0 1,053
Madinah 22 3 52 0 0 0 0 135 59 0 0 1 0 0 0 0 0 1 0 0 273
Qassim 12 1 41 0 0 1 0 59 34 0 0 0 0 0 0 0 0 0 0 0 148
Eastern Region 57 6 201 0 1 10 1 529 154 0 1 0 0 0 0 0 0 1 0 0 961
Asir 25 4 57 0 0 2 0 148 39 0 0 0 0 0 0 0 0 0 0 0 275
Tabuk 11 0 24 0 0 0 0 76 21 0 0 0 0 0 0 0 0 0 0 0 132
Hail 8 0 19 0 0 0 0 51 5 0 0 0 0 0 0 0 0 0 0 0 83
Northern Borders Region
8 0 12 0 0 0 0 41 2 0 0 0 0 0 0 0 0 0 0 0 63
Jazan 13 0 30 0 0 2 0 63 16 0 0 0 0 0 0 0 0 0 0 0 124
Najran 9 0 23 0 0 0 0 32 12 0 0 0 0 0 0 0 0 0 0 0 76
Baha 5 1 21 0 0 0 0 20 5 0 0 0 0 0 0 0 0 0 0 0 52
Jawf 6 0 12 0 0 0 0 45 3 0 0 0 0 0 0 0 0 0 0 0 66
Total 319 33 1,164 2 4 36 6 2,384 856 0 2 1 1 10 1 1 5 4 0 0 4,829
Source: Council of Cooperative Health Insurance.

Saud
i Ara
bian
Mon
etar
y Au
thor
ity |
56th
Ann
ual R
epor
t
88
Finance SectorSAMA is entrusted with regulatory and supervisory functions over the finance sector in Saudi Arabia, taking the actions necessary to maintain its soundness and stability and protect its workers and clients’ rights. Moreover, SAMA develops regulatory and supervisory frameworks to enhance the financial stability of this sector, ensure fair transactions for all stakeholders, and support sustainable economic growth.
SAMA is also responsible for issuing licenses to practice finance activities in accordance with finance laws and regulations. The following are the key developments regarding finance companies infrastructure, supervisory and control functions, and the protection of consumer rights.
I. Developments and RegulationsThe key developments in SAMA’s work to advance the non-banking finance sector during 2019 were as follows:• Working on the Risk-Based Supervision
Project for Finance Companies, which is aimed at directing resources towards high-risk activities.
• Issuing a number of regulations for the finance companies sector, including Rules Regulating Consumer Microfinance Companies, the Updated Rules of Engaging in Microfinance Activity, cancelling compulsory IPOs of finance companies, amending some articles of the Implementing Regulations of the Finance Companies Control Law and the Rules Governing Disposal of Finance Assets or Their Contractual Rights, Rules for Lessor’s Recovery of Movable Assets in Finance Lease Contracts, and Requirements of Mortgage Registration and Documentation.
• SAMA is working on a number of initiatives aimed at training finance companies’ employees and improving awareness of
rules and regulations within the finance companies sector.
With regard to SAMA’s supervisory role, 23 circulars were issued during 2019 on a number of topics related to finance companies’ activities, including (1) a circular regarding rules on ownership of properties within Makkah and Madinah’s borders for banks and real estate finance companies, (2) a circular on amendment of some articles of the Implementing Regulations of the Finance Companies Control Law and Rules Governing Disposal of Finance Assets, and (3) a circular on the updated Microfinance Rules. The circulars were issued with the aim of protecting clients’ rights and advancing and maintaining the stability of the sector.
A number of controls and rules were also issued in 2019, including (1) the Rules on Outsourcing for Finance Companies, (2) the second update of the Requirements for Appointments to Senior Positions in Financial Institutions Supervised by SAMA, (3) the Controls for the Settlement of Total Loss in Motor Finance Lease Contracts, and (4) Rules for Lessor’s Recovery of Movable Assets in Finance Lease Contracts. The total number of finance-related rules and regulations published on SAMA’s website until the end of 2019 reached 22.
II. Finance Companies Licensed to Operate in Saudi Arabia The number of licensed finance companies stood at 38 in 2019 with six real estate finance companies, one real estate refinance company, one microfinance company, one contract registration company, and 29 companies offering other types of finance (Table 6-8). It is worth mentioning that in 2019, initial approvals were granted to three new finance companies. There were three licensing visits, 20 finance company visits, and 128 inspection visits during the year.

89
Insu
ranc
e Se
ctor
The finance portfolio for the sector totaled around SAR 50.2 billion at the end of 2019, as compared to SAR 47.6 billion at the end of 2018. Real estate finance accounted for 39.6 percent of the total finance portfolio. The total capital of all of the finance companies exceeded SAR 14 billion (Table 6-8).
In terms of employment and Saudization, the total number of employees at finance companies in Saudi Arabia reached 5,498 at the end of 2019, with Saudis constituting 80 percent of the total number.
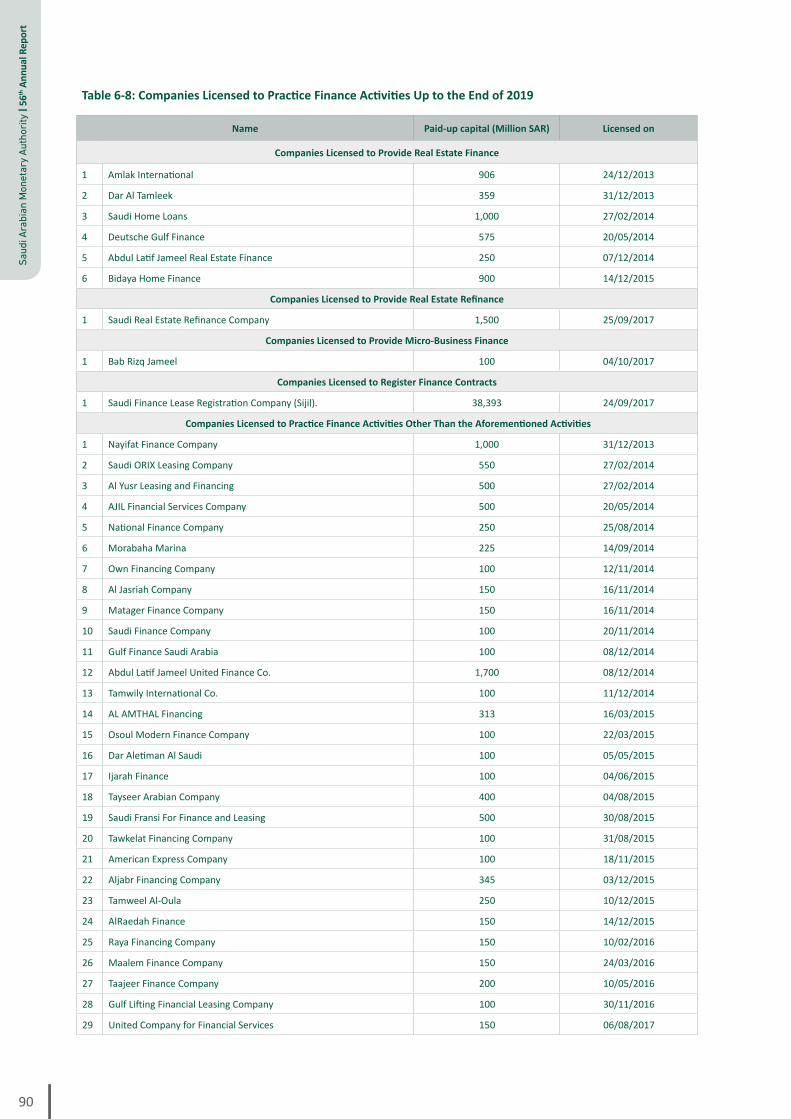
Saud
i Ara
bian
Mon
etar
y Au
thor
ity |
56th
Ann
ual R
epor
t
90
Table 6-8: Companies Licensed to Practice Finance Activities Up to the End of 2019
Name Paid-up capital (Million SAR) Licensed on
Companies Licensed to Provide Real Estate Finance
1 Amlak International 906 24/12/2013
2 Dar Al Tamleek 359 31/12/2013
3 Saudi Home Loans 1,000 27/02/2014
4 Deutsche Gulf Finance 575 20/05/2014
5 Abdul Latif Jameel Real Estate Finance 250 07/12/2014
6 Bidaya Home Finance 900 14/12/2015
Companies Licensed to Provide Real Estate Refinance
1 Saudi Real Estate Refinance Company 1,500 25/09/2017
Companies Licensed to Provide Micro-Business Finance
1 Bab Rizq Jameel 100 04/10/2017
Companies Licensed to Register Finance Contracts
1 Saudi Finance Lease Registration Company (Sijil). 38,393 24/09/2017
Companies Licensed to Practice Finance Activities Other Than the Aforementioned Activities
1 Nayifat Finance Company 1,000 31/12/2013
2 Saudi ORIX Leasing Company 550 27/02/2014
3 Al Yusr Leasing and Financing 500 27/02/2014
4 AJIL Financial Services Company 500 20/05/2014
5 National Finance Company 250 25/08/2014
6 Morabaha Marina 225 14/09/2014
7 Own Financing Company 100 12/11/2014
8 Al Jasriah Company 150 16/11/2014
9 Matager Finance Company 150 16/11/2014
10 Saudi Finance Company 100 20/11/2014
11 Gulf Finance Saudi Arabia 100 08/12/2014
12 Abdul Latif Jameel United Finance Co. 1,700 08/12/2014
13 Tamwily International Co. 100 11/12/2014
14 AL AMTHAL Financing 313 16/03/2015
15 Osoul Modern Finance Company 100 22/03/2015
16 Dar Aletiman Al Saudi 100 05/05/2015
17 Ijarah Finance 100 04/06/2015
18 Tayseer Arabian Company 400 04/08/2015
19 Saudi Fransi For Finance and Leasing 500 30/08/2015
20 Tawkelat Financing Company 100 31/08/2015
21 American Express Company 100 18/11/2015
22 Aljabr Financing Company 345 03/12/2015
23 Tamweel Al-Oula 250 10/12/2015
24 AlRaedah Finance 150 14/12/2015
25 Raya Financing Company 150 10/02/2016
26 Maalem Finance Company 150 24/03/2016
27 Taajeer Finance Company 200 10/05/2016
28 Gulf Lifting Financial Leasing Company 100 30/11/2016
29 United Company for Financial Services 150 06/08/2017

CONSUMER PRICE INDEX

Saud
i Ara
bian
Mon
etar
y Au
thor
ity |
56th
Ann
ual R
epor
t
92
Consumer Price Index
Inflation in Saudi Arabia is measured by using the general consumer price index (CPI) calculated by the General Authority for Statistics (GaStat). The CPI is one of the most important economic statistics relating to daily life of individuals. It provides information on the average price change of a basket of goods and services purchased by households in the Saudi markets.
At the beginning of 2020, GaStat rebased the CPI to 2018 from 2013, the previous year, based on the international recommendations that suggest changing the base year every five years. In this regard, GaStat updated the weights and components of the consumer basket and changed the base year based on the results of the 2018 Household Income and Expenditure Survey.
In its update, GaStat followed the latest Classification of Individual Consumption According to Purpose (COICOP) issued by the UN in order to establish divisions, groups and classes constituting the consumer basket. GaStat also used the modified Laspeyres formula in calculating the CPI, which depends on the geometric mean of proportional distribution, in line with the international recommendations in this regard.
Consumer Price Index in 2019The general CPI declined by 2.1 percent in 2019 versus a 2.5 percent rise in 2018. The non-oil GDP deflator, which captures the average prices of all goods and services produced in the non-oil sector within a given year, rose by 0.9 percent in 2019 compared to an increase of 4.3 percent in 2018 (Table 7-1).
In 2019, most major components of the general CPI recorded inflation rates lower than the average annual change for the past three years (2016-2018). However, food and beverages, education, clothing and footwear, and restaurants and hotels registered inflation rates higher than the average annual change for the past three years (2016-2018). Seven sections of the CPI recorded an annual decrease in 2019, namely housing, water, electricity, gas and other fuels with 8.6 percent; recreation and culture with 1.7 percent; transport as well as clothing and footwear with 1.4 percent each; communication with 1.3 percent; home furnishing, equipment and maintenance with 0.6 percent; and miscellaneous goods and services with 0.4 percent. On the other hand, restaurants and hotels increased by 3.2 percent, education by 2.5 percent, food and beverages by 2.1 percent, tobacco by 1.0 percent, and health by 0.1 percent (Table 7-2).
Table 7-1: Annual Growth Rates of Selected Indicators
(Percentage)
2016 2017 2018 2019
Non-oil GDP deflator (2010 = 100)* 1.4 0.2 4.3 0.9
General Consumer Price Index for All Cities (2018 = 100) 2.1 -0.8 2.5 -2.1
Non-oil GDP at constant prices (2010 = 100)* 0.2 1.3 2.2 3.3
Government expenditure -17.1 12.0 16.1 -1.9
Money supply (M3) 0.8 0.3 2.7 7.1
* Preliminary data in 2019 Sources: GaStat, MoF & SAMA.

93
Cons
umer
Pric
e In
dex
Effect of Major Sections on Consumer Price IndexMost major sections contributed to the CPI by various rates during 2019. Housing, water, electricity, gas and other fuels contributed the most with 63.3 percent, followed by food and beverages with 12.1 percent; transport with 7.3 percent; restaurants and hotels with 5.5 percent; miscellaneous goods and services with 2.6 percent; education as well as communication with 2.2 percent each; home furnishing, equipment and maintenance with 1.7 percent; clothing and footwear with 1.5 percent; recreation and culture with 1.4 percent; and lastly tobacco and health with 0.2 percent and 0.1 percent respectively (Table 7-3 and Chart 7-1).
Wholesale Price Index in 2019The wholesale price index (WPI) measures the average changes in local and imported commodities in wholesale markets over two different periods of time. The WPI represents a sample of 343 items categorized into five
main sections according to the Central Product Classification (CPC2). The index increased by 2.0 percent in 2019 against a rise of 16.0 percent in 2018. In 2019, the WPI witnessed an increase in
Table 7-2: General Consumer Price Index (All Population)
(2018 = 100)
2015 2016 2017 2018 2019Average
annual change (2016-2018)
Change% 2019
General Index 96.4 98.4 97.6 100.0 97.9 1.2 -2.1
Food and Beverages 96.0 94.7 93.9 100.0 102.1 1.4 2.1
Tobacco 55.3 63.2 80.0 100.0 101.0 22.0 1.0
Clothing and Footwear 109.8 110.9 107.5 100.0 98.6 -3.0 -1.4
Housing, Water, Electricity, Gas, and Other Fuels 97.3 102.0 101.2 100.0 91.4 1.0 -8.6
Home Furnishing, Equipment and Maintenance 99.9 100.4 98.5 100.0 99.4 0.0 -0.6
Health 94.3 96.3 96.3 100.0 100.1 2.0 0.1
Transport 85.8 92.2 90.3 100.0 98.6 5.4 -1.4
Communication 99.5 99.7 98.8 100.0 98.7 0.2 -1.3
Recreation and Culture 103.4 101.8 98.9 100.0 98.3 -1.1 -1.7
Education 96.2 99.2 99.7 100.0 102.5 1.3 2.5
Restaurants and Hotels 92.2 92.5 93.0 100.0 103.2 2.8 3.2
Miscellaneous Goods and Services 99.1 99.8 99.7 100.0 99.6 0.3 -0.4
Source: GaStat.
Food and Beverages Other Sections*Tobacco
Housing, Water, Electricity,Gas, and Other Fuels
Communication
Home Furnishing, Equipmentand Maintenance
Clothing and Footwear
TransportRestaurants and Hotels
%63.3
%1.5 %5.5
%7.3
%12.1
%2.2%1.7
%6.3%0.2
*Other sections include health; recreation and culture; miscellaneous goods and services; and education.
Chart 7-1: Effect of Major Sections on 2019 Consumer Price Index

Saud
i Ara
bian
Mon
etar
y Au
thor
ity |
56th
Ann
ual R
epor
t
94
some of its main components. Metal products, machinery and equipment recorded the highest increase of 4.9 percent, followed by other goods with 1.2 percent. In contrast, agriculture and fishery products declined by 1.5 percent; ores and minerals by 1.4 percent; and food products, beverages, tobacco and textiles by 0.6 percent (Table 7-4).
Developments and Impact of World PricesIn 2019, the value of merchandise imports including cost, insurance, and freight (CIF) rose by 5.3 percent
to SAR 541.3 billion. The changes in world prices of goods and commodities imported by Saudi Arabia affect the domestic CPI. Based on the Commodity Markets Outlook issued by the World Bank in April 2020, the index of precious metals rose by 8.4 percent in 2019. However, the energy index decreased by 12.6 percent. The indexes of raw materials and food also declined by 4.2 percent and 3.8 percent respectively (Table 7-5).
The CPI in Saudi Arabia is also influenced by price levels in the top countries exporting to Saudi Arabia.
Table 7-3: Impact of Major sections on the General Consumer Price Index (All Cities)
(2018 = 100)
Change% 2019 Weights% Impact of Major sections on 2019 index
General Index -2.1 100.00 100.00
Food and Beverages 2.1 18.78 12.06
Tobacco 1.0 0.60 0.16
Clothing and Footwear -1.4 4.20 1.54
Housing, Water, Electricity, Gas, and Other Fuels -8.6 25.50 63.33
Home Furnishing, Equipment and Maintenance -0.6 6.74 1.68
Health 0.1 1.43 0.12
Transport -1.4 13.05 7.26
Communication -1.3 5.62 2.18
Recreation and Culture -1.7 3.06 1.42
Education 2.5 2.87 2.21
Restaurants and Hotels 3.2 5.60 5.52
Miscellaneous Goods and Services -0.4 12.57 2.57
Source: GaStat.
Table 7-4: Average Annual Wholesale Price Index
(2014 = 100)
Weights% 2017 2018 2019Change%
2018 2019
General Index 100.0 100.7 116.8 119.1 16.0 2.0
Agriculture and fishery products 8.7 101.1 101.9 100.4 0.8 -1.5
Ores and minerals 0.6 93.0 98.7 97.3 6.1 -1.4
Food products, beverages, tobacco and textiles 17.3 100.6 108.1 107.4 7.5 -0.6
*Other goods 33.7 106.7 143.9 145.6 34.9 1.2
Metal products, machinery and equipment 39.7 95.8 101.1 106.1 5.5 4.9
* Other goods include wooden products, pulp and paper, refined petroleum products, basic chemicals, other chemical products and artificialfibers, rubber and plastics products, glass and non-metallic products, furniture and other transportable goods not elsewhere classified. Source: GaStat.
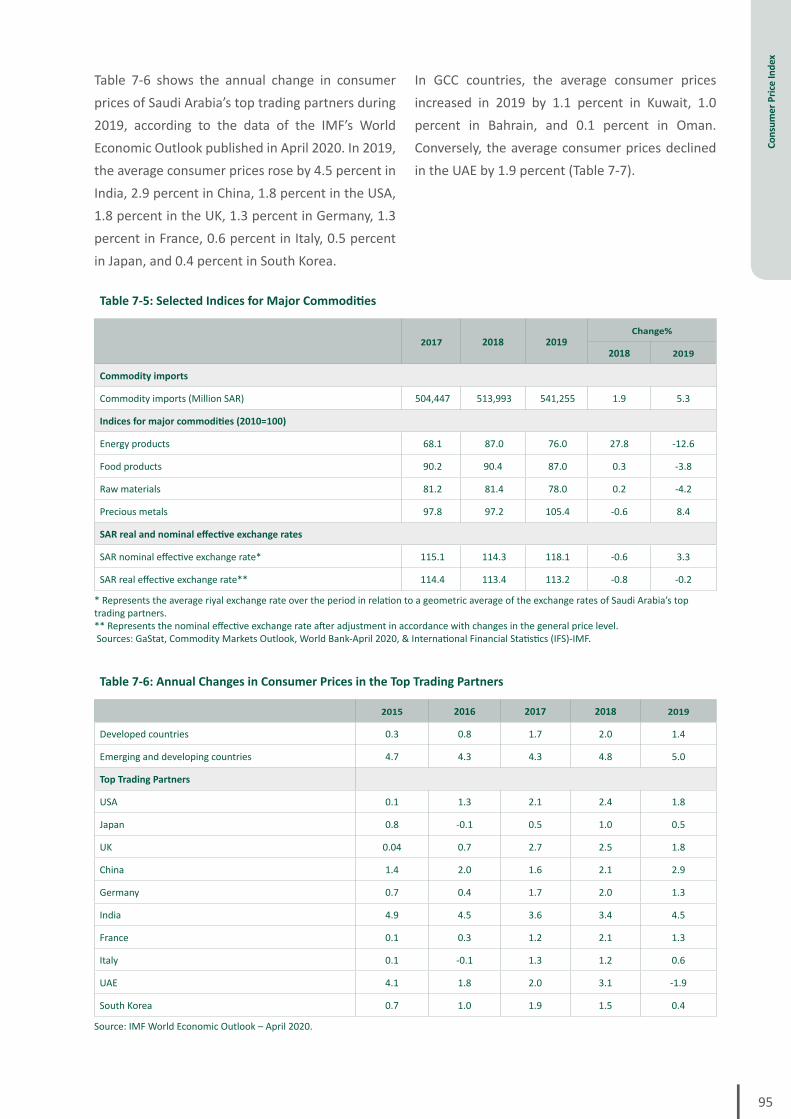
95
Cons
umer
Pric
e In
dex
Table 7-6 shows the annual change in consumer prices of Saudi Arabia’s top trading partners during 2019, according to the data of the IMF’s World Economic Outlook published in April 2020. In 2019, the average consumer prices rose by 4.5 percent in India, 2.9 percent in China, 1.8 percent in the USA, 1.8 percent in the UK, 1.3 percent in Germany, 1.3 percent in France, 0.6 percent in Italy, 0.5 percent in Japan, and 0.4 percent in South Korea.
In GCC countries, the average consumer prices increased in 2019 by 1.1 percent in Kuwait, 1.0 percent in Bahrain, and 0.1 percent in Oman. Conversely, the average consumer prices declined in the UAE by 1.9 percent (Table 7-7).
Table 7-5: Selected Indices for Major Commodities
2017 2018 2019Change%
2018 2019
Commodity imports
Commodity imports (Million SAR) 504,447 513,993 541,255 1.9 5.3
Indices for major commodities (2010=100)
Energy products 68.1 87.0 76.0 27.8 -12.6
Food products 90.2 90.4 87.0 0.3 -3.8
Raw materials 81.2 81.4 78.0 0.2 -4.2
Precious metals 97.8 97.2 105.4 -0.6 8.4
SAR real and nominal effective exchange rates
SAR nominal effective exchange rate* 115.1 114.3 118.1 -0.6 3.3
SAR real effective exchange rate** 114.4 113.4 113.2 -0.8 -0.2
* Represents the average riyal exchange rate over the period in relation to a geometric average of the exchange rates of Saudi Arabia’s top trading partners. ** Represents the nominal effective exchange rate after adjustment in accordance with changes in the general price level. Sources: GaStat, Commodity Markets Outlook, World Bank-April 2020, & International Financial Statistics (IFS)-IMF.
Table 7-6: Annual Changes in Consumer Prices in the Top Trading Partners
2015 2016 2017 2018 2019
Developed countries 0.3 0.8 1.7 2.0 1.4
Emerging and developing countries 4.7 4.3 4.3 4.8 5.0
Top Trading Partners
USA 0.1 1.3 2.1 2.4 1.8
Japan 0.8 -0.1 0.5 1.0 0.5
UK 0.04 0.7 2.7 2.5 1.8
China 1.4 2.0 1.6 2.1 2.9
Germany 0.7 0.4 1.7 2.0 1.3
India 4.9 4.5 3.6 3.4 4.5
France 0.1 0.3 1.2 2.1 1.3
Italy 0.1 -0.1 1.3 1.2 0.6
UAE 4.1 1.8 2.0 3.1 -1.9
South Korea 0.7 1.0 1.9 1.5 0.4
Source: IMF World Economic Outlook – April 2020.
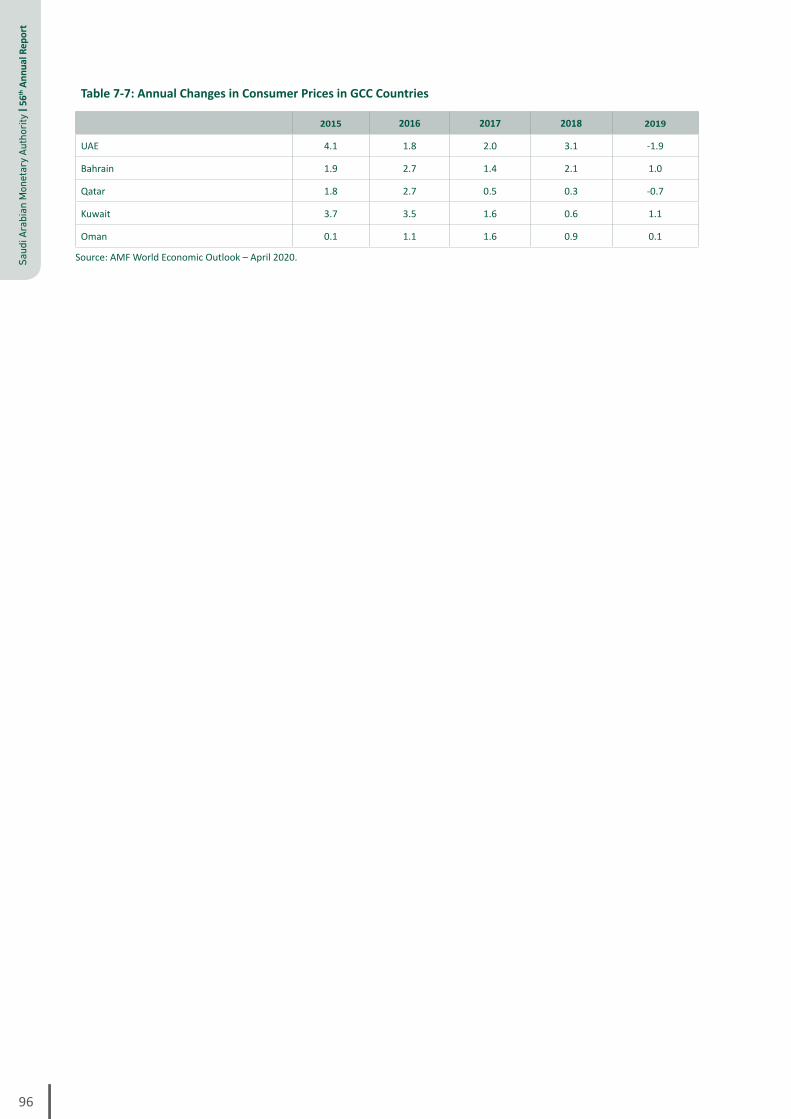
Saud
i Ara
bian
Mon
etar
y Au
thor
ity |
56th
Ann
ual R
epor
t
96
Table 7-7: Annual Changes in Consumer Prices in GCC Countries
2015 2016 2017 2018 2019
UAE 4.1 1.8 2.0 3.1 -1.9
Bahrain 1.9 2.7 1.4 2.1 1.0
Qatar 1.8 2.7 0.5 0.3 -0.7
Kuwait 3.7 3.5 1.6 0.6 1.1
Oman 0.1 1.1 1.6 0.9 0.1
Source: AMF World Economic Outlook – April 2020.

CAPITAL MARKET
Saud
i Ara
bian
Mon
etar
y Au
thor
ity |
56th
Ann
ual R
epor
t
98
Capital Market
The Capital Market Authority (CMA), the regulator and supervisor of the Saudi capital market, took many actions in 2019 aimed at the further development of the financial sector. CMA also strengthened procedures to further reduce risks related to securities transactions, protect investors from unfair practices, and ensure fairness and transparency in securities transactions. In addition, CMA introduced several initiatives under the Financial Leadership Program (FLP) and the Financial Sector Development Program (FSDP) with the aim of solidifying the position of the Saudi capital market as the main market in the Middle East and one of the world’s top ten capital markets. In order to raise investment awareness, CMA continued to carry out many financial awareness and literacy campaigns through media and awareness activities and programs as well as communication with the public.
In 2019, CMA approved the initial public offering of five companies operating in software and services, commercial and professional services, real estate management and development, consumer services, and energy, in addition to one real estate investment trust (REIT). All these companies were listed on the Main Market (Tadawul), bringing the total number of listed companies and REITs to 199 at the end of 2019. Compared to 2018, the Tadawul All Share Index (TASI) went up by 7.2 percent in 2019 although the number of shares traded dropped by 13.1 percent. The total domestic assets of investment funds increased by 42.5 percent (SAR 39.8 billion) to SAR 133.4 billion at the end of 2019.
Tadawul Developments in 2019CMA approved the IPO of the Saudi Arabian Oil Company (Saudi Aramco), which became the world’s biggest-ever IPO, with the company’s listing on the Main Market. The Saudi capital market was further expanded through the listing of new companies and the increase of trading activity and values. CMA also made a number of fundamental changes to the Parallel Market (Nomu). The most notable changes included allowing companies to be directly listed on Nomu without an initial public offering, setting procedures for the transfer of companies from Nomu to the Main Market, and introducing Nomu Capped Index (NomuC)3. In addition, CMA amended the Merger and Acquisition Regulations, through which the merger of the SABB and Alawwal Bank was completed; this was the first merger between listed companies in the history of Tadawul. As part of its efforts to develop the Sukuk and traditional debt instruments market and support the initiatives introduced by the Financial Sector Development Program to deepen the debt instruments market in Saudi Arabia, CMA approved the listing and trading of government debt instruments with a total value exceeding SAR 69 billion in 2019. In addition, in cooperation with the Saudi Stock Exchange (Tadawul) and the National Debt Management Center, CMA made several improvements to the Sukuk and debt instruments market. To enhance the market attractiveness to foreign investors, Tadawul achieved its full inclusion in the Morgan Stanley Capital International (MSCI), Financial Times Stock Exchange (FTSE) Russell, and Standard and Poor’s Dow Jones (S&P DJI) emerging markets indices. In addition, the MSCI Tadawul 30 (MT30) Index was launched. The Index represents the performance of the largest
3 NomuC will follow the same calculation methodology used for the main market indices, with the application of a capping threshold of 20% to limit the weight of any company in the Index, which will be reviewed on a quarterly basis.

99
Capi
tal M
arke
t
and most liquid securities listed on Tadawul for investors.
In addition, Saudi REITs were included in the FTSE EPRA/Nareit Global Real Estate Index. The inclusion is aimed at increasing the level of disclosure and transparency, broadening the investor base, and enhancing accessibility to the capital market by foreign investors.
As for the developments of the Tadawul indices during 2019, TASI closed at 8,389.2 at the end of 2019, compared to 7,826.7 at the end of 2018, increasing by 7.2 percent. TASI registered its highest closing point of 9,362.0 on May 1, 2019. The market capitalization of issued shares dramatically increased by 385.5 percent to SAR 9,025.4 billion at the end of 2019 from SAR 1,859.0 billion at the end of 2018, due to Saudi Aramco’s IPO.
The number of shares traded during 2019 dropped by 13.1 percent to 33.1 billion from 38.1 billion in the preceding year. However, the total value of shares traded increased by 1.1 percent to SAR 880.1 billion from SAR 870.9 billion in 2018. The number of transactions also rose by 13.5 percent to 28.4 million compared to 25.0 million in the preceding year (Table 8-1).
Table 8-1: Saudi Stock Market Indicators
Year No. of shares traded Change%
Value of shares traded
(Billion SAR)
Change%
Market capitalization
of issued shares
(Billion SAR)
Change%No. of trades
(Thousand)Change% TASI Change%
2014 67,134,345,824 30.2 2,146.5 56.7 1,812.9 560.4 35,761.1 23.5 8,333.3 -2.4
2015 64,374,649,643 -4.1 1,660.6 -22.6 1,579.1 -12.9 30,444.2 -14.9 6,911.8 -17.1
2016 65,005,407,626 1.0 1,157.0 -30.3 1,682.0 6.5 27,273.7 -10.4 7,210.4 4.3
2017 43,763,049,609 -32.7 836.3 -27.7 1,689.6 0.5 21,895.3 -19.7 7,226.3 0.2
2018 38,050,788,298 -13.1 870.9 4.1 1,859.0 10.0 25,011.9 14.2 7,826.7 8.3
2019 33,055,251,386 -13.1 880.1 1.1 9,025.4 385.5 28,395.8 13.5 8,389.2 7.2
Source: Saudi Stock Exchange (Tadawul).
The daily average value of traded shares was SAR 3.5 billion in 2019. The daily average number of traded shares decreased by 13.5 percent to 132.2 million from 152.8 million in the preceding year. However, the daily average number of transactions executed went up by 13.1 percent to 113.6 thousand from 100.4 thousand.
On the other hand, Nomu closed at 7,439.9 at the end of 2019 against 2,520.7 at the end of 2018, increasing significantly by 195.1 percent. It registered its highest closing point of 7,664.3 on December 3, 2019. The market capitalization of issued shares increased by SAR 217.1 million to SAR 2.5 billion at the end of 2019.
The number of Nomu Index shares traded during 2019 went up by 207.9 percent to 80.0 million from 26.0 million in the preceding year. The total value of traded shares also jumped by 452.7 percent to SAR 2.3 billion from SAR 412.5 million in the preceding year. In addition, the number of transactions rose by 228.6 percent to 138.5 thousand compared to 42.2 thousand in the preceding year (Table 8-2).
The daily value of shares traded on Nomu averaged SAR 9.1 million against SAR 1.7 million in the preceding year, rising by 435.3 percent. The daily average number of traded shares also went

Saud
i Ara
bian
Mon
etar
y Au
thor
ity |
56th
Ann
ual R
epor
t
100
up by 229.9 percent to 319.0 thousand in 2019 from 96.7 thousand in 2018. Similarly, the daily number of transactions averaged 553.9 against 169.3 in the preceding year, increasing by 227.2 percent.
The number of investors and investment portfolios registered in Tadawul in 2019 increased by 15.7 percent and 0.5 percent to 5.5 million and 9.9 million, respectively (Table 8-3).
A sectoral review of the activity of the Main Market (Tadawul) during 2019 indicates that the banks sector was the most active in terms of the number of shares traded, amounting to 7.9 billion and representing 24.0 percent of the total volume traded. Materials came second with 7.6 billion (23.0 percent of the total), followed by real estate management and development in third place with 3.6 billion (11.0 percent of the total).
In terms of the value of shares traded, banks ranked first with SAR 280.0 billion, representing 31.8 percent of the total value of shares traded in 2019. Materials came in second with SAR
214.3 billion (24.4 percent of the total), followed by energy with SAR 63.1 billion (7.2 percent of the total).
A review of Tadawul’s performance by the number of transactions executed reveals that materials ranked first with 6.6 million, accounting for 23.4 percent of the total number of transactions executed in 2019. Banks came next with 4.4 million (15.6 percent of the total), followed by insurance with 3.3 million (11.8 percent of the total).
A sectoral comparison of the market capitalization of issued shares by the end of 2019 shows that energy ranked first with a value of SAR 7,089.1 billion, representing 78.5 percent of the total market capitalization of issued shares. Banks came second with SAR 690.3 million (7.6 percent of the total), followed by materials with SAR 541.9 million (6.0 percent of the total) (Table 8-4).
Regarding the three most active companies in terms of the number of transactions executed in 2019, Al Rajhi Bank took the lead with 1.2 million,
Table 8-2: Saudi Stock Market Indicators (Parallel Market - Nomu)
Year No. of shares traded Change%
Value of shares traded
(Million SAR)
Change%
Market capitalization
of issued shares
(Billion SAR)
Change% No. of trades (Thousand) Change% TASI Change%
2018 25,968,243 -64.4 412.5 393.4 2.3 -99.2 42.2 -93.0 2,520.7 3.7
2019 79,957,689 207.9 2,279.8 452.7 2.5 9.3 138.5 228.6 7,439.9 195.1
Source: Saudi Stock Exchange (Tadawul).
Table 8-3: Number of Investors and Portfolios Registered in Tadawul
(End of year)
YearNo. of investors registered
in TadawulChange%
No. of portfolios registered in Tadawul
Change%
2016 4,616,540 1.3 8,988,585 6.7
2017 4,675,535 1.3 9,378,957 4.3
2018 4,741,870 1.4 9,844,247 5.0
2019 5,485,716 15.7 9,891,677 0.5
Source: Saudi Stock Exchange (Tadawul).

101
Capi
tal M
arke
t
followed by Alinma Bank with 1.1 million and then SABIC with 813.3 thousand. In terms of the value of shares traded, Al Rajhi Bank led the market with SAR 108.9 billion, followed by SABIC with SAR 80 billion and Alinma Bank with SAR 57.8 billion. As for the number of shares traded, Alinma Bank topped the list with 2.4 billion, followed by Dar Al-Arkan and Al Rajhi Bank with 2.2 billion and 1.7 billion, respectively (Table 8-5).
An analysis of the activity of the Parallel Market (Nomu) by sectors during 2019 indicates that retailing came first in terms of the number of shares traded with 28.5 million, representing 35.5 percent of the total number of shares traded. Materials came second with 20.2 million (25.2 percent of the total), followed by capital goods with 12.8 million (16.0 percent of the total).
With regard to the value of shares traded on Nomu, retailing ranked first with SAR 785.4 million, representing 34.4 percent of the total value of shares traded in 2019. Capital goods came second with SAR 629.8 million (27.6 percent of the total), followed by materials with SAR 425.9 million (18.7 percent of the total).
A review of the trading activity of Nomu by the number of transactions executed in 2019 shows that retailing accounted for the largest share with 53.0 thousand, constituting 38.3 percent of the total number of transactions executed. Capital goods came in second place with 30.8 thousand (22.2 percent of the total). Materials came third with 20.4 thousand (14.7 percent of the total) (Table 8-6).
New Public Offerings in TadawulIn 2019, the shares of five companies and one REIT were floated on Tadawul, with a total capital of SAR 114.5 billion. The number of issued shares totaled 200.6 billion, of which 3.2 billion were offered
to the public. The total market capitalization of issued shares amounted to SAR 7.1 trillion. Oversubscription averaged 2.0 times for companies with subscribers at the level of individuals in the market (Table 8-7).
The total number of subscribers for companies floated in 2019 was 5.2 million. Different subscription channels, such as telephone/online banking, ATMs and bank branches, contributed to facilitating the subscription process and reducing its completion time. The number of subscribers via telephone banking reached 103.7 thousand (2.0 percent of the total number of subscribers), 1.9 million (36 percent) via ATMs, and 1.5 million (28.3 percent) via online banking. Moreover, the number of subscribers via bank branches amounted to 1.7 million, accounting for 33.6 percent of the total number of subscribers (Table 8-8).
New Companies and REITs Added to TASIThe following companies and REIT were added to TASI in 2019:
1. Al Moammar Information Systems Company.2. Alkhabeer REIT Fund.3. Maharah Human Resources Company.4. Arabian Centers Company.5. Ataa Educational Company.6. Saudi Arabian Oil Company (Saudi Aramco).
The following companies were delisted in 2019:1. Sahara Petrochemical Company.2. Alawwal Bank.
CMA’s Efforts in Raising Investor Awareness in 2019 CMA publishes news and resolutions issued by its Board on its website to ensure that information is instantaneously and equally communicated to all investors. It also provides guidance for investors in securities and raises their awareness

Saud
i Ara
bian
Mon
etar
y Au
thor
ity |
56th
Ann
ual R
epor
t
102
Table 8-4: Saudi Stock Market Activity by Sector During 2019
SectorNo. Of shares traded Value of shares traded No. Of trades Market capitalization
(Million shares)
(%) Ratio to total
(Billion SAR)
(%) Ratio to total (Thousand) (%) Ratio to
total(Million
SAR)(%) Ratio to
total
Energy 1,858.5 5.6 63.1 7.2 1,500.7 5.3 7,089,144 78.5
Materials 7,605.5 23.0 214.3 24.4 6,610.3 23.3 541,863 6.0
Capital Goods 1,255.6 3.8 25.2 2.9 1,696.7 6.0 9,617 0.1
Commercial & Professional Services 138.9 0.4 7.3 0.8 324.9 1.1 12,437 0.1
Transport 603.3 1.8 13.0 1.5 652.2 2.3 13,918 0.2
Consumer Durables & Apparel 338.2 1.0 6.8 0.8 511.8 1.8 4,183 0.1
Consumer Services 857.6 2.6 19.1 2.2 980.2 3.5 21,164 0.2
Media 111.1 0.3 6.4 0.7 336.0 1.2 6,485 0.1
Retailing 591.6 1.8 22.7 2.6 942.8 3.3 34,139 0.4
Food & Staples Retailing 296.8 0.9 6.0 0.7 439.4 1.6 8,475 0.1
Food & Beverages 986.8 3.0 30.4 3.5 1,530.1 5.4 79,104 0.9
Health Care Equipment & Services
344.4 1.0 13.1 1.5 572.5 2.0 21,770 0.2
Pharma, Biotech & Life Science
29.1 0.1 0.8 0.1 46.5 0.2 3,270 0.01
Banks 7,945.7 24.0 280.0 31.8 4,428.3 15.6 690,297 7.6
Diversified Financials 343.4 1.0 4.3 0.5 339.9 1.2 30,120 0.3
Insurance 2,726.6 8.3 48.8 5.6 3,336.0 11.8 39,204 0.4
Software and Services 49.2 0.2 2.5 0.3 101.1 0.4 710 0.0
Communications 1,889.1 5.7 50.4 5.7 1,205.8 4.3 229,955 2.5
Utilities 526.2 1.6 10.0 1.1 330.0 1.2 86,566 1.0
REITs 955.0 2.9 8.5 1.0 738.6 2.6 15,102 0.2
Real Estate Management & Development
3,602.5 11.0 47.5 5.4 1,771.8 6.3 87,914 1.0
Total 33,055 100.0 880.138 100.0 28,396 100.0 9,025,435 100.0
Source: Tadawul 2019 Annual Report.
Table 8-5: Three Most Active Joint-Stock Companies in 2019
No. Of Transactions Company Al Rajhi Bank Alinma Bank SABIC
(Thousand) 1,195.7 1,119.0 813.3
No. Of Shares Traded Company Alinma Bank Dar Al-Arkan Al Rajhi Bank
(Billion) 2.4 2.2 1.7
Value of Shares Traded Company Al Rajhi Bank SABIC Alinma Bank
(Billion SAR) 108.9 80.0 57.8
Source: Tadawul 2019 Annual Report.

103
Capi
tal M
arke
t
Table 8-6: Saudi Stock Market Activity (Parallel Market - Nomu) by Sector During 2019
SectorNo. Of shares traded Value of shares traded No. Of trades Market capitalization
(Million shares)
(%) Ratio to total
(Million SAR)
(%) Ratio to total (Thousand) (%) Ratio to
total(Million
SAR)(%) Ratio to
total
Materials 20.2 25.2 425.9 18.7 20.4 14.7 -- --
Capital Goods 12.8 16.0 629.8 27.6 30.8 22.2 1,922.4 75.6
Commercial & Professional Services 0.3 0.4 5.1 0.2 1.9 1.4 202.2 8.0
Consumer Durables & Apparel 8.1 10.1 101.3 4.4 8.2 5.9 -- --
Consumer Services 9.5 11.8 292.4 12.8 20.1 14.5 197.3 7.8
Retailing 28.5 35.5 785.4 34.4 53.0 38.3 -- --
Software and Services 0.9 1.1 40.0 1.8 4.0 2.9 219.8 8.6
Total 80.2 100.0 2,279.8 100.0 138.47 100.0 2,542 100.0
Source: Tadawul 2019 Annual Report.
Table 8-7: New Public Offerings in the Saudi Stock Market (Main Market) in 2019
Com
pany
Sect
or
Date
of I
PO
Capi
tal
(Mill
ion
SAR)
Tota
l iss
ued
shar
es (M
illio
n sh
ares
)
No.
Of s
hare
s offe
red
for p
ublic
subs
crip
tion
(Mill
ion
shar
es)
Flo
ating
pric
e
Clos
ing
pric
e31
/12/
2019
Valu
e of
offe
ring
(Mill
ion
SAR)
No.
Of s
ubsc
riber
s (T
hous
and)
Mar
ket c
apita
lizati
on
(Mill
ion
SAR)
No.
Of o
ver-
subs
crip
tion
(Tim
es)
Al Moammar Information Systems Company
Software and Services 17 March 160 16 5 45 44 216 8 710 1.5
Shuaa REIT Fund REITs 25 March 592 59 31 10 -- 305 -- -- --
Maharah Human Resources Company
Commercial &
Professional Services
08 May 375 38 11 69 86 776 31 3,229 2.3
Arabian Centers Company
Real Estate Management
& Development
09 May 4,750 475 95 26 29 2,476 26 13,846 0.6
Ataa Educational Company
Consumer Services 14 July 400 40 12 29 30 348 39 1,182 4.3
Saudi Arabian Oil Company (Saudi Aramco)
Energy 17 November 60,000 200,000 3,000 32 35 110,400 5,056 7,050,000 1.5
Total -- -- 66,277 200,628 3,153.6 -- -- 114,521 -- 7,068,967 --
Source: CMA and Tadawul 2019 Annual Report.
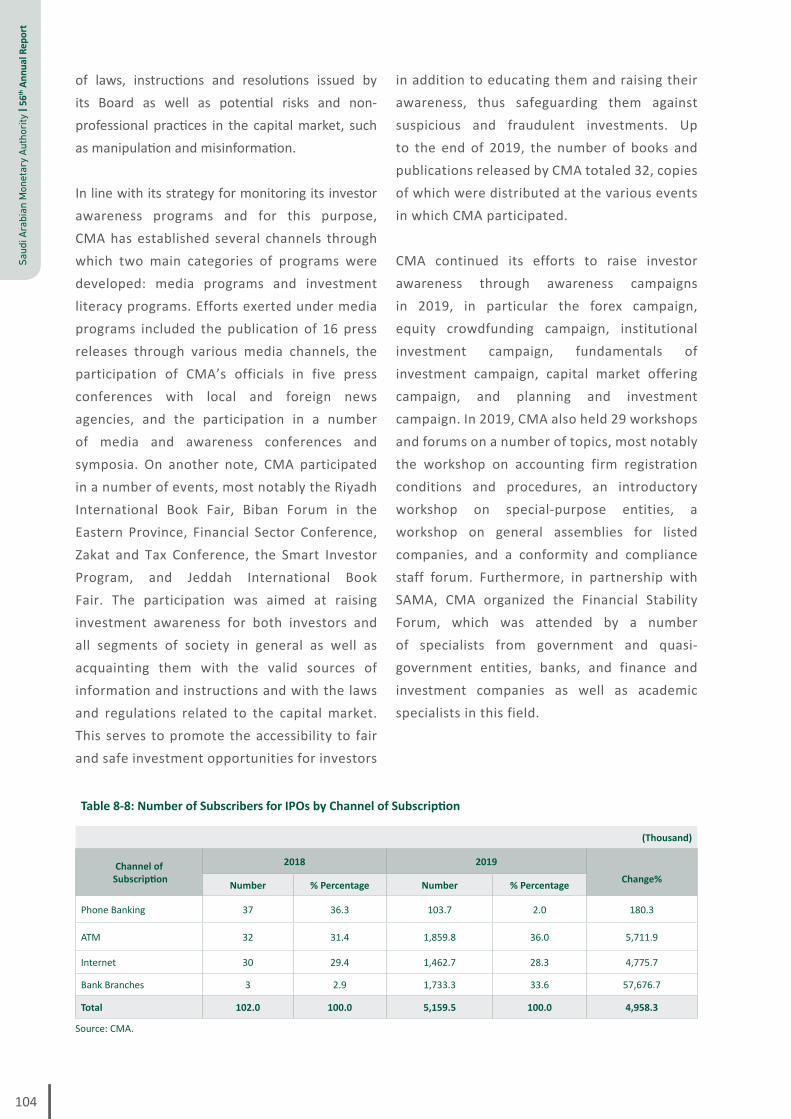
Saud
i Ara
bian
Mon
etar
y Au
thor
ity |
56th
Ann
ual R
epor
t
104
of laws, instructions and resolutions issued by its Board as well as potential risks and non-professional practices in the capital market, such as manipulation and misinformation.
In line with its strategy for monitoring its investor awareness programs and for this purpose, CMA has established several channels through which two main categories of programs were developed: media programs and investment literacy programs. Efforts exerted under media programs included the publication of 16 press releases through various media channels, the participation of CMA’s officials in five press conferences with local and foreign news agencies, and the participation in a number of media and awareness conferences and symposia. On another note, CMA participated in a number of events, most notably the Riyadh International Book Fair, Biban Forum in the Eastern Province, Financial Sector Conference, Zakat and Tax Conference, the Smart Investor Program, and Jeddah International Book Fair. The participation was aimed at raising investment awareness for both investors and all segments of society in general as well as acquainting them with the valid sources of information and instructions and with the laws and regulations related to the capital market. This serves to promote the accessibility to fair and safe investment opportunities for investors
in addition to educating them and raising their awareness, thus safeguarding them against suspicious and fraudulent investments. Up to the end of 2019, the number of books and publications released by CMA totaled 32, copies of which were distributed at the various events in which CMA participated.
CMA continued its efforts to raise investor awareness through awareness campaigns in 2019, in particular the forex campaign, equity crowdfunding campaign, institutional investment campaign, fundamentals of investment campaign, capital market offering campaign, and planning and investment campaign. In 2019, CMA also held 29 workshops and forums on a number of topics, most notably the workshop on accounting firm registration conditions and procedures, an introductory workshop on special-purpose entities, a workshop on general assemblies for listed companies, and a conformity and compliance staff forum. Furthermore, in partnership with SAMA, CMA organized the Financial Stability Forum, which was attended by a number of specialists from government and quasi-government entities, banks, and finance and investment companies as well as academic specialists in this field.
Table 8-8: Number of Subscribers for IPOs by Channel of Subscription
(Thousand)
Channel of Subscription
2018 2019 Change%Number % Percentage Number % Percentage
Phone Banking 37 36.3 103.7 2.0 180.3
ATM 32 31.4 1,859.8 36.0 5,711.9
Internet 30 29.4 1,462.7 28.3 4,775.7
Bank Branches 3 2.9 1,733.3 33.6 57,676.7
Total 102.0 100.0 5,159.5 100.0 4,958.3
Source: CMA.

105
Capi
tal M
arke
t
CMA’s Efforts in 2019 in Support of Achieving Vision 2030CMA is working on several initiatives under the Financial Leadership Program (FLP) and the Financial Sector Development Program (FSDP) in support of Tadawul’s position as the largest stock market in the Middle East and one of the world’s top ten capital markets. Table 8-9 shows the most salient achievements made during 2019 and their impact.
Sukuk and Bonds Market in 2019The Sukuk and Bonds Market Index closed at 1,007.3 points, bringing the total traded value of the Market to SAR 5,056.3 million in 2019. The traded value of corporate Sukuk and bonds reached SAR 140.7 million in 2019. The traded value of government debt instruments stood at SAR 4,915.6 million. In the same year, the number of transactions in the Sukuk and Bonds Market amounted to 185; government debt instruments constituted 96 percent of these transactions and corporate Sukuk and bonds accounted for the remaining 4 percent (Table 8-10).
Comparison Between Tadawul and Arab Stock Exchanges in 2019The performance of Arab stock exchanges participating in the Arab Markets Database (AMDB) varied in 2019. Arab stock exchange indices declined in six Arab markets, namely Jordan, Oman, Tunisia, Lebanon, Palestine, and Syria. The stock exchanges of Lebanon, Oman, and Syria recorded the highest declines of 19.5 percent, 7.9 percent and 5.7 percent, respectively. On the other hand, the Khartoum Stock Exchange recorded the highest rise of 27.9 percent (Table 8-11).
The average total market capitalization of Arab financial markets increased by 187.7 percent to $200.0 billion at the end of 2019 as compared to $69.5 billion at the end of 2018. The market capitalization of the Saudi Stock Exchange
(Tadawul) recorded the highest increase of 385 percent, followed by the Damascus Securities Exchange with a rise of 58.9 percent. In contrast, the market capitalization of the Beirut Stock Exchange recorded the highest decrease of 19.8 percent at the end of 2019.
A comparison of selected Arab stock exchange indices at the end of 2019 shows that the Saudi Stock Exchange recorded the highest market capitalization among all Arab stock exchanges. The market capitalization of Tadawul stood at $2,407.0 billion, compared to an average of $200.0 billion for the Arab countries composing the AMF Index. The market capitalization of the Saudi Stock Exchange represented 80.2 percent of the total market capitalization of Arab stock exchanges at the end of 2019. Moreover, the value of shares traded on the Saudi Stock Exchange amounted to $62.5 billion at the end of 2019, constituting 68.2 percent of the total value of shares traded on the markets of Arab countries participating in AMDB.
The number of companies traded on Tadawul reached 199 at the end of 2019. The average market capitalization stood at $2,407 billion per company, compared to an average number of 99 companies with an average market capitalization of $200.0 billion per company for the Arab countries (Table 8-12 and Chart 8-1).
Developments of Investment FundsThe number of investment funds managed by investment companies in Saudi Arabia increased by 1.6 percent to 253 in 2019. The total assets of these funds also rose, by 43 percent, to SAR 160.0 billion. Domestic assets and foreign assets of investment funds increased by 42.5 percent and 45.6 percent to SAR 133.4 billion and SAR 26.5 billion, respectively. Moreover, foreign assets constituted 16.6 percent of the total assets of the funds compared to 83.4 percent for domestic

Saud
i Ara
bian
Mon
etar
y Au
thor
ity |
56th
Ann
ual R
epor
t
106
assets. The number of investment fund subscribers stood at around 330 thousand at the end of 2019, decreasing by 0.9 percent from that of the preceding year (Table 8-13 and Chart 8-2). A review of the breakdown of funds’ investments inside and outside Saudi Arabia in 2019 indicates that total investments on global stock exchanges decreased by 4.0 percent to SAR 4.1 billion. However, investment in domestic equities rose by 6.9 percent to SAR 23.0 billion, accounting for 14.4 percent of total funds’ investments in equities versus 19.2 percent at the end of 2018. Investment in domestic and foreign equities accounted for 17.0 percent of total assets of investment funds at the end of 2019 against 23.1 percent at the end of 2018.
Funds’ investments in foreign bonds declined by 2.1 percent to SAR 1.0 billion in 2019. Funds’ investments in domestic Sukuk and bonds, however, went up by 53.9 percent to SAR 6.9 billion compared to SAR 4.5 billion at the end of 2018. Investments in domestic and foreign bond markets accounted for 5.0 percent of investment funds’ total assets at the end of 2019 compared to 4.9 percent at the end of the preceding year.
Funds’ investments in domestic and foreign money market instruments accounted for 61.3 percent of investment funds’ total assets at the end of 2019 against 52.0 percent at the end of the preceding year. Investment in domestic money market instruments increased by 68.8 percent from SAR 45.4 billion at the end of 2018 to SAR 76.7 billion at the end of 2019, accounting for 78.3 percent of total investments in money market instruments against 78.1 percent at the end of 2018. Furthermore, investments in foreign money market instruments rose by 67.1 percent to SAR 21.3 billion at the end of 2019 compared to SAR 12.7 billion at the end of 2018.
Investments in other domestic assets went up by 17.6 percent to SAR 3.04 billion at the end of 2019, accounting for 97.5 percent of total investments in other domestic and foreign assets compared to 95.5 percent at the end of the preceding year. Nevertheless, investments in other foreign assets declined by 35.4 percent to SAR 80 million at the end of 2019.
On the other hand, investments in real estate assets increased by 21.1 percent to SAR 23.8 billion in 2019, representing 14.9 percent of investment funds’ total assets compared to 17.5 percent at the end of the preceding year (Table 8-14).
An analysis of the classification of investment companies by funds’ assets shows that NCB Capital took the lead in terms of the assets of its investment funds, which stood at SAR 47.8 billion, representing 29.9 percent of total assets of investment funds. Riyad Capital came next with SAR 30.4 billion (19.0 percent of the total), followed by Al Rajhi Capital with SAR 14.1 billion (8.8 percent of the total).
As for the total number of investment funds, Riyad Capital came first with 30 funds, one of which was close-ended. NCB Capital came second with 26 funds, two of which were close-ended. Samba Capital and Investment Management Company came third with 20 funds, all of which were open-ended.
A breakdown of investment companies ranking by the number of subscribers shows that Riyad Capital ranked first with 75.6 thousand, followed by NCB Capital with 37.3 thousand and Al Rajhi Capital with 35.7 thousand (Table 8-15).

107
Capi
tal M
arke
t
Table 8-9: CMA’s Key Achievements in 2019 to Realize Vision 2030 and the Expected Impact
Initiative Purpose Achievement & Impact Description
Facilitating
Financing
1) Deepening the
Capital Market
and enhancing
its role in capital
formation
AchievementAmendment of the Rules on the Offer of Securities and Updated Continuing Obligations. Approval of the amended Listing Rules.
Impact
The investment restrictions imposed under the Capital Market Law and its Implementing Regulations do not apply to the foreign investors’ investments (whether residents or non-residents) in the shares of a foreign issuer whose shares are listed on the Main Market pursuant to the Listing Rules. *Allowing all categories of foreigners to directly invest in the shares of a foreign issuer whose shares are listed on the Main Market pursuant to the Listing Rules. *Allowing companies to be directly listed on the Parallel Market (Nomu) without an initial public offering. *Setting procedures for the transfer of companies from the Parallel Market to the Main Market. *Expanding the scope of exempt offer to include individual investors in one of the exempt offers (under certain conditions).
Achievement IPO and listing of the Saudi Arabian Oil Company (Saudi Aramco).
ImpactDeepening the Saudi Capital Market through the listing of new companies and the increase of trading activity and values.
Achievement
A number of fundamental changes were made to the Parallel Market (Nomu), most notably the following: -Allowing companies to be directly listed on Nomu without an initial public offering. -Setting procedures for the transfer of companies from the Parallel Market to the Main Market. -Changing the frequency of financial reporting from quarterly to semi-annual. -Introducing Nomu Capped Index (NomuC).
Impact-Developing the Parallel Market and increasing the number of its listed companies. -Higher market performance and increasing numbers of investors. -Higher trading activity and values in the Parallel Market.
Achievement
-Announcement of several incentives for listed companies, in cooperation with various government entities, as follows: -Raising financing limits for publicly listed companies (Saudi Industrial Development Fund). -Providing a fast-track service and a relationship manager to help settle any disputes related to zakat or tax (General Authority of Zakat and Tax). -Facilitating the approval process for listed companies to register foreign partners (Saudi Arabian General Investment Authority).
ImpactSupporting publicly-listed national companies and encouraging qualified companies to list on the stock market.
Achievement Amendment of the Merger and Acquisition Regulations.
ImpactSuccessful completion of the merger of SABB and Alawwal Bank as the first merger between listed companies in the history of Tadawul.
2) Developing
the Sukuk and
debt instruments
market
Achievement
Announcement of a series of enhancements to the Sukuk and debt instruments market by the CMA, Tadawul and the Debt Management Office, including the following:-Reducing the par values of government issued Sukuk from SAR 1 million to SAR 1,000.-Reducing Edaa’s IPO file upload fees.-Reducing Edaa’s annual registry fees. -Reducing the minimum annual listing fees for first and subsequent issuances.-Introducing caps for annual listing fees for first and subsequent issuances.-Reducing the trading commission for Sukuk and bonds.
ImpactStimulating the listing and trading of Sukuk and debt instruments by restructuring the fees, thus increasing the number of transactions.
AchievementListing and trading of government debt instruments on the Saudi Stock Exchange, with a total value exceeding SAR 69 billion in 2019.
ImpactContinued government coordination to deepen the debt instruments market in Saudi Arabia, as one of the main initiatives of the Financial Sector Development Program.

Saud
i Ara
bian
Mon
etar
y Au
thor
ity |
56th
Ann
ual R
epor
t
108
Encouraging
Investment
3) Enhancing the market attractiveness to foreign investors
Achievement Allowing online opening of investment accounts.
Impact Enabling investors to open investment accounts online.
AchievementIssuance of the “Instructions for the Foreign Strategic Investors' Ownership in Listed Companies”.
Impact
Setting out the provisions, requirements and conditions necessary for the Foreign Strategic Investors’ ownership of Strategic Shareholdings in listed companies. - There is no maximum limit on the percentage of foreign strategic investors' ownership in listed companies.
Achievement Inclusion in the emerging markets indices: MSCI, FTSE Russel, and S&P Dow Jones.
ImpactHigher numbers of qualified foreign investors. Higher foreign investor ownership. Higher net foreign investment in the financial market.
Achievement Inclusion of Saudi REITs in the FTSE EPRA/Nareit Global Real Estate Index.
ImpactIncreasing the level of disclosure and transparency in REITs market, keeping pace with international best practices, and broadening the investor base by enhancing the visibility of the Saudi REITs market for foreign investors.
AchievementLaunching the MSCI Tadawul 30 Index (MT30), which represents the performance of the largest securities listed on the Saudi equity market.
Impact
The MT30 Index will provide investors with a useful benchmark of the 30 largest and most liquid securities listed on the Saudi equity market and will serve as the basis for the development of an index futures contract listed on Tadawul. It can be used as a base for financial products including derivatives and exchange-traded funds (ETFs).
Achievement Higher ranking of Saudi Arabia in international indicators.
Impact
Enhancing the market attractiveness to foreign investors, as: -Saudi Arabia ranked 36, compared to 39 in 2018, as indicated in the Global Competitiveness Report 2019 issued by the World Economic Forum. -Saudi Arabia ranked 62, compared to 92 last year, advancing 30 places according to Doing Business 2020 report issued by WBG. According to the report, Saudi Arabia is among the economies with the most notable improvement in Doing Business. -Saudi Arabia’s ranking rose in 13 indicators, related to the CMA’s work, in the IMD’s World Competitiveness Yearbook.
AchievementThe joining of CMA to the membership of the International Forum of Independent Audit Regulators (IFIAR).
Impact
Enhancing cooperation and consistency in regulatory activity and providing a platform for dialogue with other international organizations that have an interest in audit quality. The platform enables members to exchange information about the evolving audit environment and practical experience of the audit independent regulatory activity.
4) Diversifying investment products and mechanisms available in the capital market
Achievement Adding a trade-at-last session to trade at the closing price.
ImpactAligning the market with the international best practices by setting a flexible mechanism that allows investors to trade after the closing auction at the closing price.
Achievement Establishment of “Fintech Saudi Hub” in cooperation with SAMA.
ImpactSupporting fintech entrepreneurs and SMEs by providing spaces for the joint work and design of innovative models for innovative solutions and a business accelerator program.
Source: CMA.

109
Capi
tal M
arke
t
Encouraging
Investment
3) Enhancing the market attractiveness to foreign investors
Achievement Allowing online opening of investment accounts.
Impact Enabling investors to open investment accounts online.
AchievementIssuance of the “Instructions for the Foreign Strategic Investors' Ownership in Listed Companies”.
Impact
Setting out the provisions, requirements and conditions necessary for the Foreign Strategic Investors’ ownership of Strategic Shareholdings in listed companies. - There is no maximum limit on the percentage of foreign strategic investors' ownership in listed companies.
Achievement Inclusion in the emerging markets indices: MSCI, FTSE Russel, and S&P Dow Jones.
ImpactHigher numbers of qualified foreign investors. Higher foreign investor ownership. Higher net foreign investment in the financial market.
Achievement Inclusion of Saudi REITs in the FTSE EPRA/Nareit Global Real Estate Index.
ImpactIncreasing the level of disclosure and transparency in REITs market, keeping pace with international best practices, and broadening the investor base by enhancing the visibility of the Saudi REITs market for foreign investors.
AchievementLaunching the MSCI Tadawul 30 Index (MT30), which represents the performance of the largest securities listed on the Saudi equity market.
Impact
The MT30 Index will provide investors with a useful benchmark of the 30 largest and most liquid securities listed on the Saudi equity market and will serve as the basis for the development of an index futures contract listed on Tadawul. It can be used as a base for financial products including derivatives and exchange-traded funds (ETFs).
Achievement Higher ranking of Saudi Arabia in international indicators.
Impact
Enhancing the market attractiveness to foreign investors, as: -Saudi Arabia ranked 36, compared to 39 in 2018, as indicated in the Global Competitiveness Report 2019 issued by the World Economic Forum. -Saudi Arabia ranked 62, compared to 92 last year, advancing 30 places according to Doing Business 2020 report issued by WBG. According to the report, Saudi Arabia is among the economies with the most notable improvement in Doing Business. -Saudi Arabia’s ranking rose in 13 indicators, related to the CMA’s work, in the IMD’s World Competitiveness Yearbook.
AchievementThe joining of CMA to the membership of the International Forum of Independent Audit Regulators (IFIAR).
Impact
Enhancing cooperation and consistency in regulatory activity and providing a platform for dialogue with other international organizations that have an interest in audit quality. The platform enables members to exchange information about the evolving audit environment and practical experience of the audit independent regulatory activity.
4) Diversifying investment products and mechanisms available in the capital market
Achievement Adding a trade-at-last session to trade at the closing price.
ImpactAligning the market with the international best practices by setting a flexible mechanism that allows investors to trade after the closing auction at the closing price.
Achievement Establishment of “Fintech Saudi Hub” in cooperation with SAMA.
ImpactSupporting fintech entrepreneurs and SMEs by providing spaces for the joint work and design of innovative models for innovative solutions and a business accelerator program.
Source: CMA.
Table 8-10: Sukuk and Bonds Market Statistics in 2019
Sukuk and bondsIndex closed at
(Point)Value traded (Million SAR)
Number of trades (Trade)
Corporates Sukuk & Bonds 994.2 140.7 7
Government Debt Instruments 1,019.7 4,915.6 178
Sukuk & Bonds Market 1,007.3 5,056.3 185
Source: Tadawul 2019 Annual Report.
Table 8-11: Annual Change in Selected Arab Markets (2019)
(Percentage)
Market Number of shares traded Market capitalization of shares Price index of shares
Saudi Arabia -0.6 385.0 7.2
Kuwait 69.1 25.1 11.8
Egypt -11.7 1.4 7.1
Morocco -4.3 6.2 7.1
Bahrain -39.2 23.6 20.4
Jordan -17.1 -7.5 -4.9
Oman 29.9 3.2 -7.9
Tunisia -17.7 -14.8 -5.2
Lebanon -71.4 -19.8 -19.5
Abu Dhabi 2.5 5.1 3.3
Algeria 121.7 0.8 8.0
Dubai -0.4 9.1 9.3
Sudan -78.3 25.4 27.9
Palestine 1.9 13.0 -0.6
Syria 59.3 58.9 -5.7
Source: Arab Monetary Fund, the Arab Capital Market Database - Arab Capital Markets, 4th Quarter Bulletin 2019.

Saud
i Ara
bian
Mon
etar
y Au
thor
ity |
56th
Ann
ual R
epor
t
110
Table 8-12: Key Indicators of Arab Capital Markets in 2019
Index annual change (%)
Market capitalization
(Million $)
No. of listed companies
GDP at current prices
(Billion $)*
Average company size
(Million $)
Market depth (%)**
Saudi Arabia 7.2 2,406,948 199 1,901 12,095 126.6
Kuwait 12 118,067 216 309 547 38.2
Egypt 7 42,358 248 1,391 171 3.0
Morocco 7 64,204 75 327 856 19.6
Bahrain 20 26,882 44 77 611 34.9
Jordan -5 21,022 191 96 110 21.8
Oman -8 48,744 130 205 375 23.8
Tunisia -5 8,377 81 149 103 5.6
Lebanon -19 7,759 28 84 277 9.2
Abu Dhabi 3 144,607 69 744 2,096 19.4
Algeria 8 372 2 669 186 0.1
Dubai 9 101,970 67 744 1,522 13.7
Sudan 28 3,114 67 175 46 1.8
Palestine -1 4,210 48 -- 88 --
Syria -6 2,059 24 -- 86 --
Average 3.9 200,046 99 529 1,278 24
* International Monetary Fund. ** Market capitalization to GDP.Source: Arab Monetary Fund, the Arab Capital Market Database - Arab Capital Markets, 4th Quarter Bulletin 2019.
Chart 8-1: Percentage Shares of Arab Stock Markets Composing the Arab Monetary Fund›s Index at the End of 2019 by Market Capitalization
%39.27 Saudi Arabia
%11.27 Abu Dhabi
%9.79 Kuwait
%5.86 Morocco
%5.74 Dubai
%4.75 Egypt
%2.48 Bahrain%2.32 Oman
%2.19 Jordan%1.06 Tunisia
%0.43 Lebanon
%0.23 Palestine%0.20 Sudan
%0.05 Syria%0.01 Algeria
Saudi Arabia Abu Dhabi Kuwait Morocco Dubai Egypt Bahrain Oman
Jordan Tunisia Lebanon Palestine Sudan Syria Algeria

111
Capi
tal M
arke
t
Chart 8-2: Assets of Investment Funds at Domestic Investment Companies
2015 2016 2017 2018 2019
160
140
120
100
80
60
40
20
0
B
illio
n riy
als
Domestic AssetsForeign Assets
Table 8-13: Key Indicators of Investment Funds Managed by Domestic Investment Companies
Year No. Of funds
Change %
Investments in domestic assets
(Billion SAR)
Change %
Investments in Foreign assets
(Billion SAR)
Change %
Funds’ total assets(Billion SAR)
Change %
No. Of subscribers (Thousand)
Change %
2014 252 6.8 81.9 0.0 28.8 35.3 110.7 7.3 246.0 -4.7
2015 270 7.1 75.9 -7.3 27.0 -6.4 102.9 -7.1 237.0 -3.7
2016 275 1.9 70.7 -6.9 17.2 -36.3 87.8 -14.6 224.4 -5.3
2017 273 -0.7 91.1 29.0 19.1 11.1 110.2 25.5 238.4 6.3
2018 249 -8.8 93.6 2.7 18.2 -4.6 111.9 1.5 332.6 39.5
2019 253 1.6 133.4 42.5 26.5 45.6 160.0 43.0 329.7 -0.9
Source: CMA.
Table 8-14: Assets of Investment Funds Managed by Domestic Investment Companies by Type of Investment
(Million SAR)
End of period
Domestic equities
Foreign equities
Domestic sukuk and
bonds
Foreign bonds
Domestic money market
instruments
Foreign money market
instruments
Other domestic
assets
Other foreign assets
Real estate investments
Total assets
2015 20,025 10,573 5,830 2,017 43,691 12,976 4,014 407 3,365 102,898
2016 16,386 4,940 5,577 1,282 40,793 10,570 4,698 388 3,200 87,836
2017 17,988 5,420 4,996 1,528 55,169 11,598 8,743 542 4,249 110,233
2018 21,512 4,321 4,494 1,032 45,447 12,736 2,588 123 19,609 111,862
2019 23,000 4,150 6,915 1,011 76,729 21,276 3,043 80 23,754 159,958
Source: CMA.

Saud
i Ara
bian
Mon
etar
y Au
thor
ity |
56th
Ann
ual R
epor
t
112
Table 8-15: Classification of Investment Companies by Assets, Number of Funds and Subscribers in 2019
Company
No. of funds
Total
Assets of funds (Million SAR)
TotalNo. of
subscribersClose-ended
Open-ended
Domestic Foreign
Saudi Economic and Development Company (SEDCO)
1 1 2 1,204.6 0.0 1,204.6 19,069
HSBC Saudi Arabia Limited 0 19 19 7,745.8 581.7 8,327.5 22,932
Itqan Capital Co. 0 2 2 54.2 38.1 92.3 46
Arbah Capital Co. 0 2 2 25.5 10.4 35.9 27
Ashmore Investment Saudi Arabia 0 2 2 407.4 375.7 783.1 32
Osool & Bakheet Investment Company 1 4 5 728.8 0.0 728.8 3,133
Alistithmar for Financial Securities and Brokerage Company (Alistithmar Capital)
0 4 4 746.6 187.0 933.6 457
Alinma Investment Co. 1 8 9 8,927.5 0.0 8,927.5 4,884
NCB Capital Co. 2 24 26 37,474.1 10,383.6 47,857.7 37,274
Alawwal Capital Co. 0 3 3 297.4 3.8 301.2 65
Alawwal Invest Co. 0 7 7 1,735.4 85.3 1,820.7 1,663
AlBilad Investment Co. 0 10 10 1,989.0 31.1 2,020.1 22,557
Al Jazira Capital Co. 3 11 14 2,895.9 2,690.1 5,586.0 4,189
Alkhabeer Capital Co. 1 0 1 1,041.6 0.0 1,041.6 6,696
Alkhabeer Capital Saudi Arabia Co. 0 4 4 26.7 22.3 48.9 43
Al Rajhi Financial Services Co. 1 13 14 8,136.0 5,997.7 14,133.7 35,706
Riyad Capital Co. 1 29 30 29,466.7 951.3 30,418.0 75,602
Saudi Fransi Capital 2 10 12 4,802.5 578.1 5,380.6 13,384
Middle East Financial Investment Co. 2 3 5 1,378.0 0.0 1,378.0 11,577
ANB Invest Co. 1 7 8 3,284.6 1.0 3,285.6 6,027
Alfa Financial LLC 0 2 2 524.8 278.9 803.7 48
Wasatah Capital Co. 0 1 1 9.7 0.0 9.7 7
Blominvest Saudi Arabia Co. 0 4 4 127.4 15.0 142.4 14
Global Investment House - Saudia (Global Saudi)
0 1 1 625.7 0.0 625.7 3
Saudi Kuwaiti Finance House 0 3 3 50.1 5.2 55.3 119
Bait Al Mal Al Khaleeji Co. 0 3 3 75.7 0.0 75.7 28
Tharwat for Financial Securities Co. 0 1 1 1.9 0.0 1.9 1
Jadwa Investment Co. 2 5 7 2,841.5 268.2 3,109.7 16,154
GIB Capital 0 3 3 106.0 11.9 117.9 19
Derayah Financial Co. 1 2 3 1,562.6 3.7 1,566.3 5,111
Samba Capital 0 20 20 9,660.1 3,766.8 13,426.9 23,854
Swicorp 1 0 1 1,116.3 0.0 1,116.3 5,532
Audi Capital Co. 0 3 3 83.8 51.6 135.4 33
FALCOM Financial Services 0 5 5 1,117.8 0.0 1,117.8 731
KASB Capital 2 4 6 338.1 0.0 338.1 1,220
Muscat Capital Co. 1 2 3 760.3 177.9 938.2 3,423
Musharaka Capital Co. 1 1 2 1,085.5 0.0 1,085.5 3,613
Mulkia Investment Co. 1 2 3 910.0 0.0 910.0 4,434
Morgan Stanley Saudi Arabia Co. 0 1 1 64.8 0.0 64.8 7
Al-Nefaie Investment Group 0 2 2 11.2 0.0 11.2 25
Total 25 228 253 133,441.6 26,516.4 159,958.1 329,739
Source: CMA.

EXTERNAL SECTOR

Saud
i Ara
bian
Mon
etar
y Au
thor
ity |
56th
Ann
ual R
epor
t
114
External Sector
According to preliminary data of the General Authority for Statistics (GaStat), the total value of Saudi Arabia’s oil exports stood at SAR 758.9 billion in 2019, accounting for 77.4 percent of Saudi Arabia’s total exports, compared to SAR 868.4 billion in 2018. The ratio of 2019 oil exports to GDP reached 25.5 percent. The total value of imports (CIF) amounted to SAR 541.3 billion, constituting 18.2 percent of GDP. Estimates of Saudi Arabia’s balance of payments indicated a surplus of SAR 186.9 billion in the current account in 2019, constituting 6.3 percent of GDP.
External TradeExternal trade figures showed that the total value of Saudi Arabia’s merchandise trade (exports + imports) decreased by 5.9 percent to SAR 1,521.9 billion in 2019 compared to SAR 1,617.9 billion in the preceding year. As an indication of commercial openness to the world economy, the external merchandise trade to GDP ratio stood at 51.2
percent in 2019 compared to 54.9 percent in the preceding year.
ExportsAccording to GaStat data, the total value of Saudi Arabia’s merchandise exports recorded SAR 980.7 billion in 2019 compared to SAR 1,103.9 billion in 2018, dropping by 11.2 percent compared to a rise of 32.7 percent in the preceding year (Table 9-1). Oil ExportsSaudi Arabia’s oil exports amounted to SAR 758.9 billion, dropping by 12.6 percent compared to a rise of 36.0 percent in the preceding year. They constituted 77.4 percent of total exports (Table 9-1). This decline from 2018 was attributed to the decrease in oil prices in global markets, with the average price of Arab light crude standing at $64.96 per barrel in 2019 compared to $70.59 per barrel in 2018, according to OPEC data, and the fall of Saudi Arabia’s average production of crude oil from 10.32 million bpd in 2018 to 9.81 million bpd in 2019.
Data on oil exports by type indicate that the value of crude oil exports dropped by 11.1 percent from
Table 9-1: Saudi Arabia’s Commodity Exports
(Million SAR)
2015 2016 2017 2018 2019*Share Change%
2018Change%
20192016 2017 2018 2019
Oil exports 573,412 510,729 638,402 868,442 758,887 74.2 76.7 78.7 77.4 36.0 -12.6
Crude Oil 486,546 419,878 513,181 704,505 626,508 61.0 61.7 63.8 63.9 37.3 -11.1
Refined Products 86,866 90,851 125,222 163,938 132,379 13.2 15.1 14.9 13.5 30.9 -19.3
Non-Oil Exports 189,901 177,694 193,479 235,443 221,794 25.8 23.3 21.3 22.6 21.7 -5.8
Petrochemicals 114,916 104,519 116,609 154,721 140,613 15.2 14.0 14.0 14.3 32.7 -9.1
Construction Materials 13,681 13,291 14,424 20,776 17,632 1.9 1.7 1.9 1.8 44.0 -15.1
Agricultural, Animal and Food Products
13,611 13,544 13,279 13,789 13,771 2.0 1.6 1.2 1.4 3.8 -0.1
**Other Goods 47,693 46,340 49,167 46,157 49,778 6.7 5.9 4.2 5.1 -6.1 7.8
Total 763,313 688,423 831,881 1,103,900 980,681 100.0 100.0 100.0 100.0 32.7 -11.2
* Preliminary data. ** Including re-exports. Source: GaStat.

115
Exte
rnal
Sec
tor
SAR 704.5 billion in 2018 to SAR 626.5 billion in 2019, constituting 63.9 percent of total exports. The value of refined products exports fell by 19.3 percent from SAR 163.9 billion to SAR 132.4 billion, representing 13.5 percent of total exports. Chart 9-1 shows the developments in Saudi Arabia’s oil exports.
Non-oil ExportsAccording to non-oil exports data, Saudi Arabia’s non-oil exports declined by 5.8 percent to SAR 221.8 billion in 2019 versus an increase of 21.7 percent in the preceding year, representing a share of 22.6 percent of total exports (Table 9-1). The value of petrochemical exports went down by 9.1 percent to SAR 140.6 billion with a share of 14.3 percent of total exports. The value of construction materials exports fell by 15.1 percent to SAR
17.6 billion, constituting a share of 1.8 percent of the total. On the other hand, the value of other commodities exports, including re-exports, increased by 7.8 percent to SAR 49.8 billion, representing a share of 5.1 percent of the total. The value of agricultural, animal and food products exports remained at SAR 13.8 billion with a share of 1.4 percent of total exports. Chart 9-2 shows the values and developments of non-oil exports over the period 2015-2019.
Development of Saudi Non-Oil ExportsThe Saudi Export Program (SEP) is one of the key programs launched by the Saudi Fund for Development (SFD). The program offers credit facilities and insurance to exporters with the aim of diversifying the national income sources through developing non-oil exports and promoting
Chart 9-1: Saudi Oil Exports رسم بياني رقم 9-1: قيمة صادرات المملكة النفطية
0
200
400
600
800
1000
1200
2015 2016 2017 2018 2019
Crude Oil Refined Products
Billi
on R
iyal
s
2014
Chart 9-2: Components of Saudi Non-Oil Exports
0
20
40
60
80
100
2015 2016 2017 2018
رسم بياني رقم 9-2: قيمة مكونات صادرات المملكة غير النفطية
120
140
160
Billi
on R
iyal
s
2019
Petrochemicals Other Goods (Including Re-Exports) Construction Materials Agricultural, Animal and Food Products

Saud
i Ara
bian
Mon
etar
y Au
thor
ity |
56th
Ann
ual R
epor
t
116
their competitiveness in line with the objectives of Saudi Vision 2030. In addition, the Saudi Export Development Authority (SEDA) plays a prominent role in developing exports by conducting studies and developing plans to overcome the challenges facing exporters. It also participates in international events and trade commissions with the goal of marketing national products, and organizes workshops to develop the capacities and expertise of Saudi exporting institutions. Moreover, SEDA sets the national strategy and development programs for non-oil exports in consultation and cooperation with relevant bodies.
The value of finance operations approved by the SFD since the launch of the SEP has reached a total of SAR 47.7 billion. SEP approved a diverse set of export finance operations with a total value of SAR 1.8 billion in 2019 (Table 9-2). SEP finance operations in 2019 were as follows: SAR 1.6 billion to manufacturing, SAR 225 million to construction, and SAR 11 million to financial activities.
ImportsData show that the value of imports of goods (CIF) increased by 5.3 percent to SAR 541.3 billion in 2019 against SAR 514.0 billion in the preceding year (Table 9-3).
Detailed data on Saudi Arabia’s imports by main component for 2019 (Chart 9-3) show that imports
of electric machinery, appliances and equipment (SAR 117.2 billion) ranked first with a share of 21.6 percent of total imports, an increase of 5.4 percent over the preceding year. Imports of transport equipment (SAR 105.9 billion) came second, constituting 19.6 percent and increasing by 25.1 percent. Imports of other goods (SAR 82.6 billion) came third and constituted 15.3 percent of total imports, decreasing by 4.6 percent, followed by imports of foodstuffs (SAR 75.5 billion) with a share of 14.0 percent, a decline of 5.9 percent. Imports of chemical and related products (SAR 72.7 billion) ranked fifth with a share of 13.4 percent, rising by 5.1 percent; imports of ordinary metals and their products (SAR 47.2 billion) with a share of 8.7 percent, increasing by 7.3 percent; and imports of textiles and clothing (SAR 22.1 billion) with a share of 4.1 percent, increasing by 22.0 percent. The final category, imports of wood and jewelry (SAR 18.0 billion), had a share of 3.3 percent, falling by 9.9 percent from the preceding year.
Destination of Exports and Origin of ImportsThe destination of exports and origin of imports are divided into four groups. The first group includes the top five non-Arab countries. The second group comprises the GCC member countries, the third contains Arab countries excluding the GCC, and the fourth includes other countries (Table 9-4).
Table 9-2: Finance and Insurance of Saudi Exports
(Million SAR)
Sector2016 2017 2018 2019*
Finance Insurance Finance Insurance Finance Insurance Finance Insurance
Manufactured Metal Products, Machines and Equipment 0 214 150 385 12,155 632 1,605 --
Chemical and Plastic Products 5,063 1,892 375 1,165 0 2,078 0 --
Capital Projects 0 0 750 0 2,452 0 225 --
Credit Lines 563 0 56 0 0 0 11 --
Others 11 60 0 47 0 72 0 --
Total 5,636 2,166 1,331 1,598 14,607 2,782 1,841 --
* Preliminary data. Source: The Saudi Fund for Development.

117
Exte
rnal
Sec
tor
Imports by Origin Detailed data of total imports indicate that imports from the top five non-Arab exporting countries to Saudi Arabia increased by 8.1 percent to SAR 240.6 billion in 2019, with a share of 43.0 percent of Saudi Arabia’s total imports. Imports from China (SAR 101.5 billion) ranked first with a share of 18.1 percent of the total imports, increasing by 24.1 percent over the preceding year, followed by imports from the United States (SAR 64.0 billion) with a share of 11.4 percent, down by 9.4 percent. Imports from Germany (SAR 26.3 billion) ranked third with a share of 4.7 percent, dropping by 7.2 percent; imports from Japan (SAR 24.5 billion) came fourth with a share of 4.4 percent, increasing by 19.2 percent; and imports from India (SAR 24.3 billion) followed with a share of 4.3 percent and an increase of 14.1 percent.
Saudi Arabia’s imports from GCC countries fell by 4.6 percent to SAR 54.3 billion during 2019, accounting for 10.0 percent of total imports. However, imports from other Arab countries rose by 27.3 percent to SAR 18.4 billion, constituting 3.4 percent of the total. Imports from other countries also rose by 3.6 percent to SAR 227.9 billion, accounting for 42.1 percent of the total. Chart 9-4A illustrates Saudi Arabia’s imports by origin in 2019.
Destination of Exports Saudi Arabia’s exports to the top five non-Arab countries decreased by 9.2 percent to SAR 510.4 billion in 2019, with a share of 52.0 percent of total exports. Exports to China (SAR 179.7 billion) ranked first with a share of 18.3 percent of total exports, increasing by 22.5 percent. Exports to
Chart 9-3: Shares of Saudi Imports (CIF) by Main Components
Table 9-3: Saudi Arabia’s Imports (CIF) by Main Component
Million SAR Share Change%
2016 2017 2018 2019* 2016 2017 2018 2019 2018 2019
Machines, appliances and elec-trical equipment 129,334 120,522 111,167 117,179 24.6 23.9 21.6 21.6 -7.8 5.4
Foodstuffs 85,075 81,774 80,249 75,532 16.2 16.2 15.6 14.0 -1.9 -5.9
Chemical and related products 66,777 66,827 69,202 72,742 12.7 13.2 13.5 13.4 3.6 5.1
Textiles and clothing 20,050 18,830 18,115 22,093 3.8 3.7 3.5 4.1 -3.8 22.0
Metals and their products 47,411 43,449 43,988 47,199 9.0 8.6 8.6 8.7 1.2 7.3
Wood and jewelry 15,763 17,501 19,997 18,019 3.0 3.5 3.9 3.3 14.3 -9.9
Transport equipment 93,925 79,397 84,652 105,870 17.9 15.7 16.5 19.6 6.6 25.1
Other goods 67,301 76,146 86,623 82,622 12.8 15.1 16.9 15.3 13.8 -4.6
Total 525,636 504,446 513,993 541,256 100.0 100.0 100.0 100.0 1.9 5.3
* Preliminary data. Source: GaStat.
0
5
10
15
20
25
2015 2016 2017 2018
رسم بياني رقم 9-3: نصيب واردات المملكة (سيف) حسب مكوناتها الرئيسة من الإجمالي
30
Perc
ent
2019
Machines, Appliances, Electrical Equipment Foodstuffs Metal and Chemical Products Textiles and Clothing
Other GoodsTransport EquipmentWood and JewelryMetals and their Products

Saud
i Ara
bian
Mon
etar
y Au
thor
ity |
56th
Ann
ual R
epor
t
118
Chart 9-4A: Saudi Arabia’s Imports by Origin Chart 9-4B: Saudi Arabia’s Exports by Destination
Table 9-4: Destination of Exports and Origin of Imports**
Million SAR Share Change%
2017 2018 2019* 2017 2018 2019 2018 2019
Imports
China 76,971 81,821 101,500 15.3 15.9 18.8 6.3 24.1
USA 68,086 70,642 63,984 13.5 13.7 11.8 3.8 -9.4
Germany 29,497 28,306 26,264 5.8 5.5 4.9 -4.0 -7.2
Japan 20,569 20,590 24,547 4.1 4.0 4.5 0.1 19.2
India 20,176 21,322 24,334 4.0 4.1 4.5 5.7 14.1
Total of the Five Countries 215,300 222,681 240,629 42.7 43.3 44.5 3.4 8.1
GCC Countries 45,379 56,924 54,296 9.0 11.1 10.0 25.4 -4.6
Other Arab Countries 17,934 14,468 18,417 3.6 2.8 3.4 -19.3 27.3
Other Countries 225,834 219,920 227,913 44.8 42.8 42.1 -2.6 3.6
Imports (FOB) 462,752 467,733 492,542 -- -- -- -- --
Total Imports 504,447 513,993 541,255 100.0 100.0 100.0 1.9 5.3
Exports
China 97,354 146,703 179,653 11.7 13.3 18.3 50.7 22.5
India 73,801 98,689 102,582 8.9 8.9 10.5 33.7 3.9
Japan 100,382 123,646 100,102 12.1 11.2 10.2 23.2 -19.0
South Korea 74,027 97,592 77,901 8.9 8.8 7.9 31.8 -20.2
USA 68,867 95,622 50,189 8.3 8.7 5.1 38.9 -47.5
Total of the Five Countries 414,431 562,252 510,428 49.8 50.9 52.0 35.7 -9.2
GCC Countries 93,705 102,403 86,412 11.3 9.3 8.8 9.3 -15.6
Other Arab Countries 48,537 51,292 57,342 5.8 4.6 5.8 5.7 11.8
Other Countries 275,208 387,953 326,503 33.1 35.1 33.3 41.0 -15.8
Total Exports 831,880 1,103,900 980,685 100.0 100.0 100.0 32.7 -11.2
*Preliminary data.** Including re-exports. Source: GaStat.
رسم بياني رقم 9-4ب: وجهة صادرات المملكةرسم بياني رقم 9-4أ: واردات المملكة حسب المنشأ
%18.8
% 4.9
% 4.5
%55.5
%11.8
%4.5
Japan
IndiaGermany
USAChina
Other Countries
Japan South Korea
India USA
China
Other Countries
%18.3
%7.9
%10.5
%5.1
%48.0
%10.2
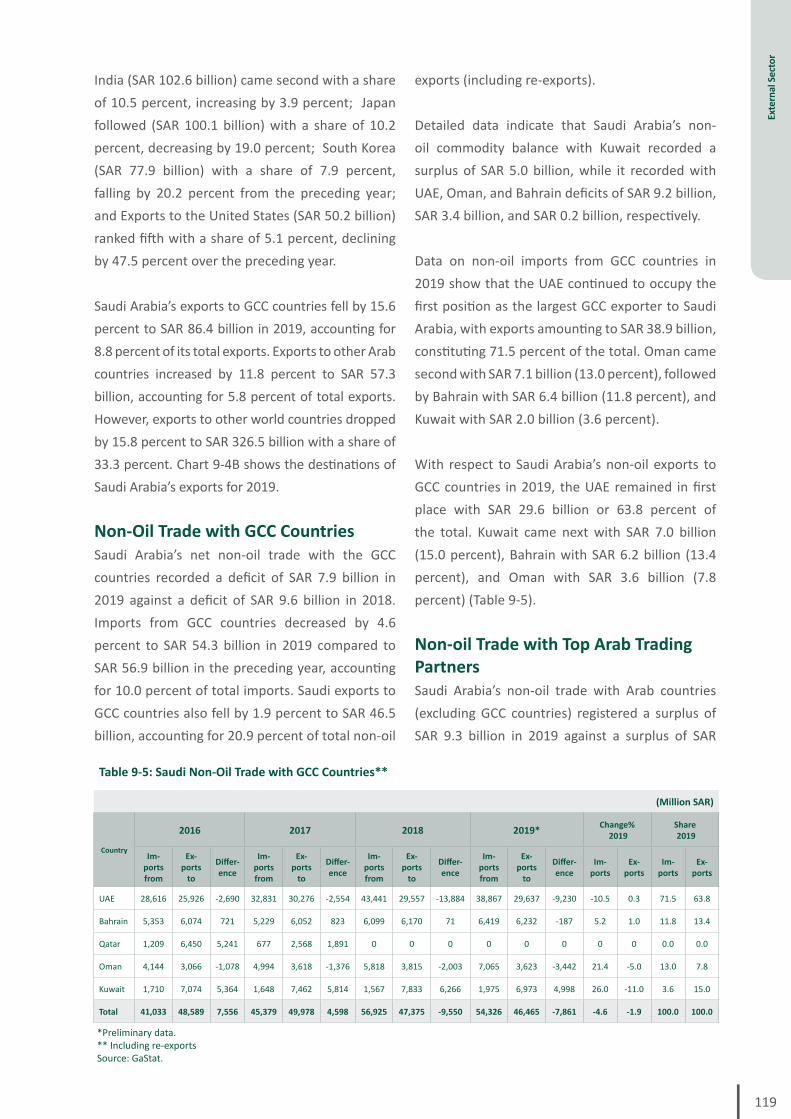
119
Exte
rnal
Sec
tor
India (SAR 102.6 billion) came second with a share of 10.5 percent, increasing by 3.9 percent; Japan followed (SAR 100.1 billion) with a share of 10.2 percent, decreasing by 19.0 percent; South Korea (SAR 77.9 billion) with a share of 7.9 percent, falling by 20.2 percent from the preceding year; and Exports to the United States (SAR 50.2 billion) ranked fifth with a share of 5.1 percent, declining by 47.5 percent over the preceding year.
Saudi Arabia’s exports to GCC countries fell by 15.6 percent to SAR 86.4 billion in 2019, accounting for 8.8 percent of its total exports. Exports to other Arab countries increased by 11.8 percent to SAR 57.3 billion, accounting for 5.8 percent of total exports. However, exports to other world countries dropped by 15.8 percent to SAR 326.5 billion with a share of 33.3 percent. Chart 9-4B shows the destinations of Saudi Arabia’s exports for 2019.
Non-Oil Trade with GCC CountriesSaudi Arabia’s net non-oil trade with the GCC countries recorded a deficit of SAR 7.9 billion in 2019 against a deficit of SAR 9.6 billion in 2018. Imports from GCC countries decreased by 4.6 percent to SAR 54.3 billion in 2019 compared to SAR 56.9 billion in the preceding year, accounting for 10.0 percent of total imports. Saudi exports to GCC countries also fell by 1.9 percent to SAR 46.5 billion, accounting for 20.9 percent of total non-oil
exports (including re-exports).
Detailed data indicate that Saudi Arabia’s non-oil commodity balance with Kuwait recorded a surplus of SAR 5.0 billion, while it recorded with UAE, Oman, and Bahrain deficits of SAR 9.2 billion, SAR 3.4 billion, and SAR 0.2 billion, respectively.
Data on non-oil imports from GCC countries in 2019 show that the UAE continued to occupy the first position as the largest GCC exporter to Saudi Arabia, with exports amounting to SAR 38.9 billion, constituting 71.5 percent of the total. Oman came second with SAR 7.1 billion (13.0 percent), followed by Bahrain with SAR 6.4 billion (11.8 percent), and Kuwait with SAR 2.0 billion (3.6 percent).
With respect to Saudi Arabia’s non-oil exports to GCC countries in 2019, the UAE remained in first place with SAR 29.6 billion or 63.8 percent of the total. Kuwait came next with SAR 7.0 billion (15.0 percent), Bahrain with SAR 6.2 billion (13.4 percent), and Oman with SAR 3.6 billion (7.8 percent) (Table 9-5).
Non-oil Trade with Top Arab Trading PartnersSaudi Arabia’s non-oil trade with Arab countries (excluding GCC countries) registered a surplus of SAR 9.3 billion in 2019 against a surplus of SAR
Table 9-5: Saudi Non-Oil Trade with GCC Countries**
(Million SAR)
Country
2016 2017 2018 2019* Change% 2019
Share 2019
Im-ports from
Ex-ports
to
Differ-ence
Im-ports from
Ex-ports
to
Differ-ence
Im-ports from
Ex-ports
to
Differ-ence
Im-ports from
Ex-ports
to
Differ-ence
Im-ports
Ex-ports
Im-ports
Ex-ports
UAE 28,616 25,926 -2,690 32,831 30,276 -2,554 43,441 29,557 -13,884 38,867 29,637 -9,230 -10.5 0.3 71.5 63.8
Bahrain 5,353 6,074 721 5,229 6,052 823 6,099 6,170 71 6,419 6,232 -187 5.2 1.0 11.8 13.4
Qatar 1,209 6,450 5,241 677 2,568 1,891 0 0 0 0 0 0 0 0 0.0 0.0
Oman 4,144 3,066 -1,078 4,994 3,618 -1,376 5,818 3,815 -2,003 7,065 3,623 -3,442 21.4 -5.0 13.0 7.8
Kuwait 1,710 7,074 5,364 1,648 7,462 5,814 1,567 7,833 6,266 1,975 6,973 4,998 26.0 -11.0 3.6 15.0
Total 41,033 48,589 7,556 45,379 49,978 4,598 56,925 47,375 -9,550 54,326 46,465 -7,861 -4.6 -1.9 100.0 100.0
*Preliminary data. ** Including re-exportsSource: GaStat.

Saud
i Ara
bian
Mon
etar
y Au
thor
ity |
56th
Ann
ual R
epor
t
120
15.6 billion in 2018. Imports from Arab countries increased by 27.3 percent to SAR 18.4 billion compared to SAR 14.5 billion, accounting for 3.4 percent of total imports. Exports to Arab countries declined by 7.9 percent to SAR 27.7 billion, constituting 12.5 percent of total non-oil exports (including re-exports).
Detailed data on Saudi trade with top Arab trading partners show that Saudi Arabia recorded a surplus of SAR 3.3 billion in trade with Yemen, SAR 1.9 billion with Jordan, SAR 2.7 billion with Iraq, SAR 813 million with Morocco, SAR 20 million with Lebanon, and SAR 106 million with Sudan. However, trade with Egypt and Syria recorded deficits of SAR 2.2 billion and SAR 559 million, respectively.
With regard to Saudi Arabia’s non-oil imports from its top Arab trading partners in 2019, Egypt ranked first with SAR 9.0 billion (48.8 percent of the total), Jordan with SAR 3.5 billion (18.9 percent), Sudan with SAR 2.1 billion (11.4 percent), and Lebanon with SAR 1.1 billion (5.9 percent). Morocco came next with SAR 592 million, followed by Yemen with
SAR 569 million, Syria with SAR 562 million, and Iraq with SAR 20 million.
As for non-oil exports to top Arab trading partners, Egypt also ranked first with SAR 6.8 billion (24.6 percent of the total), followed by Jordan with SAR 5.4 billion (19.4 percent), and Yemen with SAR 3.9 billion. Iraq and Sudan occupied the fourth and fifth positions, with exports amounting to SAR 2.7 billion and SAR 2.2 billion, respectively. Morocco came next with SAR 1.4 billion, Lebanon with SAR 1.1 billion, and Syria with SAR 3 million. (Table 9-6).
Private Sector Exports Financed by Commercial BanksPrivate sector exports financed by commercial banks (settled letters of credit) fell by 17.1 percent to SAR 36.9 billion in 2019 compared to SAR 44.5 billion in 2018. Their ratio to total non-oil exports (including re-exports) went down to 16.6 percent from 18.8 percent in 2018.
Data on private sector exports financed by commercial banks (settled letters of credit) in 2019 show that exports of other industrial products
Table 9-6: Non-oil Trade with Top Arab Trading Partners** (Excluding GCC countries)
(Million SAR)
Country2016 2017 2018 2019*
Imports from
Exports to
Differ-ence
Imports from
Exports to
Differ-ence
Imports from
Exports to
Differ-ence
Imports from
Exports to
Differ-ence
Egypt 7,933 5,926 -2,007 8,492 5,323 -3,170 5,635 7,522 1,887 8,986 6,822 -2,164
Jordan 4,042 4,761 719 3,176 4,681 1,504 3,019 5,872 2,853 3,488 5,387 1,899
Yemen 243 2,138 1,895 470 2,082 1,612 573 3,679 3,106 569 3,907 3,338
Lebanon 1,457 1,463 6 1,557 1,674 118 1,082 1,909 827 1,083 1,103 20
Morocco 776 1,328 552 739 1,477 738 750 1,628 878 592 1,405 813
Sudan 1,959 1,799 -160 2,383 2,389 6 2,128 2,445 317 2,105 2,211 106
Iraq 23 1,550 1,527 30 1,902 1,872 44 2,463 2,419 20 2,734 2,715
Syria -- -- -- 346 79 -267 400 5 -395 562 3 -559
Other Arab countries 1,950 4,444 2,494 741 4,012 3,271 837 4,579 3,742 1,013 4,154 3,141
Total 18,383 23,409 5,026 17,934 23,620 5,686 14,468 30,102 15,634 18,417 27,726 9,309
*Preliminary data.**Including re-exports.Source: GaStat.

121
Exte
rnal
Sec
tor
rose by 15.1 percent to SAR 34.1 billion, ranking first with a share of 92.4 percent of total exports as compared to 2018. Chemical and plastic products came next with SAR 2.6 billion, recording a decline of 38.6 percent and accounting for a share of 7.0 percent, followed by agricultural and animal products with SAR 168 million, increasing by 80.6 percent and accounting for 0.5 percent of the total.
Private Sector Imports Financed by Commercial BanksPrivate sector imports financed by commercial banks (settled letters of credit and bills under collection) increased by 2.0 percent to SAR 135.7 billion in 2019 compared to SAR 132.5 billion in the preceding year. Their share of the total value of Saudi Arabia’s imports was 25.0 percent against 25.5 percent in 2018.
The decline in this ratio was attributable to the decreases in the financing of imports of other goods by 2.8 percent to SAR 67.0 billion; construction materials by 3.4 percent to SAR 14.9 billion; grain by 18.6 percent to SAR 5.0 billion; livestock and meat by 4.2 percent to SAR 2.4 billion; sugar, tea and coffee beans by 9.8 percent to SAR 757 million; and fruit and vegetables by 56.3 percent to SAR 265 million. On the other hand, financing of imports of textiles and clothing went up by 9.6 percent to SAR 1.9 billion, appliances by 1.0 percent to SAR 3.4 billion, machinery by 12.8 percent to SAR 6.0 billion, other foodstuffs by 2.6 percent to SAR 7.9 billion, and vehicles by 28.7 percent to SAR 25.4 billion.
As for their share, financing of imports of other goods ranked first with a share of 49.6 percent of total imports, followed by that of motor vehicles in second place with 18.8 percent. Financing of imports of construction materials occupied third place with 11.0 percent, other foodstuffs with a share of 5.8 percent, and machinery with 4.5 percent.
Exports Through PortsAccording to data issued by the Saudi Ports Authority, the volume of exports (excluding crude oil exports) handled at Saudi ports decreased by 5.5 percent to 212.5 million tons in 2019 compared to 224.9 million tons in the preceding year.This was attributable to the decline in exports of refined oil products and gas by 5.4 percent to 126.6 million tons, and in exports of other goods by 32.5 percent to 20.6 million tons from 30.5 million tons. The exports of construction materials and steel recorded an increase by 8.0 percent to 18.8 million tons, transshipment goods by 4.0 percent to 13.0 million tons, and petrochemicals by 8.5 percent to 33.3 million tons.
As for their share in the total volume of exports handled at ports, refined oil products and gas ranked first with a share of 59.6 percent, followed by petrochemicals with 15.7 percent, and other exports with 9.7 percent. Construction materials and steel exports came fourth with a share of 8.8 percent, followed by transshipment goods with 6.1 percent, and agricultural products with 0.1 percent.
Imports Through PortsAccording to data issued by the Saudi Ports Authority, the volume of imports handled at Saudi ports fell by 0.3 percent to 105.5 million tons in 2019 due to a drop in the imports handled at commercial ports by 0.9 percent to 64.1 million tons. The fall was mainly attributed to a drop in imports of foodstuffs by 12.0 percent to 22.7 million tons, while equipment rose by 5.9 percent to 1.8 million tons, construction materials jumped by 21.8 percent to 10.6 million tons, and general merchandise increased by 1.4 percent to 28.9 million tons. However, imports through industrial ports rose by 0.7 percent to 41.4 million tons.
As for their share, general merchandise ranked first with a share of 27.4 percent of total imports through ports, followed by foodstuffs with 21.5

Saud
i Ara
bian
Mon
etar
y Au
thor
ity |
56th
Ann
ual R
epor
t
122
percent, construction materials with 10.0 percent, and equipment with 1.7 percent. The volume of imports through industrial ports accounted for 39.2 percent of the total imports (in tons).With respect to motor vehicles and livestock imported through Saudi ports during 2019, the number of motor vehicles increased by 22.4 percent to 632.7 thousand from 517.0 thousand in 2018, while that of livestock reached 6.0 million, declining by 11.8 percent from that of the preceding year.
Imports and Exports by Use of GoodsDetailed data on Saudi Arabia’s imports by use of goods for 2019 show that imports of consumer goods amounted to SAR 216.9 billion (12.4 million tons), ranking first with a share of 40.1 percent of total imports and rising by 7.8 percent over the preceding year, followed by imports of intermediate goods with SAR 197.4 billion (55.6 million tons), constituting a share of 36.5 percent of total imports dropping by 4.2 percent over the preceding year. Capital goods came third with SAR 127 billion (2.5 million tons) with a share of 23.5 percent, rising by 19.1 percent.
With regard to Saudi Arabia’s exports by use of goods in 2019, intermediate goods ranked first with SAR 920.6 billion (481.1 million tons) and a share of 93.9 percent, dropping by 11.6 percent over the preceding year. Consumer goods ranked second with SAR 43.5 billion (9.4 million tons) with a
share of 4.4 percent of total exports, falling by 12.3 percent. Capital goods amounted to SAR 16.6 billion (0.6 million tons), ranking third with a share of 1.7 percent and increasing by 25.6 percent (Table 9-7).
Imports and Exports by Type of Goods Data on Saudi Arabia’s imports by type of goods (the stage of processing) for 2019 show that imports of manufactured (finished) goods amounted to SAR 401.6 billion (25.2 million tons), ranking first with a share of 74.2 percent of total imports, increasing by 10.3 percent over the preceding year. Partly manufactured (semi-finished) goods came second with SAR 123.3 billion (33.6 million tons), constituting 22.8 percent, a decline of 0.3 percent, and imports of raw material goods with SAR 16.4 billion (11.8 million tons) and a share of 3.0 percent, declining by 38.0 percent.
With regard to Saudi Arabia’s exports by type of goods (the stage of processing) in 2019, exports of raw material goods ranked first with SAR 640.0 billion (357.7 million tons) and a share of 65.3 percent, a decline of 11.4 percent from the preceding year. Exports of manufactured (finished) goods ranked second with SAR 175.3 billion (67 million tons) and a share of 17.9 percent, dropping by 11.8 percent, and partly manufactured (semi-finished) goods with SAR 165.4 billion (66.3 million tons) and a share of 16.9 percent, decreasing by 9.7 percent (Table 9-8).
Table 9-7: Imports and Exports by Use of Goods
Weight (Thousand Ton)/Value (Million SAR)
Goods2016 2017 2018 2019* Change%
2019Share 2019Weight Value Weight Value Weight Value Weight Value
Imports
Consumer 13,042 210,037 12,335 197,841 11,543 201,257 12,424 216,898 7.8 40.1
Intermediate 61,200 203,918 61,434 199,217 61,641 206,122 55,611 197,364 -4.2 36.5
Capital 2,489 111,680 2,229 107,388 2,055 106,614 2,544 126,993 19.1 23.5
Exports
Consumer 11,408 39,801 11,712 46,633 11,258 49,610 9,372 43,498 -12.3 4.4
Intermediate 488,304 631,100 471,354 769,360 497,955 1,041,058 481,096 920,571 -11.6 93.9
Capital 565 17,523 701 15,888 585 13,232 574 16,616 25.6 1.7
* Preliminary data. Source: GaStat.
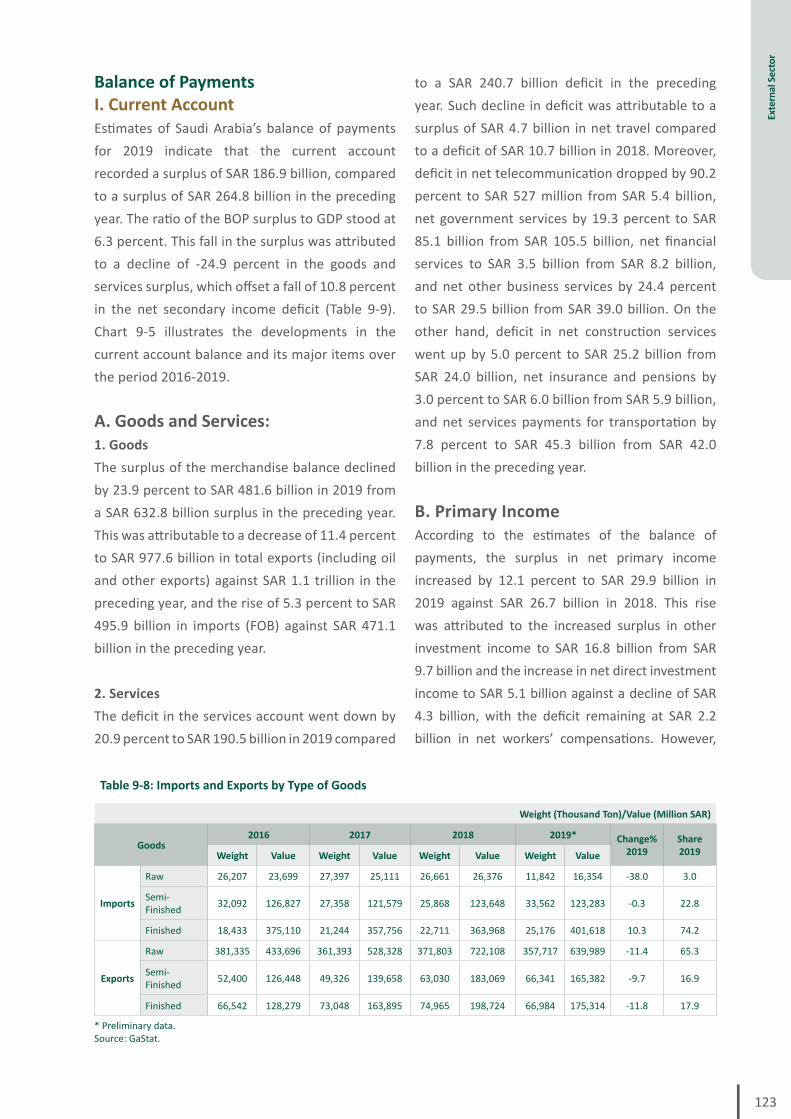
123
Exte
rnal
Sec
tor
to a SAR 240.7 billion deficit in the preceding year. Such decline in deficit was attributable to a surplus of SAR 4.7 billion in net travel compared to a deficit of SAR 10.7 billion in 2018. Moreover, deficit in net telecommunication dropped by 90.2 percent to SAR 527 million from SAR 5.4 billion, net government services by 19.3 percent to SAR 85.1 billion from SAR 105.5 billion, net financial services to SAR 3.5 billion from SAR 8.2 billion, and net other business services by 24.4 percent to SAR 29.5 billion from SAR 39.0 billion. On the other hand, deficit in net construction services went up by 5.0 percent to SAR 25.2 billion from SAR 24.0 billion, net insurance and pensions by 3.0 percent to SAR 6.0 billion from SAR 5.9 billion, and net services payments for transportation by 7.8 percent to SAR 45.3 billion from SAR 42.0 billion in the preceding year.
B. Primary IncomeAccording to the estimates of the balance of payments, the surplus in net primary income increased by 12.1 percent to SAR 29.9 billion in 2019 against SAR 26.7 billion in 2018. This rise was attributed to the increased surplus in other investment income to SAR 16.8 billion from SAR 9.7 billion and the increase in net direct investment income to SAR 5.1 billion against a decline of SAR 4.3 billion, with the deficit remaining at SAR 2.2 billion in net workers’ compensations. However,
Table 9-8: Imports and Exports by Type of Goods
Weight (Thousand Ton)/Value (Million SAR)
Goods2016 2017 2018 2019* Change%
2019Share 2019Weight Value Weight Value Weight Value Weight Value
Imports
Raw 26,207 23,699 27,397 25,111 26,661 26,376 11,842 16,354 -38.0 3.0
Semi-Finished 32,092 126,827 27,358 121,579 25,868 123,648 33,562 123,283 -0.3 22.8
Finished 18,433 375,110 21,244 357,756 22,711 363,968 25,176 401,618 10.3 74.2
Exports
Raw 381,335 433,696 361,393 528,328 371,803 722,108 357,717 639,989 -11.4 65.3
Semi-Finished 52,400 126,448 49,326 139,658 63,030 183,069 66,341 165,382 -9.7 16.9
Finished 66,542 128,279 73,048 163,895 74,965 198,724 66,984 175,314 -11.8 17.9
* Preliminary data. Source: GaStat.
Balance of PaymentsI. Current AccountEstimates of Saudi Arabia’s balance of payments for 2019 indicate that the current account recorded a surplus of SAR 186.9 billion, compared to a surplus of SAR 264.8 billion in the preceding year. The ratio of the BOP surplus to GDP stood at 6.3 percent. This fall in the surplus was attributed to a decline of -24.9 percent in the goods and services surplus, which offset a fall of 10.8 percent in the net secondary income deficit (Table 9-9). Chart 9-5 illustrates the developments in the current account balance and its major items over the period 2016-2019.
A. Goods and Services:1. GoodsThe surplus of the merchandise balance declined by 23.9 percent to SAR 481.6 billion in 2019 from a SAR 632.8 billion surplus in the preceding year. This was attributable to a decrease of 11.4 percent to SAR 977.6 billion in total exports (including oil and other exports) against SAR 1.1 trillion in the preceding year, and the rise of 5.3 percent to SAR 495.9 billion in imports (FOB) against SAR 471.1 billion in the preceding year.
2. Services The deficit in the services account went down by 20.9 percent to SAR 190.5 billion in 2019 compared

Saud
i Ara
bian
Mon
etar
y Au
thor
ity |
56th
Ann
ual R
epor
t
124
net portfolio investment income decreased to SAR 10.2 billion as compared to SAR 23.4 billion.
C. Secondary IncomeThe deficit in the secondary income account fell by 10.8 percent to SAR 137.3 billion in 2019 compared to a deficit of SAR 154.0 billion in the preceding year. This was attributed to a drop in expatriate remittances by 8.1 percent to SAR 113.6 billion, and a decline in government transfers by 23.1 percent to SAR 22.6 billion against SAR 29.4 billion in 2018. Table 9-10 illustrates the developments in expatriate remittances in Saudi Arabia and their ratio to private sector GDP since 2010.
II. Capital AccountThe capital account registered an outflow of SAR 6.5 billion in 2019 against SAR 8.7 billion in 2018.
III. Financial AccountNet direct investments rose by SAR 32.3 billion in 2019. Net portfolio investments, however, decreased by SAR 53.3 billion. Net other investments rose by SAR 183.2 billion and reserve assets by SAR 11.2 billion.
International Investment Position (IIP)Direct InvestmentDirect investment abroad grew by 17.1 percent to SAR 461.4 billion in 2019. Direct investment in Saudi Arabia also increased by 2.0 percent to SAR 885.5 billion as compared to the preceding year.
Portfolio InvestmentsPortfolio investments abroad rose by 28.5 percent to SAR 1.06 trillion in 2019 while portfolio investments in Saudi Arabia rose by 34.5 percent to SAR 477.3 billion.
Other InvestmentsOther investments abroad grew by 11.5 percent to SAR 947.3 billion and other investments in Saudi
Arabia rose by 24.0 percent to SAR 416.8 billion in 2019.
Reserve AssetsReserve assets increased by 0.6 percent in 2019 to SAR 1,873.4 billion.
Net International Investment PositionNet international investment position rose by 8.1 percent to SAR 2.6 trillion in 2019 compared to SAR 2.4 trillion in 2018 (Table 9-11).
Saudi Developmental Aid and Loans AbroadSaudi aid, loans, and contributions abroad reached SAR 153.7 billion during the period 2015-2019 (Table 9-12). Aid and loans constituted 84.0 percent (SAR 129.1 billion). The contributions to associations and organizations amounted to SAR 24.4 billion or 15.9 percent of the total. Aid provided through multilateral aid programs amounted to SAR 150 million or 0.1 percent of the total.
Saudi aid and loans provided through bilateral channels and multilateral associations, organizations and institutions in 2019 reached SAR 2.4 billion, jumping by 259.8 percent from the preceding year and constituting 6.5 percent of the total. Aid and loans extended in 2019 constituted the bulk of the total, amounting to SAR 35.2 billion (93.5 percent), a decline of 6.2 percent from the preceding year.
Exchange Rate TrendsSAMA continued to maintain the official exchange rate of the Saudi riyal against the U.S. dollar at SAR 3.75 per one U.S. dollar during 2019. The nominal effective exchange rate (NEER) index decreased by 9.41 points from 117.59 at end-2018 to 108.18 at end-2019. Furthermore, the real effective exchange rate (REER) index for Saudi Arabia fell by 12.93 points, from 116.45 at end-2018 to 103.52 at end-2019.

125
Exte
rnal
Sec
tor
Table 9-9: Balance of Payments
(Million SAR)
2015 2016 2017 2018 2019* Change% 2019
I. Current Account Balance -212,714 -89,410 39,241 264,774 186,908 -29.4
A. Goods and services -109,863 10,312 142,566 392,097 294,343 -24.9
1. Goods 165,995 209,115 369,229 632,811 481,616 -23.9
Exports 763,262 688,528 831,981 1,103,952 977,565 -11.4
Imports 597,267 479,413 462,752 471,141 495,949 5.3
2. Services -275,858 -198,803 -226,663 -240,714 -190,467 -20.9
Credit 54,277 64,697 67,994 73,696 90,682 23.0
Debit 330,135 263,501 294,656 314,409 281,148 -10.6
B. Primary income 64,800 58,975 40,117 26,675 29,891 12.1
Credit 95,912 89,890 70,916 71,901 78,391 9.0
Debit 31,112 30,914 30,799 45,226 48,500 7.2
C. Secondary income -167,651 -158,698 -143,442 -153,998 -137,324 -10.8
Credit 0 0 0 0 0 0.0
Debit 167,651 158,698 143,442 153,998 22,579 -85.3
II. Capital Account -3,983 -3,365 -6,931 -8,733 -6,499 -25.6
III. Financial Account -274,058 -342,584 27,985 252,691 173,486 -31.3
1. Direct Investment -10,317 5,564 21,978 70,276 32,335 -54.0
Net Acquisition of Financial Assets 20,212 33,511 27,298 86,203 49,443 -42.6
Net Incurrence of Liabilities 30,529 27,947 5,321 15,927 17,107 7.4
2. Portfolio Investments 40,386 -42,798 -9,521 14,294 -53,295 -472.9
Net Acquisition of Financial Assets 39,081 20,308 72,010 79,821 119,937 50.3
Net Incurrence of Liabilities -1,305 63,106 81,531 65,527 173,232 164.4
3. Other Investments 130,630 -3,021 163,180 167,500 183,245 9.4
Net Acquisition of Financial Assets 145,232 30,882 179,107 211,427 258,990 22.5
Net Incurrence of Liabilities 14,602 33,903 15,927 43,927 75,746 72.4
4. Reserve Assets -434,758 -302,328 -147,652 621 11,202 1,702.9
Errors and Omissions -57,361 -249,808 -4,324 -3,350 -4,813 43.7
* Estimates. Minus sign (-) = Payments in the current account items.
Chart 9-5: Current Account Balance
-200
-100
0
100
200
300
2016 2017 2018
رسم بياني رقم 9-5: ميزان الحساب الجاري
400
500
Billi
on S
AR
2019
Current Account Balance Goods and Services Primary Income Secondary Income
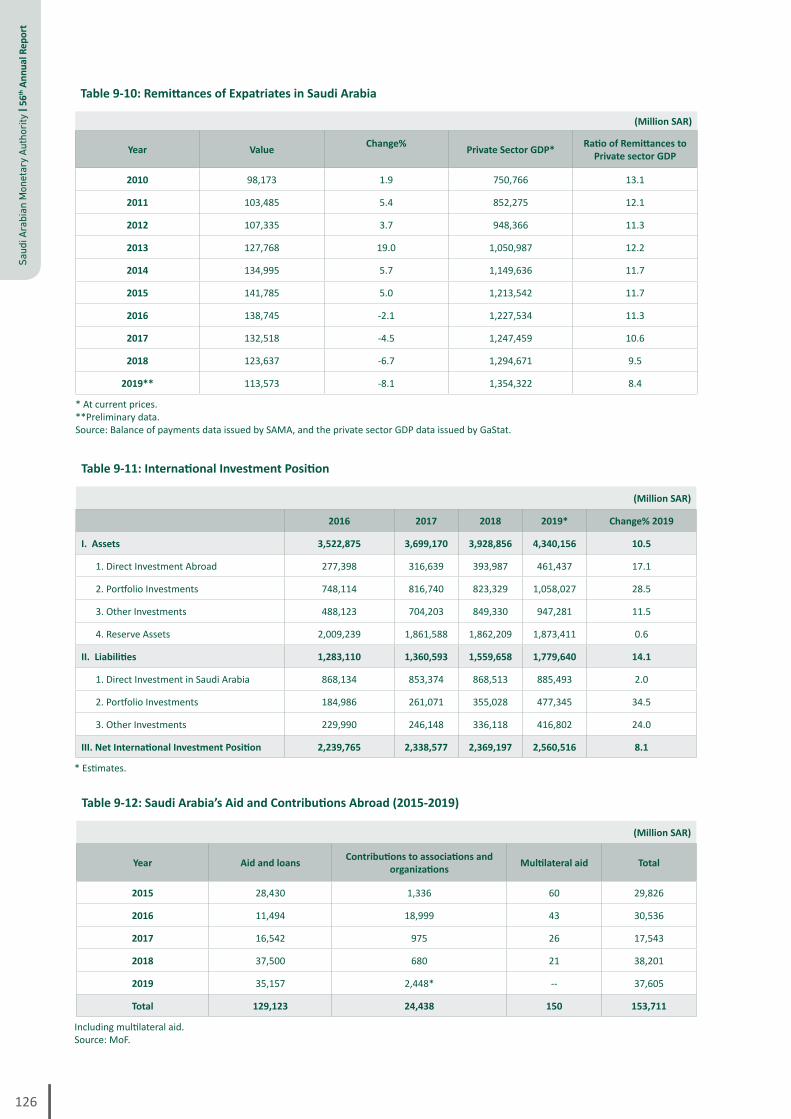
Saud
i Ara
bian
Mon
etar
y Au
thor
ity |
56th
Ann
ual R
epor
t
126
Table 9-11: International Investment Position
(Million SAR)
2016 2017 2018 2019* Change% 2019
I. Assets 3,522,875 3,699,170 3,928,856 4,340,156 10.5
1. Direct Investment Abroad 277,398 316,639 393,987 461,437 17.1
2. Portfolio Investments 748,114 816,740 823,329 1,058,027 28.5
3. Other Investments 488,123 704,203 849,330 947,281 11.5
4. Reserve Assets 2,009,239 1,861,588 1,862,209 1,873,411 0.6
II. Liabilities 1,283,110 1,360,593 1,559,658 1,779,640 14.1
1. Direct Investment in Saudi Arabia 868,134 853,374 868,513 885,493 2.0
2. Portfolio Investments 184,986 261,071 355,028 477,345 34.5
3. Other Investments 229,990 246,148 336,118 416,802 24.0
III. Net International Investment Position 2,239,765 2,338,577 2,369,197 2,560,516 8.1
* Estimates.
Table 9-12: Saudi Arabia’s Aid and Contributions Abroad (2015-2019)
(Million SAR)
Year Aid and loans Contributions to associations and organizations Multilateral aid Total
2015 28,430 1,336 60 29,826
2016 11,494 18,999 43 30,536
2017 16,542 975 26 17,543
2018 37,500 680 21 38,201
2019 35,157 2,448* -- 37,605
Total 129,123 24,438 150 153,711
Including multilateral aid. Source: MoF.
Table 9-10: Remittances of Expatriates in Saudi Arabia
(Million SAR)
Year Value Change% Private Sector GDP* Ratio of Remittances to Private sector GDP
2010 98,173 1.9 750,766 13.1
2011 103,485 5.4 852,275 12.1
2012 107,335 3.7 948,366 11.3
2013 127,768 19.0 1,050,987 12.2
2014 134,995 5.7 1,149,636 11.7
2015 141,785 5.0 1,213,542 11.7
2016 138,745 -2.1 1,227,534 11.3
2017 132,518 -4.5 1,247,459 10.6
2018 123,637 -6.7 1,294,671 9.5
2019** 113,573 -8.1 1,354,322 8.4
* At current prices.**Preliminary data. Source: Balance of payments data issued by SAMA, and the private sector GDP data issued by GaStat.

PUBLIC FINANCE

Saud
i Ara
bian
Mon
etar
y Au
thor
ity |
56th
Ann
ual R
epor
t
128
In its meeting held on Monday, Rabi’ II 12, 1441H (December 9, 2019), the Council of Ministers approved the state budget for fiscal year 1441/1442H (2020). The budget aims to advance economic development and achieve fiscal sustainability and economic growth.
The approved budget is a continuation of the government’s policy to achieve Vision 2030 by implementing economic reforms, diversifying income sources, making optimum use of available resources, supporting the private sector, enhancing the efficiency of expenditure, developing facilities and services for citizens and residents, supporting social protection programs, improving government services and quality of life, and supporting housing programs.
Total expenditures are projected to be SAR 1,020 billion, 7.8 percent lower than the 2019 budget’s figure. Total 2020 revenues are budgeted at SAR 833 billion, 14.6 percent lower than the preceding year’s budgeted amount. The 2020 budget’s fiscal deficit is estimated at SAR 187 billion, increasing by 43.0 percent over the preceding fiscal year’s projections (Table 10-1).
Main Features of the State Budget for FY 1441/1442H (2020)Government spending policy focuses on achieving
economic growth and inclusive development by supporting social development, achieving fiscal targets, improving fiscal planning, and enhancing the efficiency of expenditure. The following is an overview of the main state budget appropriations for key sectors (Table 10-2 and Chart 10-1).
Security and Regional Administration Security and Regional Administration sector was allocated SAR 102.3 billion or 10.0 percent of total budgetary expenditures, declining by 0.5 percent from the 2019 budgeted amount.
Health and Social DevelopmentHealth Services and Social Development sectors were allocated SAR 167.0 billion, representing 16.4 percent of total budgetary expenditures, and decreasing by 2.9 percent from the 2019 budgeted amount.
Municipal ServicesMunicipal Services, including the Ministry of Municipal and Rural Affairs, secretariats and municipalities, were allocated SAR 53.6 billion or 5.3 percent of the budgetary expenditures, declining by 13.9 percent from the 2019 budgeted amount.
MilitaryMilitary sector was allocated SAR 181.9 billion, representing 17.8 percent of total budgetary expenditures, and decreasing by 4.7 percent from the 2019 budgeted amount.
Table 10-1: Budget Projections
(Billion SAR)
FY1440/1441 (2019)
FY1441/1442 (2020)
Change %
Total revenues 975 833 -14.6
Total expenditures 1,106 1,020 -7.8
Surplus/deficit -131 -187 43.0
Source: MoF.
Public Finance

129
Publ
ic F
inan
ce
EducationEducation was allocated SAR 193.2 billion or 18.9 percent of total budgetary expenditures, rising by 0.3 percent over the 2019 budgeted amount.
Infrastructure and TransportationInfrastructure and Transportation sector was allocated SAR 55.7 billion or 5.5 percent of total budgetary expenditures, decreasing by 20.7 percent from the 2019 budgeted amount.
Other SectorsPublic Administration was allocated SAR 28 billion or 2.7 percent of the budgetary expenditures, increasing by 1.7 percent over the 2019 budgeted amount.
The Economic Resources sector was allocated SAR 97.6 billion or 9.6 percent of total budgetary expenditures, decreasing by 25.7 percent from the 2019 budgeted amount.
The Public Programs (general items) sector was allocated SAR 140.7 billion, representing 13.8 percent of total budgetary expenditures, and decreasing by 9.9 percent from the 2019 budgeted amount.
Actual Revenues and Expenditures for FY 2019Actual revenues for fiscal year 1440/1441H (2019) grew by 2.3 percent to SAR 926.8 billion against a rise of 31.0 percent in the previous fiscal year. The ratio of actual revenues to nominal GDP was 31.2 percent, declining by 5 percent from the budgeted figure. Actual 2019 oil revenues of SAR 594.4 billion were 10.2 percent lower than the
Table 10-2: Allocation of the State Budget by Key Sector
(Million SAR)
1440/1441H (2019) 1441/1442H (2020)
Amount Share Change % Amount Share Change %
Public Administration 27,542 2.5 5.1 28,018 2.7 1.7
Military 190,978 17.3 -9.1 181,923 17.8 -4.7
Security and Regional Administration 102,827 9.3 2.0 102,348 10.0 -0.5
Municipal Services 62,238 5.6 16.5 53,560 5.3 -13.9
Education 192,622 17.4 0.1 193,168 18.9 0.3
Health and Social Development 172,041 15.6 17.4 166,980 16.4 -2.9
Economic Resources 131,340 11.9 24.7 97,645 9.6 -25.7
Infrastructure and Transportation 70,243 6.4 29.7 55,705 5.5 -20.7
Public Programs 156,169 14.1 75.0 140,652 13.8 -9.9
Total 1,106,000 100.0 13.1 1,020,000 100.0 -7.8
Source: MoF.
Infrastructure andTransportation
Military
Security and RegionalAdminstration
Economic Resources
Municipal Services Education
Public Programs
Health and Social Development
Public Administration
%16.4
%9.6
%5.5
%13.8
%2.7%17.8
%10.0
%5.3
%18.9
Chart 10-1: Budget Allocations for Fiscal Year 1441/1442H (2020) by Key Sectors

Saud
i Ara
bian
Mon
etar
y Au
thor
ity |
56th
Ann
ual R
epor
t
130
Table 10-3: State Budget Actual and Projected Revenues and Expenditures
(Million SAR)
1440/1441H (2019)
Projection Actual Difference Difference to Projection %
Total revenues 975,283 926,846 -48,437 -5.0
Oil revenues 661,875 594,424 -67,451 -10.2
Non-oil revenues 313,408 332,422 19,014 6.1
Operational Expenditures 859,959 889,995 30,036 3.5
Compensation of employees 455,842 505,030 49,188 10.8
Goods and services 175,135 160,964 -14,171 -8.1
Finance costs 21,016 21,132 116 0.6
Subsidies 31,739 23,207 -8,532 -26.9
Grants 2,795 1,008 -1,787 -63.9
Social benefits 73,439 82,128 8,689 11.8
Other expenses 99,993 96,526 -3,467 -3.5
Net non-financial acquired assets 246,040 169,449 -76,591 -31.1
Total expenditures 1,105,999 1,059,444 -46,555 -4.2
Source: MoF.
Table 10-4: Actual Revenue and Expenditure
(Million SAR)
1438/1439H (2017) 1439/1440H (2018) 1440/1441H (2019)
Value Change % Ratio to GDP* Value Change % Ratio to
GDP* Value Change % Ratio to GDP*
Total revenues 691,510 33.1 26.8 905,609 31.0 30.7 926,846 2.3 31.2
Total expenditures 929,999 12.0 36.0 1,079,467 16.1 36.6 1,059,445 -1.9 35.6
Surplus/deficit -238,489 -23.3 -9.2 -173,858 -27.1 -5.9 -132,599 -23.7 -4.5
* Including import duties (at current prices). Source: MoF.
budgeted amount. However, actual 2019 non-oil revenues were 6.1 percent higher than the budgeted amount, at SAR 332.4 billion.
As part of the implementation of the Unified GCC Excise Tax Agreement, a 50 percent excise tax on Sugar-Sweetened Beverages (SSBs) came into effect as of December 2019.
Actual expenditures for fiscal year 2019 totaled SAR 1,059.4 billion or 35.6 percent of GDP, declining by 4.2 percent from the budgeted figure. In addition, the 2019 actual expenditures were 1.9 percent lower than the 2018 actual expenditures. Actual expenditures of 2019 rose for social benefits by 11.8 percent to SAR 82.1 billion, for compensation of employees by 10.8 percent to SAR 505 billion,
and for finance costs by 0.6 percent to SAR 21.1 billion. However, actual expenditures for grants dropped by 63.9 percent to SAR 1 billion, and actual expenditures for subsidies fell by 26.9 percent to SAR 23.2 billion. Actual expenditures for goods and services also went down by 8.1 percent to SAR 161.0 billion and other actual expenditures by 3.5 percent to SAR 96.5 billion (Tables 10-3 and 10-4).
Actual Budget Deficit to GDP RatioFiscal year 2019 figures indicate a budget deficit of SAR 132.6 billion, constituting 4.5 percent of GDP, compared with a deficit of SAR 173.9 billion or 5.9 percent of GDP in the preceding year (Table 10-4 and Chart 10-2).

131
Publ
ic F
inan
ce
Table 10-5: Current Balances of Domestic Loan Program
(Million SAR)
2018 2019 Change %
Actual loans disbursed 438 485 10.8
Actual loans repaid 382 406 6.1
Source: MoF.
Table 10-6: Loans Extended During 2018-2019 by Field
(Million SAR)
Field
Project contracts signed
2018 2019
Number Value Number Value
Hospitality and tourism projects 3 29.8 1 7.3
Health projects 8 787.9 5 363.7
Educational projects 6 136.3 5 261.6
Total 17 954.0 11 632.6
Source: MoF.
Billi
on R
iyal
s
Surplus/DeficitTotal ExpendituresTotal Revenues
Actuals Budget projections
-200
0
200
400
600
800
1000
1200
Chart 10-2: Budget Estimates and Actuals for 1440/1441H (2019)
Domestic Loans and Subsidies I. Domestic LoansActual loans disbursed under the Domestic Loans program during 2019 totaled SAR 485 million, increasing by 10.8 percent from 2018. Loan repayments stood at SAR 406 million, rising by 6.1 percent. During fiscal year 1440/1441H (2019), 11 loans were approved, five of which were for educational projects, five for health projects, and one for hospitality and tourism projects (Tables 10-5 and 10-6).
II. Domestic SubsidiesDuring fiscal year 1440/1441H (2019), a total of SAR 3.9 billion of subsidies were disbursed as
follows: Fodder subsidy stood at SAR 2.5 billion, infant formula subsidy SAR 362.9 million, King Salman Humanitarian Aid and Relief Centre subsidy SAR 168.7 million, Equestrian Club subsidy SAR 135 million, Falcons Club subsidy SAR 100 million, King Abdulaziz Public Library subsidy SAR 72.7 million, KAICIID subsidy SAR 72.2 million, King Abdulaziz Center for National Dialogue subsidy SAR 42.7 million, and the Secretariat of the Finance Committee subsidy SAR 30 million.
Public Debt The public debt registered an increase of 21.1 percent at the end of fiscal year 1440/1441H (2019), reaching SAR 677.9 billion or 22.8 percent

Saud
i Ara
bian
Mon
etar
y Au
thor
ity |
56th
Ann
ual R
epor
t
132
Table 10-7: Public Debt
(Million SAR)
FY
Borrowed Repaid Outstanding public debt at year-end
Change %GDP (at current prices)
Ratio of public
debt to GDP
Domesticdebt
Foreign debt
Domestic debt
Foreign debt
Domestic debt
Foreign debt
Total public debt
1436/1437H (2015) 98,000 -- -- -- 142,260 -- 142,260 221.4 2,453,512 5.8
1437/1438H (2016) 97,020 103,125 25,825 -- 213,455 103,125 316,580 122.5 2,418,508 13.1
1438/1439H (2017) 58,455 80,625 12,408 -- 259,502 183,750 443,252 40.0 2,582,198 17.2
1439/1440H (2018) 48,750 71,250 3,272 -- 304,980 255,000 559,980 26.3 2,949,457 19.0
1440/1441H (2019)* 69,839 50,161 2,055 -- 372,764 305,161 677,925 21.1 2,973,626 22.8
* Preliminary data. Source: MoF.
of GDP and 33.5 percent of non-oil GDP, compared with SAR 560.0 billion or 19.0 percent of GDP in the previous year. Domestic debt stood at SAR 372.8 billion or 55.0 percent of total public debt, and foreign debt stood at SAR 305.2 billion or 45.0 percent of total public debt (Table 10-7).

NATIONAL ACCOUNTSANDSECTORAL DEVELOPMENT

Saud
i Ara
bian
Mon
etar
y Au
thor
ity |
56th
Ann
ual R
epor
t
134
Gross Domestic Product (GDP) for 2019Preliminary data from the General Authority for Statistics (GaStat) indicate that GDP at constant prices (2010=100) grew by 0.33 percent to SAR 2,639.8 billion during 2019 compared to a growth of 2.43 percent in the preceding year. The decline in growth was driven by a 3.65 percent contraction in the oil sector in 2019 against a growth of 3.13 percent in 2018. The non-oil sector, however, registered a growth of 3.31 percent in 2019
compared to a rise of 2.20 percent in the preceding year. The non-oil private sector grew by 3.78 percent against a growth of 1.91 in the preceding year. Moreover, the non-oil government sector increased by 2.20 percent in 2019 compared to a rise of 2.86 percent in 2018 (Table 11-1).
Preliminary data show that GDP at current prices went up by 0.82 percent to SAR 2,973.6 billion in 2019 compared to an increase of 14.22 percent in 2018. This was mainly attributable to a contraction of 6.04 percent in the oil sector against a rise of 34.08 percent in the preceding year. On the other hand, the non-oil sector registered a growth of 4.21 percent in 2019 compared to a rise of 6.62 percent in 2018. The non-oil private sector increased by 4.11 percent against a 4.28 percent growth in the
Table 11-1: Gross Domestic Product by Sector
(Million SAR)
2019*2018
Share Growth rate %ValueShare Growth
rate %Value
GDP at Current Prices
31.15-6.04926,33833.4334.08985,9001. Oil sector
68.134.212,026,06465.926.621,944,2022. Non-oil sector
45.544.111,354,32244.104.281,300,856 a. Private sector
22.594.41671,74321.8111.68643,346 b. Government sector
99.290.762,952,40399.3414.512,930,101GDP (excluding import duties)
0.719.6521,2230.66-17.2119,3553. Import duties
100.000.822,973,626100.0014.222,949,457GDP
GDP at constant 2010 prices
41.52-3.651,096,17043.243.131,137,6461. Oil sector
57.863.311,527,30456.192.201,478,4252. Non-oil sector
40.683.781,073,74439.321.911,034,635 a. Private sector
17.182.20453,56116.872.86443,789 b. Government sector
99.380.282,623,47499.432.602,616,070GDP (excluding import duties)
0.628.7716,3380.57-19.8915,0213. Import duties
100.000.332,639,811100.002.432,631,091GDP
Implicit deflator (2010=100)
--0.49112.65 --11.51112.10 Gross Domestic Product (GDP)
---2.4984.51 --30.0286.66 1. Oil sector
--0.88132.66 --4.33131.50 2. Non-oil sector
* Preliminary data. Source: GaStat.
National Accounts and Sectoral Development

135
Nati
onal
Acc
ount
s and
Sec
tora
l Dev
elop
men
t
preceding year. Moreover, the non-oil government sector rose by 4.41 percent compared to a 11.68 percent rise in 2018. The non-oil GDP implicit deflator 4 increased by 0.88 percent in 2019 against a rise of 4.33 percent in 2018.
The non-oil private sector constituted 40.68 percent of GDP at constant prices in 2019, compared to 39.32 percent in 2018. The non-oil government sector’s contribution increased from 16.87 percent in 2018 to 17.18 percent in 2019. The oil sector’s contribution decreased to 41.52 percent in 2019 from 43.24 percent in 2018 (Table 11-1).
An analysis of GDP at constant 2010 prices by detailed key economic production activities shows that most activities grew in 2019, albeit in varying degrees. Wholesale and retail trade, restaurants and hotels increased by 6.27 percent against 0.95 percent in 2018. In addition, transport, storage and telecommunications grew by 5.60 percent against a 2.08 percent rise in the preceding year. Finance, insurance, real estate and business services registered an increase of 5.53 percent against an
increase of 3.16 percent in the preceding year. Construction and building also increased by 4.60 percent against a decline of 3.49 percent in 2018. On the other hand, public utilities (electricity, gas and water) decreased by 3.96 percent compared to a rise of 1.89 percent in 2018. Mining and quarrying (which includes crude oil and natural gas extraction) also dropped by 3.64 percent against a growth of 3.64 percent in the preceding year. Manufacturing industries (including oil refining) declined by 1.56 percent against a 2.10 percent growth in 2018 (Table 11-2).
Contribution of Private Sector to GDPThe contribution of the private sector to GDP at current prices increased to 45.87 percent in 2019 from 44.40 percent in 2018. The private sector’s growth at current prices stood at 4.11 percent in 2019 compared to a growth of 4.28 percent in the preceding year (Table 11-3 and Chart 11-1).
Contribution of Government Sector to GDPIn 2019, the government sector’s contribution to GDP at current prices was 22.75 percent, rising
Table 11-2: Gross Domestic Product by Key Economic Sectors (At Constant Prices for 2010)
(Million SAR)
2019*201820172016
Growth % Share ValueGrowth % Share Value
-3.6438.451,008,7893.6440.021,046,9181,010,1041,046,7851. Mining and quarrying
-1.5611.95313,5532.1012.18318,529311,982307,9872. Manufacturing (including oil refining)
-3.961.2733,3981.891.3334,77634,13233,6883. Public utilities (electricity, gas and water)
4.604.51118,381-3.494.33113,172117,259121,2034. Construction and building
6.279.38246,0850.958.85231,569229,378228,0745. Wholesale and retail trade, and restaurants and hotels
5.606.24163,6182.085.92154,946151,789148,4676. Transport, storage and commu-nications
5.5310.37271,9383.169.85257,692249,794237,1437. Finance, insurance, real estate and business services
0.28100.002,623,4742.60100.002,616,0702,549,8202,566,928GDP**
* Preliminary data. ** Excluding import duties. Source: GaStat.
4 The implicit deflator for GDP is a measure of the general level of prices of all final goods in an economy in a year. Unlike the cost of living index which measures the final consumption only, GDP deflator measures inflation rate at the macroeconomic level. The GDP deflator targets all consumption, investment and government sectors based on their respective contributions to the GDP.
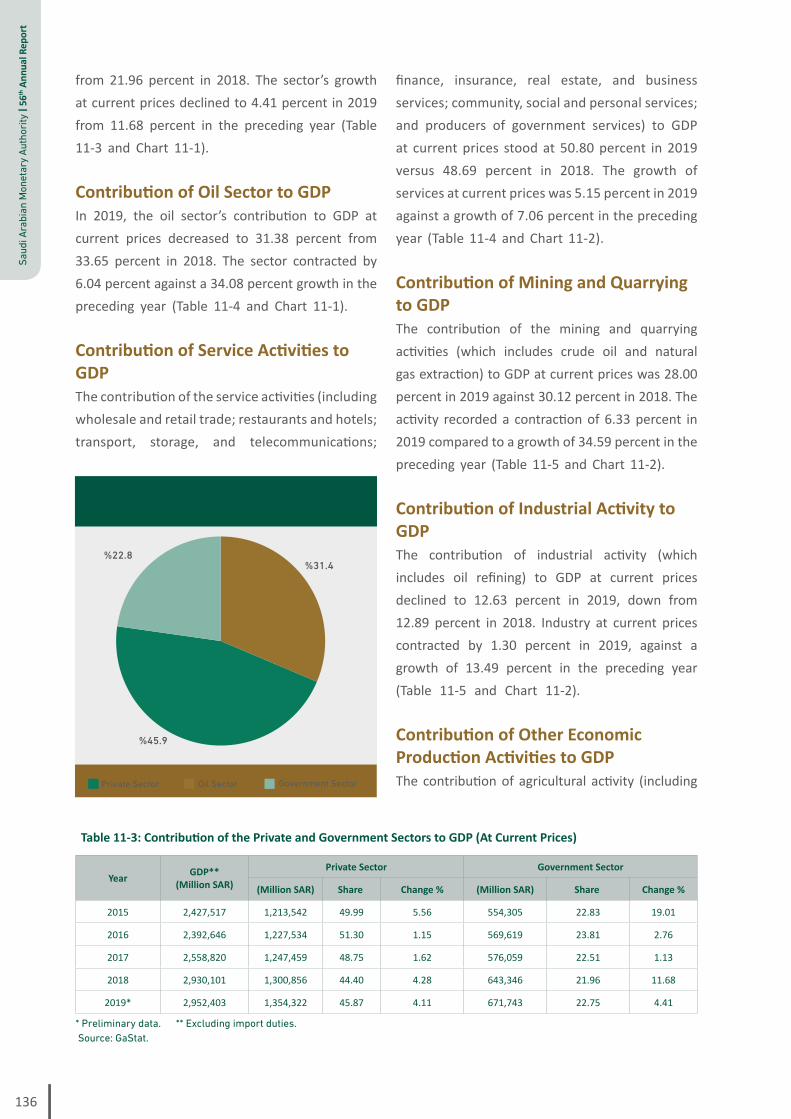
Saud
i Ara
bian
Mon
etar
y Au
thor
ity |
56th
Ann
ual R
epor
t
136
from 21.96 percent in 2018. The sector’s growth at current prices declined to 4.41 percent in 2019 from 11.68 percent in the preceding year (Table 11-3 and Chart 11-1).
Contribution of Oil Sector to GDPIn 2019, the oil sector’s contribution to GDP at current prices decreased to 31.38 percent from 33.65 percent in 2018. The sector contracted by 6.04 percent against a 34.08 percent growth in the preceding year (Table 11-4 and Chart 11-1).
Contribution of Service Activities to GDPThe contribution of the service activities (including wholesale and retail trade; restaurants and hotels; transport, storage, and telecommunications;
finance, insurance, real estate, and business services; community, social and personal services; and producers of government services) to GDP at current prices stood at 50.80 percent in 2019 versus 48.69 percent in 2018. The growth of services at current prices was 5.15 percent in 2019 against a growth of 7.06 percent in the preceding year (Table 11-4 and Chart 11-2).
Contribution of Mining and Quarrying to GDPThe contribution of the mining and quarrying activities (which includes crude oil and natural gas extraction) to GDP at current prices was 28.00 percent in 2019 against 30.12 percent in 2018. The activity recorded a contraction of 6.33 percent in 2019 compared to a growth of 34.59 percent in the preceding year (Table 11-5 and Chart 11-2).
Contribution of Industrial Activity to GDPThe contribution of industrial activity (which includes oil refining) to GDP at current prices declined to 12.63 percent in 2019, down from 12.89 percent in 2018. Industry at current prices contracted by 1.30 percent in 2019, against a growth of 13.49 percent in the preceding year (Table 11-5 and Chart 11-2).
Contribution of Other Economic Production Activities to GDPThe contribution of agricultural activity (including
Chart 11-1: Contribution of Economic Sectors to GDP in 2019 at Current Prices (Excluding import duties)
Private Sector Government SectorOil Sector
%22.8%31.4
%45.9
Table 11-3: Contribution of the Private and Government Sectors to GDP (At Current Prices)
Government SectorPrivate SectorGDP**(Million SAR)Year
Change %Share (Million SAR)Change %Share (Million SAR)
19.0122.83554,3055.5649.991,213,5422,427,5172015
2.7623.81569,6191.1551.301,227,5342,392,6462016
1.1322.51576,0591.6248.751,247,4592,558,8202017
11.6821.96643,3464.2844.401,300,8562,930,1012018
4.4122.75671,7434.1145.871,354,3222,952,4032019*
* Preliminary data. ** Excluding import duties. Source: GaStat.

137
Nati
onal
Acc
ount
s and
Sec
tora
l Dev
elop
men
t
agriculture, forestry and fishing) to GDP at current prices was 2.25 percent in 2019 against 2.24 percent in 2018. The growth of this activity at current prices was 1.22 percent in 2019 against a growth of 0.49 percent in the preceding year.
The contribution of construction and building to GDP at current prices stood at 5.54 percent in 2019 compared to 5.17 percent in the preceding year. This activity recorded a significant growth of 8.03 percent in 2019 against a decline of 2.00 percent in 2018.
In 2019, the contribution of electricity, gas and water to GDP at current prices stood at 1.60 percent versus 1.68 percent in the previous year. This activity recorded a contraction of 4.25 percent during 2019 compared to a 21.28 percent growth in 2018 (Table 11-6 and Chart 11-2).
Per Capita IncomePreliminary figures indicate that per capita share
Table 11-5: Contribution of Mining and Quarrying Activity and Industrial Activity to GDP (At Current Prices)
Industrial Activity****Mining and Quarrying ***GDP**
(Million SAR)Year
Change %Share (Million SAR)Change %Share (Million SAR)
1.6412.82311,215-46.8624.74600,5082,427,5172015
0.3013.05312,160-11.1422.30533,6362,392,6462016
6.6413.01332,90122.8925.63655,7612,558,8202017
13.4912.89377,80634.5930.12882,6132,930,1012018
-1.3012.63372,893-6.3328.00826,7062,952,4032019*
* Preliminary data. ** Excluding import duties. *** Including crude oil and natural gas. **** Including oil refining.Source: GaStat.
Table 11-4: Contribution of Oil Sector and Services Activity to GDP (At Current Prices)
Services ActivityOil SectorGDP**(Million SAR)
YearChange %Share (Million SAR)Change %Share (Million SAR)
10.8752.501,274,557-44.9127.17659,6702,427,5172015
2.5054.601,306,409-9.7324.89595,4942,392,6462016
2.0052.071,332,48123.4828.74735,3022,558,8202017
7.0648.691,426,53134.0833.65985,9002,930,1012018
5.1550.801,499,928-6.0431.38926,3382,952,4032019*
* Preliminary data. ** Excluding import duties. Source: GaStat.
of GDP at current prices in Saudi Arabia declined by 1.55 percent to SAR 86,902 in 2019, versus SAR 88,271 in 2018 (Table 11-7).
Chart 11-2: Contribution of Economic Activities to GDP in 2019 at Current Prices (Excluding import duties)
Services Activity Agricultural Activity
Industrial Activity
Mining and QuarryingActivity
Construction and BuildingActivityElectricity, Gas and WaterActivity
%50.8
%12.6
%5.5
%28.0
%1.6%2.2
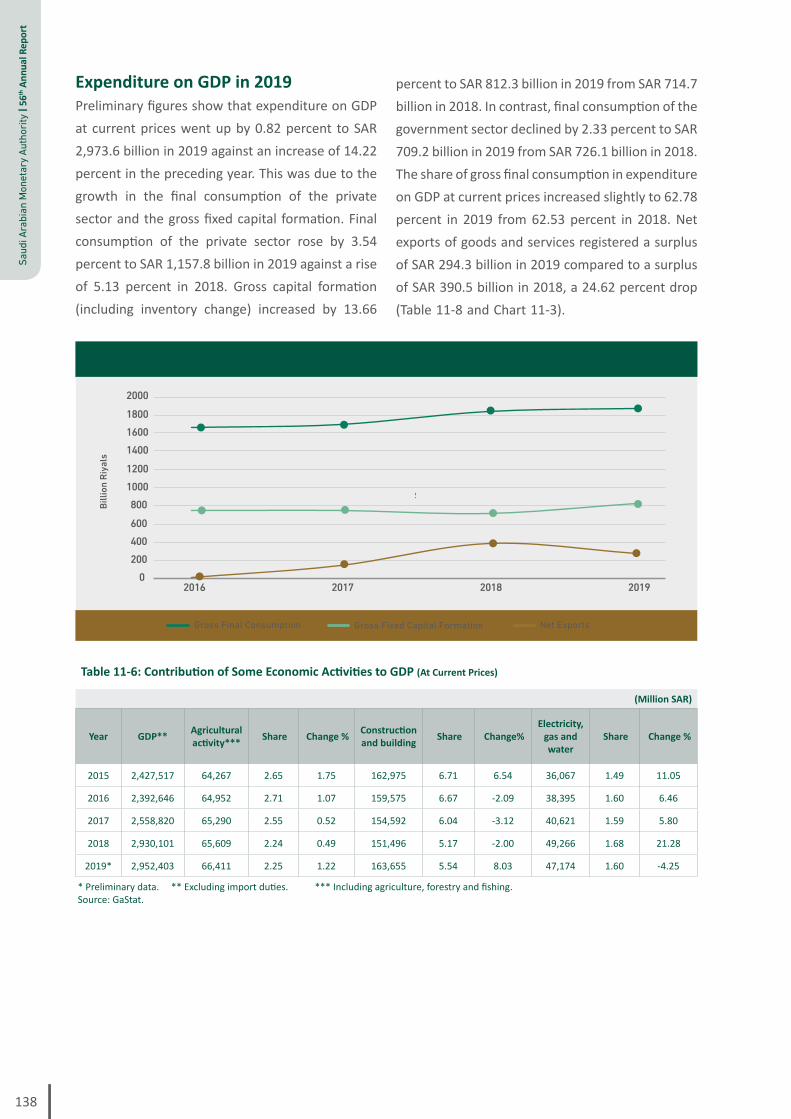
Saud
i Ara
bian
Mon
etar
y Au
thor
ity |
56th
Ann
ual R
epor
t
138
Expenditure on GDP in 2019Preliminary figures show that expenditure on GDP at current prices went up by 0.82 percent to SAR 2,973.6 billion in 2019 against an increase of 14.22 percent in the preceding year. This was due to the growth in the final consumption of the private sector and the gross fixed capital formation. Final consumption of the private sector rose by 3.54 percent to SAR 1,157.8 billion in 2019 against a rise of 5.13 percent in 2018. Gross capital formation (including inventory change) increased by 13.66
percent to SAR 812.3 billion in 2019 from SAR 714.7 billion in 2018. In contrast, final consumption of the government sector declined by 2.33 percent to SAR 709.2 billion in 2019 from SAR 726.1 billion in 2018. The share of gross final consumption in expenditure on GDP at current prices increased slightly to 62.78 percent in 2019 from 62.53 percent in 2018. Net exports of goods and services registered a surplus of SAR 294.3 billion in 2019 compared to a surplus of SAR 390.5 billion in 2018, a 24.62 percent drop (Table 11-8 and Chart 11-3).
Table 11-6: Contribution of Some Economic Activities to GDP (At Current Prices)
(Million SAR)
Change % Share Electricity,
gas and water
Change% Share Construction and building Change % Share Agricultural
activity***GDP**Year
11.051.4936,0676.546.71162,9751.752.6564,2672,427,5172015
6.461.6038,395-2.096.67159,5751.072.7164,9522,392,6462016
5.801.5940,621-3.126.04154,5920.522.5565,2902,558,8202017
21.281.6849,266-2.005.17151,4960.492.2465,6092,930,1012018
-4.251.6047,1748.035.54163,6551.222.2566,4112,952,4032019*
* Preliminary data. ** Excluding import duties. *** Including agriculture, forestry and fishing. Source: GaStat.
Chart 11-3:Contribution of Some Economic Activities to GDP (At Current Prices)
Gross Final Consumption Gross Fixed Capital Formation Net Exports
0200400600
80010001200
140016001800
2000
2016 2017 2018 2019
!
Billi
on R
iyal
s

139
Nati
onal
Acc
ount
s and
Sec
tora
l Dev
elop
men
t
Table 11-7: Per Capita GDP
Change %2019*Change %201820172016
0.822,973,62614.222,949,4572,582,1982,418,508GDP** (Current prices) (Million SAR)
2.4134.222.4633.4132.6131.79Population (million)
-1.5586,90211.4988,27179,17776,083Per Capita GDP (Riyals)
* Preliminary data. ** Including import duties. Source: GaStat.
Table 11-8: Expenditure on GDP at Purchasers’ Value (At Current Prices)
(Million SAR)
2019*201820172016
Change %
ShareValueChange
% ShareValue
Change %
ShareValueChange
% ShareValue
1.2362.781,866,9908.8362.531,844,3412.0865.631,694,622-3.7668.641,660,089Gross final consumption
-2.3323.85709,17115.0824.62726,1011.0224.44630,978-15.1525.83624,632Government consumption
3.5438.941,157,8195.1337.911,118,2412.7241.191,063,6444.7242.811,035,457Private consumption
13.6627.32812,293-4.1124.23714,662-0.3828.86745,272-13.2030.93748,108Gross capital
formation**
-24.629.90294,343174.3813.24390,4541,279.985.51142,303--0.4310,312Net exports of goods and services***
0.82100.002,973,62614.22100.002,949,4576.77100.002,582,198-1.43100.002,418,508Expenditure on GDP
* Preliminary data. ** Including change in inventory. *** Net exports of goods and services = Total exports of goods and services minus total imports of goods and services.Source: GaStat.


SAMA, ACHIEVEMENTS AND ASPIRATIONS

Saud
i Ara
bian
Mon
etar
y Au
thor
ity |
56th
Ann
ual R
epor
t
142
The Saudi Arabian Monetary Authority (SAMA) seeks to fulfill the mandate entrusted to it in line with national economy requirements and Saudi Vision 2030, based on a clear vision of the present and future of the financial sector in Saudi Arabia and its prospective role in boosting the economy. During the fiscal year 1440/1441H (2019), the national economy witnessed many strategic and regulatory developments as well as various developments in the domestic and international markets. This chapter discusses SAMA’s roles and functions, salient achievements made in 1440/1441H (2019), and SAMA’s role in Vision 2030. It also touches upon SAMA’s contributions to the society, while the last part of the chapter reviews key developments in SAMA’s financial position.
SAMA, the central bank of the Kingdom of Saudi Arabia, was founded under two royal decrees issued on 25 Rajab 1371H (20 April 1952) and has been entrusted with many functions under a number of laws and resolutions. The most important of which are the following: (1) acting as the government’s bank, (2) issuing the national currency (Saudi riyal), (3) strengthening the Saudi currency and maintaining its value internally and externally, (4) bolstering currency backing, (5) managing foreign exchange reserves, (6) managing monetary policy to maintain price and exchange rate stability, (7) encouraging the growth and ensuring the soundness and stability of the financial system, (8) supervising and overseeing commercial banks and money-changing businesses, (9) supervising cooperative insurance companies and insurance service
providers, (10) supervising finance and real estate finance companies as well as credit information companies, (11) providing innovative and secure payment systems, (12) collecting and providing financial and monetary data, and (13) conducting necessary analysis and economic and financial research.
During 1440/1441H (2019), SAMA made a number of achievements locally and internationally, including Saudi Arabia being granted full membership of the Financial Action Task Force (FATF). It is the first Arab country to obtain this membership. SAMA also won the Best Risk Manager Award at the level of central banks worldwide for 2019. As a result of SAMA’s efforts in supporting digitization, the e-invoice payment platform for businesses, “Esal”, one of SAMA’s initiatives in the Financial Sector Development Program, won the Best Technological Innovation Award for Invoices of Digital Business Payments in the Middle East for 2019.
SAMA’s StrategyIn order to achieve the sought-after monetary and financial stability and support sustainable economic growth through the financial sector, SAMA has identified four strategic goals: maintaining monetary stability, protecting the stability and resilience of the financial system, expanding and deepening the financial sector, and contributing to the economic development of Saudi Arabia. This strategy goes in line with Saudi Arabia’s current orientation and Vision 2030. The strategy adopted in 2014 constitutes a vital framework for the visions and objectives that SAMA aspires to achieve through its role. SAMA is committed to achieving these objectives by adopting the best international practices, maintaining the efficiency of human capital and continuously developing its capabilities, and benefiting from the latest technologies. Within its strategy, SAMA has identified the following
SAMA, Achievements and Aspirations

143
SAM
A, A
chie
vem
ents
and
Asp
iratio
ns
objectives:• to formulate and execute a monetary policy
consistent with the national economic goals;• to provide and disseminate appropriate
statistical reports and economic research;• to effectively and efficiently implement
its supervisory role over entities under its supervision;
• to protect customers of entities under its supervision and promote financial inclusion;
• to provide effective banking services to the government;
• to provide comprehensive and innovative payment systems; and
• to maintain the soundness of external financial assets and maximize long-term investment income, taking into account risk appetite.
Central banks usually review their strategies periodically as their functions might undergo changes, or according to significant changes in the economic cycle and the financial system. SAMA has studied all current and expected future challenges and opportunities in the financial system through strategic visualization groups of experts from all fields of work. Accordingly, SAMA focused on updating and developing its strategy for the years 2020-2023 by identifying strategic priorities for its functions and translating them into clear goals and plans to be implemented in the coming years.
Monetary PolicySAMA plays a pivotal role in the national economy through its monetary policy, which aims to maintain monetary and financial stability and ensure credit availability to meet economic needs. The following is a review of the key objectives of SAMA’s monetary policy.
Monetary Stability One of the main goals of monetary policy is to maintain Saudi riyal exchange rate stability in the
domestic and international markets. Therefore, SAMA has maintained the Saudi riyal exchange rate against the U.S. dollar pegged at SAR 3.75 per U.S. dollar since 1986. To achieve this goal, SAMA uses a package of monetary policy tools, including repo (repurchase agreements) and reverse repo rates, SAMA bills, reserve ratios for commercial banks, swaps, direct deposits, and other monetary tools available to manage liquidity levels. These tools have helped in maintaining the stability of the Saudi riyal exchange rate, which supports economic growth through imports and exports and the freedom of capital flows.
Financial Stability SAMA plays an effective role in the banking and financial system by closely supervising all banking, finance and insurance institutions in order to achieve a number of strategic objectives, including maintaining the soundness and resilience of banking and financial systems, in addition to identifying, assessing, measuring and addressing all risks. This is achieved by monitoring capital, levels of liquidity and profitability of the financial sector, and stress-testing the banking sector, as well as monitoring indicators of financial integrity in order to ensure resilience of the financial economy and its ability to withstand shocks.
1. Achievements and Aspirations1.1. National Currency ManagementSAMA’s functions include issuing the national currency (banknotes and coins), maintaining issuances and their value, holding Saudi Arabia’s currency assets, and meeting the demand for currency through SAMA’s ten branches in all regions of Saudi Arabia. The currency is printed and minted in accordance with the latest technical specifications available in the industry, and it incorporates the latest and strongest security features that make it simple for people handling cash to judge the authenticity of a banknote. In addition, SAMA seeks to raise awareness of the

Saud
i Ara
bian
Mon
etar
y Au
thor
ity |
56th
Ann
ual R
epor
t
144
national currency along with its security features.
It also pursues all cases of currency counterfeiting and continuously coordinates with security authorities in order to combat all counterfeiting attempts, a fact that has contributed to the decline of counterfeiting rates of the Saudi currency as compared to other countries. SAMA’s efforts in combating currency counterfeiting include the following: • Continuing to spread awareness about the
national currency, its security features, and technical specifications through the distribution of guides, publishing of information on SAMA’s website and social media accounts, and the production of educational films, in addition to holding specialized training courses and workshops on banknotes.
• Distributing counterfeit detector pens and UV lights to elderly vendors and shop owners in bazaars and seasonal event venues.
• Holding meetings of the Standing Committee (which is located at SAMA) for the study of sources of counterfeit currency and determining preventive measures.
• Participating in shopping centers’ events to provide information about Saudi banknotes and coins.
• Following up the development of the smart phone application that interactively provides information about Saudi banknotes and their security features.
1.2. Foreign Reserve Management By managing foreign exchange reserves, SAMA aims to achieve a balance between maximizing investment returns and meeting liquidity requirements. Foreign exchange reserves are managed by qualified and specialized national cadres with the highest level of education and professional qualification, according to international foreign asset management standards and
regulations, and through a periodically reviewed comprehensive investment policy. Investment is made through strong diversified investment portfolios that are dynamically managed in order to optimize the distribution of assets and benefit from investment opportunities. Seeking to adopt global best practices, SAMA applies the Global Investment Performance Standards (GIPS), which were formulated by the CFA Institute. Additionally, SAMA takes moral responsibility in its investment practices by banning investment in certain activities, such as gambling and trading in alcohol, tobacco, pork, and weapons.
1.3. Supervision and Control of the Banking SectorSAMA supervises and regulates banks’ business operations in order to ensure their soundness, financial solvency and efficient performance in the national economy. This is achieved through the implementation of laws; issuance of regulations, instructions and controls; and conducting necessary supervisory visits and inspection programs. The following are the key developments in 1440/1441H (2019):• SAMA updated several instructions, including
the Rules of Opening Bank Accounts, Requirements for Appointments to Senior Positions in Financial Institutions Supervised by SAMA, and the Rules on Outsourcing.
• SAMA issued instructions for the professional certification of employees of supervised financial institutions.
• SAMA issued new instructions, including the Regulation of Agent Banking in Saudi Arabia, Code of Conduct and Work Ethics in Financial Institutions, the Whistle Blowing Policy for Financial Institutions, and the Requirements for Registration, Disclosure and Risk Management for Derivatives Contracts not Listed in a Central Platform (OTC Derivatives).
• SAMA conducted periodic supervisory visits to all domestic banks and foreign banks’
145
SAM
A, A
chie
vem
ents
and
Asp
iratio
ns
branches operating in Saudi Arabia, to update and assess banks’ risk profile, and created their respective risk registers.
• SAMA continued to perform inspections by planning and implementing different on-site inspection programs. Moreover, a number of thematic, targeted and specialized inspection programs were implemented using a risk-based approach. SAMA also follows up banks’ compliance with corrective action plans relating to the results of these programs through on-site visits.
• SAMA prepared and signed memorandums of understanding (MOUs) with a number of external supervisory bodies, including a cooperation MOU between SAMA and Dubai Financial Services Authority (DFSA) in the UAE in the field of financial services, and a trilateral MOU between SAMA, the Financial Services Commission (FSC) and the Financial Supervisory Service (FSS), both in South Korea, for mutual collaboration in the area of financial institutions supervision.
• SAMA updated the Licensing Requirements for Establishing a National Bank and the Licensing Requirements for Opening a Foreign Bank Branch in Saudi Arabia. The Banking Licensing Guidelines and Minimum Criteria were published on SAMA’s website.
1.3.1 Macro-Prudential Supervisory Measures in Saudi ArabiaSAMA adopts many macroprudential instruments aimed to ensure financial stability in Saudi Arabia by managing systemic risk and preventing disruption of vital financial services necessary for economic growth. The macroprudential instruments used in 2019 include the following:• Regulatory capital requirements in line with
Basel III requirements: Common Equity Tier 1 (CET1) must be at least 4.5 percent of the risk-weighted assets. Tier 1 capital must be at least 6 percent of the risk-weighted assets.
Total regulatory capital (Tier 1 capital and Tier 2 capital) must be at least 8 percent of the risk-weighted assets.
• Capital conservation buffer must be 2.5 percent of risk-weighted assets. This requirement must be met with CET1 capital. This ratio increased from 1.88 percent in 2018 to 2.5 percent in 2019, in line with Basel III requirements.
• Countercyclical capital buffer remained at zero percent in 2019.
• Capital surcharges for systemically important banks (which were six in 2019) were stipulated, varying from 0.5 percent to 1.5 percent depending on the systemic importance.
• Reducing the risk-weighted asset ratio of residential real estate finance from 75 percent in 2017 to 50 percent as of 2018.
• A bank’s deposit liabilities should not exceed 15 times its reserves and invested capital.
• Tier 1 capital to total exposures ratio should equal a minimum of 3 percent.
• A reserve requirement at 7 percent for demand deposits and 4 percent for time deposits. As of January 2019, this requirement must be calculated by banks according to daily average deposit balances at the end of the month.
• Banks are required to maintain a minimum liquidity reserve equal to 20 percent of their deposit liabilities. SAMA, in a statement released in January 2019, stipulated that the statutory reserves must be included under the definition of liquid assets when the ratio is calculated.
• Banks are required to maintain the net stable funding ratio (NSFR) at no less than 100 percent on an ongoing basis.
• Banks are required to maintain, at a minimum and on an ongoing basis, liquidity coverage ratio equal to 100 percent of projected net cash outflows over a 30-day stress period. This ratio was raised from 90 percent in 2018

Saud
i Ara
bian
Mon
etar
y Au
thor
ity |
56th
Ann
ual R
epor
t
146
to 100 percent in 2019, in line with Basel III requirements.
• Weighted loan-to-deposit (LTD) ratio should not exceed 90 percent.
• The maximum debt-to-income (DTI) ratio will vary depending on the customer’s income and total monthly obligations (including basic expenses), according to the Responsible Lending Principles for Retail Consumers issued in 2018.
• Loan-to-value (LTV) ratio must not exceed 90 percent for citizens’ first mortgage loan for all real estate financiers (banks and finance companies), and the ratio must not exceed 70 percent for citizens’ other mortgage loans.
• Banks are required to register finance lease contracts with the Saudi Finance Lease Registration Company (Sijil).
• Written approval must be obtained from SAMA before granting certain types of loans, such as loans provided to a non-resident entity, syndicated loan in a foreign currency to non-residents, syndicated loan in local currency outside Saudi Arabia (whether to residents or non-residents), any syndicated loan in local currency in which foreign banks are invited to participate, or owning or subscribing to securities in local currency abroad.
• A bank’s total exposure to any non-bank entity or group of interconnected entities (except for individuals, individual enterprises, and commercial enterprises mostly owned by the government or a government-related entity) should not exceed 15 percent of Tier 1 capital. Total exposure to individuals or to individual or partnership enterprises should not exceed 5 percent of Tier 1 capital. As for a bank’s total exposure to any other bank, it must not exceed 25 percent of Tier 1 capital of the lending bank. (This ratio drops to 15 percent if the borrowing bank and/or the lending bank is systemically important, whether domestically or globally). In addition, a bank’s total
exposure to any commercial enterprise mostly owned by the government or a government-related entity must not exceed 25 percent of Tier 1 capital.
• A bank’s total large exposure (i.e. to any single entity or group of interconnected entities that account for 10 percent or more of Tier 1 capital) must not exceed six times the bank’s Tier 1 capital.
• Banks are required to adopt the interim regulatory treatment of accounting provisions and standards for transitional arrangements to implement the International Financial Reporting Standard 9 “Financial Instruments” (IFRS9), which came into force on 1 January 2018. Banks are required to hold general provisions of at least 1 percent of total loans and specific provisions of at least 100 percent of non-performing loans. Additionally, there is a planned update of the Rules of Regulatory Provisioning in line with IFRS9.
1.4. Supervision and Control of the Insurance SectorAs part of its supervisory role, SAMA strives to exert all efforts necessary to promote the growth and stability of the insurance sector and avoid any potential risks. SAMA publishes the laws, regulations and instructions related to the sector on its website. It also publishes information related to the insurance market and licensed companies operating in this sector as well as information about supervisory and inspection visits made by SAMA to assess the performance of insurance and reinsurance companies. The following are the key developments in 1440/1441H (2019):• SAMA continued to work on developing
a supervisory approach for all companies operating in the Saudi insurance sector. As a result, an approach was introduced in 2018 by migrating from conventional supervision to the Risk-Based Supervisory Framework.

147
SAM
A, A
chie
vem
ents
and
Asp
iratio
ns
In doing so, SAMA aims to keep abreast of the best international professional practices in its supervisory and regulatory activities by collecting all quantitative and qualitative data related to insurers, reinsurers and insurance service providers and reflecting such data in an advanced electronic system for the purpose of analyzing and assessing corporate risks as well as taking appropriate regulatory and prudential measures before the materialization of any risk.
• SAMA made eight supervisory and inspection visits to companies operating in the insurance sector during 2019. Through such visits, SAMA assesses the overall performance of companies for a specific period. In addition, SAMA conducted over 135 inspection visits and campaigns in 2019 to all insurance companies as part of various inspection programs. These programs include the Insurance Service Providers Control Program that aims to assess the compliance of service providers with the laws, regulations and instructions issued by SAMA, prevent and limit current negative behaviors in the market, and produce recommendations to develop the market based on the outputs.
• The Council of Ministers issued a resolution approving the authorization of the Governor or his designee to have discussions with the UAE Insurance Authority to sign a memorandum of understanding with SAMA in order to deepen and sustain the Saudi-Emirati Coordination Council’s initiatives and plans aimed at strengthening the integrated economic system between the two countries, including the insurance industry.
• SAMA participated in a number of working groups of the International Association of Insurance Supervisors (IAIS) whose objectives include developing and adopting international supervision standards for insurance market behavior, effective governance, liquidity
risk management, and overall supervision of companies in addition to keeping abreast of relevant developments in accounting and auditing. SAMA also participated in Takaful insurance/reinsurance standards development committees of the Islamic Financial Services Board (IFSB) with the aim of developing the basic principles of Islamic financial regulation.
• With regard to foreign representation and participation in international committees, SAMA is represented by nine key members in nine international committees. The representatives participated in the development of international standards related to governance, accounting and auditing, market conduct, financial inclusion, macroprudential supervision, Takaful and Islamic finance and attended around 32 committees’ meetings in 2019.
• After coordination with SAMA and the Council of Cooperative Health Insurance, the Ministry of Hajj and Umrah launched the insurance of expat Umrah visitors’ program, which provides health and other insurance services. The Program is dedicated to serving Umrah visitors from the moment they arrive until they leave. The insurance has a coverage of SAR 100,000 per insured individual for urgent healthcare, and SAR 380 million per accident in the 30-day insurance period.
• Due to the important role of the actuary to the activities of insurance and reinsurance companies, SAMA updated the Actuarial Work Regulation for Insurance and/or Reinsurance Companies to enhance and regulate actuaries’ performance, which will positively reflect on the insurance industry in Saudi Arabia.
1.5. Supervision and Control of the Finance SectorSAMA seeks to develop the regulatory and supervisory frameworks of the finance companies

Saud
i Ara
bian
Mon
etar
y Au
thor
ity |
56th
Ann
ual R
epor
t
148
sector to achieve the main objectives of finance laws and their implementing regulations (Finance Companies Control Law and its Implementing Regulations, Real Estate Finance Law and its Implementing Regulations, and Finance Lease Law and its Implementing Regulations) issued to enhance financial stability in the finance sector and promote sustainable economic growth. This is achieved through setting the guidelines for engaging in finance activities, ensuring fair transactions for all stakeholders, and encouraging fair competition between financiers while taking into account the principles of transparency and disclosure. SAMA is also responsible for issuing licenses for finance activities in accordance with finance laws and regulations. The following are the key developments during 1440/1441H (2019):• Three licensing visits were carried out and
three initial approvals for licenses were given in 2019.
• A total of 20 supervisory visits and 128 on-site visits to finance companies took place in 2019. The visits aimed at studying the technical and regulatory aspects of these companies, assessing their business plans and governance, and evaluating their compliance with finance laws and their implementing regulations.
• SAMA is keen on the training and development of its human resources by providing a number of programs and courses aimed to raise the quality of work and follow the international regulatory and supervisory standards. In support of this desire, SAMA provided several courses, including FSI Connect, which is a web-based information resource and learning tool developed by the Financial Stability Institute (FSI) for supervisory authorities around the world.
• The key developments in the supervision and control of finance companies include the issuance of 23 circulars covering several subjects relevant to the business of finance companies. The circulars include rules on
ownership of properties within Makkah and Madinah’s borders for banks and real estate finance companies, rules on outsourcing for finance companies, and the sharing of commercial businesses’ credit information with the Bayan Credit Bureau.
1.6. Supervision and Control of Payment Systems and CompaniesThe payments sector is witnessing global changes in terms of the rapid growth in the quality of services provided as well as the introduction of new types of payment service providers, and the rapid adoption of new digital technologies around the world. Through the FSDP program, Vision 2030 has set Saudi Arabia’s orientation to promote local economy by developing and operating digital technologies in all aspects of the economy. To achieve growth in the payments sector in a manner consistent with its soundness and efficiency, SAMA has developed supervisory and regulatory frameworks for payment and financial settlement systems and their services. SAMA has worked on developing, managing and overseeing a modern payment infrastructure in line with international best practices and technologies available in the banking industry. This comes with the realization of the key role of payment and settlement systems in the financial and banking sectors (including their use for payments, clearing and settlements through electronic channels), taking into account the Principles for Financial Market Infrastructures (PFMIs) issued by the Committee on Payment and Market Infrastructures (CPMI) and the International Organization of Securities Commissions (IOSCO). The PFMIs stress the responsibility of central banks to supervise and develop payment and settlement systems as one of their key functions. The following are the key developments in 1440/1441H (2019):• SAMA issued the Payment Services Provider
Regulations in Saudi Arabia, after publishing the draft regulations for public consultation.

149
SAM
A, A
chie
vem
ents
and
Asp
iratio
ns
By doing so, SAMA aims to regulate a competitive sector that encourages creativity in the payments sector. The Regulations pave the way for payment companies that operate within SAMA’s Regulatory Sandbox to obtain licenses. The Regulations also included instructions to regulate and protect clients’ funds (e-money) with e-wallet companies to comply with international regulatory standards.
• SAMA developed a tiered licensing framework for different types of payment service providers that is commensurate with the size of the services and activities provided, taking into account their risk profiles. There will be separate licensing categories for e-wallet companies (Electronic Money Institutions) and payment companies (Payment Institutions). Licensing categories are divided into micro and macro companies based on their size to boost creativity and the development of new businesses.
• SAMA adopted a risk-based supervisory approach that requires the preparation of different reports based on the entity type, in addition to ongoing assessment and follow-up by SAMA to ensure compliance with the relevant laws and instructions.
• The Payment Systems and Companies Control Department in cooperation with several departments in SAMA conducted supervisory visits to fintech companies to ensure their compliance with regulations and instructions issued by SAMA, in addition to ensuring their readiness to exit the regulatory sandbox and obtain licenses.
1.7. Anti-Money Laundering and Counter-Terrorist Financing (AML/CTF)SAMA continued to conduct periodic inspections of financial institutions under its supervision to ensure their adherence to instructions and
regulations, detect any irregularities, and follow up with the necessary corrective actions in areas such as AML/CTF. SAMA’s efforts in this regard are as follows:• The Financial Action Task Force (FATF)
granted full membership to Saudi Arabia. The membership was granted at the FATF’s Plenary held in Orlando, USA in June 2019. Saudi Arabia is the first Arab country to be granted this membership and the approval of such granting came after an AML\CFT mutual evaluation was conducted by FATF and MENAFATF.
• The AML/CFT Manual was issued in November 2019 to financial institutions supervised by SAMA, in order to assist them in the development and adoption of a risk-based approach in conducting their businesses to meet the requirements of the Anti-Money Laundering Law issued by Royal Decree No. M/20 dated 02/02/1439H and its Implementing Regulations issued by Presidency of State Security Decision No. 14525 dated 19/02/1439H, and the requirements of Terrorist Crimes and their Financing Law issued by Royal Decree No. M/21 Dated 21/02/1439H and its Implementing Regulations issued under the Council of Ministers Resolution No. 228 dated 02/05/1440H. The Manual shall replace the Rules Governing Anti-Money Laundering and Combating Terrorist Financing updated in February 2012.
• The Permanent Financial Committees for sectors supervised by SAMA (domestic banks, branches of foreign banks, exchange companies and finance companies) continued to hold regular meetings to discuss issues of compliance and combating financial crimes. Their work includes: ե continuously promoting effective
implementation of the requirements of combating financial crimes, money

Saud
i Ara
bian
Mon
etar
y Au
thor
ity |
56th
Ann
ual R
epor
t
150
laundering, terrorist financing and combating proliferation of weapons;
ե enhancing cooperation among banks with regard to freezing, banning and imposition of international financial and economic sanctions;
ե implementing strategic objectives, roles and requirements received from the Anti-Money Laundering Permanent Committee;
ե raising society awareness of the risks of money laundering, terrorist financing and fraud through lectures, participating in seminars, media through the Media Committee and raising awareness of financial institutions’ clients;
ե promoting initiatives that reduce dependence on cash and the use of informal methods to execute financial transactions; and
ե promoting the use of advanced technology in combating financial crimes, money laundering and terrorism financing.
• SAMA promoted national and international cooperation and coordination in the field of AML/CTF through focusing on bilateral meetings with AML/CTF and proliferation entities.
• Work has been done to develop the ability of discovering money laundering, terrorist financing and proliferation crimes by taking measures to encourage financial institutions to strengthen their detection systems and ensure reporting of suspicious transactions. The first stage of the E-Reporting project has been launched in cooperation with the Financial Intelligence Unit at the Presidency of State Security and the National Information Center. Through e-reporting, financial institutions can urgently and confidentially report suspicious transactions to the Financial Intelligence Unit.
• A number of mechanisms and guidelines have been updated, including “Guidance to
the Implementation Mechanisms of United Nations Security Council Resolutions to Counter the Financing and Proliferation of Weapons of Mass Destruction”.
• In order to bring awareness programs and specialized training into effect, Saudi Arabia hosted a number of conferences, symposia and workshops, including the 11th Annual Compliance and Anti-Money Laundering Seminar held in November 2019. The event was organized in cooperation and coordination between the Anti-Money Laundering Permanent Committee and Thomson Reuters.
• The Anti-Money Laundering Permanent Committee and SAMA worked on achieving the National Strategic Objectives, which were approved by the Council of Ministers in the Ministerial Decision No. 42 dated 15/01/1440H. The Objectives help in reducing ML/TF risks in Saudi Arabia by enhancing national and international cooperation and coordination, improving the effectiveness of relevant entities’ work, and ensuring relevant entities’ understanding and assessment of risks.
• SAMA launched the AML/CTF National Awareness Campaign in coordination with the Presidency of State Security in November 2019. The Campaign aimed at raising community AML/CTF awareness based on the Anti-Money Laundering Law and its Implementing Regulations and the Law of Terrorism Crimes and Financing and its Implementing Regulations.
1.8. Economic Research and StatisticsSAMA seeks to make the Research and International Affairs Deputyship its intellectual source and an active and dependable department by conducting highly valued internal and external studies in financial and economic fields. SAMA strives to make the Deputyship a source of the latest and most accurate monetary, banking and financial

151
SAM
A, A
chie
vem
ents
and
Asp
iratio
ns
data, to keep pace with national and international economic developments. The key achievements of the Deputyship include the following:• Preparing SAMA’s Annual Report, which is
a key reference for researchers and those interested in the national economy.
• Holding quarterly workshops that aim to enrich knowledge and share ideas with academics, bankers, and other interested researchers. These workshops address various topics and developments in the economic and financial fields. The Deputyship held four workshops during 1440-1441H (2019).
• Making monthly presentation on working papers to SAMA’s senior management and other officials concerned with financial and economic affairs to raise the level of idea sharing between the employees of SAMA and other government entities.
• Preparing and publishing monthly, quarterly and annual reports and statistics on SAMA’s website, including the Monthly Statistical Bulletins, Inflation Report, Monetary and Banking Developments Report, in addition to the Financial Stability Report.
• Working on meeting the requirements of the G20 Data Gaps Initiative.
• Contributing to Saudi Arabia’s subscription to the IMF’s Special Data Dissemination Standard (SDDS), in cooperation with The Ministry of Finance and the General Authority for Statistics.
• Preparing working papers in various economic, financial and development fields and publishing them on SAMA’s website.
• Providing relevant authorities with specialized research papers on monetary, banking and financial topics and on SAMA’s projections for the Saudi economy.
2. Risk and ComplianceAs part of SAMA’s efforts to instill the concept of
compliance and risk management in order to raise awareness, SAMA developed a set of methods and mechanisms to address risks, promote risk management culture, increase compliance with regulations and instructions to protect SAMA’s resources, and provide the necessary support to ensure the continuity of its critical functions to fulfil its objectives and strategies. SAMA has fulfilled all requirements in the implementation of best international standards and practices. As a result of its efforts, the Central Banking Awards Committee awarded SAMA the Best Risk Manager Award at the level of central banks worldwide for 2019. After confirming the implementation of all standards and requirements for the award, the Committee found that SAMA was the best among all central banks to be classified as the Best Risk Manager in the world.
3. Saudi Vision 2030SAMA is fulfilling its roles in line with the development requirements and needs of the economy through its work on maintaining monetary and financial stability and promoting sustainable economic growth. SAMA constantly coordinates with the authorities responsible for realizing Saudi Vision 2030 and its programs to identify areas of cooperation and overcome the obstacles associated with SAMA’s functions and responsibilities, in a manner consistent with the requirements of monetary and financial stability. Saudi Vision 2030 has several economic and development goals on which many initiatives and projects are based. Some of the main goals include advancing Saudi Arabia from its current position into the top 15 economies in the world in terms of GDP by 2030. This will be achieved through increasing the private sector’s contribution from 40 percent to 65 percent of GDP, raising the share of non-oil exports in non-oil GDP from 16 percent to 50 percent, and increasing small and medium-sized enterprises’ (SMEs) contribution to GDP from 20 percent to 35 percent by 2030. Another goal

Saud
i Ara
bian
Mon
etar
y Au
thor
ity |
56th
Ann
ual R
epor
t
152
of the Vision is to promote social engagement in achieving the national objectives and aspirations, such as increasing household savings from 6 percent to 10 percent of total household income by 2030.
3.1. Financial Sector Development Program (FSDP)SAMA, in partnership with the Ministry of Finance and the Capital Market Authority (CMA), has been working to support the implementation of the initiatives falling under the Financial Sector Development Program (FSDP), which was launched by the Council of Economic and Development Affairs on 21 Rajab 1438H (24 April 2017). The FSDP aims to develop a diversified and effective financial sector to support the development of the national economy; stimulate savings, finance and investment by developing and deepening financial sector institutions; develop an advanced capital market; and promote financial planning for all segments of society. SAMA also contributed to the planning of many initiatives related to developing the financial sector, in particular the banking, insurance, and finance sectors, payment systems and consumer protection. SAMA is currently working on the implementation of these initiatives that will enable financial institutions to support private sector growth, develop an advanced capital market, and promote financial planning. SAMA’s key achievements in the Financial Sector Development Program in 1440/1441H (2019) are as follows:• The announcement was made of the
independent legal entity of the Saudi Payments Company after the Council of Ministers issued Resolution No. 195 dated 08/03/1441H authorizing SAMA to establish a Saudi joint-stock company owned by SAMA to operate payment and financial settlement systems and services. This is one of the achievements of the initiative to open financial services to new types of players.
• In a drive towards the cashless society
initiative, SAMA made several achievements, including linking smart phone payments with the Apple operating system (Apple Pay), and implementing the “Elevation Program” to incentivize merchants and cardholders to increase cashless payments. In this context, the share of non-cash transactions of total transactions for the retail sector (individuals) recorded 36 percent in July 2019 surpassing the FSDP target for the year 2020. Moreover, the e-invoice payment platform for businesses “Esal”, won the Best Technological Innovation Award for Invoices of Digital Business Payments in the Middle East for 2019.
• The strategy for the Financial Literacy Entity has been finalized to promote and enable financial planning as one of the program pillars.
• A regulatory sandbox was designed to enhance innovation in financial services and e-payment services and help financial institutions and fintech companies test their innovative products with relaxed controls, which can positively reflect on the financial sector. Moreover, 11 domestic and international banks were allowed to use the sandbox to open and update bank accounts without the customer visiting the bank branch, and seven companies were licensed to provide various digital payment services.
• The online opening of bank accounts and e-wallets for individual institutions was implemented, as was the online opening of bank accounts and e-wallets for resident companies’ experiments in the sandbox for testing innovative financial products and services in Saudi Arabia.
• The regulation of the practice of crowdfunding was implemented. This initiative allows individuals, in their personal capacity, to finance SMEs’ projects to provide an additional and creative source of income in line with the financial literacy initiatives, and create a new funding source for SMEs.

153
SAM
A, A
chie
vem
ents
and
Asp
iratio
ns
• SAMA finished the development of an online factoring platform, which is aimed at developing quick, flexible and fully digitized factoring solutions to businesses, especially SMEs. This is one the accomplishments under the initiative of building a national online factoring platform.
• The Saudi insurance market witnessed the start of three mergers of six insurance companies. This comes as a result of SAMA’s efforts aiming at maintaining the stability and resilience of the financial system by encouraging insurance companies’ mergers.
• SAMA, in cooperation with the General Authority for Small and Medium Enterprises (Monsha’at), launched the “Tamweel Portal” through the Monsha’at website. Due to SAMA’s efforts to incentivize the financial sector to finance SMEs, the portal surpassed the 2020 target for SME loans as a percentage of bank loans registering 5.7 percent in 2019.
• SAMA approved the Updated Rules of Engaging in Microfinance Activity to regulate the business of licensed microfinance companies in Saudi Arabia.
• Development of the regulatory aspects of payments was advanced by working on “The Payment Systems and Services in Saudi Arabia”. This project aims to develop a regulatory framework for the payments infrastructure to keep pace with payments industry developments, raise the efficiency and mobility of financial transactions, and promote innovation in financial services in line with international standards.
• The Financial Academy was established as one of the FSDP’s initiatives to offer various training and development solutions, in order to provide knowledge and necessary skills to all employees of different job levels in the financial sector (banks and finance, insurance, and securities companies) and to improve their
performance and enhance their capabilities. In 2019, the Financial Academy offered 242 training programs covering different financial sectors. The programs were attended by 4,088 trainees.
3.2. Housing ProgramIn line with Saudi Vision 2030 and the Housing Program, which aim to raise the percentage of home ownership among Saudi citizens to 60 percent by 2020 and 70 percent by 2030, the number of new residential mortgage contracts from banks and finance companies was 179.2 thousand in 2019, compared to 50.5 thousand in 2018. The total mortgage loans amounted to SAR 79.1 billion in 2019 compared to SAR 29.5 billion in 2018, recording an increase of 169.2 percent.
3.3. Doyof Al Rahman ProgramSAMA is dedicated to its role in providing comprehensive and innovative payment systems and seeks to reduce cash transactions and spread the culture of electronic payment. Therefore, in 2019, SAMA facilitated payments for Doyof of Al-Rahman (Hajj and Umrah visitors) with the participation of entities supervised by SAMA. The Saudi Payments Company allowed a bank to issue a bank card (a plastic card and digital cards for smart devices) during the first quarter of 2019 and the bank printed and distributed a million bank cards (Hajj and Umrah cards) in cooperation with several international banks. In addition, the bank provided a multi-lingual toll-free number for banking service for cardholders, which offers all transactions that the customer may need. Upon the end of the Hajj and Umrah season, the remaining balance in the card will be returned automatically through the same correspondent bank, without the need to use the card outside Saudi Arabia. The validity of the card has also been linked to the validity of the Hajj and Umrah visas, so that the card is not used illegally if its holder does not exit the Kingdom.

Saud
i Ara
bian
Mon
etar
y Au
thor
ity |
56th
Ann
ual R
epor
t
154
4. Human Resources4.1. Training and DevelopmentSAMA has spared no effort in developing its human resources through a highly regarded scholarship program, giving its employees the opportunity to earn Master’s and PhD degrees from various accredited international institutes and universities. SAMA also offers internal and external training in addition to relevant education and training programs provided by the Financial Academy. Moreover, university students specializing in majors relevant to SAMA’s functions can join the Cooperative Training Program to prepare for their future careers, or work at SAMA by assuming tasks relevant to their areas of study during their summer vacation to gain work experience and training.
SAMA continuously develops its human resources through a number of programs and procedures, the most prominent of which are:• The Leadership Development Program, which
aims to develop and retain SAMA’s leadership and competencies through leadership programs with the best leading international institutions and universities. The total number of employees joining the program in 2019 was 166.
• The Professional Certification Program, which aims to boost the employees’ professional side and assist them in learning the best practices in their fields. The total number of employees joining the program was 129.
• The English Language Program, which aims to enhance the English level of SAMA’s employees. The total number of employees joining the program was 132.
• The number of employees on scholarship abroad was 68, and the number of employees studying part-time or through distance learning was 51. In addition, 39 students joined the Cooperative Training Program.
• As for general courses, the number of training courses during 2019 was 1,917 and the number of employees enrolled in the training programs was 1,215.
• In order to train and qualify national talents in the field of financial and banking cybersecurity, SAMA launched the third edition of the Cybersecurity Program (SECURE 19).
• Based on the Council of Ministers Resolution No. 713, dated 30/11/1438H, stipulating that legal departments at government bodies shall be developed and supported with qualified and competent legal and Sharia law persons; and that such government bodies shall have plans put in place for appropriate development of their departments and staff to meet their objectives, SAMA developed a plan in 2019 for the hiring and attraction of qualified legal competencies, and nominated a number of employees for direct scholarship and for attending specialized workshops organized by central banks, the International Monetary Fund, and World Bank, in addition to other training programs as per the training needs of SAMA’s employees.
4.2.Women’s EmpowermentSAMA is keen to empower women and increase their participation in various fields. This is in line with Vision 2030, which aims to increase women’s participation in the workforce to 30 percent by 2030. Moreover, SAMA aims to empower women in leadership skills in order to appoint them to supervisory positions. During 2019, SAMA worked on a number of women’s empowerment programs, including hosting a number of inspiring women leaders, introducing a leadership development program for highly qualified women, in addition to offering a women’s empowerment program (Springboard) that aims at the professional and personal development of women by setting clear and practical steps and working to develop the needed skills and confidence to take such steps.

155
SAM
A, A
chie
vem
ents
and
Asp
iratio
ns
5. Social ResponsibilitySAMA seeks to exercise social responsibility in a recognized and exemplary way to positively affect all concerned parties, and to play a unique role in economic and financial maturity with continuous development of its capabilities to contribute to sustainable development. SAMA also set a strategic goal that enhances its role and stems from its responsibility toward the society, which is enhancing social responsibility. SAMA built its Social Responsibility Strategy in order to achieve this goal by working on four main aspects, which are: increasing employees’ awareness of social responsibility, instilling the principles of social responsibility in SAMA’s policies and procedures, launching initiatives and events that support social responsibility, and motivating the sectors supervised by SAMA to take on social responsibility.For the ideal application the of social responsibility, the strategy gives attention to all parties whose work is related to SAMA’s work, as well as all stakeholders, while focusing on specific categories due to their importance in highlighting SAMA’s social role. These parties include:• The Community: This includes communicating
with the community, focusing on training, education and financial awareness programs, paying attention to unemployment, enabling persons with disabilities, and supporting the third sector.
• Employees and Work Environment: This includes developing human capital, providing an attractive and ideal work environment in accordance with the best occupational health and safety standards, paying attention to employees’ families, and encouraging organized volunteer work in areas needed by the society.
• Financial Sector Entities: This includes social responsibility at the sector level and enabling financial entities to develop these practices,
which will positively reflect on the sector’s reputation and effectiveness, while continuing to develop consumer protection and awareness systems and procedures in addition to giving opportunities to local suppliers to provide their services to the sector.
• The Environment: This includes working on conserving natural resources and reducing the harmful impact on the environment through lowering energy consumption and emissions, reducing paper use, rationalizing water use, and thinking of new ideas to preserve the components of natural environment.
5.1. Financial Stability SAMA is committed to supporting financial stability as one of its key roles. Therefore, it issues the Financial Stability Report (FSR) that reviews financial soundness indicators for banks and financial institutions in order to promote publishing indicators of the financial system as a whole. In addition, the FSR provides a detailed analysis of the key systemic risks facing financial institutions as well as prudential measures and policies. Financial stability contributes significantly to sustaining economic growth, increasing job opportunities, and improving living standards for community members in addition to its role in maintaining monetary and financial stability in Saudi Arabia. SAMA also issues the Monthly Statistical Bulletin that contains the latest detailed data related to monetary and financial statistics, the activity of insurance and financing companies, exchange rates, interest rates, payment systems, the quarterly balance of payments data, and the status of international investment and external debt. This is to inform all society segments to improve their decision-making by providing transparent information from a reliable source.
5.2. Consumer Issues SAMA has established the Consumer Protection Department whose one of main objectives is to

Saud
i Ara
bian
Mon
etar
y Au
thor
ity |
56th
Ann
ual R
epor
t
156
ensure that consumers dealing with financial institutions receive transparent, honest and fair treatment in line with the laws and regulations and receive financial services and products easily and smoothly at affordable costs and high quality. The Consumer Protection Department also aims at raising awareness among all targeted segments, surveying public opinion of efforts and awareness campaigns to measure their success and benefit, and receiving and addressing the complaints of consumers of various financial sectors.
During 1440/1441H (2019), SAMA continued to receive and address complaints through the SAMACares system, which allows customers in financial sectors supervised and controlled by SAMA to submit and follow up on their complaints to SAMA within a system that ensures clarity and fast processing. In this regard, 268,383 various complaints from customers of banks and insurance and finance companies, whether submitted directly to SAMA or through other government agencies, were received and processed. In addition, 721,174 calls were received through the call center to file complaints or make inquiries. Furthermore, SAMA has worked on several initiatives to enhance financial consumer protection and raise the level of professionalism and efficiency of financial sector employees. These initiatives include: • Retail Banking Foundations Professional Exam.• Credit Adviser Professional Exam for
employees of financial institutions dealing with customers.
• Foreign Exchange Professional Exam.
5.3. Transparency PrinciplesIn recognition of the importance of transparency in its work, SAMA is giving more room for economic and financial data in its publications and is publishing its news and circulars on all traditional and electronic communication channels to reach all targeted groups. SAMA is also keen to participate in forums and conferences, respond
to all inquiries through “SAMA Cares” and answer any questions from media channels.
5.4. Development and Protection of Society against Financial and Cyber RisksSAMA serves an educational and awareness role to those benefiting from its services and the services of the institutions it supervises through ongoing awareness campaigns. SAMA also celebrates local and global social events annually through various programs to highlight its pivotal role in community service. In 2019, SAMA carried out several campaigns, initiatives, and voluntary activities, some of which were:• The national currency campaign illustrating the
security features of genuine banknotes.• Warning from unauthorized activities in the
foreign exchange market (Forex).• Sponsoring a national cadre of specialists to
train them and advance their knowledge and skills in the field of cybersecurity (SECURE 19).
• Celebrating the World Humanitarian Day on August 19, 2019 with a visit from a group of SAMA’s employees to the Social Care Home for Elderly in Riyadh, with a full-day social program with the residents prepared. The program included many heritage activities and poetry as well as lunch for everyone in attendance.
• Celebrating the World First Aid Day on September 16, 2019 with an awareness lecture in Riyadh presented by a trainer from the Saudi Red Crescent Authority. The lecture included a practical training for some of the attendance on how to give first aid to an injured or unconscious person. 60 employees attended the lecture.
• Organizing blood donation campaigns, in cooperation with the blood bank in local medical authorities (King Faisal Specialist Hospital and King Fahad Medical City). In realization of their social responsibility, the employees participated in the campaign to

157
SAM
A, A
chie
vem
ents
and
Asp
iratio
ns
support patients and soldiers injured in the southern border. The number of blood donors was 222.
• As part of efforts to recycle damaged and used materials to support environment preservation efforts, SAMA donated used furniture pieces to a group of charities from SAMA’s Environment Renovation project. More than 2,000 pieces of old office furniture were donated to six charities for usage in their work sites.
• SAMA established a medical clinic at its head office to provide health care services to the employees at their workplace in order to maintain their health condition, provide emergency health services as quickly as possible, in addition to providing both education and medicine for normal cases. The number of employees who benefited from the clinic services in 2019 was 2,632.
• SAMA held a Health Day event for employees named (Health Zone) at SAMA’s head office to provide health care services for the employees at their work place, in order to maintain their health condition and provide both education and medicine for normal cases.
• SAMA organized a seasonal flu vaccination campaign for employees at its head office.
• SAMA held an awareness event on the World Savings Day, which falls on October 28 of each year. During the event, SAMA’s savings program for its employees was highlighted. The program is an optional program aimed at encouraging savings culture and assisting enrollers in planning their future financial needs and goals. The event was well received by SAMA’s employees and was attended by 100 employees.
6. SAMA’s International and Regional Participation SAMA actively participates as a member in various international and regional financial
organizations and attends their meetings, including the meetings of the Group of Twenty (G20), the Bank for International Settlements (BIS), International Monetary Fund (IMF), the World Bank, Financial Stability Board (FSB), World Trade Organization (WTO), Arab financial organizations, Islamic Financial Services Board (IFSB), the Bank of International Settlements (BIS), International Association of Insurance Supervisors (IAIS), Islamic Development Bank (IDB), and the Accounting and Auditing Organization for Islamic Financial Institutions (AAOIFI), in addition to the meetings of Central Bank Governors held in member countries of the Organization of Islamic Cooperation and the Gulf Cooperation Council (GCC), the Gulf Monetary Council (GMCO), International Association of Deposit Insurance (IADI), and a number of technical committees and work teams associated with the Governors’ Committee. Moreover, Saudi Arabia was granted full membership of the Financial Action Task Force (FATF) in 2019.
SAMA significantly contributed to the outcomes of the G20 under the presidency of Japan in 2019 through its active participation in the financial track meetings. SAMA also worked with the Ministry of Finance in a single working group to prepare for Saudi Arabia’s G20 2020 presidency, including setting the agenda and priorities of the financial track, in addition to coordinating with member states and international organizations to boost the efforts aimed at supporting world economic growth and achieving financial stability.
7. SAMA’s Financial Position SAMA’s assets improved at the end of 2019 compared to the end of the preceding year as total assets registered an increase of 0.7 percent (SAR 12.9 billion) to SAR 1.9 trillion compared to a fall of 0.2 percent (SAR 3.8 billion) in 2018. Foreign assets accounted for the bulk of SAMA’s total assets, which witnessed an increase in 2019. These foreign assets continue to be invested

Saud
i Ara
bian
Mon
etar
y Au
thor
ity |
56th
Ann
ual R
epor
t
158
primarily in foreign securities, which fell by 0.04 percent (SAR 0.5 billion) in 2019, compared with a drop of 3.3 percent (SAR 40.6 billion) in 2018. Furthermore, SAMA deposits with banks operating abroad fell by 1.4 percent (SAR 5.7 billion) in 2019 compared to an increase of 7.3 percent (SAR 27.6 billion) in 2018. Currency backing increased by 7.4 percent (SAR 18.0 billion) to SAR 261.5 billion in 2019, compared with a rise of 6.2 percent (SAR 14.3 billion) in the preceding year (Table 12-1).
As for liabilities, government deposits and reserves accounted for 27.7 percent of SAMA total liabilities in 2019, compared with 29.6 percent in the
Table 12-1: SAMA’s Financial Position (End of year)
(Million SAR)
2015 2016 2017 2018 2019
I. Assets
Foreign currencies and gold 237,212 234,505 229,188 243,449 261,467
Cash in vault 39,300 34,516 25,831 32,584 42,987
Banknotes 39,289 34,505 25,811 32,561 42,956
Coins 11 11 20 22 31
Deposits with banks abroad 552,360 401,144 377,966 405,572 399,832
Investments in foreign securities 1,505,023 1,365,189 1,244,669 1,204,035 1,203,576
Other miscellaneous assets 39,487 41,517 26,009 14,224 4,945
Total 2,373,382 2,076,871 1,903,663 1,899,864 1,912,807
II. Liabilities
Currency issued 237,212 234,505 229,188 243,449 261,467
In circulation 197,912 199,989 203,357 210,865 218,480
At SAMA 39,300 34,516 25,831 32,584 42,987
Government deposits and reserves 1,023,304 730,580 641,378 562,367 529,249
Government current account 71,005 89,134 52,192 72,832 59,624
Government reserves 952,299 641,446 589,185 489,535 469,625
Government institutions and funds deposits 142,074 154,514 88,346 116,852 96,921
Statutory deposits for financial institutions 98,117 97,839 97,534 99,943 105,470
Foreign institutions' deposits in local currency 11,213 18,490 18,469 17,190 12,249
SAMA bills and repo agreements 182,947 164,755 138,786 116,326 124,007
Other miscellaneous liabilities 678,515 676,187 689,962 743,738 783,444
Total 2,373,382 2,076,871 1,903,663 1,899,864 1,912,807
preceding year. The government current account dropped by 18.1 percent (SAR 13.2 billion) to SAR 59.6 billion, compared with a rise of 39.5 percent in the preceding year. In addition, the government reserves fell by 4.1 percent (SAR 19.9 billion) to SAR 469.6 billion in 2019, compared with a drop of 16.9 percent (SAR 99.7 billion) in the preceding year. Deposits of government agencies and funds fell by 17.1 percent (SAR 19.9 billion) to SAR 96.9 billion, compared with an increase of 32.3 percent (SAR 28.5 billion) in the preceding year. With respect to SAMA bills and repos, they increased by 6.6 percent (SAR 7.6 billion) to SAR 124.0 billion, compared with a decline of 16.2 percent (SAR 22.5 billion) in the preceding year.

SAUDI ARABIAN MONETARY AUTHORITY BALANCESHEET

Saud
i Ara
bian
Mon
etar
y Au
thor
ity |
56th
Ann
ual R
epor
t
160
Independent Auditor’s Report To H.E. THE GOVERNOR AND MEMBERS OF THE BOARD OF DIRECTORS OF SAUDI ARABIAN MONETARY AUTHORITY
OpinionWe have audited the financial statements of Saudi Arabian Monetary Authority ("SAMA"), which comprise the statements of Issuance Department balance sheet, Banking Operation Department balance sheet, Independent Organizations and Institutions Department balance sheet, and Contra Accounts balance sheet as at 30 June 2019, and the statement of revenues and expenses for the year then ended, and notes to the financial statements, including a summary of significant accounting policies.
In our opinion, the accompanying financial statements of SAMA as at and for the year ended 30 June 2019 are prepared, in all material respects, in accordance with the basis of preparation set out in Note (2) to the financial statements.
Basis for opinion We conducted our audit in accordance with International Standards on Auditing ("ISA") as endorsed in the Kingdom of Saudi Arabia. Our responsibilities under those standards are further described in the Auditor’s Responsibilities for the Audit of the Financial Statements section of our report. We believe that the audit evidence we have obtained is sufficient and appropriate to provide a basis for our opinion.
Independence We are independent of SAMA in accordance with the code of professional conduct and ethics endorsed in the Kingdom of Saudi Arabia that are relevant to our audit of the financial statements, and we have fulfilled our other ethical responsibilities in accordance with these requirements.
Emphasis of a Matter-Basis of AccountingWe draw attention to Note (2) to the financial statements, which describes the basis of accounting. The financial statements have been prepared for SAMA’s financial reporting purposes as per its Board of Directors’ approved accounting policies. As a result, the financial statements may not be suitable for another purpose. Our opinion is not modified in respect to this matter.
Responsibilities of Management and Those Charged with Governance for the Financial Statements Management is responsible for the preparation of the financial statements in accordance with the basis of preparation set out in Note (2) to the financial statement, and for such internal control as management determines is necessary to enable the preparation of financial statements that are free from material misstatement, whether due to fraud or error. In preparing the financial statements, management is responsible for assessing SAMA’s ability to continue as a going concern, disclosing, as applicable, matters relating to going concern and using the going concern basis of accounting unless management intends to cease operations, or has no realistic alternative but to do so.
Those charged with governance are responsible for overseeing SAMA’s financial reporting process.

161
Inde
pend
ent A
udito
r’s R
epor
t
Auditor’s Responsibilities for the Audit of the Financial Statements Our objectives are to obtain reasonable assurance about whether the financial statements as a whole are free from material misstatement, whether due to fraud or error, and to issue an auditor’s report that includes our opinion. Reasonable assurance is a high level of assurance, but is not a guarantee that an audit conducted in accordance with International Standards on Auditing, as endorsed in the Kingdom of Saudi Arabia, will always detect a material misstatement when it exists. Misstatements can arise from fraud or error and are considered material if, individually or in the aggregate, they could reasonably be expected to influence the economic decisions of users taken on the basis of these financial statements. As part of an audit in accordance with International Standards on Auditing, as endorsed in the Kingdom of Saudi Arabia, we exercise professional judgment and maintain professional skepticism throughout the audit. We also:
• Identify and assess the risks of material misstatement of the financial statements, whether due to fraud or error, design and perform audit procedures responsive to those risks, and obtain audit evidence that is sufficient and appropriate to provide a basis for our opinion. The risk of not detecting a material misstatement resulting from fraud is higher than for one resulting from error, as fraud may involve collusion, forgery, intentional omissions, misrepresentations, or the override of internal control.
• Obtain an understanding of internal control relevant to the audit in order to design audit procedures that are appropriate in the circumstances, but not for the purpose of expressing an opinion on the effectiveness of SAMA’s internal control.
• Evaluate the appropriateness of accounting policies used and the reasonableness of accounting estimates and related disclosures made by management.
• Conclude on the appropriateness of management’s use of the going concern basis of accounting and, based on the audit evidence obtained, whether a material uncertainty exists related to events or conditions that may cast significant doubt on SAMA’s ability to continue as a going concern. If we conclude that a material uncertainty exists, we are required to draw attention in our auditor’s report to the related disclosures in the financial statements or, if such disclosures are inadequate, to modify our opinion. Our conclusions are based on the audit evidence obtained up to the date of our auditor’s report. However, future events or conditions may cause SAMA to cease to continue as a going concern.
We communicate with those charged with governance regarding, among other matters, the planned scope and timing of the audit and significant audit findings, including any significant deficiencies in internal control that we identify during our audit.
PricewaterhouseCoopers Certified Public Accountants
P.O. Box 8282Riyadh 11482
Kingdom of Saudi Arabia
Bader I. BenmoharebCertified Public Accountants
Registration No. 471 21 Rabie Alawal 1441H
(18 November 2019)
Ernst & YoungCertified Public Accountants
P.O. Box 2732Riyadh 11461
Kingdom of Saudi Arabia
Rashid S. AlRashoud Certified Public Accountants
Registration No. 366

Saud
i Ara
bian
Mon
etar
y Au
thor
ity |
56th
Ann
ual R
epor
t
162
SAUDI ARABIAN MONETARY AUTHORITY (SAMA) | BALANCE SHEET AS AT 30 JUNE 2019 | ASSETS
(Million SAR)
30/06/2019 30/06/2018
Issuance Department
Currency Cover
Gold (Note 2-e) 1,624 1,624
Investment in securities abroad 260,940 255,023
262,564 256,647
Banking Operation Department
Cash in Hand
Bank notes 38,661 30,706
Metal coins 14 16
38,675 30,722
Deposits in local banks -- 13,250
Deposits in banks abroad 462,969 425,798
Investments abroad 1,191,477 1,207,826
Other miscellaneous assets 2,573 2,415
1,695,694 1,680,011
Independent Organizations And Institutions Department
Deposits with banks abroad 72,968 62,285
Investments abroad 37,466 173,882
Local investments 32,734 33,381
Deposits with Banking Operating Department 854 1,855
Deposits with local banks 1,200 1,200
145,222 272,603
Contra Accounts
Cheques under collection and others 9.9 61.0
The accompanying notes from 1 to 4 form an integral part of these financial statements.

163
Inde
pend
ent A
udito
r’s R
epor
t
SAUDI ARABIAN MONETARY AUTHORITY (SAMA) | BALANCE SHEET AS AT 30 JUNE 2019 | LIABILITIES
(Million SAR)
30/06/2019 30/06/2018
Issuance Department
Saudi Bank Notes Issued
In circulation 223,235 225,459
In Banking Operation Department 38,661 30,706
261,896 256,165
Metal Coins Issued
In circulation 654 466
In Banking Operation Department 14 16
668 482
262,564 256,647
Banking Operation Department
Government deposits 597,521 610,138
Foreign organizations deposits 14,385 18,502
Government agencies and institutions deposits 119,327 106,131
Banks and insurance companies deposits 101,213 98,862
Government liabilities 22,662 30,871
Other miscellaneous liabilities and reserves 840,586 815,507
1,695,694 1,680,011
Independent Organizations And Institutions Department
Independent organizations and institutions 145,222 272,603
145,222 272,603
Contra Accounts
Liabilities for cheques under collection and others 9.9 61.0
The accompanying notes from 1 to 4 form an integral part of these financial statements.
SAUDI ARABIAN MONETARY AUTHORITY (SAMA) | STATEMENT OF REVENUES AND EXPENSES
FOR THE YEAR ENDED 30 JUNE 2019
(Million SAR)
30/06/2019 30/06/2018
Revenues 4,591 4,998
Expenses
General and Administration 2,569 2,180
SAMA's contribution to the Public Pension Agency (Note 4) 39 39
2,608 2,219
Surplus transferred to reserve for Building Of Head Office and branches 1,983 2,779
4,591 4,998
The accompanying notes from 1 to 4 form an integral part of these financial statements.

Saud
i Ara
bian
Mon
etar
y Au
thor
ity |
56th
Ann
ual R
epor
t
164
SAUDI ARABIAN MONETARY AGENCY (SAMA)NOTES TO THE FINANCIAL STATEMENTS
FOR THE YEAR ENDED 30 JUNE 2019
1. NATURE OF OPERATION OF SAMA AND BASIS OF PRESENTATION OF THE FINANCIAL STATEMENTS In accordance with its charter, the Saudi Arabian Monetary Authority ("SAMA") acts as the bankof the Government of the Kingdom of Saudi Arabia (the "Government") and also maintainsaccounts for the Government.
The financial statements are presented for each of SAMA’s following activities:Issuance Department:The main activity is to mint coins and print national bank notes (Saudi Riyal) and support the stability of the currency and fixing its rate internally and externally.
Banking Operation Department:SAMA accepts deposits from Government organizations and others, and invests such deposits on their behalf. Both the deposit and the carrying value of investments are reported in the Banking Operation Department balance sheet. Investment income is reported as part of Government agencies and institutions deposits and not in SAMA’s statement of revenues and expenses.
Independent Organizations and Institutions Department:SAMA accepts deposits from independent organizations and institutions and invests such deposits on their behalf. Both the deposits and the carrying value of investments are reported in the Independent Organizations and Institutions Department balance sheet. Investment income are reported as part of of independent organizations and institutions department account and not in SAMA’s statement of revenues and expenses.
2. SUMMARY OF SIGNIFICANT ACCOUNTING POLICIESa. Basis of Preparation of the Financial Statements:These financial statements have been prepared in accordance with the accounting policies approved by Board of Directors (“BoD”) as described below, which are consistent with those followed in previous years.
b. Basis of Accounting:SAMA follows the cash basis of accounting in recording its transactions, Except for depreciation of fixed assets and accrual of certain employee benefits.The financial statements are prepared under the historical cost convention.
c. Investments:Investments are carried at cost. At the end of the year, portfolios managed in different currencies are valued at the same functional currency as the underlying investment by SAMA at lower of cost or market value (historical basis). Differences resulting from the decline in value are recognized in the investment

165
Inde
pend
ent A
udito
r’s R
epor
tvaluation difference account. Gains or losses are recorded in the beneficiaries’ accounts when received/paid in accordance with the policies followed by SAMA.
d. Foreign Currencies:Translation of foreign currency balances and transactions to Saudi Riyals is made using fixed book rates approved by SAMA Governor on 7 July 1986 (corresponding to 29 Shawwal 1406H), and the subsequent amendment for Euro rate adopted by management on 25 April 1999 (corresponding to 9 Al Muharram 1420H).
e. Gold held as currency cover:In accordance with Royal Decree No. 38 dated 13 Rajab 1393 H (corresponding to 12 August 1973), gold held as a currency cover is valued at a rate of one Saudi Riyal per 0.20751 gram.
f. Furniture, equipment and motor vehicles:Furniture, equipment and motor vehicles are stated at cost less accumulated depreciation and are included in other miscellaneous assets as part of the Banking Operation Department’s balance sheet. The cost of furniture, equipment and motor vehicles are depreciated on a straight line basis over the estimated useful lives of these assets.
g. Lands and buildings:Lands are stated at cost and buildings are stated at cost less accumulated depreciation. The cost of buildings is depreciated on a straight line basis at 5% annually. Lands and buildings are included in other miscellaneous assets in the Banking Operation Department’s balance sheet. h. Revenues and expenses: In accordance with Article 2 of its charter, SAMA earns fees for services rendered in order to cover its expenses. SAMA transfers the excess of revenues over expenses to the reserve for the building of head office and branches account which is shown under other miscellaneous liabilities and reserves in the Banking Operation Department’s balance sheet.
3. FINANCIAL STATEMENTS PERIODThese financial statements are prepared for the period from 1 July 2018 to 30 June 2019 (corresponding to 17 Shawal 1439H to 27 Shawal 1440H).
4. CONTRIBUTION TO THE PUBLIC PENSION AGENCYContributions to the Public Pension Agency on behalf of SAMA employees are made in accordance with Article 13 of the Civil Retirement Regulations issued by Royal Decree No. M/41 dated 29 Rajab 1393H (corresponding to 28 August 1973).

Classification NumberISSN: 1319 - 1845
Annual Report Statistics are available on SAMA’s website: http://www.sama.gov.sa/ar-sa/EconomicReports/Pages/YearlyStatistics.aspx
Annual Report feedback survey is available on SAMA’s website: http://www.sama.gov.sa/ar-sa/EconomicReports/Pages/QuestionAnswer.aspx

167
Inde
pend
ent A
udito
r’s R
epor
t