Annual Report - Queensland Treasury · the detailed requirements set out in the Annual report...
116
Queensland Treasury
Transcript of Annual Report - Queensland Treasury · the detailed requirements set out in the Annual report...
Queensland Treasury2017 –2018 Annual Reportwww.treasury.qld.gov.au
Queensland Treasury
Queensland Treasury Annual Report 2017–18

14 September 2018
The Honourable Jackie Trad MP Deputy Premier, Treasurer and Minister for Aboriginal and Torres Strait Islander Partnerships
1 William Street Brisbane Qld 4000
Dear Deputy Premier
I am pleased to submit for presentation to the Parliament the Annual Report 2017–18 and �nancial statements for Queensland Treasury.
This report is prepared on the basis of the current administrative arrangements for this department applying for the whole of the 2017–18 �nancial year. That is, it reflects the structure, operations and performance of the department as it now exists.
I certify that this Annual Report complies with:
the prescribed requirements of the Financial Accountability Act 2009
the Financial and Performance Management Standard 2009, and
the detailed requirements set out in the Annual report requirements for Queensland Government agencies.
A checklist outlining the annual reporting requirements can be found at page 112 of this annual report.
Yours sincerely
Jim Murphy Under Treasurer
TRANSLATING AND INTERPRETING ASSISTANCEThe Queensland Government is committed to providing accessible services to Queenslanders from all cultural and
linguistic backgrounds. If you have di�culty in understanding the annual report, you can contact us on telephone (07) 3035 3503 and we will arrange an interpreter to e�ectively communicate the report to you.
LICENCEThis annual report is licensed by the State of Queensland (Queensland Treasury) under a Creative Commons Attribution (CC BY) 4.0 International licence.
In essence, you are free to copy, communicate and adapt this annual report, as long as you attribute the work to the State of Queensland (Queensland Treasury). To view a copy
of this licence, visit http://creativecommons.org/licenses/by/4.0/
ISSN 1837-2848
© The State of Queensland (Queensland Treasury) 2018
ABOUT OUR ANNUAL REPORTThe Queensland Treasury Annual Report 2017–18 is an integral part of our corporate governance framework and one of the main tools we use to ensure we are accountable to the Queensland Parliament and the community about our activities.
This report details our achievements, performance and �nancial position for the 2017–18 �nancial year. It aligns with the Queensland Government’s objectives for the community, the Queensland Treasury Strategic Plan 2017–21, and our Service Delivery Statement 2017–18.
It also provides information on our future direction, people management and corporate governance processes.
FIND OUR REPORT ONLINEThis report is available online:
www.treasury.qld.gov.au/publications-resources/
For enquiries about this annual report, contact the Principal Communication O�cer, Strategic Communications on (07) 3035 3532 or via [email protected].
Follow us

001CONTENTS
CONTENTSLetter of complianceINSIDE FRONT COVER
Under Treasurer’s report002
Our performance003
Highlights006
About us007
Managing our organisation009
Our people020
SERVICE REPORTS
Economic and �scal coordination023
Agency performance027
Commercial services028
Revenue management035
FINANCIAL
Financial summary 040
Financial statements045
APPENDICES
External scrutiny107
Publications105
Government bodies105
Consultancies, language services, overseas travel105
Legislation105
Glossary110
Contact us111
Compliance checklist112

QUEENSLAND TREASURY ANNUAL REPORT 2017–18
Treasury’s focus during 2017–18 was on delivering the government’s plan for economic growth, jobs and improved prosperity.
COMMUNITY BUILDINGCentral to that plan is infrastructure; it creates the jobs and services Queensland’s growing population needs. Its bene�ts extend beyond the physical assets created. Cross River Rail – the Queensland Government’s highest priority infrastructure project – will provide not only more e�cient public transport, but better lifestyles, and the enormous social impact of employment. These bene�ts extend across generations, and require a long-term and outcomes-focussed approach.
Further outcomes were delivered through the Business Development Fund. 2017–18 proved very productive, with investments totalling $14.2 million in innovations for elderly people and people with dementia, medical technologies, and initiatives that keep pace with the changing needs of businesspeople.
A THRIVING ECONOMYInvesting in infrastructure allows the economy to thrive. Queensland’s debt is stable and sustainable, owing to the government’s management of its �scal strategy. Overall growth in the economy is expected to have strengthened to 2¾ per cent in 2017–18. Employment growth is forecast to remain sustainable. GSP is forecast to remain favourable. These are all signs of a responsible economic plan.
A STRONG REVENUE BASERevenue initiatives are key to balancing Queensland’s budget. In addition to administering a revenue base of around $15.3 billion, the O�ce of State Revenue implemented measures to strengthen that base, including a land tax surcharge for absentee landowners and a new tax on betting.
A FAIR SHARE FOR QUEENSLANDTreasury advocates for Queensland’s interests in the Commonwealth-State �nancial relations arena. During the year, the Australian Productivity Commission held an inquiry into horizontal �scal equalisation – a fundamental principle of the distribution of GST revenue. Because the APC’s recommendations have the potential to change the amount of GST revenue Queensland receives, the focus going forward is expected to be on negotiations over proposed reforms.
Treasury’s agenda for the coming year will be driven by the government’s Advancing Queensland’s Priorities, for jobs and a strong economy, a great start for children, keeping Queenslanders healthy, keeping communities safe, protecting the Reef, and responsive government. We are already partnering with agencies to address funding for these priorities.
Alongside our public sector leadership role is our place in the communities we serve. In late 2017, Treasury was accredited as a White Ribbon workplace, one that seeks to end domestic and family violence, and one that supports employees who experience violence in their lives.
This is my �nal annual report for Queensland Treasury. My tenure here has put me in touch with many outstanding people, whom I commend to the government. Public policy never happens without people, and their hard work and commitment have been tremendous assets during my time as Under Treasurer.
Jim Murphy
Under Treasurer
002
UNDER TREASURER’S REPORT

OUR PERFORMANCE 003
OUR PERFORMANCE
Economic and fiscal coordination
Service standardsFiscal coordination Notes
2017–18 Adjusted target/
estimate
2017–18 Estimated
actual
Effectiveness measures
Target ongoing reduction in Queensland’s relative debt burden, as measured by the General Government debt-to-revenue ratio 1 60% 54%
Target net operating surplus that ensures any new capital investment in the General Government sector is funded primarily through recurrent revenues rather than borrowing 2 59% 99%
Manage the capital program to ensure a consistent flow of works to support jobs and the economy and reduce the risk of backlogs emerging Met Met
Maintain competitive taxation – own-source revenue to remain at or below 8.5% as a proportion of nominal gross state product 7.7% 8.5%
Target full funding of long-term liabilities such as superannuation and WorkCover in accordance with actuarial advice Met Met
Maintain a sustainable public service by ensuring overall growth in full-time equivalent employees, on average over the forward estimates, does not exceed population growth 1.7% 1.7%
Efficiency measure
Average cost per hour of advice and support output 3 $129.81 $116.23
Service standardsEconomic policy, analysis and forecasting
2017–18 Adjusted target/
estimate
2017–18 End of year
actual
Efficiency measure
Average cost per hour of advice and support output $116.60 $107.92
End of year variance notes
1. The improvement in the debt-to-revenue ratio between the 2017-18 adjusted target and the 2017-18. Estimated actual reflects both higher than forecast revenue (primarily associated with higher coal prices) and lower than forecast debt levels.
2. The estimated actual is higher than adjusted target as a result of the 2017–18 operating surplus.3. The average cost per hour of advice and support output is calculated using 2017–18 end-of-year actual information.
Statistical services
ServiceStatistical services Notes
2017–18 Adjusted target/
estimate
2017–18 End of year
actual
Effectiveness measure
Stakeholder and customer satisfaction with Queensland Government Statistician outputs (rated satis�ed or very satis�ed) 95% 100%
Efficiency measure
Average cost per hour of advice and support output $104.09 $96.91

QUEENSLAND TREASURY ANNUAL REPORT 2017–18004
Agency performance
Service2017–18
Adjusted target/estimate
2017–18 End of year
actual
Effectiveness measures
Overall customer satisfaction with policy and performance advice provided 75% 85%
Efficiency measure
Average cost per hour of advice and support output $106.33 $100.27
Commercial services
ServiceCommercial projects
Notes2017–18
Adjusted target/estimate
2017–18 End of year
actual
Effectiveness measures
Percentage of key project milestones met 1 85% 100%
Achievement of agreed cost targets for projects 2 85% 100%
Efficiency measure
Average cost per hour of project services $130.55 $114.85
ServiceShareholder services
Notes2017–18
Adjusted target/estimate
2017–18 End of year
actual
Effectiveness measures
Overall customer satisfaction with advice and support provided 3 80% 70%
Efficiency measure
Average cost per hour of advice and support output $104.67 $97.75
End of year variance notes
1 All key project milestones have been met.2 All key project milestones have been met.3 This service standard measures overall client satisfaction considering quality, timeliness, sta� knowledge, access and outcome. It is derived
from an annual survey of GOCs. The 2017–18 end-of-year actual result reflects the desire of GOCs for con�rmation of the policy approach of the new term of government.
OUR PERFORMANCE

005OUR PERFORMANCE
Revenue management
Service standardsRevenue services Notes
2017–18 Adjusted target/
estimate
2017–18 End of year
actual
Effectiveness measures
Customer satisfaction with services provided 70% 77.6%
Average overdue debt as a percentage of total revenue collected 2% 2.1%
Total revenue dollars administered per dollar expended - accrual 1 $198 $238
Efficiency measure
Service standardsPenalty debt services
Notes2017–18
Adjusted target/estimate
2017–18 End of year
actual
Effectiveness measures
State Penalty Enforcement Registry (SPER) clearance rate (�nalisations/lodgements) 2 75% 99%
Efficiency measure
Average cost of case management per SPER customer $49 $49
End of year variance notes
1 The increase between the adjusted target and End of year actual is mainly due to higher than projected coal royalties and lower than anticipated operating expenses as a result of the re-pro�ling of expenses associated with OSR’s Transformation Program to improve compliance, client interaction and service delivery, to future years.
2 This higher clearance rate is due to higher volumes of debt �nalisations being maintained against similar volumes of new debt referrals for the period.

QUEENSLAND TREASURY ANNUAL REPORT 2017–18006
HIGHLIGHTS
ENABLE SUSTAINABLE GROWTH THAT SUPPORTS CURRENT AND FUTURE GOVERNMENT OBJECTIVES Developed the Queensland Budget 2018–19.
Initiated a program of enhancements to Queensland’s regulatory frameworks, to reduce red tape and the regulatory burden on businesses, families and communities.
Implemented the $1.16 billion Powering Queensland Plan, to ensure a¦ordable, secure and sustainable electricity supply for Queensland.
Continued partnering in the Business Development Fund, which in 2017–18 invested $14.2 million in innovative Queensland businesses.
Supported the Deputy Premier in her responsibilities for Queensland’s response to the Australian Government Policy on the development of Northern Australia.
Advocated for Queensland’s position on horizontal �scal equalisation to the Australian Productivity Commission.
Implemented revenue measures designed to deliver a sustainable revenue base for Queensland, including a land tax surcharge for absentee landowners and a new point of consumption tax on betting.
PARTNER PROACTIVELY TO FACILITATE BETTER OUTCOMES FOR THE COMMUNITY Progressed the $5.4 billion Cross River Rail project, the Queensland Government’s highest priority infrastructure project, to early works and procurement.
Continued working with Building Queensland and government agency partners on a range of major infrastructure and service delivery projects, including expansions at Logan and Caboolture Hospitals, the Townsville Eastern Access Rail Corridor, and Rookwood Weir on the Lower Fitzroy.
Reduced growth in Queensland’s penalty debt pool from 15 per cent to 3.2 per cent, and achieved penalty debt �nalisation of 99 per cent.
Introduced work and development orders as an additional option for people in �nancial hardship to resolve their penalty debt.
Collaborated with Victoria University’s Centre of Policy Studies to model the economic impacts of interstate migration on the Queensland economy.
ENSURE OUR SERVICES ARE TAILORED, FIT-FOR-PURPOSE AND EASY TO ACCESS Expanded online revenue management services, achieving 77 per cent of queries able to be resolved at �rst contact.
Used machine learning to predict – to 71 per cent accuracy – those taxpayers at risk of defaulting on their obligations.
DEVELOP A CAPABLE AND FLEXIBLE WORKFORCE THAT CAN LEAD IN POLICY DEVELOPMENT AND SERVICE DELIVERYAchieved accreditation as a White Ribbon workplace, as part of the government's commitment to ending domestic and family violence.
Ranked 17 on the Australian Association of Graduate Employers’ list of top graduate employers in Australia (up from 45 in 2017).
Achieved Recognised Employer Partner status with CPA Australia, which means that our relevant experience, training and development meets CPA Australia requirements.
Graduated 11 participants and welcomed 14 new participants into the Great Leaders program.

007ABOUT US
ABOUT US “Treasury’s vision is to grow the Queensland economy
and improve the wellbeing of all Queenslanders.”
VALUESTreasury’s strength in ful�lling its vision is drawn from the public service values of: customers �rst ideas into action unleash potential be courageous empower people
and by its own cultural practices of working collaboratively, taking collective responsibility, and continuous improvement.
This facilitates trusted, impartial and influential advice for the economy and state �nances, by: enabling sustainable growth
that supports current and future government objectives
partnering proactively to facilitate better outcomes for the community
ensuring services are tailored, �t-for-purpose and easy to access
developing a capable and flexible workforce that can lead in policy development and service delivery.
The Queensland Government’s objectives for the community guide Treasury’s work. Read more about how Treasury employees are being equipped to deliver for Queenslanders on pages 20 to 22.
HOW WE BEGANAlthough it administers a wide range of legislation to support Queensland’s economic growth and �scal strength, Treasury has no single legislative charter. The Treasury Department began in 1859 with the separation of the Colony of Queensland from the Colony of New South Wales. The appointment of the �rst Colonial Treasurer, Robert Ramsay Mackenzie, was gazetted on 15 December 1859.
SERVICESQueensland Treasury is in the business of growing the Queensland economy and improving the wellbeing of all Queenslanders. As a central agency, it leverages a government-wide perspective to provide trusted, impartial and influential advice and services to clients, and partner with agencies for better outcomes in the economy and state �nances, revenue and commercial services.
Read more about Treasury’s services: Economic and �scal coordination Agency performance Commercial services Revenue management
on pages 24 to 39.
Statutory and other bodies
The work of the following bodies complements that of Treasury. They are the legal responsibilities of the Deputy Premier and/or the Under Treasurer: Cross River Rail Delivery Authority Motor Accident Insurance
Commission Nominal Defendant
National Injury Insurance Scheme Queensland Agency
Queensland Treasury Corporation Queensland Competition Authority Queensland Productivity
Commission
These organisations produce their own annual reports.
Clients
The diverse ways in which Treasury helps to grow the Queensland economy are reflected in its range of clients, such as: the Deputy Premier, Treasurer and
Minister for Aboriginal and Torres Strait Islander Partnerships, who is supported to:
create jobs and a strong economy
give all children a great start keep Queenslanders healthy keep communities safe protect the Great Barrier Reef be a responsive government government agencies with
whom Treasury partners to meet their infrastructure and procurement needs

QUEENSLAND TREASURY ANNUAL REPORT 2017–18008
ABOUT US
the business and non-government sectors, on investment and service delivery opportunities
�rst homebuyers taxpayers �ne debtors
as well as relationships with industry, academia and other key stakeholders.
Changes for Treasury
In late 2017, Treasury’s roles and functions changed in response to changes to Ministerial portfolios a«er the Queensland election. These changes will enhance the public sector’s ability to deliver on the government’s priorities for the community.
The O�ce of Industrial Relations, including the functions of: industrial relations chemical hazards electrical safety workers’ compensation work health and safety
moved to the Department of Education, in the portfolio of the Minister for Education and Minister for Industrial Relations.
Functions for employment programs and policy, including Back to Work, moved to the new Department of Employment, Small Business and Training. There it will continue the government’s commitment to small business growth, employment, skills and training opportunities.
Treasury’s Market Led Proposals team moved to the Department of State Development, Manufacturing, Infrastructure and Planning. This will allow the team to leverage that agency’s expertise in large-scale development and infrastructure projects to meet Queensland’s growing need for infrastructure.
The Cities Transformation Taskforce moved to Queensland Treasury from the former Department of Infrastructure, Local Government and Planning. This will facilitate a cohesive approach to urban growth and design in cities and regions across Queensland.
The Cross River Rail Delivery Authority, the board of which is chaired by the Under Treasurer, joined Queensland Treasury, where it can take advantage of inhouse commercial services expertise. Read more about Cross River Rail on page 28.
Trade and Investment Queensland, an independent statutory body, moved to the portfolio of the Premier, and Minister for Trade where it will continue to support investment attraction for the bene�t of Queensland’s economy.
The Queensland Racing Integrity Commission, an independent statutory body, moved to the Department of Agriculture and Fisheries, where it will oversee the integrity of Queensland’s racing industry participants and the welfare of racing animals.

MANAGING OUR ORGANISATION 009
MANAGING OUR ORGANISATION
THE GOVERNMENT’S FISCAL STRATEGY The government’s ability to grow the economy and improve the wellbeing of all Queenslanders is supported by a solid, prudent �scal strategy. It is a cornerstone of each year’s Queensland Budget, and
outlines the principles by which the government manages Queensland’s �nances in a responsible and measured way.
Each year’s Budget, mid-year review and end-of-year reports outline the government’s performance against these principles.
Treasury strengthens the government’s �nancial accountability by partnering with agencies so they can meet their obligations under the Financial Accountability Act 2009, and make their best possible contribution to the government’s priorities for Queenslanders.
PRINCIPLE 3Manage the capital program to
ensure a consistent flow of works to support jobs and the economy and reduce the risk of backlogs
emerging.
PRINCIPLE 4Maintain competitive taxation
by ensuring that General Government sector own-source
revenue remains at or below 8.5 per cent of nominal gross
state product, on average over the forward estimates.
PRINCIPLE 5Target full funding of
long-term liabilities such as superannuation and
WorkCover Queensland in accordance with actuarial
advice.
PRINCIPLE 6Maintain a sustainable public
service by ensuring overall growth in full-time equivalent employees, on average over the forward estimates, does
not exceed population growth from 2017–18.
PRINCIPLE 1Target ongoing reductions in Queensland’s relative debt burden, as measured by the
General Government debt-to-revenue ratio.
PRINCIPLE 2Target a net operating
surplus that ensures any new capital investment is funded primarily through recurrent
revenues rather than borrowing.

QUEENSLAND TREASURY ANNUAL REPORT 2017–18010
MANAGING OUR ORGANISATION
STRONG GOVERNANCE Underpinning the government’s �scal principles and priorities for the community are strong corporate governance practices in: leadership and planning internal and external accountability corporate support rigorous �nancial controls workforce planning, capability and
performance resource allocation information management.
Decisions in these areas are made directly and e¦ectively by Treasury’s Executive Leadership Team.
MANAGING OUR PERFORMANCE Treasury’s performance is managed in line with the Queensland Government’s Performance Management Framework, which provides the means to: strengthen public sector
accountability identify risks and opportunities
for agencies, government and the community
develop plans to address these.
At an organisation-wide level, the Strategic Plan is the roadmap that guides longer-term e¦orts to deliver Treasury’s purpose.
This is translated into �nancial year objectives and performance measures for each service area through the Service Delivery Statement, and reported against these in the annual report. Read more in the service reports on pages 23 to 39.
Treasury’s performance is monitored externally through the Parliamentary Estimates Committee process held a«er each year’s Queensland Budget. Treasury is accountable to the Deputy Premier, Treasurer and Minister for Aboriginal and Torres Strait Islander Partnerships, who reports against the Service Delivery Statement through this process.
Annual Operational Plans for each Treasury business group show a direct link between priority initiatives and Treasury’s strategic objectives.
The operational plans are updated each year, but they can also be amended at any time to reflect emerging risks, opportunities and government priorities. These plans provide a foundation for managers and employees to agree on priority deliverables which are tracked in individual Performance Excellence Plans. Overall, this planning framework provides alignment between the government’s priorities, Treasury’s vision, and its employees’ day-to-day work.
THE QUEENSLAND GOVERNMENT’S OBJECTIVES FOR THE COMMUNITYThroughout the 2017–18 reporting year, the Queensland Government’s agenda for meeting Queenslanders’ needs was clear: Jobs and a diverse economy Quality frontline services A protected, sustainable
environment Safe, caring and connected
communities.
Treasury’s expertise in economic and �scal management directly supports the economic, service delivery and community objectives of this agenda, and indirectly in the form of support for agencies to make their own unique contributions. Examples of speci�c contributions to the objectives are outlined overleaf.

011MANAGING OUR ORGANISATION
OUR SUPPORT FOR THE OBJECTIVES IN 2017–18
Creating jobs and a diverse economy
Delivered the 2018–19 Queensland Budget, which included support for around 38,000 jobs through the government’s $45.8 billion infrastructure program.
Supported the government’s revenue base with revenue initiatives such as a land tax surcharge for absentee landowners and a wagering (betting) tax.
Led job-generating infrastructure projects such as Cross River Rail and Brisbane International Cruise Terminal, and worked to maximise the Northern Australia Infrastructure Facility’s value to Queensland.
Delivering quality frontline services
Partnered with agencies in initiatives such as social housing, long-term funding for schools and public transport services.
Played a lead role in implementing the Powering Queensland Plan for a¦ordable, secure and sustainable electricity supply.
Advocated for Queensland’s interests in Commonwealth-State �nancial relations, to pursue a fair share of GST revenue for our communities.
Building safe, caring and connected communities
Established the Crime Statistics and Research Unit to better understand the origins and patterns of crime so that agencies and communities can design more e¦ective intervention and prevention strategies.
Introduced work and development orders as an option for people in hardship to resolve their penalty debt.
Protecting the environment
Worked towards strong growth in renewables, including through the Queensland Renewable Energy Target.
Continued large-scale reform to secure proper rehabilitation for legacy mining sites.
OUR FUTURE STATE: ADVANCING QUEENSLAND’S PRIORITIESIn mid-2018, the government announced its priorities for the major challenges facing Queensland: Create jobs in a strong economy
– creating jobs, increasing private sector investment, engaging more young Queenslanders in education, training or work.
Give all children a great start – increasing the number of babies born healthier, increasing childhood immunisation rates, improving wellbeing prior to school.
Keep Queenslanders healthy – increasing the number of Queenslanders with a healthy body weight, reducing suicides.
Keep communities safe – reducing the rate of crime victims, reducing rates of youth reo¦ending.
Protect the Great Barrier Reef – reducing Queensland’s contribution to climate change, improving water quality.
Be a responsive government – making Queensland Government services easy to use.
As a central agency, Treasury works across government to prioritise funding to deliver against these priorities. It will continue this support during 2018–19 via a roadmap for achieving targets under the Creating Jobs in a Strong Economy outcome.

012 QUEENSLAND TREASURY ANNUAL REPORT 2017–18
MANAGING OUR ORGANISATIONOUR LEADERS
Jim Murphy Under Treasurer
Jim is an outstanding senior policy executive and government leader. He commenced as Under Treasurer on 1 June 2015.
Formerly, Jim was a senior executive with the ANZ Bank. He was Deputy Secretary in the (Australian) Treasury for more than a decade and held senior executive positions in the Commonwealth Departments of Treasury, Attorney General and Finance.
His distinguished career also includes a role as an advisor with the International Monetary Fund in Washington DC and, for a short period, Chief of Sta¦ in the O�ce of the Prime Minister.
Jim was awarded a Public Service Medal for his strategic economic advice, which formed the Australian Government’s response to the global �nancial crisis.
Jim attained a Bachelor of Arts (Economics and History) from the University of New South Wales, a Bachelor of Laws from the University of Sydney and a Master of Public Law from the Australian National University.
Maryanne Kelly Acting Deputy Under Treasurer, Agency Performance
Maryanne commenced as Acting Deputy Under Treasurer of the Agency Performance Group in December 2017.
In this role, Maryanne is responsible for advice and analysis on public policy, �scal and economic issues, particularly for the health, education, communities, justice, Indigenous policy and housing portfolios.
Previously Maryanne was Assistant Under Treasurer for Treasury’s Economics Strategy division. In this role, she was responsible for employment and economic policy including overseeing the implementation of the government’s Back to Work program and the production of Budget forecasts and the Budget Economic Framework.
Maryanne has more than 20 years’ experience in leadership roles in the Queensland, Australian and United Kingdom governments. Her senior management roles in Queensland Government agencies include Treasury; Department of Communities, Child Safety and Disability Services; and Queensland Reconstruction Authority.
She has a Bachelor of Commerce and a Master of Social Planning and Development from the University of Queensland, and a Graduate Diploma of Business with a major in accounting.
Luan Sadikaj Acting Deputy Under Treasurer, Agency Performance and Investment
Luan was appointed Acting Deputy Under Treasurer of the Agency Performance and Investment Group in May 2018.
In his current role, Luan is responsible for commercial, �scal and economic advice on the state’s economic portfolios and Treasury’s investment policy and attraction programs. He represents Treasury on the Long Term Assets Advisory Board, a board of Queensland Treasury Corporation which manages certain superannuation and other long-term assets.
Prior to this current appointment, Luan held a senior executive role within Queensland Treasury’s Agency Performance Group. In this role, he worked closely with Queensland Health, Justice and the Attorney-General and public safety agencies to develop, fund and implement public policy. Luan has been involved in the development of the Queensland Budget since 2008.
Luan has a Bachelor of Business with a major in �nance and has completed his professional accreditation with CPA Australia.
Alison Rayner Deputy Under Treasurer, Economics and Fiscal Coordination
Alison was appointed Deputy Under Treasurer of the Economic and Fiscal Coordination Group in September 2017.
She is responsible for providing economic and �scal advice, analysis and guidance to government on matters of signi�cance to the economic and �scal performance of Queensland, particularly for the Queensland Budget, �scal e�ciency, economic policy, forecasting and reporting.
More recently, Alison has been in a senior executive management role working closely with Treasury’s partner agencies to develop, fund and implement public policy, and has been involved in the development of the Queensland Budget since 2013–14.
During 20 years in government, Alison has held key roles in developing and implementing the government’s budget and reporting system, and its �nancial accountability framework.

013MANAGING OUR ORGANISATION
She has been responsible for providing advice to government and agencies on �nancial management and complex commercial transactions.
Alison is a chartered accountant who started her career in the private sector, initially working in the business and tax advisory services industry, followed by several years in commercial banking, before joining government in 1998 with the Department of Education.
She joined Queensland Treasury during the period the government was transitioning to accrual based budgeting.
Robert Fleming Acting Deputy Under Treasurer, Commercial
Robert is an economist with a background in government policy and project management within a career built in the public sector.
He began his career in policy and budget development, working predominantly in social justice and transport portfolios.
During his 20 years in government, Robert has been responsible for advising on some of the state’s largest infrastructure projects in Queensland Treasury Corporation and Queensland Treasury. He has led teams which have developed business cases and procured key infrastructure projects including the Toowoomba Second Range Crossing, Herston Quarter redevelopment, Gold Coast Light Rail, Cross River Rail, and market-led proposals such as the Logan Motorway Enhancement Project.
Geoff Waite Executive General Manager, Risk and Intelligence
Geo¦ �rst joined Treasury in 1984 to work on joint Commonwealth/State employment programs.
He worked in a number of budget portfolio roles until his appointment as Treasury’s Director of Finance in 1995. He then headed Treasury’s corporate services function as Assistant Under Treasurer until 2001, and followed this with various roles including Assistant Under Treasurer, Budget Division and Executive Director of the O�ce of Government-Owned Corporations.
In 2007, Geo¦ started his own business consulting to state and local governments in Queensland. He returned to Treasury in 2012 and worked on internal reviews before heading the O�ce of the Under Treasurer, Corporate Group and then establishing the Risk and Intelligence role.
Geo¦ also has statutory appointments as the Independent Board Member on the Public Safety Business Agency Board of Management, and as the Government Superannuation O�cer.
He has a Bachelor of Arts from the University of Queensland, a Bachelor of Business from Queensland University of Technology, and is a Fellow of the Australian Institute of Management, and a Graduate of the Australian Institute of Company Directors.
Liz Goli Commissioner, O�ce of State Revenue
Liz was appointed Commissioner of the O�ce of State Revenue (OSR) in February 2014.
Prior to her appointment, Liz was Senior Assistant Commissioner, Indirect Tax at the Australian Taxation O�ce (ATO), and has held senior and executive management roles in tax administration since 1997.
Liz has international tax experience with the Organisation for Economic Cooperation and Development (OECD) in Paris, and previously worked in OSR from 1997 to 2001, where she had a leading role in rewriting of the state duties legislation.
She began her career as a graduate with the ATO in 1984.
Angela Wilke Executive General Manager, Operations and Change
As Executive General Manager, Operations and Change, Angela leads Treasury’s corporate enabling functions of �nance, HR, ICT delivery, strategic communications and corporate strategy and governance.
With a broad industry background in the public and private sectors, Angela has e¦ectively led corporate functions to deliver complex operational and cultural reform agendas. Among her notable achievements are the design and delivery of signi�cant transformation programs in Queensland Health, Stanwell Corporation and currently Queensland Treasury.
A specialist in strategic human resources management (HRM), industrial/employee relations, and culture and capability development, Angela also holds a Bachelor of Business (HRM) from QUT and a Master of Employment Law from Gri�th University.

014 QUEENSLAND TREASURY ANNUAL REPORT 2017–18
MANAGING OUR ORGANISATION
LEADING TREASURY As at 30 June 2018
UNDER TREASURERJim Murphy
ECONOMICS AND FISCAL COORDINATION
A/DEPUTY UNDER TREASURERMaryanne Kelly
A/DEPUTY UNDER TREASURERLuan Sadikaj
DEPUTY UNDER TREASURERAlison Rayner
Agency Performance
Health and Justice
Education and Technology
Communities
Economics
Intergovernmental Relations
AGENCY PERFORMANCE
Transport and Industry
Tourism and Business
Industry ProgramsAgency Performance
Strategic Commercial Advisory
Financial Assurance
State Actuary
Fiscal Projects
Government Banking Unit
Fiscal Management
Government Statistician
Economic Strategy
Budget O�ce
Program Management O�ce
AGENCY PERFORMANCE AND INVESTMENT

015MANAGING OUR ORGANISATION
Our Executive Leadership Team applies a strategic, cross-
divisional perspective to our organisation’s key priorities.
Property Projects
Shareholder and Structural Policy Division
Infrastructure Projects
COMMERCIAL
A/DEPUTY UNDER TREASURERRobert Fleming
Insurance Commission
O�ce of Chief Information O�cer
Legal and Administrative Review O�ce
RISK AND INTELLIGENCE
EXECUTIVE GENERAL MANAGERGeo¦ Waite
CLLO and Ministerial Services
Risk and Intelligence Policy Unit
Finance
Human Resources
Strategic Communications
OPERATIONS AND CHANGE
EXECUTIVE GENERAL MANAGERAngela Wilke
Performance and Governance
Royalties
State Penalties Enforcement Registry
State Taxes
OFFICE OF STATE REVENUE
COMMISSIONERLiz Goli
Grants

016 QUEENSLAND TREASURY ANNUAL REPORT 2017–18
MANAGING OUR ORGANISATION
AUDIT AND RISK MANAGEMENTThe Audit and Risk Management Committee helps the Under-Treasurer to meet his responsibilities under the Financial Accountability Act 2009, the Financial and Performance Management Standard 2009 and other prescribed requirements. Its business is concerned with overseeing our key �nancial, risk and performance management activities, including: reviewing the appropriateness of
accounting policies and �nancial performance
annually reviewing the risk management framework, including processes for identifying, monitoring and managing signi�cant business risks
integrity and preventing misconduct – quarterly reporting of misconduct issues and trends, prevention strategies and areas for improvement reviewing, with the assistance of internal and external audit functions, the adequacy of internal controls, including IT security
internal and external audit: reviewing and approving an
Internal Audit Plan consulting with External Audit on
a proposed audit strategy considering audit �ndings and
recommendations to ensure key risks are considered and mitigated.
The committee also performs these functions for the following related entities in our broader portfolio who prepare independent �nancial statements: Motor Accident Insurance
Commission Nominal Defendant National Injury Insurance Scheme
Queensland Agency.
2017–18 Audit and Risk Management Committee membership (as at May 2018)
Chair:
Executive General Manager, Risk and Intelligence
Members:
Deputy Under Treasurer, Economics and Fiscal Coordination Insurance Commissioner Commissioner, O�ce of State Revenue Don Licastro – independent member
Standing invitations:
Under Treasurer Chief Finance O�cer Queensland Audit O�ce (QAO) Internal Audit
2017–18 achievements
The committee met �ve times during the year and ful�lled its responsibilities in accordance with its charter and an approved work plan, which included: reviewing the 2016–17 Financial
Statements for Queensland Treasury, Motor Accident Insurance Commission and Nominal Defendant
reviewing the outcomes of 2017– 18 Internal Audit activity and endorsement of 2018–19 Internal Audit Plan
considering issues raised by QAO including recommendations from performance audits
considering Treasury-related QAO reports to Parliament.
A robust risk management framework is integrated into all Treasury business activities and systems. Employees from across the organisation were appointed as risk o�cers in 2017–18 to champion active compliance and risk management activities aimed at embedding the Treasury Risk Management strategy, and enhancing the risk skills of Treasury sta¦.
These o�cers update risk registers and identify risk mitigation strategies to be undertaken by business areas. Emerging and high-rated business area risks are reported to our Executive Leadership Team via the Annual Risk Report and agency risk pro�le. This report is also used to inform strategic and business planning, and the targeting of relevant assurance activity.
Internal Audit
Internal Audit supports the Audit and Risk Management Committee by evaluating �nancial and operational systems, reporting processes and activities.
PwC undertakes this function as an independent and objective internal audit service in accordance with Treasury’s Internal Audit Charter and ethical standards.

017MANAGING OUR ORGANISATION
Internal Audit regularly liaises with QAO to ensure appropriate assurance services are provided to Treasury. In 2017–18, Internal Audit delivered a program of work for Treasury’s three-year Internal Audit Plan (approved by the Audit and Risk Management Committee). Its work comprised 23 reviews, including: QGrants Systems and First Home
Owners’ Grant Review reviews of revenue management
activities and systems, including State Penalties Enforcement Registry (SPER) operational processes
reviews of selected agency and frontline service delivery functions including National Injury Insurance Scheme Queensland Agency and whole-of-government �nancial assurance
security reviews, including cyber security, information security and building security
business process improvement and business intelligence reviews including monitoring of data controls, data analysis and reporting, and contract management.
This plan aligned with Treasury’s key risk areas, operations, and strategic objectives, and drew on additional specialist expertise as needed.
VALUING AND PROTECTING OUR INFORMATION ASSETSTreasury’s information security and information management practices support its role as the government’s trusted �nancial and economic advisor.
With the constant evolution of technology and the rise of large, complex data sets, Treasury seeks to improve how it creates, uses, �nds, manages and secures information.
Through e¦ectively managing and leveraging information assets, Treasury has been able to integrate and streamline processes, improve services and compliance, enable easier access to information, to make more informed decisions.
Over 2017–18, major achievements included: commencing the Information
Security Program to mitigate Treasury’s cyber security risk pro�le, and to establish a trusted environment to position Treasury for digital and strategic data initiatives
delivering an updated information security management system that aligns to the Queensland Government’s Chief Information O�cer’s policy directive
settling a digital strategy to focus on digital by default, recognising data as a strategic asset, providing client-centric digital experiences and developing a digital culture
providing assurance services for strategic activities
providing advice, guidance and support to business area applications to ensure they meet whole-of-government data security requirements
developing an automated infrastructure platform to host the Queensland Budget website and allow seamless transition to 2018–19 content on Budget Day
collaborating with Treasury’s Government Banking Unit to develop and implement an analytics solution to review credit card transaction data across government
improving the digital workplace with Windows 10 and piloting new products available in the Microso« O�ce 365 roadmap
delivering a new Treasury retention and disposal schedule
redeveloping Treasury’s corporate space to include a new Governance Centre, a central repository for corporate policies, procedures and guidelines, and a delegations app, making it easier for employees to �nd information relevant to the approval authority of particular positions
embedding the electronic records management system to improve records management and compliance activities, increase business process e�ciencies with automated workflows, and automate sentencing and disposal processes
developing a new SharePoint Strategy and Roadmap, which will integrate the existing business platform with a range of cloud-based, new generation O�ce 365 tools and applications. This will enable employees to work and collaborate from any device, anywhere.

018 QUEENSLAND TREASURY ANNUAL REPORT 2017–18
OUR PEOPLE
TRANSFORMING OUR PEOPLE FOR TOMORROW In ful�lling its responsibilities to Queenslanders, Treasury must continue to develop frameworks that attract private sector investments and support job creation. This requires a focus on developing workforce skills and capabilities.
The One Treasury: Agency Excellence Reform Program is Treasury's long-term cultural program, designed to strengthen its client focus, adopt a more strategic partnering approach with agencies, and be more collaborative as 'One Treasury'. This program involves making changes to structure, culture and work practices to evolve as a more responsive, client-centric organisation.
In 2017–18, this included: building networks and strategic
partnerships for shared goals strengthening workforce
culture around clear values and cultural pillars
capability development initiatives which build the strategic thinking and transformational capabilities of Treasury’s leaders.
Performance Excellence focuses on the achievement of objectives, providing for regular reviews which ensure that Treasury delivers results at the operational, strategic, and individual level. To measure individual employee performance, the iPerform system was introduced, and has been used to outline employee objectives, identify development needs, and document regular employee-manager discussions.
This leader-led approach ensures individuals and the team are aligned to a consistent organisational direction.
Today’s work environments are continually changing. To adapt, Treasury needs to create and share information throughout the organisation at a faster pace to enable e¦ective decision making.
In the coming year, Treasury will embark on the Public Service Commission-driven Capability Blueprint project. This is a whole-of-government program which will involve a detailed analysis of organisational strength in the key areas of leadership, strategy and delivery, and the identi�cation of opportunities for improvement.
OUR WORKFORCE AT A GLANCEAt the end of the year, our workforce comprised:
1,031*PEOPLE
991.85FULL-TIME EQUIVALENT
EMPLOYEES1
136PART-TIME EMPLOYEES
* Includes Treasury employees outsourced to Motor Accident Insurance Commission and Nominal Defendant. Represents employees active and paid at 30 June 2018.

019OUR PEOPLE
WORKFORCE COMPOSITIONNumber % of workforce1
Men 464 45.00%
Women 567 55.00%
Permanent separation rate (excluding O�ce of Industrial Relations) 63 6.11%
Aboriginal Peoples and Torres Strait Islander Peoples6 8 0.78%
People from non-English speaking backgrounds 160 15.52%
People with disability6 26 2.52%
Women in middle and upper management (AO7–AO8)2 120 52.17%
Women in senior o�cer and senior executive service positions (SO-CEO equivalent)3 46 43.81%
Women in senior executive service positions (SES-CEO equiv)4 16 37.21%
Average annual earnings by men (nominal salary)5 $103,682
Average annual earnings by women (nominal salary)5 $93,655
1 Percentage of total workforce or demographic cohort2 Represents 11.64 per cent of total workforce3 Represents 4.46 per cent of total workforce4 Includes SES, S122 and CEO equivalent roles5 Nominal salary based on full-time earnings for each gender – correct at 30 June 20186 The data against disability and ATSI is self-reported by employees so may be signi�cantly under-reported
Women Men
0
50
100
150
200
250
300
Administrative (Trainee to AO3)
Administration (AO4-AO6)
Professional (PO2-PO4)
Middle management (AO7-AO8) (PO5-PO6)
Senior management (SO-CEO)
TOTAL STAFF BY GENDER AND CLASSIFICATION
EARLY RETIREMENT, REDUNDANCY AND RETRENCHMENT During the period, one employee received a redundancy package at a cost of $81,000.

020 QUEENSLAND TREASURY ANNUAL REPORT 2017–18
OUR PEOPLE
INVESTING IN OUR NEXT GENERATION OF LEADERS To uphold the standards of the organisation, Treasury must invest in the future of its people. This is achieved through empowering them to be diverse and innovative thinkers, to be brave and to seek new and better ways of doing things through challenging old practices. Development programs provide a supportive start for new graduates, and give employees an opportunity to expand their professional knowledge and prepare to lead with impact.
The GRADStart program continues to be a highly regarded and e¦ective program for attracting and developing talent. In 2018, the Australian Association of Graduate Employers ranked Treasury 17 on the list of top graduate employers in Australia, up from 45 in 2017. This year the program welcomed 12 graduates, including two scholarship holders, who completed a scholarship program during their �nal year of study.
Treasury's Great Leaders Program develops emerging leaders, individuals who have demonstrated professional success and commitment to Agency Excellence through delivering a comprehensive and tailored professional development program, developed in partnership with Queensland University of Technology.
In March 2018, Treasury celebrated the graduation of 11 participants, and welcomed 14 new participants into the program. Individual participants and their leadership qualities were promoted to internal audiences and through social media to model ideal leadership qualities to other employees, and to position Treasury as an employer of choice.
During the year, Treasury became a Recognised Employer Partner with CPA Australia. This means that relevant experience, training and development provided inhouse meets CPA Australia’s exacting professional development requirements.
A FLEXIBLE, AGILE, AND HARMONIOUS WORKFORCEThe Public Service Commission's 3-year Human Capital strategic roadmap, released in 2017, found agile and flexible working a strategic imperative for the Queensland public sector. These qualities are key to creating an innovative and diverse workforce, capable of responsive service delivery.
Flexible work practices help support employees’ wellbeing, and improve overall productivity and performance. Treasury embraced the Commission's Flexible by Design framework, and has employees accessing flexible work arrangements on both a formal and ad-hoc basis. Examples of flexible work options for employees' access include:
adjusting their hours of work with flexible start and �nish times, working compressed hours, job sharing and working part-time, accessing family and breastfeeding rooms in the workplace
changing their place of work, so they can work remotely
taking leave at half pay.
Employees can access these arrangements to help them manage their life circumstances including parenting responsibilities, caring responsibilities, and transitioning to retirement.
Treasury actively promotes the ways flexible work practices are being used through employee communication channels. Managers and employees are encouraged to discuss flexible work options, and develop a team culture where working flexibly is the norm.
In 2018–19, Treasury will continue to promote flexible work practices to help make those practices part of organisational culture and thinking. This will help ensure workplaces match the expectations of both current and future employees.
021OUR PEOPLE
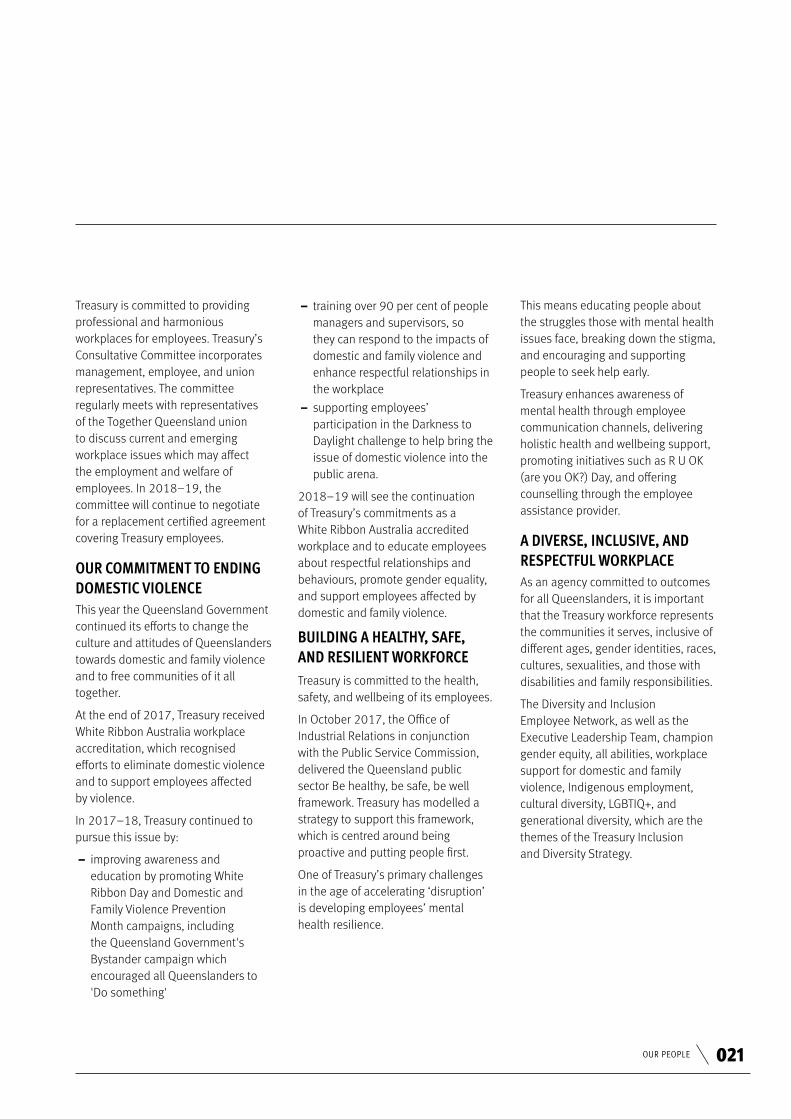
Treasury is committed to providing professional and harmonious workplaces for employees. Treasury’s Consultative Committee incorporates management, employee, and union representatives. The committee regularly meets with representatives of the Together Queensland union to discuss current and emerging workplace issues which may a¦ect the employment and welfare of employees. In 2018–19, the committee will continue to negotiate for a replacement certi�ed agreement covering Treasury employees.
OUR COMMITMENT TO ENDING DOMESTIC VIOLENCE This year the Queensland Government continued its e¦orts to change the culture and attitudes of Queenslanders towards domestic and family violence and to free communities of it all together.
At the end of 2017, Treasury received White Ribbon Australia workplace accreditation, which recognised e¦orts to eliminate domestic violence and to support employees a¦ected by violence.
In 2017–18, Treasury continued to pursue this issue by: improving awareness and
education by promoting White Ribbon Day and Domestic and Family Violence Prevention Month campaigns, including the Queensland Government's Bystander campaign which encouraged all Queenslanders to 'Do something'
training over 90 per cent of people managers and supervisors, so they can respond to the impacts of domestic and family violence and enhance respectful relationships in the workplace
supporting employees’ participation in the Darkness to Daylight challenge to help bring the issue of domestic violence into the public arena.
2018–19 will see the continuation of Treasury’s commitments as a White Ribbon Australia accredited workplace and to educate employees about respectful relationships and behaviours, promote gender equality, and support employees a¦ected by domestic and family violence.
BUILDING A HEALTHY, SAFE, AND RESILIENT WORKFORCE Treasury is committed to the health, safety, and wellbeing of its employees.
In October 2017, the O�ce of Industrial Relations in conjunction with the Public Service Commission, delivered the Queensland public sector Be healthy, be safe, be well framework. Treasury has modelled a strategy to support this framework, which is centred around being proactive and putting people �rst.
One of Treasury’s primary challenges in the age of accelerating ‘disruption’ is developing employees’ mental health resilience.
This means educating people about the struggles those with mental health issues face, breaking down the stigma, and encouraging and supporting people to seek help early.
Treasury enhances awareness of mental health through employee communication channels, delivering holistic health and wellbeing support, promoting initiatives such as R U OK (are you OK?) Day, and o¦ering counselling through the employee assistance provider.
A DIVERSE, INCLUSIVE, AND RESPECTFUL WORKPLACE As an agency committed to outcomes for all Queenslanders, it is important that the Treasury workforce represents the communities it serves, inclusive of di¦erent ages, gender identities, races, cultures, sexualities, and those with disabilities and family responsibilities.
The Diversity and Inclusion Employee Network, as well as the Executive Leadership Team, champion gender equity, all abilities, workplace support for domestic and family violence, Indigenous employment, cultural diversity, LGBTIQ+, and generational diversity, which are the themes of the Treasury Inclusion and Diversity Strategy.

022 QUEENSLAND TREASURY ANNUAL REPORT 2017–18
OUR PEOPLE
Throughout the year across Treasury’s Health, Wellbeing and Diversity calendar of events, employees are educated about the value of diversity and inclusion in communities, through alignment with state, national, and international events including: celebrating International Women's
Day and Queensland Women's Week
participating in activities to end domestic and family violence such as the Darkness to Daylight run and White Ribbon Day
building respectful relationships with Aboriginal peoples and Torres Strait Islander peoples in National Reconciliation Week and celebrating their achievements during NAIDOC Week
encouraging employees to 'bring their whole self' to work through Wear It Purple Day
demonstrating the abilities of people with a disability through Disability Action Week
embracing all generations in the workforce.
To support the diverse needs of employees, the 1 William Street workplace includes private facilities which allow working mothers to express and employees to care for their dependents. Private rooms for prayer are also provided.
LIVING OUR VALUES Treasury has incorporated the Queensland public service values into its cultural pillars, which drive its business model:
Values customers �rst ideas into action unleash potential be courageous empower people.
Cultural pillars Client centricity Collaboration Collective responsibility Continuous improvement
These values are at the heart of Treasury’s identity as a workforce, and how employees are able to deliver economic growth for Queensland’s economy and improve the wellbeing of all Queenslanders. Treasury puts customers �rst through being client centric, employees empower themselves and unleash potential through collaboration, they show courage through taking collective responsibility, and they put ideas into action through continuous improvement.
Treasury upholds the Code of Conduct for the Queensland Public Service, the blueprint for its work as a public sector agency. It is based on the ethics principles outlined in the Public Sector Ethics Act 1994:integrity and impartiality promoting the public good commitment to the system of
government accountability and transparency.
All new starters receive Code of Conduct training, and when required messaging about the code is reinforced with existing employees. Treasury also publishes resources to help employees model ideal professional behaviour, manage conflicts of interest, and appropriately engage in community or charitable activities in the workplace.
In 2018, Treasury will participate in a review of the Code of Conduct, with a view to a new code in late 2018.

023
ECONOMIC AND FISCAL COORDINATIONSERVICE REPORT
Jobs and a strong economyTreasury provides economic and �scal advice and strategy to support the government’s focus on creating jobs, delivering responsive government, driving sustainable economic growth, increasing private sector investment, and delivering quality frontline services.
This advice helps inform the development of the government’s economic and �scal policies, strategies and initiatives to enhance the quality of life and living standards of all Queenslanders.
Treasury does this by delivering whole-of-government
economic, �scal, revenue, �nancial management, accounting, policy and reporting services to the Under Treasurer, the Treasurer and the Cabinet Budget Review Committee
coordinating the development of the Queensland Budget each year, and managing the state’s debt and balance sheet in accordance with government policies
providing economic policy advice, economic impact modelling and data to inform public policy and decision making, and to promote economic growth and job creation
through the Queensland Government Statistician, delivering statistical, demographic research and program evaluation services across government.
OUR OPERATING ENVIRONMENT
Revenue and expenses growth 2017–18 to 2021–22
7.0%
6.0%
5.0%
4.0%
3.0%
2.0%
1.0%
0.0%
-1.0%
-2.0%
Revenue growth Expenses growth
2017–18 2018–19 2019–20 2020–21 2021–22
Analysis
The �scal environment beyond 2017–18 is heavily influenced by anticipated reductions in Australian Government grants, as well as an expected decrease in dividends and coal royalties. While the operating balance is forecast to remain in surplus, the surpluses are expected to moderate as the average annual growth in revenue is budgeted to be 2.07 per cent, with expenses to grow 2.9 per cent. We will assist the government to manage the �scal pressures to support the ongoing delivery of its �scal strategy. Read more about the government’s �scal strategy on page 9. Source: Queensland Treasury
Economic growth1, Queensland and Australia
QueenslandAustralia
9%
6%
3%
0%1993–94 1997–98 2001–02 2005–06 2009–10 2013–14 2017–18 2021–22
Housing boom
Miningboom
LNG investment
GFC and natural disasters
LNGexportramp-up
Analysis
Growth in the Queensland economy is expected to strengthen to 2¾ per cent in 2017–18, reflecting further improvement in domestic demand and a recovery in coal exports following Severe Tropical Cyclone Debbie. Economic growth is forecast to accelerate further to 3 per cent in 2018–19, before increasing 2¾ per cent in both 2019–20 and 2020–21. Note: 1. Chain volume measures, 2015–16 reference year, 2017–18 onwards are forecasts/projections. Sources: ABS 5206.0, Australian Government Budget 2018–19 and Queensland Treasury.
ECONOMIC AND FISCAL COORDINATION SERVICE REPORT

024 QUEENSLAND TREASURY ANNUAL REPORT 2017–18
Employment growth1 and unemployment rate2, Queensland3
8
6
4
2
0
12
8
4
01993–94 1997–98 2001–02 2005–06 2009–10 2013–14 2017–18 2021–22
Employment growth (lhs)
Unemployment rate (rhs)
Annu
al %
cha
nge
%
Analysis
Employment growth was stronger than expected in 2017–18. While employment growth moderated in early 2018, the exceptional gains in late 2017 mean growth over the year to June quarter 2018 was 3.0 per cent. Employment growth is expected to return to more sustainable rates of 1½ per cent and 1¾ per cent respectively over the next two years. By industry, health care (up 39,000 persons in year-average terms), education (up 14,000), agriculture and support services (both up 10,500) were the main drivers of Queensland employment growth in 2017–18. Labour market conditions in many regional areas improved in 2017– 18 and the overall gap between regional and South East Queensland unemployment rates narrowed substantially.Strong jobs growth has encouraged jobseekers to re-enter the labour force, seeing the participation rate climbing to its highest rate in three years. As a result, the unemployment rate is forecast to remain at 6¼ per cent in the near term (June quarter 2019). Notes: 1. Through-the-year growth rate to the June quarter (seasonally adjusted). 2. Seasonally adjusted rate for the June quarter. 3. 2018–19 onwards are forecasts/projections. Sources: ABS 6202.0 and Queensland Treasury.
ECONOMIC AND FISCAL COORDINATIONSERVICE REPORT
025ECONOMIC AND FISCAL COORDINATION SERVICE REPORT
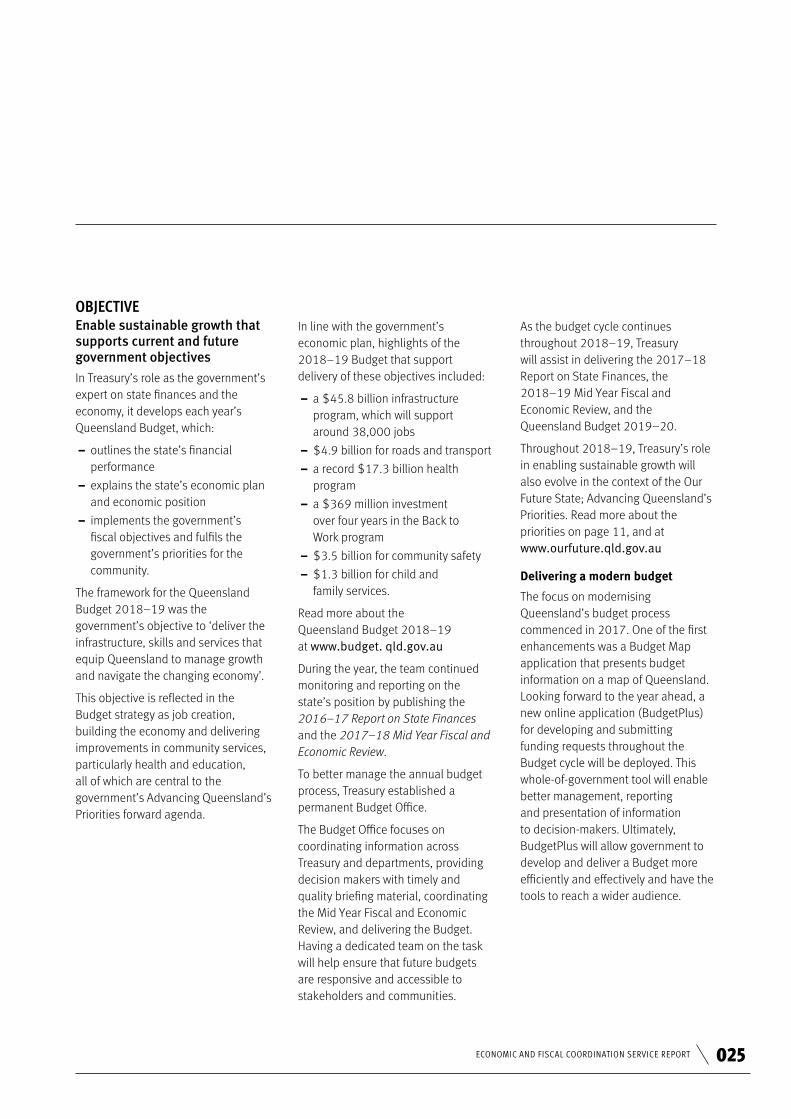
OBJECTIVEEnable sustainable growth that supports current and future government objectives
In Treasury’s role as the government’s expert on state �nances and the economy, it develops each year’s Queensland Budget, which: outlines the state’s �nancial
performance explains the state’s economic plan
and economic position implements the government’s
�scal objectives and ful�ls the government’s priorities for the community.
The framework for the Queensland Budget 2018–19 was the government’s objective to ‘deliver the infrastructure, skills and services that equip Queensland to manage growth and navigate the changing economy’.
This objective is reflected in the Budget strategy as job creation, building the economy and delivering improvements in community services, particularly health and education, all of which are central to the government’s Advancing Queensland’s Priorities forward agenda.
In line with the government’s economic plan, highlights of the 2018–19 Budget that support delivery of these objectives included: a $45.8 billion infrastructure
program, which will support around 38,000 jobs
$4.9 billion for roads and transport a record $17.3 billion health
program a $369 million investment
over four years in the Back to Work program
$3.5 billion for community safety $1.3 billion for child and
family services.
Read more about the Queensland Budget 2018–19 at www.budget. qld.gov.au
During the year, the team continued monitoring and reporting on the state’s position by publishing the 2016–17 Report on State Finances and the 2017–18 Mid Year Fiscal and Economic Review.
To better manage the annual budget process, Treasury established a permanent Budget O�ce.
The Budget O�ce focuses on coordinating information across Treasury and departments, providing decision makers with timely and quality brie�ng material, coordinating the Mid Year Fiscal and Economic Review, and delivering the Budget. Having a dedicated team on the task will help ensure that future budgets are responsive and accessible to stakeholders and communities.
As the budget cycle continues throughout 2018–19, Treasury will assist in delivering the 2017–18 Report on State Finances, the 2018–19 Mid Year Fiscal and Economic Review, and the Queensland Budget 2019–20.
Throughout 2018–19, Treasury’s role in enabling sustainable growth will also evolve in the context of the Our Future State; Advancing Queensland’s Priorities. Read more about the priorities on page 11, and at www.ourfuture.qld.gov.au
Delivering a modern budget
The focus on modernising Queensland’s budget process commenced in 2017. One of the �rst enhancements was a Budget Map application that presents budget information on a map of Queensland. Looking forward to the year ahead, a new online application (BudgetPlus) for developing and submitting funding requests throughout the Budget cycle will be deployed. This whole-of-government tool will enable better management, reporting and presentation of information to decision-makers. Ultimately, BudgetPlus will allow government to develop and deliver a Budget more e�ciently and e¦ectively and have the tools to reach a wider audience.

026 QUEENSLAND TREASURY ANNUAL REPORT 2017–18
ECONOMIC AND FISCAL COORDINATIONSERVICE REPORT
Strong, sustainable regulatory frameworks
A constant presence in the business sector’s operating environment is government regulation. In response to previous issues raised by business, last year the government began developing an enhanced regulatory reform framework to: support a more risk-based
approach to regulation ensure more timely review of
regulation drive improved regulatory
engagement and performance.
Ongoing development and implementation of the framework will help re-focus and re-invigorate the government’s regulatory reform e¦orts to reduce red tape and the regulatory burden for Queensland businesses, families and communities.
Accountability for taxpayers’ resources
As a central agency, Treasury plays a key role in public sector �nancial accountability by equipping agencies (including Treasury) with policies and guidelines to be accountable for the �nancial resources they use on behalf of Queenslanders when delivering services.
Over the next two years, Queensland Government agencies will adopt several new accounting standards. Treasury’s role will be to engage with agencies on proposed transitional accounting methods and accounting policies ahead of their introduction. A smooth transition for agencies will ultimately mean uninterrupted service delivery to communities.
OBJECTIVEPartner proactively to facilitate better outcomes for the community
Building community safety and wellbeing
Understanding communities is the key to improving the wellbeing of Queenslanders: how they live, where they live, and the bene�t they can draw from the infrastructure and services provided by government.
The Queensland Population Projections is one of Treasury’s key statistical products. In the year ahead, updated projections will be released, allowing government agencies, business and the community to use to inform decision making and plan services and infrastructure in areas such as transport networks, schools and health services.
During the year, Treasury collaborated with the Centre of Policy Studies at Victoria University to model the economic impacts of interstate migration on the Queensland economy. This research, which informed preparation of the Queensland Budget 2018–19, supported the government’s focus on servicing Queensland’s growing population.
Understanding the origins and patterns of crime is also an essential part of knowing communities and aligns with the government’s Our Future State priority of keeping communities safe.
During 2017–18 Treasury established the Crime Statistics and Research Unit in the Queensland Government Statistician’s O�ce and commenced development of a range of crime-related statistical products. A Crime Research Reference Committee was also established to develop a research agenda covering key criminal justice themes. This work will help support keeping communities safe across the whole of Queensland.

027AGENCY PERFORMANCE SERVICE REPORT
AGENCY PERFORMANCESERVICE REPORT
Clients are at the heart of Treasury’s purpose. Treasury’s role is to manage public policy, �scal and economic issues across government so that agencies can improve frontline services for Queenslanders, by providing economic and �scally
responsible public policy analysis and advice to agencies to support government priorities
partnering with agencies to optimise performance, balancing service delivery within budget parameters
managing and coordinating intergovernmental �nancial relations issues
managing whole-of-government banking and payment services contracts.
OPERATING ENVIRONMENTThe operating environment of Treasury and the agencies with whom it partners is influenced signi�cantly by: decision making and negotiations
on funding in the national arena emerging issues in the
community services sphere such as homelessness and housing a¦ordability
communities’ ongoing needs for social infrastructure.
These emphasise the need for Treasury to continue to grow its strategic partnerships with agencies and ensure positive outcomes are achieved for Queenslanders.
OBJECTIVEPartner proactively to facilitate better outcomes for the community
2017–18 provided many opportunities to improve the wellbeing of Queenslanders by working with agencies on the following initiatives: In partnership with the Department
of Housing and Public Works, negotiating the new National Housing and Homelessness Agreement, to secure funding for social housing and homelessness.
Providing advice on a range of policy and �nancial matters related to the National Disability Insurance Scheme, with the Department of Communities, Child Safety and Disability Services, the Department of the Premier and Cabinet and other relevant agencies.
Worked with the Department of Education on the long-term school funding agreement with the Australian Government to provide funding for Queensland schools beyond 2018.
Delivering the 2018 Gold Coast Commonwealth Games on time and on budget. Gri�th University modelling predicted that, a«er taking into account the government’s $1.5 billion investment, the Games will contribute $2 billion to Gross State Product for Queensland.
Negotiating contracts with private providers for public transport bus services in South East Queensland.
Advising government on future provision of whole-of-government �nancial services. These arrangements underpin all �nancial transactions between government agencies and their clients.
Working with agencies to deliver the government’s signi�cant capital program to meet community service needs and create jobs, particularly in the development of strategic and detailed business cases for capital works projects across the state.
OBJECTIVEEnable sustainable growth that supports current and future government objectives
Advocating for Queensland’s interest in Commonwealth–State financial relations Treasury takes a lead role in managing and coordinating intergovernmental relations. Key activities in 2017–18 included:advocating that Queensland receives
its fair share of GST revenue. This included the Deputy Premier and Under Treasurer presenting Queensland’s position on horizontal �scal equalisation to the Australian Productivity Commission at a public hearing in Brisbane in February 2018. The Productivity Commission’s �nal report has been released and the Australian Government has responded with a series of long-term recommendations. As the negotiation of the reforms progresses, Treasury will respond to the Australian Government’s proposal in a way designed to ensure Queensland’s fair share of revenue.
negotiating, in partnership with agencies, a range of funding agreements around health, education, housing and homelessness, remote housing, and the National Disability Insurance Scheme.
028 QUEENSLAND TREASURY ANNUAL REPORT 2017–18
COMMERCIAL SERVICESSERVICE REPORT
Value for money infrastructure and attracting investmentTreasury secures the infrastructure Queensland needs to grow by: providing commercial and
�nancial advice to government on infrastructure projects
managing the procurement of privately �nanced major public infrastructure and service projects
working with government agencies to realise the contracted value of major public infrastructure projects through the delivery phase
providing policy advice on private sector investment in Queensland
ensuring rigorous project procurement across government through administration of the state’s project assessment framework
assessing government-owned corporations' (GOCs) capital investments and driving a focus on maximising performance and rates of return through improved commercial focus.
Key issues in our environment
The government’s ability to realise its priorities as they relate to infrastructure and service delivery objectives may be impacted by the following: Australian Government decisions
around which infrastructure projects it will fund will impact the a¦ordability of critical infrastructure delivery.
The current dynamic market change in the energy sector will need to be taken into account as Treasury works to place Queensland in a strong position to deliver reliable, a¦ordable energy with the right mix of baseload and renewable energy.
OBJECTIVEPartner proactively to facilitate better outcomes for the community
Cross River Rail
Cross River Rail, Brisbane’s $5.4 billion, 10.2 kilometre underground rail link from Dutton Park to Bowen Hills, is the government’s highest priority infrastructure project. It will ease congestion, improve network reliability and increase accessibility to the Brisbane CBD.
During 2017–18, this project progressed to early works and procurement. It is being managed by the Cross River Rail Delivery Authority through the Cross River Rail Delivery Authority Board, which is chaired by the Under Treasurer.
Treasury will continue to advise the authority and board on subsequent project phases including assessment of station precinct redevelopment proposals.
Construction is due to be completed by 2024. Read more about Cross River Rail at www.crossriverrail.qld.gov.au
Brisbane International Cruise Terminal
The Brisbane International Cruise Terminal project is a market-led proposal from Port of Brisbane Pty Ltd (PBPL) for a new terminal at Luggage Point at the mouth of the river. This $158 million, privately funded and �nanced project will support an average of 245 jobs per annum during construction. In October 2017, the government signed a contract with PBPL. Responsibility for managing delivery is now with the Department of State Development, Manufacturing, Infrastructure and Planning.
Continued support for major infrastructure projects
During the year, support continued for Building Queensland and Treasury’s government agency partners with feasibility assessment and preparation for investment in a range of major infrastructure and service delivery projects, including: expansions at the Logan and
Caboolture Hospitals �ve new schools at Ripley (primary
and secondary), Mango Hill, Yarrabilba and Coomera
the Lower Fitzroy River Infrastructure Project (Rookwood Weir)
the Townsville Eastern Access Rail Corridor
procurement of heavy vehicle tolling services for Toowoomba Second Range Crossing

029COMMERCIAL SERVICES SERVICE REPORT
contract advice and support to the Department of Transport and Main Roads in the delivery phase of the New Generation Rollingstock public private partnership.
Support for these projects will continue throughout 2018–19.
Rookwood Weir
During the year, Treasury worked with the Department of Natural Resources, Mines and Energy (DNRME) on the proposed Rookwood Weir, a major component of the Lower Fitzroy River Infrastructure Project located approximately 60 kilometres south-east of Rockhampton.
When completed, the weir (with associated roads, bridges and other infrastructure) will be capable of supplying 76,000 ML per annum for customers.
In 2017–18, Building Queensland released the project’s detailed business case. The Queensland Government allocated $176 million across the next four years, matched by the Australian Government. Engagement with relevant Australian Government agencies will continue in 2018–19 to formalise funding arrangements to facilitate construction from 2019.
Treasury will also work with DNRME and SunWater (the preferred constructor and operator for Rookwood Weir) to progress the project.
Local management arrangements for irrigation schemes
During the year, Treasury supported DNRME in investigating the transfer of SunWater’s irrigation water channel distribution schemes to local irrigator ownership. The government reached agreement on the terms of transfer for two schemes at St George and Theodore. As more agreements are reached throughout 2018–19, support for the department in completing agreements to transfer to local management arrangements will continue.
OBJECTIVEEnable sustainable growth that supports current and future government objectives
Our advice to government on reforms to key economic sectors helps strengthen the roles those sectors play in the economy of this state.
Power for Queensland
Implementation of the $1.16 billion Powering Queensland Plan, designed to ensure a¦ordable, secure and sustainable electricity supply for our state, began in 2017–18.
Its actions include: $770 million to cover the cost
of the Solar Bonus Scheme returning Swanbank E gas-�red
power station to operation directions to Stanwell to
put downward pressure on wholesale prices
$386 million to strengthen and diversify North Queensland’s energy supply, including a commitment of $100 million towards the Burdekin Hydro Power Station (subject to investigations)
con�rmation of the Queensland Renewable Energy Target of 50 per cent renewable energy by 2030
progress the Renewables 400 auction, which will allow the state to procure 400 megawatts of renewable energy
establish the Queensland Energy Security Taskforce to coordinate the work of government departments and energy GOCs in ensuring reliable electricity supply for Queensland
investigate the establishment of CleanCo, a separate generator to operate Queensland’s existing renewable and low-emissions energy generation assets
implement the Queensland Gas Action Plan
improve large-scale renewable project facilitation, planning and network connections
advocacy for stable, integrated national climate and energy policies.

030 QUEENSLAND TREASURY ANNUAL REPORT 2017–18
COMMERCIAL SERVICESSERVICE REPORT
ASX Base Futures Prices – 2019 calendar year
6065707580859095
100105110
Powering Queensland Plan announced:Direction on Stanwell and return Swanbank E to service
$ /
MW
H
1 Ja
n 20
17
1 Fe
b 20
17
1 M
ar 2
017
1 Ap
r 201
7
1 M
ay 2
017
1 Ju
n 20
17
1 Ju
l 201
7
1 Au
g 20
17
1 Se
p 20
17
1 O
ct 2
017
1 N
ov 2
017
1 De
c 20
17
1 Ja
n 20
18
1 Fe
b 20
18
1 M
ar 2
018
1 Ap
r 201
8
1 M
ay 2
018
1 Ju
n 20
18
1 Ju
l 201
8
QLD price NSW price VIC price SA price
Following the government’s announcement to return Swanbank E power station to service and directing Stanwell to put downward pressure on wholesale prices, electricity futures fell across the National Electricity Market (NEM) and Queensland futures continue to remain the lowest in the NEM compared to other states.
Queensland Renewables Output
Non-renewables Rooftop PV Large-scale renewables
8.6%
Existing 2018 projected 2019 projected
17.6% 21.9%
The Powering Queensland Plan has the potential to bring about generational change in the state’s energy sector.
Our focus in 2018–19 will be to: monitor and implement the
Powering Queensland Plan’s initiatives to ensure they are providing responsive services to consumers
work towards strong growth in renewables and the 50 per cent Queensland Renewable Energy Target
progress options to improve reliability and price through the transition to renewables, including:
working with Building Queensland to �nalise the business case for the Burdekin Hydro Power Station.
work with Building Queensland, Stanwell, and DNRME to �nalise the government’s position on the project
continuing our work with stakeholders and DNRME on the establishment of CleanCo.
Read more about the Powering Queensland Plan at www.dnrme.qld.gov.au
Sour
ce: A
SX E
nerg
y 23
July
201
8
Signi�cant progress has also been made towards reaching the Queensland Renewable Energy Target of 50 per cent by 2030. By the end of 2018, approximately 17.6 per cent of Queensland output is expected to be comprised of renewables. This is expected to grow to 21.9 per cent by the end of 2019.

031COMMERCIAL SERVICES SERVICE REPORT
Business Development Fund
With around 86 per cent of Queensland jobs delivered by the private sector, stimulating business investment is one of the government’s highest priorities.
The Business Development Fund (BDF) is the Queensland Government’s $80 million early stage and follow-on venture capital fund for growing innovative Queensland businesses.
2017–18 was a productive year for BDF, with the fund investing a total of $14.2 million into businesses, including: $1 million in Find-Me Technologies,
for a personal wristwatch-like emergency alert system to help elderly people and people with dementia
$215,000 in Spare Workspace, a marketplace for people to book short-term commercial workspace
$1 million in Lode Solutions, an online employment marketplace connecting employers with university talent
$2.5 million in Serene Medical Pty Ltd, a platform technology for locating and treating motor nerves for facial applications.
The 2018–19 Queensland Budget committed a further $40 million towards BDF, bringing total investment in the fund to $80 million. Throughout 2018–19, BDF will continue to support innovative businesses, create high-value jobs and strengthen Queensland’s entrepreneurial ecosystem.
The report of the BDF Investment Panel is available at www.treasury. qld.gov.au. Read more about BDF at www.advance.qld.gov.au
Cities Transformation Taskforce
In late 2017, the government’s Cities Transformation Taskforce joined Treasury, where it continued implementing the Townsville City Deal, signed in 2016.
Treasury also established the Queensland Cities Advisory Group and the SEQ City Deal Queensland Government Agency Steering Committee, and released the SEQ Benchmarking Report and SEQ Economic Foundations Paper, which will act as the framework for a future SEQ City Deal.
Work on both the Townsville and South East Queensland City Deals will continue over the coming year, the latter in collaboration with the Council of Mayors SEQ.
Jobs and Regional Growth Fund
This fund supports economic activity and job creation in regional Queensland by helping businesses to grow and expand.
Our partnership with the Department of State Development, Manufacturing, Infrastructure and Planning leverages private sector investment to maximise employment and economic opportunities across regional Queensland. A rigorous assessment framework ensures value for money from the state’s investment and that the fund meets its objectives.
In 2017–18, the fund assessed and supported many applications, including: the expansion of the Swickers
Bacon Factory at Kingaroy and associated SunPork Commercial Piggeries, which created 110 new long-term jobs
Hawker Paci�c’s $4.5 million expansion to its aviation facility in Cairns, helping to create 39 new operational jobs and 50 jobs during construction
up to 400 jobs in the meatworks industry, by helping workers displaced by the closure of the Churchill abattoir into employment at JBS Australia’s facilities at Wacol and Dinmore.
The 2018–19 Budget allocated a further $20 million to the Jobs and Regional Growth Fund, taking the total of the fund to $150 million. The additional funding will help fast track even more business activity in regional Queensland.

032 QUEENSLAND TREASURY ANNUAL REPORT 2017–18
COMMERCIAL SERVICESSERVICE REPORT
Resources Regional Development Framework
During the year, Treasury administered applications under the Resources Regional Development Framework, which promotes investment in undeveloped or underdeveloped resource regions across Queensland, including the Galilee and Surat Basins, and the North West Minerals Province.
Project proponents are required to provide jobs and common-user infrastructure, and to have a positive impact on the state’s �nances. Administering applications includes active engagement with proponents to ensure that they meet the conditions for accessing the framework’s bene�ts.
Financial assurance for mine rehabilitation
During 2017–18, a large-scale reform project to deliver improved �nancial assurance outcomes in the resources sector was continued. Financial assurance is the money held by government to ensure mining sites are properly rehabilitated when mining ends. The focus during the year was in collaborating with key stakeholder agencies, the resources sector and environment and community groups.
Treasury's work resulted in the Mineral and Energy Resources (Financial Provisioning) Bill 2018 being introduced into Parliament in February 2018. When enacted, this legislation will form the basis for a new, responsive �nancial provisioning scheme.
Queensland’s third-party access regime
Treasury reformed the state’s third-party access regime with the introduction and passage of the Queensland Competition Authority Amendment Bill 2018 in early 2018. Queensland’s access regime is contained under Part 5 of the Queensland Competition Authority Act 1997 and provides the framework for competitors to access signi�cant monopoly infrastructure in Queensland such as ports and railways, with the objective of promoting competition and delivering economic bene�ts. The amendments to the regime clarify its application and emphasise economic e�ciency.
Treasury will continue to monitor Queensland’s regulatory environment to identify further opportunities for reform.
Queensland Competition Authority Declaration Review
On 4 April 2018, the QCA commenced a review into whether services declared for third-party access under the Queensland Competition Authority Act 1997 should remain declared a«er the existing declarations expire in September 2020.
In Queensland, the "declared services" are: rail transport services on the
Central Queensland Coal Network rail transport services on
the intrastate passenger and freight network operated by Queensland Rail
coal handling services at Dalrymple Bay Coal Terminal.
The review is important for ensuring that third-party access is only applied where it is appropriate.
The QCA will make its recommendations to the Deputy Premier at least six months, but not more than 12 months, before the expiry of each declaration.

033COMMERCIAL SERVICES SERVICE REPORT
Queensland Competition Authority Performance Framework
In 2017–18, Treasury and the QCA jointly developed a performance framework for the QCA.
The framework will operate from 2018–19 with public reporting of results in the QCA’s annual report and website. The aim of the framework is to improve the operational performance of the QCA and provide increased transparency and accountability.
The framework involves the QCA regularly and publicly reporting its activities against performance standards and engaging in a process of self-assessment and continuous improvement.
The framework sets key standards in the following �elds: e¦ective and e�cient regulatory
outcomes timely and transparent processes e�cient and reasonable QCA costs
and regulatory fees e¦ective stakeholder engagement
and communication.
Work with the QCA to re�ne the framework over the �rst few years of its operations will continue in the coming year.
Queensland Manufacturing Inquiry
Manufacturing enterprises in Queensland, from small niche business to large-scale concerns, employ 160,000 people and earn Queensland around $15.6 billion in exports. There is much to be gained from ensuring that this important sector is performing at optimum levels.
The Queensland Productivity Commission (QPC) delivered its Final Report on Manufacturing in Queensland to the government in October 2017. The report contained 17 recommendations for improving the productivity and competitiveness of the Queensland manufacturing sector.
Treasury and the Department of State Development, Manufacturing, Infrastructure and Planning developed the government’s response to the report, which was published in May 2018. The government largely accepted all but one of the QPC's recommendations. A key part of the government’s response is the establishment of a Manufacturing Ministerial Committee, which will take charge with a renewed focus on building Queensland’s manufacturing base.
Both the QPC’s report and the government’s response can be accessed from www.qpc.qld.gov.au/ inquiries/manufacturing
South East Queensland bulk water prices
In April 2018, the Queensland Competition Authority (QCA) publicly released its Final Report Seqwater Bulk Water Price Review 2018–21.
Treasury and DNRME worked together to analyse the QCA’s recommendations and their implications for bulk water prices for the three years to 2021. As a result of analysis of the two options proposed by the QCA, the government accepted the ‘smoothed’ pricing option, setting price increases over three years with all council areas reaching the common price of $3.12 per kilolitre in July 2020. This option is expected to provide certainty for councils, and reduce cost-of-living pressures for customers.
Rural Irrigation Water Price Review
Irrigation water prices across 39 water supply schemes in Queensland are currently set until 30 June 2019. Throughout 2017–18 Treasury partnered with relevant state agencies and stakeholders to progress key policies which underpin irrigation water pricing. In deciding on the policies for future prices, the government will seek the right balance between customer impacts and cost-recovery. The QCA, as the state’s independent economic regulator, is expected to commence a review of irrigation pricing later this year, subject to a direction from government.
034 QUEENSLAND TREASURY ANNUAL REPORT 2017–18
COMMERCIAL SERVICESSERVICE REPORT
Developing Northern Australia
In 2017, the Deputy Premier assumed responsibility for Queensland’s response to Australian Government Policy on the Development of Northern Australia. Treasury's role is to support the Deputy Premier, and to progress outcomes of the Ministerial Forum on Northern Development and the Northern Australia Senior O�cials Network Group (NASONG).
During the year, NASONG led an audit of economic infrastructure across northern Australia and an audit of programs and policies for Indigenous business innovation and growth. The group’s �ndings helped inform a forward program of work agreed to by the Ministerial Forum on Northern Development in April 2018.
The Ministerial Forum, which meets twice-yearly, will next meet in Queensland, in November 2018. This body reports on the progress of developing the north, including strategies to enhance defence industry capability and tourism.
Treasury coordinates the North Queensland Interdepartmental Committee, which identi�es matters of strategic importance to north Queensland and ensures information sharing and a collaborative response across agencies. It also works closely with the Department of the Premier and Cabinet to support preparations for the Northern Australia Strategic Partnership.
In addition, Treasury leads the Queensland Government’s engagement with the Cairns-based Northern Australia Infrastructure Facility (NAIF). The objective is to maximise NAIF’s value to our state and ensure Queensland proponents secure a fair share of the available �nancial assistance.
In April 2018, the Australian Government changed NAIF’s flexibility and ability to support a broader portfolio of projects. Treasury will continue to engage with NAIF, with a view to building on the state's e¦orts in delivering important infrastructure for Queensland.
Land Restoration Fund
To drive the government’s ‘Saving Habitat, Protecting Wildlife and Restoring Land’ commitment, during the year Treasury began supporting the establishment of the Land Restoration Fund. This fund will: facilitate a pipeline of qualifying
Queensland-based carbon o¦set projects, including through private and philanthropic investment
pursue other environmental, economic and social bene�ts for the community
undertake or commission research and development into emerging carbon farming areas where Queensland has a comparative advantage.
Treasury has partnered with the Department of Environment and Science (DES) to establish the fund’s Project Management O�ce in that department. The o�ce will manage a $30 million budget to: establish the fund and its
associated research and science program
undertake extensive community and stakeholder consultation
procure expert advice from the �nance, agricultural and conservation sectors
fund pilot projects for its research and development program.

035REVENUE MANAGEMENT SERVICE REPORT
REVENUE MANAGEMENTSERVICE REPORT
Customers are the focus To help fund services for Queenslanders, Treasury administers a revenue base of around $15.3 billion by delivering and administering simple, e�cient and equitable revenue management services for state taxes and royalty revenue. It also undertakes revenue compliance, grant schemes, debt recovery and penalty infringement enforcement activities for the government.
Treasury’s strategic objectives are achieved through: leading e-business practices with
high-level client support and �rm and fair enforcement
legislation and revenue policy advice to government
transforming the Revenue Management System to support innovative business practices
targeted, fair and e�cient penalty infringement enforcement strategies
leading end-to-end penalty debt management improvements through collaborative stakeholder engagement
business intelligence and behavioural insights to inform enforcement and debt collection policy and strategies.
Key issues in our environment
Queensland’s economic growth in 2018–19 is forecast to be 3 per cent.
Changes and trends in the Queensland and global economies invariably impact on the revenue available to government to fund service delivery. Revenue from taxation is forecast to increase at an average rate of 2.1 per cent over the 5 years to 2021–22. This growth, in major taxes such as transfer duty, land tax and payroll tax, is supported by average annual growth in taxation of 5.3 per cent and current grants of 3 per cent: Growth in transfer duty revenue is
expected to be driven by modest growth in both residential and non-residential transactions, and by the introduction of the additional registration duty for premium vehicles and the increase in the rate of the additional foreign acquirer duty from 1 July 2018.
Land tax revenue is estimated to grow in 2018–19, largely due to the new marginal tax rate on land holdings above $10 million from 1 July 2018, along with growth in land values in recent years.
Payroll tax revenue is expected to grow in 2018–19 following key sectors such as construction, manufacturing and mining and associated industries contributing to growth for the �rst time in two years in 2017–18.
Higher-than-budgeted growth in revenue in 2017–18 is due to increased GST revenue from the Australian Government, and from royalties. However, royalty revenue from coal is forecast to decline gradually over the 4 years to 2021–22. Although coal royalties are expected to decline, other royalties are expected to grow from other factors, such as stronger petroleum revenue (including lique�ed natural gas).
OBJECTIVEEnsure our services are tailored, fit-for-purpose and easy to access
Throughout 2017–18, e¦orts were focussed on transforming Treasury’s business to deliver quicker, easier and more consistent services for clients, most visibly through: the new intelligent virtual assistant
Sam, who responds to routine payroll tax inquiries 24/7. In its �rst few months of operation in early 2018, Sam was able to resolve 77 per cent of queries at �rst contact, which is above the industry standard of 65 per cent. Sam has been extended across all revenue lines from July 2018.
more personalised client services through increased use of data analytics, machine learning, targeted education campaigns and improved data quality and client validation

036 QUEENSLAND TREASURY ANNUAL REPORT 2017–18
a ‘low touch’ taxation approach, in which services are designed for the majority of clients who do the right thing, rather than those who do not. ‘Low touch’ also means that compliance activities will be based on risk, transparency and behaviour, knowing that most clients will do the right thing willingly. This allows the organisation to o¦er a ‘nimbler’ approach, with simple and accessible revenue services, reliable and easy to understand information, and services that are tailored to clients’ behaviours and circumstances.
From August 2018, Treasury will take this further by replacing a number of repetitive, rule-based transactions with automated machine-based responses, including automated form approvals, decision-making support capability, and, from 2019, robotic process automation.
Treasury’s work in this space will be aided greatly by a new enterprise-wide data warehouse (EDW), which will consolidate most data sources into a single data repository. The EDW will allow Treasury to leverage the full value of its data in all analytics and intelligence-related activities. A data quality �rewall has been established to protect and optimise the value of this critical asset.
Improving service delivery through digital technologies
Treasury has long known that predicting taxpayer behaviour would lead to better services for clients and improved debt collection. In 2017, the opportunity to do this came in the form of machine learning.
Machine learning occurs when a computer ‘learns’ from the data it takes in and then makes predictions based on that data. In July 2017, Treasury partnered with global giant SAP to develop a proof of concept for machine learning.
The proof of concept solution provided never-before-seen insights into the taxpayer journey, identifying the high-risk events or influences that led to payment default and predicting taxpayers who may become debtors with a 71 per cent accuracy.
The production roll-out of the solution is now underway with a focus on increasing both data quality and sources, to drive improvements in the overall accuracy of the predictions and insights. The �rst implementation is planned for land tax in August 2018.
The business value of this solution will be signi�cant, as it will provide the ability to deploy proactive intervention strategy to reduce the number of taxpayers becoming debtors; and provide management strategies tailored to individual taxpayers’ circumstances.
This project was recognised internationally, receiving the global SAP 2018 Next-Gen Innovator Award in May 2018.
OBJECTIVEEnable sustainable growth that supports current and future government objectives
Each year, Treasury implements revenue initiatives designed to deliver a secure, sustainable revenue base to support the government’s objectives for the community.
Absentee landowners
In 2017–18, Treasury implemented the government’s 1.5 per cent land tax surcharge for absentee landowners, which applies to land holdings with a value of $350,000 or higher (in addition to other land tax payable). This charge is designed to ensure absentee landowners make a fair contribution for the bene�ts they receive by owning property in Queensland.
Additional foreign acquirer duty
Additional foreign acquirer duty (AFAD) is an additional amount of duty paid by foreign acquirers (usually purchasers, either directly or indirectly) of residential property. It was introduced by the government in the 2016–17 Queensland Budget, at a rate of 3 per cent, to ensure foreign acquirers of residential property who bene�t from government services and infrastructure also contribute to their delivery. From 1 July 2018, the rate of this duty will rise to 7 per cent.
REVENUE MANAGEMENTSERVICE REPORT

037REVENUE MANAGEMENT SERVICE REPORT
In the 2018–19 �nancial year, AFAD is forecast to raise approximately $33 million in revenue, which will be applied to deliver services to Queenslanders.
Premium motor vehicle duty
During the year, preparations were made to implement additional vehicle registration duty for vehicles of more than $100,000 in (dutiable) value from 1 July 2018. This premium motor vehicle duty applies an additional $2 for each $100 for light vehicles. Revenue forecast to result from this duty is $24.02 million in 2018–19.
Land tax for landholdings over $10 million
Preparations were also made for a 0.5 percentage point increase in land tax rates for high-value landholdings from 2018–19. Revenue forecast to result from this increase is $71 million in 2018–19.
Wagering (betting) tax
In 2017, the government announced a new point of consumption (POC) tax on betting. In June 2018 the Betting Tax Act 2018, which commences from 1 October 2018, became law. The POC is a tax on the revenue of betting operators from bets made by customers in Queensland. The POC tax applies a rate of 15 per cent on taxable betting revenue exceeding an annual threshold of $300,000 ($225,000 in 2018–19 due to the 1 October 2018 commencement).
This POC will supersede Queensland’s point of supply wagering tax, and responds to rapidly changing technology and betting consumer behaviour.
During the year, Treasury undertook industry consultation which informed the design and implementation of the tax.
The betting tax is expected to generate revenue of $367 million over four years (including $71 million in 2018–19 reflecting the October start date). For its implementation, Treasury created supporting electronic lodgement and payment systems, client education initiatives, and sta¦ training.
Apprentice and trainee wages rebate
In Queensland, apprentice and trainee wages are generally exempt from payroll tax. A payroll rebate of 25 per cent for businesses who employ apprentices and trainees, calculated on the exempt wages of those employees, was introduced in 2015. This rebate was doubled to 50 per cent from 1 July 2016 until 30 June 2018. The 50 per cent rebate on the exempt wages of apprentices and trainees has been further extended until 30 June 2019. From 1 July 2015 to 30 June 2018, 4,668 businesses bene�tted from the rebate to the value of $51.6 million.
First Home Owners’ Grant
The First Home Owners’ Grant helps Queenslanders buy their �rst home and stimulates employment and growth in the state’s construction and related sectors. The grant applies to newly constructed houses, townhouses or units valued at less than $750,000.
As part of the Queensland Budget 2018–19, the government further extended the (temporary) $5,000 increase in the First Home Owners Grant until 30 June 2018, a«er which it has revereted to $15,000. Over the course of 2017–18, Treasury received 9,493 applications worth $187.9 million.
OBJECTIVEPartner proactively to facilitate better outcomes for the community
Treasury’s approach to achieving better outcomes for the community in the �eld of penalty debt is threefold: streamlined services that help
people resolve their debt �rm measures for high-value
customers realistic options for people in
hardship.
Improvements in penalty debt management
The new business model for the State Penalties Enforcement Registry (SPER) will culminate when the new ICT platform is fully implemented. This platform will o¦er:

038 QUEENSLAND TREASURY ANNUAL REPORT 2017–18
REVENUE MANAGEMENTSERVICE REPORT
new self-service tools for customers and stakeholders
a new case management approach informed by data analytics and behavioural economics
the ability to take a tailored approach to a customer’s entire case from the time their debt �rst comes to SPER.
Transforming the SPER business resulted in a substantial increase in performance in 2017–18: Growth in the debt pool fell from
almost 15 per cent in 2015–16 to just 3.2 per cent.
A debt �nalisation rate of 99 per cent was achieved, well above the target rate of 75 per cent.
The prediction that people would respond to a personal phone call (rather than a mailed reminder) proved correct. In 2017–18, 48,000 customers were called, resulting in the collection of $20.2 million.
Better options for people in hardship
Queenslanders expect that people with SPER debt will do the right thing and resolve it as quickly as possible. However, when a person is in hardship, simply expecting the debt to be paid is o«en not realistic. The aim was to o¦er more avenues for people who genuinely want to meet their obligations, but can’t a¦ord to do so �nancially.
In late 2017, Treasury launched work and development orders (WDOs) to give people in �nancial hardship an additional option to resolve their debt.
WDOs are o¦ered to customers in partnership with Queensland Corrective Services (QCS), who supervise people as they undertake unpaid community work.
Since December 2017, approximately 3,200 people have applied for WDOs with QCS. Of these, 928 people have successfully completed their WDOs, which has resolved $1.8 million worth of SPER debt. A further $7.5 million in penalty debt is set to be �nalised through orders that are currently in place.
In the coming year, WDOs will be expanded to a range of government and community-based organisations who will partner with SPER to provide options for debtors experiencing hardship, including from domestic and family violence, homelessness, mental illness or cognitive disability, or serious substance abuse.
Enforcement for high-value debtors
In 2016, SPER began a vehicle immobilisation (wheel clamping), seizure and sale (VISS) program for high-value debtors (people who owe $5,000 or more). In just over two years, the program has collected more than $8.1 million in debt.
SPER also participated in a number of joint roadside operations with Queensland Police Service, and expanded the program to regional areas by undertaking VISS operations in Toowoomba and Bundaberg. In the coming year, VISS will be further expanded to more areas in Queensland.
Penalty Debt Management CouncilDuring the year, SPER continued its active involvement with the Penalty Debt Management Council, a forum in which agencies that issue �nes collaborate to improve how penalty debt is managed.
In early 2018, the Queensland Auditor-General published a report into the �ne collection process, which recommended a more integrated end-to-end approach to improve the �nalisation of �nes in Queensland.
Developing an action plan to address the Queensland Audit O�ce’s recommendations is a major commitment for members of the Penalty Debt Management Council.

039REVENUE MANAGEMENT SERVICE REPORT
Grants management capability
Other government agencies continued to leverage Treasury’s success in grants management to improve their own service delivery through the QGrants solution, most notably in the following agencies:
Department of Employment, Small Business and Training $73.19 million in regional
back-to-work grants $17.9 million in back-to-work
grants in South East Queensland
Department of Housing and Public Works $6.17 million in Get Started
vouchers redeemed, to encourage young people to play club sport
Department of Education$64.52 million in grants for long
day care programs $84.21 million in grants to
kindergarten providers $40.70 million in grants to early
years’ service programs $122,572 in grants for the pre-
prep kindergarten program $5.60 million in grants for
disability inclusion support for the Queensland Kindergarten program
In the coming year, much of the government’s focus will be on creating jobs, giving children a great start in life, and on keeping Queenslanders healthy. E�cient, e¦ective grants management will help ensure these and many other grants programs achieve the lifechanging impact for which they were designed.
Total revenue administered by Office of State Revenue 2013-14 to 2017-18
2013–14 2014–15 2015–16 2016–17 2017–18-
0.51.01.52.02.53.03.54.04.55.0
Duties Payroll taxGrants Royalties
Land Tax Other tax (includes gambling and gaming tax)
$ b
illio
ns
SPER Debt Finalisation rate for 2017-18 FY
100%90%80%70%60%50%
30%20%10%
0%
40%
Jun
17
Jul 1
7
Aug
17
Sept
17
Oct
17
Nov
17
Dec
17
Jan
18
Feb
18
Mar
18
Apr 1
8
May
18
Jun
18
Rolling 12 month (99%)
Target (75%)
12 month rolling finalisation rates Target (75%)
Office of State Revenue administered revenue 2017-18
Royalties 28%
Payroll tax 26%
Transfer duty 20%
Gambling taxes 8%
Land tax 8%
General insurance duty 5%
Vehicle registration duty 3%
Other duties 1%
Grants 1%

040 QUEENSLAND TREASURY ANNUAL REPORT 2017–18
OUR FINANCIAL POSITION EXPLAINED
Queensland Treasury’s �nancial statements fall into two categories:
Administered – funds administered on behalf of the government.
Controlled – revenue, expenses, assets and liabilities used to conduct business as a department.
ANALYSIS In 2017–18, Queensland Treasury administered $35.43 billion of revenue and $6 billion of expenses on behalf of the State. This excludes administered item revenue which is appropriation revenue received from the Consolidated Fund to meet administered expenses.
The largest single source of administered revenue was grants and other contributions of $19.86 billion, followed by state taxes of $10.819 billion.
The main component of Commonwealth grant revenue was Queensland’s share of the GST. Other Commonwealth revenue includes funding for National Partnership Payments and Natural Disaster Relief and Recovery funding arrangements.
Treasury administered a number of grants on behalf of the State in 2017–18 including Queensland First Home Owners’ Grant.
Controlled revenue consists principally of Parliamentary appropriations. In 2017–18, revenue allocated to services was $254.79 million (compared with $241.10 million in 2016–17).

041ADMINISTERED FINANCIAL SUMMARY
ADMINISTERED
QUEENSLAND GOVERNMENT INSURANCE FUND The Queensland Government Insurance Fund (QGIF), administered by Treasury, is a self-insurance arrangement into which government agencies pay premiums intended to meet the cost of claims arising from incidents occurring in the premium year.
Claims are paid out of Queensland Treasury’s Administered accounts, while the provision for future claims is held at the whole-of-government level.
The liability balance at 30 June 2018 was $1,267 million, compared to $1,168.9 million at 30 June 2017. Investments to su�ciently cover the government’s outstanding claims liabilities are held by Queensland Treasury Corporation within its long-term assets. The fund reinsurance program has been in place since 1 November 2011 and is subject to annual renewal.
In 2017–18, $500 million from QGIF’s investments was repatriated from the actuarially assessed QGIF surplus to assist funding of priority infrastructure projects.
QGIF claims, liabilities and associated investment balances are reported in the government’s annual Report on State Finances.
Queensland Government Insurance Fund Financial Summary
30 June 2018 $M
30 June 2017 $M
Assets under investment 1,507.1 1,838.3
Provision for future liabilities 1,267.3 1,168.9
Premiums collected 191.3 189.4
Net claims paid 130.9 121.7
Fund operating expenses 5.1 4.9
Reinsurance expense 25.2 25.4
Reinsurance recoveries 2.9 0.0
QUEENSLAND TREASURY ADMINISTERED REVENUE
2017–18 2016–17
Commonwealth funding as a percentage of total revenues 48% 48%
State funding as a percentage of total revenues 14% 15%
Funding from external sources as a percentage of total revenues 38% 37%
Royalties, state taxes, fees, levies and fines 2017–18
Payroll tax $3.95B
Duties $4.50B
Royalties $4.26B
Land tax $1.18B
Gaming taxes and other taxes $1.11B
Fees, levies and fines $0.31B
Total administered expenses by category 2017–18
Superannuation benefit payments $1.72B
Finance costs $1.39B
Annual Leave Central Scheme $1.72B
All other expenses $0.31B
Long service leave reimbursements $0.41B
Grants and subsidies $0.09B
Benefit payments $0.21B
Supplies and services $0.16B
Administered revenue collected by O§ce of State Revenue increased 4.13% to $15.31 billion in 2017-18

042 QUEENSLAND TREASURY ANNUAL REPORT 2017–18
QUEENSLAND TREASURY ADMINISTERED STATEMENT OF COMPREHENSIVE INCOME FOR THE YEAR ENDED 30 JUNE 2018
Increase is largely attributable to Queensland's increased share in GST revenue and Commonwealth Speci�c Purpose Payments for school funding, disability services, skills and workforce development and a¦ordable housing. This is partially o¦set by a decrease due to timing in payments for natural disaster reconstruction and recovery, and road and rail.
Increase mainly relates to higher payroll tax revenue due to improved employment conditions and growth in the mining and construction sectors.
Decrease is due to the machinery of government (MOG) transfer of the O�ce of Industrial Relations to the Department of Education e¦ective 1 January 2018.
Increase is due to the impact of higher oil prices in lique�ed natural gas royalties and slightly higher coal prices and export volumes than in 2016–17.
Appropriation revenue is received from Consolidated Fund (CF) to fund administered expenses. Material variances in administered expenses are outlined below.
Increase due to the bad debt write-o¦s arising in part from the �nalisation of legal proceedings.
Increase is mainly attributable to higher payments for Back to Work Grants and grants to Trade and Investment Queensland.
Increase is due to higher First Home Owners' Grant payments and grant to the James Cook University for the Cairns Innovation Centre.
Decrease is mainly due to one-o¦ market value realisation charges in 2016–17 and reduction in the whole-of-government debt pool as a result of the Debt Action Plan.
Increase reflects higher state share of superannuation bene�ciary payments compared to 2016–17.
This represents revenues collected on behalf of Queensland Government which are transferred to CF. Material variances in administered revenue are outlined above.
Treasury Department
Actual 2016–17
$'000
Treasury Department
Actual 2017–18
$'000
Income from continuing operations
Revenue
Grants and other contributions 19,559,579 19,859,938
Taxes 10,630,683 10,818,926
User charges and fees 105,390 71,248
Royalties 3,846,737 4,263,206
Interest 54,941 35,580
Appropriation revenue 6,082,395 5,944,629
Other revenue 358,015 381,050
Total income from continuing operations 40,637,740 41,374,578
Expenses
Supplies and services 167,796 157,855
Losses on sale/revaluation of assets 10,042 88,014
Grants and subsidies 63,462 90,827
Bene�t payments 158,069 205,737
Finance/borrowing costs 1,811,934 1,389,795
Superannuation bene�t payments 1,669,447 1,720,696
Long service leave reimbursements 372,644 411,868
Annual Leave Central Scheme claims paid 1,605,539 1,716,867
Other expenses 217,920 221,018
Total expenses from continuing operations 6,076,853 6,002,677
Operating result for the year before transfers to government
34,560,887 35,371,901
Transfers of administered revenue to government
34,560,887 35,371,901
Total administered comprehensive income – –

043CONTROLLED FINANCIAL SUMMARY
CONTROLLED
Employee expenses $156.35M
Supplies and services $130.46M
Grants and subsidies $10.98M
Depreciation and amortisation $2.76M
Other $24.22M
Total expenses by service 2017–18
2017–182016–17
Economics andfiscal coordination
Agencyperformance
Commercialservices
Revenuemanagement
Industrialrelations*
180
160
140
120
100
80
60
40
20
0
$M
*Industrial relations transferred to Department of Education from 1 January 2018
2016–17 actual 2017–18 actual
Net cost of services funded by appropriation ($M) $241.92 $254.79
State funding as a % of total revenue 65% 78%
Fixed and intangible assets employed ($’000) $15,151 $19,872
Net assets ($’000) $61,649 $64,154
Total expenses by category 2017–18
Queensland Treasury-controlled key financial performance indicators

044 QUEENSLAND TREASURY ANNUAL REPORT 2017–18
QUEENSLAND TREASURY CONTROLLED STATEMENT OF COMPREHENSIVE INCOME FOR THE YEAR ENDED 30 JUNE 2018
Treasury Department
Actual 2016–17
$'000
Treasury Department
Actual 2017–18
$'000Income from continuing operationsRevenueAppropriation revenue 241,099 254,790 User charges and fees 30,311 18,051 Grants and other contributions 99,515 50,802 Other revenue 1,291 1,118
Total income from continuing operations 372,216 324,761
Expenses from continuing operationsEmployee expenses 202,679 156,349 Supplies and services 137,641 130,461 Grants and subsidies 11,626 10,979 Depreciation and amortisation 3,331 2,757 Impairment expense 139 371 Other expenses 17,619 23,844
Total expenses from continuing operations 373,035 324,761
Operating result from continuing operations (819) -
Total comprehensive income (819) -
Increase relates to funding associated with SPER and OSR Transformation Programs, promotional campaigns for Move up in the World and First Home Owners' Grant, funding for Financial Assurance Framework reforms and establishment of CleanCo.
Decrease due to reduction in reimbursements from other departments for projects led by Treasury's Commercial Group, including Logan enhancement program and Herston site redevelopment.
Decrease due to MOG transfer of O�ce of Industrial Relations (OIR) and Treasury’s employment functions from 1 January 2018.
Decrease mainly due to MOG transfer of OIR, partially o¦set by impact of enterprise bargaining wage increase.
Decrease mainly due to MOG transfer of OIR and costs associated with reimbursable projects managed by Commercial Group. This is partially o¦set by costs associated with SPER and OSR Transformation Programs.
Decrease predominately driven by MOG transfer of OIR.
Increase due to annual review of Business Development Fund (BDF) investments.
Increase primarily relates to increased other expenses recognised for appropriation payable resulting from re-pro�ling of some departmental projects and initiatives to future years, in accordance with Section 3B.2 of the Financial Reporting Requirements. Also contributing are costs associated with CleanCo.
QUEENSLAND TREASURY CONTROLLED STATEMENT OF FINANCIAL POSITION AS AT 30 JUNE 2018
Treasury Department
Actual 2016–17
$'000
Treasury Department
Actual 2017–18
$'000
AssetsCash 53,116 37,247
Receivables 9,245 7,004
Other 3,925 2,993
Financial assets 26,833 46,463
Intangible assets 10,940 19,783Property, plant and equipment 4,211 89
Total assets 108,270 113,579
LiabilitiesPayables 37,116 44,430 Accrued employee bene�ts 9,109 4,798
Other liabilities 396 197
Total liabilities 46,621 49,424 Net assets 61,649 64,154
Total equity 61,649 64,154
Decrease primarily due to MOG transfer of OIR and Treasury’s employment functions, and return of cash to Consolidated Fund as a result of conversion from equity to output funding.
Decrease predominantly due to MOG transfer of OIR annual leave receivable and appropriation receivable to Department of Education, partially o¦set by increase in accrued revenue and trade debtors relating to post MOG transactions for Treasury’s employment and market-led proposal functions.
Decrease mainly due to reduction in prepayments as a result of MOG transfer of OIR.
Increase reflects additional BDF investments o¦set by provision for impairment for investment.
Increase predominately reflects capital expenditure associated with OSR Transformation Program, partially o¦set by MOG transfer of OIR.
Decrease is due to MOG transfer of assets associated with OIR.
Increase due to payables associated with OSR and SPER Transformation Programs, along with increased appropriation payable to Consolidated Fund.
Decrease mainly due to MOG transfer of OIR, and Treasury’s employment and market-led proposal functions e¦ective 1 January 2018, partially o¦set by formation of Crime Statistics Research Unit.
Decrease due to MOG transfer of OIR.
Increase predominately due to equity injections for additional BDF investments, Financial Assurance Framework Reforms capital expenditure and OSR Transformation Program capital expenditure. This is partially o¦set by MOG transfer of OIR and return of cash to Consolidated Fund as a result of conversion from equity to output funding.

045FINANCIAL STATEMENTS
FINANCIAL STATEMENTS
46 Foreword
47 Controlled Statement of Comprehensive Income
48 Controlled Statement of Financial Position
49 Controlled Statement of Changes in Equity
50 Controlled Statement of Cash Flows
51 Controlled Reconciliation of Operating Surplus to Net Cash from Operating Activities
52 Controlled Statement of Comprehensive Income by Major Departmental Services
53 Controlled Statement of Assets and Liabilities by Major Departmental Services
54 Basis of Financial Statements Preparation
57 Objectives and Major Activities of the Department
58 Notes To and Forming Part of the Controlled Financial Statements
79 Administered Statement of Comprehensive Income
80 Administered Statement of Financial Position
81 Administered Statement of Cash Flows
82 Administered Reconciliation of Comprehensive Income to Net Cash from Operating Activities
83 Administered Statement of Comprehensive Income by Major Departmental Services
84 Administered Statement of Assets and Liabilities by Major Departmental Services
85 Notes To and Forming Part of the Administered Financial Statements
98 Other Note Disclosures
101 Management Certi�cate
102 Independent Auditor’s Report

046 QUEENSLAND TREASURY ANNUAL REPORT 2017–182 Financial Statements – Queensland Treasury
Foreword
Queensland Treasury’s Financial Statements are general purpose financial statements prepared in accordance with prescribed requirements including Australian Accounting Standards and the Financial Reporting Requirements issued by the Treasurer.
The Financial Statements comprise the following components:
• Statements of Comprehensive Income• Statements of Financial Position • Statements of Changes in Equity • Statements of Cash Flows • Statements of Comprehensive Income by Major Departmental Services • Statements of Assets and Liabilities by Major Departmental Services • Notes To and Forming Part of the Financial Statements.
In addition, the department administers transactions and balances in a trust or fiduciary capacity. These are identified in notes 51–54.
Queensland Treasury and Queensland Treasury Holdings (QTH) are controlled by the State of Queensland which is the ultimate parent entity.
The head office and principal place of business of Queensland Treasury (Treasury) is:
1 William Street Brisbane Qld 4000
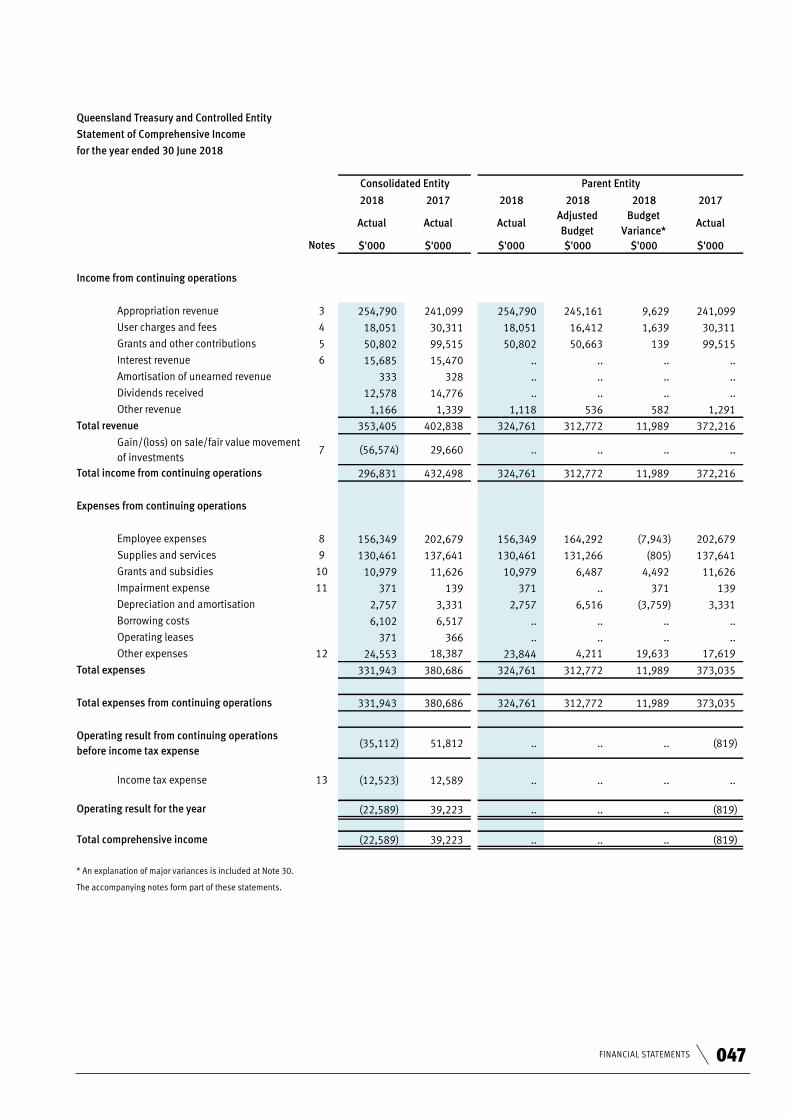
047FINANCIAL STATEMENTS
3 Financial Statements – Queensland Treasury
2018 2017 2018 2018 2018 2017
Actual Actual ActualAdjusted Budget
Budget Variance*
Actual
Notes $'000 $'000 $'000 $'000 $'000 $'000
01 - Appropr
Appropriation revenue 3 254,790 241,099 254,790 245,161 9,629 241,09902 - User
User charges and fees 4 18,051 30,311 18,051 16,412 1,639 30,31103 - Grants
Grants and other contributions 5 50,802 99,515 50,802 50,663 139 99,515Interest revenue 6 15,685 15,470 .. .. .. ..Amortisation of unearned revenue 333 328 .. .. .. ..Dividends received 12,578 14,776 .. .. .. ..
05 - Other
Other revenue 1,166 1,339 1,118 536 582 1,291
353,405 402,838 324,761 312,772 11,989 372,216
Gain/(loss) on sale/fair value movement of investments
7 (56,574) 29,660 .. .. .. ..
296,831 432,498 324,761 312,772 11,989 372,216
09 - Employ
Employee expenses 8 156,349 202,679 156,349 164,292 (7,943) 202,67910 - Supplie
Supplies and services 9 130,461 137,641 130,461 131,266 (805) 137,64111 - Grants
Grants and subsidies 10 10,979 11,626 10,979 6,487 4,492 11,62616 - Impair
Impairment expense 11 371 139 371 .. 371 13912 - Depreci
Depreciation and amortisation 2,757 3,331 2,757 6,516 (3,759) 3,331Borrowing costs 6,102 6,517 .. .. .. ..Operating leases 371 366 .. .. .. ..
17 - Other ExpensesOther expenses 12 24,553 18,387 23,844 4,211 19,633 17,619
331,943 380,686 324,761 312,772 11,989 373,035
331,943 380,686 324,761 312,772 11,989 373,035
(35,112) 51,812 .. .. .. (819)
Income tax expense 13 (12,523) 12,589 .. .. .. ..
(22,589) 39,223 .. .. .. (819)
Total comprehensive income (22,589) 39,223 .. .. .. (819)
The accompanying notes form part of these statements.
Expenses from continuing operations
Parent EntityConsolidated Entity
* An explanation of major variances is included at Note 30.
Total income from continuing operations
Total expenses from continuing operations
Operating result for the year
Total expenses
Operating result from continuing operations before income tax expense
Queensland Treasury and Controlled Entity
Statement of Comprehensive Income
Total revenue
Income from continuing operations
for the year ended 30 June 2018
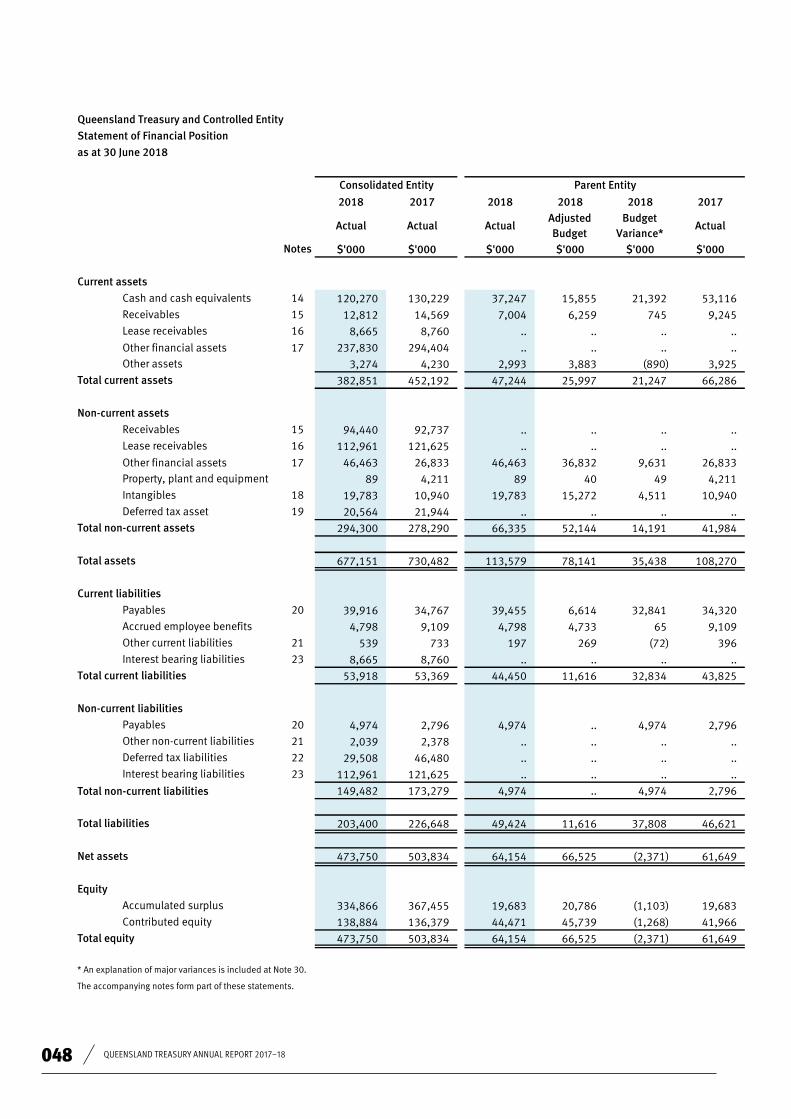
048 QUEENSLAND TREASURY ANNUAL REPORT 2017–18
4 Financial Statements – Queensland Treasury
2018 2017 2018 2018 2018 2017
Actual Actual ActualAdjusted Budget
Budget Variance*
Actual
Notes $'000 $'000 $'000 $'000 $'000 $'000
A - Cash and
Cash and cash equivalents 14 120,270 130,229 37,247 15,855 21,392 53,116B - Current
Receivables 15 12,812 14,569 7,004 6,259 745 9,245Lease receivables 16 8,665 8,760 .. .. .. ..
Other financial assets 17 237,830 294,404 .. .. .. ..F - Other Assets
Other assets 3,274 4,230 2,993 3,883 (890) 3,925
382,851 452,192 47,244 25,997 21,247 66,286
Receivables 15 94,440 92,737 .. .. .. ..Lease receivables 16 112,961 121,625 .. .. .. ..
H - Other financial assetsOther financial assets 17 46,463 26,833 46,463 36,832 9,631 26,833M - PP&E Property, plant and equipment 89 4,211 89 40 49 4,211L - Intangible assetsIntangibles 18 19,783 10,940 19,783 15,272 4,511 10,940
Deferred tax asset 19 20,564 21,944 .. .. .. ..
294,300 278,290 66,335 52,144 14,191 41,984
677,151 730,482 113,579 78,141 35,438 108,270
O - Payable
Payables 20 39,916 34,767 39,455 6,614 32,841 34,320P -
Accrued Accrued employee benefits 4,798 9,109 4,798 4,733 65 9,109
Q - Unearne
Other current liabilities 21 539 733 197 269 (72) 396Interest bearing liabilities 23 8,665 8,760 .. .. .. ..
53,918 53,369 44,450 11,616 32,834 43,825
20 4,974 2,796 4,974 .. 4,974 2,79621 2,039 2,378 .. .. .. ..22 29,508 46,480 .. .. .. ..
Payables
Other non current liabilities
Deferred tax liabilities
Interest bearing liabilities 23 112,961 121,625 .. .. .. ..
149,482 173,279 4,974 .. 4,974 2,796
203,400 226,648 49,424 11,616 37,808 46,621
473,750 503,834 64,154 66,525 (2,371) 61,649
W - Accumu
Accumulated surplus 334,866 367,455 19,683 20,786 (1,103) 19,683X -
ContribContributed equity 138,884 136,379 44,471 45,739 (1,268) 41,966
473,750 503,834 64,154 66,525 (2,371) 61,649
The accompanying notes form part of these statements.
Total non-current liabilities
Current liabilities
Total current liabilities
Equity
Total equity
Net assets
Total liabilities
* An explanation of major variances is included at Note 30.
Parent Entity
Queensland Treasury and Controlled Entity
Statement of Financial Position
Non-current liabilities
Total current assets
as at 30 June 2018
Total non-current assets
Non-current assets
Total assets
Consolidated Entity
Current assets

049FINANCIAL STATEMENTS
5 Financial Statements – Queensland Treasury
2018 2017 2018 2017Notes $'000 $'000 $'000 $'000
Balance 1 July 367,455 328,232 19,683 20,502Operating result from continuing operations (22,589) 39,223 .. (819)Dividend paid – Type A shareholders (10,000) .. .. ..Balance 30 June 334,866 367,455 19,683 19,683
Balance 1 July 136,379 128,428 41,966 34,015Transactions with owners as owners:
Appropriated equity injections 3 37,529 13,911 37,529 13,911Appropriated equity withdrawals 3 (20,733) (3,460) (20,733) (3,460)
Non appropriation equity withdrawal (3,691) (2,500) (3,691) (2,500)Net assets transferred in/(out) - Machinery of Government, (Office of Industrial Relations)* (10,600) .. (10,600) ..
Balance 30 June 138,884 136,379 44,471 41,966
473,750 503,834 64,154 61,649
Queensland Treasury and Controlled Entity
Statement of Changes in Equity
as at 30 June 2018
Contributed equity
Total equity
The accompanying notes form part of these statements.
Consolidated Entity Parent Entity
* Non-reciprocal transfers of assets and liabilities between wholly-owned Queensland state public sector entities as a result of machinery-of-government (MoG) changes are adjusted to ‘Contributed equity’ in accordance with Interpretation 1038 Contributions by Owners Made to Wholly-Owned Public Sector Entities. Appropriations for equity adjustments are similarly designated, refer note 2(b).
Accumulated surplus

050 QUEENSLAND TREASURY ANNUAL REPORT 2017–18
2018 2017 2018 2018 2018 2017
Actual Actual ActualAdjusted Budget
Budget Variance*
Actual
Notes $'000 $'000 $'000 $'000 $'000 $'000
Appropriation receipts 238,846 240,396 238,846 245,161 (6,315) 240,396Grants and other contributions 50,663 114,305 50,663 50,663 .. 114,305User charges and fees 23,630 32,656 23,582 25,654 (2,072) 32,608GST input tax credits from Australian Taxation Office (ATO)
13,731 12,234 13,007 .. 13,007 11,510
Other 1,122 1,341 1,122 522 600 1,341Interest received 7,990 8,175 .. .. .. ..
Employee expenses (157,529) (202,240) (157,529) (165,700) 8,171 (202,240)Supplies and services (132,918) (148,287) (131,858) (131,332) (526) (147,247)Grants and subsidies (10,979) (11,626) (10,979) (6,487) (4,492) (11,626)
(2,028) (7,898) (1,304) .. (1,304) (7,171)Income tax paid (3,045) (2,528) .. .. .. ..Other (5,006) (7,635) (5,006) (4,211) (795) (7,635)
24,477 28,893 20,544 14,270 6,274 24,241
Lease payments received 1,288 1,235 .. .. .. ..Proceeds from investments 5,500 5,000 .. .. .. ..Novation payments received 7,472 7,658 .. .. .. ..
Dividends received 12,578 14,776 .. .. .. ..
Payments for property, plant and equipment (312) (1,867) (312) (549) 237 (1,867)Payments for investments (20,000) (10,000) (20,000) (10,000) (10,000) (10,000)Payments for intangibles (13,542) (5,119) (13,542) (12,034) (1,508) (5,119)
(7,016) 11,683 (33,854) (22,583) (11,271) (16,986)
Equity injections 37,529 13,911 37,529 22,203 15,326 13,911
Repayment of borrowings (8,759) (8,892) .. .. .. ..Interest paid (6,102) (6,517) .. .. .. ..Dividend paid (10,000) .. .. .. .. ..Equity withdrawals (24,424) (5,960) (24,424) (7,543) (16,881) (5,960)
(11,756) (7,458) 13,105 14,660 (1,555) 7,951
5,705 33,118 (205) 6,347 (6,552) 15,206
130,229 97,111 53,116 25,729 27,387 37,910
Cash transfers from restructure(15,664) .. (15,664) (16,221) 557 ..
14 120,270 130,229 37,247 15,855 21,392 53,116
Parent Entity
Cash flows from investing activities
Outflows
Net cash provided by/(used in) investing activities
Cash flows from financing activities
Inflows
Outflows
Net cash provided by/(used in) operating activities
Inflows
Cash and cash equivalents at end of financial year
The accompanying notes form part of these statements.
Inflows
Outflows
Net cash provided by/(used in) financing activities
Net increase/(decrease) in cash and cash equivalentsCash and cash equivalents at beginning of financial year
* An explanation of major variances is included at Note 30.
Queensland Treasury and Controlled Entity
Statement of Cash Flows
for the year ended 30 June 2018
Cash flows from operating activities
GST remitted to ATO
Consolidated Entity

051FINANCIAL STATEMENTS
7 Financial Statements – Queensland Treasury
2018 2017 2018 2017
$'000 $'000 $'000 $'000
Operating surplus/(deficit) (22,589) 39,223 .. (819)
Impairment expense 370 139 370 139Gain/loss on shares – unrealised 56,574 (29,660) .. ..Interest – loans and receivables (7,687) (7,202) .. ..Dividend received (12,578) (14,775) .. ..Amortisation of unearned income (333) (328) .. ..Depreciation/amortisation expense 2,757 3,331 2,757 3,331Interest expense 6,102 6,517 .. ..
Change in assets and liabilities:
(Increase)/decrease in appropriation receivable .. (703) .. (703)(Increase)/decrease in trade debtors 2,469 7,652 1,785 7,082(Increase)/decrease in annual leave reimbursements 1,767 (214) 1,767 (214)(Increase)/decrease in other receivables (1,310) (424) (1,310) (424)(Increase)/decrease in other assets 972 (995) 932 (1,097)Increase/(decrease) in trade creditors 7,524 2,848 7,524 2,848Increase/(decrease) in accrued employee benefits (4,311) 1,336 (4,311) 1,336Increase/(decrease) in other payables (911) 12,085 (199) 12,762Increase/(decrease) in tax provision 25 (607) .. ..Increase/(decrease) in deferred tax liability (16,972) 8,905 .. ..Decrease in deferred tax asset 1,380 1,765 .. ..Adjustment to various assets and liabilities due to MoG (non-cash items)
11,228 .. 11,228 ..
Net cash provided by/(used in) operating activities 24,477 28,893 20,543 24,241
Consolidated Entity Parent Entity
Queensland Treasury and Controlled Entity
for the year ended 30 June 2018Reconciliation of Operating Surplus to Net Cash from Operating Activities
Opening Balance
Transfers to/(from) other Queensland
Government Entities
New Leases Acquired
Other Cash
ReceivedCash
RepaymentsClosing Balance
Notes $'000 $'000 $'000 $'000 $'000 $'000
Interest bearing liabilities 23 130,385 .. .. .. .. (8,759) 121,626
130,385 .. .. .. .. (8,759) 121,626
Current/non-current liabilities
CashflowsNon-Cash Changes
Reconciliation of Liabilities Arising from Financing Activitiesas at 30 June 2018
Consolidated Entity^
^There are no liabilities arising from Financing Activities in the Parent Entity accounts.
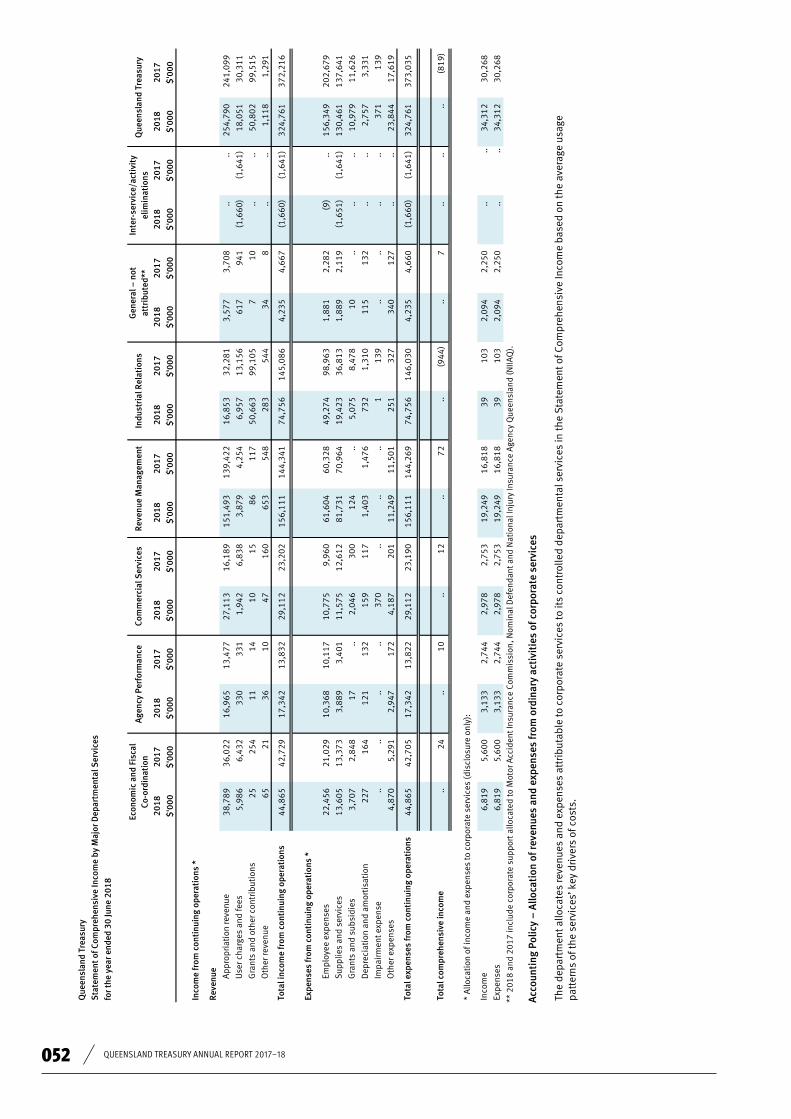
052 QUEENSLAND TREASURY ANNUAL REPORT 2017–18
8 F
inan
cial
Sta
tem
ents
– Q
ueen
slan
d Tr
easu
ry
Que
ensl
and
Trea
sury
2018
2017
2018
2017
2018
2017
2018
2017
2018
2017
2018
2017
2018
2017
2018
2017
$'0
00$
'000
$'0
00$
'000
$'0
00$
'000
$'0
00$
'000
$'0
00$
'000
$'0
00$
'000
$'0
00$
'000
$'0
00$
'000
App
ropr
iati
on re
venu
e38
,789
36,0
2216
,965
13,4
7727
,113
16,1
8915
1,49
313
9,42
216
,853
32,2
813,
577
3,70
8..
..25
4,79
024
1,09
9U
ser c
harg
es a
nd fe
es5,
986
6,43
233
033
11,
942
6,83
83,
879
4,25
46,
957
13,1
5661
794
1(1
,660
)(1
,641
)18
,051
30,3
11G
rant
s an
d ot
her c
ontr
ibut
ions
2525
411
1410
1586
117
50,6
6399
,105
710
....
50,8
0299
,515
Oth
er re
venu
e65
2136
1047
160
653
548
283
544
348
....
1,11
81,
291
44,8
6542
,729
17,3
4213
,832
29,1
1223
,202
156,
111
144,
341
74,7
5614
5,08
64,
235
4,66
7(1
,660
)(1
,641
)32
4,76
137
2,21
6
Empl
oyee
exp
ense
s22
,456
21,0
2910
,368
10,1
1710
,775
9,96
061
,604
60,3
2849
,274
98,9
631,
881
2,28
2(9
)..
156,
349
202,
679
Supp
lies
and
serv
ices
13,6
0513
,373
3,88
93,
401
11,5
7512
,612
81,7
3170
,964
19,4
2336
,813
1,88
92,
119
(1,6
51)
(1,6
41)
130,
461
137,
641
Gra
nts
and
subs
idie
s3,
707
2,84
817
..2,
046
300
124
..5,
075
8,47
810
....
..10
,979
11,6
26
Dep
reci
atio
n an
d am
orti
sati
on22
716
412
113
215
911
71,
403
1,47
673
21,
310
115
132
....
2,75
73,
331
Impa
irm
ent e
xpen
se..
....
..37
0..
....
113
9..
....
..37
113
9O
ther
exp
ense
s4,
870
5,29
12,
947
172
4,18
720
111
,249
11,5
0125
132
734
012
7..
..23
,844
17,6
19
44,8
6542
,705
17,3
4213
,822
29,1
1223
,190
156,
111
144,
269
74,7
5614
6,03
04,
235
4,66
0(1
,660
)(1
,641
)32
4,76
137
3,03
5
..24
..10
..12
..72
..(9
44)
..7
....
..(8
19)
* A
lloca
tion
of i
ncom
e an
d ex
pens
es to
cor
pora
te s
ervi
ces
(dis
clos
ure
only
):
6,81
95,
600
3,13
32,
744
2,97
82,
753
19,2
4916
,818
3910
32,
094
2,25
0..
..34
,312
30,2
68
6,81
95,
600
3,13
32,
744
2,97
82,
753
19,2
4916
,818
3910
32,
094
2,25
0..
..34
,312
30,2
68
Inco
me
Rev
enue
Tota
l exp
ense
s fr
om c
onti
nuin
g op
erat
ions
Tota
l com
preh
ensi
ve in
com
e
Tota
l inc
ome
from
con
tinu
ing
oper
atio
ns
Expe
nses
from
con
tinu
ing
oper
atio
ns *
Expe
nses
Indu
stri
al R
elat
ions
Gen
eral
– n
ot
attr
ibut
ed**
Inte
r-se
rvic
e/ac
tivi
ty
elim
inat
ions
Inco
me
from
con
tinu
ing
oper
atio
ns *
Sta
tem
ent o
f Com
preh
ensi
ve In
com
e by
Maj
or D
epar
tmen
tal S
ervi
ces
for t
he y
ear e
nded
30
June
201
8
Econ
omic
and
Fis
cal
Co
-ord
inat
ion
Age
ncy
Perf
orm
ance
Com
mer
cial
Ser
vice
s R
even
ue M
anag
emen
tQ
ueen
slan
d Tr
easu
ry
** 2
018
and
20
17 in
clud
e co
rpor
ate
sup
port
allo
cate
d to
Mot
or A
ccid
ent I
nsu
ranc
e C
omm
issi
on, N
omin
al D
efen
dan
t and
Nat
iona
l Inj
ury
Insu
ranc
e A
genc
y Q
ueen
slan
d (N
IIAQ
).
Acc
ount
ing
Polic
y –
Allo
cati
on o
f rev
enue
s an
d ex
pens
es fr
om o
rdin
ary
acti
viti
es o
f cor
pora
te s
ervi
ces
The
depa
rtm
ent a
lloca
tes
reve
nues
and
exp
ense
s at
trib
utab
le to
cor
pora
te s
ervi
ces
to it
s co
ntro
lled
dep
artm
enta
l ser
vice
s in
the
Sta
tem
ent o
f Com
preh
ensi
ve In
com
e ba
sed
on th
e av
erag
e us
age
patt
erns
of t
he s
ervi
ces’
key
dri
vers
of c
osts
.

053FINANCIAL STATEMENTS
9 F
inan
cial
Sta
tem
ents
– Q
ueen
slan
d Tr
easu
ry
2018
2017
2018
2017
2018
2017
2018
2017
2018
2017
2018
2017
2018
2017
$'0
00$
'000
$'0
00 $
'000
$'0
00$
'000
$'0
00 $
'000
$'0
00 $
'000
$'0
00$
'000
$'0
00$
'000
Cash
ass
ets
21,7
4120
,716
1,20
31,
790
1,88
62,
936
12,0
9817
,193
..9,
905
318
576
37,2
4753
,116
Rece
ivab
les
1,95
81,
516
9179
1,77
81,
195
1,92
21,
845
..3,
452
1,25
61,
159
7,00
49,
245
Oth
er a
sset
s44
42..
....
..2,
254
2,28
1..
813
695
789
2,99
33,
925
23,7
4322
,274
1,29
41,
869
3,66
44,
131
16,2
7421
,319
..14
,170
2,26
92,
524
47,2
4466
,286
Prop
erty
, pla
nt a
nd e
quip
men
t5
9..
....
..84
30..
4,17
2..
..89
4,21
1In
tang
ible
ass
ets
..7
....
980
..16
,510
5,40
4..
2,40
22,
293
3,12
719
,783
10,9
40O
ther
fina
ncia
l ass
ets
....
....
39,6
3020
,000
6,83
36,
833
....
....
46,4
6326
,833
516
....
40,6
1020
,000
23,4
2712
,267
..6,
574
2,29
33,
127
66,3
3541
,984
23,7
4822
,290
1,29
41,
869
44,2
7424
,131
39,7
0133
,586
..20
,744
4,56
25,
651
113,
579
108,
270
Paya
bles
19,7
5117
,424
3013
2,83
51,
127
12,1
678,
260
..4,
654
4,67
22,
843
39,4
5534
,320
Acc
rued
em
ploy
ee b
enef
its
777
750
352
313
464
356
2,08
22,
043
..4,
661
1,12
498
64,
798
9,10
9O
ther
cur
rent
liab
iliti
es19
724
7..
....
....
22..
127
....
197
396
20,7
2518
,421
382
326
3,29
91,
483
14,2
4910
,325
..9,
442
5,79
63,
829
44,4
5043
,825
Paya
bles
....
....
....
....
..70
34,
974
2,09
34,
974
2,79
6
....
....
....
....
..70
34,
974
2,09
34,
974
2,79
6
20,7
2518
,421
382
326
3,29
91,
483
14,2
4910
,325
..10
,145
10,7
705,
922
49,4
2446
,621
3,02
33,
869
912
1,54
340
,975
22,6
4825
,452
23,2
61..
10,5
99(6
,208
)(2
71)
64,1
5461
,649
* Th
e d
epar
tmen
t has
sys
tem
s in
pla
ce to
allo
cate
ass
ets
and
liab
iliti
es b
y M
ajor
Dep
artm
enta
l Ser
vice
.
** In
clud
es a
sset
s an
d li
abili
ties
ass
ocia
ted
wit
h co
rpor
ate
supp
ort f
unct
ions
.
Que
ensl
and
Trea
sury
as a
t 30
June
201
8
Econ
omic
and
Fis
cal
Co
-ord
inat
ion*
Age
ncy
Perf
orm
ance
*
Sta
tem
ent o
f Ass
ets
and
Liab
iliti
es b
y M
ajor
Dep
artm
enta
l Ser
vice
s
Tota
l cur
rent
liab
iliti
es
Tota
l cur
rent
ass
ets
Tota
l non
-cur
rent
ass
ets
Net
ass
ets
Tota
l lia
bilit
ies
Tota
l ass
ets
Non
-cur
rent
liab
iliti
es
Tota
l non
-cur
rent
liab
iliti
es
Rev
enue
Man
agem
ent*
Curr
ent l
iabi
litie
s
Curr
ent a
sset
s
Que
ensl
and
Trea
sury
G
ener
al –
not
at
trib
uted
**Co
mm
erci
al S
ervi
ces*
Indu
stri
al R
elat
ions
Non
-cur
rent
ass
ets

054 QUEENSLAND TREASURY ANNUAL REPORT 2017–18
QUEENSLAND TREASURYNOTES TO AND FORMING PART OF THE FINANCIAL STATEMENTS 2017–18Queensland Treasury Notes To and Forming Part of the Financial Statements 2017-18
10 Financial Statements – Queensland Treasury
1 Basis of financial statements preparation
(a) Statement of compliance Queensland Treasury (Treasury) has prepared these financial statements in compliance with section 42 of the Financial and Performance Management Standard 2009.
These financial statements are general purpose financial statements, prepared in accordance with Australian Accounting Standards and Interpretations. In addition, the financial statements comply with the Treasurer’sMinimum Reporting Requirements for the year beginning 1 July 2017 and other authoritative pronouncements.
The department as an economic entity consists of the parent entity together with QTH. To provide enhanced disclosure, the department has adopted the principles outlined in Australian Accounting Standard AASB 10 Consolidated Financial Statements and AASB 12 Disclosure of Interests in Other Entities. This approach is considered appropriate as it reflects the relationship between the department’s core business activities and those of its controlled entities. In the process of reporting on the department as a single economic entity, all transactions and balances internal to the economic entity have been eliminated in full.
The accrual basis of accounting has been adopted for both controlled transactions and balances, and those administered by the department on a whole-of-Government (WoG) basis. Except when stated, the historical cost convention is used.
(c) Controlled and Administered transactions and balances Transactions and balances are controlled by the department where they can be deployed for the achievement of departmental objectives. The department administers, but does not control, certain resources on behalf of the government such as the collection of grants, state taxes, royalties and State Penalties Enforcement Registry (SPER) fines. In doing so, it is responsible and accountable for administering related transactions and items, but does not have the discretion to deploy the resources for the achievement of the department’s objectives. Transactions and balances relating to administered resources are not recognised as controlled revenues, expenses, assets or liabilities, but are disclosed separately as administered transactions and balances in the administered statements and associated notes. If not otherwise stated the controlled accounting policies also apply to administered.
(d) Loans and receivables The QTH consolidated entity carries long term loans and receivables at amortised cost. In 2011, QTH paid an amount of $121.2 million for licence fees receivable from Port of Brisbane Pty Ltd (PBPL). The licence fee is based on a revenue sharing arrangement whereby Brisbane Port Holdings Pty Ltd(BPH) will receive a percentage of revenue above a hurdle amount from PBPL for a period of 35 years. The QTH consolidated entity made anupfront payment to BPH for the rights to these cash flows using funds provided from QTC. The upfront payment was based on assumed volume growth for the Port of Brisbane using macroeconomic forecasts combined withanalysis of local market and supply chain constraints. The licence fee which is payable up to 2050 has been discounted at a rate which takes into account the risks and uncertainties. Due to risks and uncertainties around the revalue forecasts, this exposes the QTH consolidated entity to volatility over future revenues and therefore the valuation of the investment. At each balance date the receivable is reviewed for impairment, incorporating current projections of trade volumes and price growth and where the carrying value of the receivable is not supported by these forecasts, an impairment is recognised (refer note 15).
(e) Deferred tax asset The QTH consolidated entity has recognised a deferred tax asset in relation to the difference between the purchase price of a long-term receivable and its carrying amount. Between 2013 and 2016, QTH impaired a long-term receivable which relates to a licence fee arrangement with the Port of Brisbane. This receivable was originally recognised by QTH in 2011 at $121.2 million and is currently recognised at $52.7 million due to the timing of the related cash flows which have been forecast to 2050. The long-term receivable has beendiscounted at 9.55% based on a pre-tax discount rate. The associated deferred tax asset has not been discounted based on the requirement of AASB 112 Income Taxes (refer note 19).
(f) Australian Government Taxes Treasury is a State body as defined under the Income Tax Assessment Act 1936 and is exempt from Commonwealth taxation with the exception of fringe benefits tax (FBT) and goods and services tax (GST). Assuch, FBT and GST credits receivable from/payable to the ATO are recognised and accrued.
QTH is subject to the National Tax Equivalents Regime (NTER), and payments are made to the State Treasurer equivalent (Consolidated Fund) to the amount of Commonwealth income tax.
(b) The reporting entity For financial reporting purposes, Treasury is a department in terms of the Financial Accountability Act 2009 and issubsequently consolidated into the Report on State Finances of the Queensland Government. The consolidatedfinancial statements include the value of all revenues, expenses, assets, liabilities and equity of the department and the entities that it controls. Details of the department’s controlled entities are disclosed in note 26.

055FINANCIAL STATEMENTS
QUEENSLAND TREASURYNOTES TO AND FORMING PART OF THE FINANCIAL STATEMENTS 2017–18Queensland Treasury Notes To and Forming Part of the Financial Statements 2017-18
11 Financial Statements – Queensland Treasury
1 Basis of financial statements preparation (continued)
The QTH controlled entity falls under the Taxation of Financial Arrangements (TOFA) legislation and applies the default realisation and accrual methods.
(g) Rounding and comparatives Amounts included in the financial statements are in Australian dollars and have been rounded to the nearest $1,000 or, where that amount is $500 or less, to zero unless disclosure of the full amount is specifically required.
Comparative information reflects the audited 2016-17 financial statements.
(h) Issuance of financial statements The financial statements are authorised for issue by the Under Treasurer and Chief Finance Officer at the date of signing the Management Certificate.
(i) Accounting estimates and judgements Estimates and assumptions that have a potential significant effect are outlined in the following notes and categories on the face of the statements:
• notes 15 and 42 (Allowance for impairment) • Notes 17, QIC investments (Allowance for impairment) • notes 25 and 47 (Contingencies) • note 29 (b) and (f) (Financial Instruments)• note 48 (a) and (e) (Financial Instruments)
Further, the matters covered in each of those notes necessarily involve estimation uncertainty with the potential to materially impact on the carrying amount of the department's assets and liabilities in the next reporting period. Reference should be made to the respective notes for more information.
(j) First year application of new accounting standards or change in accounting policy AASB 2016-2 Amendments to Australian Accounting Standards – Disclosure Initiative: Amendments to AASB107
From 2017-18, this standard required additional disclosures to enable the reader to evaluate changes in liabilities arising from financing activities. These disclosures include both cash flows and non-cash changes between the opening and closing balance of the relevant liabilities and be disclosed by wayof reconciliation in the notes to the statement of cash flows.
(k) Future impact of Accounting Standards not yet effective At the date of authorisation of the financial report, the expected impacts of new or amended Australian Accounting Standards issued but with future commencement dates set out below:
AASB 9 Financial Instruments and AASB 2014-7 Amendments to Australian Accounting Standards arising from AASB 9 (December 2014)
These standards will first apply to the department from its financial statements for 2018-19 with a 1 July 2018 date of transition. The main impact of the standards to the department is that it will change the requirements for classification, measurement, impairment and disclosures associated with the department’s financial assets. AASB 9 will introduce different criteria for whether financial assets can be measured at amortised cost or fair value through the profit or loss. For financial liabilities, AASB 9 has largely adopted the classification and measurement criteria currently contained in AASB 139.
Under the new standard, the consolidated entity’s licence fee receivable (refer note 15) which is currently recorded on an amortised cost basis, will be valued at fair value through profit or loss. This will change the nature of how this is recorded as well as the amount receivable. The estimated impact on the carrying amount on 1 July 2018 will reflect an increase from $52.714 million to $67.983 million, with an unrealised gain of $15.179 million recognised through profit and loss.
The new impairment requirements will result in a provision being applied to all receivables rather than only on those receivables that are credit impaired. The department will be adopting the simplified approach under AASB9. Analysis is still being undertaken by the department on whether to individually assess the debts or use a provision matrix to measure the impairment provision. The Office of State Revenue (OSR) will be adopting the provision matrix approach for payroll tax, land tax, duties and SPER. Trade receivables relating to the recovery of First Home Owners Grants (FHOG), Queensland Building Boost (QBB), gaming machine and royalties will be assessed individually due to low value write-offs and secured debts.
Applying this approach for the department has estimated the opening provision for the impairment of payroll tax receivables on 1 July 2018 to be $27.7 million, a decrease of $6.5 million compared to the amount reported at 30 June 2018. This will result in a net receivable of $866.6 million on transition. Land tax, duties, gaming, royalties and SPER have no significant material change in the provision for impairment from the 30 June 2018 balance.

056 QUEENSLAND TREASURY ANNUAL REPORT 2017–18
QUEENSLAND TREASURYNOTES TO AND FORMING PART OF THE FINANCIAL STATEMENTS 2017–18Queensland Treasury Notes To and Forming Part of the Financial Statements 2017-18
12 Financial Statements – Queensland Treasury
1 Basis of financial statements preparation (continued)
AASB 1058 Income of Not-for-Profit Entities and AASB 15 Revenue from Contracts with Customers
These standards will first apply to the department from its financial statements for 2019-20. The department has commenced analysing the new revenue recognition requirements under these standards and is yet to form conclusions about significant impacts.
The new requirements of AASB 15 may potentially result in a change to the timing of revenue from sales of the department’s goods and services such that some revenue may need to be deferred to a later reporting period to the extent that the department has received cash but has not met its associated performance obligations. The department is yet to complete its analysis of existing arrangements and the impact, if any, on revenue recognition has not yet been determined.
AASB 16 Leases
This standard will first apply to the department from its financial statements for 2019-20. When applied, the standard supersedes AASB 117 Leases, AASB Interpretation 4 Determining whether an Arrangement contains a Lease, AASB Interpretation 115 Operating Leases – Incentives and AASB Interpretation 127 Evaluating the Substance of Transactions Involving the Legal Form of a Lease.
Impact for Lessees
Unlike AASB 117 Leases, AASB 16 introduces a single lease accounting model for lessees. Lessees will be required to recognise a right-of-use asset (representing rights to use the underlying leased asset) and a liability (representing the obligation to make lease payments) for all leases with a term of more than 12 months, unless the underlying assets are of low value.
Treasury’s current lease commitments (refer note 24) may include items that would be excluded under AASB16 because the low value or short-term lease exemption is satisfied. The department has analysed its existing operating lease commitments to estimate the expected impacts on transition based on information available at 30 June 2018. The department’s leases with internal-to-government lessors include rental accommodation managed by the Queensland Government Accommodation Office. The department currently has two accommodation leases, the primary one being 1 William Street, Brisbane.
At 30 June 2018, the department has total operating lease commitments of $210.459 million (untill 2023-24, note 24(b)) and an annual accommodation lease payment of $11.984 million (2017-18, including Office of Industrial Relations (OIR)) for office accommodation.
Considering their operation and impact across WoG, the department is currently awaiting formal guidance from Treasury policy unit as to whether this arrangement should be accounted for on-balance sheet under AASB 16.
In the event these arrangements are to be accounted for on-balance sheet, the department estimates for office accommodation leases a right-of-use asset and lease liability. On transition these are expected to be different to the undiscounted amounts disclosed in the commitments note and will equal the amount calculated in accordance with AASB 16. Currently the transition value is not practically quantifiable due to key factors still requiring assessment including identification of an appropriate discount rate. There will be no material financial statement impact if these arrangements are not accounted for on-balance sheet.

057FINANCIAL STATEMENTS
QUEENSLAND TREASURYNOTES TO AND FORMING PART OF THE FINANCIAL STATEMENTS 2017–18Queensland Treasury Notes To and Forming Part of the Financial Statements 2017-18
13 Financial Statements – Queensland Treasury
2 Objectives and major activities of the department
Treasury's vision is to grow the Queensland economy and improve the wellbeing of all Queenslanders. It aims to support this through providing the government with trusted, impartial advice on state finances and the economy, innovative revenue and commercial services and support for fair, safe and productive workplaces. This includes managing the state's finances in line with the government's fiscal principles listed in the Charter of Fiscal Responsibility.
Treasury's strategic objectives are to:
• enable sustainable growth that supports current and future government objectives • partner proactively to facilitate better outcomes for the community• ensure our services are tailored, fit-for-purpose and easy to access• develop a capable and flexible workforce that can lead in policy development and service delivery.
Details on Treasury’s departmental service areas can be viewed in the department’s Budget Paper 5 – Service Delivery Statements – Treasury, at https://budget.qld.gov.au/files/SDS-Treasury-2018-19.pdf
(a) Major activities of the department
Major activities of the department are detailed in the face of the statements by Major Departmental Services for both controlled and administered items.
The Financial Statements have been aggregated into the following disclosures (refer Notes 1(b) and 1(c) for full details of this aggregation):
1. Controlled
(a) Treasury (as an entity in its own right and to which the remainder of this financial report refers) – columnheaded ‘Parent Entity’.
(b) Consolidated (Queensland Treasury and its controlled entity Queensland Treasury Holdings Pty Ltd (QTH) and its subsidiaries) – column headed ‘Consolidated Entity’.
2. Administered on behalf of WoG – shaded statements and notes.

058 QUEENSLAND TREASURY ANNUAL REPORT 2017–18
QUEENSLAND TREASURYNOTES TO AND FORMING PART OF THE FINANCIAL STATEMENTS 2017–18Queensland Treasury Notes To and Forming Part of the Financial Statements 2017-18
14 Financial Statements – Queensland Treasury
(b) Machinery-of-government changes
The following transfers, based on the Administrative Arrangements Order (No.4 2017) dated 21 December 2017 were made effective on 1 January 2018:
1
2
3
4
$'000 $'000 $'000 $'000 $'000 $'000 $'000 $'000 $'000 $'0001 2 3 4 Total 1 2 3 4 Total
Cash assets 14,959 705 .. .. 15,664 .. .. .. ..Receivables 13,942 34 .. .. 13,976 8,408 .. .. .. 8,408Other assets 974 .. .. .. 974 .. .. .. ..
29,875 739 .. .. 30,614 8,408 .. .. .. 8,408
.. .. .. ..
Other financial assets .. .. .. .. .. .. .. .. .. ..Intangible assets 2,322 .. .. .. 2,322 .. .. .. .. ..Property, plant and equipment
3,844 .. .. .. 3,844 .. .. .. .. ..
6,166 .. .. .. 6,166 .. .. .. .. ..
36,041 739 .. .. 36,780 8,408 .. .. .. 8,408
Payables 6,343 677 .. .. 7,020 8,408 .. .. .. 8,408Accrued employee benefits
4,568 62 .. .. 4,630 .. .. .. .. ..
Other current liabilities 13,829 .. .. .. 13,829 .. .. .. .. ..
24,740 739 .. .. 25,479 8,408 .. .. .. 8,408
Payables 701 .. .. .. 701 .. .. .. .. ..
701 .. .. .. 701 .. .. .. .. ..
25,441 739 .. .. 26,180 8,408 .. .. .. 8,408
10,600 .. .. .. 10,600 .. .. .. .. ..
(Former Department of Infrastructure, Local Government and Planning)
Total non-current liabilities
Total liabilities
Net assets
Controlled
Non-current liabilities
Administered
Total non-current assets
Total assets
Current liabilities
Total current liabilities
Current assets
Total current assets
Non-current assets
Transferring area
The Office of Industrial Relations
Employment (Treasury)
Market ed Proposals (Treasury)
Cities Transformation Taskforce
Transferring to/(from)
Department of Education
Department of Employment, Small Business and Training
Department of State Development, Manufacturing, Infrastructure and Planning
The decrease in assets of $10.6 million has been accounted for as a decrease in contributed equity as disclosed in the Statement of Changes to Equity.
Budgeted appropriation revenue (controlled) of $22.1 million was reallocated from Treasury to the Department of Education ($12.955 million), the Department of Employment, Small Business and Training ($8.080 million) and the Department of State Development, Manufacturing, Infrastructure and Planning ($1.062 million) as part of the machinery-of-government changes. The former Department of Infrastructure, Local Government and Planning reallocated budgeted appropriation revenue of $2.250 million to Treasury for the Cities Transformation Taskforce.

059FINANCIAL STATEMENTS
QUEENSLAND TREASURYNOTES TO AND FORMING PART OF THE FINANCIAL STATEMENTS 2017–18Queensland Treasury Notes To and Forming Part of the Financial Statements 2017-18
15 Financial Statements – Queensland Treasury
2018 2017 2018 2017
$'000 $'000 $'000 $'000
3 Reconciliation of payments from Consolidated Fund to appropriated revenue recognised in the Statement of Comprehensive Income
265,008 251,486 265,008 251,486
(19,847) .. (19,847) ..
(2,136) (11,090) (2,136) (11,090)
(4,179) .. (4,179) ..
238,846 240,396 238,846 240,396
(703) .. (703) ..
703 .. 703 ..
15,944 3,163 15,944 3,163
(18,698) (15,241) (18,698) (15,241)
236,092 228,318 236,092 228,318
18,698 12,781 18,698 12,781
254,790 241,099 254,790 241,099
14,660 11,058 14,660 11,058
.. .. .. ..
2,136 (607) 2,136 (607)
16,796 10,451 16,796 10,451
Budgeted appropriation revenue
Transfer (to)/from other departments
Transfer (to)/from other heading
Lapsed appropriation revenue
Total appropriation receipts
Less opening balance of appropriation revenue receivable
Plus non cash MoG transfer of appropriation revenue receivable
Plus opening balance of deferred appropriation payable
Less closing balance of deferred appropriation payable
Net appropriation revenue
Plus deferred appropriation payable to Consolidated Fund
Appropriation revenue recognised in Statement of Comprehensive Income
Reconciliation of payments from Consolidated Fund to appropriated equity adjustments recognised in contributed equity
Budgeted equity adjustment appropriation
Unforeseen expenditure
Transfer (to)/from other heading
Total equity adjustment receipts
Appropriated equity adjustment recognised in contributed equity 16,796 10,451 16,796 10,451
Parent EntityConsolidated Entity
Accounting Policy – Departmental service revenue Appropriations provided under the Annual Appropriation Act are recognised as revenue when received or when approved as an accrual at year end. In some circumstances when approval is granted a deferred appropriation payable is recognised with a corresponding expense at year end.
4 User charges and fees
Sale of services 18,028 30,304 18,028 30,304Other fees 23 7 23 7
18,051 30,311 18,051 30,311
Accounting Policy – User charges and fees User charges and fees are recognised as revenues when the revenue has been earned and can be measured reliably with a sufficient degree of certainty. This involves either invoicing for related goods/services and/or the recognition of accrued revenue.

060 QUEENSLAND TREASURY ANNUAL REPORT 2017–18
QUEENSLAND TREASURYNOTES TO AND FORMING PART OF THE FINANCIAL STATEMENTS 2017–18Queensland Treasury Notes To and Forming Part of the Financial Statements 2017-18
16 Financial Statements – Queensland Treasury
2018 2017 2018 2017
$'000 $'000 $'000 $'000
5 Grants and other contributions
Contributions from Workcover 44,039 84,099 44,039 84,099Industry contributions 6,624 14,989 6,624 14,989Resources received below fair value 139 427 139 427
50,802 99,515 50,802 99,515
Parent EntityConsolidated Entity
Accounting Policy – Grants and other contributions Grants, donations, gifts and other contributions that are non-reciprocal in nature are recognised as revenue in the year in which the department obtains control over them (control is generally obtained at the time of receipt). Where grants are received that are reciprocal in nature, revenue is progressively recognised as it is earned, according to the terms of the funding agreements.
6 Interest revenue
Interest – loans and receivables ** 7,687 7,202 .. ..Interest – lease receivables * 6,102 6,517 .. ..Interest – QTC 1,896 1,751 .. ..
15,685 15,470 .. ..
** Relates to interest recognised on QTH financial assets acquired from Brisbane Port Holdings Pty Ltd (BPH) following the long-term lease of the Port of Brisbane (refer note 15).
* Relates to interest recognised on QTH Lease receivables by Dalrymple Bay Coal Terminal Holdings (DBCTH) Pty Ltd (refer note 16).
7 Gain/(loss) on sale/fair value movement of investments
Gain/(loss) on shares – unrealised * (56,574) 29,660 .. ..
(56,574) 29,660 .. ..
* Relates to the market movement on remaining shares held in Aurizon Holdings Ltd (AZJ) (formerly QR National Limited) recorded at fair value (recognised at the closing listed market price of $4.33 per share (2017: $5.36 per share)).
8 Employee expenses
120,872 157,397 120,872 157,397
12,866 15,746 12,866 15,746
11,808 17,466 11,808 17,466
4,197 2,979 4,197 2,979
2,547 3,024 2,547 3,024
2,530 3,466 2,530 3,466
695 1,167 695 1,167
584 1,786 584 1,786
251 437 251 437
Salaries, wages and related - overnment employeesAnnual leave Employer contributions - Accumulation schemesEmployer contributions - Defined benefit schemeLong service leave Other employee related expensesFringe benefits tax expenseRedundancy paymentsWorkers' compensation premiumOther employee related expenses - non Long Service Leave (LSL) and Annual Leave Central Scheme (ALCS) .. (789) .. (789)
156,349 202,679 156,349 202,679
Number of employees: 954 1,757 954 1,757
The number of employees as at 30 June, including both full-time employees and part-time employees, measured on a full-time equivalent basis (reflecting Minimum Obligatory Human Resource Information (MOHRI)) is:
061FINANCIAL STATEMENTS
QUEENSLAND TREASURYNOTES TO AND FORMING PART OF THE FINANCIAL STATEMENTS 2017–18Queensland Treasury Notes To and Forming Part of the Financial Statements 2017-18
17 Financial Statements – Queensland Treasury
8 Employee expenses (continued)
Accounting Policy – Employee expenses Employer superannuation contributions, annual leave levies and long service leave levies are regarded as employee benefits. Workers’ compensation insurance is a consequence of employing staff and are not included in an employee’s total remuneration package as employee benefits and are recognised separately as employee related expenses.
Accounting Policy – Wages and salaries Salaries and wages expenses are recognised at the current salary rates as it is expected these liabilities will be wholly settled within 12 months of year end.
Accounting Policy – Sick leave History indicates that on average, sick leave taken each reporting period is less than the entitlement accrued. This is expected to continue in future periods. Accordingly, it is unlikely that existing accumulated entitlements will be used by employees and no liability for unused sick leave entitlements is recognised. As sick leave is non-vesting, an expense is recognised for this leave as it is taken.
Annual leave No provision for annual leave has been recognised in the department's financial statements as the liability is held on a WoG basis and reported in those financial statements pursuant to AASB 1049 Whole of Government and General Government Sector Financial Reporting, under the Annual Leave Central Scheme (ALCS). A levy is made on the department to cover the cost of employees’ annual leave (including leave loading and on-costs). The levies are expensed in the period in which they are payable. Amounts paid to employees for annual leave are claimed from the scheme quarterly in arrears.
Long service leave Under the Queensland Government’s long service leave scheme, a levy is made on the department to cover the cost of employees' long service leave. Levies are expensed in the period in which they are paid or payable.
Amounts paid to employees for long service leave are claimed from the scheme quarterly in arrears. Therefore, no provision for long service leave is recognised in the department’s financial statements, the liability being held on a WoG basis and reported in those financial statements prepared pursuant to AASB 1049 Whole of Government and General Government Sector Financial Reporting.
Superannuation Employer superannuation contributions are paid to QSuper and other members’ choice superannuation funds, at rates determined by the Treasurer on the advice of the State Actuary. Contributions are expensed in the period in which they are paid or payable. The department’s obligation is limited to its contribution to QSuper and other members’ choice superannuation funds.
The QSuper scheme has defined benefit and defined contribution categories. The liability for defined benefits is held on a WoG basis and reported in those financial statements pursuant to AASB 1049 Whole of Government and General Government Sector Financial Reporting.
(a) Key management personnel and remuneration
From 2016-17, the department’s Treasurer is identified as part of the department’s key management personnel (KMP), consistent with additional guidance included in the revised version of AASB 124 Related Party Disclosures. This Minister is the Deputy Premier, Treasurer and Minister for Aboriginal and Torres Strait Islander Partnerships – Jacklyn Anne Trad (formerly Curtis Pitt, Treasurer and Minister for Trade and Investment prior to the MoG change, refer note 2).
The Treasurer’s remuneration entitlements are outlined in the Legislative Assembly of Queensland’s Members’ Remuneration Handbook. The department does not bear any cost of remuneration of Ministers. The majority of Ministerial entitlements are paid by the Legislative Assembly, with the remaining entitlements being provided by Ministerial Services Branch within the Department of the Premier and Cabinet. As all Ministers are reported as KMP of the Queensland Government, aggregate remuneration expenses for all Ministers is disclosed in the Queensland General Government and WoG Consolidated Financial Statements as from 2016–17, which are published as part of the Treasurer’s Report on State Finances.
Remuneration policy for the department's other KMP is set by the Queensland Public Service Commission as provided for under the Public Service Act 2008. Individual remuneration and other terms of employment (including motor vehicle entitlements and performance payments if applicable) are specified in employment contracts.
The following details for non-Ministerial KMP reflect those departmental positions that had authority and responsibility for planning, directing and controlling the activities of the department during the respective reporting periods. Further information about these positions can be found in the body of the Annual Report under the section relating to Executive Management.
The following disclosures focus on the expenses incurred by the department during the respective reporting periods that are attributable to non-Ministerial KMP.
Transactions with people/entities related to KMP
There are no related party transactions with the Treasury consolidated entity that involve KMP, close family members and their personal business interests.
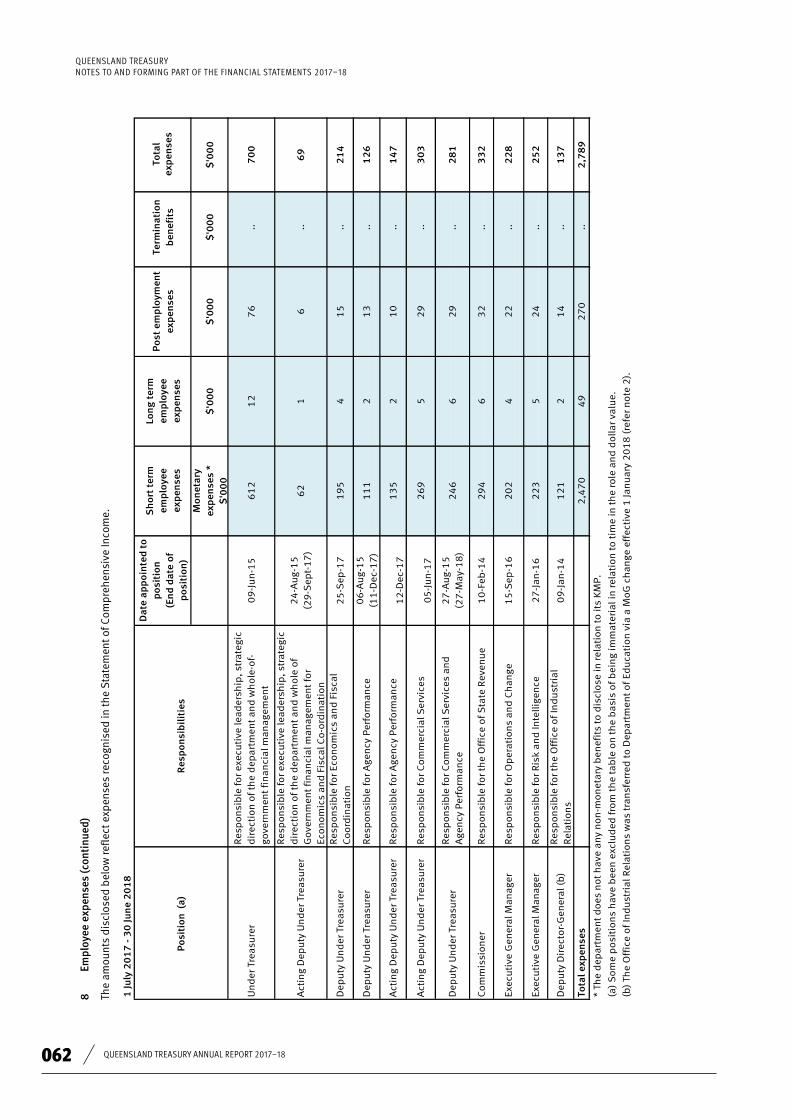
062 QUEENSLAND TREASURY ANNUAL REPORT 2017–18
QUEENSLAND TREASURYNOTES TO AND FORMING PART OF THE FINANCIAL STATEMENTS 2017–18
Que
ensl
and
Trea
sury
N
otes
To
and
Form
ing
Part
of t
he F
inan
cial
Sta
tem
ents
201
7-18
18
Fina
ncia
l Sta
tem
ents
– Q
ueen
slan
d Tr
easu
ry
8 Em
ploy
ee e
xpen
ses
(con
tinu
ed)
The
amou
nts
disc
lose
d b e
low
refle
ct e
xpen
ses
reco
gnis
ed in
the
Stat
emen
t of C
ompr
ehen
sive
Inco
me.
1 Ju
ly 2
01
7 -
30
Jun
e 2
01
8
Dat
e ap
po
inte
d t
o
po
siti
on
(En
d d
ate
of
po
siti
on
)
Sh
ort
ter
m
emp
loye
e ex
pen
ses
Lon
g t
erm
em
plo
yee
exp
ense
s
Po
st e
mp
loym
ent
exp
ense
sTe
rmin
atio
n
ben
efit
sTo
tal
exp
ense
s
Mo
net
ary
exp
ense
s *
$
'00
0$
'00
0$
'00
0$
'00
0$
'00
0
* Th
e d
epa
rtm
ent
do
es n
ot
hav
e an
y n
on
-mo
net
ary
ben
efit
s to
dis
clo
se in
rel
atio
n t
o it
s K
MP
.
(a)
So
me
po
siti
on
s h
ave
bee
n e
xclu
ded
fro
m t
he
tab
le o
n t
he
ba
sis
of
bei
ng
imm
ate
rial
in r
elat
ion
to
tim
e in
th
e ro
le a
nd
do
llar
valu
e.
(b)
The
Off
ice
of
Ind
ust
rial
Rel
atio
ns
was
tra
nsf
erre
d t
o D
epar
tmen
t o
f Ed
uca
tio
n v
ia a
Mo
G c
han
ge e
ffec
tive
1 Ja
nu
ary
20
18
(re
fer
no
te 2
).
26
9
5
Po
siti
on
(a)
Res
po
nsi
bil
itie
s
Exec
uti
ve G
ener
al M
anag
er
Res
po
nsi
ble
for
Ris
k an
d In
telli
gen
ce2
7-J
an-1
6
Act
ing
Dep
uty
Un
der
Tre
asu
rer
Res
po
nsi
ble
for
Co
mm
erci
al S
ervi
ces
05
-Ju
n-1
7
Res
po
nsi
ble
for
exec
uti
ve le
ader
ship
, str
ateg
ic
dir
ecti
on
of
the
dep
art
men
t an
d w
ho
le o
f G
ove
rnm
ent
fin
anci
al m
anag
emen
t fo
r Ec
on
om
ics
and
Fis
cal C
o-o
rdin
atio
n
24
-Au
g-1
5
(29
-Sep
t-1
7)
Un
der
Tre
asu
rer
Act
ing
Dep
uty
Un
der
Tre
asu
rer
6
2
Res
po
nsi
ble
for
exec
uti
ve le
ader
ship
, str
ateg
ic
dir
ecti
on
of
the
dep
art
men
t an
d w
ho
le-o
f-go
vern
men
t fi
nan
cial
man
agem
ent
09
-Ju
n-1
56
12
12
-Dec
-17
13
5
2
..
70
0
1
6
..
12
7
6
69
10
..
1
47
15
..
2
14
13
..
1
26
Act
ing
Dep
uty
Un
der
Tre
asu
rer
Res
po
nsi
ble
for
Age
ncy
Per
form
ance
32
..
3
32
30
3
Dep
uty
Un
der
Tre
asu
rer
R
esp
on
sib
le fo
r C
om
mer
cial
Ser
vice
s an
d
Age
ncy
Per
form
ance
27
-Au
g-1
5
(27
-May
-18
)2
46
6
2
9
..
28
1
29
..
22
..
2
28
Co
mm
issi
on
erR
esp
on
sib
le fo
r th
e O
ffic
e o
f S
tate
Rev
enu
e1
0-F
eb-1
42
94
6
Exec
uti
ve G
ener
al M
anag
er
Res
po
nsi
ble
for
Op
erat
ion
s an
d C
han
ge
15
-Sep
-16
20
2
4
25
2
Dep
uty
Dir
ecto
r-G
ener
al (
b)
Res
po
nsi
ble
for
the
Off
ice
of
Ind
ust
rial
R
elat
ion
s0
9-J
an-1
41
21
2
1
4
..
13
7
22
3
5
24
..
27
0
..
2,7
89
To
tal e
xpen
ses
2,4
70
4
9
Dep
uty
Un
der
Tre
asu
rer
Res
po
nsi
ble
for
Age
ncy
Per
form
ance
06
-Au
g-1
5
(11
-Dec
-17
)1
11
2
Dep
uty
Un
der
Tre
asu
rer
Res
po
nsi
ble
for
Eco
no
mic
s an
d F
isca
l C
oo
rdin
atio
n2
5-S
ep-1
71
95
4

063FINANCIAL STATEMENTS
QUEENSLAND TREASURYNOTES TO AND FORMING PART OF THE FINANCIAL STATEMENTS 2017–18
Que
ensl
and
Trea
sury
N
otes
To
and
Form
ing
Part
of t
he F
inan
cial
Sta
tem
ents
201
7-18
19
Fina
ncia
l Sta
tem
ents
– Q
ueen
slan
d Tr
easu
ry
8 Em
ploy
ee e
xpen
ses
(con
tinu
ed)
1 Ju
ly 2
01
6 -
30
June
20
17
Dat
e ap
poin
ted
to
posi
tion
(End
dat
e of
po
siti
on)
Sh
ort
term
em
ploy
ee e
xpen
ses
Long
ter
mem
ploy
eeex
pens
es
Post
em
ploy
men
t ex
pen
ses
Term
inat
ion
ben
efit
sTo
tal
exp
ense
s
Mon
eta
ry e
xpen
ses*
$'0
00
$'0
00
$'0
00
$'0
00
$'0
00
* Th
e d
epar
tmen
t doe
s n
ot h
ave
any
non
-mon
etar
y b
enef
its
to d
iscl
ose
in re
lati
on to
its
KM
P.
(a) S
ome
pos
itio
ns
hav
e b
een
exc
lud
ed fr
om th
e ta
ble
on
the
bas
is o
f bei
ng
imm
ater
ial i
n re
lati
on to
tim
e in
the
role
an
d d
olla
r val
ue.
(b) T
he
form
er A
ctin
g D
epu
ty U
nd
er T
reas
ure
r was
rem
un
erat
ed b
y Q
TC a
nd
dep
arte
d o
n a
inte
rch
ange
agr
eem
ent
on 1
6 Ju
ne
20
17
.
(c) A
pp
oin
ted
as
Act
ing
Exec
uti
ve G
ener
al M
anag
er o
n 1
5 S
epte
mb
er 2
01
6 fo
llow
ing
a d
epar
tmen
tal r
estr
uct
ure
. Pr
evio
usl
y in
a n
on K
MP
pos
itio
n.
.. 6
82
Posi
tion
(a)
Res
pons
ibili
ties
59
6
Un
der
Tre
asu
rer
12
7
4
Res
pon
sib
le fo
r exe
cuti
ve le
ader
ship
, str
ateg
ic
dir
ecti
on o
f th
e d
epar
tmen
t an
d w
hol
e-of
-go
vern
men
t fin
anci
al m
anag
emen
t 0
9-J
un
-15
26
3
6-A
ug-
15
Res
pon
sib
le fo
r Age
ncy
Per
form
ance
23
3
Dep
uty
Un
der
Tre
asu
rer
5
32
Act
ing
Dep
uty
Un
der
Tre
asu
rer
..
28
6
Dep
uty
Un
der
Tre
asu
rer
4
26
..
Res
pon
sib
le fo
r Com
mer
cial
Ser
vice
s an
d
Age
ncy
Per
form
ance
..
26
9
Act
ing
Dep
uty
Un
der
Tre
asu
rer
5
26
..
Res
pon
sib
le fo
r exe
cuti
ve le
ader
ship
, str
ateg
ic
dir
ecti
on o
f th
e d
epar
tmen
t an
d w
hol
e of
G
over
nm
ent f
inan
cial
man
agem
ent f
or
Econ
omic
s an
d F
isca
l Coo
rdin
atio
n
24
-Au
g-1
52
38
32
2
Res
pon
sib
le fo
r Com
mer
cial
Ser
vice
s 2
0-A
pr-
15
(16
-Ju
n-1
7) (
b)
.. ..
..
Res
pon
sib
le fo
r th
e O
ffic
e of
Sta
te R
even
ue
.. 3
23
2
7-A
ug-
15
.. 6
3
2
.. 3
1
5
16
1
15
-Sep
t-1
6 (c
)
Com
mis
sion
er
Dep
uty
Dir
ecto
r-G
ener
al
5
27
27
-Jan
-16
Exec
uti
ve G
ener
al M
anag
er
4
24
10
-Feb
-14
28
4
14
3
Act
ing
Exec
uti
ve G
ener
al M
anag
er
Res
pon
sib
le fo
r O
per
atio
ns
and
Ch
ange
.. 2
77
24
7
Res
pon
sib
le fo
r Ris
k an
d In
telli
gen
ce2
19
24
5
..
Res
pon
sib
le fo
r th
e O
ffic
e of
Ind
ust
rial
R
elat
ion
s0
9-J
an-1
4
25
6
..
2,5
44
To
tal e
xpen
ses
2,2
44
4
4

064 QUEENSLAND TREASURY ANNUAL REPORT 2017–18
QUEENSLAND TREASURYNOTES TO AND FORMING PART OF THE FINANCIAL STATEMENTS 2017–18
Queensland Treasury Notes To and Forming Part of the Financial Statements 2017-18
20 Financial Statements – Queensland Treasury
2018 2017 2018 2017
$'000 $'000 $'000 $'000
9 Supplies and services
Computer charges 33,712 30,810 33,712 30,810Contractors and employment agency charges 27,952 24,737 27,952 24,737Property leases 17,791 21,854 17,791 21,854Administration and advertising 11,044 11,717 11,044 11,717SPER call centre costs 10,892 10,881 10,892 10,881Consultants 10,183 12,379 10,183 12,379Other property charges 8,313 9,813 8,313 9,813Professional legal fees, service fees and charges 7,056 10,284 7,056 10,284
Other supplies and services 3,517 5,166 3,517 5,166
130,461 137,641 130,461 137,641
Consolidated Entity Parent Entity
Accounting Policy – Supplies and services The department recognises expenses when incurred, usually when goods are received or services are consumed, which may not be when the goods or services are actually paid for.
Operating lease payments are representative of the pattern of benefits derived from the leased assets and are expensed in the periods in which they are incurred. Property leases are recognised on a straight-line basis over the lease life including any applicable lease incentives and annual rent increments, in accordance with AASB 117 Leases.
10 Grants and subsidies
Safe Work Australia 1,008 2,037 1,008 2,037Anzac Day Trust 1,323 1,299 1,323 1,299Financial Assurance 2,032 .. 2,032 ..Back to Work 3,670 2,848 3,670 2,848Queensland Ambulance Service 1,868 3,918 1,868 3,918Other recurrent grants 1,078 1,524 1,078 1,524
10,979 11,626 10,979 11,626
11 Impairment expense
Impairment losses on receivables 1 139 1 139Impairment losses on investments 370 .. 370 ..
371 139 371 139
12 Other expenses
Deferred appropriation payable to Consolidated Fund 18,698 12,781 18,698 12,781Bank charges 1,763 1,750 1,763 1,750Internal audit fees 1,376 1,525 1,376 1,525Sundry expenses 1,375 802 1,076 485External audit fees* 813 812 773 773Company secretariat and accounting services – QTC 370 412 .. ..Qld Government Insurance Fund - insurance premiums 86 137 86 137Sponsorships and special payments 73 168 73 168
24,553 18,387 23,844 17,619
* Total audit fees quoted by the Queensland Audit Office relating to the 2017-18 financial statements for the parent entity is $500k (2017: $540k).

065FINANCIAL STATEMENTS
QUEENSLAND TREASURYNOTES TO AND FORMING PART OF THE FINANCIAL STATEMENTS 2017–18
Queensland Treasury Notes To and Forming Part of the Financial Statements 2017-18
21 Financial Statements – Queensland Treasury
2018 2017 2018 2017
$'000 $'000 $'000 $'000
13 Income tax expense
Current tax comprises:
Current tax on profit for the year 3,072 2,499 .. ..
3,072 2,499 .. ..Deferred tax comprises:
Decrease/(increase) in deferred tax asset 1,377 1,192 .. ..(Decrease)/increase in deferred tax liability (16,972) 8,898 .. ..
(15,595) 10,090 .. ..Income tax expense/(benefit) (12,523) 12,589 .. ..
Numerical reconciliation of income tax expense to prima facie tax payable:Profit/(loss) before income tax expense (35,112) 52,631 .. ..Less (profit)/loss of non taxable entities (345) (327) .. ..Plus dividend received from AZJ (6,289) (10,343) .. ..
Profit/(loss) before income tax expense from taxable entities (41,746) 41,961 .. ..
Tax at the Australian company tax rate of 30% (12,523) 12,589 .. ..Income tax expense/(benefit) (12,523) 12,589 .. ..
Consolidated Entity Parent Entity
14 Cash and ash equivalents
Cash on hand and at bank 37,250 53,117 37,247 53,116QTC Cash Fund 83,020 77,112 .. ..
Cash at the end of financial year 120,270 130,229 37,247 53,116
Accounting Policy – Cash and cash equivalents Cash assets include all cash as well as deposits at call with financial institutions. Cash equivalents include investments with short periods to maturity that are readily convertible to cash on hand at the department’s option and that are subject to a low risk of changes in value.
Bank accounts grouped within the WoG set-off arrangement with the Queensland Treasury Corporation (QTC) do not earn interest on surplus funds. Interest earned on the aggregate set-off arrangement balance accrues to the Consolidated Fund.
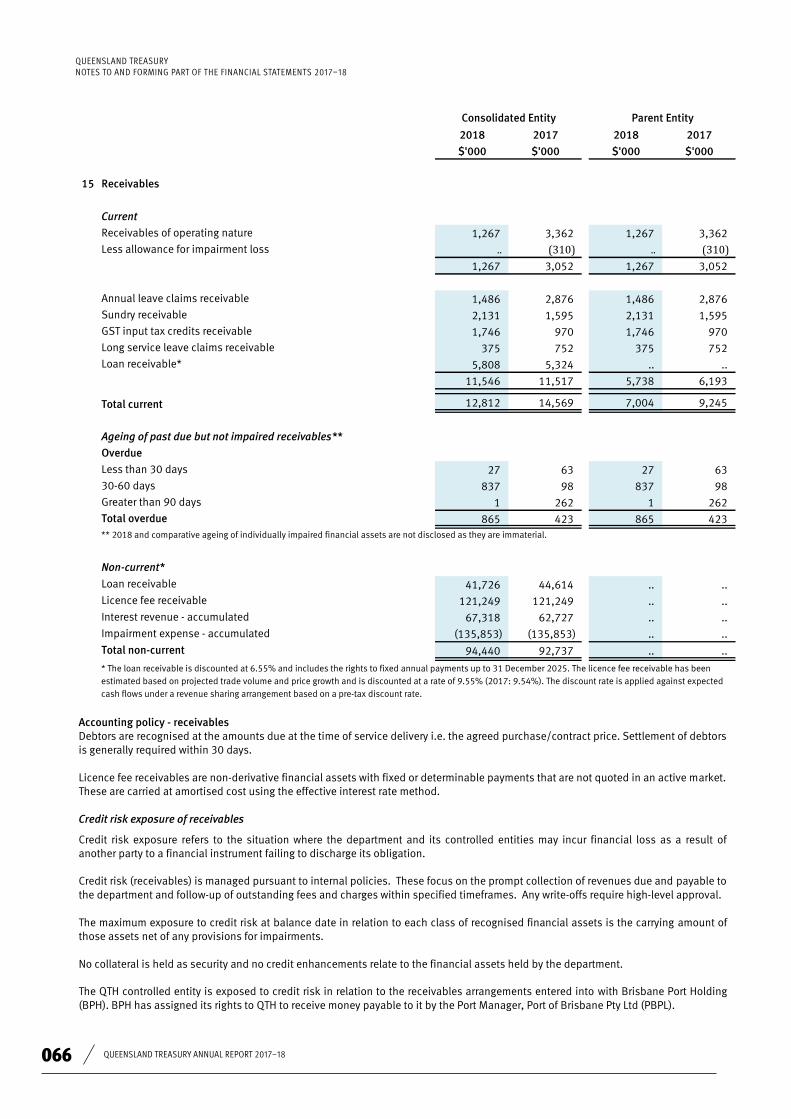
066 QUEENSLAND TREASURY ANNUAL REPORT 2017–18
QUEENSLAND TREASURYNOTES TO AND FORMING PART OF THE FINANCIAL STATEMENTS 2017–18
Queensland Treasury Notes To and Forming Part of the Financial Statements 2017-18
2018 2017 2018 2017
$'000 $'000 $'000 $'000
15 Receivables
1,267 3,362 1,267 3,362
.. (310) .. (310)1,267 3,052 1,267 3,052
1,486 2,876 1,486 2,876
2,131 1,595 2,131 1,595
1,746 970 1,746 970
375 752 375 752
5,808 5,324 .. ..
11,546 11,517 5,738 6,193
12,812 14,569 7,004 9,245
27 63 27 63
837 98 837 98
1 262 1 262
Current
Receivables of operating nature
Less allowance for impairment loss
Annual leave claims receivable
Sundry receivable
GST input tax credits receivable
Long service leave claims receivable
Loan receivable*
Total current
Ageing of past due but not impaired eceivables**
Overdue
Less than 30 days
30-60 days
Greater than 90 days
Total overdue 865 423 865 423
41,726 44,614 .. ..
121,249 121,249 .. ..
67,318 62,727 .. ..
(135,853) (135,853) .. ..
Non-current*
Loan receivable
Licence fee receivable
Interest revenue - accumulated
Impairment expense - accumulated
Total on-current 94,440 92,737 .. ..
Consolidated Entity Parent Entity
** 2018 and comparative ageing of individually impaired financial assets are not disclosed as they are immaterial.
* The loan receivable is discounted at 6.55% and includes the rights to fixed annual payments up to 31 December 2025. The licence fee receivable has been estimated based on projected trade volume and price growth and is discounted at a rate of 9.55% (2017: 9.54%). The discount rate is applied against expected cash flows under a revenue sharing arrangement based on a pre-tax discount rate.
Accounting olicy - eceivables Debtors are recognised at the amounts due at the time of service delivery i.e. the agreed purchase/contract price. Settlement of debtors is generally required within 30 days.
Licence fee receivables are non-derivative financial assets with fixed or determinable payments that are not quoted in an active market. These are carried at amortised cost using the effective interest rate method.
Credit risk exposure of receivables
Credit risk exposure refers to the situation where the department and its controlled entities may incur financial loss as a result of another party to a financial instrument failing to discharge its obligation.
Credit risk (receivables) is managed pursuant to internal policies. These focus on the prompt collection of revenues due and payable to the department and follow-up of outstanding fees and charges within specified timeframes. Any write-offs require high level approval.
The maximum exposure to credit risk at balance date in relation to each class of recognised financial assets is the carrying amount of those assets net of any provisions for impairments.
No collateral is held as security and no credit enhancements relate to the financial assets held by the department.
The QTH controlled entity is exposed to credit risk in relation to the receivables arrangements entered into with Brisbane Port Holding (BPH). BPH has assigned its rights to QTH to receive money payable to it by the Port Manager, Port of Brisbane Pty Ltd (PBPL).
22 Financial Statements – Queensland Treasury

067FINANCIAL STATEMENTS
QUEENSLAND TREASURYNOTES TO AND FORMING PART OF THE FINANCIAL STATEMENTS 2017–18
23 Financial Statements – Queensland Treasury
Queensland Treasury Notes To and Forming Part of the Financial Statements 2017-18
The allowance for impairment reflects the occurrence of loss events. The most readily identifiable loss event is where a debtor is overdue in paying a debt to the department and its controlled entities, according to the due date (normally terms of 30 days). Economic changes impacting debtors, and relevant industry data, also form part of the documented risk analysis.
If no loss events have arisen in respect of a particular debtor or group of debtors, no allowance for impairment is made in respect of that debt/group of debtors. If the department and its controlled entities determine that an amount owing by such a debtor does become uncollectible (after an appropriate range of debt recovery actions), that amount is recognised as a bad debt expense and written off directly against receivables.
2018 2017 2018 201716 Lease receivables $'000 $'000 $'000 $'000
Current
Finance lease receivable 1,351 1,288 .. ..Novation receivable 7,314 7,472 .. ..
8,665 8,760 .. ..Non-current
Finance lease receivable 105,801 107,151 .. ..Novation receivable 7,160 14,474 .. ..
112,961 121,625 .. ..Total
Lease receivable 107,152 108,439 .. ..Novation receivable 14,474 21,946 .. ..
121,626 130,385 .. ..
Finance leases
Minimum lease payments
- Not later than one year 6,471 6,471 .. ..- Later than one year and not later than five years 25,882 25,882 .. ..- Later than five years 182,522 188,992 .. ..
Minimum lease commitments receivable at balance date * 214,875 221,345 .. ..
Less future finance charges (107,723) (112,906) .. ..Total lease receivable 107,152 108,439 .. ..
Present value of minimum lease payments
- Not later than one year 6,281 6,281 .. ..- Later than one year and not later than five years 22,328 22,329 .. ..- Later than five years 78,543 79,829 .. ..
107,152 108,439 .. ..
* These lease commitments receivable represent payments due from the primary lessee under the Plant lease, On-shore sub-lease, Off-shore sub-sub-lease and Road sub-sub-lease. The terms of the Plant lease and On-shore sub-lease are 50 years each, with options to renew for a further 49 years, while the Off-shore sub-sub-lease and Road sub-sub-lease terms are 99 years each. There are no guaranteed residuals for any of the leases.
Consolidated Entity Parent Entity

068 QUEENSLAND TREASURY ANNUAL REPORT 2017–18
QUEENSLAND TREASURYNOTES TO AND FORMING PART OF THE FINANCIAL STATEMENTS 2017–18
Queensland Treasury Notes To and Forming Part of the Financial Statements 2017-18
24 Financial Statements – Queensland Treasury
2018 2017 2018 2017
$'000 $'000 $'000 $'00016 Lease receivables (continued)
Novation receivable
Operating lease
Minimum lease payments
- Not later than one year 7,877 8,391 .. ..- Later than one year and not later than five years 7,376 15,253 .. ..
Minimum novation payments receivable at balance date * 15,253 23,644 .. ..
Less: future finance charges (779) (1,698) .. ..Total novation receivable 14,474 21,946 .. ..
Present value of minimum lease payments- Not later than one year 7,648 8,147 .. ..- Later than one year and not later than five years 6,826 13,799 .. ..
14,474 21,946 .. ..
Consolidated Entity Parent Entity
* The novation receivable represents payments owing to North Queensland Bulk Ports Corporation Limited from DBCT Management Pty Ltd which has been novated to DBCT Holdings Pty Ltd. The novation payments to be made are set out in the Framework Agreement, with the final payment to be made on 30 June2020.
17 Other financial assets
Current
Shares – AZJ * 237,830 294,404 .. ..
237,830 294,404 .. ..
Non-current
Shares held in unlisted company at cost 6,833 6,833 6,833 6,833QIC investments (net) - Business Development Fund at cost ** 39,630 20,000 39,630 20,000
46,463 26,833 46,463 26,833
* The QTH controlled entity holds 54,926,186 shares (2017: 54,926,186 shares) in AZJ, purchased at the institutional price of $2.55 per share. The shares aremarket valued based on the closing listed share price of $4.33 per share (2017: $5.36).
Accounting Policy – Other financial assets The department carries equity investments in unlisted companies at cost under AASB 139 Financial Instruments: Recognition and Measurement. The fair value of the investments cannot be reliably determined due to inactive markets for identical investments.
Impairment **The assessment of impairment requires significant judgement as the investments are in businesses that are in a start-up phase with limited financial information available to assess future financial performance which would support the carrying value of the investment. Each investment is reviewed to identify if there are any indicators of impairment and if so a provision for estimated loss is assigned (currently set at 50% or 100%) based on information provided by the investees’ management teams and may include valuations attributed to the investee as a result of subsequent funding rounds, audited or unaudited financial statements, cashflow projections and various other management reports. The impairment is reversed if the financial performance of the investor subsequently improves. Impairment expense for the 2018 financial year is $0.370 million (2017: nil), refer note 11.
Investments are fully impaired when the business is no longer operating or plans have commenced to wind up the entity.

069FINANCIAL STATEMENTS
QUEENSLAND TREASURYNOTES TO AND FORMING PART OF THE FINANCIAL STATEMENTS 2017–18
Queensland Treasury Notes To and Forming Part of the Financial Statements 2017-18
25 Financial Statements – Queensland Treasury
2018 2017 2018 2017
$'000 $'000 $'000 $'000
18 Intangibles
Internally generated software
– at cost 18,703 11,092 18,703 11,092– accumulated amortisation (4,274) (4,871) (4,274) (4,871)
14,429 6,221 14,429 6,221Other software/licences
– at cost 10,091 10,250 10,091 10,250– accumulated amortisation (9,613) (9,468) (9,613) (9,468)
478 782 478 782Work in progress
– at cost 4,876 3,937 4,876 3,937
4,876 3,937 4,876 3,937Total intangibles
– net book value 19,783 10,940 19,783 10,940
Consolidated Entity Parent Entity
Accounting Policy – Intangibles
All intangible assets of the department have finite useful lives and are amortised on a straight-line basis.
For each class of intangible asset, the following amortisation rates were used:
Intangibles Amortisation rates– Internally generated software 7.14% - 20%– Purchased software/licences 12.5% - 25%
Reconciliation
2018 2017 2018 2017 2018 2017 2018 2017
$'000 $'000 $'000 $'000 $'000 $'000 $'000 $'000
Carrying amount at 1 July 6,221 5,648 782 990 3,937 1,843 10,940 8,481Acquisitions 10,715 .. .. 500 2,828 4,619 13,543 5,119MoG Transfer in .. .. .. .. .. .. .. ..MoG Transfer out (1,407) .. (128) .. (787) .. (2,322) ..Disposals .. (404) .. .. .. .. .. (404)Transfers between asset classes 1,102 2,366 .. 159 (1,102) (2,525) .. ..Amortisation * (2,202) (1,389) (176) (867) .. .. (2,378) (2,256)Carrying amount at 30 June 14,429 6,221 478 782 4,876 3,937 19,783 10,940
* Amortisation of intangibles is included in the line item 'Depreciation and amortisation' in the Statement of Comprehensive Income.
Treasury has intangibles which are fully amortised and still in use that had an original cost of $9.869 million (2016–17: $9.733 million).
Internally generated software
Other software/licences
Software works in progress
Total

070 QUEENSLAND TREASURY ANNUAL REPORT 2017–18
QUEENSLAND TREASURYNOTES TO AND FORMING PART OF THE FINANCIAL STATEMENTS 2017–18
Queensland Treasury Notes To and Forming Part of the Financial Statements 2017-18
26 Financial Statements – Queensland Treasury
2018 2017 2018 2017
$'000 $'000 $'000 $'000
19 Deferred tax asset
The balance comprises temporary differences attributable to:
Long term receivable – BPH licence fee 20,564 21,944 .. ..
20,564 21,944 .. ..
Consolidated Entity Parent Entity
20 Payables
Current
Payables of operating nature 20,525 16,281 20,525 16,281Interdepartmental payable .. 2,147 .. 2,147Deferred appropriation for departmental services payable 18,698 15,241 18,698 15,241FBT payable 202 387 83 289GST payable 139 352 139 352Sundry payables 353 359 11 10
39,916 34,767 39,455 34,320
Non-currentPayables of operating nature. 4,974 2,796 4,974 2,796
4,974 2,796 4,974 2,796
Accounting Policy - Payables Creditors are recognised upon receipt of goods and services at the agreed purchase price. Amounts owing are generally settled on 30-day terms.
21 Other current liabilities
Current
Unearned revenue 197 396 197 396Sub-lease on land* 342 337 .. ..
539 733 197 396
Non-currentSub-lease on land* 2,039 2,378 .. ..
2,039 2,378 .. ..
* The QTH controlled entity, through DBCTH, has deferred revenue resulting from an upfront payment on a long-term lease arrangement.
Accounting Policy – Lease receivables
Deferred Revenue he consolidated entity thro h D has deferred reven e res ltin from an pfront payment on a lon term lease
arran ement. he deferred reven e is amortised in proportion to the relevant lease payments.
22 Deferred tax liabilities
Attributable to temporary differences:
Financial assets at fair value – AZJ 29,330 46,302 .. ..Investments in subsidiaries – DBCTH 178 178 .. ..
29,508 46,480 .. ..
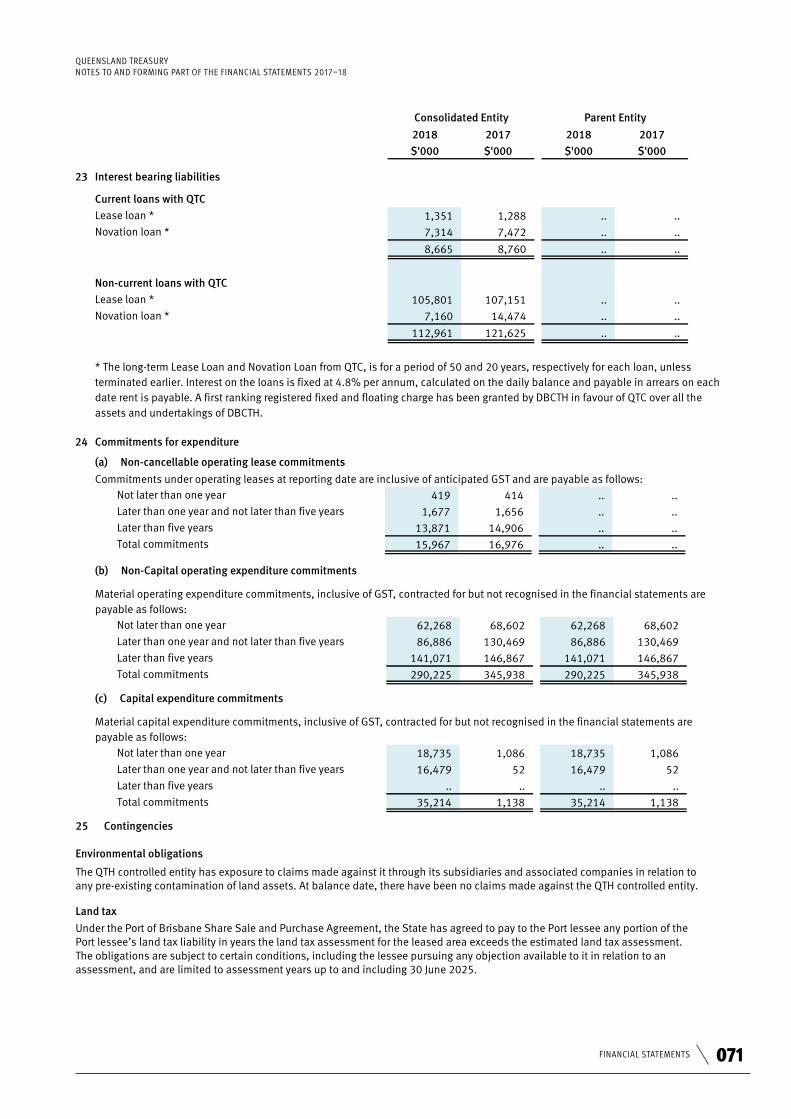
071FINANCIAL STATEMENTS
QUEENSLAND TREASURYNOTES TO AND FORMING PART OF THE FINANCIAL STATEMENTS 2017–18
Queensland Treasury Notes To and Forming Part of the Financial Statements 2017-18
27 Financial Statements – Queensland Treasury
2018 2017 2018 2017
$'000 $'000 $'000 $'000
23 Interest bearing liabilities
Current loans with QTC
Lease loan * 1,351 1,288 .. ..Novation loan * 7,314 7,472 .. ..
8,665 8,760 .. ..
Non-current loans with QTC
Lease loan * 105,801 107,151 .. ..Novation loan * 7,160 14,474 .. ..
112,961 121,625 .. ..
* The long-term Lease Loan and Novation Loan from QTC, is for a period of 50 and 20 years, respectively for each loan, unless terminated earlier. Interest on the loans is fixed at 4.8% per annum, calculated on the daily balance and payable in arrears on eachdate rent is payable. A first ranking registered fixed and floating charge has been granted by DBCTH in favour of QTC over all the assets and undertakings of DBCTH.
Consolidated Entity Parent Entity
24 Commitments for expenditure
(a) Non-cancellable operating lease commitments
Not later than one year 419 414 .. ..Later than one year and not later than five years 1,677 1,656 .. ..Later than five years 13,871 14,906 .. ..Total commitments 15,967 16,976 .. ..
(b) Non-Capital operating expenditure commitments
Not later than one year 62,268 68,602 62,268 68,602Later than one year and not later than five years 86,886 130,469 86,886 130,469Later than five years 141,071 146,867 141,071 146,867Total commitments 290,225 345,938 290,225 345,938
(c) Capital expenditure commitments
Not later than one year 18,735 1,086 18,735 1,086Later than one year and not later than five years 16,479 52 16,479 52Later than five years .. .. .. ..Total commitments 35,214 1,138 35,214 1,138
Material capital expenditure commitments, inclusive of GST, contracted for but not recognised in the financial statements are payable as follows:
Material operating expenditure commitments, inclusive of GST, contracted for but not recognised in the financial statements are payable as follows:
Commitments under operating leases at reporting date are inclusive of anticipated GST and are payable as follows:
25 Contingencies
Environmental obligations
The QTH controlled entity has exposure to claims made against it through its subsidiaries and associated companies in relation to any pre-existing contamination of land assets. At balance date, there have been no claims made against the QTH controlled entity.
Land tax Under the Port of Brisbane Share Sale and Purchase Agreement, the State has agreed to pay to the Port lessee any portion of the Port lessee’s land tax liability in years the land tax assessment for the leased area exceeds the estimated land tax assessment. The obligations are subject to certain conditions, including the lessee pursuing any objection available to it in relation to an assessment, and are limited to assessment years up to and including 30 June 2025.
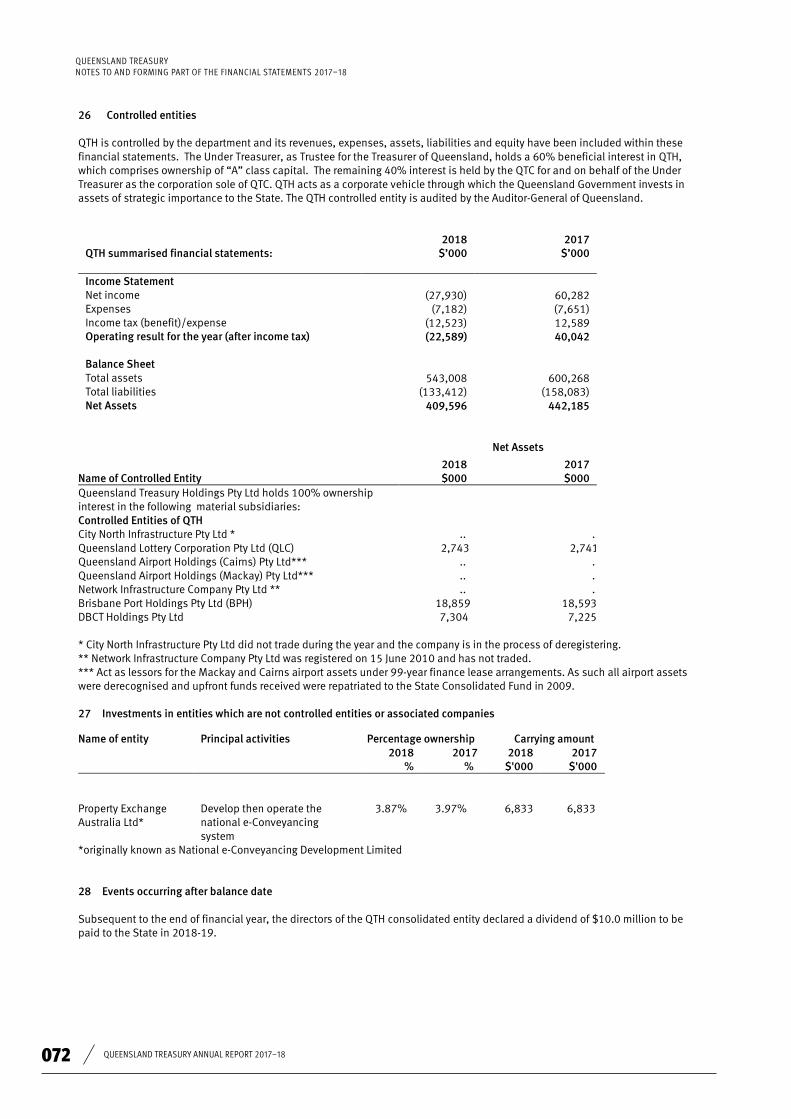
072 QUEENSLAND TREASURY ANNUAL REPORT 2017–18
QUEENSLAND TREASURYNOTES TO AND FORMING PART OF THE FINANCIAL STATEMENTS 2017–18Queensland Treasury Notes To and Forming Part of the Financial Statements 2017-18
28 Financial Statements – Queensland Treasury
26 Controlled entities
QTH is controlled by the department and its revenues, expenses, assets, liabilities and equity have been included within these financial statements. The Under Treasurer, as Trustee for the Treasurer of Queensland, holds a 60% beneficial interest in QTH, which comprises ownership of “A” class capital. The remaining 40% interest is held by the QTC for and on behalf of the Under Treasurer as the corporation sole of QTC. QTH acts as a corporate vehicle through which the Queensland Government invests in assets of strategic importance to the State. The QTH controlled entity is audited by the Auditor-General of Queensland.
QTH summarised financial statements: 2018
$’000 2017
$’000
(27,930) 60,282 (7,182)
(12,523) (7,651) 12,589
(22,589) 40,042
543,008 600,268 (133,412) (158,083)
Income Statement Net income Expenses Income tax (benefit)/expense Operating result for the year (after income tax)
Balance Sheet Total assets Total liabilities Net Assets 409,596 442,185
Name of Controlled Entity
Net Assets
2018 $000
2017 $000
Queensland Treasury Holdings Pty Ltd holds 100% ownership interest in the following material subsidiaries: Controlled Entities of QTH City North Infrastructure Pty Ltd * .. .. Queensland Lottery Corporation Pty Ltd (QLC) 2,743 2,741 Queensland Airport Holdings (Cairns) Pty Ltd*** .. .. Queensland Airport Holdings (Mackay) Pty Ltd*** .. .. Network Infrastructure Company Pty Ltd ** .. .. Brisbane Port Holdings Pty Ltd (BPH) 18,859 18,593 DBCT Holdings Pty Ltd 7,304 7,225
* City North Infrastructure Pty Ltd did not trade during the year and the company is in the process of deregistering.** Network Infrastructure Company Pty Ltd was registered on 15 June 2010 and has not traded. *** Act as lessors for the Mackay and Cairns airport assets under 99-year finance lease arrangements. As such all airport assetswere derecognised and upfront funds received were repatriated to the State Consolidated Fund in 2009.
27 Investments in entities which are not controlled entities or associated companies
Name of entity Principal activities Percentage ownership Carrying amount 2018 2017 2018 2017
% % $'000 $'000
Property Exchange Australia Ltd*
Develop then operate the national e-Conveyancing system
3.87% 3.97% 6,833 6,833
*originally known as National e-Conveyancing Development Limited
28 Events occurring after balance date
Subsequent to the end of financial year, the directors of the QTH consolidated entity declared a dividend of $10.0 million to be paid to the State in 2018-19.

073FINANCIAL STATEMENTS
QUEENSLAND TREASURYNOTES TO AND FORMING PART OF THE FINANCIAL STATEMENTS 2017–18Queensland Treasury
Notes To and Forming Part of the Financial Statements 2017-18
29 Financial Statements – Queensland Treasury
29 Financial instruments
(a) Accounting policy
Recognition
Financial assets and financial liabilities are recognised in the Statements of Financial Position when the department becomes party to the contractual provisions of the financial instrument.
Classification Financial instruments are classified and measured as follows:
1. Financial assets – held at costo Cash and cash equivalents
2. Financial assets – amortised costo Receivables (mostly held at cost)o Lease receivables o Loans and advances
3. Financial assets at fair value through profit or loss – held at fair valueo Other financial assets – Shares in Aurizon Holdings Ltd (AZJ)
4. Equity Instrument – held at cost o Other financial assets
5. Financial liabilities – held at amortised cost o Payables (held at cost)o Interest bearing liabilities – Commonwealth, QTC borrowings and Advances payable to GOC’s
(b) Categorisation of financial instruments
The consolidated entity has the following categories of financial assets and financial liabilities:
Note 2018 2017$'000 $'000
Financial assets
Cash and cash equivalents 14 120,270 130,229
Receivables* 15 107,252 107,306
Finance lease receivables 16 121,626 130,385
Other financial assets 17
Shares – AZJ 237,830 294,404
Shares held in unlisted company at cost 6,833 6,833
QIC investments, Business Development Fund 39,630 20,000Total 633,440 689,157
Financial liabilities
Payables 20 39,916 34,767
Interest bearing liabilities 23 121,626 130,385Total 161,542 165,152
*The loan receivable is discounted at 6.55% and includes the rights to fixed annual payments up to 31 December 2025.
Category
(c) Financial risk management
The consolidated entity’s activities expose it to a variety of financial risks – credit risk (refer notes 15 & 42), liquidity risk and market risk.
Financial risk management is implemented pursuant to Government and Treasury policy. These policies focus on the unpredictability of financial markets and seek to minimise potential adverse effects on the financial performance of the department.
The department and its controlled entities manage exposure to these financial risks through advice and consultation with QTCprimarily in relation to borrowing activities. Risk management parameters are reviewed regularly to reflect changes in marketconditions and changes to the department and its controlled entities’ activities.
ValuationInterest bearing liabilities are initially recognised at fair value, plus any transaction costs directly attributable to the interest-bearing liability, then subsequently held at amortised cost using the effective interest method. The effective interest rate is the rate that exactly discounts estimated future cash payments or receipts through the expected life of a financial instrument (or, when appropriate, a shorter period) to the net carrying amount of that instrument. The consolidated entity’s activities expose it to a variety of financial risks – credit risk, liquidity risk and market risk. For discussion on managing credit risk, refer to notes 15 and 42.
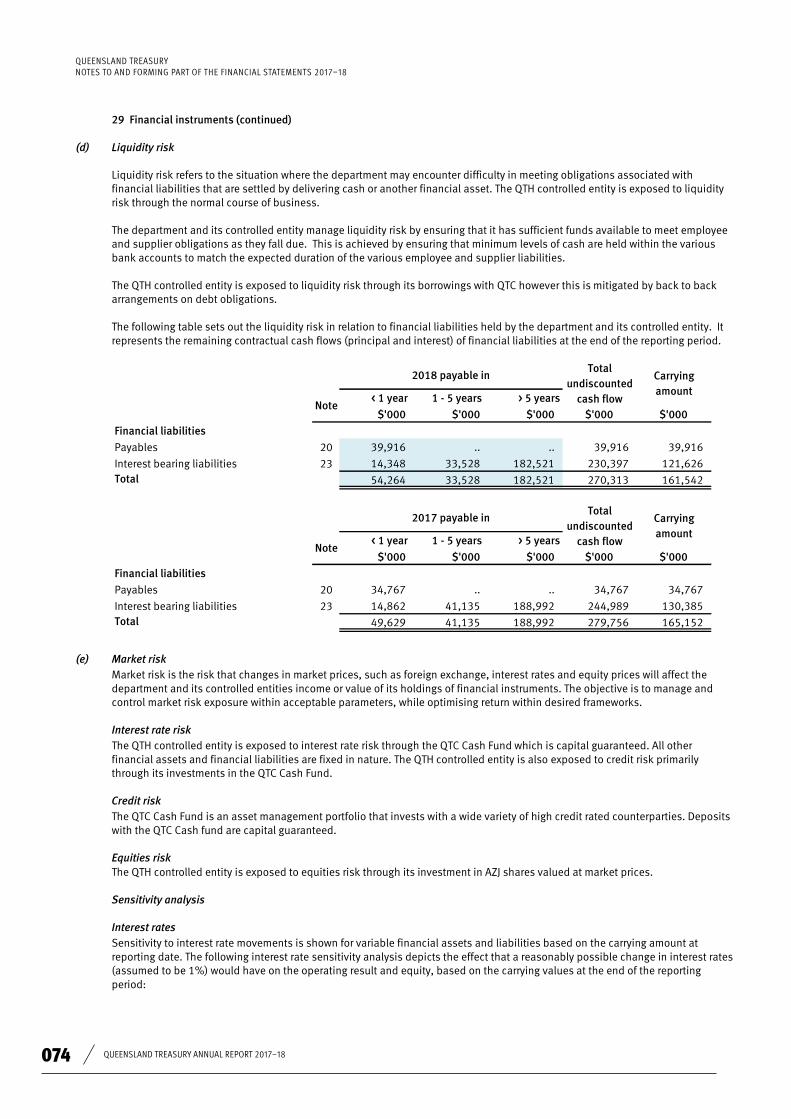
074 QUEENSLAND TREASURY ANNUAL REPORT 2017–18
QUEENSLAND TREASURYNOTES TO AND FORMING PART OF THE FINANCIAL STATEMENTS 2017–18
Queensland Treasury Notes To and Forming Part of the Financial Statements 2017-18
30 Financial Statements – Queensland Treasury
29 Financial instruments (continued)
(d) Liquidity risk
Liquidity risk refers to the situation where the department may encounter difficulty in meeting obligations associated withfinancial liabilities that are settled by delivering cash or another financial asset. The QTH controlled entity is exposed to liquidity risk through the normal course of business.
The department and its controlled entity manage liquidity risk by ensuring that it has sufficient funds available to meet employee and supplier obligations as they fall due. This is achieved by ensuring that minimum levels of cash are held within the various bank accounts to match the expected duration of the various employee and supplier liabilities.
The QTH controlled entity is exposed to liquidity risk through its borrowings with QTC however this is mitigated by back to backarrangements on debt obligations.
The following table sets out the liquidity risk in relation to financial liabilities held by the department and its controlled entity. It represents the remaining contractual cash flows (principal and interest) of financial liabilities at the end of the reporting period.
< 1 year 1 - 5 years > 5 years
$'000 $'000 $'000 $'000 $'000
Financial liabilities
Payables 20 39,916 .. .. 39,916 39,916
Interest bearing liabilities 23 14,348 33,528 182,521 230,397 121,626Total 54,264 33,528 182,521 270,313 161,542
< 1 year 1 - 5 years > 5 years
$'000 $'000 $'000 $'000 $'000
Financial liabilities
Payables 20 34,767 .. .. 34,767 34,767
Interest bearing liabilities 23 14,862 41,135 188,992 244,989 130,385Total 49,629 41,135 188,992 279,756 165,152
2017 payable inTotal
undiscounted cash flow
Carrying amount
Note
2018 payable inTotal
undiscounted cash flow
Carrying amount
Note
(e) Market risk Market risk is the risk that changes in market prices, such as foreign exchange, interest rates and equity prices will affect the department and its controlled entities income or value of its holdings of financial instruments. The objective is to manage and control market risk exposure within acceptable parameters, while optimising return within desired frameworks.
Interest rate risk The QTH controlled entity is exposed to interest rate risk through the QTC Cash Fund which is capital guaranteed. All other financial assets and financial liabilities are fixed in nature. The QTH controlled entity is also exposed to credit risk primarily through its investments in the QTC Cash Fund.
Credit risk The QTC Cash Fund is an asset management portfolio that invests with a wide variety of high credit rated counterparties. Deposits with the QTC Cash fund are capital guaranteed.
Equities risk The QTH controlled entity is exposed to equities risk through its investment in AZJ shares valued at market prices.
Sensitivity analysis
Interest rates Sensitivity to interest rate movements is shown for variable financial assets and liabilities based on the carrying amount at reporting date. The following interest rate sensitivity analysis depicts the effect that a reasonably possible change in interest rates (assumed to be 1%) would have on the operating result and equity, based on the carrying values at the end of the reportingperiod:

075FINANCIAL STATEMENTS
QUEENSLAND TREASURYNOTES TO AND FORMING PART OF THE FINANCIAL STATEMENTS 2017–18
Queensland Treasury Notes To and Forming Part of the Financial Statements 2017-18
31 Financial Statements – Queensland Treasury
29 Financial instruments (continued)
(e) Market risk (continued)
Financial instruments Profit Equity Profit Equity
$'000 $'000 $'000 $'000 $'000
Cash * 83,023 (830) (830) 830 830Potential impact (830) (830) 830 830
* excludes fixed rate or non-interestbearing assets
Financial instruments Profit Equity Profit Equity
$'000 $'000 $'000 $'000 $'000
Cash* 77,113 (771) (771) 771 771Potential impact (771) (771) 771 771
* excludes fixed rate or non-interest bearing assets
2017 Interest rate risk
Carrying amount
-1% 1%
Carrying amount
-1% 1%
2018 Interest rate risk
Equities
Sensitivity analysis for equity instruments is based on a reasonably possible change in the ASX200 share price which is estimated at +/- 10% (2017: +/- 10%).
Financial instruments Profit Equity Profit Equity
$'000 $'000 $'000 $'000 $'000
Other financial assets – Shares – AZJ 237,830 (23,783) (23,783) 23,783 23,783Potential impact (23,783) (23,783) 23,783 23,783
Financial instruments Profit Equity Profit Equity
$'000 $'000 $'000 $'000 $'000
Other financial assets – Shares – AZJ 294,404 (29,440) (29,440) 29,440 29,440Potential impact (29,440) (29,440) 29,440 29,440
Carrying amount
-10% 10%
2017 Equities
-10% 10%
2018 Equities
Carrying amount
(f) Fair value
Fair value hierarchy
Financial instruments measured at fair value have been classified in accordance with the hierarchy described in AASB 13 Fair Value Measurement. The fair value hierarchy is categorised into three levels based on the observability of the inputs to fair valuation techniques.
level 1 – represents fair value measurements that reflect unadjusted quoted market prices in active markets for identical assets and liabilities level 2 – represents fair value measurements that are substantially derived from inputs (other than quoted prices included within level 1) that are observable, either directly or indirectly and level 3 – represents fair value measurements that are substantially derived from unobservable inputs.

076 QUEENSLAND TREASURY ANNUAL REPORT 2017–18
QUEENSLAND TREASURYNOTES TO AND FORMING PART OF THE FINANCIAL STATEMENTS 2017–18
Queensland Treasury Notes To and Forming Part of the Financial Statements 2017-18
32 Financial Statements – Queensland Treasury
29 Financial instruments (continued)
(f) Fair value (continued)
According to the above hierarchy, the fair values of each class of asset recognised at fair value are as follows:
Level 1
$'000
Level 2
$'000
Level 3
$'000
Total$'000
Financial assets
Cash and cash equivalents 37,250 83,020 .. 120,270
Other financial assets – Shares – AZJ 237,830 .. .. 237,830
Total 275,080 83,020 .. 358,100
Level 1
$'000
Level 2
$'000
Level 3
$'000
Total$'000
Financial assets
Cash and cash equivalents 53,117 77,112 .. 130,229
Other financial assets – Shares – AZJ 294,404 .. .. 294,404
Total 347,521 77,112 .. 424,633
Classification according to fair value hierarchy
Classification according to fair value hierarchy
2018 Carrying amount
2017 Carrying amount
Class
Class
Classification of instruments into fair value hierarchy levels is reviewed annually, and any transfers are deemed to occur at the end of the reporting period. There were no transfers between Level 1 and Level 2 and no transfers in or out of Level 3 during the year ended 30 June 2018.
Level 2 instruments for the QTC Cash Fund are measured at net realisable value.
The fair values of financial assets and liabilities not carried at fair value at balance date are as follows:
Carrying amount
Fair value Carrying amount
Fair value
$'000 $'000 $'000 $'000Financial asset
Loan receivable ^ 15 47,534 54,243 49,938 57,894Licence fee receivable ^ 15 52,714 64,415 48,123 60,069Total 100,248 118,658 98,061 117,963^ QTH only
Note
2018 2017
For financial assets and financial liabilities, fair values have been based on the following:
• Loans and advances are discounted to present value using a discount rate considering the entity specific risks and using valuation techniques.
• The lease receivable and associated interest-bearing liabilities (lease loan and novation loan) are back to back leasingarrangements held by DBCTH. Both the lease receivable and associated loan fair values are reasonably approximate to the carrying value at balance date due to the offsetting nature of these arrangements.

077FINANCIAL STATEMENTS
QUEENSLAND TREASURYNOTES TO AND FORMING PART OF THE FINANCIAL STATEMENTS 2017–18
Queensland Treasury Notes To and Forming Part of the Financial Statements 2017-18
33 Financial Statements – Queensland Treasury
30 Budget vs Actual comparison - Controlled
NB. A budget vs actual comparison, and explanations of major variances, has not been included for the Statement of Changes in Equity, as major variances relating to that statement have been addressed in explanations of major variances for other statements.
Explanation of major variances for Statement of Comprehensive Income
Note 4. User charges and fees – The increase is primarily driven by the volume and values of reimbursable projects managed by the Commercial Group unknown during budget development ($1.030M). Also contributing is $0.389M in the OSR which primarily relates to greater than anticipated contribution to the QGrants system from other departments, $0.368M higher than expected corporate support charges and $0.184M unbudgeted salary reimbursements received. This is partially offset by $0.209M in lower than anticipated licencing charges and self-insurance levies in OIR.
Face Other revenue – The increase is primarily due to unbudgeted revenue of $0.242M from the Department of Natural Resources, Mines and Energy (DNRME) and OIR for works associated with finance systems, $0.199M higher than anticipated OIR fines and forfeiture revenue, and $0.178M in the OSR for proceeds of legal proceedings.
Note 10. Grants and subsidies – The increase is mainly due to greater than budgeted grant payments of $2.350M in the OIR primarily relates to grants paid to the Queensland Ambulance Service (QAS). Also contributing are grant payments of $2.032M to the Department of Environment and Science and DNRME for the Financial Assurance Framework Reforms.
Face Depreciation and amortisation – The decrease relates to $3.720M in the OSR due to a changed capitalisation schedule for capital expenditure associated with the OSR Transformation Program and Secure the Integrity of the State Revenue Base.
Note 11. Impairment expenses – The increase reflects the annual review of the Business Development Fund investments.
Note 12. Other expenses – The increase primarily relates to the recognition of appropriation payable resulting from the re-profiling of a number of departmental projects and initiatives from 2017-18 to future years, in accordance with section 3B.2 of the Financial Reporting Requirements.
Explanation of major variances for Statement of Financial Position
Note 14. Cash and cash equivalents – The increase is primarily due to increased payables ($37.816M) at 30 June, partially offset by cash returned to the Consolidated Fund as a result of conversion from equity to output funding ($14M).
Note 17. Other financial assets – The increase relates to investment by the Business Development Fund. The Fund supports the growth of angel and venture capital funding available to Queensland businesses, thereby strengthening Queensland's entrepreneurial and start-up ecosystem.
Note 18. Intangible assets – The increase is mainly due to lower than anticipated amortisation costs as a result of a changed amortisation schedule for capital expenditure associated with the OSR Transformation Program and Secure the Integrity of the State Revenue Base. Also contributing is unbudgeted capital expenditure associated with the Financial Assurance Framework Reforms.
Note 20. Payables (Current) - The increase is mainly due to $18.697M in appropriation payable resulting from re-profiling of a number of departmental programs and initiatives from 2017-18 to future years. Also contributing are higher than anticipated operational payables primarily in OSR and the State Penalties Enforcement Registry.
Face Payables (Non-current) – The increase is a result of the straight-line methodology adopted for lease expenses after assessing the application of AASB 117 to leased property portfolio.

078 QUEENSLAND TREASURY ANNUAL REPORT 2017–18
QUEENSLAND TREASURYNOTES TO AND FORMING PART OF THE FINANCIAL STATEMENTS 2017–18
34 Financial Statements – Queensland Treasury
30 Budget vs Actual comparison – Controlled (continued)
Explanation of major variances for Statement of Cash Flows
Operating Activity inflows GST input tax credits from ATO – The variance is due to the amount of Input tax credits paid by the Australian Taxation Office (ATO) for supplier invoices processed which were not budgeted for.
Other – The increase is primarily due to unbudgeted revenue of $0.242M from the DNRME and OIR for works associated with the finance systems, $0.199M in higher than anticipated OIR fines and forfeiture revenue, and $0.178M in unbudgeted OSR proceeds from legal proceedings.
Operating Activity outflows Grants and subsidies – The increase is mainly due to greater than budgeted grant payments of $2.350M in OIR primarily relating to grants paid to QAS. Also contributing are grant payments of $2.032M to the Department of Environment and Science and DNRME associated with the Financial Assurance Framework Reforms.
GST remitted to ATO – The variance is due to GST input credit collected and remitted to the ATO for customer invoices processed which were not budgeted for.
Other – The increase primarily relates to the CleanCo project, unbudgeted goods and services received below fair value and a cost reimbursement paid to the Department of Justice and Attorney-General.
Investing Activity outflows Payments for property, plant and equipment – The decrease is due to a lower than anticipated asset replacement.
Payments for investments – The increase relates to additional investment by the Business Development Fund.
Payments for intangibles – The increase primarily relates to $0.980M additional capital acquisition associated with the implementation of the Financial Assurance Framework Reforms. Also contributing is higher than expected capital acquisition associated with the OSR Transformation Program and a number of unbudgeted software acquisitions in OIR.
Financing Activity inflows Equity injections – The increase primarily relates to $10M in additional investment by the Business Development Fund and $5.445M to implement the Financial Assurance Framework.
Financing Activity outflows Equity withdrawals – The increase primarily relates to a conversion of $14M from equity to appropriation funding. Also contributing is the payments of $3.691M in capital funding associated with the Financial Assurance Framework Reforms to other Government departments through equity transfers.

079FINANCIAL STATEMENTS
QUEENSLAND TREASURYADMINISTERED STATEMENT OF COMPREHENSIVE INCOMEFOR THE YEAR ENDED 30 JUNE 2018
35 Financial Statements – Queensland Treasury
2018 2018 2018 2017
ActualAdjusted Budget
Budget Variance*
Actual
Notes $'000 $'000 $'000 $'000
01 - Grant
Grants and other contributions 31 19,859,938 19,917,397 (57,459) 19,559,57902 -
Taxes Taxes 32 10,818,926 10,925,654 (106,728) 10,630,683
04 - Royal
Royalties 33 4,263,206 3,332,706 930,500 3,846,73705 -
FinanInterest 34 35,580 53,351 (17,771) 54,941
06 - Admi
Appropriation revenue 35 5,944,629 6,124,065 (179,436) 6,082,39503 -
User User charges and fees 71,248 73,587 (2,339) 105,390
07 - Other
Other revenue 36 381,050 369,871 11,179 358,015
41,374,578 40,796,631 577,947 40,637,740
08 - Suppl
Supplies and services 37 157,855 160,221 (2,366) 167,79613 -
LosseLosses on receivables 38 88,014 57,844 30,170 10,042
12 - Finan
Finance/borrowing costs 39 1,389,795 1,440,314 (50,519) 1,811,93410 -
GrantGrants and subsidies 296,563 355,577 (59,014) 221,531
16 - Other
Other expenses 40 4,070,449 4,167,953 (97,504) 3,865,550
6,002,677 6,181,909 (179,232) 6,076,853
35,371,901 34,614,722 757,179 34,560,887
35,371,901 34,614,722 757,179 34,560,887
Transfers of administered revenue to government 35,371,901 34,614,722 757,179 34,560,887
.. .. .. ..
Income from continuing operations
Revenue
Total income from continuing operations
Queensland Treasury
Administered Statement of Comprehensive Income
for the year ended 30 June 2018
Income and expenses administered on behalf of the whole-of-government
Total administered comprehensive income
Expenses from continuing operations
Total expenses from continuing operations
Operating result from continuing operations before transfers to government
The accompanying notes form part of these statements.
Operating result for the year before transfers to government
* An explanation of major variances is included at Note 49.
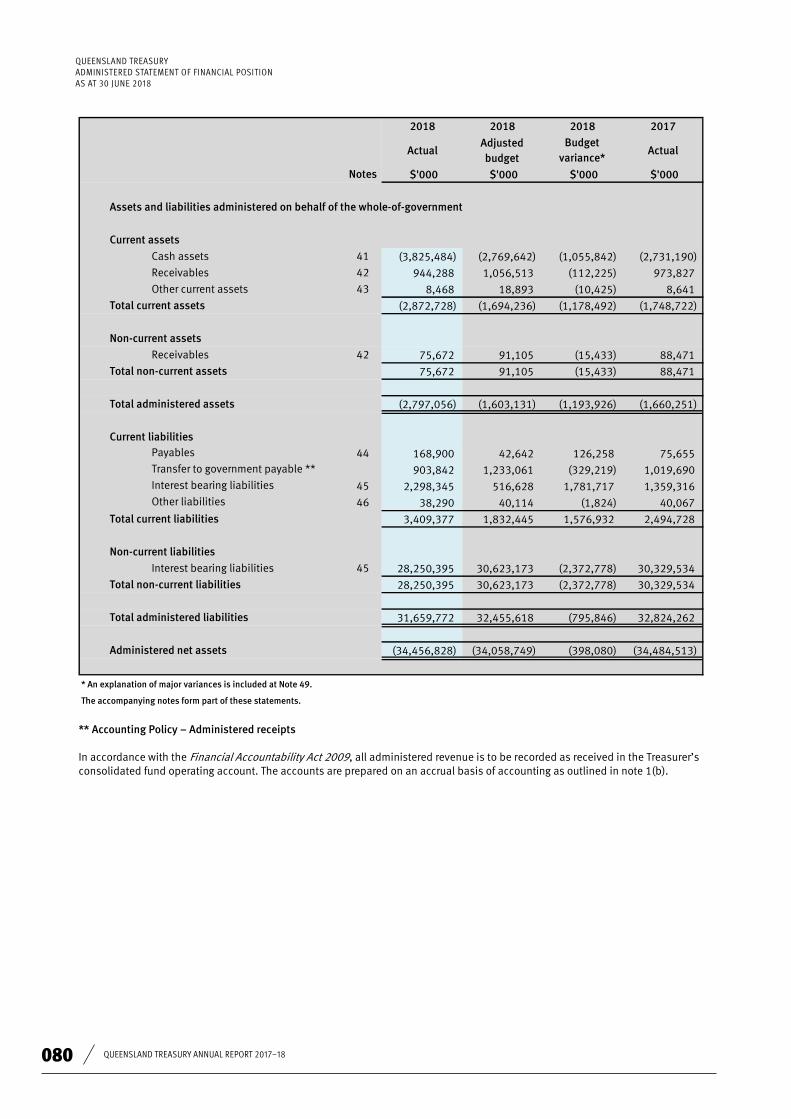
080 QUEENSLAND TREASURY ANNUAL REPORT 2017–18
QUEENSLAND TREASURYADMINISTERED STATEMENT OF FINANCIAL POSITIONAS AT 30 JUNE 2018
36 Financial Statements – Queensland Treasury
2018 2018 2018 2017
ActualAdjusted budget
Budget variance*
Actual
Notes $'000 $'000 $'000 $'000
A - Cash
Cash assets 41 (3,825,484) (2,769,642) (1,055,842) (2,731,190)B - Current receivablesD - Current loans and advancesReceivables 42 944,288 1,056,513 (112,225) 973,827E - Othe
Other current assets 43 8,468 18,893 (10,425) 8,641
(2,872,728) (1,694,236) (1,178,492) (1,748,722)
G - Non-
Receivables 42 75,672 91,105 (15,433) 88,471
75,672 91,105 (15,433) 88,471
(2,797,056) (1,603,131) (1,193,926) (1,660,251)
H - Paya
44 168,900 42,642 126,258 75,655I -
Tran903,842 1,233,061 (329,219) 1,019,690
J - Curr
45 2,298,345 516,628 1,781,717 1,359,316K -
Othe
Payables
Transfer to government payable **
Interest bearing liabilities
Other liabilities 46 38,290 40,114 (1,824) 40,067
3,409,377 1,832,445 1,576,932 2,494,728
M - Non-
L - QTC borrowingsInterest bearing liabilities 45 28,250,395 30,623,173 (2,372,778) 30,329,534
28,250,395 30,623,173 (2,372,778) 30,329,534
31,659,772 32,455,618 (795,846) 32,824,262
(34,456,828) (34,058,749) (398,080) (34,484,513)
* An explanation of major variances is included at Note 49.
Queensland Treasury
Administered Statement of Financial Position
as at 30 June 2018
Assets and liabilities administered on behalf of the whole-of-government
Non-current assets
Current assets
Non-current liabilities
Total current liabilities
Total current assets
Total non-current assets
Current liabilities
Total administered assets
Total non-current liabilities
Administered net assets
The accompanying notes form part of these statements.
Total administered liabilities
** Accounting Policy – Administered receipts
In accordance with the Financial Accountability Act 2009, all administered revenue is to be recorded as received in the Treasurer’s consolidated fund operating account. The accounts are prepared on an accrual basis of accounting as outlined in note 1(b).

081FINANCIAL STATEMENTS
QUEENSLAND TREASURYADMINISTERED STATEMENT OF CASH FLOWSFOR THE YEAR ENDED 30 JUNE 2018
37 Financial Statements – Queensland Treasury
Queensland Treasury
Administered Statement of Cash Flows
for the year ended 30 June 2018
2018 2017Notes $'000 $'000
Administered item receipts 5,876,589 6,190,887Grants and other contributions 19,859,938 19,574,309Taxes 10,814,097 10,625,687Royalties 4,393,695 3,848,675Finance income 33,047 52,879GST input tax credits from ATO 4,384 5,217Other 404,653 470,907
Transfers to government (35,479,344) (34,603,883)Grants and subsidies (296,563) (221,507)Finance costs (1,350,336) (1,532,722)Supplies and services (162,197) (173,005)GST remitted to ATO (19,126) (18,936)Other (4,042,415) (3,820,559)
36,421 397,949
Loans and advances received 21,206 21,345
Loans and advances made (3,935) (445)
17,271 20,900
Equity injections 112,870 1,008,736Advances received from GOCs 3,213,790 1,398,212Borrowings 159 18,534Transfer from redraw 1,000,000 472,066
Borrowing redemptions (12,276) (1,019,472)Transfer to redraw (3,065,000) (2,505,000)Advance redemptions to GOCs (2,312,342) (53,153)Equity withdrawals (85,187) (332,944)
(1,147,986) (1,013,021)
(1,094,294) ( 1 )
(2,731,190) ( 13 01 )
41 (3,825,484) (2,731,190)
Cash flows from investing activities
Cash flows administered on behalf of the whole-of-government
Inflows
Net cash provided by/(used in) operating activities
Outflows
Cash flows from operating activities
Inflows
Cash flows from financing activities
Inflows
Outflows
Net cash provided by/(used in) investing activities
Administered cash and cash equivalents at end of financial year
The accompanying notes form part of these statements.
Outflows
Administered cash and cash equivalents at beginning of financial year
Net cash provided by/(used in) financing activities
Net increase/(decrease) in cash and cash equivalents

082 QUEENSLAND TREASURY ANNUAL REPORT 2017–18
QUEENSLAND TREASURYRECONCILIATION OF ADMINISTERED COMPREHENSIVE INCOME TO NET CASH FROM OPERATING ACTIVITIESFOR THE YEAR ENDED 30 JUNE 2018
38 Financial Statements – Queensland Treasury
Queensland Treasury
Reconciliation of administered comprehensive income to net cash from operating activities
for the year ended 30 June 2018
2018 2017
$'000 $'000
Administered on behalf of the whole-of-government
Administered comprehensive income
Non cash finance cost adjustments (1,787) (4,317)QTC market value realisation charges .. 303,720Interest expense on QTC loans 33,288 (24,774)
Change in assets and liabilities:
(Increase)/decrease in receivables 29,128 (27,554)
.. 108,491(Increase)/decrease in other assets 173 11,975Increase/(decrease) in payables 79,221 713
14,024 68,040Increase/(decrease) in transfers to government payable (115,849) (42,997)Increase/(decrease) in other liabilities (1,777) 4,652
Net cash provided by/(used in) operating activities 36,421 397,949
Increase/(decrease) in appropriation payable
(Increase)/decrease in appropriation receivable
for the year ended 30 June 2018
Opening balance
Transfers to/(from) other Queensland
Government Entities
New Leases Acquired
Interest & Admin Fees
Cash Received Cash
RepaymentsClosing balance
Notes $'000 $'000 $'000 $'000 $'000 $'000 $'000
Interest bearing liabilities 45 1,359,316 .. .. 49,858 3,213,790 (2,324,619) 2,298,345
L - QTC borrowingsInterest bearing liabilities 45 30,329,534 .. .. (14,298) 1,000,159 (3,065,000) 28,250,395
31,688,850 .. .. 35,560 4,213,949 (5,389,619) 30,548,740
Non-current liabilities
Total administered liabilities
Current liabilities
Reconciliation of Liabilities Arising from Financing Activities
Cashflows
Assets and liabilities administered on behalf of the whole-of-government
Non-Cash Changes

083FINANCIAL STATEMENTS
QUEENSLAND TREASURYADMINISTERED STATEMENT OF COMPREHENSIVE INCOME BY MAJOR DEPARTMENTAL SERVICESFOR THE YEAR ENDED 30 JUNE 2018
39
Fina
ncia
l Sta
tem
ents
– Q
ueen
slan
d Tr
easu
ry
2018
2017
2018
2017
2018
2017
2018
2017
2018
2017
2018
2017
$'0
00$
'000
$'0
00$
'000
$'0
00$
'000
$'0
00$
'000
$'0
00$
'000
$'0
00$
'000
Inco
me
from
con
tinu
ing
oper
atio
ns
Rev
enue
Gra
nts
and
othe
r con
trib
utio
ns19
,859
,938
19,5
44,8
33..
....
....
14,7
46..
..19
,859
,938
19,5
59,5
79Ta
xes
1,27
5..
10,8
46,2
2710
,642
,412
....
....
(28,
576)
(11,
729)
10,8
18,9
2610
,630
,683
Use
r cha
rges
and
fees
....
47,8
9148
,632
23,3
5756
,758
....
....
71,2
4810
5,39
0Ro
yalti
es
....
4,26
3,20
63,
846,
737
....
....
....
4,26
3,20
63,
846,
737
Inte
rest
....
16,6
2317
,027
....
28,3
3548
,016
(9,3
78)
(10,
102)
35,5
8054
,941
App
ropr
iati
on re
venu
e18
4,31
418
0,00
923
4,24
617
9,83
3..
..5,
526,
069
5,72
2,55
3..
..5,
944,
629
6,08
2,39
5O
ther
reve
nue
142,
263
119,
877
223,
394
221,
778
....
15,3
9316
,360
....
381,
050
358,
015
Tota
l inc
ome
from
con
tinu
ing
oper
atio
ns20
,187
,790
19,8
44,7
1915
,631
,587
14,9
56,4
1923
,357
56,7
585,
569,
797
5,80
1,67
5(3
7,95
4)(2
1,83
1)41
,374
,577
40,6
37,7
40
Supp
lies
and
serv
ices
126,
477
136,
905
5,22
25,
086
....
26,1
5625
,805
....
157,
855
167,
796
Loss
es o
n re
ceiv
able
s..
..88
,014
10,0
78..
(36)
....
....
88,0
1410
,042
Gra
nts
and
subs
idie
s50
,567
34,5
3920
0,24
216
2,89
9..
..45
,754
24,0
93..
..29
6,56
322
1,53
1Fi
nanc
e/bo
rrow
ing
cost
....
205
119
....
1,39
8,96
81,
821,
917
(9,3
78)
(10,
102)
1,38
9,79
51,
811,
934
Oth
er e
xpen
ses
7,27
08,
565
28,5
7611
,730
....
4,06
3,17
93,
856,
984
(28,
576)
(11,
729)
4,07
0,44
93,
865,
550
184,
314
180,
009
322,
259
189,
912
..(3
6)5,
534,
057
5,72
8,79
9(3
7,95
4)(2
1,83
1)6,
002,
676
6,07
6,85
3
20,0
03,4
7619
,664
,710
15,3
09,3
2814
,766
,507
23,3
5756
,794
35,7
4072
,876
....
35,3
71,9
0134
,560
,887
20,0
03,4
7619
,664
,710
15,3
09,3
2814
,766
,507
23,3
5756
,794
35,7
4072
,876
....
35,3
71,9
0134
,560
,887
....
....
....
....
....
....
* In
clud
es s
uper
annu
atio
n, w
hole
-of-
gove
rnm
ent o
ffse
t acc
ount
, cen
tral
sch
emes
(ins
uran
ce, a
nnua
l lea
ve a
nd lo
ng s
ervi
ce le
ave)
, and
oth
er a
dmin
iste
red
item
s.
Tota
l adm
inis
tere
d co
mpr
ehen
sive
inco
me
Inco
me
and
expe
nses
adm
inis
tere
don
beha
lf o
f the
who
le-o
f-go
vern
men
t
Ope
rati
ng re
sult
from
con
tinu
ing
oper
atio
ns
befo
re tr
ansf
ers
to g
over
nmen
t
Tran
sfer
s of
adm
inis
tere
d co
mpr
ehen
sive
inco
me
to g
over
nmen
t
Expe
nses
from
con
tinu
ing
oper
atio
ns
Tota
l exp
ense
s fr
om c
onti
nuin
g op
erat
ions
Oth
er *
Inte
r-se
rvic
e/ac
tivi
ty
elim
inat
ions
Tota
lEc
onom
ic a
nd F
isca
l Co
-ord
inat
ion
Rev
enue
Man
agem
ent
Indu
stri
al R
elat
ions
Acc
ount
ing
Polic
y –
Allo
cati
on o
f rev
enue
s an
d ex
pens
es fr
om o
rdin
ary
acti
viti
es o
f cor
pora
te s
ervi
ces
The
depa
rtm
ent a
lloca
tes
reve
nues
and
exp
ense
s at
trib
utab
le to
cor
pora
te s
ervi
ces
to it
s co
ntro
lled
dep
artm
enta
l ser
vice
s in
the
Stat
emen
t of C
ompr
ehen
sive
Inco
me
base
d on
the
aver
age
usag
e pa
tter
ns o
f the
ser
vice
s’ k
ey d
rive
rs o
f cos
ts.

084 QUEENSLAND TREASURY ANNUAL REPORT 2017–18
QUEENSLAND TREASURYADMINISTERED STATEMENT OF ASSETS AND LIABILITIES BY MAJOR DEPARTMENTAL SERVICESAS AT 30 JUNE 2018
40
Fina
ncia
l Sta
tem
ents
– Q
ueen
slan
d Tr
easu
ry
20
18
20
17
20
18
20
17
20
18
20
17
20
18
20
17
20
18
20
17
$'0
00
$'0
00
$'0
00
$'0
00
$'0
00
$'0
00
$'0
00
$'0
00
$'0
00
$'0
00
Cas
h a
nd
cas
h e
qu
ival
ents
(41
,19
8)
(96
,36
2)
91
,86
46
8,0
86
....
(3,8
76
,15
0)
(2,7
02
,91
4)
(3,8
25
,48
4)
(2,7
31
,19
0)
Rec
eiva
ble
s5
4,1
16
30
,35
78
60
,15
19
00
,46
4..
8,3
33
30
,02
13
4,6
73
94
4,2
88
97
3,8
27
Oth
er c
urr
ent a
sset
s1
48
14
6..
....
..8
,32
08
,49
58
,46
88
,64
1
13
,06
6(6
5,8
59
)9
52
,01
59
68
,55
0..
8,3
33
(3,8
37
,80
9)
(2,6
59
,74
6)
(2,8
72
,72
8)
(1,7
48
,72
2)
Rec
eiva
ble
s..
....
....
..7
5,6
72
88
,47
17
5,6
72
88
,47
1
....
....
....
75
,67
28
8,4
71
75
,67
28
8,4
71
13
,06
6(6
5,8
59
)9
52
,01
59
68
,55
0..
8,3
33
(3,7
62
,13
7)
(2,5
71
,27
5)
(2,7
97
,05
6)
(1,6
60
,25
1)
Paya
ble
s1
62
,23
37
,40
9(2
2,5
47
)(2
4,0
83
)..
..2
9,2
14
92
,32
91
68
,90
07
5,6
55
Tran
sfer
to g
over
nm
ent p
ayab
le(4
0,1
70
)3
5,7
27
93
5,8
26
95
2,1
20
..8
,33
38
,18
62
3,5
10
90
3,8
42
1,0
19
, 69
0In
tere
st b
eari
ng
liab
iliti
es..
....
....
..2
,29
8,3
45
1,3
59
,31
62
,29
8,3
45
1,3
59
,31
6O
ther
liab
iliti
es..
..3
8,2
90
40
,06
7..
....
38
,29
04
0,0
67
12
2,0
63
43
,13
69
51
,56
99
68
,10
4..
8,3
33
2,3
35
,74
51
,47
5,1
55
3,4
09
,37
72
,49
4,7
28
Inte
rest
bea
rin
g lia
bili
ties
....
....
....
28
,25
0,3
95
30
,32
9,5
34
28
,25
0,3
95
30
,32
9,5
34
....
....
....
28
,25
0,3
95
30
,32
9,5
34
28
,25
0,3
95
30
,32
9,5
34
12
2,0
63
43
,13
69
51
,56
99
68
,10
4..
8,3
33
30
,58
6,1
40
31
,80
4,6
89
31
,65
9,7
72
32
,82
4,2
62
(10
8,9
97
)(1
08
,99
5)
44
64
46
....
(34
,34
8,2
77
)(3
4,3
75
,96
4)
(34
,45
6,8
28
)(3
4,4
84
,51
3)
** In
clud
es s
uper
ann
uati
on, w
hol
e-of
-gov
ern
men
t of
fset
acc
oun
t an
d c
entr
al s
chem
es (i
nsu
ran
ce, a
nn
ual l
eave
an
d lo
ng
serv
ice
leav
e), a
nd
oth
er a
dm
inis
tere
d it
ems
.
Tota
l non
-cur
ren
t lia
bili
ties
Ad
min
iste
red
net
ass
ets
Tota
l ad
min
iste
red
liab
iliti
es
* Th
e d
epar
tmen
t h
as s
yste
ms
in p
lace
to
allo
cate
ass
ets
and
liab
ilit
ies
by
Maj
or D
epar
tmen
tal S
ervi
ces.
Tota
lR
even
ue M
anag
emen
t*O
ther
**
Cur
ren
t as
sets
Econ
omic
an
d F
isca
l C
o-or
din
atio
nIn
dus
tria
l Rel
atio
ns*
Non
-cur
ren
t lia
bili
ties
Tota
l cur
ren
t lia
bili
ties
Cur
ren
t lia
bili
ties
Tota
l ad
min
iste
red
ass
ets
Tota
l non
-cur
ren
t as
sets
Ass
ets
and
liab
iliti
es a
dm
inis
tere
d o
nb
ehal
f of t
he
wh
ole-
of-g
over
nm
ent
Non
-cur
ren
t as
sets
Tota
l cur
ren
t as
sets

085FINANCIAL STATEMENTS
QUEENSLAND TREASURYNOTES TO AND FORMING PART OF THE FINANCIAL STATEMENTS 2017–18Queensland Treasury Notes To and Forming Part of the Financial Statements 2017-18
41 Financial Statements – Queensland Treasury
2018 2017
$'000 $'000
31 Grants and other contributions
Administered on behalf of the whole-of-government
GST revenue grant 15,128,564 13,939,043National Partnership Payments - capital project 1,660,539 2,660,997National Partnership Payments - recurrent project 477,773 557,297Specific purpose - recurrent
- Schools 1,551,299 1,414,448 - Skills and workforce development 299,240 296,292 - Disability services 406,317 341,285 - Affordable housing 272,138 269,497
Other 64,070 80,720
19,859,938 19,559,579
* Refer note 5 accounting policy.
32 Taxes
Administered on behalf of the whole-of-government
Taxes
Duties 4,497,502 4,683,602Payroll tax 3,947,625 3,735,578Land tax 1,182,968 1,083,395Gaming machine tax 715,054 683,767Gold Lotto 221,960 206,793Casino tax 104,092 98,466Golden Casket 33,481 33,672Keno tax 20,282 20,452Wagering tax 9,452 9,917Other taxes 1,961 2,241
10,734,377 10,557,883Levies
Health services levy 84,549 72,800
84,549 72,800
10,818,926 10,630,683
Accounting Policy – Taxes The main revenue streams and the governing Acts which underpin them include: • Duties Act 2001 • Payroll Tax Act 1971 • Land Tax Act 2010 • Taxation Administration Act 2001• Local Government Act 2009, (National Tax Equivalents Regime (NTER)) • Gaming Machine Act 1991, Casino Control Act 1982, Keno Act 1996, Lotteries Act 1997 and Wagering Act 1998
(administered by The Office of Liquor and Gaming Regulation (OLGR))

086 QUEENSLAND TREASURY ANNUAL REPORT 2017–18
QUEENSLAND TREASURYNOTES TO AND FORMING PART OF THE FINANCIAL STATEMENTS 2017–18Queensland Treasury Notes To and Forming Part of the Financial Statements 2017-18
42 Financial Statements – Queensland Treasury
32 Taxes (continued)
Revenue is recognised when one or more of the following events are satisfied: • the underlying transaction or event which gives rise to the right to collect the revenue occurs and can be measured
reliably • the assessment is raised by the self-assessor (a person who lodges transactions online), predominantly for payroll
tax and duties. Additional revenue is recognised upon amended assessment• the assessment is issued because of Commissioner-assessed transactions or following compliance activities such
as reviews and audits, predominantly for land and gaming taxes • tax penalty and interest revenue is recognised when raised, when an assessment becomes overdue or further
enforcement activity commences.
2018 2017
$'000 $'000
33
Administered on behalf of the whole-of-government
Mining royalties 4,263,206 3,846,737
4,263,206 3,846,737
Royalties
Accounting Policy – Royalties The main revenue streams and the governing Acts which underpin them include: • Mineral Resources Act 1989, Petroleum and Gas (Production and Safety Act) 2004• Taxation Administration Act 2001
Revenue is recognised when one or more of the following events are satisfied: • the underlying transaction or event which gives rise to the right to collect the revenue occurs and can be measured
reliably • the assessment is raised by the self-assessor (a person who lodges transactions online), additional revenue is
recognised upon amended assessment• the assessment is issued because of Commissioner-assessed transactions or following compliance activities such
as reviews and audits • tax penalty and interest revenue is recognised when raised, when an assessment becomes overdue or further
enforcement activity commences.
34 Interest
Administered on behalf of the whole-of-government
Interest from investments 13,825 32,748Interest from trust funds * 16,623 17,027Time value financial assets (non-cash) 3,915 4,101Interest from loans 1,097 952Other^ 120 113
35,580 54,941
* interest collected from Trust Funds under the Property Occupations and Motor Dealers and Chattel Auctioneers Act 2014.

087FINANCIAL STATEMENTS
QUEENSLAND TREASURYNOTES TO AND FORMING PART OF THE FINANCIAL STATEMENTS 2017–18
Queensland Treasury Notes To and Forming Part of the Financial Statements 2017-18
43 Financial Statements – Queensland Treasury
2018 2017
$'000 $'000
35 Appropriation revenue
Administered on behalf of the whole-of-government
Budgeted administered item appropriation and equity 6,194,203 5,762,535Transfer (to)/from other departments 14,667 25,628Transfer (to)/from other heading .. 11,697Lapsed appropriation (219,792) ..Unforeseen expenditure .. 1,068,359Total administered item receipts including equity 5,989,078 6,868,219
Less opening balance of administered item receivable .. (108,491)plus opening balance of administered deferred appropriation payable 68,040 ..Less closing balance of administered deferred appropriation payable (82,064) (68,040)Net approriation revenue 5,975,054 6,691,688Plus deferred appropriation expense payable to Consolidated Fund 82,064 68,040Total administered appropriation revenue recognised in the Statement of Comprehensive Income including equity
6,057,118 6,759,728
This is represented by:
Administered item revenue recognised in Statement of Comprehensive Income
5,944,629 6,082,395
Appropriated equity adjustment recognised in equity injection/(withdrawal)
112,489 677,333
Total administered appropriation revenue recognised in the Statement of Comprehensive Income including equity
6,057,118 6,759,728
36 Other revenue
Administered on behalf of the whole-of-government
SPER fines 219,731 218,130Competitive neutrality fees 137,846 114,756Proceeds of crime from the Public Trustee 8,137 11,103Miscellaneous receipts 15,336 14,026
381,050 358,015
Accounting Policy – Other revenue and user charges and fees
The State Penalties Enforcement Act 1999 largely covers administrative arrangements for the enforcement and recovery of court ordered fines, related levies and unpaid infringement notices. Revenue is recognised when the unpaid penalty, fine or levy has been transferred and registered with SPER, such as court, traffic offences and tolling fines. Additional income from enforcement fees on overdue fines is recognised when they are subject to further enforcement action.
Administered user charges and fees primarily relate to SPER administration fees which are brought to account when the underlying transaction or event which gives rise to the right to collect the revenue occurs and can be measured reliably. This occurs on registration of the default certificate where the amount unpaid is increased by the amount of the registration fee.
Competitive neutrality fees are a requirement for Government business activities to pay taxes (or tax equivalents) to remove benefits (and costs) as a result of their public ownership which accrue to Government business activities when competing with the private sector.

088 QUEENSLAND TREASURY ANNUAL REPORT 2017–18
QUEENSLAND TREASURYNOTES TO AND FORMING PART OF THE FINANCIAL STATEMENTS 2017–18Queensland Treasury
Notes To and Forming Part of the Financial Statements 2017-18
44 Financial Statements – Queensland Treasury
2018 2017
$'000 $'000
37 Supplies and services
Administered on behalf of the whole-of-government
GST administration expense remitted to the Commonwealth 126,477 136,905Reinsurance expense 25,213 25,403Administration fees. 1,432 916Other. 4,732 4,572
157,855 167,796
38 Impairment losses on receivables
Administered on behalf of the whole-of-government
Impairment losses on receivables – Taxation 10,571 1,174
Impairment Loss ReversalsImpairment Loss Reversals - SPER (71,000) (14,000)Bad debts written off * 148,442 22,868
88,014 10,042
* Debt Write Off Guidelines 1/2013, enables the SPER Registrar to write off bad debts in all circumstances in which it is unlikely the debts could be recovered cost effectively. Includes bad debts written off directly, not through provisionfor impairment, $128.4 million (refer to note 42).
39 Finance/borrowing costs
Administered on behalf of the whole-of-government
Interest on loans – QTC 1,305,337 1,468,965Interest paid by Treasury Offset Bank Account 1,856 1,871Interest on loans – Commonwealth Government 1,063 914Interest - other 57,565 12,630Market Value Realisation charge on repayment of QTC borrowings .. 303,720Administration fees 21,846 24,053Unwind concessional loan discount - Commonwealth borrowings 2,295 1,005
Concessional loan discount - NDRRA loans * (166) (1,224)
1,389,795 1,811,934
* represents the discount on initial recognition of NDRRA loans.

089FINANCIAL STATEMENTS
QUEENSLAND TREASURYNOTES TO AND FORMING PART OF THE FINANCIAL STATEMENTS 2017–18Queensland Treasury
Notes To and Forming Part of the Financial Statements 2017-18
45 Financial Statements – Queensland Treasury
2018 2017
$'000 $'000
40 Other expenses
Administered on behalf of the whole-of-government
Superannuation benefit payments 1,720,696 1,669,447Annual leave central scheme claims paid 1,716,867 1,605,539Long service leave reimbursements 411,868 372,644Queensland Government Insurance Fund claims 131,209 121,956Ex-gratia payments * 7,270 8,522Sundry 82,539 87,442
4,070,449 3,865,550
* A portion of dividends and tax equivalent payments received by the State under the National Tax Equivalents Regime are paid to local governments via ex gratia payments from Treasury administered.
41 Cash assets
Administered on behalf of the whole-of-government
Cash at bank (3,825,484) (2,731,190)Comprised of: Whole-of-Government Treasury Offset arrangement * (3,899,974) (2,735,481)Other administered bank accounts 74,490 4,291
(3,825,484) (2,731,190)
* The WoG Treasury offset arrangement incorporates the Treasury Offset Bank Account which is an overdraft facility as required under section 49 (1) of the Financial Accountability Act 2009 and a QTC Working Capital Facility. This overdraft facility is part of an offset arrangement with other departmental bank accounts and is considered in determining the interest earned on the WoG position. Cash at bank is an aggregate of Treasury administered bank accounts including the Treasury Offset Bank Account.
In addition, Treasury has established another offset arrangement with the Commonwealth Bank of Australia to maximise interest earned on surplus cash balances held by departmental bank accounts that do not fall within the WoG offset arrangement.
The QTC Cash Advances Fund is utilised to transfer government-owned corporations’ surplus funds to the Treasury Offset arrangement (refer note 45).
The QTC Working Capital Facility is used for short term borrowings. The market value of the borrowings in the QTC Working Capital Facility at 30 June 2018 is represented by its book value (as notified by QTC). Interest is calculated daily based on the Reserve Bank’s official cash rate. Interest is charged at rates between 1.5% and 1.8% (2017: between 2.05% to 1.5%) along with an administration margin of 0.10% (2017: 0.10%).
A post balance date transfer of $0.5b (2017: $1.0b) occurred from the QTC borrowings to the WoG Treasury Offset Arrangement in line with the department’s operating requirements, also refer note 45.

090 QUEENSLAND TREASURY ANNUAL REPORT 2017–18
QUEENSLAND TREASURYNOTES TO AND FORMING PART OF THE FINANCIAL STATEMENTS 2017–18Queensland Treasury Notes To and Forming Part of the Financial Statements 2017-18
46 Financial Statements – Queensland Treasury
2018 2017
$'000 $'000
42 Receivables
Administered on behalf of the whole-of-government
Current
Debtors* 1,250,928 1,367,712Less allowance for impairment* (390,258) (450,803)
860,670 916,909
Competitive neutrality fees. 36,002 29,403Other advances 19,672 20,084Sundry receivable. 27,695 7,209GST input tax credits receivable 249 223
83,618 56,919
944,288 973,828Non-current
Other advances. 75,003 87,058Sundry receivable 669 1,413
75,672 88,471
1,019,959 1,062,299
* The debtors balance includes receivables of $1006.7 million (2017: $980.2 million) for SPER fines. As at 30 June 2018, $345.0 million of the fines receivable were impaired (2017: $416.0 million) representing 34% of the total amount receivable (2017: 42%).
Administered on behalf of the whole-of-government
Overdue
Less than 30 days 31,586 65,64130 to 60 days 22,762 26,85061 to 90 days 31,104 26,068Greater than 90 days 679,185 686,155Total overdue 764,637 804,714
Movements in allowance for impairment of impaired receivables
Balance at 1 July 450,803 463,629Amounts written off during the year (20,054) (22,868)OIR MoG transfer out (117) ..Increase/(decrease) recognised in Statement of Comprehensive Income * (40,373) 10,042
Balance at 30 June 390,258 450,803
* does not include amounts written off directly to bad debts expense, $128.4 million, (refer note 38).
Accounting Policy - Receivables
Administered receivables are recognised in line with revenue criteria, explained in notes 32–33.

091FINANCIAL STATEMENTS
QUEENSLAND TREASURYNOTES TO AND FORMING PART OF THE FINANCIAL STATEMENTS 2017–18
Queensland Treasury Notes To and Forming Part of the Financial Statements 2017-18
47 Financial Statements – Queensland Treasury
42 Receivables (continued)
Ageing of individually impaired Receivables
2018 2017
Administered on behalf of the whole-of-government
Gross Receivables
*
Allowance for impairment
Carrying amount
Gross Receivables*
Allowance for impairment
Carrying amount
Not due/overdue $'000 $'000 $'000 $'000 $'000 $'000
Not yet due 200 (200) .. 32 (32) ..Less than 30 days 844 (844) .. 194 (194) ..30 to 60 days 530 (530) .. 1,049 (1,049) ..61 to 90 days 533 (533) .. 610 (610) ..Greater than 90 days 43,151 (43,151) .. 32,918 (32,918) ..Total overdue 45,258 (45,258) .. 34,803 (34,803) ..
* gross receivables should be those receivables that have been individually impaired and not the total gross receivables in note 42 above.
Credit risk exposure of receivables
The department manages credit risk using a credit management strategy. This strategy focuses on the prompt collection of revenues due and payable to the department and follow up of outstanding fees and charges within specified timeframes. Exposure to credit risk is monitored on an ongoing basis.
Risk assessments are performed upon non-payment of debt and maintained in the State Revenue Risk Register with assigned risk ratings. Under this risk based revenue management framework compliance plans are developed with reference to the debt management strategies.
An allowance for impairment for tax collections is calculated based on the solvency status of the debtor and the age of the debt. SPER debts are impaired on consideration of the likelihood of collectability with reference to historical activity for the specific debt types being assessed. Historical activity of the specific debt is determined based on a debt resolution rate. Debt resolution rates include rates of debt resolved through payment, non-monetary satisfaction, recalled or withdrawn by issuing agencies, or written-off as unrecoverable. Management judgement is required in assessing the debt resolution rates.
A number of debt collection measures are undertaken including the exercising of legislative powers contained within the Taxation Administration Act 2001 and the State Penalties Enforcement Act 1999, prior to impairing debt. If no loss events have arisen in respect of a particular debtor or group of debtors, no allowance for impairment is made in respect of that debt/group of debtors. If the department determines that an amount owing by such a debtor does become uncollectible, the amount is impaired, then subsequently recognised as a bad debt expense and written-off directly against receivables. In other cases where a debt becomes uncollectible but the uncollectible amount exceeds the amount already allowed for impairment of that debt, the excess is recognised as a bad debt expense and written off directly against receivables.
2018 2017
$'000 $'00043 Other current assets
Administered on behalf of the whole-of-government
Accrued revenue 148 146Prepayments 8,320 8,495
8,468 8,641
44 Payables
Administered on behalf of the whole-of-government
Deferred appropriation payable to Consolidated Fund 82,064 68,040Grants payable 80,903 ..Trade creditors 931 1,039Other creditors 5,002 6,576
168,900 75,655

092 QUEENSLAND TREASURY ANNUAL REPORT 2017–18
QUEENSLAND TREASURYNOTES TO AND FORMING PART OF THE FINANCIAL STATEMENTS 2017–18Queensland Treasury
Notes To and Forming Part of the Financial Statements 2017-18
48 Financial Statements – Queensland Treasury
2018 2017
$'000 $'000
45 Interest Bearing Liabilities
Administered on behalf of the whole-of-government
Current
Advances payable to GOC's* 2,284,333 1,345,079Commonwealth borrowings 14,011 14,237
2,298,345 1,359,316
Non-current
QTC borrowings ** 28,195,628 30,265,029Commonwealth borrowings. 58,891 70,782Less concessional loan discount and unwind (4,123) (6,277)
28,250,395 30,329,534
* Government Owned Corporations (GOCs) are required to make any surplus cash available to the General Government Sector through modified set-off banking arrangements. Advances are made to the Treasury Offset Bank Account Arrangement (refer note 41). QTC charge interest at rates between 4.1% and 2.23% (2016–17: between 3.39% and 2.50%) along with an administration margin of 0.15% (2016–17: 0.15%).** Interest of between 4.48% and 3.56% (2016-17: between 4.75% and 2.50%) is charged on WoG borrowings with QTC.
46 Other liabilities
Administered on behalf of the whole-of-government
Unearned revenue 37,840 39,500Sundry liabilities 450 567
38,290 40,067
Accounting Policy – Unearned revenue
Administered unearned revenue are recognised when money is receipted prior to the recognition criteria being met for revenue, as explained in notes 32-33.
47 Contingencies
Administered on behalf of WoG
Litigation in progress
As at 30 June 2018, the following number of cases were filed in the courts:
Cases Estimated Amount $'000
Supreme Court 9 1,617 Civil and Administrative Tribunal 14 7,766 Total 23 9,383
These cases relate to revenue collected by the Office of State Revenue. The department’s legal advisers and management believe there is insufficient information available to determine the outcome of the abovementioned cases. Accordingly, no provision has been taken up in Treasury’s financial statements.

093FINANCIAL STATEMENTS
QUEENSLAND TREASURYNOTES TO AND FORMING PART OF THE FINANCIAL STATEMENTS 2017–18
49 Financial Statements – Queensland Treasury
48 Financial instruments
(a) Categorisation of financial instruments
Administered on behalf of the whole-of-government
2018 2017
Category $'000 $'000
Financial assets
Cash and cash equivalents 41 (3,825,484) (2,731,190)
Receivables* 42 1,019,959 1,062,298
Other accrued revenue 43 148 146Total (2,805,377) (1,668,746)
Financial liabilities
Payables 44 168,900 75,655
Transfer to government payable 903,842 1,019,690
Advances payable to GOCs 45 2,284,333 1,345,079
QTC borrowings** 45 28,195,628 30,265,029
Commonwealth borrowings held at amortised cost* 45 68,779 78,742
Other liabilities 46 450 567Total 31,621,932 32,784,762
Notes
* Natural Disaster Relief and Recovery Arrangements loans (NDRRA) are carried at amortised cost, $94.7 million (2017: $107.1 million). Interest is charged on NDRRA loans at a predetermined rate and recognised as an expense as it accrues. Repayments are received yearly in arrears. The Commonwealth Attorney-General’s Department – Emergency Management Australia determines the annual interest rate to be applied to the loans. In the 2017–18 year the interest rate was 1.25% (2017: 1.16%), which was calculated as 50% of the 10-year Treasury bond rate, averaged over the three-month period between April and June 2017.
** Interest is charged on WoG borrowing with QTC at rates of between 3.56% and 4.48% (2017: between 2.50% and 4.75%) along with an administration margin at rates between 0.07% and 0.15% (2017: between 0.07% and 0.15%) which is accrued and paid quarterly to QTC.
(b) Financial risk management
The department’s activities expose it to a variety of financial risks – credit risk, liquidity risk and market risk. For discussion on managing credit risk refer to note 42.
The department adopts a risk based revenue management framework in conjunction with debt management strategies to manage credit risk, refer to note 42 Receivables for further information.
The management of financial risks is integral to Treasury’s overall governance framework. The department has adopted various strategies for the mitigation of each risk category, including active monitoring by the Fiscal Strategy Division of borrowings by the State on behalf of WoG.
It is assisted in the discharge of these responsibilities through the provision of professional advice and assistance by the QTC (borrowings and short-term investments).
The department’s internal financial reporting framework and oversight by the Executive Leadership Team also contribute to the effective management of financial risks.
(c) Liquidity risk
The department is exposed to liquidity risk in respect of its payables, Commonwealth borrowings, borrowings from QTC for the Floating Rate Government Debt Pools and Advances payable to GOCs.
The following table sets out the liquidity risk of financial liabilities held by the department. It represents the contractual maturity of financial liabilities, calculated based on undiscounted cash flows relating to the liabilities at reporting date. The undiscounted cash flows in these tables differ from the amounts included in the Statement of Financial Position that are based on amortised cost.
QTC borrowings are interest only with no fixed repayment date for the principal component. For the purposes of completing the maturity analysis, the principal component of these loans has been included in the more than five-year time band with no interest payment assumed in this time band.

094 QUEENSLAND TREASURY ANNUAL REPORT 2017–18
QUEENSLAND TREASURYNOTES TO AND FORMING PART OF THE FINANCIAL STATEMENTS 2017–18
Queensland Treasury Notes To and Forming Part of the Financial Statements 2017-18
50 Financial Statements – Queensland Treasury
48 Financial instruments (continued)
(c) Liquidity risk (continued)
Administered on behalf of the whole-of-government
< 1 year 1 - 5 years > 5 years
$'000 $'000 $'000
Financial liabilities
Payables 44 168,900 .. .. 168,900 168,900
Transfer to government payable 903,842 .. .. 903,842 903,842
Commonwealth borrowings* 45 14,923 40,425 20,618 75,966 72,902
Advances payable to GOCs 45 2,284,333 .. .. 2,284,333 2,284,333
QTC borrowings 45 1,187,885 4,749,129 28,165,988 34,103,002 28,195,628
Other liabilities 46 450 .. .. 450 450
Total 4,560,333 4,789,554 28,186,606 37,536,493 31,626,055
Administered on behalf of the whole-of-government
< 1 year 1 - 5 years > 5 years
$'000 $'000 $'000
Financial liabilities
Payables 44 75,655 .. .. 75,655 75,655
Transfer to government payable 1,019,690 .. .. 1,019,690 1,019,690
Commonwealth borrowings* 45 15,579 42,387 30,657 88,623 85,019
Advances payable to GOCs 45 1,345,079 .. .. 1,345,079 1,345,079
QTC borrowings 45 1,295,804 5,318,992 31,230,988 37,845,784 30,265,029
Other liabilities 46 567 .. .. 567 567
Total 3,752,374 5,361,379 31,261,645 40,375,398 32,791,039
*Carrying amount excludes amortised cost component of Commonwealth borrowings.
2018 payable inTotal
undiscounted cash flow
$'000
Carrying amount$'000
Carrying amount$'000
Notes
2017 payable inTotal
undiscounted cash flow
$'000Notes
(d) Market risk
Whilst Treasury (administered) does not trade in foreign currency, the mining industry is impacted by changes in the Australian dollar exchange rate and commodity prices, which may impact the royalty revenue received. The department is exposed to interest rate risk through its borrowings, loans and advances and cash deposited in interest bearing accounts.
(e) Interest rate sensitivity analysis
The following interest rate sensitivity analysis depicts the outcome on comprehensive income if interest rates were tochange by +/- 1% from the year end rates applicable to the department’s financial assets and liabilities. This is mainly attributable to the department’s exposure to variable interest rates on its borrowings from QTC, the Commonwealth and cash holdings.

095FINANCIAL STATEMENTS
QUEENSLAND TREASURYNOTES TO AND FORMING PART OF THE FINANCIAL STATEMENTS 2017–18Queensland Treasury
Notes To and Forming Part of the Financial Statements 2017-18
51 Financial Statements – Queensland Treasury
48 Financial instruments (continued)
(e) Interest rate sensitivity analysis
Administered on behalf of the whole-of-government
Transfer to government
Equity Increase in
appropriation revenue
Equity
$'000 $'000 $'000 $'000 $'000
Cash (3,899,974) 39,000 39,000 (39,000) (39,000)
Receivables
Loans and advances 72,902 (729) (729) 729 729
Interest bearing liabilities
Commonwealth borrowings 72,902 729 729 (729) (729)
Advances payable to GOCs 2,284,333 22,843 22,843 (22,843) (22,843)
QTC borrowings – Fixed Rate Debt Pool 7,898,663 .. .. .. ..
QTC borrowings – General Debt Pool (floating rate) 20,296,965 14,073 14,073 (12,821) (12,821)Potential impact 75,916 75,916 (74,664) (74,664)
Administered on behalf of the whole-of-government
Transfer to government
Equity Increase in
appropriation revenue
Equity
$'000 $'000 $'000 $'000 $'000
Cash (2,735,481) 27,355 27,355 (27,355) (27,355)
Receivables
Loans and advances 85,019 (850) (850) 850 850
Interest bearing liabilities
Commonwealth borrowings 85,019 850 850 (850) (850)
Advances payable to GOCs 1,345,079 13,451 13,451 (13,451) (13,451)
QTC borrowings – Fixed Rate Debt Pool 7,898,605 .. .. .. ..
QTC borrowings – General Debt Pool (floating rate) 22,366,424 15,586 15,586 (14,241) (14,241)Potential impact 56,392 56,392 (55,047) (55,047)
Financial instruments
2017 Interest rate risk
Carrying amount
-1% 1%
Financial instruments
2018 Interest rate risk
Carrying amount
-1% 1%
(f) Fair value Fair value hierarchy Financial instruments measured at fair value have been classified in accordance with the hierarchy described in AASB 13 Fair Value Measurement. The fair value hierarchy is categorised into three levels based on the observability of the inputs to fair valuation techniques.
Level 1 – represents fair value measurements that reflect unadjusted quoted market prices in active markets for identical assets and liabilities Level 2 – represents fair value measurements that are substantially derived from inputs (other than quoted prices included within level 1) that are observable, either directly or indirectly and Level 3 – represents fair value measurements that are substantially derived from unobservable inputs.
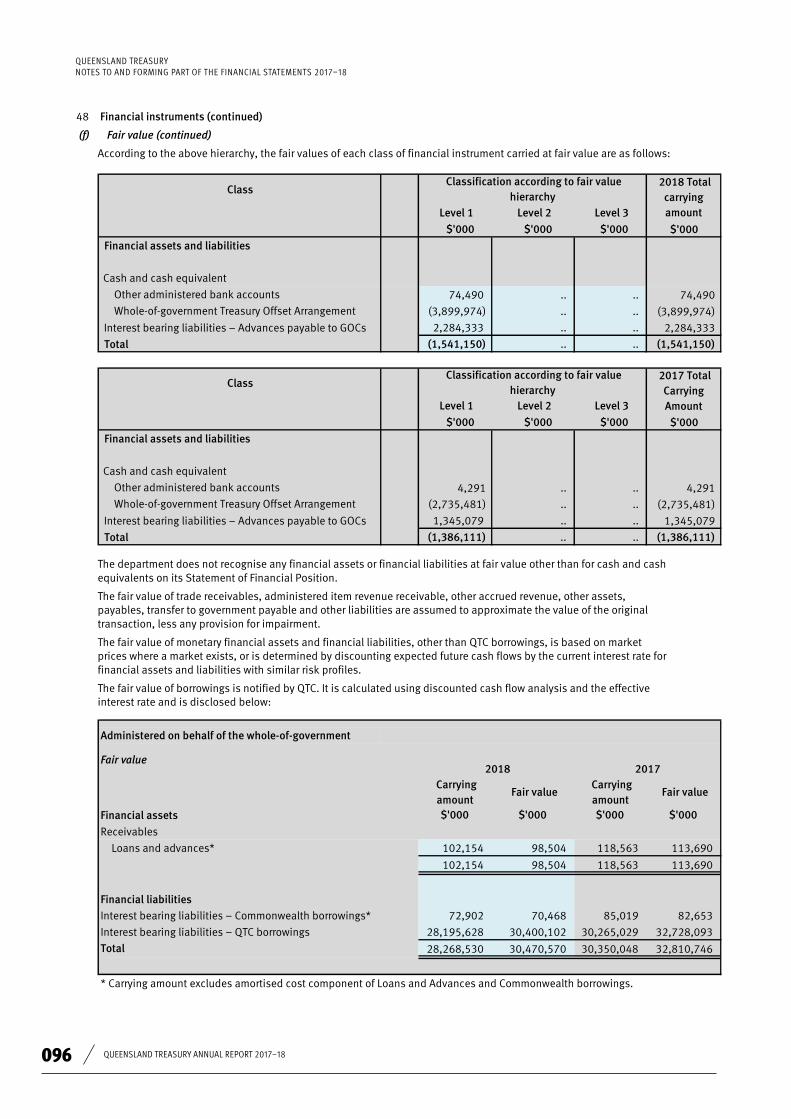
QUEENSLAND TREASURY ANNUAL REPORT 2017–18096
QUEENSLAND TREASURYNOTES TO AND FORMING PART OF THE FINANCIAL STATEMENTS 2017–18Queensland Treasury
Notes To and Forming Part of the Financial Statements 2017-18
52 Financial Statements – Queensland Treasury
48 Financial instruments (continued) (f) Fair value (continued)
According to the above hierarchy, the fair values of each class of financial instrument carried at fair value are as follows:
Class
Level 1 Level 2 Level 3
$'000 $'000 $'000 $'000
Financial assets and liabilities
Cash and cash equivalent
Other administered bank accounts 74,490 .. .. 74,490 Whole-of-government Treasury Offset Arrangement (3,899,974) .. .. (3,899,974)
Interest bearing liabilities – Advances payable to GOCs 2,284,333 .. .. 2,284,333
Total (1,541,150) .. .. (1,541,150)
Class
Level 1 Level 2 Level 3
$'000 $'000 $'000 $'000
Financial assets and liabilities
Cash and cash equivalent
Other administered bank accounts 4,291 .. .. 4,291 Whole-of-government Treasury Offset Arrangement (2,735,481) .. .. (2,735,481)
Interest bearing liabilities – Advances payable to GOCs 1,345,079 .. .. 1,345,079
Total (1,386,111) .... (1,386,111)
Classification according to fair value hierarchy
Classification according to fair value hierarchy
2018 Total carrying amount
2017 Total Carrying Amount
The department does not recognise any financial assets or financial liabilities at fair value other than for cash and cash equivalents on its Statement of Financial Position. The fair value of trade receivables, administered item revenue receivable, other accrued revenue, other assets, payables, transfer to government payable and other liabilities are assumed to approximate the value of the original transaction, less any provision for impairment. The fair value of monetary financial assets and financial liabilities, other than QTC borrowings, is based on market prices where a market exists, or is determined by discounting expected future cash flows by the current interest rate for financial assets and liabilities with similar risk profiles. The fair value of borrowings is notified by QTC. It is calculated using discounted cash flow analysis and the effective interest rate and is disclosed below:
Administered on behalf of the whole-of-government
Fair value
Carrying amount
Fair value Carrying amount
Fair value
$'000 $'000 $'000 $'000Financial assets
Receivables
Loans and advances* 102,154 98,504 118,563 113,690
102,154 98,504 118,563 113,690
Financial liabilities
Interest bearing liabilities – Commonwealth borrowings* 72,902 70,468 85,019 82,653
Interest bearing liabilities – QTC borrowings 28,195,628 30,400,102 30,265,029 32,728,093
Total 28,268,530 30,470,570 30,350,048 32,810,746
* Carrying amount excludes amortised cost component of Loans and Advances and Commonwealth borrowings.
2018 2017

097FINANCIAL STATEMENTS
QUEENSLAND TREASURYNOTES TO AND FORMING PART OF THE FINANCIAL STATEMENTS 2017–18Queensland Treasury
Notes To and Forming Part of the Financial Statements 2017-18
53 Financial Statements – Queensland Treasury
49 Budget vs Actual comparison
A budget vs actual comparison, and explanations of major variances, has not been included for the Statement of Cash Flows, as major variances relating to that statement have been addressed in explanations of major variances for other statements.
Explanation of major variances for Statement of Comprehensive Income
Note 33. Royalties – The increase reflects the impact of higher coal prices on coal royalties.
Note 34. Interest – The decrease is mainly due to less than anticipated interest on trust fund, partially offset by higher than budgeted interest on Treasurer's Cash Balances.
Note 38. Losses of receivables – The increase is mainly due to higher than anticipated impairments in the OSR ($122M) arising in part from the finalisation of legal proceedings. This is partially offset by lower than anticipated impairment losses in the SPER ($91.8M) driven by an impairment loss reversal of $71M as a result of a review into collection rates.
Face Grants and subsidies – The decrease is mainly due to lower than anticipated grant payments associated with the Jobs and Regional Growth Fund ($88.833M) and realignment of grant payment to the Cross River Rail Delivery Authority from 2017-18 to future years ($22M). This is partially offset by increased payments for the First Home Owners' Grant ($47.565M) and the one-off State Government contribution to the Cairns Innovation Centre ($10M).
Explanation of major variances for Statement of Financial Position
Note 41. Cash and cash equivalents – The decrease is mostly attributable to the Treasury Offset Account (TOA). The purpose of TOA is to act as an offset account against departmental and consolidated fund cash balances under the WoG cash offset arrangements to facilitate the management of WoG cash position. As such, the balances in TOA fluctuate from year to year depending on the balances of other accounts within the WoG cash offset arrangements.
Note 42. Receivables (Current) – The decrease is primarily due to lower than anticipated mining royalties receivables recognised at year end, partially offset by lower than anticipated impairment losses in the SPER as a result of a review into collection rates.
Receivables (Non-Current) – The decrease is primarily due to reclassification of NDRRA Commonwealth and State loans from non-current to current ($18.697M).
Note 43. Other current assets - The decrease is primarily due to lower than anticipated recovery from the Queensland Reconstruction Authority for grant payments made to the Queensland Rural and Industry Development Authority.
Note 44. Payables (Current) - The increase is primarily due to unbudgeted appropriation payable to the Consolidated Fund and GST revenue to be returned to the Commonwealth Government.
Face The decrease reflects lower than expected administered revenue earned but yet to be transferred to Consolidated Fund at year end.
Note 45. Interest bearing liabilities – The increase mainly represents unbudgeted advances received from overnment-owned orporations as part of the Cash Management Strategy.
QUEENSLAND TREASURY ANNUAL REPORT 2017–18098
QUEENSLAND TREASURYNOTES TO AND FORMING PART OF THE FINANCIAL STATEMENTS 2017–18
Queensland Treasury Notes To and Forming Part of the Financial Statements 2017-18
54 Financial Statements – Queensland Treasury
50 Related entity transactions with other government departments
The references to note numbers in the following disclosures may include other items to those listed below that are not classified as material or significant related entity transactions. Note 2 summarises the transfer of assets and liabilities arising from a MoG change.
Controlled transactions
The department paid grants to the Department of State Development, Manufacturing, Infrastructure and Planning and the Department of Education to support the objectives of the Back to Work Regional Employment package (note 10).
To support the Advance Queensland initiative the department holds an investment with QIC for the Business Development Fund, which provides early stage co-investment funding to promote angel and venture capital to Queensland ased businesses (note 17).
The department received revenue from the Department of Justice and Attorney-General to undertake analysis of workers’ compensation and courts data, from the Department of Education for education planning services and from Queensland Health for surveys of maternity outpatient clinic experience and general surgery outpatient clinic experience (note 4).
The department engaged QFleet for OIR’s motor vehicle leases (note 9).
The department paid the Department of Public Works for the management of accommodation leases, Queensland Shared Services(QSS) for business service fees and for outsourcing of SPER contact centre and OIR's IT works and services. (The SPER contact centre expenses and OIR's IT orks and services were paid to the then Department of Science, Information Technology and Innovation which ceased as a result of the MoG changes). (Note 9)
OIR received workplace health and safety contributions from WorkCover Queensland and Queensland Health; and electrical safety industry contributions from Energy Queensland (note 5).
OIR paid grant funding to Queensland Ambulance Services to undertake transport and pre-hospital patient care for injured workers under the Queensland Workers’ Compensation Scheme (note 10).
The department paid legal fees to the Department of Justice and Attorney-General for professional services rendered in relation to State Revenue legal cases (note 9).
The department paid grants and equity withdrawals for the development of an ICT system for the delivery of the Financial Assurance Framework Reforms to the Department of Environment and Science and DNRME (note 10).
The QTH consolidated entity invested funds with the QTC Cash Fund as at 30 June 2018 totalled $83.0 million (2017: $77.1 million) and interest revenue net of management fees received during the year totalled $1.8 million (2017: $1.6million).
The QTH consolidated entity has loan balances outstanding to QTC as at 30 June 2018 of $121.6 million ($2017: $130.4 million) with interest expense and fees totalling $6.1 million (2017: $6.5 million) capitalised against these loans.
QTC provides company secretariat and accounting services to the QTH consolidated entity. A fee of $370,240 (2017: $411,642) was charged for these services.
Administered transactions
The department administers the Queensland Government Insurance Fund, which receives premiums from and pays claims to member agencies relating to a full suite of insurance lines (note 40).
The department operates a WoG offset arrangement, which includes the Treasury Offset Bank Account and a Working Capital Facility. Note 41 outlines the key terms and conditions of these arrangements which covers advances and principal repayments from the General Government Debt Pool (GDP). This includes advances from GOC’s under the GOC cash offset arrangements (Note 45)
The department administers the collection of competitive neutrality fees from GOCs under the National Competition Policy (Note 36).
The department’s State Revenue collection is responsible for administering local government tax equivalents under the Local Government Act 2009 (note 32). Commercialised business units that are in scope under these administrative arrangements are subject to payroll tax, land tax, vehicle registration duty, insurance duty and transfer duty.
The department receives appropriation revenue (note 3 and 35) provided in cash via the state’s Consolidated Fund.
The department pays interest for borrowings it undertakes with QTC (note 39), note 41 outlines the key terms and conditions of those borrowings.
The department collects state revenues and transfers to the Consolidated Fund, refer to the Administered Statement of Comprehensive Income.

099FINANCIAL STATEMENTS
QUEENSLAND TREASURYNOTES TO AND FORMING PART OF THE FINANCIAL STATEMENTS 2017–18Queensland Treasury Notes To and Forming Part of the Financial Statements 2017-18
55 Financial Statements – Queensland Treasury
50 Related entity transactions with other government departments (continued)
The department administers the receipt of unclaimed money and proceeds of crime from the Public Trustee Office (PTO) for transfer to the Consolidated Fund (note 36).
51 Transfer payments
Payments under the Intergovernmental Agreement on Federal Financial Relations are made from the Commonwealth Treasury to the state and territory Treasuries. These payments represent Specific Purpose Payments, National Partnership Payments and general revenue assistance.
While most of these payments are receipted and paid out to departments via appropriation funding, some payments are passed on directly to the relevant entities. These payments occur where:
the payment is ultimately for a third party, for example, non-government schools the payment is a reimbursement of expenditure incurred by the State after invoicing the Commonwealth, or the agreement with the Commonwealth requires the payment to be paid into an interest-bearing account held by the final recipient of the funding.
Amounts received from the Commonwealth for direct payments to the following entities in 2017-18 totalled $2.559 billion (2016–17: $2.403 billion):
Department of Education (non-government schools, $2.548 billion (2016–17: $2.394 billion) Department of Agriculture and Fisheries (plant disease and eradication, $10.647 million) (2016–17: $2.245 million) (2016-17: National Insurance Affordability initiative, $7 million, former Department of Infrastructure, Local Government and Planning)
52 Agency transactions
Treasury currently acts as an agent and processes grant payments on behalf of a number of Queensland overnment departments. These transactions do not form part of Treasury's accounts and are instead reported by the various departments. For the 2017–18 financial year the total value of grants paid was $249.462 million (2016–17: $219.507 million). The increase in 2017–18 is predominantly due to the inclusion of Back to Work grants paid from 1 January 2018 ($49.079 million), which following a MoG change, resulted in responsibility for the program moving to the Department of Employment, Small Business and Training (refer note 2).
QSuper operates the Employers Contribution bank account on behalf of Treasury, in accordance with the Financial Accountability Act 2009. The account is utilised to provide for the WoG Long Service and Annual Leave Central Schemes and Employer Superannuation Contributions. The account balance as at 30 June 2018 was $3.481million (2016–17 $4.082 million), which represents money in transit to be identified as owing to either the Consolidated Fund and/or other overnment agencies.
53 Queensland Government E-merchant program
Treasury acts as a custodian over the settlement account (held by the third party, Cuscal) for the Queensland Government’s pre-paid debit card program. At reporting date, the balance in the account is $0.853 million (2016–17: $0.863 million) including interest earned for the year, $10,760.81 (2016–17: $15,946.02), which represents unspent funds advanced by agencies.
Accounting Policy
The department administers certain transactions and balances in a trust or fiduciary capacity such as the settlement account held by the third party Cuscal for the Queensland Government E-merchant program (note 53).
As the department performs only a custodial role in respect of these transactions and balances, they are not recognised in the financial statements. While these transactions and balances are in the care of the department, they are subject to the department’s normal system of internal control and external audit by the Auditor-General (notes 51–54).
The department administers the provision of State and Commonwealth loans and grants for NDRRA to Queensland Reconstruction Authority (QRA) and Queensland Rural and Industry Development Authority (QRIDA) (formerly Queensland Rural Adjustment Authority (QRAA), (note 42).
The department administered grant and equity withdrawal payments to statutory bodies including Queensland Productivity Commission (QPC), Queensland Competition Authority (QCA), Queensland Racing Integrity Commission (QRIC), Trade and Investment Queensland (TIQ), and the Cross River Rail Delivery Authorities. Refer to grants and subsidies on the Administered Statement of Comprehensive Income. Grant payments to TIQ and QRIC are only up to 31 December 2017 as a result of the MoG changes effective 1 January 2018.

QUEENSLAND TREASURY ANNUAL REPORT 2017–18100
QUEENSLAND TREASURYNOTES TO AND FORMING PART OF THE FINANCIAL STATEMENTS 2017–18Queensland Treasury Notes To and Forming Part of the Financial Statements 2017-18
56 Financial Statements – Queensland Treasury
54 Trust transactions and balances
(a) Treasury also acts as an agent in the collection and distribution of unpaid infringement fines and court ordered monetary amounts for various external parties including local government bodies, universities and individuals.
2018 2017
$'000 $'000
Opening balance 17,415 14,670 Collections: Cash receipts Debtor overpayments Cash not receipted Cash not banked Other
43,831 (973) (626)
107 37
41,434 (273) (137) (124)
(6) Distributions to principals (44,565) (38,148)
Balance 30 June 15,226 17,415

101FINANCIAL STATEMENTS
QUEENSLAND TREASURYNOTES TO AND FORMING PART OF THE FINANCIAL STATEMENTS 2017–18Queensland Treasury Notes To and Forming Part of the Financial Statements 2017-18
57 Financial Statements – Queensland Treasury
CERTIFICATE OF QUEENSLAND TREASURY These consolidated general purpose financial statements have been prepared pursuant to section 62(1) (a) of the Financial Accountability Act 2009 (the Act), relevant sections of the Financial and Performance Management Standard 2009 and other prescribed requirements. In accordance with section 62(1) (b) of the Act, we certify that in our opinion: (a) the prescribed requirements for establishing and keeping the accounts have been complied with in all material respects, and (b) the statements have been drawn up to present a true and fair view, in accordance with prescribed accounting standards, of
the transactions of Treasury for the financial year ended 30 June 2018 and of the financial position of the department at the end of that year.
The assertions in this certificate are based on an appropriate system of internal controls and risk management processes being effective, in all material respects, with respect to financial reporting throughout the reporting period. D. Brooks BComm, FCPA J. Murphy BA, LLB, Master of Public Law Chief Finance Officer Under Treasurer 30 August 2018 30 August 2018

QUEENSLAND TREASURY ANNUAL REPORT 2017–18102
QUEENSLAND TREASURYNOTES TO AND FORMING PART OF THE FINANCIAL STATEMENTS 2017–18
INDEPENDENT AUDITOR’S REPORT
To the Accountable Officer of Queensland Treasury
Report on the audit of the financial report
Opinion
I have audited the accompanying �nancial report of Queensland Treasury (the parent) and its controlled entities (the group).
In my opinion, the �nancial report:
a) gives a true and fair view of the parent's and group's �nancial position as at 30 June 2018, and their �nancial performance and cash flows for the year then ended
b) complies with the Financial Accountability Act 2009, the Financial and Performance Management Standard 2009 and Australian Accounting Standards.
The �nancial report comprises the statements of �nancial position and statements of assets and liabilities by major departmental services as at 30 June 2018, the statements of comprehensive income, statements of changes in equity, statements of cash flows and statements of comprehensive income by major departmental services for the year then ended, notes to the �nancial statements including summaries of signi�cant accounting policies and other explanatory information, and the certi�cate given by the Under Treasurer and the Chief Finance O�cer.
Basis for opinion
I conducted my audit in accordance with the Auditor-General of Queensland Auditing Standards, which incorporate the Australian Auditing Standards. My responsibilities under those standards are further described in the Auditor’s Responsibilities for the Audit of the Financial Report section of my report.
I am independent of the parent and group in accordance with the ethical requirements of the Accounting Professional and Ethical Standards Board’s APES 110 Code of Ethics for Professional Accountants (the Code) that are relevant to my audit of the �nancial report in Australia. I have also ful�lled my other ethical responsibilities in accordance with the Code and the Auditor-General of Queensland Auditing Standards.
I believe that the audit evidence I have obtained is su�cient and appropriate to provide a basis for my opinion.
Key audit matters
Key audit matters are those matters that, in my professional judgement, were of most signi�cance in my audit of the �nancial report of the current period. I addressed these matters in the context of my audit of the �nancial report as a whole, and in forming my opinion thereon, and I do not provide a separate opinion on these matters.
Completeness of payroll tax revenue ($3.948 billion at 30 June 2018)
Refer to note 32 in the �nancial report
Key audit matter How my audit addressed the key audit matter
Payroll tax is a material balance of the department. The self-assessed nature of payroll tax increases the risk over completeness of payroll tax revenue collected and accrued, as reported in the administered statement of comprehensive income.
Completeness of revenue recognised is dependent on whether:
• all liable taxpayers have registered to pay payroll tax• the amounts disclosed by taxpayers accurately reflect their
operations, and thus the calculation base for the tax is complete.
The department veri�es taxpayer compliance using a risk-management approach, to ensure taxpayers are paying the correct amount of tax.
The department has implemented an annual compliance program to address this risk.
My procedures included, but were not limited to:
• Testing the controls within the revenue management system to con�rm the accuracy of the payroll tax calculation.
• Reviewing outcomes of Queensland Treasury’s compliance program for payroll tax and assessing the extent of historical recoveries to determine the impact on the overall payroll tax revenue.
• Performing the following analytical review over payroll tax income: • analysing and corroborating the year on year trends at business
partner level to identify any unusual movements/relationships • comparing the trends in external data such as wage growth rate
and employment rate to the movement in payroll tax income, and corroborating any unusual movements/relationships
• analysing and corroborating the year on year trends between the payroll tax revenue, budgeted payroll tax revenue and the Mid-Year Fiscal and Economic Review (that provides update on the State’s economic and �scal and Economic Review (that provides update on the State’s economic and �scal position since the original budget).

103FINANCIAL STATEMENTS
QUEENSLAND TREASURYNOTES TO AND FORMING PART OF THE FINANCIAL STATEMENTS 2017–18
Impairment of State Penalties Enforcement Registry (SPER) Fines Receivable (SPER fines revenue $219.731 million for 2017-18; receivables of $1,006.7 million at 30 June 2018)
Refer to notes 36, 38 and 42 in the �nancial report
Key audit matter How my audit addressed the key audit matter
SPER debts are impaired on consideration of the likelihood of collectability with reference to historical activity for the speci�c debt types being assessed.
Management judgement is required in assessing the extent to which debts may be impaired.
My procedures included but were not limited to:
• Assessing management’s controls over SPER collection and �nalisation rates of the referred debts as these impact the determination of the long-term debt �nalisation, withdrawal and recall rates.
• Obtaining an understanding of the methodology used and assessing its design, integrity and appropriateness.
• Recalculating the long-term debt �nalisation, withdrawal and recall rates to validate the mathematical accuracy of the model.
• Recalculating the impairment charge by applying the longterm debt �nalisation, withdrawal and recall rates to the debt pool and comparing the impairment charge to the general ledger.
Responsibilities of the accountable officer for the financial report
The accountable o�cer is responsible for the preparation of the �nancial report that gives a true and fair view in accordance with the Financial Accountability Act 2009, the Financial and Performance Management Standard 2009 and Australian Accounting Standards, and for such internal control as the accountable o�cer determines is necessary to enable the preparation of the �nancial report that is free from material misstatement, whether due to fraud or error.
The accountable o�cer is also responsible for assessing the parent's and group's ability to continue as a going concern, disclosing, as applicable, matters relating to going concern and using the going concern basis of accounting unless it is intended to abolish the parent or group or to otherwise cease operations.
Auditor’s responsibilities for the audit of the financial report
My objectives are to obtain reasonable assurance about whether the �nancial report as a whole is free from material misstatement, whether due to fraud or error, and to issue an auditor’s report that includes my opinion. Reasonable assurance is a high level of assurance, but is not a guarantee that an audit conducted in accordance with the Australian Auditing Standards will always detect a material misstatement when it exists. Misstatements can arise from fraud or error and are considered material if, individually or in aggregate, they could reasonably be expected to influence the economic decisions of users taken on the basis of this �nancial report.
As part of an audit in accordance with the Australian Auditing Standards, I exercise professional judgement and maintain professional scepticism throughout the audit. I also:
• Identify and assess the risks of material misstatement of the �nancial report, whether due to fraud or error, design and perform audit procedures responsive to those risks, and obtain audit evidence that is su�cient and appropriate to provide a basis for my opinion. The risk of not detecting a material misstatement resulting from fraud is higher than for one resulting from error, as fraud may involve collusion, forgery, intentional omissions, misrepresentations, or the override of internal control.
• Obtain an understanding of internal control relevant to the audit in order to design audit procedures that are appropriate in the circumstances, but not for expressing an opinion on the e¦ectiveness of the parent's and group's internal control.
• Evaluate the appropriateness of accounting policies used and the reasonableness of accounting estimates and related disclosures made by the group.
• Conclude on the appropriateness of the parent's and group's use of the going concern basis of accounting and, based on the audit evidence obtained, whether a material uncertainty exists related to events or conditions that may cast signi�cant doubt on the parent's or group's ability to continue as a going concern. If I conclude that a material uncertainty exists, I am required to draw attention in my auditor’s report to the related disclosures in the �nancial report or, if such disclosures are inadequate, to modify my opinion. I base my conclusions on the audit evidence obtained up to the date of my auditor’s report. However, future events or conditions may cause the parent or group to cease to continue as a going concern.
QUEENSLAND TREASURY ANNUAL REPORT 2017–18104
QUEENSLAND TREASURYNOTES TO AND FORMING PART OF THE FINANCIAL STATEMENTS 2017–18
• Evaluate the overall presentation, structure and content of the �nancial report, including the disclosures, and whether the �nancial report represents the underlying transactions and events in a manner that achieves fair presentation.
• Obtain su�cient appropriate audit evidence regarding the �nancial information of the entities or business activities within the group to express an opinion on the �nancial report. I am responsible for the direction, supervision and performance of the audit of the group. I remain solely responsible for my audit opinion.
I communicate with the Accountable o�cer regarding, among other matters, the planned scope and timing of the audit and signi�cant audit �ndings, including any signi�cant de�ciencies in internal control that I identify during my audit.
From the matters communicated with the accountable o�cer, I determine those matters that were of most signi�cance in the audit of the �nancial report of the current period and are therefore the key audit matters. I describe these matters in my auditor’s report unless law or regulation precludes public disclosure about the matter or when, in extremely rare circumstances, I determine that a matter should not be communicated in my report because the adverse consequences of doing so would reasonably be expected to outweigh the public interest bene�ts of such communication.
Report on other legal and regulatory requirements
In accordance with s.40 of the Auditor-General Act 2009, for the year ended 30 June 2018:
a) I received all the information and explanations I required.b) In my opinion, the prescribed requirements in relation to the establishment and keeping of accounts were complied
with in all material respects.
30 August 2018
Brendan Worrall Queensland Audit O�ceAuditor-General Brisbane
105APPENDICES
APPENDICES
PUBLICATIONSWe produce a range of publications, guidelines, and other useful resources about:each year’s Queensland
Budget cycle�nancial and economic policygovernment-owned corporationseconomic, statistical and
demographic researchinfrastructure projectsstate revenue, including land tax,
payroll tax and dutiesthe �rst Home Owners’ Grantadvice on paying infringement
notices and �nes.
Many of these are available through www.treasury.qld.gov.au or by contacting us.
GOVERNMENT BODIESA report on the activities of the Business Development Fund Investment Panel is available at www.treasury.qld.gov.au.
CONSULTANCIES, LANGUAGE SERVICES, OVERSEAS TRAVELReports of Treasury’s expenditure on consultancies, language services and overseas travel are published on the Open Data website data.qld.gov.au
LEGISLATION ADMINISTERED BY TREASURYAboriginal Land Act 1991 (Part 18 to the extent that it is relevant to royalties)
Airport Assets (Restructuring and Disposal) Act 2008
Alcan Queensland Pty. Limited Agreement Act 1965 (to the extent that it is relevant to royalties)
Appropriation Act 2016
Appropriation Act 2017
Appropriation Act (No. 2) 2016
Appropriation Act (No. 2) 2017
Appropriation (Parliament) Act 2016
Appropriation (Parliament) Act 2017
Appropriation (Parliament) Act (No. 2) 2015
Appropriation (Parliament) Act (No. 2) 2017
Betting Tax Act 2018
Brisbane Trades Hall Management Act 1984
Building Boost Grant Act 2011
Central Queensland Coal Associates Agreement Act 1968 (to the extent that it is relevant to royalties); (Sch pt V)
Commonwealth Aluminium Corporation Pty. Limited Agreement Act 1957 (to the extent that it is relevant to royalties)
Commonwealth Places (Mirror Taxes Administration) Act 1999
Community Ambulance Cover Levy Repeal Act 2011
Competition Policy Reform (Queensland) Act 1996
Cross River Rail Delivery Authority Act 2016
Dalrymple Bay Coal Terminal (Long-term Lease) Act 2001
Duties Act 2001
Financial Accountability Act 2009
Financial Agreement Act 1994
Financial Intermediaries Act 1996
Financial Sector Reform (Queensland) Act 1999
First Home Owner Grant Act 2000
Fossicking Act 1994 (to the extent that it is relevant to royalties)
Fuel Subsidy Repeal Act 2009
Gaming Machine Act 1991 (s 322(a))

QUEENSLAND TREASURY ANNUAL REPORT 2017–18106
Geothermal Energy Act 2010 (to the extent that it is relevant to royalties)
Government Owned Corporations Act 1993
GST and Related Matters Act 2000
Infrastructure Investment (Asset Restructuring and Disposal) Act 2009
Judges (Pensions and Long Leave) Act 1957 (s17)
Land Tax Act 2010
Mineral Resources Act 1989 (to the extent that it is relevant to royalties)
Motor Accident Insurance Act 1994
Mount Isa Mines Limited Agreement Act 1985 (to the extent that it is relevant to royalties)
Mutual Recognition (Queensland) Act 1992
National Injury Insurance Scheme (Queensland) Act 2016
Occupational Licensing National Law (Queensland) Act 2010
O¦shore Minerals Act 1998 (to the extent that it is relevant to royalties)
Payroll Tax Act 1971
Petroleum Act 1923 (to the extent that it is relevant to royalties)
Petroleum and Gas (Production and Safety) Act 2004 (to the extent that it is relevant to royalties)
Petroleum (Submerged Lands) Act 1982 (to the extent that it is relevant to royalties)
Public O�cers Superannuation Bene�ts Recovery Act 1988
Queensland Competition Authority Act 1997
Queensland Investment Corporation Act 1991
Queensland Nickel Agreement Act 1970 (all �nancial and related matters); (to the extent that it is relevant to royalties)
Queensland Productivity Commission Act 2015
Queensland Treasury Corporation Act 1988
South East Queensland Water (Restructuring) Act 2007 (including as a responsible Minister for the purposes of Chapter 2 of the Act)
State Financial Institutions and Metway Merger Facilitation Act 1996
State Penalties Enforcement Act 1999 (except to the extent administered by the Attorney-General and Minister for Justice and Minister for Training and Skills)
Statistical Returns Act 1896
Statutory Authorities (Superannuation Arrangements) Act 1994
Statutory Bodies Financial Arrangements Act 1982
Superannuation (Public Employees Portability) Act 1985
Superannuation (State Public Sector) Act 1990
Taxation Administration Act 2001
Thiess Peabody Coal Pty. Ltd. Agreement Act 1962 (to the extent that it is relevant to royalties)
Thiess Peabody Mitsui Coal Pty. Ltd. Agreements Act 1965 (to the extent that it is relevant to royalties)
Torres Strait Islander Land Act 1991 (Part 13 to the extent that it is relevant to royalties)
Trans-Tasman Mutual Recognition (Queensland) Act 2003
APPENDICES

107APPENDICES
EXTERNAL SCRUTINYExternal audits and reviews aid transparency in government, help us improve our performance, and help us monitor our progress in advancing Queensland’s priorities.
The following reports of independent reviews were tabled in Parliament during 2017–18:
Auditor-General Report to Parliament No. 11 for 2017–18 Queensland State Government 2016–17 results of financial audits Tabled 22 February 2018
Recommendations
No key audit matters identi�ed with Treasury’s 2016–17 �nancial audit.
Our response
This report noted the following issues which Treasury will address:additional expenditure expected
in 2017–18 for the Gold Coast Commonwealth Games and the response to recent disaster events
that the 2017–18 Queensland Budget and Mid Year Fiscal and Economic Review to include estimates of this expenditure
Both Treasury and the Department of the Premier and Cabinet will work to assess any additional process required to collect information on key management personnel.
Auditor-General Report to Parliament Finalising unpaid fines Tabled 22 February 2018
Recommendations
That the State Penalties Enforcement Registry (SPER):adopt processes and measures to
assess cost and e¦ectiveness of its enforcement actions
seeks revised and debt write-o¦ guidelines in accordance with the State Penalties Enforcement Act from the Minister
assesses and writes o¦ aged and unrecoverable debt in accordance with the revised debt write-o¦ guidelines.
Our response
SPER is in the process of implementing a new business model with a new supporting ICT system that will have more capacity around management reporting. The revised approach will be reflected in the new business processes and practise that will commence with the implementation of the new ICT system.
Parliamentary Committees – Report No. 51 Consideration of the recommendations of the Strategic Review of the Queensland Audit Office October 2017
Recommendation
That the Premier and Treasurer advise all Ministers and departments of their expectation that they will ensure timely preparation and submission of �nancial statements to the Queensland Audit O�ce.
Our response
The Under Treasurer wrote to all accountable o�cers concerning their obligations for �nancial statements under the Financial Accountability Act 2009.

QUEENSLAND TREASURY ANNUAL REPORT 2017–18108
INDEX
1 William Street 22About us 7
Changes for Treasury 8 Clients 7 How we began 7 Our services 7 Purpose, values 7Agency Excellence 18, 20Agency performance service 27
Appendices 105 Consultancies 105 Contact us 111 External scrutiny 107 Glossary 110 Government bodies 105, www.treasury.qld.gov.au Language services 105 Legislation 105 Overseas travel 105 Publications 105Back to Work 8, 12, 25, 39, 42Betting tax 37Biographies, senior management 12-13Brisbane International Cruise Terminal 11, 28Budget, Queensland 6, 9, 10, 11, 17, 23-26, 36, 37, 107Business Development Fund 6,31, 44, 105,
www.treasury.qld.gov.auCairns Innovation Centre 42Capability (workforce) 18Changes for Treasury (machinery of government) 8Cities Transformation Taskforce 8City Deals 31CleanCo 29Clients 7Code of Conduct (public service) 22Commercial services 28-34
Committee – Audit and risk management 16-17Commonwealth/federal funding 11, 27, 40, 41, 42Commonwealth Games 27, 107Commonwealth Grants Commission 110Consultancies Open Data portalContact us 111Copyright and licensing Inside front coverCorporate governance 9-17Crime statistics 26
Cross River Rail 6, 8, 11, 13, 28Cruise terminal, Brisbane 11, 28Cyclone Debbie 23Debt Action Plan 42Debt, penalty 6, 11, 35, 37, 38, 110Diversity and inclusion 21-22Document and records management 17Domestic and family violence 6, 21, 22, 38Duties 35-37, 41Economic and fiscal coordination service 23-26
Economic growth 7, 22, 23, 35, 110Electricity pricing, a¦ordability 6, 11, 29, 30Employment and jobs 8, 12, 24, 31, 39, 42, 44Energy, including reform 11, 28, 29, 30Ethics 22Executive management, biographies 12-13External audits/scrutiny 107Federal/Commonwealth funding 11, 27, 40, 41, 42Financial assurance/mine rehabilitation 32, 44Financial statements 45-104Financial summary 40-44Fines – revenue, penalty debt 6, 11, 35, 37, 38, 110First Home Owners’ Grant 17, 37, 40, 42, 44Fiscal principles, strategy 9, 23Gas Action Plan 29Gender 21Glossary 110Governance, corporate 9-17Government-owned corporations 28Government objectives for community 10-11Graduate recruitment 6, 20Grants 17, 23, 35, 37, 39, 40-44Great Leaders Program 20Gri�th University 27GST 11, 27, 35, 40, 42Health and safety 20, 21, 22Herston Quarter redevelopment 13, 44Highlights 6History/How we began 7Hospitals 6, 28Housing, homelessness 11, 27Indigenous business, employment 21, 34Information/records management 17Infrastructure 6, 8, 11, 25, 26, 27, 28-34, 41

109INDEX
Internal audit 16-17Interpreting, translating Inside front coverJobs and Regional Growth Fund/package 31Key performance indicators 3-5Land Restoration Fund 34Land tax 6, 35, 36, 37, 39, 41Language services reporting Open Data PortalLeading Treasury 12-15Legislation 105-106Letter of compliance Inside front coverLicensing/copyright Inside front coverMachine learning 35, 36Machinery of government (changes for Treasury) 8Managing our organisation 9-17 Fiscal strategy 9 Government’s objectives for community 10-11 Information management 17 Internal audit 16-17 Leading Treasury/org. chart 12-15 Performance 3-5Manufacturing 33Market-Led Proposals 8, 28Migration 6, 26Mine rehabilitation/�nancial assurance 32, 44Mid-Year Fiscal and Economic Review 9, 25, 107National Injury Insurance Scheme 7, 16, 17, 106, 111National Partnerships 40Northern Australia 6, 11, 34, 110Objectives for the community 10-11O�ce of Industrial Relations 8, 19, 21, 42, 44O�ce of State Revenue 35-39Organisational chart 14-15Our �nancial position explained 40-44Our people 18-22 Employee development 18-22 Graduate recruitment 20 Workforce demographics 18-19Our services 23-39 Agency performance 27 Commercial services 28-34 Economic and �scal coordination 23-26 Revenue management 35-39Payroll tax 35, 37, 39, 41, 42Penalty debt 6, 11, 35, 37, 38, 110
Performance indicators 3-5Population projections 26Powering Queensland Plan 6, 11, 29, 30Productivity Commission 6, 7, 20, 27, 33Publications 105, www.qld.gov.auPublic availability Inside front coverPublic service code of conduct 22Public Service Commission 18, 20, 21Public transport 11, 27Queensland Budget 6, 9, 10, 11, 17, 23-26, 36, 37, 107Queensland Competition Authority 7, 32, 33Queensland Government Insurance Fund 41Queensland Racing Integrity Commission 8Queensland Rail 32Records 17Redundancies, separations 19Resources Regional Development Framework 32Revenue management service 35-39
Risk management 16Rookwood Weir 6, 28, 29Royalties 23, 35, 39, 41, 42Schools 27, 28Solar pricing 29State Penalties Enforcement Registry (SPER) 17, 37, 44, 107Statistical research 26Statutory bodies 7, 8, 111, www.treasury.qld.gov.auStrategic Plan 10Taxes (state) 39, 41Third party access 32Toowoomba Second Range Crossing 28Townsville Eastern Access Rail Corridor 6, 28Trade and Investment Queensland 8Transfer duty 35, 39Translating, interpreting Inside front coverUnder Treasurer’s report 2Values 7Vehicle immobilisation 38, 110Vision 7Water 29, 33, 110Work and development orders 6, 11, 38, 110, Workforce demographics 18-19Workforce planning, performance 18-22Work/life balance 20

QUEENSLAND TREASURY ANNUAL REPORT 2017–18110
GLOSSARY
Additional foreign acquirer dutyAn additional amount of duty paid by foreign acquirers (usually purchasers, either directly or indirectly) of residential property (see Duties below).
BDF Business Development Fund
Duties A state tax on certain transactions including transfer of property (transfer duty), vehicle registration, insurance contracts and other acquisitions.
ELT Treasury’s Executive Leadership Team
GOC Government-owned corporation
Horizontal fiscal equalisation (HFE)A process to address the di¦erences between states’ and territories’ ability and capacity to raise revenue. Australia’s Commonwealth Grants Commission states that HFE ‘aims to put all states on a level �scal playing �eld’.
Land tax State tax on freehold land, assessed on the taxable value of an owner’s total land holdings.
LGBTIQ+Lesbian, gay, bisexual, transgender, intersex, queer, and inclusiveness of other identities and experiences.
Market-Led Proposal A proposal from the private sector seeking an exclusive commercial arrangement with government to deliver a service or infrastructure to meet a community need.
NAIF Northern Australia Infrastructure Facility
Nominal DefendantA statutory body that compensates people injured by unidenti�ed and/or uninsured vehicles.
OSR O�ce of State Revenue
Payroll tax State tax paid if an employer, or group of employers, pays more than $1.1 million per year in total Australian taxable wages.
Productivity A measure of how e�ciently an economy uses resources (e.g., labour and capital) to produce outputs (goods and services). Productivity growth reflects the extent to which additional output is generated from managing the resources or inputs more e¦ectively. Increased productivity is a key factor in long-term economic growth, which in turn results in greater prosperity and improvements in living standards.
Project proponent In the context of major infrastructure, a proponent is one who puts forward a proposition or proposal.
QAO Queensland Audit O�ce
QCAQueensland Competition Authority, an independent economic regulator, whose primary role is to ensure monopoly businesses operating in Queensland, particularly those that provide key infrastructure (for example rail, water or transport infrastructure), do not abuse their market power through unfair pricing or restrictive access arrangements.
QPC Queensland Productivity Commission, a body established to drive economic growth and li« productivity and living standards by advising on complex economic and regulatory issues.
Royalty revenue Royalties are payments to the owners of a resource for the right to sell, dispose of or use that resource. In the context of Treasury’s revenue management service, these resources are usually from petroleum, coal and other mining activities.
State Penalties Enforcement Registry (SPER) Part of the O�ce of State Revenue, SPER collects and enforces unpaid infringement notice �nes, court ordered monetary �nes and o¦ender recovery orders issued in Queensland.
Third party accessThird party access provides a (legislated) right for a party (the third party) to use another person’s infrastructure. For example, a mining company may seek to transport minerals from its mines to a port via a rail line owned and operated by someone else. Third party access may need to be regulated where owners or operators of signi�cant natural monopoly infrastructure have the potential to deny access to their facilities or charge excessive prices, which would hinder or prevent competition in a dependent market.
VISSVehicle Immobilisation Seizure and Sale program, in which vehicles of high-value �ne debtors (those owing $5,000 or more) are immobilised through wheel clamping, removed from the owner and/or sold to recoup unpaid penalty debt.
Work and development order (WDO)A means for resolving penalty debt. WDOs allow debtors experiencing hardship to undertake activities such as �nancial or other counselling, education, vocational or life-skills programs, and unpaid community work, when they cannot a¦ord to pay the debt.

CONTACT US 111
CONTACT US
QUEENSLAND TREASURY – PRINCIPAL PLACE OF BUSINESS1 William Street, Brisbane Qld 4001, Australia Phone: +61 7 3035 1933 GPO Box 611, Brisbane Qld 4001, Australia www.treasury.qld.gov.au
STATUTORY AND OTHER BODIES
Cross River Rail Delivery Authority
PO Box 15476, Brisbane City East Qld 4002, Australia Phone: 1800 010 875 Email: [email protected] Web: www.crossriverrail.qld.gov.au/about-us/
Motor Accident Insurance Commission
GPO Box 2203, Brisbane Qld 4001, Australia Phone: +61 7 3035 6327 Email: [email protected] Web: www.maic.qld.gov.au
National Injury insurance Scheme Queensland Agency
PO Box to 1391, Brisbane Qld 4001, Australia Phone: 1300 607 566 Email: [email protected]
Nominal Defendant
GPO Box 2203, Brisbane Qld 4001, Australia Phone: +61 7 3035 6321 Email: [email protected]
Queensland Competition Authority
Level 27, 145 Ann Street, Brisbane Qld 4000, Australia GPO Box 2257, Brisbane Qld 4001, Australia Phone: +61 7 3222 0500
Queensland Productivity Commission
Level 27, 145 Ann Street, Brisbane Qld 4000, Australia PO Box 12112, George Street Brisbane Qld 4003, Australia Phone: +61 7 3015 5111 Email: [email protected] Web: www.qpc.qld.gov.au
Queensland Treasury Corporation
Level 31, 111 Eagle Street, Brisbane Qld 4000, Australia GPO Box 1096, Brisbane Qld 4001, Australia Phone: +61 7 3842 4600 Email: [email protected] Web: www.qtc.qld.gov.au/qtc/public
Feedback
Help us improve our annual report by sharing your feedback with us through the government’s Get Involved website – www.qld.gov.au/annualreportfeedback

QUEENSLAND TREASURY ANNUAL REPORT 2017–18112
QUEENSLAND TREASURY ANNUAL REPORT 2017–18 COMPLIANCE CHECKLIST
Requirement Basis for requirement AR page ref.Letter of compliance From accountable o�cer to relevant Minister/s ARRs1 – section 7 Inside front cover
Accessibility Table of contents ARRs – section 9.1 1
Glossary ARRs – section 9.1 110
Public availability ARRs – section 9.2 Inside front cover
Interpreter statement Queensland Government Language Services Policy ARRs – section 9.3
Inside front cover
Copyright notice Copyright Act 1968 ARRs – section 9.4 Inside front cover
Information licensing QGEA – Information Licensing ARRs – section 9.5 Inside front cover
General information Introductory information ARRs – section 10.1 2, 7-17
Agency role and main functions ARRs – section 10.2 7-8
Operating environment ARRs – section 10.3 23-39
Non-�nancial performance Government’s objectives for the community ARRs – section 11.1 10-11Other whole-of-government plans/speci�c initiatives ARRs – section 11.2 27,40
Agency objectives and performance indicators ARRs – section 11.3 3-5, 23-39
Agency service areas and service standards ARRs – section 11.4 3-5
Financial performance Summary of �nancial performance ARRs – section 12.1 40-44
Governance – management and structure
Organisational structure ARRs – section 13.1 14-15
Executive management ARRs – section 13.2 12-15Government bodies (statutory bodies and other entities) ARRs – section 13.3 105
Public Sector Ethics Act 1994 Public Sector Ethics Act 1994 ARRs – section 13.4 22
Queensland public service values ARRs – section 13.5 7,18,22
Governance – risk management and accountability
Risk management ARRs – section 14.1 16-17
Audit committee ARRs – section 14.2 16-17
Internal audit ARRs – section 14.3 16-17
External scrutiny ARRs – section 14.4 107
Information systems & recordkeeping ARRs – section 14.5 17
Governance – human resources
Workforce planning and performance ARRs – section 15.1 18-22
Early retirement, redundancy and retrenchment Directive 11/12 Early Retirement, Redundancy and Retrenchment
Directive 16/16 Early Retirement, Redundancy and Retrenchment (20/5/16)
ARRs – section 15.2
19
Open Data Statement advising publication of information ARRs – section 16 105
Consultancies ARRs – section 33.1 Open Data Portal
Overseas travel ARRs – section 33.2 Open Data Portal
Queensland Language Services Policy ARRs – section 33.3 Open Data Portal
Financial statementsCerti�cation of �nancial statements
FAA2 – section 62 FPMS3 – sections 42, 43 and 50 ARRs – section 17.1
101
Independent Auditor’s Report FAA – section 62 FPMS – section 50 ARRs – section 17.2
102
1ARRs Annual report requirements for Queensland Government agencies2FAA Financial Accountability Act 2009 3FPMS Financial and Performance Management Standard 2009

14 September 2018
The Honourable Jackie Trad MP Deputy Premier, Treasurer and Minister for Aboriginal and Torres Strait Islander Partnerships
1 William Street Brisbane Qld 4000
Dear Deputy Premier
I am pleased to submit for presentation to the Parliament the Annual Report 2017–18 and �nancial statements for Queensland Treasury.
This report is prepared on the basis of the current administrative arrangements for this department applying for the whole of the 2017–18 �nancial year. That is, it reflects the structure, operations and performance of the department as it now exists.
I certify that this Annual Report complies with:
the prescribed requirements of the Financial Accountability Act 2009
the Financial and Performance Management Standard 2009, and
the detailed requirements set out in the Annual report requirements for Queensland Government agencies.
A checklist outlining the annual reporting requirements can be found at page 112 of this annual report.
Yours sincerely
Jim Murphy Under Treasurer
TRANSLATING AND INTERPRETING ASSISTANCEThe Queensland Government is committed to providing accessible services to Queenslanders from all cultural and
linguistic backgrounds. If you have di�culty in understanding the annual report, you can contact us on telephone (07) 3035 3503 and we will arrange an interpreter to e�ectively communicate the report to you.
LICENCEThis annual report is licensed by the State of Queensland (Queensland Treasury) under a Creative Commons Attribution (CC BY) 4.0 International licence.
In essence, you are free to copy, communicate and adapt this annual report, as long as you attribute the work to the State of Queensland (Queensland Treasury). To view a copy
of this licence, visit http://creativecommons.org/licenses/by/4.0/
ISSN 1837-2848
© The State of Queensland (Queensland Treasury) 2018
ABOUT OUR ANNUAL REPORTThe Queensland Treasury Annual Report 2017–18 is an integral part of our corporate governance framework and one of the main tools we use to ensure we are accountable to the Queensland Parliament and the community about our activities.
This report details our achievements, performance and �nancial position for the 2017–18 �nancial year. It aligns with the Queensland Government’s objectives for the community, the Queensland Treasury Strategic Plan 2017–21, and our Service Delivery Statement 2017–18.
It also provides information on our future direction, people management and corporate governance processes.
FIND OUR REPORT ONLINEThis report is available online:
www.treasury.qld.gov.au/publications-resources/
For enquiries about this annual report, contact the Principal Communication O�cer, Strategic Communications on (07) 3035 3532 or via [email protected].
Follow us

Queensland Treasury2017 –2018 Annual Reportwww.treasury.qld.gov.au
Queensland Treasury
Queensland Treasury Annual Report 2017–18


![[ANNUAL REPORT] - University of Queensland](https://static.fdocuments.in/doc/165x107/6273a2942339010f907e01c3/annual-report-university-of-queensland.jpg)